ANNUAL REPORT AND ACCOUNTS - XP Power
194
ANNUAL REPORT AND ACCOUNTS for the year ended 31 December 2021
-
Upload
khangminh22 -
Category
Documents
-
view
1 -
download
0
Transcript of ANNUAL REPORT AND ACCOUNTS - XP Power

30801 8 March 2022 9:38 am v9
ANNUAL REPORT AND ACCOUNTS
for the year ended 31 December 2021
XP POW
ERAN
NU
AL REPORT &
ACCOU
NTS for the year ended 31 D
ecember 2021
30801-XP-Power AR21-Strategic.indd 330801-XP-Power AR21-Strategic.indd 3 08/03/2022 10:56:3608/03/2022 10:56:36

30801 8 March 2022 9:38 am v9
We provide our customers with solutions to power their critical systems.We have moved steadily up the value chain from a specialist distributor, to designer, to design manufacturer.
WE ARE BUILDING RESILIENCE, AND GROWING SUSTAINABLY:Strengthening our supply chain and developing our relationships with suppliers and customers
Gaining market share in growing markets through our proven business model
Focusing on what matters most to us and our stakeholders
SEE PAGES 09–12 FOR MORE INFORMATION
30801-XP-Power AR21-Strategic.indd 330801-XP-Power AR21-Strategic.indd 3 08/03/2022 10:56:4008/03/2022 10:56:40

30801 8 March 2022 9:38 am v9
We have delivered a robust performance in a year of ongoing global challenges, delivering record orders and growing revenue, whilst continuing to invest in the business by adding capacity, developing new products and increasing our global workforce.”
GAVIN GRIGGSCHIEF EXECUTIVE
FIND US ONLINE AT XPPOWERLTD.COM
ContentsOVERVIEWXP POWER AT A GLANCE 02
WHAT WE DO 02
CHAIR’S STATEMENT 06
BUILDING RESILIENCE, GROWING SUSTAINABLY 08
OUR PURPOSE, VISION, STRATEGY, VALUES AND CULTURE 14
FINANCIAL AND OPERATIONAL HIGHLIGHTS 16
REASONS TO INVEST 17
STRATEGIC REPORTOUR MARKETPLACE 20
GROWING OUR ADDRESSABLE MARKETS 20
OUR BUSINESS MODEL 26
OUR STRATEGY 28
KEY PERFORMANCE INDICATORS 30
PERFORMANCE: OPERATIONAL REVIEW 32
PERFORMANCE: FINANCIAL REVIEW 38
MANAGING OUR RISKS 42
MANAGING OUR RISKS: VIABILITY STATEMENT 49
SECTION 172(1) STATEMENT; HOW WE ENGAGE WITH OUR EMPLOYEES 50
SUSTAINABILITY INTRODUCTION AND PROGRESS UPDATE 52
OUR SUSTAINABILITY STRATEGY 53
1. SUSTAINABLE PRODUCTS 56
2. ENVIRONMENTAL LEADERSHIP 59
3. PEOPLE AND WORKPLACE 63
4. ETHICS AND COMPLIANCE 71
COMMITMENT TO REDUCING CLIMATE CHANGE: TCFD REPORT 73
GOVERNANCECHAIR'S INTRODUCTION TO GOVERNANCE 80
BOARD OF DIRECTORS 82
CORPORATE GOVERNANCE REPORT 84
NOMINATION COMMITTEE REPORT 96
AUDIT COMMITTEE REPORT 104
REMUNERATION COMMITTEE REPORT 110
OTHER GOVERNANCE AND STATUTORY DISCLOSURES 128
STATEMENT BY DIRECTORS 129
FINANCIALSINDEPENDENT AUDITOR’S REPORT 132
CONSOLIDATED STATEMENT OF COMPREHENSIVE INCOME 137
CONSOLIDATED BALANCE SHEET 138
CONSOLIDATED STATEMENT OF CHANGES IN EQUITY 139
CONSOLIDATED STATEMENT OF CASH FLOWS 140
NOTES TO THE CONSOLIDATED FINANCIAL STATEMENTS 141
COMPANY BALANCE SHEET 179
NOTES TO THE COMPANY BALANCE SHEET 180
FIVE-YEAR REVIEW CONSOLIDATED INFORMATION 189
ADVISERS 190
30801-XP-Power AR21-Strategic.indd 130801-XP-Power AR21-Strategic.indd 1 08/03/2022 10:56:4208/03/2022 10:56:42

30801 8 March 2022 9:38 am v9
Our products help power the world’s critical systems
SEE PAGE 05 FOR A CASE STUDY
READ MORE ABOUT OUR CUSTOMERS' NEEDS IN OUR MARKETPLACE ON PAGES 23–25
These products will either power the electronics, in the case of our low-voltage products, or processes, in the case of our high-voltage and radio frequency (RF) power systems, in critical systems in the Healthcare, Industrial Technology or Semiconductor Manufacturing Equipment sectors.
How we differentiateOur customers provide mission-critical systems to service their relevant market sectors. Therefore, our products need to be reliable, resilient and safe. We have built a product portfolio of over 250 product families that give us the broadest product offering in the industry.
Our global network gives us a strong competitive advantage over both our smaller competitors, who do not have the scale and geographical reach to serve global customers, and our larger competitors, who often lack the operational flexibility to provide the excellent services and speed that customers seek.
XP Power designs and manufactures power control systems, the essential hardware component in every piece of electrical equipment that converts power from the electricity grid into the right form for equipment to function.
Our customersOur customers are original equipment manufacturers who can be characterised as having expertise in their field, whether with healthcare devices, fast-growing industrial technologies or semiconductor equipment manufacturing, but generally do not have deep in-house power conversion expertise.
We provide this expertise and assist our customers to design-in a suitable power supply from our extensive range of products that meet the customers' cost and technical requirements. These technical requirements often involve helping the customer meet the equipment safety standards that operate in their industry, such as relevant medical or electrical safety standards, as well as electromagnetic compatibility (conducted and radiated electrical noise).
We pride ourselves on our customer focus, providing rapid response to their technical issues to solve their power problems and help them get to market as fast as possible.
02
XP Power Annual Report & Accounts for the year ended 31 December 2021
XP POWER AT A GLANCE:WHAT WE DO
30801-XP-Power AR21-Strategic.indd 230801-XP-Power AR21-Strategic.indd 2 08/03/2022 10:56:4508/03/2022 10:56:45

30801 8 March 2022 9:38 am v9
Semiconductor manufacturing equipmentEXAMPLES OF END-USER PRODUCTS:• Deposition• Semiconductor test• Ion implantation• Lithography
HealthcareEXAMPLES OF END-USER PRODUCTS:• Diagnostics• Surgical tools• Patient monitoring• Analytics and imaging
Industrial technologyEXAMPLES OF END-USER PRODUCTS:• 3D and industrial printing• Transport• Robotics• Security
03
OVERVIEW
30801-XP-Power AR21-Strategic.indd 330801-XP-Power AR21-Strategic.indd 3 08/03/2022 10:56:4808/03/2022 10:56:48

30801 8 March 2022 9:38 am v9
READ MORE ABOUT GROWING OUR ADDRESSABLE MARKETS ON PAGE 22
READ MORE ABOUT OUR GROWTH DRIVERS ON PAGE 23 NORTH AMERICA
The North American network consists of 11 sales offices, design centres in Massachusetts, New Jersey and Southern California, and an engineering solutions group in Silicon Valley. This network allows us to provide our major customers with local, face-to-face support and rapid response times. Production facilities are based in Massachusetts, New Jersey and Silicon Valley.
£141.2mTOTAL REVENUE
+8% CER COMPARED TO FY 20
EUROPEIn Europe, the network consists of eight direct sales offices and a further nine distributor offices. In addition, we have engineering solutions centres in Germany and the UK and in January 2022 added the acquisitions of FuG Elektronik GmbH and Guth High Voltage GmbH, also in Germany. With good coverage across Europe, we have the operational flexibility to provide high-quality and rapid service delivery. We maintain a small production facility in the UK for customer modifications.
£67.3mOF TOTAL REVENUE
+3% COMPARED TO FY 20
Our network of sales, engineering and manufacturing provides us with the flexibility of a global organisation and the ability to partner with our customers locally.
04
XP Power Annual Report & Accounts for the year ended 31 December 2021
XP POWER AT A GLANCE:THE POWER OF OUR GLOBAL REACH
30801-XP-Power AR21-Strategic.indd 430801-XP-Power AR21-Strategic.indd 4 08/03/2022 10:56:4808/03/2022 10:56:48

30801 8 March 2022 9:38 am v9
ASIAWe have five direct sales offices in Asia operating from Singapore, where we also manage a network of seven distributors serving the region. We have design engineering solutions capability in Singapore and South Korea to complement our offering to customers in the region.
£31.8mOF TOTAL REVENUE
+30% CER COMPARED TO FY 20
CASE STUDY
Enabling our customers to deliverCUSTOMER REQUIREMENT:The customer makes digital inkjet printers that use Ultraviolet (UV) light as part of the printing process.
Priorities:• The UV light is generated by LEDs
which requires a high power;• Flexibility so it can be adjusted
for different end product configurations;
• User configurability provided through GUI and system connectivity.
Requirement:A 5kW, digital high power product platform providing full user configurability.
OUR SOLUTION:We worked with the customer to design a simple and cost effective solution that was both flexible and scalable.
Why we won:• Simple and cost effective solution;• Being able to run from a 3 phase
input with no neutral;• Scalable solution for different
system configurations;• Speed of response and technical
support throughout the design process.
Key
MANUFACTURING
GLOBAL WAREHOUSE
R&D
05
OVERVIEW
30801-XP-Power AR21-Strategic.indd 530801-XP-Power AR21-Strategic.indd 5 08/03/2022 10:56:5008/03/2022 10:56:50

30801 8 March 2022 9:38 am v9
We made further strategic progress in 2021, delivering a robust set of results in what continued to be a difficult global environment.”
JAMES PETERSCHAIR
Our Progress in 2021 We made further strategic progress in 2021 and have produced a robust set of results in what continued to be a difficult global environment characterised by ongoing challenges resulting from COVID-19. A key priority since the start of the pandemic has been to protect the health and wellbeing of our colleagues and we continued this focus as we navigated the issues we faced in 2021. These impacts were compounded by the global supply chain challenges and component shortages faced by our industry worldwide, particularly in the fourth quarter. I would like to thank all colleagues for their ongoing
commitment and adaptability during this difficult period.
The clear highlight of the year was our record order book, which underlines the strength of demand for XP Power’s products. Revenues were above those achieved for 2020 and we delivered robust profitability and strong cash conversion despite the difficult global backdrop.
We saw continued momentum in the Semiconductor Manufacturing
Equipment sector, a recovery in Industrial Technology from the impact
of the pandemic shutdowns in 2020 and a normalisation of demand in Healthcare as
customers re-focused on innovation after the COVID-19 related spike in demand for critical care
equipment during 2020.
Our strong cash generation and confidence in the Group’s long-term prospects supported the continuation of our progressive dividend policy throughout 2021. The Board is proposing a final dividend of 36p for 2021 (2020: 36p), which would, if approved by shareholders, bring the total 2021 dividend per share to 94p (2020: 74p).
Our Board In January 2021, Gavin Griggs succeeded Duncan Penny as Chief Executive Officer and in May 2021 Oskar Zahn joined as Chief Financial Officer. The new senior team, supported by the strong Executive Leadership team we have throughout the business, have navigated successfully through a challenging period. We have confidence that under the new leadership the Group will deliver further growth in shareholder value.
After almost 35 years with the Group, and with XP Power performing well, I believe the time is right to begin implementing our succession plans for the position of Board Chair. I am delighted that Jamie Pike, also the Chair of Spirax-Sarco Engineering plc, is joining the Board in March 2022 as Non-Executive Director and Chair designate, and I look forward to working closely with him in the period until I retire from the Board, which is currently planned to be on or before the date of the AGM in 2023.
£343.4mORDER INTAKE +43% CER
COMPARED TO FY 20
06
XP Power Annual Report & Accounts for the year ended 31 December 2021
CHAIR’S STATEMENT
30801-XP-Power AR21-Strategic.indd 630801-XP-Power AR21-Strategic.indd 6 08/03/2022 10:56:5108/03/2022 10:56:51

30801 8 March 2022 9:38 am v9
Our People and Our Values The success of any organisation is dependent on its culture and the people and talent within it. The Board continues to engage with the Executive Leadership Team and colleagues throughout the Group to ensure we are continuing to identify and develop our key people and bringing new talent and capabilities into the business to help underpin our growth ambitions. We made a number of important hires in engineering, manufacturing and product management during the year as we look to further enhance our capabilities in these critical areas and to support the growth ambitions we have for the Group.
I am proud of what our people have achieved in 2021 and I know from our engagement with them that they are proud to be part of the XP Power team.
Sustainability Sustainability has been a long-term focus for XP Power and we are committed to reducing our environmental footprint and in 2021 our progress was recognised by ASM, a key customer, when we received its inaugural PRISM award, for sustainability. We have set Company targets to reduce CO2 emissions intensity by a minimum of 3% per annum over the short and medium term and an aspiration to achieve carbon neutrality by 2040. During 2021 the focus has been on building on our platform to ensure sustainability is fully embedded in XP Power. We have re-launched our Sustainability Council reinforcing our internal sustainability structure. The Board and senior management have undertaken sustainability training to raise our internal capability and develop the next stage of our strategy.
Strategy Review The Group has consistently executed a clear strategy, which has successfully delivered meaningful value creation for all stakeholders and this focus continued through 2021.
We recently completed our annual review of our strategy, which confirmed it remains appropriate. We continue to evolve individual elements to improve their effectiveness and to ensure it takes account of changes in the operating environment. Today, we are one of a few power companies in the world with the breadth of product portfolio across power and voltage spectrum. We remain focused on growth, both organically and inorganically and, despite many years of strong performance, we still have relatively low market shares in the markets we operate in and the sectors we focus on. Going forward, we will use our product portfolio and engineering services capabilities to provide customers with power solutions and continue to increase our market share.
Our strategy continues to deliver sustainable long-term earnings growth through revenue growth and market share gains in our target sectors and customers. This success is demonstrated by our consistent performance and resilience over the cycle in the sectors in which we operate. We are confident
we can continue to develop market-leading products and, encouraged by the potential of our product and sales backlog and pipeline, to continue to deliver organic growth.
The Group’s strong financial liquidity ensures we have sufficient resources to support targeted acquisitions to enhance our product portfolio and expand our addressable market. We completed the acquisition of two German based High Voltage businesses in January 2022. They are highly complementary to our existing high voltage portfolio and significantly enhance our capabilities in this attractive area. We will continue to maintain a highly disciplined approach to acquisitions ensuring targets enhance our existing portfolio and will complement our organic growth.
Outlook We delivered a robust performance in 2021 despite facing significant external challenges, particularly in the second half, demonstrating, once again, the resilience of our business model and quality of our people.
For 2022, despite the ongoing challenges and uncertainty that remain in relation to our supply chain, component shortages and inflationary pressures, the record order book and the positive demand backdrop, across all our sectors, provides us with confidence for our prospects. We remain excited about our longer-term outlook.
JAMES PETERSCHAIR
1 March 2022
The record order book and the positive demand backdrop across all our sectors provides us with confidence for our prospects.”
READ MORE ABOUT OUR BUSINESS STRATEGY ON PAGES 28–29
READ MORE ABOUT OUR SUSTAINABILITY STRATEGY ON PAGES 52–55
07
OVERVIEW
30801-XP-Power AR21-Strategic.indd 730801-XP-Power AR21-Strategic.indd 7 08/03/2022 10:56:5108/03/2022 10:56:51
30801 8 March 2022 9:38 am v9
08
XP Power Annual Report & Accounts for the year ended 31 December 2021
BUILDING RESILIENCE, GROWING SUSTAINABLY
30801-XP-Power AR21-Strategic.indd 830801-XP-Power AR21-Strategic.indd 8 08/03/2022 10:56:5308/03/2022 10:56:53

30801 8 March 2022 9:38 am v9
HOW WE HAVE DEVELOPED OUR SUPPLY CHAIN AND PRODUCTION FOOTPRINT TO LIMIT ANY SUPPLY CHAIN RISKSOur main production facilities are in China and Vietnam. We proactively manage these sites to optimise our supply chain and provide resilience of supply for our customers. Our total Asian manufacturing capacity is more than US$350 million per year. During 2021, we invested in additional equipment in Vietnam to expand capacity to meet our current levels of demand and to support the transfer of more products into Vietnam from China and our North American manufacturing facilities, as we seek to benefit from lower production costs.
Vietnam is now qualified to produce a total of 2,708 different low-voltage products as we continue the transfer of production capabilities. In addition, there are now 810 different high-voltage modules capable of being manufactured in Vietnam, now that the transfer of low-power, high-voltage DC-DC modules, previously manufactured in Minden, Nevada, is complete.
The dual supply capability has benefited our customers through the COVID-19 pandemic and as they seek to navigate changes in trade relations between China and the USA. We expect this important strategic capability of having production facilities in both Vietnam and China to enable us to win more design slots with key customers.
As the business continues to grow, we will require further production capacity and will commence construction of a new manufacturing facility in a third country in 2022 to increase capacity to meet the demand from across the world. Our overall objective is to provide a resilient and flexible supply chain with the capability to manufacture the majority of products in China, Vietnam and the new location to provide enhanced business continuity planning.
We also have three smaller, more technically specialist manufacturing facilities in North America. These include a customer-focused engineering services facility in California, a site in New Jersey focused on high-voltage products, and an RF-focused facility in Massachusetts. These facilities have continued to operate throughout 2021 except for short periods where decontamination was required following COVID-19 cases.
Our relationships with our suppliersQuality and reliability are paramount to our customers who often provide critical healthcare or industrial systems. For that reason, we need excellent suppliers with high-quality standards.
We have a rigorous approval process that looks at all aspects of a supplier before we engage with them. This includes prospective suppliers’ quality systems and standards, their financial viability, their environmental performance and treatment of their people. We are a full member of the Responsible Business Alliance (RBA) and have adopted the RBA Code of Conduct throughout our organisation. This deals with environmental standards, treatment of people, health and safety, and business ethics.
Throughout the year, we have seen supply issues for certain components and increased safety stocks of key components to manage through any future supply issues. We monitor market dynamics closely working with our supply partners. We have also designed out some particularly problematic components using our engineering team.
Our relationships with our customersOur customers are at the heart of what we do. We sell directly to our key customers where we can add genuine value, offering excellent service and support combined with class-leading products.
We build strong and long lasting relationships with our customers, driven by our large and technically capable sales engineering team and backed up by our highly skilled power systems engineers and the safety and reliability benefits of world-class manufacturing.
This structure was crucial during 2021 as we navigated the supply chain issues, and had to provide the same solutions with different components due to shortages.
READ MORE ABOUT OUR SUSTAINABLE SUPPLY CHAIN ON PAGES 56–70
READ MORE ABOUT OUR COMMITMENT TO REDUCING CLIMATE CHANGE ON PAGES 73–77
Building resilienceWe are building resilience across our supply chain and continue to strengthen relationships with our suppliers and customers.
09
OVERVIEW
30801-XP-Power AR21-Strategic.indd 930801-XP-Power AR21-Strategic.indd 9 08/03/2022 10:56:5308/03/2022 10:56:53
30801 8 March 2022 9:38 am v9
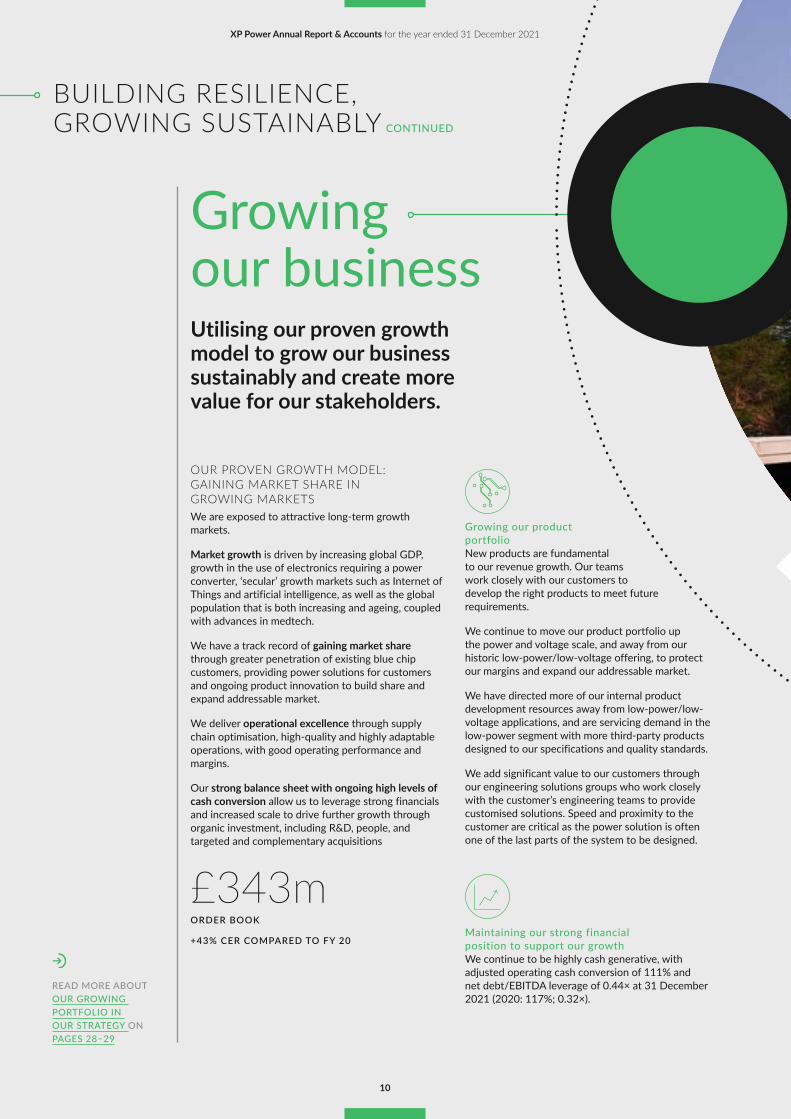
Growing our businessUtilising our proven growth model to grow our business sustainably and create more value for our stakeholders.
OUR PROVEN GROWTH MODEL: GAINING MARKET SHARE IN GROWING MARKETSWe are exposed to attractive long-term growth markets.
Market growth is driven by increasing global GDP, growth in the use of electronics requiring a power converter, ‘secular’ growth markets such as Internet of Things and artificial intelligence, as well as the global population that is both increasing and ageing, coupled with advances in medtech.
We have a track record of gaining market share through greater penetration of existing blue chip customers, providing power solutions for customers and ongoing product innovation to build share and expand addressable market.
We deliver operational excellence through supply chain optimisation, high-quality and highly adaptable operations, with good operating performance and margins.
Our strong balance sheet with ongoing high levels of cash conversion allow us to leverage strong financials and increased scale to drive further growth through organic investment, including R&D, people, and targeted and complementary acquisitions
£343mORDER BOOK
+43% CER COMPARED TO FY 20
READ MORE ABOUT OUR GROWING PORTFOLIO IN OUR STRATEGY ON PAGES 28–29
Growing our product portfolioNew products are fundamental to our revenue growth. Our teams work closely with our customers to develop the right products to meet future requirements.
We continue to move our product portfolio up the power and voltage scale, and away from our historic low-power/low-voltage offering, to protect our margins and expand our addressable market.
We have directed more of our internal product development resources away from low-power/low-voltage applications, and are servicing demand in the low-power segment with more third-party products designed to our specifications and quality standards.
We add significant value to our customers through our engineering solutions groups who work closely with the customer’s engineering teams to provide customised solutions. Speed and proximity to the customer are critical as the power solution is often one of the last parts of the system to be designed.
Maintaining our strong financial position to support our growthWe continue to be highly cash generative, with adjusted operating cash conversion of 111% and net debt/EBITDA leverage of 0.44× at 31 December 2021 (2020: 117%; 0.32×).
10
XP Power Annual Report & Accounts for the year ended 31 December 2021
BUILDING RESILIENCE, GROWING SUSTAINABLY CONTINUED
30801-XP-Power AR21-Strategic.indd 1030801-XP-Power AR21-Strategic.indd 10 08/03/2022 10:56:5508/03/2022 10:56:55

30801 8 March 2022 9:38 am v9
STRONG BALANCE SHEET WITH ONGOING HIGH LEVELS OF CASH CONVERSION
GROWING MARKETS
OUR TRACK RECORD OF GAINING MARKET SHARE
OPERATIONAL EXCELLENCE
OVERVIEW
11
30801-XP-Power AR21-Strategic.indd 1130801-XP-Power AR21-Strategic.indd 11 08/03/2022 10:56:5908/03/2022 10:56:59

30801 8 March 2022 9:38 am v9
Focusing on what mattersWe continue to focus on the most important issues to us and our stakeholders...
HEALTH AND SAFETY
OUR PEOPLE
ENVIRONMENTAL LEADERSHIP
SUSTAINABLE PRODUCTS
ETHICS AND COMPLIANCE
XP Power Annual Report & Accounts for the year ended 31 December 2021
12
BUILDING RESILIENCE, GROWING SUSTAINABLY CONTINUED
30801-XP-Power AR21-Strategic.indd 1230801-XP-Power AR21-Strategic.indd 12 08/03/2022 10:57:0008/03/2022 10:57:00
30801 8 March 2022 9:38 am v9
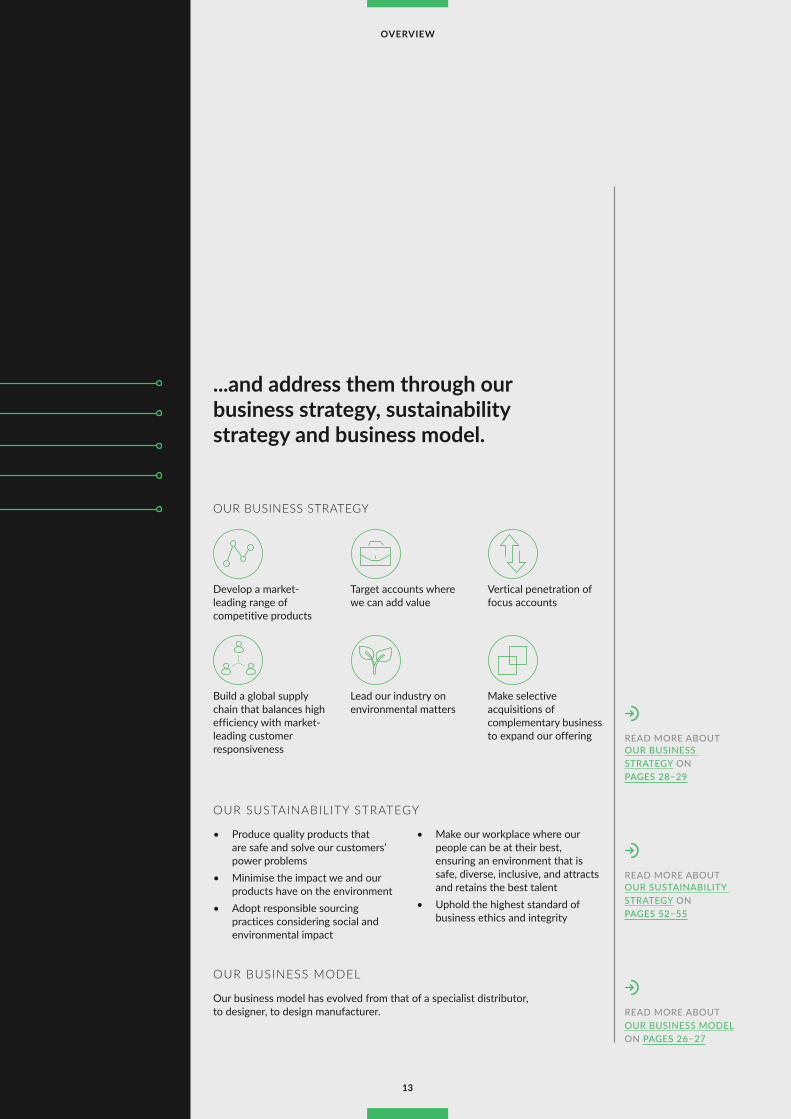
...and address them through our business strategy, sustainability strategy and business model.
READ MORE ABOUT OUR BUSINESS STRATEGY ON PAGES 28–29
READ MORE ABOUT OUR SUSTAINABILITY STRATEGY ON PAGES 52–55
READ MORE ABOUT OUR BUSINESS MODEL ON PAGES 26–27
OUR BUSINESS STRATEGY
Develop a market-leading range of competitive products
Target accounts where we can add value
Vertical penetration of focus accounts
Build a global supply chain that balances high efficiency with market-leading customer responsiveness
Lead our industry on environmental matters
Make selective acquisitions of complementary business to expand our offering
OUR SUSTAINABILITY STRATEGY
• Produce quality products that are safe and solve our customers’ power problems
• Minimise the impact we and our products have on the environment
• Adopt responsible sourcing practices considering social and environmental impact
• Make our workplace where our people can be at their best, ensuring an environment that is safe, diverse, inclusive, and attracts and retains the best talent
• Uphold the highest standard of business ethics and integrity
OUR BUSINESS MODEL
Our business model has evolved from that of a specialist distributor, to designer, to design manufacturer.
13
OVERVIEW
30801-XP-Power AR21-Strategic.indd 1330801-XP-Power AR21-Strategic.indd 13 08/03/2022 10:57:0008/03/2022 10:57:00

30801 8 March 2022 9:38 am v9
KnowledgeFlexibility
Customer Focus SpeedIntegrity
We link our purpose, vision, strategy, values and culture to clearly communicate to our colleagues and drive our business forward.
Our VisionWhere we want to be:To be the first-choice power solutions provider and to deliver the ultimate experience for our customers and our people.
Our StrategyHow we will deliver our vision:We have a well-articulated strategy that we have continued to refine and consistently execute over a significant period.
Our sustainability strategyOur sustainability strategy focuses on some of the most material issues across our business, ensuring that the value we create is for the long term.
Our Core ValuesOur fundamental beliefs for continued success: Our core values of Integrity, Knowledge, Flexibility, Speed and Customer Focus are our DNA and are fundamental to our continued success.
14
XP Power Annual Report & Accounts for the year ended 31 December 2021
OUR PURPOSE, VISION, STRATEGY, VALUES AND CULTURE
30801-XP-Power AR21-Strategic.indd 1430801-XP-Power AR21-Strategic.indd 14 08/03/2022 10:57:0408/03/2022 10:57:04

30801 8 March 2022 9:38 am v9
Our CultureOur culture places our people and customers at the heart of the business. Most importantly, it is driven by our sustainable mindset, which allows us to amplify our goals across XP Power by developing our talent and empowering our people to deliver sustainable value.
Our PurposeWhy we exist: We power the world’s critical systems.Being a purpose-led business:We add genuine value to our customers, helping them get to market quickly with complete power solutions. Our people understand how we create value for the customer.
OVERVIEW
15
30801-XP-Power AR21-Strategic.indd 1530801-XP-Power AR21-Strategic.indd 15 08/03/2022 10:57:0408/03/2022 10:57:04

30801 8 March 2022 9:38 am v9
FOR MORE INFORMATION ON OUR PERFORMANCE SEE PAGES 32–37
Financial highlights
ORDER INTAKE (£M)
£343.4mTOTAL REVENUE (£M)
£240.3mADJUSTED PROFIT BEFORE TAX (£M)
£43.8m2021
2020
2019
2018
2017
343.4
258.0
214.9
198.4
184.3
2021
2020
2019
2018
2017
240.3
233.3
199.9
195.1
166.8
2021
2020
2019
2018
2017
43.8
44.3
32.3
41.2
36.1
PROFIT BEFORE TAX (£M)
£28.4mADJUSTED EARNINGS PER SHARE (P)
176.3pDIVIDEND PER SHARE (P)
94p2021
2020
2019
2018
2017
28.4
35.7
24.0
37.6
32.2
2021
2020
2019
2018
2017
176.3
198.4
141.4
172.8
147.0
2021
2020
2019
2018
2017
94
74
55
85
71
Operational highlights• Order intake increased by 33% to £343.4
million, driven by all three sectors – continued momentum in the semiconductor manufacturing equipment sector, a strong recovery in industrial technology and normalisation of demand from our healthcare customers following the exceptional COVID-19-related demand in 2020.
• Reported revenue grew 3% to £240.3 million and 10% on a constant currency basis, compared to a strong 2020 comparator that included £15–20 million related to exceptional COVID-19 healthcare shipments.
• Gross margin decreased to 45.1% due to increased freight costs and temporary higher production costs due to COVID-19 in H2. H1 gross margin of 46.6%, reducing to 43.5% in H2.
16
XP Power Annual Report & Accounts for the year ended 31 December 2021
FINANCIAL AND OPERATIONAL HIGHLIGHTS
30801-XP-Power AR21-Strategic.indd 1630801-XP-Power AR21-Strategic.indd 16 08/03/2022 10:57:0508/03/2022 10:57:05

30801 8 March 2022 9:38 am v9
We are continuing to build resilience and grow our business sustainably to create long-term value for all stakeholders.
We are a growing businessOur record order book underlines the strength of demand for our products. Revenues continue to grow despite the difficult global backdrop.
SEE PAGES 23–25 FOR MORE INFORMATION
We operate in growing marketsOur markets are driven by increasing global GDP, growth in the use of electronics requiring a power converter; ‘secular’ growth markets such as Internet of Things and Artificial Intelligence, as well as the global population that is both increasing and ageing, coupled with advances in medtech.
SEE PAGES 20–22 FOR MORE INFORMATION
We have a strong financial positionWe have a strong balance sheet and continuing high cash conversion.
SEE PAGES 38–40 FOR MORE INFORMATION
We are differentiated and specialists in the power conversion marketWe have built a broad product portfolio of over 250 product families that give us the broadest product offering in the industry. Our global network gives us a strong competitive advantage over both our smaller competitors, who do not have the scale and geographical reach to serve global customers, and our larger competitors, who often lack the operational flexibility to provide the excellent services and speed that customers seek.
SEE PAGES 28–29 FOR MORE INFORMATION
We create sustainable valueBy investing in our people, prioritising our customers, strengthening our supply chain, growing our product portfolio and maintaining a strong cash position.
SEE PAGES 52–55 FOR MORE INFORMATION
We have built our business to remain agile and resilientOur global footprint and robust, multi-site, low cost manufacturing, along with strong and long-lasting relationships with our customers enables us to be agile and resilient.
SEE PAGES 26–27 FOR MORE INFORMATION
17
OVERVIEW
REASONS TO INVEST
30801-XP-Power AR21-Strategic.indd 1730801-XP-Power AR21-Strategic.indd 17 08/03/2022 10:57:0508/03/2022 10:57:05

30801 8 March 2022 9:38 am v9
XP Power Annual Report & Accounts for the year ended 31 December 2021
18
30801-XP-Power AR21-Strategic.indd 1830801-XP-Power AR21-Strategic.indd 18 08/03/2022 10:57:0608/03/2022 10:57:06

30801 8 March 2022 9:38 am v9
Strategic Report
CONTENTS
OUR MARKETPLACE 20
GROWING OUR ADDRESSABLE MARKETS 20
OUR BUSINESS MODEL 26
OUR STRATEGY 28
KEY PERFORMANCE INDICATORS 30
PERFORMANCE: OPERATIONAL REVIEW 32
PERFORMANCE: FINANCIAL REVIEW 38
MANAGING OUR RISKS 42
MANAGING OUR RISKS: VIABILITY STATEMENT 49
SECTION 172(1) STATEMENT: HOW WE ENGAGE WITH OUR EMPLOYEES 50
SUSTAINABILITY INTRODUCTION AND PROGRESS UPDATE 52
OUR SUSTAINABILITY STRATEGY 53
1. SUSTAINABLE PRODUCTS 56
2. ENVIRONMENTAL LEADERSHIP 59
3. PEOPLE AND WORKPLACE 63
4. ETHICS AND COMPLIANCE 71
COMMITMENT TO REDUCING CLIMATE CHANGE: TCFD REPORT 73
STRATEGIC REPORT
19
30801-XP-Power AR21-Strategic.indd 1930801-XP-Power AR21-Strategic.indd 19 08/03/2022 10:57:0608/03/2022 10:57:06

30801 8 March 2022 9:38 am v9
US$ BILLIONSESTIMATED MARKET
LOW VOLTAGE
3.5PROCESS POWER
2.5TOTAL
6.0XP POWER ESTIMATED SHARE
LOW VOLTAGE
7.6%PROCESS POWER
4.9%TOTAL
5.3%Source: Microtech Consultants and XP Power management estimates
We operate in a highly diverse market with great opportunity to grow market share.
OVERVIEWOur end markets can be broken down to the low voltage market, powering electronic systems, and the high voltage and radio frequency (RF) market, which powers processes such as the generation of plasmas or some sort of particle acceleration or ionisation.
The fragmented nature of the market means we have numerous competitors dependent on the product type, end application or geographic location with no particular competitor having a dominant share. We consider that we have strong relationships with the leading customers in the higher growth market niches, which will allow us to continue to grow our market share. This is particularly true in process power where our share is currently low.
LOW VOLTAGE
$3,500mTOTAL MARKET VALUE
OVERVIEW The low voltage market principally powers electronic systems and is highly fragmented globally.
OUR RESPONSEOur broad, easily modified, up-to-date product portfolio combined with our engineering capability allow us to provide effective solutions to diverse range of applications.
HIGH VOLTAGE
$700mTOTAL MARKET VALUE
OVERVIEW High voltage high power is an attractive market where we are finding many new opportunities since acquiring this product range.
OUR RESPONSE Our sales force is finding attractive opportunities in our existing customer base in semiconductor manufacturing equipment, research, additive manufacturing and healthcare applications for these products.
RF POWER
$1,870mTOTAL MARKET VALUE
OVERVIEW The RF Power market is substantial and has attractive growth prospects. The semiconductor equipment manufacturers are significant users of this product, but is also used in healthcare and applications involving dielectric and induction heating.
OUR RESPONSE The RF Power market presents an exciting opportunity for us to grow our revenues with customers who already value our service and support.
20
XP Power Annual Report & Accounts for the year ended 31 December 2021
OUR MARKETPLACEGROWING OUR ADDRESSABLE MARKETS
30801-XP-Power AR21-Strategic.indd 2030801-XP-Power AR21-Strategic.indd 20 08/03/2022 10:57:0708/03/2022 10:57:07

30801 8 March 2022 9:38 am v9
Semiconductor manufacturing equipment
Industrial technology Healthcare
The semiconductor manufacturing equipment market recovered strongly from the last cyclical downturn in 2018–19, and has continued to grow in 2021. We see this as an attractive sector for our long-term growth as the demand for semiconductor devices is driven by multiple factors such as artificial intelligence (AI), big data, the Internet of Things (IoT), autonomous vehicles and the roll-out of 5G.
XP POWER MARKET OVERVIEWWe are one of the few companies in the world that can offer the whole spectrum of power and voltage products required for semiconductor manufacture, and have capability to combine these into a complete power solution. This is particularly important to our customers as the latest generation of devices become more capital intensive to manufacture as they become multilayered and dimensions continue to shrink.
PERFORMANCE THIS YEARWe have benefited from ongoing demand and market share gains as a number of new programme wins, driven by technology advances, have entered production.
The industrial technology market is the most diversified of all our markets. There are no large individual programmes even though we are dealing with many blue chip industrial customers.
XP POWER MARKET OVERVIEWWe focus on fast growing niches in this market, such as robotics, test and measurement, 3D printing and additive manufacturing, smart grid, and analytical instruments.
PERFORMANCE THIS YEARDemand in industrial technology has remained robust despite supply chain challenges having a major impact during 2021.
The market for healthcare tends to be less cyclical than our other sectors, which adds resilience to our business model. We have a broad medical power converter offering with full traceability of components and high-quality in-house manufacturing.
XP POWER MARKET OVERVIEWHealthcare remains an attractive market for us, given the long-term demand growth dynamics and the safety critical nature of products. Our broad medical product range and high level of customer service make our value proposition very attractive.
PERFORMANCE THIS YEARDemand from our healthcare customers normalised as they switched from critical care equipment used to treat COVID-19 patients, to more normal demand patterns.
34%FIVE-YEAR CAGR
1%FIVE-YEAR CAGR
2%FIVE-YEAR CAGR
REVENUE (£M)
39% total revenue
£93.3m
REVENUE (£M)
38% total revenue
£92.0m
REVENUE (£M)
23% total revenue
£55.0m2021
2020
2019
2018
2017
93.3
69.6
37.4
47.4
29.1
2021
2020
2019
2018
2017
92.0
94.4
116.6
104.1
86.7
2021
2020
2019
2018
2017
55.0
69.3
45.9
43.6
51.0
Our products serve markets in multiple sectors and across our three market regions.
21
STRATEGIC REPORT
THE MARKET SECTORS WE SERVE
30801-XP-Power AR21-Strategic.indd 2130801-XP-Power AR21-Strategic.indd 21 08/03/2022 10:57:0908/03/2022 10:57:09

30801 8 March 2022 9:38 am v9
North America Europe AsiaNorth America is a significant market for power electronics with many large customers, particularly in healthcare and semiconductor manufacturing equipment.
Market overviewIn general, our customers in North America are the most innovative and fast moving. We see this particularly in healthcare. North America is also the de facto leader in semiconductor manufacturing equipment – a sector we consider to have strong long-term growth prospects for XP Power.
Performance this year North America produced strong growth in 2021 as the semiconductor manufacturing equipment sector continued to grow, and healthcare orders normalised following the benefit from COVID-19-related orders in 2020.
The European market is much more fragmented than North America or Asia, as it contains numerous smaller industrial technology companies, as well as several larger healthcare companies.
Market overviewOur European customers are principally involved in industrial technology with some healthcare, but very little semiconductor manufacturing equipment. It is our most diverse market.
Performance this year Europe benefited from significantly higher demand for critical healthcare products in 2021, but it was also the most impacted by the decline in the industrial technology sector due to COVID-19. Europe also did not benefit from the semiconductor manufacturing equipment exposure that Asia and North America have.
Although Asia is a large market, much of it is not available to XP Power, as many customers value cost over service and support. Nevertheless, there are several significant niches where our proposition is compelling. Asia’s up-and-coming semiconductor manufacturing equipment market is particularly attractive.
Market overviewMarkets in Asia are generally growing faster than in North America and significantly faster than in Europe. Although many applications are not attractive to us as customers choose cost over service and support, there are many attractive areas that we can service with our more complex high-power and high-voltage products.
Performance this yearAsia produced excellent growth in healthcare and semiconductor manufacturing equipment in 2021, and benefited from new design wins with the RF and high-voltage high-power capabilities added to the product portfolio through the Comdel and Glassman acquisitions, creating new revenue opportunities.
11%FIVE-YEAR CAGR
4%FIVE-YEAR CAGR
21%FIVE-YEAR CAGR
REVENUE (£M)
59% total revenue
£141.2m
REVENUE (£M)
28% total revenue
£67.3m
REVENUE (£M)
13% total revenue
£31.8m2021
2020
2019
2018
2017
147.2
115.5
119.1
94.4
141.2 67.32021
2020
2019
2018
2017
65.0
64.4
61.1
57.5
2021
2020
2019
2018
2017
21.1
20.0
14.9
14.9
31.8
22
XP Power Annual Report & Accounts for the year ended 31 December 2021
OUR MARKETPLACEGROWING OUR ADDRESSABLE MARKETS CONTINUED
30801-XP-Power AR21-Strategic.indd 2230801-XP-Power AR21-Strategic.indd 22 08/03/2022 10:57:1008/03/2022 10:57:10

30801 8 March 2022 9:38 am v9
Growth drivers and market challenges We see many opportunities to expand our addressable market and customer base.
STRATEGIC KEY
1 An event causes a disruption to our manufacturing facilities
2 Product recall
3 Competition from new market entrants and new technologies
4 Fluctuations of revenues, expenses and operating results due to an economic shocks
5 Dependence on key customers
6 Cybersecurity/information systems failure
7 Risks relating to regulation, compliance and taxation
8 Strategic risk associated with valuing or integrating new acquisitions
9 Loss of key personnel or failure to attract new personnel
10 Exposure to exchange rate fluctuations
11 Risk associated with supply chain
RISKS KEY
Develop a market-leading range of competitive products
Target accounts where we can add value
Vertical penetration of focus accounts
Build a global supply chain
Lead our industry on environmental matters
Make selective acquisitions
HealthcareA global population that is both increasing and ageing, coupled with advances in diagnostic technology and surgical robotics, is driving the demand for more healthcare devices. This makes healthcare an excellent sector for XP Power.
These customers demand the ultimate quality and reliability, and appreciate and value our proposition. COVID-19 has brought into focus that, generally, the healthcare infrastructure is inadequate in today’s world.
How we are respondingWe have the broadest, most up-to-date range of medically approved power converters in our industry, and are the world’s leading provider of healthcare power conversion products.
Link to
Strategy
Risks3, 9
Proliferation of electronic devicesElectronic devices are becoming more and more pervasive in our lives as new technologies and innovation continues. This trend is accelerating with the adoption of the Internet of Things (IoT), artificial intelligence (AI), big data and the roll-out of 5G.
These devices drive demand for semiconductor manufacturing equipment, which is a key focus area for XP Power.
How we are respondingWe have the broadest range of standard products in our industry, which are designed to be easily modified to power the customer's specific application. Many of our products are suitable to power semiconductor manufacturing equipment processes and electronics, and these customers value our engineering services proposition.
Link to
Strategy
Risks3, 9
Connectivity and industrial revolution 4.0Customers’ applications are becoming more complicated and increasingly more connected, enabling the industrial revolution 4.0. Demand for communication between the customers’ applications and power conversion solutions are rapidly expanding.
How we are respondingOur engineering services groups are providing complete power solutions including connectivity to and from the customer's application using firmware and software and, where required, connection to the internet.
Link to
Strategy
Risks2, 4, 5
23
STRATEGIC REPORT
30801-XP-Power AR21-Strategic.indd 2330801-XP-Power AR21-Strategic.indd 23 08/03/2022 10:57:1008/03/2022 10:57:10

30801 8 March 2022 9:38 am v9
Customer penetrationOur blue chip customer base provides good opportunities to win additional new product programmes from multiple engineering teams across the globe.
We have gained corporate approval at many blue chip companies over the past few years. We are now capitalising on these to win a larger share of the business that is available to those customers by expanding our product offering.
How we are respondingRF and high voltage power solutions from our previous acquisitions have helped to increase our available market to US$6.0 billion. The recent acquisition of FuG and Guth enhances further our ability to grow in these markets.
Link to
Strategy
Risks5, 6, 9
Climate change Climate change and emission of greenhouse gases is becoming an increasingly significant issue as emerging countries develop and urbanise. We have taken a leading role in developing ultra-efficient products, which consume and waste less energy, and are suitable for use in healthcare and industrial applications.
How we are respondingWe have developed a portfolio of XP Green Power products with class-leading efficiencies and have the most environmentally friendly manufacturing facility in our industry.
Link to
Strategy
Risks1, 4, 7, 9, 11
Energy efficiency and reliability The requirement from customers and legislation for products to consume and waste less energy is driving demand for more efficient power converters. This goes hand-in-hand with reliability for critical applications as ultra-high efficiency products do not require relatively unreliable fans to cool them, and cooler systems mean key components such as electrolytic capacitors have longer lifetimes.
How we are respondingWe have developed a portfolio of XP Green Power products with class-leading efficiencies and low standby power, which can operate without fan cooling.
Link to
Strategy
Risks1, 7, 9
24
XP Power Annual Report & Accounts for the year ended 31 December 2021
OUR MARKETPLACEGROWING OUR ADDRESSABLE MARKETS CONTINUED
30801-XP-Power AR21-Strategic.indd 2430801-XP-Power AR21-Strategic.indd 24 08/03/2022 10:57:1108/03/2022 10:57:11

30801 8 March 2022 9:38 am v9
LegislationOur industry continues to be the subject of an increasing raft of legislation from numerous countries and standards relating to areas such as environmental impacts, safety requirements and, above all, energy efficiency. The compliance costs of keeping up with this legislation is significant. We are of a size where we can dedicate significant resources to this area, yet be agile to respond quickly with new products or documentation as required.
How we are respondingWe have dedicated resources devoted to power converter legislation, including the latest safety regulations, which our customers value.
Link to
Strategy
Risks3, 7, 9, 10
Capital equipmentOur products are designed into and power capital equipment, so are subject to the capital equipment cycles. We have found growth niches in new industrial technologies such as 3D printing, analytical instruments, smart grid and robotics.
New capital investment generally leads to greater productivity. We consider that the medium and long-term opportunities remain positive for capital equipment. This is particularly the case in emerging markets as labour costs rise significantly.
How we are respondingWe have the largest direct sales force in our industry, together with the broadest product portfolio, so we are well positioned to take advantage of growth in the capital equipment markets. We have also targeted newer and faster growth industrial sectors such as 3D printing, analytical instruments, robotics and smart grid infrastructure.
Link to
Strategy
Risks2, 5, 11
InnovationOur customers possess a competitive need to launch new products that offer increased productivity and functionality, while reducing harmful environmental impacts. In addition, our customers are trying to differentiate their products from their competitors, which frequently results in different or new power conversion requirements.
How we are respondingWe have five design centres around the globe offering a diverse range of products, and have added new capability through the acquisition of FuG and Guth.
Link to
Strategy
Risks8, 9
STRATEGIC KEY
1 An event causes a disruption to our manufacturing facilities
2 Product recall
3 Competition from new market entrants and new technologies
4 Fluctuations of revenues, expenses and operating results due to an economic shocks
5 Dependence on key customers
6 Cybersecurity/information systems failure
7 Risks relating to regulation, compliance and taxation
8 Strategic risk associated with valuing or integrating new acquisitions
9 Loss of key personnel or failure to attract new personnel
10 Exposure to exchange rate fluctuations
11 Risk associated with supply chain
RISKS KEY
Develop a market-leading range of competitive products
Target accounts where we can add value
Vertical penetration of focus accounts
Build a global supply chain
Lead our industry on environmental matters
Make selective acquisitions
25
STRATEGIC REPORT
30801-XP-Power AR21-Strategic.indd 2530801-XP-Power AR21-Strategic.indd 25 08/03/2022 10:57:1108/03/2022 10:57:11

30801 8 March 2022 9:38 am v9
Our business model has evolved from that of a specialist distributor, to designer, to design manufacturer.
Key activitiesIDENTIFYOur customers are at the heart of what we do. We work closely with our key customers to understand their requirements and sell to them when we can add genuine value. We offer excellent service and support combined with class-leading products.
We have carved out a leading position in our industry. An up-to-date, high-efficiency product offering, delivered to our customers by the largest and most technically competent sales engineering team in the industry, backed up by highly skilled power systems engineers, combined with the safety and reliability benefits of world-class manufacturing, provide a compelling value proposition to our customers.
Our approachA new design programme is identified by a customer where we are an approved or preferred vendor. This is typically quite late in the customer’s development cycle as they will not usually know the total power requirement of their system until they have a working prototype.
DESIGNWe have transitioned our business from a specialist distributor, to designer, to design manufacturer. This has enabled us to ascend the value chain to grow our revenues and margins.
Through acquisition, we have moved further up the power and voltage scale, so we can fulfil more opportunities presented to us by our target customers.
We have design engineering teams on three continents – this allows us to release a high number of innovative new products required by this highly diversified market. These products often have class-leading energy efficiency and small footprints to meet the ever-increasing demands of our key customers. Additional engineering service teams in Germany, North America, Singapore and the UK are able to provide value-added services close to our key customers.
Our approachWe can provide modified product solutions, which allow the customer to easily integrate the power converter into their equipment.
MANUFACTURE AND DISTRIBUTEThe management of our supply chain is critical to our success. Quality and reliability are paramount to our customers who often provide critical healthcare or industrial systems.
For that reason, we need excellent suppliers with high-quality standards. We have a rigorous approval process that looks at all aspects of a supplier before we engage with them. This includes a prospective suppliers’ quality systems and standards, their financial viability, their environmental performance, and treatment of their people.
Our global footprint and robust, multi-site, low cost manufacturing and our network of sales, engineering and manufacturing provides us with the flexibility of a global organisation and the ability to partner with our customers locally
Our approachWe manufacture our own products, and this provides us with the ability to ensure excellent quality, and an agile supply chain to meet customer's needs.
InputsOUR PURPOSE AND WHY WE EXIST:
We power the world’s critical systems
OUR VALUES:
KnowledgeFlexibility
Customer Focus SpeedIntegrity
OUR VISION AND WHERE WE WANT TO BE:To be the first-choice power solutions provider delivering the ultimate experience for our customers and our people.
KEY RESOURCES:
Strong relationshipswith our suppliers, employees and Shareholders.Our people and leadershipAn experienced and committed workforce, and a strong Executive team with a clear strategic vision. TechnologyWe are investing in our future through our investment in infrastructure and technology.Global reach and scaleOperational flexibility, speed and the ability to reach global customers.
26
XP Power Annual Report & Accounts for the year ended 31 December 2021
OUR BUSINESS MODEL
30801-XP-Power AR21-Strategic.indd 2630801-XP-Power AR21-Strategic.indd 26 08/03/2022 10:57:1108/03/2022 10:57:11

30801 8 March 2022 9:38 am v9
Value generated for our stakeholders
OUR PEOPLEWe provide a safe and healthy working environment that is stimulating and collegiate. We take the approach: if we look after our people, they will look after our customers.
OUR CUSTOMERSWe solve our customers’ power problems and help them to get to market quickly. We provide innovative solutions that are reliable and reduce the running costs of our customers’ equipment.
OUR SUPPLIERSWe behave ethically and build long-term relationships with our key suppliers. We abide by our rigorous Code of Conduct dealing with ethics, health and safety employee relations and environmentally friendly practices, and require our suppliers to do the same.
OUR COMMUNITIES AND THE ENVIRONMENTWe produce XP Green Power products that consume less energy and materials, and avoid the use of hazardous substances. We have the most environmentally friendly manufacturing facility in our industry, and support our people with paid leave to contribute in the communities we operate.
OUR SHAREHOLDERSWe execute our published strategy on a consistent basis that has produced excellent Total Shareholder Returns over a significant period. We allocate our capital appropriately and maintain a dividend policy.
Key activitiesIDENTIFYOur customers are at the heart of what we do. We work closely with our key customers to understand their requirements and sell to them when we can add genuine value. We offer excellent service and support combined with class-leading products.
We have carved out a leading position in our industry. An up-to-date, high-efficiency product offering, delivered to our customers by the largest and most technically competent sales engineering team in the industry, backed up by highly skilled power systems engineers, combined with the safety and reliability benefits of world-class manufacturing, provide a compelling value proposition to our customers.
Our approachA new design programme is identified by a customer where we are an approved or preferred vendor. This is typically quite late in the customer’s development cycle as they will not usually know the total power requirement of their system until they have a working prototype.
DESIGNWe have transitioned our business from a specialist distributor, to designer, to design manufacturer. This has enabled us to ascend the value chain to grow our revenues and margins.
Through acquisition, we have moved further up the power and voltage scale, so we can fulfil more opportunities presented to us by our target customers.
We have design engineering teams on three continents – this allows us to release a high number of innovative new products required by this highly diversified market. These products often have class-leading energy efficiency and small footprints to meet the ever-increasing demands of our key customers. Additional engineering service teams in Germany, North America, Singapore and the UK are able to provide value-added services close to our key customers.
Our approachWe can provide modified product solutions, which allow the customer to easily integrate the power converter into their equipment.
MANUFACTURE AND DISTRIBUTEThe management of our supply chain is critical to our success. Quality and reliability are paramount to our customers who often provide critical healthcare or industrial systems.
For that reason, we need excellent suppliers with high-quality standards. We have a rigorous approval process that looks at all aspects of a supplier before we engage with them. This includes a prospective suppliers’ quality systems and standards, their financial viability, their environmental performance, and treatment of their people.
Our global footprint and robust, multi-site, low cost manufacturing and our network of sales, engineering and manufacturing provides us with the flexibility of a global organisation and the ability to partner with our customers locally
Our approachWe manufacture our own products, and this provides us with the ability to ensure excellent quality, and an agile supply chain to meet customer's needs.
4.20EMPLOYEE
ENGAGEMENT SCORE
LAST YEAR
130NEW PRODUCT
FAMILIES RELEASED OVER A FIVE-YEAR
PERIOD
21%DIVIDEND INCREASE
OVER A FIVE-YEAR PERIOD
27
STRATEGIC REPORT
30801-XP-Power AR21-Strategic.indd 2730801-XP-Power AR21-Strategic.indd 27 08/03/2022 10:57:1108/03/2022 10:57:11

30801 8 March 2022 9:38 am v9
We have a clear and consistent strategy of moving up the value chain through our internally developed products, and adding complementary products through acquisitions. We target key accounts where we can add genuine value.
DEVELOP A MARKET-LEADING RANGE OF COMPETITIVE PRODUCTS
TARGET ACCOUNTS WHERE WE CAN ADD VALUE
VERTICAL PENETRATION OF FOCUS ACCOUNTS
BUILD A GLOBAL SUPPLY CHAIN THAT BALANCES HIGH EFFICIENCY WITH MARKET-LEADING CUSTOMER RESPONSIVENESS
LEAD OUR INDUSTRY ON ENVIRONMENTAL MATTERS
MAKE SELECTIVE ACQUISITIONS OF COMPLEMENTARY BUSINESSES TO EXPAND OUR OFFERING
We need a market-leading range of products to be attractive to our customers. This range also needs to be broad due to the fragmented nature of the markets we serve, which have a multitude of product requirements. The broader and more up to date our product range, the more chance we will have something that will work effectively in our target customers’ applications.
We pride ourselves in the level of service and support we offer to our customers, particularly during the design-in stage. We have a compelling proposition where customers expect excellent quality and reliability to power their mission-critical equipment, particularly where they face a power problem due to either heat dissipation or electrical noise. These are our target customers.
We still have a relatively small share of the available business in some of the accounts we call on. We are continuing to expand our product portfolio so we can address more opportunities that are available to grow our revenues.
Since listing in 2000, we have built a strong brand in the power converter market. This, together with our product portfolio and excellent customer service, has allowed us to consistently take market share and grow significantly. As the Company grows, we need to upgrade our systems and processes, especially our supply chain processes, so to scale and run a much larger business as we continue to grow.
Strong corporate social responsibility is important to our customers, our employees and the communities we operate in. This incorporates environmental performance, health and safety, treatment of our people and business ethics.
Our strong balance sheet and cash generative business model allow us the capacity to pursue complementary business acquisitions. This is another avenue to expand our product offering and addressable market.
Target/goalTo release sufficient products to achieve at least a 10% organic revenue growth at attractive margins.
Target/goalOrganic revenue growth of more than 10%.
Target/goalOrganic revenue growth of more than 10%.
Target/goalReduction in manufacturing costs, freight and logistics, alongside consistent improvement in lead time and on-time delivery.
Target/goalExcellent health and safety performance and consistent reduction in our CO2 intensity.
Target/goalBolt-on acquisitions driving inorganic revenue growth of more than 5%.
Past performanceOver the past few years, we have been expanding our product portfolio and have developed several highly efficient, leading-edge products.
Past performanceWe have targeted customers where reliability is key or where their equipment may be in harsh environments. These customers value the support and service that our highly trained sales force and power systems engineers deliver.
Past performanceWe have spent the last few years gaining approved or preferred supplier status with the key customers in the healthcare, industrial technology, and semiconductor manufacturing equipment sectors. We are focused on this existing customer base to grow our revenues.
Past performanceWe have evolved from a distributor to a manufacturer, now having manufacturing facilities in China, Vietnam and North America, and we have invested to increase capacity and flexibility.
Past performanceWe are a full member of the Responsible Business Alliance (RBA). The RBA Code of Conduct, to which we comply, addresses all these important ethical and environmental matters, which we strongly endorse.
Past performanceThrough our recent acquisitions, we have added both RF Power and high power/high voltage to our product range, including through the acquisition of FuG and Guth in January 2022.
Planned future actionsWe are focused on developing product platforms that are easy to modify and can be reused over multiple sectors and applications, and on expanding our portfolio of XP Green Power products with class-leading efficiencies and low standby power.
Planned future actionsWe are prioritising our resource on the customers that fit our value proposition. We are de-emphasising customers that may have significant revenue potential but where cost is a more critical factor than quality and reliability, or engineering support during the design phase.
Planned future actionsAs we expand our product offering through continued product development augmented by acquisitions, we aim to address an increasing proportion of our customers’ requirements with our excellent service and support.
Planned future actionsFollowing the upgrade of our ERP system in our sales companies in Asia, Europe and North America, we plan to complete roll-out of the system into our supply chain in 2022. We also plan to further expand our manufacturing capacity with investment in a new site beginning 2022.
Planned future actionsWe will remain a committed member of the RBA.
We strive to lead our industry on sustainability matters and have established a Sustainability Committee to embed sustainability across our strategy during 2022.
Planned future actionsWe will integrate new acquisitions into our global supply chain, product development and sales structures to maximise the growth opportunities, whilst continuing to develop a pipeline of potential acquisitions to expand our product offering and engineering capabilities.
Link to
KPIs1, 5
Risks3, 9
Material issues1, 3
Link to
KPIs1
Risks2, 5
Material issues3, 7
Link to
KPIs2
Risks2, 5
Material issues3, 7
Link to
KPIs4
Risks6, 9
Material issues2, 3
Link to
KPIs7
Risks7, 9
Material issues2, 7, 8, 9, 11
Link to
KPIs5
Risks8
Material issues4, 7
1 Revenue growth
2 Revenue from Top 30 customers
3 Adjusted operating cash conversion
4 Adjusted diluted earnings per share growth
5 New product families released
6 Employee engagement score
7 Lifetime CO2 emission savings from products
KPIs KEY
28
XP Power Annual Report & Accounts for the year ended 31 December 2021
OUR STRATEGY
30801-XP-Power AR21-Strategic.indd 2830801-XP-Power AR21-Strategic.indd 28 08/03/2022 10:57:1208/03/2022 10:57:12

30801 8 March 2022 9:38 am v9
DEVELOP A MARKET-LEADING RANGE OF COMPETITIVE PRODUCTS
TARGET ACCOUNTS WHERE WE CAN ADD VALUE
VERTICAL PENETRATION OF FOCUS ACCOUNTS
BUILD A GLOBAL SUPPLY CHAIN THAT BALANCES HIGH EFFICIENCY WITH MARKET-LEADING CUSTOMER RESPONSIVENESS
LEAD OUR INDUSTRY ON ENVIRONMENTAL MATTERS
MAKE SELECTIVE ACQUISITIONS OF COMPLEMENTARY BUSINESSES TO EXPAND OUR OFFERING
We need a market-leading range of products to be attractive to our customers. This range also needs to be broad due to the fragmented nature of the markets we serve, which have a multitude of product requirements. The broader and more up to date our product range, the more chance we will have something that will work effectively in our target customers’ applications.
We pride ourselves in the level of service and support we offer to our customers, particularly during the design-in stage. We have a compelling proposition where customers expect excellent quality and reliability to power their mission-critical equipment, particularly where they face a power problem due to either heat dissipation or electrical noise. These are our target customers.
We still have a relatively small share of the available business in some of the accounts we call on. We are continuing to expand our product portfolio so we can address more opportunities that are available to grow our revenues.
Since listing in 2000, we have built a strong brand in the power converter market. This, together with our product portfolio and excellent customer service, has allowed us to consistently take market share and grow significantly. As the Company grows, we need to upgrade our systems and processes, especially our supply chain processes, so to scale and run a much larger business as we continue to grow.
Strong corporate social responsibility is important to our customers, our employees and the communities we operate in. This incorporates environmental performance, health and safety, treatment of our people and business ethics.
Our strong balance sheet and cash generative business model allow us the capacity to pursue complementary business acquisitions. This is another avenue to expand our product offering and addressable market.
Target/goalTo release sufficient products to achieve at least a 10% organic revenue growth at attractive margins.
Target/goalOrganic revenue growth of more than 10%.
Target/goalOrganic revenue growth of more than 10%.
Target/goalReduction in manufacturing costs, freight and logistics, alongside consistent improvement in lead time and on-time delivery.
Target/goalExcellent health and safety performance and consistent reduction in our CO2 intensity.
Target/goalBolt-on acquisitions driving inorganic revenue growth of more than 5%.
Past performanceOver the past few years, we have been expanding our product portfolio and have developed several highly efficient, leading-edge products.
Past performanceWe have targeted customers where reliability is key or where their equipment may be in harsh environments. These customers value the support and service that our highly trained sales force and power systems engineers deliver.
Past performanceWe have spent the last few years gaining approved or preferred supplier status with the key customers in the healthcare, industrial technology, and semiconductor manufacturing equipment sectors. We are focused on this existing customer base to grow our revenues.
Past performanceWe have evolved from a distributor to a manufacturer, now having manufacturing facilities in China, Vietnam and North America, and we have invested to increase capacity and flexibility.
Past performanceWe are a full member of the Responsible Business Alliance (RBA). The RBA Code of Conduct, to which we comply, addresses all these important ethical and environmental matters, which we strongly endorse.
Past performanceThrough our recent acquisitions, we have added both RF Power and high power/high voltage to our product range, including through the acquisition of FuG and Guth in January 2022.
Planned future actionsWe are focused on developing product platforms that are easy to modify and can be reused over multiple sectors and applications, and on expanding our portfolio of XP Green Power products with class-leading efficiencies and low standby power.
Planned future actionsWe are prioritising our resource on the customers that fit our value proposition. We are de-emphasising customers that may have significant revenue potential but where cost is a more critical factor than quality and reliability, or engineering support during the design phase.
Planned future actionsAs we expand our product offering through continued product development augmented by acquisitions, we aim to address an increasing proportion of our customers’ requirements with our excellent service and support.
Planned future actionsFollowing the upgrade of our ERP system in our sales companies in Asia, Europe and North America, we plan to complete roll-out of the system into our supply chain in 2022. We also plan to further expand our manufacturing capacity with investment in a new site beginning 2022.
Planned future actionsWe will remain a committed member of the RBA.
We strive to lead our industry on sustainability matters and have established a Sustainability Committee to embed sustainability across our strategy during 2022.
Planned future actionsWe will integrate new acquisitions into our global supply chain, product development and sales structures to maximise the growth opportunities, whilst continuing to develop a pipeline of potential acquisitions to expand our product offering and engineering capabilities.
Link to
KPIs1, 5
Risks3, 9
Material issues1, 3
Link to
KPIs1
Risks2, 5
Material issues3, 7
Link to
KPIs2
Risks2, 5
Material issues3, 7
Link to
KPIs4
Risks6, 9
Material issues2, 3
Link to
KPIs7
Risks7, 9
Material issues2, 7, 8, 9, 11
Link to
KPIs5
Risks8
Material issues4, 7
1 An event causes a disruption to our manufacturing facilities
2 Product recall
3 Competition from new market entrants and new technologies
4 Fluctuations of revenues, expenses and operating results due to an economic shocks
5 Dependence on key customers – link to strategic
6 Cybersecurity/information systems failure
7 Risks relating to regulation, compliance and taxation
8 Strategic risk associated with valuing or integrating new acquisitions
9 Loss of key personnel or failure to attract new personnel
10 Exposure to exchange rate fluctuations – link to strategic
11 Risk associated with supply chain
1 Product responsibility (safety and quality)
2 Responsible supply chain
3 Product solutions and innovation
4 Attracting retaining and rewarding talent
5 Employee welfare
6 Health and safety (inc. occupational)
7 Ethical conduct and compliance
8 Energy efficiency
9 Waste management
10 Diversity and equal opportunity
11 Emissions
RISKS KEY
MATERIAL ISSUES KEY
29
STRATEGIC REPORT
30801-XP-Power AR21-Strategic.indd 2930801-XP-Power AR21-Strategic.indd 29 08/03/2022 10:57:1208/03/2022 10:57:12

30801 8 March 2022 9:38 am v9
Financials Non-Financials
REVENUE GROWTH (%)REVENUE FROM TOP 30 CUSTOMERS (%)
ADJUSTED OPERATING CASH CONVERSION (%)
ADJUSTED DILUTED EARNINGS PER SHARE (EPS) GROWTH (%)
NEW PRODUCT FAMILIES RELEASED
EMPLOYEE ENGAGEMENT SCORE
LIFETIME CO2 EMISSION SAVINGS FROM GREEN PRODUCTS (TONNES)
Performance2021
2020
2019
2018
2017
3
17
2
17
29
2021
2020
2019
2018
2017
58
58
49
52
50
2021
2020
2019
2018
2017
111
117
132
62
81
Definition We target revenue growth of 10% per annum, measured at actual exchange rates. Whether we achieve this or not can depend on market cyclicality and exchange rates.
We expect revenue from our top 30 customers to increase as we pursue our strategy.
We target adjusted operating cash conversion of 100%.
We aim to grow this metric by a double-digit percentage each year.
In assessing new product opportunities, we consider the potential revenue from a new product family as well as the absolute number of new product introductions. We target 30 new releases per annum.
We target to improve this score and be at least above the benchmark for similar sized international companies.
We have set a target to increase the lifetime CO2 emissions savings from XP Green Power products by at least 5% per annum.
Target achieved No Yes Yes No No Yes Yes
Our progress in 2021
• Revenue Growth of 3% was impacted by exchange rates, increasing to 10% on a constant currency basis.
• Growth in semiconductor manufacturing equipment offset by healthcare demand returning to normalised levels following COVID-19-related impact in 2020.
• This metric remained at 58% in 2021 as the market for semiconductor manufacturing equipment continued to perform strongly.
• Continued strong cash conversion performance through working capital management whilst investing in inventory to meet customer demand.
• Focused cash flow forecasting made better use of available cash to meet requirements across the Group.
• Reduced gross margin, exchange rates and higher income tax charge, more than offsetting the growth in revenue driven largely by the semiconductor manufacturing equipment market.
• We released 24 new product families in 2021 (2020: 30).
• 20 of these new product families can be classified as XP Green Power products.
• In 2021, we changed providers to Gallup, which will have benefits in providing tools for leadership development.
• We continue to undertake an annual employee engagement survey to identify areas our people tell us where we can improve to deliver the ultimate employee experience.
• Lifetime emission savings exceeded target in 2021, and all new product families launched were green.
Our plans for 2022
• Continue to utilise our broad product offering through all sales regions.
• Provide increasing support to our customers through our engineering solutions group.
• We continue to grow share of our large customers.
• Continue to seek opportunities to reduce working capital by reducing lead times and improved inventory management.
• Revenue and earnings outcome for 2021 is dependent on continued demand in the semiconductor manufacturing equipment sector and industrial technology.
• We are focusing our design engineering on producing product platforms that can more easily be shared and reused over numerous applications and sectors.
• Use the results of the new Gallup survey to develop leaders.
• We will continue to release products with class-leading efficiency.
• We will continue to promote environmental awareness and adopt environmentally friendly practices.
Link to strategy
• Target accounts where we can add value.
• Vertical penetration of focus accounts.
• Build a global supply chain that balances high efficiency with market-leading customer responsiveness.
• Target customers where we can add value.
• Vertical penetration of focus accounts.
• Develop a broad range of competitive products.
• Supports all aspects of our strategy.
• Leading our industry regarding sustainability matters.
Link to core values
Link to risk 1 42 53 6 6 97 108 11 1 42 53 6 97 108 11 1 42 53 6 97 108 6 97 108 11
Link to remuneration
Revenue growth drives the annual growth of our adjusted profit before tax, which is a target in our Group bonus plan.
Placing emphasis on revenue from our top 30 customers aligns with our strategy and drives long-term earnings growth. Long-term earnings growth is a performance condition in the Company’s Long-Term Incentive Plan (LTIP).
Operating cash conversion is a metric in our Group bonus plan.
Growth in adjusted EPS is a performance condition in our Long-Term Incentive Plan.
30
XP Power Annual Report & Accounts for the year ended 31 December 2021
KEY PERFORMANCE INDICATORS
30801-XP-Power AR21-Strategic.indd 3030801-XP-Power AR21-Strategic.indd 30 08/03/2022 10:57:1308/03/2022 10:57:13

30801 8 March 2022 9:38 am v9
Financials Non-Financials
REVENUE GROWTH (%)REVENUE FROM TOP 30 CUSTOMERS (%)
ADJUSTED OPERATING CASH CONVERSION (%)
ADJUSTED DILUTED EARNINGS PER SHARE (EPS) GROWTH (%)
NEW PRODUCT FAMILIES RELEASED
EMPLOYEE ENGAGEMENT SCORE
LIFETIME CO2 EMISSION SAVINGS FROM GREEN PRODUCTS (TONNES)
Performance2021
2020
2019
2018
2017
-11
40
-16
18
27
2021
2020
2019
2018
2017
24
20
32
27
27
2021
2020
4.20
3.97
2021
2020
2019
2018
2017
128,000
117,000
108,000
108,000
134,000
Definition We target revenue growth of 10% per annum, measured at actual exchange rates. Whether we achieve this or not can depend on market cyclicality and exchange rates.
We expect revenue from our top 30 customers to increase as we pursue our strategy.
We target adjusted operating cash conversion of 100%.
We aim to grow this metric by a double-digit percentage each year.
In assessing new product opportunities, we consider the potential revenue from a new product family as well as the absolute number of new product introductions. We target 30 new releases per annum.
We target to improve this score and be at least above the benchmark for similar sized international companies.
We have set a target to increase the lifetime CO2 emissions savings from XP Green Power products by at least 5% per annum.
Target achieved No Yes Yes No No Yes Yes
Our progress in 2021
• Revenue Growth of 3% was impacted by exchange rates, increasing to 10% on a constant currency basis.
• Growth in semiconductor manufacturing equipment offset by healthcare demand returning to normalised levels following COVID-19-related impact in 2020.
• This metric remained at 58% in 2021 as the market for semiconductor manufacturing equipment continued to perform strongly.
• Continued strong cash conversion performance through working capital management whilst investing in inventory to meet customer demand.
• Focused cash flow forecasting made better use of available cash to meet requirements across the Group.
• Reduced gross margin, exchange rates and higher income tax charge, more than offsetting the growth in revenue driven largely by the semiconductor manufacturing equipment market.
• We released 24 new product families in 2021 (2020: 30).
• 20 of these new product families can be classified as XP Green Power products.
• In 2021, we changed providers to Gallup, which will have benefits in providing tools for leadership development.
• We continue to undertake an annual employee engagement survey to identify areas our people tell us where we can improve to deliver the ultimate employee experience.
• Lifetime emission savings exceeded target in 2021, and all new product families launched were green.
Our plans for 2022
• Continue to utilise our broad product offering through all sales regions.
• Provide increasing support to our customers through our engineering solutions group.
• We continue to grow share of our large customers.
• Continue to seek opportunities to reduce working capital by reducing lead times and improved inventory management.
• Revenue and earnings outcome for 2021 is dependent on continued demand in the semiconductor manufacturing equipment sector and industrial technology.
• We are focusing our design engineering on producing product platforms that can more easily be shared and reused over numerous applications and sectors.
• Use the results of the new Gallup survey to develop leaders.
• We will continue to release products with class-leading efficiency.
• We will continue to promote environmental awareness and adopt environmentally friendly practices.
Link to strategy
• Target accounts where we can add value.
• Vertical penetration of focus accounts.
• Build a global supply chain that balances high efficiency with market-leading customer responsiveness.
• Target customers where we can add value.
• Vertical penetration of focus accounts.
• Develop a broad range of competitive products.
• Supports all aspects of our strategy.
• Leading our industry regarding sustainability matters.
Link to core values
Link to risk 1 42 53 6 6 97 108 11 1 42 53 6 97 108 11 1 42 53 6 97 108 6 97 108 11
Link to remuneration
Revenue growth drives the annual growth of our adjusted profit before tax, which is a target in our Group bonus plan.
Placing emphasis on revenue from our top 30 customers aligns with our strategy and drives long-term earnings growth. Long-term earnings growth is a performance condition in the Company’s Long-Term Incentive Plan (LTIP).
Operating cash conversion is a metric in our Group bonus plan.
Growth in adjusted EPS is a performance condition in our Long-Term Incentive Plan.
31
STRATEGIC REPORT
30801-XP-Power AR21-Strategic.indd 3130801-XP-Power AR21-Strategic.indd 31 08/03/2022 10:57:1308/03/2022 10:57:13

30801 8 March 2022 9:38 am v9
We have delivered a robust performance in a year of ongoing global challenges as a result of COVID-19. We continued to invest in the business, adding capacity, developing new products and increasing our global workforce.”
GAVIN GRIGGSCHIEF EXECUTIVE OFFICER
Review of our yearThe Group delivered
a robust performance in a year in which the ongoing
challenges brought about by COVID-19 were compounded by component
shortages and disruption to global logistics. All of our facilities continued to operate throughout the period while ensuring the safety and wellbeing of our people and we made good strategic progress despite the challenges of navigating through the COVID-19 pandemic. We have continued to invest in the business through this challenging period, adding capacity, developing new products and increasing our global workforce. Our success is down to the tenacity and commitment of the XP Power team globally.
The Semiconductor Manufacturing Equipment sector performed strongly throughout 2021.
The performance was underpinned by a combination of increased end-market
demand and our market share gains from design wins on new tools. These ongoing
design wins are being supported by the development of closer relationships with our customers. The Industrial Technology sector experienced a healthy rebound, beginning in early 2021, driven by pent-up demand following the 2020 slowdown linked to the pandemic. Demand from our
Healthcare customers normalised as they switched from critical care
equipment used to treat patients with COVID-19 to more normal demand
patterns, supporting product innovation. While Healthcare demand was below the
exceptional levels seen in 2020, it was comfortably ahead of 2019. Demand across all sectors was strong and this, combined with the lengthening of lead times in supply chains, has resulted in our order book being at record levels as we entered 2022.
Our diversified manufacturing footprint and supply chain is recognised as an important strategic differentiator by our key customers, many of whom are otherwise concerned about USA/China trade relations and general supply chain resiliency. In the last couple of years we have been able to demonstrate this resilience with product shipments continuing in very challenging conditions. Continuing shipments to customers were the priority. As an example, during 2020, our Vietnam facility allowed us to maintain product supply to our customers while production at our Chinese factory was impacted by COVID-19 restrictions imposed by the Chinese government. In H2 2021, Vietnam experienced a surge in COVID-19 infections and enforced its own strict lockdown. Our Vietnam facility was allowed to continue operating through this period but at reduced levels of throughput as the number of employees on site was reduced by c.50%, and as we faced the peak period of component challenges. During this period, we were able to flex our supply chain and increased production in China.
Global supply chains came under significant additional pressure in 2021 and this impacted both our financial performance for the year but also the service we could provide to our customers. Many components have been in short supply as the COVID-19 restrictions limited production and as demand spiked as the global economy reopened. Semiconductors were the first components to be impacted and saw the most severe availability gaps. Supply issues and material shortages also impacted other components critical to the manufacture of XP Power’s products. These included standard components such as multilayer ceramic capacitors (MLCC), transistors, diodes and resistors. While our strong supplier relationships and higher levels of safety stocks ensured we were able to limit the impact, increasing lead times and shortages in the second half reduced our potential revenue and profits for the year. We are managing the situation proactively; we have redesigned some products where shortages have been significant and we continue to pay premiums
£240.3mTOTAL REVENUE (£M)
+10% CER
COMPARED TO FY 20
32
XP Power Annual Report & Accounts for the year ended 31 December 2021
PERFORMANCE: OPERATIONAL REVIEW
30801-XP-Power AR21-Strategic.indd 3230801-XP-Power AR21-Strategic.indd 32 08/03/2022 10:57:1408/03/2022 10:57:14

30801 8 March 2022 9:38 am v9
to market prices to secure and expedite supply. Supply of some components remains tight, driven by inventory depletion through multiple layers in the supply chain, which is creating volatility in supply and lead times. We expect this situation to continue during the first half of 2022.
A second supply chain challenge we faced related to global logistics. With air travel below pre-pandemic levels and challenges around port handling during the pandemic, both air and sea freight have had tight supply leading to increased transit times and significant cost increases. Following the end of COVID-19 restrictions in Q4 2021, production from our Vietnam facility ramped back up to previous levels to fulfil the pent-up customer demand. We also shipped a higher proportion of product by air rather than by ocean freight to meet customer commitments, which was our priority. This resulted in significantly higher freight costs in this period, but we expect these to normalise in H1 2022.
During 2021, we continued to develop our Enterprise Resource Planning (ERP) system despite the global travel restrictions. We plan to deploy the second phase of this project within our supply chain and at our Asian manufacturing sites in the first half of 2022. This project has been slightly delayed due to COVID-19 restrictions, but its deployment, de-risked by the first phase roll-out, will further strengthen our supply chain and improve efficiency.
Expansion of our product portfolio by acquisition remains an important element of our growth strategy. Subsequent to the year-end we were delighted to complete the acquisitions of FuG Elektronik GmbH (FuG) and Guth High Voltage GmbH (Guth), for c.£32.8 million. They are two complementary German businesses operating in the high voltage market segment. The acquisitions strengthen our position in the important German market, adding speciality high voltage capabilities one near Munich and the other near Stuttgart. The acquired businesses are an excellent fit with our existing operations, adding wholly new and highly complementary product portfolios and technical capabilities to the Group. We expect to grow the acquired businesses’ revenues significantly by selling FuG and Guth’s products through our existing industry-leading sales teams and distribution network. It also allows us to access new areas within the important Industrial Technology and Semiconductor manufacturing sectors.
Balance sheet and liquidityThe Group benefits from strong financial liquidity with significant flexibility to invest to support organic growth, and to increase inventory and working capital to adapt to the higher levels of demand and uncertainty in the supply chain.
Our balance sheet remains strong, with c.£77 million of available liquidity and net debt to EBITDA of 0.44× as at 31 December 2021.
As mentioned above, on 31 January 2022, XP Power completed the acquisition of FuG and Guth from Dr Simon Consulting GmbH for a cash consideration of €39.0 million.
MarketplaceThe Group delivered revenue growth of 3% in 2021 with revenue of £240.3 million (2020: £233.3 million), or 10% growth at constant currency.
Order intake was up 33% on a reported basis to £343.4 million (2020: £258.0 million which included £15–£20 million of COVID-19-related orders). Orders and revenue for 2021 represent a full year, book-to-bill ratio of 1.43 (2020: 1.11). The Group had a record order book of £217.0 million on 31 December 2021 (31 December 2020: £124.1 million), providing excellent visibility for 2022 and underpinning prospects for the year.
Marketplace: Sector DynamicsThe Semiconductor Manufacturing Equipment sector remains an exciting and important area for XP Power with excellent long-term growth prospects. Revenue from these customers increased by 34% to £93.3 million (2020: £69.6 million) or 46% growth at constant currency. We believe we not only benefited from ongoing demand but also from market share gains as a number of new programme wins, driven by technology advances, entered production. Revenue from Semiconductor Manufacturing Equipment sector customers represented 39% of overall revenue (2020: 30%). Our Radio Frequency (“RF”) and high-voltage and high-power products, combined with our low voltage portfolio and engineering services offering, has made us an attractive supplier to this market. The new higher power and higher voltage products we now offer allow us to service considerably more of the opportunities in this sector, significantly expanding our addressable market. The recent acquisitions of FuG and Guth further strengthen our position in this market, adding access to new sub-sectors including lithography.
Investment in semiconductor manufacturing capacity is growing rapidly worldwide as the industry responds to a structural supply shortage and to meet demand for ever more technologically sophisticated semiconductors. Demand for semiconductor manufacturing equipment remains strong and Wafer Fabrication Equipment (WFE) capex grew by c.40% in 2021, with further growth forecast in 2022. In total, there were 59 new semiconductor manufacturing facilities announced in 2021 with WFE spend of US$300 billion expected in the next few years.
The highlight of the year was our record order book, which underlines the strength of demand for XP Power’s products.”
READ MORE ABOUT OUR MARKETPLACE ON PAGES 20–25
READ MORE ABOUT OUR STRONG FINANCIAL POSITION ON PAGES 38–40
33
STRATEGIC REPORT
30801-XP-Power AR21-Strategic.indd 3330801-XP-Power AR21-Strategic.indd 33 08/03/2022 10:57:1408/03/2022 10:57:14

30801 8 March 2022 9:38 am v9
The latest generation of semiconductor logic and memory devices are becoming more capital intensive to manufacture as they become multilayered, and as dimensions continue to shrink. This plays to XP Power’s strengths as one of the few companies in the world that can offer the whole spectrum of power and voltage required for semiconductor manufacture, and an ability to combine these into a complete power solution, making us a compelling partner to the manufacturers of these state-of-the-art tools. Our two largest customers operate within this sector and we are growing revenues with both of them, as well as diversifying into a wider global customer base.
Revenue from the Industrial Technology sector increased by 3% on a constant currency basis (declined by 3% as reported) to £92.0 million (2020: £94.4 million) and represented 38% (2020: 40%) of overall revenue. Demand in Industrial Technology remains robust, with supply chain challenges having a major impact during 2021. The sector is extremely diversified with few of these customers making it into our top 30 customer list by revenue. Applications in this sector vary significantly and are principally driven by new and emerging electronic technologies and high growth niches rather than traditional areas such as industrial machinery, automotive or mining. Typical drivers of our revenue in this sector include analytical instruments, test and measurement equipment, robotics, displays, industrial printing, renewable energy and smart grid. Industrial Technology is a resilient, highly diversified, long-term growth market for XP Power with innovation a key driver of growth. Our Distribution business, which represents 10% (2020: 10%) of our overall revenue and is exposed to a very diverse range of end markets, is also included within our Industrial Technology sector. Distribution has remained an attractive growth market where we have been increasing market share with existing customers and adding new distributors to expand geographic reach and increase our market penetration to small and mid-tier customers.
Revenue from Healthcare customers declined 15% at constant currency (down by 21% as reported) to £55.0 million (2020: £69.3 million), representing 23% of overall revenue (2020: 30%). In 2020, we experienced exceptional demand of £15–20 million directly related to the COVID-19 pandemic and other applications were down significantly. In 2021, demand for critical care products has normalised and we have seen a recovery in our growth markets such as robotic surgical tools, dentistry, endoscopy and medical imaging, and we are working with a number of customers on innovative solutions to challenges they are facing. We have delivered ongoing growth after adjusting for the one-off impact in 2020. Healthcare remains an attractive market for XP Power given the long-term demand growth dynamics, the safety critical nature of products, the breadth of our medical product range and the high level of customer service required by blue chip medical device manufacturers. Healthcare customers are demanding in terms of quality and reliability, making our value proposition very attractive to them. We provide mission-critical power solutions for numerous applications in the healthcare arena and understand the many special requirements and regulatory approvals that a medical power solution must meet. In normal circumstances, Healthcare tends to be much less cyclical than the other sectors we address, which adds resilience to our diversified business model.
Marketplace: North AmericaOur North America revenue was US$194.5 million in 2021 (2020: US$180.4 million), an increase of 8%. North America represented 59% of overall revenue (2020: 61%).
Order intake in North America was US$270.2 million (2020: US$194.5 million), an increase of 39% resulting in a healthy book-to-bill ratio of 1.38.
34
XP Power Annual Report & Accounts for the year ended 31 December 2021
PERFORMANCE: OPERATIONAL REVIEW CONTINUED
30801-XP-Power AR21-Strategic.indd 3430801-XP-Power AR21-Strategic.indd 34 08/03/2022 10:57:1608/03/2022 10:57:16

30801 8 March 2022 9:38 am v9
Marketplace: EuropeOur European revenue grew by 3% to £67.3 million (2020: £65.6 million). While Europe benefited from significantly higher demand for critical healthcare products, it was also most impacted by the decline in the Industrial Technology sector due to COVID-19. Europe represented 28% of overall revenues (2020: 28%).
Order intake in Europe was £93.1 million (2020: £73.7 million), an increase of 26%, resulting in a strong book-to-bill ratio of 1.38.
Marketplace: AsiaAsian revenues were US$43.8 million (2020: US$33.8 million), an increase of 30%, with strong growth in Healthcare and Semiconductor Manufacturing Equipment, offset by weakness in Industrial Technology. Asia represented 13% of overall revenue (2020: 11%). Our Asia business is benefiting from new design wins with the RF and high-voltage product portfolios. We expect these design wins to contribute to revenue in 2022 and beyond as they enter production.
Order intake in Asia was US$74.8 million (2020: US$39.6 million), an increase of 89%, resulting in a book-to-bill ratio of 1.71.
Our Strategy and Value PropositionOur vision is to be the first-choice power solutions provider, delivering the ultimate experience for our customers and making XP Power a great place to work. Over time, we have expanded our product portfolio up the power and voltage scale to enhance our margins and provide our customers with a broader offering to solve their power problems. We have also added RF technology and increased our engineering resource to provide enhanced engineering services capabilities and deliver a complete power solution to our key customers. We are now one of very few providers who can offer customers a complete spectrum of power and voltage capabilities and package several power converters into an overall solution customised to the customer’s application. This makes us an extremely attractive partner to our key customers and is a key driver of our market share gains.
Our strategy can be summarised as follows:
• Develop a market-leading range of competitive products, organically and through selective acquisitions.
• Target accounts where we can add value.• Increase penetration of those target accounts.• Build a global end-to-end supply chain that
balances high efficiency with market-leading customer responsiveness; and
• Lead our industry on environmental matters.
The industry wide challenges we have faced in recent years have not diverted us from our strategic path, and we continue to invest for the medium and long
term in new product development, new capabilities and capacity. We continued to execute well against our strategy in the period, gaining further design wins with our newer product introductions, particularly in higher power applications, and through our increased focus on engineering solutions.
Acquisitions have been a key part of our growth strategy expanding our product portfolio and addressable market. The FuG and Guth acquisitions completed in January 2022 are the latest examples of this strategy in action.
Our value proposition to customers is to solve their power problems, reduce their overall cost of design, manufacture and operation and help them get their product to market as quickly as possible. We achieve this by providing excellent sales engineering support and producing new highly reliable products that are easy to design into the customer’s system, consume less power, take up less space and reduce installation times.
Looking forward, whilst our strategy is clearly effective and adding shareholder value, it will continue to evolve, building further organisational and supply chain agility to better serve our customers and further enhance execution. We will also increase our focus on people and development to ensure we are able to continue to grow our business.
ManufacturingXP Power’s main production facilities are located in China and Vietnam. We proactively manage the sites to optimise our supply chain and provide resilience of supply for our customers. Our total Asian manufacturing capacity is more than US$350 million per year. During 2021, we invested in additional equipment in Vietnam to expand capacity with a new surface mount line, and additional test and burn-in facilities, to meet our current and future levels of demand and to support the transfer of more products into Vietnam from China and our North American manufacturing facilities, as we seek to benefit from lower production costs and increase supply chain resilience and flexibility.
Vietnam is now qualified to produce a total of 2,708 different low voltage products (2020: 2,616), with the ongoing transfer of production capabilities. In addition, the factory is now qualified on 810 different high voltage modules and we are increasing the number of customer solution products that are capable of being manufactured in Vietnam.
The dual supply capability has benefited our customers through the COVID-19 pandemic and also as they seek to navigate changes in trade relations between China and the USA. The US Government implemented Section 301 tariffs at a rate of 10% from September 2018 and increased these to 25% in May 2019, which remains in place. The ability to manufacture in Vietnam has become a compelling value proposition to our customers wherever they are located. A number of customers have already
READ MORE ABOUT STRATEGY ON PAGES 28–29
READ MORE ABOUT MANUFACTURING ON PAGE 26
35
STRATEGIC REPORT
30801-XP-Power AR21-Strategic.indd 3530801-XP-Power AR21-Strategic.indd 35 08/03/2022 10:57:1608/03/2022 10:57:16

30801 8 March 2022 9:38 am v9
informed us that they will no longer design-in products manufactured in China due to concerns over China/USA trade tensions irrespective of the tariff situation. We expect this important strategic capability of having production facilities in both Vietnam and China to enable us to win more design slots with key customers. The benefit of dual supply has been highlighted as China was in lockdown in 2020 and then Vietnam in 2021, and we were able to effectively redirect production to maintain a continuity of supply for our customers.
As the business continues to grow, we will require further production capacity and we will commence construction of a new manufacturing facility in North West Malaysia in 2022 to increase capacity to meet the demand from across the Group. We expect to commission this new facility in 2023. Our overall objective is to provide a resilient and flexible supply chain with the capability to manufacture the majority of products in China, Vietnam and the new third location to provide enhanced business continuity planning. The increased level of capital expenditure that the Group will incur during the construction will be phased in line with the facility and this will initially be spread across 2022 and 2023.
We also have three smaller, more technically specialist manufacturing facilities in North America. These include a customer-focused engineering services facility in California, a site in New Jersey focused on high voltage products and an RF-focused facility in Massachusetts. These facilities have continued to operate throughout 2021 except for short periods where decontamination was required following COVID-19 cases. High demand for RF and HV products has led to some supply challenges and we are increasing capacity to meet the demand levels.
We monitor market dynamics closely, working through our supply partners and maintain a level of safety stocks of key components. Throughout the
year, we have seen significant supply issues for certain components and increased safety stocks to manage through any future supply issues, although this became increasingly challenging in H2 2021. We have also designed-out some particularly problematic components using our engineering team. While the level of shortages has peaked and has since reduced, we do expect some ongoing issues in 2022.
Research and DevelopmentNew products are fundamental to our longer-term revenue growth. The broader our product offering, the higher the probability that we will have a product that will work in the customer’s application with or without a modification by our engineering team. By expanding into RF power in 2017, and high voltage in 2018 and 2022, we estimate that our addressable market has increased from around US$2.7 billion to approximately US$6.0 billion.
The design-in cycles required by our customers to qualify the power converter into their equipment and to gain the necessary safety agency approvals are lengthy. Typically, we see a period of around 18 months, or even longer in Healthcare, from first identifying a customer opportunity to receiving the first production order. Revenue will then start to build, often peaking a number of years later. The positive aspect of this characteristic is that our business has a strong annuity base where programmes typically last five to seven years. Another aspect of this model is that the many new products we have introduced over the last three years have yet to make a meaningful impact on our revenue, creating a significant benefit for future years as they enter production.
We continue to move our product portfolio up the power and voltage scale and away from our historic low-power/low voltage offering, to protect our margins and expand our addressable market. RF power is a significant long-term opportunity and is a market that contains many interesting and significant
36
XP Power Annual Report & Accounts for the year ended 31 December 2021
PERFORMANCE: OPERATIONAL REVIEW CONTINUED
30801-XP-Power AR21-Strategic.indd 3630801-XP-Power AR21-Strategic.indd 36 08/03/2022 10:57:1708/03/2022 10:57:17
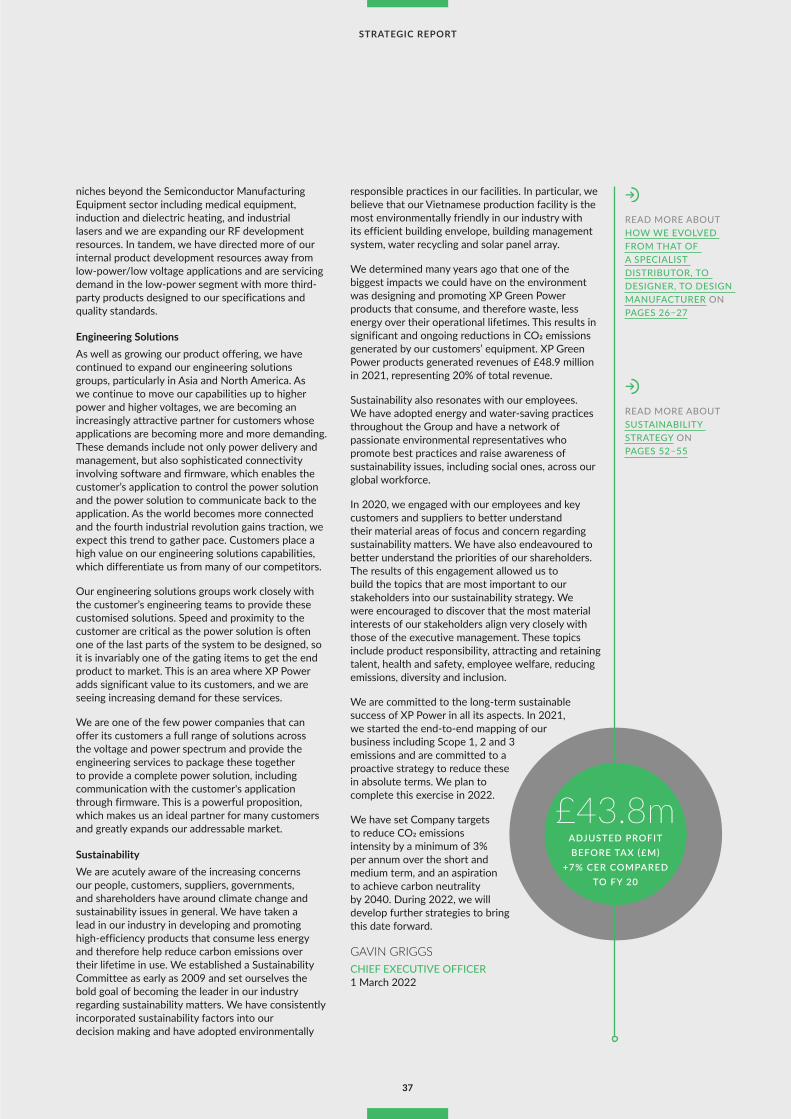
30801 8 March 2022 9:38 am v9
niches beyond the Semiconductor Manufacturing Equipment sector including medical equipment, induction and dielectric heating, and industrial lasers and we are expanding our RF development resources. In tandem, we have directed more of our internal product development resources away from low-power/low voltage applications and are servicing demand in the low-power segment with more third-party products designed to our specifications and quality standards.
Engineering SolutionsAs well as growing our product offering, we have continued to expand our engineering solutions groups, particularly in Asia and North America. As we continue to move our capabilities up to higher power and higher voltages, we are becoming an increasingly attractive partner for customers whose applications are becoming more and more demanding. These demands include not only power delivery and management, but also sophisticated connectivity involving software and firmware, which enables the customer’s application to control the power solution and the power solution to communicate back to the application. As the world becomes more connected and the fourth industrial revolution gains traction, we expect this trend to gather pace. Customers place a high value on our engineering solutions capabilities, which differentiate us from many of our competitors.
Our engineering solutions groups work closely with the customer’s engineering teams to provide these customised solutions. Speed and proximity to the customer are critical as the power solution is often one of the last parts of the system to be designed, so it is invariably one of the gating items to get the end product to market. This is an area where XP Power adds significant value to its customers, and we are seeing increasing demand for these services.
We are one of the few power companies that can offer its customers a full range of solutions across the voltage and power spectrum and provide the engineering services to package these together to provide a complete power solution, including communication with the customer's application through firmware. This is a powerful proposition, which makes us an ideal partner for many customers and greatly expands our addressable market.
SustainabilityWe are acutely aware of the increasing concerns our people, customers, suppliers, governments, and shareholders have around climate change and sustainability issues in general. We have taken a lead in our industry in developing and promoting high-efficiency products that consume less energy and therefore help reduce carbon emissions over their lifetime in use. We established a Sustainability Committee as early as 2009 and set ourselves the bold goal of becoming the leader in our industry regarding sustainability matters. We have consistently incorporated sustainability factors into our decision making and have adopted environmentally
responsible practices in our facilities. In particular, we believe that our Vietnamese production facility is the most environmentally friendly in our industry with its efficient building envelope, building management system, water recycling and solar panel array.
We determined many years ago that one of the biggest impacts we could have on the environment was designing and promoting XP Green Power products that consume, and therefore waste, less energy over their operational lifetimes. This results in significant and ongoing reductions in CO2 emissions generated by our customers’ equipment. XP Green Power products generated revenues of £48.9 million in 2021, representing 20% of total revenue.
Sustainability also resonates with our employees. We have adopted energy and water-saving practices throughout the Group and have a network of passionate environmental representatives who promote best practices and raise awareness of sustainability issues, including social ones, across our global workforce.
In 2020, we engaged with our employees and key customers and suppliers to better understand their material areas of focus and concern regarding sustainability matters. We have also endeavoured to better understand the priorities of our shareholders. The results of this engagement allowed us to build the topics that are most important to our stakeholders into our sustainability strategy. We were encouraged to discover that the most material interests of our stakeholders align very closely with those of the executive management. These topics include product responsibility, attracting and retaining talent, health and safety, employee welfare, reducing emissions, diversity and inclusion.
We are committed to the long-term sustainable success of XP Power in all its aspects. In 2021, we started the end-to-end mapping of our business including Scope 1, 2 and 3 emissions and are committed to a proactive strategy to reduce these in absolute terms. We plan to complete this exercise in 2022.
We have set Company targets to reduce CO2 emissions intensity by a minimum of 3% per annum over the short and medium term, and an aspiration to achieve carbon neutrality by 2040. During 2022, we will develop further strategies to bring this date forward.
GAVIN GRIGGSCHIEF EXECUTIVE OFFICER 1 March 2022
READ MORE ABOUT HOW WE EVOLVED FROM THAT OF A SPECIALIST DISTRIBUTOR, TO DESIGNER, TO DESIGN MANUFACTURER ON PAGES 26–27
READ MORE ABOUT SUSTAINABILITY STRATEGY ON PAGES 52–55
£43.8mADJUSTED PROFIT BEFORE TAX (£M)
+7% CER COMPARED TO FY 20
37
STRATEGIC REPORT
30801-XP-Power AR21-Strategic.indd 3730801-XP-Power AR21-Strategic.indd 37 08/03/2022 10:57:1708/03/2022 10:57:17
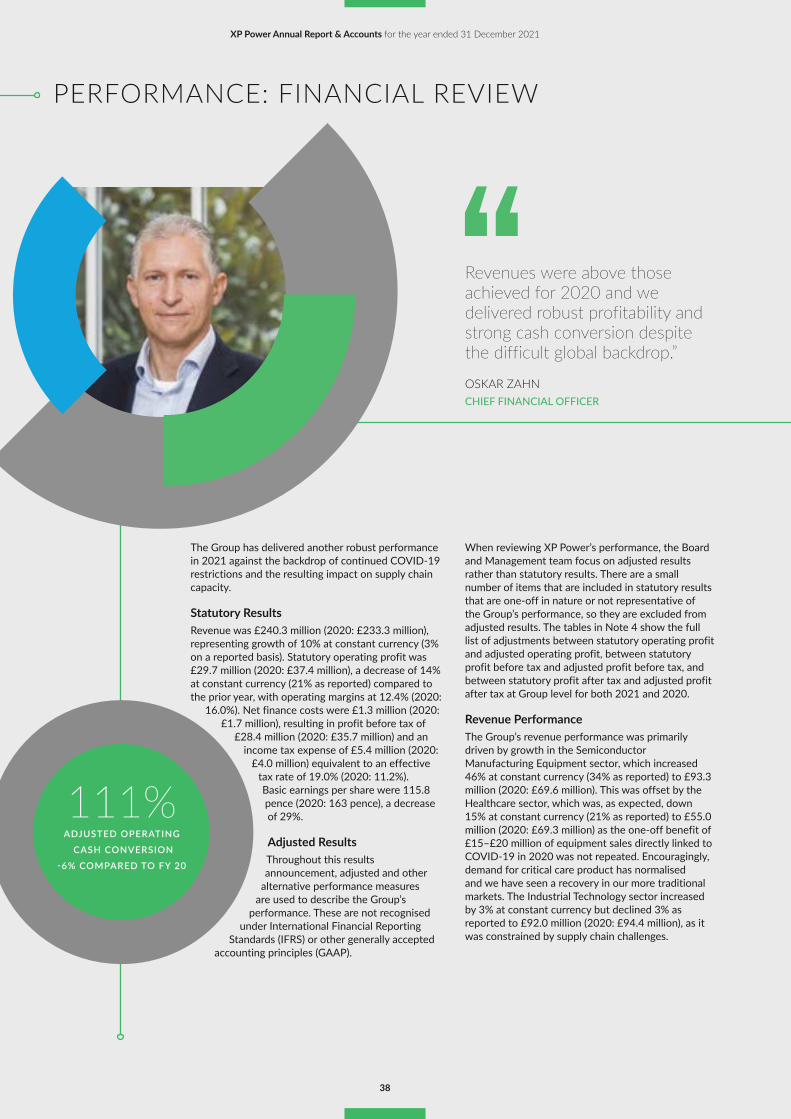
30801 8 March 2022 9:38 am v9
Revenues were above those achieved for 2020 and we delivered robust profitability and strong cash conversion despite the difficult global backdrop.”
OSKAR ZAHNCHIEF FINANCIAL OFFICER
The Group has delivered another robust performance in 2021 against the backdrop of continued COVID-19 restrictions and the resulting impact on supply chain capacity.
Statutory Results Revenue was £240.3 million (2020: £233.3 million), representing growth of 10% at constant currency (3% on a reported basis). Statutory operating profit was £29.7 million (2020: £37.4 million), a decrease of 14% at constant currency (21% as reported) compared to the prior year, with operating margins at 12.4% (2020:
16.0%). Net finance costs were £1.3 million (2020: £1.7 million), resulting in profit before tax of
£28.4 million (2020: £35.7 million) and an income tax expense of £5.4 million (2020:
£4.0 million) equivalent to an effective tax rate of 19.0% (2020: 11.2%). Basic earnings per share were 115.8 pence (2020: 163 pence), a decrease of 29%.
Adjusted Results Throughout this results announcement, adjusted and other
alternative performance measures are used to describe the Group’s
performance. These are not recognised under International Financial Reporting
Standards (IFRS) or other generally accepted accounting principles (GAAP).
When reviewing XP Power’s performance, the Board and Management team focus on adjusted results rather than statutory results. There are a small number of items that are included in statutory results that are one-off in nature or not representative of the Group’s performance, so they are excluded from adjusted results. The tables in Note 4 show the full list of adjustments between statutory operating profit and adjusted operating profit, between statutory profit before tax and adjusted profit before tax, and between statutory profit after tax and adjusted profit after tax at Group level for both 2021 and 2020.
Revenue Performance The Group’s revenue performance was primarily driven by growth in the Semiconductor Manufacturing Equipment sector, which increased 46% at constant currency (34% as reported) to £93.3 million (2020: £69.6 million). This was offset by the Healthcare sector, which was, as expected, down 15% at constant currency (21% as reported) to £55.0 million (2020: £69.3 million) as the one-off benefit of £15–£20 million of equipment sales directly linked to COVID-19 in 2020 was not repeated. Encouragingly, demand for critical care product has normalised and we have seen a recovery in our more traditional markets. The Industrial Technology sector increased by 3% at constant currency but declined 3% as reported to £92.0 million (2020: £94.4 million), as it was constrained by supply chain challenges.
111%ADJUSTED OPERATING
CASH CONVERSION
-6% COMPARED TO FY 20
38
XP Power Annual Report & Accounts for the year ended 31 December 2021
PERFORMANCE: FINANCIAL REVIEW
30801-XP-Power AR21-Strategic.indd 3830801-XP-Power AR21-Strategic.indd 38 08/03/2022 10:57:1808/03/2022 10:57:18

30801 8 March 2022 9:38 am v9
Our North America region continued to benefit from the growth in demand for Semiconductor Manufacturing Equipment, increasing revenue by 8% to US$194.6 million from US$180.4 million in 2021. This growth was despite not seeing the repeat of the sales directly linked to COVID-19 which was predominantly in North America in 2020. Europe delivered growth of 3% to £67.3 million (2020: £65.6 million), as growth from Semiconductor Manufacturing and Industrial Technology sectors was offset by a small decrease in the Healthcare sector. Asia revenue grew by 30% to US$43.8 million (2020: US$33.8 million), driven by continued growth in the Semiconductor Manufacturing Equipment sector. Asia now contributes 13.2% of Group revenues (2020: 11.4%).
Gross Profitability Gross margin decreased to 45.1% (2020: 47.2%), primarily because of COVID-related restrictions at our manufacturing sites in H2. This caused significantly reduced capacity and efficiency, along with the availability of key components and higher logistics costs with a greater proportion of air freight, impacting deliveries towards the end of the year. H1 gross margin of 46.6% reduced to 43.5% in H2. Additionally, a benefit of £0.6 million received in 2020 as a grant related to COVID-19 from the Singaporean government as part of the Jobs Support Scheme was not repeated in 2021. We believe the impact on gross margins to be temporary.
Adjusted Operating Expenses and Margins A slight increase in operating expenses in 2021 was more than offset by foreign exchange gains of £1.9 million, resulting in adjusted operating expenses decreasing by 2% to £63.2 million. Resulting adjusted operating margin decreased to 18.8% (2020: 19.7%) as a result of lower gross margins.
Finance Cost Net finance cost decreased by 24% to £1.3 million (2020: £1.7 million) due to lower effective interest rate.
Adjusted Profit Before Tax The Group generated adjusted profit before tax and specific items of £43.8 million, representing an improvement of 7% at constant currency (a decrease of 1% as reported) compared to last year.
Specific ItemsIn 2021, the Group incurred £15.4 million (2020: £8.6 million) of specific items. This was predominantly legal costs of £10.1 million (2020: £0.4 million) relating to a non-customer-related legal dispute in North America (see Legal below), £2.8 million of amortisation of intangible assets relating to previous business combinations (2020: £3.2 million), and ERP implementation costs of £2.1 million (2020: £1.9 million). The ERP implementation is expected to be completed in H1 2022, and remaining costs will continue to be classified as specific items.
LegalAs reported last year, in September 2020, Comet Technologies USA Inc., Comet AG, and YXLON International (collectively “Comet”) filed a lawsuit against XP Power LLC, alleging trade secret misappropriation relating to RF match and generator technology. The lawsuit is still ongoing, and the Group has incurred legal costs of £10.1 million in 2021 (2020: £0.4 million).
XP Power believes there is no merit to this lawsuit and is vigorously defending claims brought against it by Comet. A jury trial for this lawsuit is currently set to begin on 14 March 2022. The Group expects to incur further legal costs until this matter is resolved, the magnitude of which cannot currently be estimated with any certainty. No provision in relation to the dispute has been recognised as the amount of outflow, if any, cannot be estimated reliably. Further information about the matter and its possible outcomes are not provided as such disclosures could be detrimental to the interests of the company in this dispute.
Profit Before TaxProfit before tax of £28.4m was 13% lower at constant exchange rates than 2020 mainly due to the legal costs associated with the lawsuit in North America noted above.
Taxation The effective tax rate on adjusted profit before tax increased by 770bps to 19.2% (2020: 11.5%), within our guidance range, as the one-off impacts in 2020 of employee share option awards and utilisation of tax losses were not repeated.
The effective tax rate on statutory profit before tax increased by 780bps to 19.0% (2020: 11.2%). Going forward, XP Power expects the effective tax rate to be approximately 17–20%, depending predominantly on the regional mix of profits.
Research and Development (R&D)Gross R&D expenditure was £16.8 million, representing 7% of revenue; an increase of 6% over prior year. Innovation is a key part of the Group’s strategy and, as a result, R&D investment is expected to continue to grow as the Group extends its engineering capabilities with a particular focus on RF and high-power, high-voltage product development activities.
The Group capitalised £8.3 million of R&D costs (2020: £7.7 million), which reflects the development of new products as the Group expands its product portfolio. In 2022 we are expecting this investment to increase to c.£10 million.
Our strong cash generation and confidence in the Group’s long-term prospects supported the continuation of our progressive dividend policy throughout 2021.”
READ MORE ABOUT CONSOLIDATED STATEMENT OF COMPREHENSIVE INCOME ON PAGE 137
READ MORE ABOUT SEGMENTAL REPORTING ON PAGES 151–153
39
STRATEGIC REPORT
30801-XP-Power AR21-Strategic.indd 3930801-XP-Power AR21-Strategic.indd 39 08/03/2022 10:57:1808/03/2022 10:57:18

30801 8 March 2022 9:38 am v9
Capital ExpenditureThe Group continued to invest in its infrastructure, both through the upgrade of our ERP system and capital investment at our manufacturing facilities to expand capacity and improve operational performance. £13.6 million (2020: £7.2 million) was incurred on capital expenditure during 2021.
We expect 2022 to be an abnormally high year of expenditure before returning towards historic levels. The expenditure is necessary to meet our longer-term growth plans and will generate attractive returns. We plan to invest c.£18 million during the new financial year, with the main investments related to maintenance and expansion of our existing manufacturing facilities, investment in required new manufacturing capacity in Asia to meet long term demand. The completion and upgrade of our ERP system is expected to be c.£4 million.
Earnings Per ShareBasic adjusted earnings per share decreased to 115.8p (2020: 163.0p) and diluted adjusted earnings per share decreased by 11% to 179.4 pence and 176.3 pence respectively (2020: 201.8 pence and 198.4 pence).
Cash Flow The Group continues to be highly cash generative, with net cash from operations of £36.4 million (2020: £45.6 million), representing cash conversion of 122% (2020: 122%). Within working capital, inventory increased through investment in raw materials and safety stocks to manage supply issues and the customer demand backlog. On an adjusted basis, excluding specific items, the cash conversion is 111% (2020: 117%).
Free cash flow before acquisitions, dividends and repayment of borrowings was £12.5 million (2020: £31.3 million).
The Group finished 2021 with net debt of £24.6 million (2020: £17.9 million), comprising cash and cash equivalents of £9.0 million and gross debt of £33.6 million. The increase in net debt during 2021 was a result specific items, offset by the continued strong cash conversion.
Capital AllocationThe Group will continue its disciplined approach to capital allocation, prioritising the maintenance of a strong balance sheet and sufficient committed facilities, while continuing to focus on investing in the business to drive organic growth. Where opportunities are in line with the Group’s strategy and meet management’s strict criteria to deliver value to shareholders, the Group will continue to review acquisition opportunities.
The year’s cash flow performance and continued good liquidity has enabled the Board to recommend a final dividend of 36 pence per share for the fourth quarter of 2021. This dividend will be payable to members on the register on 25 March 2022 and will be paid on 28 April 2022. When combined with the interim dividends for the previous three quarters, the total dividend for the year will be 94 pence per share (2020: 74 pence).
The Group plans to operate in a range of between 1 - 2x net debt to adjusted EBITDA in the medium term.
Foreign ExchangeThe Group reports its results in sterling, but the US dollar continues to be our principal trading currency, with approximately 87% (2020: 85%) of our revenues denominated in US dollars. The average sterling to US dollar exchange rate increased by 8% from 1.28 to 1.38 resulting in a £3.2 million adverse impact on adjusted operating profit.
OutlookFor 2022, despite the ongoing challenges and uncertainty that remain in relation to our supply chain, component shortages and inflationary pressures, the record order book and the positive demand backdrop, across all our sectors, provides us with cautious optimism for our prospects. We remain excited about our longer-term outlook.
OSKAR ZAHNCHIEF FINANCIAL OFFICER 1 March 2022
READ MORE ABOUT CONSOLIDATED BALANCE SHEET ON PAGE 138
READ MORE ABOUT CONSOLIDATED STATEMENT OF CHANGES IN EQUITY ON PAGE 139
40
XP Power Annual Report & Accounts for the year ended 31 December 2021
PERFORMANCE: FINANCIAL REVIEW CONTINUED
30801-XP-Power AR21-Strategic.indd 4030801-XP-Power AR21-Strategic.indd 40 08/03/2022 10:57:2108/03/2022 10:57:21

30801 8 March 2022 9:38 am v9
41
STRATEGIC REPORT
30801-XP-Power AR21-Strategic.indd 4130801-XP-Power AR21-Strategic.indd 41 08/03/2022 10:57:2408/03/2022 10:57:24
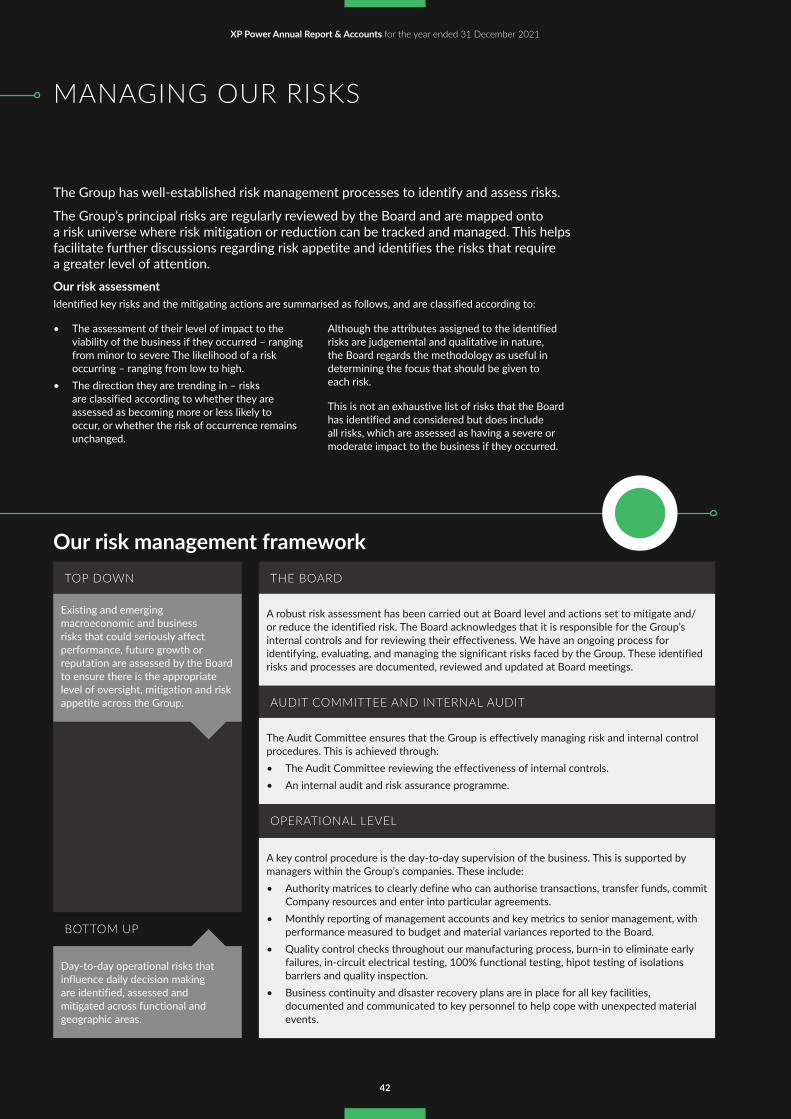
30801 8 March 2022 9:38 am v9
The Group has well-established risk management processes to identify and assess risks.
The Group’s principal risks are regularly reviewed by the Board and are mapped onto a risk universe where risk mitigation or reduction can be tracked and managed. This helps facilitate further discussions regarding risk appetite and identifies the risks that require a greater level of attention.Our risk assessmentIdentified key risks and the mitigating actions are summarised as follows, and are classified according to:
• The assessment of their level of impact to the viability of the business if they occurred – ranging from minor to severe The likelihood of a risk occurring – ranging from low to high.
• The direction they are trending in – risks are classified according to whether they are assessed as becoming more or less likely to occur, or whether the risk of occurrence remains unchanged.
Although the attributes assigned to the identified risks are judgemental and qualitative in nature, the Board regards the methodology as useful in determining the focus that should be given to each risk.
This is not an exhaustive list of risks that the Board has identified and considered but does include all risks, which are assessed as having a severe or moderate impact to the business if they occurred.
THE BOARD
A robust risk assessment has been carried out at Board level and actions set to mitigate and/or reduce the identified risk. The Board acknowledges that it is responsible for the Group’s internal controls and for reviewing their effectiveness. We have an ongoing process for identifying, evaluating, and managing the significant risks faced by the Group. These identified risks and processes are documented, reviewed and updated at Board meetings.
AUDIT COMMITTEE AND INTERNAL AUDIT
The Audit Committee ensures that the Group is effectively managing risk and internal control procedures. This is achieved through:• The Audit Committee reviewing the effectiveness of internal controls.• An internal audit and risk assurance programme.
OPERATIONAL LEVEL
A key control procedure is the day-to-day supervision of the business. This is supported by managers within the Group’s companies. These include:• Authority matrices to clearly define who can authorise transactions, transfer funds, commit
Company resources and enter into particular agreements.• Monthly reporting of management accounts and key metrics to senior management, with
performance measured to budget and material variances reported to the Board.• Quality control checks throughout our manufacturing process, burn-in to eliminate early
failures, in-circuit electrical testing, 100% functional testing, hipot testing of isolations barriers and quality inspection.
• Business continuity and disaster recovery plans are in place for all key facilities, documented and communicated to key personnel to help cope with unexpected material events.
TOP DOWN
Existing and emerging macroeconomic and business risks that could seriously affect performance, future growth or reputation are assessed by the Board to ensure there is the appropriate level of oversight, mitigation and risk appetite across the Group.
BOTTOM UP
Day-to-day operational risks that influence daily decision making are identified, assessed and mitigated across functional and geographic areas.
Our risk management framework
42
XP Power Annual Report & Accounts for the year ended 31 December 2021
MANAGING OUR RISKS
30801-XP-Power AR21-Strategic.indd 4230801-XP-Power AR21-Strategic.indd 42 08/03/2022 10:57:2408/03/2022 10:57:24

30801 8 March 2022 9:38 am v9
Impact
Likelihood
Severe
MinorLow High
1
29 3
11
48
56 10
7
1 An event causes a disruption to our manufacturing facilities
2 Product recall
3 Competition from new market entrants and new technologies
4 Fluctuations of revenues, expenses and operating results due to an economic shocks
5 Dependence on key customers
6 Cybersecurity/information systems failure
7 Risks relating to regulation, compliance and taxation
8 Strategic risk associated with valuing or integrating new acquisitions
9 Loss of key personnel or failure to attract new personnel
10 Exposure to exchange rate fluctuations
11 Risk associated with supply chain
Heat map of the identified risks indicating the likelihood and level of impact
Risk appetiteThe Board determines the amount and types of risk that the Company is willing to take to achieve its strategic and operational objectives. Our approach has been refined in the year, with a risk appetite rating applied to each risk.
A key focus for the Board is minimising the Group’s exposure to financial, operational, human, legislative and reputational risks.
COVID-192021 continued to be a difficult global environment characterised by ongoing challenges resulting from COVID-19. A key priority since the start of the pandemic has been to protect the health and wellbeing of our colleagues, and we continue this focus as we navigated the issues we faced in 2021.
Our business continuity plans were already in place before COVID-19, and enabled us to respond immediately to restrictions that impacted manufacturing capacity in Vietnam during 2021, where we ensured the welfare of our people and flexed our supply chain to increase production in China to minimise the operational impact.
The experience and learnings of the pandemic, and the ongoing impact on the global supply chain, are reflected in our risk reviews and will enhance our response to the next disruptive event.
Emerging risksWe continue to monitor and assess emerging risks throughout our risk processes.
The COVID-19 pandemic and its wider impact continues to impact the emerging risks we face, with increased inflationary pressure and ongoing component shortages and logistics disruption.
We continue to enhance our supply chain resilience and have multi-site manufacturing in Asia, where most of our products can now be produced in either our Chinese or Vietnamese facilities. We have been working to develop our supply chain to reduce dependency on single sources or single regions. We will commence construction of a new manufacturing facility in a third country in 2022 to increase capacity to meet the demand from across the Group, but also to help strengthen our supply chain.
The impact of climate-related change and severe weather events are assessed through our Sustainability Committee and included in our Sustainability Report, and are an increased area of focus for our emerging risks.
43
STRATEGIC REPORT
30801-XP-Power AR21-Strategic.indd 4330801-XP-Power AR21-Strategic.indd 43 08/03/2022 10:57:2408/03/2022 10:57:24

30801 8 March 2022 9:38 am v9
RISKEXPLANATIONOF RISK
POTENTIALIMPACT MITIGATION
PRIORITIES FOR 2022
ASSESSEDTREND
1 An event causes a disruption to our manufacturing facilities
LINK TO STRATEGIC PILLAR
An event that results in the temporary or permanent loss of a manufacturing facility would be a serious issue.
This could include climate-related events such as severe weather or government-imposed restrictions.
As the Group manufactures 80% of revenues, this would undoubtedly cause at least a short-term loss of revenues and profits, and disruption to our customers, and therefore damage to reputation.
• We have two facilities (China and Vietnam) where we can produce most of our power converters.
• We have disaster recovery plans in place for both facilities.
• We have undertaken a risk review with the manufacturing management to identify and assess risks that could cause a serious disruption to manufacturing, and identified and implemented actions to reduce or mitigate these risks where possible.
• Commence construction of a new manufacturing facility.
• Continued transfer of products from China to Vietnam and from North America.
2 Product recall
LINK TO STRATEGIC PILLAR
A product recall due to a quality or safety issue.
This would have serious repercussions to the business in terms of potential cost and reputational damage as a supplier to critical systems.
• We perform 100% functional testing on all own manufactured products and 100% hipot testing, which determines the adequacy of electrical insulation. This ensures the integrity of the isolation barrier between the mains supply and the end user of the equipment. We also test all medical products we manufacture to ensure the leakage current is within the medical specifications.
• Where we have contracts with customers, we limit our contractual liability regarding recall costs.
• Continue to enhance our product design processes.
• Expand supplier quality capabilities.
No change to risk
KEY Increase to risk Decrease to risk
Develop a market-leading range of competitive products
Target accounts where we can add value
Vertical penetration of focus accounts
Build a global supply chain that balances high efficiency with market-leading customer responsiveness
Lead our industry on environmental matters
Make selective acquisitions of complementary businesses to expand our offering
STRATEGIC KEY
44
XP Power Annual Report & Accounts for the year ended 31 December 2021
MANAGING OUR RISKS CONTINUED
30801-XP-Power AR21-Strategic.indd 4430801-XP-Power AR21-Strategic.indd 44 08/03/2022 10:57:2408/03/2022 10:57:24

30801 8 March 2022 9:38 am v9
RISKEXPLANATIONOF RISK
POTENTIALIMPACT MITIGATION
PRIORITIES FOR 2022
ASSESSEDTREND
3 Competition from new market entrants and new technologies
LINK TO STRATEGIC PILLAR
The power supply market is diverse and competitive. The Directors believe that the development of new technologies could encourage significant new competition, which may have a material effect on the business.
At the lower end of the Group’s target market, in terms of both power range and programme size, the barriers to entry are lower and there is a risk that competition could quickly increase, particularly from emerging low-cost manufacturers in Asia.
Improvements in power conversion technology have been incremental as more high-performing components become available.
• The Group reviews activities of its competition, particularly product releases, and stays up to date with new technological advances in our industry, especially those relating to new components and materials. The Group also tries to keep its cost base competitive by manufacturing in low-cost geographies where appropriate.
• The general direction of our product roadmap is to move away from lower-complexity products and to increase our engineering solutions capabilities as to reduce the inherent market competitiveness.
• Integration of newly acquired FuG and Guth businesses, which complements our product portfolio in higher power and more complex solutions.
• We continue to develop higher power, higher voltage and high complexity product platforms, and de-emphasising low-power, low-voltage low complexity areas of the market.
4 Fluctuations of revenues, expenses and operating results due to an economic shock
LINK TO STRATEGIC PILLAR
The revenues, expenses and operating results of the Group could vary significantly from period to period due to a variety of factors, some of which are outside our control. These factors include general economic conditions; adverse movements in interest rates; conditions specific to the market; seasonal trends in revenues, capital expenditure and other costs; and the introduction of new products or services by the Group or its competitors.
In response to a changing competitive environment, the Group may elect to make certain pricing, service, marketing decisions or acquisitions that could have a short-term material adverse effect on the Group’s revenues, results of operations and financial condition.
• Although not immune from an economic shock or the cyclicality of the capital equipment markets, the Group’s diverse customer base, geographic spread and revenue annuities reduce exposure to this risk.
• The Group’s business model is not capital intensive and the strong profit margins lead to healthy cash generation, which also helps mitigate risks from these external factors.
• We will transfer the manufacture of products from North America to Asia to reduce costs.
• We will extend our product portfolio to protect against sector-specific shocks.
• We will explore outsourcing of appropriate products and subassemblies to reduce our fixed costs.
45
STRATEGIC REPORT
30801-XP-Power AR21-Strategic.indd 4530801-XP-Power AR21-Strategic.indd 45 08/03/2022 10:57:2408/03/2022 10:57:24

30801 8 March 2022 9:38 am v9
RISKEXPLANATIONOF RISK
POTENTIALIMPACT MITIGATION
PRIORITIES FOR 2022
ASSESSEDTREND
5 Dependence on key customers
LINK TO STRATEGIC PILLAR
The Group is dependent on retaining its key customers.
If the Group lost some of its key customers, this could have a material impact on its financial condition and results of operations. However, for the year ended 31 December 2021, no single customer accounted for more than 17% of revenue, and that revenue was spread over a large number of individual programmes.
• The Group mitigates this risk by providing excellent service. Customer complaints and non-conformances are reviewed monthly by members of the Executive Leadership team.
• Given that a key tenant of the Group’s strategy is to vertically penetrate its key customers, customer concentration is likely to increase. However, the Board believes that, as each customer revenue stream is made up of many individual programmes and these are designed in, the loss of an entire customer is unlikely. We will continue to ensure we provide excellent service to our customers at competitive price points.
6 Cybersecurity/ information systems failure
LINK TO STRATEGIC PILLAR
The Group is reliant on information technology in multiple aspects of the business from communications to data storage. Assets accessible online are potentially vulnerable to theft and customer channels are vulnerable to disruption.
Any failure or downtime of these systems, or any data theft, could have a significant adverse impact on the Group’s reputation or on the results of operations.
• The Group has a defined business impact assessment, which identifies the key information assets, replication of data on different systems or in the Cloud, an established backup process in place, and a robust anti-malware solution on our networks.
• Internally produced training materials are used to educate users regarding good IT security practice and to promote the Group’s IT policy.
• All recommendations from an outsourced internal auditor assessment have been implemented to further mitigate cyber risk and safeguard the Group’s assets.
• We will continue to enhance our cybersecurity tools and processes, and continue to promote heightened awareness to cybersecurity risks among our people.
46
XP Power Annual Report & Accounts for the year ended 31 December 2021
MANAGING OUR RISKS CONTINUED
30801-XP-Power AR21-Strategic.indd 4630801-XP-Power AR21-Strategic.indd 46 08/03/2022 10:57:2508/03/2022 10:57:25

30801 8 March 2022 9:38 am v9
RISKEXPLANATIONOF RISK
POTENTIALIMPACT MITIGATION
PRIORITIES FOR 2022
ASSESSEDTREND
7 Risks relating to regulation, compliance and taxation
LINK TO STRATEGIC PILLAR
The Group operates in multiple jurisdictions with applicable trade and tax regulations that vary.
Failing to comply with local regulations or a change in legislation could impact the profits of the Group. In addition, the effective tax rate of the Group is affected by where its profits fall geographically. The Group’s effective tax rate could therefore fluctuate over time and have an impact on earnings and potentially its share price.
• An outsourced internal audit function provides risk assurance in targeted areas of the business and recommendations for improvement. The scope of these reviews includes behaviour, culture and ethics.
• The Group hires employees with relevant skills and uses external advisers to keep up to date with changes in regulations to remain compliant.
• We will continue to ensure we stay current with the latest legislation and will ensure we have the necessary contemporaneous documentation for compliance and tax purposes.
8 Strategic risk associated with valuing or integrating new acquisitions
LINK TO STRATEGIC PILLAR
The Group may elect to make strategic acquisitions. A degree of uncertainty exists in valuation, particularly in evaluating potential synergies.
Post-acquisition risks arise in the form of change of control and integration challenges. Any of these influence the Group’s revenues, results of operations and financial condition.
• Preparation of robust business plans and cash projections with sensitivity analysis and the help of professional advisers if appropriate.
• Post-acquisition reviews are performed to extract “lessons learned”.
• Integration of FuG and Guth businesses.
• For further acquisitions, we will ensure we have robust integration plans and integrate learnings from post-acquisition reviews of current integration projects.
9 Loss of key personnel or failure to attract new personnel
LINK TO STRATEGIC PILLAR
The future success of the Group is substantially dependent on the continuing services and contributions of its Directors, senior management and other key personnel.
The loss of key employees could have a material adverse effect on the Group’s business.
• The Group undertakes performance evaluations and reviews to help it stay close to its key personnel, as well as with annual employee engagement surveys. Where appropriate, the Group also makes use of financial retention tools such as equity awards.
• We will continue to focus on people management and leadership development, including the roll-out of performance management training and ongoing review of engagement surveys.
No change to risk
KEY Increase to risk Decrease to risk
Develop a market-leading range of competitive products
Target accounts where we can add value
Vertical penetration of focus accounts
Build a global supply chain that balances high efficiency with market-leading customer responsiveness
Lead our industry on environmental matters
Make selective acquisitions of complementary businesses to expand our offering
STRATEGIC KEY
47
STRATEGIC REPORT
30801-XP-Power AR21-Strategic.indd 4730801-XP-Power AR21-Strategic.indd 47 08/03/2022 10:57:2508/03/2022 10:57:25

30801 8 March 2022 9:38 am v9
RISKEXPLANATIONOF RISK
POTENTIALIMPACT MITIGATION
PRIORITIES FOR 2022
ASSESSEDTREND
10 Exposure to exchange rate fluctuations
LINK TO STRATEGIC PILLAR
The Group deals in many currencies for both its purchases and sales including US dollars, euros and its reporting currency pounds sterling. North America represents an important geographic market for the Group where virtually all the revenues are denominated in US dollars. The Group also sources components in US dollars and the Chinese yuan.
The Group has an exposure to foreign currency fluctuations. This could lead to material adverse movements in reported earnings and cash flows.
• The Group reviews balance sheet and cash flow currency exposures and, where appropriate, uses forward exchange contracts to hedge these exposures.
• The Group does not hedge any translation of its subsidiaries’ results to sterling for reporting purposes.
• We will continue to regularly review our balance sheet and cash flow exposures and take action to mitigate exposures as appropriate.
11 Risk associated with supply chain LINK TO STRATEGIC PILLAR
The Group is dependent on retaining its key suppliers and ensuring that deliveries are on time and materials supplied are of an appropriate quality.
As the proportion of our own-manufactured products has increased, the reliance on suppliers for third-party product has been mitigated proportionally. There has been a shift from a finished goods risk to a raw materials risk, particularly where components have a single source of supply.
• We conduct regular audits of our key suppliers and keep large amounts of safety inventory of key components, which we also regularly review. We also dual source our components where possible to minimise dependency on any single supplier.
• We will design new products with multiple sources of components where possible.
• We will continue to diversify and localise our supply chains.
• We will conduct a review of all approaches to component management following recent component shortages.
• We will develop outsourced resource for various subassemblies and finished goods as appropriate.
No change to risk
KEY Increase to risk Decrease to risk
Develop a market-leading range of competitive products
Target accounts where we can add value
Vertical penetration of focus accounts
Build a global supply chain that balances high efficiency with market-leading customer responsiveness
Lead our industry on environmental matters
Make selective acquisitions of complementary businesses to expand our offering
STRATEGIC KEY
48
XP Power Annual Report & Accounts for the year ended 31 December 2021
MANAGING OUR RISKS CONTINUED
30801-XP-Power AR21-Strategic.indd 4830801-XP-Power AR21-Strategic.indd 48 08/03/2022 10:57:2508/03/2022 10:57:25

30801 8 March 2022 9:38 am v9
In accordance with provision 4.31 of the 2018 revision of the UK Corporate Governance Code, the Directors are required to assess the prospects of the Group over a period longer than the 12 months required by the “Going Concern” provision.In making this assessment, the Directors considered the Group’s current financial position, its recent and historic financial performance and forecasts, strategy and business model (pages 26–27), and the principal risks and uncertainties (page 43). The impact of COVID-19 has also been considered in determining the impact of the severe downside scenarios.
The Directors have determined the three-year period to December 2024 to be an appropriate period over which to assess the Group’s viability, as this timeframe is within the Group’s strategic financial planning period used to evaluate performance and liquidity, and aligns with the design-in cycle that the Group has visibility of. In making the assessment, the Directors considered a three-year financial model including the Group annual plan for 2022 and strategic financial plan for the following years.
The Group has a business model where its products are designed into numerous applications, with numerous customers, in numerous geographies. The Group’s products are all designed into capital equipment, which is generally in production for several consecutive years, resulting in a revenue annuity. This diversity and revenue annuity are both deemed important factors in mitigating many of the risks that could affect the long-term viability of the Group.
In determining the viability term, the Board assessed the conservative scenarios against the controls in place to prevent or mitigate principal risks of the Group.
It also considered them against the Group’s current banking facilities, a revolving credit facility of US$150 million, which expires in November 2024.
In forming the viability statement, the Directors carried out an assessment of the principal risks and uncertainties facing the Group that could impact the business. 2021 has seen continued impact of COVID-19 restrictions, which whilst short term in nature, have increased uncertainty around supply chain capacity and logistics. Particular focus has also been given to the longer-term impact of climate change and weather-related events, including manufacturing downtime from natural events such as storms and wildfire, and the potential economic impact on the broader economy and our customers.
The financial model was stress-tested with various downside scenarios. The potential impact of the principal risks was then considered in the context of each of these downside scenarios. Certain subjective assumptions and judgments were made to achieve this. Given the cash generative nature of the business, each risk scenario occurring in isolation did not breach the Group’s theoretical borrowing facility headroom. The most severe threats occurring in isolation were found to be a prolonged closure of a manufacturing facility, or a significant and permanent economic collapse. A reverse-stress test was also performed, modelling how long the business could withstand a period without revenue, to demonstrate the impact required to breach available headroom.
The unlikely event of more than one risk occurring at the same time was also considered. A combination of a temporary or permanent disruption at one of our facilities, together with a serious and prolonged economic shock, was considered. The potential impact of this scenario did not put the Group in breach of its theoretical borrowing capacity.
Based on this assessment, the Directors confirm that they have a reasonable expectation that the Group will continue in operation and meet its liabilities as they fall due for at least a period of three years to 31 December 2024.
49
STRATEGIC REPORT
MANAGING OUR RISKS: VIABILITY STATEMENT
30801-XP-Power AR21-Strategic.indd 4930801-XP-Power AR21-Strategic.indd 49 08/03/2022 10:57:2508/03/2022 10:57:25

30801 8 March 2022 9:38 am v9
Section 172(1) Engaging with our stakeholders is fundamental, so we focus on what mattersSection 172 requires the directors of a company to act in the way they consider, in good faith, would be most likely to promote the success of the company for the benefit of its members as a whole and, in doing so, consider:
a. the likely consequences of any decision in the long term
b. the interests of the company’s employeesc. the need to foster the company’s business
relationships with suppliers, customers and othersd. the impact of the company’s operations on the
community and the environmente. the desirability of the company maintaining a
reputation for high standards of business conductf. the need to act fairly between members of the
company
In the process of making key decisions, the Board and management consider all stakeholders that are likely to be impacted.
We have a Code of Conduct, which all our employees and key suppliers sign up to, covering what we expect from those stakeholders regarding business ethics, responsible environmental behaviour, health and safety, and treatment of people.
During the pandemic, we have been very clear on our priorities to all parties, which have been:
1. the safety and wellbeing of our people2. keeping our customers supplied with product.
OUR PEOPLE CUSTOMERS SUPPLIERSCOMMUNITIES AND OUR ENVIRONMENT SHAREHOLDERS
Why we engageOur workforce is our most valuable asset, and their health, safety and wellbeing is of paramount importance. Having engaged teams is important to XP Power and we want all colleagues to be committed to our vision.
Why we engageWe continue to work closely with customers to deliver power products and solutions that make their businesses more sustainable, while delivering economic value to all parties in the value chain. We focus on two-way engagement to ensure we have effective partnerships in place and listen to their technology roadmaps so we can partner them effectively.
Why we engageOur suppliers are critical to our supply chain, and we need them to work in partnership with us. The aim is to increase the strength of the supplier base.
Why we engageWe engage with the communities that we operate in to build trust and understand their important local issues. Minimising the impact we have on the environment is a priority.
Why we engageWe are committed to a transparent engagement with Shareholders to ensure clear understanding of how the Company performs in all areas from strategic and financial performance to environmental, social and governance.
How we engageWe believe communication is best from line managers to teams so, while we have regular town halls with senior management, we work to ensure messages are cascaded and discussed. We track our performance with all-staff surveys and a Non-Executive Director holds regular fireside chats to get input from teams.
How we engageOur sales teams frequently engage with our focus customers to understand our performance and their issues.We also ask some to complete anonymous surveys to further understand our performance.
How we engageWe hold quarterly business reviews with our key suppliers to monitor performance and to understand their challenges, issues and concerns throughout the pandemic.
How we engageKey areas of focus include how we can support local causes and issues, create opportunities to recruit and develop local people, and help to look after the environment. The impact of decisions on the environment, both locally and nationally, is considered with such issues as waste management being addressed wherever possible. Our commitment to sustainability is long standing and is detailed in the sustainability report on pages.
How we engageWe encourage engagement throughout the year and are transparent in all areas of the business.Our CEO, CFO and IR team have regular sessions with current and prospective investors to ensure they understand the XP Power investment proposition, ESG performance and current performance.Our Chair and Remuneration Committee Chair have had discussions with our key Shareholders regarding executive remuneration and CEO succession to ensure we can take account of their views.
Key topics discussed • Diversity at XP Power• Women in engineering • Building a career • Business performance
Key topics discussed • Solving power problems and
embedding our power solutions into customer processes
• Clear communication on delivery timing and how deliveries can be expedited during the supply chain challenges
Key topics discussed • XP Power Code of Conduct• Supplier performance• Component shortages and mitigation
and expediting
Key topics discussed • Understanding from communities which
local charities can be supported by our employees to have the biggest impact
• Sharing with communities XP Power's sustainability strategy
Key topics discussed • Executive remuneration • ESG priorities and strategy
How we responded • Implementing smart recruitment
methodologies• Enhance retention and succession
planning• More engagement with the
workforce
How we responded • Working with the customer to get
the most effective solution• Increasing development spend• Product and technology roadmaps
based on customers’ feedback
How we responded • Consolidated our supplier base focusing
on quality provision to give greater confidence in delivery
• Used our supplier and customer network to address component shortages
• Worked with distributors to secure long-term demand for key components
How we responded • Local Coat and Food Drive supported
throughout the Group• Earth Week Global: During April 2021,
the business held Earth Week• Local charitable initiatives supported
across the Group
How we responded To understand what material matters impact them regarding environmental, social and governance. This has been used to input how we evolve our approach to sustainability
SEE PAGE 90 FOR MORE INFORMATION ON HOW OUR BOARD ENGAGED WITH OUR WORKFORCE THIS YEAR
SEE PAGE 88 FOR MORE INFORMATION ON HOW OUR BOARD ENGAGED WITH OUR CUSTOMERS THIS YEAR
SEE PAGE 91 FOR MORE INFORMATION ON HOW OUR BOARD ENGAGED WITH OUR SUPPLIERS THIS YEAR
SEE PAGE 88 FOR MORE INFORMATION ON HOW OUR BOARD ENGAGED WITH OUR COMMUNITIES AND OUR ENVIRONMENT THIS YEAR
SEE PAGE 92 FOR MORE INFORMATION ON HOW OUR BOARD ENGAGED WITH OUR SHAREHOLDERS THIS YEAR
50
XP Power Annual Report & Accounts for the year ended 31 December 2021
SECTION 172(1) STATEMENT: HOW WE ENGAGE WITH OUR EMPLOYEES
30801-XP-Power AR21-Strategic.indd 5030801-XP-Power AR21-Strategic.indd 50 08/03/2022 10:57:2508/03/2022 10:57:25

30801 8 March 2022 9:38 am v9
OUR PEOPLE CUSTOMERS SUPPLIERSCOMMUNITIES AND OUR ENVIRONMENT SHAREHOLDERS
Why we engageOur workforce is our most valuable asset, and their health, safety and wellbeing is of paramount importance. Having engaged teams is important to XP Power and we want all colleagues to be committed to our vision.
Why we engageWe continue to work closely with customers to deliver power products and solutions that make their businesses more sustainable, while delivering economic value to all parties in the value chain. We focus on two-way engagement to ensure we have effective partnerships in place and listen to their technology roadmaps so we can partner them effectively.
Why we engageOur suppliers are critical to our supply chain, and we need them to work in partnership with us. The aim is to increase the strength of the supplier base.
Why we engageWe engage with the communities that we operate in to build trust and understand their important local issues. Minimising the impact we have on the environment is a priority.
Why we engageWe are committed to a transparent engagement with Shareholders to ensure clear understanding of how the Company performs in all areas from strategic and financial performance to environmental, social and governance.
How we engageWe believe communication is best from line managers to teams so, while we have regular town halls with senior management, we work to ensure messages are cascaded and discussed. We track our performance with all-staff surveys and a Non-Executive Director holds regular fireside chats to get input from teams.
How we engageOur sales teams frequently engage with our focus customers to understand our performance and their issues.We also ask some to complete anonymous surveys to further understand our performance.
How we engageWe hold quarterly business reviews with our key suppliers to monitor performance and to understand their challenges, issues and concerns throughout the pandemic.
How we engageKey areas of focus include how we can support local causes and issues, create opportunities to recruit and develop local people, and help to look after the environment. The impact of decisions on the environment, both locally and nationally, is considered with such issues as waste management being addressed wherever possible. Our commitment to sustainability is long standing and is detailed in the sustainability report on pages.
How we engageWe encourage engagement throughout the year and are transparent in all areas of the business.Our CEO, CFO and IR team have regular sessions with current and prospective investors to ensure they understand the XP Power investment proposition, ESG performance and current performance.Our Chair and Remuneration Committee Chair have had discussions with our key Shareholders regarding executive remuneration and CEO succession to ensure we can take account of their views.
Key topics discussed • Diversity at XP Power• Women in engineering • Building a career • Business performance
Key topics discussed • Solving power problems and
embedding our power solutions into customer processes
• Clear communication on delivery timing and how deliveries can be expedited during the supply chain challenges
Key topics discussed • XP Power Code of Conduct• Supplier performance• Component shortages and mitigation
and expediting
Key topics discussed • Understanding from communities which
local charities can be supported by our employees to have the biggest impact
• Sharing with communities XP Power's sustainability strategy
Key topics discussed • Executive remuneration • ESG priorities and strategy
How we responded • Implementing smart recruitment
methodologies• Enhance retention and succession
planning• More engagement with the
workforce
How we responded • Working with the customer to get
the most effective solution• Increasing development spend• Product and technology roadmaps
based on customers’ feedback
How we responded • Consolidated our supplier base focusing
on quality provision to give greater confidence in delivery
• Used our supplier and customer network to address component shortages
• Worked with distributors to secure long-term demand for key components
How we responded • Local Coat and Food Drive supported
throughout the Group• Earth Week Global: During April 2021,
the business held Earth Week• Local charitable initiatives supported
across the Group
How we responded To understand what material matters impact them regarding environmental, social and governance. This has been used to input how we evolve our approach to sustainability
SEE PAGE 90 FOR MORE INFORMATION ON HOW OUR BOARD ENGAGED WITH OUR WORKFORCE THIS YEAR
SEE PAGE 88 FOR MORE INFORMATION ON HOW OUR BOARD ENGAGED WITH OUR CUSTOMERS THIS YEAR
SEE PAGE 91 FOR MORE INFORMATION ON HOW OUR BOARD ENGAGED WITH OUR SUPPLIERS THIS YEAR
SEE PAGE 88 FOR MORE INFORMATION ON HOW OUR BOARD ENGAGED WITH OUR COMMUNITIES AND OUR ENVIRONMENT THIS YEAR
SEE PAGE 92 FOR MORE INFORMATION ON HOW OUR BOARD ENGAGED WITH OUR SHAREHOLDERS THIS YEAR
51
STRATEGIC REPORT
30801-XP-Power AR21-Strategic.indd 5130801-XP-Power AR21-Strategic.indd 51 08/03/2022 10:57:2608/03/2022 10:57:26

30801 8 March 2022 9:38 am v9
Our aim is to be an industry leader in sustainability, with a commitment to reach net zero carbon by 2040.”
GAVIN GRIGGSCHIEF EXECUTIVE OFFICER
Introduction to Sustainability from the CEO At XP Power, we believe that conducting ourselves in alignment with high stakeholder expectations of our societal and environmental impact makes good business sense. We have a moral obligation to “do the right thing” for our planet and each other, and sustainability is an enabler of good business; using resources more efficiently means we can do more with less, as well as minimising waste.
We have a long history of setting high standards of environmental performance in our industry, whether through our products or manufacturing operations. Our high efficiency green products provide an ongoing commercial opportunity whilst progressing our own sustainability agenda and supporting customers to reduce their own carbon footprint. We continue to invest in our operations, infrastructure, technology and people. This has helped to embed sustainability into the everyday operational fabric of our business, influencing our decisions and actions across the Group, and ultimately making sustainability business as usual. We became the first power converter manufacturer to be admitted into the Responsible Business Alliance, which sets high standards for environmental performance, the treatment of people, health and safety, business ethics and business systems.
Our aim is to be an industry leader in sustainability. We have a proud legacy to build on but remain focused on finding ways to dramatically reduce our impact across the whole value chain to achieve our
commitment to net zero by 2040. Our colleagues contribute in making ours a truly sustainable company, which requires multiple targets and pathways to achieve success. It informs decision making at all levels from operational procedure to investment spend. Building on our innovation and engineering excellence is vital to minimise our carbon footprint while helping our customers to limit their impact. Our factories still provide opportunity to reduce our operations’ carbon footprint through new leaner ways of working to use less resources and create less waste. Logistics and packaging are under review. We’re looking at our products – from increasing energy efficiency to untapped opportunities – which will continue to support our relentless customer focus. We already work with our suppliers, but we need greater understanding of their upstream activities and carbon impact to inform our future decisions and actions.
Sustainability is an integral part of our strategy. At XP Power, we will continue to make a difference and create an environment where we can be the best for our customers, ourselves, and the communities our business and products serve all over the world.
GAVIN GRIGGSCHIEF EXECUTIVE OFFICER 1 March 2022
52
XP Power Annual Report & Accounts for the year ended 31 December 2021
SUSTAINABILITY INTRODUCTION AND PROGRESS UPDATE
30801-XP-Power AR21-Strategic.indd 5230801-XP-Power AR21-Strategic.indd 52 08/03/2022 10:57:2608/03/2022 10:57:26

30801 8 March 2022 9:38 am v9
Our power converters are the safety critical element of the end application providing the isolation barrier between the end user and the relatively high voltage mains electricity.
Link to
Material issues1, 3
SEE PAGE 56 FOR OUR PERFORMANCE AGAINST THIS STRATEGIC PILLAR, METRICS, TARGETS AND PRIORITIES FOR NEXT YEAR
Produce quality products that are safe and solve our customers’ power problems
Our sustainable business goal is to be the leader of our industry regarding environmental matters, and to minimise the impact we and our products have on the environment.
Link to
Material issues8, 9, 11
SEE PAGE 59 FOR OUR PERFORMANCE AGAINST THIS STRATEGIC PILLAR, METRICS, TARGETS AND PRIORITIES FOR NEXT YEAR
Minimise the impact we and our products have on the environment and adopt responsible sourcing practices considering social and environmental impacts
Our sustainable business goal is to improve the physical and mental health of our employees, provide them with a safe place to work and to create an environment where our people can be their best.
Link to
Material issues4, 5, 6, 10
SEE PAGE 63 FOR OUR PERFORMANCE AGAINST THIS STRATEGIC PILLAR, METRICS, TARGETS AND PRIORITIES FOR NEXT YEAR
Make XP Power a workplace where our people can be at their best, ensuring an environment that is safe, diverse, inclusive and attracts and retains the best talent
Our sustainable business goal is to have zero breaches of our Code of Conduct and uphold the highest standard of ethics and integrity.
Link to
Material issues2, 7
SEE PAGE 71 FOR OUR PERFORMANCE AGAINST THIS STRATEGIC PILLAR, METRICS, TARGETS AND PRIORITIES FOR NEXT YEAR
Uphold the highest standard of business ethics and integrity
53
STRATEGIC REPORT
OUR SUSTAINABILITY STRATEGY
30801-XP-Power AR21-Strategic.indd 5330801-XP-Power AR21-Strategic.indd 53 08/03/2022 10:57:2708/03/2022 10:57:27

30801 8 March 2022 9:38 am v9
Our sustainability strategy is to: • Produce quality products that are safe and efficient, and solve our customers’ power problems; • Minimise the impact we and our products have on the environment; • Adopt responsible sourcing practices while considering social and environmental impacts; • Make XP Power a workplace where our people can be at their best to ensure an environment that is safe,
diverse, inclusive, and attracts and retains the best talent; and • Uphold the highest standard of business ethics and integrity.
Materiality assessment We aim to address issues that matter most to our Company, from a financial and business purpose perspective, and the impact on society and our stakeholders. The material issues we identified by engaging with our stakeholders shape our sustainability strategy, priorities, approach and reporting. The findings enable us to focus on areas that will improve our impact on the wider world whilst allowing our business to prosper.
Impo
rtan
ce to
XP
Pow
er's
stak
ehol
ders
Watch list Focus areaOngoing importance
Importance to XP Power
1
2
3
4
56 7
8
9
10
11
1 Product responsibility (safety and quality)
2 Responsible supply chain
3 Product solutions and innovation
4 Attracting, retaining and rewarding talent
5 Employee welfare
6 Health and safety (inc. occupational)
7 Ethical conduct and compliance
8 Energy efficiency
9 Waste management
10 Diversity and equal opportunity
11 Emissions
KEY
54
XP Power Annual Report & Accounts for the year ended 31 December 2021
OUR SUSTAINABILITY STRATEGY CONTINUED
30801-XP-Power AR21-Strategic.indd 5430801-XP-Power AR21-Strategic.indd 54 08/03/2022 10:57:3108/03/2022 10:57:31

30801 8 March 2022 9:38 am v9
Sustainability governanceAddressing sustainability is core to our business strategy so we have a robust structure of sustainability oversight and risk management in place. Full details of our sustainability governance model and its responsibilities are outlined in the TCFD report (page 73). At the highest level, the Board of Directors has ultimate oversight of, and responsibility for, our sustainability strategy. Our Non-Executive Director and Chair of the Remuneration Committee, Pauline Lafferty, supports the Board in this function and brings considerable sustainability experience. ESG engagements with the Board have been a particular theme this year with external input providing the Board with feedback from auditors, investors and sustainability experts.
This year, we established our Sustainability Council, now led by our CEO, to provide more structure to our sustainability management ,which should accelerate our ambition within the Group. The Sustainability Council draws on senior expertise across Group functions and allows us to prioritise our impact through organisational workstreams and to monitor progress against our plans across the Group. The Sustainability Council is tasked with the formation and successful delivery of the XP Power sustainability action plan and, within this, the action plan.
Sust
ainab
ility m
etric
s Goals & Objectives
XPPowerMainBoard
Executive TeamChaired by CEO
Monthly
Sustainability CouncilChaired by CEO
Quarterly
Programme TeamLed by Sustainability Lead
Monthly
SUSTAINABILITY ROADMAP
ACHIEVEMENTS IN PAST 12 MONTHS • Relaunched our Sustainability Council and
workstream leads, reinforcing our internal sustainability structure
• Senior management/Board sustainability training to raise our internal capability and develop the next stage of our strategy
• Won the inaugural supplier sustainability award “Sustainability PRISM Award-Supply Chain” from ASM International, one of our valued customers
• Maintained safety of employees whilst ensuring the full functioning of our key plant in Vietnam
• Updated our sustainability engagement for current and prospective employees, through enhanced website and onboarding materials
• Reported to Task Force on Climate-related Financial Disclosures (TCFD) for the first time, including integrating climate-related risk assessment into the Group’s overall risk management framework
• Shipped XP Green Power products resulting in minimum lifetime CO2 emission savings of 128,000 tonnes (versus target 120,000 tonnes)
PRIORITIES GOING FORWARD• Determine our full carbon footprint, including our
Scope 3 emissions• Enhance our understanding or carbon in product
through lifecycle analysis• Develop our net zero action plan and submit our
targets to Science Based Targets Initiative (SBTi)• Further ESG data and disclosure enhancements
(e.g. reporting to SASB requirements)• Expand the coverage of our Environmental
Management System (ISO 14001) across more sites in the Group
• Review core business processes for opportunities to embed sustainability
• Communicate our sustainability objectives across the Group, further engage employees and set clear expectations
55
STRATEGIC REPORT
30801-XP-Power AR21-Strategic.indd 5530801-XP-Power AR21-Strategic.indd 55 08/03/2022 10:57:3208/03/2022 10:57:32
30801 8 March 2022 9:38 am v9
Estimated lifetime savings from XP Green Power productsOne of our biggest contributors to reduction in CO2 emissions is from adoption of our XP Green Power products, which have ultra-high efficiency and low standby power. The CO2 emission savings from these products consistently exceed our Scope 1 and 2 CO2 emissions combined. These XP Green Power products are our high-efficiency products, which consume less electricity while powering the load and on standby mode when compared to the average power converter.
To achieve these efficiency gains requires a greater number of higher cost components and more complex circuits. XP Green Power products also have functionality that enables them to consume less energy when on standby mode while not powering the customers’ application. The return on investment of a higher efficiency product can be captured in terms of consumption of electricity. The full payback on electricity costs is usually within the first year of use. Therefore, we continue to promote and encourage the use of these high-efficiency products. We anticipate that the trend in the market through demand and legislation for higher efficiency products is expected to continue in the electronics industry. These legislative requirements are projected to extend across various industries from consumer equipment to the healthcare and industrial markets we serve.
The estimated lifetime savings from the XP Green Power products that we have shipped during 2021 is 128,000 tonnes CO2. In estimating these savings, we have assumed the following: • An average power converter is 80% efficient (XP
Green Power products are generally around 90% efficient).
• The power converter will run for eight hours a day, five days a week, 50 weeks a year, for seven years, in the customers’ equipment.
• The customer will run the power converter at 75% of its rated power.
• 1kWh of electricity produces 0.418kg of CO2.
A power converter operating at 90% efficiency wastes less than half of a power supply operating at 80% efficiency. Consequently, the savings in energy and, therefore, CO2 emissions of the lifetime of the product are very compelling.
Boosting innovationOur ambition is to be an industry leader on sustainability and that includes our products. We were the first to introduce greener, safer converters with efficiency rates of 95%, and we believe that we have the broadest and most up-to-date product portfolio in our industry. To have a sustainable business, we need to continue to develop products and solutions that are innovative and solve our customers’ power
problems. Product design is our customers’ top material impact and scored even higher than customer experience and satisfaction. Our R&D investment is a key part of the Group’s strategy, with particular focus on delivering to our clients’ needs in RF and high-power, high-voltage product and energy efficiency. We are also undertaking a full lifecycle analysis of our products, from raw materials to transport, to better understand our carbon footprint and where we can make improvements.
Our engineers bring ideas, skills and innovation to reducing energy usage for our customers, and we continue to integrate sustainability into our product design as new materials and components become available. We consider and respond to environmental issues throughout every stage of our product lifecycle, and our high-efficiency products play a role in helping the economy move to a low-carbon future. We integrate sustainability into our product design as follows:
• Energy efficiency – We have consistently led the industry in developing high-efficiency XP Green Power products, in the industrial and medical sectors, which consume and, therefore, waste less electricity. This is while powering the application or while on standby mode. This results in significantly reduced CO2 emissions over the lifetime of the customers' equipment, which is often seven to eight years. We estimate that our high-efficiency products shipped in 2021 alone will reduce CO2 emissions by over 128,000 tonnes over their lifetime of use.
• Novel materials – Wherever possible, we have introduced novel materials into our higher-end products, like ultra-efficient silicon carbide devices. We have also used new semiconductor components for the control of our power supplies, which allow soft switching to reach very high efficiency rates and low standby power ratings. Future developments in power transistor technology are expected to allow significant reduction in the size of power converters and increase their efficiency in some applications.
• Product lifecycle management – Our design processes consider the complete product lifecycle of our power conversion products from the outset. The characteristics of a product that make it more energy efficient also increase its reliability and useful lifetime – highly efficient products run cooler, which increases the lifetime of key components that are sensitive to heat, such as electrolytic capacitors. Efficient products also avoid the need for an electromechanical fan to exhaust the waste heat – one of the most unreliable components of a traditional power conversion system.
• Hazardous substances – We avoid the use of hazardous substances in our products, facilitating their recycling at the end of their lifetime and reducing their impact on the environment.
How this strategic pillar links to the UN SDGsThis aligns with UN SDGs 9 “Industry, innovation and infrastructure” in promoting sustainable industrialisation and 12 “Responsible consumption and production” in the efficient use of natural resources
Business KPIsNew XP Green Power product introductions, CO2 estimated lifetime savings from XP Green Power products.• 2021: 24
product families; 128,000 tCO2e
• Target (year): 15 product families (2021);, 120,000 tCO2e (2021).
56
XP Power Annual Report & Accounts for the year ended 31 December 2021
OUR SUSTAINABILITY STRATEGY
01: SUSTAINABLE PRODUCTS
30801-XP-Power AR21-Strategic.indd 5630801-XP-Power AR21-Strategic.indd 56 08/03/2022 10:57:3308/03/2022 10:57:33

30801 8 March 2022 9:38 am v9
• Low carbon manufacturing – As well as designing our products so they are highly efficient, we also consider the manufacturing process. Traditionally, products undergo burn-in after manufacture to eliminate early failures by running them under stress. When we burn-in our products, we recycle the power in the manufacturing facility to significantly reduce our carbon footprint. Burn-in cycles are monitored and reduced based on the defect data, further reducing CO2 emissions.
• Product safety – A power converter is a safety critical part of any electrical system or application as it provides the isolation barrier between the end-user and the potentially lethal high voltage mains electricity. A drug delivery system is an excellent example where a steel needle could be inserted into a vein of a patient, directly connected to the mains via a conducting solution containing the drug, passing through the drug delivery machine, connected to the mains via the power converter. All our products are 100% tested for isolation using a high voltage. In addition, all our medically approved products are 100% tested for mains leakage current to ensure their absolute safety. All XP Power products come under the remit of our ISO 9001 registration.
In 2021, XP Power won the inaugural 2021 Sustainability PRISM Award – Supply Chain from ASM International in the category of Sustainability Leadership. We were selected from a deep portfolio of distinguished suppliers and recognised for outstanding contributions in this area via projects integrating sustainable methods (PRISM). ASM is a valued customer and a leading global supplier of semiconductor process equipment for wafer processing. Like us, they are strong advocates of sustainability and have enhanced their products and manufacturing operations to help combat climate change.
Specific commendations included:• Our strong commitment to integrating
sustainability into our overall strategy and operations. ASM cited our admittance into the Responsible Business Alliance as the first power converter manufacturer back in 2012 (formerly the EICC). This is in addition to our environmental policy, our internationally accredited environmental management system and our continued collaboration with CDP.
• Our green power products that deliver high efficiency conversion with low standby power, which we continually develop to reduce energy usage for our customers in support of their sustainability agendas.
• Our innovative burn-in production process that reduces the time and recycles the electricity we use to test our products. Annually, this conserves 560MWh and stops over 230 tonnes of CO2 being released into the atmosphere.
57
STRATEGIC REPORT
30801-XP-Power AR21-Strategic.indd 5730801-XP-Power AR21-Strategic.indd 57 08/03/2022 10:57:3608/03/2022 10:57:36

30801 8 March 2022 9:38 am v9
Responsible sourcingIt is important that our suppliers apply the same principles of value, transparency and respect as we do. We require our suppliers to adhere to our Code of Conduct, which covers diversity, modern slavery and human trafficking, health and safety, business integrity and ethics, environment and sustainability. Our supplier qualification and ongoing audit programme reviews supplier compliance with our Code of Conduct, and we will disengage with suppliers who do not meet these standards. XP Power’s Code of Conduct is available at xppower.com/company/policies.
Conflict minerals We support initiatives and regulations to avoid the use of any “conflict minerals”, which originate from mining operations in the Democratic Republic of the Congo (DRC) and adjoining countries. These involve tantalum, tin, tungsten and gold. We only purchase our electronic components from reputable sources, and purchases of materials such as solder are only purchased from vendors who are on the Conformant Smelter & Refiner Lists. We also obtain information from our suppliers concerning the origin of the metals used in the manufacture of our products. This way, we can assure our customers and ourselves that we are not knowingly using conflict minerals in our products. Our supply chain organisation is responsible for the qualification and ongoing monitoring of our suppliers. XP Power’s policy on conflict minerals is set out at xppower.com/company/policies.
58
XP Power Annual Report & Accounts for the year ended 31 December 2021
OUR SUSTAINABILITY STRATEGY
01: SUSTAINABLE PRODUCTS CONTINUED
30801-XP-Power AR21-Strategic.indd 5830801-XP-Power AR21-Strategic.indd 58 08/03/2022 10:57:3808/03/2022 10:57:38

30801 8 March 2022 9:38 am v9
How this strategic pillar link to the UN SDGsTaking urgent action to combat climate change aligns with UN SDG 13 “Climate action”.
Business KPIsCO2 intensity metric.
• 2021: 28.9kg CO2/£’000 of revenue (2020: 29.5kg** CO2/ £’000 of revenue)
• Target (year): 22.3kg CO2/£’000 of revenue (2025)
** restated
We are focused on finding ways to reduce our impact across the whole value chain to achieve our commitment of net zero by 2040. By net zero, we mean reducing our Scope 1, 2, and 3 emissions to zero, or to a residual level where any residual emissions are neutralised through the permanent removal and storage of an equivalent amount of carbon from the atmosphere. That means minimising the impact we and our products have on the environment. Since 2009, we have reduced our carbon emissions per unit of revenue by 35%. We want to get our net zero plan right and will undertake further analysis in 2022 to allow us to develop a meaningful pathway for reducing our Scope 1, 2 and 3 emissions.
Our commitment to transparency includes the regular public disclosure of our carbon emissions, collaboration with CDP and, for the first time ever, we have published our TCFD report (page 73), which includes details of our oversight, risk assessment and strategy of climate-related issues.
We want to set the standard for green business practices in our industry. Wherever possible, we look to embed sustainability initiatives at our sites to reduce our carbon impact. These include water reduction initiatives, solar panels on multiple sites, introducing low-energy T6 or LED lighting, EV charging stations, and recycling the electricity we use to burn-in our products during testing. Our manufacturing facility near Ho Chi Minh, Vietnam, is one of the most environmentally friendly in the industry, with recycled burn-in energy, high-efficiency insulation and air conditioning, low-flush toilets, and rainwater capture and reuse. It was the first building in Vietnam to be accredited with the BCA Gold Mark+ relating to its environmental performance. Across all sites, we recycle our paper and packaging, and the minimal waste created during our manufacturing process is also recycled for reuse. Any chemicals used for cleaning are disposed of safely by certified professionals.
Managing environmental performanceThe Group has a comprehensive environmental policy, as well as an internationally accredited Environmental Management System (ISO 14001) at 10 (83%) of our 12 sites, which include our main production centres and accounts for around 90% of the Group’s energy use. Compliance is ensured through our internal audit process together with external assessments by our registrar, British Standards Institution (BSI). The Group has not had any environmental fines in the last 12 months.
We will strive to improve our environmental performance by: • As a minimum, complying with all relevant
environmental legislation and regulations as they relate to each location and community we operate.
• Employing best practices to maximise the efficient use of resources to minimise waste and prevent pollution.
• Focusing on promoting an environment of continuous improvement and risk mitigation through identifying objectives and setting measurable goals.
• Considering and respond to environmental issues through all phases of our product lifecycle.
• Communicating our environmental policy and objectives to our suppliers and employees, and encourage their participation in environmental best practices. Our environmental policy is available at xppower.com/company/policies.
Energy and greenhouse gas emissionsWe measure our CO2 emissions in accordance with the internationally recognised Greenhouse Gas (GHG) Protocol and our metrics include Scope 1 and 2 emissions. We have made minor revisions to our previously reported emissions and energy use figures in relation to updated grid and emissions factors. Our Scope 3 CO2 emissions represent estimated CO2 emissions from air travel and paper usage only. We are developing our data and a deeper understanding of Scope 3 emissions and will report in due course.
2021
28.9kgTARGET FOR 2025 22.3KG
59
STRATEGIC REPORT
OUR SUSTAINABILITY STRATEGY
02: ENVIRONMENTAL LEADERSHIP
30801-XP-Power AR21-Strategic.indd 5930801-XP-Power AR21-Strategic.indd 59 08/03/2022 10:57:3808/03/2022 10:57:38

30801 8 March 2022 9:38 am v9
Emissions & Energy
FY21 FY20 FY19
UKGlobal
(excl UK) Total UKGlobal
(excl UK) Total UKGlobal
(excl UK) TotalIntensity measure
Group turnover £m – – 240.3 – – 233.3 – – 199.9GHG Emissions (tCO2e)
Total Scope 1 (tCO2e) 1.9 229.6 231.5 2.1 191.9 194.1 – 12 12Total Scope 2 location based (tCO2e) 34 6,166.4 6,200.4 31.1 6,092.4 6,123.5 58 5,321.0 5,379.0Purchased goods and services (non-production related) 2.1 491 493.1 2.4 546.9 549.3 152.9 180.8 333.7Business travel 10 2 12 17 2.7 19.7 85.7 196.6 282.3Total Scope 3 (tCO2e) 12.1 493 505.1 19.4 549.7 569 238.6 377.4 616Total Scope 1, 2 and 3 (tCO2e) 48 6889 6937 52.6 6834 6886.6 296.6 5710.4 6007GHG emissions intensity ratio (per Group turnover) £m – – 28.9 – – 29.5 – – 30
Energy consumption (kWh) Total renewable fuels consumption (kWh) – – – – – – – – –Diesel 0 155,906 155,906 0 35,401 35,401 0 44,450 44,450Gas 10,672 617,896 628,568 11,710 620,435 632,145 9,671 840,112 849,783Propane 0 374,741 374,741 0 374,741 374,741 0 456,321 456,321Total non-renewable fuels consumption (kWh) 10,672 1,148,543 1,159,215 11,710 1,030,577 1,042,287 9,671 1,340,883 1,350,554Total fuels consumption (kWh) 10,672 1,148,543 1,159,215 11,710 1,030,577 1,042,287 9,671 1,340,883 1,350,554Consumption of purchased or acquired electricity renewable – – – – – – – – –Consumption of self-generated non-fuel renewable energy (solar) 23,506 37,266 60,772 3,347 39,604 42,951 1,862 43,644 45,506Consumption of purchased or acquired electricity non-renewable 135,191 10,749,647 10,884,838 123,725 10,668,213 10,791,938 150,511 9,907,011 10,057,522Total electricity consumption (kWh) 158,697 10,786,913 10,945,610 127,072 10,707,817 10,834,889 152,373 9,950,655 10,103,028Total renewable energy consumption (kWh) 23,506 37,266 60,772 3,347 39,604 42,951 1,862 43,644 45,506Total non-renewable energy consumption (kWh) 145,863 11,898,190 12,044,053 135,435 11,698,790 11,834,225 160,182 11,247,894 11,408,076Total energy consumption (kWh) 169,369 11,935,456 12,104,825 138,782 11,738,394 11,877,176 162,044 11,291,538 11,453,582% renewable electricity from total electricity 15% 0% 1% 3% 0% 0% 1% 0% 0%% grid electricity from total electricity 85% 100% 99% 97% 100% 100% 99% 100% 100%Energy intensity ratio (per Group turnover) £m 50,374 50,909 57,297
Until we set our net zero targets, the Group retains its target of a 3% annual reduction in our CO2 emissions intensity metric (2021: -2% year on year). Actions to achieve this would include the reduction in burn-in times for mature products, reduction of air freight to use more sea and rail, evaluation of packaging and further site efficiency initiatives including high-efficiency HVAC systems and water appliances, more solar panels, power purchase agreements and smart meters.
60
XP Power Annual Report & Accounts for the year ended 31 December 2021
OUR SUSTAINABILITY STRATEGY
02: ENVIRONMENTAL LEADERSHIP CONTINUED
30801-XP-Power AR21-Strategic.indd 6030801-XP-Power AR21-Strategic.indd 60 08/03/2022 10:57:3908/03/2022 10:57:39
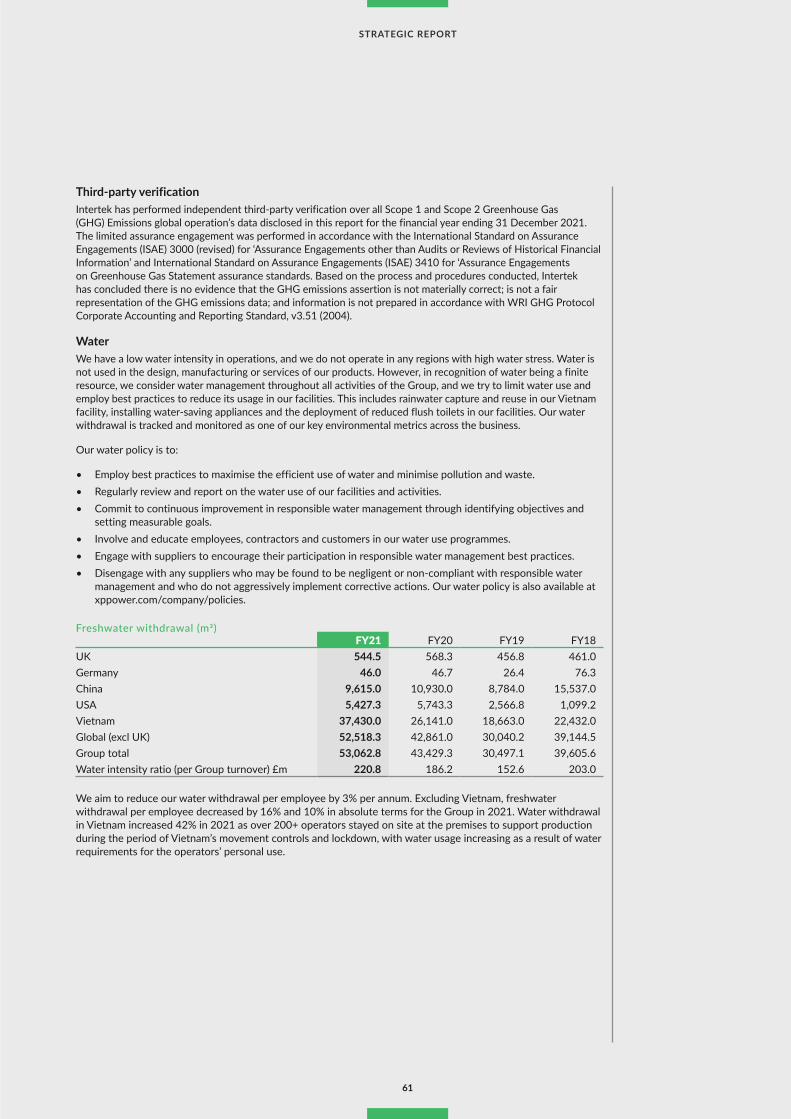
30801 8 March 2022 9:38 am v9
Third-party verificationIntertek has performed independent third-party verification over all Scope 1 and Scope 2 Greenhouse Gas (GHG) Emissions global operation’s data disclosed in this report for the financial year ending 31 December 2021. The limited assurance engagement was performed in accordance with the International Standard on Assurance Engagements (ISAE) 3000 (revised) for ‘Assurance Engagements other than Audits or Reviews of Historical Financial Information’ and International Standard on Assurance Engagements (ISAE) 3410 for ‘Assurance Engagements on Greenhouse Gas Statement assurance standards. Based on the process and procedures conducted, Intertek has concluded there is no evidence that the GHG emissions assertion is not materially correct; is not a fair representation of the GHG emissions data; and information is not prepared in accordance with WRI GHG Protocol Corporate Accounting and Reporting Standard, v3.51 (2004).
WaterWe have a low water intensity in operations, and we do not operate in any regions with high water stress. Water is not used in the design, manufacturing or services of our products. However, in recognition of water being a finite resource, we consider water management throughout all activities of the Group, and we try to limit water use and employ best practices to reduce its usage in our facilities. This includes rainwater capture and reuse in our Vietnam facility, installing water-saving appliances and the deployment of reduced flush toilets in our facilities. Our water withdrawal is tracked and monitored as one of our key environmental metrics across the business.
Our water policy is to:
• Employ best practices to maximise the efficient use of water and minimise pollution and waste. • Regularly review and report on the water use of our facilities and activities. • Commit to continuous improvement in responsible water management through identifying objectives and
setting measurable goals. • Involve and educate employees, contractors and customers in our water use programmes. • Engage with suppliers to encourage their participation in responsible water management best practices. • Disengage with any suppliers who may be found to be negligent or non-compliant with responsible water
management and who do not aggressively implement corrective actions. Our water policy is also available at xppower.com/company/policies.
Freshwater withdrawal (m3)FY21 FY20 FY19 FY18
UK 544.5 568.3 456.8 461.0 Germany 46.0 46.7 26.4 76.3 China 9,615.0 10,930.0 8,784.0 15,537.0 USA 5,427.3 5,743.3 2,566.8 1,099.2 Vietnam 37,430.0 26,141.0 18,663.0 22,432.0 Global (excl UK) 52,518.3 42,861.0 30,040.2 39,144.5 Group total 53,062.8 43,429.3 30,497.1 39,605.6 Water intensity ratio (per Group turnover) £m 220.8 186.2 152.6 203.0
We aim to reduce our water withdrawal per employee by 3% per annum. Excluding Vietnam, freshwater withdrawal per employee decreased by 16% and 10% in absolute terms for the Group in 2021. Water withdrawal in Vietnam increased 42% in 2021 as over 200+ operators stayed on site at the premises to support production during the period of Vietnam’s movement controls and lockdown, with water usage increasing as a result of water requirements for the operators’ personal use.
61
STRATEGIC REPORT
30801-XP-Power AR21-Strategic.indd 6130801-XP-Power AR21-Strategic.indd 61 08/03/2022 10:57:3908/03/2022 10:57:39

30801 8 March 2022 9:38 am v9
Waste managementOur manufacturing processes produce relatively little waste, but we are committed to reducing waste where we can. One major source of waste is the excess solder from the wave solder machines, so-called “solder dross”. This is recycled into new solder and reused by our operations. In 2021, we sent 8.8 tonnes of solder dross for recycling and received back 4.7 tonnes of recycled solder, which is a 53% recovery rate. We use certain chemicals to clean flux from printed circuit boards, which is cleaned using activated carbon. We dispose of these chemicals and the containers they are delivered in through a certified, licensed professional third party who disposes of these materials safely. Our paper, other packaging and e-waste is collected by recycling providers. The Group recycled 315 tonnes (2020: 301 tonnes) of paper and packaging during the year.
The tables below outline waste generation and treatment from our sites in China and Vietnam, which account for 80% of the Group.
Waste generation (tonnes) FY21 FY20 FY19Hazardous waste 7.4 1.9 5.1 Non-hazardous waste 150.8 161.5 99.2 Total waste 158.2 163.4 104.2 Hazardous waste intensity ratio (per Group turnover) £m 0.66 0.70 0.52
Waste treatment/disposal (tonnes) FY21 FY20 FY19Hazardous waste recycled – – – Hazardous waste incinerated 7.4 1.9 5.1 Hazardous waste sent to landfill – – – Non-hazardous waste recycled 108.8 123.1 87.8 Non-hazardous waste incinerated – – – Non-hazardous waste sent to landfill 42.0 38.4 11.4 Solder sent for internal recycling 8.8 9.2 6.1 Recycled waste (solder) received and used 4.7 5.6 2.5 Internal rate of recovery of solder (%) 53.1% 60.8% 41.2%Solder dross disposed* 1.6 2.8 1.3 Total waste recycled 108.8 123.1 87.8 Total waste incinerated 7.4 1.9 5.1 Total waste sent to landfill 42.0 38.4 11.4 Total waste non-recycled 49.4 40.4 16.5 Total waste 158.2 163.4 104.2 *Transferred to treatment contractor for recycling
FY21 FY20 FY19Total Group paper and packaging recycled (tonnes) 314.7 300.9 269.4
Our Environmental Committee is responsible for our environmental policy (available at xppower.com/company/policies) including waste management. Our manufacturing processes produce relatively little waste.
62
XP Power Annual Report & Accounts for the year ended 31 December 2021
OUR SUSTAINABILITY STRATEGY
02: ENVIRONMENTAL LEADERSHIP CONTINUED
30801-XP-Power AR21-Strategic.indd 6230801-XP-Power AR21-Strategic.indd 62 08/03/2022 10:57:3908/03/2022 10:57:39

30801 8 March 2022 9:38 am v9
BOARD OF DIRECTORSREVIEWS HEALTH AND SAFETY
PERFORMANCE
CEORESPONSIBLE FOR HEALTH AND
SAFETY PROGRAMME AT XP POWER
Site leaders across 17 different sites Responsible for health and safety at the site and that appropriate resources are available
Site health and safety representatives Responsible for day-to-day health and safety programme through a cross-functional team
Response to COVID-19 (2021)At XP Power, health and safety during COVID-19 continues to be of paramount importance to us as a responsible employer. We strive to safeguard the health, safety and wellbeing of our people (including contractors), whether working on site or working from home. With the pandemic continuing to impact our people, workplaces and practices during the year, we continued to operate with control measures, identified through our risk assessments, to ensure the safety and wellbeing of our people. Considering the recommendations of the local authorities in countries in which we operate, we employed measures such as:
• Social distancing and working from home wherever possible;
• Compulsory wearing of face masks; • Sanitisation of hands and feet at the entrance to
the site; • Temperature checks and monitoring before
entering the site; • Sanitisation of any vehicles entering the site; • Regular deep cleans and regular sanitisation of
surfaces in the facilities; and• Restrictions on any visitors to the facilities.
In addition, in Vietnam over 200+ operators stayed on site to support production during the period of lock down. We continue to monitor the situation with the virus and the feedback we receive from our colleagues.
Safety firstSafety is important at XP Power. Our health and safety programme is driven from the top, with the Board having ultimate responsibility. Our corporate health and safety framework below clearly defines those responsible and accountable for health and safety at each of our key sites.
The procedure also defines the minimum standards required at each key site, which can be summarised as follows:
• Risk assessments based on the activities performed at each site, which are reviewed and updated annually;
• An annual internal audit of the health and safety processes at each site to ensure they are in line with the corporate procedure;
• Health and safety metrics are recorded covering health and safety incidents and near misses and these are reported and analysed. The Board of Directors review these health and safety metrics at each Board meeting;
• Metrics relating to walkthrough safety audits, fire drills and update of risk assessments are recorded and monitored; and
• Consideration is given at each site to ergonomics, laboratory and electrical safety, legal requirements, use of chemicals, use of equipment and tools, facility preparedness and evacuation, and slips, trips and falls.
How this strategic pillar links to the UN SDGsThis aligns with UN SDG 3 “Good health and wellbeing” and UN SDGs 5 “Gender equality”, 8 “Decent work and economic growth”, and 10 “Reduced inequalities”.*change in measurement basis (see below)
Business KPIsReduce the annual lost time from health and safety incidents through implementing best practice in training, incident reporting, audits and risk assessments• 2021: 119 lost days
(2020: 62 lost days)• Target (year):
zero days (2021)
Gallup Employee Engagement score • 4.20/5.00;
(2020: 3.91/5.00)• Target (year):
4.18 (2021)
Proportion of women in management roles• 19%* (2020: 31%)• Target (year):
35% (2022)
63
STRATEGIC REPORT
OUR SUSTAINABILITY STRATEGY
03: PEOPLE AND WORKPLACE
30801-XP-Power AR21-Strategic.indd 6330801-XP-Power AR21-Strategic.indd 63 08/03/2022 10:57:3908/03/2022 10:57:39

30801 8 March 2022 9:38 am v9
We are committed to maintain a healthy and safe working environment to minimise the number of occupational accidents and illnesses, and ultimately achieve an accident-free workplace. We encourage our people to look out for each other to keep us all safe. We have enhanced health and safety through expenditure on improved product racking, use of health and safety consultants, advisers and auditors. XP Power’s health and safety policy is available on our website at xppower.com/company/policies.
We provide all our employees with health and safety training appropriate to their role. The number of employees trained on health and safety standards within 2021 are:
2021Europe 82Asia 1,444US 237Global 1,763
Safety performanceWe report all health and safety incidents, including near misses, whether they resulted in lost time, and we actively encourage the reporting of near misses as well so we can learn from these events. Our incident rate is calculated as the total number of incidents divided by the average number of employees expressed as incidents per 1,000 employees. Our target is to have an incident rate of zero.
In 2021, we had 19 health and safety incidents (2020: 22), including four near misses (2020: 2). Of these, nine incidents (2020: 10) resulted in lost time, with total lost time of 119 days (2020: 62 days) largely related to a single incident (leg fracture), which resulted in 90 lost days. Zero incidents resulted in death of any persons in 2021 (2020: zero). We continue to review all accidents and near misses to ensure we learn from them and make improvements to keep all employees safe from harm or injury. The figures in the table below cover 100% employees and contractors.
Health and safety incidents2021 2020 2019 2018 2017 2016
Asia 3 10 7 6 9 6Europe 3 0 3 8 9 2US 13 12 11 3 14 5Global 19 22 21 17 32 13Average number of employees 2,229 2,108 1,859 1,972 1,953 1,506 Incident rate per 1,000 employees 8.5 10.4 11.3 8.6 16.4 8.6 LTIR* 0.76 0.87 0.57
* Lost time incident rate (LTIR) is defined as total number of lost time incidents in a year, divided by the total number of hours worked, multiplied by 200,000
64
XP Power Annual Report & Accounts for the year ended 31 December 2021
OUR SUSTAINABILITY STRATEGY
03: PEOPLE AND WORKPLACE CONTINUED
30801-XP-Power AR21-Strategic.indd 6430801-XP-Power AR21-Strategic.indd 64 08/03/2022 10:57:4008/03/2022 10:57:40

30801 8 March 2022 9:38 am v9
Health and wellbeingWe encourage our employees to have active lifestyles and we provide facilities and programmes designed to improve their wellbeing. These include the provision of sports facilities (e.g. basketball courts, football pitches and shower facilities at sites) and the facilitation of group events (e.g. softball leagues, yoga sessions and five-a-side football leagues). The restrictions on gatherings associated with COVID-19 have reduced our ability to hold these events to the same degree, but we are keen to resume them once we can safely do so. In lieu, XP Power provided a paid Health and Wellness Day in the fourth quarter for employees, in recognition of our commitment to our people, to ensure their health and wellbeing is of top priority.
We also operate a comprehensive Employee Assistance Programme (EAP), which provides a complete support network that offers confidential expert advice and compassionate guidance 24/7, online and by phone, in the relevant language, covering a wide range of issues and resources for our employees and their families.
Our PeopleWe look after our employees, support their training and development, recognise cultural differences, respect their human rights and promote a fair working environment with equal opportunities for all. As a global business, we capitalise on our cultural differences and strive to make XP Power a fulfilling place to work.
EngagementOur vision is to deliver the ultimate experience for our customers and for our people. Through workforce engagement, the views of our employees are heard at the Board level and are considered in Board discussions and decision making. Pauline Lafferty is the designated Non-Executive Director responsible for workforce engagement and, as a former Chief People Officer, is passionate about employee engagement.
We use several methods to engage with our people but derive high value from our Gallup engagement survey, which was first conducted last year. In 2021, we again had excellent survey participation rates across the workforce of 93% (2020: 94%), which is used to drive further employee programmes and enhancements to our engagement. In 2020, we scored a respectable 3.91 out of 5.00, placing us at the 38th percentile rank in the Gallup database, which is notably better than companies of a similar size. This year, our engagement has meaningfully increased by +0.29 to 4.20 out of 5.00, putting XP Power at the 59th percentile in the Gallup database. The survey highlighted that our biggest cultural strength as an organisation is a strong sense of respect, ethics and integrity. We believe this to be the bedrock of a strong culture. We have seen similar improvement in our voluntary turnover figures:
Full-time employee voluntary turnover percentage (%)
2021 2020 2019
Asia Average employees 1,606 1,483 1,265
Voluntary leavers 602 670 528
Voluntary turnover 37.5% 45.2% 41.7%
Europe Average employees 154 153 161
Voluntary leavers 17 11 17
Voluntary turnover 11.0% 7.2% 10.6%
US Average employees 411 397 408
Voluntary leavers 48 56 28
Voluntary turnover 11.7% 14.1% 6.9%
Global Average employees 2,171 2,033 1,834
Voluntary leavers 667 737 573
Voluntary turnover 30.7% 36.3% 31.2%
65
STRATEGIC REPORT
30801-XP-Power AR21-Strategic.indd 6530801-XP-Power AR21-Strategic.indd 65 08/03/2022 10:57:4008/03/2022 10:57:40

30801 8 March 2022 9:38 am v9
Diversity and inclusionBecoming a truly diverse and inclusive Company is not only the right thing to do, but also crucial to helping us grow our business, innovate, attract and retain talent, and engage the people who buy our power solutions. Different experiences, views and opinions allow us to explore more options when considering decisions, which we believe results in better outcomes for the business and our stakeholders. We operate globally and recognise the cultural differences that may exist in the countries we do business in. A truly diverse workforce reflects our markets and will help us succeed in those markets. We will not tolerate any form of discrimination. We are committed to equality of opportunity in all our employment practices, procedures and policies. When we hire or promote someone, we choose the best candidate irrespective of age, race, national origin, disability, religion, gender, gender reassignment, sexual preference, marital status or membership/non-membership of any trade unions. We apply the same standards when selecting business partners. The Board of Directors has oversight of the Company’s diversity policy, which is also available on our website at xppower.com/company/policies. Our diversity policy is embedded in our Code of Conduct.
We aim:
• to create an environment where individual differences and the contributions of all team members are recognised and valued;
• to create a working environment that promotes dignity and respect for every employee;• to not tolerate any form of intimidation, bullying or harassment, and to discipline those that breach this
policy;• to make training, development and progression opportunities available to all staff;• to promote equality in the workplace, which we believe is good management practice and makes sound
business sense;• to encourage anyone who feels they have been subject to discrimination to raise their concerns so we can
apply corrective measures; and• to regularly review all our employment practices and procedures so that fairness is always maintained.
The Group is supportive of flexible working such as working from home, part-time and flexible hours according to the requirements of the position. The Group employs contract and temporary workers across many locations to fill local requirements. This is particularly the case in our manufacturing facilities globally, to ensure we are meeting our customer requirements. Many of our temporary staff choose to become permanent employees.
Number and percentage (%) of contract or temporary workers to total employees
2021
Asia Average employees 1,606
Number of temporary or contract employees 199
Percentage of temporary or contract employees to permanent 12.4%
Europe Average employees 154
Number of temporary or contract employees 15
Percentage of temporary or contract employees to permanent 9.7%
US Average employees 411
Number of temporary or contract employees 39
Percentage of temporary or contract employees to permanent 9.5%
Global Average employees 2,171
Number of temporary or contract employees 253
Percentage of temporary or contract employees to permanent 11.7%
In the UK, for employees with more than two years of service, we pay maternity or adoption leave for three months at 100% of salary compared to the statutory six weeks at 90% of salary. We also provide two weeks of paid paternity leave at 100% of salary compared to statutory paternity leave of two weeks at £151 or 90% of usual pay if lower.
We have undertaken some analysis based around gender representation to help understand our gender pay gap, even though we have fewer than 250 employees in the UK and are, therefore, exempt from gender pay gap reporting. We are committed to eliminating any form of discrimination. It should be noted that one in three of the women in the lower quartile pay band work part time, which explains their over representation in this quartile.
66
XP Power Annual Report & Accounts for the year ended 31 December 2021
OUR SUSTAINABILITY STRATEGY
03: PEOPLE AND WORKPLACE CONTINUED
30801-XP-Power AR21-Strategic.indd 6630801-XP-Power AR21-Strategic.indd 66 08/03/2022 10:57:4008/03/2022 10:57:40

30801 8 March 2022 9:38 am v9
In 2021, we changed the basis of our recording of management roles from using direct reports to the Executive Leadership team to using job sizes, which has disproportionately impacted the ratio of females recorded in management roles. 45% of our UK workforce are female.
UK Gender Pay Gap – 2021
2021 2020 2019
Male Female Total Male Female Male Female Male Female
Lower Quartile Pay Band 11 18 29 38% 62% 40% 60% 40% 60%
Lower Middle Quartile Pay Band 10 18 28 36% 64% 58% 42% 58% 42%
Upper Middle Quartile Pay Band 19 8 27 70% 30% 77% 23% 77% 23%
Upper Quartile Pay Band 23 8 31 74% 26% 92% 8% 92% 8%
Employees by gender and region as at 31 December 2021
Male Female Total
Europe 101 65 166
North America 327 148 475
Asia 767 932 1,699
Total 1,195 1,145 2,340
Gender Diversity Statistics
Male Female Total Male Female
Board 5 2 7 71% 29%
Executive Management 5 2 7 71% 29%
Management 65 13 78 83% 17%
All other 1,120 1,129 2,249 50% 50%
Total 1,195 1,146 2,341 51% 49%
67
STRATEGIC REPORT
30801-XP-Power AR21-Strategic.indd 6730801-XP-Power AR21-Strategic.indd 67 08/03/2022 10:57:4308/03/2022 10:57:43

30801 8 March 2022 9:38 am v9
Talent and career managementDeveloping our talent is key to our ongoing success and is the responsibility of our Chief People Officer. We have implemented and rolled out an online learning management system to all employees. This has greatly improved the delivery of training to our employees in local languages and allows us to track and report on the training statistics of all our people, including Code of Conduct training. This tool is also used for onboarding new employees and for training on new information technology tools such as our various cybersecurity applications. Our training statistics are outlined on the following page. Training hours per employee in US was lower than the Group average, due to lower annual requirements for the roles. Talent management and succession planning for the Executive Directors and Senior Leadership team is reviewed and discussed at Board level. Personalised people and organisation plans aligned to the attainment of the Group’s strategy are agreed with all our executive leaders, and our people leaders (with more than four direct reports) receive a people leadership programme.
All our employees receive annual performance evaluations. We operate various bonus schemes and all non-sales commissioned employees are eligible to participate in either our general or executive bonus scheme. The overall bonus pools are determined by the level of adjusted profit before tax and operating cash conversion. Individual bonuses are then allocated based on individual performance. We also have several spot recognition award schemes and have a CEO award, which is made annually for each region and globally to individuals who have gone significantly beyond what is expected of them. These awards are sometimes given to teams rather than individuals to recognise and promote collaboration. As well as recognition schemes, we also provide healthcare benefits and life assurance according to the customs in the regions we operate.
We had two apprenticeships in 2021 and run apprenticeship programmes in areas such as finance, human resources, information technology and logistics.
68
XP Power Annual Report & Accounts for the year ended 31 December 2021
OUR SUSTAINABILITY STRATEGY
03: PEOPLE AND WORKPLACE CONTINUED
30801-XP-Power AR21-Strategic.indd 6830801-XP-Power AR21-Strategic.indd 68 08/03/2022 10:57:4508/03/2022 10:57:45

30801 8 March 2022 9:38 am v9
Average training time (in days) per employee
2021
Asia Average employees 1,606
Total hours of training 14,426
Training hours per employee 9.0
Training days per employee 1.1
Europe Average employees 154
Total hours of training 2,101
Training hours per employee 13.6
Training days per employee 1.7
US Average employees 411
Total hours of training 747
Training hours per employee 1.8
Training days per employee 0.2
Global Average employees 2,171
Total hours of training 17,274
Training hours per employee 8.0
Training days per employee 1.0
Freedom of association We allow our employees to freely associate with any relevant unions, but only our employees in Vietnam are members of the local union. The number and percentage of employees covered by collective agreements is:
2021 2020 2019
Asia (Vietnam) Average number of employees 1,606 (1,089) 1,483 (1,024) 1,265 (647)Average number of employees covered by collective agreements 1,063 (1,063) 939 (939) 619 (619)Percentage of employees covered by collective agreements 66.2% (97.6%) 63.3% (91.7%) 48.9% (95.7%)
Europe Average number of employees 154 153 161Average number of employees covered by collective agreements – – –Percentage of employees covered by collective agreements 0.0% 0.0% 0.0%
US Average number of employees 411 397 408Average number of employees covered by collective agreements – – –Percentage of employees covered by collective agreements 0.0% 0.0% 0.0%
Global Average number of employees 2,171 2,033 1,834Average number of employees covered by collective agreements 1,063 939 619Percentage of employees covered by collective agreements 49.0% 46.2% 33.8%
69
STRATEGIC REPORT
30801-XP-Power AR21-Strategic.indd 6930801-XP-Power AR21-Strategic.indd 69 08/03/2022 10:57:4508/03/2022 10:57:45

30801 8 March 2022 9:38 am v9
Community partnershipsWe believe that we should give back to the communities where we work as they make up an integral part of our lives. All employees are encouraged to get involved in environmental and community activities. We allow every employee to take a paid day’s leave to contribute to a charitable or worthy cause in the community.
XP Power has a community relations team with representatives at all sites. In 2021, we achieved what we had planned with improved outcomes and engagement from previous years. This is a significant achievement considering the continued impact of COVID-19 on the business and the business demands our employees are supporting.
Our activities in 2021 included: • Our Global Coat and Food Drive: Employees were
encouraged to donate new or used coats, and canned and non-perishable foods, which were distributed to food banks and shelters. The Group organised kerbside pick-up of donations from employees working from home.
• Earth Week Global: During April, the business held Earth Week, which saw various initiatives including collection and recycle of unwanted electronics and batteries, a social-distanced litter pick, plant-based lunches for employees and local area planting activities.
• Gloucester Chili Cook Off and Fundraiser: Our Gloucester site held a charity event in aid of The Open Door, an organisation that provides food security and household stability to children, families and seniors in Essex County, MA. Through XP Power’s support, The Open Door has been able to provide an online ordering system that vastly improves choice and access to the service, and biodegradable containers to help reduce waste.
• The donation of much needed school supplies for local schools in our Back to School drive in July to September.
• Contributions from Movember across six sites in the Group, harnessing the power of the moustache to change the face of men’s health.
The Group made cash donations to local charities totalling £14,291 in 2021 (2020: £1,490).
2021 marked the third year of collaboration between XP Power Singapore and Food Bank Singapore to give back to society by packing and doing door-to-door distribution of food bundles to low-income and underprivileged households. Despite the threat of the new Omicron variant, December saw our team of 21 volunteers visit over 200 households with volunteers from Beyond Social Services, a charity dedicated to helping children and youths from less privileged backgrounds break away from the poverty cycle.
70
XP Power Annual Report & Accounts for the year ended 31 December 2021
OUR SUSTAINABILITY STRATEGY
03: PEOPLE AND WORKPLACE CONTINUED
30801-XP-Power AR21-Strategic.indd 7030801-XP-Power AR21-Strategic.indd 70 08/03/2022 10:57:4708/03/2022 10:57:47

30801 8 March 2022 9:38 am v9
How this strategic pillar links to the UN SDGsThis aligns with UN SDG 16 “Peace, justice and strong institutions” through internationally promoting of the rule of law and reducing corruption and bribery in all forms.
Business KPIsEmployees completed ethics training %; zero breaches of our Code of Conduct.
• 2021: 99.8%; zero• Target (year): Same
targets for 2022
It is the Company’s policy to conduct all business in an honest and ethical manner. The first of our five core values is “Integrity” and this is, therefore, embedded into our culture. It is also embedded into our Code of Conduct and the policies outlined in the following sub-sections. To ensure awareness and understanding of our Code of Conduct, we use our learning management system to monitor all employees on their annual training on the Code of Conduct and its contents. Employee compliance with the annual Code of Conduct training is 99.8%. The Group also relies on its general financial controls, authority matrix, general management oversight and review of financial and other reporting. In addition, we have an independent whistleblowing service available to employees who do not feel able to raise issues of concern to their line manager or their superior. The Audit Committee is responsible for monitoring, and compliance matters are regularly reviewed by the Board of Directors.
WhistleblowingXP Power is committed to an environment where open, honest communications are the expectation. Employees should be comfortable to bring any concerns forward where they believe violations of policies or standards have occurred in the secure knowledge that they will be taken seriously and there will be no adverse repercussions when they have acted in good faith. This is embedded into our Code of Conduct. We operate an internal, well-publicised, confidential whistleblowing programme administered through an independent third party. Called “Speak Up”, it runs in every country we operate in, and in their chosen language. This guarantees that employees' experiences of legal or ethical misconduct will be heard and acted upon quickly wherever it occurs within the business. Concerns can be raised through a website or phone, on an anonymous basis and in any chosen local language. The Company protects employees who are whistleblowers from any detrimental treatment resulting from any whistleblowing, providing they acted in good faith.
Our whistleblowing policy encourages our employees to report issues where they have a reasonable belief that:
• our Code of Conduct has been breached• a criminal offence has been committed, is being
committed, or is likely to be committed • a person has failed, is failing, or is likely to fail to
comply with a legal obligation• a miscarriage of justice has occurred, is occurring,
or is likely to occur• the health and safety of any individual has been,
is being or is likely to be endangered • the environment has been, is being or is likely to
be damaged /or• information to show any matter falling within any
one of the above categories has been, is being or is likely to be deliberately concealed
A whistleblowing report is automatically distributed to the Chair of the Audit Committee by the independent third-party provider, where it is reviewed and assigned to management or an independent third party for further investigation and response as required. Whistleblowing is a scheduled agenda item at Audit Committee meetings. The Company is committed to taking appropriate action regarding all qualifying disclosures that are upheld. There were no whistleblowing reports in 2021. In 2020 there was one whistleblowing report that could not be substantiated after thorough investigation. In 2019, an incident involving collusion between two employees and a supplier was investigated by a third party and resulted in the individuals being summarily dismissed from the Company.
Anti-bribery and corruptionIt is XP Power’s policy to conduct all business in an honest and ethical manner. We will not accept or give bribes or other means of inducement to obtain improper advantage. The Company takes a zero-tolerance approach to bribery and corruption, and is committed to acting professionally, fairly and with integrity in all business dealings and relationships, and enforces effective systems to counter bribery. Our policy on anti-bribery and corruption is embedded in our Code of Conduct, which all employees receive annual training on. Our Code of Conduct’s section on bribery and corruption is detailed and includes numerous examples so employees can clearly understand what is acceptable and unacceptable. The requirements of our Code of Conduct are communicated to our suppliers, and they are required to comply with its provisions.
We use our online learning management system, which was rolled out worldwide in 2020, to manage and monitor the training of our employees. Our Code of Conduct was refreshed in 2020 and all employees were required to complete relevant training and acknowledge that they understand the Code. The Board of Directors is ultimately responsible for compliance with all aspects of our Code of Conduct. There were no instances of bribery or corruption in 2021 that executive management or the Board were aware of.
Modern slaveryXP Power supports the Modern Slavery Act 2015, and this is explicitly included within our Code of Conduct. We do not engage in any form of slavery or human trafficking activities, and we are strongly against any offences of slavery, servitude forced labour and/or human trafficking. We have also adopted a corporate policy, which has been communicated to all employees through our Code of Conduct, and is supported by all levels of the organisation. The policy can be found here: xppower.com/company/policies. Any abuse of human rights would be acted upon immediately and appropriate action taken. All our employees are trained on our modern slavery policy through the annual online Code of Conduct training.
2021
99.8%TARGET FOR
NEXT YEAR: 100%
71
STRATEGIC REPORT
OUR SUSTAINABILITY STRATEGY
04: ETHICS AND COMPLIANCE
30801-XP-Power AR21-Strategic.indd 7130801-XP-Power AR21-Strategic.indd 71 08/03/2022 10:57:4708/03/2022 10:57:47

30801 8 March 2022 9:38 am v9
Human rightsHuman rights are at the heart of sustainable business. XP Power is committed to respecting human rights in accordance with international human rights principles including the UN Guiding Principles on Business and Human Rights, the UN Universal Declaration of Human Rights, and the International Labour Organisation’s Declaration on Fundamental Principles and Rights at Work. The policy can be found here: xppower.com/company/policies. Training on human rights is included in our annual online Code of Conduct training.
Information systems and technologyThe Group considers that it has appropriately robust and secure information technology (IT) systems while acknowledging that no IT system can be absolutely secure. The Group IT Director is responsible for the integrity and security of the IT systems and communications network. The Group has processes in place for penetration testing, data back-up and recovery, and there are various processes, software and hardware in place to prevent data security breaches and unauthorised access to the Group’s systems and data. The Group also holds regular cybersecurity training and awareness to ensure that our employees remain alert to threats.
Tax transparencyThe Group is committed to compliance with all applicable tax laws and regulations in all areas it operates in or is required to make filings. All required tax filings are made accurately and on time with the relevant authorities. It is the Group’s policy to not engage in any aggressive tax planning or tax avoidance schemes.
XP Power believe that its tax activities should adhere to the spirit and the letter of all relevant tax laws and
regulations where it operates. We are committed to a transparent and open approach to reporting on tax. Our policy, as part of our governance framework, is to file all tax returns on time, and to pay tax as it falls due.
The Group has a low-risk tolerance for uncertain tax positions where it operates. We do not undertake any aggressive or unreasonable tax planning schemes for the purpose of tax avoidance, and broadly aim to align tax payments to revenue generation. We do not knowingly help others avoid their tax obligations.
We prohibit tax avoidance through transfer pricing. All intra-group transactions are required to be priced on an arm’s length basis in accordance with the Group’s internal transfer pricing policies, which reflect internationally accepted transfer pricing standards and local tax laws. We commit to not transfer value created to low tax jurisdictions and not use tax structures intended for tax avoidance.
XP Power do not operate in countries considered as partially compliant or non-compliant according to the OECD tax transparency report, or in any countries blacklisted or grey listed by the EU for tax avoidance and harmful tax practices (as at 31 October 2021).
Our commitments on taxation are implemented through a system of procedures and controls in place across the Group. Tax is a regular agenda item for the Audit Committee, which meets at least four times a year, and reports to the main Board. Tax compliance risks are managed through the Group’s governance framework, overseen by the Audit Committee, and supported by the CFO.
Government contractsThe Group has no direct relationships where it sells products or services to any government entity.
72
XP Power Annual Report & Accounts for the year ended 31 December 2021
OUR SUSTAINABILITY STRATEGY
04: ETHICS AND COMPLIANCE CONTINUED
30801-XP-Power AR21-Strategic.indd 7230801-XP-Power AR21-Strategic.indd 72 08/03/2022 10:57:4908/03/2022 10:57:49

30801 8 March 2022 9:38 am v9
GovernanceXP Power has a robust governance structure in place to manage our response to climate-related issues. The Board of Directors has overall responsibility and oversight of climate-related risks and opportunities, as with all matters which impact the strategy, risk management, vision and values of the Group. The Board monitors progress of the Group’s sustainability performance against our reported emissions, energy use, water use and waste. The Chair of the Remuneration Committee supports the Board in this function. The CEO has responsibility for ensuring climate-related issues are considered in the review of XP Power’s strategy, budget and business. The Board reviews our climate-related risk and opportunities register every four months at meetings scheduled to approve the Group’s overall risk controls.
At the executive level, the Executive team (chaired by the CEO) meets monthly and identifies risks to the climate (and sustainability) strategy, reports to the Board, determines the relevant goals and objectives, approve KPIs, targets, plans and policies. Our Sustainability Council supports the Executive team through reviewing KPIs, resolving issues, mitigating risks to the plan, recommending policies and processes to Executive team and Board. The Sustainability Council, chaired by the CEO, meets quarterly and is tasked with the formation and successful delivery of the XP Power sustainability action plan and, within this, the net zero action plan. In turn, the Programme Team sits below the Sustainability Council, and has more of an operational remit and is responsible for managing the progress to plan. On a monthly basis, the Programme team monitors any ongoing risks, identifies areas for improvement and embeds the sustainability action plan into process. Further details of our Sustainability Governance structure are outlined on page 89.
Risk managementXP Power takes into consideration climate-related risks and opportunities in all physical and transition risk categories, current and emerging, whether they occur within our own operations, or upstream and downstream of the Group and whether they occur within the short, medium or long-term time horizons. Risks and opportunities relevant to XP Power were identified with the help of external consultants, CEN-ESG and refined through consultation with the Sustainability Council and senior management.
Climate-related risks and opportunities are evaluated for likelihood on five-point scales for likelihood (low to high) and impact (minor to severe) to ensure that the significance of climate-related risks is considered in relation to risks identified in the standard risk management processes. The completed climate-related risk and opportunity register was reviewed and approved by the Board during 2021. The Board reviews our climate-related risk and opportunities register on a regular basis as part of assessing and approving the Group’s overall risk controls. This ensures that the management of climate-related risks is integrated into XP Power overall risk management framework.
Further details related to each key risk and opportunity, such as a quantification of the financial impact, the appropriate strategic response and cost of response and the variance of key risks in relation to climate-related scenarios were developed where possible. These details help to determine the materiality of each risk and alongside the magnitude and likelihood assessment outlined above. This allows us to prioritise resources in managing the most material climate-related impacts, determine the best management response or highlight areas requiring further investigation. Further details of the Group’s risk management process are on page 42 Managing Our Risks.
73
STRATEGIC REPORT
COMMITMENT TO REDUCING CLIMATE CHANGETCFD REPORT
30801-XP-Power AR21-Strategic.indd 7330801-XP-Power AR21-Strategic.indd 73 08/03/2022 10:57:5008/03/2022 10:57:50

30801 8 March 2022 9:38 am v9
StrategyThe following four key climate-related risks and six key climate-related opportunities that could have a material financial impact on the organisation have been identified. These are incorporated into our strategic planning:
RiskStorm and flood disruption Supply chain risks Transportation cost
China’s mandated power shutdowns
Type Physical (severe weather)
Physical (severe weather)
Transition (emerging regulation)
Transition (market)
Area Own operations Upstream Upstream Own operations
Primary potential financial impact
Lost production/revenues
Lost production/revenues
Higher cost of inputs Lost production/revenues
Time horizon Medium term Medium term Medium term Short term
Likelihood Medium-high Medium-high High Medium-high
Magnitude of impact Moderate Major Moderate Severe
Opportunity Solar powerPower Purchase agreements (PPAs)
Reduction of air freight
Legislation on energy efficiency
Type Energy source Energy source Material efficiency Products & services, market
Area Own operations Own operations Downstream Downstream
Primary potential financial impact
Reduced direct costs Reduced direct costs Reduced costs Higher revenues
Time horizon Short to medium term
Short to medium term
Short term Short term
Likelihood Medium Medium Medium-high High
Magnitude of impact Major Major Major Moderate
Opportunity ElectrificationEnergy and waste savings
Type Markets Material efficiency
Area Downstream Own operationsPrimary potential financial impact Higher revenues Reduced cost
Time horizon Short term Medium term
Likelihood High Medium-high
Magnitude of impact Moderate Minor
In consideration with our commitment to net zero by 2040 and of the time horizons related to climate change, the time horizons for our risk assessment analysis are as follows:
Short term: 0–3 years Medium term: 3–10 years Long term: beyond 10 years
We have conducted preliminary climate-related scenario analysis to analyse how our risks react to different climate outcomes. We used three public climate-related scenarios to help us understand the resilience of our business to climate change:
74
XP Power Annual Report & Accounts for the year ended 31 December 2021
COMMITMENT TO REDUCING CLIMATE CHANGETCFD REPORT CONTINUED
30801-XP-Power AR21-Strategic.indd 7430801-XP-Power AR21-Strategic.indd 74 08/03/2022 10:57:5008/03/2022 10:57:50

30801 8 March 2022 9:38 am v9
• Sustainable Development (SDS)* outlining a global low carbon transition, which limits the global temperatures rise to 1.65°C by 2100, with 50% probability.
• Stated Policies (STEPS)* outlining a combination of physical and transitions risk impacts as temperatures rise by 2.6°C by 2100, with 50% probability.
• RCP 8.5** an extreme physical risk scenario, where global temperatures rise between 4.1–4.8°C by 2100.
* IEA, World Energy Model (2021) https://www.iea.org/reports/world-energy-model
** IPCC, Climate Change 2014: Synthesis Report (2014) Contribution of Working Groups I, II and III to the Fifth Assessment Report of the Intergovernmental Panel on Climate Change.
To inform our assumptions on each of our risks, we supplemented the scenario findings with additional sources specific to each risk. Much of our scenario analysis remains qualitative at this stage, but against certain risks, we have begun to develop quantified impacts internally where the underlying data is available and where the current understanding of the risks is robust. There will be opportunities in future years to increase the sophistication of modelling as new data is made available both internally and externally to support a meaningful quantitative assessment.
Climate-related risksSTORM AND FLOOD DISRUPTIONExtreme weather events are expected to rise in both frequency and magnitude as an impact of climate change. Global temperatures rise in all three scenarios
we studied, peaking only in 2050 in even the SDS scenario. Under STEPS, extreme rainfall is expected to occur up to twice as often as today and be three-to-four-times more intense. RCP 8.5 is more extreme. The sites with risks identified using geospatial modelling are in the US at Comdel, MA and Glassman, NJ (hurricanes) and Vietnam (inundation). These sites have already experienced some weather-related disruption, albeit manageable under business as usual. The Group operates with flexibility in capacity and can respond to outages with changes in work patterns to compensate. We are investigating a third major site, which would provide further manufacturing flexibility and reduce manufacturing reliance on Vietnam.
SUPPLY CHAIN RISKSPhysical climate change impacts could result in disruption to our supply chain. Our supply of metals and fabricated items is flexible, but electronic components are specialised, and supply cannot easily be switched out for alternatives. We have not quantified this impact, but our exposure to individual suppliers is reduced as we source components from many suppliers. We are already reviewing supply chain resilience because of issues experienced under COVID-19. This includes analysis of the supply chain to understand better what the critical component supplier relationships are, whether key suppliers have site-specific climate-related risks and what options there are for switching to suppliers with greater internal resilience and manufacturing flexibility. This could be conducted alongside analysis to determine where the carbon is in the value chain (Scope 3 assessment and lifecycle analysis). In addition, we plan to enhance our supplier assessment process to include supplier resilience and business continuity plans.
75
STRATEGIC REPORT
30801-XP-Power AR21-Strategic.indd 7530801-XP-Power AR21-Strategic.indd 75 08/03/2022 10:57:5108/03/2022 10:57:51

30801 8 March 2022 9:38 am v9
TRANSPORTATION COSTXP Power is exposed to carbon price impacts on transportation costs, especially in relation to air freight. There has been an increase in the proportion of goods air freighted recently to compensate for longer lead times resulting from COVID-19. Initial analysis indicates that one tonne shipped by air on our routes generates 70–80 times the emissions of a tonne shipped by sea, which means that our mode of transport materially changes our transportation emissions (Scope 3). In addition, carbon prices (US$/tCO2e) under SDS and STEPS are projected to increase as below. How carbon prices are applied to transport is uncertain, but these scenarios outline potential additional costs that could relate to our mode of transport.
CARBON PRICE ESTIMATES (US$/T)
Scenario – SDS 2030 2040 2050Developed economies with net zero pledges 120 170 200China 30 95 160Emerging economies with net zero pledges 40 110 160
Scenario – STEPS 2030 2040 2050EU 65 75 90China 30 45 55Korea 40 65 90
Customer service is critical, and whilst there is cost and emissions rationale to changing the freight model, this may require engagement with suppliers and customers if lead times are impacted.
CHINA’S MANDATED POWER SHUTDOWNSEnergy supply in China is subject to top-down control, in part related to emissions targets and policy-related factors. XP Power’s production in China experienced power supply issues during 2021 reportedly because of a restriction on the consumption of coal at power stations and subsequent (temporary) restrictions on the use of back-up diesel generation. We are encouraged by the rapid pace of renewable generation capacity additions in China. The SDS sees China build substantial generation capacity in solar and wind, increasing total capacity by 4–5% CAGR through to 2040. However, currently there appears to be power supply risks during the generation transition of the grid. We note that, under SDS scenario, whilst the carbon price in China is expected to rise to US$30/tCO2e in 2030 and US$95/tCO2e in 2040 (IEA), there is an offsetting trend in the carbon intensity of China's grid that is expected to drop 19% by 2030 and 46% by 2040. Under STEPS, there is expected to be no carbon price introduced whilst the carbon intensity of the grid is expected to improve by 10% in 2040. This means that our Scope 2 emissions and exposure to carbon prices in China would decrease over time, even without any self-generation. XP Power operates with sufficient manufacturing flexibility to make up for lost time and the Company is investigating renewable self-generation and measures to improve energy efficiency (see page 73).
The Group explored four additional risks, which we outline below for completeness, but which currently are not material enough to be incorporated into our businesses, strategy and financial planning:
• Carbon price impacts on energy: Whilst the introduction of carbon price/carbon tax could result in an increase in the cost of energy, XP Power is not energy intensive, and our energy costs are relatively limited.
76
XP Power Annual Report & Accounts for the year ended 31 December 2021
COMMITMENT TO REDUCING CLIMATE CHANGETCFD REPORT CONTINUED
30801-XP-Power AR21-Strategic.indd 7630801-XP-Power AR21-Strategic.indd 76 08/03/2022 10:57:5308/03/2022 10:57:53

30801 8 March 2022 9:38 am v9
• Californian Wildfires: Our Californian sites are in tier 2 fire threat locations (CPUC), but the sites themselves are in industrial areas, 2–3 miles away from vegetation. Sites are less material to the group.
• Falling Behind: we believe the risk of XP Power’s falling behind from a competitive positioning standpoint is low. Our technology leads or is in line with the market and we are in constant communication with our customers to meet their efficiency requirements.
• Carbon price on components: Introduction of carbon price/carbon tax could result in an increase in the cost for carbon-intensive commodity inputs. Quantification of our carbon in components (c.65% COGS) and metalwork (c.5% COGS) requires lifecycle analysis. Components have long life and high visibility of period of use.
Climate-related opportunitiesSOLAR POWERAs part of the FY22 budget proposals, the Group is looking to install solar self-generation where practically possible and economically viable. Solar installations will reduce reliance on local grid and reduce emissions. Our sites in Vietnam and China have the largest power use in the Group (c.80% of power use combined) and draw from grids with the highest emissions intensity. In addition to cost savings, solar self-generation will avoid potential carbon tax impacts (see above).
POWER PURCHASE AGREEMENTS Renewable energy Power Purchase Agreements (PPA) are contractual agreements to buy renewably generated energy from a supplier, typically over a period of between 10–20 years. They allow for reduction in emissions without capital spend and create stable electricity pricing over time. At COP26, Vietnam set a 2050 net zero goal, but at this stage the pace of roll-out in renewable generation capacity is uncertain. Encouragingly, there was a pilot PPA in Vietnam during 2021. With the recent net zero/zero coal commitments in China, it should be increasingly likely that China will see PPAs being offered and should see support from the government to use these to help drive investment. Whilst the cost of electricity may be marginally higher under PPAs, contracts can provide fixed costs over several years as well as reduce our Scope 2 emissions.
REDUCTION OF AIR FREIGHTThere are good cost and emissions reasons to move our freight to sea from air where possible. Our scenario analysis provides further impetus for this move. That said, customer service is critical, and changing the freight model may require engagement with suppliers and customers if lead times are impacted.
LEGISLATION ON ENERGY EFFICIENCYIn a transition to a low carbon economy, legislation on the efficiency requirements for power conversion could become more stringent. The Company expects the standards currently in place for higher volume consumer applications, such as external power supplies, will be extended to industrial and healthcare applications. Within SDS, there is expectation of widespread enforcement of minimum energy performance standards in industry. In addition, mandatory energy management systems and energy audits are expected, which will increase customer requirements for energy efficient products. STEPS outlines no legislation, but there would be investment programmes in US, UK and EU designed to support decarbonisation. XP Power is well positioned to address this customer need with products offering high efficiency and/or low standby power. Alongside legislation, general concerns over climate change should lead to an increasing emphasis by our customers on efficiency. Development and expansion of product families that are classified as ‘Green Power’ forms part of our ongoing R&D expense.
ELECTRIFICATIONThere is potential of new markets for XP Power on the back of increased electrification in the global economy. It is not clear what opportunities this will create for the Group, but we monitor areas of interest such as wind turbines, 5G infrastructure and network densification, which would provide new opportunities for the Group. Certain of these opportunities are linked to the pace of regulation and investment related to the different scenarios we have analysed.
ENERGY AND WASTE SAVINGSActions to improve energy efficiency and reduce energy consumption will provide incremental improvements and the cost to implement should be limited. We have outlined various efficiency projects at site level depending on requirements and opportunities at each site, as well as company-wide initiatives, such as the reduction in packaging. Certain gains from behaviour or process change can be achieved at zero cost.
METRICS AND TARGETSWe monitor our Scope 1, 2 and certain Scope 3 greenhouse gas emissions, energy use, freshwater withdrawal and waste management, as reported on page 59 Environmental Leadership. XP Power has made the public commitment to be net zero by 2040 and we recognise we need to set broader climate-related targets. Our next steps will be to develop our understanding of our Scope 3 emissions and then set targets for net zero by 2040, aligned with the Science Based Targets initiative’s (SBTi) target-setting criteria.
77
STRATEGIC REPORT
30801-XP-Power AR21-Strategic.indd 7730801-XP-Power AR21-Strategic.indd 77 08/03/2022 10:57:5308/03/2022 10:57:53

30801 8 March 2022 10:08 am V9
78
XP Power Annual Report & Accounts for the year ended 31 December 2021
30801-XP-Power AR21 Governance.indd 7830801-XP-Power AR21 Governance.indd 78 08/03/2022 10:55:0108/03/2022 10:55:01

30801 8 March 2022 10:08 am V9
Governance
CONTENTS
CHAIR'S INTRODUCTION TO GOVERNANCE 80
BOARD OF DIRECTORS 82
CORPORATE GOVERNANCE REPORT 84
NOMINATION COMMITTEE REPORT 96
AUDIT COMMITTEE REPORT 104
REMUNERATION COMMITTEE REPORT 110
OTHER GOVERNANCE AND STATUTORY DISCLOSURES 128
STATEMENT BY DIRECTORS 129
79
GOVERNANCE
30801-XP-Power AR21 Governance.indd 7930801-XP-Power AR21 Governance.indd 79 08/03/2022 10:55:0108/03/2022 10:55:01
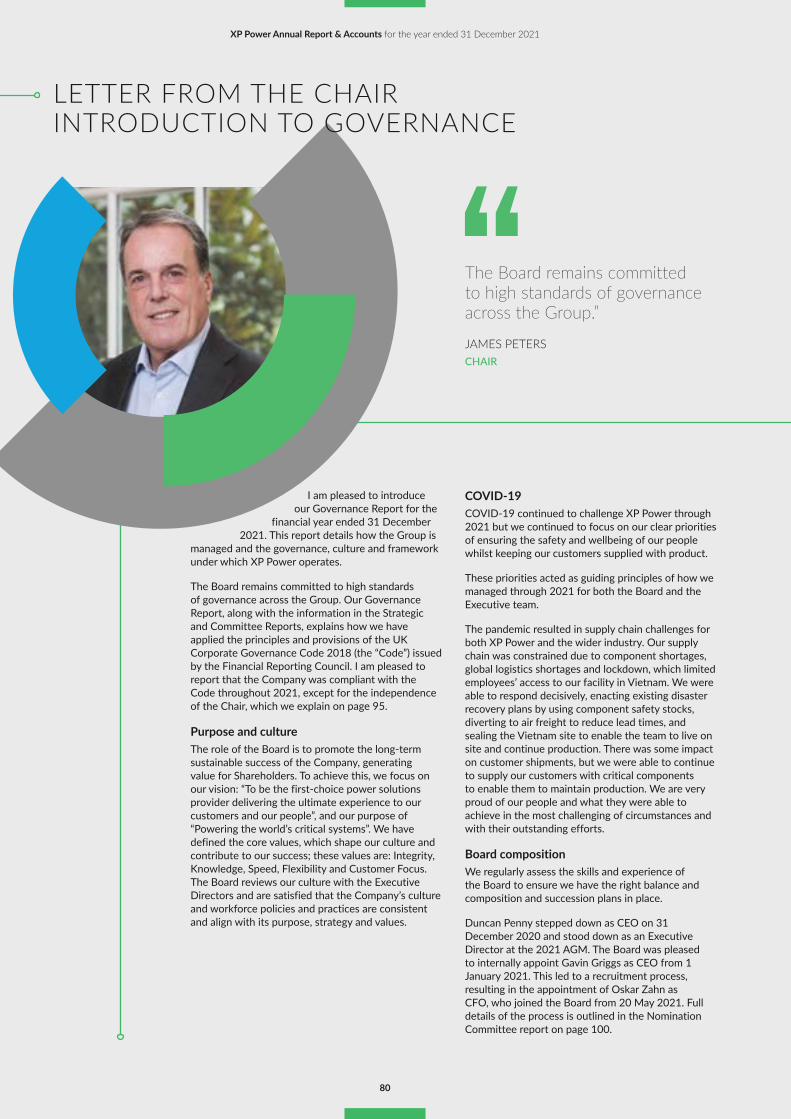
30801 8 March 2022 10:08 am V9
The Board remains committed to high standards of governance across the Group.”
JAMES PETERSCHAIR
I am pleased to introduce our Governance Report for the
financial year ended 31 December 2021. This report details how the Group is
managed and the governance, culture and framework under which XP Power operates.
The Board remains committed to high standards of governance across the Group. Our Governance Report, along with the information in the Strategic and Committee Reports, explains how we have applied the principles and provisions of the UK Corporate Governance Code 2018 (the “Code”) issued by the Financial Reporting Council. I am pleased to report that the Company was compliant with the Code throughout 2021, except for the independence of the Chair, which we explain on page 95.
Purpose and cultureThe role of the Board is to promote the long-term sustainable success of the Company, generating value for Shareholders. To achieve this, we focus on our vision: “To be the first-choice power solutions provider delivering the ultimate experience to our customers and our people”, and our purpose of “Powering the world’s critical systems”. We have defined the core values, which shape our culture and contribute to our success; these values are: Integrity, Knowledge, Speed, Flexibility and Customer Focus. The Board reviews our culture with the Executive Directors and are satisfied that the Company’s culture and workforce policies and practices are consistent and align with its purpose, strategy and values.
COVID-19COVID-19 continued to challenge XP Power through 2021 but we continued to focus on our clear priorities of ensuring the safety and wellbeing of our people whilst keeping our customers supplied with product.
These priorities acted as guiding principles of how we managed through 2021 for both the Board and the Executive team.
The pandemic resulted in supply chain challenges for both XP Power and the wider industry. Our supply chain was constrained due to component shortages, global logistics shortages and lockdown, which limited employees’ access to our facility in Vietnam. We were able to respond decisively, enacting existing disaster recovery plans by using component safety stocks, diverting to air freight to reduce lead times, and sealing the Vietnam site to enable the team to live on site and continue production. There was some impact on customer shipments, but we were able to continue to supply our customers with critical components to enable them to maintain production. We are very proud of our people and what they were able to achieve in the most challenging of circumstances and with their outstanding efforts.
Board compositionWe regularly assess the skills and experience of the Board to ensure we have the right balance and composition and succession plans in place.
Duncan Penny stepped down as CEO on 31 December 2020 and stood down as an Executive Director at the 2021 AGM. The Board was pleased to internally appoint Gavin Griggs as CEO from 1 January 2021. This led to a recruitment process, resulting in the appointment of Oskar Zahn as CFO, who joined the Board from 20 May 2021. Full details of the process is outlined in the Nomination Committee report on page 100.
LETTER FROM THE CHAIR INTRODUCTION TO GOVERNANCE
80
XP Power Annual Report & Accounts for the year ended 31 December 2021
30801-XP-Power AR21 Governance.indd 8030801-XP-Power AR21 Governance.indd 80 08/03/2022 10:55:0208/03/2022 10:55:02

30801 8 March 2022 10:08 am V9
We have a continued focus on Board succession planning, and have discussed my intention to retire from the Board at the Company’s AGM in April 2023. This led to a process that has resulted in the appointment of Jamie Pike to the Board as Non-Executive Director and designate Chair from 1 March 2022. This will enable a thorough induction and smooth transition as we move through 2022 and into 2023.
Division of responsibilitiesIt is the responsibility of the Chair to manage the Board and ensure it is effective. We encourage a culture of openness and debate to ensure all views are heard and taken into consideration. The CEO and CFO ensure that Directors receive accurate, timely, clear and relevant information in order to discharge their duties.
There is clear division of responsibility between the Chair, who is responsible for the management of the Board, and the CEO, who is responsible for the day-to-day running of the Company and execution of our strategy.
StrategyWe have deployed a consistent strategy over many years, which we continue to evolve, refine, review and constructively challenge as a Board as the business continues to grow and develop. We have reviewed this strategy again in 2021 and made refinements where appropriate. We are pleased to report that we have, again, executed well against our strategy, as evidenced by the results achieved and progress we have made.
Workforce engagementWorkforce engagement has been particularly important in 2021 due to the ongoing impact of the pandemic. Despite the restrictions on international travel, we have endeavoured to stay close to our employees and support them during this difficult time. We have ensured that our managers continue to take extra time to check in with their teams who are working remotely or from home.
Many of our employees have been working from home for a significant amount of 2021 and we have stayed connected with them through frequent all-hands employee meetings over video call with questions and answers. We have also conducted several employee surveys.
Future of XP PowerWe have confidence in our strategy and business model, and the Management team in place, to execute our strategic plans. The business has performed strongly over a significant period despite numerous external challenges. We remain confident and excited of the long-term prospects for the future of XP Power.
JAMES PETERSCHAIR 1 March 2022
Our purpose is to power the world’s critical systems.”
READ MORE ABOUT THE BOARD OF DIRECTORS ON PAGES 82-83
READ MORE ABOUT ENGAGING WITH OUR STAKEHOLDERS ON PAGES 90-93
81
GOVERNANCE
30801-XP-Power AR21 Governance.indd 8130801-XP-Power AR21 Governance.indd 81 08/03/2022 10:55:0408/03/2022 10:55:04

30801 8 March 2022 10:08 am V9
JAMES PETERS CHAIR
GAVIN GRIGGS CHIEF EXECUTIVEOFFICER
OSKAR ZAHN CHIEF FINANCIALOFFICER
ANDY SNG EXECUTIVE VICEPRESIDENT, ASIA
TERRY TWIGGER SENIOR INDEPENDENT DIRECTOR
POLLY WILLIAMS INDEPENDENT NON-EXECUTIVE DIRECTOR
PAULINE LAFFERTY INDEPENDENT NON-EXECUTIVE DIRECTOR
Date of appointment:30 June 2014
Executive/Non-Executive:Non-Executive
Committee Membership:Nomination (Chair)
Date of appointment:Gavin joined the Group on 31 October 2017 as CFO. He was appointed CEO with effect from 1 January 2021.
Executive/Non-Executive:Executive
Committee Membership:None
Date of appointment:20 May 2021
Executive/Non-Executive:Executive
Committee Membership:None
Date of appointment:24 April 2007
Executive/Non-Executive:Executive
Committee Membership:None
Date of appointment:1 January 2015
Executive/Non-Executive:Non-Executive
Committee Membership:Audit (Chair), Nomination, Remuneration
Date of appointment:1 January 2016
Executive/Non-Executive:Non-Executive
Committee Membership:Audit, Nomination, Remuneration, Board representative for ESG
Date of appointment:3 December 2019
Executive/Non-Executive:Non-Executive
Committee Membership:Remuneration (Chair), Audit, Nomination, designated NED for employee engagement
Skills and experience:• James founded XP Power in
November 1988.
• Appointed European Managing Director in April 2000, responsible for the development of the Group’s European business.
• Became Deputy Chair in February 2003 and moved to a Non-Executive role in May 2012, before his appointment as Non-Executive Chair in June 2014.
External Appointments:None
Skills and experience:• Gavin is a CIMA-qualified
accountant who has worked in a range of acquisitive, growth focused businesses with an international footprint in a number of industries.
• Held senior finance and strategy roles at Logica, Sodexo, PepsiCo and SABMiller.
• Served as CFO of Alternative Networks plc, a listed information technology provider, prior to its acquisition by Daisy in December 2016, when he became Group Finance Director for the Daisy Group.
External Appointments:None
Skills and experience:• Oskar is a chartered
accountant who has worked in large complex international businesses with continuous improvement and growth-focused cultures.
• Held finance leadership roles at Telefex, British Airways, Georgia-Pacific and Spearhead International.
• Served as CFO at Scapa Group plc, a leading global manufacturer to the healthcare and industrial markets, from 2018 until its acquisition by SWM International, Inc. in 2021.
External Appointments:None
Skills and experience:• Andy has over 22 years
experience in the power converter industry.
• Graduated from Nanyang Technological University with a degree in Electrical and Electronic Engineering, and an MBA from Manchester Business School.
• Prior to joining the Group, held technical and commercial roles with companies such as Silicon Systems (Singapore) and Advanced Micro Devices (Singapore).
External Appointments:None
Skills and experience:• Between July 1993 and May
2013, Terry spent 20 years with Meggitt PLC, the FTSE 100 global engineering group.
• For the last 12 years at Meggitt, Terry was Chief Executive Officer and grew its revenues from £0.4 billion to £1.6 billion through a combination of organic growth and numerous successful acquisitions.
External Appointments:None
Skills and experience:• Polly is a chartered accountant
and a former Partner at KPMG LLP. She resigned from her partnership in 2003 and has since held a number of Non-Executive directorship roles.
External Appointments:Polly is currently a Non-Executive Director at :
• Jupiter Fund Management plc;
• Royal Bank of Canada Europe Ltd; and
• The Rugby Football Union.
She is also a Trustee of the Guide Dogs for the Blind Association.
Skills and experience:• Pauline was formerly Chief
People Officer at The Weir Group plc, a position she held between 2011 and 2017.
• Between 1998 to 2011, she worked in executive search for The Miles Partnership at Russell Reynolds Associates
• Prior to that, Pauline worked in supply chain roles for Digital Equipment Corporation and Motorola.
External Appointments:Pauline currently holds non-executive positions at:
• Breedon Group plc; and
• Scottish Event Campus Limited (SEC).
82
XP Power Annual Report & Accounts for the year ended 31 December 2021
BOARD OF DIRECTORS
30801-XP-Power AR21 Governance.indd 8230801-XP-Power AR21 Governance.indd 82 08/03/2022 10:55:0708/03/2022 10:55:07

30801 8 March 2022 10:08 am V9
CHANGES TO THE BOARD DURING 2021
Gavin Griggs was appointed CEO with effect from 1 January 2021.
Duncan Penny stood down from the Board at the AGM on 20 April 2021.
Oskar Zahn was appointed to the Board as CFO on 20 May 2021.
BOARD ROLE Chair
Executive Director
Senior Non-Executive Director
Non-Executive Director
JAMES PETERS CHAIR
GAVIN GRIGGS CHIEF EXECUTIVEOFFICER
OSKAR ZAHN CHIEF FINANCIALOFFICER
ANDY SNG EXECUTIVE VICEPRESIDENT, ASIA
TERRY TWIGGER SENIOR INDEPENDENT DIRECTOR
POLLY WILLIAMS INDEPENDENT NON-EXECUTIVE DIRECTOR
PAULINE LAFFERTY INDEPENDENT NON-EXECUTIVE DIRECTOR
Date of appointment:30 June 2014
Executive/Non-Executive:Non-Executive
Committee Membership:Nomination (Chair)
Date of appointment:Gavin joined the Group on 31 October 2017 as CFO. He was appointed CEO with effect from 1 January 2021.
Executive/Non-Executive:Executive
Committee Membership:None
Date of appointment:20 May 2021
Executive/Non-Executive:Executive
Committee Membership:None
Date of appointment:24 April 2007
Executive/Non-Executive:Executive
Committee Membership:None
Date of appointment:1 January 2015
Executive/Non-Executive:Non-Executive
Committee Membership:Audit (Chair), Nomination, Remuneration
Date of appointment:1 January 2016
Executive/Non-Executive:Non-Executive
Committee Membership:Audit, Nomination, Remuneration, Board representative for ESG
Date of appointment:3 December 2019
Executive/Non-Executive:Non-Executive
Committee Membership:Remuneration (Chair), Audit, Nomination, designated NED for employee engagement
Skills and experience:• James founded XP Power in
November 1988.
• Appointed European Managing Director in April 2000, responsible for the development of the Group’s European business.
• Became Deputy Chair in February 2003 and moved to a Non-Executive role in May 2012, before his appointment as Non-Executive Chair in June 2014.
External Appointments:None
Skills and experience:• Gavin is a CIMA-qualified
accountant who has worked in a range of acquisitive, growth focused businesses with an international footprint in a number of industries.
• Held senior finance and strategy roles at Logica, Sodexo, PepsiCo and SABMiller.
• Served as CFO of Alternative Networks plc, a listed information technology provider, prior to its acquisition by Daisy in December 2016, when he became Group Finance Director for the Daisy Group.
External Appointments:None
Skills and experience:• Oskar is a chartered
accountant who has worked in large complex international businesses with continuous improvement and growth-focused cultures.
• Held finance leadership roles at Telefex, British Airways, Georgia-Pacific and Spearhead International.
• Served as CFO at Scapa Group plc, a leading global manufacturer to the healthcare and industrial markets, from 2018 until its acquisition by SWM International, Inc. in 2021.
External Appointments:None
Skills and experience:• Andy has over 22 years
experience in the power converter industry.
• Graduated from Nanyang Technological University with a degree in Electrical and Electronic Engineering, and an MBA from Manchester Business School.
• Prior to joining the Group, held technical and commercial roles with companies such as Silicon Systems (Singapore) and Advanced Micro Devices (Singapore).
External Appointments:None
Skills and experience:• Between July 1993 and May
2013, Terry spent 20 years with Meggitt PLC, the FTSE 100 global engineering group.
• For the last 12 years at Meggitt, Terry was Chief Executive Officer and grew its revenues from £0.4 billion to £1.6 billion through a combination of organic growth and numerous successful acquisitions.
External Appointments:None
Skills and experience:• Polly is a chartered accountant
and a former Partner at KPMG LLP. She resigned from her partnership in 2003 and has since held a number of Non-Executive directorship roles.
External Appointments:Polly is currently a Non-Executive Director at :
• Jupiter Fund Management plc;
• Royal Bank of Canada Europe Ltd; and
• The Rugby Football Union.
She is also a Trustee of the Guide Dogs for the Blind Association.
Skills and experience:• Pauline was formerly Chief
People Officer at The Weir Group plc, a position she held between 2011 and 2017.
• Between 1998 to 2011, she worked in executive search for The Miles Partnership at Russell Reynolds Associates
• Prior to that, Pauline worked in supply chain roles for Digital Equipment Corporation and Motorola.
External Appointments:Pauline currently holds non-executive positions at:
• Breedon Group plc; and
• Scottish Event Campus Limited (SEC).
83
GOVERNANCE
30801-XP-Power AR21 Governance.indd 8330801-XP-Power AR21 Governance.indd 83 08/03/2022 10:55:0908/03/2022 10:55:09

30801 8 March 2022 10:08 am V9
Corporate Governance Statement 2021The Board of Directors’ primary remit is to provide direction to help shape the strategy of the Group and ensure that this is being executed effectively within a structure that is well controlled, mitigates risk and is compliant with corporate and social responsibility. Good corporate governance emanates from the top, which is why the Board gives continued prominence to this area.
Under the Singapore Companies Act 1967, the Company is not required to follow the Singapore Corporate Governance Code. The Company has voluntarily agreed to the principles of corporate governance contained in the UK Corporate Governance Code (the “Code”) as required under the Listing Rules of the Financial Services Authority of the United Kingdom.
We have clearly laid out how the principles of the Code have been applied under the areas of:
01 Board leadership and Company purpose;
02 Division of responsibilities;
03 Composition, succession and evaluation;
04 Audit, risk and internal control; and
05 Remuneration.
JAMES PETERSCHAIR
GAVIN GRIGGSCHIEF EXECUTIVE OFFICER
1 March 2022
Our approach to governance
BOARD LEADERSHIP AND COMPANY PURPOSEA Effective Board (page 82 to 83)B Purposes, values and culture (page 89)C Governance framework and Board resources (page 84 to 85)D Stakeholder engagement (page 90)E Workforce policies and practices (page 90)
DIVISION OF RESPONSIBILITIESF Board roles (page 86)G Independence (page 95)H External commitments and conflicts of interest (page 82 to 83)I Key activities of the Board in 2021 (page 88 to 89)
COMPOSITION, SUCCESSION AND EVALUATIONJ Appointments to the Board (page 100 to 101)K Board skills, experience and knowledge (page 108 to 109)L Annual Board evaluation (page 102)
AUDIT, RISK AND INTERNAL CONTROLM Financial reporting (page 106 to 107)
External Auditor and internal audit (page 107 to 109)N Review of the 2021 Annual Report (page 107 to 109)O Internal financial controls (page 108)
REMUNERATIONP Linking remuneration with purpose and strategy (page 112 to 115)Q Remuneration Policy review (page 123 to 125)R Performance outcomes in 2021 and strategic targets (page 116)
XP Power Annual Report & Accounts for the year ended 31 December 2021
84
CORPORATE GOVERNANCE REPORT
30801-XP-Power AR21 Governance.indd 8430801-XP-Power AR21 Governance.indd 84 08/03/2022 10:55:0908/03/2022 10:55:09
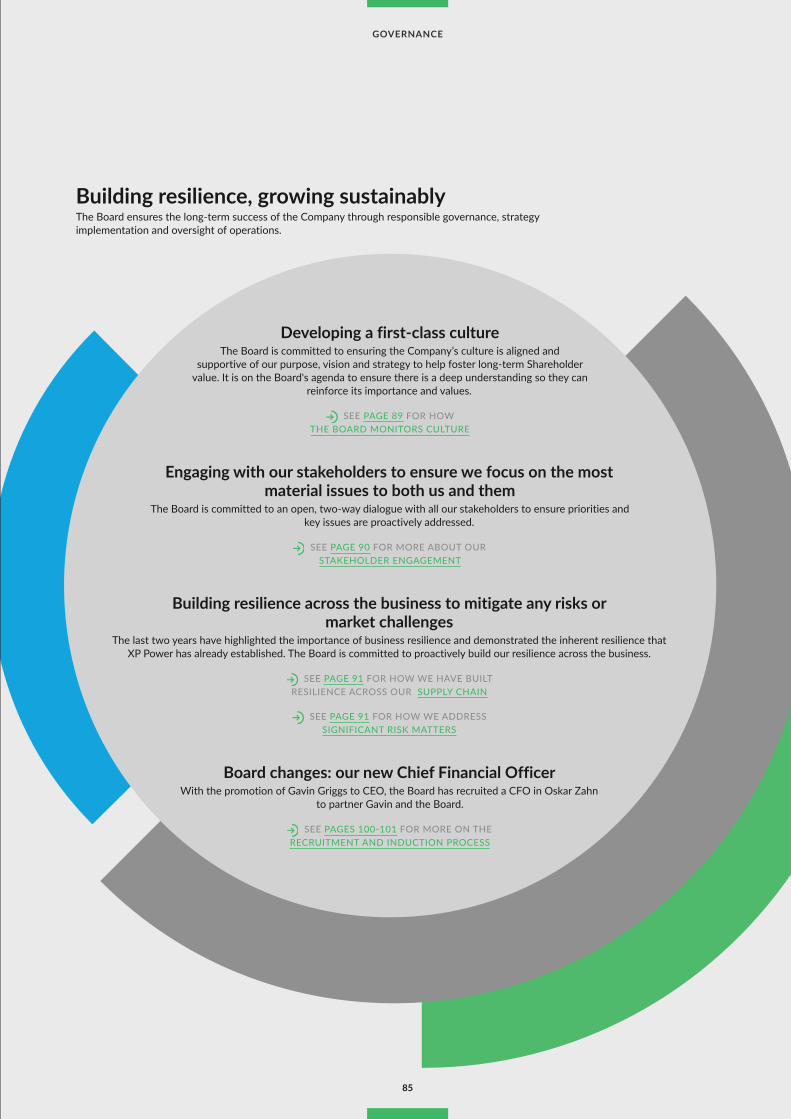
30801 8 March 2022 10:08 am V9
Building resilience, growing sustainablyThe Board ensures the long-term success of the Company through responsible governance, strategy implementation and oversight of operations.
Developing a first-class cultureThe Board is committed to ensuring the Company’s culture is aligned and
supportive of our purpose, vision and strategy to help foster long-term Shareholder value. It is on the Board's agenda to ensure there is a deep understanding so they can
reinforce its importance and values.
SEE PAGE 89 FOR HOW THE BOARD MONITORS CULTURE
Engaging with our stakeholders to ensure we focus on the most material issues to both us and them
The Board is committed to an open, two-way dialogue with all our stakeholders to ensure priorities and key issues are proactively addressed.
SEE PAGE 90 FOR MORE ABOUT OUR STAKEHOLDER ENGAGEMENT
Building resilience across the business to mitigate any risks or market challenges
The last two years have highlighted the importance of business resilience and demonstrated the inherent resilience that XP Power has already established. The Board is committed to proactively build our resilience across the business.
SEE PAGE 91 FOR HOW WE HAVE BUILT RESILIENCE ACROSS OUR SUPPLY CHAIN
SEE PAGE 91 FOR HOW WE ADDRESS SIGNIFICANT RISK MATTERS
Board changes: our new Chief Financial OfficerWith the promotion of Gavin Griggs to CEO, the Board has recruited a CFO in Oskar Zahn
to partner Gavin and the Board.
SEE PAGES 100-101 FOR MORE ON THE RECRUITMENT AND INDUCTION PROCESS
85
GOVERNANCE
30801-XP-Power AR21 Governance.indd 8530801-XP-Power AR21 Governance.indd 85 08/03/2022 10:55:1008/03/2022 10:55:10
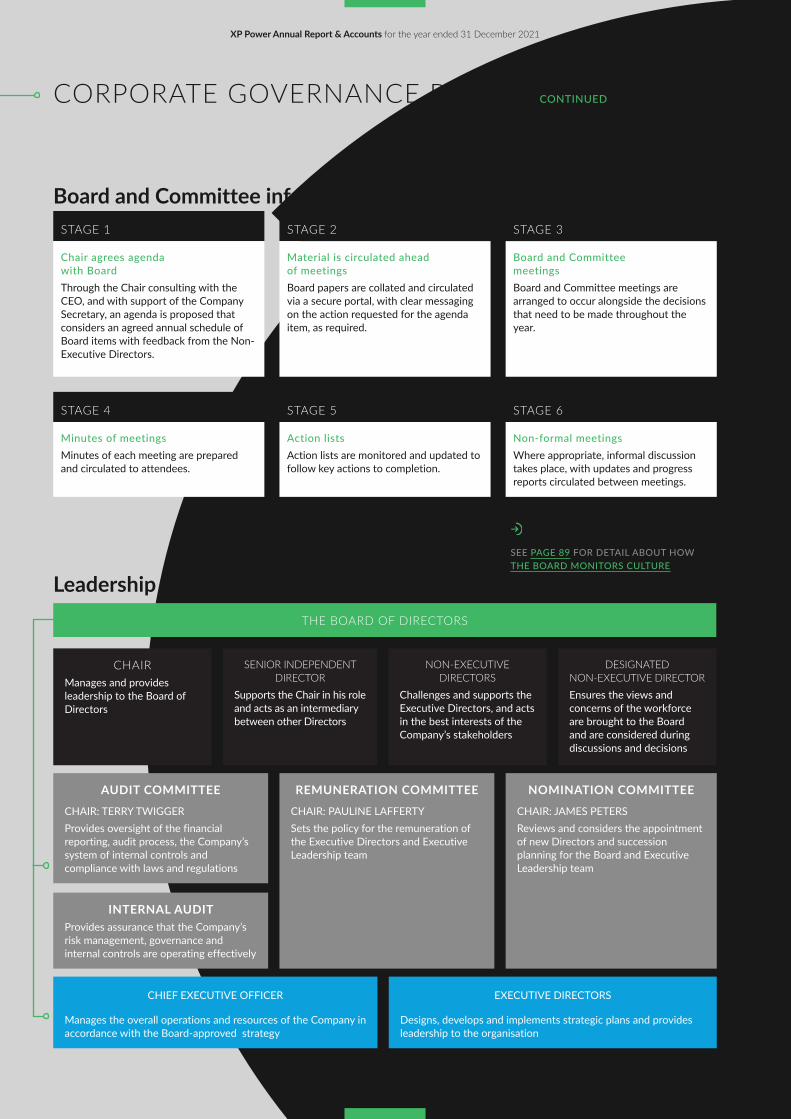
30801 8 March 2022 10:08 am V9
Board and Committee information flowSTAGE 1 STAGE 2 STAGE 3
Chair agrees agenda with BoardThrough the Chair consulting with the CEO, and with support of the Company Secretary, an agenda is proposed that considers an agreed annual schedule of Board items with feedback from the Non-Executive Directors.
Material is circulated ahead of meetingsBoard papers are collated and circulated via a secure portal, with clear messaging on the action requested for the agenda item, as required.
Board and Committee meetingsBoard and Committee meetings are arranged to occur alongside the decisions that need to be made throughout the year.
STAGE 4 STAGE 5 STAGE 6
Minutes of meetingsMinutes of each meeting are prepared and circulated to attendees.
Action listsAction lists are monitored and updated to follow key actions to completion.
Non-formal meetingsWhere appropriate, informal discussion takes place, with updates and progress reports circulated between meetings.
SEE PAGE 89 FOR DETAIL ABOUT HOW THE BOARD MONITORS CULTURE
Leadership structureTHE BOARD OF DIRECTORS
CHAIRManages and provides leadership to the Board of Directors
SENIOR INDEPENDENT DIRECTOR
Supports the Chair in his role and acts as an intermediary between other Directors
NON-EXECUTIVE DIRECTORS
Challenges and supports the Executive Directors, and acts in the best interests of the Company’s stakeholders
DESIGNATED NON-EXECUTIVE DIRECTOREnsures the views and concerns of the workforce are brought to the Board and are considered during discussions and decisions
AUDIT COMMITTEE
CHAIR: TERRY TWIGGERProvides oversight of the financial reporting, audit process, the Company’s system of internal controls and compliance with laws and regulations
REMUNERATION COMMITTEE
CHAIR: PAULINE LAFFERTYSets the policy for the remuneration of the Executive Directors and Executive Leadership team
NOMINATION COMMITTEE
CHAIR: JAMES PETERSReviews and considers the appointment of new Directors and succession planning for the Board and Executive Leadership team
INTERNAL AUDITProvides assurance that the Company’s risk management, governance and internal controls are operating effectively
CHIEF EXECUTIVE OFFICER
Manages the overall operations and resources of the Company in accordance with the Board-approved strategy
EXECUTIVE DIRECTORS
Designs, develops and implements strategic plans and provides leadership to the organisation
86
XP Power Annual Report & Accounts for the year ended 31 December 2021
CORPORATE GOVERNANCE REPORT CONTINUED
30801-XP-Power AR21 Governance.indd 8630801-XP-Power AR21 Governance.indd 86 08/03/2022 10:55:1008/03/2022 10:55:10

30801 8 March 2022 10:08 am V9
Board meetings and attendanceThe Board met five times, excluding committee meetings, during 2021, and all Directors attended every meeting. In addition, there were several meetings with management outside of the formal Board meetings to review risk management, product lifecycle management, people plans and Corporate Governance updates.
A description of some of the main areas and activities covered by the board during the year is set out on the following page.
Member(s) Meetings AttendanceJames Peters 5/5Gavin Griggs 5/5Oskar Zahn+ 4/4Andy Sng 5/5Duncan Penny* 1/1Terry Twigger 5/5Pauline Lafferty 5/5Polly Williams 5/5+ appointed to the Board on 20 May 2021.
* stood down from the Board on 20 April 2021.
87
GOVERNANCE
30801-XP-Power AR21 Governance.indd 8730801-XP-Power AR21 Governance.indd 87 08/03/2022 10:55:1108/03/2022 10:55:11
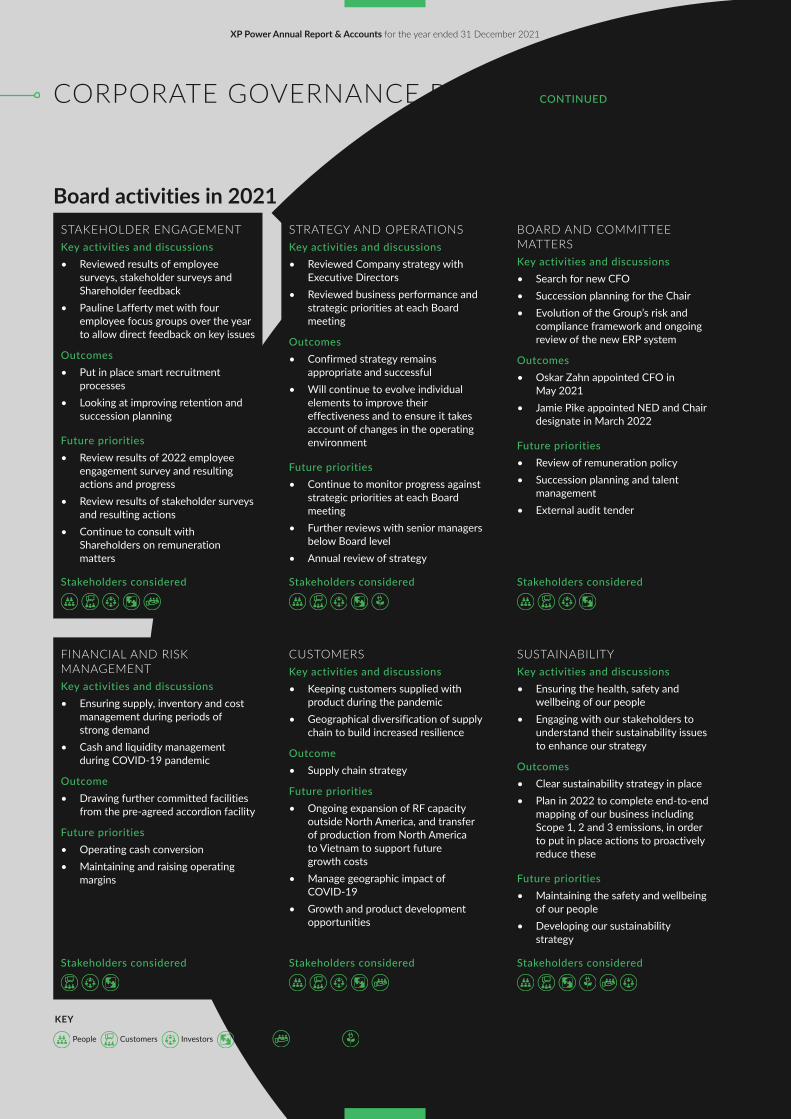
30801 8 March 2022 10:08 am V9
Board activities in 2021STAKEHOLDER ENGAGEMENTKey activities and discussions• Reviewed results of employee
surveys, stakeholder surveys and Shareholder feedback
• Pauline Lafferty met with four employee focus groups over the year to allow direct feedback on key issues
Outcomes• Put in place smart recruitment
processes• Looking at improving retention and
succession planning
Future priorities• Review results of 2022 employee
engagement survey and resulting actions and progress
• Review results of stakeholder surveys and resulting actions
• Continue to consult with Shareholders on remuneration matters
STRATEGY AND OPERATIONSKey activities and discussions• Reviewed Company strategy with
Executive Directors• Reviewed business performance and
strategic priorities at each Board meeting
Outcomes• Confirmed strategy remains
appropriate and successful• Will continue to evolve individual
elements to improve their effectiveness and to ensure it takes account of changes in the operating environment
Future priorities• Continue to monitor progress against
strategic priorities at each Board meeting
• Further reviews with senior managers below Board level
• Annual review of strategy
BOARD AND COMMITTEE MATTERSKey activities and discussions• Search for new CFO• Succession planning for the Chair• Evolution of the Group’s risk and
compliance framework and ongoing review of the new ERP system
Outcomes• Oskar Zahn appointed CFO in
May 2021• Jamie Pike appointed NED and Chair
designate in March 2022
Future priorities• Review of remuneration policy• Succession planning and talent
management• External audit tender
Stakeholders considered Stakeholders considered Stakeholders considered
FINANCIAL AND RISK MANAGEMENTKey activities and discussions• Ensuring supply, inventory and cost
management during periods of strong demand
• Cash and liquidity management during COVID-19 pandemic
Outcome• Drawing further committed facilities
from the pre-agreed accordion facility
Future priorities• Operating cash conversion• Maintaining and raising operating
margins
CUSTOMERSKey activities and discussions• Keeping customers supplied with
product during the pandemic• Geographical diversification of supply
chain to build increased resilience
Outcome• Supply chain strategy
Future priorities• Ongoing expansion of RF capacity
outside North America, and transfer of production from North America to Vietnam to support future growth costs
• Manage geographic impact of COVID-19
• Growth and product development opportunities
SUSTAINABILITYKey activities and discussions• Ensuring the health, safety and
wellbeing of our people• Engaging with our stakeholders to
understand their sustainability issues to enhance our strategy
Outcomes• Clear sustainability strategy in place• Plan in 2022 to complete end-to-end
mapping of our business including Scope 1, 2 and 3 emissions, in order to put in place actions to proactively reduce these
Future priorities• Maintaining the safety and wellbeing
of our people• Developing our sustainability
strategy
Stakeholders considered Stakeholders considered Stakeholders considered
People Customers Investors Suppliers Communities The Environment
KEY
88
XP Power Annual Report & Accounts for the year ended 31 December 2021
CORPORATE GOVERNANCE REPORT CONTINUED
30801-XP-Power AR21 Governance.indd 8830801-XP-Power AR21 Governance.indd 88 08/03/2022 10:55:1208/03/2022 10:55:12

30801 8 March 2022 10:08 am V9
Health and SafetyThe Board is committed to providing a safe working environment for all employees, contractors and partners across the Group. The CEO receives and reviews health and safety reports from across the Group and where health and safety matters need to be brought to the Board's attention, these are included as part of the CEO's monthly report. The Board also receives a more structured in-depth health and safety report bi-annually. The duties of the local health and safety committees which report into the CEO include, reviewing the health and safety policy; compliance with applicable legislation; monitoring health and safety statistics, including incident rates and near misses and health and safety audit findings.
Developing a first-class cultureThe Board is responsible for the culture of the Company. Its role is to influence and monitor culture to ensure we are emulating desired beliefs and behaviours in and outside the boardroom, and identifying areas where culture is embedded strongly and where there are gaps. The Board has been on a journey to help influence the right culture throughout the Company, as set out below:
ACTION DESCRIPTION
Reviewed results and updates from employee engagement surveys
The Board has continued to review the results of cultural and engagement surveys during 2021. Despite the ongoing challenges of COVID-19, trends in employee satisfaction were monitored to understand how the Company’s core values have been embraced.
Engagement survey Gallup engagement surveys, which were introduced in December 2020, have continued to higher employee engagement in 2021 and will continue to be used to assess the views of our employees in the future.
Code of Conduct training Our Code of Conduct was refreshed and rolled out to all employees including reinforcing our core values of: Integrity, Knowledge, Speed, Flexibility and Customer Focus.
Senior leadership workshops The Executive Leadership team engaged with all organisation leaders through three workshops, which covered strategy and priorities. Leaders communicated these materials and the outcome from these sessions to their teams.
Sustainability impact assessment
During Q4 of 2020, we engaged with our employees to understand what sustainability impacts are most important to them. This has been factored into our sustainability strategy, the progress of which the Board have reviewed in 2021 and will sign off in 2022.
How we ensure culture is aligned to our purpose, values and strategy, and how we address any potential misalignment:
The Board reviews all employee surveys, receives updates and presentations from leadership and seeks to have direct engagement with a broad range of employees. While this has not been possible due to the travel restrictions, Pauline Lafferty, the Non-Executive Director responsible for employee engagement, has held a number of virtual forums, without Executive management present, to get direct feedback.
89
GOVERNANCE
30801-XP-Power AR21 Governance.indd 8930801-XP-Power AR21 Governance.indd 89 08/03/2022 10:55:1208/03/2022 10:55:12

30801 8 March 2022 10:08 am V9
How we ensured employees voices were heard on the Board in 2021During the year, I held four virtual engagement sessions with a diverse group of
employees from across all of the Company’s key locations, representing a number of different roles. Each meeting was centred around a theme and facilitated to encourage
open debate and the view of the workforce. The environment created in these sessions also provided a forum for employees to ask questions on any other topic, including wider pay policy and
executive remuneration.
The output and observations from these sessions were discussed by the Board. The Board agreed that these engagement sessions will continue throughout 2022.
How we uphold culture across our workforce and encourage engagement We have several processes to ensure the views of employees are solicited and the Company’s culture is monitored.
All employees complete the Gallup Q12 survey at least annually. This is benchmarked against a broad range of other companies to ensure our culture and engagement are supportive of our strategy and growth ambitions.
Engaging with our stakeholders: our people and our Shareholders
PAULINE LAFFERTYDESIGNATED NON-EXECUTIVE DIRECTOR FOR WORKFORCE ENGAGEMENT
THE BOARD
SPECIFIC ANONYMOUS EMPLOYEE SURVEYS
LIVE COMMUNICATION MEETINGS
CONFIDENTIAL, INDEPENDENT WHISTLEBLOWING HOTLINE
Workforce engagement process
AUDIT COMMITTEE
ENGAGEMENT WITH THE WORKFORCE – Designated Non-Executive Director, Pauline Lafferty
XP has so many great people, and the work is really interesting. This is genuinely the best company I think I have ever worked for.”Attendee of virtual engagement session October 2021
4.2/5EMPLOYEE
ENGAGEMENT SCORE LAST YEAR (2020:3.9)
90
XP Power Annual Report & Accounts for the year ended 31 December 2021
CORPORATE GOVERNANCE REPORT CONTINUED
30801-XP-Power AR21 Governance.indd 9030801-XP-Power AR21 Governance.indd 90 08/03/2022 10:55:1308/03/2022 10:55:13

30801 8 March 2022 10:08 am V9
Our Board in action: responding to COVID-19 How we mitigated supply chain issues XP Power has disaster recovery plans in place and has completed risk assessments across the business. For the Asian production facilities, we were able to flex production as lockdowns or constraints impacted China and Vietnam. We also had a plan to “seal” the Vietnam site, with employees living on site for a period of the lockdown, which enabled production to continue.
We hold a level of safety stock of critical or at-risk components and finished products as a matter of course. The levels are actively managed and, when the component shortages were mooted in H2 2020, we increased the level. This helped mitigate immediate challenges but, as the shortages became wider, it became increasingly challenging.
We proactively manage our global logistics, seeking to manage air freight and sea freight to balance cost and environmental impact against lead time and customer
on-time delivery requirements. We secured space on key global routes to ensure delivery to customers.
We have learnt a great deal during the pandemic and supply chain challenges, and have ensured these learnings are reflected in our operating plans.
How we looked after our peopleOur people’s health, safety and wellbeing is of paramount importance, and this has been reiterated throughout the last two years. We follow all government guidelines locally and seek to ensure best practices are shared and adopted across the business. We ensured all staff had appropriate PPE and working environments to maintain safe working practices, and employees – where their roles allowed – were fully supported to work from home. We maintained regular, proactive engagement to encourage good physical and mental health practices. Everyone was given an additional day's leave to focus on their mental health.
Fair balanced and understandableThe Board considers that the Annual Report, taken as a whole, is fair, balanced and understandable. It provides the information necessary for Shareholders to assess the Group’s position, performance, business model and strategy. To get to this position, the Board relies on the Audit Committee who recommends the Annual Report and Accounts to the Board.
The February 2022 Audit Committee meeting confirmed that the 2021 Annual Report and Accounts were true and fair, that the work of the external Auditor was effective, and that the process supporting the viability statement was robust. The Board asked the Executive Directors to provide evidence around the content and process for preparing the 2021 Annual Report and Accounts at our February 2022 Board meeting.
Risk management and internal controlThe Board has responsibility for the Company’s overall approach to risk management. It has in place an ongoing process for identifying, evaluating and managing the emerging and principal risks faced by the Group, which is set out in the Managing Our Risks section on pages 42 - 49. The risk management framework and processes have been in place throughout the year, with the framework ensuring that risk management is embedded in the day-to-day operations of the business.
One of our key control procedures is the day-to-day supervision of the business, performed by the Executive Directors, who are supported by managers within the Group companies. Examples of key controls with respect to ongoing processes include:
• Authority matrices are in place to clearly define who can authorise particular transactions, transfer funds, commit Company resources and enter into particular agreements.
• Monthly reporting of management accounts and key metrics to senior management, with performance measured to budget and material variances reported to the Board.
• Quality control checks throughout our manufacturing process, burn-in, electrical testing to detect early failures, 100% functional testing, and quality inspection.
• Disaster recovery and business continuity plans are in place at all our key facilities, documented and communicated to key personnel to help cope with unexpected events.
• An internal audit and risk assurance programme is in operation.
Details of the internal controls of the Company and how the Board and the Audit Committee assess the operational effectiveness of internal controls and risk management systems, during the year and up to the date of approval of the Annual Report and Accounts, are set out as part of the Audit Committee Report on page 108.
91
GOVERNANCE
30801-XP-Power AR21 Governance.indd 9130801-XP-Power AR21 Governance.indd 91 08/03/2022 10:55:1308/03/2022 10:55:13

30801 8 March 2022 10:08 am V9
Shareholder communicationThe Company enables effective engagement with, and encourages participation from, Shareholders and stakeholders in a number of ways. For institutional and private investors, the Group engages in two-way communication, responding quickly to all queries received. The Group uses its website xppowerplc.com to give private investors access to the same information that institutional investors receive, in terms of investor presentations. This includes video interviews with the CEO and CFO available in the morning of the interim and annual results that are scheduled to be published. The Company also makes available informational videos on its investor relations website, which cover products, markets, strategy, business model, growth drivers and its investment proposition.
Interested parties are also able to register for the Group’s email alert service on this website to receive timely announcements and other information published from time to time.
The Chair and Senior Independent Director are available to meet Shareholders if required. Board members receive feedback prepared by brokers or our financial PR company following meetings with Shareholders to keep in touch with their opinions.
The Remuneration Committee consults with major Shareholders regarding significant decisions on Executive remuneration, including in relation to Remuneration policy, which was last approved by Shareholders at the April 2020 AGM.
Constructive use of the Annual General MeetingCertain Directors are available at the AGM to answer any questions from Shareholders.
However, given that we have a Singaporean Parent Company, we recognise it is not generally convenient for our UK-based investors to attend this meeting. The CEO and CFO do, however, make themselves readily available throughout the year to answer questions from Shareholders.
Substantial ShareholdersWe have safeguards in place to monitor transactions between major Shareholders of the Company, including reviewing our major Shareholders’ holdings on a quarterly basis and monitoring any regulatory notifications of the acquisition or disposal of major Shareholders.
Other than the Directors’ interests, as at 31 December 2021, the Company had been notified, pursuant to DTR5, of the following interests in voting rights, attached to ordinary shares and financial instruments relating to the share capital of the Company:
Number of shares
% of voting rights
Abrdn plc 2,548,303 12.98BlackRock Inc 1,379,883 7.02Kempen Capital Mgt 962,117 5.00Mawer Investment Mgt 967,699 4.93The Capital Group Companies, Inc 861,669 4.47Montanaro Investment Managers 760,100 3.95
As at 25 February 2022, no further changes to the shareholdings reported above had been notified to the Company in accordance with DTR5.
92
XP Power Annual Report & Accounts for the year ended 31 December 2021
CORPORATE GOVERNANCE REPORT CONTINUED
30801-XP-Power AR21 Governance.indd 9230801-XP-Power AR21 Governance.indd 92 08/03/2022 10:55:1608/03/2022 10:55:16

30801 8 March 2022 10:08 am V9
Division of responsibilitiesThe Chair leads the Board and is responsible for its overall effectiveness in directing the Company.
The Chair should demonstrate objective judgement throughout their tenure and promote a culture of openness and debate. In addition, the Chair facilitates constructive Board relations and the effective contribution of all Non-Executive Directors, and ensures that Directors receive accurate, timely and clear information.
The roles of Chair (James Peters) and CEO (Gavin Griggs) are separate and clearly defined. The Chair is responsible for the running of Board meetings. The CEO is responsible for the day-to-day running of the Company and the execution of the strategy.
To ensure the Board is effective, we review and monitor the skillset of Directors. We also ensure there is a clear division of responsibilities, as set out below. These principles are demonstrated through the following skills matrix.
RESPONSIBILITIES OF THE BOARD
Chair The Chair sets the calendar and agenda of the Board and facilitates the discussions. The Chair also initiates and coordinates the processes defined below, which evaluate the effectiveness of the Board and of the individual Directors.
How our Chair promotes a culture of opennessThe Chair conducts Board meetings in a manner that the views of all Board members are sought and welcomed. Open discussion is encouraged. An evaluation of Board effectiveness is conducted each year. A full evaluation by an independent party is planned for 2022.
Executive Directors
Other than their normal attendance and participation in discussions at Board meetings, the Executive Directors are responsible for the day-to-day running of the Company and the implementation of the agreed strategy.
Senior Independent Director
The Senior Independent Director supports the Chair in their role. The SID leads the Non-Executive Directors in the annual evaluation of the Chair and is also available to Shareholders if they have concerns that contact through the Chair, CEO or CFO has failed to resolve.
Terry Twigger is the Senior Independent Director.
Non-Executive Directors
Other than their normal attendance and participation in discussions at Board meetings, the Non-Executive Directors actively participate in the review and determination of the Company’s strategy.
Designated Non-Executive Director
The designated Non-Executive Director is responsible for engaging with the workforce and ensuring that their views and interests are considered in Board discussions and decision making.
Pauline Lafferty is the designated Non-Executive Director for employee engagement.
Polly Williams is the designated Non-Executive Director for ESG matters.
93
GOVERNANCE
30801-XP-Power AR21 Governance.indd 9330801-XP-Power AR21 Governance.indd 93 08/03/2022 10:55:1608/03/2022 10:55:16
30801 8 March 2022 10:08 am V9
Matters reserved for the BoardThese matters are specifically reserved for the Board’s decision:
• Opinion on the Group’s viability and going concern.
• Approval of strategic plans, financial plans and budgets, and any material changes to them.
• Oversight of the Group’s operations, ensuring competent and prudent management, sound planning, an adequate system of internal control and adequate accounting and other records.
• Changes to the structure, size and composition of the Board.
• Consideration of the independence of Non-Executive Directors.
• Review of management structure and senior management responsibilities.
• With the assistance of the Remuneration Committee, approval of remuneration policies across the Group.
• Final approval of annual financial statements and accounting policies.
• Approval of the dividend policy.
• Approval of the acquisition or disposal of subsidiaries and major investments and capital projects.
• Delegation of the Board’s powers and authorities, including the division of responsibilities between the Chair, CEO and the other Executive Directors.
Conflicts of interest and time commitmentIt is important that Non-Executive Directors have sufficient time to meet their Board responsibilities. The Non-Executive Directors provided constructive challenge, strategic guidance, specialist advice and held management to account during 2021.
While it is recognised that the Chair has significant shareholdings, none of the Board has any conflict of interest with those of the Company.
No Directors had any significant changes to their outside commitments during 2021, and each devoted significant time to their XP Power Board responsibilities during the year.
All Directors attended all Board meetings.
94
XP Power Annual Report & Accounts for the year ended 31 December 2021
CORPORATE GOVERNANCE REPORT CONTINUED
30801-XP-Power AR21 Governance.indd 9430801-XP-Power AR21 Governance.indd 94 08/03/2022 10:55:1808/03/2022 10:55:18

30801 8 March 2022 10:08 am V9
Following the Chair’s evaluation of each Director, the Board is satisfied that all Directors remain committed to the Company and have devoted the appropriate amount of time and effort to their role.
Change in Directors’ responsibilities On 1 January 2021, Gavin Griggs, formerly CFO, took over the role of CEO from Duncan Penny, who subsequently stood down from the Board at the 2021 AGM.
The Company completed its executive search for a CFO with Oskar Zahn being appointed as CFO on 4 May 2021 and to the Board on 20 May 2021.
There were no changes to the composition of the Board’s committees during the year.
Board independenceThe Board consists of four Non-Executives, including the Chair and three Executives. Of the Non-Executives, three (75%) are considered independent. There is clear division of responsibilities between the Executive and Non-Executive Directors.
The Chair, James Peters, is not considered independent, based on provision 10 of the Code. However, the Board’s view is that his material shareholding in the Company aligns his interests closely with Shareholders as a whole and that this, combined with his knowledge of the business and industry, and the fact that there are clear divisions of responsibilities between the Chair and CEO, means that this is advantageous to Shareholders and does not present a problem.
James Peters holds 1,004,279 shares in the Company, representing 5.11% of the issued share capital. No other Non-Executive Directors have a shareholding in the Company.
Anti-takeover measures As a policy, we do not have any devices that would limit the ability to perform a takeover of XP Power. This includes devices that would limit share ownership and/or issue new capital for the purpose of limiting or stopping a takeover.
VotingOur capital structure is such that one vote is afforded per common share.
95
GOVERNANCE
30801-XP-Power AR21 Governance.indd 9530801-XP-Power AR21 Governance.indd 95 08/03/2022 10:55:1908/03/2022 10:55:19

30801 8 March 2022 10:08 am V9
Dear Shareholder, I am pleased to present the Nomination Committee Report for 2021. The year began with the search for a new CFO to replace Gavin Griggs, who was appointed to the role of CEO from 1 January 2021. Following a rigorous executive search process, in April 2021, we were delighted to announce the appointment of Oskar Zahn as CFO, who joined the Company from 4 May 2021 and was appointed to the Board on 20 May 2021.
The Committee has worked with management to ensure Oskar’s induction programme was delivered, albeit with adaptions because of COVID-19-related travel restrictions.
During the year, the Committee also focused on governance, including reviewing the Board diversity and inclusion policy and in December 2021, we completed a review of the effectiveness of the Nomination Committee; no material issues were noted from this.
Board succession is an ongoing discussion to ensure we proactively manage and look forward. I have informed the Committee of my intention to retire from the role of Chair and from the Board in 2023.
After a thorough process led by the Senior Independent Director, Terry Twigger, working with executive search consultancy firm, Russell Reynolds, and involving all members of the Board, we appointed Jamie Pike as Non-Executive Director and designate Chair from 1 March 2022. It is planned that they will take the Chair role following the AGM scheduled for April 2023.
Our primary focus for 2022 will be to provide a thorough induction for Jamie Pike to ensure a planned, smooth transition into 2023.
We will also continue to review the strength and depth of the talent within our Board and business to ensure we have the relevant capabilities onboard to support the continued growth of the business.
JAMES PETERSCHAIR
1 March 2022
Committee membership
James Peters Chair
Terry Twigger
Pauline Lafferty
Polly Williams
The Board has the right skills and experience to direct the Company in the successful execution of its strategy.”
JAMES PETERSNOMINATION COMMITTEE CHAIR
96
XP Power Annual Report & Accounts for the year ended 31 December 2021
NOMINATION COMMITTEE REPORT
30801-XP-Power AR21 Governance.indd 9630801-XP-Power AR21 Governance.indd 96 08/03/2022 10:55:2208/03/2022 10:55:22
30801 8 March 2022 10:08 am V9
GovernanceGiven the importance of Board and other senior management appointments, all Non-Executive Directors are members of our Nomination Committee. The CEO will also attend meetings on request to present to the Nomination Committee or to be consulted where appropriate.
The Nomination Committee consists of James Peters (Chair), Terry Twigger, Pauline Lafferty and Polly Williams. The Committee reviews and considers the appointment of new Directors, and all Non-Executive Directors are involved in the appointment of proposed candidates.
Any appointment of a new Director is voted on by the whole Board.
The Nomination Committee met formally twice during the year. The attendees were as follows:
Members AttendanceJames Peters (Committee Chair) 2/2Terry Twigger 2/2Pauline Lafferty 2/2Polly Williams 2/2
Responsibilities The Committee’s main responsibilities are to:
• regularly review the structure, size and composition of the Board including skills, knowledge and capabilities;
• review succession planning for Directors and other senior executives, considering the skills and expertise needed on the Board in the future;
• be responsible for identifying and nominating candidates to fill Board vacancies when they arise, to be approved by the Board; and
• review the leadership needs of the organisation, both Executive and Non-Executive, to ensure the continued ability of the organisation to effectively compete in the marketplace.
The Nomination Committee’s terms of reference are available on the Company’s website at xppowerplc.com.
97
GOVERNANCE
30801-XP-Power AR21 Governance.indd 9730801-XP-Power AR21 Governance.indd 97 08/03/2022 10:55:2408/03/2022 10:55:24

30801 8 March 2022 10:08 am V9
Composition, succession and evaluationBoard successionWe were pleased to appoint an experienced candidate as our new CFO. Oskar Zahn became CFO on 4 May 2021 and was appointed to the Board on 20 May 2021. He succeeds Gavin Griggs, who was appointed to the role of CEO, taking over from Duncan Penny who stepped down as CEO on 31 December 2020 and stood down from the Board in April 2021 at the Annual General Meeting. We appointed Oskar Zahn after a rigorous executive search process, which is detailed later in this report. This process occupied a significant amount of time for the Nomination Committee in 2021. Having appointed Oskar Zahn as CFO, the Committee assessed succession in the Board regarding the role of the Chair: a process that commenced in August 2021.
The Committee has reviewed succession plans for senior management positions throughout 2021.
Committee evaluation As with our other Board committees, we performed an anonymous online evaluation survey using an external consultant to gain feedback regarding the effectiveness of the Nomination Committee. There were no significant issues identified in the survey and the results were very positive and indicated that the Committee was operating effectively.
Board diversityThe Committee considers that diversity and inclusion on the Board and throughout the Company is not only the right thing to do; it is crucial in helping grow our business, innovate, attract and retain talent, and engage the customers who buy our power solutions.
We operate globally and recognise the cultural differences that may exist in the countries where we do business. We recognise that a truly diverse workforce reflects our markets and will help us succeed in them. We will not tolerate any form of discrimination.
We are committed to equal opportunities in all our employment practices, procedures and policies. When we hire or promote someone, we choose the best candidate irrespective of age, race, national origin, disability, religion, gender, gender reassignment, sexual preference, marital status or membership/non-membership of any trade unions. We apply the same standards when selecting business partners and appointments to the Board.
Our Board Diversity policy reflects our commitment to use open advertising or work with external executive search firms that have signed up to the Voluntary Code of Conduct for Executive Search Firms, to ensure that balanced shortlists are reached. The Company supports the Hamilton-Alexander and Parker reviews, and will continue to work towards the target of a minimum of 33% female representation, and maintaining at least one ethnically diverse Board member.
Our Board and Company Diversity and Inclusion policies are available on our website at xppower.com.
Diversity is monitored and analysed on a Group-wide scale and presented within the Sustainability section of the Strategic report on page 67. As at 31 December 2021, the Board comprised seven Directors, including two women (29% of the Board). The spread of nationalities is six British and one Singaporean. The gender balance of our most senior management, together with our Company Secretary at year-end was three women and five men, so 38% were female.
Board skills and experience When searching and selecting Board Directors, we have ensured that we have a strong balance of the necessary skills, experience and specific capabilities required based on our markets and chosen strategy and business model. skills and experience of each Director is set out in their biography on pages 82 to 83, and a matrix summarising the skills of our Board is set out on page 99. This includes specific industry skills, as well as non-specific industry skills, such as strategic human resource management, business development and managing growth.
98
XP Power Annual Report & Accounts for the year ended 31 December 2021
NOMINATION COMMITTEE REPORT CONTINUED
30801-XP-Power AR21 Governance.indd 9830801-XP-Power AR21 Governance.indd 98 08/03/2022 10:55:2408/03/2022 10:55:24

30801 8 March 2022 10:08 am V9
Board compositionWe continue to review the size, structure and composition of the Board to ensure it continues to be effective in executing our strategy and to deliver sustainable profitable growth over the cycle of the markets where we operate. We consider that the Board has an appropriate structure and balance of skills and diversity as demonstrated below.
BOARD GENDER PROFILE BOARD AGE PROFILE
2
55
1
1
Male Female 45-50 51-55 55+
BOARD TENURE ETHNICITY
3 1
1
2
1
6
<1 year 1-3 years
4-6 years 7+ years
White Asian
Board skills matrixNumber of Directors
Power electronics experience
Risk management
Electronics and electrical industry experience
Strategic human resource management
Business development and managing growth
Prior public company experience
Investor relations
99
GOVERNANCE
30801-XP-Power AR21 Governance.indd 9930801-XP-Power AR21 Governance.indd 99 08/03/2022 10:55:2408/03/2022 10:55:24
30801 8 March 2022 10:08 am V9
Appointments to the Board and Director re-electionEach relevant Director offers themselves for re-election each year. A majority of votes cast at the Annual General Meeting is required for the re-election of each Director. The appointment to the Board of Oskar Zahn as CFO was made in 2021 and the appointment of Jamie Pike as Non-Executive Director and designate Chair was made on 1 March 2022, both of whom will offer themselves for election at the forthcoming AGM.
Appointing our new Chief Financial OfficerOVERVIEW OF CANDIDATE SPECIFICATION AND SEARCH CRITERIAA detailed candidate specification was developed with executive search firm Russell Reynolds, who encompassed the desired experience and expertise, leadership capabilities, cultural fit and impact. The initial long list of candidates was selected from a diverse range of potential candidates from various industries, which ensured our diversity policy was considered from the outset of the search. Russell Reynolds has no other connection with the Company.
Developing a candidate profileCandidate profile developed in collaboration with executive search firm Russell Reynolds. Search strategy agreed and long list of candidates compiled.
2021
January
February - March
April
Interviews and assessmentsShortlist of ten candidates compiled and interviewed by the CEO and Chief People Officer. Shortlist reduced to four candidates who met with the CEO again who proposed a shortlist of one candidate who undertook a psychometric assessment from the Executive Search firm then met all the Non-Executive Directors and the Chair.
Final decisionAfter interview of final candidates, the Nomination Committee met to agree approach, resulting in the appointment of Oskar Zahn.
100
XP Power Annual Report & Accounts for the year ended 31 December 2021
NOMINATION COMMITTEE REPORT CONTINUED
30801-XP-Power AR21 Governance.indd 10030801-XP-Power AR21 Governance.indd 100 08/03/2022 10:55:2608/03/2022 10:55:26

30801 8 March 2022 10:08 am V9
Board induction and trainingDirectors receive a full induction on joining the Board. The induction programme is tailored to the individual needs of each Director and includes meeting the Executive Leadership team and training on products and markets. For Oskar Zahn, joining at a time with restricted travel meant that site visits were replaced with video tours to give a better understanding of the different work locations.
An example of a Board induction process is outlined in the below infographic.
Board training in 2021As the pandemic has meant site visits and face-to-face meetings were discouraged in 2021, the Board held video meetings with members of the Executive Leadership Team present, received presentations from functional heads throughout the year. Talks by outside parties on developments on governance, developments in accounting standards and market updates on remuneration also formed part of the Board's continuing development. We expect to reinstate site visits as travel restrictions ease.
STAGE 1
This will include an overview of the structure, history, strategy, Board procedures, listing requirements and governance
STAGE 2
Meeting members of the Executive Leadership team
Meeting external brokers and advisers as required
STAGE 3
Visiting sites virtually, access to videos, photographs and site plans, to understand the operations of the business and specific functional areas
STAGE 4
Understanding what knowledge would be beneficial to enable the Board to function more effectively
STAGE 5
Determining how best to train or impart the knowledge required
STAGE 6
Implementation by way of training or specific virtual site visits with presentations from the functional areas
Board induction process
101
GOVERNANCE
30801-XP-Power AR21 Governance.indd 10130801-XP-Power AR21 Governance.indd 101 08/03/2022 10:55:2608/03/2022 10:55:26

30801 8 March 2022 10:08 am V9
Board evaluationThe Corporate Governance Code discusses the need to evaluate the Board. This evaluation should cover the Board’s composition and diversity, and how effectively members work together to achieve objectives.
The Board’s evaluation of its own performance and that of its committees is conducted annually using anonymous online Board effectiveness questionnaires conducted by a third party. The questionnaire covers all aspects of effectiveness: capabilities and communication; culture and practice; process and organisation; meeting rigour and relationships. To continually improve the Board effectiveness, the questionnaire also asked Directors to comment on what it should stop doing, start doing and continue doing.
The Chair and Non-Executive Directors regularly meet without the Executive Directors present, to ensure that there is an opportunity to discuss potentially sensitive matters. At least annually, the Senior Independent Director meets with the Non-Executive Directors, excluding the Chair, to evaluate the Chair’s performance.
BOARD EVALUATION FINDINGS IN 2021There were no significant issues or concerns identified in the 2021 Board effectiveness questionnaires. The need to reconnect in person through recommencing site visits to global locations, dependent on travel restrictions, with the opportunity to engage with all employees when on site were raised as areas to improve board effectiveness.
2020 Board evaluation progress
2020 BOARD EVALUATION FINDING 1More presentations to the Board from functional leaders.
Actions taken this yearPresentations from the executive leaders were made during the year on a number of topics, including strategic and digital marketing, global engineering and Asia growth strategy.
2020 BOARD EVALUATION FINDING 2Further development regarding succession planning and talent management.
Actions taken this yearThe Board has focussed on succession planning for the role of Chair.
The CEO and Chief People Officer also presented talent management plans to the Board.
BOARD EVALUATION PROCESS
STAGE 1
Questions set were reviewed and agreed by the Chair, Company Secretary, and the Committee Chairs.
STAGE 2
Directors complete an anonymous online questionnaire. This includes questions such as whether the Directors operate with independent judgement.
STAGE 3
The results of the questionnaire are collated by an external consultant, who reviews the results and produces a report for the Board.
STAGE 4
The results of the evaluation report are discussed by the Board and actions for improvement are determined.
102
XP Power Annual Report & Accounts for the year ended 31 December 2021
NOMINATION COMMITTEE REPORT CONTINUED
30801-XP-Power AR21 Governance.indd 10230801-XP-Power AR21 Governance.indd 102 08/03/2022 10:55:2808/03/2022 10:55:28

30801 8 March 2022 10:08 am V9
103
GOVERNANCE
30801-XP-Power AR21 Governance.indd 10330801-XP-Power AR21 Governance.indd 103 08/03/2022 10:55:3108/03/2022 10:55:31

30801 8 March 2022 10:08 am V9
Dear ShareholderAs Chair of the XP Power Audit Committee, I
am pleased to present the 2021 Audit Committee Report to Shareholders. I trust that this report will provide you with an insight into our work, the matters handled and the focus of the Audit Committee’s deliberations during 2021.
The primary role of the Committee is to assist the Board in fulfilling its oversight responsibilities, in areas such as the integrity of financial reporting, the effectiveness of the risk management framework and system of internal controls as well as consideration of ethics and compliance matters.
As detailed elsewhere in the Annual Report, 2021 was dominated by the ongoing impact of the COVID-19 pandemic, which caused supply chain constraints. The Committee continued to operate with travel restrictions throughout 2021 but is satisfied that it has been able to maintain oversight of the Group’s internal controls, risk management framework and financial reporting. The Committee continues to scrutinise the Group’s internal control framework, maintaining a focus on the internal audit agenda and ensuring that this continues despite the challenges brought by the pandemic.
The report aims to provide the following information:
• The Audit Committee’s principal responsibilities and its governance.
• The key activities that were reviewed by the Audit Committee, including regular annual review items and other current areas of focus.
• The discussions and actions undertaken in conjunction with the external Auditor and internal Auditors on any significant judgements and/or issues.
• Details of the ongoing review of the external Auditor and the amount of non-audit work undertaken.
I believe that the Audit Committee has the necessary experience, expertise and financial understanding, supported by the internal and external Auditors, to fulfil its responsibilities and to continue to monitor and contribute to the various improvement initiatives.
The Audit Committee is satisfied that the Company has maintained adequate risk management and internal controls throughout the year, and that the internal audit programme has been planned and sufficiently resourced to confirm this.
In last year’s report, I anticipated that the external audit would be retendered in 2022. The ongoing challenges brought by the pandemic have resulted in delays to the completion of the Group’s ERP system upgrade, and limitations around travel, making it difficult to plan an appropriate retender process. As a result, we have decided to wait for a period of stability prior to commencing the retender.
The Audit Committee has recommended to the Board that the reappointment of PricewaterhouseCoopers LLP (PwC) should be proposed at the forthcoming Annual General Meeting, and I hope you will support me in this resolution.
TERRY TWIGGERAUDIT COMMITTEE CHAIR
1 March 2022
Committee membership
Terry Twigger Chair
Pauline Lafferty
Polly Williams
The primary role of the Committee is to assist the Board in fulfilling its oversight responsibilities, in areas such as the integrity of financial reporting, the effectiveness of the risk management framework and system of internal controls as well as consideration of ethics and compliance matters.”
TERRY TWIGGERAUDIT COMMITTEE CHAIR
104
XP Power Annual Report & Accounts for the year ended 31 December 2021
AUDIT COMMITTEE REPORT
30801-XP-Power AR21 Governance.indd 10430801-XP-Power AR21 Governance.indd 104 08/03/2022 10:55:3308/03/2022 10:55:33

30801 8 March 2022 10:08 am V9
GovernanceThe current Audit Committee members are all independent Non-Executive Directors and have financial and/or related business experience gained in senior positions in other diverse organisations. Terry Twigger has been the Audit Committee Chair since 2015 and the Board is satisfied that Terry has recent and relevant financial experience.
The Audit Committee met four times during 2021, with attendance as follows:
Members AttendanceTerry Twigger (Committee Chair) 4/4Pauline Lafferty 4/4Polly Williams 4/4
Committee evaluationDuring the year, the Audit Committee reviewed its performance facilitated by an anonymous online survey managed by an independent third party as part of the Board’s updated evaluation process.
The Committee considered it has adequate qualifications and skills to perform its responsibilities, particularly through Terry Twigger’s financial and management background and Polly Williams’ financial and audit experience. Following feedback from last year, the Committee has formalised its approach to the performance reviews of the internal and external Auditor.
The Committee concluded the performance was effective in 2021 and that it fulfilled its role in accordance with its terms of reference.
ResponsibilitiesThe Committee is responsible for:
• Ensuring the financial performance of the Group is properly reported and monitored;
• Advising the Board on whether it believes the Annual Report and Accounts, taken as a whole, is fair, balanced and understandable;
• Compliance with legal requirements;• Adoption and correct implementation of
accounting standards;• Meeting the requirements of the FCA’s UK Listing
regime;• Assessing the Group’s internal control processes
and assurance framework;• Reviewing any instances of fraud or
whistleblowing;• Supervising the relationship and performance of
the external and internal Auditors; and• Reviewing the nature and extent of audit and
non-audit services provided to the Group by the external Auditor.
The Audit Committee’s Terms of Reference are available in the Corporate Governance section of the Company’s investor relations website xppowerplc.com.
105
GOVERNANCE
30801-XP-Power AR21 Governance.indd 10530801-XP-Power AR21 Governance.indd 105 08/03/2022 10:55:3308/03/2022 10:55:33

30801 8 March 2022 10:08 am V9
ActivitiesThe Audit Committee carried out its functions in accordance with Section 201B(5) of the Singapore Companies Act 1967. In 2021, the Audit Committee’s activities included:
• Examining the 31 December 2021 Annual Report and discussing it with management and the external Auditor to assess whether the reports, taken as a whole, were fair, balanced, and understandable prior to recommending these to the Board for approval.
• Reviewing the balance sheet of the Company and the consolidated financial statements of the Group for the financial year ended 31 December 2021 before their submission to the Board of Directors, as well as the Independent Auditor’s report on the same.
• Receiving reports from management and the external Auditor on the key accounting issues and areas of significant judgement, reviewing and challenging these areas and the level of disclosure, including an assessment of the ongoing impact of COVID-19 on the Group’s results and reviewing the disclosure of a contingent liability. The principal matters discussed are described in “Significant risks and judgements in the financial reporting” below.
• Reviewing the assistance given by the Company’s management to the independent Auditor.
• Challenging the assumptions and analysis produced by management regarding the Group’s going concern basis of preparation, the long-term viability statement and associated risk assumptions, the accounting policies and disclosures, the financial reporting issues and assumptions and adjustments made, including those related to goodwill and capitalised product development.
• Reviewing dividend flows across group entities, including the remediation for the payment of dividends prior to the filing of accounts for the subsidiary.
• Reviewing and approving the use of Alternative Performance measures in the Annual Report.
• Approving the going concern and viability statements, including the ongoing impact of COVID-19.
• Reviewing the 30 June 2021 Half-Year Report. • Evolving the Group’s risk and compliance
framework by directing the outsourced internal Auditor, Deloitte LLP, and reviewing the work scopes of the target areas.
• Reviewing the internal audit plan. • Reviewing the findings of the internal audit work
and the follow-up of previous year’s reviews.• Ongoing review of the development and
implementation of the Company’s new ERP system.
• Managing and reviewing the external audit plan, including receiving updates on delivery of the plan.
• Reviewing reports from the external Auditor on the Group’s financial reporting and their observations on the internal financial control environment.
• Reviewing the effectiveness of the Group’s internal controls and disclosures made in the Annual Report and Financial Statements, considering the continuing impact of COVID-19.
• Assessing the accounting principles to be adopted in the preparation of the 2021 accounts.
• Reviewing any material issues of fraud, whistleblowing and litigation.
The Audit Committee is satisfied that the Company has maintained adequate risk management and internal controls throughout the year.
106
XP Power Annual Report & Accounts for the year ended 31 December 2021
AUDIT COMMITTEE REPORT CONTINUED
30801-XP-Power AR21 Governance.indd 10630801-XP-Power AR21 Governance.indd 106 08/03/2022 10:55:3408/03/2022 10:55:34

30801 8 March 2022 10:08 am V9
Consideration of significant financial reporting mattersIn relation to the 31 December 2021 Financial Statements, in this report on pages 137-178, the Audit Committee considered the following topics. These areas are considered significant, due to the level of materiality and degree of judgement exercised by management. The Audit Committee questioned the judgements and estimates made on each significant matter detailed below and resolved that they were appropriate and acceptable.
SIGNIFICANT MATTERS FOR THE YEAR ENDED 31 DECEMBER 2021
HOW THE AUDIT COMMITTEE ADDRESSED THESE MATTERS CONCLUSION
VALUATION OF GOODWILL
The carrying value of goodwill is a material item on the Group balance sheet and may require impairment if expected future benefit of cash-generating units reduces.
Impairment assessments are performed at least annually by management to generate discounted cash flows for each cash-generating unit (CGU) and provide comfort over the balance sheet value.The Committee challenges the appropriateness of judgements and forecasts used in management’s impairment assessment, including the calculation of discount rates and forecast growth rates.Sensitivity analysis of cost inflation assumptions and the ongoing appropriateness of CGUs were also specifically reviewed in the context of the wider economic challenges and the structure of the Group.
Impairment calculations indicated that there remains significant headroom between the value in use and the carrying value. The Committee was satisfied that there was no indication of impairment.
CAPITALISED PRODUCT DEVELOPMENT
As part of the Group’s product development process, direct costs associated with new products are capitalised and amortised over their expected useful life. The carrying value of these costs is rising in line with increased product development as the business has grown, and requires judgement over future success and useful lives of these products.
The Committee assesses a regular review of revenue streams for capitalised products that have been released for sale, which is performed and presented by management.This enables challenge of performance of new products compared to expectations, and the impact of significant projects to overall carrying value.
The Committee was satisfied with the judgements used and carrying value of capitalised product development.
INVENTORY Inventory levels increased during the year as the Group responded to increased demand and delays in the global supply chain.The risk of obsolescence and ongoing control over existence and completeness of inventory balances is a key focus for balance sheet accuracy.
Physical inventory across all sites was validated through a combination of ongoing cycle counts, wall-to-wall stock counts and, where appropriate, sample counts held at year-end.The Committee reviewed the accuracy of ongoing cycle counts and challenged targets set by management. Inventory counts were reviewed by management and the external Auditor, and the results reported to the Committee.
The Committee was satisfied that the counts were conducted appropriately.
VIABILITY STATEMENT AND GOING CONCERN
Management prepares a going concern assessment and viability statement with consideration of longer-term forecast cash flows that consider principal risks including climate-related considerations.
The Committee reviewed the period over which viability should be assessed, and reaffirmed that three years remains appropriate. They also considered how the Group’s principal risks should be reflected in the modelling of sensitivity analysis for liquidity and solvency. It reviewed the results of management’s scenario modelling and the reverse stress-testing of these models, along with consideration of the Group’s financing facilities, covenant tests and future funding plans.
Based on this review, the Committee confirmed that the application of the going concern basis for the preparation of the financial statements continued to be appropriate and recommended the approval of the viability statement, which can be found on page 49.
SPECIFIC ONE-OFF ITEMS AND ADJUSTED MEASURES
Adjusted measures are not reported as part of the financial statements but are used in the Annual Report and Accounts to clarify underlying performance for users of the accounts by excluding specific one-off items.
The classification of specific items is reviewed by the Committee and only includes items of significant income and expense, which, due to their size, nature or frequency, merit separate presentation to allow Shareholders to better understand the elements of financial performance. The Committee reviewed items to be included throughout the year to confirm appropriateness.
The Committee was satisfied that the classification of specific items was appropriate.
107
GOVERNANCE
30801-XP-Power AR21 Governance.indd 10730801-XP-Power AR21 Governance.indd 107 08/03/2022 10:55:3408/03/2022 10:55:34

30801 8 March 2022 10:08 am V9
Fair, balanced and understandable The Committee considered the Annual Report and Half-Year Report, on behalf of the Board, to be fair, balanced and understandable, in accordance with requirements of the UK Corporate Governance Code. In particular, the Committee considered the continuing impact of COVID-19 on the Group and the reporting of these impacts throughout the Report.
To assist in this process, the Committee considered comments raised by the external Auditors. The Committee also considered the Group’s use of alternative performance measures, including the appropriateness of their current use and their disclosure in the Financial Statements and Strategic Report. The Committee concluded that their current use was fair, balanced and understandable.
The FRC undertook a thematic review for the year ending 31 December 2020, which resulted in no questions or queries they wished to raise at the time.
Internal controlThe Board is ultimately responsible for the Group’s system of internal controls and the ongoing assessment of these; further details are included in our Risk Management Framework on page 42.
In 2021, the Committee, on behalf of the Board and with the assistance of the internal audit function, monitored, reviewed and assessed the effectiveness of the Group’s internal control systems and principal financial risks. The Committee reviewed, at each meeting, the outcome of the audits of key financial controls included in the internal audit programme. Management also provided the Committee with an update of key accounting issues and financial controls at each meeting.
Internal auditThe internal audit function, performed by Deloitte LLP, provides independent and objective assurance of the effectiveness of the Group’s risk management, control and governance processes. The Committee reviewed the scope and nature of the internal audit work performed by Deloitte LLP in early 2021, and reviewed updates to the plan at subsequent meetings, including changes due to the ongoing impact of COVID-19. These reviews also ensure that the internal audit framework remains appropriate in combination with the Board’s risk monitoring process, which used it to identify areas for risk assurance work and internal audits to be carried out.
In 2021, this included a review of ethics and compliance procedures, HR processes in Europe, key financial controls in North America, and key controls over supply chain management in Europe. The Group has continued with the Controls Self-Assessments programme, completed for all sites and this was reviewed by the internal audit team. The internal auditor’s recommendations are assessed by management and addressed within an agreed timeline.
The recommendations and control observations from the reviews are rated and presented to the Committee for comment or further action.
The internal Auditor regularly follows up on these actions and keeps the Committee informed of progress against the agreed timeline.
External audit effectiveness and independenceThe Committee assesses audit effectiveness throughout the financial year. This includes reviewing the detailed audit plan and the key audit risks included in it, the amount and composition of resources on the audit and the use of specialists, where appropriate. Focus continued on PwC's ability to adapt their audit approach to the risks posed by COVID-19 and the need to conduct some audit procedures remotely. The Committee reviewed and agreed issues that arose during the audit and agreed the resolution of these with the external Auditor. During the last part of the year, PwC agreed to acquire consultants that were assisting the Company in its SAP implementation, resulting in the need for the Company to appoint different consultants, to avoid any conflict of independence.
The Committee also received feedback from management evaluating the performance of the external audit teams. Consideration was given to the quality of the audit, communication and interaction with the finance teams across the Group. Management concluded that the relationship with the external Auditor continued to be effective.
The Committee has concluded that the external Auditor and the audit process were effective and that audit teams had provided effective challenge. The Committee has reported to the Board that the reappointment of PwC should be proposed at the forthcoming Annual General Meeting.
108
XP Power Annual Report & Accounts for the year ended 31 December 2021
AUDIT COMMITTEE REPORT CONTINUED
30801-XP-Power AR21 Governance.indd 10830801-XP-Power AR21 Governance.indd 108 08/03/2022 10:55:3408/03/2022 10:55:34

30801 8 March 2022 10:08 am V9
The current external Auditor, PwC, was appointed in 2007. In line with best practice, the audit partner rotated off after five years in 2019 when the current audit partner took over the engagement.
Due to the continued pandemic-related impact on travel from the COVID-19 pandemic, and the resulting delayed implementation of the upgrade of the Group’s ERP system and restrictions of travel to Singapore from where the audit is based, the Committee concluded that it should wait for a period of stability before commencing a retender process. It is anticipated that this will be after 2022.
The Audit Committee reviews the role and independence of the external Auditor. A formal statement of independence is received each year, together with a report on the safeguards in place to maintain their independence, and the internal measures to ensure their objectivity. The Committee also discusses with the external Auditor areas where they have challenged management and how any disagreements have been resolved.
The Committee is satisfied that this independence has been maintained.
The Committee has formalised its policy and continues to operate an approved a set of procedures regarding the appointment of external Auditors to undertake audit and non-audit work. Under this policy:
• The award of audit-related services to the Auditor over £50,000 must be approved by the Chair of the Audit Committee, who, in their decision to approve, will consider the aggregate of audit-related revenue already earned by the Auditor in that year. Audit-related services include formalities relating to borrowing, Shareholder and other circulars, regulatory reports, work relating to disposals and acquisitions, tax assurance work and advice on accounting policies.
• The award of tax consulting services to the Auditor over £50,000, subject to compliance with the EU member state restrictions, must first be approved by the Chair of the Audit Committee; and
• The award of other non-audit-related services to the Auditor over £20,000 must first be approved by the Chair of the Audit Committee.
During the year, non-audit fees of £0.02 million (2020: £0.02 million) were paid to the Auditor for review of the 30 June 2021 interim financial statements.
109
GOVERNANCE
30801-XP-Power AR21 Governance.indd 10930801-XP-Power AR21 Governance.indd 109 08/03/2022 10:55:3708/03/2022 10:55:37

30801 8 March 2022 10:08 am V9
Dear ShareholderThis report sets out details of the Directors’ remuneration in 2021 and how the Remuneration Committee anticipates operating the Directors’ Remuneration Policy in 2022. This has been my first full year as Chair of the Remuneration Committee, and it has coincided with some significant leadership changes. Gavin Griggs succeeded Duncan Penny as Chief Executive Officer at the start of the year, and Oskar Zahn joined as Chief Financial Officer from 4 May 2021 and was appointed to the board from 20 May 2021.
The context to the major decisions and activities made in the yearFollowing the global challenges we all faced in 2020, 2021 was another difficult year. The business continued to face COVID-19 impacts with ongoing cases and lockdowns across many countries – most notably for XP in Vietnam. The business and its people, again, demonstrated their resilience and dedication; the business continued supporting our people and customers, and kept operating throughout the year. The Group was also impacted by the well-documented electronic component shortages and global logistics challenges. Against this backdrop, XP Power has delivered another set of strong results in terms of order growth, profit and cash generation, while continuing to execute on its strategy to ensure it can deliver on its growth ambitions.
The Remuneration Committee met on five occasions during the year.
Members AttendancePauline Lafferty (Committee Chair) 5/5Terry Twigger 5/5Polly Williams 5/5
At the 2021 AGM, over 90% of Shareholders supported the Directors’ Remuneration Report, and the Remuneration Committee was grateful for the continued support. We do not take this for granted and we shall continue to engage with our investors on any major pay changes.
XP Power has delivered strong results above 2020, which included the beneficial impact of demand for products required in treating COVID-19 patients. 2021 has seen performance broadly in line with the targets we set under the annual bonus scheme. While the Total Shareholder Return element of the long-term incentive was achieved in full, as XP Power has delivered exceptional returns to Shareholders over the last three years, adjusted EPS performance fell short of the challenging targets set for the business. The Remuneration Committee considered these outturns to be appropriate and did not apply discretion to amend the formulaic outputs in the year.
No employees were furloughed during the year, XP Power did not benefit from any UK Government aid and no COVID-19-related redundancies were made. The business supported its employees through the ongoing pandemic by ensuring the working
Committee membership
Pauline Lafferty Chair
Terry Twigger
Polly Williams
The Board continues to be impressed with the resilience of the business across the globe in what has been another challenging year.”
PAULINE LAFFERTYREMUNERATION COMMITTEE CHAIR
110
XP Power Annual Report & Accounts for the year ended 31 December 2021
REMUNERATION COMMITTEE REPORT
30801-XP-Power AR21 Governance.indd 11030801-XP-Power AR21 Governance.indd 110 08/03/2022 10:55:3908/03/2022 10:55:39

30801 8 March 2022 10:08 am V9
environment was safe for everyone and supported those who could work from home. The Vietnamese Government locked down the country from July to October but, due to the commitment of the team, our manufacturing facility continued to produce the critical power conversion solutions that our customers require. 2021 was a challenging time for many of our customers and suppliers, and we worked closely with them to support them through the ongoing pandemic and component shortages that we experienced to maintain our supply chain.
The Company’s share price has continued to grow, increasing by 8.7% in the year to 31 December 2021 (representing growth in total Shareholder value of 159% over three years). Dividends were resumed in 2020 and continued to grow in 2021.
Key remuneration decisions for 2021 Annual bonusThe annual bonus for 2021 was based on adjusted profit before tax, adjusted operating cash conversion measured at each quarter-end and the attainment of strategic goals. The details of the financial measures and targets and the achievement against them is shown on pages 112 to 113.
Bonus payments for 2021, as a percentage of maximum, were 73.4%, 68.3% and 64.1% of maximum for Gavin Griggs, Oskar Zahn and Andy Sng, respectively. Oskar’s annual bonus was pro-rated for the period of the year he was employed by XP Power. Half the bonuses earned by the Executive Directors are deferred into shares for two years, and clawback provisions may be invoked up to three years after the date of vesting.
The vesting of the 2019 LTIP awardThe 2019 awards made under the LTIP will vest based on adjusted EPS growth (for 67% of the award) and relative Total Shareholder Return (for 33% of the award).
• The three-year compound annual growth rate of EPS was 0.7% compared with a target CAGR range was 6%–12%, resulting in zero vesting of the EPS portion of the awards.
• XP Power’s relative TSR performance was above the upper quintile, so this portion of the shares vested in full.
The overall percentage of vested shares was 33% of the total award. Half of the shares vest three years after the grant date and the remainder a year later.
The Committee has proactively tracked wage inflation by each market XP Power operates in as it has been clear that inflation levels has been increasing throughout 2021. This has been reflected in the salary increases proposed for April 2022 for all employees.
The pay implications of Board changes As previously announced, Duncan Penny stepped down as CEO with effect from 31 December 2020 and continued as an Executive Director of the Company until the Annual General Meeting in April 2021. Duncan was eligible to receive an annual bonus for 2021, pro-rated to the period of the year worked. His bonus was in line with the Group plan, based on adjusted profit before tax (50%), adjusted operating cash flow as a percentage of adjusted operating income (25%) and strategic objectives (25%), and 68.3% of the maximum opportunity was delivered. Duncan committed to retain shares, with an after-tax value of 200% of his final base salary for the first year of his leaving and 100% for the second year.
Gavin Griggs succeeded Duncan as CEO with the new salary on his promotion set at £500,000. As disclosed last year, the Committee agreed to review his salary again from 1 April 2022, considering the circumstances at the time and with the intention of moving Gavin closer to market levels for companies of a similar size and scope. The Remuneration Committee has undertaken this review and has agreed to move Gavin’s salary to £550,000, an increase of 10%. This level of increase reflects Gavin’s development in the role of CEO and his strong performance since appointment, while keeping remuneration modest relative to other listed companies of a similar market capitalisation.
Oskar Zahn was appointed Chief Financial Officer with effect from 4 May 2021 and to the Board with effect from 20 May 2021. His base salary was set at £400,000, approximately 24% above Gavin Griggs’ previous base salary in the role. As noted last year, Gavin’s salary had been below market levels for a company of this size and scope, and the Remuneration Committee believes the remuneration package for Oskar to be at the appropriate level.
Decisions effective from 2022As outlined above, Gavin Griggs’ base salary will increase by 10% to £550,000 with effect from 1 April 2022. Base salaries for Oskar Zahn and Andy Sng will each increase by 4%. This is in line with the increases made to most employees in the UK and Singapore.
The Committee intends to award performance shares with a face value of 100% of base salary and restricted shares with a face value of 12.5% of base salary to Gavin Griggs and Oskar Zahn. The awards to Andy Sng are 75% of salary and 15% of salary respectively.
The views of our Shareholders are important to us. I hope that you will support the Directors’ Remuneration Report. If you have any questions or comments, I can be reached at [email protected].
PAULINE LAFFERTYREMUNERATION COMMITTEE CHAIR 1 March 2022
111
GOVERNANCE
30801-XP-Power AR21 Governance.indd 11130801-XP-Power AR21 Governance.indd 111 08/03/2022 10:55:3908/03/2022 10:55:39

30801 8 March 2022 10:08 am V9
Context to major decisions and activities in the year• Absolute share price performance / relative TSR
against the FTSE 250• Profits/revenue performance• Operating cash conversion performance• Rising wage inflation
SEE PAGE 110 FOR MORE INFORMATION
Key remuneration decisions for 2021 and 2022• up to 73.4% of the maximum annual bonus
opportunity was paid for 2021.• 33% of shares vested under the 2019 LTIP.• Executive Directors’ base salaries will increase
between 4% and 10% from 1 April 2022.
SEE PAGE 111 FOR MORE INFORMATION
Total Remuneration receivable for Executive Directors (£'000)
GAVIN GRIGGS OSKAR ZAHN1 ANDY SNG
309
492
1,315
1837
459
267
182
21 15
61
546 404
103158
105 29
9
Base salary Benefits Pension Annual bonus Long-term incentives
1 Oskar Zahn was appointed CFO with effect from 4 May 2021 and to the Board with effect from 20 May 2021. Total remuneration for Oskar in 2021 reflects pay for the portion of the year in which he was an Executive Director.
112
XP Power Annual Report & Accounts for the year ended 31 December 2021
REMUNERATION AT A GLANCE
30801-XP-Power AR21 Governance.indd 11230801-XP-Power AR21 Governance.indd 112 08/03/2022 10:55:4208/03/2022 10:55:42

30801 8 March 2022 10:08 am V9
ACHIEVEMENT OF PERFORMANCE CONDITIONS UNDER THE 2021 ANNUAL BONUSADJUSTED OPERATING CASH CONVERSION (25%)
Threshold
100%
90%
110% 111%105%
110%
115%
100%
95%
90%
85%
80%On-target Maximum Actual
120%
125%
ADJUSTED PROFIT BEFORE TAX (50%)
Threshold
£44.7m£40.2m
£49.2m
£43.8m
£55.0m
£50.0m
£45.0m
£40.0m
£35.0m
£30.0mOn-target Maximum Actual
Andy Sng’s adjusted profit before tax targets are set with reference to divisional, rather than Group, performance. Performance against these targets resulted in 16.6% of maximum becoming payable for this element of his annual bonus.
SEE PAGE 115 FOR MORE INFORMATION
ACHIEVEMENT OF PERFORMANCE CONDITIONS UNDER THE 2019 LONG-TERM INCENTIVE AWARDSEPS COMPOUND ANNUAL GROWTH (67%)
Threshold
12%
6%
0.7%
15%
10%
5%
0%Maximum Actual
TSR (33%)
Threshold
Upperquartile
Median
95thpercentile
100%
90%
80%
70%
60%
50%
40%
30%
20%
10%
0%Maximum Actual
SEE PAGE 117 FOR MORE INFORMATION
113
GOVERNANCE
30801-XP-Power AR21 Governance.indd 11330801-XP-Power AR21 Governance.indd 113 08/03/2022 10:55:4308/03/2022 10:55:43

30801 8 March 2022 10:08 am V9
Annual report on remunerationSingle total figure of remunerationThe table below shows the total remuneration receivable for each Executive Director with respect to the financial year ended 31 December 2021 and December 2020, respectively.
£’000 Salary/fees Benefits4 PensionTotal fixed
payAnnual bonus5
Long-term incentives6,7
Total variable pay Total
Executive DirectorsGavin Griggs1 2021 492 18 37 547 459 309 768 1,315
2020 314 23 23 360 321 455 776 1,136Duncan Penny2 2021 137 2 11 150 93 341 434 584
2020 438 4 30 472 441 592 1,033 1,505Oskar Zahn3 2021 267 15 21 303 182 61 243 546
2020 – – – – – – – –Andy Sng 2021 158 29 9 196 105 103 208 404
2020 149 38 10 197 137 149 286 483Chair and Non-Executive DirectorsJames Peters 2021 60 3 – 63 – – – 63
2020 58 2 – 60 – – – 60Pauline Lafferty 2021 55 – – 55 – – – 55
2020 48 – – 48 – – – 48Polly Williams 2021 50 – – 50 – – – 50
2020 51 – – 51 – – – 51Terry Twigger 2021 60 – – 60 – – – 60
2020 56 – – 56 – – – 56
1 Gavin Griggs was appointed CEO with effect from 1 January 2021. Total remuneration for Gavin in 2020 reflects pay for his previous role of CFO.2 Duncan Penny stepped down as CEO with effect from 31 December 2020 and stood down as an Executive Director on 20 April 2021. Total remuneration for
Duncan in 2021 reflects pay for the portion of the year in which he was an Executive Director.3 Oskar Zahn was appointed CFO with effect from 4 May 2021 and to the Board with effect from 20 May 2021. Total remuneration for Oskar in 2021 reflects pay
for the portion of the year in which he was an Executive Director.4 Benefits include life insurance, private medical cover, housing allowance in China for Andy Sng, and car allowance.5 The value of the annual bonus represents performance over the relevant financial year: 50% of the pay out was deferred into shares. Further details of the
annual bonus, including performance measures, actual performance and bonus pay outs, can be found on page 115.6 The value of long-term incentives for 2021 represents (i) the performance-based awards granted on 16 March 2019 with performance measured over three
financial years to 31 December 2021, based on the three-month average share price to the year-end of £51.6148 and dividend equivalents payable to this date, (ii) for Gavin Griggs and Andy Sng, the value at grant of the Restricted Share awards granted on 3 March 2021 based on a grant price of £51.80, and (iii) for Oskar Zahn, the value at grant of the Restricted Share awards granted on 10 May 2021 based on a grant price of £49.85. The values shown for Gavin Griggs, Duncan Penny and Andy Sng include the impact of share price growth and dividend equivalent payments on the March 2019 LTIP equal to £142,000, £197,000 and £51,000, respectively. The value of the March 2019 LTIP will be updated in next year’s Directors’ Remuneration Report to reflect the updated share price and dividend equivalent payments. Further details of the LTIP, including performance measures, actual performance and vesting, can be found on page 117. Further details of the 2021 RSP can be found on pages 118-119.
7 The value of long-term incentives for 2020 represents (i) for Gavin Griggs, the performance-based awards granted on 1 November 2017 with performance measured over three financial years to 31 December 2020, (ii) for Duncan Penny and Andy Sng, the performance-based awards granted on 16 May 2018 with performance measured over three financial years to 31 December 2020, and (iii) the value at grant of the Restricted Share awards granted on 22 April 2020 based on a grant price of £30.90. The November 2017 LTIP vested 50% on 31 December 2020 and 50% on 31 December 2021 and the value of these awards reflects the share prices on vesting of £46.90 and £51.00, respectively and final dividend equivalent payments. The May 2018 LTIP vested 50% on 16 May 2021 and will vest 50% on 16 May 2022 and the value of these awards reflects the share price on vesting of £48.65 for 50% of the awards and the three-month average share price to the year-end of £51.6148 for the remaining 50% of the award, and dividend equivalents payable to this date.
114
XP Power Annual Report & Accounts for the year ended 31 December 2021
REMUNERATION COMMITTEE REPORT CONTINUED
30801-XP-Power AR21 Governance.indd 11430801-XP-Power AR21 Governance.indd 114 08/03/2022 10:55:4308/03/2022 10:55:43

30801 8 March 2022 10:08 am V9
Notes to the single total figure tableBASE SALARY IN THE YEAR ENDED 31 DECEMBER 2021Executive Directors’ base salaries are reviewed by the Remuneration Committee with effect from 1 April each year and when an individual changes position or responsibility. Changes in Executive Directors’ base salaries during the year are:
Base salary from 1 April 2020 Base salary from 1 April 2021 Percentage increaseGavin Griggs1 £323,000 £500,000 +54.8%Duncan Penny2 £450,000 £450,000 –Oskar Zahn3 – £400,000 –Andy Sng S$265,225 S$300,000 +13.1%
1 Gavin Griggs was appointed as CEO with effect from 1 January 2021. His base salary for 2020 reflects pay for his previous role of CFO.2 Duncan Penny stepped down as CEO with effect from 31 December 2020 and stood down as an Executive Director on 20 April 2021. Duncan was not eligible
for a salary increase with effect from 1 April 2021.3 Oskar Zahn was appointed as CFO with effect from 4 May 2021, with a base salary of £400,000.
CHAIR’S AND NON-EXECUTIVE DIRECTORS’ FEESFees for the Chair and the Non-Executive Directors were reviewed and, subject to Shareholder approval, in accordance with the Singapore Companies Act 1967, an additional fee for extra responsibility will be payable from 1 April 2022, no other fee increases are recommended. There has been no change in fees during the year.
Fee from 1 April 2021 Fee from 1 April 2022Chair’s fee £60,000 £60,000Base fee £50,000 £50,000Additional fee for chairing a Committee £5,000 £5,000Additional fee for acting as Senior Independent Director £5,000 £5,000Additional fee for extra responsibility* – £5,000* Extra responsibilities include acting as designated NED for workforce engagement or as board representative on an executive committee.
Due to the current Chair’s shareholding, James has agreed to take the same fee as the Senior Independent Director, which, from April 2021, was £60,000. This remains materially below the fees for the Chair of other UK-listed companies of a similar size.
PENSIONS IN THE YEAR ENDED 31 DECEMBER 2021Executive Directors’ pension contributions are aligned to those offered to all XP Power employees in their respective countries of employment. This is 8% of base salary for UK Executive Directors and 6% of base salary for Any Sng, who is based in Singapore.
ANNUAL BONUS IN THE YEAR ENDED 31 DECEMBER 2021The maximum annual bonus opportunity in 2021 was 125% of base salary for the CEO and 100% of base salary for other Executive Directors. This table summarises performance against the Group performance targets set by the Remuneration Committee for the year.
WeightingThreshold
(25%)On-target
(50%)Maximum
(100%) Actual % achievedAdjusted profit before tax1 50% £40.2m £44.7m £49.2m £43.8m 23.3%1
Adjusted operating cash conversion2 25% 90% 100% 110% 111% 25%Strategic objectives 25% See below 20%-25%Total Gavin Griggs 73.4%
Oskar Zahn 68.3%Andy Sng 64.1%
1 Andy Sng’s adjusted profit before tax targets are set with reference to divisional performance, and the targets are commercially sensitive. Performance against these targets resulted in 16.6% of maximum becoming payable for this element of his annual bonus.
2 Calculated as adjusted operating cash flow as a percentage of adjusted operating profit measured at the end of each quarter and the average performance taken. This is to ensure cash conversion is an ongoing focus throughout the year. The full-year adjusted operating cash conversion was 111%.
3 Duncan Penny's annual bonus was structured in line with the annual bonus plan for other Executive Directors, with 25% based on the assessment of his performance against the same strategic objectives set for Gavin Griggs, together with ensuring an orderly handover. He achieved 20% of the maximum 25% for strategic objectives and received a bonus pro-rated for the period worked.
115
GOVERNANCE
30801-XP-Power AR21 Governance.indd 11530801-XP-Power AR21 Governance.indd 115 08/03/2022 10:55:4308/03/2022 10:55:43

30801 8 March 2022 10:08 am V9
The table below summarises the strategic team objectives for the CEO and CFO in the year.
Gavin Griggs Oskar Zahn Performance assessment in 2021
To deliver XP Power’s strategic priorities in the right way • Strong performance against customer sampling and new business
won both were above targets. Group design wins targets exceeded in 2021
• CO2 emission savings of 128,000 tonnes from revenue from Green products which exceeded targets for 2021
• Relaunched Sustainability Council and enhanced Health and Safety processes
• Due Diligence and completion of FuG and Guth acquisitions
Leadership of the global ERP roll out for implementation • Project on track to go live in H1 2022 despite significant challenges
Review XP strategy to establish requirements to deliver long term. sustainable growth. Ensure the strategic priorities of the Group are effectively executed
• Completed as agreed• Good progress made on target metrics, routes to market and
supply chain• Due diligence complete and acquisitions announced 31
January 2022
Global Supply Chain management throughout 2021 to maximise supply to customers with stock levels optimised
• Extensive engagement with customers and suppliers to manage during the ongoing industrywide global supply chain challenges
• Review strategy for future requirements covering business case and design work and execution resulting in increased capacity and resilience and Asia 3 site
• Global sea freight at 59.3% vs 60% target
Assess and build a world-class finance function that adds value: ensuring cross functional collaboration; insightful reporting and improving speed and accuracy of forecasting; and optimising the management of inventory across the Group.
n/a • Recruited high potential talent into key roles• Established with relevant internal and external stakeholders
including Board, leadership team, investors and bankers• Ownership and delivery of 2022 plan• Ongoing inventory management
People, new organisational design and strengthening of senior leadership “bench”
n/a • Assessment of all senior leaders and training and development needs identified and addressed
= Exceeded = Met = Partially Met
On the basis of the Committee's holistic and systematic assessment of the CEO's performance against each of the objectives, the Committee decided he should receive the maximum payment for this element of bonus. His contribution has been excellent through the most difficult circumstances.
The CFO joined in May 2021 and quickly established as a key member of the Board and Leadership team. Of particular note was the leadership of the recent acquisitions through due diligence to completion. Overall, his contribution has been strong and it is proposed that he receives an on target payment for this element of his bonus, pro-rated for the period worked.
Andy Sng’s strategic performance objectives are set with reference to divisional performance and are more sensitive than the Group objectives. The Remuneration Committee acknowledge his leadership, particularly supporting the ongoing customer dialogue. His strategic objectives largely reflected the priorities set out above for Gavin Griggs and Oskar Zahn.
Duncan Penny was eligible to receive an annual bonus for 2021, pro-rated for the period worked. His annual bonus was structured in line with the other Executive Directors, with 25% linked to strategic objectives. 80% of the maximum opportunity was delivered on strategic performance objectives.
The Remuneration Committee carefully considered whether these outturns were appropriate and, reflecting on performance achieved in the year, the Committee did not apply its discretion to amend the formulaic outputs in the year. Half of the 2021 annual bonuses for Executive Directors (with the exception of Duncan Penny) are deferred in shares for two years.
116
XP Power Annual Report & Accounts for the year ended 31 December 2021
REMUNERATION COMMITTEE REPORT CONTINUED
30801-XP-Power AR21 Governance.indd 11630801-XP-Power AR21 Governance.indd 116 08/03/2022 10:55:4308/03/2022 10:55:43
30801 8 March 2022 10:08 am V9
LONG-TERM INCENTIVE AWARDS VESTED OR DUE TO VEST WITH RESPECT TO PERFORMANCE IN THE YEAR ENDED 31 DECEMBER 2021
2019 LTIP awards
The 2019 LTIP awards granted on 16 March 2019 were measured over three financial years from 1 January 2019, based two-thirds on compound annual EPS growth and one-third on TSR compared with companies in the FTSE 250 index excluding investment trusts. Awards were granted to Gavin Griggs, Duncan Penny and Andy Sng over shares worth 97%, 57% and 40% of salary, respectively. The table below summarises performance against the performance targets.
Weighting Threshold (25%) Maximum (100%) Actual % achievedEPS growth 67% 6% 12% 0% 0%TSR 33% Median Upper quintile Above upper quintile 100%Total 33%
Half of the shares under this award vested on 16 March 2022, and half will vest on 16 March 2023.
Date of grant
Type of award
Number of shares
awarded % vesting
Dividend equivalent payments per share¹
Number of shares vested
or due
Value of shares vested
or due to vest¹
Gavin Griggs 16 March 2019 Nominal-cost options 13,659 33.33% 2.20 4,553 £244,973Duncan Penny 16 March 2019 Nominal-cost options 19,024 33.33% 2.20 6,341 £341,176Andy Sng 16 March 2019 Nominal-cost options 4,878 33.33% 2.20 1,626 £87,487
1 The value of long-term incentives represents LTIP awards that vest with respect to performance periods ending during the year. As these awards were not due to vest until March 2022, the value of these has been estimated using the average share price in the last three months of 2021, being £51.6148, and an estimate of dividend equivalents.
SCHEME INTERESTS AWARDED IN THE YEAR ENDED 31 DECEMBER 2021The following awards were granted to Executive Directors in 2021:
Date of grant Plan Type of awardFace value of
award3Number of
shares awarded
End of performance
periodGavin Griggs 3 March 2021 LTIP 2017¹ Nominal-cost options £499,974 9,652 31/12/2023
3 March 2021 RSP 2020¹ Nominal-cost options £62,471 1,206 n/a4 March 2021 DBP 2017¹ Nil-cost options £160,684 3,102 n/a
Oskar Zahn 10 May 2021 LTIP 2017² Nominal-cost options £399,996 8,024 31/12/202310 May 2021 RSP 2020² Nominal-cost options £59,970 1,203 n/a
Andy Sng 3 March 2021 LTIP 2017¹ Nominal-cost options £99,974 1,930 31/12/20233 March 2021 RSP 2020¹ Nominal-cost options £14,970 289 n/a4 March 2021 DBP 2017¹ Nil-cost options £68,687 1,326 n/a
1 2021 awards were granted under the LTIP 2017, RSP 2020 and DBP 2017 to Gavin Griggs and Andy Sng based on the share price for 3 March 2021, being £51.80.2 2021 awards were granted under the LTIP 2017 and RSP 2020 to Oskar Zahn based on the share price for 10 May 2021, being £49.85.3 The face value of the award has been calculated using the share price of each award stated in Note 1 and 2.
LONG-TERM INCENTIVE MEASURES AND TARGETSThe performance targets for the 2020 and 2021 LTIP awards are summarised below.
2020 award (67% EPS and 33% TSR) 2021 award (67% EPS and 33% TSR)Earnings Per Share Operation Cumulative EPS over three financial years Cumulative EPS over three financial years
Threshold (25% vest) 523.4p 576.7pMaximum (100% vest) 586.0p 645.9p
Total Shareholder Return
Operation Relative TSR compared with that for the constituents of the FTSE 250 index (excluding
investment trusts)Median (50th percentile)
Upper quintile (80th percentile)
Relative TSR compared with that for the constituents of the FTSE 250 index
(excluding investment trusts)Median (50th percentile)
Upper quintile (80th percentile)Threshold (25% vest)Maximum (100% vest)
Awards of restricted shares that were granted to Executive Directors in 2021 are not subject to performance conditions on vesting.
117
GOVERNANCE
30801-XP-Power AR21 Governance.indd 11730801-XP-Power AR21 Governance.indd 117 08/03/2022 10:55:4308/03/2022 10:55:43

30801 8 March 2022 10:08 am V9
DIRECTORS’ SHAREHOLDING AND SHARE INTERESTS
A shareholding guideline applies to Executive Directors, which requires them to build and maintain a shareholding equal to 200% of base salary. The guideline will continue to apply in full for one-year post-cessation, with 50% of the guideline level (100% of base salary) applying for a second year. Deferred bonus shares, Restricted Shares, vested Share Options and LTIP shares that are still in their holding period will be counted against these requirements on a net of tax basis.
This table summarises the Directors’ beneficial interests (including that of their connected persons) in the Company’s shares:
Interest in share awardsBeneficially
owned shares at 31 December
20201
Beneficially owned shares
at 31 December 20212
Subject to performance
measures
Not subject to performance
measuresVested but
unexercised
Shareholding guideline
(% of salary)Shareholding
guideline met?Executive DirectorsGavin Griggs – – 20,105 10,639 12,684 200% NDuncan Penny 106,990 49,990 14,563 18,153 55,038 200% YOskar Zahn – – 8,024 1,203 – 200% NAndy Sng 24,000 24,000 5,166 6,873 2,744 200% YChair and Non-Executive DirectorsJames Peters 1,254,279 1,004,279 – – – n/a n/aTerry Twigger – – – – – n/a n/aPolly Williams – – – – – n/a n/aPauline Lafferty – – – – – n/a n/a
1 Oskar Zahn was appointed as CFO with effect from 4 May 2021 and joined the Board with effect from 20 May 2021. The beneficially owned shares shown for Oskar represent his shareholding at the date of appointment.
2 Duncan Penny stepped down as CEO with effect from 31 December 2021 and stood down as an Executive Director on 20 April 2021. The beneficially owned shares shown for Duncan represent his shareholding at the 20 April 2021. Duncan confirmed that he will retain shares equal to 200% of his final base salary for one year commencing on the date he stood down as an Executive Director and that he will retain shares equal to 100% of his final base salary for a second year.
The table below summarises the outstanding share awards for Gavin Griggs:
Date of grant Exercise priceInterest as at
31/12/20Granted in
the yearForfeited in
the yearExercised in
the yearInterest as at
31/12/21 Vesting date Expiry date2017 LTIP01/11/17 £0.01 8,000 – – – 8,000 31/12/20 31/12/2216/03/19 £0.01 13,659 – (9,106) – 4,553 16/03/22 16/03/2422/04/20 £0.01 10,453 – – – 10,453 22/04/25 22/04/2603/03/21 £0.01 – 9,652 – – 9,652 03/03/26 03/03/272020 RSP22/04/20 £0.01 1,307 – – – 1,307 22/04/25 22/04/2603/03/21 £0.01 – 1,206 – – 1,206 03/03/26 03/03/27Deferred Bonus02/03/18 – 515 – – – 515 31/12/19 –06/03/19 – 4,349 – – – 4,349 31/12/20 –04/03/20 – 471 – – – 471 28/02/22 –04/03/21 – – 3,102 – – 3,102 26/02/23 –
118
XP Power Annual Report & Accounts for the year ended 31 December 2021
REMUNERATION COMMITTEE REPORT CONTINUED
30801-XP-Power AR21 Governance.indd 11830801-XP-Power AR21 Governance.indd 118 08/03/2022 10:55:4308/03/2022 10:55:43
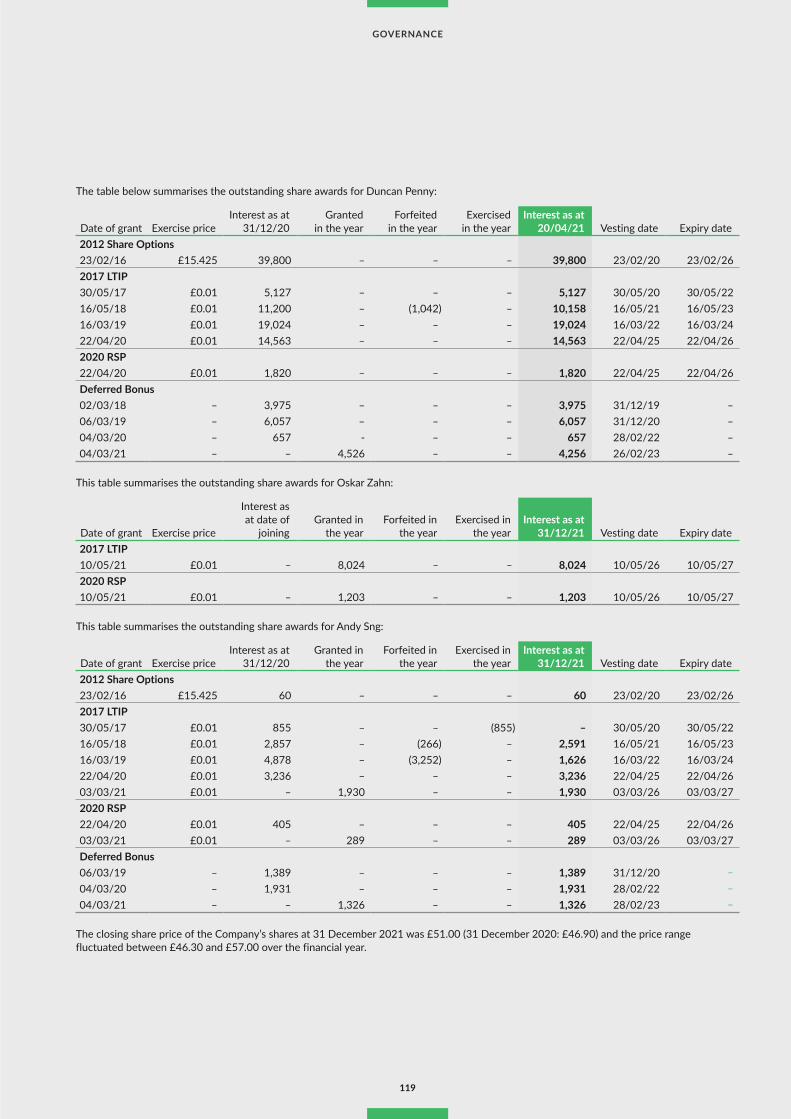
30801 8 March 2022 10:08 am V9
The table below summarises the outstanding share awards for Duncan Penny:
Date of grant Exercise priceInterest as at
31/12/20Granted
in the yearForfeited
in the yearExercised
in the yearInterest as at
20/04/21 Vesting date Expiry date2012 Share Options23/02/16 £15.425 39,800 – – – 39,800 23/02/20 23/02/262017 LTIP30/05/17 £0.01 5,127 – – – 5,127 30/05/20 30/05/2216/05/18 £0.01 11,200 – (1,042) – 10,158 16/05/21 16/05/2316/03/19 £0.01 19,024 – – – 19,024 16/03/22 16/03/2422/04/20 £0.01 14,563 – – – 14,563 22/04/25 22/04/262020 RSP22/04/20 £0.01 1,820 – – – 1,820 22/04/25 22/04/26Deferred Bonus02/03/18 – 3,975 – – – 3,975 31/12/19 –06/03/19 – 6,057 – – – 6,057 31/12/20 –04/03/20 – 657 - – – 657 28/02/22 –04/03/21 – – 4,526 – – 4,256 26/02/23 –
This table summarises the outstanding share awards for Oskar Zahn:
Date of grant Exercise price
Interest as at date of
joiningGranted in
the yearForfeited in
the yearExercised in
the yearInterest as at
31/12/21 Vesting date Expiry date2017 LTIP10/05/21 £0.01 – 8,024 – – 8,024 10/05/26 10/05/272020 RSP10/05/21 £0.01 – 1,203 – – 1,203 10/05/26 10/05/27
This table summarises the outstanding share awards for Andy Sng:
Date of grant Exercise priceInterest as at
31/12/20Granted in
the yearForfeited in
the yearExercised in
the yearInterest as at
31/12/21 Vesting date Expiry date2012 Share Options23/02/16 £15.425 60 – – – 60 23/02/20 23/02/262017 LTIP30/05/17 £0.01 855 – – (855) – 30/05/20 30/05/2216/05/18 £0.01 2,857 – (266) – 2,591 16/05/21 16/05/2316/03/19 £0.01 4,878 – (3,252) – 1,626 16/03/22 16/03/2422/04/20 £0.01 3,236 – – – 3,236 22/04/25 22/04/2603/03/21 £0.01 – 1,930 – – 1,930 03/03/26 03/03/272020 RSP22/04/20 £0.01 405 – – – 405 22/04/25 22/04/2603/03/21 £0.01 – 289 – – 289 03/03/26 03/03/27Deferred Bonus06/03/19 – 1,389 – – – 1,389 31/12/20 –04/03/20 – 1,931 – – – 1,931 28/02/22 –04/03/21 – – 1,326 – – 1,326 28/02/23 –
The closing share price of the Company’s shares at 31 December 2021 was £51.00 (31 December 2020: £46.90) and the price range fluctuated between £46.30 and £57.00 over the financial year.
119
GOVERNANCE
30801-XP-Power AR21 Governance.indd 11930801-XP-Power AR21 Governance.indd 119 08/03/2022 10:55:4408/03/2022 10:55:44

30801 8 March 2022 10:08 am V9
PAYMENTS TO PAST DIRECTORSNo payments were made to former directors in the year, other than to Duncan Penny as disclosed in the single total figure table on page 114. Duncan has continued to support the business as an employee. He received a total of £37,500 during the financial year in relation to this employment and not to services as a Director.
PAYMENTS FOR LOSS OF OFFICEDuncan Penny stepped down as CEO on 31 December 2020 and stood down from the Board with effect from 20 April 2021. Duncan received his base salary, benefits and pension as CEO until he stood down from the Board. As disclosed on page 116, Duncan received an annual bonus for 2021, pro-rated for the period he was an Executive Director.
All outstanding awards remain subject to performance conditions and vesting periods as they apply for as long as Duncan continues to be an employee.
ASSESSING PAY AND PERFORMANCEThis chart shows the Total Shareholder Return for XP Power since 31 December 2011 compared with that of the FTSE 250 (excluding investment trusts), rebased at 100.
Tota
l Sha
reho
lder
Ret
urn,
reba
sed
to 1
00
at 3
1 D
ecem
ber 2
011
700
800
600
500
400
300
200
100
0
31/1
2/20
11
31/1
2/20
12
31/1
2/20
13
31/1
2/20
14
31/1
2/20
15
31/1
2/20
16
31/1
2/20
17
31/1
2/20
18
31/1
2/20
19
31/1
2/20
20
31/1
2/20
21
Source: Refinitiv Datastream
XP PowerFTSE 250 (ex ITs)
This table shows total remuneration, annual bonus outturn and long-term incentive outturn for the CEO over the same period.
2012 2013 2014 2015 2016 2017 2018 2019 2020 2021¹
CEO total remuneration(£’000) £274 £271 £271 £310 £800 £531 £684 £562 £1,357 £1,315
Annual bonus(% of maximum) 0% 0% 0% 15% 27% 100% 71% 11% 98% 73%
Long-term incentives(% of maximum) n/a n/a n/a n/a 81% n/a n/a 80% 81% 33%
1 Duncan Penny stepped down as CEO with effect from 31 December 2020. Gavin Griggs was appointed CEO with effect from 1 January 2021.
CONTEXT FOR DIRECTORS’ REMUNERATIONWhile the Remuneration Committee has not engaged directly with employees on how Executive remuneration aligns with the wider pay policy, the Board has engaged with employees more widely through employee focus groups as outlined on page 90. The Remuneration Committee Chair acts as the designated Non-Executive Director for employee engagement and, to the extent employees wish to discuss executive pay, they are encouraged to ask questions on this and any other topics at these focus groups.
120
XP Power Annual Report & Accounts for the year ended 31 December 2021
REMUNERATION COMMITTEE REPORT CONTINUED
30801-XP-Power AR21 Governance.indd 12030801-XP-Power AR21 Governance.indd 120 08/03/2022 10:55:4408/03/2022 10:55:44

30801 8 March 2022 10:08 am V9
ANNUAL PERCENTAGE CHANGE IN REMUNERATION OF DIRECTORS AND EMPLOYEESThe table below shows the percentage change in salary, taxable benefits and annual bonus earned between 2019 and 2020 and between 2020 and 2021 in respect of each Director, compared to that of the average employee (excluding employees in China and Vietnam, where there has been significant salary inflation).
Percentage change between 2019 and 2020 Percentage change between 2020 and 2021
Base salaryTaxable
benefits Annual bonus Base salaryTaxable benefits Annual bonus
Average employee 4% 3% 670% 8% 139% (33%)Executive Directors Gavin Griggs1 10% (2%) 938% 57% (22%) 43%
Duncan Penny2 10% 3% 923% (69%) (50%) (79%)Oskar Zahn3 – – – – – –
Andy Sng 1% (9%) 6% 6% (24%) (23%)
Non-Executive Directors
James Peters 15% 1% – 3% 50% –Terry Twigger 25% – – 7% – –Polly Williams 27% – – (2%) – –
Pauline Lafferty 1338% – – 15% – –
1 Gavin Griggs was appointed CEO with effect from 1 January 2021. The percentage change between 2020 and 2021 compared his pay as CEO with his pay as CFO.2 Duncan Penny stepped down as CEO with effect from 31 December 2020 and stood down as an Executive Director on 20 April 2021.3 Oskar Zahn was appointed as CFO with effect from 4 May 2021, so no year-on-year comparison is possible.
CEO PAY RATIOThe table below shows the ratio of the CEO’s total remuneration to that of the lower quartile, median and upper quartile UK employee and for the CEO.
Year Method1 25th percentile pay ratio 50th percentile pay ratio 75th percentile pay ratio2021 Option A 40 : 1 25 : 1 15 : 1 2020 Option A 50 : 1 31 : 1 18 : 12019 Option A 21 : 1 13 : 1 7 : 1
1 Option A was selected because it is the best reflection of the underlying data. Because a large portion of the CEO’s pay is variable, the pay ratio is heavily dependent on the outcomes of variable pay plans and, in the case of long-term share-based awards, share price movements.
The year-on-year difference in the ratio of the CEO's pay to the pay of UK employees is principally explained by the variable pay outturns paid in 2020 which were higher than those paid in 2021. Annual bonus and long-term incentives make up a significant proportion of Executive remuneration while it is only a relatively low proportion of total pay for the wider workforce.
The table below shows the total pay and benefits, and the salary component for the employees who sit at each of the three quartiles in 2021.
Year Total pay and benefits Salary component of total pay25th percentile £32,801 £27,50950th percentile £53,138 £46,69075th percentile £87,833 £78,409Chief Executive £1,315,000 £492,000
The ratio of the CEO’s pay to the median pay of employees in the UK is a function of XP Power’s pay, reward and progression policies for the Company’s UK employees and indeed for all XP Power’s employees. The Company aims to pay all employees, including the CEO, in accordance with both its values, a desire to pay for performance, internal relativities and the appropriate external market reference points.
121
GOVERNANCE
30801-XP-Power AR21 Governance.indd 12130801-XP-Power AR21 Governance.indd 121 08/03/2022 10:55:4408/03/2022 10:55:44

30801 8 March 2022 10:08 am V9
RELATIVE IMPORTANCE OF SPEND ON PAYThis chart illustrates the relative importance of spend on pay compared to Shareholder dividends paid.
£7.3m
2020Distribution to
Shareholder dividends1Group employment
costs2
2021 2020 2021
£18.2m (+149%)
£70.3m
£75.2m (+7%)
£100m
£75m
£25m
£50m
£0
1 Refer to Financial Statements – Note 9 for more details.2 Group employment costs includes Directors’ remuneration. Refer to Financial Statements – Note 5 for more details.
ADVICE RECEIVED IN THE YEARDuring the year, FIT Remuneration Consultants LLP (“FIT”) provided advice to the Company with respect to the Executive Directors’ remuneration. FIT provides no other services to the Remuneration Committee, has no further connection with the Company or individual Director and is a signatory to the Remuneration Consultants Group’s Code of Conduct. The fees paid by the Company to FIT in the year was £51,250 excluding VAT. On this basis, the Remuneration Committee satisfied itself that the advice of FIT was objective and independent.
VOTING ON REMUNERATIONThe table below sets out voting in respect of the approval of the Directors’ Remuneration Policy at the Annual General Meeting on 21 April 2020 and the Directors’ Remuneration Report at the Annual General Meeting on 20 April 2021.
Meeting Votes for % of votes for Votes against% of votes
against Votes withheldApproval of Directors’ Remuneration Policy 21 April 2020 11,125,326 79.15% 2,930,138 20.85% 299,852Approval of Directors’Remuneration Report 20 April 2021 11,656,814 90.5% 1,218,147 9.5% 192
We continue to engage with our Shareholders on executive remuneration and seek to strike the right balance of interest among all our Shareholders.
122
XP Power Annual Report & Accounts for the year ended 31 December 2021
REMUNERATION COMMITTEE REPORT CONTINUED
30801-XP-Power AR21 Governance.indd 12230801-XP-Power AR21 Governance.indd 122 08/03/2022 10:55:4408/03/2022 10:55:44
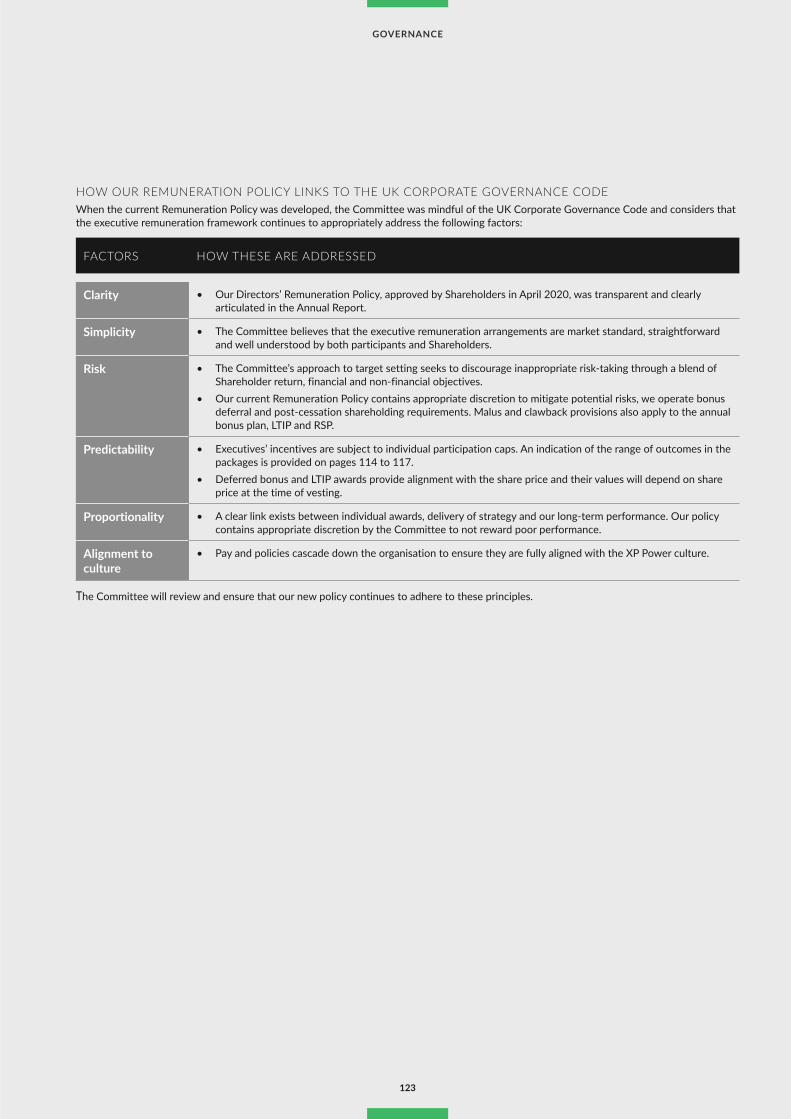
30801 8 March 2022 10:08 am V9
HOW OUR REMUNERATION POLICY LINKS TO THE UK CORPORATE GOVERNANCE CODE When the current Remuneration Policy was developed, the Committee was mindful of the UK Corporate Governance Code and considers that the executive remuneration framework continues to appropriately address the following factors:
FACTORS HOW THESE ARE ADDRESSED
Clarity • Our Directors’ Remuneration Policy, approved by Shareholders in April 2020, was transparent and clearly articulated in the Annual Report.
Simplicity • The Committee believes that the executive remuneration arrangements are market standard, straightforward and well understood by both participants and Shareholders.
Risk • The Committee’s approach to target setting seeks to discourage inappropriate risk-taking through a blend of Shareholder return, financial and non-financial objectives.
• Our current Remuneration Policy contains appropriate discretion to mitigate potential risks, we operate bonus deferral and post-cessation shareholding requirements. Malus and clawback provisions also apply to the annual bonus plan, LTIP and RSP.
Predictability • Executives’ incentives are subject to individual participation caps. An indication of the range of outcomes in the packages is provided on pages 114 to 117.
• Deferred bonus and LTIP awards provide alignment with the share price and their values will depend on share price at the time of vesting.
Proportionality • A clear link exists between individual awards, delivery of strategy and our long-term performance. Our policy contains appropriate discretion by the Committee to not reward poor performance.
Alignment to culture
• Pay and policies cascade down the organisation to ensure they are fully aligned with the XP Power culture.
The Committee will review and ensure that our new policy continues to adhere to these principles.
123
GOVERNANCE
30801-XP-Power AR21 Governance.indd 12330801-XP-Power AR21 Governance.indd 123 08/03/2022 10:55:4408/03/2022 10:55:44

30801 8 March 2022 10:08 am V9
Implementation of the Directors’ Remuneration Policy in 2022This table summarises the key components of the Directors’ Remuneration Policy as approved by Shareholders at the AGM on 21 April 2020, and how the Committee intends to implement the Policy in 2022. The full Directors’ Remuneration Policy is available in the 2020 Directors’ Remuneration Report and is available on our website at xppower.com.
COMPONENT SUMMARY OF POLICY OPERATION IN 2022
Base salary Base salaries are reviewed annually. Increases will not normally exceed the range of increases awarded to other employees within the Group.
The Remuneration Committee may also increase a Director’s salary should there be a change in the scope of their role, the scale or complexity of the business or if significant changes to market practice arise.
The Remuneration Committee undertook its regular review of Executive Directors’ base salaries, with increases due to take effect from 1 April 2022.
• Gavin Griggs’ base salary will increase from £500,000 to £550,000 (an increase of 10%)
• Andy Sng’s base salary will increase from S$300,000 to S$312,000 (an increase of 4%)
• Oskar Zahn’s base salary was set at £400,000 on his appointment as CFO from 4 May 2021. Oskar Zahn will increase to £416,000 (an increase of 4%).
Benefits Benefits are set by the Remuneration Committee and reviewed annually.
Benefits include life insurance, private medical cover, housing allowance in China for Andy Sng and car allowance.
Pensions Executive Directors’ pension contributions are in line with pension benefits offered to the XP Power workforce in the relevant geography, which is currently 8% in the UK.
Gavin Griggs and Oskar Zahn each receive a pension contribution of 8% of base salary. Andy Sng receives a pension contribution of 6% of salary, in line with the pension benefits offered to employees in Singapore.
Annual bonuses The maximum bonus opportunity is 125% of base salary for the CEO and 100% for other Executive Directors. 50% of any annual bonus is deferred in shares, which vest after two years subject to continued employment.
Specific targets and weightings may vary according to strategic priorities and may include:
• Financial performance• Attainment of personal
and strategic objectives
For 2022, the maximum bonus opportunity will be capped at 125% of salary for the CEO and 100% for other Executive Directors, with on-target payouts of 50% of maximum.
Bonuses will continue to be based on a combination of financial and strategic performance measures. The precise targets are considered commercially sensitive and so the targets are not disclosed prospectively. The targets and performance achieved against these will be published in next year’s Annual Report on Remuneration. The performance measures that will apply are:
• Adjusted profit before tax (50%)• Adjusted operating cash flow as a percentage of adjusted operating
income (25%)• Strategic objectives (25%)
Andy Sng’s strategic performance objectives are set with reference to divisional performance and largely reflect the priorities set out for Gavin Griggs and Oskar Zahn.
124
XP Power Annual Report & Accounts for the year ended 31 December 2021
REMUNERATION COMMITTEE REPORT CONTINUED
30801-XP-Power AR21 Governance.indd 12430801-XP-Power AR21 Governance.indd 124 08/03/2022 10:55:4408/03/2022 10:55:44

30801 8 March 2022 10:08 am V9
COMPONENT SUMMARY OF POLICY OPERATION IN 2022
Long-term incentive plan (LTIP)
The LTIP is made up of a Performance Share Plan (PSP) and a Restricted Share Plan (RSP).
The normal maximum award level under the LTIP is 150% of base salary or up to 200% of base salary in exceptional circumstances. Up to a maximum of 15% of base salary may be granted as restricted shares without performance conditions. In calculating value against the LTIP limit, the value of restricted share awards will be multiplied by two to reflect that they do not have performance conditions attached.
PSP performance is typically measured over three financial years starting with the year of date of grant. RSP awards may be granted without performance conditions.
In 2022, the Remuneration Committee anticipates granting the following awards:
NamePSP award
(% of salary)RSP award
(% of salary)Gavin Griggs 100% 12.5%Oskar Zahn 100% 12.5%Andy Sng 75% 15.0%
The PSP awards will vest subject to a combination of (i) cumulative diluted adjusted EPS performance and (ii) TSR performance compared with the TSR of companies in the FTSE 250 excluding investment trusts, both measured over three financial years. The performance targets are:
Cumulative diluted adjusted EPS (67% of maximum)
TSR vs FTSE 250 ex investment trusts (33% of maximum) Vesting
650.2 pence per share or aboveUpper quintile
(80th percentile) or above 100%580.5 pence per share Median (50th percentile) 25%Below 580.5 pence per share Below median No vesting
Vesting between threshold and maximum will be measured on a straight-line basis.
125
GOVERNANCE
30801-XP-Power AR21 Governance.indd 12530801-XP-Power AR21 Governance.indd 125 08/03/2022 10:55:4408/03/2022 10:55:44
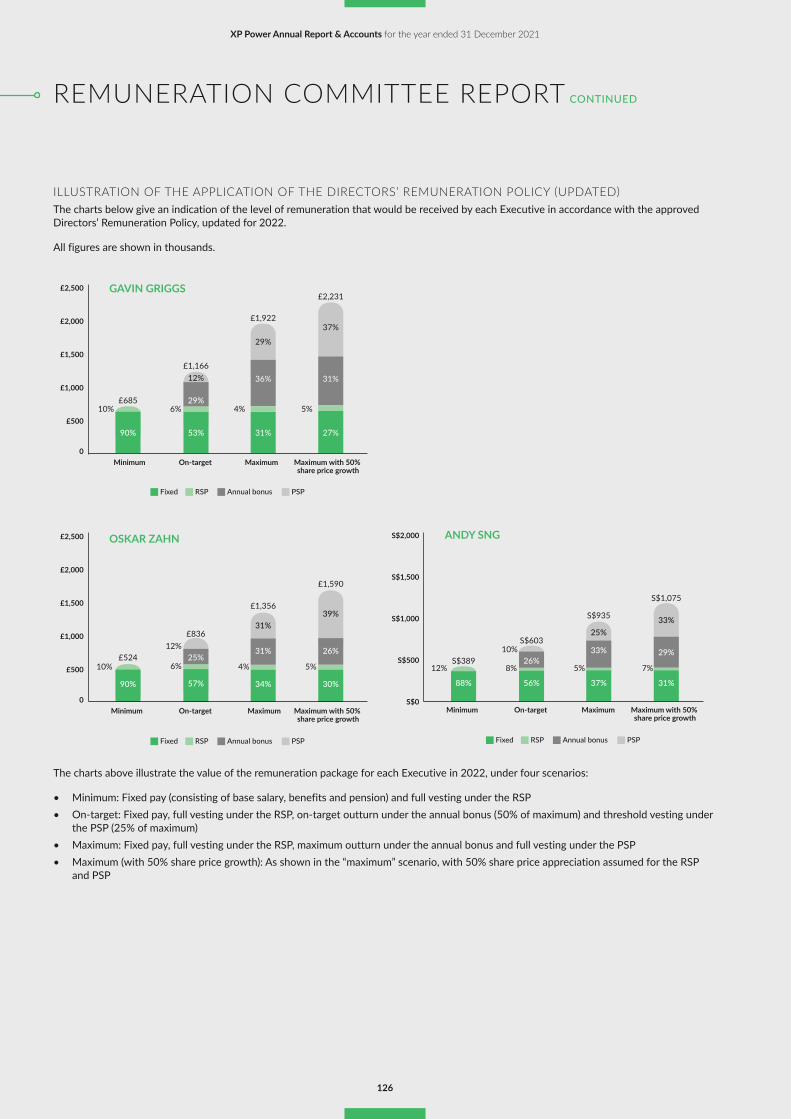
30801 8 March 2022 10:08 am V9
ILLUSTRATION OF THE APPLICATION OF THE DIRECTORS’ REMUNERATION POLICY (UPDATED)The charts below give an indication of the level of remuneration that would be received by each Executive in accordance with the approved Directors’ Remuneration Policy, updated for 2022.
All figures are shown in thousands.
£685
£1,166
£1,922
£2,231
90% 53% 31% 27%
10% 6% 4% 5%
10% 6%
12%
4% 5%
29%
12% 36% 31%
29%
£524
£836
£1,356
£1,590
90% 57% 34% 30%
25%31% 26%
31%39%
S$389
S$603
S$935
S$1,075
88%
12% 8% 5% 7%
10%
56% 37% 31%
26%33%
25%
29%
33%
37%
£2,500
£2,000
£1,500
£1,000
£500
£2,500
£2,000
£1,500
£1,000
£500
S$2,000
S$1,500
S$1,000
S$500
S$0
Minimum On-target Maximum Maximum with 50% share price growth
Maximum with 50% share price growth
Maximum with 50% share price growth
Minimum On-target Maximum
Minimum On-target Maximum
GAVIN GRIGGS
OSKAR ZAHN
ANDY SNG
0
0
Fixed RSP Annual bonus PSP
Fixed RSP Annual bonus PSP
Fixed RSP Annual bonus PSP
The charts above illustrate the value of the remuneration package for each Executive in 2022, under four scenarios:
• Minimum: Fixed pay (consisting of base salary, benefits and pension) and full vesting under the RSP• On-target: Fixed pay, full vesting under the RSP, on-target outturn under the annual bonus (50% of maximum) and threshold vesting under
the PSP (25% of maximum)• Maximum: Fixed pay, full vesting under the RSP, maximum outturn under the annual bonus and full vesting under the PSP• Maximum (with 50% share price growth): As shown in the “maximum” scenario, with 50% share price appreciation assumed for the RSP
and PSP
126
XP Power Annual Report & Accounts for the year ended 31 December 2021
REMUNERATION COMMITTEE REPORT CONTINUED
30801-XP-Power AR21 Governance.indd 12630801-XP-Power AR21 Governance.indd 126 08/03/2022 10:55:4408/03/2022 10:55:44

30801 8 March 2022 10:08 am V9
The fixed elements of remuneration are as follows (on an annualised basis):
Position Name Base salary Benefits Pension Total fixed payChief Executive Officer Gavin Griggs £550,000 £21,800 £44,000 £615,800Chief Financial Officer Oskar Zahn £416,000 £22,500 £33,300 £471,800Executive Vice President, Asia Andy Sng S$312,000 S$11,400 S$18,700 S$342,100
DIRECTORS’ CONTRACTSThe Executive Directors’ contracts run for an indefinite period, with the Company being able to terminate the contracts without cause giving 12 months’ notice. When a Director is terminated without cause, the Director is entitled to a termination payment of 12 months of basic pay. Directors’ service contracts are available for inspection at the Annual General Meeting of the Company. Directors are able to terminate the contracts giving 12 months’ notice.
The Non-Executive Directors’ contracts run for an indefinite period, with the Company being able to terminate the contracts without cause giving 12 months’ notice. If the Shareholders do not re-elect a Non-Executive Director, or they are retired from office under the Articles, their appointment terminates automatically, with immediate effect and without compensation. In accordance with the Code, Non-Executive Directors will not serve more than nine years. Non-Executive Directors are not entitled to share option awards, long-term incentive plans or pensions.
127
GOVERNANCE
30801-XP-Power AR21 Governance.indd 12730801-XP-Power AR21 Governance.indd 127 08/03/2022 10:55:4408/03/2022 10:55:44

30801 8 March 2022 10:08 am V9
DividendsDividends paid during the year and proposed are as follows:
Period Payment date Amount 2020 ComparativeFirst quarter 14 July 2021 18.0 pence –Second quarter 14 October 2021 19.0 pence 18.0 penceThird quarter 17 January 2022 21.0 pence 20.0 penceFourth quarter (proposed) 28 April 2022 36.0 pence 36.0 penceTotal 94.0 pence 74.0 pence
The Directors are recommending a final dividend of 36.0 pence per share, which would be paid on 28 April 2022 to members on the register as at 25 March 2022. This would make the total dividend for the year at 94.0 pence (2020: 74.0 pence), which is an increase of 27%.
The trustee of the Employee Benefit Trust has waived its right to dividends paid on any ordinary shares it holds on the terms of the Employee Benefit Trust in respect of the period covered by the financial statements and future periods. Such waivers represent less than 1% of the total dividend payable on the Company’s ordinary shares.
Directors and directors’ interestsThe Company’s Articles of Association (the “Articles”) give the Directors power to appoint and replace Directors. Under the terms of reference of the Nomination Committee, any appointment must be recommended by the Nomination Committee for approval by the Board of Directors.
Directors of the Company in office at 31 December 2021 and at the date of this report, together with their biographical details, are shown on page 82 and 83. In addition, Duncan Penny served as an Executive Director until 20 April 2021. Details of the Directors’ service contracts are given in the Directors’ Remuneration Report on page 127.
The present membership of the Board and the interests of the Directors in the shares of the Company are set out in the Directors’ Remuneration Report. No Director had any dealings in the shares of the Company between 31 December 2021 and the date of this report.
In line with the 2018 UK Corporate Governance Code, each relevant Director will be standing for election or re-election, as appropriate, at the forthcoming AGM.
Liability insurance and indemnitiesThe Company has agreed to indemnify, to the extent permitted by law, each of the Company’s Directors against any liability incurred in respect of acts or omissions arising in the course of their office. Each Director is covered by appropriate directors’ and officers’ liability insurance, at the Company’s expense.
The Audit Committee has recommended to the Board that the independent Auditor, PwC LLP, be nominated for reappointment at the forthcoming AGM.
Share capital and capital structureAt the date of this report, the Company’s total share capital of the Company was 19,642,296 ordinary shares of 1 pence each, of which 7,500 were held in treasury. Therefore, the total voting rights in the Company are 19,634,796. Ordinary Shareholders are entitled to
receive notice of and to attend and speak at general meetings. On a show of hands, every Shareholder present in person or by proxy (or a duly authorised corporate representative) shall have one vote and, on a poll, every member present in person or by proxy (or a duly authorised corporate representative) shall have one vote for every share held by that member. The rights and obligations attached to the ordinary shares are governed by the Articles and prevailing legislation. There are no other classes of share capital.
There are no restrictions on the voting rights attached to the Company’s ordinary shares or on the transfer of shares in the Company. No Shareholder holds shares in the Company that carry special rights or control of the Company’s share capital. The Directors are not aware of any agreements between holders of shares that may result in restrictions on the transfer of shares or on voting rights.
Power to issue and allotAt the 2021 AGM, authority was given to the Directors to allot unissued shares in the Company up to a maximum amount equivalent to approximately one-third of the issued share capital, excluding shares held in treasury, for general purposes, plus up to a further one-third of the Company’s issued share capital, excluding shares held in treasury, but only in the case of a rights issue. A further special resolution passed at that meeting granted authority to the Directors to allot equity securities in the Company for cash up to five per cent of the Company’s then issued ordinary share capital without regard to the pre-emption rights. Both authorities expire on the date of the 2022 AGM, at which the Directors propose to renew them for a further year.
Authority to purchase own sharesAt the 2021 AGM, Shareholders gave the Company authority to make market purchases of up to 10 per cent of the Company’s then issued ordinary share capital. Any shares purchased in this way could either be cancelled or held in treasury (or a combination of these). No purchases have been made under this authority. The Directors propose to seek an equivalent authority at the 2022 AGM, but have no current intention of using this authority, if granted.
Annual general meetingDetails of the Company’s AGM and the proposed resolutions will be set out in a separate Notice of Meeting.
Independent auditorOur Auditor, PwC LLP, has indicated their willingness to continue in office, and on the recommendation of the Audit Committee, resolutions to reappoint PwC LLP as Auditor and to authorise the Directors to determine the Auditor’s remuneration will be proposed at the forthcoming AGM.
128
XP Power Annual Report & Accounts for the year ended 31 December 2021
OTHER GOVERNANCE ANDSTATUTORY DISCLOSURES
30801-XP-Power AR21 Governance.indd 12830801-XP-Power AR21 Governance.indd 128 08/03/2022 10:55:4508/03/2022 10:55:45

30801 8 March 2022 10:08 am V9
Articles of associationAny amendments to the Articles of Association of the Company may be made by special resolution of the Shareholders.
Significant contracts and change of controlThe Group has borrowing facilities that may require the immediate repayment of all outstanding loans together with accrued interest in the event of a change of control. The rules of the Company’s employee share plans set out the consequences of a change in control of the Company on participants’ rights under the plans. Generally, such rights will vest and become exercisable on a change of control subject to the satisfaction of performance conditions. None of the Executive Directors’ service contracts contain provisions that are affected by a change of control and there are no other agreements that the Company is party to that take effect, alter or terminate in the event of a change of control of the Company, which are considered to be significant in terms of their potential impact on the Group. The Company does not have any contractual or other arrangements that are essential to the business of the Group.
Political donationsThe Group did not make any political donations or incur any political expenditure during the year.
Financial risk managementThe Group’s exposure to and management of capital, liquidity, credit, interest rate and foreign currency risks are contained in note 29 on pages 173 to 178.
Post-balance sheet eventsEvents after the year-end are reported in note 30 to the Group's Consolidated Financial Statements on page 178.
Incorporation by reference The Company’s business activities, together with factors that potentially affect its future development, performance or position, can be found on pages 20 to 31. The Group’s key activity in R&D is discussed in the Operational Review on pages 36 to 37. Details of the Company’s financial position and cash flows are outlined in the Financial Review on pages 38 to 40, and the Group’s Viability Statement is on page 49.
Information required to be disclosed by Listing Rule (LR) 9.8.4R can be found in the following locations within the Annual Report:
Listing Rule Section Topic Location and page(1) Capitalised interest Note 6 to the Group’s Consolidated Financial Statements on
page 154. Related tax relief is insignificant.(2) Publication of unaudited financial information Nothing to disclose(4) Details of long-term incentive plans established specifically
to recruit or retain a directorNothing to disclose
(5) (6) Waiver of emoluments by a director of the company Nothing to disclose(7) (8) Allotments for cash of ordinary shares Nothing to disclose(9) Parent participation in a placing by a listed subsidiary Nothing to disclose(10) Contracts of significance Nothing to disclose(11) (14) Controlling Shareholder disclosures Nothing to disclose(12) (13) Dividend waiver Other Disclosures on page 128
In the opinion of the Directors,a. at the balance sheet of the Company and the consolidated
financial statements of the Group, as set out on pages 137 to 188, are drawn up to give a true and fair view of the state of affairs of the Company and of the Group as at 31 December 2021, and of the results of the business, changes in equity and cash flows of the Group for the financial year then ended; and
b. at the date of this statement, there are reasonable grounds to believe that the Company will be able to pay its debts as and when they fall due.
On behalf of the Directors
JAMES PETERS NON-EXECUTIVE CHAIR
GAVIN GRIGGS CHIEF EXECUTIVE OFFICER 1 March 2022
129
GOVERNANCE
STATEMENT BY DIRECTORS
30801-XP-Power AR21 Governance.indd 12930801-XP-Power AR21 Governance.indd 129 08/03/2022 10:55:4508/03/2022 10:55:45

30801 8 March 2022 10:52 am V8
130
XP Power Annual Report & Accounts for the year ended 31 December 2021
30801-XP-Power AR21 Financials.indd 13030801-XP-Power AR21 Financials.indd 130 08/03/2022 10:52:4108/03/2022 10:52:41

30801 8 March 2022 10:52 am V8
CONTENTS
INDEPENDENT AUDITOR’S REPORT 132
CONSOLIDATED STATEMENT OF COMPREHENSIVE INCOME 137
CONSOLIDATED BALANCE SHEET 138
CONSOLIDATED STATEMENT OF CHANGES IN EQUITY 139
CONSOLIDATED STATEMENT OF CASH FLOWS 140
NOTES TO THE CONSOLIDATED FINANCIAL STATEMENTS 141
COMPANY BALANCE SHEET 179
NOTES TO THE COMPANY BALANCE SHEET 180
FIVE-YEAR REVIEW CONSOLIDATED INFORMATION 189
ADVISERS 190
131
FINANCIALS
Financials
30801-XP-Power AR21 Financials.indd 13130801-XP-Power AR21 Financials.indd 131 08/03/2022 10:52:4108/03/2022 10:52:41

30801 8 March 2022 10:52 am V8
Report on the Financial StatementsOUR OPINIONIn our opinion, the accompanying consolidated financial statements of XP Power Limited (the “Company”) and its subsidiary corporations (the “Group”) and the balance sheet of the Company are properly drawn up in accordance with the provisions of the Singapore Companies Act 1967 (the “Act”), Singapore Financial Reporting Standards (International) (“SFRS(I)s”) and International Financial Reporting Standards (“IFRSs”) as issued by the International Accounting Standards Board (“IFRS as issued by the IASB”), so as to give a true and fair view of the consolidated financial position of the Group and the financial position of the Company as at 31 December 2021, and of the consolidated financial performance, consolidated changes in equity and consolidated cash flows of the Group for the financial year ended on that date.
WHAT WE HAVE AUDITEDThe financial statements of the Company and the Group comprise:
• The consolidated statement of comprehensive income of the Group for the financial year ended 31 December 2021;
• The consolidated balance sheet of the Group as at 31 December 2021;
• The balance sheet of the Company as at 31 December 2021;• The consolidated statement of changes in equity of the Group for
the financial year then ended;• The consolidated statement of cash flows of the Group for the
financial year then ended; and• The notes to the financial statements, including a summary of
significant accounting policies.
THE BASIS FOR OUR OPINIONWe conducted our audit in accordance with International Standards on Auditing (“ISAs”). Our responsibilities under those standards are further described in the “What are we responsible for” section of our report.
We believe that the audit evidence we have obtained is sufficient and appropriate to provide a basis for our opinion.
INDEPENDENCEWe are independent of the Group in accordance with the Accounting and Corporate Regulatory Authority Code of Professional Conduct and Ethics for Public Accountants and Accounting Entities (“ACRA Code”) together with the ethical requirements that are relevant to our audit of the consolidated financial statements in Singapore, and we have fulfilled our other ethical responsibilities in accordance with these requirements and the ACRA Code.
Our audit approach – overview MATERIALITYThe overall materiality which we have used to plan our work for the Group amounted to £2.0 million, which represented 7% of profit before taxation. The overall materiality applied to the audit of the Company balance sheet amounted to £0.7 million.
AUDIT SCOPEWe performed an audit of the complete financial information and of significant financial statement line items for significant reporting units which included operations based in North America, Europe and Asia. This accounted for approximately 92% of Group revenues and 93% of Group assets.
Key Audit Matters
We identified the following key audit matters: • Goodwill; and• Capitalised product development.
Materiality
Audit Scope
Key AuditMatters
132
XP Power Annual Report & Accounts for the year ended 31 December 2021
INDEPENDENT AUDITOR’S REPORTTO THE MEMBERS OF XP POWER LIMITED
30801-XP-Power AR21 Financials.indd 13230801-XP-Power AR21 Financials.indd 132 08/03/2022 10:52:4208/03/2022 10:52:42

30801 8 March 2022 10:52 am V8
HOW WE DETERMINED MATERIALITYThe scope of our audit was influenced by our application of materiality. We set certain quantitative thresholds for materiality. These, together with qualitative considerations, helped us to determine the scope of our audit and the nature, timing and extent of our audit procedures on the financial statement line items and disclosures and in evaluating the effect of misstatements, both individually and in aggregate on the financial statements as a whole.
For each component in the scope of our Group audit, we allocated a materiality that is less than our overall Group materiality. The range of materiality allocated across components was £0.4 million to £1.9 million. Certain components were audited to a local statutory audit materiality that was also less than our overall Group materiality.
Based on our professional judgement, we determined that the benchmark of profit before taxation is appropriate as it reflects the Group’s growth and investment plans. We believe this is a key measure used by shareholders in assessing the performance of the Group.
We agreed with the Audit Committee that we would report to them misstatements identified during our audit above £0.2 million as well as misstatements below that amount that, in our view, warranted reporting for qualitative reasons.
HOW WE TAILORED THE AUDIT SCOPEThe Group operates across North America, Europe and Asia. In establishing the overall approach to the Group audit, we determined the type of work that needed to be performed at the local operations by us, as the Group engagement team, or component auditors from other PwC network firms operating under our instruction. Where the work was performed by component auditors, we determined the level of involvement we needed to have in the audit work at those local operations to be able to conclude whether sufficient appropriate audit evidence had been obtained as a basis for our opinion on the Group financial statements as a whole.
We designed our audit of the Group by determining materiality and assessing the risks of material misstatement in the financial statements. In particular, we looked at where management made subjective judgements, for example in respect of significant accounting estimates, that involved making assumptions and considering future events that are inherently uncertain. As in all of our audits, we also addressed the risk of management override of internal controls, including evaluating whether there was evidence of bias by the management that represented a risk of material misstatement due to fraud.
We tailored the scope of our audit to ensure that we performed sufficient work to be able to give an opinion on the financial statements as a whole, taking into account the geographic structure of the Group, the accounting processes and controls, and the industry in which the Group operates.
WHAT ARE THE KEY AUDIT MATTERSKey audit matters are those matters that, in the auditor’s professional judgement, were of most significance in the audit of the financial statements of the current period. Key audit matters include the most significant assessed risks of material misstatement (whether or not due to fraud) identified by the auditors, including those which had the greatest effect on: the overall audit strategy; the allocation of resources in the audit; and the directing of the efforts of the engagement team. These matters, and any comments we make on the results of our procedures thereon, were addressed in the context of our audit of the financial statements as a whole, and in forming our opinion thereon, and we do not provide a separate opinion on these matters. This is not a complete list of all risks identified by our audit.
133
FINANCIALS
30801-XP-Power AR21 Financials.indd 13330801-XP-Power AR21 Financials.indd 133 08/03/2022 10:52:4208/03/2022 10:52:42

30801 8 March 2022 10:52 am V8
Key audit matters How did our audit address these
GoodwillRefer to page 106 (Report from the Chair of the Audit Committee), page 150 (Critical accounting judgements and key sources of estimation uncertainty – Impairment of Goodwill) and pages 157–158 (Note 11 – Goodwill).
The Group has goodwill of £52.5 million at 31 December 2021 contained within three cash-generating units (“CGUs”) defined by its geographical split – North America, Europe and Asia.
We focused on this area due to the relative size of the carrying amount of goodwill, which represented 19% of total assets, and because management’s assessment of the ‘value-in-use’ of the Group’s CGUs involves significant judgements and assumptions about the future results of the business and the discount rates applied to future cash flow forecasts.
Key judgements and assumptions about the future results of the business include: revenue and profit growth rates, expected changes to overhead costs as well as risks specific to the three CGUs.
The Group’s assessment of the potential financial impacts of climate change are disclosed in Note 11 to the financial statements.
We evaluated the suitability and appropriateness of the impairment model as prepared by management and noted no significant exceptions.
We assessed the reasonableness of the inputs used to derive the discount rates. We also focused on understanding and challenging management’s plans for future growth for each of the three CGUs. Forecasted growth in revenue and profits are driven by constant innovation in the development of new product families as well as the broadening of the customer base in the three CGUs. We benchmarked key market-related assumptions in management’s forecasts such as revenue and profit growth rates and changes in the overhead costs with relevant economic, industry indicators and historical trends for revenue growth and considered that such targets as set by management were achievable. Sensitivity analyses were also performed on the discount rates and growth rates. We agreed with management that no impairment was required.
We evaluated how the Group’s response to climate change had been reflected in the impairment assessment of goodwill.
Capitalised product developmentRefer to page 106 (Report from the Chair of the Audit Committee), page 150 (Critical accounting judgements and key sources of estimation uncertainty – Recoverability and useful lives of Capitalised development costs) and page 159 (Note 12 – Intangible assets).
Part of the Group’s strategy is to invest in research and development to create new products. As at 31 December 2021, the carrying value of product development costs capitalised as an intangible asset is £30.0 million, of which £8.3 million was capitalised in the current financial year.
We focused on the appropriateness of capitalisation of product development costs due to the relative size of the carrying amount of this intangible asset, which represented 11% of total assets, and because significant judgement is involved in determining whether the criteria to capitalise such product development costs, as set out in IAS 38 Intangible Assets, have been fulfilled and that the capitalised amounts are recoverable.
We also identified the useful lives of the capitalised product development costs as an area involving significant judgement. The carrying value of the capitalised product development costs is heavily dependent on the useful lives of the developed products. Management determined the useful lives of the developed products based on the expected life cycle of these products, taking into consideration expected customer demand and technological innovation.
We assessed the appropriateness of capitalisation of product development costs by ensuring compliance with the criteria to capitalise product development costs as set out in IAS 38, and challenged management through discussions and qualitative reviews of the products’ feasibility. We also tested the accuracy and allocation of capitalised material costs and labour costs. Management was able to support the capitalisation of product development costs.
For selected samples of developed products, we reviewed the actual sales during the year along with projected sales to ensure that the capitalised development costs are supported by demand and are recoverable. For selected samples of products in development, we reviewed the project business case, forecasted demand, and other supporting analysis to support the recoverability of these products.
In the assessment of the useful lives of the capitalised product development costs, we performed a benchmarking exercise to compare the useful lives of the capitalised product development costs against other companies within the same industry. The useful lives as determined by management are in line with that of the industry and consistent with our understanding of the life cycle of the products.
134
XP Power Annual Report & Accounts for the year ended 31 December 2021
INDEPENDENT AUDITOR’S REPORT CONTINUEDTO THE MEMBERS OF XP POWER LIMITED
30801-XP-Power AR21 Financials.indd 13430801-XP-Power AR21 Financials.indd 134 08/03/2022 10:52:4208/03/2022 10:52:42

30801 8 March 2022 10:52 am V8
Information other than the Financial Statements and Auditor’s Report thereonGOING CONCERNUnder the UK Listing Rules (“Listing Rules”) we are required to review the Directors’ statement, set out on page 129, in relation to going concern. We have nothing to report having performed our review.
THE DIRECTORS’ ASSESSMENT OF THE PROSPECTS OF THE GROUP Under the Listing Rules we are required to review the Directors’ statement that they have carried out a robust assessment of the principal risks facing the Group and the Directors’ statement in relation to the longer-term viability of the Group, set out on page 49. Our review was substantially less in scope than an audit and only consisted of making enquiries and considering the Directors’ process supporting their statements; checking that the statements are in alignment with the relevant provisions of the UK Corporate Governance Code; and considering whether the statements are consistent with the knowledge acquired by us in the course of performing our audit. We have nothing to report having performed our review.
CORPORATE GOVERNANCE STATEMENTUnder the Listing Rules, we are required to review the part of the Corporate Governance Statement relating to Provisions 6 and 24 to 29 of the UK Corporate Governance Code. We have nothing to report having performed our review.
OTHER INFORMATIONManagement is responsible for the other information. The other information comprises the “Overview” section set out on pages 02 to 17, “Strategic Report” section set out on pages 20 to 77, “Governance” section set out on pages 80 to 129, and the “Financials” section on page 190 of the Annual Report. Other information, as defined in this section, does not include matters that we are required to review and report on under the Listing Rules, as described above.
Our opinion on the financial statements does not cover the other information and we do not and will not express any form of assurance conclusion thereon.
In connection with our audit of the financial statements, our responsibility is to read the other information and, in doing so, consider whether the other information is materially inconsistent with the financial statements or our knowledge obtained in the audit or otherwise appears to be materially misstated.
If, based on the work we have performed, we conclude that there is a material misstatement of this other information, we are required to report that fact. We have nothing to report in this regard.
Responsibilities for the financial statements and the auditWHAT ARE MANAGEMENT AND DIRECTORS RESPONSIBLE FORManagement is responsible for the preparation of financial statements that give a true and fair view in accordance with the provisions of the Act, SFRS(I)s and IFRS as issued by the IASB, and for devising and maintaining a system of internal accounting controls sufficient to provide a reasonable assurance that assets are safeguarded against loss from unauthorised use or disposition; and transactions are properly authorised and that they are recorded as necessary to permit the preparation of true and fair financial statements and to maintain accountability of assets.
In preparing the financial statements, management is responsible for assessing the Group’s ability to continue as a going concern, disclosing, as applicable, matters related to going concern and using the going concern basis of accounting unless management either intends to liquidate the Group or to cease operations, or has no realistic alternative but to do so.
The Directors are responsible for overseeing the Group’s financial reporting process.
WHAT ARE WE RESPONSIBLE FOROur objectives are to obtain reasonable assurance about whether the financial statements as a whole are free from material misstatement, whether due to fraud or error, and to issue an auditor’s report that includes our opinion. Reasonable assurance is a high level of assurance, but is not a guarantee that an audit conducted in accordance with ISAs will always detect a material misstatement when it exists. Misstatements can arise from fraud or error and are considered material if, individually or in the aggregate, they could reasonably be expected to influence the economic decisions of users taken on the basis of these financial statements.
As part of an audit in accordance with ISAs, we exercise professional judgement and maintain professional scepticism throughout the audit. We also:
• Identify and assess the risks of material misstatement of the consolidated financial statements, whether due to fraud or error, design and perform audit procedures responsive to those risks, and obtain audit evidence that is sufficient and appropriate to provide a basis for our opinion. The risk of not detecting a material misstatement resulting from fraud is higher than for one resulting from error, as fraud may involve collusion, forgery, intentional omissions, misrepresentations, or the override of internal control.
• Obtain an understanding of internal control relevant to the audit in order to design audit procedures that are appropriate in the circumstances, but not for the purpose of expressing an opinion on the effectiveness of the Group’s internal control.
135
FINANCIALS
30801-XP-Power AR21 Financials.indd 13530801-XP-Power AR21 Financials.indd 135 08/03/2022 10:52:4208/03/2022 10:52:42

30801 8 March 2022 10:52 am V8
• Evaluate the appropriateness of accounting policies used and the reasonableness of accounting estimates and related disclosures made by management.
• Conclude on the appropriateness of management’s use of the going concern basis of accounting and based on the audit evidence obtained, whether a material uncertainty exists related to events or conditions that may cast significant doubt on the Group’s ability to continue as a going concern. If we conclude that a material uncertainty exists, we are required to draw attention in our auditor’s report to the related disclosures in the consolidated financial statements or, if such disclosures are inadequate, to modify our opinion. Our conclusions are based on the audit evidence obtained up to the date of our auditor’s report. However, future events or conditions may cause the Group to cease to continue as a going concern.
• Evaluate the overall presentation, structure and content of the consolidated financial statements, including the disclosures, and whether the consolidated financial statements represent the underlying transactions and events in a manner that achieves fair presentation.
• Obtain sufficient appropriate audit evidence regarding the financial information of the entities or business activities within the Group to express an opinion on the consolidated financial statements. We are responsible for the direction, supervision and performance of the Group audit. We remain solely responsible for our audit opinion.
We communicate with the Audit Committee regarding, among other matters, the planned scope and timing of the audit and significant audit findings, including any significant deficiencies in internal control that we identify during our audit.
We also provide the Audit Committee with a statement that we have complied with relevant ethical requirements regarding independence, and to communicate with them all relationships and other matters that may reasonably be thought to bear on our independence, and where applicable, related safeguards.
From the matters communicated with the Audit Committee, we determine those matters that were of most significance in the audit of the consolidated financial statements of the current year and are therefore the key audit matters. We describe these matters in our auditor’s report, unless law or regulation precludes public disclosure about the matter or when, in extremely rare circumstances, we determine that a matter should not be communicated in our report because the adverse consequences of doing so would reasonably be expected to outweigh the public interest benefits of such communication.
Report on other legal and regulatory requirementsIn our opinion, the accounting and other records required by the Act to be kept by the Company and by those subsidiaries incorporated in Singapore of which we are the auditors, have been properly kept in accordance with the provisions of the Act.
The engagement partner on the audit resulting in this independent auditor’s report is Greg Unsworth.
PRICEWATERHOUSECOOPERS LLPPublic Accountants and Chartered Accountants Singapore
1 March 2022
136
XP Power Annual Report & Accounts for the year ended 31 December 2021
INDEPENDENT AUDITOR’S REPORT CONTINUEDTO THE MEMBERS OF XP POWER LIMITED
30801-XP-Power AR21 Financials.indd 13630801-XP-Power AR21 Financials.indd 136 08/03/2022 10:52:4208/03/2022 10:52:42

30801 8 March 2022 10:52 am V8
£m Note 2021 2020
Revenue 4 240.3 233.3Cost of sales 7 (132.0) (123.2)Gross profit 108.3 110.1Other income * 0.6ExpensesDistribution and marketing 7 (47.8) (52.4)Administrative 7 (14.0) (5.0)Research and development 7 (16.8) (15.9)Operating profit 29.7 37.4Finance charge 6 (1.3) (1.7)Profit before tax 28.4 35.7Income tax expense 8 (5.4) (4.0)Profit after tax 23.0 31.7Other comprehensive income:Items that may be reclassified subsequently to profit or loss:Exchange differences on translation of foreign operations 0.9 (3.6)
0.9 (3.6)Items that will not be reclassified subsequently to profit or loss:Currency translation differences arising from consolidation * *Other comprehensive income/(loss) for the year, net of tax 0.9 (3.6)Total comprehensive income for the year 23.9 28.1Profit attributable to:Equity holders of the Company 22.6 31.5Non-controlling interests 0.4 0.2
23.0 31.7Total comprehensive income attributable to:Equity holders of the Company 23.5 27.9Non-controlling interests 0.4 0.2
23.9 28.1Earnings per share attributable to equity holders of the Company (pence per share)Basic earnings per share 10 115.8 163.0Diluted earnings per share 10 113.8 160.3
* Balance is less than £100,000.
The accompanying notes form an integral part of these financial statements.
137
FINANCIALS
CONSOLIDATED STATEMENT OF COMPREHENSIVE INCOMEFOR THE FINANCIAL YEAR ENDED 31 DECEMBER 2021
30801-XP-Power AR21 Financials.indd 13730801-XP-Power AR21 Financials.indd 137 08/03/2022 10:52:4208/03/2022 10:52:42

30801 8 March 2022 10:52 am V8
£m Note 2021 2020ASSETS Current assets Corporate tax recoverable 2.9 3.8Cash and cash equivalents 16 9.0 13.9Inventories 17 74.0 54.2Trade receivables 18 30.8 30.2Other current assets 19 5.0 4.6Derivative financial instruments 23 * 0.3Total current assets 121.7 107.0Non-current assets Goodwill 11 52.5 52.2Intangible assets 12 56.3 46.6Property, plant and equipment 13 30.2 28.4Right-of-use assets 14 8.3 5.1Deferred income tax assets 24 3.2 2.9ESOP loan to employees * *Total non-current assets 150.5 135.2Total assets 272.2 242.2LIABILITIES Current liabilities Current income tax liabilities 2.4 4.9Trade and other payables 20 44.7 28.2Derivative financial instruments 23 0.1 0.1Lease liabilities 22 1.6 1.5Accrued consideration 21 * –Borrowings 22 0.2 –Total current liabilities 49.0 34.7Non-current liabilities Accrued consideration 21 1.3 1.0Borrowings 22 33.4 31.8Deferred income tax liabilities 24 9.4 6.7Provisions 0.2 0.1Lease liabilities 22 6.5 3.4Total non-current liabilities 50.8 43.0Total liabilities 99.8 77.7NET ASSETS 172.4 164.5EQUITY Equity attributable to equity holders of the CompanyShare capital 25 27.2 27.2Merger reserve 25 0.2 0.2Share-based payment reserve 25 5.6 4.1Treasury shares reserve 25 * (0.1)Translation reserve 25 (2.9) (3.8)Other reserve 25 4.4 3.6Retained earnings 25 137.0 132.6
171.5 163.8Non-controlling interests 0.9 0.7TOTAL EQUITY 172.4 164.5
* Balance is less than £100,000.
The accompanying notes form an integral part of these financial statements.
138
XP Power Annual Report & Accounts for the year ended 31 December 2021
CONSOLIDATED BALANCE SHEETAS AT 31 DECEMBER 2021
30801-XP-Power AR21 Financials.indd 13830801-XP-Power AR21 Financials.indd 138 08/03/2022 10:52:4208/03/2022 10:52:42

30801 8 March 2022 10:52 am V8
Attributable to equity holders of the Company
£m NoteShare
capital
Share-based
payment reserve
Treasury shares
reserveMerger reserve
Translation reserve
Otherreserve
Retainedearnings Total
Non-controlling
interestsTotal
equityBalance at 1 January 2020 27.2 3.9 (0.5) 0.2 (0.2) (0.8) 108.4 138.2 0.7 138.9Exercise of share-based payment awards – (1.2) 0.4 – – 4.3 – 3.5 – 3.5Employee share-based payment expenses – 1.5 – – – – – 1.5 – 1.5Tax on employee share-based payment expenses – (0.1) – – – – – (0.1) – (0.1)Dividends paid 9 – * – – – – (7.3) (7.3) * (7.3)Future acquisition of non-controlling interest – – – – – (0.1) – (0.1) – (0.1)Change in non-controlling interest – – – – – 0.2 – 0.2 (0.2) –Exchange difference arising from translation of financial statements of foreign operations – * – – (3.6) – * (3.6) * (3.6)Profit for the year – – – – – – 31.5 31.5 0.2 31.7Total comprehensive income for the year – – – – (3.6) – 31.5 27.9 0.2 28.1Balance at 31 December 2020 27.2 4.1 (0.1) 0.2 (3.8) 3.6 132.6 163.8 0.7 164.5Exercise of share-based payment awards – (0.5) 0.1 – – 1.0 – 0.6 – 0.6Employee share-based payment expenses – 1.5 – – – – – 1.5 – 1.5Tax on employee share-based payment expenses – 0.5 – – – – – 0.5 – 0.5Dividends paid 9 – – – – – – (18.2) (18.2) (0.2) (18.4)Future acquisition of non-controlling interest – – – – – (0.2) – (0.2) – (0.2)Exchange difference arising from translation of financial statements of foreign operations – * – – 0.9 – * 0.9 * 0.9Profit for the year – – – – – – 22.6 22.6 0.4 23.0Total comprehensive income for the year – * – – 0.9 – 22.6 23.5 0.4 23.9Balance at 31 December 2021 27.2 5.6 * 0.2 (2.9) 4.4 137.0 171.5 0.9 172.4
* Balance is less than £100,000.
The accompanying notes form an integral part of these financial statements.
139
FINANCIALS
CONSOLIDATED STATEMENT OF CHANGES IN EQUITYFOR THE FINANCIAL YEAR ENDED 31 DECEMBER 2021
30801-XP-Power AR21 Financials.indd 13930801-XP-Power AR21 Financials.indd 139 08/03/2022 10:52:4208/03/2022 10:52:42

30801 8 March 2022 10:52 am V8
£m Note 2021 2020
Cash flows from operating activitiesProfit after tax 23.0 31.7Adjustments for:– Income tax expense 8 5.4 4.0– Amortisation and depreciation 7 13.2 14.0– Finance charge 6 1.3 1.7– Share-based payment expenses 5 1.5 1.5– Fair value loss on derivative financial instruments 0.3 0.5– Loss on disposal of property, plant, and equipment * *– Loss on disposal of intangible assets – 1.2– Unrealised currency translation (gain)/ loss (0.1) 0.2– Provision for doubtful debts 29 (d) * 0.4Change in working capital, net of effects from acquisitions:– Inventories 26 (19.0) (12.3)– Trade and other receivables 26 (1.1) 2.7– Trade and other payables 26 16.1 3.3– Provision for liabilities and other charges 26 * *Cash generated from operations 40.6 48.9Income tax paid, net of refund (4.2) (3.3)Net cash provided by operating activities 36.4 45.6Cash flows from investing activitiesPurchases and construction of property, plant and equipment 13 (5.5) (4.0)Additions of development costs 12 (8.3) (7.7)Additions of software and software under development 12 (8.1) (3.2)Proceeds from disposal of property, plant and equipment * 0.1Proceeds from repayment of ESOP loans * *Payment of accrued consideration 21 – (0.6)Net cash used in investing activities (21.9) (15.4)Cash flows from financing activitiesProceeds from borrowings 22 3.7 – Repayment of borrowings 22 (2.9) (20.7)Principal payment of lease liabilities 22 (1.7) (1.7)Proceeds from exercise of share-based payment awards 0.6 3.5Interest paid 22 (0.9) (1.3)Dividend paid to equity holders of the Company 9 (18.2) (7.3)Dividend paid to non-controlling interests (0.2) *Net cash used in financing activities (19.6) (27.5)Net (decrease) / increase in cash and cash equivalents (5.1) 2.7Cash and cash equivalents at beginning of financial year 13.9 11.2Effects of currency translation on cash and cash equivalents * *Cash and cash equivalents at end of financial year 16 8.8 13.9
* Balance is less than £100,000.
The accompanying notes form an integral part of these financial statements.
140
XP Power Annual Report & Accounts for the year ended 31 December 2021
CONSOLIDATED STATEMENT OF CASH FLOWSFOR THE FINANCIAL YEAR ENDED 31 DECEMBER 2021
30801-XP-Power AR21 Financials.indd 14030801-XP-Power AR21 Financials.indd 140 08/03/2022 10:52:4208/03/2022 10:52:42

30801 8 March 2022 10:52 am V8
1. General InformationXP Power Limited (the “Company”) is listed on the London Stock Exchange and incorporated and domiciled in Singapore. The address of its registered office is 401 Commonwealth Drive, Lobby B, #02-02, Haw Par Technocentre, Singapore 149598. With effect from 7 February 2022, the address of registered office has changed to 19 Tai Seng Avenue, #07-01, Singapore 534054.
The nature of XP Power Limited and its subsidiaries’ operations and its principal activities are set out in the “Markets and Products” sections of the Annual Report on pages 02–03.
2. Summary of significant accounting policiesThe principal accounting policies applied in the preparation of these consolidated financial statements are set out below. These policies have been consistently applied to all the years presented, unless otherwise stated.
2.1 BASIS OF PREPARATIONThe consolidated financial statements of XP Power Limited and its subsidiaries (the “Group”) have been prepared in accordance with International Financial Reporting Standards (“IFRSs”) as issued by the International Accounting Standards Board (IFRS as issued by the IASB) and Singapore Financial Reporting Standards (International) (“SFRS(I)s”).
Adoption of IFRS as issued by the IASB On 31 December 2020, IFRS as adopted by the European Union at that date was brought into UK law and became IFRS as adopted by the United Kingdom, with future changes being subject to endorsement by the UK Endorsement Board.
Instead of transitioning into IFRS as adopted by the UK, XP Power Limited adopted IFRS as issued by the IASB in its consolidated financial statements on 1 January 2021. This change constitutes a change in accounting framework. However, there is no impact on recognition, measurement or disclosure in the period reported as a result of the change in framework.
Adoption of SFRS(I)The Group has voluntarily adopted SFRS(I)s as issued by the Accounting Standards Council on 1 January 2021. These financial statements for the year ended 31 December 2021 are the first set of financial statements the Group prepared in accordance with SFRS(I)s and IFRS as issued by the IASB. The Group’s previously issued financial statements for periods up to and including the financial year ended 31 December 2020 were prepared in accordance with IFRS as adopted by the EU.
In adopting SFRS(I) on 1 January 2021, the Group is required to apply all of the specific transition requirements in SFRS(I) 1 - First-time Adoption of SFRS(I).
Under SFRS(I) 1, these financial statements are required to be prepared using accounting policies that comply with SFRS(I) effective as at 31 December 2021. The same accounting policies are applied throughout all periods presented in these financial statements, subject to the mandatory exceptions and optional exemptions under SFRS(I) 1.
The Group’s opening balance sheet has been prepared as at 1 January 2020, which is the Group’s date of transition to SFRS(I) (“date of transition”). There was no impact on the adoption of the new framework in the period of initial application as shown below.
£m
Balance sheet as at 31 December 2019
prepared in accordance with IFRS as adopted by
the EU
Balance sheet as at 1 January 2020 prepared
in accordance with SFRS(I)
Current Asset 96.0 96.0Non-current Asset 137.4 137.4Current liabilities 30.4 30.4Non-current liabilities 64.1 64.1Equity 138.9 138.9
All references to SFRS(I)s and IFRSs are subsequently referred to as IFRS in these consolidated financial statements unless otherwise specified.
The consolidated financial statements have been prepared on the historical cost convention except as disclosed in the accounting policies below.
The preparation of financial statements requires management to make judgements, estimates and assumptions that affect the application of these accounting policies and the reported amounts of assets, liabilities, income and expenses. The estimates and associated assumptions are based on historical experience and various other factors that are believed to be reasonable under the circumstances, the results of which form the basis of making the judgements about carrying amounts of assets and liabilities that are not readily apparent from other sources. Areas involving a higher degree of judgement or complexity, or areas where assumptions and estimates are significant to the consolidated financial statements, are disclosed in Note 3.
141
FINANCIALS
NOTES TO THE CONSOLIDATEDFINANCIAL STATEMENTSFOR THE FINANCIAL YEAR ENDED 31 DECEMBER 2021
30801-XP-Power AR21 Financials.indd 14130801-XP-Power AR21 Financials.indd 141 08/03/2022 10:52:4208/03/2022 10:52:42

30801 8 March 2022 10:52 am V8
2. Summary of significant accounting policies continued
a. Going concernThe Group’s business activities, together with the factors likely to affect its future development, performance and position are set out in the strategic report on pages 20–25. The financial position of the Group, its cash flows, liquidity position and borrowing facilities are described in the financial review on pages 38–40. The principal risks of the Group are set out on pages 43–49. The directors have considered these areas alongside the principal risks and how they may impact going concern.
The directors reviewed budgets and forecasts to assess the cash requirements of the Group to continue in operational existence for a minimum period of 12 months from the date of the approval of these financial statements.
The Directors also reviewed downside scenarios to the budgets and forecasts, which reflect the possible impact of risks identified in the risk management framework. The greatest consideration was given to those risks with the highest potential impact if they occurred and those with the highest probability of occurring. Throughout these downside scenarios, the Group continues to have significant headroom on its financial debt covenants.
Therefore, after making the above enquiries, the Directors have a reasonable expectation that the Group has adequate resources to continue in operational existence for the foreseeable future. The Group, therefore, continues to adopt the going concern basis in preparing its consolidated financial statements.
b. Changes in accounting policy and disclosuresi New and amended standards adopted by the GroupOn 1 January 2021, the Group adopted the new or amended IFRS, Interpretations issued by the IFRS Interpretations Committee of the IASB (“IFRIC”) and Interpretations of SFRS(I) (“INT SFRIS(I)”) (collectively referred to as “Standards and Interpretations”) that are mandatory for application for the financial year. Changes to the Group’s accounting policies have been made as required, in accordance with the transitional provisions in the respective Standards and Interpretations.
The adoption of these new or amended Standards and Interpretations did not result in substantial changes to the Group’s accounting policies and had no material effect on the amounts reported for the current or previous financial years.
ii New standards and interpretations issued not yet adoptedCertain new accounting Standards and Interpretations have been published that are not mandatory for 31 December 2021 reporting periods and have not been early adopted by the Group. These are not expected to have a material impact on the entity in the current or future reporting periods and on foreseeable future transactions.
2.2 FOREIGN CURRENCY TRANSLATIONa. Functional and presentation currencyItems included in the financial statements of each entity in the Group are measured using the currency of the primary economic environment in which the entity operates (“functional currency”). The consolidated financial statements are presented in Pounds Sterling, which is different from the Company’s functional currency. The Company’s functional currency is the US Dollar.
The financial statements are presented in Pounds Sterling, as the majority of the Company’s Shareholders are based in the UK and the Company is listed on the London Stock Exchange. It is the currency that the Directors of the Group use when controlling and monitoring the performance and financial position of the Group.
b. Transactions and balancesForeign currency transactions are translated into the functional currency using the exchange rates at the dates of the transactions. Foreign exchange gains and losses resulting from the settlement of such transactions and from the translation of monetary assets and liabilities denominated in foreign currencies at year end exchange rates, are generally recognised in profit or loss. They are deferred in equity if they relate to qualifying cash flow hedges and qualifying net investment hedges or are attributable to part of the net investment in a foreign operation.
Non-monetary items that are measured at fair value in a foreign currency are translated using the exchange rates at the date when the fair value was determined. Translation differences on assets and liabilities carried at fair value are reported as part of the fair value gain or loss.
c. Group companiesThe results and financial position of all the Group’s foreign operations (none of which has the currency of a hyperinflationary economy) that have a functional currency different from the presentation currency are translated into the presentation currency as follows:
i. Assets and liabilities for each balance sheet presented are translated at the closing rate at the date of that balance sheet; ii. Income and expenses for each statement of profit or loss and statement of comprehensive income are translated at average exchange
rates (unless this is not a reasonable approximation of the cumulative effect of the rates prevailing on the transaction dates, in which case income and expenses are translated at the dates of the transactions);
iii. All resulting exchange differences are recognised in other comprehensive income.
142
XP Power Annual Report & Accounts for the year ended 31 December 2021
NOTES TO THE CONSOLIDATEDFINANCIAL STATEMENTS CONTINUEDFOR THE FINANCIAL YEAR ENDED 31 DECEMBER 2021
30801-XP-Power AR21 Financials.indd 14230801-XP-Power AR21 Financials.indd 142 08/03/2022 10:52:4208/03/2022 10:52:42

30801 8 March 2022 10:52 am V8
2. Summary of significant accounting policies continued
When a foreign operation is sold, the associated exchange differences are reclassified to profit or loss, as part of the gain or loss on sale.
Goodwill and fair value adjustments arising on the acquisition of a foreign operation are treated as assets and liabilities of the foreign operation and translated at the closing rate.
The Group has elected to treat goodwill and fair value adjustments arising on the acquisitions before the date of initial transition to IFRS as Pound Sterling-denominated assets and liabilities converted using the exchange rates at the dates of acquisition.
2.3 REVENUE RECOGNITIONa. Sales of goodsThe Group manufactures and sells a range of power products. Sales are recognised at a point in time when control of the products has transferred to its customer. Transfer of control occurs when delivery to the customer takes place, depending on the delivery terms agreed with the customer.
Power products are sometimes sold with volume discounts based on aggregate sales over a 12-month period or early payment discounts if the customers made early repayment. Revenue from these sales is recognised based on the price specified in the contract, net of the discounts. Accumulated experience is used to estimate and provide for the volume discounts, using the expected value method, and early payment discounts, using most likely approach. Revenue is only recognised to the extent that it is highly probable that a significant reversal will not occur. No element of financing is deemed present as the sales are made with a credit term of 30 days, which is consistent with market practice. The Group will usually issue a credit note for refund for faulty products.
A receivable (financial asset) is recognised when the goods are delivered as this is the point in time that the consideration is unconditional because only the passage of time is required before payment is due.
Volume rebates and early payment discounts are recognised when the goods are delivered and is presented as a reduction in trade and other receivables.
The Group has elected to apply the practical expedient not to adjust the transaction price for the existence of significant financing component when the period between the transfer of control of good or service to a customer and the payment date is one year or less.
b. Interest incomeInterest income is recognised using the effective interest rate method.
2.4 GROUP ACCOUNTING a. SubsidiariesSubsidiaries are all entities (including structured entities) over which the Group has control. The Group controls an entity when the Group is exposed to, or has the rights to, variable returns from its involvement with the entity and has the ability to affect those returns through its power to direct the activities of the entity. The existence and effect of potential voting rights that are currently exercisable or convertible are considered when assessing whether the Group controls another entity. Subsidiaries are fully consolidated from the date on which control is transferred to the Group. They are deconsolidated from the date that control ceases.
The Group uses the acquisition method of accounting to account for business combinations. The consideration transferred for the acquisition of a subsidiary comprises the fair value of the assets transferred, the liabilities incurred to the former owners of the acquired business, the equity interests issued by the Group, the fair value of any asset or liability resulting from a contingent consideration arrangement and the fair value of any pre-existing equity interest in the subsidiary. Identifiable assets acquired, liabilities and contingent liabilities assumed in a business combination are, with limited exceptions, measured initially at their fair values at the acquisition date. The Group recognises any non-controlling interest in the acquired entity, on an acquisition-by-acquisition basis, either at fair value or at the non-controlling interest’s proportionate share of the acquired entity’s net identifiable assets. Acquisition-related costs are expensed as incurred.
The excess of the consideration transferred, the amount of any non-controlling interest in the acquired entity and the acquisition-date fair value of any previously held equity interest in the acquired entity over the fair value of the net identifiable assets acquired is recorded as goodwill. If those amounts are less than the fair value of the net identifiable assets of the business acquired, the difference is recognised directly in profit or loss as a bargain purchase.
Inter-company transactions, balances and unrealised gains on transactions between Group companies are eliminated. Unrealised losses are also eliminated, unless the transaction provides evidence of an impairment of the transferred asset. Accounting policies of subsidiaries have been changed where necessary to ensure consistency with the policies adopted by the Group.
Investments in subsidiaries are held at cost less accumulated impairment losses in the separate financial statements.
b. Transactions with non-controlling interestsNon-controlling interests in the results and equity of subsidiaries are shown separately in the consolidated statement of profit or loss, statement of comprehensive income, statement of changes in equity and balance sheet respectively.
143
FINANCIALS
30801-XP-Power AR21 Financials.indd 14330801-XP-Power AR21 Financials.indd 143 08/03/2022 10:52:4208/03/2022 10:52:42

30801 8 March 2022 10:52 am V8
2. Summary of significant accounting policies continued
The Group treats transactions with non-controlling interests that do not result in a loss of control as transactions with equity owners of the Group. A change in ownership interest results in an adjustment between the carrying amounts of the controlling and non-controlling interests to reflect their relative interests in the subsidiary. Any difference between the amount of the adjustment to non-controlling interests and any consideration paid or received is recognised in a separate reserve within equity attributable to owners of the Company.
When the Group ceases to have control or significant influence, any retained interest in the entity is remeasured to its fair value, with the change in carrying amount recognised in profit or loss. The fair value is the initial carrying amount for the purposes of subsequently accounting for the retained interest as an associate, joint venture or financial asset. In addition, any amounts previously recognised in other comprehensive income in respect of that entity are accounted for as if the Group had directly disposed of the related assets or liabilities. This may mean that amounts previously recognised in other comprehensive income are reclassified to profit or loss.
2.5 INVENTORIESInventories are stated at the lower of cost and net realisable value. The cost of finished goods and work-in-progress comprises raw materials, direct labour, other direct costs and related production overheads (based on normal operating capacity) but excludes borrowing costs.
Costs are assigned to individual items of inventory on the basis of weighted average costs. Costs of purchased inventory are determined after deducting rebates and discounts. Net realisable value is the estimated selling price in the ordinary course of business less the estimated costs of completion and the estimated costs to make the sale.
2.6 PROPERTY, PLANT AND EQUIPMENT Items of property, plant and equipment, including land and buildings, are stated at historical cost less accumulated depreciation and any recognised impairment losses.
The historical cost of an item of property, plant and equipment initially recognised includes its purchase price and any cost that is directly attributable to bringing the asset to the location and condition necessary for it to be capable of operating in the manner intended by management.
Subsequent costs are included in the asset’s carrying amount, as appropriate, only when it is probable that future economic benefits associated with the item will flow to the Group and the cost of the item can be measured reliably. All other repairs and maintenance are charged to profit or loss during the financial period in which they are incurred.
Freehold land and property under development are not depreciated. Depreciation on other items of property, plant and equipment is calculated using the straight-line method to allocate their cost over their estimated useful lives as follows:
Plant and equipment – 10–33%Motor vehicles – 20–25%Building improvements – 10–33%Buildings – 2–5%
The residual values, estimated useful lives and depreciation method of property, plant and equipment are reviewed, and adjusted as appropriate, at each balance sheet date. The effects of any revision are recognised in profit or loss when the changes arise.
An asset’s carrying amount is written down immediately to its recoverable amount if the asset’s carrying amount is greater than its estimated recoverable amount.
Gains or losses on disposals are determined by comparing proceeds with carrying amount. These are included in profit or loss.
2.7 INTANGIBLE ASSETSa. GoodwillThe excess of the consideration transferred, the amount of any non-controlling interest in the acquired entity and the acquisition-date fair value of any previously held equity interest in the acquired entity over the fair value of the net identifiable assets acquired is recorded as goodwill.
Goodwill is not amortised but tested for impairment annually, or more frequently if events or changes in circumstances indicate that it might be impaired, and is carried at cost less accumulated impairment losses. Gains and losses on the disposal of an entity include the carrying amount of goodwill relating to the entity sold.
Goodwill is allocated to cash-generating units (“CGUs”) for the purpose of impairment testing. The allocation is made to those CGUs or groups of CGUs that are expected to benefit from the business combination in which the goodwill arose. The units or groups of units are identified at the lowest level at which goodwill is monitored for internal management purposes, being the operating segments. The operating segments are segregated based on three primary geographic areas, North America, Europe and Asia.
144
XP Power Annual Report & Accounts for the year ended 31 December 2021
NOTES TO THE CONSOLIDATEDFINANCIAL STATEMENTS CONTINUEDFOR THE FINANCIAL YEAR ENDED 31 DECEMBER 2021
30801-XP-Power AR21 Financials.indd 14430801-XP-Power AR21 Financials.indd 144 08/03/2022 10:52:4308/03/2022 10:52:43

30801 8 March 2022 10:52 am V8
2. Summary of significant accounting policies continued
b. Internally generated intangible asset - Software Costs associated with maintaining software programmes are recognised as an expense as incurred. Development costs that are directly attributable to the design and testing of identifiable and unique software products controlled by the group are recognised as intangible assets where the following criteria are met:
• it is technically feasible to complete the software so that it will be available for use;• management intends to complete the software and use or sell it;• there is an ability to use or sell the software;• it can be demonstrated how the software will generate probable future economic benefits;• adequate technical, financial and other resources to complete the development and to use or sell the software are available; and• the expenditure attributable to the software during its development can be reliably measured.
Directly attributable costs that are capitalised as part of the software include consultancy costs, employee costs and other directly attributable costs.
Capitalised development costs are recorded as intangible assets and amortised from the point at which the asset is ready for use. Amortisation is recognised in profit or loss on a straight-line basis over estimated useful lives of seven to ten years.
c. Internally generated intangible asset - Research and development Research expenditure and development expenditure that do not meet the criteria in b. above are recognised as an expense as incurred. Development costs previously recognised as an expense are not recognised as an asset in a subsequent period.
Development costs include materials used, direct labour and other directly attributable costs to bringing the asset to the condition necessary for it to be capable of operating in the manner intended by management.
Capitalised research and development expenditure are amortised on a straight-line basis over their useful lives, which vary between three and seven years depending on the exact nature of the project undertaken. Amortisation commences when the product is ready and available for sale.
The amortisation period and amortisation method of intangible assets other than goodwill are reviewed at least at each balance sheet date. The effects of any revision are recognised in profit or loss when the changes arise.
d. Other intangible assetsOther intangible assets that are acquired by the Group are initially recognised at cost. The cost of intangible assets acquired in a business combination is its fair value as at the date of acquisition. Following initial recognition, intangible assets are carried at cost less any accumulated amortisation. Amortisation is recognised in profit or loss on a straight-line basis over the estimated useful lives as follows:
Brand – 10%–50%Technology – 10%–20%Customer relationships – 10%–20%Customer contracts – 90%–100%
2.8 BORROWING COSTSBorrowing costs are recognised in profit or loss using effective interest rate method except for those costs that are directly attributable to the development of intangible assets.
Borrowing costs on general borrowings are capitalised by applying a capitalisation rate to the development expenditure that are financed by general borrowings.
General and specific borrowing costs that are directly attributable to the acquisition, construction or production of a qualifying asset are capitalised during the period of time that is required to complete and prepare the asset for its intended use or sale. Qualifying assets are assets that necessarily take a substantial period of time to get ready for their intended use or sale.
Other borrowing costs are expensed in the period in which they are incurred.
145
FINANCIALS
30801-XP-Power AR21 Financials.indd 14530801-XP-Power AR21 Financials.indd 145 08/03/2022 10:52:4308/03/2022 10:52:43
30801 8 March 2022 10:52 am V8
2. Summary of significant accounting policies continued
2.9 IMPAIRMENT OF NON-FINANCIAL ASSETSGoodwill is not subject to amortisation and is tested annually for impairment, or more frequently if events or changes in circumstances indicate that they might be impaired. Other non-financial assets are tested for impairment whenever events or changes in circumstances indicate that the carrying amount might not be recoverable. An impairment loss is recognised for the amount by which the asset’s carrying amount exceeds its recoverable amount. The recoverable amount is the higher of an asset’s fair value less costs of disposal and value in use. For the purposes of assessing impairment, assets are grouped at the lowest levels for which there are separately identifiable cash inflows which are largely independent of the cash inflows from other assets or groups of assets (cash-generating units).
Non-financial assets other than goodwill that suffered an impairment are reviewed for possible reversal of the impairment at the end of each reporting period.
2.10 FINANCIAL ASSETSa. Classification The Group classifies its financial assets in the following measurement categories:
• Those to be measured at amortised cost; and• Those to be measured subsequently at fair value (either through other comprehensive income, or through profit or loss).
The classification depends on the Group’s business model for managing the financial assets and the contractual terms of the cash flows.
For assets measured at fair values, gains or losses will either be recorded in profit or loss or in other comprehensive income. For investments in equity instruments that are not held for trading, this will depend on whether the group has made an irrevocable election at the time of initial recognition to account for the equity investment at fair value through other comprehensive income (FVOCI).
The Group reclassifies debt investments when and only when its business model for managing those assets changes.
b. Recognition and derecognition Regular way purchases and sales of financial assets are recognised on trade-date, the date on which the Group commits to purchase or sell the asset. Financial assets are derecognised when the rights to receive cash flows from the financial assets have expired or have been transferred and the Group has transferred substantially all the risks and rewards of ownership.
c. Measurement At initial recognition, the Group measures a financial asset at its fair value plus, in the case of a financial asset not at fair value through profit or loss (FVPL), transaction costs that are directly attributable to the acquisition of the financial asset. Transaction costs of financial assets carried at fair value through profit or loss are expensed in profit or loss.
Debt instrumentsDebt instruments mainly comprise of “trade receivables”, “other current assets (excluding prepayments, VAT receivables and rights to returned goods)”, “cash and cash equivalents” and “ESOP loan to employees” in the balance sheet.
Subsequent measurement of debt instruments depends on the Group’s business model for managing the asset and the cash flow characteristics of the asset. There are three measurement categories into which the Group classifies its debt instruments:
• Amortised cost: Assets that are held for collection of contractual cash flows, where those cash flows represent solely payments of principal and interest, are measured at amortised cost. Interest income from these financial assets is included in finance income using the effective interest rate method. Any gain or loss arising on derecognition is recognised directly in profit or loss and presented in other gains/(losses) together with foreign exchange gains and losses. Impairment losses are presented as a separate line item in the statement of profit or loss.
• FVOCI: Assets that are held for collection of contractual cash flows and for selling the financial assets, where the assets’ cash flows represent solely payments of principal and interest, are measured at FVOCI. Movements in the carrying amount are taken through other comprehensive income, except for the recognition of impairment gains or losses, interest income and foreign exchange gains and losses, which are recognised in profit or loss. When the financial asset is derecognised, the cumulative gain or loss previously recognised in other comprehensive income is reclassified from equity to profit or loss and recognised in other gains/(losses). Interest income from these financial assets is included in finance income using the effective interest rate method. Foreign exchange gains and losses are presented in other gains/(losses), and impairment expenses are presented as a separate line item in the statement of profit or loss.
• FVPL: Assets that do not meet the criteria for amortised cost or FVOCI are measured at FVPL. A gain or loss on a debt investment that is subsequently measured at FVPL is recognised in profit or loss and presented net within other gains/(losses) in the period in which it arises.
146
XP Power Annual Report & Accounts for the year ended 31 December 2021
NOTES TO THE CONSOLIDATEDFINANCIAL STATEMENTS CONTINUEDFOR THE FINANCIAL YEAR ENDED 31 DECEMBER 2021
30801-XP-Power AR21 Financials.indd 14630801-XP-Power AR21 Financials.indd 146 08/03/2022 10:52:4308/03/2022 10:52:43

30801 8 March 2022 10:52 am V8
2. Summary of significant accounting policies continued
d. Impairment The Group assesses on a forward looking basis the expected credit losses associated with its debt instruments carried at amortised cost and FVOCI. The impairment methodology applied depends on whether there has been a significant increase in credit risk.
For trade receivables, the Group applies the simplified approach permitted by IFRS 9, which requires expected lifetime losses to be recognised from initial recognition of the receivables, Expected credit loss is assessed separately for each of the Group’s key regions and is based on each region’s two-year historical credit loss experience.
2.11 OFFSETTING FINANCIAL INSTRUMENTSFinancial assets and liabilities are offset and the net amount reported in the balance sheet when there is a legally enforceable right to offset and there is an intention to settle on a net basis or realise the asset and the liability simultaneously.
2.12 TRADE AND OTHER PAYABLESTrade payables are obligations to pay for goods and services that have been acquired in the ordinary course of business from suppliers. Accounts payable are classified as current liabilities if payment is due within one year or less (or in the normal operating cycle of the business if longer). If not, they are presented as non-current liabilities.
Trade and other payables are initially recognised at fair value, and subsequently carried at amortised cost using the effective interest rate method.
2.13 PROVISIONSProvisions are recognised when the Group has a present legal or constructive obligation as a result of past events, and it is more likely than not that an outflow of resources will be required to settle the obligation and the amount has been reliably estimated.
Provisions are measured at the present value of the expenditure expected to be required to settle the obligation using a pre-tax discount rate that reflects the current market assessment of the time value of money and the risks specific to the obligation. The increase in the provision due to the passage of time is recognised as a finance expense. Changes in the estimated timing or amount of the expenditure or discount rate are recognised in profit or loss when the changes arise.
2.14 BORROWINGSBorrowings are recognised initially at fair value, net of transaction costs incurred. Borrowings are subsequently carried at amortised cost; any difference between the proceeds (net of transaction costs) and the redemption value is recognised in profit or loss over the period of the borrowings using the effective interest rate method.
Fees paid on the establishment of loan facilities are recognised as transaction costs of the loan to the extent that it is probable that some or all of the facility will be drawn down. In this case, the fee is deferred until the drawdown occurs. To the extent there is no evidence that it is probable that some or all of the facility will be drawn down, the fee is capitalised as a prepayment for liquidity services and amortised over the period of the facility to which it relates.
Borrowings are presented as current liabilities unless the Group has an unconditional right to defer settlement for at least 12 months after the balance sheet date, in which case they are presented as non-current liabilities.
2.15 LEASESWhen the Group is the lessee:
At the inception of the contract, the Group assesses if the contract contains a lease. A contract contains a lease if the contract conveys the right to control the use of an identified asset for a period of time in exchange for consideration. Reassessment is only required when the terms and conditions of the contract are changed.
a. Right-of-use assetsThe Group recognised a right-of-use asset and lease liability at the date which the underlying asset is available for use. Right-of-use assets are measured at cost which comprises the initial measurement of lease liabilities adjusted for any lease payments made at or before the commencement date and lease incentive received. Any initial direct costs that would not have been incurred if the lease had not been obtained are added to the carrying amount of the right-of-use assets.
These right-of-use assets are subsequently depreciated using the straight-line method from the commencement date to the earlier of the end of the useful life of the right-of-use asset or the end of the lease term.
147
FINANCIALS
30801-XP-Power AR21 Financials.indd 14730801-XP-Power AR21 Financials.indd 147 08/03/2022 10:52:4308/03/2022 10:52:43

30801 8 March 2022 10:52 am V8
2. Summary of significant accounting policies continued
b. Lease liabilitiesThe initial measurement of lease liability is measured at the present value of the lease payments discounted using the implicit rate in the lease, if the rate can be readily determined. If that rate cannot be readily determined, the Group shall use its incremental borrowing rate.
Lease payments include the following:
• Fixed payment (including in-substance fixed payments), less any lease incentives receivables;• Variable lease payment that are based on an index or rate, initially measured using the index or rate at the commencement date;• Amount expected to be payable under residual value guarantees;• The exercise price of a purchase option if is reasonably certain to exercise the option; and• Payment of penalties for terminating the lease, if the lease term reflects the Group exercising that option.
For contract that contain both lease and non-lease components, the Group allocates the consideration to each lease component on the basis of the relative standalone price of the lease and non-lease component. The Group has elected to not separate lease and non-lease component for property leases and account these as one single lease component.
Lease liability is measured at amortised cost using the effective interest rate method. Lease liability shall be remeasured when:
• There is a change in future lease payments arising from changes in an index or rate;• There is a change in the Group’s assessment of whether it will exercise an extension option; or • There is modification in the scope or the consideration of the lease that was not part of the original term.
Lease liability is remeasured with a corresponding adjustment to the right-of-use asset, or is recorded in profit or loss if the carrying amount of the right-of-use asset has been reduced to zero.
Lease payments are presented as follows in the Group statement of cash flows:
• Short-term lease payments, payments for leases of low-value assets and variable lease payments that are not included in the measurement of the lease liabilities are presented within cash flows from operating activities;
• Payments for the interest element of recognised lease liabilities are included in ‘interest paid’ within cash flows from financing activities; and
• Payments for the principal element of recognised lease liabilities are presented within cash flows from financing activities.
c. Short-term or low-value leasesThe Group has elected to not recognised right-of-use assets and lease liabilities for short-term leases that have lease terms of 12 months or less and leases of low-value leases, except for sublease arrangements. Lease payments relating to these leases are expensed to profit or loss on a straight-line basis over the lease term.
d. Variable lease paymentsVariable lease payments that are not based on an index or a rate are not included as part of the measurement and initial recognition of lease liability. The Group shall recognise those lease payments in profit or loss in the periods that triggered those lease payments.
2.16 DERIVATIVE FINANCIAL INSTRUMENTS A derivative financial instrument for which no hedge accounting is applied is initially recognised at its fair value at the date the contract is entered into and is subsequently carried at its fair value. Changes in fair value are recognised in profit or loss. The Group does not apply hedge accounting for its derivative financial instruments.
The Group’s activities expose it primarily to the financial risks of changes in foreign currency exchange rates and interest rates. The Group periodically uses foreign exchange forward contracts to manage the foreign currency exposures.
2.17 CURRENT AND DEFERRED INCOME TAXThe tax expense represents the sum of the tax currently payable and deferred tax.
The tax currently payable is based on the taxable profit for the year. Taxable profit differs from net profit as reported in the statement of comprehensive income because it excludes items of income or expense that are taxable or deductible in other years and it further excludes items that are never taxable or deductible. The Group’s liability for current tax is calculated using tax rates that have been enacted or substantively enacted by the balance sheet date. Management periodically evaluates positions taken in tax returns with respect to situations in which applicable tax regulation is subject to interpretation. It establishes provisions, where appropriate, on the basis of amounts expected to be paid to the tax authorities.
148
XP Power Annual Report & Accounts for the year ended 31 December 2021
NOTES TO THE CONSOLIDATEDFINANCIAL STATEMENTS CONTINUEDFOR THE FINANCIAL YEAR ENDED 31 DECEMBER 2021
30801-XP-Power AR21 Financials.indd 14830801-XP-Power AR21 Financials.indd 148 08/03/2022 10:52:4308/03/2022 10:52:43
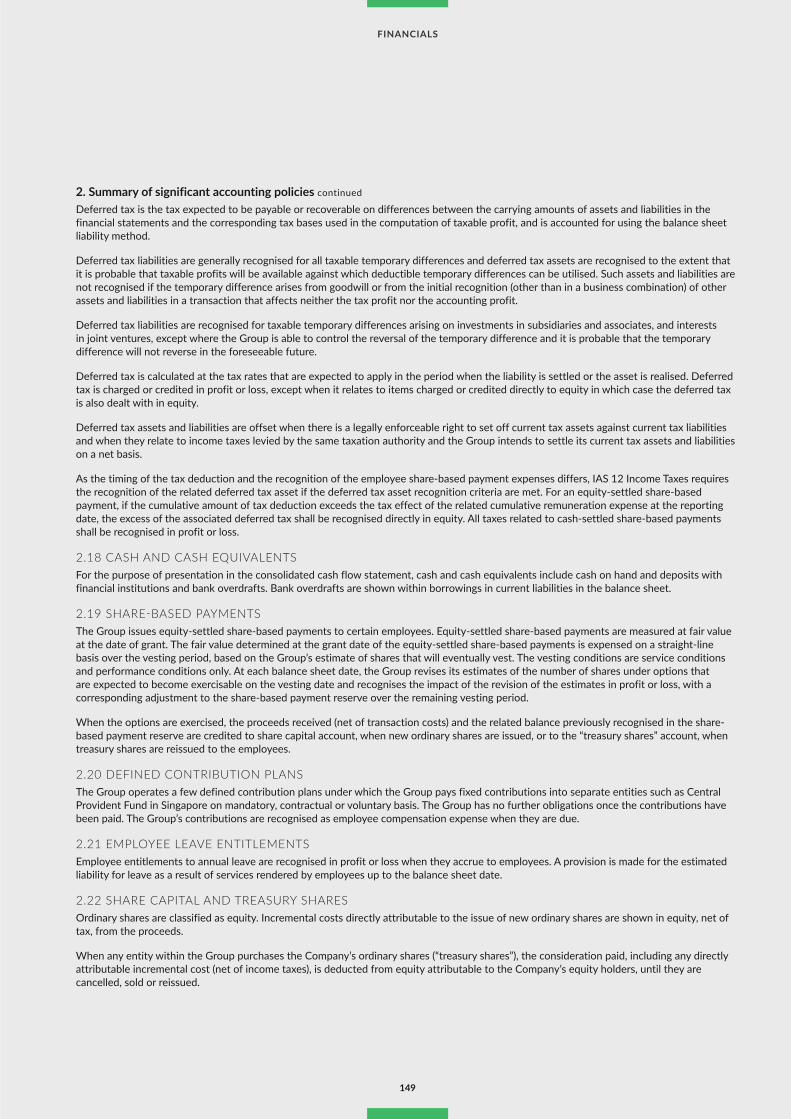
30801 8 March 2022 10:52 am V8
2. Summary of significant accounting policies continued
Deferred tax is the tax expected to be payable or recoverable on differences between the carrying amounts of assets and liabilities in the financial statements and the corresponding tax bases used in the computation of taxable profit, and is accounted for using the balance sheet liability method.
Deferred tax liabilities are generally recognised for all taxable temporary differences and deferred tax assets are recognised to the extent that it is probable that taxable profits will be available against which deductible temporary differences can be utilised. Such assets and liabilities are not recognised if the temporary difference arises from goodwill or from the initial recognition (other than in a business combination) of other assets and liabilities in a transaction that affects neither the tax profit nor the accounting profit.
Deferred tax liabilities are recognised for taxable temporary differences arising on investments in subsidiaries and associates, and interests in joint ventures, except where the Group is able to control the reversal of the temporary difference and it is probable that the temporary difference will not reverse in the foreseeable future.
Deferred tax is calculated at the tax rates that are expected to apply in the period when the liability is settled or the asset is realised. Deferred tax is charged or credited in profit or loss, except when it relates to items charged or credited directly to equity in which case the deferred tax is also dealt with in equity.
Deferred tax assets and liabilities are offset when there is a legally enforceable right to set off current tax assets against current tax liabilities and when they relate to income taxes levied by the same taxation authority and the Group intends to settle its current tax assets and liabilities on a net basis.
As the timing of the tax deduction and the recognition of the employee share-based payment expenses differs, IAS 12 Income Taxes requires the recognition of the related deferred tax asset if the deferred tax asset recognition criteria are met. For an equity-settled share-based payment, if the cumulative amount of tax deduction exceeds the tax effect of the related cumulative remuneration expense at the reporting date, the excess of the associated deferred tax shall be recognised directly in equity. All taxes related to cash-settled share-based payments shall be recognised in profit or loss.
2.18 CASH AND CASH EQUIVALENTSFor the purpose of presentation in the consolidated cash flow statement, cash and cash equivalents include cash on hand and deposits with financial institutions and bank overdrafts. Bank overdrafts are shown within borrowings in current liabilities in the balance sheet.
2.19 SHARE-BASED PAYMENTSThe Group issues equity-settled share-based payments to certain employees. Equity-settled share-based payments are measured at fair value at the date of grant. The fair value determined at the grant date of the equity-settled share-based payments is expensed on a straight-line basis over the vesting period, based on the Group’s estimate of shares that will eventually vest. The vesting conditions are service conditions and performance conditions only. At each balance sheet date, the Group revises its estimates of the number of shares under options that are expected to become exercisable on the vesting date and recognises the impact of the revision of the estimates in profit or loss, with a corresponding adjustment to the share-based payment reserve over the remaining vesting period.
When the options are exercised, the proceeds received (net of transaction costs) and the related balance previously recognised in the share-based payment reserve are credited to share capital account, when new ordinary shares are issued, or to the “treasury shares” account, when treasury shares are reissued to the employees.
2.20 DEFINED CONTRIBUTION PLANSThe Group operates a few defined contribution plans under which the Group pays fixed contributions into separate entities such as Central Provident Fund in Singapore on mandatory, contractual or voluntary basis. The Group has no further obligations once the contributions have been paid. The Group’s contributions are recognised as employee compensation expense when they are due.
2.21 EMPLOYEE LEAVE ENTITLEMENTSEmployee entitlements to annual leave are recognised in profit or loss when they accrue to employees. A provision is made for the estimated liability for leave as a result of services rendered by employees up to the balance sheet date.
2.22 SHARE CAPITAL AND TREASURY SHARESOrdinary shares are classified as equity. Incremental costs directly attributable to the issue of new ordinary shares are shown in equity, net of tax, from the proceeds.
When any entity within the Group purchases the Company’s ordinary shares (“treasury shares”), the consideration paid, including any directly attributable incremental cost (net of income taxes), is deducted from equity attributable to the Company’s equity holders, until they are cancelled, sold or reissued.
149
FINANCIALS
30801-XP-Power AR21 Financials.indd 14930801-XP-Power AR21 Financials.indd 149 08/03/2022 10:52:4308/03/2022 10:52:43

30801 8 March 2022 10:52 am V8
2. Summary of significant accounting policies continued
When treasury shares are subsequently cancelled, the cost of treasury shares are deducted against the share capital account if the shares are purchased out of capital of the Company, or against the retained earnings of the Company if the shares are purchased out of earnings of the Company.
When treasury shares are subsequently sold or reissued pursuant to the employee share-based payment plans, the cost of treasury shares is reversed from the treasury share reserve and the realised gain or loss on sale or reissue, net of any directly attributable incremental transaction costs and related income tax, is recognised in the other reserve of the Company.
Other reserve comprises future transactions with the non-controlling interest. The amount that may become payable under the agreement is initially recognised at the present value of the redemption amount within liabilities with a corresponding charge directly to equity. The liability is subsequently accreted through equity up to the redemption amount that is payable at the date at which the agreement first becomes exercisable.
2.23 DIVIDEND DISTRIBUTIONDividend distributions to the Company’s Shareholders are recognised when the dividends are approved for payment or, in the case of interim dividends, when paid.
2.24 SEGMENT REPORTINGOperating segments are reported in a manner consistent with the internal reporting provided to the Chief Operating Decision Makers who are responsible for allocating resources and assessing performance of the operating segments. Segment reporting is disclosed in Note 4.
3. Critical accounting judgements and key sources of estimation uncertaintyIn the process of applying the Group’s accounting policies, as described in Note 2, management has made the following judgements and estimations that have the most significant effect on the amounts recognised in the financial statements.
a. Recoverability of capitalised development costsDuring the year £8.3 million (2020: £7.7 million) of development costs were capitalised, bringing the total carrying amount of development costs capitalised as intangible assets as at 31 December 2021 to £30.0 million (2020: £25.1 million), net of amortisation. Management has reviewed the balances by project, compared the carrying amount to expected future revenues and profits and is satisfied that no impairment exists and that the costs capitalised will be fully recovered as the products are launched to market. New product projects are monitored regularly and should the technical or market feasibility of a new product be in question, the project would be cancelled and capitalised costs to date will be removed from the balance sheet and recognised in profit or loss. Significant judgements are used by the Group to estimate future sales of products and expected future cash flows. In making these estimates, management has relied on past performance, its expectations of market developments, and industry trends.
b. Useful lives of capitalised development costsThe Group estimates the useful lives of capitalised development costs based on the period over which the assets are expected to be available for use by the Group. Significant judgements are used by the Group in determining the useful lives of capitalised development costs based on the expected life cycle of these products, taking into consideration expected customer demand and technological innovation.
c. Impairment of goodwillThe Group tests annually for impairment of goodwill, or more frequently if there are indications that goodwill might be impaired.
An impairment loss is recognised when the carrying amount of a CGU, including the goodwill, exceeds the recoverable amount of the CGU. The recoverable amount of a CGU is the higher of the CGU’s fair value less cost to sell and value-in-use.
The recoverable amount of the goodwill is determined from value-in-use calculations. The key assumptions and estimates for the value-in-use calculations are those regarding the discount rates, growth rates and expected changes to sales and overheads during the period. Management estimates discount rates using pre-tax rates that reflect current market assessments of the time value of money and the risks specific to the cash-generating units.
The Group prepares cash flow forecasts derived from the most recent financial results and takes into account industry growth forecasts for the next five years and extrapolates cash flows for the following five years assuming no growth from that date. The carrying amount of goodwill as at 31 December 2021 was £52.5 million (2020: £52.2 million) with no impairment adjustment required for 2021.
Management assessed that there are no realistic foreseeable changes that will result in impairment loss on the goodwill allocated to the North America, Europe and Asia operating segments.
Each CGUs or group of CGUs have been tested for impairment to demonstrate the impact of the possibility of an extreme weather even causing a temporary closure of a manufacturing site followed by a ramp up of production back to original levels, or government restrictions on power (see Climate Risks in the Sustainability Report) that could result in ongoing reduction of capacity. The impacts of the headroom of North America, Europe and Asia is a reduction of £12.4 million, £12.4 million and £22.7 million respectively. The recoverable amounts exceed the carrying values as at 31 December 2021 and no potential indicator of impairment was identified.
150
XP Power Annual Report & Accounts for the year ended 31 December 2021
NOTES TO THE CONSOLIDATEDFINANCIAL STATEMENTS CONTINUEDFOR THE FINANCIAL YEAR ENDED 31 DECEMBER 2021
30801-XP-Power AR21 Financials.indd 15030801-XP-Power AR21 Financials.indd 150 08/03/2022 10:52:4308/03/2022 10:52:43

30801 8 March 2022 10:52 am V8
4. Segmented and revenue informationManagement has determined the operating segments based on the reports reviewed by the Chief Operating Decision Makers (“CODM”) that are used to make strategic decisions. The CODM are the Executive Board of Directors who will review the operating results and forecasts to make decisions about resources to be allocated to the segments and assess their performance.
The Executive Board of Directors considers and manages the business on a geographic basis. Management manages and monitors the business based on the three primary geographic areas: North America, Europe and Asia. All geographic locations market the same class of products to their respective customer base.
The Executive Board of Directors assesses the performance of the operating segments based on net sales and operating income. Net sales for geographic segments are based on the location of the design win rather than where the end sale is made. The operating income for each segment includes net sales to third parties, related cost of sales, operating expenses directly attributable to the segment, and a portion of corporate expenses. Costs excluded from segment operating income include share-based payment expenses, income taxes, various non-operating charges, and other separately managed general and administrative costs.
Segment assets consist primarily of property, plant and equipment, right-of-use assets, goodwill, intangible assets, inventories, trade receivables, cash and cash equivalents, derivative financial instruments and exclude tax assets.
Segment liabilities comprise trade and other current liabilities, derivative financial instruments, borrowings, accrued consideration and exclude tax liabilities.
(I) REVENUEThe Group derives revenue from the transfer of goods at a point in time in the following major product lines and geographical regions.
The revenue by class of customer and location of the design win is as follows:
Year to 31 December 2021 Year to 31 December 2020
£m EuropeNorth
America Asia Total EuropeNorth
America Asia Total
Semiconductor Manufacturing Equipment 3.0 75.2 15.1 93.3 1.8 60.6 7.2 69.6Industrial Technology 43.7 37.1 11.2 92.0 42.8 37.4 14.2 94.4Healthcare 20.6 28.9 5.5 55.0 21.0 43.2 5.1 69.3Total 67.3 141.2 31.8 240.3 65.6 141.2 26.5 233.3
Revenues of £40.2 million (2020: £32.1 million) are derived from a single external customer. These revenues are attributable to the semiconductor manufacturing equipment sector.
The revenue by region or country where sales are generated is as follows:
£m 2021 2020
North America 144.5 134.8United Kingdom 27.9 33.4Singapore 29.1 31.0Germany 21.4 14.5Switzerland 1.7 2.6France 3.3 3.8Other countries 12.4 13.2Total revenue 240.3 233.3
The majority of North America’s revenue is generated from the United States of America.
(II) SEGMENTAs permitted under IFRS 15 Revenue from Contracts with Customers, the aggregated transaction price allocated to unsatisfied contracts of periods one year or less, or are billed based on time incurred, is not disclosed.
The segment information provided to the CODM for the reportable segments for the year ended 31 December 2021 and prior year comparatives is as follows:
151
FINANCIALS
30801-XP-Power AR21 Financials.indd 15130801-XP-Power AR21 Financials.indd 151 08/03/2022 10:52:4308/03/2022 10:52:43

30801 8 March 2022 10:52 am V8
4. Segmented and revenue information continued
Reconciliation of segment results to profit after tax:
£m 2021 20201
Europe 20.3 18.2North America 46.1 48.7Asia 10.0 8.4Segment results 76.4 75.3Research and development (16.0) (14.9)Manufacturing (3.6) (3.1)Corporate cost from operating segment (11.7) (11.3)Adjusted operating profit 45.1 46.0Finance charge (1.3) (1.7)Specific items (15.4) (8.6)Profit before tax 28.4 35.7Income tax expense (5.4) (4.0)Profit after tax 23.0 31.7
1 Prior year comparatives were reclassified to ensure consistency with 2021 segmental presentation.
Year to 31 December 2021 Year to 31 December 2020
£m EuropeNorth
America Asia Total EuropeNorth
America Asia Total
Other informationProperty, plant and equipment additions 0.2 3.3 2.0 5.5 0.1 1.8 2.1 4.0Depreciation of property, plant and equipment 0.2 1.6 2.2 4.0 0.4 1.5 2.1 4.0Right-of-use assets additions 0.4 0.1 4.5 5.0 0.4 * 0.4 0.8Depreciation of right-of-use assets 0.5 0.9 0.4 1.8 0.5 1.1 0.3 1.9Intangible assets additions – 4.6 11.8 16.4 * 4.4 6.5 10.9Amortisation 0.2 4.3 2.9 7.4 0.2 4.2 3.7 8.1Balance sheetSegment assets 26.0 145.9 94.2 266.1 29.1 130.7 75.7 235.5Unallocated deferred and current income tax 6.1 6.7Consolidated total assets 272.2 242.2Segment liabilities (5.7) (52.2) (30.1) (88.0) (5.8) (44.8) (15.5) (66.1)Unallocated deferred and current income tax (11.8) (11.6)Consolidated total liabilities (99.8) (77.7)
* Balance is less than £100,000.
Non-current assets, other than deferred income tax assets, by countries:
£m 2021 2020
North America 83.3 81.6United Kingdom 11.6 11.8Singapore 39.0 25.2Germany 0.5 0.5Switzerland * 0.1France * *Other countries 12.9 13.1Total non-current assets 147.3 132.3
* Balance is less than £100,000.
152
XP Power Annual Report & Accounts for the year ended 31 December 2021
NOTES TO THE CONSOLIDATEDFINANCIAL STATEMENTS CONTINUEDFOR THE FINANCIAL YEAR ENDED 31 DECEMBER 2021
30801-XP-Power AR21 Financials.indd 15230801-XP-Power AR21 Financials.indd 152 08/03/2022 10:52:4308/03/2022 10:52:43

30801 8 March 2022 10:52 am V8
4. Segmented and revenue information continued
Reconciliation of adjusted measuresThe Group presents adjusted operating profit and adjusted profit before tax by making adjustments for costs and profits, which management believes to be significant by virtue of their size, nature or incidence or which have a distortive effect on current year earnings. Such items may include, but are not limited to, costs associated with business combinations, gains and losses on the disposal of businesses, fair value movements, restructuring changes, acquisition related costs and amortisation of intangible assets arising from business combinations.
In addition, the Group presents an adjusted profit after tax measure by making adjustments for certain tax charges and credits, which management believes to be significant by virtue of their size, nature or incidence or which have a distortive effect.
The Group uses these adjusted measures to evaluate performance and as a method to provide shareholders with clear and consistent reporting. See below for a reconciliation of operating profit to adjusted operating profit, a reconciliation of profit before tax to adjusted profit before tax and a reconciliation of profit after tax to adjusted profit after tax.
a. A reconciliation of operating profit to adjusted operating profit is as follows:
£m 2021 2020
Operating profit 29.7 37.4Adjusted for:Acquisition costs 0.1 0.3Costs related to ERP implementation 2.1 1.9Amortisation of intangible assets due to business combination 2.8 3.2Legal costs 10.1 0.4Restructuring costs – 2.3Fair value loss on derivative financial instruments 0.3 0.5
15.4 8.6Adjusted operating profit 45.1 46.0
b. A reconciliation of profit before income tax to adjusted profit before tax is as follows:
£m 2021 2020
Profit before tax (“PBT”) 28.4 35.7Adjusted for:Acquisition costs 0.1 0.3Costs related to ERP implementation 2.1 1.9Amortisation of intangible assets due to business combination 2.8 3.2Legal costs 10.1 0.4Restructuring costs – 2.3Fair value loss on derivative financial instruments 0.3 0.5
15.4 8.6Adjusted PBT 43.8 44.3
c. A reconciliation of profit after tax to adjusted profit after tax is as follows:
£m 2021 2020
Profit after tax (“PAT”) 23.0 31.7Adjusted for:Acquisition costs 0.1 0.3Costs related to ERP implementation 2.1 1.9Amortisation of intangible assets due to business combination 2.8 3.2Legal costs 10.1 0.4Restructuring costs – 2.3Fair value loss on derivative financial instruments 0.3 0.5Non-recurring tax benefits1 (3.0) (1.1)
12.4 7.5Adjusted PAT 35.4 39.2
1 Adjusted for tax on specific items relating to completed acquisitions of £10,058 (2020: £0.1 million), costs related to ERP implementation of £0.3 million (2020: £0.3 million), legal costs of £2.6 million (2020: £0.1 million), restructuring costs of £nil (2020: £0.5 million) and fair value loss on derivative financial instruments of £0.1 million (2020: £0.1 million)
153
FINANCIALS
30801-XP-Power AR21 Financials.indd 15330801-XP-Power AR21 Financials.indd 153 08/03/2022 10:52:4308/03/2022 10:52:43

30801 8 March 2022 10:52 am V8
5. Employee compensation (including Directors)£m 2021 2020
Wages and salaries 65.6 60.7Employers’ contribution to defined contribution plans 8.1 8.1Share-based payment expenses 1.5 1.5
75.2 70.3Less: amount capitalised in intangible assets (7.6) (6.9)Total 67.6 63.4
For further information regarding Directors’ remuneration, refer to the Directors’ Remuneration Report.
6. Finance charge£m 2021 2020
Interest income * *Interest expense – Bank borrowings and overdrafts 1.2 1.5– Lease liabilities 0.2 0.3
1.4 1.8Unwinding of discount for asset retirement obligation * *Unwinding of discount for accrued consideration 0.1 *
1.5 1.8Less: amount capitalised in intangible assets (0.2) (0.1)Amount recognised in profit or loss 1.3 1.7
* Balance is less than £100,000.
Finance expenses on general financing were capitalised at a rate of 1.1% per annum (2020: 1.2% per annum).
154
XP Power Annual Report & Accounts for the year ended 31 December 2021
NOTES TO THE CONSOLIDATEDFINANCIAL STATEMENTS CONTINUEDFOR THE FINANCIAL YEAR ENDED 31 DECEMBER 2021
30801-XP-Power AR21 Financials.indd 15430801-XP-Power AR21 Financials.indd 154 08/03/2022 10:52:4308/03/2022 10:52:43
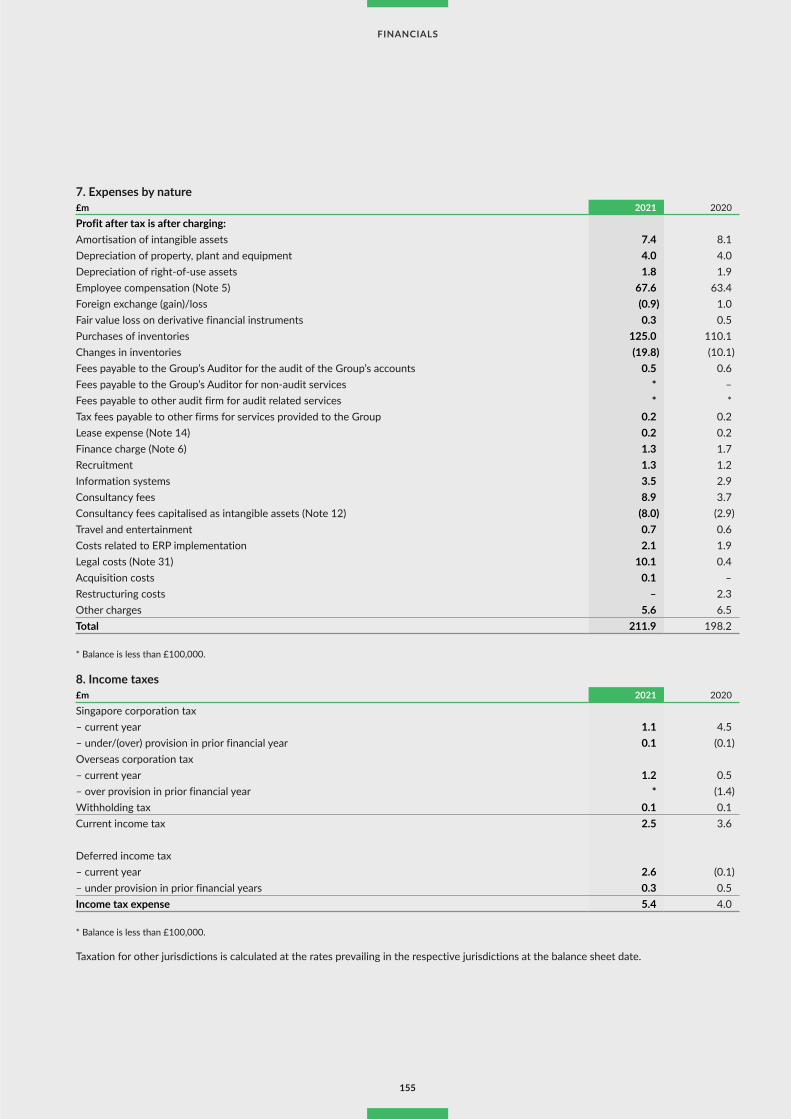
30801 8 March 2022 10:52 am V8
7. Expenses by nature £m 2021 2020
Profit after tax is after charging:Amortisation of intangible assets 7.4 8.1Depreciation of property, plant and equipment 4.0 4.0Depreciation of right-of-use assets 1.8 1.9Employee compensation (Note 5) 67.6 63.4Foreign exchange (gain)/loss (0.9) 1.0Fair value loss on derivative financial instruments 0.3 0.5Purchases of inventories 125.0 110.1Changes in inventories (19.8) (10.1)Fees payable to the Group’s Auditor for the audit of the Group’s accounts 0.5 0.6Fees payable to the Group’s Auditor for non-audit services * –Fees payable to other audit firm for audit related services * *Tax fees payable to other firms for services provided to the Group 0.2 0.2Lease expense (Note 14) 0.2 0.2Finance charge (Note 6) 1.3 1.7Recruitment 1.3 1.2Information systems 3.5 2.9Consultancy fees 8.9 3.7Consultancy fees capitalised as intangible assets (Note 12) (8.0) (2.9)Travel and entertainment 0.7 0.6Costs related to ERP implementation 2.1 1.9Legal costs (Note 31) 10.1 0.4Acquisition costs 0.1 –Restructuring costs – 2.3Other charges 5.6 6.5Total 211.9 198.2
* Balance is less than £100,000.
8. Income taxes£m 2021 2020
Singapore corporation tax– current year 1.1 4.5– under/(over) provision in prior financial year 0.1 (0.1)Overseas corporation tax– current year 1.2 0.5– over provision in prior financial year * (1.4)Withholding tax 0.1 0.1Current income tax 2.5 3.6
Deferred income tax– current year 2.6 (0.1)– under provision in prior financial years 0.3 0.5Income tax expense 5.4 4.0
* Balance is less than £100,000.
Taxation for other jurisdictions is calculated at the rates prevailing in the respective jurisdictions at the balance sheet date.
155
FINANCIALS
30801-XP-Power AR21 Financials.indd 15530801-XP-Power AR21 Financials.indd 155 08/03/2022 10:52:4308/03/2022 10:52:43

30801 8 March 2022 10:52 am V8
8. Income taxes continued
The differences between the total income tax expense shown above and the amount calculated by applying the standard rate of Singapore income tax rate to the profit before income tax are as follows:
£m 2021 2020
Profit before tax 28.4 35.7Tax on profit at standard Singapore tax rate of 17% (2020: 17%) 4.8 6.1Tax incentives (0.7) (0.6)Higher rates of overseas corporation tax 1.1 0.5Tax effect of share-based payments (0.3) (1.2)Non-deductible expenditure 0.2 0.3Non-taxable income (0.1) (0.2)Deferred tax effect of change in tax rate (0.1) –Under/(over) provision of tax in prior financial years 0.4 (1.0) Withholding tax 0.1 0.1Income tax expense 5.4 4.0
Aggregate deferred tax asset arising in the reporting period and not recognised in net profit or loss or other comprehensive income but directly (debited) or credited to equity:
£m 2021 2020
Deferred tax asset – share-based payments (0.5) (0.1)Total (0.5) (0.1)
9. DividendsAmounts recognised as distributions to equity holders in the period:
2021 2020
Pence per share £m
Pence per share £m
Prior year third quarter dividend paid 20.0* 3.9 20.0 3.8Prior year final dividend paid 36.0* 7.1 – –First quarter dividend paid 18.0^ 3.5 – –Second quarter dividend paid 19.0^ 3.7 18.0* 3.5Total 93.0 18.2 38.0 7.3
* Dividends in respect of 2020 (74.0p).^ Dividends in respect of 2021 (94.0p).
The third quarter dividend of 21.0 pence per share was paid on 17 January 2022. The proposed final dividend of 36.0 pence per share for the year ended 31 December 2021 is subject to approval by Shareholders at the Annual General Meeting scheduled for 19 April 2022 and has not been included as a liability in these financial statements. It is proposed that the final dividend be paid on 28 April 2022 to members on the register as at 25 March 2022. These financial statements do not reflect this dividend, which will be accounted for in shareholders’ equity as an appropriation of retained earnings in the financial year ending 31 December 2022.
156
XP Power Annual Report & Accounts for the year ended 31 December 2021
NOTES TO THE CONSOLIDATEDFINANCIAL STATEMENTS CONTINUEDFOR THE FINANCIAL YEAR ENDED 31 DECEMBER 2021
30801-XP-Power AR21 Financials.indd 15630801-XP-Power AR21 Financials.indd 156 08/03/2022 10:52:4308/03/2022 10:52:43

30801 8 March 2022 10:52 am V8
10. Earnings per shareThe calculations of the basic and diluted earnings per share attributable to the ordinary equity holders of the Company are based on the following data:
£m 2021 2020
EarningsEarnings for the purposes of basic and diluted earnings per share(profit attributable to equity holders of the Company) 22.6 31.5Earnings for earnings per share 22.6 31.5Number of sharesWeighted average number of shares for the purposes of basic earnings per share (thousands) 19,514 19,326Effect of potentially dilutive share-based payment plans (thousands) 344 327Weighted average number of shares for the purposes of dilutive earnings per share (thousands) 19,858 19,653Earnings per share from operationsBasic 115.8p 163.0pBasic adjusted* 179.4p 201.8pDiluted 113.8p 160.3pDiluted adjusted* 176.3p 198.4p
* Reconciliation to compute the diluted adjusted earnings from operations is as per below:
£m 2021 2020
Earnings for the purposes of basic and diluted earnings per share(profit attributable to equity holders of the Company) 22.6 31.5Amortisation of intangible assets due to business combination 2.8 3.2Acquisition costs 0.1 0.3Non-recurring tax benefits (3.0) (1.1)Costs related to ERP implementation 2.1 1.9Legal costs 10.1 0.4Restructuring costs – 2.3Fair value loss on derivative financial instruments 0.3 0.5Adjusted earnings 35.0 39.0
11. Goodwill£m 2021 2020
Cost and net book value At 1 January 52.2 53.2Accrued consideration (Note 21) 0.2 (0.3)Currency translation differences 0.1 (0.7)At 31 December 52.5 52.2
Goodwill arises on the consolidation of business/subsidiary undertakings.
For the purpose of impairment tests for goodwill, goodwill is allocated to the cash-generating units (“CGUs”) according to operating segments identified in Note 4.
A segment-level summary of the goodwill allocation is as follows:
£m 2021 2020
North America 41.3 41.2Europe 9.7 9.5Asia 1.5 1.5At 31 December 52.5 52.2
157
FINANCIALS
30801-XP-Power AR21 Financials.indd 15730801-XP-Power AR21 Financials.indd 157 08/03/2022 10:52:4408/03/2022 10:52:44

30801 8 March 2022 10:52 am V8
11. Goodwill continued
The recoverable amount of the CGU is determined from value-in-use calculations. Cash flow projections used in the value-in-use calculations were based on financial budgets approved by management covering a five-year period. Cash flows beyond the five-year period were extrapolated using the estimated growth rates stated below.
Key assumptions used for value-in-use calculations:
31 December 2021 31 December 2020
Growth rate1
Discount rate2
Terminal growth rate
Growth rate1
Discount rate2
Terminal growth rate
North America 9.9% 11.0% 2.0% 5.3% 11.9% 2.0%Europe 6.3% 12.3% 2.0% 2.4% 11.0% 2.0%Asia 11.5% 12.1% 2.0% 7.8% 14.0% 2.0%
1 Compound annual growth rate of projected revenue over five years2 Pre-tax discount rate applied to the pre-tax cash flow projections
A sensitivity analysis was performed for each of the CGUs or group of CGUs, management concluded that no reasonably possible change in any of the key assumptions would result in the carrying value of the CGU to exceed its recoverable amount.
The impairment test carried out at 31 December 2021 for the North America CGU, which includes 78.7% of the goodwill recognised on the balance sheet, has revealed that the recoverable amount of the CGU is £331.4 million or 189.2% higher than its carrying amount. A reasonably possible change of an increase in the discount rate by 27.9% or a decrease in growth rate by 5.9% would result in the recoverable amount of the North America CGU being equal to its carrying value.
The impairment test carried out at 31 December 2021 for the Europe CGU, which includes 18.5% of the goodwill recognised on the balance sheet, has revealed that the recoverable amount of the CGU is £42.7 million or 101.9% higher than its carrying amount. A reasonably possible change of an increase in the discount rate by 20.1% or a decrease in growth rate by 3.2% would result in the recoverable amount of the Europe CGU being equal to its carrying value.
The impairment test carried out at 31 December 2021 for the Asia CGU, which includes 2.8% of the goodwill recognised on the balance sheet, has revealed that the recoverable amount of the CGU is £223.2 million or 178.7% higher than its carrying amount. A reasonably possible change of a decrease in growth rate by 11.1% would result in the recoverable amount of the Asia CGU being equal to its carrying value.
The impairment test also modelled the potential impact on future cashflows due to climate change. A sensitivity analysis was performed for each CGUs or group of CGUs to demonstrate the impact of a disruption that would result in 50% reduction of revenue and profit in a given year with 30% in the following year and 20% after that before returning to normal levels. This was considered to be a reasonable test as it reflects the expectation that financial impacts would be time-bound and most likely to impact the organisation’s ability to meet demand for a period. An initial 50% reduction was chosen on the basis that it reflects the possibility of an extreme weather even causing a temporary closure of a manufacturing site followed by a ramp up of production back to original levels, or government restrictions on power (see Climate Risks in the Sustainability Report) that could result in ongoing reduction of capacity. The impacts of the headroom of North America, Europe and Asia is a reduction of £12.4 million, £12.4 million and £22.7 million respectively. The impacts would still leave significant headroom and as a result no potential indicator of impairment was identified.
158
XP Power Annual Report & Accounts for the year ended 31 December 2021
NOTES TO THE CONSOLIDATEDFINANCIAL STATEMENTS CONTINUEDFOR THE FINANCIAL YEAR ENDED 31 DECEMBER 2021
30801-XP-Power AR21 Financials.indd 15830801-XP-Power AR21 Financials.indd 158 08/03/2022 10:52:4408/03/2022 10:52:44

30801 8 March 2022 10:52 am V8
12. Intangible assets
£mDevelopment
costs Brand Trademarks TechnologyCustomer
relationshipsCustomer contracts Software
Software under
development TotalCostAt 1 January 2020 43.2 1.0 1.0 4.9 17.8 0.6 7.4 – 75.9Additions 7.7 – – – – – 0.3 2.9 10.9Disposal (1.2) – – – – – – – (1.2)Transfer – – – – – – 1.3 (1.3) –Currency translation differences (1.3) (0.1) 0.1 * (0.6) * (0.3) (0.1) (2.3)At 31 December 2020 48.4 0.9 1.1 4.9 17.2 0.6 8.7 1.5 83.3Additions 8.3 – – – – – 0.1 8.0 16.4Reclassification from property, plant and equipment – – – – – – * – *Currency translation differences 0.5 * * * 0.2 * 0.1 0.2 1.0At 31 December 2021 57.2 0.9 1.1 4.9 17.4 0.6 8.9 9.7 100.7Accumulated amortisationAt 1 January 2020 19.8 0.2 0.9 1.4 4.7 0.6 1.9 – 29.5Charge for the year 4.1 * – 0.6 2.5 – 0.9 – 8.1Currency translation differences (0.6) 0.1 0.1 * (0.4) * (0.1) – (0.9)At 31 December 2020 23.3 0.3 1.0 2.0 6.8 0.6 2.7 – 36.7 Charge for the year 3.7 * – 0.6 2.2 – 0.9 – 7.4Currency translation differences 0.2 0.1 – (0.1) 0.1 * * – 0.3At 31 December 2021 27.2 0.4 1.0 2.5 9.1 0.6 3.6 – 44.4Carrying amountAt 31 December 2021 30.0 0.5 0.1 2.4 8.3 – 5.3 9.7 56.3At 31 December 2020 25.1 0.6 0.1 2.9 10.4 – 6.0 1.5 46.6
* Balance is less than £100,000.
The remaining amortisation period for customer relationships ranges from one to seven years.
The Group’s trademarks used to identify and distinguish the Group’s name and logo have a cost of £0.1 million (2020: £0.1 million). The Group intends to renew the trademarks continuously and evidence supports its ability to do so, based on its past experience. An analysis of market and competitive trends provides evidence that the trademarks will generate net cash inflows for the Group for an indefinite period. Therefore, the trademarks are carried at cost without amortisation, but is tested for impairment on an annual basis.
159
FINANCIALS
30801-XP-Power AR21 Financials.indd 15930801-XP-Power AR21 Financials.indd 159 08/03/2022 10:52:4408/03/2022 10:52:44
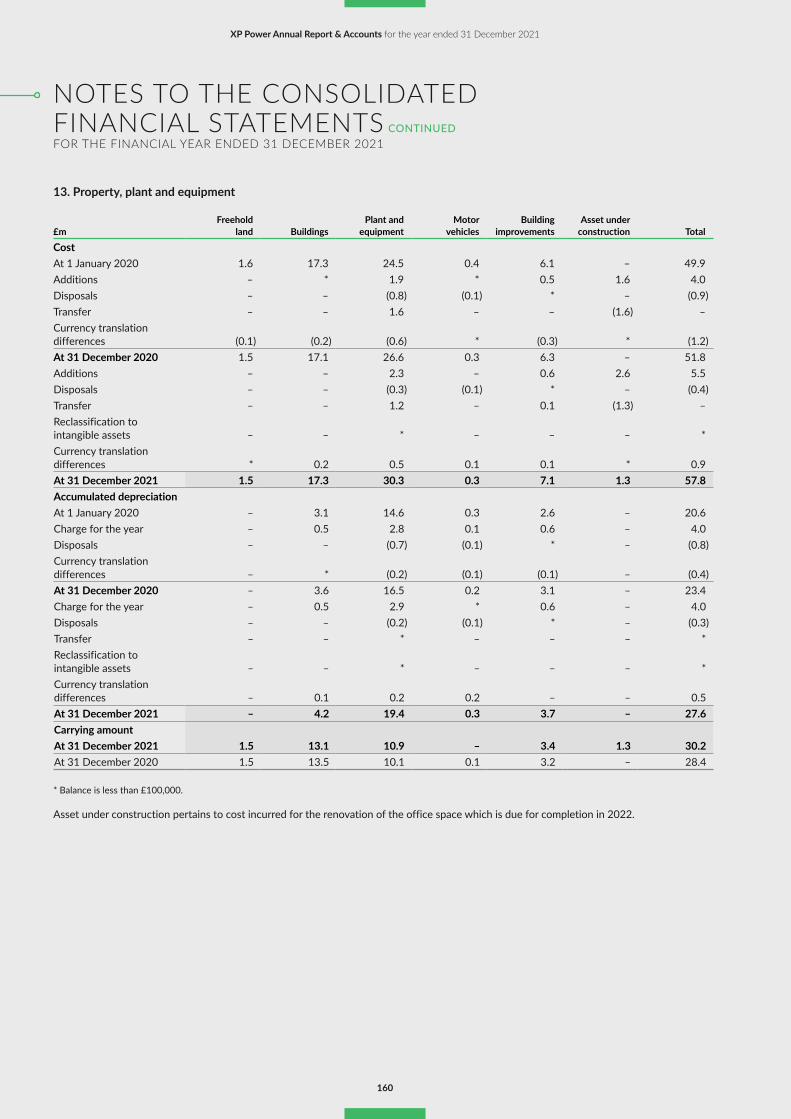
30801 8 March 2022 10:52 am V8
13. Property, plant and equipment
£mFreehold
land BuildingsPlant and
equipmentMotor
vehiclesBuilding
improvementsAsset under
construction TotalCostAt 1 January 2020 1.6 17.3 24.5 0.4 6.1 – 49.9Additions – * 1.9 * 0.5 1.6 4.0Disposals – – (0.8) (0.1) * – (0.9)Transfer – – 1.6 – – (1.6) –Currency translation differences (0.1) (0.2) (0.6) * (0.3) * (1.2)At 31 December 2020 1.5 17.1 26.6 0.3 6.3 – 51.8Additions – – 2.3 – 0.6 2.6 5.5Disposals – – (0.3) (0.1) * – (0.4)Transfer – – 1.2 – 0.1 (1.3) –Reclassification to intangible assets – – * – – – *Currency translation differences * 0.2 0.5 0.1 0.1 * 0.9At 31 December 2021 1.5 17.3 30.3 0.3 7.1 1.3 57.8Accumulated depreciationAt 1 January 2020 – 3.1 14.6 0.3 2.6 – 20.6Charge for the year – 0.5 2.8 0.1 0.6 – 4.0Disposals – – (0.7) (0.1) * – (0.8)Currency translation differences – * (0.2) (0.1) (0.1) – (0.4)At 31 December 2020 – 3.6 16.5 0.2 3.1 – 23.4Charge for the year – 0.5 2.9 * 0.6 – 4.0Disposals – – (0.2) (0.1) * – (0.3)Transfer – – * – – – *Reclassification to intangible assets – – * – – – *Currency translation differences – 0.1 0.2 0.2 – – 0.5At 31 December 2021 – 4.2 19.4 0.3 3.7 – 27.6Carrying amountAt 31 December 2021 1.5 13.1 10.9 – 3.4 1.3 30.2At 31 December 2020 1.5 13.5 10.1 0.1 3.2 – 28.4
* Balance is less than £100,000.
Asset under construction pertains to cost incurred for the renovation of the office space which is due for completion in 2022.
160
XP Power Annual Report & Accounts for the year ended 31 December 2021
NOTES TO THE CONSOLIDATEDFINANCIAL STATEMENTS CONTINUEDFOR THE FINANCIAL YEAR ENDED 31 DECEMBER 2021
30801-XP-Power AR21 Financials.indd 16030801-XP-Power AR21 Financials.indd 160 08/03/2022 10:52:4408/03/2022 10:52:44

30801 8 March 2022 10:52 am V8
14. LeasesNATURE OF THE GROUP’S LEASING ACTIVITIESLeasehold land and buildingsThe Group has made an upfront payment to secure the right-of-use of two 50-year leasehold lands, which are used in the Group’s production operations. The Group also leases office space for the purpose of back office operations, sales activities, and warehousing activities.
Equipment and motor vehiclesThe Group leases vehicles to render logistic services, and leases copier machines for back office use.
a. Right-of-use assetsCarrying amounts and depreciation charge during the year
£mLeasehold land
and buildingsEquipment and motor vehicles Total
Carrying amountAt 1 January 2020 6.3 0.3 6.6Additions 0.5 0.3 0.8Disposals (0.3) (0.1) (0.4)Depreciation charge during the year (1.7) (0.2) (1.9)Currency translation differences * * *At 31 December 2020 4.8 0.3 5.1Additions 4.7 0.3 5.0Disposals * * *Depreciation charge during the year (1.6) (0.2) (1.8)Currency translation differences * * *At 31 December 2021 7.9 0.4 8.3
* Balance is less than £100,000.
b. Lease expense not capitalised in lease liabilities
£m 2021 2020
Lease expense – short-term leases 0.2 0.2Lease expense – low-value leases * *Total (Note 7) 0.2 0.2
* Balance is less than £100,000.
c. Total cash outflow for all leases in 2021 was £2.1 million (2020: £2.2 million).
d. Future cash outflows which are not capitalised in lease liabilitiesEXTENSION OPTIONSThe leases for certain office spaces contain extension options, for which the related lease payments have not been included in lease liabilities as the Group is not reasonably certain to exercise these extension options. The Group negotiates extension options to optimise operational flexibility in terms of managing the assets used in the Group’s operations. All the extensions are exercisable by the Group and not by the lessor.
161
FINANCIALS
30801-XP-Power AR21 Financials.indd 16130801-XP-Power AR21 Financials.indd 161 08/03/2022 10:52:4408/03/2022 10:52:44

30801 8 March 2022 10:52 am V8
15. SubsidiariesThe Group has the following principal subsidiaries as at 31 December 2021 and 2020:
Name of SubsidiaryPlace of business / Country of incorporation
Ownership interest
2021(%)
Ownership interest
2020(%)
Directly owned by the CompanyXP Power Plc UK 100 100XP Power Singapore Holdings Pte Limited Singapore 100 100
Indirectly owned by the CompanyXP PLC UK 100 100XP Power Holdings Limited UK 100 100XP Power AG Switzerland 100 100Powersolve Electronics Limited* UK 89.9 89.9XP Power Srl Italy 100 100XP Power ApS Denmark 100 100XP Power Sweden AB Sweden 100 100XP Power GmbH Germany 100 100XP Power SA France 100 100XP Power Norway AS Norway 100 100XP Power International Limited UK 100 100Forx, Inc. USA 100 100XP Power LLC USA 100 100XP Power (Shanghai) Co., Limited China 100 100XP Power (Hong Kong) Limited Hong Kong 100 100XP Power (Vietnam) Co., Limited Vietnam 100 100XP Power Singapore Manufacturing Pte. Ltd. Singapore 100 100XP Power (Israel) Ltd1 Israel – 100Hanpower Co., Ltd* South Korea 66 66
1 XP Power (Israel) Ltd was dissolved and certified on 9 December 2021.* Refer to Note 21
16. Cash and cash equivalents £m 2021 2020
Cash at bank and on hand 8.9 13.8Short-term bank deposits 0.1 0.1Total 9.0 13.9
For the purpose of presenting the consolidated statement of cash flows, cash and cash equivalents comprise the following:
£m 2021 2020
Cash at bank balances (as above) 9.0 13.9Less: Bank overdrafts (Note 22) (0.2) –Cash and cash equivalents per consolidated statement of cash flows 8.8 13.9
162
XP Power Annual Report & Accounts for the year ended 31 December 2021
NOTES TO THE CONSOLIDATEDFINANCIAL STATEMENTS CONTINUEDFOR THE FINANCIAL YEAR ENDED 31 DECEMBER 2021
30801-XP-Power AR21 Financials.indd 16230801-XP-Power AR21 Financials.indd 162 08/03/2022 10:52:4408/03/2022 10:52:44

30801 8 March 2022 10:52 am V8
17. Inventories£m 2021 2020
Finished goods 25.5 24.6Raw materials 36.3 22.2Work in progress 12.2 7.4Total 74.0 54.2
The cost of inventories recognised as an expense and included in “cost of sales” amounts to £105.2 million (2020: £100.0 million).
18. Trade receivables£m 2021 2020
Current assetsTrade receivables 30.8 30.7Loss allowance (Note 29 (d)) * (0.5)Total 30.8 30.2
* Balance is less than £100,000.
The average credit period taken on sales of goods is 47 days (2020: 47 days). No interest is charged on the outstanding receivables balance. The carrying amounts of trade receivables approximate their fair values.
19. Other current assets£m 2021 2020
Prepayments 3.3 3.0Deposits 0.3 0.3VAT receivables 0.6 0.5Rights to returned goods 0.2 0.5Other receivables 0.6 0.3Total 5.0 4.6
Other current assets are not impaired as at 31 December 2021 and 31 December 2020.
20. Trade and other payables£m 2021 2020
Trade payables 26.0 12.0Other taxes 4.0 3.5Other creditors and accruals 14.1 11.8Refund liabilities 0.6 0.9Total 44.7 28.2
Customers have a right to return the goods to the Group within a given period.
The Group recognised the refund liabilities for the amounts of consideration received for which the Group does not expect to be entitled. The Group also recognised a right to the returned goods measured by reference to the former carrying amounting of the goods.
21. Accrued consideration£m 2021 2020
At 1 January 1.0 1.7Movement in provision during the year 0.3 (0.1)Payment – (0.6)At 31 December 1.3 1.0
£m 2021 2020
Current portion * –Non-current portion 1.3 1.0At 31 December 1.3 1.0
* Balance is less than £100,000.
163
FINANCIALS
30801-XP-Power AR21 Financials.indd 16330801-XP-Power AR21 Financials.indd 163 08/03/2022 10:52:4408/03/2022 10:52:44

30801 8 March 2022 10:52 am V8
21. Accrued consideration continued
The Group owns 89.9% (2020: 89.9%) of the shares of Powersolve Electronics Limited (“Powersolve”) and entered into an amended agreement on 29 October 2016 to purchase the remaining 10.1% of the shares in 2022. On 26 February 2021, the Group entered into a deed of variation to amend the purchase of the remaining 10.1% of shares in 2022 to purchase 0.7% of the shares in 2022 and another 9.4% in 2025.
The Group entered into an agreement on 20 May 2015 with Hanpower Co Ltd (“Hanpower”) to purchase an additional 15% of the shares in 2020 and another 15% of the shares in 2025. The purchase of the first additional 15% was completed in 2020 and the Group now owns 66% (2020: 66%) of the shares of Hanpower.
The commitment to purchase the remaining ownership interests has been accounted for as accrued consideration and is calculated based on the expected future payment which will be based on a predefined multiple of the average earnings for the most recent at the point of payment in the past three years.
The future payment is discounted to the present value, with the discount amortised to interest expense each period as the payment draws nearer. At each reporting period, the anticipated future payment is recalculated and an adjustment made accordingly, with a corresponding adjustment to goodwill for Powersolve. For Hanpower, the amount that is payable under the agreement is initially recognised at the present value of the redemption amount within liabilities with a corresponding charge directly to equity. The liability is subsequently accreted through equity up to the redemption amount that is payable in 2025.
22. Borrowings and lease liabilities£m 2021 2020
CurrentBank overdrafts 0.2 –Lease liabilities 1.6 1.5Total 1.8 1.5
Non-currentBank borrowings 33.4 31.8Lease liabilities 6.5 3.4Total 39.9 35.2
UNDRAWN BORROWING FACILITIES
£m 2021 2020
Expiring beyond one year 77.0 76.9Total 77.0 76.9
The facility has no fixed repayment terms until maturity in 2024. The revolving loan denominated in USD is priced at LIBOR plus a margin of 1.0% (2020: 1.0%-1.2%) for the utilisation facility and a margin of 0.4% (2020: 0.4%–0.5%) for the unutilised facility.
There is drawdown on bank overdrafts denominated in GBP of £0.2 million (2020: £nil) during the year.
The fair value of the Group’s bank borrowings and overdrafts approximates their carrying amount.
RECONCILIATION OF LIABILITIES ARISING FROM FINANCING ACTIVITIES
£m1 January
2021
Proceeds from
borrowings
Principal and interest
payments
Non-cash changesAddition
during the year
Disposal during
the yearInterest expense
Foreign exchange
movement31 December
2021Bank borrowings 31.8 3.7 (3.6) – – 1.2 0.3 33.4Lease liabilities 4.9 – (1.9) 5.0 * 0.2 (0.1) 8.1
* Balance is less than £100,000.
£m1 January
2020
Principal and interest
payments
Non-cash changesAddition
during the year
Disposal during
the yearInterest expense
Foreign exchange
movement31 December
2020
Bank borrowings 52.5 (21.7) – – 1.5 (0.5) 31.8Lease liabilities 6.4 (2.0) 0.7 (0.4) 0.3 (0.1) 4.9
164
XP Power Annual Report & Accounts for the year ended 31 December 2021
NOTES TO THE CONSOLIDATEDFINANCIAL STATEMENTS CONTINUEDFOR THE FINANCIAL YEAR ENDED 31 DECEMBER 2021
30801-XP-Power AR21 Financials.indd 16430801-XP-Power AR21 Financials.indd 164 08/03/2022 10:52:4408/03/2022 10:52:44

30801 8 March 2022 10:52 am V8
23. Derivative financial instrumentsCURRENCY FORWARDSDerivative financial instruments comprise of the USD/GBP currency forwards used to manage the exposure from issuance of dividends in GBP.
The contracted notional principal amounts ad fair values of these currency forwards are as follows:
31 December 2021 £m
Assets LiabilitiesContractual
notional amount Fair value
Contractual notional amount Fair value
Currency forwards (current) 1.0 * 8.0 (0.1)
* Balance is less than £100,000.
31 December 2020 £m
Assets Liabilities
Contractual notional amount Fair value
Contractual notional amount Fair value
Currency forwards (current) 5.8 0.3 2.4 (0.1)
24. Deferred income taxesThe movement in deferred income tax assets and liabilities during the financial year is as follows:
DEFERRED INCOME TAX ASSET
£m Share-based
paymentTax
losses
Other temporary
differences TotalAt 1 January 2020 1.8 – – 1.8Credited to profit or loss 0.5 0.4 0.2 1.1At 31 December 2020 2.3 0.4 0.2 2.9Charged to profit or loss * * (0.2) (0.2)Credited to equity 0.5 – – 0.5At 31 December 2021 2.8 0.4 – 3.2
* Balance is less than £100,000.
DEFERRED INCOME TAX LIABILITIES
£m Accelerated
tax depreciation
Intangible asset
amortisation
Capitalised development
costs
Other temporary
differences TotalAt 1 January 2020 (1.0) (1.1) (5.1) 1.7 (5.5)(Charged)/credited to profit or loss (0.8) (0.3) (0.6) 0.2 (1.5)Currency translation differences 0.1 * 0.2 * 0.3At 31 December 2020 (1.7) (1.4) (5.5) 1.9 (6.7)Charged to profit or loss (0.6) (0.9) (1.0) (0.2) (2.7)Currency translation differences * * * *At 31 December 2021 (2.3) (2.3) (6.5) 1.7 (9.4)
* Balance is less than £100,000.
165
FINANCIALS
30801-XP-Power AR21 Financials.indd 16530801-XP-Power AR21 Financials.indd 165 08/03/2022 10:52:4408/03/2022 10:52:44

30801 8 March 2022 10:52 am V8
25. Share capital and reservesA. SHARE CAPITAL
Number of shares
Total £m
At 31 December 2020 19,642,296 27.2At 31 December 2021 19,642,296 27.2
All issued ordinary shares are fully paid. There is no par value for these ordinary shares. They entitle the holder to participate in dividends, and to share in the proceeds of winding up the company in proportion to the number of and amounts paid on the shares held. On a show of hands, every holder of ordinary shares present at a meeting, in person or by proxy, is entitled to one vote; and, on a poll, each share is entitled to one vote
B. TREASURY SHARES Treasury shares are shares in the Company that are held by the Company’s Employee Share Ownership Plan (ESOP) Trust for the purpose of issuing shares under the Company’s share-based payment plans. Shares issued to employees are recognised on a first in, first out basis.
£mNumber
of shares Total
£mAt 1 January 2020 (46,090) (0.5)Acquisition of shares by the Trust (400,000) *Employees shares purchase under the DPS held on behalf by ESOP Trust (12,500) *Issue of shares under share-based payments 301,630 0.4At 31 December 2020 (156,960) (0.1)Acquisition of shares by the Trust (900) *Issue of shares under share-based payments 64,979 *At 31 December 2021 (92,811) *
* Balance is less than £100,000.
In 2020, the Company issued 400,000 ordinary shares at 1 pence per share and held under ESOP Trust.
The Company re-issued 64,979 (2020: 301,630) treasury shares during the financial year pursuant to the Company’s share-based payment plans at an exercise price ranging from £0.01 to £15.43 (2020: £0.01 to £15.43). The cost of the treasury shares re-issued amounted to £17,000 (2020: £437,000). The total consideration (net of expense) for the treasury shares issued is as follows:
£m 2021 2020
Exercise price paid by employees 0.5 3.5Value of employee services 0.5 1.2Total net consideration 1.0 4.7
Accordingly, a gain on re-issue of treasury shares of £1,000,000 (2020: £4,300,000) is recognised in the other reserve.
C. OTHER RESERVES Other reserves represents merger reserve, share-based payment reserve, translation reserve and other reserve.
Merger reserve represents the difference between the value of shares issued by the Company in exchange for the value of shares of subsidiaries acquired under common control.
Share-based payment reserve represents the equity-settled share-based payments granted to employees. The reserve is made up of the cumulative value of services received from employees recorded over the vesting period commencing from the grant date of equity-settled share-based payments and is reduced by the expiry or exercise of share-based payments.
Translation reserve represents exchange differences arising from the translation of financial statements of foreign operations whose functional currencies are different from that of the Group’s presentation currency.
Other reserve comprises future transactions with the non-controlling interest. The amount that may become payable under the agreement is initially recognised at the present value of the redemption amount within liabilities with a corresponding change directly to equity. The liability is subsequently accreted through finance charges up to the redemption amount that is payable at the date at which the agreement first becomes exercisable. The Group has an agreement with the non-controlling shareholders of Hanpower Co. Ltd, a subsidiary, to purchase an additional 15.0% of the shares in 2025.
166
XP Power Annual Report & Accounts for the year ended 31 December 2021
NOTES TO THE CONSOLIDATEDFINANCIAL STATEMENTS CONTINUEDFOR THE FINANCIAL YEAR ENDED 31 DECEMBER 2021
30801-XP-Power AR21 Financials.indd 16630801-XP-Power AR21 Financials.indd 166 08/03/2022 10:52:4408/03/2022 10:52:44

30801 8 March 2022 10:52 am V8
26. Cash flow from movement in working capital The following adjustments have been made to reconcile from the movement in balance sheet heading to the amount presented in the cash flow from the movement in working capital. This is in order to more appropriately reflect the cash impact of the underlying transactions.
2021£m
Inventories (Note 17)
Trade and other receivables
(Note 18 and 19)
Trade and other payables Provisions
Total working capital
movementTrade and other payables (Note 20) – – (44.7) –Accrued consideration (Note 21) – – (1.3) –Provisions – – – (0.2)At 31 December 2021 74.0 35.8 (46.0) (0.2)At 31 December 2020 54.2 34.8 (29.2) (0.1)Balance sheet movement (19.8) (1.0) 16.8 0.1 (3.9)Provision for reinstatement costs – – – (0.1) (0.1)Increase in interest accruals – – 0.1 – 0.1Accrued consideration on acquisition – – (0.3) – (0.3)Currency translations differences 0.8 (0.1) (0.5) – 0.2Movements as shown in consolidated statement of cash flows (19.0) (1.1) 16.1 * (4.0)
* Balance is less than £100,000.
2020 £m
Inventories (Note 17)
Trade and other receivables
(Note 18 and 19)
Trade and other payables Provisions
Total working capital
movement
Trade and other payables (Note 20) – – (28.2) –Accrued consideration (Note 21) – – (1.0) –Provisions – – – (0.1)At 31 December 2020 54.2 34.8 (29.2) (0.1)At 31 December 2019 44.1 38.1 (26.9) (0.1)Balance sheet movement (10.1) 3.3 2.3 * (4.5)Increase in interest accruals – (0.4) – – (0.4)Accrued considerations on acquisitions – – 0.6 – 0.6Currency translations differences (2.2) (0.2) 0.4 – (2.0)Movements as shown in consolidated statement of cash flows (12.3) 2.7 3.3 * (6.3)
* Balance is less than £100,000.
27. Related party transactionsKEY MANAGEMENT PERSONNEL COMPENSATIONKey management personnel are the Directors of the Group.
£m 2021 2020
Short-term employee benefits 1.9 1.9Post-employment benefits 0.1 0.1Share-based payment 0.7 0.6Total 2.7 2.6
Further information about the remuneration of the individual Directors is provided in the Directors’ Remuneration Report on pages 110–127.
167
FINANCIALS
30801-XP-Power AR21 Financials.indd 16730801-XP-Power AR21 Financials.indd 167 08/03/2022 10:52:4508/03/2022 10:52:45

30801 8 March 2022 10:52 am V8
28. Share-based paymentsThe Group operates several equity-settled share-based payment plans.
A. XP POWER SHARE OPTION PLAN (THE “SOP”) The SOP was approved by the Shareholders on 2 April 2012. A total of 345,000 options and 418,000 options were granted in 2012 and 2016 respectively under the SOP. These options vest only if certain performance conditions are met. The vesting of outstanding options is based on Total Shareholder Return (“TSR”) relative to the FTSE350 Electronic and Electric Equipment Sector. The options may only be exercised within 10 years from grant date. All options under the SOP are fully vested as at 31 December 2021.
Set out below are summaries of options granted under the plan:
2021 2020
Number of
share options
Weighted average
exercise price per share option
Number of share options
Weighted average exercise
price per share option
At 1 January 118,329 £14.92 389,583 £13.60Forfeited during the year (1,592) £15.43 (1,614) £15.43Exercised during the year* (39,852) £13.93 (269,640) £13.01At 31 December 76,885 £15.43 118,329 £14.91Exercisable at 31 December 76,885 £15.43 118,329 £14.91
* The weighted average share price at the date of exercise of options exercised during the year ended 31 December 2021 was £43.12 (2020: £38.44).
Share options outstanding at the end of the year have the following expiry dates and exercise prices:
Grant date Expiry date Exercise price
Share options 31 December
2021
Share options 31 December
2020
10 October 2012 10 October 2022 £9.46 – 10,00023 February 2016 23 February 2026 £15.43 76,885 108,329Total 76,885 118,329Weighted average remaining contractual life of options outstanding at end of period 4.1 years 4.8 years
B. XP POWER LIMITED LONG TERM INCENTIVE PLAN 2017 (THE “XP LTIP 2017”)The XP LTIP 2017 was approved by the Shareholders on 19 April 2017 and amended by the Remuneration Committee on 28 February 2020 in respect of awards made on or after that date. The only participants under the XP LTIP 2017 are the Executive Directors who are granted Performance Share Awards. These Awards vest only if certain performance conditions are met. The vesting of outstanding Awards is based on TSR relative to the companies in the FTSE 250 index excluding investment trusts and earnings per share growth.
Set out below are summaries of Awards granted under the plan:
2021 2020
Number of shares under
award
Weighted average
exercise price per share under
award
Number of shares under
award
Weighted average exercise
price per share under award
At 1 January 93,852 £0.01 67,618 £0.01Granted during the year 19,606 £0.01 28,252 £0.01Forfeited during the year (26,349) £0.01 (1,164) £0.01Exercised during the year (855) £0.01 (854) £0.01At 31 December 86,254 £0.01 93,852 £0.01Exercisable at 31 December 19,502 £0.01 6,991 £0.01
168
XP Power Annual Report & Accounts for the year ended 31 December 2021
NOTES TO THE CONSOLIDATEDFINANCIAL STATEMENTS CONTINUEDFOR THE FINANCIAL YEAR ENDED 31 DECEMBER 2021
30801-XP-Power AR21 Financials.indd 16830801-XP-Power AR21 Financials.indd 168 08/03/2022 10:52:4508/03/2022 10:52:45

30801 8 March 2022 10:52 am V8
28. Share-based payments continued
Awards outstanding at the end of the year have the following expiry dates and exercise prices:
Grant date Expiry date Exercise price
Shares under award
31 December 2021
Shares under award
31 December 2020
30 May 20171 30 May 2022 £0.01 5,127 5,9821 November 20171 31 December 2022 £0.01 8,000 8,00016 May 20182 16 May 2023 £0.01 12,749 14,05716 March 2019 16 March 2024 £0.01 12,520 37,56122 April 2020 22 April 2026 £0.01 28,252 28,2523 March 2021 3 March 2027 £0.01 11,582 –10 May 2021 10 May 2027 £0.01 8,024 –Total 86,254 93,852
1 These awards are fully vested. 2 50% of the awards vested in 2021 and the remaining 50% will vest in 2022.
Fair value of awards The fair values at grant date of awards granted during the year under the XP LTIP 2017 are determined using the valuation models below. The model inputs are as follows:
Options granted 19,606Fair value at grant date £39.87Model used Monte Carlo model and Black–Scholes model Assumption used:Share price £51.00Exercise price £0.01Expected volatility 39.44%Expected option life 5 yearsExpected dividend yield 3.00%Risk-free interest rate 0.79%
C. XP POWER LIMITED SENIOR MANAGERS LONG TERM INCENTIVE PLAN 2017 (THE “XP SENIOR MANAGERS LTIP 2017”)The XP Senior Managers LTIP 2017 was approved by the Shareholders on 19 April 2017 and amended by the Remuneration Committee on 28 February 2020 in respect of awards made on or after that date and introduced for non-Board members for certain grants made from 1 April 2020. The participants under the XP Senior Managers LTIP 2017 are the senior management of companies under the Group.
There are four different types of awards granted under the XP Senior Managers LTIP 2017:
1. Performance Share Awards2. Performance Restricted Share Units (“Performance RSUs”) 3. Restricted Share Awards4. Restricted Share Units (“RSUs”)
Performance RSUs and RSUs are only granted to participants in the United States and they are exercised at nil cost. Performance Share Awards and Restricted Share Awards are granted to participants outside of the United States and they are exercised at nominal cost.
Performance Share Awards and Performance RSUs vest only if certain performance conditions are met. The vesting of outstanding Awards is based on TSR relative to the companies in the FTSE 250 index excluding investment trusts and earnings per share growth.
For each tranche of Performance Share Awards and Performance RSUs granted in 2017, 2018 and 2019, 50% of the awards will vest after the third year and the remaining 50% of the share awards will vest after the fourth year. For each tranche of Performance Share Awards and Performance RSUs granted in 2020 and 2021, 100% of the awards will vest after the third year.
Restricted Share Awards and RSUs vest over the service period of three years. There is no performance condition attached.
169
FINANCIALS
30801-XP-Power AR21 Financials.indd 16930801-XP-Power AR21 Financials.indd 169 08/03/2022 10:52:4508/03/2022 10:52:45

30801 8 March 2022 10:52 am V8
28. Share-based payments continued
Performance Share AwardsSet out below are summaries of Performance Share Awards granted under the plan:
2021 2020
Number of shares under
award
Weighted average
exercise price per share under
award
Number of shares under
award
Weighted average exercise
price per share under award
At 1 January 82,366 £0.01 69,047 £0.01Granted during the year 17,285 £0.01 21,915 £0.01Forfeited during the year (29,935) £0.01 (3,081) £0.01Exercised during the year (6,935) £0.01 (5,515) £0.01At 31 December 62,781 £0.01 82,366 £0.01Exercisable at 31 December 9,272 £0.01 4,007 £0.01
Awards outstanding at the end of the year have the following expiry dates and exercise prices:
Grant date Expiry date Exercise price
Shares under award
31 December 2021
Shares under award
31 December 2020
30 May 20171 30 May 2022 £0.01 2,991 8,01316 May 20182 16 May 2023 £0.01 12,561 15,5744 September 20182 4 September 2023 £0.01 – 80016 March 2019 16 March 2024 £0.01 11,665 37,44122 April 2020 22 April 2024 £0.01 19,729 20,5383 March 2021 3 March 2025 £0.01 15,835 –Total 62,781 82,366
1 These awards are fully vested. 2 50% of the awards vested in 2021 and the remaining 50% will vest in 2022.
Performance RSUsSet out below are summaries of Performance RSUs granted under the plan:
2021 2020
Number of shares under
award
Weighted average
exercise price per share under
award
Number of shares under
award
Weighted average exercise
price per share under award
At 1 January 98,754 – 90,648 –Granted during the year 10,995 – 23,206 –Forfeited during the year (34,194) – (8,381) –Exercised during the year (13,856) – (6,719) –At 31 December 61,699 – 98,754 –Exercisable at 31 December 8,267 – 4,297 –
170
XP Power Annual Report & Accounts for the year ended 31 December 2021
NOTES TO THE CONSOLIDATEDFINANCIAL STATEMENTS CONTINUEDFOR THE FINANCIAL YEAR ENDED 31 DECEMBER 2021
30801-XP-Power AR21 Financials.indd 17030801-XP-Power AR21 Financials.indd 170 08/03/2022 10:52:4508/03/2022 10:52:45

30801 8 March 2022 10:52 am V8
28. Share-based payments continued
Awards outstanding at the end of the year have the following expiry dates and exercise prices:
Grant date Expiry date Exercise price
Shares under award
31 December 2021
Shares under award
31 December 2020
30 May 20171 30 May 2022 – 1,388 7,24412 October 20171 12 October 2022 – 450 1,35016 May 20182 16 May 2023 – 12,857 22,62016 March 2019 16 March 2024 – 14,614 44,33422 April 2020 22 April 2024 – 21,588 23,2063 March 2021 3 March 2025 – 10,802 –Total 61,699 98,754
1 These awards are fully vested. 2 50% of the awards vested in 2021 and the remaining 50% will vest in 2022.
Restricted Share Awards Set out below are summaries of Restricted Share Awards granted under the plan:
2021 2020
Number of shares under
award
Weighted average
exercise price per share under
award
Number of shares under
award
Weighted average exercise
price per share under award
At 1 January 2,425 £0.01 – –Granted during the year 1,793 £0.01 2,425 £0.01Forfeited during the year (306) £0.01 – –At 31 December 3,912 £0.01 2,425 £0.01Exercisable at 31 December – – – –
Awards outstanding at the end of the year have the following expiry dates and exercise prices:
Grant date Expiry date Exercise price
Shares under award
31 December 2021
Shares under award
31 December 2020
22 April 2020 22 April 2024 £0.01 2,324 2,4253 March 2021 3 March 2025 £0.01 1,588 –Total 3,912 2,425
RSUs Set out below are summaries of RSUs granted under the plan:
2021 2020
Number of shares under
award
Weighted average
exercise price per share under
award
Number of shares under
award
Weighted average exercise
price per share under award
At 1 January 1,248 – – –Granted during the year 577 – 1,248 –Forfeited during the year (202) – – –At 31 December 1,623 – 1,248 –Exercisable at 31 December – – – –
171
FINANCIALS
30801-XP-Power AR21 Financials.indd 17130801-XP-Power AR21 Financials.indd 171 08/03/2022 10:52:4508/03/2022 10:52:45

30801 8 March 2022 10:52 am V8
28. Share-based payments continued
Awards outstanding at the end of the year have the following expiry dates and exercise prices:
Grant date Expiry date Exercise price
Shares under award
31 December 2021
Shares under award
31 December 2020
22 April 2020 22 April 2024 – 1,046 1,2483 March 2021 3 March 2025 – 577 –Total 1,623 1,248
Fair value of awards The fair values at grant date of awards granted during the year under the XP Senior Managers LTIP 2017 are determined using the valuation models below. The model inputs are as follows:
Performance Share Award Performance RSU
Restricted Share Award Restricted RSU
Options granted 17,285 10,995 1,793 577Fair value at grant date £40.44 £40.44 £49.22 £49.22Model used Monte Carlo model and
Black–Scholes model Monte Carlo model and
Black–Scholes modelBlack–Scholes
model Black–Scholes
modelAssumption used:Share price £51.80 £51.80 £51.80 £51.80Exercise price £0.01 – £0.01 –Expected volatility 39.44% 39.44% 39.13% 39.13%Expected option life 3 years 3 years 3 years 3 yearsExpected dividend yield 3.00% 3.00% 1.70% 1.70%Risk-free interest rate 0.79% 0.79% 0.78% 0.78%
D. XP POWER LIMITED RESTRICTED SHARE PLAN 2020 (THE “XP RSP 2020”)The XP RSP 2020 was approved by the Shareholders on 21 April 2020. The only participants under the XP RSP 2020 are the Executive Directors who are granted Restricted Shares. Restricted Shares vest over the service period of five years. There is no performance condition attached.
Set out below are summaries of Restricted Shares granted under the plan:
2021 2020
Number of shares under
award
Weighted average
exercise price per share under
award
Number of shares under
award
Weighted average exercise
price per share under award
At 1 January 3,532 £0.01 – –Granted during the year 2,698 £0.01 3,532 £0.01At 31 December 6,230 £0.01 3,532 £0.01Exercisable at 31 December – – – –
Awards outstanding at the end of the year have the following expiry dates and exercise prices:
Grant date Expiry date Exercise price
Shares under award
31 December 2021
Shares under award
31 December 2020
22 April 2020 22 April 2026 £0.01 3,532 3,5323 March 2021 3 March 2027 £0.01 1,495 –10 May 2021 10 May 2027 £0.01 1,203 –Total 6,230 3,532
172
XP Power Annual Report & Accounts for the year ended 31 December 2021
NOTES TO THE CONSOLIDATEDFINANCIAL STATEMENTS CONTINUEDFOR THE FINANCIAL YEAR ENDED 31 DECEMBER 2021
30801-XP-Power AR21 Financials.indd 17230801-XP-Power AR21 Financials.indd 172 08/03/2022 10:52:4508/03/2022 10:52:45

30801 8 March 2022 10:52 am V8
28. Share-based payments continued
Fair value of awards The fair value at grant date of awards granted during the year under the XP RSP 2020 is determined using the Black-Scholes model. The model inputs are as follows:
Options granted 2,698Fair value at grant date £45.50Assumption used:Share price £50.93Exercise price £0.01Expected volatility1 34.93%Expected option life 5 yearsExpected dividend yield 1.70%Risk-free interest rate 0.78%
1 Volatility was estimated based on the historical volatility of the shares over a five-year period prior to grant date.
29. Financial risk managementThe Group’s activities expose it to capital risk, market risk (including currency risk and interest rate risk), credit risk and liquidity risk. The Group seeks to minimise adverse effects from the unpredictability of financial markets on the Group’s financial performance.
A. CAPITAL RISKThe Group manages its capital to ensure that the entities in the Group will be able to continue as a going concern while maximising the return to shareholders through the optimisation of the debt and equity.
The capital structure of the Group consists of debt, which includes the borrowings disclosed in Note 22, cash and equity attributable to equity holders of the parent, comprising issued capital, reserves and retained earnings as disclosed in Note 25.
The Board reviews the capital structure of the business and considers the cost of capital and risks associated with each class of capital. The Group aims to balance its overall capital structure through the payment of dividends, new share issues and share buyback as well as the issue of new debt or the redemption of existing debt.
B. CURRENCY RISKThe Group operates in North America, Europe and Asia. Entities in the Group regularly transact in currencies other than their respective functional currencies (“foreign currencies”). The Group monitors and manages the currency risk through internal reports analysing major currency exposures. Where possible, the Group seeks to offset exposures by matching monetary asset and liability exposures in like currencies against each other, often using its bank facilities to square off or reduce exposures. The Group also manages some currency exposure by entering into currency forwards with banks
The Group’s currency exposure based on the information provided to key management is as follows:
£m GBP EUR USD Others TotalAt 31 December 2021 Financial assets Cash and cash equivalents 1.1 0.5 5.6 1.8 9.0Trade receivables 2.4 2.3 25.9 0.2 30.8Other current assets 0.1 * 0.4 0.4 0.9ESOP loan to employees * – – – –Subtotal 3.6 2.8 31.9 2.4 40.7Financial liabilitiesBorrowings (0.2) – (33.4) – (33.6)Trade and other payables (3.8) (0.6) (33.6) (5.3) (43.3)Lease liabilities (0.2) (0.5) (2.8) (4.6) (8.1)Other financial liabilities (0.9) – – (0.7) (1.6)Subtotal (5.1) (1.1) (69.8) (10.6) (86.6)Net financial (liabilities)/assets (1.5) 1.7 (37.9) (8.2) (45.9)Less: Currency forwards 9.0 – – – 9.0Currency profile 7.5 1.7 (37.9) (8.2) (36.9)Financial liabilities/(assets) denominated in the respective entities’ functional currencies 0.8 (1.2) 43.2 (0.1) 42.7Currency exposure of financial assets/(liabilities) 8.3 0.5 5.3 (8.3) 5.8
* Balance is less than £100,000.173
FINANCIALS
30801-XP-Power AR21 Financials.indd 17330801-XP-Power AR21 Financials.indd 173 08/03/2022 10:52:4508/03/2022 10:52:45

30801 8 March 2022 10:52 am V8
29. Financial risk management continued£m GBP EUR USD Others TotalAt 31 December 2020 Financial assets Cash and cash equivalents 4.6 0.8 7.2 1.3 13.9Trade receivables 1.8 2.2 25.7 0.5 30.2Other current assets 0.1 * 0.3 0.2 0.6ESOP loan to employees * – – – –Subtotal 6.5 3.0 33.2 2.0 44.7Financial liabilitiesBorrowings – – (31.8) – (31.8)Trade and other payables (4.2) (0.9) (18.9) (3.6) (27.6)Lease liabilities (0.3) (0.5) (3.6) (0.5) (4.9)Other financial liabilities (0.7) – – (0.4) (1.1)Subtotal (5.2) (1.4) (54.3) (4.5) (65.4)Net financial assets/(liabilities) 1.3 1.6 (21.1) (2.5) (20.7)Currency forwards 8.2 – – – 8.2Currency profile 9.5 1.6 (21.1) (2.5) (12.5)Financial (assets)/liabilities denominated in the respective entities’ functional currencies (2.4) (0.8) 26.8 0.1 23.7Currency exposure of financial assets/(liabilities) 7.1 0.8 5.7 (2.4) 11.2
* Balance is less than £100,000.
If the USD and EUR change against GBP by 1.0% and 1.9% respectively (2020: USD 1%, EUR 1%) with all other variables, including tax rates, being held constant, the effects arising from the net financial asset/(liability) that are exposed to currency risk will be as follows:
2021 Profit after tax
2020 Profit after tax
EUR against GBP – Strengthened * *– Weakened * *USD against GBP– Strengthened * *– Weakened * *
* Balance is less than £100,000.
The impact of the currency risk on the other comprehensive income is not significant.
C. INTEREST RATE RISKCash flow interest rate risk is the risk that the future cash flows of a financial instrument will fluctuate because of changes in market interest rates. As the Group has no significant interest-bearing assets, the Group’s income is substantially independent of changes in the market interest rates.
All of the Group’s borrowings are at variable interest rates and are denominated in USD. If the USD interest rates on these borrowings increased/decreased by 1.0% (2020: 1.0%) with all other variables, including tax rates, being held constant, the profit after tax will be lower/higher by £335,000 (2020: £318,000) as a result of higher/lower interest expense on these borrowings.
174
XP Power Annual Report & Accounts for the year ended 31 December 2021
NOTES TO THE CONSOLIDATEDFINANCIAL STATEMENTS CONTINUEDFOR THE FINANCIAL YEAR ENDED 31 DECEMBER 2021
30801-XP-Power AR21 Financials.indd 17430801-XP-Power AR21 Financials.indd 174 08/03/2022 10:52:4508/03/2022 10:52:45

30801 8 March 2022 10:52 am V8
29. Financial risk management continued
D. CREDIT RISKCredit risk refers to the risk that the counterparty will default on its contractual obligations resulting in a financial loss to the Group. For trade receivables the Group adopts a policy of only dealing with customers of appropriate credit history or rating. For other financial assets, the Group adopts the policy of only dealing with high credit quality counterparties.
The Group uses a provision matrix to measure the lifetime expected credit loss allowance for trade receivables. In measuring the expected credit loss, trade receivables are grouped based on shared credit risk characteristics and days past due.
In calculating the expected credit loss rates, the Group considers historical loss rates for each category of customers and adjusts to reflect current and forward macroeconomic factors affecting the ability of the customers to settle the receivables. The Group has identified gross domestic product (GDP) and the public policy of the countries in which it sells goods as the most relevant factors.
Trade receivables are written off when there is no reasonable expectation of recovery, such as a debtor failing to engage in a repayment plan with the Group. The Group considers a financial asset as in default if the counterparty fails to make contractual payments within 90 days when they fall due and writes off the financial asset when a debtor is in significant financial difficulties and have defaulted on payment that is usually greater than 120 days past due. Where receivables are written off, the Company continues to engage in enforcement activity to attempt to recover the receivables due. Where recoveries are made, these are recognised in profit or loss.
In 2020, management has identified a group of debtors from the North America region to be credit impaired as they experienced significant financial difficulties or the aged balances can neither be matched nor acknowledged by the customers. Hence, management has assessed the recoverability of the outstanding balances separately from the provision matrix.
Debtors separately identified as credit-impaired£m 2021 2020
Gross carrying amount – 0.5Less: loss allowance – (0.5)Carrying amount net of allowance – –
The Group’s credit risk exposure in relation to trade receivables under IFRS 9 is set out in the provision matrix as follows:
Past due
£m Current 1–30 days 31–60 days 61–90 days 91–120 days >120 days TotalAt 31 December 2021North America regionExpected loss rate 0.0% 0.1% 0.2% 0.2% 0.3% 5.1%Trade receivables 14.8 1.7 0.5 0.4 0.1 0.2 17.7Loss allowance – * * * * * *Europe regionExpected loss rate 0.0% 0.1% 0.2% 0.2% 0.3% 29.6%Trade receivables 7.8 1.2 0.2 0.1 * 0.1 9.4Loss allowance – * * * * * *Asia regionExpected loss rate 0.0% 0.0% 0.0% 0.0% 0.0% 0.0%Trade receivables 2.9 0.6 0.2 * * * 3.7Loss allowance – – – – – – –
* Balance is less than £100,000.
175
FINANCIALS
30801-XP-Power AR21 Financials.indd 17530801-XP-Power AR21 Financials.indd 175 08/03/2022 10:52:4508/03/2022 10:52:45

30801 8 March 2022 10:52 am V8
29. Financial risk management continuedPast due
£m Current 1–30 days 31–60 days 61–90 days 91–120 days >120 days Total
At 31 December 2020North America regionExpected loss rate 0.0% 0.1% 0.2% 0.2% 0.3% 37.8%Trade receivables 15.5 1.2 0.3 0.1 0.1 * 17.2Loss allowance – * * * * * *Europe regionExpected loss rate 0.0% 0.1% 0.2% 0.2% 0.3% 24.0%Trade receivables 7.0 1.4 0.3 0.2 0.1 0.1 9.1Loss allowance – * * * * * *Asia regionExpected loss rate 0.0% 0.0% 0.0% 0.0% 0.0% 0.0%Trade receivables 3.6 0.2 0.1 * * * 3.9Loss allowance – – – – – – –
* Balance is less than £100,000.
The movement in the allowance for impairment of trade receivables is as follows:
£m 2021 2020
Beginning of financial year (0.5) (0.1)Loss allowance(a) recognised in profit or loss during the year on assets acquired/originated * (0.4)Receivables written off as uncollectible 0.5 *Currency translation differences * *End of the financial year * (0.5)
(a) Loss allowance measured at lifetime ECL.* Balance is less than £100,000.
E. LIQUIDITY RISKPrudent liquidity risk management includes maintaining sufficient cash, the availability of funding through an adequate amount of committed credit facilities (Note 22) and the ability to close out market positions at a short notice. The Group manages liquidity risk by maintaining adequate reserves, banking facilities and reserve borrowing facilities by continuously monitoring forecast and actual cash flows. All significant subsidiaries prepare weekly cash forecast on a 13-weeks outlook basis and reviewed it on a weekly basis with the management.
At the balance sheet date, assets held by the Group and the Company for managing liquidity risk included cash and short-term deposits as disclosed in Note 16.
The Group has Revolving Credit Facility (“RCF”) which is due to mature in November 2024. The main features of the RCF are as follows:
• The interest rate on the amounts drawn under the facility is determined as USD LIBOR plus margin depending on leverage ratio .• Market standard financial covenants of the facility, as discussed below.• A US$30 million accordion feature, providing the Group with additional flexibility to increase the size of the banking facility to US$180
million, subject to approval of its bank lending group.
The covenants to 31 December 2021 include:
• The ratio of net debt to consolidated EBITDA permitted under the revolving credit facility must not exceed a multiple of three times.• Consolidated EBITDA must also cover relevant finance charges by a minimum of four times.
For covenant testing purposes, the Group’s definition of consolidated EBITDA is adjusted to exclude specific items. Consolidated EBITDA, for covenant test purposes, is based on the previous 12-month period, measured on the last day of each financial quarter of the Group. Throughout the year and at 31 December 2021 both of these covenants were met.
176
XP Power Annual Report & Accounts for the year ended 31 December 2021
NOTES TO THE CONSOLIDATEDFINANCIAL STATEMENTS CONTINUEDFOR THE FINANCIAL YEAR ENDED 31 DECEMBER 2021
30801-XP-Power AR21 Financials.indd 17630801-XP-Power AR21 Financials.indd 176 08/03/2022 10:52:4608/03/2022 10:52:46

30801 8 March 2022 10:52 am V8
29. Financial risk management continued
The table below analyses non-derivative financial liabilities of the Group into relevant maturity groupings based on the remaining period from the balance sheet date to the contractual maturity date. The amounts disclosed in the table are the contractual undiscounted cashflows. Balances due within 12 months equal their carrying amounts as the impact of discounting is not significant.
£mLess than
1 yearBetween
1 and 2 yearsBetween
2 and 5 yearsOver
5 years TotalGroupAt 31 December 2021Trade and other payables 43.3 – – – 43.3Lease liabilities 1.9 2.0 2.4 2.2 8.5Accrued consideration * – 1.3 – 1.3Borrowings, including interest 0.9 0.7 34.0 – 35.6Total 46.1 2.7 37.7 2.2 88.7At 31 December 2020Trade and other payables 27.6 – – – 27.6Lease liabilities 1.8 1.4 2.0 0.3 5.5Accrued consideration – 0.1 0.9 – 1.0Borrowings, including interest 0.7 0.7 33.0 – 34.4Total 30.1 2.2 35.9 0.3 68.5
* Balance is less than £100,000.
The Group manages the liquidity risk by maintaining sufficient cash and bank facilities to enable it to meet its normal operating commitments.
F. FAIR VALUE MEASUREMENTSThe table below presents assets and liabilities recognised and measured at fair value and classified by level of the following fair value measurement hierarchy:
i. Quoted prices (unadjusted) in active markets for identical assets or liabilities (Level 1);ii. Inputs other than quoted prices included within Level 1 that are observable for the asset or liability, either directly (i.e. as prices) or
indirectly (i.e. derived from prices) (Level 2); andiii. Inputs for the asset or liability that are not based on observable market data (unobservable inputs) (Level 3).
As at 31 December 2021 £m Level 1 Level 2 Level 3 Total
AssetsDerivative financial instruments – * – *LiabilitiesDerivative financial instruments – (0.1) – (0.1)As at 31 December 2020 £mAssetsDerivative financial instruments – 0.3 – 0.3LiabilitiesDerivative financial instruments – (0.1) – (0.1)
* Balance is less than £100,000.
The fair values of financial instruments traded in active markets (such as exchange-traded and over-the-counter securities and derivatives) are based on quoted market prices at the balance sheet date.
The fair values of current financial assets and liabilities carried at amortised cost approximate their carrying amounts.
The fair value of financial instruments that are not traded in an active market (for example, over-the-counter derivatives) is determined by using valuation techniques. The Group uses a variety of methods and makes assumptions that are based on market conditions existing at each balance sheet date. The fair value of currency forwards is determined using quoted forward currency rates at the balance sheet date. These derivative financial instruments are included in Level 2.
177
FINANCIALS
30801-XP-Power AR21 Financials.indd 17730801-XP-Power AR21 Financials.indd 177 08/03/2022 10:52:4608/03/2022 10:52:46

30801 8 March 2022 10:52 am V8
29. Financial risk management continued
G. FINANCIAL INSTRUMENTS BY CATEGORYThe carrying amount of the different categories of financial instruments are as follows:
£m 2021 2020
Financial assets, at FVPL * 0.3Financial liabilities, at FVPL (1.5) (1.1)Financial assets, at amortised cost 40.7 44.7Financial liabilities, at amortised cost (85.1) (64.4)
* Balance is less than £100,000.
H. OFFSETTING FINANCIAL ASSETS AND FINANCIAL LIABILITIESThe Group has no financial instruments subject to enforceable master netting arrangements.
30. Subsequent eventOn 31 January 2022, the Group announced the acquisition of FuG Elektronik GmbH and Guth High Voltage GmbH for a cash consideration of €39 million (circa. £32.8 million). The acquisition was funded by the Group’s existing debt facilities and is subject to customary post-completion working capital adjustments.
31. Contingent liabilitiesAs reported last year, in September 2020, Comet Technologies USA Inc., Comet AG, and YXLON International (collectively “Comet”) filed a lawsuit against XP Power LLC, alleging trade secret misappropriation relating to RF match and generator technology. The lawsuit is still ongoing, and the Group has incurred legal costs of £10.1 million in 2021 (2020: £0.4 million). XP Power believes there is no merit to this lawsuit and is vigorously defending claims brought against it by Comet. A jury trial for this lawsuit is currently set to begin on March 14, 2022. The Group expects to incur further legal costs until this matter is resolved, the magnitude of which cannot currently be estimated with any certainty. No provision in relation to the dispute has been recognised as the amount of outflow of economic benefits, if any, cannot be estimated reliably. Further information about the matter and its possible outcomes are not provided as such disclosures could prejudice seriously the position and interests of the company in this dispute.
32. Other informationThese financial statements were authorised for issue in accordance with a resolution of the Board of Directors of XP Power Limited on 1 March 2022.
178
XP Power Annual Report & Accounts for the year ended 31 December 2021
NOTES TO THE CONSOLIDATEDFINANCIAL STATEMENTS CONTINUEDFOR THE FINANCIAL YEAR ENDED 31 DECEMBER 2021
30801-XP-Power AR21 Financials.indd 17830801-XP-Power AR21 Financials.indd 178 08/03/2022 10:52:4608/03/2022 10:52:46

30801 8 March 2022 10:52 am V8
£‘000 Note 2021 2020
ASSETS Current assets Cash and cash equivalents 36 3,469 4,336Trade and other receivables 37 45,712 46,132Other current assets 38 1,051 845Derivative financial instruments 39 * 300Inventories 40 11,283 15,827Total current assets 61,515 67,440Non-current assets Investment in subsidiaries 35 43,928 43,484Property, plant and equipment 41 1,838 1,561Right-of-use assets 42 4,515 336Intangible assets 43 27,287 17,738Long-term receivable 46 6,660 6,593Total non-current assets 84,228 69,712Total assets 145,743 137,152LIABILITIES Current liabilities Trade and other payables 45 50,111 39,016Current income tax liabilities 47 1,422 4,794Derivative financial instruments 39 129 111Lease liabilities 339 263Total current liabilities 52,001 44,184Non-current liabilities Deferred income tax liabilities 44 4,458 2,832Other long term creditors 113 –Lease liabilities 4,109 96Total non-current liabilities 8,680 2,928Total liabilities 60,681 47,112NET ASSETS 85,062 90,040EQUITY Share capital 48 29,774 29,774Share-based payment reserve 48 951 565Translation reserve 48 16,386 15,530Retained earnings 48 37,951 44,171TOTAL EQUITY 85,062 90,040
* Balance is less than £1,000.
179
FINANCIALS
COMPANY BALANCE SHEETAS AT 31 DECEMBER 2021
30801-XP-Power AR21 Financials.indd 17930801-XP-Power AR21 Financials.indd 179 08/03/2022 10:52:4608/03/2022 10:52:46

30801 8 March 2022 10:52 am V8
33. General informationXP Power Limited (the “Company”) is listed on the London Stock Exchange and incorporated and domiciled in Singapore. The address of its registered office is 401 Commonwealth Drive, Lobby B, #02-02, Haw Par Technocentre, Singapore 149598. With effect from 7 February 2022, the address of registered office has changed to 19 Tai Seng Avenue, #07-01, Singapore 534054.
The nature of the Company’s operations and its principal activities are providing power supply solutions and acting as an investment holding company.
34. Basis of accounting policiesThe Company applies the same principal accounting policies as the Group as set out in Note 2 under the Group Consolidated Financial Statements.
On 1 January 2021, the Company adopted the new or amended IFRS and International Financial Reporting Interpretations Committee (“IFRIC”) that are mandatory for application for the financial year. Changes to the Company’s accounting policies have been made as required, in accordance with the transitional provisions in the respective IFRS and IFRIC.
The adoption of these new or amended IFRS and IFRIC did not result in substantial changes to the Company’s accounting policies and had no material effect on the amounts reported for the current or previous financial years except for the following:
FINANCIAL GUARANTEESThe Company has issued corporate guarantees to banks for bank borrowings of its subsidiaries. These guarantees are financial guarantees as they require the Company to reimburse the banks if the subsidiaries fail to make principal or interest payments when due in accordance with the terms of their borrowings. Intragroup transactions are eliminated on consolidation.
Financial guarantee contracts are initially measured at fair values plus transaction costs and subsequently measured at the higher of:
(a) premium received on initial recognition less the cumulative amount of income recognised in accordance with the principles of IFRS 15; and(b) the amount of expected loss computed using the impairment methodology under IFRS 9.
35. Investment in subsidiaries £’000 2021 2020
Cost and carrying amount At 1 January 43,484 44,892Currency translation differences 444 (1,408)At 31 December 43,928 43,484
Name of Subsidiary
Places of business / Country of
incorporation
Ownership interest
2021
Ownership interest
2020XP Power Plc UK 100 100XP Power Singapore Holdings Pte Limited Singapore 100 100
180
XP Power Annual Report & Accounts for the year ended 31 December 2021
NOTES TO THE COMPANYBALANCE SHEETAS AT 31 DECEMBER 2021
30801-XP-Power AR21 Financials.indd 18030801-XP-Power AR21 Financials.indd 180 08/03/2022 10:52:4608/03/2022 10:52:46

30801 8 March 2022 10:52 am V8
36. Cash and cash equivalents£‘000 2021 2020
Cash at bank 3,469 4,336Total 3,469 4,336
The Company’s cash at bank is denominated in the following currencies:
£’000 GBP USD EUR SGD JPY TOTAL
At 31 December 2021 481 2,310 579 69 30 3,469At 31 December 2020 495 3,000 687 130 24 4,336
37. Trade and other receivables £’000 2021 2020
Trade receivables 3,705 3,408Trade receivables from related parties 26,221 29,100Other receivables from related parties 4,553 6,980Loan receivables from a related party 11,233 6,644Total 45,712 46,132
The average credit period taken on sales of goods to third party is 46 days (2020: 40 days). No interest is charged on the outstanding receivables balance.
The carrying amount of trade and other receivables approximates their fair value.
Loan from a related party is unsecured and bears interest at LIBOR plus 1.5% per annum.
Trade and other receivables from related parties are interest-free.
38. Other current assets £’000 2021 2020
Prepayments 496 578Deposit 89 72VAT receivables 389 148Other receivables 77 47Total 1,051 845
39. Derivative financial instrumentsCURRENCY FORWARDSDerivative financial instruments comprise of the USD/GBP currency forwards used to manage the exposure from issuance of dividends in GBP. Hedge accounting has not been applied to these contracts:
The contracted notional principal amounts ad fair values of these currency forwards are as follows:
31 December 2021 £’000
Assets LiabilitiesContractual
notional amount Fair value Contractual
notional amount Fair value
Currency forwards (current) 1,050 * 7,950 (129)
31 December 2020 £’000
Assets LiabilitiesContractual
notional amount Fair value Contractual
notional amount Fair value
Currency forwards (current) 5,800 300 2,400 (111)
* Balance is less than £1,000.
181
FINANCIALS
30801-XP-Power AR21 Financials.indd 18130801-XP-Power AR21 Financials.indd 181 08/03/2022 10:52:4608/03/2022 10:52:46

30801 8 March 2022 10:52 am V8
40. Inventories £’000 2021 2020
Finished goods 11,283 15,827
41. Property, plant and equipment
£‘000Freehold
land BuildingPlant and
equipmentMotor
vehiclesBuilding
improvementsAsset under
construction TotalCostAt 1 January 2020 220 1,767 1,575 41 478 – 4,081Additions – – 64 – 32 (0) 96Disposals – – (7) – – – (7)Transfer from related party – – 65 – – – 65Currency translation differences (7) (54) (60) (1) (14) – (136)At 31 December 2020 213 1,713 1,637 40 496 (0) 4,099Additions – – 202 – 10 238 450Currency translation differences 2 18 22 1 5 2 50At 31 December 2021 215 1,731 1,861 41 511 240 4,599Accumulated depreciationAt 1 January 2020 – 592 1,383 26 454 – 2,455Additions – 55 101 9 13 – 178Disposals – – (7) – – – (7)Currency translation differences – (24) (48) (2) (14) – (88)At 31 December 2020 – 623 1,429 33 453 – 2,538Additions – 51 102 7 33 – 193Currency translation differences – 7 17 1 5 – 30At 31 December 2021 – 681 1,548 41 491 – 2,761Carrying amountAt 31 December 2021 215 1,050 313 – 20 240 1,838At 31 December 2020 213 1,090 208 7 43 (0) 1,561
Asset under construction pertains to costs incurred for the renovation of office space which is due for completion in 2022.
42. Right-of-use assets
£‘000Leasehold land
and buildingsCarrying amountAt 1 January 2020 333Depreciation charge during the year (224)Additions 241Currency translation differences (14)At 31 December 2020 336Depreciation charge during the year (321)Additions 4,454Currency translation differences 46At 31 December 2021 4,515
182
XP Power Annual Report & Accounts for the year ended 31 December 2021
NOTES TO THE COMPANYBALANCE SHEET CONTINUEDAS AT 31 DECEMBER 2021
30801-XP-Power AR21 Financials.indd 18230801-XP-Power AR21 Financials.indd 182 08/03/2022 10:52:4608/03/2022 10:52:46

30801 8 March 2022 10:52 am V8
43. Intangible assets
£‘000Development
costs TrademarksIntangible
software
Intangible software under
development TotalCostAt 1 January 2020 19,582 87 5,171 – 24,840Additions 3,565 – 3 2,911 6,479Disposals (1,180) – – – (1,180)Transfer – – 1,252 (1,252) –Currency translation differences (707) (3) (194) (118) (1,022)At 31 December 2020 21,260 84 6,232 1,541 29,117Additions 3,766 – 74 7,955 11,795Currency translation differences 314 1 65 184 564At 31 December 2021 25,340 85 6,371 9,680 41,476Accumulated amortisationAt 1 January 2020 8,297 – 166 – 8,463Charge for the year 2,805 – 598 – 3,403Currency translation differences (445) – (42) – (487)At 31 December 2020 10,657 – 722 – 11,379Charge for the year 1,988 – 656 – 2,644Currency translation differences 147 – 19 – 166At 31 December 2021 12,792 – 1,397 – 14,189Carrying amountAt 31 December 2021 12,548 85 4,974 9,680 27,287At 31 December 2020 10,603 84 5,510 1,541 17,738
The Company’s trademarks used to identify and distinguish the Company’s name and logo have a cost of £85,000 (2020: £84,000). The Company intends to renew the trademarks continuously and evidence supports its ability to do so, based on its past experience. An analysis of market and competitive trends provides evidence that the trademarks will generate net cash inflows for the Company for an indefinite period. Therefore, the trademarks are carried at cost without amortisation, but is tested for impairment on an annual basis.
44. Deferred income tax liabilitiesThe movement in deferred income tax liabilities during the financial year is as follow:
£‘000Accelerated tax
depreciation
Capitalised development
costs
Intangible assets
amortisation
Other temporary
differences TotalAt 1 January 2020 23 (1,918) (487) (97) (2,479)(Charged)/credited to profit or loss (135) 60 (356) (29) (460)Currency translation differences 8 56 38 5 107At 31 December 2020 (104) (1,802) (805) (121) (2,832)Charged to profit or loss (418) (306) (833) (8) (1,565)Currency translation differences (9) (24) (24) (4) (61)At 31 December 2021 (531) (2,132) (1,662) (133) (4,458)
45. Trade and other payables£‘000 2021 2020
Trade payables and other creditors 11,673 6,480Amount payable to related parties 38,438 32,536Total 50,111 39,016
Amount payable to related parties consists of advances from related parties amounting to £7,190,000 (2020: nil) which pertain to cash pooling arrangements and are unsecured, repayable on demand and bear interest ranging from 1.5% to 3.0% per annum.
The Company borrows from subsidiaries at an interest rate of 1.5%–2.0% above LIBOR. The borrowing is repayable on demand. The outstanding amount as at year end is £25,443,000 (2020: £26,518,000)
183
FINANCIALS
30801-XP-Power AR21 Financials.indd 18330801-XP-Power AR21 Financials.indd 183 08/03/2022 10:52:4608/03/2022 10:52:46

30801 8 March 2022 10:52 am V8
46. Long-term receivable£‘000 2021 2020
Loans to subsidiaries 6,660 6,593Total 6,660 6,593
Loans to subsidiaries amounting to are unsecured and denominated in the USD. The loans are repayable on demand and bear interest at LIBOR plus 2.0% per annum.
47. Current income tax liabilitiesMovement in current income tax liabilities:
£‘000 2021 2020
At 1 January 4,794 2,449Currency translation differences 88 (339)Income tax paid (net of refund) (4,418) (1,648)Current year tax expense 844 4,332Under provision in prior financial year 114 –At 31 December 1,422 4,794
48. Share capital and reservesA. SHARE CAPITALThe Company’s share capital comprises fully paid up 19,242,296 (2020: 19,242,296) ordinary shares with no par value, amounting to £29,774,000 (2020: £29,774,000). The movement in 2021 relates to transaction costs incurred in anticipation of an equity issuance.
B. SHARE-BASED PAYMENT RESERVEShare-based payments reserve represents the equity-settled share-based payments granted to employees. The reserve is made up of the cumulative value of services received from employees recorded over the vesting period commencing from the grant date of equity-settled share-based payments and is reduced by the expiry or exercise of share-based payments.
£‘000 2021 2020
At 1 January 565 404Share-based payment expenses 381 174Currency translation differences 5 (13)At 31 December 951 565
C. TRANSLATION RESERVETranslation reserve represents exchange differences arising from the translation of financial statements of foreign transactions and balances which functional currencies are different from that of the Company’s presentation currency.
£‘000 2021 2020
At 1 January 15,530 18,868Currency translation differences 856 (3,338)At 31 December 16,386 15,530
D. RETAINED EARNINGSThe movement in retained earnings during the financial year is as follow:
£‘000 2021 2020
At 1 January 44,171 28,814Dividends paid (18,178) (7,360)Profit for the year 11,958 22,717At 31 December 37,951 44,171
184
XP Power Annual Report & Accounts for the year ended 31 December 2021
NOTES TO THE COMPANYBALANCE SHEET CONTINUEDAS AT 31 DECEMBER 2021
30801-XP-Power AR21 Financials.indd 18430801-XP-Power AR21 Financials.indd 184 08/03/2022 10:52:4608/03/2022 10:52:46

30801 8 March 2022 10:52 am V8
49. Financial risk managementThe Company’s activities expose it to capital risk, market risk (including currency risk and interest rate risk), credit risk and liquidity risk. The Company seeks to minimise adverse effects from the unpredictability of financial markets on the Company’s financial performance.
A. CAPITAL RISKThe Company manages its capital to ensure that it will be able to continue as a going concern while maximising the return to shareholders through the optimisation of the debt and equity balance.
The capital structure of the Company consists of debt, cash and equity attributable to equity holders of the parent, comprising issued capital, reserves and retained earnings as disclosed in Note 48.
B. CURRENCY RISKThe Company transacts in North America, Europe and Asia. The Company monitors and manages the currency risks through internal reports analysing major currency exposures. Where possible the Company seeks to offset exposures by matching monetary asset and liability exposures in like currencies against each other often using its bank facilities to square off or reduce exposures. The Company manages some currency exposure by entering into currency forwards with banks.
The Company’s currency exposure based on the information provided to key management is as follows:
At 31 December 2021£‘000 GBP EUR USD Others TotalFinancial assets Cash and cash equivalents 481 579 2,310 99 3,469Trade and other receivables 981 903 42,098 1,730 45,712Other current assets – 4 – 162 166Long-term receivables – 6,660 – 6,660Subtotal 1,462 1,486 51,068 1,991 56,007Financial liabilitiesTrade and other payables (13,068) (342) (34,498) (1,532) (49,440)Lease liabilities – – – (4,448) (4,448)Other financial liabilities – – – (113) (113)Subtotal (13,068) (342) (34,498) (6,093) (54,001)Net financial (liabilities)/assets (11,606) 1,144 16,570 (4,102) 2,006Currency forwards 9,000 – – – 9,000Currency profile excluding non-financial assets and liabilities (2,606) 1,144 16,570 (4,102) 11,006Less: Financial assets denominated in the entity’s functional currency – – 16,570 – 16,570Currency exposure of financial (liabilities)/assets (2,606) 1,144 – (4,102) (5,564)
At 31 December 2020£‘000 GBP EUR USD Others Total
Financial assets Cash and cash equivalents 495 687 2,999 155 4,336Trade and other receivables 866 357 43,655 1,254 46,132Other current assets – – 47 72 119Long-term receivables – – 6,593 – 6,593Subtotal 1,361 1,044 53,294 1,481 57,180Financial liabilitiesTrade and other payables (10,208) (232) (28,006) (474) (38,920)Lease liabilities – – – (359) (359)Subtotal (10,208) (232) (28,006) (833) (39,279)Net financial (liabilities)/assets (8,847) 812 25,288 648 17,901Currency forwards 8,200 – – – 8,200Currency profile excluding non-financial assets and liabilities (647) 812 25,288 648 26,101Less: Financial assets denominated in the entity’s functional currency – – 25,288 – 25,288Currency exposure of financial (liabilities)/assets (647) 812 – 648 813
185
FINANCIALS
30801-XP-Power AR21 Financials.indd 18530801-XP-Power AR21 Financials.indd 185 08/03/2022 10:52:4708/03/2022 10:52:47

30801 8 March 2022 10:52 am V8
49. Financial risk management continued
C. INTEREST RATE RISKCash flow interest rate risk is the risk that the future cash flows of a financial instrument will fluctuate because of changes in market interest rates. As the Company has no significant interest-bearing assets, the Company’s income is substantially independent of changes in the market interest rates.
The Company borrows from subsidiaries at an interest rate of 1.5%–2.0% above LIBOR. If the average interest rates on these borrowings increased/decreased by 0.14% (2020: 1.45%) with all other variables, including tax rates, being held constant, the profit after tax will be lower/higher by £31,958 (2020: £394,140) as a result of higher/lower interest expense on these borrowings.
D. CREDIT RISKCredit risk refers to the risk that the counterparty will default on its contractual obligations resulting in a financial loss to the Company. For trade receivables the Company adopts a policy of only dealing with customers of appropriate credit history or rating. For other financial assets, the Company adopts the policy of only dealing with high credit quality counterparties.
The Company is not exposed to significant credit risk as a majority of the sales are made to the subsidiaries. Trade receivables are neither past due nor impaired are substantially companies with a good collection track record with the Company.
The Company does not hold any collateral and the maximum exposure to credit risk for each class of financial instruments is the carrying amount of that class of financial instruments on the balance sheet.
The Company applies the simplified approach by using the provision matrix to measure the lifetime expected credit loss for all trade receivables. In measuring the expected credit losses, it is based on the Company’s two years historical credit loss experience and a provision matrix has been set up using the amount of bad debt incurred over the carrying value of the trade receivables per ageing brackets at each financial year end.
The Company’s credit risk exposure in relation to trade receivables are set out in the provision matrix as follows:
Past due£‘000 Current 1–30 days 31–60 days 61–90 days 91–120 days >120 days TotalAt 31 December 2021Expected loss rate 0% 0% 0% 0% 0% 0%Trade receivables 6,659 8,064 3,182 2,783 841 8,397 29,926Loss allowance – – – – – – –
Past due
£‘000 Current 1–30 days 31–60 days 61–90 days 91–120 days >120 days Total
At 31 December 2020Expected loss rate 0% 0% 0% 0% 0% 0%Trade receivables 7,637 2,969 3,385 4,188 4,413 9,916 32,508Loss allowance – – – – – – –
The Company monitors the credit risk of the related parties based on the past due information to assess if there is any significant increase in credit risk. The related corporation has made interest payment on a timely basis and considered to have low risk of default. The loan balance of £6,660,000 (2020: £6,593,000) is measured on 12-month expected credit losses. The credit loss is immaterial.
186
XP Power Annual Report & Accounts for the year ended 31 December 2021
NOTES TO THE COMPANYBALANCE SHEET CONTINUEDAS AT 31 DECEMBER 2021
30801-XP-Power AR21 Financials.indd 18630801-XP-Power AR21 Financials.indd 186 08/03/2022 10:52:4708/03/2022 10:52:47

30801 8 March 2022 10:52 am V8
49. Financial risk management continued
Financial assets at amortised costsThe Company uses the following categories of internal credit risk rating for financial assets which are subject to expected credit losses under the 3-stage general approach. These four categories reflect the respective credit risk and how the loss provision is determined for each of those categories.
Category of internal credit rating Performing Underperforming Non-performing Write offDefinition of category Issuers have a low
risk of default and a strong capacity to meet contractual cash flows
Issuers for which there is a significant increase in credit risk, as significant in credit risk is presumed if interest and/or principal repayment are 30 days past due
Interest and/or principal payments are 90 days past due
Interest and/or principal repayments are 120 days past due and there is no reasonable expectation of recovery
Basis of recognition of expected credit loss
12-month expected credit losses
Lifetime expected credit losses
Lifetime expected credit losses
Asset is written off
E. LIQUIDITY RISKThe table below analyses non-derivative financial liabilities of the Company into relevant maturity groupings based on the remaining period from the balance sheet date to the contractual maturity date. The amounts disclosed in the table are the contractual undiscounted cash flows. Balances due within 12 months equal their carrying amounts as the impact of discounting is not significant.
£‘000Less than
1 yearBetween
1 and 2 yearsBetween
2 and 5 yearsOver
5 years TotalAt 31 December 2021Trade and other payables 49,440 – – – 49,440Lease liabilities 353 794 1,298 2,003 4,448Total 49,793 794 1,298 2,003 53,888
£‘000Less than
1 yearBetween
1 and 2 yearsBetween
2 and 5 yearsOver
5 years Total
At 31 December 2020Trade and other payables 38,920 – – – 38,920Lease liabilities 275 89 – – 364Total 39,195 89 – – 39,284
The Company manages the liquidity risk by maintaining sufficient cash and bank facilities to enable it to meet its normal operating commitments.
187
FINANCIALS
30801-XP-Power AR21 Financials.indd 18730801-XP-Power AR21 Financials.indd 187 08/03/2022 10:52:4708/03/2022 10:52:47
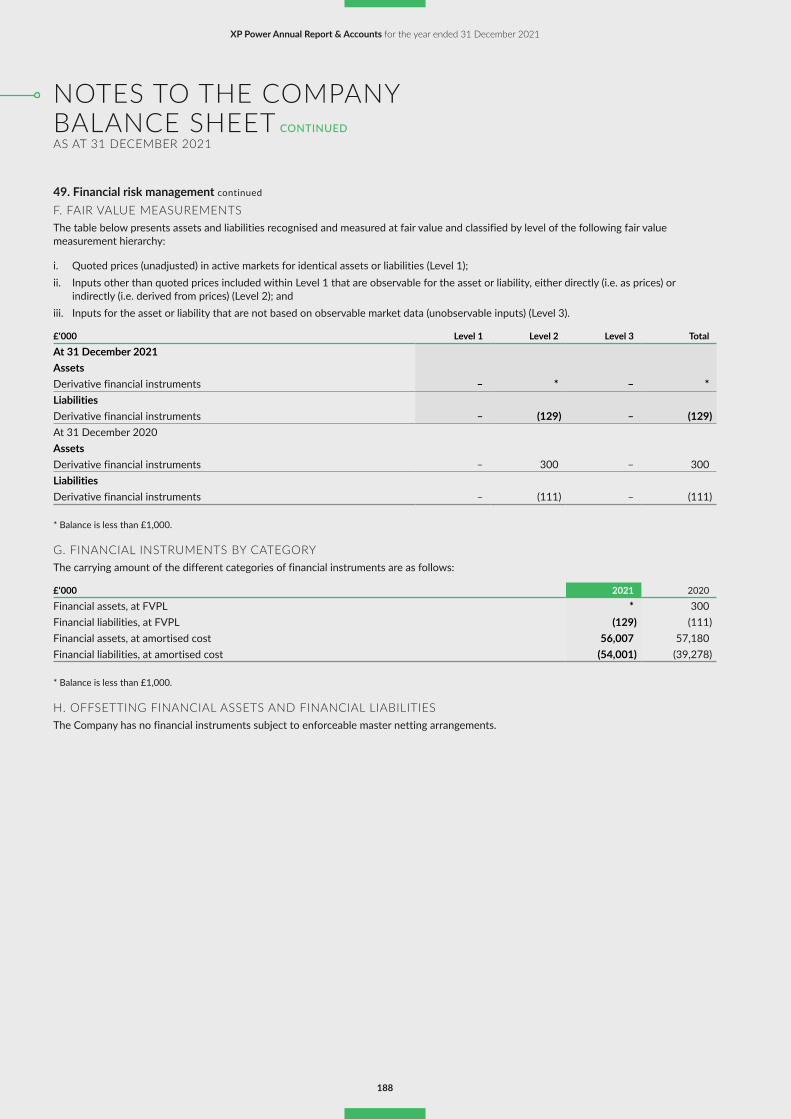
30801 8 March 2022 10:52 am V8
49. Financial risk management continued
F. FAIR VALUE MEASUREMENTSThe table below presents assets and liabilities recognised and measured at fair value and classified by level of the following fair value measurement hierarchy:
i. Quoted prices (unadjusted) in active markets for identical assets or liabilities (Level 1);ii. Inputs other than quoted prices included within Level 1 that are observable for the asset or liability, either directly (i.e. as prices) or
indirectly (i.e. derived from prices) (Level 2); andiii. Inputs for the asset or liability that are not based on observable market data (unobservable inputs) (Level 3).
£‘000 Level 1 Level 2 Level 3 TotalAt 31 December 2021AssetsDerivative financial instruments – * – *LiabilitiesDerivative financial instruments – (129) – (129)At 31 December 2020AssetsDerivative financial instruments – 300 – 300LiabilitiesDerivative financial instruments – (111) – (111)
* Balance is less than £1,000.
G. FINANCIAL INSTRUMENTS BY CATEGORYThe carrying amount of the different categories of financial instruments are as follows:
£‘000 2021 2020
Financial assets, at FVPL * 300Financial liabilities, at FVPL (129) (111)Financial assets, at amortised cost 56,007 57,180Financial liabilities, at amortised cost (54,001) (39,278)
* Balance is less than £1,000.
H. OFFSETTING FINANCIAL ASSETS AND FINANCIAL LIABILITIESThe Company has no financial instruments subject to enforceable master netting arrangements.
188
XP Power Annual Report & Accounts for the year ended 31 December 2021
NOTES TO THE COMPANYBALANCE SHEET CONTINUEDAS AT 31 DECEMBER 2021
30801-XP-Power AR21 Financials.indd 18830801-XP-Power AR21 Financials.indd 188 08/03/2022 10:52:4708/03/2022 10:52:47

30801 8 March 2022 10:52 am V8
2021£m
2020£m
2019£m
2018£m
2017£m
ResultsRevenue 240.3 233.3 199.9 195.1 166.8Profit from operations 29.7 37.4 26.7 39.3 32.5Profit before tax 28.4 35.7 24.0 37.6 32.2Assets employedNon-current assets 150.5 135.2 137.4 129.2 88.1Current assets 121.7 107.0 96.0 105.1 83.5Current liabilities (49.0) (34.7) (30.4) (26.8) (25.1)Non-current liabilities (50.8) (43.0) (64.1) (70.1) (29.6)Net assets 172.4 164.5 138.9 137.4 116.9Financed byEquity 171.5 163.8 138.2 136.4 116.0Non-controlling interests 0.9 0.7 0.7 1.0 0.9
172.4 164.5 138.9 137.4 116.9Key statistics (pence)Earnings per share 115.8 163.0 107.0 157.8 148.3Adjusted earnings per share 179.4 201.8 144.1 176.1 149.4Diluted earnings per share 113.8 160.3 105.0 154.9 146.0Diluted adjusted earnings per share 176.3 198.4 141.4 172.8 147.0Share price in the yearHigh 5,700.0 4,790.0 3,110.0 3,740.0 3,626.0Low 4,630.0 2,130.0 1,965.0 2,090.0 1,725.0Dividends per share 94.0 74.0 55.0 85.0 78.0
189
FINANCIALS
FIVE-YEAR REVIEW CONSOLIDATED INFORMATION
30801-XP-Power AR21 Financials.indd 18930801-XP-Power AR21 Financials.indd 189 08/03/2022 10:52:4708/03/2022 10:52:47

30801 8 March 2022 10:52 am V8
Company BrokersInvestec 2 Gresham StreetLondonEC2V 7QPUnited Kingdom
Principal BankersHSBC Bank plcLevel 7Thames TowerStation RoadReadingRG1 1LXUnited Kingdom
SolicitorsEversheds Sutherland1 Wood StreetLondonEC2V 7WSUnited Kingdom
RegistrarsLink Asset ServicesThe Registry34 Beckenham RoadBeckenhamKentBR3 4TUUnited Kingdom
Company SecretaryM & C Services Private Limited112 Robinson Road #05-01The Corporate OfficeSingapore 068902
AuditorsPricewaterhouseCoopers LLP7 Straits View Marina One, East Tower, Level 12Singapore 018936
190
XP Power Annual Report & Accounts for the year ended 31 December 2021
ADVISERS
30801-XP-Power AR21 Financials.indd 19030801-XP-Power AR21 Financials.indd 190 08/03/2022 10:52:4708/03/2022 10:52:47

30801 8 March 2022 10:52 am V8
This document is printed on Revive Silk 100 which is made from 100% FSC® Recycled pulp and post-consumer waste paper. This reduces waste sent to landfill, greenhouse gas emissions, as well as the amount of water and energy consumed.
The paper is Carbon Balanced with World Land Trust, an international conservation charity, who offset carbon emissions through the purchase and preservation of high conservation value land. Through protecting standing forests, under threat of clearance, carbon is locked in that would otherwise be released. These protected forests are then able to continue absorbing carbon from the atmosphere,referred to as REDD (Reduced Emissions from Deforestation and forest Degradation). This is now recognised as one of the most cost-effective and swiftest ways to arrest the rise in atmospheric CO₂ and global warming effects. Additional to the carbon benefits is the flora and fauna this land preserves, including a number of species identified at risk of extinction on the IUCN Red List of Threatened Species.
30801-XP-Power AR21 Financials.indd 330801-XP-Power AR21 Financials.indd 3 08/03/2022 10:52:4708/03/2022 10:52:47

30801 8 March 2022 9:38 am v9
P O W E R I N G T H E W O R L D ’ S C R I T I C A L S Y S T E M S
XP POW
ERAN
NU
AL REPORT &
ACCOU
NTS for the year ended 31 D
ecember 2021
XP Power Limited19 Tai Seng Avenue#07-01Singapore 534054T: +65 6411 6900F: +65 6479 6305
30801-XP-Power AR21-Strategic.indd 330801-XP-Power AR21-Strategic.indd 3 08/03/2022 10:56:2808/03/2022 10:56:28