The Fidelity Master Trust Trustees' Report and Financial ...
247
The Fidelity Master Trust Trustees’ Report and Financial Statements For the year ended 30 June 2021 Scheme Registration No. 12008988
-
Upload
khangminh22 -
Category
Documents
-
view
0 -
download
0
Transcript of The Fidelity Master Trust Trustees' Report and Financial ...
The Fidelity Master Trust
Trustees’ Report and Financial Statements For the year ended 30 June 2021
Scheme Registration No. 12008988
The Fidelity Master Trust Report and Financial Statements for the year ended 30 June 2021
Contents Page
Trustees’ Report 1 - 14
Investment Report 15 - 20
Independent Auditor’s Report 21 - 23
Fund Account 24
Statement of Net Assets Available for Benefits 25
Notes to the Financial Statements 26 - 34
Independent Auditor’s Statement about Contributions 35
Summary of Contributions 36
Chair’s Statement 37 - 60
Appendix 1 – Statement of Investment Principles 61 - 123 (Full version all sections)
Appendix 2 - Fund charges summary 124 - 131
Appendix 3 - Example cost and charges illustrations 132 - 206
Appendix 4 – Implementaton Report 207 - 245

The Fidelity Master Trust Report and Financial Statements for the year ended 30 June 2021
1
Trustees’ Report 1 Constitution of the Scheme The Scheme was set up on 13 December 2013 to provide defined contribution benefits to the current and former employees of the Participating Employers, a list of which can be found on pages 5 to 9. It may also provide benefits to members who have been transferred to the Scheme by the trustees of another pension scheme. The Scheme is a registered pension scheme for tax purposes under the Finance Act 2004 (Registered Pension Scheme number 0081028RS). The Scheme is governed by a Master Trust Board which meets the independence requirements as defined by the Department for Work and Pensions (DWP). The Board is responsible for ensuring the Scheme is operating in accordance with the Scheme Trust Deed and Rules dated 13 December 2013 and Deed of Amendment dated 24 June 2016, together with the Deeds of Participation for each Participating Employer and the Statement of Investment Principles. Participating Employers are able to vary the rules in certain areas and these are set out in the relevant Deed of Participation. The Scheme’s Trust Deed and Rules were updated to incorporate the new Master Trust Requirements introduced under the Pension Schemes Act 2017 via a Deed of Amendment dated 7 February 2019. The Fidelity Master Trust received authorisation from the Pensions Regulator (TPR) with effect from 28 June 2019. The Scheme is now subject to TPR’s ongoing supervision to ensure the Scheme continues to meet the authorisation criteria set out in the Pension Schemes Act 2017. FIL Life Insurance Ltd, ‘(Fidelity)’, is the Scheme Sponsor and is responsible for setting up the Master Trust and appointing the Trustees. The Trustees are responsible for the administration and investment policy of the Scheme. The Trustees meet formally four times a year, and more frequently as required. Under the terms of the Trust Deed, resolutions are passed on a simple majority of those voting, with the Chair having a casting vote when necessary. The Trustees have established three joint Sub-Committees with the Independent Governance Committee (IGC) of Fidelity which is responsible for oversight of Fidelity’s contract based workplace pension schemes. Each Committee comprises of at least two independent Trustees including the independent Chair:
• The joint Communications Sub-Committee, which allows the Trustees to better understand and influence Fidelity’s communication strategy, and to set the strategy for the Trust;
• The joint Investment Sub-Committee, which allows the Trustees to better understand and influence Fidelity’s investment strategy, and to set the strategy for the Trust; and
• The joint Administration Sub-Committee, set up during the year, which allows the Trustees to better understand, influence and monitor Fidelity’s administration proposition. The first Administration Sub-Committee meeting was held on 23 June 2020.
The Trustees have a delegation policy covering the payment of retirement benefits, transfers and certain discretionary benefit payments including the authority to make decisions on death, ill health and serious ill health cases. The delegation policy is reviewed on a regular basis and delegated decisions are reported at each Trustee meeting.

The Fidelity Master Trust Report and Financial Statements for the year ended 30 June 2021
2
The Trustees appointed Fidelity as Scheme Administrator (‘the Administrator’) on 1 April 2014. The Administrator is responsible for the day-to-day operation of the Scheme including member communications, member and Participating Employer websites, record keeping, allocation of contributions to member funds and payment of benefits. The Administrator is remunerated through the Annual Management Charges (AMCs) deducted from members’ pension accounts. In some cases, fees may be payable by a Participating Employer. All other fees are paid by Fidelity except for bespoke investment adviser fees which are met by the Participating Employer. 2 The Trustees As Scheme Sponsor, Fidelity is responsible for the appointment and removal of the Trustees. Trustees are appointed for a fixed term of office of up to 5 years, subject to a 10 year cumulative maximum. Details of the current Trustees may be found on pages 58 and 59, in the Chair’s Statement. The Trustees have a Trustee Action Plan which is used to help ensure the Scheme is run efficiently. The Trustees have responsibility for controls and risk management and have identified and logged risks in a risk register. The risk register is used to document the risks to which the Scheme is exposed and to record the likelihood and impact of those risks and the mitigating actions required. The risk register consists of six key areas covering operational, investment, governance, strategic, communication and regulatory and compliance risks, and is updated at least annually or as and when risks are identified or the assessment changes. Details of any changes to the risk register are formally recorded and shared with TPR as part of the annual supervisory return. The Trustees are now subject to TPR’s ongoing supervision to ensure the Scheme continues to meet the authorisation criteria set out in the Pension Schemes Act 2017. TPR has published its supervision and enforcement policy which sets out how it will supervise master trusts and use its enforcement powers. All master trusts will be supervised and required to submit an annual supervisory return. The Regulator expects those responsible for running master trusts to:
• be open, honest and transparent in their interactions with TPR, responding promptly to information requests;
• proactively liaise with TPR and volunteer information about material developments, risks and issues in their scheme, which may affect the scheme’s ability to continue to meet the authorisation criteria and other obligations;
• satisfy TPR that they continue to meet their obligations and that there is a low risk of them failing to meet their obligations going forward, including providing relevant evidence; and
• be proactive in identifying and monitoring risks, and proactive in rectifying any issues that may arise and affect the scheme’s ability to continue to meet the authorisation criteria or other obligations.
In addition to the supervisory requirements, the Trustees continue to commission an independent reporting accountant to assess the design and operating effectiveness of the control procedures of the Scheme on an annual basis. The AAF 05/20 assurance report on internal controls covers the control procedures in place to meet the control objectives described in the Institute of Chartered Accountants in England and Wales (‘ICAEW’) Assurance reporting on Master Trusts (TECH 05/20 AAF).

The Fidelity Master Trust Report and Financial Statements for the year ended 30 June 2021
3
3 Conflicts of Interest A conflicts of interest policy is in place to assist the Trustees in identifying, managing and monitoring any actual or potential conflicts of interest which may arise in relation to the Scheme. This policy is reviewed annually. The Trustees keep a register of interests which is reviewed at the start of each Trustees’ meeting and any additional conflicts noted at that time. 4 Statement of Trustees’ Responsibilities The financial statements, which are prepared in accordance with United Kingdom Generally Accepted Accounting Practice, including the Financial Reporting Standard applicable in the UK (FRS 102) are the responsibility of the Trustees. Pension scheme regulations require, and the Trustees are responsible for ensuring, that those financial statements:
• show a true and fair view of the financial transactions of the Scheme during the Scheme year and of the amount and disposition at the end of that year of the assets and liabilities, other than liabilities to pay pensions and benefits after the end of the Scheme year; and
• contain the information specified in Regulation 3A of The Occupational Pension
Schemes (Requirement to obtain Audited Accounts and a Statement from the Auditor) Regulations 1996, including making a statement whether the financial statements have been prepared in accordance with the relevant financial reporting framework applicable to occupational pension schemes.
In discharging the above responsibilities, the Trustees are responsible for selecting suitable accounting policies, to be applied consistently, making any estimates and judgments on a prudent and reasonable basis, and for the preparation of the financial statements on a going concern basis unless it is inappropriate to presume that the Scheme will not be wound up. The Trustees are also responsible for making available certain other information about the Scheme in the form of an Annual Report (called Trustees’ Report and Financial Statements). The Trustees have a general responsibility for ensuring that adequate accounting records are kept and for taking such steps as are reasonably open to them to safeguard the assets of the Scheme and to prevent and detect fraud and other irregularities, including the maintenance of an appropriate system of internal control. The Trustees are responsible under pensions legislation for ensuring that payment schedules are prepared, maintained and from time to time revised showing the rates of contributions payable to the Scheme by or on behalf of the employers and the active members of the Scheme and the dates on or before which such contributions are to be paid. The Trustees are also responsible for keeping records of contributions received in respect of any active member of the Scheme and for adopting risk-based processes to monitor whether contributions are made to the Scheme by the employer in accordance with the payment schedules. Where breaches of the schedules occur, the Trustees are required by the Pensions Acts 1995 and 2004 to consider making reports to TPR and affected members.
The Fidelity Master Trust Report and Financial Statements for the year ended 30 June 2021
4
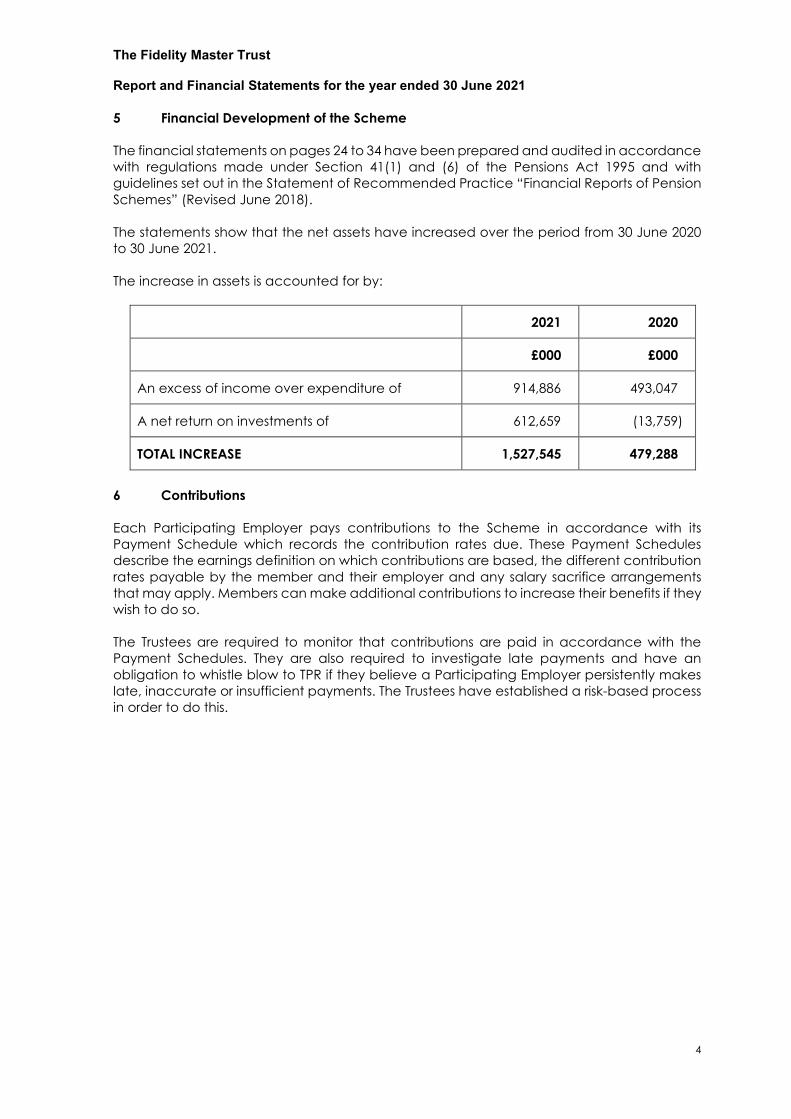
5 Financial Development of the Scheme The financial statements on pages 24 to 34 have been prepared and audited in accordance with regulations made under Section 41(1) and (6) of the Pensions Act 1995 and with guidelines set out in the Statement of Recommended Practice “Financial Reports of Pension Schemes” (Revised June 2018). The statements show that the net assets have increased over the period from 30 June 2020 to 30 June 2021. The increase in assets is accounted for by:
2021 2020
£000 £000
An excess of income over expenditure of 914,886 493,047
A net return on investments of 612,659 (13,759)
TOTAL INCREASE 1,527,545 479,288
6 Contributions Each Participating Employer pays contributions to the Scheme in accordance with its Payment Schedule which records the contribution rates due. These Payment Schedules describe the earnings definition on which contributions are based, the different contribution rates payable by the member and their employer and any salary sacrifice arrangements that may apply. Members can make additional contributions to increase their benefits if they wish to do so. The Trustees are required to monitor that contributions are paid in accordance with the Payment Schedules. They are also required to investigate late payments and have an obligation to whistle blow to TPR if they believe a Participating Employer persistently makes late, inaccurate or insufficient payments. The Trustees have established a risk-based process in order to do this.
The Fidelity Master Trust Report and Financial Statements for the year ended 30 June 2021
5
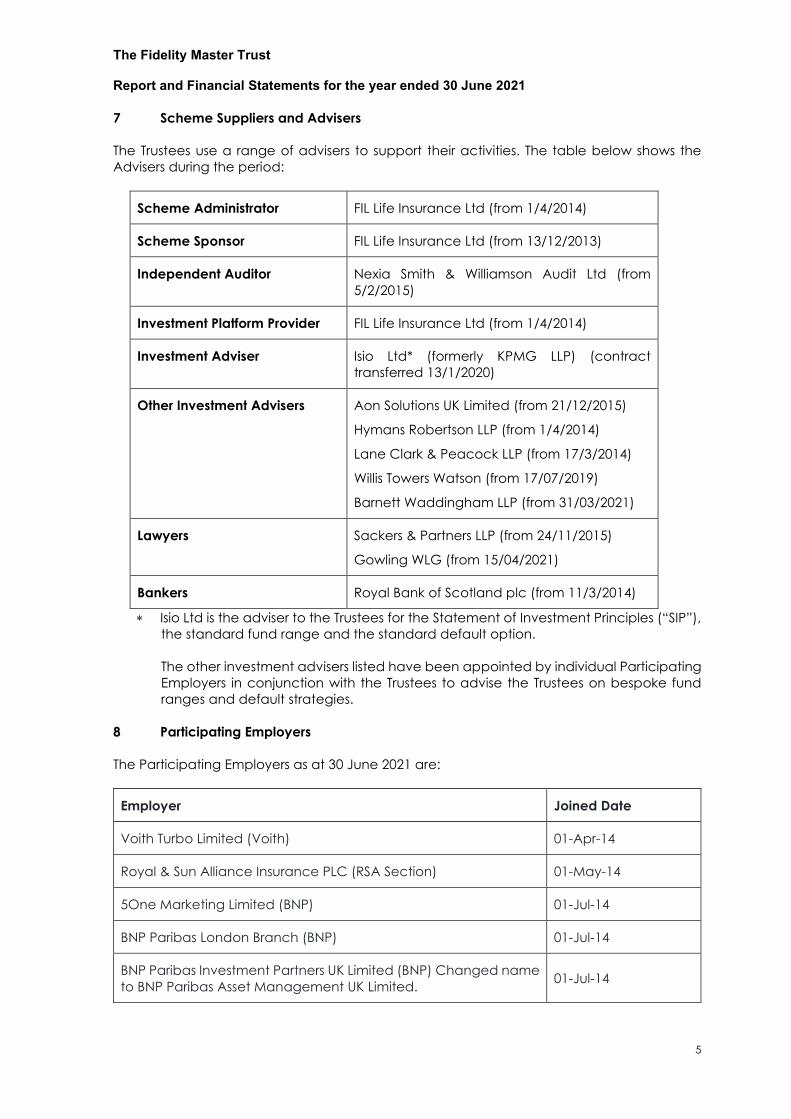
7 Scheme Suppliers and Advisers The Trustees use a range of advisers to support their activities. The table below shows the Advisers during the period:
Scheme Administrator FIL Life Insurance Ltd (from 1/4/2014)
Scheme Sponsor FIL Life Insurance Ltd (from 13/12/2013)
Independent Auditor Nexia Smith & Williamson Audit Ltd (from 5/2/2015)
Investment Platform Provider FIL Life Insurance Ltd (from 1/4/2014)
Investment Adviser Isio Ltd* (formerly KPMG LLP) (contract transferred 13/1/2020)
Other Investment Advisers Aon Solutions UK Limited (from 21/12/2015)
Hymans Robertson LLP (from 1/4/2014)
Lane Clark & Peacock LLP (from 17/3/2014)
Willis Towers Watson (from 17/07/2019)
Barnett Waddingham LLP (from 31/03/2021)
Lawyers Sackers & Partners LLP (from 24/11/2015)
Gowling WLG (from 15/04/2021)
Bankers Royal Bank of Scotland plc (from 11/3/2014)
∗ Isio Ltd is the adviser to the Trustees for the Statement of Investment Principles (“SIP”), the standard fund range and the standard default option. The other investment advisers listed have been appointed by individual Participating Employers in conjunction with the Trustees to advise the Trustees on bespoke fund ranges and default strategies.
8 Participating Employers The Participating Employers as at 30 June 2021 are:
Employer Joined Date
Voith Turbo Limited (Voith) 01-Apr-14
Royal & Sun Alliance Insurance PLC (RSA Section) 01-May-14
5One Marketing Limited (BNP) 01-Jul-14
BNP Paribas London Branch (BNP) 01-Jul-14
BNP Paribas Investment Partners UK Limited (BNP) Changed name to BNP Paribas Asset Management UK Limited. 01-Jul-14
The Fidelity Master Trust Report and Financial Statements for the year ended 30 June 2021
6
Employer Joined Date
BNP Paribas Securities Services SA (BNP) 01-Jul-14
Creation Financial Services Limited (BNP) 01-Jul-14
Arval UK Group Limited (BNP) 01-Feb-15
Capital One (Europe) PLC (Capital One) 01-Apr-15
BNP Paribas Leasing Solutions Limited (BNP) 01-May-15
Bank Insinger de Beaufort NV (BNP) 01-Jul-15
Rentokil Initial PLC (Rentokil) 01-Aug-15
Rentokil Insurance Limited (Rentokil) 01-Aug-15
Initial Medical Services Limited (Rentokil) 01-Aug-15
Rentokil Initial 1927 PLC (Rentokil) 01-Aug-15
Rentokil Initial UK Limited (Rentokil) 01-Aug-15
Dudley Industries Limited (Rentokil) 01-Aug-15
Rentokil Initial Services Limited (Rentokil) 01-Aug-15
Colt Technology Services Group Limited (COLT) 17-Sep-15
Warranty Direct Limited (BNP) 01-Oct-15
Cardif Pinnacle Insurance Management Services plc (BNP) 05-Oct-15
British Engineering Services Limited (British Engineering Section) 01-Nov-15
Peugeot Citroën Automobiles UK Limited (PSA Section) 01-Dec-15
BNP Commercial Finance Limited (BNP) 01-Jan-16
Sony Corporate Services Europe Limited 01-Apr-16
Sony Music Entertainment UK Limited 01-Apr-16
SM Publishing (UK) Limited (Sony ATV) 01-Apr-16
BNP Paribas Real Estate Advisory & Property Management UK Limited 01-May-16
BNP Real Estate Facilities Management Ltd. 01-Jun-16
Owens-Corning Veil UK Ltd. 01-Jun-16
Owens-Corning Britinvest Limited 01-Jun-16
The Fidelity Master Trust Report and Financial Statements for the year ended 30 June 2021
7
Employer Joined Date
Sytner Group Limited 01-Nov-16
Isaac Agnew (Holdings) Limited 01-Nov-16
Charterhouse Development Capital Limited 01-Jan-17
Pentair plc (Pentair Section) 01-Apr-17
Pentair Technical Solutions UK Limited (Pentair Section) 01-Apr-17
Credit Suisse Services AG, London Branch (Registered no. BR019183) 01-Jun-17
Credit Suisse Securities (Europe) Limited (Company no.00891554) 01-Jun-17
Credit Suisse Asset Management Limited (Company no. 01688075) 01-Jun-17
Credit Suisse (UK) Limited (Company no. 02009520); 01-Jun-17
Credit Suisse AG, London Branch (Registered no. BR000469) 01-Jun-17
Credit Suisse Quantitative and Systematic Asset Management Limited (Company no. 09867306) 01-Jun-17
Credit Suisse International (Company no. 02500199) 01-Jun-17
HG Management Services Limited (Company no. 00688522) 01-Jun-17
Hunting Energy Services (UK) Limited (Company no. 00908371) 01-Jun-17
Hunting Energy Services (Well Intervention) Limited (Company no. SC095310) (Hunting Section) 01-Jun-17
Vaki Scotland Limited (Pentair Section) 01-Oct-17
Credit Suisse Asset Management (UK) Holdings Limited 01-Jan-18
Mondrian Investment Partners Limited 01-Feb-18
Pentair Technical Solutions UK Limited now nVent Solutions (UK) Limited (Company no. 03710607) (nVent Section) 01-Apr-18
Nvent Electric PLC (Company no. 605257) (nVent Section) 01-Apr-18
Hypro EU Limited (Company no. 02571559) 01-Apr-18
DENSO Sales UK Limited (Company no.01781529) 01-Jul-18
W. L. Gore & Associates (U.K.) Holding Company Limited (Company no. 10253213) 01-Jul-18
The Fidelity Master Trust Report and Financial Statements for the year ended 30 June 2021
8
Employer Joined Date
W. L. Gore & Associates (U.K.) Limited (Company no. 00856254) 01-Jul-18
Thomson Reuters (Professional) UK Limited (Company no.01679046) 01-Jul-18
TR Organisation Limited (Company no.02978875) 01-Jul-18
Reuters News and Media Limited (Company no.02505735) 01-Jul-18
ASOS.com Limited (Company no. 3584121) 01-Jul-18
Northern Bank Limited (Company No. R0000568) - Danske Bank Section 01-Oct-18
Universal Music Holdings Limited (Company no. 05344517) 01-Oct-18
Kimberly-Clark Limited (Company no. 00308676) 01-Jan-19
Kimberly-Clark Europe Limited (Company no. 04060641) 01-Jan-19
Kimberly-Clark European Services Limited (Company no. 04071548) 01-Jan-19
National Bank of Kuwait (International) Plc (Company no. 02773743) 01-Feb-19
Prudential Services Limited (Company No. 2313235) 01-Jul-19
Eastspring Investments (Luxembourg) S.A. (Company No. S00000937) combined in one Deed. 01-Jul-19
Telegraph Media Group Limited (Company No. 451593) 01-Oct-19
Telegraph Publishing Limited (Company No. 01984132) 01-Oct-19
Derwent London PLC (Company no. 01819699) 05-Oct-19
Derwent Valley Central Limited (Company no. 00205226) 05-Oct-19
Caledonian Properties Limited (Company no. 00669924) 05-Oct-19
Vauhall Motors Limited (Company No. 00135767) (PSA) 01-Jan-20
IBC Vehicles Limited (Company No. 02091272) (PSA) 01-Jan-20
Thomas Miller & Co Limited (Company no. 01898192) 01-Mar-20
Thomas Miller Claims Management Limited (Company no. 04246831) 01-Mar-20
Building Lifeplans Limited (Company no. 03871048) 01-Mar-20
The Fidelity Master Trust Report and Financial Statements for the year ended 30 June 2021
9
Employer Joined Date
Thomas Miller Law Limited (Company no. 08589434) 01-Mar-20
Clydesdale Bank PLC (Company no. SC001111) - Virgin Money Master Trust Section. 01-Jun-20
Special Metals Wiggin Limited 01-Oct-20
SPS Technologies Limited (Company No.00303951 ) PCC Section 01-Oct-20
SPS Aerostructures Limited (Company No.00303951 ) PCC Section 01-Oct-20
KG Coating Limited (Company No.02981419) PCC Section 05-Oct-20
Wyman-Gordon Limited (Company No. 02889486) PCC Section 01-Nov-20
Colt Technology Services (Company no. 02452736) 01-Jan-21
Colt Technology Services Group Limited (Company no. 03232904) 01-Jan-21
Colt Data Centre Services UK Limited (Company no. 07306352) 01-Jan-21
Timet UK Limited(Company No. 00530589) (PCC) 01-Feb-21
Caledonian Alloys Limited (Company No. SC162625) 01-Apr-21
Workday (UK) Limited (Company number 04162863) 01-Apr-21
Warner Media International Limited and Others (Company 02713670) 01-Apr-21
AWAL Recordings Ltd (Company no. 06618565) (Sony Music) 01-Jun-21
Kobalt Neighbouring Rights Limited (Company no. 038493332) (Sony Music) 01-Jun-21
The Fidelity Master Trust Report and Financial Statements for the year ended 30 June 2021
10
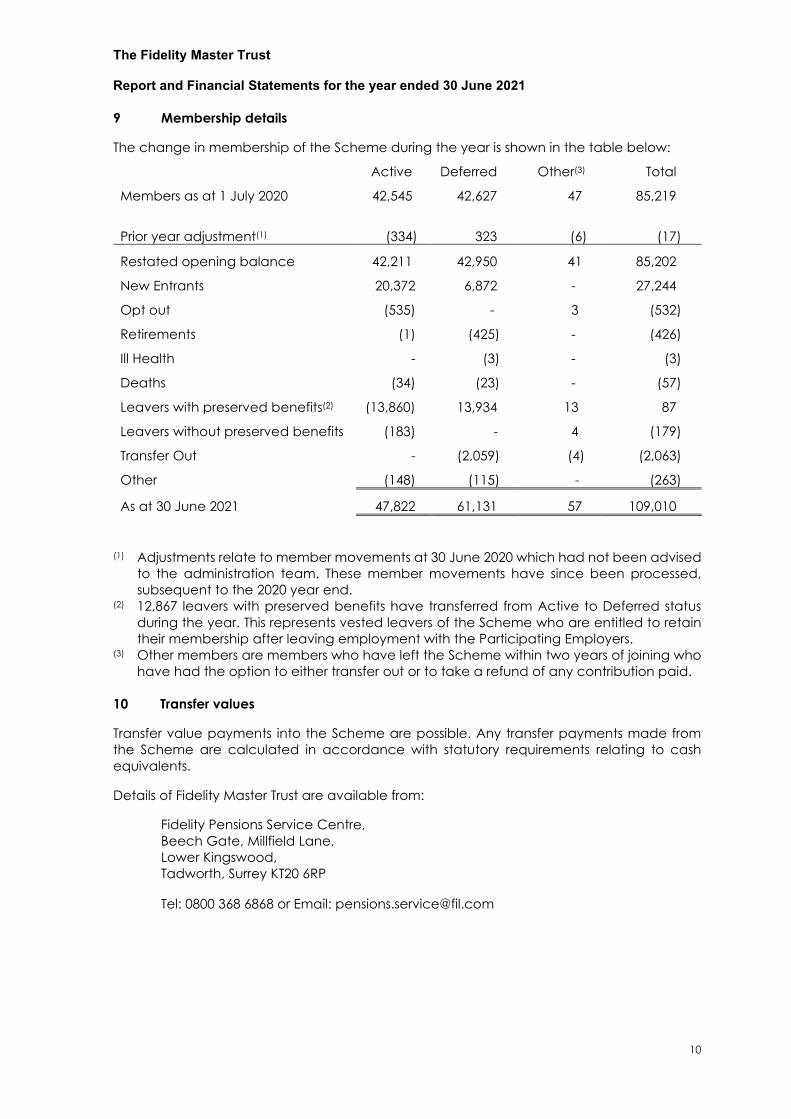
9 Membership details The change in membership of the Scheme during the year is shown in the table below:
Active Deferred Other(3) Total
Members as at 1 July 2020 42,545
42,627 47 85,219
Prior year adjustment(1) (334) 323 (6) (17)
Restated opening balance 42,211 42,950 41 85,202
New Entrants 20,372 6,872 - 27,244
Opt out (535) - 3 (532)
Retirements (1) (425) - (426)
Ill Health - (3) - (3)
Deaths (34) (23) - (57)
Leavers with preserved benefits(2) (13,860) 13,934 13 87
Leavers without preserved benefits (183) - 4 (179)
Transfer Out - (2,059) (4) (2,063)
Other (148) (115) - (263)
As at 30 June 2021 47,822 61,131 57 109,010
(1) Adjustments relate to member movements at 30 June 2020 which had not been advised
to the administration team. These member movements have since been processed, subsequent to the 2020 year end.
(2) 12,867 leavers with preserved benefits have transferred from Active to Deferred status during the year. This represents vested leavers of the Scheme who are entitled to retain their membership after leaving employment with the Participating Employers.
(3) Other members are members who have left the Scheme within two years of joining who have had the option to either transfer out or to take a refund of any contribution paid.
10 Transfer values Transfer value payments into the Scheme are possible. Any transfer payments made from the Scheme are calculated in accordance with statutory requirements relating to cash equivalents. Details of Fidelity Master Trust are available from:
Fidelity Pensions Service Centre, Beech Gate, Millfield Lane, Lower Kingswood, Tadworth, Surrey KT20 6RP Tel: 0800 368 6868 or Email: [email protected]
The Fidelity Master Trust Report and Financial Statements for the year ended 30 June 2021
11
11 Disclosure of information This report has been prepared in accordance with the Occupational Pension Schemes (Disclosure of Information) Regulations 1996. 12 Statement of Investment Principles The Trustees have produced a Statement of Investment Principles detailing decisions about investments for the purposes of the Plan in accordance with section 35 of the Pensions Act 1995. A copy of the statement is included in Appendix 1. 13 Sustainable Investing and Investor Engagement The primary objective of the fund managers of the underlying investments is to produce financial returns for investors in line with their investment objective. The Trustees believe that investing sustainably can help reduce specific risks and therefore increase the potential to achieve better investment returns over the long-term. Consequently, the Trustees expect fund managers’ investment processes to take social, environmental and governance issues into account when, in its view, these may have a material impact on either investment risk or return. One of the most effective ways to bring about change is to encourage fund managers to engage actively with the companies they invest in. That is why the Trustees actively monitor the fund managers’ level of engagement, voting activities and the investment processes they apply. The goal of the Trustees is to see whether their engagement has resulted in a positive outcome for members.
The Trustees review voting and engagement activities on a quantitative and qualitative basis. The Trustees also meet directly with fund managers to understand how they have exercised their voting rights and what key issues the managers have engaged on. This is done on an annual basis. The Trustees will also strive to ensure all managers of funds available in the core range apply the UK Stewardship Code and are signed up to the UN Principles for Responsible Investment (UNPRI) which works to incorporate ESG factors into investment and ownership decisions. Fund managers are also assessed against the Trustee’s sustainability beliefs, and this information is available to the members of the Master Trust once a year via the Implementation Statement (Appendix 4).
The Fidelity Master Trust Report and Financial Statements for the year ended 30 June 2021
12
14 Internal Dispute Resolution Procedure The Trustees have put in place a two stage dispute procedure to resolve any disputes raised by beneficiaries or potential beneficiaries of the Scheme. Details of the dispute procedure can be obtained by writing to:
The Fidelity Master Trust, Fidelity Pensions Service Centre, Beech Gate, Millfield Lane, Lower Kingswood, Tadworth, Surrey KT20 6RP
Alternatively, copies can be obtained by calling the Pensions Service Centre on 0800 368 6868 (calls are recorded) or by email to [email protected]. 15 The Pensions Ombudsman – Early Resolution Service The role of the Pension Ombudsman’s Early Resolution Service is to help members or their beneficiaries at any time with any questions they may have about the Plan or with any difficulty they failed to resolve with the Trustees or administrator.
The address to contact is:
The Office of the Pensions Ombudsman 10 South Colonnade Canary Wharf E14 4PU
Tel: 0800 917 4487 and select the option to discuss a potential complaint Email: [email protected] www.pensions-ombudsman.org.uk
16 Pensions Ombudsman The Pensions Ombudsman may be able to investigate any complaint or dispute that the early resolution service is unable to resolve for you. The address is:
The Office of the Pensions Ombudsman 10 South Colonnade Canary Wharf E14 4PU
The Fidelity Master Trust Report and Financial Statements for the year ended 30 June 2021
13
17 The Pensions Regulator The Pensions Regulator can intervene if it considers that a scheme’s trustees, advisers or the employer are not carrying out their duties correctly. The address for the Regulator is:
The Pensions Regulator, Napier House, Trafalgar Place, Brighton, BN1 4DW. Tel 0845 600 0707 Email: [email protected]
18 The Department for Work and Pensions (DWP) Pension Tracing Service The Pensions Tracing Service is able to help members trace benefits which they may have from previous employers. The contact details are:
Tel: 0800 731 0193 Website: www.gov.uk/find-lost-pension
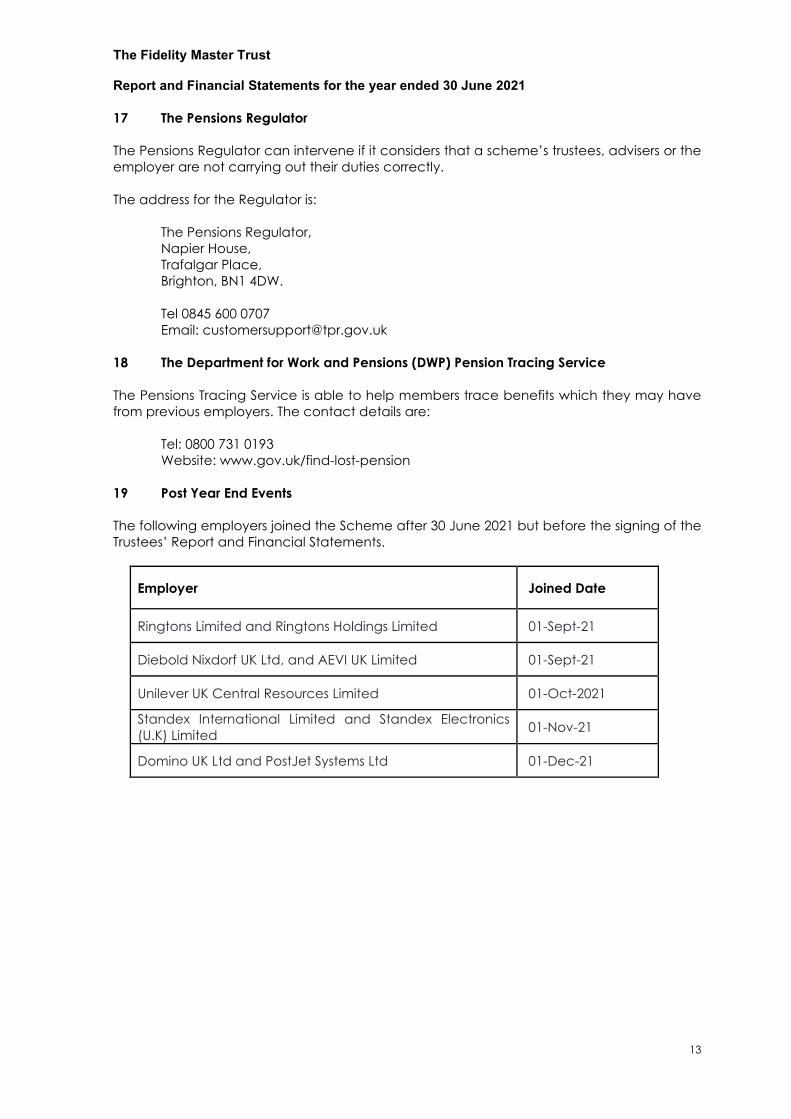
19 Post Year End Events The following employers joined the Scheme after 30 June 2021 but before the signing of the Trustees’ Report and Financial Statements.
Employer Joined Date
Ringtons Limited and Ringtons Holdings Limited 01-Sept-21
Diebold Nixdorf UK Ltd, and AEVI UK Limited 01-Sept-21
Unilever UK Central Resources Limited 01-Oct-2021
Standex International Limited and Standex Electronics (U.K) Limited 01-Nov-21
Domino UK Ltd and PostJet Systems Ltd 01-Dec-21
The Fidelity Master Trust Report and Financial Statements for the year ended 30 June 2021
14
20 COVID-19 Pandemic The Trustees have assessed, and continue to monitor, the consequences of the COVID-19 pandemic for the Scheme and have considered the following areas in particular:
• The administration of benefits by the Scheme’s Administrator, FIL Life Insurance Ltd, including their business continuity planning, operational resilience, cyber/IT security measures and the maintenance of their control environment;
• The financial position of the Participating Employers and the payment of contributions due;
• The effect on the Trustees‘ investment strategy, the value of the Scheme’s assets and the ability to provide sufficient cashflow to support benefit and other payments.
• The communication to members in relation to the impact of volatility in markets as a result of COVID-19 and the long-term nature of pension benefits, and other educational materials.
The Trustees are satisfied having assessed these areas that the risks posed to the operation and management of the Scheme and its investments as a result of the COVID-19 pandemic have been sufficiently understood and mitigated where appropriate. Signed on behalf of the Trustees: ____________________________
Dianne Day
Chair of the Board of Trustees
Date:
The Fidelity Master Trust Report and Financial Statements for the year ended 30 June 2021
15
Investment Report The Trustees are required to develop and maintain a Statement of Investment Principles (‘SIP’), obtaining advice from a regulated investment adviser to ensure that the investments and default arrangements proposed are appropriate, consistent with the Pensions Regulator’s framework and likely to achieve optimum outcomes for members. The SIP has been prepared in accordance with Section 35 of the Pensions Act 1995 and outlines the Scheme’s investment objectives and strategy. The Trustees monitor compliance with the SIP. During the period under review all investments were in accordance with the SIP. The SIP is included as Appendix 1 and is also available on the following publicly accessible webpage: www.fidelitypensions.co.uk/costs-charges Investments under the sole governance of the Trustees The Fidelity Master Trust offers a standard fund range and a default strategy available to employers who do not wish to establish a bespoke default and fund range. Members who are automatically enrolled are invested in the default until such a time that they make an alternative investment choice. The risk profiles and investment objectives for both the default investment strategy and all other investment funds can be found on the fund factsheets. The investment objectives of the default fund can also be found in the Scheme literature. The Trustees receive advice from their investment adviser regarding the appropriateness of funds for the membership. The membership profile is considered when producing this advice. The appropriateness for active and deferred members is considered together with the risk and maturity profile. The investment advice received also ensures that a suitable range of investments is provided for those members who wish to make an active investment choice. This advice is reviewed at least every three years or in the event of a significant change to the member demographic profile or investment policy to ensure it remains appropriate.
Investments with shared governance by the Trustees and Employers
In addition to the standard fund range, the Scheme can accommodate bespoke investment strategies which can be created from the full range of funds available via Fidelity’s Workplace Investing Platform or blended funds which invest in a combination of funds. Some Participating Employers have introduced employer-designed fund ranges and default strategies for their section of membership but the Trustees are ultimately responsible for the investment selection. Where an employer-designed range is required, the Trustees take investment advice from an adviser jointly appointed by the Participating Employer and the Trustees to ensure that the proposals are suitable and in accordance with the Scheme’s SIP. Fidelity will also carry out due diligence to ensure that the proposals are deliverable. Assuming both the Trustees and Fidelity are comfortable, the employer-designed fund range can be adopted on a shared governance basis. The investment advice is reviewed at least every three years or in the event of a significant change to ensure it remains appropriate. Fidelity reports quarterly to the Master Trust Board on investment performance. The Trustees can access details of all funds and holdings online at any time. Participating Employers can access details for their section of the Scheme. If necessary (in conjunction with their investment advisers) the Trustees can remove any investment options that are no longer deemed suitable for Scheme investment, for example where a fund is underperforming or is no longer appropriate for the Scheme’s objectives.
The Fidelity Master Trust Report and Financial Statements for the year ended 30 June 2021
16
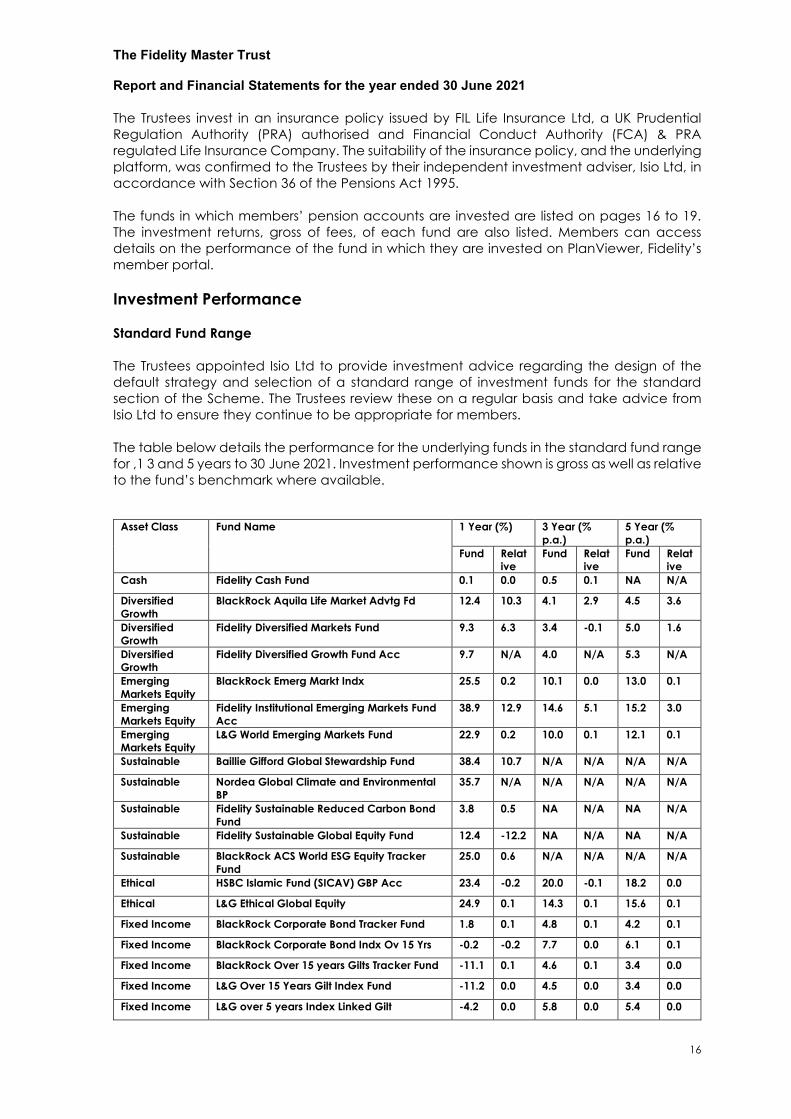
The Trustees invest in an insurance policy issued by FIL Life Insurance Ltd, a UK Prudential Regulation Authority (PRA) authorised and Financial Conduct Authority (FCA) & PRA regulated Life Insurance Company. The suitability of the insurance policy, and the underlying platform, was confirmed to the Trustees by their independent investment adviser, Isio Ltd, in accordance with Section 36 of the Pensions Act 1995. The funds in which members’ pension accounts are invested are listed on pages 16 to 19. The investment returns, gross of fees, of each fund are also listed. Members can access details on the performance of the fund in which they are invested on PlanViewer, Fidelity’s member portal. Investment Performance Standard Fund Range The Trustees appointed Isio Ltd to provide investment advice regarding the design of the default strategy and selection of a standard range of investment funds for the standard section of the Scheme. The Trustees review these on a regular basis and take advice from Isio Ltd to ensure they continue to be appropriate for members. The table below details the performance for the underlying funds in the standard fund range for ,1 3 and 5 years to 30 June 2021. Investment performance shown is gross as well as relative to the fund’s benchmark where available.
Asset Class Fund Name 1 Year (%) 3 Year (% p.a.)
5 Year (% p.a.)
Fund Relative
Fund Relative
Fund Relative
Cash Fidelity Cash Fund 0.1 0.0 0.5 0.1 NA N/A
Diversified Growth
BlackRock Aquila Life Market Advtg Fd 12.4 10.3 4.1 2.9 4.5 3.6
Diversified Growth
Fidelity Diversified Markets Fund 9.3 6.3 3.4 -0.1 5.0 1.6
Diversified Growth
Fidelity Diversified Growth Fund Acc 9.7 N/A 4.0 N/A 5.3 N/A
Emerging Markets Equity
BlackRock Emerg Markt Indx 25.5 0.2 10.1 0.0 13.0 0.1
Emerging Markets Equity
Fidelity Institutional Emerging Markets Fund Acc
38.9 12.9 14.6 5.1 15.2 3.0
Emerging Markets Equity
L&G World Emerging Markets Fund 22.9 0.2 10.0 0.1 12.1 0.1
Sustainable Baillie Gifford Global Stewardship Fund 38.4 10.7 N/A N/A N/A N/A
Sustainable Nordea Global Climate and Environmental BP
35.7 N/A N/A N/A N/A N/A
Sustainable Fidelity Sustainable Reduced Carbon Bond Fund
3.8 0.5 NA N/A NA N/A
Sustainable Fidelity Sustainable Global Equity Fund 12.4 -12.2 NA N/A NA N/A
Sustainable BlackRock ACS World ESG Equity Tracker Fund
25.0 0.6 N/A N/A N/A N/A
Ethical HSBC Islamic Fund (SICAV) GBP Acc 23.4 -0.2 20.0 -0.1 18.2 0.0
Ethical L&G Ethical Global Equity 24.9 0.1 14.3 0.1 15.6 0.1
Fixed Income BlackRock Corporate Bond Tracker Fund 1.8 0.1 4.8 0.1 4.2 0.1
Fixed Income BlackRock Corporate Bond Indx Ov 15 Yrs -0.2 -0.2 7.7 0.0 6.1 0.1
Fixed Income BlackRock Over 15 years Gilts Tracker Fund -11.1 0.1 4.6 0.1 3.4 0.0
Fixed Income L&G Over 15 Years Gilt Index Fund -11.2 0.0 4.5 0.0 3.4 0.0
Fixed Income L&G over 5 years Index Linked Gilt -4.2 0.0 5.8 0.0 5.4 0.0
The Fidelity Master Trust Report and Financial Statements for the year ended 30 June 2021
17
Asset Class Fund Name 1 Year (%) 3 Year (% p.a.)
5 Year (% p.a.)
Fund Relative
Fund Relative
Fund Relative
Fixed Income L&G Corporate Bond All Stocks Fund -0.6 -0.2 3.9 0.1 3.3 0.1
Fixed Income Fidelity Institutional Sterling Corporate Bond Fund Acc
3.6 1.8 6.0 1.2 5.3 1.3
Fixed Income Fidelity Pre-Retirement Bond Fund F Accumulation Shares
-2.0 1.3 5.6 1.3 4.8 1.3
Fixed Income Fidelity Institutional UK Aggregate Bond Fund Acc
-0.7 1.7 5.2 1.2 4.5 1.4
Global Equity BlackRock Aquila MSCI World Global Equity Index Fund
24.9 0.6 13.9 0.6 14.8 0.7
Global Equity BlackRock ACS 30:70 Global Equity Curr Hedged Fund
31.5 0.5 10.3 -0.1 12.1 -0.2
Global Equity L&G Global Equity Market Weights 30:70 Index Fund GBP Hedged
30.0 0.0 10.3 0.0 12.5 0.0
Global Equity (UK Biased)
BlackRock ACS 50:50 Global Equity Fund 22.2 -0.1 6.7 -0.1 9.9 -0.1
Global Equity (UK Biased)
L&G Global Equity 50/50 22.3 0.1 7.0 0.1 10.6 0.1
International Equity (ex UK)
BlackRock ACS World ex UK Fund 25.5 0.1 14.1 0.2 15.0 0.3
International Equity (ex UK)
L&G World ex-UK Developed World Equity Index Fund
25.5 0.0 14.2 0.0 15.6 0.0
Multi Asset Schroder Dynamic Multi Asset Fund 16.4 13.9 5.6 3.9 5.5 3.5
Property L&G 70:30 Hybrid Property Fund 079 11.4 -0.6 3.9 -0.2 5.5 0.1
UK Equity BlackRock ACS UK Equity Fund 20.9 -0.1 1.9 0.0 6.4 0.0
UK Equity L&G UK Equity Index Fund 21.2 0.1 2.0 0.1 7.1 0.1
Note: N/A denotes that performance for the fund/benchmark is not available Past performance is not a reliable indicator of future results. The value of investments and the level of income from them may go down as well as up and a member may not get back the amount invested. Source: Fidelity Employer-Designed Fund Range The Scheme provides Participating Employers with the flexibility to create their own investment strategy from the Workplace Investing platform to suit their requirements. Blended funds which combine funds from different managers can also be accommodated. These “tailored” funds can be modified, with underlying funds being added or removed over time. Employer-designed funds and default arrangements operate on a shared governance basis as described above. The table below shows the investment performance (gross of fees) for the additional underlying funds used by bespoke sections available for 1, 3 and 5 years (where available) to 30 June 2021 and performance relative to the funds’ benchmark.
Asset Class Fund Name 1 Year (%) 3 Year (% p.a.) 5 Year (% p.a.)
Fund Relative
Fund Relative
Fund Relative
Alternatives TM Fulcrum Diversified Liquid Alternatives Fund
15.6 N/A N/A N/A N/A N/A
Cash BlackRock Cash Fund 0.1 0.2 0.5 0.2 0.4 0.2
Cash L&G Cash Fund 0.0 0.1 0.4 0.1 0.4 0.1
Diversified Growth
Baillie Gifford Diversified Growth Fund 14.7 11.1 5.1 1.2 5.9 3.3

The Fidelity Master Trust Report and Financial Statements for the year ended 30 June 2021
18
Asset Class Fund Name 1 Year (%) 3 Year (% p.a.) 5 Year (% p.a.)
Fund Relative
Fund Relative
Fund Relative
Diversified Growth
L&G Diversified Fund 13.7 -4.5 7.4 -2.3 8.2 -4.2
Diversified Growth
BNY Mellon Real Return Fund (Exempt Class 2)
13.6 9.5 8.4 4.0 4.8 0.4
Diversified Growth
SSGA As of Priced Dynamic Diversified sub-Fund
18.0 17.9 5.9 5.5 6.4 6.0
Diversified Growth
Nordea 1 - GBP Diversified Return Fund 10.9 6.9 6.4 1.9 N/A N/A
Diversified Growth
Invesco Global Targeted Returns (UK) Fund
-0.7 -0.7 -0.1 -0.7 N/A N/A
Diversified Growth
BlackRock Dynamic Allocation Fund 10.6 10.5 6.1 5.7 N/A N/A
Diversified Growth
Schroder Diversified Growth Series 2 18.4 11.2 7.0 0.3 6.8 -0.3
Emerging Markets Equity
JPM Life All-Emerging Market Equity Fund 31.6 5.6 17.7 8.1 18.2 5.9
Emerging Markets Equity
State Street Emerging Markets Equity Index Fund
23.1 0.1 9.8 0.1 N/A N/A
Sustainable BlackRock ACS World Multifactor ESG Equity Tracker Fund
25.9 0.4 N/A N/A N/A N/A
Sustainable Impax Environmental Leaders (Ireland) Sterling 'S'
32.6 8.0 N/A N/A N/A N/A
Sustainable Schroder Sustainable Global Multi Factor Equity
26.8 2.2 N/A N/A N/A N/A
Ethical BMO Responsible UK Equity B Acc 26.1 4.6 6.3 4.2 10.8 4.4
Ethical L&G UK Ethical Equity Index 19.3 0.0 2.2 0.0 7.1 0.1
European Equity
BlackRock ACS Continental European Equity Fund
22.0 -0.4 9.9 -0.2 11.7 -0.1
Fixed Income BlackRock Index Linked Gilt Tracker Fund -4.4 0.0 5.5 0.0 5.3 0.0
Fixed Income Fidelity Global High Yield W-Accumulation
14.8 1.7 5.6 -0.1 6.5 1.1
Fixed Income Fidelity Institutional Long Dated Sterling Corporate Bond Fund Acc
2.4 1.5 7.7 0.7 6.5 0.9
Fixed Income L&G Overseas Bond Index Fund 085 -11.8
0.0 1.8 0.0 0.9 0.0
Fixed Income L&G Pre-Retirement Fund -2.5 -0.2 5.4 0.0 4.3 0.0
Fixed Income L&G Emerging Markets Passive Local Currency Bond
-6.0 -0.4 2.1 -0.3 N/A N/A
Fixed Income Fidelity Institutional Index Linked Bond Fund Acc
-4.3 0.2 5.4 0.2 5.1 0.1
Fixed Income BNY Mellon Global Dynamic Bond Fund 3.4 1.4 3.4 1.0 2.7 0.3
Fixed Income SSGA As of Priced UK Index Linked Gilts All Stocks Index sub-Fund
-4.0 -0.1 4.6 -0.2 4.5 -0.1
Fixed Income SSGA As of Priced Sterling Non-Gilts Bond All Stocks Index sub-Fund
1.5 -0.2 5.0 0.3 4.2 0.2
Fixed Income L&G Inflation Sensitive Pre-Retirement Fund
-1.3 -0.2 5.2 0.1 4.6 0.1
Fixed Income M&G Total Return Credit Fund 9.2 9.2 5.2 4.8 5.0 4.6
Fixed Income State Street As of Price (Net) UK conventional Gilts All Stock Index Sub-Fund
-6.1 0.1 N/A N/A N/A N/A
Global Equity Global Developed Small Cap Index Fund 36.6 0.0 N/A N/A N/A N/A
Global Equity L&G All World Equity Index Fund GBP Hgd 35.9 -0.1 N/A N/A N/A N/A
Global Equity AQR Sustainable Style Premia Global Equity UCITS Fund
20.4 -4.0 N/A N/A N/A N/A
Global Equity Unconstrained
BNY Mellon Global Equity Fund 22.6 -1.9 14.4 1.5 13.5 -0.3
Global Equity Unconstrained
Schroder QEP Global Active Value Fund 29.8 5.2 9.0 -3.9 10.9 -2.9

The Fidelity Master Trust Report and Financial Statements for the year ended 30 June 2021
19
Asset Class Fund Name 1 Year (%) 3 Year (% p.a.) 5 Year (% p.a.)
Fund Relative
Fund Relative
Fund Relative
International Equity (ex UK)
BlackRock Overseas Cons Indx 24.2 0.1 12.9 0.5 14.1 0.4
International Equity (ex UK)
BlackRock Aquila Currency Hedged World ex UK Equity
36.7 -0.1 14.2 -0.3 14.4 -0.2
International Equity (ex UK)
State Street As of Price (Net) International Equity Index Sub-fund
25.5 0.2 N/A N/A N/A N/A
Japanese Equity
BlackRock ACS Japanese Equity Fund 11.2 0.4 5.6 0.3 10.1 0.3
Multi Asset Baillie Gifford Multi Asset Growth 15.2 11.6 5.5 1.5 N/A N/A
Multi Asset Fidelity Multi Asset Allocator Strategic Fund W-Accumulation
9.7 N/A 7.1 N/A 5.8 N/A
Multi Asset Fidelity Multi Asset Allocator Defensive Fund W-Accumulation
4.8 N/A 5.6 N/A 3.8 N/A
Multi Asset Fidelity Multi Asset Allocator Growth Fund W-Accumulation
14.8 N/A 8.8 N/A 7.5 N/A
Multi Asset Fidelity Multi Asset Balanced Income Fund W Accumulation Shares
10.4 N/A N/A N/A N/A N/A
Multi Asset L&G Retirement Income Multi Asset Fund 10.4 6.8 N/A N/A N/A N/A
Pacific Equity BlackRock Pacific Rim Equity Index Fund 29.1 0.3 9.3 0.3 12.0 0.0
Property L&G Managed Property Fund 7.7 -0.8 2.9 -0.1 5.2 0.8
Property Threadneedle Pensions Property Fund 9.1 0.6 3.6 0.7 5.2 0.3
TDF Timewise Target Retirement 2020 Sub-Fund
9.1 3.4 6.2 0.8 6.8 0.6
TDF Timewise Target Retirement 2025 Sub-Fund
15.0 4.1 7.0 0.5 8.1 0.3
TDF Timewise Target Retirement 2030 Sub-Fund
21.5 6.0 8.3 0.8 9.5 0.6
TDF Timewise Target Retirement 2035 Sub-Fund
25.1 4.6 9.5 0.4 10.7 0.5
TDF Timewise Target Retirement 2040 Sub-Fund
27.1 3.7 10.7 0.8 11.5 0.7
TDF Timewise Target Retirement 2045 Sub-Fund
27.3 3.7 10.9 0.8 11.6 0.8
TDF Timewise Target Retirement 2050 Sub-Fund
27.3 3.7 10.9 0.8 11.6 0.8
TDF Timewise Target Retirement 2055 Sub-Fund
27.2 3.7 10.9 0.9 11.6 0.8
TDF State Street Timewise Target Retirement 2065 Sub-Fund
27.4 3.9 10.9 0.9 N/A N/A
TDF Timewise Target Retirement Choice Sub-Fund
8.1 3.7 6.1 1.0 6.0 0.7
TDF Timewise Target Retirement 2060 Sub-Fund
27.2 3.7 11.0 1.0 11.7 0.8
Traditional Balanced
BlackRock Consensus 85 Fund 13.8 0.1 7.0 0.3 8.4 0.3
Traditional Balanced
Standard Life Managed Fund FA 14.2 -0.8 6.1 0.5 8.4 1.0
UK Equity Baillie Gifford UK Equity Focus Fund 27.1 4.0 9.0 6.0 13.5 6.4
UK Equity LF Majedie UK Equity Fund X Share Class 26.2 4.8 1.7 -0.3 6.8 0.4
UK Equity MPF As Of Priced (Net) UK Equity Index Sub-Fund
20.3 0.7 N/A N/A N/A N/A
US Equity BlackRock ACS US Equity Fund 27.7 0.2 17.1 0.3 17.0 0.1
Note: N/A denotes that performance for the fund/benchmark is not available Past performance is not a reliable indicator of future results. The value of investments and the level of income from them may go down as well as up and a member may not get back the amount invested. Source: Fidelity

The Fidelity Master Trust Report and Financial Statements for the year ended 30 June 2021
20
12 Month Investment Market Review to 30 June 2021 Global equity markets added value over the quarter to 30 September 2020, despite some regional divergence. Overseas markets, in particular the US, were supported by increased optimism surrounding an economic recovery as well as continued signs of long term loose monetary policy. However, UK equities underperformed the wider market, with key headwinds being sector composition (such as high relative exposure to oil and gas) and continued uncertainty surrounding the potential for a UK/EU trade deal. Q4 2020 saw the announcements of a COVID-19 vaccine having a positive impact as markets rallied, boosting the global economic outlook. Markets were further aided by additional support measures announced by governments and central banks. UK equities performed well over the quarter due to their higher weighting towards more economically sensitive sectors which rebounded on the news of effective vaccines for COVID-19. Gilt yields decreased modestly over the quarter as the Bank of England announced an increase to its asset purchase program to support the economy as another national lockdown was announced in the UK. Global markets performed positively during Q1 2021 following further US fiscal stimulus and the successful rollout of the COVID-19 vaccination programmes in the UK and US. This positive sentiment led to sharp rises in gilt yields, as investors rotated portfolios into higher risk asset classes. While global equities performed positively over Q1, Emerging Markets delivered relatively weak returns as their vaccination programme lagged developed markets. UK equities performed well over the quarter as the reduction in people being hospitalised with COVID-19 increased investor optimism for a sustainable reopening of the economy. As gilt yields increased markedly over the quarter, government bonds delivered negative returns. Investor optimism strengthened during the quarter to 30 June 2021 as vaccinations continued to be successfully rolled out and businesses re-opened, leading to positive global equity returns. The continued monetary stimulus measures from central banks further enhanced these returns. Credit markets delivered positive performance as they benefited from narrowing credit spreads and strong fundamentals, including low expected default rates and supportive monetary policy. Gilt yields declined over the quarter following a significant rally in Q1, as investors weighed the impact of the COVID-19 delta variant on the promise of an economic reopening. Additionally, consideration was given to what extent the recent inflationary pressures would be transitory in nature. Signed on behalf of the Trustees: ____________________________
Dianne Day
Chair of the Board of Trustees
Date:
The Fidelity Master Trust Report and Financial Statements for the year ended 30 June 2021
21
INDEPENDENT AUDITOR’S REPORT TO THE TRUSTEES OF THE FIDELITY MASTER TRUST Opinion We have audited the financial statements of the Fidelity Master Trust for the year ended 30 June 2021 which comprise the Fund Account, the Net Assets Statement and the notes to the financial statements, including significant accounting policies. The financial reporting framework that has been applied in their preparation is applicable law and United Kingdom Accounting Standards, including FRS 102 “The Financial Reporting Standard applicable in the UK and Republic of Ireland” (United Kingdom Generally Accepted Accounting Practice). In our opinion the financial statements:
• show a true and fair view of the financial transactions of the scheme during the year ended 30 June 2021, and of the amount and disposition at that date of its assets and liabilities, other than the liabilities to pay pensions and benefits after the end of the year;
• have been properly prepared in accordance with United Kingdom Generally Accepted Accounting Practice; and
• contain the information specified in Regulation 3A of the Occupational Pension Schemes (Requirement to obtain Audited Accounts and a Statement from the Auditor) Regulations 1996, made under the Pensions Act 1995.
Basis for opinion We conducted our audit in accordance with International Standards on Auditing (UK) (ISAs (UK)) and applicable law. Our responsibilities under those standards are further described in the Auditor’s responsibilities for the audit of the financial statements section of our report. We are independent of the scheme in accordance with the ethical requirements that are relevant to our audit of the financial statements in the UK, including the FRC’s Ethical Standard and we have fulfilled our other ethical responsibilities in accordance with these requirements. We believe that the audit evidence we have obtained is sufficient and appropriate to provide a basis for our opinion. Conclusions relating to going concern In auditing the financial statements, we have concluded that the trustees’ use of the going concern basis of accounting in the preparation of the financial statements is appropriate. Based on the work we have performed, we have not identified any material uncertainties relating to events or conditions that, individually or collectively, may cast significant doubt on the scheme’s ability to continue as a going concern for a period of at least twelve months from when the financial statements are authorised for issue. Our responsibilities and the responsibilities of the trustees with respect to going concern are described in the relevant sections of this report.

The Fidelity Master Trust Report and Financial Statements for the year ended 30 June 2021
22
Other information The other information comprises the information included in the Trustees’ Report and Financial Statements, other than the financial statements and our auditor’s report thereon. The trustees are responsible for the other information contained within the Trustees’ Report and Financial Statements. Our opinion on the financial statements does not cover the other information and we do not express any form of assurance conclusion thereon. Our responsibility is to read the other information and, in doing so, consider whether the other information is materially inconsistent with the financial statements or our knowledge obtained in the course of the audit, or otherwise appears to be materially misstated. If we identify such material inconsistencies or apparent material misstatements, we are required to determine whether this gives rise to a material misstatement in the financial statements themselves. If, based on the work we have performed, we conclude that there is a material misstatement of this other information, we are required to report that fact. We have nothing to report in this regard. Responsibilities of trustees As explained more fully in the Statement of Trustees’ Responsibilities set out on page 3, the trustees are responsible for the preparation of financial statements and for being satisfied that they give a true and fair view, and for such internal control as the trustees determine is necessary to enable the preparation of financial statements that are free from material misstatement, whether due to fraud or error. In preparing the financial statements, the trustees are responsible for assessing the scheme’s ability to continue as a going concern, disclosing, as applicable, matters related to going concern and using the going concern basis of accounting unless the trustees either intend to wind up the scheme or have no realistic alternative but to do so. Auditor’s responsibilities for the audit of the financial statements Our objectives are to obtain reasonable assurance about whether the financial statements as a whole are free from material misstatement, whether due to fraud or error, and to issue an auditor’s report that includes our opinion. Reasonable assurance is a high level of assurance, but is not a guarantee that an audit conducted in accordance with ISAs (UK) will always detect a material misstatement when it exists. Misstatements can arise from fraud or error and are considered material if, individually or in the aggregate, they could reasonably be expected to influence the economic decisions of users taken on the basis of these financial statements.
The Fidelity Master Trust Report and Financial Statements for the year ended 30 June 2021
23
Irregularities, including fraud, are instances of non-compliance with laws and regulations. We design procedures in line with our responsibilities, outlined above, to detect material misstatements in respect of irregularities, including fraud. The extent to which our procedures are capable of detecting irregularities, including fraud, is detailed below: Based on our understanding of the scheme and industry, we identified that the principal risks of non-compliance with laws and regulations related to breaches of UK pensions legislation such as the Pensions Acts 1995, 2004, 2008 and 2014 and we considered the extent to which non-compliance might have a material effect on the financial statements. We also considered those laws and regulations that have a direct impact on the financial statements such as the Occupational Pension Schemes (Requirement to obtain Audited Accounts and a Statement from the Auditor) Regulations 1996, made under the Pensions Act 1995. We evaluated trustees’ opportunities for fraudulent manipulation of the financial statements (including the risk of override of controls) and determined that the principal risks were related to misappropriation of assets, particularly cash and investments and posting inappropriate journal entries. Audit procedures performed included:
• enquiry of the trustees to identify the existence of any correspondence with the Pensions Regulator or any instances of non-compliance with applicable laws and regulations
• review of minutes of trustee meetings • obtaining independent confirmation of, and testing of a risk-based sample of
investment balances at the year end • testing of a risk-based sample of journal entries to supporting documentation • designing audit procedures to incorporate unpredictability around the nature, timing
or extent of our testing A further description of our responsibilities is available on the Financial Reporting Council’s website at: www.frc.org.uk/auditorsresponsibilities. This description forms part of our auditor’s report. Use of our report This report is made solely to the scheme’s trustees, as a body, in accordance with Regulation 3 of the Occupational Pension Schemes (Requirement to obtain Audited Accounts and a Statement from the Auditor) Regulations 1996, made under the Pensions Act 1995. Our audit work has been undertaken so that we might state to the scheme’s trustees those matters we are required to state to them in an auditor’s report and for no other purpose. To the fullest extent permitted by law, we do not accept or assume responsibility to anyone other than the scheme’s trustees as a body, for our audit work, for this report, or for the opinions we have formed. Nexia Smith & Williamson Statutory Auditor Chartered Accountants Bristol Date:

The Fidelity Master Trust Report and Financial Statements for the year ended 30 June 2021
24
FUND ACCOUNT Notes Year to
30/06/2021 £’000s
Year to 30/06/2020
£’000s Contributions and Benefits Employer contributions 316,158 268,722 Employee contributions 12,036 8,058 Total contributions 4 328,194 276,780 Transfers in 5 732,980 298,351 Other income 6 1,639 3,941 1,062,813 579,072 Benefits paid or payable 7 (25,056) (20,382) Payments to and on account of leavers 8 (122,871) (65,643) (147,927) (86,025) Net additions from dealings with members 914,886 493,047 Return on investments Change in market value of investments 9 612,659 (13,759) Net returns on investments 612,659 (13,759) Net increase in the fund during the period 1,527,545 479,288 Net assets of the Scheme at beginning of period 2,944,157 2,464,869
Net assets at the end of period 4,471,702 2,944,157 The notes on pages 26 to 34 form part of these financial statements.

The Fidelity Master Trust Report and Financial Statements for the year ended 30 June 2021
25
STATEMENT OF NET ASSETS AVAILABLE FOR BENEFITS AS AT 30 JUNE 2021 Note 30/06/2021
£’000s 30/06/2020
£’000s Investment assets Pooled investment vehicles 4,388,025 2,908,604 AVC investments 65,078 21,694 Total investments 9 4,453,103 2,930,298 Current assets 12 18,838 17,021 Current liabilities 13 (239) (3,162) Net assets of the Scheme 4,471,702 2,944,157
The financial statements summarise the transactions and net assets of the Scheme. They do not take account of obligations to pay benefits which fall due after the end of the Scheme year. The notes on pages 26 to 34 form part of these financial statements. These financial statements were approved by the Trustees on _____________________
____________________________
Dianne Day
Chair of the Board of Trustees
Date:
The Fidelity Master Trust Report and Financial Statements for the year ended 30 June 2021
26
NOTES TO THE FINANCIAL STATEMENTS 1 Basis of preparation
These Financial Statements have been prepared as at 30 June 2021 in accordance with the Occupational Pension Schemes (Requirement to obtain Audited Accounts and a Statement from the Auditor) Regulations 1996, Financial Reporting Standard 102 – The Financial Reporting Standard applicable in the UK and Republic of Ireland (FRS 102) issued by the Financial Reporting Council and the guidance set out in the Statement of Recommended Practice “Financial Reports of Pension Schemes” (Revised June 2018) (“the SORP”).
2 Identification of the financial statements The Scheme is a registered pension scheme under Chapter 2, Part 4 of the Finance Act 2004. This means that contributions by the Employers are normally eligible for tax relief, and income and capital gains earned by the Scheme are generally tax exempt. The address for enquiries to the Scheme is The Fidelity Master Trust, Fidelity Pensions Service Centre, Beech Gate, Millfield Lane, Lower Kingswood, Tadworth, Surrey, KT20 6RP.
3 Accounting policies
The principal accounting policies are set out below. 3.1 Functional currency The functional currency used in these financial statements is Sterling (GBP).
3.2 Valuation of investments The market value of pooled investment vehicles is taken as the net asset value price determined in accordance with fair value principles, as advised by the investment manager.
3.3 Contributions and benefits Contributions and benefits are accounted for in the period in which they fall due. When there is a choice of benefits, these are accounted for on the later of the date of retirement/death and the date at which the option is communicated to the Trustees.
3.4 Transfer Values
Individual transfers are accounted for when the transfer has been agreed by both parties and the receiving scheme has accepted liability for the transfer. Bulk transfers are accounted for on the accruals basis where the Trustees have agreed to accept the liability for members’ benefits.
The Fidelity Master Trust Report and Financial Statements for the year ended 30 June 2021
27
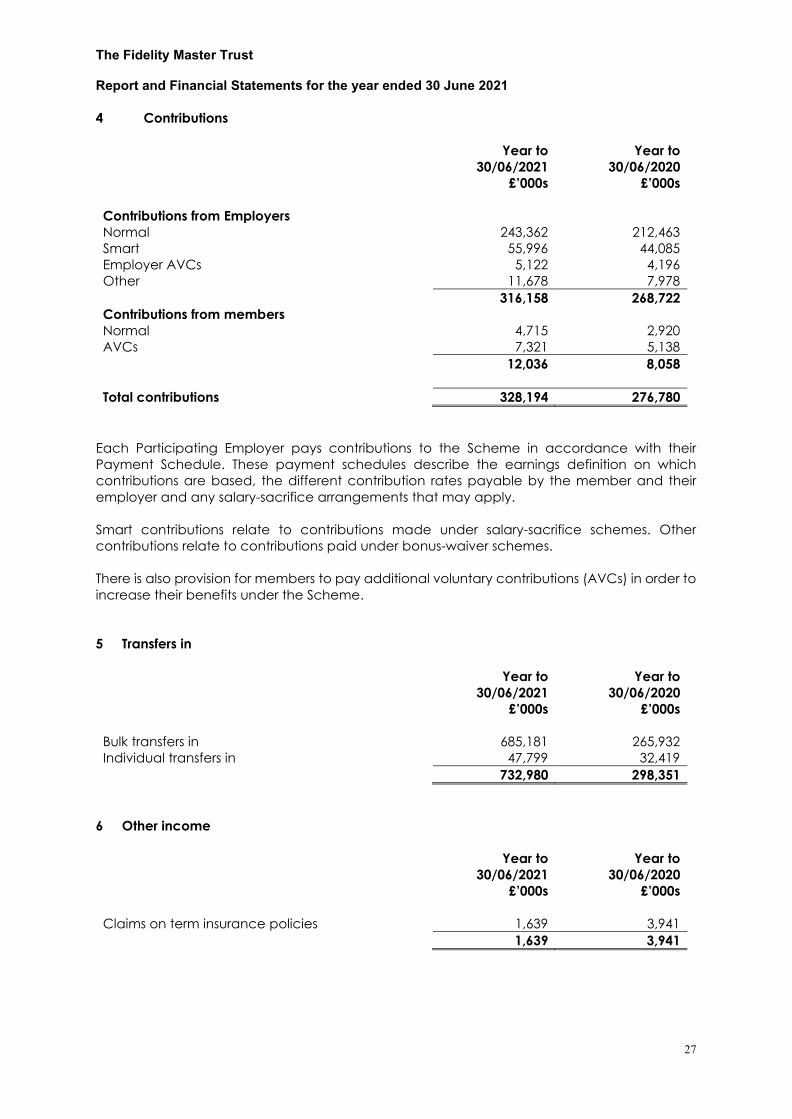
4 Contributions Year to
30/06/2021 £’000s
Year to 30/06/2020
£’000s Contributions from Employers Normal 243,362 212,463 Smart 55,996 44,085 Employer AVCs 5,122 4,196 Other 11,678 7,978 316,158 268,722 Contributions from members Normal 4,715 2,920 AVCs 7,321 5,138 12,036 8,058 Total contributions 328,194 276,780
Each Participating Employer pays contributions to the Scheme in accordance with their Payment Schedule. These payment schedules describe the earnings definition on which contributions are based, the different contribution rates payable by the member and their employer and any salary-sacrifice arrangements that may apply. Smart contributions relate to contributions made under salary-sacrifice schemes. Other contributions relate to contributions paid under bonus-waiver schemes. There is also provision for members to pay additional voluntary contributions (AVCs) in order to increase their benefits under the Scheme. 5 Transfers in Year to
30/06/2021 £’000s
Year to 30/06/2020
£’000s Bulk transfers in 685,181 265,932 Individual transfers in 47,799 32,419 732,980 298,351
6 Other income Year to
30/06/2021 £’000s
Year to 30/06/2020
£’000s Claims on term insurance policies 1,639 3,941 1,639 3,941
The Fidelity Master Trust Report and Financial Statements for the year ended 30 June 2021
28
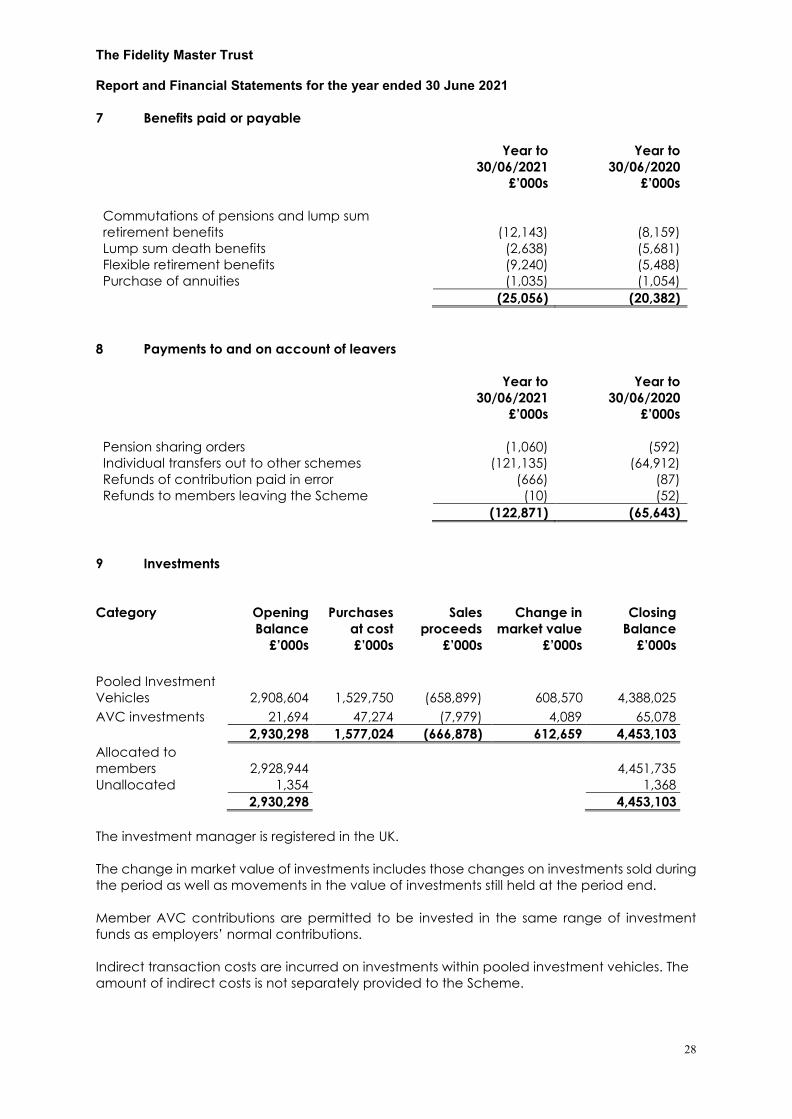
7 Benefits paid or payable
Year to 30/06/2021
£’000s
Year to 30/06/2020
£’000s Commutations of pensions and lump sum retirement benefits (12,143) (8,159) Lump sum death benefits (2,638) (5,681) Flexible retirement benefits (9,240) (5,488) Purchase of annuities (1,035) (1,054) (25,056) (20,382)
8 Payments to and on account of leavers Year to
30/06/2021 £’000s
Year to 30/06/2020
£’000s Pension sharing orders (1,060) (592) Individual transfers out to other schemes (121,135) (64,912) Refunds of contribution paid in error (666) (87) Refunds to members leaving the Scheme (10) (52) (122,871) (65,643)
9 Investments Category Opening
Balance Purchases
at cost Sales
proceeds Change in
market value Closing
Balance £’000s £’000s £’000s £’000s £’000s Pooled Investment Vehicles 2,908,604 1,529,750 (658,899) 608,570 4,388,025 AVC investments 21,694 47,274 (7,979) 4,089 65,078 2,930,298 1,577,024 (666,878) 612,659 4,453,103 Allocated to members 2,928,944
4,451,735
Unallocated 1,354 1,368 2,930,298 4,453,103
The investment manager is registered in the UK. The change in market value of investments includes those changes on investments sold during the period as well as movements in the value of investments still held at the period end. Member AVC contributions are permitted to be invested in the same range of investment funds as employers’ normal contributions. Indirect transaction costs are incurred on investments within pooled investment vehicles. The amount of indirect costs is not separately provided to the Scheme.

The Fidelity Master Trust Report and Financial Statements for the year ended 30 June 2021
29
9.1 Pooled investment vehicles (including AVC investments) 30/06/2021
£’000s 30/06/2020
£’000s Equity funds 2,449,173 1,675,117 Bond funds 258,061 178,819 Diversified growth funds 1,381,153 762,417 Multi asset funds 243,832 205,291 Property funds 6,505 6,516 Cash funds 114,379 102,138 4,453,103 2,930,298
10 Investment Fair Value Hierarchy The fair value of financial instruments has been determined using the following fair value hierarchy: Level 1 - The unadjusted quoted price in an active market for identical assets or liabilities that the entity can access at the measurement date.
Level 2 - Inputs other than quoted prices included within Level 1 that are observable (ie developed using market data) for the asset or liability, either directly or indirectly. Level 3 - Inputs are unobservable (i.e. for which market data is unavailable) for the asset or liability. The Fund’s investments have been analysed using the above hierarchy categories as follows: 30/06/2021 Level 1 Level 2 Level 3 Total £’000s £’000s £’000s £’000s Pooled investment vehicles - 4,388,025 - 4,388,025 AVC investments - 65,078 - 65,078 - 4,453,103 - 4,453,103
Analysis for the prior period end is as follows: 30/06/2020 Level 1 Level 2 Level 3 Total £’000s £’000s £’000s £’000s Pooled investment vehicles - 2,901,136 7,468 2,908,604 AVC investments - 21,694 - 21,694 - 2,922,830 7,468 2,930,298
In the prior year, all funds are categorised as Fair Value Hierarchy Level 2 funds, apart from the L&G and Threadneedle Property funds which, due to the impact of COVID-19, were changed from Level 2 to Level 3 due to a temporary suspension of the Property funds. Dealing in the Threadneedle Pensions Property fund recommenced from 17 September 2020 and dealing in the L&G 70:30 Hybrid Property Fund and L&G Managed Property Fund recommenced from 1 October 2020.
The Fidelity Master Trust Report and Financial Statements for the year ended 30 June 2021
30
11 Investment Risks FRS 102 requires the disclosure of information in relation to certain investment risks. Credit risk is the risk that one party to a financial instrument will cause a financial loss for the other party by failing to discharge an obligation, either directly or indirectly. In response to the above the Scheme is subject to credit risk in relation to:
i. Fidelity through its holding in unit linked insurance funds provided to the Scheme by Fidelity.
ii. The Scheme is also subject to indirect credit and market risk arising from the underlying investments held in the underlying funds.
Market risk comprises currency risk, interest rate risk and other price risk, defined as follows:
• Currency risk is the risk that the fair value or future cash flows of a financial asset will fluctuate because of changes in foreign exchange rates.
• Interest rate risk is the risk that the fair value or future cash flows of a financial asset will
fluctuate because of changes in market interest rates.
• Other price risk is the risk that the fair value or future cash flows of a financial asset will fluctuate because of changes in market prices (other than those arising from interest rate risk or currency risk), whether those changes are caused by factors specific to the individual financial instrument or its issuer, or factors affecting all similar financial instruments traded in the market.
Market risks are inherent to certain asset classes and securities and as such, funds that invest in, or have economic exposure to, these asset classes and securities will be subject to these market risks. The Master Trust’s participating employers access their DC investments through the Master Trust’s life policy issued by Fidelity. Fidelity offers the Trustees a range of unit linked funds that in turn are invested with a range of underlying fund managers. The day to day management of the underlying investments within these funds is the responsibility of the respective managers, including the direct management of credit and market risks. Before offering a unit linked insurance fund via the FIL Life Platform, Fidelity carries out due diligence on the credit risk of funds as well as fund managers or insurance companies that manage the funds and that contract with FIL Life. Once a fund is brought onto the FIL Life platform this due diligence is carried out and refreshed on a regular basis. Credit risk arises through reinsurance agreements between FIL Life and third party insurance companies. If a third party insurance company were in a position where they were unable to honour a reinsurance agreement with FIL Life then there would be financial loss for FIL Life and the schemes that contract with FIL Life.
The Trustees determined the Scheme’s investment strategy after taking advice from its investment adviser. The Fund has exposure to the aforementioned risks via the investments held to implement the investment strategy.
The Fidelity Master Trust Report and Financial Statements for the year ended 30 June 2021
31
11 Investment Risks (continued) Within each investment portfolio, investment objectives and restrictions to manage risk are implemented through the legal agreements in place with the Scheme’s investment managers. The Trustees monitor the performance of the strategy and associated risks, and each investment manager against its objectives and restrictions, on a regular basis. Please note the default strategy used by the Scheme and the range of underlying funds and their collective blends are either part of the standard fund range or have been agreed by the Trustees of the Scheme on the advice of their investment advisers. The risk categorisation table on the next page for each of the funds is based purely on information supplied by Fidelity on behalf of the managers of the underlying funds. It should not be relied upon to make any decisions relating to the funds provided to the Scheme. Member level risk disclosure will depend on the funds invested in by members.

The Fidelity Master Trust Report and Financial Statements for the year ended 30 June 2021
32
11 Investment Risks (continued)
Risk Categorisation
Value
Direct and Indirect Credit
Risk Indirect Market Risk
30/06/2021
£000’s 30/06/2020
£000’s Credit Risk Currency Interest Rate Other Price
Risk Global equity index 1,217,112 796,041 × Diversified Markets Fund 780,109 485,430 Ethical global equity 775,261 624,536 × Diversified Growth Fund 558,896 246,756 Multi asset Fund 230,742 193,841 UK Aggregate Bond 160,615 101,612 × × Cash 114,676 102,351 × Global 30/70 95,195 14,750 × US Equity 68,879 47,452 × World emerging markets 68,137 41,895 × UK Equity 53,529 34,490 × × Pre retirement Bond 52,477 30,606 × World ex UK Developed equity 47,272 25,566 × Over 5 year Gilts 35,191 30,905 × × European equity 32,347 25,557 × Corporate Bonds 31,273 25,794 × Global 50/50 29,401 21,501 × Pacific Rim Equity 26,663 19,056 × Islamic Fund 16,469 9,063 × Standard Life Managed Fund 12,098 10,949 Japanese equity 11,064 8,915 × Over 15 years Gilts 7,990 9,536 × × Total return credit 5,044 4,649 × Dynamic Allocation Fund 4,707 3,663 Index linked bond Fund 4,150 1,524 × × Property Fund 4,005 12 × 70/30 property 3,044 2,750 × Overseas Equity 2,806 1,683 × Market Advantage Fund 2,182 1,910 Annuity Targeting Fund 932 978 × × Managed Property 482 4,706 × Fixed Interest Gilts 180 577 × × UK Corporate Bond 133 98 × × Global high yield Fund 42 23 × Low Volatility Fund - 837 × Consensus equity - 257 × Select Global equity - 29 × 4,453,103 2,930,298
= risk applies × = risk does not apply In the table above, similar funds are grouped together as they share the same risk profile.
The Fidelity Master Trust Report and Financial Statements for the year ended 30 June 2021
33
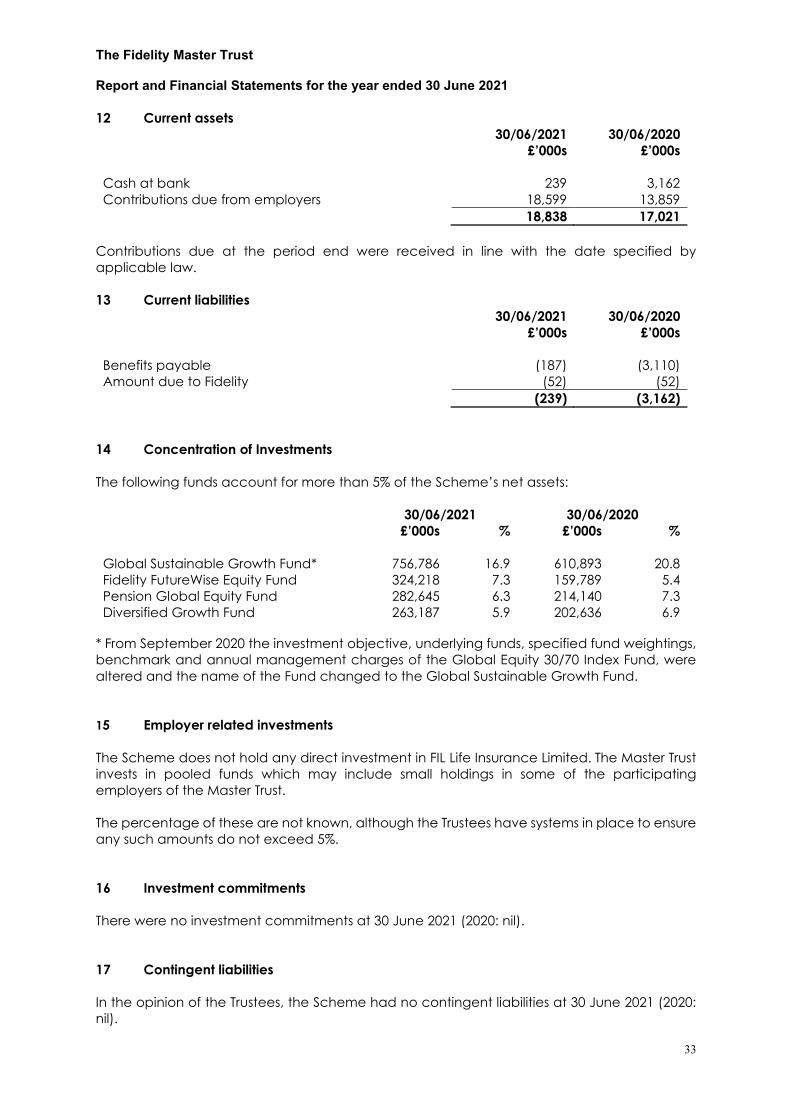
12 Current assets 30/06/2021
£’000s 30/06/2020
£’000s Cash at bank 239 3,162 Contributions due from employers 18,599 13,859 18,838 17,021
Contributions due at the period end were received in line with the date specified by applicable law. 13 Current liabilities 30/06/2021
£’000s 30/06/2020
£’000s Benefits payable (187) (3,110) Amount due to Fidelity (52) (52) (239) (3,162)
14 Concentration of Investments The following funds account for more than 5% of the Scheme’s net assets: 30/06/2021 30/06/2020 £’000s % £’000s % Global Sustainable Growth Fund* 756,786 16.9 610,893 20.8 Fidelity FutureWise Equity Fund 324,218 7.3 159,789 5.4 Pension Global Equity Fund 282,645 6.3 214,140 7.3 Diversified Growth Fund 263,187 5.9 202,636 6.9
* From September 2020 the investment objective, underlying funds, specified fund weightings, benchmark and annual management charges of the Global Equity 30/70 Index Fund, were altered and the name of the Fund changed to the Global Sustainable Growth Fund. 15 Employer related investments The Scheme does not hold any direct investment in FIL Life Insurance Limited. The Master Trust invests in pooled funds which may include small holdings in some of the participating employers of the Master Trust. The percentage of these are not known, although the Trustees have systems in place to ensure any such amounts do not exceed 5%. 16 Investment commitments There were no investment commitments at 30 June 2021 (2020: nil). 17 Contingent liabilities In the opinion of the Trustees, the Scheme had no contingent liabilities at 30 June 2021 (2020: nil).
The Fidelity Master Trust Report and Financial Statements for the year ended 30 June 2021
34
18 Related parties The unit trusts, OEICs and SICAV’s in which the Scheme’s assets are invested incur management fees which are charged to each fund concerned and received by FIL Investment Services (UK) Limited (FISL) or FIL Fund Management (Bermuda) Limited in their capacity as managers of these funds. In addition, FISL and FIL Investment Management (Luxembourg) S.A. receive fees for administration services from each fund concerned. These fees are incurred but are not separately identifiable. All professional fees in respect of services provided to the Trustees together with the fees for the independent trustees (PTL Governance Limited, ITS Limited and Punter Southall Governance Services Limited) were paid by Fidelity. 19 Subsequent events There are no subsequent events requiring disclosure in the Financial Statements.

The Fidelity Master Trust Report and Financial Statements for the year ended 30 June 2021
35
INDEPENDENT AUDITORS STATEMENT ABOUT CONTRIBUTIONS Independent Auditor’s Statement about Contributions to the Trustees of the Fidelity Master Trust. We have examined the summary of contributions payable to the Fidelity Master Trust (“the Scheme”) for the year ended 30 June 2021 which is set out on page 36. In our opinion contributions for the Scheme year ended 30 June 2021 as reported in the summary of contributions and payable under the payment schedules have in all material respects been paid at least in accordance with the payment schedules. Scope of work on Statement about Contributions Our examination involves obtaining evidence sufficient to give reasonable assurance that contributions reported in the attached summary of contributions have in all material respects been paid at least in accordance with the payment schedules. This includes an examination, on a test basis, of evidence relevant to the amounts of contributions payable to the scheme and the timing of those payments under the payment schedules. Respective responsibilities of Trustees and the Auditor As explained more fully in the Statement of Trustees’ Responsibilities, the Trustees are responsible for securing that payment schedules are prepared, maintained and, from time-to-time, revised and for monitoring whether contributions are made to the scheme by the employers in accordance with the payment schedules. It is our responsibility to provide a Statement about Contributions payable under the payment schedules and to report our opinion to you. Use of our report This statement is made solely to the Trustees, as a body, in accordance with our engagement letter dated 11 June 2019. Our work has been undertaken so that we might state to the Trustees those matters we are required to state to them in an auditor’s statement and for no other purpose. To the fullest extent permitted by law, we do not accept or assume responsibility to anyone other than the Trustees, as a body, for our work, for this statement or for the opinions we have formed. Nexia Smith & Williamson Chartered Accountants Statutory Auditor Bristol Date:

The Fidelity Master Trust Report and Financial Statements for the year ended 30 June 2021
36
SUMMARY OF CONTRIBUTIONS PAYABLE IN THE PERIOD During the year from 1 July 2020 to 30 June 2021, the contributions payable to the Scheme by the employers were as follows:
Employee Employers £’000s £’000s Required by the payment schedules Normal and Smart contributions 4,715 299,358 Total (as reported on by the independent auditor) 4,715 299,358 Other contributions payable AVCs 7,321 5,122 Other employer additional – Bonus Waiver - 11,678 Total (as per Fund Account) 12,036 316,158
Signed on behalf of the Trustees: ____________________________
Dianne Day
Chair of the Board of Trustees
Date:
The Fidelity Master Trust Report and Financial Statements for the year ended 30 June 2021
37
Chair’s Statement Introduction On behalf of the Trustees of the Fidelity Master Trust (which we will refer to as “the Scheme” in this document), I am pleased to present the Chair’s Statement. This statement covers 1 July 2020 to 30 June 2021 (“the Scheme Year”) and has been prepared in accordance with regulation 23 of The Occupational Pension Schemes (Scheme Administration) Regulations 1996 (inserted via The Occupational Pension Schemes (Charges and Governance) Regulations 2015). The Fidelity Master Trust is designed to provide employers and their employees with a well-governed, value-for-money pension scheme. It uses the DC platform and member services of its administrator, Fidelity, to provide members with the opportunity to achieve the best possible retirement outcomes from the pension contributions they, and their employers, make. As at 30 June 2021, the Trustees have responsibility for pension savings worth around £4.4bn, on behalf of more than 108,000 members, from 93 participating employers. A note about the pandemic The situation with the pandemic was challenging for much of the Scheme Year. To help ensure members were kept financially safe, we closely monitored the administration service throughout the period, including the business continuity plan (BCP), and monitored investment performance. In addition, we developed and issued essential communications to members about the rise of pension-related scams and the options for those who were close to retirement. Statement on DC Governance 1. Default Investment Arrangements and Statement of Investment Principles Statement of Investment Principles The Scheme has a Statement of Investment Principles (SIP), which was reviewed in September 2020, February 2021, September 2021 and December 2021. It was formally signed by the Trustees on 7 December 2021. This outlines the Trustees’ policies on:
• Choosing investments • Investment objectives (these can vary between sections of the Scheme, so we’ve put
them in the section-specific appendices at the end) • Risks • Expected return on investments • The process for selling investments • Investment pathways • Sustainable investing, including environmental, social and governance (ESG) factors • Compliance
We believe that integrating sustainability (including climate change issues) into an investment process is likely to lead to improved risk-adjusted returns, which would mean better retirement outcomes for members. As a result, we have developed a set of sustainable investing beliefs that are outlined in the latest SIP. Information on how the fund managers have acted on these principles, including a summary of engagement and voting activity over the Scheme Year, is provided in the Implementation Statement in Appendix 4.

The Fidelity Master Trust Report and Financial Statements for the year ended 30 June 2021
38
The requirements of Regulation 2A of the Investment Regulations 2005 are covered in the SIP and / or detailed in this statement. A copy of the latest SIP, along with appendices to the SIP relating to the various employers who participated in the Scheme during the Scheme Year and who have bespoke investment options, is in Appendix 1. This is available online, free of charge, at: https://retirement.fidelity.co.uk/costs-and-charges/. Please select your relevant employer from the website and click “Document 2”. Default arrangements for the Scheme – Introduction The main goal of a default arrangement is to create the potential for good member outcomes at retirement by taking a managed level of investment risk over a member’s working life. This is set up to be appropriate for the majority of members, on the basis that most will not want to make an active investment choice. We support employees at many companies and have a number of different default arrangements within the Scheme for different employee groups. Our standard default arrangement was created to give employers an option they can use without taking advice, but they are also free to design their own default investment strategy, as long as we have received and accepted suitable ongoing investment advice on its appropriateness for our members in that section. When it comes to default arrangements, we:
• take into account the needs of the relevant section of the Scheme’s membership when determining the default investment strategy for that section
• review each default investment strategy every year. We look at the actual investment returns generated from the strategy, the prospective returns and the expected volatility (investment risk), as well as the funds and asset classes used within the strategy
Review of performance Over the Scheme Year, we received information about investment performance from Fidelity every three months for all investment funds which are within the default arrangements. Our investment advisers are required to let us know at any time if something significant happens or the underlying managers change, so we can take the relevant actions. We also reviewed the outcomes of Fidelity’s governance process every three months to oversee the funds available within the Scheme and take action when we felt it was necessary. Our review process involved comparing investment returns to those of market-index benchmarks and/or cash, as well as considering the performance of comparable funds and levels of transaction costs. We also took into account any structural issues or concerns with the underlying managers. Standard default arrangement – FutureWise FutureWise is the Scheme’s standard default arrangement and it aims to deliver a good outcome for members regardless of how they take their retirement income. It is offered to all members except those with employers who have selected their own default investment strategy.
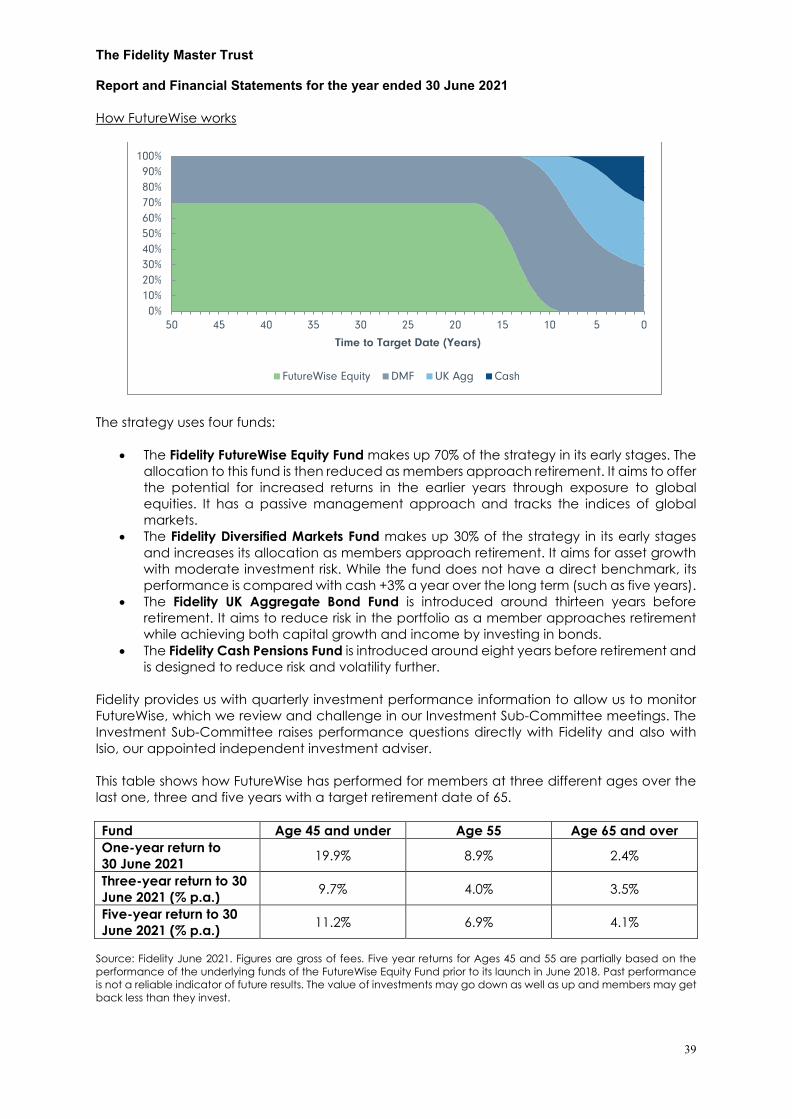
The Fidelity Master Trust Report and Financial Statements for the year ended 30 June 2021
39
How FutureWise works
The strategy uses four funds:
• The Fidelity FutureWise Equity Fund makes up 70% of the strategy in its early stages. The allocation to this fund is then reduced as members approach retirement. It aims to offer the potential for increased returns in the earlier years through exposure to global equities. It has a passive management approach and tracks the indices of global markets.
• The Fidelity Diversified Markets Fund makes up 30% of the strategy in its early stages and increases its allocation as members approach retirement. It aims for asset growth with moderate investment risk. While the fund does not have a direct benchmark, its performance is compared with cash +3% a year over the long term (such as five years).
• The Fidelity UK Aggregate Bond Fund is introduced around thirteen years before retirement. It aims to reduce risk in the portfolio as a member approaches retirement while achieving both capital growth and income by investing in bonds.
• The Fidelity Cash Pensions Fund is introduced around eight years before retirement and is designed to reduce risk and volatility further.
Fidelity provides us with quarterly investment performance information to allow us to monitor FutureWise, which we review and challenge in our Investment Sub-Committee meetings. The Investment Sub-Committee raises performance questions directly with Fidelity and also with Isio, our appointed independent investment adviser. This table shows how FutureWise has performed for members at three different ages over the last one, three and five years with a target retirement date of 65. Fund Age 45 and under Age 55 Age 65 and over One-year return to 30 June 2021 19.9% 8.9% 2.4%
Three-year return to 30 June 2021 (% p.a.) 9.7% 4.0% 3.5%
Five-year return to 30 June 2021 (% p.a.) 11.2% 6.9% 4.1%
Source: Fidelity June 2021. Figures are gross of fees. Five year returns for Ages 45 and 55 are partially based on the performance of the underlying funds of the FutureWise Equity Fund prior to its launch in June 2018. Past performance is not a reliable indicator of future results. The value of investments may go down as well as up and members may get back less than they invest.
0%10%20%30%40%50%60%70%80%90%
100%
50 45 40 35 30 25 20 15 10 5 0
Time to Target Date (Years)
FutureWise Equity DMF UK Agg Cash

The Fidelity Master Trust Report and Financial Statements for the year ended 30 June 2021
40
Having reviewed the performance and obtained advice the Trustees concluded that the performance of FutureWise is consistent with the aims and objectives of the default arrangement as set out in the Statement of Investment Principles. Review of FutureWise On 2nd September 2020 the Investment Sub-Committee met to review the suitability of the standard default arrangement, FutureWise, taking advice from Isio. As a result of this review, the Trustees confirmed the default investment strategy was appropriate, and subsequently the following changes were made in the Scheme Year. Asset allocation approach – Fidelity has developed the Diversified Markets Fund over the Scheme Year, making changes which should result in the asset allocation reacting quicker to market conditions. ESG integration – the funds within FutureWise are currently managed by Fidelity International and BlackRock Asset Management. Both managers are signatories to the UN PRI (Principles for Responsible Investment) and received A+ ratings in strategy and governance in relation to sustainable investing in 2020. Both also have an ESG (environmental, social and governance) or sustainable investing team to integrate these principles into their core investment process. Over the Scheme Year, FutureWise has seen two important sustainability developments. First, between September 2020 and March 2021, Fidelity integrated its proprietary ESG rating system into the Fidelity Diversified Markets Fund, as part of its continued focus on integrating sustainability into its funds. This ranks companies based on their management of ESG-related issues and it moves the fund towards companies with good management of these issues and away from those with poor management. Second, at the end of June 2021, several ESG-related exclusions were applied to the underlying BlackRock UK Equity and BlackRock World ex-UK funds within the FutureWise Equity Fund (which is used heavily in the early years of the FutureWise strategy). These excluded companies involved with business activities in controversial weapons, thermal coal and oil sands, as well as violators of the United Nations Global Compact Compliance. The last full triennial review of the Scheme’s standard default arrangement, FutureWise, was carried out on 20th June 2018. The next triennial review will take place in the Scheme Year 2021/22. Regulatory (deemed) defaults In last year’s report, we told you about how we moved members’ future contributions to an alternative fund after we received short-notice notification from fund managers about property fund suspensions. The Fidelity Cash Pensions Fund was selected in order to protect the short term value of members’ contributions from market movements until we could choose a more suitable long-term solution. When the property fund suspensions continued for longer than expected, we then moved members’ holdings from the Fidelity Cash Pensions Fund into the Fidelity Diversified Markets Fund and also redirected future contributions into this fund. This fund already forms a key part of the FutureWise default strategy for standard sections and aims to grow capital over time in a risk-controlled way. Both funds were considered regulatory ‘deemed’ default arrangements under statutory guidance. There was no specific review of the two regulatory default arrangements within the Scheme Year, except to the extent that both funds form part of the standard default arrangement, FutureWise (see above). A review of these regulatory default funds will occur alongside the next triennial review of FutureWise in the Scheme Year 2021/22.

The Fidelity Master Trust Report and Financial Statements for the year ended 30 June 2021
41
Review of the standard self-select fund range There were 26 self-select funds available under the Scheme’s standard arrangement as at 30 June 2021. They represent a variety of asset classes – including equities, property, multi-asset, bonds and cash – and cover both active and passive management, as well as a range of approaches to incorporating sustainability. This means they provide members with a suitable range of funds to meet their needs if they wish to self-select. Over the course of the Scheme Year, there have been several changes to the self-select fund range:
• Following advice agreed on 28th September 2020, Investment Pathways were introduced as fund options for members in retirement in October 2020 (we have more details about them below).
• Following advice agreed on the 6th October 2020, we decided to remove the Multi Asset Allocator Funds from the range. This change was finished in October 2020.
• Following advice agreed on 12th February 2021, we renamed the existing Master Trust ESG Passive Equity Fund as the Sustainable Passive Equity Fund, and introduced four new sustainable funds into the standard self-select fund range in April 2021. These funds use a variety of asset classes, management styles and approaches to sustainability to provide members with a broad range of options in this area.
During the Scheme Year, Fidelity also changed how the Fidelity Pre-Retirement Bond Fund is managed – moving from an actively managed approach to systematic management with active oversight. Finally, as we broadened our selection of sustainable funds, we took the decision following advice agreed on 30th April 2021 to remove the L&G Ethical Fund from our range, which happened in November 2021. Its investment approach overlaps significantly with the Sustainable Passive Equity Fund (which invests in the BlackRock ESG Equity Tracker Fund) in terms of economic exposure, approach, management style and exclusions, but the Sustainable Passive Equity Fund costs less for members. The performance of the self-select funds was reviewed every three months during the Scheme Year and Isio carried out its annual independent review, advising that the range is suitable for members. Investment Pathways Following a consultation with Fidelity, the Scheme began offering four Investment Pathways from October 2020. These aim to cover the range of goals that members may have for their retirement pots, and were made available as part of the new regular Income Drawdown facility also launched in October 2020.
Investment Pathway Objective
Fidelity Investment Pathway 1 (Fidelity Diversified Markets Fund)
I do not plan on touching my money within the next five years
Fidelity Investment Pathway 2 (Fidelity Pre-Retirement Bond Fund)
I plan on purchasing a guaranteed income (annuity) within the next five years
Fidelity Investment Pathway 3 (Fidelity Multi Asset Balanced Income Fund)
I plan on starting to take a long-term income within the next five years
Fidelity Investment Pathway 4 (Fidelity Cash Fund) I plan on taking all my money within the next five years
The Fidelity Master Trust Report and Financial Statements for the year ended 30 June 2021
42
Since October 2020, members have had the following options when they ask about accessing their retirement benefits:
• Selecting from the Investment Pathways • Remaining in their current investment options • Selecting alternative investment options from the fund range available to them
Employer-designed default arrangements and self-select funds Where an employer chooses not to use the standard investment strategy, they can appoint an adviser to help them develop an ‘employer-designed’ default option and/or a self-select fund range. In these circumstances, we also appoint the investment adviser to provide advice on the appropriateness of the section at the outset and on an ongoing basis. We conduct a full review of the default arrangement strategy, self-select fund range and performance at least every three years, with an annual review to confirm continued suitability. Reviews of employer-designed default arrangements and self-select funds during the Scheme Year Within this year’s Statement we have changed the structure of our reporting on employer-designed default arrangements. First, we set out the areas which are common to all employer-designed defaults, such as the aims and objectives, and the way in which ongoing performance is monitored. Then we follow with details of the specific performance and strategy reviews for each Section below. The employer-designed default arrangements share common investment objectives which are to provide a suitable default investment option which is likely to be suitable for a typical member of the Section, and to enable members to grow their savings above inflation over the long-term whilst mitigating risks where possible. Fidelity provides us with quarterly investment performance information to allow us to monitor funds within each employer-designed default arrangements, which we review and challenge in our Investment Sub-Committee meetings. The Investment Sub-Committee raises performance questions directly with Fidelity and the investment advisers for each employer-designed section. Having reviewed the performance and obtained advice for all employer-designed sections the Trustees concluded that the performance was consistent with the aims and objectives of the default arrangement as set out in the Statement of Investment Principles. The following table shows the date of the Trustees’ last triennial review of the employer-designed default arrangements and self-select funds, and the year in which the next review is due.
Section Adviser Previous triennial review agreed
Next triennial review due
BNP Paribas Aon 04/09/2019 2022 Credit Suisse Aon 02/09/2020 2023
MyColt Willis Towers Watson 27/10/2020 2022 RSA Lane Clark & Peacock (LCP) 04/09/2019 2022
Telegraph Media Lane Clark & Peacock (LCP) 16/12/2019* 2022 Universal Music Hyman Robertson 22/06/2021 2024
Unilever Barnett Waddingham 03/07/2021* 2024 Virgin Money Hyman Robertson 30/05/2020 2023 Voith Turbo Hyman Robertson 08/04/2021 2023
*Initial advice on joining the Master Trust
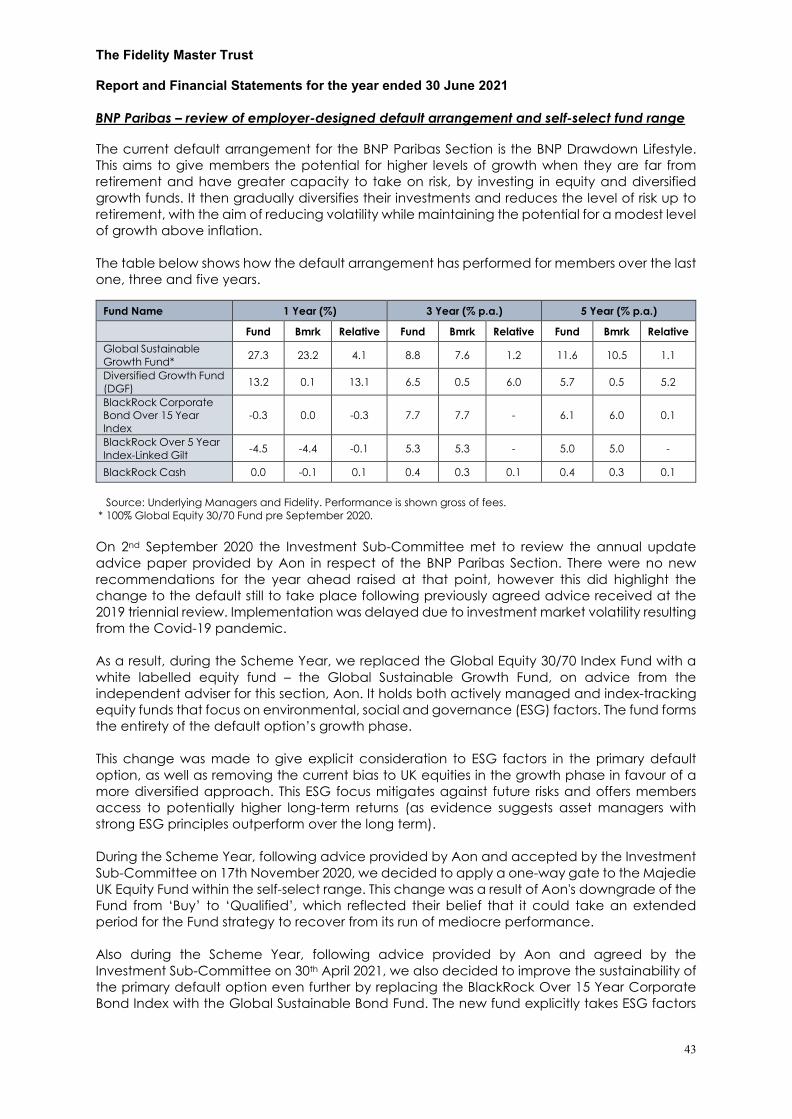
The Fidelity Master Trust Report and Financial Statements for the year ended 30 June 2021
43
BNP Paribas – review of employer-designed default arrangement and self-select fund range The current default arrangement for the BNP Paribas Section is the BNP Drawdown Lifestyle. This aims to give members the potential for higher levels of growth when they are far from retirement and have greater capacity to take on risk, by investing in equity and diversified growth funds. It then gradually diversifies their investments and reduces the level of risk up to retirement, with the aim of reducing volatility while maintaining the potential for a modest level of growth above inflation. The table below shows how the default arrangement has performed for members over the last one, three and five years.
Fund Name 1 Year (%) 3 Year (% p.a.) 5 Year (% p.a.)
Fund Bmrk Relative Fund Bmrk Relative Fund Bmrk Relative Global Sustainable Growth Fund* 27.3 23.2 4.1 8.8 7.6 1.2 11.6 10.5 1.1
Diversified Growth Fund (DGF) 13.2 0.1 13.1 6.5 0.5 6.0 5.7 0.5 5.2
BlackRock Corporate Bond Over 15 Year Index
-0.3 0.0 -0.3 7.7 7.7 - 6.1 6.0 0.1
BlackRock Over 5 Year Index-Linked Gilt -4.5 -4.4 -0.1 5.3 5.3 - 5.0 5.0 -
BlackRock Cash 0.0 -0.1 0.1 0.4 0.3 0.1 0.4 0.3 0.1
Source: Underlying Managers and Fidelity. Performance is shown gross of fees. * 100% Global Equity 30/70 Fund pre September 2020. On 2nd September 2020 the Investment Sub-Committee met to review the annual update advice paper provided by Aon in respect of the BNP Paribas Section. There were no new recommendations for the year ahead raised at that point, however this did highlight the change to the default still to take place following previously agreed advice received at the 2019 triennial review. Implementation was delayed due to investment market volatility resulting from the Covid-19 pandemic. As a result, during the Scheme Year, we replaced the Global Equity 30/70 Index Fund with a white labelled equity fund – the Global Sustainable Growth Fund, on advice from the independent adviser for this section, Aon. It holds both actively managed and index-tracking equity funds that focus on environmental, social and governance (ESG) factors. The fund forms the entirety of the default option’s growth phase. This change was made to give explicit consideration to ESG factors in the primary default option, as well as removing the current bias to UK equities in the growth phase in favour of a more diversified approach. This ESG focus mitigates against future risks and offers members access to potentially higher long-term returns (as evidence suggests asset managers with strong ESG principles outperform over the long term). During the Scheme Year, following advice provided by Aon and accepted by the Investment Sub-Committee on 17th November 2020, we decided to apply a one-way gate to the Majedie UK Equity Fund within the self-select range. This change was a result of Aon's downgrade of the Fund from ‘Buy’ to ‘Qualified’, which reflected their belief that it could take an extended period for the Fund strategy to recover from its run of mediocre performance. Also during the Scheme Year, following advice provided by Aon and agreed by the Investment Sub-Committee on 30th April 2021, we also decided to improve the sustainability of the primary default option even further by replacing the BlackRock Over 15 Year Corporate Bond Index with the Global Sustainable Bond Fund. The new fund explicitly takes ESG factors

The Fidelity Master Trust Report and Financial Statements for the year ended 30 June 2021
44
into account, as well as following a more diversified approach. This change was made in September 2021. For this section, we believe that the default arrangement and self-select fund range remain appropriate for members’ needs, based on the advice we have received. Credit Suisse – review of employer-designed self-select fund range Credit Suisse have a bespoke self-select fund range but use FutureWise as their default arrangement. We are advised by Aon for the self-select range, which is reviewed each year. On 2nd September 2020 the Investment Sub-Committee met to review the annual update advice paper provided by Aon in respect of the Credit Suisse Section. Within this update Aon recommended that the number of funds in the self-select fund range be reduced. This was agreed by the Investment Sub-Committee and the fund range was reduced in March 2021, when similar (but higher-cost) Legal & General funds were removed from the fund range. For this section, we believe that the standard default arrangement and self-select fund range remain appropriate for members’ needs, based on the advice we have received. Hunting – review of employer-designed default arrangement and self-select fund range There was no review of the employer-designed default arrangement carred out in the Scheme Year. Prior to February 2021 the Hunting section of the Fidelity Master Trust used a shared governance arrangement, with an employer-designed default strategy and self-select fund range. Following advice from LCP, the company chose to remove the shared governance arrangement and become part of the standard Fidelity Master Trust offering. We received and accepted advice in relation to this transition on 16th November 2020 and the transition was completed on 22nd February 2021. The previous default investment option was a drawdown lifestyle strategy. This invested 50% in global equities and 50% in diversified growth funds until 15 years before retirement. Members were then switched into less risky assets over the next 15 years until retirement. At retirement, they were invested in a 37.5% allocation to a Diversified Growth Fund, 37.5% to an absolute return bond fund and 25% to a cash fund. The default lifestyle option for members in the Fidelity Master Trust is the FutureWise strategy, which has a universal target at retirement unlike the previous default, which targeted drawdown. We gave members who were using one or more of the section’s self-select funds the option of choosing alternative funds from the Master Trust self-select range. Unless members told us otherwise, we moved their money into the FutureWise default strategy. For this section, we believe that the standard default arrangement and self-select fund range are appropriate for members’ needs, based on the advice we have received. MyColt – review of employer-designed default arrangement and self-select fund range The default investment option for the MyColt Retirement Savings Section is an Income Drawdown Lifestyle. The growth phase of the strategy adopts a ‘medium risk’ approach, predominantly investing in equities, but with some exposure to other asset classes accessed via a diversified growth fund (DGF). The consolidation and at-retirement phases of the strategy is designed to specifically reflect the risk exposure expected for the portfolios to facilitate income drawdown in retirement.
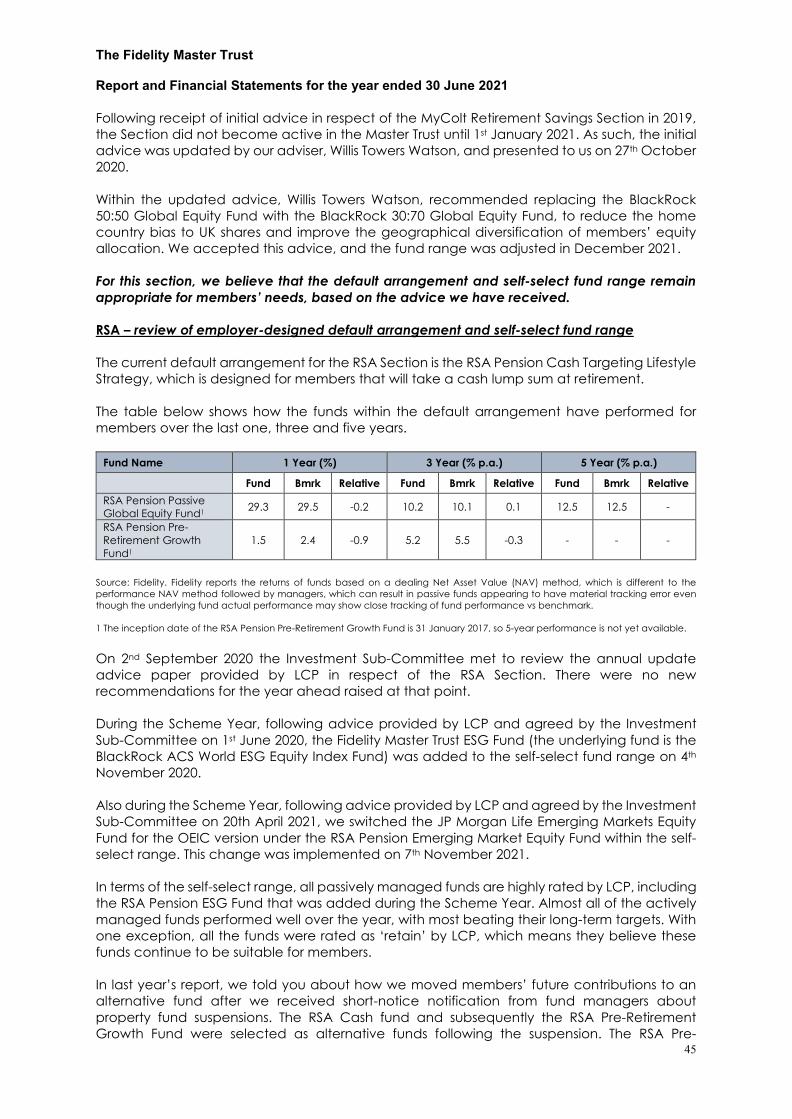
The Fidelity Master Trust Report and Financial Statements for the year ended 30 June 2021
45
Following receipt of initial advice in respect of the MyColt Retirement Savings Section in 2019, the Section did not become active in the Master Trust until 1st January 2021. As such, the initial advice was updated by our adviser, Willis Towers Watson, and presented to us on 27th October 2020. Within the updated advice, Willis Towers Watson, recommended replacing the BlackRock 50:50 Global Equity Fund with the BlackRock 30:70 Global Equity Fund, to reduce the home country bias to UK shares and improve the geographical diversification of members’ equity allocation. We accepted this advice, and the fund range was adjusted in December 2021. For this section, we believe that the default arrangement and self-select fund range remain appropriate for members’ needs, based on the advice we have received. RSA – review of employer-designed default arrangement and self-select fund range The current default arrangement for the RSA Section is the RSA Pension Cash Targeting Lifestyle Strategy, which is designed for members that will take a cash lump sum at retirement. The table below shows how the funds within the default arrangement have performed for members over the last one, three and five years.
Fund Name 1 Year (%) 3 Year (% p.a.) 5 Year (% p.a.)
Fund Bmrk Relative Fund Bmrk Relative Fund Bmrk Relative RSA Pension Passive Global Equity Fund1 29.3 29.5 -0.2 10.2 10.1 0.1 12.5 12.5 -
RSA Pension Pre-Retirement Growth Fund1
1.5 2.4 -0.9 5.2 5.5 -0.3 - - -
Source: Fidelity. Fidelity reports the returns of funds based on a dealing Net Asset Value (NAV) method, which is different to the performance NAV method followed by managers, which can result in passive funds appearing to have material tracking error even though the underlying fund actual performance may show close tracking of fund performance vs benchmark. 1 The inception date of the RSA Pension Pre-Retirement Growth Fund is 31 January 2017, so 5-year performance is not yet available. On 2nd September 2020 the Investment Sub-Committee met to review the annual update advice paper provided by LCP in respect of the RSA Section. There were no new recommendations for the year ahead raised at that point. During the Scheme Year, following advice provided by LCP and agreed by the Investment Sub-Committee on 1st June 2020, the Fidelity Master Trust ESG Fund (the underlying fund is the BlackRock ACS World ESG Equity Index Fund) was added to the self-select fund range on 4th November 2020. Also during the Scheme Year, following advice provided by LCP and agreed by the Investment Sub-Committee on 20th April 2021, we switched the JP Morgan Life Emerging Markets Equity Fund for the OEIC version under the RSA Pension Emerging Market Equity Fund within the self-select range. This change was implemented on 7th November 2021. In terms of the self-select range, all passively managed funds are highly rated by LCP, including the RSA Pension ESG Fund that was added during the Scheme Year. Almost all of the actively managed funds performed well over the year, with most beating their long-term targets. With one exception, all the funds were rated as ‘retain’ by LCP, which means they believe these funds continue to be suitable for members. In last year’s report, we told you about how we moved members’ future contributions to an alternative fund after we received short-notice notification from fund managers about property fund suspensions. The RSA Cash fund and subsequently the RSA Pre-Retirement Growth Fund were selected as alternative funds following the suspension. The RSA Pre-
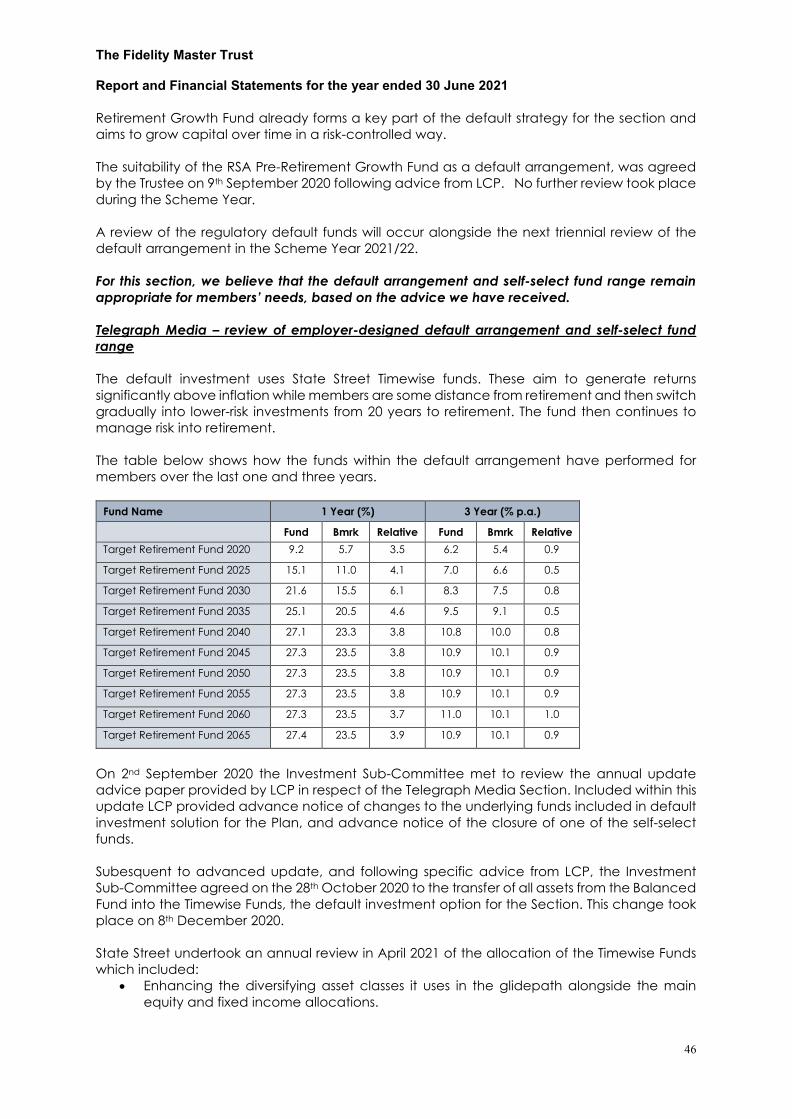
The Fidelity Master Trust Report and Financial Statements for the year ended 30 June 2021
46
Retirement Growth Fund already forms a key part of the default strategy for the section and aims to grow capital over time in a risk-controlled way. The suitability of the RSA Pre-Retirement Growth Fund as a default arrangement, was agreed by the Trustee on 9th September 2020 following advice from LCP. No further review took place during the Scheme Year. A review of the regulatory default funds will occur alongside the next triennial review of the default arrangement in the Scheme Year 2021/22. For this section, we believe that the default arrangement and self-select fund range remain appropriate for members’ needs, based on the advice we have received. Telegraph Media – review of employer-designed default arrangement and self-select fund range The default investment uses State Street Timewise funds. These aim to generate returns significantly above inflation while members are some distance from retirement and then switch gradually into lower-risk investments from 20 years to retirement. The fund then continues to manage risk into retirement. The table below shows how the funds within the default arrangement have performed for members over the last one and three years.
Fund Name 1 Year (%) 3 Year (% p.a.)
Fund Bmrk Relative Fund Bmrk Relative Target Retirement Fund 2020 9.2 5.7 3.5 6.2 5.4 0.9
Target Retirement Fund 2025 15.1 11.0 4.1 7.0 6.6 0.5
Target Retirement Fund 2030 21.6 15.5 6.1 8.3 7.5 0.8
Target Retirement Fund 2035 25.1 20.5 4.6 9.5 9.1 0.5
Target Retirement Fund 2040 27.1 23.3 3.8 10.8 10.0 0.8
Target Retirement Fund 2045 27.3 23.5 3.8 10.9 10.1 0.9
Target Retirement Fund 2050 27.3 23.5 3.8 10.9 10.1 0.9
Target Retirement Fund 2055 27.3 23.5 3.8 10.9 10.1 0.9
Target Retirement Fund 2060 27.3 23.5 3.7 11.0 10.1 1.0
Target Retirement Fund 2065 27.4 23.5 3.9 10.9 10.1 0.9
On 2nd September 2020 the Investment Sub-Committee met to review the annual update advice paper provided by LCP in respect of the Telegraph Media Section. Included within this update LCP provided advance notice of changes to the underlying funds included in default investment solution for the Plan, and advance notice of the closure of one of the self-select funds. Subesquent to advanced update, and following specific advice from LCP, the Investment Sub-Committee agreed on the 28th October 2020 to the transfer of all assets from the Balanced Fund into the Timewise Funds, the default investment option for the Section. This change took place on 8th December 2020. State Street undertook an annual review in April 2021 of the allocation of the Timewise Funds which included:
• Enhancing the diversifying asset classes it uses in the glidepath alongside the main equity and fixed income allocations.
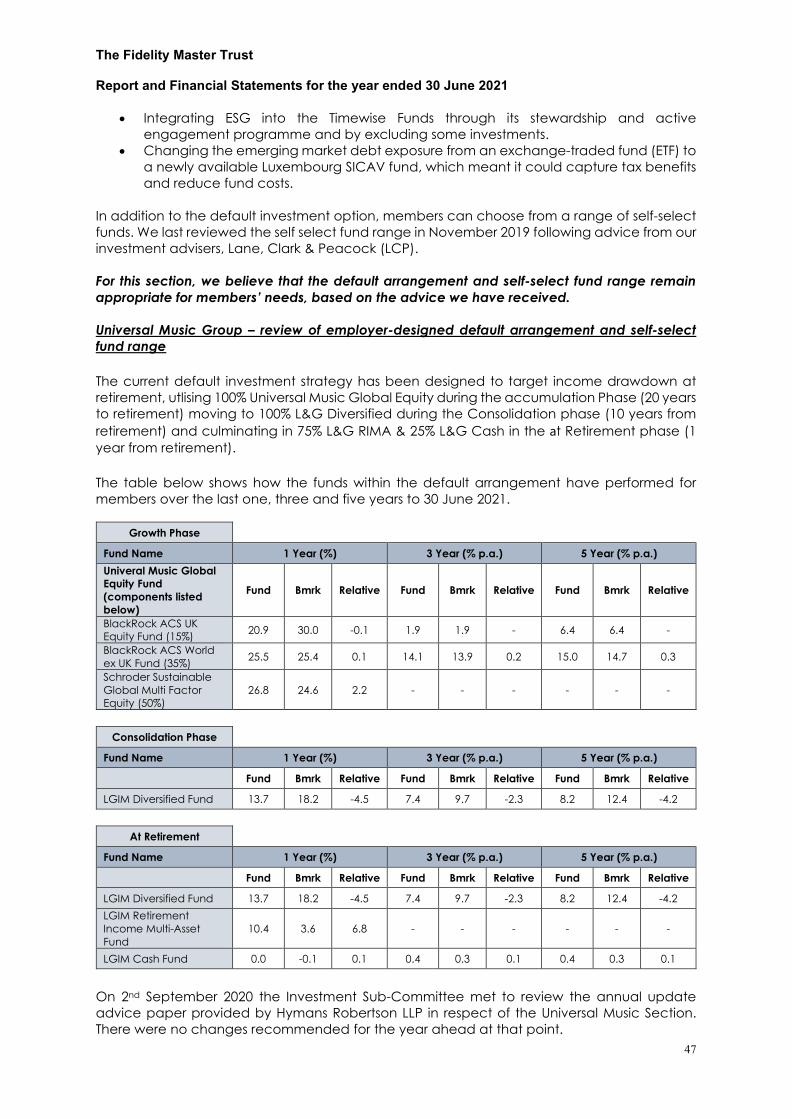
The Fidelity Master Trust Report and Financial Statements for the year ended 30 June 2021
47
• Integrating ESG into the Timewise Funds through its stewardship and active engagement programme and by excluding some investments.
• Changing the emerging market debt exposure from an exchange-traded fund (ETF) to a newly available Luxembourg SICAV fund, which meant it could capture tax benefits and reduce fund costs.
In addition to the default investment option, members can choose from a range of self-select funds. We last reviewed the self select fund range in November 2019 following advice from our investment advisers, Lane, Clark & Peacock (LCP). For this section, we believe that the default arrangement and self-select fund range remain appropriate for members’ needs, based on the advice we have received. Universal Music Group – review of employer-designed default arrangement and self-select fund range
The current default investment strategy has been designed to target income drawdown at retirement, utlising 100% Universal Music Global Equity during the accumulation Phase (20 years to retirement) moving to 100% L&G Diversified during the Consolidation phase (10 years from retirement) and culminating in 75% L&G RIMA & 25% L&G Cash in the at Retirement phase (1 year from retirement).
The table below shows how the funds within the default arrangement have performed for members over the last one, three and five years to 30 June 2021.
Growth Phase
Fund Name 1 Year (%) 3 Year (% p.a.) 5 Year (% p.a.) Univeral Music Global Equity Fund (components listed below)
Fund Bmrk Relative Fund Bmrk Relative Fund Bmrk Relative
BlackRock ACS UK Equity Fund (15%) 20.9 30.0 -0.1 1.9 1.9 - 6.4 6.4 -
BlackRock ACS World ex UK Fund (35%) 25.5 25.4 0.1 14.1 13.9 0.2 15.0 14.7 0.3
Schroder Sustainable Global Multi Factor Equity (50%)
26.8 24.6 2.2 - - - - - -
Consolidation Phase
Fund Name 1 Year (%) 3 Year (% p.a.) 5 Year (% p.a.)
Fund Bmrk Relative Fund Bmrk Relative Fund Bmrk Relative
LGIM Diversified Fund 13.7 18.2 -4.5 7.4 9.7 -2.3 8.2 12.4 -4.2
At Retirement
Fund Name 1 Year (%) 3 Year (% p.a.) 5 Year (% p.a.)
Fund Bmrk Relative Fund Bmrk Relative Fund Bmrk Relative
LGIM Diversified Fund 13.7 18.2 -4.5 7.4 9.7 -2.3 8.2 12.4 -4.2 LGIM Retirement Income Multi-Asset Fund
10.4 3.6 6.8 - - - - - -
LGIM Cash Fund 0.0 -0.1 0.1 0.4 0.3 0.1 0.4 0.3 0.1
On 2nd September 2020 the Investment Sub-Committee met to review the annual update advice paper provided by Hymans Robertson LLP in respect of the Universal Music Section. There were no changes recommended for the year ahead at that point.

The Fidelity Master Trust Report and Financial Statements for the year ended 30 June 2021
48
Later in the Scheme Year, there were two key changes to investment arrangements for this section. First, Fidelity closed one of the funds in the self-select range – the Fidelity Global Select Fund in November 2020. Our investment adviser, Hymans Robertson, recommended that members affected by this change should be transferred into the Universal Music Global Equity Fund, as this also allows members to invest on a global basis and it has lower costs.
In June 2021, Hymans Robertson presented the final results of the Triennial Investment Strategy review for the section, which included a number of recommendations that, on 22nd June 2021, we agree should be carried out:
1. Reposition the Universal Music Global Equity Fund to integrate an ESG approach that is consistent with Universal Music’s beliefs on responsible investment and sustainability, as well as our beliefs, which we have set out in our SIP. This would involve:
o Reducing the allocation of the current Schroders Sustainable Multi Factor Equity Fund from 50% to 45%
o Replacing the BlackRock passive equity funds with the BlackRock ESG Equity Tracker Fund at a 40% allocation
o Introducing a 15% allocation to the Baillie Gifford Positive Change Fund 2. Increase diversification in the lead up to retirement (i.e. between fourteen and two
years to retirement) by introducing a 20% allocation to the Fulcrum Diversified Liquid Alternatives Fund (and reducing the L&G Diversified Fund allocation to 80%).
3. Reduce the risk profile at retirement by reducing the L&G RIMA allocation to 66% with the remainder invested in the L&G Cash Fund.
There were also two recommendations for the self-select range that we agreed should be carried out:
1. Include the changes in points 1 and 2 above within the two alternative lifestyle options (cash and annuity).
2. Add the Baillie Gifford Positive Change Fund and the BlackRock ESG Equity Tracker Fund to the self-select range.
Implementation of these recommendations was completed after the Scheme Year end, in December 2021, and members were informed ahead of the changes.
Performance of the underlying funds within the previous default arrangement was monitored throughout the Scheme Year, and the first update following the implementation of the new strategy above will take place in the Q1 2022 Investment Sub-Committee meeting. In last year’s report, we told you about how we moved members’ future contributions to an alternative fund after we received short-notice notification from fund managers about property fund suspensions. The Fidelity Cash Fund was selected as an alternative default arrangement following the suspension. No review of this default arrangement took place during the Scheme Year. A review of this regulatory default funds will occur alongside the next triennial review of the default arrangement in the Scheme Year 2021/22. For this section, we believe that the default arrangement and self-select fund range as amended by the changes described above are appropriate for members’ needs, based on the advice we have received.
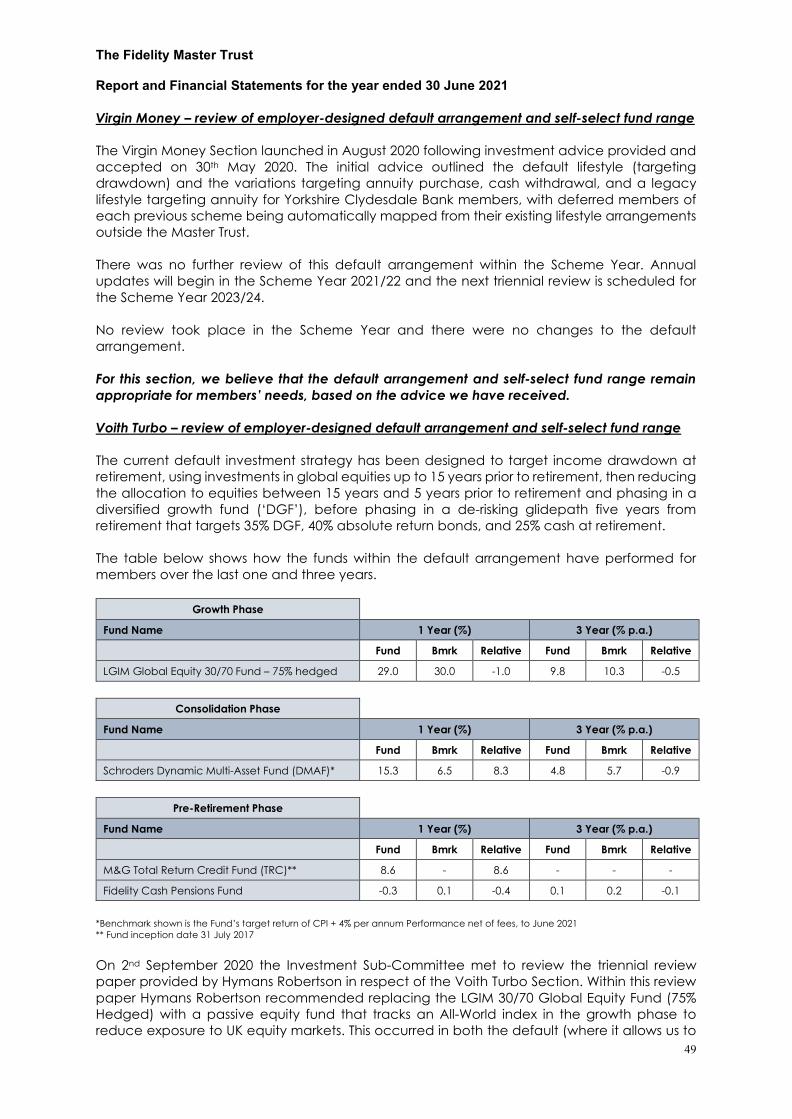
The Fidelity Master Trust Report and Financial Statements for the year ended 30 June 2021
49
Virgin Money – review of employer-designed default arrangement and self-select fund range The Virgin Money Section launched in August 2020 following investment advice provided and accepted on 30th May 2020. The initial advice outlined the default lifestyle (targeting drawdown) and the variations targeting annuity purchase, cash withdrawal, and a legacy lifestyle targeting annuity for Yorkshire Clydesdale Bank members, with deferred members of each previous scheme being automatically mapped from their existing lifestyle arrangements outside the Master Trust. There was no further review of this default arrangement within the Scheme Year. Annual updates will begin in the Scheme Year 2021/22 and the next triennial review is scheduled for the Scheme Year 2023/24. No review took place in the Scheme Year and there were no changes to the default arrangement. For this section, we believe that the default arrangement and self-select fund range remain appropriate for members’ needs, based on the advice we have received. Voith Turbo – review of employer-designed default arrangement and self-select fund range The current default investment strategy has been designed to target income drawdown at retirement, using investments in global equities up to 15 years prior to retirement, then reducing the allocation to equities between 15 years and 5 years prior to retirement and phasing in a diversified growth fund (‘DGF’), before phasing in a de-risking glidepath five years from retirement that targets 35% DGF, 40% absolute return bonds, and 25% cash at retirement. The table below shows how the funds within the default arrangement have performed for members over the last one and three years.
Growth Phase
Fund Name 1 Year (%) 3 Year (% p.a.)
Fund Bmrk Relative Fund Bmrk Relative
LGIM Global Equity 30/70 Fund – 75% hedged 29.0 30.0 -1.0 9.8 10.3 -0.5
Consolidation Phase
Fund Name 1 Year (%) 3 Year (% p.a.)
Fund Bmrk Relative Fund Bmrk Relative
Schroders Dynamic Multi-Asset Fund (DMAF)* 15.3 6.5 8.3 4.8 5.7 -0.9
Pre-Retirement Phase
Fund Name 1 Year (%) 3 Year (% p.a.)
Fund Bmrk Relative Fund Bmrk Relative
M&G Total Return Credit Fund (TRC)** 8.6 - 8.6 - - -
Fidelity Cash Pensions Fund -0.3 0.1 -0.4 0.1 0.2 -0.1
*Benchmark shown is the Fund’s target return of CPI + 4% per annum Performance net of fees, to June 2021 ** Fund inception date 31 July 2017 On 2nd September 2020 the Investment Sub-Committee met to review the triennial review paper provided by Hymans Robertson in respect of the Voith Turbo Section. Within this review paper Hymans Robertson recommended replacing the LGIM 30/70 Global Equity Fund (75% Hedged) with a passive equity fund that tracks an All-World index in the growth phase to reduce exposure to UK equity markets. This occurred in both the default (where it allows us to
The Fidelity Master Trust Report and Financial Statements for the year ended 30 June 2021
50
introduce a more diversified global equity allocation into the growth phase) and self-select range. The advice also recommended the addition of an ESG fund to the self-select fund range, the Sustainable Passive Equity fund. This is a white-labelled fund currently investing in the BlackRock ESG Equity Tracker fund. Following discussion with the investment adviser, these changes were agreed by the Investment Sub-Committee on the 8th April 2021 and were implemented on 17th August 2021. For this section, we believe that the default arrangement and self-select fund range remain appropriate for members’ needs, based on the advice we have received. 2. Core financial transactions We closely monitor the processes and controls in place for ‘core financial transactions’ to ensure they are processed promptly and accurately. These include:
• Investment of contributions paid into the Scheme • Fund switches within the Scheme • Transfers in and out of the Scheme • Payments out of the Scheme to members and beneficiaries
Performance against service-level agreements We have an administration agreement (including a service-level agreement (SLA)) in place with Fidelity, as administrator, that sets out what it will do for us and the standards we expect, including how quickly any tasks will be carried out. The tasks covered by the SLA include:
• Contribution processing • Switching of investments • Benefit payments on death, retirement or transfer • Benefit statement production • Data changes • Leavers and new joiners
The SLA requires Fidelity to comply with the Trust Deed and Rules and applicable legislation to provide accurate processing and record keeping of members’ benefits. We monitor Fidelity’s performance in carrying out core financial transactions through its quarterly administration report. These transactions need to be carried out promptly and accurately to ensure members’ investments are not adversely affected. In the last Chair’s Statement, we reported that performance against service standards had improved and we are pleased to say that this has continued in the Scheme Year, with service-level standards being met over 99.7% of the time. We will continue to monitor this performance to ensure it benefits from the additional resource provided as the Scheme grows and Fidelity increases its focus on automation. We note that member behaviour changed during 2020/21, with the helpline receiving more calls and longer calls. This has meant some capacity issues, particularly as there have also been resource and working constraints as a direct result of the pandemic. However, the quality of the calls hasn’t been affected and member satisfaction levels have been consistent over the past 12 months. During the scheme year, Fidelity has continued to manage complaints quickly, so members can get an explanation, and appropriate compensation where necessary. We have reviewed the response times over the Scheme Year and although there were improvements in the second half of 2020, there was an increase in the number of complaints and a rise in response times during the first half of 2021 although the average resolution time did not go above 18

The Fidelity Master Trust Report and Financial Statements for the year ended 30 June 2021
51
days. This was due to a rise in membership numbers. The complaint rate (complaints per 1,000 members) did increase slightly at the end of 2020 and the start of 2021 but it then fell in the second quarter of 2021, which closed with 17 open complaints and an average resolution time of 17 days. Fidelity uses straight through processing for contribution processing and investment switches, and checks the timeliness of contributions against the statutory deadline. It runs a report on the 26th of each month to see if any contributions were late or are still outstanding. If they haven’t been paid yet, the contributions are chased by the 10th of the following month. In addition to this formal process, the Client Administration Managers work with employers proactively to remind them of their payment obligations and help them resolve any issues. We are told about late payments through Fidelity’s administration reports, along with details of any historic instances of late payments. We then decide if we should report the late-paying employer to The Pensions Regulator (TPR). During the Scheme Year, some employers missed the statutory deadline for various reasons, including administrative errors and changes in personnel. No late payment resulted in a material impact on members. However, controls have now been tightened to reduce the risk of this happening again. We continue to monitor late payments in our quarterly meetings and in doing so we take into account any previous history of late payments. Any employers who persistently fail to meet the statutory deadline will be reported to TPR. No participating employers were reported during the Scheme Year. The Administration Sub-Committee (ASC) oversees Fidelity’s administration service, along with data protection and audit requirements. The ASC reviews the administration reports from Fidelity every three months. As the COVID pandemic continued, we were unable to carry out our usual site visit in person to the Kingswood office this year, given the COVID restrictions, but we have continued to interact with staff and obtain presentations on administration processes virtually. This includes:
• Reviewing the Business Continuity Plan and its implementation in September 2020, along with the address tracing processes.
• Reviewing the Fidelity administration agreement and the processes for making determinations in respect of death cases in December 2020. We also delegate some cases to Fidelity and we reviewed how that works as well.
• Reviewing the implementation process and tightening up controls. We now receive a monthly report from Fidelity on implementation progress plus a quarterly presentation where we can query any elements of each project.
• Considering the Fidelity project to enhance fund factsheets. • Reviewing the ill-health early retirement process in April 2021 • Agreeing to make the Pensions Regulator’s “Pledge to combat pension scams”. • Reviewing the process to prevent suspicious transfers in June 2021.
As part of the information required under TPR’s master trust supervision regime, we keep a log of any changes made to systems and processes, as do Fidelity. In general, we are comfortable with the controls in place and how they are operating. However, there are a few areas where we are keeping a closer watch on the control framework. This includes:
• The progress that Fidelity is making in reducing the number of manual controls and replacing them with automated controls, as this should reduce the chances of mistakes happening that lead to complaints.
• Asking Fidelity to review its processes around data sharing and to use more anonymous or pseudonymous data when it is shared with us.
The Fidelity Master Trust Report and Financial Statements for the year ended 30 June 2021
52
• Asking Fidelity to pay closer attention to its resourcing levels for the phone teams so they can meet the ambition to drive member engagement.
• More closely monitoring the progress of platform development to ensure that Fidelity is delivering updates and upgrades on schedule.
Fidelity’s Quality Oversight Group monitors its administration teams and we receive the details as part of the quarterly administration report. Fidelity also regularly audits the individual process areas within Workplace Investing Operations and provides the ASC with quarterly updates, including details of any issues it finds. In addition, the ASC reviews the Fidelity three-line governance model (business, risk/compliance and internal audit), while the full Trustee Board reviews the governance framework and are informed of any issues found as part of the internal audits. We review the independently audited AAF 01/20 report about Fidelity’s processes and have confirmed that none of the exceptions it raised are an issue for the Scheme. During the Scheme Year we reviewed the report covering the period from 1 July 2019 to 30 June 2020 and during the 2021/2022 Scheme year we will review the report covering the period from 1 July 2020 to 30 June 2021. In addition, we will review the independently audited AAF 01/20 report about Fidelity’s Workplace Investing pension administration and systems, which is due on 31 March 2022. The Trustees’ Annual Report and Accounts (including financial transactions) are produced by Fidelity in conjunction with Railpen and are independently audited by Nexia Smith & Williamson each year. As reported in the previous Chair’s Statement, there is a rectification exercise going on that affects a small number of members with protected tax-free cash entitlements. This is being handled by a separate team at Fidelity, so it has not directly affected general service levels. We are pleased with the way Fidelity pro-actively identified the issue and took steps to address it. Fidelity has contacted members who are affected and (if required) compensated them so they are back in the position they would have been if the mistake hadn’t been made. All workable cases have been completed and follow up communications issued where members have yet to contact Fidelity. The project has been winding down throughout 2021 and is due to close in the final months of the year. Any final unpaid or unclaimed cases will then be dealt with as business as usual by Fidelity’s administration teams. The Pensions Regulator is aware of the issue and the project to rectify it. Taking all of the above into consideration, we are satisfied that the majority of core financial transactions have been processed promptly and accurately during the Scheme Year. All issues have been resolved, or are currently being resolved, to our satisfaction. 3. Charges and transaction costs The Government and a number of regulatory bodies have been looking at how transparent costs and charges are for investors, and have introduced legislation to make these costs more visible. In this Statement, we explain the charges and transaction costs (in other words, the costs of buying and selling investments in the Scheme) which are paid by members rather than the employer, over the Scheme Year. Each section of the Scheme is separately priced depending on:
• The investment choices and design • Membership demographics • Contribution levels

The Fidelity Master Trust Report and Financial Statements for the year ended 30 June 2021
53
The costs and charges paid by members of the Scheme are as follows:
- A total expense ratio (TER) is applied to members’ savings within the Scheme. For example, a TER of 0.20% means a charge of £2 per £1,000 invested each year. This ratio combines the annual management charges with other expenses, such as auditing and registry fees.
- Transaction costs are included in the unit price of each investment fund and relate to the costs of buying and selling investments within the fund. They are a necessary part of trading a fund’s underlying investments to achieve its investment objective. A more detailed explanation of transaction costs is set out below.
Transaction cost information The governance bodies of DC workplace pension schemes must report on the level of charges and transaction costs in their schemes every year. These costs include the explicit costs of trading, such as stamp duty and commissions. They also include implicit costs, such as any difference in the price of a stock from the time an order is placed to the time it is carried out or any impact on the price because of the size of a potential trade. Transactions cannot be carried out at “no cost” because explicit costs are always incurred. However, implicit costs can sometimes mean money is made on a trade overall, rather than a cost incurred. We have agreed a framework with Fidelity for assessing value for money on transaction costs using a red, amber, green rating system combined with more detailed reviews when funds flag as red. During the year, we noted that although the transparency around transaction costs was still improving, there were several funds that hit amber ratings and required further investigation. This was either because there wasn’t enough transparency in the data from the fund manager or the funds were generating higher transaction costs than their peer-group averages (which are made up of funds with similar management styles that invest across a similar universe of assets). For the funds that hit amber, we worked with Fidelity to get more detailed information from the managers and justification for higher transaction costs. In many cases, this was because of higher costs associated with investing in the underlying investments (such as in emerging markets) or as a result of fund structures. We are satisfied that no further action is currently required on any of the funds offered and we will continue to monitor the level of transaction costs for funds used across the scheme and engage with fund managers where necessary. We have received transaction costs for all funds used in the Scheme. Level of charges and transaction costs paid by members on the default strategies The TER appliable to the default strategies may vary throughout a member’s lifetime as a result of the changing investment mix. The range of charges that applies to the default investment strategies (excluding transaction costs)is: FutureWise:
• Age 45: A TER of 0.23% to 0.56% a year, so between £2.30 and £5.60 per £1,000 invested • Age 55: A TER of 0.32% to 0.65% a year, so between £3.20 to £6.50 per £1,000 invested • Age 65: A TER of 0.27% to 0.55% a year, so between £2.70 to £5.50 per £1,000 invested

The Fidelity Master Trust Report and Financial Statements for the year ended 30 June 2021
54
Other employer-designed default strategies:
• Age 45: A TER of 0.26% to 0.40% a year so between £2.60 and £4.00 per £1,000 invested • Age 55: A TER of 0.27% to 0.52% a year so between £2.70 and £5.20 per £1,000 invested • Age 65: A TER of 0.15% to 0.68% a year so between £1.50 and £6.80 per £1,000 invested
Examples illustrating the impact of cost and charges, plus transaction cost information and a full list of the charges and transaction costs applying to default funds, can be found in Appendix 2. The full list can also be found at www.fidelitypensions.co.uk/costs-charges which is updated quarterly. Charge cap A charge cap sets out the maximum level of charges that can be deducted from members in a default fund each year. It is currently 0.75% per year of the funds under management (so £7.50 per £1,000 invested). All default arrangements used in the Scheme are regularly monitored and have remained within the charge cap since it was introduced in 2015. Level of charges and transaction costs paid by members on self-select funds The charges and transaction costs on self-select funds depend on the investments that are chosen by the member. They can be affected by a range of factors, including the type of fund, investment style and membership demographics. The TER that members pay ranges from 0.11% to 1.20% a year (so £1.10 to £12.00 per £1,000 invested). There is a full list of the TERs and transaction costs for self-select funds in Appendix 2 and at www.fidelitypensions.co.uk/costs-charges How to find out more about fees and investment funds Members need to understand what they are investing in and how much they are paying for their investments. Details of fund objectives and specific charges that apply to a member’s arrangement can be found in the fund factsheets, which are available through PlanViewer (https://www.planviewer.fidelity.co.uk/planviewer) or directly from Fidelity. Illustration of the cumulative effect of costs and charges We have produced examples that illustrate the cumulative effect of costs and charges over time on the value of a member’s benefits. These are based on the statutory guidance published by the Department for Work and Pensions and can be found in Appendix 3 or at: www.fidelitypensions.co.uk/costs-charges. . Good value assessment When we are assessing the charges and transaction costs that members pay, we must consider if they represent good value for members. We consider if the investment options and benefits offered by the Scheme in return for those charges and costs represent good value, compared with other options in the market. Member charges are intended to cover all bundled services provided by Fidelity. This means they include administration, investment, member communications and other services, and other professional fees relating to external services provided to us – such as legal and other professional advice. However, Fidelity met the cost of all external professional services directly during the Scheme Year. For a pension plan to offer good value, we expect it to meet certain standards that are set out in our value for members framework. We review the features of the Scheme against these

The Fidelity Master Trust Report and Financial Statements for the year ended 30 June 2021
55
expectations and set out where we think Fidelity has exceeded, met, partly met or not met expectations. To make this assessment we collect evidence from Fidelity and also from external sources including benchmarking surveys and feedback from employers and members. Full details of the evidence collected and our assessment are included within our value for members framework. The Trustees believe that determining value for members involves the assessment of the following elements:
• The suitability of the investment strategy • The costs and charges that members pay • The level and quality of service that members receive • The level and quality of benefits that members receive, compared with the
contributions they make • The security of members’ investments
Each year, we carry out a value for members assessment. This Scheme Year, we have concluded the Scheme provides value for members. The key areas of quality include:
• There is a robust procedure and controls framework in place to ensure funds are closely monitored and changes made where needed
• The response to the pandemic has been positive, with the business continuity plan carried out and operating as expected alongside additional communications.
• Members are able to speak to Fidelity on the phone (even through the pandemic) and the feedback has been positive for these experiences
• The launch of Fidelity’s regular income drawdown facility, including four new Investment Pathways options, gives members access to comprehensive retirement options within the scheme at competitive fees
• The integration of sustainable solutions into FutureWise and the addition of four new ESG funds to the standard fund range, each with different approaches to sustainability, has increased the array of sustainable investment options for members
We have also identified some areas for further development that we will be working on with Fidelity over the coming Scheme year:
• FutureWise – Fidelity has begun work on the next iteration of FutureWise. We will be working with Fidelity and Isio as our investment adviser, to ensure value for members is maintained. We expect this will include the introduction of further sustainable investment, a more dynamic approach to market changes, along with looking at the period of de-risking.
• Member communications – We want members to receive clear communications at the relevant times, so they can make informed decisions about their retirement plans, with a particular focus on digital communications. Good progress has been made on developing the communications over the year and we have asked Fidelity to focus on making sure the language is in plain English and accessible for members.
• Member tools and online experience – The existing tools require further development
to ensure they are fit for purpose and allow members to plan both in accumulation and decumulation.
• Ease of changing contribution level – The level of contributions paid into a member’s
pension account has a significant bearing on the member’s retirement outcome. We want to make it as easy as possible for members to be able to change their contribution levels, so we will continue to work with Fidelity and employers to tackle the barriers that currently exist. Scheme members who wish to increase contributions should speak with their employers’ HR or payroll teams.
The Fidelity Master Trust Report and Financial Statements for the year ended 30 June 2021
56
• Sustainable investing and climate change – We have made significant progress on our
sustainability plans; having set out our beliefs around sustainability, worked with Fidelity to integrate sustainable solutions into FutureWise and added four new sustainable funds to the scheme over the past year. However, we also recognise this is a long-term journey. We will continue to work with Fidelity on integrating sustainability into FutureWise as well as the upcoming requirements for trustees around climate change and TCFD reporting due by 2023.
4. Knowledge and understanding We have a formal training policy which is used to monitor and assess the knowledge and understanding of each Trustee. This includes an annual skills assessment to review their strengths and experience, and ensure any training needs are addressed. The skills assessment for the Scheme Year was completed on 12 October 2020 and it identified a few areas for training. These included:
- Dealing with vunerable customers. Training was provided at the 17 May 2021 meeting. - The law relating to pensions schemes. At each quarterly meeting, the legal advisors
include their quarterly updates in the pack and Fidelity sets out how it is dealing with upcoming regulatory change.
- Digital member journeys. Training was provided at the 15 February 2021 meeting on Fidelity’s member communications programme, Workplace Workout, and how segmentation is applied to focus on the needs of particular member groups. At the 17 May 2021 meeting we received training on how members are profiled and the results of the data analysis communicated.
We considered our fitness and propriety policy and skills assessment in our Q4 2020 Trustee meeting on 4th November 2020. As the new Trustee Board is now in place, we undertook a formal Board effectiveness review during 2021 with the support of the Fidelity company secretarial team who have no day-to-day involvement in the running of the Scheme. Over this Scheme Year, we have also looked at the roles and responsibilities of Fidelity and the Trustees, following the appointment of Katherine Milton as Scheme Manager, which we told you about in the last Chair’s Statement. We wanted to ensure that our interactions with Fidelity are as efficient as possible (as well as meeting all regulatory requirements). This project has now finished and led to the appointment of Catherine Fitzsimons as Director for Governance. She will be responsible for driving the high quality and efficiency of governance processes. To support this, Fidelity has established an internal governance forum, which includes a named lead for each sub-committee of the Master Trust. In addition, as part of our process for developing our understanding and increasing our efficiency, we have:
• Reviewed the behaviour of members at retirement and the choices they have been making now that regular income drawdown and Investment Pathways are available.
• Set out our sustainability principles. • Launched the engagement programme for employers and members.
Each Trustee has a personal training log and is expected to spend at least fifteen hours a year maintaining and developing their general knowledge and skills. All professional Trustees are accredited or, in the case of our new Trustee, appointed after the scheme year-end, working towards accreditation.

The Fidelity Master Trust Report and Financial Statements for the year ended 30 June 2021
57
Throughout the Scheme Year, each of the Trustees have demonstrated that they have met the requirements for knowledge and understanding in the following ways:
A. The Scheme’s Trust Deed and Rules Trustees have demonstrated a working knowledge of the Trust Deed and Rules by having access to the documents on their online directory, Convene, and making decisions in line with the Rules. A Balance of Powers document has been created and maintained for each section of the Scheme. Marianne Jaekel provides legal expertise to the Trustee Board to ensure compliance with the Rules and legal advice is sought from the Scheme Lawyers – Sacker & Partners LLP and Gowling WLG. B. The current SIP Trustees have a working knowledge of the current SIP, having considered the performance of both the default and self-select funds against the requirements set out in the SIP through the performance information provided in quarterly meetings. Trustees have also considered their approach to sustainable investing and amended the SIP accordingly. C. Documents setting out the Trustees’ current policies PTL provides us with secretarial services and operates a governance framework that includes policies about how we will deal with conflicts, manage risk, ensure key tasks are completed in time and deal with member complaints. Trustees have demonstrated a working knowledge of documents setting out our policies, as we review these documents regularly (including looking at all policies in this Scheme Year) to ensure they are still suitable and make any changes as required, as set out in the Trustee Action Plan. Since achieving authorisation in 2019, the Scheme has been under the master trust supervisory regime of the Pensions Regulator. The first supervision meeting was held on 16 July 2020 and the first supervisory return has been submitted. There were no concerns raised by the Pensions Regulator. D. The law relating to pensions and trusts and the relevant principles relating to the
funding and investment of occupational pension schemes In a wider context, the Scheme’s professional independent Trustees for the Scheme Year – PTL, ITS and Punter Southall Governance Services Limited – work for a broad range of clients and are familiar with the law relating to pensions and trusts. This can be shown through the qualifications held by the representatives of independent Trustees and their continued involvement with many pension schemes. Marianne Jaekel also has professional CPD requirements as a qualified lawyer and a wider role within Fidelity, which involves knowledge of law relating to pensions and trusts. James Carter’s business role involves engaging with Government and industry bodies on the interpretation and development of pension law and regulation. All the professional Trustees are accredited with the Association of Professional Pension Trustees or the Pensions Management Institute (PMI). Trustees are required to demonstrate fitness and propriety as part of the Master Trust’s compliance with the ongoing supervisory regime.
The Trustees operate three sub-committees: Investment, Communications and Administration. Each sub-committee has its own decision-making powers and actions delegated to them under their terms of reference, which are reviewed annually. The sub-committee Chairs provide a report of each sub-committee’s actions to the full Board. We are comfortable that
The Fidelity Master Trust Report and Financial Statements for the year ended 30 June 2021
58
the sub-committees have sufficient knowledge of pensions and investment matters to be able to challenge their advisers and have regularly challenged advice in the past. Induction process for new Trustees When a new Trustee joins the Trustee Board, they must complete a training programme that covers the Trustee governance framework, how Fidelity operates and the current issues affecting the Scheme, as well as the key areas set out above. This is carried out through a series of meetings and training sessions with the Trustee Chair, Secretary and Fidelity. No new Trustees were appointed during the Scheme Year, although BESTrustees were appointed after it ended. The Trustees in place over the course of the Scheme Year ending 30 June 2021 were: PTL Governance Ltd represented by Kim Nash – Chair of the Board of Trustees of the Scheme Kim Nash is a Director at PTL Governance Ltd (PTL), having joined PTL in February 2012. Kim is a qualified Actuary and an accredited Member of the Association of Professional Pension Trustees, and previously worked for Willis Towers Watson as an actuarial benefit consultant. Kim is able to bring her significant DC experience both as a Trustee and a member of Independent Governance Committees to lead the Scheme’s Trustee Board in assessing value for money and make comparisons on Fidelity’s performance against the wider market. Kim is also the chair of the ASC. Kim is currently on leave and PTL is represented by Anne Sander in the interim. Independent Trustee Services Ltd represented by Dianne Day – Independent Trustee and Interim Chair of the Board of Trustees Dianne Day is a Client Director at Independent Trustee Services Ltd (ITS). She joined ITS in 2015, specialising in DC schemes. Dianne holds the PMI Certificate in DC Governance, is a Fellow of the Financial Services Institute of Australasia and is an accredited Member of the Association of Professional Pension Trustees. She has worked for major investment firms in senior communications and management roles. Dianne applies her extensive DC governance and communications experience to help with the evaluation of Fidelity’s member service, communications and engagement programmes. Dianne is also the chair of the CSC. Punter Southall Governance Services Limited represented by Gerald Wellesley – Independent Trustee Gerald Wellesley is a Professional Trustee and Client Director of Punter Southall Governance Services Limited. He has over 35 years’ experience in the finance industry, 17 years as a pension trustee and 3 years in HR management. His current portfolio of trusteeships includes chair, sole trustee and sub-committee positions with DB and DC schemes and DC Master Trusts. He brings strengths in the investment and financial management disciplines, together with broader trustee skills. He was previously at BNY Mellon where he led the European pension industry strategy. Gerald is also the chair of the ISC. Marianne Jaekel – Trustee / Fidelity Representative Marianne Jaekel is a qualified solicitor and joined Fidelity in 2012. She is the Head of UK Business Legal department and has responsibility for all legal aspects of Fidelity’s UK Business. Prior to joining Fidelity, Marianne gained 13 years of experience as a City lawyer, having qualified at Travers Smith and most recently practising as a Senior Associate in the Pensions team of Squire Patton Boggs (previously Hammonds). Marianne is a full member of the Association of Pension Lawyers.

The Fidelity Master Trust Report and Financial Statements for the year ended 30 June 2021
59
James Carter – Trustee / Fidelity representative James Carter is Head of Pension Products and Policy at Fidelity with 20 years’ experience in the workplace pensions market. He is responsible for the product implementation and management of Fidelity’s workplace pension products. James also leads Fidelity’s engagement with the government, regulators and industry bodies in the development of pension policy and the business’ analysis of the impact and opportunities of new pensions regulation. Prior to joining Fidelity, James was a Director in Willis Towers Watson’s pension consulting business, having also worked for KPMG and Aon, advising trustees and employers operating large DC pension schemes. Following an open and transparent process in which all independent trustee organisations on the TPR register were contacted and asked to provide candidates, one additional trustee was appointed after the end of the Scheme Year: BESTrustees Ltd represented by Roger Breeden –- Independent Trustee (appointed on 27 September 2021) Roger Breeden is a Trustee Executive at independent trustee company BESTrustees Ltd, specialising in workplace defined contribution and Master Trust pension schemes. He brings more than 40 years’ financial services experience and will chair the ASC. He will also be a member of the CSC. Conclusion Based on the outcome of the latest skills assessment, our professional qualifications and ongoing experience, and the training that has been undertaken to date; we are satisfied with our level of Trustee Knowledge and Understanding. The Board was established to ensure each individual has a complementary skill set so that together we have the experience and knowledge needed to run the Scheme. We are confident that our combined knowledge, skills and experience, together with the advice that is available to us from our advisers, enables us to properly exercise our functions as Trustees. 5. Non-affiliation of Trustees We are responsible for the appointment and removal of Trustees, with the consent of Fidelity as Scheme sponsor. At the end of the Scheme Year, the Trustee Board is made up of five Trustees; three of whom are not affiliated to Fidelity – the Chair (Kim Nash – PTL, Dianne Day – ITS, Gerald Wellesley – PSGS). This governance structure meets the legal independence requirements. The independent members of the Trustee Board are each “non-affiliated” as defined in regulation 28(7) of The Occupational Pension Schemes (Scheme Administration) Regulations 1996. This is demonstrated by the fact that each of the three non-affiliated Trustees is independent of any firm which provides advisory, administration, investment or other services in respect of the Scheme. In addition, the additional requirements of regulation 28 regarding the process for appointments and terms of office in order to count as non-affiliated have been satisfied as each of the non-affiliated Trustees has been appointed as a Trustee of the Scheme (since 6 April 2015 when this requirement came in) for no more than ten years in total and for no more than any one period of five years, as at the end of the Scheme Year. 6. Member representation Given the size of the Scheme and its diverse membership, we seek members’ views both directly and through participating employers. We are very keen to encourage members, or their representatives, to tell us their views on matters relating to the Scheme. We also
The Fidelity Master Trust Report and Financial Statements for the year ended 30 June 2021
60
encourage employers to share any member feedback they receive. Members can get in touch with us in several ways, including member forums and by emailing [email protected]. We used a variety of channels to tell members that they can contact us, such as the Master Trust explanatory video on Fidelity’s website, the member guide and our annual member newsletter, which was issued in January 2021. Four comments were received from members to our mailbox during the Scheme Year. We met with one participating employer directly over the course of year and held an employer forum that 21 participating employers attended (including the one noted above). Fidelity uses the Net Promoter Score (NPS) to capture feedback from the employers and members, which is used to gauge how members rate the service received and identify areas for continuous change and development. The NPS scores and their trends were considered at each quarterly Trustee meeting in the Scheme Year. Over the Scheme Year, Fidelity was not able to hold any member forums due to changes to their engagement program and COVID-19 restrictions but it plans to hold forums in the coming Scheme Year. It also carried out a pilot member survey that was used to create its Financial Confidence index. It now plans to roll this out as a twice-yearly regular survey from 2022 and the information will be shared with us. Over the Scheme Year, we also issued quarterly communications to participating employers to share information with them about our key areas of focus. This Chair’s Statement can be accessed online at: www.fidelitypensions.co.uk/costs-charges Members will be notified about this Chair’s Statement, and given details about where they can obtain a copy or access the online version, in their annual benefit statement. Signed: Dianne Day Chair of the Board of Trustees of the Fidelity Master Trust Date: Appendix 1: SIP Appendix 2: Costs and charges Appendix 3: Cost and charges illustrations Appendix 4: Implementation Statement

The Fidelity Master Trust Report and Financial Statements for the year ended 30 June 2021
61
Appendix 1 - Statement of Investment Principles
Fidelity Master Trust
Statement of Investment Principles 7th December 2021
This document has been split into several sections:
1: Background
2: Key Parties in the Master Trust
3: Investment Objectives and Options
4: Scheme Default Investment Arrangement
5. Investment Pathways
6: Risks
7. Sustainable Investing and ESG
8. Compliance
9. Appendix

The Fidelity Master Trust Report and Financial Statements for the year ended 30 June 2021
62
1. Background
1.1 By law the trustees of the Fidelity Master Trust (the “Scheme”) (referred to hereinafter as the “Trustees”) are required to produce a “Statement of Investment Principles” (“SIP”).
1.2 The SIP states the investment principles governing decisions about investments for the purposes of the Scheme and is produced by the Trustees of the Scheme in compliance with section 35 of the Pensions Act 1995 and all subsequent relevant legislation.
1.3 The Scheme operates to provide retirement and death benefits to eligible participants and beneficiaries for members of the Scheme.
1.4 The Scheme is designed for multiple employers but is delivered under a single trust arrangement and governed by a board of trustees (the “Trustees”) consisting of both independent professional trustees and senior Fidelity employees.
1.5 The SIP will be made available to all participating employers and prospective employers prior to selecting the Scheme. All advice the Trustees receive regarding investment options for an employer of the Scheme will make reference to the SIP and indicate how the principles defined within it have been addressed. It will also consider the appropriateness of fees and charges payable by members of the Scheme.
2. Key Parties in the Scheme
2.1 There are multiple parties that work together to deliver the highest standards of governance in running the Scheme. The key parties involved are as follows:
(i) The Trustees: The Trustees’ overall responsibility is to make sure that the Scheme is
well-run and to look after members’ best interests. Responsibilities include:
a. Selecting, monitoring and reviewing the investment options made on the default arrangement and Core Fund Range of the Scheme and any bespoke fund arrangements offered to some of the participating employers
b. Communicating to members as appropriate
c. Ensuring the Scheme meets all legal and regulatory requirements
d. To act in the best interests of the members of the Scheme
e. Preparing and making available to participating employers and members, a Chair’s Statement confirming how the scheme meets the relevant governance standards and including information on the Trustees’ ‘Value for Members’ (VFM) assessment of the Scheme
f. Producing, reviewing and signing off the Scheme’s SIP
g. Taking into account financially material factors such as Environmental, Social and Governance (ESG) in the selection, retention and realisation of investments
h. Considering how and whether non-financially material factors should be taken into account

The Fidelity Master Trust Report and Financial Statements for the year ended 30 June 2021
63
(ii) The Platform Provider: Funds are offered to members of the Scheme through a DC platform provider, currently FIL Life Insurance Limited (“FIL Life”). The responsibilities of the Platform Provider include: a. Making available a suitable range of funds for trustees to choose from b. Quarterly reports on the performance of the funds used within the Scheme c. The safekeeping and provision of appropriate administration of the assets used
within the pooled funds in the Scheme d. Suggesting, where appropriate, the default arrangement and fund choices for
consideration by the Trustees and their advisers e. Due diligence undertaken when onboarding funds
(iii) Fund Managers: The Trustees access their funds through a life policy issued by FIL
Life. FIL Life in turn links into underlying funds managed by a range of fund managers. The Fund Managers manage the investment of the funds’ assets on a day-to-day basis. Their responsibilities primarily focus on ensuring the funds meet their stated objectives, managing the funds within the fund guidelines and providing notification of any changes to the management of the funds where appropriate. The Trustees also expect Fund Managers to report on their shareholder voting and engagement policies as well as provide information to trustees around how they are integrating ESG into their investment process.
(iv) Investment Advisor: The Trustees retain an investment advisor. The Investment Advisor provides advice on all investment matters including reviewing the default arrangement and core fund range for each section of the scheme. They may also assist with the points mentioned in 2.1(i) above. The investment advisor to the Trustees also provides advice on the contents of the SIP which is reviewed on an annual basis.
(v) Legal Advisor: The legal advisor provides legal advice to the Trustees on matters
related to legal and regulatory requirements.
(vi) Auditor: The Auditor carries out independent checks on the Master Trust’s report and accounts.
3. Investment Objectives and Options
3.1 The Trustees have the sole power to invest assets of the Scheme. The investments are accessed through life funds which are issued by FIL Life.
3.2 The Trustees offer access to a suitably diverse range of life funds covering an appropriate spread of risk and return options. The Trustees have a standard default arrangement and core fund range but can offer access to a bespoke default arrangement and extended fund range for any of the underlying sponsors sections subject to suitable ongoing investment advice being received. The Trustees have specified that the standard fund range should:
(i) Include choices suitable for members of different ages and with different retirement plans
(ii) Be designed to deliver long term positive returns taking into account a number of risks

The Fidelity Master Trust Report and Financial Statements for the year ended 30 June 2021
64
(iii) Seek where possible to mitigate the risks described below in section 6
(iv) Be suitable for employers regardless of their industry or size
(v) Include funds that can be used within default arrangements
(vi) Include consideration for ESG factors
3.3 As a DC scheme, member benefits are solely dependent on the amount of money paid
into (or withdrawn from) their individual accounts and the performance of their investments (net of costs).
Investment Objectives 3.4 The Trustees’ overall objective is to provide investment options that enable members to
grow their savings (after charges) over the long term, and to manage risks appropriately. 3.5 The Scheme offers a standard selection of investments termed the “core fund range” that
fully falls under the governance remit of the Trustees. 3.6 The Scheme also offers a default arrangement that is expected to meet the objective stated
in 3.4 and takes into account guidance from the Pensions Regulator and the Department for Work & Pensions guidance for offering a default arrangement for defined contribution automatic enrolment pension schemes.
3.7 Furthermore, the Trustees believe that the self-select funds, offered as an alternative to the
default arrangement in the core fund range, enable members to choose their own portfolio of funds which would achieve the same objective stated in 3.4.
3.8 The Trustees also consider financially material factors such as ESG within the default
arrangement and the available choice of self-select funds made available for the Scheme. Investment Options 3.9 Details of the default arrangement of the standard investment offering of the Scheme are
contained in Section 4. Details of the investment pathways funds that the Master Trust make available to members who have crystallised their assets are available in section 5. Details of the self-select investment options in the core fund range for the standard section are contained in the appendix.
3.10 If employers do not wish to utilize the standard section of the scheme they may take
independent advice and establish their own bespoke fund range and default arrangement. The Trustees must be provided with advice around the appropriateness of any bespoke fund range and default in relation to their ongoing suitability.
3.11 Where a bespoke default arrangement and /or fund range is established, details are
contained in a separate “Employer Specific” appendix to the SIP.
4 Scheme Default Investment Arrangement
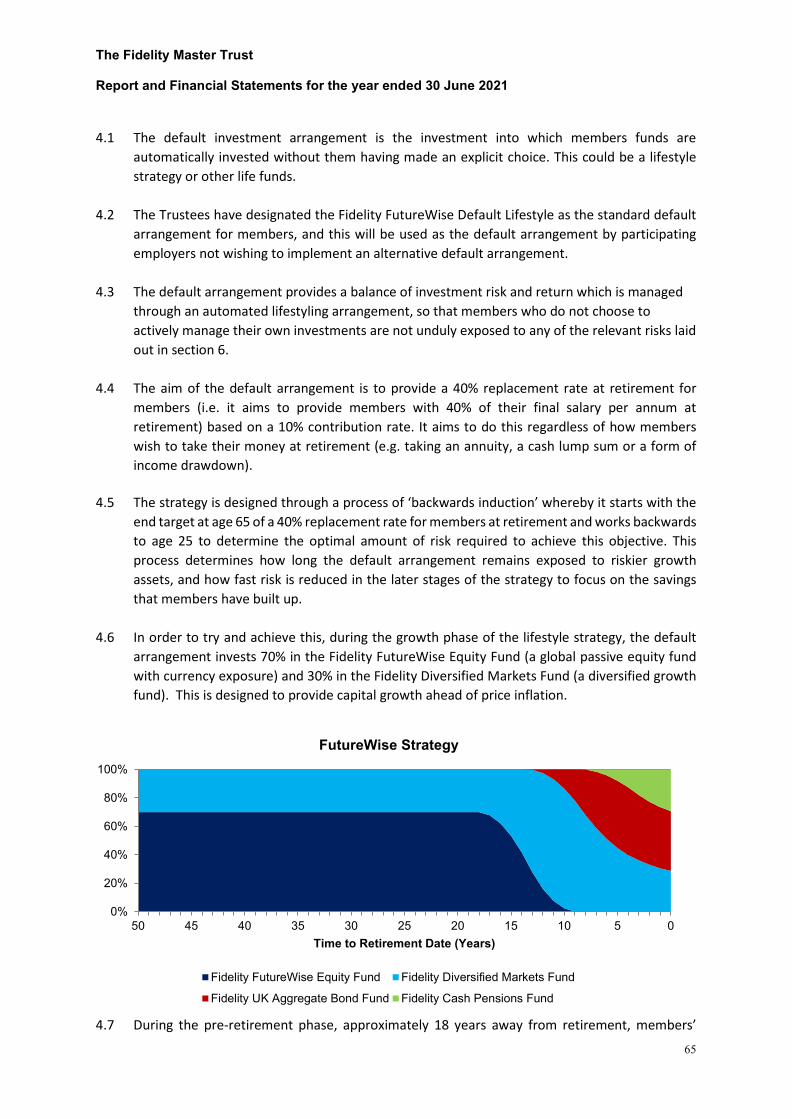
The Fidelity Master Trust Report and Financial Statements for the year ended 30 June 2021
65
4.1 The default investment arrangement is the investment into which members funds are
automatically invested without them having made an explicit choice. This could be a lifestyle strategy or other life funds.
4.2 The Trustees have designated the Fidelity FutureWise Default Lifestyle as the standard default
arrangement for members, and this will be used as the default arrangement by participating employers not wishing to implement an alternative default arrangement.
4.3 The default arrangement provides a balance of investment risk and return which is managed
through an automated lifestyling arrangement, so that members who do not choose to actively manage their own investments are not unduly exposed to any of the relevant risks laid out in section 6.
4.4 The aim of the default arrangement is to provide a 40% replacement rate at retirement for
members (i.e. it aims to provide members with 40% of their final salary per annum at retirement) based on a 10% contribution rate. It aims to do this regardless of how members wish to take their money at retirement (e.g. taking an annuity, a cash lump sum or a form of income drawdown).
4.5 The strategy is designed through a process of ‘backwards induction’ whereby it starts with the
end target at age 65 of a 40% replacement rate for members at retirement and works backwards to age 25 to determine the optimal amount of risk required to achieve this objective. This process determines how long the default arrangement remains exposed to riskier growth assets, and how fast risk is reduced in the later stages of the strategy to focus on the savings that members have built up.
4.6 In order to try and achieve this, during the growth phase of the lifestyle strategy, the default
arrangement invests 70% in the Fidelity FutureWise Equity Fund (a global passive equity fund with currency exposure) and 30% in the Fidelity Diversified Markets Fund (a diversified growth fund). This is designed to provide capital growth ahead of price inflation.
4.7 During the pre-retirement phase, approximately 18 years away from retirement, members’
0%
20%
40%
60%
80%
100%
50 45 40 35 30 25 20 15 10 5 0Time to Retirement Date (Years)
FutureWise Strategy
Fidelity FutureWise Equity Fund Fidelity Diversified Markets Fund
Fidelity UK Aggregate Bond Fund Fidelity Cash Pensions Fund
The Fidelity Master Trust Report and Financial Statements for the year ended 30 June 2021
66
assets are phased such that the exposure to the FutureWise Equity Fund is reduced and the exposure to the Fidelity Diversified Markets Fund is increased. When members are around 13 years away from retirement, members’ assets are phased such that an allocation to the Fidelity UK Aggregate Bond Fund is introduced, and the remainder of the exposure is in the Fidelity Diversified Markets Fund. From around 8 years to retirement, the Fidelity Cash Fund is introduced, such that at retirement members have an approximate allocation of 29% Fidelity Diversified Markets Fund, 29% Fidelity Cash Fund and 42% Fidelity UK Aggregate Bond Fund.
4.8 The default retirement age for members is 65. Members can change their retirement age if they
wish. 4.9 Throughout the default investment arrangement, the Scheme invests in life funds which can be
quickly realised as required, notwithstanding comments in section 7 relating to liquidity. 4.10 The default arrangement will be reviewed at least triennially or earlier in the event of any
significant changes in the investment policy or member demographics. The review will take into account the manner in which members take their benefits from the Scheme and any significant changes in the demographic profile of the relevant members. In addition to the triennial review, there are regular annual reviews around the continued suitability of the default arrangement, investment pathways and self-select fund range offered as well as quarterly reviews of performance.
4.11 The Trustees will also review the default arrangement on an ongoing basis to ensure that
it appropriately aligns to their views on ESG (indicated in section 7) and may make changes to the default arrangement where necessary.
4.12 The Trustees’ policies in relation to the default arrangement in respect of matters set out in the
Occupational Pension Schemes (Investment) Regulation 2005, as amended, are those set out in the rest of this statement.
4.13 In addition, the Trustees offer a range of self-select funds. These funds encompass a wider range
of asset classes including equity, fixed income and multi-asset funds. Passive and Active options are available to members, and full details are contained in the Appendix.
2005 Investment Regulations Section 2A - Additional requirements in relation to default arrangement 4.14 It should be noted that in the past (during a period of property fund suspensions within the
Master Trust), future fund contributions for members were, for a period, redirected to the Fidelity Cash Fund as a temporary holding position. These future fund contributions were subsequently re-directed along with any assets accumulated as a result of the contributions within this period, from the Fidelity Cash Fund to the Fidelity Diversified Markets Fund.
4.15 The Trustees chose the Fidelity Cash Fund as a short-term solution to re-direct members’ future
contributions to in order to protect the value of those contributions from short-term market movements until a more appropriate long-term solution could be applied. For this period the main goal of the cash fund was to preserve the value of members’ assets. The fund’s objective is to maintain the value of the members’ investments while also aiming to pay out an income.

The Fidelity Master Trust Report and Financial Statements for the year ended 30 June 2021
67
As such the fund has a heavy focus on capital preservation by investing in lower risk instruments, while also investing in instruments with strong liquidity profiles allowing assets to be quickly realised.
4.16 Going forwards in the event of fund suspensions and fund closures the Trustees have identified
the Fidelity Diversified Markets Fund as the investment option to which future contributions and assets (if required) will be mapped. This applies where members don’t make an alternative investment choice.
4.17 The aim of the Fidelity Diversified Markets Fund is to deliver capital growth over the long term
in a risk-controlled manner. It does this by delivering dynamic exposure to asset classes based on their risk behavior using Fidelity’s proprietary volatility targeting approach. The fund targets a volatility range of 6-8% p.a. The Trustees have chosen the fund as a long-term default option based on key characteristics including its ability to diversify across multiple asset classes and regions at the same time providing members with broad market exposure as well as the risk-focus of the strategy which seeks to provide members with a stable and predictable volatility profile over time. The fund also looks to access asset classes in the most efficient and liquid way possible to keep costs low. Overall, this means the fund looks to deliver the long-term capital growth required for younger members while also keeping a focus on risk control for those closer to retirement. The Diversified Markets Fund is reviewed on a regular basis by the Trustees to ensure its long-term suitability as a default option going forward.
5 Investment Pathways
5.1 Both the standard and bespoke sections of the Master Trust offer members who are looking to crystallise their assets the option to select one or more investment pathways. These will be funds which aim to meet one of four goals for members at retirement. These are listed in the table below.
Investment Pathway
Objective Underlying Fund
1 I do not plan on touching my money within 5 years
Fidelity Diversified Markets Fund
2 I plan on purchasing a guaranteed income or annuity within 5 years
Fidelity Pre-Retirement Bond Fund
3 I plan on taking a long term income within the next 5 years
Fidelity Multi-Asset Balanced Income Fund
4 I plan on taking all my money as cash within the next 5 years
Fidelity Cash Fund
5.2 The underlying funds have been selected by the Trustees, working in conjunction with Fidelity and having received investment advice. This selection was based on the goal, time horizon and assumed risk/return requirements for each pathway.
5.3 At the point of crystallising their benefits, members will be required to actively select one of the investment pathways if they wish or otherwise either remain invested in the funds they

The Fidelity Master Trust Report and Financial Statements for the year ended 30 June 2021
68
currently hold or choose new funds from the range available to them. Members will not be defaulted or automatically moved into any of the investment pathways.
5.4 The investment pathways are offered through a tailored portfolio structure and as such offer Fidelity and the Trustees flexibility in changing the underlying fund solutions without requiring a switch to another fund.
5.5 Fidelity and the Trustees have the right to change the underlying investments within the pathways as they see fit to ensure they continue to remain suitable.
5.6 The Trustees will review the suitability of the pathways along with the appropriateness and performance of the underlying investments regularly alongside Fidelity and the Master Trust’s advisors.
5.7 A ‘Drawdown Payment Account’ fund has been added to each section of the Scheme solely to facilitate income drawdown for members. This fund will invest in the Fidelity Cash Fund and have no charge. Members will be unable to invest in this fund directly.
6 Risks
6.1 For all sections in the Scheme, the Trustees will consider how best to safeguard members from the risks associated with investing their savings. The following list summarises some of the key risks and how the fund range is designed in light of these.
Risk Meaning How it is managed Inflation Risk The risk that investment
returns do not keep pace with inflation and hence purchasing power diminishes
The Trustees choose the core fund range with the expectation that the performance of the majority of member funds should protect the value of real savings
Shortfall Risk Members could receive a retirement benefit less than they had hoped for
The Trustees will inform members annually of the likely value of their potential benefit to help inform their decision making
Volatility Risk Funds which have a higher chance of achieving higher returns for members are likely to see greater volatility over short periods
An appropriate level of risk for a specific default arrangement will be considered against the profile of the membership and a range of funds with different levels of risk will be offered as part of the standard section core fund range
Risk of loss For members approaching retirement, the impact of poor performance is significantly increased as they have less time to make up any lost return
All default arrangements will need to factor in a mechanism such as lifestyling that recognises the changing requirements of members as they approach retirement, for example with a greater focus on capital preservation in the approach to retirement. Funds with a focus on capital preservation will be made available for members in the self-select range
Manager Risk Selecting a fund from a Fund The Trustees will continue to monitor
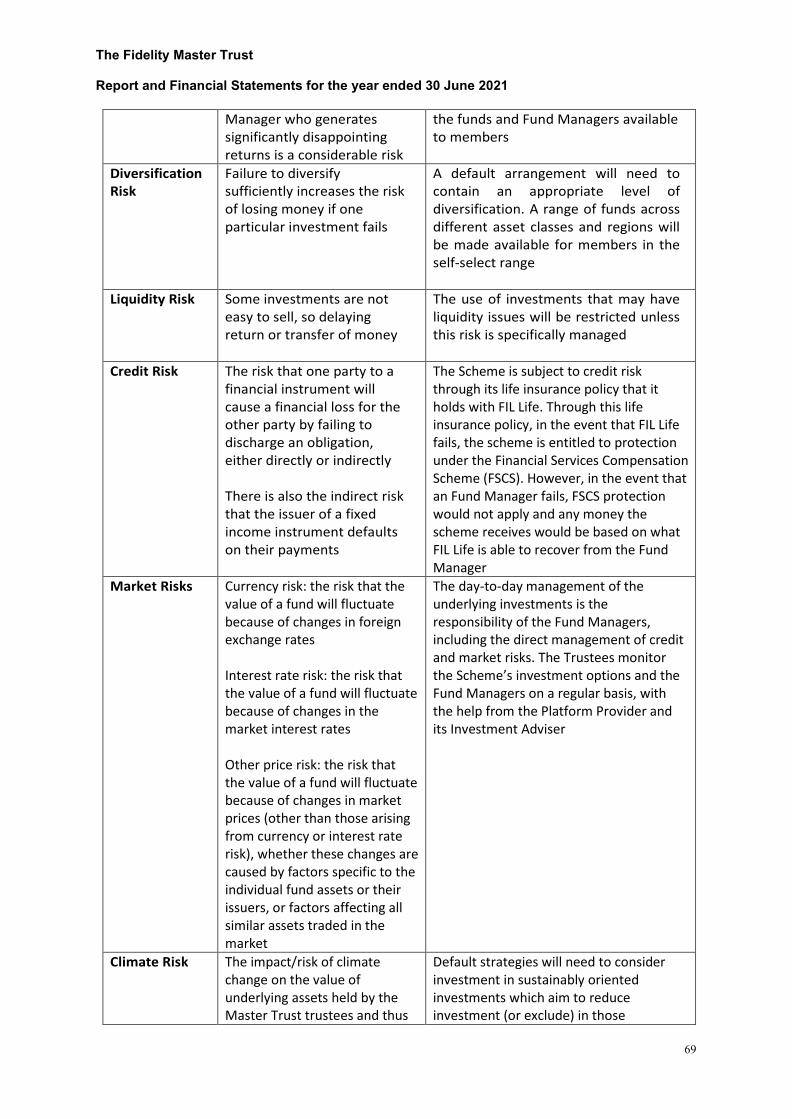
The Fidelity Master Trust Report and Financial Statements for the year ended 30 June 2021
69
Manager who generates significantly disappointing returns is a considerable risk
the funds and Fund Managers available to members
Diversification Risk
Failure to diversify sufficiently increases the risk of losing money if one particular investment fails
A default arrangement will need to contain an appropriate level of diversification. A range of funds across different asset classes and regions will be made available for members in the self-select range
Liquidity Risk Some investments are not easy to sell, so delaying return or transfer of money
The use of investments that may have liquidity issues will be restricted unless this risk is specifically managed
Credit Risk The risk that one party to a financial instrument will cause a financial loss for the other party by failing to discharge an obligation, either directly or indirectly There is also the indirect risk that the issuer of a fixed income instrument defaults on their payments
The Scheme is subject to credit risk through its life insurance policy that it holds with FIL Life. Through this life insurance policy, in the event that FIL Life fails, the scheme is entitled to protection under the Financial Services Compensation Scheme (FSCS). However, in the event that an Fund Manager fails, FSCS protection would not apply and any money the scheme receives would be based on what FIL Life is able to recover from the Fund Manager
Market Risks Currency risk: the risk that the value of a fund will fluctuate because of changes in foreign exchange rates
Interest rate risk: the risk that the value of a fund will fluctuate because of changes in the market interest rates
Other price risk: the risk that the value of a fund will fluctuate because of changes in market prices (other than those arising from currency or interest rate risk), whether these changes are caused by factors specific to the individual fund assets or their issuers, or factors affecting all similar assets traded in the market
The day-to-day management of the underlying investments is the responsibility of the Fund Managers, including the direct management of credit and market risks. The Trustees monitor the Scheme’s investment options and the Fund Managers on a regular basis, with the help from the Platform Provider and its Investment Adviser
Climate Risk The impact/risk of climate change on the value of underlying assets held by the Master Trust trustees and thus
Default strategies will need to consider investment in sustainably oriented investments which aim to reduce investment (or exclude) in those
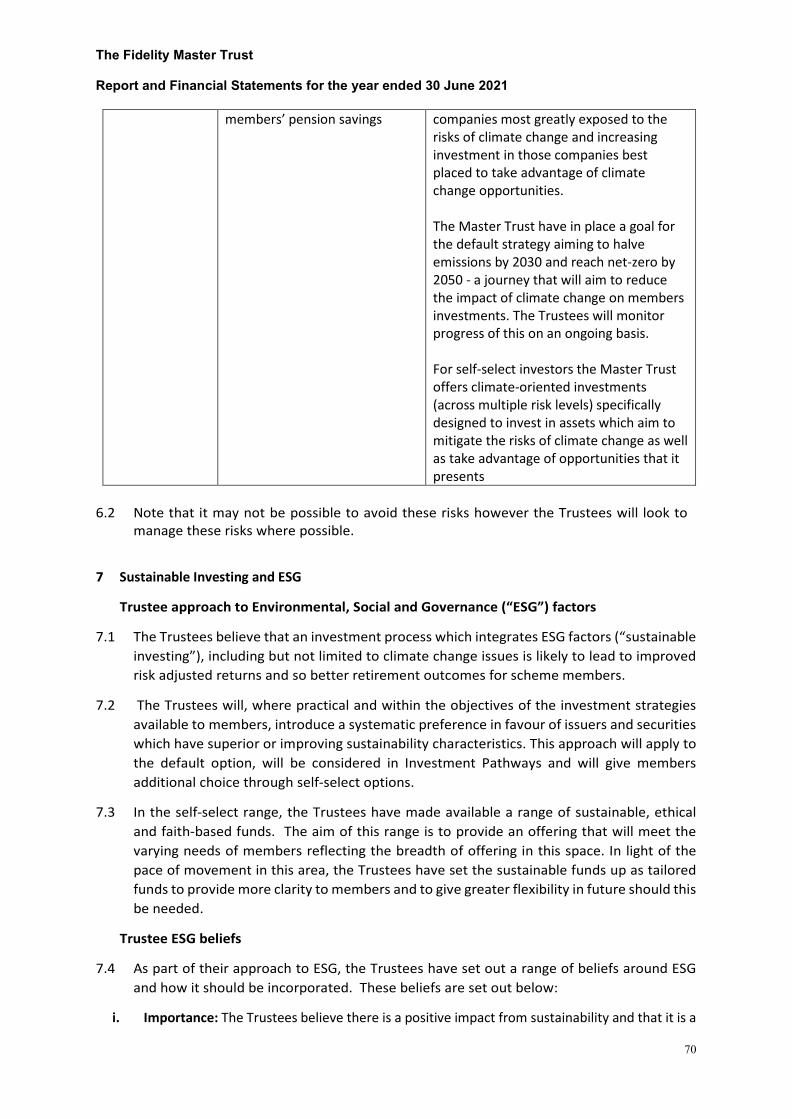
The Fidelity Master Trust Report and Financial Statements for the year ended 30 June 2021
70
members’ pension savings companies most greatly exposed to the risks of climate change and increasing investment in those companies best placed to take advantage of climate change opportunities. The Master Trust have in place a goal for the default strategy aiming to halve emissions by 2030 and reach net-zero by 2050 - a journey that will aim to reduce the impact of climate change on members investments. The Trustees will monitor progress of this on an ongoing basis. For self-select investors the Master Trust offers climate-oriented investments (across multiple risk levels) specifically designed to invest in assets which aim to mitigate the risks of climate change as well as take advantage of opportunities that it presents
6.2 Note that it may not be possible to avoid these risks however the Trustees will look to
manage these risks where possible.
7 Sustainable Investing and ESG
Trustee approach to Environmental, Social and Governance (“ESG”) factors
7.1 The Trustees believe that an investment process which integrates ESG factors (“sustainable investing”), including but not limited to climate change issues is likely to lead to improved risk adjusted returns and so better retirement outcomes for scheme members.
7.2 The Trustees will, where practical and within the objectives of the investment strategies available to members, introduce a systematic preference in favour of issuers and securities which have superior or improving sustainability characteristics. This approach will apply to the default option, will be considered in Investment Pathways and will give members additional choice through self-select options.
7.3 In the self-select range, the Trustees have made available a range of sustainable, ethical and faith-based funds. The aim of this range is to provide an offering that will meet the varying needs of members reflecting the breadth of offering in this space. In light of the pace of movement in this area, the Trustees have set the sustainable funds up as tailored funds to provide more clarity to members and to give greater flexibility in future should this be needed.
Trustee ESG beliefs
7.4 As part of their approach to ESG, the Trustees have set out a range of beliefs around ESG and how it should be incorporated. These beliefs are set out below:
i. Importance: The Trustees believe there is a positive impact from sustainability and that it is a

The Fidelity Master Trust Report and Financial Statements for the year ended 30 June 2021
71
financially material risk which should be considered when setting an investment strategy as this will lead to better risk-adjusted returns over the long term
ii. Flexibility: The Trustees believe a consideration of sustainability should be implemented
flexibly across the Master Trust. The approach may vary between different investment strategies
iii. Continuous Evolution: The Trustees’ approach to sustainability is an evolving journey that
should be continuously reviewed
iv. Engagement: The Trustees encourage positive engagement on sustainability issues between the Fund Managers within the Scheme and the companies in which they invest
v. Varies by member: The Trustees believe the needs and aspirations of members are important
and will be incorporated into the design of the Scheme. Non-financial factors will be factored into the range of funds available to members
Engagement with Fund Managers
7.5 The Trustees have adopted a policy of delegating voting decisions on stocks to the Fund
Managers. Fund Managers are expected to undertake monitoring and engagement in line with their policies on stewardship. They are also expected to outline how they engage with companies on ESG matters and how they measure the effectiveness of this strategy whilst considering the long-term financial interests of the scheme members.
7.6 While the Trustees have limited influence over Fund Managers’ investment practices, the Trustees meet the Fund Managers which manage funds within the default investment option and standard fund range on an annual basis to outline their beliefs and policies around ESG and to understand how the investment managers’ approaches align to these.
7.7 As part of this, the Trustees will strive to ensure all Managers of funds available in the core range apply the UK Stewardship Code and are signed up to the UN Principles for Responsible Investment (UNPRI) which works to incorporate ESG factors into investment and ownership decisions. The Trustees expect that the Managers of funds made available to members will integrate ESG risk factors into their investment process and be able to explain how such factors impact their decisions.
7.8 The Trustees review reports on the voting and engagement policies of the Fund Managers within the core fund range, to ensure that they are acting in the best interests of the members. On an annual basis, the Trustees will also invite their key Fund Managers to talk through their current and forward-looking position around ESG policies and to ensure they are comfortable that there is suitable oversight and process around this with the underlying managers.
7.9 The funds within the default arrangement are currently managed by Fidelity International and BlackRock Asset Management. Both of these Fund Managers are signatories to the PRI (Principles for Responsible Investment) and both received A+ ratings in strategy and governance in relation to ESG in 2020 1. Both of these Fund Managers also employ an ESG or Sustainable Investing team to integrate ESG into their core investment process. The
1 BlackRock ‘2019 Investment Stewardship Annual Report’ and Fidelity ‘2018 Sustainable Investing Report’

The Fidelity Master Trust Report and Financial Statements for the year ended 30 June 2021
72
Trustees will continue to work closely with them to deepen the ESG focus of the default arrangement.
7.10 Rather than focusing on short term factors and performance, the Trustees monitor the long-term performance of all the funds used within the default arrangement and core fund range. The Trustees expect Fund Managers to deliver in line with the mandates of the respective funds and will flag any concerns and challenge the Fund Managers where these relate to the long-term performance of the funds.
7.11 As part of this the managers are actively encouraged to consider ESG factors both within the investment process and as part of their engagement with the underlying companies in which they invest. The Trustees may challenge or remove a Fund Manager where they feel that the Fund Manager is not delivering on any of the aforementioned aspects including long-term performance of the underlying funds or consideration of ESG factors in the investment process.
Membership Views - Non-financial factors 7.12 The Trustees understand that members may have strong views on where they believe their
savings should and should not be invested.
7.13 The Trustees have engaged with members to learn about their views on ESG and will continue to do so as the ESG landscape evolves.
7.14 Where members voice considerations around non-financial factors, including but not limited to ESG and responsible investing, the Trustees will consider where such factors may be financially material and whether to take account of them within the context of the investment choices made available to members.
Consideration of Climate Change
7.15 The Trustees recognise the significant impact that climate change is having and will have on our planet as well as the risks and opportunities that climate change presents for members’ investments in the Scheme.
7.16 The Trustees will set out a Climate Policy detailing their approach to climate-related matters in the context of the running of the Scheme and will keep this up to date and in line with their beliefs.
The Fidelity Master Trust Report and Financial Statements for the year ended 30 June 2021
73
7.17 The Trustees will also produce, on an annual basis, a report in line with the recommendations set out in the Taskforce for Climate-Related Financial Disclosures (TCFD). As part of this, the Trustees will carry out an analysis of the climate impact of the Scheme’s investments as well as how the investments are aligned to any goals the Trustees may adopt in relation to climate.
7.18 The Trustees’ Climate Policy and its TCFD related analysis may influence decisions on the long-term asset allocation of the Scheme’s default investment strategy, as well as the self-select investment options.
Bespoke Sections
7.19 Employers of bespoke sections of the Scheme may have their own beliefs around ESG and sustainability and these may differ from those of the Trustees. If employers would like other factors to be considered in relation to ESG, they should raise them, with supporting reasons with the Trustees. The Trustees may consider these factors when setting and reviewing their beliefs.
Other Investment Policies
Evaluation of Fund Managers’ performance and remuneration
7.20 The Trustees monitor performance of the underlying funds used within the default option and standard fund range on a quarterly basis. Medium to long term performance is monitored in line with a set of triggers that the Trustees review on a regular basis.
7.21 Fund Managers are remunerated through the annual management fee ‘AMC’ paid for the
investment fund. The Trustees review the AMCs and overall costs of all funds used within the default option and standard fund range on a regular basis to ensure that they represent value for money and are in line with the mandates set out by the manager on a net-of-fees basis.
Portfolio turnover costs
7.22 On a regular basis the Trustees review the transaction costs for the funds within the default option and self-select range. This information includes the aggregate transaction costs for all funds split by asset class and management style (passively managed vs actively managed) and then splits the funds further according to the aggregate transaction cost that they are reporting.
7.23 The Trustees implement a RAG rating system to assess the transaction and turnover costs for a
fund relative to its peer group (where common in asset class and management style). As part of their annual meeting with each investment manager the Trustees will challenge the manager where they feel there is either excessive transaction costs or turnover within their portfolio.
7.24 While there is no obligation on the investment managers to send over transaction cost
information on less than an annual basis, the Trustees encourage managers to provide transaction cost data on a quarterly basis.
7.25 Where transaction cost data is not made available or the Trustees have concerns around the
accuracy or consistency of the data being made available, they will work with the Platform Provider to chase the Fund Manager to understand why this is not the case and determine a timeline for when the latest/accurate data will be received.
The Fidelity Master Trust Report and Financial Statements for the year ended 30 June 2021
74
Duration of investment managers 7.26 The Scheme invests in pooled funds, the duration of which are flexible, and the Trustees
will regularly consider the appropriateness of the fund range and whether existing funds should continue to be held or new funds added.
Liquidity and realisation of investments
7.27 The Scheme invests in life funds which in turn invest in underlying pooled funds. These can be realised to provide benefits when members make a valid request to withdraw them or transfer them to an alternative pension arrangement.
7.28 The Trustees expect that the Platform Provider and Fund Manager will normally be able to sell
funds within a reasonable timescale. 7.29 There may however be instances where either the Platform Provider or Fund Manager may
impose restrictions on the timing of purchases and sales of funds (most notably for investments in property funds), to protect the interests of all investors in the fund.
7.30 Nevertheless, the Trustees recognise that most members’ pension pots have a long investment
timeframe, during which assets which are less easily traded (such as property) can be managed to deliver good long-term returns while avoiding the impact of liquidity issues at retirement.
Suitability
7.31 The Trustees take advice from the Investment Adviser to ensure the investment options made
available are suitable for the Scheme. The Trustees continue to monitor and take advice on these investment options on an ongoing basis.
8. Compliance
The Statement will be reviewed triennially by the Trustees and without delay after any significant change in the Trustees’ investment policy.

The Fidelity Master Trust Report and Financial Statements for the year ended 30 June 2021
75
In preparing the Statement, the Trustees have obtained and considered the written advice of a person who is reasonably believed by the Trustees to be qualified by his ability in and practical experience of financial matters and to have the appropriate knowledge and experience of the management of the investments of schemes such as the Scheme. The Trustees have consulted with Fidelity as the sponsoring employer, and who is appointed to act on behalf of the participating employers to the Scheme.
Before revising this Statement at any time in the future, the Trustees will obtain and consider the written advice of a specialist independent investment adviser (currently ISIO) and will consult with FIL Life.
Signed:
Name: Dianne Day Position: Chair of Trustees of the Fidelity Master Trust
Date: 8th December 2021

The Fidelity Master Trust Report and Financial Statements for the year ended 30 June 2021
76
9.1 Appendix - Fidelity Master Trust - Self-Select Options for Standard Section
In addition to the default arrangement the Trustees offer members a range of self-select fund options, as set out in the table below.
Equity Funds Active/Passive Benchmark
L&G UK Equity Fund Passive FTSE All Share Index
L&G Global Equity 50/50 Fund Passive
Composite of 50/50 distribution between UK and overseas
L&G Global Equity Market Weighted 30 / 70 (75% Hedged) Passive
Composite of 30/70 distribution between UK and overseas, 75% GBP Hedged
L&G World ex-UK Developed Equity Index Fund Passive
FTSE Developed (ex UK) Index
L&G World Emerging Markets Fund Passive FTSE AW All Emerging Index
Fidelity Emerging Markets Equity Pension Fund Active
MSCI Emerging Markets Index
BlackRock Aquila MSCI World Global Equity Index Fund Passive
MSCI World Index Net Total Return GBP
BlackRock ACS World ex-UK Fund * Passive FTSE All World Developed ex UK
BlackRock ACS 30:70 Currency Hedged Global Equity *
Passive
Composite of 30% FTSE All Share Index, 60% Developed Overseas Equities with currency hedging back to sterling and 10% Emerging market equities
BlackRock ACS 50:50 Global Equity *
Passive
Composite of 50% FTSE All Share Index and 50% Fixed Overseas Weights (16.7& Continental Europe, 16.7% North America, 8.3% Japan, 8.3% Pacific Basin)
BlackRock ACS UK Equity * Passive FTSE All Share Index
BlackRock Aquila Connect Emerging Markets Fund*
Passive MSCI Global Emerging Markets Index
Multi Asset Funds Active/Passive Benchmark
BlackRock Aquila Life Market Advantage Fund
Active
3 month £ Libor + 3.5% p.a.
Schroder Dynamic Multi Asset Fund Active CPI + 4% p.a.

The Fidelity Master Trust Report and Financial Statements for the year ended 30 June 2021
77
Fidelity Diversified Growth Pensions Fund Active
RPI + 5% p.a.
Fidelity Diversified Markets Fund Active Sonia + 3% p.a.
Fixed Income Funds Active/Passive Benchmark
L&G Over 15 years Gilts Fund Passive FTSE Over 15 years Gilts Index
L&G Over 5 Year ILG Fund Passive FTSE A UK Index-Linked Over 5 Years Index
L&G Corporate Bond All Stocks Fund Passive iBoxx £ Non Gilts ex BBB Index
Fidelity UK Corporate Bond Pensions Fund
Active
Merrill Lynch Euro Sterling Bond Index
Fidelity Pre-Retirement Bond Pensions Fund
Active
Composite of Merrill Lynch gilt and sterling bond indices
Fidelity UK Aggregate Bond Pensions Fund
Active
Composite of iBoxx gilt and sterling bond indices
BlackRock Corporate Bond Tracker Fund * Passive
iBoxx £ Non-Gilts Index
BlackRock Over 15 Years Gilt Tracker Fund* Passive
FTSE Over 15 years Gilts Index
BlackRock Index-Linked Gilt Tracker Fund*
Passive
FTSE A UK Index-Linked Over 5 Years Index
Ethical Funds Active/Passive Benchmark
Fidelity HSBC Islamic Pension Fund Passive DJ Islamic Market Titans 100 (TR)
Sustainable Funds Active/Passive Benchmark
Master Trust Sustainable Climate Equity Fund
Active MSCI World - Net Return Index
Master Trust Sustainable Positive Change Fund
Active MSCI ACWI
Master Trust Sustainable Climate Bond Fund
Active Bloomberg Barclays Global Aggregate Corporate Index Hedged to GBP
Master Trust Sustainable Active Equity Fund
Active MSCI ACWI ESG Leaders Index
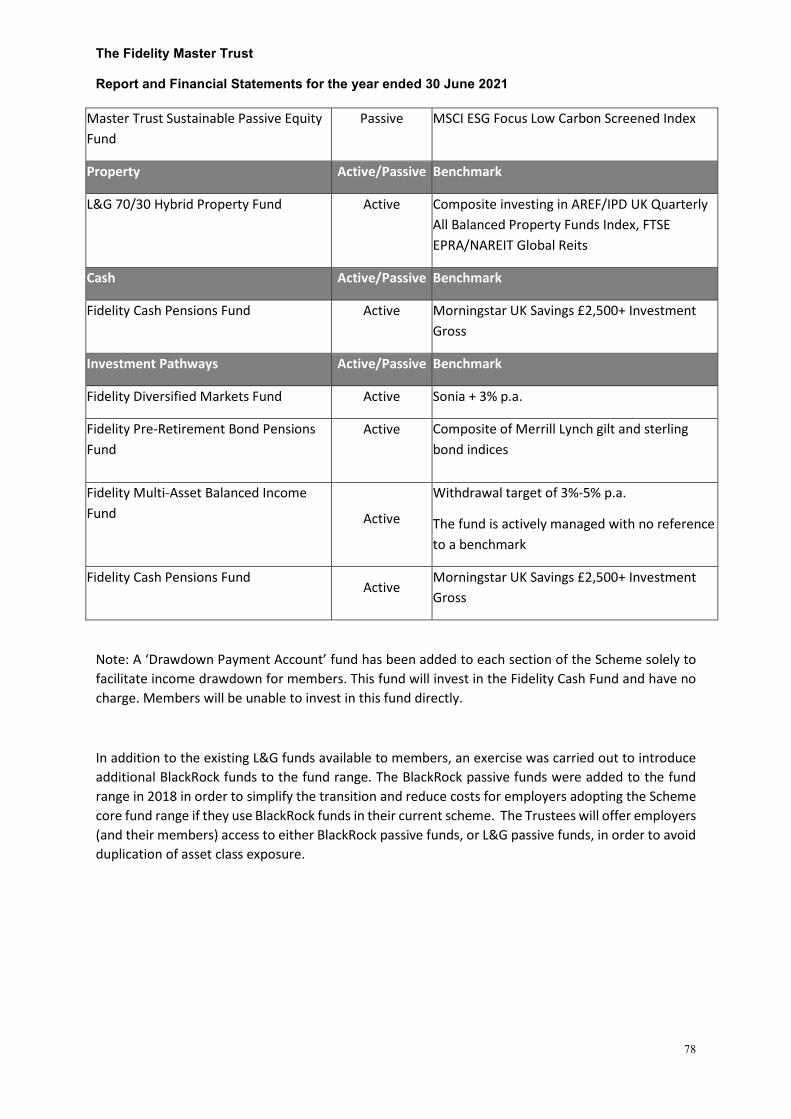
The Fidelity Master Trust Report and Financial Statements for the year ended 30 June 2021
78
Master Trust Sustainable Passive Equity Fund
Passive MSCI ESG Focus Low Carbon Screened Index
Property Active/Passive Benchmark
L&G 70/30 Hybrid Property Fund Active Composite investing in AREF/IPD UK Quarterly All Balanced Property Funds Index, FTSE EPRA/NAREIT Global Reits
Cash Active/Passive Benchmark
Fidelity Cash Pensions Fund Active Morningstar UK Savings £2,500+ Investment Gross
Investment Pathways Active/Passive Benchmark
Fidelity Diversified Markets Fund Active Sonia + 3% p.a.
Fidelity Pre-Retirement Bond Pensions Fund
Active
Composite of Merrill Lynch gilt and sterling bond indices
Fidelity Multi-Asset Balanced Income Fund Active
Withdrawal target of 3%-5% p.a.
The fund is actively managed with no reference to a benchmark
Fidelity Cash Pensions Fund
Active Morningstar UK Savings £2,500+ Investment Gross
Note: A ‘Drawdown Payment Account’ fund has been added to each section of the Scheme solely to facilitate income drawdown for members. This fund will invest in the Fidelity Cash Fund and have no charge. Members will be unable to invest in this fund directly.
In addition to the existing L&G funds available to members, an exercise was carried out to introduce additional BlackRock funds to the fund range. The BlackRock passive funds were added to the fund range in 2018 in order to simplify the transition and reduce costs for employers adopting the Scheme core fund range if they use BlackRock funds in their current scheme. The Trustees will offer employers (and their members) access to either BlackRock passive funds, or L&G passive funds, in order to avoid duplication of asset class exposure.
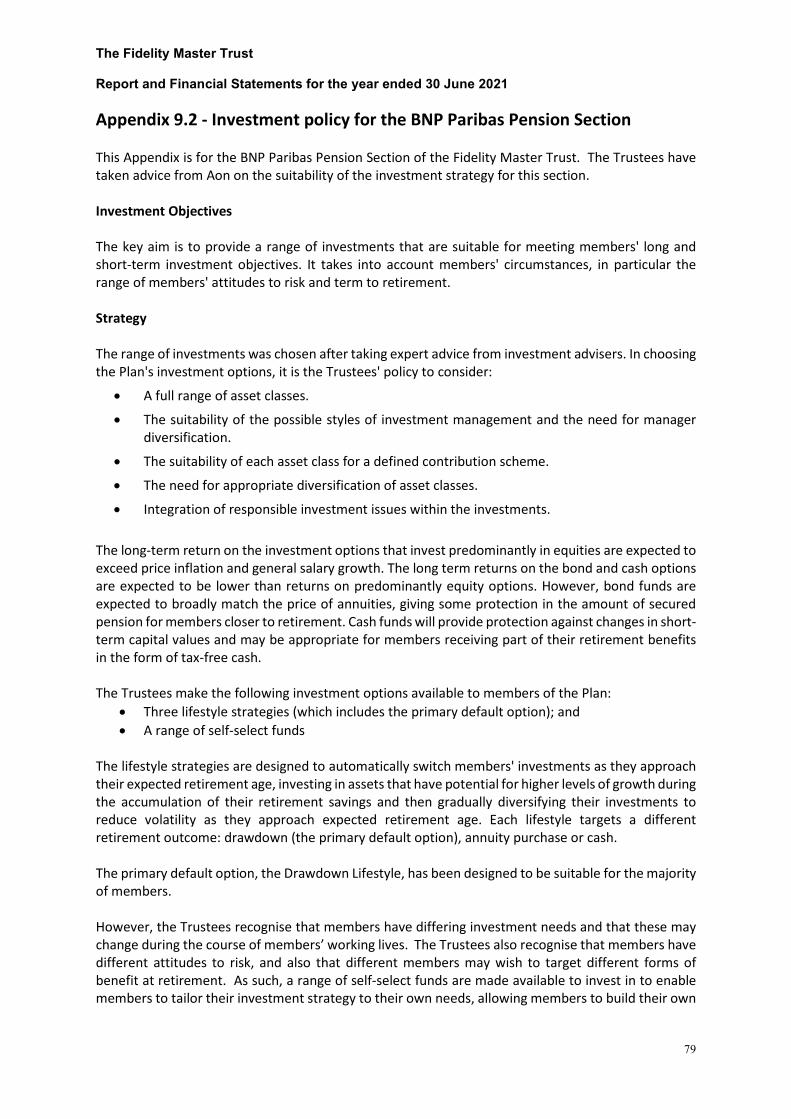
The Fidelity Master Trust Report and Financial Statements for the year ended 30 June 2021
79
Appendix 9.2 - Investment policy for the BNP Paribas Pension Section This Appendix is for the BNP Paribas Pension Section of the Fidelity Master Trust. The Trustees have taken advice from Aon on the suitability of the investment strategy for this section. Investment Objectives The key aim is to provide a range of investments that are suitable for meeting members' long and short-term investment objectives. It takes into account members' circumstances, in particular the range of members' attitudes to risk and term to retirement. Strategy The range of investments was chosen after taking expert advice from investment advisers. In choosing the Plan's investment options, it is the Trustees' policy to consider:
• A full range of asset classes.
• The suitability of the possible styles of investment management and the need for manager diversification.
• The suitability of each asset class for a defined contribution scheme.
• The need for appropriate diversification of asset classes.
• Integration of responsible investment issues within the investments. The long-term return on the investment options that invest predominantly in equities are expected to exceed price inflation and general salary growth. The long term returns on the bond and cash options are expected to be lower than returns on predominantly equity options. However, bond funds are expected to broadly match the price of annuities, giving some protection in the amount of secured pension for members closer to retirement. Cash funds will provide protection against changes in short-term capital values and may be appropriate for members receiving part of their retirement benefits in the form of tax-free cash. The Trustees make the following investment options available to members of the Plan:
• Three lifestyle strategies (which includes the primary default option); and • A range of self-select funds
The lifestyle strategies are designed to automatically switch members' investments as they approach their expected retirement age, investing in assets that have potential for higher levels of growth during the accumulation of their retirement savings and then gradually diversifying their investments to reduce volatility as they approach expected retirement age. Each lifestyle targets a different retirement outcome: drawdown (the primary default option), annuity purchase or cash. The primary default option, the Drawdown Lifestyle, has been designed to be suitable for the majority of members. However, the Trustees recognise that members have differing investment needs and that these may change during the course of members’ working lives. The Trustees also recognise that members have different attitudes to risk, and also that different members may wish to target different forms of benefit at retirement. As such, a range of self-select funds are made available to invest in to enable members to tailor their investment strategy to their own needs, allowing members to build their own
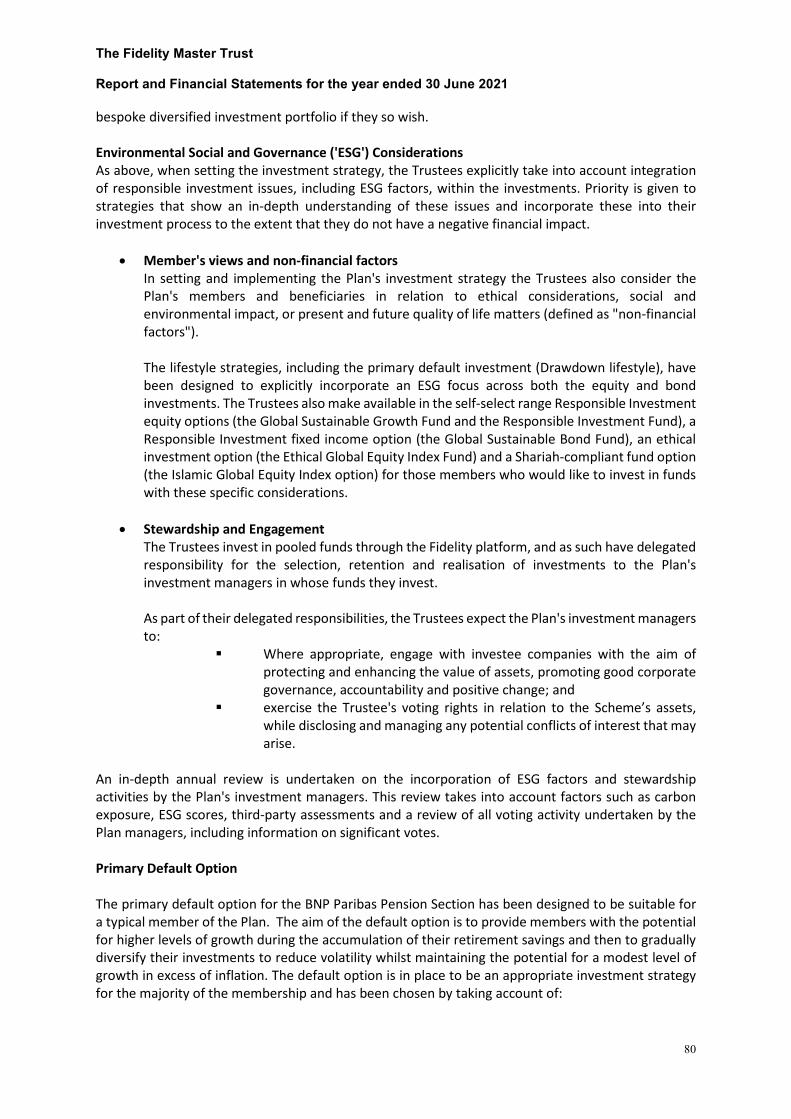
The Fidelity Master Trust Report and Financial Statements for the year ended 30 June 2021
80
bespoke diversified investment portfolio if they so wish. Environmental Social and Governance ('ESG') Considerations As above, when setting the investment strategy, the Trustees explicitly take into account integration of responsible investment issues, including ESG factors, within the investments. Priority is given to strategies that show an in-depth understanding of these issues and incorporate these into their investment process to the extent that they do not have a negative financial impact.
• Member's views and non-financial factors In setting and implementing the Plan's investment strategy the Trustees also consider the Plan's members and beneficiaries in relation to ethical considerations, social and environmental impact, or present and future quality of life matters (defined as "non-financial factors"). The lifestyle strategies, including the primary default investment (Drawdown lifestyle), have been designed to explicitly incorporate an ESG focus across both the equity and bond investments. The Trustees also make available in the self-select range Responsible Investment equity options (the Global Sustainable Growth Fund and the Responsible Investment Fund), a Responsible Investment fixed income option (the Global Sustainable Bond Fund), an ethical investment option (the Ethical Global Equity Index Fund) and a Shariah-compliant fund option (the Islamic Global Equity Index option) for those members who would like to invest in funds with these specific considerations.
• Stewardship and Engagement
The Trustees invest in pooled funds through the Fidelity platform, and as such have delegated responsibility for the selection, retention and realisation of investments to the Plan's investment managers in whose funds they invest. As part of their delegated responsibilities, the Trustees expect the Plan's investment managers to:
Where appropriate, engage with investee companies with the aim of protecting and enhancing the value of assets, promoting good corporate governance, accountability and positive change; and
exercise the Trustee's voting rights in relation to the Scheme’s assets, while disclosing and managing any potential conflicts of interest that may arise.
An in-depth annual review is undertaken on the incorporation of ESG factors and stewardship activities by the Plan's investment managers. This review takes into account factors such as carbon exposure, ESG scores, third-party assessments and a review of all voting activity undertaken by the Plan managers, including information on significant votes. Primary Default Option The primary default option for the BNP Paribas Pension Section has been designed to be suitable for a typical member of the Plan. The aim of the default option is to provide members with the potential for higher levels of growth during the accumulation of their retirement savings and then to gradually diversify their investments to reduce volatility whilst maintaining the potential for a modest level of growth in excess of inflation. The default option is in place to be an appropriate investment strategy for the majority of the membership and has been chosen by taking account of:

The Fidelity Master Trust Report and Financial Statements for the year ended 30 June 2021
81
• The kinds of investments to be held
• Investment risks
• The expected return on investments
• Realisation of investments
• Responsible investment requirements
• The unique nature of the membership, including how they can flexibly access their retirement savings
Drawdown Lifestyle (primary default option): invests 100% in the Global Sustainable Growth Fund until the member reaches the point 30 years before their expected retirement age, at which point a portion of the member's investment is gradually switched to the Diversified Growth Fund over the next 20 years. Over the final 9 years a portion of the member's investment is gradually switched to the Index Linked Gilt Fund and Global Sustainable Bond Fund. At the member's expected retirement date, the investments will be split 35% in the Global Sustainable Growth Fund, 20% in the Diversified Growth Fund, 25% in the Global Sustainable Bond Fund and 20% in the Index Linked Gilt Fund.
Secondary Default Option A secondary default option was created in April 2020 when the Property Fund was suspended and ceased accepting new contributions, as a result of the Covid-19 pandemic. This fund is only available to members as a self-select option. Rather than leaving future contributions intended for the Property Fund uninvested, the Trustees decided to redirect these contributions into the BlackRock Cash Fund, until the suspension of the Property Fund is lifted. As a result of such action, the BlackRock Cash Fund is classified as a default investment option for regulatory reporting and monitoring purposes.
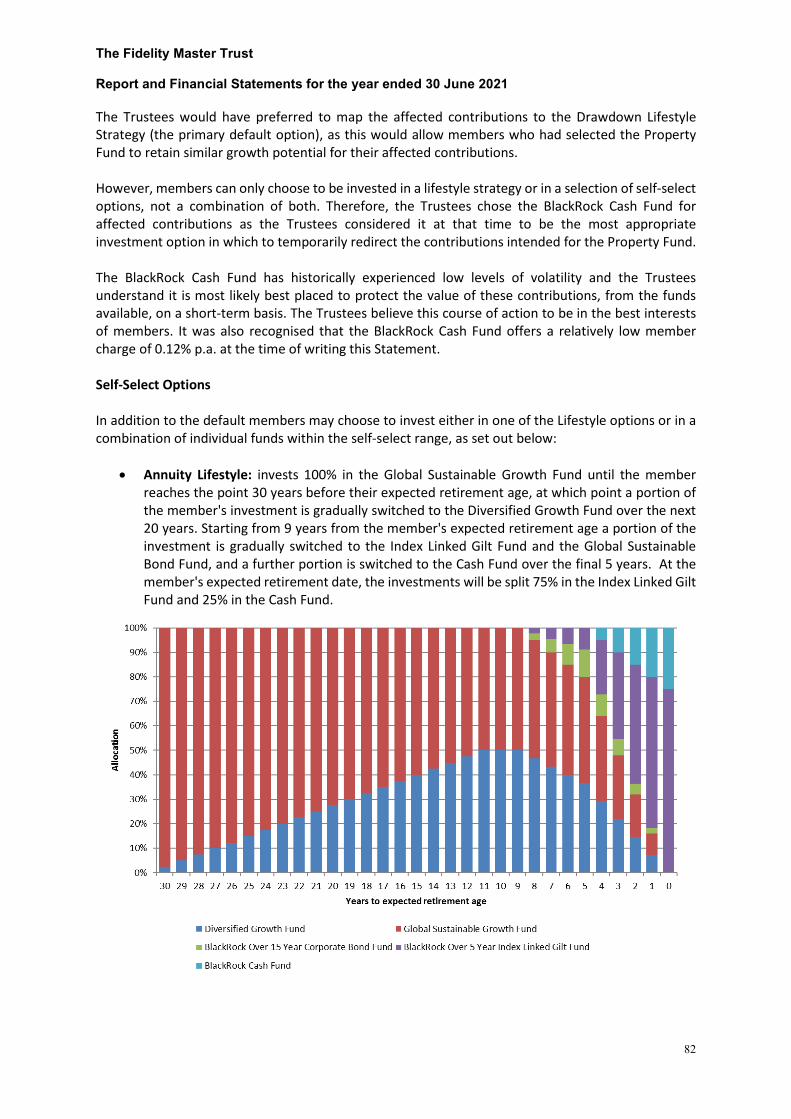
The Fidelity Master Trust Report and Financial Statements for the year ended 30 June 2021
82
The Trustees would have preferred to map the affected contributions to the Drawdown Lifestyle Strategy (the primary default option), as this would allow members who had selected the Property Fund to retain similar growth potential for their affected contributions. However, members can only choose to be invested in a lifestyle strategy or in a selection of self-select options, not a combination of both. Therefore, the Trustees chose the BlackRock Cash Fund for affected contributions as the Trustees considered it at that time to be the most appropriate investment option in which to temporarily redirect the contributions intended for the Property Fund. The BlackRock Cash Fund has historically experienced low levels of volatility and the Trustees understand it is most likely best placed to protect the value of these contributions, from the funds available, on a short-term basis. The Trustees believe this course of action to be in the best interests of members. It was also recognised that the BlackRock Cash Fund offers a relatively low member charge of 0.12% p.a. at the time of writing this Statement. Self-Select Options In addition to the default members may choose to invest either in one of the Lifestyle options or in a combination of individual funds within the self-select range, as set out below:
• Annuity Lifestyle: invests 100% in the Global Sustainable Growth Fund until the member reaches the point 30 years before their expected retirement age, at which point a portion of the member's investment is gradually switched to the Diversified Growth Fund over the next 20 years. Starting from 9 years from the member's expected retirement age a portion of the investment is gradually switched to the Index Linked Gilt Fund and the Global Sustainable Bond Fund, and a further portion is switched to the Cash Fund over the final 5 years. At the member's expected retirement date, the investments will be split 75% in the Index Linked Gilt Fund and 25% in the Cash Fund.
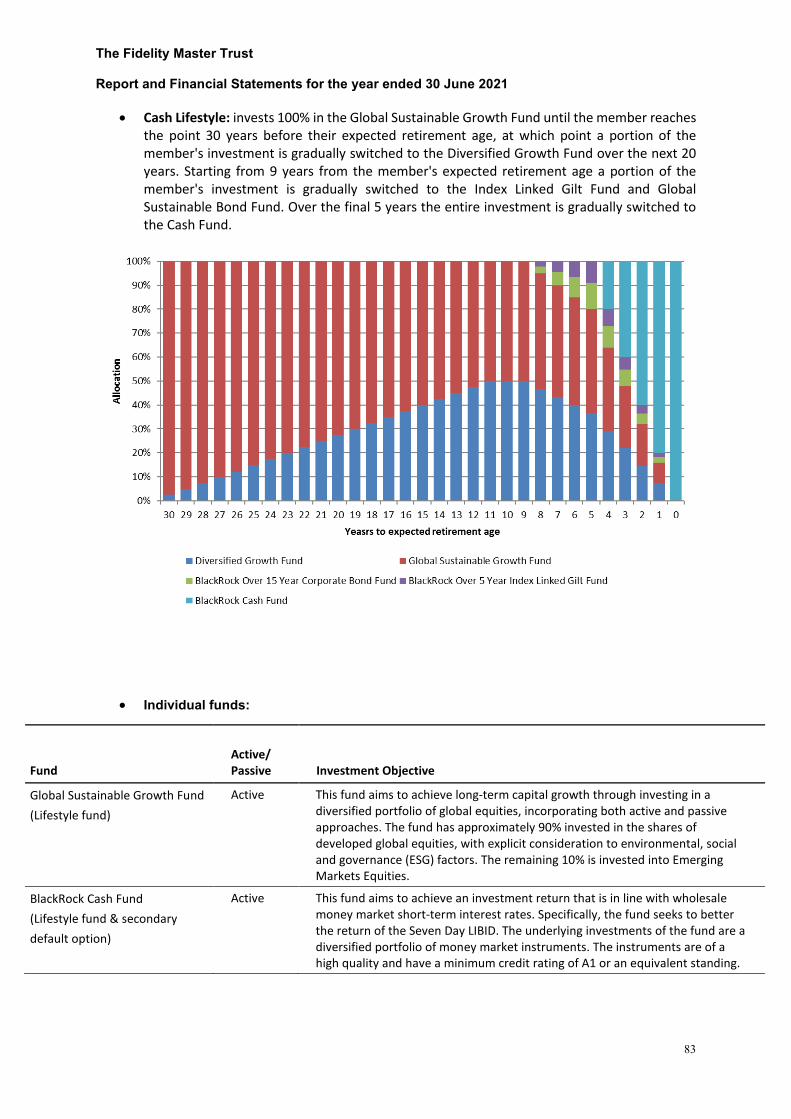
The Fidelity Master Trust Report and Financial Statements for the year ended 30 June 2021
83
• Cash Lifestyle: invests 100% in the Global Sustainable Growth Fund until the member reaches the point 30 years before their expected retirement age, at which point a portion of the member's investment is gradually switched to the Diversified Growth Fund over the next 20 years. Starting from 9 years from the member's expected retirement age a portion of the member's investment is gradually switched to the Index Linked Gilt Fund and Global Sustainable Bond Fund. Over the final 5 years the entire investment is gradually switched to the Cash Fund.
• Individual funds:
Fund
Active/ Passive
Investment Objective
Global Sustainable Growth Fund (Lifestyle fund)
Active This fund aims to achieve long-term capital growth through investing in a diversified portfolio of global equities, incorporating both active and passive approaches. The fund has approximately 90% invested in the shares of developed global equities, with explicit consideration to environmental, social and governance (ESG) factors. The remaining 10% is invested into Emerging Markets Equities.
BlackRock Cash Fund (Lifestyle fund & secondary default option)
Active This fund aims to achieve an investment return that is in line with wholesale money market short-term interest rates. Specifically, the fund seeks to better the return of the Seven Day LIBID. The underlying investments of the fund are a diversified portfolio of money market instruments. The instruments are of a high quality and have a minimum credit rating of A1 or an equivalent standing.

The Fidelity Master Trust Report and Financial Statements for the year ended 30 June 2021
84
Fund
Active/ Passive
Investment Objective
Diversified Growth Fund (Lifestyle fund)
Active This fund aims for long-term capital growth by investing or reinsuring into underlying funds managed by Fidelity or our Fund Partners, which invest in a range of asset classes in the UK and overseas including equities, bonds, cash/currencies, real estate, commodities, hedge funds, high yield debt and private equity.
BlackRock Over 5 Years Index- Linked Gilt Fund (Lifestyle fund)
Passive This fund invests in UK government index-linked securities (index-linked gilts) that have a maturity period of 5 years or longer. The fund aims to achieve a return consistent with the FTSE UK Gilts Index-Linked Over 5 Years Index, which is widely regarded as the benchmark for UK pension fund investment in the longer dated end of the UK index-linked gilt market.
Global Sustainable Bond Fund (Lifestyle fund)
Active This fund invests in a range of global fixed income securities, predominantly corporate bonds, with a focus on environmental, social and governance (“ESG”) considerations. The fund is fully hedged into sterling and aims to outperform the Bloomberg Barclays Global Aggregate Corporates Index.
Responsible Investment Fund Active This fund aims to achieve long-term capital growth through investing in a globally diversified portfolio of global equities, which are expected to benefit either directly or indirectly from a focus on environmental, social and governance (ESG) considerations.
BlackRock Dynamic Allocation Fund
Active This fund targets a consistent investment return of 3.5% above the Bank of England base rate measured over rolling three-year periods by utilising a multi-asset flexible investment approach. The focus on getting the asset mix “right” in order to achieve the target means this fund will generally hold a variety of different types of assets at any one time.
Fidelity Emerging Markets Equity Pensions Fund
Active The fund’s investment objective is to achieve long-term capital appreciation. The fund will invest primarily in securities of countries experiencing rapid economic growth including, without limitation, Africa, the Indian sub-continent, Latin America, South East Asia, Europe and the Middle East. There is no policy to restrict investment to particular economic sectors.
M&G Total Return Credit Fund Active The fund aims to maximise total return through prudent investment in a diversified pool of debt and debt like assets with a focus on credit. The fund will seek to preserve capital by allocating to cash and government bonds from time to time.
Nordea Diversified Return Fund Active The fund aims to preserve shareholders' capital (over a three-year investment horizon) and provide a stable, positive rate of return on investment. Investments are made globally in equities, bonds (including bonds convertible in equity shares) and money market instruments denominated in various currencies.
Active Global Equity Fund Active The fund aims to provide an investment return in excess of the MSCI World Index by investing in a diversified portfolio of global equities .
Schroder Diversified Growth Fund
Active The objective of the Schroder Life Intermediated Diversified Growth Fund (IDGF) is to achieve a return of Consumer Price Inflation (CPI) +5% per annum over a full market cycle, which is typically five to seven years. It aims to achieve this objective with approximately a one third reduction in the level of volatility associated with an all equity portfolio.

The Fidelity Master Trust Report and Financial Statements for the year ended 30 June 2021
85
Fund
Active/ Passive
Investment Objective
Standard Life Managed Fund Active The fund aims to provide long term growth whilst investing in a diversified portfolio of assets (including equities, bonds, property, cash deposits and money-market instruments) in order to reduce the risk associated with being solely invested in any one asset class. These assets can be from both the UK and overseas. The fund is predominantly equity based and is actively managed by our investment team, who will vary the proportions held in each asset class to try to take advantage of opportunities they have identified.
Diversified Fund Active The fund aims to provide positive real long term returns by investing in a diversified range of asset classes and return drivers including equities, bonds, real estate, commodities, high yield debt and private equity. The fund also aims to reduce the risk and magnitude of falls in capital value.
Majedie UK Equity Fund Active The Fund aims to produce a total return in excess of the FTSE All-Share Index over the long-term through investment in a diversified portfolio, with at least 80% of the Fund invested in UK equities.
Property Fund Active To invest primarily in direct UK commercial property. It aims to generate total returns (from income and capital appreciation) that are above its benchmark, over rolling three-year periods.
BlackRock UK Equity Index Fund Passive This fund invests in the shares of UK companies and aims to achieve a return that is consistent with the return of the FTSE All-Share Index.
World (ex-UK) Equity Index Fund Passive This fund invests in shares of companies outside the UK and aims to achieve a return that is consistent with the return of the FTSE All-World Developed ex-UK Index.
BlackRock US Equity Index Fund Passive This fund invests in the shares of US companies and aims to achieve a return that is consistent with the return of the FTSE All-World USA Index.
BlackRock European Equity Index Fund
Passive This fund invests in the shares of companies in Europe and aims to achieve a return that is consistent with the return of the FTSE All-World Developed Europe ex-UK Index.
BlackRock Japanese Equity Index Fund
Passive This fund invests in the shares of Japanese companies and aims to achieve a return that is consistent with the return of the FTSE All-World Japan Index.
BlackRock Pacific Rim Equity Index Fund
Passive This fund invests in the shares of companies in the Pacific Rim and aims to achieve a return that is consistent with the return of the FTSE All-World Developed Asia Pacific ex-Japan Index.
BlackRock Over 15 Years UK Gilt Index Fund
Passive This fund invests in UK government fixed income securities (gilts) that have a maturity period of 15 years or longer. The fund aims to achieve a return consistent with the FTSE UK Gilts Over 15 Years Index.
Islamic Global Equity Index Fund Passive This fund aims to provide long term capital growth by primarily investing in a broad range of company shares from around the world, which meet the Islamic investment principles. The Fund aims to track the performance of its benchmark, the Dow Jones Islamic Titans 100 Index.
Ethical Global Equity Index Fund Passive This fund aims to provide long term capital growth by investing in shares of companies that are incorporating ethical principles. The Fund aims to track the performance of its benchmark, the FTSE All World - 4Good Global Index.

The Fidelity Master Trust Report and Financial Statements for the year ended 30 June 2021
86
Fund
Active/ Passive
Investment Objective
Emerging Markets Equity Index Fund
Passive This fund aims to provide long term capital growth by investing in shares of companies in countries designated as emerging markets. The Fund aims to track the performance of its benchmark, the FTSE All World Emerging Markets Index.
Risks specific to this Section No Section specific risks. The key risk, which isn't Section specific, is that members will have insufficient income in retirement or an income that does not meet their expectations. This risk was considered when setting the investment options and strategy for the Plan, along with:
• Risk of not meeting the reasonable expectations of members, bearing in mind members’ contributions and fund choices.
• Risk of fund managers not meeting their objectives (“manager risk”). This risk is considered by the Trustee and its advisers both upon the initial appointment of the fund manager and on an ongoing basis thereafter.
• The risk that the pooled funds, through which the Trustee allows members to invest, do not provide the required level of liquidity.
• Risk of the default fund being unsuitable for the requirements of some members. • The risk of fraud, poor advice or acts of negligence (“operational risk”). The Trustee has sought
to minimise such risk by ensuring that all advisers and third-party service providers are suitably qualified and experienced and that suitable liability and compensation clauses are included in all contracts for professional services received.
• The risk that the investment return over members’ working lives will not keep pace with inflation and does not, therefore, secure an adequate pension;
• The risk that investment in overseas markets will be affected by changes in exchange rates leading to lower returns in pound sterling terms (e.g. due to appreciation of pound sterling relative to overseas currency);
• The risk that investment market movements particularly in the period immediately prior to retirement leads to a substantial reduction in the anticipated level of retirement income; and
• The risk that the investment vehicles in which monies are invested under-perform the expectations of the Trustee.
Dated – 14 September 2021
The Fidelity Master Trust Report and Financial Statements for the year ended 30 June 2021
87
Appendix 9.3 – Investment policy for the Credit Suisse Section This Appendix is for the Credit Suisse Section of the Fidelity Master Trust. The Trustees have taken advice from Aon Solutions UK Limited on the suitability of the investment strategy for this section. Investment Objectives The Trustees' overall objective is to provide investment options that enable members to grow their savings over the long term, and to manage risks appropriately. The default option, as described below, is expected to meet this objective and also takes into account guidance from the Pension's Regulator and the Department for Work & Pension's guidance for offering a default option for defined contribution automatic enrolment pension schemes. Furthermore, the Trustees believe that the self-select funds offered as an alternative to the default enables members to choose their own portfolio of funds which would achieve the overall objective. The main investment objectives are:
• to include a suitable default option that is likely to be suitable for a typical member
• to include a range of alternative choices suitable for members of different ages and with different retirement benefit plans, objectives and risk tolerances
• to enable members to grow their savings over the long term
• to seek, where possible, to mitigate the risks described in this statement
The long-term return on the investment options that invest predominantly in equities are expected to exceed price inflation and general salary growth. The long term returns on the bond and cash options are expected to be lower than returns on predominantly equity options. However, bond funds are expected to broadly match the price of annuities, giving some protection in the amount of secured pension for members closer to retirement. Cash funds will provide protection against changes in short-term capital values, and may be appropriate for members receiving part of their retirement benefits in the form of tax-free cash, as well as those wishing to take further levels of taxed cash. Default Option Credit Suisse use the Master Trust default strategy ‘FutureWise’ as their default strategy. Information on the strategy is provided in the main body of the SIP. Self-Select Options In addition to the default as described above, members can choose from a range of self-select fund options, as set out in the table below. The table illustrates funds which are "core" to the Fidelity Master Trust and those which are specific to the Credit Suisse Section "extended".
Equity Funds Active/ Passive Benchmark Range
BlackRock MSCI World Global Equity Index Fund Passive MSCI World Index Net Total Return GBP Core BlackRock UK Equity Index Fund Passive FTSE All Share Index Core BlackRock Global 50:50 Index Fund Passive Composite of 50/50 UK and overseas Core
L&G Global Equity 30/70 (75% H) Index Fund Passive Composite of 30/70 UK and overseas (75% Hedged)
Core
The Fidelity Master Trust Report and Financial Statements for the year ended 30 June 2021
88
BlackRock European Equity Index Fund Passive FTSE AW Developed Europe ex UK Index Extended BlackRock Overseas Consensus Fund Passive Composite Index Extended BlackRock Japanese Equity Index Fund Passive FTSE AW Japan Index Extended BlackRock Pacific Rim Equity Index Fund Passive FTSE AW Developed Asia Pacific ex Japan Index Extended BlackRock US Equity Index Fund Passive FTSE US Index Extended Fidelity Emerging Markets Equity Fund Active MSCI Emerging Markets Index Core BlackRock Emerging Markets Equity Fund Passive MSCI Global Emerging Markets Index Core BlackRock World ex-UK Equity Fund Passive FTSE Developed ex UK Index Core
Multi Asset Funds Active/ Passive Benchmark
BlackRock Aquila Life Market Advantage Fund Active 3 month £ LIBOR + 3.5% p.a. Core Schroder Dynamic Multi Asset Fund Active CPI + 4% p.a. Core Fidelity Diversified Growth Fund Active RPI + 5% p.a. Core Fidelity Diversified Markets Fund Active Sonia + 3% p.a. Core
Fixed Income Funds Active/ Passive Benchmark
BlackRock Over 15 Year Gilts Index Fund Passive FTSE Actuaries Over 15 Years Gilts Index Core
BlackRock Over 5 Year I-L-Gilt Fund Passive FTSE Actuaries UK Index-Linked Over 5 Years Index
Extended
L&G Corporate Bond All Stock Index Fund Passive iBoxx £ Non Gilts ex BBB Index Core Fidelity UK Corporate Bond Fund Active Merrill Lynch Euro Sterling Bond Index Core
Fidelity Pre-Retirement Bond Fund Active Composite of Merrill Lynch Gilt and Sterling Bond Indices
Core
Fidelity UK Aggregate Bond Fund Active Composite of iBoxx Gilt and Sterling Bond Indices Core
Ethical Funds Active/ Passive Benchmark
L&G Ethical Global Equity Index Fund Passive FTSE4Good Global Equity Index Core HSBC Life Islamic Fund Passive Dow Jones Islamic Market Titans 100 (TR) Core Sustainable Funds Active/
Passive Benchmark
Master Trust Sustainable Climate Equity Fund Active MSCI World - Net Return Index Core Master Trust Sustainable Positive Change Fund Active MSCI ACWI Core Master Trust Sustainable Climate Bond Fund Active Bloomberg Barclays Global Aggregate Corporate
Index Hedged to GBP Core
Master Trust Sustainable Active Equity Fund Active MSCI ACWI ESG Leaders Index Core Master Trust Sustainable Passive Equity Fund Passive MSCI ESG Focus Low Carbon Screened Index Core
Property Active/ Passive Benchmark
L&G 70:30 Hybrid Property Fund Active Composite Index Core
Cash Active/ Passive Benchmark
Fidelity Cash Fund Active Morningstar UK Savings £2,500+ Investment Gross
Core
BlackRock Cash Fund Active 7 Day LIBID Extended Risks specific to the Credit Suisse Section No Section specific risks. The key risk, which isn't Section specific, is that members will have insufficient income in retirement or an income that does not meet their expectations. This risk was considered when setting the investment options and strategy, along with:
• Risk of not meeting the reasonable expectations of Credit Suisse members, bearing in mind members’ contributions, fund choices and retirement intentions.
• Risk of the default fund being unsuitable for the requirements of some members, specifically the risk that the Credit Suisse population’s typical member does not represent the basis of the typical member in relation to the Trustees’ default fund overall.
The Fidelity Master Trust Report and Financial Statements for the year ended 30 June 2021
89
Other Investment Policies No Section specific investment policies. The Trustee of the Fidelity Master Trust is responsible for investment policies including:
• Consideration of material and non-financially material matters (including climate change and other ESG considerations);
• Consideration of stewardship matters, including reviewing of voting activity of appointed asset managers; and
• Evaluation of costs and charges associated with the default strategy and self-select funds, including portfolio turnover costs.
Compliance
The Trustee have taken advice from Aon Solutions UK Limited on the suitability of the ‘extended’ range of investment funds for this Section. Credit Suisse use the Master Trust default strategy which is reviewed regularly by the Master Trust trustees and their advisors.
Dated – 10 August 2021

The Fidelity Master Trust Report and Financial Statements for the year ended 30 June 2021
90
Appendix 9.4 - Investment policy for the RSA Section This Appendix is for the RSA Section of the Fidelity Master Trust. The Trustees have taken advice from Lane Clark & Peacock LLP on the suitability of the investment strategy for this section. Investment Objectives The main investment objectives are:
• to provide a default investment option that is likely to be suitable for those members that do not wish to make their own investment decisions;
• to provide a range of investment options for members that wish to make their own investment decisions, suitable for members of different ages and with different retirement plans and objectives; and
• to mitigate, where possible, the risks described in this statement. Default option and alternative strategies A bespoke default option has been designed to be suitable for a typical member of the RSA Section. The default option has been chosen taking account of:
• The kinds of investments to be held • The balance between different kinds of investments • Investment risks • The expected return on investments • Realisation of investments • Financially material considerations including risks around Environmental, Social and
Governance (ESG) The default option is the RSA Pension Cash Targeting Lifestyle Strategy, which is designed for members that will take a cash lump sum at retirement. The rationale for the default targeting cash is that the Scheme has a number of members close to retirement whose DB benefits are likely to be of much greater value than their DC benefits. The default option has been designed on the assumption that it is likely that members will choose to use their DB benefits to fund their ongoing regular retirement expenses and take their smaller DC benefits as cash to fund short-term expenses. Further supporting the default’s target is the fact that the average projected account size for members that are close to retirement is also relatively small, and trends across DC schemes in general are that small account sizes tend to be taken as a cash lump sum when members retire. The default option is a lifestyle strategy, which means that members’ assets are automatically moved between different investment funds as they approach their target retirement date. Members that are more than 15 years to retirement are invested 100% in the RSA Global Equity Fund. From 15 years to retirement the strategy begins to de-risk from equities to a more diversified portfolio including bonds and property by switching to the RSA Pre-Retirement Growth Fund. At 3.5 years to retirement members begin to de-risk further into a cash fund, such that by 0.5 years to retirement members are 100% invested in the RSA Cash Fund. Details of the funds are set out in the next section. In addition to the default option, members are able to select two alternative lifestyle strategies. The RSA Pension Drawdown Targeting Lifestyle is designed for members wishing to remain largely invested and gradually draw down their investments over time for income in retirement; the RSA Pension Annuity Income Targeting Lifestyle is designed for members wishing to target annuity purchase (guaranteed income for life). Both alternative lifestyles are invested in the same manner as the default
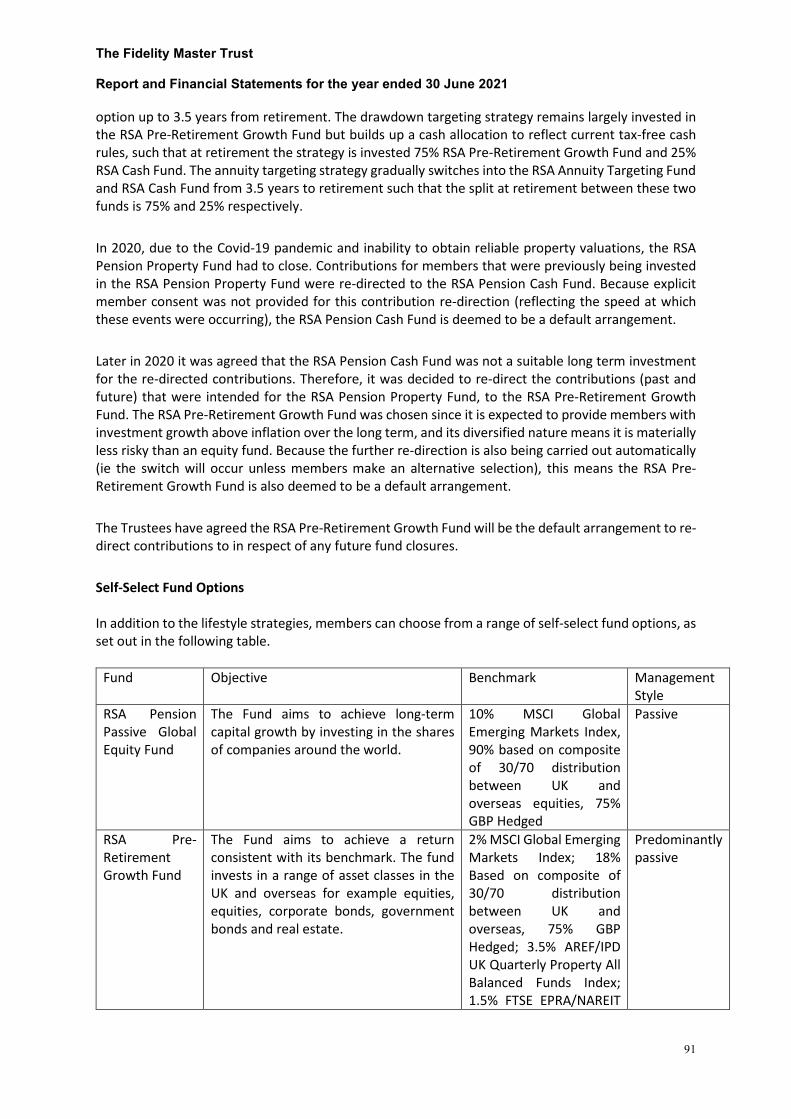
The Fidelity Master Trust Report and Financial Statements for the year ended 30 June 2021
91
option up to 3.5 years from retirement. The drawdown targeting strategy remains largely invested in the RSA Pre-Retirement Growth Fund but builds up a cash allocation to reflect current tax-free cash rules, such that at retirement the strategy is invested 75% RSA Pre-Retirement Growth Fund and 25% RSA Cash Fund. The annuity targeting strategy gradually switches into the RSA Annuity Targeting Fund and RSA Cash Fund from 3.5 years to retirement such that the split at retirement between these two funds is 75% and 25% respectively.
In 2020, due to the Covid-19 pandemic and inability to obtain reliable property valuations, the RSA Pension Property Fund had to close. Contributions for members that were previously being invested in the RSA Pension Property Fund were re-directed to the RSA Pension Cash Fund. Because explicit member consent was not provided for this contribution re-direction (reflecting the speed at which these events were occurring), the RSA Pension Cash Fund is deemed to be a default arrangement.
Later in 2020 it was agreed that the RSA Pension Cash Fund was not a suitable long term investment for the re-directed contributions. Therefore, it was decided to re-direct the contributions (past and future) that were intended for the RSA Pension Property Fund, to the RSA Pre-Retirement Growth Fund. The RSA Pre-Retirement Growth Fund was chosen since it is expected to provide members with investment growth above inflation over the long term, and its diversified nature means it is materially less risky than an equity fund. Because the further re-direction is also being carried out automatically (ie the switch will occur unless members make an alternative selection), this means the RSA Pre-Retirement Growth Fund is also deemed to be a default arrangement.
The Trustees have agreed the RSA Pre-Retirement Growth Fund will be the default arrangement to re-direct contributions to in respect of any future fund closures.
Self-Select Fund Options In addition to the lifestyle strategies, members can choose from a range of self-select fund options, as set out in the following table.
Fund Objective Benchmark Management Style
RSA Pension Passive Global Equity Fund
The Fund aims to achieve long-term capital growth by investing in the shares of companies around the world.
10% MSCI Global Emerging Markets Index, 90% based on composite of 30/70 distribution between UK and overseas equities, 75% GBP Hedged
Passive
RSA Pre-Retirement Growth Fund
The Fund aims to achieve a return consistent with its benchmark. The fund invests in a range of asset classes in the UK and overseas for example equities, equities, corporate bonds, government bonds and real estate.
2% MSCI Global Emerging Markets Index; 18% Based on composite of 30/70 distribution between UK and overseas, 75% GBP Hedged; 3.5% AREF/IPD UK Quarterly Property All Balanced Funds Index; 1.5% FTSE EPRA/NAREIT
Predominantly passive
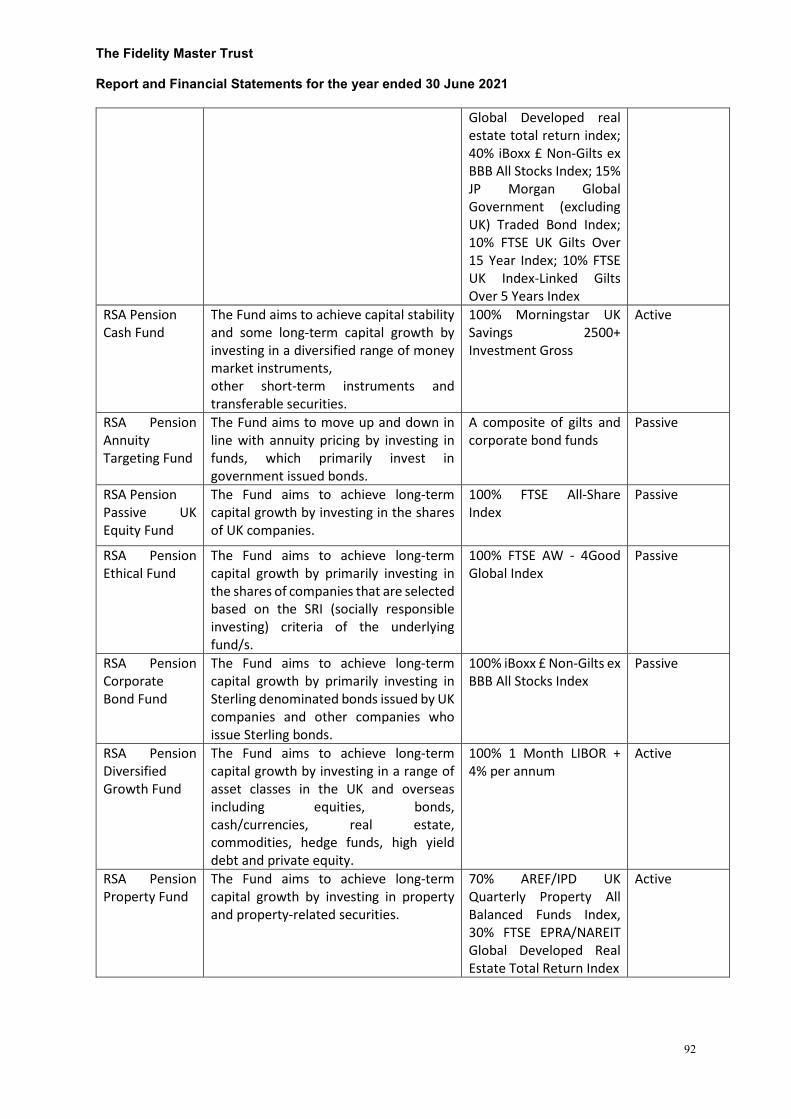
The Fidelity Master Trust Report and Financial Statements for the year ended 30 June 2021
92
Global Developed real estate total return index; 40% iBoxx £ Non-Gilts ex BBB All Stocks Index; 15% JP Morgan Global Government (excluding UK) Traded Bond Index; 10% FTSE UK Gilts Over 15 Year Index; 10% FTSE UK Index-Linked Gilts Over 5 Years Index
RSA Pension Cash Fund
The Fund aims to achieve capital stability and some long-term capital growth by investing in a diversified range of money market instruments, other short-term instruments and transferable securities.
100% Morningstar UK Savings 2500+ Investment Gross
Active
RSA Pension Annuity Targeting Fund
The Fund aims to move up and down in line with annuity pricing by investing in funds, which primarily invest in government issued bonds.
A composite of gilts and corporate bond funds
Passive
RSA Pension Passive UK Equity Fund
The Fund aims to achieve long-term capital growth by investing in the shares of UK companies.
100% FTSE All-Share Index
Passive
RSA Pension Ethical Fund
The Fund aims to achieve long-term capital growth by primarily investing in the shares of companies that are selected based on the SRI (socially responsible investing) criteria of the underlying fund/s.
100% FTSE AW - 4Good Global Index
Passive
RSA Pension Corporate Bond Fund
The Fund aims to achieve long-term capital growth by primarily investing in Sterling denominated bonds issued by UK companies and other companies who issue Sterling bonds.
100% iBoxx £ Non-Gilts ex BBB All Stocks Index
Passive
RSA Pension Diversified Growth Fund
The Fund aims to achieve long-term capital growth by investing in a range of asset classes in the UK and overseas including equities, bonds, cash/currencies, real estate, commodities, hedge funds, high yield debt and private equity.
100% 1 Month LIBOR + 4% per annum
Active
RSA Pension Property Fund
The Fund aims to achieve long-term capital growth by investing in property and property-related securities.
70% AREF/IPD UK Quarterly Property All Balanced Funds Index, 30% FTSE EPRA/NAREIT Global Developed Real Estate Total Return Index
Active
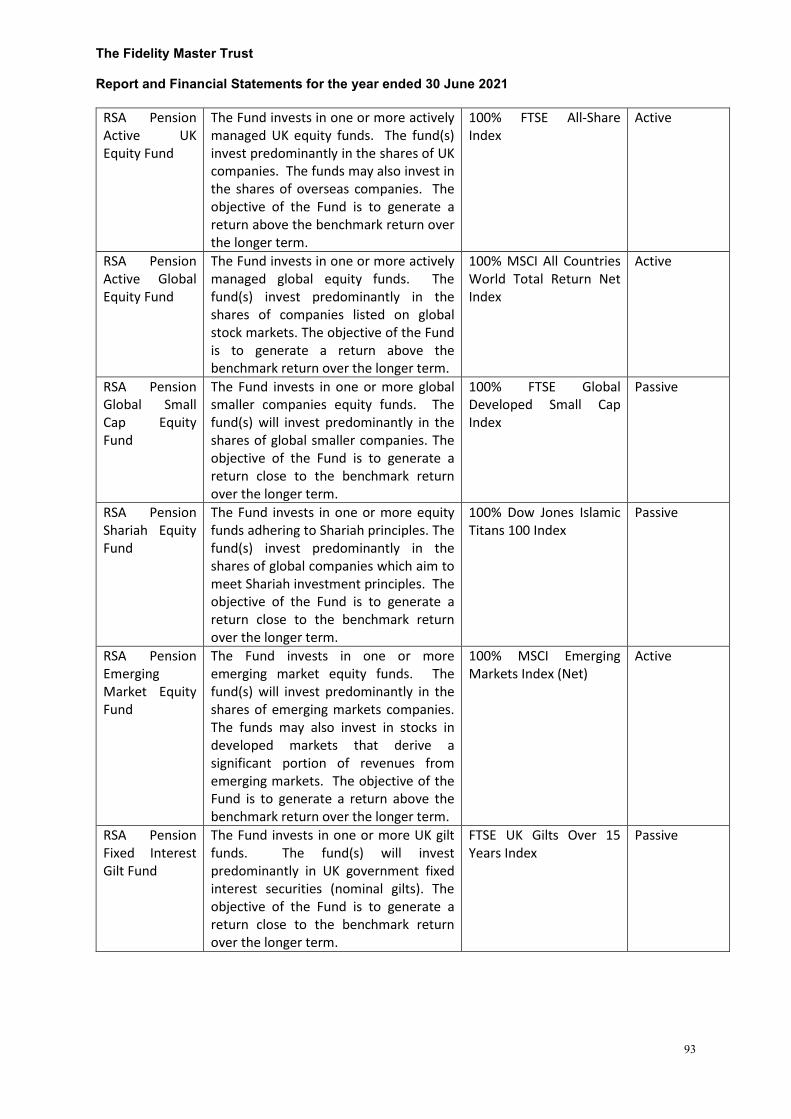
The Fidelity Master Trust Report and Financial Statements for the year ended 30 June 2021
93
RSA Pension Active UK Equity Fund
The Fund invests in one or more actively managed UK equity funds. The fund(s) invest predominantly in the shares of UK companies. The funds may also invest in the shares of overseas companies. The objective of the Fund is to generate a return above the benchmark return over the longer term.
100% FTSE All-Share Index
Active
RSA Pension Active Global Equity Fund
The Fund invests in one or more actively managed global equity funds. The fund(s) invest predominantly in the shares of companies listed on global stock markets. The objective of the Fund is to generate a return above the benchmark return over the longer term.
100% MSCI All Countries World Total Return Net Index
Active
RSA Pension Global Small Cap Equity Fund
The Fund invests in one or more global smaller companies equity funds. The fund(s) will invest predominantly in the shares of global smaller companies. The objective of the Fund is to generate a return close to the benchmark return over the longer term.
100% FTSE Global Developed Small Cap Index
Passive
RSA Pension Shariah Equity Fund
The Fund invests in one or more equity funds adhering to Shariah principles. The fund(s) invest predominantly in the shares of global companies which aim to meet Shariah investment principles. The objective of the Fund is to generate a return close to the benchmark return over the longer term.
100% Dow Jones Islamic Titans 100 Index
Passive
RSA Pension Emerging Market Equity Fund
The Fund invests in one or more emerging market equity funds. The fund(s) will invest predominantly in the shares of emerging markets companies. The funds may also invest in stocks in developed markets that derive a significant portion of revenues from emerging markets. The objective of the Fund is to generate a return above the benchmark return over the longer term.
100% MSCI Emerging Markets Index (Net)
Active
RSA Pension Fixed Interest Gilt Fund
The Fund invests in one or more UK gilt funds. The fund(s) will invest predominantly in UK government fixed interest securities (nominal gilts). The objective of the Fund is to generate a return close to the benchmark return over the longer term.
FTSE UK Gilts Over 15 Years Index
Passive

The Fidelity Master Trust Report and Financial Statements for the year ended 30 June 2021
94
RSA Pension Index-Linked Gilt Fund
The Fund invests in one or more UK index-linked gilt funds. The fund(s) to invest predominantly in UK government index-linked securities (index-linked gilts). The objective of the Fund is to generate a return close to the benchmark return over the longer term.
FTSE UK Index-Linked Gilts Over 5 Years Index
Passive
RSA Pension ESG Fund
The Fund invests in one or more equity funds that explicitly address environmental, social and governance (ESG) considerations. The objective of the Fund is to maximise exposure to positive ESG factors while minimising the carbon exposures and targeting risk and return characteristics similar to those of the benchmark index.
MSCI World ESG Focus Low Carbon Screened Index
Passive
Risks specific to this Section The RSA Section is subject to the risks outlined in the main part of this Statement. There are no other Section specific risks. Dated - 10 September 2020
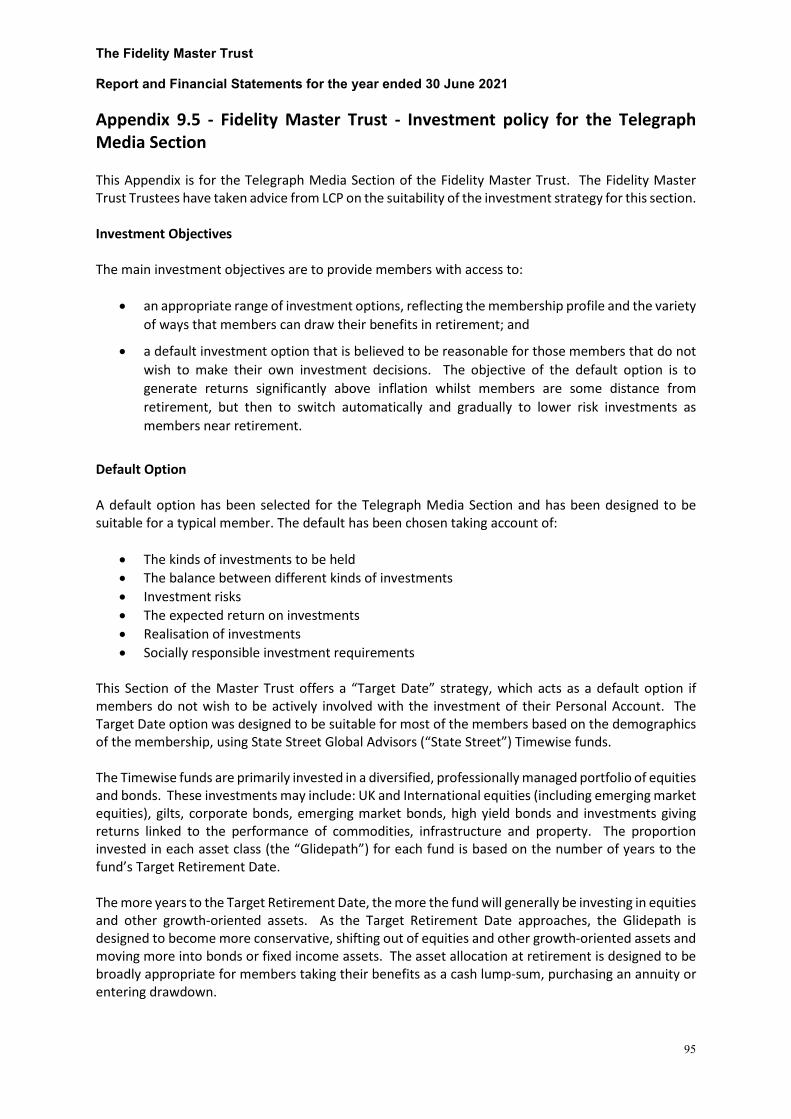
The Fidelity Master Trust Report and Financial Statements for the year ended 30 June 2021
95
Appendix 9.5 - Fidelity Master Trust - Investment policy for the Telegraph Media Section This Appendix is for the Telegraph Media Section of the Fidelity Master Trust. The Fidelity Master Trust Trustees have taken advice from LCP on the suitability of the investment strategy for this section. Investment Objectives The main investment objectives are to provide members with access to:
• an appropriate range of investment options, reflecting the membership profile and the variety of ways that members can draw their benefits in retirement; and
• a default investment option that is believed to be reasonable for those members that do not wish to make their own investment decisions. The objective of the default option is to generate returns significantly above inflation whilst members are some distance from retirement, but then to switch automatically and gradually to lower risk investments as members near retirement.
Default Option A default option has been selected for the Telegraph Media Section and has been designed to be suitable for a typical member. The default has been chosen taking account of:
• The kinds of investments to be held • The balance between different kinds of investments • Investment risks • The expected return on investments • Realisation of investments • Socially responsible investment requirements
This Section of the Master Trust offers a “Target Date” strategy, which acts as a default option if members do not wish to be actively involved with the investment of their Personal Account. The Target Date option was designed to be suitable for most of the members based on the demographics of the membership, using State Street Global Advisors (“State Street”) Timewise funds. The Timewise funds are primarily invested in a diversified, professionally managed portfolio of equities and bonds. These investments may include: UK and International equities (including emerging market equities), gilts, corporate bonds, emerging market bonds, high yield bonds and investments giving returns linked to the performance of commodities, infrastructure and property. The proportion invested in each asset class (the “Glidepath”) for each fund is based on the number of years to the fund’s Target Retirement Date. The more years to the Target Retirement Date, the more the fund will generally be investing in equities and other growth-oriented assets. As the Target Retirement Date approaches, the Glidepath is designed to become more conservative, shifting out of equities and other growth-oriented assets and moving more into bonds or fixed income assets. The asset allocation at retirement is designed to be broadly appropriate for members taking their benefits as a cash lump-sum, purchasing an annuity or entering drawdown.
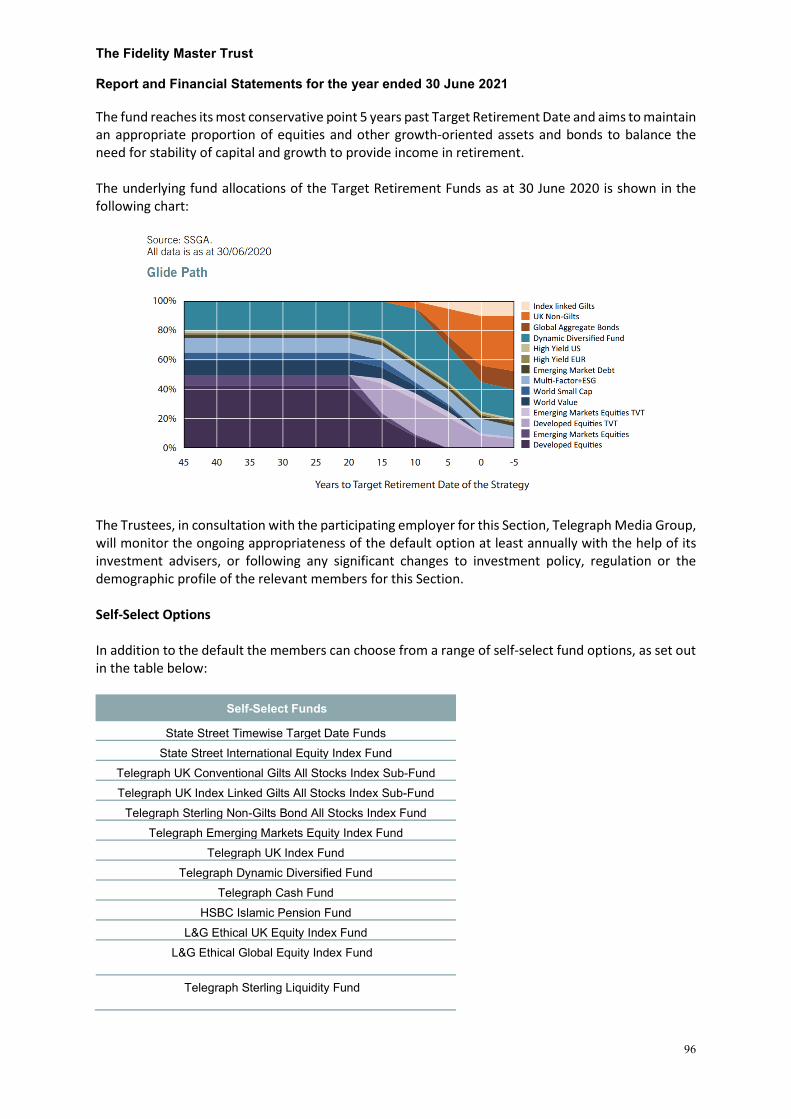
The Fidelity Master Trust Report and Financial Statements for the year ended 30 June 2021
96
The fund reaches its most conservative point 5 years past Target Retirement Date and aims to maintain an appropriate proportion of equities and other growth-oriented assets and bonds to balance the need for stability of capital and growth to provide income in retirement. The underlying fund allocations of the Target Retirement Funds as at 30 June 2020 is shown in the following chart:
The Trustees, in consultation with the participating employer for this Section, Telegraph Media Group, will monitor the ongoing appropriateness of the default option at least annually with the help of its investment advisers, or following any significant changes to investment policy, regulation or the demographic profile of the relevant members for this Section. Self-Select Options In addition to the default the members can choose from a range of self-select fund options, as set out in the table below:
Self-Select Funds
State Street Timewise Target Date Funds State Street International Equity Index Fund
Telegraph UK Conventional Gilts All Stocks Index Sub-Fund Telegraph UK Index Linked Gilts All Stocks Index Sub-Fund
Telegraph Sterling Non-Gilts Bond All Stocks Index Fund Telegraph Emerging Markets Equity Index Fund
Telegraph UK Index Fund Telegraph Dynamic Diversified Fund
Telegraph Cash Fund HSBC Islamic Pension Fund
L&G Ethical UK Equity Index Fund L&G Ethical Global Equity Index Fund
Telegraph Sterling Liquidity Fund

The Fidelity Master Trust Report and Financial Statements for the year ended 30 June 2021
97
Risks specific to this Section In addition to the risks detailed in the main part of this Statement, the risks listed below also need to be considered for this Section:
1. Unsuitable investments
This Section offers a range of investments. By doing so, it is believed members have suitable options available for their individual circumstances.
2. Risk from excessive charges
If the investment management charges together with other charges levied on, for example, transfers or early retirement are excessive, then the value of a member’s account will be reduced unnecessarily. The charges applicable within this Section are in line with market practice and are assessed regularly to consider whether these continue to represent good value for members. 3. Risk of Inadequate returns
2 As members’ benefits are dependent on the investment returns achieved, it is important that investment options are available which can be expected to produce adequate real returns over the longer term. Accordingly, equity and equity-based funds, which are expected to provide positive returns above inflation over the long term, have been made available to members and feature in the growth phase of the default option. To reduce the chance of a sharp deterioration in members’ benefits close to retirement, the default option has been made a “Target Date” strategy.
4. Illiquidity/marketability risk
3 This is the risk that core financial transactions, such as investing members’ contributions, are not processed promptly due to lack of liquidity in the investments. Illiquidity/marketability risk is managed within this Section manage by only using pooled funds with daily dealing within the default strategy and diversifying the strategy across different types of investment.
Dated – 8 January 2021

The Fidelity Master Trust Report and Financial Statements for the year ended 30 June 2021
98
Appendix 9.6 - Fidelity Master Trust - Investment policy for the Universal Music Section This Appendix is for the Universal Music Section (“the Section”) of the Fidelity Master Trust (the “Scheme”). The Trustees have taken advice from Hymans Robertson LLP on the suitability of the investment strategy for this section. Investment Objectives The main investment objectives are:
• to include a suitable default option that is likely to be suitable for a typical member; • to include a range of alternative choices suitable for members of different ages and with
different retirement benefit plans and objectives; • to enable members to grow their savings above inflation over the long term; • to seek, where possible, to mitigate the risks described in the main Statement of Investment
Principles and this appendix; Default Option – drawdown lifestyle strategy A default option has been selected for the Section, and has been designed to be suitable for a typical member. The default has been chosen taking account of:
• The kinds of investments to be held; • The balance between different kinds of investments; • The expected return on investments; • Realisation of investments; • An appropriate level of risk depending on the member’s term to retirement; • Providing members with long-term growth of contributions; • Taking into account environmental, social and governance factors; and • Providing members with flexibility at retirement.
The default option is structured as a lifestyle strategy, which provides members with flexibility with regards to when they take benefits and how. The default option is structured in three phases as follows: A Growth Phase – this will form the majority of the strategy and aims to maximise the growth for members. This phase should be invested in growth assets, to provide the maximum opportunity for long-term growth. In addition, regular contributions will result in a smoother experience for members, especially when fund values are smaller. A Consolidation Phase – this phase aims to manage the investment risk as the size of the member’s pot is more significant at this stage and members have less time to recoup losses over this phase. A Pre-Retirement Phase – this phase aims to invest in a manner which matches the way that members intend to take their benefits to manage pension conversion risk (the risk that the investments at retirement do not match the way benefits are taken resulting in losses from converting the assets to benefits).

The Fidelity Master Trust Report and Financial Statements for the year ended 30 June 2021
99
Therefore, the default option is structured as follows:
Phase of retirement journey Fund Growth (15 years or more to selected retirement date)
Universal Music Global Equity Fund (BlackRock UK Equity Fund (15%), BlackRock World (ex UK) Equity Fund (35%) and Schroders Sustainable Multi-Factor Equity (50%))
Consolidation (between 14 and 6 years to selected retirement date)
Universal Music Global Equity Fund and LGIM Diversified Fund
Pre-retirement (5 years or less to selected retirement date)
LGIM Diversified Fund, L&G Retirement Income Multi-Asset Fund and L&G Cash Fund
Alternative lifestyle strategies The Section also offers two alternative lifestyle strategies for members who believe that the target retirement benefits of the default option are not appropriate to their needs, but otherwise do not want to take an active part in selecting where contributions are invested. The alternative lifestyle strategies manage the principal risks faced by members during their membership but offer a choice of targeting taking their retirement benefits as cash at retirement or as an annuity at retirement. Cash lifestyle strategy – this strategy aims to protect members who wish to take their entire fund as a single or small number of cash lump sums against market downturns. Annuity lifestyle strategy – this strategy aims to invest to match broadly the way in which annuity rates change and thus maintain members’ annuity purchasing power. The growth and consolidation phases of the alternative lifestyle strategies are the same as the default option. However, once a member moves into the pre-retirement phase, the lifestyle strategies have different approaches in order to match the target retirement benefit type. This is shown in the graphs below.
0
10
20
30
40
50
60
70
80
90
100
15+ 14 13 12 11 10 9 8 7 6 5 4 3 2 1
Allo
catio
n %
Years to retirement
Drawdown lifestyle strategy

The Fidelity Master Trust Report and Financial Statements for the year ended 30 June 2021
100
Inadvertent or temporary Default Arrangements From time to time Fidelity, or a fund manager, may suspend trading in a fund due to market / liquidity conditions or decide to close a fund for commercial or regulatory reasons. This would be outside the control of the Master Trust Trustees. Should these circumstances occur, it may be necessary for the Trustees to redirect contributions temporarily to an investment option which differs from members’ original selected choices.
For this section, the Trustees will temporarily redirect contributions to the Fidelity Cash Fund. This temporary default fund’s objectives are:
• To maintain the original value of the members’ investments with the least amount of fluctuation prior to the temporary default being created.
• To invest in securities with the strongest liquidity profiles allowing assets to be quickly realised once contributions can be re-directed back to the original fund.
• To maintain an all-in fund charge that is under the regulatory charge cap for DC default strategies.
In all such circumstances, the Trustees will notify members of the issue and identify any actions members may take including allowing members the choice of another self-select fund. Where a fund suspension has been resolved, the Trustees will notify members of their investment options. They will not arrange for the re-investment of past, nor re-direction of future, contributions back into the investment option originally chosen by members.
It should be noted that in the past (during a period of property fund suspensions within the Master Trust), contributions that were to be invested in the L&G Managed Property Fund were, for a period, redirected to the Fidelity Cash Fund as a temporary holding position. Members were written to and informed of alternative choices they could make.
0
20
40
60
80
100
6 5 4 3 2 1
Years to retirement
Annuity lifestyle strategy (last 6yrs)
0
20
40
60
80
100
6 5 4 3 2 1
Years to retirement
Cash lifestyle strategy (last 6yrs)
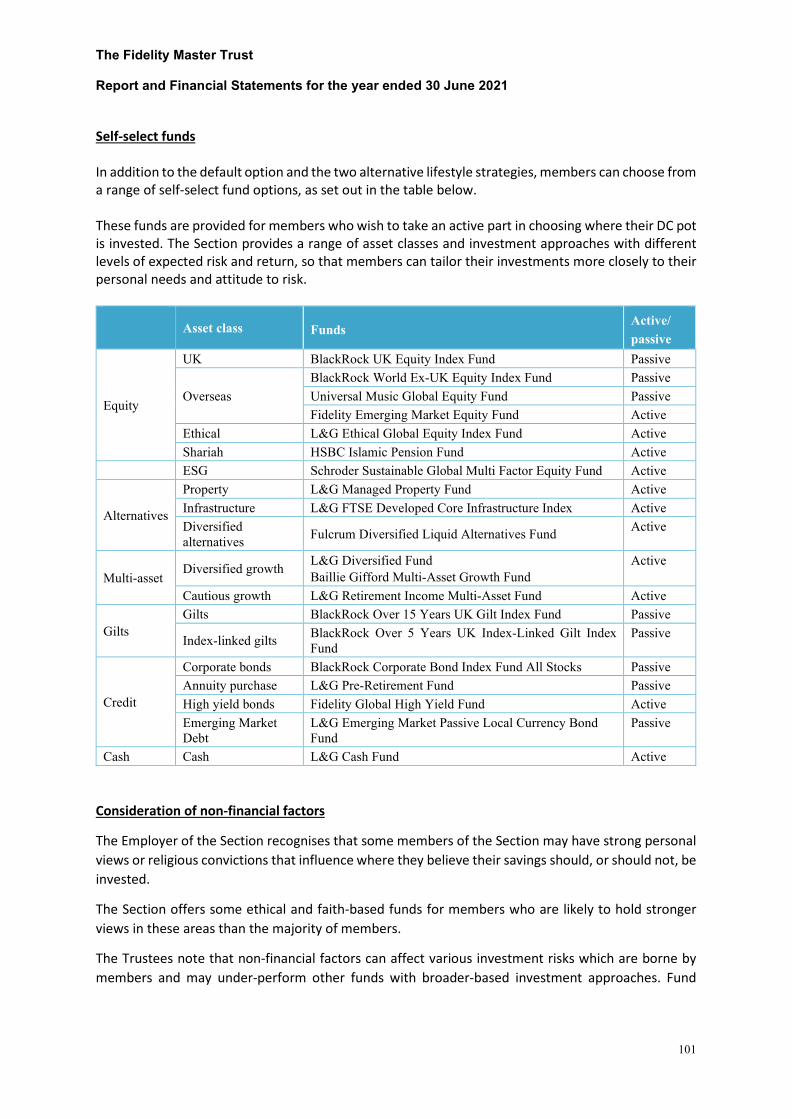
The Fidelity Master Trust Report and Financial Statements for the year ended 30 June 2021
101
Self-select funds In addition to the default option and the two alternative lifestyle strategies, members can choose from a range of self-select fund options, as set out in the table below. These funds are provided for members who wish to take an active part in choosing where their DC pot is invested. The Section provides a range of asset classes and investment approaches with different levels of expected risk and return, so that members can tailor their investments more closely to their personal needs and attitude to risk.
Asset class Funds
Active/ passive
Equity
UK BlackRock UK Equity Index Fund Passive
Overseas BlackRock World Ex-UK Equity Index Fund Passive Universal Music Global Equity Fund Passive Fidelity Emerging Market Equity Fund Active
Ethical L&G Ethical Global Equity Index Fund Active Shariah HSBC Islamic Pension Fund Active
ESG Schroder Sustainable Global Multi Factor Equity Fund Active
Alternatives
Property L&G Managed Property Fund Active Infrastructure L&G FTSE Developed Core Infrastructure Index Active Diversified alternatives Fulcrum Diversified Liquid Alternatives Fund Active
Multi-asset Diversified growth L&G Diversified Fund
Baillie Gifford Multi-Asset Growth Fund Active
Cautious growth L&G Retirement Income Multi-Asset Fund Active
Gilts Gilts BlackRock Over 15 Years UK Gilt Index Fund Passive
Index-linked gilts BlackRock Over 5 Years UK Index-Linked Gilt Index Fund
Passive
Credit
Corporate bonds BlackRock Corporate Bond Index Fund All Stocks Passive Annuity purchase L&G Pre-Retirement Fund Passive High yield bonds Fidelity Global High Yield Fund Active Emerging Market Debt
L&G Emerging Market Passive Local Currency Bond Fund
Passive
Cash Cash L&G Cash Fund Active Consideration of non-financial factors
The Employer of the Section recognises that some members of the Section may have strong personal views or religious convictions that influence where they believe their savings should, or should not, be invested.
The Section offers some ethical and faith-based funds for members who are likely to hold stronger views in these areas than the majority of members.
The Trustees note that non-financial factors can affect various investment risks which are borne by members and may under-perform other funds with broader-based investment approaches. Fund
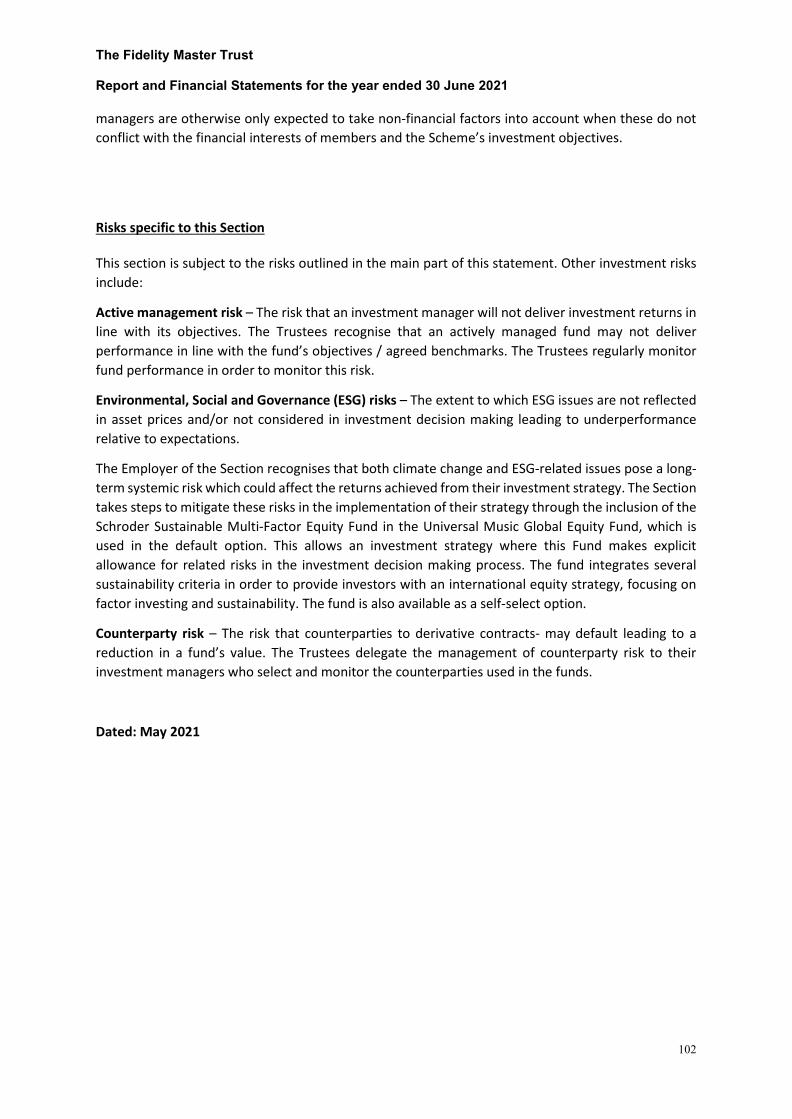
The Fidelity Master Trust Report and Financial Statements for the year ended 30 June 2021
102
managers are otherwise only expected to take non-financial factors into account when these do not conflict with the financial interests of members and the Scheme’s investment objectives.
Risks specific to this Section This section is subject to the risks outlined in the main part of this statement. Other investment risks include:
Active management risk – The risk that an investment manager will not deliver investment returns in line with its objectives. The Trustees recognise that an actively managed fund may not deliver performance in line with the fund’s objectives / agreed benchmarks. The Trustees regularly monitor fund performance in order to monitor this risk.
Environmental, Social and Governance (ESG) risks – The extent to which ESG issues are not reflected in asset prices and/or not considered in investment decision making leading to underperformance relative to expectations.
The Employer of the Section recognises that both climate change and ESG-related issues pose a long-term systemic risk which could affect the returns achieved from their investment strategy. The Section takes steps to mitigate these risks in the implementation of their strategy through the inclusion of the Schroder Sustainable Multi-Factor Equity Fund in the Universal Music Global Equity Fund, which is used in the default option. This allows an investment strategy where this Fund makes explicit allowance for related risks in the investment decision making process. The fund integrates several sustainability criteria in order to provide investors with an international equity strategy, focusing on factor investing and sustainability. The fund is also available as a self-select option.
Counterparty risk – The risk that counterparties to derivative contracts- may default leading to a reduction in a fund’s value. The Trustees delegate the management of counterparty risk to their investment managers who select and monitor the counterparties used in the funds.
Dated: May 2021

The Fidelity Master Trust Report and Financial Statements for the year ended 30 June 2021
103
Appendix 9.7 - Fidelity Master Trust - Investment policy for the Virgin Money Section
This Appendix is for the Virgin Money Section of the Fidelity Master Trust. Investment Objectives The main investment objectives are:
• to include a suitable default option that is likely to be suitable for a typical member • to include a range of alternative choices suitable for members of different ages
and with different retirement benefit plans and objectives • to enable members to grow their savings above inflation over the long term • to seek, where possible, to mitigate the risks described in this statement
Scheme Default Investment Arrangement A default option has been selected for the Virgin Money Section, and has been designed to be suitable for a typical member. The default has been chosen taking account of:
• The kinds of investments to be held • The balance between different kinds of investments • Manages the main investment risks members face • The expected return on investments and to maximise investment returns relative to inflation
while taking an appropriate level of risk for the majority of members who do not make investment choices
• Realisation of investments • Financially material considerations including environmental, social and governance
considerations including climate change over an appropriate timescale • Reflects members’ likely benefit choices at retirement
The default arrangement is a lifestyle strategy which targets members who are expected to use flexible retirement with a high probability of using Flexible Access Income Drawdown for a significant part of their retirement savings during their retirement.
The default lifestyle strategy gradually moves investments between different funds to manage the levels of expected investment risks and returns at each stage of membership of the Scheme.
The expected levels of investment returns (after the deduction of charges) and risks for the funds used are consistent with the Trustee’s objectives for the default arrangement.
Default Arrangement – Drawdown Lifestyle (Default) Strategy The Default Arrangement is a lifestyle strategy which targets cash and income drawdown at retirement.
Members are invested in funds expected to give higher returns relative to inflation up to 15 years before their selected/normal retirement date.
Members are gradually switched into funds which are expected to give good returns relative to
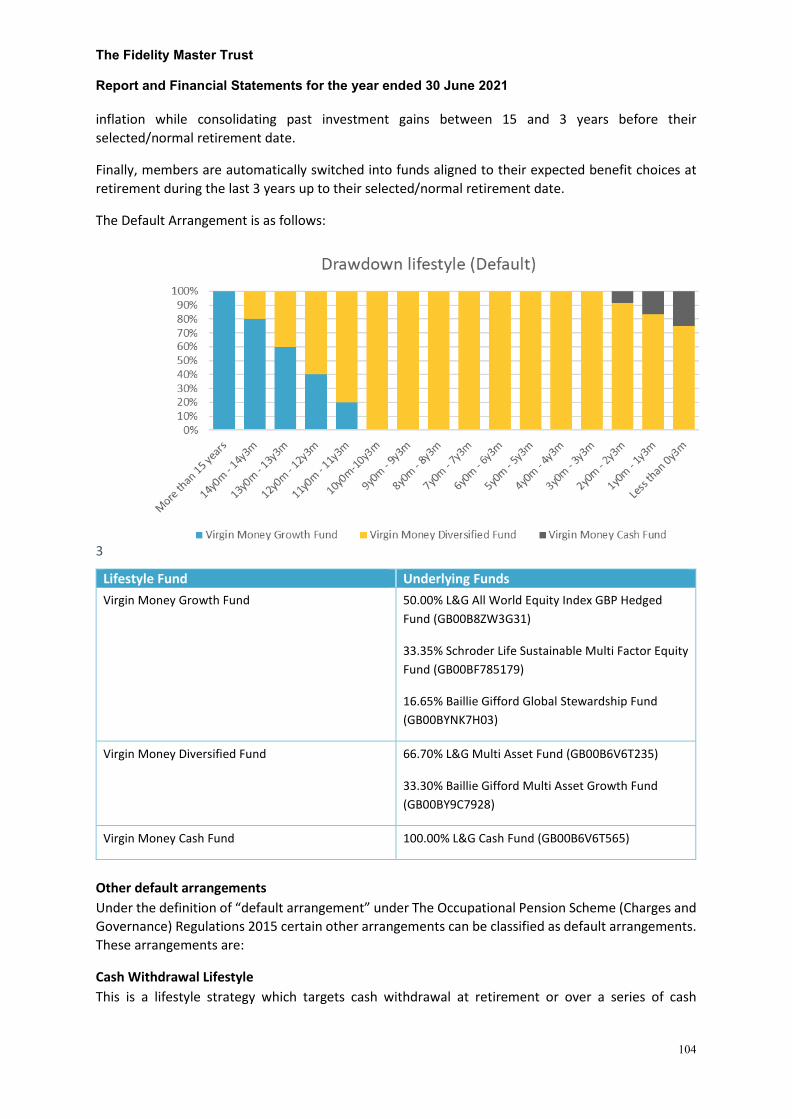
The Fidelity Master Trust Report and Financial Statements for the year ended 30 June 2021
104
inflation while consolidating past investment gains between 15 and 3 years before their selected/normal retirement date.
Finally, members are automatically switched into funds aligned to their expected benefit choices at retirement during the last 3 years up to their selected/normal retirement date.
The Default Arrangement is as follows:
3
Lifestyle Fund Underlying Funds Virgin Money Growth Fund 50.00% L&G All World Equity Index GBP Hedged
Fund (GB00B8ZW3G31)
33.35% Schroder Life Sustainable Multi Factor Equity Fund (GB00BF785179)
16.65% Baillie Gifford Global Stewardship Fund (GB00BYNK7H03)
Virgin Money Diversified Fund 66.70% L&G Multi Asset Fund (GB00B6V6T235)
33.30% Baillie Gifford Multi Asset Growth Fund (GB00BY9C7928)
Virgin Money Cash Fund 100.00% L&G Cash Fund (GB00B6V6T565)
Other default arrangements Under the definition of “default arrangement” under The Occupational Pension Scheme (Charges and Governance) Regulations 2015 certain other arrangements can be classified as default arrangements. These arrangements are:
Cash Withdrawal Lifestyle This is a lifestyle strategy which targets cash withdrawal at retirement or over a series of cash

The Fidelity Master Trust Report and Financial Statements for the year ended 30 June 2021
105
withdrawals over a few years.
Members are invested in funds expected to give higher returns relative to inflation up to 15 years before their selected/normal retirement date.
Members are gradually switched into funds which are expected to give good returns relative to inflation while consolidating past investment gains between 15 and 5 years before their selected/normal retirement date.
Finally, members are automatically switched into funds aligned to their expected benefit choices at retirement during the last 5 years up to their selected/normal retirement date.
This arrangement is as follows:
Lifestyle Fund Underlying Funds Virgin Money Growth Fund 50.00% L&G All World Equity Index GBP Hedged
Fund (GB00B8ZW3G31)
33.35% Schroder Life Sustainable Multi Factor Equity Fund (GB00BF785179)
16.65% Baillie Gifford Global Stewardship Fund (GB00BYNK7H03)
Virgin Money Diversified Fund 66.70% L&G Multi Asset Fund (GB00B6V6T235)
33.30% Baillie Gifford Multi Asset Growth Fund (GB00BY9C7928)
Virgin Money Diversified Bonds Fund 100.00% M&G Total Return Credit Investment Fund (LU0895902996)
Virgin Money Cash Fund 100.00% L&G Cash Fund (GB00B6V6T565)
0%10%20%30%40%50%60%70%80%90%
100%
Cash Withdrawal lifestyle
Virgin Money Growth Fund Virgin Money Diversified Fund
Virgin Money Defensive Bonds Fund Virgin Money Cash Fund

The Fidelity Master Trust Report and Financial Statements for the year ended 30 June 2021
106
Annuity Lifestyle This is a lifestyle strategy which targets cash and annuity purchase at retirement.
Members are invested in funds expected to give higher returns relative to inflation up to 15 years before their selected/normal retirement date.
Members are gradually switched into funds which are expected to give good returns relative to inflation while consolidating past investment gains between 15 and 5 years before their selected/normal retirement date.
Finally, members are automatically switched into funds aligned to their expected benefit choices at retirement during the last 5 years up to their selected/normal retirement date.
This arrangement is as follows:
Lifestyle Fund Underlying Funds Virgin Money Growth Fund 50.00% L&G All World Equity Index GBP Hedged
Fund (GB00B8ZW3G31)
33.35% Schroder Life Sustainable Multi Factor Equity Fund (GB00BF785179)
16.65% Baillie Gifford Global Stewardship Fund (GB00BYNK7H03)
Virgin Money Diversified Fund 66.70% L&G Multi Asset Fund (GB00B6V6T235)
33.30% Baillie Gifford Multi Asset Growth Fund (GB00BY9C7928)
Virgin Money Pre-Retirement Fund (Targeting Annuity)
100.00% L&G Pre-Retirement Fund (GB00B6V70Q77)
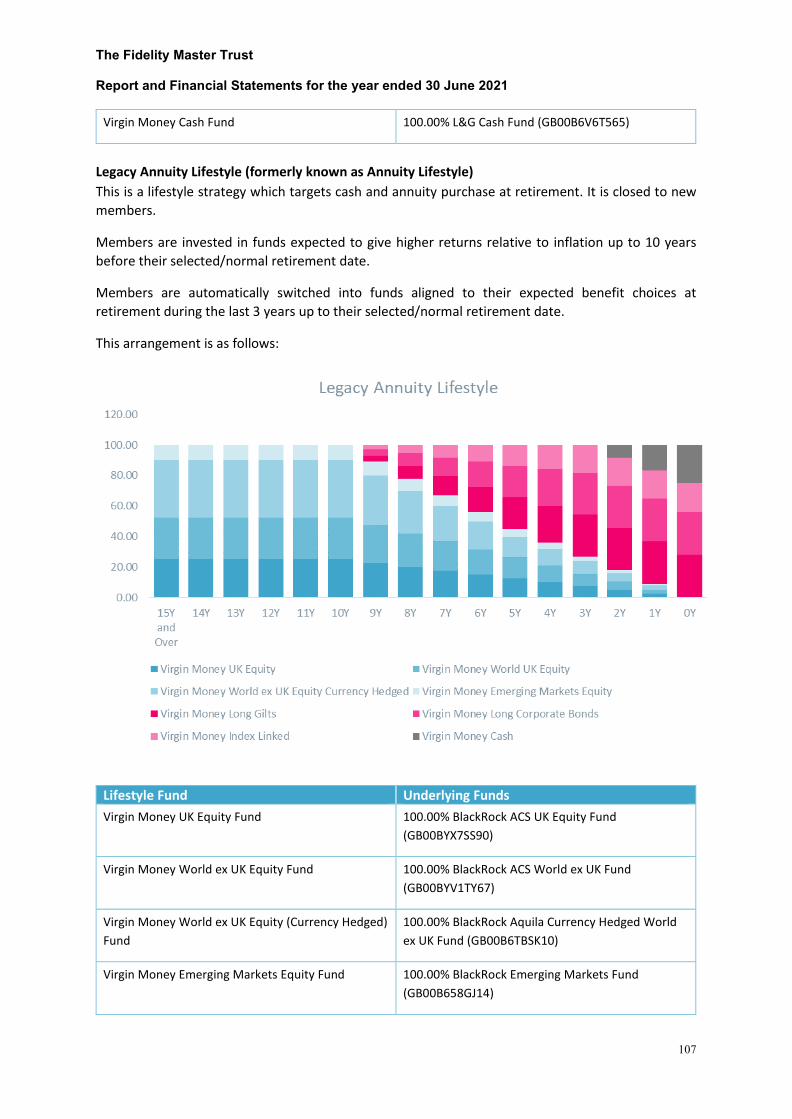
The Fidelity Master Trust Report and Financial Statements for the year ended 30 June 2021
107
Virgin Money Cash Fund 100.00% L&G Cash Fund (GB00B6V6T565)
Legacy Annuity Lifestyle (formerly known as Annuity Lifestyle) This is a lifestyle strategy which targets cash and annuity purchase at retirement. It is closed to new members.
Members are invested in funds expected to give higher returns relative to inflation up to 10 years before their selected/normal retirement date.
Members are automatically switched into funds aligned to their expected benefit choices at retirement during the last 3 years up to their selected/normal retirement date.
This arrangement is as follows:
Lifestyle Fund Underlying Funds Virgin Money UK Equity Fund 100.00% BlackRock ACS UK Equity Fund
(GB00BYX7SS90)
Virgin Money World ex UK Equity Fund 100.00% BlackRock ACS World ex UK Fund (GB00BYV1TY67)
Virgin Money World ex UK Equity (Currency Hedged) Fund
100.00% BlackRock Aquila Currency Hedged World ex UK Fund (GB00B6TBSK10)
Virgin Money Emerging Markets Equity Fund 100.00% BlackRock Emerging Markets Fund (GB00B658GJ14)
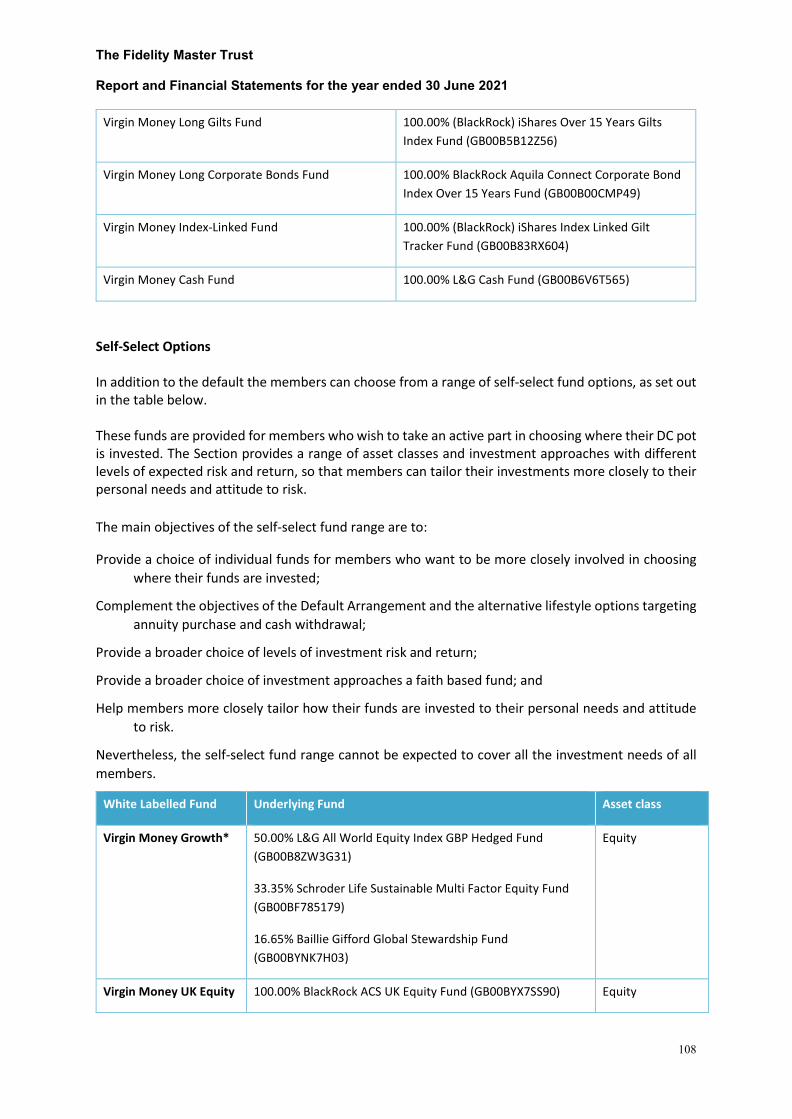
The Fidelity Master Trust Report and Financial Statements for the year ended 30 June 2021
108
Virgin Money Long Gilts Fund 100.00% (BlackRock) iShares Over 15 Years Gilts Index Fund (GB00B5B12Z56)
Virgin Money Long Corporate Bonds Fund 100.00% BlackRock Aquila Connect Corporate Bond Index Over 15 Years Fund (GB00B00CMP49)
Virgin Money Index-Linked Fund 100.00% (BlackRock) iShares Index Linked Gilt Tracker Fund (GB00B83RX604)
Virgin Money Cash Fund 100.00% L&G Cash Fund (GB00B6V6T565)
Self-Select Options In addition to the default the members can choose from a range of self-select fund options, as set out in the table below. These funds are provided for members who wish to take an active part in choosing where their DC pot is invested. The Section provides a range of asset classes and investment approaches with different levels of expected risk and return, so that members can tailor their investments more closely to their personal needs and attitude to risk. The main objectives of the self-select fund range are to:
Provide a choice of individual funds for members who want to be more closely involved in choosing where their funds are invested;
Complement the objectives of the Default Arrangement and the alternative lifestyle options targeting annuity purchase and cash withdrawal;
Provide a broader choice of levels of investment risk and return;
Provide a broader choice of investment approaches a faith based fund; and
Help members more closely tailor how their funds are invested to their personal needs and attitude to risk.
Nevertheless, the self-select fund range cannot be expected to cover all the investment needs of all members.
White Labelled Fund Underlying Fund Asset class
Virgin Money Growth* 50.00% L&G All World Equity Index GBP Hedged Fund (GB00B8ZW3G31)
33.35% Schroder Life Sustainable Multi Factor Equity Fund (GB00BF785179)
16.65% Baillie Gifford Global Stewardship Fund (GB00BYNK7H03)
Equity
Virgin Money UK Equity 100.00% BlackRock ACS UK Equity Fund (GB00BYX7SS90) Equity

The Fidelity Master Trust Report and Financial Statements for the year ended 30 June 2021
109
White Labelled Fund Underlying Fund Asset class
Virgin Money World ex UK Equity
100.00% BlackRock ACS World ex UK Fund (GB00BYV1TY67) Equity
Virgin Money World ex UK Equity (currency hedged)
100.00% BlackRock Aquila Currency Hedged World ex UK Equity Fund (GB00B6TBSK10)s
Equity
Virgin Money Emerging Markets Equity
100.00% BlackRock Emerging Markets Fund (GB00B658GJ14) Equity
Virgin Money ESG Equity
66.70% Schroder Life Sustainable Multi Factor Equity Fund (GB00BF785179)
33.30% Baillie Gifford Global Stewardship Fund (GB00BYNK7H03)
Equity
Virgin Money Islamic Equity
100.00% HSBC Islamic Global Equity Index Fund (LU1092475968)
Equity
Virgin Money Diversified*
66.70% L&G Multi Asset Fund (GB00B6V6T235)
33.30% Baillie Gifford Multi Asset Growth Fund (GB00BY9C7928)
Multi-Asset
Virgin Money Property 100.00% L&G Managed Property Fund (GB00B8ZC7P04) Property
Virgin Money Long Gilts 100.00% BlackRock Aquila Connect Corporate Bond Index Over 15 Years Fund (GB00B00CMP49)
Bonds
Virgin Money Long Corporate Bonds
100.00% BlackRock Aquila Connect Corporate Bond Index Over 15 Years Fund (GB00B00CMP49)
Bonds
Virgin Money Pre-Retirement (Targeting Annuity)
100.00% L&G Pre-Retirement Fund (GB00B6V70Q77) Bonds
Virgin Money Index-Linked
100.00% (BlackRock) iShares Index Linked Gilt Tracker Fund (GB00B83RX604)
Bonds
Virgin Money Defensive Bonds*
100.00% M&G Total Return Credit Investment Fund (LU0895902996)
Bonds
Virgin Money Cash* 100.00% L&G Cash Fund (GB00B6V6T565) Cash
*Funds used in Lifestyle Strategies
Risks Specific to this Section
The Fidelity Master Trust Report and Financial Statements for the year ended 30 June 2021
110
Climate risk – The extent to which climate change causes a material deterioration in asset values as a consequence of factors including, but not limited to: policy change, physical impacts and the expected transition to a low-carbon economy.
The Trustees recognise that climate change poses a long-term systemic risk which could affect the returns achieved from their investment strategy. The Section takes steps to mitigate climate risk in the implementation of their strategy through the inclusion of the Schroder Sustainable Multi-Factor Equity Fund and Baillie Gifford Global Stewardship Fund in the Virgin Money Growth Fund and Virgin Money ESG Fund, with the former used in the Default lifestyle, Cash Withdrawal Lifestyle and Annuity Lifestyle and both in the self-select range. This allows an investment strategy where this Fund makes explicit allowance for climate-related risks in the investment decision making process.
Counterparty risk – the financial institutions holding a fund’s assets may get into financial difficulties leading to a reduction in a fund’s value.
Factor based investing – equity investments may show several factors (supported by academic research) that may be expected to deliver stronger returns over the longer-term, but which may show increased risks (including timing) in the shorter-term.
Legislative/Regulatory - Changes in government policy or taxation may have a long-term positive or negative impact on certain sectors of a country’s economy or one country relative to its neighbours over the medium to longer-term. Changes in Regulations can also affect the operational costs, tax efficiency and security of one investment vehicle relative to other vehicles over the shorter-term.
The Trustees manage these other investment risks as part of the process for selecting and ongoing monitoring of the funds used by the Section. The funds used give a good spread of investments which will help manage risks associated with market conditions, fund manager actions and default. The Trustees believe that the Section’s investment options are appropriate for managing the risks typically faced by members.
Other Investment Policies Non-financial factors The Employer of the Section recognises that some members will have strong views or convictions on where their savings should, or should not, be invested.
The Section offers a fund managed on Shariah principles for members who are likely to hold stronger views in these areas than the majority of members.
The Trustees notes that non-financial factors can affect various investment risks which are borne by members and may under-perform other funds with broader-based investment approaches.
In all cases fund managers are expected to act in accordance with the financial interests of members and the Section’s investment objectives.
Compliance
The Trustees have taken advice from Hymans Robertson LLP on the suitability of the investment strategy for this section. The investment strategy will be reviewed at least triennially.
Dated – 7 September 2020
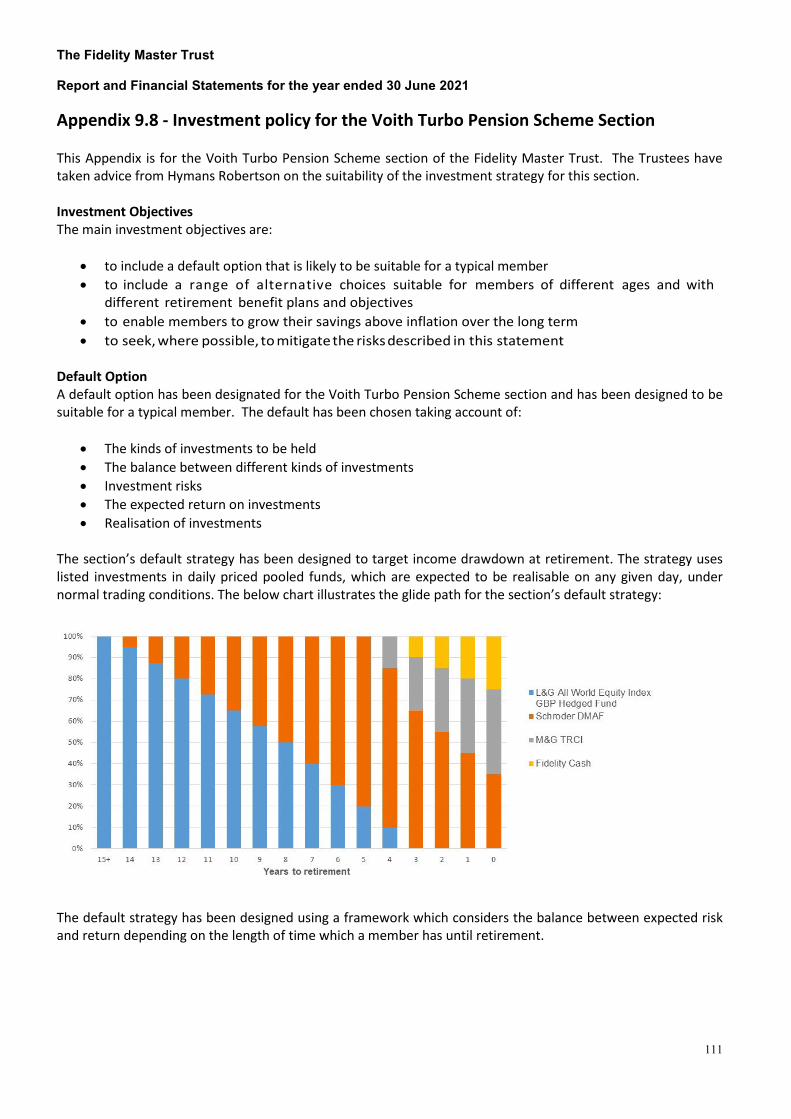
The Fidelity Master Trust Report and Financial Statements for the year ended 30 June 2021
111
Appendix 9.8 - Investment policy for the Voith Turbo Pension Scheme Section This Appendix is for the Voith Turbo Pension Scheme section of the Fidelity Master Trust. The Trustees have taken advice from Hymans Robertson on the suitability of the investment strategy for this section. Investment Objectives The main investment objectives are:
• to include a default option that is likely to be suitable for a typical member • to include a range of alternative choices suitable for members of different ages and with
different retirement benefit plans and objectives • to enable members to grow their savings above inflation over the long term • to seek, where possible, to mitigate the risks described in this statement
Default Option A default option has been designated for the Voith Turbo Pension Scheme section and has been designed to be suitable for a typical member. The default has been chosen taking account of:
• The kinds of investments to be held • The balance between different kinds of investments • Investment risks • The expected return on investments • Realisation of investments
The section’s default strategy has been designed to target income drawdown at retirement. The strategy uses listed investments in daily priced pooled funds, which are expected to be realisable on any given day, under normal trading conditions. The below chart illustrates the glide path for the section’s default strategy:
The default strategy has been designed using a framework which considers the balance between expected risk and return depending on the length of time which a member has until retirement.
The Fidelity Master Trust Report and Financial Statements for the year ended 30 June 2021
112
Growth phase (over 15 years to retirement) During the growth phase members’ assets are invested in the L&G All World Equity Index (GDP Hedged) Fund up until 15 years before retirement. Over the long term, equities are expected to offer a high level of growth but combined with a high level of price volatility. Most members can tolerate this greater level of price volatility in the earlier years but are less tolerant as they near retirement. Rather than price volatility a more significant risk for members in the growth phase is too low growth. Consolidation phase (15 to 5 years before retirement) During the consolidation phase the allocation to equities is gradually reduced and the allocation to the Schroder’s Dynamic Multi-Asset Fund (‘DMAF’) is gradually increased. The consolidation phase will typically have a lower expected return and lower risk, and the gradual switching into Schroder’s DMAF in combination with a diminishing equity allocation is expected to strike the right balance between growth of members’ portfolios in real terms combined with increasing downside protection. Pre-retirement phase (less than 5 years before retirement) During the pre-retirement phase, members’ assets are switched into funds which help mitigate the risk of capital loss, which becomes more important in the approach to retirement compared to the earlier years of members’ saving. When targeting income drawdown, members will have an extended time horizon for their invested assets in comparison to exchanging their entire fund for an annuity at retirement. For that reason, members will be required to retain a significant allocation to assets targeting returns in excess of inflation. The default strategy targets a final at retirement allocation of 35% in the Schroder DMAF, 40% in the M&G Total Return Credit (TRCI) Fund and 25% in Fidelity’s Cash Fund. Inadvertent Default Arrangements From time to time Fidelity, or a fund manager, may suspend trading in a fund due to market / liquidity conditions or decide to close a fund for commercial or regulatory reasons. This would be outside the control of the Master Trust Trustees. Should these circumstances occur it may be necessary for the Trustees to redirect contributions, and transfer assets in the case of fund closure, to an investment option which differs from members’ original selected choices. For this section the Trustees will redirect contributions and, where required, transfer assets to the Fidelity Cash Fund. This inadvertent default fund’s objectives are:
• To maintain the original value of the members’ investments with the least amount of fluctuation prior to the inadvertent default being created.
• To invest in securities with the strongest liquidity profiles allowing assets to be quickly realized. • To maintain an all-in fund charge that is under the regulatory charge cap for DC default strategies.
In all such circumstances, the Trustees will notify members of the issue and identify any actions members may take including allowing members the choice of another self-select fund. Where a fund suspension has been resolved, the Trustees will notify members of their investment options. They will not arrange for the re-investment of past, nor re-direction of future, contributions back into the investment option originally chosen by members.
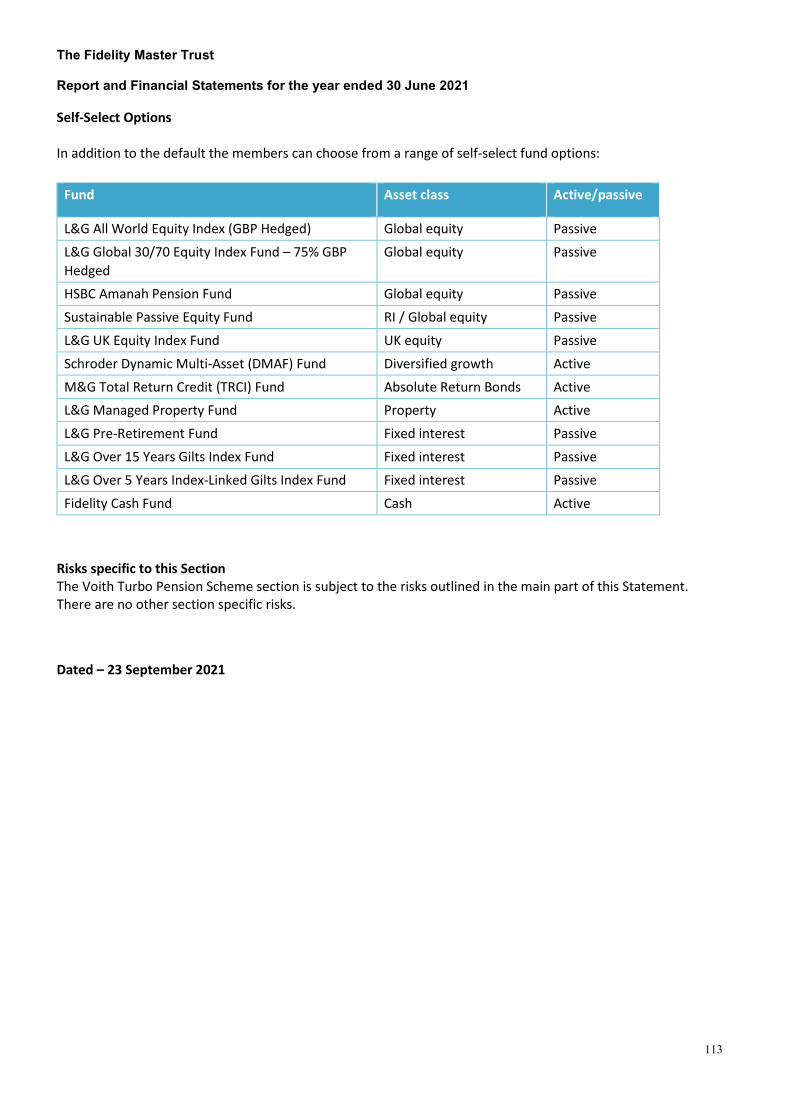
The Fidelity Master Trust Report and Financial Statements for the year ended 30 June 2021
113
Self-Select Options In addition to the default the members can choose from a range of self-select fund options:
Risks specific to this Section The Voith Turbo Pension Scheme section is subject to the risks outlined in the main part of this Statement. There are no other section specific risks.
Dated – 23 September 2021
Fund Asset class Active/passive
L&G All World Equity Index (GBP Hedged) Global equity Passive
L&G Global 30/70 Equity Index Fund – 75% GBP Hedged
Global equity Passive
HSBC Amanah Pension Fund Global equity Passive
Sustainable Passive Equity Fund RI / Global equity Passive
L&G UK Equity Index Fund UK equity Passive
Schroder Dynamic Multi-Asset (DMAF) Fund Diversified growth Active
M&G Total Return Credit (TRCI) Fund Absolute Return Bonds Active L&G Managed Property Fund Property Active
L&G Pre-Retirement Fund Fixed interest Passive
L&G Over 15 Years Gilts Index Fund Fixed interest Passive
L&G Over 5 Years Index-Linked Gilts Index Fund Fixed interest Passive
Fidelity Cash Fund Cash Active

The Fidelity Master Trust Report and Financial Statements for the year ended 30 June 2021
114
Appendix 9.9 - Investment policy for the MyColt Retirement Savings Section
This Appendix is for the MyColt Retirement Savings Section (‘the Section’) of the Fidelity Master Trust. The Trustees have taken advice from Towers Watson Limited on the suitability of the investment strategy for this Section.
Investment objectives
The Trustees’ overall objective is to provide a long-term savings vehicle which, through contributions from members and the participating employer, enables members to acquire assets in an investment account at retirement with which to provide retirement benefits.
The Trustees’ investment objectives are:
• to provide a suitable default investment option which is likely to be suitable for a typical member of the Section
• to provide an appropriate self-select choice framework by offering a range of alternative options suitable for members of different ages, different levels of risk tolerance, and with different retirement objectives
• to enable members to grow their savings above inflation over the long-term
• to seek, insofar as is possible, to mitigate the risks described in this Statement
Default investment
Members who do not make an investment choice are invested in the Section’s default investment option. The Trustees consider the needs of the members and how members are likely to use their investment account at retirement when determining the appropriate default investment strategy. Following analysis of the membership, and having taken advice, the Trustees believe that the majority of defaulting members will take their retirement benefits in the form of income drawdown. Therefore, the Trustees have selected the Drawdown Lifestyle strategy as the default investment strategy.
As part of an exercise undertaken by the ceding scheme from which the Section’s assets were transferred, all members at that time who were invested in the de-risking phase of the previous lifestyle options were redirected to the Annuity Lifestyle strategy. Therefore, the Trustees treat this as a legacy default investment option.
The Section offers three lifestyle strategy options, two lifestyle options as described above and FutureWise as described below (plus a range of self-select funds to members with growth or protection objectives). The default and legacy default lifestyle strategies have been designed to target either flexible income (Drawdown Lifestyle strategy) or secure income (Annuity Lifestyle strategy) as retirement objectives. With both of these options, a member’s investments are automatically switched between different funds as the member approaches retirement to reflect the changing nature of the risks to which they are exposed. Both lifestyles invest in equities and diversified assets during the ‘accumulation phase’.
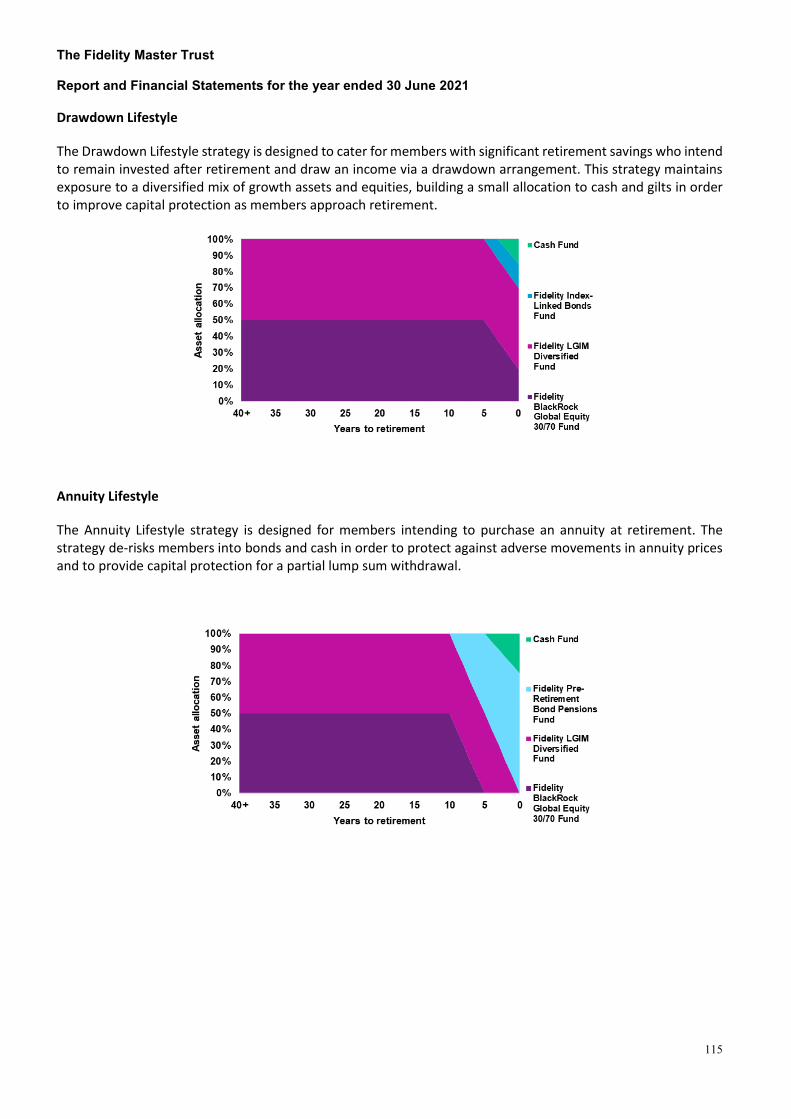
The Fidelity Master Trust Report and Financial Statements for the year ended 30 June 2021
115
Drawdown Lifestyle
The Drawdown Lifestyle strategy is designed to cater for members with significant retirement savings who intend to remain invested after retirement and draw an income via a drawdown arrangement. This strategy maintains exposure to a diversified mix of growth assets and equities, building a small allocation to cash and gilts in order to improve capital protection as members approach retirement.
Annuity Lifestyle
The Annuity Lifestyle strategy is designed for members intending to purchase an annuity at retirement. The strategy de-risks members into bonds and cash in order to protect against adverse movements in annuity prices and to provide capital protection for a partial lump sum withdrawal.

The Fidelity Master Trust Report and Financial Statements for the year ended 30 June 2021
116
Self-select investment options
In addition to the two lifestyle options described above, members can self-select from the following range of options, as well as a third lifestyle option, Fidelity FutureWise. The table illustrates funds which are "standard" to the Fidelity Master Trust and those which are specific to the MyColt Section "extended".
Fund Benchmark or target Range Management style
LGIM Diversified Cash + 3.5% Extended Passive BlackRock ACS UK Equity Index FTSE All Share Standard Passive
Standard Life UK Equity Select FTSE All Share Extended Active
BlackRock Global Equity 30:70
30% FTSE All Share, 60% FTSE World ex-UK GBP Hedged, 10% MSCI Emerging Markets
Extended Passive
Fidelity Global Focus Pensions
MSCI All Country World Index Mid Cap Extended Active
Fidelity Pre Retirement Bond Pensions
50% BofA Merrill Lynch 5+ Years UK Gilt, 50% BofA Merrill Lynch All Maturities Sterling Non-Gilt
Standard Active
Fidelity Index Linked Bond Pensions
FTSE A Index Linked Gilt 5+ Years Extended Active
Fidelity Cash Pensions Morningstar UK Savings 2,500 Investment Gross (Lagged 1M)
Standard Active
HSBC Islamic Pension Dow Jones Islamic Market Titans 100 Standard Passive
BMO Responsible UK Equity Growth FTSE All Share Extended Active
Fidelity Diversified Markets Fund
Sonia + 3% p.a. Standard Active
Fidelity Diversified Growth Fund
RPI + 5% p.a. Standard Active
Fidelity UK Aggregate Bond 50% Iboxx Sterling Non-Gilt Index, 50% Iboxx Sterling Gilt Index
Standard Active
BlackRock ACS World ex UK FTSE All World Developed ex UK Standard Passive
BlackRock Aquila Connect Emerging Markets
MSCI Global Emerging Markets Index Standard Passive
BlackRock Corporate Bond Index All Stocks
iBoxx Sterling Non Gilt 1300CET (midday) index Standard Passive
BlackRock Index-Linked Gilt Index fund
FTSE A UK Index-Linked Over 5 Years Index Standard Passive
BlackRock Over 15 Years Gilt Index fund
FTSE Over 15 years Gilts Index Standard Passive
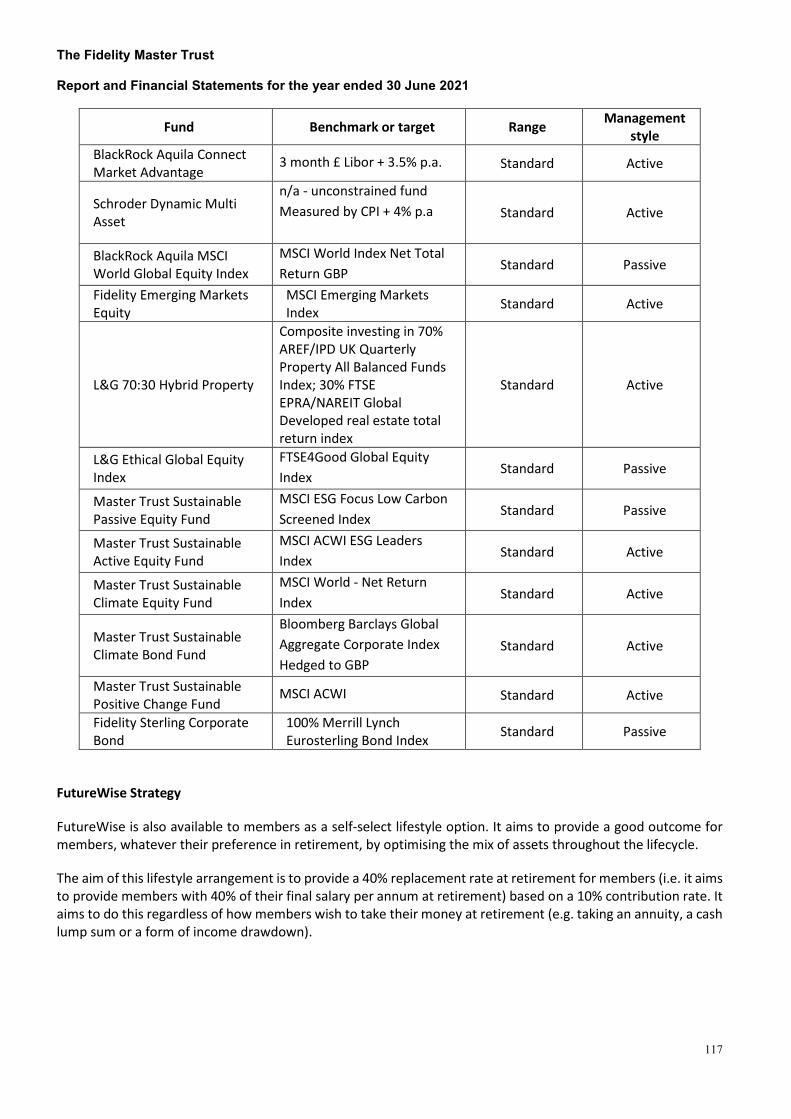
The Fidelity Master Trust Report and Financial Statements for the year ended 30 June 2021
117
Fund Benchmark or target Range Management style
BlackRock Aquila Connect Market Advantage
3 month £ Libor + 3.5% p.a. Standard Active
Schroder Dynamic Multi Asset
n/a - unconstrained fund Measured by CPI + 4% p.a
Standard Active
BlackRock Aquila MSCI World Global Equity Index
MSCI World Index Net Total Return GBP Standard Passive
Fidelity Emerging Markets Equity
MSCI Emerging Markets Index Standard Active
L&G 70:30 Hybrid Property
Composite investing in 70% AREF/IPD UK Quarterly Property All Balanced Funds Index; 30% FTSE EPRA/NAREIT Global Developed real estate total return index
Standard Active
L&G Ethical Global Equity Index
FTSE4Good Global Equity Index Standard Passive
Master Trust Sustainable Passive Equity Fund
MSCI ESG Focus Low Carbon Screened Index Standard Passive
Master Trust Sustainable Active Equity Fund
MSCI ACWI ESG Leaders Index Standard Active
Master Trust Sustainable Climate Equity Fund
MSCI World - Net Return Index Standard Active
Master Trust Sustainable Climate Bond Fund
Bloomberg Barclays Global Aggregate Corporate Index Hedged to GBP
Standard Active
Master Trust Sustainable Positive Change Fund
MSCI ACWI Standard Active
Fidelity Sterling Corporate Bond
100% Merrill Lynch Eurosterling Bond Index Standard Passive
FutureWise Strategy
FutureWise is also available to members as a self-select lifestyle option. It aims to provide a good outcome for members, whatever their preference in retirement, by optimising the mix of assets throughout the lifecycle.
The aim of this lifestyle arrangement is to provide a 40% replacement rate at retirement for members (i.e. it aims to provide members with 40% of their final salary per annum at retirement) based on a 10% contribution rate. It aims to do this regardless of how members wish to take their money at retirement (e.g. taking an annuity, a cash lump sum or a form of income drawdown).

The Fidelity Master Trust Report and Financial Statements for the year ended 30 June 2021
118
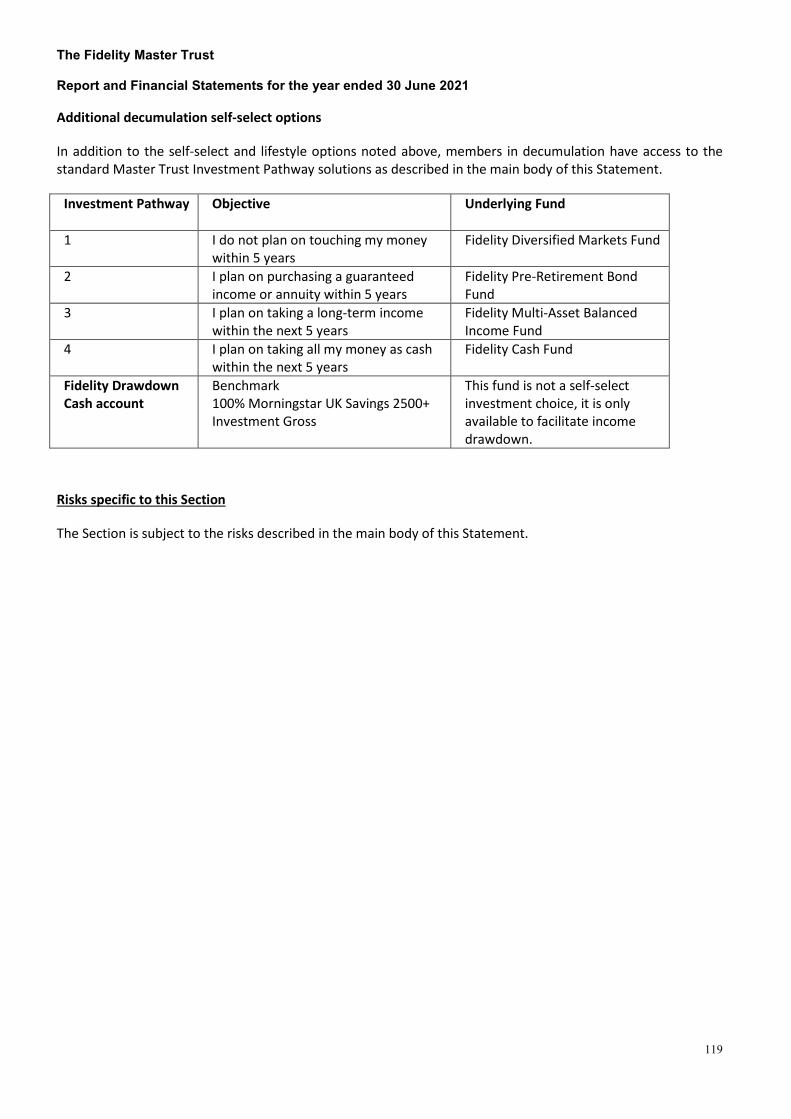
The Fidelity Master Trust Report and Financial Statements for the year ended 30 June 2021
119
Additional decumulation self-select options
In addition to the self-select and lifestyle options noted above, members in decumulation have access to the standard Master Trust Investment Pathway solutions as described in the main body of this Statement.
Investment Pathway
Objective Underlying Fund
1 I do not plan on touching my money within 5 years
Fidelity Diversified Markets Fund
2 I plan on purchasing a guaranteed income or annuity within 5 years
Fidelity Pre-Retirement Bond Fund
3 I plan on taking a long-term income within the next 5 years
Fidelity Multi-Asset Balanced Income Fund
4 I plan on taking all my money as cash within the next 5 years
Fidelity Cash Fund
Fidelity Drawdown Cash account
Benchmark 100% Morningstar UK Savings 2500+ Investment Gross
This fund is not a self-select investment choice, it is only available to facilitate income drawdown.
Risks specific to this Section
The Section is subject to the risks described in the main body of this Statement.
The Fidelity Master Trust Report and Financial Statements for the year ended 30 June 2021
120
Appendix 9.10 - Investment policy for the Unilever Section This Appendix is for the Unilever Section of the Fidelity Master Trust. Investment Objectives The main investment objectives are:
• To enable members to grow their savings above inflation over the long term (after charges);
• To provide a range of investment options suitable for members of different ages and with different retirement benefit plans and objectives, including (where appropriate) a default option that is suitable for a typical member; and,
• To seek, where possible, to mitigate the risks described in this statement, including through appropriate diversification of the asset types used and in accordance with the objective of each respective investment option.
Scheme Default Investment Arrangement A default strategy is not required for auto-enrolment purposes for members in deferment and in retirement since an active choice is required to join the Unilever section. However, regulations pertaining to SIPs adopt a broader definition of a default strategy. In addition, a default strategy is required for operational purposes in relation to members who decide to transfer-in benefits from schemes other than Unilever UK Pension Fund (“UUKPF”). The default option chosen has been designed to be suitable for a typical member, taking into account the investment objectives set out above and the following considerations:
• The kinds of investments to be held; • The balance between different kinds of investments; • Investment risks; • The expected return on investments; • Realisation of investments; and, • Financially material considerations, such as Environmental, Social and Governance (“ESG”) factors,
including climate risk. The default option is a lifestyle arrangement that is consistent with members taking their retirement benefits using income drawdown. The default option is called the Moderate Growth to Flexibility Automatic Switch Facility and is illustrated below. The underlying funds are described later in this Appendix.
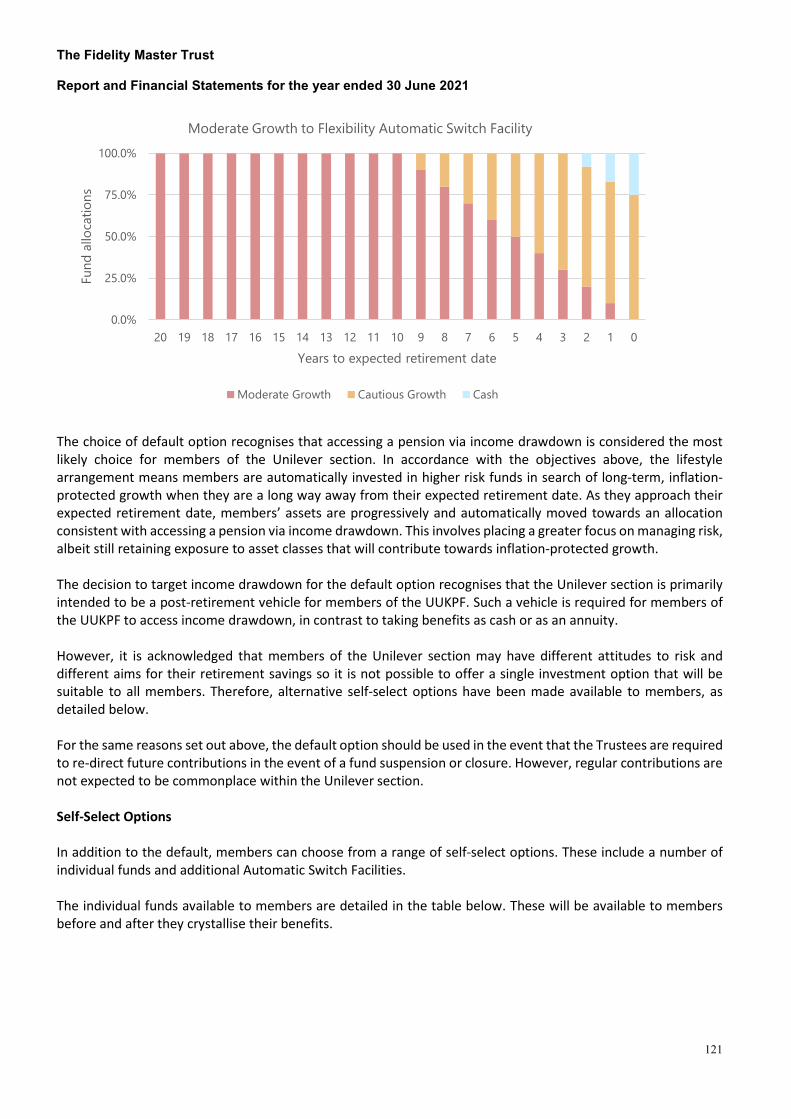
The Fidelity Master Trust Report and Financial Statements for the year ended 30 June 2021
121
The choice of default option recognises that accessing a pension via income drawdown is considered the most likely choice for members of the Unilever section. In accordance with the objectives above, the lifestyle arrangement means members are automatically invested in higher risk funds in search of long-term, inflation-protected growth when they are a long way away from their expected retirement date. As they approach their expected retirement date, members’ assets are progressively and automatically moved towards an allocation consistent with accessing a pension via income drawdown. This involves placing a greater focus on managing risk, albeit still retaining exposure to asset classes that will contribute towards inflation-protected growth. The decision to target income drawdown for the default option recognises that the Unilever section is primarily intended to be a post-retirement vehicle for members of the UUKPF. Such a vehicle is required for members of the UUKPF to access income drawdown, in contrast to taking benefits as cash or as an annuity. However, it is acknowledged that members of the Unilever section may have different attitudes to risk and different aims for their retirement savings so it is not possible to offer a single investment option that will be suitable to all members. Therefore, alternative self-select options have been made available to members, as detailed below. For the same reasons set out above, the default option should be used in the event that the Trustees are required to re-direct future contributions in the event of a fund suspension or closure. However, regular contributions are not expected to be commonplace within the Unilever section. Self-Select Options In addition to the default, members can choose from a range of self-select options. These include a number of individual funds and additional Automatic Switch Facilities. The individual funds available to members are detailed in the table below. These will be available to members before and after they crystallise their benefits.
0.0%
25.0%
50.0%
75.0%
100.0%
20 19 18 17 16 15 14 13 12 11 10 9 8 7 6 5 4 3 2 1 0
Fund
allo
catio
ns
Years to expected retirement date
Moderate Growth to Flexibility Automatic Switch Facility
Moderate Growth Cautious Growth Cash

The Fidelity Master Trust Report and Financial Statements for the year ended 30 June 2021
122
Unilever Fund Objective
Unilever Moderate Growth Fund
Aims to achieve a return over the long term (5 years or more) that exceeds the return on the Cautious growth fund (albeit with a higher prospect that a negative return could be experienced over the same period).
Unilever Cautious Growth Fund
Aims to achieve a return over the long term (5 years or more) that exceeds the return on the cash fund (albeit with a higher prospect that a negative return could be experience over the same period).
Unilever Global Equity Fund
Aims to achieve a return similar to that which could be achieved via a portfolio invested in globally diversified equity markets.
Unilever Emerging Markets Fund
Aims to achieve a return similar to that which could be achieved via a portfolio invested in securities listed in or related to Emerging market countries.
Unilever Real Return Fund
Aims to achieve a return over the long term (5 years or more) that provides some degree of protection against changes in Consumer Prices Index inflation, thus maintaining the real purchasing power of the amount invested.
Unilever Bond Fund Aims to achieve a return which provides some protection against changes in fixed annuity prices as a member approaches retirement, as well as operating as a relatively low risk bond fund.
Unilever Cash Fund Aims to preserve capital whilst aiming to provide a return on investments similar to that which might be achieved on cash deposits in a bank or building society.
The alternative Automatic Switch Facilities are detailed in the investment guide available to members. These are only available to members before they crystallise their benefits. The Fidelity Investment Pathways will be made available to members of the bespoke section when they crystallise their benefits. The main body of the SIP considers these in detail. Risks Investment risk is not considered in isolation, but in conjunction with expected investment returns and retirement outcomes for members. The main risks taken into account when designing the investment strategy are set out in the main body of this statement, with the exception of ESG including climate risk (which is considered as part of the policy on financially material factors set out below). Other Investment Policies Financially material considerations (such as ESG, including climate risk) and stewardship activities are considered in the selection, retention, and realisation of investments in line with the policies set out in the main body of this statement. The Employer will keep this under review and work with the Trustees in the event its views diverge materially from the Trustees’ stated policy. However, non-financial matters (such as members’ ethical views) are not currently considered in the selection, retention, and realisation of investments for the Unilever section. This is reviewed on a periodic basis. The arrangements with asset managers are reviewed periodically (usually annually) as part of advice on the ongoing suitability of the fund options to the Trustees. They are also considered at least every three years
The Fidelity Master Trust Report and Financial Statements for the year ended 30 June 2021
123
alongside reviewing the investment strategy and prior to appointment of any fund managers. Where appropriate, this may include but is not limited to:
• The extent of alignment between managers’ investment process and the Trustees’ policies and objectives;
• An evaluation of performance over time horizons commensurate with members’ objectives and taking into account manager remuneration;
• Portfolio turnover costs; and, • The duration of arrangements with asset managers.
These reviews will take into account the Trustees’ prevailing policies on these matters as set out in the main body of the SIP. In the event a fund manager is no longer considered suitable, their appointment may be terminated.
Compliance The Trustees receive written advice from Barnett Waddingham on the suitability of the investment options offered to members in the Unilever section. The investment strategy will be reviewed at least triennially by the Trustees, including consultation with the Employer.

The Fidelity Master Trust Report and Financial Statements for the year ended 30 June 2021
124
Appendix 2 - Fund Charges Summary at 30 June 2021
Fund Name Total expense ratio (%)
Transaction cost (%)
BCIF iShares Index Lked Gilt Tracker Fd 0.18 -0.01 BCIF iShares O15 years Gilts Tracker Fnd 0.18 -0.04 BlackRock 30/70 Cur Hedged Gl Eq Cl 9 0.21 0.09 BlackRock ACS UK Equity Fund 0.18 0.05 BlackRock Aquila Life Mkt Adv Fund Cl 11 0.47 0.21 BlackRock Aquila Life Mkt Adv Fund Cl5 0.52 0.21 BlackRock Aquila Life Mkt Adv Fund Cl8 0.67 0.21 BlackRock Aquila Life Mkt Adv Fund Cl9 0.42 0.21 BlackRock Cash Fund 0.12 0.02 BlackRock Corporate Bond Over 15 Yr Idx 0.15 -0.01 BlackRock Dynamic Allocation Fund 0.57 0.35 BlackRock Emerging Markets Fund 0.34 0.00 BlackRock European Equity Index Fund 0.15 0.00 BlackRock Global Equity (50/50) Fd Cl 11 0.30 0.03 BlackRock Global Equity (50/50) Fd Cl 12 0.42 0.03 BlackRock Japanese Equity Index Fund 0.15 0.00 BlackRock O 5 Ys Ind Linked Gilt Fd Cl11 0.28 -0.01 BlackRock O15 Yrs UK Gilt Indx Fund Cl11 0.28 -0.04 BlackRock Over 15 Yr UK Gilt Index Fund 0.13 -0.04 BlackRock Over 5 Year Index Linked Gilt 0.13 -0.01 BlackRock Pacific Rim Equity Index Fund 0.15 0.00 BlackRock UK Equity Index Fund 0.13 0.05 BlackRock UK Equity Index Fund Class 11 0.28 0.05 BlackRock UK Equity Index Fund Class 12 0.40 0.05 BlackRock US Equity Index Fund 0.15 0.03 BlackRock World (ex UK) Fund Class 11 0.30 0.00 Diversified Fund 0.74 0.28 Diversified Growth Fund 0.74 0.28 Diversified Markets Fund 0.37 0.02 Emerging Markets Equity Index Fund 0.44 N/A Ethical Global Equity Index Fund 0.40 0.00 Fid Baillie Gifford MA Growth Fd C10 0.63 0.69 Fid BCIF iShares Corp Bnd Tracker Fd C11 0.31 0.05 Fid BlackRock 3070 Curr Hdg Gl Eq Fd C6 0.23 0.09 Fid BlackRock Corp Bd In All Stk C6 0.19 0.05 Fid BlackRock Corp Bond Fd All Stocks C1 0.21 0.05 Fid BlackRock Corp Bond Fd All Stocks C4 0.50 0.05 Fid BlackRock Corp Bond Fd All Stocks C5 0.25 0.05 Fid BlackRock Corp Bond Fd All Stocks C8 0.35 0.05 Fid BlackRock Corp Bond Fd All Stocks C9 0.16 0.05 Fid BlackRock Emerging Markets Fd Cls 12 0.50 0.00 Fid BlackRock Emerging Markets Fund C10 0.37 0.00 Fid BlackRock Emerging Markets Fund Cl 5 0.55 0.00 Fid BlackRock Emerging Markets Fund Cl 9 0.40 0.00 Fid BlackRock Global Equity 50/50 Fnd C1 0.26 0.03 Fid BlackRock Global Equity 50/50 Fnd C5 0.35 0.03 Fid BlackRock Global Equity 50/50 Fnd C8 0.50 0.03 Fid BlackRock Global Equity 50/50 Fnd C9 0.16 0.03 Fid BlackRock Ovr 15Yr UK Gilt Idx Fd C1 0.21 -0.04

The Fidelity Master Trust Report and Financial Statements for the year ended 30 June 2021
125
Fund Name Total expense ratio (%)
Transaction cost (%)
Fid BlackRock Ovr 15Yr UK Gilt Idx Fd C5 0.20 -0.04 Fid BlackRock Ovr 15Yr UK Gilt Idx Fd C8 0.30 -0.04 Fid BlackRock Ovr 5Yr I-L-Gilt Fund C1 0.21 -0.01 Fid BlackRock Ovr 5Yr I-L-Gilt Fund C5 0.20 -0.01 Fid BlackRock Ovr 5Yr I-L-Gilt Fund C8 0.30 -0.01 Fid BlackRock UK Equity Fund Class 2 0.26 0.05 Fid BlackRock UK Equity Index Fd C6 0.19 0.05 Fid BlackRock UK Equity Index Fund Cl 1 0.21 0.05 Fid BlackRock UK Equity Index Fund Cl 4 0.60 0.05 Fid BlackRock UK Equity Index Fund Cl 5 0.30 0.05 Fid BlackRock World (ex UK) Fund Cl 2 0.21 0.00 Fid BlackRock World (ex-UK) Equity Fd C1 0.26 0.00 Fid BlackRock World (ex-UK) Equity Fd C5 0.35 0.00 Fid BlackRock World (ex-UK) Equity Fd C8 0.50 0.00 Fid BlackRock World (ex-UK) Equity Fd C9 0.16 0.00 Fid BlckRck 3070 Curr Hdgd Gl Eqty Fd C1 0.28 0.09 Fid BlkRck Global Equity 50:50 Fund Cl 2 0.21 0.03 Fid BMO Responsible UK Eq Growth Fd Cl1 0.80 0.68 Fid BR (30/70) Curr H Gl Equity Fd Cl 12 0.45 0.09 Fid BR 30:70 Cur Hedged Gl Eq Fund 0.26 0.09 Fid BR 3070 Cur Hdgd Global Equity Cl5 0.33 0.09 Fid BR Aquila Life Mkt Advantage Fd Cl10 0.72 0.21 Fid BR MSCI World Global Equity Fund C1 0.26 0.00 Fid BR MSCI World Global Equity Fund C11 0.31 0.00 Fid BR MSCI World Global Equity Fund Cl2 0.21 0.00 Fid BR MSCI World Global Equity Fund Cl4 0.36 0.00 Fid BR MSCI World Global Equity Fund Cl9 0.16 0.00 Fid BR Over 15 Years UK Gilt Index Fund 0.50 -0.04 Fid BR Over 5 Years Ind Linked Gilt Cl6 0.50 -0.01 Fid BRock 30:70 Curr Heg Gl Eq Fd Cl8 0.56 0.09 Fid Capital One FutureWise Equity Fund 0.24 0.02 Fid CSMT BlackRock Em Markets Equity Fd 0.45 0.00 Fid CSMT BlackRock Over 15 Year Glts Ind 0.15 -0.04 Fid CSMT BlackRock Overseas Consensus 0.17 0.00 Fid CSMT BlackRock Wld ex UK Equity In 0.15 0.00 Fid CSMT Sustainable Active Equity Fund 0.63 N/A Fid CSMT Sustainable Climate Bond Fund 0.49 N/A Fid CSMT Sustainable Climate Equity Fund 0.79 N/A Fid CSMT Sustainable Passive Equity Fund 0.20 0.13 Fid CSMT Sustainable Positive Chng Eq Fd 0.60 0.21 Fid Diversified Growth Pensions Fund Cl1 0.73 0.23 Fid Diversified Growth Pensions Fund Cl5 0.69 0.23 Fid Diversified Markets Pension Fd - Cl1 0.50 0.02 Fid Diversified Markets Pension Fd - Cl5 0.60 0.02 Fid Diversified Markets Pension Fd - Cl9 0.40 0.02 Fid Diversified Markets Pension Fd Cl 12 0.35 0.02 Fid Diversified Markets Pension Fd-Cl11 0.45 0.02 Fid Emerging Markets Eqty Pensions Fd C8 0.95 0.26 Fid Emerging Markets Equity Pensions Fd 0.54 0.26 Fid Fulcrum Div Liquid Alternatives C10 1.04 0.99 Fid L&G 70/30 Hybrid Property Fd C10 0.56 0.00 Fid L&G 70:30 Hybrid Property Fund Cl 8 0.90 0.00

The Fidelity Master Trust Report and Financial Statements for the year ended 30 June 2021
126
Fund Name Total expense ratio (%)
Transaction cost (%)
Fid L&G Corporate Bd All Stocks In Cl11 0.31 0.00 Fid L&G Corporate Bond All Stocks 0.15 0.00 Fid L&G Corporate Bond All Stocks In Cl1 0.27 0.00 Fid L&G Corporate Bond All Stocks In Cl4 0.66 0.00 Fid L&G Corporate Bond All Stocks In Cl8 0.51 0.00 Fid L&G Em Mkt Pass Local Cur Gov Bd C10 0.49 0.01 Fid L&G Ethical Global Eq Index Fd Cl1 0.45 0.00 Fid L&G Ethical Global Eq Index Fd Cl4 0.84 0.00 Fid L&G Ethical Global Equity In Fd C10 0.35 0.00 Fid L&G Ethical Global Equity Index 0.35 0.00 Fid L&G FTSE Dev Core Infrast Ind Fd C10 0.49 0.00 Fid L&G Glbl Eq 30/70 Indx Fd (Hgd) Cl 5 0.36 0.04 Fid L&G Glbl Eq 30/70 Indx Fd (Hgd) Cl1 0.27 0.04 Fid L&G Glbl Eq 30/70 Indx Fd (Hgd) Cl11 0.31 0.04 Fid L&G Global Eq MW 30:70 I GBP Heg Cl4 0.66 0.04 Fid L&G Global Equity MW 30/70 (Hedged) 0.25 0.04 Fid L&G Over 15 years Gilts Index 0.13 0.00 Fid L&G Over 15 Yrs Gilts Idx Fd Cls 8 0.50 0.00 Fid L&G Over 5 years Index Linked Gilt 0.13 0.02 Fid L&G Ovr 5 Yrs Idx Lnkd Glt Fd - Cls8 0.50 0.02 Fid L&G UK Equity Index Fund Class 11 0.29 0.00 Fid L&G UK Equity Index Fund Class 5 0.35 0.00 Fid L&G World Emerging Markets Class 9 0.50 0.03 Fid L&G Wrld xUK Developd Eq Indx Fd Cl1 0.26 0.00 Fid L&G Wrld xUK Developd Eq Indx Fd Cl4 0.65 0.00 Fid Pre Retirement Bond Fund - Class 6 0.55 0.07 Fid Pre-Retirement Bond Pensions Fd Cls1 0.25 0.07 Fid Pre-Retirement Bond Pensions Fd Cls4 0.55 0.07 Fid Pre-Retirement Bond Pensions Fd Cls5 0.30 0.07 Fid Pre-Retirement Bond Pensions Fd Cls8 0.40 0.07 Fid Schroder Sustainable Gl MF Eq Fd C10 0.36 0.41 Fid Standard Life UK Equity Select Cl5 0.80 0.11 Fid UK Aggregate Bond Pensions Fund C1 0.42 -0.13 Fid UK Aggregate Bond Pensions Fund C4 0.65 -0.13 Fid UK Aggregate Bond Pensions Fund C5 0.40 -0.13 Fid UK Aggregate Bond Pensions Fund C8 0.50 -0.13 Fidelity - Investment Pathway 1 - Class 2 0.35 0.00 Fidelity - Investment Pathway 2 - Class 10 0.35 0.07 Fidelity - Investment Pathway 3 - Class 2 0.50 N/A Fidelity - Investment Pathway 4 - Class 1 0.16 0.00 Fidelity BlackRock Aq Life Mkt Adv-Cl12 0.59 0.21 Fidelity BlackRock Corp Bd In AllStk C12 0.43 0.05 Fidelity BlackRock Em Mkts Fund - Cl 8 0.70 0.00 Fidelity BlackRock Ov 15 Yrs UK GI Cl12 0.41 -0.04 Fidelity BlackRock Over 5 Yrs ILG Cls 12 0.41 -0.01 Fidelity BlackRock World Ex UK Eq Cls 12 0.43 0.00 Fidelity Cash Fund 0.16 0.00 Fidelity Cash Pension Fund Class 11 0.31 0.00 Fidelity Cash Pensions Fund 0.16 0.00 Fidelity Cash Pensions Fund Class 2 0.21 0.00 Fidelity Cash Pensions Fund Class 4 0.31 0.00 Fidelity Cash Pensions Fund Class 5 0.26 0.00

The Fidelity Master Trust Report and Financial Statements for the year ended 30 June 2021
127
Fund Name Total expense ratio (%)
Transaction cost (%)
Fidelity Cash Pensions Fund Class 9 0.11 0.00 Fidelity CSMT BA Aquila Life Market Adv 0.37 0.21 Fidelity CSMT BlackRock Cash Fund 0.18 0.02 Fidelity CSMT BlackRock European Equ Ind 0.17 0.00 Fidelity CSMT BlackRock Global 50:50 Ind 0.14 0.03 Fidelity CSMT BlackRock Japanese Equ Ind 0.17 0.00 Fidelity CSMT BlackRock MSCI Wrld Gl Eq 0.15 0.00 Fidelity CSMT BlackRock Over 5 Yr IL Glt 0.15 -0.01 Fidelity CSMT BlackRock Pac Rim Equ Ind 0.17 0.00 Fidelity CSMT BlackRock UK Equity Index 0.15 0.05 Fidelity CSMT BlackRock US Equity Index 0.17 0.03 Fidelity CSMT Cash Fund 0.11 0.00 Fidelity CSMT Diversified Growth Fund 0.66 0.23 Fidelity CSMT Diversified Markets Fund 0.32 0.02 Fidelity CSMT Emerging Markets Equity 1.02 0.26 Fidelity CSMT HSBC Life Islamic Fund 0.54 0.02 Fidelity CSMT L&G 70:30 Hybrid Property 0.51 0.00 Fidelity CSMT L&G Corporate Bond All Stk 0.21 0.00 Fidelity CSMT L&G Ethical Global Equ Ind 0.40 0.00 Fidelity CSMT L&G Gl Eq MW 30/70 (75% H) 0.24 0.04 Fidelity CSMT Pre-Retirement Bond Fund 0.38 0.07 Fidelity CSMT Schroder Dynamic MA Fund 0.48 0.23 Fidelity CSMT UK Aggregate Bond Fund 0.34 -0.13 Fidelity CSMT UK Corporate Bond Fund 0.40 -0.12 Fidelity Diversified Markets Fund 0.43 0.02 Fidelity Diversified Markets Fund 0.43 0.02 Fidelity Diversified Markets Fund 0.37 0.02 Fidelity Diversified Markets Fund 0.35 0.02 Fidelity Diversified Markets Fund 0.32 0.02 Fidelity Diversified Markets PensFd - C8 0.65 0.02 Fidelity Drawdown Cash Account 0.00 0.00 Fidelity Emerging Markets Equity 1.12 0.26 Fidelity Emerging Markets Equity 0.99 0.26 Fidelity Emerging Mkts Eq Pensions Fund 0.86 0.26 Fidelity FutureWise Equity 0.30 0.02 Fidelity FutureWise Equity 0.19 0.02 Fidelity FutureWise Equity Fund 0.24 0.02 Fidelity FutureWise Equity Fund 0.23 0.02 Fidelity FutureWise Equity Fund 0.19 0.02 Fidelity Global Focus Pensions Fund Cl6 1.20 0.31 Fidelity Global High Yield Fund 0.58 0.56 Fidelity HG HSBC Islamic Global Eq Index 0.45 0.02 Fidelity HSBC Islamic Fund Class 4 0.75 0.02 Fidelity HSBC Islamic Fund Class 9 0.45 0.02 Fidelity HSBC Islamic Pension Fd Cl9 0.45 0.02 Fidelity Index Linked Bond Fund Class 5 0.35 0.06 Fidelity Investment Pathway 1 Cl1 0.55 0.02 Fidelity Investment Pathway 1 Cl11 0.50 0.02 Fidelity Investment Pathway 1 Cl12 0.40 0.02 Fidelity Investment Pathway 1 Cl2 0.35 0.02 Fidelity Investment Pathway 1 Cl5 0.65 0.02 Fidelity Investment Pathway 1 Cl8 0.70 0.02
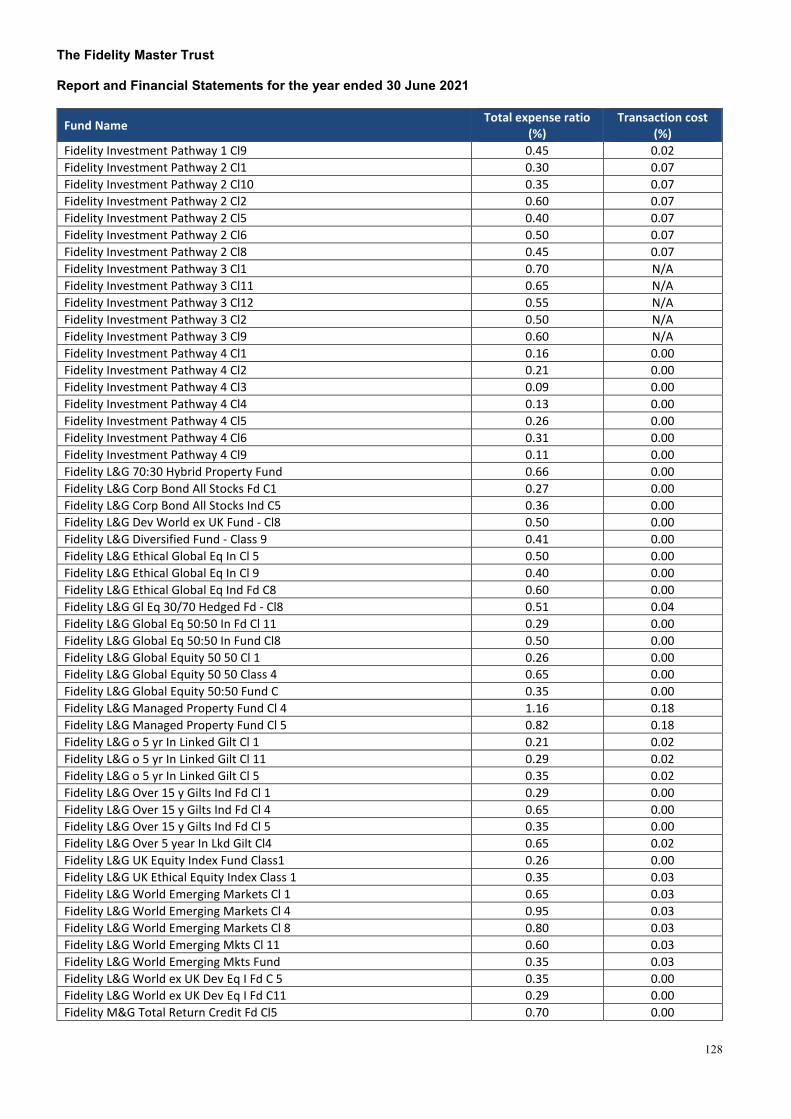
The Fidelity Master Trust Report and Financial Statements for the year ended 30 June 2021
128
Fund Name Total expense ratio (%)
Transaction cost (%)
Fidelity Investment Pathway 1 Cl9 0.45 0.02 Fidelity Investment Pathway 2 Cl1 0.30 0.07 Fidelity Investment Pathway 2 Cl10 0.35 0.07 Fidelity Investment Pathway 2 Cl2 0.60 0.07 Fidelity Investment Pathway 2 Cl5 0.40 0.07 Fidelity Investment Pathway 2 Cl6 0.50 0.07 Fidelity Investment Pathway 2 Cl8 0.45 0.07 Fidelity Investment Pathway 3 Cl1 0.70 N/A Fidelity Investment Pathway 3 Cl11 0.65 N/A Fidelity Investment Pathway 3 Cl12 0.55 N/A Fidelity Investment Pathway 3 Cl2 0.50 N/A Fidelity Investment Pathway 3 Cl9 0.60 N/A Fidelity Investment Pathway 4 Cl1 0.16 0.00 Fidelity Investment Pathway 4 Cl2 0.21 0.00 Fidelity Investment Pathway 4 Cl3 0.09 0.00 Fidelity Investment Pathway 4 Cl4 0.13 0.00 Fidelity Investment Pathway 4 Cl5 0.26 0.00 Fidelity Investment Pathway 4 Cl6 0.31 0.00 Fidelity Investment Pathway 4 Cl9 0.11 0.00 Fidelity L&G 70:30 Hybrid Property Fund 0.66 0.00 Fidelity L&G Corp Bond All Stocks Fd C1 0.27 0.00 Fidelity L&G Corp Bond All Stocks Ind C5 0.36 0.00 Fidelity L&G Dev World ex UK Fund - Cl8 0.50 0.00 Fidelity L&G Diversified Fund - Class 9 0.41 0.00 Fidelity L&G Ethical Global Eq In Cl 5 0.50 0.00 Fidelity L&G Ethical Global Eq In Cl 9 0.40 0.00 Fidelity L&G Ethical Global Eq Ind Fd C8 0.60 0.00 Fidelity L&G Gl Eq 30/70 Hedged Fd - Cl8 0.51 0.04 Fidelity L&G Global Eq 50:50 In Fd Cl 11 0.29 0.00 Fidelity L&G Global Eq 50:50 In Fund Cl8 0.50 0.00 Fidelity L&G Global Equity 50 50 Cl 1 0.26 0.00 Fidelity L&G Global Equity 50 50 Class 4 0.65 0.00 Fidelity L&G Global Equity 50:50 Fund C 0.35 0.00 Fidelity L&G Managed Property Fund Cl 4 1.16 0.18 Fidelity L&G Managed Property Fund Cl 5 0.82 0.18 Fidelity L&G o 5 yr In Linked Gilt Cl 1 0.21 0.02 Fidelity L&G o 5 yr In Linked Gilt Cl 11 0.29 0.02 Fidelity L&G o 5 yr In Linked Gilt Cl 5 0.35 0.02 Fidelity L&G Over 15 y Gilts Ind Fd Cl 1 0.29 0.00 Fidelity L&G Over 15 y Gilts Ind Fd Cl 4 0.65 0.00 Fidelity L&G Over 15 y Gilts Ind Fd Cl 5 0.35 0.00 Fidelity L&G Over 5 year In Lkd Gilt Cl4 0.65 0.02 Fidelity L&G UK Equity Index Fund Class1 0.26 0.00 Fidelity L&G UK Ethical Equity Index Class 1 0.35 0.03 Fidelity L&G World Emerging Markets Cl 1 0.65 0.03 Fidelity L&G World Emerging Markets Cl 4 0.95 0.03 Fidelity L&G World Emerging Markets Cl 8 0.80 0.03 Fidelity L&G World Emerging Mkts Cl 11 0.60 0.03 Fidelity L&G World Emerging Mkts Fund 0.35 0.03 Fidelity L&G World ex UK Dev Eq I Fd C 5 0.35 0.00 Fidelity L&G World ex UK Dev Eq I Fd C11 0.29 0.00 Fidelity M&G Total Return Credit Fd Cl5 0.70 0.00

The Fidelity Master Trust Report and Financial Statements for the year ended 30 June 2021
129
Fund Name Total expense ratio (%)
Transaction cost (%)
Fidelity Schroder Diversified Growth 0.79 0.36 Fidelity Schroder Dynamic MA Fd Class 10 0.55 0.23 Fidelity Schroder Dynamic Multi Asset C5 0.60 0.23 Fidelity Schroder Dynamic Multi Asset C8 0.65 0.23 Fidelity Schroder Dynamic Multi Asset C9 0.50 0.23 Fidelity Standard Life Managed Fund 0.66 0.14 Fidelity State Street Timewise Target Retirement 2020 Fund Class 9 0.34 -0.03 Fidelity State Street Timewise Target Retirement 2025 Fund Class 9 0.34 -0.03 Fidelity State Street Timewise Target Retirement 2030 Fund Class 9 0.34 -0.03 Fidelity State Street Timewise Target Retirement 2035 Fund Class 9 0.34 -0.03 Fidelity State Street Timewise Target Retirement 2040 Fund Class 9 0.34 -0.03 Fidelity State Street Timewise Target Retirement 2045 Fund Class 9 0.34 -0.03 Fidelity State Street Timewise Target Retirement 2050 Fund Class 9 0.34 -0.03 Fidelity State Street Timewise Target Retirement 2055 Fund Class 9 0.34 -0.03 Fidelity State Street Timewise Target Retirement 2060 Fund Class 9 0.34 -0.03 Fidelity State Street Timewise Target Retirement 2065 Fund Class 9 0.34 0.00 Fidelity State Street Timewise Target Retirement Choice Fund Class 9 0.34 0.11 Fidelity Sterling Corporate Bond Pen C 1 0.58 -0.12 Fidelity Sterling Corporate Bond Pen C 8 0.50 -0.12 Fidelity Sterling Corporate Bond Pen C1 0.43 -0.12 Fidelity Sterling Corporate Bond Pen C4 0.65 -0.12 Fidelity Sterling Corporate Bond Pen C5 0.40 -0.12 Fidelity Sterling Corporate Bond Pen llc 0.75 -0.12 Fidelity Telegraph Cash Fund 0.26 0.02 Fidelity Telegraph Dynamic Diversified Fund 0.56 0.41 Fidelity Telegraph Emerging Markets Equity Index Fund 0.35 -0.28 Fidelity Telegraph International Equity Index Sub-fund 0.20 -0.67 Fidelity Telegraph Sterling Liquidity Fund 0.25 0.00 Fidelity Telegraph Sterling Non-Gilts Bond All Stocks Index Fund 0.25 -0.04 Fidelity Telegraph UK conventional Gilts All Stock Index Sub-Fund 0.20 -0.42 Fidelity Telegraph UK Index Fund 0.22 -0.10 Fidelity Telegraph UK Index Linked Gilts All Stocks Index sub-Fund 0.20 -0.21 Fidelity UK Aggregate Bond 0.35 -0.13 Fidelity UK Aggregate Bond Fund Class 10 0.34 -0.13 Fidelty L&G 70:30 Hybrid Property Fd Cl5 0.81 0.00 FutureWise Equity Fund - Class 1 0.32 0.02 FutureWise Equity Fund - Class 10 0.37 0.02 FutureWise Equity Fund - Class 11 0.27 0.02 FutureWise Equity Fund - Class 2 0.34 0.02 FutureWise Equity Fund - Class 4 0.85 0.02 FutureWise Equity Fund - Class 8 0.47 0.02 FutureWise Equity Fund - Class 9 0.22 0.02 Global Active Equity Fund 0.49 N/A Global Sustainable Growth Fund 0.29 0.23 HG Corporate Bond Fund 0.38 0.00 HG Fixed Interest Gilt Fund 0.14 -0.04 HG Global Equity Fund 0.16 0.03 HG Index Linked Gilt Fund 0.14 -0.01 HG Overseas Equity Fund 0.16 0.00 Islamic Global Equity Index Fund 0.50 0.02 L&G 70:30 Hybrid Property Fund 0.63 0.00 L&G Cash 0.20 0.00
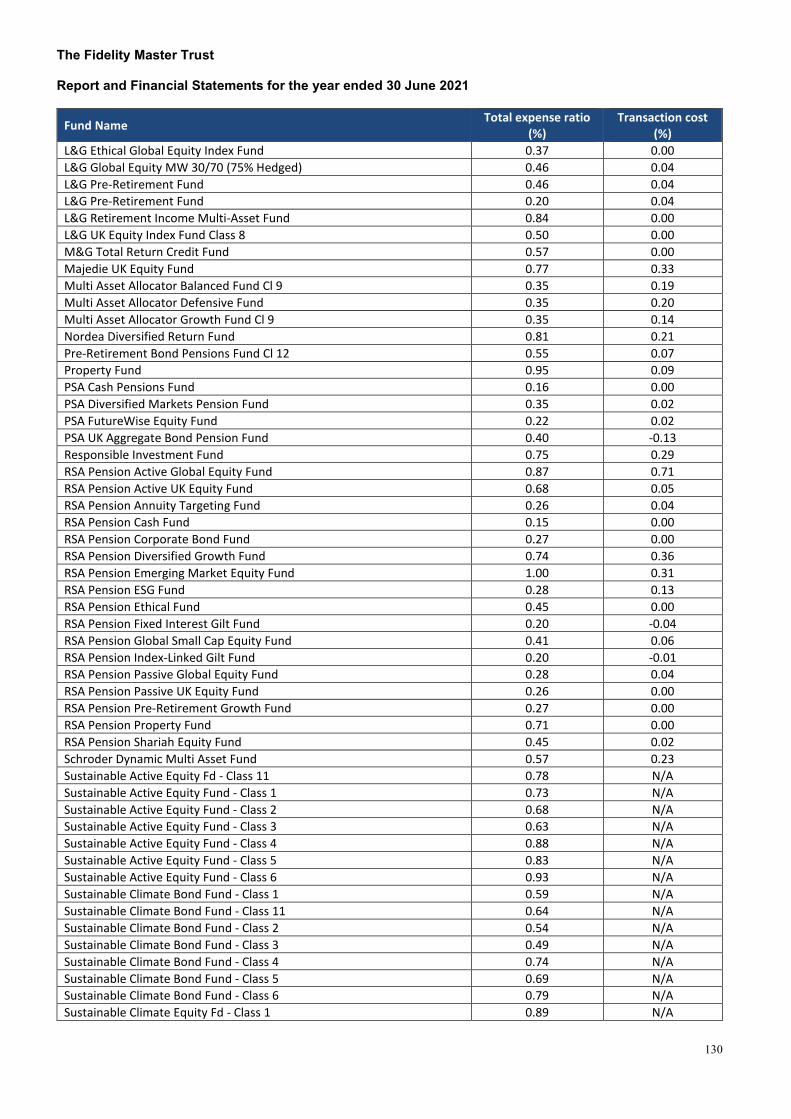
The Fidelity Master Trust Report and Financial Statements for the year ended 30 June 2021
130
Fund Name Total expense ratio (%)
Transaction cost (%)
L&G Ethical Global Equity Index Fund 0.37 0.00 L&G Global Equity MW 30/70 (75% Hedged) 0.46 0.04 L&G Pre-Retirement Fund 0.46 0.04 L&G Pre-Retirement Fund 0.20 0.04 L&G Retirement Income Multi-Asset Fund 0.84 0.00 L&G UK Equity Index Fund Class 8 0.50 0.00 M&G Total Return Credit Fund 0.57 0.00 Majedie UK Equity Fund 0.77 0.33 Multi Asset Allocator Balanced Fund Cl 9 0.35 0.19 Multi Asset Allocator Defensive Fund 0.35 0.20 Multi Asset Allocator Growth Fund Cl 9 0.35 0.14 Nordea Diversified Return Fund 0.81 0.21 Pre-Retirement Bond Pensions Fund Cl 12 0.55 0.07 Property Fund 0.95 0.09 PSA Cash Pensions Fund 0.16 0.00 PSA Diversified Markets Pension Fund 0.35 0.02 PSA FutureWise Equity Fund 0.22 0.02 PSA UK Aggregate Bond Pension Fund 0.40 -0.13 Responsible Investment Fund 0.75 0.29 RSA Pension Active Global Equity Fund 0.87 0.71 RSA Pension Active UK Equity Fund 0.68 0.05 RSA Pension Annuity Targeting Fund 0.26 0.04 RSA Pension Cash Fund 0.15 0.00 RSA Pension Corporate Bond Fund 0.27 0.00 RSA Pension Diversified Growth Fund 0.74 0.36 RSA Pension Emerging Market Equity Fund 1.00 0.31 RSA Pension ESG Fund 0.28 0.13 RSA Pension Ethical Fund 0.45 0.00 RSA Pension Fixed Interest Gilt Fund 0.20 -0.04 RSA Pension Global Small Cap Equity Fund 0.41 0.06 RSA Pension Index-Linked Gilt Fund 0.20 -0.01 RSA Pension Passive Global Equity Fund 0.28 0.04 RSA Pension Passive UK Equity Fund 0.26 0.00 RSA Pension Pre-Retirement Growth Fund 0.27 0.00 RSA Pension Property Fund 0.71 0.00 RSA Pension Shariah Equity Fund 0.45 0.02 Schroder Dynamic Multi Asset Fund 0.57 0.23 Sustainable Active Equity Fd - Class 11 0.78 N/A Sustainable Active Equity Fund - Class 1 0.73 N/A Sustainable Active Equity Fund - Class 2 0.68 N/A Sustainable Active Equity Fund - Class 3 0.63 N/A Sustainable Active Equity Fund - Class 4 0.88 N/A Sustainable Active Equity Fund - Class 5 0.83 N/A Sustainable Active Equity Fund - Class 6 0.93 N/A Sustainable Climate Bond Fund - Class 1 0.59 N/A Sustainable Climate Bond Fund - Class 11 0.64 N/A Sustainable Climate Bond Fund - Class 2 0.54 N/A Sustainable Climate Bond Fund - Class 3 0.49 N/A Sustainable Climate Bond Fund - Class 4 0.74 N/A Sustainable Climate Bond Fund - Class 5 0.69 N/A Sustainable Climate Bond Fund - Class 6 0.79 N/A Sustainable Climate Equity Fd - Class 1 0.89 N/A

The Fidelity Master Trust Report and Financial Statements for the year ended 30 June 2021
131
Fund Name Total expense ratio (%)
Transaction cost (%)
Sustainable Climate Equity Fd - Class 11 0.94 N/A Sustainable Climate Equity Fd - Class 2 0.84 N/A Sustainable Climate Equity Fd - Class 3 0.79 N/A Sustainable Climate Equity Fd - Class 4 1.04 N/A Sustainable Climate Equity Fd - Class 5 0.99 N/A Sustainable Climate Equity Fd - Class 6 1.09 N/A Sustainable Passive Equity Fd - Class 1 0.28 0.13 Sustainable Passive Equity Fd - Class 11 0.33 0.13 Sustainable Passive Equity Fd - Class 12 0.43 0.13 Sustainable Passive Equity Fd - Class 2 0.23 0.13 Sustainable Passive Equity Fd - Class 5 0.38 0.13 Sustainable Positive Change Eq Fd - Cl 1 0.70 0.21 Sustainable Positive Change Eq Fd - Cl 2 0.65 0.21 Sustainable Positive Change Eq Fd - Cl 3 0.60 0.21 Sustainable Positive Change Eq Fd - Cl 4 0.85 0.21 Sustainable Positive Change Eq Fd - Cl 5 0.80 0.21 Sustainable Positive Change Eq Fd - Cl 6 0.90 0.21 Sustainable Positive Chng Eq Fd - Cl 11 0.75 0.21 Universal Music Global Equity 0.26 0.21 Virgin Money Cash 0.18 0.00 Virgin Money Defensive Bonds 0.51 0.00 Virgin Money Diversified 0.38 0.25 Virgin Money Emerging Markets Equity 0.28 0.00 Virgin Money ESG Equity 0.40 N/A Virgin Money Growth 0.32 N/A Virgin Money Index-Linked 0.15 -0.01 Virgin Money Islamic Equity 0.36 0.02 Virgin Money Long Corporate Bonds 0.17 -0.01 Virgin Money Long Gilts 0.15 -0.04 Virgin Money Pre-Retirement (Targeting A 0.18 0.04 Virgin Money Property 0.73 0.18 Virgin Money UK Equity 0.15 0.05 Virgin Money World ex UK Equity 0.17 0.00 Virgin Money World ex UK Equity (CurHgd) 0.22 0.00 World (ex- UK) Equity Index Fund 0.16 0.00
The Fidelity Master Trust Report and Financial Statements for the year ended 30 June 2021
132
Appendix 3 - Example Costs and Charges Illustrations
To illustrate the impact of charges on a typical member’s pension pot, we have provided a range of example illustrations for each section of the Fidelity Master Trust to show the impact of charges and transaction costs on the growth of a pension plan.
For Lifestyle Strategies, the time to retirement relates to the period to a member’s selected retirement age, or if not selected the plan’s normal retirement age.

The Fidelity Master Trust Report and Financial Statements for the year ended 30 June 2021
133
The ASOS Pension Plan Illustrations are shown for the default option, the FutureWise Lifestyle Strategy, together with the following self select funds:
• One of the funds with the highest before costs expected return – example used is the BlackRock Global Equity (50/50) Fd Cl 12
• One of the funds with the lowest before costs expected return - example used is the Fid UK Aggregate Bond Pensions Fund C8
• The fund with the highest annual member borne costs - this is the Fidelity Emerging Markets Equity • The fund with the lowest annual member borne costs - this is the Fidelity Drawdown Cash Account
Projected Pot Sizes in Today’s Money
Years
FutureWise Lifestyle Strategy BlackRock Global Equity (50/50) Fd Cl 12
Fid UK Aggregate Bond Pensions Fund C8
Pot size with no costs incurred
Pot size after all costs
deducted
Pot size with no costs incurred
Pot size after all costs
deducted
Pot size with no costs incurred
Pot size after all costs
deducted 1 £16,077 £16,018 £16,077 £16,015 £15,534 £15,485 3 £26,606 £26,359 £26,606 £26,346 £24,391 £24,197 5 £37,654 £37,118 £37,654 £37,091 £32,973 £32,577
10 £67,722 £65,961 £67,722 £65,873 £53,284 £52,156 20 £139,900 £132,990 £139,900 £132,650 £89,413 £86,044 30 £231,746 £214,737 £231,746 £213,916 £120,282 £113,947 40 £346,433 £311,539 £348,618 £312,813 £146,658 £136,923 50 £411,652 £359,964 £497,338 £433,166 £169,193 £155,842
Reduction in yield: 0.5% Reduction in yield: 0.5% Reduction in yield: 0.4%
Years
Fidelity Emerging Markets Equity Fidelity Drawdown Cash Account Pot size with
no costs incurred
Pot size after all costs
deducted
Pot size with no costs incurred
Pot size after all costs
deducted 1 £16,077 £15,887 £15,627 £15,627 3 £26,606 £25,812 £24,759 £24,759 5 £37,654 £35,943 £33,731 £3,732
10 £67,722 £62,203 £55,482 £55,483 20 £139,900 £118,956 £96,210 £96,212 30 £231,746 £181,859 £133,499 £133,504 40 £348,618 £251,580 £167,640 £167,649 50 £497,338 £328,856 £198,900 £198,912
Reduction in yield: 1.4% Reduction in yield: 0.0%

The Fidelity Master Trust Report and Financial Statements for the year ended 30 June 2021
134
Notes: • Projected pension pot values are shown in today’s terms, and do not need to be reduced further for the effect
of future inflation • The starting pot size is assumed to be £11,000. • Inflation is assumed to be 2.5% each year. • Total contributions are assumed are assumed to be £400 per month. • Values shown are estimates and are not guaranteed • The projected growth rate for each fund or arrangement are as follows:
o Equity asset classes 2.44% o Bond asset classes -1.56% o Cash asset classes -0.88%

The Fidelity Master Trust Report and Financial Statements for the year ended 30 June 2021
135
British Engineering Services Plan Illustrations are shown for the default option, the FutureWise Lifestyle Strategy, together with the following self select funds:
• One of the funds with the highest before costs expected return – example used is the BlackRock Aquila Life Mkt Adv Fund Cl8
• One of the funds with the lowest before costs expected return - example used is the Fid L&G; Corporate Bond All Stocks in Cl8
• The fund with the highest annual member borne costs - this is the Fid Emerging Markets Eqty Pensions Fd C8
• The fund with the lowest annual member borne costs - this is the Fidelity Drawdown Cash Account
Projected Pot Sizes in Today’s Money
Years
FutureWise Lifestyle Strategy BlackRock Aquila Life Mkt Adv Fund Cl8
Fid L&G; Corporate Bond All Stocks in Cl8
Pot size with no costs incurred
Pot size after all costs
deducted
Pot size with no costs incurred
Pot size after all costs
deducted
Pot size with no costs incurred
Pot size after all costs
deducted 1 £28,548 £28,412 £28,548 £28,322 £27,539 £27,412 3 £42,126 £41,606 £42,126 £41,259 £38,358 £37,904 5 £56,374 £55,306 £56,374 £54,598 £48,843 £47,968
10 £95,150 £91,904 £95,150 £89,789 £73,654 £71,368 20 £188,233 £176,309 £188,233 £168,791 £117,789 £111,451 30 £306,681 £278,224 £306,681 £260,859 £155,499 £143,996 40 £454,534 £397,645 £457,404 £368,155 £187,719 £170,420 50 £537,138 £456,106 £649,197 £493,199 £215,248 £191,875
Reduction in yield: 0.6% Reduction in yield: 0.9% Reduction in yield: 0.5%
Years
Fid Emerging Markets Eqty Pensions Fd C8
Fidelity Drawdown Cash Account
Pot size with no costs incurred
Pot size after all costs
deducted
Pot size with no costs incurred
Pot size after all costs
deducted 1 £28,548 £28,237 £27,711 £27,711 3 £42,126 £40,937 £38,983 £38,984 5 £56,374 £53,946 £50,058 £50,059
10 £95,150 £87,866 £76,906 £76,908 20 £188,233 £162,123 £127,178 £127,182 30 £306,681 £245,840 £173,206 £173,213 40 £457,404 £340,223 £215,348 £215,360 50 £649,197 £446,631 £253,933 £253,949
Reduction in yield: 1.2% Reduction in yield: 0.0

The Fidelity Master Trust Report and Financial Statements for the year ended 30 June 2021
136
Notes: • Projected pension pot values are shown in today’s terms, and do not need to be reduced further for the effect
of future inflation • The starting pot size is assumed to be £22,000. • Inflation is assumed to be 2.5% each year. • Total contributions are assumed are assumed to be £500 per month. • Values shown are estimates and are not guaranteed • The projected growth rate for each fund or arrangement are as follows:
o Equity asset classes 2.44% o Bond asset classes -1.56% o Cash asset classes -0.88%

The Fidelity Master Trust Report and Financial Statements for the year ended 30 June 2021
137
BNP Paribas Pension Illustrations are shown for the default option, the Drawdown Lifestyle Strategy, together with the following self select funds:
• One of the funds with the highest before costs expected return – example used is the BlackRock Dynamic Allocation Fund
• One of the funds with the lowest before costs expected return - example used is the BlackRock Corporate Bond Over 15 Yr Idx
• The fund with the highest annual member borne costs - this is the Fidelity Schroder Diversified Growth • The fund with the lowest annual member borne costs - this is the Fidelity Drawdown Cash Account
Projected Pot Sizes in Today’s Money
Years
Drawdown Lifestyle Strategy BlackRock Dynamic Allocation Fund
BlackRock Corporate Bond Over 15 Yr Idx
Pot size with no costs incurred
Pot size after all costs
deducted
Pot size with no costs incurred
Pot size after all costs
deducted
Pot size with no costs incurred
Pot size after all costs
deducted 1 £75,847 £75,468 £75,847 £75,184 £73,013 £72,914 3 £91,195 £92,890 £94,195 £91,923 £84,758 £84,441 5 £113,448 £110,981 £113,448 £109,170 £96,140 £95,580
10 £165,843 £159,309 £165,843 £154,605 £123,075 £121,811 20 £291,621 £270,769 £291,621 £256,304 £170,987 £167,983 30 £451,671 £403,094 £451,671 £374,365 £211,923 £206,877 40 £655,334 £555,407 £655,334 £511,420 £246,901 £239,641 50 £847,943 £687,890 £914,492 £670,525 £276,786 £267,241
Reduction in yield: 0.6% Reduction in yield: 0.9% Reduction in yield: 0.1%
Years
Fidelity Schroder Diversified Growth
Fidelity Drawdown Cash Account
Pot size with no costs incurred
Pot size after all costs
deducted
Pot size with no costs incurred
Pot size after all costs
deducted 1 £75,847 £75,018 £73,497 £73,497 3 £94,195 £91,362 £86,320 £86,320 5 £113,448 £108,123 £98,919 £98,920
10 £165,843 £151,922 £129,460 £129,463 20 £291,621 £248,259 £186,648 £186,655 30 £451,671 £357,544 £239,009 £239,020 40 £655,334 £481,517 £286,949 £286,966 50 £914,492 £622,154 £330,842 £330,865
Reduction in yield: 1.2% Reduction in yield: 0.0%

The Fidelity Master Trust Report and Financial Statements for the year ended 30 June 2021
138
Notes: • Projected pension pot values are shown in today’s terms, and do not need to be reduced further for the effect
of future inflation • The starting pot size is assumed to be £67,000. • Inflation is assumed to be 2.5% each year. • Total contributions are assumed are assumed to be £600 per month. • Values shown are estimates and are not guaranteed • The projected growth rate for each fund or arrangement are as follows:
o Equity asset classes 2.44% o Bond asset classes -1.56% o Cash asset classes -0.88%
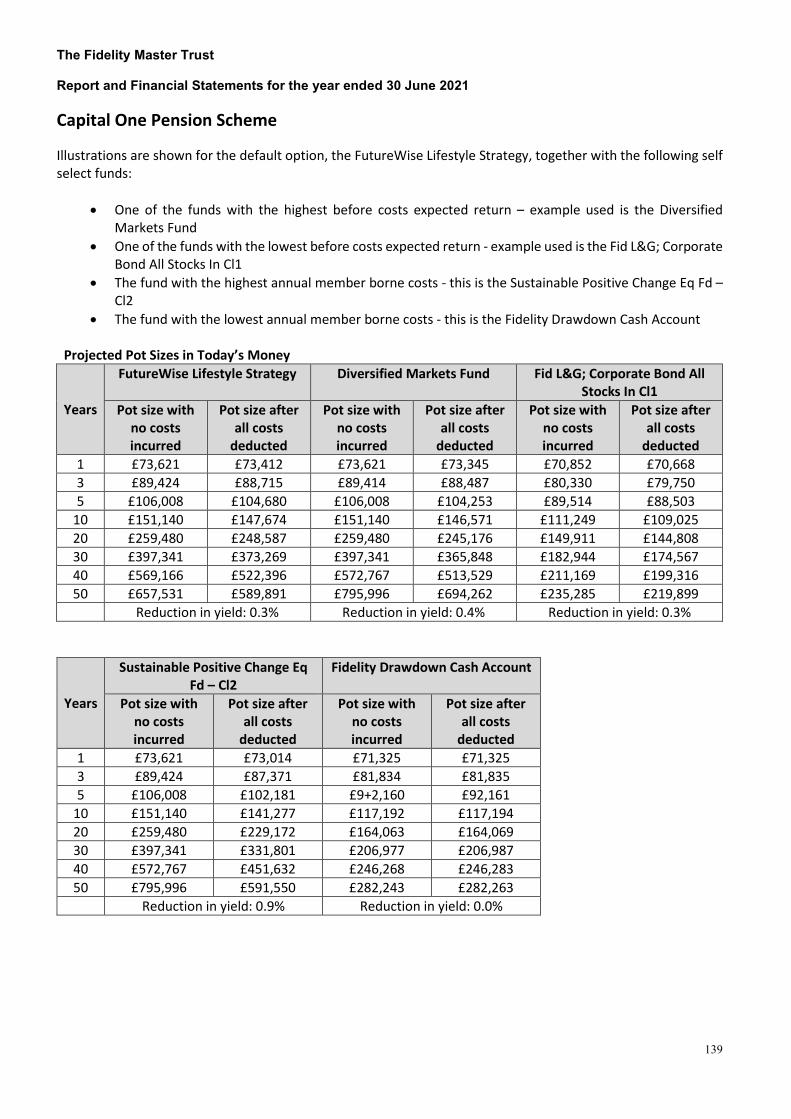
The Fidelity Master Trust Report and Financial Statements for the year ended 30 June 2021
139
Capital One Pension Scheme Illustrations are shown for the default option, the FutureWise Lifestyle Strategy, together with the following self select funds:
• One of the funds with the highest before costs expected return – example used is the Diversified Markets Fund
• One of the funds with the lowest before costs expected return - example used is the Fid L&G; Corporate Bond All Stocks In Cl1
• The fund with the highest annual member borne costs - this is the Sustainable Positive Change Eq Fd – Cl2
• The fund with the lowest annual member borne costs - this is the Fidelity Drawdown Cash Account
Projected Pot Sizes in Today’s Money
Years
FutureWise Lifestyle Strategy Diversified Markets Fund Fid L&G; Corporate Bond All Stocks In Cl1
Pot size with no costs incurred
Pot size after all costs
deducted
Pot size with no costs incurred
Pot size after all costs
deducted
Pot size with no costs incurred
Pot size after all costs
deducted 1 £73,621 £73,412 £73,621 £73,345 £70,852 £70,668 3 £89,424 £88,715 £89,414 £88,487 £80,330 £79,750 5 £106,008 £104,680 £106,008 £104,253 £89,514 £88,503
10 £151,140 £147,674 £151,140 £146,571 £111,249 £109,025 20 £259,480 £248,587 £259,480 £245,176 £149,911 £144,808 30 £397,341 £373,269 £397,341 £365,848 £182,944 £174,567 40 £569,166 £522,396 £572,767 £513,529 £211,169 £199,316 50 £657,531 £589,891 £795,996 £694,262 £235,285 £219,899
Reduction in yield: 0.3% Reduction in yield: 0.4% Reduction in yield: 0.3%
Years
Sustainable Positive Change Eq Fd – Cl2
Fidelity Drawdown Cash Account
Pot size with no costs incurred
Pot size after all costs
deducted
Pot size with no costs incurred
Pot size after all costs
deducted 1 £73,621 £73,014 £71,325 £71,325 3 £89,424 £87,371 £81,834 £81,835 5 £106,008 £102,181 £9+2,160 £92,161
10 £151,140 £141,277 £117,192 £117,194 20 £259,480 £229,172 £164,063 £164,069 30 £397,341 £331,801 £206,977 £206,987 40 £572,767 £451,632 £246,268 £246,283 50 £795,996 £591,550 £282,243 £282,263
Reduction in yield: 0.9% Reduction in yield: 0.0%

The Fidelity Master Trust Report and Financial Statements for the year ended 30 June 2021
140
Notes: • Projected pension pot values are shown in today’s terms, and do not need to be reduced further for the effect
of future inflation • The starting pot size is assumed to be £66,000. • Inflation is assumed to be 2.5% each year. • Total contributions are assumed are assumed to be £500 per month. • Values shown are estimates and are not guaranteed • The projected growth rate for each fund or arrangement are as follows:
o Equity asset classes 2.44% o Bond asset classes -1.56% o Cash asset classes -0.88%

The Fidelity Master Trust Report and Financial Statements for the year ended 30 June 2021
141
CDC Pension Scheme Illustrations are shown for the default option, the FutureWise Lifestyle Strategy, together with the following self select funds:
• One of the funds with the highest before costs expected return – example used is the BlackRock Aquila Life Mkt Adv Fund Cl8
• One of the funds with the lowest before costs expected return - example used is the Fid L&G; Corporate Bond All Stocks In Cl4
• The fund with the highest annual member borne costs - this is the Fidelity Emerging Markets Equity • The fund with the lowest annual member borne costs - this is the Fidelity Drawdown Cash Account
Projected Pot Sizes in Today’s Money
Years
FutureWise Lifestyle Strategy BlackRock Aquila Life Mkt Adv Fund Cl8
Fid L&G; Corporate Bond All Stocks In Cl4
Pot size with no costs incurred
Pot size after all costs
deducted
Pot size with no costs incurred
Pot size after all costs
deducted
Pot size with no costs incurred
Pot size after all costs
deducted 1 £118,381 £117,787 £118,381 £117,388 £113,949 £113,231 3 £146,129 £144,096 £146,129 £142,739 £131,430 £129,151 5 £175,248 £171,415 £175,248 £168,878 £148,369 £144,376
10 £254,491 £244,394 £254,491 £237,838 £188,457 £179,592 20 £444,718 £412,705 £444,718 £392,647 £259,765 £239,253 30 £686,779 £615,931 £686,779 £573,061 £320,692 £286,973 40 £988,547 £853,594 £994,799 £783,316 £372,749 £325,140 50 £1,145,796 £963,228 £1,386,752 £1,028,347 £417,228 £355,669
Reduction in yield: 0.5% Reduction in yield: 0.9% Reduction in yield: 0.7%
Years
Fidelity Emerging Markets Equity Fidelity Drawdown Cash Account Pot size with
no costs incurred
Pot size after all costs
deducted
Pot size with no costs incurred
Pot size after all costs
deducted 1 £118,381 £116,825 £114,706 £114,706 3 £146,129 £140,842 £133,862 £133,863 5 £175,248 £165,359 £152,684 £152,686
10 £254,491 £228,905 £198,311 £198,315 20 £444,718 £366,238 £283,745 £283,754 30 £686,779 £518,455 £361,967 £361,984 40 £994,799 £687,168 £433,585 £433,611 50 £1,386,752 £874,166 £499,159 £499,194
Reduction in yield: 1.4% Reduction in yield: 0.0%

The Fidelity Master Trust Report and Financial Statements for the year ended 30 June 2021
142
Notes: • Projected pension pot values are shown in today’s terms, and do not need to be reduced further for the effect
of future inflation • The starting pot size is assumed to be £105,000. • Inflation is assumed to be 2.5% each year. • Total contributions are assumed are assumed to be £900 per month. • Values shown are estimates and are not guaranteed • The projected growth rate for each fund or arrangement are as follows:
o Equity asset classes 2.44% o Bond asset classes -1.56% o Cash asset classes -0.88%
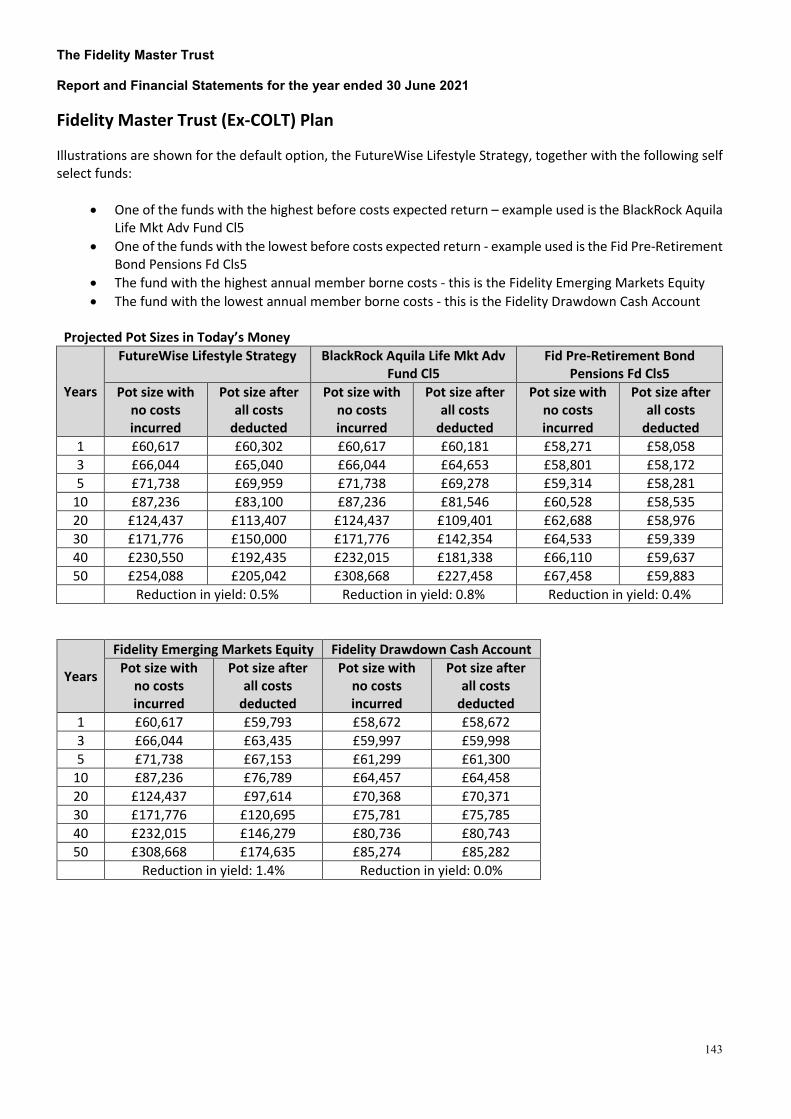
The Fidelity Master Trust Report and Financial Statements for the year ended 30 June 2021
143
Fidelity Master Trust (Ex-COLT) Plan Illustrations are shown for the default option, the FutureWise Lifestyle Strategy, together with the following self select funds:
• One of the funds with the highest before costs expected return – example used is the BlackRock Aquila Life Mkt Adv Fund Cl5
• One of the funds with the lowest before costs expected return - example used is the Fid Pre-Retirement Bond Pensions Fd Cls5
• The fund with the highest annual member borne costs - this is the Fidelity Emerging Markets Equity • The fund with the lowest annual member borne costs - this is the Fidelity Drawdown Cash Account
Projected Pot Sizes in Today’s Money
Years
FutureWise Lifestyle Strategy BlackRock Aquila Life Mkt Adv Fund Cl5
Fid Pre-Retirement Bond Pensions Fd Cls5
Pot size with no costs incurred
Pot size after all costs
deducted
Pot size with no costs incurred
Pot size after all costs
deducted
Pot size with no costs incurred
Pot size after all costs
deducted 1 £60,617 £60,302 £60,617 £60,181 £58,271 £58,058 3 £66,044 £65,040 £66,044 £64,653 £58,801 £58,172 5 £71,738 £69,959 £71,738 £69,278 £59,314 £58,281
10 £87,236 £83,100 £87,236 £81,546 £60,528 £58,535 20 £124,437 £113,407 £124,437 £109,401 £62,688 £58,976 30 £171,776 £150,000 £171,776 £142,354 £64,533 £59,339 40 £230,550 £192,435 £232,015 £181,338 £66,110 £59,637 50 £254,088 £205,042 £308,668 £227,458 £67,458 £59,883
Reduction in yield: 0.5% Reduction in yield: 0.8% Reduction in yield: 0.4%
Years
Fidelity Emerging Markets Equity Fidelity Drawdown Cash Account Pot size with
no costs incurred
Pot size after all costs
deducted
Pot size with no costs incurred
Pot size after all costs
deducted 1 £60,617 £59,793 £58,672 £58,672 3 £66,044 £63,435 £59,997 £59,998 5 £71,738 £67,153 £61,299 £61,300
10 £87,236 £76,789 £64,457 £64,458 20 £124,437 £97,614 £70,368 £70,371 30 £171,776 £120,695 £75,781 £75,785 40 £232,015 £146,279 £80,736 £80,743 50 £308,668 £174,635 £85,274 £85,282
Reduction in yield: 1.4% Reduction in yield: 0.0%

The Fidelity Master Trust Report and Financial Statements for the year ended 30 June 2021
144
Notes: • Projected pension pot values are shown in today’s terms, and do not need to be reduced further for the effect
of future inflation • The starting pot size is assumed to be £58,000. • Inflation is assumed to be 2.5% each year. • Total contributions are assumed are assumed to be £100 per month. • Values shown are estimates and are not guaranteed • The projected growth rate for each fund or arrangement are as follows:
o Equity asset classes 2.44% o Bond asset classes -1.56% o Cash asset classes -0.88%

The Fidelity Master Trust Report and Financial Statements for the year ended 30 June 2021
145
MyColt Retirement Savings Illustrations are shown for the default option, the FutureWise Lifestyle Strategy, together with the following self select funds:
• One of the funds with the highest before costs expected return – example used is the BlackRock Aquila Life Mkt Adv Fund Cl 11
• One of the funds with the lowest before costs expected return - example used is the BlackRock O 5 Ys Ind Linked Gilt Fd Cl11
• The fund with the highest annual member borne costs - this is the Fidelity Global Focus Pensions Fund Cl6
• The fund with the lowest annual member borne costs - this is the Fidelity Drawdown Cash Account
Projected Pot Sizes in Today’s Money
Years
FutureWise Lifestyle Strategy BlackRock Aquila Life Mkt Adv Fund Cl 11
BlackRock O 5 Ys Ind Linked Gilt Fd Cl11
Pot size with no costs incurred
Pot size after all costs
deducted
Pot size with no costs incurred
Pot size after all costs
deducted
Pot size with no costs incurred
Pot size after all costs
deducted 1 £123,147 £122,701 £123,147 £122,340 £118,487 £118,182 3 £146,264 £144,767 £146,264 £143,564 £131,158 £130,210 5 £170,522 £167,750 £170,522 £165,535 £143,437 £141,804
10 £236,537 £229,472 £236,537 £223,910 £172,495 £168,989 20 £395,008 £373,458 £395,008 £356,965 £224,184 £216,405 30 £596,662 £549,941 £596,662 £515,163 £268,348 £255,854 40 £847,896 £759,217 £853,264 £703,254 £306,083 £288,676 50 £974,173 £850,711 £1,179,787 £926,886 £338,324 £315,984
Reduction in yield: 0.4% Reduction in yield: 0.7% Reduction in yield: 0.3%
Years
Fidelity Global Focus Pensions Fund Cl6
Fidelity Drawdown Cash Account
Pot size with no costs incurred
Pot size after all costs
deducted
Pot size with no costs incurred
Pot size after all costs
deducted 1 £123,147 £121,358 £119,238 £119,283 3 £146,264 £140,327 £133,656 £133,657 5 £170,522 £159,640 £147,779 £147,781
10 £236,537 £209,471 £182,014 £182,018 20 £395,008 £316,108 £246,119 £246,127 30 £596,662 £432,774 £304,811 £304,826 40 £853,264 £560,411 £358,550 £358,572 50 £1,179,787 £700,052 £407,751 £407,781
Reduction in yield: 1.5% Reduction in yield: 0.0%

The Fidelity Master Trust Report and Financial Statements for the year ended 30 June 2021
146
Notes: • Projected pension pot values are shown in today’s terms, and do not need to be reduced further for the effect
of future inflation • The starting pot size is assumed to be £112,000. • Inflation is assumed to be 2.5% each year. • Total contributions are assumed are assumed to be £700 per month. • Values shown are estimates and are not guaranteed • The projected growth rate for each fund or arrangement are as follows:
o Equity asset classes 2.44% o Bond asset classes -1.56% o Cash asset classes -0.88%

The Fidelity Master Trust Report and Financial Statements for the year ended 30 June 2021
147
Credit Suisse Master Trust Illustrations are shown for the default option, the FutureWise Lifestyle Strategy, together with the following self select funds:
• One of the funds with the highest before costs expected return – example used is the Fid CSMT BlackRock Em Markets Equity Fd
• One of the funds with the lowest before costs expected return - example used is the Fid CSMT BlackRock Over 15 Year Glts Ind
• The fund with the highest annual member borne costs - this is the Fidelity CSMT Emerging Markets Equity
• The fund with the lowest annual member borne costs - this is the Fidelity Drawdown Cash Account
Projected Pot Sizes in Today’s Money
Years
FutureWise Lifestyle Strategy Fid CSMT BlackRock Em Markets Equity Fd
Fid CSMT BlackRock Over 15 Year Glts Ind
Pot size with no costs incurred
Pot size after all costs
deducted
Pot size with no costs incurred
Pot size after all costs
deducted
Pot size with no costs incurred
Pot size after all costs
deducted 1 £101,322 £101,089 £101,322 £100,894 £97,598 £97,503 3 £133,096 £132,265 £133,096 £131,571 £120,255 £119,939 5 £166,438 £164,820 £166,438 £163,475 £142,209 £141,635
10 £257,176 £252,653 £257,176 £248,926 £194,166 £192,796 20 £474,997 £459,592 £474,997 £447,123 £286,586 £283,103 30 £752,170 £716,557 £752,170 £688,227 £365,551 £359,468 40 £1,097,934 £1,026,038 £1,104,872 £981,527 £433,021 £424,044 50 £1,284,585 £1,179,365 £1,553,680 £1,338,323 £490,669 £478,649
Reduction in yield: 0.3% Reduction in yield: 0.5% Reduction in yield: 0.1%
Years
Fidelity CSMT Emerging Markets Equity
Fidelity Drawdown Cash Account
Pot size with no costs incurred
Pot size after all costs
deducted
Pot size with no costs incurred
Pot size after all costs
deducted 1 £101,322 £100,109 £98,234 £98,235 3 £133,096 £128,809 £122,381 £122,382 5 £166,438 £158,164 £146,106 £146,108
10 £257,176 £234,519 £203,620 £203,624 20 £474,997 £400,790 £311,311 £311,321 30 £752,170 £586,935 £409,912 £409,930 40 £1,104,872 £795,330 £500,189 £500,217 50 £1,553,680 £1,028,634 £582,845 £582,884
Reduction in yield: 1.3% Reduction in yield: 0.0%

The Fidelity Master Trust Report and Financial Statements for the year ended 30 June 2021
148
Notes: • Projected pension pot values are shown in today’s terms, and do not need to be reduced further for the effect
of future inflation • The starting pot size is assumed to be £86,000. • Inflation is assumed to be 2.5% each year. • Total contributions are assumed are assumed to be £1,100 per month. • Values shown are estimates and are not guaranteed • The projected growth rate for each fund or arrangement are as follows:
o Equity asset classes 2.44% o Bond asset classes -1.56% o Cash asset classes -0.88%

The Fidelity Master Trust Report and Financial Statements for the year ended 30 June 2021
149
Danske Bank Master Trust Pension Plan Illustrations are shown for the default option, the FutureWise Lifestyle Strategy, together with the following self select funds:
• One of the funds with the highest before costs expected return – example used is the BlackRock Aquila Life Mkt Adv Fund Cl5
• One of the funds with the lowest before costs expected return - example used is the Fid Pre-Retirement Bond Pensions Fd Cls4
• The fund with the highest annual member borne costs - this is the Fid Emerging Markets Eqty Pensions Fd C8
• The fund with the lowest annual member borne costs - this is the Fidelity Drawdown Cash Account
Projected Pot Sizes in Today’s Money
Years
FutureWise Lifestyle Strategy BlackRock Aquila Life Mkt Adv Fund Cl5
Fid Pre-Retirement Bond Pensions Fd Cls4
Pot size with no costs incurred
Pot size after all costs
deducted
Pot size with no costs incurred
Pot size after all costs
deducted
Pot size with no costs incurred
Pot size after all costs
deducted 1 £23,070 £22,997 £23,070 £22,914 £22,233 £22,105 3 £31,510 £31,245 £31,510 £30,943 £28,548 £28,116 5 £40,367 £39,841 £40,367 £39,246 £34,667 £33,868
10 £64,471 £62,954 £64,471 £61,268 £49,148 £47,192 20 £122,332 £117,017 £122,332 £111,272 £74,908 £69,834 30 £195,959 £183,515 £195,959 £170,428 £96,917 £88,017 40 £287,831 £262,59 £289,649 £240,411 £115,722 £102,621 50 £338,153 £300,779 £408,869 £323,203 £131,790 £114,349
Reduction in yield: 0.4% Reduction in yield: 0.8% Reduction in yield: 0.6%
Years
Fid Emerging Markets Eqty Pensions Fd C8
Fidelity Drawdown Cash Account
Pot size with no costs incurred
Pot size after all costs
deducted
Pot size with no costs incurred
Pot size after all costs
deducted 1 £23,070 £22,812 £22,376 £22,376 3 £31,510 £30,575 £29,039 £29,039 5 £40,367 £38,526 £35,585 £35,585
10 £64,471 £59,258 £51,454 £51,455 20 £122,332 £104,646 £81,169 £81,171 30 £195,959 £155,815 £108,375 £108,380 40 £289,649 £213,504 £133,285 £133,292 50 £408,869 £278,542 £156,092 £156,102
Reduction in yield: 1.2% Reduction in yield: 0.0%

The Fidelity Master Trust Report and Financial Statements for the year ended 30 June 2021
150
Notes: • Projected pension pot values are shown in today’s terms, and do not need to be reduced further for the effect
of future inflation • The starting pot size is assumed to be £19,000. • Inflation is assumed to be 2.5% each year. • Total contributions are assumed are assumed to be £300 per month. • Values shown are estimates and are not guaranteed • The projected growth rate for each fund or arrangement are as follows:
o Equity asset classes 2.44% o Bond asset classes -1.56% o Cash asset classes -0.88%
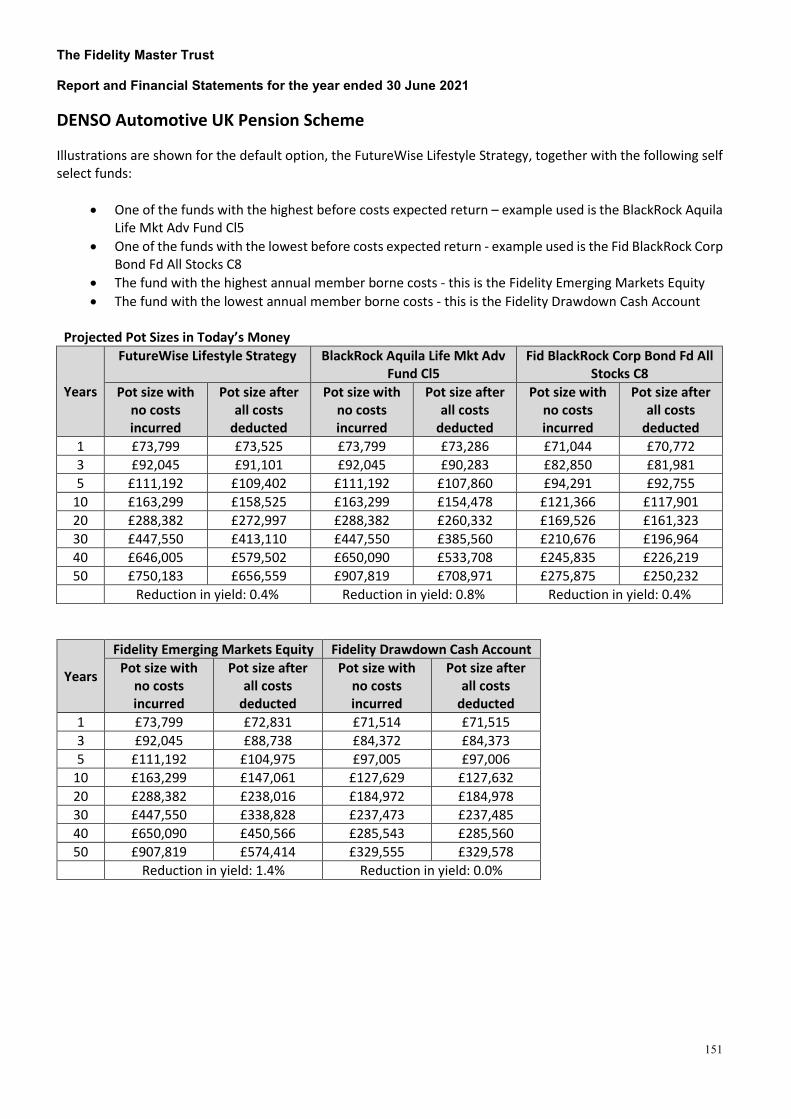
The Fidelity Master Trust Report and Financial Statements for the year ended 30 June 2021
151
DENSO Automotive UK Pension Scheme Illustrations are shown for the default option, the FutureWise Lifestyle Strategy, together with the following self select funds:
• One of the funds with the highest before costs expected return – example used is the BlackRock Aquila Life Mkt Adv Fund Cl5
• One of the funds with the lowest before costs expected return - example used is the Fid BlackRock Corp Bond Fd All Stocks C8
• The fund with the highest annual member borne costs - this is the Fidelity Emerging Markets Equity • The fund with the lowest annual member borne costs - this is the Fidelity Drawdown Cash Account
Projected Pot Sizes in Today’s Money
Years
FutureWise Lifestyle Strategy BlackRock Aquila Life Mkt Adv Fund Cl5
Fid BlackRock Corp Bond Fd All Stocks C8
Pot size with no costs incurred
Pot size after all costs
deducted
Pot size with no costs incurred
Pot size after all costs
deducted
Pot size with no costs incurred
Pot size after all costs
deducted 1 £73,799 £73,525 £73,799 £73,286 £71,044 £70,772 3 £92,045 £91,101 £92,045 £90,283 £82,850 £81,981 5 £111,192 £109,402 £111,192 £107,860 £94,291 £92,755
10 £163,299 £158,525 £163,299 £154,478 £121,366 £117,901 20 £288,382 £272,997 £288,382 £260,332 £169,526 £161,323 30 £447,550 £413,110 £447,550 £385,560 £210,676 £196,964 40 £646,005 £579,502 £650,090 £533,708 £245,835 £226,219 50 £750,183 £656,559 £907,819 £708,971 £275,875 £250,232
Reduction in yield: 0.4% Reduction in yield: 0.8% Reduction in yield: 0.4%
Years
Fidelity Emerging Markets Equity Fidelity Drawdown Cash Account Pot size with
no costs incurred
Pot size after all costs
deducted
Pot size with no costs incurred
Pot size after all costs
deducted 1 £73,799 £72,831 £71,514 £71,515 3 £92,045 £88,738 £84,372 £84,373 5 £111,192 £104,975 £97,005 £97,006
10 £163,299 £147,061 £127,629 £127,632 20 £288,382 £238,016 £184,972 £184,978 30 £447,550 £338,828 £237,473 £237,485 40 £650,090 £450,566 £285,543 £285,560 50 £907,819 £574,414 £329,555 £329,578
Reduction in yield: 1.4% Reduction in yield: 0.0%

The Fidelity Master Trust Report and Financial Statements for the year ended 30 June 2021
152
Notes: • Projected pension pot values are shown in today’s terms, and do not need to be reduced further for the effect
of future inflation • The starting pot size is assumed to be £65,000. • Inflation is assumed to be 2.5% each year. • Total contributions are assumed are assumed to be £600 per month. • Values shown are estimates and are not guaranteed • The projected growth rate for each fund or arrangement are as follows:
o Equity asset classes 2.44% o Bond asset classes -1.56% o Cash asset classes -0.88%

The Fidelity Master Trust Report and Financial Statements for the year ended 30 June 2021
153
Derwent London Employee Investment Plan Illustrations are shown for the default option, the FutureWise Working Life Strategy, together with the following self select funds:
• One of the funds with the highest before costs expected return – example used is the BlackRock Aquila Life Mkt Adv Fund Cl 11
• One of the funds with the lowest before costs expected return - example used is the BlackRock O5 Ys Ind Linked Gilt Fd Cl11
• The fund with the highest annual member borne costs - this is the Fid Emerging Markets Eqty Pensions Fd C8
• The fund with the lowest annual member borne costs - this is the Fidelity Drawdown Cash Account
Projected Pot Sizes in Today’s Money
Years
FutureWise Working Life Strategy
BlackRock Aquila Life Mkt Adv Fund Cl 11
BlackRock O5 Ys Ind Linked Gilt Fd Cl11
Pot size with no costs incurred
Pot size after all costs
deducted
Pot size with no costs incurred
Pot size after all costs
deducted
Pot size with no costs incurred
Pot size after all costs
deducted 1 £124,214 £123,834 £124,214 £123,421 £119,639 £119,340 3 £161,986 £160,639 £161,986 £159,182 £146,282 £145,295 5 £201,622 £199,010 £201,622 £196,202 £172,099 £170,312
10 £309,488 £302,240 £309,488 £294,558 £233,197 £228,973 20 £568,425 £543,978 £568,425 £518,746 £341,878 £331,287 30 £897,920 £841,761 £897,920 £785,297 £434,797 £416,413 40 £1,308,926 £1,197,416 £1,317,198 £1,102,214 £514,077 £487,237 50 £1,530,086 £1,367,922 £1,850,726 £1,479,015 £581,868 £546,163
Reduction in yield: 0.4% Reduction in yield: 0.7% Reduction in yield: 0.3%
Years
Fid Emerging Markets Eqty Pensions Fd C8
Fidelity Drawdown Cash Account
Pot size with no costs incurred
Pot size after all costs
deducted
Pot size with no costs incurred
Pot size after all costs
deducted 1 £124,214 £122,805 £120,420 £120,421 3 £161,986 £157,024 £148,882 £148,883 5 £201,622 £192,075 £176,847 £176,849
10 £309,488 £283,468 £244,637 £244,642 20 £568,425 £483,546 £371,571 £371,583 30 £897,920 £709,113 £487,790 £487,812 40 £1,317,198 £963,418 £594,198 £594,232 50 £1,850,726 £1,250,121 £691,624 £691,671
Reduction in yield: 1.2% Reduction in yield: 0.0%

The Fidelity Master Trust Report and Financial Statements for the year ended 30 June 2021
154
Notes: • Projected pension pot values are shown in today’s terms, and do not need to be reduced further for the effect
of future inflation • The starting pot size is assumed to be £106,000. • Inflation is assumed to be 2.5% each year. • Total contributions are assumed are assumed to be £1,300 per month. • Values shown are estimates and are not guaranteed • The projected growth rate for each fund or arrangement are as follows:
o Equity asset classes 2.44% o Bond asset classes -1.56% o Cash asset classes -0.88%
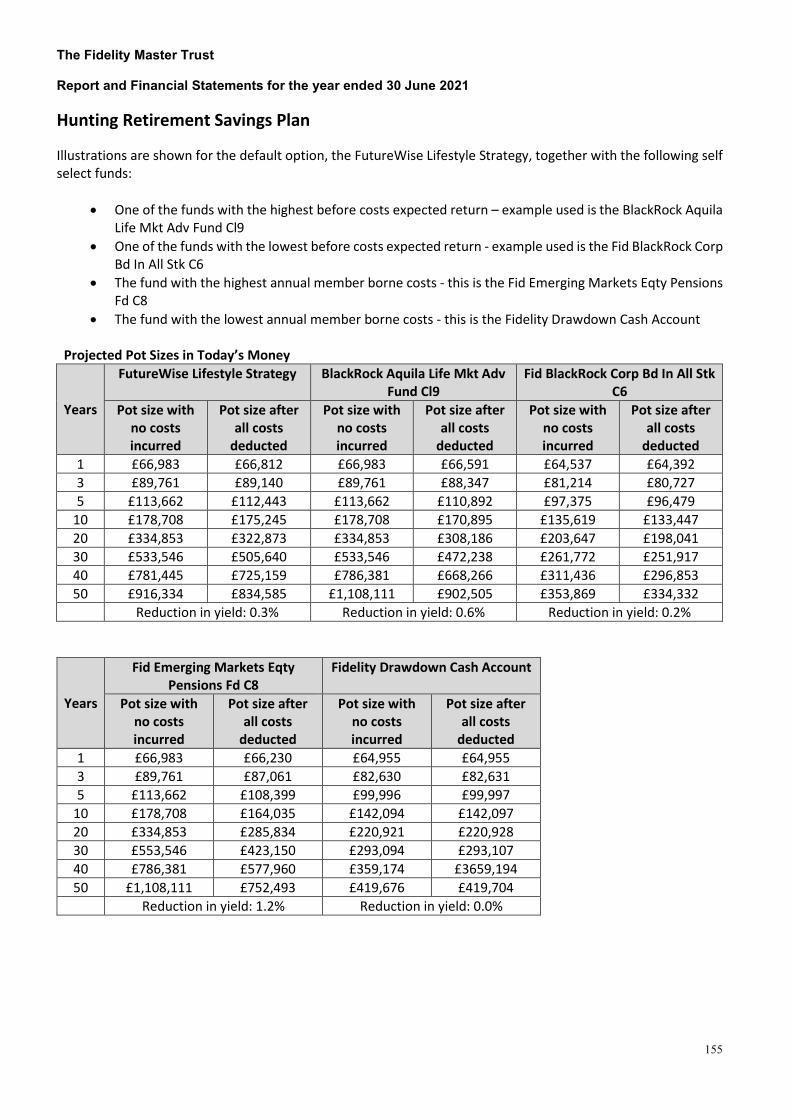
The Fidelity Master Trust Report and Financial Statements for the year ended 30 June 2021
155
Hunting Retirement Savings Plan Illustrations are shown for the default option, the FutureWise Lifestyle Strategy, together with the following self select funds:
• One of the funds with the highest before costs expected return – example used is the BlackRock Aquila Life Mkt Adv Fund Cl9
• One of the funds with the lowest before costs expected return - example used is the Fid BlackRock Corp Bd In All Stk C6
• The fund with the highest annual member borne costs - this is the Fid Emerging Markets Eqty Pensions Fd C8
• The fund with the lowest annual member borne costs - this is the Fidelity Drawdown Cash Account
Projected Pot Sizes in Today’s Money
Years
FutureWise Lifestyle Strategy BlackRock Aquila Life Mkt Adv Fund Cl9
Fid BlackRock Corp Bd In All Stk C6
Pot size with no costs incurred
Pot size after all costs
deducted
Pot size with no costs incurred
Pot size after all costs
deducted
Pot size with no costs incurred
Pot size after all costs
deducted 1 £66,983 £66,812 £66,983 £66,591 £64,537 £64,392 3 £89,761 £89,140 £89,761 £88,347 £81,214 £80,727 5 £113,662 £112,443 £113,662 £110,892 £97,375 £96,479
10 £178,708 £175,245 £178,708 £170,895 £135,619 £133,447 20 £334,853 £322,873 £334,853 £308,186 £203,647 £198,041 30 £533,546 £505,640 £533,546 £472,238 £261,772 £251,917 40 £781,445 £725,159 £786,381 £668,266 £311,436 £296,853 50 £916,334 £834,585 £1,108,111 £902,505 £353,869 £334,332
Reduction in yield: 0.3% Reduction in yield: 0.6% Reduction in yield: 0.2%
Years
Fid Emerging Markets Eqty Pensions Fd C8
Fidelity Drawdown Cash Account
Pot size with no costs incurred
Pot size after all costs
deducted
Pot size with no costs incurred
Pot size after all costs
deducted 1 £66,983 £66,230 £64,955 £64,955 3 £89,761 £87,061 £82,630 £82,631 5 £113,662 £108,399 £99,996 £99,997
10 £178,708 £164,035 £142,094 £142,097 20 £334,853 £285,834 £220,921 £220,928 30 £553,546 £423,150 £293,094 £293,107 40 £786,381 £577,960 £359,174 £3659,194 50 £1,108,111 £752,493 £419,676 £419,704
Reduction in yield: 1.2% Reduction in yield: 0.0%

The Fidelity Master Trust Report and Financial Statements for the year ended 30 June 2021
156
Notes: • Projected pension pot values are shown in today’s terms, and do not need to be reduced further for the effect
of future inflation • The starting pot size is assumed to be £56,000. • Inflation is assumed to be 2.5% each year. • Total contributions are assumed are assumed to be £800 per month. • Values shown are estimates and are not guaranteed • The projected growth rate for each fund or arrangement are as follows:
o Equity asset classes 2.44% o Bond asset classes -1.56% o Cash asset classes -0.88%
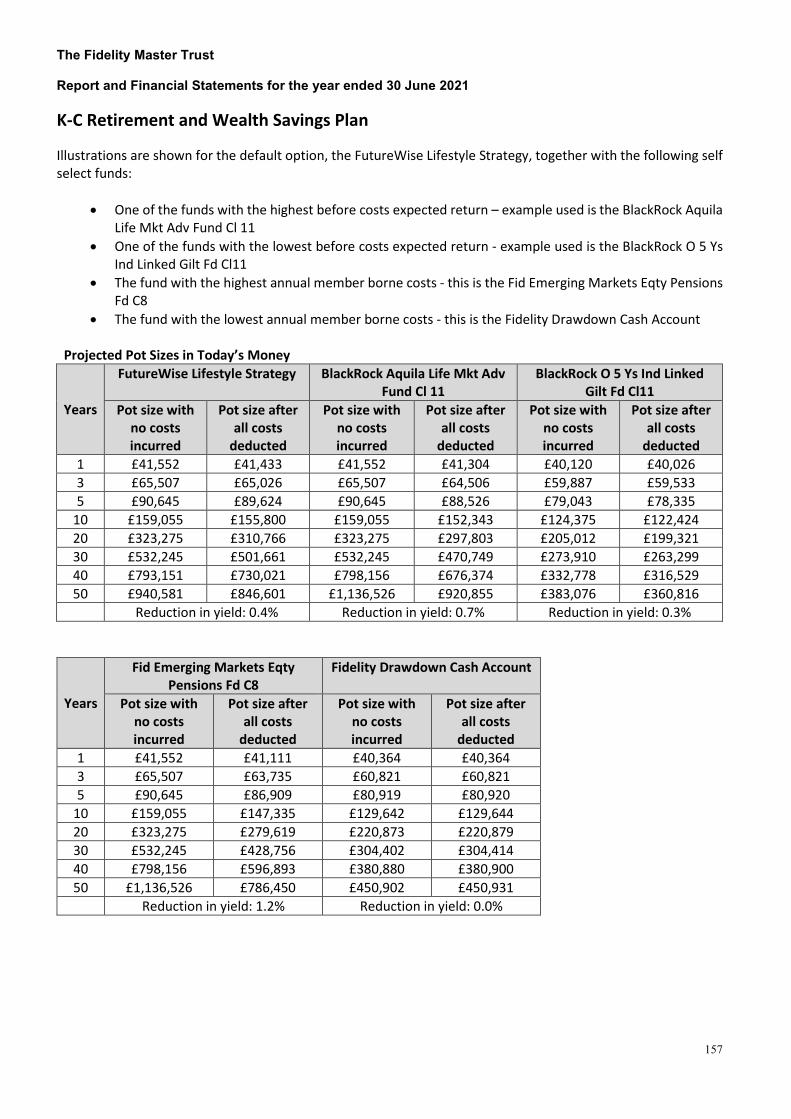
The Fidelity Master Trust Report and Financial Statements for the year ended 30 June 2021
157
K-C Retirement and Wealth Savings Plan Illustrations are shown for the default option, the FutureWise Lifestyle Strategy, together with the following self select funds:
• One of the funds with the highest before costs expected return – example used is the BlackRock Aquila Life Mkt Adv Fund Cl 11
• One of the funds with the lowest before costs expected return - example used is the BlackRock O 5 Ys Ind Linked Gilt Fd Cl11
• The fund with the highest annual member borne costs - this is the Fid Emerging Markets Eqty Pensions Fd C8
• The fund with the lowest annual member borne costs - this is the Fidelity Drawdown Cash Account
Projected Pot Sizes in Today’s Money
Years
FutureWise Lifestyle Strategy BlackRock Aquila Life Mkt Adv Fund Cl 11
BlackRock O 5 Ys Ind Linked Gilt Fd Cl11
Pot size with no costs incurred
Pot size after all costs
deducted
Pot size with no costs incurred
Pot size after all costs
deducted
Pot size with no costs incurred
Pot size after all costs
deducted 1 £41,552 £41,433 £41,552 £41,304 £40,120 £40,026 3 £65,507 £65,026 £65,507 £64,506 £59,887 £59,533 5 £90,645 £89,624 £90,645 £88,526 £79,043 £78,335
10 £159,055 £155,800 £159,055 £152,343 £124,375 £122,424 20 £323,275 £310,766 £323,275 £297,803 £205,012 £199,321 30 £532,245 £501,661 £532,245 £470,749 £273,910 £263,299 40 £793,151 £730,021 £798,156 £676,374 £332,778 £316,529 50 £940,581 £846,601 £1,136,526 £920,855 £383,076 £360,816
Reduction in yield: 0.4% Reduction in yield: 0.7% Reduction in yield: 0.3%
Years
Fid Emerging Markets Eqty Pensions Fd C8
Fidelity Drawdown Cash Account
Pot size with no costs incurred
Pot size after all costs
deducted
Pot size with no costs incurred
Pot size after all costs
deducted 1 £41,552 £41,111 £40,364 £40,364 3 £65,507 £63,735 £60,821 £60,821 5 £90,645 £86,909 £80,919 £80,920
10 £159,055 £147,335 £129,642 £129,644 20 £323,275 £279,619 £220,873 £220,879 30 £532,245 £428,756 £304,402 £304,414 40 £798,156 £596,893 £380,880 £380,900 50 £1,136,526 £786,450 £450,902 £450,931
Reduction in yield: 1.2% Reduction in yield: 0.0%

The Fidelity Master Trust Report and Financial Statements for the year ended 30 June 2021
158
Notes: • Projected pension pot values are shown in today’s terms, and do not need to be reduced further for the effect
of future inflation • The starting pot size is assumed to be £30,000. • Inflation is assumed to be 2.5% each year. • Total contributions are assumed are assumed to be £900 per month. • Values shown are estimates and are not guaranteed • The projected growth rate for each fund or arrangement are as follows:
o Equity asset classes 2.44% o Bond asset classes -1.56% o Cash asset classes -0.88%
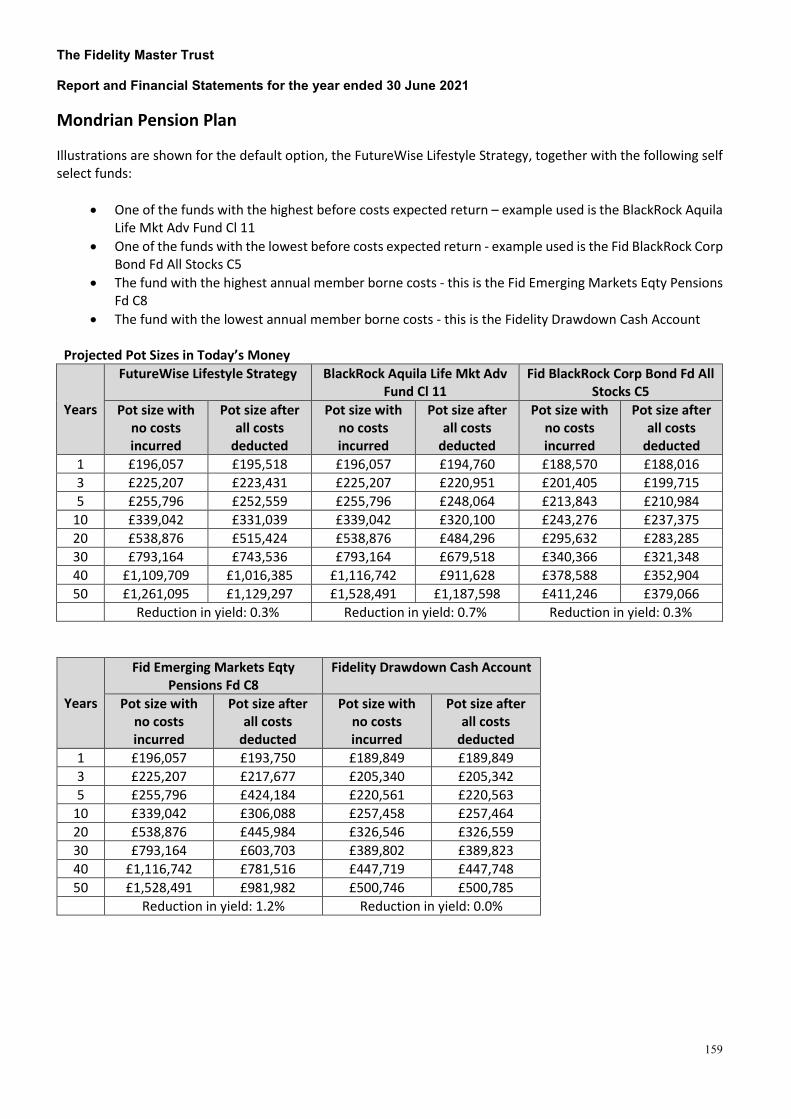
The Fidelity Master Trust Report and Financial Statements for the year ended 30 June 2021
159
Mondrian Pension Plan Illustrations are shown for the default option, the FutureWise Lifestyle Strategy, together with the following self select funds:
• One of the funds with the highest before costs expected return – example used is the BlackRock Aquila Life Mkt Adv Fund Cl 11
• One of the funds with the lowest before costs expected return - example used is the Fid BlackRock Corp Bond Fd All Stocks C5
• The fund with the highest annual member borne costs - this is the Fid Emerging Markets Eqty Pensions Fd C8
• The fund with the lowest annual member borne costs - this is the Fidelity Drawdown Cash Account
Projected Pot Sizes in Today’s Money
Years
FutureWise Lifestyle Strategy BlackRock Aquila Life Mkt Adv Fund Cl 11
Fid BlackRock Corp Bond Fd All Stocks C5
Pot size with no costs incurred
Pot size after all costs
deducted
Pot size with no costs incurred
Pot size after all costs
deducted
Pot size with no costs incurred
Pot size after all costs
deducted 1 £196,057 £195,518 £196,057 £194,760 £188,570 £188,016 3 £225,207 £223,431 £225,207 £220,951 £201,405 £199,715 5 £255,796 £252,559 £255,796 £248,064 £213,843 £210,984
10 £339,042 £331,039 £339,042 £320,100 £243,276 £237,375 20 £538,876 £515,424 £538,876 £484,296 £295,632 £283,285 30 £793,164 £743,536 £793,164 £679,518 £340,366 £321,348 40 £1,109,709 £1,016,385 £1,116,742 £911,628 £378,588 £352,904 50 £1,261,095 £1,129,297 £1,528,491 £1,187,598 £411,246 £379,066
Reduction in yield: 0.3% Reduction in yield: 0.7% Reduction in yield: 0.3%
Years
Fid Emerging Markets Eqty Pensions Fd C8
Fidelity Drawdown Cash Account
Pot size with no costs incurred
Pot size after all costs
deducted
Pot size with no costs incurred
Pot size after all costs
deducted 1 £196,057 £193,750 £189,849 £189,849 3 £225,207 £217,677 £205,340 £205,342 5 £255,796 £424,184 £220,561 £220,563
10 £339,042 £306,088 £257,458 £257,464 20 £538,876 £445,984 £326,546 £326,559 30 £793,164 £603,703 £389,802 £389,823 40 £1,116,742 £781,516 £447,719 £447,748 50 £1,528,491 £981,982 £500,746 £500,785
Reduction in yield: 1.2% Reduction in yield: 0.0%

The Fidelity Master Trust Report and Financial Statements for the year ended 30 June 2021
160
Notes: • Projected pension pot values are shown in today’s terms, and do not need to be reduced further for the effect
of future inflation • The starting pot size is assumed to be £182,000. • Inflation is assumed to be 2.5% each year. • Total contributions are assumed are assumed to be £800 per month. • Values shown are estimates and are not guaranteed • The projected growth rate for each fund or arrangement are as follows:
o Equity asset classes 2.44% o Bond asset classes -1.56% o Cash asset classes -0.88%
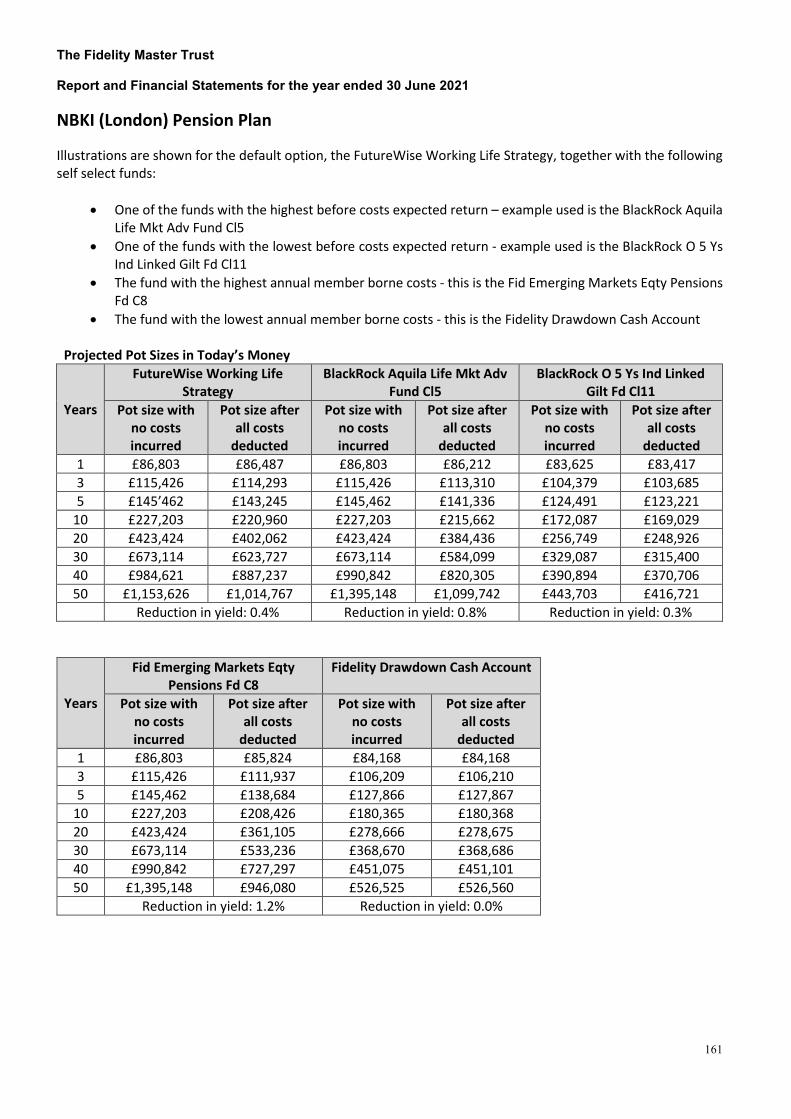
The Fidelity Master Trust Report and Financial Statements for the year ended 30 June 2021
161
NBKI (London) Pension Plan Illustrations are shown for the default option, the FutureWise Working Life Strategy, together with the following self select funds:
• One of the funds with the highest before costs expected return – example used is the BlackRock Aquila Life Mkt Adv Fund Cl5
• One of the funds with the lowest before costs expected return - example used is the BlackRock O 5 Ys Ind Linked Gilt Fd Cl11
• The fund with the highest annual member borne costs - this is the Fid Emerging Markets Eqty Pensions Fd C8
• The fund with the lowest annual member borne costs - this is the Fidelity Drawdown Cash Account
Projected Pot Sizes in Today’s Money
Years
FutureWise Working Life Strategy
BlackRock Aquila Life Mkt Adv Fund Cl5
BlackRock O 5 Ys Ind Linked Gilt Fd Cl11
Pot size with no costs incurred
Pot size after all costs
deducted
Pot size with no costs incurred
Pot size after all costs
deducted
Pot size with no costs incurred
Pot size after all costs
deducted 1 £86,803 £86,487 £86,803 £86,212 £83,625 £83,417 3 £115,426 £114,293 £115,426 £113,310 £104,379 £103,685 5 £145’462 £143,245 £145,462 £141,336 £124,491 £123,221
10 £227,203 £220,960 £227,203 £215,662 £172,087 £169,029 20 £423,424 £402,062 £423,424 £384,436 £256,749 £248,926 30 £673,114 £623,727 £673,114 £584,099 £329,087 £315,400 40 £984,621 £887,237 £990,842 £820,305 £390,894 £370,706 50 £1,153,626 £1,014,767 £1,395,148 £1,099,742 £443,703 £416,721
Reduction in yield: 0.4% Reduction in yield: 0.8% Reduction in yield: 0.3%
Years
Fid Emerging Markets Eqty Pensions Fd C8
Fidelity Drawdown Cash Account
Pot size with no costs incurred
Pot size after all costs
deducted
Pot size with no costs incurred
Pot size after all costs
deducted 1 £86,803 £85,824 £84,168 £84,168 3 £115,426 £111,937 £106,209 £106,210 5 £145,462 £138,684 £127,866 £127,867
10 £227,203 £208,426 £180,365 £180,368 20 £423,424 £361,105 £278,666 £278,675 30 £673,114 £533,236 £368,670 £368,686 40 £990,842 £727,297 £451,075 £451,101 50 £1,395,148 £946,080 £526,525 £526,560
Reduction in yield: 1.2% Reduction in yield: 0.0%

The Fidelity Master Trust Report and Financial Statements for the year ended 30 June 2021
162
Notes: • Projected pension pot values are shown in today’s terms, and do not need to be reduced further for the effect
of future inflation • The starting pot size is assumed to be £73,000. • Inflation is assumed to be 2.5% each year. • Total contributions are assumed are assumed to be £1,000 per month. • Values shown are estimates and are not guaranteed • The projected growth rate for each fund or arrangement are as follows:
o Equity asset classes 2.44% o Bond asset classes -1.56% o Cash asset classes -0.88%

The Fidelity Master Trust Report and Financial Statements for the year ended 30 June 2021
163
nVent UK Retirement Plan Illustrations are shown for the default option, the FutureWise Lifestyle Strategy, together with the following self select funds:
• One of the funds with the highest before costs expected return – example used is the Fid BR Aquila Life Mkt Advantage Fd Cl10
• One of the funds with the lowest before costs expected return - example used is the Fid BR Over 15 Years UK Gilt Index Fund
• The fund with the highest annual member borne costs - this is the Fidelity Emerging Markets Equity • The fund with the lowest annual member borne costs - this is the Fidelity Drawdown Cash Account
Projected Pot Sizes in Today’s Money
Years
FutureWise Lifestyle Strategy Fid BR Aquila Life Mkt Advantage Fd Cl10
Fid BR Over 15 Years UK Gilt Index Fund
Pot size with no costs incurred
Pot size after all costs
deducted
Pot size with no costs incurred
Pot size after all costs
deducted
Pot size with no costs incurred
Pot size after all costs
deducted 1 £50,238 £49,968 £50,238 £49,803 £48,403 £48,196 3 £67,320 £66,351 £67,320 £65,761 £60,911 £60,217 5 £85,247 £83,346 £85,247 £82,198 £73,031 £71,759
10 £134,031 £128,664 £134,031 £125,484 £101,714 £98,644 20 £251,140 £232,785 £251,140 £222,291 £152,736 £144,872 30 £400,160 £357,877 £400,160 £334,546 £196,329 £182,599 40 £586,083 £503,477 £589,786 £464,716 £233,577 £213,388 50 £687,251 £569,119 £831,083 £615,658 £265,402 £238,516
Reduction in yield: 0.6% Reduction in yield: 1.0% Reduction in yield: 0.5%
Years
Fidelity Emerging Markets Equity Fidelity Drawdown Cash Account Pot size with
no costs incurred
Pot size after all costs
deducted
Pot size with no costs incurred
Pot size after all costs
deducted 1 £50,238 £49,594 £48,716 £48,716 3 £67,320 £65,017 £61,973 £61,973 5 £85,247 £80,761 £74,997 £74,998
10 £134,031 £121,569 £106,571 £106,573 20 £251,140 £209,761 £165,691 £165,696 30 £400,160 £307,511 £219,820 £219,830 40 £589,786 £415,854 £269,380 £269,395 50 £831,083 £535,940 £314,757 £314,778
Reduction in yield: 1.4% Reduction in yield: 0.0%

The Fidelity Master Trust Report and Financial Statements for the year ended 30 June 2021
164
Notes: • Projected pension pot values are shown in today’s terms, and do not need to be reduced further for the effect
of future inflation • The starting pot size is assumed to be £42,000. • Inflation is assumed to be 2.5% each year. • Total contributions are assumed are assumed to be £600 per month. • Values shown are estimates and are not guaranteed • The projected growth rate for each fund or arrangement are as follows:
o Equity asset classes 2.44% o Bond asset classes -1.56% o Cash asset classes -0.88%

The Fidelity Master Trust Report and Financial Statements for the year ended 30 June 2021
165
Fidelity Master Trust Owens Corning Plan Illustrations are shown for the default option, the FutureWise Lifestyle Strategy, together with the following self select funds:
• One of the funds with the highest before costs expected return – example used is the BlackRock Aquila Life Mkt Adv Fund Cl5
• One of the funds with the lowest before costs expected return - example used is the Fid Pre-Retirement Bond Pensions Fd Cls4
• The fund with the highest annual member borne costs - this is the Fid Emerging Markets Eqty Pensions Fd C8
• The fund with the lowest annual member borne costs - this is the Fidelity Drawdown Cash Account
Projected Pot Sizes in Today’s Money
Years
FutureWise Lifestyle Strategy BlackRock Aquila Life Mkt Adv Fund Cl5
Fid Pre-Retirement Bond Pensions Fd Cls4
Pot size with no costs incurred
Pot size after all costs
deducted
Pot size with no costs incurred
Pot size after all costs
deducted
Pot size with no costs incurred
Pot size after all costs
deducted 1 £70,725 £70,372 £70,725 £70,235 £68,091 £67,690 3 £88,820 £87,598 £88,820 £87,128 £79,989 £78,703 5 £107,808 £105,486 £107,808 £104,597 £91,518 £89,244
10 £159,481 £153,270 £159,481 £150,929 £118,803 £113,659 20 £283,525 £263,473 £283,525 £256,133 £167,336 £155,147 30 £441,369 £396,538 £441,369 £380,593 £208,805 £188,467 40 £638,189 £552,213 £642,224 £527,832 £244,236 £215,226 50 £741,975 £625,219 £897,810 £702,019 £274,509 £236,717
Reduction in yield: 0.5% Reduction in yield: 0.8% Reduction in yield: 0.6%
Years
Fid Emerging Markets Eqty Pensions Fd C8
Fidelity Drawdown Cash Account
Pot size with no costs incurred
Pot size after all costs
deducted
Pot size with no costs incurred
Pot size after all costs
deducted 1 £70,725 £69,914 £68,541 £68,541 3 £88,820 £86,029 £81,450 £81,451 5 £107,808 £102,535 £94,134 £94,135
10 £159,481 £145,574 £124,883 £124,885 20 £283,525 £239,796 £182,457 £182,463 30 £441,369 £346,022 £235,171 £235,182 40 £642,224 £465,780 £283,435 £283,452 50 £897,810 £600,797 £327,625 £327,648
Reduction in yield: 1.2% Reduction in yield: 0.0%

The Fidelity Master Trust Report and Financial Statements for the year ended 30 June 2021
166
Notes: • Projected pension pot values are shown in today’s terms, and do not need to be reduced further for the effect
of future inflation • The starting pot size is assumed to be £62,000. • Inflation is assumed to be 2.5% each year. • Total contributions are assumed are assumed to be £600 per month. • Values shown are estimates and are not guaranteed • The projected growth rate for each fund or arrangement are as follows:
o Equity asset classes 2.44% o Bond asset classes -1.56% o Cash asset classes -0.88%
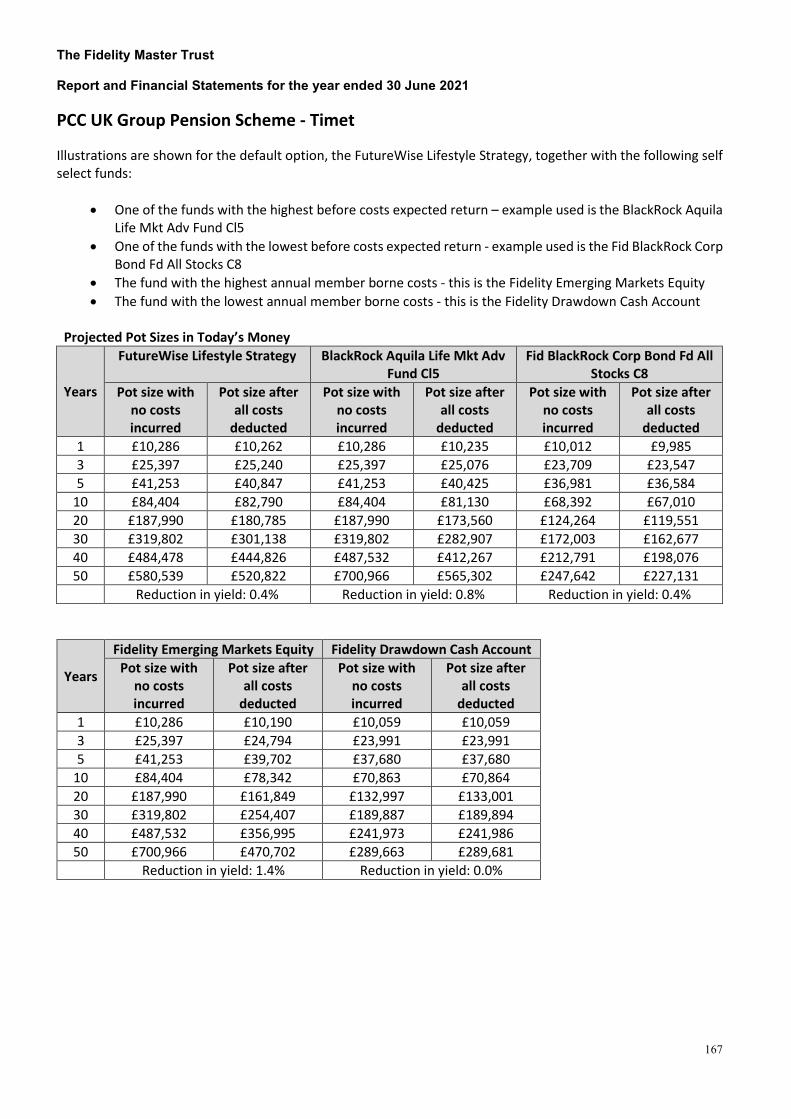
The Fidelity Master Trust Report and Financial Statements for the year ended 30 June 2021
167
PCC UK Group Pension Scheme - Timet Illustrations are shown for the default option, the FutureWise Lifestyle Strategy, together with the following self select funds:
• One of the funds with the highest before costs expected return – example used is the BlackRock Aquila Life Mkt Adv Fund Cl5
• One of the funds with the lowest before costs expected return - example used is the Fid BlackRock Corp Bond Fd All Stocks C8
• The fund with the highest annual member borne costs - this is the Fidelity Emerging Markets Equity • The fund with the lowest annual member borne costs - this is the Fidelity Drawdown Cash Account
Projected Pot Sizes in Today’s Money
Years
FutureWise Lifestyle Strategy BlackRock Aquila Life Mkt Adv Fund Cl5
Fid BlackRock Corp Bond Fd All Stocks C8
Pot size with no costs incurred
Pot size after all costs
deducted
Pot size with no costs incurred
Pot size after all costs
deducted
Pot size with no costs incurred
Pot size after all costs
deducted 1 £10,286 £10,262 £10,286 £10,235 £10,012 £9,985 3 £25,397 £25,240 £25,397 £25,076 £23,709 £23,547 5 £41,253 £40,847 £41,253 £40,425 £36,981 £36,584
10 £84,404 £82,790 £84,404 £81,130 £68,392 £67,010 20 £187,990 £180,785 £187,990 £173,560 £124,264 £119,551 30 £319,802 £301,138 £319,802 £282,907 £172,003 £162,677 40 £484,478 £444,826 £487,532 £412,267 £212,791 £198,076 50 £580,539 £520,822 £700,966 £565,302 £247,642 £227,131
Reduction in yield: 0.4% Reduction in yield: 0.8% Reduction in yield: 0.4%
Years
Fidelity Emerging Markets Equity Fidelity Drawdown Cash Account Pot size with
no costs incurred
Pot size after all costs
deducted
Pot size with no costs incurred
Pot size after all costs
deducted 1 £10,286 £10,190 £10,059 £10,059 3 £25,397 £24,794 £23,991 £23,991 5 £41,253 £39,702 £37,680 £37,680
10 £84,404 £78,342 £70,863 £70,864 20 £187,990 £161,849 £132,997 £133,001 30 £319,802 £254,407 £189,887 £189,894 40 £487,532 £356,995 £241,973 £241,986 50 £700,966 £470,702 £289,663 £289,681
Reduction in yield: 1.4% Reduction in yield: 0.0%

The Fidelity Master Trust Report and Financial Statements for the year ended 30 June 2021
168
Notes: • Projected pension pot values are shown in today’s terms, and do not need to be reduced further for the effect
of future inflation • The starting pot size is assumed to be £3,000. • Inflation is assumed to be 2.5% each year. • Total contributions are assumed are assumed to be £600 per month. • Values shown are estimates and are not guaranteed • The projected growth rate for each fund or arrangement are as follows:
o Equity asset classes 2.44% o Bond asset classes -1.56% o Cash asset classes -0.88%

The Fidelity Master Trust Report and Financial Statements for the year ended 30 June 2021
169
PCC UK Group Pension Scheme Illustrations are shown for the default option, the FutureWise Lifestyle Strategy, together with the following self select funds:
• One of the funds with the highest before costs expected return – example used is the BlackRock Aquila Life Mkt Adv Fund Cl5
• One of the funds with the lowest before costs expected return - example used is the Fid BlackRock Corp Bond Fd All Stocks C8
• The fund with the highest annual member borne costs - this is the Fidelity Emerging Markets Equity • The fund with the lowest annual member borne costs - this is the Fidelity Drawdown Cash Account
Projected Pot Sizes in Today’s Money
Years
FutureWise Lifestyle Strategy BlackRock Aquila Life Mkt Adv Fund Cl5
Fid BlackRock Corp Bond Fd All Stocks C8
Pot size with no costs incurred
Pot size after all costs
deducted
Pot size with no costs incurred
Pot size after all costs
deducted
Pot size with no costs incurred
Pot size after all costs
deducted 1 £11,802 £11,766 £11,802 £11,728 £11,404 £11,365 3 £19,686 £19,533 £19,686 £19,374 £18,055 £17,900 5 £27,959 £27,627 £27,959 £27,282 £24,499 £24,181
10 £50,473 £49,378 £50,473 £48,255 £39,750 £38,840 20 £104,520 £100,197 £104,520 £95,877 £66,877 £64,155 30 £173,294 £162,610 £173,294 £152,215 £90,056 £84,933 40 £259,173 £237,063 £260,808 £218,865 £109,860 £101,988 50 £308,055 £275,243 £372,169 £297,713 £126,781 £115,987
Reduction in yield: 0.4% Reduction in yield: 0.8% Reduction in yield: 0.4%
Years
Fidelity Emerging Markets Equity Fidelity Drawdown Cash Account Pot size with
no costs incurred
Pot size after all costs
deducted
Pot size with no costs incurred
Pot size after all costs
deducted 1 £11,802 £11,662 £11,472 £11,472 3 £19,686 £19,101 £18,326 £18,326 5 £27,959 £26,694 £25,059 £25,060
10 £50,473 £46,375 £41,383 £41,383 20 £104,520 £88,910 £71,948 £71,950 30 £173,294 £136,054 £99,932 £99,936 40 £260,808 £188,307 £125,555 £125,561 50 £372,169 £246,224 £149,014 £149,023
Reduction in yield: 1.4% Reduction in yield: 0.0%

The Fidelity Master Trust Report and Financial Statements for the year ended 30 June 2021
170
Notes: • Projected pension pot values are shown in today’s terms, and do not need to be reduced further for the effect
of future inflation • The starting pot size is assumed to be £8,000. • Inflation is assumed to be 2.5% each year. • Total contributions are assumed are assumed to be £300 per month. • Values shown are estimates and are not guaranteed • The projected growth rate for each fund or arrangement are as follows:
o Equity asset classes 2.44% o Bond asset classes -1.56% o Cash asset classes -0.88%

The Fidelity Master Trust Report and Financial Statements for the year ended 30 June 2021
171
Pentair UK Retirement Plan Illustrations are shown for the default option, the FutureWise Lifestyle Strategy, together with the following self select funds:
• One of the funds with the highest before costs expected return – example used is the Fid BR Aquila Life Mkt Advantage Fd Cl10
• One of the funds with the lowest before costs expected return - example used is the Fd BR Ovr 15 Years UK Gilt Index Fund
• The fund with the highest annual member borne costs - this is the Fidelity Emerging Markets Equity • The fund with the lowest annual member borne costs - this is the Fidelity Drawdown Cash Account
Projected Pot Sizes in Today’s Money
Years
FutureWise Lifestyle Strategy Fid BR Aquila Life Mkt Advantage Fd Cl10
Fd BR Ovr 15 Years UK Gilt Index Fund
Pot size with no costs incurred
Pot size after all costs
deducted
Pot size with no costs incurred
Pot size after all costs
deducted
Pot size with no costs incurred
Pot size after all costs
deducted 1 £35,050 £34,871 £35,050 £34,761 £33,829 £33,692 3 £53,816 £53,108 £53,816 £52,676 £49,123 £48,614 5 £73,510 £72,026 £73,510 £71,130 £63,943 £62,941
10 £127,103 £122,476 £127,103 £119,728 £99,015 £96,314 20 £255,754 £238,384 £25,754 £228,413 £161,401 £153,698 30 £419,463 £377,638 £419,463 £354,442 £214,704 £200,530 40 £623,843 £539,921 £627,780 £500,584 £260,248 £238,750 50 £738,860 £616,893 £892,861 £670,047 £299,162 £269,942
Reduction in yield: 0.6% Reduction in yield: 1.0% Reduction in yield: 0.5%
Years
Fidelity Emerging Markets Equity Fidelity Drawdown Cash Account Pot size with
no costs incurred
Pot size after all costs
deducted
Pot size with no costs incurred
Pot size after all costs
deducted 1 £35,050 £34,621 £34,038 £34,038 3 £53,816 £52,132 £49,902 £49,902 5 £73,510 £70,007 £65,489 £65,489
10 £127,103 £116,337 £103,274 £103,276 20 £255,754 £216,465 £174,025 £174,030 30 £419,463 £327,445 £238,804 £238,814 40 £627,780 £450,452 £298,114 £298,130 50 £892,861 £586,789 £352,418 £352,440
Reduction in yield: 1.4% Reduction in yield: 0.0%

The Fidelity Master Trust Report and Financial Statements for the year ended 30 June 2021
172
Notes: • Projected pension pot values are shown in today’s terms, and do not need to be reduced further for the effect
of future inflation • The starting pot size is assumed to be £26,000. • Inflation is assumed to be 2.5% each year. • Total contributions are assumed are assumed to be £700 per month. • Values shown are estimates and are not guaranteed • The projected growth rate for each fund or arrangement are as follows:
o Equity asset classes 2.44% o Bond asset classes -1.56% o Cash asset classes -0.88%
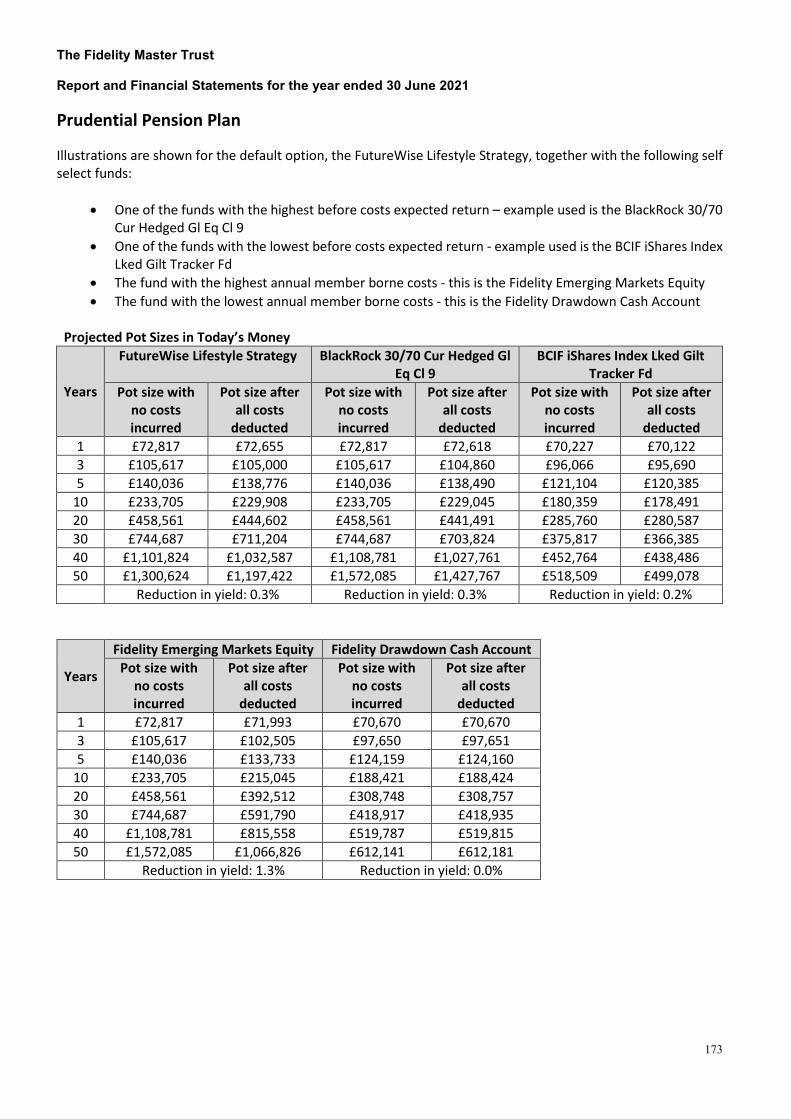
The Fidelity Master Trust Report and Financial Statements for the year ended 30 June 2021
173
Prudential Pension Plan Illustrations are shown for the default option, the FutureWise Lifestyle Strategy, together with the following self select funds:
• One of the funds with the highest before costs expected return – example used is the BlackRock 30/70 Cur Hedged Gl Eq Cl 9
• One of the funds with the lowest before costs expected return - example used is the BCIF iShares Index Lked Gilt Tracker Fd
• The fund with the highest annual member borne costs - this is the Fidelity Emerging Markets Equity • The fund with the lowest annual member borne costs - this is the Fidelity Drawdown Cash Account
Projected Pot Sizes in Today’s Money
Years
FutureWise Lifestyle Strategy BlackRock 30/70 Cur Hedged Gl Eq Cl 9
BCIF iShares Index Lked Gilt Tracker Fd
Pot size with no costs incurred
Pot size after all costs
deducted
Pot size with no costs incurred
Pot size after all costs
deducted
Pot size with no costs incurred
Pot size after all costs
deducted 1 £72,817 £72,655 £72,817 £72,618 £70,227 £70,122 3 £105,617 £105,000 £105,617 £104,860 £96,066 £95,690 5 £140,036 £138,776 £140,036 £138,490 £121,104 £120,385
10 £233,705 £229,908 £233,705 £229,045 £180,359 £178,491 20 £458,561 £444,602 £458,561 £441,491 £285,760 £280,587 30 £744,687 £711,204 £744,687 £703,824 £375,817 £366,385 40 £1,101,824 £1,032,587 £1,108,781 £1,027,761 £452,764 £438,486 50 £1,300,624 £1,197,422 £1,572,085 £1,427,767 £518,509 £499,078
Reduction in yield: 0.3% Reduction in yield: 0.3% Reduction in yield: 0.2%
Years
Fidelity Emerging Markets Equity Fidelity Drawdown Cash Account Pot size with
no costs incurred
Pot size after all costs
deducted
Pot size with no costs incurred
Pot size after all costs
deducted 1 £72,817 £71,993 £70,670 £70,670 3 £105,617 £102,505 £97,650 £97,651 5 £140,036 £133,733 £124,159 £124,160
10 £233,705 £215,045 £188,421 £188,424 20 £458,561 £392,512 £308,748 £308,757 30 £744,687 £591,790 £418,917 £418,935 40 £1,108,781 £815,558 £519,787 £519,815 50 £1,572,085 £1,066,826 £612,141 £612,181
Reduction in yield: 1.3% Reduction in yield: 0.0%

The Fidelity Master Trust Report and Financial Statements for the year ended 30 June 2021
174
Notes: • Projected pension pot values are shown in today’s terms, and do not need to be reduced further for the effect
of future inflation • The starting pot size is assumed to be £57,000. • Inflation is assumed to be 2.5% each year. • Total contributions are assumed are assumed to be £1,200 per month. • Values shown are estimates and are not guaranteed • The projected growth rate for each fund or arrangement are as follows:
o Equity asset classes 2.44% o Bond asset classes -1.56% o Cash asset classes -0.88%

The Fidelity Master Trust Report and Financial Statements for the year ended 30 June 2021
175
PSA Retirement Savings Account Illustrations are shown for the default option, the FutureWise Lifestyle Strategy, together with the following self select funds:
• One of the funds with the highest before costs expected return – example used is the BlackRock Aquila Life Mkt Adv Fund Cl9
• One of the funds with the lowest before costs expected return - example used is the Fid L&G; Corporate Bond All Stocks In Cl1
• The fund with the highest annual member borne costs - this is the Fid Emerging Markets Eqty Pensions Fd C8
• The fund with the lowest annual member borne costs - this is the Fidelity Drawdown Cash Account
Projected Pot Sizes in Today’s Money
Years
FutureWise Lifestyle Strategy BlackRock Aquila Life Mkt Adv Fund Cl9
Fid L&G; Corporate Bond All Stocks In Cl1
Pot size with no costs incurred
Pot size after all costs
deducted
Pot size with no costs incurred
Pot size after all costs
deducted
Pot size with no costs incurred
Pot size after all costs
deducted 1 £20,352 £20,304 £20,352 £20,424 £19,664 £19,618 3 £33,526 £33,324 £33,526 £33,064 £30,727 £30,548 5 £47,350 £46,911 £47,350 £46,352 £41,448 £41,082
10 £84,970 £83,530 £84,970 £81,716 £66,819 £65,779 20 £175,280 £169,609 £175,280 £162,632 £111,949 £108,842 30 £290,197 £276,177 £290,197 £259,319 £150,509 £144,655 40 £433,692 £404,317 £436,428 £374,853 £183,455 £174,440 50 £515,249 £470,639 £622,506 £512,908 £211,605 £199,210
Reduction in yield: 0.3% Reduction in yield: 0.6% Reduction in yield: 0.3%
Years
Fid Emerging Markets Eqty Pensions Fd C8
Fidelity Drawdown Cash Account
Pot size with no costs incurred
Pot size after all costs
deducted
Pot size with no costs incurred
Pot size after all costs
deducted 1 £20,352 £20,140 £19,781 £19,781 3 £33,526 £32,644 £31,192 £31,192 5 £47,350 £45,452 £42,404 £42,404
10 £84,970 £78,847 £69,582 £69,583 20 £175,280 £151,955 £120,472 £120,475 30 £290,197 £234,376 £167,065 £167,072 40 £436,428 £327,299 £209,726 £209,737 50 £622,506 £432,060 £248,785 £248,801
Reduction in yield: 1.2% Reduction in yield: 0.0%

The Fidelity Master Trust Report and Financial Statements for the year ended 30 June 2021
176
Notes: • Projected pension pot values are shown in today’s terms, and do not need to be reduced further for the effect
of future inflation • The starting pot size is assumed to be £14,000. • Inflation is assumed to be 2.5% each year. • Total contributions are assumed are assumed to be £500 per month. • Values shown are estimates and are not guaranteed • The projected growth rate for each fund or arrangement are as follows:
o Equity asset classes 2.44% o Bond asset classes -1.56% o Cash asset classes -0.88%
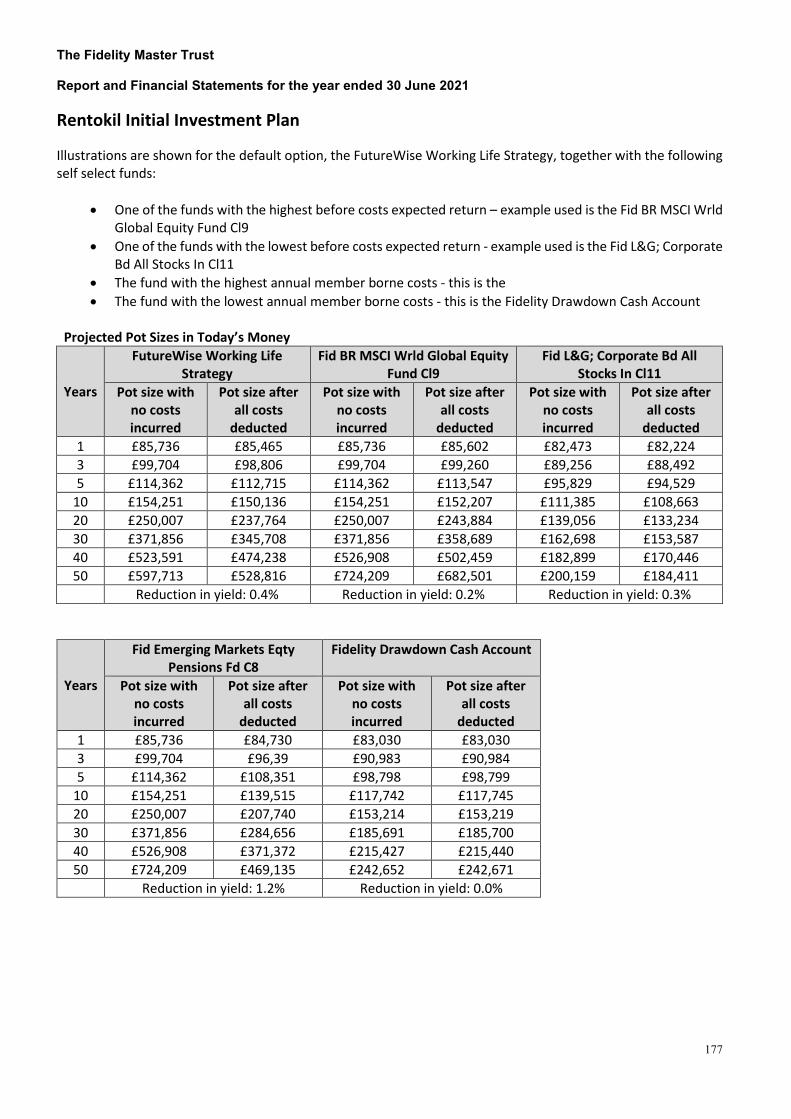
The Fidelity Master Trust Report and Financial Statements for the year ended 30 June 2021
177
Rentokil Initial Investment Plan Illustrations are shown for the default option, the FutureWise Working Life Strategy, together with the following self select funds:
• One of the funds with the highest before costs expected return – example used is the Fid BR MSCI Wrld Global Equity Fund Cl9
• One of the funds with the lowest before costs expected return - example used is the Fid L&G; Corporate Bd All Stocks In Cl11
• The fund with the highest annual member borne costs - this is the • The fund with the lowest annual member borne costs - this is the Fidelity Drawdown Cash Account
Projected Pot Sizes in Today’s Money
Years
FutureWise Working Life Strategy
Fid BR MSCI Wrld Global Equity Fund Cl9
Fid L&G; Corporate Bd All Stocks In Cl11
Pot size with no costs incurred
Pot size after all costs
deducted
Pot size with no costs incurred
Pot size after all costs
deducted
Pot size with no costs incurred
Pot size after all costs
deducted 1 £85,736 £85,465 £85,736 £85,602 £82,473 £82,224 3 £99,704 £98,806 £99,704 £99,260 £89,256 £88,492 5 £114,362 £112,715 £114,362 £113,547 £95,829 £94,529
10 £154,251 £150,136 £154,251 £152,207 £111,385 £108,663 20 £250,007 £237,764 £250,007 £243,884 £139,056 £133,234 30 £371,856 £345,708 £371,856 £358,689 £162,698 £153,587 40 £523,591 £474,238 £526,908 £502,459 £182,899 £170,446 50 £597,713 £528,816 £724,209 £682,501 £200,159 £184,411
Reduction in yield: 0.4% Reduction in yield: 0.2% Reduction in yield: 0.3%
Years
Fid Emerging Markets Eqty Pensions Fd C8
Fidelity Drawdown Cash Account
Pot size with no costs incurred
Pot size after all costs
deducted
Pot size with no costs incurred
Pot size after all costs
deducted 1 £85,736 £84,730 £83,030 £83,030 3 £99,704 £96,39 £90,983 £90,984 5 £114,362 £108,351 £98,798 £98,799
10 £154,251 £139,515 £117,742 £117,745 20 £250,007 £207,740 £153,214 £153,219 30 £371,856 £284,656 £185,691 £185,700 40 £526,908 £371,372 £215,427 £215,440 50 £724,209 £469,135 £242,652 £242,671
Reduction in yield: 1.2% Reduction in yield: 0.0%

The Fidelity Master Trust Report and Financial Statements for the year ended 30 June 2021
178
Notes: • Projected pension pot values are shown in today’s terms, and do not need to be reduced further for the effect
of future inflation • The starting pot size is assumed to be £79,000. • Inflation is assumed to be 2.5% each year. • Total contributions are assumed are assumed to be £400 per month. • Values shown are estimates and are not guaranteed • The projected growth rate for each fund or arrangement are as follows:
o Equity asset classes 2.44% o Bond asset classes -1.56% o Cash asset classes -0.88%

The Fidelity Master Trust Report and Financial Statements for the year ended 30 June 2021
179
RSA Pension Scheme Illustrations are shown for the default option, the RSA Pension Cash Targeting Lifestyle, together with the following self select funds:
• One of the funds with the highest before costs expected return – example used is the Fidelity Investment Pathway 1 Cl9
• One of the funds with the lowest before costs expected return - example used is the Fidelity Investment Pathway 2 Cl8
• The fund with the highest annual member borne costs - this is the RSA Pension Active Global Equity Fund
• The fund with the lowest annual member borne costs - this is the Fidelity Drawdown Cash Account
Projected Pot Sizes in Today’s Money
Years
RSA Pension Cash Targeting Lifestyle
Fidelity Investment Pathway 1 Cl9
Fidelity Investment Pathway 2 Cl8
Pot size with no costs incurred
Pot size after all costs
deducted
Pot size with no costs incurred
Pot size after all costs
deducted
Pot size with no costs incurred
Pot size after all costs
deducted 1 £39,816 £39,700 £39,816 £39,642 £38,367 £38,182 3 £53,950 £53,531 £53,950 £53,319 £48,851 £48,227 5 £68,783 £67,953 £68,783 £67,536 £59,010 £57,860
10 £109,148 £106,773 £109,148 £105,590 £83,053 £80,251 20 £206,045 £197,767 £206,045 £193,718 £125,820 £118,580 30 £329,346 £310,003 £329,346 £300,711 £162,360 £149,672 40 £486,245 £448,569 £486,245 £430,606 £193,581 £174,894 50 £645,278 £585,452 £685,897 £588,306 £220,258 £195,353
Reduction in yield: 0.3% Reduction in yield: 0.5% Reduction in yield: 0.5%
Years
RSA Pension Active Global Equity Fund
Fidelity Drawdown Cash Account
Pot size with no costs incurred
Pot size after all costs
deducted
Pot size with no costs incurred
Pot size after all costs
deducted 1 £39,816 £39,235 £38,615 £38,615 3 £53,950 £51,861 £49,696 £49,696 5 £68,783 £64,699 £60,584 £60,584
10 £109,148 £97,743 £86,978 £86,797 20 £206,045 £168,098 £136,399 £136,403 30 £329,346 £244,548 £181,648 £181,656 40 £486,245 £327,624 £223,078 £223,091 50 £685,897 £417,900 £261,010 £261,028
Reduction in yield: 1.6% Reduction in yield: 0.0%

The Fidelity Master Trust Report and Financial Statements for the year ended 30 June 2021
180
Notes: • Projected pension pot values are shown in today’s terms, and do not need to be reduced further for the effect
of future inflation • The starting pot size is assumed to be £33,000. • Inflation is assumed to be 2.5% each year. • Total contributions are assumed are assumed to be £500 per month. • Values shown are estimates and are not guaranteed • The projected growth rate for each fund or arrangement are as follows:
o Equity asset classes 2.44% o Bond asset classes -1.56% o Cash asset classes -0.88%
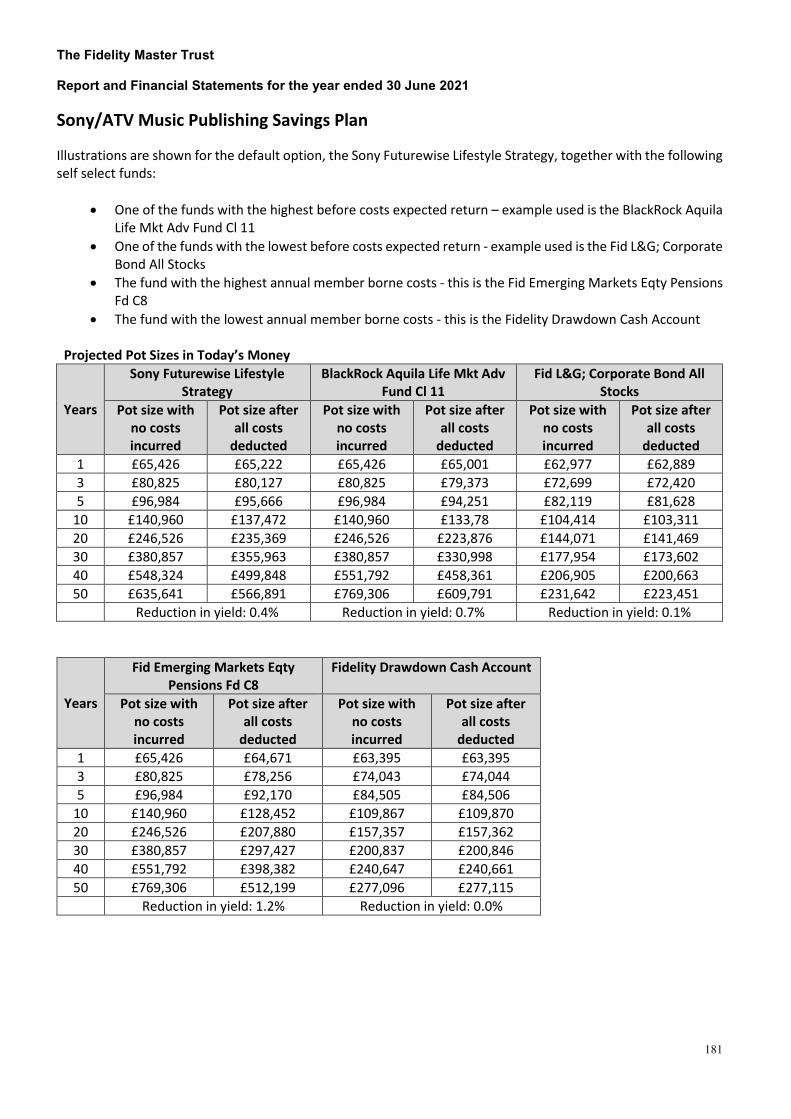
The Fidelity Master Trust Report and Financial Statements for the year ended 30 June 2021
181
Sony/ATV Music Publishing Savings Plan Illustrations are shown for the default option, the Sony Futurewise Lifestyle Strategy, together with the following self select funds:
• One of the funds with the highest before costs expected return – example used is the BlackRock Aquila Life Mkt Adv Fund Cl 11
• One of the funds with the lowest before costs expected return - example used is the Fid L&G; Corporate Bond All Stocks
• The fund with the highest annual member borne costs - this is the Fid Emerging Markets Eqty Pensions Fd C8
• The fund with the lowest annual member borne costs - this is the Fidelity Drawdown Cash Account
Projected Pot Sizes in Today’s Money
Years
Sony Futurewise Lifestyle Strategy
BlackRock Aquila Life Mkt Adv Fund Cl 11
Fid L&G; Corporate Bond All Stocks
Pot size with no costs incurred
Pot size after all costs
deducted
Pot size with no costs incurred
Pot size after all costs
deducted
Pot size with no costs incurred
Pot size after all costs
deducted 1 £65,426 £65,222 £65,426 £65,001 £62,977 £62,889 3 £80,825 £80,127 £80,825 £79,373 £72,699 £72,420 5 £96,984 £95,666 £96,984 £94,251 £82,119 £81,628
10 £140,960 £137,472 £140,960 £133,78 £104,414 £103,311 20 £246,526 £235,369 £246,526 £223,876 £144,071 £141,469 30 £380,857 £355,963 £380,857 £330,998 £177,954 £173,602 40 £548,324 £499,848 £551,792 £458,361 £206,905 £200,663 50 £635,641 £566,891 £769,306 £609,791 £231,642 £223,451
Reduction in yield: 0.4% Reduction in yield: 0.7% Reduction in yield: 0.1%
Years
Fid Emerging Markets Eqty Pensions Fd C8
Fidelity Drawdown Cash Account
Pot size with no costs incurred
Pot size after all costs
deducted
Pot size with no costs incurred
Pot size after all costs
deducted 1 £65,426 £64,671 £63,395 £63,395 3 £80,825 £78,256 £74,043 £74,044 5 £96,984 £92,170 £84,505 £84,506
10 £140,960 £128,452 £109,867 £109,870 20 £246,526 £207,880 £157,357 £157,362 30 £380,857 £297,427 £200,837 £200,846 40 £551,792 £398,382 £240,647 £240,661 50 £769,306 £512,199 £277,096 £277,115
Reduction in yield: 1.2% Reduction in yield: 0.0%

The Fidelity Master Trust Report and Financial Statements for the year ended 30 June 2021
182
Notes: • Projected pension pot values are shown in today’s terms, and do not need to be reduced further for the effect
of future inflation • The starting pot size is assumed to be £58,000. • Inflation is assumed to be 2.5% each year. • Total contributions are assumed are assumed to be £500 per month. • Values shown are estimates and are not guaranteed • The projected growth rate for each fund or arrangement are as follows:
o Equity asset classes 2.44% o Bond asset classes -1.56% o Cash asset classes -0.88%

The Fidelity Master Trust Report and Financial Statements for the year ended 30 June 2021
183
Sony Corporate Services Savings Plan Illustrations are shown for the default option, the Sony Futurewise Lifestyle Strategy, together with the following self select funds:
• One of the funds with the highest before costs expected return – example used is the BlackRock Aquila Life Mkt Adv Fund Cl 11
• One of the funds with the lowest before costs expected return - example used is the Fid L&G; Corporate Bond All Stocks
• The fund with the highest annual member borne costs - this is the Fid Emerging Markets Eqty Pensions Fd C8
• The fund with the lowest annual member borne costs - this is the Fidelity Drawdown Cash Account
Projected Pot Sizes in Today’s Money
Years
Sony Futurewise Lifestyle Strategy
BlackRock Aquila Life Mkt Adv Fund Cl 11
Fid L&G; Corporate Bond All Stocks
Pot size with no costs incurred
Pot size after all costs
deducted
Pot size with no costs incurred
Pot size after all costs
deducted
Pot size with no costs incurred
Pot size after all costs
deducted 1 £114,639 £114,287 £114,639 £113,904 £110,395 £110,244 3 £147,070 £145,833 £147,070 £144,496 £132,655 £132,161 5 £181,103 £178,723 £181,103 £176,166 £154,226 £153,337
10 £273,719 £267,207 £273,719 £260,308 £205,273 £203,200 20 £496,047 £474,413 £496,047 £452,097 £296,076 £290,949 30 £778,956 £729,658 £778,956 £680,126 £373,660 £364,845 40 £1,131,802 £1,034,429 £1,138,956 £951,242 £439,949 £427,074 50 £1,320,156 £1,180,854 £1,597,053 £1,273,588 £496,588 £479,479
Reduction in yield: 0.4% Reduction in yield: 0.7% Reduction in yield: 0.1%
Years
Fid Emerging Markets Eqty Pensions Fd C8
Fidelity Drawdown Cash Account
Pot size with no costs incurred
Pot size after all costs
deducted
Pot size with no costs incurred
Pot size after all costs
deducted 1 £114,639 £113,332 £111,120 £111,120 3 £147,070 £142,515 £135,042 £135,043 5 £181,103 £172,408 £158,546 £158,547
10 £273,719 £250,351 £215,523 £215,527 20 £496,047 £420,984 £322,209 £322,220 30 £778,956 £613,356 £419,889 £419,909 40 £1,138,956 £830,236 £509,324 £509,353 50 £1,597,053 £1,074,747 £591,209 £591,250
Reduction in yield: 1.2% Reduction in yield: 0.0%

The Fidelity Master Trust Report and Financial Statements for the year ended 30 June 2021
184
Notes: • Projected pension pot values are shown in today’s terms, and do not need to be reduced further for the effect
of future inflation • The starting pot size is assumed to be £99,000. • Inflation is assumed to be 2.5% each year. • Total contributions are assumed are assumed to be £1,100 per month. • Values shown are estimates and are not guaranteed • The projected growth rate for each fund or arrangement are as follows:
o Equity asset classes 2.44% o Bond asset classes -1.56% o Cash asset classes -0.88%

The Fidelity Master Trust Report and Financial Statements for the year ended 30 June 2021
185
Sony Music Savings Plan Illustrations are shown for the default option, the Sony Futurewise Lifestyle Strategy, together with the following self select funds:
• One of the funds with the highest before costs expected return – example used is the BlackRock Aquila Life Mkt Adv Fund Cl 11
• One of the funds with the lowest before costs expected return - example used is the Fid L&G; Corporate Bond All Stocks
• The fund with the highest annual member borne costs - this is the Fid Emerging Markets Eqty Pensions Fd C8
• The fund with the lowest annual member borne costs - this is the Fidelity Drawdown Cash Account
Projected Pot Sizes in Today’s Money
Years
Sony Futurewise Lifestyle Strategy
BlackRock Aquila Life Mkt Adv Fund Cl 11
Fid L&G; Corporate Bond All Stocks
Pot size with no costs incurred
Pot size after all costs
deducted
Pot size with no costs incurred
Pot size after all costs
deducted
Pot size with no costs incurred
Pot size after all costs
deducted 1 £51,262 £51,106 £51,262 £50,937 £49,387 £49,320 3 £68,395 £67,835 £68,395 £67,230 £61,865 £61,640 5 £86,375 £85,277 £86,375 £84,096 £73,955 £73,544
10 £135,304 £132,199 £135,304 £128,908 £102,569 £101,573 20 £252,759 £242,079 £252,759 £231,048 £153,466 £150,899 30 £402,220 £377,433 £402,220 £352,489 £196,953 £192,437 40 £588,689 £539,143 £592,408 £496,878 £234,110 £227,417 50 £689,987 £618,600 £834,420 £668,549 £265,857 £256,875
Reduction in yield: 0.4% Reduction in yield: 0.7% Reduction in yield: 0.1%
Years
Fid Emerging Markets Eqty Pensions Fd C8
Fidelity Drawdown Cash Account
Pot size with no costs incurred
Pot size after all costs
deducted
Pot size with no costs incurred
Pot size after all costs
deducted 1 £51,262 £50,685 £49,708 £49,708 3 £68,395 £66,333 £62,947 £62,947 5 £86,375 £82,361 £75,954 £75,955
10 £135,304 £124,154 £107,486 £107,488 20 £252,759 £215,646 £166,529 £166,534 30 £402,220 £318,795 £220,588 £220,598 40 £592,408 £435,086 £270,083 £270,098 50 £834,420 £566,191 £315,400 £315,421
Reduction in yield: 1.2% Reduction in yield: 0.0%
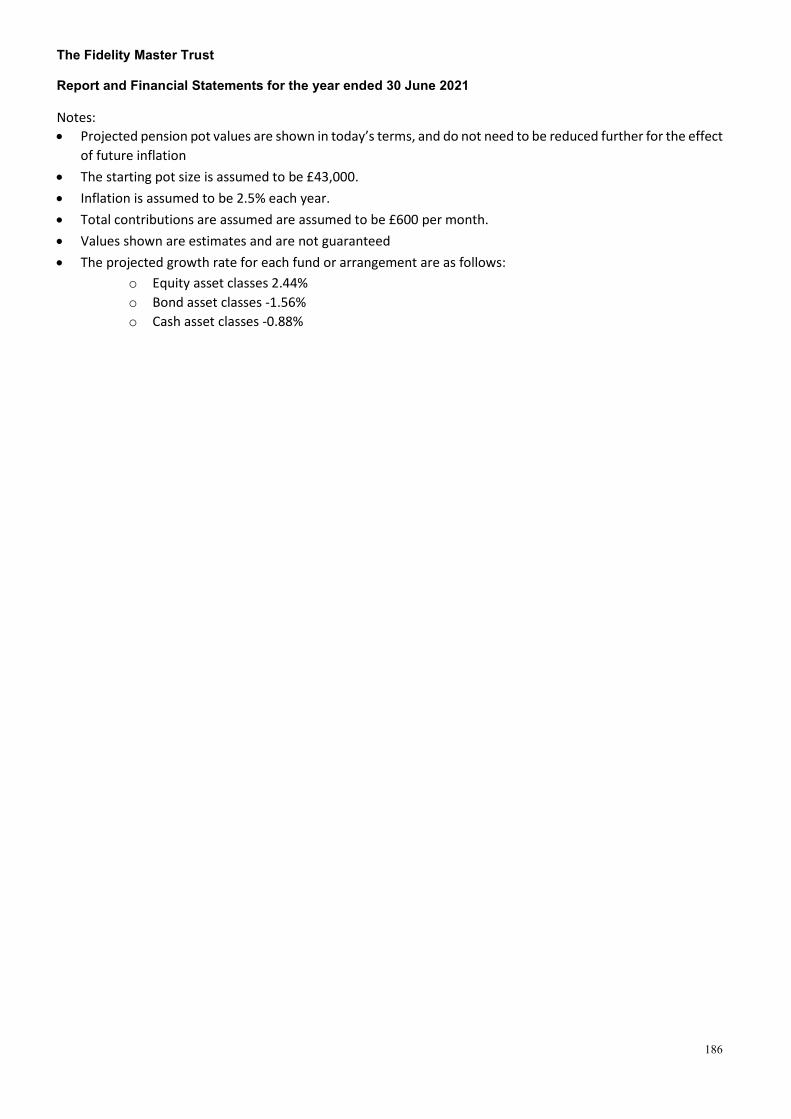
The Fidelity Master Trust Report and Financial Statements for the year ended 30 June 2021
186
Notes: • Projected pension pot values are shown in today’s terms, and do not need to be reduced further for the effect
of future inflation • The starting pot size is assumed to be £43,000. • Inflation is assumed to be 2.5% each year. • Total contributions are assumed are assumed to be £600 per month. • Values shown are estimates and are not guaranteed • The projected growth rate for each fund or arrangement are as follows:
o Equity asset classes 2.44% o Bond asset classes -1.56% o Cash asset classes -0.88%

The Fidelity Master Trust Report and Financial Statements for the year ended 30 June 2021
187
Sytner Group Retirement Plan Illustrations are shown for the default option, the Sytner Group Retirement Plan FutureWise, together with the following self select funds:
• One of the funds with the highest before costs expected return – example used is the BlackRock Aquila Life Mkt Adv Fund Cl8
• One of the funds with the lowest before costs expected return - example used is the Fid L&G; Corporate Bond All Stocks In Cl8
• The fund with the highest annual member borne costs - this is the Fid Emerging Markets Eqty Pensions Fd C8
• The fund with the lowest annual member borne costs - this is the Fidelity Drawdown Cash Account
Projected Pot Sizes in Today’s Money
Years
Sytner Group Retirement Plan FutureWise
BlackRock Aquila Life Mkt Adv Fund Cl8
Fid L&G; Corporate Bond All Stocks In Cl8
Pot size with no costs incurred
Pot size after all costs
deducted
Pot size with no costs incurred
Pot size after all costs
deducted
Pot size with no costs incurred
Pot size after all costs
deducted 1 £15,721 £15,667 £15,721 £15,593 £15,150 £15,078 3 £21,365 £21,166 £21,365 £20,901 £19,350 £19,107 5 £27,288 £26,894 £27,288 £26,373 £23,419 £22,972
10 £43,405 £42,275 £43,405 £40,810 £33,050 £31,957 20 £82,094 £78,158 £82,094 £73,221 £50,182 £47,349 30 £131,326 £122,139 £131,326 £110,991 £64,819 £59,846 40 £192,756 £174,430 £193,973 £155,009 £77,326 £69,993 50 £226,347 £199,902 £273,691 £206,308 £88,012 £78,232
Reduction in yield: 0.4% Reduction in yield: 0.9% Reduction in yield: 0.5%
Years
Fid Emerging Markets Eqty Pensions Fd C8
Fidelity Drawdown Cash Account
Pot size with no costs incurred
Pot size after all costs
deducted
Pot size with no costs incurred
Pot size after all costs
deducted 1 £15,721 £15,545 £15,248 £15,248 3 £21,365 £20,729 £19,684 £19,684 5 £27,288 £26,038 £24,042 £24,042
10 £43,405 £39,881 £34,608 £34,609 20 £82,094 £70,187 £54,392 £54,394 30 £131,326 £104,355 £72,506 £72,509 40 £193,973 £142,874 £89,091 £89,096 50 £273,691 £186,302 £104,275 £104,282
Reduction in yield: 1.2% Reduction in yield: 0.0%

The Fidelity Master Trust Report and Financial Statements for the year ended 30 June 2021
188
Notes: • Projected pension pot values are shown in today’s terms, and do not need to be reduced further for the effect
of future inflation • The starting pot size is assumed to be £13,000. • Inflation is assumed to be 2.5% each year. • Total contributions are assumed are assumed to be £200 per month. • Values shown are estimates and are not guaranteed • The projected growth rate for each fund or arrangement are as follows:
o Equity asset classes 2.44% o Bond asset classes -1.56% o Cash asset classes -0.88%

The Fidelity Master Trust Report and Financial Statements for the year ended 30 June 2021
189
Thomas Miller Retirement Savings Plan Illustrations are shown for the default option, the FutureWise Lifestyle Strategy, together with the following self select funds:
• One of the funds with the highest before costs expected return – example used is the BlackRock Aquila Life Mkt Adv Fund Cl9
• One of the funds with the lowest before costs expected return - example used is the Fid BlackRock Corp Bond Fd All Stocks C1
• The fund with the highest annual member borne costs - this is the Fid Emerging Markets Eqty Pensions Fd C8
• The fund with the lowest annual member borne costs - this is the Fidelity Drawdown Cash Account
Projected Pot Sizes in Today’s Money
Years
FutureWise Lifestyle Strategy BlackRock Aquila Life Mkt Adv Fund Cl9
Fid BlackRock Corp Bond Fd All Stocks C1
Pot size with no costs incurred
Pot size after all costs
deducted
Pot size with no costs incurred
Pot size after all costs
deducted
Pot size with no costs incurred
Pot size after all costs
deducted 1 £100,433 £100,166 £100,433 £9,824 £96,638 £96,394 3 £119,94 £119,097 £119,994 £117,949 £107,652 £106,891 5 £140,521 £138,853 £140,521 £136,732 £118,324 £117,009
10 £196,383 £192,097 £196,383 £186,723 £143,581 £140,738 20 £330,482 £317,257 £330,482 £301,103 £188,507 £182,140 30 £501,122 £472,208 £501,122 £437,780 £226,894 £216,603 40 £713,742 £657,897 £718,259 £601,097 £259,692 £245,289 50 £821,324 £742,339 £994,565 £796,248 £287,715 £269,167
Reduction in yield: 0.3% Reduction in yield: 0.6% Reduction in yield: 0.3%
Years
Fid Emerging Markets Eqty Pensions Fd C8
Fidelity Drawdown Cash Account
Pot size with no costs incurred
Pot size after all costs
deducted
Pot size with no costs incurred
Pot size after all costs
deducted 1 £100,433 £9,264 £97,286 £97,286 3 £119,994 £116,091 £109,693 £109,694 5 £140,521 £133,327 £121,883 £121,885
10 £196,383 £178,269 £151,434 £151,438 20 £330,482 £276,656 £206,767 £206,775 30 £501,122 £387,578 £257,429 £257,442 40 £718,259 £512,631 £303,814 £303,833 50 £994,565 £653,615 £346,284 £346,309
Reduction in yield: 1.2% Reduction in yield: 0.0%

The Fidelity Master Trust Report and Financial Statements for the year ended 30 June 2021
190
Notes: • Projected pension pot values are shown in today’s terms, and do not need to be reduced further for the effect
of future inflation • The starting pot size is assumed to be £91,000. • Inflation is assumed to be 2.5% each year. • Total contributions are assumed are assumed to be £600 per month. • Values shown are estimates and are not guaranteed • The projected growth rate for each fund or arrangement are as follows:
o Equity asset classes 2.44% o Bond asset classes -1.56% o Cash asset classes -0.88%

The Fidelity Master Trust Report and Financial Statements for the year ended 30 June 2021
191
Thomson Reuters UK DC Plan Illustrations are shown for the default option, the FutureWise Lifestyle Strategy, together with the following self select funds:
• One of the funds with the highest before costs expected return – example used is the BlackRock Aquila Life Mkt Adv Fund Cl9
• One of the funds with the lowest before costs expected return - example used is the Fid BlackRock Corp Bond Fd All Stocks C1
• The fund with the highest annual member borne costs - this is the Fid Emerging Markets Eqty Pensions Fd C8
• The fund with the lowest annual member borne costs - this is the Fidelity Drawdown Cash Account
Projected Pot Sizes in Today’s Money
Years
FutureWise Lifestyle Strategy BlackRock Aquila Life Mkt Adv Fund Cl9
Fid BlackRock Corp Bond Fd All Stocks C1
Pot size with no costs incurred
Pot size after all costs
deducted
Pot size with no costs incurred
Pot size after all costs
deducted
Pot size with no costs incurred
Pot size after all costs
deducted 1 £48,544 £48,423 £48,544 £48,267 £46,818 £46,707 3 £70,411 £69,950 £70,411 £69,359 £64,044 £63,650 5 £93,358 £92,415 £93,358 £91,216 £80,736 £79,982
10 £155,804 £152,961 £155,804 £149,387 £120,239 £118,285 20 £305,707 £295,284 £305,707 £282,485 £190,507 £185,114 30 £496,458 £471,484 £496,458 £441,527 £250,545 £240,742 40 £734,550 £683,185 £739,187 £631,569 £301,842 £287,046 50 £867,082 £789,379 £1,048,057 £858,655 £345,673 £325,589
Reduction in yield: 0.3% Reduction in yield: 0.6% Reduction in yield: 0.3%
Years
Fid Emerging Markets Eqty Pensions Fd C8
Fidelity Drawdown Cash Account
Pot size with no costs incurred
Pot size after all costs
deducted
Pot size with no costs incurred
Pot size after all costs
deducted 1 £48,544 £48,013 £47,113 £47,113 3 £70,411 £68,402 £65,100 £65,101 5 £93,358 £89,286 £82,773 £82,773
10 £155,804 £143,742 £125,614 £125,616 20 £305,707 £262,955 £205,832 £205,838 30 £496,458 £397,357 £279,278 £279,290 40 £739,187 £548,881 £346,524 £346,543 50 £1,048,057 £719,709 £408,094 £408,121
Reduction in yield: 1.2% Reduction in yield: 0.0%

The Fidelity Master Trust Report and Financial Statements for the year ended 30 June 2021
192
Notes: • Projected pension pot values are shown in today’s terms, and do not need to be reduced further for the effect
of future inflation • The starting pot size is assumed to be £38,000. • Inflation is assumed to be 2.5% each year. • Total contributions are assumed are assumed to be £800 per month. • Values shown are estimates and are not guaranteed • The projected growth rate for each fund or arrangement are as follows:
o Equity asset classes 2.44% o Bond asset classes -1.56% o Cash asset classes -0.88%

The Fidelity Master Trust Report and Financial Statements for the year ended 30 June 2021
193
Telegraph Group Pension Plan Illustrations are shown for the default option, the Fidelity State Street Timewise Target Retirement 2060 Fund Class 9, together with the following self select funds:
• One of the funds with the highest before costs expected return – example used is the Fidelity Telegraph Emerging Markets Equity Index Fund
• One of the funds with the lowest before costs expected return - example used is the Fidelity Telegraph Sterling Liquidity Fund
• The fund with the highest annual member borne costs - this is the • The fund with the lowest annual member borne costs - this is the Fidelity Drawdown Cash Account
Projected Pot Sizes in Today’s Money
Years
Fidelity State Street Timewise Target Retirement 2060 Fund
Class 9
Fidelity Telegraph Emerging Markets Equity Index Fund
Fidelity Telegraph Sterling Liquidity Fund
Pot size with no costs incurred
Pot size after all costs
deducted
Pot size with no costs incurred
Pot size after all costs
deducted
Pot size with no costs incurred
Pot size after all costs
deducted 1 £59,400 £59,200 £59,457 £59,418 £57,530 £57,395 3 £76,900 £76,300 £76,995 £76,856 £70,381 £69,932 5 £95,300 £94,100 £95,399 £95,130 £82,958 £82,140
10 £145,000 £142,000 £145,484 £144,736 £113,237 £111,278 20 £265,000 £254,000 £265,713 £263,182 £169,109 £164,055 30 £417,000 £391,000 £418,704 £412,851 £219,266 £210,264 40 £558,000 £513,000 £613,383 £601,976 £264,293 £250,722
Reduction in yield: 0.3% Reduction in yield: 0.1% Reduction in yield: 0.3%
Years
Fidelity Telegraph Dynamic Diversified Fund
Fidelity Telegraph International Equity Index Sub-fund
Pot size with no costs incurred
Pot size after all costs
deducted
Pot size with no costs incurred
Pot size after all costs
deducted 1 £57,530 £57,006 £59,457 £59,722 3 £70,381 £68,655 £76,995 £77,937 5 £82,958 £79,835 £95,399 £97,232
10 £113,237 £105,862 £145,484 £150,624 20 £169,109 £150,559 £265,713 £283,494 30 £219,266 £186,973 £418,704 £460,705 40 £264,293 £216,640 £613,383 £697,085
Reduction in yield: 1.0% Reduction in yield: -0.5%

The Fidelity Master Trust Report and Financial Statements for the year ended 30 June 2021
194
Notes: • Projected pension pot values are shown in today’s terms, and do not need to be reduced further for the effect
of future inflation • The starting pot size is assumed to be £51,000. • Inflation is assumed to be 2.5% each year. • Total contributions are assumed are assumed to be £600 per month. • Values shown are estimates and are not guaranteed • The projected growth rate for each fund or arrangement are as follows:
o Equity asset classes 2.44% o Bond asset classes -1.07% o Cash asset classes -0.49%

The Fidelity Master Trust Report and Financial Statements for the year ended 30 June 2021
195
Universal Music Master Trust Illustrations are shown for the default option, the Flexible Lifestyle Strategy, together with the following self select funds:
• One of the funds with the highest before costs expected return – example used is the Fid Baillie Gifford MA Growth Fd C10
• One of the funds with the lowest before costs expected return - example used is the Fid BlackRock Corp Bond Fd All Stocks C1
• The fund with the highest annual member borne costs - this is the Fid Fulcrum Div Liquid Alternatives C10
• The fund with the lowest annual member borne costs - this is the Fidelity Drawdown Cash Account
Projected Pot Sizes in Today’s Money
Years
Flexible Lifestyle Strategy Fid Baillie Gifford MA Growth Fd C10
Fid BlackRock Corp Bond Fd All Stocks C1
Pot size with no costs incurred
Pot size after all costs
deducted
Pot size with no costs incurred
Pot size after all costs
deducted
Pot size with no costs incurred
Pot size after all costs
deducted 1 £50,238 £50,017 £50,238 £49,622 £48,403 £48,285 3 £67,320 £66,524 £67,320 £65,116 £60,911 £60,515 5 £85,247 £83,685 £85,247 £80,952 £73,031 £72,304
10 £134,031 £129,612 £134,031 £122,086 £101,714 £99,951 20 £251,140 £235,967 £251,140 £211,392 £152,736 £148,189 30 £400,160 £365,074 £400,160 £310,978 £196,329 £188,342 40 £589,786 £522,157 £589,786 £422,030 £233,577 £221,765 50 £817,737 £701,150 £831,083 £545,865 £265,402 £249,586
Reduction in yield: 0.5% Reduction in yield: 1.3% Reduction in yield: 0.3%
Years
Fid Fulcrum Div Liquid Alternatives C10
Fidelity Drawdown Cash Account
Pot size with no costs incurred
Pot size after all costs
deducted
Pot size with no costs incurred
Pot size after all costs
deducted 1 £50,238 £49,294 £48,716 £48,716 3 £67,320 £63,965 £61,973 £61,973 5 £85,247 £78,748 £74,997 £74,998
10 £134,031 £116,201 £106,571 £106,573 20 £251,140 £193,275 £165,691 £165,696 30 £400,160 £273,336 £219,820 £219,830 40 £589,786 £356,497 £269,380 £269,395 50 £831,083 £442,880 £314,757 £314,778
Reduction in yield: 2.1% Reduction in yield: 0.0%

The Fidelity Master Trust Report and Financial Statements for the year ended 30 June 2021
196
Notes: • Projected pension pot values are shown in today’s terms, and do not need to be reduced further for the effect
of future inflation • The starting pot size is assumed to be £42,000. • Inflation is assumed to be 2.5% each year. • Total contributions are assumed are assumed to be £600 per month. • Values shown are estimates and are not guaranteed • The projected growth rate for each fund or arrangement are as follows:
o Equity asset classes 2.44% o Bond asset classes -1.56% o Cash asset classes -0.88%

The Fidelity Master Trust Report and Financial Statements for the year ended 30 June 2021
197
Virgin Money Master Trust Illustrations are shown for the default option, the Drawdown Lifestyle, together with the following self select funds:
• One of the funds with the highest before costs expected return – example used is the Fidelity Investment Pathway 1 Cl 12
• One of the funds with the lowest before costs expected return - example used is the Fidelity Investment Pathway 2 Cl5
• The fund with the highest annual member borne costs - this is the Virgin Money Property • The fund with the lowest annual member borne costs - this is the Fidelity Drawdown Cash Account
Projected Pot Sizes in Today’s Money
Years
Drawdown Lifestyle Fidelity Investment Pathway 1 Cl 12
Fidelity Investment Pathway 2 Cl5
Pot size with no costs incurred
Pot size after all costs
deducted
Pot size with no costs incurred
Pot size after all costs
deducted
Pot size with no costs incurred
Pot size after all costs
deducted 1 £30,910 £30,814 £30,910 £30,782 £29,724 £29,587 3 £34,869 £34,558 £34,869 £34,455 £31,138 £30,726 5 £39,025 £38,462 £39,025 £38,277 £32,508 £31,819
10 £50,333 £48969 £50,333 £48,524 £35,750 £34,365 20 £77,480 £73,592 £77,480 £72,345 £41,517 £38,739 30 £112,023 £103,952 £112,023 £101,411 £46,444 £42,304 40 £155,980 £140,365 £155,980 £136,875 £50,655 £45,211 50 £209,550 £179,047 £211,914 £180,147 £54,252 £47,581
Reduction in yield: 0.4% Reduction in yield: 0.4% Reduction in yield: 0.5%
Years
Virgin Money Property Fidelity Drawdown Cash Account Pot size with
no costs incurred
Pot size after all costs
deducted
Pot size with no costs incurred
Pot size after all costs
deducted 1 £30,910 £30,634 £29,926 £29,926 3 £34,869 £33,978 £31,754 £31,755 5 £39,025 £37,422 £33,550 £33,551
10 £50,333 £46,501 £37,905 £37,906 20 £77,480 £66,832 £46,058 £46,059 30 £112,023 £90,453 £53,522 £53,525 40 £155,980 £117,894 £60,357 £60,361 50 £211,914 £149,775 £66,615 £66,620
Reduction in yield: 0.9% Reduction in yield: 0.0%

The Fidelity Master Trust Report and Financial Statements for the year ended 30 June 2021
198
Notes: • Projected pension pot values are shown in today’s terms, and do not need to be reduced further for the effect
of future inflation • The starting pot size is assumed to be £29,000. • Inflation is assumed to be 2.5% each year. • Total contributions are assumed are assumed to be £100 per month. • Values shown are estimates and are not guaranteed • The projected growth rate for each fund or arrangement are as follows:
o Equity asset classes 2.44% o Bond asset classes -1.56% o Cash asset classes -0.88%

The Fidelity Master Trust Report and Financial Statements for the year ended 30 June 2021
199
Voith Turbo Pension Scheme Illustrations are shown for the default option, the Voith Turbo Income Drawdown Lifestyle, together with the following self select funds:
• One of the funds with the highest before costs expected return – example used is the Fidelity HSBC Islamic Fund Class 4
• One of the funds with the lowest before costs expected return - example used is the Fid L&G; Over 15 Yrs Gilts Idx Fd Cls 8
• The fund with the highest annual member borne costs - this is the Fidelity L&G; Managed Property Fund Cl 4
• The fund with the lowest annual member borne costs - this is the Fidelity Drawdown Cash Account
Projected Pot Sizes in Today’s Money
Years
Voith Turbo Income Drawdown Lifestyle
Fidelity HSBC Islamic Fund Class 4
Fid L&G; Over 15 Yrs Gilts Idx Fd Cls 8
Pot size with no costs incurred
Pot size after all costs
deducted
Pot size with no costs incurred
Pot size after all costs
deducted
Pot size with no costs incurred
Pot size after all costs
deducted 1 £69,523 £69,190 £69,523 £69,011 £66,914 £66,594 3 £85,125 £83,987 £85,125 £83,383 £76,514 £75,500 5 £101,496 £99,360 £101,496 £98,233 £85,817 £84,044
10 £146,050 £140,462 £146,050 £137,563 £107,831 £103,916 20 £253,003 £235,426 £253,003 £226,592 £146,991 £137,982 30 £389,099 £350,365 £389,099 £331,486 £180,449 £165,666 40 £562,280 £488,284 £562,280 £455,073 £209,037 £188,165 50 £740,518 £607,418 £782,651 £600,684 £233,463 £206,450
Reduction in yield: 0.6% Reduction in yield: 0.8% Reduction in yield: 0.5%
Years
Fidelity L&G; Managed Property Fund Cl 4
Fidelity Drawdown Cash Account
Pot size with no costs incurred
Pot size after all costs
deducted
Pot size with no costs incurred
Pot size after all costs
deducted 1 £69,523 £68,634 £67,360 £67,360 3 £85,125 £82,115 £77,939 £77,939 5 £101,496 £95,889 £88,333 £88,334
10 £146,050 £131,638 £113,530 £113,532 20 £253,003 £209,132 £160,710 £160,715 30 £389,099 £295,370 £203,907 £203,917 40 £562,280 £391,337 £243,458 £243,472 50 £782,651 £498,132 £279,669 £279,689
Reduction in yield: 1.4% Reduction in yield: 0.0%

The Fidelity Master Trust Report and Financial Statements for the year ended 30 June 2021
200
Notes: • Projected pension pot values are shown in today’s terms, and do not need to be reduced further for the effect
of future inflation • The starting pot size is assumed to be £62,000. • Inflation is assumed to be 2.5% each year. • Total contributions are assumed are assumed to be £500 per month. • Values shown are estimates and are not guaranteed • The projected growth rate for each fund or arrangement are as follows:
o Equity asset classes 2.44% o Bond asset classes -1.56% o Cash asset classes -0.88%
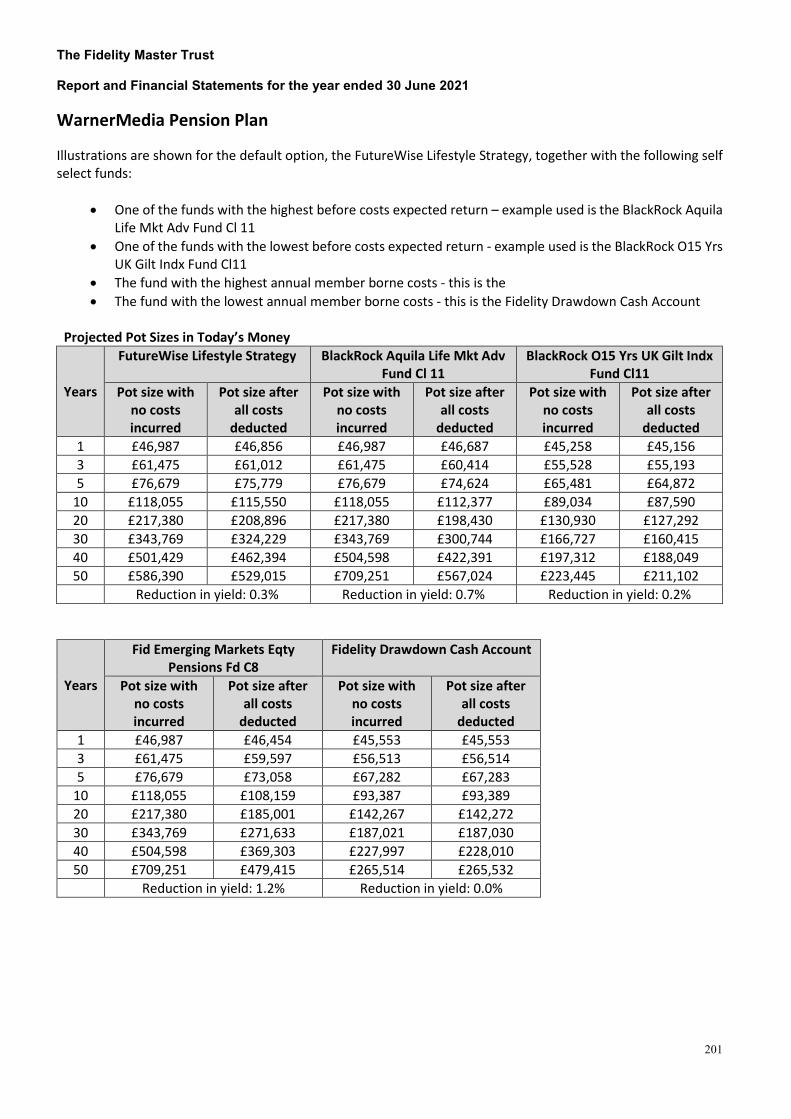
The Fidelity Master Trust Report and Financial Statements for the year ended 30 June 2021
201
WarnerMedia Pension Plan Illustrations are shown for the default option, the FutureWise Lifestyle Strategy, together with the following self select funds:
• One of the funds with the highest before costs expected return – example used is the BlackRock Aquila Life Mkt Adv Fund Cl 11
• One of the funds with the lowest before costs expected return - example used is the BlackRock O15 Yrs UK Gilt Indx Fund Cl11
• The fund with the highest annual member borne costs - this is the • The fund with the lowest annual member borne costs - this is the Fidelity Drawdown Cash Account
Projected Pot Sizes in Today’s Money
Years
FutureWise Lifestyle Strategy BlackRock Aquila Life Mkt Adv Fund Cl 11
BlackRock O15 Yrs UK Gilt Indx Fund Cl11
Pot size with no costs incurred
Pot size after all costs
deducted
Pot size with no costs incurred
Pot size after all costs
deducted
Pot size with no costs incurred
Pot size after all costs
deducted 1 £46,987 £46,856 £46,987 £46,687 £45,258 £45,156 3 £61,475 £61,012 £61,475 £60,414 £55,528 £55,193 5 £76,679 £75,779 £76,679 £74,624 £65,481 £64,872
10 £118,055 £115,550 £118,055 £112,377 £89,034 £87,590 20 £217,380 £208,896 £217,380 £198,430 £130,930 £127,292 30 £343,769 £324,229 £343,769 £300,744 £166,727 £160,415 40 £501,429 £462,394 £504,598 £422,391 £197,312 £188,049 50 £586,390 £529,015 £709,251 £567,024 £223,445 £211,102
Reduction in yield: 0.3% Reduction in yield: 0.7% Reduction in yield: 0.2%
Years
Fid Emerging Markets Eqty Pensions Fd C8
Fidelity Drawdown Cash Account
Pot size with no costs incurred
Pot size after all costs
deducted
Pot size with no costs incurred
Pot size after all costs
deducted 1 £46,987 £46,454 £45,553 £45,553 3 £61,475 £59,597 £56,513 £56,514 5 £76,679 £73,058 £67,282 £67,283
10 £118,055 £108,159 £93,387 £93,389 20 £217,380 £185,001 £142,267 £142,272 30 £343,769 £271,633 £187,021 £187,030 40 £504,598 £369,303 £227,997 £228,010 50 £709,251 £479,415 £265,514 £265,532
Reduction in yield: 1.2% Reduction in yield: 0.0%

The Fidelity Master Trust Report and Financial Statements for the year ended 30 June 2021
202
Notes: • Projected pension pot values are shown in today’s terms, and do not need to be reduced further for the effect
of future inflation • The starting pot size is assumed to be £40,000. • Inflation is assumed to be 2.5% each year. • Total contributions are assumed are assumed to be £500 per month. • Values shown are estimates and are not guaranteed • The projected growth rate for each fund or arrangement are as follows:
o Equity asset classes 2.44% o Bond asset classes -1.56% o Cash asset classes -0.88%
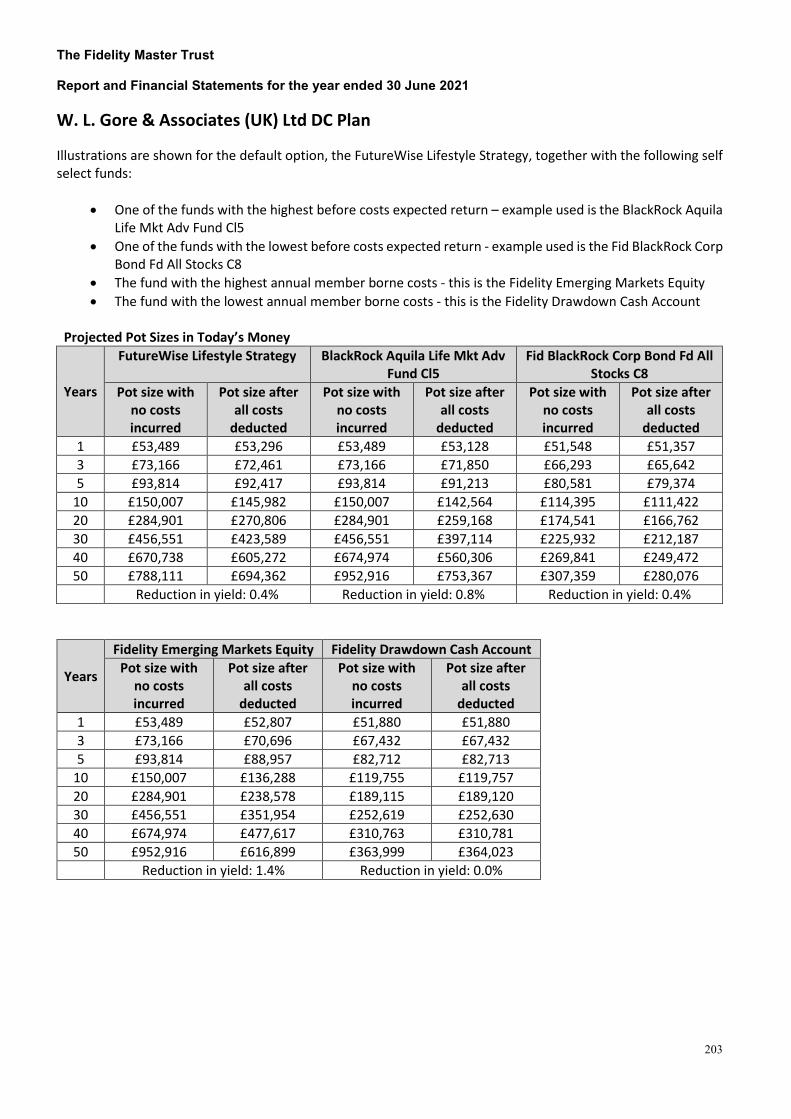
The Fidelity Master Trust Report and Financial Statements for the year ended 30 June 2021
203
W. L. Gore & Associates (UK) Ltd DC Plan Illustrations are shown for the default option, the FutureWise Lifestyle Strategy, together with the following self select funds:
• One of the funds with the highest before costs expected return – example used is the BlackRock Aquila Life Mkt Adv Fund Cl5
• One of the funds with the lowest before costs expected return - example used is the Fid BlackRock Corp Bond Fd All Stocks C8
• The fund with the highest annual member borne costs - this is the Fidelity Emerging Markets Equity • The fund with the lowest annual member borne costs - this is the Fidelity Drawdown Cash Account
Projected Pot Sizes in Today’s Money
Years
FutureWise Lifestyle Strategy BlackRock Aquila Life Mkt Adv Fund Cl5
Fid BlackRock Corp Bond Fd All Stocks C8
Pot size with no costs incurred
Pot size after all costs
deducted
Pot size with no costs incurred
Pot size after all costs
deducted
Pot size with no costs incurred
Pot size after all costs
deducted 1 £53,489 £53,296 £53,489 £53,128 £51,548 £51,357 3 £73,166 £72,461 £73,166 £71,850 £66,293 £65,642 5 £93,814 £92,417 £93,814 £91,213 £80,581 £79,374
10 £150,007 £145,982 £150,007 £142,564 £114,395 £111,422 20 £284,901 £270,806 £284,901 £259,168 £174,541 £166,762 30 £456,551 £423,589 £456,551 £397,114 £225,932 £212,187 40 £670,738 £605,272 £674,974 £560,306 £269,841 £249,472 50 £788,111 £694,362 £952,916 £753,367 £307,359 £280,076
Reduction in yield: 0.4% Reduction in yield: 0.8% Reduction in yield: 0.4%
Years
Fidelity Emerging Markets Equity Fidelity Drawdown Cash Account Pot size with
no costs incurred
Pot size after all costs
deducted
Pot size with no costs incurred
Pot size after all costs
deducted 1 £53,489 £52,807 £51,880 £51,880 3 £73,166 £70,696 £67,432 £67,432 5 £93,814 £88,957 £82,712 £82,713
10 £150,007 £136,288 £119,755 £119,757 20 £284,901 £238,578 £189,115 £189,120 30 £456,551 £351,954 £252,619 £252,630 40 £674,974 £477,617 £310,763 £310,781 50 £952,916 £616,899 £363,999 £364,023
Reduction in yield: 1.4% Reduction in yield: 0.0%

The Fidelity Master Trust Report and Financial Statements for the year ended 30 June 2021
204
Notes: • Projected pension pot values are shown in today’s terms, and do not need to be reduced further for the effect
of future inflation • The starting pot size is assumed to be £44,000. • Inflation is assumed to be 2.5% each year. • Total contributions are assumed are assumed to be £700 per month. • Values shown are estimates and are not guaranteed • The projected growth rate for each fund or arrangement are as follows:
o Equity asset classes 2.44% o Bond asset classes -1.56% o Cash asset classes -0.88%

The Fidelity Master Trust Report and Financial Statements for the year ended 30 June 2021
205
Workday Retirement Savings Plan Illustrations are shown for the default option, the FutureWise Lifestyle Strategy, together with the following self select funds:
• One of the funds with the highest before costs expected return – example used is the BlackRock Aquila Life Mkt Adv Fund Cl9
• One of the funds with the lowest before costs expected return - example used is the Fid BlackRock Corp Bond Fd All Stocks C1
• The fund with the highest annual member borne costs - this is the Fid Emerging Markets Eqty Pensions Fd C8
• The fund with the lowest annual member borne costs - this is the Fidelity Drawdown Cash Account
Projected Pot Sizes in Today’s Money
Years
FutureWise Lifestyle Strategy BlackRock Aquila Life Mkt Adv Fund Cl9
Fid BlackRock Corp Bond Fd All Stocks C1
Pot size with no costs incurred
Pot size after all costs
deducted
Pot size with no costs incurred
Pot size after all costs
deducted
Pot size with no costs incurred
Pot size after all costs
deducted 1 £11,311 £11,289 £11,311 £11,260 £10,996 £10,976 3 £26,472 £26,342 £26,472 £26,175 £24,663 £24,550 5 £42,381 £42,051 £42,381 £41,630 £37,906 £37,634
10 £85,677 £84,389 £85,677 £82,764 £69,246 £68,320 20 £189,609 £183,912 £189,609 £176,882 £124,994 £121,860 30 £321,863 £307,124 £321,863 £289,344 £172,626 £166,426 40 £487,083 £455,439 £490,154 £423,729 £213,324 £203,522 50 £583,275 £535,668 £704,302 £584,307 £248,098 £234,401
Reduction in yield: 0.3% Reduction in yield: 0.6% Reduction in yield: 0.3%
Years
Fid Emerging Markets Eqty Pensions Fd C8
Fidelity Drawdown Cash Account
Pot size with no costs incurred
Pot size after all costs
deducted
Pot size with no costs incurred
Pot size after all costs
deducted 1 £11,311 £11,214 £11,050 £11,050 3 £26,472 £25,904 £24,965 £24,965 5 £42,381 £40,951 £38,636 £38,637
10 £85,677 £80,185 £71,779 £71,780 20 £189,609 £166,076 £133,836 £133,839 30 £321,863 £262,910 £190,654 £190,661 40 £490,154 £372,080 £242,676 £242,688 50 £704,302 £495,159 £290,307 £290,325
Reduction in yield: 1.2% Reduction in yield: 0.0%

The Fidelity Master Trust Report and Financial Statements for the year ended 30 June 2021
206
Notes: • Projected pension pot values are shown in today’s terms, and do not need to be reduced further for the effect
of future inflation • The starting pot size is assumed to be £4,000. • Inflation is assumed to be 2.5% each year. • Total contributions are assumed are assumed to be £600 per month. • Values shown are estimates and are not guaranteed • The projected growth rate for each fund or arrangement are as follows:
o Equity asset classes 2.44% o Bond asset classes -1.56% o Cash asset classes -0.88%

The Fidelity Master Trust Report and Financial Statements for the year ended 30 June 2021
207
Appendix 4 – Implementation Report
Fidelity Master Trust
Implementation Report
Year End 30 June 2021
Background

The Fidelity Master Trust Report and Financial Statements for the year ended 30 June 2021
208
In the Statement of Investment Principles (SIP) the Fidelity Master Trust (the Scheme) sets out its:
• policies for managing financially material considerations including ESG factors and climate change • policies on the stewardship of the investments
The SIP can be found online on Fidelity’s cost and charges webpage https://retirement.fidelity.co.uk/about-workplace-pensions/investing/costs-and-charges. Changes to the SIP are detailed on the following pages.
Implementation Report
This Implementation Report provides evidence that the Scheme continues to follow and act on the principles outlined in the SIP. This report details:
• actions the Trustees have taken to manage financially material risks • the current beliefs of the Trustees with regards to sustainability as articulated within the SIP, and how these are
being implemented within the Scheme • the Trustees’ engagement with fund managers and in turn the engagement activity of the fund managers with the
companies they invest • voting behaviour covering the reporting year up to 30 June 2021 for and on behalf of the Scheme including
significant votes cast by the Scheme or on its behalf where available
Implementation Statement
This report demonstrates that the Scheme has adhered to its investment principles and its policies for managing financially material considerations including ESG factors and climate change during the year up to 30 June 2021.
Signed:
Position:
Date:

The Fidelity Master Trust Report and Financial Statements for the year ended 30 June 2021
209
Managing Risks and Policy Actions
This section sets out how the Trustees have followed their policies to manage the Scheme’s key risks over the reporting period.
Risk Meaning How it is managed Activity over the year
Inflation Risk The risk that investment returns do not keep pace with inflation and hence purchasing power diminishes
The Trustees choose the core fund range with the expectation that the performance of the majority of member funds should protect the value of real savings
Fund performance has been reviewed quarterly
Shortfall Risk Members could receive a retirement benefit less than they had hoped for
The Trustees inform members annually of the likely value of their potential benefit to help inform their investment and contributions decision making
Annual benefits statements were issued to members over the year
Volatility Risk Funds which have a higher chance of achieving higher returns for members are likely to see greater volatility over short periods
An appropriate level of risk for a specific default arrangement is considered against the profile of the membership and a range of funds with different levels of risk will be offered as part of the standard section core fund range
The risk levels of the default strategy are reviewed annually by trustees and risk ratings are communicated to members via fund factsheets
Risk of loss For members approaching retirement, the impact of poor performance is significantly increased as they have less time to make up any lost return
All default arrangements factor in a mechanism such as lifestyling that recognises the changing requirements of members as they approach retirement, for example a greater focus on capital preservation. Funds with a focus on capital preservation will be made available for members in the self-select range
The Trustees reviewed the suitability of the default strategy and self-select fund range as part of their annual review in September 2020, and have undertaken a full triennial review of the strategy over 2021
Manager Risk Selecting a fund from a manager who generates significantly disappointing returns is a considerable risk
The Trustees monitor the funds and managers available to members
Fund/manager performance has been reviewed quarterly and the Trustees’ independent investment adviser provides advice on an annual basis in relation to suitability of the funds offered
Diversification Risk
Failure to diversify sufficiently increases the risk of losing money if one particular investment fails
A default arrangement needs to contain an appropriate level of diversification. A range of funds across different asset classes and regions will be made available for members in the self-select range
The Trustees reviewed the suitability of the default strategy and self-select fund range as part of their annual review in September 2020. 4 new sustainable funds were added to

The Fidelity Master Trust Report and Financial Statements for the year ended 30 June 2021
210
the self-select fund range over the reporting period to increase diversification of options
Liquidity Risk Some investments are not easy to sell, so delaying return or transfer of money
The use of investments that may have liquidity issues is restricted unless this risk is specifically managed
Any fund liquidity concerns are reviewed quarterly. The L&G Hybrid Property Fund used in the standard section reopened during this period. The L&G Managed Property and Threadneedle Property Funds used by several bespoke sections also reopened during this period
Credit Risk The risk that one party to a financial instrument will cause a financial loss for the other party by failing to discharge an obligation, either directly or indirectly There is also the indirect risk that the issuer of a fixed income instrument defaults on their payments
The Scheme is subject to credit risk through its life insurance policy that it holds with FIL Life. Through this life insurance policy, in the event that FIL Life fails, the Scheme is entitled to protection under the Financial Services Compensation Scheme (FSCS). However, in the event that an underlying fund manager fails, FSCS protection would not apply and any money the scheme receives would be based on what FIL Life is able to recover from the underlying manager
No significant events related to this risk were reported over the year
Market Risks Currency risk: the risk that the value of a fund will fluctuate because of changes in foreign exchange rates
Interest rate risk: the risk that the value of a fund will fluctuate because of changes in the market interest rates
Other price risk: the risk that the value of a fund will fluctuate because of changes in market prices (other than those arising from currency or interest rate risk), whether these changes are caused by factors specific to the individual fund assets or their issuers, or factors affecting all similar assets traded in the market
Default strategies will need to consider investment in sustainably oriented investments which aim to reduce investment (or exclude) in those companies most greatly exposed to the risks of climate change and increasing investment in those companies best placed to take advantage of climate change opportunities.
Fund performance has been reviewed quarterly
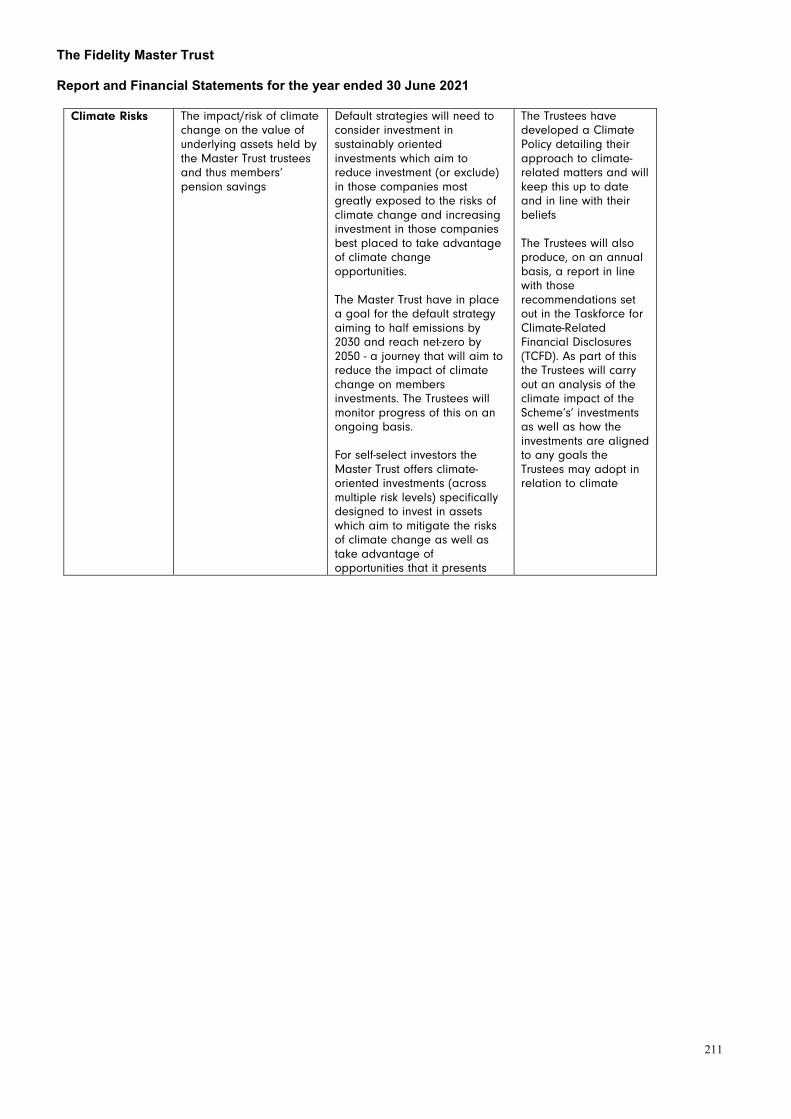
The Fidelity Master Trust Report and Financial Statements for the year ended 30 June 2021
211
Climate Risks The impact/risk of climate change on the value of underlying assets held by the Master Trust trustees and thus members’ pension savings
Default strategies will need to consider investment in sustainably oriented investments which aim to reduce investment (or exclude) in those companies most greatly exposed to the risks of climate change and increasing investment in those companies best placed to take advantage of climate change opportunities. The Master Trust have in place a goal for the default strategy aiming to half emissions by 2030 and reach net-zero by 2050 - a journey that will aim to reduce the impact of climate change on members investments. The Trustees will monitor progress of this on an ongoing basis. For self-select investors the Master Trust offers climate-oriented investments (across multiple risk levels) specifically designed to invest in assets which aim to mitigate the risks of climate change as well as take advantage of opportunities that it presents
The Trustees have developed a Climate Policy detailing their approach to climate-related matters and will keep this up to date and in line with their beliefs The Trustees will also produce, on an annual basis, a report in line with those recommendations set out in the Taskforce for Climate-Related Financial Disclosures (TCFD). As part of this the Trustees will carry out an analysis of the climate impact of the Scheme’s’ investments as well as how the investments are aligned to any goals the Trustees may adopt in relation to climate

The Fidelity Master Trust Report and Financial Statements for the year ended 30 June 2021
212
Changes to the Statement of Investment Principles (SIP)
The SIP was last reviewed in December 2021 to reflect the Trustees’ consideration of climate-related matters, as well as changes to the bespoke section funds. The table below summarises all changes to the SIP over the reporting period.
Additions to the SIP
Addition of Investment Pathways (2020)
• New funds have been made available to members at retirement which align with four investment pathways, each of which are tailored to a particular goal or outcome at retirement. The Master Trust made these investments available in October 2020 to members who have crystallised their assets.
Fund removal (2021) • Removal of three funds from standard range: o Fidelity Multi Asset Allocator Strategic Fund o Fidelity Multi Asset Allocator Defensive Fund o Fidelity Multi Asset Allocator Growth Fund
New sustainable funds (2021) • Four new sustainable funds were added to the core self-select range over the reporting period, to offer members greater choice across core asset classes. This brings the total number of sustainable funds offered within the core self-select range to five.
Credit Suisse Section (2021) • Updated to reflect the changes in the core fund range.
Hunting Section (2021) • Removal of bespoke section appendix.
MyColt Section (2021) • New bespoke section appendix added.
RSA Section (2021) • Updated to reflect addition of RSA Pension ESG Fund.
Telegraph Media Group Section (2020)
• New bespoke section appendix added.
Telegraph Media Group Section (2021)
• Updated to reflect the removal of State Street Balanced Index Fund.
Universal Music Section (2021)
• Updated to reflect the removal of the Fidelity Global Select Fund from the self-select fund range for this Section.
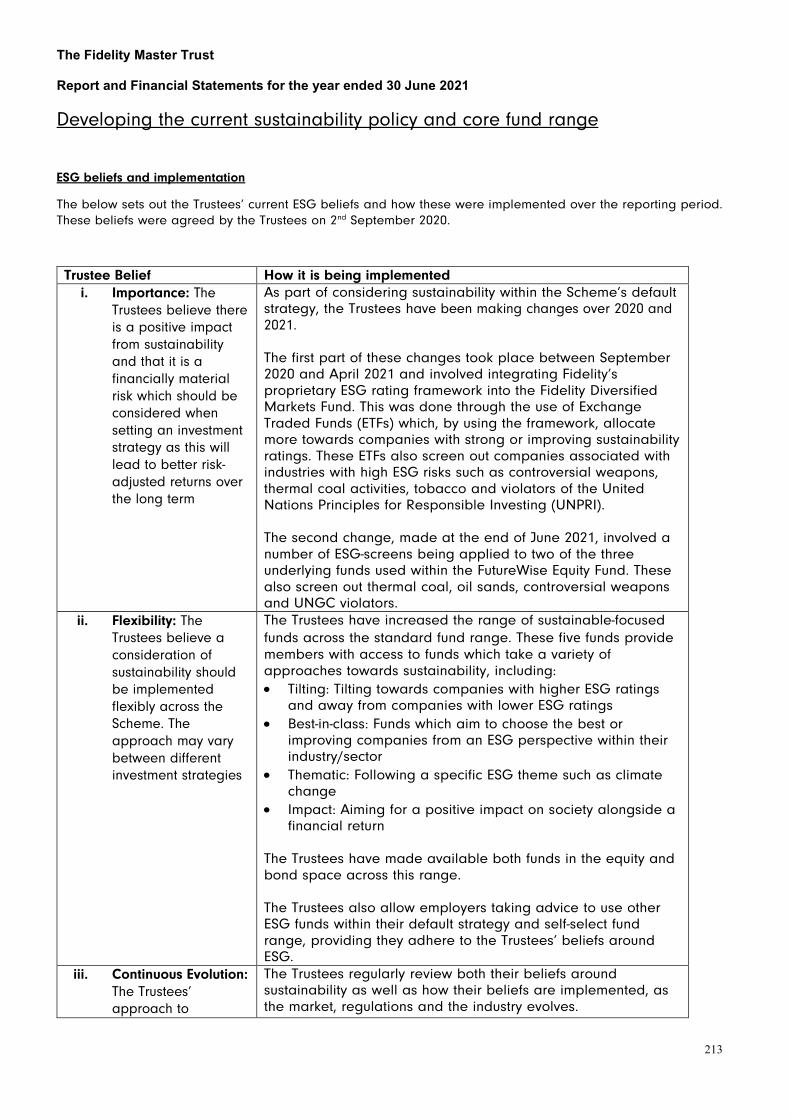
The Fidelity Master Trust Report and Financial Statements for the year ended 30 June 2021
213
Developing the current sustainability policy and core fund range
ESG beliefs and implementation
The below sets out the Trustees’ current ESG beliefs and how these were implemented over the reporting period. These beliefs were agreed by the Trustees on 2nd September 2020.
Trustee Belief How it is being implemented i. Importance: The
Trustees believe there is a positive impact from sustainability and that it is a financially material risk which should be considered when setting an investment strategy as this will lead to better risk-adjusted returns over the long term
As part of considering sustainability within the Scheme’s default strategy, the Trustees have been making changes over 2020 and 2021. The first part of these changes took place between September 2020 and April 2021 and involved integrating Fidelity’s proprietary ESG rating framework into the Fidelity Diversified Markets Fund. This was done through the use of Exchange Traded Funds (ETFs) which, by using the framework, allocate more towards companies with strong or improving sustainability ratings. These ETFs also screen out companies associated with industries with high ESG risks such as controversial weapons, thermal coal activities, tobacco and violators of the United Nations Principles for Responsible Investing (UNPRI). The second change, made at the end of June 2021, involved a number of ESG-screens being applied to two of the three underlying funds used within the FutureWise Equity Fund. These also screen out thermal coal, oil sands, controversial weapons and UNGC violators.
ii. Flexibility: The Trustees believe a consideration of sustainability should be implemented flexibly across the Scheme. The approach may vary between different investment strategies
The Trustees have increased the range of sustainable-focused funds across the standard fund range. These five funds provide members with access to funds which take a variety of approaches towards sustainability, including: • Tilting: Tilting towards companies with higher ESG ratings
and away from companies with lower ESG ratings • Best-in-class: Funds which aim to choose the best or
improving companies from an ESG perspective within their industry/sector
• Thematic: Following a specific ESG theme such as climate change
• Impact: Aiming for a positive impact on society alongside a financial return
The Trustees have made available both funds in the equity and bond space across this range. The Trustees also allow employers taking advice to use other ESG funds within their default strategy and self-select fund range, providing they adhere to the Trustees’ beliefs around ESG.
iii. Continuous Evolution: The Trustees’ approach to
The Trustees regularly review both their beliefs around sustainability as well as how their beliefs are implemented, as the market, regulations and the industry evolves.
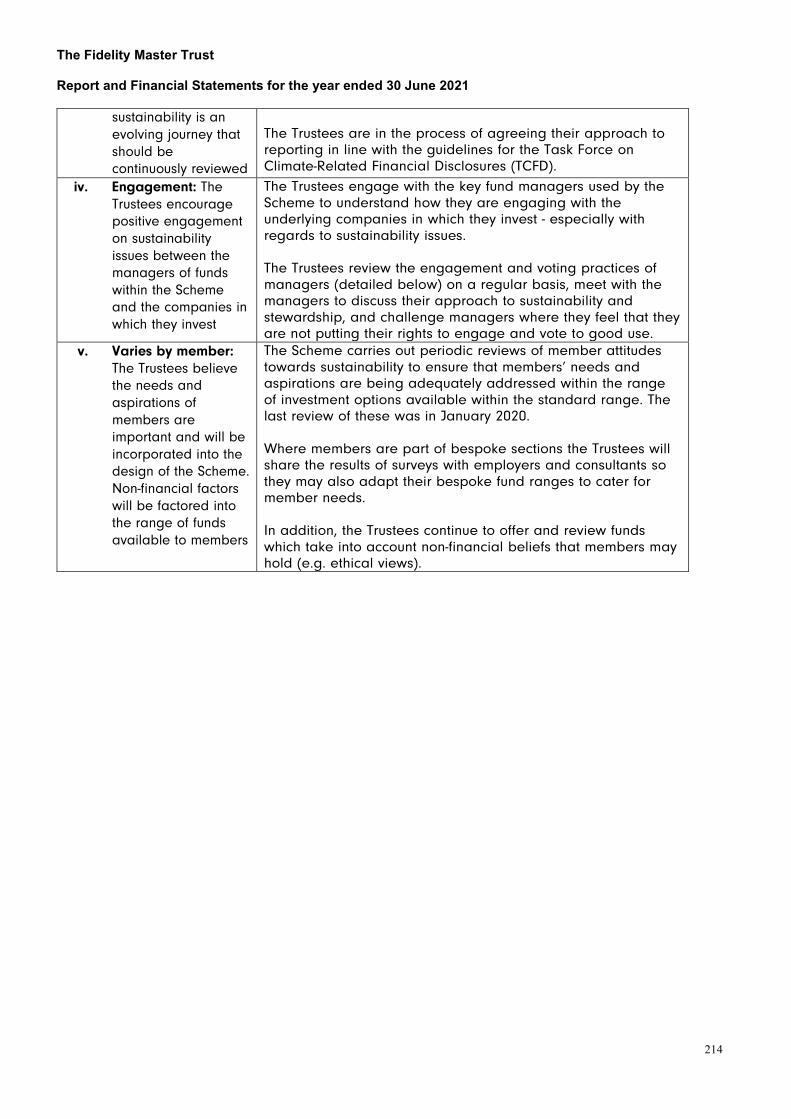
The Fidelity Master Trust Report and Financial Statements for the year ended 30 June 2021
214
sustainability is an evolving journey that should be continuously reviewed
The Trustees are in the process of agreeing their approach to reporting in line with the guidelines for the Task Force on Climate-Related Financial Disclosures (TCFD).
iv. Engagement: The Trustees encourage positive engagement on sustainability issues between the managers of funds within the Scheme and the companies in which they invest
The Trustees engage with the key fund managers used by the Scheme to understand how they are engaging with the underlying companies in which they invest - especially with regards to sustainability issues. The Trustees review the engagement and voting practices of managers (detailed below) on a regular basis, meet with the managers to discuss their approach to sustainability and stewardship, and challenge managers where they feel that they are not putting their rights to engage and vote to good use.
v. Varies by member: The Trustees believe the needs and aspirations of members are important and will be incorporated into the design of the Scheme. Non-financial factors will be factored into the range of funds available to members
The Scheme carries out periodic reviews of member attitudes towards sustainability to ensure that members’ needs and aspirations are being adequately addressed within the range of investment options available within the standard range. The last review of these was in January 2020. Where members are part of bespoke sections the Trustees will share the results of surveys with employers and consultants so they may also adapt their bespoke fund ranges to cater for member needs. In addition, the Trustees continue to offer and review funds which take into account non-financial beliefs that members may hold (e.g. ethical views).
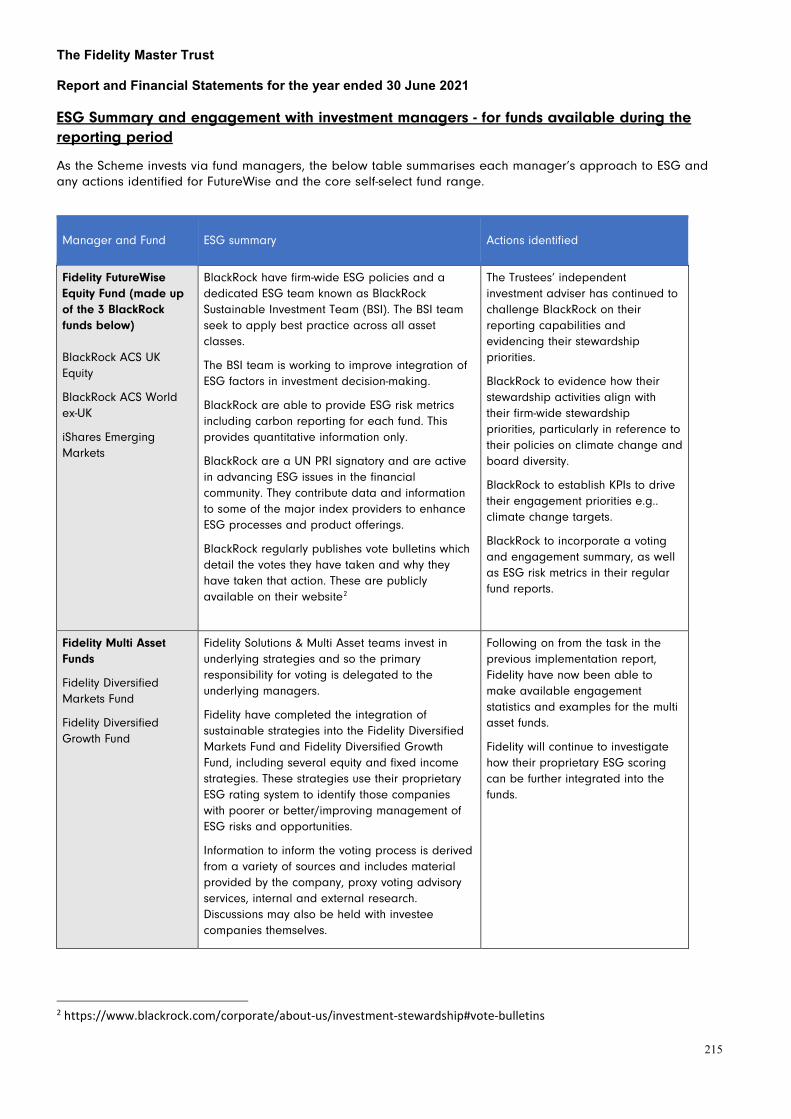
The Fidelity Master Trust Report and Financial Statements for the year ended 30 June 2021
215
ESG Summary and engagement with investment managers - for funds available during the reporting period
As the Scheme invests via fund managers, the below table summarises each manager’s approach to ESG and any actions identified for FutureWise and the core self-select fund range.
2 https://www.blackrock.com/corporate/about-us/investment-stewardship#vote-bulletins
Manager and Fund ESG summary Actions identified
Fidelity FutureWise Equity Fund (made up of the 3 BlackRock funds below) BlackRock ACS UK Equity
BlackRock ACS World ex-UK
iShares Emerging Markets
BlackRock have firm-wide ESG policies and a dedicated ESG team known as BlackRock Sustainable Investment Team (BSI). The BSI team seek to apply best practice across all asset classes.
The BSI team is working to improve integration of ESG factors in investment decision-making.
BlackRock are able to provide ESG risk metrics including carbon reporting for each fund. This provides quantitative information only.
BlackRock are a UN PRI signatory and are active in advancing ESG issues in the financial community. They contribute data and information to some of the major index providers to enhance ESG processes and product offerings.
BlackRock regularly publishes vote bulletins which detail the votes they have taken and why they have taken that action. These are publicly available on their website2
The Trustees’ independent investment adviser has continued to challenge BlackRock on their reporting capabilities and evidencing their stewardship priorities.
BlackRock to evidence how their stewardship activities align with their firm-wide stewardship priorities, particularly in reference to their policies on climate change and board diversity.
BlackRock to establish KPIs to drive their engagement priorities e.g.. climate change targets.
BlackRock to incorporate a voting and engagement summary, as well as ESG risk metrics in their regular fund reports.
Fidelity Multi Asset Funds
Fidelity Diversified Markets Fund
Fidelity Diversified Growth Fund
Fidelity Solutions & Multi Asset teams invest in underlying strategies and so the primary responsibility for voting is delegated to the underlying managers.
Fidelity have completed the integration of sustainable strategies into the Fidelity Diversified Markets Fund and Fidelity Diversified Growth Fund, including several equity and fixed income strategies. These strategies use their proprietary ESG rating system to identify those companies with poorer or better/improving management of ESG risks and opportunities.
Information to inform the voting process is derived from a variety of sources and includes material provided by the company, proxy voting advisory services, internal and external research. Discussions may also be held with investee companies themselves.
Following on from the task in the previous implementation report, Fidelity have now been able to make available engagement statistics and examples for the multi asset funds.
Fidelity will continue to investigate how their proprietary ESG scoring can be further integrated into the funds.
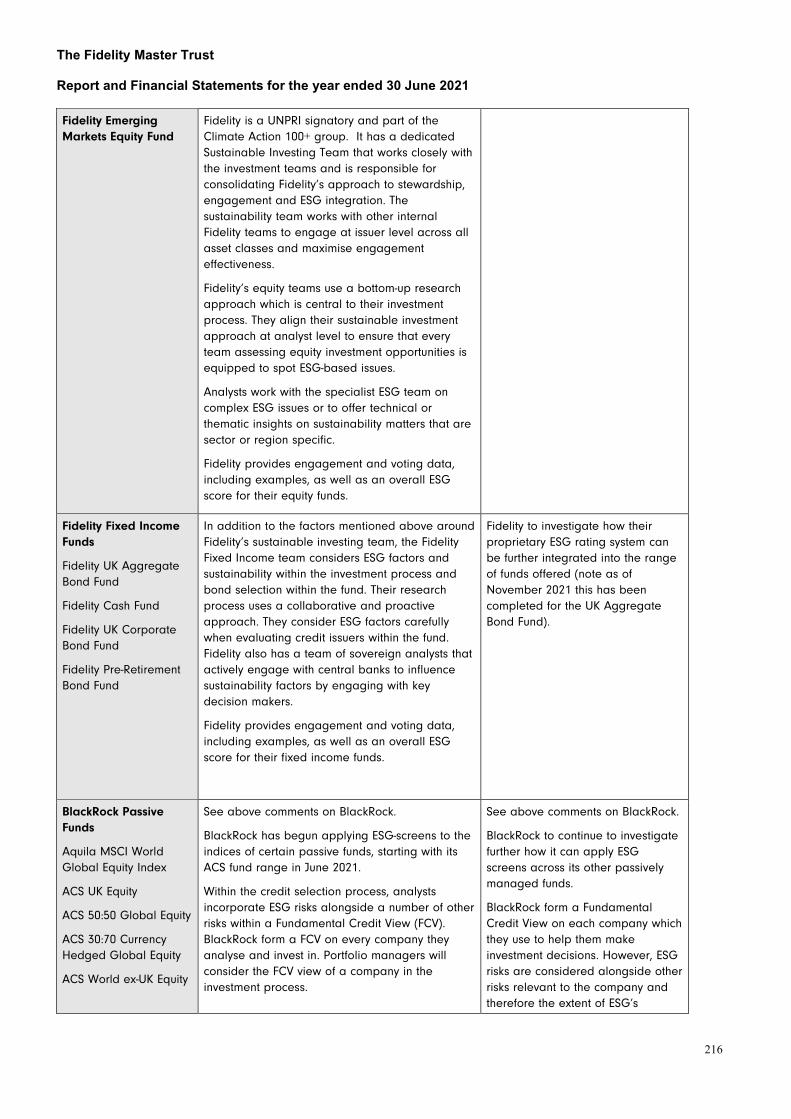
The Fidelity Master Trust Report and Financial Statements for the year ended 30 June 2021
216
Fidelity Emerging Markets Equity Fund
Fidelity is a UNPRI signatory and part of the Climate Action 100+ group. It has a dedicated Sustainable Investing Team that works closely with the investment teams and is responsible for consolidating Fidelity’s approach to stewardship, engagement and ESG integration. The sustainability team works with other internal Fidelity teams to engage at issuer level across all asset classes and maximise engagement effectiveness.
Fidelity’s equity teams use a bottom-up research approach which is central to their investment process. They align their sustainable investment approach at analyst level to ensure that every team assessing equity investment opportunities is equipped to spot ESG-based issues.
Analysts work with the specialist ESG team on complex ESG issues or to offer technical or thematic insights on sustainability matters that are sector or region specific.
Fidelity provides engagement and voting data, including examples, as well as an overall ESG score for their equity funds.
Fidelity Fixed Income Funds
Fidelity UK Aggregate Bond Fund
Fidelity Cash Fund
Fidelity UK Corporate Bond Fund
Fidelity Pre-Retirement Bond Fund
In addition to the factors mentioned above around Fidelity’s sustainable investing team, the Fidelity Fixed Income team considers ESG factors and sustainability within the investment process and bond selection within the fund. Their research process uses a collaborative and proactive approach. They consider ESG factors carefully when evaluating credit issuers within the fund. Fidelity also has a team of sovereign analysts that actively engage with central banks to influence sustainability factors by engaging with key decision makers.
Fidelity provides engagement and voting data, including examples, as well as an overall ESG score for their fixed income funds.
Fidelity to investigate how their proprietary ESG rating system can be further integrated into the range of funds offered (note as of November 2021 this has been completed for the UK Aggregate Bond Fund).
BlackRock Passive Funds
Aquila MSCI World Global Equity Index
ACS UK Equity
ACS 50:50 Global Equity
ACS 30:70 Currency Hedged Global Equity
ACS World ex-UK Equity
See above comments on BlackRock.
BlackRock has begun applying ESG-screens to the indices of certain passive funds, starting with its ACS fund range in June 2021.
Within the credit selection process, analysts incorporate ESG risks alongside a number of other risks within a Fundamental Credit View (FCV). BlackRock form a FCV on every company they analyse and invest in. Portfolio managers will consider the FCV view of a company in the investment process.
See above comments on BlackRock.
BlackRock to continue to investigate further how it can apply ESG screens across its other passively managed funds.
BlackRock form a Fundamental Credit View on each company which they use to help them make investment decisions. However, ESG risks are considered alongside other risks relevant to the company and therefore the extent of ESG’s
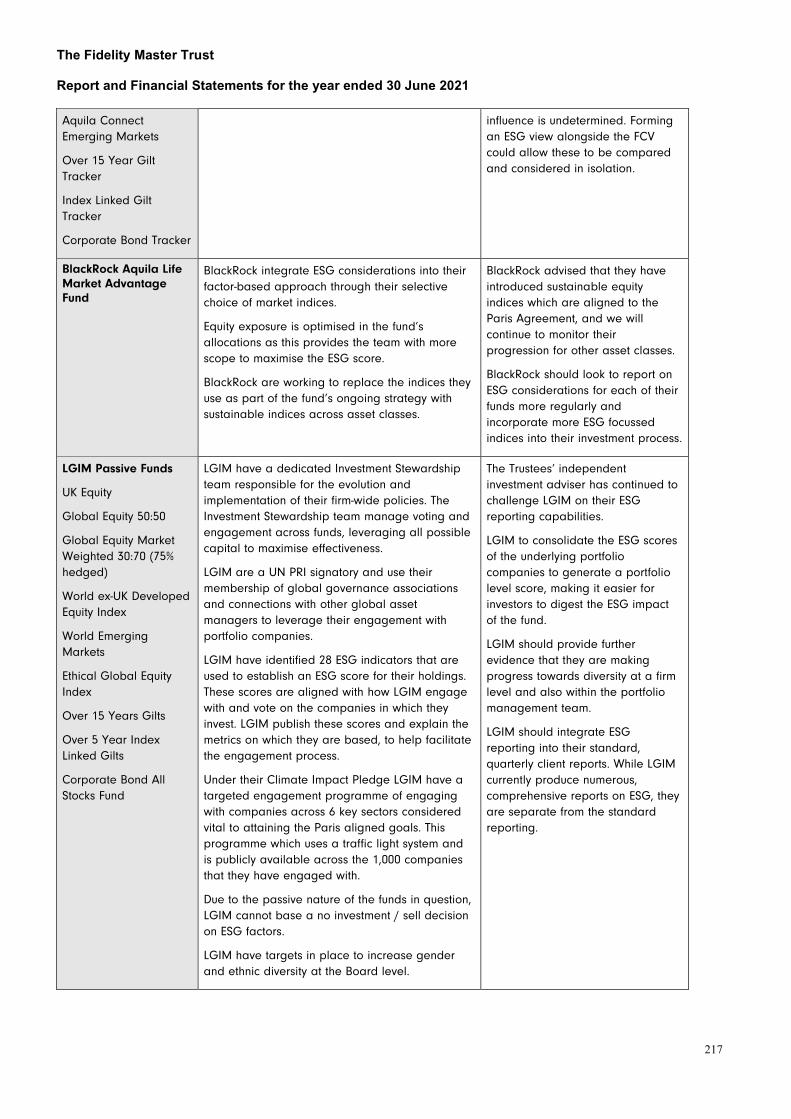
The Fidelity Master Trust Report and Financial Statements for the year ended 30 June 2021
217
Aquila Connect Emerging Markets
Over 15 Year Gilt Tracker
Index Linked Gilt Tracker
Corporate Bond Tracker
influence is undetermined. Forming an ESG view alongside the FCV could allow these to be compared and considered in isolation.
BlackRock Aquila Life Market Advantage Fund
BlackRock integrate ESG considerations into their factor-based approach through their selective choice of market indices.
Equity exposure is optimised in the fund’s allocations as this provides the team with more scope to maximise the ESG score.
BlackRock are working to replace the indices they use as part of the fund’s ongoing strategy with sustainable indices across asset classes.
BlackRock advised that they have introduced sustainable equity indices which are aligned to the Paris Agreement, and we will continue to monitor their progression for other asset classes.
BlackRock should look to report on ESG considerations for each of their funds more regularly and incorporate more ESG focussed indices into their investment process.
LGIM Passive Funds
UK Equity
Global Equity 50:50
Global Equity Market Weighted 30:70 (75% hedged)
World ex-UK Developed Equity Index
World Emerging Markets
Ethical Global Equity Index
Over 15 Years Gilts
Over 5 Year Index Linked Gilts
Corporate Bond All Stocks Fund
LGIM have a dedicated Investment Stewardship team responsible for the evolution and implementation of their firm-wide policies. The Investment Stewardship team manage voting and engagement across funds, leveraging all possible capital to maximise effectiveness.
LGIM are a UN PRI signatory and use their membership of global governance associations and connections with other global asset managers to leverage their engagement with portfolio companies.
LGIM have identified 28 ESG indicators that are used to establish an ESG score for their holdings. These scores are aligned with how LGIM engage with and vote on the companies in which they invest. LGIM publish these scores and explain the metrics on which they are based, to help facilitate the engagement process.
Under their Climate Impact Pledge LGIM have a targeted engagement programme of engaging with companies across 6 key sectors considered vital to attaining the Paris aligned goals. This programme which uses a traffic light system and is publicly available across the 1,000 companies that they have engaged with.
Due to the passive nature of the funds in question, LGIM cannot base a no investment / sell decision on ESG factors.
LGIM have targets in place to increase gender and ethnic diversity at the Board level.
The Trustees’ independent investment adviser has continued to challenge LGIM on their ESG reporting capabilities.
LGIM to consolidate the ESG scores of the underlying portfolio companies to generate a portfolio level score, making it easier for investors to digest the ESG impact of the fund.
LGIM should provide further evidence that they are making progress towards diversity at a firm level and also within the portfolio management team.
LGIM should integrate ESG reporting into their standard, quarterly client reports. While LGIM currently produce numerous, comprehensive reports on ESG, they are separate from the standard reporting.

The Fidelity Master Trust Report and Financial Statements for the year ended 30 June 2021
218
LGIM 70:30 Hybrid Property Fund
LGIM have a dedicated ESG Real Estate team, with key focusses on: climate change and energy; resource use and environment; and communities and risk management.
All assets within the Managed Property Fund undergo a review of ESG issues in the due diligence phase and the Investment Committee must sign off an ESG assessment before completing a transaction.
The Global REITs component is index tracking, therefore does not make active decisions based on ESG issues. However, LGIM have initiatives to promote best practice in ESG across all asset classes and REITs are included in their broader engagement activities, focussing on themes including pay, diversity and climate risk.
LGIM have identified key areas they must implement to become net zero carbon across their real estate portfolios by 2050, including: the introduction of a new property management model and technologies; setting more ambitious targets and understanding what this means for the organisation and investors/clients.
LGIM work alongside tenants on ESG initiatives and conduct engagements with tenants but there is little evidence as to the tangible outcomes of this engagement. There is also a lack of reporting on diversity at a portfolio level, however there is adequate reporting on these issues from the wider LGIM business.
HSBC Islamic Pension Fund
The Fund is passively managed and aims to replicate the Dow Jones Islamic Market Titans 100 Index. The index, which the Fund aims to replicate, uses a rules-based screening approach based on Shariah principles for inclusion. The Fund therefore indirectly adopts these principles by replicating the Index’s constituents.
The Shariah Committee monitors the Fund throughout the year and issues an annual Shariah Certificate on the Fund’s compliance with Shariah principles.
HSBC have a large internal, specialist Responsible Investment (RI) committee who oversee RI policy, strategy and engagement decisions. The committee works closely with client teams to develop RI solutions for client portfolios and monitor RI implementation across the wider fund range.
HSBC are members of the UNPRI’s Engagements’ Advisory Committee and have led, or engaged with, collaborative engagements on ESG issues within the financial services industry.
HSBC should quantify the key ESG related risks at portfolio level to generate an overall portfolio score. This will allow investors to better understand the Fund’s exposure to ESG risks.
HSBC should develop an ESG scorecard for their portfolio companies, highlighting the key ESG related risks at the individual stock level.
HSBC should include Fund specific ESG metrics within their standard reporting package.
HSBC should establish key performance indicators to enable them to measure the effectiveness of their engagements with portfolio companies.
Schroder Dynamic Multi-Asset Fund
Schroders are a signatory of a wide range of key organisations linked to ESG and climate change initiatives and collaborate with other asset managers on ESG and stewardship policy via roundtables and company engagement.
Schroders have a firm wide ESG policy in place on their engagement with companies. The Fund is top-down in approach and invests in a number of underlying funds, including some ESG-tilted funds.
ESG priority areas to be more clearly defined in ESG policy to enable investors to understand Schroders’ focus.
ESG risks are quantified as part of the investment approach and are monitored at portfolio level. Schroders are to look to provide more reporting against these risks as a way for investors to see what

The Fidelity Master Trust Report and Financial Statements for the year ended 30 June 2021
219
ESG risks are taken into account at portfolio level, however there is little evidence of reported risk metrics and these being linked to strategic priorities. The fund itself does not have any specific ESG objectives.
For long-term asset class expected returns, Schroders incorporate assumptions related to the costs associated with climate change and the potential impact on both productivity and GDP growth.
they are exposed to and how these risks are being managed.
ESG-specific objective to be considered as part of a more active investment approach.
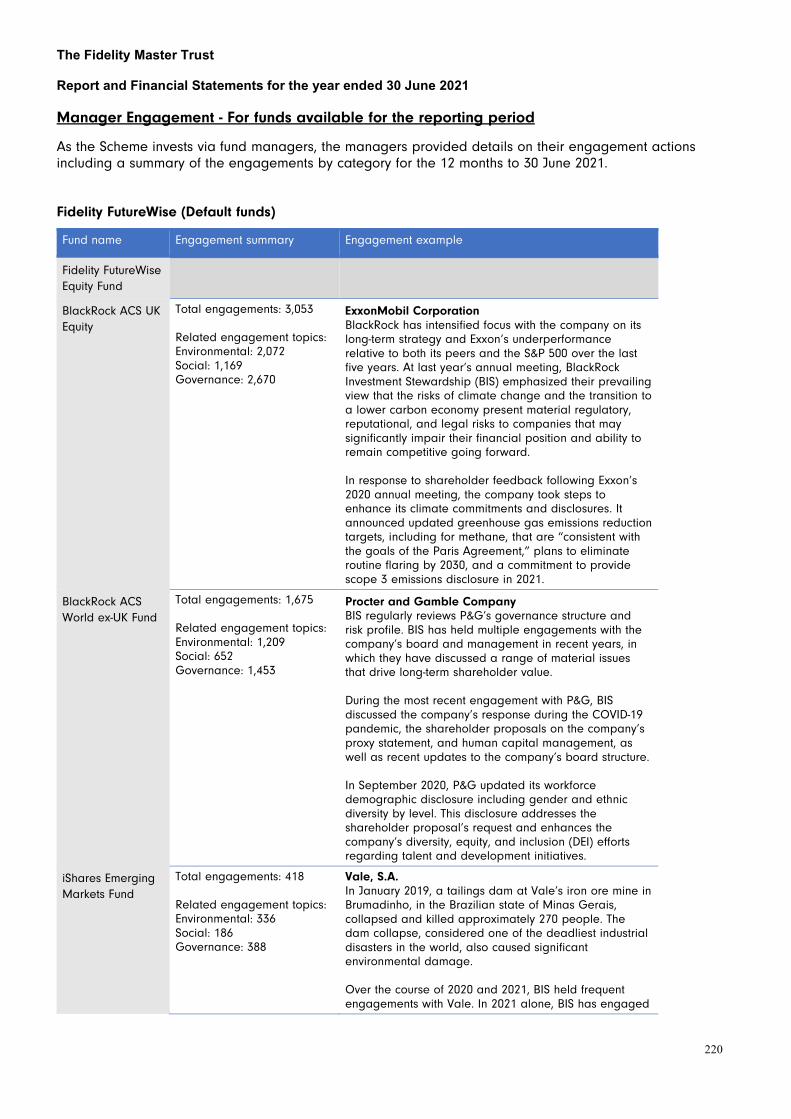
The Fidelity Master Trust Report and Financial Statements for the year ended 30 June 2021
220
Manager Engagement - For funds available for the reporting period
As the Scheme invests via fund managers, the managers provided details on their engagement actions including a summary of the engagements by category for the 12 months to 30 June 2021.
Fidelity FutureWise (Default funds)
Fund name Engagement summary Engagement example
Fidelity FutureWise Equity Fund
BlackRock ACS UK Equity
Total engagements: 3,053 Related engagement topics: Environmental: 2,072 Social: 1,169 Governance: 2,670
ExxonMobil Corporation BlackRock has intensified focus with the company on its long-term strategy and Exxon’s underperformance relative to both its peers and the S&P 500 over the last five years. At last year’s annual meeting, BlackRock Investment Stewardship (BIS) emphasized their prevailing view that the risks of climate change and the transition to a lower carbon economy present material regulatory, reputational, and legal risks to companies that may significantly impair their financial position and ability to remain competitive going forward. In response to shareholder feedback following Exxon’s 2020 annual meeting, the company took steps to enhance its climate commitments and disclosures. It announced updated greenhouse gas emissions reduction targets, including for methane, that are “consistent with the goals of the Paris Agreement,” plans to eliminate routine flaring by 2030, and a commitment to provide scope 3 emissions disclosure in 2021.
BlackRock ACS World ex-UK Fund
Total engagements: 1,675 Related engagement topics: Environmental: 1,209 Social: 652 Governance: 1,453
Procter and Gamble Company BIS regularly reviews P&G’s governance structure and risk profile. BIS has held multiple engagements with the company’s board and management in recent years, in which they have discussed a range of material issues that drive long-term shareholder value. During the most recent engagement with P&G, BIS discussed the company’s response during the COVID-19 pandemic, the shareholder proposals on the company’s proxy statement, and human capital management, as well as recent updates to the company’s board structure. In September 2020, P&G updated its workforce demographic disclosure including gender and ethnic diversity by level. This disclosure addresses the shareholder proposal’s request and enhances the company’s diversity, equity, and inclusion (DEI) efforts regarding talent and development initiatives.
iShares Emerging Markets Fund
Total engagements: 418 Related engagement topics: Environmental: 336 Social: 186 Governance: 388
Vale, S.A. In January 2019, a tailings dam at Vale’s iron ore mine in Brumadinho, in the Brazilian state of Minas Gerais, collapsed and killed approximately 270 people. The dam collapse, considered one of the deadliest industrial disasters in the world, also caused significant environmental damage. Over the course of 2020 and 2021, BIS held frequent engagements with Vale. In 2021 alone, BIS has engaged

The Fidelity Master Trust Report and Financial Statements for the year ended 30 June 2021
221
with Vale over 10 times. Vale has provided updates on the Brumadinho disaster – including the status of the investigation process and final settlement. Vale has provided additional context on the frequent public announcements about: 1) the steps the Board of Directors and management have taken to strengthen risk management and governance policies to ensure the safety of people and operations; and 2) the remediation measures regarding the environmental damages and socioeconomic impacts to the local community caused by the collapse.
Fidelity Diversified Markets Fund
Total engagements: 351 Related engagement topics: Environmental: 111 Social: 99 Governance: 289
United Health Group (USA) Theme: Product safety & control and data privacy and security Fidelity engaged with UnitedHealth (UNH) to better understand their ESG practices, including product safety and control, data privacy and security. It was Fidelity’s understanding, born out by discussion, that the company has a good overall sustainability story, but are lacking concrete targets and disclosures with tangible KPIs. The company stated that they are developing long term ESG goals which will focus across areas such as environment, next gen healthcare system and people/ culture. Their underlying aim as a business is to improve access, affordability, outcomes and patient/physician experience. Through Optum (their pharmacy benefit manager business), the company must fundamentally have a lot of data in these areas - however, further targets based on some of these factors would be welcome and could highlight how UNH is trying to improve healthcare sustainability. UNH told Fidelity that they are actively engaging with MSCI to address ratings shortfalls and hope to materially improve their rating from BB. MSCI highlighted shortcomings in two key areas - data privacy and security as well as product safety and quality. Fidelity discussed both areas with UNH who believe they have robust policies in place across these areas. Fidelity encouraged them to provide more substantive and regular disclosures in order for investors to better understand if they are indeed better than below average. The company is trying to better control the cost of healthcare by adopting a vertical integration strategy to manage access, costs, patient outcomes - i.e., generally well aligned to broader sustainability goals. However, the company is still relatively early in the formulisation of their stated ESG policies and practices. The publishing of and commitment to new long-term goals in 2021 will hopefully help address concerns and low ratings. Fidelity plan to continue to have an open engagement with the company to encourage improvement going forward.
Fidelity UK Aggregate Bond Fund
Total engagements: 44 Related ESG topics (e.g. Climate change, Executive Remuneration and Governance): 83
Barclays PLC Fidelity’s fixed income and equity analysts have conducted an ongoing engagement plan with the firm and met with the incoming Barclays Chairman Nigel Higgins in March 2020. This was followed with a
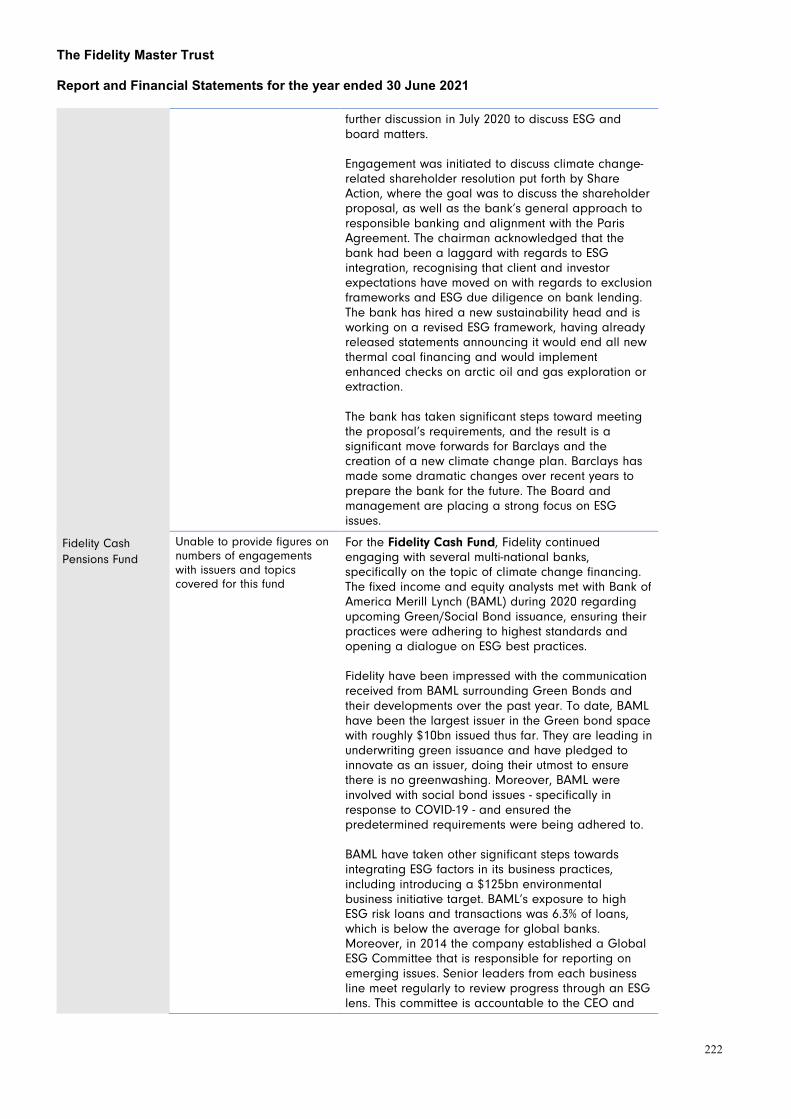
The Fidelity Master Trust Report and Financial Statements for the year ended 30 June 2021
222
further discussion in July 2020 to discuss ESG and board matters. Engagement was initiated to discuss climate change-related shareholder resolution put forth by Share Action, where the goal was to discuss the shareholder proposal, as well as the bank’s general approach to responsible banking and alignment with the Paris Agreement. The chairman acknowledged that the bank had been a laggard with regards to ESG integration, recognising that client and investor expectations have moved on with regards to exclusion frameworks and ESG due diligence on bank lending. The bank has hired a new sustainability head and is working on a revised ESG framework, having already released statements announcing it would end all new thermal coal financing and would implement enhanced checks on arctic oil and gas exploration or extraction. The bank has taken significant steps toward meeting the proposal’s requirements, and the result is a significant move forwards for Barclays and the creation of a new climate change plan. Barclays has made some dramatic changes over recent years to prepare the bank for the future. The Board and management are placing a strong focus on ESG issues.
Fidelity Cash Pensions Fund
Unable to provide figures on numbers of engagements with issuers and topics covered for this fund
For the Fidelity Cash Fund, Fidelity continued engaging with several multi-national banks, specifically on the topic of climate change financing. The fixed income and equity analysts met with Bank of America Merill Lynch (BAML) during 2020 regarding upcoming Green/Social Bond issuance, ensuring their practices were adhering to highest standards and opening a dialogue on ESG best practices. Fidelity have been impressed with the communication received from BAML surrounding Green Bonds and their developments over the past year. To date, BAML have been the largest issuer in the Green bond space with roughly $10bn issued thus far. They are leading in underwriting green issuance and have pledged to innovate as an issuer, doing their utmost to ensure there is no greenwashing. Moreover, BAML were involved with social bond issues - specifically in response to COVID-19 - and ensured the predetermined requirements were being adhered to. BAML have taken other significant steps towards integrating ESG factors in its business practices, including introducing a $125bn environmental business initiative target. BAML’s exposure to high ESG risk loans and transactions was 6.3% of loans, which is below the average for global banks. Moreover, in 2014 the company established a Global ESG Committee that is responsible for reporting on emerging issues. Senior leaders from each business line meet regularly to review progress through an ESG lens. This committee is accountable to the CEO and
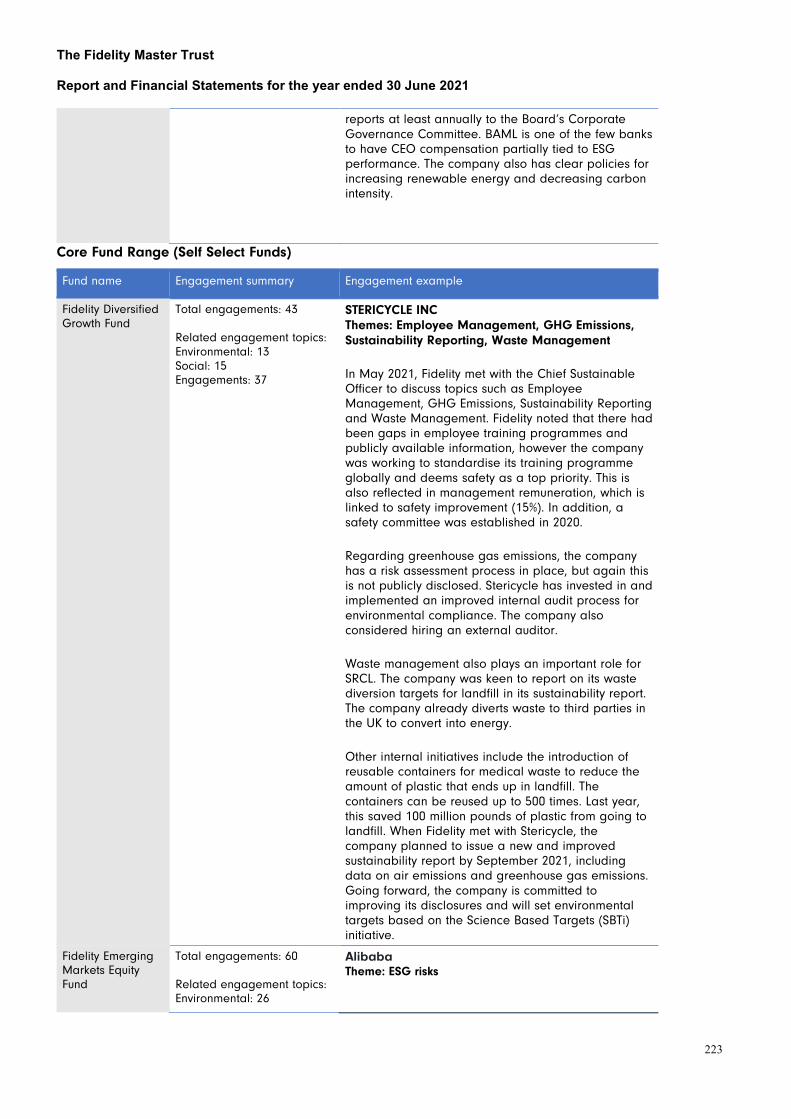
The Fidelity Master Trust Report and Financial Statements for the year ended 30 June 2021
223
reports at least annually to the Board’s Corporate Governance Committee. BAML is one of the few banks to have CEO compensation partially tied to ESG performance. The company also has clear policies for increasing renewable energy and decreasing carbon intensity.
Core Fund Range (Self Select Funds)
Fund name Engagement summary Engagement example
Fidelity Diversified Growth Fund
Total engagements: 43 Related engagement topics: Environmental: 13 Social: 15 Engagements: 37
STERICYCLE INC Themes: Employee Management, GHG Emissions, Sustainability Reporting, Waste Management
In May 2021, Fidelity met with the Chief Sustainable Officer to discuss topics such as Employee Management, GHG Emissions, Sustainability Reporting and Waste Management. Fidelity noted that there had been gaps in employee training programmes and publicly available information, however the company was working to standardise its training programme globally and deems safety as a top priority. This is also reflected in management remuneration, which is linked to safety improvement (15%). In addition, a safety committee was established in 2020.
Regarding greenhouse gas emissions, the company has a risk assessment process in place, but again this is not publicly disclosed. Stericycle has invested in and implemented an improved internal audit process for environmental compliance. The company also considered hiring an external auditor.
Waste management also plays an important role for SRCL. The company was keen to report on its waste diversion targets for landfill in its sustainability report. The company already diverts waste to third parties in the UK to convert into energy.
Other internal initiatives include the introduction of reusable containers for medical waste to reduce the amount of plastic that ends up in landfill. The containers can be reused up to 500 times. Last year, this saved 100 million pounds of plastic from going to landfill. When Fidelity met with Stericycle, the company planned to issue a new and improved sustainability report by September 2021, including data on air emissions and greenhouse gas emissions. Going forward, the company is committed to improving its disclosures and will set environmental targets based on the Science Based Targets (SBTi) initiative.
Fidelity Emerging Markets Equity Fund
Total engagements: 60 Related engagement topics: Environmental: 26
Alibaba Theme: ESG risks
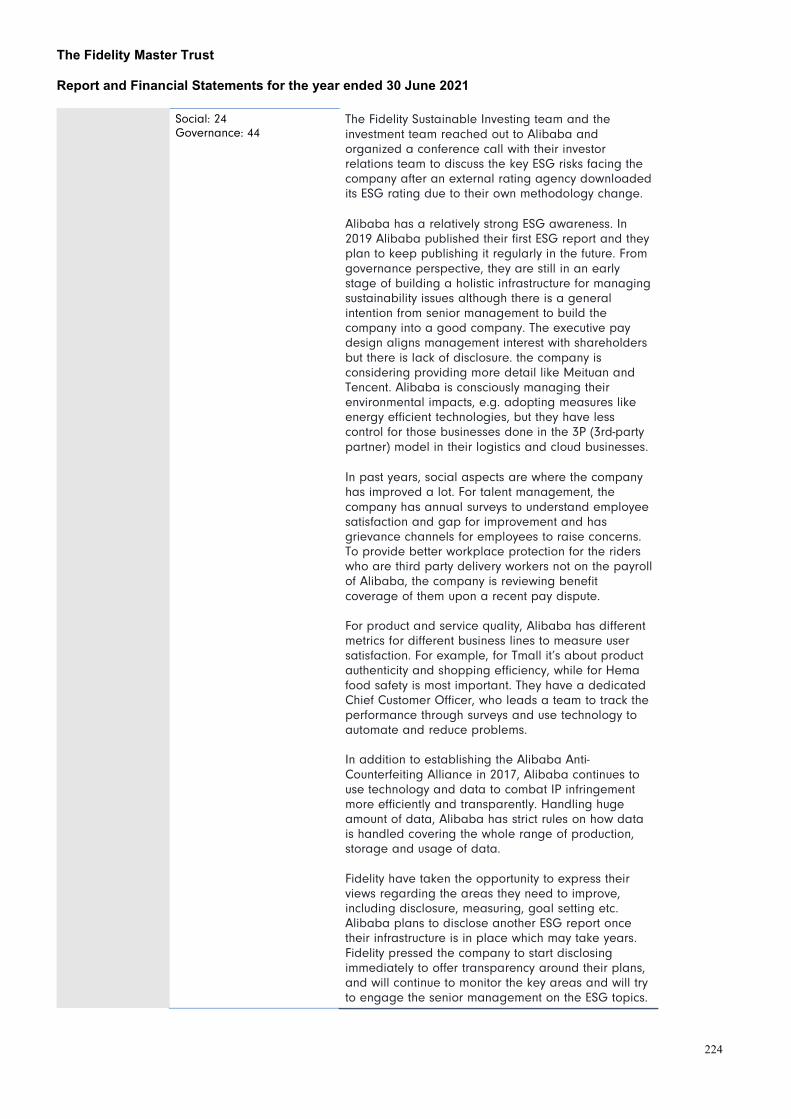
The Fidelity Master Trust Report and Financial Statements for the year ended 30 June 2021
224
Social: 24 Governance: 44
The Fidelity Sustainable Investing team and the investment team reached out to Alibaba and organized a conference call with their investor relations team to discuss the key ESG risks facing the company after an external rating agency downloaded its ESG rating due to their own methodology change. Alibaba has a relatively strong ESG awareness. In 2019 Alibaba published their first ESG report and they plan to keep publishing it regularly in the future. From governance perspective, they are still in an early stage of building a holistic infrastructure for managing sustainability issues although there is a general intention from senior management to build the company into a good company. The executive pay design aligns management interest with shareholders but there is lack of disclosure. the company is considering providing more detail like Meituan and Tencent. Alibaba is consciously managing their environmental impacts, e.g. adopting measures like energy efficient technologies, but they have less control for those businesses done in the 3P (3rd-party partner) model in their logistics and cloud businesses. In past years, social aspects are where the company has improved a lot. For talent management, the company has annual surveys to understand employee satisfaction and gap for improvement and has grievance channels for employees to raise concerns. To provide better workplace protection for the riders who are third party delivery workers not on the payroll of Alibaba, the company is reviewing benefit coverage of them upon a recent pay dispute. For product and service quality, Alibaba has different metrics for different business lines to measure user satisfaction. For example, for Tmall it’s about product authenticity and shopping efficiency, while for Hema food safety is most important. They have a dedicated Chief Customer Officer, who leads a team to track the performance through surveys and use technology to automate and reduce problems. In addition to establishing the Alibaba Anti-Counterfeiting Alliance in 2017, Alibaba continues to use technology and data to combat IP infringement more efficiently and transparently. Handling huge amount of data, Alibaba has strict rules on how data is handled covering the whole range of production, storage and usage of data. Fidelity have taken the opportunity to express their views regarding the areas they need to improve, including disclosure, measuring, goal setting etc. Alibaba plans to disclose another ESG report once their infrastructure is in place which may take years. Fidelity pressed the company to start disclosing immediately to offer transparency around their plans, and will continue to monitor the key areas and will try to engage the senior management on the ESG topics.

The Fidelity Master Trust Report and Financial Statements for the year ended 30 June 2021
225
Fidelity Sterling Corporate Bond Fund
Total engagements: 38 Related ESG topics (e.g. Climate change, executive remuneration & governance): 66
LVMH Theme: Human Rights/Modern Slavery In February 2021, as part of the thematic engagement on supply chain and human rights, Fidelity had a call with the luxury goods company to understand how they address the issue. Given it undertakes much of its manufacturing in-house, the risk should be relatively limited compared to peers. However, the extent of the supply chain and potential areas of risks were not clear on the call and the company admitted they need to do more on social aspects. On the other hand, they have put a screening in place on suppliers based on an external assessment (following the introduction of French law on ‘duty of vigilance’ in 2018), they conduct >1,300 supplier audits a year (with results shared within the group via an internal platform) and have conducted surveys among some suppliers’ employees. Fidelity encouraged them to provide more details on the risks identified and issues found going forward in public disclosure. They seem willing to structure and communicate more on their sustainability efforts at group level and Fidelity will follow up next year on this issue.
Fidelity Pre-Retirement Bond Fund
Total engagements: 21 Related ESG Topics (e.g. Climate change, executive remuneration & governance): 30
Procter & Gamble Theme: Climate Change, Human Rights, Governance and Waste & Pollution In November 2020, the Fidelity Equity and Sustainable Investing Analysts held a 1:1 sustainability engagement call with Proctor & Gamble. They drilled down on their sustainable palm oil policies, requesting an update since the AGM Shareholder Resolution on better/more reporting on deforestation and palm oil. P&G explained that they are working with a team of experts to take a critical look at doing what the resolution asks for. They may be able to accelerate certification on palm oil and wood pulp and will complete the CDP (Carbon Disclosure Project) forest survey. They confirmed that P&G are committed to NDPE (No Deforestation No Peat No Exploitation) and are members of RSPO 2018 and feel it’s a good update/policy. However, they also expressed that NGOs could confuse the issue for people not so close to the topic, and that no certification is perfect. P&G expressed that climate change issues at the forefront for them include: pursuing the science-based targets they have established; looking at ways to reduce emissions; accelerating work (on emissions reduction) with their supply chain; reducing packaging waste; and continuing to focus on water scarcity. On governance, Fidelity highlighted that all of the Board members are within a two-hour flight of P&G headquarters in Cincinnati, Ohio, and that some broader (i.e. international) experience could be of benefit to the otherwise multinational company.

The Fidelity Master Trust Report and Financial Statements for the year ended 30 June 2021
226
BlackRock Aquila MSCI World Global Equity Index Fund
Total engagements: 1,741 Related engagement topics: Environmental: 1,246 Social: 669 Governance: 1,469
Royal Dutch Shell plc BlackRock Investment Stewardship (BIS) has engaged with the company for several years to discuss corporate governance issues, including management and board oversight of climate-related risks and sustainability disclosures. At the 2021 annual general meeting (AGM), management proposed, as a first for the industry, an advisory shareholder vote on the company’s Energy Transition Strategy, 2 i.e., a “say on climate.” As part of the resolution, Shell will publish an update to its Energy Transition Strategy every three years to 2050, with the next update expected before the AGM in 2024. Beginning in 2022, the company will offer shareholders an annual advisory vote on its progress towards achieving its stated plans and targets.
BlackRock ACS UK Equity Fund
See commentary for fund above
BlackRock ACS 50:50 Global Equity Fund
Total engagements: 2,138 Related engagement topics: Environmental: 1,456 Social: 791 Governance: 1,840
Chevron Corporation BIS has a long history of constructive engagement with Chevron where they discuss corporate governance and sustainability topics that BlackRock believe drive long-term shareholder value. This has included climate risk, corporate strategy, and human capital management, among others. BlackRock have found Chevron to be receptive and open to shareholder feedback and BIS has had regular engagement with independent members of Chevron’s Board. BlackRock welcome the steps that the company has taken to enhance the oversight, management, and disclosure of climate-related risks and opportunities.
BlackRock ACS 30:70 Currency Hedged Global Equity Fund
Total engagements: 2,453 Related engagement topics: Environmental: 1,702 Social: 921 Governance: 2,136
Royal Dutch Shell plc BIS has engaged with the company to discuss corporate governance issues, including management and board oversight of climate-related risks and sustainability disclosures. At the 2021 annual general meeting (AGM), management proposed, as a first for the industry, an advisory shareholder vote on the company’s Energy Transition Strategy, 2 i.e., a “say on climate.” As part of the resolution, Shell will publish an update to its Energy Transition Strategy every three years to 2050, with the next update expected before the AGM in 2024. Beginning in 2022, the company will offer shareholders an annual advisory vote on its progress towards achieving its stated plans and targets.
BlackRock ACS World ex-UK Fund
See commentary for fund above
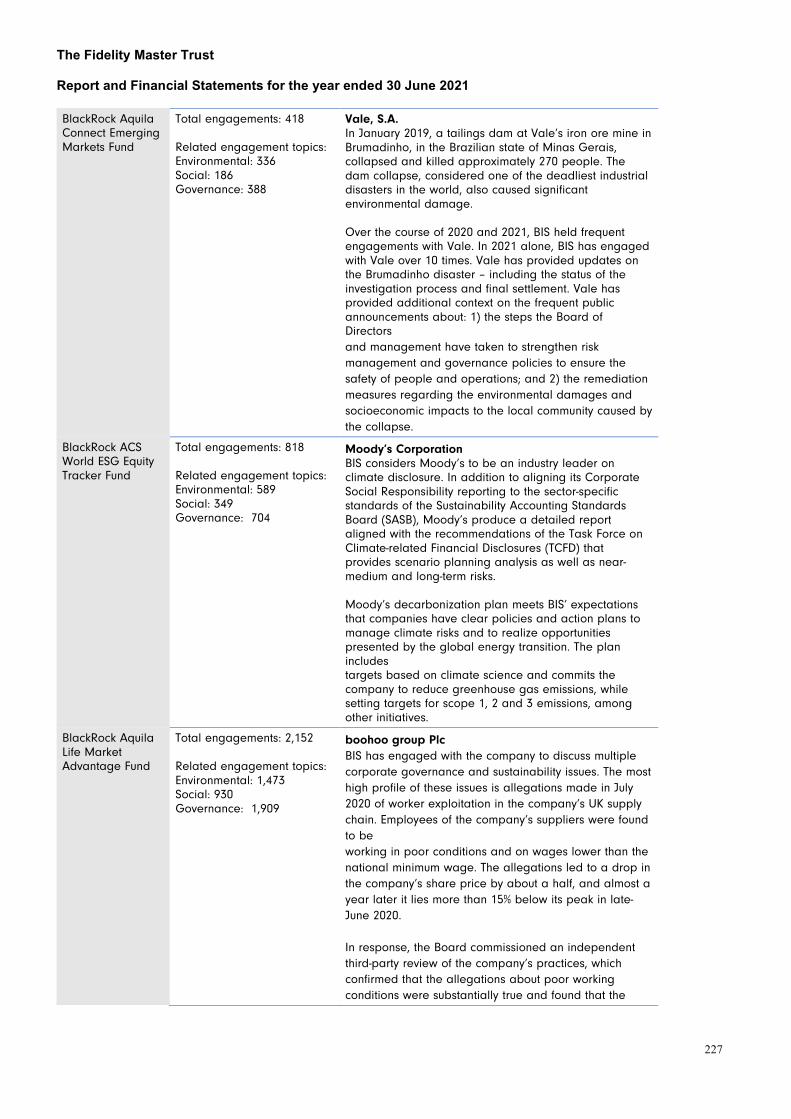
The Fidelity Master Trust Report and Financial Statements for the year ended 30 June 2021
227
BlackRock Aquila Connect Emerging Markets Fund
Total engagements: 418 Related engagement topics: Environmental: 336 Social: 186 Governance: 388
Vale, S.A. In January 2019, a tailings dam at Vale’s iron ore mine in Brumadinho, in the Brazilian state of Minas Gerais, collapsed and killed approximately 270 people. The dam collapse, considered one of the deadliest industrial disasters in the world, also caused significant environmental damage. Over the course of 2020 and 2021, BIS held frequent engagements with Vale. In 2021 alone, BIS has engaged with Vale over 10 times. Vale has provided updates on the Brumadinho disaster – including the status of the investigation process and final settlement. Vale has provided additional context on the frequent public announcements about: 1) the steps the Board of Directors and management have taken to strengthen risk management and governance policies to ensure the safety of people and operations; and 2) the remediation measures regarding the environmental damages and socioeconomic impacts to the local community caused by the collapse.
BlackRock ACS World ESG Equity Tracker Fund
Total engagements: 818 Related engagement topics: Environmental: 589 Social: 349 Governance: 704
Moody’s Corporation BIS considers Moody’s to be an industry leader on climate disclosure. In addition to aligning its Corporate Social Responsibility reporting to the sector-specific standards of the Sustainability Accounting Standards Board (SASB), Moody’s produce a detailed report aligned with the recommendations of the Task Force on Climate-related Financial Disclosures (TCFD) that provides scenario planning analysis as well as near-medium and long-term risks. Moody’s decarbonization plan meets BIS’ expectations that companies have clear policies and action plans to manage climate risks and to realize opportunities presented by the global energy transition. The plan includes targets based on climate science and commits the company to reduce greenhouse gas emissions, while setting targets for scope 1, 2 and 3 emissions, among other initiatives.
BlackRock Aquila Life Market Advantage Fund
Total engagements: 2,152 Related engagement topics: Environmental: 1,473 Social: 930 Governance: 1,909
boohoo group Plc BIS has engaged with the company to discuss multiple corporate governance and sustainability issues. The most high profile of these issues is allegations made in July 2020 of worker exploitation in the company’s UK supply chain. Employees of the company’s suppliers were found to be working in poor conditions and on wages lower than the national minimum wage. The allegations led to a drop in the company’s share price by about a half, and almost a year later it lies more than 15% below its peak in late-June 2020. In response, the Board commissioned an independent third-party review of the company’s practices, which confirmed that the allegations about poor working conditions were substantially true and found that the
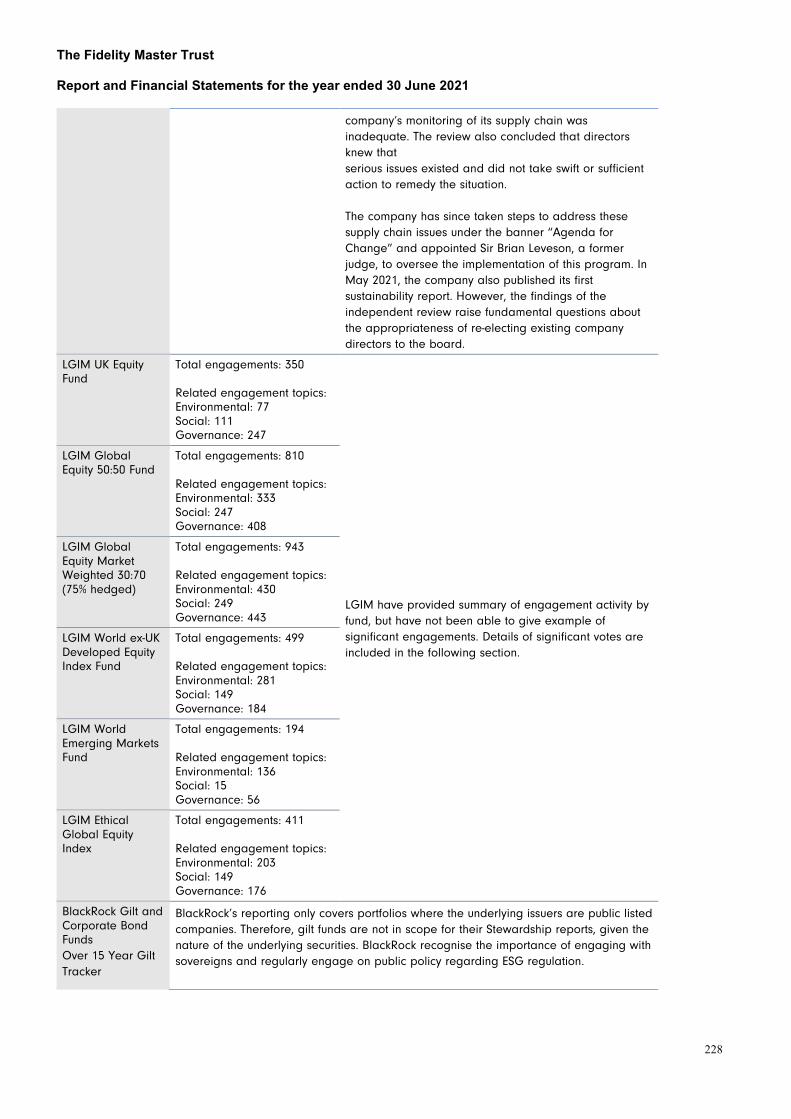
The Fidelity Master Trust Report and Financial Statements for the year ended 30 June 2021
228
company’s monitoring of its supply chain was inadequate. The review also concluded that directors knew that serious issues existed and did not take swift or sufficient action to remedy the situation. The company has since taken steps to address these supply chain issues under the banner “Agenda for Change” and appointed Sir Brian Leveson, a former judge, to oversee the implementation of this program. In May 2021, the company also published its first sustainability report. However, the findings of the independent review raise fundamental questions about the appropriateness of re-electing existing company directors to the board.
LGIM UK Equity Fund
Total engagements: 350 Related engagement topics: Environmental: 77 Social: 111 Governance: 247
LGIM have provided summary of engagement activity by fund, but have not been able to give example of significant engagements. Details of significant votes are included in the following section.
LGIM Global Equity 50:50 Fund
Total engagements: 810 Related engagement topics: Environmental: 333 Social: 247 Governance: 408
LGIM Global Equity Market Weighted 30:70 (75% hedged)
Total engagements: 943 Related engagement topics: Environmental: 430 Social: 249 Governance: 443
LGIM World ex-UK Developed Equity Index Fund
Total engagements: 499 Related engagement topics: Environmental: 281 Social: 149 Governance: 184
LGIM World Emerging Markets Fund
Total engagements: 194 Related engagement topics: Environmental: 136 Social: 15 Governance: 56
LGIM Ethical Global Equity Index
Total engagements: 411 Related engagement topics: Environmental: 203 Social: 149 Governance: 176
BlackRock Gilt and Corporate Bond Funds Over 15 Year Gilt Tracker
BlackRock’s reporting only covers portfolios where the underlying issuers are public listed companies. Therefore, gilt funds are not in scope for their Stewardship reports, given the nature of the underlying securities. BlackRock recognise the importance of engaging with sovereigns and regularly engage on public policy regarding ESG regulation.

The Fidelity Master Trust Report and Financial Statements for the year ended 30 June 2021
229
Index Linked Gilt Tracker
iShares Corporate Bond Index fund
Total engagements: 272 Related engagement topics: Environmental: 197 Social: 114 Governance: 228
AT&T Inc. BlackRock Investment Stewardship (BIS) has engaged with the company for several years to discuss corporate governance and ESG topics that they believe drive long-term shareholder value, including board quality and effectiveness, corporate strategy and executive compensation - such as the approach to one-time awards and severance packages in the context of past leadership transitions. AT&T has published reports aligned with the recommendations of the Task Force on Climate-related Financial Disclosure (TCFD) and the Sustainability Accounting Standards Board (SASB) standard for its sector, consistent with our expectations. However, BlackRock has concerns with certain inconsistencies and reduced transparency around AT&T’s pay practices in the last year.
LGIM Over 15 Years Gilt Fund
LGIM are currently unable to provide engagement data by fund for the over 15 year gilt fund but are considering how such information can be provided going forward.
LGIM Over 5 Year Index Linked Gilts
Total engagements: 34 Related engagement topics: Environmental: 28 Social: 6 Governance: 14
LGIM have provided summary of engagement activity by fund, but have not been able to give example of significant engagements. Details of significant votes are included in the following section.
LGIM AAA-AA-A Corporate Bond All Stocks Fund
Total engagements: 125 Related engagement topics: Environmental: 73 Social: 38 Governance: 61
HSBC Islamic Pension Fund
Total engagements: 95 Related engagement topics: Governance: 54 Environmental and Governance: 9 Social and Governance: 7 Environmental: 17 Environmental, Social and Governance: 8
Apple Inc, Cisco Systems Inc, Nintendo Company Ltd HSBC reviewed their exposure to the issue of e-waste and identified a number of companies in the electric instruments and components, technology hardware, automotive and electrical equipment industries that lacked substantial reporting about how e-waste is managed.
They contacted these companies to investigate which programmes they have in place to address this issue. HSBC were not completely satisfied by Apple’s response since some of the commendable initiatives they have in place – encouraging trade-in for new purchase, using more recycled materials, net zero carbon targets, enhancing product durability – are counterweighted by negative strategies – focus on hardware sales, lobbying against right to repair, short software support lives and not inclusion of product modularity.
Cisco System is one of the e-waste and CE leaders. Their products mostly have long use lives (5 years +), and the

The Fidelity Master Trust Report and Financial Statements for the year ended 30 June 2021
230
company actively seeks to take back products so it can refurbish and recycle them. In addition to this, Cisco also started working on product design to include circular design principles so in future products should be more modular.
Nintendo replied to HSBC’s letter and a call/meeting has yet to be arranged.
Schroder Dynamic Multi-Asset
Breakdown of engagements not provided
Siemens Gamesa Schroders continued to engage on Siemens’ decision to provide services to clients operating in areas exposed to potential human rights concerns following the latest decision to accept another project in Western Sahara.
While Schroders are broadly satisfied by the Company’s decision-making framework to manage human rights issues and acknowledge the unique circumstances of this issue, Schroders remain concerned by how the business is communicating and managing this material reputation risk. As a result, Schroders have now proactively written to management to request improvement on the way this growing concern is being addressed and managed.
LGIM 70:30 Hybrid Property Fund
Total engagements: 82 Related engagement topics: Environmental: 53 Social: 18 Governance: 30
LGIM are currently unable to provide detail of engagement by fund but are considering how such information can be provided going forward.
Voting (Equity and Multi Asset Funds)
As the Scheme invests via fund managers, the managers provided details on their voting actions including a summary of the activity covering the reporting year up to 30 June 2021. The managers also provided examples of any significant votes.
Fidelity FutureWise (Default funds)
Fund name Voting summary Examples of significant votes
Fidelity FutureWise Equity Fund
BlackRock ACS UK Equity Votable proposals: 11,089 Proposals voted: 100.00% Votes ‘with’ management: 94% Votes ‘against’ management: 5%
Aena S.M.E. SA Item 12: Amendment of the Bylaws to add a new Article 50 bis (FOR) This item seeks to embed into the company’s bylaws the requirements that the company maintain a current climate action plan and provide shareholders with an annual update report on progress towards the objectives laid out in the plan, as well as provide shareholders with an annual advisory vote on the plan or progress report. BIS commented that a proposal to amend a company’s bylaws, which set forth the rules and framework for governing the management and operations of the company, should not be taken lightly. In this case, they determined to support the proposal, as the company’s controlled ownership structure dilutes the influence of
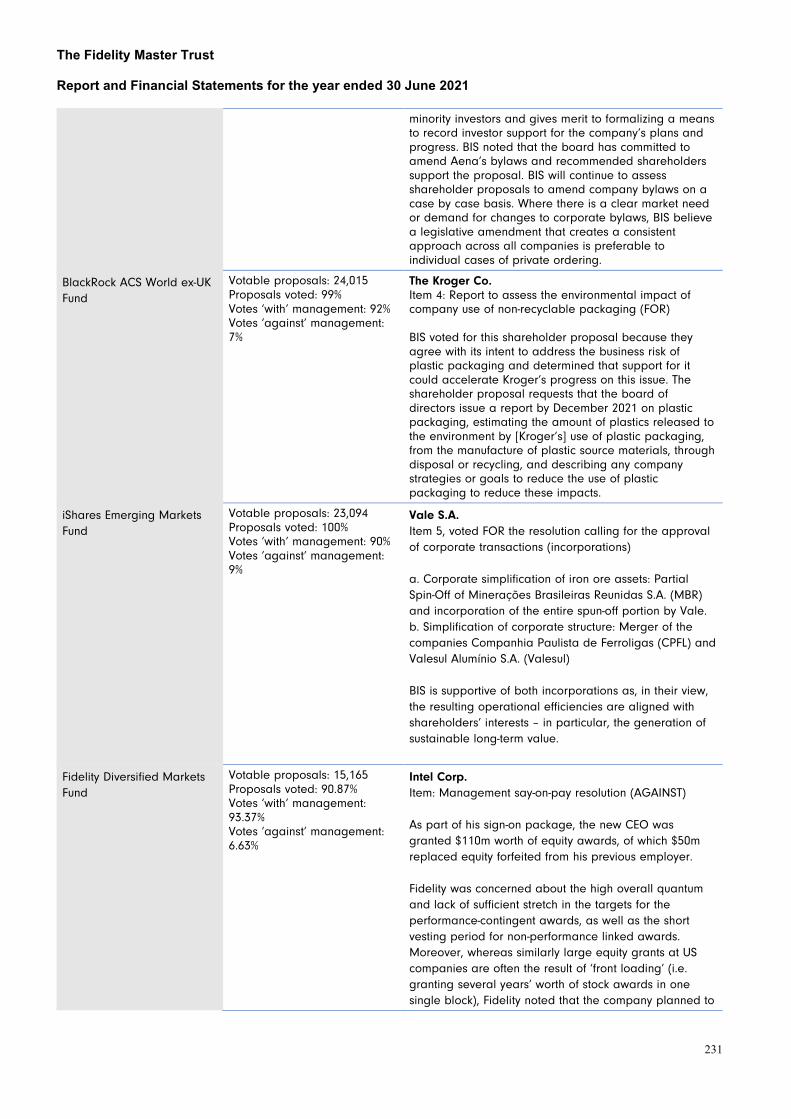
The Fidelity Master Trust Report and Financial Statements for the year ended 30 June 2021
231
minority investors and gives merit to formalizing a means to record investor support for the company’s plans and progress. BIS noted that the board has committed to amend Aena’s bylaws and recommended shareholders support the proposal. BIS will continue to assess shareholder proposals to amend company bylaws on a case by case basis. Where there is a clear market need or demand for changes to corporate bylaws, BIS believe a legislative amendment that creates a consistent approach across all companies is preferable to individual cases of private ordering.
BlackRock ACS World ex-UK Fund
Votable proposals: 24,015 Proposals voted: 99% Votes ‘with’ management: 92% Votes ‘against’ management: 7%
The Kroger Co. Item 4: Report to assess the environmental impact of company use of non-recyclable packaging (FOR) BIS voted for this shareholder proposal because they agree with its intent to address the business risk of plastic packaging and determined that support for it could accelerate Kroger’s progress on this issue. The shareholder proposal requests that the board of directors issue a report by December 2021 on plastic packaging, estimating the amount of plastics released to the environment by [Kroger’s] use of plastic packaging, from the manufacture of plastic source materials, through disposal or recycling, and describing any company strategies or goals to reduce the use of plastic packaging to reduce these impacts.
iShares Emerging Markets Fund
Votable proposals: 23,094 Proposals voted: 100% Votes ‘with’ management: 90% Votes ‘against’ management: 9%
Vale S.A. Item 5, voted FOR the resolution calling for the approval of corporate transactions (incorporations) a. Corporate simplification of iron ore assets: Partial Spin-Off of Minerações Brasileiras Reunidas S.A. (MBR) and incorporation of the entire spun-off portion by Vale. b. Simplification of corporate structure: Merger of the companies Companhia Paulista de Ferroligas (CPFL) and Valesul Alumínio S.A. (Valesul) BIS is supportive of both incorporations as, in their view, the resulting operational efficiencies are aligned with shareholders’ interests – in particular, the generation of sustainable long-term value.
Fidelity Diversified Markets Fund
Votable proposals: 15,165 Proposals voted: 90.87% Votes ‘with’ management: 93.37% Votes ‘against’ management: 6.63%
Intel Corp. Item: Management say-on-pay resolution (AGAINST) As part of his sign-on package, the new CEO was granted $110m worth of equity awards, of which $50m replaced equity forfeited from his previous employer. Fidelity was concerned about the high overall quantum and lack of sufficient stretch in the targets for the performance-contingent awards, as well as the short vesting period for non-performance linked awards. Moreover, whereas similarly large equity grants at US companies are often the result of ‘front loading’ (i.e. granting several years’ worth of stock awards in one single block), Fidelity noted that the company planned to

The Fidelity Master Trust Report and Financial Statements for the year ended 30 June 2021
232
commence granting to the CEO at market-competitive levels the following year. As a result of these concerns, Fidelity voted against the management say-on-pay resolution.
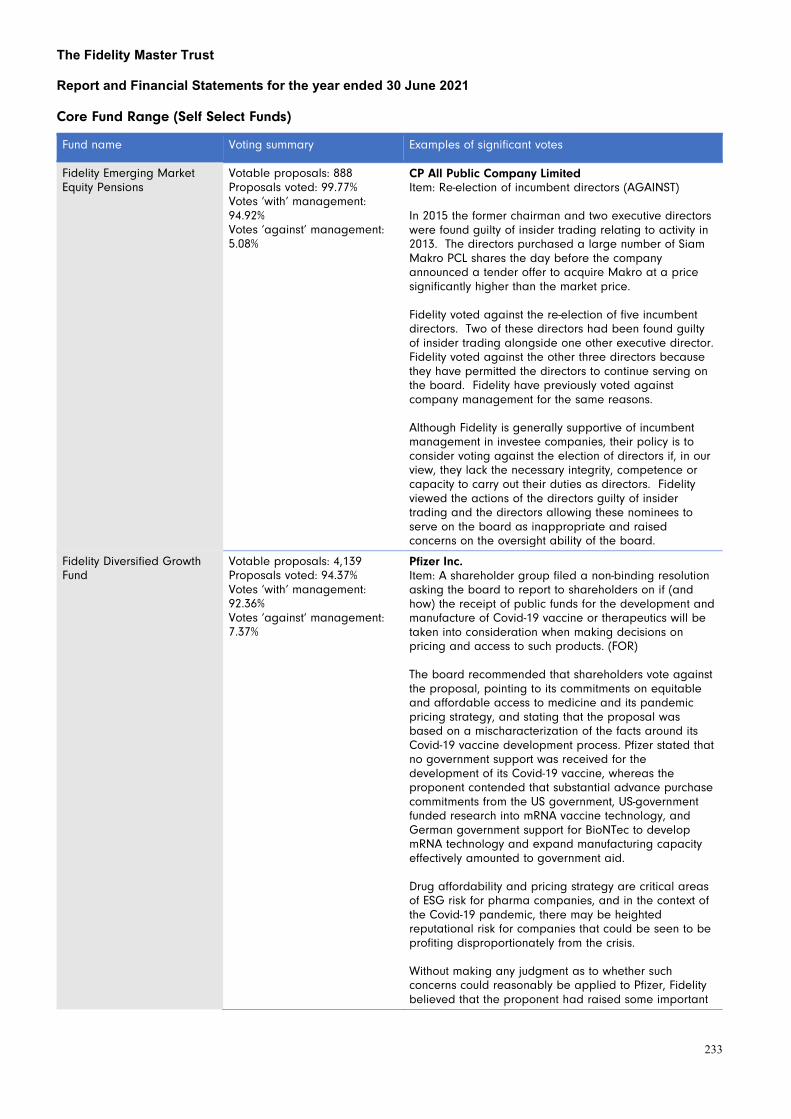
The Fidelity Master Trust Report and Financial Statements for the year ended 30 June 2021
233
Core Fund Range (Self Select Funds)
Fund name Voting summary Examples of significant votes
Fidelity Emerging Market Equity Pensions
Votable proposals: 888 Proposals voted: 99.77% Votes ‘with’ management: 94.92% Votes ‘against’ management: 5.08%
CP All Public Company Limited Item: Re-election of incumbent directors (AGAINST) In 2015 the former chairman and two executive directors were found guilty of insider trading relating to activity in 2013. The directors purchased a large number of Siam Makro PCL shares the day before the company announced a tender offer to acquire Makro at a price significantly higher than the market price. Fidelity voted against the re-election of five incumbent directors. Two of these directors had been found guilty of insider trading alongside one other executive director. Fidelity voted against the other three directors because they have permitted the directors to continue serving on the board. Fidelity have previously voted against company management for the same reasons. Although Fidelity is generally supportive of incumbent management in investee companies, their policy is to consider voting against the election of directors if, in our view, they lack the necessary integrity, competence or capacity to carry out their duties as directors. Fidelity viewed the actions of the directors guilty of insider trading and the directors allowing these nominees to serve on the board as inappropriate and raised concerns on the oversight ability of the board.
Fidelity Diversified Growth Fund
Votable proposals: 4,139 Proposals voted: 94.37% Votes ‘with’ management: 92.36% Votes ‘against’ management: 7.37%
Pfizer Inc. Item: A shareholder group filed a non-binding resolution asking the board to report to shareholders on if (and how) the receipt of public funds for the development and manufacture of Covid-19 vaccine or therapeutics will be taken into consideration when making decisions on pricing and access to such products. (FOR) The board recommended that shareholders vote against the proposal, pointing to its commitments on equitable and affordable access to medicine and its pandemic pricing strategy, and stating that the proposal was based on a mischaracterization of the facts around its Covid-19 vaccine development process. Pfizer stated that no government support was received for the development of its Covid-19 vaccine, whereas the proponent contended that substantial advance purchase commitments from the US government, US-government funded research into mRNA vaccine technology, and German government support for BioNTec to develop mRNA technology and expand manufacturing capacity effectively amounted to government aid. Drug affordability and pricing strategy are critical areas of ESG risk for pharma companies, and in the context of the Covid-19 pandemic, there may be heighted reputational risk for companies that could be seen to be profiting disproportionately from the crisis. Without making any judgment as to whether such concerns could reasonably be applied to Pfizer, Fidelity believed that the proponent had raised some important
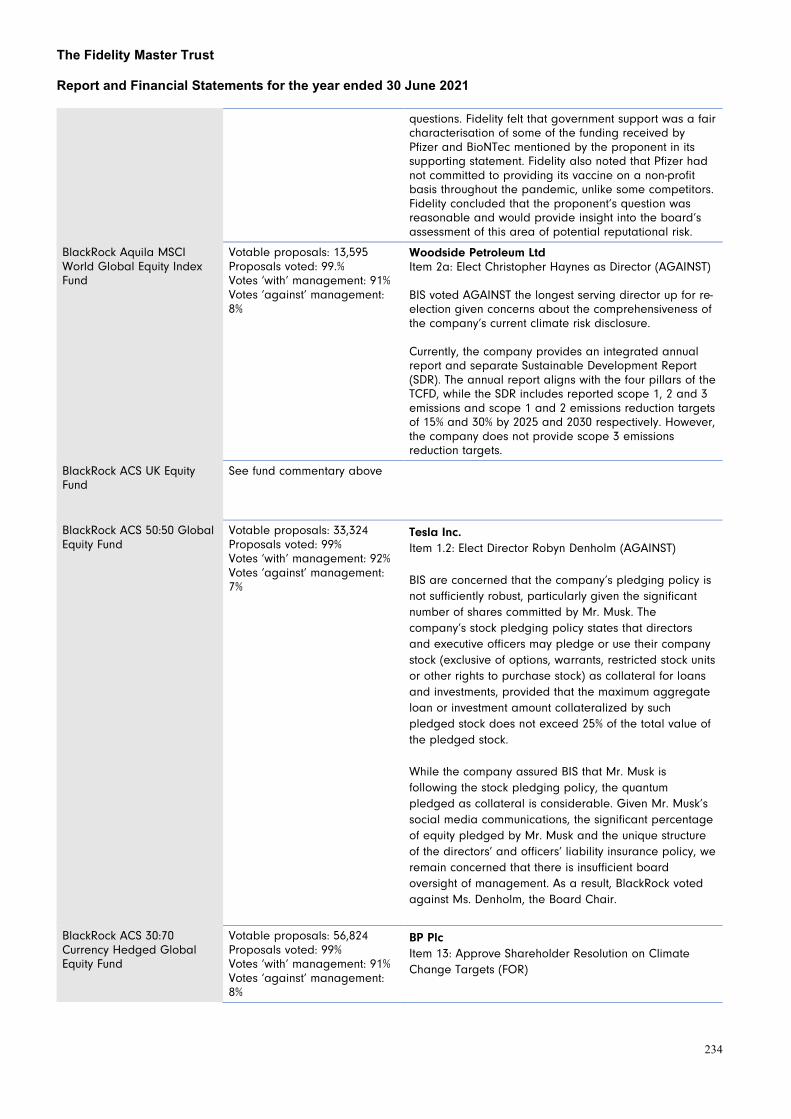
The Fidelity Master Trust Report and Financial Statements for the year ended 30 June 2021
234
questions. Fidelity felt that government support was a fair characterisation of some of the funding received by Pfizer and BioNTec mentioned by the proponent in its supporting statement. Fidelity also noted that Pfizer had not committed to providing its vaccine on a non-profit basis throughout the pandemic, unlike some competitors. Fidelity concluded that the proponent’s question was reasonable and would provide insight into the board’s assessment of this area of potential reputational risk.
BlackRock Aquila MSCI World Global Equity Index Fund
Votable proposals: 13,595 Proposals voted: 99.% Votes ‘with’ management: 91% Votes ‘against’ management: 8%
Woodside Petroleum Ltd Item 2a: Elect Christopher Haynes as Director (AGAINST) BIS voted AGAINST the longest serving director up for re-election given concerns about the comprehensiveness of the company’s current climate risk disclosure. Currently, the company provides an integrated annual report and separate Sustainable Development Report (SDR). The annual report aligns with the four pillars of the TCFD, while the SDR includes reported scope 1, 2 and 3 emissions and scope 1 and 2 emissions reduction targets of 15% and 30% by 2025 and 2030 respectively. However, the company does not provide scope 3 emissions reduction targets.
BlackRock ACS UK Equity Fund
See fund commentary above
BlackRock ACS 50:50 Global Equity Fund
Votable proposals: 33,324 Proposals voted: 99% Votes ‘with’ management: 92% Votes ‘against’ management: 7%
Tesla Inc. Item 1.2: Elect Director Robyn Denholm (AGAINST) BIS are concerned that the company’s pledging policy is not sufficiently robust, particularly given the significant number of shares committed by Mr. Musk. The company’s stock pledging policy states that directors and executive officers may pledge or use their company stock (exclusive of options, warrants, restricted stock units or other rights to purchase stock) as collateral for loans and investments, provided that the maximum aggregate loan or investment amount collateralized by such pledged stock does not exceed 25% of the total value of the pledged stock.
While the company assured BIS that Mr. Musk is following the stock pledging policy, the quantum pledged as collateral is considerable. Given Mr. Musk’s social media communications, the significant percentage of equity pledged by Mr. Musk and the unique structure of the directors’ and officers’ liability insurance policy, we remain concerned that there is insufficient board oversight of management. As a result, BlackRock voted against Ms. Denholm, the Board Chair.
BlackRock ACS 30:70 Currency Hedged Global Equity Fund
Votable proposals: 56,824 Proposals voted: 99% Votes ‘with’ management: 91% Votes ‘against’ management: 8%
BP Plc Item 13: Approve Shareholder Resolution on Climate Change Targets (FOR)

The Fidelity Master Trust Report and Financial Statements for the year ended 30 June 2021
235
BIS voted for this shareholder resolution. While recognizing the company's efforts to date and direction of travel, supporting the resolution signals BlackRock’s desire to see the company accelerate its efforts on climate risk management.
BlackRock ACS World ex-UK Equity Fund
See previous fund commentary above
BlackRock Aquila Connect Emerging Markets Fund
Votable proposals: 23,066 Proposals voted: 96.92% Votes ‘with’ management: 87.27% Votes ‘against’ management: 9.65%
Vale S.A. Item 5, voted FOR the resolution calling for the approval of corporate transactions (incorporations) a. Corporate simplification of iron ore assets: Partial Spin-Off of Minerações Brasileiras Reunidas S.A. (MBR) and incorporation of the entire spun-off portion by Vale. b. Simplification of corporate structure: Merger of the companies Companhia Paulista de Ferroligas (CPFL) and Valesul Alumínio S.A. (Valesul) BIS is supportive of both incorporations as, in their view, the resulting operational efficiencies are aligned with shareholders’ interests – in particular, the generation of sustainable long-term value.
BlackRock ACS World ESG Equity Tracker Fund
Votable proposals: 3,762 Proposals voted: 100% Votes ‘with’ management: 92% Votes ‘against’ management: 7%
TransDigm Group Incorporated Item 1.5: Elect Director W. Nicholas Howley. BIS voted AGAINST BIS remain unsatisfied with the company’s climate risk oversight and believe there has been insufficient progress on climate-related reporting, despite laying out clear expectations in past engagements. In addition, the shareholder proposal received approximately 45% support at the 2020 annual meeting. The company also has not made progress on SASB-aligned reporting. As stated in US proxy voting guidelines, BIS will hold members of the relevant committee or the most senior non-executive director accountable for inadequate disclosures and the underlying business practices. As the company has no lead director or committee designated as responsible for climate risk, BlackRock are holding the Chairman (W. Nicholas Howley) to account by voting against his re-election.
BlackRock Aquila Life Market Advantage Fund
Votable proposals: 53,391 Proposals voted: 99% Votes ‘with’ management: 91% Votes ‘against’ management: 8%
Johnson & Johnson Item 2: Advisory Vote to Ratify Named Executive Officers' Compensation (FOR) BIS voted for the Say on Pay proposal because BIS believe the company has taken appropriate steps to incentivize current executives and to set compensation plans that are performance based.
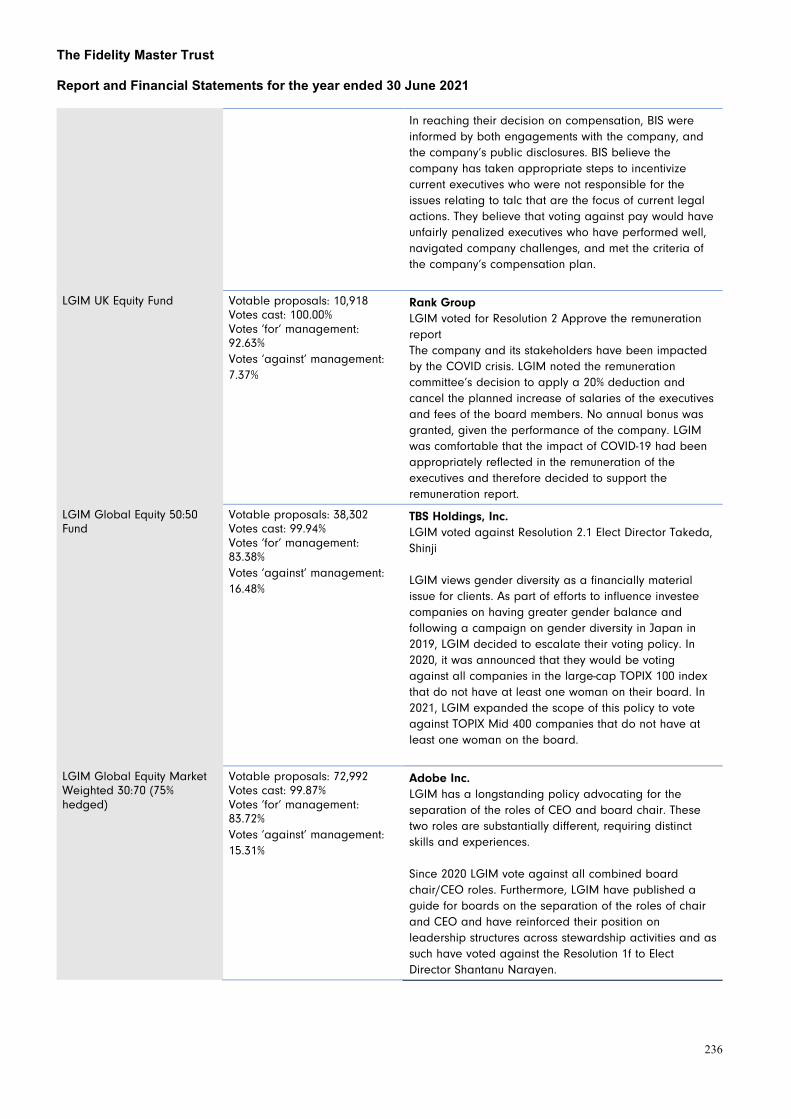
The Fidelity Master Trust Report and Financial Statements for the year ended 30 June 2021
236
In reaching their decision on compensation, BIS were informed by both engagements with the company, and the company’s public disclosures. BIS believe the company has taken appropriate steps to incentivize current executives who were not responsible for the issues relating to talc that are the focus of current legal actions. They believe that voting against pay would have unfairly penalized executives who have performed well, navigated company challenges, and met the criteria of the company’s compensation plan.
LGIM UK Equity Fund Votable proposals: 10,918 Votes cast: 100.00% Votes ‘for’ management: 92.63% Votes ‘against’ management: 7.37%
Rank Group LGIM voted for Resolution 2 Approve the remuneration report The company and its stakeholders have been impacted by the COVID crisis. LGIM noted the remuneration committee’s decision to apply a 20% deduction and cancel the planned increase of salaries of the executives and fees of the board members. No annual bonus was granted, given the performance of the company. LGIM was comfortable that the impact of COVID-19 had been appropriately reflected in the remuneration of the executives and therefore decided to support the remuneration report.
LGIM Global Equity 50:50 Fund
Votable proposals: 38,302 Votes cast: 99.94% Votes ‘for’ management: 83.38% Votes ‘against’ management: 16.48%
TBS Holdings, Inc. LGIM voted against Resolution 2.1 Elect Director Takeda, Shinji LGIM views gender diversity as a financially material issue for clients. As part of efforts to influence investee companies on having greater gender balance and following a campaign on gender diversity in Japan in 2019, LGIM decided to escalate their voting policy. In 2020, it was announced that they would be voting against all companies in the large-cap TOPIX 100 index that do not have at least one woman on their board. In 2021, LGIM expanded the scope of this policy to vote against TOPIX Mid 400 companies that do not have at least one woman on the board.
LGIM Global Equity Market Weighted 30:70 (75% hedged)
Votable proposals: 72,992 Votes cast: 99.87% Votes ‘for’ management: 83.72% Votes ‘against’ management: 15.31%
Adobe Inc. LGIM has a longstanding policy advocating for the separation of the roles of CEO and board chair. These two roles are substantially different, requiring distinct skills and experiences. Since 2020 LGIM vote against all combined board chair/CEO roles. Furthermore, LGIM have published a guide for boards on the separation of the roles of chair and CEO and have reinforced their position on leadership structures across stewardship activities and as such have voted against the Resolution 1f to Elect Director Shantanu Narayen.
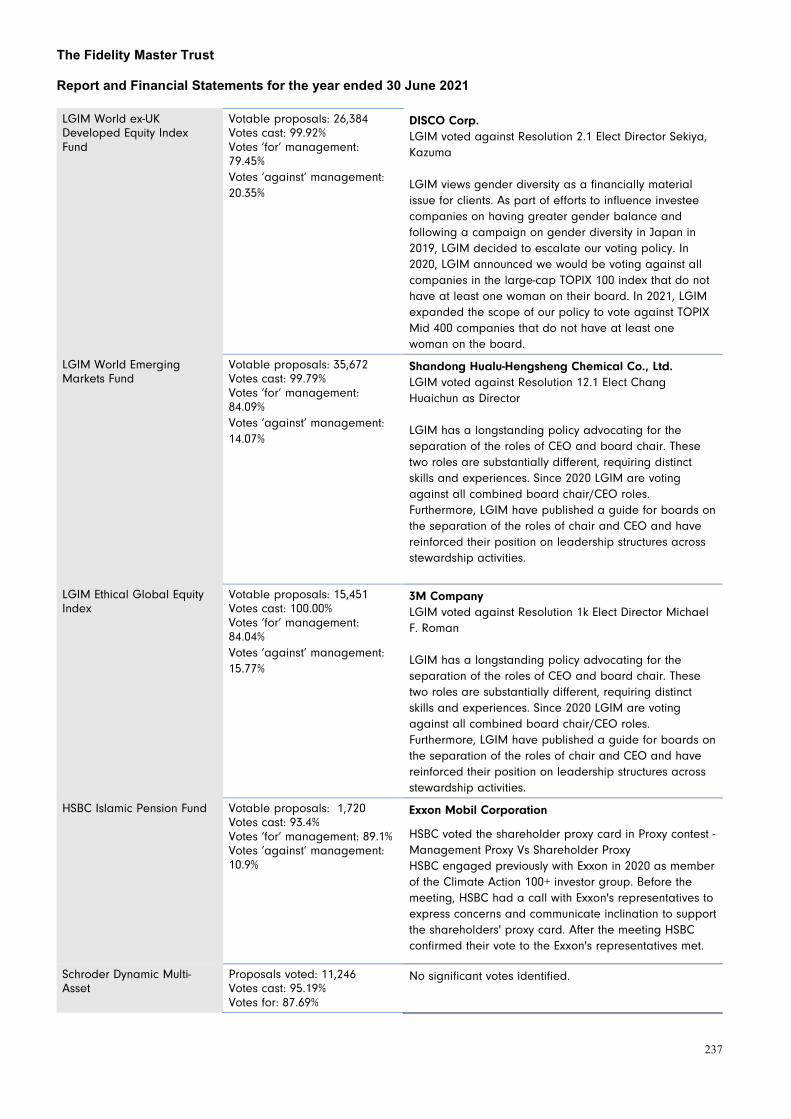
The Fidelity Master Trust Report and Financial Statements for the year ended 30 June 2021
237
LGIM World ex-UK Developed Equity Index Fund
Votable proposals: 26,384 Votes cast: 99.92% Votes ‘for’ management: 79.45% Votes ‘against’ management: 20.35%
DISCO Corp. LGIM voted against Resolution 2.1 Elect Director Sekiya, Kazuma LGIM views gender diversity as a financially material issue for clients. As part of efforts to influence investee companies on having greater gender balance and following a campaign on gender diversity in Japan in 2019, LGIM decided to escalate our voting policy. In 2020, LGIM announced we would be voting against all companies in the large-cap TOPIX 100 index that do not have at least one woman on their board. In 2021, LGIM expanded the scope of our policy to vote against TOPIX Mid 400 companies that do not have at least one woman on the board.
LGIM World Emerging Markets Fund
Votable proposals: 35,672 Votes cast: 99.79% Votes ‘for’ management: 84.09% Votes ‘against’ management: 14.07%
Shandong Hualu-Hengsheng Chemical Co., Ltd. LGIM voted against Resolution 12.1 Elect Chang Huaichun as Director LGIM has a longstanding policy advocating for the separation of the roles of CEO and board chair. These two roles are substantially different, requiring distinct skills and experiences. Since 2020 LGIM are voting against all combined board chair/CEO roles. Furthermore, LGIM have published a guide for boards on the separation of the roles of chair and CEO and have reinforced their position on leadership structures across stewardship activities.
LGIM Ethical Global Equity Index
Votable proposals: 15,451 Votes cast: 100.00% Votes ‘for’ management: 84.04% Votes ‘against’ management: 15.77%
3M Company LGIM voted against Resolution 1k Elect Director Michael F. Roman LGIM has a longstanding policy advocating for the separation of the roles of CEO and board chair. These two roles are substantially different, requiring distinct skills and experiences. Since 2020 LGIM are voting against all combined board chair/CEO roles. Furthermore, LGIM have published a guide for boards on the separation of the roles of chair and CEO and have reinforced their position on leadership structures across stewardship activities.
HSBC Islamic Pension Fund Votable proposals: 1,720 Votes cast: 93.4% Votes ‘for’ management: 89.1% Votes ‘against’ management: 10.9%
Exxon Mobil Corporation
HSBC voted the shareholder proxy card in Proxy contest - Management Proxy Vs Shareholder Proxy HSBC engaged previously with Exxon in 2020 as member of the Climate Action 100+ investor group. Before the meeting, HSBC had a call with Exxon's representatives to express concerns and communicate inclination to support the shareholders' proxy card. After the meeting HSBC confirmed their vote to the Exxon's representatives met.
Schroder Dynamic Multi-Asset
Proposals voted: 11,246 Votes cast: 95.19% Votes for: 87.69%
No significant votes identified.

The Fidelity Master Trust Report and Financial Statements for the year ended 30 June 2021
238
Votes against: 7.50%
LGIM 70:30 Hybrid Property Fund
Votable proposals: 4,149 Votes cast: 100.00% Votes ‘for’ management: 82.26% Votes ‘against’ management: 17.69%
UDR, Inc. LGIM voted against Resolution 1i Elect Director Thomas W. Toomey LGIM deemed the company to not meet minimum standards with regards to climate risk management and disclosure.

The Fidelity Master Trust Report and Financial Statements for the year ended 30 June 2021
239
Bespoke Sections
The policy on engagement adopted by the Trustees will be followed by each Bespoke Section. As for the governed Sections, the Trustees have delegated to their investment managers the exercise of voting rights. Therefore, the Trustees are not able to direct how votes are exercised. The Trustees are satisfied that the voting and engagement policies have been followed by each of the Bespoke Sections over the year.
Section Commentary
Voith Turbo Section
ESG Policy Whilst the funds used within the default arrangement do not explicitly consider ESG factors at present, the fund managers all integrate ESG into their core investment process. The funds are currently managed by Legal & General Investment Management (LGIM), Schroders Investment Management, M&G Investments and Fidelity International. All are signatories to the United Nations Principles for Responsible Investment and all received A+ ratings in strategy and governance in relation to ESG in 2020. The Sustainable Passive Equity Fund was added to the self-select range in December 2020 to enable members the opportunity to invest in this manner. A faith-based self-select option is also currently available for those members who wish to invest in it.
Engagement Policy The Voith Turbo Section’s investment advisers have a research team that will meet most of the investment managers which manage funds within the default arrangement and self-select range on a periodic basis. Review of reports on voting and engagement policies will be considered, as will the long term performance of the investment managers funds (and ensure it is consistent with the style of the manager and their investment processes). On average, meetings will take place on an annual basis, while monitoring will be done on an annual basis also. An investment manager may be removed if it is felt that they are not delivering on their stewardship responsibilities, long term performance or consideration of ESG within their investment process. Adoption of any new funds will be made with explicit consideration to the underlying investment manager’s policies and credentials surrounding ESG and stewardship.
Voting Policy Voting reports by LGIM and Schroders (those managers with equity holdings in the portfolio) are monitored on an annual basis and reported back to the Employer and the Trustee on an exceptions basis. Significant votes Significant vote 1: The Procter & Gamble Company – Report on effort to eliminate deforestation (13 October 2020) The resolution received the support of 67.68% of shareholders. LGIM voted for the proposal, citing their concerns at lack of meeting targets, suppliers linked to illegal deforestation and lack of response to CDP Forest disclosure. Schroders also voted for the proposal, noting it would be beneficial to all stakeholders given the company failed to achieve its own deforestation targets. Significant vote 2: Cardinal Health – Advisory Vote to Ratify Named Executive Officers’ Compensation (4 November 2020) The resolution encountered a significant amount of oppose votes from shareholders, with 38.6% voting against the resolution and 61.4% supporting the proposal.
RSA Insurance Company Section
ESG policy The RSA Section self-select fund range includes a white-labelled fund called the “RSA Pension ESG Fund”, which invests in a passive equity fund that tracks an equity index with an ESG focus and low carbon screen. The investment advisers to the RSA Section reviewed the investment arrangements in 2019 which covered ESG considerations, including an assessment of each fund manager with respect to responsible investment. The manager underlying the RSA Pension Active UK Equity Fund was the only manager rated as below average; since there were no other concerns with the manager they were retained, but feedback has been given to them and improvement would be looked for by the time of the next review in 2022.

The Fidelity Master Trust Report and Financial Statements for the year ended 30 June 2021
240
The next review will have a focus on ESG and how it can be more directly integrated in the default strategy. It was felt that ESG investment approaches are a rapidly developing area and further fund options should be available by the time of the 2022 review, and hence no ESG fund was incorporated into the default investment strategy as part of the 2019 review. Voting and Engagement Policies
• LGIM - All decisions are made by LGIM’s Investment Stewardship team and in accordance with their relevant Corporate Governance & Responsible Investment and Conflicts of Interest policy documents which are reviewed annually. Each member of the team is allocated a specific sector globally so that the voting is undertaken by the same individuals who engage with the relevant company. This ensures their stewardship approach flows smoothly throughout the engagement and voting process and that engagement is fully integrated into the vote decision process, therefore sending consistent messaging to companies. Ongoing dialogue with companies is a fundamental aspect of LGIM’s commitment to responsible investment. Engagement will be triggered in a variety of ways, such as a regular catch-ups; analysis of responsible investment themes and voting issues; general knowledge of the company; or a media report.
• BlackRock - BlackRock and its voting and engagement work continuously evolves in response to changing governance related developments and expectations. Their voting guidelines are market-specific to ensure they take into account a company's unique circumstances by market, where relevant. BlackRock inform their vote decisions through research and engage as necessary. BlackRock’s engagement priorities are global in nature and are informed by their observations of governance related and market developments, as well as through dialogue with multiple stakeholders, including clients. BlackRock may also update their regional engagement priorities based on issues that they believe could impact the long-term sustainable financial performance of companies in those markets. BlackRock welcome discussions with their clients on engagement and voting topics and priorities to get their perspective and better understand which issues are important to them.
Description of voting behaviour during the year All of the Trustees’ holdings in listed equities are within pooled funds and However, they have sought to include voting data on the RSA section’s funds that hold equities as follows:
• LGIM Global Equity Market Weights (30:70) - 75% Hedged Fund (used in the default strategy); • LGIM Ethical Global Equity Index Fund (self-select fund underlying the RSA Pension Ethical Fund); • BlackRock Emerging Markets Equity Index Fund (used in the default strategy); and • BlackRock World ESG Equity Tracker Fund (self-select underlying the RSA Pension ESG Fund).
Examples of significant votes over the year
• M&T Bank Corporation, April 2021. Vote: Withhold. Summary of resolutions: Elect Director Rene F. Jones. Rationale for the voting decision: LGIM has a longstanding policy advocating for the separation of the roles of CEO and board chair. These two roles are substantially different, requiring distinct skills and experiences. Since 2015 LGIM have supported shareholder proposals seeking the appointment of independent board chairs, and since 2020 LGIM are voting against all combined board chair/CEO roles. Furthermore, LGIM have published a guide for boards on the separation of the roles of chair and CEO (available on their website), and LGIM have reinforced their position on leadership structures across their stewardship activities – for example, via individual corporate engagements and director conferences.
• Daimler AG, July 2020. Vote: Against. Summary of resolution: Resolutions on ratification of Supervisory Board members’ actions in the 2019 financial year, election of Timotheus Höttges as a member of the Supervisory Board and amendment of Article 16 of the Articles of Incorporation (Annual Meeting – Resolution)
Rationale for the voting decision: Concerns about progress on climate-related risk reporting, the external mandates held by the proposed Supervisory Board member, and the reduction in shareholder rights from the proposed article amendment.

The Fidelity Master Trust Report and Financial Statements for the year ended 30 June 2021
241
BNP Paribas Pension Section
ESG Policy The primary default option for the Section is the Drawdown Lifestyle. Over 2018/19, the Trustees undertook and completed a review of the primary default option and agreed to replace the BNP Global 30/70 Equity fund with the Global Sustainable Growth Fund. This change was made effective from September 2020. The Global Sustainable Growth Fund was designed with explicit consideration of ESG risks and managers were assessed on several factors including how they were able to integrate and account for these risks in the investment strategy, with preference being given to managers demonstrating a robust policy. This was done by assessing the ESG integration capabilities of the managers using ESG-specific ratings provided by Aon as well as by meeting with the managers to understand their ESG policies more fully. In light of the above assessments, the Trustees agreed to invest in the ESG specific versions of the BlackRock equity tracker funds as opposed to the 'standard' versions which do not have an explicit ESG objective, demonstrating the preference for funds and strategies that have superior sustainability characteristics. Over the year to 30 June 2021, the Trustees decided to make further changes to the primary default option to further improve the sustainability characteristics of members’ investments. This change focused on improving the sustainability characteristics of the primary default option’s corporate bond investments. The changes agreed will be implemented in September 2021 and will involve replacing the existing BlackRock Corporate Bond Over 15 Year Index with the Global Sustainable Bond Fund. Voting and Engagement Policies The Trustees have obtained details of the votes undertaken on its behalf by the BNP Paribas Pension Plan's equity and multi-asset managers for the funds invested in by members. Information provided by the managers covers the 12 months to 31 March 2021, which reflects the most recent data available at the time of writing this statement. Examples of significant votes
• Yanzhou Coal Mining Company. December 2020. Vote: Against • Summary of resolutions: To consider and approve Equity Interests and Assets Transfer
Agreement between Yankuang Group Company Limited and Yanzhou Coal Mining Company Limited and to approve the transactions contemplated thereunder. Rationale for the voting decision: In September 2020, Yanzhou Coal proposed to acquire the equity interests held by Yangkuang Group in seven business entities for a total cash consideration of CNY 18.4 billion. The key assets to be acquired include a coal liquefaction project, a supporting coal mine and a coal-fired power plant, as well as other ancillary facilities. BlackRock believes it was in their clients’ best long-term economic interests to vote against the proposed acquisition due to two primary concerns: 1) the underlying valuation for the terms of the transaction and 2) management's oversight of potential stranded asset risk. Yanzhou Coal as a state-owned enterprise did not articulate how the acquisition of these coal-related assets aligns with China’s stated goals, including the new Nationally Determined Contributions to be updated at the UN Climate Change Conference (COP 26). In particular, concerns remained about Yanzhou Coal’s decision to acquire a coal-fired power plant as part of this transaction. Therefore, such an acquisition could well exacerbate the company’s stranded asset risks and delay progress to achieve the company’s decarbonisation targets.
• Nike, July 2020. Vote: Against. Summary of resolution: Advisory Vote to Ratify Named Executive Officers' Compensation. Rationale for the voting decision: Nordea think that bonuses and share based incentives should only be paid when management reach clearly defined and relevant targets which are aligned with the interest of the shareholders. Nordea also voted against re-election of the proposed board members in the Compensation Committee
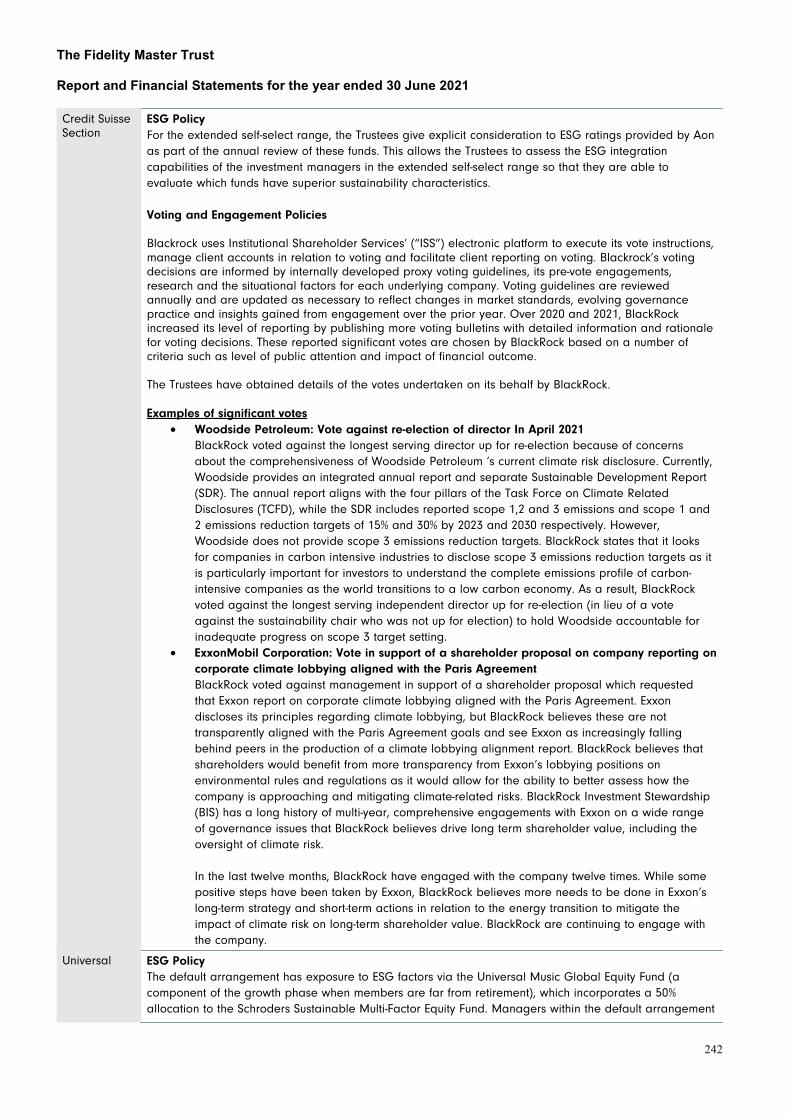
The Fidelity Master Trust Report and Financial Statements for the year ended 30 June 2021
242
Credit Suisse Section
ESG Policy For the extended self-select range, the Trustees give explicit consideration to ESG ratings provided by Aon as part of the annual review of these funds. This allows the Trustees to assess the ESG integration capabilities of the investment managers in the extended self-select range so that they are able to evaluate which funds have superior sustainability characteristics. Voting and Engagement Policies Blackrock uses Institutional Shareholder Services’ (“ISS”) electronic platform to execute its vote instructions, manage client accounts in relation to voting and facilitate client reporting on voting. Blackrock’s voting decisions are informed by internally developed proxy voting guidelines, its pre-vote engagements, research and the situational factors for each underlying company. Voting guidelines are reviewed annually and are updated as necessary to reflect changes in market standards, evolving governance practice and insights gained from engagement over the prior year. Over 2020 and 2021, BlackRock increased its level of reporting by publishing more voting bulletins with detailed information and rationale for voting decisions. These reported significant votes are chosen by BlackRock based on a number of criteria such as level of public attention and impact of financial outcome. The Trustees have obtained details of the votes undertaken on its behalf by BlackRock. Examples of significant votes
• Woodside Petroleum: Vote against re-election of director In April 2021 BlackRock voted against the longest serving director up for re-election because of concerns about the comprehensiveness of Woodside Petroleum ‘s current climate risk disclosure. Currently, Woodside provides an integrated annual report and separate Sustainable Development Report (SDR). The annual report aligns with the four pillars of the Task Force on Climate Related Disclosures (TCFD), while the SDR includes reported scope 1,2 and 3 emissions and scope 1 and 2 emissions reduction targets of 15% and 30% by 2023 and 2030 respectively. However, Woodside does not provide scope 3 emissions reduction targets. BlackRock states that it looks for companies in carbon intensive industries to disclose scope 3 emissions reduction targets as it is particularly important for investors to understand the complete emissions profile of carbon-intensive companies as the world transitions to a low carbon economy. As a result, BlackRock voted against the longest serving independent director up for re-election (in lieu of a vote against the sustainability chair who was not up for election) to hold Woodside accountable for inadequate progress on scope 3 target setting.
• ExxonMobil Corporation: Vote in support of a shareholder proposal on company reporting on corporate climate lobbying aligned with the Paris Agreement BlackRock voted against management in support of a shareholder proposal which requested that Exxon report on corporate climate lobbying aligned with the Paris Agreement. Exxon discloses its principles regarding climate lobbying, but BlackRock believes these are not transparently aligned with the Paris Agreement goals and see Exxon as increasingly falling behind peers in the production of a climate lobbying alignment report. BlackRock believes that shareholders would benefit from more transparency from Exxon’s lobbying positions on environmental rules and regulations as it would allow for the ability to better assess how the company is approaching and mitigating climate-related risks. BlackRock Investment Stewardship (BIS) has a long history of multi-year, comprehensive engagements with Exxon on a wide range of governance issues that BlackRock believes drive long term shareholder value, including the oversight of climate risk. In the last twelve months, BlackRock have engaged with the company twelve times. While some positive steps have been taken by Exxon, BlackRock believes more needs to be done in Exxon’s long-term strategy and short-term actions in relation to the energy transition to mitigate the impact of climate risk on long-term shareholder value. BlackRock are continuing to engage with the company.
Universal ESG Policy The default arrangement has exposure to ESG factors via the Universal Music Global Equity Fund (a component of the growth phase when members are far from retirement), which incorporates a 50% allocation to the Schroders Sustainable Multi-Factor Equity Fund. Managers within the default arrangement

The Fidelity Master Trust Report and Financial Statements for the year ended 30 June 2021
243
include Legal & General Investment Management (LGIM), Schroders Investment Management, and BlackRock Investment Management (UK) Limited. Each manager is expected to exercise their stewardship responsibilities in line with stated policies. All are signatories to the United Nations Principles for Responsible Investment and all received A+ ratings in strategy and governance in relation to ESG in 2020. Engagement Policy The Universal Music section’s investment advisers have a research team that will meet most of the investment managers which manage funds within the default arrangement and self-select range on a periodic basis. Review of reports on voting and engagement policies will be considered, as will the long term performance of the investment managers’ funds (and ensure it is consistent with the style of the manager and their investment processes). On average, meetings will take place on an annual basis, while monitoring will be done on an annual basis also. An investment manager may be removed if it is felt that they are not delivering on their stewardship responsibilities, long term performance or consideration of ESG within their investment process. Adoption of any new funds will be made with explicit consideration to the underlying investment manager’s policies and credentials surrounding ESG and stewardship. Voting Policy Voting reports by BlackRock, LGIM and Schroders (those managers responsible for equity and multi-asset funds within the default arrangement) are monitored on an annual basis and reported back to the Employer and the Trustee on an exceptions basis. Example of significant votes Significant vote 1: The Procter & Gamble Company – Report on effort to eliminate deforestation (13 October 2020) The resolution received the support of 67.68% of shareholders. Schroders voted for the proposal, noting it would be beneficial to all stakeholders given the company failed to achieve its own deforestation targets. Significant vote 2: Microsoft Corporation – Report on employee representation on the board of directors (2 December 2020) The resolution was opposed by 94.9% of shareholders.
Telegraph ESG policy The State Street Global Advisers (“SSgA”) Timewise Funds The Trustees recognise that some members may wish for ethical matters to be taken into account in their investments and therefore it has made available the following self-select funds:
• HSBC Islamic Global Equity Fund • L&G Ethical UK Equity Index Fund • L&G Ethical Global Equity Index Fund
Over the course of the year to 30 June 2021, SSgA advised the Trustees that it will be excluding certain companies from some of its managed pension fund index funds, such as violators of the UN Global Compact and controversial weapons companies. This impacts the SSgA Timewise funds and some of the equity and fixed income self-select funds offered in this Section of the Scheme. LCP provided advice to the Trustees on these changes and has since carried out an annual review of the fund range for the Trustees. The conclusion of this review was to make no changes to the self-select fund range. whilst also confirming that the SSgA Timewise Funds continue to be suitable as the default arrangement for the Section. Voting and Engagement Policies SSgA’s Stewardship Team has developed an Issuer Engagement Protocol which complies with the principles of the SRD II and a framework to increase the transparency of its engagement philosophy, approach and processes. This protocol is designed to communicate the objectives of its engagement activities and to facilitate a better understanding of its preferred terms of engagement with investee companies. SSgA actively seeks direct dialogue with the board and management of companies that it has identified through its screening processes. In 2020, a board member was present for 32% of its 672 comprehensive engagements. Furthermore, it regularly reviews its Issuer Engagement Protocol to ensure that its

The Fidelity Master Trust Report and Financial Statements for the year ended 30 June 2021
244
interactions with companies remain effective and meaningful. This includes reviewing indicators in its screening models and assessing emerging ESG issues and trends. Description of voting behaviour during the year All voting decisions are exercised in accordance with SSgA’s in-house policies and views, ensuring the interests of its clients remain the sole consideration when discharging its stewardship responsibilities. SSgA voted at over 19,000 meetings over the course of 2020. SSgA prioritises companies for review based on factors including the size of its holdings, past engagement, corporate performance, and voting items identified as areas of potential concern. Based on SSgA’s priority assessment, it allocates appropriate time and resources to shareholder meetings as well as specific ballot items of interest with the expressed purpose of maximising value for its clients. Like engagement, SSgA views proxy voting as a tool available for communicating its views to companies and it used a variety of third party service providers to support its stewardship activities. In general, it relies more on proxy voting in contexts where its relative holding values are smaller compared to other investors, engagement culture is less developed, and/or companies have not been responsive to engagement efforts. SSgA has established robust controls and auditing procedures to ensure that votes cast are executed in accordance with its instructions, based on its proxy voting policies and in-house operational guidelines. Transparency on these key issues is vital. In this regard, SSgA publishes a record of its global voting activity on the Asset Stewardship section of its website. The Trustees have collated a summary of voting behaviour over the year to 30 June 2021. Examples of significant votes over the year
Virgin Money ESG Policy The Trustees choose fund managers whose voting policy are consistent with the Virgin Money Section’s objectives; Expect fund managers to vote in a way which enhances the value of the funds in which the Virgin Money Section Plan invests; and monitor how the fund managers exercise their voting rights. Voting and Engagement Policy
• BlackRock Proxy voting is executed by a team called BlackRock Investment Stewardship ("BIS") which is comprised of BlackRock employees who do not have other responsibilities other than their roles in BIS. The Global Head has primary oversight of the activities of BIS, including voting in accordance with the guidelines.
• Baillie Gifford considers their proxy advisers’ voting recommendations (ISS and Glass Lewis), but do not delegate or outsource any of their stewardship activities or follow/rely upon their

The Fidelity Master Trust Report and Financial Statements for the year ended 30 June 2021
245
recommendations when deciding how to vote on our clients’ shares. All client voting decisions are made in-house. Baillie Gifford votes in line with their in-house policy and not with the proxy voting providers’ policies
• HSBC uses the voting research and platform provider ISS to assist with the global application of their own bespoke voting guidelines. ISS reviews company meeting resolutions and provides recommendations highlighting resolutions which contravene our guidelines.
• L&G uses ISS’s ‘Proxy Exchange’ electronic voting platform to electronically vote clients’ shares. All voting decisions are made by L&G and they do not outsource any part of the strategic decisions. To ensure the proxy provider votes in accordance with the Manager’s position on ESG, L&G have put in place a custom voting policy with specific voting instructions.
• Schroders receives research from both ISS and the Investment Association’s Institutional Voting Information Services (IVIS) for upcoming general meetings, however this is only one component that feeds into voting decisions. In addition to relying on their policies, they will also be informed by company reporting, company engagements, country specific policies, engagements with stakeholders and the views of portfolio managers and analysts.
Examples of significant votes
• JP Morgan Chase, May 2021 Summary of resolution: Shareholder proposal for Report on Climate Change Rationale for the voting decision: The company is being asked to issue a report outlining if and how it intends to reduce the GHG emissions associated with its lending activities in alignment with the Paris Agreement's goal of maintaining global temperature rise below 1.5 degrees Celsius. A vote 'for' is warranted as the manager would welcome greater disclosure of the company's approach on this matter given its relatively high exposure to carbon-intensive industries through its lending portfolio. The manager also notes that the company is falling behind some of its peers with regard to reporting on metrics and targets under the TCFD framework, and if / how its business activities (including lending) align with the goals of the Paris Agreement.
• Cosmo Pharmaceuticals NV, May 2021 Summary of resolution: Employee Stock Plan Rationale for the voting decision: Opposed the resolution which sought authority to issue equity because the potential dilution levels are not in the interests of shareholders. Manager continued to vote against the remuneration of directors due to high levels of incentive-based pay for nonexecutives. They do not believe independent directors should receive incentive pay as this can compromise their independence and have recommended to the company that such directors or commissioners are remunerated through a fixed annual fee.