FIDELITY CONCORD STREET TRUST Form N-CSR Filed 2021-04-21
461
Business Address 245 SUMMER STREET BOSTON MA 02210 617-563-7000 Mailing Address 245 SUMMER STREET BOSTON MA 02210 SECURITIES AND EXCHANGE COMMISSION FORM N-CSR Certified annual shareholder report of registered management investment companies filed on Form N-CSR Filing Date: 2021-04-21 | Period of Report: 2021-02-28 SEC Accession No. 0001379491-21-001503 (HTML Version on secdatabase.com) FILER FIDELITY CONCORD STREET TRUST CIK:819118| IRS No.: 000000000 | State of Incorp.:MA | Fiscal Year End: 0228 Type: N-CSR | Act: 40 | File No.: 811-05251 | Film No.: 21840794 Copyright © 2021 www.secdatabase.com . All Rights Reserved. Please Consider the Environment Before Printing This Document
-
Upload
khangminh22 -
Category
Documents
-
view
1 -
download
0
Transcript of FIDELITY CONCORD STREET TRUST Form N-CSR Filed 2021-04-21
Business Address245 SUMMER STREETBOSTON MA 02210617-563-7000
Mailing Address245 SUMMER STREETBOSTON MA 02210
SECURITIES AND EXCHANGE COMMISSION
FORM N-CSRCertified annual shareholder report of registered management investment companies filed on
Form N-CSR
Filing Date: 2021-04-21 | Period of Report: 2021-02-28SEC Accession No. 0001379491-21-001503
(HTML Version on secdatabase.com)
FILERFIDELITY CONCORD STREET TRUSTCIK:819118| IRS No.: 000000000 | State of Incorp.:MA | Fiscal Year End: 0228Type: N-CSR | Act: 40 | File No.: 811-05251 | Film No.: 21840794
Copyright © 2021 www.secdatabase.com. All Rights Reserved.Please Consider the Environment Before Printing This Document

Registrant's telephone number, including area code:
Item 1.
UNITED STATESSECURITIES AND EXCHANGE COMMISSION
Washington, D.C. 20549
FORM N-CSRCERTIFIED SHAREHOLDER REPORT OF REGISTERED
MANAGEMENT INVESTMENT COMPANIES
Investment Company Act file number 811-05251
Fidelity Concord Street Trust(Exact name of registrant as specified in charter)
245 Summer St., Boston, Massachusetts 02210(Address of principal executive offices) (Zip code)
Cynthia Lo Bessette, Secretary245 Summer St.
Boston, Massachusetts 02210(Name and address of agent for service)
617-563-7000
Date of fiscal year end: February 28
Date of reporting period: February 28, 2021
Reports to Stockholders
Fidelity® Total Market Index FundFidelity® Extended Market Index FundFidelity® International Index Fund
Annual ReportFebruary 28, 2021
Copyright © 2021 www.secdatabase.com. All Rights Reserved.Please Consider the Environment Before Printing This Document
ContentsNote to ShareholdersFidelity® Total Market Index Fund
PerformanceManagement's Discussion of Fund PerformanceInvestment SummarySchedule of InvestmentsFinancial Statements
Fidelity® Extended Market Index FundPerformanceManagement's Discussion of Fund Performance
Copyright © 2021 www.secdatabase.com. All Rights Reserved.Please Consider the Environment Before Printing This Document

Investment SummarySchedule of InvestmentsFinancial Statements
Fidelity® International Index FundPerformanceManagement's Discussion of Fund PerformanceInvestment SummarySchedule of InvestmentsFinancial Statements
Notes to Financial StatementsReport of Independent Registered Public Accounting FirmTrustees and OfficersShareholder Expense ExampleDistributionsBoard Approval of Investment Advisory ContractsLiquidity Risk Management ProgramProxy Voting Results
To view a fund's proxy voting guidelines and proxy voting record for the 12-month period ended June 30, visithttp://www.fidelity.com/proxyvotingresults or visit the Securities and Exchange Commission's (SEC) web site athttp://www.sec.gov.You may also call 1-800-544-8544 to request a free copy of the proxy voting guidelines.The funds or securities referred to herein are not sponsored, endorsed, or promoted by MSCI, and MSCI bears no liability withrespect to any such funds or securities or any index on which such funds or securities are based. The prospectus contains a moredetailed description of the limited relationship MSCI has with Fidelity and any related funds.Standard & Poor's, S&P and S&P 500 are registered service marks of The McGraw-Hill Companies, Inc. and have been licensed foruse by Fidelity Distributors Corporation.Other third-party marks appearing herein are the property of their respective owners.All other marks appearing herein are registered or unregistered trademarks or service marks of FMR LLC or an affiliated company.© 2021 FMR LLC. All rights reserved.
This report and the financial statements contained herein are submitted for the general information of the shareholders of the Funds.This report is not authorized for distribution to prospective investors in the Funds unless preceded or accompanied by an effectiveprospectus.A fund files its complete schedule of portfolio holdings with the SEC for the first and third quarters of each fiscal year on Form N-PORT. Forms N-PORT are available on the SEC�s web site at http://www.sec.gov. A fund's Forms N-PORT may be reviewed andcopied at the SEC�s Public Reference Room in Washington, DC. Information regarding the operation of the SEC's Public ReferenceRoom may be obtained by calling 1-800-SEC-0330.For a complete list of a fund's portfolio holdings, view the most recent holdings listing, semiannual report, or annual report onFidelity's web site at http://www.fidelity.com, http://www.institutional.fidelity.com, or http://www.401k.com, as applicable.NOT FDIC INSURED ��MAY LOSE VALUE ��NO BANK GUARANTEENeither the Funds nor Fidelity Distributors Corporation is a bank.
Note to Shareholders:Early in 2020, the outbreak and spread of a new coronavirus emerged as a public health emergency that had a major influence onfinancial markets, primarily based on its impact on the global economy and the outlook for corporate earnings. The virus causes a
Copyright © 2021 www.secdatabase.com. All Rights Reserved.Please Consider the Environment Before Printing This Document
respiratory disease known as COVID-19. On March 11, 2020 the World Health Organization declared the COVID-19 outbreak apandemic, citing sustained risk of further global spread.In the weeks following, as the crisis worsened, we witnessed an escalating human tragedy with wide-scale social and economicconsequences from coronavirus-containment measures. The outbreak of COVID-19 prompted a number of measures to limit thespread, including travel and border restrictions, quarantines, and restrictions on large gatherings. In turn, these resulted in lowerconsumer activity, diminished demand for a wide range of products and services, disruption in manufacturing and supply chains, and� given the wide variability in outcomes regarding the outbreak � significant market uncertainty and volatility. Amid the turmoil,global governments and central banks took unprecedented action to help support consumers, businesses, and the broader economies,and to limit disruption to financial systems.The situation continues to unfold, and the extent and duration of its impact on financial markets and the economy remain highlyuncertain. Extreme events such as the coronavirus crisis are �exogenous shocks� that can have significant adverse effects on mutualfunds and their investments. Although multiple asset classes may be affected by market disruption, the duration and impact may notbe the same for all types of assets.Fidelity is committed to helping you stay informed amid news about COVID-19 and during increased market volatility, and we�retaking extra steps to be responsive to customer needs. We encourage you to visit our websites, where we offer ongoing updates,commentary, and analysis on the markets and our funds.Fidelity® Total Market Index Fund
Performance: The Bottom LineAverage annual total return reflects the change in the value of an investment, assuming reinvestment of distributions from dividendincome and capital gains (the profits earned upon the sale of securities that have grown in value, if any) and assuming a constant rateof performance each year. The hypothetical investment and the average annual total returns do not reflect the deduction of taxes thata shareholder would pay on fund distributions or the redemption of fund shares. During periods of reimbursement by Fidelity, afund�s total return will be greater than it would be had the reimbursement not occurred. How a fund did yesterday is no guarantee ofhow it will do tomorrow.Average Annual Total ReturnsFor the periods ended February 28, 2021 Past 1 year Past 5 years Past 10 yearsFidelity® Total Market Index Fund 35.50% 17.41% 13.42%
The initial offering of Fidelity Total Market Index Fund (formerly named Institutional Premium Class) took place on September 8,2011. Returns prior to September 8, 2011 are those of the former Premium Class and have not been restated to reflect currentexpenses.$10,000 Over 10 YearsLet's say hypothetically that $10,000 was invested in Fidelity® Total Market Index Fund on February 28, 2011.The chart shows how the value of your investment would have changed, and also shows how the Dow Jones U.S. Total StockMarket Index℠ performed over the same period.
Copyright © 2021 www.secdatabase.com. All Rights Reserved.Please Consider the Environment Before Printing This Document
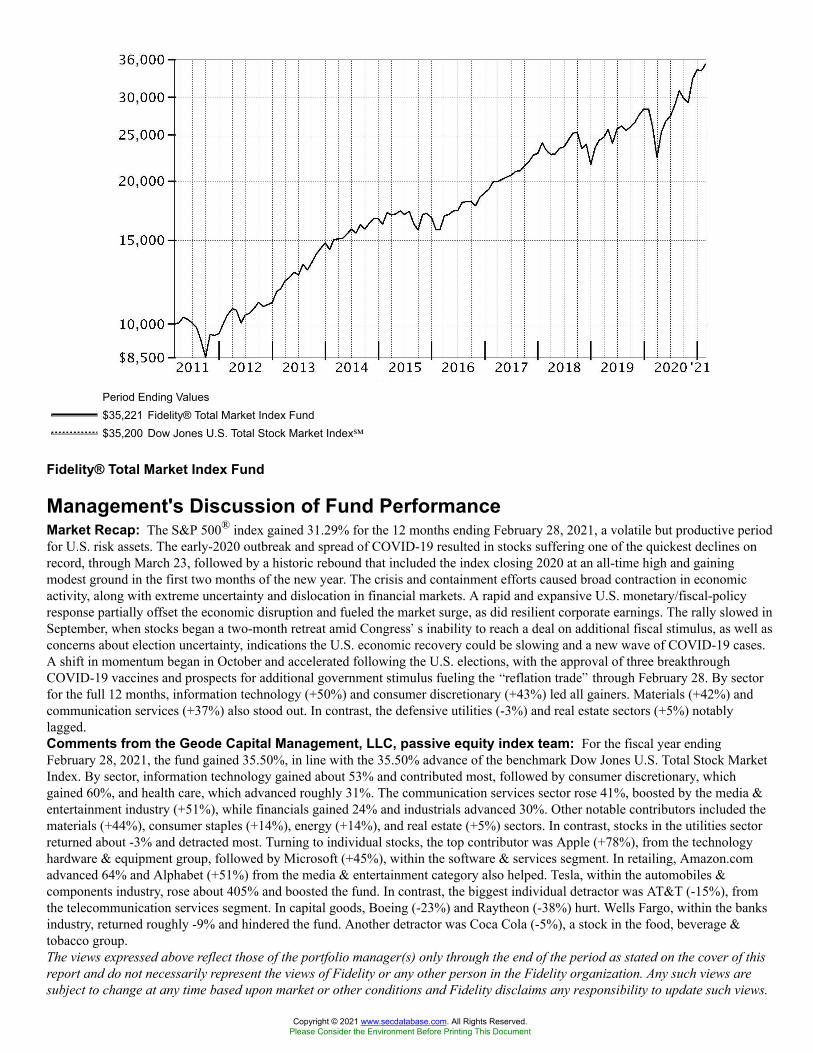
Period Ending Values$35,221 Fidelity® Total Market Index Fund$35,200 Dow Jones U.S. Total Stock Market Index℠
Fidelity® Total Market Index Fund
Management's Discussion of Fund PerformanceMarket Recap: The S&P 500® index gained 31.29% for the 12 months ending February 28, 2021, a volatile but productive periodfor U.S. risk assets. The early-2020 outbreak and spread of COVID-19 resulted in stocks suffering one of the quickest declines onrecord, through March 23, followed by a historic rebound that included the index closing 2020 at an all-time high and gainingmodest ground in the first two months of the new year. The crisis and containment efforts caused broad contraction in economicactivity, along with extreme uncertainty and dislocation in financial markets. A rapid and expansive U.S. monetary/fiscal-policyresponse partially offset the economic disruption and fueled the market surge, as did resilient corporate earnings. The rally slowed inSeptember, when stocks began a two-month retreat amid Congress�s inability to reach a deal on additional fiscal stimulus, as well asconcerns about election uncertainty, indications the U.S. economic recovery could be slowing and a new wave of COVID-19 cases.A shift in momentum began in October and accelerated following the U.S. elections, with the approval of three breakthroughCOVID-19 vaccines and prospects for additional government stimulus fueling the �reflation trade� through February 28. By sectorfor the full 12 months, information technology (+50%) and consumer discretionary (+43%) led all gainers. Materials (+42%) andcommunication services (+37%) also stood out. In contrast, the defensive utilities (-3%) and real estate sectors (+5%) notablylagged.Comments from the Geode Capital Management, LLC, passive equity index team: For the fiscal year endingFebruary 28, 2021, the fund gained 35.50%, in line with the 35.50% advance of the benchmark Dow Jones U.S. Total Stock MarketIndex. By sector, information technology gained about 53% and contributed most, followed by consumer discretionary, whichgained 60%, and health care, which advanced roughly 31%. The communication services sector rose 41%, boosted by the media &entertainment industry (+51%), while financials gained 24% and industrials advanced 30%. Other notable contributors included thematerials (+44%), consumer staples (+14%), energy (+14%), and real estate (+5%) sectors. In contrast, stocks in the utilities sectorreturned about -3% and detracted most. Turning to individual stocks, the top contributor was Apple (+78%), from the technologyhardware & equipment group, followed by Microsoft (+45%), within the software & services segment. In retailing, Amazon.comadvanced 64% and Alphabet (+51%) from the media & entertainment category also helped. Tesla, within the automobiles &components industry, rose about 405% and boosted the fund. In contrast, the biggest individual detractor was AT&T (-15%), fromthe telecommunication services segment. In capital goods, Boeing (-23%) and Raytheon (-38%) hurt. Wells Fargo, within the banksindustry, returned roughly -9% and hindered the fund. Another detractor was Coca Cola (-5%), a stock in the food, beverage &tobacco group.The views expressed above reflect those of the portfolio manager(s) only through the end of the period as stated on the cover of thisreport and do not necessarily represent the views of Fidelity or any other person in the Fidelity organization. Any such views aresubject to change at any time based upon market or other conditions and Fidelity disclaims any responsibility to update such views.
Copyright © 2021 www.secdatabase.com. All Rights Reserved.Please Consider the Environment Before Printing This Document
These views may not be relied on as investment advice and, because investment decisions for a Fidelity fund are based on numerousfactors, may not be relied on as an indication of trading intent on behalf of any Fidelity fund.Fidelity® Total Market Index Fund
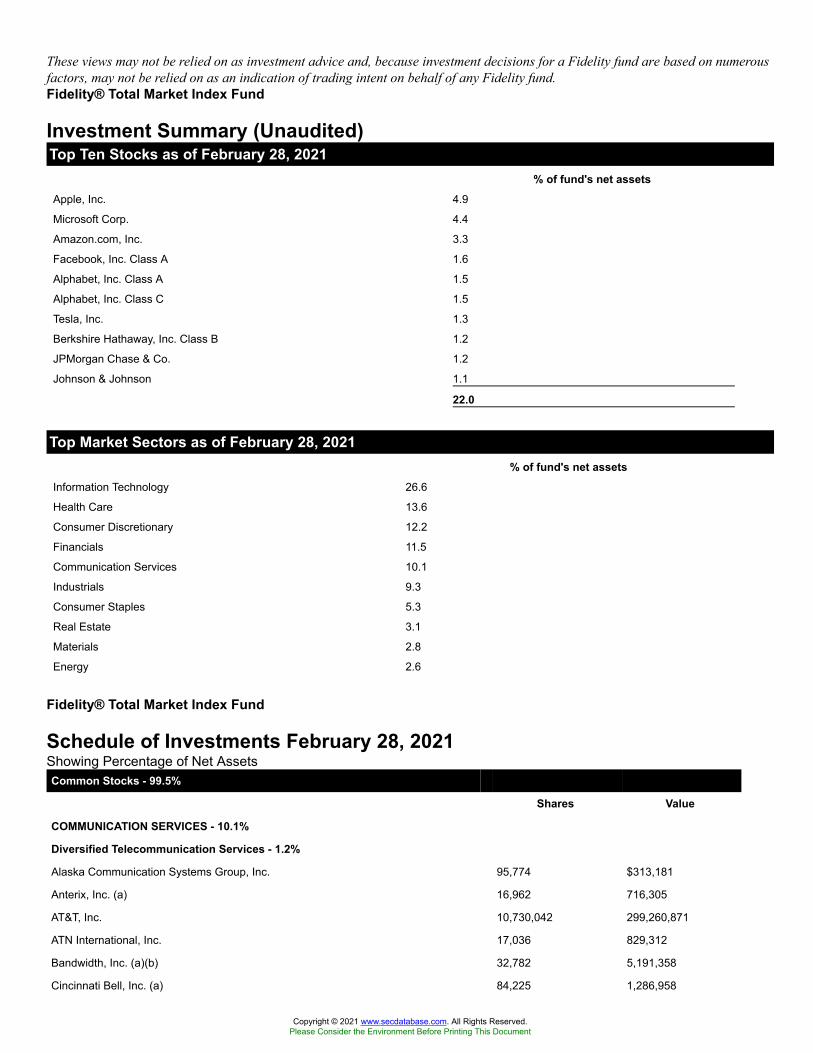
Investment Summary (Unaudited)Top Ten Stocks as of February 28, 2021
% of fund's net assetsApple, Inc. 4.9
Microsoft Corp. 4.4
Amazon.com, Inc. 3.3
Facebook, Inc. Class A 1.6
Alphabet, Inc. Class A 1.5
Alphabet, Inc. Class C 1.5
Tesla, Inc. 1.3
Berkshire Hathaway, Inc. Class B 1.2
JPMorgan Chase & Co. 1.2
Johnson & Johnson 1.1
22.0
Top Market Sectors as of February 28, 2021% of fund's net assets
Information Technology 26.6
Health Care 13.6
Consumer Discretionary 12.2
Financials 11.5
Communication Services 10.1
Industrials 9.3
Consumer Staples 5.3
Real Estate 3.1
Materials 2.8
Energy 2.6
Fidelity® Total Market Index Fund
Schedule of Investments February 28, 2021Showing Percentage of Net AssetsCommon Stocks - 99.5%
Shares Value
COMMUNICATION SERVICES - 10.1%
Diversified Telecommunication Services - 1.2%
Alaska Communication Systems Group, Inc. 95,774 $313,181
Anterix, Inc. (a) 16,962 716,305
AT&T, Inc. 10,730,042 299,260,871
ATN International, Inc. 17,036 829,312
Bandwidth, Inc. (a)(b) 32,782 5,191,358
Cincinnati Bell, Inc. (a) 84,225 1,286,958
Copyright © 2021 www.secdatabase.com. All Rights Reserved.Please Consider the Environment Before Printing This Document
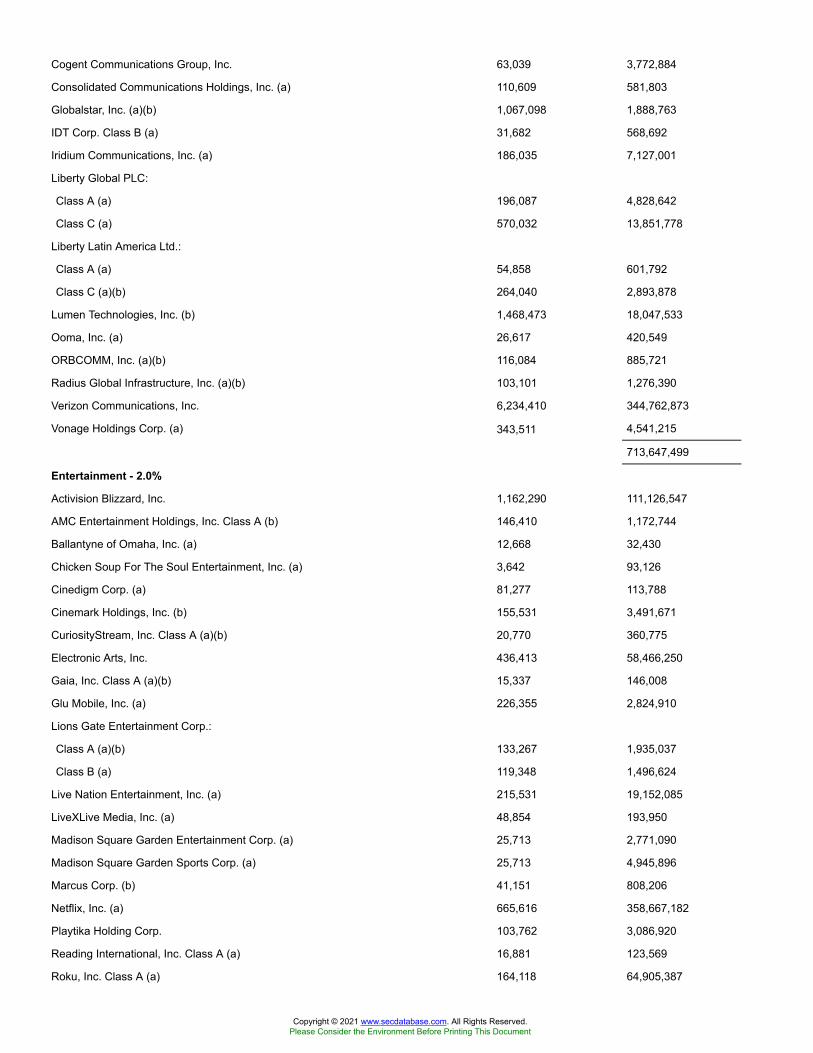
Cogent Communications Group, Inc. 63,039 3,772,884
Consolidated Communications Holdings, Inc. (a) 110,609 581,803
Globalstar, Inc. (a)(b) 1,067,098 1,888,763
IDT Corp. Class B (a) 31,682 568,692
Iridium Communications, Inc. (a) 186,035 7,127,001
Liberty Global PLC:
Class A (a) 196,087 4,828,642
Class C (a) 570,032 13,851,778
Liberty Latin America Ltd.:
Class A (a) 54,858 601,792
Class C (a)(b) 264,040 2,893,878
Lumen Technologies, Inc. (b) 1,468,473 18,047,533
Ooma, Inc. (a) 26,617 420,549
ORBCOMM, Inc. (a)(b) 116,084 885,721
Radius Global Infrastructure, Inc. (a)(b) 103,101 1,276,390
Verizon Communications, Inc. 6,234,410 344,762,873
Vonage Holdings Corp. (a) 343,511 4,541,215
713,647,499
Entertainment - 2.0%
Activision Blizzard, Inc. 1,162,290 111,126,547
AMC Entertainment Holdings, Inc. Class A (b) 146,410 1,172,744
Ballantyne of Omaha, Inc. (a) 12,668 32,430
Chicken Soup For The Soul Entertainment, Inc. (a) 3,642 93,126
Cinedigm Corp. (a) 81,277 113,788
Cinemark Holdings, Inc. (b) 155,531 3,491,671
CuriosityStream, Inc. Class A (a)(b) 20,770 360,775
Electronic Arts, Inc. 436,413 58,466,250
Gaia, Inc. Class A (a)(b) 15,337 146,008
Glu Mobile, Inc. (a) 226,355 2,824,910
Lions Gate Entertainment Corp.:
Class A (a)(b) 133,267 1,935,037
Class B (a) 119,348 1,496,624
Live Nation Entertainment, Inc. (a) 215,531 19,152,085
LiveXLive Media, Inc. (a) 48,854 193,950
Madison Square Garden Entertainment Corp. (a) 25,713 2,771,090
Madison Square Garden Sports Corp. (a) 25,713 4,945,896
Marcus Corp. (b) 41,151 808,206
Netflix, Inc. (a) 665,616 358,667,182
Playtika Holding Corp. 103,762 3,086,920
Reading International, Inc. Class A (a) 16,881 123,569
Roku, Inc. Class A (a) 164,118 64,905,387
Copyright © 2021 www.secdatabase.com. All Rights Reserved.Please Consider the Environment Before Printing This Document
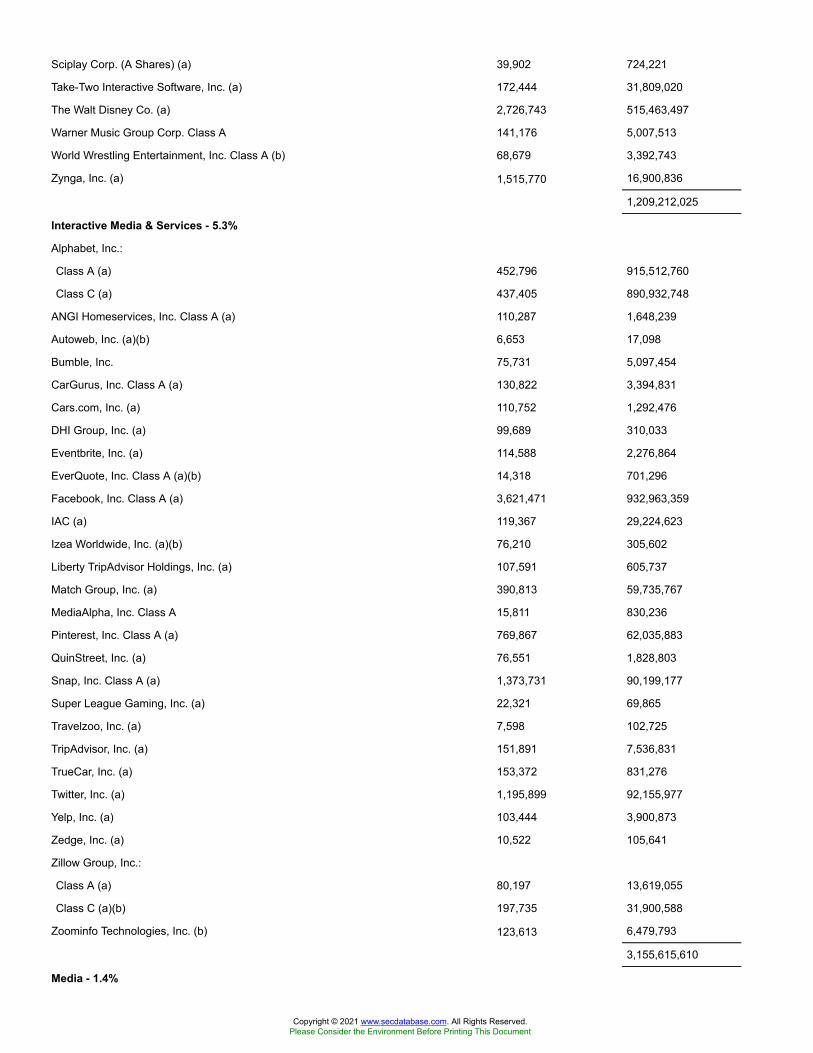
Sciplay Corp. (A Shares) (a) 39,902 724,221
Take-Two Interactive Software, Inc. (a) 172,444 31,809,020
The Walt Disney Co. (a) 2,726,743 515,463,497
Warner Music Group Corp. Class A 141,176 5,007,513
World Wrestling Entertainment, Inc. Class A (b) 68,679 3,392,743
Zynga, Inc. (a) 1,515,770 16,900,836
1,209,212,025
Interactive Media & Services - 5.3%
Alphabet, Inc.:
Class A (a) 452,796 915,512,760
Class C (a) 437,405 890,932,748
ANGI Homeservices, Inc. Class A (a) 110,287 1,648,239
Autoweb, Inc. (a)(b) 6,653 17,098
Bumble, Inc. 75,731 5,097,454
CarGurus, Inc. Class A (a) 130,822 3,394,831
Cars.com, Inc. (a) 110,752 1,292,476
DHI Group, Inc. (a) 99,689 310,033
Eventbrite, Inc. (a) 114,588 2,276,864
EverQuote, Inc. Class A (a)(b) 14,318 701,296
Facebook, Inc. Class A (a) 3,621,471 932,963,359
IAC (a) 119,367 29,224,623
Izea Worldwide, Inc. (a)(b) 76,210 305,602
Liberty TripAdvisor Holdings, Inc. (a) 107,591 605,737
Match Group, Inc. (a) 390,813 59,735,767
MediaAlpha, Inc. Class A 15,811 830,236
Pinterest, Inc. Class A (a) 769,867 62,035,883
QuinStreet, Inc. (a) 76,551 1,828,803
Snap, Inc. Class A (a) 1,373,731 90,199,177
Super League Gaming, Inc. (a) 22,321 69,865
Travelzoo, Inc. (a) 7,598 102,725
TripAdvisor, Inc. (a) 151,891 7,536,831
TrueCar, Inc. (a) 153,372 831,276
Twitter, Inc. (a) 1,195,899 92,155,977
Yelp, Inc. (a) 103,444 3,900,873
Zedge, Inc. (a) 10,522 105,641
Zillow Group, Inc.:
Class A (a) 80,197 13,619,055
Class C (a)(b) 197,735 31,900,588
Zoominfo Technologies, Inc. (b) 123,613 6,479,793
3,155,615,610
Media - 1.4%
Copyright © 2021 www.secdatabase.com. All Rights Reserved.Please Consider the Environment Before Printing This Document
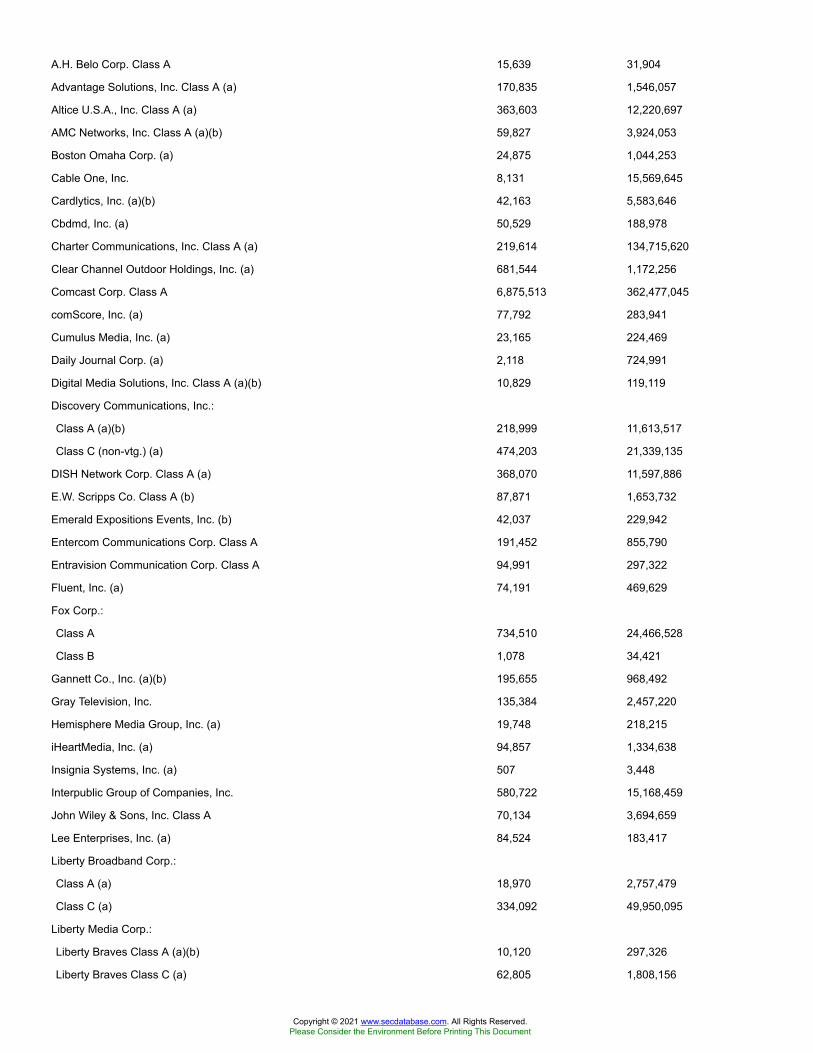
A.H. Belo Corp. Class A 15,639 31,904
Advantage Solutions, Inc. Class A (a) 170,835 1,546,057
Altice U.S.A., Inc. Class A (a) 363,603 12,220,697
AMC Networks, Inc. Class A (a)(b) 59,827 3,924,053
Boston Omaha Corp. (a) 24,875 1,044,253
Cable One, Inc. 8,131 15,569,645
Cardlytics, Inc. (a)(b) 42,163 5,583,646
Cbdmd, Inc. (a) 50,529 188,978
Charter Communications, Inc. Class A (a) 219,614 134,715,620
Clear Channel Outdoor Holdings, Inc. (a) 681,544 1,172,256
Comcast Corp. Class A 6,875,513 362,477,045
comScore, Inc. (a) 77,792 283,941
Cumulus Media, Inc. (a) 23,165 224,469
Daily Journal Corp. (a) 2,118 724,991
Digital Media Solutions, Inc. Class A (a)(b) 10,829 119,119
Discovery Communications, Inc.:
Class A (a)(b) 218,999 11,613,517
Class C (non-vtg.) (a) 474,203 21,339,135
DISH Network Corp. Class A (a) 368,070 11,597,886
E.W. Scripps Co. Class A (b) 87,871 1,653,732
Emerald Expositions Events, Inc. (b) 42,037 229,942
Entercom Communications Corp. Class A 191,452 855,790
Entravision Communication Corp. Class A 94,991 297,322
Fluent, Inc. (a) 74,191 469,629
Fox Corp.:
Class A 734,510 24,466,528
Class B 1,078 34,421
Gannett Co., Inc. (a)(b) 195,655 968,492
Gray Television, Inc. 135,384 2,457,220
Hemisphere Media Group, Inc. (a) 19,748 218,215
iHeartMedia, Inc. (a) 94,857 1,334,638
Insignia Systems, Inc. (a) 507 3,448
Interpublic Group of Companies, Inc. 580,722 15,168,459
John Wiley & Sons, Inc. Class A 70,134 3,694,659
Lee Enterprises, Inc. (a) 84,524 183,417
Liberty Broadband Corp.:
Class A (a) 18,970 2,757,479
Class C (a) 334,092 49,950,095
Liberty Media Corp.:
Liberty Braves Class A (a)(b) 10,120 297,326
Liberty Braves Class C (a) 62,805 1,808,156
Copyright © 2021 www.secdatabase.com. All Rights Reserved.Please Consider the Environment Before Printing This Document

Liberty Formula One Group Series C (a)(b) 311,723 13,684,640
Liberty Media Class A (a) 32,992 1,279,100
Liberty SiriusXM Series A (a) 558 24,781
Liberty SiriusXM Series C (a) 381,626 16,837,339
Loral Space & Communications Ltd. 20,010 887,243
Marchex, Inc. Class B (a) 35,256 105,768
MDC Partners, Inc. Class A (a) 94,948 300,036
Mediaco Holding, Inc. (a) 178 614
Meredith Corp. 61,937 1,534,799
MSG Network, Inc. Class A (a)(b) 65,173 1,105,334
National CineMedia, Inc. 107,997 509,746
News Corp.:
Class A 664,061 15,572,230
Class B 103,906 2,381,526
Nexstar Broadcasting Group, Inc. Class A 68,986 9,489,024
Omnicom Group, Inc. 321,579 22,102,125
Saga Communications, Inc. Class A 7,361 152,225
Salem Communications Corp. Class A 7,646 19,497
Scholastic Corp. 42,704 1,229,875
Sinclair Broadcast Group, Inc. Class A 77,434 2,395,034
Sirius XM Holdings, Inc. (b) 1,799,616 10,527,754
Srax, Inc. (a) 18,248 66,605
Srax, Inc. rights 12/31/20 (a)(c) 7,116 1,281
TechTarget, Inc. (a) 37,197 3,110,785
Tegna, Inc. 325,959 5,942,233
The New York Times Co. Class A 215,009 11,002,011
Thryv Holdings, Inc. (a) 3,784 81,924
Townsquare Media, Inc. 906 9,875
Tribune Publishing Co. 36,628 621,943
Urban One, Inc.:
Class A (a) 5,499 30,519
Class D (non-vtg.) (a) 22,803 36,827
ViacomCBS, Inc.:
Class A 7,764 498,915
Class B 858,136 55,341,191
WideOpenWest, Inc. (a) 73,189 1,028,305
869,137,284
Wireless Telecommunication Services - 0.2%
Boingo Wireless, Inc. (a) 71,959 820,333
Gogo, Inc. (a)(b) 77,671 920,401
NII Holdings, Inc. (a)(c) 149,032 323,399
Copyright © 2021 www.secdatabase.com. All Rights Reserved.Please Consider the Environment Before Printing This Document

Shenandoah Telecommunications Co. 72,091 3,197,236
Spok Holdings, Inc. 30,552 327,517
T-Mobile U.S., Inc. 877,392 105,260,718
Telephone & Data Systems, Inc. 152,977 2,736,759
U.S. Cellular Corp. (a) 20,827 612,939
114,199,302
TOTAL COMMUNICATION SERVICES 6,061,811,720
CONSUMER DISCRETIONARY - 12.2%
Auto Components - 0.3%
Adient PLC (a) 137,342 5,092,641
American Axle & Manufacturing Holdings, Inc. (a) 183,058 1,788,477
Aptiv PLC 405,745 60,796,831
Autoliv, Inc. (b) 116,454 10,480,860
BorgWarner, Inc. (b) 366,535 16,494,075
Cooper Tire & Rubber Co. 73,255 4,193,116
Cooper-Standard Holding, Inc. (a) 28,839 1,033,013
Dana, Inc. 222,087 5,287,891
Dorman Products, Inc. (a) 42,626 4,250,238
Fox Factory Holding Corp. (a) 62,628 7,963,150
Gentex Corp. 365,184 12,920,210
Gentherm, Inc. (a) 45,265 3,204,309
Horizon Global Corp. (a) 37,011 347,903
LCI Industries 38,648 5,447,049
Lear Corp. 80,755 13,412,598
Modine Manufacturing Co. (a) 80,051 1,110,307
Motorcar Parts of America, Inc. (a) 28,082 597,585
Patrick Industries, Inc. (b) 32,644 2,576,591
Standard Motor Products, Inc. 32,227 1,353,856
Stoneridge, Inc. (a) 42,614 1,306,545
Strattec Security Corp. 4,907 252,809
Superior Industries International, Inc. (a) 42,371 241,938
Sypris Solutions, Inc. (a) 11,882 48,954
Tenneco, Inc. (a) 96,053 1,070,030
The Goodyear Tire & Rubber Co. 359,307 6,039,951
Veoneer, Inc. (a)(b) 156,282 4,294,629
Visteon Corp. (a) 41,808 5,316,723
Workhorse Group, Inc. (a)(b) 159,215 2,574,507
XPEL, Inc. (a)(b) 26,707 1,291,283
180,788,069
Automobiles - 1.6%
Copyright © 2021 www.secdatabase.com. All Rights Reserved.Please Consider the Environment Before Printing This Document

Arcimoto, Inc. (a)(b) 34,685 621,555
AYRO, Inc. (a)(b) 23,186 166,244
Fisker, Inc. (a)(b) 244,699 6,973,922
Ford Motor Co. 5,866,706 68,640,460
General Motors Co. 1,892,886 97,161,838
Harley-Davidson, Inc. 233,324 8,322,667
Lordstown Motors Corp. (a)(b) 175,501 3,394,189
Tesla, Inc. (a) 1,142,302 771,625,001
Thor Industries, Inc. 83,213 9,740,914
Winnebago Industries, Inc. 50,950 3,546,120
970,192,910
Distributors - 0.1%
Core-Mark Holding Co., Inc. 66,862 2,178,364
Educational Development Corp. (b) 4,042 63,096
Funko, Inc. (a)(b) 28,522 387,329
Genuine Parts Co. 217,405 22,903,617
LKQ Corp. (a) 417,621 16,450,091
Pool Corp. 59,935 20,064,440
Weyco Group, Inc. 9,583 168,182
62,215,119
Diversified Consumer Services - 0.2%
Adtalem Global Education, Inc. (a) 74,382 2,923,213
American Public Education, Inc. (a) 23,374 688,131
Aspen Group, Inc. (a)(b) 21,363 189,703
Bright Horizons Family Solutions, Inc. (a) 91,111 14,546,782
Carriage Services, Inc. 23,992 790,776
Chegg, Inc. (a)(b) 209,064 20,180,948
Franchise Group, Inc. 42,510 1,491,251
Frontdoor, Inc. (a) 128,034 6,705,141
Graham Holdings Co. 6,825 4,100,665
Grand Canyon Education, Inc. (a) 71,335 7,468,061
H&R Block, Inc. 291,850 5,612,276
Houghton Mifflin Harcourt Co. (a) 191,531 1,168,339
Laureate Education, Inc. Class A (a) 171,025 2,351,594
Lincoln Educational Services Corp. (a) 19,728 114,028
OneSpaWorld Holdings Ltd. (b) 69,225 755,245
Perdoceo Education Corp. (a) 102,066 1,313,589
Regis Corp. (a)(b) 39,837 468,085
Select Interior Concepts, Inc. (a) 30,016 261,439
Service Corp. International 266,684 12,736,828
StoneMor, Inc. (a) 128,851 269,299
Copyright © 2021 www.secdatabase.com. All Rights Reserved.Please Consider the Environment Before Printing This Document

Strategic Education, Inc. 35,859 3,260,300
Stride, Inc. (a) 60,176 1,447,233
Terminix Global Holdings, Inc. (a) 198,268 8,924,043
Universal Technical Institute, Inc. (a) 29,762 182,441
Vivint Smart Home, Inc. Class A (a)(b) 64,246 1,092,182
WW International, Inc. (a)(b) 71,928 2,121,157
Xpresspa Group, Inc. (a)(b) 107,575 189,332
Zovio, Inc. (a) 36,795 188,758
101,540,839
Hotels, Restaurants & Leisure - 1.9%
Accel Entertainment, Inc. (a) 81,607 905,022
Airbnb, Inc. Class A (b) 78,009 16,097,157
ARAMARK Holdings Corp. 380,171 14,111,948
Bally's Corp. (b) 25,647 1,526,509
BBQ Holdings, Inc. (a) 5,376 31,450
Biglari Holdings, Inc. (a) 174 101,884
Biglari Holdings, Inc. (a) 1,764 206,635
BJ's Restaurants, Inc. 32,052 1,779,848
Bloomin' Brands, Inc. 130,439 3,240,105
Bluegreen Vacations Corp. (b) 15,559 124,472
Bluegreen Vacations Holding Corp. Class A (a) 22,171 352,075
Boyd Gaming Corp. (a) 120,073 7,048,285
Brinker International, Inc. 68,641 4,708,086
Caesars Entertainment, Inc. (a) 314,105 29,349,971
Carnival Corp. 1,199,855 32,096,121
Carrols Restaurant Group, Inc. (a) 60,237 372,265
Century Casinos, Inc. (a) 39,038 314,646
Chipotle Mexican Grill, Inc. (a) 42,085 60,686,570
Choice Hotels International, Inc. 42,900 4,498,923
Churchill Downs, Inc. 52,917 12,204,248
Chuy's Holdings, Inc. (a) 28,759 1,179,119
Cracker Barrel Old Country Store, Inc. 35,658 5,522,354
Darden Restaurants, Inc. 195,183 26,804,481
Dave & Buster's Entertainment, Inc. 72,960 2,962,906
Del Taco Restaurants, Inc. 63,136 633,885
Denny's Corp. (a) 93,594 1,642,575
Dine Brands Global, Inc. 24,886 1,968,731
Domino's Pizza, Inc. 59,528 20,627,047
Dover Motorsports, Inc. 7,047 15,574
DraftKings, Inc. Class A (a)(b) 481,199 29,608,174
Drive Shack, Inc. (a) 83,508 217,956
Copyright © 2021 www.secdatabase.com. All Rights Reserved.Please Consider the Environment Before Printing This Document
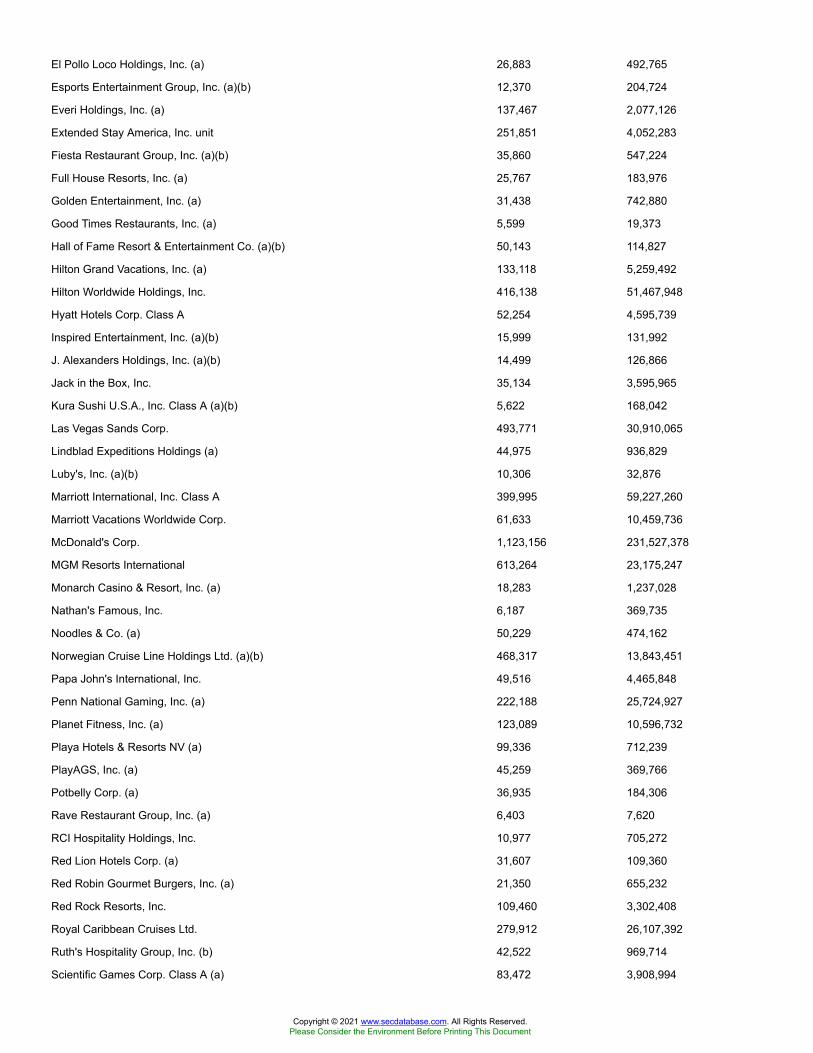
El Pollo Loco Holdings, Inc. (a) 26,883 492,765
Esports Entertainment Group, Inc. (a)(b) 12,370 204,724
Everi Holdings, Inc. (a) 137,467 2,077,126
Extended Stay America, Inc. unit 251,851 4,052,283
Fiesta Restaurant Group, Inc. (a)(b) 35,860 547,224
Full House Resorts, Inc. (a) 25,767 183,976
Golden Entertainment, Inc. (a) 31,438 742,880
Good Times Restaurants, Inc. (a) 5,599 19,373
Hall of Fame Resort & Entertainment Co. (a)(b) 50,143 114,827
Hilton Grand Vacations, Inc. (a) 133,118 5,259,492
Hilton Worldwide Holdings, Inc. 416,138 51,467,948
Hyatt Hotels Corp. Class A 52,254 4,595,739
Inspired Entertainment, Inc. (a)(b) 15,999 131,992
J. Alexanders Holdings, Inc. (a)(b) 14,499 126,866
Jack in the Box, Inc. 35,134 3,595,965
Kura Sushi U.S.A., Inc. Class A (a)(b) 5,622 168,042
Las Vegas Sands Corp. 493,771 30,910,065
Lindblad Expeditions Holdings (a) 44,975 936,829
Luby's, Inc. (a)(b) 10,306 32,876
Marriott International, Inc. Class A 399,995 59,227,260
Marriott Vacations Worldwide Corp. 61,633 10,459,736
McDonald's Corp. 1,123,156 231,527,378
MGM Resorts International 613,264 23,175,247
Monarch Casino & Resort, Inc. (a) 18,283 1,237,028
Nathan's Famous, Inc. 6,187 369,735
Noodles & Co. (a) 50,229 474,162
Norwegian Cruise Line Holdings Ltd. (a)(b) 468,317 13,843,451
Papa John's International, Inc. 49,516 4,465,848
Penn National Gaming, Inc. (a) 222,188 25,724,927
Planet Fitness, Inc. (a) 123,089 10,596,732
Playa Hotels & Resorts NV (a) 99,336 712,239
PlayAGS, Inc. (a) 45,259 369,766
Potbelly Corp. (a) 36,935 184,306
Rave Restaurant Group, Inc. (a) 6,403 7,620
RCI Hospitality Holdings, Inc. 10,977 705,272
Red Lion Hotels Corp. (a) 31,607 109,360
Red Robin Gourmet Burgers, Inc. (a) 21,350 655,232
Red Rock Resorts, Inc. 109,460 3,302,408
Royal Caribbean Cruises Ltd. 279,912 26,107,392
Ruth's Hospitality Group, Inc. (b) 42,522 969,714
Scientific Games Corp. Class A (a) 83,472 3,908,994
Copyright © 2021 www.secdatabase.com. All Rights Reserved.Please Consider the Environment Before Printing This Document
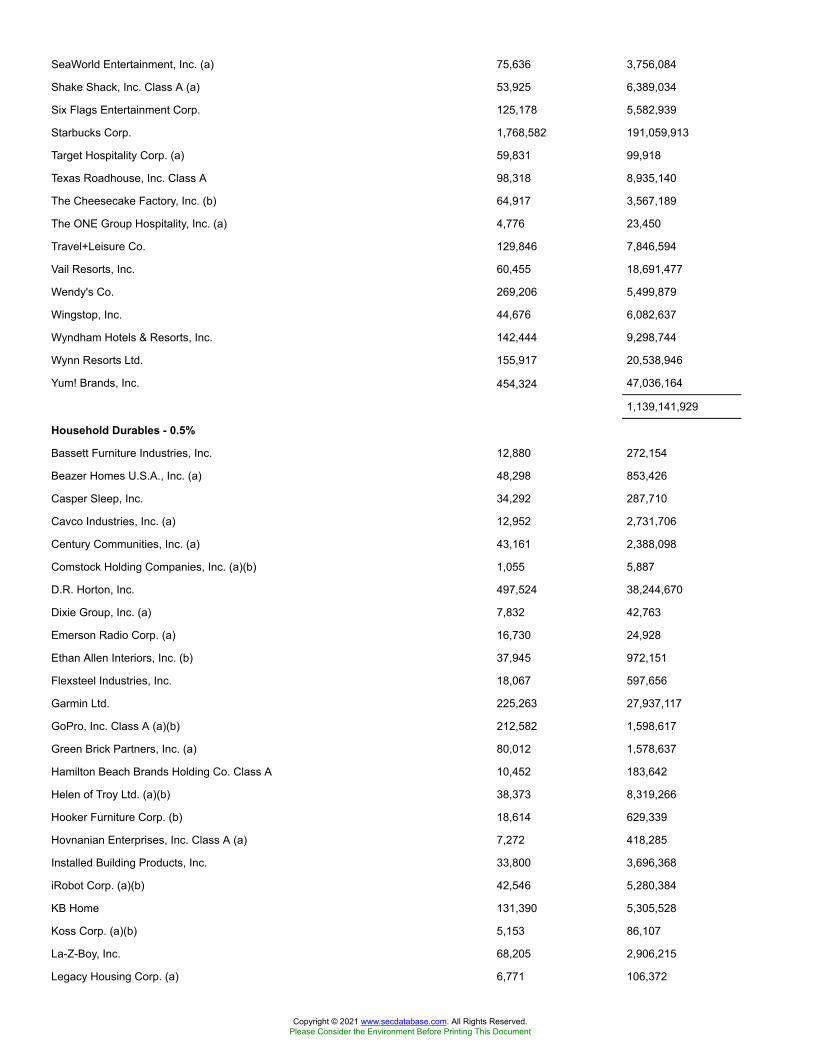
SeaWorld Entertainment, Inc. (a) 75,636 3,756,084
Shake Shack, Inc. Class A (a) 53,925 6,389,034
Six Flags Entertainment Corp. 125,178 5,582,939
Starbucks Corp. 1,768,582 191,059,913
Target Hospitality Corp. (a) 59,831 99,918
Texas Roadhouse, Inc. Class A 98,318 8,935,140
The Cheesecake Factory, Inc. (b) 64,917 3,567,189
The ONE Group Hospitality, Inc. (a) 4,776 23,450
Travel+Leisure Co. 129,846 7,846,594
Vail Resorts, Inc. 60,455 18,691,477
Wendy's Co. 269,206 5,499,879
Wingstop, Inc. 44,676 6,082,637
Wyndham Hotels & Resorts, Inc. 142,444 9,298,744
Wynn Resorts Ltd. 155,917 20,538,946
Yum! Brands, Inc. 454,324 47,036,164
1,139,141,929
Household Durables - 0.5%
Bassett Furniture Industries, Inc. 12,880 272,154
Beazer Homes U.S.A., Inc. (a) 48,298 853,426
Casper Sleep, Inc. 34,292 287,710
Cavco Industries, Inc. (a) 12,952 2,731,706
Century Communities, Inc. (a) 43,161 2,388,098
Comstock Holding Companies, Inc. (a)(b) 1,055 5,887
D.R. Horton, Inc. 497,524 38,244,670
Dixie Group, Inc. (a) 7,832 42,763
Emerson Radio Corp. (a) 16,730 24,928
Ethan Allen Interiors, Inc. (b) 37,945 972,151
Flexsteel Industries, Inc. 18,067 597,656
Garmin Ltd. 225,263 27,937,117
GoPro, Inc. Class A (a)(b) 212,582 1,598,617
Green Brick Partners, Inc. (a) 80,012 1,578,637
Hamilton Beach Brands Holding Co. Class A 10,452 183,642
Helen of Troy Ltd. (a)(b) 38,373 8,319,266
Hooker Furniture Corp. (b) 18,614 629,339
Hovnanian Enterprises, Inc. Class A (a) 7,272 418,285
Installed Building Products, Inc. 33,800 3,696,368
iRobot Corp. (a)(b) 42,546 5,280,384
KB Home 131,390 5,305,528
Koss Corp. (a)(b) 5,153 86,107
La-Z-Boy, Inc. 68,205 2,906,215
Legacy Housing Corp. (a) 6,771 106,372
Copyright © 2021 www.secdatabase.com. All Rights Reserved.Please Consider the Environment Before Printing This Document
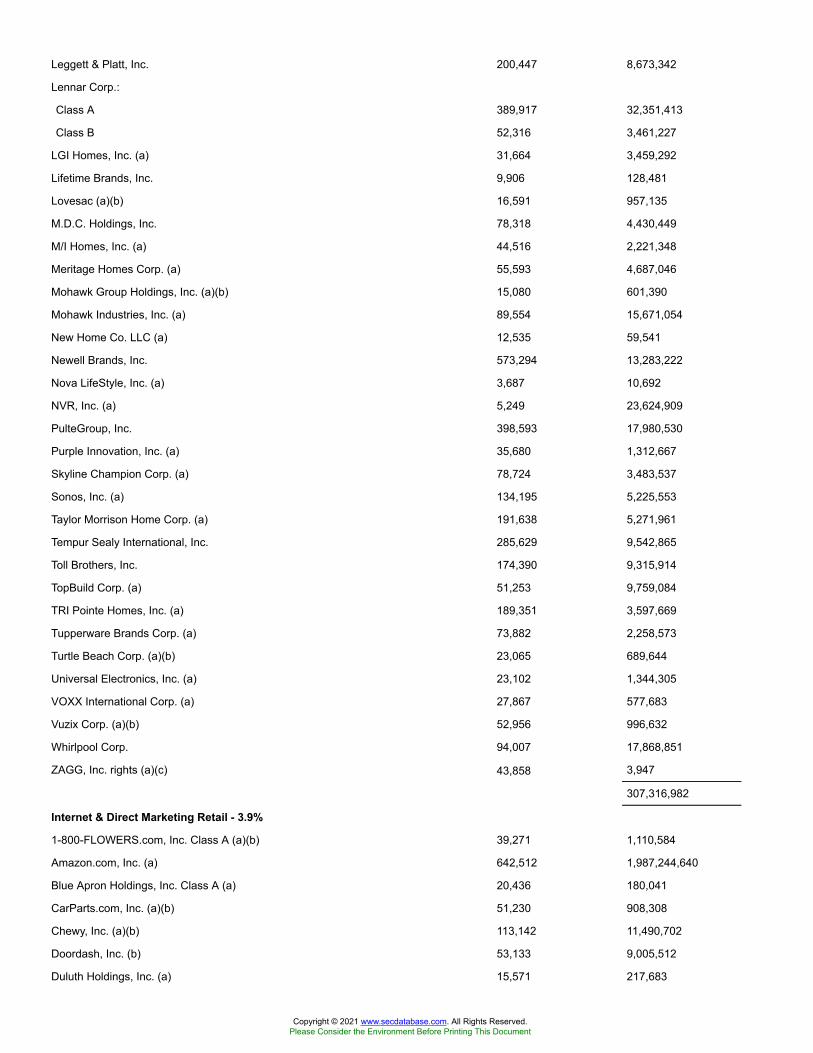
Leggett & Platt, Inc. 200,447 8,673,342
Lennar Corp.:
Class A 389,917 32,351,413
Class B 52,316 3,461,227
LGI Homes, Inc. (a) 31,664 3,459,292
Lifetime Brands, Inc. 9,906 128,481
Lovesac (a)(b) 16,591 957,135
M.D.C. Holdings, Inc. 78,318 4,430,449
M/I Homes, Inc. (a) 44,516 2,221,348
Meritage Homes Corp. (a) 55,593 4,687,046
Mohawk Group Holdings, Inc. (a)(b) 15,080 601,390
Mohawk Industries, Inc. (a) 89,554 15,671,054
New Home Co. LLC (a) 12,535 59,541
Newell Brands, Inc. 573,294 13,283,222
Nova LifeStyle, Inc. (a) 3,687 10,692
NVR, Inc. (a) 5,249 23,624,909
PulteGroup, Inc. 398,593 17,980,530
Purple Innovation, Inc. (a) 35,680 1,312,667
Skyline Champion Corp. (a) 78,724 3,483,537
Sonos, Inc. (a) 134,195 5,225,553
Taylor Morrison Home Corp. (a) 191,638 5,271,961
Tempur Sealy International, Inc. 285,629 9,542,865
Toll Brothers, Inc. 174,390 9,315,914
TopBuild Corp. (a) 51,253 9,759,084
TRI Pointe Homes, Inc. (a) 189,351 3,597,669
Tupperware Brands Corp. (a) 73,882 2,258,573
Turtle Beach Corp. (a)(b) 23,065 689,644
Universal Electronics, Inc. (a) 23,102 1,344,305
VOXX International Corp. (a) 27,867 577,683
Vuzix Corp. (a)(b) 52,956 996,632
Whirlpool Corp. 94,007 17,868,851
ZAGG, Inc. rights (a)(c) 43,858 3,947
307,316,982
Internet & Direct Marketing Retail - 3.9%
1-800-FLOWERS.com, Inc. Class A (a)(b) 39,271 1,110,584
Amazon.com, Inc. (a) 642,512 1,987,244,640
Blue Apron Holdings, Inc. Class A (a) 20,436 180,041
CarParts.com, Inc. (a)(b) 51,230 908,308
Chewy, Inc. (a)(b) 113,142 11,490,702
Doordash, Inc. (b) 53,133 9,005,512
Duluth Holdings, Inc. (a) 15,571 217,683
Copyright © 2021 www.secdatabase.com. All Rights Reserved.Please Consider the Environment Before Printing This Document
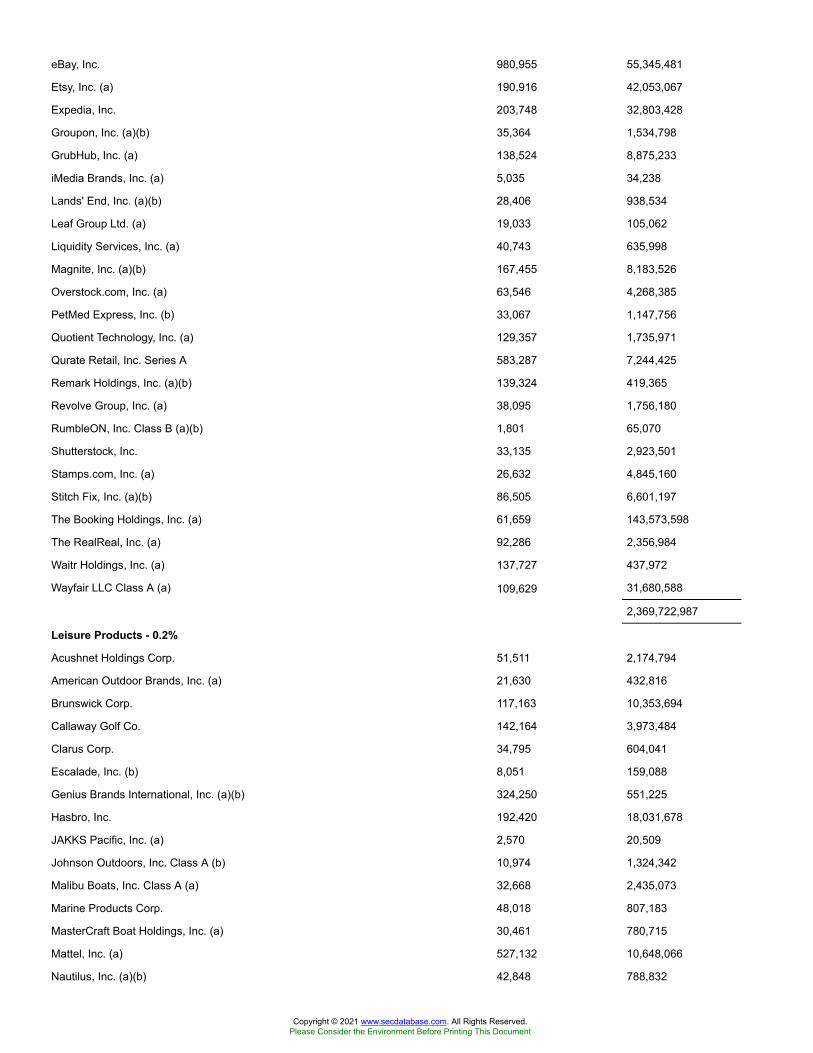
eBay, Inc. 980,955 55,345,481
Etsy, Inc. (a) 190,916 42,053,067
Expedia, Inc. 203,748 32,803,428
Groupon, Inc. (a)(b) 35,364 1,534,798
GrubHub, Inc. (a) 138,524 8,875,233
iMedia Brands, Inc. (a) 5,035 34,238
Lands' End, Inc. (a)(b) 28,406 938,534
Leaf Group Ltd. (a) 19,033 105,062
Liquidity Services, Inc. (a) 40,743 635,998
Magnite, Inc. (a)(b) 167,455 8,183,526
Overstock.com, Inc. (a) 63,546 4,268,385
PetMed Express, Inc. (b) 33,067 1,147,756
Quotient Technology, Inc. (a) 129,357 1,735,971
Qurate Retail, Inc. Series A 583,287 7,244,425
Remark Holdings, Inc. (a)(b) 139,324 419,365
Revolve Group, Inc. (a) 38,095 1,756,180
RumbleON, Inc. Class B (a)(b) 1,801 65,070
Shutterstock, Inc. 33,135 2,923,501
Stamps.com, Inc. (a) 26,632 4,845,160
Stitch Fix, Inc. (a)(b) 86,505 6,601,197
The Booking Holdings, Inc. (a) 61,659 143,573,598
The RealReal, Inc. (a) 92,286 2,356,984
Waitr Holdings, Inc. (a) 137,727 437,972
Wayfair LLC Class A (a) 109,629 31,680,588
2,369,722,987
Leisure Products - 0.2%
Acushnet Holdings Corp. 51,511 2,174,794
American Outdoor Brands, Inc. (a) 21,630 432,816
Brunswick Corp. 117,163 10,353,694
Callaway Golf Co. 142,164 3,973,484
Clarus Corp. 34,795 604,041
Escalade, Inc. (b) 8,051 159,088
Genius Brands International, Inc. (a)(b) 324,250 551,225
Hasbro, Inc. 192,420 18,031,678
JAKKS Pacific, Inc. (a) 2,570 20,509
Johnson Outdoors, Inc. Class A (b) 10,974 1,324,342
Malibu Boats, Inc. Class A (a) 32,668 2,435,073
Marine Products Corp. 48,018 807,183
MasterCraft Boat Holdings, Inc. (a) 30,461 780,715
Mattel, Inc. (a) 527,132 10,648,066
Nautilus, Inc. (a)(b) 42,848 788,832
Copyright © 2021 www.secdatabase.com. All Rights Reserved.Please Consider the Environment Before Printing This Document
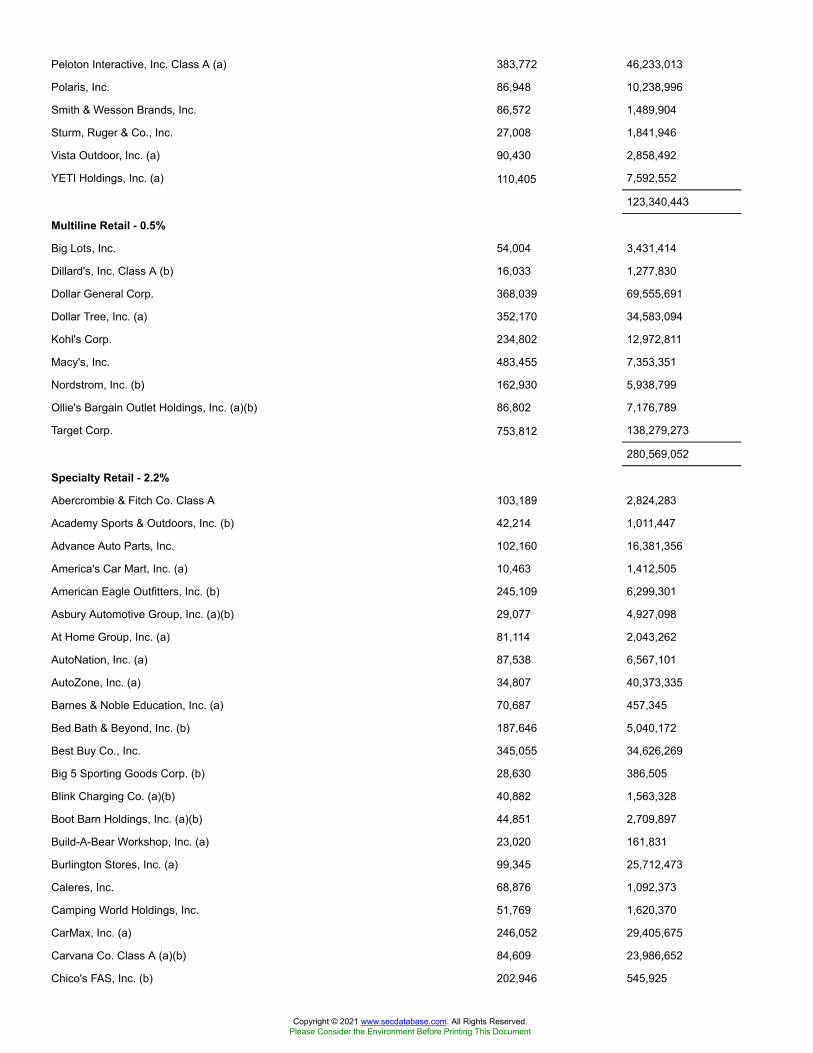
Peloton Interactive, Inc. Class A (a) 383,772 46,233,013
Polaris, Inc. 86,948 10,238,996
Smith & Wesson Brands, Inc. 86,572 1,489,904
Sturm, Ruger & Co., Inc. 27,008 1,841,946
Vista Outdoor, Inc. (a) 90,430 2,858,492
YETI Holdings, Inc. (a) 110,405 7,592,552
123,340,443
Multiline Retail - 0.5%
Big Lots, Inc. 54,004 3,431,414
Dillard's, Inc. Class A (b) 16,033 1,277,830
Dollar General Corp. 368,039 69,555,691
Dollar Tree, Inc. (a) 352,170 34,583,094
Kohl's Corp. 234,802 12,972,811
Macy's, Inc. 483,455 7,353,351
Nordstrom, Inc. (b) 162,930 5,938,799
Ollie's Bargain Outlet Holdings, Inc. (a)(b) 86,802 7,176,789
Target Corp. 753,812 138,279,273
280,569,052
Specialty Retail - 2.2%
Abercrombie & Fitch Co. Class A 103,189 2,824,283
Academy Sports & Outdoors, Inc. (b) 42,214 1,011,447
Advance Auto Parts, Inc. 102,160 16,381,356
America's Car Mart, Inc. (a) 10,463 1,412,505
American Eagle Outfitters, Inc. (b) 245,109 6,299,301
Asbury Automotive Group, Inc. (a)(b) 29,077 4,927,098
At Home Group, Inc. (a) 81,114 2,043,262
AutoNation, Inc. (a) 87,538 6,567,101
AutoZone, Inc. (a) 34,807 40,373,335
Barnes & Noble Education, Inc. (a) 70,687 457,345
Bed Bath & Beyond, Inc. (b) 187,646 5,040,172
Best Buy Co., Inc. 345,055 34,626,269
Big 5 Sporting Goods Corp. (b) 28,630 386,505
Blink Charging Co. (a)(b) 40,882 1,563,328
Boot Barn Holdings, Inc. (a)(b) 44,851 2,709,897
Build-A-Bear Workshop, Inc. (a) 23,020 161,831
Burlington Stores, Inc. (a) 99,345 25,712,473
Caleres, Inc. 68,876 1,092,373
Camping World Holdings, Inc. 51,769 1,620,370
CarMax, Inc. (a) 246,052 29,405,675
Carvana Co. Class A (a)(b) 84,609 23,986,652
Chico's FAS, Inc. (b) 202,946 545,925
Copyright © 2021 www.secdatabase.com. All Rights Reserved.Please Consider the Environment Before Printing This Document
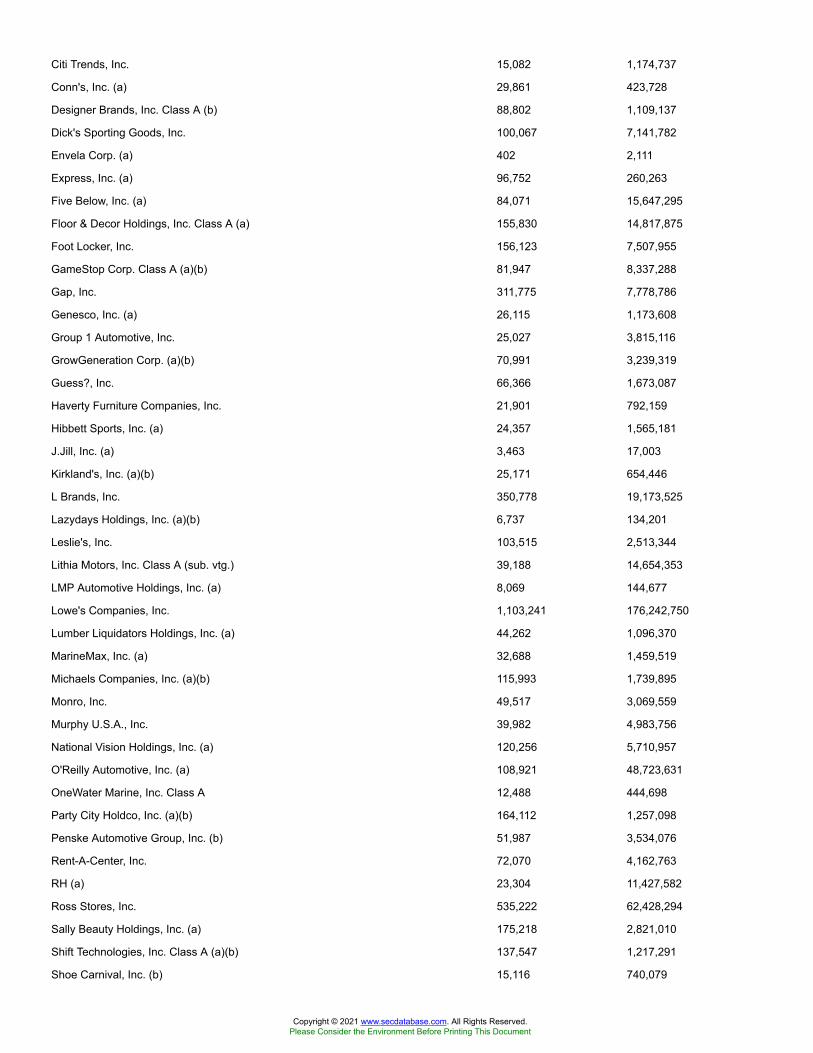
Citi Trends, Inc. 15,082 1,174,737
Conn's, Inc. (a) 29,861 423,728
Designer Brands, Inc. Class A (b) 88,802 1,109,137
Dick's Sporting Goods, Inc. 100,067 7,141,782
Envela Corp. (a) 402 2,111
Express, Inc. (a) 96,752 260,263
Five Below, Inc. (a) 84,071 15,647,295
Floor & Decor Holdings, Inc. Class A (a) 155,830 14,817,875
Foot Locker, Inc. 156,123 7,507,955
GameStop Corp. Class A (a)(b) 81,947 8,337,288
Gap, Inc. 311,775 7,778,786
Genesco, Inc. (a) 26,115 1,173,608
Group 1 Automotive, Inc. 25,027 3,815,116
GrowGeneration Corp. (a)(b) 70,991 3,239,319
Guess?, Inc. 66,366 1,673,087
Haverty Furniture Companies, Inc. 21,901 792,159
Hibbett Sports, Inc. (a) 24,357 1,565,181
J.Jill, Inc. (a) 3,463 17,003
Kirkland's, Inc. (a)(b) 25,171 654,446
L Brands, Inc. 350,778 19,173,525
Lazydays Holdings, Inc. (a)(b) 6,737 134,201
Leslie's, Inc. 103,515 2,513,344
Lithia Motors, Inc. Class A (sub. vtg.) 39,188 14,654,353
LMP Automotive Holdings, Inc. (a) 8,069 144,677
Lowe's Companies, Inc. 1,103,241 176,242,750
Lumber Liquidators Holdings, Inc. (a) 44,262 1,096,370
MarineMax, Inc. (a) 32,688 1,459,519
Michaels Companies, Inc. (a)(b) 115,993 1,739,895
Monro, Inc. 49,517 3,069,559
Murphy U.S.A., Inc. 39,982 4,983,756
National Vision Holdings, Inc. (a) 120,256 5,710,957
O'Reilly Automotive, Inc. (a) 108,921 48,723,631
OneWater Marine, Inc. Class A 12,488 444,698
Party City Holdco, Inc. (a)(b) 164,112 1,257,098
Penske Automotive Group, Inc. (b) 51,987 3,534,076
Rent-A-Center, Inc. 72,070 4,162,763
RH (a) 23,304 11,427,582
Ross Stores, Inc. 535,222 62,428,294
Sally Beauty Holdings, Inc. (a) 175,218 2,821,010
Shift Technologies, Inc. Class A (a)(b) 137,547 1,217,291
Shoe Carnival, Inc. (b) 15,116 740,079
Copyright © 2021 www.secdatabase.com. All Rights Reserved.Please Consider the Environment Before Printing This Document
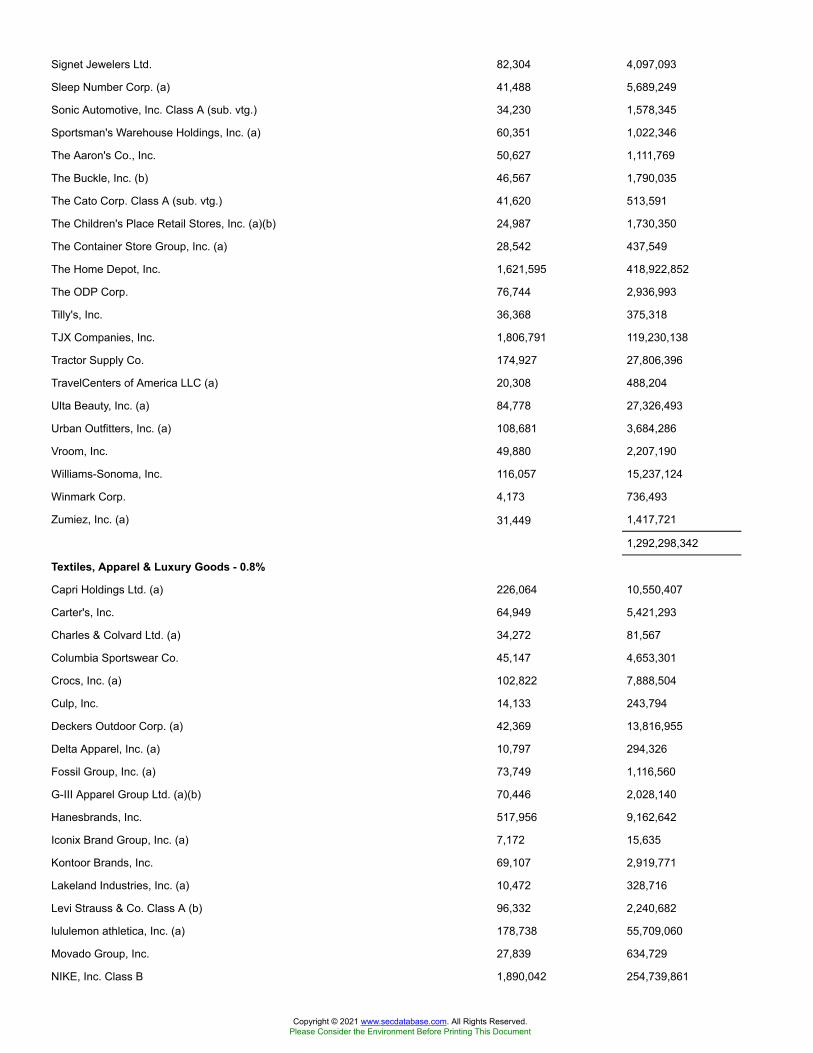
Signet Jewelers Ltd. 82,304 4,097,093
Sleep Number Corp. (a) 41,488 5,689,249
Sonic Automotive, Inc. Class A (sub. vtg.) 34,230 1,578,345
Sportsman's Warehouse Holdings, Inc. (a) 60,351 1,022,346
The Aaron's Co., Inc. 50,627 1,111,769
The Buckle, Inc. (b) 46,567 1,790,035
The Cato Corp. Class A (sub. vtg.) 41,620 513,591
The Children's Place Retail Stores, Inc. (a)(b) 24,987 1,730,350
The Container Store Group, Inc. (a) 28,542 437,549
The Home Depot, Inc. 1,621,595 418,922,852
The ODP Corp. 76,744 2,936,993
Tilly's, Inc. 36,368 375,318
TJX Companies, Inc. 1,806,791 119,230,138
Tractor Supply Co. 174,927 27,806,396
TravelCenters of America LLC (a) 20,308 488,204
Ulta Beauty, Inc. (a) 84,778 27,326,493
Urban Outfitters, Inc. (a) 108,681 3,684,286
Vroom, Inc. 49,880 2,207,190
Williams-Sonoma, Inc. 116,057 15,237,124
Winmark Corp. 4,173 736,493
Zumiez, Inc. (a) 31,449 1,417,721
1,292,298,342
Textiles, Apparel & Luxury Goods - 0.8%
Capri Holdings Ltd. (a) 226,064 10,550,407
Carter's, Inc. 64,949 5,421,293
Charles & Colvard Ltd. (a) 34,272 81,567
Columbia Sportswear Co. 45,147 4,653,301
Crocs, Inc. (a) 102,822 7,888,504
Culp, Inc. 14,133 243,794
Deckers Outdoor Corp. (a) 42,369 13,816,955
Delta Apparel, Inc. (a) 10,797 294,326
Fossil Group, Inc. (a) 73,749 1,116,560
G-III Apparel Group Ltd. (a)(b) 70,446 2,028,140
Hanesbrands, Inc. 517,956 9,162,642
Iconix Brand Group, Inc. (a) 7,172 15,635
Kontoor Brands, Inc. 69,107 2,919,771
Lakeland Industries, Inc. (a) 10,472 328,716
Levi Strauss & Co. Class A (b) 96,332 2,240,682
lululemon athletica, Inc. (a) 178,738 55,709,060
Movado Group, Inc. 27,839 634,729
NIKE, Inc. Class B 1,890,042 254,739,861
Copyright © 2021 www.secdatabase.com. All Rights Reserved.Please Consider the Environment Before Printing This Document
Oxford Industries, Inc. 27,906 2,127,553
PVH Corp. 108,671 10,862,753
Ralph Lauren Corp. 72,053 8,435,965
Rocky Brands, Inc. 10,160 442,874
Sequential Brands Group, Inc. (a) 1,459 23,709
Skechers U.S.A., Inc. Class A (sub. vtg.) (a) 205,876 7,535,062
Steven Madden Ltd. 114,681 4,242,050
Superior Group of Companies, Inc. 16,600 395,412
Tapestry, Inc. 416,967 17,570,989
Under Armour, Inc.:
Class A (sub. vtg.) (a) 332,642 7,281,533
Class C (non-vtg.) (a) 232,796 4,236,887
Unifi, Inc. (a) 23,352 582,165
Vera Bradley, Inc. (a) 33,550 318,390
VF Corp. 479,060 37,908,018
Vince Holding Corp. (a) 3,162 27,193
Wolverine World Wide, Inc. 122,930 4,296,404
478,132,900
TOTAL CONSUMER DISCRETIONARY 7,305,259,572
CONSUMER STAPLES - 5.3%
Beverages - 1.2%
Alkaline Water Co., Inc. (a)(b) 59,159 68,033
Boston Beer Co., Inc. Class A (a) 13,769 14,164,308
Brown-Forman Corp.:
Class A 73,583 4,899,892
Class B (non-vtg.) 282,469 20,219,131
Celsius Holdings, Inc. (a) 44,064 2,623,130
Coca-Cola Bottling Co. Consolidated 6,884 1,766,847
Constellation Brands, Inc. Class A (sub. vtg.) 254,887 54,581,502
Keurig Dr. Pepper, Inc. (b) 871,957 26,612,128
MGP Ingredients, Inc. (b) 20,436 1,305,452
Molson Coors Beverage Co. Class B 283,193 12,587,929
Monster Beverage Corp. (a) 556,187 48,799,847
National Beverage Corp. (b) 37,110 1,768,663
Newage, Inc. (a)(b) 116,092 305,322
PepsiCo, Inc. 2,082,816 269,078,999
REED'S, Inc. (a) 35,577 37,356
The Coca-Cola Co. 5,827,388 285,483,738
744,302,277
Food & Staples Retailing - 1.2%
Copyright © 2021 www.secdatabase.com. All Rights Reserved.Please Consider the Environment Before Printing This Document

Albertsons Companies, Inc. (b) 70,943 1,147,148
Andersons, Inc. 49,516 1,294,348
BJ's Wholesale Club Holdings, Inc. (a) 206,571 8,300,023
Casey's General Stores, Inc. 55,582 11,225,341
Chefs' Warehouse Holdings (a) 48,209 1,501,228
Costco Wholesale Corp. 664,703 220,016,693
Grocery Outlet Holding Corp. (a) 129,194 4,649,692
HF Foods Group, Inc. (a)(b) 51,019 376,010
Ingles Markets, Inc. Class A 22,175 1,152,213
Kroger Co. 1,167,523 37,605,916
Natural Grocers by Vitamin Cottage, Inc. 14,534 204,639
Performance Food Group Co. (a) 199,660 10,829,558
PriceSmart, Inc. 35,704 3,443,651
Rite Aid Corp. (a)(b) 84,039 1,645,484
SpartanNash Co. 56,475 1,029,539
Sprouts Farmers Market LLC (a) 171,996 3,630,836
Sysco Corp. 765,562 60,961,702
U.S. Foods Holding Corp. (a) 332,651 12,128,455
United Natural Foods, Inc. (a)(b) 83,244 2,201,804
Village Super Market, Inc. Class A 10,604 244,422
Walgreens Boots Alliance, Inc. 1,078,209 51,678,557
Walmart, Inc. 2,088,013 271,274,649
Weis Markets, Inc. (b) 28,274 1,511,245
708,053,153
Food Products - 1.0%
Alico, Inc. 3,906 115,774
Arcadia Biosciences, Inc. (a)(b) 10,882 34,496
Archer Daniels Midland Co. 835,649 47,281,020
B&G Foods, Inc. Class A (b) 93,995 2,850,868
Beyond Meat, Inc. (a)(b) 74,382 10,821,093
Bunge Ltd. 209,215 16,021,685
Cal-Maine Foods, Inc. (a) 61,762 2,353,132
Calavo Growers, Inc. 25,925 1,950,856
Campbell Soup Co. (b) 306,172 13,924,703
Coffee Holding Co., Inc. (a) 10,373 51,969
Conagra Brands, Inc. 735,820 24,966,373
Darling Ingredients, Inc. (a) 242,937 15,314,748
Farmer Brothers Co. (a) 19,225 150,147
Flowers Foods, Inc. 299,529 6,514,756
Fresh Del Monte Produce, Inc. 41,629 1,071,530
Freshpet, Inc. (a) 64,278 10,019,655
Copyright © 2021 www.secdatabase.com. All Rights Reserved.Please Consider the Environment Before Printing This Document
General Mills, Inc. 921,456 50,689,295
Hormel Foods Corp. (b) 424,339 19,676,599
Hostess Brands, Inc. Class A (a)(b) 187,203 2,693,851
Ingredion, Inc. 100,197 9,037,769
J&J Snack Foods Corp. 23,519 3,733,876
John B. Sanfilippo & Son, Inc. 14,429 1,247,531
Kellogg Co. (b) 383,256 22,117,704
Laird Superfood, Inc. 1,809 71,401
Lamb Weston Holdings, Inc. 219,339 17,496,672
Lancaster Colony Corp. 29,522 5,156,608
Landec Corp. (a) 46,512 518,609
Lifeway Foods, Inc. (a) 1,384 7,889
Limoneira Co. 21,703 332,707
McCormick & Co., Inc. (non-vtg.) 371,342 31,296,704
Mission Produce, Inc. (b) 9,389 196,793
Mondelez International, Inc. 2,152,684 114,436,681
Pilgrim's Pride Corp. (a) 73,553 1,646,852
Post Holdings, Inc. (a) 94,972 9,123,010
S&W Seed Co. (a) 4,077 13,576
Sanderson Farms, Inc. 29,462 4,492,955
Seaboard Corp. 382 1,265,619
Seneca Foods Corp. Class A (a) 11,293 615,017
Tattooed Chef, Inc. (a) 31,034 618,508
The Hain Celestial Group, Inc. (a) 120,061 5,064,173
The Hershey Co. 221,912 32,321,483
The J.M. Smucker Co. 172,219 19,288,528
The Kraft Heinz Co. 969,942 35,286,490
The Simply Good Foods Co. (a) 127,911 3,731,164
Tootsie Roll Industries, Inc. (b) 28,995 893,336
TreeHouse Foods, Inc. (a) 83,895 4,196,428
Tyson Foods, Inc. Class A 439,707 29,754,973
Utz Brands, Inc. Class A (b) 86,737 2,191,844
Vital Farms, Inc. (a)(b) 21,900 593,928
Whole Earth Brands, Inc. Class A (a) 46,303 594,067
583,845,445
Household Products - 1.2%
Central Garden & Pet Co. (a) 68,586 3,127,522
Central Garden & Pet Co. Class A (non-vtg.) (a) 5,848 242,750
Church & Dwight Co., Inc. 375,467 29,568,026
Clorox Co. 189,078 34,232,572
Colgate-Palmolive Co. 1,292,855 97,222,696
Copyright © 2021 www.secdatabase.com. All Rights Reserved.Please Consider the Environment Before Printing This Document

Energizer Holdings, Inc. (b) 93,152 3,893,754
Kimberly-Clark Corp. 512,820 65,810,191
Ocean Bio-Chem, Inc. (b) 523 5,465
Oil-Dri Corp. of America 9,041 303,597
Procter & Gamble Co. 3,736,894 461,618,516
Reynolds Consumer Products, Inc. (b) 79,189 2,186,408
Spectrum Brands Holdings, Inc. 61,914 4,801,431
WD-40 Co. (b) 20,182 6,291,739
709,304,667
Personal Products - 0.2%
BellRing Brands, Inc. Class A (a) 62,008 1,408,822
Coty, Inc. Class A 465,392 3,569,557
Cyanotech Corp. (a) 1,622 6,164
Edgewell Personal Care Co. (b) 82,231 2,515,446
elf Beauty, Inc. (a) 53,016 1,359,860
Estee Lauder Companies, Inc. Class A 340,707 97,394,503
Guardion Health Sciences, Inc. (a) 128,965 65,089
Herbalife Nutrition Ltd. (a) 146,756 6,601,085
Inter Parfums, Inc. 28,479 2,083,808
LifeVantage Corp. (a) 21,148 185,045
Mannatech, Inc. 422 7,524
MediFast, Inc. 17,249 4,363,825
Natural Health Trends Corp. 15,505 104,814
Nature's Sunshine Products, Inc. (a) 14,073 231,923
Nu Skin Enterprises, Inc. Class A 77,594 3,971,261
Revlon, Inc. (a) 16,265 184,282
Summer Infant, Inc. (a) 2,555 41,263
USANA Health Sciences, Inc. (a) 18,350 1,781,051
Veru, Inc. (a) 75,614 1,044,985
126,920,307
Tobacco - 0.5%
22nd Century Group, Inc. (a)(b) 182,517 611,432
Altria Group, Inc. 2,798,866 122,030,558
Philip Morris International, Inc. 2,345,870 197,099,997
Turning Point Brands, Inc. (b) 21,840 1,074,528
Universal Corp. (b) 39,521 2,008,457
Vector Group Ltd. 184,603 2,519,831
325,344,803
TOTAL CONSUMER STAPLES 3,197,770,652
ENERGY - 2.6%
Copyright © 2021 www.secdatabase.com. All Rights Reserved.Please Consider the Environment Before Printing This Document
Energy Equipment & Services - 0.3%
Archrock, Inc. (b) 186,304 1,920,794
Aspen Aerogels, Inc. (a) 36,455 811,124
Baker Hughes Co. Class A 1,033,655 25,303,874
Bristow Group, Inc. (a) 36,501 971,657
Cactus, Inc. 71,073 2,265,097
Championx Corp. (a) 283,982 6,040,297
Core Laboratories NV(b) 67,749 2,407,799
Dawson Geophysical Co. (a) 16,756 47,755
DMC Global, Inc. 22,779 1,434,849
Dril-Quip, Inc. (a)(b) 52,747 1,791,288
ENGlobal Corp. (a)(b) 22,963 118,030
Enservco Corp. (a)(b) 967 1,953
Exterran Corp. (a) 49,663 271,657
Forum Energy Technologies, Inc. (a)(b) 6,537 139,565
Frank's International NV (a) 163,814 742,077
Geospace Technologies Corp. (a) 18,281 180,068
Gulf Island Fabrication, Inc. (a) 16,117 64,790
Halliburton Co. 1,326,834 28,964,786
Helix Energy Solutions Group, Inc. (a) 222,819 1,091,813
Helmerich & Payne, Inc. 159,406 4,579,734
Independence Contract Drilling, Inc. (a)(b) 2,530 15,863
ION Geophysical Corp. (a) 18,615 56,590
KLX Energy Services Holdings, Inc. (a) 7,463 111,870
Liberty Oilfield Services, Inc. Class A 93,212 1,089,648
Mammoth Energy Services, Inc. (a) 44,395 246,836
MIND Technology, Inc. (a) 16,422 39,741
Nabors Industries Ltd. 11,119 1,234,320
Natural Gas Services Group, Inc. (a) 16,673 173,399
NCS Multistage Holdings, Inc. (a) 1,463 55,740
Newpark Resources, Inc. (a) 154,268 533,767
Nextier Oilfield Solutions, Inc. (a) 267,599 1,244,335
Nine Energy Service, Inc. (a) 20,239 68,813
NOV, Inc. 587,518 8,871,522
Oceaneering International, Inc. (a) 152,715 1,802,037
Oil States International, Inc. (a) 97,333 713,451
Patterson-UTI Energy, Inc. 274,043 2,027,918
Profire Energy, Inc. (a) 29,334 32,561
ProPetro Holding Corp. (a) 121,819 1,397,264
Ranger Energy Services, Inc. Class A (a) 3,186 17,555
RigNet, Inc. (a) 20,511 190,137
Copyright © 2021 www.secdatabase.com. All Rights Reserved.Please Consider the Environment Before Printing This Document
RPC, Inc. (a) 97,866 621,449
Schlumberger Ltd. 2,085,079 58,194,555
SEACOR Marine Holdings, Inc. (a) 36,271 143,633
Select Energy Services, Inc. Class A (a) 103,572 654,575
Smart Sand, Inc. (a)(b) 29,122 94,938
Solaris Oilfield Infrastructure, Inc. Class A 51,951 613,541
Superior Drilling Products, Inc. (a)(b) 18,281 17,329
TechnipFMC PLC 626,931 5,153,373
TETRA Technologies, Inc. (a) 184,288 460,720
Tidewater, Inc. (a) 63,015 785,167
Transocean Ltd. (United States) (a)(b) 888,200 3,082,054
U.S. Silica Holdings, Inc. 118,181 1,572,989
U.S. Well Services, Inc. (a)(b) 24,436 43,252
170,509,949
Oil, Gas & Consumable Fuels - 2.3%
Abraxas Petroleum Corp. (a)(b) 13,277 51,382
Adams Resources & Energy, Inc. 1,474 42,893
Aemetis, Inc. (a) 27,141 266,796
Alto Ingredients, Inc. (a)(b) 90,298 585,131
Altus Midstream Co. 5,123 271,212
American Resources Corp. (a)(b) 28,935 150,462
Amplify Energy Corp. New 36,298 105,990
Antero Midstream GP LP 422,456 3,726,062
Antero Resources Corp. (a) 358,188 3,223,692
Apache Corp. 572,062 11,286,783
Arch Resources, Inc. 22,524 1,079,350
Barnwell Industries, Inc. (a) 2,008 6,406
Battalion Oil Corp. (a) 1,701 19,732
Berry Petroleum Corp. 88,071 436,832
Bonanza Creek Energy, Inc. (a) 28,264 902,470
Brigham Minerals, Inc. Class A 53,963 772,211
Cabot Oil & Gas Corp. 600,380 11,113,034
Callon Petroleum Co. (a)(b) 63,172 1,615,308
Centennial Resource Development, Inc. Class A (a)(b) 298,555 1,182,278
Centrus Energy Corp. Class A (a) 10,476 246,081
Cheniere Energy, Inc. (a) 344,906 23,243,215
Chevron Corp. 2,900,825 290,082,500
Cimarex Energy Co. 157,624 9,140,616
Clean Energy Fuels Corp. (a) 210,405 2,743,681
CNX Resources Corp. (a) 331,517 4,180,429
Comstock Resources, Inc. (a) 84,064 480,005
Copyright © 2021 www.secdatabase.com. All Rights Reserved.Please Consider the Environment Before Printing This Document

ConocoPhillips Co. 2,035,729 105,878,265
CONSOL Energy, Inc. (a) 42,708 461,673
Contango Oil & Gas Co. (a) 199,857 973,304
Continental Resources, Inc. 90,565 2,189,862
CVR Energy, Inc. (b) 47,964 1,059,045
Delek U.S. Holdings, Inc. 109,667 2,693,422
Denbury, Inc. (a) 78,325 3,348,394
Devon Energy Corp. 898,808 19,360,324
Diamond S Shipping, Inc. (a) 39,413 319,245
Diamondback Energy, Inc. 239,130 16,566,926
Dorian LPG Ltd. (a) 50,344 626,783
Earthstone Energy, Inc. (a)(b) 26,960 190,877
EOG Resources, Inc. 874,632 56,466,242
EQT Corp. 407,419 7,247,984
Equitrans Midstream Corp. 603,261 4,361,577
Evolution Petroleum Corp. (b) 44,969 159,640
Exxon Mobil Corp. 6,370,020 346,337,987
Falcon Minerals Corp. 69,442 274,296
Gevo, Inc. (a)(b) 169,618 1,646,991
Goodrich Petroleum Corp. (a) 18,445 179,101
Green Plains, Inc. (a) 61,818 1,565,232
Hallador Energy Co. 21,030 33,438
Hess Corp. 411,874 26,990,103
Highpoint Resources, Inc. (a)(b) 3,342 33,687
HollyFrontier Corp. 225,472 8,540,879
Houston American Energy Corp. (a)(b) 2,058 4,651
International Seaways, Inc. 41,343 716,888
Kinder Morgan, Inc. 2,935,454 43,151,174
Kosmos Energy Ltd. 606,943 1,869,384
Laredo Petroleum, Inc. (a)(b) 13,824 450,524
Magnolia Oil & Gas Corp. Class A (a) 188,167 2,269,294
Marathon Oil Corp. 1,168,512 12,970,483
Marathon Petroleum Corp. 978,326 53,436,166
Matador Resources Co. 165,063 3,448,166
Murphy Oil Corp. (b) 217,567 3,552,869
NACCO Industries, Inc. Class A (b) 5,538 138,118
New Fortress Energy LLC 29,157 1,377,960
Nextdecade Corp. (a)(b) 198,308 392,650
Northern Oil & Gas, Inc. (a) 40,324 535,503
Occidental Petroleum Corp. 1,257,920 33,473,251
ONEOK, Inc. 665,932 29,494,128
Copyright © 2021 www.secdatabase.com. All Rights Reserved.Please Consider the Environment Before Printing This Document

Overseas Shipholding Group, Inc. (a) 101,293 222,845
Ovintiv, Inc. 387,394 8,937,180
Par Pacific Holdings, Inc. (a) 57,453 1,015,195
PBF Energy, Inc. Class A 150,245 2,133,479
PDC Energy, Inc. (a) 149,009 5,207,865
Peabody Energy Corp. (a)(b) 124,567 535,638
Penn Virginia Corp. (a) 21,818 319,416
Phillips 66 Co. 657,436 54,600,060
Phx Minerals, Inc. Class A 22,781 79,961
Pioneer Natural Resources Co. 304,214 45,197,074
PrimeEnergy Corp. (a) 89 4,165
QEP Resources, Inc. 376,545 1,295,315
Range Resources Corp. (a) 407,661 3,929,852
Renewable Energy Group, Inc. (a) 57,799 4,495,028
Rex American Resources Corp. (a)(b) 8,974 844,184
Riley Exploration Permian, Inc. 889 2,196
Ring Energy, Inc. (a)(b) 91,164 202,384
SandRidge Energy, Inc. (a) 51,200 256,512
SilverBow Resources, Inc. (a)(b) 8,845 70,760
SM Energy Co. 176,375 2,444,558
Southwestern Energy Co. (a) 975,918 3,952,468
Talos Energy, Inc. (a) 36,205 383,411
Targa Resources Corp. 350,743 10,848,481
Tellurian, Inc. (a)(b) 271,538 839,052
The Williams Companies, Inc. 1,827,349 41,736,651
Torchlight Energy Resources, Inc. (a) 126,214 313,011
U.S. Energy Corp. (a)(b) 159 743
Uranium Energy Corp. (a) 263,968 559,612
VAALCO Energy, Inc. (a) 66,191 217,106
Valero Energy Corp. 613,443 47,222,842
Vertex Energy, Inc. (a)(b) 12,570 19,358
W&T Offshore, Inc. (a)(b) 146,133 480,778
Westwater Resources, Inc. (a)(b) 20,474 125,710
Whiting Petroleum Corp. (a) 61,484 2,108,901
World Fuel Services Corp. 92,155 2,864,177
1,405,207,005
TOTAL ENERGY 1,575,716,954
FINANCIALS - 11.5%
Banks - 4.5%
1st Constitution Bancorp 12,298 215,830
Copyright © 2021 www.secdatabase.com. All Rights Reserved.Please Consider the Environment Before Printing This Document
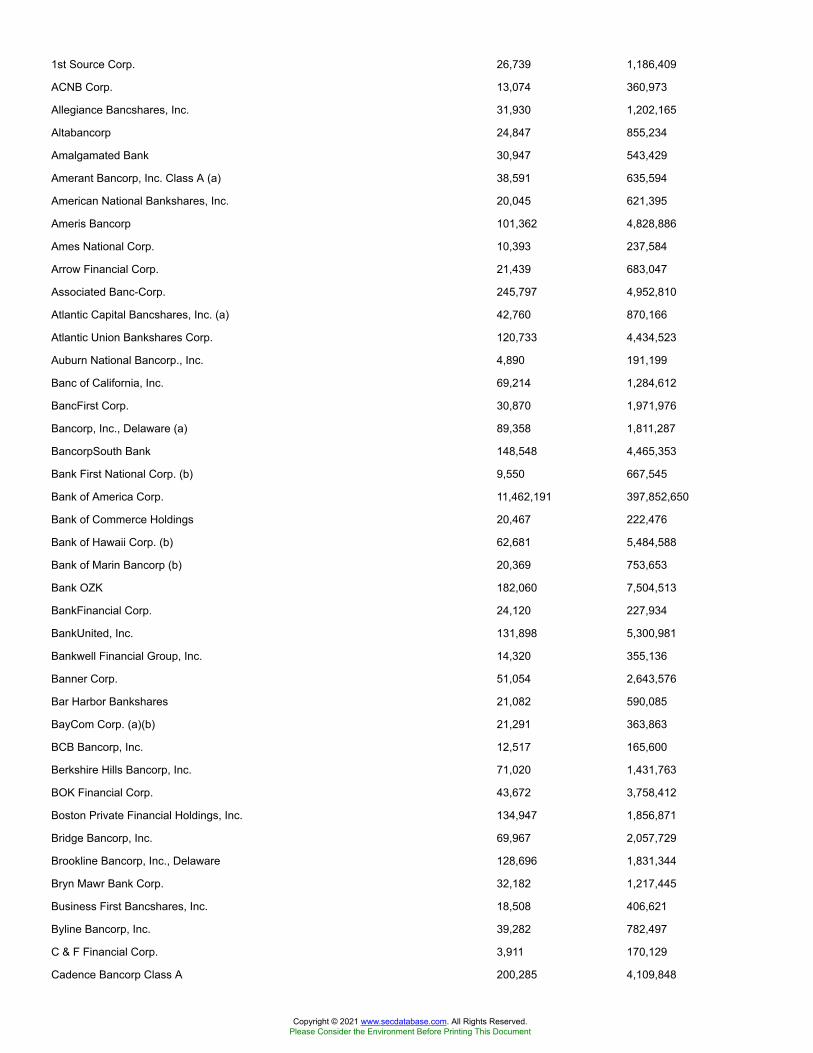
1st Source Corp. 26,739 1,186,409
ACNB Corp. 13,074 360,973
Allegiance Bancshares, Inc. 31,930 1,202,165
Altabancorp 24,847 855,234
Amalgamated Bank 30,947 543,429
Amerant Bancorp, Inc. Class A (a) 38,591 635,594
American National Bankshares, Inc. 20,045 621,395
Ameris Bancorp 101,362 4,828,886
Ames National Corp. 10,393 237,584
Arrow Financial Corp. 21,439 683,047
Associated Banc-Corp. 245,797 4,952,810
Atlantic Capital Bancshares, Inc. (a) 42,760 870,166
Atlantic Union Bankshares Corp. 120,733 4,434,523
Auburn National Bancorp., Inc. 4,890 191,199
Banc of California, Inc. 69,214 1,284,612
BancFirst Corp. 30,870 1,971,976
Bancorp, Inc., Delaware (a) 89,358 1,811,287
BancorpSouth Bank 148,548 4,465,353
Bank First National Corp. (b) 9,550 667,545
Bank of America Corp. 11,462,191 397,852,650
Bank of Commerce Holdings 20,467 222,476
Bank of Hawaii Corp. (b) 62,681 5,484,588
Bank of Marin Bancorp (b) 20,369 753,653
Bank OZK 182,060 7,504,513
BankFinancial Corp. 24,120 227,934
BankUnited, Inc. 131,898 5,300,981
Bankwell Financial Group, Inc. 14,320 355,136
Banner Corp. 51,054 2,643,576
Bar Harbor Bankshares 21,082 590,085
BayCom Corp. (a)(b) 21,291 363,863
BCB Bancorp, Inc. 12,517 165,600
Berkshire Hills Bancorp, Inc. 71,020 1,431,763
BOK Financial Corp. 43,672 3,758,412
Boston Private Financial Holdings, Inc. 134,947 1,856,871
Bridge Bancorp, Inc. 69,967 2,057,729
Brookline Bancorp, Inc., Delaware 128,696 1,831,344
Bryn Mawr Bank Corp. 32,182 1,217,445
Business First Bancshares, Inc. 18,508 406,621
Byline Bancorp, Inc. 39,282 782,497
C & F Financial Corp. 3,911 170,129
Cadence Bancorp Class A 200,285 4,109,848
Copyright © 2021 www.secdatabase.com. All Rights Reserved.Please Consider the Environment Before Printing This Document
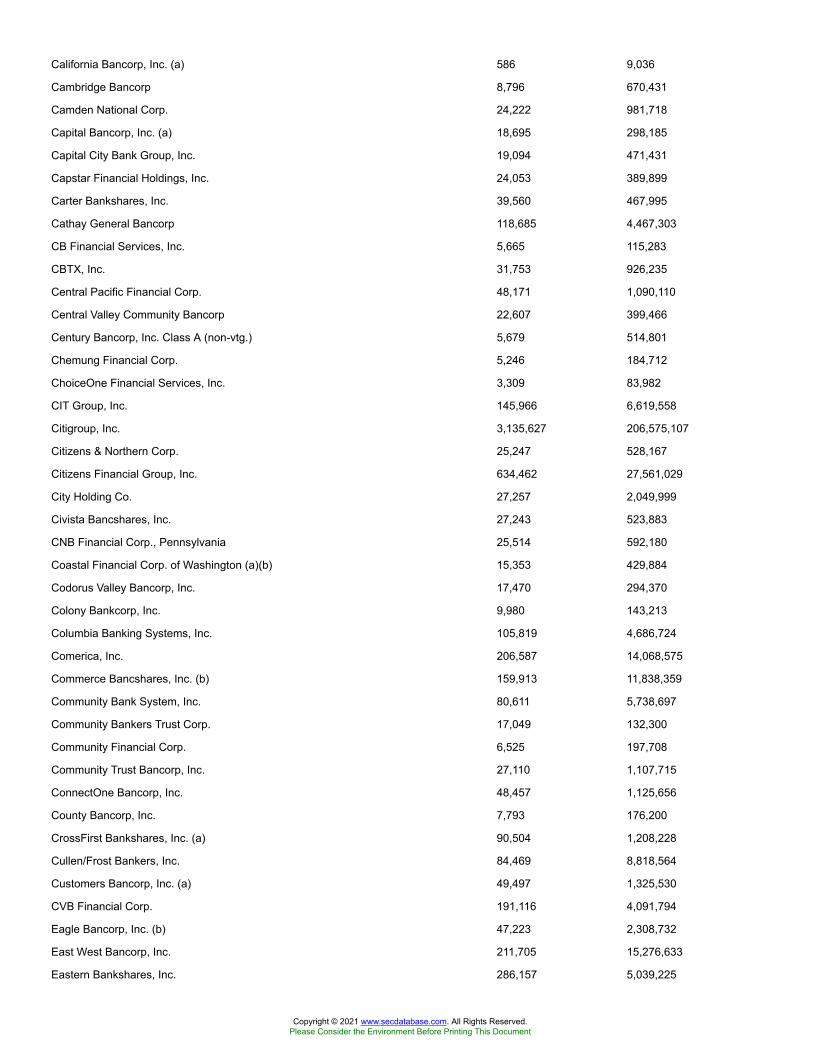
California Bancorp, Inc. (a) 586 9,036
Cambridge Bancorp 8,796 670,431
Camden National Corp. 24,222 981,718
Capital Bancorp, Inc. (a) 18,695 298,185
Capital City Bank Group, Inc. 19,094 471,431
Capstar Financial Holdings, Inc. 24,053 389,899
Carter Bankshares, Inc. 39,560 467,995
Cathay General Bancorp 118,685 4,467,303
CB Financial Services, Inc. 5,665 115,283
CBTX, Inc. 31,753 926,235
Central Pacific Financial Corp. 48,171 1,090,110
Central Valley Community Bancorp 22,607 399,466
Century Bancorp, Inc. Class A (non-vtg.) 5,679 514,801
Chemung Financial Corp. 5,246 184,712
ChoiceOne Financial Services, Inc. 3,309 83,982
CIT Group, Inc. 145,966 6,619,558
Citigroup, Inc. 3,135,627 206,575,107
Citizens & Northern Corp. 25,247 528,167
Citizens Financial Group, Inc. 634,462 27,561,029
City Holding Co. 27,257 2,049,999
Civista Bancshares, Inc. 27,243 523,883
CNB Financial Corp., Pennsylvania 25,514 592,180
Coastal Financial Corp. of Washington (a)(b) 15,353 429,884
Codorus Valley Bancorp, Inc. 17,470 294,370
Colony Bankcorp, Inc. 9,980 143,213
Columbia Banking Systems, Inc. 105,819 4,686,724
Comerica, Inc. 206,587 14,068,575
Commerce Bancshares, Inc. (b) 159,913 11,838,359
Community Bank System, Inc. 80,611 5,738,697
Community Bankers Trust Corp. 17,049 132,300
Community Financial Corp. 6,525 197,708
Community Trust Bancorp, Inc. 27,110 1,107,715
ConnectOne Bancorp, Inc. 48,457 1,125,656
County Bancorp, Inc. 7,793 176,200
CrossFirst Bankshares, Inc. (a) 90,504 1,208,228
Cullen/Frost Bankers, Inc. 84,469 8,818,564
Customers Bancorp, Inc. (a) 49,497 1,325,530
CVB Financial Corp. 191,116 4,091,794
Eagle Bancorp, Inc. (b) 47,223 2,308,732
East West Bancorp, Inc. 211,705 15,276,633
Eastern Bankshares, Inc. 286,157 5,039,225
Copyright © 2021 www.secdatabase.com. All Rights Reserved.Please Consider the Environment Before Printing This Document
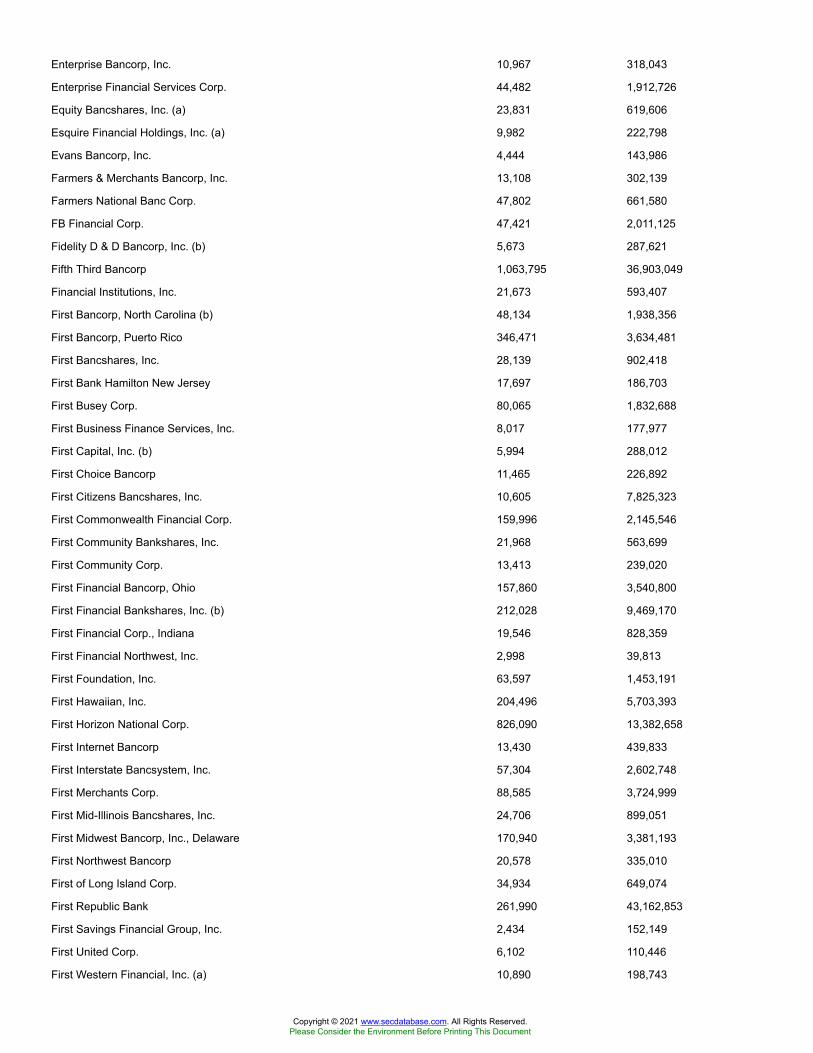
Enterprise Bancorp, Inc. 10,967 318,043
Enterprise Financial Services Corp. 44,482 1,912,726
Equity Bancshares, Inc. (a) 23,831 619,606
Esquire Financial Holdings, Inc. (a) 9,982 222,798
Evans Bancorp, Inc. 4,444 143,986
Farmers & Merchants Bancorp, Inc. 13,108 302,139
Farmers National Banc Corp. 47,802 661,580
FB Financial Corp. 47,421 2,011,125
Fidelity D & D Bancorp, Inc. (b) 5,673 287,621
Fifth Third Bancorp 1,063,795 36,903,049
Financial Institutions, Inc. 21,673 593,407
First Bancorp, North Carolina (b) 48,134 1,938,356
First Bancorp, Puerto Rico 346,471 3,634,481
First Bancshares, Inc. 28,139 902,418
First Bank Hamilton New Jersey 17,697 186,703
First Busey Corp. 80,065 1,832,688
First Business Finance Services, Inc. 8,017 177,977
First Capital, Inc. (b) 5,994 288,012
First Choice Bancorp 11,465 226,892
First Citizens Bancshares, Inc. 10,605 7,825,323
First Commonwealth Financial Corp. 159,996 2,145,546
First Community Bankshares, Inc. 21,968 563,699
First Community Corp. 13,413 239,020
First Financial Bancorp, Ohio 157,860 3,540,800
First Financial Bankshares, Inc. (b) 212,028 9,469,170
First Financial Corp., Indiana 19,546 828,359
First Financial Northwest, Inc. 2,998 39,813
First Foundation, Inc. 63,597 1,453,191
First Hawaiian, Inc. 204,496 5,703,393
First Horizon National Corp. 826,090 13,382,658
First Internet Bancorp 13,430 439,833
First Interstate Bancsystem, Inc. 57,304 2,602,748
First Merchants Corp. 88,585 3,724,999
First Mid-Illinois Bancshares, Inc. 24,706 899,051
First Midwest Bancorp, Inc., Delaware 170,940 3,381,193
First Northwest Bancorp 20,578 335,010
First of Long Island Corp. 34,934 649,074
First Republic Bank 261,990 43,162,853
First Savings Financial Group, Inc. 2,434 152,149
First United Corp. 6,102 110,446
First Western Financial, Inc. (a) 10,890 198,743
Copyright © 2021 www.secdatabase.com. All Rights Reserved.Please Consider the Environment Before Printing This Document

Flushing Financial Corp. 42,344 878,638
FNB Corp., Pennsylvania 502,187 5,940,872
FNCM Bancorp, Inc. (b) 19,280 135,731
Franklin Financial Services Corp. 7,585 208,284
Fulton Financial Corp. 259,700 4,012,365
FVCBankcorp, Inc. (a) 20,878 329,872
German American Bancorp, Inc. 38,770 1,527,538
Glacier Bancorp, Inc. 140,111 7,594,016
Great Southern Bancorp, Inc. 19,976 1,054,533
Great Western Bancorp, Inc. 88,343 2,370,243
Guaranty Bancshares, Inc. Texas 16,206 494,283
Hancock Whitney Corp. 127,731 4,821,845
Hanmi Financial Corp. 52,122 892,329
HarborOne Bancorp, Inc. 87,577 1,046,545
Hawthorn Bancshares, Inc. 7,315 147,324
HBT Financial, Inc. 18,682 301,527
Heartland Financial U.S.A., Inc. 53,009 2,477,641
Heritage Commerce Corp. 92,495 879,627
Heritage Financial Corp., Washington 58,219 1,507,290
Hilltop Holdings, Inc. 111,913 3,697,606
Home Bancshares, Inc. 245,123 5,990,806
HomeTrust Bancshares, Inc. 25,888 599,048
Hope Bancorp, Inc. 167,072 2,198,668
Horizon Bancorp, Inc. Indiana 69,865 1,247,789
Howard Bancorp, Inc. (a) 24,716 339,845
Huntington Bancshares, Inc. 1,520,525 23,324,854
Independent Bank Corp. 39,714 820,888
Independent Bank Corp., Massachusetts (b) 49,316 4,217,011
Independent Bank Group, Inc. 57,936 4,037,560
International Bancshares Corp. 81,726 3,561,619
Investar Holding Corp. (b) 17,521 336,403
Investors Bancorp, Inc. 325,916 4,347,719
JPMorgan Chase & Co. 4,591,389 675,714,719
KeyCorp 1,468,806 29,581,753
Lakeland Bancorp, Inc. 83,124 1,303,384
Lakeland Financial Corp. 42,143 2,905,760
LCNB Corp. 17,540 297,654
Level One Bancorp, Inc. 9,927 212,438
Live Oak Bancshares, Inc. 44,851 2,471,739
M&T Bank Corp. 190,507 28,755,127
Macatawa Bank Corp. 33,702 297,589
Copyright © 2021 www.secdatabase.com. All Rights Reserved.Please Consider the Environment Before Printing This Document
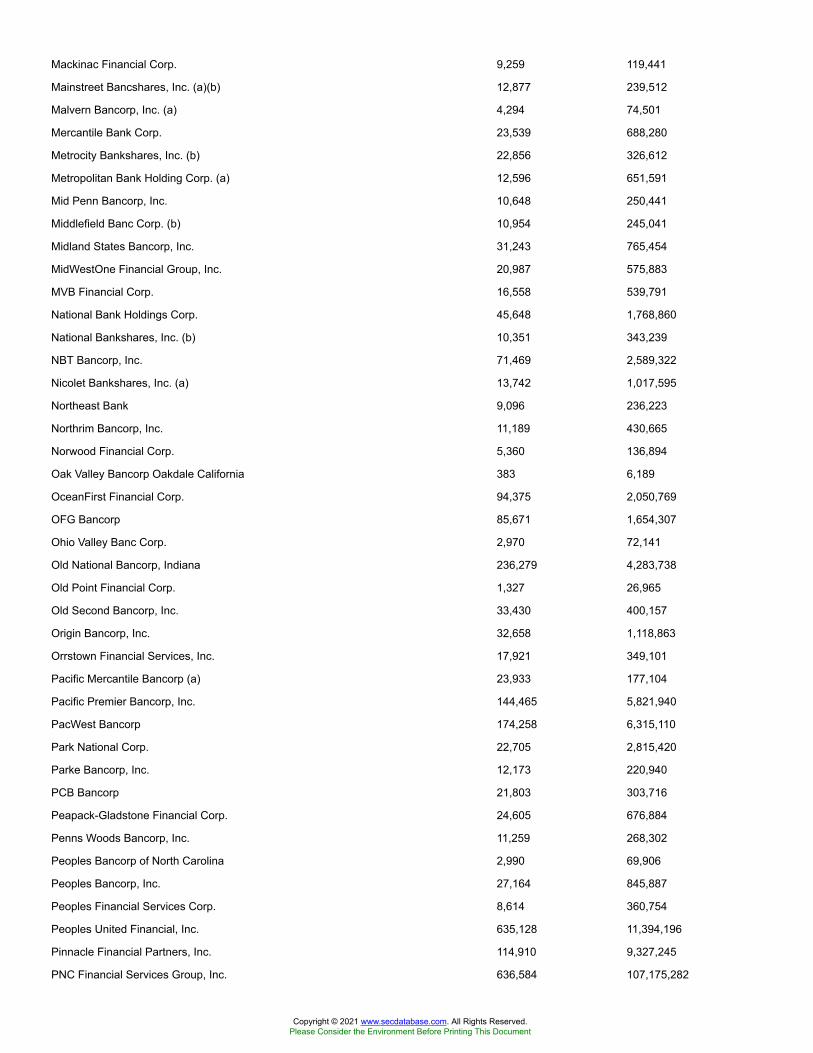
Mackinac Financial Corp. 9,259 119,441
Mainstreet Bancshares, Inc. (a)(b) 12,877 239,512
Malvern Bancorp, Inc. (a) 4,294 74,501
Mercantile Bank Corp. 23,539 688,280
Metrocity Bankshares, Inc. (b) 22,856 326,612
Metropolitan Bank Holding Corp. (a) 12,596 651,591
Mid Penn Bancorp, Inc. 10,648 250,441
Middlefield Banc Corp. (b) 10,954 245,041
Midland States Bancorp, Inc. 31,243 765,454
MidWestOne Financial Group, Inc. 20,987 575,883
MVB Financial Corp. 16,558 539,791
National Bank Holdings Corp. 45,648 1,768,860
National Bankshares, Inc. (b) 10,351 343,239
NBT Bancorp, Inc. 71,469 2,589,322
Nicolet Bankshares, Inc. (a) 13,742 1,017,595
Northeast Bank 9,096 236,223
Northrim Bancorp, Inc. 11,189 430,665
Norwood Financial Corp. 5,360 136,894
Oak Valley Bancorp Oakdale California 383 6,189
OceanFirst Financial Corp. 94,375 2,050,769
OFG Bancorp 85,671 1,654,307
Ohio Valley Banc Corp. 2,970 72,141
Old National Bancorp, Indiana 236,279 4,283,738
Old Point Financial Corp. 1,327 26,965
Old Second Bancorp, Inc. 33,430 400,157
Origin Bancorp, Inc. 32,658 1,118,863
Orrstown Financial Services, Inc. 17,921 349,101
Pacific Mercantile Bancorp (a) 23,933 177,104
Pacific Premier Bancorp, Inc. 144,465 5,821,940
PacWest Bancorp 174,258 6,315,110
Park National Corp. 22,705 2,815,420
Parke Bancorp, Inc. 12,173 220,940
PCB Bancorp 21,803 303,716
Peapack-Gladstone Financial Corp. 24,605 676,884
Penns Woods Bancorp, Inc. 11,259 268,302
Peoples Bancorp of North Carolina 2,990 69,906
Peoples Bancorp, Inc. 27,164 845,887
Peoples Financial Services Corp. 8,614 360,754
Peoples United Financial, Inc. 635,128 11,394,196
Pinnacle Financial Partners, Inc. 114,910 9,327,245
PNC Financial Services Group, Inc. 636,584 107,175,282
Copyright © 2021 www.secdatabase.com. All Rights Reserved.Please Consider the Environment Before Printing This Document
Popular, Inc. 126,077 8,424,465
Preferred Bank, Los Angeles 21,696 1,257,283
Premier Financial Bancorp, Inc. 22,021 342,206
Professional Holdings Corp. (A Shares) 5,458 87,328
Prosperity Bancshares, Inc. 138,432 10,170,599
QCR Holdings, Inc. 22,029 912,001
RBB Bancorp 15,932 299,522
Red River Bancshares, Inc. 5,460 283,374
Regions Financial Corp. 1,430,923 29,519,941
Reliant Bancorp, Inc. 16,187 357,895
Renasant Corp. 79,615 3,127,277
Republic Bancorp, Inc., Kentucky Class A 15,393 647,122
Republic First Bancorp, Inc. (a) 81,890 290,710
Richmond Mutual Bancorp., Inc. 20,641 269,984
S&T Bancorp, Inc. 63,512 1,834,227
Sandy Spring Bancorp, Inc. 68,266 2,565,436
SB Financial Group, Inc. 938 16,218
Seacoast Banking Corp., Florida (a) 81,135 2,916,803
Select Bancorp, Inc. New (a) 33,142 362,573
ServisFirst Bancshares, Inc. 73,654 3,650,292
Shore Bancshares, Inc. 14,735 225,446
Sierra Bancorp 20,538 489,831
Signature Bank 85,500 18,668,070
Silvergate Capital Corp. (a) 27,765 3,541,703
Simmons First National Corp. Class A 160,158 4,689,426
SmartFinancial, Inc. 23,763 499,023
South Plains Financial, Inc. 4,649 89,726
South State Corp. 106,330 8,385,184
Southern First Bancshares, Inc. (a) 13,815 607,860
Southern National Bancorp of Virginia, Inc. 27,408 389,194
Southside Bancshares, Inc. 52,721 1,823,092
Spirit of Texas Bancshares, Inc. 21,188 439,863
Sterling Bancorp 287,649 6,279,378
Stock Yards Bancorp, Inc. (b) 34,128 1,681,487
Summit Financial Group, Inc. 14,847 357,664
SVB Financial Group (a) 77,897 39,366,028
Synovus Financial Corp. 219,275 9,277,525
TCF Financial Corp. 232,241 10,409,042
Texas Capital Bancshares, Inc. (a) 78,211 5,959,678
The Bank of Princeton 5,641 148,189
The First Bancorp, Inc. 12,659 323,564
Copyright © 2021 www.secdatabase.com. All Rights Reserved.Please Consider the Environment Before Printing This Document
Tompkins Financial Corp. 19,976 1,544,744
TowneBank 104,629 3,017,500
Trico Bancshares 43,839 1,888,146
TriState Capital Holdings, Inc. (a) 38,334 879,765
Triumph Bancorp, Inc. (a) 38,327 2,939,681
Truist Financial Corp. 2,028,990 115,571,270
Trustmark Corp. 102,660 3,096,226
U.S. Bancorp 2,060,772 103,038,600
UMB Financial Corp. 67,817 5,721,720
Umpqua Holdings Corp. 339,391 5,793,404
Union Bankshares, Inc. (b) 1,287 35,418
United Bankshares, Inc., West Virginia (b) 191,772 7,085,975
United Community Bank, Inc. 124,402 4,112,730
United Security Bancshares, California 17,486 130,446
Unity Bancorp, Inc. 4,170 82,775
Univest Corp. of Pennsylvania 49,540 1,245,931
Valley National Bancorp 578,842 7,090,815
Veritex Holdings, Inc. 77,139 2,243,202
Washington Trust Bancorp, Inc. 25,196 1,198,070
Webster Financial Corp. 133,346 7,375,367
Wells Fargo & Co. 6,225,563 225,178,614
WesBanco, Inc. 103,697 3,347,339
West Bancorp., Inc. 30,143 688,165
Westamerica Bancorp. 42,832 2,574,632
Western Alliance Bancorp. 150,381 13,761,365
Wintrust Financial Corp. 89,751 6,611,059
Zions Bancorp NA 244,763 13,014,049
2,678,515,006
Capital Markets - 2.9%
Affiliated Managers Group, Inc. 68,478 9,584,866
Ameriprise Financial, Inc. 178,407 39,470,765
Apollo Global Management LLC Class A 311,941 15,428,602
Ares Management Corp. 147,920 7,688,882
Artisan Partners Asset Management, Inc. 85,008 4,037,880
Ashford, Inc. (a) 2,235 20,271
Assetmark Financial Holdings, Inc. (a) 24,518 579,360
Associated Capital Group, Inc. 5,126 174,797
B. Riley Financial, Inc. 23,450 1,543,479
Bank of New York Mellon Corp. 1,223,338 51,575,930
BGC Partners, Inc. Class A 462,935 2,073,949
BlackRock, Inc. Class A 213,496 148,272,972
Copyright © 2021 www.secdatabase.com. All Rights Reserved.Please Consider the Environment Before Printing This Document
Blucora, Inc. (a) 80,680 1,307,016
BrightSphere Investment Group, Inc. 93,860 1,698,866
Carlyle Group LP 174,262 5,968,474
Cboe Global Markets, Inc. 161,847 16,016,379
Charles Schwab Corp. 2,246,483 138,652,931
CME Group, Inc. 540,118 107,861,565
Cohen & Co., Inc. (a) 486 8,320
Cohen & Steers, Inc. 33,385 2,149,326
Cowen Group, Inc. Class A (b) 44,103 1,492,887
Diamond Hill Investment Group, Inc. 5,542 786,133
Donnelley Financial Solutions, Inc. (a) 44,885 1,166,561
Eaton Vance Corp. (non-vtg.) 171,892 12,560,148
Evercore, Inc. Class A 61,860 7,408,972
FactSet Research Systems, Inc. 57,234 17,393,985
Federated Hermes, Inc. Class B (non-vtg.) 140,971 3,766,745
Focus Financial Partners, Inc. Class A (a) 47,585 2,236,971
Franklin Resources, Inc. 407,361 10,660,637
GAMCO Investors, Inc. Class A 5,653 107,407
Goldman Sachs Group, Inc. 518,086 165,518,115
Greenhill & Co., Inc. 26,471 399,447
Hamilton Lane, Inc. Class A 46,752 4,179,629
Heritage Global, Inc. (a) 17,766 62,181
Houlihan Lokey 78,218 4,971,536
Interactive Brokers Group, Inc. 120,661 8,734,650
Intercontinental Exchange, Inc. 845,963 93,318,179
Invesco Ltd. 563,899 12,642,616
Janus Henderson Group PLC 257,125 7,515,764
KKR & Co. LP 854,923 38,950,292
Lazard Ltd. Class A 172,820 6,686,406
LPL Financial 119,106 15,667,203
Manning & Napier, Inc. Class A 15,374 114,690
MarketAxess Holdings, Inc. 57,127 31,759,184
Moelis & Co. Class A 81,581 4,212,843
Moody's Corp. 242,872 66,763,084
Morgan Stanley 2,151,297 165,370,200
Morningstar, Inc. 32,225 7,226,456
MSCI, Inc. 124,684 51,684,012
NASDAQ, Inc. 172,710 23,884,066
Northern Trust Corp. 311,615 29,643,935
Open Lending Corp. (a) 133,348 5,099,228
Oppenheimer Holdings, Inc. Class A (non-vtg.) 13,722 520,064
Copyright © 2021 www.secdatabase.com. All Rights Reserved.Please Consider the Environment Before Printing This Document
Piper Jaffray Companies 22,506 2,392,838
PJT Partners, Inc. 35,449 2,471,504
Pzena Investment Management, Inc. 24,334 224,359
Raymond James Financial, Inc. 182,532 21,308,786
S&P Global, Inc. 362,397 119,359,076
Safeguard Scientifics, Inc. (a) 30,517 233,455
Sculptor Capital Management, Inc. Class A 27,498 567,559
SEI Investments Co. 179,444 10,048,864
Silvercrest Asset Management Group Class A 4,236 59,473
State Street Corp. 530,144 38,578,579
StepStone Group, Inc. Class A 36,574 1,317,030
Stifel Financial Corp. 204,288 12,477,911
StoneX Group, Inc. (a) 25,246 1,456,442
T. Rowe Price Group, Inc. 340,015 55,130,032
The Blackstone Group LP 1,013,596 70,171,251
Tradeweb Markets, Inc. Class A 136,661 9,947,554
U.S. Global Investments, Inc. Class A 16,788 117,348
Victory Capital Holdings, Inc. 20,662 490,723
Virtu Financial, Inc. Class A 123,253 3,361,109
Virtus Investment Partners, Inc. 11,542 2,895,888
Waddell & Reed Financial, Inc. Class A 101,350 2,542,872
Westwood Holdings Group, Inc. 11,777 203,153
WisdomTree Investments, Inc. (b) 197,978 1,049,283
1,713,023,945
Consumer Finance - 0.6%
Ally Financial, Inc. 562,432 23,340,928
American Express Co. 982,098 132,838,575
Atlanticus Holdings Corp. (a) 8,957 235,390
Capital One Financial Corp. 688,036 82,695,047
Consumer Portfolio Services, Inc. (a) 8,413 34,998
Credit Acceptance Corp. (a)(b) 18,328 6,653,431
CURO Group Holdings Corp. 22,644 327,659
Discover Financial Services 460,601 43,328,736
Elevate Credit, Inc. (a) 23,656 96,516
Encore Capital Group, Inc. (a)(b) 46,747 1,562,285
Enova International, Inc. (a) 51,826 1,591,058
EZCORP, Inc. (non-vtg.) Class A (a)(b) 87,514 420,067
First Cash Financial Services, Inc. 64,527 4,085,850
Green Dot Corp. Class A (a) 80,503 3,804,572
LendingClub Corp. (a) 124,365 1,339,411
LendingTree, Inc. (a)(b) 16,157 4,344,133
Copyright © 2021 www.secdatabase.com. All Rights Reserved.Please Consider the Environment Before Printing This Document
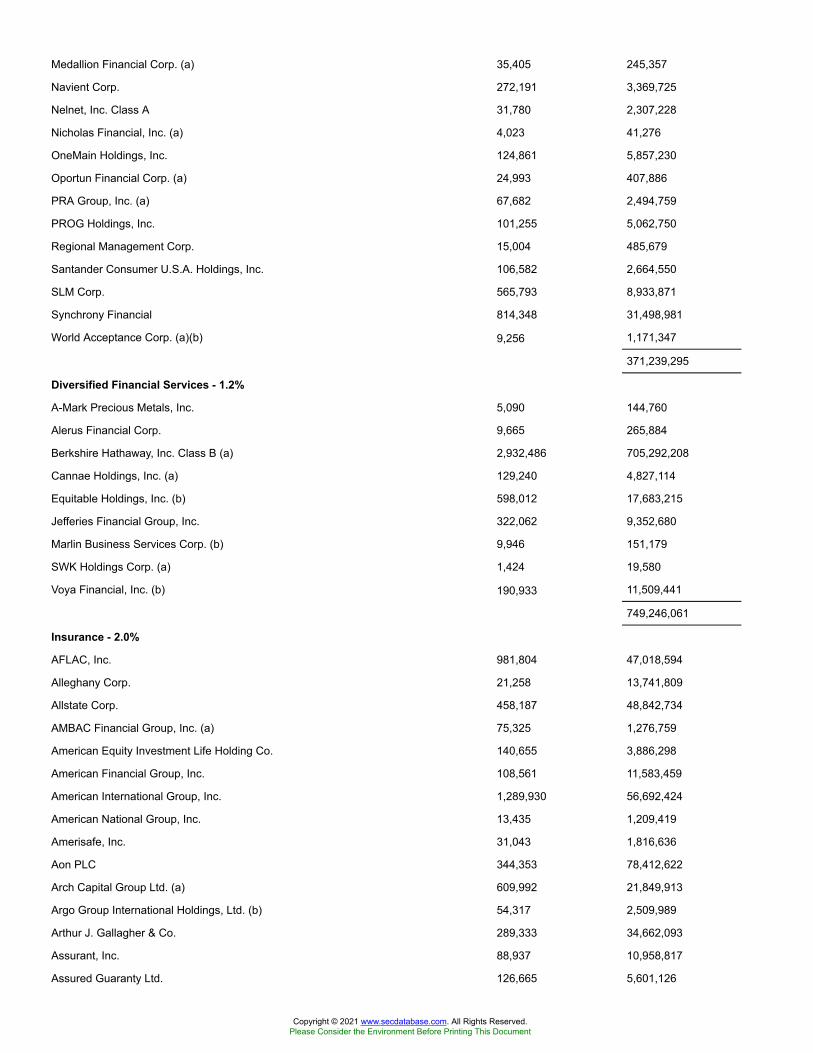
Medallion Financial Corp. (a) 35,405 245,357
Navient Corp. 272,191 3,369,725
Nelnet, Inc. Class A 31,780 2,307,228
Nicholas Financial, Inc. (a) 4,023 41,276
OneMain Holdings, Inc. 124,861 5,857,230
Oportun Financial Corp. (a) 24,993 407,886
PRA Group, Inc. (a) 67,682 2,494,759
PROG Holdings, Inc. 101,255 5,062,750
Regional Management Corp. 15,004 485,679
Santander Consumer U.S.A. Holdings, Inc. 106,582 2,664,550
SLM Corp. 565,793 8,933,871
Synchrony Financial 814,348 31,498,981
World Acceptance Corp. (a)(b) 9,256 1,171,347
371,239,295
Diversified Financial Services - 1.2%
A-Mark Precious Metals, Inc. 5,090 144,760
Alerus Financial Corp. 9,665 265,884
Berkshire Hathaway, Inc. Class B (a) 2,932,486 705,292,208
Cannae Holdings, Inc. (a) 129,240 4,827,114
Equitable Holdings, Inc. (b) 598,012 17,683,215
Jefferies Financial Group, Inc. 322,062 9,352,680
Marlin Business Services Corp. (b) 9,946 151,179
SWK Holdings Corp. (a) 1,424 19,580
Voya Financial, Inc. (b) 190,933 11,509,441
749,246,061
Insurance - 2.0%
AFLAC, Inc. 981,804 47,018,594
Alleghany Corp. 21,258 13,741,809
Allstate Corp. 458,187 48,842,734
AMBAC Financial Group, Inc. (a) 75,325 1,276,759
American Equity Investment Life Holding Co. 140,655 3,886,298
American Financial Group, Inc. 108,561 11,583,459
American International Group, Inc. 1,289,930 56,692,424
American National Group, Inc. 13,435 1,209,419
Amerisafe, Inc. 31,043 1,816,636
Aon PLC 344,353 78,412,622
Arch Capital Group Ltd. (a) 609,992 21,849,913
Argo Group International Holdings, Ltd. (b) 54,317 2,509,989
Arthur J. Gallagher & Co. 289,333 34,662,093
Assurant, Inc. 88,937 10,958,817
Assured Guaranty Ltd. 126,665 5,601,126
Copyright © 2021 www.secdatabase.com. All Rights Reserved.Please Consider the Environment Before Printing This Document
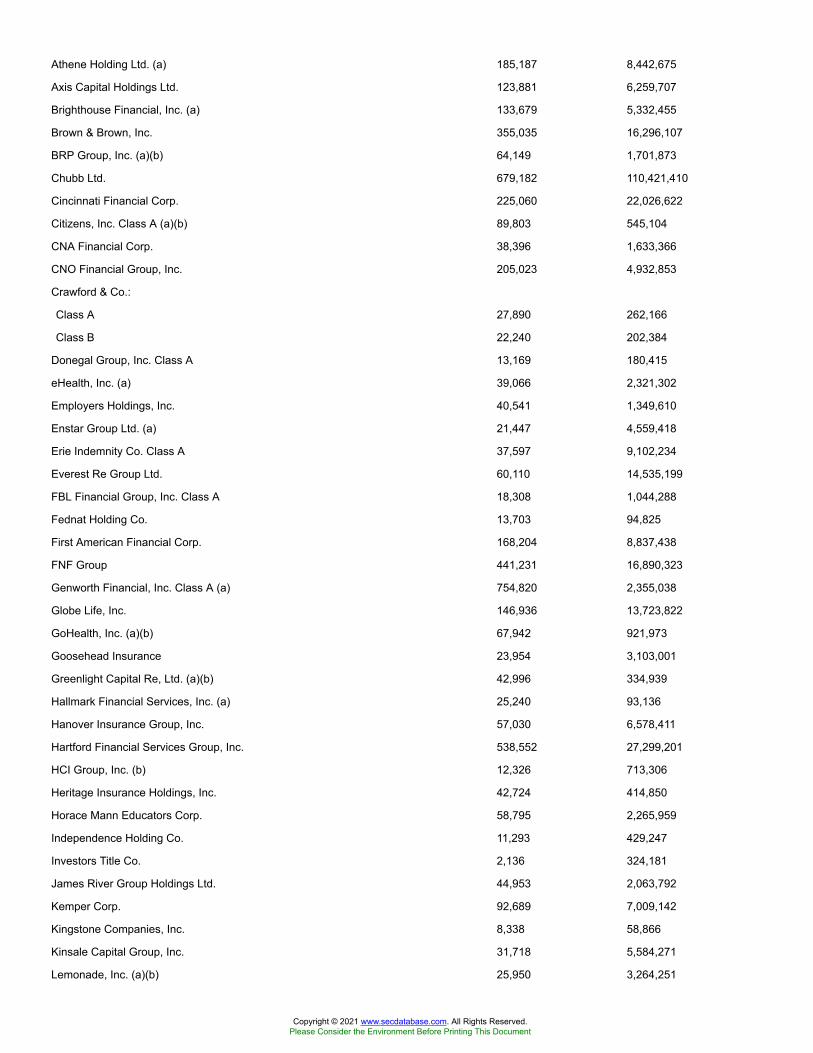
Athene Holding Ltd. (a) 185,187 8,442,675
Axis Capital Holdings Ltd. 123,881 6,259,707
Brighthouse Financial, Inc. (a) 133,679 5,332,455
Brown & Brown, Inc. 355,035 16,296,107
BRP Group, Inc. (a)(b) 64,149 1,701,873
Chubb Ltd. 679,182 110,421,410
Cincinnati Financial Corp. 225,060 22,026,622
Citizens, Inc. Class A (a)(b) 89,803 545,104
CNA Financial Corp. 38,396 1,633,366
CNO Financial Group, Inc. 205,023 4,932,853
Crawford & Co.:
Class A 27,890 262,166
Class B 22,240 202,384
Donegal Group, Inc. Class A 13,169 180,415
eHealth, Inc. (a) 39,066 2,321,302
Employers Holdings, Inc. 40,541 1,349,610
Enstar Group Ltd. (a) 21,447 4,559,418
Erie Indemnity Co. Class A 37,597 9,102,234
Everest Re Group Ltd. 60,110 14,535,199
FBL Financial Group, Inc. Class A 18,308 1,044,288
Fednat Holding Co. 13,703 94,825
First American Financial Corp. 168,204 8,837,438
FNF Group 441,231 16,890,323
Genworth Financial, Inc. Class A (a) 754,820 2,355,038
Globe Life, Inc. 146,936 13,723,822
GoHealth, Inc. (a)(b) 67,942 921,973
Goosehead Insurance 23,954 3,103,001
Greenlight Capital Re, Ltd. (a)(b) 42,996 334,939
Hallmark Financial Services, Inc. (a) 25,240 93,136
Hanover Insurance Group, Inc. 57,030 6,578,411
Hartford Financial Services Group, Inc. 538,552 27,299,201
HCI Group, Inc. (b) 12,326 713,306
Heritage Insurance Holdings, Inc. 42,724 414,850
Horace Mann Educators Corp. 58,795 2,265,959
Independence Holding Co. 11,293 429,247
Investors Title Co. 2,136 324,181
James River Group Holdings Ltd. 44,953 2,063,792
Kemper Corp. 92,689 7,009,142
Kingstone Companies, Inc. 8,338 58,866
Kinsale Capital Group, Inc. 31,718 5,584,271
Lemonade, Inc. (a)(b) 25,950 3,264,251
Copyright © 2021 www.secdatabase.com. All Rights Reserved.Please Consider the Environment Before Printing This Document

Lincoln National Corp. 268,838 15,288,817
Loews Corp. 355,595 17,000,997
Maiden Holdings Ltd. (a) 88,227 238,213
Markel Corp. (a) 20,797 22,643,774
Marsh & McLennan Companies, Inc. 763,172 87,932,678
MBIA, Inc. (a) 87,611 639,560
Mercury General Corp. 42,951 2,508,338
MetLife, Inc. 1,148,326 66,143,578
National Western Life Group, Inc. 3,737 780,398
NI Holdings, Inc. (a) 9,696 172,880
Old Republic International Corp. 429,992 8,311,745
Palomar Holdings, Inc. (a) 35,108 2,988,744
Primerica, Inc. 60,709 8,573,932
Principal Financial Group, Inc. 382,810 21,659,390
ProAssurance Corp. 85,084 2,105,829
Progressive Corp. 882,769 75,873,996
ProSight Global, Inc. (a) 13,713 173,332
Protective Insurance Corp. Class B 10,441 239,203
Prudential Financial, Inc. 593,238 51,445,599
Reinsurance Group of America, Inc. 101,050 12,351,342
RenaissanceRe Holdings Ltd. 76,963 12,851,282
RLI Corp. 60,952 6,359,732
Root, Inc. (b) 44,116 595,125
Safety Insurance Group, Inc. 23,962 1,894,915
Selective Insurance Group, Inc. 88,266 5,987,083
Selectquote, Inc. 55,214 1,684,027
Siriuspoint Ltd. (a) 134,616 1,374,429
State Auto Financial Corp. 29,642 555,491
Stewart Information Services Corp. 38,933 1,837,638
The Travelers Companies, Inc. 381,203 55,465,037
Tiptree, Inc. 23,381 117,139
Trean Insurance Group, Inc. (a) 8,448 142,940
Trupanion, Inc. (a) 48,930 4,734,467
United Fire Group, Inc. 35,716 1,051,836
United Insurance Holdings Corp. 35,027 217,868
Universal Insurance Holdings, Inc. (b) 51,387 765,152
Unum Group 298,564 7,905,975
W.R. Berkley Corp. 213,401 14,795,091
Watford Holdings Ltd. (a) 34,988 1,211,634
White Mountains Insurance Group Ltd. 4,706 5,623,952
Willis Towers Watson PLC 194,237 42,856,452
Copyright © 2021 www.secdatabase.com. All Rights Reserved.Please Consider the Environment Before Printing This Document
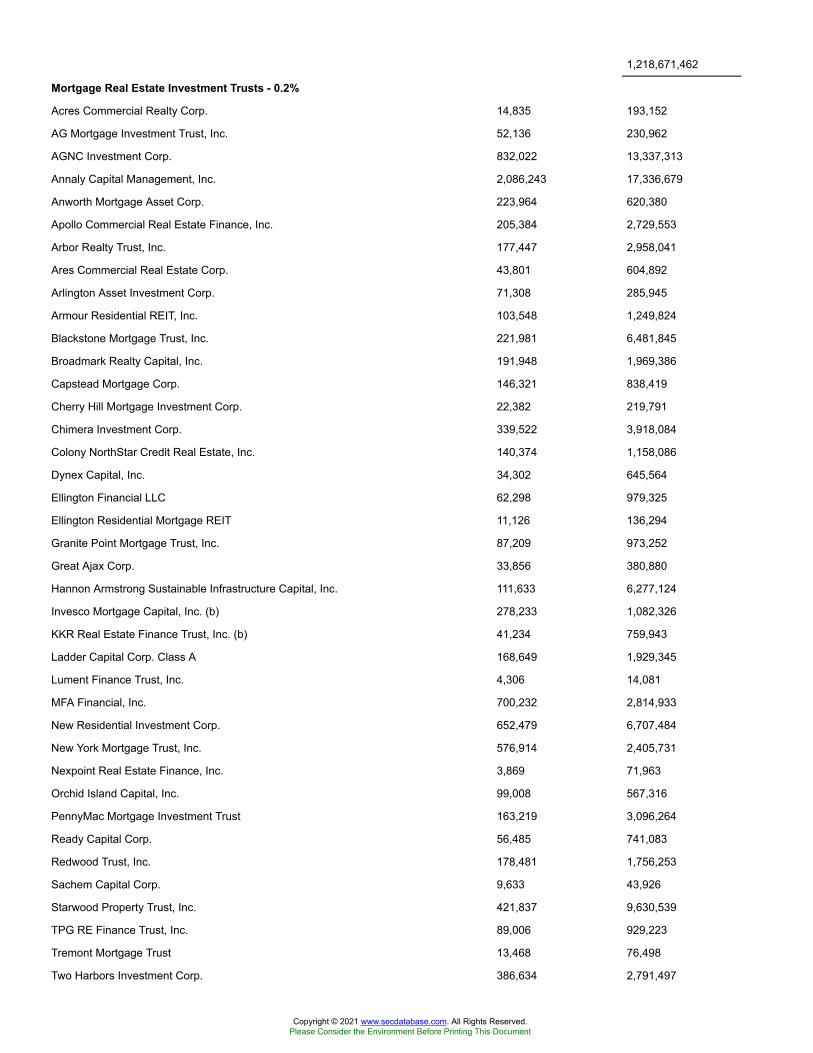
1,218,671,462
Mortgage Real Estate Investment Trusts - 0.2%
Acres Commercial Realty Corp. 14,835 193,152
AG Mortgage Investment Trust, Inc. 52,136 230,962
AGNC Investment Corp. 832,022 13,337,313
Annaly Capital Management, Inc. 2,086,243 17,336,679
Anworth Mortgage Asset Corp. 223,964 620,380
Apollo Commercial Real Estate Finance, Inc. 205,384 2,729,553
Arbor Realty Trust, Inc. 177,447 2,958,041
Ares Commercial Real Estate Corp. 43,801 604,892
Arlington Asset Investment Corp. 71,308 285,945
Armour Residential REIT, Inc. 103,548 1,249,824
Blackstone Mortgage Trust, Inc. 221,981 6,481,845
Broadmark Realty Capital, Inc. 191,948 1,969,386
Capstead Mortgage Corp. 146,321 838,419
Cherry Hill Mortgage Investment Corp. 22,382 219,791
Chimera Investment Corp. 339,522 3,918,084
Colony NorthStar Credit Real Estate, Inc. 140,374 1,158,086
Dynex Capital, Inc. 34,302 645,564
Ellington Financial LLC 62,298 979,325
Ellington Residential Mortgage REIT 11,126 136,294
Granite Point Mortgage Trust, Inc. 87,209 973,252
Great Ajax Corp. 33,856 380,880
Hannon Armstrong Sustainable Infrastructure Capital, Inc. 111,633 6,277,124
Invesco Mortgage Capital, Inc. (b) 278,233 1,082,326
KKR Real Estate Finance Trust, Inc. (b) 41,234 759,943
Ladder Capital Corp. Class A 168,649 1,929,345
Lument Finance Trust, Inc. 4,306 14,081
MFA Financial, Inc. 700,232 2,814,933
New Residential Investment Corp. 652,479 6,707,484
New York Mortgage Trust, Inc. 576,914 2,405,731
Nexpoint Real Estate Finance, Inc. 3,869 71,963
Orchid Island Capital, Inc. 99,008 567,316
PennyMac Mortgage Investment Trust 163,219 3,096,264
Ready Capital Corp. 56,485 741,083
Redwood Trust, Inc. 178,481 1,756,253
Sachem Capital Corp. 9,633 43,926
Starwood Property Trust, Inc. 421,837 9,630,539
TPG RE Finance Trust, Inc. 89,006 929,223
Tremont Mortgage Trust 13,468 76,498
Two Harbors Investment Corp. 386,634 2,791,497
Copyright © 2021 www.secdatabase.com. All Rights Reserved.Please Consider the Environment Before Printing This Document

Western Asset Mortgage Capital Corp. 75,043 244,640
99,187,836
Thrifts & Mortgage Finance - 0.1%
Axos Financial, Inc.(a) 83,691 3,872,383
Bridgewater Bancshares, Inc. (a) 40,020 578,289
Capitol Federal Financial, Inc. 230,592 3,069,180
Columbia Financial, Inc. (a)(b) 86,235 1,409,080
ESSA Bancorp, Inc. 14,301 224,669
Essent Group Ltd. 168,572 6,950,224
Farmer Mac Class C (non-vtg.) 16,148 1,392,765
Flagstar Bancorp, Inc. 75,703 3,284,753
FS Bancorp, Inc. 6,824 413,739
Guild Holdings Co. Class A 3,409 55,635
Hingham Institution for Savings 2,412 584,621
Home Bancorp, Inc. 10,333 334,273
HomeStreet, Inc. 39,908 1,714,448
Impac Mortgage Holdings, Inc. (a)(b) 16,166 50,115
Kearny Financial Corp. 133,106 1,510,753
Luther Burbank Corp. 21,747 222,037
Merchants Bancorp 24,057 818,660
Meridian Bancorp, Inc. Maryland 91,079 1,525,573
Meta Financial Group, Inc. (b) 55,510 2,458,538
MGIC Investment Corp. 508,676 6,195,674
MMA Capital Management, LLC (a) 7,609 168,920
Mr. Cooper Group, Inc. (a) 114,661 3,606,088
New York Community Bancorp, Inc. 697,539 8,516,951
NMI Holdings, Inc. (a) 124,889 2,854,963
Northfield Bancorp, Inc. 70,790 969,115
Northwest Bancshares, Inc. 197,345 2,786,511
Ocwen Financial Corp. (a) 10,664 298,272
OP Bancorp 28,065 257,917
PCSB Financial Corp. 32,661 527,802
PDL Community Bancorp (a) 12,371 125,937
Pennymac Financial Services, Inc. 64,117 3,796,368
Pioneer Bancorp, Inc. (a) 18,130 195,804
Premier Financial Corp. 64,269 1,970,488
Provident Bancorp, Inc. 5,332 65,317
Provident Financial Holdings, Inc. 2,162 34,052
Provident Financial Services, Inc. 106,138 2,147,172
Radian Group, Inc. 293,022 5,977,649
Riverview Bancorp, Inc. 36,754 242,576
Copyright © 2021 www.secdatabase.com. All Rights Reserved.Please Consider the Environment Before Printing This Document

Rocket Cos., Inc. (b) 175,021 3,824,209
Security National Financial Corp. Class A 9,836 88,622
Southern Missouri Bancorp, Inc. (b) 9,308 341,976
Sterling Bancorp, Inc. 31,816 163,534
Territorial Bancorp, Inc. 9,340 229,577
TFS Financial Corp. 70,282 1,372,607
Timberland Bancorp, Inc. 9,834 272,894
Trustco Bank Corp., New York 157,902 1,086,366
Velocity Financial, Inc. (a) 2,026 14,263
Walker & Dunlop, Inc. 43,820 4,367,101
Washington Federal, Inc. 115,043 3,476,599
Waterstone Financial, Inc. 41,989 815,846
Western New England Bancorp, Inc. 30,118 241,245
WSFS Financial Corp. 81,666 4,339,731
91,841,881
TOTAL FINANCIALS 6,921,725,486
HEALTH CARE - 13.6%
Biotechnology - 2.8%
89Bio, Inc. (a) 9,764 239,804
AbbVie, Inc. 2,658,000 286,372,920
Abeona Therapeutics, Inc. (a) 99,135 239,907
ACADIA Pharmaceuticals, Inc. (a)(b) 175,576 8,597,957
Acceleron Pharma, Inc. (a) 77,828 10,597,060
Acorda Therapeutics, Inc. (a)(b) 10,397 60,511
Actinium Pharmaceuticals, Inc. (a) 16,114 129,879
Adamas Pharmaceuticals, Inc. (a) 27,046 128,469
Adicet Bio, Inc. (a) 3,198 48,961
Adicet Bio, Inc. rights (a)(c) 3,198 0
ADMA Biologics, Inc. (a)(b) 164,905 380,931
Advaxis, Inc. (a) 79,002 66,354
Adverum Biotechnologies, Inc. (a) 128,644 1,650,503
Aeglea BioTherapeutics, Inc. (a) 42,550 316,998
Aevi Genomic Medicine, Inc. rights (a)(c) 29,385 989
Agenus, Inc. (a)(b) 214,161 856,644
AgeX Therapeutics, Inc. (a) 24,431 49,106
Agios Pharmaceuticals, Inc. (a) 92,387 4,382,839
Aikido Pharma, Inc. (a)(b) 45,239 53,834
AIM ImmunoTech, Inc. (a) 36,509 82,510
Akebia Therapeutics, Inc. (a)(b) 212,752 736,122
Akero Therapeutics, Inc. (a)(b) 25,258 767,843
Copyright © 2021 www.secdatabase.com. All Rights Reserved.Please Consider the Environment Before Printing This Document
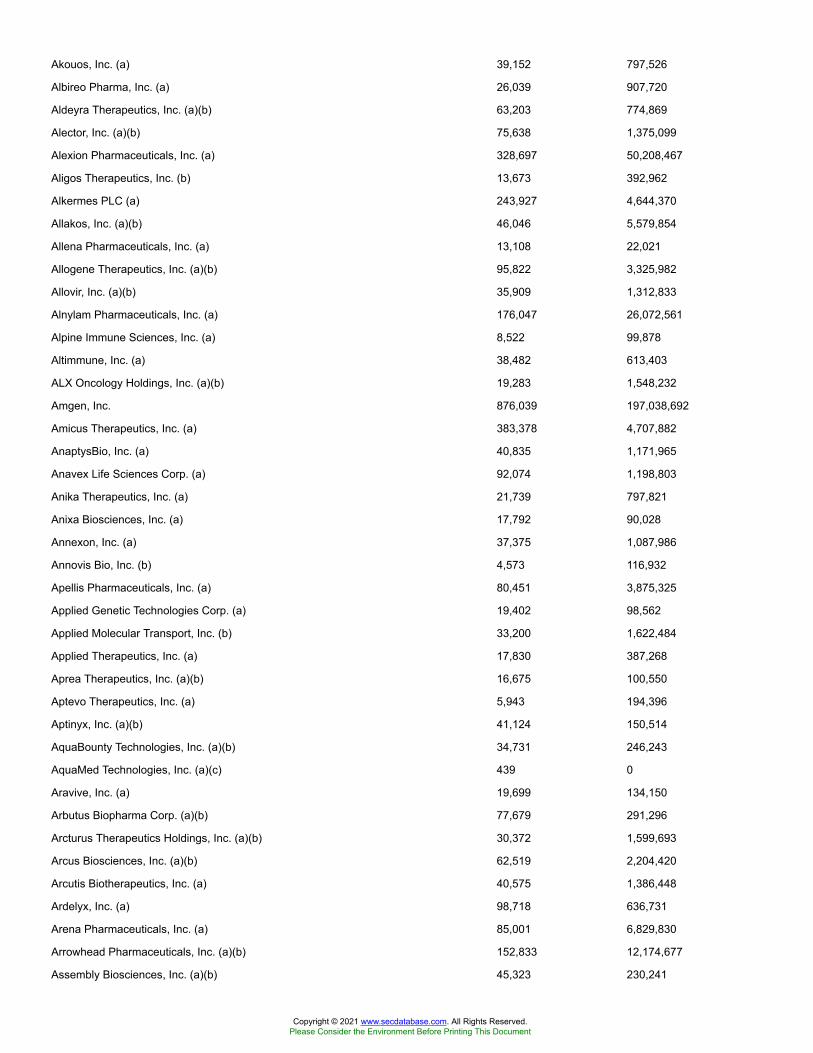
Akouos, Inc. (a) 39,152 797,526
Albireo Pharma, Inc. (a) 26,039 907,720
Aldeyra Therapeutics, Inc. (a)(b) 63,203 774,869
Alector, Inc. (a)(b) 75,638 1,375,099
Alexion Pharmaceuticals, Inc. (a) 328,697 50,208,467
Aligos Therapeutics, Inc. (b) 13,673 392,962
Alkermes PLC (a) 243,927 4,644,370
Allakos, Inc. (a)(b) 46,046 5,579,854
Allena Pharmaceuticals, Inc. (a) 13,108 22,021
Allogene Therapeutics, Inc. (a)(b) 95,822 3,325,982
Allovir, Inc. (a)(b) 35,909 1,312,833
Alnylam Pharmaceuticals, Inc. (a) 176,047 26,072,561
Alpine Immune Sciences, Inc. (a) 8,522 99,878
Altimmune, Inc. (a) 38,482 613,403
ALX Oncology Holdings, Inc. (a)(b) 19,283 1,548,232
Amgen, Inc. 876,039 197,038,692
Amicus Therapeutics, Inc. (a) 383,378 4,707,882
AnaptysBio, Inc. (a) 40,835 1,171,965
Anavex Life Sciences Corp. (a) 92,074 1,198,803
Anika Therapeutics, Inc. (a) 21,739 797,821
Anixa Biosciences, Inc. (a) 17,792 90,028
Annexon, Inc. (a) 37,375 1,087,986
Annovis Bio, Inc. (b) 4,573 116,932
Apellis Pharmaceuticals, Inc. (a) 80,451 3,875,325
Applied Genetic Technologies Corp. (a) 19,402 98,562
Applied Molecular Transport, Inc. (b) 33,200 1,622,484
Applied Therapeutics, Inc. (a) 17,830 387,268
Aprea Therapeutics, Inc. (a)(b) 16,675 100,550
Aptevo Therapeutics, Inc. (a) 5,943 194,396
Aptinyx, Inc. (a)(b) 41,124 150,514
AquaBounty Technologies, Inc. (a)(b) 34,731 246,243
AquaMed Technologies, Inc. (a)(c) 439 0
Aravive, Inc. (a) 19,699 134,150
Arbutus Biopharma Corp. (a)(b) 77,679 291,296
Arcturus Therapeutics Holdings, Inc. (a)(b) 30,372 1,599,693
Arcus Biosciences, Inc. (a)(b) 62,519 2,204,420
Arcutis Biotherapeutics, Inc. (a) 40,575 1,386,448
Ardelyx, Inc. (a) 98,718 636,731
Arena Pharmaceuticals, Inc. (a) 85,001 6,829,830
Arrowhead Pharmaceuticals, Inc. (a)(b) 152,833 12,174,677
Assembly Biosciences, Inc. (a)(b) 45,323 230,241
Copyright © 2021 www.secdatabase.com. All Rights Reserved.Please Consider the Environment Before Printing This Document
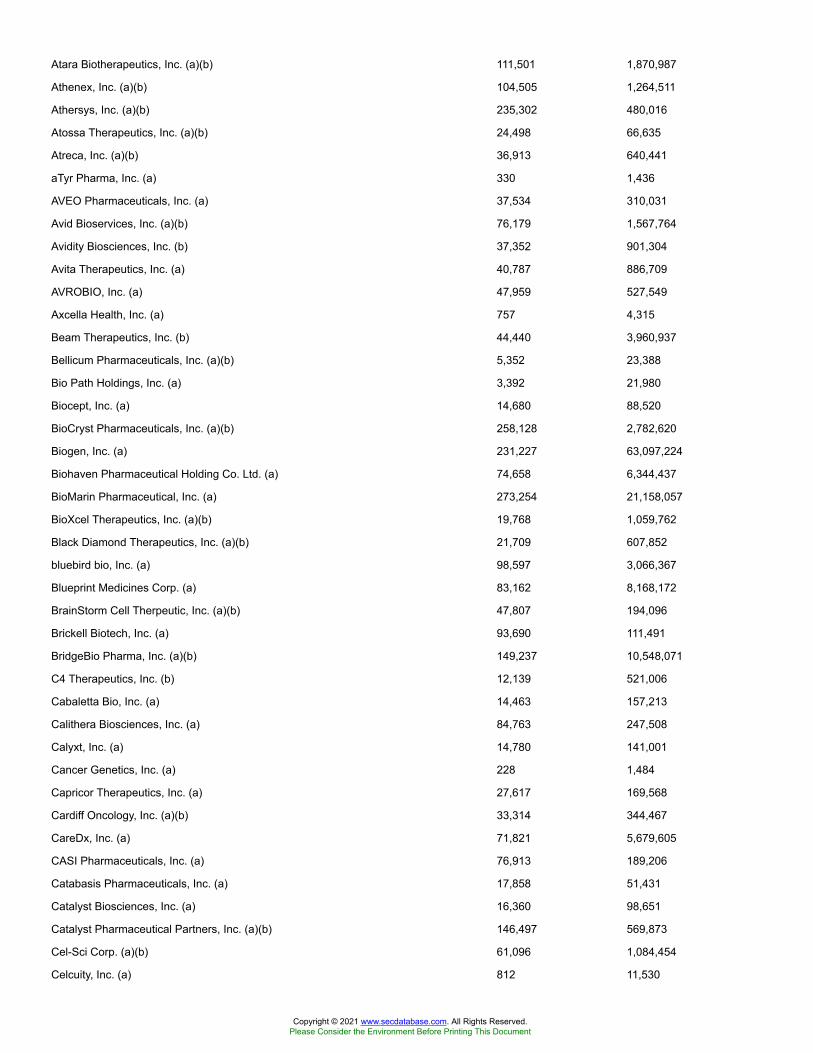
Atara Biotherapeutics, Inc. (a)(b) 111,501 1,870,987
Athenex, Inc. (a)(b) 104,505 1,264,511
Athersys, Inc. (a)(b) 235,302 480,016
Atossa Therapeutics, Inc. (a)(b) 24,498 66,635
Atreca, Inc. (a)(b) 36,913 640,441
aTyr Pharma, Inc. (a) 330 1,436
AVEO Pharmaceuticals, Inc. (a) 37,534 310,031
Avid Bioservices, Inc. (a)(b) 76,179 1,567,764
Avidity Biosciences, Inc. (b) 37,352 901,304
Avita Therapeutics, Inc. (a) 40,787 886,709
AVROBIO, Inc. (a) 47,959 527,549
Axcella Health, Inc. (a) 757 4,315
Beam Therapeutics, Inc. (b) 44,440 3,960,937
Bellicum Pharmaceuticals, Inc. (a)(b) 5,352 23,388
Bio Path Holdings, Inc. (a) 3,392 21,980
Biocept, Inc. (a) 14,680 88,520
BioCryst Pharmaceuticals, Inc. (a)(b) 258,128 2,782,620
Biogen, Inc. (a) 231,227 63,097,224
Biohaven Pharmaceutical Holding Co. Ltd. (a) 74,658 6,344,437
BioMarin Pharmaceutical, Inc. (a) 273,254 21,158,057
BioXcel Therapeutics, Inc. (a)(b) 19,768 1,059,762
Black Diamond Therapeutics, Inc. (a)(b) 21,709 607,852
bluebird bio, Inc. (a) 98,597 3,066,367
Blueprint Medicines Corp. (a) 83,162 8,168,172
BrainStorm Cell Therpeutic, Inc. (a)(b) 47,807 194,096
Brickell Biotech, Inc. (a) 93,690 111,491
BridgeBio Pharma, Inc. (a)(b) 149,237 10,548,071
C4 Therapeutics, Inc. (b) 12,139 521,006
Cabaletta Bio, Inc. (a) 14,463 157,213
Calithera Biosciences, Inc. (a) 84,763 247,508
Calyxt, Inc. (a) 14,780 141,001
Cancer Genetics, Inc. (a) 228 1,484
Capricor Therapeutics, Inc. (a) 27,617 169,568
Cardiff Oncology, Inc. (a)(b) 33,314 344,467
CareDx, Inc. (a) 71,821 5,679,605
CASI Pharmaceuticals, Inc. (a) 76,913 189,206
Catabasis Pharmaceuticals, Inc. (a) 17,858 51,431
Catalyst Biosciences, Inc. (a) 16,360 98,651
Catalyst Pharmaceutical Partners, Inc. (a)(b) 146,497 569,873
Cel-Sci Corp. (a)(b) 61,096 1,084,454
Celcuity, Inc. (a) 812 11,530
Copyright © 2021 www.secdatabase.com. All Rights Reserved.Please Consider the Environment Before Printing This Document
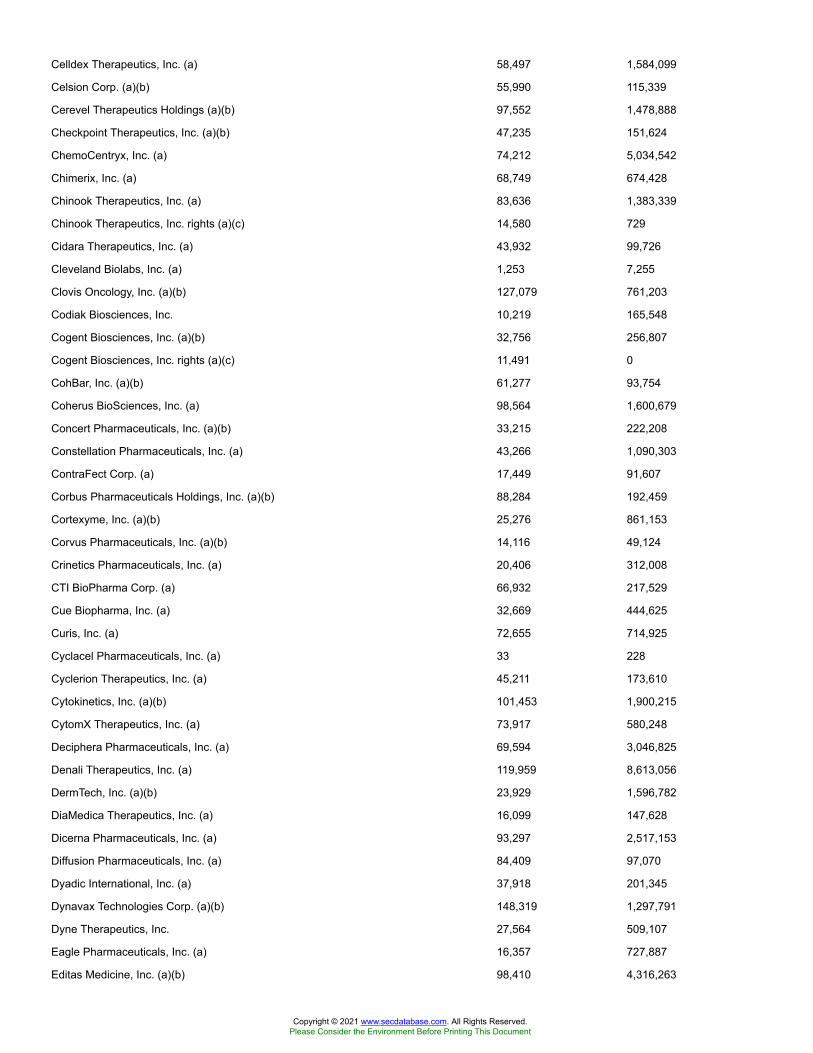
Celldex Therapeutics, Inc. (a) 58,497 1,584,099
Celsion Corp. (a)(b) 55,990 115,339
Cerevel Therapeutics Holdings (a)(b) 97,552 1,478,888
Checkpoint Therapeutics, Inc. (a)(b) 47,235 151,624
ChemoCentryx, Inc. (a) 74,212 5,034,542
Chimerix, Inc. (a) 68,749 674,428
Chinook Therapeutics, Inc. (a) 83,636 1,383,339
Chinook Therapeutics, Inc. rights (a)(c) 14,580 729
Cidara Therapeutics, Inc. (a) 43,932 99,726
Cleveland Biolabs, Inc. (a) 1,253 7,255
Clovis Oncology, Inc. (a)(b) 127,079 761,203
Codiak Biosciences, Inc. 10,219 165,548
Cogent Biosciences, Inc. (a)(b) 32,756 256,807
Cogent Biosciences, Inc. rights (a)(c) 11,491 0
CohBar, Inc. (a)(b) 61,277 93,754
Coherus BioSciences, Inc. (a) 98,564 1,600,679
Concert Pharmaceuticals, Inc. (a)(b) 33,215 222,208
Constellation Pharmaceuticals, Inc. (a) 43,266 1,090,303
ContraFect Corp. (a) 17,449 91,607
Corbus Pharmaceuticals Holdings, Inc. (a)(b) 88,284 192,459
Cortexyme, Inc. (a)(b) 25,276 861,153
Corvus Pharmaceuticals, Inc. (a)(b) 14,116 49,124
Crinetics Pharmaceuticals, Inc. (a) 20,406 312,008
CTI BioPharma Corp. (a) 66,932 217,529
Cue Biopharma, Inc. (a) 32,669 444,625
Curis, Inc. (a) 72,655 714,925
Cyclacel Pharmaceuticals, Inc. (a) 33 228
Cyclerion Therapeutics, Inc. (a) 45,211 173,610
Cytokinetics, Inc. (a)(b) 101,453 1,900,215
CytomX Therapeutics, Inc. (a) 73,917 580,248
Deciphera Pharmaceuticals, Inc. (a) 69,594 3,046,825
Denali Therapeutics, Inc. (a) 119,959 8,613,056
DermTech, Inc. (a)(b) 23,929 1,596,782
DiaMedica Therapeutics, Inc. (a) 16,099 147,628
Dicerna Pharmaceuticals, Inc. (a) 93,297 2,517,153
Diffusion Pharmaceuticals, Inc. (a) 84,409 97,070
Dyadic International, Inc. (a) 37,918 201,345
Dynavax Technologies Corp. (a)(b) 148,319 1,297,791
Dyne Therapeutics, Inc. 27,564 509,107
Eagle Pharmaceuticals, Inc. (a) 16,357 727,887
Editas Medicine, Inc. (a)(b) 98,410 4,316,263
Copyright © 2021 www.secdatabase.com. All Rights Reserved.Please Consider the Environment Before Printing This Document

Eiger Biopharmaceuticals, Inc. (a) 57,373 583,483
Eledon Pharmaceuticals, Inc. (a) 179 2,877
Emergent BioSolutions, Inc. (a) 66,978 6,429,888
Enanta Pharmaceuticals, Inc. (a)(b) 24,762 1,221,262
Enochian Biosciences, Inc. (a)(b) 27,857 98,614
Epizyme, Inc. (a)(b) 133,125 1,276,669
Equillium, Inc. (a) 21,675 152,809
Esperion Therapeutics, Inc. (a)(b) 39,960 1,094,504
Evelo Biosciences, Inc. (a)(b) 26,511 322,639
Exact Sciences Corp. (a) 241,450 32,866,174
Exelixis, Inc. (a) 464,867 10,069,019
Exicure, Inc. (a) 134,393 291,633
F-star Therapeutics, Inc. (a) 1,612 13,331
F-star Therapeutics, Inc.:
rights (a)(c) 1,612 0
rights (a)(c) 1,612 0
Fate Therapeutics, Inc. (a) 116,272 10,431,924
FibroGen, Inc. (a)(b) 123,584 6,182,908
Five Prime Therapeutics, Inc. (a) 67,917 1,509,795
Flexion Therapeutics, Inc. (a)(b) 61,425 676,904
Foghorn Therapeutics, Inc. 5,151 84,785
Forma Therapeutics Holdings, Inc. (b) 32,214 1,243,783
Forte Biosciences, Inc. (a)(b) 16,638 474,017
Fortress Biotech, Inc. (a) 86,223 320,750
Frequency Therapeutics, Inc. (a)(b) 59,657 2,935,721
G1 Therapeutics, Inc. (a)(b) 45,009 994,699
Galectin Therapeutics, Inc. (a)(b) 63,339 141,879
Galera Therapeutics, Inc. (a)(b) 4,354 45,673
Generation Bio Co. (b) 32,944 1,150,404
Genocea Biosciences, Inc. (a)(b) 33,261 101,113
Genprex, Inc. (a) 35,574 183,562
Geron Corp. (a)(b) 515,851 923,373
Gilead Sciences, Inc. 1,885,743 115,784,620
Global Blood Therapeutics, Inc. (a) 93,094 3,965,804
GlycoMimetics, Inc. (a) 51,855 172,159
Gossamer Bio, Inc. (a)(b) 61,084 574,190
Gritstone Oncology, Inc. (a) 28,447 386,026
Halozyme Therapeutics, Inc. (a) 216,216 9,783,774
Harpoon Therapeutics, Inc. (a) 14,759 284,701
Heat Biologics, Inc. (a)(b) 35,946 286,849
Heron Therapeutics, Inc. (a)(b) 126,357 2,284,535
Copyright © 2021 www.secdatabase.com. All Rights Reserved.Please Consider the Environment Before Printing This Document
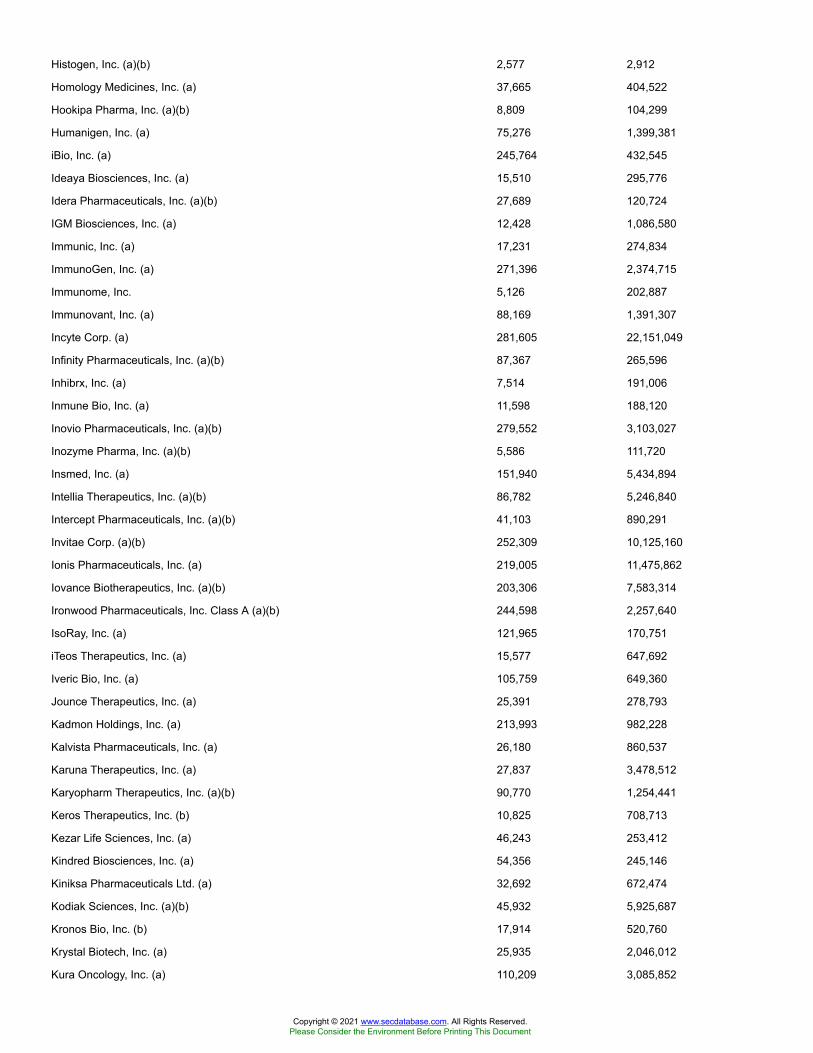
Histogen, Inc. (a)(b) 2,577 2,912
Homology Medicines, Inc. (a) 37,665 404,522
Hookipa Pharma, Inc. (a)(b) 8,809 104,299
Humanigen, Inc. (a) 75,276 1,399,381
iBio, Inc. (a) 245,764 432,545
Ideaya Biosciences, Inc. (a) 15,510 295,776
Idera Pharmaceuticals, Inc. (a)(b) 27,689 120,724
IGM Biosciences, Inc. (a) 12,428 1,086,580
Immunic, Inc. (a) 17,231 274,834
ImmunoGen, Inc. (a) 271,396 2,374,715
Immunome, Inc. 5,126 202,887
Immunovant, Inc. (a) 88,169 1,391,307
Incyte Corp. (a) 281,605 22,151,049
Infinity Pharmaceuticals, Inc. (a)(b) 87,367 265,596
Inhibrx, Inc. (a) 7,514 191,006
Inmune Bio, Inc. (a) 11,598 188,120
Inovio Pharmaceuticals, Inc. (a)(b) 279,552 3,103,027
Inozyme Pharma, Inc. (a)(b) 5,586 111,720
Insmed, Inc. (a) 151,940 5,434,894
Intellia Therapeutics, Inc. (a)(b) 86,782 5,246,840
Intercept Pharmaceuticals, Inc. (a)(b) 41,103 890,291
Invitae Corp. (a)(b) 252,309 10,125,160
Ionis Pharmaceuticals, Inc. (a) 219,005 11,475,862
Iovance Biotherapeutics, Inc. (a)(b) 203,306 7,583,314
Ironwood Pharmaceuticals, Inc. Class A (a)(b) 244,598 2,257,640
IsoRay, Inc. (a) 121,965 170,751
iTeos Therapeutics, Inc. (a) 15,577 647,692
Iveric Bio, Inc. (a) 105,759 649,360
Jounce Therapeutics, Inc. (a) 25,391 278,793
Kadmon Holdings, Inc. (a) 213,993 982,228
Kalvista Pharmaceuticals, Inc. (a) 26,180 860,537
Karuna Therapeutics, Inc. (a) 27,837 3,478,512
Karyopharm Therapeutics, Inc. (a)(b) 90,770 1,254,441
Keros Therapeutics, Inc. (b) 10,825 708,713
Kezar Life Sciences, Inc. (a) 46,243 253,412
Kindred Biosciences, Inc. (a) 54,356 245,146
Kiniksa Pharmaceuticals Ltd. (a) 32,692 672,474
Kodiak Sciences, Inc. (a)(b) 45,932 5,925,687
Kronos Bio, Inc. (b) 17,914 520,760
Krystal Biotech, Inc. (a) 25,935 2,046,012
Kura Oncology, Inc. (a) 110,209 3,085,852
Copyright © 2021 www.secdatabase.com. All Rights Reserved.Please Consider the Environment Before Printing This Document
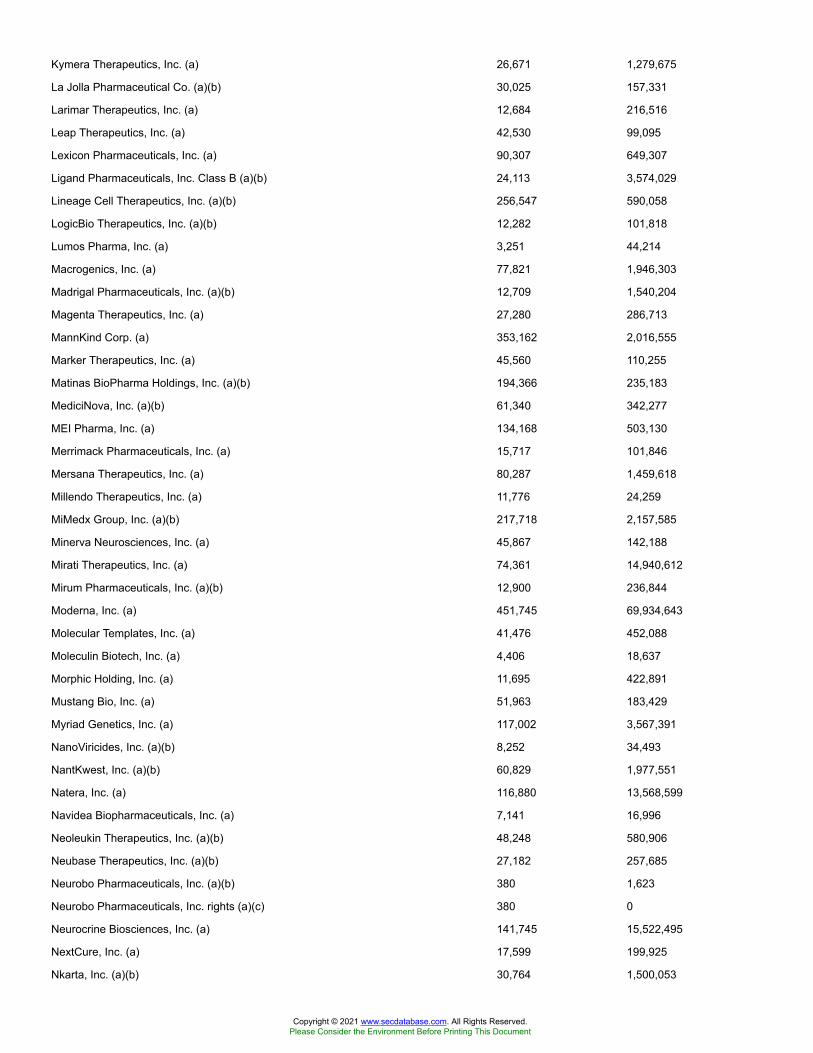
Kymera Therapeutics, Inc. (a) 26,671 1,279,675
La Jolla Pharmaceutical Co. (a)(b) 30,025 157,331
Larimar Therapeutics, Inc. (a) 12,684 216,516
Leap Therapeutics, Inc. (a) 42,530 99,095
Lexicon Pharmaceuticals, Inc. (a) 90,307 649,307
Ligand Pharmaceuticals, Inc. Class B (a)(b) 24,113 3,574,029
Lineage Cell Therapeutics, Inc. (a)(b) 256,547 590,058
LogicBio Therapeutics, Inc. (a)(b) 12,282 101,818
Lumos Pharma, Inc. (a) 3,251 44,214
Macrogenics, Inc. (a) 77,821 1,946,303
Madrigal Pharmaceuticals, Inc. (a)(b) 12,709 1,540,204
Magenta Therapeutics, Inc. (a) 27,280 286,713
MannKind Corp. (a) 353,162 2,016,555
Marker Therapeutics, Inc. (a) 45,560 110,255
Matinas BioPharma Holdings, Inc. (a)(b) 194,366 235,183
MediciNova, Inc. (a)(b) 61,340 342,277
MEI Pharma, Inc. (a) 134,168 503,130
Merrimack Pharmaceuticals, Inc. (a) 15,717 101,846
Mersana Therapeutics, Inc. (a) 80,287 1,459,618
Millendo Therapeutics, Inc. (a) 11,776 24,259
MiMedx Group, Inc. (a)(b) 217,718 2,157,585
Minerva Neurosciences, Inc. (a) 45,867 142,188
Mirati Therapeutics, Inc. (a) 74,361 14,940,612
Mirum Pharmaceuticals, Inc. (a)(b) 12,900 236,844
Moderna, Inc. (a) 451,745 69,934,643
Molecular Templates, Inc. (a) 41,476 452,088
Moleculin Biotech, Inc. (a) 4,406 18,637
Morphic Holding, Inc. (a) 11,695 422,891
Mustang Bio, Inc. (a) 51,963 183,429
Myriad Genetics, Inc. (a) 117,002 3,567,391
NanoViricides, Inc. (a)(b) 8,252 34,493
NantKwest, Inc. (a)(b) 60,829 1,977,551
Natera, Inc. (a) 116,880 13,568,599
Navidea Biopharmaceuticals, Inc. (a) 7,141 16,996
Neoleukin Therapeutics, Inc. (a)(b) 48,248 580,906
Neubase Therapeutics, Inc. (a)(b) 27,182 257,685
Neurobo Pharmaceuticals, Inc. (a)(b) 380 1,623
Neurobo Pharmaceuticals, Inc. rights (a)(c) 380 0
Neurocrine Biosciences, Inc. (a) 141,745 15,522,495
NextCure, Inc. (a) 17,599 199,925
Nkarta, Inc. (a)(b) 30,764 1,500,053
Copyright © 2021 www.secdatabase.com. All Rights Reserved.Please Consider the Environment Before Printing This Document
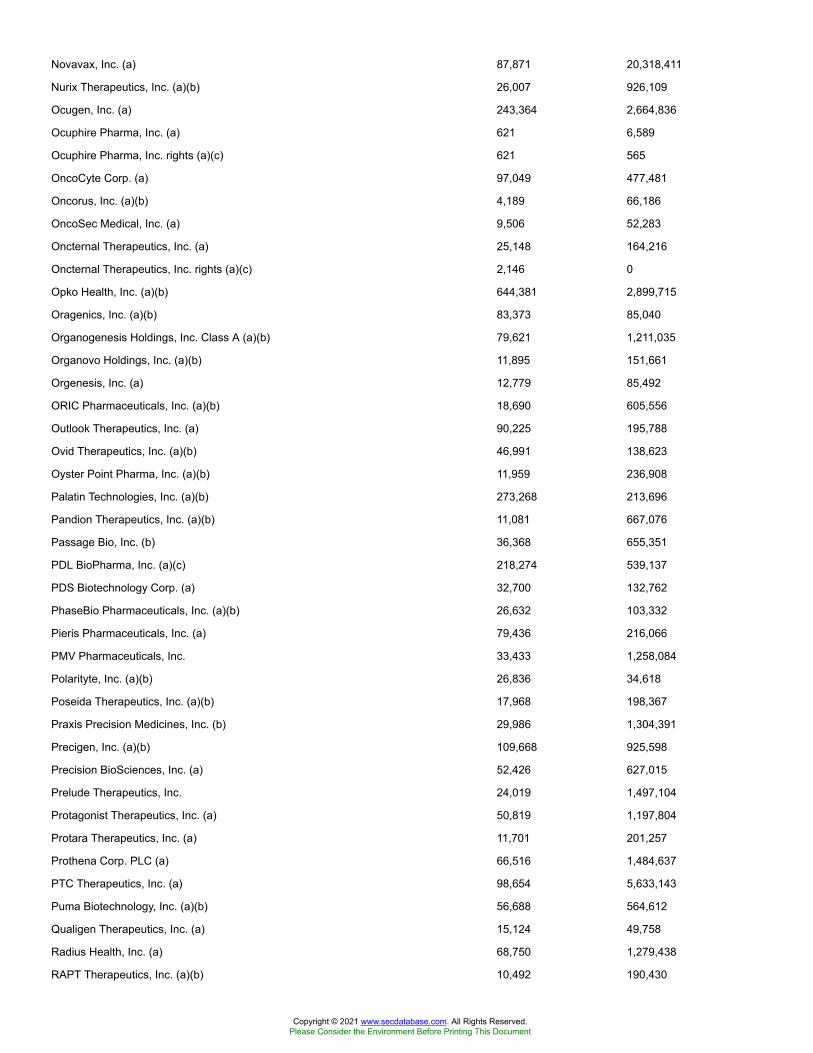
Novavax, Inc. (a) 87,871 20,318,411
Nurix Therapeutics, Inc. (a)(b) 26,007 926,109
Ocugen, Inc. (a) 243,364 2,664,836
Ocuphire Pharma, Inc. (a) 621 6,589
Ocuphire Pharma, Inc. rights (a)(c) 621 565
OncoCyte Corp. (a) 97,049 477,481
Oncorus, Inc. (a)(b) 4,189 66,186
OncoSec Medical, Inc. (a) 9,506 52,283
Oncternal Therapeutics, Inc. (a) 25,148 164,216
Oncternal Therapeutics, Inc. rights (a)(c) 2,146 0
Opko Health, Inc. (a)(b) 644,381 2,899,715
Oragenics, Inc. (a)(b) 83,373 85,040
Organogenesis Holdings, Inc. Class A (a)(b) 79,621 1,211,035
Organovo Holdings, Inc. (a)(b) 11,895 151,661
Orgenesis, Inc. (a) 12,779 85,492
ORIC Pharmaceuticals, Inc. (a)(b) 18,690 605,556
Outlook Therapeutics, Inc. (a) 90,225 195,788
Ovid Therapeutics, Inc. (a)(b) 46,991 138,623
Oyster Point Pharma, Inc. (a)(b) 11,959 236,908
Palatin Technologies, Inc. (a)(b) 273,268 213,696
Pandion Therapeutics, Inc. (a)(b) 11,081 667,076
Passage Bio, Inc. (b) 36,368 655,351
PDL BioPharma, Inc. (a)(c) 218,274 539,137
PDS Biotechnology Corp. (a) 32,700 132,762
PhaseBio Pharmaceuticals, Inc. (a)(b) 26,632 103,332
Pieris Pharmaceuticals, Inc. (a) 79,436 216,066
PMV Pharmaceuticals, Inc. 33,433 1,258,084
Polarityte, Inc. (a)(b) 26,836 34,618
Poseida Therapeutics, Inc. (a)(b) 17,968 198,367
Praxis Precision Medicines, Inc. (b) 29,986 1,304,391
Precigen, Inc. (a)(b) 109,668 925,598
Precision BioSciences, Inc. (a) 52,426 627,015
Prelude Therapeutics, Inc. 24,019 1,497,104
Protagonist Therapeutics, Inc. (a) 50,819 1,197,804
Protara Therapeutics, Inc. (a) 11,701 201,257
Prothena Corp. PLC (a) 66,516 1,484,637
PTC Therapeutics, Inc. (a) 98,654 5,633,143
Puma Biotechnology, Inc. (a)(b) 56,688 564,612
Qualigen Therapeutics, Inc. (a) 15,124 49,758
Radius Health, Inc. (a) 68,750 1,279,438
RAPT Therapeutics, Inc. (a)(b) 10,492 190,430
Copyright © 2021 www.secdatabase.com. All Rights Reserved.Please Consider the Environment Before Printing This Document
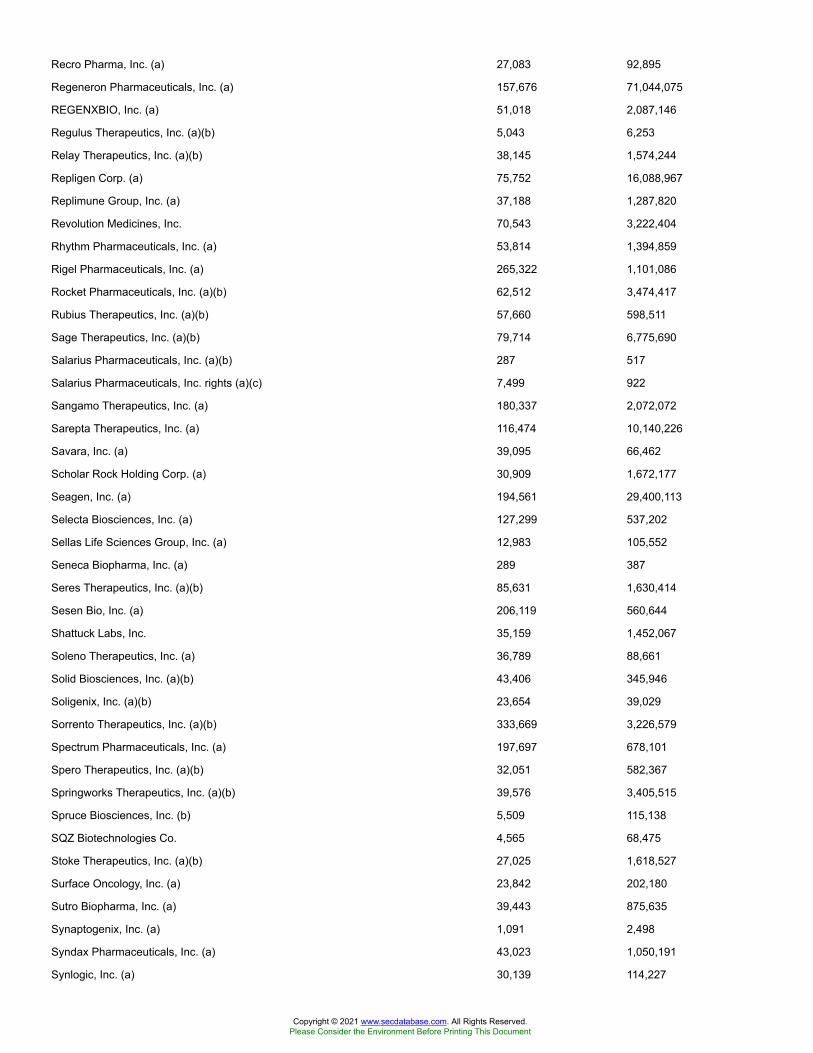
Recro Pharma, Inc. (a) 27,083 92,895
Regeneron Pharmaceuticals, Inc. (a) 157,676 71,044,075
REGENXBIO, Inc. (a) 51,018 2,087,146
Regulus Therapeutics, Inc. (a)(b) 5,043 6,253
Relay Therapeutics, Inc. (a)(b) 38,145 1,574,244
Repligen Corp. (a) 75,752 16,088,967
Replimune Group, Inc. (a) 37,188 1,287,820
Revolution Medicines, Inc. 70,543 3,222,404
Rhythm Pharmaceuticals, Inc. (a) 53,814 1,394,859
Rigel Pharmaceuticals, Inc. (a) 265,322 1,101,086
Rocket Pharmaceuticals, Inc. (a)(b) 62,512 3,474,417
Rubius Therapeutics, Inc. (a)(b) 57,660 598,511
Sage Therapeutics, Inc. (a)(b) 79,714 6,775,690
Salarius Pharmaceuticals, Inc. (a)(b) 287 517
Salarius Pharmaceuticals, Inc. rights (a)(c) 7,499 922
Sangamo Therapeutics, Inc. (a) 180,337 2,072,072
Sarepta Therapeutics, Inc. (a) 116,474 10,140,226
Savara, Inc. (a) 39,095 66,462
Scholar Rock Holding Corp. (a) 30,909 1,672,177
Seagen, Inc. (a) 194,561 29,400,113
Selecta Biosciences, Inc. (a) 127,299 537,202
Sellas Life Sciences Group, Inc. (a) 12,983 105,552
Seneca Biopharma, Inc. (a) 289 387
Seres Therapeutics, Inc. (a)(b) 85,631 1,630,414
Sesen Bio, Inc. (a) 206,119 560,644
Shattuck Labs, Inc. 35,159 1,452,067
Soleno Therapeutics, Inc. (a) 36,789 88,661
Solid Biosciences, Inc. (a)(b) 43,406 345,946
Soligenix, Inc. (a)(b) 23,654 39,029
Sorrento Therapeutics, Inc. (a)(b) 333,669 3,226,579
Spectrum Pharmaceuticals, Inc. (a) 197,697 678,101
Spero Therapeutics, Inc. (a)(b) 32,051 582,367
Springworks Therapeutics, Inc. (a)(b) 39,576 3,405,515
Spruce Biosciences, Inc. (b) 5,509 115,138
SQZ Biotechnologies Co. 4,565 68,475
Stoke Therapeutics, Inc. (a)(b) 27,025 1,618,527
Surface Oncology, Inc. (a) 23,842 202,180
Sutro Biopharma, Inc. (a) 39,443 875,635
Synaptogenix, Inc. (a) 1,091 2,498
Syndax Pharmaceuticals, Inc. (a) 43,023 1,050,191
Synlogic, Inc. (a) 30,139 114,227
Copyright © 2021 www.secdatabase.com. All Rights Reserved.Please Consider the Environment Before Printing This Document
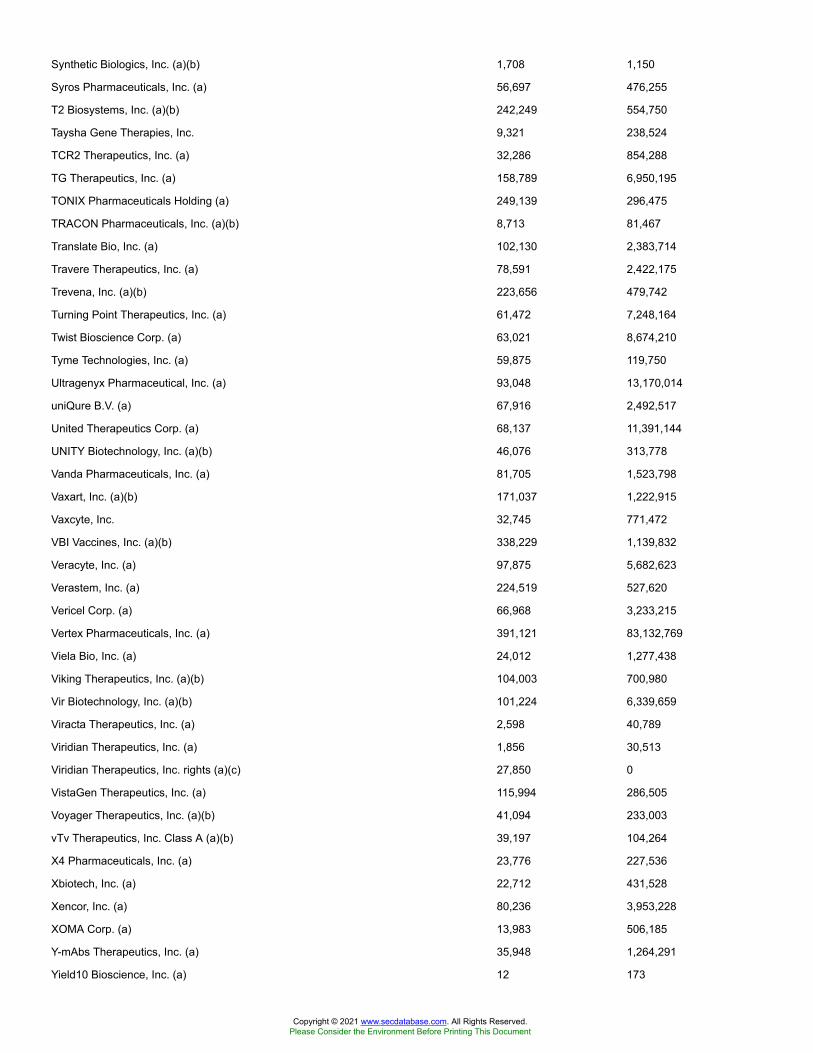
Synthetic Biologics, Inc. (a)(b) 1,708 1,150
Syros Pharmaceuticals, Inc. (a) 56,697 476,255
T2 Biosystems, Inc. (a)(b) 242,249 554,750
Taysha Gene Therapies, Inc. 9,321 238,524
TCR2 Therapeutics, Inc. (a) 32,286 854,288
TG Therapeutics, Inc. (a) 158,789 6,950,195
TONIX Pharmaceuticals Holding (a) 249,139 296,475
TRACON Pharmaceuticals, Inc. (a)(b) 8,713 81,467
Translate Bio, Inc. (a) 102,130 2,383,714
Travere Therapeutics, Inc. (a) 78,591 2,422,175
Trevena, Inc. (a)(b) 223,656 479,742
Turning Point Therapeutics, Inc. (a) 61,472 7,248,164
Twist Bioscience Corp. (a) 63,021 8,674,210
Tyme Technologies, Inc. (a) 59,875 119,750
Ultragenyx Pharmaceutical, Inc. (a) 93,048 13,170,014
uniQure B.V. (a) 67,916 2,492,517
United Therapeutics Corp. (a) 68,137 11,391,144
UNITY Biotechnology, Inc. (a)(b) 46,076 313,778
Vanda Pharmaceuticals, Inc. (a) 81,705 1,523,798
Vaxart, Inc. (a)(b) 171,037 1,222,915
Vaxcyte, Inc. 32,745 771,472
VBI Vaccines, Inc. (a)(b) 338,229 1,139,832
Veracyte, Inc. (a) 97,875 5,682,623
Verastem, Inc. (a) 224,519 527,620
Vericel Corp. (a) 66,968 3,233,215
Vertex Pharmaceuticals, Inc. (a) 391,121 83,132,769
Viela Bio, Inc. (a) 24,012 1,277,438
Viking Therapeutics, Inc. (a)(b) 104,003 700,980
Vir Biotechnology, Inc. (a)(b) 101,224 6,339,659
Viracta Therapeutics, Inc. (a) 2,598 40,789
Viridian Therapeutics, Inc. (a) 1,856 30,513
Viridian Therapeutics, Inc. rights (a)(c) 27,850 0
VistaGen Therapeutics, Inc. (a) 115,994 286,505
Voyager Therapeutics, Inc. (a)(b) 41,094 233,003
vTv Therapeutics, Inc. Class A (a)(b) 39,197 104,264
X4 Pharmaceuticals, Inc. (a) 23,776 227,536
Xbiotech, Inc. (a) 22,712 431,528
Xencor, Inc. (a) 80,236 3,953,228
XOMA Corp. (a) 13,983 506,185
Y-mAbs Therapeutics, Inc. (a) 35,948 1,264,291
Yield10 Bioscience, Inc. (a) 12 173
Copyright © 2021 www.secdatabase.com. All Rights Reserved.Please Consider the Environment Before Printing This Document
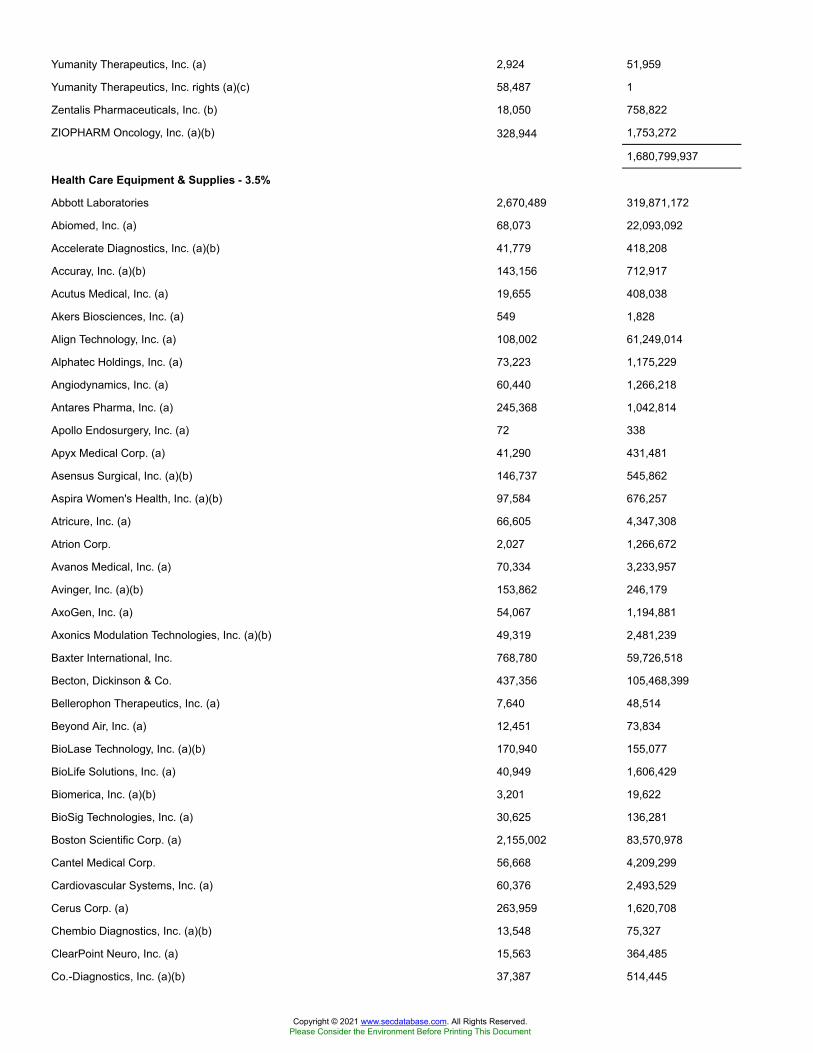
Yumanity Therapeutics, Inc. (a) 2,924 51,959
Yumanity Therapeutics, Inc. rights (a)(c) 58,487 1
Zentalis Pharmaceuticals, Inc. (b) 18,050 758,822
ZIOPHARM Oncology, Inc. (a)(b) 328,944 1,753,272
1,680,799,937
Health Care Equipment & Supplies - 3.5%
Abbott Laboratories 2,670,489 319,871,172
Abiomed, Inc. (a) 68,073 22,093,092
Accelerate Diagnostics, Inc. (a)(b) 41,779 418,208
Accuray, Inc. (a)(b) 143,156 712,917
Acutus Medical, Inc. (a) 19,655 408,038
Akers Biosciences, Inc. (a) 549 1,828
Align Technology, Inc. (a) 108,002 61,249,014
Alphatec Holdings, Inc. (a) 73,223 1,175,229
Angiodynamics, Inc. (a) 60,440 1,266,218
Antares Pharma, Inc. (a) 245,368 1,042,814
Apollo Endosurgery, Inc. (a) 72 338
Apyx Medical Corp. (a) 41,290 431,481
Asensus Surgical, Inc. (a)(b) 146,737 545,862
Aspira Women's Health, Inc. (a)(b) 97,584 676,257
Atricure, Inc. (a) 66,605 4,347,308
Atrion Corp. 2,027 1,266,672
Avanos Medical, Inc. (a) 70,334 3,233,957
Avinger, Inc. (a)(b) 153,862 246,179
AxoGen, Inc. (a) 54,067 1,194,881
Axonics Modulation Technologies, Inc. (a)(b) 49,319 2,481,239
Baxter International, Inc. 768,780 59,726,518
Becton, Dickinson & Co. 437,356 105,468,399
Bellerophon Therapeutics, Inc. (a) 7,640 48,514
Beyond Air, Inc. (a) 12,451 73,834
BioLase Technology, Inc. (a)(b) 170,940 155,077
BioLife Solutions, Inc. (a) 40,949 1,606,429
Biomerica, Inc. (a)(b) 3,201 19,622
BioSig Technologies, Inc. (a) 30,625 136,281
Boston Scientific Corp. (a) 2,155,002 83,570,978
Cantel Medical Corp. 56,668 4,209,299
Cardiovascular Systems, Inc. (a) 60,376 2,493,529
Cerus Corp. (a) 263,959 1,620,708
Chembio Diagnostics, Inc. (a)(b) 13,548 75,327
ClearPoint Neuro, Inc. (a) 15,563 364,485
Co.-Diagnostics, Inc. (a)(b) 37,387 514,445
Copyright © 2021 www.secdatabase.com. All Rights Reserved.Please Consider the Environment Before Printing This Document

ConforMis, Inc. (a) 98,971 99,961
CONMED Corp. (b) 43,150 5,310,039
Cryolife, Inc. (a)(b) 58,485 1,476,746
CryoPort, Inc. (a)(b) 64,907 3,858,072
Cutera, Inc. (a) 27,141 958,620
CytoSorbents Corp. (a)(b) 49,362 464,990
Danaher Corp. 952,639 209,266,209
Dare Bioscience, Inc. (a) 12,167 22,752
DarioHealth Corp. (a)(b) 10,018 266,479
Delcath Systems, Inc. (a)(b) 4,791 86,286
Dentsply Sirona, Inc. 328,620 17,439,863
DexCom, Inc. (a) 144,479 57,470,857
Eargo, Inc. (a) 22,432 1,310,253
Edwards Lifesciences Corp. (a) 938,165 77,961,512
Ekso Bionics Holdings, Inc. (a)(b) 5,328 38,095
electroCore, Inc. (a) 58,573 127,103
Electromed, Inc. (a) 6,101 64,427
ENDRA Life Sciences, Inc. (a) 2,359 5,898
Envista Holdings Corp. (a) 238,934 9,208,516
Fonar Corp. (a) 12,634 244,973
Genmark Diagnostics, Inc. (a) 102,403 2,001,979
Glaukos Corp. (a) 66,760 6,312,826
Globus Medical, Inc. (a) 113,776 7,111,000
Haemonetics Corp. (a) 75,849 9,594,899
Helius Medical Technologies, Inc. (U.S.) (a) 534 7,278
Heska Corp. (a)(b) 12,971 2,443,736
Hill-Rom Holdings, Inc. 101,432 10,819,751
Hologic, Inc. (a) 387,257 27,917,357
ICU Medical, Inc. (a) 29,202 6,059,415
IDEXX Laboratories, Inc. (a) 128,098 66,632,737
Inari Medical, Inc. 15,078 1,577,159
Inogen, Inc. (a) 26,003 1,364,897
Insulet Corp. (a) 99,427 25,761,536
Integer Holdings Corp. (a) 48,334 4,262,575
Integra LifeSciences Holdings Corp. (a) 106,930 7,307,596
Intersect ENT, Inc. (a) 48,150 1,098,302
IntriCon Corp. (a)(b) 10,720 246,131
Intuitive Surgical, Inc. (a) 177,012 130,422,442
Invacare Corp. (b) 53,785 489,444
IRadimed Corp. (a) 7,211 160,805
iRhythm Technologies, Inc. (a)(b) 43,248 6,958,603
Copyright © 2021 www.secdatabase.com. All Rights Reserved.Please Consider the Environment Before Printing This Document
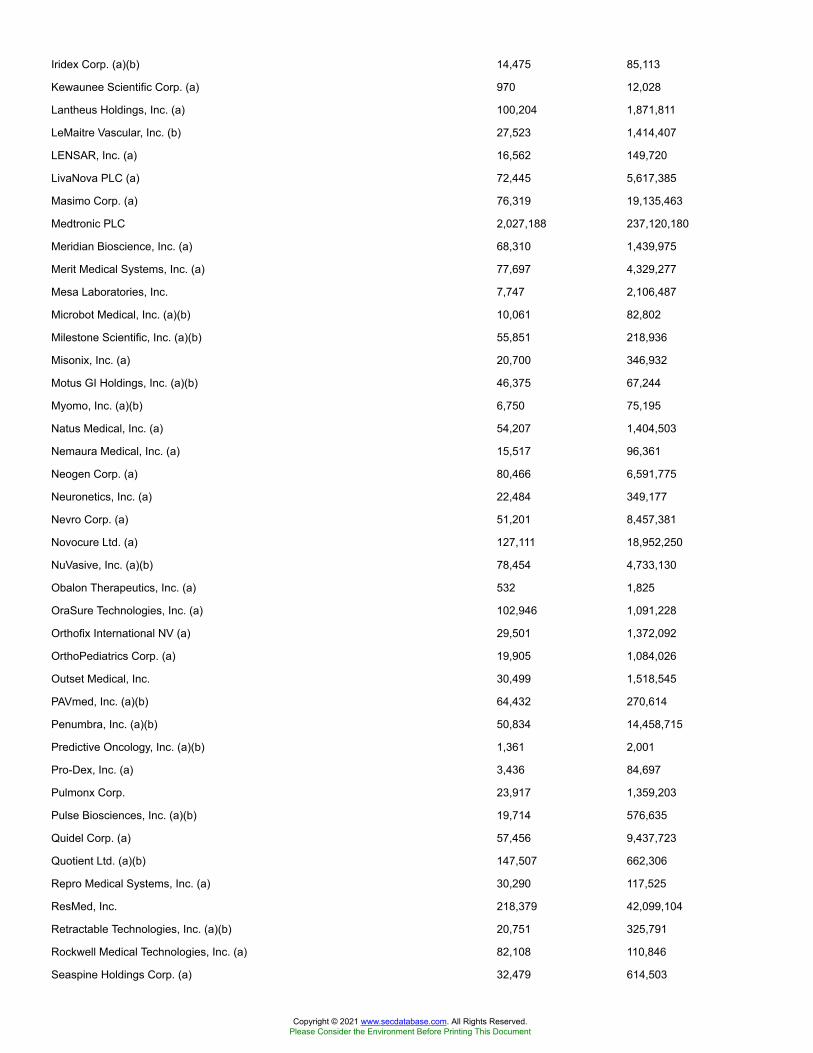
Iridex Corp. (a)(b) 14,475 85,113
Kewaunee Scientific Corp. (a) 970 12,028
Lantheus Holdings, Inc. (a) 100,204 1,871,811
LeMaitre Vascular, Inc. (b) 27,523 1,414,407
LENSAR, Inc. (a) 16,562 149,720
LivaNova PLC (a) 72,445 5,617,385
Masimo Corp. (a) 76,319 19,135,463
Medtronic PLC 2,027,188 237,120,180
Meridian Bioscience, Inc. (a) 68,310 1,439,975
Merit Medical Systems, Inc. (a) 77,697 4,329,277
Mesa Laboratories, Inc. 7,747 2,106,487
Microbot Medical, Inc. (a)(b) 10,061 82,802
Milestone Scientific, Inc. (a)(b) 55,851 218,936
Misonix, Inc. (a) 20,700 346,932
Motus GI Holdings, Inc. (a)(b) 46,375 67,244
Myomo, Inc. (a)(b) 6,750 75,195
Natus Medical, Inc. (a) 54,207 1,404,503
Nemaura Medical, Inc. (a) 15,517 96,361
Neogen Corp. (a) 80,466 6,591,775
Neuronetics, Inc. (a) 22,484 349,177
Nevro Corp. (a) 51,201 8,457,381
Novocure Ltd. (a) 127,111 18,952,250
NuVasive, Inc. (a)(b) 78,454 4,733,130
Obalon Therapeutics, Inc. (a) 532 1,825
OraSure Technologies, Inc. (a) 102,946 1,091,228
Orthofix International NV (a) 29,501 1,372,092
OrthoPediatrics Corp. (a) 19,905 1,084,026
Outset Medical, Inc. 30,499 1,518,545
PAVmed, Inc. (a)(b) 64,432 270,614
Penumbra, Inc. (a)(b) 50,834 14,458,715
Predictive Oncology, Inc. (a)(b) 1,361 2,001
Pro-Dex, Inc. (a) 3,436 84,697
Pulmonx Corp. 23,917 1,359,203
Pulse Biosciences, Inc. (a)(b) 19,714 576,635
Quidel Corp. (a) 57,456 9,437,723
Quotient Ltd. (a)(b) 147,507 662,306
Repro Medical Systems, Inc. (a) 30,290 117,525
ResMed, Inc. 218,379 42,099,104
Retractable Technologies, Inc. (a)(b) 20,751 325,791
Rockwell Medical Technologies, Inc. (a) 82,108 110,846
Seaspine Holdings Corp. (a) 32,479 614,503
Copyright © 2021 www.secdatabase.com. All Rights Reserved.Please Consider the Environment Before Printing This Document
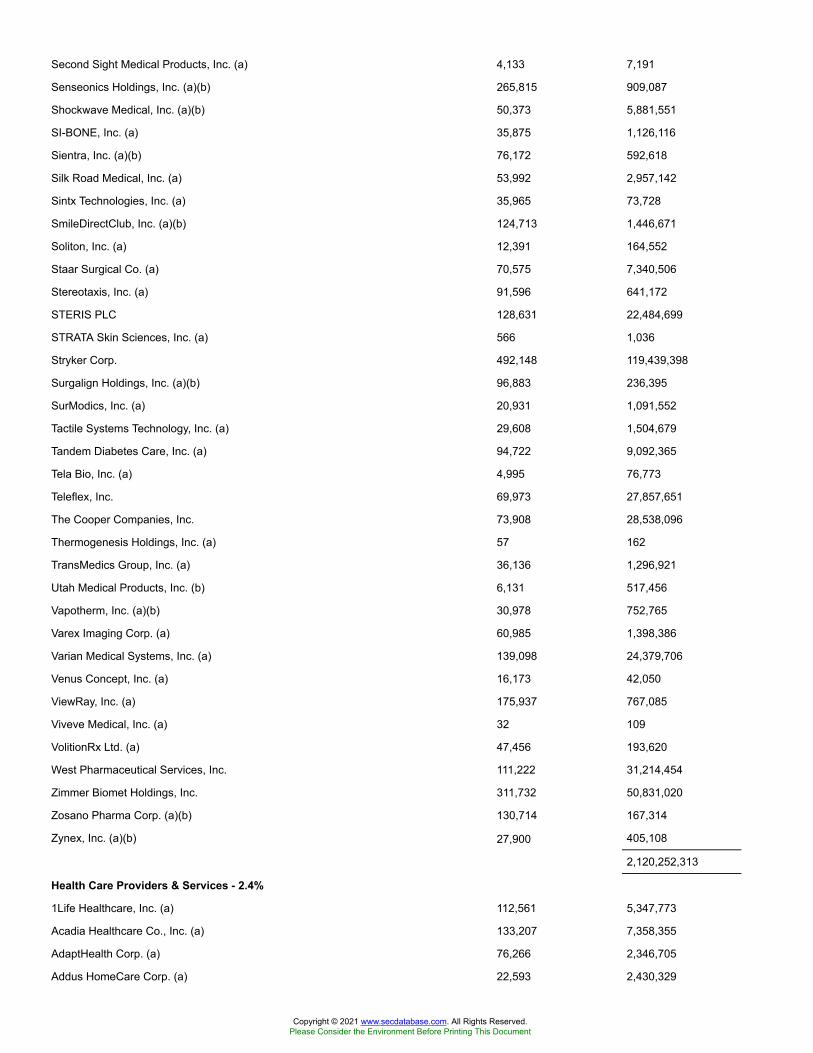
Second Sight Medical Products, Inc. (a) 4,133 7,191
Senseonics Holdings, Inc. (a)(b) 265,815 909,087
Shockwave Medical, Inc. (a)(b) 50,373 5,881,551
SI-BONE, Inc. (a) 35,875 1,126,116
Sientra, Inc. (a)(b) 76,172 592,618
Silk Road Medical, Inc. (a) 53,992 2,957,142
Sintx Technologies, Inc. (a) 35,965 73,728
SmileDirectClub, Inc. (a)(b) 124,713 1,446,671
Soliton, Inc. (a) 12,391 164,552
Staar Surgical Co. (a) 70,575 7,340,506
Stereotaxis, Inc. (a) 91,596 641,172
STERIS PLC 128,631 22,484,699
STRATA Skin Sciences, Inc. (a) 566 1,036
Stryker Corp. 492,148 119,439,398
Surgalign Holdings, Inc. (a)(b) 96,883 236,395
SurModics, Inc. (a) 20,931 1,091,552
Tactile Systems Technology, Inc. (a) 29,608 1,504,679
Tandem Diabetes Care, Inc. (a) 94,722 9,092,365
Tela Bio, Inc. (a) 4,995 76,773
Teleflex, Inc. 69,973 27,857,651
The Cooper Companies, Inc. 73,908 28,538,096
Thermogenesis Holdings, Inc. (a) 57 162
TransMedics Group, Inc. (a) 36,136 1,296,921
Utah Medical Products, Inc. (b) 6,131 517,456
Vapotherm, Inc. (a)(b) 30,978 752,765
Varex Imaging Corp. (a) 60,985 1,398,386
Varian Medical Systems, Inc. (a) 139,098 24,379,706
Venus Concept, Inc. (a) 16,173 42,050
ViewRay, Inc. (a) 175,937 767,085
Viveve Medical, Inc. (a) 32 109
VolitionRx Ltd. (a) 47,456 193,620
West Pharmaceutical Services, Inc. 111,222 31,214,454
Zimmer Biomet Holdings, Inc. 311,732 50,831,020
Zosano Pharma Corp. (a)(b) 130,714 167,314
Zynex, Inc. (a)(b) 27,900 405,108
2,120,252,313
Health Care Providers & Services - 2.4%
1Life Healthcare, Inc. (a) 112,561 5,347,773
Acadia Healthcare Co., Inc. (a) 133,207 7,358,355
AdaptHealth Corp. (a) 76,266 2,346,705
Addus HomeCare Corp. (a) 22,593 2,430,329
Copyright © 2021 www.secdatabase.com. All Rights Reserved.Please Consider the Environment Before Printing This Document
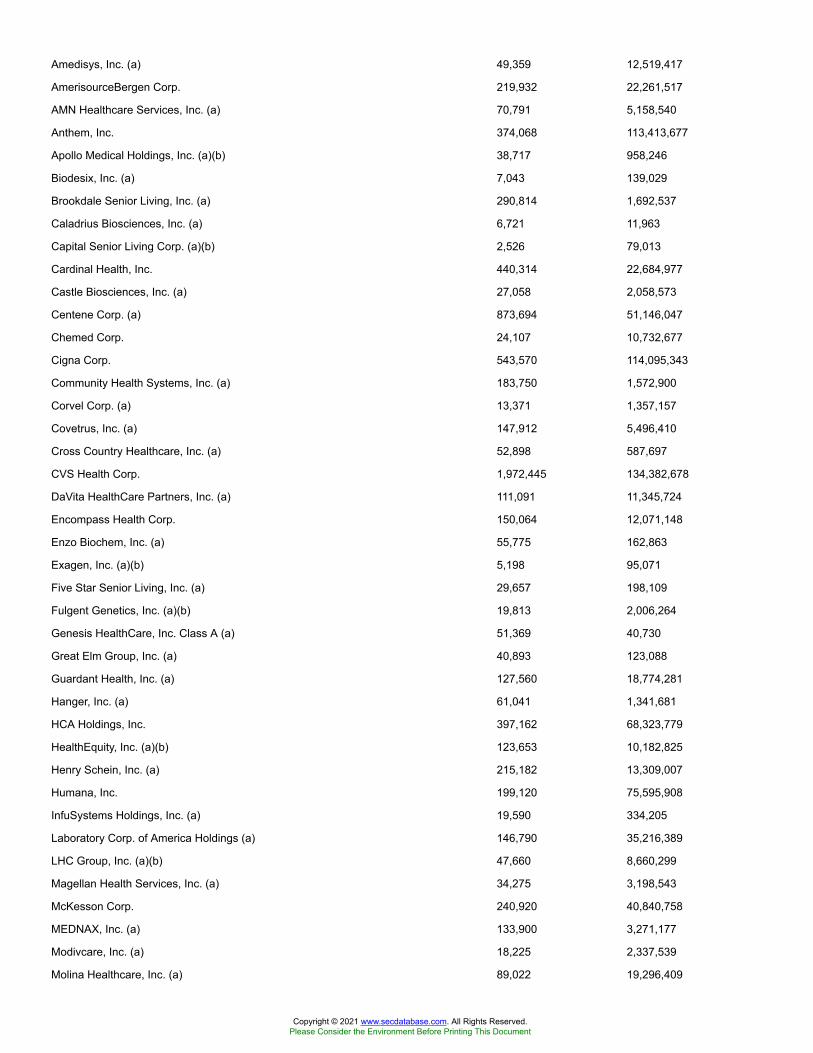
Amedisys, Inc. (a) 49,359 12,519,417
AmerisourceBergen Corp. 219,932 22,261,517
AMN Healthcare Services, Inc. (a) 70,791 5,158,540
Anthem, Inc. 374,068 113,413,677
Apollo Medical Holdings, Inc. (a)(b) 38,717 958,246
Biodesix, Inc. (a) 7,043 139,029
Brookdale Senior Living, Inc. (a) 290,814 1,692,537
Caladrius Biosciences, Inc. (a) 6,721 11,963
Capital Senior Living Corp. (a)(b) 2,526 79,013
Cardinal Health, Inc. 440,314 22,684,977
Castle Biosciences, Inc. (a) 27,058 2,058,573
Centene Corp. (a) 873,694 51,146,047
Chemed Corp. 24,107 10,732,677
Cigna Corp. 543,570 114,095,343
Community Health Systems, Inc. (a) 183,750 1,572,900
Corvel Corp. (a) 13,371 1,357,157
Covetrus, Inc. (a) 147,912 5,496,410
Cross Country Healthcare, Inc. (a) 52,898 587,697
CVS Health Corp. 1,972,445 134,382,678
DaVita HealthCare Partners, Inc. (a) 111,091 11,345,724
Encompass Health Corp. 150,064 12,071,148
Enzo Biochem, Inc. (a) 55,775 162,863
Exagen, Inc. (a)(b) 5,198 95,071
Five Star Senior Living, Inc. (a) 29,657 198,109
Fulgent Genetics, Inc. (a)(b) 19,813 2,006,264
Genesis HealthCare, Inc. Class A (a) 51,369 40,730
Great Elm Group, Inc. (a) 40,893 123,088
Guardant Health, Inc. (a) 127,560 18,774,281
Hanger, Inc. (a) 61,041 1,341,681
HCA Holdings, Inc. 397,162 68,323,779
HealthEquity, Inc. (a)(b) 123,653 10,182,825
Henry Schein, Inc. (a) 215,182 13,309,007
Humana, Inc. 199,120 75,595,908
InfuSystems Holdings, Inc. (a) 19,590 334,205
Laboratory Corp. of America Holdings (a) 146,790 35,216,389
LHC Group, Inc. (a)(b) 47,660 8,660,299
Magellan Health Services, Inc. (a) 34,275 3,198,543
McKesson Corp. 240,920 40,840,758
MEDNAX, Inc. (a) 133,900 3,271,177
Modivcare, Inc. (a) 18,225 2,337,539
Molina Healthcare, Inc. (a) 89,022 19,296,409
Copyright © 2021 www.secdatabase.com. All Rights Reserved.Please Consider the Environment Before Printing This Document
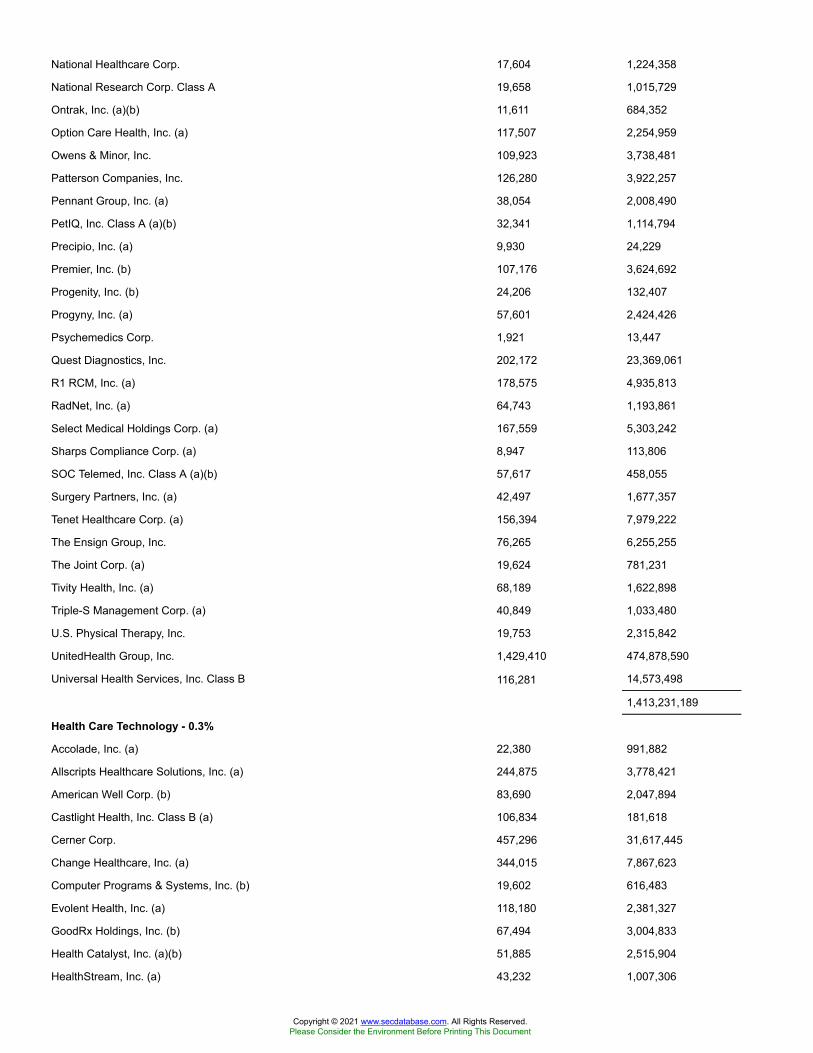
National Healthcare Corp. 17,604 1,224,358
National Research Corp. Class A 19,658 1,015,729
Ontrak, Inc. (a)(b) 11,611 684,352
Option Care Health, Inc. (a) 117,507 2,254,959
Owens & Minor, Inc. 109,923 3,738,481
Patterson Companies, Inc. 126,280 3,922,257
Pennant Group, Inc. (a) 38,054 2,008,490
PetIQ, Inc. Class A (a)(b) 32,341 1,114,794
Precipio, Inc. (a) 9,930 24,229
Premier, Inc. (b) 107,176 3,624,692
Progenity, Inc. (b) 24,206 132,407
Progyny, Inc. (a) 57,601 2,424,426
Psychemedics Corp. 1,921 13,447
Quest Diagnostics, Inc. 202,172 23,369,061
R1 RCM, Inc. (a) 178,575 4,935,813
RadNet, Inc. (a) 64,743 1,193,861
Select Medical Holdings Corp. (a) 167,559 5,303,242
Sharps Compliance Corp. (a) 8,947 113,806
SOC Telemed, Inc. Class A (a)(b) 57,617 458,055
Surgery Partners, Inc. (a) 42,497 1,677,357
Tenet Healthcare Corp. (a) 156,394 7,979,222
The Ensign Group, Inc. 76,265 6,255,255
The Joint Corp. (a) 19,624 781,231
Tivity Health, Inc. (a) 68,189 1,622,898
Triple-S Management Corp. (a) 40,849 1,033,480
U.S. Physical Therapy, Inc. 19,753 2,315,842
UnitedHealth Group, Inc. 1,429,410 474,878,590
Universal Health Services, Inc. Class B 116,281 14,573,498
1,413,231,189
Health Care Technology - 0.3%
Accolade, Inc. (a) 22,380 991,882
Allscripts Healthcare Solutions, Inc. (a) 244,875 3,778,421
American Well Corp. (b) 83,690 2,047,894
Castlight Health, Inc. Class B (a) 106,834 181,618
Cerner Corp. 457,296 31,617,445
Change Healthcare, Inc. (a) 344,015 7,867,623
Computer Programs & Systems, Inc. (b) 19,602 616,483
Evolent Health, Inc. (a) 118,180 2,381,327
GoodRx Holdings, Inc. (b) 67,494 3,004,833
Health Catalyst, Inc. (a)(b) 51,885 2,515,904
HealthStream, Inc. (a) 43,232 1,007,306
Copyright © 2021 www.secdatabase.com. All Rights Reserved.Please Consider the Environment Before Printing This Document
HMS Holdings Corp. (a) 136,207 5,010,375
HTG Molecular Diagnostics (a)(b) 3,005 16,678
iCAD, Inc. (a) 27,391 506,460
Inovalon Holdings, Inc. Class A (a) 119,919 2,945,211
Inspire Medical Systems, Inc. (a) 42,071 9,793,708
MultiPlan Corp. Class A (a)(b) 439,719 3,126,402
NantHealth, Inc. (a)(b) 40,006 152,823
Nextgen Healthcare, Inc. (a) 75,250 1,407,175
Omnicell, Inc. (a) 64,293 8,158,782
OptimizeRx Corp. (a) 17,269 918,365
Phreesia, Inc. (a) 47,063 2,882,609
Schrodinger, Inc. 51,603 5,288,275
Simulations Plus, Inc. 21,877 1,569,018
Tabula Rasa HealthCare, Inc. (a)(b) 32,291 1,309,400
Teladoc Health, Inc. (a)(b) 187,637 41,484,664
Veeva Systems, Inc. Class A (a) 203,849 57,100,143
Vocera Communications, Inc. (a) 50,773 2,175,115
199,855,939
Life Sciences Tools & Services - 1.3%
10X Genomics, Inc. (a) 106,216 18,905,386
Adaptive Biotechnologies Corp. (a) 122,588 6,934,803
Agilent Technologies, Inc. 460,717 56,239,724
Avantor, Inc. (a) 774,860 21,595,348
Berkeley Lights, Inc. (a) 14,048 870,555
Bio-Rad Laboratories, Inc. Class A (a) 32,470 18,978,715
Bio-Techne Corp. 57,943 20,957,404
Bioanalytical Systems, Inc. (a) 6,921 117,934
BioNano Genomics, Inc. (a)(b) 277,602 2,701,067
Bruker Corp. 155,251 9,467,206
Champions Oncology, Inc. (a) 6,812 79,564
Charles River Laboratories International, Inc. (a) 74,781 21,397,835
ChromaDex, Inc. (a)(b) 68,132 949,079
Codexis, Inc. (a) 82,534 1,824,827
Fluidigm Corp. (a)(b) 109,764 504,914
Harvard Bioscience, Inc. (a) 38,036 166,978
Illumina, Inc. (a) 219,498 96,449,616
IQVIA Holdings, Inc. (a) 288,149 55,552,246
Luminex Corp. 63,906 2,078,223
Medpace Holdings, Inc. (a) 42,083 6,835,542
Mettler-Toledo International, Inc. (a) 35,736 39,883,163
Nanostring Technologies, Inc. (a) 65,897 4,598,952
Copyright © 2021 www.secdatabase.com. All Rights Reserved.Please Consider the Environment Before Printing This Document
NeoGenomics, Inc. (a)(b) 165,826 8,452,151
Pacific Biosciences of California, Inc. (a) 281,764 8,613,525
PerkinElmer, Inc. 167,743 21,150,715
Personalis, Inc. (a) 40,421 1,246,179
PPD, Inc. 161,838 5,674,040
PRA Health Sciences, Inc. (a) 96,756 14,262,802
Quanterix Corp. (a) 39,547 2,995,685
Syneos Health, Inc. (a) 113,132 8,750,760
Thermo Fisher Scientific, Inc. 597,220 268,796,778
Waters Corp. (a) 93,574 25,628,047
752,659,763
Pharmaceuticals - 3.3%
9 Meters Biopharma, Inc. (a) 134,856 223,861
AcelRx Pharmaceuticals, Inc. (a) 108,373 203,741
Acer Therapeutics, Inc. (a)(b) 6,588 20,752
Aclaris Therapeutics, Inc. (a) 70,209 1,564,257
Adamis Pharmaceuticals Corp. (a) 152,571 170,880
Adial Pharmaceuticals, Inc. (a) 12,772 32,058
Aerie Pharmaceuticals, Inc. (a)(b) 71,273 1,310,710
Aerpio Pharmaceuticals, Inc. (a) 17,597 31,323
Agile Therapeutics, Inc. (a)(b) 85,784 246,200
Alimera Sciences, Inc. (a) 1,036 8,361
Amneal Pharmaceuticals, Inc. (a)(b) 186,979 1,007,817
Amphastar Pharmaceuticals, Inc. (a) 53,793 942,991
Ampio Pharmaceuticals, Inc. (a)(b) 240,032 410,455
ANI Pharmaceuticals, Inc. (a)(b) 13,713 399,048
ANI Pharmaceuticals, Inc. rights (a)(c) 21,445 0
Aquestive Therapeutics, Inc. (a) 29,801 136,489
Arvinas Holding Co. LLC (a) 46,284 3,624,037
Assertio Holdings, Inc. (a) 96,805 82,575
AstraZeneca PLC rights (a)(c) 7,692 0
Atea Pharmaceuticals, Inc. (b) 21,147 1,593,638
Athira Pharma, Inc. 18,986 418,831
Avenue Therapeutics, Inc. (a)(b) 6,166 28,980
Axsome Therapeutics, Inc. (a)(b) 40,072 2,699,250
Aytu BioScience, Inc. (a) 10,771 82,614
Baudax Bio, Inc. (a)(b) 10,668 14,402
Biodelivery Sciences International, Inc. (a) 137,541 577,672
Bristol-Myers Squibb Co. 3,405,997 208,889,796
Cara Therapeutics, Inc. (a) 63,036 1,156,711
Cassava Sciences, Inc. (a) 53,886 2,617,782
Copyright © 2021 www.secdatabase.com. All Rights Reserved.Please Consider the Environment Before Printing This Document
Catalent, Inc. (a) 248,021 28,202,468
Cerecor, Inc. (a) 77,918 262,584
Chiasma, Inc. (a)(b) 54,736 212,923
Citius Pharmaceuticals, Inc. (a) 61,506 124,857
Clearside Biomedical, Inc. (a) 56,255 186,204
Cocrystal Pharma, Inc. (a)(b) 40,430 63,475
Collegium Pharmaceutical, Inc. (a)(b) 48,986 1,155,580
Corcept Therapeutics, Inc. (a) 162,810 4,094,672
CorMedix, Inc. (a) 43,788 656,820
Cumberland Pharmaceuticals, Inc. (a) 5,048 17,163
CymaBay Therapeutics, Inc. (a) 111,875 537,000
Durect Corp. (a)(b) 300,972 668,158
Elanco Animal Health, Inc. (a) 711,068 23,365,694
Elanco Animal Health, Inc. rights (a)(c) 71,624 1
Eli Lilly & Co. 1,195,949 245,037,991
Eloxx Pharmaceuticals, Inc. (a)(b) 43,872 197,863
Endo International PLC (a) 355,706 2,820,749
Eton Pharmaceuticals, Inc. (a) 10,183 80,548
Evofem Biosciences, Inc. (a)(b) 110,621 428,103
Evoke Pharma, Inc. (a) 5,940 17,523
Evolus, Inc. (a) 37,906 459,042
Eyenovia, Inc. (a) 16,586 98,355
Eyepoint Pharmaceuticals, Inc. (a) 7,633 82,513
Fulcrum Therapeutics, Inc. (a)(b) 20,622 260,043
Graybug Vision, Inc. (b) 6,561 131,745
Harrow Health, Inc. (a)(b) 29,956 229,763
Hepion Pharmaceuticals, Inc. (a)(b) 49,750 93,530
Horizon Therapeutics PLC (a) 342,442 31,131,402
IMARA, Inc. (b) 8,877 111,761
Innoviva, Inc. (a) 104,480 1,194,206
Intra-Cellular Therapies, Inc. (a)(b) 103,084 3,652,266
Jaguar Health, Inc. (a)(b) 98,030 205,863
Jazz Pharmaceuticals PLC (a) 83,573 14,043,607
Johnson & Johnson 3,966,179 628,480,724
Kala Pharmaceuticals, Inc. (a)(b) 77,128 571,518
Kaleido Biosciences, Inc. (a) 20,352 181,743
Lannett Co., Inc. (a) 54,109 327,901
Lipocine, Inc. (a) 82,853 131,736
Liquidia Technologies, Inc. (a) 38,093 106,660
Marinus Pharmaceuticals, Inc. (a)(b) 41,020 619,812
Merck & Co., Inc. 3,813,847 276,961,569
Copyright © 2021 www.secdatabase.com. All Rights Reserved.Please Consider the Environment Before Printing This Document

Nektar Therapeutics (a)(b) 265,835 6,031,796
Neos Therapeutics, Inc. (a) 61,752 52,619
NGM Biopharmaceuticals, Inc. (a)(b) 25,441 679,784
NovaBay Pharmaceuticals, Inc. (a)(b) 4,499 5,084
Novan, Inc. (a) 169,083 240,098
Ocular Therapeutix, Inc. (a) 107,135 1,964,856
Odonate Therapeutics, Inc. (a) 30,486 641,730
Omeros Corp. (a)(b) 89,147 1,777,591
Onconova Therapeutics, Inc. (a) 286,989 358,736
OptiNose, Inc. (a) 48,331 187,524
Osmotica Pharmaceuticals PLC (a)(b) 15,165 57,627
Otonomy, Inc. (a) 64,513 188,055
Pacira Biosciences, Inc. (a) 64,296 4,725,756
Paratek Pharmaceuticals, Inc. (a)(b) 56,395 421,835
Perrigo Co. PLC 206,240 8,323,846
Petros Pharmaceuticals, Inc. (a)(b) 1,091 3,633
Pfizer, Inc. 8,374,747 280,470,277
Phathom Pharmaceuticals, Inc. (a)(b) 19,221 846,685
Phibro Animal Health Corp. Class A (b) 34,319 740,261
Pliant Therapeutics, Inc. (b) 12,956 428,714
Plx Pharma PLC/New (a)(b) 6,567 48,793
Prestige Brands Holdings, Inc. (a) 71,911 2,999,408
ProPhase Labs, Inc. (a)(b) 5,086 38,959
Provention Bio, Inc. (a) 67,605 859,936
Pulmatrix, Inc. (a) 13,881 21,377
Reata Pharmaceuticals, Inc. (a)(b) 38,962 4,763,494
Relmada Therapeutics, Inc. (a)(b) 23,122 770,887
Revance Therapeutics, Inc. (a) 105,704 2,775,787
Royalty Pharma PLC 130,078 6,057,732
Satsuma Pharmaceuticals, Inc. (a) 10,782 61,242
scPharmaceuticals, Inc. (a) 4,001 29,527
SCYNEXIS, Inc. (a)(b) 8,775 68,270
Seelos Therapeutics, Inc. (a) 79,237 235,334
Seelos Therapeutics, Inc. rights (a)(b)(c) 1,387 0
SIGA Technologies, Inc. (a) 87,801 554,902
Strongbridge Biopharma PLC (a) 41,930 131,660
Supernus Pharmaceuticals, Inc. (a) 81,268 2,183,671
Tarsus Pharmaceuticals, Inc. (a) 6,751 244,724
Teligent, Inc. (a) 9,911 8,780
TFF Pharmaceuticals, Inc. (a) 16,550 235,341
TherapeuticsMD, Inc. (a) 404,788 615,278
Copyright © 2021 www.secdatabase.com. All Rights Reserved.Please Consider the Environment Before Printing This Document
Theravance Biopharma, Inc. (a)(b) 71,109 1,178,276
Timber Pharmaceuticals, Inc. (a)(b) 207 373
Titan Pharmaceuticals, Inc. (a) 44 146
Tricida, Inc. (a) 43,460 222,081
Urovant Sciences Ltd. (a) 13,986 226,154
Verrica Pharmaceuticals, Inc. (a)(b) 20,129 275,969
Viatris, Inc. (a) 1,809,832 26,876,005
Vyne Therapeutics, Inc. (a)(b) 59,505 443,907
WAVE Life Sciences (a)(b) 48,055 452,198
Xeris Pharmaceuticals, Inc. (a) 64,426 351,122
Zoetis, Inc. Class A 714,463 110,913,236
Zogenix, Inc. (a) 77,650 1,646,957
Zomedica Corp. (a)(b) 981,794 1,835,955
Zynerba Pharmaceuticals, Inc. (a)(b) 30,528 137,223
1,971,112,577
TOTAL HEALTH CARE 8,137,911,718
INDUSTRIALS - 9.3%
Aerospace & Defense - 1.5%
AAR Corp. 52,938 2,105,874
Aerojet Rocketdyne Holdings, Inc. 110,410 5,660,721
AeroVironment, Inc. (a) 33,728 3,712,778
Air Industries Group, Inc. (a)(b) 17,165 26,434
Astronics Corp. (a) 36,467 576,179
Astrotech Corp. (a) 1,228 2,689
Axon Enterprise, Inc. (a) 94,838 15,694,741
BWX Technologies, Inc. 144,201 8,365,100
CPI Aerostructures, Inc. (a) 4,217 19,398
Cubic Corp. 47,345 3,288,110
Curtiss-Wright Corp. 61,584 6,804,416
Ducommun, Inc. (a) 17,391 946,070
General Dynamics Corp. 350,476 57,292,312
HEICO Corp. 78,558 9,881,025
HEICO Corp. Class A 93,403 10,812,331
Hexcel Corp. 127,190 6,837,734
Howmet Aerospace, Inc. 585,791 16,466,585
Huntington Ingalls Industries, Inc. 61,871 10,883,728
Innovative Solutions & Support, Inc. 15,429 98,128
Kaman Corp. 44,496 2,165,175
Kratos Defense & Security Solutions, Inc. (a) 188,640 5,187,600
L3Harris Technologies, Inc. 317,271 57,714,768
Copyright © 2021 www.secdatabase.com. All Rights Reserved.Please Consider the Environment Before Printing This Document

Lockheed Martin Corp. 371,474 122,679,289
Maxar Technologies, Inc. 91,060 4,357,221
Mercury Systems, Inc. (a) 85,200 5,568,672
Moog, Inc. Class A 45,207 3,510,776
National Presto Industries, Inc. 6,980 714,263
Northrop Grumman Corp. 233,528 68,110,776
PAE, Inc. (a)(b) 82,944 677,652
Park Aerospace Corp. 27,998 388,892
Parsons Corp. (a)(b) 33,255 1,188,534
Raytheon Technologies Corp. 2,286,183 164,582,314
SIFCO Industries, Inc. (a) 628 5,099
Spirit AeroSystems Holdings, Inc. Class A 163,291 6,993,754
Teledyne Technologies, Inc. (a) 55,318 20,522,978
Textron, Inc. 342,305 17,231,634
The Boeing Co. 799,146 169,426,943
TransDigm Group, Inc. (a) 81,947 47,256,376
Triumph Group, Inc. 81,636 1,189,437
Vectrus, Inc. (a) 17,920 978,432
Virgin Galactic Holdings, Inc. (a)(b) 193,497 7,203,893
867,128,831
Air Freight & Logistics - 0.6%
Air Transport Services Group, Inc. (a) 93,480 2,480,959
Atlas Air Worldwide Holdings, Inc. (a) 40,368 2,225,488
C.H. Robinson Worldwide, Inc. 203,679 18,504,237
Echo Global Logistics, Inc. (a) 43,503 1,211,994
Expeditors International of Washington, Inc. 255,322 23,448,772
FedEx Corp. 363,693 92,559,869
Forward Air Corp. 41,722 3,578,496
Hub Group, Inc. Class A (a) 49,931 2,875,027
Radiant Logistics, Inc. (a) 55,818 377,888
United Parcel Service, Inc. Class B 1,076,871 169,962,550
XPO Logistics, Inc. (a) 135,922 15,848,505
333,073,785
Airlines - 0.3%
Alaska Air Group, Inc. 183,202 11,911,794
Allegiant Travel Co. 19,218 4,846,587
American Airlines Group, Inc. 932,068 19,517,504
Delta Air Lines, Inc. 957,289 45,892,435
Hawaiian Holdings, Inc. 75,332 2,020,404
JetBlue Airways Corp. (a) 467,004 8,606,884
Mesa Air Group, Inc. (a) 46,703 569,777
Copyright © 2021 www.secdatabase.com. All Rights Reserved.Please Consider the Environment Before Printing This Document
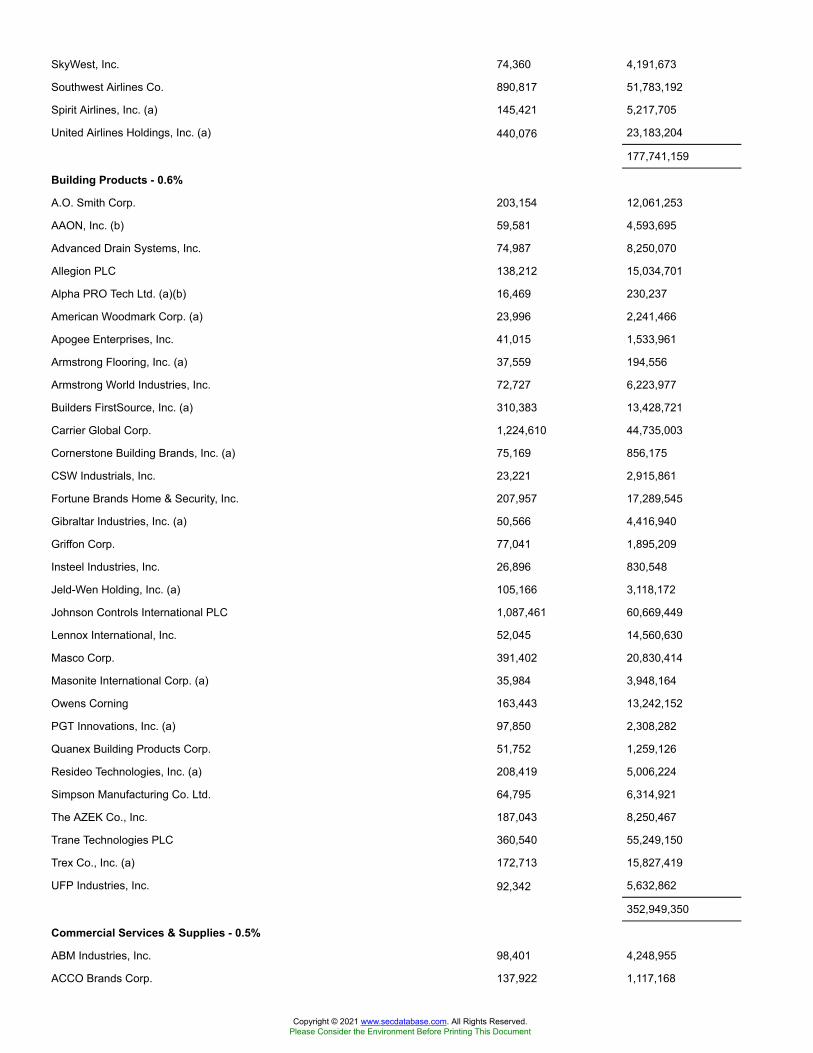
SkyWest, Inc. 74,360 4,191,673
Southwest Airlines Co. 890,817 51,783,192
Spirit Airlines, Inc. (a) 145,421 5,217,705
United Airlines Holdings, Inc. (a) 440,076 23,183,204
177,741,159
Building Products - 0.6%
A.O. Smith Corp. 203,154 12,061,253
AAON, Inc. (b) 59,581 4,593,695
Advanced Drain Systems, Inc. 74,987 8,250,070
Allegion PLC 138,212 15,034,701
Alpha PRO Tech Ltd. (a)(b) 16,469 230,237
American Woodmark Corp. (a) 23,996 2,241,466
Apogee Enterprises, Inc. 41,015 1,533,961
Armstrong Flooring, Inc. (a) 37,559 194,556
Armstrong World Industries, Inc. 72,727 6,223,977
Builders FirstSource, Inc. (a) 310,383 13,428,721
Carrier Global Corp. 1,224,610 44,735,003
Cornerstone Building Brands, Inc. (a) 75,169 856,175
CSW Industrials, Inc. 23,221 2,915,861
Fortune Brands Home & Security, Inc. 207,957 17,289,545
Gibraltar Industries, Inc. (a) 50,566 4,416,940
Griffon Corp. 77,041 1,895,209
Insteel Industries, Inc. 26,896 830,548
Jeld-Wen Holding, Inc. (a) 105,166 3,118,172
Johnson Controls International PLC 1,087,461 60,669,449
Lennox International, Inc. 52,045 14,560,630
Masco Corp. 391,402 20,830,414
Masonite International Corp. (a) 35,984 3,948,164
Owens Corning 163,443 13,242,152
PGT Innovations, Inc. (a) 97,850 2,308,282
Quanex Building Products Corp. 51,752 1,259,126
Resideo Technologies, Inc. (a) 208,419 5,006,224
Simpson Manufacturing Co. Ltd. 64,795 6,314,921
The AZEK Co., Inc. 187,043 8,250,467
Trane Technologies PLC 360,540 55,249,150
Trex Co., Inc. (a) 172,713 15,827,419
UFP Industries, Inc. 92,342 5,632,862
352,949,350
Commercial Services & Supplies - 0.5%
ABM Industries, Inc. 98,401 4,248,955
ACCO Brands Corp. 137,922 1,117,168
Copyright © 2021 www.secdatabase.com. All Rights Reserved.Please Consider the Environment Before Printing This Document
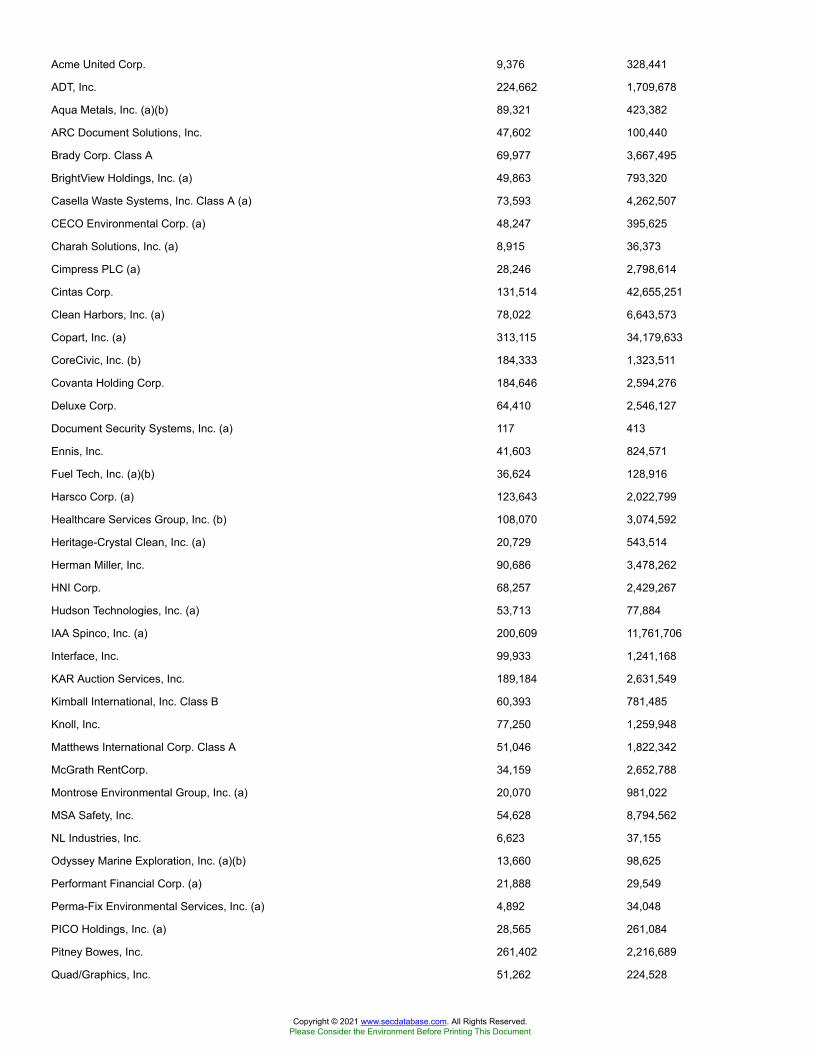
Acme United Corp. 9,376 328,441
ADT, Inc. 224,662 1,709,678
Aqua Metals, Inc. (a)(b) 89,321 423,382
ARC Document Solutions, Inc. 47,602 100,440
Brady Corp. Class A 69,977 3,667,495
BrightView Holdings, Inc. (a) 49,863 793,320
Casella Waste Systems, Inc. Class A (a) 73,593 4,262,507
CECO Environmental Corp. (a) 48,247 395,625
Charah Solutions, Inc. (a) 8,915 36,373
Cimpress PLC (a) 28,246 2,798,614
Cintas Corp. 131,514 42,655,251
Clean Harbors, Inc. (a) 78,022 6,643,573
Copart, Inc. (a) 313,115 34,179,633
CoreCivic, Inc. (b) 184,333 1,323,511
Covanta Holding Corp. 184,646 2,594,276
Deluxe Corp. 64,410 2,546,127
Document Security Systems, Inc. (a) 117 413
Ennis, Inc. 41,603 824,571
Fuel Tech, Inc. (a)(b) 36,624 128,916
Harsco Corp. (a) 123,643 2,022,799
Healthcare Services Group, Inc. (b) 108,070 3,074,592
Heritage-Crystal Clean, Inc. (a) 20,729 543,514
Herman Miller, Inc. 90,686 3,478,262
HNI Corp. 68,257 2,429,267
Hudson Technologies, Inc. (a) 53,713 77,884
IAA Spinco, Inc. (a) 200,609 11,761,706
Interface, Inc. 99,933 1,241,168
KAR Auction Services, Inc. 189,184 2,631,549
Kimball International, Inc. Class B 60,393 781,485
Knoll, Inc. 77,250 1,259,948
Matthews International Corp. Class A 51,046 1,822,342
McGrath RentCorp. 34,159 2,652,788
Montrose Environmental Group, Inc. (a) 20,070 981,022
MSA Safety, Inc. 54,628 8,794,562
NL Industries, Inc. 6,623 37,155
Odyssey Marine Exploration, Inc. (a)(b) 13,660 98,625
Performant Financial Corp. (a) 21,888 29,549
Perma-Fix Environmental Services, Inc. (a) 4,892 34,048
PICO Holdings, Inc. (a) 28,565 261,084
Pitney Bowes, Inc. 261,402 2,216,689
Quad/Graphics, Inc. 51,262 224,528
Copyright © 2021 www.secdatabase.com. All Rights Reserved.Please Consider the Environment Before Printing This Document

Quest Resource Holding Corp. (a) 2,099 6,318
R.R. Donnelley & Sons Co. 105,289 357,983
Recycling Asset Holdings, Inc. (a)(c) 1,142 40
Republic Services, Inc. 318,954 28,415,612
Rollins, Inc. 327,720 10,870,472
SP Plus Corp. (a) 36,498 1,209,909
Steelcase, Inc. Class A 137,111 1,911,327
Stericycle, Inc. (a) 137,661 8,930,069
Team, Inc. (a) 50,049 555,043
Tetra Tech, Inc. 81,875 11,329,044
The Brink's Co. (b) 73,274 5,629,641
U.S. Ecology, Inc. (a) 42,345 1,618,002
UniFirst Corp. 22,423 5,432,869
Viad Corp. 32,024 1,339,884
Virco Manufacturing Co. (a) 1,891 5,862
VSE Corp. 13,767 530,856
Waste Management, Inc. 587,473 65,144,881
300,520,647
Construction & Engineering - 0.2%
AECOM (a) 223,576 12,942,815
Aegion Corp. (a) 51,535 1,332,180
Ameresco, Inc. Class A (a) 29,804 1,702,404
API Group Corp. (a)(d) 201,937 3,735,835
Arcosa, Inc. 75,012 4,255,431
Argan, Inc. 22,516 1,126,250
Comfort Systems U.S.A., Inc. 57,420 3,556,595
Concrete Pumping Holdings, Inc. (a) 49,943 307,649
Construction Partners, Inc. Class A (a) 53,034 1,534,804
Dycom Industries, Inc. (a) 48,747 3,733,045
EMCOR Group, Inc. 79,950 7,784,732
Fluor Corp. (b) 215,064 3,690,498
Granite Construction, Inc. (b) 72,759 2,501,454
Great Lakes Dredge & Dock Corp. (a) 111,001 1,686,105
HC2 Holdings, Inc. (a) 108,565 379,978
IES Holdings, Inc. (a) 30,759 1,409,993
Infrastructure and Energy Alternatives, Inc. (a)(b) 12,116 201,974
iSun, Inc. (a)(b) 5,821 79,748
Jacobs Engineering Group, Inc. 194,157 22,343,588
Limbach Holdings, Inc. (a) 9,347 114,781
MasTec, Inc. (a) 86,152 7,473,686
Matrix Service Co. (a) 45,828 621,886
Copyright © 2021 www.secdatabase.com. All Rights Reserved.Please Consider the Environment Before Printing This Document
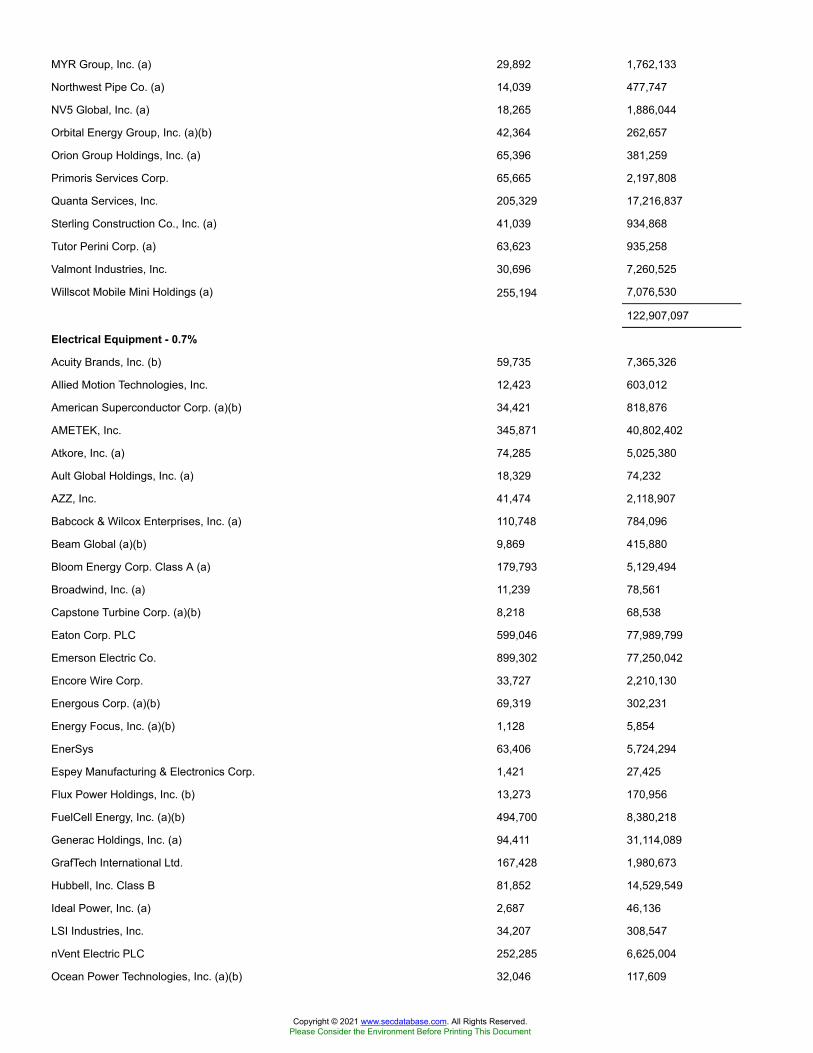
MYR Group, Inc. (a) 29,892 1,762,133
Northwest Pipe Co. (a) 14,039 477,747
NV5 Global, Inc. (a) 18,265 1,886,044
Orbital Energy Group, Inc. (a)(b) 42,364 262,657
Orion Group Holdings, Inc. (a) 65,396 381,259
Primoris Services Corp. 65,665 2,197,808
Quanta Services, Inc. 205,329 17,216,837
Sterling Construction Co., Inc. (a) 41,039 934,868
Tutor Perini Corp. (a) 63,623 935,258
Valmont Industries, Inc. 30,696 7,260,525
Willscot Mobile Mini Holdings (a) 255,194 7,076,530
122,907,097
Electrical Equipment - 0.7%
Acuity Brands, Inc. (b) 59,735 7,365,326
Allied Motion Technologies, Inc. 12,423 603,012
American Superconductor Corp. (a)(b) 34,421 818,876
AMETEK, Inc. 345,871 40,802,402
Atkore, Inc. (a) 74,285 5,025,380
Ault Global Holdings, Inc. (a) 18,329 74,232
AZZ, Inc. 41,474 2,118,907
Babcock & Wilcox Enterprises, Inc. (a) 110,748 784,096
Beam Global (a)(b) 9,869 415,880
Bloom Energy Corp. Class A (a) 179,793 5,129,494
Broadwind, Inc. (a) 11,239 78,561
Capstone Turbine Corp. (a)(b) 8,218 68,538
Eaton Corp. PLC 599,046 77,989,799
Emerson Electric Co. 899,302 77,250,042
Encore Wire Corp. 33,727 2,210,130
Energous Corp. (a)(b) 69,319 302,231
Energy Focus, Inc. (a)(b) 1,128 5,854
EnerSys 63,406 5,724,294
Espey Manufacturing & Electronics Corp. 1,421 27,425
Flux Power Holdings, Inc. (b) 13,273 170,956
FuelCell Energy, Inc. (a)(b) 494,700 8,380,218
Generac Holdings, Inc. (a) 94,411 31,114,089
GrafTech International Ltd. 167,428 1,980,673
Hubbell, Inc. Class B 81,852 14,529,549
Ideal Power, Inc. (a) 2,687 46,136
LSI Industries, Inc. 34,207 308,547
nVent Electric PLC 252,285 6,625,004
Ocean Power Technologies, Inc. (a)(b) 32,046 117,609
Copyright © 2021 www.secdatabase.com. All Rights Reserved.Please Consider the Environment Before Printing This Document
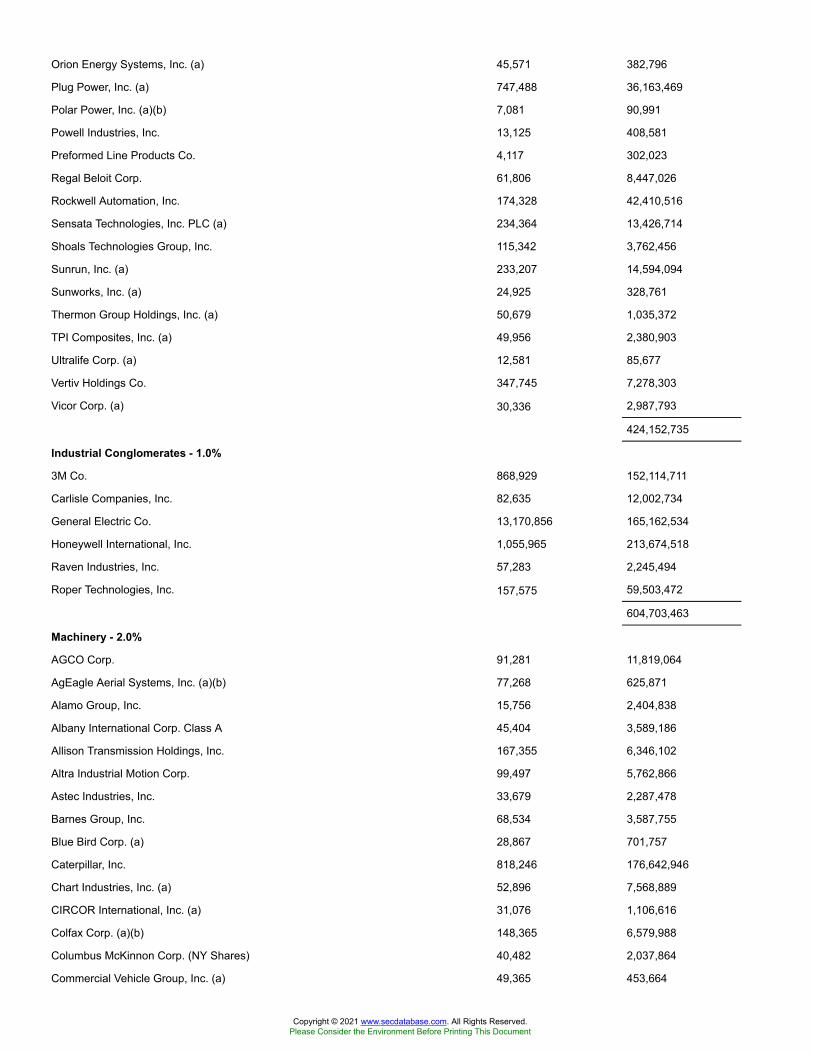
Orion Energy Systems, Inc. (a) 45,571 382,796
Plug Power, Inc. (a) 747,488 36,163,469
Polar Power, Inc. (a)(b) 7,081 90,991
Powell Industries, Inc. 13,125 408,581
Preformed Line Products Co. 4,117 302,023
Regal Beloit Corp. 61,806 8,447,026
Rockwell Automation, Inc. 174,328 42,410,516
Sensata Technologies, Inc. PLC (a) 234,364 13,426,714
Shoals Technologies Group, Inc. 115,342 3,762,456
Sunrun, Inc. (a) 233,207 14,594,094
Sunworks, Inc. (a) 24,925 328,761
Thermon Group Holdings, Inc. (a) 50,679 1,035,372
TPI Composites, Inc. (a) 49,956 2,380,903
Ultralife Corp. (a) 12,581 85,677
Vertiv Holdings Co. 347,745 7,278,303
Vicor Corp. (a) 30,336 2,987,793
424,152,735
Industrial Conglomerates - 1.0%
3M Co. 868,929 152,114,711
Carlisle Companies, Inc. 82,635 12,002,734
General Electric Co. 13,170,856 165,162,534
Honeywell International, Inc. 1,055,965 213,674,518
Raven Industries, Inc. 57,283 2,245,494
Roper Technologies, Inc. 157,575 59,503,472
604,703,463
Machinery - 2.0%
AGCO Corp. 91,281 11,819,064
AgEagle Aerial Systems, Inc. (a)(b) 77,268 625,871
Alamo Group, Inc. 15,756 2,404,838
Albany International Corp. Class A 45,404 3,589,186
Allison Transmission Holdings, Inc. 167,355 6,346,102
Altra Industrial Motion Corp. 99,497 5,762,866
Astec Industries, Inc. 33,679 2,287,478
Barnes Group, Inc. 68,534 3,587,755
Blue Bird Corp. (a) 28,867 701,757
Caterpillar, Inc. 818,246 176,642,946
Chart Industries, Inc. (a) 52,896 7,568,889
CIRCOR International, Inc. (a) 31,076 1,106,616
Colfax Corp. (a)(b) 148,365 6,579,988
Columbus McKinnon Corp. (NY Shares) 40,482 2,037,864
Commercial Vehicle Group, Inc. (a) 49,365 453,664
Copyright © 2021 www.secdatabase.com. All Rights Reserved.Please Consider the Environment Before Printing This Document

Crane Co. 75,457 6,327,824
Cummins, Inc. 222,616 56,366,371
Deere & Co. 471,982 164,778,356
Donaldson Co., Inc. 189,798 11,181,000
Douglas Dynamics, Inc. 37,087 1,786,852
Dover Corp. 216,427 26,676,792
Eastern Co. 3,940 100,470
Energy Recovery, Inc. (a)(b) 52,674 927,062
Enerpac Tool Group Corp. Class A (b) 85,579 2,113,801
EnPro Industries, Inc. 28,118 2,259,000
ESCO Technologies, Inc. 37,924 4,007,429
Evoqua Water Technologies Corp. (a) 177,187 4,349,941
ExOne Co. (a)(b) 20,320 692,912
Federal Signal Corp. 91,180 3,319,864
Flowserve Corp. 196,592 7,273,904
Fortive Corp. 505,231 33,254,304
Franklin Electric Co., Inc. 56,765 4,260,781
FreightCar America, Inc. (a) 13,689 46,474
Gates Industrial Corp. PLC (a) 69,518 1,042,770
Gencor Industries, Inc. (a) 10,152 144,158
Gorman-Rupp Co. 30,271 968,369
Graco, Inc. 252,950 17,542,083
Graham Corp. 19,661 301,600
Greenbrier Companies, Inc. (b) 49,957 2,350,477
Helios Technologies, Inc. 44,299 2,897,155
Hillenbrand, Inc. 116,103 5,394,145
Hurco Companies, Inc. 8,700 273,441
Hyliion Holdings Corp. Class A (a)(b) 147,352 2,227,962
Hyster-Yale Materials Handling Class A 15,771 1,349,209
IDEX Corp. 113,477 22,147,306
Illinois Tool Works, Inc. 433,030 87,550,005
Ingersoll Rand, Inc. (a) 558,459 25,878,990
ITT, Inc. 127,418 10,573,146
John Bean Technologies Corp. 47,291 6,978,733
Kadant, Inc. 18,432 3,207,168
Kennametal, Inc. 121,642 4,544,545
L.B. Foster Co. Class A (a) 14,144 239,741
Lincoln Electric Holdings, Inc. 89,192 10,534,467
Lindsay Corp. 17,700 2,836,425
LiqTech International, Inc. (a)(b) 36,587 405,018
Lydall, Inc. (a) 28,565 994,919
Copyright © 2021 www.secdatabase.com. All Rights Reserved.Please Consider the Environment Before Printing This Document

Manitex International, Inc. (a) 15,946 119,914
Manitowoc Co., Inc. (a) 54,859 893,653
Mayville Engineering Co., Inc. (a) 18,124 253,917
Meritor, Inc. (a) 105,850 3,214,665
Middleby Corp. (a) 83,071 12,162,425
Miller Industries, Inc. (b) 17,789 702,132
Mueller Industries, Inc. 91,022 3,699,134
Mueller Water Products, Inc. Class A 239,068 3,081,587
Navistar International Corp. (a) 75,660 3,333,580
Nikola Corp. (a)(b) 206,521 3,738,030
NN, Inc. (a)(b) 70,310 429,594
Nordson Corp. 80,790 15,544,804
Omega Flex, Inc. (b) 5,326 918,735
Oshkosh Corp. 101,591 10,768,646
Otis Worldwide Corp. 612,980 39,052,956
PACCAR, Inc. 519,293 47,250,470
Park-Ohio Holdings Corp. 15,706 507,775
Parker Hannifin Corp. 193,489 55,523,603
Pentair PLC 249,191 13,937,253
Proto Labs, Inc. (a) 40,062 5,836,232
RBC Bearings, Inc. (a) 37,896 7,543,578
REV Group, Inc. 39,332 488,503
Rexnord Corp. 179,075 8,049,421
Snap-On, Inc. 80,818 16,414,944
SPX Corp. (a) 70,031 3,893,023
SPX Flow, Inc. (a) 64,699 3,982,870
Standex International Corp. 19,575 1,919,525
Stanley Black & Decker, Inc. 241,005 42,137,314
Tennant Co. 29,822 2,272,436
Terex Corp. 100,108 4,122,447
The L.S. Starrett Co. Class A (a) 3,411 21,830
The Shyft Group, Inc. 46,782 1,538,660
Timken Co. 100,602 7,882,167
Titan International, Inc. 85,722 708,921
Toro Co. 161,930 16,317,686
TriMas Corp. (a) 70,955 2,383,378
Trinity Industries, Inc. (b) 141,654 4,547,093
Twin Disc, Inc. (a)(b) 11,715 96,883
Wabash National Corp. 88,082 1,460,400
Watts Water Technologies, Inc. Class A 41,027 4,680,770
Welbilt, Inc. (a) 207,390 3,314,092
Copyright © 2021 www.secdatabase.com. All Rights Reserved.Please Consider the Environment Before Printing This Document
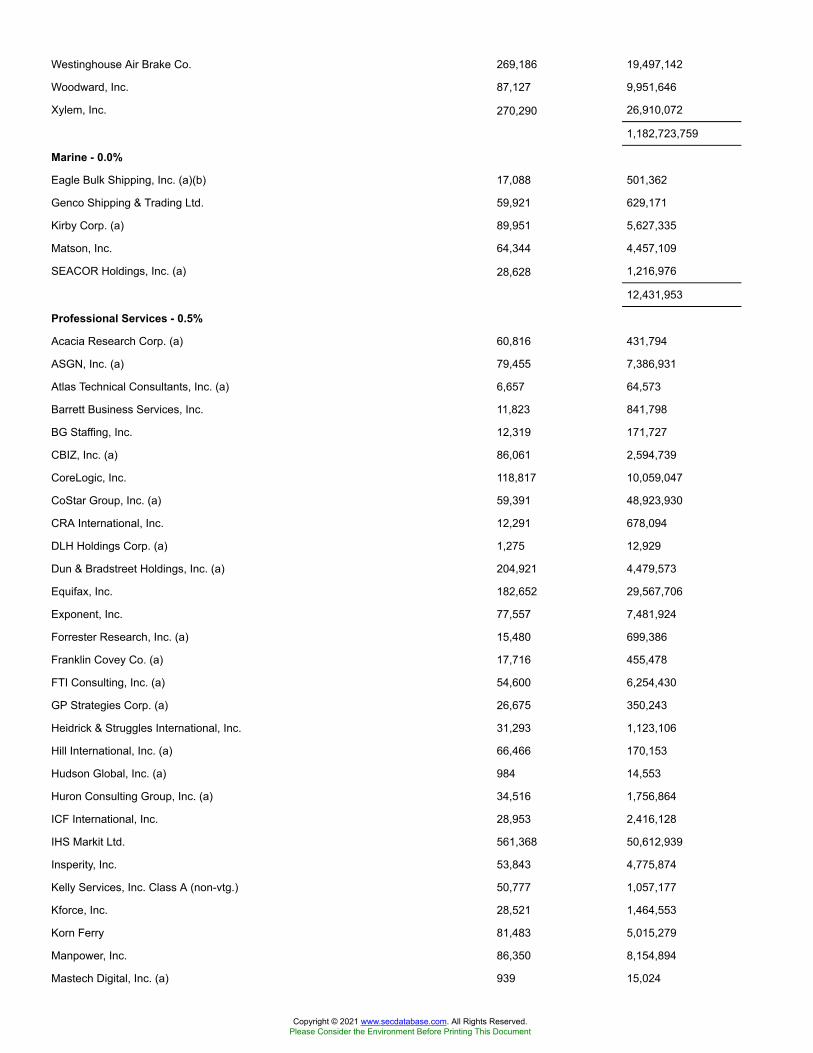
Westinghouse Air Brake Co. 269,186 19,497,142
Woodward, Inc. 87,127 9,951,646
Xylem, Inc. 270,290 26,910,072
1,182,723,759
Marine - 0.0%
Eagle Bulk Shipping, Inc. (a)(b) 17,088 501,362
Genco Shipping & Trading Ltd. 59,921 629,171
Kirby Corp. (a) 89,951 5,627,335
Matson, Inc. 64,344 4,457,109
SEACOR Holdings, Inc. (a) 28,628 1,216,976
12,431,953
Professional Services - 0.5%
Acacia Research Corp. (a) 60,816 431,794
ASGN, Inc. (a) 79,455 7,386,931
Atlas Technical Consultants, Inc. (a) 6,657 64,573
Barrett Business Services, Inc. 11,823 841,798
BG Staffing, Inc. 12,319 171,727
CBIZ, Inc. (a) 86,061 2,594,739
CoreLogic, Inc. 118,817 10,059,047
CoStar Group, Inc. (a) 59,391 48,923,930
CRA International, Inc. 12,291 678,094
DLH Holdings Corp. (a) 1,275 12,929
Dun & Bradstreet Holdings, Inc. (a) 204,921 4,479,573
Equifax, Inc. 182,652 29,567,706
Exponent, Inc. 77,557 7,481,924
Forrester Research, Inc. (a) 15,480 699,386
Franklin Covey Co. (a) 17,716 455,478
FTI Consulting, Inc. (a) 54,600 6,254,430
GP Strategies Corp. (a) 26,675 350,243
Heidrick & Struggles International, Inc. 31,293 1,123,106
Hill International, Inc. (a) 66,466 170,153
Hudson Global, Inc. (a) 984 14,553
Huron Consulting Group, Inc. (a) 34,516 1,756,864
ICF International, Inc. 28,953 2,416,128
IHS Markit Ltd. 561,368 50,612,939
Insperity, Inc. 53,843 4,775,874
Kelly Services, Inc. Class A (non-vtg.) 50,777 1,057,177
Kforce, Inc. 28,521 1,464,553
Korn Ferry 81,483 5,015,279
Manpower, Inc. 86,350 8,154,894
Mastech Digital, Inc. (a) 939 15,024
Copyright © 2021 www.secdatabase.com. All Rights Reserved.Please Consider the Environment Before Printing This Document
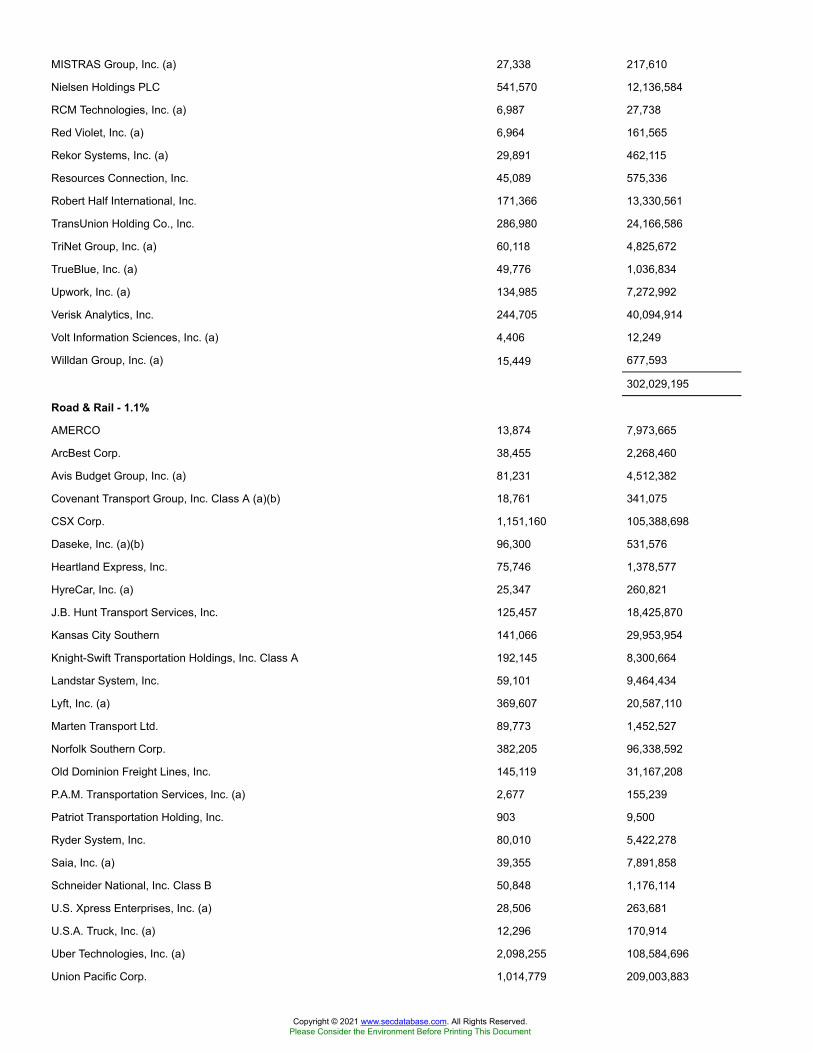
MISTRAS Group, Inc. (a) 27,338 217,610
Nielsen Holdings PLC 541,570 12,136,584
RCM Technologies, Inc. (a) 6,987 27,738
Red Violet, Inc. (a) 6,964 161,565
Rekor Systems, Inc. (a) 29,891 462,115
Resources Connection, Inc. 45,089 575,336
Robert Half International, Inc. 171,366 13,330,561
TransUnion Holding Co., Inc. 286,980 24,166,586
TriNet Group, Inc. (a) 60,118 4,825,672
TrueBlue, Inc. (a) 49,776 1,036,834
Upwork, Inc. (a) 134,985 7,272,992
Verisk Analytics, Inc. 244,705 40,094,914
Volt Information Sciences, Inc. (a) 4,406 12,249
Willdan Group, Inc. (a) 15,449 677,593
302,029,195
Road & Rail - 1.1%
AMERCO 13,874 7,973,665
ArcBest Corp. 38,455 2,268,460
Avis Budget Group, Inc. (a) 81,231 4,512,382
Covenant Transport Group, Inc. Class A (a)(b) 18,761 341,075
CSX Corp. 1,151,160 105,388,698
Daseke, Inc. (a)(b) 96,300 531,576
Heartland Express, Inc. 75,746 1,378,577
HyreCar, Inc. (a) 25,347 260,821
J.B. Hunt Transport Services, Inc. 125,457 18,425,870
Kansas City Southern 141,066 29,953,954
Knight-Swift Transportation Holdings, Inc. Class A 192,145 8,300,664
Landstar System, Inc. 59,101 9,464,434
Lyft, Inc. (a) 369,607 20,587,110
Marten Transport Ltd. 89,773 1,452,527
Norfolk Southern Corp. 382,205 96,338,592
Old Dominion Freight Lines, Inc. 145,119 31,167,208
P.A.M. Transportation Services, Inc. (a) 2,677 155,239
Patriot Transportation Holding, Inc. 903 9,500
Ryder System, Inc. 80,010 5,422,278
Saia, Inc. (a) 39,355 7,891,858
Schneider National, Inc. Class B 50,848 1,176,114
U.S. Xpress Enterprises, Inc. (a) 28,506 263,681
U.S.A. Truck, Inc. (a) 12,296 170,914
Uber Technologies, Inc. (a) 2,098,255 108,584,696
Union Pacific Corp. 1,014,779 209,003,883
Copyright © 2021 www.secdatabase.com. All Rights Reserved.Please Consider the Environment Before Printing This Document
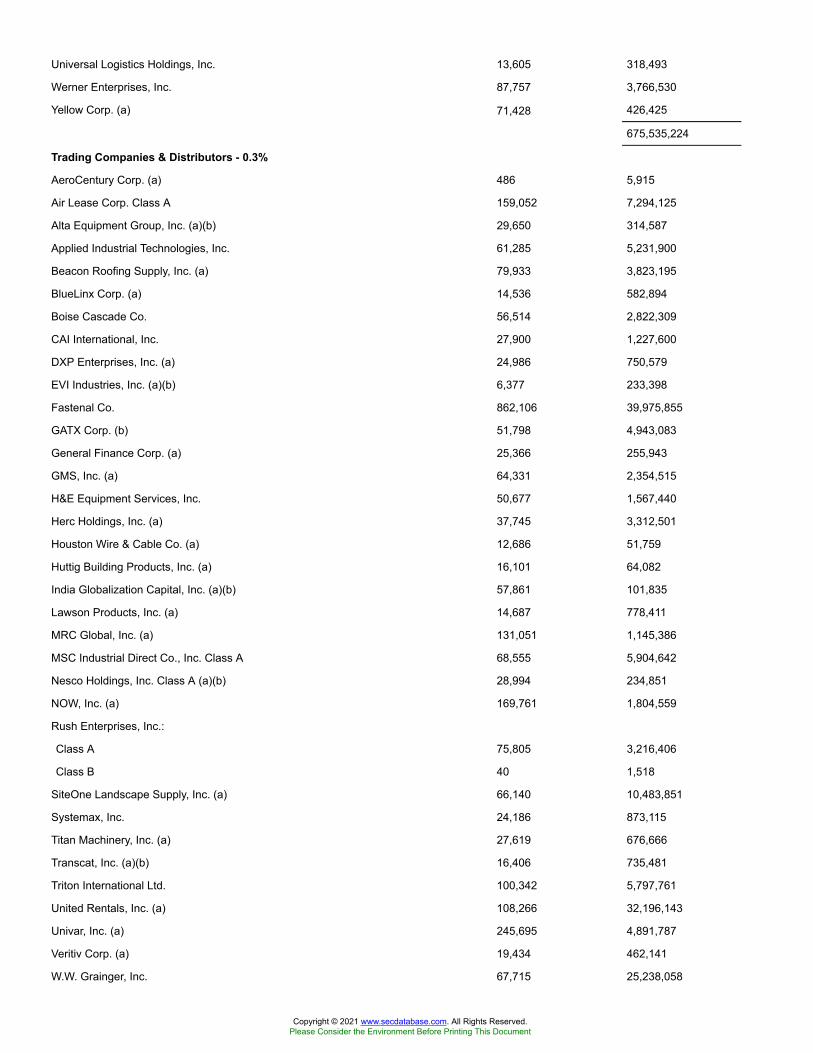
Universal Logistics Holdings, Inc. 13,605 318,493
Werner Enterprises, Inc. 87,757 3,766,530
Yellow Corp. (a) 71,428 426,425
675,535,224
Trading Companies & Distributors - 0.3%
AeroCentury Corp. (a) 486 5,915
Air Lease Corp. Class A 159,052 7,294,125
Alta Equipment Group, Inc. (a)(b) 29,650 314,587
Applied Industrial Technologies, Inc. 61,285 5,231,900
Beacon Roofing Supply, Inc. (a) 79,933 3,823,195
BlueLinx Corp. (a) 14,536 582,894
Boise Cascade Co. 56,514 2,822,309
CAI International, Inc. 27,900 1,227,600
DXP Enterprises, Inc. (a) 24,986 750,579
EVI Industries, Inc. (a)(b) 6,377 233,398
Fastenal Co. 862,106 39,975,855
GATX Corp. (b) 51,798 4,943,083
General Finance Corp. (a) 25,366 255,943
GMS, Inc. (a) 64,331 2,354,515
H&E Equipment Services, Inc. 50,677 1,567,440
Herc Holdings, Inc. (a) 37,745 3,312,501
Houston Wire & Cable Co. (a) 12,686 51,759
Huttig Building Products, Inc. (a) 16,101 64,082
India Globalization Capital, Inc. (a)(b) 57,861 101,835
Lawson Products, Inc. (a) 14,687 778,411
MRC Global, Inc. (a) 131,051 1,145,386
MSC Industrial Direct Co., Inc. Class A 68,555 5,904,642
Nesco Holdings, Inc. Class A (a)(b) 28,994 234,851
NOW, Inc. (a) 169,761 1,804,559
Rush Enterprises, Inc.:
Class A 75,805 3,216,406
Class B 40 1,518
SiteOne Landscape Supply, Inc. (a) 66,140 10,483,851
Systemax, Inc. 24,186 873,115
Titan Machinery, Inc. (a) 27,619 676,666
Transcat, Inc. (a)(b) 16,406 735,481
Triton International Ltd. 100,342 5,797,761
United Rentals, Inc. (a) 108,266 32,196,143
Univar, Inc. (a) 245,695 4,891,787
Veritiv Corp. (a) 19,434 462,141
W.W. Grainger, Inc. 67,715 25,238,058
Copyright © 2021 www.secdatabase.com. All Rights Reserved.Please Consider the Environment Before Printing This Document
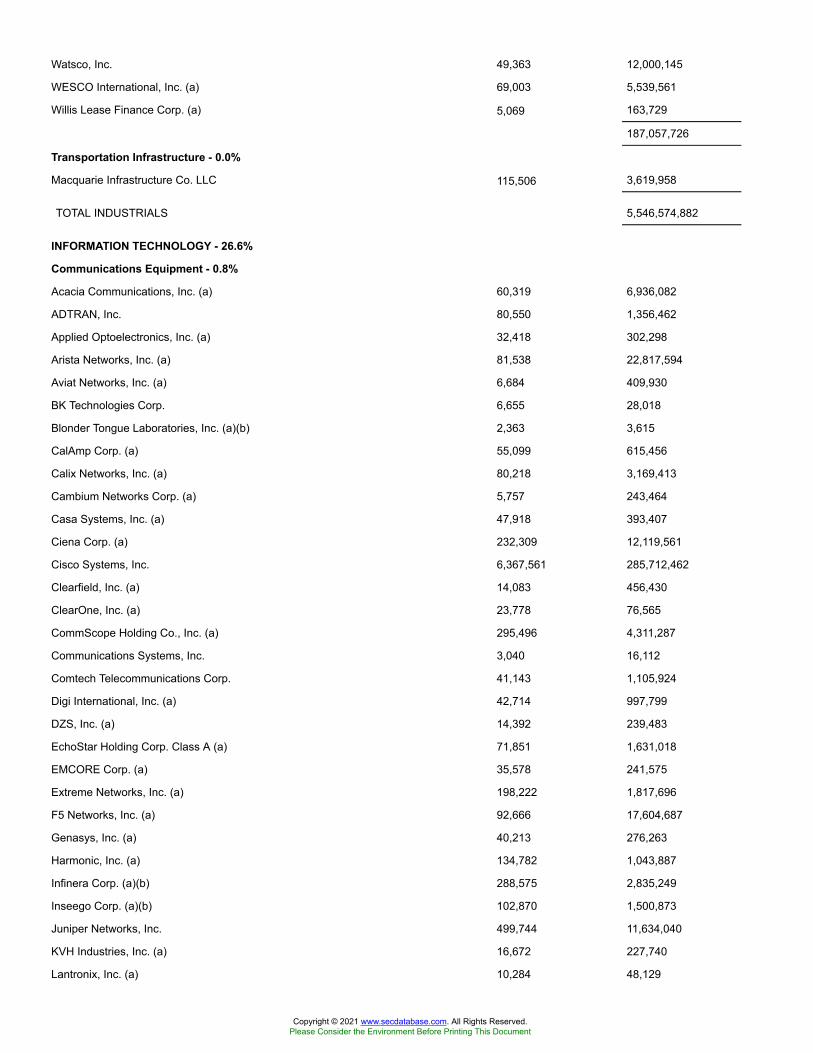
Watsco, Inc. 49,363 12,000,145
WESCO International, Inc. (a) 69,003 5,539,561
Willis Lease Finance Corp. (a) 5,069 163,729
187,057,726
Transportation Infrastructure - 0.0%
Macquarie Infrastructure Co. LLC 115,506 3,619,958
TOTAL INDUSTRIALS 5,546,574,882
INFORMATION TECHNOLOGY - 26.6%
Communications Equipment - 0.8%
Acacia Communications, Inc. (a) 60,319 6,936,082
ADTRAN, Inc. 80,550 1,356,462
Applied Optoelectronics, Inc. (a) 32,418 302,298
Arista Networks, Inc. (a) 81,538 22,817,594
Aviat Networks, Inc. (a) 6,684 409,930
BK Technologies Corp. 6,655 28,018
Blonder Tongue Laboratories, Inc. (a)(b) 2,363 3,615
CalAmp Corp. (a) 55,099 615,456
Calix Networks, Inc. (a) 80,218 3,169,413
Cambium Networks Corp. (a) 5,757 243,464
Casa Systems, Inc. (a) 47,918 393,407
Ciena Corp. (a) 232,309 12,119,561
Cisco Systems, Inc. 6,367,561 285,712,462
Clearfield, Inc. (a) 14,083 456,430
ClearOne, Inc. (a) 23,778 76,565
CommScope Holding Co., Inc. (a) 295,496 4,311,287
Communications Systems, Inc. 3,040 16,112
Comtech Telecommunications Corp. 41,143 1,105,924
Digi International, Inc. (a) 42,714 997,799
DZS, Inc. (a) 14,392 239,483
EchoStar Holding Corp. Class A (a) 71,851 1,631,018
EMCORE Corp. (a) 35,578 241,575
Extreme Networks, Inc. (a) 198,222 1,817,696
F5 Networks, Inc. (a) 92,666 17,604,687
Genasys, Inc. (a) 40,213 276,263
Harmonic, Inc. (a) 134,782 1,043,887
Infinera Corp. (a)(b) 288,575 2,835,249
Inseego Corp. (a)(b) 102,870 1,500,873
Juniper Networks, Inc. 499,744 11,634,040
KVH Industries, Inc. (a) 16,672 227,740
Lantronix, Inc. (a) 10,284 48,129
Copyright © 2021 www.secdatabase.com. All Rights Reserved.Please Consider the Environment Before Printing This Document
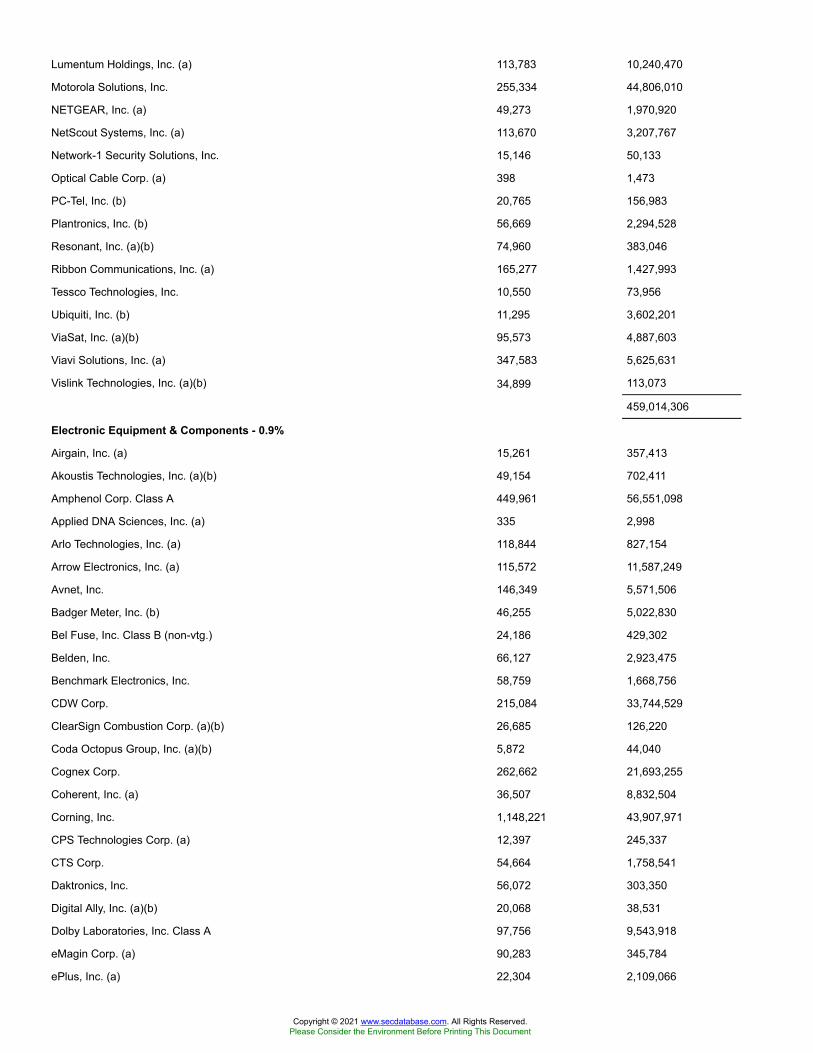
Lumentum Holdings, Inc. (a) 113,783 10,240,470
Motorola Solutions, Inc. 255,334 44,806,010
NETGEAR, Inc. (a) 49,273 1,970,920
NetScout Systems, Inc. (a) 113,670 3,207,767
Network-1 Security Solutions, Inc. 15,146 50,133
Optical Cable Corp. (a) 398 1,473
PC-Tel, Inc. (b) 20,765 156,983
Plantronics, Inc. (b) 56,669 2,294,528
Resonant, Inc. (a)(b) 74,960 383,046
Ribbon Communications, Inc. (a) 165,277 1,427,993
Tessco Technologies, Inc. 10,550 73,956
Ubiquiti, Inc. (b) 11,295 3,602,201
ViaSat, Inc. (a)(b) 95,573 4,887,603
Viavi Solutions, Inc. (a) 347,583 5,625,631
Vislink Technologies, Inc. (a)(b) 34,899 113,073
459,014,306
Electronic Equipment & Components - 0.9%
Airgain, Inc. (a) 15,261 357,413
Akoustis Technologies, Inc. (a)(b) 49,154 702,411
Amphenol Corp. Class A 449,961 56,551,098
Applied DNA Sciences, Inc. (a) 335 2,998
Arlo Technologies, Inc. (a) 118,844 827,154
Arrow Electronics, Inc. (a) 115,572 11,587,249
Avnet, Inc. 146,349 5,571,506
Badger Meter, Inc. (b) 46,255 5,022,830
Bel Fuse, Inc. Class B (non-vtg.) 24,186 429,302
Belden, Inc. 66,127 2,923,475
Benchmark Electronics, Inc. 58,759 1,668,756
CDW Corp. 215,084 33,744,529
ClearSign Combustion Corp. (a)(b) 26,685 126,220
Coda Octopus Group, Inc. (a)(b) 5,872 44,040
Cognex Corp. 262,662 21,693,255
Coherent, Inc. (a) 36,507 8,832,504
Corning, Inc. 1,148,221 43,907,971
CPS Technologies Corp. (a) 12,397 245,337
CTS Corp. 54,664 1,758,541
Daktronics, Inc. 56,072 303,350
Digital Ally, Inc. (a)(b) 20,068 38,531
Dolby Laboratories, Inc. Class A 97,756 9,543,918
eMagin Corp. (a) 90,283 345,784
ePlus, Inc. (a) 22,304 2,109,066
Copyright © 2021 www.secdatabase.com. All Rights Reserved.Please Consider the Environment Before Printing This Document
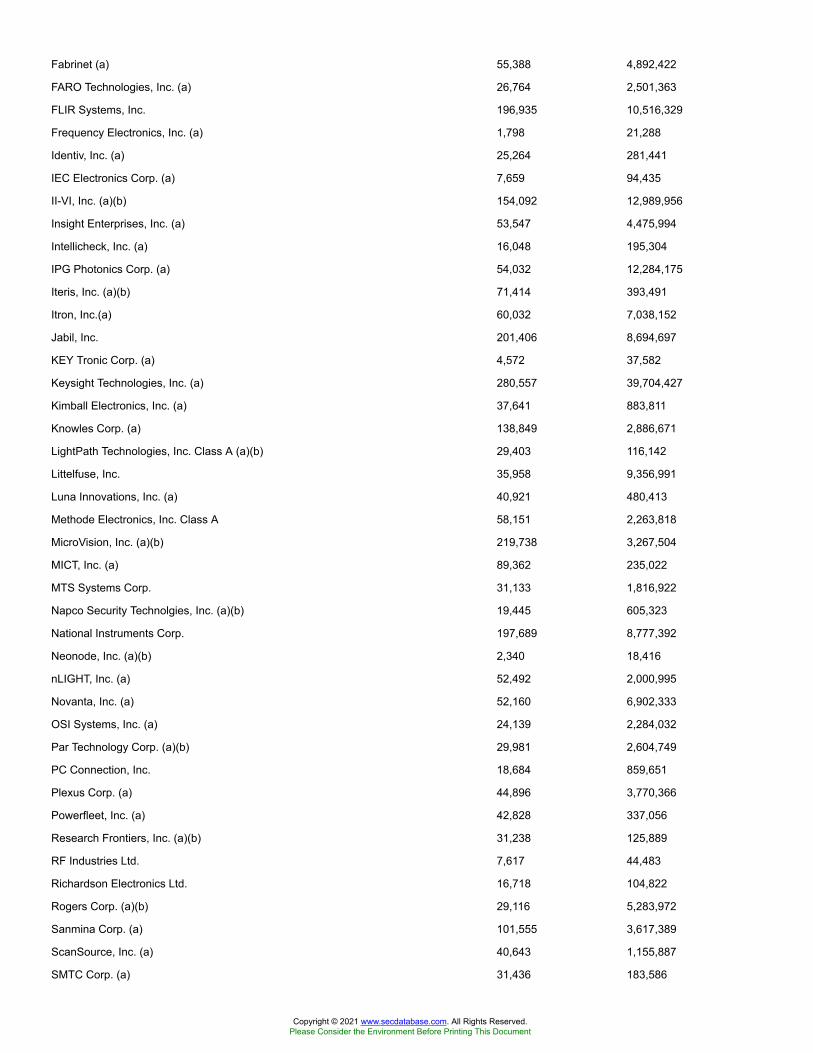
Fabrinet (a) 55,388 4,892,422
FARO Technologies, Inc. (a) 26,764 2,501,363
FLIR Systems, Inc. 196,935 10,516,329
Frequency Electronics, Inc. (a) 1,798 21,288
Identiv, Inc. (a) 25,264 281,441
IEC Electronics Corp. (a) 7,659 94,435
II-VI, Inc. (a)(b) 154,092 12,989,956
Insight Enterprises, Inc. (a) 53,547 4,475,994
Intellicheck, Inc. (a) 16,048 195,304
IPG Photonics Corp. (a) 54,032 12,284,175
Iteris, Inc. (a)(b) 71,414 393,491
Itron, Inc.(a) 60,032 7,038,152
Jabil, Inc. 201,406 8,694,697
KEY Tronic Corp. (a) 4,572 37,582
Keysight Technologies, Inc. (a) 280,557 39,704,427
Kimball Electronics, Inc. (a) 37,641 883,811
Knowles Corp. (a) 138,849 2,886,671
LightPath Technologies, Inc. Class A (a)(b) 29,403 116,142
Littelfuse, Inc. 35,958 9,356,991
Luna Innovations, Inc. (a) 40,921 480,413
Methode Electronics, Inc. Class A 58,151 2,263,818
MicroVision, Inc. (a)(b) 219,738 3,267,504
MICT, Inc. (a) 89,362 235,022
MTS Systems Corp. 31,133 1,816,922
Napco Security Technolgies, Inc. (a)(b) 19,445 605,323
National Instruments Corp. 197,689 8,777,392
Neonode, Inc. (a)(b) 2,340 18,416
nLIGHT, Inc. (a) 52,492 2,000,995
Novanta, Inc. (a) 52,160 6,902,333
OSI Systems, Inc. (a) 24,139 2,284,032
Par Technology Corp. (a)(b) 29,981 2,604,749
PC Connection, Inc. 18,684 859,651
Plexus Corp. (a) 44,896 3,770,366
Powerfleet, Inc. (a) 42,828 337,056
Research Frontiers, Inc. (a)(b) 31,238 125,889
RF Industries Ltd. 7,617 44,483
Richardson Electronics Ltd. 16,718 104,822
Rogers Corp. (a)(b) 29,116 5,283,972
Sanmina Corp. (a) 101,555 3,617,389
ScanSource, Inc. (a) 40,643 1,155,887
SMTC Corp. (a) 31,436 183,586
Copyright © 2021 www.secdatabase.com. All Rights Reserved.Please Consider the Environment Before Printing This Document
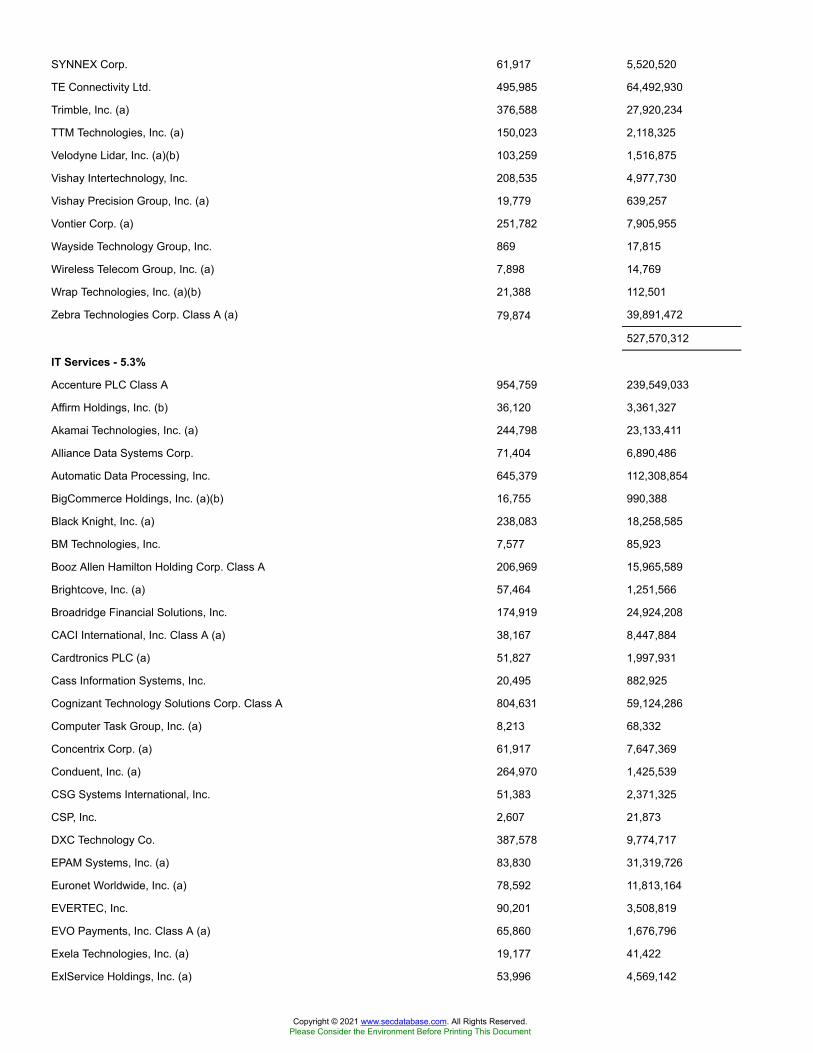
SYNNEX Corp. 61,917 5,520,520
TE Connectivity Ltd. 495,985 64,492,930
Trimble, Inc. (a) 376,588 27,920,234
TTM Technologies, Inc. (a) 150,023 2,118,325
Velodyne Lidar, Inc. (a)(b) 103,259 1,516,875
Vishay Intertechnology, Inc. 208,535 4,977,730
Vishay Precision Group, Inc. (a) 19,779 639,257
Vontier Corp. (a) 251,782 7,905,955
Wayside Technology Group, Inc. 869 17,815
Wireless Telecom Group, Inc. (a) 7,898 14,769
Wrap Technologies, Inc. (a)(b) 21,388 112,501
Zebra Technologies Corp. Class A (a) 79,874 39,891,472
527,570,312
IT Services - 5.3%
Accenture PLC Class A 954,759 239,549,033
Affirm Holdings, Inc. (b) 36,120 3,361,327
Akamai Technologies, Inc. (a) 244,798 23,133,411
Alliance Data Systems Corp. 71,404 6,890,486
Automatic Data Processing, Inc. 645,379 112,308,854
BigCommerce Holdings, Inc. (a)(b) 16,755 990,388
Black Knight, Inc. (a) 238,083 18,258,585
BM Technologies, Inc. 7,577 85,923
Booz Allen Hamilton Holding Corp. Class A 206,969 15,965,589
Brightcove, Inc. (a) 57,464 1,251,566
Broadridge Financial Solutions, Inc. 174,919 24,924,208
CACI International, Inc. Class A (a) 38,167 8,447,884
Cardtronics PLC (a) 51,827 1,997,931
Cass Information Systems, Inc. 20,495 882,925
Cognizant Technology Solutions Corp. Class A 804,631 59,124,286
Computer Task Group, Inc. (a) 8,213 68,332
Concentrix Corp. (a) 61,917 7,647,369
Conduent, Inc. (a) 264,970 1,425,539
CSG Systems International, Inc. 51,383 2,371,325
CSP, Inc. 2,607 21,873
DXC Technology Co. 387,578 9,774,717
EPAM Systems, Inc. (a) 83,830 31,319,726
Euronet Worldwide, Inc. (a) 78,592 11,813,164
EVERTEC, Inc. 90,201 3,508,819
EVO Payments, Inc. Class A (a) 65,860 1,676,796
Exela Technologies, Inc. (a) 19,177 41,422
ExlService Holdings, Inc. (a) 53,996 4,569,142
Copyright © 2021 www.secdatabase.com. All Rights Reserved.Please Consider the Environment Before Printing This Document
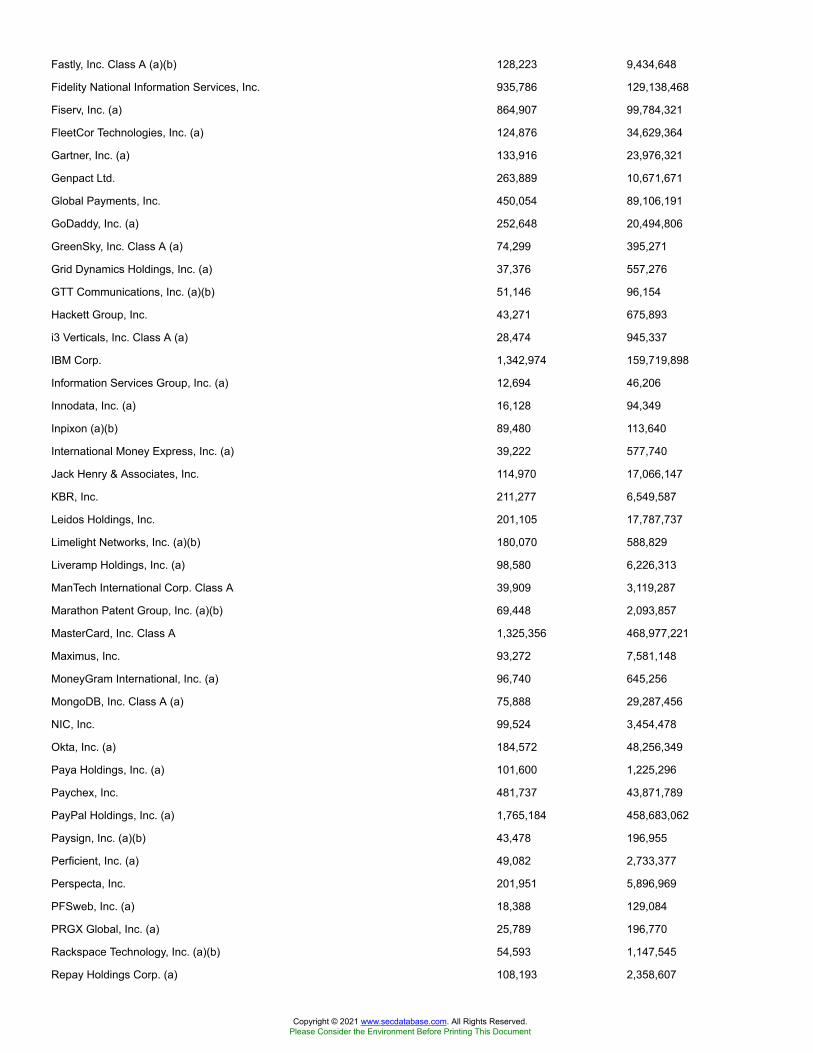
Fastly, Inc. Class A (a)(b) 128,223 9,434,648
Fidelity National Information Services, Inc. 935,786 129,138,468
Fiserv, Inc. (a) 864,907 99,784,321
FleetCor Technologies, Inc. (a) 124,876 34,629,364
Gartner, Inc. (a) 133,916 23,976,321
Genpact Ltd. 263,889 10,671,671
Global Payments, Inc. 450,054 89,106,191
GoDaddy, Inc. (a) 252,648 20,494,806
GreenSky, Inc. Class A (a) 74,299 395,271
Grid Dynamics Holdings, Inc. (a) 37,376 557,276
GTT Communications, Inc. (a)(b) 51,146 96,154
Hackett Group, Inc. 43,271 675,893
i3 Verticals, Inc. Class A (a) 28,474 945,337
IBM Corp. 1,342,974 159,719,898
Information Services Group, Inc. (a) 12,694 46,206
Innodata, Inc. (a) 16,128 94,349
Inpixon (a)(b) 89,480 113,640
International Money Express, Inc. (a) 39,222 577,740
Jack Henry & Associates, Inc. 114,970 17,066,147
KBR, Inc. 211,277 6,549,587
Leidos Holdings, Inc. 201,105 17,787,737
Limelight Networks, Inc. (a)(b) 180,070 588,829
Liveramp Holdings, Inc. (a) 98,580 6,226,313
ManTech International Corp. Class A 39,909 3,119,287
Marathon Patent Group, Inc. (a)(b) 69,448 2,093,857
MasterCard, Inc. Class A 1,325,356 468,977,221
Maximus, Inc. 93,272 7,581,148
MoneyGram International, Inc. (a) 96,740 645,256
MongoDB, Inc. Class A (a) 75,888 29,287,456
NIC, Inc. 99,524 3,454,478
Okta, Inc. (a) 184,572 48,256,349
Paya Holdings, Inc. (a) 101,600 1,225,296
Paychex, Inc. 481,737 43,871,789
PayPal Holdings, Inc. (a) 1,765,184 458,683,062
Paysign, Inc. (a)(b) 43,478 196,955
Perficient, Inc. (a) 49,082 2,733,377
Perspecta, Inc. 201,951 5,896,969
PFSweb, Inc. (a) 18,388 129,084
PRGX Global, Inc. (a) 25,789 196,770
Rackspace Technology, Inc. (a)(b) 54,593 1,147,545
Repay Holdings Corp. (a) 108,193 2,358,607
Copyright © 2021 www.secdatabase.com. All Rights Reserved.Please Consider the Environment Before Printing This Document
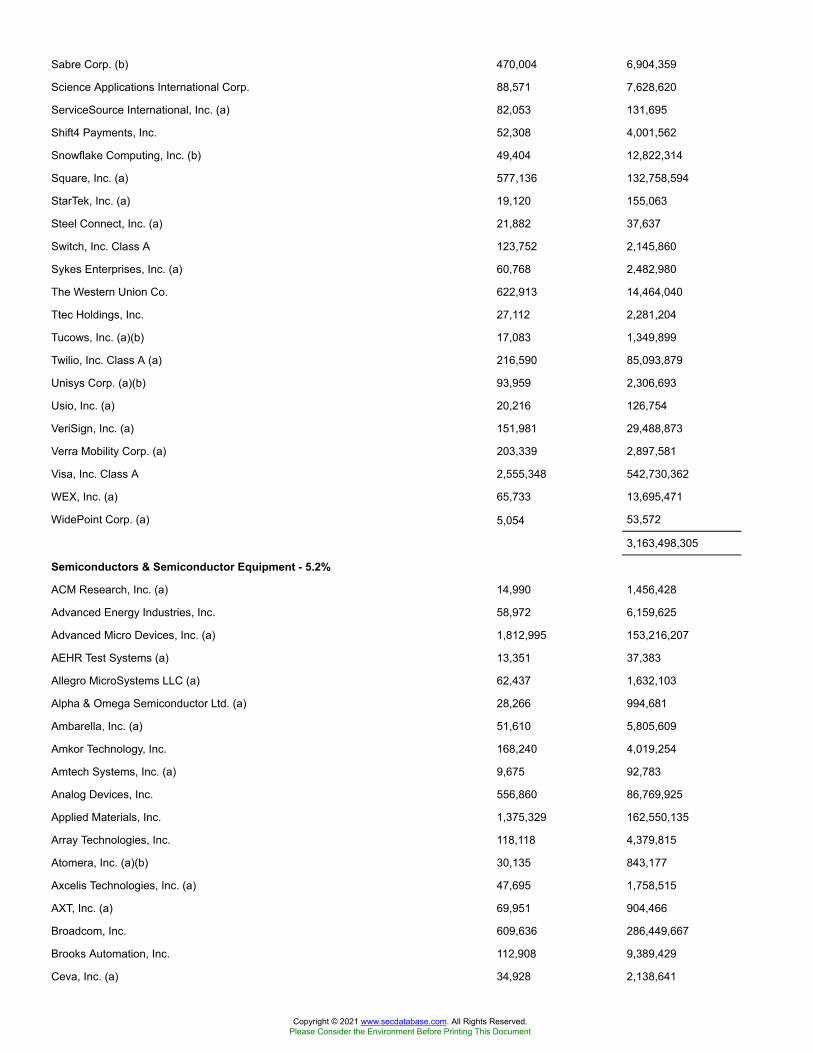
Sabre Corp. (b) 470,004 6,904,359
Science Applications International Corp. 88,571 7,628,620
ServiceSource International, Inc. (a) 82,053 131,695
Shift4 Payments, Inc. 52,308 4,001,562
Snowflake Computing, Inc. (b) 49,404 12,822,314
Square, Inc. (a) 577,136 132,758,594
StarTek, Inc. (a) 19,120 155,063
Steel Connect, Inc. (a) 21,882 37,637
Switch, Inc. Class A 123,752 2,145,860
Sykes Enterprises, Inc. (a) 60,768 2,482,980
The Western Union Co. 622,913 14,464,040
Ttec Holdings, Inc. 27,112 2,281,204
Tucows, Inc. (a)(b) 17,083 1,349,899
Twilio, Inc. Class A (a) 216,590 85,093,879
Unisys Corp. (a)(b) 93,959 2,306,693
Usio, Inc. (a) 20,216 126,754
VeriSign, Inc. (a) 151,981 29,488,873
Verra Mobility Corp. (a) 203,339 2,897,581
Visa, Inc. Class A 2,555,348 542,730,362
WEX, Inc. (a) 65,733 13,695,471
WidePoint Corp. (a) 5,054 53,572
3,163,498,305
Semiconductors & Semiconductor Equipment - 5.2%
ACM Research, Inc. (a) 14,990 1,456,428
Advanced Energy Industries, Inc. 58,972 6,159,625
Advanced Micro Devices, Inc. (a) 1,812,995 153,216,207
AEHR Test Systems (a) 13,351 37,383
Allegro MicroSystems LLC (a) 62,437 1,632,103
Alpha & Omega Semiconductor Ltd. (a) 28,266 994,681
Ambarella, Inc. (a) 51,610 5,805,609
Amkor Technology, Inc. 168,240 4,019,254
Amtech Systems, Inc. (a) 9,675 92,783
Analog Devices, Inc. 556,860 86,769,925
Applied Materials, Inc. 1,375,329 162,550,135
Array Technologies, Inc. 118,118 4,379,815
Atomera, Inc. (a)(b) 30,135 843,177
Axcelis Technologies, Inc. (a) 47,695 1,758,515
AXT, Inc. (a) 69,951 904,466
Broadcom, Inc. 609,636 286,449,667
Brooks Automation, Inc. 112,908 9,389,429
Ceva, Inc. (a) 34,928 2,138,641
Copyright © 2021 www.secdatabase.com. All Rights Reserved.Please Consider the Environment Before Printing This Document
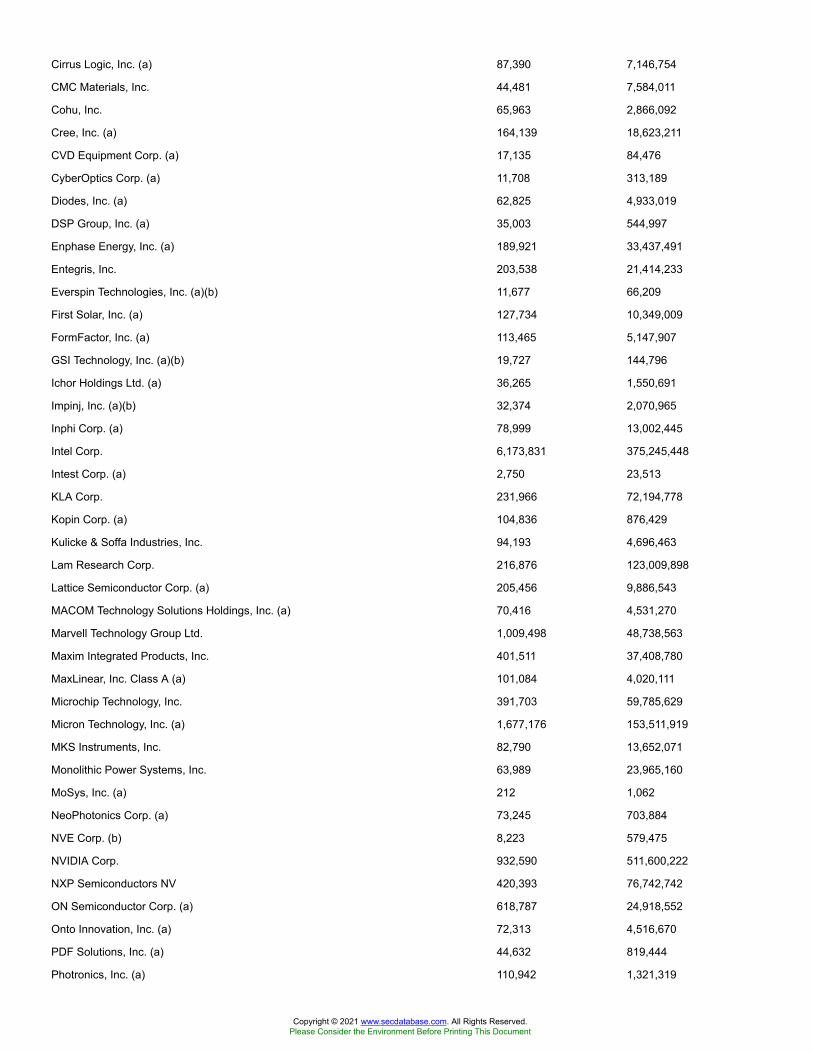
Cirrus Logic, Inc. (a) 87,390 7,146,754
CMC Materials, Inc. 44,481 7,584,011
Cohu, Inc. 65,963 2,866,092
Cree, Inc. (a) 164,139 18,623,211
CVD Equipment Corp. (a) 17,135 84,476
CyberOptics Corp. (a) 11,708 313,189
Diodes, Inc. (a) 62,825 4,933,019
DSP Group, Inc. (a) 35,003 544,997
Enphase Energy, Inc. (a) 189,921 33,437,491
Entegris, Inc. 203,538 21,414,233
Everspin Technologies, Inc. (a)(b) 11,677 66,209
First Solar, Inc. (a) 127,734 10,349,009
FormFactor, Inc. (a) 113,465 5,147,907
GSI Technology, Inc. (a)(b) 19,727 144,796
Ichor Holdings Ltd. (a) 36,265 1,550,691
Impinj, Inc. (a)(b) 32,374 2,070,965
Inphi Corp. (a) 78,999 13,002,445
Intel Corp. 6,173,831 375,245,448
Intest Corp. (a) 2,750 23,513
KLA Corp. 231,966 72,194,778
Kopin Corp. (a) 104,836 876,429
Kulicke & Soffa Industries, Inc. 94,193 4,696,463
Lam Research Corp. 216,876 123,009,898
Lattice Semiconductor Corp. (a) 205,456 9,886,543
MACOM Technology Solutions Holdings, Inc. (a) 70,416 4,531,270
Marvell Technology Group Ltd. 1,009,498 48,738,563
Maxim Integrated Products, Inc. 401,511 37,408,780
MaxLinear, Inc. Class A (a) 101,084 4,020,111
Microchip Technology, Inc. 391,703 59,785,629
Micron Technology, Inc. (a) 1,677,176 153,511,919
MKS Instruments, Inc. 82,790 13,652,071
Monolithic Power Systems, Inc. 63,989 23,965,160
MoSys, Inc. (a) 212 1,062
NeoPhotonics Corp. (a) 73,245 703,884
NVE Corp. (b) 8,223 579,475
NVIDIA Corp. 932,590 511,600,222
NXP Semiconductors NV 420,393 76,742,742
ON Semiconductor Corp. (a) 618,787 24,918,552
Onto Innovation, Inc. (a) 72,313 4,516,670
PDF Solutions, Inc. (a) 44,632 819,444
Photronics, Inc. (a) 110,942 1,321,319
Copyright © 2021 www.secdatabase.com. All Rights Reserved.Please Consider the Environment Before Printing This Document
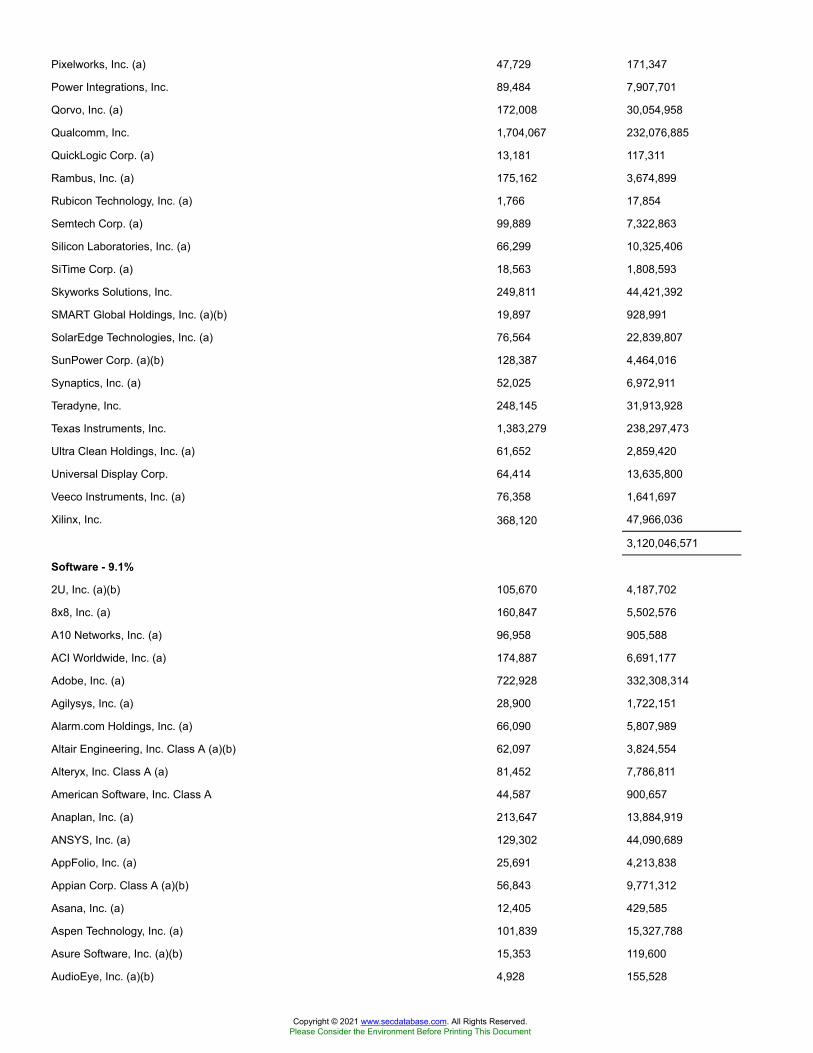
Pixelworks, Inc. (a) 47,729 171,347
Power Integrations, Inc. 89,484 7,907,701
Qorvo, Inc. (a) 172,008 30,054,958
Qualcomm, Inc. 1,704,067 232,076,885
QuickLogic Corp. (a) 13,181 117,311
Rambus, Inc. (a) 175,162 3,674,899
Rubicon Technology, Inc. (a) 1,766 17,854
Semtech Corp. (a) 99,889 7,322,863
Silicon Laboratories, Inc. (a) 66,299 10,325,406
SiTime Corp. (a) 18,563 1,808,593
Skyworks Solutions, Inc. 249,811 44,421,392
SMART Global Holdings, Inc. (a)(b) 19,897 928,991
SolarEdge Technologies, Inc. (a) 76,564 22,839,807
SunPower Corp. (a)(b) 128,387 4,464,016
Synaptics, Inc. (a) 52,025 6,972,911
Teradyne, Inc. 248,145 31,913,928
Texas Instruments, Inc. 1,383,279 238,297,473
Ultra Clean Holdings, Inc. (a) 61,652 2,859,420
Universal Display Corp. 64,414 13,635,800
Veeco Instruments, Inc. (a) 76,358 1,641,697
Xilinx, Inc. 368,120 47,966,036
3,120,046,571
Software - 9.1%
2U, Inc. (a)(b) 105,670 4,187,702
8x8, Inc. (a) 160,847 5,502,576
A10 Networks, Inc. (a) 96,958 905,588
ACI Worldwide, Inc. (a) 174,887 6,691,177
Adobe, Inc. (a) 722,928 332,308,314
Agilysys, Inc. (a) 28,900 1,722,151
Alarm.com Holdings, Inc. (a) 66,090 5,807,989
Altair Engineering, Inc. Class A (a)(b) 62,097 3,824,554
Alteryx, Inc. Class A (a) 81,452 7,786,811
American Software, Inc. Class A 44,587 900,657
Anaplan, Inc. (a) 213,647 13,884,919
ANSYS, Inc. (a) 129,302 44,090,689
AppFolio, Inc. (a) 25,691 4,213,838
Appian Corp. Class A (a)(b) 56,843 9,771,312
Asana, Inc. (a) 12,405 429,585
Aspen Technology, Inc. (a) 101,839 15,327,788
Asure Software, Inc. (a)(b) 15,353 119,600
AudioEye, Inc. (a)(b) 4,928 155,528
Copyright © 2021 www.secdatabase.com. All Rights Reserved.Please Consider the Environment Before Printing This Document

Autodesk, Inc. (a) 330,195 91,133,820
Avalara, Inc. (a) 127,467 20,004,671
Avaya Holdings Corp. (a) 130,385 3,868,523
Benefitfocus, Inc. (a) 47,410 720,632
Bill.Com Holdings, Inc. (a) 88,913 14,671,534
Blackbaud, Inc. (b) 73,700 5,072,034
BlackLine, Inc. (a) 76,267 9,458,633
Bottomline Technologies, Inc. (a) 58,876 2,642,355
Box, Inc. Class A (a) 227,481 4,174,276
BSQUARE Corp. (a) 7,885 37,848
Cadence Design Systems, Inc. (a) 418,408 59,033,185
CDK Global, Inc. 182,594 9,155,263
Cerence, Inc. (a)(b) 55,400 6,161,588
Ceridian HCM Holding, Inc. (a) 195,300 17,510,598
ChannelAdvisor Corp. (a) 43,842 990,829
Citrix Systems, Inc. 185,540 24,784,433
Cleanspark, Inc. (a)(b) 27,361 654,749
Cloudera, Inc. (a)(b) 324,124 5,231,361
Cloudflare, Inc. (a) 267,121 19,758,940
CommVault Systems, Inc. (a) 69,293 4,416,043
Cornerstone OnDemand, Inc. (a) 98,364 4,969,349
Coupa Software, Inc. (a) 105,671 36,589,640
Crowdstrike Holdings, Inc. (a) 284,708 61,496,928
Datadog, Inc. Class A (a) 295,287 28,173,333
Datto Holding Corp. 48,588 1,131,129
Digimarc Corp. (a)(b) 18,096 662,133
Digital Turbine, Inc. (a) 111,689 9,222,161
DocuSign, Inc. (a) 281,958 63,908,600
Domo, Inc. Class B (a) 37,488 2,389,110
Dropbox, Inc. Class A (a) 433,799 9,779,998
Duck Creek Technologies, Inc. (a)(b) 48,897 2,312,828
Dynatrace, Inc. (a) 275,869 13,727,241
Ebix, Inc. (b) 34,764 847,546
eGain Communications Corp. (a) 26,085 303,108
Elastic NV (a) 92,303 12,404,600
Envestnet, Inc. (a) 82,081 5,254,826
Everbridge, Inc. (a)(b) 52,199 7,998,453
Evolving Systems, Inc. (a) 3,507 9,855
Fair Isaac Corp. (a) 43,611 19,954,213
FireEye, Inc. (a) 343,664 6,639,588
Five9, Inc. (a) 99,741 18,476,023
Copyright © 2021 www.secdatabase.com. All Rights Reserved.Please Consider the Environment Before Printing This Document
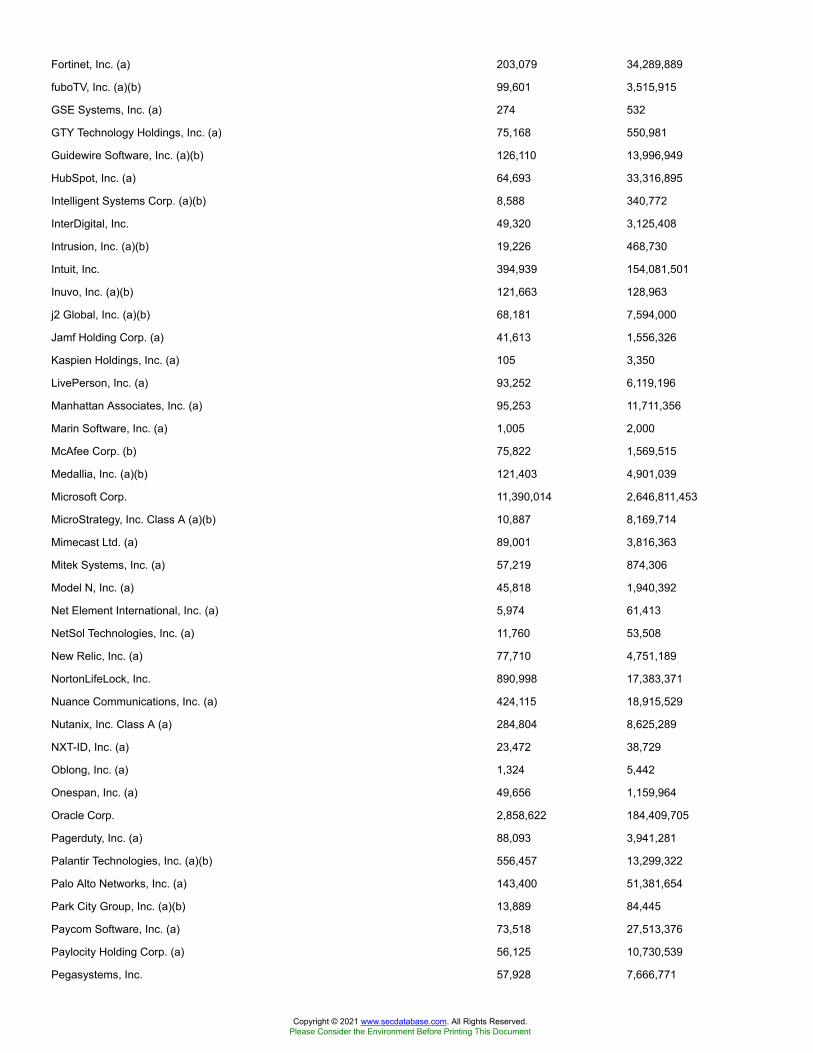
Fortinet, Inc. (a) 203,079 34,289,889
fuboTV, Inc. (a)(b) 99,601 3,515,915
GSE Systems, Inc. (a) 274 532
GTY Technology Holdings, Inc. (a) 75,168 550,981
Guidewire Software, Inc. (a)(b) 126,110 13,996,949
HubSpot, Inc. (a) 64,693 33,316,895
Intelligent Systems Corp. (a)(b) 8,588 340,772
InterDigital, Inc. 49,320 3,125,408
Intrusion, Inc. (a)(b) 19,226 468,730
Intuit, Inc. 394,939 154,081,501
Inuvo, Inc. (a)(b) 121,663 128,963
j2 Global, Inc. (a)(b) 68,181 7,594,000
Jamf Holding Corp. (a) 41,613 1,556,326
Kaspien Holdings, Inc. (a) 105 3,350
LivePerson, Inc. (a) 93,252 6,119,196
Manhattan Associates, Inc. (a) 95,253 11,711,356
Marin Software, Inc. (a) 1,005 2,000
McAfee Corp. (b) 75,822 1,569,515
Medallia, Inc. (a)(b) 121,403 4,901,039
Microsoft Corp. 11,390,014 2,646,811,453
MicroStrategy, Inc. Class A (a)(b) 10,887 8,169,714
Mimecast Ltd. (a) 89,001 3,816,363
Mitek Systems, Inc. (a) 57,219 874,306
Model N, Inc. (a) 45,818 1,940,392
Net Element International, Inc. (a) 5,974 61,413
NetSol Technologies, Inc. (a) 11,760 53,508
New Relic, Inc. (a) 77,710 4,751,189
NortonLifeLock, Inc. 890,998 17,383,371
Nuance Communications, Inc. (a) 424,115 18,915,529
Nutanix, Inc. Class A (a) 284,804 8,625,289
NXT-ID, Inc. (a) 23,472 38,729
Oblong, Inc. (a) 1,324 5,442
Onespan, Inc. (a) 49,656 1,159,964
Oracle Corp. 2,858,622 184,409,705
Pagerduty, Inc. (a) 88,093 3,941,281
Palantir Technologies, Inc. (a)(b) 556,457 13,299,322
Palo Alto Networks, Inc. (a) 143,400 51,381,654
Park City Group, Inc. (a)(b) 13,889 84,445
Paycom Software, Inc. (a) 73,518 27,513,376
Paylocity Holding Corp. (a) 56,125 10,730,539
Pegasystems, Inc. 57,928 7,666,771
Copyright © 2021 www.secdatabase.com. All Rights Reserved.Please Consider the Environment Before Printing This Document
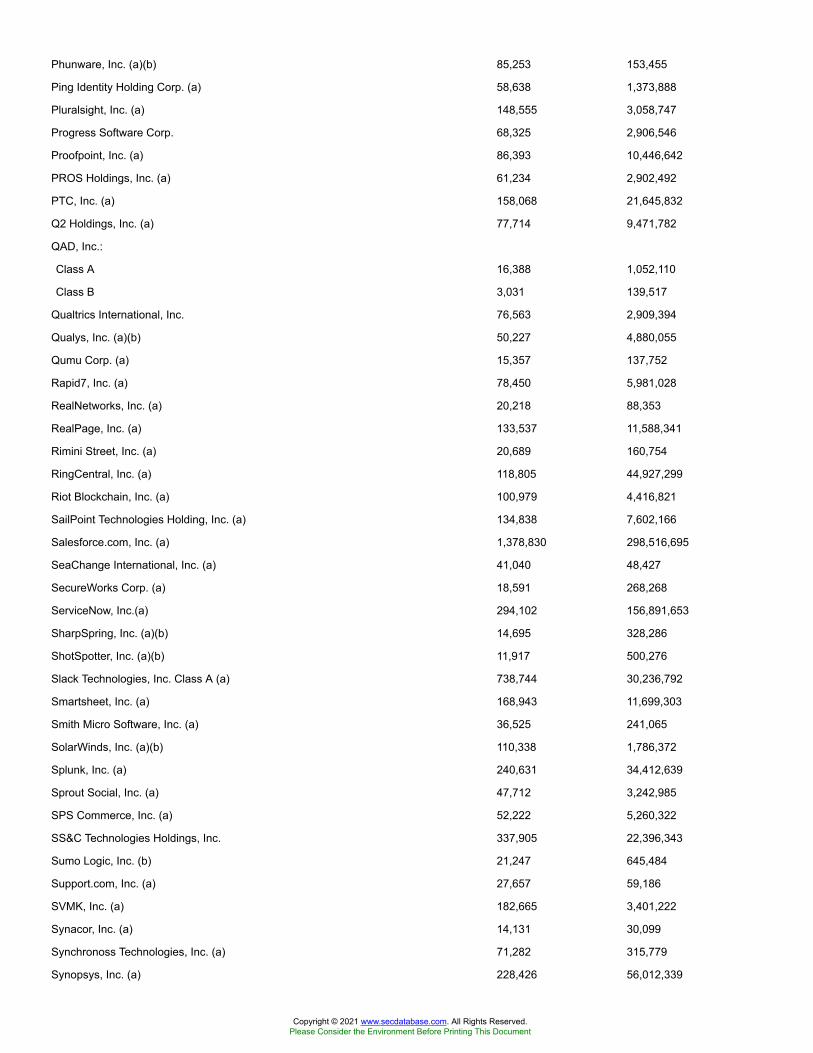
Phunware, Inc. (a)(b) 85,253 153,455
Ping Identity Holding Corp. (a) 58,638 1,373,888
Pluralsight, Inc. (a) 148,555 3,058,747
Progress Software Corp. 68,325 2,906,546
Proofpoint, Inc. (a) 86,393 10,446,642
PROS Holdings, Inc. (a) 61,234 2,902,492
PTC, Inc. (a) 158,068 21,645,832
Q2 Holdings, Inc. (a) 77,714 9,471,782
QAD, Inc.:
Class A 16,388 1,052,110
Class B 3,031 139,517
Qualtrics International, Inc. 76,563 2,909,394
Qualys, Inc. (a)(b) 50,227 4,880,055
Qumu Corp. (a) 15,357 137,752
Rapid7, Inc. (a) 78,450 5,981,028
RealNetworks, Inc. (a) 20,218 88,353
RealPage, Inc. (a) 133,537 11,588,341
Rimini Street, Inc. (a) 20,689 160,754
RingCentral, Inc. (a) 118,805 44,927,299
Riot Blockchain, Inc. (a) 100,979 4,416,821
SailPoint Technologies Holding, Inc. (a) 134,838 7,602,166
Salesforce.com, Inc. (a) 1,378,830 298,516,695
SeaChange International, Inc. (a) 41,040 48,427
SecureWorks Corp. (a) 18,591 268,268
ServiceNow, Inc.(a) 294,102 156,891,653
SharpSpring, Inc. (a)(b) 14,695 328,286
ShotSpotter, Inc. (a)(b) 11,917 500,276
Slack Technologies, Inc. Class A (a) 738,744 30,236,792
Smartsheet, Inc. (a) 168,943 11,699,303
Smith Micro Software, Inc. (a) 36,525 241,065
SolarWinds, Inc. (a)(b) 110,338 1,786,372
Splunk, Inc. (a) 240,631 34,412,639
Sprout Social, Inc. (a) 47,712 3,242,985
SPS Commerce, Inc. (a) 52,222 5,260,322
SS&C Technologies Holdings, Inc. 337,905 22,396,343
Sumo Logic, Inc. (b) 21,247 645,484
Support.com, Inc. (a) 27,657 59,186
SVMK, Inc. (a) 182,665 3,401,222
Synacor, Inc. (a) 14,131 30,099
Synchronoss Technologies, Inc. (a) 71,282 315,779
Synopsys, Inc. (a) 228,426 56,012,339
Copyright © 2021 www.secdatabase.com. All Rights Reserved.Please Consider the Environment Before Printing This Document
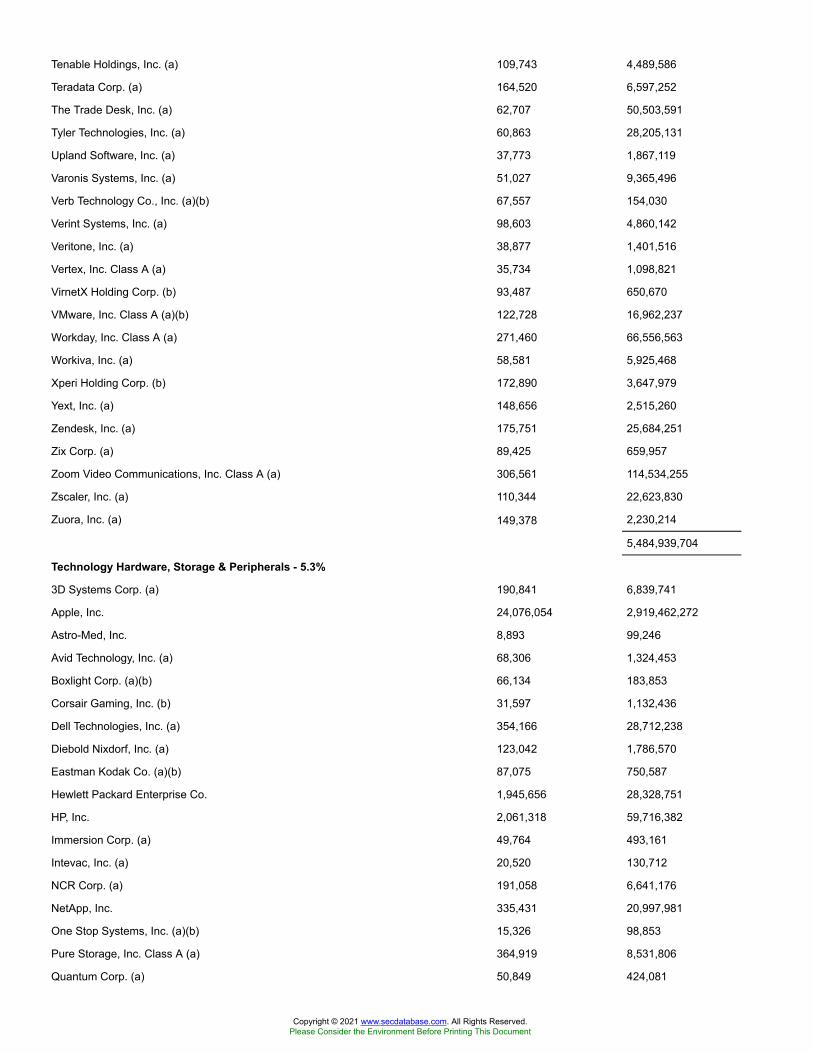
Tenable Holdings, Inc. (a) 109,743 4,489,586
Teradata Corp. (a) 164,520 6,597,252
The Trade Desk, Inc. (a) 62,707 50,503,591
Tyler Technologies, Inc. (a) 60,863 28,205,131
Upland Software, Inc. (a) 37,773 1,867,119
Varonis Systems, Inc. (a) 51,027 9,365,496
Verb Technology Co., Inc. (a)(b) 67,557 154,030
Verint Systems, Inc. (a) 98,603 4,860,142
Veritone, Inc. (a) 38,877 1,401,516
Vertex, Inc. Class A (a) 35,734 1,098,821
VirnetX Holding Corp. (b) 93,487 650,670
VMware, Inc. Class A (a)(b) 122,728 16,962,237
Workday, Inc. Class A (a) 271,460 66,556,563
Workiva, Inc. (a) 58,581 5,925,468
Xperi Holding Corp. (b) 172,890 3,647,979
Yext, Inc. (a) 148,656 2,515,260
Zendesk, Inc. (a) 175,751 25,684,251
Zix Corp. (a) 89,425 659,957
Zoom Video Communications, Inc. Class A (a) 306,561 114,534,255
Zscaler, Inc. (a) 110,344 22,623,830
Zuora, Inc. (a) 149,378 2,230,214
5,484,939,704
Technology Hardware, Storage & Peripherals - 5.3%
3D Systems Corp. (a) 190,841 6,839,741
Apple, Inc. 24,076,054 2,919,462,272
Astro-Med, Inc. 8,893 99,246
Avid Technology, Inc. (a) 68,306 1,324,453
Boxlight Corp. (a)(b) 66,134 183,853
Corsair Gaming, Inc. (b) 31,597 1,132,436
Dell Technologies, Inc. (a) 354,166 28,712,238
Diebold Nixdorf, Inc. (a) 123,042 1,786,570
Eastman Kodak Co. (a)(b) 87,075 750,587
Hewlett Packard Enterprise Co. 1,945,656 28,328,751
HP, Inc. 2,061,318 59,716,382
Immersion Corp. (a) 49,764 493,161
Intevac, Inc. (a) 20,520 130,712
NCR Corp. (a) 191,058 6,641,176
NetApp, Inc. 335,431 20,997,981
One Stop Systems, Inc. (a)(b) 15,326 98,853
Pure Storage, Inc. Class A (a) 364,919 8,531,806
Quantum Corp. (a) 50,849 424,081
Copyright © 2021 www.secdatabase.com. All Rights Reserved.Please Consider the Environment Before Printing This Document
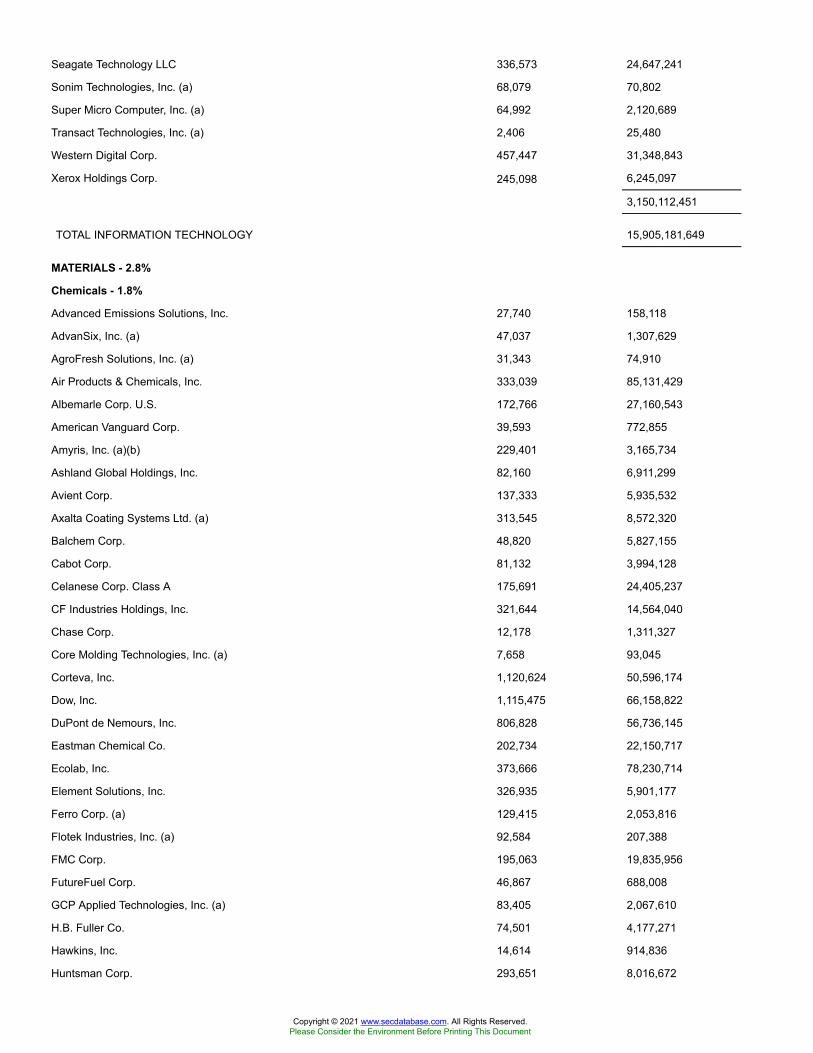
Seagate Technology LLC 336,573 24,647,241
Sonim Technologies, Inc. (a) 68,079 70,802
Super Micro Computer, Inc. (a) 64,992 2,120,689
Transact Technologies, Inc. (a) 2,406 25,480
Western Digital Corp. 457,447 31,348,843
Xerox Holdings Corp. 245,098 6,245,097
3,150,112,451
TOTAL INFORMATION TECHNOLOGY 15,905,181,649
MATERIALS - 2.8%
Chemicals - 1.8%
Advanced Emissions Solutions, Inc. 27,740 158,118
AdvanSix, Inc. (a) 47,037 1,307,629
AgroFresh Solutions, Inc. (a) 31,343 74,910
Air Products & Chemicals, Inc. 333,039 85,131,429
Albemarle Corp. U.S. 172,766 27,160,543
American Vanguard Corp. 39,593 772,855
Amyris, Inc. (a)(b) 229,401 3,165,734
Ashland Global Holdings, Inc. 82,160 6,911,299
Avient Corp. 137,333 5,935,532
Axalta Coating Systems Ltd. (a) 313,545 8,572,320
Balchem Corp. 48,820 5,827,155
Cabot Corp. 81,132 3,994,128
Celanese Corp. Class A 175,691 24,405,237
CF Industries Holdings, Inc. 321,644 14,564,040
Chase Corp. 12,178 1,311,327
Core Molding Technologies, Inc. (a) 7,658 93,045
Corteva, Inc. 1,120,624 50,596,174
Dow, Inc. 1,115,475 66,158,822
DuPont de Nemours, Inc. 806,828 56,736,145
Eastman Chemical Co. 202,734 22,150,717
Ecolab, Inc. 373,666 78,230,714
Element Solutions, Inc. 326,935 5,901,177
Ferro Corp. (a) 129,415 2,053,816
Flotek Industries, Inc. (a) 92,584 207,388
FMC Corp. 195,063 19,835,956
FutureFuel Corp. 46,867 688,008
GCP Applied Technologies, Inc. (a) 83,405 2,067,610
H.B. Fuller Co. 74,501 4,177,271
Hawkins, Inc. 14,614 914,836
Huntsman Corp. 293,651 8,016,672
Copyright © 2021 www.secdatabase.com. All Rights Reserved.Please Consider the Environment Before Printing This Document

Ingevity Corp. (a) 61,274 4,257,318
Innospec, Inc. 38,486 3,865,919
International Flavors & Fragrances, Inc. 373,626 50,630,059
Intrepid Potash, Inc. (a) 16,359 485,699
Koppers Holdings, Inc. (a) 31,948 1,067,383
Kraton Performance Polymers, Inc. (a) 51,103 1,900,521
Kronos Worldwide, Inc. 40,274 581,959
Linde PLC 790,978 193,212,196
Livent Corp. (a)(b) 232,838 4,335,444
Loop Industries, Inc. (a)(b) 29,687 255,605
LSB Industries, Inc. (a) 30,831 137,198
LyondellBasell Industries NV Class A 386,813 39,876,552
Marrone Bio Innovations, Inc. (a) 136,318 348,292
Minerals Technologies, Inc. 48,190 3,432,574
NewMarket Corp. 11,736 4,447,709
Olin Corp. 223,731 6,922,237
Orion Engineered Carbons SA 86,875 1,537,688
PPG Industries, Inc. 355,536 47,933,364
PQ Group Holdings, Inc. 66,053 1,014,574
Quaker Chemical Corp. (b) 19,959 5,636,022
Rayonier Advanced Materials, Inc. (a) 90,547 837,560
RPM International, Inc. 196,397 15,641,057
Sensient Technologies Corp. 66,328 5,163,635
Sherwin-Williams Co. 123,019 83,694,746
Stepan Co. 31,081 3,751,166
The Chemours Co. LLC (b) 247,808 5,830,922
The Mosaic Co. 516,489 15,184,777
The Scotts Miracle-Gro Co. Class A 60,786 12,956,536
Trecora Resources (a) 22,997 163,279
Tredegar Corp. 40,525 617,601
Trinseo SA 57,027 3,690,217
Tronox Holdings PLC 163,298 2,994,885
Valhi, Inc. 4,257 78,669
Valvoline, Inc. 276,591 6,903,711
Venator Materials PLC (a) 76,553 293,198
W.R. Grace & Co. 94,813 5,618,618
Westlake Chemical Corp. 51,510 4,408,741
1,046,828,238
Construction Materials - 0.1%
Eagle Materials, Inc. 62,999 7,898,815
Forterra, Inc. (a) 30,943 720,044
Copyright © 2021 www.secdatabase.com. All Rights Reserved.Please Consider the Environment Before Printing This Document

Martin Marietta Materials, Inc. 93,732 31,575,499
Summit Materials, Inc. (a) 169,684 4,701,944
Tecnoglass, Inc. 26,251 193,995
U.S. Concrete, Inc. (a) 24,906 1,281,663
United States Lime & Minerals, Inc. 2,834 397,157
Vulcan Materials Co. 199,834 33,370,280
80,139,397
Containers & Packaging - 0.4%
Amcor PLC 2,352,981 25,741,612
Aptargroup, Inc. 98,891 12,862,752
Avery Dennison Corp. 125,391 21,969,757
Ball Corp. 492,441 42,049,537
Berry Global Group, Inc. (a) 199,922 11,075,679
Crown Holdings, Inc. 202,884 19,387,595
Graphic Packaging Holding Co. 422,975 6,712,613
Greif, Inc.:
Class A 42,211 2,038,791
Class B 9,210 455,895
International Paper Co. 587,147 29,151,849
Myers Industries, Inc. 59,545 1,318,326
O-I Glass, Inc. 237,218 2,770,706
Packaging Corp. of America 141,542 18,686,375
Pactiv Evergreen, Inc. 53,159 743,163
Ranpak Holdings Corp. (A Shares) (a) 48,017 864,786
Sealed Air Corp. 231,194 9,687,029
Silgan Holdings, Inc. 116,887 4,390,276
Sonoco Products Co. 149,058 8,879,385
UFP Technologies, Inc. (a) 10,975 543,482
WestRock Co. 392,287 17,099,790
236,429,398
Metals & Mining - 0.5%
Alcoa Corp. (a) 287,680 7,062,544
Allegheny Technologies, Inc. (a)(b) 190,616 3,747,511
Alpha Metallurgical Resources (a) 29,324 439,860
Ampco-Pittsburgh Corp. (a)(b) 10,622 81,152
Arconic Rolled Products Corp. (a) 142,779 3,129,716
Carpenter Technology Corp. (b) 70,705 2,874,865
Century Aluminum Co. (a) 77,869 1,069,141
Cleveland-Cliffs, Inc. 688,010 9,178,053
Coeur d'Alene Mines Corp. (a) 369,368 3,328,006
Commercial Metals Co. 184,347 4,636,327
Copyright © 2021 www.secdatabase.com. All Rights Reserved.Please Consider the Environment Before Printing This Document
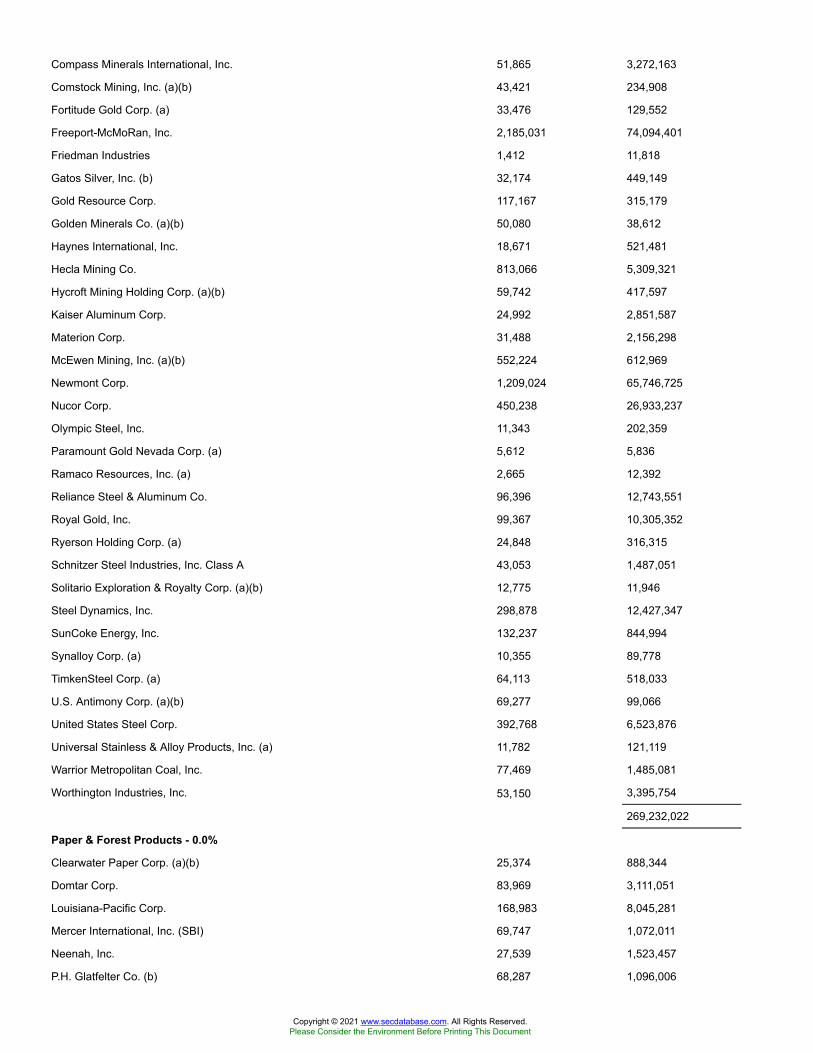
Compass Minerals International, Inc. 51,865 3,272,163
Comstock Mining, Inc. (a)(b) 43,421 234,908
Fortitude Gold Corp. (a) 33,476 129,552
Freeport-McMoRan, Inc. 2,185,031 74,094,401
Friedman Industries 1,412 11,818
Gatos Silver, Inc. (b) 32,174 449,149
Gold Resource Corp. 117,167 315,179
Golden Minerals Co. (a)(b) 50,080 38,612
Haynes International, Inc. 18,671 521,481
Hecla Mining Co. 813,066 5,309,321
Hycroft Mining Holding Corp. (a)(b) 59,742 417,597
Kaiser Aluminum Corp. 24,992 2,851,587
Materion Corp. 31,488 2,156,298
McEwen Mining, Inc. (a)(b) 552,224 612,969
Newmont Corp. 1,209,024 65,746,725
Nucor Corp. 450,238 26,933,237
Olympic Steel, Inc. 11,343 202,359
Paramount Gold Nevada Corp. (a) 5,612 5,836
Ramaco Resources, Inc. (a) 2,665 12,392
Reliance Steel & Aluminum Co. 96,396 12,743,551
Royal Gold, Inc. 99,367 10,305,352
Ryerson Holding Corp. (a) 24,848 316,315
Schnitzer Steel Industries, Inc. Class A 43,053 1,487,051
Solitario Exploration & Royalty Corp. (a)(b) 12,775 11,946
Steel Dynamics, Inc. 298,878 12,427,347
SunCoke Energy, Inc. 132,237 844,994
Synalloy Corp. (a) 10,355 89,778
TimkenSteel Corp. (a) 64,113 518,033
U.S. Antimony Corp. (a)(b) 69,277 99,066
United States Steel Corp. 392,768 6,523,876
Universal Stainless & Alloy Products, Inc. (a) 11,782 121,119
Warrior Metropolitan Coal, Inc. 77,469 1,485,081
Worthington Industries, Inc. 53,150 3,395,754
269,232,022
Paper & Forest Products - 0.0%
Clearwater Paper Corp. (a)(b) 25,374 888,344
Domtar Corp. 83,969 3,111,051
Louisiana-Pacific Corp. 168,983 8,045,281
Mercer International, Inc. (SBI) 69,747 1,072,011
Neenah, Inc. 27,539 1,523,457
P.H. Glatfelter Co. (b) 68,287 1,096,006
Copyright © 2021 www.secdatabase.com. All Rights Reserved.Please Consider the Environment Before Printing This Document
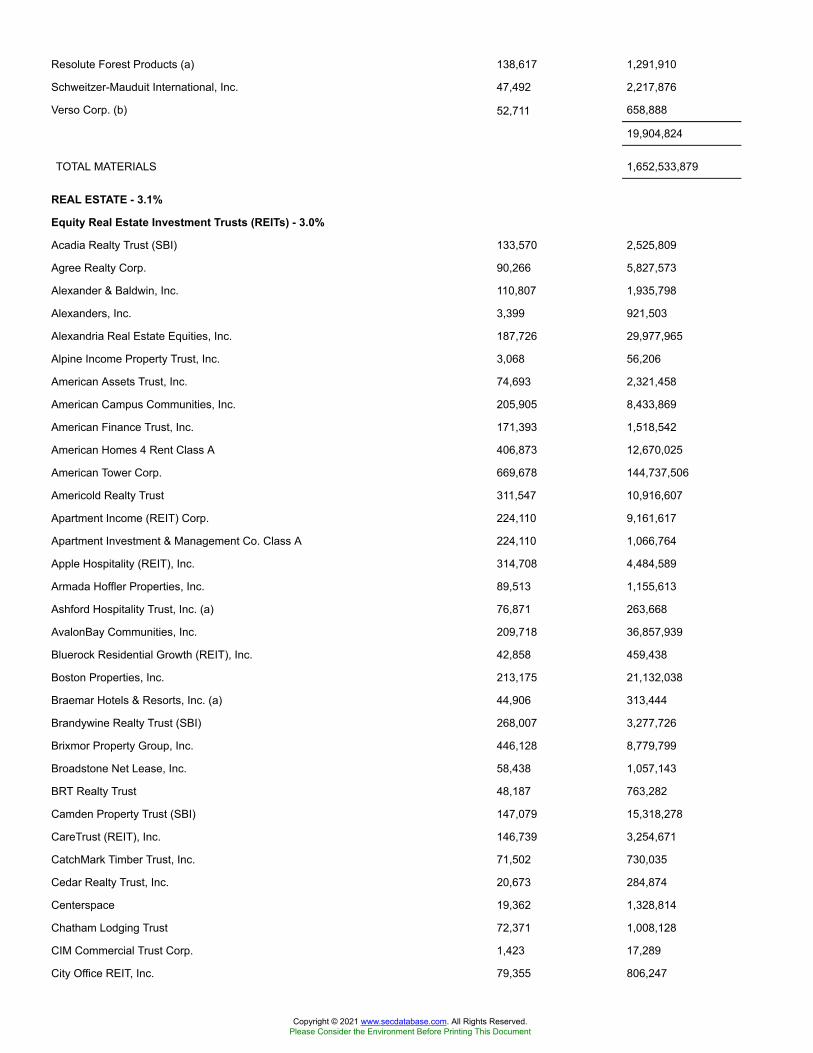
Resolute Forest Products (a) 138,617 1,291,910
Schweitzer-Mauduit International, Inc. 47,492 2,217,876
Verso Corp. (b) 52,711 658,888
19,904,824
TOTAL MATERIALS 1,652,533,879
REAL ESTATE - 3.1%
Equity Real Estate Investment Trusts (REITs) - 3.0%
Acadia Realty Trust (SBI) 133,570 2,525,809
Agree Realty Corp. 90,266 5,827,573
Alexander & Baldwin, Inc. 110,807 1,935,798
Alexanders, Inc. 3,399 921,503
Alexandria Real Estate Equities, Inc. 187,726 29,977,965
Alpine Income Property Trust, Inc. 3,068 56,206
American Assets Trust, Inc. 74,693 2,321,458
American Campus Communities, Inc. 205,905 8,433,869
American Finance Trust, Inc. 171,393 1,518,542
American Homes 4 Rent Class A 406,873 12,670,025
American Tower Corp. 669,678 144,737,506
Americold Realty Trust 311,547 10,916,607
Apartment Income (REIT) Corp. 224,110 9,161,617
Apartment Investment & Management Co. Class A 224,110 1,066,764
Apple Hospitality (REIT), Inc. 314,708 4,484,589
Armada Hoffler Properties, Inc. 89,513 1,155,613
Ashford Hospitality Trust, Inc. (a) 76,871 263,668
AvalonBay Communities, Inc. 209,718 36,857,939
Bluerock Residential Growth (REIT), Inc. 42,858 459,438
Boston Properties, Inc. 213,175 21,132,038
Braemar Hotels & Resorts, Inc. (a) 44,906 313,444
Brandywine Realty Trust (SBI) 268,007 3,277,726
Brixmor Property Group, Inc. 446,128 8,779,799
Broadstone Net Lease, Inc. 58,438 1,057,143
BRT Realty Trust 48,187 763,282
Camden Property Trust (SBI) 147,079 15,318,278
CareTrust (REIT), Inc. 146,739 3,254,671
CatchMark Timber Trust, Inc. 71,502 730,035
Cedar Realty Trust, Inc. 20,673 284,874
Centerspace 19,362 1,328,814
Chatham Lodging Trust 72,371 1,008,128
CIM Commercial Trust Corp. 1,423 17,289
City Office REIT, Inc. 79,355 806,247
Copyright © 2021 www.secdatabase.com. All Rights Reserved.Please Consider the Environment Before Printing This Document

Clipper Realty, Inc. 13,163 114,913
Colony Capital, Inc. (b) 760,222 4,500,514
Columbia Property Trust, Inc. 159,833 2,256,842
Community Healthcare Trust, Inc. 34,652 1,518,797
Condor Hospitality Trust, Inc. (a) 76 373
CorEnergy Infrastructure Trust, Inc. 20,064 149,878
CorePoint Lodging, Inc. 63,549 578,931
CoreSite Realty Corp. 64,937 7,903,482
Corporate Office Properties Trust (SBI) 167,425 4,353,050
Cousins Properties, Inc. 224,346 7,524,565
Crown Castle International Corp. 650,506 101,316,310
CTO Realty Growth, Inc. 9,746 504,356
CubeSmart 297,549 10,997,411
CyrusOne, Inc. 182,555 11,981,085
DiamondRock Hospitality Co. (a) 301,580 3,051,990
Digital Realty Trust, Inc. 422,011 56,857,542
Diversified Healthcare Trust (SBI) 354,601 1,595,705
Douglas Emmett, Inc. 245,674 8,045,824
Duke Realty Corp. 561,802 22,050,729
Easterly Government Properties, Inc. 135,481 2,977,872
EastGroup Properties, Inc. 59,832 8,143,734
Empire State Realty Trust, Inc. 226,638 2,495,284
EPR Properties 116,111 5,245,895
Equinix, Inc. 134,161 86,981,943
Equity Commonwealth 194,914 5,498,524
Equity Lifestyle Properties, Inc. 255,982 15,781,290
Equity Residential (SBI) 516,832 33,805,981
Essential Properties Realty Trust, Inc. 156,832 3,638,502
Essex Property Trust, Inc. 98,126 25,001,524
Extra Space Storage, Inc. 194,373 24,432,686
Farmland Partners, Inc. 63,109 754,784
Federal Realty Investment Trust (SBI) 103,970 10,518,645
First Industrial Realty Trust, Inc. 195,448 8,347,584
Four Corners Property Trust, Inc. 110,358 2,989,598
Franklin Street Properties Corp. 166,446 825,572
Gaming & Leisure Properties 325,251 14,441,144
Getty Realty Corp. 57,459 1,607,703
Gladstone Commercial Corp. 49,303 920,980
Gladstone Land Corp. 28,639 512,352
Global Medical REIT, Inc. 67,288 906,369
Global Net Lease, Inc. 142,870 2,654,525
Copyright © 2021 www.secdatabase.com. All Rights Reserved.Please Consider the Environment Before Printing This Document

Healthcare Realty Trust, Inc. 206,708 5,965,593
Healthcare Trust of America, Inc. 337,028 9,153,680
Healthpeak Properties, Inc. 809,210 23,539,919
Hersha Hospitality Trust 63,989 711,558
Highwoods Properties, Inc. (SBI) 157,071 6,276,557
Host Hotels & Resorts, Inc. 1,050,281 17,424,162
Hudson Pacific Properties, Inc. 230,193 5,890,639
Independence Realty Trust, Inc. 137,363 1,928,577
Industrial Logistics Properties Trust 106,689 2,269,275
Invitation Homes, Inc. 845,994 24,652,265
Iron Mountain, Inc. (b) 436,282 15,178,251
iStar Financial, Inc. (b) 117,954 2,090,145
JBG SMITH Properties 170,684 5,419,217
Kilroy Realty Corp. 156,965 9,960,999
Kimco Realty Corp. 647,715 11,872,616
Kite Realty Group Trust 138,925 2,663,192
Lamar Advertising Co. Class A 129,193 11,186,822
Lexington Corporate Properties Trust 416,232 4,462,007
Life Storage, Inc. 111,532 9,357,535
LTC Properties, Inc. 61,833 2,529,588
Mack-Cali Realty Corp. 128,271 1,791,946
Medical Properties Trust, Inc. 858,450 18,533,936
Mid-America Apartment Communities, Inc. 172,859 23,289,293
Monmouth Real Estate Investment Corp. Class A 147,146 2,548,569
National Health Investors, Inc. 69,200 4,724,284
National Retail Properties, Inc. 261,757 11,475,427
National Storage Affiliates Trust 93,142 3,590,624
NETSTREIT Corp. 19,143 336,343
New Senior Investment Group, Inc. 142,626 871,445
NexPoint Residential Trust, Inc. 35,986 1,476,865
Office Properties Income Trust 73,464 1,857,905
Omega Healthcare Investors, Inc. 342,137 12,706,968
One Liberty Properties, Inc. 29,137 623,823
Outfront Media, Inc. 217,663 4,414,206
Paramount Group, Inc. 254,610 2,360,235
Park Hotels & Resorts, Inc. 352,526 7,667,441
Pebblebrook Hotel Trust 200,456 4,542,333
Physicians Realty Trust 309,241 5,257,097
Piedmont Office Realty Trust, Inc. Class A 195,849 3,341,184
Plymouth Industrial REIT, Inc. 40,903 610,273
Postal Realty Trust, Inc. 11,996 192,896
Copyright © 2021 www.secdatabase.com. All Rights Reserved.Please Consider the Environment Before Printing This Document

Potlatch Corp. 101,709 5,161,732
Preferred Apartment Communities, Inc. Class A 69,615 572,931
Prologis (REIT), Inc. 1,112,457 110,211,115
PS Business Parks, Inc. 30,172 4,370,716
Public Storage 229,435 53,674,024
QTS Realty Trust, Inc. Class A 97,555 6,060,117
Rayonier, Inc. 208,320 6,799,565
Realty Income Corp. 527,981 31,816,135
Regency Centers Corp. 239,771 13,134,655
Retail Opportunity Investments Corp. 176,034 2,783,098
Retail Properties America, Inc. 334,094 3,518,010
Retail Value, Inc. 27,342 456,611
Rexford Industrial Realty, Inc. 201,233 9,602,839
RLJ Lodging Trust 242,422 3,806,025
RPT Realty 129,153 1,416,808
Ryman Hospitality Properties, Inc. 85,576 6,614,169
Sabra Health Care REIT, Inc. 309,120 5,323,046
Safehold, Inc. 21,726 1,656,608
Saul Centers, Inc. 20,139 713,323
SBA Communications Corp. Class A 166,952 42,594,464
Seritage Growth Properties (a)(b) 53,700 1,084,203
Service Properties Trust 244,650 3,141,306
Simon Property Group, Inc. 493,327 55,706,485
SITE Centers Corp. 235,940 3,147,440
SL Green Realty Corp. (b) 110,199 7,611,445
Sotherly Hotels, Inc. 1,919 7,062
Spirit Realty Capital, Inc. 170,820 7,348,676
Stag Industrial, Inc. 232,860 7,346,733
Store Capital Corp. 356,227 11,912,231
Summit Hotel Properties, Inc. 162,980 1,686,843
Sun Communities, Inc. 163,299 24,813,283
Sunstone Hotel Investors, Inc. 312,157 4,123,594
Tanger Factory Outlet Centers, Inc. (b) 144,409 2,272,998
Terreno Realty Corp. 103,197 5,783,160
The GEO Group, Inc. (b) 187,252 1,348,214
The Macerich Co. (b) 169,575 2,190,909
UDR, Inc. 442,883 18,233,493
UMH Properties, Inc. 56,601 966,179
Uniti Group, Inc. 373,239 4,445,276
Universal Health Realty Income Trust (SBI) 18,927 1,172,528
Urban Edge Properties 178,440 2,944,260
Copyright © 2021 www.secdatabase.com. All Rights Reserved.Please Consider the Environment Before Printing This Document
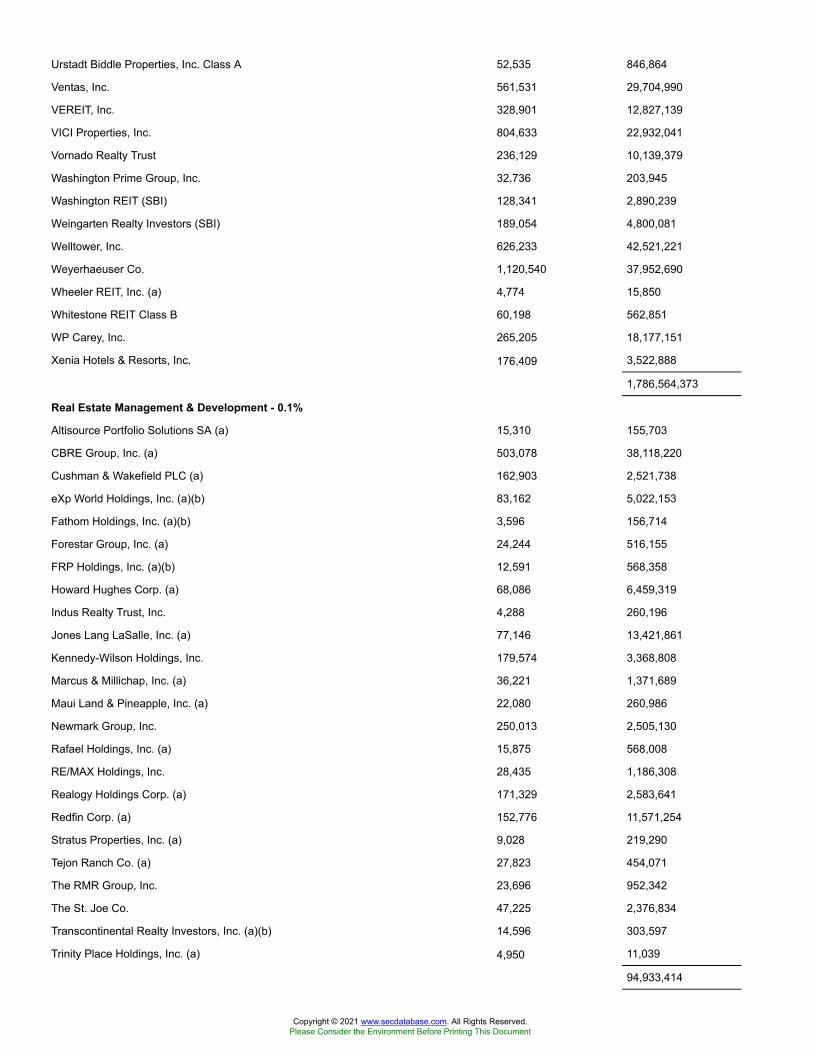
Urstadt Biddle Properties, Inc. Class A 52,535 846,864
Ventas, Inc. 561,531 29,704,990
VEREIT, Inc. 328,901 12,827,139
VICI Properties, Inc. 804,633 22,932,041
Vornado Realty Trust 236,129 10,139,379
Washington Prime Group, Inc. 32,736 203,945
Washington REIT (SBI) 128,341 2,890,239
Weingarten Realty Investors (SBI) 189,054 4,800,081
Welltower, Inc. 626,233 42,521,221
Weyerhaeuser Co. 1,120,540 37,952,690
Wheeler REIT, Inc. (a) 4,774 15,850
Whitestone REIT Class B 60,198 562,851
WP Carey, Inc. 265,205 18,177,151
Xenia Hotels & Resorts, Inc. 176,409 3,522,888
1,786,564,373
Real Estate Management & Development - 0.1%
Altisource Portfolio Solutions SA (a) 15,310 155,703
CBRE Group, Inc. (a) 503,078 38,118,220
Cushman & Wakefield PLC (a) 162,903 2,521,738
eXp World Holdings, Inc. (a)(b) 83,162 5,022,153
Fathom Holdings, Inc. (a)(b) 3,596 156,714
Forestar Group, Inc. (a) 24,244 516,155
FRP Holdings, Inc. (a)(b) 12,591 568,358
Howard Hughes Corp. (a) 68,086 6,459,319
Indus Realty Trust, Inc. 4,288 260,196
Jones Lang LaSalle, Inc. (a) 77,146 13,421,861
Kennedy-Wilson Holdings, Inc. 179,574 3,368,808
Marcus & Millichap, Inc. (a) 36,221 1,371,689
Maui Land & Pineapple, Inc. (a) 22,080 260,986
Newmark Group, Inc. 250,013 2,505,130
Rafael Holdings, Inc. (a) 15,875 568,008
RE/MAX Holdings, Inc. 28,435 1,186,308
Realogy Holdings Corp. (a) 171,329 2,583,641
Redfin Corp. (a) 152,776 11,571,254
Stratus Properties, Inc. (a) 9,028 219,290
Tejon Ranch Co. (a) 27,823 454,071
The RMR Group, Inc. 23,696 952,342
The St. Joe Co. 47,225 2,376,834
Transcontinental Realty Investors, Inc. (a)(b) 14,596 303,597
Trinity Place Holdings, Inc. (a) 4,950 11,039
94,933,414
Copyright © 2021 www.secdatabase.com. All Rights Reserved.Please Consider the Environment Before Printing This Document
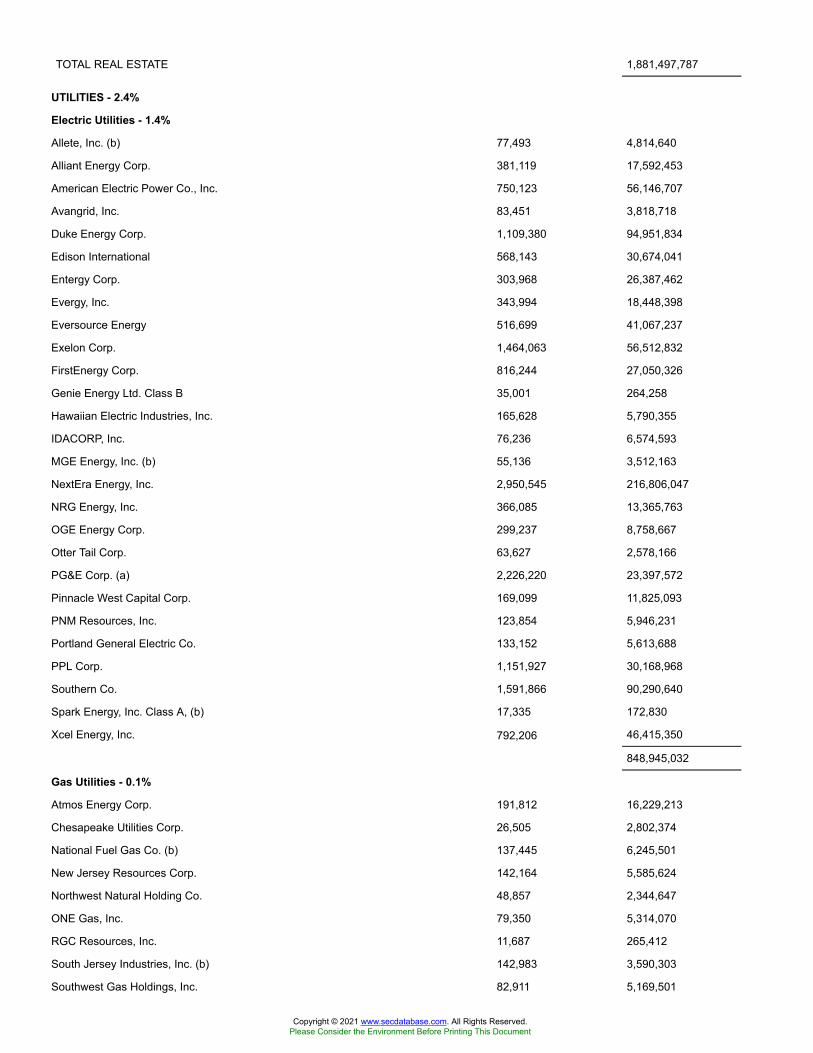
TOTAL REAL ESTATE 1,881,497,787
UTILITIES - 2.4%
Electric Utilities - 1.4%
Allete, Inc. (b) 77,493 4,814,640
Alliant Energy Corp. 381,119 17,592,453
American Electric Power Co., Inc. 750,123 56,146,707
Avangrid, Inc. 83,451 3,818,718
Duke Energy Corp. 1,109,380 94,951,834
Edison International 568,143 30,674,041
Entergy Corp. 303,968 26,387,462
Evergy, Inc. 343,994 18,448,398
Eversource Energy 516,699 41,067,237
Exelon Corp. 1,464,063 56,512,832
FirstEnergy Corp. 816,244 27,050,326
Genie Energy Ltd. Class B 35,001 264,258
Hawaiian Electric Industries, Inc. 165,628 5,790,355
IDACORP, Inc. 76,236 6,574,593
MGE Energy, Inc. (b) 55,136 3,512,163
NextEra Energy, Inc. 2,950,545 216,806,047
NRG Energy, Inc. 366,085 13,365,763
OGE Energy Corp. 299,237 8,758,667
Otter Tail Corp. 63,627 2,578,166
PG&E Corp. (a) 2,226,220 23,397,572
Pinnacle West Capital Corp. 169,099 11,825,093
PNM Resources, Inc. 123,854 5,946,231
Portland General Electric Co. 133,152 5,613,688
PPL Corp. 1,151,927 30,168,968
Southern Co. 1,591,866 90,290,640
Spark Energy, Inc. Class A, (b) 17,335 172,830
Xcel Energy, Inc. 792,206 46,415,350
848,945,032
Gas Utilities - 0.1%
Atmos Energy Corp. 191,812 16,229,213
Chesapeake Utilities Corp. 26,505 2,802,374
National Fuel Gas Co. (b) 137,445 6,245,501
New Jersey Resources Corp. 142,164 5,585,624
Northwest Natural Holding Co. 48,857 2,344,647
ONE Gas, Inc. 79,350 5,314,070
RGC Resources, Inc. 11,687 265,412
South Jersey Industries, Inc. (b) 142,983 3,590,303
Southwest Gas Holdings, Inc. 82,911 5,169,501
Copyright © 2021 www.secdatabase.com. All Rights Reserved.Please Consider the Environment Before Printing This Document
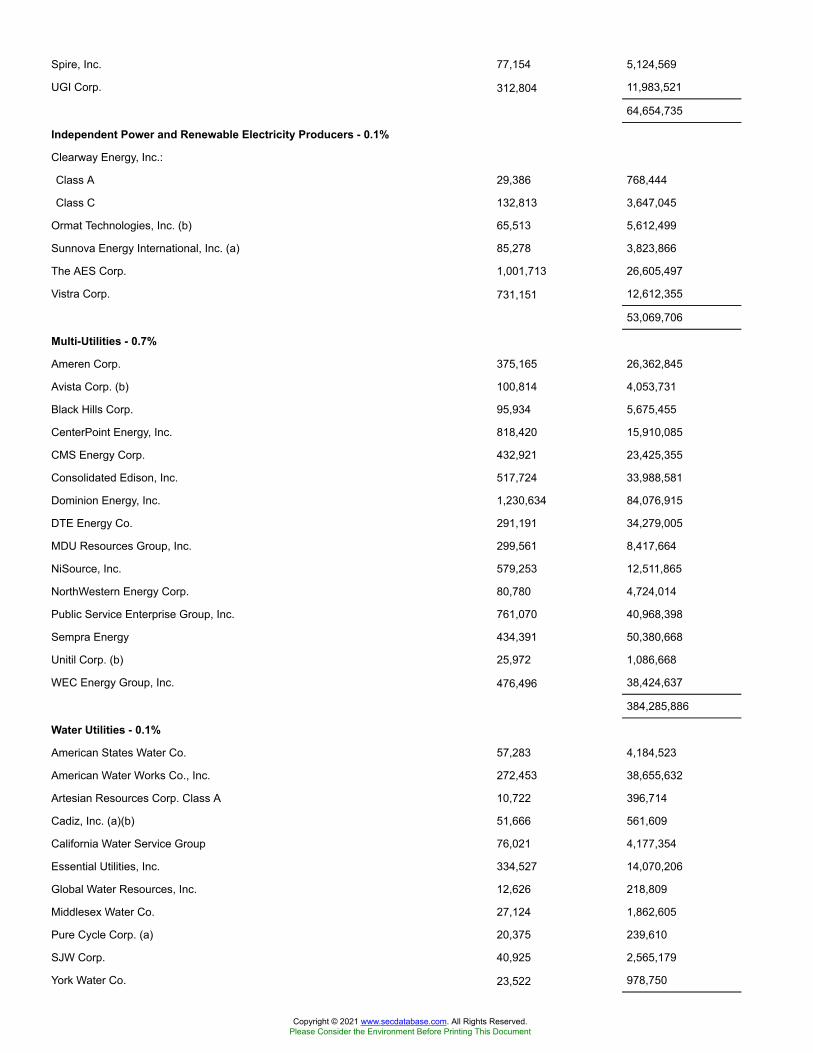
Spire, Inc. 77,154 5,124,569
UGI Corp. 312,804 11,983,521
64,654,735
Independent Power and Renewable Electricity Producers - 0.1%
Clearway Energy, Inc.:
Class A 29,386 768,444
Class C 132,813 3,647,045
Ormat Technologies, Inc. (b) 65,513 5,612,499
Sunnova Energy International, Inc. (a) 85,278 3,823,866
The AES Corp. 1,001,713 26,605,497
Vistra Corp. 731,151 12,612,355
53,069,706
Multi-Utilities - 0.7%
Ameren Corp. 375,165 26,362,845
Avista Corp. (b) 100,814 4,053,731
Black Hills Corp. 95,934 5,675,455
CenterPoint Energy, Inc. 818,420 15,910,085
CMS Energy Corp. 432,921 23,425,355
Consolidated Edison, Inc. 517,724 33,988,581
Dominion Energy, Inc. 1,230,634 84,076,915
DTE Energy Co. 291,191 34,279,005
MDU Resources Group, Inc. 299,561 8,417,664
NiSource, Inc. 579,253 12,511,865
NorthWestern Energy Corp. 80,780 4,724,014
Public Service Enterprise Group, Inc. 761,070 40,968,398
Sempra Energy 434,391 50,380,668
Unitil Corp. (b) 25,972 1,086,668
WEC Energy Group, Inc. 476,496 38,424,637
384,285,886
Water Utilities - 0.1%
American States Water Co. 57,283 4,184,523
American Water Works Co., Inc. 272,453 38,655,632
Artesian Resources Corp. Class A 10,722 396,714
Cadiz, Inc. (a)(b) 51,666 561,609
California Water Service Group 76,021 4,177,354
Essential Utilities, Inc. 334,527 14,070,206
Global Water Resources, Inc. 12,626 218,809
Middlesex Water Co. 27,124 1,862,605
Pure Cycle Corp. (a) 20,375 239,610
SJW Corp. 40,925 2,565,179
York Water Co. 23,522 978,750
Copyright © 2021 www.secdatabase.com. All Rights Reserved.Please Consider the Environment Before Printing This Document

67,910,991
TOTAL UTILITIES 1,418,866,350
TOTAL COMMON STOCKS
(Cost $33,054,201,111) 59,604,850,649
Principal Amount Value
U.S. Treasury Obligations - 0.0%
U.S. Treasury Bills, yield at date of purchase 0.09% 5/6/21 (e)
(Cost $9,998,423) 10,000,000 9,999,328
Shares Value
Money Market Funds - 1.9%
Fidelity Cash Central Fund 0.07% (f) 184,182,719 $184,219,556
Fidelity Securities Lending Cash Central Fund 0.08% (f)(g) 922,442,379 922,534,623
TOTAL MONEY MARKET FUNDS
(Cost $1,106,723,594) 1,106,754,179
TOTAL INVESTMENT IN SECURITIES - 101.4%
(Cost $34,170,923,128) 60,721,604,156
NET OTHER ASSETS (LIABILITIES) - (1.4)% (837,440,525)
NET ASSETS - 100% $59,884,163,631
Futures Contracts
Number ofcontracts
ExpirationDate
NotionalAmount Value
Unrealized Appreciation/(Depreciation)
Purchased
Equity Index Contracts
CME E-mini Russell 2000 Index Contracts(United States) 311
March2021 $34,197,560 $2,600,306 $2,600,306
CME E-mini S&P 500 Index Contracts(United States) 1,228
March2021 233,884,880 4,654,165 4,654,165
CME E-mini S&P MidCap 400 IndexContracts (United States) 68
March2021 16,963,960 1,024,024 1,024,024
TOTAL FUTURES CONTRACTS $8,278,495
The notional amount of futures purchased as a percentage of Net Assets is 0.5%Legend(a) Non-income producing(b) Security or a portion of the security is on loan at period end.(c) Level 3 security(d) Security exempt from registration under Rule 144A of the Securities Act of 1933. These securities may be resold in transactions
exempt from registration, normally to qualified institutional buyers. At the end of the period, the value of these securities amountedto $3,735,835 or 0.0% of net assets.(e) Security or a portion of the security was pledged to cover margin requirements for futures contracts. At period end, the value of
securities pledged amounted to $9,999,328.(f) Affiliated fund that is generally available only to investment companies and other accounts managed by Fidelity Investments. The
rate quoted is the annualized seven-day yield of the fund at period end. A complete unaudited listing of the fund's holdings as of itsmost recent quarter end is available upon request. In addition, each Fidelity Central Fund's financial statements, which are not
Copyright © 2021 www.secdatabase.com. All Rights Reserved.Please Consider the Environment Before Printing This Document
covered by the Fund's Report of Independent Registered Public Accounting Firm, are available on the SEC's website or uponrequest.(g) Investment made with cash collateral received from securities on loan.Affiliated Central FundsInformation regarding fiscal year to date income earned by the Fund from investments in Fidelity Central Funds is as follows:
Fund Income earnedFidelity Cash Central Fund $102,810
Fidelity Securities Lending Cash Central Fund 8,212,961
Total $8,315,771
Amounts in the income column in the above table include any capital gain distributions from underlying funds, which are presentedin the corresponding line-item in the Statement of Operations, if applicable. Amount for Fidelity Securities Lending Cash CentralFund represents the income earned on investing cash collateral, less rebates paid to borrowers and any lending agent fees associatedwith the loan, plus any premium payments received for lending certain types of securities.Investment ValuationThe following is a summary of the inputs used, as of February 28, 2021, involving the Fund's assets and liabilities carried at fairvalue. The inputs or methodology used for valuing securities may not be an indication of the risk associated with investing in thosesecurities. For more information on valuation inputs, and their aggregation into the levels used below, please refer to the InvestmentValuation section in the accompanying Notes to Financial Statements.
Valuation Inputs at Reporting Date:Description Total Level 1 Level 2 Level 3Investments in Securities:Equities:
Communication Services $6,061,811,720 $6,061,487,040 $-- $324,680
Consumer Discretionary 7,305,259,572 7,305,255,625 -- 3,947
Consumer Staples 3,197,770,652 3,197,770,652 -- --
Energy 1,575,716,954 1,575,716,954 -- --
Financials 6,921,725,486 6,921,725,486 -- --
Health Care 8,137,911,718 8,137,369,374 -- 542,344
Industrials 5,546,574,882 5,546,574,842 -- 40
Information Technology 15,905,181,649 15,905,095,726 85,923 --
Materials 1,652,533,879 1,652,533,879 -- --
Real Estate 1,881,497,787 1,881,497,787 -- --
Utilities 1,418,866,350 1,418,866,350 -- --
U.S. Government and Government Agency Obligations 9,999,328 -- 9,999,328 --
Money Market Funds 1,106,754,179 1,106,754,179 -- --
Total Investments in Securities: $60,721,604,156 $60,710,647,894 $10,085,251 $871,011
Derivative Instruments:Assets
Futures Contracts $8,278,495 $8,278,495 $-- $--
Total Assets $8,278,495 $8,278,495 $-- $--
Total Derivative Instruments: $8,278,495 $8,278,495 $-- $--
Value of Derivative InstrumentsThe following table is a summary of the Fund's value of derivative instruments by primary risk exposure as of February 28, 2021.For additional information on derivative instruments, please refer to the Derivative Instruments section in the accompanying Notesto Financial Statements.
Primary Risk Exposure / Derivative Type ValueAsset Liability
Copyright © 2021 www.secdatabase.com. All Rights Reserved.Please Consider the Environment Before Printing This Document
Equity Risk
Futures Contracts(a) $8,278,495 $0
Total Equity Risk 8,278,495 0
Total Value of Derivatives $8,278,495 $0
(a) Reflects gross cumulative appreciation (depreciation) on futures contracts as presented in the Schedule of Investments. In theStatement of Assets and Liabilities, the period end daily variation margin is included in receivable or payable for daily variationmargin on futures contracts, and the net cumulative appreciation (depreciation) is included in Total accumulated earnings (loss).See accompanying notes which are an integral part of the financial statements.
Fidelity® Total Market Index Fund
Financial StatementsStatement of Assets and Liabilities
February 28,2021
AssetsInvestment in securities, at value (including securities loaned of $902,634,275) � Seeaccompanying schedule:Unaffiliated issuers (cost $33,064,199,534) $59,614,849,977
Fidelity Central Funds (cost $1,106,723,594) 1,106,754,179
Total Investment in Securities (cost $34,170,923,128) $60,721,604,156
Segregated cash with brokers for derivative instruments 4,876,570
Cash 16,084
Receivable for investments sold 205,209
Receivable for fund shares sold 147,917,057
Dividends receivable 71,175,598
Distributions receivable from Fidelity Central Funds 480,917
Other receivables 1,321,819
Total assets 60,947,597,410
LiabilitiesPayable for investments purchased $100,640,068
Payable for fund shares redeemed 37,285,507
Accrued management fee 759,918
Payable for daily variation margin on futures contracts 1,132,311
Other payables and accrued expenses 1,322,420
Collateral on securities loaned 922,293,555
Total liabilities 1,063,433,779
Net Assets $59,884,163,631
Net Assets consist of:
Paid in capital $34,004,006,752
Total accumulated earnings (loss) 25,880,156,879
Net Assets $59,884,163,631
Net Asset Value and Maximum Offering PriceFidelity Total Market Index Fund:Net Asset Value, offering price and redemption price per share ($59,884,163,631 ÷ 540,473,723shares) $110.80
Copyright © 2021 www.secdatabase.com. All Rights Reserved.Please Consider the Environment Before Printing This Document
See accompanying notes which are an integral part of the financial statements.
Statement of OperationsYear ended February 28, 2021
Investment IncomeDividends $796,166,177
Interest 9,214
Income from Fidelity Central Funds (including $8,212,961 from security lending) 8,315,771
Total income 804,491,162
ExpensesManagement fee $7,278,203
Independent trustees' fees and expenses 269,607
Legal 15
Interest 28,193
Miscellaneous 31,046
Total expenses before reductions 7,607,064
Expense reductions (2,445)
Total expenses after reductions 7,604,619
Net investment income (loss) 796,886,543
Realized and Unrealized Gain (Loss)Net realized gain (loss) on:
Investment securities:
Unaffiliated issuers (269,618,569)
Fidelity Central Funds 29,981
Foreign currency transactions 3
Futures contracts 27,063,846
Total net realized gain (loss) (242,524,739)
Change in net unrealized appreciation (depreciation) on:
Investment securities:
Unaffiliated issuers 14,735,431,314
Fidelity Central Funds (13,989)
Futures contracts 13,546,333
Total change in net unrealized appreciation (depreciation) 14,748,963,658
Net gain (loss) 14,506,438,919
Net increase (decrease) in net assets resulting from operations $15,303,325,462
See accompanying notes which are an integral part of the financial statements.
Statement of Changes in Net AssetsYear ended February 28, 2021 Year ended February 29, 2020
Increase (Decrease) in Net AssetsOperations
Net investment income (loss) $796,886,543 $927,392,110
Net realized gain (loss) (242,524,739) 12,310,807,893
Change in net unrealized appreciation (depreciation) 14,748,963,658 (9,329,265,371)
Net increase (decrease) in net assets resulting from operations 15,303,325,462 3,908,934,632
Copyright © 2021 www.secdatabase.com. All Rights Reserved.Please Consider the Environment Before Printing This Document
Distributions to shareholders (824,389,466) (1,042,068,060)
Share transactions - net increase (decrease) (580,768,870) (16,484,258,670)
Total increase (decrease) in net assets 13,898,167,126 (13,617,392,098)
Net AssetsBeginning of period 45,985,996,505 59,603,388,603
End of period $59,884,163,631 $45,985,996,505
See accompanying notes which are an integral part of the financial statements.
Financial HighlightsFidelity Total Market Index Fund
Years ended February 28, 2021 2020 A 2019 2018 2017
Selected Per�Share Data
Net asset value, beginning of period $83.06 $79.36 $77.42 $68.19 $55.31
Income from Investment Operations
Net investment income (loss)B 1.50 1.57 1.45 1.36 1.28
Net realized and unrealized gain (loss) 27.80 3.88 2.28 9.65 13.17
Total from investment operations 29.30 5.45 3.73 11.01 14.45
Distributions from net investment income (1.56) (1.63) (1.46) (1.27) (1.17)
Distributions from net realized gain � (.13) (.34) (.51) (.39)
Total distributions (1.56) (1.75)C (1.79)C (1.78) (1.57)C
Redemption fees added to paid in capitalB � � � � �D
Net asset value, end of period $110.80 $83.06 $79.36 $77.42 $68.19
Total ReturnE 35.50% 6.77% 5.02% 16.25% 26.32%
Ratios to Average Net AssetsF,G
Expenses before reductions .02% .02% .02% .02% .02%
Expenses net of fee waivers, if any .02% .02% .02% .02% .02%
Expenses net of all reductions .02% .02% .02% .02% .02%
Net investment income (loss) 1.60% 1.84% 1.90% 1.86% 2.02%
Supplemental Data
Net assets, end of period (000 omitted) $59,884,164 $45,985,996 $43,922,333 $6,114,864 $4,684,669
Portfolio turnover rateH 6%I 11%I 8% 2% 4%
A For the year ended February 29.B Calculated based on average shares outstanding during the period.C Total distributions per share do not sum due to rounding.D Amount represents less than $.005 per share.E Total returns would have been lower if certain expenses had not been reduced during the applicable periods shown.F Fees and expenses of any underlying mutual funds or exchange-traded funds (ETFs) are not included in the Fund's expense
ratio. The Fund indirectly bears its proportionate share of these expenses. For additional expense information related to investmentsin Fidelity Central Funds, please refer to the "Investments in Fidelity Central Funds" note found in the Notes to Financial Statementssection of the most recent Annual or Semi-Annual report.G Expense ratios reflect operating expenses of the class. Expenses before reductions do not reflect amounts reimbursed, waived,
or reduced through arrangements with the investment adviser, brokerage services, or other offset arrangements, if applicable, anddo not represent the amount paid by the class during periods when reimbursements, waivers or reductions occur.H Amount does not include the portfolio activity of any underlying mutual funds or exchange-traded funds (ETFs).
Copyright © 2021 www.secdatabase.com. All Rights Reserved.Please Consider the Environment Before Printing This Document
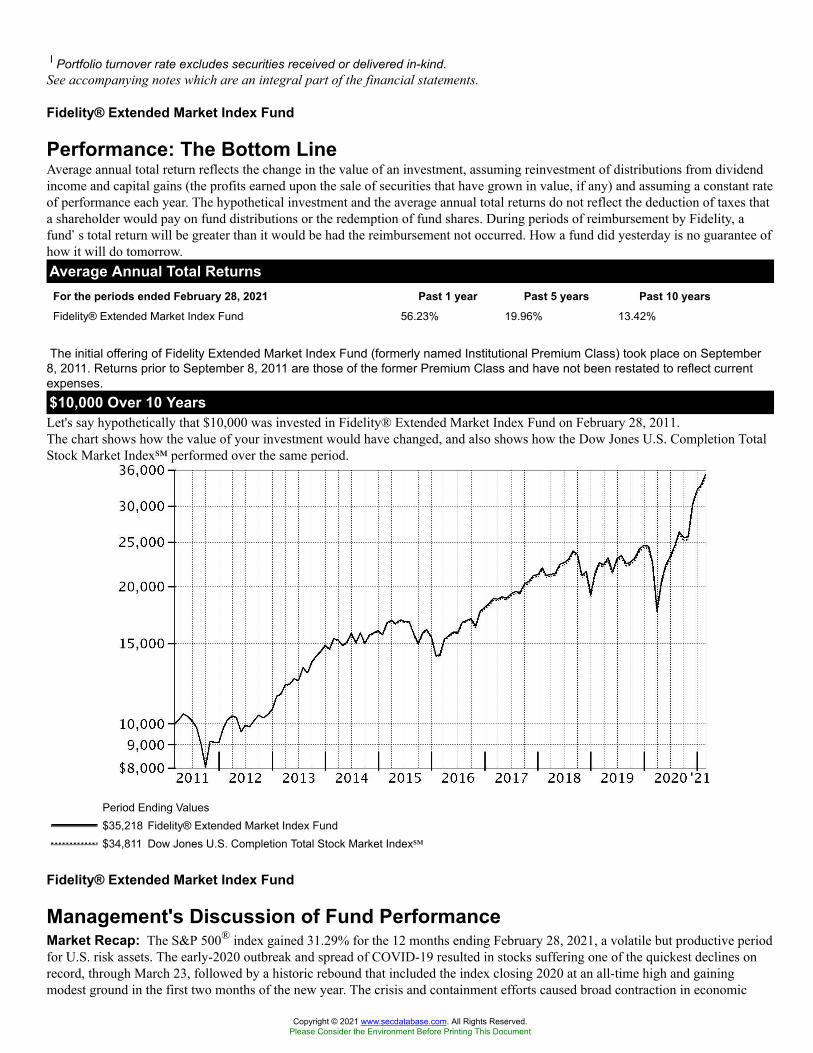
I Portfolio turnover rate excludes securities received or delivered in-kind.See accompanying notes which are an integral part of the financial statements.
Fidelity® Extended Market Index Fund
Performance: The Bottom LineAverage annual total return reflects the change in the value of an investment, assuming reinvestment of distributions from dividendincome and capital gains (the profits earned upon the sale of securities that have grown in value, if any) and assuming a constant rateof performance each year. The hypothetical investment and the average annual total returns do not reflect the deduction of taxes thata shareholder would pay on fund distributions or the redemption of fund shares. During periods of reimbursement by Fidelity, afund�s total return will be greater than it would be had the reimbursement not occurred. How a fund did yesterday is no guarantee ofhow it will do tomorrow.Average Annual Total ReturnsFor the periods ended February 28, 2021 Past 1 year Past 5 years Past 10 yearsFidelity® Extended Market Index Fund 56.23% 19.96% 13.42%
The initial offering of Fidelity Extended Market Index Fund (formerly named Institutional Premium Class) took place on September8, 2011. Returns prior to September 8, 2011 are those of the former Premium Class and have not been restated to reflect currentexpenses.$10,000 Over 10 YearsLet's say hypothetically that $10,000 was invested in Fidelity® Extended Market Index Fund on February 28, 2011.The chart shows how the value of your investment would have changed, and also shows how the Dow Jones U.S. Completion TotalStock Market Index℠ performed over the same period.
Period Ending Values$35,218 Fidelity® Extended Market Index Fund$34,811 Dow Jones U.S. Completion Total Stock Market Index℠
Fidelity® Extended Market Index Fund
Management's Discussion of Fund PerformanceMarket Recap: The S&P 500® index gained 31.29% for the 12 months ending February 28, 2021, a volatile but productive periodfor U.S. risk assets. The early-2020 outbreak and spread of COVID-19 resulted in stocks suffering one of the quickest declines onrecord, through March 23, followed by a historic rebound that included the index closing 2020 at an all-time high and gainingmodest ground in the first two months of the new year. The crisis and containment efforts caused broad contraction in economic
Copyright © 2021 www.secdatabase.com. All Rights Reserved.Please Consider the Environment Before Printing This Document
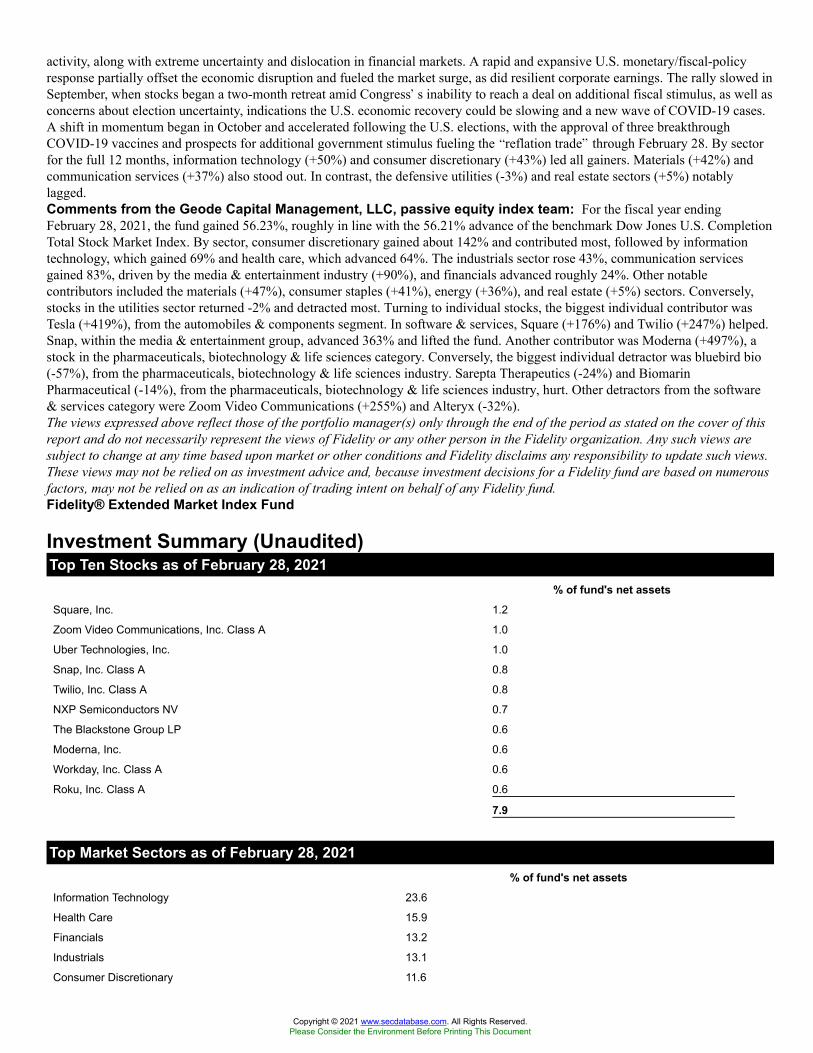
activity, along with extreme uncertainty and dislocation in financial markets. A rapid and expansive U.S. monetary/fiscal-policyresponse partially offset the economic disruption and fueled the market surge, as did resilient corporate earnings. The rally slowed inSeptember, when stocks began a two-month retreat amid Congress�s inability to reach a deal on additional fiscal stimulus, as well asconcerns about election uncertainty, indications the U.S. economic recovery could be slowing and a new wave of COVID-19 cases.A shift in momentum began in October and accelerated following the U.S. elections, with the approval of three breakthroughCOVID-19 vaccines and prospects for additional government stimulus fueling the �reflation trade� through February 28. By sectorfor the full 12 months, information technology (+50%) and consumer discretionary (+43%) led all gainers. Materials (+42%) andcommunication services (+37%) also stood out. In contrast, the defensive utilities (-3%) and real estate sectors (+5%) notablylagged.Comments from the Geode Capital Management, LLC, passive equity index team: For the fiscal year endingFebruary 28, 2021, the fund gained 56.23%, roughly in line with the 56.21% advance of the benchmark Dow Jones U.S. CompletionTotal Stock Market Index. By sector, consumer discretionary gained about 142% and contributed most, followed by informationtechnology, which gained 69% and health care, which advanced 64%. The industrials sector rose 43%, communication servicesgained 83%, driven by the media & entertainment industry (+90%), and financials advanced roughly 24%. Other notablecontributors included the materials (+47%), consumer staples (+41%), energy (+36%), and real estate (+5%) sectors. Conversely,stocks in the utilities sector returned -2% and detracted most. Turning to individual stocks, the biggest individual contributor wasTesla (+419%), from the automobiles & components segment. In software & services, Square (+176%) and Twilio (+247%) helped.Snap, within the media & entertainment group, advanced 363% and lifted the fund. Another contributor was Moderna (+497%), astock in the pharmaceuticals, biotechnology & life sciences category. Conversely, the biggest individual detractor was bluebird bio(-57%), from the pharmaceuticals, biotechnology & life sciences industry. Sarepta Therapeutics (-24%) and BiomarinPharmaceutical (-14%), from the pharmaceuticals, biotechnology & life sciences industry, hurt. Other detractors from the software& services category were Zoom Video Communications (+255%) and Alteryx (-32%).The views expressed above reflect those of the portfolio manager(s) only through the end of the period as stated on the cover of thisreport and do not necessarily represent the views of Fidelity or any other person in the Fidelity organization. Any such views aresubject to change at any time based upon market or other conditions and Fidelity disclaims any responsibility to update such views.These views may not be relied on as investment advice and, because investment decisions for a Fidelity fund are based on numerousfactors, may not be relied on as an indication of trading intent on behalf of any Fidelity fund.Fidelity® Extended Market Index Fund
Investment Summary (Unaudited)Top Ten Stocks as of February 28, 2021
% of fund's net assetsSquare, Inc. 1.2
Zoom Video Communications, Inc. Class A 1.0
Uber Technologies, Inc. 1.0
Snap, Inc. Class A 0.8
Twilio, Inc. Class A 0.8
NXP Semiconductors NV 0.7
The Blackstone Group LP 0.6
Moderna, Inc. 0.6
Workday, Inc. Class A 0.6
Roku, Inc. Class A 0.6
7.9
Top Market Sectors as of February 28, 2021% of fund's net assets
Information Technology 23.6
Health Care 15.9
Financials 13.2
Industrials 13.1
Consumer Discretionary 11.6
Copyright © 2021 www.secdatabase.com. All Rights Reserved.Please Consider the Environment Before Printing This Document
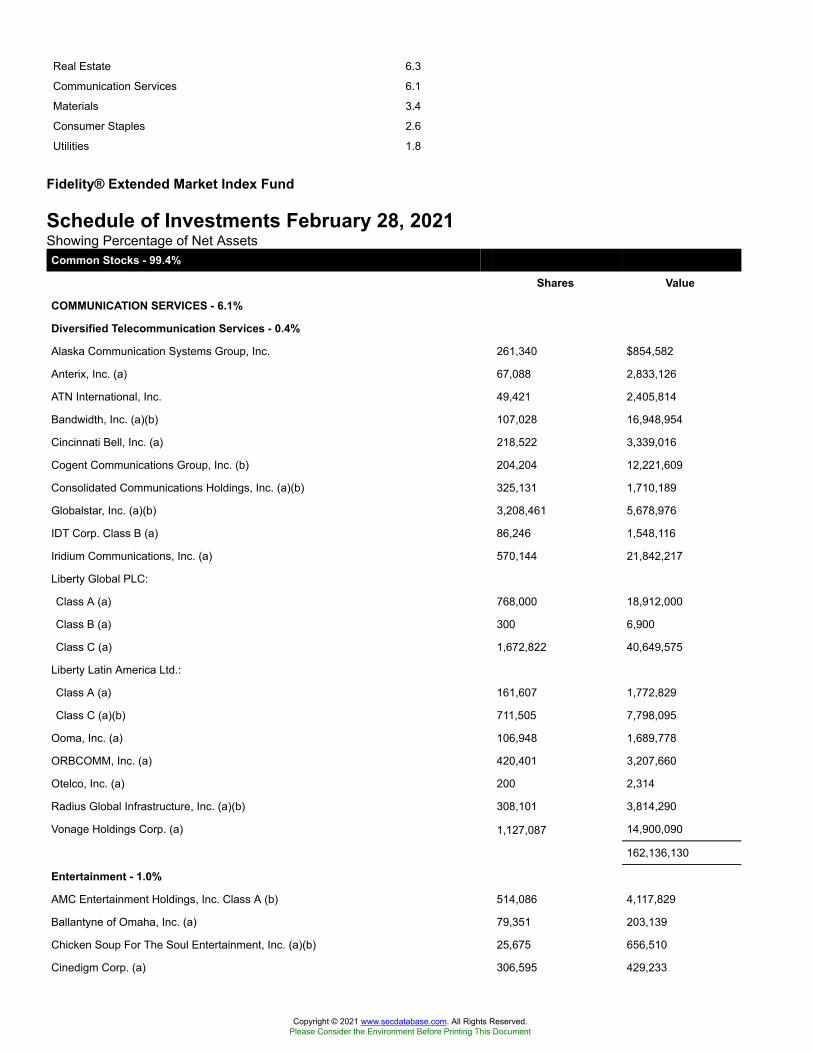
Real Estate 6.3
Communication Services 6.1
Materials 3.4
Consumer Staples 2.6
Utilities 1.8
Fidelity® Extended Market Index Fund
Schedule of Investments February 28, 2021Showing Percentage of Net AssetsCommon Stocks - 99.4%
Shares Value
COMMUNICATION SERVICES - 6.1%
Diversified Telecommunication Services - 0.4%
Alaska Communication Systems Group, Inc. 261,340 $854,582
Anterix, Inc. (a) 67,088 2,833,126
ATN International, Inc. 49,421 2,405,814
Bandwidth, Inc. (a)(b) 107,028 16,948,954
Cincinnati Bell, Inc. (a) 218,522 3,339,016
Cogent Communications Group, Inc. (b) 204,204 12,221,609
Consolidated Communications Holdings, Inc. (a)(b) 325,131 1,710,189
Globalstar, Inc. (a)(b) 3,208,461 5,678,976
IDT Corp. Class B (a) 86,246 1,548,116
Iridium Communications, Inc. (a) 570,144 21,842,217
Liberty Global PLC:
Class A (a) 768,000 18,912,000
Class B (a) 300 6,900
Class C (a) 1,672,822 40,649,575
Liberty Latin America Ltd.:
Class A (a) 161,607 1,772,829
Class C (a)(b) 711,505 7,798,095
Ooma, Inc. (a) 106,948 1,689,778
ORBCOMM, Inc. (a) 420,401 3,207,660
Otelco, Inc. (a) 200 2,314
Radius Global Infrastructure, Inc. (a)(b) 308,101 3,814,290
Vonage Holdings Corp. (a) 1,127,087 14,900,090
162,136,130
Entertainment - 1.0%
AMC Entertainment Holdings, Inc. Class A (b) 514,086 4,117,829
Ballantyne of Omaha, Inc. (a) 79,351 203,139
Chicken Soup For The Soul Entertainment, Inc. (a)(b) 25,675 656,510
Cinedigm Corp. (a) 306,595 429,233
Copyright © 2021 www.secdatabase.com. All Rights Reserved.Please Consider the Environment Before Printing This Document

Cinemark Holdings, Inc. (b) 473,320 10,626,034
CuriosityStream, Inc. Class A (a)(b) 105,433 1,831,371
Dolphin Entertainment, Inc. (a)(b) 26,771 124,753
Gaia, Inc. Class A (a)(b) 70,283 669,094
Glu Mobile, Inc. (a) 718,956 8,972,571
Lions Gate Entertainment Corp.:
Class A (a)(b) 299,542 4,349,350
Class B (a) 472,810 5,929,037
LiveXLive Media, Inc. (a)(b) 288,846 1,146,719
Madison Square Garden Entertainment Corp. (a) 88,122 9,496,908
Madison Square Garden Sports Corp. (a) 75,814 14,582,823
Marcus Corp. (b) 131,490 2,582,464
NTN Communications, Inc. (a) 20,786 75,245
Playtika Holding Corp. 337,788 10,049,193
Reading International, Inc. Class A (a) 94,967 695,158
Roku, Inc. Class A (a) 523,782 207,145,305
Sciplay Corp. (A Shares) (a) 115,096 2,088,992
Warner Music Group Corp. Class A 435,453 15,445,518
World Wrestling Entertainment, Inc. Class A (b) 243,556 12,031,666
Zynga, Inc. (a) 4,835,140 53,911,811
367,160,723
Interactive Media & Services - 2.9%
ANGI Homeservices, Inc. Class A (a) 396,457 5,925,050
Autoweb, Inc. (a)(b) 46,143 118,588
Bumble, Inc. 243,270 16,374,504
CarGurus, Inc. Class A (a) 417,512 10,834,436
Cars.com, Inc. (a) 332,926 3,885,246
Creatd, Inc. (a)(b) 21,797 112,255
DHI Group, Inc. (a) 262,377 815,992
Eventbrite, Inc. (a)(b) 329,426 6,545,695
EverQuote, Inc. Class A (a) 49,669 2,432,788
IAC (a) 382,851 93,733,410
Izea Worldwide, Inc. (a) 216,089 866,517
Kubient, Inc. (b) 23,259 160,720
Liberty TripAdvisor Holdings, Inc. (a) 355,528 2,001,623
Match Group, Inc. (a) 1,248,407 190,819,010
MediaAlpha, Inc. Class A (b) 59,749 3,137,420
Pinterest, Inc. Class A (a) 2,452,756 197,643,078
Professional Diversity Network, Inc. (a)(b) 32,999 91,407
QuinStreet, Inc. (a) 239,059 5,711,120
Snap, Inc. Class A (a) 4,386,583 288,023,040
Copyright © 2021 www.secdatabase.com. All Rights Reserved.Please Consider the Environment Before Printing This Document

Super League Gaming, Inc. (a) 64,359 201,444
Travelzoo, Inc. (a) 17,983 243,130
TripAdvisor, Inc. (a)(b) 462,315 22,940,070
TrueCar, Inc. (a) 459,834 2,492,300
Yelp, Inc. (a) 333,494 12,576,059
Zedge, Inc. (a) 45,844 460,274
Zillow Group, Inc.:
Class A (a) 242,968 41,260,826
Class C (a)(b) 638,389 102,991,297
Zoominfo Technologies, Inc. (b) 393,772 20,641,528
1,033,038,827
Media - 1.7%
A.H. Belo Corp. Class A 90,747 185,124
Advantage Solutions, Inc. Class A (a) 616,050 5,575,253
Altice U.S.A., Inc. Class A (a) 1,278,652 42,975,494
AMC Networks, Inc. Class A (a)(b) 131,324 8,613,541
Beasley Broadcast Group, Inc. Class A 105,521 257,471
Boston Omaha Corp. (a)(b) 145,455 6,106,201
Cable One, Inc. 25,340 48,522,299
Cardlytics, Inc. (a)(b) 136,392 18,062,393
Cbdmd, Inc. (a)(b) 199,426 745,853
Clear Channel Outdoor Holdings, Inc. (a) 2,404,410 4,135,585
comScore, Inc. (a)(b) 403,920 1,474,308
Creative Realities, Inc. (a)(b) 108,411 297,046
Cumulus Media, Inc. (a)(b) 128,827 1,248,334
Daily Journal Corp. (a) 6,710 2,296,833
Digital Media Solutions, Inc. Class A (a)(b) 143,971 1,583,681
E.W. Scripps Co. Class A (b) 256,753 4,832,091
Emerald Expositions Events, Inc. 156,029 853,479
Entercom Communications Corp. Class A 571,458 2,554,417
Entravision Communication Corp. Class A 291,837 913,450
Fluent, Inc. (a) 317,944 2,012,586
Gannett Co., Inc. (a)(b) 592,584 2,933,291
Gray Television, Inc. (b) 405,341 7,356,939
Hemisphere Media Group, Inc. (a) 108,444 1,198,306
iHeartMedia, Inc. (a) 364,161 5,123,745
Insignia Systems, Inc. (a)(b) 30,844 209,739
John Wiley & Sons, Inc. Class A (b) 262,804 13,844,515
Lee Enterprises, Inc. (a) 533,104 1,156,836
Liberty Broadband Corp.:
Class A (a) 20,228 2,940,342
Copyright © 2021 www.secdatabase.com. All Rights Reserved.Please Consider the Environment Before Printing This Document
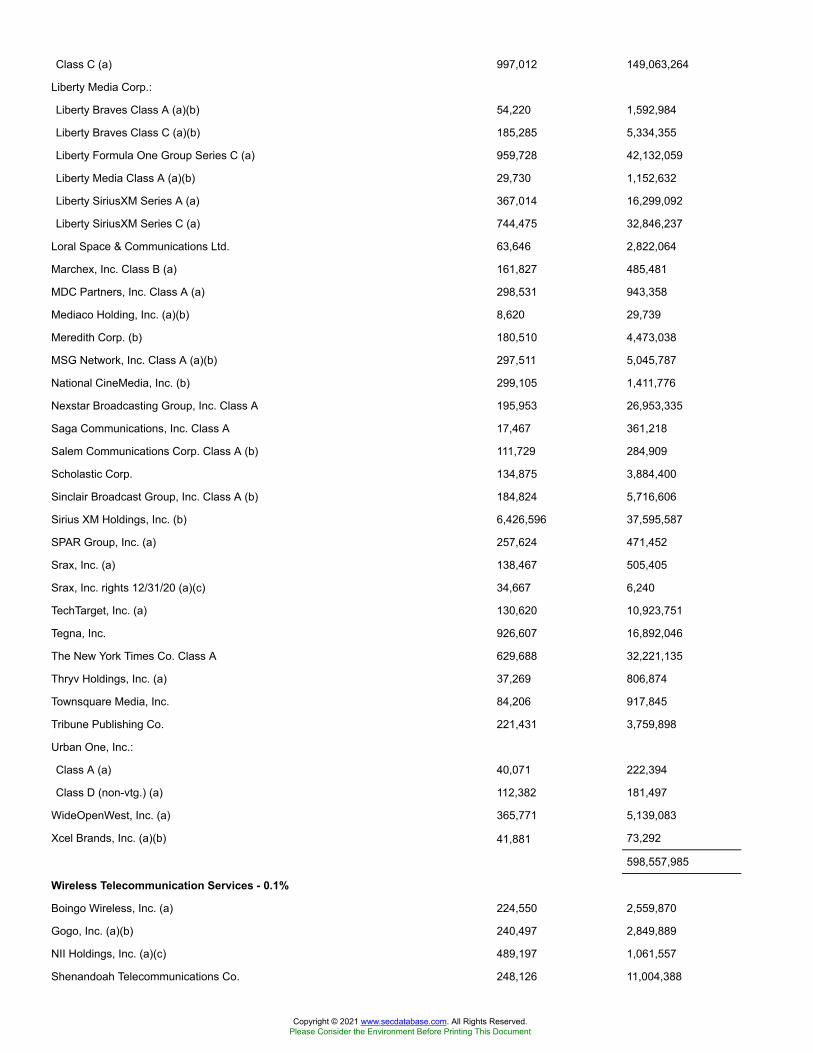
Class C (a) 997,012 149,063,264
Liberty Media Corp.:
Liberty Braves Class A (a)(b) 54,220 1,592,984
Liberty Braves Class C (a)(b) 185,285 5,334,355
Liberty Formula One Group Series C (a) 959,728 42,132,059
Liberty Media Class A (a)(b) 29,730 1,152,632
Liberty SiriusXM Series A (a) 367,014 16,299,092
Liberty SiriusXM Series C (a) 744,475 32,846,237
Loral Space & Communications Ltd. 63,646 2,822,064
Marchex, Inc. Class B (a) 161,827 485,481
MDC Partners, Inc. Class A (a) 298,531 943,358
Mediaco Holding, Inc. (a)(b) 8,620 29,739
Meredith Corp. (b) 180,510 4,473,038
MSG Network, Inc. Class A (a)(b) 297,511 5,045,787
National CineMedia, Inc. (b) 299,105 1,411,776
Nexstar Broadcasting Group, Inc. Class A 195,953 26,953,335
Saga Communications, Inc. Class A 17,467 361,218
Salem Communications Corp. Class A (b) 111,729 284,909
Scholastic Corp. 134,875 3,884,400
Sinclair Broadcast Group, Inc. Class A (b) 184,824 5,716,606
Sirius XM Holdings, Inc. (b) 6,426,596 37,595,587
SPAR Group, Inc. (a) 257,624 471,452
Srax, Inc. (a) 138,467 505,405
Srax, Inc. rights 12/31/20 (a)(c) 34,667 6,240
TechTarget, Inc. (a) 130,620 10,923,751
Tegna, Inc. 926,607 16,892,046
The New York Times Co. Class A 629,688 32,221,135
Thryv Holdings, Inc. (a) 37,269 806,874
Townsquare Media, Inc. 84,206 917,845
Tribune Publishing Co. 221,431 3,759,898
Urban One, Inc.:
Class A (a) 40,071 222,394
Class D (non-vtg.) (a) 112,382 181,497
WideOpenWest, Inc. (a) 365,771 5,139,083
Xcel Brands, Inc. (a)(b) 41,881 73,292
598,557,985
Wireless Telecommunication Services - 0.1%
Boingo Wireless, Inc. (a) 224,550 2,559,870
Gogo, Inc. (a)(b) 240,497 2,849,889
NII Holdings, Inc. (a)(c) 489,197 1,061,557
Shenandoah Telecommunications Co. 248,126 11,004,388
Copyright © 2021 www.secdatabase.com. All Rights Reserved.Please Consider the Environment Before Printing This Document
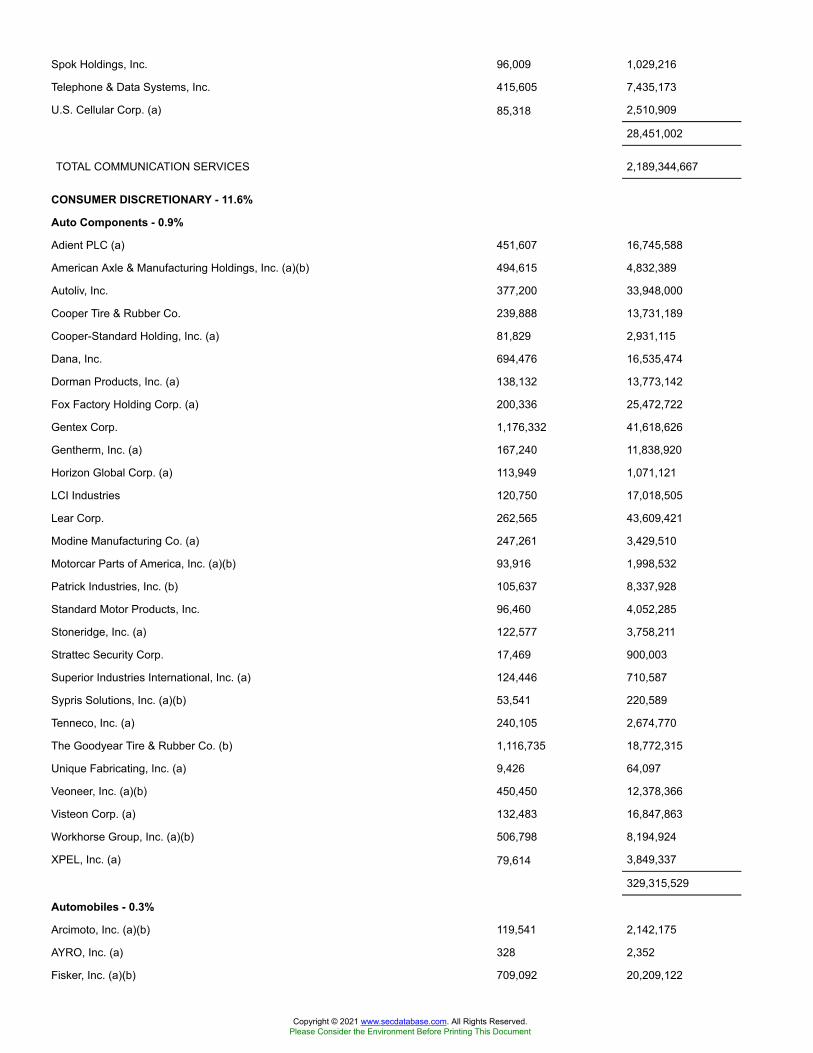
Spok Holdings, Inc. 96,009 1,029,216
Telephone & Data Systems, Inc. 415,605 7,435,173
U.S. Cellular Corp. (a) 85,318 2,510,909
28,451,002
TOTAL COMMUNICATION SERVICES 2,189,344,667
CONSUMER DISCRETIONARY - 11.6%
Auto Components - 0.9%
Adient PLC (a) 451,607 16,745,588
American Axle & Manufacturing Holdings, Inc. (a)(b) 494,615 4,832,389
Autoliv, Inc. 377,200 33,948,000
Cooper Tire & Rubber Co. 239,888 13,731,189
Cooper-Standard Holding, Inc. (a) 81,829 2,931,115
Dana, Inc. 694,476 16,535,474
Dorman Products, Inc. (a) 138,132 13,773,142
Fox Factory Holding Corp. (a) 200,336 25,472,722
Gentex Corp. 1,176,332 41,618,626
Gentherm, Inc. (a) 167,240 11,838,920
Horizon Global Corp. (a) 113,949 1,071,121
LCI Industries 120,750 17,018,505
Lear Corp. 262,565 43,609,421
Modine Manufacturing Co. (a) 247,261 3,429,510
Motorcar Parts of America, Inc. (a)(b) 93,916 1,998,532
Patrick Industries, Inc. (b) 105,637 8,337,928
Standard Motor Products, Inc. 96,460 4,052,285
Stoneridge, Inc. (a) 122,577 3,758,211
Strattec Security Corp. 17,469 900,003
Superior Industries International, Inc. (a) 124,446 710,587
Sypris Solutions, Inc. (a)(b) 53,541 220,589
Tenneco, Inc. (a) 240,105 2,674,770
The Goodyear Tire & Rubber Co. (b) 1,116,735 18,772,315
Unique Fabricating, Inc. (a) 9,426 64,097
Veoneer, Inc. (a)(b) 450,450 12,378,366
Visteon Corp. (a) 132,483 16,847,863
Workhorse Group, Inc. (a)(b) 506,798 8,194,924
XPEL, Inc. (a) 79,614 3,849,337
329,315,529
Automobiles - 0.3%
Arcimoto, Inc. (a)(b) 119,541 2,142,175
AYRO, Inc. (a) 328 2,352
Fisker, Inc. (a)(b) 709,092 20,209,122
Copyright © 2021 www.secdatabase.com. All Rights Reserved.Please Consider the Environment Before Printing This Document
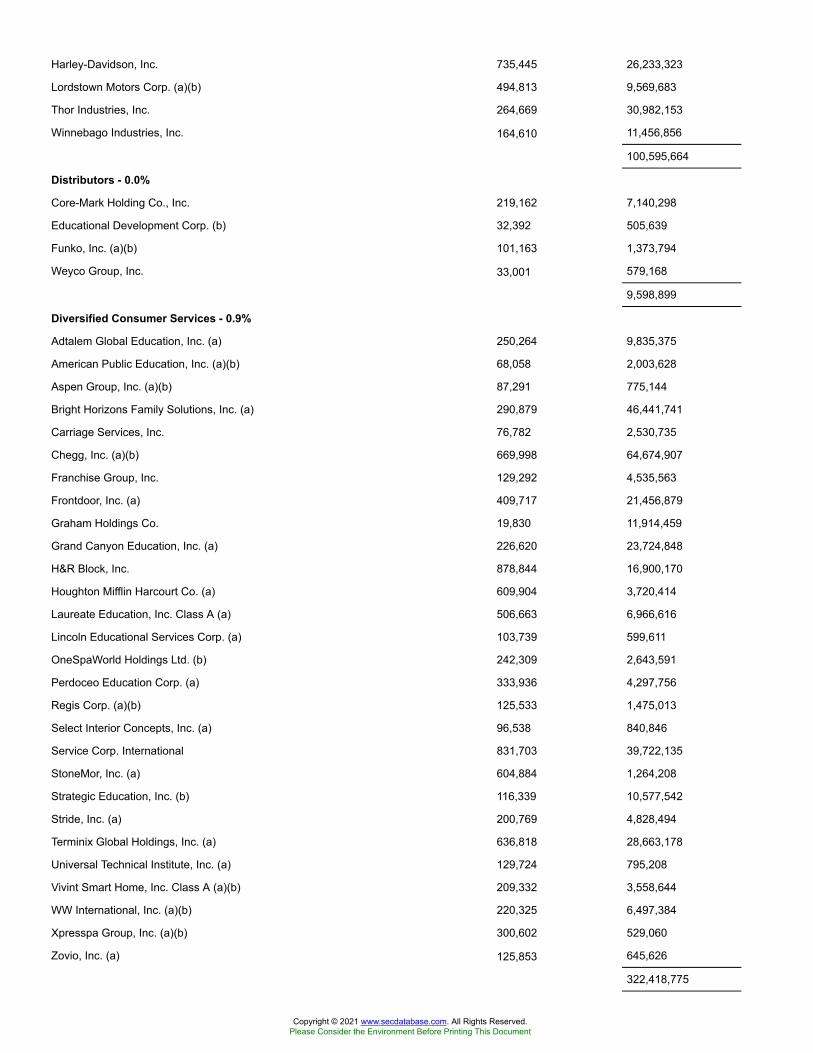
Harley-Davidson, Inc. 735,445 26,233,323
Lordstown Motors Corp. (a)(b) 494,813 9,569,683
Thor Industries, Inc. 264,669 30,982,153
Winnebago Industries, Inc. 164,610 11,456,856
100,595,664
Distributors - 0.0%
Core-Mark Holding Co., Inc. 219,162 7,140,298
Educational Development Corp. (b) 32,392 505,639
Funko, Inc. (a)(b) 101,163 1,373,794
Weyco Group, Inc. 33,001 579,168
9,598,899
Diversified Consumer Services - 0.9%
Adtalem Global Education, Inc. (a) 250,264 9,835,375
American Public Education, Inc. (a)(b) 68,058 2,003,628
Aspen Group, Inc. (a)(b) 87,291 775,144
Bright Horizons Family Solutions, Inc. (a) 290,879 46,441,741
Carriage Services, Inc. 76,782 2,530,735
Chegg, Inc. (a)(b) 669,998 64,674,907
Franchise Group, Inc. 129,292 4,535,563
Frontdoor, Inc. (a) 409,717 21,456,879
Graham Holdings Co. 19,830 11,914,459
Grand Canyon Education, Inc. (a) 226,620 23,724,848
H&R Block, Inc. 878,844 16,900,170
Houghton Mifflin Harcourt Co. (a) 609,904 3,720,414
Laureate Education, Inc. Class A (a) 506,663 6,966,616
Lincoln Educational Services Corp. (a) 103,739 599,611
OneSpaWorld Holdings Ltd. (b) 242,309 2,643,591
Perdoceo Education Corp. (a) 333,936 4,297,756
Regis Corp. (a)(b) 125,533 1,475,013
Select Interior Concepts, Inc. (a) 96,538 840,846
Service Corp. International 831,703 39,722,135
StoneMor, Inc. (a) 604,884 1,264,208
Strategic Education, Inc. (b) 116,339 10,577,542
Stride, Inc. (a) 200,769 4,828,494
Terminix Global Holdings, Inc. (a) 636,818 28,663,178
Universal Technical Institute, Inc. (a) 129,724 795,208
Vivint Smart Home, Inc. Class A (a)(b) 209,332 3,558,644
WW International, Inc. (a)(b) 220,325 6,497,384
Xpresspa Group, Inc. (a)(b) 300,602 529,060
Zovio, Inc. (a) 125,853 645,626
322,418,775
Copyright © 2021 www.secdatabase.com. All Rights Reserved.Please Consider the Environment Before Printing This Document
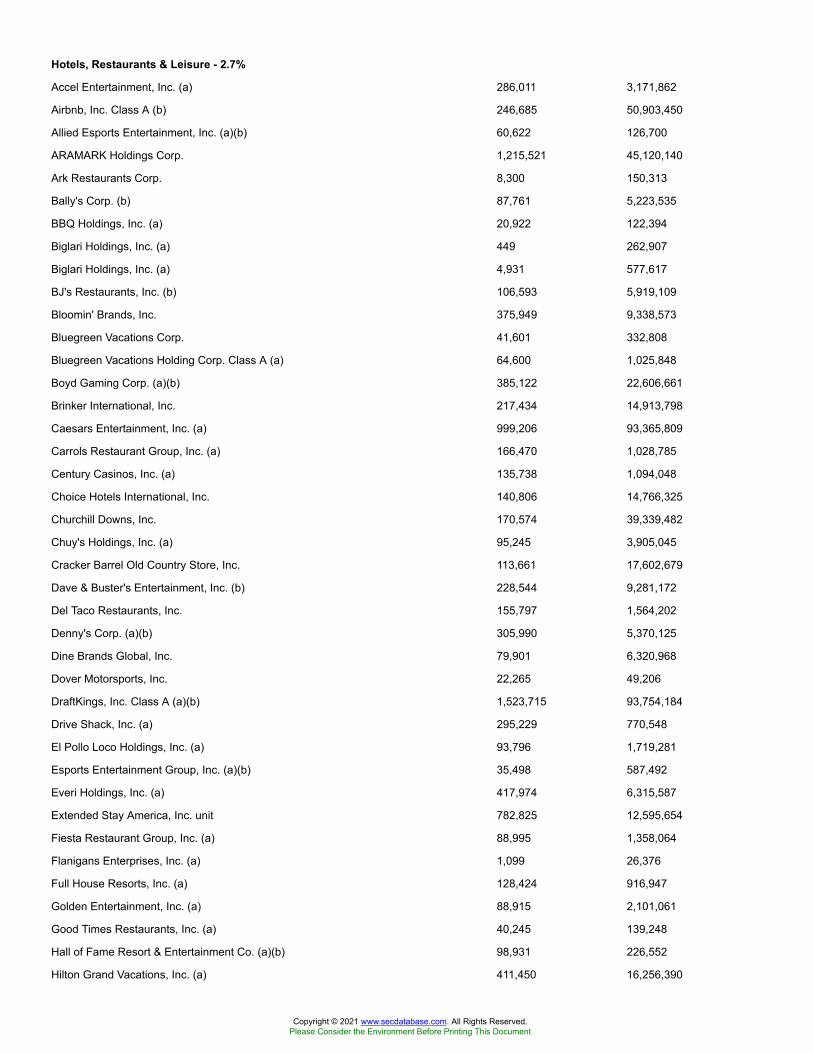
Hotels, Restaurants & Leisure - 2.7%
Accel Entertainment, Inc. (a) 286,011 3,171,862
Airbnb, Inc. Class A (b) 246,685 50,903,450
Allied Esports Entertainment, Inc. (a)(b) 60,622 126,700
ARAMARK Holdings Corp. 1,215,521 45,120,140
Ark Restaurants Corp. 8,300 150,313
Bally's Corp. (b) 87,761 5,223,535
BBQ Holdings, Inc. (a) 20,922 122,394
Biglari Holdings, Inc. (a) 449 262,907
Biglari Holdings, Inc. (a) 4,931 577,617
BJ's Restaurants, Inc. (b) 106,593 5,919,109
Bloomin' Brands, Inc. 375,949 9,338,573
Bluegreen Vacations Corp. 41,601 332,808
Bluegreen Vacations Holding Corp. Class A (a) 64,600 1,025,848
Boyd Gaming Corp. (a)(b) 385,122 22,606,661
Brinker International, Inc. 217,434 14,913,798
Caesars Entertainment, Inc. (a) 999,206 93,365,809
Carrols Restaurant Group, Inc. (a) 166,470 1,028,785
Century Casinos, Inc. (a) 135,738 1,094,048
Choice Hotels International, Inc. 140,806 14,766,325
Churchill Downs, Inc. 170,574 39,339,482
Chuy's Holdings, Inc. (a) 95,245 3,905,045
Cracker Barrel Old Country Store, Inc. 113,661 17,602,679
Dave & Buster's Entertainment, Inc. (b) 228,544 9,281,172
Del Taco Restaurants, Inc. 155,797 1,564,202
Denny's Corp. (a)(b) 305,990 5,370,125
Dine Brands Global, Inc. 79,901 6,320,968
Dover Motorsports, Inc. 22,265 49,206
DraftKings, Inc. Class A (a)(b) 1,523,715 93,754,184
Drive Shack, Inc. (a) 295,229 770,548
El Pollo Loco Holdings, Inc. (a) 93,796 1,719,281
Esports Entertainment Group, Inc. (a)(b) 35,498 587,492
Everi Holdings, Inc. (a) 417,974 6,315,587
Extended Stay America, Inc. unit 782,825 12,595,654
Fiesta Restaurant Group, Inc. (a) 88,995 1,358,064
Flanigans Enterprises, Inc. (a) 1,099 26,376
Full House Resorts, Inc. (a) 128,424 916,947
Golden Entertainment, Inc. (a) 88,915 2,101,061
Good Times Restaurants, Inc. (a) 40,245 139,248
Hall of Fame Resort & Entertainment Co. (a)(b) 98,931 226,552
Hilton Grand Vacations, Inc. (a) 411,450 16,256,390
Copyright © 2021 www.secdatabase.com. All Rights Reserved.Please Consider the Environment Before Printing This Document
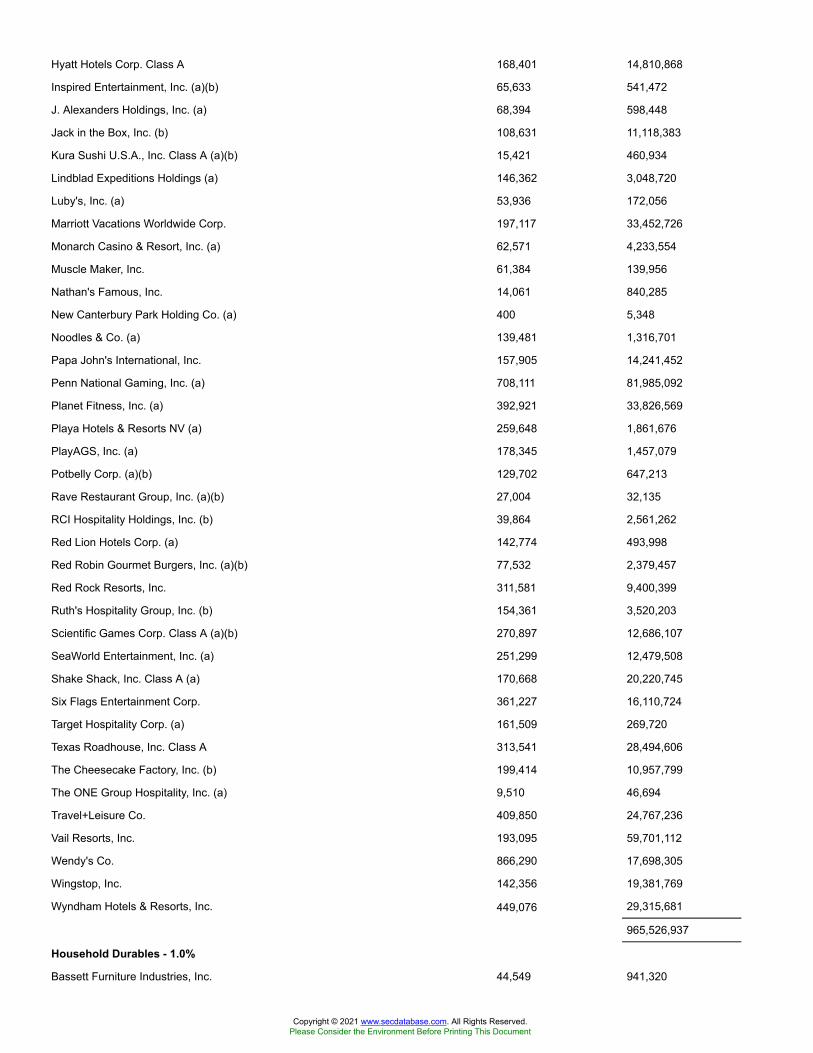
Hyatt Hotels Corp. Class A 168,401 14,810,868
Inspired Entertainment, Inc. (a)(b) 65,633 541,472
J. Alexanders Holdings, Inc. (a) 68,394 598,448
Jack in the Box, Inc. (b) 108,631 11,118,383
Kura Sushi U.S.A., Inc. Class A (a)(b) 15,421 460,934
Lindblad Expeditions Holdings (a) 146,362 3,048,720
Luby's, Inc. (a) 53,936 172,056
Marriott Vacations Worldwide Corp. 197,117 33,452,726
Monarch Casino & Resort, Inc. (a) 62,571 4,233,554
Muscle Maker, Inc. 61,384 139,956
Nathan's Famous, Inc. 14,061 840,285
New Canterbury Park Holding Co. (a) 400 5,348
Noodles & Co. (a) 139,481 1,316,701
Papa John's International, Inc. 157,905 14,241,452
Penn National Gaming, Inc. (a) 708,111 81,985,092
Planet Fitness, Inc. (a) 392,921 33,826,569
Playa Hotels & Resorts NV (a) 259,648 1,861,676
PlayAGS, Inc. (a) 178,345 1,457,079
Potbelly Corp. (a)(b) 129,702 647,213
Rave Restaurant Group, Inc. (a)(b) 27,004 32,135
RCI Hospitality Holdings, Inc. (b) 39,864 2,561,262
Red Lion Hotels Corp. (a) 142,774 493,998
Red Robin Gourmet Burgers, Inc. (a)(b) 77,532 2,379,457
Red Rock Resorts, Inc. 311,581 9,400,399
Ruth's Hospitality Group, Inc. (b) 154,361 3,520,203
Scientific Games Corp. Class A (a)(b) 270,897 12,686,107
SeaWorld Entertainment, Inc. (a) 251,299 12,479,508
Shake Shack, Inc. Class A (a) 170,668 20,220,745
Six Flags Entertainment Corp. 361,227 16,110,724
Target Hospitality Corp. (a) 161,509 269,720
Texas Roadhouse, Inc. Class A 313,541 28,494,606
The Cheesecake Factory, Inc. (b) 199,414 10,957,799
The ONE Group Hospitality, Inc. (a) 9,510 46,694
Travel+Leisure Co. 409,850 24,767,236
Vail Resorts, Inc. 193,095 59,701,112
Wendy's Co. 866,290 17,698,305
Wingstop, Inc. 142,356 19,381,769
Wyndham Hotels & Resorts, Inc. 449,076 29,315,681
965,526,937
Household Durables - 1.0%
Bassett Furniture Industries, Inc. 44,549 941,320
Copyright © 2021 www.secdatabase.com. All Rights Reserved.Please Consider the Environment Before Printing This Document
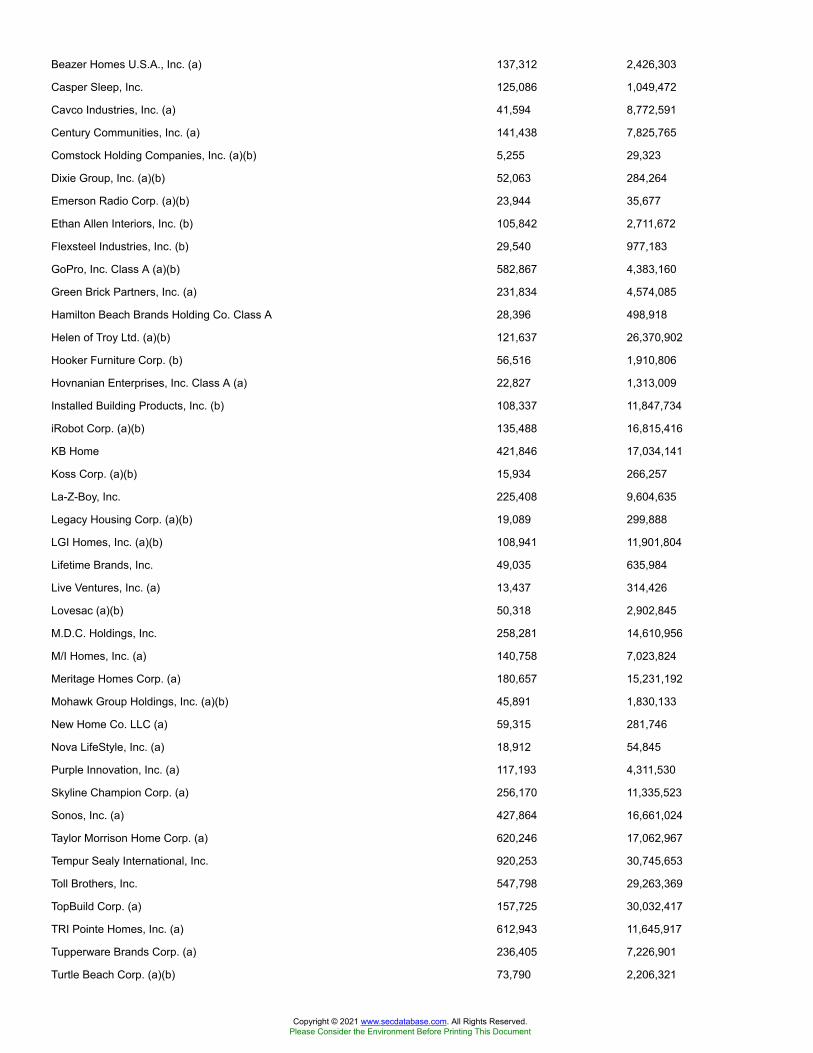
Beazer Homes U.S.A., Inc. (a) 137,312 2,426,303
Casper Sleep, Inc. 125,086 1,049,472
Cavco Industries, Inc. (a) 41,594 8,772,591
Century Communities, Inc. (a) 141,438 7,825,765
Comstock Holding Companies, Inc. (a)(b) 5,255 29,323
Dixie Group, Inc. (a)(b) 52,063 284,264
Emerson Radio Corp. (a)(b) 23,944 35,677
Ethan Allen Interiors, Inc. (b) 105,842 2,711,672
Flexsteel Industries, Inc. (b) 29,540 977,183
GoPro, Inc. Class A (a)(b) 582,867 4,383,160
Green Brick Partners, Inc. (a) 231,834 4,574,085
Hamilton Beach Brands Holding Co. Class A 28,396 498,918
Helen of Troy Ltd. (a)(b) 121,637 26,370,902
Hooker Furniture Corp. (b) 56,516 1,910,806
Hovnanian Enterprises, Inc. Class A (a) 22,827 1,313,009
Installed Building Products, Inc. (b) 108,337 11,847,734
iRobot Corp. (a)(b) 135,488 16,815,416
KB Home 421,846 17,034,141
Koss Corp. (a)(b) 15,934 266,257
La-Z-Boy, Inc. 225,408 9,604,635
Legacy Housing Corp. (a)(b) 19,089 299,888
LGI Homes, Inc. (a)(b) 108,941 11,901,804
Lifetime Brands, Inc. 49,035 635,984
Live Ventures, Inc. (a) 13,437 314,426
Lovesac (a)(b) 50,318 2,902,845
M.D.C. Holdings, Inc. 258,281 14,610,956
M/I Homes, Inc. (a) 140,758 7,023,824
Meritage Homes Corp. (a) 180,657 15,231,192
Mohawk Group Holdings, Inc. (a)(b) 45,891 1,830,133
New Home Co. LLC (a) 59,315 281,746
Nova LifeStyle, Inc. (a) 18,912 54,845
Purple Innovation, Inc. (a) 117,193 4,311,530
Skyline Champion Corp. (a) 256,170 11,335,523
Sonos, Inc. (a) 427,864 16,661,024
Taylor Morrison Home Corp. (a) 620,246 17,062,967
Tempur Sealy International, Inc. 920,253 30,745,653
Toll Brothers, Inc. 547,798 29,263,369
TopBuild Corp. (a) 157,725 30,032,417
TRI Pointe Homes, Inc. (a) 612,943 11,645,917
Tupperware Brands Corp. (a) 236,405 7,226,901
Turtle Beach Corp. (a)(b) 73,790 2,206,321
Copyright © 2021 www.secdatabase.com. All Rights Reserved.Please Consider the Environment Before Printing This Document
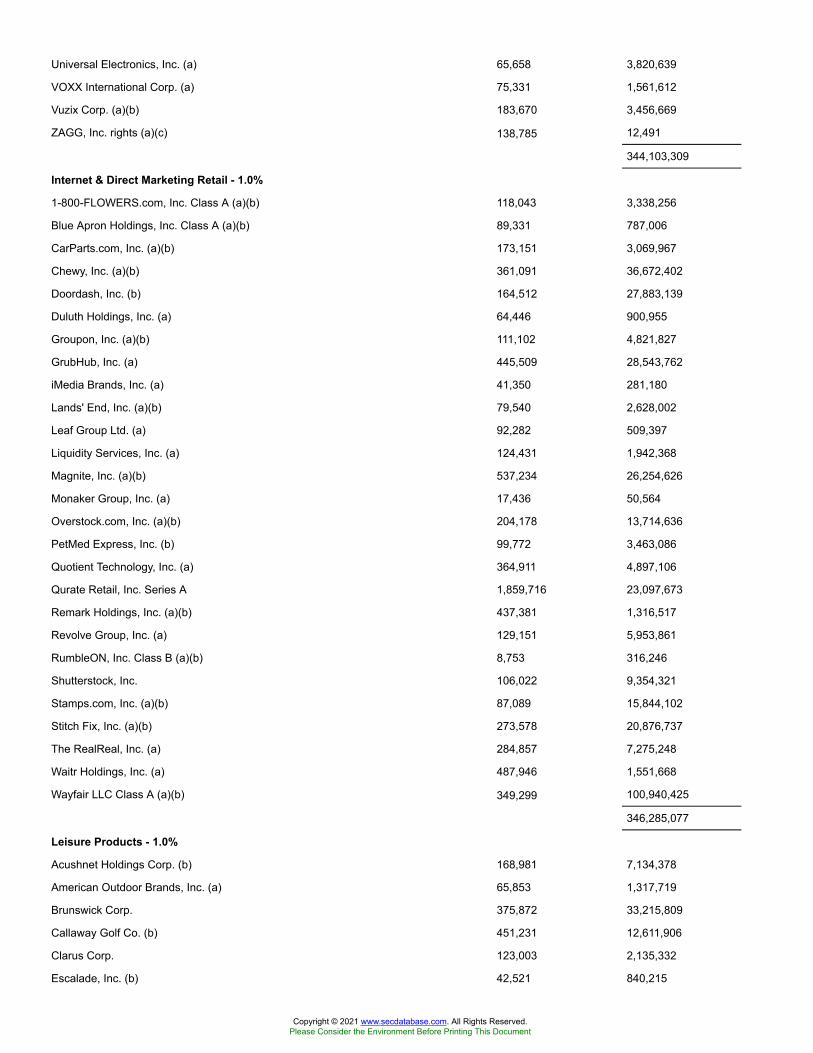
Universal Electronics, Inc. (a) 65,658 3,820,639
VOXX International Corp. (a) 75,331 1,561,612
Vuzix Corp. (a)(b) 183,670 3,456,669
ZAGG, Inc. rights (a)(c) 138,785 12,491
344,103,309
Internet & Direct Marketing Retail - 1.0%
1-800-FLOWERS.com, Inc. Class A (a)(b) 118,043 3,338,256
Blue Apron Holdings, Inc. Class A (a)(b) 89,331 787,006
CarParts.com, Inc. (a)(b) 173,151 3,069,967
Chewy, Inc. (a)(b) 361,091 36,672,402
Doordash, Inc. (b) 164,512 27,883,139
Duluth Holdings, Inc. (a) 64,446 900,955
Groupon, Inc. (a)(b) 111,102 4,821,827
GrubHub, Inc. (a) 445,509 28,543,762
iMedia Brands, Inc. (a) 41,350 281,180
Lands' End, Inc. (a)(b) 79,540 2,628,002
Leaf Group Ltd. (a) 92,282 509,397
Liquidity Services, Inc. (a) 124,431 1,942,368
Magnite, Inc. (a)(b) 537,234 26,254,626
Monaker Group, Inc. (a) 17,436 50,564
Overstock.com, Inc. (a)(b) 204,178 13,714,636
PetMed Express, Inc. (b) 99,772 3,463,086
Quotient Technology, Inc. (a) 364,911 4,897,106
Qurate Retail, Inc. Series A 1,859,716 23,097,673
Remark Holdings, Inc. (a)(b) 437,381 1,316,517
Revolve Group, Inc. (a) 129,151 5,953,861
RumbleON, Inc. Class B (a)(b) 8,753 316,246
Shutterstock, Inc. 106,022 9,354,321
Stamps.com, Inc. (a)(b) 87,089 15,844,102
Stitch Fix, Inc. (a)(b) 273,578 20,876,737
The RealReal, Inc. (a) 284,857 7,275,248
Waitr Holdings, Inc. (a) 487,946 1,551,668
Wayfair LLC Class A (a)(b) 349,299 100,940,425
346,285,077
Leisure Products - 1.0%
Acushnet Holdings Corp. (b) 168,981 7,134,378
American Outdoor Brands, Inc. (a) 65,853 1,317,719
Brunswick Corp. 375,872 33,215,809
Callaway Golf Co. (b) 451,231 12,611,906
Clarus Corp. 123,003 2,135,332
Escalade, Inc. (b) 42,521 840,215
Copyright © 2021 www.secdatabase.com. All Rights Reserved.Please Consider the Environment Before Printing This Document

Genius Brands International, Inc. (a)(b) 1,144,218 1,945,171
JAKKS Pacific, Inc. (a) 19,880 158,642
Johnson Outdoors, Inc. Class A (b) 35,346 4,265,555
Malibu Boats, Inc. Class A (a)(b) 99,076 7,385,125
Marine Products Corp. 122,059 2,051,812
MasterCraft Boat Holdings, Inc. (a) 87,650 2,246,470
Mattel, Inc. (a)(b) 1,669,958 33,733,152
Nautilus, Inc. (a)(b) 144,928 2,668,124
Peloton Interactive, Inc. Class A (a) 1,227,082 147,826,569
Polaris, Inc. 278,232 32,764,600
Smith & Wesson Brands, Inc. 268,509 4,621,040
Sturm, Ruger & Co., Inc. 83,812 5,715,978
Vinco Ventures, Inc. (a)(b) 64,229 186,264
Vista Outdoor, Inc. (a) 277,833 8,782,301
YETI Holdings, Inc. (a) 358,546 24,657,208
336,263,370
Multiline Retail - 0.3%
Big Lots, Inc. (b) 170,908 10,859,494
Dillard's, Inc. Class A (b) 35,992 2,868,562
Kohl's Corp. 756,756 41,810,769
Macy's, Inc. (b) 1,486,570 22,610,730
Nordstrom, Inc. (b) 519,094 18,920,976
Ollie's Bargain Outlet Holdings, Inc. (a)(b) 274,316 22,680,447
119,750,978
Specialty Retail - 2.3%
Abercrombie & Fitch Co. Class A 294,966 8,073,219
Academy Sports & Outdoors, Inc. (b) 141,925 3,400,523
America's Car Mart, Inc. (a) 29,785 4,020,975
American Eagle Outfitters, Inc. (b) 715,907 18,398,810
Asbury Automotive Group, Inc. (a) 80,832 13,696,982
At Home Group, Inc. (a) 259,337 6,532,699
AutoNation, Inc. (a) 283,876 21,296,378
Barnes & Noble Education, Inc. (a) 185,417 1,199,648
Bed Bath & Beyond, Inc. (b) 601,406 16,153,765
Big 5 Sporting Goods Corp. 104,788 1,414,638
Blink Charging Co. (a)(b) 131,074 5,012,270
Boot Barn Holdings, Inc. (a) 141,558 8,552,934
Build-A-Bear Workshop, Inc. (a) 60,976 428,661
Burlington Stores, Inc. (a) 318,036 82,314,078
Caleres, Inc. 179,937 2,853,801
Camping World Holdings, Inc. 177,007 5,540,319
Copyright © 2021 www.secdatabase.com. All Rights Reserved.Please Consider the Environment Before Printing This Document
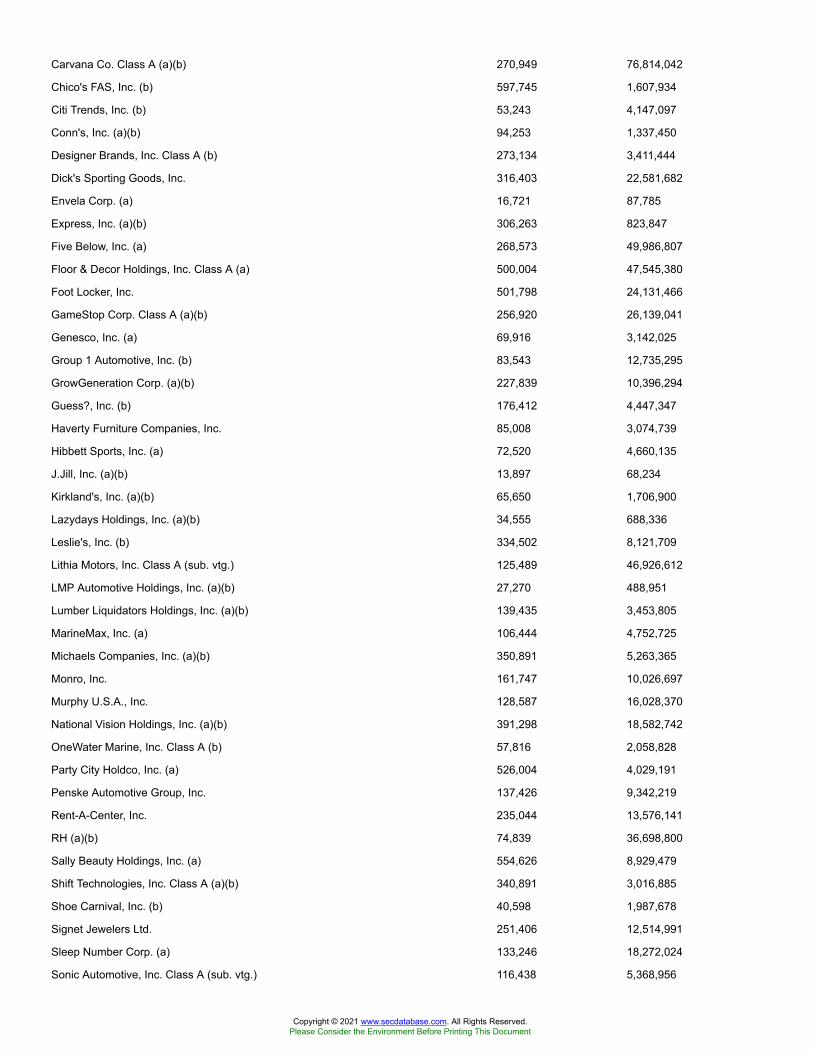
Carvana Co. Class A (a)(b) 270,949 76,814,042
Chico's FAS, Inc. (b) 597,745 1,607,934
Citi Trends, Inc. (b) 53,243 4,147,097
Conn's, Inc. (a)(b) 94,253 1,337,450
Designer Brands, Inc. Class A (b) 273,134 3,411,444
Dick's Sporting Goods, Inc. 316,403 22,581,682
Envela Corp. (a) 16,721 87,785
Express, Inc. (a)(b) 306,263 823,847
Five Below, Inc. (a) 268,573 49,986,807
Floor & Decor Holdings, Inc. Class A (a) 500,004 47,545,380
Foot Locker, Inc. 501,798 24,131,466
GameStop Corp. Class A (a)(b) 256,920 26,139,041
Genesco, Inc. (a) 69,916 3,142,025
Group 1 Automotive, Inc. (b) 83,543 12,735,295
GrowGeneration Corp. (a)(b) 227,839 10,396,294
Guess?, Inc. (b) 176,412 4,447,347
Haverty Furniture Companies, Inc. 85,008 3,074,739
Hibbett Sports, Inc. (a) 72,520 4,660,135
J.Jill, Inc. (a)(b) 13,897 68,234
Kirkland's, Inc. (a)(b) 65,650 1,706,900
Lazydays Holdings, Inc. (a)(b) 34,555 688,336
Leslie's, Inc. (b) 334,502 8,121,709
Lithia Motors, Inc. Class A (sub. vtg.) 125,489 46,926,612
LMP Automotive Holdings, Inc. (a)(b) 27,270 488,951
Lumber Liquidators Holdings, Inc. (a)(b) 139,435 3,453,805
MarineMax, Inc. (a) 106,444 4,752,725
Michaels Companies, Inc. (a)(b) 350,891 5,263,365
Monro, Inc. 161,747 10,026,697
Murphy U.S.A., Inc. 128,587 16,028,370
National Vision Holdings, Inc. (a)(b) 391,298 18,582,742
OneWater Marine, Inc. Class A (b) 57,816 2,058,828
Party City Holdco, Inc. (a) 526,004 4,029,191
Penske Automotive Group, Inc. 137,426 9,342,219
Rent-A-Center, Inc. 235,044 13,576,141
RH (a)(b) 74,839 36,698,800
Sally Beauty Holdings, Inc. (a) 554,626 8,929,479
Shift Technologies, Inc. Class A (a)(b) 340,891 3,016,885
Shoe Carnival, Inc. (b) 40,598 1,987,678
Signet Jewelers Ltd. 251,406 12,514,991
Sleep Number Corp. (a) 133,246 18,272,024
Sonic Automotive, Inc. Class A (sub. vtg.) 116,438 5,368,956
Copyright © 2021 www.secdatabase.com. All Rights Reserved.Please Consider the Environment Before Printing This Document
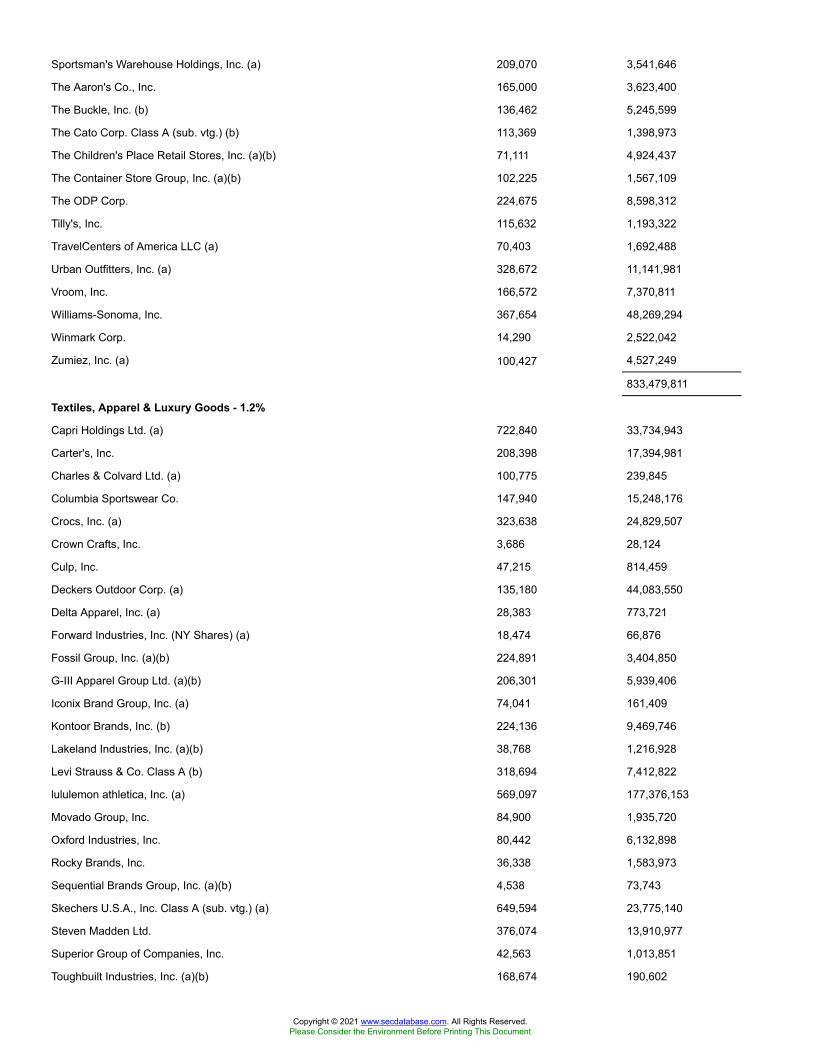
Sportsman's Warehouse Holdings, Inc. (a) 209,070 3,541,646
The Aaron's Co., Inc. 165,000 3,623,400
The Buckle, Inc. (b) 136,462 5,245,599
The Cato Corp. Class A (sub. vtg.) (b) 113,369 1,398,973
The Children's Place Retail Stores, Inc. (a)(b) 71,111 4,924,437
The Container Store Group, Inc. (a)(b) 102,225 1,567,109
The ODP Corp. 224,675 8,598,312
Tilly's, Inc. 115,632 1,193,322
TravelCenters of America LLC (a) 70,403 1,692,488
Urban Outfitters, Inc. (a) 328,672 11,141,981
Vroom, Inc. 166,572 7,370,811
Williams-Sonoma, Inc. 367,654 48,269,294
Winmark Corp. 14,290 2,522,042
Zumiez, Inc. (a) 100,427 4,527,249
833,479,811
Textiles, Apparel & Luxury Goods - 1.2%
Capri Holdings Ltd. (a) 722,840 33,734,943
Carter's, Inc. 208,398 17,394,981
Charles & Colvard Ltd. (a) 100,775 239,845
Columbia Sportswear Co. 147,940 15,248,176
Crocs, Inc. (a) 323,638 24,829,507
Crown Crafts, Inc. 3,686 28,124
Culp, Inc. 47,215 814,459
Deckers Outdoor Corp. (a) 135,180 44,083,550
Delta Apparel, Inc. (a) 28,383 773,721
Forward Industries, Inc. (NY Shares) (a) 18,474 66,876
Fossil Group, Inc. (a)(b) 224,891 3,404,850
G-III Apparel Group Ltd. (a)(b) 206,301 5,939,406
Iconix Brand Group, Inc. (a) 74,041 161,409
Kontoor Brands, Inc. (b) 224,136 9,469,746
Lakeland Industries, Inc. (a)(b) 38,768 1,216,928
Levi Strauss & Co. Class A (b) 318,694 7,412,822
lululemon athletica, Inc. (a) 569,097 177,376,153
Movado Group, Inc. 84,900 1,935,720
Oxford Industries, Inc. 80,442 6,132,898
Rocky Brands, Inc. 36,338 1,583,973
Sequential Brands Group, Inc. (a)(b) 4,538 73,743
Skechers U.S.A., Inc. Class A (sub. vtg.) (a) 649,594 23,775,140
Steven Madden Ltd. 376,074 13,910,977
Superior Group of Companies, Inc. 42,563 1,013,851
Toughbuilt Industries, Inc. (a)(b) 168,674 190,602
Copyright © 2021 www.secdatabase.com. All Rights Reserved.Please Consider the Environment Before Printing This Document
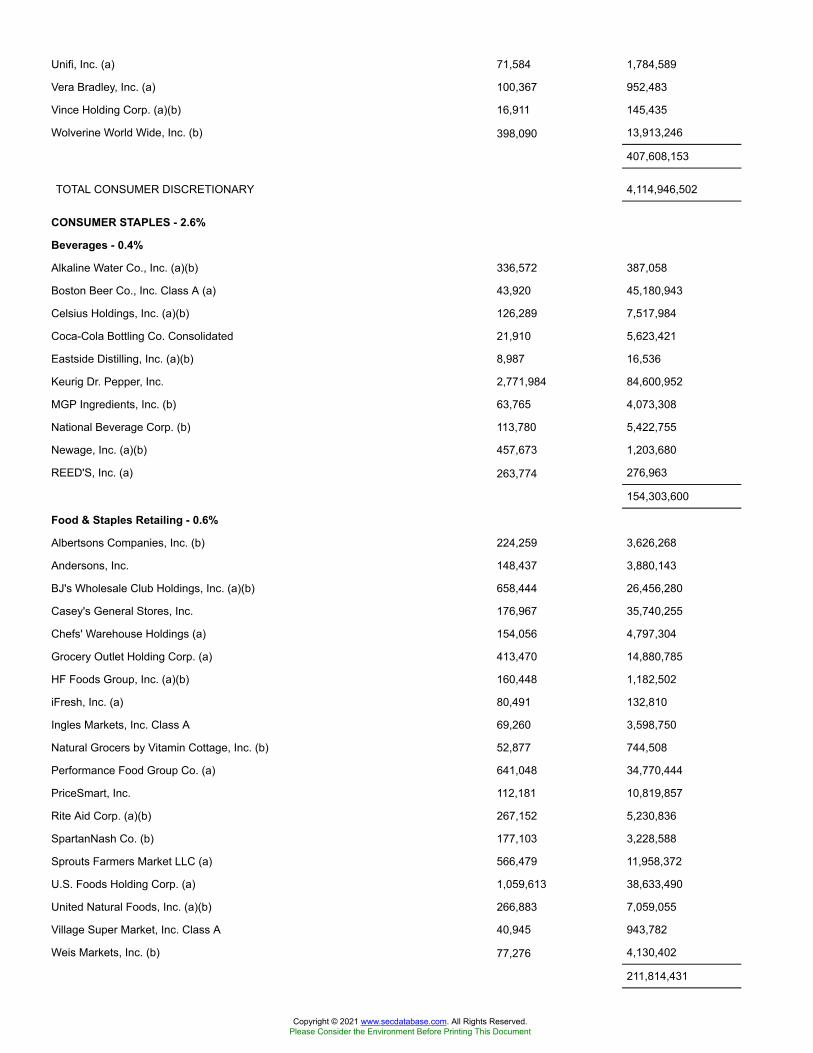
Unifi, Inc. (a) 71,584 1,784,589
Vera Bradley, Inc. (a) 100,367 952,483
Vince Holding Corp. (a)(b) 16,911 145,435
Wolverine World Wide, Inc. (b) 398,090 13,913,246
407,608,153
TOTAL CONSUMER DISCRETIONARY 4,114,946,502
CONSUMER STAPLES - 2.6%
Beverages - 0.4%
Alkaline Water Co., Inc. (a)(b) 336,572 387,058
Boston Beer Co., Inc. Class A (a) 43,920 45,180,943
Celsius Holdings, Inc. (a)(b) 126,289 7,517,984
Coca-Cola Bottling Co. Consolidated 21,910 5,623,421
Eastside Distilling, Inc. (a)(b) 8,987 16,536
Keurig Dr. Pepper, Inc. 2,771,984 84,600,952
MGP Ingredients, Inc. (b) 63,765 4,073,308
National Beverage Corp. (b) 113,780 5,422,755
Newage, Inc. (a)(b) 457,673 1,203,680
REED'S, Inc. (a) 263,774 276,963
154,303,600
Food & Staples Retailing - 0.6%
Albertsons Companies, Inc. (b) 224,259 3,626,268
Andersons, Inc. 148,437 3,880,143
BJ's Wholesale Club Holdings, Inc. (a)(b) 658,444 26,456,280
Casey's General Stores, Inc. 176,967 35,740,255
Chefs' Warehouse Holdings (a) 154,056 4,797,304
Grocery Outlet Holding Corp. (a) 413,470 14,880,785
HF Foods Group, Inc. (a)(b) 160,448 1,182,502
iFresh, Inc. (a) 80,491 132,810
Ingles Markets, Inc. Class A 69,260 3,598,750
Natural Grocers by Vitamin Cottage, Inc. (b) 52,877 744,508
Performance Food Group Co. (a) 641,048 34,770,444
PriceSmart, Inc. 112,181 10,819,857
Rite Aid Corp. (a)(b) 267,152 5,230,836
SpartanNash Co. (b) 177,103 3,228,588
Sprouts Farmers Market LLC (a) 566,479 11,958,372
U.S. Foods Holding Corp. (a) 1,059,613 38,633,490
United Natural Foods, Inc. (a)(b) 266,883 7,059,055
Village Super Market, Inc. Class A 40,945 943,782
Weis Markets, Inc. (b) 77,276 4,130,402
211,814,431
Copyright © 2021 www.secdatabase.com. All Rights Reserved.Please Consider the Environment Before Printing This Document

Food Products - 1.1%
Alico, Inc. 17,841 528,807
Arcadia Biosciences, Inc. (a)(b) 30,854 97,807
B&G Foods, Inc. Class A (b) 304,911 9,247,951
Beyond Meat, Inc. (a)(b) 237,690 34,579,141
Bridgford Foods Corp. (a) 700 10,780
Bunge Ltd. 670,229 51,326,137
Cal-Maine Foods, Inc. (a)(b) 178,149 6,787,477
Calavo Growers, Inc. (b) 78,734 5,924,734
Coffee Holding Co., Inc. (a) 29,362 147,104
Darling Ingredients, Inc. (a) 779,166 49,118,625
Farmer Brothers Co. (a)(b) 70,663 551,878
Flowers Foods, Inc. 948,129 20,621,806
Fresh Del Monte Produce, Inc. 139,787 3,598,117
Freshpet, Inc. (a) 204,712 31,910,507
Hostess Brands, Inc. Class A (a)(b) 619,508 8,914,720
Ingredion, Inc. 320,912 28,946,262
J&J Snack Foods Corp. (b) 72,878 11,570,111
John B. Sanfilippo & Son, Inc. (b) 44,212 3,822,570
Laird Superfood, Inc. 24,259 957,503
Lancaster Colony Corp. 93,233 16,285,008
Landec Corp. (a) 128,834 1,436,499
Lifeway Foods, Inc. (a) 26,937 153,541
Limoneira Co. 78,053 1,196,552
Mission Produce, Inc. (b) 61,722 1,293,693
Pilgrim's Pride Corp. (a) 243,797 5,458,615
Post Holdings, Inc. (a) 292,489 28,096,493
RiceBran Technologies (a)(b) 102,744 98,686
Rocky Mountain Chocolate Factory, Inc. 4,045 21,398
S&W Seed Co. (a) 104,872 349,224
Sanderson Farms, Inc. 94,784 14,454,560
Seaboard Corp. 1,245 4,124,859
Seneca Foods Corp. Class A (a) 35,257 1,920,096
Tattooed Chef, Inc. (a)(b) 149,078 2,971,125
The Hain Celestial Group, Inc. (a) 395,437 16,679,533
The Simply Good Foods Co. (a) 401,120 11,700,670
Tootsie Roll Industries, Inc. (b) 82,317 2,536,187
TreeHouse Foods, Inc. (a) 271,351 13,572,977
Utz Brands, Inc. Class A 216,188 5,463,071
Vital Farms, Inc. (a)(b) 79,784 2,163,742
Whole Earth Brands, Inc. Class A (a) 156,340 2,005,842
Copyright © 2021 www.secdatabase.com. All Rights Reserved.Please Consider the Environment Before Printing This Document
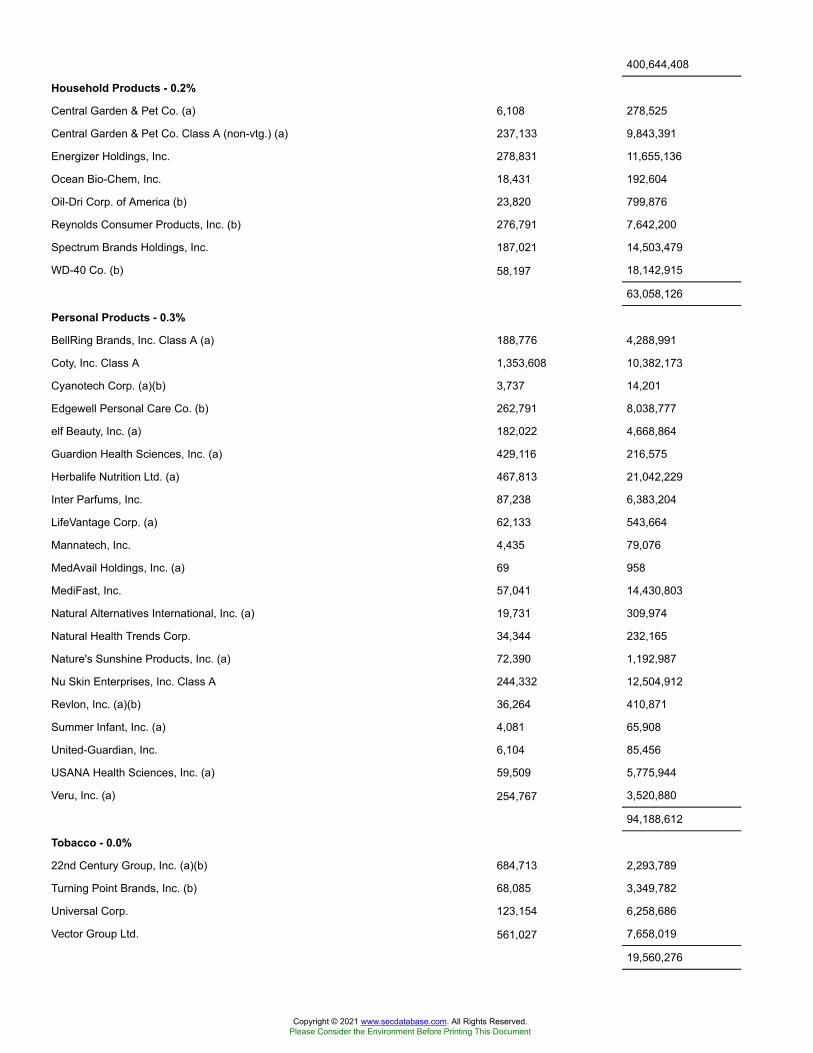
400,644,408
Household Products - 0.2%
Central Garden & Pet Co. (a) 6,108 278,525
Central Garden & Pet Co. Class A (non-vtg.) (a) 237,133 9,843,391
Energizer Holdings, Inc. 278,831 11,655,136
Ocean Bio-Chem, Inc. 18,431 192,604
Oil-Dri Corp. of America (b) 23,820 799,876
Reynolds Consumer Products, Inc. (b) 276,791 7,642,200
Spectrum Brands Holdings, Inc. 187,021 14,503,479
WD-40 Co. (b) 58,197 18,142,915
63,058,126
Personal Products - 0.3%
BellRing Brands, Inc. Class A (a) 188,776 4,288,991
Coty, Inc. Class A 1,353,608 10,382,173
Cyanotech Corp. (a)(b) 3,737 14,201
Edgewell Personal Care Co. (b) 262,791 8,038,777
elf Beauty, Inc. (a) 182,022 4,668,864
Guardion Health Sciences, Inc. (a) 429,116 216,575
Herbalife Nutrition Ltd. (a) 467,813 21,042,229
Inter Parfums, Inc. 87,238 6,383,204
LifeVantage Corp. (a) 62,133 543,664
Mannatech, Inc. 4,435 79,076
MedAvail Holdings, Inc. (a) 69 958
MediFast, Inc. 57,041 14,430,803
Natural Alternatives International, Inc. (a) 19,731 309,974
Natural Health Trends Corp. 34,344 232,165
Nature's Sunshine Products, Inc. (a) 72,390 1,192,987
Nu Skin Enterprises, Inc. Class A 244,332 12,504,912
Revlon, Inc. (a)(b) 36,264 410,871
Summer Infant, Inc. (a) 4,081 65,908
United-Guardian, Inc. 6,104 85,456
USANA Health Sciences, Inc. (a) 59,509 5,775,944
Veru, Inc. (a) 254,767 3,520,880
94,188,612
Tobacco - 0.0%
22nd Century Group, Inc. (a)(b) 684,713 2,293,789
Turning Point Brands, Inc. (b) 68,085 3,349,782
Universal Corp. 123,154 6,258,686
Vector Group Ltd. 561,027 7,658,019
19,560,276
Copyright © 2021 www.secdatabase.com. All Rights Reserved.Please Consider the Environment Before Printing This Document
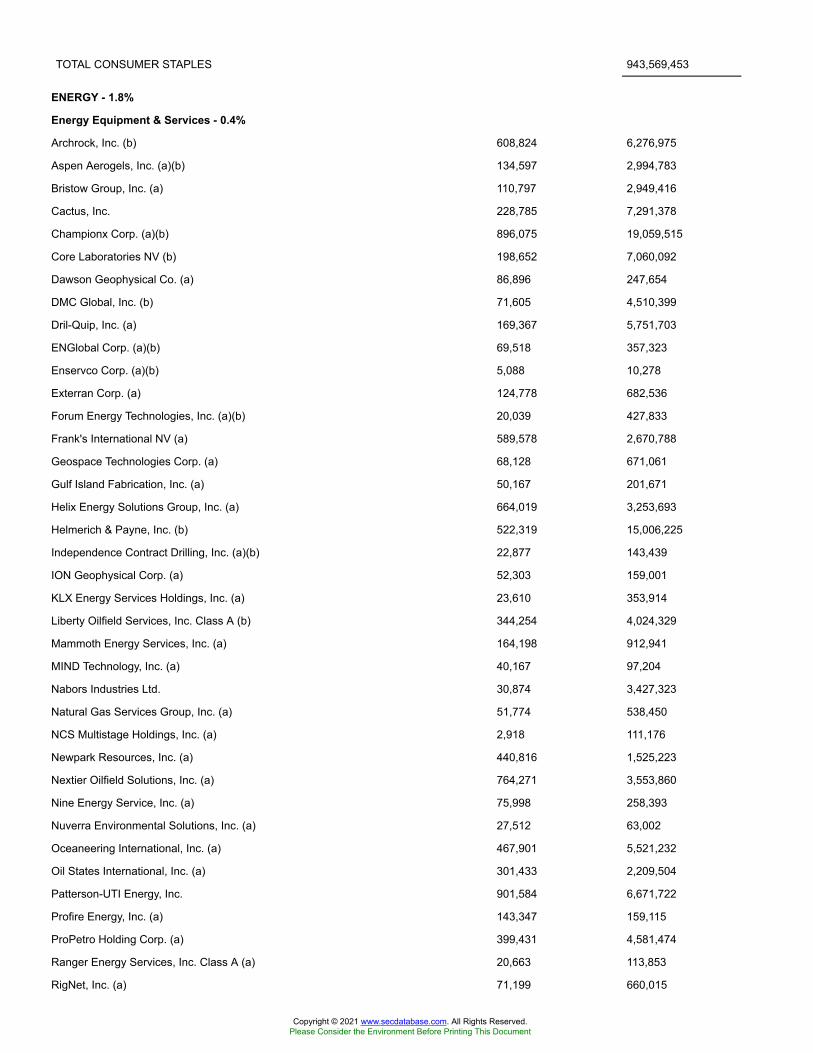
TOTAL CONSUMER STAPLES 943,569,453
ENERGY - 1.8%
Energy Equipment & Services - 0.4%
Archrock, Inc. (b) 608,824 6,276,975
Aspen Aerogels, Inc. (a)(b) 134,597 2,994,783
Bristow Group, Inc. (a) 110,797 2,949,416
Cactus, Inc. 228,785 7,291,378
Championx Corp. (a)(b) 896,075 19,059,515
Core Laboratories NV (b) 198,652 7,060,092
Dawson Geophysical Co. (a) 86,896 247,654
DMC Global, Inc. (b) 71,605 4,510,399
Dril-Quip, Inc. (a) 169,367 5,751,703
ENGlobal Corp. (a)(b) 69,518 357,323
Enservco Corp. (a)(b) 5,088 10,278
Exterran Corp. (a) 124,778 682,536
Forum Energy Technologies, Inc. (a)(b) 20,039 427,833
Frank's International NV (a) 589,578 2,670,788
Geospace Technologies Corp. (a) 68,128 671,061
Gulf Island Fabrication, Inc. (a) 50,167 201,671
Helix Energy Solutions Group, Inc. (a) 664,019 3,253,693
Helmerich & Payne, Inc. (b) 522,319 15,006,225
Independence Contract Drilling, Inc. (a)(b) 22,877 143,439
ION Geophysical Corp. (a) 52,303 159,001
KLX Energy Services Holdings, Inc. (a) 23,610 353,914
Liberty Oilfield Services, Inc. Class A (b) 344,254 4,024,329
Mammoth Energy Services, Inc. (a) 164,198 912,941
MIND Technology, Inc. (a) 40,167 97,204
Nabors Industries Ltd. 30,874 3,427,323
Natural Gas Services Group, Inc. (a) 51,774 538,450
NCS Multistage Holdings, Inc. (a) 2,918 111,176
Newpark Resources, Inc. (a) 440,816 1,525,223
Nextier Oilfield Solutions, Inc. (a) 764,271 3,553,860
Nine Energy Service, Inc. (a) 75,998 258,393
Nuverra Environmental Solutions, Inc. (a) 27,512 63,002
Oceaneering International, Inc. (a) 467,901 5,521,232
Oil States International, Inc. (a) 301,433 2,209,504
Patterson-UTI Energy, Inc. 901,584 6,671,722
Profire Energy, Inc. (a) 143,347 159,115
ProPetro Holding Corp. (a) 399,431 4,581,474
Ranger Energy Services, Inc. Class A (a) 20,663 113,853
RigNet, Inc. (a) 71,199 660,015
Copyright © 2021 www.secdatabase.com. All Rights Reserved.Please Consider the Environment Before Printing This Document

RPC, Inc. (a)(b) 275,755 1,751,044
SAExploration Holdings, Inc.:
Series A warrants 7/27/21 (a)(c)(d) 42 0
Series B warrants 7/27/21 (a)(c)(d) 42 0
SEACOR Marine Holdings, Inc. (a) 91,533 362,471
Select Energy Services, Inc. Class A (a) 319,356 2,018,330
Smart Sand, Inc. (a)(b) 100,045 326,147
Solaris Oilfield Infrastructure, Inc. Class A 153,664 1,814,772
Superior Drilling Products, Inc. (a)(b) 61,142 57,957
Technip Energies NV ADR (a) 21,496 272,354
TechnipFMC PLC 2,007,482 16,501,502
TETRA Technologies, Inc. (a) 568,895 1,422,238
Tidewater, Inc. (a) 193,127 2,406,362
Transocean Ltd. (United States) (a)(b) 2,765,202 9,595,251
U.S. Silica Holdings, Inc. 353,358 4,703,195
U.S. Well Services, Inc. (a)(b) 175,672 310,939
156,051,055
Oil, Gas & Consumable Fuels - 1.4%
Abraxas Petroleum Corp. (a)(b) 37,558 145,349
Adams Resources & Energy, Inc. 9,725 282,998
Aemetis, Inc. (a) 88,655 871,479
Alto Ingredients, Inc. (a)(b) 223,039 1,445,293
Altus Midstream Co. (b) 14,634 774,724
American Resources Corp. (a)(b) 67,987 353,532
Amplify Energy Corp. New (b) 192,796 562,964
Antero Midstream GP LP 1,396,782 12,319,617
Antero Resources Corp. (a) 1,197,041 10,773,369
Arch Resources, Inc. (b) 70,289 3,368,249
Barnwell Industries, Inc. (a) 11,088 35,371
Berry Petroleum Corp. 279,701 1,387,317
Bonanza Creek Energy, Inc. (a) 88,263 2,818,238
Brigham Minerals, Inc. Class A 166,078 2,376,576
Callon Petroleum Co. (a)(b) 190,682 4,875,739
Camber Energy, Inc. (a) 124,269 178,947
Centennial Resource Development, Inc. Class A (a)(b) 979,757 3,879,838
Centrus Energy Corp. Class A (a) 41,668 978,781
Cheniere Energy, Inc. (a) 1,101,847 74,253,469
Cimarex Energy Co. 496,871 28,813,549
Clean Energy Fuels Corp. (a) 555,261 7,240,603
CNX Resources Corp. (a)(b) 1,080,300 13,622,583
Comstock Resources, Inc. (a)(b) 247,772 1,414,778
Copyright © 2021 www.secdatabase.com. All Rights Reserved.Please Consider the Environment Before Printing This Document
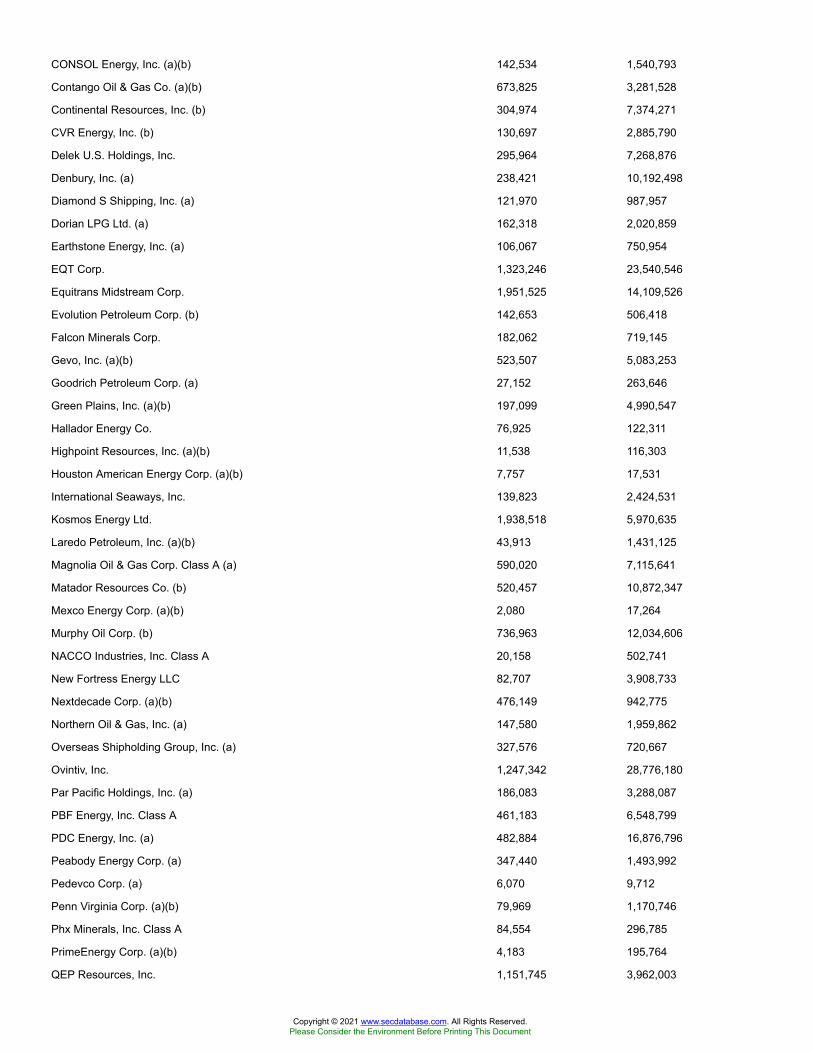
CONSOL Energy, Inc. (a)(b) 142,534 1,540,793
Contango Oil & Gas Co. (a)(b) 673,825 3,281,528
Continental Resources, Inc. (b) 304,974 7,374,271
CVR Energy, Inc. (b) 130,697 2,885,790
Delek U.S. Holdings, Inc. 295,964 7,268,876
Denbury, Inc. (a) 238,421 10,192,498
Diamond S Shipping, Inc. (a) 121,970 987,957
Dorian LPG Ltd. (a) 162,318 2,020,859
Earthstone Energy, Inc. (a) 106,067 750,954
EQT Corp. 1,323,246 23,540,546
Equitrans Midstream Corp. 1,951,525 14,109,526
Evolution Petroleum Corp. (b) 142,653 506,418
Falcon Minerals Corp. 182,062 719,145
Gevo, Inc. (a)(b) 523,507 5,083,253
Goodrich Petroleum Corp. (a) 27,152 263,646
Green Plains, Inc. (a)(b) 197,099 4,990,547
Hallador Energy Co. 76,925 122,311
Highpoint Resources, Inc. (a)(b) 11,538 116,303
Houston American Energy Corp. (a)(b) 7,757 17,531
International Seaways, Inc. 139,823 2,424,531
Kosmos Energy Ltd. 1,938,518 5,970,635
Laredo Petroleum, Inc. (a)(b) 43,913 1,431,125
Magnolia Oil & Gas Corp. Class A (a) 590,020 7,115,641
Matador Resources Co. (b) 520,457 10,872,347
Mexco Energy Corp. (a)(b) 2,080 17,264
Murphy Oil Corp. (b) 736,963 12,034,606
NACCO Industries, Inc. Class A 20,158 502,741
New Fortress Energy LLC 82,707 3,908,733
Nextdecade Corp. (a)(b) 476,149 942,775
Northern Oil & Gas, Inc. (a) 147,580 1,959,862
Overseas Shipholding Group, Inc. (a) 327,576 720,667
Ovintiv, Inc. 1,247,342 28,776,180
Par Pacific Holdings, Inc. (a) 186,083 3,288,087
PBF Energy, Inc. Class A 461,183 6,548,799
PDC Energy, Inc. (a) 482,884 16,876,796
Peabody Energy Corp. (a) 347,440 1,493,992
Pedevco Corp. (a) 6,070 9,712
Penn Virginia Corp. (a)(b) 79,969 1,170,746
Phx Minerals, Inc. Class A 84,554 296,785
PrimeEnergy Corp. (a)(b) 4,183 195,764
QEP Resources, Inc. 1,151,745 3,962,003
Copyright © 2021 www.secdatabase.com. All Rights Reserved.Please Consider the Environment Before Printing This Document

Range Resources Corp. (a) 1,240,928 11,962,546
Renewable Energy Group, Inc. (a)(b) 173,061 13,458,954
Rex American Resources Corp. (a)(b) 26,022 2,447,890
Riley Exploration Permian, Inc. 46,660 115,250
Ring Energy, Inc. (a)(b) 300,992 668,202
SandRidge Energy, Inc. (a) 160,445 803,829
SilverBow Resources, Inc. (a)(b) 25,559 204,472
SM Energy Co. 523,067 7,249,709
Southwestern Energy Co. (a) 3,119,094 12,632,331
Talos Energy, Inc. (a) 99,929 1,058,248
Targa Resources Corp. 1,104,795 34,171,309
Tellurian, Inc. (a)(b) 867,041 2,679,157
Torchlight Energy Resources, Inc. (a)(b) 587,158 1,456,152
U.S. Energy Corp. (a)(b) 1,627 7,598
Uranium Energy Corp. (a)(b) 917,347 1,944,776
VAALCO Energy, Inc. (a) 270,263 886,463
Vertex Energy, Inc. (a)(b) 110,097 169,549
W&T Offshore, Inc. (a)(b) 443,687 1,459,730
Westwater Resources, Inc. (a)(b) 65,698 403,386
Whiting Petroleum Corp. (a) 181,258 6,217,149
World Fuel Services Corp. 301,883 9,382,524
478,445,130
TOTAL ENERGY 634,496,185
FINANCIALS - 13.2%
Banks - 4.9%
1st Constitution Bancorp 41,322 725,201
1st Source Corp. 80,104 3,554,214
ACNB Corp. 42,632 1,177,070
Allegiance Bancshares, Inc. 98,492 3,708,224
Altabancorp 88,016 3,029,511
Amalgamated Bank 141,004 2,476,030
Amerant Bancorp, Inc. Class A (a) 113,833 1,874,830
American National Bankshares, Inc. 49,866 1,545,846
American River Bankshares 17,301 255,882
Ameris Bancorp 334,343 15,928,101
AmeriServ Financial, Inc. 29,733 115,959
Ames National Corp. 29,574 676,062
Arrow Financial Corp. 74,454 2,372,104
Associated Banc-Corp. (b) 743,963 14,990,854
Atlantic Capital Bancshares, Inc. (a) 116,659 2,374,011
Copyright © 2021 www.secdatabase.com. All Rights Reserved.Please Consider the Environment Before Printing This Document

Atlantic Union Bankshares Corp. 371,053 13,628,777
Auburn National Bancorp., Inc. (b) 5,397 211,023
Banc of California, Inc. 212,849 3,950,477
BancFirst Corp. (b) 93,235 5,955,852
Bancorp, Inc., Delaware (a) 248,308 5,033,203
BancorpSouth Bank (b) 469,789 14,121,857
Bank First National Corp. (b) 29,165 2,038,634
Bank of Commerce Holdings 96,497 1,048,922
Bank of Hawaii Corp. (b) 190,778 16,693,075
Bank of Marin Bancorp 62,562 2,314,794
Bank of South Carolina Corp. 11,284 199,050
Bank of the James Financial Group, Inc. 200 2,958
Bank OZK 577,897 23,820,914
Bank7 Corp. 254 4,148
BankFinancial Corp. 79,534 751,596
BankUnited, Inc. 443,166 17,810,842
Bankwell Financial Group, Inc. (b) 40,214 997,307
Banner Corp. 164,326 8,508,800
Bar Harbor Bankshares 74,348 2,081,001
BayCom Corp. (a) 58,769 1,004,362
BCB Bancorp, Inc. 73,258 969,203
Berkshire Hills Bancorp, Inc. 234,565 4,728,830
BOK Financial Corp. 155,908 13,417,442
Boston Private Financial Holdings, Inc. 394,293 5,425,472
Bridge Bancorp, Inc. (b) 189,176 5,563,666
Brookline Bancorp, Inc., Delaware (b) 395,723 5,631,138
Bryn Mawr Bank Corp. 102,345 3,871,711
Business First Bancshares, Inc. (b) 89,937 1,975,916
Byline Bancorp, Inc. 124,884 2,487,689
C & F Financial Corp. (b) 12,095 526,133
Cadence Bancorp Class A 623,817 12,800,725
Cambridge Bancorp 31,124 2,372,271
Camden National Corp. 76,877 3,115,825
Capital City Bank Group, Inc. 61,468 1,517,645
Capstar Financial Holdings, Inc. 64,046 1,038,186
Carter Bankshares, Inc. 113,445 1,342,054
Cathay General Bancorp 365,503 13,757,533
CB Financial Services, Inc. 33,968 691,249
CBTX, Inc. 92,471 2,697,379
Central Pacific Financial Corp. 143,053 3,237,289
Central Valley Community Bancorp 60,316 1,065,784
Copyright © 2021 www.secdatabase.com. All Rights Reserved.Please Consider the Environment Before Printing This Document
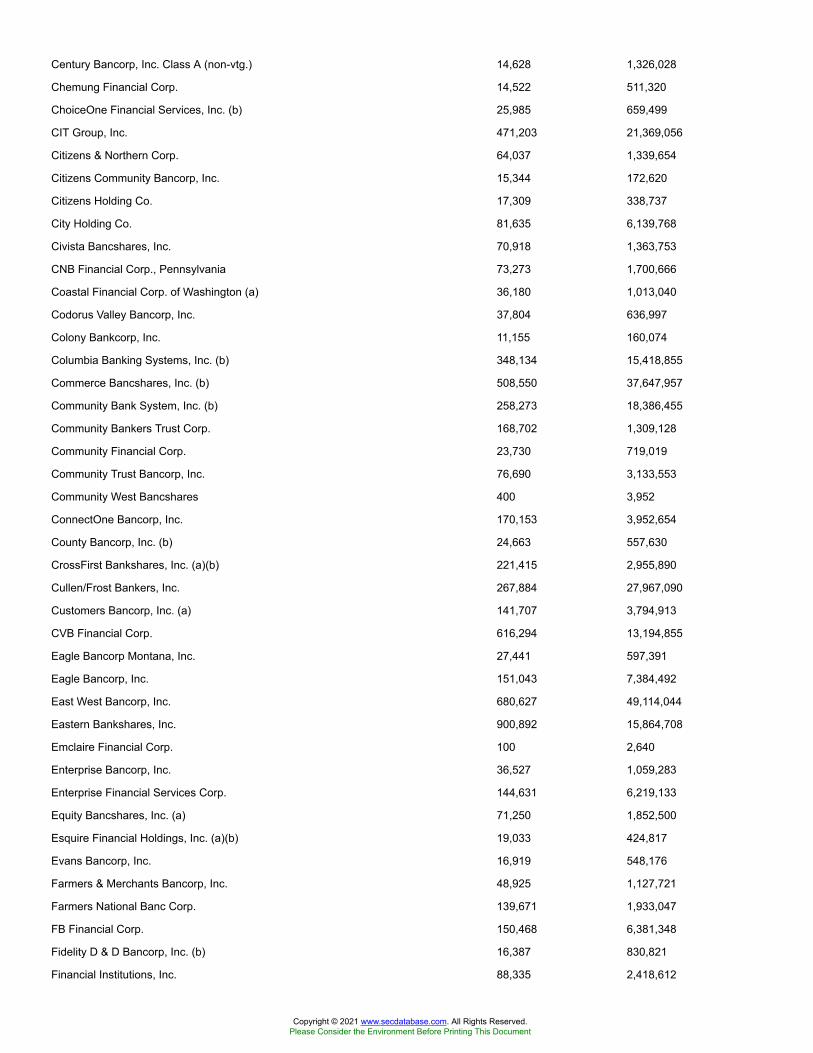
Century Bancorp, Inc. Class A (non-vtg.) 14,628 1,326,028
Chemung Financial Corp. 14,522 511,320
ChoiceOne Financial Services, Inc. (b) 25,985 659,499
CIT Group, Inc. 471,203 21,369,056
Citizens & Northern Corp. 64,037 1,339,654
Citizens Community Bancorp, Inc. 15,344 172,620
Citizens Holding Co. 17,309 338,737
City Holding Co. 81,635 6,139,768
Civista Bancshares, Inc. 70,918 1,363,753
CNB Financial Corp., Pennsylvania 73,273 1,700,666
Coastal Financial Corp. of Washington (a) 36,180 1,013,040
Codorus Valley Bancorp, Inc. 37,804 636,997
Colony Bankcorp, Inc. 11,155 160,074
Columbia Banking Systems, Inc. (b) 348,134 15,418,855
Commerce Bancshares, Inc. (b) 508,550 37,647,957
Community Bank System, Inc. (b) 258,273 18,386,455
Community Bankers Trust Corp. 168,702 1,309,128
Community Financial Corp. 23,730 719,019
Community Trust Bancorp, Inc. 76,690 3,133,553
Community West Bancshares 400 3,952
ConnectOne Bancorp, Inc. 170,153 3,952,654
County Bancorp, Inc. (b) 24,663 557,630
CrossFirst Bankshares, Inc. (a)(b) 221,415 2,955,890
Cullen/Frost Bankers, Inc. 267,884 27,967,090
Customers Bancorp, Inc. (a) 141,707 3,794,913
CVB Financial Corp. 616,294 13,194,855
Eagle Bancorp Montana, Inc. 27,441 597,391
Eagle Bancorp, Inc. 151,043 7,384,492
East West Bancorp, Inc. 680,627 49,114,044
Eastern Bankshares, Inc. 900,892 15,864,708
Emclaire Financial Corp. 100 2,640
Enterprise Bancorp, Inc. 36,527 1,059,283
Enterprise Financial Services Corp. 144,631 6,219,133
Equity Bancshares, Inc. (a) 71,250 1,852,500
Esquire Financial Holdings, Inc. (a)(b) 19,033 424,817
Evans Bancorp, Inc. 16,919 548,176
Farmers & Merchants Bancorp, Inc. 48,925 1,127,721
Farmers National Banc Corp. 139,671 1,933,047
FB Financial Corp. 150,468 6,381,348
Fidelity D & D Bancorp, Inc. (b) 16,387 830,821
Financial Institutions, Inc. 88,335 2,418,612
Copyright © 2021 www.secdatabase.com. All Rights Reserved.Please Consider the Environment Before Printing This Document
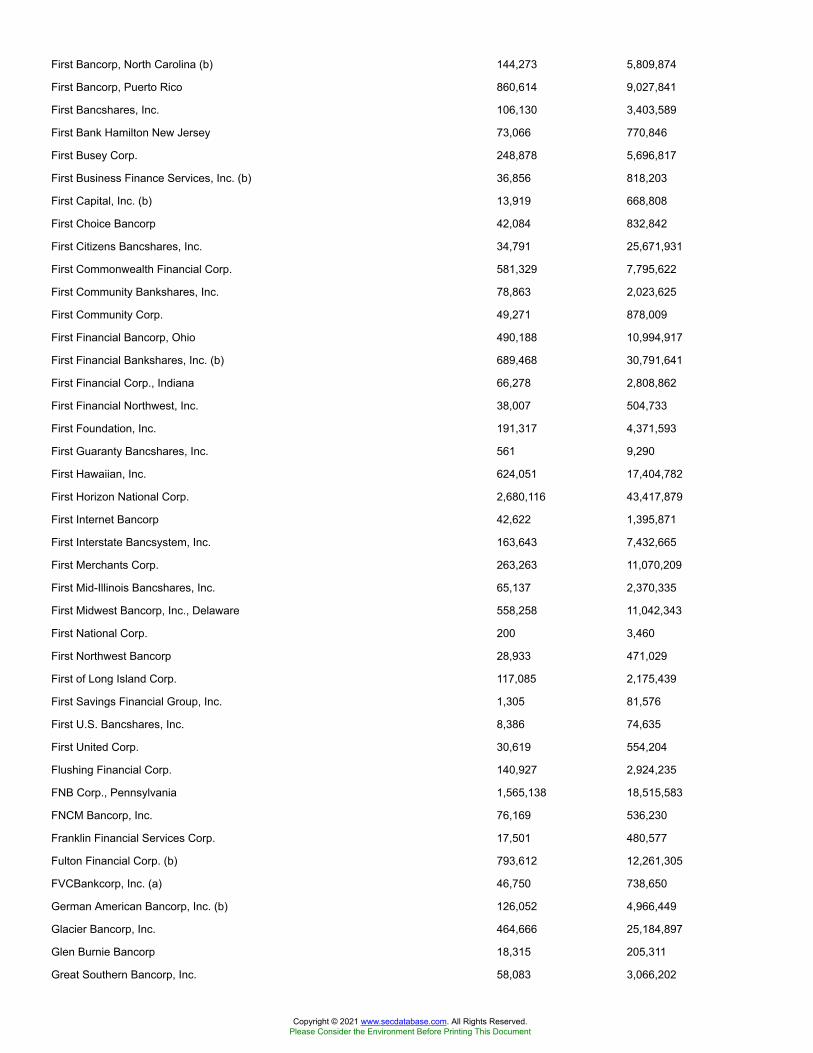
First Bancorp, North Carolina (b) 144,273 5,809,874
First Bancorp, Puerto Rico 860,614 9,027,841
First Bancshares, Inc. 106,130 3,403,589
First Bank Hamilton New Jersey 73,066 770,846
First Busey Corp. 248,878 5,696,817
First Business Finance Services, Inc. (b) 36,856 818,203
First Capital, Inc. (b) 13,919 668,808
First Choice Bancorp 42,084 832,842
First Citizens Bancshares, Inc. 34,791 25,671,931
First Commonwealth Financial Corp. 581,329 7,795,622
First Community Bankshares, Inc. 78,863 2,023,625
First Community Corp. 49,271 878,009
First Financial Bancorp, Ohio 490,188 10,994,917
First Financial Bankshares, Inc. (b) 689,468 30,791,641
First Financial Corp., Indiana 66,278 2,808,862
First Financial Northwest, Inc. 38,007 504,733
First Foundation, Inc. 191,317 4,371,593
First Guaranty Bancshares, Inc. 561 9,290
First Hawaiian, Inc. 624,051 17,404,782
First Horizon National Corp. 2,680,116 43,417,879
First Internet Bancorp 42,622 1,395,871
First Interstate Bancsystem, Inc. 163,643 7,432,665
First Merchants Corp. 263,263 11,070,209
First Mid-Illinois Bancshares, Inc. 65,137 2,370,335
First Midwest Bancorp, Inc., Delaware 558,258 11,042,343
First National Corp. 200 3,460
First Northwest Bancorp 28,933 471,029
First of Long Island Corp. 117,085 2,175,439
First Savings Financial Group, Inc. 1,305 81,576
First U.S. Bancshares, Inc. 8,386 74,635
First United Corp. 30,619 554,204
Flushing Financial Corp. 140,927 2,924,235
FNB Corp., Pennsylvania 1,565,138 18,515,583
FNCM Bancorp, Inc. 76,169 536,230
Franklin Financial Services Corp. 17,501 480,577
Fulton Financial Corp. (b) 793,612 12,261,305
FVCBankcorp, Inc. (a) 46,750 738,650
German American Bancorp, Inc. (b) 126,052 4,966,449
Glacier Bancorp, Inc. 464,666 25,184,897
Glen Burnie Bancorp 18,315 205,311
Great Southern Bancorp, Inc. 58,083 3,066,202
Copyright © 2021 www.secdatabase.com. All Rights Reserved.Please Consider the Environment Before Printing This Document
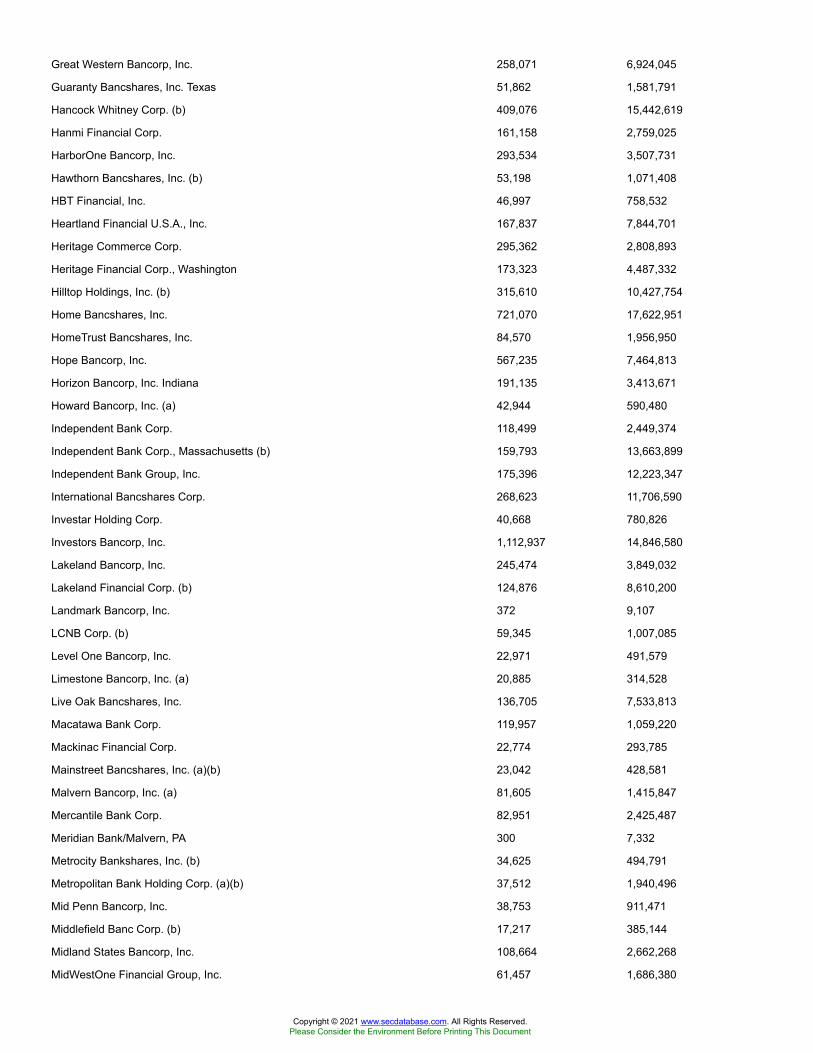
Great Western Bancorp, Inc. 258,071 6,924,045
Guaranty Bancshares, Inc. Texas 51,862 1,581,791
Hancock Whitney Corp. (b) 409,076 15,442,619
Hanmi Financial Corp. 161,158 2,759,025
HarborOne Bancorp, Inc. 293,534 3,507,731
Hawthorn Bancshares, Inc. (b) 53,198 1,071,408
HBT Financial, Inc. 46,997 758,532
Heartland Financial U.S.A., Inc. 167,837 7,844,701
Heritage Commerce Corp. 295,362 2,808,893
Heritage Financial Corp., Washington 173,323 4,487,332
Hilltop Holdings, Inc. (b) 315,610 10,427,754
Home Bancshares, Inc. 721,070 17,622,951
HomeTrust Bancshares, Inc. 84,570 1,956,950
Hope Bancorp, Inc. 567,235 7,464,813
Horizon Bancorp, Inc. Indiana 191,135 3,413,671
Howard Bancorp, Inc. (a) 42,944 590,480
Independent Bank Corp. 118,499 2,449,374
Independent Bank Corp., Massachusetts (b) 159,793 13,663,899
Independent Bank Group, Inc. 175,396 12,223,347
International Bancshares Corp. 268,623 11,706,590
Investar Holding Corp. 40,668 780,826
Investors Bancorp, Inc. 1,112,937 14,846,580
Lakeland Bancorp, Inc. 245,474 3,849,032
Lakeland Financial Corp. (b) 124,876 8,610,200
Landmark Bancorp, Inc. 372 9,107
LCNB Corp. (b) 59,345 1,007,085
Level One Bancorp, Inc. 22,971 491,579
Limestone Bancorp, Inc. (a) 20,885 314,528
Live Oak Bancshares, Inc. 136,705 7,533,813
Macatawa Bank Corp. 119,957 1,059,220
Mackinac Financial Corp. 22,774 293,785
Mainstreet Bancshares, Inc. (a)(b) 23,042 428,581
Malvern Bancorp, Inc. (a) 81,605 1,415,847
Mercantile Bank Corp. 82,951 2,425,487
Meridian Bank/Malvern, PA 300 7,332
Metrocity Bankshares, Inc. (b) 34,625 494,791
Metropolitan Bank Holding Corp. (a)(b) 37,512 1,940,496
Mid Penn Bancorp, Inc. 38,753 911,471
Middlefield Banc Corp. (b) 17,217 385,144
Midland States Bancorp, Inc. 108,664 2,662,268
MidWestOne Financial Group, Inc. 61,457 1,686,380
Copyright © 2021 www.secdatabase.com. All Rights Reserved.Please Consider the Environment Before Printing This Document

MVB Financial Corp. 60,252 1,964,215
National Bank Holdings Corp. 149,373 5,788,204
National Bankshares, Inc. (b) 30,379 1,007,368
NBT Bancorp, Inc. 218,205 7,905,567
Nicolet Bankshares, Inc. (a)(b) 46,261 3,425,627
Northeast Bank 44,271 1,149,718
Northrim Bancorp, Inc. 32,146 1,237,300
Norwood Financial Corp. 25,663 655,433
Oak Valley Bancorp Oakdale California (b) 988 15,966
OceanFirst Financial Corp. 297,681 6,468,608
OFG Bancorp 246,657 4,762,947
Ohio Valley Banc Corp. (b) 14,225 345,525
Old National Bancorp, Indiana (b) 792,903 14,375,331
Old Point Financial Corp. 8,643 175,626
Old Second Bancorp, Inc. 137,721 1,648,520
Origin Bancorp, Inc. 102,616 3,515,624
Orrstown Financial Services, Inc. 49,439 963,072
Pacific Mercantile Bancorp (a) 74,732 553,017
Pacific Premier Bancorp, Inc. (b) 448,670 18,081,401
PacWest Bancorp 555,509 20,131,646
Park National Corp. 68,608 8,507,392
Parke Bancorp, Inc. 46,200 838,530
Pathfinder Bancorp, Inc. 200 2,970
Patriot National Bancorp, Inc. (a) 1,376 14,310
PCB Bancorp 58,618 816,549
Peapack-Gladstone Financial Corp. 85,204 2,343,962
Penns Woods Bancorp, Inc. 27,874 664,237
Peoples Bancorp of North Carolina (b) 30,748 718,888
Peoples Bancorp, Inc. (b) 96,806 3,014,539
Peoples Financial Services Corp. 30,443 1,274,953
Pinnacle Financial Partners, Inc. 367,691 29,845,478
Plumas Bancorp 200 5,002
Popular, Inc. 410,704 27,443,241
Preferred Bank, Los Angeles 66,814 3,871,871
Premier Financial Bancorp, Inc. 39,963 621,025
Professional Holdings Corp. (A Shares) (b) 38,201 611,216
Prosperity Bancshares, Inc. 446,774 32,824,486
QCR Holdings, Inc. 78,151 3,235,451
RBB Bancorp 72,154 1,356,495
Red River Bancshares, Inc. 11,824 613,666
Reliant Bancorp, Inc. 67,458 1,491,496
Copyright © 2021 www.secdatabase.com. All Rights Reserved.Please Consider the Environment Before Printing This Document
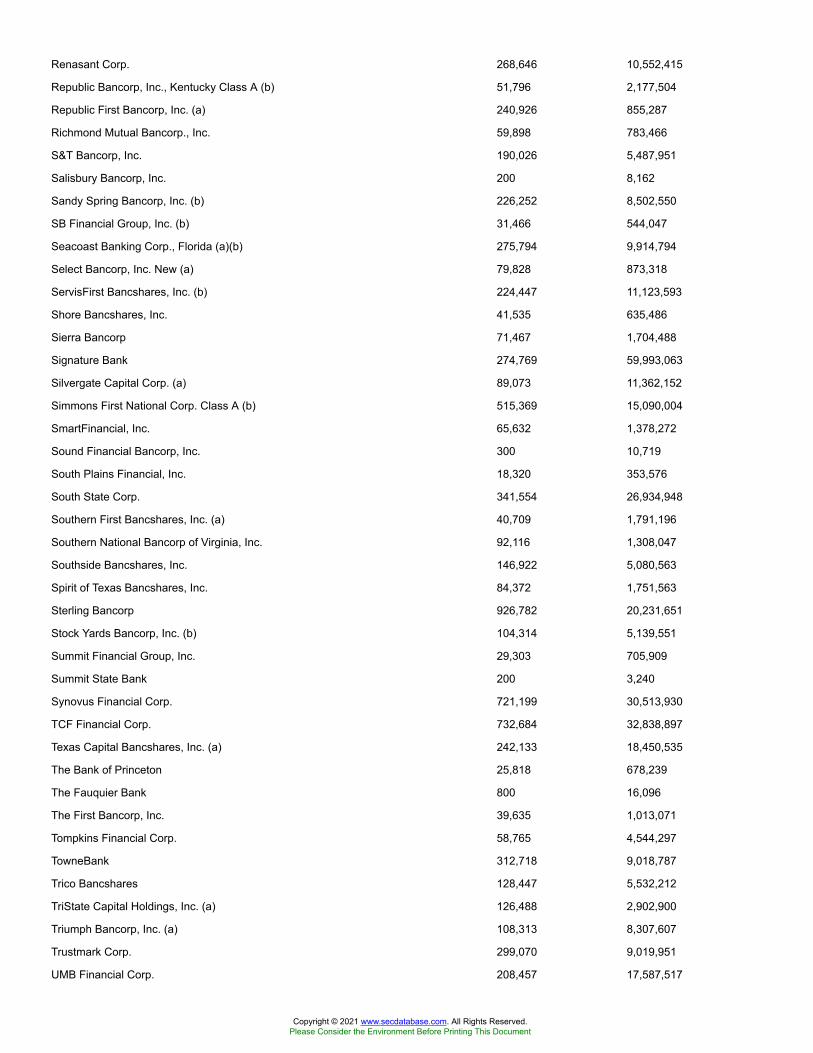
Renasant Corp. 268,646 10,552,415
Republic Bancorp, Inc., Kentucky Class A (b) 51,796 2,177,504
Republic First Bancorp, Inc. (a) 240,926 855,287
Richmond Mutual Bancorp., Inc. 59,898 783,466
S&T Bancorp, Inc. 190,026 5,487,951
Salisbury Bancorp, Inc. 200 8,162
Sandy Spring Bancorp, Inc. (b) 226,252 8,502,550
SB Financial Group, Inc. (b) 31,466 544,047
Seacoast Banking Corp., Florida (a)(b) 275,794 9,914,794
Select Bancorp, Inc. New (a) 79,828 873,318
ServisFirst Bancshares, Inc. (b) 224,447 11,123,593
Shore Bancshares, Inc. 41,535 635,486
Sierra Bancorp 71,467 1,704,488
Signature Bank 274,769 59,993,063
Silvergate Capital Corp. (a) 89,073 11,362,152
Simmons First National Corp. Class A (b) 515,369 15,090,004
SmartFinancial, Inc. 65,632 1,378,272
Sound Financial Bancorp, Inc. 300 10,719
South Plains Financial, Inc. 18,320 353,576
South State Corp. 341,554 26,934,948
Southern First Bancshares, Inc. (a) 40,709 1,791,196
Southern National Bancorp of Virginia, Inc. 92,116 1,308,047
Southside Bancshares, Inc. 146,922 5,080,563
Spirit of Texas Bancshares, Inc. 84,372 1,751,563
Sterling Bancorp 926,782 20,231,651
Stock Yards Bancorp, Inc. (b) 104,314 5,139,551
Summit Financial Group, Inc. 29,303 705,909
Summit State Bank 200 3,240
Synovus Financial Corp. 721,199 30,513,930
TCF Financial Corp. 732,684 32,838,897
Texas Capital Bancshares, Inc. (a) 242,133 18,450,535
The Bank of Princeton 25,818 678,239
The Fauquier Bank 800 16,096
The First Bancorp, Inc. 39,635 1,013,071
Tompkins Financial Corp. 58,765 4,544,297
TowneBank 312,718 9,018,787
Trico Bancshares 128,447 5,532,212
TriState Capital Holdings, Inc. (a) 126,488 2,902,900
Triumph Bancorp, Inc. (a) 108,313 8,307,607
Trustmark Corp. 299,070 9,019,951
UMB Financial Corp. 208,457 17,587,517
Copyright © 2021 www.secdatabase.com. All Rights Reserved.Please Consider the Environment Before Printing This Document
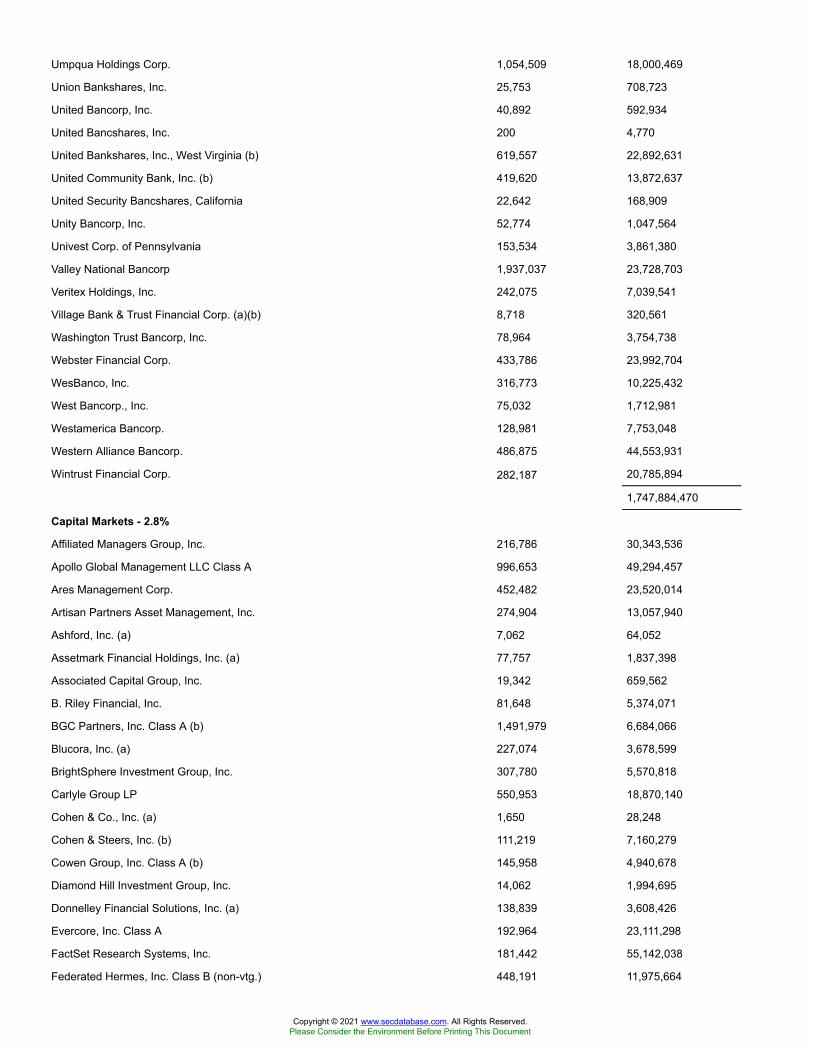
Umpqua Holdings Corp. 1,054,509 18,000,469
Union Bankshares, Inc. 25,753 708,723
United Bancorp, Inc. 40,892 592,934
United Bancshares, Inc. 200 4,770
United Bankshares, Inc., West Virginia (b) 619,557 22,892,631
United Community Bank, Inc. (b) 419,620 13,872,637
United Security Bancshares, California 22,642 168,909
Unity Bancorp, Inc. 52,774 1,047,564
Univest Corp. of Pennsylvania 153,534 3,861,380
Valley National Bancorp 1,937,037 23,728,703
Veritex Holdings, Inc. 242,075 7,039,541
Village Bank & Trust Financial Corp. (a)(b) 8,718 320,561
Washington Trust Bancorp, Inc. 78,964 3,754,738
Webster Financial Corp. 433,786 23,992,704
WesBanco, Inc. 316,773 10,225,432
West Bancorp., Inc. 75,032 1,712,981
Westamerica Bancorp. 128,981 7,753,048
Western Alliance Bancorp. 486,875 44,553,931
Wintrust Financial Corp. 282,187 20,785,894
1,747,884,470
Capital Markets - 2.8%
Affiliated Managers Group, Inc. 216,786 30,343,536
Apollo Global Management LLC Class A 996,653 49,294,457
Ares Management Corp. 452,482 23,520,014
Artisan Partners Asset Management, Inc. 274,904 13,057,940
Ashford, Inc. (a) 7,062 64,052
Assetmark Financial Holdings, Inc. (a) 77,757 1,837,398
Associated Capital Group, Inc. 19,342 659,562
B. Riley Financial, Inc. 81,648 5,374,071
BGC Partners, Inc. Class A (b) 1,491,979 6,684,066
Blucora, Inc. (a) 227,074 3,678,599
BrightSphere Investment Group, Inc. 307,780 5,570,818
Carlyle Group LP 550,953 18,870,140
Cohen & Co., Inc. (a) 1,650 28,248
Cohen & Steers, Inc. (b) 111,219 7,160,279
Cowen Group, Inc. Class A (b) 145,958 4,940,678
Diamond Hill Investment Group, Inc. 14,062 1,994,695
Donnelley Financial Solutions, Inc. (a) 138,839 3,608,426
Evercore, Inc. Class A 192,964 23,111,298
FactSet Research Systems, Inc. 181,442 55,142,038
Federated Hermes, Inc. Class B (non-vtg.) 448,191 11,975,664
Copyright © 2021 www.secdatabase.com. All Rights Reserved.Please Consider the Environment Before Printing This Document

Focus Financial Partners, Inc. Class A (a)(b) 164,345 7,725,858
GAMCO Investors, Inc. Class A 21,697 412,243
Greenhill & Co., Inc. (b) 69,158 1,043,594
Hamilton Lane, Inc. Class A 146,451 13,092,719
Hennessy Advisors, Inc. (b) 9,579 81,613
Heritage Global, Inc. (a) 17,766 62,181
Houlihan Lokey 244,877 15,564,382
Interactive Brokers Group, Inc. 385,623 27,915,249
Janus Henderson Group PLC 820,076 23,970,821
KKR & Co. LP 2,727,198 124,251,141
Lazard Ltd. Class A 536,820 20,769,566
LPL Financial 379,144 49,872,602
Manning & Napier, Inc. Class A 53,255 397,282
Medley Management, Inc. (a)(b) 3,210 29,404
Moelis & Co. Class A 267,156 13,795,936
Morningstar, Inc. 102,667 23,023,075
Open Lending Corp. (a) 429,992 16,442,894
Oppenheimer Holdings, Inc. Class A (non-vtg.) 44,930 1,702,847
Piper Jaffray Companies (b) 68,621 7,295,785
PJT Partners, Inc. (b) 112,630 7,852,564
Pzena Investment Management, Inc. (b) 60,039 553,560
Safeguard Scientifics, Inc. (a) 95,305 729,083
Sculptor Capital Management, Inc. Class A 91,651 1,891,677
SEI Investments Co. 571,998 32,031,888
Siebert Financial Corp. (a)(b) 58,418 272,812
Silvercrest Asset Management Group Class A (b) 18,263 256,413
StepStone Group, Inc. Class A (b) 107,824 3,882,742
Stifel Financial Corp. 626,372 38,258,802
StoneX Group, Inc. (a) 76,089 4,389,574
The Blackstone Group LP 3,228,069 223,479,217
Tradeweb Markets, Inc. Class A 436,846 31,798,020
U.S. Global Investments, Inc. Class A (b) 55,489 387,868
Value Line, Inc. 10,562 304,819
Victory Capital Holdings, Inc. 72,251 1,715,961
Virtu Financial, Inc. Class A 352,147 9,603,049
Virtus Investment Partners, Inc. 33,954 8,519,059
Waddell & Reed Financial, Inc. Class A 290,604 7,291,254
Westwood Holdings Group, Inc. 42,478 732,746
WisdomTree Investments, Inc. (b) 522,621 2,769,891
991,086,170
Consumer Finance - 0.7%
Copyright © 2021 www.secdatabase.com. All Rights Reserved.Please Consider the Environment Before Printing This Document
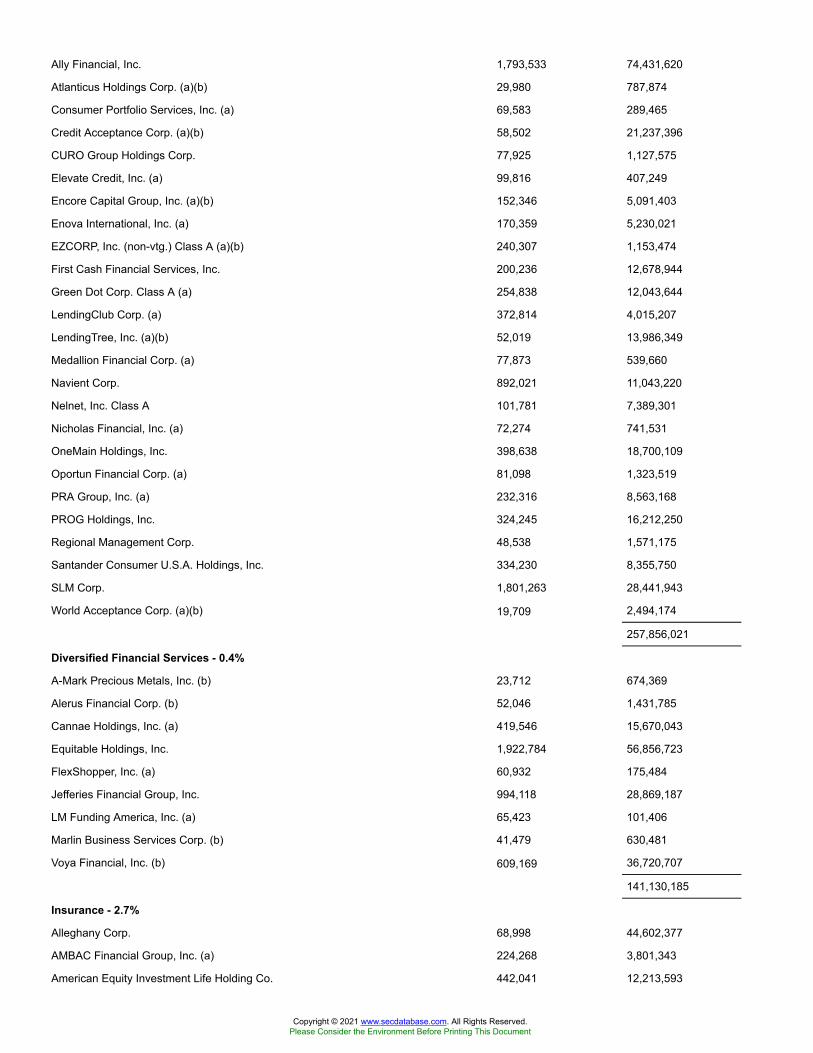
Ally Financial, Inc. 1,793,533 74,431,620
Atlanticus Holdings Corp. (a)(b) 29,980 787,874
Consumer Portfolio Services, Inc. (a) 69,583 289,465
Credit Acceptance Corp. (a)(b) 58,502 21,237,396
CURO Group Holdings Corp. 77,925 1,127,575
Elevate Credit, Inc. (a) 99,816 407,249
Encore Capital Group, Inc. (a)(b) 152,346 5,091,403
Enova International, Inc. (a) 170,359 5,230,021
EZCORP, Inc. (non-vtg.) Class A (a)(b) 240,307 1,153,474
First Cash Financial Services, Inc. 200,236 12,678,944
Green Dot Corp. Class A (a) 254,838 12,043,644
LendingClub Corp. (a) 372,814 4,015,207
LendingTree, Inc. (a)(b) 52,019 13,986,349
Medallion Financial Corp. (a) 77,873 539,660
Navient Corp. 892,021 11,043,220
Nelnet, Inc. Class A 101,781 7,389,301
Nicholas Financial, Inc. (a) 72,274 741,531
OneMain Holdings, Inc. 398,638 18,700,109
Oportun Financial Corp. (a) 81,098 1,323,519
PRA Group, Inc. (a) 232,316 8,563,168
PROG Holdings, Inc. 324,245 16,212,250
Regional Management Corp. 48,538 1,571,175
Santander Consumer U.S.A. Holdings, Inc. 334,230 8,355,750
SLM Corp. 1,801,263 28,441,943
World Acceptance Corp. (a)(b) 19,709 2,494,174
257,856,021
Diversified Financial Services - 0.4%
A-Mark Precious Metals, Inc. (b) 23,712 674,369
Alerus Financial Corp. (b) 52,046 1,431,785
Cannae Holdings, Inc. (a) 419,546 15,670,043
Equitable Holdings, Inc. 1,922,784 56,856,723
FlexShopper, Inc. (a) 60,932 175,484
Jefferies Financial Group, Inc. 994,118 28,869,187
LM Funding America, Inc. (a) 65,423 101,406
Marlin Business Services Corp. (b) 41,479 630,481
Voya Financial, Inc. (b) 609,169 36,720,707
141,130,185
Insurance - 2.7%
Alleghany Corp. 68,998 44,602,377
AMBAC Financial Group, Inc. (a) 224,268 3,801,343
American Equity Investment Life Holding Co. 442,041 12,213,593
Copyright © 2021 www.secdatabase.com. All Rights Reserved.Please Consider the Environment Before Printing This Document
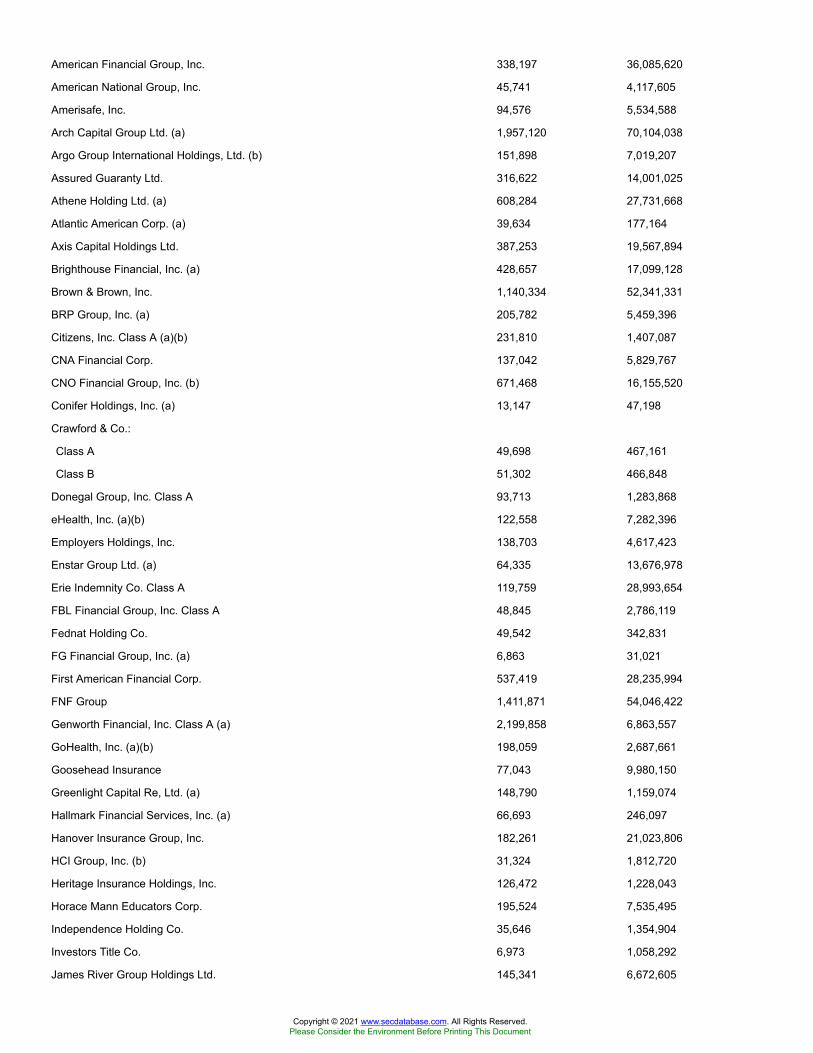
American Financial Group, Inc. 338,197 36,085,620
American National Group, Inc. 45,741 4,117,605
Amerisafe, Inc. 94,576 5,534,588
Arch Capital Group Ltd. (a) 1,957,120 70,104,038
Argo Group International Holdings, Ltd. (b) 151,898 7,019,207
Assured Guaranty Ltd. 316,622 14,001,025
Athene Holding Ltd. (a) 608,284 27,731,668
Atlantic American Corp. (a) 39,634 177,164
Axis Capital Holdings Ltd. 387,253 19,567,894
Brighthouse Financial, Inc. (a) 428,657 17,099,128
Brown & Brown, Inc. 1,140,334 52,341,331
BRP Group, Inc. (a) 205,782 5,459,396
Citizens, Inc. Class A (a)(b) 231,810 1,407,087
CNA Financial Corp. 137,042 5,829,767
CNO Financial Group, Inc. (b) 671,468 16,155,520
Conifer Holdings, Inc. (a) 13,147 47,198
Crawford & Co.:
Class A 49,698 467,161
Class B 51,302 466,848
Donegal Group, Inc. Class A 93,713 1,283,868
eHealth, Inc. (a)(b) 122,558 7,282,396
Employers Holdings, Inc. 138,703 4,617,423
Enstar Group Ltd. (a) 64,335 13,676,978
Erie Indemnity Co. Class A 119,759 28,993,654
FBL Financial Group, Inc. Class A 48,845 2,786,119
Fednat Holding Co. 49,542 342,831
FG Financial Group, Inc. (a) 6,863 31,021
First American Financial Corp. 537,419 28,235,994
FNF Group 1,411,871 54,046,422
Genworth Financial, Inc. Class A (a) 2,199,858 6,863,557
GoHealth, Inc. (a)(b) 198,059 2,687,661
Goosehead Insurance 77,043 9,980,150
Greenlight Capital Re, Ltd. (a) 148,790 1,159,074
Hallmark Financial Services, Inc. (a) 66,693 246,097
Hanover Insurance Group, Inc. 182,261 21,023,806
HCI Group, Inc. (b) 31,324 1,812,720
Heritage Insurance Holdings, Inc. 126,472 1,228,043
Horace Mann Educators Corp. 195,524 7,535,495
Independence Holding Co. 35,646 1,354,904
Investors Title Co. 6,973 1,058,292
James River Group Holdings Ltd. 145,341 6,672,605
Copyright © 2021 www.secdatabase.com. All Rights Reserved.Please Consider the Environment Before Printing This Document
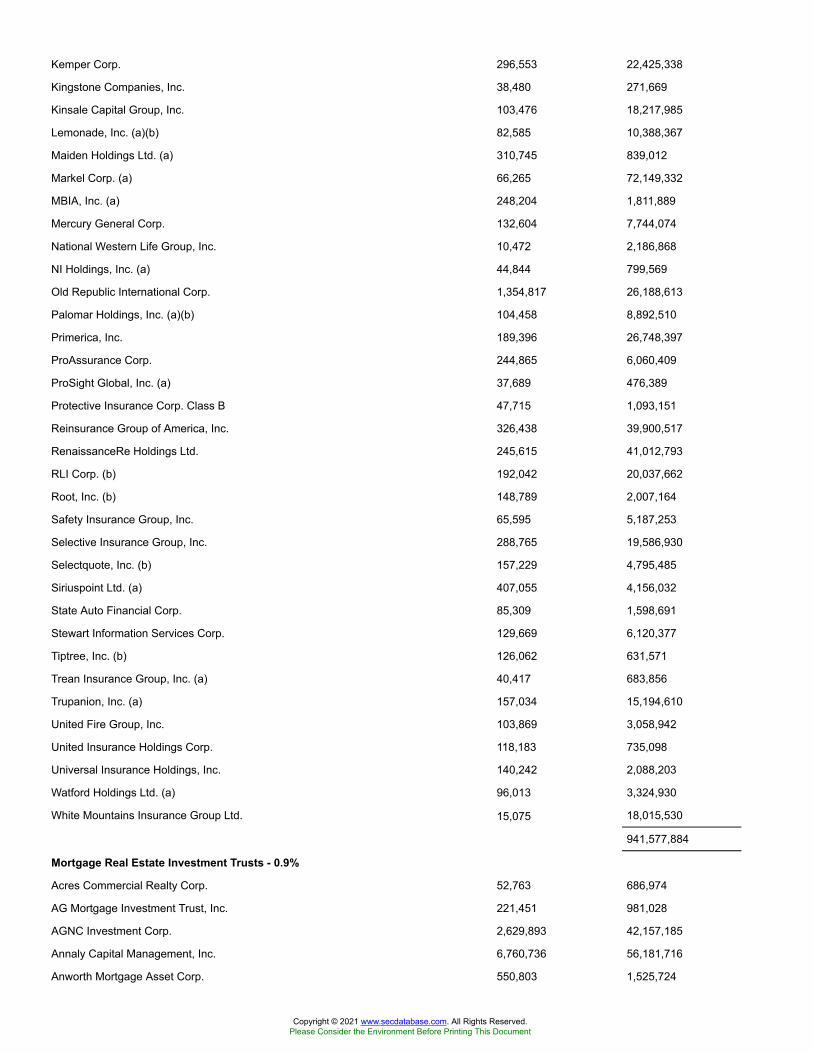
Kemper Corp. 296,553 22,425,338
Kingstone Companies, Inc. 38,480 271,669
Kinsale Capital Group, Inc. 103,476 18,217,985
Lemonade, Inc. (a)(b) 82,585 10,388,367
Maiden Holdings Ltd. (a) 310,745 839,012
Markel Corp. (a) 66,265 72,149,332
MBIA, Inc. (a) 248,204 1,811,889
Mercury General Corp. 132,604 7,744,074
National Western Life Group, Inc. 10,472 2,186,868
NI Holdings, Inc. (a) 44,844 799,569
Old Republic International Corp. 1,354,817 26,188,613
Palomar Holdings, Inc. (a)(b) 104,458 8,892,510
Primerica, Inc. 189,396 26,748,397
ProAssurance Corp. 244,865 6,060,409
ProSight Global, Inc. (a) 37,689 476,389
Protective Insurance Corp. Class B 47,715 1,093,151
Reinsurance Group of America, Inc. 326,438 39,900,517
RenaissanceRe Holdings Ltd. 245,615 41,012,793
RLI Corp. (b) 192,042 20,037,662
Root, Inc. (b) 148,789 2,007,164
Safety Insurance Group, Inc. 65,595 5,187,253
Selective Insurance Group, Inc. 288,765 19,586,930
Selectquote, Inc. (b) 157,229 4,795,485
Siriuspoint Ltd. (a) 407,055 4,156,032
State Auto Financial Corp. 85,309 1,598,691
Stewart Information Services Corp. 129,669 6,120,377
Tiptree, Inc. (b) 126,062 631,571
Trean Insurance Group, Inc. (a) 40,417 683,856
Trupanion, Inc. (a) 157,034 15,194,610
United Fire Group, Inc. 103,869 3,058,942
United Insurance Holdings Corp. 118,183 735,098
Universal Insurance Holdings, Inc. 140,242 2,088,203
Watford Holdings Ltd. (a) 96,013 3,324,930
White Mountains Insurance Group Ltd. 15,075 18,015,530
941,577,884
Mortgage Real Estate Investment Trusts - 0.9%
Acres Commercial Realty Corp. 52,763 686,974
AG Mortgage Investment Trust, Inc. 221,451 981,028
AGNC Investment Corp. 2,629,893 42,157,185
Annaly Capital Management, Inc. 6,760,736 56,181,716
Anworth Mortgage Asset Corp. 550,803 1,525,724
Copyright © 2021 www.secdatabase.com. All Rights Reserved.Please Consider the Environment Before Printing This Document
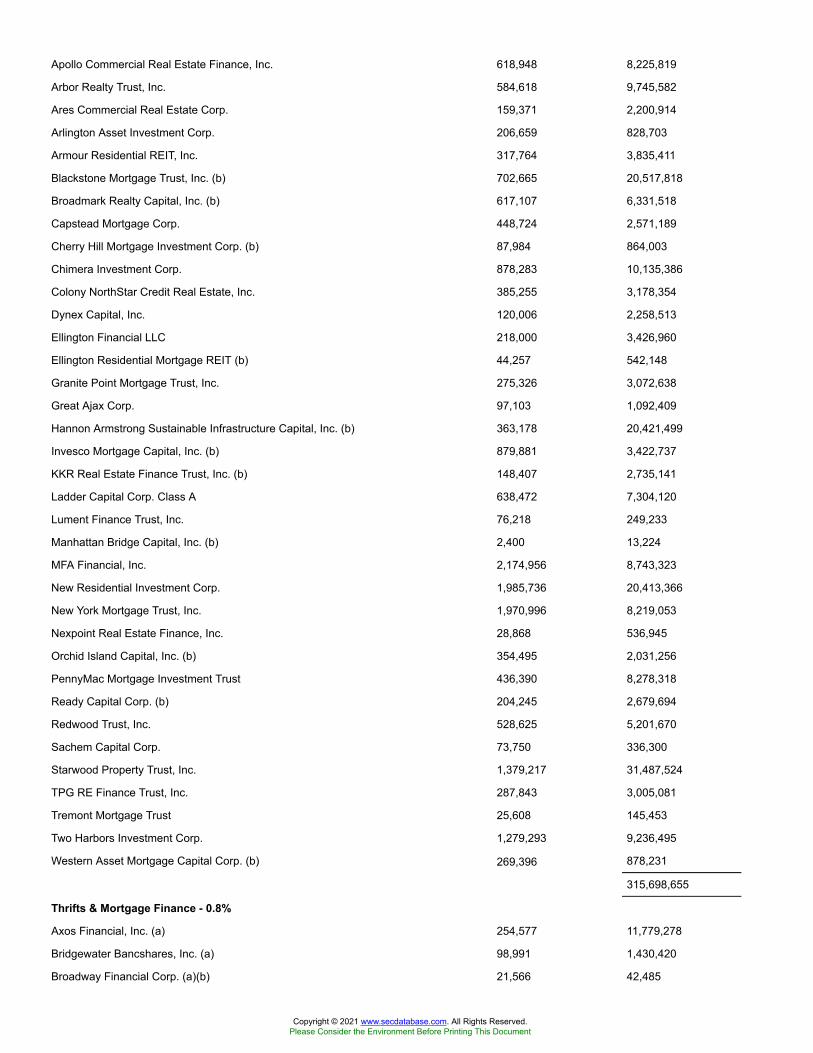
Apollo Commercial Real Estate Finance, Inc. 618,948 8,225,819
Arbor Realty Trust, Inc. 584,618 9,745,582
Ares Commercial Real Estate Corp. 159,371 2,200,914
Arlington Asset Investment Corp. 206,659 828,703
Armour Residential REIT, Inc. 317,764 3,835,411
Blackstone Mortgage Trust, Inc. (b) 702,665 20,517,818
Broadmark Realty Capital, Inc. (b) 617,107 6,331,518
Capstead Mortgage Corp. 448,724 2,571,189
Cherry Hill Mortgage Investment Corp. (b) 87,984 864,003
Chimera Investment Corp. 878,283 10,135,386
Colony NorthStar Credit Real Estate, Inc. 385,255 3,178,354
Dynex Capital, Inc. 120,006 2,258,513
Ellington Financial LLC 218,000 3,426,960
Ellington Residential Mortgage REIT (b) 44,257 542,148
Granite Point Mortgage Trust, Inc. 275,326 3,072,638
Great Ajax Corp. 97,103 1,092,409
Hannon Armstrong Sustainable Infrastructure Capital, Inc. (b) 363,178 20,421,499
Invesco Mortgage Capital, Inc. (b) 879,881 3,422,737
KKR Real Estate Finance Trust, Inc. (b) 148,407 2,735,141
Ladder Capital Corp. Class A 638,472 7,304,120
Lument Finance Trust, Inc. 76,218 249,233
Manhattan Bridge Capital, Inc. (b) 2,400 13,224
MFA Financial, Inc. 2,174,956 8,743,323
New Residential Investment Corp. 1,985,736 20,413,366
New York Mortgage Trust, Inc. 1,970,996 8,219,053
Nexpoint Real Estate Finance, Inc. 28,868 536,945
Orchid Island Capital, Inc. (b) 354,495 2,031,256
PennyMac Mortgage Investment Trust 436,390 8,278,318
Ready Capital Corp. (b) 204,245 2,679,694
Redwood Trust, Inc. 528,625 5,201,670
Sachem Capital Corp. 73,750 336,300
Starwood Property Trust, Inc. 1,379,217 31,487,524
TPG RE Finance Trust, Inc. 287,843 3,005,081
Tremont Mortgage Trust 25,608 145,453
Two Harbors Investment Corp. 1,279,293 9,236,495
Western Asset Mortgage Capital Corp. (b) 269,396 878,231
315,698,655
Thrifts & Mortgage Finance - 0.8%
Axos Financial, Inc. (a) 254,577 11,779,278
Bridgewater Bancshares, Inc. (a) 98,991 1,430,420
Broadway Financial Corp. (a)(b) 21,566 42,485
Copyright © 2021 www.secdatabase.com. All Rights Reserved.Please Consider the Environment Before Printing This Document
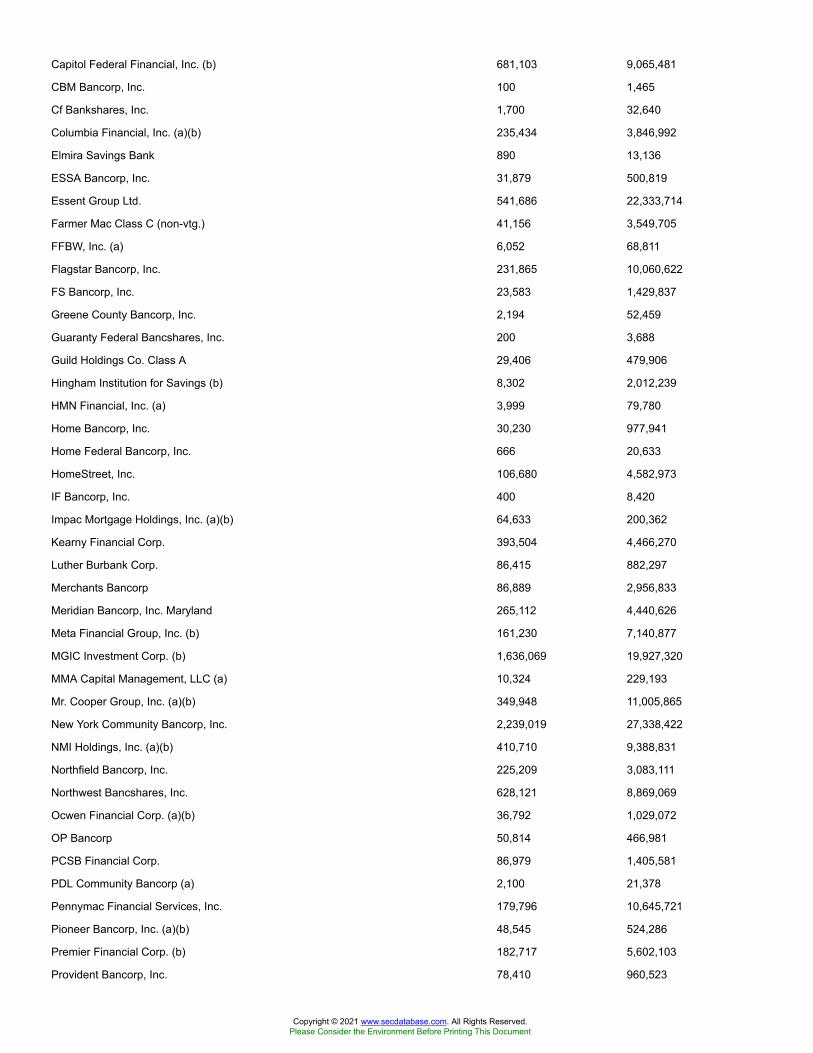
Capitol Federal Financial, Inc. (b) 681,103 9,065,481
CBM Bancorp, Inc. 100 1,465
Cf Bankshares, Inc. 1,700 32,640
Columbia Financial, Inc. (a)(b) 235,434 3,846,992
Elmira Savings Bank 890 13,136
ESSA Bancorp, Inc. 31,879 500,819
Essent Group Ltd. 541,686 22,333,714
Farmer Mac Class C (non-vtg.) 41,156 3,549,705
FFBW, Inc. (a) 6,052 68,811
Flagstar Bancorp, Inc. 231,865 10,060,622
FS Bancorp, Inc. 23,583 1,429,837
Greene County Bancorp, Inc. 2,194 52,459
Guaranty Federal Bancshares, Inc. 200 3,688
Guild Holdings Co. Class A 29,406 479,906
Hingham Institution for Savings (b) 8,302 2,012,239
HMN Financial, Inc. (a) 3,999 79,780
Home Bancorp, Inc. 30,230 977,941
Home Federal Bancorp, Inc. 666 20,633
HomeStreet, Inc. 106,680 4,582,973
IF Bancorp, Inc. 400 8,420
Impac Mortgage Holdings, Inc. (a)(b) 64,633 200,362
Kearny Financial Corp. 393,504 4,466,270
Luther Burbank Corp. 86,415 882,297
Merchants Bancorp 86,889 2,956,833
Meridian Bancorp, Inc. Maryland 265,112 4,440,626
Meta Financial Group, Inc. (b) 161,230 7,140,877
MGIC Investment Corp. (b) 1,636,069 19,927,320
MMA Capital Management, LLC (a) 10,324 229,193
Mr. Cooper Group, Inc. (a)(b) 349,948 11,005,865
New York Community Bancorp, Inc. 2,239,019 27,338,422
NMI Holdings, Inc. (a)(b) 410,710 9,388,831
Northfield Bancorp, Inc. 225,209 3,083,111
Northwest Bancshares, Inc. 628,121 8,869,069
Ocwen Financial Corp. (a)(b) 36,792 1,029,072
OP Bancorp 50,814 466,981
PCSB Financial Corp. 86,979 1,405,581
PDL Community Bancorp (a) 2,100 21,378
Pennymac Financial Services, Inc. 179,796 10,645,721
Pioneer Bancorp, Inc. (a)(b) 48,545 524,286
Premier Financial Corp. (b) 182,717 5,602,103
Provident Bancorp, Inc. 78,410 960,523
Copyright © 2021 www.secdatabase.com. All Rights Reserved.Please Consider the Environment Before Printing This Document
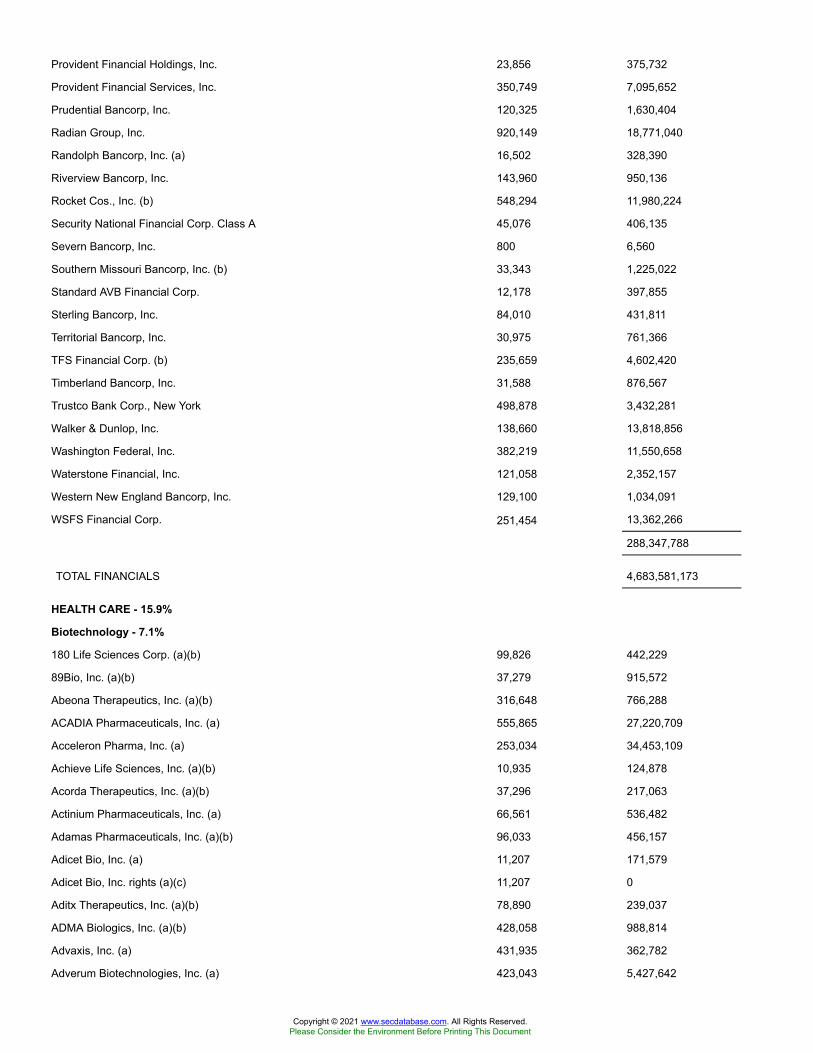
Provident Financial Holdings, Inc. 23,856 375,732
Provident Financial Services, Inc. 350,749 7,095,652
Prudential Bancorp, Inc. 120,325 1,630,404
Radian Group, Inc. 920,149 18,771,040
Randolph Bancorp, Inc. (a) 16,502 328,390
Riverview Bancorp, Inc. 143,960 950,136
Rocket Cos., Inc. (b) 548,294 11,980,224
Security National Financial Corp. Class A 45,076 406,135
Severn Bancorp, Inc. 800 6,560
Southern Missouri Bancorp, Inc. (b) 33,343 1,225,022
Standard AVB Financial Corp. 12,178 397,855
Sterling Bancorp, Inc. 84,010 431,811
Territorial Bancorp, Inc. 30,975 761,366
TFS Financial Corp. (b) 235,659 4,602,420
Timberland Bancorp, Inc. 31,588 876,567
Trustco Bank Corp., New York 498,878 3,432,281
Walker & Dunlop, Inc. 138,660 13,818,856
Washington Federal, Inc. 382,219 11,550,658
Waterstone Financial, Inc. 121,058 2,352,157
Western New England Bancorp, Inc. 129,100 1,034,091
WSFS Financial Corp. 251,454 13,362,266
288,347,788
TOTAL FINANCIALS 4,683,581,173
HEALTH CARE - 15.9%
Biotechnology - 7.1%
180 Life Sciences Corp. (a)(b) 99,826 442,229
89Bio, Inc. (a)(b) 37,279 915,572
Abeona Therapeutics, Inc. (a)(b) 316,648 766,288
ACADIA Pharmaceuticals, Inc. (a) 555,865 27,220,709
Acceleron Pharma, Inc. (a) 253,034 34,453,109
Achieve Life Sciences, Inc. (a)(b) 10,935 124,878
Acorda Therapeutics, Inc. (a)(b) 37,296 217,063
Actinium Pharmaceuticals, Inc. (a) 66,561 536,482
Adamas Pharmaceuticals, Inc. (a)(b) 96,033 456,157
Adicet Bio, Inc. (a) 11,207 171,579
Adicet Bio, Inc. rights (a)(c) 11,207 0
Aditx Therapeutics, Inc. (a)(b) 78,890 239,037
ADMA Biologics, Inc. (a)(b) 428,058 988,814
Advaxis, Inc. (a) 431,935 362,782
Adverum Biotechnologies, Inc. (a) 423,043 5,427,642
Copyright © 2021 www.secdatabase.com. All Rights Reserved.Please Consider the Environment Before Printing This Document
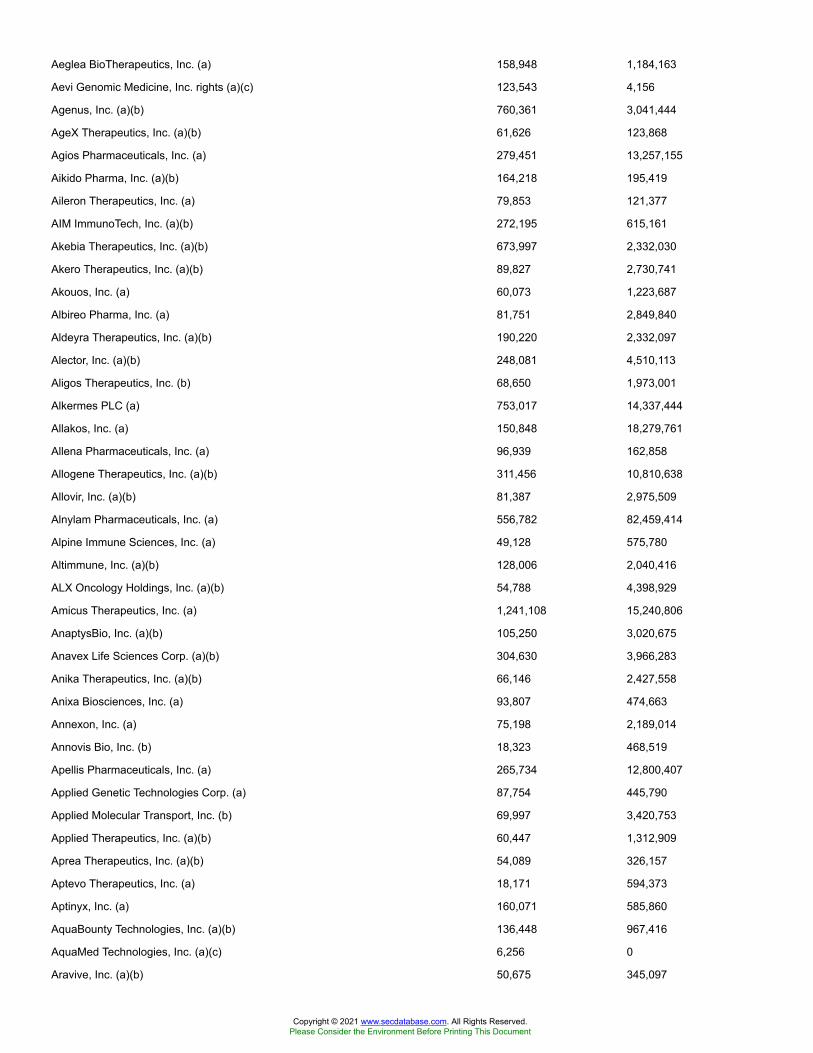
Aeglea BioTherapeutics, Inc. (a) 158,948 1,184,163
Aevi Genomic Medicine, Inc. rights (a)(c) 123,543 4,156
Agenus, Inc. (a)(b) 760,361 3,041,444
AgeX Therapeutics, Inc. (a)(b) 61,626 123,868
Agios Pharmaceuticals, Inc. (a) 279,451 13,257,155
Aikido Pharma, Inc. (a)(b) 164,218 195,419
Aileron Therapeutics, Inc. (a) 79,853 121,377
AIM ImmunoTech, Inc. (a)(b) 272,195 615,161
Akebia Therapeutics, Inc. (a)(b) 673,997 2,332,030
Akero Therapeutics, Inc. (a)(b) 89,827 2,730,741
Akouos, Inc. (a) 60,073 1,223,687
Albireo Pharma, Inc. (a) 81,751 2,849,840
Aldeyra Therapeutics, Inc. (a)(b) 190,220 2,332,097
Alector, Inc. (a)(b) 248,081 4,510,113
Aligos Therapeutics, Inc. (b) 68,650 1,973,001
Alkermes PLC (a) 753,017 14,337,444
Allakos, Inc. (a) 150,848 18,279,761
Allena Pharmaceuticals, Inc. (a) 96,939 162,858
Allogene Therapeutics, Inc. (a)(b) 311,456 10,810,638
Allovir, Inc. (a)(b) 81,387 2,975,509
Alnylam Pharmaceuticals, Inc. (a) 556,782 82,459,414
Alpine Immune Sciences, Inc. (a) 49,128 575,780
Altimmune, Inc. (a)(b) 128,006 2,040,416
ALX Oncology Holdings, Inc. (a)(b) 54,788 4,398,929
Amicus Therapeutics, Inc. (a) 1,241,108 15,240,806
AnaptysBio, Inc. (a)(b) 105,250 3,020,675
Anavex Life Sciences Corp. (a)(b) 304,630 3,966,283
Anika Therapeutics, Inc. (a)(b) 66,146 2,427,558
Anixa Biosciences, Inc. (a) 93,807 474,663
Annexon, Inc. (a) 75,198 2,189,014
Annovis Bio, Inc. (b) 18,323 468,519
Apellis Pharmaceuticals, Inc. (a) 265,734 12,800,407
Applied Genetic Technologies Corp. (a) 87,754 445,790
Applied Molecular Transport, Inc. (b) 69,997 3,420,753
Applied Therapeutics, Inc. (a)(b) 60,447 1,312,909
Aprea Therapeutics, Inc. (a)(b) 54,089 326,157
Aptevo Therapeutics, Inc. (a) 18,171 594,373
Aptinyx, Inc. (a) 160,071 585,860
AquaBounty Technologies, Inc. (a)(b) 136,448 967,416
AquaMed Technologies, Inc. (a)(c) 6,256 0
Aravive, Inc. (a)(b) 50,675 345,097
Copyright © 2021 www.secdatabase.com. All Rights Reserved.Please Consider the Environment Before Printing This Document
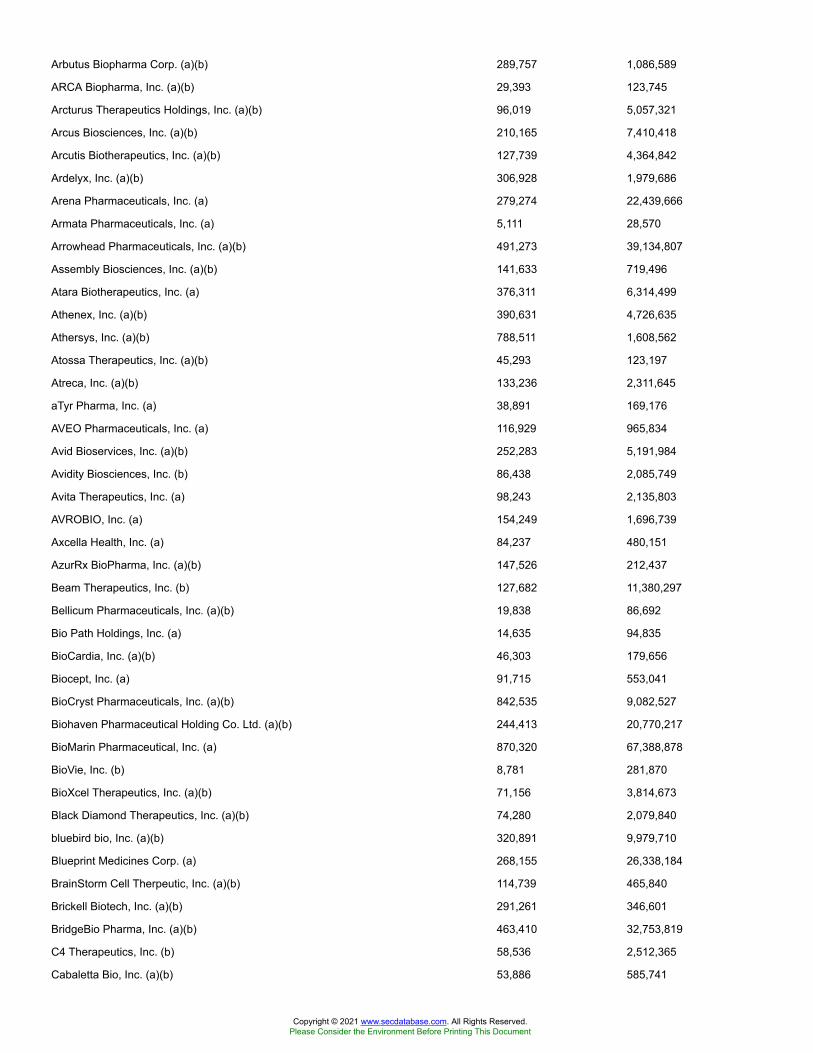
Arbutus Biopharma Corp. (a)(b) 289,757 1,086,589
ARCA Biopharma, Inc. (a)(b) 29,393 123,745
Arcturus Therapeutics Holdings, Inc. (a)(b) 96,019 5,057,321
Arcus Biosciences, Inc. (a)(b) 210,165 7,410,418
Arcutis Biotherapeutics, Inc. (a)(b) 127,739 4,364,842
Ardelyx, Inc. (a)(b) 306,928 1,979,686
Arena Pharmaceuticals, Inc. (a) 279,274 22,439,666
Armata Pharmaceuticals, Inc. (a) 5,111 28,570
Arrowhead Pharmaceuticals, Inc. (a)(b) 491,273 39,134,807
Assembly Biosciences, Inc. (a)(b) 141,633 719,496
Atara Biotherapeutics, Inc. (a) 376,311 6,314,499
Athenex, Inc. (a)(b) 390,631 4,726,635
Athersys, Inc. (a)(b) 788,511 1,608,562
Atossa Therapeutics, Inc. (a)(b) 45,293 123,197
Atreca, Inc. (a)(b) 133,236 2,311,645
aTyr Pharma, Inc. (a) 38,891 169,176
AVEO Pharmaceuticals, Inc. (a) 116,929 965,834
Avid Bioservices, Inc. (a)(b) 252,283 5,191,984
Avidity Biosciences, Inc. (b) 86,438 2,085,749
Avita Therapeutics, Inc. (a) 98,243 2,135,803
AVROBIO, Inc. (a) 154,249 1,696,739
Axcella Health, Inc. (a) 84,237 480,151
AzurRx BioPharma, Inc. (a)(b) 147,526 212,437
Beam Therapeutics, Inc. (b) 127,682 11,380,297
Bellicum Pharmaceuticals, Inc. (a)(b) 19,838 86,692
Bio Path Holdings, Inc. (a) 14,635 94,835
BioCardia, Inc. (a)(b) 46,303 179,656
Biocept, Inc. (a) 91,715 553,041
BioCryst Pharmaceuticals, Inc. (a)(b) 842,535 9,082,527
Biohaven Pharmaceutical Holding Co. Ltd. (a)(b) 244,413 20,770,217
BioMarin Pharmaceutical, Inc. (a) 870,320 67,388,878
BioVie, Inc. (b) 8,781 281,870
BioXcel Therapeutics, Inc. (a)(b) 71,156 3,814,673
Black Diamond Therapeutics, Inc. (a)(b) 74,280 2,079,840
bluebird bio, Inc. (a)(b) 320,891 9,979,710
Blueprint Medicines Corp. (a) 268,155 26,338,184
BrainStorm Cell Therpeutic, Inc. (a)(b) 114,739 465,840
Brickell Biotech, Inc. (a)(b) 291,261 346,601
BridgeBio Pharma, Inc. (a)(b) 463,410 32,753,819
C4 Therapeutics, Inc. (b) 58,536 2,512,365
Cabaletta Bio, Inc. (a)(b) 53,886 585,741
Copyright © 2021 www.secdatabase.com. All Rights Reserved.Please Consider the Environment Before Printing This Document

Calithera Biosciences, Inc. (a)(b) 267,213 780,262
Calyxt, Inc. (a) 69,215 660,311
Cancer Genetics, Inc. (a) 30,884 201,055
Capricor Therapeutics, Inc. (a)(b) 104,761 643,233
Cardiff Oncology, Inc. (a)(b) 124,383 1,286,120
CareDx, Inc. (a) 234,395 18,535,957
CASI Pharmaceuticals, Inc. (a) 345,561 850,080
Catabasis Pharmaceuticals, Inc. (a)(b) 71,200 205,056
Catalyst Biosciences, Inc. (a) 78,458 473,102
Catalyst Pharmaceutical Partners, Inc. (a)(b) 465,135 1,809,375
Cel-Sci Corp. (a)(b) 161,677 2,869,767
Celcuity, Inc. (a) 14,316 203,287
Celldex Therapeutics, Inc. (a) 190,198 5,150,562
Cellectar Biosciences, Inc. (a)(b) 105,255 195,774
Celsion Corp. (a)(b) 149,766 308,518
Cerevel Therapeutics Holdings (a)(b) 198,840 3,014,414
Checkpoint Therapeutics, Inc. (a)(b) 259,134 831,820
ChemoCentryx, Inc. (a) 238,825 16,201,888
Chimerix, Inc. (a)(b) 239,256 2,347,101
Chinook Therapeutics, Inc. (a) 177,399 2,934,179
Chinook Therapeutics, Inc. rights (a)(c) 51,768 2,588
Cidara Therapeutics, Inc. (a) 130,297 295,774
Cleveland Biolabs, Inc. (a) 28,514 165,096
Clovis Oncology, Inc. (a)(b) 429,531 2,572,891
Codiak Biosciences, Inc. 27,389 443,702
Cogent Biosciences, Inc. (a)(b) 145,520 1,140,877
Cogent Biosciences, Inc. rights (a)(c) 43,783 0
CohBar, Inc. (a)(b) 197,921 302,819
Coherus BioSciences, Inc. (a)(b) 320,094 5,198,327
Concert Pharmaceuticals, Inc. (a)(b) 109,391 731,826
Constellation Pharmaceuticals, Inc. (a) 146,920 3,702,384
ContraFect Corp. (a)(b) 117,579 617,290
Corbus Pharmaceuticals Holdings, Inc. (a)(b) 306,666 668,532
Cortexyme, Inc. (a)(b) 64,938 2,212,438
Corvus Pharmaceuticals, Inc. (a)(b) 62,848 218,711
Crinetics Pharmaceuticals, Inc. (a)(b) 82,413 1,260,095
CTI BioPharma Corp. (a) 258,742 840,912
Cue Biopharma, Inc. (a) 121,232 1,649,968
Curis, Inc. (a) 258,143 2,540,127
Cyclacel Pharmaceuticals, Inc. (a)(b) 17,710 122,199
Cyclerion Therapeutics, Inc. (a)(b) 134,102 514,952
Copyright © 2021 www.secdatabase.com. All Rights Reserved.Please Consider the Environment Before Printing This Document
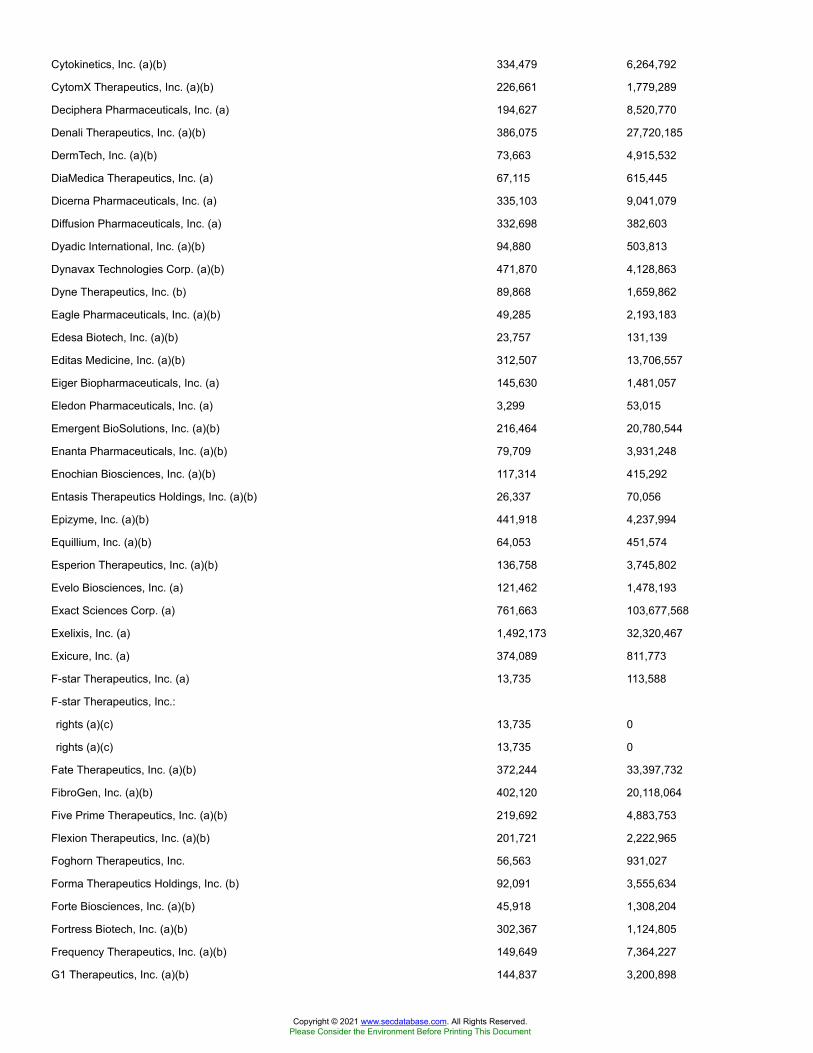
Cytokinetics, Inc. (a)(b) 334,479 6,264,792
CytomX Therapeutics, Inc. (a)(b) 226,661 1,779,289
Deciphera Pharmaceuticals, Inc. (a) 194,627 8,520,770
Denali Therapeutics, Inc. (a)(b) 386,075 27,720,185
DermTech, Inc. (a)(b) 73,663 4,915,532
DiaMedica Therapeutics, Inc. (a) 67,115 615,445
Dicerna Pharmaceuticals, Inc. (a) 335,103 9,041,079
Diffusion Pharmaceuticals, Inc. (a) 332,698 382,603
Dyadic International, Inc. (a)(b) 94,880 503,813
Dynavax Technologies Corp. (a)(b) 471,870 4,128,863
Dyne Therapeutics, Inc. (b) 89,868 1,659,862
Eagle Pharmaceuticals, Inc. (a)(b) 49,285 2,193,183
Edesa Biotech, Inc. (a)(b) 23,757 131,139
Editas Medicine, Inc. (a)(b) 312,507 13,706,557
Eiger Biopharmaceuticals, Inc. (a) 145,630 1,481,057
Eledon Pharmaceuticals, Inc. (a) 3,299 53,015
Emergent BioSolutions, Inc. (a)(b) 216,464 20,780,544
Enanta Pharmaceuticals, Inc. (a)(b) 79,709 3,931,248
Enochian Biosciences, Inc. (a)(b) 117,314 415,292
Entasis Therapeutics Holdings, Inc. (a)(b) 26,337 70,056
Epizyme, Inc. (a)(b) 441,918 4,237,994
Equillium, Inc. (a)(b) 64,053 451,574
Esperion Therapeutics, Inc. (a)(b) 136,758 3,745,802
Evelo Biosciences, Inc. (a) 121,462 1,478,193
Exact Sciences Corp. (a) 761,663 103,677,568
Exelixis, Inc. (a) 1,492,173 32,320,467
Exicure, Inc. (a) 374,089 811,773
F-star Therapeutics, Inc. (a) 13,735 113,588
F-star Therapeutics, Inc.:
rights (a)(c) 13,735 0
rights (a)(c) 13,735 0
Fate Therapeutics, Inc. (a)(b) 372,244 33,397,732
FibroGen, Inc. (a)(b) 402,120 20,118,064
Five Prime Therapeutics, Inc. (a)(b) 219,692 4,883,753
Flexion Therapeutics, Inc. (a)(b) 201,721 2,222,965
Foghorn Therapeutics, Inc. 56,563 931,027
Forma Therapeutics Holdings, Inc. (b) 92,091 3,555,634
Forte Biosciences, Inc. (a)(b) 45,918 1,308,204
Fortress Biotech, Inc. (a)(b) 302,367 1,124,805
Frequency Therapeutics, Inc. (a)(b) 149,649 7,364,227
G1 Therapeutics, Inc. (a)(b) 144,837 3,200,898
Copyright © 2021 www.secdatabase.com. All Rights Reserved.Please Consider the Environment Before Printing This Document
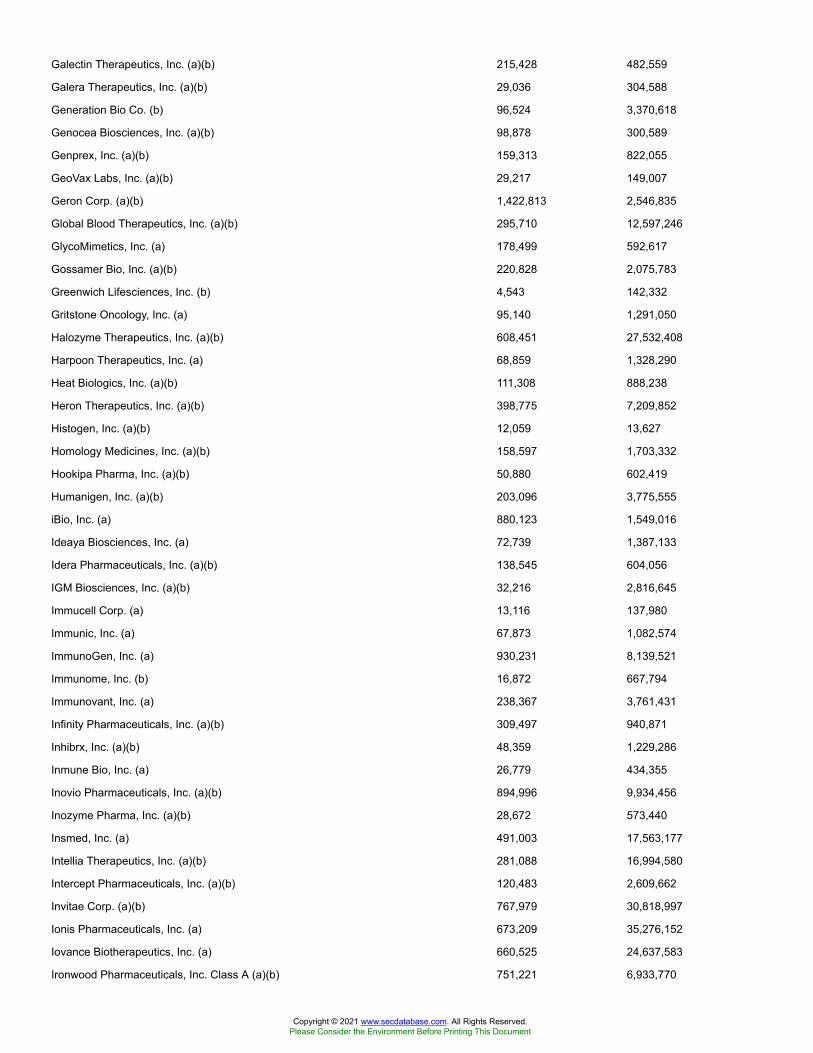
Galectin Therapeutics, Inc. (a)(b) 215,428 482,559
Galera Therapeutics, Inc. (a)(b) 29,036 304,588
Generation Bio Co. (b) 96,524 3,370,618
Genocea Biosciences, Inc. (a)(b) 98,878 300,589
Genprex, Inc. (a)(b) 159,313 822,055
GeoVax Labs, Inc. (a)(b) 29,217 149,007
Geron Corp. (a)(b) 1,422,813 2,546,835
Global Blood Therapeutics, Inc. (a)(b) 295,710 12,597,246
GlycoMimetics, Inc. (a) 178,499 592,617
Gossamer Bio, Inc. (a)(b) 220,828 2,075,783
Greenwich Lifesciences, Inc. (b) 4,543 142,332
Gritstone Oncology, Inc. (a) 95,140 1,291,050
Halozyme Therapeutics, Inc. (a)(b) 608,451 27,532,408
Harpoon Therapeutics, Inc. (a) 68,859 1,328,290
Heat Biologics, Inc. (a)(b) 111,308 888,238
Heron Therapeutics, Inc. (a)(b) 398,775 7,209,852
Histogen, Inc. (a)(b) 12,059 13,627
Homology Medicines, Inc. (a)(b) 158,597 1,703,332
Hookipa Pharma, Inc. (a)(b) 50,880 602,419
Humanigen, Inc. (a)(b) 203,096 3,775,555
iBio, Inc. (a) 880,123 1,549,016
Ideaya Biosciences, Inc. (a) 72,739 1,387,133
Idera Pharmaceuticals, Inc. (a)(b) 138,545 604,056
IGM Biosciences, Inc. (a)(b) 32,216 2,816,645
Immucell Corp. (a) 13,116 137,980
Immunic, Inc. (a) 67,873 1,082,574
ImmunoGen, Inc. (a) 930,231 8,139,521
Immunome, Inc. (b) 16,872 667,794
Immunovant, Inc. (a) 238,367 3,761,431
Infinity Pharmaceuticals, Inc. (a)(b) 309,497 940,871
Inhibrx, Inc. (a)(b) 48,359 1,229,286
Inmune Bio, Inc. (a) 26,779 434,355
Inovio Pharmaceuticals, Inc. (a)(b) 894,996 9,934,456
Inozyme Pharma, Inc. (a)(b) 28,672 573,440
Insmed, Inc. (a) 491,003 17,563,177
Intellia Therapeutics, Inc. (a)(b) 281,088 16,994,580
Intercept Pharmaceuticals, Inc. (a)(b) 120,483 2,609,662
Invitae Corp. (a)(b) 767,979 30,818,997
Ionis Pharmaceuticals, Inc. (a) 673,209 35,276,152
Iovance Biotherapeutics, Inc. (a) 660,525 24,637,583
Ironwood Pharmaceuticals, Inc. Class A (a)(b) 751,221 6,933,770
Copyright © 2021 www.secdatabase.com. All Rights Reserved.Please Consider the Environment Before Printing This Document

IsoRay, Inc. (a) 372,805 521,927
iTeos Therapeutics, Inc. (a) 54,961 2,285,278
Iveric Bio, Inc. (a)(b) 406,854 2,498,084
Jounce Therapeutics, Inc. (a) 76,862 843,945
Kadmon Holdings, Inc. (a)(b) 796,503 3,655,949
Kalvista Pharmaceuticals, Inc. (a) 83,066 2,730,379
Karuna Therapeutics, Inc. (a)(b) 76,751 9,590,805
Karyopharm Therapeutics, Inc. (a)(b) 312,164 4,314,106
Keros Therapeutics, Inc. (b) 31,197 2,042,468
Kezar Life Sciences, Inc. (a) 152,617 836,341
Kindred Biosciences, Inc. (a) 179,235 808,350
Kiniksa Pharmaceuticals Ltd. (a)(b) 108,590 2,233,696
Kintara Therapeutics, Inc. (a)(b) 112,030 238,624
Kodiak Sciences, Inc. (a)(b) 150,653 19,435,744
Kronos Bio, Inc. (b) 76,227 2,215,919
Krystal Biotech, Inc. (a) 77,166 6,087,626
Kura Oncology, Inc. (a) 308,156 8,628,368
Kymera Therapeutics, Inc. (a) 50,749 2,434,937
La Jolla Pharmaceutical Co. (a)(b) 115,502 605,230
Lantern Pharma, Inc. (a) 9,235 164,106
Larimar Therapeutics, Inc. (a)(b) 56,635 966,759
Leap Therapeutics, Inc. (a) 186,936 435,561
Lexicon Pharmaceuticals, Inc. (a) 269,253 1,935,929
Ligand Pharmaceuticals, Inc.:
Class B (a)(b) 76,972 11,408,790
General CVR (a) 26,087 496
Glucagon CVR (a) 26,087 287
rights (a) 26,087 600
TR Beta CVR (a)(c) 26,087 5,478
Lineage Cell Therapeutics, Inc. (a)(b) 724,431 1,666,191
LogicBio Therapeutics, Inc. (a)(b) 61,056 506,154
Lumos Pharma, Inc. (a) 13,119 178,418
Macrogenics, Inc. (a) 280,197 7,007,727
Madrigal Pharmaceuticals, Inc. (a)(b) 47,938 5,809,606
Magenta Therapeutics, Inc. (a) 128,081 1,346,131
MannKind Corp. (a)(b) 1,125,516 6,426,696
Marker Therapeutics, Inc. (a)(b) 139,201 336,866
Matinas BioPharma Holdings, Inc. (a)(b) 729,652 882,879
MediciNova, Inc. (a)(b) 201,492 1,124,325
MEI Pharma, Inc. (a)(b) 409,177 1,534,414
Merrimack Pharmaceuticals, Inc. (a)(b) 57,524 372,756
Copyright © 2021 www.secdatabase.com. All Rights Reserved.Please Consider the Environment Before Printing This Document
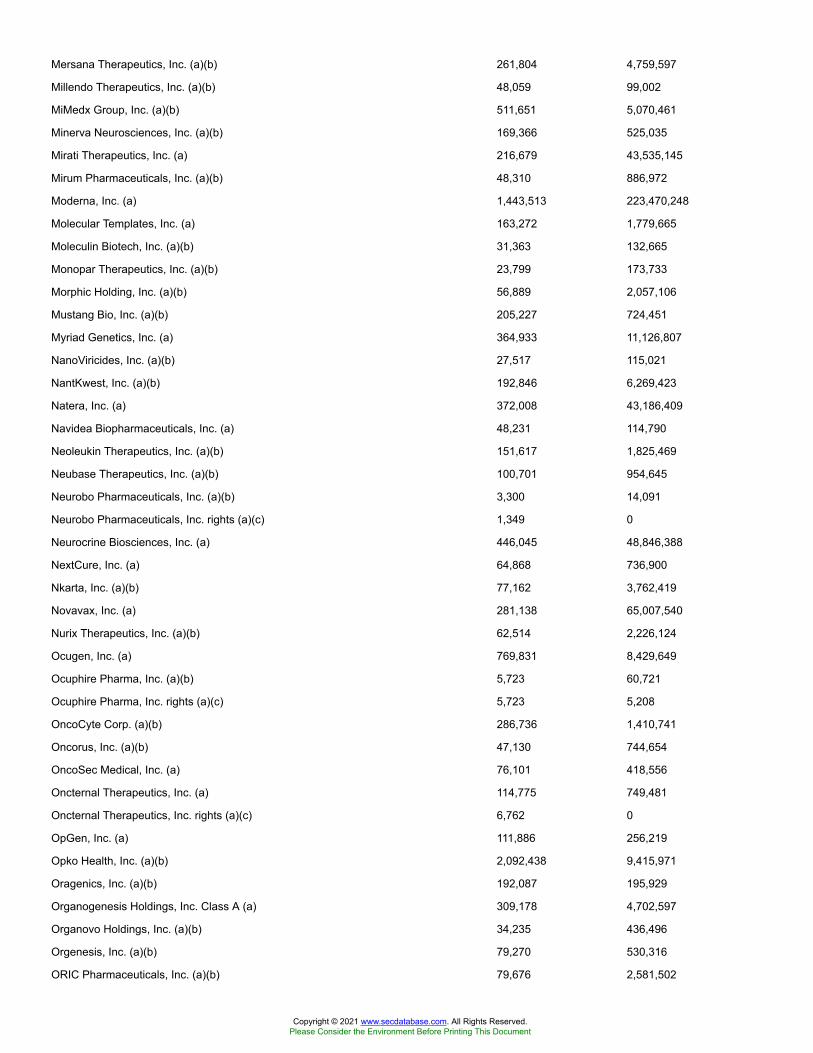
Mersana Therapeutics, Inc. (a)(b) 261,804 4,759,597
Millendo Therapeutics, Inc. (a)(b) 48,059 99,002
MiMedx Group, Inc. (a)(b) 511,651 5,070,461
Minerva Neurosciences, Inc. (a)(b) 169,366 525,035
Mirati Therapeutics, Inc. (a) 216,679 43,535,145
Mirum Pharmaceuticals, Inc. (a)(b) 48,310 886,972
Moderna, Inc. (a) 1,443,513 223,470,248
Molecular Templates, Inc. (a) 163,272 1,779,665
Moleculin Biotech, Inc. (a)(b) 31,363 132,665
Monopar Therapeutics, Inc. (a)(b) 23,799 173,733
Morphic Holding, Inc. (a)(b) 56,889 2,057,106
Mustang Bio, Inc. (a)(b) 205,227 724,451
Myriad Genetics, Inc. (a) 364,933 11,126,807
NanoViricides, Inc. (a)(b) 27,517 115,021
NantKwest, Inc. (a)(b) 192,846 6,269,423
Natera, Inc. (a) 372,008 43,186,409
Navidea Biopharmaceuticals, Inc. (a) 48,231 114,790
Neoleukin Therapeutics, Inc. (a)(b) 151,617 1,825,469
Neubase Therapeutics, Inc. (a)(b) 100,701 954,645
Neurobo Pharmaceuticals, Inc. (a)(b) 3,300 14,091
Neurobo Pharmaceuticals, Inc. rights (a)(c) 1,349 0
Neurocrine Biosciences, Inc. (a) 446,045 48,846,388
NextCure, Inc. (a) 64,868 736,900
Nkarta, Inc. (a)(b) 77,162 3,762,419
Novavax, Inc. (a) 281,138 65,007,540
Nurix Therapeutics, Inc. (a)(b) 62,514 2,226,124
Ocugen, Inc. (a) 769,831 8,429,649
Ocuphire Pharma, Inc. (a)(b) 5,723 60,721
Ocuphire Pharma, Inc. rights (a)(c) 5,723 5,208
OncoCyte Corp. (a)(b) 286,736 1,410,741
Oncorus, Inc. (a)(b) 47,130 744,654
OncoSec Medical, Inc. (a) 76,101 418,556
Oncternal Therapeutics, Inc. (a) 114,775 749,481
Oncternal Therapeutics, Inc. rights (a)(c) 6,762 0
OpGen, Inc. (a) 111,886 256,219
Opko Health, Inc. (a)(b) 2,092,438 9,415,971
Oragenics, Inc. (a)(b) 192,087 195,929
Organogenesis Holdings, Inc. Class A (a) 309,178 4,702,597
Organovo Holdings, Inc. (a)(b) 34,235 436,496
Orgenesis, Inc. (a)(b) 79,270 530,316
ORIC Pharmaceuticals, Inc. (a)(b) 79,676 2,581,502
Copyright © 2021 www.secdatabase.com. All Rights Reserved.Please Consider the Environment Before Printing This Document

Outlook Therapeutics, Inc. (a)(b) 305,516 662,970
Ovid Therapeutics, Inc. (a)(b) 168,808 497,984
Oyster Point Pharma, Inc. (a)(b) 52,153 1,033,151
Palatin Technologies, Inc. (a)(b) 1,049,809 820,951
Pandion Therapeutics, Inc. (a)(b) 37,131 2,235,286
Passage Bio, Inc. (b) 113,794 2,050,568
PDL BioPharma, Inc. (a)(b)(c) 562,926 1,390,427
PDS Biotechnology Corp. (a)(b) 97,361 395,286
PhaseBio Pharmaceuticals, Inc. (a)(b) 68,737 266,700
Phio Pharmaceuticals Corp. (a) 164 469
Pieris Pharmaceuticals, Inc. (a)(b) 241,212 656,097
Plus Therapeutics, Inc. (a)(b) 6,336 18,058
PMV Pharmaceuticals, Inc. (b) 65,870 2,478,688
Polarityte, Inc. (a)(b) 96,620 124,640
Poseida Therapeutics, Inc. (a)(b) 63,194 697,662
Praxis Precision Medicines, Inc. 57,652 2,507,862
Precigen, Inc. (a)(b) 343,651 2,900,414
Precision BioSciences, Inc. (a)(b) 196,725 2,352,831
Prelude Therapeutics, Inc. (b) 55,817 3,479,074
Protagonist Therapeutics, Inc. (a) 174,710 4,117,915
Protara Therapeutics, Inc. (a)(b) 54,985 945,742
Prothena Corp. PLC (a) 119,100 2,658,312
PTC Therapeutics, Inc. (a) 327,497 18,700,079
Puma Biotechnology, Inc. (a)(b) 156,467 1,558,411
Qualigen Therapeutics, Inc. (a) 76,560 251,882
Qualigen Therapeutics, Inc. rights (a)(c) 2,906 196
Radius Health, Inc. (a) 229,761 4,275,852
RAPT Therapeutics, Inc. (a)(b) 38,738 703,095
Recro Pharma, Inc. (a)(b) 82,926 284,436
REGENXBIO, Inc. (a) 159,336 6,518,436
Regulus Therapeutics, Inc. (a)(b) 197,166 244,486
Relay Therapeutics, Inc. (a)(b) 99,783 4,118,044
Repligen Corp. (a) 242,219 51,444,893
Replimune Group, Inc. (a) 121,735 4,215,683
Revolution Medicines, Inc. 221,923 10,137,443
Rhythm Pharmaceuticals, Inc. (a) 170,102 4,409,044
Rigel Pharmaceuticals, Inc. (a) 795,226 3,300,188
Rocket Pharmaceuticals, Inc. (a)(b) 198,815 11,050,138
Rubius Therapeutics, Inc. (a)(b) 170,211 1,766,790
Sage Therapeutics, Inc. (a)(b) 251,165 21,349,025
Salarius Pharmaceuticals, Inc. (a)(b) 91,779 165,202
Copyright © 2021 www.secdatabase.com. All Rights Reserved.Please Consider the Environment Before Printing This Document
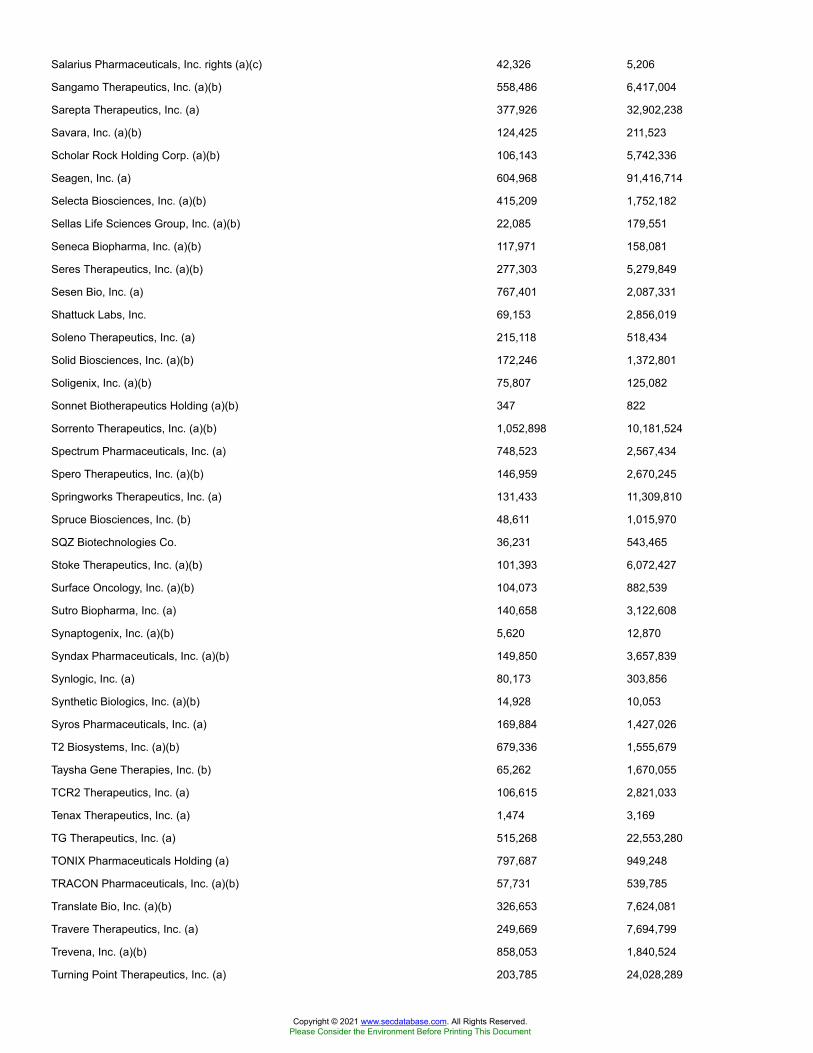
Salarius Pharmaceuticals, Inc. rights (a)(c) 42,326 5,206
Sangamo Therapeutics, Inc. (a)(b) 558,486 6,417,004
Sarepta Therapeutics, Inc. (a) 377,926 32,902,238
Savara, Inc. (a)(b) 124,425 211,523
Scholar Rock Holding Corp. (a)(b) 106,143 5,742,336
Seagen, Inc. (a) 604,968 91,416,714
Selecta Biosciences, Inc. (a)(b) 415,209 1,752,182
Sellas Life Sciences Group, Inc. (a)(b) 22,085 179,551
Seneca Biopharma, Inc. (a)(b) 117,971 158,081
Seres Therapeutics, Inc. (a)(b) 277,303 5,279,849
Sesen Bio, Inc. (a) 767,401 2,087,331
Shattuck Labs, Inc. 69,153 2,856,019
Soleno Therapeutics, Inc. (a) 215,118 518,434
Solid Biosciences, Inc. (a)(b) 172,246 1,372,801
Soligenix, Inc. (a)(b) 75,807 125,082
Sonnet Biotherapeutics Holding (a)(b) 347 822
Sorrento Therapeutics, Inc. (a)(b) 1,052,898 10,181,524
Spectrum Pharmaceuticals, Inc. (a) 748,523 2,567,434
Spero Therapeutics, Inc. (a)(b) 146,959 2,670,245
Springworks Therapeutics, Inc. (a) 131,433 11,309,810
Spruce Biosciences, Inc. (b) 48,611 1,015,970
SQZ Biotechnologies Co. 36,231 543,465
Stoke Therapeutics, Inc. (a)(b) 101,393 6,072,427
Surface Oncology, Inc. (a)(b) 104,073 882,539
Sutro Biopharma, Inc. (a) 140,658 3,122,608
Synaptogenix, Inc. (a)(b) 5,620 12,870
Syndax Pharmaceuticals, Inc. (a)(b) 149,850 3,657,839
Synlogic, Inc. (a) 80,173 303,856
Synthetic Biologics, Inc. (a)(b) 14,928 10,053
Syros Pharmaceuticals, Inc. (a) 169,884 1,427,026
T2 Biosystems, Inc. (a)(b) 679,336 1,555,679
Taysha Gene Therapies, Inc. (b) 65,262 1,670,055
TCR2 Therapeutics, Inc. (a) 106,615 2,821,033
Tenax Therapeutics, Inc. (a) 1,474 3,169
TG Therapeutics, Inc. (a) 515,268 22,553,280
TONIX Pharmaceuticals Holding (a) 797,687 949,248
TRACON Pharmaceuticals, Inc. (a)(b) 57,731 539,785
Translate Bio, Inc. (a)(b) 326,653 7,624,081
Travere Therapeutics, Inc. (a) 249,669 7,694,799
Trevena, Inc. (a)(b) 858,053 1,840,524
Turning Point Therapeutics, Inc. (a) 203,785 24,028,289
Copyright © 2021 www.secdatabase.com. All Rights Reserved.Please Consider the Environment Before Printing This Document

Twist Bioscience Corp. (a) 196,852 27,094,709
Tyme Technologies, Inc. (a) 276,137 552,274
Ultragenyx Pharmaceutical, Inc. (a) 297,387 42,092,156
uniQure B.V. (a) 184,965 6,788,216
United Therapeutics Corp. (a) 212,774 35,571,557
UNITY Biotechnology, Inc. (a) 157,268 1,070,995
Vaccinex, Inc. (a)(b) 55,951 208,138
Vanda Pharmaceuticals, Inc. (a) 271,500 5,063,475
Vaxart, Inc. (a)(b) 524,868 3,752,806
Vaxcyte, Inc. (b) 91,505 2,155,858
VBI Vaccines, Inc. (a)(b) 1,089,298 3,670,934
Veracyte, Inc. (a) 312,690 18,154,781
Verastem, Inc. (a) 822,102 1,931,940
Vericel Corp. (a) 214,403 10,351,377
Viela Bio, Inc. (a) 78,884 4,196,629
Viking Therapeutics, Inc. (a)(b) 279,333 1,882,704
Vir Biotechnology, Inc. (a)(b) 310,815 19,466,343
Viracta Therapeutics, Inc. (a)(b) 20,900 328,130
Viridian Therapeutics, Inc. (a)(b) 16,140 265,342
Viridian Therapeutics, Inc. rights (a)(c) 167,699 2
VistaGen Therapeutics, Inc. (a) 329,186 813,089
Voyager Therapeutics, Inc. (a)(b) 126,993 720,050
vTv Therapeutics, Inc. Class A (a)(b) 24,729 65,779
X4 Pharmaceuticals, Inc. (a) 83,212 796,339
Xbiotech, Inc. (a) 61,581 1,170,039
Xencor, Inc. (a) 282,749 13,931,043
Xenetic Biosciences, Inc. (a) 312 746
XOMA Corp. (a)(b) 70,254 2,543,195
Y-mAbs Therapeutics, Inc. (a) 122,192 4,297,493
Yield10 Bioscience, Inc. (a) 1,319 19,046
Yumanity Therapeutics, Inc. (a)(b) 9,938 176,598
Yumanity Therapeutics, Inc. rights (a)(c) 198,769 2
Zentalis Pharmaceuticals, Inc. (b) 64,837 2,725,747
ZIOPHARM Oncology, Inc. (a)(b) 1,020,662 5,440,128
2,517,890,341
Health Care Equipment & Supplies - 2.6%
Accelerate Diagnostics, Inc. (a)(b) 145,371 1,455,164
Accuray, Inc. (a)(b) 444,942 2,215,811
Acutus Medical, Inc. (a)(b) 48,295 1,002,604
Aethlon Medical, Inc. (a)(b) 55,022 121,048
Akers Biosciences, Inc. (a) 28,424 94,652
Copyright © 2021 www.secdatabase.com. All Rights Reserved.Please Consider the Environment Before Printing This Document
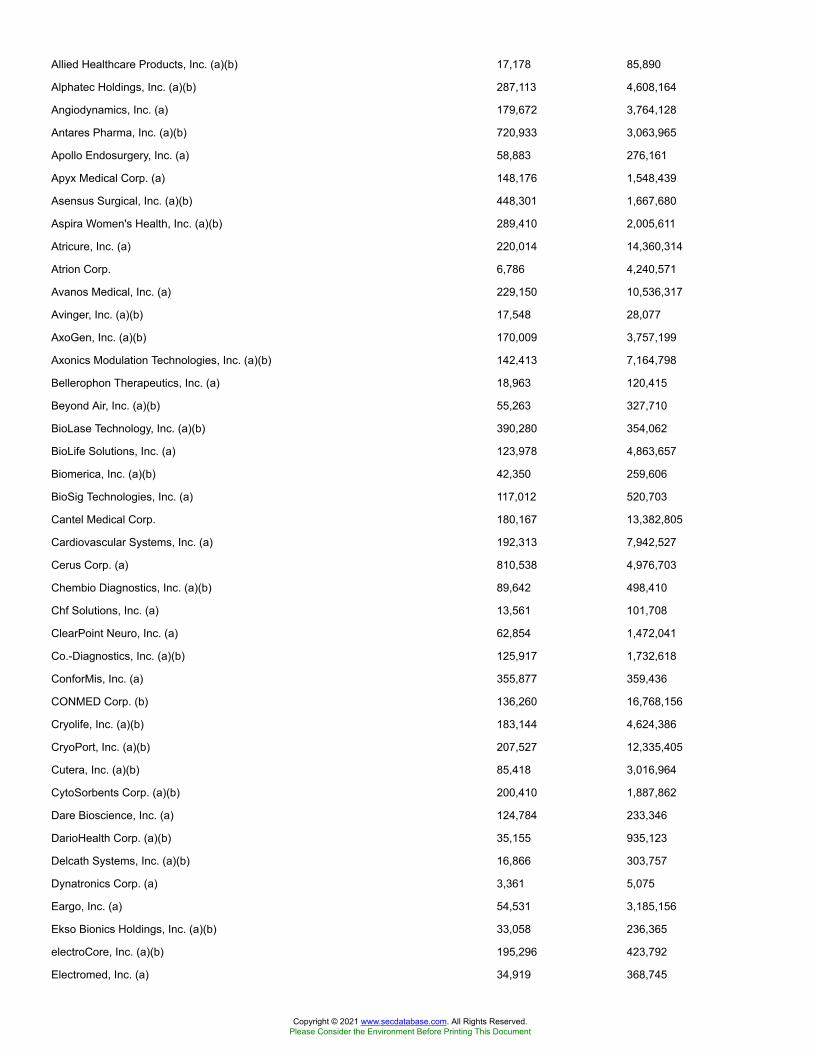
Allied Healthcare Products, Inc. (a)(b) 17,178 85,890
Alphatec Holdings, Inc. (a)(b) 287,113 4,608,164
Angiodynamics, Inc. (a) 179,672 3,764,128
Antares Pharma, Inc. (a)(b) 720,933 3,063,965
Apollo Endosurgery, Inc. (a) 58,883 276,161
Apyx Medical Corp. (a) 148,176 1,548,439
Asensus Surgical, Inc. (a)(b) 448,301 1,667,680
Aspira Women's Health, Inc. (a)(b) 289,410 2,005,611
Atricure, Inc. (a) 220,014 14,360,314
Atrion Corp. 6,786 4,240,571
Avanos Medical, Inc. (a) 229,150 10,536,317
Avinger, Inc. (a)(b) 17,548 28,077
AxoGen, Inc. (a)(b) 170,009 3,757,199
Axonics Modulation Technologies, Inc. (a)(b) 142,413 7,164,798
Bellerophon Therapeutics, Inc. (a) 18,963 120,415
Beyond Air, Inc. (a)(b) 55,263 327,710
BioLase Technology, Inc. (a)(b) 390,280 354,062
BioLife Solutions, Inc. (a) 123,978 4,863,657
Biomerica, Inc. (a)(b) 42,350 259,606
BioSig Technologies, Inc. (a) 117,012 520,703
Cantel Medical Corp. 180,167 13,382,805
Cardiovascular Systems, Inc. (a) 192,313 7,942,527
Cerus Corp. (a) 810,538 4,976,703
Chembio Diagnostics, Inc. (a)(b) 89,642 498,410
Chf Solutions, Inc. (a) 13,561 101,708
ClearPoint Neuro, Inc. (a) 62,854 1,472,041
Co.-Diagnostics, Inc. (a)(b) 125,917 1,732,618
ConforMis, Inc. (a) 355,877 359,436
CONMED Corp. (b) 136,260 16,768,156
Cryolife, Inc. (a)(b) 183,144 4,624,386
CryoPort, Inc. (a)(b) 207,527 12,335,405
Cutera, Inc. (a)(b) 85,418 3,016,964
CytoSorbents Corp. (a)(b) 200,410 1,887,862
Dare Bioscience, Inc. (a) 124,784 233,346
DarioHealth Corp. (a)(b) 35,155 935,123
Delcath Systems, Inc. (a)(b) 16,866 303,757
Dynatronics Corp. (a) 3,361 5,075
Eargo, Inc. (a) 54,531 3,185,156
Ekso Bionics Holdings, Inc. (a)(b) 33,058 236,365
electroCore, Inc. (a)(b) 195,296 423,792
Electromed, Inc. (a) 34,919 368,745
Copyright © 2021 www.secdatabase.com. All Rights Reserved.Please Consider the Environment Before Printing This Document
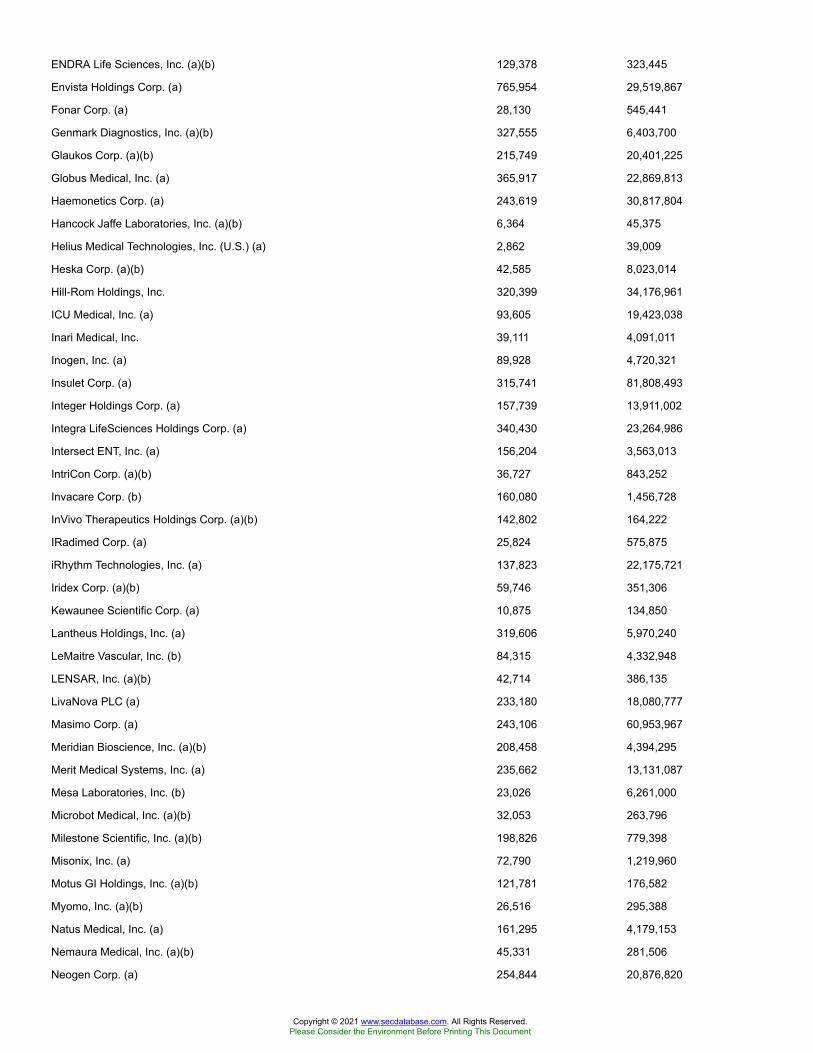
ENDRA Life Sciences, Inc. (a)(b) 129,378 323,445
Envista Holdings Corp. (a) 765,954 29,519,867
Fonar Corp. (a) 28,130 545,441
Genmark Diagnostics, Inc. (a)(b) 327,555 6,403,700
Glaukos Corp. (a)(b) 215,749 20,401,225
Globus Medical, Inc. (a) 365,917 22,869,813
Haemonetics Corp. (a) 243,619 30,817,804
Hancock Jaffe Laboratories, Inc. (a)(b) 6,364 45,375
Helius Medical Technologies, Inc. (U.S.) (a) 2,862 39,009
Heska Corp. (a)(b) 42,585 8,023,014
Hill-Rom Holdings, Inc. 320,399 34,176,961
ICU Medical, Inc. (a) 93,605 19,423,038
Inari Medical, Inc. 39,111 4,091,011
Inogen, Inc. (a) 89,928 4,720,321
Insulet Corp. (a) 315,741 81,808,493
Integer Holdings Corp. (a) 157,739 13,911,002
Integra LifeSciences Holdings Corp. (a) 340,430 23,264,986
Intersect ENT, Inc. (a) 156,204 3,563,013
IntriCon Corp. (a)(b) 36,727 843,252
Invacare Corp. (b) 160,080 1,456,728
InVivo Therapeutics Holdings Corp. (a)(b) 142,802 164,222
IRadimed Corp. (a) 25,824 575,875
iRhythm Technologies, Inc. (a) 137,823 22,175,721
Iridex Corp. (a)(b) 59,746 351,306
Kewaunee Scientific Corp. (a) 10,875 134,850
Lantheus Holdings, Inc. (a) 319,606 5,970,240
LeMaitre Vascular, Inc. (b) 84,315 4,332,948
LENSAR, Inc. (a)(b) 42,714 386,135
LivaNova PLC (a) 233,180 18,080,777
Masimo Corp. (a) 243,106 60,953,967
Meridian Bioscience, Inc. (a)(b) 208,458 4,394,295
Merit Medical Systems, Inc. (a) 235,662 13,131,087
Mesa Laboratories, Inc. (b) 23,026 6,261,000
Microbot Medical, Inc. (a)(b) 32,053 263,796
Milestone Scientific, Inc. (a)(b) 198,826 779,398
Misonix, Inc. (a) 72,790 1,219,960
Motus GI Holdings, Inc. (a)(b) 121,781 176,582
Myomo, Inc. (a)(b) 26,516 295,388
Natus Medical, Inc. (a) 161,295 4,179,153
Nemaura Medical, Inc. (a)(b) 45,331 281,506
Neogen Corp. (a) 254,844 20,876,820
Copyright © 2021 www.secdatabase.com. All Rights Reserved.Please Consider the Environment Before Printing This Document
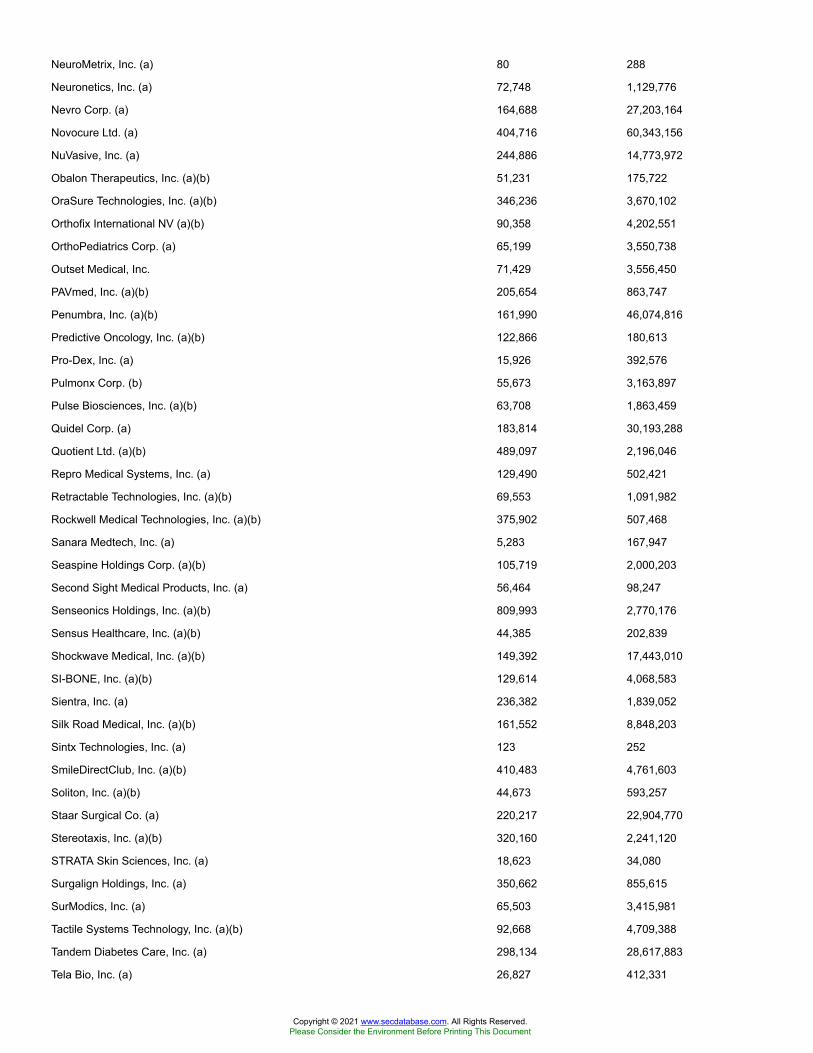
NeuroMetrix, Inc. (a) 80 288
Neuronetics, Inc. (a) 72,748 1,129,776
Nevro Corp. (a) 164,688 27,203,164
Novocure Ltd. (a) 404,716 60,343,156
NuVasive, Inc. (a) 244,886 14,773,972
Obalon Therapeutics, Inc. (a)(b) 51,231 175,722
OraSure Technologies, Inc. (a)(b) 346,236 3,670,102
Orthofix International NV (a)(b) 90,358 4,202,551
OrthoPediatrics Corp. (a) 65,199 3,550,738
Outset Medical, Inc. 71,429 3,556,450
PAVmed, Inc. (a)(b) 205,654 863,747
Penumbra, Inc. (a)(b) 161,990 46,074,816
Predictive Oncology, Inc. (a)(b) 122,866 180,613
Pro-Dex, Inc. (a) 15,926 392,576
Pulmonx Corp. (b) 55,673 3,163,897
Pulse Biosciences, Inc. (a)(b) 63,708 1,863,459
Quidel Corp. (a) 183,814 30,193,288
Quotient Ltd. (a)(b) 489,097 2,196,046
Repro Medical Systems, Inc. (a) 129,490 502,421
Retractable Technologies, Inc. (a)(b) 69,553 1,091,982
Rockwell Medical Technologies, Inc. (a)(b) 375,902 507,468
Sanara Medtech, Inc. (a) 5,283 167,947
Seaspine Holdings Corp. (a)(b) 105,719 2,000,203
Second Sight Medical Products, Inc. (a) 56,464 98,247
Senseonics Holdings, Inc. (a)(b) 809,993 2,770,176
Sensus Healthcare, Inc. (a)(b) 44,385 202,839
Shockwave Medical, Inc. (a)(b) 149,392 17,443,010
SI-BONE, Inc. (a)(b) 129,614 4,068,583
Sientra, Inc. (a) 236,382 1,839,052
Silk Road Medical, Inc. (a)(b) 161,552 8,848,203
Sintx Technologies, Inc. (a) 123 252
SmileDirectClub, Inc. (a)(b) 410,483 4,761,603
Soliton, Inc. (a)(b) 44,673 593,257
Staar Surgical Co. (a) 220,217 22,904,770
Stereotaxis, Inc. (a)(b) 320,160 2,241,120
STRATA Skin Sciences, Inc. (a) 18,623 34,080
Surgalign Holdings, Inc. (a) 350,662 855,615
SurModics, Inc. (a) 65,503 3,415,981
Tactile Systems Technology, Inc. (a)(b) 92,668 4,709,388
Tandem Diabetes Care, Inc. (a) 298,134 28,617,883
Tela Bio, Inc. (a) 26,827 412,331
Copyright © 2021 www.secdatabase.com. All Rights Reserved.Please Consider the Environment Before Printing This Document
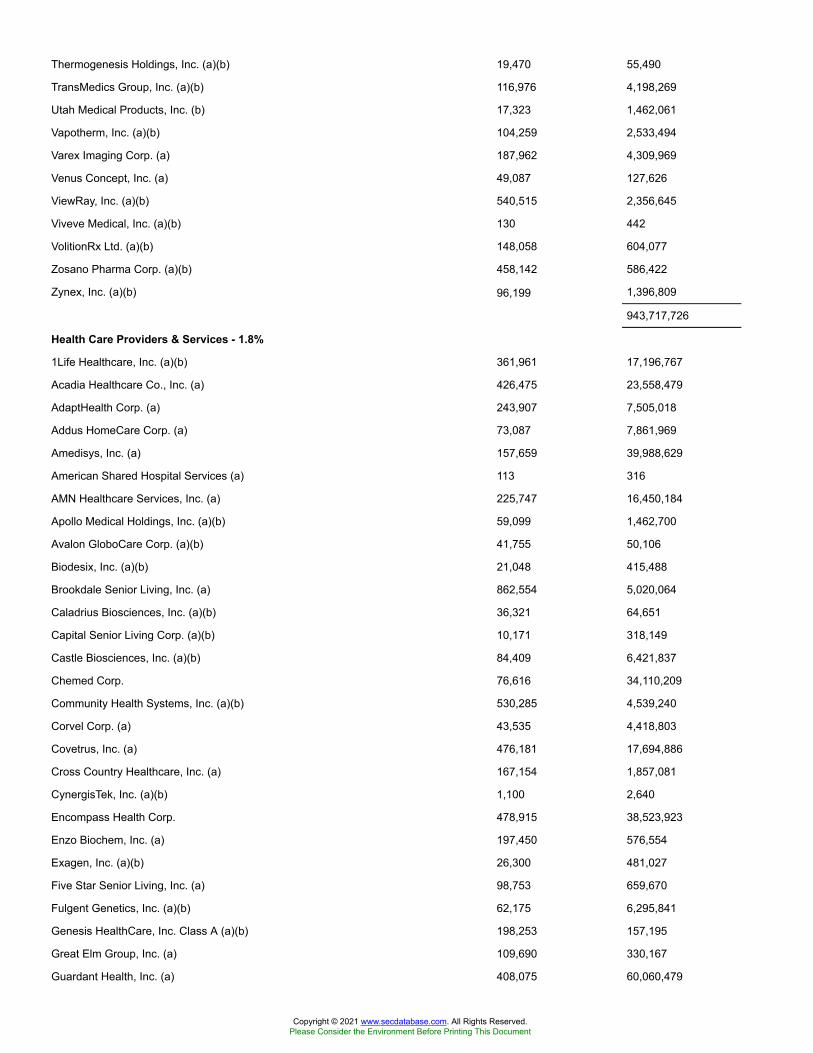
Thermogenesis Holdings, Inc. (a)(b) 19,470 55,490
TransMedics Group, Inc. (a)(b) 116,976 4,198,269
Utah Medical Products, Inc. (b) 17,323 1,462,061
Vapotherm, Inc. (a)(b) 104,259 2,533,494
Varex Imaging Corp. (a) 187,962 4,309,969
Venus Concept, Inc. (a) 49,087 127,626
ViewRay, Inc. (a)(b) 540,515 2,356,645
Viveve Medical, Inc. (a)(b) 130 442
VolitionRx Ltd. (a)(b) 148,058 604,077
Zosano Pharma Corp. (a)(b) 458,142 586,422
Zynex, Inc. (a)(b) 96,199 1,396,809
943,717,726
Health Care Providers & Services - 1.8%
1Life Healthcare, Inc. (a)(b) 361,961 17,196,767
Acadia Healthcare Co., Inc. (a) 426,475 23,558,479
AdaptHealth Corp. (a) 243,907 7,505,018
Addus HomeCare Corp. (a) 73,087 7,861,969
Amedisys, Inc. (a) 157,659 39,988,629
American Shared Hospital Services (a) 113 316
AMN Healthcare Services, Inc. (a) 225,747 16,450,184
Apollo Medical Holdings, Inc. (a)(b) 59,099 1,462,700
Avalon GloboCare Corp. (a)(b) 41,755 50,106
Biodesix, Inc. (a)(b) 21,048 415,488
Brookdale Senior Living, Inc. (a) 862,554 5,020,064
Caladrius Biosciences, Inc. (a)(b) 36,321 64,651
Capital Senior Living Corp. (a)(b) 10,171 318,149
Castle Biosciences, Inc. (a)(b) 84,409 6,421,837
Chemed Corp. 76,616 34,110,209
Community Health Systems, Inc. (a)(b) 530,285 4,539,240
Corvel Corp. (a) 43,535 4,418,803
Covetrus, Inc. (a) 476,181 17,694,886
Cross Country Healthcare, Inc. (a) 167,154 1,857,081
CynergisTek, Inc. (a)(b) 1,100 2,640
Encompass Health Corp. 478,915 38,523,923
Enzo Biochem, Inc. (a) 197,450 576,554
Exagen, Inc. (a)(b) 26,300 481,027
Five Star Senior Living, Inc. (a) 98,753 659,670
Fulgent Genetics, Inc. (a)(b) 62,175 6,295,841
Genesis HealthCare, Inc. Class A (a)(b) 198,253 157,195
Great Elm Group, Inc. (a) 109,690 330,167
Guardant Health, Inc. (a) 408,075 60,060,479
Copyright © 2021 www.secdatabase.com. All Rights Reserved.Please Consider the Environment Before Printing This Document
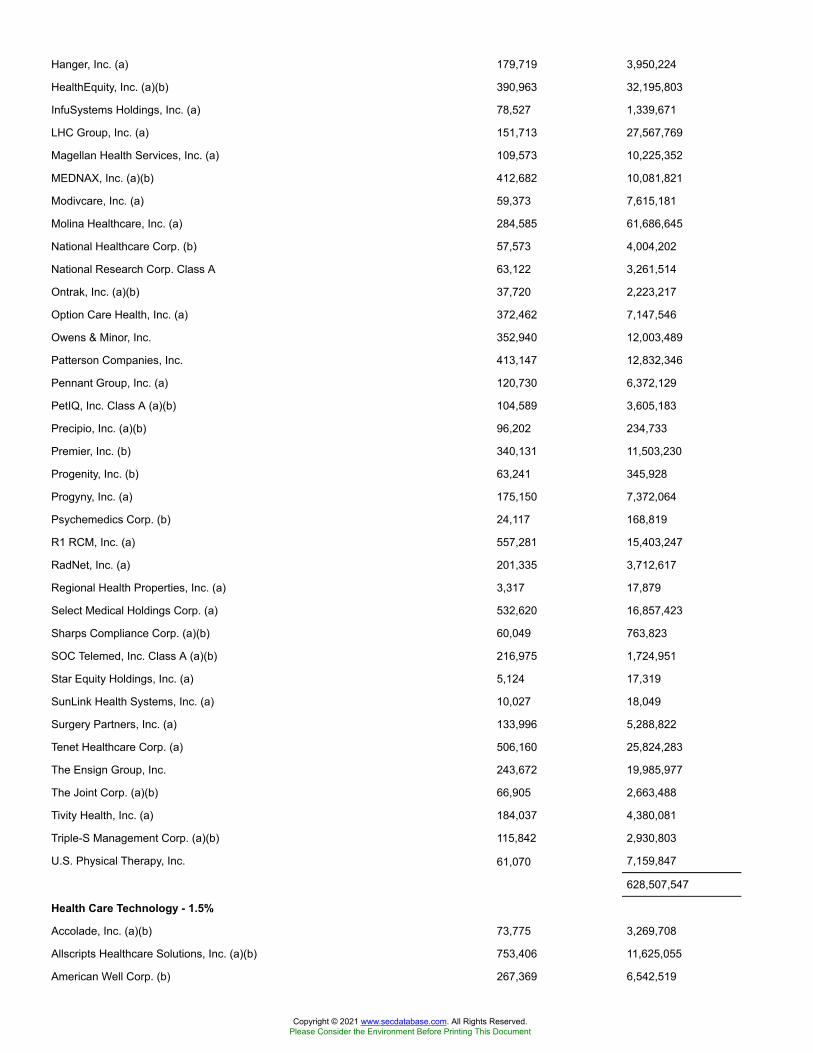
Hanger, Inc. (a) 179,719 3,950,224
HealthEquity, Inc. (a)(b) 390,963 32,195,803
InfuSystems Holdings, Inc. (a) 78,527 1,339,671
LHC Group, Inc. (a) 151,713 27,567,769
Magellan Health Services, Inc. (a) 109,573 10,225,352
MEDNAX, Inc. (a)(b) 412,682 10,081,821
Modivcare, Inc. (a) 59,373 7,615,181
Molina Healthcare, Inc. (a) 284,585 61,686,645
National Healthcare Corp. (b) 57,573 4,004,202
National Research Corp. Class A 63,122 3,261,514
Ontrak, Inc. (a)(b) 37,720 2,223,217
Option Care Health, Inc. (a) 372,462 7,147,546
Owens & Minor, Inc. 352,940 12,003,489
Patterson Companies, Inc. 413,147 12,832,346
Pennant Group, Inc. (a) 120,730 6,372,129
PetIQ, Inc. Class A (a)(b) 104,589 3,605,183
Precipio, Inc. (a)(b) 96,202 234,733
Premier, Inc. (b) 340,131 11,503,230
Progenity, Inc. (b) 63,241 345,928
Progyny, Inc. (a) 175,150 7,372,064
Psychemedics Corp. (b) 24,117 168,819
R1 RCM, Inc. (a) 557,281 15,403,247
RadNet, Inc. (a) 201,335 3,712,617
Regional Health Properties, Inc. (a) 3,317 17,879
Select Medical Holdings Corp. (a) 532,620 16,857,423
Sharps Compliance Corp. (a)(b) 60,049 763,823
SOC Telemed, Inc. Class A (a)(b) 216,975 1,724,951
Star Equity Holdings, Inc. (a) 5,124 17,319
SunLink Health Systems, Inc. (a) 10,027 18,049
Surgery Partners, Inc. (a) 133,996 5,288,822
Tenet Healthcare Corp. (a) 506,160 25,824,283
The Ensign Group, Inc. 243,672 19,985,977
The Joint Corp. (a)(b) 66,905 2,663,488
Tivity Health, Inc. (a) 184,037 4,380,081
Triple-S Management Corp. (a)(b) 115,842 2,930,803
U.S. Physical Therapy, Inc. 61,070 7,159,847
628,507,547
Health Care Technology - 1.5%
Accolade, Inc. (a)(b) 73,775 3,269,708
Allscripts Healthcare Solutions, Inc. (a)(b) 753,406 11,625,055
American Well Corp. (b) 267,369 6,542,519
Copyright © 2021 www.secdatabase.com. All Rights Reserved.Please Consider the Environment Before Printing This Document
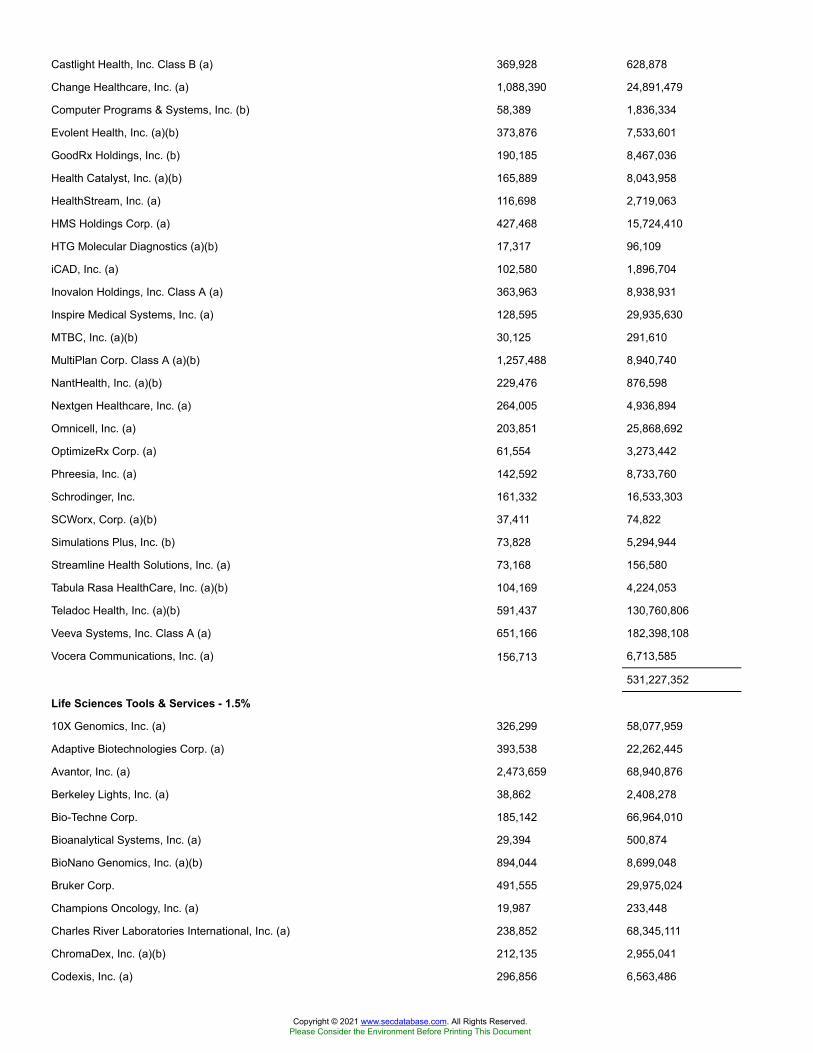
Castlight Health, Inc. Class B (a) 369,928 628,878
Change Healthcare, Inc. (a) 1,088,390 24,891,479
Computer Programs & Systems, Inc. (b) 58,389 1,836,334
Evolent Health, Inc. (a)(b) 373,876 7,533,601
GoodRx Holdings, Inc. (b) 190,185 8,467,036
Health Catalyst, Inc. (a)(b) 165,889 8,043,958
HealthStream, Inc. (a) 116,698 2,719,063
HMS Holdings Corp. (a) 427,468 15,724,410
HTG Molecular Diagnostics (a)(b) 17,317 96,109
iCAD, Inc. (a) 102,580 1,896,704
Inovalon Holdings, Inc. Class A (a) 363,963 8,938,931
Inspire Medical Systems, Inc. (a) 128,595 29,935,630
MTBC, Inc. (a)(b) 30,125 291,610
MultiPlan Corp. Class A (a)(b) 1,257,488 8,940,740
NantHealth, Inc. (a)(b) 229,476 876,598
Nextgen Healthcare, Inc. (a) 264,005 4,936,894
Omnicell, Inc. (a) 203,851 25,868,692
OptimizeRx Corp. (a) 61,554 3,273,442
Phreesia, Inc. (a) 142,592 8,733,760
Schrodinger, Inc. 161,332 16,533,303
SCWorx, Corp. (a)(b) 37,411 74,822
Simulations Plus, Inc. (b) 73,828 5,294,944
Streamline Health Solutions, Inc. (a) 73,168 156,580
Tabula Rasa HealthCare, Inc. (a)(b) 104,169 4,224,053
Teladoc Health, Inc. (a)(b) 591,437 130,760,806
Veeva Systems, Inc. Class A (a) 651,166 182,398,108
Vocera Communications, Inc. (a) 156,713 6,713,585
531,227,352
Life Sciences Tools & Services - 1.5%
10X Genomics, Inc. (a) 326,299 58,077,959
Adaptive Biotechnologies Corp. (a) 393,538 22,262,445
Avantor, Inc. (a) 2,473,659 68,940,876
Berkeley Lights, Inc. (a) 38,862 2,408,278
Bio-Techne Corp. 185,142 66,964,010
Bioanalytical Systems, Inc. (a) 29,394 500,874
BioNano Genomics, Inc. (a)(b) 894,044 8,699,048
Bruker Corp. 491,555 29,975,024
Champions Oncology, Inc. (a) 19,987 233,448
Charles River Laboratories International, Inc. (a) 238,852 68,345,111
ChromaDex, Inc. (a)(b) 212,135 2,955,041
Codexis, Inc. (a) 296,856 6,563,486
Copyright © 2021 www.secdatabase.com. All Rights Reserved.Please Consider the Environment Before Printing This Document
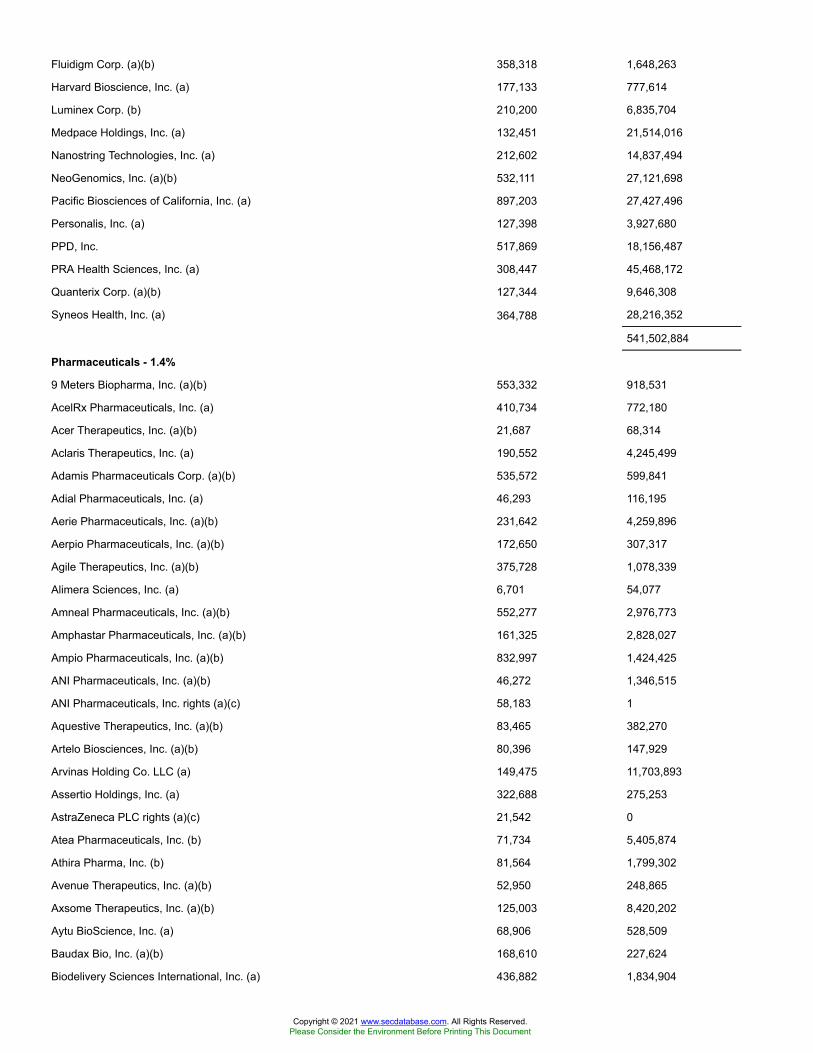
Fluidigm Corp. (a)(b) 358,318 1,648,263
Harvard Bioscience, Inc. (a) 177,133 777,614
Luminex Corp. (b) 210,200 6,835,704
Medpace Holdings, Inc. (a) 132,451 21,514,016
Nanostring Technologies, Inc. (a) 212,602 14,837,494
NeoGenomics, Inc. (a)(b) 532,111 27,121,698
Pacific Biosciences of California, Inc. (a) 897,203 27,427,496
Personalis, Inc. (a) 127,398 3,927,680
PPD, Inc. 517,869 18,156,487
PRA Health Sciences, Inc. (a) 308,447 45,468,172
Quanterix Corp. (a)(b) 127,344 9,646,308
Syneos Health, Inc. (a) 364,788 28,216,352
541,502,884
Pharmaceuticals - 1.4%
9 Meters Biopharma, Inc. (a)(b) 553,332 918,531
AcelRx Pharmaceuticals, Inc. (a) 410,734 772,180
Acer Therapeutics, Inc. (a)(b) 21,687 68,314
Aclaris Therapeutics, Inc. (a) 190,552 4,245,499
Adamis Pharmaceuticals Corp. (a)(b) 535,572 599,841
Adial Pharmaceuticals, Inc. (a) 46,293 116,195
Aerie Pharmaceuticals, Inc. (a)(b) 231,642 4,259,896
Aerpio Pharmaceuticals, Inc. (a)(b) 172,650 307,317
Agile Therapeutics, Inc. (a)(b) 375,728 1,078,339
Alimera Sciences, Inc. (a) 6,701 54,077
Amneal Pharmaceuticals, Inc. (a)(b) 552,277 2,976,773
Amphastar Pharmaceuticals, Inc. (a)(b) 161,325 2,828,027
Ampio Pharmaceuticals, Inc. (a)(b) 832,997 1,424,425
ANI Pharmaceuticals, Inc. (a)(b) 46,272 1,346,515
ANI Pharmaceuticals, Inc. rights (a)(c) 58,183 1
Aquestive Therapeutics, Inc. (a)(b) 83,465 382,270
Artelo Biosciences, Inc. (a)(b) 80,396 147,929
Arvinas Holding Co. LLC (a) 149,475 11,703,893
Assertio Holdings, Inc. (a) 322,688 275,253
AstraZeneca PLC rights (a)(c) 21,542 0
Atea Pharmaceuticals, Inc. (b) 71,734 5,405,874
Athira Pharma, Inc. (b) 81,564 1,799,302
Avenue Therapeutics, Inc. (a)(b) 52,950 248,865
Axsome Therapeutics, Inc. (a)(b) 125,003 8,420,202
Aytu BioScience, Inc. (a) 68,906 528,509
Baudax Bio, Inc. (a)(b) 168,610 227,624
Biodelivery Sciences International, Inc. (a) 436,882 1,834,904
Copyright © 2021 www.secdatabase.com. All Rights Reserved.Please Consider the Environment Before Printing This Document
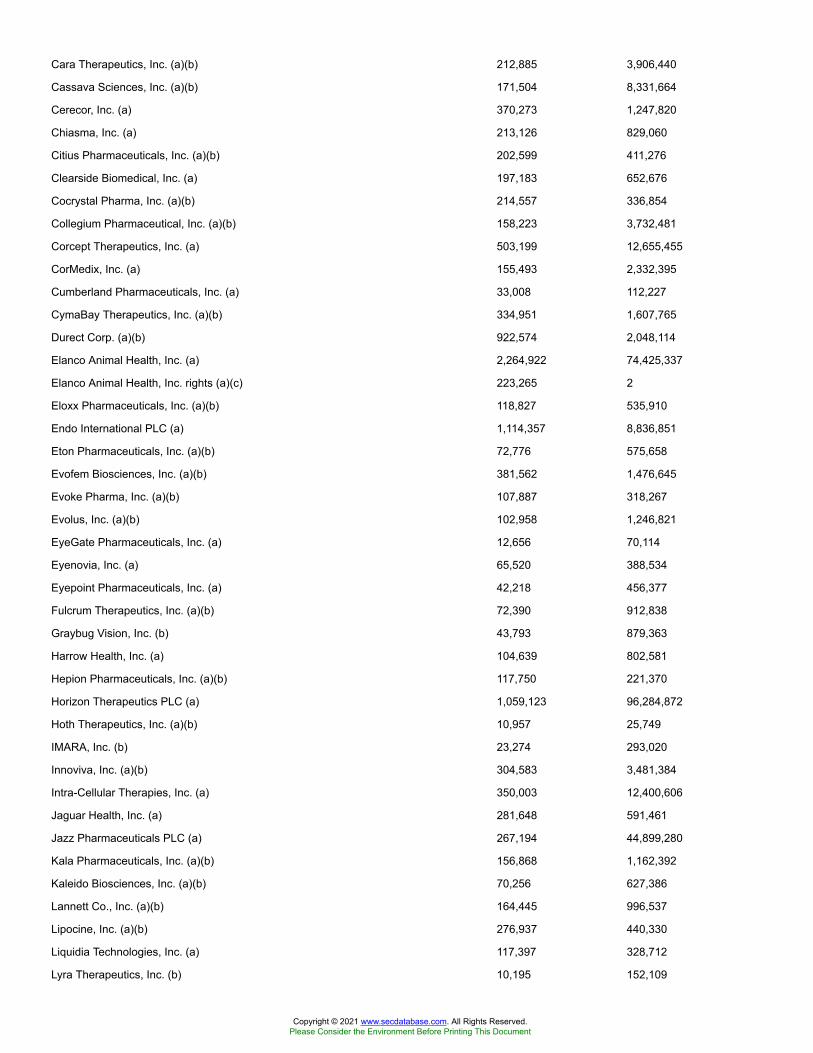
Cara Therapeutics, Inc. (a)(b) 212,885 3,906,440
Cassava Sciences, Inc. (a)(b) 171,504 8,331,664
Cerecor, Inc. (a) 370,273 1,247,820
Chiasma, Inc. (a) 213,126 829,060
Citius Pharmaceuticals, Inc. (a)(b) 202,599 411,276
Clearside Biomedical, Inc. (a) 197,183 652,676
Cocrystal Pharma, Inc. (a)(b) 214,557 336,854
Collegium Pharmaceutical, Inc. (a)(b) 158,223 3,732,481
Corcept Therapeutics, Inc. (a) 503,199 12,655,455
CorMedix, Inc. (a) 155,493 2,332,395
Cumberland Pharmaceuticals, Inc. (a) 33,008 112,227
CymaBay Therapeutics, Inc. (a)(b) 334,951 1,607,765
Durect Corp. (a)(b) 922,574 2,048,114
Elanco Animal Health, Inc. (a) 2,264,922 74,425,337
Elanco Animal Health, Inc. rights (a)(c) 223,265 2
Eloxx Pharmaceuticals, Inc. (a)(b) 118,827 535,910
Endo International PLC (a) 1,114,357 8,836,851
Eton Pharmaceuticals, Inc. (a)(b) 72,776 575,658
Evofem Biosciences, Inc. (a)(b) 381,562 1,476,645
Evoke Pharma, Inc. (a)(b) 107,887 318,267
Evolus, Inc. (a)(b) 102,958 1,246,821
EyeGate Pharmaceuticals, Inc. (a) 12,656 70,114
Eyenovia, Inc. (a) 65,520 388,534
Eyepoint Pharmaceuticals, Inc. (a) 42,218 456,377
Fulcrum Therapeutics, Inc. (a)(b) 72,390 912,838
Graybug Vision, Inc. (b) 43,793 879,363
Harrow Health, Inc. (a) 104,639 802,581
Hepion Pharmaceuticals, Inc. (a)(b) 117,750 221,370
Horizon Therapeutics PLC (a) 1,059,123 96,284,872
Hoth Therapeutics, Inc. (a)(b) 10,957 25,749
IMARA, Inc. (b) 23,274 293,020
Innoviva, Inc. (a)(b) 304,583 3,481,384
Intra-Cellular Therapies, Inc. (a) 350,003 12,400,606
Jaguar Health, Inc. (a) 281,648 591,461
Jazz Pharmaceuticals PLC (a) 267,194 44,899,280
Kala Pharmaceuticals, Inc. (a)(b) 156,868 1,162,392
Kaleido Biosciences, Inc. (a)(b) 70,256 627,386
Lannett Co., Inc. (a)(b) 164,445 996,537
Lipocine, Inc. (a)(b) 276,937 440,330
Liquidia Technologies, Inc. (a) 117,397 328,712
Lyra Therapeutics, Inc. (b) 10,195 152,109
Copyright © 2021 www.secdatabase.com. All Rights Reserved.Please Consider the Environment Before Printing This Document
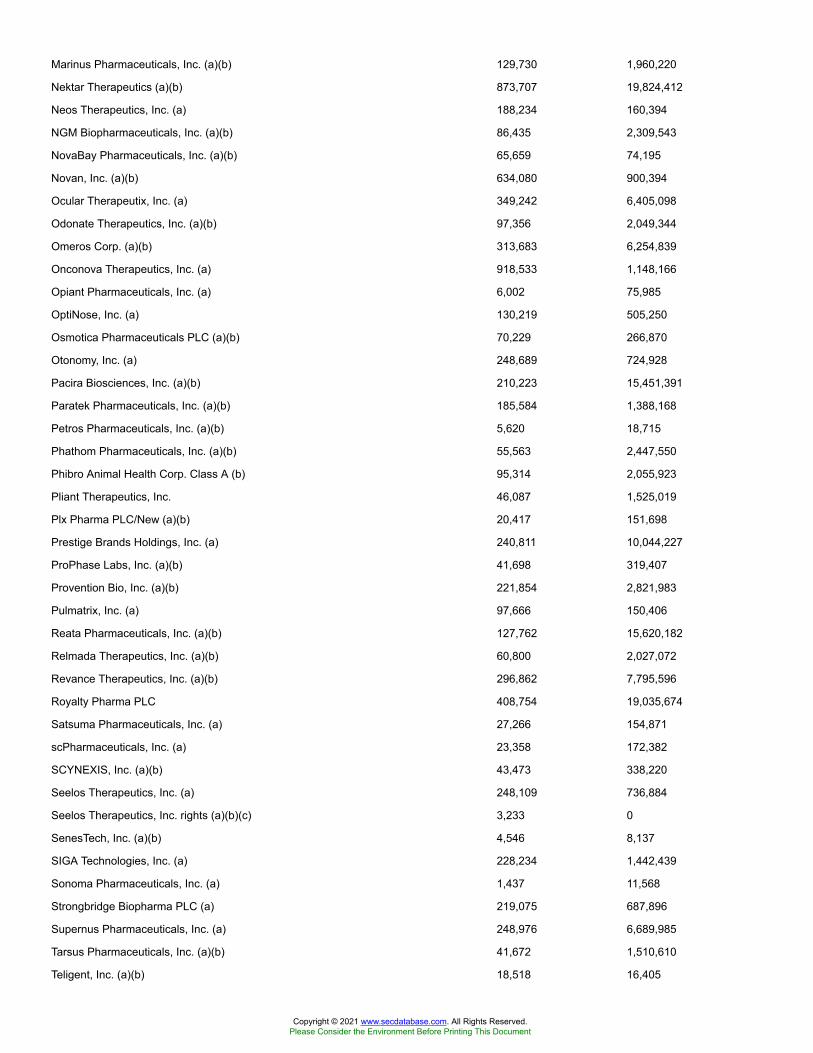
Marinus Pharmaceuticals, Inc. (a)(b) 129,730 1,960,220
Nektar Therapeutics (a)(b) 873,707 19,824,412
Neos Therapeutics, Inc. (a) 188,234 160,394
NGM Biopharmaceuticals, Inc. (a)(b) 86,435 2,309,543
NovaBay Pharmaceuticals, Inc. (a)(b) 65,659 74,195
Novan, Inc. (a)(b) 634,080 900,394
Ocular Therapeutix, Inc. (a) 349,242 6,405,098
Odonate Therapeutics, Inc. (a)(b) 97,356 2,049,344
Omeros Corp. (a)(b) 313,683 6,254,839
Onconova Therapeutics, Inc. (a) 918,533 1,148,166
Opiant Pharmaceuticals, Inc. (a) 6,002 75,985
OptiNose, Inc. (a) 130,219 505,250
Osmotica Pharmaceuticals PLC (a)(b) 70,229 266,870
Otonomy, Inc. (a) 248,689 724,928
Pacira Biosciences, Inc. (a)(b) 210,223 15,451,391
Paratek Pharmaceuticals, Inc. (a)(b) 185,584 1,388,168
Petros Pharmaceuticals, Inc. (a)(b) 5,620 18,715
Phathom Pharmaceuticals, Inc. (a)(b) 55,563 2,447,550
Phibro Animal Health Corp. Class A (b) 95,314 2,055,923
Pliant Therapeutics, Inc. 46,087 1,525,019
Plx Pharma PLC/New (a)(b) 20,417 151,698
Prestige Brands Holdings, Inc. (a) 240,811 10,044,227
ProPhase Labs, Inc. (a)(b) 41,698 319,407
Provention Bio, Inc. (a)(b) 221,854 2,821,983
Pulmatrix, Inc. (a) 97,666 150,406
Reata Pharmaceuticals, Inc. (a)(b) 127,762 15,620,182
Relmada Therapeutics, Inc. (a)(b) 60,800 2,027,072
Revance Therapeutics, Inc. (a)(b) 296,862 7,795,596
Royalty Pharma PLC 408,754 19,035,674
Satsuma Pharmaceuticals, Inc. (a) 27,266 154,871
scPharmaceuticals, Inc. (a) 23,358 172,382
SCYNEXIS, Inc. (a)(b) 43,473 338,220
Seelos Therapeutics, Inc. (a) 248,109 736,884
Seelos Therapeutics, Inc. rights (a)(b)(c) 3,233 0
SenesTech, Inc. (a)(b) 4,546 8,137
SIGA Technologies, Inc. (a) 228,234 1,442,439
Sonoma Pharmaceuticals, Inc. (a) 1,437 11,568
Strongbridge Biopharma PLC (a) 219,075 687,896
Supernus Pharmaceuticals, Inc. (a) 248,976 6,689,985
Tarsus Pharmaceuticals, Inc. (a)(b) 41,672 1,510,610
Teligent, Inc. (a)(b) 18,518 16,405
Copyright © 2021 www.secdatabase.com. All Rights Reserved.Please Consider the Environment Before Printing This Document
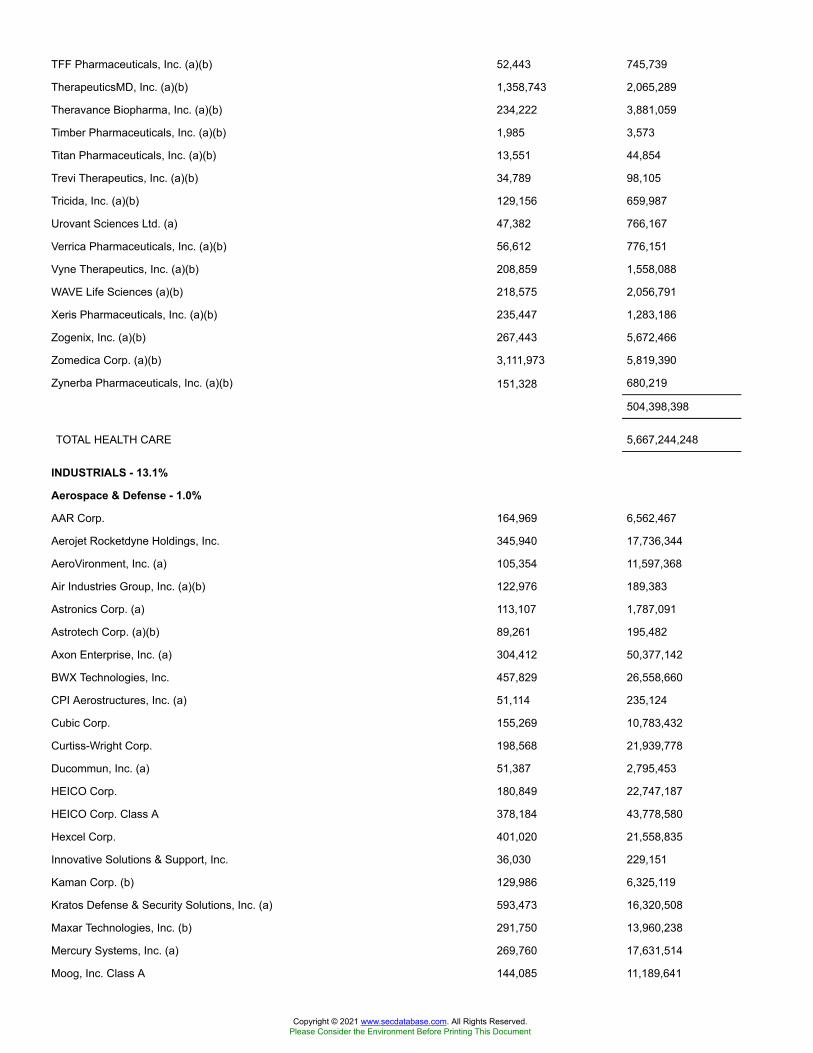
TFF Pharmaceuticals, Inc. (a)(b) 52,443 745,739
TherapeuticsMD, Inc. (a)(b) 1,358,743 2,065,289
Theravance Biopharma, Inc. (a)(b) 234,222 3,881,059
Timber Pharmaceuticals, Inc. (a)(b) 1,985 3,573
Titan Pharmaceuticals, Inc. (a)(b) 13,551 44,854
Trevi Therapeutics, Inc. (a)(b) 34,789 98,105
Tricida, Inc. (a)(b) 129,156 659,987
Urovant Sciences Ltd. (a) 47,382 766,167
Verrica Pharmaceuticals, Inc. (a)(b) 56,612 776,151
Vyne Therapeutics, Inc. (a)(b) 208,859 1,558,088
WAVE Life Sciences (a)(b) 218,575 2,056,791
Xeris Pharmaceuticals, Inc. (a)(b) 235,447 1,283,186
Zogenix, Inc. (a)(b) 267,443 5,672,466
Zomedica Corp. (a)(b) 3,111,973 5,819,390
Zynerba Pharmaceuticals, Inc. (a)(b) 151,328 680,219
504,398,398
TOTAL HEALTH CARE 5,667,244,248
INDUSTRIALS - 13.1%
Aerospace & Defense - 1.0%
AAR Corp. 164,969 6,562,467
Aerojet Rocketdyne Holdings, Inc. 345,940 17,736,344
AeroVironment, Inc. (a) 105,354 11,597,368
Air Industries Group, Inc. (a)(b) 122,976 189,383
Astronics Corp. (a) 113,107 1,787,091
Astrotech Corp. (a)(b) 89,261 195,482
Axon Enterprise, Inc. (a) 304,412 50,377,142
BWX Technologies, Inc. 457,829 26,558,660
CPI Aerostructures, Inc. (a) 51,114 235,124
Cubic Corp. 155,269 10,783,432
Curtiss-Wright Corp. 198,568 21,939,778
Ducommun, Inc. (a) 51,387 2,795,453
HEICO Corp. 180,849 22,747,187
HEICO Corp. Class A 378,184 43,778,580
Hexcel Corp. 401,020 21,558,835
Innovative Solutions & Support, Inc. 36,030 229,151
Kaman Corp. (b) 129,986 6,325,119
Kratos Defense & Security Solutions, Inc. (a) 593,473 16,320,508
Maxar Technologies, Inc. (b) 291,750 13,960,238
Mercury Systems, Inc. (a) 269,760 17,631,514
Moog, Inc. Class A 144,085 11,189,641
Copyright © 2021 www.secdatabase.com. All Rights Reserved.Please Consider the Environment Before Printing This Document
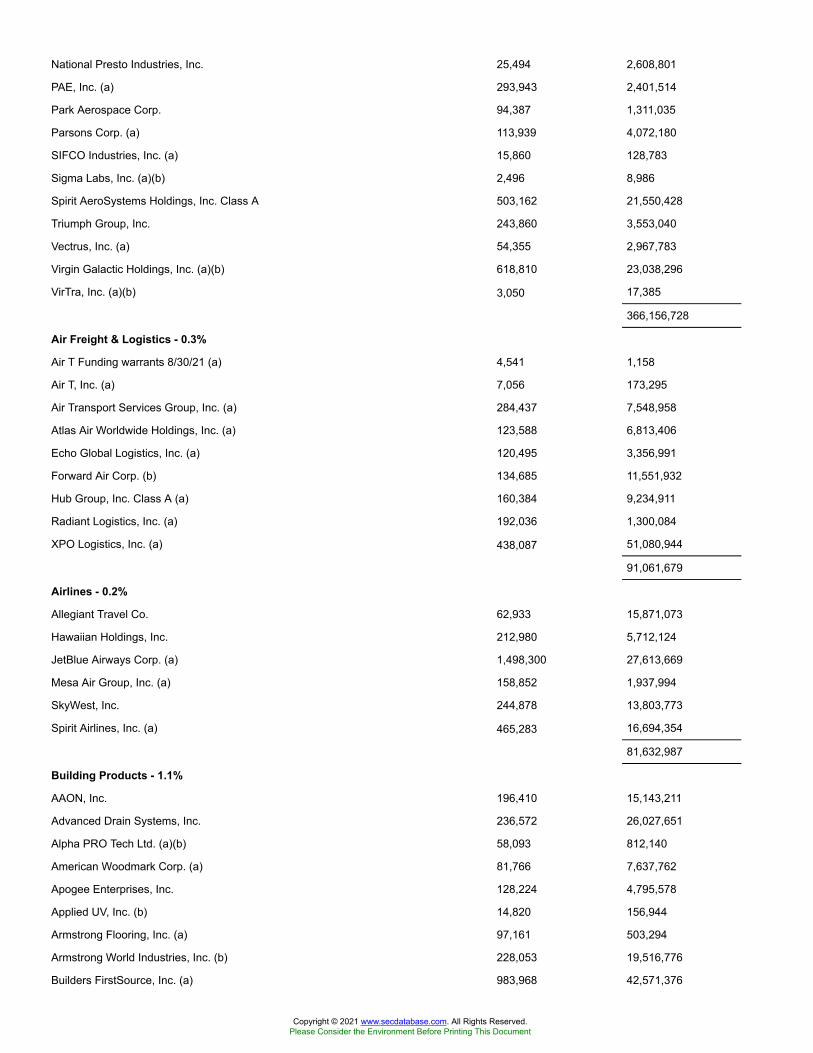
National Presto Industries, Inc. 25,494 2,608,801
PAE, Inc. (a) 293,943 2,401,514
Park Aerospace Corp. 94,387 1,311,035
Parsons Corp. (a) 113,939 4,072,180
SIFCO Industries, Inc. (a) 15,860 128,783
Sigma Labs, Inc. (a)(b) 2,496 8,986
Spirit AeroSystems Holdings, Inc. Class A 503,162 21,550,428
Triumph Group, Inc. 243,860 3,553,040
Vectrus, Inc. (a) 54,355 2,967,783
Virgin Galactic Holdings, Inc. (a)(b) 618,810 23,038,296
VirTra, Inc. (a)(b) 3,050 17,385
366,156,728
Air Freight & Logistics - 0.3%
Air T Funding warrants 8/30/21 (a) 4,541 1,158
Air T, Inc. (a) 7,056 173,295
Air Transport Services Group, Inc. (a) 284,437 7,548,958
Atlas Air Worldwide Holdings, Inc. (a) 123,588 6,813,406
Echo Global Logistics, Inc. (a) 120,495 3,356,991
Forward Air Corp. (b) 134,685 11,551,932
Hub Group, Inc. Class A (a) 160,384 9,234,911
Radiant Logistics, Inc. (a) 192,036 1,300,084
XPO Logistics, Inc. (a) 438,087 51,080,944
91,061,679
Airlines - 0.2%
Allegiant Travel Co. 62,933 15,871,073
Hawaiian Holdings, Inc. 212,980 5,712,124
JetBlue Airways Corp. (a) 1,498,300 27,613,669
Mesa Air Group, Inc. (a) 158,852 1,937,994
SkyWest, Inc. 244,878 13,803,773
Spirit Airlines, Inc. (a) 465,283 16,694,354
81,632,987
Building Products - 1.1%
AAON, Inc. 196,410 15,143,211
Advanced Drain Systems, Inc. 236,572 26,027,651
Alpha PRO Tech Ltd. (a)(b) 58,093 812,140
American Woodmark Corp. (a) 81,766 7,637,762
Apogee Enterprises, Inc. 128,224 4,795,578
Applied UV, Inc. (b) 14,820 156,944
Armstrong Flooring, Inc. (a) 97,161 503,294
Armstrong World Industries, Inc. (b) 228,053 19,516,776
Builders FirstSource, Inc. (a) 983,968 42,571,376
Copyright © 2021 www.secdatabase.com. All Rights Reserved.Please Consider the Environment Before Printing This Document
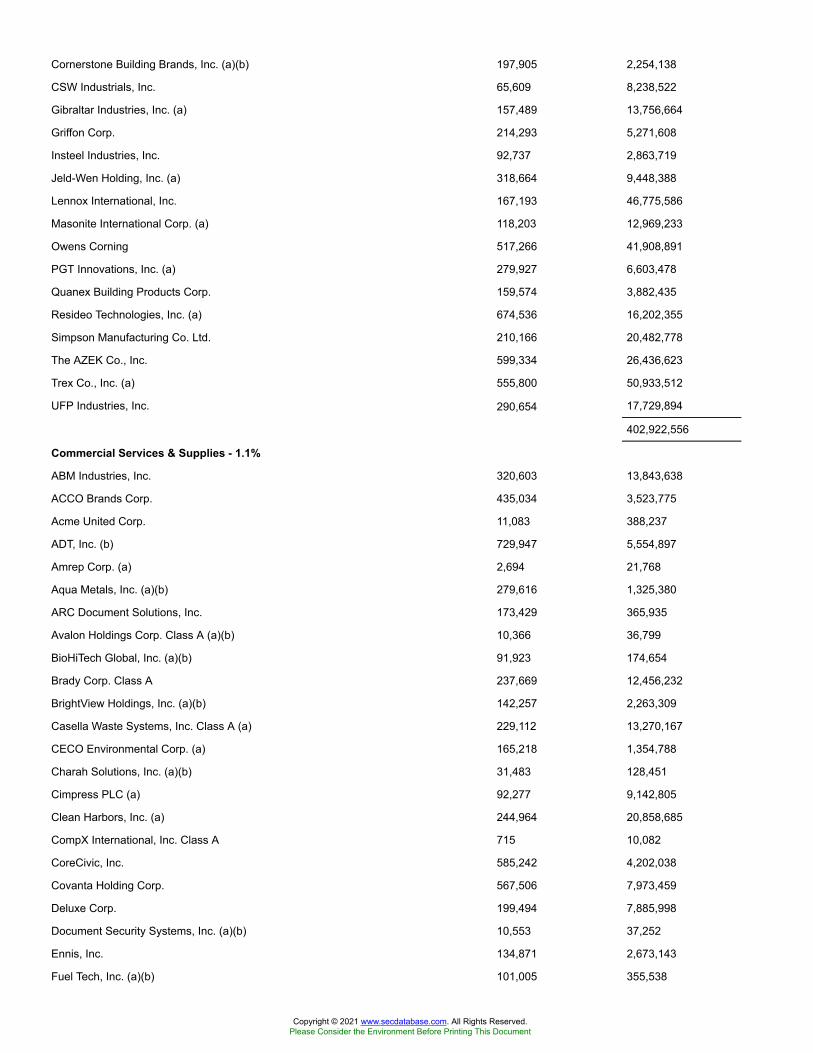
Cornerstone Building Brands, Inc. (a)(b) 197,905 2,254,138
CSW Industrials, Inc. 65,609 8,238,522
Gibraltar Industries, Inc. (a) 157,489 13,756,664
Griffon Corp. 214,293 5,271,608
Insteel Industries, Inc. 92,737 2,863,719
Jeld-Wen Holding, Inc. (a) 318,664 9,448,388
Lennox International, Inc. 167,193 46,775,586
Masonite International Corp. (a) 118,203 12,969,233
Owens Corning 517,266 41,908,891
PGT Innovations, Inc. (a) 279,927 6,603,478
Quanex Building Products Corp. 159,574 3,882,435
Resideo Technologies, Inc. (a) 674,536 16,202,355
Simpson Manufacturing Co. Ltd. 210,166 20,482,778
The AZEK Co., Inc. 599,334 26,436,623
Trex Co., Inc. (a) 555,800 50,933,512
UFP Industries, Inc. 290,654 17,729,894
402,922,556
Commercial Services & Supplies - 1.1%
ABM Industries, Inc. 320,603 13,843,638
ACCO Brands Corp. 435,034 3,523,775
Acme United Corp. 11,083 388,237
ADT, Inc. (b) 729,947 5,554,897
Amrep Corp. (a) 2,694 21,768
Aqua Metals, Inc. (a)(b) 279,616 1,325,380
ARC Document Solutions, Inc. 173,429 365,935
Avalon Holdings Corp. Class A (a)(b) 10,366 36,799
BioHiTech Global, Inc. (a)(b) 91,923 174,654
Brady Corp. Class A 237,669 12,456,232
BrightView Holdings, Inc. (a)(b) 142,257 2,263,309
Casella Waste Systems, Inc. Class A (a) 229,112 13,270,167
CECO Environmental Corp. (a) 165,218 1,354,788
Charah Solutions, Inc. (a)(b) 31,483 128,451
Cimpress PLC (a) 92,277 9,142,805
Clean Harbors, Inc. (a) 244,964 20,858,685
CompX International, Inc. Class A 715 10,082
CoreCivic, Inc. 585,242 4,202,038
Covanta Holding Corp. 567,506 7,973,459
Deluxe Corp. 199,494 7,885,998
Document Security Systems, Inc. (a)(b) 10,553 37,252
Ennis, Inc. 134,871 2,673,143
Fuel Tech, Inc. (a)(b) 101,005 355,538
Copyright © 2021 www.secdatabase.com. All Rights Reserved.Please Consider the Environment Before Printing This Document
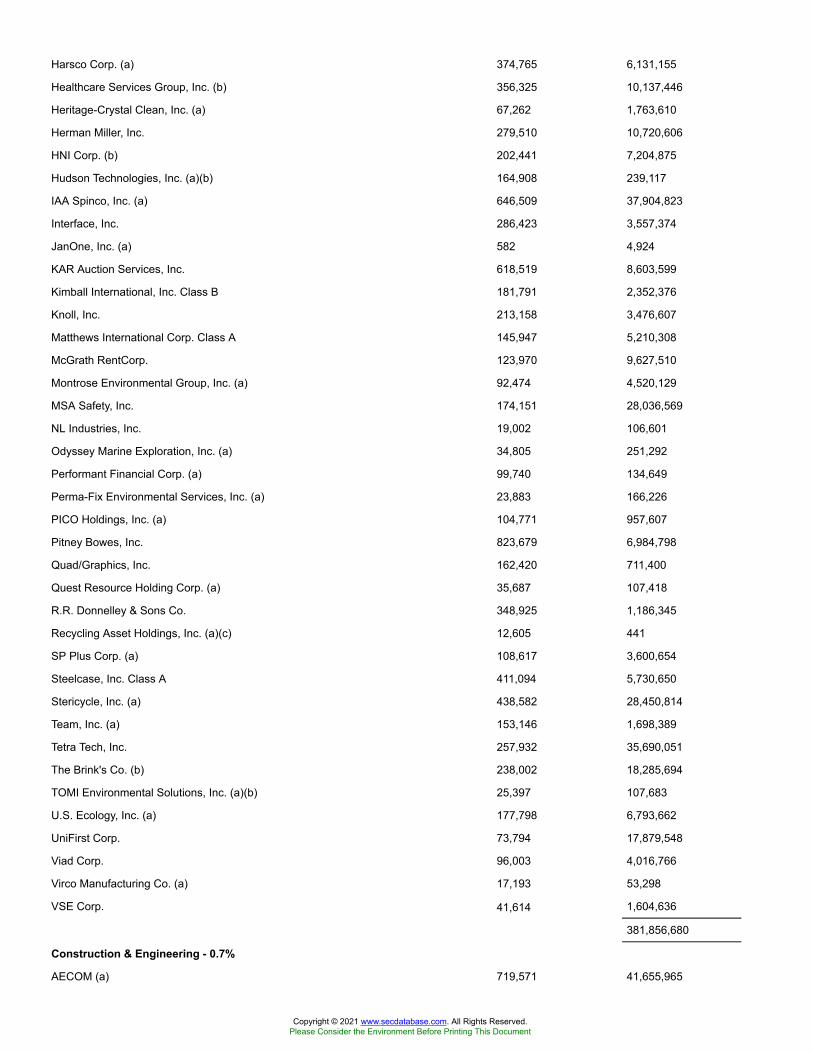
Harsco Corp. (a) 374,765 6,131,155
Healthcare Services Group, Inc. (b) 356,325 10,137,446
Heritage-Crystal Clean, Inc. (a) 67,262 1,763,610
Herman Miller, Inc. 279,510 10,720,606
HNI Corp. (b) 202,441 7,204,875
Hudson Technologies, Inc. (a)(b) 164,908 239,117
IAA Spinco, Inc. (a) 646,509 37,904,823
Interface, Inc. 286,423 3,557,374
JanOne, Inc. (a) 582 4,924
KAR Auction Services, Inc. 618,519 8,603,599
Kimball International, Inc. Class B 181,791 2,352,376
Knoll, Inc. 213,158 3,476,607
Matthews International Corp. Class A 145,947 5,210,308
McGrath RentCorp. 123,970 9,627,510
Montrose Environmental Group, Inc. (a) 92,474 4,520,129
MSA Safety, Inc. 174,151 28,036,569
NL Industries, Inc. 19,002 106,601
Odyssey Marine Exploration, Inc. (a) 34,805 251,292
Performant Financial Corp. (a) 99,740 134,649
Perma-Fix Environmental Services, Inc. (a) 23,883 166,226
PICO Holdings, Inc. (a) 104,771 957,607
Pitney Bowes, Inc. 823,679 6,984,798
Quad/Graphics, Inc. 162,420 711,400
Quest Resource Holding Corp. (a) 35,687 107,418
R.R. Donnelley & Sons Co. 348,925 1,186,345
Recycling Asset Holdings, Inc. (a)(c) 12,605 441
SP Plus Corp. (a) 108,617 3,600,654
Steelcase, Inc. Class A 411,094 5,730,650
Stericycle, Inc. (a) 438,582 28,450,814
Team, Inc. (a) 153,146 1,698,389
Tetra Tech, Inc. 257,932 35,690,051
The Brink's Co. (b) 238,002 18,285,694
TOMI Environmental Solutions, Inc. (a)(b) 25,397 107,683
U.S. Ecology, Inc. (a) 177,798 6,793,662
UniFirst Corp. 73,794 17,879,548
Viad Corp. 96,003 4,016,766
Virco Manufacturing Co. (a) 17,193 53,298
VSE Corp. 41,614 1,604,636
381,856,680
Construction & Engineering - 0.7%
AECOM (a) 719,571 41,655,965
Copyright © 2021 www.secdatabase.com. All Rights Reserved.Please Consider the Environment Before Printing This Document
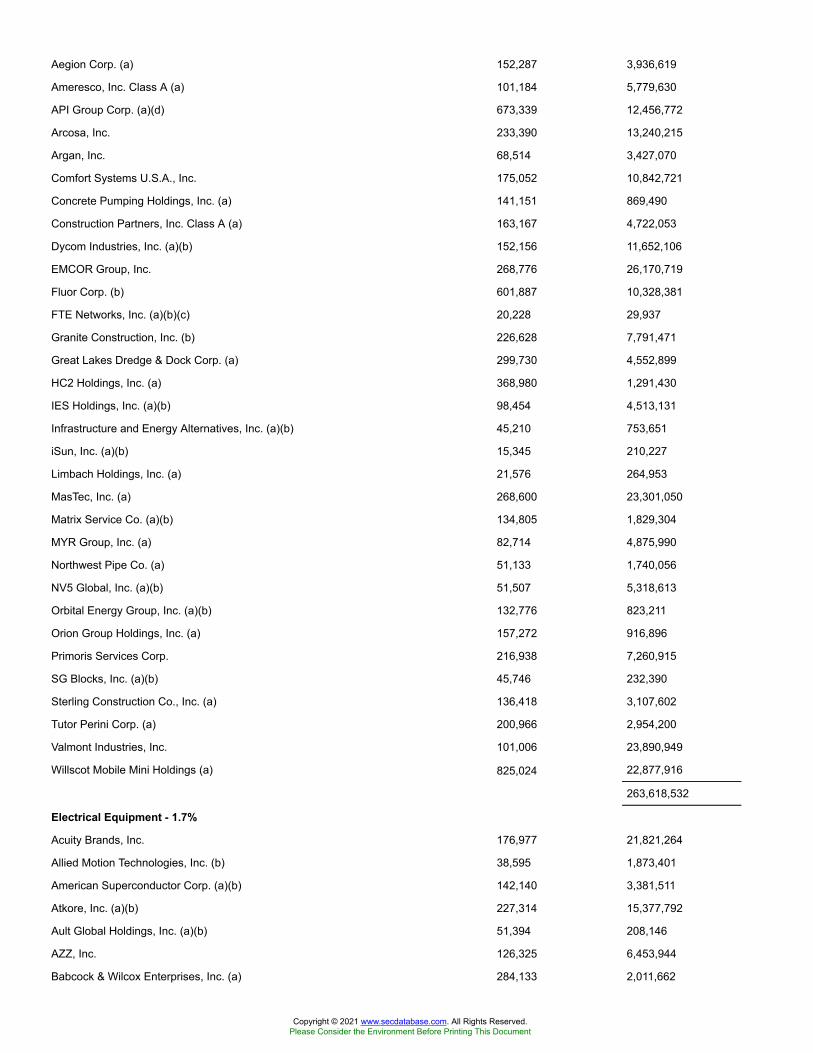
Aegion Corp. (a) 152,287 3,936,619
Ameresco, Inc. Class A (a) 101,184 5,779,630
API Group Corp. (a)(d) 673,339 12,456,772
Arcosa, Inc. 233,390 13,240,215
Argan, Inc. 68,514 3,427,070
Comfort Systems U.S.A., Inc. 175,052 10,842,721
Concrete Pumping Holdings, Inc. (a) 141,151 869,490
Construction Partners, Inc. Class A (a) 163,167 4,722,053
Dycom Industries, Inc. (a)(b) 152,156 11,652,106
EMCOR Group, Inc. 268,776 26,170,719
Fluor Corp. (b) 601,887 10,328,381
FTE Networks, Inc. (a)(b)(c) 20,228 29,937
Granite Construction, Inc. (b) 226,628 7,791,471
Great Lakes Dredge & Dock Corp. (a) 299,730 4,552,899
HC2 Holdings, Inc. (a) 368,980 1,291,430
IES Holdings, Inc. (a)(b) 98,454 4,513,131
Infrastructure and Energy Alternatives, Inc. (a)(b) 45,210 753,651
iSun, Inc. (a)(b) 15,345 210,227
Limbach Holdings, Inc. (a) 21,576 264,953
MasTec, Inc. (a) 268,600 23,301,050
Matrix Service Co. (a)(b) 134,805 1,829,304
MYR Group, Inc. (a) 82,714 4,875,990
Northwest Pipe Co. (a) 51,133 1,740,056
NV5 Global, Inc. (a)(b) 51,507 5,318,613
Orbital Energy Group, Inc. (a)(b) 132,776 823,211
Orion Group Holdings, Inc. (a) 157,272 916,896
Primoris Services Corp. 216,938 7,260,915
SG Blocks, Inc. (a)(b) 45,746 232,390
Sterling Construction Co., Inc. (a) 136,418 3,107,602
Tutor Perini Corp. (a) 200,966 2,954,200
Valmont Industries, Inc. 101,006 23,890,949
Willscot Mobile Mini Holdings (a) 825,024 22,877,916
263,618,532
Electrical Equipment - 1.7%
Acuity Brands, Inc. 176,977 21,821,264
Allied Motion Technologies, Inc. (b) 38,595 1,873,401
American Superconductor Corp. (a)(b) 142,140 3,381,511
Atkore, Inc. (a)(b) 227,314 15,377,792
Ault Global Holdings, Inc. (a)(b) 51,394 208,146
AZZ, Inc. 126,325 6,453,944
Babcock & Wilcox Enterprises, Inc. (a) 284,133 2,011,662
Copyright © 2021 www.secdatabase.com. All Rights Reserved.Please Consider the Environment Before Printing This Document
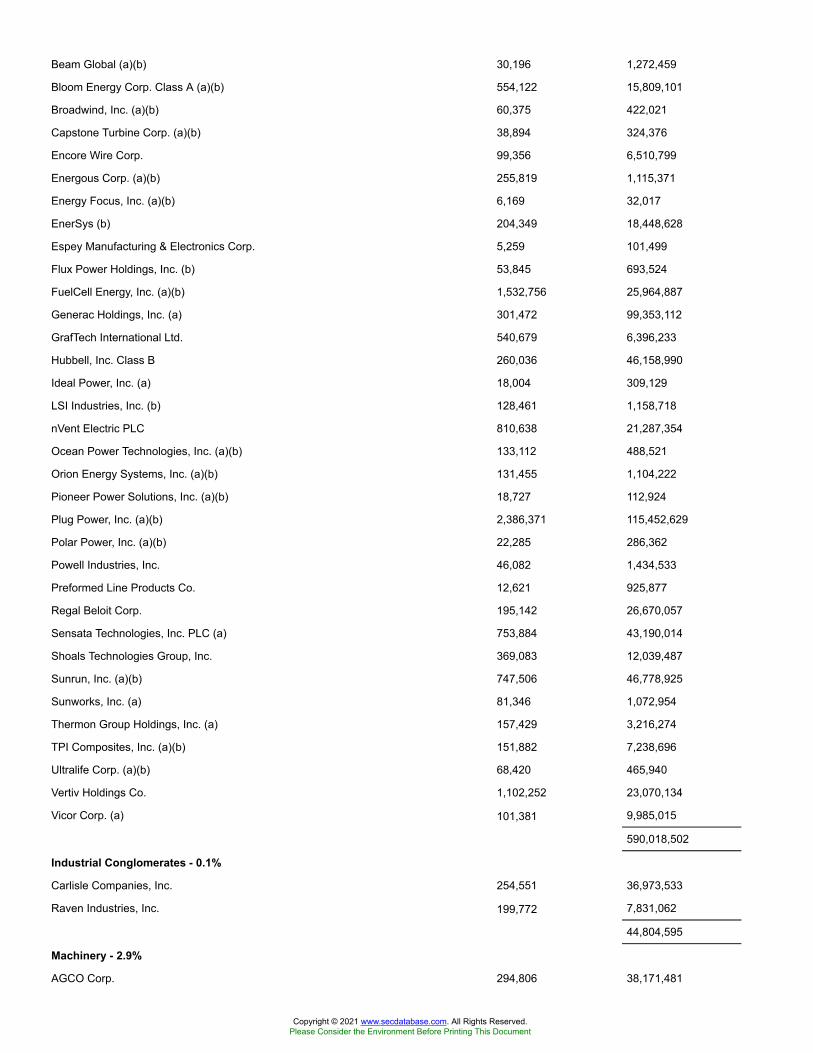
Beam Global (a)(b) 30,196 1,272,459
Bloom Energy Corp. Class A (a)(b) 554,122 15,809,101
Broadwind, Inc. (a)(b) 60,375 422,021
Capstone Turbine Corp. (a)(b) 38,894 324,376
Encore Wire Corp. 99,356 6,510,799
Energous Corp. (a)(b) 255,819 1,115,371
Energy Focus, Inc. (a)(b) 6,169 32,017
EnerSys (b) 204,349 18,448,628
Espey Manufacturing & Electronics Corp. 5,259 101,499
Flux Power Holdings, Inc. (b) 53,845 693,524
FuelCell Energy, Inc. (a)(b) 1,532,756 25,964,887
Generac Holdings, Inc. (a) 301,472 99,353,112
GrafTech International Ltd. 540,679 6,396,233
Hubbell, Inc. Class B 260,036 46,158,990
Ideal Power, Inc. (a) 18,004 309,129
LSI Industries, Inc. (b) 128,461 1,158,718
nVent Electric PLC 810,638 21,287,354
Ocean Power Technologies, Inc. (a)(b) 133,112 488,521
Orion Energy Systems, Inc. (a)(b) 131,455 1,104,222
Pioneer Power Solutions, Inc. (a)(b) 18,727 112,924
Plug Power, Inc. (a)(b) 2,386,371 115,452,629
Polar Power, Inc. (a)(b) 22,285 286,362
Powell Industries, Inc. 46,082 1,434,533
Preformed Line Products Co. 12,621 925,877
Regal Beloit Corp. 195,142 26,670,057
Sensata Technologies, Inc. PLC (a) 753,884 43,190,014
Shoals Technologies Group, Inc. 369,083 12,039,487
Sunrun, Inc. (a)(b) 747,506 46,778,925
Sunworks, Inc. (a) 81,346 1,072,954
Thermon Group Holdings, Inc. (a) 157,429 3,216,274
TPI Composites, Inc. (a)(b) 151,882 7,238,696
Ultralife Corp. (a)(b) 68,420 465,940
Vertiv Holdings Co. 1,102,252 23,070,134
Vicor Corp. (a) 101,381 9,985,015
590,018,502
Industrial Conglomerates - 0.1%
Carlisle Companies, Inc. 254,551 36,973,533
Raven Industries, Inc. 199,772 7,831,062
44,804,595
Machinery - 2.9%
AGCO Corp. 294,806 38,171,481
Copyright © 2021 www.secdatabase.com. All Rights Reserved.Please Consider the Environment Before Printing This Document
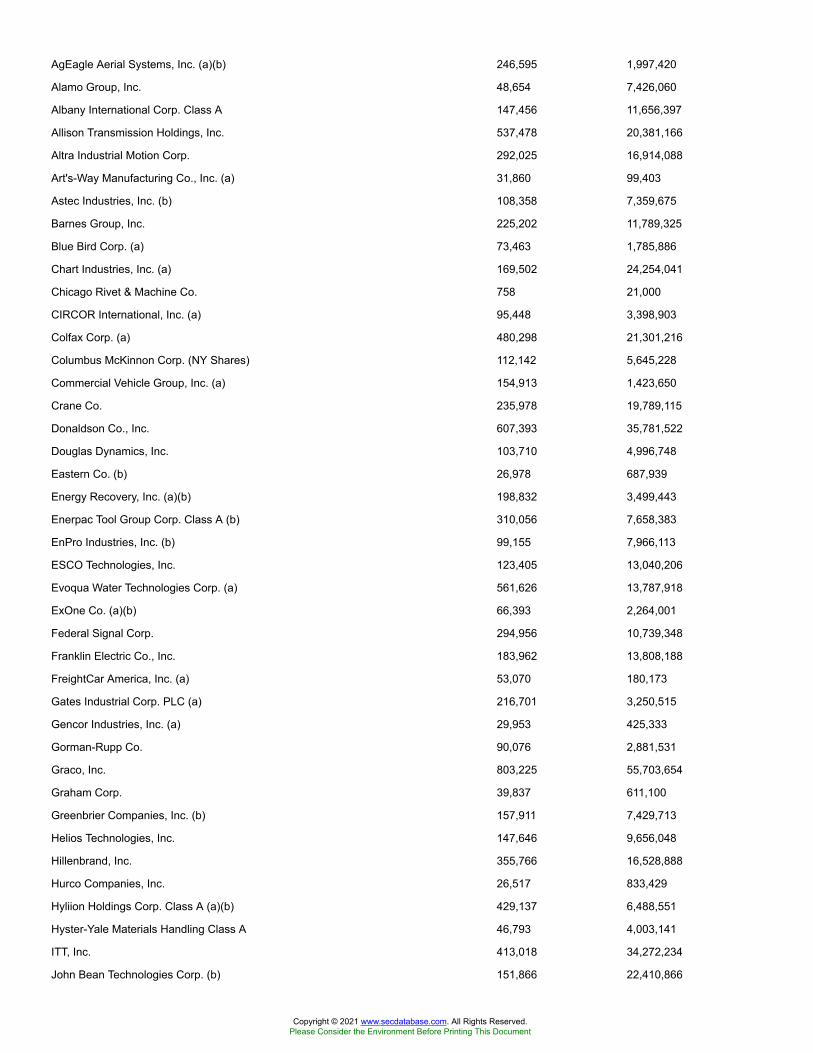
AgEagle Aerial Systems, Inc. (a)(b) 246,595 1,997,420
Alamo Group, Inc. 48,654 7,426,060
Albany International Corp. Class A 147,456 11,656,397
Allison Transmission Holdings, Inc. 537,478 20,381,166
Altra Industrial Motion Corp. 292,025 16,914,088
Art's-Way Manufacturing Co., Inc. (a) 31,860 99,403
Astec Industries, Inc. (b) 108,358 7,359,675
Barnes Group, Inc. 225,202 11,789,325
Blue Bird Corp. (a) 73,463 1,785,886
Chart Industries, Inc. (a) 169,502 24,254,041
Chicago Rivet & Machine Co. 758 21,000
CIRCOR International, Inc. (a) 95,448 3,398,903
Colfax Corp. (a) 480,298 21,301,216
Columbus McKinnon Corp. (NY Shares) 112,142 5,645,228
Commercial Vehicle Group, Inc. (a) 154,913 1,423,650
Crane Co. 235,978 19,789,115
Donaldson Co., Inc. 607,393 35,781,522
Douglas Dynamics, Inc. 103,710 4,996,748
Eastern Co. (b) 26,978 687,939
Energy Recovery, Inc. (a)(b) 198,832 3,499,443
Enerpac Tool Group Corp. Class A (b) 310,056 7,658,383
EnPro Industries, Inc. (b) 99,155 7,966,113
ESCO Technologies, Inc. 123,405 13,040,206
Evoqua Water Technologies Corp. (a) 561,626 13,787,918
ExOne Co. (a)(b) 66,393 2,264,001
Federal Signal Corp. 294,956 10,739,348
Franklin Electric Co., Inc. 183,962 13,808,188
FreightCar America, Inc. (a) 53,070 180,173
Gates Industrial Corp. PLC (a) 216,701 3,250,515
Gencor Industries, Inc. (a) 29,953 425,333
Gorman-Rupp Co. 90,076 2,881,531
Graco, Inc. 803,225 55,703,654
Graham Corp. 39,837 611,100
Greenbrier Companies, Inc. (b) 157,911 7,429,713
Helios Technologies, Inc. 147,646 9,656,048
Hillenbrand, Inc. 355,766 16,528,888
Hurco Companies, Inc. 26,517 833,429
Hyliion Holdings Corp. Class A (a)(b) 429,137 6,488,551
Hyster-Yale Materials Handling Class A 46,793 4,003,141
ITT, Inc. 413,018 34,272,234
John Bean Technologies Corp. (b) 151,866 22,410,866
Copyright © 2021 www.secdatabase.com. All Rights Reserved.Please Consider the Environment Before Printing This Document
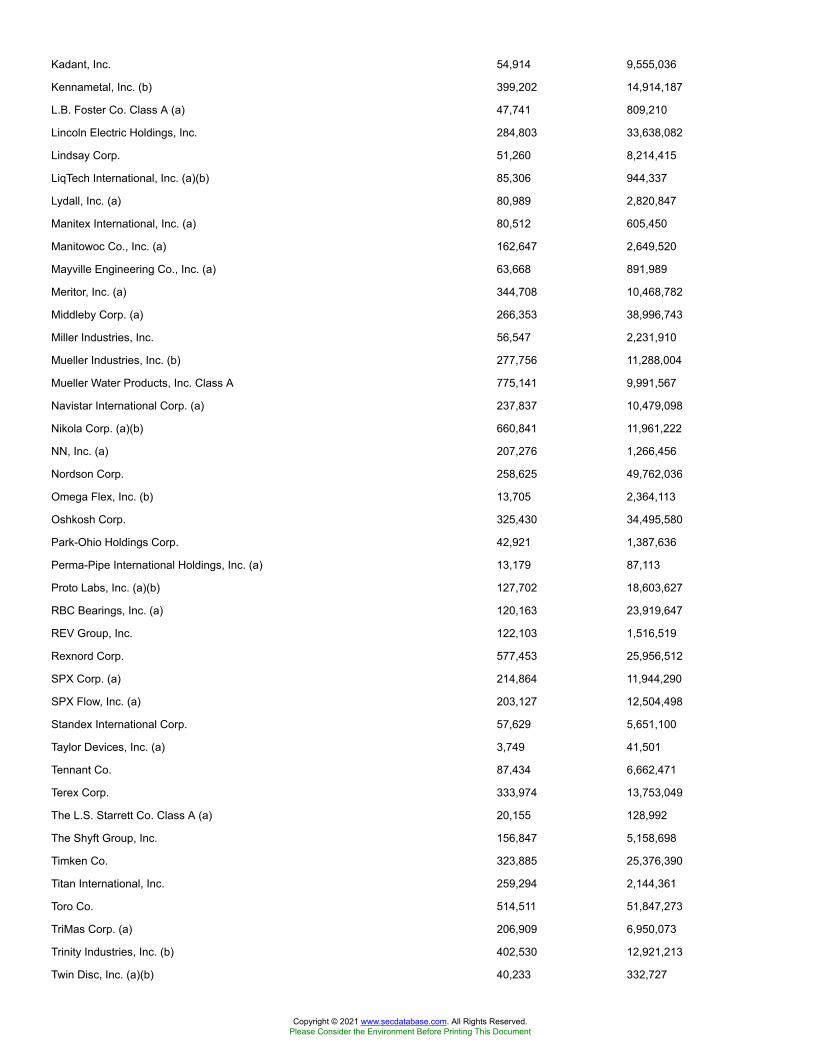
Kadant, Inc. 54,914 9,555,036
Kennametal, Inc. (b) 399,202 14,914,187
L.B. Foster Co. Class A (a) 47,741 809,210
Lincoln Electric Holdings, Inc. 284,803 33,638,082
Lindsay Corp. 51,260 8,214,415
LiqTech International, Inc. (a)(b) 85,306 944,337
Lydall, Inc. (a) 80,989 2,820,847
Manitex International, Inc. (a) 80,512 605,450
Manitowoc Co., Inc. (a) 162,647 2,649,520
Mayville Engineering Co., Inc. (a) 63,668 891,989
Meritor, Inc. (a) 344,708 10,468,782
Middleby Corp. (a) 266,353 38,996,743
Miller Industries, Inc. 56,547 2,231,910
Mueller Industries, Inc. (b) 277,756 11,288,004
Mueller Water Products, Inc. Class A 775,141 9,991,567
Navistar International Corp. (a) 237,837 10,479,098
Nikola Corp. (a)(b) 660,841 11,961,222
NN, Inc. (a) 207,276 1,266,456
Nordson Corp. 258,625 49,762,036
Omega Flex, Inc. (b) 13,705 2,364,113
Oshkosh Corp. 325,430 34,495,580
Park-Ohio Holdings Corp. 42,921 1,387,636
Perma-Pipe International Holdings, Inc. (a) 13,179 87,113
Proto Labs, Inc. (a)(b) 127,702 18,603,627
RBC Bearings, Inc. (a) 120,163 23,919,647
REV Group, Inc. 122,103 1,516,519
Rexnord Corp. 577,453 25,956,512
SPX Corp. (a) 214,864 11,944,290
SPX Flow, Inc. (a) 203,127 12,504,498
Standex International Corp. 57,629 5,651,100
Taylor Devices, Inc. (a) 3,749 41,501
Tennant Co. 87,434 6,662,471
Terex Corp. 333,974 13,753,049
The L.S. Starrett Co. Class A (a) 20,155 128,992
The Shyft Group, Inc. 156,847 5,158,698
Timken Co. 323,885 25,376,390
Titan International, Inc. 259,294 2,144,361
Toro Co. 514,511 51,847,273
TriMas Corp. (a) 206,909 6,950,073
Trinity Industries, Inc. (b) 402,530 12,921,213
Twin Disc, Inc. (a)(b) 40,233 332,727
Copyright © 2021 www.secdatabase.com. All Rights Reserved.Please Consider the Environment Before Printing This Document
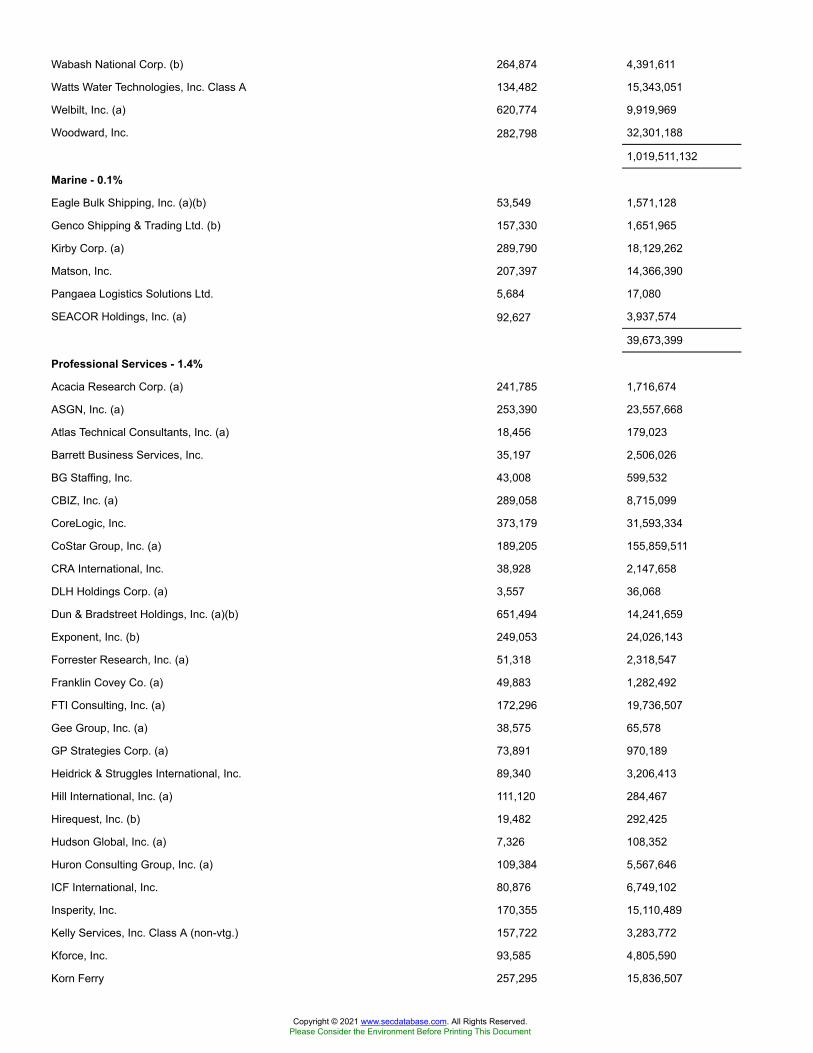
Wabash National Corp. (b) 264,874 4,391,611
Watts Water Technologies, Inc. Class A 134,482 15,343,051
Welbilt, Inc. (a) 620,774 9,919,969
Woodward, Inc. 282,798 32,301,188
1,019,511,132
Marine - 0.1%
Eagle Bulk Shipping, Inc. (a)(b) 53,549 1,571,128
Genco Shipping & Trading Ltd. (b) 157,330 1,651,965
Kirby Corp. (a) 289,790 18,129,262
Matson, Inc. 207,397 14,366,390
Pangaea Logistics Solutions Ltd. 5,684 17,080
SEACOR Holdings, Inc. (a) 92,627 3,937,574
39,673,399
Professional Services - 1.4%
Acacia Research Corp. (a) 241,785 1,716,674
ASGN, Inc. (a) 253,390 23,557,668
Atlas Technical Consultants, Inc. (a) 18,456 179,023
Barrett Business Services, Inc. 35,197 2,506,026
BG Staffing, Inc. 43,008 599,532
CBIZ, Inc. (a) 289,058 8,715,099
CoreLogic, Inc. 373,179 31,593,334
CoStar Group, Inc. (a) 189,205 155,859,511
CRA International, Inc. 38,928 2,147,658
DLH Holdings Corp. (a) 3,557 36,068
Dun & Bradstreet Holdings, Inc. (a)(b) 651,494 14,241,659
Exponent, Inc. (b) 249,053 24,026,143
Forrester Research, Inc. (a) 51,318 2,318,547
Franklin Covey Co. (a) 49,883 1,282,492
FTI Consulting, Inc. (a) 172,296 19,736,507
Gee Group, Inc. (a) 38,575 65,578
GP Strategies Corp. (a) 73,891 970,189
Heidrick & Struggles International, Inc. 89,340 3,206,413
Hill International, Inc. (a) 111,120 284,467
Hirequest, Inc. (b) 19,482 292,425
Hudson Global, Inc. (a) 7,326 108,352
Huron Consulting Group, Inc. (a) 109,384 5,567,646
ICF International, Inc. 80,876 6,749,102
Insperity, Inc. 170,355 15,110,489
Kelly Services, Inc. Class A (non-vtg.) 157,722 3,283,772
Kforce, Inc. 93,585 4,805,590
Korn Ferry 257,295 15,836,507
Copyright © 2021 www.secdatabase.com. All Rights Reserved.Please Consider the Environment Before Printing This Document
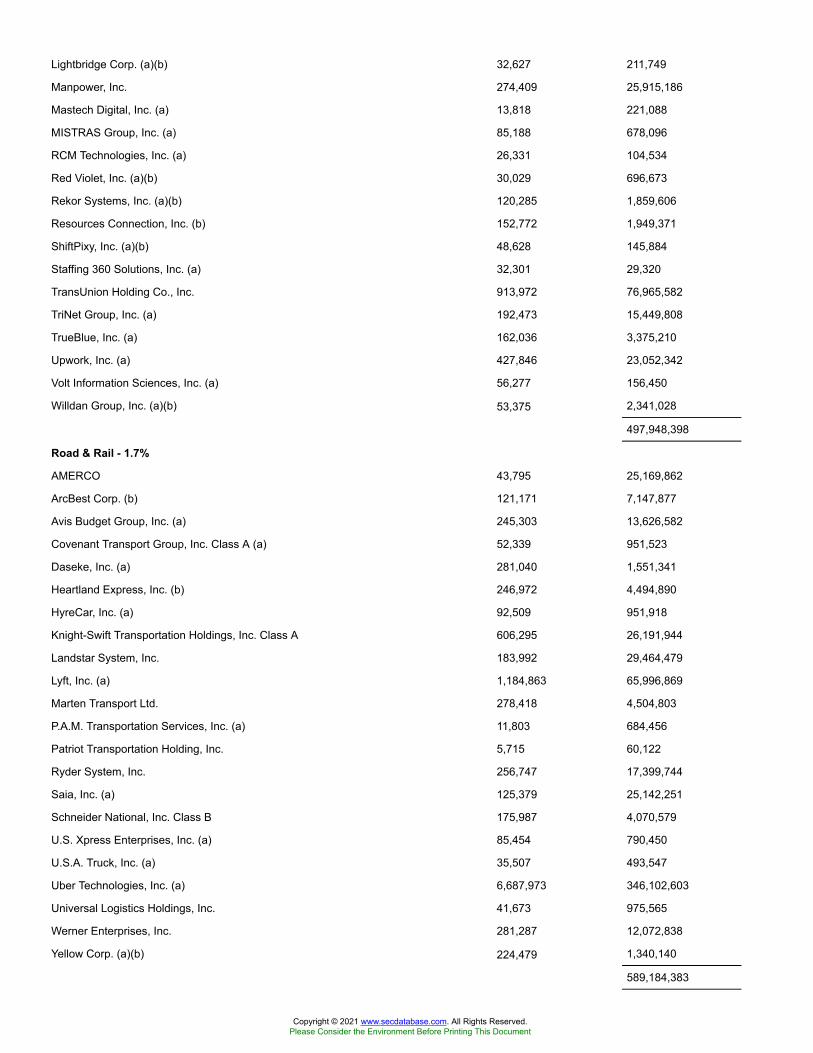
Lightbridge Corp. (a)(b) 32,627 211,749
Manpower, Inc. 274,409 25,915,186
Mastech Digital, Inc. (a) 13,818 221,088
MISTRAS Group, Inc. (a) 85,188 678,096
RCM Technologies, Inc. (a) 26,331 104,534
Red Violet, Inc. (a)(b) 30,029 696,673
Rekor Systems, Inc. (a)(b) 120,285 1,859,606
Resources Connection, Inc. (b) 152,772 1,949,371
ShiftPixy, Inc. (a)(b) 48,628 145,884
Staffing 360 Solutions, Inc. (a) 32,301 29,320
TransUnion Holding Co., Inc. 913,972 76,965,582
TriNet Group, Inc. (a) 192,473 15,449,808
TrueBlue, Inc. (a) 162,036 3,375,210
Upwork, Inc. (a) 427,846 23,052,342
Volt Information Sciences, Inc. (a) 56,277 156,450
Willdan Group, Inc. (a)(b) 53,375 2,341,028
497,948,398
Road & Rail - 1.7%
AMERCO 43,795 25,169,862
ArcBest Corp. (b) 121,171 7,147,877
Avis Budget Group, Inc. (a) 245,303 13,626,582
Covenant Transport Group, Inc. Class A (a) 52,339 951,523
Daseke, Inc. (a) 281,040 1,551,341
Heartland Express, Inc. (b) 246,972 4,494,890
HyreCar, Inc. (a) 92,509 951,918
Knight-Swift Transportation Holdings, Inc. Class A 606,295 26,191,944
Landstar System, Inc. 183,992 29,464,479
Lyft, Inc. (a) 1,184,863 65,996,869
Marten Transport Ltd. 278,418 4,504,803
P.A.M. Transportation Services, Inc. (a) 11,803 684,456
Patriot Transportation Holding, Inc. 5,715 60,122
Ryder System, Inc. 256,747 17,399,744
Saia, Inc. (a) 125,379 25,142,251
Schneider National, Inc. Class B 175,987 4,070,579
U.S. Xpress Enterprises, Inc. (a) 85,454 790,450
U.S.A. Truck, Inc. (a) 35,507 493,547
Uber Technologies, Inc. (a) 6,687,973 346,102,603
Universal Logistics Holdings, Inc. 41,673 975,565
Werner Enterprises, Inc. 281,287 12,072,838
Yellow Corp. (a)(b) 224,479 1,340,140
589,184,383
Copyright © 2021 www.secdatabase.com. All Rights Reserved.Please Consider the Environment Before Printing This Document
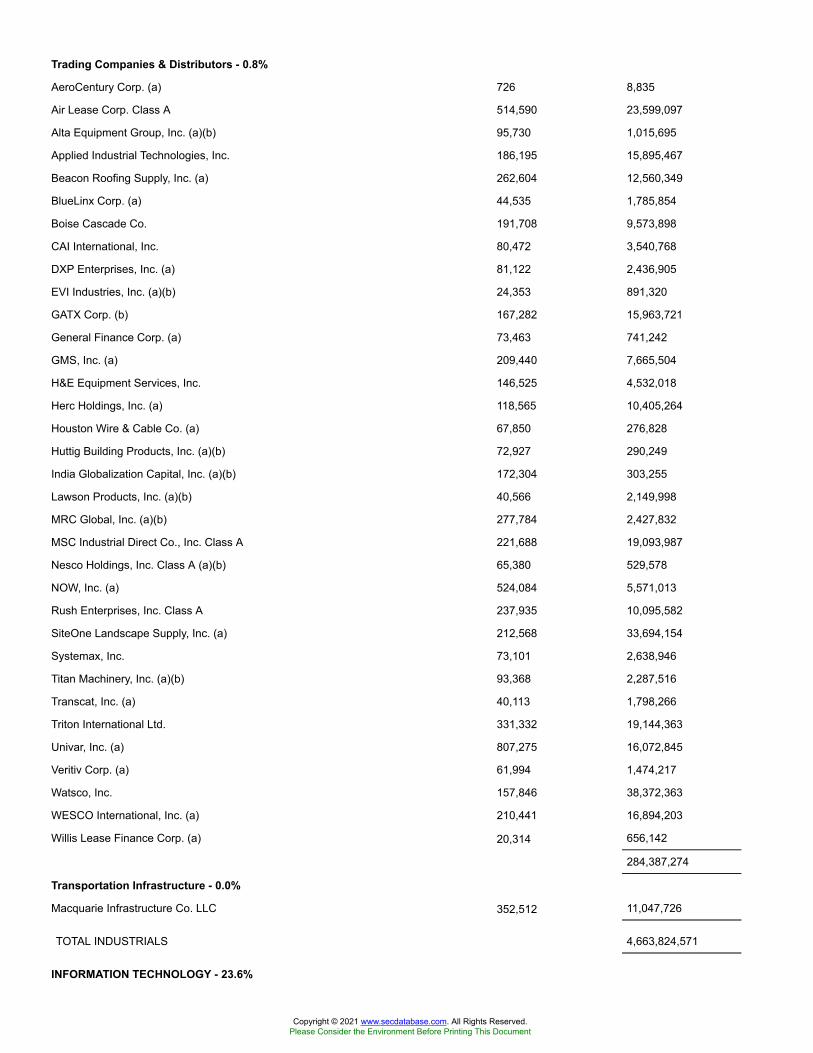
Trading Companies & Distributors - 0.8%
AeroCentury Corp. (a) 726 8,835
Air Lease Corp. Class A 514,590 23,599,097
Alta Equipment Group, Inc. (a)(b) 95,730 1,015,695
Applied Industrial Technologies, Inc. 186,195 15,895,467
Beacon Roofing Supply, Inc. (a) 262,604 12,560,349
BlueLinx Corp. (a) 44,535 1,785,854
Boise Cascade Co. 191,708 9,573,898
CAI International, Inc. 80,472 3,540,768
DXP Enterprises, Inc. (a) 81,122 2,436,905
EVI Industries, Inc. (a)(b) 24,353 891,320
GATX Corp. (b) 167,282 15,963,721
General Finance Corp. (a) 73,463 741,242
GMS, Inc. (a) 209,440 7,665,504
H&E Equipment Services, Inc. 146,525 4,532,018
Herc Holdings, Inc. (a) 118,565 10,405,264
Houston Wire & Cable Co. (a) 67,850 276,828
Huttig Building Products, Inc. (a)(b) 72,927 290,249
India Globalization Capital, Inc. (a)(b) 172,304 303,255
Lawson Products, Inc. (a)(b) 40,566 2,149,998
MRC Global, Inc. (a)(b) 277,784 2,427,832
MSC Industrial Direct Co., Inc. Class A 221,688 19,093,987
Nesco Holdings, Inc. Class A (a)(b) 65,380 529,578
NOW, Inc. (a) 524,084 5,571,013
Rush Enterprises, Inc. Class A 237,935 10,095,582
SiteOne Landscape Supply, Inc. (a) 212,568 33,694,154
Systemax, Inc. 73,101 2,638,946
Titan Machinery, Inc. (a)(b) 93,368 2,287,516
Transcat, Inc. (a) 40,113 1,798,266
Triton International Ltd. 331,332 19,144,363
Univar, Inc. (a) 807,275 16,072,845
Veritiv Corp. (a) 61,994 1,474,217
Watsco, Inc. 157,846 38,372,363
WESCO International, Inc. (a) 210,441 16,894,203
Willis Lease Finance Corp. (a) 20,314 656,142
284,387,274
Transportation Infrastructure - 0.0%
Macquarie Infrastructure Co. LLC 352,512 11,047,726
TOTAL INDUSTRIALS 4,663,824,571
INFORMATION TECHNOLOGY - 23.6%
Copyright © 2021 www.secdatabase.com. All Rights Reserved.Please Consider the Environment Before Printing This Document
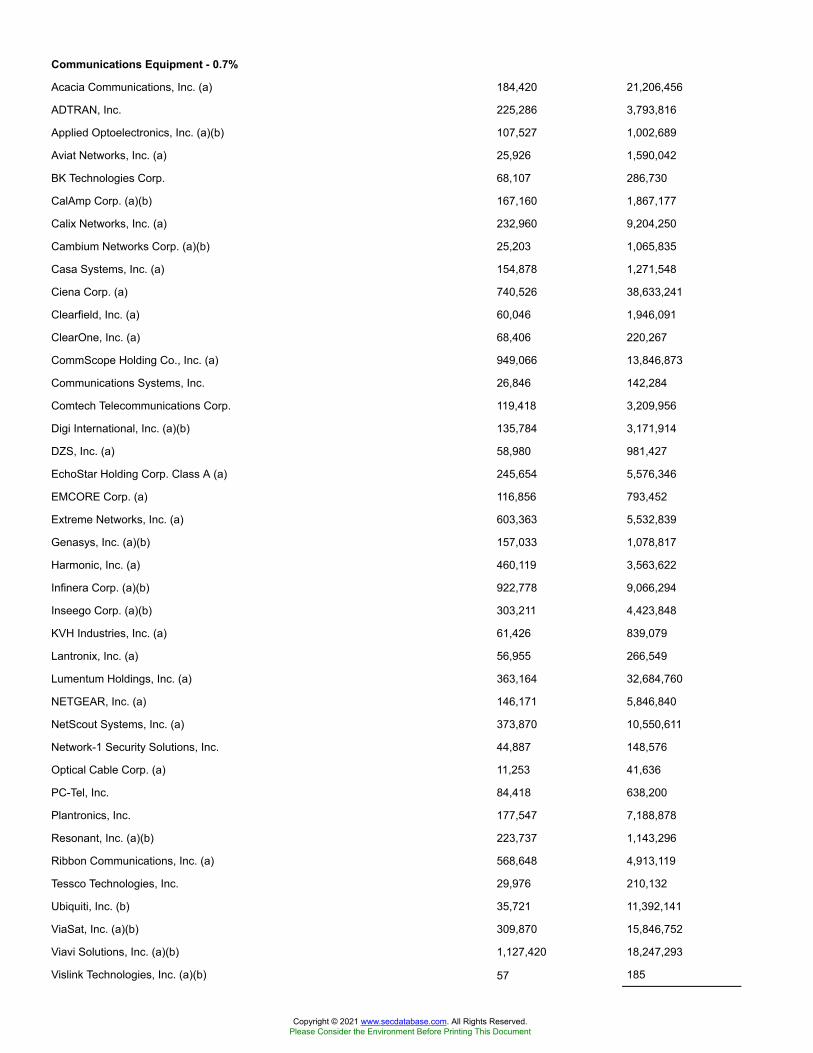
Communications Equipment - 0.7%
Acacia Communications, Inc. (a) 184,420 21,206,456
ADTRAN, Inc. 225,286 3,793,816
Applied Optoelectronics, Inc. (a)(b) 107,527 1,002,689
Aviat Networks, Inc. (a) 25,926 1,590,042
BK Technologies Corp. 68,107 286,730
CalAmp Corp. (a)(b) 167,160 1,867,177
Calix Networks, Inc. (a) 232,960 9,204,250
Cambium Networks Corp. (a)(b) 25,203 1,065,835
Casa Systems, Inc. (a) 154,878 1,271,548
Ciena Corp. (a) 740,526 38,633,241
Clearfield, Inc. (a) 60,046 1,946,091
ClearOne, Inc. (a) 68,406 220,267
CommScope Holding Co., Inc. (a) 949,066 13,846,873
Communications Systems, Inc. 26,846 142,284
Comtech Telecommunications Corp. 119,418 3,209,956
Digi International, Inc. (a)(b) 135,784 3,171,914
DZS, Inc. (a) 58,980 981,427
EchoStar Holding Corp. Class A (a) 245,654 5,576,346
EMCORE Corp. (a) 116,856 793,452
Extreme Networks, Inc. (a) 603,363 5,532,839
Genasys, Inc. (a)(b) 157,033 1,078,817
Harmonic, Inc. (a) 460,119 3,563,622
Infinera Corp. (a)(b) 922,778 9,066,294
Inseego Corp. (a)(b) 303,211 4,423,848
KVH Industries, Inc. (a) 61,426 839,079
Lantronix, Inc. (a) 56,955 266,549
Lumentum Holdings, Inc. (a) 363,164 32,684,760
NETGEAR, Inc. (a) 146,171 5,846,840
NetScout Systems, Inc. (a) 373,870 10,550,611
Network-1 Security Solutions, Inc. 44,887 148,576
Optical Cable Corp. (a) 11,253 41,636
PC-Tel, Inc. 84,418 638,200
Plantronics, Inc. 177,547 7,188,878
Resonant, Inc. (a)(b) 223,737 1,143,296
Ribbon Communications, Inc. (a) 568,648 4,913,119
Tessco Technologies, Inc. 29,976 210,132
Ubiquiti, Inc. (b) 35,721 11,392,141
ViaSat, Inc. (a)(b) 309,870 15,846,752
Viavi Solutions, Inc. (a)(b) 1,127,420 18,247,293
Vislink Technologies, Inc. (a)(b) 57 185
Copyright © 2021 www.secdatabase.com. All Rights Reserved.Please Consider the Environment Before Printing This Document
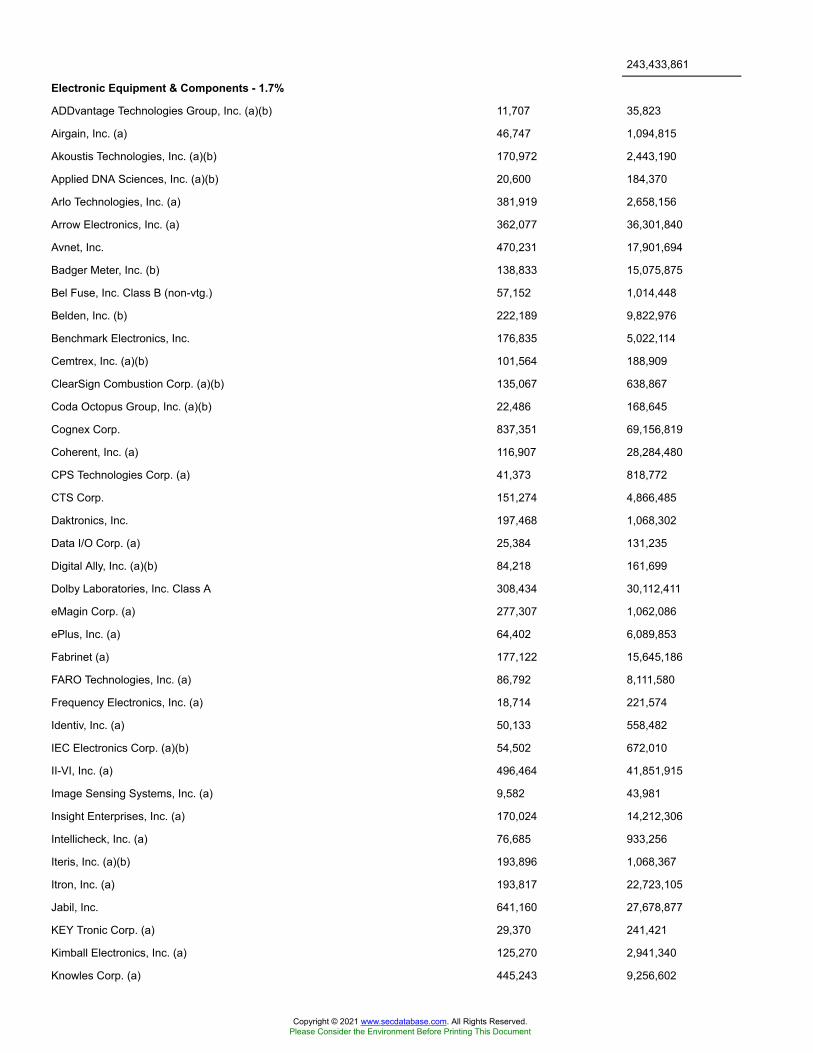
243,433,861
Electronic Equipment & Components - 1.7%
ADDvantage Technologies Group, Inc. (a)(b) 11,707 35,823
Airgain, Inc. (a) 46,747 1,094,815
Akoustis Technologies, Inc. (a)(b) 170,972 2,443,190
Applied DNA Sciences, Inc. (a)(b) 20,600 184,370
Arlo Technologies, Inc. (a) 381,919 2,658,156
Arrow Electronics, Inc. (a) 362,077 36,301,840
Avnet, Inc. 470,231 17,901,694
Badger Meter, Inc. (b) 138,833 15,075,875
Bel Fuse, Inc. Class B (non-vtg.) 57,152 1,014,448
Belden, Inc. (b) 222,189 9,822,976
Benchmark Electronics, Inc. 176,835 5,022,114
Cemtrex, Inc. (a)(b) 101,564 188,909
ClearSign Combustion Corp. (a)(b) 135,067 638,867
Coda Octopus Group, Inc. (a)(b) 22,486 168,645
Cognex Corp. 837,351 69,156,819
Coherent, Inc. (a) 116,907 28,284,480
CPS Technologies Corp. (a) 41,373 818,772
CTS Corp. 151,274 4,866,485
Daktronics, Inc. 197,468 1,068,302
Data I/O Corp. (a) 25,384 131,235
Digital Ally, Inc. (a)(b) 84,218 161,699
Dolby Laboratories, Inc. Class A 308,434 30,112,411
eMagin Corp. (a) 277,307 1,062,086
ePlus, Inc. (a) 64,402 6,089,853
Fabrinet (a) 177,122 15,645,186
FARO Technologies, Inc. (a) 86,792 8,111,580
Frequency Electronics, Inc. (a) 18,714 221,574
Identiv, Inc. (a) 50,133 558,482
IEC Electronics Corp. (a)(b) 54,502 672,010
II-VI, Inc. (a) 496,464 41,851,915
Image Sensing Systems, Inc. (a) 9,582 43,981
Insight Enterprises, Inc. (a) 170,024 14,212,306
Intellicheck, Inc. (a) 76,685 933,256
Iteris, Inc. (a)(b) 193,896 1,068,367
Itron, Inc. (a) 193,817 22,723,105
Jabil, Inc. 641,160 27,678,877
KEY Tronic Corp. (a) 29,370 241,421
Kimball Electronics, Inc. (a) 125,270 2,941,340
Knowles Corp. (a) 445,243 9,256,602
Copyright © 2021 www.secdatabase.com. All Rights Reserved.Please Consider the Environment Before Printing This Document
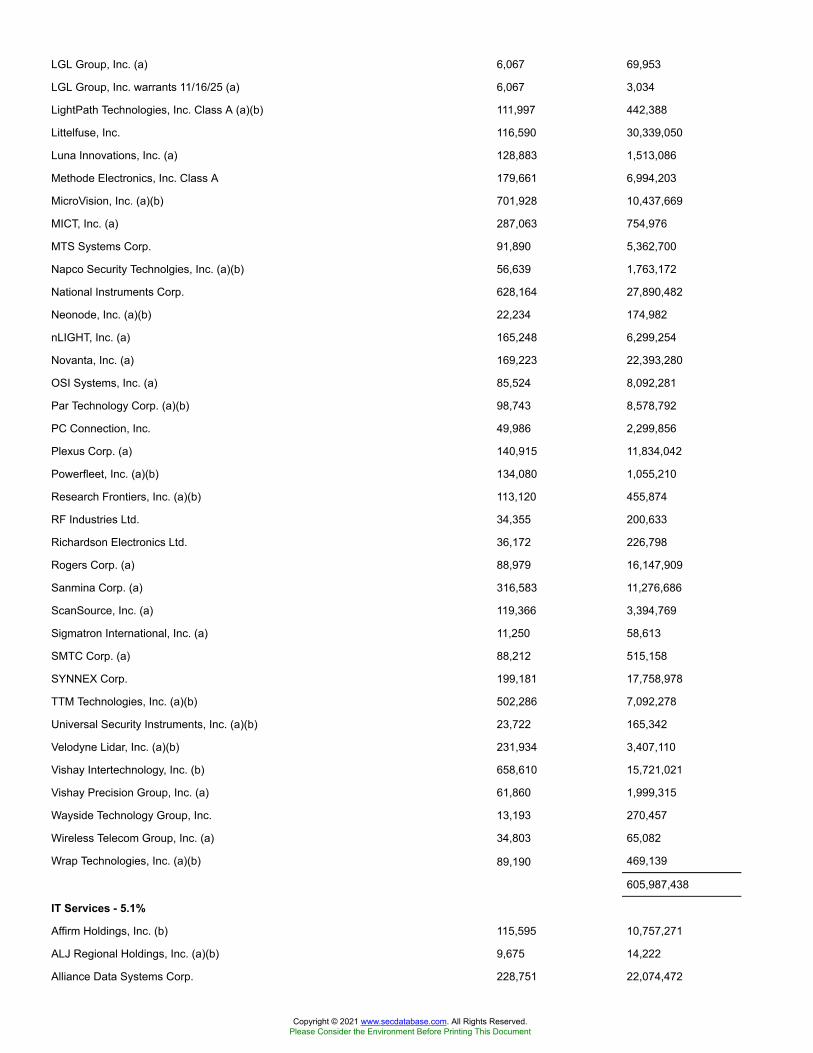
LGL Group, Inc. (a) 6,067 69,953
LGL Group, Inc. warrants 11/16/25 (a) 6,067 3,034
LightPath Technologies, Inc. Class A (a)(b) 111,997 442,388
Littelfuse, Inc. 116,590 30,339,050
Luna Innovations, Inc. (a) 128,883 1,513,086
Methode Electronics, Inc. Class A 179,661 6,994,203
MicroVision, Inc. (a)(b) 701,928 10,437,669
MICT, Inc. (a) 287,063 754,976
MTS Systems Corp. 91,890 5,362,700
Napco Security Technolgies, Inc. (a)(b) 56,639 1,763,172
National Instruments Corp. 628,164 27,890,482
Neonode, Inc. (a)(b) 22,234 174,982
nLIGHT, Inc. (a) 165,248 6,299,254
Novanta, Inc. (a) 169,223 22,393,280
OSI Systems, Inc. (a) 85,524 8,092,281
Par Technology Corp. (a)(b) 98,743 8,578,792
PC Connection, Inc. 49,986 2,299,856
Plexus Corp. (a) 140,915 11,834,042
Powerfleet, Inc. (a)(b) 134,080 1,055,210
Research Frontiers, Inc. (a)(b) 113,120 455,874
RF Industries Ltd. 34,355 200,633
Richardson Electronics Ltd. 36,172 226,798
Rogers Corp. (a) 88,979 16,147,909
Sanmina Corp. (a) 316,583 11,276,686
ScanSource, Inc. (a) 119,366 3,394,769
Sigmatron International, Inc. (a) 11,250 58,613
SMTC Corp. (a) 88,212 515,158
SYNNEX Corp. 199,181 17,758,978
TTM Technologies, Inc. (a)(b) 502,286 7,092,278
Universal Security Instruments, Inc. (a)(b) 23,722 165,342
Velodyne Lidar, Inc. (a)(b) 231,934 3,407,110
Vishay Intertechnology, Inc. (b) 658,610 15,721,021
Vishay Precision Group, Inc. (a) 61,860 1,999,315
Wayside Technology Group, Inc. 13,193 270,457
Wireless Telecom Group, Inc. (a) 34,803 65,082
Wrap Technologies, Inc. (a)(b) 89,190 469,139
605,987,438
IT Services - 5.1%
Affirm Holdings, Inc. (b) 115,595 10,757,271
ALJ Regional Holdings, Inc. (a)(b) 9,675 14,222
Alliance Data Systems Corp. 228,751 22,074,472
Copyright © 2021 www.secdatabase.com. All Rights Reserved.Please Consider the Environment Before Printing This Document

American Virtual Cloud Technologies, Inc. (a)(b) 5,957 40,031
BigCommerce Holdings, Inc. (a)(b) 55,714 3,293,255
Black Knight, Inc. (a) 756,003 57,977,870
BM Technologies, Inc. 21,807 247,291
Booz Allen Hamilton Holding Corp. Class A 661,467 51,025,564
Brightcove, Inc. (a) 195,906 4,266,833
CACI International, Inc. Class A (a) 121,711 26,939,513
Cardtronics PLC (a) 169,919 6,550,377
Cass Information Systems, Inc. (b) 58,565 2,522,980
Computer Task Group, Inc. (a) 43,271 360,015
Concentrix Corp. (a) 197,959 24,449,916
Conduent, Inc. (a) 764,243 4,111,627
Crexendo, Inc. (a)(b) 7,104 41,700
CSG Systems International, Inc. (b) 156,868 7,239,458
CSP, Inc. 3,689 30,951
Enveric Biosciences, Inc. (a) 2,697 9,224
EPAM Systems, Inc. (a) 268,656 100,372,568
Euronet Worldwide, Inc. (a) 251,383 37,785,379
EVERTEC, Inc. 285,126 11,091,401
EVO Payments, Inc. Class A (a)(b) 233,611 5,947,736
Exela Technologies, Inc. (a) 149,163 322,192
ExlService Holdings, Inc. (a) 167,742 14,194,328
Fastly, Inc. Class A (a)(b) 402,830 29,640,231
Genpact Ltd. 845,384 34,187,329
GoDaddy, Inc. (a) 804,233 65,239,381
GreenSky, Inc. Class A (a)(b) 250,463 1,332,463
Grid Dynamics Holdings, Inc. (a)(b) 115,168 1,717,155
GTT Communications, Inc. (a)(b) 142,846 268,550
Hackett Group, Inc. 130,530 2,038,879
i3 Verticals, Inc. Class A (a) 93,111 3,091,285
Information Services Group, Inc. (a) 106,909 389,149
Innodata, Inc. (a)(b) 95,748 560,126
Inpixon (a)(b) 232,204 294,899
International Money Express, Inc. (a) 125,449 1,847,864
KBR, Inc. 679,520 21,065,120
Limelight Networks, Inc. (a)(b) 604,998 1,978,343
Liveramp Holdings, Inc. (a) 318,213 20,098,333
ManTech International Corp. Class A (b) 132,773 10,377,538
Marathon Patent Group, Inc. (a)(b) 220,229 6,639,904
Maximus, Inc. 296,006 24,059,368
MoneyGram International, Inc. (a)(b) 310,225 2,069,201
Copyright © 2021 www.secdatabase.com. All Rights Reserved.Please Consider the Environment Before Printing This Document
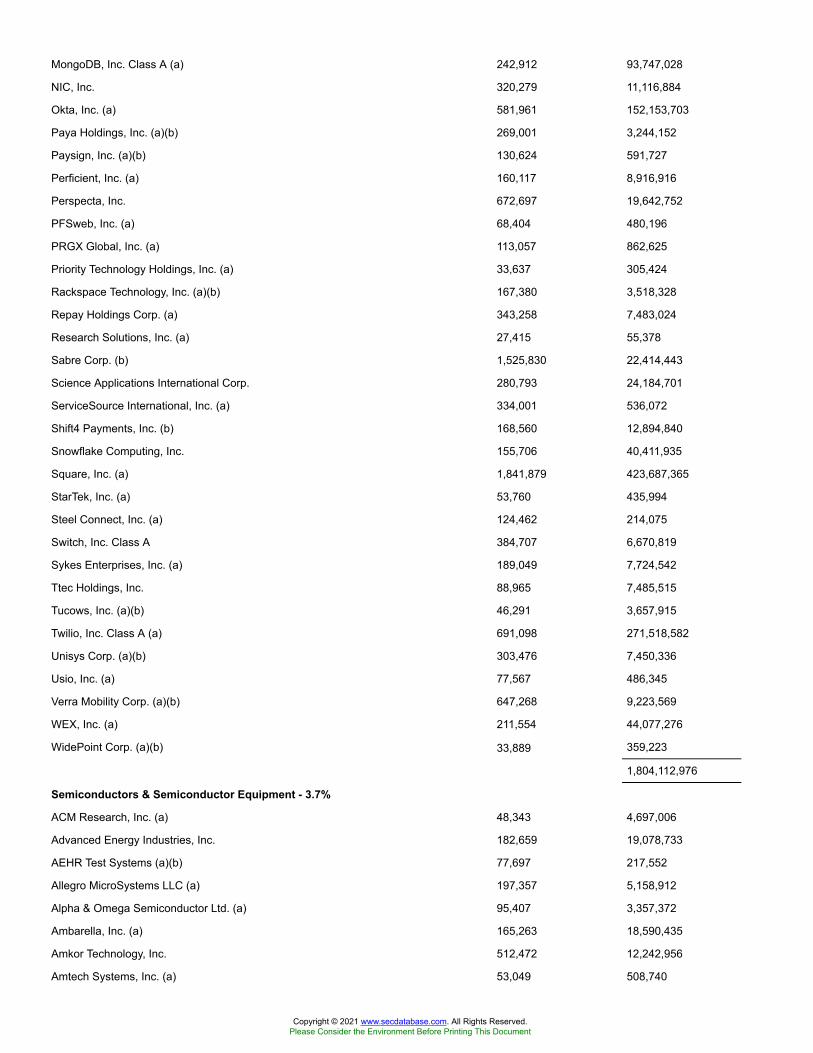
MongoDB, Inc. Class A (a) 242,912 93,747,028
NIC, Inc. 320,279 11,116,884
Okta, Inc. (a) 581,961 152,153,703
Paya Holdings, Inc. (a)(b) 269,001 3,244,152
Paysign, Inc. (a)(b) 130,624 591,727
Perficient, Inc. (a) 160,117 8,916,916
Perspecta, Inc. 672,697 19,642,752
PFSweb, Inc. (a) 68,404 480,196
PRGX Global, Inc. (a) 113,057 862,625
Priority Technology Holdings, Inc. (a) 33,637 305,424
Rackspace Technology, Inc. (a)(b) 167,380 3,518,328
Repay Holdings Corp. (a) 343,258 7,483,024
Research Solutions, Inc. (a) 27,415 55,378
Sabre Corp. (b) 1,525,830 22,414,443
Science Applications International Corp. 280,793 24,184,701
ServiceSource International, Inc. (a) 334,001 536,072
Shift4 Payments, Inc. (b) 168,560 12,894,840
Snowflake Computing, Inc. 155,706 40,411,935
Square, Inc. (a) 1,841,879 423,687,365
StarTek, Inc. (a) 53,760 435,994
Steel Connect, Inc. (a) 124,462 214,075
Switch, Inc. Class A 384,707 6,670,819
Sykes Enterprises, Inc. (a) 189,049 7,724,542
Ttec Holdings, Inc. 88,965 7,485,515
Tucows, Inc. (a)(b) 46,291 3,657,915
Twilio, Inc. Class A (a) 691,098 271,518,582
Unisys Corp. (a)(b) 303,476 7,450,336
Usio, Inc. (a) 77,567 486,345
Verra Mobility Corp. (a)(b) 647,268 9,223,569
WEX, Inc. (a) 211,554 44,077,276
WidePoint Corp. (a)(b) 33,889 359,223
1,804,112,976
Semiconductors & Semiconductor Equipment - 3.7%
ACM Research, Inc. (a) 48,343 4,697,006
Advanced Energy Industries, Inc. 182,659 19,078,733
AEHR Test Systems (a)(b) 77,697 217,552
Allegro MicroSystems LLC (a) 197,357 5,158,912
Alpha & Omega Semiconductor Ltd. (a) 95,407 3,357,372
Ambarella, Inc. (a) 165,263 18,590,435
Amkor Technology, Inc. 512,472 12,242,956
Amtech Systems, Inc. (a) 53,049 508,740
Copyright © 2021 www.secdatabase.com. All Rights Reserved.Please Consider the Environment Before Printing This Document
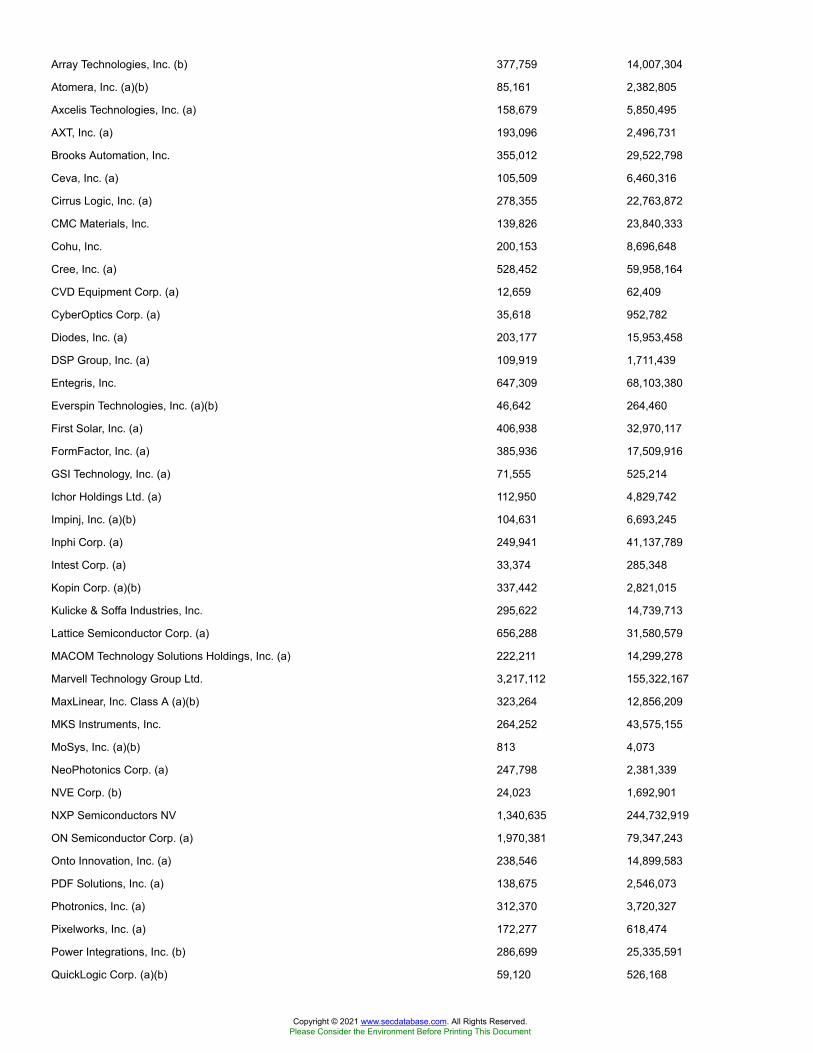
Array Technologies, Inc. (b) 377,759 14,007,304
Atomera, Inc. (a)(b) 85,161 2,382,805
Axcelis Technologies, Inc. (a) 158,679 5,850,495
AXT, Inc. (a) 193,096 2,496,731
Brooks Automation, Inc. 355,012 29,522,798
Ceva, Inc. (a) 105,509 6,460,316
Cirrus Logic, Inc. (a) 278,355 22,763,872
CMC Materials, Inc. 139,826 23,840,333
Cohu, Inc. 200,153 8,696,648
Cree, Inc. (a) 528,452 59,958,164
CVD Equipment Corp. (a) 12,659 62,409
CyberOptics Corp. (a) 35,618 952,782
Diodes, Inc. (a) 203,177 15,953,458
DSP Group, Inc. (a) 109,919 1,711,439
Entegris, Inc. 647,309 68,103,380
Everspin Technologies, Inc. (a)(b) 46,642 264,460
First Solar, Inc. (a) 406,938 32,970,117
FormFactor, Inc. (a) 385,936 17,509,916
GSI Technology, Inc. (a) 71,555 525,214
Ichor Holdings Ltd. (a) 112,950 4,829,742
Impinj, Inc. (a)(b) 104,631 6,693,245
Inphi Corp. (a) 249,941 41,137,789
Intest Corp. (a) 33,374 285,348
Kopin Corp. (a)(b) 337,442 2,821,015
Kulicke & Soffa Industries, Inc. 295,622 14,739,713
Lattice Semiconductor Corp. (a) 656,288 31,580,579
MACOM Technology Solutions Holdings, Inc. (a) 222,211 14,299,278
Marvell Technology Group Ltd. 3,217,112 155,322,167
MaxLinear, Inc. Class A (a)(b) 323,264 12,856,209
MKS Instruments, Inc. 264,252 43,575,155
MoSys, Inc. (a)(b) 813 4,073
NeoPhotonics Corp. (a) 247,798 2,381,339
NVE Corp. (b) 24,023 1,692,901
NXP Semiconductors NV 1,340,635 244,732,919
ON Semiconductor Corp. (a) 1,970,381 79,347,243
Onto Innovation, Inc. (a) 238,546 14,899,583
PDF Solutions, Inc. (a) 138,675 2,546,073
Photronics, Inc. (a) 312,370 3,720,327
Pixelworks, Inc. (a) 172,277 618,474
Power Integrations, Inc. (b) 286,699 25,335,591
QuickLogic Corp. (a)(b) 59,120 526,168
Copyright © 2021 www.secdatabase.com. All Rights Reserved.Please Consider the Environment Before Printing This Document
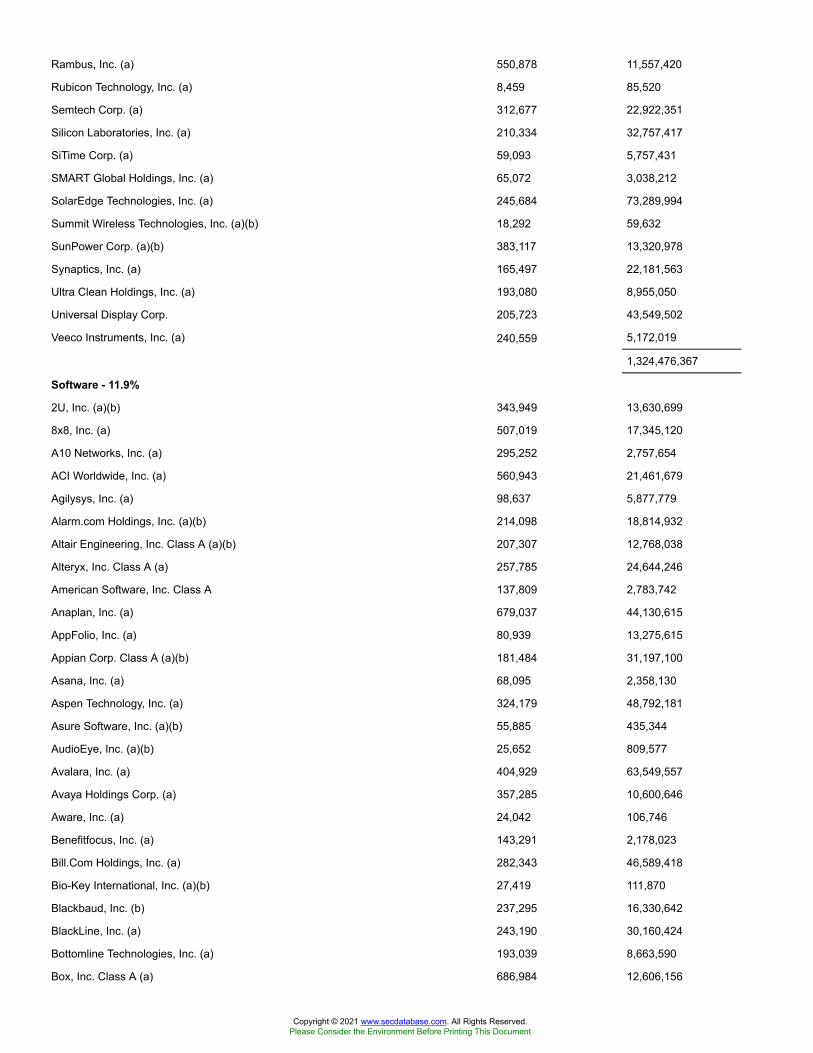
Rambus, Inc. (a) 550,878 11,557,420
Rubicon Technology, Inc. (a) 8,459 85,520
Semtech Corp. (a) 312,677 22,922,351
Silicon Laboratories, Inc. (a) 210,334 32,757,417
SiTime Corp. (a) 59,093 5,757,431
SMART Global Holdings, Inc. (a) 65,072 3,038,212
SolarEdge Technologies, Inc. (a) 245,684 73,289,994
Summit Wireless Technologies, Inc. (a)(b) 18,292 59,632
SunPower Corp. (a)(b) 383,117 13,320,978
Synaptics, Inc. (a) 165,497 22,181,563
Ultra Clean Holdings, Inc. (a) 193,080 8,955,050
Universal Display Corp. 205,723 43,549,502
Veeco Instruments, Inc. (a) 240,559 5,172,019
1,324,476,367
Software - 11.9%
2U, Inc. (a)(b) 343,949 13,630,699
8x8, Inc. (a) 507,019 17,345,120
A10 Networks, Inc. (a) 295,252 2,757,654
ACI Worldwide, Inc. (a) 560,943 21,461,679
Agilysys, Inc. (a) 98,637 5,877,779
Alarm.com Holdings, Inc. (a)(b) 214,098 18,814,932
Altair Engineering, Inc. Class A (a)(b) 207,307 12,768,038
Alteryx, Inc. Class A (a) 257,785 24,644,246
American Software, Inc. Class A 137,809 2,783,742
Anaplan, Inc. (a) 679,037 44,130,615
AppFolio, Inc. (a) 80,939 13,275,615
Appian Corp. Class A (a)(b) 181,484 31,197,100
Asana, Inc. (a) 68,095 2,358,130
Aspen Technology, Inc. (a) 324,179 48,792,181
Asure Software, Inc. (a)(b) 55,885 435,344
AudioEye, Inc. (a)(b) 25,652 809,577
Avalara, Inc. (a) 404,929 63,549,557
Avaya Holdings Corp. (a) 357,285 10,600,646
Aware, Inc. (a) 24,042 106,746
Benefitfocus, Inc. (a) 143,291 2,178,023
Bill.Com Holdings, Inc. (a) 282,343 46,589,418
Bio-Key International, Inc. (a)(b) 27,419 111,870
Blackbaud, Inc. (b) 237,295 16,330,642
BlackLine, Inc. (a) 243,190 30,160,424
Bottomline Technologies, Inc. (a) 193,039 8,663,590
Box, Inc. Class A (a) 686,984 12,606,156
Copyright © 2021 www.secdatabase.com. All Rights Reserved.Please Consider the Environment Before Printing This Document
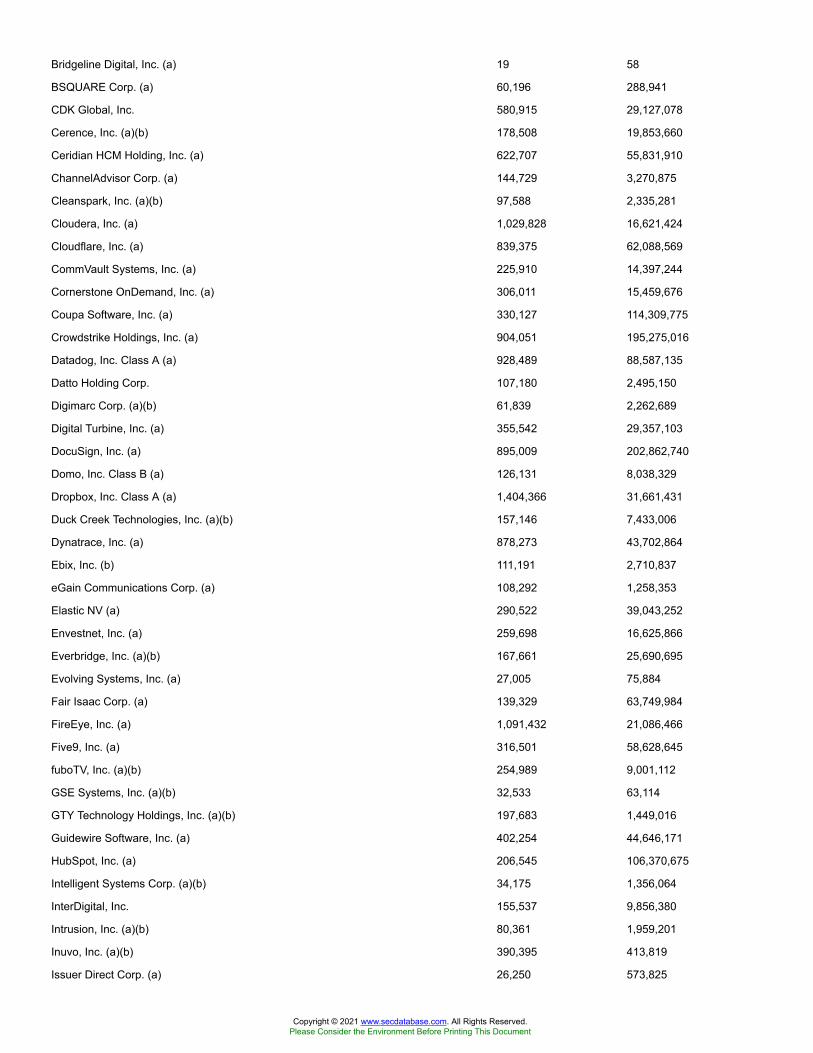
Bridgeline Digital, Inc. (a) 19 58
BSQUARE Corp. (a) 60,196 288,941
CDK Global, Inc. 580,915 29,127,078
Cerence, Inc. (a)(b) 178,508 19,853,660
Ceridian HCM Holding, Inc. (a) 622,707 55,831,910
ChannelAdvisor Corp. (a) 144,729 3,270,875
Cleanspark, Inc. (a)(b) 97,588 2,335,281
Cloudera, Inc. (a) 1,029,828 16,621,424
Cloudflare, Inc. (a) 839,375 62,088,569
CommVault Systems, Inc. (a) 225,910 14,397,244
Cornerstone OnDemand, Inc. (a) 306,011 15,459,676
Coupa Software, Inc. (a) 330,127 114,309,775
Crowdstrike Holdings, Inc. (a) 904,051 195,275,016
Datadog, Inc. Class A (a) 928,489 88,587,135
Datto Holding Corp. 107,180 2,495,150
Digimarc Corp. (a)(b) 61,839 2,262,689
Digital Turbine, Inc. (a) 355,542 29,357,103
DocuSign, Inc. (a) 895,009 202,862,740
Domo, Inc. Class B (a) 126,131 8,038,329
Dropbox, Inc. Class A (a) 1,404,366 31,661,431
Duck Creek Technologies, Inc. (a)(b) 157,146 7,433,006
Dynatrace, Inc. (a) 878,273 43,702,864
Ebix, Inc. (b) 111,191 2,710,837
eGain Communications Corp. (a) 108,292 1,258,353
Elastic NV (a) 290,522 39,043,252
Envestnet, Inc. (a) 259,698 16,625,866
Everbridge, Inc. (a)(b) 167,661 25,690,695
Evolving Systems, Inc. (a) 27,005 75,884
Fair Isaac Corp. (a) 139,329 63,749,984
FireEye, Inc. (a) 1,091,432 21,086,466
Five9, Inc. (a) 316,501 58,628,645
fuboTV, Inc. (a)(b) 254,989 9,001,112
GSE Systems, Inc. (a)(b) 32,533 63,114
GTY Technology Holdings, Inc. (a)(b) 197,683 1,449,016
Guidewire Software, Inc. (a) 402,254 44,646,171
HubSpot, Inc. (a) 206,545 106,370,675
Intelligent Systems Corp. (a)(b) 34,175 1,356,064
InterDigital, Inc. 155,537 9,856,380
Intrusion, Inc. (a)(b) 80,361 1,959,201
Inuvo, Inc. (a)(b) 390,395 413,819
Issuer Direct Corp. (a) 26,250 573,825
Copyright © 2021 www.secdatabase.com. All Rights Reserved.Please Consider the Environment Before Printing This Document
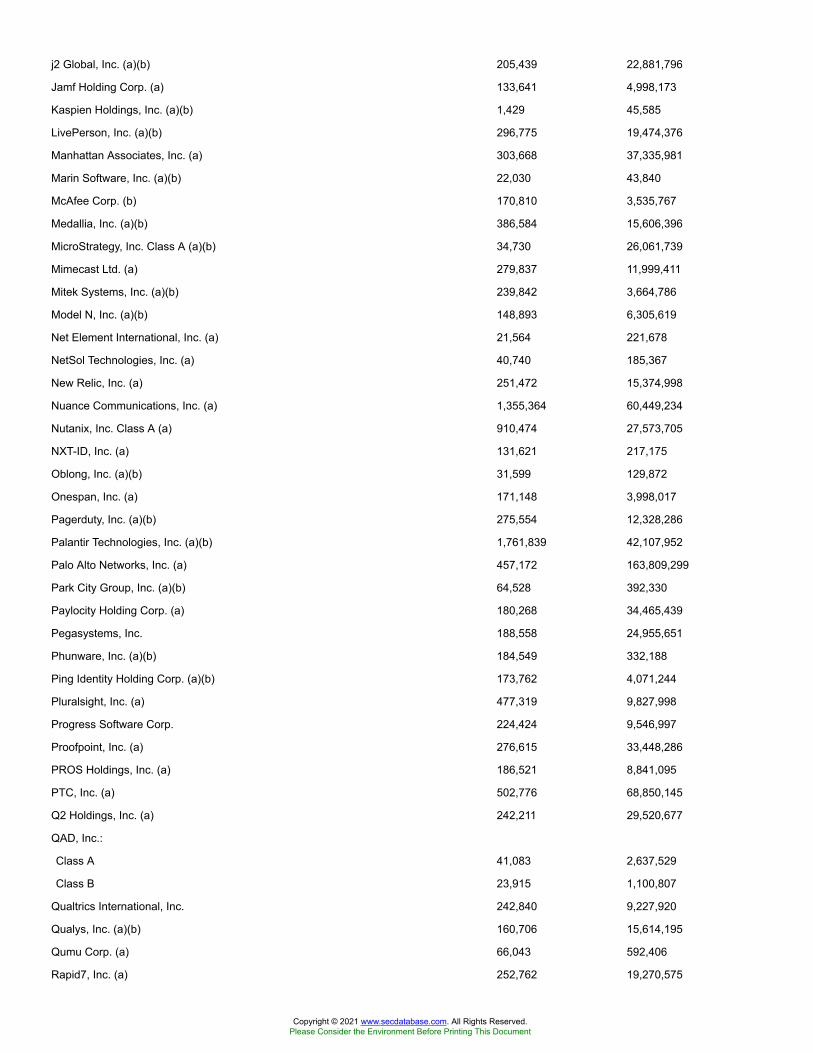
j2 Global, Inc. (a)(b) 205,439 22,881,796
Jamf Holding Corp. (a) 133,641 4,998,173
Kaspien Holdings, Inc. (a)(b) 1,429 45,585
LivePerson, Inc. (a)(b) 296,775 19,474,376
Manhattan Associates, Inc. (a) 303,668 37,335,981
Marin Software, Inc. (a)(b) 22,030 43,840
McAfee Corp. (b) 170,810 3,535,767
Medallia, Inc. (a)(b) 386,584 15,606,396
MicroStrategy, Inc. Class A (a)(b) 34,730 26,061,739
Mimecast Ltd. (a) 279,837 11,999,411
Mitek Systems, Inc. (a)(b) 239,842 3,664,786
Model N, Inc. (a)(b) 148,893 6,305,619
Net Element International, Inc. (a) 21,564 221,678
NetSol Technologies, Inc. (a) 40,740 185,367
New Relic, Inc. (a) 251,472 15,374,998
Nuance Communications, Inc. (a) 1,355,364 60,449,234
Nutanix, Inc. Class A (a) 910,474 27,573,705
NXT-ID, Inc. (a) 131,621 217,175
Oblong, Inc. (a)(b) 31,599 129,872
Onespan, Inc. (a) 171,148 3,998,017
Pagerduty, Inc. (a)(b) 275,554 12,328,286
Palantir Technologies, Inc. (a)(b) 1,761,839 42,107,952
Palo Alto Networks, Inc. (a) 457,172 163,809,299
Park City Group, Inc. (a)(b) 64,528 392,330
Paylocity Holding Corp. (a) 180,268 34,465,439
Pegasystems, Inc. 188,558 24,955,651
Phunware, Inc. (a)(b) 184,549 332,188
Ping Identity Holding Corp. (a)(b) 173,762 4,071,244
Pluralsight, Inc. (a) 477,319 9,827,998
Progress Software Corp. 224,424 9,546,997
Proofpoint, Inc. (a) 276,615 33,448,286
PROS Holdings, Inc. (a) 186,521 8,841,095
PTC, Inc. (a) 502,776 68,850,145
Q2 Holdings, Inc. (a) 242,211 29,520,677
QAD, Inc.:
Class A 41,083 2,637,529
Class B 23,915 1,100,807
Qualtrics International, Inc. 242,840 9,227,920
Qualys, Inc. (a)(b) 160,706 15,614,195
Qumu Corp. (a) 66,043 592,406
Rapid7, Inc. (a) 252,762 19,270,575
Copyright © 2021 www.secdatabase.com. All Rights Reserved.Please Consider the Environment Before Printing This Document

RealNetworks, Inc. (a) 88,984 388,860
RealPage, Inc. (a) 424,268 36,817,977
Rimini Street, Inc. (a) 97,430 757,031
RingCentral, Inc. (a) 380,627 143,937,906
Riot Blockchain, Inc. (a)(b) 332,694 14,552,036
SailPoint Technologies Holding, Inc. (a)(b) 435,673 24,563,244
SeaChange International, Inc. (a)(b) 146,521 172,895
SecureWorks Corp. (a)(b) 43,872 633,073
SharpSpring, Inc. (a) 46,113 1,030,164
ShotSpotter, Inc. (a)(b) 36,848 1,546,879
SilverSun Technologies, Inc. (A Shares) (b) 17,056 95,684
Slack Technologies, Inc. Class A (a) 2,353,577 96,331,907
Smartsheet, Inc. (a) 543,795 37,657,804
Smith Micro Software, Inc. (a) 152,489 1,006,427
SolarWinds, Inc. (a)(b) 342,518 5,545,366
Splunk, Inc. (a) 768,564 109,912,338
Sprout Social, Inc. (a)(b) 133,779 9,092,959
SPS Commerce, Inc. (a) 170,359 17,160,262
SS&C Technologies Holdings, Inc. 1,070,212 70,933,651
Sumo Logic, Inc. (b) 88,926 2,701,572
Support.com, Inc. (a) 54,868 117,418
SVMK, Inc. (a) 566,789 10,553,611
Synacor, Inc. (a) 119,442 254,411
Synchronoss Technologies, Inc. (a)(b) 183,108 811,168
Tenable Holdings, Inc. (a) 328,508 13,439,262
Teradata Corp. (a) 521,737 20,921,654
The Trade Desk, Inc. (a) 201,200 162,044,468
Upland Software, Inc. (a) 133,091 6,578,688
Varonis Systems, Inc. (a) 163,044 29,925,096
Verb Technology Co., Inc. (a)(b) 212,880 485,366
Verint Systems, Inc. (a) 311,122 15,335,203
Veritone, Inc. (a)(b) 121,611 4,384,077
Vertex, Inc. Class A (a)(b) 135,637 4,170,838
VirnetX Holding Corp. (b) 306,358 2,132,252
VMware, Inc. Class A (a)(b) 389,890 53,886,697
Workday, Inc. Class A (a) 863,274 211,657,519
Workiva, Inc. (a) 191,304 19,350,400
Xperi Holding Corp. (b) 509,441 10,749,205
Yext, Inc. (a)(b) 478,563 8,097,286
Zendesk, Inc. (a) 558,800 81,663,032
Zix Corp. (a) 273,769 2,020,415
Copyright © 2021 www.secdatabase.com. All Rights Reserved.Please Consider the Environment Before Printing This Document

Zoom Video Communications, Inc. Class A (a) 978,411 365,544,134
Zscaler, Inc. (a) 353,605 72,499,633
Zuora, Inc. (a) 472,309 7,051,573
4,231,354,811
Technology Hardware, Storage & Peripherals - 0.5%
3D Systems Corp. (a)(b) 592,984 21,252,547
Astro-Med, Inc. 35,940 401,090
Avid Technology, Inc. (a) 202,542 3,927,289
Boxlight Corp. (a)(b) 223,243 620,616
Corsair Gaming, Inc. (b) 99,556 3,568,087
Dell Technologies, Inc. (a) 1,126,585 91,332,246
Diebold Nixdorf, Inc. (a) 375,159 5,447,309
Eastman Kodak Co. (a)(b) 300,086 2,586,741
Immersion Corp. (a) 92,246 914,158
Intevac, Inc. (a) 91,937 585,639
NCR Corp. (a) 616,343 21,424,083
One Stop Systems, Inc. (a)(b) 47,116 303,898
Pure Storage, Inc. Class A (a) 1,157,518 27,062,771
Quantum Corp. (a) 196,357 1,637,617
Socket Mobile, Inc. (a) 29,658 311,706
Sonim Technologies, Inc. (a)(b) 173,952 180,910
Super Micro Computer, Inc. (a) 215,801 7,041,587
Transact Technologies, Inc. (a) 27,805 294,455
188,892,749
TOTAL INFORMATION TECHNOLOGY 8,398,258,202
MATERIALS - 3.4%
Chemicals - 1.5%
Advanced Emissions Solutions, Inc. 96,954 552,638
AdvanSix, Inc. (a) 136,031 3,781,662
AgroFresh Solutions, Inc. (a) 114,965 274,766
American Vanguard Corp. 133,922 2,614,157
Amyris, Inc. (a)(b) 714,651 9,862,184
Ashland Global Holdings, Inc. 262,573 22,087,641
Avient Corp. 439,028 18,974,790
Axalta Coating Systems Ltd. (a) 1,006,597 27,520,362
Balchem Corp. 156,125 18,635,080
Cabot Corp. 277,451 13,658,913
Chase Corp. 34,979 3,766,539
Core Molding Technologies, Inc. (a) 29,730 361,220
Element Solutions, Inc. 1,044,071 18,845,482
Copyright © 2021 www.secdatabase.com. All Rights Reserved.Please Consider the Environment Before Printing This Document

Ferro Corp. (a) 389,283 6,177,921
Flotek Industries, Inc. (a)(b) 264,681 592,885
FutureFuel Corp. 128,970 1,893,280
GCP Applied Technologies, Inc. (a) 233,595 5,790,820
H.B. Fuller Co. 244,280 13,696,780
Hawkins, Inc. 45,143 2,825,952
Huntsman Corp. 954,671 26,062,518
Ingevity Corp. (a) 197,741 13,739,045
Innospec, Inc. 118,496 11,902,923
Intrepid Potash, Inc. (a) 48,926 1,452,613
Koppers Holdings, Inc. (a) 101,259 3,383,063
Kraton Performance Polymers, Inc. (a) 153,285 5,700,669
Kronos Worldwide, Inc. 107,838 1,558,259
Livent Corp. (a)(b) 699,495 13,024,597
Loop Industries, Inc. (a)(b) 99,121 853,432
LSB Industries, Inc. (a) 104,556 465,274
Marrone Bio Innovations, Inc. (a) 455,249 1,163,161
Minerals Technologies, Inc. (b) 165,623 11,797,326
NewMarket Corp. 35,052 13,284,007
Northern Technologies International Corp. 14,032 227,459
Olin Corp. 679,874 21,035,302
Orion Engineered Carbons SA 293,691 5,198,331
PQ Group Holdings, Inc. 189,942 2,917,509
Quaker Chemical Corp. (b) 63,166 17,836,815
Rayonier Advanced Materials, Inc. (a) 306,484 2,834,977
RPM International, Inc. 623,962 49,692,334
Sensient Technologies Corp. 206,938 16,110,123
Stepan Co. 103,272 12,463,898
The Chemours Co. LLC 786,795 18,513,286
The Scotts Miracle-Gro Co. Class A 195,396 41,648,657
Trecora Resources (a) 90,844 644,992
Tredegar Corp. 122,777 1,871,121
Trinseo SA (b) 183,997 11,906,446
Tronox Holdings PLC (b) 520,651 9,548,739
Valhi, Inc. 11,706 216,327
Valvoline, Inc. 889,044 22,190,538
Venator Materials PLC (a) 253,191 969,722
W.R. Grace & Co. 297,196 17,611,835
Westlake Chemical Corp. 165,299 14,147,941
543,886,311
Construction Materials - 0.1%
Copyright © 2021 www.secdatabase.com. All Rights Reserved.Please Consider the Environment Before Printing This Document

Eagle Materials, Inc. 201,610 25,277,862
Forterra, Inc. (a) 87,063 2,025,956
Summit Materials, Inc. (a) 548,937 15,211,044
Tecnoglass, Inc. 87,666 647,852
U.S. Concrete, Inc. (a) 75,147 3,867,065
United States Lime & Minerals, Inc. (b) 10,066 1,410,649
48,440,428
Containers & Packaging - 0.7%
Aptargroup, Inc. 310,158 40,342,251
Berry Global Group, Inc. (a) 639,507 35,428,688
Crown Holdings, Inc. 646,296 61,760,046
Graphic Packaging Holding Co. 1,284,609 20,386,745
Greif, Inc.:
Class A (b) 97,831 4,725,237
Class B 64,018 3,168,891
Myers Industries, Inc. 167,962 3,718,679
O-I Glass, Inc. 747,220 8,727,530
Pactiv Evergreen, Inc. (b) 196,366 2,745,197
Ranpak Holdings Corp. (A Shares) (a) 180,643 3,253,380
Silgan Holdings, Inc. 377,640 14,184,158
Sonoco Products Co. 476,884 28,407,980
UFP Technologies, Inc. (a)(b) 36,463 1,805,648
228,654,430
Metals & Mining - 0.9%
Alcoa Corp. (a) 891,093 21,876,333
Allegheny Technologies, Inc. (a)(b) 616,281 12,116,084
Alpha Metallurgical Resources (a)(b) 85,195 1,277,925
Ampco-Pittsburgh Corp. (a)(b) 56,139 428,902
Arconic Rolled Products Corp. (a) 464,500 10,181,840
Carpenter Technology Corp. (b) 227,940 9,268,040
Century Aluminum Co. (a) 275,102 3,777,150
Cleveland-Cliffs, Inc. 2,193,202 29,257,315
Coeur d'Alene Mines Corp. (a) 1,168,918 10,531,951
Commercial Metals Co. (b) 575,476 14,473,221
Compass Minerals International, Inc. 160,223 10,108,469
Comstock Mining, Inc. (a)(b) 173,371 937,937
Fortitude Gold Corp. (a) 98,084 379,585
Friedman Industries 25,968 217,352
Gatos Silver, Inc. (b) 139,473 1,947,043
Gold Resource Corp. (b) 343,295 923,464
Golden Minerals Co. (a)(b) 512,658 395,259
Copyright © 2021 www.secdatabase.com. All Rights Reserved.Please Consider the Environment Before Printing This Document
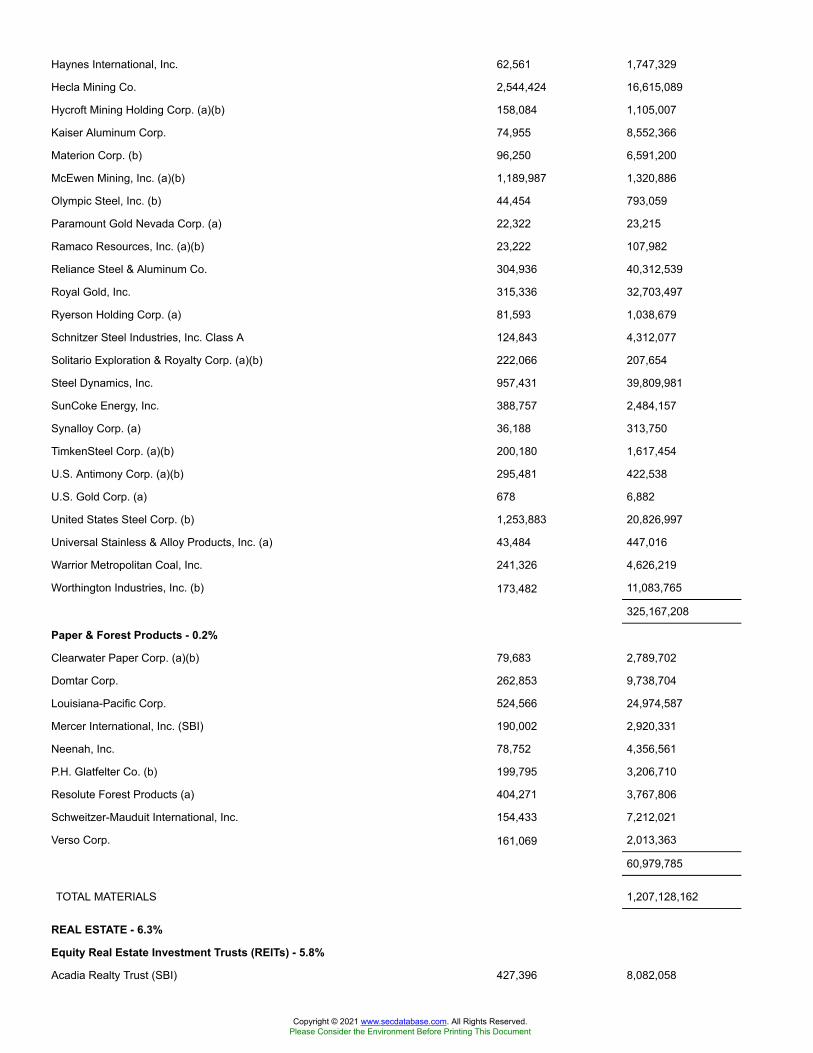
Haynes International, Inc. 62,561 1,747,329
Hecla Mining Co. 2,544,424 16,615,089
Hycroft Mining Holding Corp. (a)(b) 158,084 1,105,007
Kaiser Aluminum Corp. 74,955 8,552,366
Materion Corp. (b) 96,250 6,591,200
McEwen Mining, Inc. (a)(b) 1,189,987 1,320,886
Olympic Steel, Inc. (b) 44,454 793,059
Paramount Gold Nevada Corp. (a) 22,322 23,215
Ramaco Resources, Inc. (a)(b) 23,222 107,982
Reliance Steel & Aluminum Co. 304,936 40,312,539
Royal Gold, Inc. 315,336 32,703,497
Ryerson Holding Corp. (a) 81,593 1,038,679
Schnitzer Steel Industries, Inc. Class A 124,843 4,312,077
Solitario Exploration & Royalty Corp. (a)(b) 222,066 207,654
Steel Dynamics, Inc. 957,431 39,809,981
SunCoke Energy, Inc. 388,757 2,484,157
Synalloy Corp. (a) 36,188 313,750
TimkenSteel Corp. (a)(b) 200,180 1,617,454
U.S. Antimony Corp. (a)(b) 295,481 422,538
U.S. Gold Corp. (a) 678 6,882
United States Steel Corp. (b) 1,253,883 20,826,997
Universal Stainless & Alloy Products, Inc. (a) 43,484 447,016
Warrior Metropolitan Coal, Inc. 241,326 4,626,219
Worthington Industries, Inc. (b) 173,482 11,083,765
325,167,208
Paper & Forest Products - 0.2%
Clearwater Paper Corp. (a)(b) 79,683 2,789,702
Domtar Corp. 262,853 9,738,704
Louisiana-Pacific Corp. 524,566 24,974,587
Mercer International, Inc. (SBI) 190,002 2,920,331
Neenah, Inc. 78,752 4,356,561
P.H. Glatfelter Co. (b) 199,795 3,206,710
Resolute Forest Products (a) 404,271 3,767,806
Schweitzer-Mauduit International, Inc. 154,433 7,212,021
Verso Corp. 161,069 2,013,363
60,979,785
TOTAL MATERIALS 1,207,128,162
REAL ESTATE - 6.3%
Equity Real Estate Investment Trusts (REITs) - 5.8%
Acadia Realty Trust (SBI) 427,396 8,082,058
Copyright © 2021 www.secdatabase.com. All Rights Reserved.Please Consider the Environment Before Printing This Document
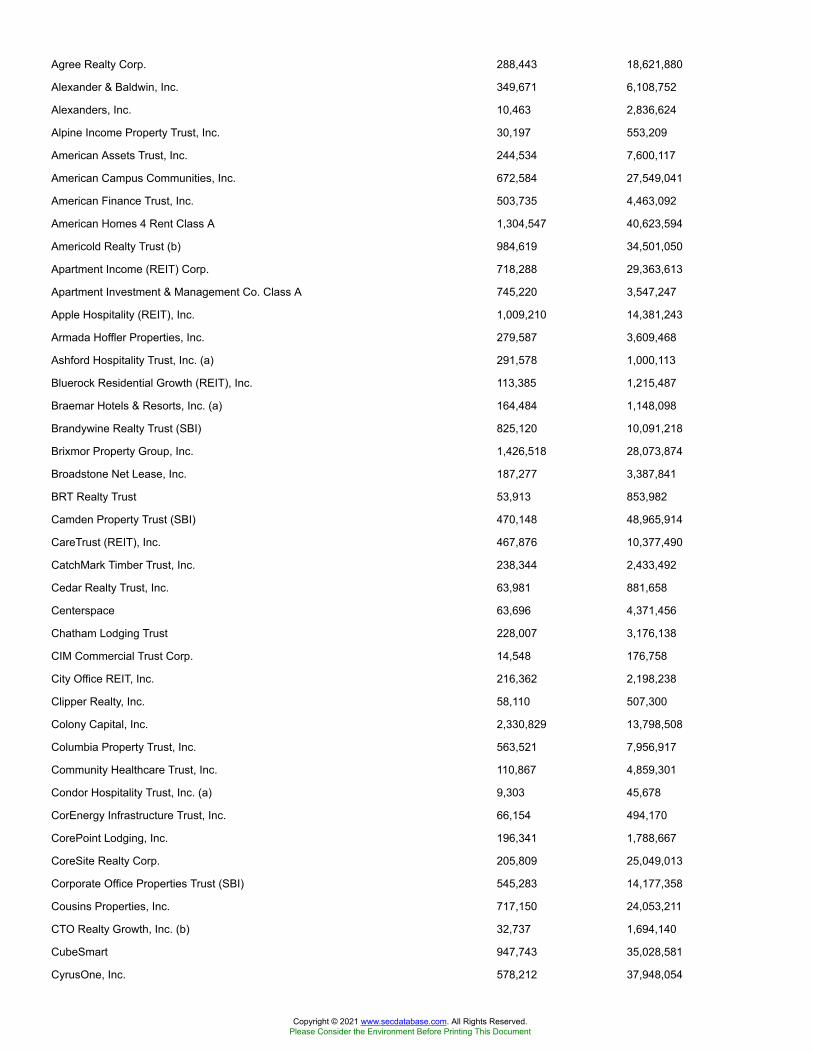
Agree Realty Corp. 288,443 18,621,880
Alexander & Baldwin, Inc. 349,671 6,108,752
Alexanders, Inc. 10,463 2,836,624
Alpine Income Property Trust, Inc. 30,197 553,209
American Assets Trust, Inc. 244,534 7,600,117
American Campus Communities, Inc. 672,584 27,549,041
American Finance Trust, Inc. 503,735 4,463,092
American Homes 4 Rent Class A 1,304,547 40,623,594
Americold Realty Trust (b) 984,619 34,501,050
Apartment Income (REIT) Corp. 718,288 29,363,613
Apartment Investment & Management Co. Class A 745,220 3,547,247
Apple Hospitality (REIT), Inc. 1,009,210 14,381,243
Armada Hoffler Properties, Inc. 279,587 3,609,468
Ashford Hospitality Trust, Inc. (a) 291,578 1,000,113
Bluerock Residential Growth (REIT), Inc. 113,385 1,215,487
Braemar Hotels & Resorts, Inc. (a) 164,484 1,148,098
Brandywine Realty Trust (SBI) 825,120 10,091,218
Brixmor Property Group, Inc. 1,426,518 28,073,874
Broadstone Net Lease, Inc. 187,277 3,387,841
BRT Realty Trust 53,913 853,982
Camden Property Trust (SBI) 470,148 48,965,914
CareTrust (REIT), Inc. 467,876 10,377,490
CatchMark Timber Trust, Inc. 238,344 2,433,492
Cedar Realty Trust, Inc. 63,981 881,658
Centerspace 63,696 4,371,456
Chatham Lodging Trust 228,007 3,176,138
CIM Commercial Trust Corp. 14,548 176,758
City Office REIT, Inc. 216,362 2,198,238
Clipper Realty, Inc. 58,110 507,300
Colony Capital, Inc. 2,330,829 13,798,508
Columbia Property Trust, Inc. 563,521 7,956,917
Community Healthcare Trust, Inc. 110,867 4,859,301
Condor Hospitality Trust, Inc. (a) 9,303 45,678
CorEnergy Infrastructure Trust, Inc. 66,154 494,170
CorePoint Lodging, Inc. 196,341 1,788,667
CoreSite Realty Corp. 205,809 25,049,013
Corporate Office Properties Trust (SBI) 545,283 14,177,358
Cousins Properties, Inc. 717,150 24,053,211
CTO Realty Growth, Inc. (b) 32,737 1,694,140
CubeSmart 947,743 35,028,581
CyrusOne, Inc. 578,212 37,948,054
Copyright © 2021 www.secdatabase.com. All Rights Reserved.Please Consider the Environment Before Printing This Document

DiamondRock Hospitality Co. (a) 966,744 9,783,449
Diversified Healthcare Trust (SBI) 1,167,629 5,254,331
Douglas Emmett, Inc. 802,790 26,291,373
Easterly Government Properties, Inc. 405,696 8,917,198
EastGroup Properties, Inc. 192,476 26,197,908
Empire State Realty Trust, Inc. 724,002 7,971,262
EPR Properties 358,120 16,179,862
Equity Commonwealth 603,681 17,029,841
Equity Lifestyle Properties, Inc. 820,451 50,580,804
Essential Properties Realty Trust, Inc. (b) 510,153 11,835,550
Farmland Partners, Inc. 153,535 1,836,279
First Industrial Realty Trust, Inc. 630,412 26,924,897
Four Corners Property Trust, Inc. 354,785 9,611,126
Franklin Street Properties Corp. 465,801 2,310,373
Gaming & Leisure Properties 1,039,916 46,172,270
Getty Realty Corp. 180,735 5,056,965
Gladstone Commercial Corp. 166,389 3,108,147
Gladstone Land Corp. 105,025 1,878,897
Global Medical REIT, Inc. 198,772 2,677,459
Global Net Lease, Inc. 423,371 7,866,233
Global Self Storage, Inc. 94,056 414,787
Healthcare Realty Trust, Inc. 659,842 19,043,040
Healthcare Trust of America, Inc. 1,061,488 28,830,014
Hersha Hospitality Trust 176,585 1,963,625
Highwoods Properties, Inc. (SBI) 496,930 19,857,323
Hudson Pacific Properties, Inc. 740,968 18,961,371
Independence Realty Trust, Inc. 461,073 6,473,465
Industrial Logistics Properties Trust 314,087 6,680,630
Invitation Homes, Inc. 2,701,344 78,717,164
iStar Financial, Inc. (b) 373,784 6,623,452
JBG SMITH Properties 540,259 17,153,223
Kilroy Realty Corp. 504,893 32,040,510
Kite Realty Group Trust 410,509 7,869,458
Lamar Advertising Co. Class A 416,724 36,084,131
Lexington Corporate Properties Trust 1,335,729 14,319,015
Life Storage, Inc. 352,399 29,566,276
LTC Properties, Inc. 192,594 7,879,021
Mack-Cali Realty Corp. 420,524 5,874,720
Medical Properties Trust, Inc. 2,734,605 59,040,122
Monmouth Real Estate Investment Corp. Class A 493,647 8,549,966
National Health Investors, Inc. 218,261 14,900,678
Copyright © 2021 www.secdatabase.com. All Rights Reserved.Please Consider the Environment Before Printing This Document

National Retail Properties, Inc. 833,658 36,547,567
National Storage Affiliates Trust 303,264 11,690,827
NETSTREIT Corp. 68,776 1,208,394
New Senior Investment Group, Inc. 386,609 2,362,181
NexPoint Residential Trust, Inc. 109,707 4,502,375
Office Properties Income Trust 224,516 5,678,010
Omega Healthcare Investors, Inc. 1,087,674 40,396,212
One Liberty Properties, Inc. 81,505 1,745,022
Outfront Media, Inc. 694,870 14,091,964
Paramount Group, Inc. 857,809 7,951,889
Park Hotels & Resorts, Inc. 1,128,547 24,545,897
Pebblebrook Hotel Trust 624,543 14,152,144
Physicians Realty Trust 1,012,297 17,209,049
Piedmont Office Realty Trust, Inc. Class A 648,832 11,069,074
Plymouth Industrial REIT, Inc. 126,215 1,883,128
Postal Realty Trust, Inc. 40,335 648,587
Potlatch Corp. 321,048 16,293,186
Preferred Apartment Communities, Inc. Class A 234,413 1,929,219
PS Business Parks, Inc. 99,826 14,460,794
QTS Realty Trust, Inc. Class A (b) 312,026 19,383,055
Rayonier, Inc. 663,805 21,666,595
Retail Opportunity Investments Corp. 573,547 9,067,778
Retail Properties America, Inc. 1,044,020 10,993,531
Retail Value, Inc. 82,624 1,379,821
Rexford Industrial Realty, Inc. 636,168 30,357,937
RLJ Lodging Trust 793,500 12,457,950
RPT Realty 392,047 4,300,756
Ryman Hospitality Properties, Inc. 263,476 20,364,060
Sabra Health Care REIT, Inc. 1,003,779 17,285,074
Safehold, Inc. 69,634 5,309,593
Saul Centers, Inc. 62,047 2,197,705
Seritage Growth Properties (a)(b) 174,732 3,527,839
Service Properties Trust 794,285 10,198,619
SITE Centers Corp. 734,703 9,800,938
Sotherly Hotels, Inc. 41,362 152,212
Spirit Realty Capital, Inc. 553,125 23,795,438
Stag Industrial, Inc. 725,668 22,894,825
Store Capital Corp. 1,145,988 38,321,839
Summit Hotel Properties, Inc. 498,217 5,156,546
Sun Communities, Inc. 518,257 78,749,151
Sunstone Hotel Investors, Inc. 1,071,004 14,147,963
Copyright © 2021 www.secdatabase.com. All Rights Reserved.Please Consider the Environment Before Printing This Document
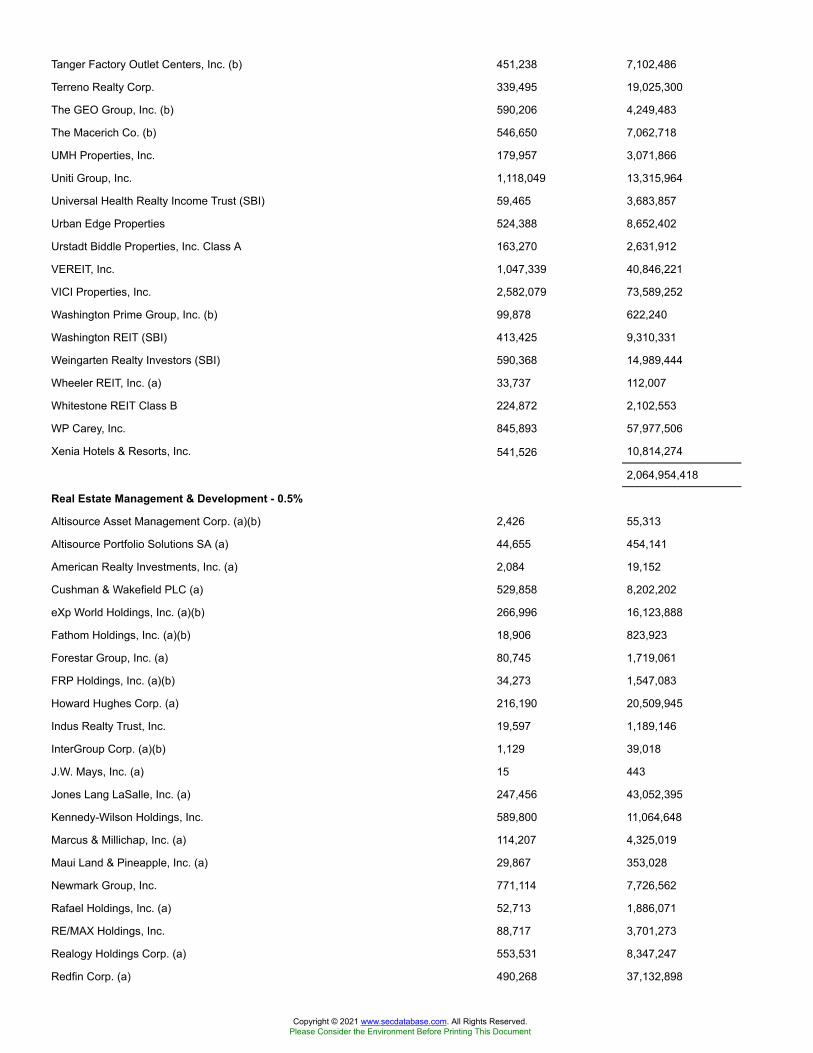
Tanger Factory Outlet Centers, Inc. (b) 451,238 7,102,486
Terreno Realty Corp. 339,495 19,025,300
The GEO Group, Inc. (b) 590,206 4,249,483
The Macerich Co. (b) 546,650 7,062,718
UMH Properties, Inc. 179,957 3,071,866
Uniti Group, Inc. 1,118,049 13,315,964
Universal Health Realty Income Trust (SBI) 59,465 3,683,857
Urban Edge Properties 524,388 8,652,402
Urstadt Biddle Properties, Inc. Class A 163,270 2,631,912
VEREIT, Inc. 1,047,339 40,846,221
VICI Properties, Inc. 2,582,079 73,589,252
Washington Prime Group, Inc. (b) 99,878 622,240
Washington REIT (SBI) 413,425 9,310,331
Weingarten Realty Investors (SBI) 590,368 14,989,444
Wheeler REIT, Inc. (a) 33,737 112,007
Whitestone REIT Class B 224,872 2,102,553
WP Carey, Inc. 845,893 57,977,506
Xenia Hotels & Resorts, Inc. 541,526 10,814,274
2,064,954,418
Real Estate Management & Development - 0.5%
Altisource Asset Management Corp. (a)(b) 2,426 55,313
Altisource Portfolio Solutions SA (a) 44,655 454,141
American Realty Investments, Inc. (a) 2,084 19,152
Cushman & Wakefield PLC (a) 529,858 8,202,202
eXp World Holdings, Inc. (a)(b) 266,996 16,123,888
Fathom Holdings, Inc. (a)(b) 18,906 823,923
Forestar Group, Inc. (a) 80,745 1,719,061
FRP Holdings, Inc. (a)(b) 34,273 1,547,083
Howard Hughes Corp. (a) 216,190 20,509,945
Indus Realty Trust, Inc. 19,597 1,189,146
InterGroup Corp. (a)(b) 1,129 39,018
J.W. Mays, Inc. (a) 15 443
Jones Lang LaSalle, Inc. (a) 247,456 43,052,395
Kennedy-Wilson Holdings, Inc. 589,800 11,064,648
Marcus & Millichap, Inc. (a) 114,207 4,325,019
Maui Land & Pineapple, Inc. (a) 29,867 353,028
Newmark Group, Inc. 771,114 7,726,562
Rafael Holdings, Inc. (a) 52,713 1,886,071
RE/MAX Holdings, Inc. 88,717 3,701,273
Realogy Holdings Corp. (a) 553,531 8,347,247
Redfin Corp. (a) 490,268 37,132,898
Copyright © 2021 www.secdatabase.com. All Rights Reserved.Please Consider the Environment Before Printing This Document
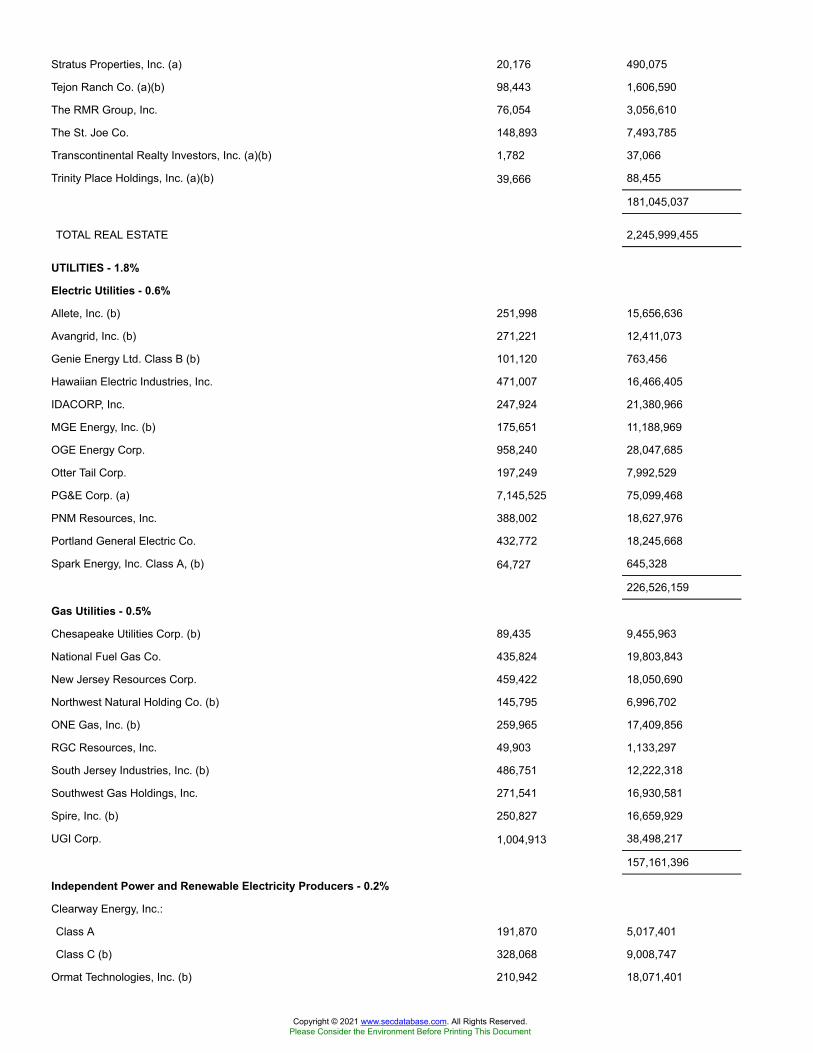
Stratus Properties, Inc. (a) 20,176 490,075
Tejon Ranch Co. (a)(b) 98,443 1,606,590
The RMR Group, Inc. 76,054 3,056,610
The St. Joe Co. 148,893 7,493,785
Transcontinental Realty Investors, Inc. (a)(b) 1,782 37,066
Trinity Place Holdings, Inc. (a)(b) 39,666 88,455
181,045,037
TOTAL REAL ESTATE 2,245,999,455
UTILITIES - 1.8%
Electric Utilities - 0.6%
Allete, Inc. (b) 251,998 15,656,636
Avangrid, Inc. (b) 271,221 12,411,073
Genie Energy Ltd. Class B (b) 101,120 763,456
Hawaiian Electric Industries, Inc. 471,007 16,466,405
IDACORP, Inc. 247,924 21,380,966
MGE Energy, Inc. (b) 175,651 11,188,969
OGE Energy Corp. 958,240 28,047,685
Otter Tail Corp. 197,249 7,992,529
PG&E Corp. (a) 7,145,525 75,099,468
PNM Resources, Inc. 388,002 18,627,976
Portland General Electric Co. 432,772 18,245,668
Spark Energy, Inc. Class A, (b) 64,727 645,328
226,526,159
Gas Utilities - 0.5%
Chesapeake Utilities Corp. (b) 89,435 9,455,963
National Fuel Gas Co. 435,824 19,803,843
New Jersey Resources Corp. 459,422 18,050,690
Northwest Natural Holding Co. (b) 145,795 6,996,702
ONE Gas, Inc. (b) 259,965 17,409,856
RGC Resources, Inc. 49,903 1,133,297
South Jersey Industries, Inc. (b) 486,751 12,222,318
Southwest Gas Holdings, Inc. 271,541 16,930,581
Spire, Inc. (b) 250,827 16,659,929
UGI Corp. 1,004,913 38,498,217
157,161,396
Independent Power and Renewable Electricity Producers - 0.2%
Clearway Energy, Inc.:
Class A 191,870 5,017,401
Class C (b) 328,068 9,008,747
Ormat Technologies, Inc. (b) 210,942 18,071,401
Copyright © 2021 www.secdatabase.com. All Rights Reserved.Please Consider the Environment Before Printing This Document
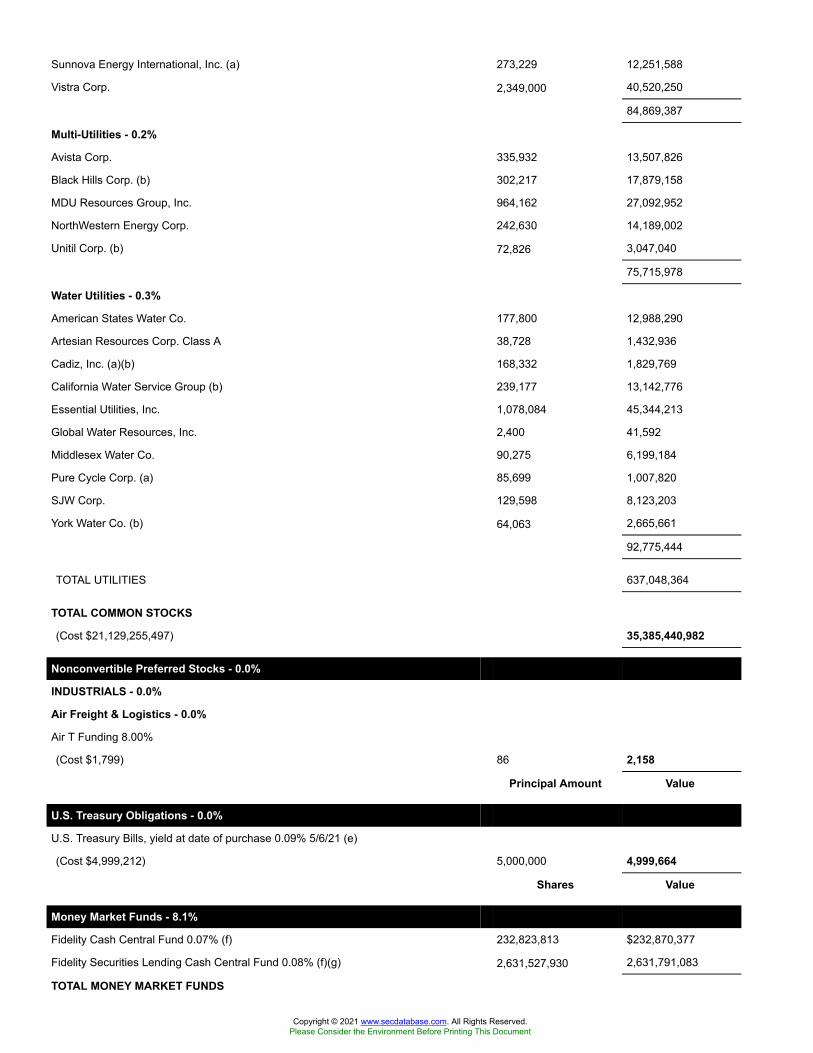
Sunnova Energy International, Inc. (a) 273,229 12,251,588
Vistra Corp. 2,349,000 40,520,250
84,869,387
Multi-Utilities - 0.2%
Avista Corp. 335,932 13,507,826
Black Hills Corp. (b) 302,217 17,879,158
MDU Resources Group, Inc. 964,162 27,092,952
NorthWestern Energy Corp. 242,630 14,189,002
Unitil Corp. (b) 72,826 3,047,040
75,715,978
Water Utilities - 0.3%
American States Water Co. 177,800 12,988,290
Artesian Resources Corp. Class A 38,728 1,432,936
Cadiz, Inc. (a)(b) 168,332 1,829,769
California Water Service Group (b) 239,177 13,142,776
Essential Utilities, Inc. 1,078,084 45,344,213
Global Water Resources, Inc. 2,400 41,592
Middlesex Water Co. 90,275 6,199,184
Pure Cycle Corp. (a) 85,699 1,007,820
SJW Corp. 129,598 8,123,203
York Water Co. (b) 64,063 2,665,661
92,775,444
TOTAL UTILITIES 637,048,364
TOTAL COMMON STOCKS
(Cost $21,129,255,497) 35,385,440,982
Nonconvertible Preferred Stocks - 0.0%
INDUSTRIALS - 0.0%
Air Freight & Logistics - 0.0%
Air T Funding 8.00%
(Cost $1,799) 86 2,158
Principal Amount Value
U.S. Treasury Obligations - 0.0%
U.S. Treasury Bills, yield at date of purchase 0.09% 5/6/21 (e)
(Cost $4,999,212) 5,000,000 4,999,664
Shares Value
Money Market Funds - 8.1%
Fidelity Cash Central Fund 0.07% (f) 232,823,813 $232,870,377
Fidelity Securities Lending Cash Central Fund 0.08% (f)(g) 2,631,527,930 2,631,791,083
TOTAL MONEY MARKET FUNDS
Copyright © 2021 www.secdatabase.com. All Rights Reserved.Please Consider the Environment Before Printing This Document
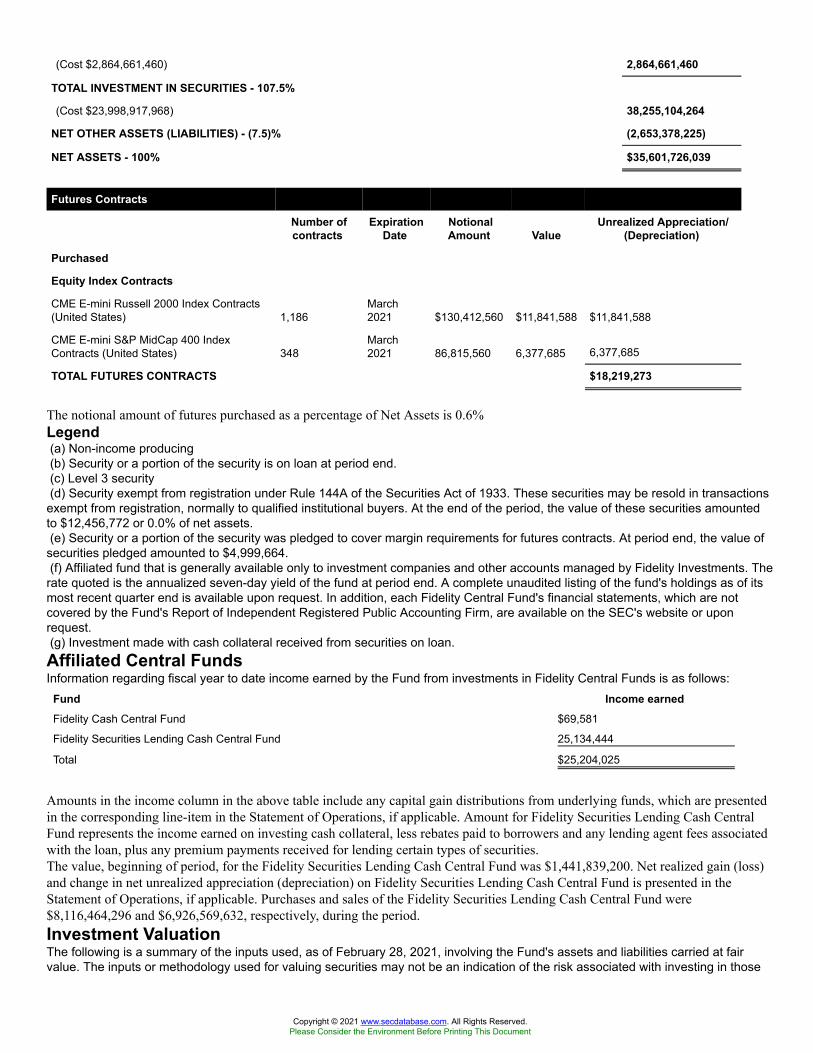
(Cost $2,864,661,460) 2,864,661,460
TOTAL INVESTMENT IN SECURITIES - 107.5%
(Cost $23,998,917,968) 38,255,104,264
NET OTHER ASSETS (LIABILITIES) - (7.5)% (2,653,378,225)
NET ASSETS - 100% $35,601,726,039
Futures Contracts
Number ofcontracts
ExpirationDate
NotionalAmount Value
Unrealized Appreciation/(Depreciation)
Purchased
Equity Index Contracts
CME E-mini Russell 2000 Index Contracts(United States) 1,186
March2021 $130,412,560 $11,841,588 $11,841,588
CME E-mini S&P MidCap 400 IndexContracts (United States) 348
March2021 86,815,560 6,377,685 6,377,685
TOTAL FUTURES CONTRACTS $18,219,273
The notional amount of futures purchased as a percentage of Net Assets is 0.6%Legend(a) Non-income producing(b) Security or a portion of the security is on loan at period end.(c) Level 3 security(d) Security exempt from registration under Rule 144A of the Securities Act of 1933. These securities may be resold in transactions
exempt from registration, normally to qualified institutional buyers. At the end of the period, the value of these securities amountedto $12,456,772 or 0.0% of net assets.(e) Security or a portion of the security was pledged to cover margin requirements for futures contracts. At period end, the value of
securities pledged amounted to $4,999,664.(f) Affiliated fund that is generally available only to investment companies and other accounts managed by Fidelity Investments. The
rate quoted is the annualized seven-day yield of the fund at period end. A complete unaudited listing of the fund's holdings as of itsmost recent quarter end is available upon request. In addition, each Fidelity Central Fund's financial statements, which are notcovered by the Fund's Report of Independent Registered Public Accounting Firm, are available on the SEC's website or uponrequest.(g) Investment made with cash collateral received from securities on loan.Affiliated Central FundsInformation regarding fiscal year to date income earned by the Fund from investments in Fidelity Central Funds is as follows:
Fund Income earnedFidelity Cash Central Fund $69,581
Fidelity Securities Lending Cash Central Fund 25,134,444
Total $25,204,025
Amounts in the income column in the above table include any capital gain distributions from underlying funds, which are presentedin the corresponding line-item in the Statement of Operations, if applicable. Amount for Fidelity Securities Lending Cash CentralFund represents the income earned on investing cash collateral, less rebates paid to borrowers and any lending agent fees associatedwith the loan, plus any premium payments received for lending certain types of securities.The value, beginning of period, for the Fidelity Securities Lending Cash Central Fund was $1,441,839,200. Net realized gain (loss)and change in net unrealized appreciation (depreciation) on Fidelity Securities Lending Cash Central Fund is presented in theStatement of Operations, if applicable. Purchases and sales of the Fidelity Securities Lending Cash Central Fund were$8,116,464,296 and $6,926,569,632, respectively, during the period.Investment ValuationThe following is a summary of the inputs used, as of February 28, 2021, involving the Fund's assets and liabilities carried at fairvalue. The inputs or methodology used for valuing securities may not be an indication of the risk associated with investing in those
Copyright © 2021 www.secdatabase.com. All Rights Reserved.Please Consider the Environment Before Printing This Document

securities. For more information on valuation inputs, and their aggregation into the levels used below, please refer to the InvestmentValuation section in the accompanying Notes to Financial Statements.
Valuation Inputs at Reporting Date:Description Total Level 1 Level 2 Level 3Investments in Securities:Equities:
Communication Services $2,189,344,667 $2,188,276,870 $-- $1,067,797
Consumer Discretionary 4,114,946,502 4,114,934,011 -- 12,491
Consumer Staples 943,569,453 943,569,453 -- --
Energy 634,496,185 634,496,185 -- --
Financials 4,683,581,173 4,683,581,173 -- --
Health Care 5,667,244,248 5,665,830,982 -- 1,413,266
Industrials 4,663,826,729 4,663,796,351 -- 30,378
Information Technology 8,398,258,202 8,398,010,911 247,291 --
Materials 1,207,128,162 1,207,128,162 -- --
Real Estate 2,245,999,455 2,245,999,455 -- --
Utilities 637,048,364 637,048,364 -- --
U.S. Government and Government Agency Obligations 4,999,664 -- 4,999,664 --
Money Market Funds 2,864,661,460 2,864,661,460 -- --
Total Investments in Securities: $38,255,104,264 $38,247,333,377 $5,246,955 $2,523,932
Derivative Instruments:Assets
Futures Contracts $18,219,273 $18,219,273 $-- $--
Total Assets $18,219,273 $18,219,273 $-- $--
Total Derivative Instruments: $18,219,273 $18,219,273 $-- $--
Value of Derivative InstrumentsThe following table is a summary of the Fund's value of derivative instruments by primary risk exposure as of February 28, 2021.For additional information on derivative instruments, please refer to the Derivative Instruments section in the accompanying Notesto Financial Statements.
Primary Risk Exposure / Derivative Type ValueAsset Liability
Equity Risk
Futures Contracts(a) $18,219,273 $0
Total Equity Risk 18,219,273 0
Total Value of Derivatives $18,219,273 $0
(a) Reflects gross cumulative appreciation (depreciation) on futures contracts as presented in the Schedule of Investments. In theStatement of Assets and Liabilities, the period end daily variation margin is included in receivable or payable for daily variationmargin on futures contracts, and the net cumulative appreciation (depreciation) is included in Total accumulated earnings (loss).See accompanying notes which are an integral part of the financial statements.
Fidelity® Extended Market Index Fund
Financial StatementsStatement of Assets and Liabilities
February 28,2021
Copyright © 2021 www.secdatabase.com. All Rights Reserved.Please Consider the Environment Before Printing This Document

AssetsInvestment in securities, at value (including securities loaned of $2,580,466,238) � Seeaccompanying schedule:Unaffiliated issuers (cost $21,134,256,508) $35,390,442,804
Fidelity Central Funds (cost $2,864,661,460) 2,864,661,460
Total Investment in Securities (cost $23,998,917,968) $38,255,104,264
Segregated cash with brokers for derivative instruments 6,903,995
Cash 11,138
Receivable for investments sold 40,171,627
Receivable for fund shares sold 59,394,155
Dividends receivable 15,134,624
Distributions receivable from Fidelity Central Funds 1,731,596
Other receivables 707,303
Total assets 38,379,158,702
LiabilitiesPayable for investments purchased $81,604,960
Payable for fund shares redeemed 61,921,400
Accrued management fee 1,052,783
Payable for daily variation margin on futures contracts 154,244
Other payables and accrued expenses 670,040
Collateral on securities loaned 2,632,029,236
Total liabilities 2,777,432,663
Net Assets $35,601,726,039
Net Assets consist of:
Paid in capital $19,212,641,027
Total accumulated earnings (loss) 16,389,085,012
Net Assets $35,601,726,039
Net Asset Value, offering price and redemption price per share ($35,601,726,039 ÷394,259,101 shares) $90.30
See accompanying notes which are an integral part of the financial statements.
Statement of OperationsYear ended February 28, 2021
Investment IncomeDividends $273,920,561
Interest 6,703
Income from Fidelity Central Funds (including $25,134,444 from security lending) 25,204,025
Total income 299,131,289
ExpensesManagement fee $9,303,475
Independent trustees' fees and expenses 135,777
Interest 12,300
Miscellaneous 15,368
Total expenses before reductions 9,466,920
Expense reductions (12,744)
Total expenses after reductions 9,454,176
Copyright © 2021 www.secdatabase.com. All Rights Reserved.Please Consider the Environment Before Printing This Document
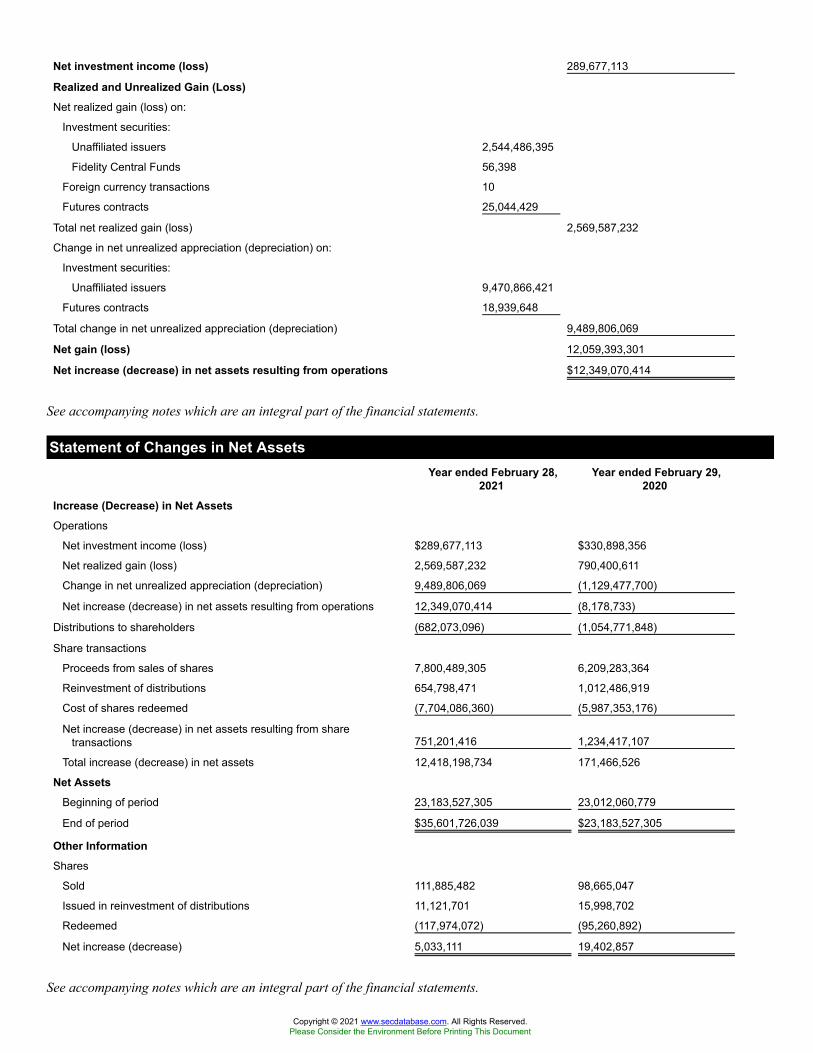
Net investment income (loss) 289,677,113
Realized and Unrealized Gain (Loss)Net realized gain (loss) on:
Investment securities:
Unaffiliated issuers 2,544,486,395
Fidelity Central Funds 56,398
Foreign currency transactions 10
Futures contracts 25,044,429
Total net realized gain (loss) 2,569,587,232
Change in net unrealized appreciation (depreciation) on:
Investment securities:
Unaffiliated issuers 9,470,866,421
Futures contracts 18,939,648
Total change in net unrealized appreciation (depreciation) 9,489,806,069
Net gain (loss) 12,059,393,301
Net increase (decrease) in net assets resulting from operations $12,349,070,414
See accompanying notes which are an integral part of the financial statements.
Statement of Changes in Net AssetsYear ended February 28,
2021Year ended February 29,
2020Increase (Decrease) in Net AssetsOperations
Net investment income (loss) $289,677,113 $330,898,356
Net realized gain (loss) 2,569,587,232 790,400,611
Change in net unrealized appreciation (depreciation) 9,489,806,069 (1,129,477,700)
Net increase (decrease) in net assets resulting from operations 12,349,070,414 (8,178,733)
Distributions to shareholders (682,073,096) (1,054,771,848)
Share transactions
Proceeds from sales of shares 7,800,489,305 6,209,283,364
Reinvestment of distributions 654,798,471 1,012,486,919
Cost of shares redeemed (7,704,086,360) (5,987,353,176)
Net increase (decrease) in net assets resulting from sharetransactions 751,201,416 1,234,417,107
Total increase (decrease) in net assets 12,418,198,734 171,466,526
Net AssetsBeginning of period 23,183,527,305 23,012,060,779
End of period $35,601,726,039 $23,183,527,305
Other InformationShares
Sold 111,885,482 98,665,047
Issued in reinvestment of distributions 11,121,701 15,998,702
Redeemed (117,974,072) (95,260,892)
Net increase (decrease) 5,033,111 19,402,857
See accompanying notes which are an integral part of the financial statements.
Copyright © 2021 www.secdatabase.com. All Rights Reserved.Please Consider the Environment Before Printing This Document

Financial HighlightsFidelity Extended Market Index Fund
Years ended February 28, 2021 2020 A 2019 2018 2017
Selected Per��Share DataNet asset value, beginning of period $59.56 $62.22 $61.68 $58.09 $45.99
Income from Investment Operations
Net investment income (loss)B .75 .86 .88 .83 .81
Net realized and unrealized gain (loss) 31.78 (.72) 2.89 6.24 13.98
Total from investment operations 32.53 .14 3.77 7.07 14.79
Distributions from net investment income (.78) (.92) (.90) (.81) (.76)
Distributions from net realized gain (1.01) (1.88) (2.33) (2.67) (1.93)
Total distributions (1.79) (2.80) (3.23) (3.48) (2.69)
Redemption fees added to paid in capitalB � � � � �C
Net asset value, end of period $90.30 $59.56 $62.22 $61.68 $58.09
Total ReturnD 56.23% - %E 6.77% 12.35% 32.58%
Ratios to Average Net AssetsF,G
Expenses before reductions .04% .05% .05% .05% .05%
Expenses net of fee waivers, if any .04% .05% .05% .05% .05%
Expenses net of all reductions .04% .05% .05% .05% .05%
Net investment income (loss) 1.12% 1.38% 1.47% 1.37% 1.52%
Supplemental DataNet assets, end of period (000 omitted) $35,601,726 $23,183,527 $23,012,061 $2,985,201 $2,219,377
Portfolio turnover rateH 26%I 15% 13%I 11% 12%
A For the year ended February 29.B Calculated based on average shares outstanding during the period.C Amount represents less than $.005 per share.D Total returns would have been lower if certain expenses had not been reduced during the applicable periods shown.E Amount represents less than .005%.F Fees and expenses of any underlying mutual funds or exchange-traded funds (ETFs) are not included in the Fund's expense
ratio. The Fund indirectly bears its proportionate share of these expenses. For additional expense information related to investmentsin Fidelity Central Funds, please refer to the "Investments in Fidelity Central Funds" note found in the Notes to Financial Statementssection of the most recent Annual or Semi-Annual report.G Expense ratios reflect operating expenses of the class. Expenses before reductions do not reflect amounts reimbursed, waived,
or reduced through arrangements with the investment advisor, brokerage services, or other offset arrangements, if applicable, anddo not represent the amount paid by the class during periods when reimbursements, waivers or reductions occur.H Amount does not include the portfolio activity of any underlying mutual funds or exchange-traded funds (ETFs).I Portfolio turnover rate excludes securities received or delivered in-kind.
See accompanying notes which are an integral part of the financial statements.
Fidelity® International Index Fund
Performance: The Bottom LineAverage annual total return reflects the change in the value of an investment, assuming reinvestment of distributions from dividendincome and capital gains (the profits earned upon the sale of securities that have grown in value, if any) and assuming a constant rate
Copyright © 2021 www.secdatabase.com. All Rights Reserved.Please Consider the Environment Before Printing This Document
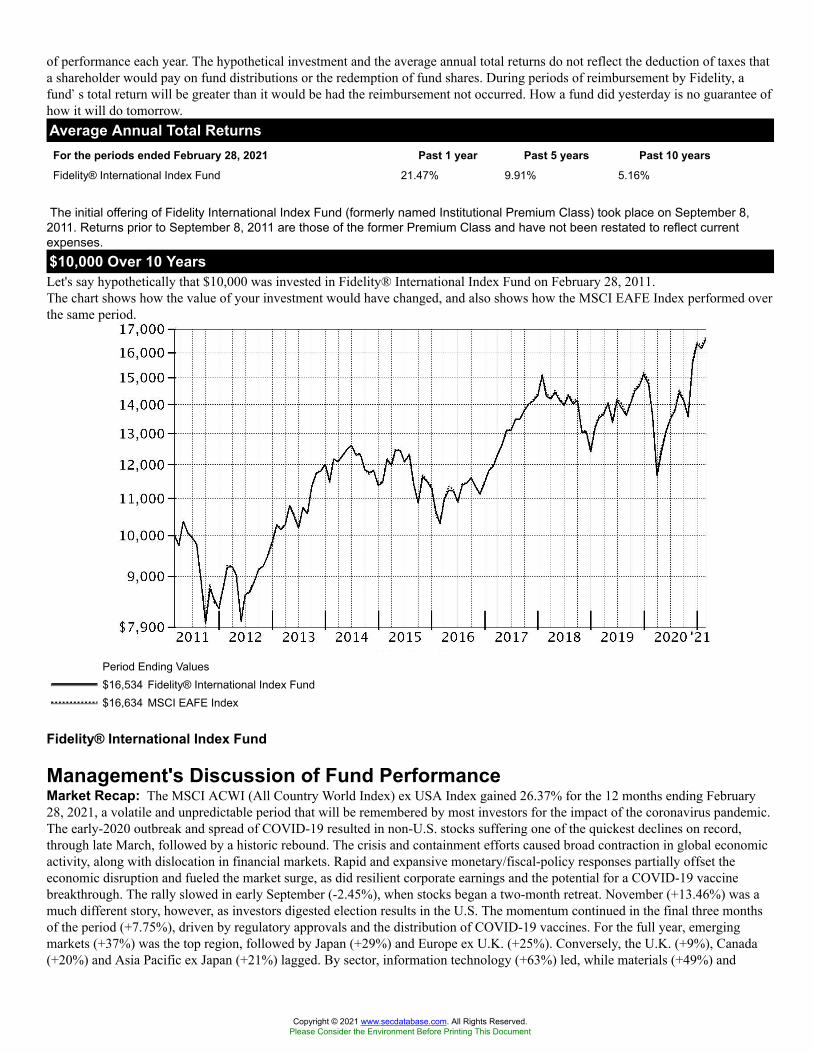
of performance each year. The hypothetical investment and the average annual total returns do not reflect the deduction of taxes thata shareholder would pay on fund distributions or the redemption of fund shares. During periods of reimbursement by Fidelity, afund�s total return will be greater than it would be had the reimbursement not occurred. How a fund did yesterday is no guarantee ofhow it will do tomorrow.Average Annual Total ReturnsFor the periods ended February 28, 2021 Past 1 year Past 5 years Past 10 yearsFidelity® International Index Fund 21.47% 9.91% 5.16%
The initial offering of Fidelity International Index Fund (formerly named Institutional Premium Class) took place on September 8,2011. Returns prior to September 8, 2011 are those of the former Premium Class and have not been restated to reflect currentexpenses.$10,000 Over 10 YearsLet's say hypothetically that $10,000 was invested in Fidelity® International Index Fund on February 28, 2011.The chart shows how the value of your investment would have changed, and also shows how the MSCI EAFE Index performed overthe same period.
Period Ending Values$16,534 Fidelity® International Index Fund$16,634 MSCI EAFE Index
Fidelity® International Index Fund
Management's Discussion of Fund PerformanceMarket Recap: The MSCI ACWI (All Country World Index) ex USA Index gained 26.37% for the 12 months ending February28, 2021, a volatile and unpredictable period that will be remembered by most investors for the impact of the coronavirus pandemic.The early-2020 outbreak and spread of COVID-19 resulted in non-U.S. stocks suffering one of the quickest declines on record,through late March, followed by a historic rebound. The crisis and containment efforts caused broad contraction in global economicactivity, along with dislocation in financial markets. Rapid and expansive monetary/fiscal-policy responses partially offset theeconomic disruption and fueled the market surge, as did resilient corporate earnings and the potential for a COVID-19 vaccinebreakthrough. The rally slowed in early September (-2.45%), when stocks began a two-month retreat. November (+13.46%) was amuch different story, however, as investors digested election results in the U.S. The momentum continued in the final three monthsof the period (+7.75%), driven by regulatory approvals and the distribution of COVID-19 vaccines. For the full year, emergingmarkets (+37%) was the top region, followed by Japan (+29%) and Europe ex U.K. (+25%). Conversely, the U.K. (+9%), Canada(+20%) and Asia Pacific ex Japan (+21%) lagged. By sector, information technology (+63%) led, while materials (+49%) and
Copyright © 2021 www.secdatabase.com. All Rights Reserved.Please Consider the Environment Before Printing This Document
consumer discretionary (+43%) also stood out. In contrast, real estate (+2%), energy (+4%) and utilities (+7%) notablyunderperformed.Comments from the Geode Capital Management, LLC, passive equity index team: For the fiscal year endingFebruary 28, 2021, the fund gained 21.47%, roughly in line with the 22.68% advance of the benchmark MSCI EAFE Index. (Thefund's performance relative to the index can be affected by Fidelity's methodologies for valuing certain foreign stocks and forincorporating foreign exchange rates, which differ from those used by the index.) By region, notable contributors included Japan(+29%) and Europe ex U.K. (+23%), with the latter driven by Germany (+26%). By sector, industrials gained 28% and contributedmost, boosted by the capital goods industry (+32%), followed by the consumer discretionary (+36%) and materials (+49%) sectors.The information technology sector rose about 41%, financials gained 16%, and health care advanced roughly 13%. Other notablecontributors included the communication services (+27%), consumer staples (+9%), utilities (+6%), energy (+4%), and real estate(+3%) sectors. Turning to individual stocks, the biggest individual contributor was ASML Holding (+107%), from thesemiconductors & semiconductor equipment group. In materials, BHP (+83%) and Rio Tinto (+96%) helped. SoftBank Group,within the telecommunication services category, advanced approximately 102% and lifted the fund. Another contributor was LVMHMoet Hennessy Louis Vuitton (+56%), a stock in the consumer durables & apparel industry. Conversely, the biggest individualdetractor was HSBC Holdings (-15%), from the banks segment, followed by BP (-14%), which is in the energy sector. Withinsoftware & services, Wirecard returned -99% and hurt. Other notable detractors were GlaxoSmithKline (-12%), a stock in thepharmaceuticals, biotechnology & life sciences industry, and Unilever (+2%), from the household & personal products segment.The views expressed above reflect those of the portfolio manager(s) only through the end of the period as stated on the cover of thisreport and do not necessarily represent the views of Fidelity or any other person in the Fidelity organization. Any such views aresubject to change at any time based upon market or other conditions and Fidelity disclaims any responsibility to update such views.These views may not be relied on as investment advice and, because investment decisions for a Fidelity fund are based on numerousfactors, may not be relied on as an indication of trading intent on behalf of any Fidelity fund.Fidelity® International Index Fund
Investment Summary (Unaudited)Top Ten Stocks as of February 28, 2021
% of fund's net assetsNestle SA (Reg. S) (Switzerland, Food Products) 1.8
ASML Holding NV (Netherlands) (Netherlands, Semiconductors & Semiconductor Equipment) 1.5
Roche Holding AG (participation certificate) (Switzerland, Pharmaceuticals) 1.4
Novartis AG (Switzerland, Pharmaceuticals) 1.2
LVMH Moet Hennessy Louis Vuitton SE (France, Textiles, Apparel & Luxury Goods) 1.1
Toyota Motor Corp. (Japan, Automobiles) 1.0
AIA Group Ltd. (Hong Kong, Insurance) 0.9
SoftBank Group Corp. (Japan, Wireless Telecommunication Services) 0.9
Unilever PLC (United Kingdom, Personal Products) 0.8
Sony Corp. (Japan, Household Durables) 0.8
11.4
Top Market Sectors as of February 28, 2021% of fund's net assets
Financials 16.5
Industrials 15.6
Consumer Discretionary 12.3
Health Care 11.8
Consumer Staples 9.3
Information Technology 8.8
Materials 8.1
Communication Services 4.7
Utilities 3.3
Copyright © 2021 www.secdatabase.com. All Rights Reserved.Please Consider the Environment Before Printing This Document
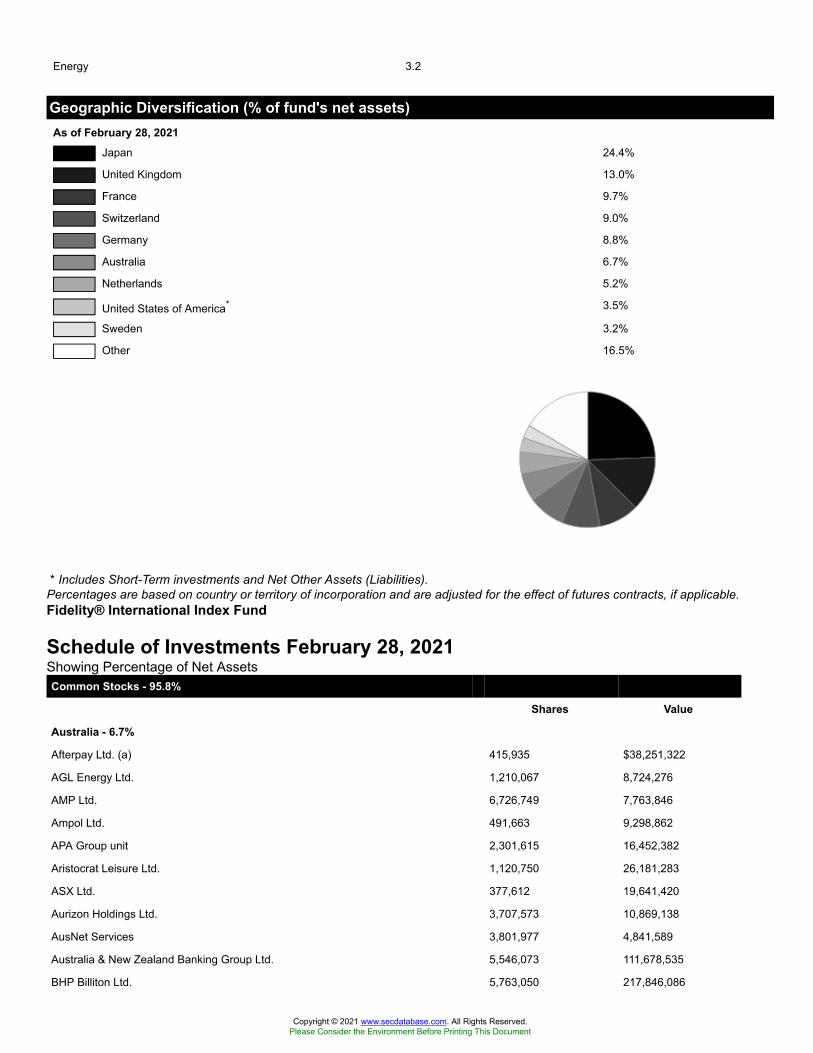
Energy 3.2
Geographic Diversification (% of fund's net assets)As of February 28, 2021
Japan 24.4%
United Kingdom 13.0%
France 9.7%
Switzerland 9.0%
Germany 8.8%
Australia 6.7%
Netherlands 5.2%
United States of America* 3.5%
Sweden 3.2%
Other 16.5%
* Includes Short-Term investments and Net Other Assets (Liabilities).Percentages are based on country or territory of incorporation and are adjusted for the effect of futures contracts, if applicable.Fidelity® International Index Fund
Schedule of Investments February 28, 2021Showing Percentage of Net AssetsCommon Stocks - 95.8%
Shares Value
Australia - 6.7%
Afterpay Ltd. (a) 415,935 $38,251,322
AGL Energy Ltd. 1,210,067 8,724,276
AMP Ltd. 6,726,749 7,763,846
Ampol Ltd. 491,663 9,298,862
APA Group unit 2,301,615 16,452,382
Aristocrat Leisure Ltd. 1,120,750 26,181,283
ASX Ltd. 377,612 19,641,420
Aurizon Holdings Ltd. 3,707,573 10,869,138
AusNet Services 3,801,977 4,841,589
Australia & New Zealand Banking Group Ltd. 5,546,073 111,678,535
BHP Billiton Ltd. 5,763,050 217,846,086
Copyright © 2021 www.secdatabase.com. All Rights Reserved.Please Consider the Environment Before Printing This Document
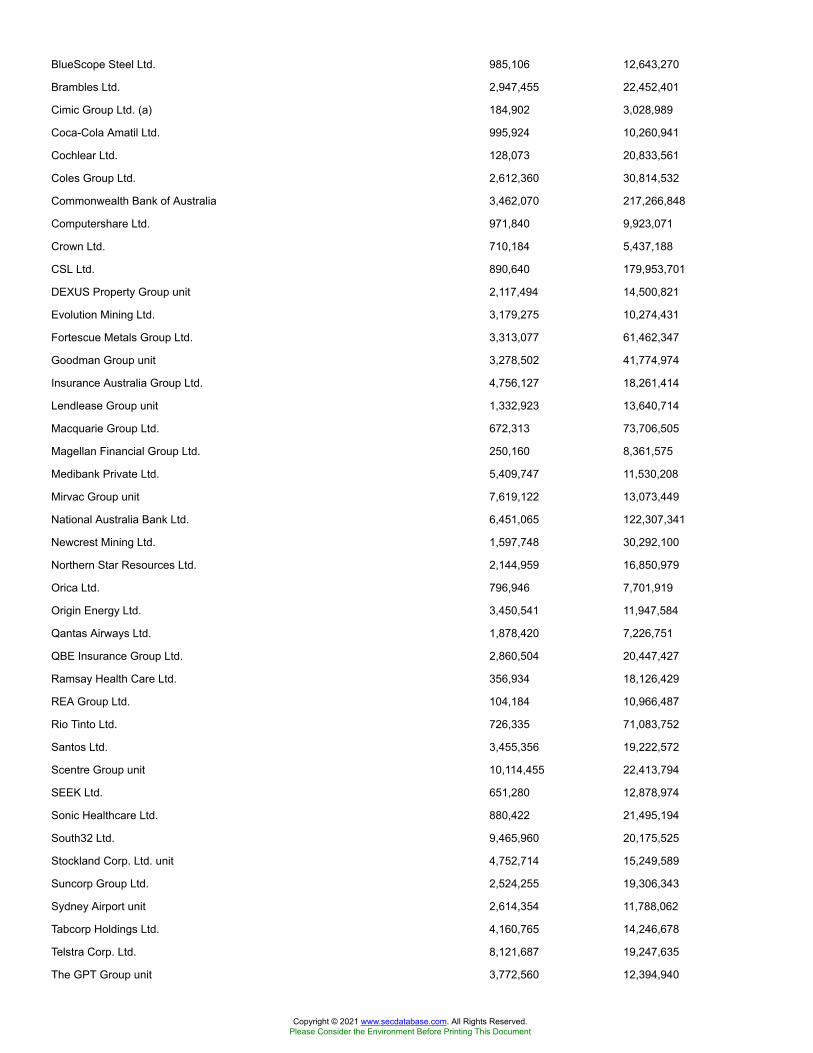
BlueScope Steel Ltd. 985,106 12,643,270
Brambles Ltd. 2,947,455 22,452,401
Cimic Group Ltd. (a) 184,902 3,028,989
Coca-Cola Amatil Ltd. 995,924 10,260,941
Cochlear Ltd. 128,073 20,833,561
Coles Group Ltd. 2,612,360 30,814,532
Commonwealth Bank of Australia 3,462,070 217,266,848
Computershare Ltd. 971,840 9,923,071
Crown Ltd. 710,184 5,437,188
CSL Ltd. 890,640 179,953,701
DEXUS Property Group unit 2,117,494 14,500,821
Evolution Mining Ltd. 3,179,275 10,274,431
Fortescue Metals Group Ltd. 3,313,077 61,462,347
Goodman Group unit 3,278,502 41,774,974
Insurance Australia Group Ltd. 4,756,127 18,261,414
Lendlease Group unit 1,332,923 13,640,714
Macquarie Group Ltd. 672,313 73,706,505
Magellan Financial Group Ltd. 250,160 8,361,575
Medibank Private Ltd. 5,409,747 11,530,208
Mirvac Group unit 7,619,122 13,073,449
National Australia Bank Ltd. 6,451,065 122,307,341
Newcrest Mining Ltd. 1,597,748 30,292,100
Northern Star Resources Ltd. 2,144,959 16,850,979
Orica Ltd. 796,946 7,701,919
Origin Energy Ltd. 3,450,541 11,947,584
Qantas Airways Ltd. 1,878,420 7,226,751
QBE Insurance Group Ltd. 2,860,504 20,447,427
Ramsay Health Care Ltd. 356,934 18,126,429
REA Group Ltd. 104,184 10,966,487
Rio Tinto Ltd. 726,335 71,083,752
Santos Ltd. 3,455,356 19,222,572
Scentre Group unit 10,114,455 22,413,794
SEEK Ltd. 651,280 12,878,974
Sonic Healthcare Ltd. 880,422 21,495,194
South32 Ltd. 9,465,960 20,175,525
Stockland Corp. Ltd. unit 4,752,714 15,249,589
Suncorp Group Ltd. 2,524,255 19,306,343
Sydney Airport unit 2,614,354 11,788,062
Tabcorp Holdings Ltd. 4,160,765 14,246,678
Telstra Corp. Ltd. 8,121,687 19,247,635
The GPT Group unit 3,772,560 12,394,940
Copyright © 2021 www.secdatabase.com. All Rights Reserved.Please Consider the Environment Before Printing This Document

TPG Telecom Ltd. 731,690 3,828,392
Transurban Group unit 5,360,780 52,798,108
Treasury Wine Estates Ltd. 1,411,741 11,840,279
Vicinity Centres unit 7,748,007 9,777,195
Washington H. Soul Pattinson & Co. Ltd. 213,740 4,914,132
Wesfarmers Ltd. 2,218,979 84,072,050
Westpac Banking Corp. 7,073,438 129,671,869
WiseTech Global Ltd. 279,599 5,866,798
Woodside Petroleum Ltd. 1,868,580 35,326,227
Woolworths Group Ltd. 2,471,642 74,931,114
TOTAL AUSTRALIA 2,169,145,918
Austria - 0.2%
Erste Group Bank AG 553,628 18,229,170
OMV AG 290,449 13,968,588
Raiffeisen International Bank-Holding AG 304,751 6,184,669
Verbund AG 132,881 10,132,702
Voestalpine AG 230,449 9,131,104
TOTAL AUSTRIA 57,646,233
Bailiwick of Jersey - 0.7%
Experian PLC 1,793,121 56,920,517
Ferguson PLC 439,903 52,045,398
Glencore Xstrata PLC 19,546,752 79,547,480
WPP PLC 2,413,259 28,861,234
TOTAL BAILIWICK OF JERSEY 217,374,629
Belgium - 0.8%
Ageas 345,669 19,376,930
Anheuser-Busch InBev SA NV 1,491,109 85,803,839
Colruyt NV 108,205 6,480,737
Elia System Operator SA/NV 61,301 6,627,060
Galapagos Genomics NV (a) 82,983 6,852,021
Groupe Bruxelles Lambert SA 221,359 21,943,350
KBC Groep NV 486,448 34,992,399
Proximus 297,650 5,817,900
Sofina SA 30,389 10,064,775
Solvay SA Class A 145,178 17,709,132
UCB SA 247,465 24,614,844
Umicore SA 384,024 22,560,930
TOTAL BELGIUM 262,843,917
Copyright © 2021 www.secdatabase.com. All Rights Reserved.Please Consider the Environment Before Printing This Document
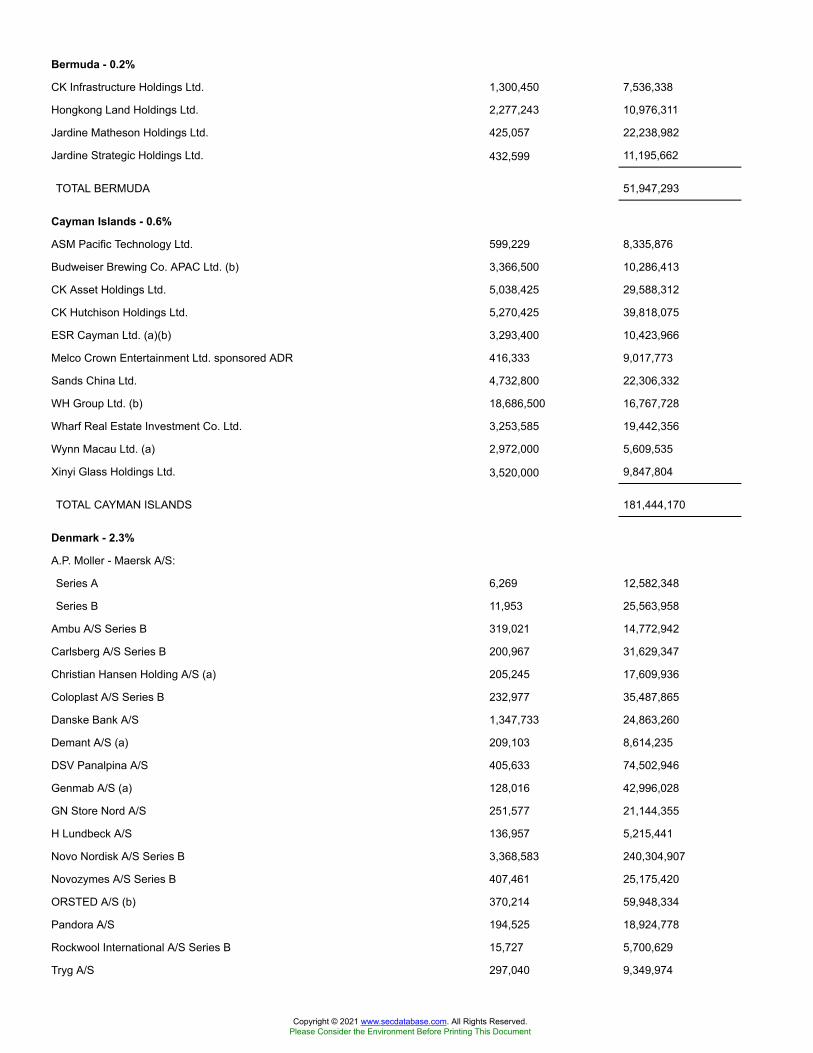
Bermuda - 0.2%
CK Infrastructure Holdings Ltd. 1,300,450 7,536,338
Hongkong Land Holdings Ltd. 2,277,243 10,976,311
Jardine Matheson Holdings Ltd. 425,057 22,238,982
Jardine Strategic Holdings Ltd. 432,599 11,195,662
TOTAL BERMUDA 51,947,293
Cayman Islands - 0.6%
ASM Pacific Technology Ltd. 599,229 8,335,876
Budweiser Brewing Co. APAC Ltd. (b) 3,366,500 10,286,413
CK Asset Holdings Ltd. 5,038,425 29,588,312
CK Hutchison Holdings Ltd. 5,270,425 39,818,075
ESR Cayman Ltd. (a)(b) 3,293,400 10,423,966
Melco Crown Entertainment Ltd. sponsored ADR 416,333 9,017,773
Sands China Ltd. 4,732,800 22,306,332
WH Group Ltd. (b) 18,686,500 16,767,728
Wharf Real Estate Investment Co. Ltd. 3,253,585 19,442,356
Wynn Macau Ltd. (a) 2,972,000 5,609,535
Xinyi Glass Holdings Ltd. 3,520,000 9,847,804
TOTAL CAYMAN ISLANDS 181,444,170
Denmark - 2.3%
A.P. Moller - Maersk A/S:
Series A 6,269 12,582,348
Series B 11,953 25,563,958
Ambu A/S Series B 319,021 14,772,942
Carlsberg A/S Series B 200,967 31,629,347
Christian Hansen Holding A/S (a) 205,245 17,609,936
Coloplast A/S Series B 232,977 35,487,865
Danske Bank A/S 1,347,733 24,863,260
Demant A/S (a) 209,103 8,614,235
DSV Panalpina A/S 405,633 74,502,946
Genmab A/S (a) 128,016 42,996,028
GN Store Nord A/S 251,577 21,144,355
H Lundbeck A/S 136,957 5,215,441
Novo Nordisk A/S Series B 3,368,583 240,304,907
Novozymes A/S Series B 407,461 25,175,420
ORSTED A/S (b) 370,214 59,948,334
Pandora A/S 194,525 18,924,778
Rockwool International A/S Series B 15,727 5,700,629
Tryg A/S 297,040 9,349,974
Copyright © 2021 www.secdatabase.com. All Rights Reserved.Please Consider the Environment Before Printing This Document

Vestas Wind Systems A/S 386,340 72,448,441
TOTAL DENMARK 746,835,144
Finland - 1.2%
Elisa Corp. (A Shares) 279,335 16,632,512
Fortum Corp. 865,796 21,613,315
Kesko Oyj 530,450 13,465,904
Kone OYJ (B Shares) 664,683 52,994,394
Neste Oyj 827,946 54,403,266
Nokia Corp. (a) 11,057,292 44,053,567
Nordea Bank ABP (Stockholm Stock Exchange) 6,362,242 57,621,716
Orion Oyj (B Shares) 207,307 8,496,789
Sampo Oyj (A Shares) 924,670 41,134,406
Stora Enso Oyj (R Shares) 1,136,535 22,386,249
UPM-Kymmene Corp. 1,040,373 39,666,280
Wartsila Corp. 867,496 9,945,528
TOTAL FINLAND 382,413,926
France - 9.6%
Accor SA (a) 355,695 14,831,901
Aeroports de Paris SA 58,273 7,396,537
Air Liquide SA 570,221 85,872,385
Alstom SA (a) 490,204 24,434,188
Amundi SA (b) 118,751 9,026,578
Arkema SA 136,221 15,038,706
Atos Origin SA (a) 192,121 14,979,148
AXA SA 3,793,141 95,390,856
bioMerieux SA 81,089 10,292,550
BNP Paribas SA 2,205,971 131,139,254
Bollore SA 1,686,637 8,070,857
Bouygues SA 445,434 18,036,432
Bureau Veritas SA 579,854 15,664,555
Capgemini SA 316,725 50,882,546
Carrefour SA 1,198,666 20,891,088
CNP Assurances 354,829 6,383,253
Compagnie de St. Gobain (a) 1,000,798 53,819,256
Compagnie Generale des Etablissements Michelin SCA Series B 330,752 47,823,712
Covivio 104,575 8,788,086
Credit Agricole SA (a) 2,250,487 31,538,501
Danone SA 1,209,971 82,279,137
Dassault Aviation SA (a) 4,788 5,158,827
Copyright © 2021 www.secdatabase.com. All Rights Reserved.Please Consider the Environment Before Printing This Document

Dassault Systemes SA 259,554 53,833,042
Edenred SA 480,545 26,607,094
EDF SA (a) 200,740 2,399,746
EDF SA 1,206,929 14,428,230
Eiffage SA 165,881 17,044,239
ENGIE (a) 3,577,800 52,168,462
Essilor International SA 556,377 90,763,588
Eurazeo SA (a) 76,790 5,684,137
Faurecia SA (a) 165,484 8,547,647
Gecina SA 88,568 12,257,039
Getlink SE (a) 875,121 14,328,254
Hermes International SCA 62,110 69,183,519
Iliad SA 29,138 5,153,936
Ipsen SA 72,271 6,160,579
Kering SA 148,507 94,052,170
Klepierre SA 376,107 8,871,632
L'Oreal SA (a) 201,944 73,699,413
L'Oreal SA 290,189 105,904,404
La Francaise des Jeux SAEM (b) 172,469 7,780,577
Legrand SA 521,674 45,268,301
LVMH Moet Hennessy Louis Vuitton SE 543,340 344,270,526
Natixis SA (a) 1,812,301 8,825,246
Orange SA 3,908,578 45,033,915
Orpea (a) 101,055 12,129,388
Pernod Ricard SA 410,349 77,905,021
Publicis Groupe SA 423,646 24,811,225
Remy Cointreau SA 43,590 8,309,775
Renault SA 375,023 16,798,468
Safran SA (a) 628,483 85,670,128
Sanofi SA 2,216,463 203,406,376
Sartorius Stedim Biotech 54,072 23,617,087
Schneider Electric SA 1,055,816 156,128,139
SCOR SE 309,746 10,269,936
SEB SA 45,452 8,154,724
Societe Generale Series A 1,581,097 39,126,401
Sodexo SA 90,520 8,652,163
Sodexo SA (a) 84,696 8,095,488
SR Teleperformance SA 115,341 40,789,169
Suez Environnement SA 677,122 14,092,932
Thales SA 207,735 19,660,410
Total SA 4,929,691 229,872,100
Copyright © 2021 www.secdatabase.com. All Rights Reserved.Please Consider the Environment Before Printing This Document
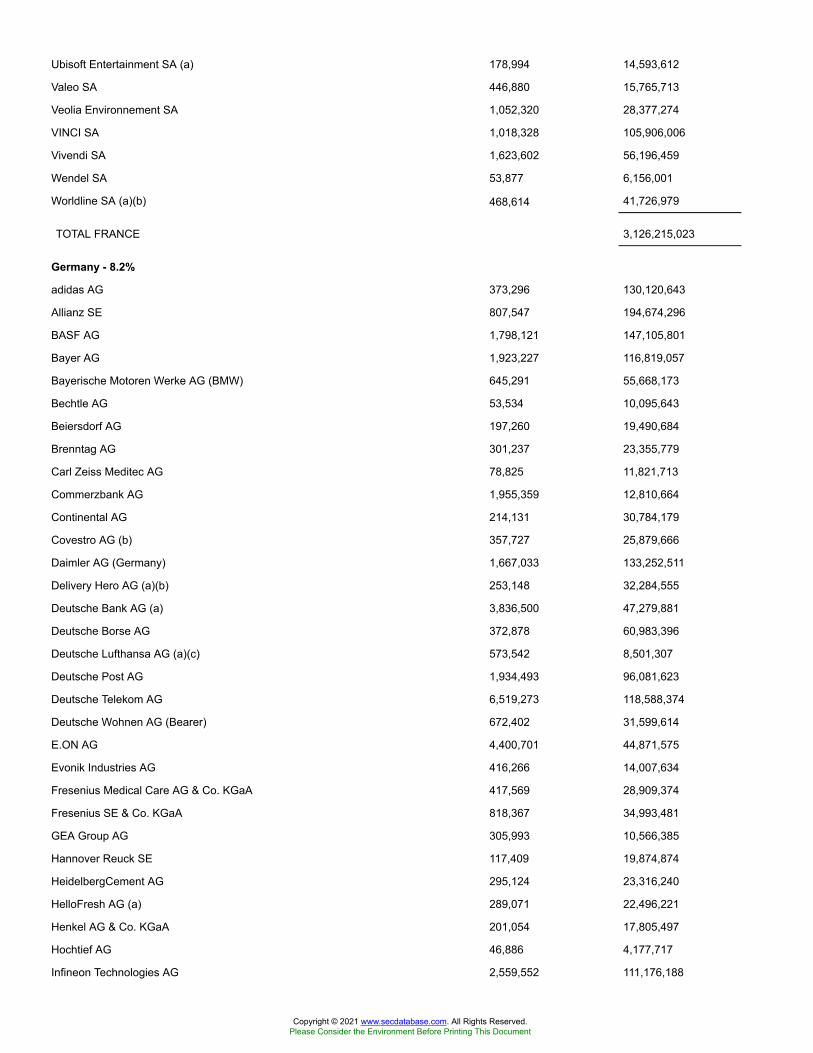
Ubisoft Entertainment SA (a) 178,994 14,593,612
Valeo SA 446,880 15,765,713
Veolia Environnement SA 1,052,320 28,377,274
VINCI SA 1,018,328 105,906,006
Vivendi SA 1,623,602 56,196,459
Wendel SA 53,877 6,156,001
Worldline SA (a)(b) 468,614 41,726,979
TOTAL FRANCE 3,126,215,023
Germany - 8.2%
adidas AG 373,296 130,120,643
Allianz SE 807,547 194,674,296
BASF AG 1,798,121 147,105,801
Bayer AG 1,923,227 116,819,057
Bayerische Motoren Werke AG (BMW) 645,291 55,668,173
Bechtle AG 53,534 10,095,643
Beiersdorf AG 197,260 19,490,684
Brenntag AG 301,237 23,355,779
Carl Zeiss Meditec AG 78,825 11,821,713
Commerzbank AG 1,955,359 12,810,664
Continental AG 214,131 30,784,179
Covestro AG (b) 357,727 25,879,666
Daimler AG (Germany) 1,667,033 133,252,511
Delivery Hero AG (a)(b) 253,148 32,284,555
Deutsche Bank AG (a) 3,836,500 47,279,881
Deutsche Borse AG 372,878 60,983,396
Deutsche Lufthansa AG (a)(c) 573,542 8,501,307
Deutsche Post AG 1,934,493 96,081,623
Deutsche Telekom AG 6,519,273 118,588,374
Deutsche Wohnen AG (Bearer) 672,402 31,599,614
E.ON AG 4,400,701 44,871,575
Evonik Industries AG 416,266 14,007,634
Fresenius Medical Care AG & Co. KGaA 417,569 28,909,374
Fresenius SE & Co. KGaA 818,367 34,993,481
GEA Group AG 305,993 10,566,385
Hannover Reuck SE 117,409 19,874,874
HeidelbergCement AG 295,124 23,316,240
HelloFresh AG (a) 289,071 22,496,221
Henkel AG & Co. KGaA 201,054 17,805,497
Hochtief AG 46,886 4,177,717
Infineon Technologies AG 2,559,552 111,176,188
Copyright © 2021 www.secdatabase.com. All Rights Reserved.Please Consider the Environment Before Printing This Document

KION Group AG 143,512 12,110,419
Knorr-Bremse AG 142,969 18,205,570
Lanxess AG 165,818 12,268,152
LEG Immobilien AG 139,966 19,106,628
Merck KGaA 252,831 41,044,914
MTU Aero Engines Holdings AG (c) 103,339 24,562,683
Muenchener Rueckversicherungs-Gesellschaft AG in Muenchen 274,851 80,584,018
Nemetschek Se 115,639 7,276,189
Puma AG 191,204 20,296,738
Rational AG 9,919 8,485,148
RWE AG 1,258,633 47,593,038
SAP SE 2,043,555 252,760,512
Scout24 AG (b) 214,066 16,129,669
Siemens AG 1,497,702 231,786,260
Siemens Healthineers AG (b) 526,289 29,101,775
Symrise AG 251,771 29,381,050
TeamViewer AG (a)(b) 294,333 15,803,173
Telefonica Deutschland Holding AG 2,072,171 5,525,393
Uniper SE 394,742 13,812,003
United Internet AG 208,824 9,191,377
Volkswagen AG 67,291 15,726,494
Vonovia SE 1,020,386 64,930,678
Zalando SE (a)(b) 299,191 30,691,276
TOTAL GERMANY 2,645,765,902
Hong Kong - 2.6%
AIA Group Ltd. 23,672,800 298,547,862
Bank of East Asia Ltd. 2,537,761 5,993,951
BOC Hong Kong (Holdings) Ltd. 7,204,066 23,962,625
CLP Holdings Ltd. 3,201,657 31,257,598
Galaxy Entertainment Group Ltd. 4,245,000 38,802,609
Hang Lung Properties Ltd. 3,954,423 10,247,459
Hang Seng Bank Ltd. 1,491,101 28,836,020
Henderson Land Development Co. Ltd. 2,920,381 12,721,247
Hong Kong & China Gas Co. Ltd. 20,919,705 31,571,679
Hong Kong Exchanges and Clearing Ltd. 2,358,738 143,900,215
Link (REIT) 4,070,382 38,413,445
MTR Corp. Ltd. 2,997,342 17,988,419
New World Development Co. Ltd. 2,942,450 14,965,564
PCCW Ltd. 8,376,612 4,805,797
Power Assets Holdings Ltd. 2,731,176 15,176,232
Copyright © 2021 www.secdatabase.com. All Rights Reserved.Please Consider the Environment Before Printing This Document
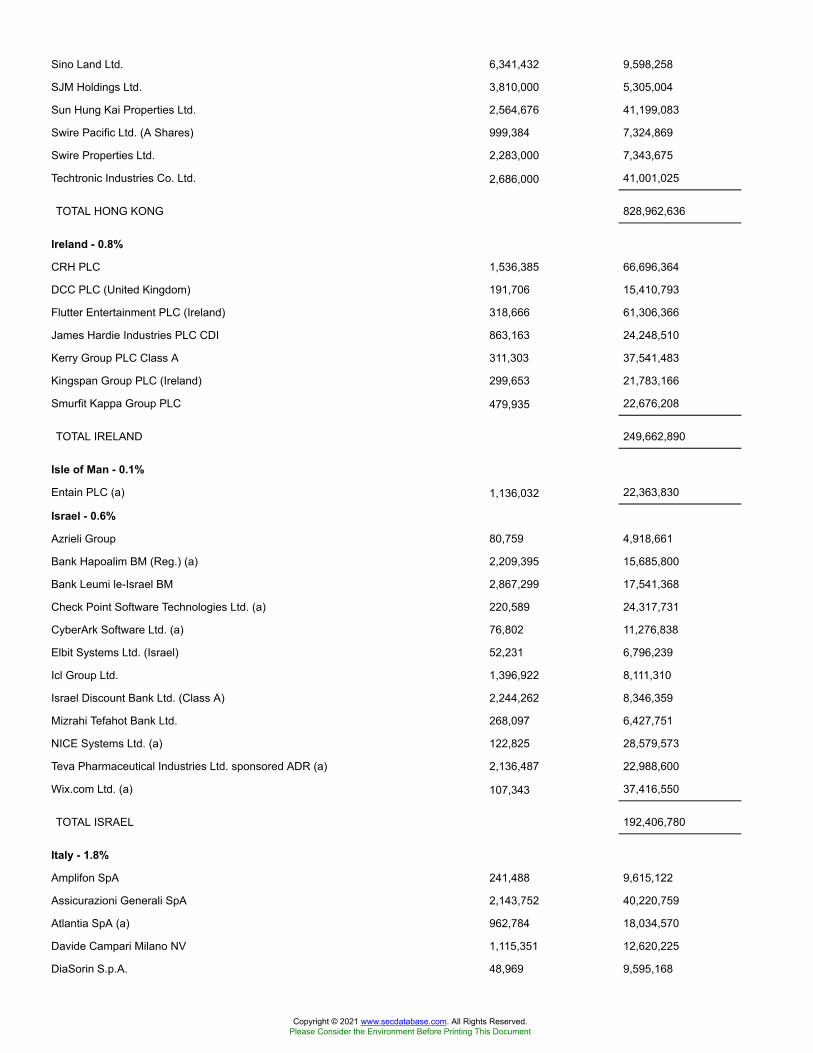
Sino Land Ltd. 6,341,432 9,598,258
SJM Holdings Ltd. 3,810,000 5,305,004
Sun Hung Kai Properties Ltd. 2,564,676 41,199,083
Swire Pacific Ltd. (A Shares) 999,384 7,324,869
Swire Properties Ltd. 2,283,000 7,343,675
Techtronic Industries Co. Ltd. 2,686,000 41,001,025
TOTAL HONG KONG 828,962,636
Ireland - 0.8%
CRH PLC 1,536,385 66,696,364
DCC PLC (United Kingdom) 191,706 15,410,793
Flutter Entertainment PLC (Ireland) 318,666 61,306,366
James Hardie Industries PLC CDI 863,163 24,248,510
Kerry Group PLC Class A 311,303 37,541,483
Kingspan Group PLC (Ireland) 299,653 21,783,166
Smurfit Kappa Group PLC 479,935 22,676,208
TOTAL IRELAND 249,662,890
Isle of Man - 0.1%
Entain PLC (a) 1,136,032 22,363,830
Israel - 0.6%
Azrieli Group 80,759 4,918,661
Bank Hapoalim BM (Reg.) (a) 2,209,395 15,685,800
Bank Leumi le-Israel BM 2,867,299 17,541,368
Check Point Software Technologies Ltd. (a) 220,589 24,317,731
CyberArk Software Ltd. (a) 76,802 11,276,838
Elbit Systems Ltd. (Israel) 52,231 6,796,239
Icl Group Ltd. 1,396,922 8,111,310
Israel Discount Bank Ltd. (Class A) 2,244,262 8,346,359
Mizrahi Tefahot Bank Ltd. 268,097 6,427,751
NICE Systems Ltd. (a) 122,825 28,579,573
Teva Pharmaceutical Industries Ltd. sponsored ADR (a) 2,136,487 22,988,600
Wix.com Ltd. (a) 107,343 37,416,550
TOTAL ISRAEL 192,406,780
Italy - 1.8%
Amplifon SpA 241,488 9,615,122
Assicurazioni Generali SpA 2,143,752 40,220,759
Atlantia SpA (a) 962,784 18,034,570
Davide Campari Milano NV 1,115,351 12,620,225
DiaSorin S.p.A. 48,969 9,595,168
Copyright © 2021 www.secdatabase.com. All Rights Reserved.Please Consider the Environment Before Printing This Document

Enel SpA 15,918,237 150,091,487
Eni SpA 4,952,571 56,622,839
FinecoBank SpA 1,188,601 20,894,932
Infrastrutture Wireless Italiane SpA (b) 652,529 6,782,666
Intesa Sanpaolo SpA 32,554,153 83,697,757
Mediobanca SpA (a) 1,271,445 13,220,546
Moncler SpA 377,416 23,360,546
Nexi SpA (a)(b) 855,691 15,367,780
Poste Italiane SpA (b) 1,004,313 11,395,333
Prysmian SpA 470,223 15,142,506
Recordati SpA 204,112 10,377,874
Snam Rete Gas SpA 3,898,241 20,205,904
Telecom Italia SpA 16,772,096 7,963,646
Telecom Italia SpA (Risparmio Shares) 11,823,229 6,336,654
Terna SpA 2,741,387 19,078,355
UniCredit SpA 4,132,193 42,577,856
TOTAL ITALY 593,202,525
Japan - 24.4%
ABC-MART, Inc. 64,900 3,689,610
ACOM Co. Ltd. 778,100 3,467,306
Advantest Corp. 390,400 32,249,828
AEON Co. Ltd. 1,280,300 38,660,617
AEON MALL Co. Ltd. 199,240 3,349,482
AGC, Inc. 375,435 13,835,060
Air Water, Inc. 352,700 5,796,992
Aisin Seiki Co. Ltd. 316,000 10,746,283
Ajinomoto Co., Inc. 909,966 18,131,180
Alfresa Holdings Corp. 369,200 7,114,187
Amada Co. Ltd. 623,000 7,611,825
Ana Holdings, Inc. (a) 304,900 7,368,708
Asahi Group Holdings 889,303 38,824,404
ASAHI INTECC Co. Ltd. 381,600 10,936,611
Asahi Kasei Corp. 2,455,027 26,633,690
Astellas Pharma, Inc. 3,643,100 57,601,710
Azbil Corp. 240,600 10,213,565
Bandai Namco Holdings, Inc. 392,050 29,988,795
Bank of Kyoto Ltd. 108,900 6,528,177
Bridgestone Corp. 1,042,779 41,194,265
Brother Industries Ltd. 438,900 8,617,831
Calbee, Inc. 171,900 4,515,409
Copyright © 2021 www.secdatabase.com. All Rights Reserved.Please Consider the Environment Before Printing This Document

Canon, Inc. 1,956,244 42,427,307
Capcom Co. Ltd. 170,500 10,364,839
Casio Computer Co. Ltd. 379,900 7,363,039
Central Japan Railway Co. 282,000 46,466,344
Chiba Bank Ltd. 1,010,974 6,474,706
Chubu Electric Power Co., Inc. 1,263,464 15,513,705
Chugai Pharmaceutical Co. Ltd. 1,313,875 58,986,621
Chugoku Electric Power Co., Inc. 576,900 6,878,746
Coca-Cola West Co. Ltd. 234,500 4,025,845
Concordia Financial Group Ltd. 2,004,984 7,765,859
Cosmos Pharmaceutical Corp. 39,200 5,608,143
CyberAgent, Inc. 197,500 11,927,368
Dai Nippon Printing Co. Ltd. 479,521 8,668,854
Dai-ichi Mutual Life Insurance Co. 2,110,800 37,515,571
Daifuku Co. Ltd. 198,300 18,937,980
Daiichi Sankyo Kabushiki Kaisha 3,328,710 94,523,338
Daikin Industries Ltd. 487,394 94,987,711
Daito Trust Construction Co. Ltd. 129,063 14,299,301
Daiwa House Industry Co. Ltd. 1,111,184 31,519,887
Daiwa House REIT Investment Corp. 3,923 10,290,077
Daiwa Securities Group, Inc. 2,819,585 13,798,572
DENSO Corp. 847,038 51,173,344
Dentsu Group, Inc. 427,100 14,913,952
Disco Corp. 56,200 17,609,456
East Japan Railway Co. 591,400 44,078,289
Eisai Co. Ltd. 493,178 34,010,301
ENEOS Holdings, Inc. 6,009,700 26,574,824
FANUC Corp. 375,172 93,758,085
Fast Retailing Co. Ltd. 114,167 113,194,122
Fuji Electric Co. Ltd. 248,030 10,373,231
Fujifilm Holdings Corp. 704,605 40,289,517
Fujitsu Ltd. 384,907 55,841,687
Fukuoka Financial Group, Inc. 326,160 5,892,449
GLP J-REIT 8,119 13,146,390
GMO Payment Gateway, Inc. 79,700 10,549,904
Hakuhodo DY Holdings, Inc. 463,300 7,623,511
Hamamatsu Photonics K.K. 275,300 16,193,358
Hankyu Hanshin Holdings, Inc. 448,700 14,880,196
Harmonic Drive Systems, Inc. 84,600 6,500,061
Hikari Tsushin, Inc. 41,100 8,131,704
Hino Motors Ltd. 560,400 5,298,584
Copyright © 2021 www.secdatabase.com. All Rights Reserved.Please Consider the Environment Before Printing This Document
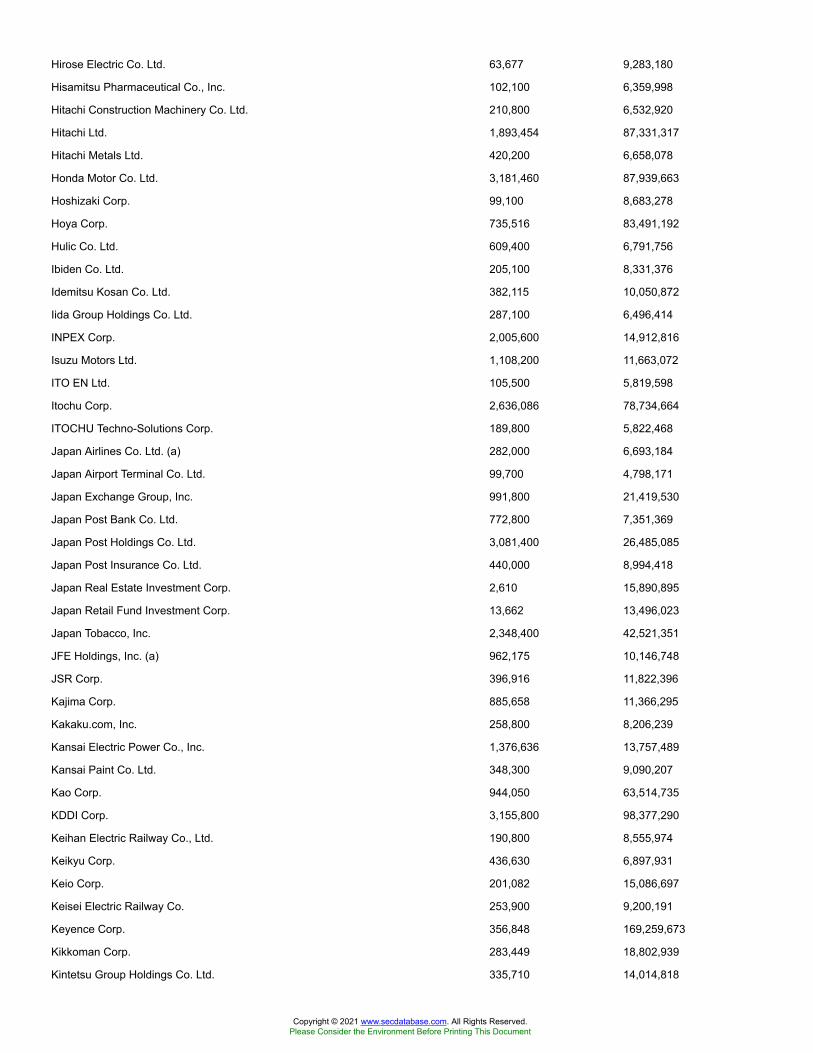
Hirose Electric Co. Ltd. 63,677 9,283,180
Hisamitsu Pharmaceutical Co., Inc. 102,100 6,359,998
Hitachi Construction Machinery Co. Ltd. 210,800 6,532,920
Hitachi Ltd. 1,893,454 87,331,317
Hitachi Metals Ltd. 420,200 6,658,078
Honda Motor Co. Ltd. 3,181,460 87,939,663
Hoshizaki Corp. 99,100 8,683,278
Hoya Corp. 735,516 83,491,192
Hulic Co. Ltd. 609,400 6,791,756
Ibiden Co. Ltd. 205,100 8,331,376
Idemitsu Kosan Co. Ltd. 382,115 10,050,872
Iida Group Holdings Co. Ltd. 287,100 6,496,414
INPEX Corp. 2,005,600 14,912,816
Isuzu Motors Ltd. 1,108,200 11,663,072
ITO EN Ltd. 105,500 5,819,598
Itochu Corp. 2,636,086 78,734,664
ITOCHU Techno-Solutions Corp. 189,800 5,822,468
Japan Airlines Co. Ltd. (a) 282,000 6,693,184
Japan Airport Terminal Co. Ltd. 99,700 4,798,171
Japan Exchange Group, Inc. 991,800 21,419,530
Japan Post Bank Co. Ltd. 772,800 7,351,369
Japan Post Holdings Co. Ltd. 3,081,400 26,485,085
Japan Post Insurance Co. Ltd. 440,000 8,994,418
Japan Real Estate Investment Corp. 2,610 15,890,895
Japan Retail Fund Investment Corp. 13,662 13,496,023
Japan Tobacco, Inc. 2,348,400 42,521,351
JFE Holdings, Inc. (a) 962,175 10,146,748
JSR Corp. 396,916 11,822,396
Kajima Corp. 885,658 11,366,295
Kakaku.com, Inc. 258,800 8,206,239
Kansai Electric Power Co., Inc. 1,376,636 13,757,489
Kansai Paint Co. Ltd. 348,300 9,090,207
Kao Corp. 944,050 63,514,735
KDDI Corp. 3,155,800 98,377,290
Keihan Electric Railway Co., Ltd. 190,800 8,555,974
Keikyu Corp. 436,630 6,897,931
Keio Corp. 201,082 15,086,697
Keisei Electric Railway Co. 253,900 9,200,191
Keyence Corp. 356,848 169,259,673
Kikkoman Corp. 283,449 18,802,939
Kintetsu Group Holdings Co. Ltd. 335,710 14,014,818
Copyright © 2021 www.secdatabase.com. All Rights Reserved.Please Consider the Environment Before Printing This Document
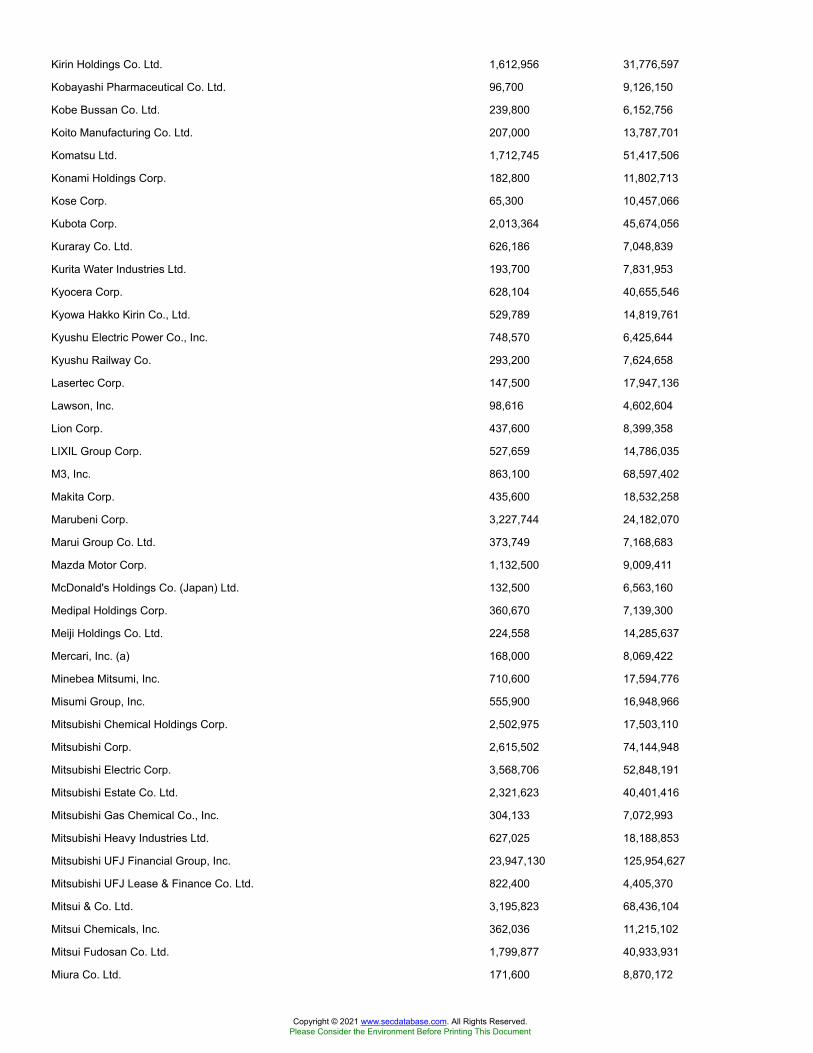
Kirin Holdings Co. Ltd. 1,612,956 31,776,597
Kobayashi Pharmaceutical Co. Ltd. 96,700 9,126,150
Kobe Bussan Co. Ltd. 239,800 6,152,756
Koito Manufacturing Co. Ltd. 207,000 13,787,701
Komatsu Ltd. 1,712,745 51,417,506
Konami Holdings Corp. 182,800 11,802,713
Kose Corp. 65,300 10,457,066
Kubota Corp. 2,013,364 45,674,056
Kuraray Co. Ltd. 626,186 7,048,839
Kurita Water Industries Ltd. 193,700 7,831,953
Kyocera Corp. 628,104 40,655,546
Kyowa Hakko Kirin Co., Ltd. 529,789 14,819,761
Kyushu Electric Power Co., Inc. 748,570 6,425,644
Kyushu Railway Co. 293,200 7,624,658
Lasertec Corp. 147,500 17,947,136
Lawson, Inc. 98,616 4,602,604
Lion Corp. 437,600 8,399,358
LIXIL Group Corp. 527,659 14,786,035
M3, Inc. 863,100 68,597,402
Makita Corp. 435,600 18,532,258
Marubeni Corp. 3,227,744 24,182,070
Marui Group Co. Ltd. 373,749 7,168,683
Mazda Motor Corp. 1,132,500 9,009,411
McDonald's Holdings Co. (Japan) Ltd. 132,500 6,563,160
Medipal Holdings Corp. 360,670 7,139,300
Meiji Holdings Co. Ltd. 224,558 14,285,637
Mercari, Inc. (a) 168,000 8,069,422
Minebea Mitsumi, Inc. 710,600 17,594,776
Misumi Group, Inc. 555,900 16,948,966
Mitsubishi Chemical Holdings Corp. 2,502,975 17,503,110
Mitsubishi Corp. 2,615,502 74,144,948
Mitsubishi Electric Corp. 3,568,706 52,848,191
Mitsubishi Estate Co. Ltd. 2,321,623 40,401,416
Mitsubishi Gas Chemical Co., Inc. 304,133 7,072,993
Mitsubishi Heavy Industries Ltd. 627,025 18,188,853
Mitsubishi UFJ Financial Group, Inc. 23,947,130 125,954,627
Mitsubishi UFJ Lease & Finance Co. Ltd. 822,400 4,405,370
Mitsui & Co. Ltd. 3,195,823 68,436,104
Mitsui Chemicals, Inc. 362,036 11,215,102
Mitsui Fudosan Co. Ltd. 1,799,877 40,933,931
Miura Co. Ltd. 171,600 8,870,172
Copyright © 2021 www.secdatabase.com. All Rights Reserved.Please Consider the Environment Before Printing This Document
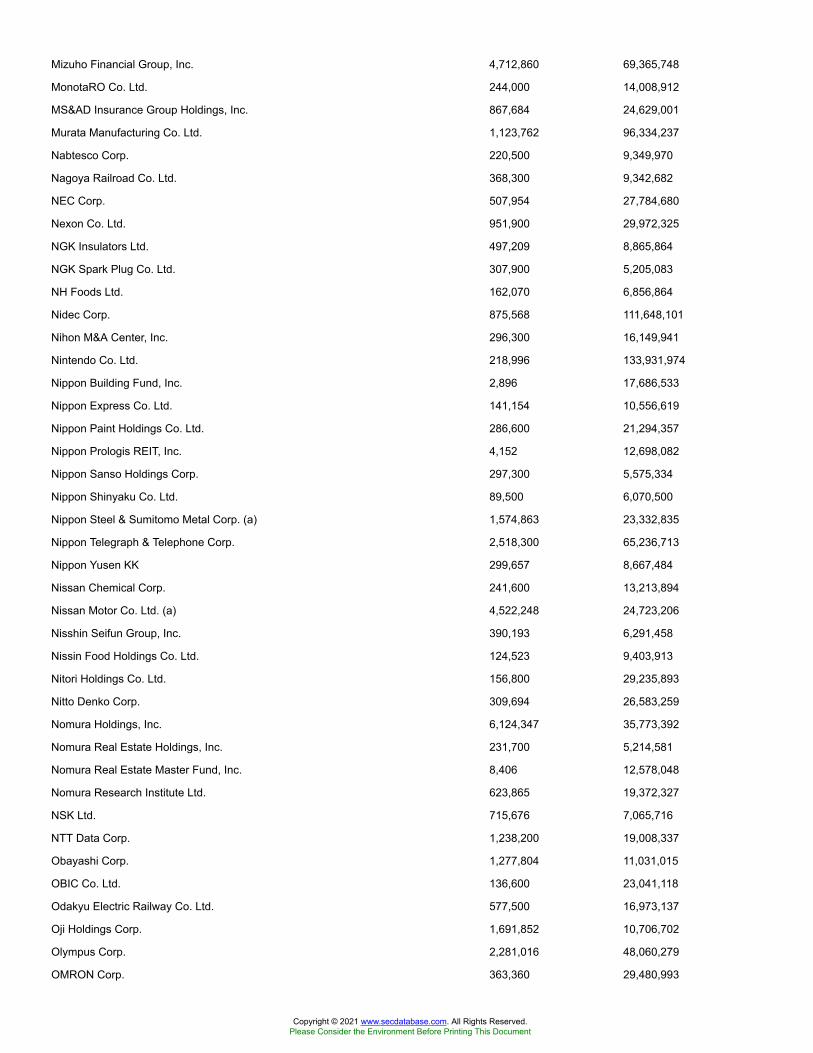
Mizuho Financial Group, Inc. 4,712,860 69,365,748
MonotaRO Co. Ltd. 244,000 14,008,912
MS&AD Insurance Group Holdings, Inc. 867,684 24,629,001
Murata Manufacturing Co. Ltd. 1,123,762 96,334,237
Nabtesco Corp. 220,500 9,349,970
Nagoya Railroad Co. Ltd. 368,300 9,342,682
NEC Corp. 507,954 27,784,680
Nexon Co. Ltd. 951,900 29,972,325
NGK Insulators Ltd. 497,209 8,865,864
NGK Spark Plug Co. Ltd. 307,900 5,205,083
NH Foods Ltd. 162,070 6,856,864
Nidec Corp. 875,568 111,648,101
Nihon M&A Center, Inc. 296,300 16,149,941
Nintendo Co. Ltd. 218,996 133,931,974
Nippon Building Fund, Inc. 2,896 17,686,533
Nippon Express Co. Ltd. 141,154 10,556,619
Nippon Paint Holdings Co. Ltd. 286,600 21,294,357
Nippon Prologis REIT, Inc. 4,152 12,698,082
Nippon Sanso Holdings Corp. 297,300 5,575,334
Nippon Shinyaku Co. Ltd. 89,500 6,070,500
Nippon Steel & Sumitomo Metal Corp. (a) 1,574,863 23,332,835
Nippon Telegraph & Telephone Corp. 2,518,300 65,236,713
Nippon Yusen KK 299,657 8,667,484
Nissan Chemical Corp. 241,600 13,213,894
Nissan Motor Co. Ltd. (a) 4,522,248 24,723,206
Nisshin Seifun Group, Inc. 390,193 6,291,458
Nissin Food Holdings Co. Ltd. 124,523 9,403,913
Nitori Holdings Co. Ltd. 156,800 29,235,893
Nitto Denko Corp. 309,694 26,583,259
Nomura Holdings, Inc. 6,124,347 35,773,392
Nomura Real Estate Holdings, Inc. 231,700 5,214,581
Nomura Real Estate Master Fund, Inc. 8,406 12,578,048
Nomura Research Institute Ltd. 623,865 19,372,327
NSK Ltd. 715,676 7,065,716
NTT Data Corp. 1,238,200 19,008,337
Obayashi Corp. 1,277,804 11,031,015
OBIC Co. Ltd. 136,600 23,041,118
Odakyu Electric Railway Co. Ltd. 577,500 16,973,137
Oji Holdings Corp. 1,691,852 10,706,702
Olympus Corp. 2,281,016 48,060,279
OMRON Corp. 363,360 29,480,993
Copyright © 2021 www.secdatabase.com. All Rights Reserved.Please Consider the Environment Before Printing This Document
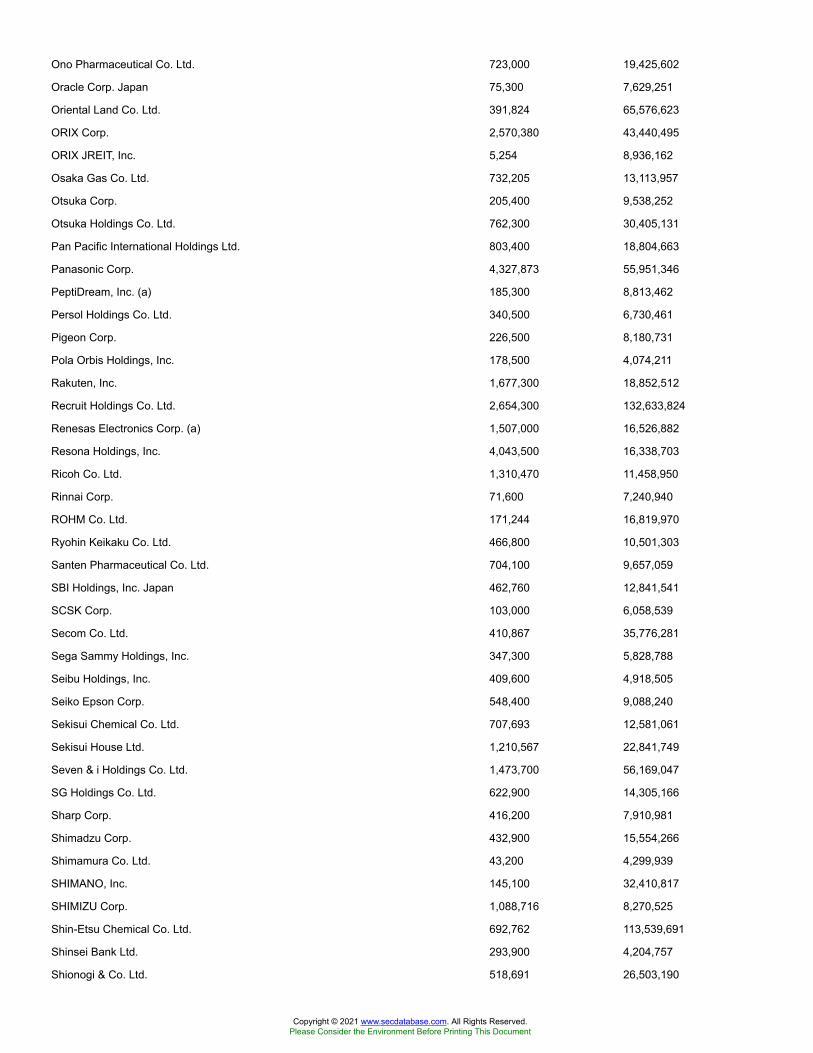
Ono Pharmaceutical Co. Ltd. 723,000 19,425,602
Oracle Corp. Japan 75,300 7,629,251
Oriental Land Co. Ltd. 391,824 65,576,623
ORIX Corp. 2,570,380 43,440,495
ORIX JREIT, Inc. 5,254 8,936,162
Osaka Gas Co. Ltd. 732,205 13,113,957
Otsuka Corp. 205,400 9,538,252
Otsuka Holdings Co. Ltd. 762,300 30,405,131
Pan Pacific International Holdings Ltd. 803,400 18,804,663
Panasonic Corp. 4,327,873 55,951,346
PeptiDream, Inc. (a) 185,300 8,813,462
Persol Holdings Co. Ltd. 340,500 6,730,461
Pigeon Corp. 226,500 8,180,731
Pola Orbis Holdings, Inc. 178,500 4,074,211
Rakuten, Inc. 1,677,300 18,852,512
Recruit Holdings Co. Ltd. 2,654,300 132,633,824
Renesas Electronics Corp. (a) 1,507,000 16,526,882
Resona Holdings, Inc. 4,043,500 16,338,703
Ricoh Co. Ltd. 1,310,470 11,458,950
Rinnai Corp. 71,600 7,240,940
ROHM Co. Ltd. 171,244 16,819,970
Ryohin Keikaku Co. Ltd. 466,800 10,501,303
Santen Pharmaceutical Co. Ltd. 704,100 9,657,059
SBI Holdings, Inc. Japan 462,760 12,841,541
SCSK Corp. 103,000 6,058,539
Secom Co. Ltd. 410,867 35,776,281
Sega Sammy Holdings, Inc. 347,300 5,828,788
Seibu Holdings, Inc. 409,600 4,918,505
Seiko Epson Corp. 548,400 9,088,240
Sekisui Chemical Co. Ltd. 707,693 12,581,061
Sekisui House Ltd. 1,210,567 22,841,749
Seven & i Holdings Co. Ltd. 1,473,700 56,169,047
SG Holdings Co. Ltd. 622,900 14,305,166
Sharp Corp. 416,200 7,910,981
Shimadzu Corp. 432,900 15,554,266
Shimamura Co. Ltd. 43,200 4,299,939
SHIMANO, Inc. 145,100 32,410,817
SHIMIZU Corp. 1,088,716 8,270,525
Shin-Etsu Chemical Co. Ltd. 692,762 113,539,691
Shinsei Bank Ltd. 293,900 4,204,757
Shionogi & Co. Ltd. 518,691 26,503,190
Copyright © 2021 www.secdatabase.com. All Rights Reserved.Please Consider the Environment Before Printing This Document
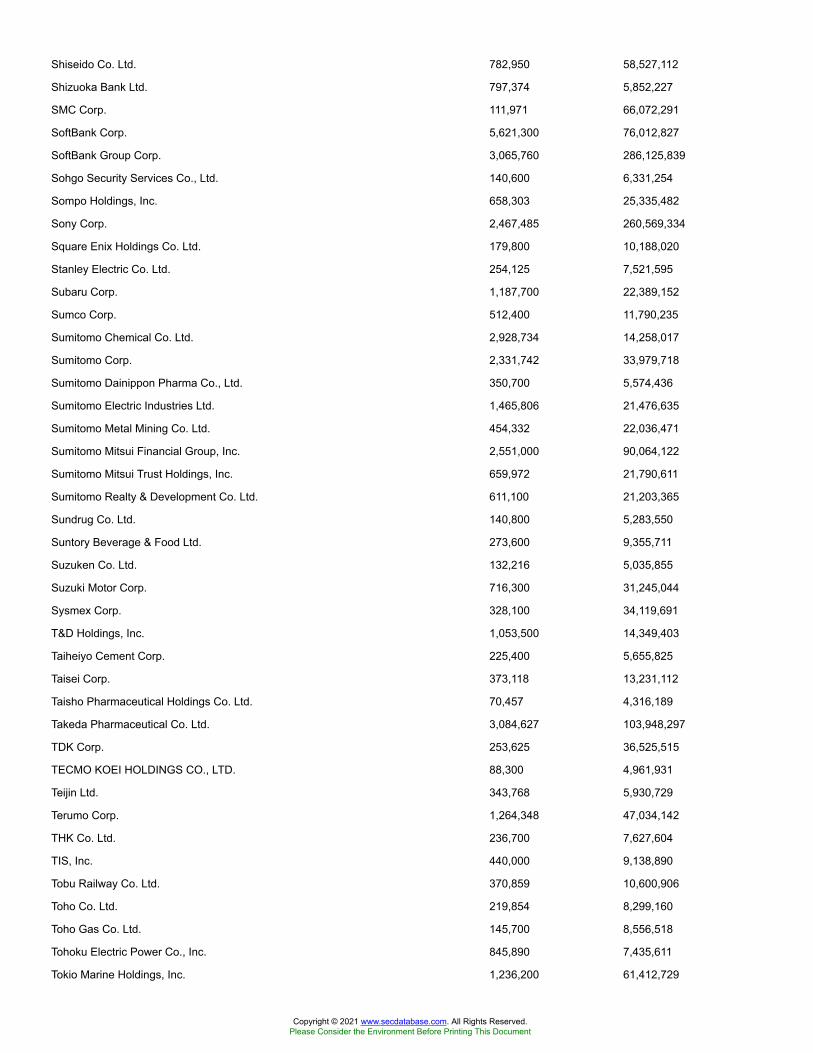
Shiseido Co. Ltd. 782,950 58,527,112
Shizuoka Bank Ltd. 797,374 5,852,227
SMC Corp. 111,971 66,072,291
SoftBank Corp. 5,621,300 76,012,827
SoftBank Group Corp. 3,065,760 286,125,839
Sohgo Security Services Co., Ltd. 140,600 6,331,254
Sompo Holdings, Inc. 658,303 25,335,482
Sony Corp. 2,467,485 260,569,334
Square Enix Holdings Co. Ltd. 179,800 10,188,020
Stanley Electric Co. Ltd. 254,125 7,521,595
Subaru Corp. 1,187,700 22,389,152
Sumco Corp. 512,400 11,790,235
Sumitomo Chemical Co. Ltd. 2,928,734 14,258,017
Sumitomo Corp. 2,331,742 33,979,718
Sumitomo Dainippon Pharma Co., Ltd. 350,700 5,574,436
Sumitomo Electric Industries Ltd. 1,465,806 21,476,635
Sumitomo Metal Mining Co. Ltd. 454,332 22,036,471
Sumitomo Mitsui Financial Group, Inc. 2,551,000 90,064,122
Sumitomo Mitsui Trust Holdings, Inc. 659,972 21,790,611
Sumitomo Realty & Development Co. Ltd. 611,100 21,203,365
Sundrug Co. Ltd. 140,800 5,283,550
Suntory Beverage & Food Ltd. 273,600 9,355,711
Suzuken Co. Ltd. 132,216 5,035,855
Suzuki Motor Corp. 716,300 31,245,044
Sysmex Corp. 328,100 34,119,691
T&D Holdings, Inc. 1,053,500 14,349,403
Taiheiyo Cement Corp. 225,400 5,655,825
Taisei Corp. 373,118 13,231,112
Taisho Pharmaceutical Holdings Co. Ltd. 70,457 4,316,189
Takeda Pharmaceutical Co. Ltd. 3,084,627 103,948,297
TDK Corp. 253,625 36,525,515
TECMO KOEI HOLDINGS CO., LTD. 88,300 4,961,931
Teijin Ltd. 343,768 5,930,729
Terumo Corp. 1,264,348 47,034,142
THK Co. Ltd. 236,700 7,627,604
TIS, Inc. 440,000 9,138,890
Tobu Railway Co. Ltd. 370,859 10,600,906
Toho Co. Ltd. 219,854 8,299,160
Toho Gas Co. Ltd. 145,700 8,556,518
Tohoku Electric Power Co., Inc. 845,890 7,435,611
Tokio Marine Holdings, Inc. 1,236,200 61,412,729
Copyright © 2021 www.secdatabase.com. All Rights Reserved.Please Consider the Environment Before Printing This Document
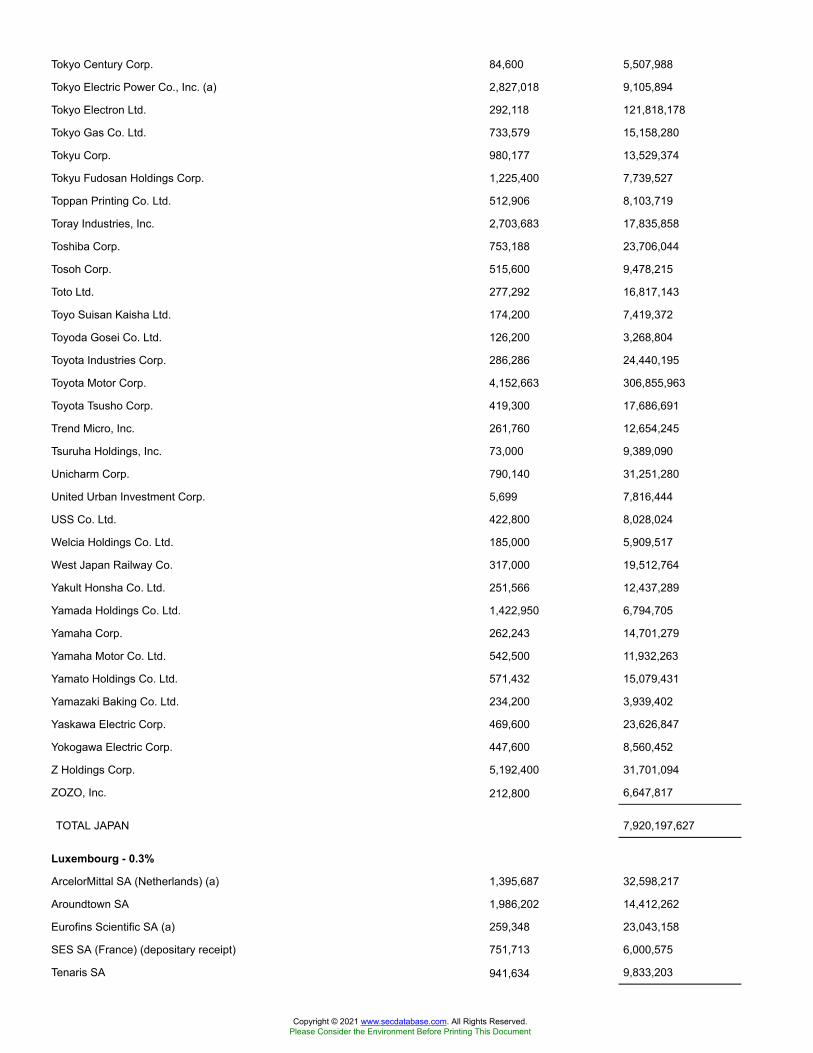
Tokyo Century Corp. 84,600 5,507,988
Tokyo Electric Power Co., Inc. (a) 2,827,018 9,105,894
Tokyo Electron Ltd. 292,118 121,818,178
Tokyo Gas Co. Ltd. 733,579 15,158,280
Tokyu Corp. 980,177 13,529,374
Tokyu Fudosan Holdings Corp. 1,225,400 7,739,527
Toppan Printing Co. Ltd. 512,906 8,103,719
Toray Industries, Inc. 2,703,683 17,835,858
Toshiba Corp. 753,188 23,706,044
Tosoh Corp. 515,600 9,478,215
Toto Ltd. 277,292 16,817,143
Toyo Suisan Kaisha Ltd. 174,200 7,419,372
Toyoda Gosei Co. Ltd. 126,200 3,268,804
Toyota Industries Corp. 286,286 24,440,195
Toyota Motor Corp. 4,152,663 306,855,963
Toyota Tsusho Corp. 419,300 17,686,691
Trend Micro, Inc. 261,760 12,654,245
Tsuruha Holdings, Inc. 73,000 9,389,090
Unicharm Corp. 790,140 31,251,280
United Urban Investment Corp. 5,699 7,816,444
USS Co. Ltd. 422,800 8,028,024
Welcia Holdings Co. Ltd. 185,000 5,909,517
West Japan Railway Co. 317,000 19,512,764
Yakult Honsha Co. Ltd. 251,566 12,437,289
Yamada Holdings Co. Ltd. 1,422,950 6,794,705
Yamaha Corp. 262,243 14,701,279
Yamaha Motor Co. Ltd. 542,500 11,932,263
Yamato Holdings Co. Ltd. 571,432 15,079,431
Yamazaki Baking Co. Ltd. 234,200 3,939,402
Yaskawa Electric Corp. 469,600 23,626,847
Yokogawa Electric Corp. 447,600 8,560,452
Z Holdings Corp. 5,192,400 31,701,094
ZOZO, Inc. 212,800 6,647,817
TOTAL JAPAN 7,920,197,627
Luxembourg - 0.3%
ArcelorMittal SA (Netherlands) (a) 1,395,687 32,598,217
Aroundtown SA 1,986,202 14,412,262
Eurofins Scientific SA (a) 259,348 23,043,158
SES SA (France) (depositary receipt) 751,713 6,000,575
Tenaris SA 941,634 9,833,203
Copyright © 2021 www.secdatabase.com. All Rights Reserved.Please Consider the Environment Before Printing This Document

TOTAL LUXEMBOURG 85,887,415
Malta - 0.0%
BGP Holdings PLC (a)(d) 5,796,476 70
Multi-National - 0.0%
HK Electric Investments & HK Electric Investments Ltd. unit 5,290,000 5,183,299
HKT Trust/HKT Ltd. unit 7,525,760 10,226,522
TOTAL MULTI-NATIONAL 15,409,821
Netherlands - 5.2%
ABN AMRO Group NV GDR (a)(b) 824,116 9,466,090
Adyen BV (a)(b) 35,626 83,129,157
AEGON NV 3,491,972 16,736,076
Airbus Group NV 1,152,061 133,840,289
Akzo Nobel NV 378,822 39,106,711
Argenx SE (a) 87,130 28,980,478
ASM International NV (Netherlands) 93,222 25,149,858
ASML Holding NV (Netherlands) 832,968 472,393,561
CNH Industrial NV 1,987,378 29,349,940
EXOR NV 211,094 16,937,248
Ferrari NV 244,638 47,669,628
Heineken Holding NV 226,206 19,432,534
Heineken NV (Bearer) 507,579 50,034,668
ING Groep NV (Certificaten Van Aandelen) 7,648,515 83,771,986
JDE Peet's BV 145,644 5,913,206
Just Eat Takeaway.com NV (a)(b) 246,213 23,729,815
Koninklijke Ahold Delhaize NV 2,152,001 56,823,031
Koninklijke DSM NV 337,104 55,539,368
Koninklijke KPN NV 7,009,835 22,974,586
Koninklijke Philips Electronics NV 1,782,751 97,332,952
NN Group NV 563,303 25,962,753
Prosus NV 954,959 113,846,913
QIAGEN NV (Germany) (a) 454,048 22,461,096
Randstad NV 234,973 15,689,259
Stellantis NV (Italy) 4,029,919 65,320,121
STMicroelectronics NV (France) 1,246,476 48,409,704
Unibail-Rodamco SE & WFD Unibail-Rodamco NV unit 269,351 19,765,615
Vopak NV 138,278 6,591,822
Wolters Kluwer NV 525,693 41,659,174
TOTAL NETHERLANDS 1,678,017,639
New Zealand - 0.3%
Copyright © 2021 www.secdatabase.com. All Rights Reserved.Please Consider the Environment Before Printing This Document

Auckland International Airport Ltd. 2,462,993 13,436,249
Fisher & Paykel Healthcare Corp. 1,125,823 23,793,805
Mercury Nz Ltd. 1,319,746 5,769,174
Meridian Energy Ltd. 2,508,902 10,333,001
Ryman Healthcare Group Ltd. 782,223 8,280,110
Spark New Zealand Ltd. 3,580,586 11,875,030
The a2 Milk Co. Ltd. (a) 1,447,249 10,132,928
Xero Ltd. (a) 239,278 21,804,438
TOTAL NEW ZEALAND 105,424,735
Norway - 0.6%
Adevinta ASA Class B (a) 470,930 6,577,356
DNB ASA 1,824,246 35,483,022
Equinor ASA 1,912,979 36,017,556
Gjensidige Forsikring ASA 392,430 9,006,709
Mowi ASA 857,377 20,706,150
Norsk Hydro ASA 2,637,537 14,601,271
Orkla ASA 1,478,240 13,615,234
Schibsted ASA:
(A Shares) 154,148 6,234,828
(B Shares) 186,943 6,420,735
Telenor ASA 1,372,196 22,179,926
Yara International ASA 341,011 16,384,700
TOTAL NORWAY 187,227,487
Papua New Guinea - 0.0%
Oil Search Ltd. ADR 3,854,714 12,575,881
Portugal - 0.1%
Banco Espirito Santo SA (Reg.) (a)(d) 2,598,658 31
Energias de Portugal SA 5,456,352 31,244,634
Galp Energia SGPS SA Class B 968,563 10,827,018
Jeronimo Martins SGPS SA 496,715 7,701,153
TOTAL PORTUGAL 49,772,836
Singapore - 1.0%
Ascendas Real Estate Investment Trust 6,449,533 14,220,509
CapitaLand Ltd. 5,293,610 12,624,629
CapitaMall Trust 8,748,882 13,778,800
City Developments Ltd. 862,600 4,761,314
DBS Group Holdings Ltd. 3,531,826 70,562,355
Genting Singapore Ltd. 12,186,159 7,813,984
Copyright © 2021 www.secdatabase.com. All Rights Reserved.Please Consider the Environment Before Printing This Document
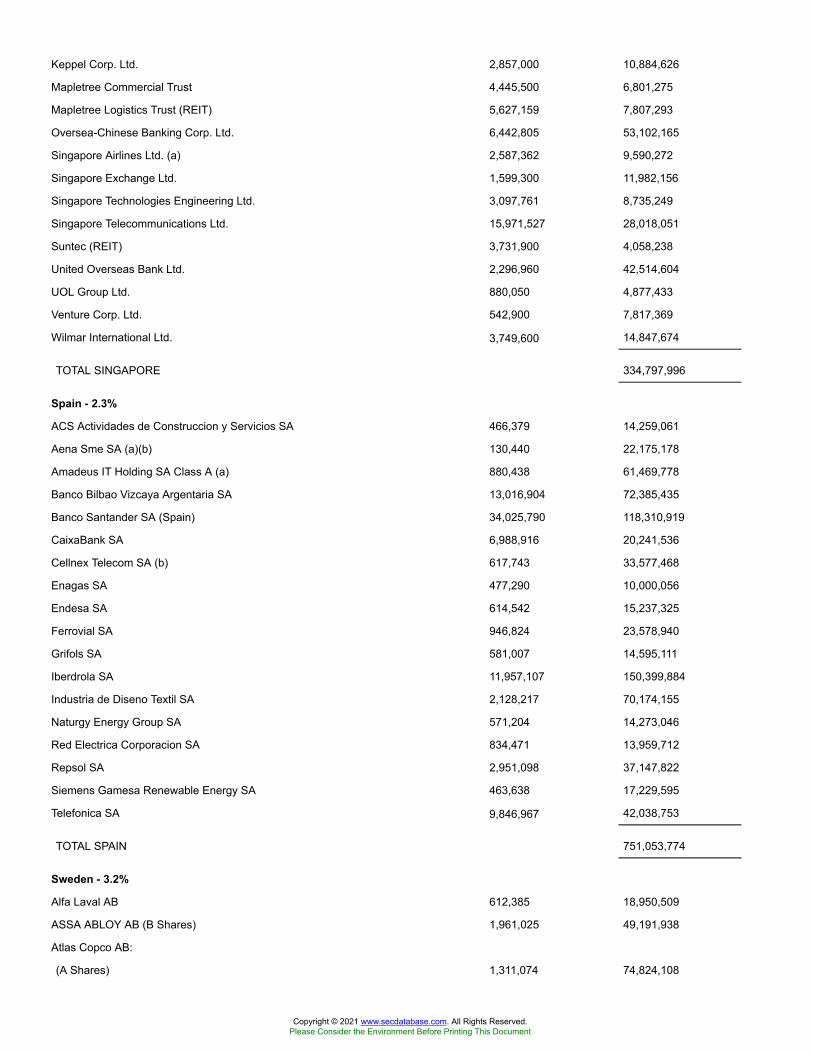
Keppel Corp. Ltd. 2,857,000 10,884,626
Mapletree Commercial Trust 4,445,500 6,801,275
Mapletree Logistics Trust (REIT) 5,627,159 7,807,293
Oversea-Chinese Banking Corp. Ltd. 6,442,805 53,102,165
Singapore Airlines Ltd. (a) 2,587,362 9,590,272
Singapore Exchange Ltd. 1,599,300 11,982,156
Singapore Technologies Engineering Ltd. 3,097,761 8,735,249
Singapore Telecommunications Ltd. 15,971,527 28,018,051
Suntec (REIT) 3,731,900 4,058,238
United Overseas Bank Ltd. 2,296,960 42,514,604
UOL Group Ltd. 880,050 4,877,433
Venture Corp. Ltd. 542,900 7,817,369
Wilmar International Ltd. 3,749,600 14,847,674
TOTAL SINGAPORE 334,797,996
Spain - 2.3%
ACS Actividades de Construccion y Servicios SA 466,379 14,259,061
Aena Sme SA (a)(b) 130,440 22,175,178
Amadeus IT Holding SA Class A (a) 880,438 61,469,778
Banco Bilbao Vizcaya Argentaria SA 13,016,904 72,385,435
Banco Santander SA (Spain) 34,025,790 118,310,919
CaixaBank SA 6,988,916 20,241,536
Cellnex Telecom SA (b) 617,743 33,577,468
Enagas SA 477,290 10,000,056
Endesa SA 614,542 15,237,325
Ferrovial SA 946,824 23,578,940
Grifols SA 581,007 14,595,111
Iberdrola SA 11,957,107 150,399,884
Industria de Diseno Textil SA 2,128,217 70,174,155
Naturgy Energy Group SA 571,204 14,273,046
Red Electrica Corporacion SA 834,471 13,959,712
Repsol SA 2,951,098 37,147,822
Siemens Gamesa Renewable Energy SA 463,638 17,229,595
Telefonica SA 9,846,967 42,038,753
TOTAL SPAIN 751,053,774
Sweden - 3.2%
Alfa Laval AB 612,385 18,950,509
ASSA ABLOY AB (B Shares) 1,961,025 49,191,938
Atlas Copco AB:
(A Shares) 1,311,074 74,824,108
Copyright © 2021 www.secdatabase.com. All Rights Reserved.Please Consider the Environment Before Printing This Document
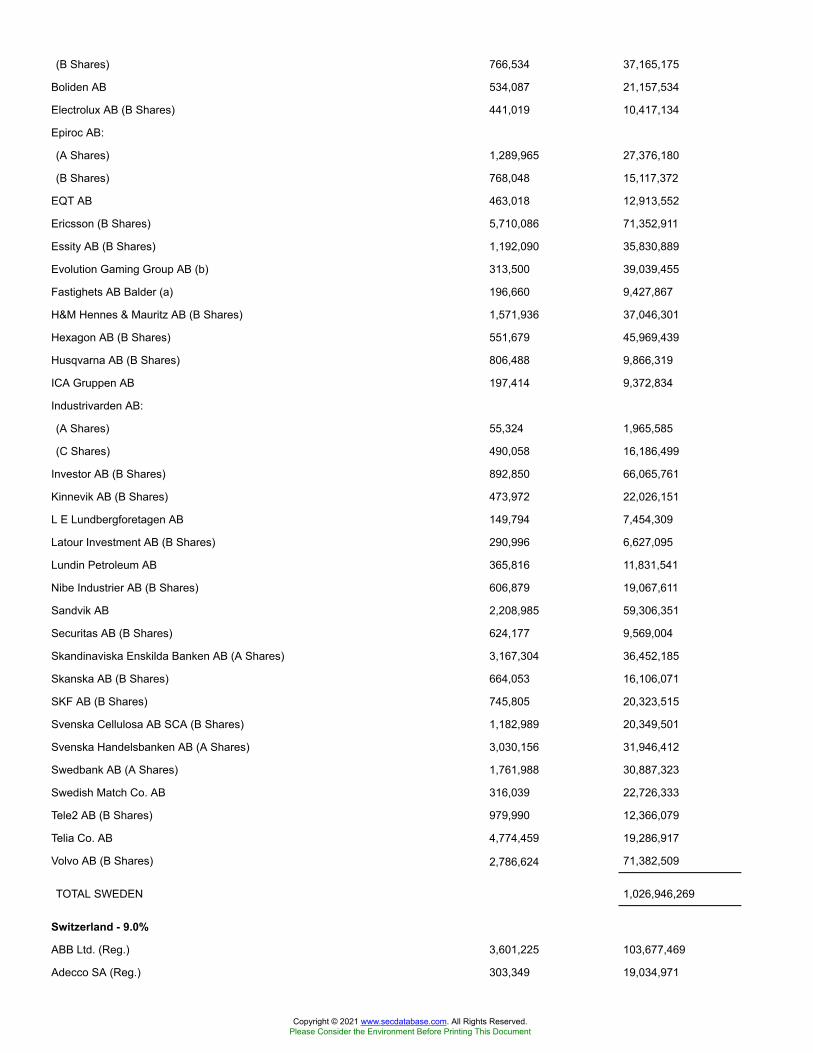
(B Shares) 766,534 37,165,175
Boliden AB 534,087 21,157,534
Electrolux AB (B Shares) 441,019 10,417,134
Epiroc AB:
(A Shares) 1,289,965 27,376,180
(B Shares) 768,048 15,117,372
EQT AB 463,018 12,913,552
Ericsson (B Shares) 5,710,086 71,352,911
Essity AB (B Shares) 1,192,090 35,830,889
Evolution Gaming Group AB (b) 313,500 39,039,455
Fastighets AB Balder (a) 196,660 9,427,867
H&M Hennes & Mauritz AB (B Shares) 1,571,936 37,046,301
Hexagon AB (B Shares) 551,679 45,969,439
Husqvarna AB (B Shares) 806,488 9,866,319
ICA Gruppen AB 197,414 9,372,834
Industrivarden AB:
(A Shares) 55,324 1,965,585
(C Shares) 490,058 16,186,499
Investor AB (B Shares) 892,850 66,065,761
Kinnevik AB (B Shares) 473,972 22,026,151
L E Lundbergforetagen AB 149,794 7,454,309
Latour Investment AB (B Shares) 290,996 6,627,095
Lundin Petroleum AB 365,816 11,831,541
Nibe Industrier AB (B Shares) 606,879 19,067,611
Sandvik AB 2,208,985 59,306,351
Securitas AB (B Shares) 624,177 9,569,004
Skandinaviska Enskilda Banken AB (A Shares) 3,167,304 36,452,185
Skanska AB (B Shares) 664,053 16,106,071
SKF AB (B Shares) 745,805 20,323,515
Svenska Cellulosa AB SCA (B Shares) 1,182,989 20,349,501
Svenska Handelsbanken AB (A Shares) 3,030,156 31,946,412
Swedbank AB (A Shares) 1,761,988 30,887,323
Swedish Match Co. AB 316,039 22,726,333
Tele2 AB (B Shares) 979,990 12,366,079
Telia Co. AB 4,774,459 19,286,917
Volvo AB (B Shares) 2,786,624 71,382,509
TOTAL SWEDEN 1,026,946,269
Switzerland - 9.0%
ABB Ltd. (Reg.) 3,601,225 103,677,469
Adecco SA (Reg.) 303,349 19,034,971
Copyright © 2021 www.secdatabase.com. All Rights Reserved.Please Consider the Environment Before Printing This Document
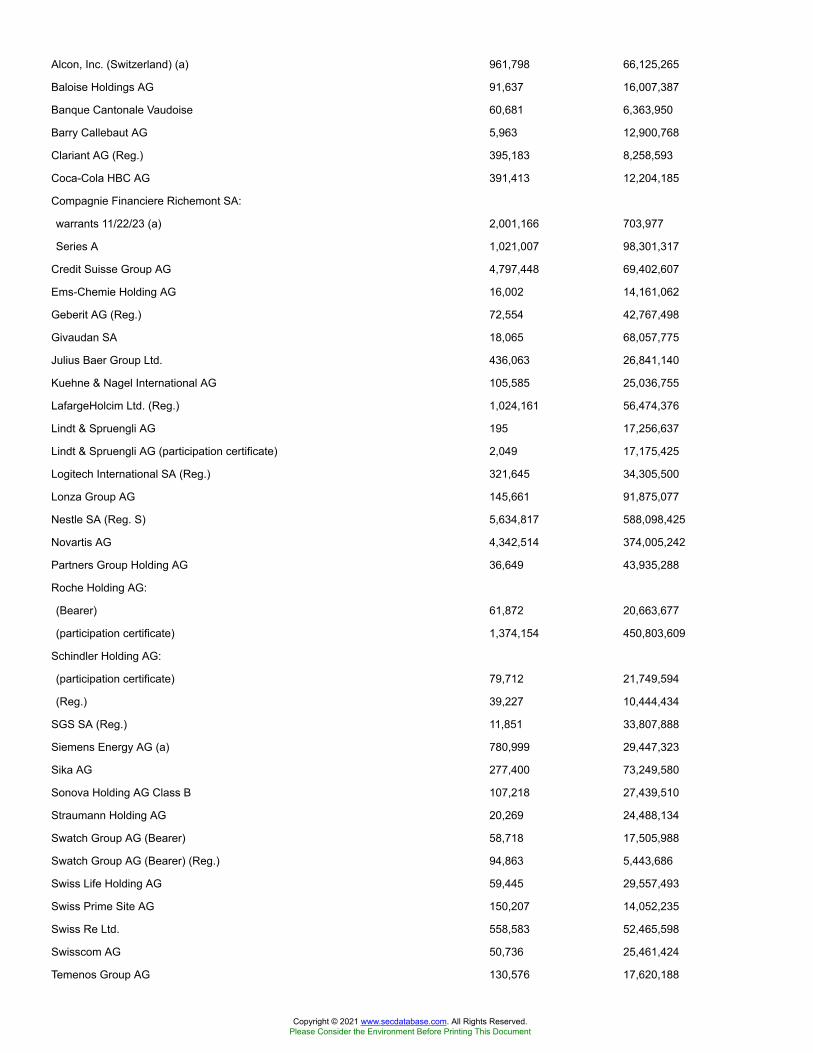
Alcon, Inc. (Switzerland) (a) 961,798 66,125,265
Baloise Holdings AG 91,637 16,007,387
Banque Cantonale Vaudoise 60,681 6,363,950
Barry Callebaut AG 5,963 12,900,768
Clariant AG (Reg.) 395,183 8,258,593
Coca-Cola HBC AG 391,413 12,204,185
Compagnie Financiere Richemont SA:
warrants 11/22/23 (a) 2,001,166 703,977
Series A 1,021,007 98,301,317
Credit Suisse Group AG 4,797,448 69,402,607
Ems-Chemie Holding AG 16,002 14,161,062
Geberit AG (Reg.) 72,554 42,767,498
Givaudan SA 18,065 68,057,775
Julius Baer Group Ltd. 436,063 26,841,140
Kuehne & Nagel International AG 105,585 25,036,755
LafargeHolcim Ltd. (Reg.) 1,024,161 56,474,376
Lindt & Spruengli AG 195 17,256,637
Lindt & Spruengli AG (participation certificate) 2,049 17,175,425
Logitech International SA (Reg.) 321,645 34,305,500
Lonza Group AG 145,661 91,875,077
Nestle SA (Reg. S) 5,634,817 588,098,425
Novartis AG 4,342,514 374,005,242
Partners Group Holding AG 36,649 43,935,288
Roche Holding AG:
(Bearer) 61,872 20,663,677
(participation certificate) 1,374,154 450,803,609
Schindler Holding AG:
(participation certificate) 79,712 21,749,594
(Reg.) 39,227 10,444,434
SGS SA (Reg.) 11,851 33,807,888
Siemens Energy AG (a) 780,999 29,447,323
Sika AG 277,400 73,249,580
Sonova Holding AG Class B 107,218 27,439,510
Straumann Holding AG 20,269 24,488,134
Swatch Group AG (Bearer) 58,718 17,505,988
Swatch Group AG (Bearer) (Reg.) 94,863 5,443,686
Swiss Life Holding AG 59,445 29,557,493
Swiss Prime Site AG 150,207 14,052,235
Swiss Re Ltd. 558,583 52,465,598
Swisscom AG 50,736 25,461,424
Temenos Group AG 130,576 17,620,188
Copyright © 2021 www.secdatabase.com. All Rights Reserved.Please Consider the Environment Before Printing This Document
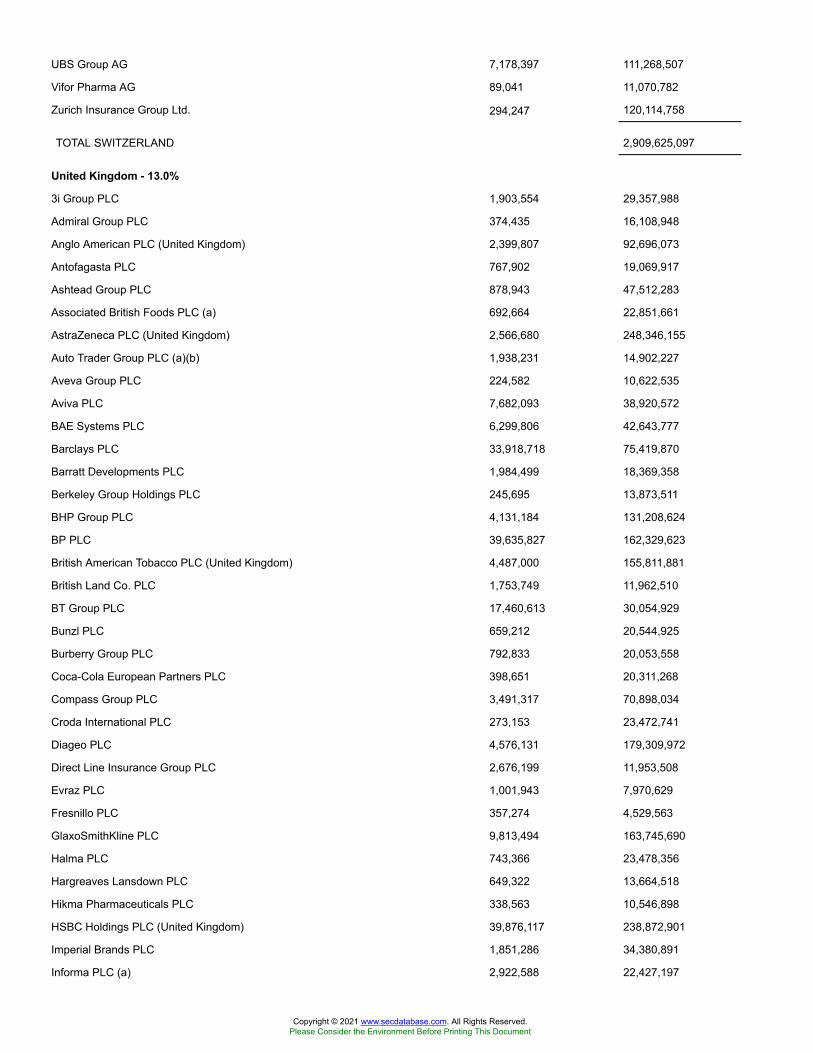
UBS Group AG 7,178,397 111,268,507
Vifor Pharma AG 89,041 11,070,782
Zurich Insurance Group Ltd. 294,247 120,114,758
TOTAL SWITZERLAND 2,909,625,097
United Kingdom - 13.0%
3i Group PLC 1,903,554 29,357,988
Admiral Group PLC 374,435 16,108,948
Anglo American PLC (United Kingdom) 2,399,807 92,696,073
Antofagasta PLC 767,902 19,069,917
Ashtead Group PLC 878,943 47,512,283
Associated British Foods PLC (a) 692,664 22,851,661
AstraZeneca PLC (United Kingdom) 2,566,680 248,346,155
Auto Trader Group PLC (a)(b) 1,938,231 14,902,227
Aveva Group PLC 224,582 10,622,535
Aviva PLC 7,682,093 38,920,572
BAE Systems PLC 6,299,806 42,643,777
Barclays PLC 33,918,718 75,419,870
Barratt Developments PLC 1,984,499 18,369,358
Berkeley Group Holdings PLC 245,695 13,873,511
BHP Group PLC 4,131,184 131,208,624
BP PLC 39,635,827 162,329,623
British American Tobacco PLC (United Kingdom) 4,487,000 155,811,881
British Land Co. PLC 1,753,749 11,962,510
BT Group PLC 17,460,613 30,054,929
Bunzl PLC 659,212 20,544,925
Burberry Group PLC 792,833 20,053,558
Coca-Cola European Partners PLC 398,651 20,311,268
Compass Group PLC 3,491,317 70,898,034
Croda International PLC 273,153 23,472,741
Diageo PLC 4,576,131 179,309,972
Direct Line Insurance Group PLC 2,676,199 11,953,508
Evraz PLC 1,001,943 7,970,629
Fresnillo PLC 357,274 4,529,563
GlaxoSmithKline PLC 9,813,494 163,745,690
Halma PLC 743,366 23,478,356
Hargreaves Lansdown PLC 649,322 13,664,518
Hikma Pharmaceuticals PLC 338,563 10,546,898
HSBC Holdings PLC (United Kingdom) 39,876,117 238,872,901
Imperial Brands PLC 1,851,286 34,380,891
Informa PLC (a) 2,922,588 22,427,197
Copyright © 2021 www.secdatabase.com. All Rights Reserved.Please Consider the Environment Before Printing This Document
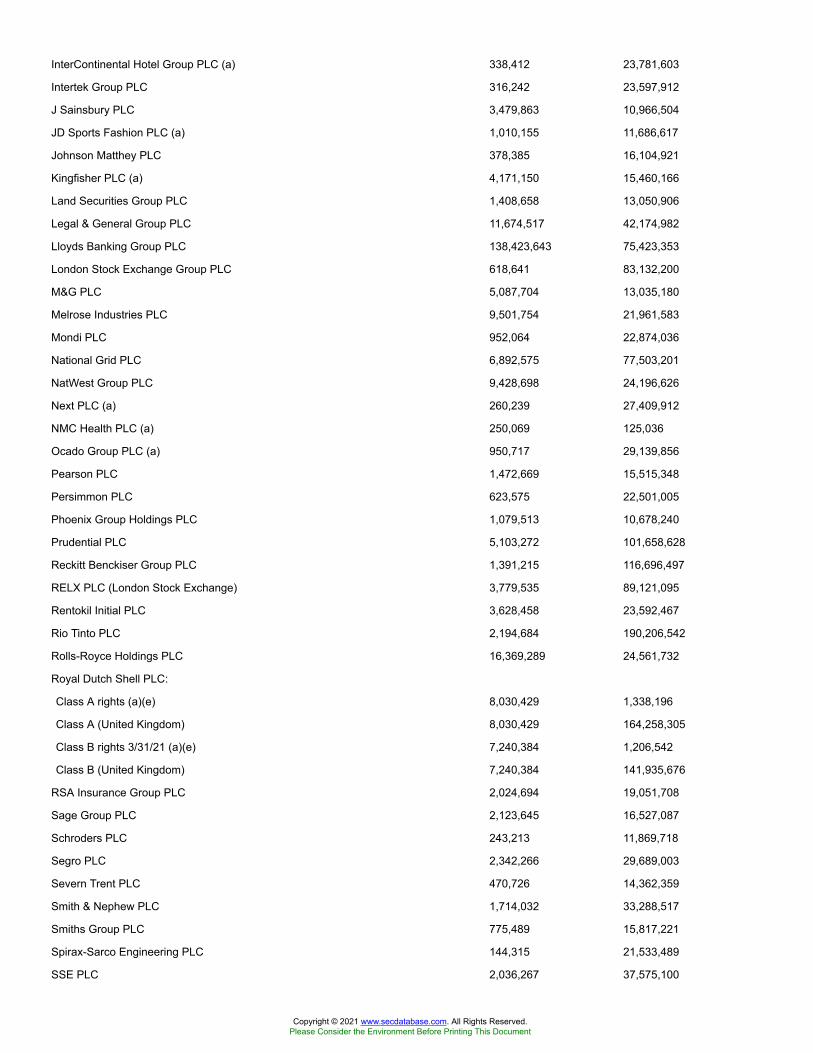
InterContinental Hotel Group PLC (a) 338,412 23,781,603
Intertek Group PLC 316,242 23,597,912
J Sainsbury PLC 3,479,863 10,966,504
JD Sports Fashion PLC (a) 1,010,155 11,686,617
Johnson Matthey PLC 378,385 16,104,921
Kingfisher PLC (a) 4,171,150 15,460,166
Land Securities Group PLC 1,408,658 13,050,906
Legal & General Group PLC 11,674,517 42,174,982
Lloyds Banking Group PLC 138,423,643 75,423,353
London Stock Exchange Group PLC 618,641 83,132,200
M&G PLC 5,087,704 13,035,180
Melrose Industries PLC 9,501,754 21,961,583
Mondi PLC 952,064 22,874,036
National Grid PLC 6,892,575 77,503,201
NatWest Group PLC 9,428,698 24,196,626
Next PLC (a) 260,239 27,409,912
NMC Health PLC (a) 250,069 125,036
Ocado Group PLC (a) 950,717 29,139,856
Pearson PLC 1,472,669 15,515,348
Persimmon PLC 623,575 22,501,005
Phoenix Group Holdings PLC 1,079,513 10,678,240
Prudential PLC 5,103,272 101,658,628
Reckitt Benckiser Group PLC 1,391,215 116,696,497
RELX PLC (London Stock Exchange) 3,779,535 89,121,095
Rentokil Initial PLC 3,628,458 23,592,467
Rio Tinto PLC 2,194,684 190,206,542
Rolls-Royce Holdings PLC 16,369,289 24,561,732
Royal Dutch Shell PLC:
Class A rights (a)(e) 8,030,429 1,338,196
Class A (United Kingdom) 8,030,429 164,258,305
Class B rights 3/31/21 (a)(e) 7,240,384 1,206,542
Class B (United Kingdom) 7,240,384 141,935,676
RSA Insurance Group PLC 2,024,694 19,051,708
Sage Group PLC 2,123,645 16,527,087
Schroders PLC 243,213 11,869,718
Segro PLC 2,342,266 29,689,003
Severn Trent PLC 470,726 14,362,359
Smith & Nephew PLC 1,714,032 33,288,517
Smiths Group PLC 775,489 15,817,221
Spirax-Sarco Engineering PLC 144,315 21,533,489
SSE PLC 2,036,267 37,575,100
Copyright © 2021 www.secdatabase.com. All Rights Reserved.Please Consider the Environment Before Printing This Document

St. James's Place Capital PLC 1,046,022 17,108,911
Standard Chartered PLC (United Kingdom) 5,243,824 33,759,619
Standard Life PLC 4,384,568 18,985,467
Taylor Wimpey PLC 7,125,168 15,644,612
Tesco PLC 15,120,441 47,525,221
Unilever PLC 5,142,964 267,476,072
United Utilities Group PLC 1,340,895 16,050,362
Vodafone Group PLC 52,383,145 89,671,697
Vodafone Group PLC sponsored ADR 7,939 136,392
Whitbread PLC (a) 396,042 18,732,446
WM Morrison Supermarkets PLC 4,708,715 11,208,070
TOTAL UNITED KINGDOM 4,219,131,029
United States of America - 0.0%
NICE Systems Ltd. sponsored ADR (a) 3 689
TOTAL COMMON STOCKS
(Cost $24,912,842,852) 31,024,299,181
Nonconvertible Preferred Stocks - 0.7%
France - 0.1%
Air Liquide SA (a) 355,967 53,606,821
Germany - 0.6%
Bayerische Motoren Werke AG (BMW) (non-vtg.) 108,038 7,306,300
Fuchs Petrolub AG 136,690 7,477,623
Henkel AG & Co. KGaA 350,721 34,521,590
Porsche Automobil Holding SE (Germany) 295,829 23,695,917
Sartorius AG (non-vtg.) 69,602 35,724,366
Volkswagen AG 360,900 75,340,502
TOTAL GERMANY 184,066,298
TOTAL NONCONVERTIBLE PREFERRED STOCKS
(Cost $155,331,584) 237,673,119
Principal Amount Value
Government Obligations - 0.1%
United States of America - 0.1%
U.S. Treasury Bills, yield at date of purchase 0.09% 5/6/21(Cost $14,997,635)(f) 15,000,000 14,998,992
Shares Value
Money Market Funds - 2.9%
Fidelity Cash Central Fund 0.07% (g) 940,941,010 941,129,198
Fidelity Securities Lending Cash Central Fund 0.08% (g)(h) 11,421,400 11,422,542
Copyright © 2021 www.secdatabase.com. All Rights Reserved.Please Consider the Environment Before Printing This Document
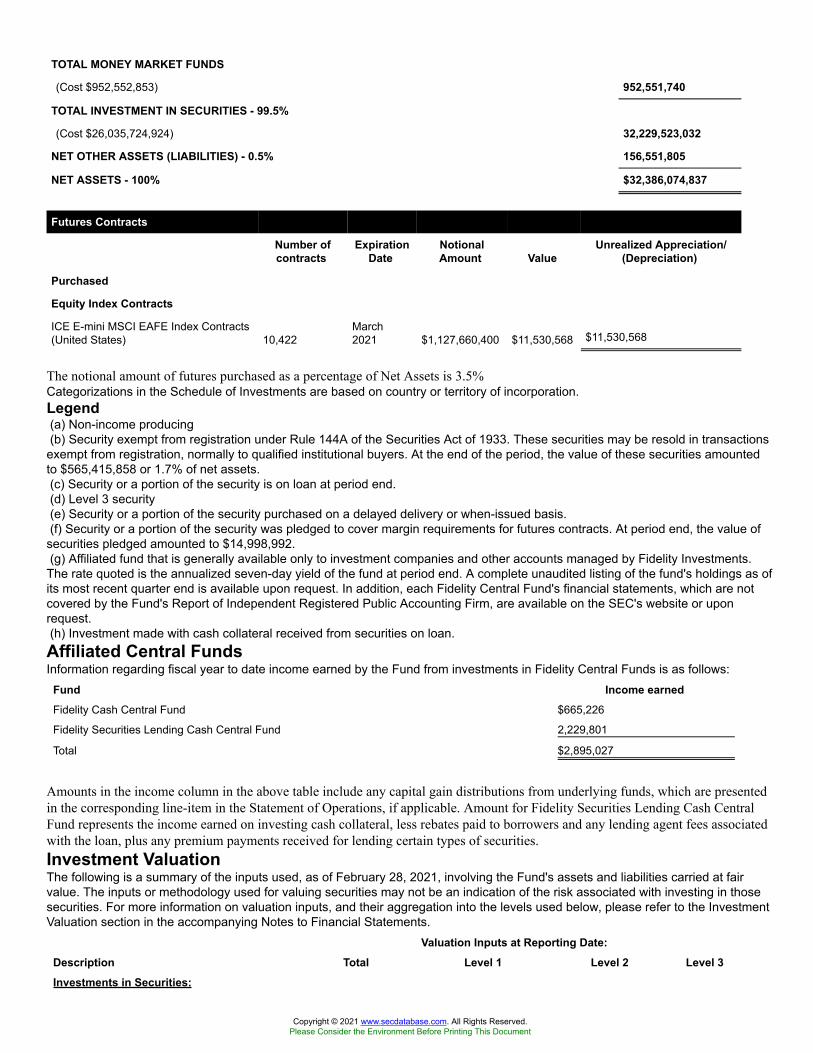
TOTAL MONEY MARKET FUNDS
(Cost $952,552,853) 952,551,740
TOTAL INVESTMENT IN SECURITIES - 99.5%
(Cost $26,035,724,924) 32,229,523,032
NET OTHER ASSETS (LIABILITIES) - 0.5% 156,551,805
NET ASSETS - 100% $32,386,074,837
Futures Contracts
Number ofcontracts
ExpirationDate
NotionalAmount Value
Unrealized Appreciation/(Depreciation)
Purchased
Equity Index Contracts
ICE E-mini MSCI EAFE Index Contracts(United States) 10,422
March2021 $1,127,660,400 $11,530,568 $11,530,568
The notional amount of futures purchased as a percentage of Net Assets is 3.5%Categorizations in the Schedule of Investments are based on country or territory of incorporation.Legend(a) Non-income producing(b) Security exempt from registration under Rule 144A of the Securities Act of 1933. These securities may be resold in transactions
exempt from registration, normally to qualified institutional buyers. At the end of the period, the value of these securities amountedto $565,415,858 or 1.7% of net assets.(c) Security or a portion of the security is on loan at period end.(d) Level 3 security(e) Security or a portion of the security purchased on a delayed delivery or when-issued basis.(f) Security or a portion of the security was pledged to cover margin requirements for futures contracts. At period end, the value of
securities pledged amounted to $14,998,992.(g) Affiliated fund that is generally available only to investment companies and other accounts managed by Fidelity Investments.
The rate quoted is the annualized seven-day yield of the fund at period end. A complete unaudited listing of the fund's holdings as ofits most recent quarter end is available upon request. In addition, each Fidelity Central Fund's financial statements, which are notcovered by the Fund's Report of Independent Registered Public Accounting Firm, are available on the SEC's website or uponrequest.(h) Investment made with cash collateral received from securities on loan.Affiliated Central FundsInformation regarding fiscal year to date income earned by the Fund from investments in Fidelity Central Funds is as follows:
Fund Income earnedFidelity Cash Central Fund $665,226
Fidelity Securities Lending Cash Central Fund 2,229,801
Total $2,895,027
Amounts in the income column in the above table include any capital gain distributions from underlying funds, which are presentedin the corresponding line-item in the Statement of Operations, if applicable. Amount for Fidelity Securities Lending Cash CentralFund represents the income earned on investing cash collateral, less rebates paid to borrowers and any lending agent fees associatedwith the loan, plus any premium payments received for lending certain types of securities.Investment ValuationThe following is a summary of the inputs used, as of February 28, 2021, involving the Fund's assets and liabilities carried at fairvalue. The inputs or methodology used for valuing securities may not be an indication of the risk associated with investing in thosesecurities. For more information on valuation inputs, and their aggregation into the levels used below, please refer to the InvestmentValuation section in the accompanying Notes to Financial Statements.
Valuation Inputs at Reporting Date:Description Total Level 1 Level 2 Level 3Investments in Securities:
Copyright © 2021 www.secdatabase.com. All Rights Reserved.Please Consider the Environment Before Printing This Document

Equities:Communication Services $1,663,008,549 $410,349,392 $1,252,659,157 $--
Consumer Discretionary 3,947,761,550 1,935,812,567 2,011,948,983 --
Consumer Staples 3,124,272,198 1,397,777,725 1,726,494,473 --
Energy 1,083,007,867 216,098,031 866,909,836 --
Financials 5,395,350,241 2,847,973,328 2,547,376,812 101
Health Care 3,789,060,292 1,362,672,384 2,426,387,908 --
Industrials 4,792,158,565 2,088,076,565 2,704,082,000 --
Information Technology 2,829,386,896 1,112,518,442 1,716,868,454 --
Materials 2,548,304,486 1,218,534,468 1,329,770,018 --
Real Estate 970,824,148 816,304,775 154,519,373 --
Utilities 1,118,837,508 700,842,281 417,995,227 --
Government Obligations 14,998,992 -- 14,998,992 --
Money Market Funds 952,551,740 952,551,740 -- --
Total Investments in Securities: $32,229,523,032 $15,059,511,698 $17,170,011,233 $101
Derivative Instruments:Assets
Futures Contracts $11,530,568 $11,530,568 $-- $--
Total Assets $11,530,568 $11,530,568 $-- $--
Total Derivative Instruments: $11,530,568 $11,530,568 $-- $--
Value of Derivative InstrumentsThe following table is a summary of the Fund's value of derivative instruments by primary risk exposure as of February 28, 2021.For additional information on derivative instruments, please refer to the Derivative Instruments section in the accompanying Notesto Financial Statements.
Primary Risk Exposure / Derivative Type ValueAsset Liability
Equity Risk
Futures Contracts(a) $11,530,568 $0
Total Equity Risk 11,530,568 0
Total Value of Derivatives $11,530,568 $0
(a) Reflects gross cumulative appreciation (depreciation) on futures contracts as presented in the Schedule of Investments. In theStatement of Assets and Liabilities, the period end daily variation margin is included in receivable or payable for daily variationmargin on futures contracts, and the net cumulative appreciation (depreciation) is included in Total accumulated earnings (loss).See accompanying notes which are an integral part of the financial statements.
Fidelity® International Index Fund
Financial StatementsStatement of Assets and Liabilities
February 28,2021
AssetsInvestment in securities, at value (including securities loaned of $10,809,333) � See accompanyingschedule:Unaffiliated issuers (cost $25,083,172,071) $31,276,971,292
Fidelity Central Funds (cost $952,552,853) 952,551,740
Copyright © 2021 www.secdatabase.com. All Rights Reserved.Please Consider the Environment Before Printing This Document
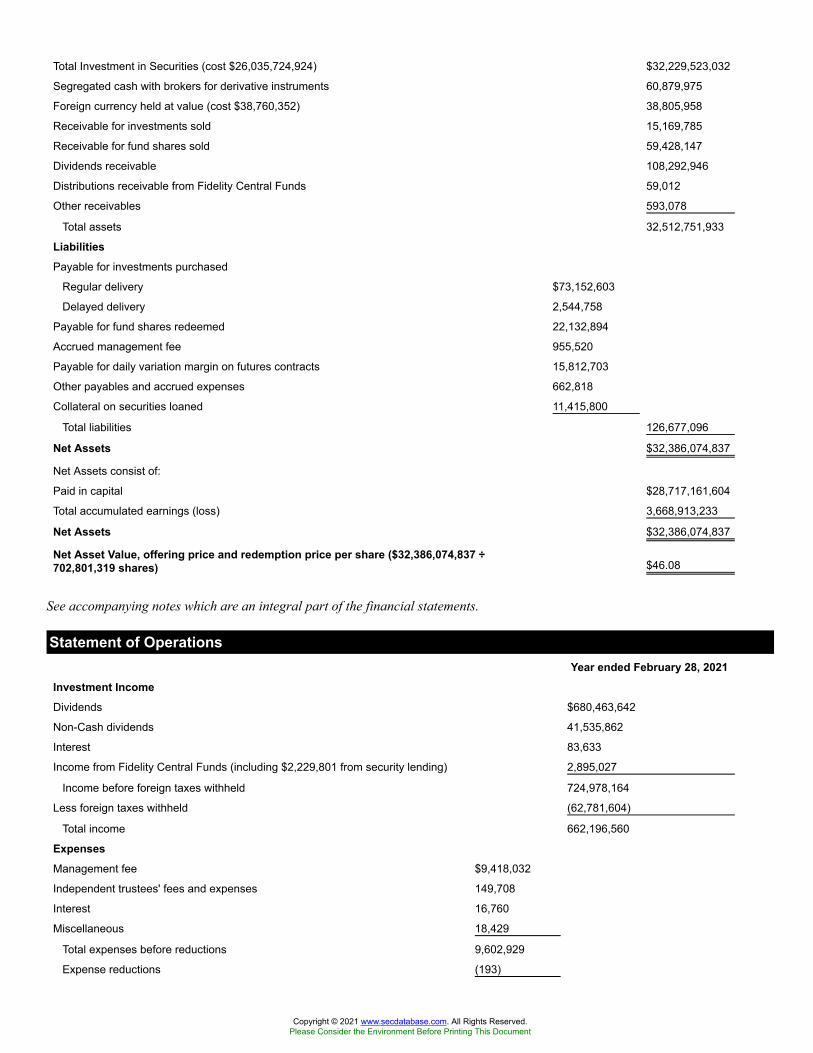
Total Investment in Securities (cost $26,035,724,924) $32,229,523,032
Segregated cash with brokers for derivative instruments 60,879,975
Foreign currency held at value (cost $38,760,352) 38,805,958
Receivable for investments sold 15,169,785
Receivable for fund shares sold 59,428,147
Dividends receivable 108,292,946
Distributions receivable from Fidelity Central Funds 59,012
Other receivables 593,078
Total assets 32,512,751,933
LiabilitiesPayable for investments purchased
Regular delivery $73,152,603
Delayed delivery 2,544,758
Payable for fund shares redeemed 22,132,894
Accrued management fee 955,520
Payable for daily variation margin on futures contracts 15,812,703
Other payables and accrued expenses 662,818
Collateral on securities loaned 11,415,800
Total liabilities 126,677,096
Net Assets $32,386,074,837
Net Assets consist of:
Paid in capital $28,717,161,604
Total accumulated earnings (loss) 3,668,913,233
Net Assets $32,386,074,837
Net Asset Value, offering price and redemption price per share ($32,386,074,837 ÷702,801,319 shares) $46.08
See accompanying notes which are an integral part of the financial statements.
Statement of OperationsYear ended February 28, 2021
Investment IncomeDividends $680,463,642
Non-Cash dividends 41,535,862
Interest 83,633
Income from Fidelity Central Funds (including $2,229,801 from security lending) 2,895,027
Income before foreign taxes withheld 724,978,164
Less foreign taxes withheld (62,781,604)
Total income 662,196,560
ExpensesManagement fee $9,418,032
Independent trustees' fees and expenses 149,708
Interest 16,760
Miscellaneous 18,429
Total expenses before reductions 9,602,929
Expense reductions (193)
Copyright © 2021 www.secdatabase.com. All Rights Reserved.Please Consider the Environment Before Printing This Document
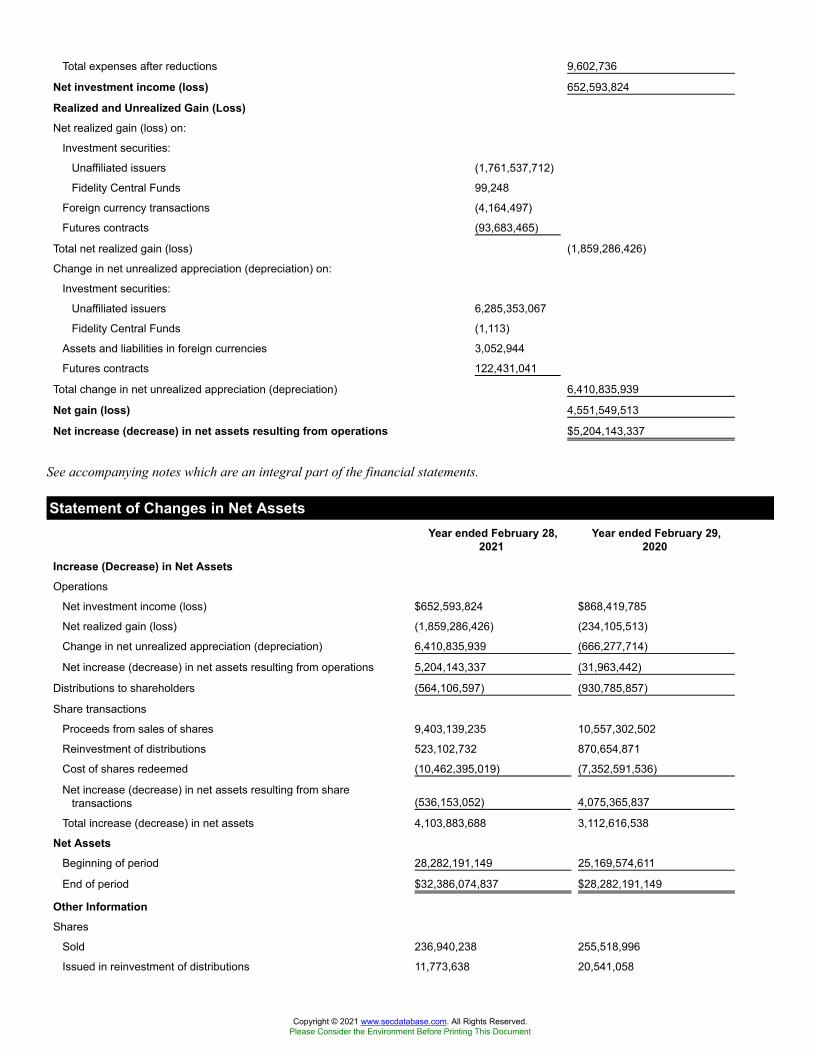
Total expenses after reductions 9,602,736
Net investment income (loss) 652,593,824
Realized and Unrealized Gain (Loss)Net realized gain (loss) on:
Investment securities:
Unaffiliated issuers (1,761,537,712)
Fidelity Central Funds 99,248
Foreign currency transactions (4,164,497)
Futures contracts (93,683,465)
Total net realized gain (loss) (1,859,286,426)
Change in net unrealized appreciation (depreciation) on:
Investment securities:
Unaffiliated issuers 6,285,353,067
Fidelity Central Funds (1,113)
Assets and liabilities in foreign currencies 3,052,944
Futures contracts 122,431,041
Total change in net unrealized appreciation (depreciation) 6,410,835,939
Net gain (loss) 4,551,549,513
Net increase (decrease) in net assets resulting from operations $5,204,143,337
See accompanying notes which are an integral part of the financial statements.
Statement of Changes in Net AssetsYear ended February 28,
2021Year ended February 29,
2020Increase (Decrease) in Net AssetsOperations
Net investment income (loss) $652,593,824 $868,419,785
Net realized gain (loss) (1,859,286,426) (234,105,513)
Change in net unrealized appreciation (depreciation) 6,410,835,939 (666,277,714)
Net increase (decrease) in net assets resulting from operations 5,204,143,337 (31,963,442)
Distributions to shareholders (564,106,597) (930,785,857)
Share transactions
Proceeds from sales of shares 9,403,139,235 10,557,302,502
Reinvestment of distributions 523,102,732 870,654,871
Cost of shares redeemed (10,462,395,019) (7,352,591,536)
Net increase (decrease) in net assets resulting from sharetransactions (536,153,052) 4,075,365,837
Total increase (decrease) in net assets 4,103,883,688 3,112,616,538
Net AssetsBeginning of period 28,282,191,149 25,169,574,611
End of period $32,386,074,837 $28,282,191,149
Other InformationShares
Sold 236,940,238 255,518,996
Issued in reinvestment of distributions 11,773,638 20,541,058
Copyright © 2021 www.secdatabase.com. All Rights Reserved.Please Consider the Environment Before Printing This Document
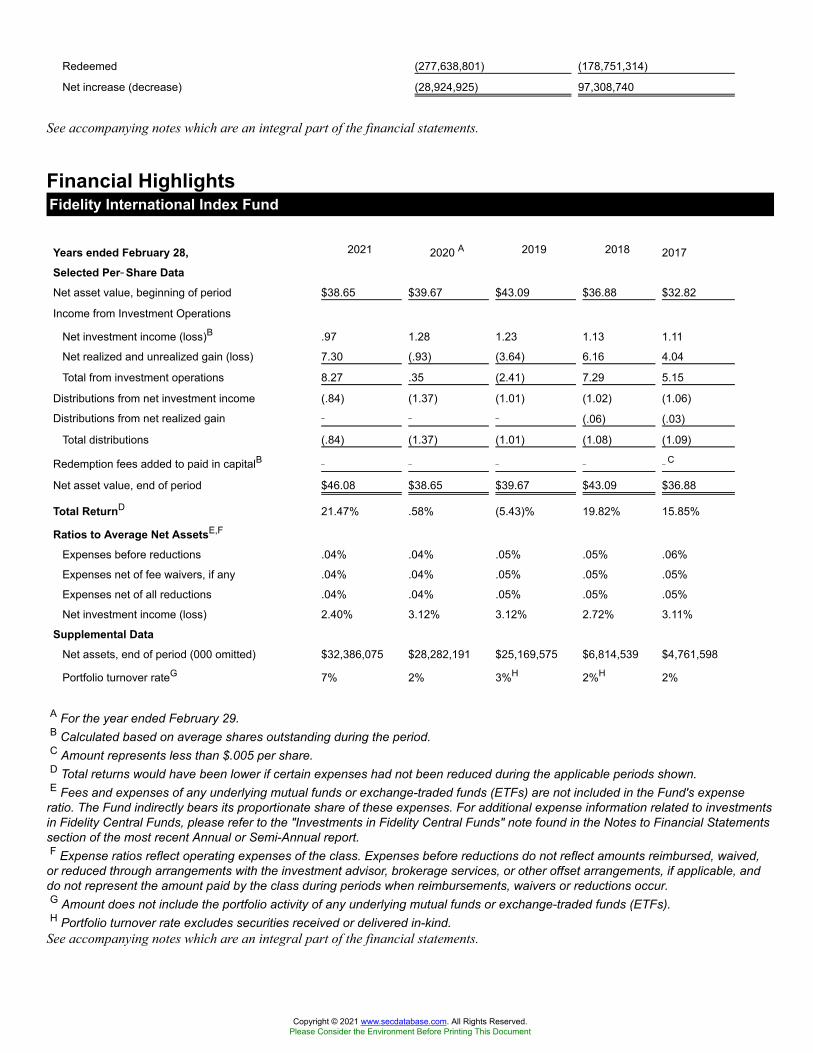
Redeemed (277,638,801) (178,751,314)
Net increase (decrease) (28,924,925) 97,308,740
See accompanying notes which are an integral part of the financial statements.
Financial HighlightsFidelity International Index Fund
Years ended February 28, 2021 2020 A 2019 2018 2017
Selected Per��Share DataNet asset value, beginning of period $38.65 $39.67 $43.09 $36.88 $32.82
Income from Investment Operations
Net investment income (loss)B .97 1.28 1.23 1.13 1.11
Net realized and unrealized gain (loss) 7.30 (.93) (3.64) 6.16 4.04
Total from investment operations 8.27 .35 (2.41) 7.29 5.15
Distributions from net investment income (.84) (1.37) (1.01) (1.02) (1.06)
Distributions from net realized gain � � � (.06) (.03)
Total distributions (.84) (1.37) (1.01) (1.08) (1.09)
Redemption fees added to paid in capitalB � � � � �C
Net asset value, end of period $46.08 $38.65 $39.67 $43.09 $36.88
Total ReturnD 21.47% .58% (5.43)% 19.82% 15.85%
Ratios to Average Net AssetsE,F
Expenses before reductions .04% .04% .05% .05% .06%
Expenses net of fee waivers, if any .04% .04% .05% .05% .05%
Expenses net of all reductions .04% .04% .05% .05% .05%
Net investment income (loss) 2.40% 3.12% 3.12% 2.72% 3.11%
Supplemental DataNet assets, end of period (000 omitted) $32,386,075 $28,282,191 $25,169,575 $6,814,539 $4,761,598
Portfolio turnover rateG 7% 2% 3%H 2%H 2%
A For the year ended February 29.B Calculated based on average shares outstanding during the period.C Amount represents less than $.005 per share.D Total returns would have been lower if certain expenses had not been reduced during the applicable periods shown.E Fees and expenses of any underlying mutual funds or exchange-traded funds (ETFs) are not included in the Fund's expense
ratio. The Fund indirectly bears its proportionate share of these expenses. For additional expense information related to investmentsin Fidelity Central Funds, please refer to the "Investments in Fidelity Central Funds" note found in the Notes to Financial Statementssection of the most recent Annual or Semi-Annual report.F Expense ratios reflect operating expenses of the class. Expenses before reductions do not reflect amounts reimbursed, waived,
or reduced through arrangements with the investment advisor, brokerage services, or other offset arrangements, if applicable, anddo not represent the amount paid by the class during periods when reimbursements, waivers or reductions occur.G Amount does not include the portfolio activity of any underlying mutual funds or exchange-traded funds (ETFs).H Portfolio turnover rate excludes securities received or delivered in-kind.
See accompanying notes which are an integral part of the financial statements.
Copyright © 2021 www.secdatabase.com. All Rights Reserved.Please Consider the Environment Before Printing This Document

Notes to Financial StatementsFor the period ended February 28, 2021
1. Organization.Fidelity Total Market Index Fund, Fidelity Extended Market Index Fund and Fidelity International Index Fund (the Funds) are fundsof Fidelity Concord Street Trust (the Trust). Each Fund is authorized to issue an unlimited number of shares. Share transactions onthe Statement of Changes in Net Assets may contain exchanges between affiliated funds. The Trust is registered under theInvestment Company Act of 1940, as amended (the 1940 Act), as an open-end management investment company organized as aMassachusetts business trust.Effective after the close of business on April 26, 2019, Fidelity Total Market Index Fund no longer offered Class F, and alloutstanding shares of Class F were redeemed. Prior fiscal period dollar and share amounts for Class F, which are presented in theNotes to Financial Statements, are for the period March 1, 2019 through April 26, 2019.2. Investments in Fidelity Central Funds.The Funds invests in Fidelity Central Funds, which are open-end investment companies generally available only to other investmentcompanies and accounts managed by the investment adviser and its affiliates. The Funds' Schedules of Investments list each of theFidelity Central Funds held as of period end, if any, as an investment of each Fund, but do not include the underlying holdings ofeach Fidelity Central Fund. As an Investing Fund, each Fund indirectly bears its proportionate share of the expenses of theunderlying Fidelity Central Funds.The Money Market Central Funds seek preservation of capital and current income and are managed by the investment adviser.Annualized expenses of the Money Market Central Funds as of their most recent shareholder report date ranged from less than.005% to .01%.A complete unaudited list of holdings for each Fidelity Central Fund is available upon request or at the Securities and ExchangeCommission (the SEC) website at www.sec.gov. In addition, the financial statements of the Fidelity Central Funds, which are notcovered by the Funds' Report of Independent Registered Public Accounting Firm, are available on the SEC website or upon request.3. Significant Accounting Policies.Each Fund is an investment company and applies the accounting and reporting guidance of the Financial Accounting StandardsBoard (FASB) Accounting Standards Codification Topic 946 Financial Services - Investment Companies. The financial statementshave been prepared in conformity with accounting principles generally accepted in the United States of America (GAAP), whichrequire management to make certain estimates and assumptions at the date of the financial statements. Actual results could differfrom those estimates. Subsequent events, if any, through the date that the financial statements were issued have been evaluated in thepreparation of the financial statements. The following summarizes the significant accounting policies of the Funds:Investment Valuation. Investments are valued as of 4:00 p.m. Eastern time on the last calendar day of the period. The Board ofTrustees (the Board) has delegated the day to day responsibility for the valuation of each Fund's investments to the Fair ValueCommittee (the Committee) established by each Fund's investment adviser. In accordance with valuation policies and proceduresapproved by the Board, each Fund attempts to obtain prices from one or more third party pricing vendors or brokers to value itsinvestments. When current market prices, quotations or currency exchange rates are not readily available or reliable, investmentswill be fair valued in good faith by the Committee, in accordance with procedures adopted by the Board. Factors used indetermining fair value vary by investment type and may include market or investment specific events, changes in interest rates andcredit quality. The frequency with which these procedures are used cannot be predicted and they may be utilized to a significantextent. The Committee oversees each Fund's valuation policies and procedures and reports to the Board on the Committee'sactivities and fair value determinations. The Board monitors the appropriateness of the procedures used in valuing each Fund'sinvestments and ratifies the fair value determinations of the Committee.Each Fund categorizes the inputs to valuation techniques used to value its investments into a disclosure hierarchy consisting of threelevels as shown below:
Level 1 � quoted prices in active markets for identical investments
Level 2 � other significant observable inputs (including quoted prices for similar investments, interest rates, prepaymentspeeds, etc.)
Level 3 � unobservable inputs (including the Fund's own assumptions based on the best information available)
Valuation techniques used to value each Fund's investments by major category are as follows:Equity securities, including restricted securities, for which market quotations are readily available, are valued at the last reportedsale price or official closing price as reported by a third party pricing vendor on the primary market or exchange on which they aretraded and are categorized as Level 1 in the hierarchy. In the event there were no sales during the day or closing prices are notavailable, securities are valued at the last quoted bid price or may be valued using the last available price and are generallycategorized as Level 2 in the hierarchy. For foreign equity securities, when market or security specific events arise, comparisons tothe valuation of American Depositary Receipts (ADRs), futures contracts, Exchange-Traded Funds (ETFs) and certain indexes as
Copyright © 2021 www.secdatabase.com. All Rights Reserved.Please Consider the Environment Before Printing This Document
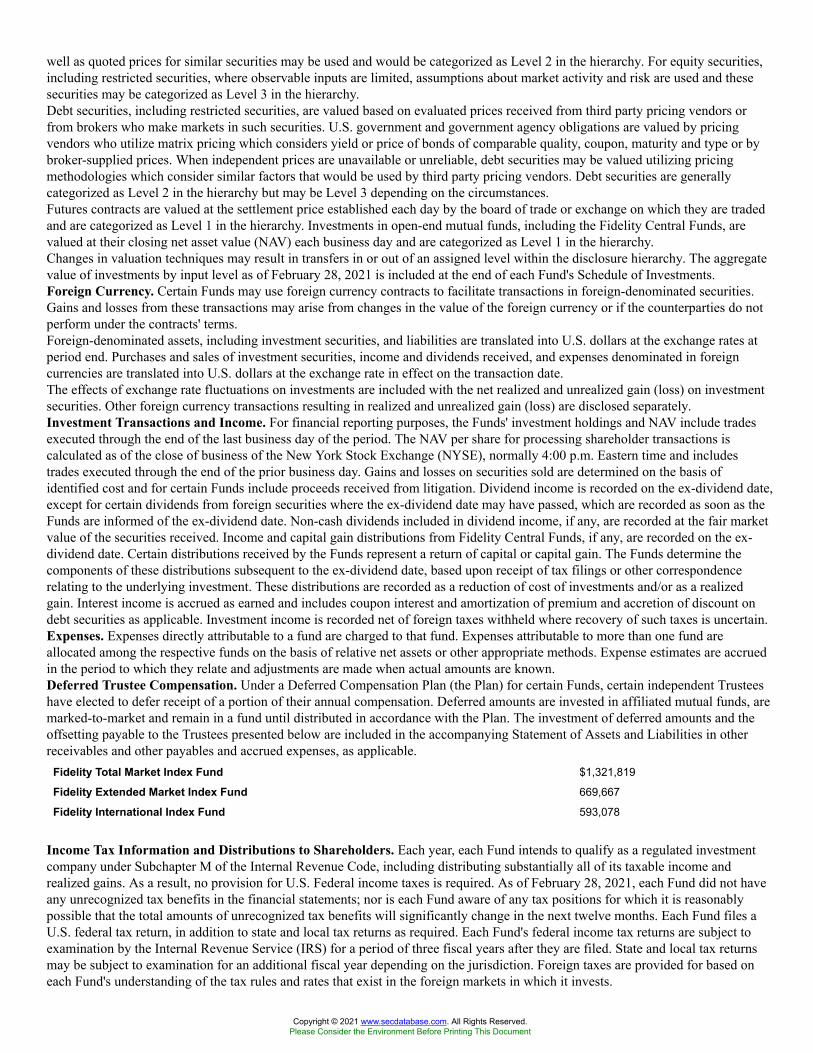
well as quoted prices for similar securities may be used and would be categorized as Level 2 in the hierarchy. For equity securities,including restricted securities, where observable inputs are limited, assumptions about market activity and risk are used and thesesecurities may be categorized as Level 3 in the hierarchy.Debt securities, including restricted securities, are valued based on evaluated prices received from third party pricing vendors orfrom brokers who make markets in such securities. U.S. government and government agency obligations are valued by pricingvendors who utilize matrix pricing which considers yield or price of bonds of comparable quality, coupon, maturity and type or bybroker-supplied prices. When independent prices are unavailable or unreliable, debt securities may be valued utilizing pricingmethodologies which consider similar factors that would be used by third party pricing vendors. Debt securities are generallycategorized as Level 2 in the hierarchy but may be Level 3 depending on the circumstances.Futures contracts are valued at the settlement price established each day by the board of trade or exchange on which they are tradedand are categorized as Level 1 in the hierarchy. Investments in open-end mutual funds, including the Fidelity Central Funds, arevalued at their closing net asset value (NAV) each business day and are categorized as Level 1 in the hierarchy.Changes in valuation techniques may result in transfers in or out of an assigned level within the disclosure hierarchy. The aggregatevalue of investments by input level as of February 28, 2021 is included at the end of each Fund's Schedule of Investments.Foreign Currency. Certain Funds may use foreign currency contracts to facilitate transactions in foreign-denominated securities.Gains and losses from these transactions may arise from changes in the value of the foreign currency or if the counterparties do notperform under the contracts' terms.Foreign-denominated assets, including investment securities, and liabilities are translated into U.S. dollars at the exchange rates atperiod end. Purchases and sales of investment securities, income and dividends received, and expenses denominated in foreigncurrencies are translated into U.S. dollars at the exchange rate in effect on the transaction date.The effects of exchange rate fluctuations on investments are included with the net realized and unrealized gain (loss) on investmentsecurities. Other foreign currency transactions resulting in realized and unrealized gain (loss) are disclosed separately.Investment Transactions and Income. For financial reporting purposes, the Funds' investment holdings and NAV include tradesexecuted through the end of the last business day of the period. The NAV per share for processing shareholder transactions iscalculated as of the close of business of the New York Stock Exchange (NYSE), normally 4:00 p.m. Eastern time and includestrades executed through the end of the prior business day. Gains and losses on securities sold are determined on the basis ofidentified cost and for certain Funds include proceeds received from litigation. Dividend income is recorded on the ex-dividend date,except for certain dividends from foreign securities where the ex-dividend date may have passed, which are recorded as soon as theFunds are informed of the ex-dividend date. Non-cash dividends included in dividend income, if any, are recorded at the fair marketvalue of the securities received. Income and capital gain distributions from Fidelity Central Funds, if any, are recorded on the ex-dividend date. Certain distributions received by the Funds represent a return of capital or capital gain. The Funds determine thecomponents of these distributions subsequent to the ex-dividend date, based upon receipt of tax filings or other correspondencerelating to the underlying investment. These distributions are recorded as a reduction of cost of investments and/or as a realizedgain. Interest income is accrued as earned and includes coupon interest and amortization of premium and accretion of discount ondebt securities as applicable. Investment income is recorded net of foreign taxes withheld where recovery of such taxes is uncertain.Expenses. Expenses directly attributable to a fund are charged to that fund. Expenses attributable to more than one fund areallocated among the respective funds on the basis of relative net assets or other appropriate methods. Expense estimates are accruedin the period to which they relate and adjustments are made when actual amounts are known.Deferred Trustee Compensation. Under a Deferred Compensation Plan (the Plan) for certain Funds, certain independent Trusteeshave elected to defer receipt of a portion of their annual compensation. Deferred amounts are invested in affiliated mutual funds, aremarked-to-market and remain in a fund until distributed in accordance with the Plan. The investment of deferred amounts and theoffsetting payable to the Trustees presented below are included in the accompanying Statement of Assets and Liabilities in otherreceivables and other payables and accrued expenses, as applicable.
Fidelity Total Market Index Fund $1,321,819
Fidelity Extended Market Index Fund 669,667
Fidelity International Index Fund 593,078
Income Tax Information and Distributions to Shareholders. Each year, each Fund intends to qualify as a regulated investmentcompany under Subchapter M of the Internal Revenue Code, including distributing substantially all of its taxable income andrealized gains. As a result, no provision for U.S. Federal income taxes is required. As of February 28, 2021, each Fund did not haveany unrecognized tax benefits in the financial statements; nor is each Fund aware of any tax positions for which it is reasonablypossible that the total amounts of unrecognized tax benefits will significantly change in the next twelve months. Each Fund files aU.S. federal tax return, in addition to state and local tax returns as required. Each Fund's federal income tax returns are subject toexamination by the Internal Revenue Service (IRS) for a period of three fiscal years after they are filed. State and local tax returnsmay be subject to examination for an additional fiscal year depending on the jurisdiction. Foreign taxes are provided for based oneach Fund's understanding of the tax rules and rates that exist in the foreign markets in which it invests.
Copyright © 2021 www.secdatabase.com. All Rights Reserved.Please Consider the Environment Before Printing This Document
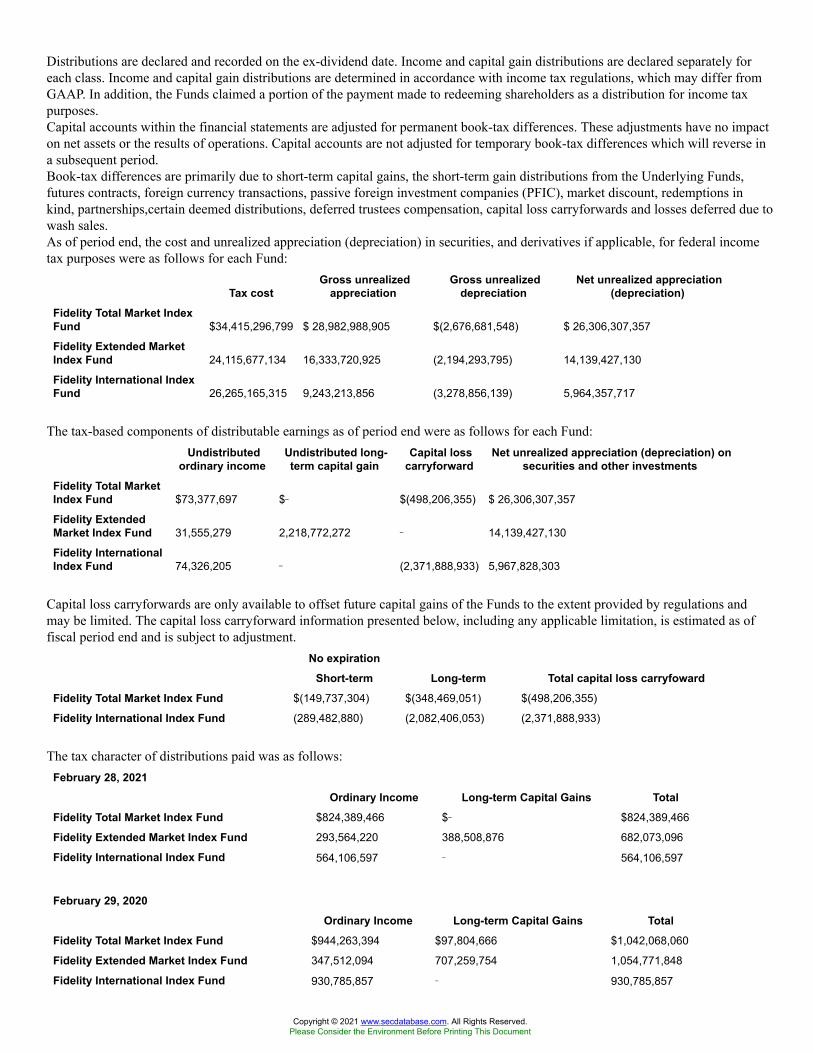
Distributions are declared and recorded on the ex-dividend date. Income and capital gain distributions are declared separately foreach class. Income and capital gain distributions are determined in accordance with income tax regulations, which may differ fromGAAP. In addition, the Funds claimed a portion of the payment made to redeeming shareholders as a distribution for income taxpurposes.Capital accounts within the financial statements are adjusted for permanent book-tax differences. These adjustments have no impacton net assets or the results of operations. Capital accounts are not adjusted for temporary book-tax differences which will reverse ina subsequent period.Book-tax differences are primarily due to short-term capital gains, the short-term gain distributions from the Underlying Funds,futures contracts, foreign currency transactions, passive foreign investment companies (PFIC), market discount, redemptions inkind, partnerships,certain deemed distributions, deferred trustees compensation, capital loss carryforwards and losses deferred due towash sales.As of period end, the cost and unrealized appreciation (depreciation) in securities, and derivatives if applicable, for federal incometax purposes were as follows for each Fund:
Tax costGross unrealized
appreciationGross unrealized
depreciationNet unrealized appreciation
(depreciation)Fidelity Total Market IndexFund $34,415,296,799 $ 28,982,988,905 $(2,676,681,548) $ 26,306,307,357
Fidelity Extended MarketIndex Fund 24,115,677,134 16,333,720,925 (2,194,293,795) 14,139,427,130
Fidelity International IndexFund 26,265,165,315 9,243,213,856 (3,278,856,139) 5,964,357,717
The tax-based components of distributable earnings as of period end were as follows for each Fund:Undistributed
ordinary incomeUndistributed long-term capital gain
Capital losscarryforward
Net unrealized appreciation (depreciation) onsecurities and other investments
Fidelity Total MarketIndex Fund $73,377,697 $� $(498,206,355) $ 26,306,307,357
Fidelity ExtendedMarket Index Fund 31,555,279 2,218,772,272 � 14,139,427,130
Fidelity InternationalIndex Fund 74,326,205 � (2,371,888,933) 5,967,828,303
Capital loss carryforwards are only available to offset future capital gains of the Funds to the extent provided by regulations andmay be limited. The capital loss carryforward information presented below, including any applicable limitation, is estimated as offiscal period end and is subject to adjustment.
No expirationShort-term Long-term Total capital loss carryfoward
Fidelity Total Market Index Fund $(149,737,304) $(348,469,051) $(498,206,355)
Fidelity International Index Fund (289,482,880) (2,082,406,053) (2,371,888,933)
The tax character of distributions paid was as follows:February 28, 2021
Ordinary Income Long-term Capital Gains TotalFidelity Total Market Index Fund $824,389,466 $� $824,389,466
Fidelity Extended Market Index Fund 293,564,220 388,508,876 682,073,096
Fidelity International Index Fund 564,106,597 � 564,106,597
February 29, 2020Ordinary Income Long-term Capital Gains Total
Fidelity Total Market Index Fund $944,263,394 $97,804,666 $1,042,068,060
Fidelity Extended Market Index Fund 347,512,094 707,259,754 1,054,771,848
Fidelity International Index Fund 930,785,857 � 930,785,857
Copyright © 2021 www.secdatabase.com. All Rights Reserved.Please Consider the Environment Before Printing This Document

Delayed Delivery Transactions and When-Issued Securities. During the period, certain Funds transacted in securities on adelayed delivery or when-issued basis. Payment and delivery may take place after the customary settlement period for that security.The price of the underlying securities and the date when the securities will be delivered and paid for are fixed at the time thetransaction is negotiated. Securities purchased on a delayed delivery or when-issued basis are identified as such in the Schedule ofInvestments. Compensation for interest forgone in the purchase of a delayed delivery or when-issued debt security may be received.With respect to purchase commitments, each applicable Fund identifies securities as segregated in its records with a value at leastequal to the amount of the commitment. Payables and receivables associated with the purchases and sales of delayed deliverysecurities having the same coupon, settlement date and broker are offset. Delayed delivery or when-issued securities that have beenpurchased from and sold to different brokers are reflected as both payables and receivables in the Statement of Assets and Liabilitiesunder the caption "Delayed delivery", as applicable. Losses may arise due to changes in the value of the underlying securities or ifthe counterparty does not perform under the contract's terms, or if the issuer does not issue the securities due to political, economic,or other factors.Restricted Securities (including Private Placements). The Funds may invest in securities that are subject to legal or contractualrestrictions on resale. These securities generally may be resold in transactions exempt from registration or to the public if thesecurities are registered. Disposal of these securities may involve time-consuming negotiations and expense, and prompt sale at anacceptable price may be difficult. Information regarding restricted securities is included at the end of each applicable Fund'sSchedule of Investments.4. Derivative Instruments.Risk Exposures and the Use of Derivative Instruments. The Funds' investment objective allows the Funds to enter into varioustypes of derivative contracts, including futures. Derivatives are investments whose value is primarily derived from underlying assets,indices or reference rates and may be transacted on an exchange or over-the-counter (OTC). Derivatives may involve a futurecommitment to buy or sell a specified asset based on specified terms, to exchange future cash flows at periodic intervals based on anotional principal amount, or for one party to make one or more payments upon the occurrence of specified events in exchange forperiodic payments from the other party.The Funds used derivatives to increase returns and to manage exposure to certain risks as defined below. The success of any strategyinvolving derivatives depends on analysis of numerous economic factors, and if the strategies for investment do not work asintended, the Funds may not achieve their objectives.The Funds' use of derivatives increased or decreased their exposure to the following risk:
EquityRisk
Equity risk relates to the fluctuations in the value of financial instruments as a result of changes in market prices (other than thosearising from interest rate risk or foreign exchange risk), whether caused by factors specific to an individual investment, its issuer,or all factors affecting all instruments traded in a market or market segment.
The Funds are also exposed to additional risks from investing in derivatives, such as liquidity risk and counterparty credit risk.Liquidity risk is the risk that the Funds will be unable to close out the derivative in the open market in a timely manner.Counterparty credit risk is the risk that the counterparty will not be able to fulfill its obligation to the Funds. Counterparty credit riskrelated to exchange-traded futures contracts may be mitigated by the protection provided by the exchange on which they trade.Investing in derivatives may involve greater risks than investing in the underlying assets directly and, to varying degrees, mayinvolve risk of loss in excess of any initial investment and collateral received and amounts recognized in the Statement of Assets andLiabilities. In addition, there may be the risk that the change in value of the derivative contract does not correspond to the change invalue of the underlying instrument.Futures Contracts. A futures contract is an agreement between two parties to buy or sell a specified underlying instrument for afixed price at a specified future date. The Funds used futures contracts to manage their exposure to the stock market.Upon entering into a futures contract, a fund is required to deposit either cash or securities (initial margin) with a clearing broker inan amount equal to a certain percentage of the face value of the contract. Futures contracts are marked-to-market daily andsubsequent daily payments (variation margin) are made or received by a fund depending on the daily fluctuations in the value of thefutures contracts and are recorded as unrealized appreciation or (depreciation). This receivable and/or payable, if any, is included indaily variation margin on futures contracts in the Statement of Assets and Liabilities. Realized gain or (loss) is recorded upon theexpiration or closing of a futures contract. The net realized gain (loss) and change in net unrealized appreciation (depreciation) onfutures contracts during the period is presented in the Statement of Operations.Any open futures contracts at period end are presented in the Schedule of Investments under the caption "Futures Contracts". Thenotional amount at value reflects each contract's exposure to the underlying instrument or index at period end and is representativeof volume of activity during the period. Securities deposited to meet initial margin requirements are identified in the Schedule ofInvestments. Cash deposited to meet initial margin requirements is presented as segregated cash with brokers for derivativeinstruments in the Statement of Assets and Liabilities.5. Purchases and Sales of Investments.
Copyright © 2021 www.secdatabase.com. All Rights Reserved.Please Consider the Environment Before Printing This Document

Purchases and sales of securities, other than short-term securities and in-kind transactions, are noted in the table below.Purchases ($) Sales ($)
Fidelity Total Market Index Fund 3,125,992,085 3,910,511,082
Fidelity Extended Market Index Fund 7,605,327,525 6,755,516,511
Fidelity International Index Fund 1,904,340,362 2,229,867,341
Unaffiliated Redemptions In-Kind. During the period, shares of the applicable Funds were redeemed in-kind for investments andcash as presented in the table below. The net realized gain on investments delivered through in-kind redemptions is included in theaccompanying Statement of Operations. The amount of the in-kind redemptions is included in share transactions in theaccompanying Statement of Changes in Net Assets. The Funds recognized no gain or loss for federal income tax purposes.
Shares Value of investments and cash Realized GainFidelity Total Market Index Fund 522,575 $49,085,493 $45,655,041
Fidelity Extended Market Index Fund 2,441,436 $204,701,487 $141,281,001
Unaffiliated Exchanges In-Kind. During the period, the Total Market Index Fund received investments, including accrued interest,and cash valued at $274,588,843 in exchange for 2,431,496 shares of the Fund. The amount of in-kind exchanges is included inshare transactions in the accompanying Statement of Changes in Net Assets.6. Fees and Other Transactions with Affiliates.Management Fee and Expense Contract. Fidelity Management & Research Company LLC (the investment adviser) and itsaffiliates provide the Funds with investment management related services for which the Funds pay a monthly management fee. Themanagement fee is based on an annual rate of .015%, .035% and .035% of average net assets for Fidelity Total Market Index Fund,Fidelity Extended Market Index Fund and Fidelity International Index Fund, respectively. The management fee is reduced by anamount equal to the fees and expenses paid by each Fund to the independent Trustees. Prior to May 1, 2020, the annual managementfee rate for Fidelity Extended Market Index Fund was .045%. Under the management contract, the investment adviser pays all otheroperating expenses, except the compensation of the independent Trustees and certain other expenses such as interest expense.Effective April 29, 2020, the Board approved to add an expense contract to each Fund. Under the expense contract, the investmentadviser pays all other operating expenses, except the compensation of the independent Trustees, as necessary so that the totalexpenses do not exceed .015%, .035% and .035% of average net assets for Fidelity Total Market Index Fund, Fidelity ExtendedMarket Index Fund and Fidelity International Index Fund, respectively. These expense contracts will remain in place through April30, 2022.Sub-Adviser. Geode Capital Management, LLC (Geode), serves as sub-adviser for the Funds. Geode provides discretionaryinvestment advisory services to the Funds and is paid by the investment adviser for providing these services.Interfund Lending Program. Pursuant to an Exemptive Order issued by the SEC, each Fund, along with other registeredinvestment companies having management contracts with Fidelity Management & Research Company LLC (FMR), or otheraffiliated entities of FMR, may participate in an interfund lending program. This program provides an alternative credit facilityallowing each Fund to borrow from, or lend money to, other participating affiliated funds. At period end, there were no interfundloans outstanding. Activity in this program during the period for which loans were outstanding is presented in the table below.Effective April 29, 2020, interest expense on borrowings is paid by the investment adviser under the Expense Contract.
Borrower orLender
Average LoanBalance
Weighted Average InterestRate
InterestExpense
Fidelity Total Market Index Fund Borrower $40,430,396 .32% $27,888
Fidelity Extended Market IndexFund Borrower $20,596,212 .52% $12,300
Fidelity International Index Fund Borrower $32,128,586 .74% $16,630
Interfund Trades. Funds may purchase from or sell securities to other Fidelity Funds under procedures adopted by the Board. Theprocedures have been designed to ensure these interfund trades are executed in accordance with Rule 17a-7 of the 1940 Act. Anyinterfund trades are included within the respective purchases and sales amounts shown in the Purchases and Sales of Investmentsnote.Prior Fiscal Year Affiliated Redemptions In-Kind. During the prior period, 227,760,667 shares of the Fidelity Total Market IndexFund were redeemed in-kind for investments and cash with a value of $18,972,597,820. The Fund had a net realized gain of$12,280,777,708 on investments delivered through in-kind redemptions. The amount of the in-kind redemptions is included in sharetransactions in the accompanying Statement of Changes in Net Assets as well as the Notes to Financial Statements. Fidelity TotalMarket Index Fund recognized no gain or loss for federal income tax purposes.
Copyright © 2021 www.secdatabase.com. All Rights Reserved.Please Consider the Environment Before Printing This Document
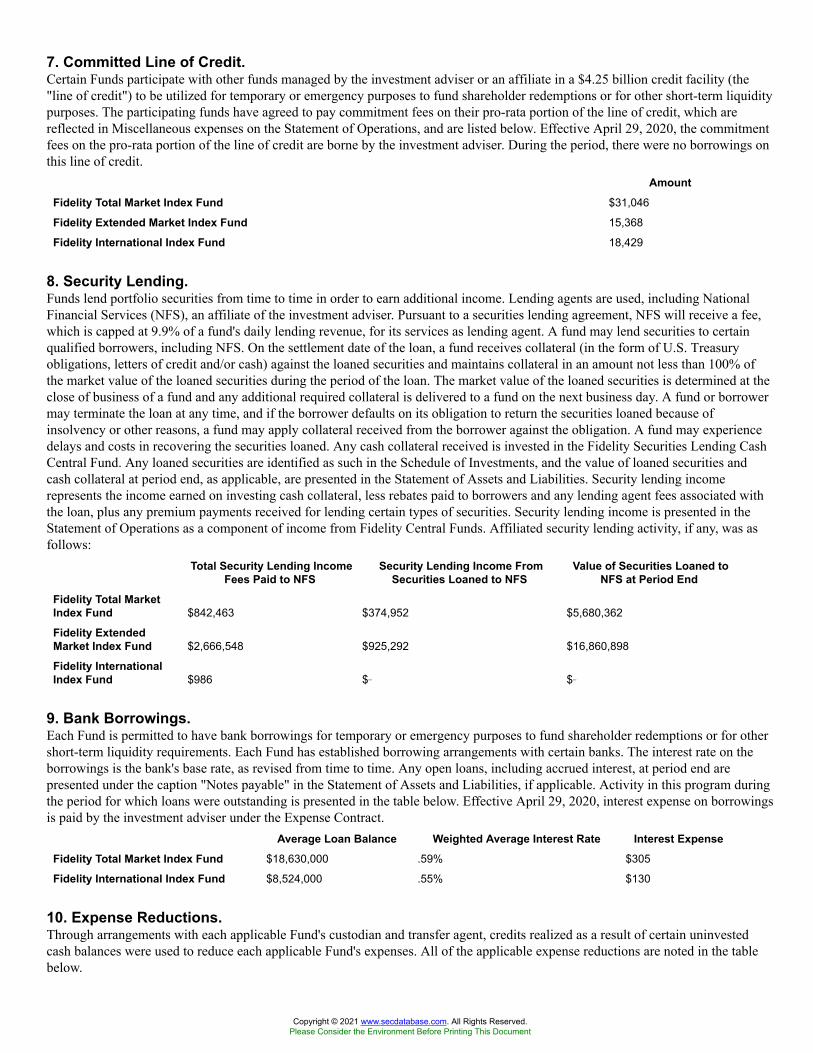
7. Committed Line of Credit.Certain Funds participate with other funds managed by the investment adviser or an affiliate in a $4.25 billion credit facility (the"line of credit") to be utilized for temporary or emergency purposes to fund shareholder redemptions or for other short-term liquiditypurposes. The participating funds have agreed to pay commitment fees on their pro-rata portion of the line of credit, which arereflected in Miscellaneous expenses on the Statement of Operations, and are listed below. Effective April 29, 2020, the commitmentfees on the pro-rata portion of the line of credit are borne by the investment adviser. During the period, there were no borrowings onthis line of credit.
AmountFidelity Total Market Index Fund $31,046
Fidelity Extended Market Index Fund 15,368
Fidelity International Index Fund 18,429
8. Security Lending.Funds lend portfolio securities from time to time in order to earn additional income. Lending agents are used, including NationalFinancial Services (NFS), an affiliate of the investment adviser. Pursuant to a securities lending agreement, NFS will receive a fee,which is capped at 9.9% of a fund's daily lending revenue, for its services as lending agent. A fund may lend securities to certainqualified borrowers, including NFS. On the settlement date of the loan, a fund receives collateral (in the form of U.S. Treasuryobligations, letters of credit and/or cash) against the loaned securities and maintains collateral in an amount not less than 100% ofthe market value of the loaned securities during the period of the loan. The market value of the loaned securities is determined at theclose of business of a fund and any additional required collateral is delivered to a fund on the next business day. A fund or borrowermay terminate the loan at any time, and if the borrower defaults on its obligation to return the securities loaned because ofinsolvency or other reasons, a fund may apply collateral received from the borrower against the obligation. A fund may experiencedelays and costs in recovering the securities loaned. Any cash collateral received is invested in the Fidelity Securities Lending CashCentral Fund. Any loaned securities are identified as such in the Schedule of Investments, and the value of loaned securities andcash collateral at period end, as applicable, are presented in the Statement of Assets and Liabilities. Security lending incomerepresents the income earned on investing cash collateral, less rebates paid to borrowers and any lending agent fees associated withthe loan, plus any premium payments received for lending certain types of securities. Security lending income is presented in theStatement of Operations as a component of income from Fidelity Central Funds. Affiliated security lending activity, if any, was asfollows:
Total Security Lending IncomeFees Paid to NFS
Security Lending Income FromSecurities Loaned to NFS
Value of Securities Loaned toNFS at Period End
Fidelity Total MarketIndex Fund $842,463 $374,952 $5,680,362
Fidelity ExtendedMarket Index Fund $2,666,548 $925,292 $16,860,898
Fidelity InternationalIndex Fund $986 $� $�
9. Bank Borrowings.Each Fund is permitted to have bank borrowings for temporary or emergency purposes to fund shareholder redemptions or for othershort-term liquidity requirements. Each Fund has established borrowing arrangements with certain banks. The interest rate on theborrowings is the bank's base rate, as revised from time to time. Any open loans, including accrued interest, at period end arepresented under the caption "Notes payable" in the Statement of Assets and Liabilities, if applicable. Activity in this program duringthe period for which loans were outstanding is presented in the table below. Effective April 29, 2020, interest expense on borrowingsis paid by the investment adviser under the Expense Contract.
Average Loan Balance Weighted Average Interest Rate Interest ExpenseFidelity Total Market Index Fund $18,630,000 .59% $305
Fidelity International Index Fund $8,524,000 .55% $130
10. Expense Reductions.Through arrangements with each applicable Fund's custodian and transfer agent, credits realized as a result of certain uninvestedcash balances were used to reduce each applicable Fund's expenses. All of the applicable expense reductions are noted in the tablebelow.
Copyright © 2021 www.secdatabase.com. All Rights Reserved.Please Consider the Environment Before Printing This Document
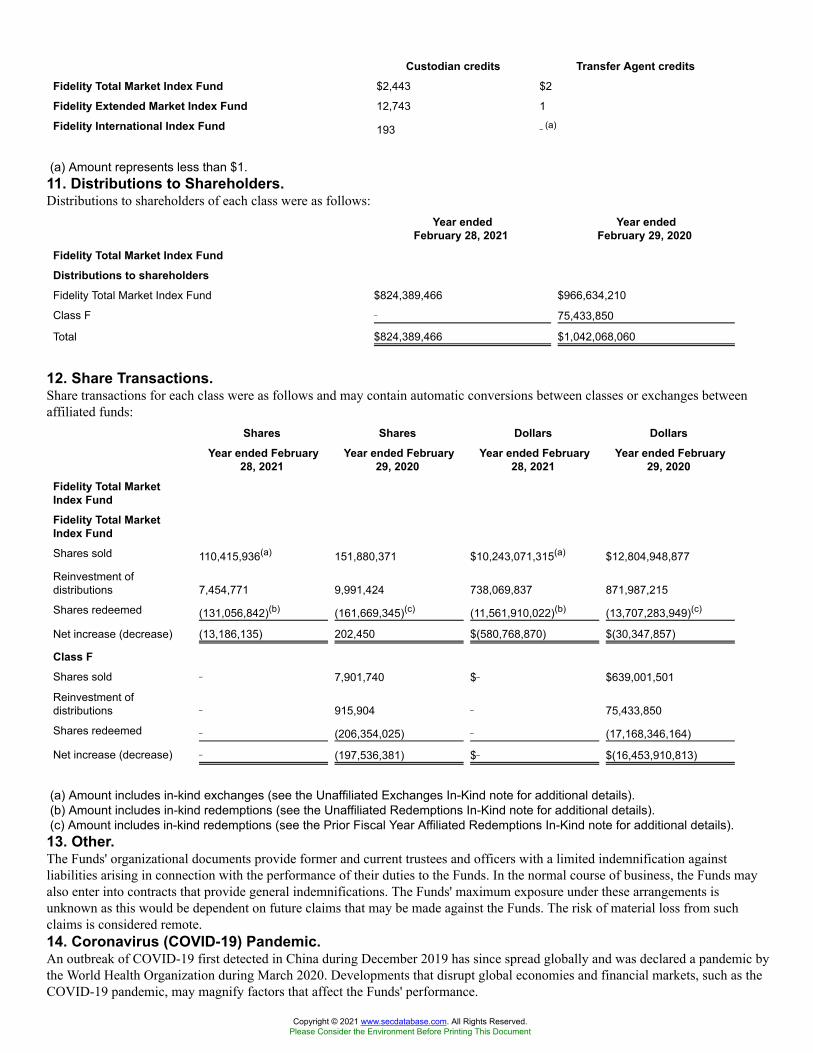
Custodian credits Transfer Agent creditsFidelity Total Market Index Fund $2,443 $2
Fidelity Extended Market Index Fund 12,743 1
Fidelity International Index Fund 193 �(a)
(a) Amount represents less than $1.11. Distributions to Shareholders.Distributions to shareholders of each class were as follows:
Year endedFebruary 28, 2021
Year endedFebruary 29, 2020
Fidelity Total Market Index FundDistributions to shareholdersFidelity Total Market Index Fund $824,389,466 $966,634,210
Class F � 75,433,850
Total $824,389,466 $1,042,068,060
12. Share Transactions.Share transactions for each class were as follows and may contain automatic conversions between classes or exchanges betweenaffiliated funds:
Shares Shares Dollars DollarsYear ended February
28, 2021Year ended February
29, 2020Year ended February
28, 2021Year ended February
29, 2020Fidelity Total MarketIndex FundFidelity Total MarketIndex FundShares sold 110,415,936(a) 151,880,371 $10,243,071,315(a) $12,804,948,877
Reinvestment ofdistributions 7,454,771 9,991,424 738,069,837 871,987,215
Shares redeemed (131,056,842)(b) (161,669,345)(c) (11,561,910,022)(b) (13,707,283,949)(c)
Net increase (decrease) (13,186,135) 202,450 $(580,768,870) $(30,347,857)
Class FShares sold � 7,901,740 $� $639,001,501
Reinvestment ofdistributions � 915,904 � 75,433,850
Shares redeemed � (206,354,025) � (17,168,346,164)
Net increase (decrease) � (197,536,381) $� $(16,453,910,813)
(a) Amount includes in-kind exchanges (see the Unaffiliated Exchanges In-Kind note for additional details).(b) Amount includes in-kind redemptions (see the Unaffiliated Redemptions In-Kind note for additional details).(c) Amount includes in-kind redemptions (see the Prior Fiscal Year Affiliated Redemptions In-Kind note for additional details).13. Other.The Funds' organizational documents provide former and current trustees and officers with a limited indemnification againstliabilities arising in connection with the performance of their duties to the Funds. In the normal course of business, the Funds mayalso enter into contracts that provide general indemnifications. The Funds' maximum exposure under these arrangements isunknown as this would be dependent on future claims that may be made against the Funds. The risk of material loss from suchclaims is considered remote.14. Coronavirus (COVID-19) Pandemic.An outbreak of COVID-19 first detected in China during December 2019 has since spread globally and was declared a pandemic bythe World Health Organization during March 2020. Developments that disrupt global economies and financial markets, such as theCOVID-19 pandemic, may magnify factors that affect the Funds' performance.
Copyright © 2021 www.secdatabase.com. All Rights Reserved.Please Consider the Environment Before Printing This Document

Report of Independent Registered Public Accounting FirmTo the Board of Trustees of Fidelity Concord Street Trust and the Shareholders of Fidelity Total Market Index Fund, FidelityExtended Market Index Fund and Fidelity International Index FundOpinions on the Financial StatementsWe have audited the accompanying statements of assets and liabilities, including the schedules of investments, of Fidelity TotalMarket Index Fund, Fidelity Extended Market Index Fund and Fidelity International Index Fund (three of the funds constitutingFidelity Concord Street Trust, hereafter collectively referred to as the �Funds�) as of February 28, 2021, the related statements ofoperations for the year ended February 28, 2021, the statements of changes in net assets for each of the two years in the periodended February 28, 2021, including the related notes, and the financial highlights for each of the five years in the period endedFebruary 28, 2021 (collectively referred to as the �financial statements�). In our opinion, the financial statements present fairly, inall material respects, the financial position of each of the Funds as of February 28, 2021, the results of each of their operations forthe year then ended, the changes in each of their net assets for each of the two years in the period ended February 28, 2021 and eachof the financial highlights for each of the five years in the period ended February 28, 2021 in conformity with accounting principlesgenerally accepted in the United States of America.Basis for OpinionsThese financial statements are the responsibility of the Funds� management. Our responsibility is to express an opinion on theFunds� financial statements based on our audits. We are a public accounting firm registered with the Public Company AccountingOversight Board (United States) (PCAOB) and are required to be independent with respect to the Funds in accordance with the U.S.federal securities laws and the applicable rules and regulations of the Securities and Exchange Commission and the PCAOB.We conducted our audits of these financial statements in accordance with the standards of the PCAOB. Those standards require thatwe plan and perform the audit to obtain reasonable assurance about whether the financial statements are free of materialmisstatement, whether due to error or fraud.Our audits included performing procedures to assess the risks of material misstatement of the financial statements, whether due toerror or fraud, and performing procedures that respond to those risks. Such procedures included examining, on a test basis, evidenceregarding the amounts and disclosures in the financial statements. Our audits also included evaluating the accounting principles usedand significant estimates made by management, as well as evaluating the overall presentation of the financial statements. Ourprocedures included confirmation of securities owned as of February 28, 2021 by correspondence with the custodians and brokers;when replies were not received from brokers, we performed other auditing procedures. We believe that our audits provide areasonable basis for our opinions./s/ PricewaterhouseCoopers LLPBoston, MassachusettsApril 15, 2021
We have served as the auditor of one or more investment companies in the Fidelity group of funds since 1932.
Trustees and OfficersThe Trustees, Members of the Advisory Board (if any), and officers of the trust and funds, as applicable, are listed below. The Boardof Trustees governs each fund and is responsible for protecting the interests of shareholders. The Trustees are experiencedexecutives who meet periodically throughout the year to oversee each fund's activities, review contractual arrangements withcompanies that provide services to each fund, oversee management of the risks associated with such activities and contractualarrangements, and review each fund's performance. Except for Jonathan Chiel, each of the Trustees oversees 309 funds. Mr. Chieloversees 176 funds.The Trustees hold office without limit in time except that (a) any Trustee may resign; (b) any Trustee may be removed by writteninstrument, signed by at least two-thirds of the number of Trustees prior to such removal; (c) any Trustee who requests to be retiredor who has become incapacitated by illness or injury may be retired by written instrument signed by a majority of the other Trustees;and (d) any Trustee may be removed at any special meeting of shareholders by a two-thirds vote of the outstanding voting securitiesof the trust. Each Trustee who is not an interested person (as defined in the 1940 Act) of the trust and the funds is referred to hereinas an Independent Trustee. Each Independent Trustee shall retire not later than the last day of the calendar year in which his or her75th birthday occurs. The Independent Trustees may waive this mandatory retirement age policy with respect to individualTrustees. Officers and Advisory Board Members hold office without limit in time, except that any officer or Advisory BoardMember may resign or may be removed by a vote of a majority of the Trustees at any regular meeting or any special meeting of theTrustees. Except as indicated, each individual has held the office shown or other offices in the same company for the past fiveyears.Each fund�s Statement of Additional Information (SAI) includes more information about the Trustees. To request a free copy, callFidelity at 1-800-544-8544.
Copyright © 2021 www.secdatabase.com. All Rights Reserved.Please Consider the Environment Before Printing This Document

Experience, Skills, Attributes, and Qualifications of the Trustees. The Governance and Nominating Committee has adopted astatement of policy that describes the experience, qualifications, attributes, and skills that are necessary and desirable for potentialIndependent Trustee candidates (Statement of Policy). The Board believes that each Trustee satisfied at the time he or she wasinitially elected or appointed a Trustee, and continues to satisfy, the standards contemplated by the Statement of Policy. TheGovernance and Nominating Committee also engages professional search firms to help identify potential Independent Trusteecandidates who have the experience, qualifications, attributes, and skills consistent with the Statement of Policy. From time to time,additional criteria based on the composition and skills of the current Independent Trustees, as well as experience or skills that maybe appropriate in light of future changes to board composition, business conditions, and regulatory or other developments, have alsobeen considered by the professional search firms and the Governance and Nominating Committee. In addition, the Board takes intoaccount the Trustees' commitment and participation in Board and committee meetings, as well as their leadership of standing and adhoc committees throughout their tenure.In determining that a particular Trustee was and continues to be qualified to serve as a Trustee, the Board has considered a variety ofcriteria, none of which, in isolation, was controlling. The Board believes that, collectively, the Trustees have balanced and diverseexperience, qualifications, attributes, and skills, which allow the Board to operate effectively in governing each fund and protectingthe interests of shareholders. Information about the specific experience, skills, attributes, and qualifications of each Trustee, which ineach case led to the Board's conclusion that the Trustee should serve (or continue to serve) as a trustee of the funds, is providedbelow.Board Structure and Oversight Function. Robert A. Lawrence is an interested person and currently serves as Acting Chairman.The Trustees have determined that an interested Chairman is appropriate and benefits shareholders because an interested Chairmanhas a personal and professional stake in the quality and continuity of services provided to the funds. Independent Trustees exercisetheir informed business judgment to appoint an individual of their choosing to serve as Chairman, regardless of whether the Trusteehappens to be independent or a member of management. The Independent Trustees have determined that they can act independentlyand effectively without having an Independent Trustee serve as Chairman and that a key structural component for assuring that theyare in a position to do so is for the Independent Trustees to constitute a substantial majority for the Board. The Independent Trusteesalso regularly meet in executive session. David M. Thomas serves as Lead Independent Trustee and as such (i) acts as a liaisonbetween the Independent Trustees and management with respect to matters important to the Independent Trustees and (ii) withmanagement prepares agendas for Board meetings.Fidelity® funds are overseen by different Boards of Trustees. The funds' Board oversees Fidelity's high income and certain equityfunds, and other Boards oversee Fidelity's investment-grade bond, money market, asset allocation, and other equity funds. The assetallocation funds may invest in Fidelity® funds overseen by the funds' Board. The use of separate Boards, each with its owncommittee structure, allows the Trustees of each group of Fidelity® funds to focus on the unique issues of the funds they oversee,including common research, investment, and operational issues. On occasion, the separate Boards establish joint committees toaddress issues of overlapping consequences for the Fidelity® funds overseen by each Board.The Trustees operate using a system of committees to facilitate the timely and efficient consideration of all matters of importance tothe Trustees, each fund, and fund shareholders and to facilitate compliance with legal and regulatory requirements and oversight ofthe funds' activities and associated risks. The Board, acting through its committees, has charged FMR and its affiliates with (i)identifying events or circumstances the occurrence of which could have demonstrably adverse effects on the funds' business and/orreputation; (ii) implementing processes and controls to lessen the possibility that such events or circumstances occur or to mitigatethe effects of such events or circumstances if they do occur; and (iii) creating and maintaining a system designed to evaluatecontinuously business and market conditions in order to facilitate the identification and implementation processes described in (i)and (ii) above. Because the day-to-day operations and activities of the funds are carried out by or through FMR, its affiliates, andother service providers, the funds' exposure to risks is mitigated but not eliminated by the processes overseen by the Trustees. Whileeach of the Board's committees has responsibility for overseeing different aspects of the funds' activities, oversight is exercisedprimarily through the Operations, Audit, and Compliance Committees. Appropriate personnel, including but not limited to thefunds' Chief Compliance Officer (CCO), FMR's internal auditor, the independent accountants, the funds' Treasurer and portfoliomanagement personnel, make periodic reports to the Board's committees, as appropriate, including an annual review of Fidelity'srisk management program for the Fidelity® funds. The responsibilities of each standing committee, including their oversightresponsibilities, are described further under "Standing Committees of the Trustees."Interested Trustees*:Correspondence intended for a Trustee who is an interested person may be sent to Fidelity Investments, 245 Summer Street, Boston,Massachusetts 02210.Name, Year of Birth; Principal Occupations and Other Relevant Experience+Jonathan Chiel (1957)
Year of Election or Appointment: 2016Trustee
Copyright © 2021 www.secdatabase.com. All Rights Reserved.Please Consider the Environment Before Printing This Document

Mr. Chiel also serves as Trustee of other Fidelity® funds. Mr. Chiel is Executive Vice President and General Counsel forFMR LLC (diversified financial services company, 2012-present). Previously, Mr. Chiel served as general counsel(2004-2012) and senior vice president and deputy general counsel (2000-2004) for John Hancock Financial Services; apartner with Choate, Hall & Stewart (1996-2000) (law firm); and an Assistant United States Attorney for the United StatesAttorney�s Office of the District of Massachusetts (1986-95), including Chief of the Criminal Division (1993-1995). Mr. Chielis a director on the boards of the Boston Bar Foundation and the Maimonides School.
Bettina Doulton (1964)Year of Election or Appointment: 2021TrusteeMs. Doulton also serves as Trustee of other Fidelity® funds. Prior to her retirement, Ms. Doulton served in a variety ofpositions at Fidelity Investments, including as a managing director of research (2006-2007), portfolio manager to certainFidelity® funds (1993-2005), equity analyst and portfolio assistant (1990-1993), and research assistant (1987-1990). Ms.Doulton currently owns and operates Phi Builders + Architects and Cellardoor Winery. Previously, Ms. Doulton served as amember of the Board of Brown Capital Management, LLC (2013-2018).
Robert A. Lawrence (1952)Year of Election or Appointment: 2020TrusteeActing Chairman of the Board of TrusteesMr. Lawrence also serves as Trustee of other funds. Previously, Mr. Lawrence served as a Member of the Advisory Board ofcertain funds. Prior to his retirement in 2008, Mr. Lawrence served as Vice President of certain Fidelity® funds (2006-2008),Senior Vice President, Head of High Income Division of Fidelity Management & Research Company (investment adviserfirm, 2006-2008), and President of Fidelity Strategic Investments (investment adviser firm, 2002-2005).
* Determined to be an �Interested Trustee� by virtue of, among other things, his or her affiliation with the trust or various entitiesunder common control with FMR.+ The information includes the Trustee's principal occupation during the last five years and other information relating to the
experience, attributes, and skills relevant to the Trustee's qualifications to serve as a Trustee, which led to the conclusion that theTrustee should serve as a Trustee for each fund.Independent Trustees:Correspondence intended for an Independent Trustee may be sent to Fidelity Investments, P.O. Box 55235, Boston, Massachusetts02205-5235.Name, Year of Birth; Principal Occupations and Other Relevant Experience+Dennis J. Dirks (1948)
Year of Election or Appointment: 2005TrusteeMr. Dirks also serves as Trustee of other Fidelity® funds. Prior to his retirement in May 2003, Mr. Dirks served as ChiefOperating Officer and as a member of the Board of The Depository Trust & Clearing Corporation (financial marketsinfrastructure), President, Chief Operating Officer and a member of the Board of The Depository Trust Company (DTC),President and a member of the Board of the National Securities Clearing Corporation (NSCC), Chief Executive Officer anda member of the Board of the Government Securities Clearing Corporation and Chief Executive Officer and a member ofthe Board of the Mortgage-Backed Securities Clearing Corporation. Mr. Dirks currently serves as a member of the FinanceCommittee (2016-present) and Board (2017-present) and is Treasurer (2018-present) of the Asolo Repertory Theatre.
Donald F. Donahue (1950)Year of Election or Appointment: 2018TrusteeMr. Donahue also serves as Trustee of other Fidelity® funds. Mr. Donahue serves as President and Chief Executive Officerof Miranda Partners, LLC (risk consulting for the financial services industry, 2012-present). Previously, Mr. Donahue servedas Chief Executive Officer (2006-2012), Chief Operating Officer (2003-2006) and Managing Director, Customer Marketingand Development (1999-2003) of The Depository Trust & Clearing Corporation (financial markets infrastructure). Mr.Donahue currently serves as a member (2007-present) and Co-Chairman (2016-present) of the Board of United Way ofNew York, a member of the Board of NYC Leadership Academy (2012-present) and a member of the Board of Advisors ofRipple Labs, Inc. (financial services, 2015-present). Mr. Donahue previously served as a member of the Advisory Board ofcertain Fidelity® funds (2015-2018).
Vicki L. Fuller (1957)Year of Election or Appointment: 2020TrusteeMs. Fuller also serves as Trustee of other Fidelity® funds. Previously, Ms. Fuller served as a member of the Advisory Boardof certain Fidelity® funds (2018-2020), Chief Investment Officer of the New York State Common Retirement Fund(2012-2018) and held a variety of positions at AllianceBernstein L.P. (global asset management, 1985-2012), includingManaging Director (2006-2012) and Senior Vice President and Senior Portfolio Manager (2001-2006). Ms. Fuller currentlyserves as a member of the Board, Audit Committee and Nominating and Governance Committee of The WilliamsCompanies, Inc. (natural gas infrastructure, 2018-present), as a member of the Board, Audit Committee and Nominating
Copyright © 2021 www.secdatabase.com. All Rights Reserved.Please Consider the Environment Before Printing This Document

and Governance Committee of two Blackstone business development companies (2020-present) and as a member of theBoard of Treliant, LLC (consulting, 2019-present).
Patricia L. Kampling (1959)Year of Election or Appointment: 2020TrusteeMs. Kampling also serves as Trustee of other Fidelity® funds. Prior to her retirement, Ms. Kampling served as Chairman ofthe Board and Chief Executive Officer (2012-2019), President and Chief Operating Officer (2011-2012) and Executive VicePresident and Chief Financial Officer (2010-2011) of Alliant Energy Corporation. Ms. Kampling currently serves as amember of the Board, Compensation Committee and Executive Committee and as Chair of the Audit Committee of Briggs &Stratton Corporation (manufacturing, 2011-present) and as a member of the Board, Audit, Finance and Risk Committee andSafety, Environmental, Technology and Operations Committee of American Water Works Company, Inc. (utilities company,2019-present). In addition, Ms. Kampling currently serves as a member of the Board of the Nature Conservancy, WisconsinChapter (2019-present). Previously, Ms. Kampling served as a Member of the Advisory Board of certain Fidelity® funds(2020), a member of the Board of Interstate Power and Light Company (2012-2019) and Wisconsin Power and LightCompany (2012-2019) (each a subsidiary of Alliant Energy Corporation) and as a member of the Board and WorkforceDevelopment Committee of the Business Roundtable (2018-2019).
Thomas A. Kennedy (1955)Year of Election or Appointment: 2021TrusteeMr. Kennedy also serves as Trustee of other Fidelity® funds. Previously, Mr. Kennedy served as a Member of the AdvisoryBoard of certain Fidelity® funds (2020) and held a variety of positions at Raytheon Company (aerospace and defense,1983-2020), including Chairman and Chief Executive Officer (2014-2020) and Executive Vice President and ChiefOperating Officer (2013-2014). Mr. Kennedy currently serves as Executive Chairman of the Board of Directors of RaytheonTechnologies Corporation (aerospace and defense, 2020-present). He is also a member of the Rutgers School ofEngineering Industry Advisory Board (2011-present) and a member of the UCLA Engineering Dean�s Executive Board(2016-present).
Garnett A. Smith (1947)Year of Election or Appointment: 2018TrusteeMr. Smith also serves as Trustee of other Fidelity® funds. Prior to his retirement, Mr. Smith served as Chairman and ChiefExecutive Officer (1990-1997) and President (1986-1990) of Inbrand Corp. (manufacturer of personal absorbent products).Prior to his employment with Inbrand Corp., he was employed by a retail fabric chain and North Carolina National Bank(now Bank of America). Mr. Smith previously served as a member of the Advisory Board of certain Fidelity® funds(2012-2013).
David M. Thomas (1949)Year of Election or Appointment: 2008TrusteeLead Independent TrusteeMr. Thomas also serves as Trustee of other Fidelity® funds. Previously, Mr. Thomas served as Executive Chairman(2005-2006) and Chairman and Chief Executive Officer (2000-2005) of IMS Health, Inc. (pharmaceutical and healthcareinformation solutions). Mr. Thomas currently serves as Non-Executive Chairman of the Board of Fortune Brands Home andSecurity (home and security products, 2011-present), and a member of the Board (2004-present) and Presiding Director(2013-present) of Interpublic Group of Companies, Inc. (marketing communication).
Susan Tomasky (1953)Year of Election or Appointment: 2020TrusteeMs. Tomasky also serves as Trustee of other Fidelity® funds. Prior to her retirement, Ms. Tomasky served in variousexecutive officer positions at American Electric Power Company, Inc. (1998-2011), including most recently as President ofAEP Transmission (2007-2011). Ms. Tomasky currently serves as a member of the Board and Sustainability Committee andas Chair of the Audit Committee of Marathon Petroleum Corporation (2018-present) and as a member of the Board,Corporate Governance Committee and Organization and Compensation Committee and as Chair of the Audit Committee ofPublic Service Enterprise Group, Inc. (utilities company, 2012-present). In addition, Ms. Tomasky currently serves as amember of the Board of the Columbus Regional Airport Authority (2007-present), as a member of the Board of the RoyalShakespeare Company � America (2009-present), as a member of the Board of the Columbus Association for thePerforming Arts (2011-present) and as a member of the Board of Kenyon College (2016-present). Previously, Ms. Tomaskyserved as a Member of the Advisory Board of certain Fidelity® funds (2020), a member of the Board (2011-2019) and asLead Independent Director (2015-2018) of Andeavor Corporation (previously Tesoro Corporation) (independent oil refinerand marketer) and as a member of the Board of Summit Midstream Partners LP (energy, 2012-2018).
Michael E. Wiley (1950)Year of Election or Appointment: 2020Trustee
Copyright © 2021 www.secdatabase.com. All Rights Reserved.Please Consider the Environment Before Printing This Document
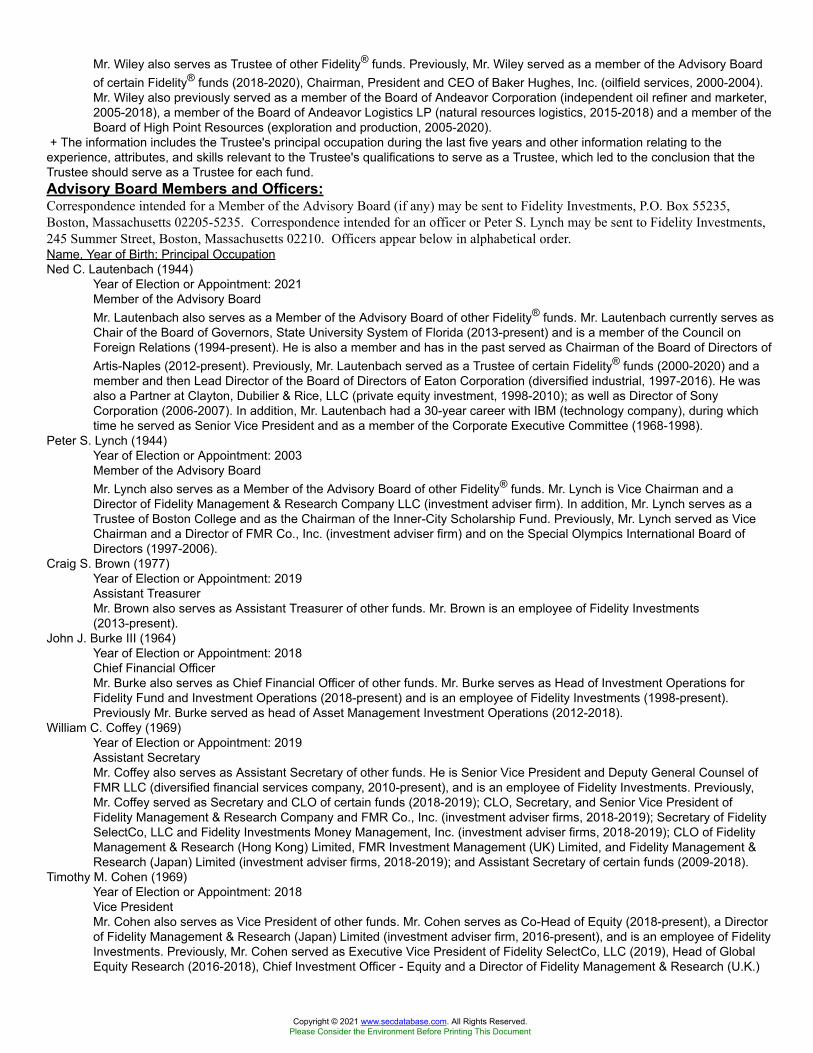
Mr. Wiley also serves as Trustee of other Fidelity® funds. Previously, Mr. Wiley served as a member of the Advisory Boardof certain Fidelity® funds (2018-2020), Chairman, President and CEO of Baker Hughes, Inc. (oilfield services, 2000-2004).Mr. Wiley also previously served as a member of the Board of Andeavor Corporation (independent oil refiner and marketer,2005-2018), a member of the Board of Andeavor Logistics LP (natural resources logistics, 2015-2018) and a member of theBoard of High Point Resources (exploration and production, 2005-2020).
+ The information includes the Trustee's principal occupation during the last five years and other information relating to theexperience, attributes, and skills relevant to the Trustee's qualifications to serve as a Trustee, which led to the conclusion that theTrustee should serve as a Trustee for each fund.Advisory Board Members and Officers:Correspondence intended for a Member of the Advisory Board (if any) may be sent to Fidelity Investments, P.O. Box 55235,Boston, Massachusetts 02205-5235. Correspondence intended for an officer or Peter S. Lynch may be sent to Fidelity Investments,245 Summer Street, Boston, Massachusetts 02210. Officers appear below in alphabetical order.Name, Year of Birth; Principal OccupationNed C. Lautenbach (1944)
Year of Election or Appointment: 2021Member of the Advisory BoardMr. Lautenbach also serves as a Member of the Advisory Board of other Fidelity® funds. Mr. Lautenbach currently serves asChair of the Board of Governors, State University System of Florida (2013-present) and is a member of the Council onForeign Relations (1994-present). He is also a member and has in the past served as Chairman of the Board of Directors ofArtis-Naples (2012-present). Previously, Mr. Lautenbach served as a Trustee of certain Fidelity® funds (2000-2020) and amember and then Lead Director of the Board of Directors of Eaton Corporation (diversified industrial, 1997-2016). He wasalso a Partner at Clayton, Dubilier & Rice, LLC (private equity investment, 1998-2010); as well as Director of SonyCorporation (2006-2007). In addition, Mr. Lautenbach had a 30-year career with IBM (technology company), during whichtime he served as Senior Vice President and as a member of the Corporate Executive Committee (1968-1998).
Peter S. Lynch (1944)Year of Election or Appointment: 2003Member of the Advisory BoardMr. Lynch also serves as a Member of the Advisory Board of other Fidelity® funds. Mr. Lynch is Vice Chairman and aDirector of Fidelity Management & Research Company LLC (investment adviser firm). In addition, Mr. Lynch serves as aTrustee of Boston College and as the Chairman of the Inner-City Scholarship Fund. Previously, Mr. Lynch served as ViceChairman and a Director of FMR Co., Inc. (investment adviser firm) and on the Special Olympics International Board ofDirectors (1997-2006).
Craig S. Brown (1977)Year of Election or Appointment: 2019Assistant TreasurerMr. Brown also serves as Assistant Treasurer of other funds. Mr. Brown is an employee of Fidelity Investments(2013-present).
John J. Burke III (1964)Year of Election or Appointment: 2018Chief Financial OfficerMr. Burke also serves as Chief Financial Officer of other funds. Mr. Burke serves as Head of Investment Operations forFidelity Fund and Investment Operations (2018-present) and is an employee of Fidelity Investments (1998-present).Previously Mr. Burke served as head of Asset Management Investment Operations (2012-2018).
William C. Coffey (1969)Year of Election or Appointment: 2019Assistant SecretaryMr. Coffey also serves as Assistant Secretary of other funds. He is Senior Vice President and Deputy General Counsel ofFMR LLC (diversified financial services company, 2010-present), and is an employee of Fidelity Investments. Previously,Mr. Coffey served as Secretary and CLO of certain funds (2018-2019); CLO, Secretary, and Senior Vice President ofFidelity Management & Research Company and FMR Co., Inc. (investment adviser firms, 2018-2019); Secretary of FidelitySelectCo, LLC and Fidelity Investments Money Management, Inc. (investment adviser firms, 2018-2019); CLO of FidelityManagement & Research (Hong Kong) Limited, FMR Investment Management (UK) Limited, and Fidelity Management &Research (Japan) Limited (investment adviser firms, 2018-2019); and Assistant Secretary of certain funds (2009-2018).
Timothy M. Cohen (1969)Year of Election or Appointment: 2018Vice PresidentMr. Cohen also serves as Vice President of other funds. Mr. Cohen serves as Co-Head of Equity (2018-present), a Directorof Fidelity Management & Research (Japan) Limited (investment adviser firm, 2016-present), and is an employee of FidelityInvestments. Previously, Mr. Cohen served as Executive Vice President of Fidelity SelectCo, LLC (2019), Head of GlobalEquity Research (2016-2018), Chief Investment Officer - Equity and a Director of Fidelity Management & Research (U.K.)
Copyright © 2021 www.secdatabase.com. All Rights Reserved.Please Consider the Environment Before Printing This Document
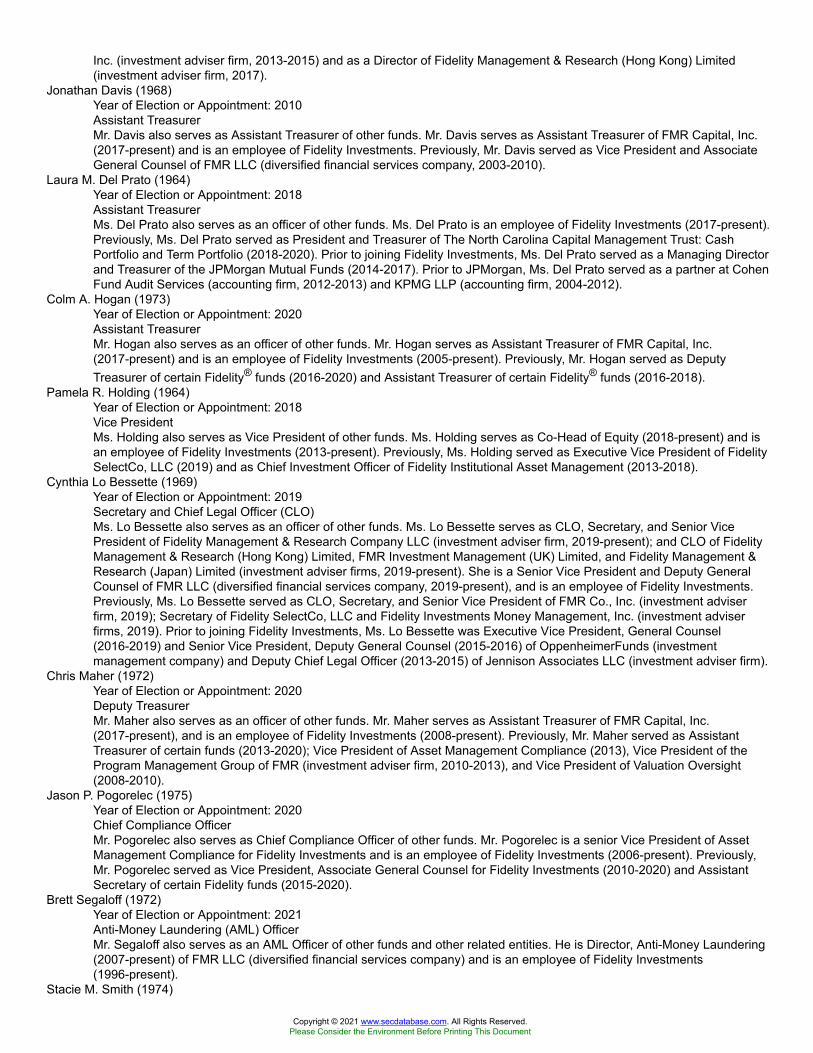
Inc. (investment adviser firm, 2013-2015) and as a Director of Fidelity Management & Research (Hong Kong) Limited(investment adviser firm, 2017).
Jonathan Davis (1968)Year of Election or Appointment: 2010Assistant TreasurerMr. Davis also serves as Assistant Treasurer of other funds. Mr. Davis serves as Assistant Treasurer of FMR Capital, Inc.(2017-present) and is an employee of Fidelity Investments. Previously, Mr. Davis served as Vice President and AssociateGeneral Counsel of FMR LLC (diversified financial services company, 2003-2010).
Laura M. Del Prato (1964)Year of Election or Appointment: 2018Assistant TreasurerMs. Del Prato also serves as an officer of other funds. Ms. Del Prato is an employee of Fidelity Investments (2017-present).Previously, Ms. Del Prato served as President and Treasurer of The North Carolina Capital Management Trust: CashPortfolio and Term Portfolio (2018-2020). Prior to joining Fidelity Investments, Ms. Del Prato served as a Managing Directorand Treasurer of the JPMorgan Mutual Funds (2014-2017). Prior to JPMorgan, Ms. Del Prato served as a partner at CohenFund Audit Services (accounting firm, 2012-2013) and KPMG LLP (accounting firm, 2004-2012).
Colm A. Hogan (1973)Year of Election or Appointment: 2020Assistant TreasurerMr. Hogan also serves as an officer of other funds. Mr. Hogan serves as Assistant Treasurer of FMR Capital, Inc.(2017-present) and is an employee of Fidelity Investments (2005-present). Previously, Mr. Hogan served as DeputyTreasurer of certain Fidelity® funds (2016-2020) and Assistant Treasurer of certain Fidelity® funds (2016-2018).
Pamela R. Holding (1964)Year of Election or Appointment: 2018Vice PresidentMs. Holding also serves as Vice President of other funds. Ms. Holding serves as Co-Head of Equity (2018-present) and isan employee of Fidelity Investments (2013-present). Previously, Ms. Holding served as Executive Vice President of FidelitySelectCo, LLC (2019) and as Chief Investment Officer of Fidelity Institutional Asset Management (2013-2018).
Cynthia Lo Bessette (1969)Year of Election or Appointment: 2019Secretary and Chief Legal Officer (CLO)Ms. Lo Bessette also serves as an officer of other funds. Ms. Lo Bessette serves as CLO, Secretary, and Senior VicePresident of Fidelity Management & Research Company LLC (investment adviser firm, 2019-present); and CLO of FidelityManagement & Research (Hong Kong) Limited, FMR Investment Management (UK) Limited, and Fidelity Management &Research (Japan) Limited (investment adviser firms, 2019-present). She is a Senior Vice President and Deputy GeneralCounsel of FMR LLC (diversified financial services company, 2019-present), and is an employee of Fidelity Investments.Previously, Ms. Lo Bessette served as CLO, Secretary, and Senior Vice President of FMR Co., Inc. (investment adviserfirm, 2019); Secretary of Fidelity SelectCo, LLC and Fidelity Investments Money Management, Inc. (investment adviserfirms, 2019). Prior to joining Fidelity Investments, Ms. Lo Bessette was Executive Vice President, General Counsel(2016-2019) and Senior Vice President, Deputy General Counsel (2015-2016) of OppenheimerFunds (investmentmanagement company) and Deputy Chief Legal Officer (2013-2015) of Jennison Associates LLC (investment adviser firm).
Chris Maher (1972)Year of Election or Appointment: 2020Deputy TreasurerMr. Maher also serves as an officer of other funds. Mr. Maher serves as Assistant Treasurer of FMR Capital, Inc.(2017-present), and is an employee of Fidelity Investments (2008-present). Previously, Mr. Maher served as AssistantTreasurer of certain funds (2013-2020); Vice President of Asset Management Compliance (2013), Vice President of theProgram Management Group of FMR (investment adviser firm, 2010-2013), and Vice President of Valuation Oversight(2008-2010).
Jason P. Pogorelec (1975)Year of Election or Appointment: 2020Chief Compliance OfficerMr. Pogorelec also serves as Chief Compliance Officer of other funds. Mr. Pogorelec is a senior Vice President of AssetManagement Compliance for Fidelity Investments and is an employee of Fidelity Investments (2006-present). Previously,Mr. Pogorelec served as Vice President, Associate General Counsel for Fidelity Investments (2010-2020) and AssistantSecretary of certain Fidelity funds (2015-2020).
Brett Segaloff (1972)Year of Election or Appointment: 2021Anti-Money Laundering (AML) OfficerMr. Segaloff also serves as an AML Officer of other funds and other related entities. He is Director, Anti-Money Laundering(2007-present) of FMR LLC (diversified financial services company) and is an employee of Fidelity Investments(1996-present).
Stacie M. Smith (1974)
Copyright © 2021 www.secdatabase.com. All Rights Reserved.Please Consider the Environment Before Printing This Document
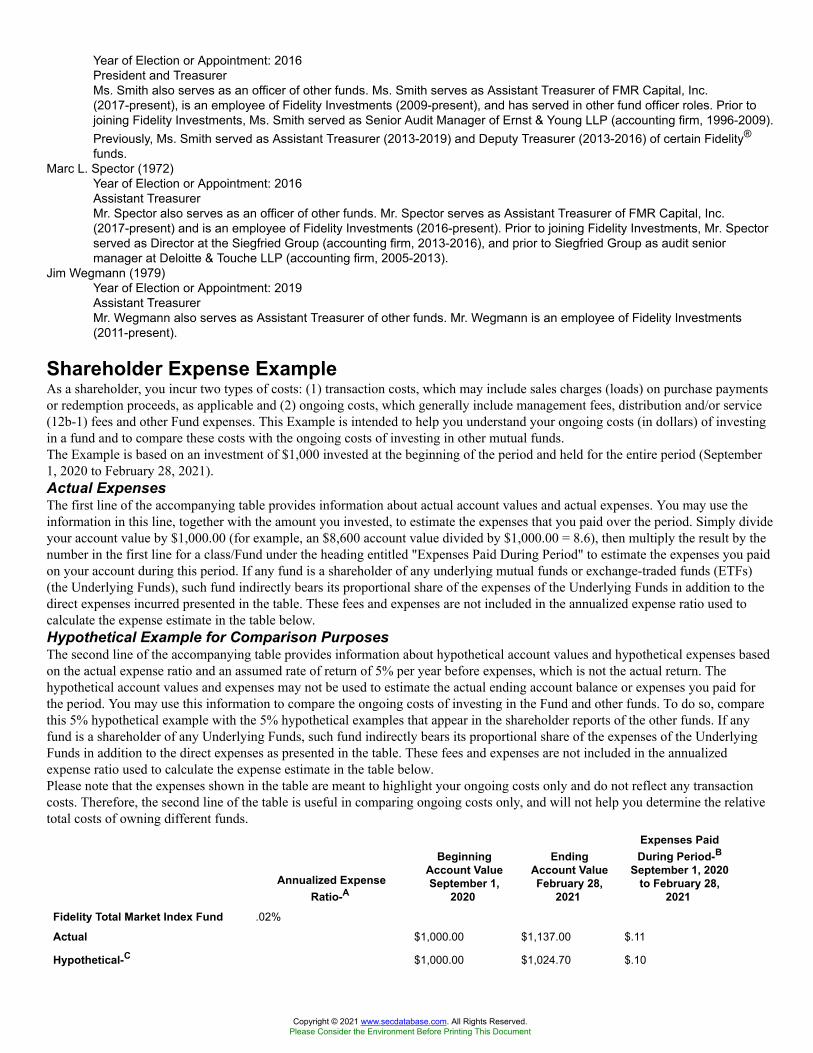
Year of Election or Appointment: 2016President and TreasurerMs. Smith also serves as an officer of other funds. Ms. Smith serves as Assistant Treasurer of FMR Capital, Inc.(2017-present), is an employee of Fidelity Investments (2009-present), and has served in other fund officer roles. Prior tojoining Fidelity Investments, Ms. Smith served as Senior Audit Manager of Ernst & Young LLP (accounting firm, 1996-2009).Previously, Ms. Smith served as Assistant Treasurer (2013-2019) and Deputy Treasurer (2013-2016) of certain Fidelity®
funds.Marc L. Spector (1972)
Year of Election or Appointment: 2016Assistant TreasurerMr. Spector also serves as an officer of other funds. Mr. Spector serves as Assistant Treasurer of FMR Capital, Inc.(2017-present) and is an employee of Fidelity Investments (2016-present). Prior to joining Fidelity Investments, Mr. Spectorserved as Director at the Siegfried Group (accounting firm, 2013-2016), and prior to Siegfried Group as audit seniormanager at Deloitte & Touche LLP (accounting firm, 2005-2013).
Jim Wegmann (1979)Year of Election or Appointment: 2019Assistant TreasurerMr. Wegmann also serves as Assistant Treasurer of other funds. Mr. Wegmann is an employee of Fidelity Investments(2011-present).
Shareholder Expense ExampleAs a shareholder, you incur two types of costs: (1) transaction costs, which may include sales charges (loads) on purchase paymentsor redemption proceeds, as applicable and (2) ongoing costs, which generally include management fees, distribution and/or service(12b-1) fees and other Fund expenses. This Example is intended to help you understand your ongoing costs (in dollars) of investingin a fund and to compare these costs with the ongoing costs of investing in other mutual funds.The Example is based on an investment of $1,000 invested at the beginning of the period and held for the entire period (September1, 2020 to February 28, 2021).Actual ExpensesThe first line of the accompanying table provides information about actual account values and actual expenses. You may use theinformation in this line, together with the amount you invested, to estimate the expenses that you paid over the period. Simply divideyour account value by $1,000.00 (for example, an $8,600 account value divided by $1,000.00 = 8.6), then multiply the result by thenumber in the first line for a class/Fund under the heading entitled "Expenses Paid During Period" to estimate the expenses you paidon your account during this period. If any fund is a shareholder of any underlying mutual funds or exchange-traded funds (ETFs)(the Underlying Funds), such fund indirectly bears its proportional share of the expenses of the Underlying Funds in addition to thedirect expenses incurred presented in the table. These fees and expenses are not included in the annualized expense ratio used tocalculate the expense estimate in the table below.Hypothetical Example for Comparison PurposesThe second line of the accompanying table provides information about hypothetical account values and hypothetical expenses basedon the actual expense ratio and an assumed rate of return of 5% per year before expenses, which is not the actual return. Thehypothetical account values and expenses may not be used to estimate the actual ending account balance or expenses you paid forthe period. You may use this information to compare the ongoing costs of investing in the Fund and other funds. To do so, comparethis 5% hypothetical example with the 5% hypothetical examples that appear in the shareholder reports of the other funds. If anyfund is a shareholder of any Underlying Funds, such fund indirectly bears its proportional share of the expenses of the UnderlyingFunds in addition to the direct expenses as presented in the table. These fees and expenses are not included in the annualizedexpense ratio used to calculate the expense estimate in the table below.Please note that the expenses shown in the table are meant to highlight your ongoing costs only and do not reflect any transactioncosts. Therefore, the second line of the table is useful in comparing ongoing costs only, and will not help you determine the relativetotal costs of owning different funds.
Annualized ExpenseRatio-A
BeginningAccount ValueSeptember 1,
2020
EndingAccount ValueFebruary 28,
2021
Expenses PaidDuring Period-B
September 1, 2020to February 28,
2021Fidelity Total Market Index Fund .02%
Actual $1,000.00 $1,137.00 $.11
Hypothetical-C $1,000.00 $1,024.70 $.10
Copyright © 2021 www.secdatabase.com. All Rights Reserved.Please Consider the Environment Before Printing This Document
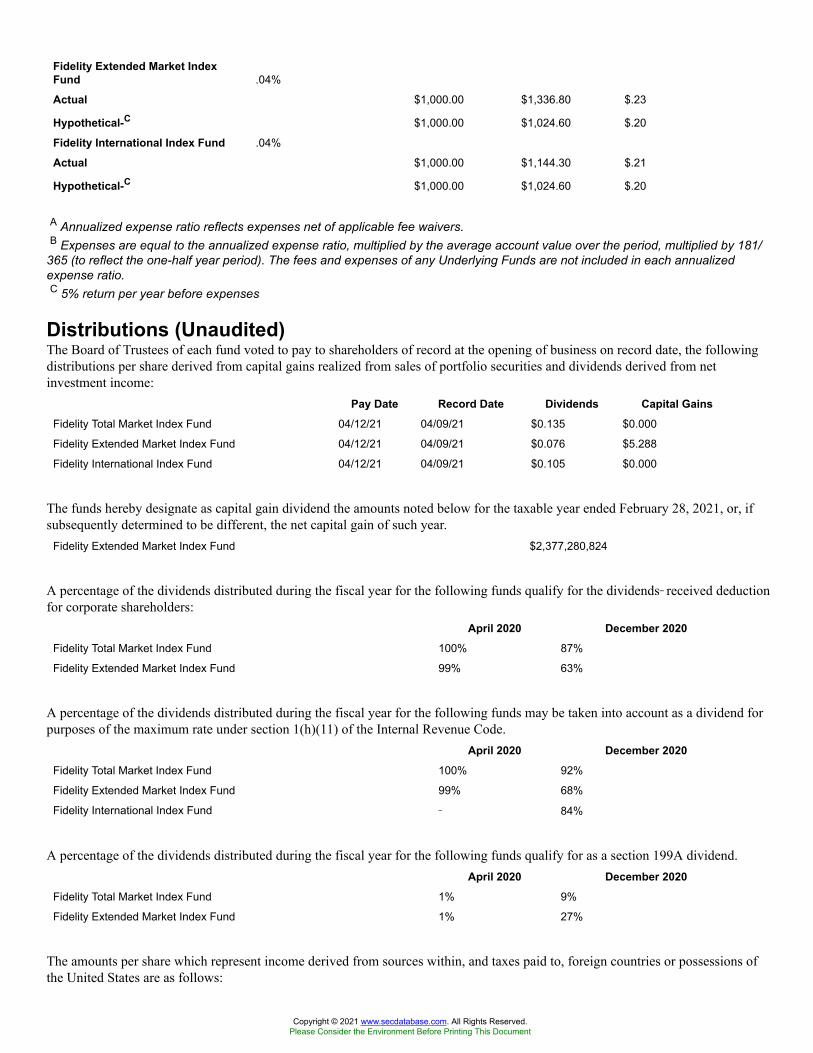
Fidelity Extended Market IndexFund .04%
Actual $1,000.00 $1,336.80 $.23
Hypothetical-C $1,000.00 $1,024.60 $.20
Fidelity International Index Fund .04%
Actual $1,000.00 $1,144.30 $.21
Hypothetical-C $1,000.00 $1,024.60 $.20
A Annualized expense ratio reflects expenses net of applicable fee waivers.B Expenses are equal to the annualized expense ratio, multiplied by the average account value over the period, multiplied by 181/
365 (to reflect the one-half year period). The fees and expenses of any Underlying Funds are not included in each annualizedexpense ratio.C 5% return per year before expenses
Distributions (Unaudited)The Board of Trustees of each fund voted to pay to shareholders of record at the opening of business on record date, the followingdistributions per share derived from capital gains realized from sales of portfolio securities and dividends derived from netinvestment income:
Pay Date Record Date Dividends Capital GainsFidelity Total Market Index Fund 04/12/21 04/09/21 $0.135 $0.000
Fidelity Extended Market Index Fund 04/12/21 04/09/21 $0.076 $5.288
Fidelity International Index Fund 04/12/21 04/09/21 $0.105 $0.000
The funds hereby designate as capital gain dividend the amounts noted below for the taxable year ended February 28, 2021, or, ifsubsequently determined to be different, the net capital gain of such year.
Fidelity Extended Market Index Fund $2,377,280,824
A percentage of the dividends distributed during the fiscal year for the following funds qualify for the dividends�received deductionfor corporate shareholders:
April 2020 December 2020Fidelity Total Market Index Fund 100% 87%
Fidelity Extended Market Index Fund 99% 63%
A percentage of the dividends distributed during the fiscal year for the following funds may be taken into account as a dividend forpurposes of the maximum rate under section 1(h)(11) of the Internal Revenue Code.
April 2020 December 2020Fidelity Total Market Index Fund 100% 92%
Fidelity Extended Market Index Fund 99% 68%
Fidelity International Index Fund � 84%
A percentage of the dividends distributed during the fiscal year for the following funds qualify for as a section 199A dividend.April 2020 December 2020
Fidelity Total Market Index Fund 1% 9%
Fidelity Extended Market Index Fund 1% 27%
The amounts per share which represent income derived from sources within, and taxes paid to, foreign countries or possessions ofthe United States are as follows:
Copyright © 2021 www.secdatabase.com. All Rights Reserved.Please Consider the Environment Before Printing This Document
Pay Date Income TaxesFidelity International Index Fund 12/14/20 $0.8763 $0.0709
The funds will notify shareholders in January 2022 of amounts for use in preparing 2021 income tax returns.
Board Approval of Investment Advisory ContractsFidelity Total Market Index FundFidelity International Index FundAt its September 2020 meeting, the Board of Trustees, including the Independent Trustees (together, the Board), voted to approve anamended and restated sub-advisory agreement with Geode Capital Management, LLC (Geode) for each fund (the AmendedContracts) to decrease the sub-advisory fee rate paid by Fidelity Management & Research Company LLC (FMR), each fund'sinvestment adviser, to Geode on behalf of each fund by 0.15 basis points. The Board, assisted by the advice of fund counsel andIndependent Trustees' counsel, considered a broad range of information.Nature, Extent, and Quality of Services Provided. The Board noted that it previously received and considered materialsrelating to the nature, extent and quality of services provided by FMR and Geode to each fund, including the resources dedicated toinvestment management and support services, shareholder and administrative services, the benefits to shareholders of investment ina large fund family and the investment performance of each fund in connection with the annual renewal of each fund's currentmanagement contract and sub-advisory agreements (Advisory Contracts). At its January 2020 meeting, the Board concluded that thenature, extent and quality of the services provided to each fund under the existing Advisory Contracts should benefit each fund'sshareholders. The Board noted that approval of the Amended Contracts would not change the fund's portfolio manager, theinvestment processes, the level or nature of services provided, the resources and personnel allocated or trading and complianceoperations. The Board concluded that the nature, extent, and quality of services to be provided to each fund under the AmendedContracts will continue to benefit each fund's shareholders.Competitiveness of Management Fee and Total Expense Ratio ..The Board considered that it received and reviewedinformation regarding each fund's current management fee and total expense ratio compared to "mapped groups" of competitivefunds and classes in connection with the annual renewal of the Advisory Contracts. Based on its review, the Board concluded at itsJanuary 2020 meeting that each fund's current management fee and total expenses are fair and reasonable in light of the services thatthe fund receives and the other factors considered.Costs of the Services and Profitability. The Board considered that it previously reviewed information regarding the revenuesearned and the expenses incurred by FMR in providing services to each fund and the level of FMR's profitability. At its January2020 meeting, the Board concluded that it was satisfied that FMR's profitability in connection with the operation of each fund wasnot excessive under the circumstances. Because the Board was approving an arrangement that would not result in any changes to themanagement fee rate, the Board did not consider the costs of the services provided by and the profits realized by FMR to besignificant factors in its decision to approve the Amended Contract.Economies of Scale. The Board considered that it previously received and reviewed information regarding whether there havebeen economies of scale in respect of the management of the Fidelity funds, whether the Fidelity funds (including each fund) haveappropriately benefited from any such economies of scale, and whether there is potential for realization of any further economies ofscale and that it concluded, at its January 2020 meeting, that economies of scale, if any, are being appropriately shared between fundshareholders and Fidelity. The Board did not consider economies of scale to be a significant factor in its decision to approve theAmended Contracts because the proposed sub-advisory fee rate will be lower than the current sub-advisory fee rate.Based on its evaluation of all of the conclusions noted above, and after considering all factors it believed relevant, the Boardconcluded that the advisory and sub-advisory fee arrangements are fair and reasonable, and that each fund's Amended Contractshould be approved.Board Approval of Investment Advisory ContractsFidelity Extended Market Index FundFidelity International Index FundFidelity Total Market Index FundAt its January 2021 meeting, the Board of Trustees, including the Independent Trustees (together, the Board), voted to continue themanagement contract with Fidelity Management & Research Company LLC (FMR), and the sub-advisory agreements and sub-subadvisory agreements, in each case, where applicable (together, the Advisory Contracts) for each fund, including each fund's sub-advisory agreement with Geode Capital Management, LLC, for four months from February 1, 2021 through May 31, 2021, inconnection with changes to the Board's meeting calendar.The Board considered that the approval of each fund's Advisory Contracts will not result in any changes in (i) the investmentprocess or strategies employed in the management of each fund's assets; (ii) the fees and expenses paid by shareholders; (iii) thenature, extent or quality of services provided under each fund's Advisory Contracts; or (iv) the day-to-day management of each fund
Copyright © 2021 www.secdatabase.com. All Rights Reserved.Please Consider the Environment Before Printing This Document
or the persons primarily responsible for such management. The Board also considered that since its last approval of each fund'sAdvisory Contracts, FMR had provided additional information on each fund in support of the annual contract renewal process,including competitive analyses on total expenses and management fees and in-depth reviews of fund performance and fundprofitability information. The Board also considered the findings of certain ad hoc committees that had been previously formed todiscuss matters relevant to all of the Fidelity funds, including economies of scale, fall-out benefits and retail vs. institutional funds.The Board concluded that each fund's Advisory Contracts are fair and reasonable, and that each fund's Advisory Contracts should berenewed, without modification, through May 31, 2021, with the understanding that the Board will consider the annual renewal for afull one year period in May 2021.In connection with its consideration of future renewals of each fund's Advisory Contracts, the Board will consider: (i) the nature,extent and quality of services provided to the funds, including shareholder and administrative services and investment performance;(ii) the competitiveness of the management fee and total expenses for each fund; (iii) the costs of the services and profitability,including the revenues earned and the expenses incurred in conducting the business of developing, marketing, distributing,managing, administering, and servicing each fund and its shareholders, to the extent applicable; and (iv) whether there have beeneconomies of scale in respect of the Fidelity funds, whether the Fidelity funds (including the funds) have appropriately benefitedfrom any such economies of scale, and whether there is the potential for realization of any further economies.Based on its evaluation of all of the conclusions noted above, and after considering all factors it believed relevant, the Boardultimately concluded that each fund's management fee structures are fair and reasonable, and that the continuation of the funds'Advisory Contracts should be approved for four months from February 1, 2021 through May 31, 2021.
Liquidity Risk Management ProgramThe Securities and Exchange Commission adopted Rule 22e-4 under the Investment Company Act of 1940 (the Liquidity Rule) topromote effective liquidity risk management throughout the open-end investment company industry, thereby reducing the risk thatfunds will be unable to meet their redemption obligations and mitigating dilution of the interests of fund shareholders.The Funds have adopted and implemented a liquidity risk management program pursuant to the Liquidity Rule (the Program)effective December 1, 2018. The Program is reasonably designed to assess and manage each Fund�s liquidity risk and to complywith the requirements of the Liquidity Rule. Each Fund�s Board of Trustees (the Board) has designated each Fund�s investmentadviser as administrator of the Program. The Fidelity advisers have established a Liquidity Risk Management Committee (the LRMCommittee) to manage the Program for each of the Fidelity Funds. The LRM Committee monitors the adequacy and effectiveness ofimplementation of the Program and on a periodic basis assesses each Fund�s liquidity risk based on a variety of factors including (1)the Fund�s investment strategy, (2) portfolio liquidity and cash flow projections during normal and reasonably foreseeable stressedconditions, (3) shareholder redemptions, (4) borrowings and other funding sources and (5) in the case of exchange-traded funds,certain additional factors including the effect of the Fund�s prices and spreads, market participants, and basket compositions on theoverall liquidity of the Fund�s portfolio, as applicable.In accordance with the Program, each of the Fund�s portfolio investments is classified into one of four liquidity categories describedbelow based on a determination of a reasonable expectation for how long it would take to convert the investment to cash (or sell ordispose of the investment) without significantly changing its market value.
• Highly liquid investments � cash or convertible to cash within three business days or less
• Moderately liquid investments � convertible to cash in three to seven calendar days
• Less liquid investments � can be sold or disposed of, but not settled, within seven calendar days
• Illiquid investments � cannot be sold or disposed of within seven calendar days
Liquidity classification determinations take into account a variety of factors including various market, trading and investment-specific considerations, as well as market depth, and generally utilize analysis from a third-party liquidity metrics service.The Liquidity Rule places a 15% limit on a fund�s illiquid investments and requires funds that do not primarily hold assets that arehighly liquid investments to determine and maintain a minimum percentage of the fund�s net assets to be invested in highly liquidinvestments (highly liquid investment minimum or HLIM). The Program includes provisions reasonably designed to comply withthe 15% limit on illiquid investments and for determining, periodically reviewing and complying with the HLIM requirement asapplicable.At a recent meeting of the Fund�s Board of Trustees, the LRM Committee provided a written report to the Board pertaining to theoperation, adequacy, and effectiveness of implementation of the Program for the annual period from December 1, 2019 throughNovember 30, 2020. The report concluded that the Program has been implemented and is operating effectively and is reasonablydesigned to assess and manage the Fund�s liquidity risk.
Proxy Voting Results
Copyright © 2021 www.secdatabase.com. All Rights Reserved.Please Consider the Environment Before Printing This Document
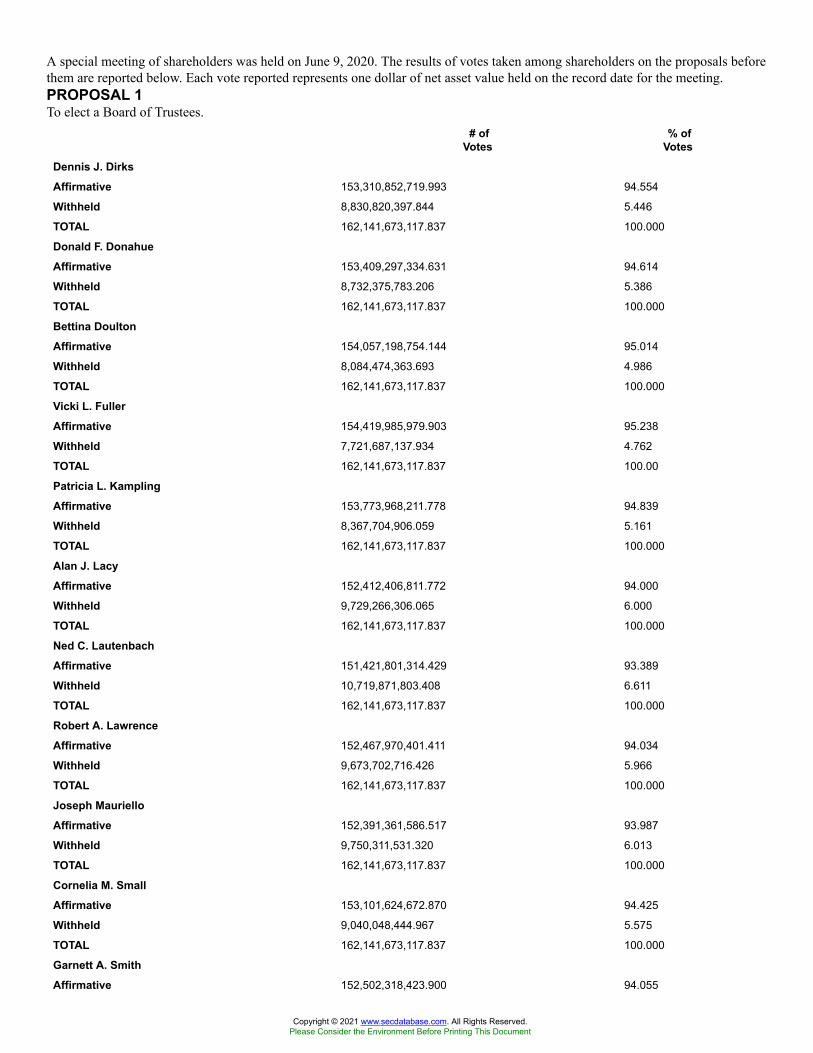
A special meeting of shareholders was held on June 9, 2020. The results of votes taken among shareholders on the proposals beforethem are reported below. Each vote reported represents one dollar of net asset value held on the record date for the meeting.PROPOSAL 1To elect a Board of Trustees.
# ofVotes
% ofVotes
Dennis J. DirksAffirmative 153,310,852,719.993 94.554
Withheld 8,830,820,397.844 5.446
TOTAL 162,141,673,117.837 100.000
Donald F. DonahueAffirmative 153,409,297,334.631 94.614
Withheld 8,732,375,783.206 5.386
TOTAL 162,141,673,117.837 100.000
Bettina DoultonAffirmative 154,057,198,754.144 95.014
Withheld 8,084,474,363.693 4.986
TOTAL 162,141,673,117.837 100.000
Vicki L. FullerAffirmative 154,419,985,979.903 95.238
Withheld 7,721,687,137.934 4.762
TOTAL 162,141,673,117.837 100.00
Patricia L. KamplingAffirmative 153,773,968,211.778 94.839
Withheld 8,367,704,906.059 5.161
TOTAL 162,141,673,117.837 100.000
Alan J. LacyAffirmative 152,412,406,811.772 94.000
Withheld 9,729,266,306.065 6.000
TOTAL 162,141,673,117.837 100.000
Ned C. LautenbachAffirmative 151,421,801,314.429 93.389
Withheld 10,719,871,803.408 6.611
TOTAL 162,141,673,117.837 100.000
Robert A. LawrenceAffirmative 152,467,970,401.411 94.034
Withheld 9,673,702,716.426 5.966
TOTAL 162,141,673,117.837 100.000
Joseph MaurielloAffirmative 152,391,361,586.517 93.987
Withheld 9,750,311,531.320 6.013
TOTAL 162,141,673,117.837 100.000
Cornelia M. SmallAffirmative 153,101,624,672.870 94.425
Withheld 9,040,048,444.967 5.575
TOTAL 162,141,673,117.837 100.000
Garnett A. SmithAffirmative 152,502,318,423.900 94.055
Copyright © 2021 www.secdatabase.com. All Rights Reserved.Please Consider the Environment Before Printing This Document
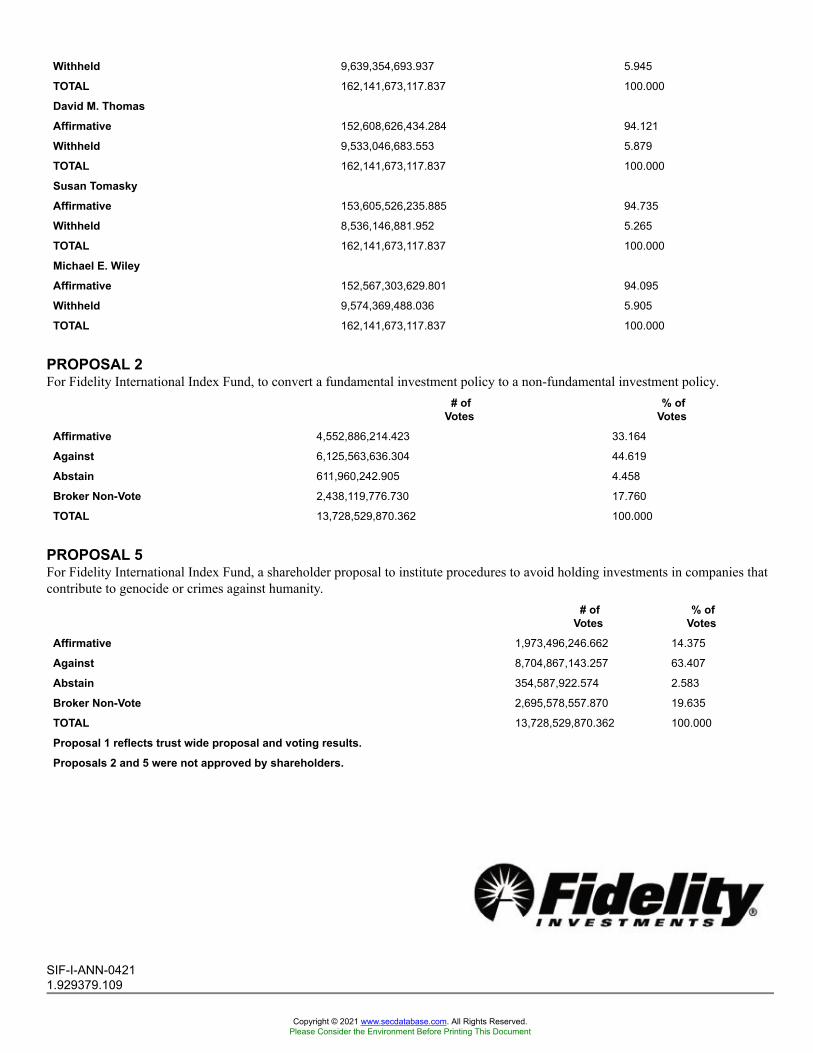
Withheld 9,639,354,693.937 5.945
TOTAL 162,141,673,117.837 100.000
David M. ThomasAffirmative 152,608,626,434.284 94.121
Withheld 9,533,046,683.553 5.879
TOTAL 162,141,673,117.837 100.000
Susan TomaskyAffirmative 153,605,526,235.885 94.735
Withheld 8,536,146,881.952 5.265
TOTAL 162,141,673,117.837 100.000
Michael E. WileyAffirmative 152,567,303,629.801 94.095
Withheld 9,574,369,488.036 5.905
TOTAL 162,141,673,117.837 100.000
PROPOSAL 2For Fidelity International Index Fund, to convert a fundamental investment policy to a non-fundamental investment policy.
# ofVotes
% ofVotes
Affirmative 4,552,886,214.423 33.164
Against 6,125,563,636.304 44.619
Abstain 611,960,242.905 4.458
Broker Non-Vote 2,438,119,776.730 17.760
TOTAL 13,728,529,870.362 100.000
PROPOSAL 5For Fidelity International Index Fund, a shareholder proposal to institute procedures to avoid holding investments in companies thatcontribute to genocide or crimes against humanity.
# ofVotes
% ofVotes
Affirmative 1,973,496,246.662 14.375
Against 8,704,867,143.257 63.407
Abstain 354,587,922.574 2.583
Broker Non-Vote 2,695,578,557.870 19.635
TOTAL 13,728,529,870.362 100.000
Proposal 1 reflects trust wide proposal and voting results.Proposals 2 and 5 were not approved by shareholders.
SIF-I-ANN-04211.929379.109
Copyright © 2021 www.secdatabase.com. All Rights Reserved.Please Consider the Environment Before Printing This Document
Fidelity® Series Total Market Index Fund
Annual ReportFebruary 28, 2021
ContentsNote to ShareholdersPerformanceManagement's Discussion of Fund PerformanceInvestment SummarySchedule of InvestmentsFinancial Statements
Copyright © 2021 www.secdatabase.com. All Rights Reserved.Please Consider the Environment Before Printing This Document
Notes to Financial StatementsReport of Independent Registered Public Accounting FirmTrustees and OfficersShareholder Expense ExampleDistributionsBoard Approval of Investment Advisory ContractsLiquidity Risk Management ProgramProxy Voting Results
To view a fund's proxy voting guidelines and proxy voting record for the 12-month period ended June 30, visithttp://www.fidelity.com/proxyvotingresults or visit the Securities and Exchange Commission's (SEC) web site athttp://www.sec.gov.You may also call 1-800-544-8544 to request a free copy of the proxy voting guidelines.Standard & Poor's, S&P and S&P 500 are registered service marks of The McGraw-Hill Companies, Inc. and have been licensed foruse by Fidelity Distributors Corporation.Other third-party marks appearing herein are the property of their respective owners.All other marks appearing herein are registered or unregistered trademarks or service marks of FMR LLC or an affiliated company.© 2021 FMR LLC. All rights reserved.
This report and the financial statements contained herein are submitted for the general information of the shareholders of the Fund.This report is not authorized for distribution to prospective investors in the Fund unless preceded or accompanied by an effectiveprospectus.A fund files its complete schedule of portfolio holdings with the SEC for the first and third quarters of each fiscal year on Form N-PORT. Forms N-PORT are available on the SEC�s web site at http://www.sec.gov. A fund's Forms N-PORT may be reviewed andcopied at the SEC�s Public Reference Room in Washington, DC. Information regarding the operation of the SEC's Public ReferenceRoom may be obtained by calling 1-800-SEC-0330.For a complete list of a fund's portfolio holdings, view the most recent holdings listing, semiannual report, or annual report onFidelity's web site at http://www.fidelity.com, http://www.institutional.fidelity.com, or http://www.401k.com, as applicable.NOT FDIC INSURED ��MAY LOSE VALUE ��NO BANK GUARANTEENeither the Fund nor Fidelity Distributors Corporation is a bank.
Note to Shareholders:Early in 2020, the outbreak and spread of a new coronavirus emerged as a public health emergency that had a major influence onfinancial markets, primarily based on its impact on the global economy and the outlook for corporate earnings. The virus causes arespiratory disease known as COVID-19. On March 11, 2020 the World Health Organization declared the COVID-19 outbreak apandemic, citing sustained risk of further global spread.In the weeks following, as the crisis worsened, we witnessed an escalating human tragedy with wide-scale social and economicconsequences from coronavirus-containment measures. The outbreak of COVID-19 prompted a number of measures to limit thespread, including travel and border restrictions, quarantines, and restrictions on large gatherings. In turn, these resulted in lowerconsumer activity, diminished demand for a wide range of products and services, disruption in manufacturing and supply chains, and� given the wide variability in outcomes regarding the outbreak � significant market uncertainty and volatility. Amid the turmoil,global governments and central banks took unprecedented action to help support consumers, businesses, and the broader economies,and to limit disruption to financial systems.The situation continues to unfold, and the extent and duration of its impact on financial markets and the economy remain highlyuncertain. Extreme events such as the coronavirus crisis are �exogenous shocks� that can have significant adverse effects on mutualfunds and their investments. Although multiple asset classes may be affected by market disruption, the duration and impact may notbe the same for all types of assets.Fidelity is committed to helping you stay informed amid news about COVID-19 and during increased market volatility, and we�retaking extra steps to be responsive to customer needs. We encourage you to visit our websites, where we offer ongoing updates,commentary, and analysis on the markets and our funds.
Copyright © 2021 www.secdatabase.com. All Rights Reserved.Please Consider the Environment Before Printing This Document

Performance: The Bottom LineAverage annual total return reflects the change in the value of an investment, assuming reinvestment of distributions from dividendincome and capital gains (the profits earned upon the sale of securities that have grown in value, if any) and assuming a constant rateof performance each year. The hypothetical investment and the average annual total returns do not reflect the deduction of taxes thata shareholder would pay on fund distributions or the redemption of fund shares. During periods of reimbursement by Fidelity, afund�s total return will be greater than it would be had the reimbursement not occurred. How a fund did yesterday is no guarantee ofhow it will do tomorrow.Average Annual Total Returns
For the periods ended February 28, 2021 Past 1 year Life of fundA
Fidelity® Series Total Market Index Fund 35.56% 18.79%
A From April 26, 2019$10,000 Over Life of FundLet�s say hypothetically that $10,000 was invested in Fidelity® Series Total Market Index Fund on April 26, 2019, when the fundstarted.The chart shows how the value of your investment would have changed, and also shows how the Dow Jones U.S. Total StockMarket Index℠ performed over the same period.
Period Ending Values$13,743 Fidelity® Series Total Market Index Fund$13,741 Dow Jones U.S. Total Stock Market Index℠
Management's Discussion of Fund PerformanceMarket Recap: The S&P 500® index gained 31.29% for the 12 months ending February 28, 2021, a volatile but productive periodfor U.S. risk assets. The early-2020 outbreak and spread of COVID-19 resulted in stocks suffering one of the quickest declines onrecord, through March 23, followed by a historic rebound that included the index closing 2020 at an all-time high and gainingmodest ground in the first two months of the new year. The crisis and containment efforts caused broad contraction in economicactivity, along with extreme uncertainty and dislocation in financial markets. A rapid and expansive U.S. monetary/fiscal-policyresponse partially offset the economic disruption and fueled the market surge, as did resilient corporate earnings. The rally slowed inSeptember, when stocks began a two-month retreat amid Congress�s inability to reach a deal on additional fiscal stimulus, as well asconcerns about election uncertainty, indications the U.S. economic recovery could be slowing and a new wave of COVID-19 cases.A shift in momentum began in October and accelerated following the U.S. elections, with the approval of three breakthrough
Copyright © 2021 www.secdatabase.com. All Rights Reserved.Please Consider the Environment Before Printing This Document

COVID-19 vaccines and prospects for additional government stimulus fueling the �reflation trade� through February 28. By sectorfor the full 12 months, information technology (+50%) and consumer discretionary (+43%) led all gainers. Materials (+42%) andcommunication services (+37%) also stood out. In contrast, the defensive utilities (-3%) and real estate sectors (+5%) notablylagged.Comments from the Geode Capital Management, LLC, passive equity index team: For the fiscal year endingFebruary 28, 2021, the fund gained 35.56%, roughly in line with the 35.50% advance of the benchmark Dow Jones U.S. Total StockMarket Index. By sector, information technology gained 53% and contributed most, followed by consumer discretionary, whichgained 60% and health care, which advanced 31%. The communication services sector rose 41%, boosted by the media &entertainment industry (+51%), financials gained about 25%, and industrials advanced 30%. Other notable contributors included thematerials (+44%), consumer staples (+14%), energy (+14%), and real estate (+5%) sectors. In contrast, stocks in the utilities sectorreturned roughly -2% and detracted most. Turning to individual stocks, the top contributor was Apple (+78%), from the technologyhardware & equipment category, followed by Microsoft (+45%), within the software & services segment. In retailing, Amazon.comadvanced roughly 65% and Alphabet (+52%) from the media & entertainment industry also helped. Tesla, within the automobiles &components group, rose about 407% and boosted the fund. In contrast, the biggest individual detractor was AT&T (-15%), from thetelecommunication services industry. In capital goods, Boeing (-23%) and Raytheon (-38%) hurt. Wells Fargo, within the bankssegment, returned approximately -8% and hindered the fund. Another detractor was Coca Cola (-5%), a stock in the food, beverage& tobacco category.The views expressed above reflect those of the portfolio manager(s) only through the end of the period as stated on the cover of thisreport and do not necessarily represent the views of Fidelity or any other person in the Fidelity organization. Any such views aresubject to change at any time based upon market or other conditions and Fidelity disclaims any responsibility to update such views.These views may not be relied on as investment advice and, because investment decisions for a Fidelity fund are based on numerousfactors, may not be relied on as an indication of trading intent on behalf of any Fidelity fund.
Investment Summary (Unaudited)Top Ten Stocks as of February 28, 2021
% of fund's net assetsApple, Inc. 4.9
Microsoft Corp. 4.4
Amazon.com, Inc. 3.3
Facebook, Inc. Class A 1.6
Alphabet, Inc. Class A 1.5
Alphabet, Inc. Class C 1.5
Tesla, Inc. 1.3
Berkshire Hathaway, Inc. Class B 1.2
JPMorgan Chase & Co. 1.2
Johnson & Johnson 1.1
22.0
Top Market Sectors as of February 28, 2021% of fund's net assets
Information Technology 26.5
Health Care 13.6
Consumer Discretionary 12.2
Financials 11.5
Communication Services 10.1
Industrials 9.3
Consumer Staples 5.3
Real Estate 3.1
Materials 2.8
Energy 2.6
Copyright © 2021 www.secdatabase.com. All Rights Reserved.Please Consider the Environment Before Printing This Document

Asset Allocation (% of fund's net assets)
As of February 28, 2021*
Stocks and Equity Futures 100.0%
* Foreign investments � 3.5%
Schedule of Investments February 28, 2021Showing Percentage of Net AssetsCommon Stocks - 99.4%
Shares Value
COMMUNICATION SERVICES - 10.1%
Diversified Telecommunication Services - 1.2%
Alaska Communication Systems Group, Inc. 40,036 $130,918
Anterix, Inc. (a) 11,006 464,783
AT&T, Inc. 6,304,563 175,834,262
ATN International, Inc. 8,500 413,780
Bandwidth, Inc. (a)(b) 19,001 3,008,998
Cincinnati Bell, Inc. (a) 46,469 710,046
Cogent Communications Group, Inc. 38,141 2,282,739
Consolidated Communications Holdings, Inc. (a) 67,057 352,720
Globalstar, Inc. (a)(b) 536,566 949,722
IDT Corp. Class B (a) 17,575 315,471
Iridium Communications, Inc. (a) 104,965 4,021,209
Liberty Global PLC:
Class A (a) 123,262 3,035,327
Class C (a) 323,044 7,849,969
Liberty Latin America Ltd.:
Class A (a) 32,880 360,694
Class C (a) 154,596 1,694,372
Lumen Technologies, Inc. (b) 868,957 10,679,482
Ooma, Inc. (a) 19,593 309,569
ORBCOMM, Inc. (a) 69,683 531,681
Radius Global Infrastructure, Inc. (a) 56,653 701,364
Copyright © 2021 www.secdatabase.com. All Rights Reserved.Please Consider the Environment Before Printing This Document
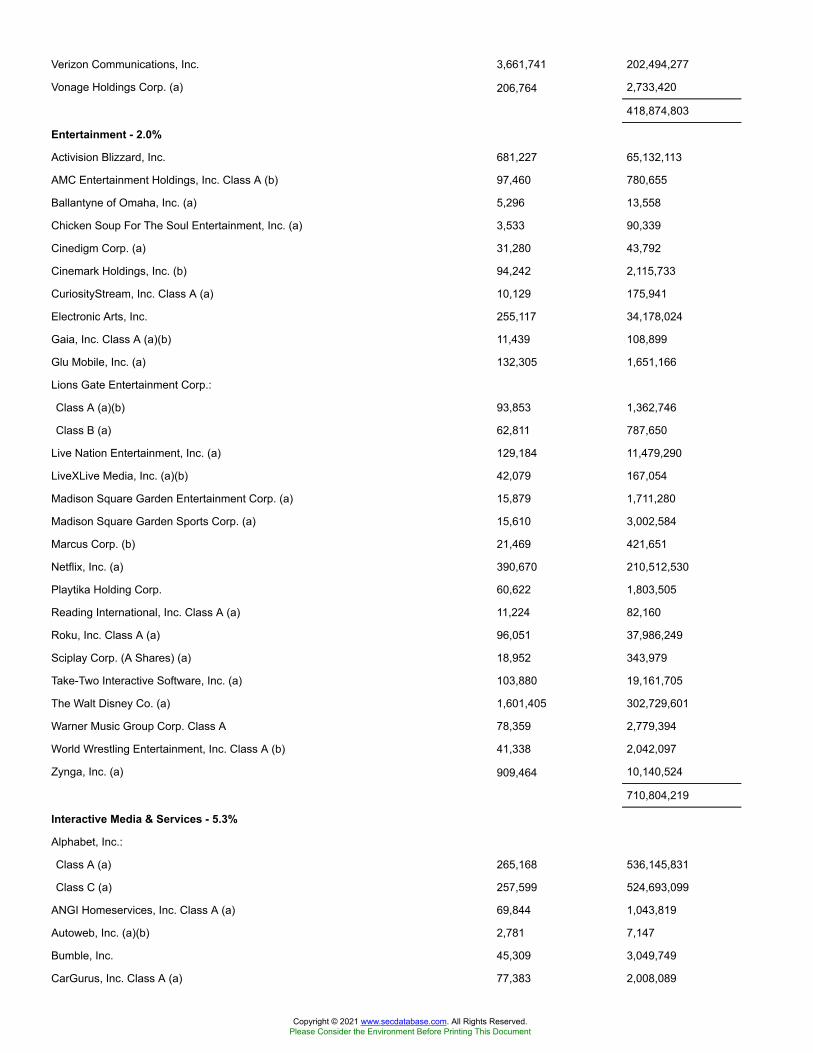
Verizon Communications, Inc. 3,661,741 202,494,277
Vonage Holdings Corp. (a) 206,764 2,733,420
418,874,803
Entertainment - 2.0%
Activision Blizzard, Inc. 681,227 65,132,113
AMC Entertainment Holdings, Inc. Class A (b) 97,460 780,655
Ballantyne of Omaha, Inc. (a) 5,296 13,558
Chicken Soup For The Soul Entertainment, Inc. (a) 3,533 90,339
Cinedigm Corp. (a) 31,280 43,792
Cinemark Holdings, Inc. (b) 94,242 2,115,733
CuriosityStream, Inc. Class A (a) 10,129 175,941
Electronic Arts, Inc. 255,117 34,178,024
Gaia, Inc. Class A (a)(b) 11,439 108,899
Glu Mobile, Inc. (a) 132,305 1,651,166
Lions Gate Entertainment Corp.:
Class A (a)(b) 93,853 1,362,746
Class B (a) 62,811 787,650
Live Nation Entertainment, Inc. (a) 129,184 11,479,290
LiveXLive Media, Inc. (a)(b) 42,079 167,054
Madison Square Garden Entertainment Corp. (a) 15,879 1,711,280
Madison Square Garden Sports Corp. (a) 15,610 3,002,584
Marcus Corp. (b) 21,469 421,651
Netflix, Inc. (a) 390,670 210,512,530
Playtika Holding Corp. 60,622 1,803,505
Reading International, Inc. Class A (a) 11,224 82,160
Roku, Inc. Class A (a) 96,051 37,986,249
Sciplay Corp. (A Shares) (a) 18,952 343,979
Take-Two Interactive Software, Inc. (a) 103,880 19,161,705
The Walt Disney Co. (a) 1,601,405 302,729,601
Warner Music Group Corp. Class A 78,359 2,779,394
World Wrestling Entertainment, Inc. Class A (b) 41,338 2,042,097
Zynga, Inc. (a) 909,464 10,140,524
710,804,219
Interactive Media & Services - 5.3%
Alphabet, Inc.:
Class A (a) 265,168 536,145,831
Class C (a) 257,599 524,693,099
ANGI Homeservices, Inc. Class A (a) 69,844 1,043,819
Autoweb, Inc. (a)(b) 2,781 7,147
Bumble, Inc. 45,309 3,049,749
CarGurus, Inc. Class A (a) 77,383 2,008,089
Copyright © 2021 www.secdatabase.com. All Rights Reserved.Please Consider the Environment Before Printing This Document
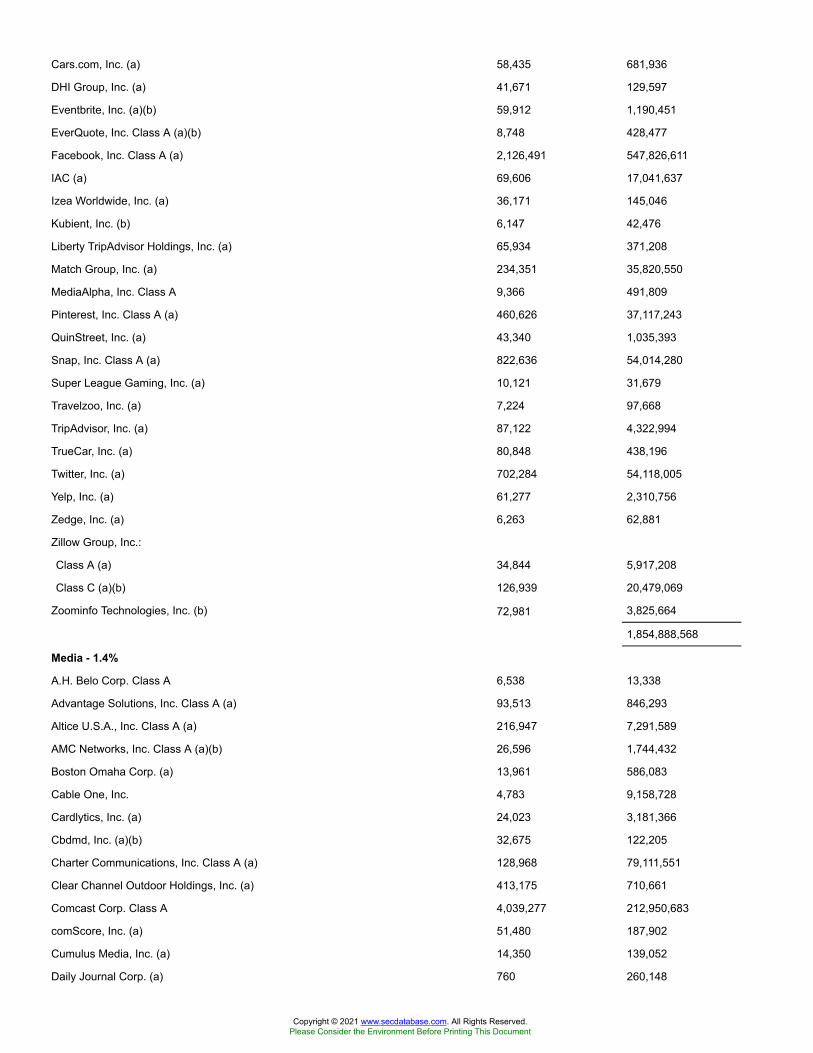
Cars.com, Inc. (a) 58,435 681,936
DHI Group, Inc. (a) 41,671 129,597
Eventbrite, Inc. (a)(b) 59,912 1,190,451
EverQuote, Inc. Class A (a)(b) 8,748 428,477
Facebook, Inc. Class A (a) 2,126,491 547,826,611
IAC (a) 69,606 17,041,637
Izea Worldwide, Inc. (a) 36,171 145,046
Kubient, Inc. (b) 6,147 42,476
Liberty TripAdvisor Holdings, Inc. (a) 65,934 371,208
Match Group, Inc. (a) 234,351 35,820,550
MediaAlpha, Inc. Class A 9,366 491,809
Pinterest, Inc. Class A (a) 460,626 37,117,243
QuinStreet, Inc. (a) 43,340 1,035,393
Snap, Inc. Class A (a) 822,636 54,014,280
Super League Gaming, Inc. (a) 10,121 31,679
Travelzoo, Inc. (a) 7,224 97,668
TripAdvisor, Inc. (a) 87,122 4,322,994
TrueCar, Inc. (a) 80,848 438,196
Twitter, Inc. (a) 702,284 54,118,005
Yelp, Inc. (a) 61,277 2,310,756
Zedge, Inc. (a) 6,263 62,881
Zillow Group, Inc.:
Class A (a) 34,844 5,917,208
Class C (a)(b) 126,939 20,479,069
Zoominfo Technologies, Inc. (b) 72,981 3,825,664
1,854,888,568
Media - 1.4%
A.H. Belo Corp. Class A 6,538 13,338
Advantage Solutions, Inc. Class A (a) 93,513 846,293
Altice U.S.A., Inc. Class A (a) 216,947 7,291,589
AMC Networks, Inc. Class A (a)(b) 26,596 1,744,432
Boston Omaha Corp. (a) 13,961 586,083
Cable One, Inc. 4,783 9,158,728
Cardlytics, Inc. (a) 24,023 3,181,366
Cbdmd, Inc. (a)(b) 32,675 122,205
Charter Communications, Inc. Class A (a) 128,968 79,111,551
Clear Channel Outdoor Holdings, Inc. (a) 413,175 710,661
Comcast Corp. Class A 4,039,277 212,950,683
comScore, Inc. (a) 51,480 187,902
Cumulus Media, Inc. (a) 14,350 139,052
Daily Journal Corp. (a) 760 260,148
Copyright © 2021 www.secdatabase.com. All Rights Reserved.Please Consider the Environment Before Printing This Document
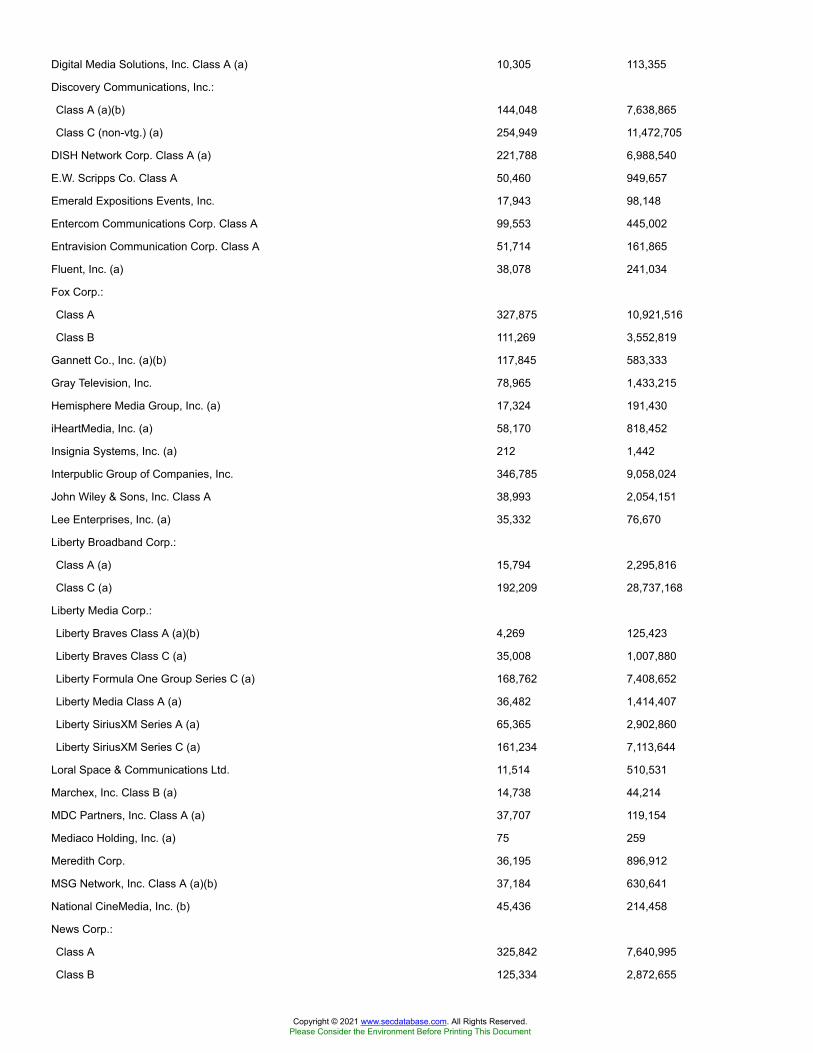
Digital Media Solutions, Inc. Class A (a) 10,305 113,355
Discovery Communications, Inc.:
Class A (a)(b) 144,048 7,638,865
Class C (non-vtg.) (a) 254,949 11,472,705
DISH Network Corp. Class A (a) 221,788 6,988,540
E.W. Scripps Co. Class A 50,460 949,657
Emerald Expositions Events, Inc. 17,943 98,148
Entercom Communications Corp. Class A 99,553 445,002
Entravision Communication Corp. Class A 51,714 161,865
Fluent, Inc. (a) 38,078 241,034
Fox Corp.:
Class A 327,875 10,921,516
Class B 111,269 3,552,819
Gannett Co., Inc. (a)(b) 117,845 583,333
Gray Television, Inc. 78,965 1,433,215
Hemisphere Media Group, Inc. (a) 17,324 191,430
iHeartMedia, Inc. (a) 58,170 818,452
Insignia Systems, Inc. (a) 212 1,442
Interpublic Group of Companies, Inc. 346,785 9,058,024
John Wiley & Sons, Inc. Class A 38,993 2,054,151
Lee Enterprises, Inc. (a) 35,332 76,670
Liberty Broadband Corp.:
Class A (a) 15,794 2,295,816
Class C (a) 192,209 28,737,168
Liberty Media Corp.:
Liberty Braves Class A (a)(b) 4,269 125,423
Liberty Braves Class C (a) 35,008 1,007,880
Liberty Formula One Group Series C (a) 168,762 7,408,652
Liberty Media Class A (a) 36,482 1,414,407
Liberty SiriusXM Series A (a) 65,365 2,902,860
Liberty SiriusXM Series C (a) 161,234 7,113,644
Loral Space & Communications Ltd. 11,514 510,531
Marchex, Inc. Class B (a) 14,738 44,214
MDC Partners, Inc. Class A (a) 37,707 119,154
Mediaco Holding, Inc. (a) 75 259
Meredith Corp. 36,195 896,912
MSG Network, Inc. Class A (a)(b) 37,184 630,641
National CineMedia, Inc. (b) 45,436 214,458
News Corp.:
Class A 325,842 7,640,995
Class B 125,334 2,872,655
Copyright © 2021 www.secdatabase.com. All Rights Reserved.Please Consider the Environment Before Printing This Document

Nexstar Broadcasting Group, Inc. Class A 38,565 5,304,616
Omnicom Group, Inc. 192,018 13,197,397
Saga Communications, Inc. Class A 3,210 66,383
Salem Communications Corp. Class A 3,196 8,150
Scholastic Corp. 30,451 876,989
Sinclair Broadcast Group, Inc. Class A 41,553 1,285,234
Sirius XM Holdings, Inc. (b) 1,058,621 6,192,933
Srax, Inc. (a) 7,628 27,842
TechTarget, Inc. (a) 21,341 1,784,748
Tegna, Inc. 193,418 3,526,010
The New York Times Co. Class A 129,943 6,649,183
Thryv Holdings, Inc. (a) 4,444 96,213
Townsquare Media, Inc. 6,126 66,773
Tribune Publishing Co. 20,998 356,546
Urban One, Inc.:
Class A (a) 2,298 12,754
Class D (non-vtg.) (a) 9,533 15,396
ViacomCBS, Inc.:
Class A 43,023 2,764,658
Class B 468,638 30,222,465
WideOpenWest, Inc. (a) 46,642 655,320
510,149,533
Wireless Telecommunication Services - 0.2%
Boingo Wireless, Inc. (a) 39,202 446,903
Gogo, Inc. (a)(b) 43,129 511,079
NII Holdings, Inc. (a)(c) 62,298 135,187
Shenandoah Telecommunications Co. 46,753 2,073,496
Spok Holdings, Inc. 12,856 137,816
T-Mobile U.S., Inc. 516,708 61,989,459
Telephone & Data Systems, Inc. 92,277 1,650,836
U.S. Cellular Corp. (a) 12,225 359,782
67,304,558
TOTAL COMMUNICATION SERVICES 3,562,021,681
CONSUMER DISCRETIONARY - 12.2%
Auto Components - 0.3%
Adient PLC (a) 82,462 3,057,691
American Axle & Manufacturing Holdings, Inc. (a) 96,789 945,629
Aptiv PLC 238,453 35,729,798
Autoliv, Inc. 69,933 6,293,970
BorgWarner, Inc. 215,289 9,688,005
Copyright © 2021 www.secdatabase.com. All Rights Reserved.Please Consider the Environment Before Printing This Document

Cooper Tire & Rubber Co. 45,350 2,595,834
Cooper-Standard Holding, Inc. (a) 14,934 534,936
Dana, Inc. 129,857 3,091,895
Dorman Products, Inc. (a) 25,995 2,591,961
Fox Factory Holding Corp. (a) 36,802 4,679,374
Gentex Corp. 218,415 7,727,523
Gentherm, Inc. (a) 29,718 2,103,737
Horizon Global Corp. (a) 16,958 159,405
LCI Industries 22,641 3,191,023
Lear Corp. 48,378 8,035,102
Modine Manufacturing Co. (a) 43,938 609,420
Motorcar Parts of America, Inc. (a) 17,573 373,953
Patrick Industries, Inc. 19,686 1,553,816
Standard Motor Products, Inc. 17,480 734,335
Stoneridge, Inc. (a) 24,343 746,356
Strattec Security Corp. 2,918 150,335
Superior Industries International, Inc. (a) 28,437 162,375
Sypris Solutions, Inc. (a) 4,966 20,460
Tenneco, Inc. (a) 43,986 490,004
The Goodyear Tire & Rubber Co. 206,217 3,466,508
Unique Fabricating, Inc. (a) 2,233 15,184
Veoneer, Inc. (a)(b) 83,361 2,290,760
Visteon Corp. (a) 24,342 3,095,572
Workhorse Group, Inc. (a)(b) 94,431 1,526,949
XPEL, Inc. (a)(b) 13,596 657,367
106,319,277
Automobiles - 1.6%
Arcimoto, Inc. (a)(b) 23,439 420,027
AYRO, Inc. (a)(b) 13,921 99,814
Fisker, Inc. (a) 131,588 3,750,258
Ford Motor Co. 3,451,343 40,380,713
General Motors Co. 1,112,313 57,095,026
Harley-Davidson, Inc. 136,681 4,875,411
Lordstown Motors Corp. (a)(b) 90,820 1,756,459
Tesla, Inc. (a) 670,861 453,166,606
Thor Industries, Inc. 49,427 5,785,925
Winnebago Industries, Inc. 29,743 2,070,113
569,400,352
Distributors - 0.1%
Core-Mark Holding Co., Inc. 40,772 1,328,352
Educational Development Corp. 7,003 109,317
Copyright © 2021 www.secdatabase.com. All Rights Reserved.Please Consider the Environment Before Printing This Document
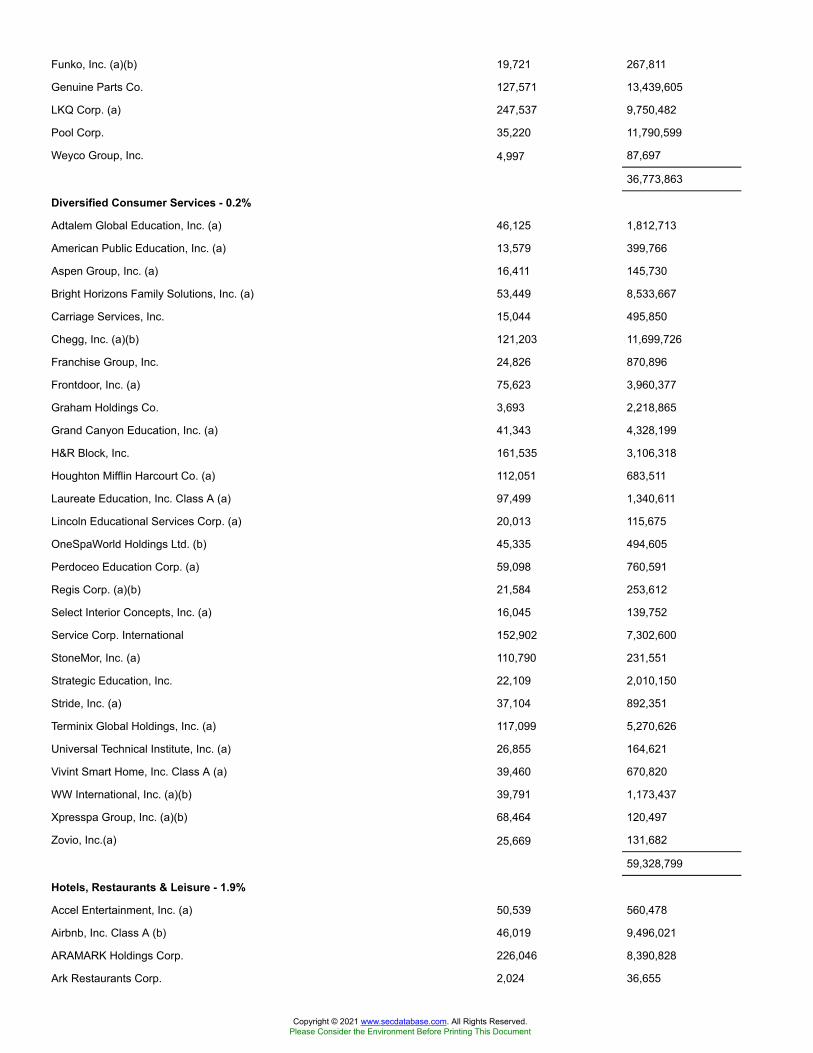
Funko, Inc. (a)(b) 19,721 267,811
Genuine Parts Co. 127,571 13,439,605
LKQ Corp. (a) 247,537 9,750,482
Pool Corp. 35,220 11,790,599
Weyco Group, Inc. 4,997 87,697
36,773,863
Diversified Consumer Services - 0.2%
Adtalem Global Education, Inc. (a) 46,125 1,812,713
American Public Education, Inc. (a) 13,579 399,766
Aspen Group, Inc. (a) 16,411 145,730
Bright Horizons Family Solutions, Inc. (a) 53,449 8,533,667
Carriage Services, Inc. 15,044 495,850
Chegg, Inc. (a)(b) 121,203 11,699,726
Franchise Group, Inc. 24,826 870,896
Frontdoor, Inc. (a) 75,623 3,960,377
Graham Holdings Co. 3,693 2,218,865
Grand Canyon Education, Inc. (a) 41,343 4,328,199
H&R Block, Inc. 161,535 3,106,318
Houghton Mifflin Harcourt Co. (a) 112,051 683,511
Laureate Education, Inc. Class A (a) 97,499 1,340,611
Lincoln Educational Services Corp. (a) 20,013 115,675
OneSpaWorld Holdings Ltd. (b) 45,335 494,605
Perdoceo Education Corp. (a) 59,098 760,591
Regis Corp. (a)(b) 21,584 253,612
Select Interior Concepts, Inc. (a) 16,045 139,752
Service Corp. International 152,902 7,302,600
StoneMor, Inc. (a) 110,790 231,551
Strategic Education, Inc. 22,109 2,010,150
Stride, Inc. (a) 37,104 892,351
Terminix Global Holdings, Inc. (a) 117,099 5,270,626
Universal Technical Institute, Inc. (a) 26,855 164,621
Vivint Smart Home, Inc. Class A (a) 39,460 670,820
WW International, Inc. (a)(b) 39,791 1,173,437
Xpresspa Group, Inc. (a)(b) 68,464 120,497
Zovio, Inc.(a) 25,669 131,682
59,328,799
Hotels, Restaurants & Leisure - 1.9%
Accel Entertainment, Inc. (a) 50,539 560,478
Airbnb, Inc. Class A (b) 46,019 9,496,021
ARAMARK Holdings Corp. 226,046 8,390,828
Ark Restaurants Corp. 2,024 36,655
Copyright © 2021 www.secdatabase.com. All Rights Reserved.Please Consider the Environment Before Printing This Document
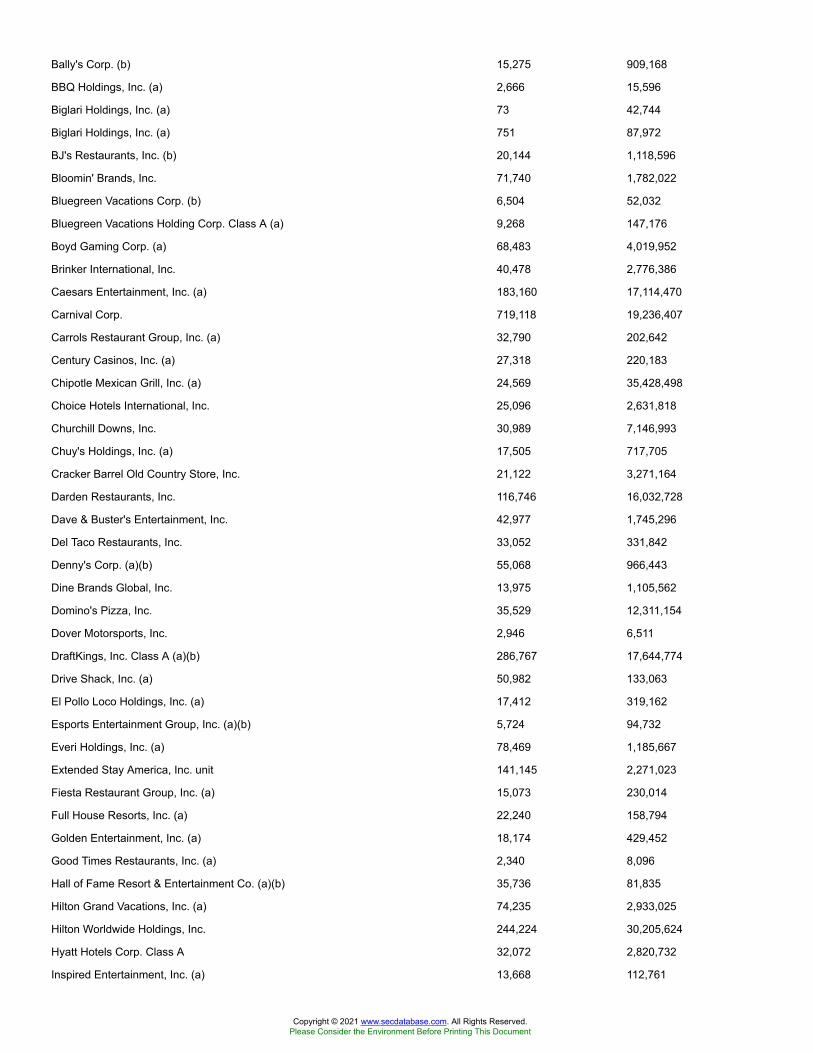
Bally's Corp. (b) 15,275 909,168
BBQ Holdings, Inc. (a) 2,666 15,596
Biglari Holdings, Inc. (a) 73 42,744
Biglari Holdings, Inc. (a) 751 87,972
BJ's Restaurants, Inc. (b) 20,144 1,118,596
Bloomin' Brands, Inc. 71,740 1,782,022
Bluegreen Vacations Corp. (b) 6,504 52,032
Bluegreen Vacations Holding Corp. Class A (a) 9,268 147,176
Boyd Gaming Corp. (a) 68,483 4,019,952
Brinker International, Inc. 40,478 2,776,386
Caesars Entertainment, Inc. (a) 183,160 17,114,470
Carnival Corp. 719,118 19,236,407
Carrols Restaurant Group, Inc. (a) 32,790 202,642
Century Casinos, Inc. (a) 27,318 220,183
Chipotle Mexican Grill, Inc. (a) 24,569 35,428,498
Choice Hotels International, Inc. 25,096 2,631,818
Churchill Downs, Inc. 30,989 7,146,993
Chuy's Holdings, Inc. (a) 17,505 717,705
Cracker Barrel Old Country Store, Inc. 21,122 3,271,164
Darden Restaurants, Inc. 116,746 16,032,728
Dave & Buster's Entertainment, Inc. 42,977 1,745,296
Del Taco Restaurants, Inc. 33,052 331,842
Denny's Corp. (a)(b) 55,068 966,443
Dine Brands Global, Inc. 13,975 1,105,562
Domino's Pizza, Inc. 35,529 12,311,154
Dover Motorsports, Inc. 2,946 6,511
DraftKings, Inc. Class A (a)(b) 286,767 17,644,774
Drive Shack, Inc. (a) 50,982 133,063
El Pollo Loco Holdings, Inc. (a) 17,412 319,162
Esports Entertainment Group, Inc. (a)(b) 5,724 94,732
Everi Holdings, Inc. (a) 78,469 1,185,667
Extended Stay America, Inc. unit 141,145 2,271,023
Fiesta Restaurant Group, Inc. (a) 15,073 230,014
Full House Resorts, Inc. (a) 22,240 158,794
Golden Entertainment, Inc. (a) 18,174 429,452
Good Times Restaurants, Inc. (a) 2,340 8,096
Hall of Fame Resort & Entertainment Co. (a)(b) 35,736 81,835
Hilton Grand Vacations, Inc. (a) 74,235 2,933,025
Hilton Worldwide Holdings, Inc. 244,224 30,205,624
Hyatt Hotels Corp. Class A 32,072 2,820,732
Inspired Entertainment, Inc. (a) 13,668 112,761
Copyright © 2021 www.secdatabase.com. All Rights Reserved.Please Consider the Environment Before Printing This Document
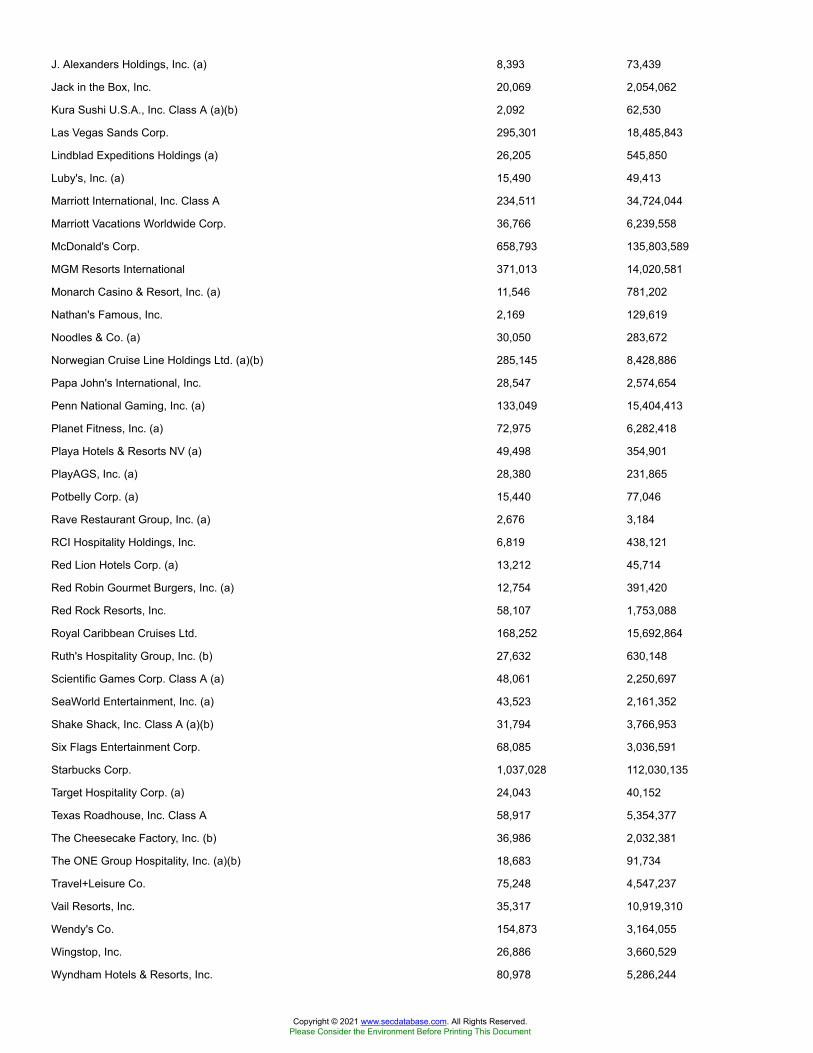
J. Alexanders Holdings, Inc. (a) 8,393 73,439
Jack in the Box, Inc. 20,069 2,054,062
Kura Sushi U.S.A., Inc. Class A (a)(b) 2,092 62,530
Las Vegas Sands Corp. 295,301 18,485,843
Lindblad Expeditions Holdings (a) 26,205 545,850
Luby's, Inc. (a) 15,490 49,413
Marriott International, Inc. Class A 234,511 34,724,044
Marriott Vacations Worldwide Corp. 36,766 6,239,558
McDonald's Corp. 658,793 135,803,589
MGM Resorts International 371,013 14,020,581
Monarch Casino & Resort, Inc. (a) 11,546 781,202
Nathan's Famous, Inc. 2,169 129,619
Noodles & Co. (a) 30,050 283,672
Norwegian Cruise Line Holdings Ltd. (a)(b) 285,145 8,428,886
Papa John's International, Inc. 28,547 2,574,654
Penn National Gaming, Inc. (a) 133,049 15,404,413
Planet Fitness, Inc. (a) 72,975 6,282,418
Playa Hotels & Resorts NV (a) 49,498 354,901
PlayAGS, Inc. (a) 28,380 231,865
Potbelly Corp. (a) 15,440 77,046
Rave Restaurant Group, Inc. (a) 2,676 3,184
RCI Hospitality Holdings, Inc. 6,819 438,121
Red Lion Hotels Corp. (a) 13,212 45,714
Red Robin Gourmet Burgers, Inc. (a) 12,754 391,420
Red Rock Resorts, Inc. 58,107 1,753,088
Royal Caribbean Cruises Ltd. 168,252 15,692,864
Ruth's Hospitality Group, Inc. (b) 27,632 630,148
Scientific Games Corp. Class A (a) 48,061 2,250,697
SeaWorld Entertainment, Inc. (a) 43,523 2,161,352
Shake Shack, Inc. Class A (a)(b) 31,794 3,766,953
Six Flags Entertainment Corp. 68,085 3,036,591
Starbucks Corp. 1,037,028 112,030,135
Target Hospitality Corp. (a) 24,043 40,152
Texas Roadhouse, Inc. Class A 58,917 5,354,377
The Cheesecake Factory, Inc. (b) 36,986 2,032,381
The ONE Group Hospitality, Inc. (a)(b) 18,683 91,734
Travel+Leisure Co. 75,248 4,547,237
Vail Resorts, Inc. 35,317 10,919,310
Wendy's Co. 154,873 3,164,055
Wingstop, Inc. 26,886 3,660,529
Wyndham Hotels & Resorts, Inc. 80,978 5,286,244
Copyright © 2021 www.secdatabase.com. All Rights Reserved.Please Consider the Environment Before Printing This Document
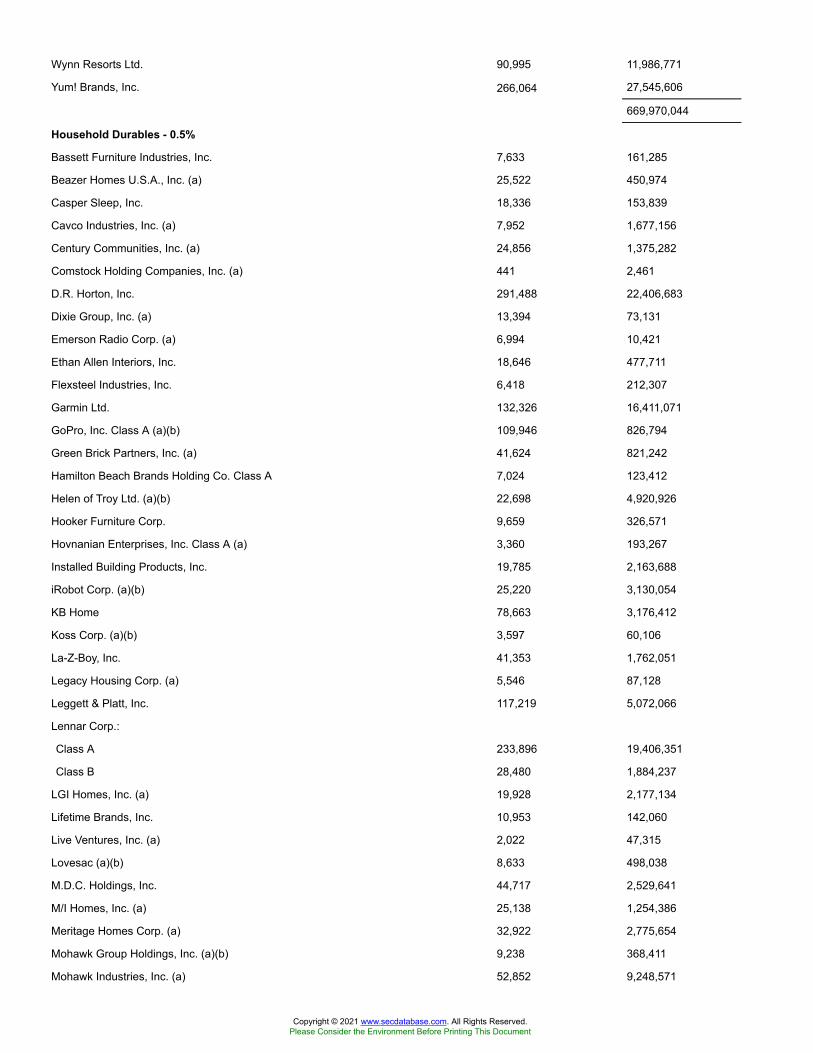
Wynn Resorts Ltd. 90,995 11,986,771
Yum! Brands, Inc. 266,064 27,545,606
669,970,044
Household Durables - 0.5%
Bassett Furniture Industries, Inc. 7,633 161,285
Beazer Homes U.S.A., Inc. (a) 25,522 450,974
Casper Sleep, Inc. 18,336 153,839
Cavco Industries, Inc. (a) 7,952 1,677,156
Century Communities, Inc. (a) 24,856 1,375,282
Comstock Holding Companies, Inc. (a) 441 2,461
D.R. Horton, Inc. 291,488 22,406,683
Dixie Group, Inc. (a) 13,394 73,131
Emerson Radio Corp. (a) 6,994 10,421
Ethan Allen Interiors, Inc. 18,646 477,711
Flexsteel Industries, Inc. 6,418 212,307
Garmin Ltd. 132,326 16,411,071
GoPro, Inc. Class A (a)(b) 109,946 826,794
Green Brick Partners, Inc. (a) 41,624 821,242
Hamilton Beach Brands Holding Co. Class A 7,024 123,412
Helen of Troy Ltd. (a)(b) 22,698 4,920,926
Hooker Furniture Corp. 9,659 326,571
Hovnanian Enterprises, Inc. Class A (a) 3,360 193,267
Installed Building Products, Inc. 19,785 2,163,688
iRobot Corp. (a)(b) 25,220 3,130,054
KB Home 78,663 3,176,412
Koss Corp. (a)(b) 3,597 60,106
La-Z-Boy, Inc. 41,353 1,762,051
Legacy Housing Corp. (a) 5,546 87,128
Leggett & Platt, Inc. 117,219 5,072,066
Lennar Corp.:
Class A 233,896 19,406,351
Class B 28,480 1,884,237
LGI Homes, Inc. (a) 19,928 2,177,134
Lifetime Brands, Inc. 10,953 142,060
Live Ventures, Inc. (a) 2,022 47,315
Lovesac (a)(b) 8,633 498,038
M.D.C. Holdings, Inc. 44,717 2,529,641
M/I Homes, Inc. (a) 25,138 1,254,386
Meritage Homes Corp. (a) 32,922 2,775,654
Mohawk Group Holdings, Inc. (a)(b) 9,238 368,411
Mohawk Industries, Inc. (a) 52,852 9,248,571
Copyright © 2021 www.secdatabase.com. All Rights Reserved.Please Consider the Environment Before Printing This Document
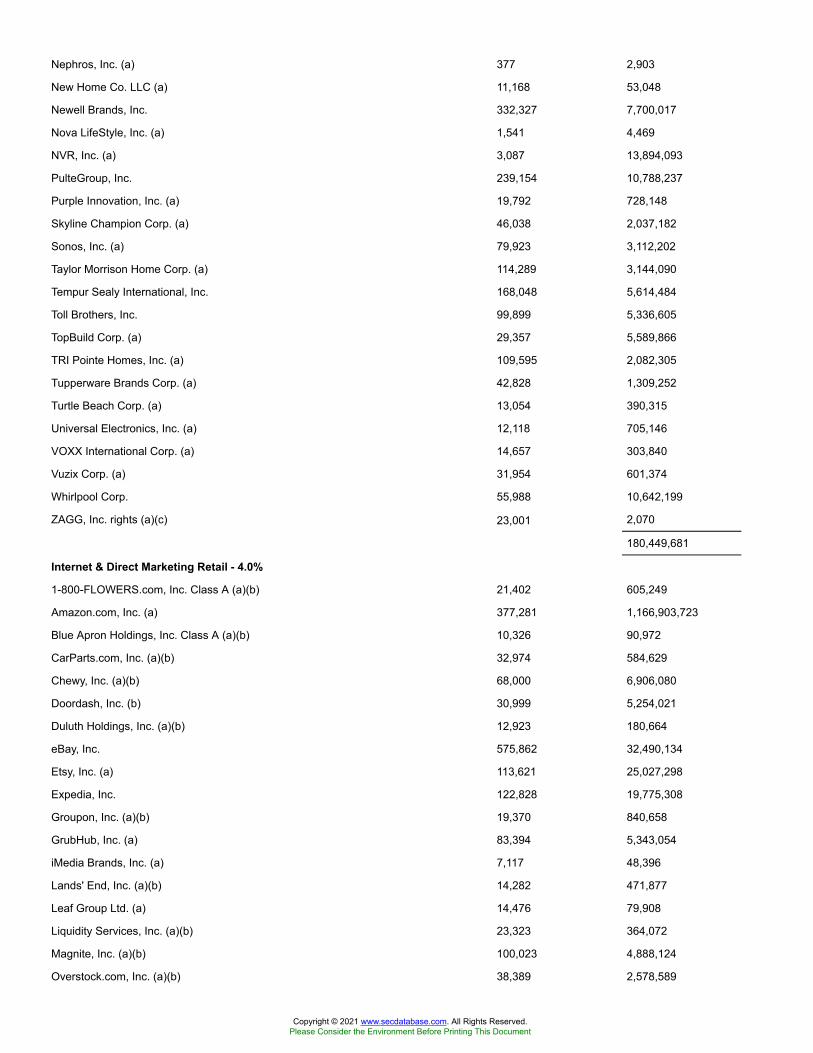
Nephros, Inc. (a) 377 2,903
New Home Co. LLC (a) 11,168 53,048
Newell Brands, Inc. 332,327 7,700,017
Nova LifeStyle, Inc. (a) 1,541 4,469
NVR, Inc. (a) 3,087 13,894,093
PulteGroup, Inc. 239,154 10,788,237
Purple Innovation, Inc. (a) 19,792 728,148
Skyline Champion Corp. (a) 46,038 2,037,182
Sonos, Inc. (a) 79,923 3,112,202
Taylor Morrison Home Corp. (a) 114,289 3,144,090
Tempur Sealy International, Inc. 168,048 5,614,484
Toll Brothers, Inc. 99,899 5,336,605
TopBuild Corp. (a) 29,357 5,589,866
TRI Pointe Homes, Inc. (a) 109,595 2,082,305
Tupperware Brands Corp. (a) 42,828 1,309,252
Turtle Beach Corp. (a) 13,054 390,315
Universal Electronics, Inc. (a) 12,118 705,146
VOXX International Corp. (a) 14,657 303,840
Vuzix Corp. (a) 31,954 601,374
Whirlpool Corp. 55,988 10,642,199
ZAGG, Inc. rights (a)(c) 23,001 2,070
180,449,681
Internet & Direct Marketing Retail - 4.0%
1-800-FLOWERS.com, Inc. Class A (a)(b) 21,402 605,249
Amazon.com, Inc. (a) 377,281 1,166,903,723
Blue Apron Holdings, Inc. Class A (a)(b) 10,326 90,972
CarParts.com, Inc. (a)(b) 32,974 584,629
Chewy, Inc. (a)(b) 68,000 6,906,080
Doordash, Inc. (b) 30,999 5,254,021
Duluth Holdings, Inc. (a)(b) 12,923 180,664
eBay, Inc. 575,862 32,490,134
Etsy, Inc. (a) 113,621 25,027,298
Expedia, Inc. 122,828 19,775,308
Groupon, Inc. (a)(b) 19,370 840,658
GrubHub, Inc. (a) 83,394 5,343,054
iMedia Brands, Inc. (a) 7,117 48,396
Lands' End, Inc. (a)(b) 14,282 471,877
Leaf Group Ltd. (a) 14,476 79,908
Liquidity Services, Inc. (a)(b) 23,323 364,072
Magnite, Inc. (a)(b) 100,023 4,888,124
Overstock.com, Inc. (a)(b) 38,389 2,578,589
Copyright © 2021 www.secdatabase.com. All Rights Reserved.Please Consider the Environment Before Printing This Document

PetMed Express, Inc. (b) 17,843 619,331
Quotient Technology, Inc. (a) 68,845 923,900
Qurate Retail, Inc. Series A 332,704 4,132,184
Remark Holdings, Inc. (a)(b) 83,320 250,793
Revolve Group, Inc. (a) 23,686 1,091,925
RumbleON, Inc. Class B (a)(b) 1,234 44,584
Shutterstock, Inc. 19,174 1,691,722
Stamps.com, Inc. (a) 16,328 2,970,553
Stitch Fix, Inc. (a)(b) 49,501 3,777,421
The Booking Holdings, Inc. (a) 36,187 84,261,791
The RealReal, Inc. (a) 54,499 1,391,904
Waitr Holdings, Inc. (a) 86,879 276,275
Wayfair LLC Class A (a)(b) 65,699 18,985,697
1,392,850,836
Leisure Products - 0.2%
Acushnet Holdings Corp. 32,085 1,354,629
American Outdoor Brands, Inc. (a) 11,889 237,899
Brunswick Corp. 69,661 6,155,943
Callaway Golf Co. 82,403 2,303,164
Clarus Corp. 24,530 425,841
Escalade, Inc. (b) 9,166 181,120
Genius Brands International, Inc. (a)(b) 206,901 351,732
Hasbro, Inc. 112,151 10,509,670
JAKKS Pacific, Inc. (a) 1,074 8,571
Johnson Outdoors, Inc. Class A 6,823 823,400
Malibu Boats, Inc. Class A (a) 18,348 1,367,660
Marine Products Corp. 26,603 447,196
MasterCraft Boat Holdings, Inc. (a) 18,022 461,904
Mattel, Inc. (a) 307,746 6,216,469
Nautilus, Inc. (a)(b) 26,922 495,634
Peloton Interactive, Inc. Class A (a) 224,604 27,058,044
Polaris, Inc. 50,534 5,950,884
Smith & Wesson Brands, Inc. (b) 50,733 873,115
Sturm, Ruger & Co., Inc. 14,886 1,015,225
Vista Outdoor, Inc. (a) 52,154 1,648,588
YETI Holdings, Inc. (a) 66,424 4,567,978
72,454,666
Multiline Retail - 0.5%
Big Lots, Inc. 31,590 2,007,229
Dillard's, Inc. Class A (b) 6,705 534,389
Dollar General Corp. 216,214 40,862,284
Copyright © 2021 www.secdatabase.com. All Rights Reserved.Please Consider the Environment Before Printing This Document

Dollar Tree, Inc. (a) 207,910 20,416,762
Kohl's Corp. 138,021 7,625,660
Macy's, Inc. 279,958 4,258,161
Nordstrom, Inc. 97,800 3,564,810
Ollie's Bargain Outlet Holdings, Inc. (a) 50,329 4,161,202
Target Corp. 442,340 81,142,850
164,573,347
Specialty Retail - 2.1%
Abercrombie & Fitch Co. Class A 53,965 1,477,022
Academy Sports & Outdoors, Inc. (b) 24,803 594,280
Advance Auto Parts, Inc. 59,623 9,560,548
America's Car Mart, Inc. (a) 5,903 796,905
American Eagle Outfitters, Inc. 129,605 3,330,849
Asbury Automotive Group, Inc. (a) 17,217 2,917,421
At Home Group, Inc. (a) 49,227 1,240,028
AutoNation, Inc. (a) 51,985 3,899,915
AutoZone, Inc. (a) 20,491 23,767,921
Barnes & Noble Education, Inc. (a) 29,549 191,182
Bed Bath & Beyond, Inc. (b) 111,899 3,005,607
Best Buy Co., Inc. 203,286 20,399,750
Big 5 Sporting Goods Corp. (b) 17,545 236,858
Blink Charging Co. (a)(b) 24,696 944,375
Boot Barn Holdings, Inc. (a) 24,717 1,493,401
Build-A-Bear Workshop, Inc. (a) 9,622 67,643
Burlington Stores, Inc. (a) 58,578 15,161,158
Caleres, Inc. 32,324 512,659
Camping World Holdings, Inc. 31,690 991,897
CarMax, Inc. (a) 144,878 17,314,370
Carvana Co. Class A (a)(b) 50,806 14,403,501
Chico's FAS, Inc. 114,208 307,220
Citi Trends, Inc. 9,628 749,925
Conn's, Inc. (a) 15,900 225,621
Designer Brands, Inc. Class A (b) 50,640 632,494
Dick's Sporting Goods, Inc. 57,732 4,120,333
Envela Corp. (a) 5,528 29,022
Express, Inc. (a) 61,972 166,705
Five Below, Inc. (a) 48,944 9,109,457
Floor & Decor Holdings, Inc. Class A (a) 92,830 8,827,205
Foot Locker, Inc. 92,576 4,451,980
GameStop Corp. Class A (a)(b) 48,517 4,936,120
Gap, Inc. 179,789 4,485,736
Copyright © 2021 www.secdatabase.com. All Rights Reserved.Please Consider the Environment Before Printing This Document
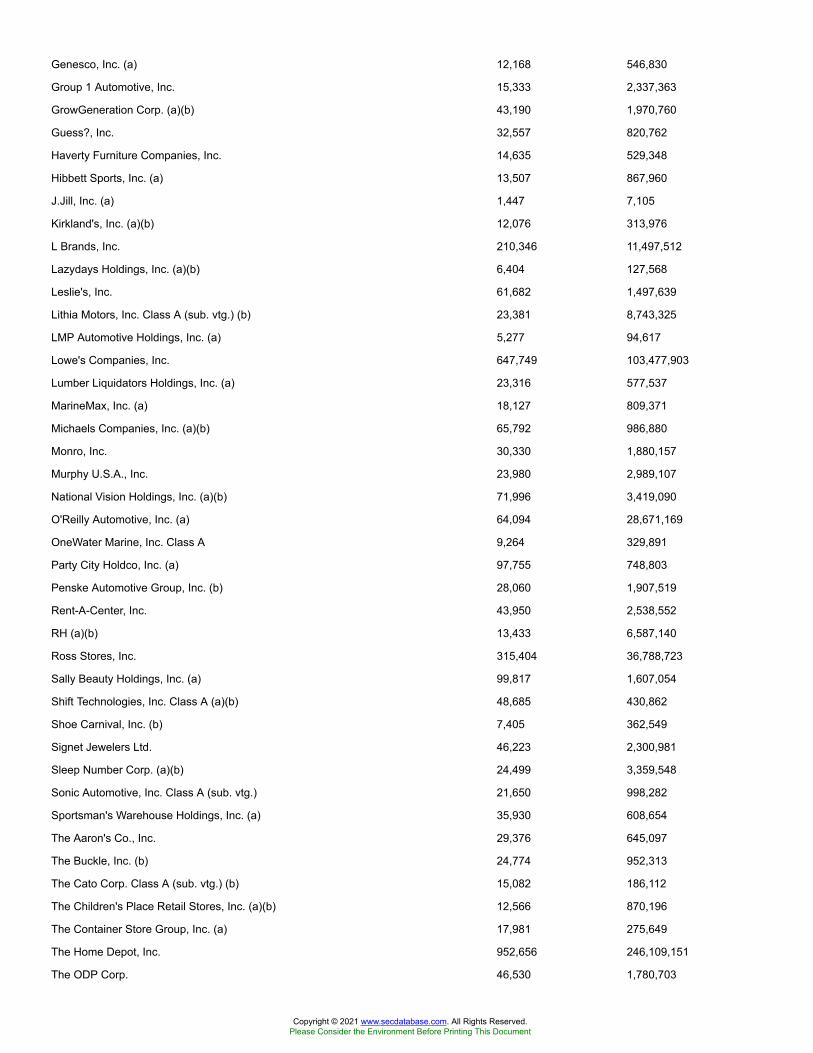
Genesco, Inc. (a) 12,168 546,830
Group 1 Automotive, Inc. 15,333 2,337,363
GrowGeneration Corp. (a)(b) 43,190 1,970,760
Guess?, Inc. 32,557 820,762
Haverty Furniture Companies, Inc. 14,635 529,348
Hibbett Sports, Inc. (a) 13,507 867,960
J.Jill, Inc. (a) 1,447 7,105
Kirkland's, Inc. (a)(b) 12,076 313,976
L Brands, Inc. 210,346 11,497,512
Lazydays Holdings, Inc. (a)(b) 6,404 127,568
Leslie's, Inc. 61,682 1,497,639
Lithia Motors, Inc. Class A (sub. vtg.) (b) 23,381 8,743,325
LMP Automotive Holdings, Inc. (a) 5,277 94,617
Lowe's Companies, Inc. 647,749 103,477,903
Lumber Liquidators Holdings, Inc. (a) 23,316 577,537
MarineMax, Inc. (a) 18,127 809,371
Michaels Companies, Inc. (a)(b) 65,792 986,880
Monro, Inc. 30,330 1,880,157
Murphy U.S.A., Inc. 23,980 2,989,107
National Vision Holdings, Inc. (a)(b) 71,996 3,419,090
O'Reilly Automotive, Inc. (a) 64,094 28,671,169
OneWater Marine, Inc. Class A 9,264 329,891
Party City Holdco, Inc. (a) 97,755 748,803
Penske Automotive Group, Inc. (b) 28,060 1,907,519
Rent-A-Center, Inc. 43,950 2,538,552
RH (a)(b) 13,433 6,587,140
Ross Stores, Inc. 315,404 36,788,723
Sally Beauty Holdings, Inc. (a) 99,817 1,607,054
Shift Technologies, Inc. Class A (a)(b) 48,685 430,862
Shoe Carnival, Inc. (b) 7,405 362,549
Signet Jewelers Ltd. 46,223 2,300,981
Sleep Number Corp. (a)(b) 24,499 3,359,548
Sonic Automotive, Inc. Class A (sub. vtg.) 21,650 998,282
Sportsman's Warehouse Holdings, Inc. (a) 35,930 608,654
The Aaron's Co., Inc. 29,376 645,097
The Buckle, Inc. (b) 24,774 952,313
The Cato Corp. Class A (sub. vtg.) (b) 15,082 186,112
The Children's Place Retail Stores, Inc. (a)(b) 12,566 870,196
The Container Store Group, Inc. (a) 17,981 275,649
The Home Depot, Inc. 952,656 246,109,151
The ODP Corp. 46,530 1,780,703
Copyright © 2021 www.secdatabase.com. All Rights Reserved.Please Consider the Environment Before Printing This Document

Tilly's, Inc. 20,521 211,777
TJX Companies, Inc. 1,062,713 70,128,431
Tractor Supply Co. 102,812 16,342,996
TravelCenters of America LLC (a) 12,184 292,903
Ulta Beauty, Inc. (a) 49,702 16,020,446
Urban Outfitters, Inc. (a) 60,687 2,057,289
Vroom, Inc. 29,527 1,306,570
Williams-Sonoma, Inc. 67,012 8,798,005
Winmark Corp. 2,709 478,111
Zumiez, Inc. (a) 17,924 808,014
758,347,408
Textiles, Apparel & Luxury Goods - 0.8%
Capri Holdings Ltd. (a) 131,592 6,141,399
Carter's, Inc. 39,574 3,303,242
Charles & Colvard Ltd. (a) 20,680 49,218
Columbia Sportswear Co. 27,653 2,850,195
Crocs, Inc. (a) 60,301 4,626,293
Crown Crafts, Inc. 3,488 26,613
Culp, Inc. 7,752 133,722
Deckers Outdoor Corp. (a) 24,592 8,019,697
Delta Apparel, Inc. (a) 3,850 104,951
Fossil Group, Inc. (a) 40,205 608,704
G-III Apparel Group Ltd. (a)(b) 38,318 1,103,175
Hanesbrands, Inc. 309,988 5,483,688
Iconix Brand Group, Inc. (a) 2,998 6,536
Kontoor Brands, Inc. 42,045 1,776,401
Lakeland Industries, Inc. (a) 7,014 220,169
Levi Strauss & Co. Class A (b) 58,041 1,350,034
lululemon athletica, Inc. (a) 104,665 32,621,987
Movado Group, Inc. 14,693 335,000
NIKE, Inc. Class B 1,110,174 149,629,252
Oxford Industries, Inc. (b) 14,555 1,109,673
PVH Corp. 62,367 6,234,205
Ralph Lauren Corp. 43,135 5,050,246
Rocky Brands, Inc. 6,166 268,776
Sequential Brands Group, Inc. (a) 610 9,913
Skechers U.S.A., Inc. Class A (sub. vtg.) (a) 120,158 4,397,783
Steven Madden Ltd. 69,025 2,553,235
Superior Group of Companies, Inc. (b) 7,343 174,910
Tapestry, Inc. 248,239 10,460,791
Toughbuilt Industries, Inc. (a) 35,986 40,664
Copyright © 2021 www.secdatabase.com. All Rights Reserved.Please Consider the Environment Before Printing This Document

Under Armour, Inc.:
Class A (sub. vtg.) (a) 199,283 4,362,305
Class C (non-vtg.) (a) 127,935 2,328,417
Unifi, Inc. (a) 15,097 376,368
Vera Bradley, Inc. (a) 18,571 176,239
VF Corp. 283,509 22,434,067
Vince Holding Corp. (a) 1,696 14,586
Wolverine World Wide, Inc. 73,865 2,581,582
280,964,036
TOTAL CONSUMER DISCRETIONARY 4,291,432,309
CONSUMER STAPLES - 5.3%
Beverages - 1.2%
Alkaline Water Co., Inc. (a)(b) 55,224 63,508
Boston Beer Co., Inc. Class A (a) 8,182 8,416,905
Brown-Forman Corp.:
Class A 40,172 2,675,053
Class B (non-vtg.) 171,191 12,253,852
Celsius Holdings, Inc. (a)(b) 23,167 1,379,132
Coca-Cola Bottling Co. Consolidated 4,042 1,037,420
Constellation Brands, Inc. Class A (sub. vtg.) 149,439 32,000,867
Keurig Dr. Pepper, Inc. (b) 517,416 15,791,536
MGP Ingredients, Inc. (b) 11,699 747,332
Molson Coors Beverage Co. Class B 170,369 7,572,902
Monster Beverage Corp. (a) 326,876 28,680,100
National Beverage Corp. (b) 19,612 934,708
Newage, Inc. (a)(b) 93,397 245,634
PepsiCo, Inc. 1,222,331 157,912,942
REED'S, Inc. (a) 79,714 83,700
The Coca-Cola Co. 3,419,619 167,527,135
437,322,726
Food & Staples Retailing - 1.2%
Albertsons Companies, Inc. (b) 40,840 660,383
Andersons, Inc. 27,457 717,726
BJ's Wholesale Club Holdings, Inc. (a) 123,433 4,959,538
Casey's General Stores, Inc. 33,029 6,670,537
Chefs' Warehouse Holdings (a) 28,664 892,597
Costco Wholesale Corp. 390,251 129,173,081
Grocery Outlet Holding Corp. (a) 76,276 2,745,173
HF Foods Group, Inc. (a)(b) 31,756 234,042
Ingles Markets, Inc. Class A (b) 13,130 682,235
Copyright © 2021 www.secdatabase.com. All Rights Reserved.Please Consider the Environment Before Printing This Document
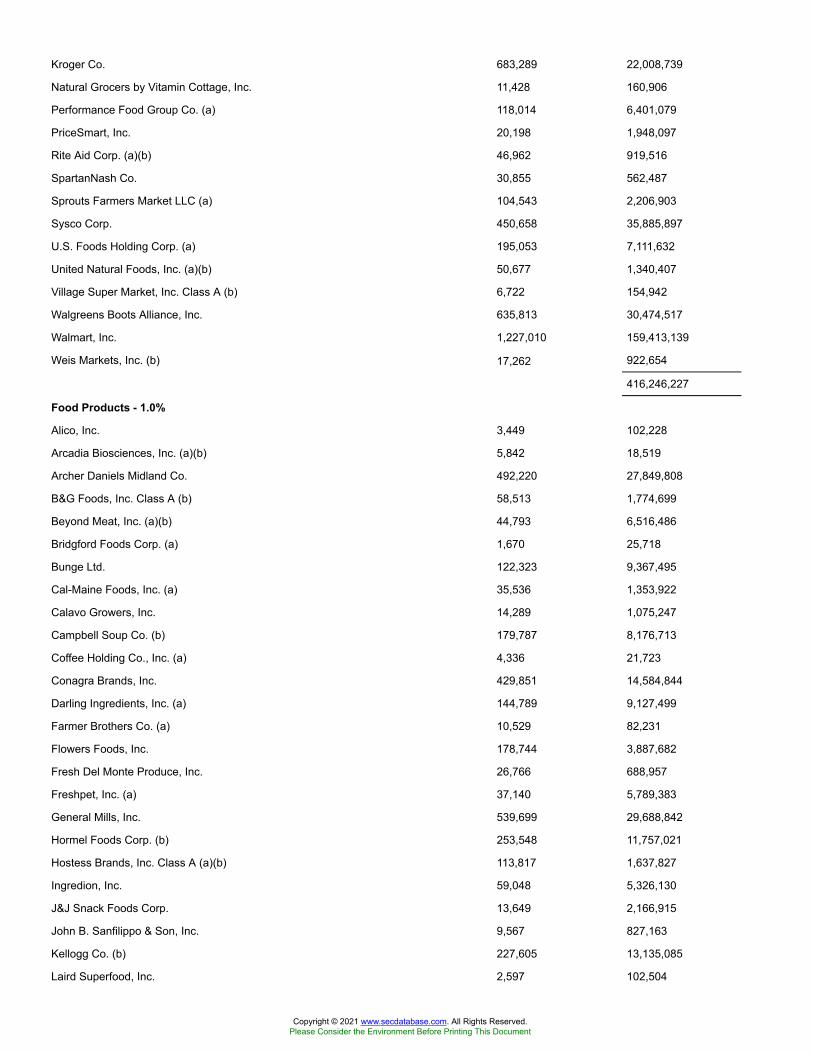
Kroger Co. 683,289 22,008,739
Natural Grocers by Vitamin Cottage, Inc. 11,428 160,906
Performance Food Group Co. (a) 118,014 6,401,079
PriceSmart, Inc. 20,198 1,948,097
Rite Aid Corp. (a)(b) 46,962 919,516
SpartanNash Co. 30,855 562,487
Sprouts Farmers Market LLC (a) 104,543 2,206,903
Sysco Corp. 450,658 35,885,897
U.S. Foods Holding Corp. (a) 195,053 7,111,632
United Natural Foods, Inc. (a)(b) 50,677 1,340,407
Village Super Market, Inc. Class A (b) 6,722 154,942
Walgreens Boots Alliance, Inc. 635,813 30,474,517
Walmart, Inc. 1,227,010 159,413,139
Weis Markets, Inc. (b) 17,262 922,654
416,246,227
Food Products - 1.0%
Alico, Inc. 3,449 102,228
Arcadia Biosciences, Inc. (a)(b) 5,842 18,519
Archer Daniels Midland Co. 492,220 27,849,808
B&G Foods, Inc. Class A (b) 58,513 1,774,699
Beyond Meat, Inc. (a)(b) 44,793 6,516,486
Bridgford Foods Corp. (a) 1,670 25,718
Bunge Ltd. 122,323 9,367,495
Cal-Maine Foods, Inc. (a) 35,536 1,353,922
Calavo Growers, Inc. 14,289 1,075,247
Campbell Soup Co. (b) 179,787 8,176,713
Coffee Holding Co., Inc. (a) 4,336 21,723
Conagra Brands, Inc. 429,851 14,584,844
Darling Ingredients, Inc. (a) 144,789 9,127,499
Farmer Brothers Co. (a) 10,529 82,231
Flowers Foods, Inc. 178,744 3,887,682
Fresh Del Monte Produce, Inc. 26,766 688,957
Freshpet, Inc. (a) 37,140 5,789,383
General Mills, Inc. 539,699 29,688,842
Hormel Foods Corp. (b) 253,548 11,757,021
Hostess Brands, Inc. Class A (a)(b) 113,817 1,637,827
Ingredion, Inc. 59,048 5,326,130
J&J Snack Foods Corp. 13,649 2,166,915
John B. Sanfilippo & Son, Inc. 9,567 827,163
Kellogg Co. (b) 227,605 13,135,085
Laird Superfood, Inc. 2,597 102,504
Copyright © 2021 www.secdatabase.com. All Rights Reserved.Please Consider the Environment Before Printing This Document
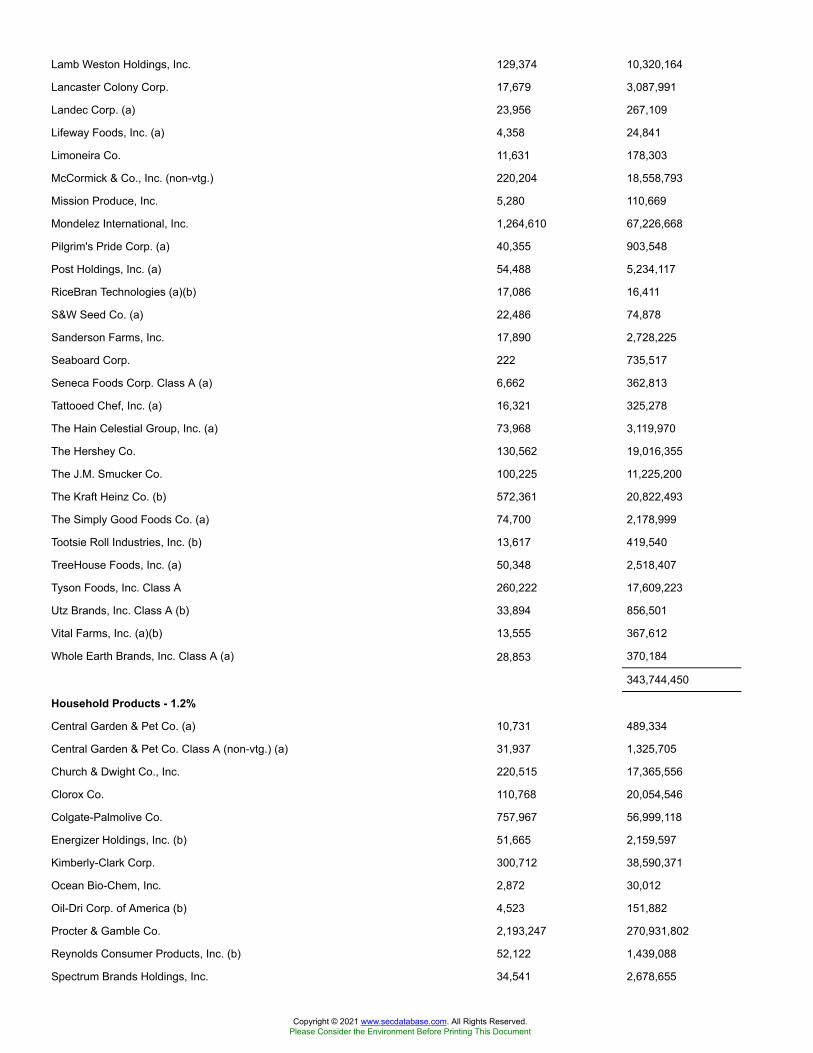
Lamb Weston Holdings, Inc. 129,374 10,320,164
Lancaster Colony Corp. 17,679 3,087,991
Landec Corp. (a) 23,956 267,109
Lifeway Foods, Inc. (a) 4,358 24,841
Limoneira Co. 11,631 178,303
McCormick & Co., Inc. (non-vtg.) 220,204 18,558,793
Mission Produce, Inc. 5,280 110,669
Mondelez International, Inc. 1,264,610 67,226,668
Pilgrim's Pride Corp. (a) 40,355 903,548
Post Holdings, Inc. (a) 54,488 5,234,117
RiceBran Technologies (a)(b) 17,086 16,411
S&W Seed Co. (a) 22,486 74,878
Sanderson Farms, Inc. 17,890 2,728,225
Seaboard Corp. 222 735,517
Seneca Foods Corp. Class A (a) 6,662 362,813
Tattooed Chef, Inc. (a) 16,321 325,278
The Hain Celestial Group, Inc. (a) 73,968 3,119,970
The Hershey Co. 130,562 19,016,355
The J.M. Smucker Co. 100,225 11,225,200
The Kraft Heinz Co. (b) 572,361 20,822,493
The Simply Good Foods Co. (a) 74,700 2,178,999
Tootsie Roll Industries, Inc. (b) 13,617 419,540
TreeHouse Foods, Inc. (a) 50,348 2,518,407
Tyson Foods, Inc. Class A 260,222 17,609,223
Utz Brands, Inc. Class A (b) 33,894 856,501
Vital Farms, Inc. (a)(b) 13,555 367,612
Whole Earth Brands, Inc. Class A (a) 28,853 370,184
343,744,450
Household Products - 1.2%
Central Garden & Pet Co. (a) 10,731 489,334
Central Garden & Pet Co. Class A (non-vtg.) (a) 31,937 1,325,705
Church & Dwight Co., Inc. 220,515 17,365,556
Clorox Co. 110,768 20,054,546
Colgate-Palmolive Co. 757,967 56,999,118
Energizer Holdings, Inc. (b) 51,665 2,159,597
Kimberly-Clark Corp. 300,712 38,590,371
Ocean Bio-Chem, Inc. 2,872 30,012
Oil-Dri Corp. of America (b) 4,523 151,882
Procter & Gamble Co. 2,193,247 270,931,802
Reynolds Consumer Products, Inc. (b) 52,122 1,439,088
Spectrum Brands Holdings, Inc. 34,541 2,678,655
Copyright © 2021 www.secdatabase.com. All Rights Reserved.Please Consider the Environment Before Printing This Document
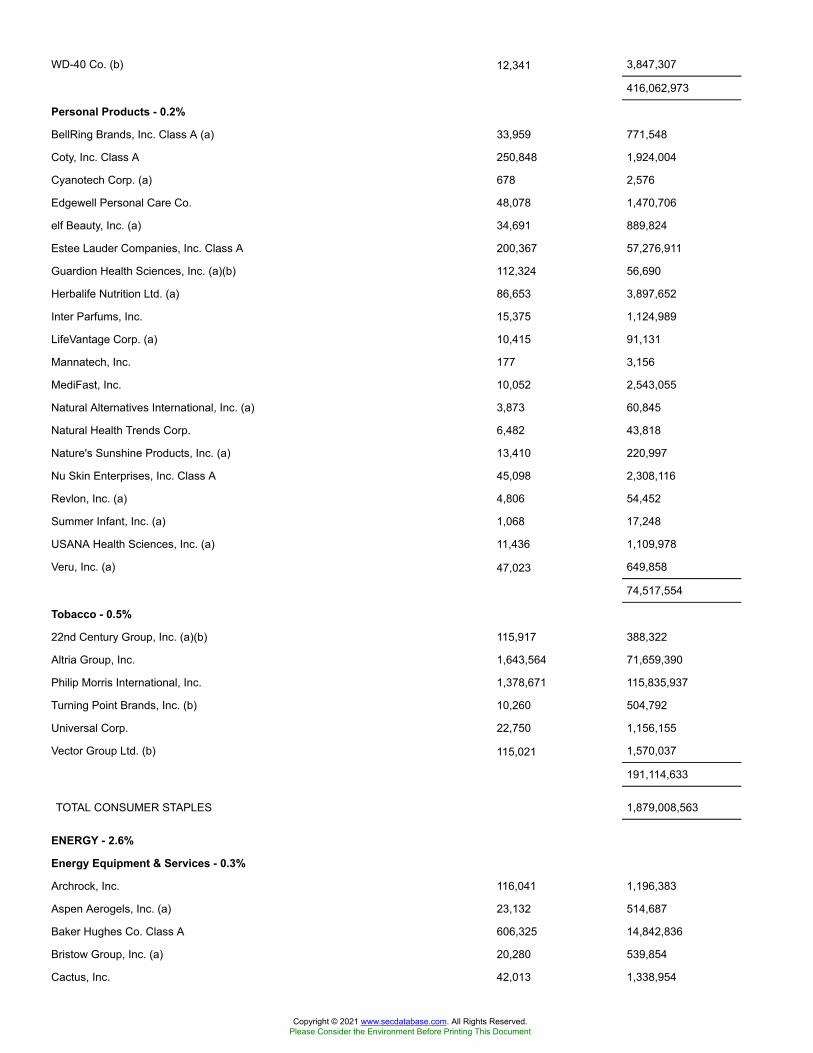
WD-40 Co. (b) 12,341 3,847,307
416,062,973
Personal Products - 0.2%
BellRing Brands, Inc. Class A (a) 33,959 771,548
Coty, Inc. Class A 250,848 1,924,004
Cyanotech Corp. (a) 678 2,576
Edgewell Personal Care Co. 48,078 1,470,706
elf Beauty, Inc. (a) 34,691 889,824
Estee Lauder Companies, Inc. Class A 200,367 57,276,911
Guardion Health Sciences, Inc. (a)(b) 112,324 56,690
Herbalife Nutrition Ltd. (a) 86,653 3,897,652
Inter Parfums, Inc. 15,375 1,124,989
LifeVantage Corp. (a) 10,415 91,131
Mannatech, Inc. 177 3,156
MediFast, Inc. 10,052 2,543,055
Natural Alternatives International, Inc. (a) 3,873 60,845
Natural Health Trends Corp. 6,482 43,818
Nature's Sunshine Products, Inc. (a) 13,410 220,997
Nu Skin Enterprises, Inc. Class A 45,098 2,308,116
Revlon, Inc. (a) 4,806 54,452
Summer Infant, Inc. (a) 1,068 17,248
USANA Health Sciences, Inc. (a) 11,436 1,109,978
Veru, Inc. (a) 47,023 649,858
74,517,554
Tobacco - 0.5%
22nd Century Group, Inc. (a)(b) 115,917 388,322
Altria Group, Inc. 1,643,564 71,659,390
Philip Morris International, Inc. 1,378,671 115,835,937
Turning Point Brands, Inc. (b) 10,260 504,792
Universal Corp. 22,750 1,156,155
Vector Group Ltd. (b) 115,021 1,570,037
191,114,633
TOTAL CONSUMER STAPLES 1,879,008,563
ENERGY - 2.6%
Energy Equipment & Services - 0.3%
Archrock, Inc. 116,041 1,196,383
Aspen Aerogels, Inc. (a) 23,132 514,687
Baker Hughes Co. Class A 606,325 14,842,836
Bristow Group, Inc. (a) 20,280 539,854
Cactus, Inc. 42,013 1,338,954
Copyright © 2021 www.secdatabase.com. All Rights Reserved.Please Consider the Environment Before Printing This Document
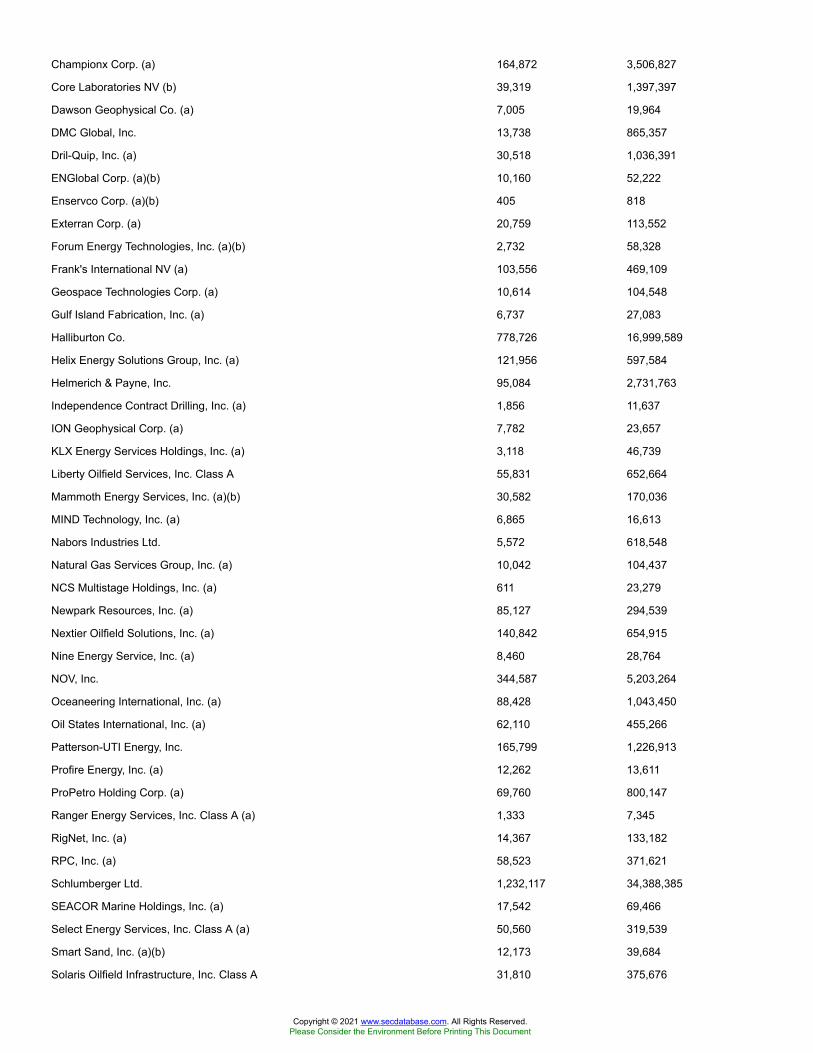
Championx Corp. (a) 164,872 3,506,827
Core Laboratories NV (b) 39,319 1,397,397
Dawson Geophysical Co. (a) 7,005 19,964
DMC Global, Inc. 13,738 865,357
Dril-Quip, Inc. (a) 30,518 1,036,391
ENGlobal Corp. (a)(b) 10,160 52,222
Enservco Corp. (a)(b) 405 818
Exterran Corp. (a) 20,759 113,552
Forum Energy Technologies, Inc. (a)(b) 2,732 58,328
Frank's International NV (a) 103,556 469,109
Geospace Technologies Corp. (a) 10,614 104,548
Gulf Island Fabrication, Inc. (a) 6,737 27,083
Halliburton Co. 778,726 16,999,589
Helix Energy Solutions Group, Inc. (a) 121,956 597,584
Helmerich & Payne, Inc. 95,084 2,731,763
Independence Contract Drilling, Inc. (a) 1,856 11,637
ION Geophysical Corp. (a) 7,782 23,657
KLX Energy Services Holdings, Inc. (a) 3,118 46,739
Liberty Oilfield Services, Inc. Class A 55,831 652,664
Mammoth Energy Services, Inc. (a)(b) 30,582 170,036
MIND Technology, Inc. (a) 6,865 16,613
Nabors Industries Ltd. 5,572 618,548
Natural Gas Services Group, Inc. (a) 10,042 104,437
NCS Multistage Holdings, Inc. (a) 611 23,279
Newpark Resources, Inc. (a) 85,127 294,539
Nextier Oilfield Solutions, Inc. (a) 140,842 654,915
Nine Energy Service, Inc. (a) 8,460 28,764
NOV, Inc. 344,587 5,203,264
Oceaneering International, Inc. (a) 88,428 1,043,450
Oil States International, Inc. (a) 62,110 455,266
Patterson-UTI Energy, Inc. 165,799 1,226,913
Profire Energy, Inc. (a) 12,262 13,611
ProPetro Holding Corp. (a) 69,760 800,147
Ranger Energy Services, Inc. Class A (a) 1,333 7,345
RigNet, Inc. (a) 14,367 133,182
RPC, Inc. (a) 58,523 371,621
Schlumberger Ltd. 1,232,117 34,388,385
SEACOR Marine Holdings, Inc. (a) 17,542 69,466
Select Energy Services, Inc. Class A (a) 50,560 319,539
Smart Sand, Inc. (a)(b) 12,173 39,684
Solaris Oilfield Infrastructure, Inc. Class A 31,810 375,676
Copyright © 2021 www.secdatabase.com. All Rights Reserved.Please Consider the Environment Before Printing This Document

Superior Drilling Products, Inc. (a)(b) 7,643 7,245
TechnipFMC PLC 380,509 3,127,784
TETRA Technologies, Inc. (a) 108,812 272,030
Tidewater, Inc. (a) 33,414 416,338
Transocean Ltd. (United States) (a)(b) 527,173 1,829,290
U.S. Silica Holdings, Inc. 67,277 895,457
U.S. Well Services, Inc. (a)(b) 39,918 70,655
100,125,422
Oil, Gas & Consumable Fuels - 2.3%
Abraxas Petroleum Corp. (a)(b) 5,550 21,479
Adams Resources & Energy, Inc. 1,020 29,682
Aemetis, Inc. (a) 10,716 105,338
Alto Ingredients, Inc. (a)(b) 54,866 355,532
Altus Midstream Co. 2,141 113,345
American Resources Corp. (a)(b) 9,700 50,440
Amplify Energy Corp. New 31,665 92,462
Antero Midstream GP LP 254,651 2,246,022
Antero Resources Corp. (a) 223,054 2,007,486
Apache Corp. 338,231 6,673,298
Arch Resources, Inc. 14,241 682,429
Barnwell Industries, Inc. (a) 839 2,676
Berry Petroleum Corp. 54,742 271,520
Bonanza Creek Energy, Inc. (a) 16,318 521,034
Brigham Minerals, Inc. Class A 33,392 477,840
Cabot Oil & Gas Corp. 356,035 6,590,208
Callon Petroleum Co. (a) 35,839 916,403
Camber Energy, Inc. (a) 39,585 57,002
Centennial Resource Development, Inc. Class A (a) 153,325 607,167
Centrus Energy Corp. Class A (a) 7,033 165,205
Cheniere Energy, Inc. (a) 202,368 13,637,580
Chevron Corp. 1,703,074 170,307,400
Cimarex Energy Co. 88,979 5,159,892
Clean Energy Fuels Corp. (a) 99,973 1,303,648
CNX Resources Corp. (a) 198,520 2,503,337
Comstock Resources, Inc. (a) 49,416 282,165
ConocoPhillips Co. 1,197,096 62,260,963
CONSOL Energy, Inc. (a) 29,501 318,906
Contango Oil & Gas Co. (a) 119,855 583,694
Continental Resources, Inc. 52,803 1,276,777
CVR Energy, Inc. 25,809 569,863
Delek U.S. Holdings, Inc. 53,120 1,304,627
Copyright © 2021 www.secdatabase.com. All Rights Reserved.Please Consider the Environment Before Printing This Document
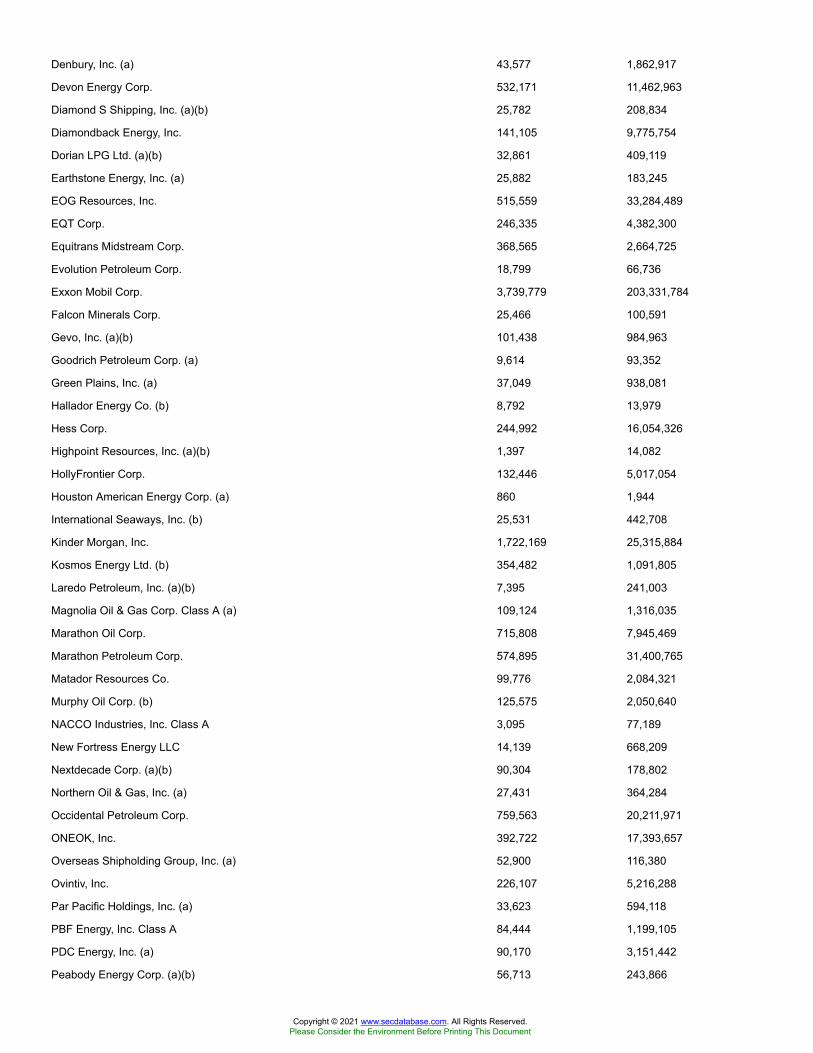
Denbury, Inc. (a) 43,577 1,862,917
Devon Energy Corp. 532,171 11,462,963
Diamond S Shipping, Inc. (a)(b) 25,782 208,834
Diamondback Energy, Inc. 141,105 9,775,754
Dorian LPG Ltd. (a)(b) 32,861 409,119
Earthstone Energy, Inc. (a) 25,882 183,245
EOG Resources, Inc. 515,559 33,284,489
EQT Corp. 246,335 4,382,300
Equitrans Midstream Corp. 368,565 2,664,725
Evolution Petroleum Corp. 18,799 66,736
Exxon Mobil Corp. 3,739,779 203,331,784
Falcon Minerals Corp. 25,466 100,591
Gevo, Inc. (a)(b) 101,438 984,963
Goodrich Petroleum Corp. (a) 9,614 93,352
Green Plains, Inc. (a) 37,049 938,081
Hallador Energy Co. (b) 8,792 13,979
Hess Corp. 244,992 16,054,326
Highpoint Resources, Inc. (a)(b) 1,397 14,082
HollyFrontier Corp. 132,446 5,017,054
Houston American Energy Corp. (a) 860 1,944
International Seaways, Inc. (b) 25,531 442,708
Kinder Morgan, Inc. 1,722,169 25,315,884
Kosmos Energy Ltd. (b) 354,482 1,091,805
Laredo Petroleum, Inc. (a)(b) 7,395 241,003
Magnolia Oil & Gas Corp. Class A (a) 109,124 1,316,035
Marathon Oil Corp. 715,808 7,945,469
Marathon Petroleum Corp. 574,895 31,400,765
Matador Resources Co. 99,776 2,084,321
Murphy Oil Corp. (b) 125,575 2,050,640
NACCO Industries, Inc. Class A 3,095 77,189
New Fortress Energy LLC 14,139 668,209
Nextdecade Corp. (a)(b) 90,304 178,802
Northern Oil & Gas, Inc. (a) 27,431 364,284
Occidental Petroleum Corp. 759,563 20,211,971
ONEOK, Inc. 392,722 17,393,657
Overseas Shipholding Group, Inc. (a) 52,900 116,380
Ovintiv, Inc. 226,107 5,216,288
Par Pacific Holdings, Inc. (a) 33,623 594,118
PBF Energy, Inc. Class A 84,444 1,199,105
PDC Energy, Inc. (a) 90,170 3,151,442
Peabody Energy Corp. (a)(b) 56,713 243,866
Copyright © 2021 www.secdatabase.com. All Rights Reserved.Please Consider the Environment Before Printing This Document
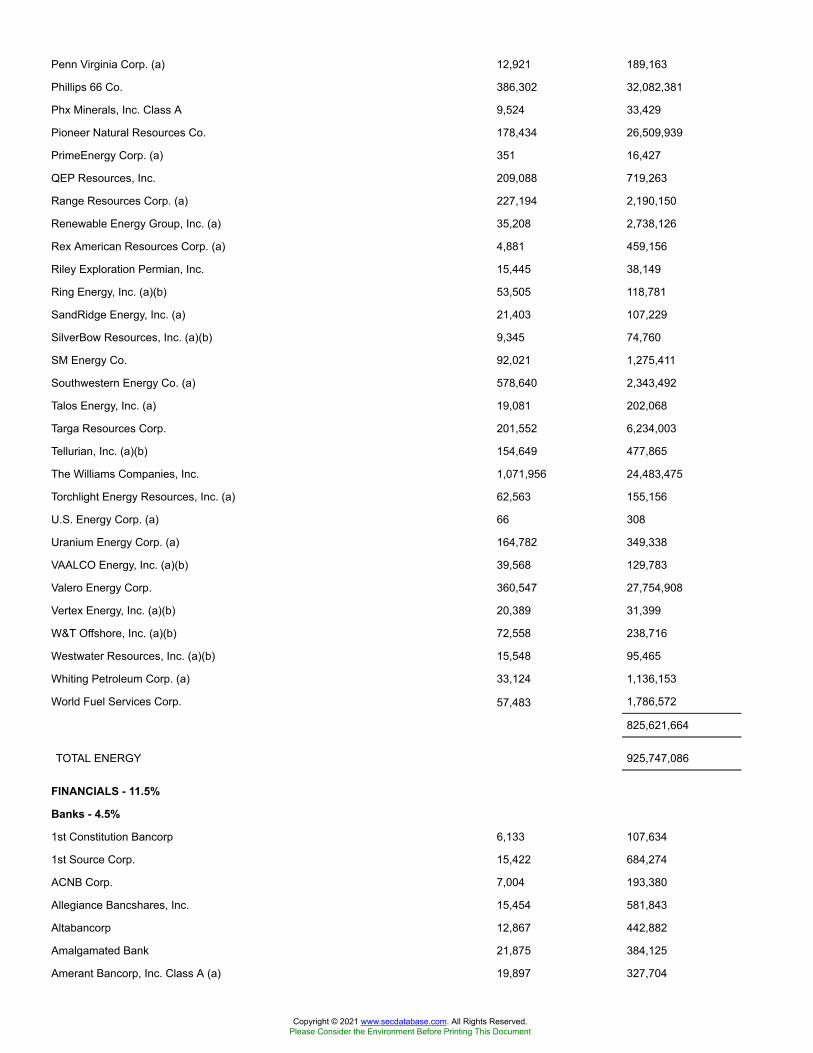
Penn Virginia Corp. (a) 12,921 189,163
Phillips 66 Co. 386,302 32,082,381
Phx Minerals, Inc. Class A 9,524 33,429
Pioneer Natural Resources Co. 178,434 26,509,939
PrimeEnergy Corp. (a) 351 16,427
QEP Resources, Inc. 209,088 719,263
Range Resources Corp. (a) 227,194 2,190,150
Renewable Energy Group, Inc. (a) 35,208 2,738,126
Rex American Resources Corp. (a) 4,881 459,156
Riley Exploration Permian, Inc. 15,445 38,149
Ring Energy, Inc. (a)(b) 53,505 118,781
SandRidge Energy, Inc. (a) 21,403 107,229
SilverBow Resources, Inc. (a)(b) 9,345 74,760
SM Energy Co. 92,021 1,275,411
Southwestern Energy Co. (a) 578,640 2,343,492
Talos Energy, Inc. (a) 19,081 202,068
Targa Resources Corp. 201,552 6,234,003
Tellurian, Inc. (a)(b) 154,649 477,865
The Williams Companies, Inc. 1,071,956 24,483,475
Torchlight Energy Resources, Inc. (a) 62,563 155,156
U.S. Energy Corp. (a) 66 308
Uranium Energy Corp. (a) 164,782 349,338
VAALCO Energy, Inc. (a)(b) 39,568 129,783
Valero Energy Corp. 360,547 27,754,908
Vertex Energy, Inc. (a)(b) 20,389 31,399
W&T Offshore, Inc. (a)(b) 72,558 238,716
Westwater Resources, Inc. (a)(b) 15,548 95,465
Whiting Petroleum Corp. (a) 33,124 1,136,153
World Fuel Services Corp. 57,483 1,786,572
825,621,664
TOTAL ENERGY 925,747,086
FINANCIALS - 11.5%
Banks - 4.5%
1st Constitution Bancorp 6,133 107,634
1st Source Corp. 15,422 684,274
ACNB Corp. 7,004 193,380
Allegiance Bancshares, Inc. 15,454 581,843
Altabancorp 12,867 442,882
Amalgamated Bank 21,875 384,125
Amerant Bancorp, Inc. Class A (a) 19,897 327,704
Copyright © 2021 www.secdatabase.com. All Rights Reserved.Please Consider the Environment Before Printing This Document

American National Bankshares, Inc. 8,502 263,562
American River Bankshares 124 1,834
Ameris Bancorp 61,964 2,951,965
Ames National Corp. 6,787 155,151
Arrow Financial Corp. 13,586 432,850
Associated Banc-Corp. 137,194 2,764,459
Atlantic Capital Bancshares, Inc. (a) 17,974 365,771
Atlantic Union Bankshares Corp. 75,037 2,756,109
Auburn National Bancorp., Inc. 2,294 89,695
Banc of California, Inc. 45,963 853,073
BancFirst Corp. 18,135 1,158,464
Bancorp, Inc., Delaware (a) 44,379 899,562
BancorpSouth Bank 92,571 2,782,684
Bank First National Corp. (b) 5,786 404,441
Bank of America Corp. 6,733,957 233,735,647
Bank of Commerce Holdings 14,624 158,963
Bank of Hawaii Corp. (b) 37,304 3,264,100
Bank of Marin Bancorp 9,414 348,318
Bank of South Carolina Corp. 800 14,112
Bank OZK 108,357 4,466,476
Bank7 Corp. 985 16,085
BankFinancial Corp. 15,633 147,732
BankUnited, Inc. 81,653 3,281,634
Bankwell Financial Group, Inc. 5,063 125,562
Banner Corp. 31,402 1,625,996
Bar Harbor Bankshares 13,058 365,493
BayCom Corp. (a) 10,110 172,780
BCB Bancorp, Inc. 11,033 145,967
Berkshire Hills Bancorp, Inc. 43,552 878,008
BOK Financial Corp. 28,090 2,417,425
Boston Private Financial Holdings, Inc. 75,488 1,038,715
Bridge Bancorp, Inc. 28,629 841,979
Brookline Bancorp, Inc., Delaware 64,144 912,769
Bryn Mawr Bank Corp. 16,610 628,356
Business First Bancshares, Inc. 16,081 353,300
Byline Bancorp, Inc. 18,609 370,691
C & F Financial Corp. 2,675 116,363
Cadence Bancorp Class A 111,521 2,288,411
California Bancorp, Inc. (a) 8,230 126,907
Cambridge Bancorp 5,700 434,454
Camden National Corp. 12,133 491,750
Copyright © 2021 www.secdatabase.com. All Rights Reserved.Please Consider the Environment Before Printing This Document

Capital Bancorp, Inc. (a) 6,080 96,976
Capital City Bank Group, Inc. 9,387 231,765
Capstar Financial Holdings, Inc. 14,636 237,250
Carter Bankshares, Inc. 22,254 263,265
Cathay General Bancorp 72,342 2,722,953
CB Financial Services, Inc. 4,110 83,639
CBTX, Inc. 17,063 497,728
Central Pacific Financial Corp. 22,620 511,891
Central Valley Community Bancorp 8,292 146,520
Century Bancorp, Inc. Class A (non-vtg.) 2,314 209,764
Chemung Financial Corp. 3,381 119,045
ChoiceOne Financial Services, Inc. 5,870 148,981
CIT Group, Inc. 87,282 3,958,239
Citigroup, Inc. 1,841,474 121,316,307
Citizens & Northern Corp. 12,486 261,207
Citizens Community Bancorp, Inc. 1,013 11,396
Citizens Financial Group, Inc. 375,735 16,321,928
Citizens Holding Co. 5,474 107,126
City Holding Co. 14,265 1,072,871
Civista Bancshares, Inc. 14,007 269,355
CNB Financial Corp., Pennsylvania 13,676 317,420
Coastal Financial Corp. of Washington (a) 7,373 206,444
Codorus Valley Bancorp, Inc. 6,440 108,514
Colony Bankcorp, Inc. 6,003 86,143
Columbia Banking Systems, Inc. 63,477 2,811,396
Comerica, Inc. 121,992 8,307,655
Commerce Bancshares, Inc. 95,478 7,068,236
Community Bank System, Inc. 50,867 3,621,222
Community Bankers Trust Corp. 13,444 104,325
Community Financial Corp. 4,131 125,169
Community Trust Bancorp, Inc. 12,844 524,806
Community West Bancshares 515 5,088
ConnectOne Bancorp, Inc. 31,296 727,006
County Bancorp, Inc. 4,756 107,533
CrossFirst Bankshares, Inc. (a) 43,440 579,924
Cullen/Frost Bankers, Inc. 50,064 5,226,682
Customers Bancorp, Inc. (a) 26,639 713,392
CVB Financial Corp. 111,462 2,386,401
Eagle Bancorp Montana, Inc. 4,647 101,165
Eagle Bancorp, Inc. 28,873 1,411,601
East West Bancorp, Inc. 124,891 9,012,135
Copyright © 2021 www.secdatabase.com. All Rights Reserved.Please Consider the Environment Before Printing This Document

Eastern Bankshares, Inc. 168,522 2,967,672
Enterprise Bancorp, Inc. 6,685 193,865
Enterprise Financial Services Corp. 32,061 1,378,623
Equity Bancshares, Inc. (a) 12,083 314,158
Esquire Financial Holdings, Inc. (a) 4,775 106,578
Evans Bancorp, Inc. 3,756 121,694
Farmers & Merchants Bancorp, Inc. 7,798 179,744
Farmers National Banc Corp. 20,442 282,917
FB Financial Corp. 27,672 1,173,570
Fidelity D & D Bancorp, Inc. (b) 2,736 138,715
Fifth Third Bancorp 630,002 21,854,769
Financial Institutions, Inc. 13,402 366,947
First Bancorp, North Carolina 29,060 1,170,246
First Bancorp, Puerto Rico 192,573 2,020,091
First Bancshares, Inc. 19,938 639,412
First Bank Hamilton New Jersey 11,255 118,740
First Busey Corp. 40,445 925,786
First Business Finance Services, Inc. 6,399 142,058
First Capital, Inc. (b) 2,413 115,945
First Choice Bancorp 7,224 142,963
First Citizens Bancshares, Inc. 6,441 4,752,749
First Commonwealth Financial Corp. 92,768 1,244,019
First Community Bankshares, Inc. 13,851 355,417
First Community Corp. 4,612 82,186
First Financial Bancorp, Ohio 85,777 1,923,978
First Financial Bankshares, Inc. (b) 128,174 5,724,251
First Financial Corp., Indiana 11,329 480,123
First Financial Northwest, Inc. 3,217 42,722
First Foundation, Inc. 34,950 798,608
First Guaranty Bancshares, Inc. 4,272 70,744
First Hawaiian, Inc. 119,639 3,336,732
First Horizon National Corp. 485,454 7,864,355
First Internet Bancorp 7,691 251,880
First Interstate Bancsystem, Inc. 32,451 1,473,924
First Merchants Corp. 47,731 2,007,089
First Mid-Illinois Bancshares, Inc. 11,425 415,756
First Midwest Bancorp, Inc., Delaware 98,390 1,946,154
First National Corp. 3,023 52,298
First Northwest Bancorp 7,528 122,556
First of Long Island Corp. 17,803 330,780
First Republic Bank 154,274 25,416,642
Copyright © 2021 www.secdatabase.com. All Rights Reserved.Please Consider the Environment Before Printing This Document
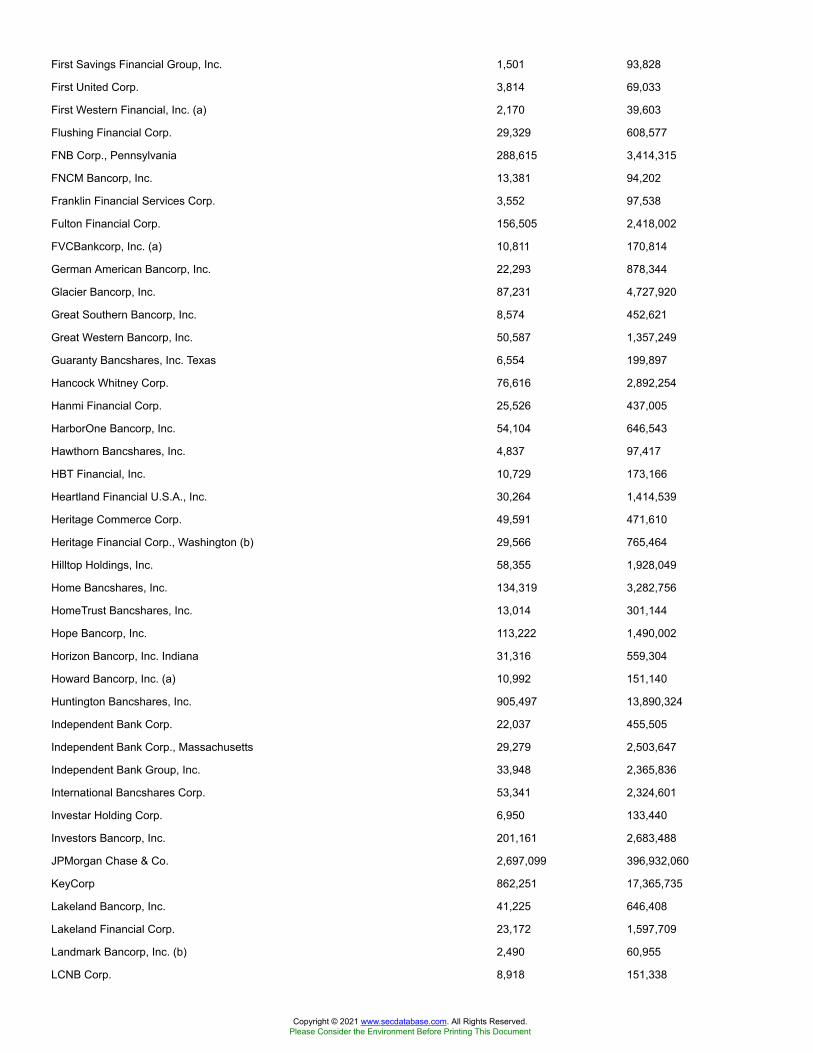
First Savings Financial Group, Inc. 1,501 93,828
First United Corp. 3,814 69,033
First Western Financial, Inc. (a) 2,170 39,603
Flushing Financial Corp. 29,329 608,577
FNB Corp., Pennsylvania 288,615 3,414,315
FNCM Bancorp, Inc. 13,381 94,202
Franklin Financial Services Corp. 3,552 97,538
Fulton Financial Corp. 156,505 2,418,002
FVCBankcorp, Inc. (a) 10,811 170,814
German American Bancorp, Inc. 22,293 878,344
Glacier Bancorp, Inc. 87,231 4,727,920
Great Southern Bancorp, Inc. 8,574 452,621
Great Western Bancorp, Inc. 50,587 1,357,249
Guaranty Bancshares, Inc. Texas 6,554 199,897
Hancock Whitney Corp. 76,616 2,892,254
Hanmi Financial Corp. 25,526 437,005
HarborOne Bancorp, Inc. 54,104 646,543
Hawthorn Bancshares, Inc. 4,837 97,417
HBT Financial, Inc. 10,729 173,166
Heartland Financial U.S.A., Inc. 30,264 1,414,539
Heritage Commerce Corp. 49,591 471,610
Heritage Financial Corp., Washington (b) 29,566 765,464
Hilltop Holdings, Inc. 58,355 1,928,049
Home Bancshares, Inc. 134,319 3,282,756
HomeTrust Bancshares, Inc. 13,014 301,144
Hope Bancorp, Inc. 113,222 1,490,002
Horizon Bancorp, Inc. Indiana 31,316 559,304
Howard Bancorp, Inc. (a) 10,992 151,140
Huntington Bancshares, Inc. 905,497 13,890,324
Independent Bank Corp. 22,037 455,505
Independent Bank Corp., Massachusetts 29,279 2,503,647
Independent Bank Group, Inc. 33,948 2,365,836
International Bancshares Corp. 53,341 2,324,601
Investar Holding Corp. 6,950 133,440
Investors Bancorp, Inc. 201,161 2,683,488
JPMorgan Chase & Co. 2,697,099 396,932,060
KeyCorp 862,251 17,365,735
Lakeland Bancorp, Inc. 41,225 646,408
Lakeland Financial Corp. 23,172 1,597,709
Landmark Bancorp, Inc. (b) 2,490 60,955
LCNB Corp. 8,918 151,338
Copyright © 2021 www.secdatabase.com. All Rights Reserved.Please Consider the Environment Before Printing This Document
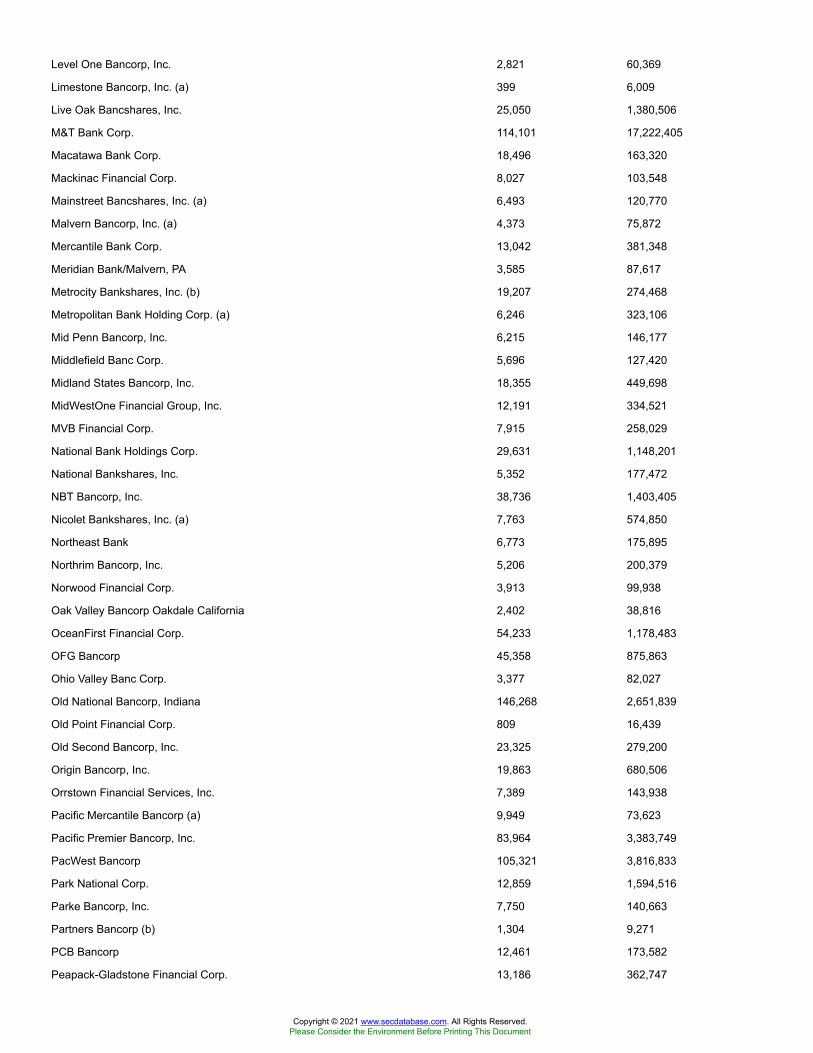
Level One Bancorp, Inc. 2,821 60,369
Limestone Bancorp, Inc. (a) 399 6,009
Live Oak Bancshares, Inc. 25,050 1,380,506
M&T Bank Corp. 114,101 17,222,405
Macatawa Bank Corp. 18,496 163,320
Mackinac Financial Corp. 8,027 103,548
Mainstreet Bancshares, Inc. (a) 6,493 120,770
Malvern Bancorp, Inc. (a) 4,373 75,872
Mercantile Bank Corp. 13,042 381,348
Meridian Bank/Malvern, PA 3,585 87,617
Metrocity Bankshares, Inc. (b) 19,207 274,468
Metropolitan Bank Holding Corp. (a) 6,246 323,106
Mid Penn Bancorp, Inc. 6,215 146,177
Middlefield Banc Corp. 5,696 127,420
Midland States Bancorp, Inc. 18,355 449,698
MidWestOne Financial Group, Inc. 12,191 334,521
MVB Financial Corp. 7,915 258,029
National Bank Holdings Corp. 29,631 1,148,201
National Bankshares, Inc. 5,352 177,472
NBT Bancorp, Inc. 38,736 1,403,405
Nicolet Bankshares, Inc. (a) 7,763 574,850
Northeast Bank 6,773 175,895
Northrim Bancorp, Inc. 5,206 200,379
Norwood Financial Corp. 3,913 99,938
Oak Valley Bancorp Oakdale California 2,402 38,816
OceanFirst Financial Corp. 54,233 1,178,483
OFG Bancorp 45,358 875,863
Ohio Valley Banc Corp. 3,377 82,027
Old National Bancorp, Indiana 146,268 2,651,839
Old Point Financial Corp. 809 16,439
Old Second Bancorp, Inc. 23,325 279,200
Origin Bancorp, Inc. 19,863 680,506
Orrstown Financial Services, Inc. 7,389 143,938
Pacific Mercantile Bancorp (a) 9,949 73,623
Pacific Premier Bancorp, Inc. 83,964 3,383,749
PacWest Bancorp 105,321 3,816,833
Park National Corp. 12,859 1,594,516
Parke Bancorp, Inc. 7,750 140,663
Partners Bancorp (b) 1,304 9,271
PCB Bancorp 12,461 173,582
Peapack-Gladstone Financial Corp. 13,186 362,747
Copyright © 2021 www.secdatabase.com. All Rights Reserved.Please Consider the Environment Before Printing This Document

Penns Woods Bancorp, Inc. 5,549 132,233
Peoples Bancorp of North Carolina 3,901 91,205
Peoples Bancorp, Inc. 15,272 475,570
Peoples Financial Services Corp. 5,029 210,615
Peoples United Financial, Inc. 386,094 6,926,526
Pinnacle Financial Partners, Inc. 68,227 5,537,986
Plumas Bancorp 2,198 54,972
PNC Financial Services Group, Inc. 375,380 63,198,977
Popular, Inc. 75,084 5,017,113
Preferred Bank, Los Angeles 12,607 730,576
Premier Financial Bancorp, Inc. 8,470 131,624
Professional Holdings Corp. (A Shares) 11,090 177,440
Prosperity Bancshares, Inc. 83,587 6,141,137
QCR Holdings, Inc. 12,290 508,806
RBB Bancorp 8,633 162,300
Red River Bancshares, Inc. 5,150 267,285
Regions Financial Corp. 858,016 17,700,870
Reliant Bancorp, Inc. 12,068 266,823
Renasant Corp. 53,387 2,097,041
Republic Bancorp, Inc., Kentucky Class A 8,345 350,824
Republic First Bancorp, Inc. (a) 34,232 121,524
Richmond Mutual Bancorp., Inc. 9,373 122,599
Riverview Financial Corp. 525 4,988
S&T Bancorp, Inc. 32,158 928,723
Salisbury Bancorp, Inc. (b) 1,700 69,377
Sandy Spring Bancorp, Inc. 41,649 1,565,169
SB Financial Group, Inc. 5,016 86,727
Seacoast Banking Corp., Florida (a) 53,923 1,938,532
Select Bancorp, Inc. New (a) 15,766 172,480
ServisFirst Bancshares, Inc. 40,507 2,007,527
Shore Bancshares, Inc. 11,188 171,176
Sierra Bancorp 11,651 277,876
Signature Bank 50,226 10,966,345
Silvergate Capital Corp. (a) 16,095 2,053,078
Simmons First National Corp. Class A 97,319 2,849,500
SmartFinancial, Inc. 12,034 252,714
South Plains Financial, Inc. 5,422 104,645
South State Corp. 63,731 5,025,827
Southern First Bancshares, Inc. (a) 5,379 236,676
Southern National Bancorp of Virginia, Inc. 16,105 228,691
Southside Bancshares, Inc. 28,943 1,000,849
Copyright © 2021 www.secdatabase.com. All Rights Reserved.Please Consider the Environment Before Printing This Document

Spirit of Texas Bancshares, Inc. 11,417 237,017
Sterling Bancorp 175,775 3,837,168
Stock Yards Bancorp, Inc. (b) 17,502 862,324
Summit Financial Group, Inc. 7,446 179,374
SVB Financial Group (a) 45,540 23,014,094
Synovus Financial Corp. 131,555 5,566,092
TCF Financial Corp. 134,417 6,024,570
Texas Capital Bancshares, Inc. (a) 45,021 3,430,600
The Bank of Princeton 3,147 82,672
The Fauquier Bank 11 221
The First Bancorp, Inc. 8,187 209,260
Tompkins Financial Corp. 9,684 748,864
TowneBank 58,235 1,679,497
Trico Bancshares 24,377 1,049,917
TriState Capital Holdings, Inc. (a) 22,318 512,198
Triumph Bancorp, Inc. (a)(b) 20,342 1,560,231
Truist Financial Corp. 1,193,774 67,997,367
Trustmark Corp. 55,248 1,666,280
U.S. Bancorp 1,215,506 60,775,300
UMB Financial Corp. 38,287 3,230,274
Umpqua Holdings Corp. 193,923 3,310,266
Union Bankshares, Inc. 1,475 40,592
United Bancshares, Inc. 205 4,889
United Bankshares, Inc., West Virginia 115,082 4,252,280
United Community Bank, Inc. 76,737 2,536,925
United Security Bancshares, California 12,691 94,675
Unity Bancorp, Inc. 4,868 96,630
Univest Corp. of Pennsylvania 24,163 607,699
Valley National Bancorp 376,816 4,615,996
Veritex Holdings, Inc. 48,160 1,400,493
Washington Trust Bancorp, Inc. 14,176 674,069
Webster Financial Corp. 79,380 4,390,508
Wells Fargo & Co. 3,658,913 132,342,883
WesBanco, Inc. 59,172 1,910,072
West Bancorp., Inc. (b) 13,174 300,762
Westamerica Bancorp. 23,939 1,438,973
Western Alliance Bancorp. 88,640 8,111,446
Wintrust Financial Corp. 52,090 3,836,949
Zions Bancorp NA 144,405 7,678,014
1,574,370,561
Capital Markets - 2.8%
Copyright © 2021 www.secdatabase.com. All Rights Reserved.Please Consider the Environment Before Printing This Document
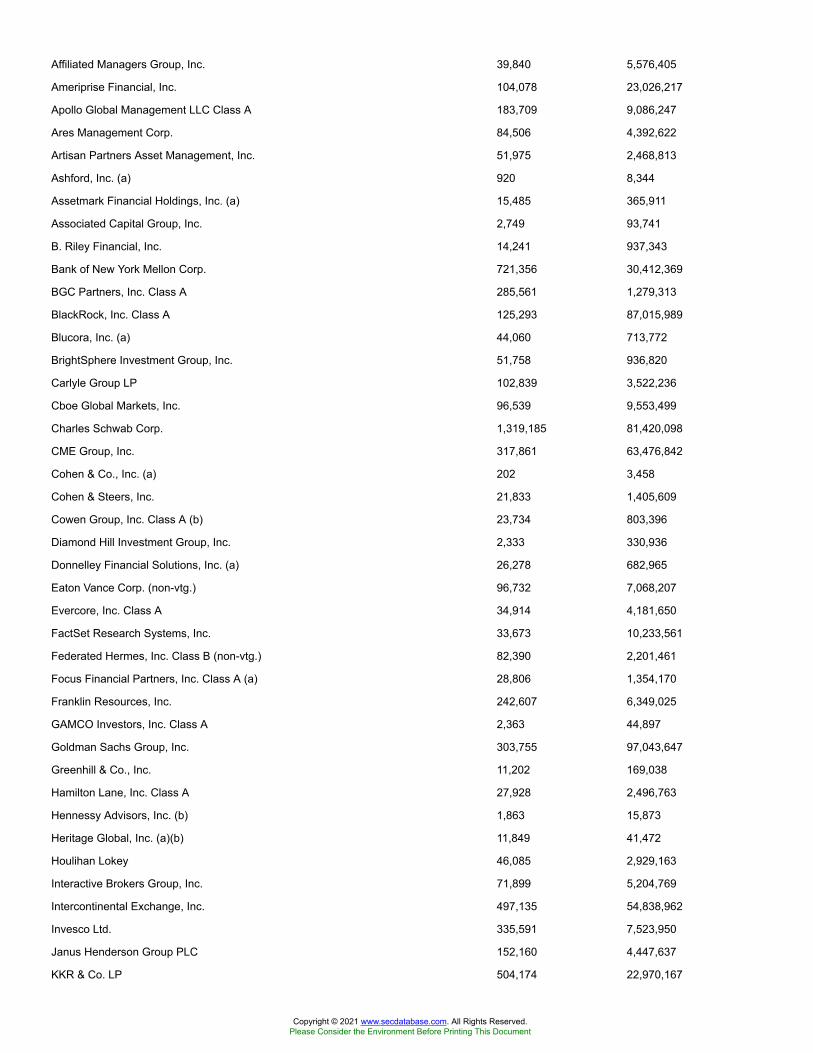
Affiliated Managers Group, Inc. 39,840 5,576,405
Ameriprise Financial, Inc. 104,078 23,026,217
Apollo Global Management LLC Class A 183,709 9,086,247
Ares Management Corp. 84,506 4,392,622
Artisan Partners Asset Management, Inc. 51,975 2,468,813
Ashford, Inc. (a) 920 8,344
Assetmark Financial Holdings, Inc. (a) 15,485 365,911
Associated Capital Group, Inc. 2,749 93,741
B. Riley Financial, Inc. 14,241 937,343
Bank of New York Mellon Corp. 721,356 30,412,369
BGC Partners, Inc. Class A 285,561 1,279,313
BlackRock, Inc. Class A 125,293 87,015,989
Blucora, Inc. (a) 44,060 713,772
BrightSphere Investment Group, Inc. 51,758 936,820
Carlyle Group LP 102,839 3,522,236
Cboe Global Markets, Inc. 96,539 9,553,499
Charles Schwab Corp. 1,319,185 81,420,098
CME Group, Inc. 317,861 63,476,842
Cohen & Co., Inc. (a) 202 3,458
Cohen & Steers, Inc. 21,833 1,405,609
Cowen Group, Inc. Class A (b) 23,734 803,396
Diamond Hill Investment Group, Inc. 2,333 330,936
Donnelley Financial Solutions, Inc. (a) 26,278 682,965
Eaton Vance Corp. (non-vtg.) 96,732 7,068,207
Evercore, Inc. Class A 34,914 4,181,650
FactSet Research Systems, Inc. 33,673 10,233,561
Federated Hermes, Inc. Class B (non-vtg.) 82,390 2,201,461
Focus Financial Partners, Inc. Class A (a) 28,806 1,354,170
Franklin Resources, Inc. 242,607 6,349,025
GAMCO Investors, Inc. Class A 2,363 44,897
Goldman Sachs Group, Inc. 303,755 97,043,647
Greenhill & Co., Inc. 11,202 169,038
Hamilton Lane, Inc. Class A 27,928 2,496,763
Hennessy Advisors, Inc. (b) 1,863 15,873
Heritage Global, Inc. (a)(b) 11,849 41,472
Houlihan Lokey 46,085 2,929,163
Interactive Brokers Group, Inc. 71,899 5,204,769
Intercontinental Exchange, Inc. 497,135 54,838,962
Invesco Ltd. 335,591 7,523,950
Janus Henderson Group PLC 152,160 4,447,637
KKR & Co. LP 504,174 22,970,167
Copyright © 2021 www.secdatabase.com. All Rights Reserved.Please Consider the Environment Before Printing This Document
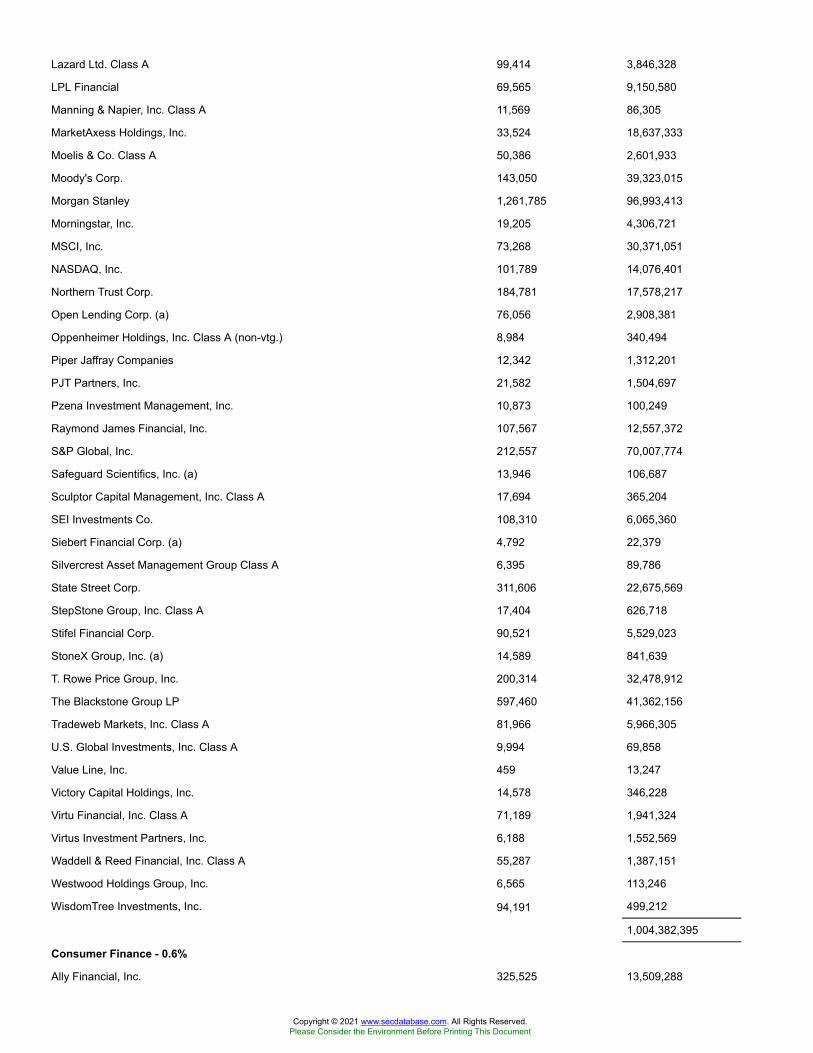
Lazard Ltd. Class A 99,414 3,846,328
LPL Financial 69,565 9,150,580
Manning & Napier, Inc. Class A 11,569 86,305
MarketAxess Holdings, Inc. 33,524 18,637,333
Moelis & Co. Class A 50,386 2,601,933
Moody's Corp. 143,050 39,323,015
Morgan Stanley 1,261,785 96,993,413
Morningstar, Inc. 19,205 4,306,721
MSCI, Inc. 73,268 30,371,051
NASDAQ, Inc. 101,789 14,076,401
Northern Trust Corp. 184,781 17,578,217
Open Lending Corp. (a) 76,056 2,908,381
Oppenheimer Holdings, Inc. Class A (non-vtg.) 8,984 340,494
Piper Jaffray Companies 12,342 1,312,201
PJT Partners, Inc. 21,582 1,504,697
Pzena Investment Management, Inc. 10,873 100,249
Raymond James Financial, Inc. 107,567 12,557,372
S&P Global, Inc. 212,557 70,007,774
Safeguard Scientifics, Inc. (a) 13,946 106,687
Sculptor Capital Management, Inc. Class A 17,694 365,204
SEI Investments Co. 108,310 6,065,360
Siebert Financial Corp. (a) 4,792 22,379
Silvercrest Asset Management Group Class A 6,395 89,786
State Street Corp. 311,606 22,675,569
StepStone Group, Inc. Class A 17,404 626,718
Stifel Financial Corp. 90,521 5,529,023
StoneX Group, Inc. (a) 14,589 841,639
T. Rowe Price Group, Inc. 200,314 32,478,912
The Blackstone Group LP 597,460 41,362,156
Tradeweb Markets, Inc. Class A 81,966 5,966,305
U.S. Global Investments, Inc. Class A 9,994 69,858
Value Line, Inc. 459 13,247
Victory Capital Holdings, Inc. 14,578 346,228
Virtu Financial, Inc. Class A 71,189 1,941,324
Virtus Investment Partners, Inc. 6,188 1,552,569
Waddell & Reed Financial, Inc. Class A 55,287 1,387,151
Westwood Holdings Group, Inc. 6,565 113,246
WisdomTree Investments, Inc. 94,191 499,212
1,004,382,395
Consumer Finance - 0.6%
Ally Financial, Inc. 325,525 13,509,288
Copyright © 2021 www.secdatabase.com. All Rights Reserved.Please Consider the Environment Before Printing This Document

American Express Co. 576,977 78,041,909
Atlanticus Holdings Corp. (a) 5,666 148,902
Capital One Financial Corp. 403,826 48,535,847
Consumer Portfolio Services, Inc. (a) 13,429 55,865
Credit Acceptance Corp. (a)(b) 10,768 3,908,999
CURO Group Holdings Corp. 13,357 193,276
Discover Financial Services 269,955 25,394,667
Elevate Credit, Inc. (a) 16,945 69,136
Encore Capital Group, Inc. (a) 28,173 941,542
Enova International, Inc. (a) 32,121 986,115
EZCORP, Inc. (non-vtg.) Class A (a)(b) 43,343 208,046
First Cash Financial Services, Inc. 36,853 2,333,532
Green Dot Corp. Class A (a) 46,981 2,220,322
LendingClub Corp. (a) 68,880 741,838
LendingTree, Inc. (a)(b) 9,892 2,659,662
Medallion Financial Corp. (a) 15,161 105,066
Navient Corp. 165,477 2,048,605
Nelnet, Inc. Class A 19,392 1,407,859
Nicholas Financial, Inc. (a) 1,682 17,257
OneMain Holdings, Inc. 74,402 3,490,198
Oportun Financial Corp. (a) 15,336 250,284
PRA Group, Inc. (a) 40,542 1,494,378
PROG Holdings, Inc. 60,481 3,024,050
Regional Management Corp. 9,574 309,910
Santander Consumer U.S.A. Holdings, Inc. 64,678 1,616,950
SLM Corp. 340,373 5,374,490
Synchrony Financial 476,945 18,448,233
World Acceptance Corp. (a)(b) 3,520 445,456
217,981,682
Diversified Financial Services - 1.2%
A-Mark Precious Metals, Inc. 4,175 118,737
Alerus Financial Corp. 11,853 326,076
Berkshire Hathaway, Inc. Class B (a) 1,722,250 414,218,348
Cannae Holdings, Inc. (a) 78,803 2,943,292
Equitable Holdings, Inc. 351,980 10,408,049
FlexShopper, Inc. (a) 9,764 28,120
Jefferies Financial Group, Inc. 181,752 5,278,078
Marlin Business Services Corp. 10,279 156,241
SWK Holdings Corp. (a) 2,913 40,054
Voya Financial, Inc. (b) 110,928 6,686,740
440,203,735
Copyright © 2021 www.secdatabase.com. All Rights Reserved.Please Consider the Environment Before Printing This Document
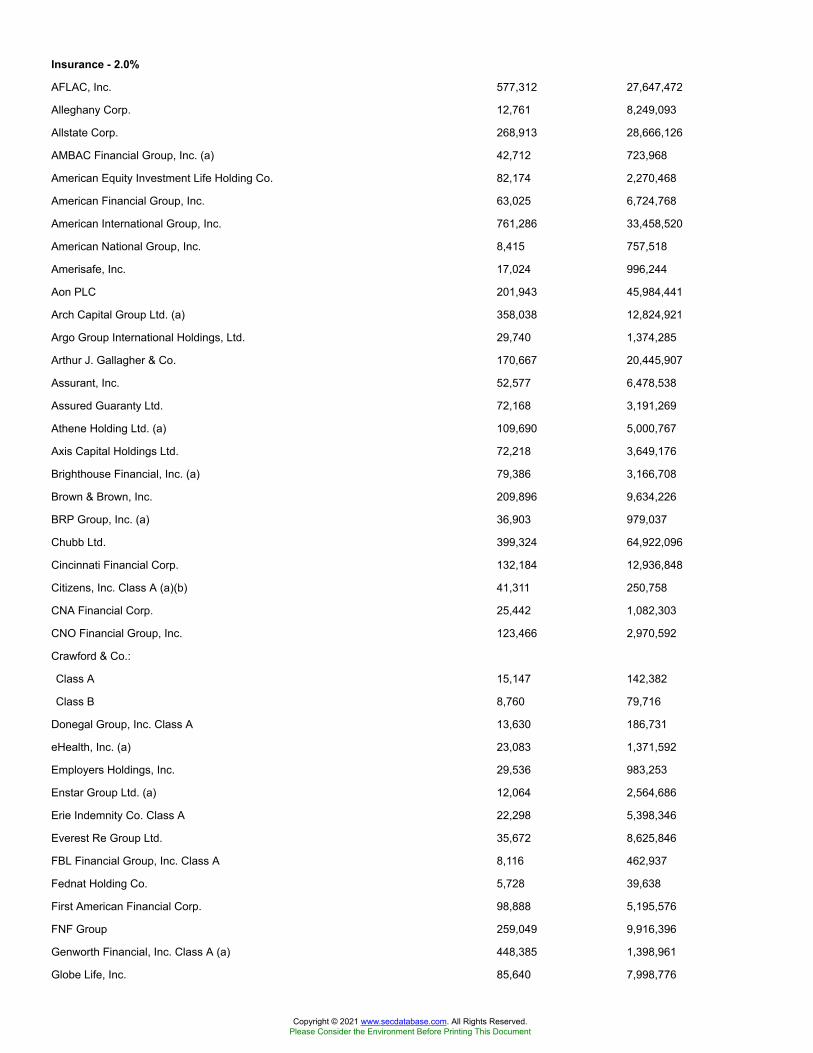
Insurance - 2.0%
AFLAC, Inc. 577,312 27,647,472
Alleghany Corp. 12,761 8,249,093
Allstate Corp. 268,913 28,666,126
AMBAC Financial Group, Inc. (a) 42,712 723,968
American Equity Investment Life Holding Co. 82,174 2,270,468
American Financial Group, Inc. 63,025 6,724,768
American International Group, Inc. 761,286 33,458,520
American National Group, Inc. 8,415 757,518
Amerisafe, Inc. 17,024 996,244
Aon PLC 201,943 45,984,441
Arch Capital Group Ltd. (a) 358,038 12,824,921
Argo Group International Holdings, Ltd. 29,740 1,374,285
Arthur J. Gallagher & Co. 170,667 20,445,907
Assurant, Inc. 52,577 6,478,538
Assured Guaranty Ltd. 72,168 3,191,269
Athene Holding Ltd. (a) 109,690 5,000,767
Axis Capital Holdings Ltd. 72,218 3,649,176
Brighthouse Financial, Inc. (a) 79,386 3,166,708
Brown & Brown, Inc. 209,896 9,634,226
BRP Group, Inc. (a) 36,903 979,037
Chubb Ltd. 399,324 64,922,096
Cincinnati Financial Corp. 132,184 12,936,848
Citizens, Inc. Class A (a)(b) 41,311 250,758
CNA Financial Corp. 25,442 1,082,303
CNO Financial Group, Inc. 123,466 2,970,592
Crawford & Co.:
Class A 15,147 142,382
Class B 8,760 79,716
Donegal Group, Inc. Class A 13,630 186,731
eHealth, Inc. (a) 23,083 1,371,592
Employers Holdings, Inc. 29,536 983,253
Enstar Group Ltd. (a) 12,064 2,564,686
Erie Indemnity Co. Class A 22,298 5,398,346
Everest Re Group Ltd. 35,672 8,625,846
FBL Financial Group, Inc. Class A 8,116 462,937
Fednat Holding Co. 5,728 39,638
First American Financial Corp. 98,888 5,195,576
FNF Group 259,049 9,916,396
Genworth Financial, Inc. Class A (a) 448,385 1,398,961
Globe Life, Inc. 85,640 7,998,776
Copyright © 2021 www.secdatabase.com. All Rights Reserved.Please Consider the Environment Before Printing This Document

GoHealth, Inc. (a) 38,990 529,094
Goosehead Insurance 13,941 1,805,917
Greenlight Capital Re, Ltd. (a) 24,616 191,759
Hallmark Financial Services, Inc. (a) 11,086 40,907
Hanover Insurance Group, Inc. 32,962 3,802,167
Hartford Financial Services Group, Inc. 316,683 16,052,661
HCI Group, Inc. 5,204 301,155
Heritage Insurance Holdings, Inc. 22,428 217,776
Horace Mann Educators Corp. 36,474 1,405,708
Independence Holding Co. 6,314 239,995
Investors Title Co. 1,199 181,972
James River Group Holdings Ltd. 27,914 1,281,532
Kemper Corp. 55,242 4,177,400
Kingstone Companies, Inc. 6,183 43,652
Kinsale Capital Group, Inc. 18,450 3,248,307
Lemonade, Inc. (a)(b) 15,556 1,956,789
Lincoln National Corp. 158,658 9,022,880
Loews Corp. 208,796 9,982,537
Maiden Holdings Ltd. (a) 59,880 161,676
Markel Corp. (a) 12,203 13,286,626
Marsh & McLennan Companies, Inc. 449,167 51,753,022
MBIA, Inc. (a)(b) 44,110 322,003
Mercury General Corp. 24,854 1,451,474
MetLife, Inc. 673,574 38,797,862
National Western Life Group, Inc. 1,837 383,621
NI Holdings, Inc. (a) 6,998 124,774
Old Republic International Corp. 249,265 4,818,292
Palomar Holdings, Inc. (a) 19,384 1,650,160
Primerica, Inc. 34,868 4,924,408
Principal Financial Group, Inc. 224,221 12,686,424
ProAssurance Corp. 50,000 1,237,500
Progressive Corp. 517,790 44,504,051
ProSight Global, Inc. (a) 6,707 84,776
Protective Insurance Corp. Class B 11,719 268,482
Prudential Financial, Inc. 349,509 30,309,420
Reinsurance Group of America, Inc. 60,595 7,406,527
RenaissanceRe Holdings Ltd. 45,392 7,579,556
RLI Corp. 35,878 3,743,511
Root, Inc. (b) 22,845 308,179
Safety Insurance Group, Inc. 12,881 1,018,629
Selective Insurance Group, Inc. 54,432 3,692,123
Copyright © 2021 www.secdatabase.com. All Rights Reserved.Please Consider the Environment Before Printing This Document
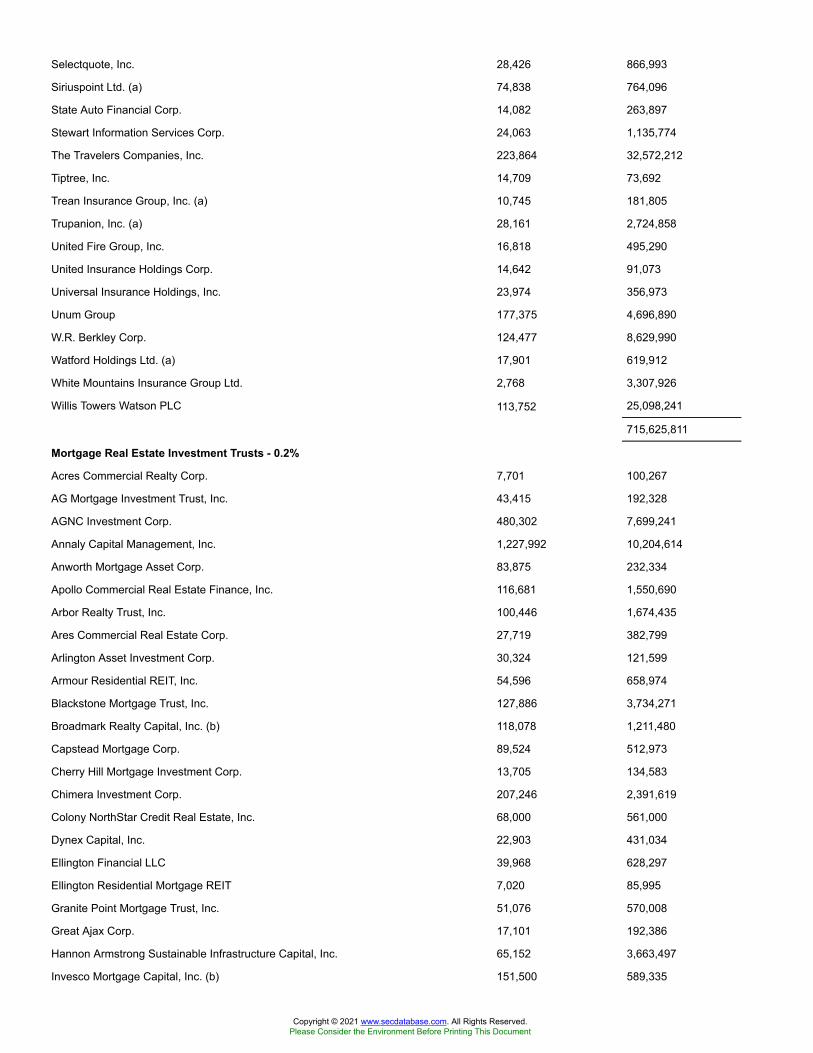
Selectquote, Inc. 28,426 866,993
Siriuspoint Ltd. (a) 74,838 764,096
State Auto Financial Corp. 14,082 263,897
Stewart Information Services Corp. 24,063 1,135,774
The Travelers Companies, Inc. 223,864 32,572,212
Tiptree, Inc. 14,709 73,692
Trean Insurance Group, Inc. (a) 10,745 181,805
Trupanion, Inc. (a) 28,161 2,724,858
United Fire Group, Inc. 16,818 495,290
United Insurance Holdings Corp. 14,642 91,073
Universal Insurance Holdings, Inc. 23,974 356,973
Unum Group 177,375 4,696,890
W.R. Berkley Corp. 124,477 8,629,990
Watford Holdings Ltd. (a) 17,901 619,912
White Mountains Insurance Group Ltd. 2,768 3,307,926
Willis Towers Watson PLC 113,752 25,098,241
715,625,811
Mortgage Real Estate Investment Trusts - 0.2%
Acres Commercial Realty Corp. 7,701 100,267
AG Mortgage Investment Trust, Inc. 43,415 192,328
AGNC Investment Corp. 480,302 7,699,241
Annaly Capital Management, Inc. 1,227,992 10,204,614
Anworth Mortgage Asset Corp. 83,875 232,334
Apollo Commercial Real Estate Finance, Inc. 116,681 1,550,690
Arbor Realty Trust, Inc. 100,446 1,674,435
Ares Commercial Real Estate Corp. 27,719 382,799
Arlington Asset Investment Corp. 30,324 121,599
Armour Residential REIT, Inc. 54,596 658,974
Blackstone Mortgage Trust, Inc. 127,886 3,734,271
Broadmark Realty Capital, Inc. (b) 118,078 1,211,480
Capstead Mortgage Corp. 89,524 512,973
Cherry Hill Mortgage Investment Corp. 13,705 134,583
Chimera Investment Corp. 207,246 2,391,619
Colony NorthStar Credit Real Estate, Inc. 68,000 561,000
Dynex Capital, Inc. 22,903 431,034
Ellington Financial LLC 39,968 628,297
Ellington Residential Mortgage REIT 7,020 85,995
Granite Point Mortgage Trust, Inc. 51,076 570,008
Great Ajax Corp. 17,101 192,386
Hannon Armstrong Sustainable Infrastructure Capital, Inc. 65,152 3,663,497
Invesco Mortgage Capital, Inc. (b) 151,500 589,335
Copyright © 2021 www.secdatabase.com. All Rights Reserved.Please Consider the Environment Before Printing This Document
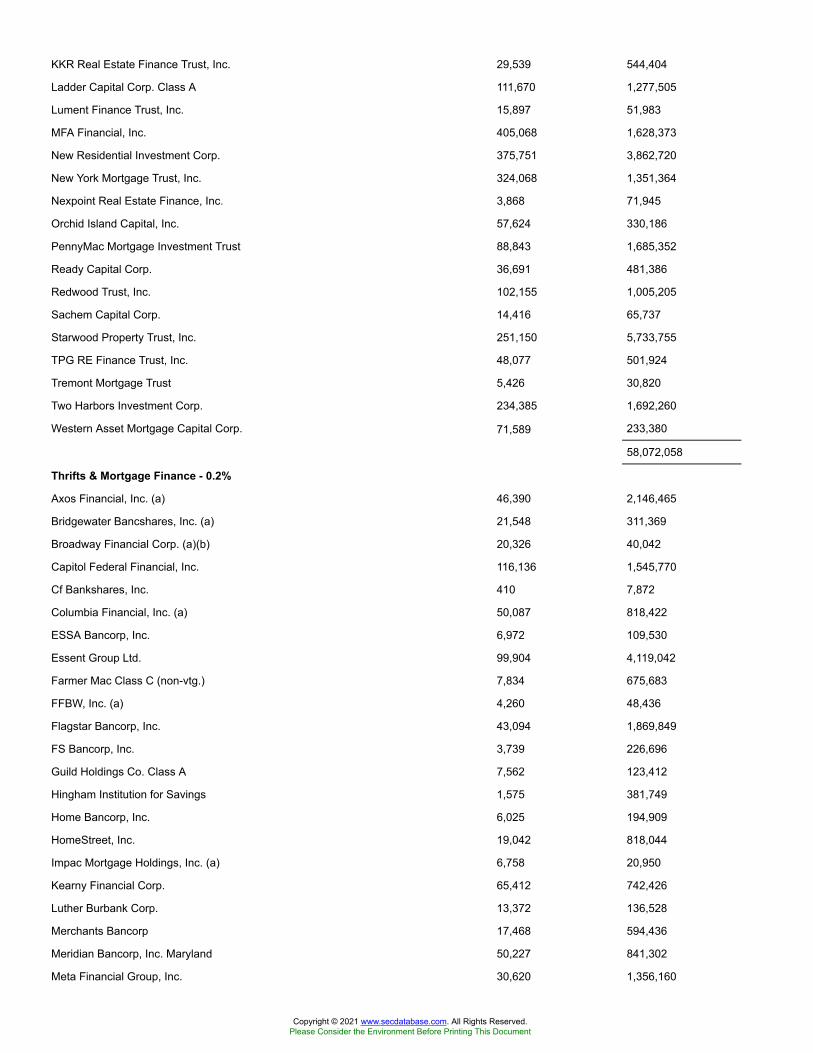
KKR Real Estate Finance Trust, Inc. 29,539 544,404
Ladder Capital Corp. Class A 111,670 1,277,505
Lument Finance Trust, Inc. 15,897 51,983
MFA Financial, Inc. 405,068 1,628,373
New Residential Investment Corp. 375,751 3,862,720
New York Mortgage Trust, Inc. 324,068 1,351,364
Nexpoint Real Estate Finance, Inc. 3,868 71,945
Orchid Island Capital, Inc. 57,624 330,186
PennyMac Mortgage Investment Trust 88,843 1,685,352
Ready Capital Corp. 36,691 481,386
Redwood Trust, Inc. 102,155 1,005,205
Sachem Capital Corp. 14,416 65,737
Starwood Property Trust, Inc. 251,150 5,733,755
TPG RE Finance Trust, Inc. 48,077 501,924
Tremont Mortgage Trust 5,426 30,820
Two Harbors Investment Corp. 234,385 1,692,260
Western Asset Mortgage Capital Corp. 71,589 233,380
58,072,058
Thrifts & Mortgage Finance - 0.2%
Axos Financial, Inc. (a) 46,390 2,146,465
Bridgewater Bancshares, Inc. (a) 21,548 311,369
Broadway Financial Corp. (a)(b) 20,326 40,042
Capitol Federal Financial, Inc. 116,136 1,545,770
Cf Bankshares, Inc. 410 7,872
Columbia Financial, Inc. (a) 50,087 818,422
ESSA Bancorp, Inc. 6,972 109,530
Essent Group Ltd. 99,904 4,119,042
Farmer Mac Class C (non-vtg.) 7,834 675,683
FFBW, Inc. (a) 4,260 48,436
Flagstar Bancorp, Inc. 43,094 1,869,849
FS Bancorp, Inc. 3,739 226,696
Guild Holdings Co. Class A 7,562 123,412
Hingham Institution for Savings 1,575 381,749
Home Bancorp, Inc. 6,025 194,909
HomeStreet, Inc. 19,042 818,044
Impac Mortgage Holdings, Inc. (a) 6,758 20,950
Kearny Financial Corp. 65,412 742,426
Luther Burbank Corp. 13,372 136,528
Merchants Bancorp 17,468 594,436
Meridian Bancorp, Inc. Maryland 50,227 841,302
Meta Financial Group, Inc. 30,620 1,356,160
Copyright © 2021 www.secdatabase.com. All Rights Reserved.Please Consider the Environment Before Printing This Document

MGIC Investment Corp. 300,358 3,658,360
MMA Capital Management, LLC (a) 3,726 82,717
Mr. Cooper Group, Inc. (a) 61,317 1,928,420
New York Community Bancorp, Inc. 413,076 5,043,658
NMI Holdings, Inc. (a) 76,626 1,751,670
Northfield Bancorp, Inc. 41,402 566,793
Northwest Bancshares, Inc. 116,543 1,645,587
Ocwen Financial Corp. (a) 7,290 203,901
OP Bancorp 8,169 75,073
PCSB Financial Corp. 13,638 220,390
PDL Community Bancorp (a) 3,682 37,483
Pennymac Financial Services, Inc. 37,368 2,212,559
Pioneer Bancorp, Inc. (a) 8,267 89,284
Premier Financial Corp. 34,423 1,055,409
Provident Bancorp, Inc. 12,024 147,294
Provident Financial Holdings, Inc. 2,705 42,604
Provident Financial Services, Inc. 71,310 1,442,601
Prudential Bancorp, Inc. 6,181 83,753
Radian Group, Inc. 172,374 3,516,430
Randolph Bancorp, Inc. (a) 4,697 93,470
Riverview Bancorp, Inc. 12,078 79,715
Rocket Cos., Inc. (b) 99,926 2,183,383
Security National Financial Corp. Class A 7,473 67,332
Severn Bancorp, Inc. 4,434 36,359
Southern Missouri Bancorp, Inc. 7,018 257,841
Standard AVB Financial Corp. 3,975 129,863
Sterling Bancorp, Inc. 13,300 68,362
Territorial Bancorp, Inc. 6,209 152,617
TFS Financial Corp. 54,860 1,071,416
Timberland Bancorp, Inc. 6,187 171,689
Trustco Bank Corp., New York 103,781 714,013
Velocity Financial, Inc. (a) 2,412 16,980
Walker & Dunlop, Inc. 26,099 2,601,026
Washington Federal, Inc. 66,066 1,996,515
Waterstone Financial, Inc. 24,856 482,952
Western New England Bancorp, Inc. 18,119 145,133
WSFS Financial Corp. 44,586 2,369,300
53,571,044
TOTAL FINANCIALS 4,064,207,286
HEALTH CARE - 13.6%
Copyright © 2021 www.secdatabase.com. All Rights Reserved.Please Consider the Environment Before Printing This Document
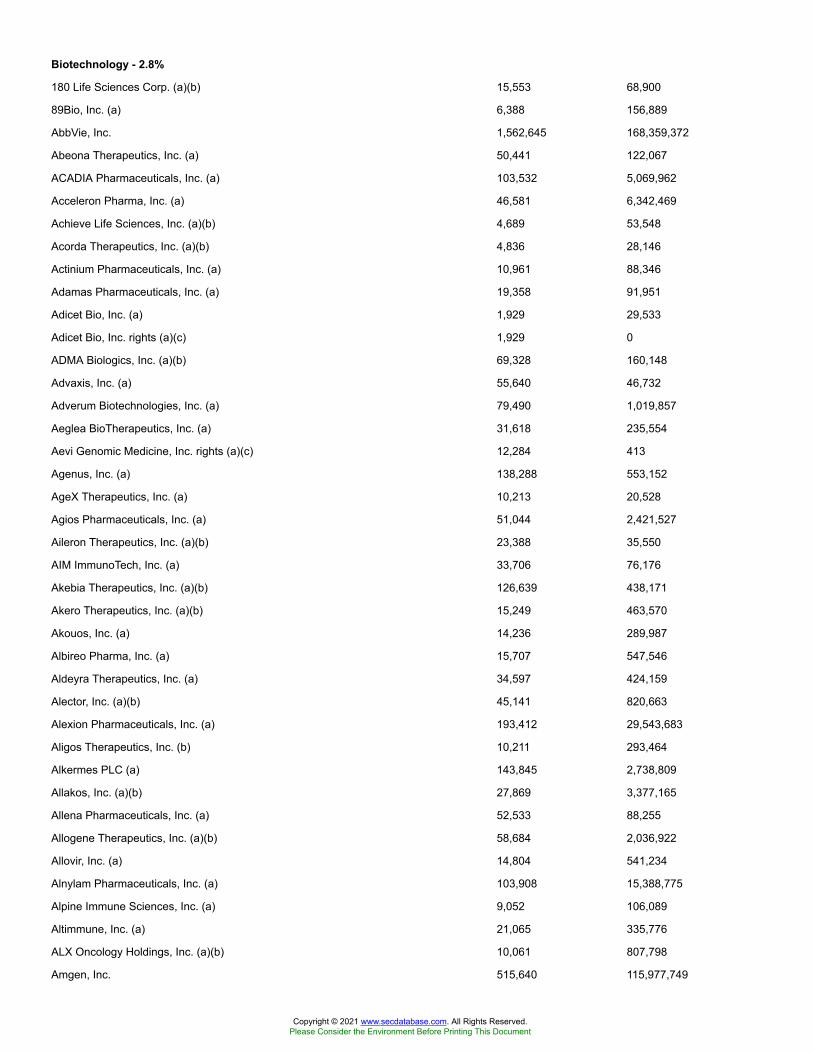
Biotechnology - 2.8%
180 Life Sciences Corp. (a)(b) 15,553 68,900
89Bio, Inc. (a) 6,388 156,889
AbbVie, Inc. 1,562,645 168,359,372
Abeona Therapeutics, Inc. (a) 50,441 122,067
ACADIA Pharmaceuticals, Inc. (a) 103,532 5,069,962
Acceleron Pharma, Inc. (a) 46,581 6,342,469
Achieve Life Sciences, Inc. (a)(b) 4,689 53,548
Acorda Therapeutics, Inc. (a)(b) 4,836 28,146
Actinium Pharmaceuticals, Inc. (a) 10,961 88,346
Adamas Pharmaceuticals, Inc. (a) 19,358 91,951
Adicet Bio, Inc. (a) 1,929 29,533
Adicet Bio, Inc. rights (a)(c) 1,929 0
ADMA Biologics, Inc. (a)(b) 69,328 160,148
Advaxis, Inc. (a) 55,640 46,732
Adverum Biotechnologies, Inc. (a) 79,490 1,019,857
Aeglea BioTherapeutics, Inc. (a) 31,618 235,554
Aevi Genomic Medicine, Inc. rights (a)(c) 12,284 413
Agenus, Inc. (a) 138,288 553,152
AgeX Therapeutics, Inc. (a) 10,213 20,528
Agios Pharmaceuticals, Inc. (a) 51,044 2,421,527
Aileron Therapeutics, Inc. (a)(b) 23,388 35,550
AIM ImmunoTech, Inc. (a) 33,706 76,176
Akebia Therapeutics, Inc. (a)(b) 126,639 438,171
Akero Therapeutics, Inc. (a)(b) 15,249 463,570
Akouos, Inc. (a) 14,236 289,987
Albireo Pharma, Inc. (a) 15,707 547,546
Aldeyra Therapeutics, Inc. (a) 34,597 424,159
Alector, Inc. (a)(b) 45,141 820,663
Alexion Pharmaceuticals, Inc. (a) 193,412 29,543,683
Aligos Therapeutics, Inc. (b) 10,211 293,464
Alkermes PLC (a) 143,845 2,738,809
Allakos, Inc. (a)(b) 27,869 3,377,165
Allena Pharmaceuticals, Inc. (a) 52,533 88,255
Allogene Therapeutics, Inc. (a)(b) 58,684 2,036,922
Allovir, Inc. (a) 14,804 541,234
Alnylam Pharmaceuticals, Inc. (a) 103,908 15,388,775
Alpine Immune Sciences, Inc. (a) 9,052 106,089
Altimmune, Inc. (a) 21,065 335,776
ALX Oncology Holdings, Inc. (a)(b) 10,061 807,798
Amgen, Inc. 515,640 115,977,749
Copyright © 2021 www.secdatabase.com. All Rights Reserved.Please Consider the Environment Before Printing This Document
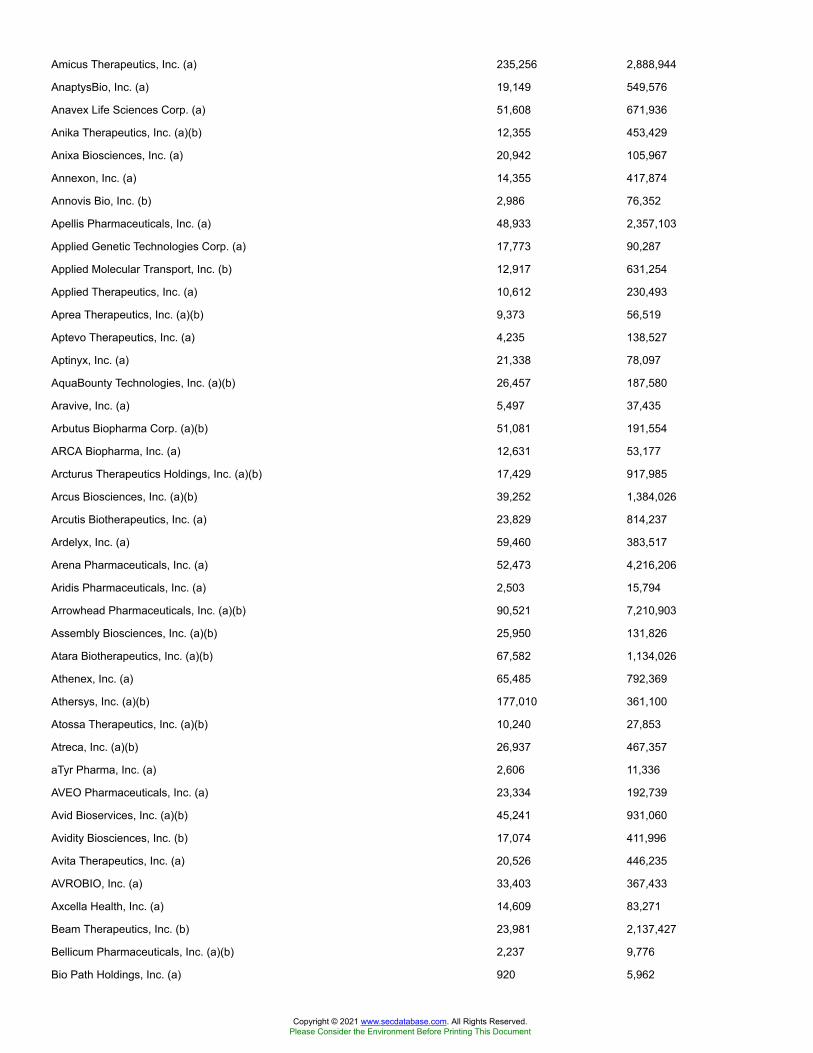
Amicus Therapeutics, Inc. (a) 235,256 2,888,944
AnaptysBio, Inc. (a) 19,149 549,576
Anavex Life Sciences Corp. (a) 51,608 671,936
Anika Therapeutics, Inc. (a)(b) 12,355 453,429
Anixa Biosciences, Inc. (a) 20,942 105,967
Annexon, Inc. (a) 14,355 417,874
Annovis Bio, Inc. (b) 2,986 76,352
Apellis Pharmaceuticals, Inc. (a) 48,933 2,357,103
Applied Genetic Technologies Corp. (a) 17,773 90,287
Applied Molecular Transport, Inc. (b) 12,917 631,254
Applied Therapeutics, Inc. (a) 10,612 230,493
Aprea Therapeutics, Inc. (a)(b) 9,373 56,519
Aptevo Therapeutics, Inc. (a) 4,235 138,527
Aptinyx, Inc. (a) 21,338 78,097
AquaBounty Technologies, Inc. (a)(b) 26,457 187,580
Aravive, Inc. (a) 5,497 37,435
Arbutus Biopharma Corp. (a)(b) 51,081 191,554
ARCA Biopharma, Inc. (a) 12,631 53,177
Arcturus Therapeutics Holdings, Inc. (a)(b) 17,429 917,985
Arcus Biosciences, Inc. (a)(b) 39,252 1,384,026
Arcutis Biotherapeutics, Inc. (a) 23,829 814,237
Ardelyx, Inc. (a) 59,460 383,517
Arena Pharmaceuticals, Inc. (a) 52,473 4,216,206
Aridis Pharmaceuticals, Inc. (a) 2,503 15,794
Arrowhead Pharmaceuticals, Inc. (a)(b) 90,521 7,210,903
Assembly Biosciences, Inc. (a)(b) 25,950 131,826
Atara Biotherapeutics, Inc. (a)(b) 67,582 1,134,026
Athenex, Inc. (a) 65,485 792,369
Athersys, Inc. (a)(b) 177,010 361,100
Atossa Therapeutics, Inc. (a)(b) 10,240 27,853
Atreca, Inc. (a)(b) 26,937 467,357
aTyr Pharma, Inc. (a) 2,606 11,336
AVEO Pharmaceuticals, Inc. (a) 23,334 192,739
Avid Bioservices, Inc. (a)(b) 45,241 931,060
Avidity Biosciences, Inc. (b) 17,074 411,996
Avita Therapeutics, Inc. (a) 20,526 446,235
AVROBIO, Inc. (a) 33,403 367,433
Axcella Health, Inc. (a) 14,609 83,271
Beam Therapeutics, Inc. (b) 23,981 2,137,427
Bellicum Pharmaceuticals, Inc. (a)(b) 2,237 9,776
Bio Path Holdings, Inc. (a) 920 5,962
Copyright © 2021 www.secdatabase.com. All Rights Reserved.Please Consider the Environment Before Printing This Document
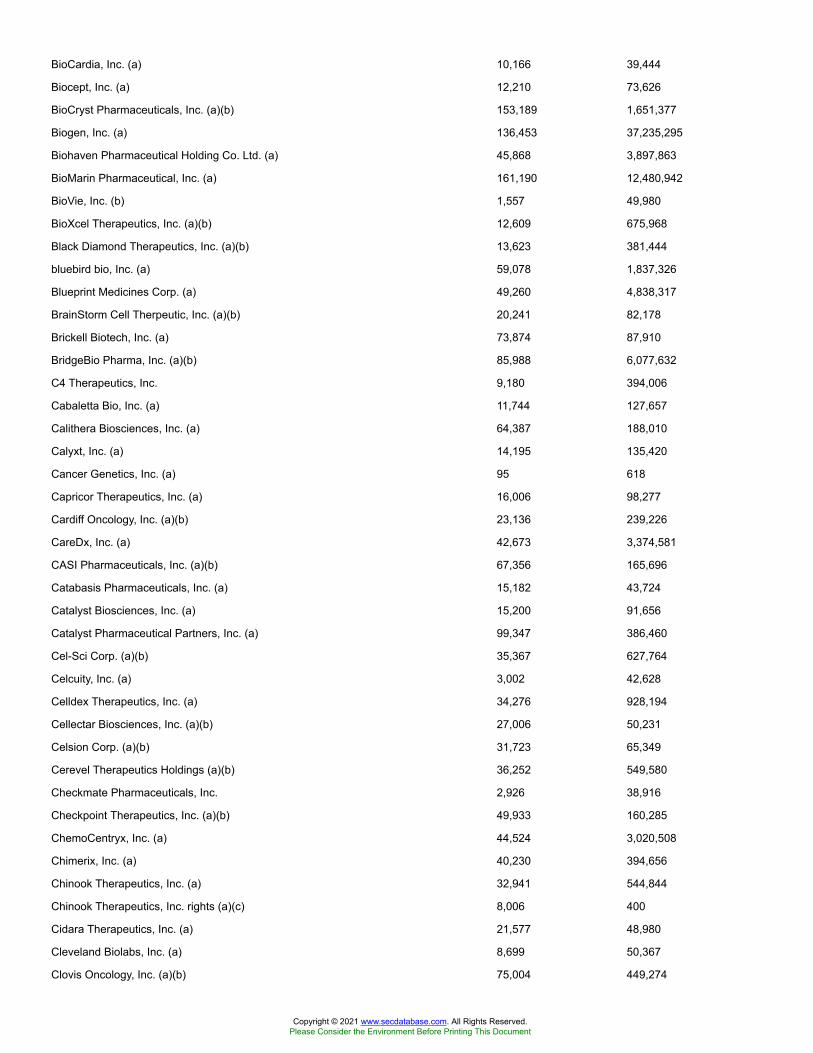
BioCardia, Inc. (a) 10,166 39,444
Biocept, Inc. (a) 12,210 73,626
BioCryst Pharmaceuticals, Inc. (a)(b) 153,189 1,651,377
Biogen, Inc. (a) 136,453 37,235,295
Biohaven Pharmaceutical Holding Co. Ltd. (a) 45,868 3,897,863
BioMarin Pharmaceutical, Inc. (a) 161,190 12,480,942
BioVie, Inc. (b) 1,557 49,980
BioXcel Therapeutics, Inc. (a)(b) 12,609 675,968
Black Diamond Therapeutics, Inc. (a)(b) 13,623 381,444
bluebird bio, Inc. (a) 59,078 1,837,326
Blueprint Medicines Corp. (a) 49,260 4,838,317
BrainStorm Cell Therpeutic, Inc. (a)(b) 20,241 82,178
Brickell Biotech, Inc. (a) 73,874 87,910
BridgeBio Pharma, Inc. (a)(b) 85,988 6,077,632
C4 Therapeutics, Inc. 9,180 394,006
Cabaletta Bio, Inc. (a) 11,744 127,657
Calithera Biosciences, Inc. (a) 64,387 188,010
Calyxt, Inc. (a) 14,195 135,420
Cancer Genetics, Inc. (a) 95 618
Capricor Therapeutics, Inc. (a) 16,006 98,277
Cardiff Oncology, Inc. (a)(b) 23,136 239,226
CareDx, Inc. (a) 42,673 3,374,581
CASI Pharmaceuticals, Inc. (a)(b) 67,356 165,696
Catabasis Pharmaceuticals, Inc. (a) 15,182 43,724
Catalyst Biosciences, Inc. (a) 15,200 91,656
Catalyst Pharmaceutical Partners, Inc. (a) 99,347 386,460
Cel-Sci Corp. (a)(b) 35,367 627,764
Celcuity, Inc. (a) 3,002 42,628
Celldex Therapeutics, Inc. (a) 34,276 928,194
Cellectar Biosciences, Inc. (a)(b) 27,006 50,231
Celsion Corp. (a)(b) 31,723 65,349
Cerevel Therapeutics Holdings (a)(b) 36,252 549,580
Checkmate Pharmaceuticals, Inc. 2,926 38,916
Checkpoint Therapeutics, Inc. (a)(b) 49,933 160,285
ChemoCentryx, Inc. (a) 44,524 3,020,508
Chimerix, Inc. (a) 40,230 394,656
Chinook Therapeutics, Inc. (a) 32,941 544,844
Chinook Therapeutics, Inc. rights (a)(c) 8,006 400
Cidara Therapeutics, Inc. (a) 21,577 48,980
Cleveland Biolabs, Inc. (a) 8,699 50,367
Clovis Oncology, Inc. (a)(b) 75,004 449,274
Copyright © 2021 www.secdatabase.com. All Rights Reserved.Please Consider the Environment Before Printing This Document

Codiak Biosciences, Inc. 5,075 82,215
Cogent Biosciences, Inc. (a)(b) 24,670 193,413
Cogent Biosciences, Inc. rights (a)(c) 4,804 0
CohBar, Inc. (a) 25,615 39,191
Coherus BioSciences, Inc. (a) 56,901 924,072
Concert Pharmaceuticals, Inc. (a) 20,686 138,389
Constellation Pharmaceuticals, Inc. (a) 26,504 667,901
ContraFect Corp. (a)(b) 19,016 99,834
Corbus Pharmaceuticals Holdings, Inc. (a)(b) 71,930 156,807
Cortexyme, Inc. (a)(b) 11,555 393,679
Corvus Pharmaceuticals, Inc. (a)(b) 13,423 46,712
Crinetics Pharmaceuticals, Inc. (a) 18,490 282,712
CTI BioPharma Corp. (a) 56,892 184,899
Cue Biopharma, Inc. (a) 21,833 297,147
Curis, Inc. (a) 43,439 427,440
Cyclacel Pharmaceuticals, Inc. (a) 14 97
Cyclerion Therapeutics, Inc. (a) 21,485 82,502
Cytokinetics, Inc. (a) 64,694 1,211,719
CytomX Therapeutics, Inc. (a) 35,728 280,465
Deciphera Pharmaceuticals, Inc. (a) 36,261 1,587,507
Denali Therapeutics, Inc. (a)(b) 72,104 5,177,067
DermTech, Inc. (a)(b) 13,216 881,904
DiaMedica Therapeutics, Inc. (a) 15,883 145,647
Dicerna Pharmaceuticals, Inc. (a) 58,905 1,589,257
Diffusion Pharmaceuticals, Inc. (a) 82,947 95,389
Dyadic International, Inc. (a) 15,307 81,280
Dynavax Technologies Corp. (a)(b) 88,060 770,525
Dyne Therapeutics, Inc. 16,052 296,480
Eagle Pharmaceuticals, Inc. (a) 11,170 497,065
Editas Medicine, Inc. (a)(b) 59,077 2,591,117
Eiger Biopharmaceuticals, Inc. (a) 29,703 302,080
Eledon Pharmaceuticals, Inc.(a) 1,077 17,307
Emergent BioSolutions, Inc. (a) 39,769 3,817,824
Enanta Pharmaceuticals, Inc. (a) 15,167 748,036
Enochian Biosciences, Inc. (a) 16,088 56,952
Epizyme, Inc. (a)(b) 78,523 753,036
Equillium, Inc. (a)(b) 12,168 85,784
Esperion Therapeutics, Inc. (a)(b) 24,002 657,415
Evelo Biosciences, Inc. (a)(b) 19,820 241,209
Exact Sciences Corp. (a) 142,877 19,448,417
Exelixis, Inc. (a) 276,003 5,978,225
Copyright © 2021 www.secdatabase.com. All Rights Reserved.Please Consider the Environment Before Printing This Document
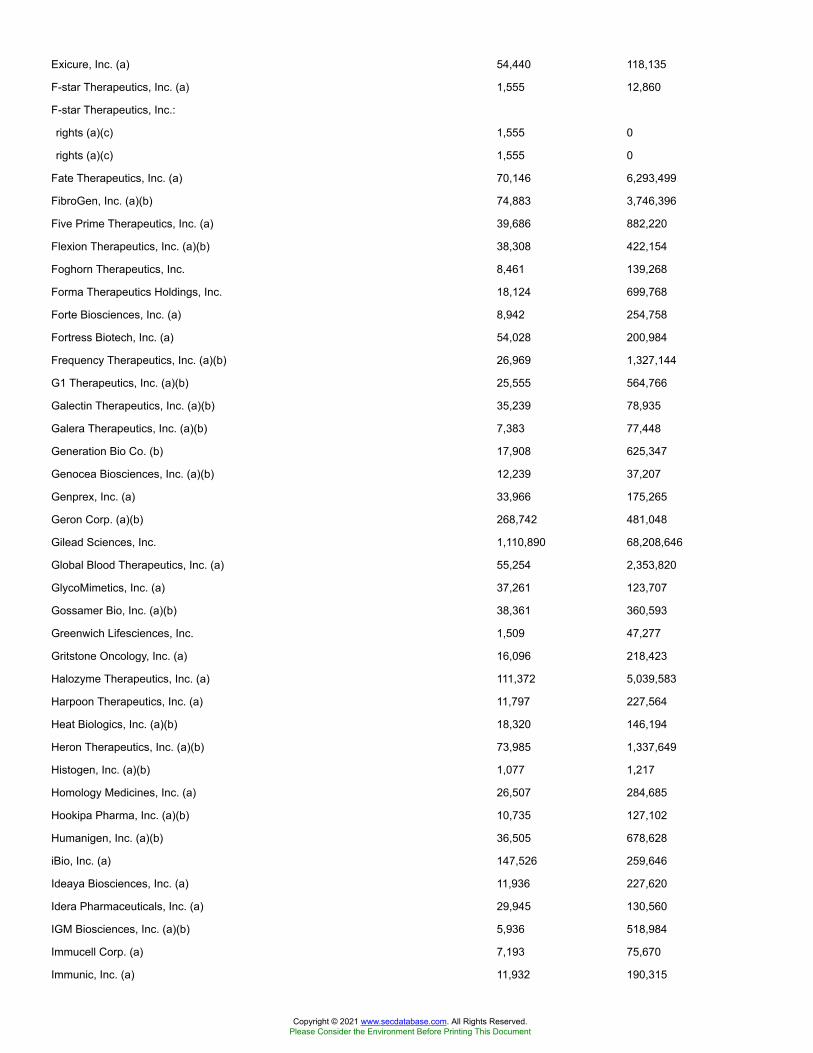
Exicure, Inc. (a) 54,440 118,135
F-star Therapeutics, Inc. (a) 1,555 12,860
F-star Therapeutics, Inc.:
rights (a)(c) 1,555 0
rights (a)(c) 1,555 0
Fate Therapeutics, Inc. (a) 70,146 6,293,499
FibroGen, Inc. (a)(b) 74,883 3,746,396
Five Prime Therapeutics, Inc. (a) 39,686 882,220
Flexion Therapeutics, Inc. (a)(b) 38,308 422,154
Foghorn Therapeutics, Inc. 8,461 139,268
Forma Therapeutics Holdings, Inc. 18,124 699,768
Forte Biosciences, Inc. (a) 8,942 254,758
Fortress Biotech, Inc. (a) 54,028 200,984
Frequency Therapeutics, Inc. (a)(b) 26,969 1,327,144
G1 Therapeutics, Inc. (a)(b) 25,555 564,766
Galectin Therapeutics, Inc. (a)(b) 35,239 78,935
Galera Therapeutics, Inc. (a)(b) 7,383 77,448
Generation Bio Co. (b) 17,908 625,347
Genocea Biosciences, Inc. (a)(b) 12,239 37,207
Genprex, Inc. (a) 33,966 175,265
Geron Corp. (a)(b) 268,742 481,048
Gilead Sciences, Inc. 1,110,890 68,208,646
Global Blood Therapeutics, Inc. (a) 55,254 2,353,820
GlycoMimetics, Inc. (a) 37,261 123,707
Gossamer Bio, Inc. (a)(b) 38,361 360,593
Greenwich Lifesciences, Inc. 1,509 47,277
Gritstone Oncology, Inc. (a) 16,096 218,423
Halozyme Therapeutics, Inc. (a) 111,372 5,039,583
Harpoon Therapeutics, Inc. (a) 11,797 227,564
Heat Biologics, Inc. (a)(b) 18,320 146,194
Heron Therapeutics, Inc. (a)(b) 73,985 1,337,649
Histogen, Inc. (a)(b) 1,077 1,217
Homology Medicines, Inc. (a) 26,507 284,685
Hookipa Pharma, Inc. (a)(b) 10,735 127,102
Humanigen, Inc. (a)(b) 36,505 678,628
iBio, Inc. (a) 147,526 259,646
Ideaya Biosciences, Inc. (a) 11,936 227,620
Idera Pharmaceuticals, Inc. (a) 29,945 130,560
IGM Biosciences, Inc. (a)(b) 5,936 518,984
Immucell Corp. (a) 7,193 75,670
Immunic, Inc. (a) 11,932 190,315
Copyright © 2021 www.secdatabase.com. All Rights Reserved.Please Consider the Environment Before Printing This Document
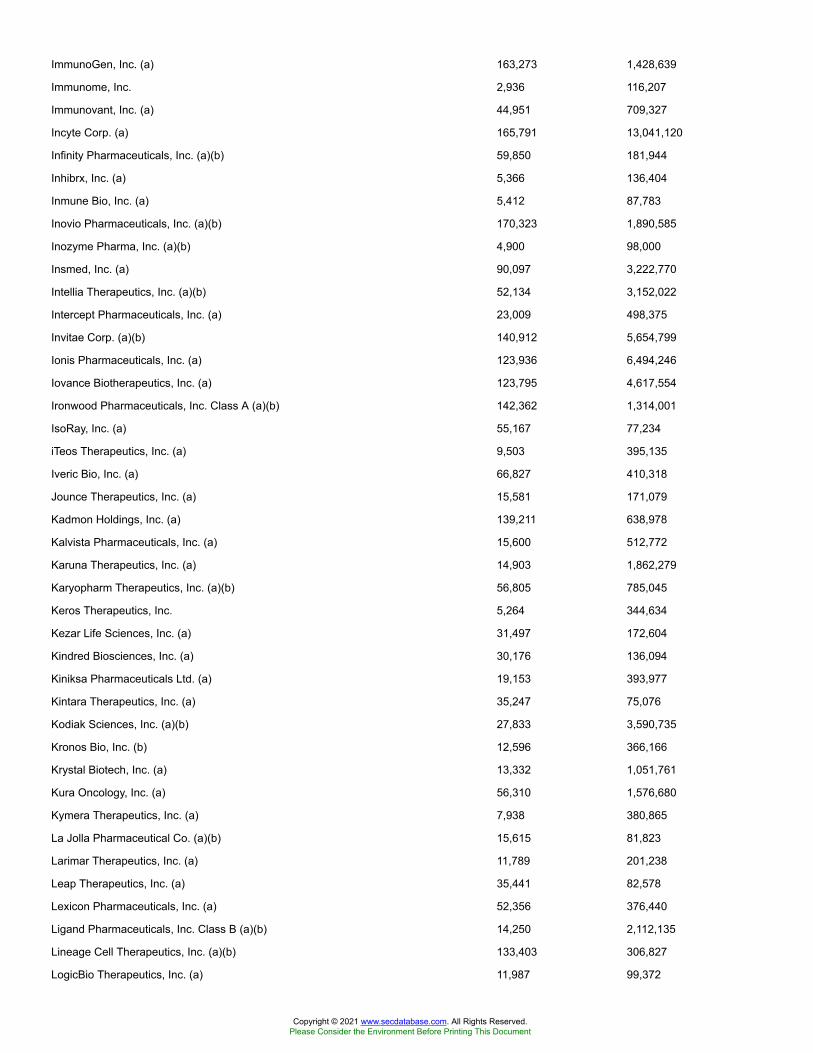
ImmunoGen, Inc. (a) 163,273 1,428,639
Immunome, Inc. 2,936 116,207
Immunovant, Inc. (a) 44,951 709,327
Incyte Corp. (a) 165,791 13,041,120
Infinity Pharmaceuticals, Inc. (a)(b) 59,850 181,944
Inhibrx, Inc. (a) 5,366 136,404
Inmune Bio, Inc. (a) 5,412 87,783
Inovio Pharmaceuticals, Inc. (a)(b) 170,323 1,890,585
Inozyme Pharma, Inc. (a)(b) 4,900 98,000
Insmed, Inc. (a) 90,097 3,222,770
Intellia Therapeutics, Inc. (a)(b) 52,134 3,152,022
Intercept Pharmaceuticals, Inc. (a) 23,009 498,375
Invitae Corp. (a)(b) 140,912 5,654,799
Ionis Pharmaceuticals, Inc. (a) 123,936 6,494,246
Iovance Biotherapeutics, Inc. (a) 123,795 4,617,554
Ironwood Pharmaceuticals, Inc. Class A (a)(b) 142,362 1,314,001
IsoRay, Inc. (a) 55,167 77,234
iTeos Therapeutics, Inc. (a) 9,503 395,135
Iveric Bio, Inc. (a) 66,827 410,318
Jounce Therapeutics, Inc. (a) 15,581 171,079
Kadmon Holdings, Inc. (a) 139,211 638,978
Kalvista Pharmaceuticals, Inc. (a) 15,600 512,772
Karuna Therapeutics, Inc. (a) 14,903 1,862,279
Karyopharm Therapeutics, Inc. (a)(b) 56,805 785,045
Keros Therapeutics, Inc. 5,264 344,634
Kezar Life Sciences, Inc. (a) 31,497 172,604
Kindred Biosciences, Inc. (a) 30,176 136,094
Kiniksa Pharmaceuticals Ltd. (a) 19,153 393,977
Kintara Therapeutics, Inc. (a) 35,247 75,076
Kodiak Sciences, Inc. (a)(b) 27,833 3,590,735
Kronos Bio, Inc. (b) 12,596 366,166
Krystal Biotech, Inc. (a) 13,332 1,051,761
Kura Oncology, Inc. (a) 56,310 1,576,680
Kymera Therapeutics, Inc. (a) 7,938 380,865
La Jolla Pharmaceutical Co. (a)(b) 15,615 81,823
Larimar Therapeutics, Inc. (a) 11,789 201,238
Leap Therapeutics, Inc. (a) 35,441 82,578
Lexicon Pharmaceuticals, Inc. (a) 52,356 376,440
Ligand Pharmaceuticals, Inc. Class B (a)(b) 14,250 2,112,135
Lineage Cell Therapeutics, Inc. (a)(b) 133,403 306,827
LogicBio Therapeutics, Inc. (a) 11,987 99,372
Copyright © 2021 www.secdatabase.com. All Rights Reserved.Please Consider the Environment Before Printing This Document
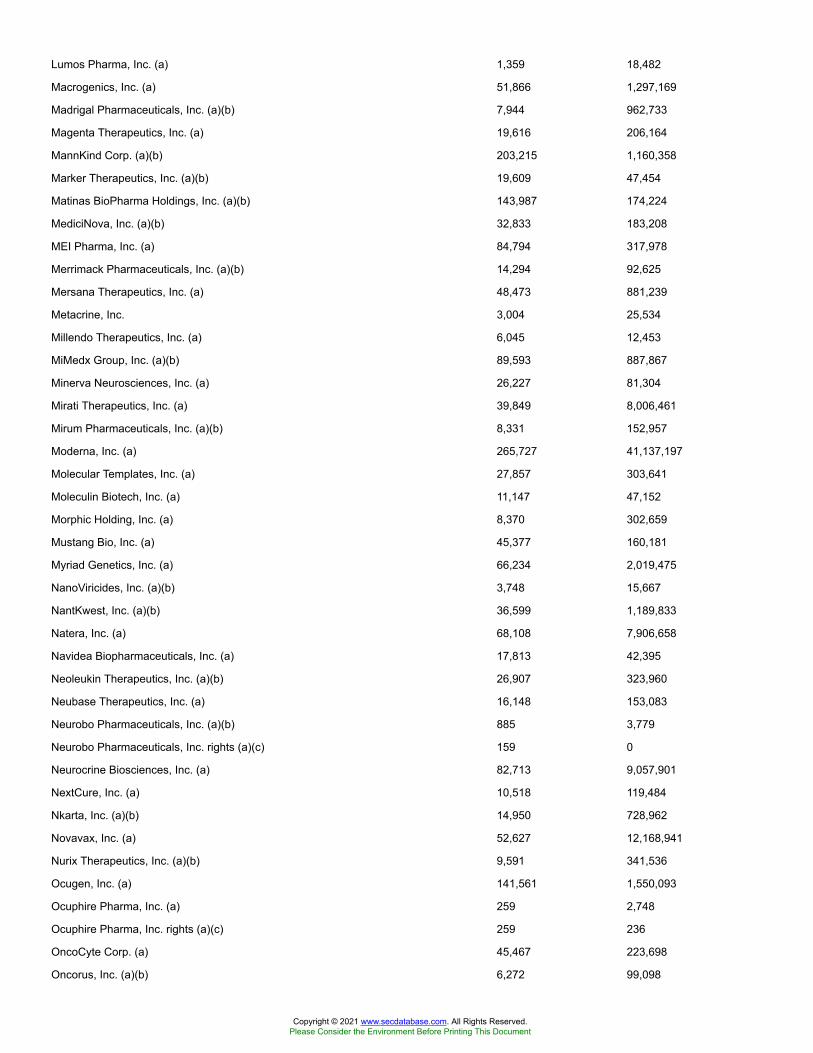
Lumos Pharma, Inc. (a) 1,359 18,482
Macrogenics, Inc. (a) 51,866 1,297,169
Madrigal Pharmaceuticals, Inc. (a)(b) 7,944 962,733
Magenta Therapeutics, Inc. (a) 19,616 206,164
MannKind Corp. (a)(b) 203,215 1,160,358
Marker Therapeutics, Inc. (a)(b) 19,609 47,454
Matinas BioPharma Holdings, Inc. (a)(b) 143,987 174,224
MediciNova, Inc. (a)(b) 32,833 183,208
MEI Pharma, Inc. (a) 84,794 317,978
Merrimack Pharmaceuticals, Inc. (a)(b) 14,294 92,625
Mersana Therapeutics, Inc. (a) 48,473 881,239
Metacrine, Inc. 3,004 25,534
Millendo Therapeutics, Inc. (a) 6,045 12,453
MiMedx Group, Inc. (a)(b) 89,593 887,867
Minerva Neurosciences, Inc. (a) 26,227 81,304
Mirati Therapeutics, Inc. (a) 39,849 8,006,461
Mirum Pharmaceuticals, Inc. (a)(b) 8,331 152,957
Moderna, Inc. (a) 265,727 41,137,197
Molecular Templates, Inc. (a) 27,857 303,641
Moleculin Biotech, Inc. (a) 11,147 47,152
Morphic Holding, Inc. (a) 8,370 302,659
Mustang Bio, Inc. (a) 45,377 160,181
Myriad Genetics, Inc. (a) 66,234 2,019,475
NanoViricides, Inc. (a)(b) 3,748 15,667
NantKwest, Inc. (a)(b) 36,599 1,189,833
Natera, Inc. (a) 68,108 7,906,658
Navidea Biopharmaceuticals, Inc. (a) 17,813 42,395
Neoleukin Therapeutics, Inc. (a)(b) 26,907 323,960
Neubase Therapeutics, Inc. (a) 16,148 153,083
Neurobo Pharmaceuticals, Inc. (a)(b) 885 3,779
Neurobo Pharmaceuticals, Inc. rights (a)(c) 159 0
Neurocrine Biosciences, Inc. (a) 82,713 9,057,901
NextCure, Inc. (a) 10,518 119,484
Nkarta, Inc. (a)(b) 14,950 728,962
Novavax, Inc. (a) 52,627 12,168,941
Nurix Therapeutics, Inc. (a)(b) 9,591 341,536
Ocugen, Inc. (a) 141,561 1,550,093
Ocuphire Pharma, Inc. (a) 259 2,748
Ocuphire Pharma, Inc. rights (a)(c) 259 236
OncoCyte Corp. (a) 45,467 223,698
Oncorus, Inc. (a)(b) 6,272 99,098
Copyright © 2021 www.secdatabase.com. All Rights Reserved.Please Consider the Environment Before Printing This Document
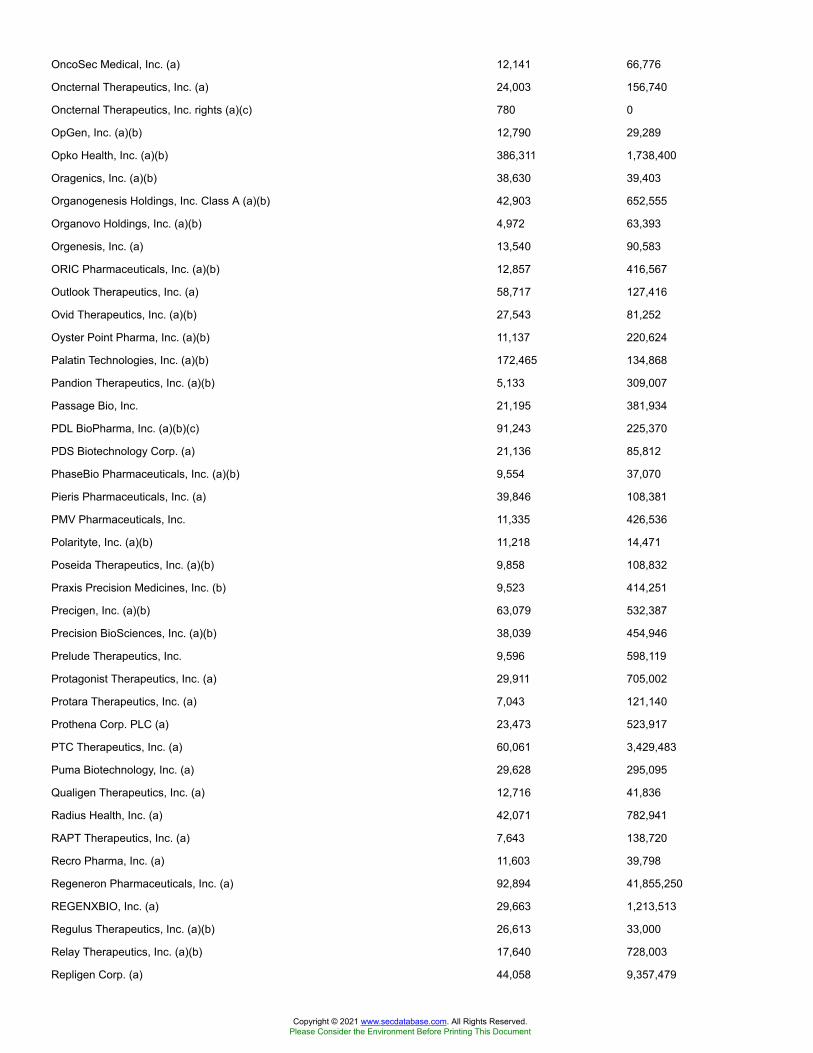
OncoSec Medical, Inc. (a) 12,141 66,776
Oncternal Therapeutics, Inc. (a) 24,003 156,740
Oncternal Therapeutics, Inc. rights (a)(c) 780 0
OpGen, Inc. (a)(b) 12,790 29,289
Opko Health, Inc. (a)(b) 386,311 1,738,400
Oragenics, Inc. (a)(b) 38,630 39,403
Organogenesis Holdings, Inc. Class A (a)(b) 42,903 652,555
Organovo Holdings, Inc. (a)(b) 4,972 63,393
Orgenesis, Inc. (a) 13,540 90,583
ORIC Pharmaceuticals, Inc. (a)(b) 12,857 416,567
Outlook Therapeutics, Inc. (a) 58,717 127,416
Ovid Therapeutics, Inc. (a)(b) 27,543 81,252
Oyster Point Pharma, Inc. (a)(b) 11,137 220,624
Palatin Technologies, Inc. (a)(b) 172,465 134,868
Pandion Therapeutics, Inc. (a)(b) 5,133 309,007
Passage Bio, Inc. 21,195 381,934
PDL BioPharma, Inc. (a)(b)(c) 91,243 225,370
PDS Biotechnology Corp. (a) 21,136 85,812
PhaseBio Pharmaceuticals, Inc. (a)(b) 9,554 37,070
Pieris Pharmaceuticals, Inc. (a) 39,846 108,381
PMV Pharmaceuticals, Inc. 11,335 426,536
Polarityte, Inc. (a)(b) 11,218 14,471
Poseida Therapeutics, Inc. (a)(b) 9,858 108,832
Praxis Precision Medicines, Inc. (b) 9,523 414,251
Precigen, Inc. (a)(b) 63,079 532,387
Precision BioSciences, Inc. (a)(b) 38,039 454,946
Prelude Therapeutics, Inc. 9,596 598,119
Protagonist Therapeutics, Inc. (a) 29,911 705,002
Protara Therapeutics, Inc. (a) 7,043 121,140
Prothena Corp. PLC (a) 23,473 523,917
PTC Therapeutics, Inc. (a) 60,061 3,429,483
Puma Biotechnology, Inc. (a) 29,628 295,095
Qualigen Therapeutics, Inc. (a) 12,716 41,836
Radius Health, Inc. (a) 42,071 782,941
RAPT Therapeutics, Inc. (a) 7,643 138,720
Recro Pharma, Inc. (a) 11,603 39,798
Regeneron Pharmaceuticals, Inc. (a) 92,894 41,855,250
REGENXBIO, Inc. (a) 29,663 1,213,513
Regulus Therapeutics, Inc. (a)(b) 26,613 33,000
Relay Therapeutics, Inc. (a)(b) 17,640 728,003
Repligen Corp. (a) 44,058 9,357,479
Copyright © 2021 www.secdatabase.com. All Rights Reserved.Please Consider the Environment Before Printing This Document

Replimune Group, Inc. (a) 23,379 809,615
Revolution Medicines, Inc. 41,479 1,894,761
Rhythm Pharmaceuticals, Inc. (a) 31,845 825,422
Rigel Pharmaceuticals, Inc. (a) 152,901 634,539
Rocket Pharmaceuticals, Inc. (a)(b) 36,259 2,015,275
Rubius Therapeutics, Inc. (a)(b) 34,075 353,699
Sage Therapeutics, Inc. (a) 45,821 3,894,785
Salarius Pharmaceuticals, Inc. (a)(b) 26,227 47,209
Salarius Pharmaceuticals, Inc. rights (a)(c) 2,725 335
Sangamo Therapeutics, Inc. (a)(b) 101,991 1,171,877
Sarepta Therapeutics, Inc. (a) 69,511 6,051,628
Savara, Inc. (a) 16,342 27,781
Scholar Rock Holding Corp. (a) 18,754 1,014,591
Seagen, Inc. (a) 111,794 16,893,191
Selecta Biosciences, Inc. (a) 78,859 332,785
Sellas Life Sciences Group, Inc. (a) 10,650 86,585
Seneca Biopharma, Inc. (a)(b) 122 163
Seres Therapeutics, Inc. (a)(b) 48,117 916,148
Sesen Bio, Inc. (a) 109,734 298,476
Shattuck Labs, Inc. 11,106 458,678
Soleno Therapeutics, Inc. (a) 39,023 94,045
Solid Biosciences, Inc. (a)(b) 26,121 208,184
Soligenix, Inc. (a)(b) 18,600 30,690
Sorrento Therapeutics, Inc. (a)(b) 199,604 1,930,171
Spectrum Pharmaceuticals, Inc. (a) 126,963 435,483
Spero Therapeutics, Inc. (a)(b) 20,291 368,687
Springworks Therapeutics, Inc. (a)(b) 24,503 2,108,483
Spruce Biosciences, Inc. (b) 6,682 139,654
SQZ Biotechnologies Co. 5,859 87,885
Stoke Therapeutics, Inc. (a)(b) 18,598 1,113,834
Surface Oncology, Inc. (a) 18,787 159,314
Sutro Biopharma, Inc. (a) 27,594 612,587
Synaptogenix, Inc. (a) 456 1,044
Syndax Pharmaceuticals, Inc. (a) 25,412 620,307
Synlogic, Inc. (a) 10,050 38,090
Synthetic Biologics, Inc. (a)(b) 714 481
Syros Pharmaceuticals, Inc. (a) 28,649 240,652
T2 Biosystems, Inc. (a)(b) 141,446 323,911
Taysha Gene Therapies, Inc. 11,612 297,151
TCR2 Therapeutics, Inc. (a) 19,997 529,121
TG Therapeutics, Inc. (a) 93,991 4,113,986
Copyright © 2021 www.secdatabase.com. All Rights Reserved.Please Consider the Environment Before Printing This Document
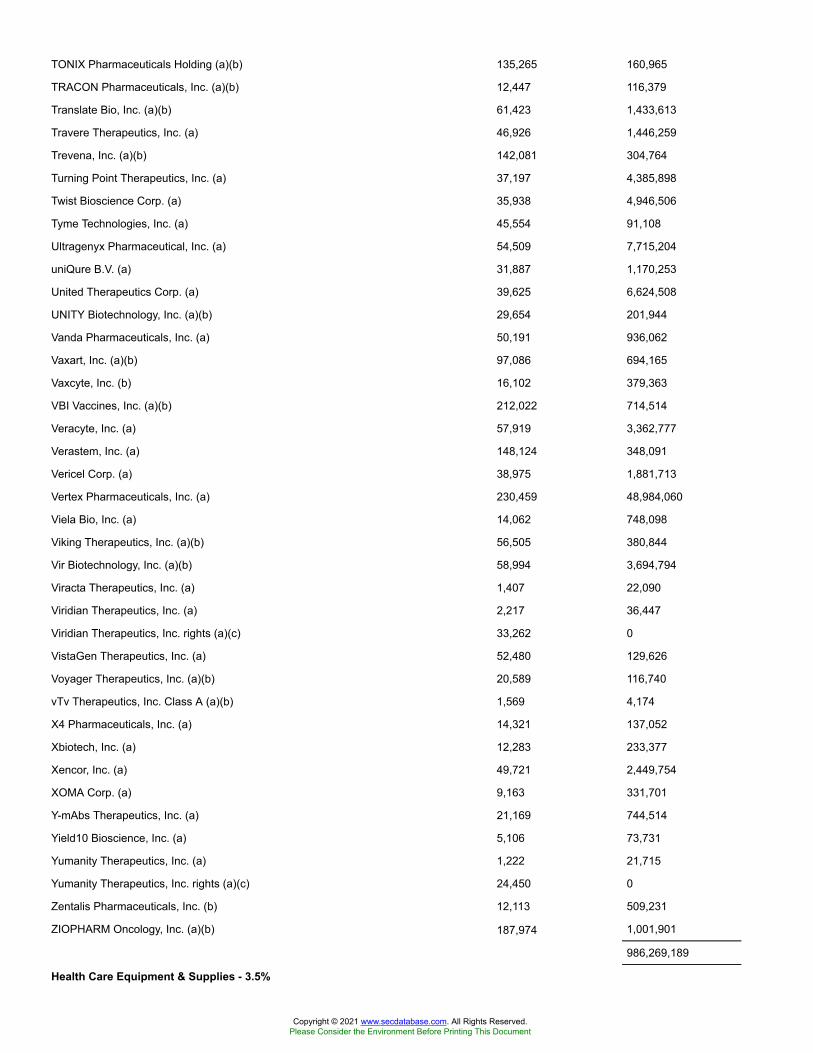
TONIX Pharmaceuticals Holding (a)(b) 135,265 160,965
TRACON Pharmaceuticals, Inc. (a)(b) 12,447 116,379
Translate Bio, Inc. (a)(b) 61,423 1,433,613
Travere Therapeutics, Inc. (a) 46,926 1,446,259
Trevena, Inc. (a)(b) 142,081 304,764
Turning Point Therapeutics, Inc. (a) 37,197 4,385,898
Twist Bioscience Corp. (a) 35,938 4,946,506
Tyme Technologies, Inc. (a) 45,554 91,108
Ultragenyx Pharmaceutical, Inc. (a) 54,509 7,715,204
uniQure B.V. (a) 31,887 1,170,253
United Therapeutics Corp. (a) 39,625 6,624,508
UNITY Biotechnology, Inc. (a)(b) 29,654 201,944
Vanda Pharmaceuticals, Inc. (a) 50,191 936,062
Vaxart, Inc. (a)(b) 97,086 694,165
Vaxcyte, Inc. (b) 16,102 379,363
VBI Vaccines, Inc. (a)(b) 212,022 714,514
Veracyte, Inc. (a) 57,919 3,362,777
Verastem, Inc. (a) 148,124 348,091
Vericel Corp. (a) 38,975 1,881,713
Vertex Pharmaceuticals, Inc. (a) 230,459 48,984,060
Viela Bio, Inc. (a) 14,062 748,098
Viking Therapeutics, Inc. (a)(b) 56,505 380,844
Vir Biotechnology, Inc. (a)(b) 58,994 3,694,794
Viracta Therapeutics, Inc. (a) 1,407 22,090
Viridian Therapeutics, Inc. (a) 2,217 36,447
Viridian Therapeutics, Inc. rights (a)(c) 33,262 0
VistaGen Therapeutics, Inc. (a) 52,480 129,626
Voyager Therapeutics, Inc. (a)(b) 20,589 116,740
vTv Therapeutics, Inc. Class A (a)(b) 1,569 4,174
X4 Pharmaceuticals, Inc. (a) 14,321 137,052
Xbiotech, Inc. (a) 12,283 233,377
Xencor, Inc. (a) 49,721 2,449,754
XOMA Corp. (a) 9,163 331,701
Y-mAbs Therapeutics, Inc. (a) 21,169 744,514
Yield10 Bioscience, Inc. (a) 5,106 73,731
Yumanity Therapeutics, Inc. (a) 1,222 21,715
Yumanity Therapeutics, Inc. rights (a)(c) 24,450 0
Zentalis Pharmaceuticals, Inc. (b) 12,113 509,231
ZIOPHARM Oncology, Inc. (a)(b) 187,974 1,001,901
986,269,189
Health Care Equipment & Supplies - 3.5%
Copyright © 2021 www.secdatabase.com. All Rights Reserved.Please Consider the Environment Before Printing This Document
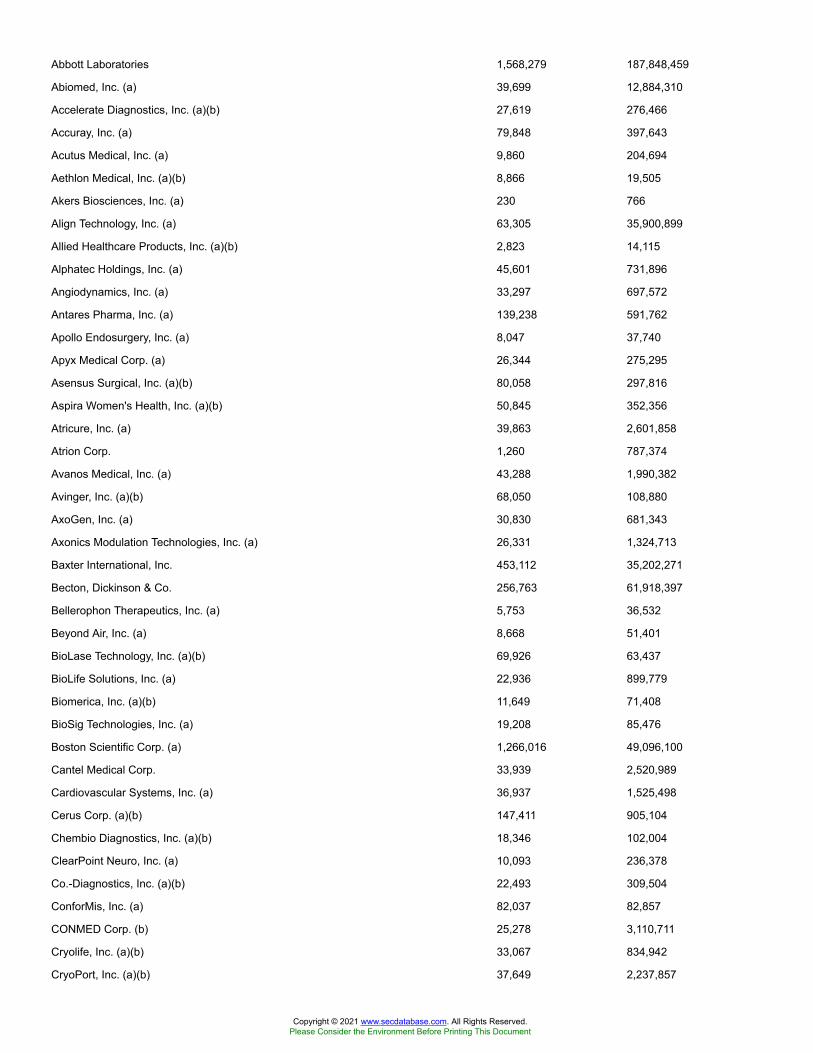
Abbott Laboratories 1,568,279 187,848,459
Abiomed, Inc. (a) 39,699 12,884,310
Accelerate Diagnostics, Inc. (a)(b) 27,619 276,466
Accuray, Inc. (a) 79,848 397,643
Acutus Medical, Inc. (a) 9,860 204,694
Aethlon Medical, Inc. (a)(b) 8,866 19,505
Akers Biosciences, Inc. (a) 230 766
Align Technology, Inc. (a) 63,305 35,900,899
Allied Healthcare Products, Inc. (a)(b) 2,823 14,115
Alphatec Holdings, Inc. (a) 45,601 731,896
Angiodynamics, Inc. (a) 33,297 697,572
Antares Pharma, Inc. (a) 139,238 591,762
Apollo Endosurgery, Inc. (a) 8,047 37,740
Apyx Medical Corp. (a) 26,344 275,295
Asensus Surgical, Inc. (a)(b) 80,058 297,816
Aspira Women's Health, Inc. (a)(b) 50,845 352,356
Atricure, Inc. (a) 39,863 2,601,858
Atrion Corp. 1,260 787,374
Avanos Medical, Inc. (a) 43,288 1,990,382
Avinger, Inc. (a)(b) 68,050 108,880
AxoGen, Inc. (a) 30,830 681,343
Axonics Modulation Technologies, Inc. (a) 26,331 1,324,713
Baxter International, Inc. 453,112 35,202,271
Becton, Dickinson & Co. 256,763 61,918,397
Bellerophon Therapeutics, Inc. (a) 5,753 36,532
Beyond Air, Inc. (a) 8,668 51,401
BioLase Technology, Inc. (a)(b) 69,926 63,437
BioLife Solutions, Inc. (a) 22,936 899,779
Biomerica, Inc. (a)(b) 11,649 71,408
BioSig Technologies, Inc. (a) 19,208 85,476
Boston Scientific Corp. (a) 1,266,016 49,096,100
Cantel Medical Corp. 33,939 2,520,989
Cardiovascular Systems, Inc. (a) 36,937 1,525,498
Cerus Corp. (a)(b) 147,411 905,104
Chembio Diagnostics, Inc. (a)(b) 18,346 102,004
ClearPoint Neuro, Inc. (a) 10,093 236,378
Co.-Diagnostics, Inc. (a)(b) 22,493 309,504
ConforMis, Inc. (a) 82,037 82,857
CONMED Corp. (b) 25,278 3,110,711
Cryolife, Inc. (a)(b) 33,067 834,942
CryoPort, Inc. (a)(b) 37,649 2,237,857
Copyright © 2021 www.secdatabase.com. All Rights Reserved.Please Consider the Environment Before Printing This Document

Cutera, Inc. (a) 16,121 569,394
CytoSorbents Corp. (a)(b) 35,924 338,404
Danaher Corp. 559,280 122,857,038
Dare Bioscience, Inc. (a) 43,337 81,040
DarioHealth Corp. (a) 6,545 174,097
Delcath Systems, Inc. (a)(b) 2,946 53,057
Dentsply Sirona, Inc. 193,214 10,253,867
DexCom, Inc. (a) 84,809 33,735,324
Eargo, Inc. (a) 8,997 525,515
Edwards Lifesciences Corp. (a) 551,959 45,867,793
Ekso Bionics Holdings, Inc. (a) 6,939 49,614
electroCore, Inc. (a) 47,369 102,791
Electromed, Inc. (a) 7,866 83,065
ENDRA Life Sciences, Inc. (a) 26,371 65,928
Envista Holdings Corp. (a) 139,958 5,393,981
Fonar Corp. (a) 4,350 84,347
Genmark Diagnostics, Inc. (a) 61,034 1,193,215
Glaukos Corp. (a) 39,501 3,735,215
Globus Medical, Inc. (a) 67,399 4,212,438
Haemonetics Corp. (a) 44,951 5,686,302
Helius Medical Technologies, Inc. (U.S.) (a) 224 3,053
Heska Corp. (a)(b) 7,853 1,479,505
Hill-Rom Holdings, Inc. 59,388 6,334,918
Hologic, Inc. (a) 226,795 16,349,652
ICU Medical, Inc. (a) 17,494 3,630,005
IDEXX Laboratories, Inc. (a) 75,343 39,191,168
Inari Medical, Inc. 6,860 717,556
Inogen, Inc. (a) 15,984 839,000
Insulet Corp. (a) 58,217 15,084,025
Integer Holdings Corp. (a) 29,359 2,589,170
Integra LifeSciences Holdings Corp. (a) 63,017 4,306,582
Intersect ENT, Inc. (a) 28,493 649,925
IntriCon Corp. (a) 6,744 154,842
Intuitive Surgical, Inc. (a) 103,945 76,586,676
Invacare Corp. (b) 33,353 303,512
IRadimed Corp. (a)(b) 4,425 98,678
iRhythm Technologies, Inc. (a) 26,263 4,225,717
Iridex Corp. (a) 12,154 71,466
Kewaunee Scientific Corp. (a) 406 5,034
Lantheus Holdings, Inc. (a) 57,801 1,079,723
LeMaitre Vascular, Inc. (b) 15,043 773,060
Copyright © 2021 www.secdatabase.com. All Rights Reserved.Please Consider the Environment Before Printing This Document
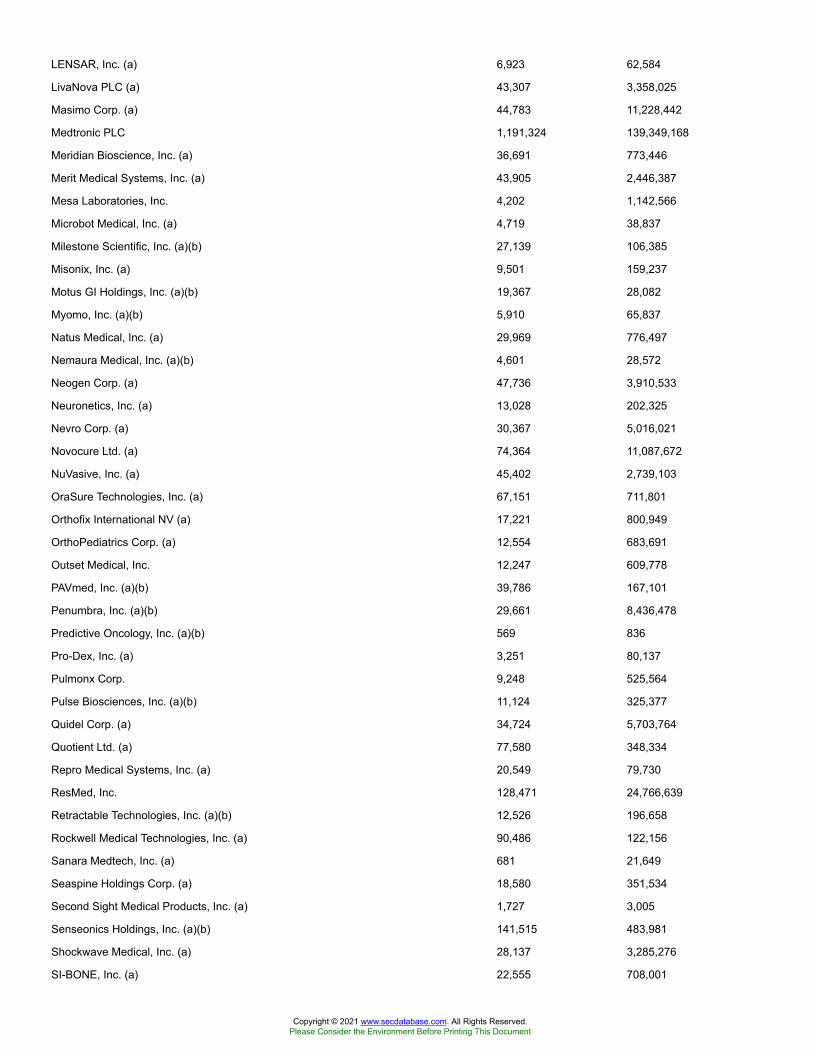
LENSAR, Inc. (a) 6,923 62,584
LivaNova PLC (a) 43,307 3,358,025
Masimo Corp. (a) 44,783 11,228,442
Medtronic PLC 1,191,324 139,349,168
Meridian Bioscience, Inc. (a) 36,691 773,446
Merit Medical Systems, Inc. (a) 43,905 2,446,387
Mesa Laboratories, Inc. 4,202 1,142,566
Microbot Medical, Inc. (a) 4,719 38,837
Milestone Scientific, Inc. (a)(b) 27,139 106,385
Misonix, Inc. (a) 9,501 159,237
Motus GI Holdings, Inc. (a)(b) 19,367 28,082
Myomo, Inc. (a)(b) 5,910 65,837
Natus Medical, Inc. (a) 29,969 776,497
Nemaura Medical, Inc. (a)(b) 4,601 28,572
Neogen Corp. (a) 47,736 3,910,533
Neuronetics, Inc. (a) 13,028 202,325
Nevro Corp. (a) 30,367 5,016,021
Novocure Ltd. (a) 74,364 11,087,672
NuVasive, Inc. (a) 45,402 2,739,103
OraSure Technologies, Inc. (a) 67,151 711,801
Orthofix International NV (a) 17,221 800,949
OrthoPediatrics Corp. (a) 12,554 683,691
Outset Medical, Inc. 12,247 609,778
PAVmed, Inc. (a)(b) 39,786 167,101
Penumbra, Inc. (a)(b) 29,661 8,436,478
Predictive Oncology, Inc. (a)(b) 569 836
Pro-Dex, Inc. (a) 3,251 80,137
Pulmonx Corp. 9,248 525,564
Pulse Biosciences, Inc. (a)(b) 11,124 325,377
Quidel Corp. (a) 34,724 5,703,764
Quotient Ltd. (a) 77,580 348,334
Repro Medical Systems, Inc. (a) 20,549 79,730
ResMed, Inc. 128,471 24,766,639
Retractable Technologies, Inc. (a)(b) 12,526 196,658
Rockwell Medical Technologies, Inc. (a) 90,486 122,156
Sanara Medtech, Inc. (a) 681 21,649
Seaspine Holdings Corp. (a) 18,580 351,534
Second Sight Medical Products, Inc. (a) 1,727 3,005
Senseonics Holdings, Inc. (a)(b) 141,515 483,981
Shockwave Medical, Inc. (a) 28,137 3,285,276
SI-BONE, Inc. (a) 22,555 708,001
Copyright © 2021 www.secdatabase.com. All Rights Reserved.Please Consider the Environment Before Printing This Document
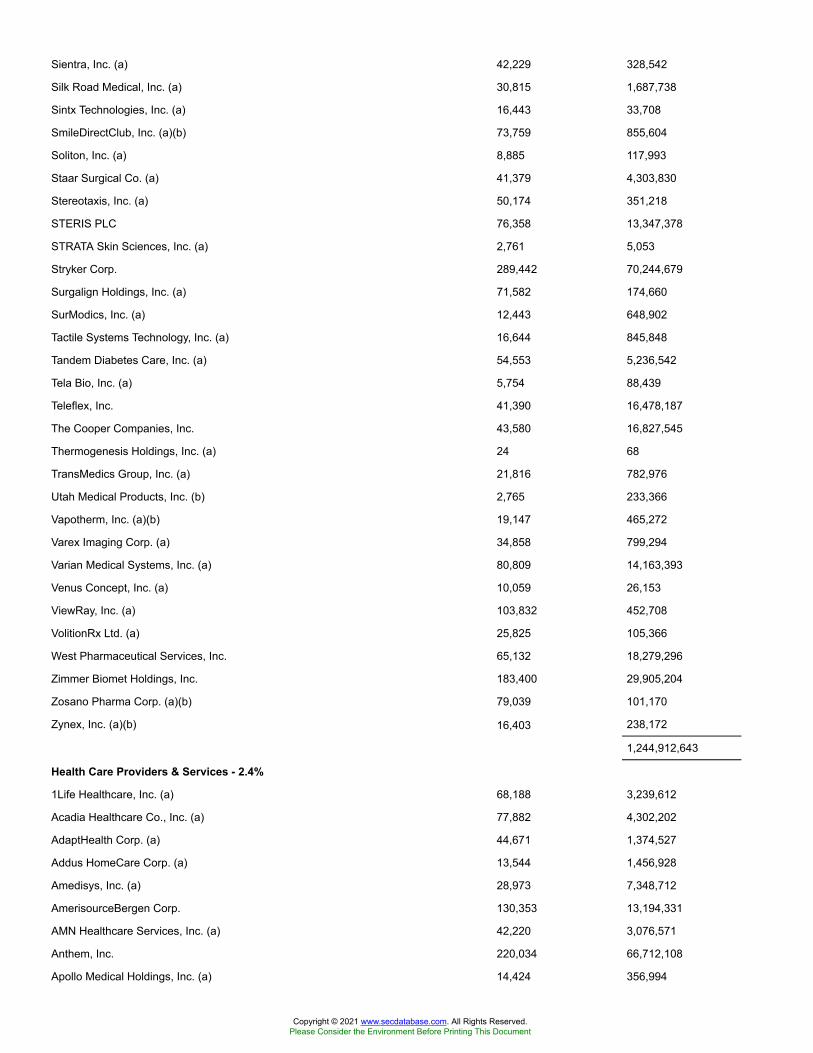
Sientra, Inc. (a) 42,229 328,542
Silk Road Medical, Inc. (a) 30,815 1,687,738
Sintx Technologies, Inc. (a) 16,443 33,708
SmileDirectClub, Inc. (a)(b) 73,759 855,604
Soliton, Inc. (a) 8,885 117,993
Staar Surgical Co. (a) 41,379 4,303,830
Stereotaxis, Inc. (a) 50,174 351,218
STERIS PLC 76,358 13,347,378
STRATA Skin Sciences, Inc. (a) 2,761 5,053
Stryker Corp. 289,442 70,244,679
Surgalign Holdings, Inc. (a) 71,582 174,660
SurModics, Inc. (a) 12,443 648,902
Tactile Systems Technology, Inc. (a) 16,644 845,848
Tandem Diabetes Care, Inc. (a) 54,553 5,236,542
Tela Bio, Inc. (a) 5,754 88,439
Teleflex, Inc. 41,390 16,478,187
The Cooper Companies, Inc. 43,580 16,827,545
Thermogenesis Holdings, Inc. (a) 24 68
TransMedics Group, Inc. (a) 21,816 782,976
Utah Medical Products, Inc. (b) 2,765 233,366
Vapotherm, Inc. (a)(b) 19,147 465,272
Varex Imaging Corp. (a) 34,858 799,294
Varian Medical Systems, Inc. (a) 80,809 14,163,393
Venus Concept, Inc. (a) 10,059 26,153
ViewRay, Inc. (a) 103,832 452,708
VolitionRx Ltd. (a) 25,825 105,366
West Pharmaceutical Services, Inc. 65,132 18,279,296
Zimmer Biomet Holdings, Inc. 183,400 29,905,204
Zosano Pharma Corp. (a)(b) 79,039 101,170
Zynex, Inc. (a)(b) 16,403 238,172
1,244,912,643
Health Care Providers & Services - 2.4%
1Life Healthcare, Inc. (a) 68,188 3,239,612
Acadia Healthcare Co., Inc. (a) 77,882 4,302,202
AdaptHealth Corp. (a) 44,671 1,374,527
Addus HomeCare Corp. (a) 13,544 1,456,928
Amedisys, Inc. (a) 28,973 7,348,712
AmerisourceBergen Corp. 130,353 13,194,331
AMN Healthcare Services, Inc. (a) 42,220 3,076,571
Anthem, Inc. 220,034 66,712,108
Apollo Medical Holdings, Inc. (a) 14,424 356,994
Copyright © 2021 www.secdatabase.com. All Rights Reserved.Please Consider the Environment Before Printing This Document
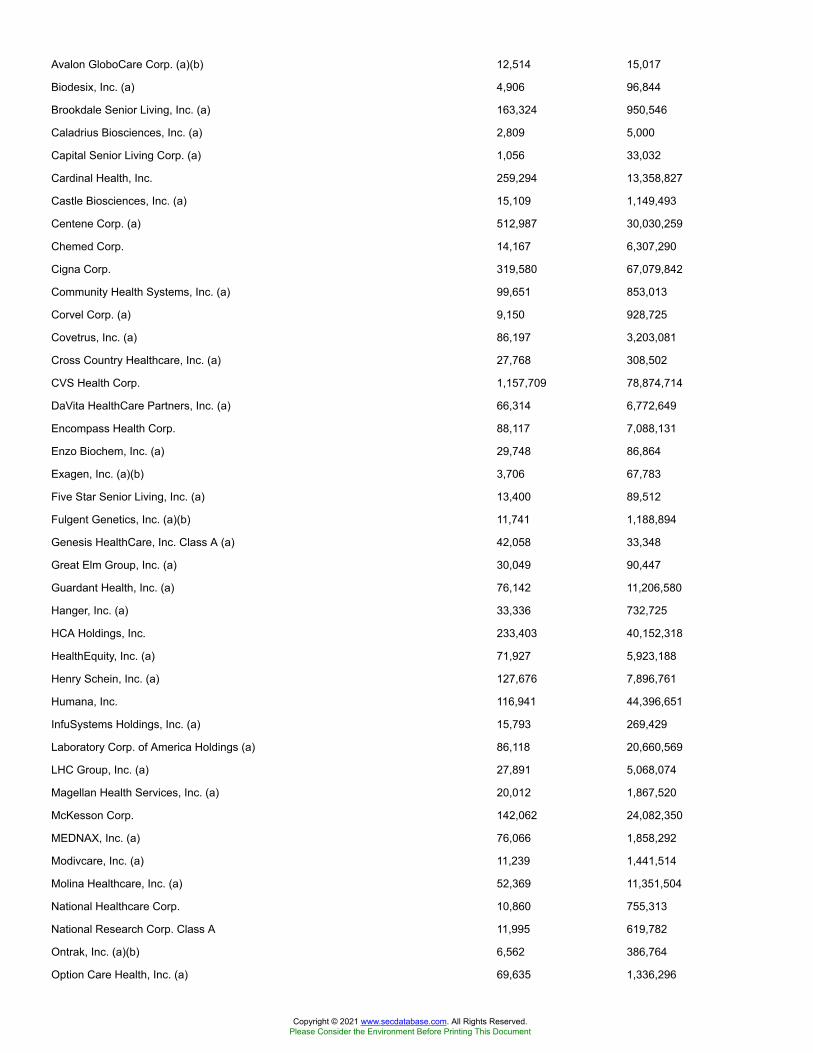
Avalon GloboCare Corp. (a)(b) 12,514 15,017
Biodesix, Inc. (a) 4,906 96,844
Brookdale Senior Living, Inc. (a) 163,324 950,546
Caladrius Biosciences, Inc. (a) 2,809 5,000
Capital Senior Living Corp. (a) 1,056 33,032
Cardinal Health, Inc. 259,294 13,358,827
Castle Biosciences, Inc. (a) 15,109 1,149,493
Centene Corp. (a) 512,987 30,030,259
Chemed Corp. 14,167 6,307,290
Cigna Corp. 319,580 67,079,842
Community Health Systems, Inc. (a) 99,651 853,013
Corvel Corp. (a) 9,150 928,725
Covetrus, Inc. (a) 86,197 3,203,081
Cross Country Healthcare, Inc. (a) 27,768 308,502
CVS Health Corp. 1,157,709 78,874,714
DaVita HealthCare Partners, Inc. (a) 66,314 6,772,649
Encompass Health Corp. 88,117 7,088,131
Enzo Biochem, Inc. (a) 29,748 86,864
Exagen, Inc. (a)(b) 3,706 67,783
Five Star Senior Living, Inc. (a) 13,400 89,512
Fulgent Genetics, Inc. (a)(b) 11,741 1,188,894
Genesis HealthCare, Inc. Class A (a) 42,058 33,348
Great Elm Group, Inc. (a) 30,049 90,447
Guardant Health, Inc. (a) 76,142 11,206,580
Hanger, Inc. (a) 33,336 732,725
HCA Holdings, Inc. 233,403 40,152,318
HealthEquity, Inc. (a) 71,927 5,923,188
Henry Schein, Inc. (a) 127,676 7,896,761
Humana, Inc. 116,941 44,396,651
InfuSystems Holdings, Inc. (a) 15,793 269,429
Laboratory Corp. of America Holdings (a) 86,118 20,660,569
LHC Group, Inc. (a) 27,891 5,068,074
Magellan Health Services, Inc. (a) 20,012 1,867,520
McKesson Corp. 142,062 24,082,350
MEDNAX, Inc. (a) 76,066 1,858,292
Modivcare, Inc. (a) 11,239 1,441,514
Molina Healthcare, Inc. (a) 52,369 11,351,504
National Healthcare Corp. 10,860 755,313
National Research Corp. Class A 11,995 619,782
Ontrak, Inc. (a)(b) 6,562 386,764
Option Care Health, Inc. (a) 69,635 1,336,296
Copyright © 2021 www.secdatabase.com. All Rights Reserved.Please Consider the Environment Before Printing This Document
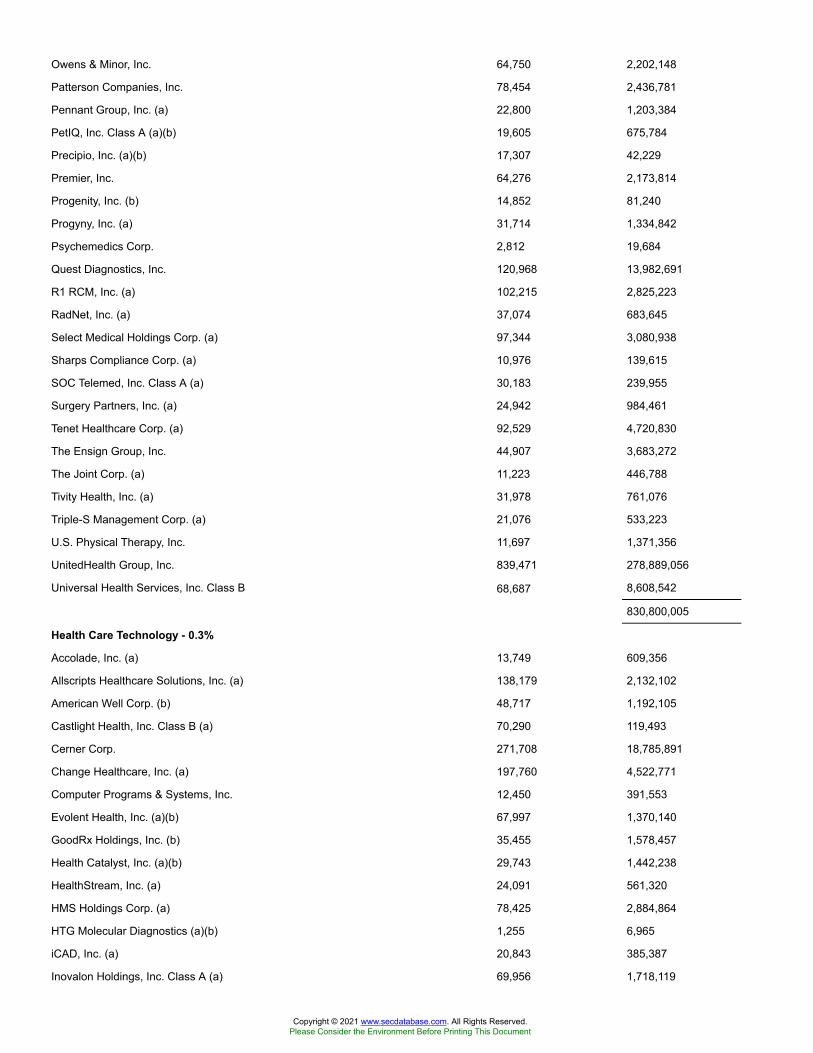
Owens & Minor, Inc. 64,750 2,202,148
Patterson Companies, Inc. 78,454 2,436,781
Pennant Group, Inc. (a) 22,800 1,203,384
PetIQ, Inc. Class A (a)(b) 19,605 675,784
Precipio, Inc. (a)(b) 17,307 42,229
Premier, Inc. 64,276 2,173,814
Progenity, Inc. (b) 14,852 81,240
Progyny, Inc. (a) 31,714 1,334,842
Psychemedics Corp. 2,812 19,684
Quest Diagnostics, Inc. 120,968 13,982,691
R1 RCM, Inc. (a) 102,215 2,825,223
RadNet, Inc. (a) 37,074 683,645
Select Medical Holdings Corp. (a) 97,344 3,080,938
Sharps Compliance Corp. (a) 10,976 139,615
SOC Telemed, Inc. Class A (a) 30,183 239,955
Surgery Partners, Inc. (a) 24,942 984,461
Tenet Healthcare Corp. (a) 92,529 4,720,830
The Ensign Group, Inc. 44,907 3,683,272
The Joint Corp. (a) 11,223 446,788
Tivity Health, Inc. (a) 31,978 761,076
Triple-S Management Corp. (a) 21,076 533,223
U.S. Physical Therapy, Inc. 11,697 1,371,356
UnitedHealth Group, Inc. 839,471 278,889,056
Universal Health Services, Inc. Class B 68,687 8,608,542
830,800,005
Health Care Technology - 0.3%
Accolade, Inc. (a) 13,749 609,356
Allscripts Healthcare Solutions, Inc. (a) 138,179 2,132,102
American Well Corp. (b) 48,717 1,192,105
Castlight Health, Inc. Class B (a) 70,290 119,493
Cerner Corp. 271,708 18,785,891
Change Healthcare, Inc. (a) 197,760 4,522,771
Computer Programs & Systems, Inc. 12,450 391,553
Evolent Health, Inc. (a)(b) 67,997 1,370,140
GoodRx Holdings, Inc. (b) 35,455 1,578,457
Health Catalyst, Inc. (a)(b) 29,743 1,442,238
HealthStream, Inc. (a) 24,091 561,320
HMS Holdings Corp. (a) 78,425 2,884,864
HTG Molecular Diagnostics (a)(b) 1,255 6,965
iCAD, Inc. (a) 20,843 385,387
Inovalon Holdings, Inc. Class A (a) 69,956 1,718,119
Copyright © 2021 www.secdatabase.com. All Rights Reserved.Please Consider the Environment Before Printing This Document
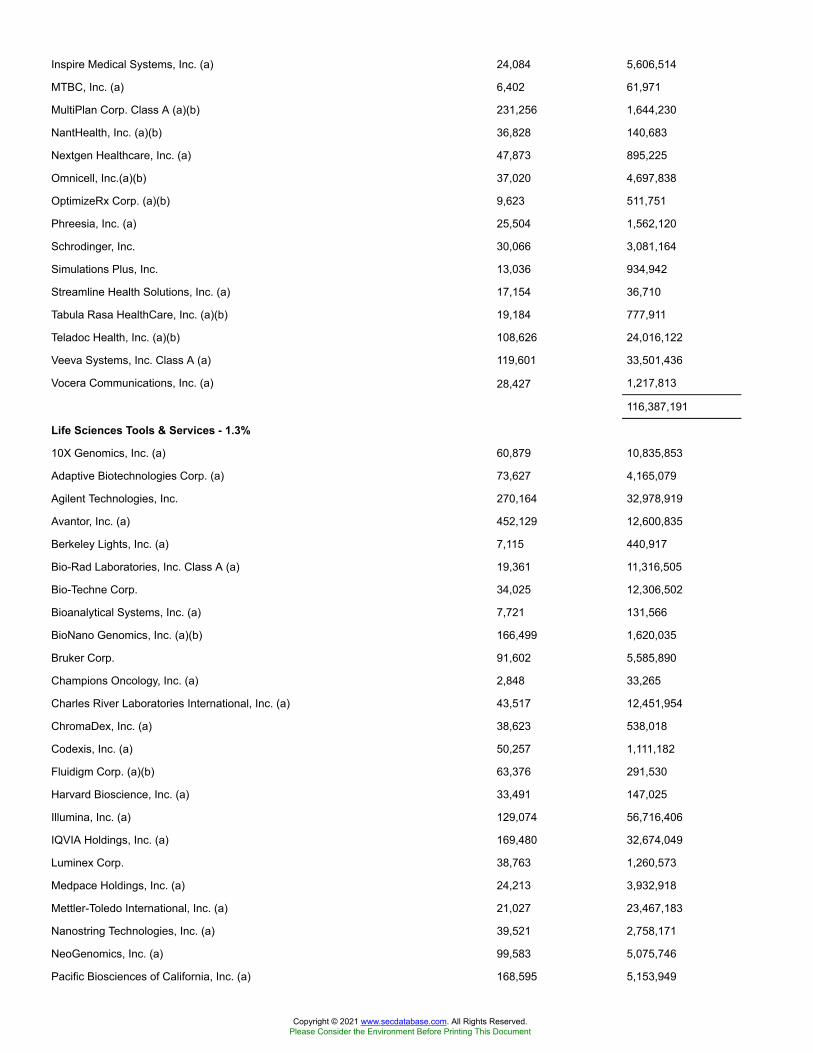
Inspire Medical Systems, Inc. (a) 24,084 5,606,514
MTBC, Inc. (a) 6,402 61,971
MultiPlan Corp. Class A (a)(b) 231,256 1,644,230
NantHealth, Inc. (a)(b) 36,828 140,683
Nextgen Healthcare, Inc. (a) 47,873 895,225
Omnicell, Inc.(a)(b) 37,020 4,697,838
OptimizeRx Corp. (a)(b) 9,623 511,751
Phreesia, Inc. (a) 25,504 1,562,120
Schrodinger, Inc. 30,066 3,081,164
Simulations Plus, Inc. 13,036 934,942
Streamline Health Solutions, Inc. (a) 17,154 36,710
Tabula Rasa HealthCare, Inc. (a)(b) 19,184 777,911
Teladoc Health, Inc. (a)(b) 108,626 24,016,122
Veeva Systems, Inc. Class A (a) 119,601 33,501,436
Vocera Communications, Inc. (a) 28,427 1,217,813
116,387,191
Life Sciences Tools & Services - 1.3%
10X Genomics, Inc. (a) 60,879 10,835,853
Adaptive Biotechnologies Corp. (a) 73,627 4,165,079
Agilent Technologies, Inc. 270,164 32,978,919
Avantor, Inc. (a) 452,129 12,600,835
Berkeley Lights, Inc. (a) 7,115 440,917
Bio-Rad Laboratories, Inc. Class A (a) 19,361 11,316,505
Bio-Techne Corp. 34,025 12,306,502
Bioanalytical Systems, Inc. (a) 7,721 131,566
BioNano Genomics, Inc. (a)(b) 166,499 1,620,035
Bruker Corp. 91,602 5,585,890
Champions Oncology, Inc. (a) 2,848 33,265
Charles River Laboratories International, Inc. (a) 43,517 12,451,954
ChromaDex, Inc. (a) 38,623 538,018
Codexis, Inc. (a) 50,257 1,111,182
Fluidigm Corp. (a)(b) 63,376 291,530
Harvard Bioscience, Inc. (a) 33,491 147,025
Illumina, Inc. (a) 129,074 56,716,406
IQVIA Holdings, Inc. (a) 169,480 32,674,049
Luminex Corp. 38,763 1,260,573
Medpace Holdings, Inc. (a) 24,213 3,932,918
Mettler-Toledo International, Inc. (a) 21,027 23,467,183
Nanostring Technologies, Inc. (a) 39,521 2,758,171
NeoGenomics, Inc. (a) 99,583 5,075,746
Pacific Biosciences of California, Inc. (a) 168,595 5,153,949
Copyright © 2021 www.secdatabase.com. All Rights Reserved.Please Consider the Environment Before Printing This Document
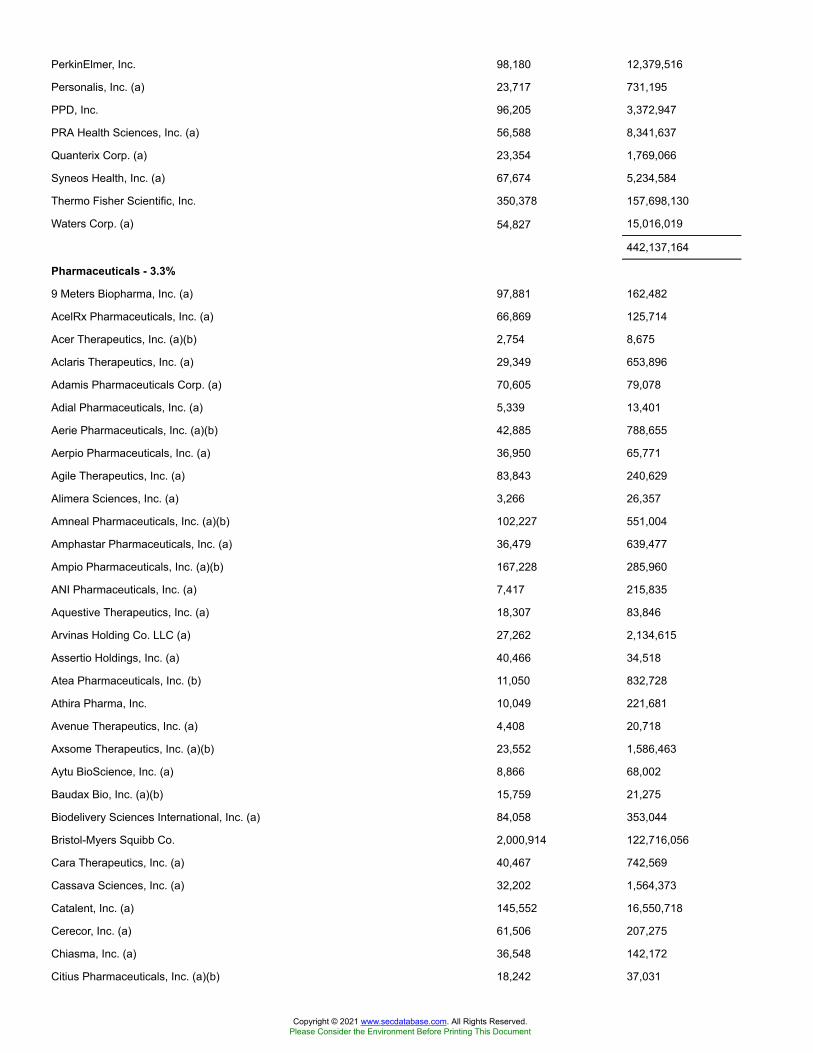
PerkinElmer, Inc. 98,180 12,379,516
Personalis, Inc. (a) 23,717 731,195
PPD, Inc. 96,205 3,372,947
PRA Health Sciences, Inc. (a) 56,588 8,341,637
Quanterix Corp. (a) 23,354 1,769,066
Syneos Health, Inc. (a) 67,674 5,234,584
Thermo Fisher Scientific, Inc. 350,378 157,698,130
Waters Corp. (a) 54,827 15,016,019
442,137,164
Pharmaceuticals - 3.3%
9 Meters Biopharma, Inc. (a) 97,881 162,482
AcelRx Pharmaceuticals, Inc. (a) 66,869 125,714
Acer Therapeutics, Inc. (a)(b) 2,754 8,675
Aclaris Therapeutics, Inc. (a) 29,349 653,896
Adamis Pharmaceuticals Corp. (a) 70,605 79,078
Adial Pharmaceuticals, Inc. (a) 5,339 13,401
Aerie Pharmaceuticals, Inc. (a)(b) 42,885 788,655
Aerpio Pharmaceuticals, Inc. (a) 36,950 65,771
Agile Therapeutics, Inc. (a) 83,843 240,629
Alimera Sciences, Inc. (a) 3,266 26,357
Amneal Pharmaceuticals, Inc. (a)(b) 102,227 551,004
Amphastar Pharmaceuticals, Inc. (a) 36,479 639,477
Ampio Pharmaceuticals, Inc. (a)(b) 167,228 285,960
ANI Pharmaceuticals, Inc. (a) 7,417 215,835
Aquestive Therapeutics, Inc. (a) 18,307 83,846
Arvinas Holding Co. LLC (a) 27,262 2,134,615
Assertio Holdings, Inc. (a) 40,466 34,518
Atea Pharmaceuticals, Inc. (b) 11,050 832,728
Athira Pharma, Inc. 10,049 221,681
Avenue Therapeutics, Inc. (a) 4,408 20,718
Axsome Therapeutics, Inc. (a)(b) 23,552 1,586,463
Aytu BioScience, Inc. (a) 8,866 68,002
Baudax Bio, Inc. (a)(b) 15,759 21,275
Biodelivery Sciences International, Inc. (a) 84,058 353,044
Bristol-Myers Squibb Co. 2,000,914 122,716,056
Cara Therapeutics, Inc. (a) 40,467 742,569
Cassava Sciences, Inc. (a) 32,202 1,564,373
Catalent, Inc. (a) 145,552 16,550,718
Cerecor, Inc. (a) 61,506 207,275
Chiasma, Inc. (a) 36,548 142,172
Citius Pharmaceuticals, Inc. (a)(b) 18,242 37,031
Copyright © 2021 www.secdatabase.com. All Rights Reserved.Please Consider the Environment Before Printing This Document
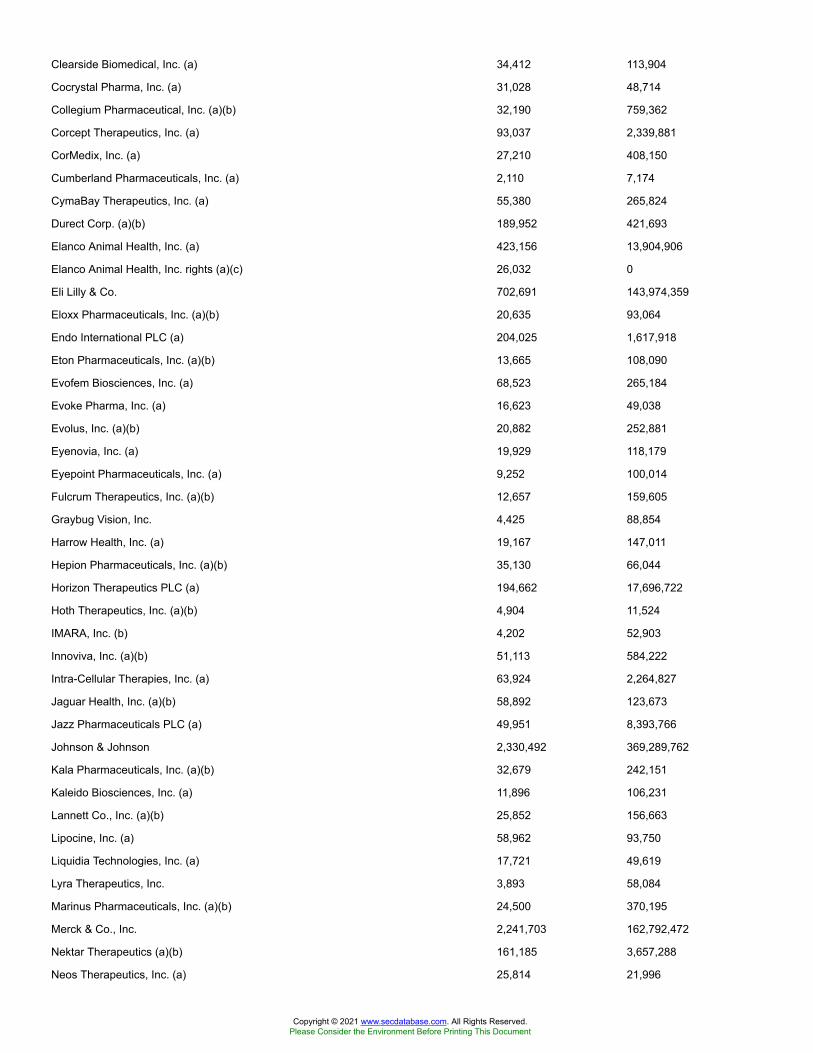
Clearside Biomedical, Inc. (a) 34,412 113,904
Cocrystal Pharma, Inc. (a) 31,028 48,714
Collegium Pharmaceutical, Inc. (a)(b) 32,190 759,362
Corcept Therapeutics, Inc. (a) 93,037 2,339,881
CorMedix, Inc. (a) 27,210 408,150
Cumberland Pharmaceuticals, Inc. (a) 2,110 7,174
CymaBay Therapeutics, Inc. (a) 55,380 265,824
Durect Corp. (a)(b) 189,952 421,693
Elanco Animal Health, Inc. (a) 423,156 13,904,906
Elanco Animal Health, Inc. rights (a)(c) 26,032 0
Eli Lilly & Co. 702,691 143,974,359
Eloxx Pharmaceuticals, Inc. (a)(b) 20,635 93,064
Endo International PLC (a) 204,025 1,617,918
Eton Pharmaceuticals, Inc. (a)(b) 13,665 108,090
Evofem Biosciences, Inc. (a) 68,523 265,184
Evoke Pharma, Inc. (a) 16,623 49,038
Evolus, Inc. (a)(b) 20,882 252,881
Eyenovia, Inc. (a) 19,929 118,179
Eyepoint Pharmaceuticals, Inc. (a) 9,252 100,014
Fulcrum Therapeutics, Inc. (a)(b) 12,657 159,605
Graybug Vision, Inc. 4,425 88,854
Harrow Health, Inc. (a) 19,167 147,011
Hepion Pharmaceuticals, Inc. (a)(b) 35,130 66,044
Horizon Therapeutics PLC (a) 194,662 17,696,722
Hoth Therapeutics, Inc. (a)(b) 4,904 11,524
IMARA, Inc. (b) 4,202 52,903
Innoviva, Inc. (a)(b) 51,113 584,222
Intra-Cellular Therapies, Inc. (a) 63,924 2,264,827
Jaguar Health, Inc. (a)(b) 58,892 123,673
Jazz Pharmaceuticals PLC (a) 49,951 8,393,766
Johnson & Johnson 2,330,492 369,289,762
Kala Pharmaceuticals, Inc. (a)(b) 32,679 242,151
Kaleido Biosciences, Inc. (a) 11,896 106,231
Lannett Co., Inc. (a)(b) 25,852 156,663
Lipocine, Inc. (a) 58,962 93,750
Liquidia Technologies, Inc. (a) 17,721 49,619
Lyra Therapeutics, Inc. 3,893 58,084
Marinus Pharmaceuticals, Inc. (a)(b) 24,500 370,195
Merck & Co., Inc. 2,241,703 162,792,472
Nektar Therapeutics (a)(b) 161,185 3,657,288
Neos Therapeutics, Inc. (a) 25,814 21,996
Copyright © 2021 www.secdatabase.com. All Rights Reserved.Please Consider the Environment Before Printing This Document
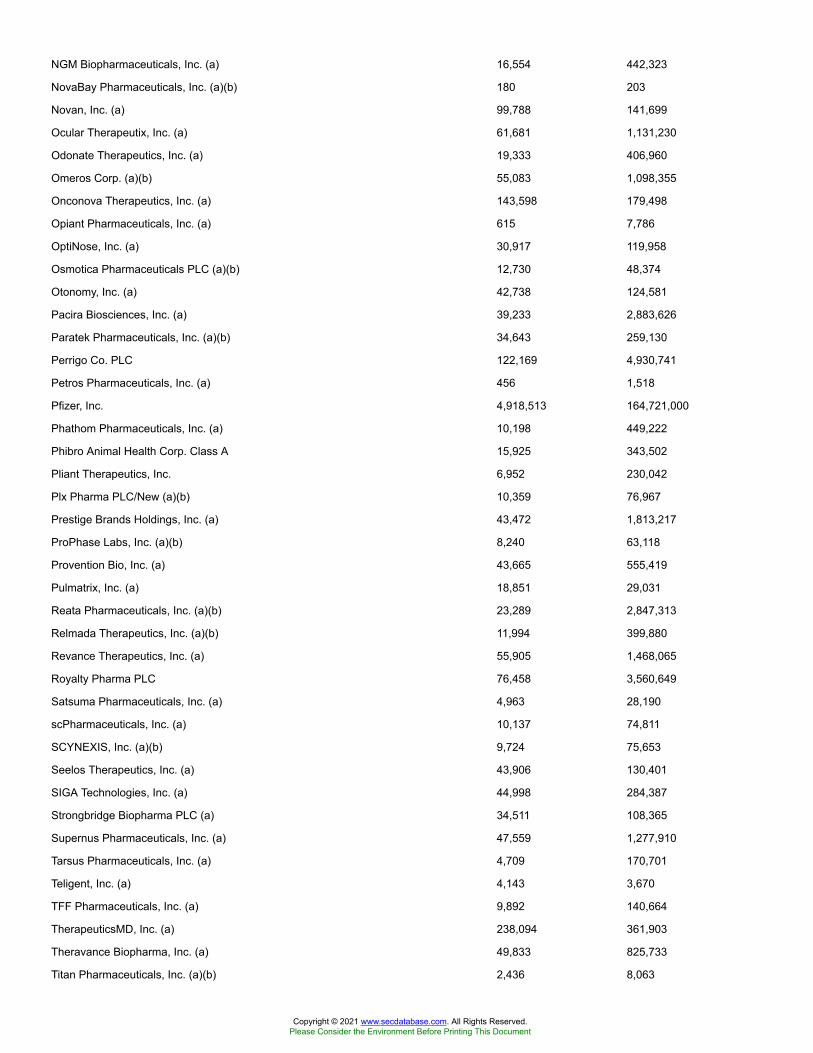
NGM Biopharmaceuticals, Inc. (a) 16,554 442,323
NovaBay Pharmaceuticals, Inc. (a)(b) 180 203
Novan, Inc. (a) 99,788 141,699
Ocular Therapeutix, Inc. (a) 61,681 1,131,230
Odonate Therapeutics, Inc. (a) 19,333 406,960
Omeros Corp. (a)(b) 55,083 1,098,355
Onconova Therapeutics, Inc. (a) 143,598 179,498
Opiant Pharmaceuticals, Inc. (a) 615 7,786
OptiNose, Inc. (a) 30,917 119,958
Osmotica Pharmaceuticals PLC (a)(b) 12,730 48,374
Otonomy, Inc. (a) 42,738 124,581
Pacira Biosciences, Inc. (a) 39,233 2,883,626
Paratek Pharmaceuticals, Inc. (a)(b) 34,643 259,130
Perrigo Co. PLC 122,169 4,930,741
Petros Pharmaceuticals, Inc. (a) 456 1,518
Pfizer, Inc. 4,918,513 164,721,000
Phathom Pharmaceuticals, Inc. (a) 10,198 449,222
Phibro Animal Health Corp. Class A 15,925 343,502
Pliant Therapeutics, Inc. 6,952 230,042
Plx Pharma PLC/New (a)(b) 10,359 76,967
Prestige Brands Holdings, Inc. (a) 43,472 1,813,217
ProPhase Labs, Inc. (a)(b) 8,240 63,118
Provention Bio, Inc. (a) 43,665 555,419
Pulmatrix, Inc. (a) 18,851 29,031
Reata Pharmaceuticals, Inc. (a)(b) 23,289 2,847,313
Relmada Therapeutics, Inc. (a)(b) 11,994 399,880
Revance Therapeutics, Inc. (a) 55,905 1,468,065
Royalty Pharma PLC 76,458 3,560,649
Satsuma Pharmaceuticals, Inc. (a) 4,963 28,190
scPharmaceuticals, Inc. (a) 10,137 74,811
SCYNEXIS, Inc. (a)(b) 9,724 75,653
Seelos Therapeutics, Inc. (a) 43,906 130,401
SIGA Technologies, Inc. (a) 44,998 284,387
Strongbridge Biopharma PLC (a) 34,511 108,365
Supernus Pharmaceuticals, Inc. (a) 47,559 1,277,910
Tarsus Pharmaceuticals, Inc. (a) 4,709 170,701
Teligent, Inc. (a) 4,143 3,670
TFF Pharmaceuticals, Inc. (a) 9,892 140,664
TherapeuticsMD, Inc. (a) 238,094 361,903
Theravance Biopharma, Inc. (a) 49,833 825,733
Titan Pharmaceuticals, Inc. (a)(b) 2,436 8,063
Copyright © 2021 www.secdatabase.com. All Rights Reserved.Please Consider the Environment Before Printing This Document
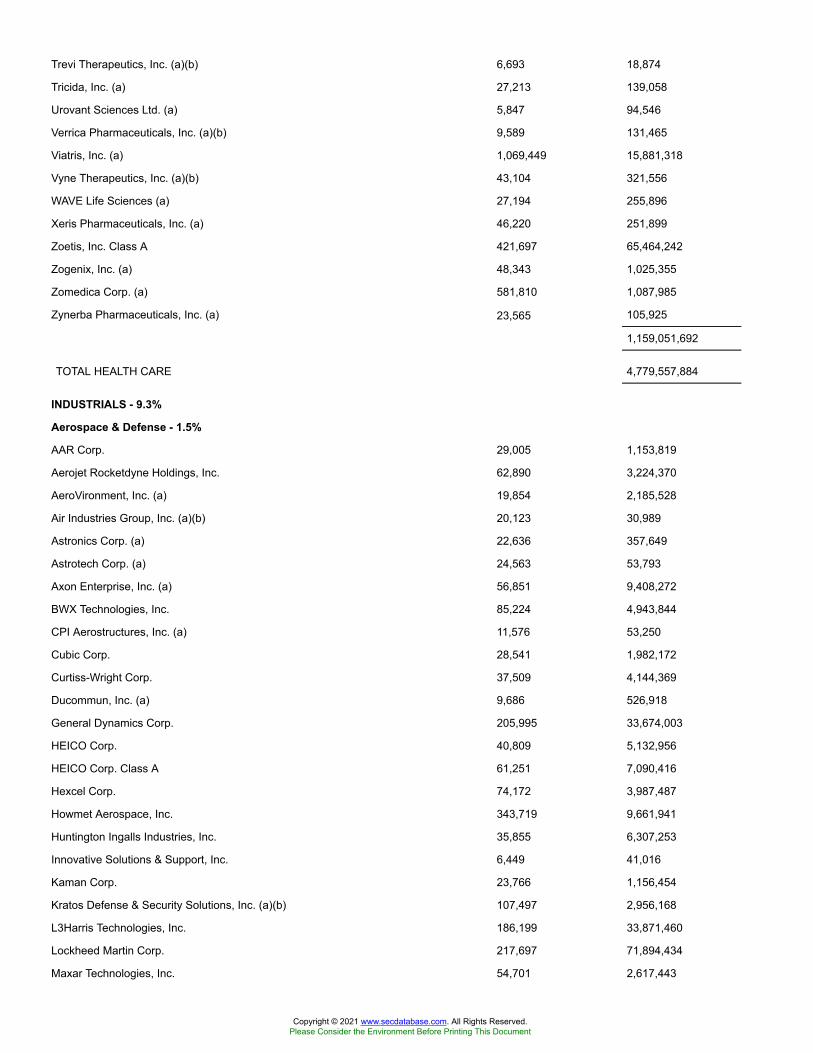
Trevi Therapeutics, Inc. (a)(b) 6,693 18,874
Tricida, Inc. (a) 27,213 139,058
Urovant Sciences Ltd. (a) 5,847 94,546
Verrica Pharmaceuticals, Inc. (a)(b) 9,589 131,465
Viatris, Inc. (a) 1,069,449 15,881,318
Vyne Therapeutics, Inc. (a)(b) 43,104 321,556
WAVE Life Sciences (a) 27,194 255,896
Xeris Pharmaceuticals, Inc. (a) 46,220 251,899
Zoetis, Inc. Class A 421,697 65,464,242
Zogenix, Inc. (a) 48,343 1,025,355
Zomedica Corp. (a) 581,810 1,087,985
Zynerba Pharmaceuticals, Inc. (a) 23,565 105,925
1,159,051,692
TOTAL HEALTH CARE 4,779,557,884
INDUSTRIALS - 9.3%
Aerospace & Defense - 1.5%
AAR Corp. 29,005 1,153,819
Aerojet Rocketdyne Holdings, Inc. 62,890 3,224,370
AeroVironment, Inc. (a) 19,854 2,185,528
Air Industries Group, Inc. (a)(b) 20,123 30,989
Astronics Corp. (a) 22,636 357,649
Astrotech Corp. (a) 24,563 53,793
Axon Enterprise, Inc. (a) 56,851 9,408,272
BWX Technologies, Inc. 85,224 4,943,844
CPI Aerostructures, Inc. (a) 11,576 53,250
Cubic Corp. 28,541 1,982,172
Curtiss-Wright Corp. 37,509 4,144,369
Ducommun, Inc. (a) 9,686 526,918
General Dynamics Corp. 205,995 33,674,003
HEICO Corp. 40,809 5,132,956
HEICO Corp. Class A 61,251 7,090,416
Hexcel Corp. 74,172 3,987,487
Howmet Aerospace, Inc. 343,719 9,661,941
Huntington Ingalls Industries, Inc. 35,855 6,307,253
Innovative Solutions & Support, Inc. 6,449 41,016
Kaman Corp. 23,766 1,156,454
Kratos Defense & Security Solutions, Inc. (a)(b) 107,497 2,956,168
L3Harris Technologies, Inc. 186,199 33,871,460
Lockheed Martin Corp. 217,697 71,894,434
Maxar Technologies, Inc. 54,701 2,617,443
Copyright © 2021 www.secdatabase.com. All Rights Reserved.Please Consider the Environment Before Printing This Document

Mercury Systems, Inc. (a) 49,848 3,258,065
Moog, Inc. Class A 25,926 2,013,413
National Presto Industries, Inc. 4,244 434,289
Northrop Grumman Corp. 137,225 40,023,044
PAE, Inc. (a) 59,526 486,327
Park Aerospace Corp. (b) 15,269 212,086
Parsons Corp. (a) 20,515 733,206
Raytheon Technologies Corp. 1,343,649 96,729,292
SIFCO Industries, Inc. (a) 6,229 50,579
Spirit AeroSystems Holdings, Inc. Class A 95,043 4,070,692
Teledyne Technologies, Inc. (a) 32,516 12,063,436
Textron, Inc. 202,677 10,202,760
The Boeing Co. 469,080 99,449,651
TransDigm Group, Inc. (a) 48,160 27,772,427
Triumph Group, Inc. 44,423 647,243
Vectrus, Inc. (a) 10,787 588,970
Virgin Galactic Holdings, Inc. (a)(b) 115,940 4,316,446
VirTra, Inc. (a)(b) 3,889 22,167
509,530,097
Air Freight & Logistics - 0.6%
Air Transport Services Group, Inc. (a) 55,004 1,459,806
Atlas Air Worldwide Holdings, Inc. (a) 22,887 1,261,760
C.H. Robinson Worldwide, Inc. 120,174 10,917,808
Echo Global Logistics, Inc. (a) 24,158 673,042
Expeditors International of Washington, Inc. 150,289 13,802,542
FedEx Corp. 213,042 54,219,189
Forward Air Corp. 26,415 2,265,615
Hub Group, Inc. Class A (a) 28,505 1,641,318
Radiant Logistics, Inc. (a) 33,553 227,154
United Parcel Service, Inc. Class B 632,543 99,834,262
XPO Logistics, Inc. (a) 80,424 9,377,438
195,679,934
Airlines - 0.3%
Alaska Air Group, Inc. 108,896 7,080,418
Allegiant Travel Co. 11,719 2,955,415
American Airlines Group, Inc. 535,528 11,213,956
Delta Air Lines, Inc. 562,694 26,975,550
Hawaiian Holdings, Inc. 40,425 1,084,199
JetBlue Airways Corp. (a) 280,174 5,163,607
Mesa Air Group, Inc. (a) 28,046 342,161
SkyWest, Inc. 45,417 2,560,156
Copyright © 2021 www.secdatabase.com. All Rights Reserved.Please Consider the Environment Before Printing This Document
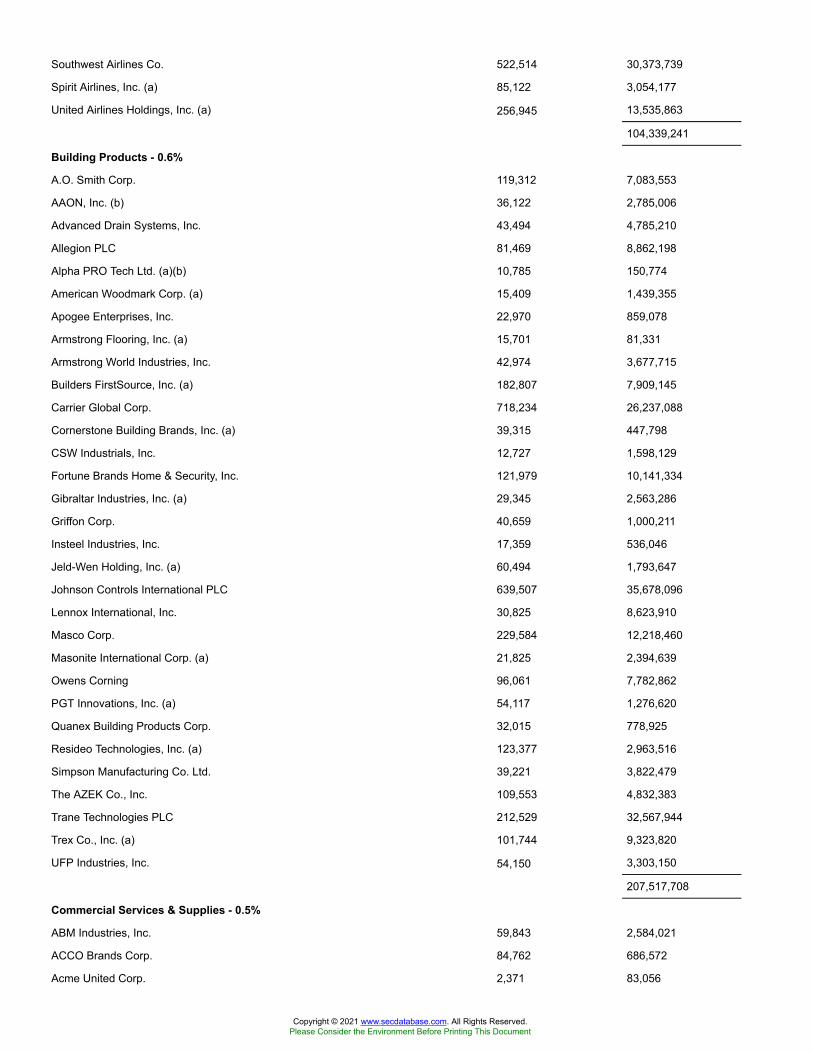
Southwest Airlines Co. 522,514 30,373,739
Spirit Airlines, Inc. (a) 85,122 3,054,177
United Airlines Holdings, Inc. (a) 256,945 13,535,863
104,339,241
Building Products - 0.6%
A.O. Smith Corp. 119,312 7,083,553
AAON, Inc. (b) 36,122 2,785,006
Advanced Drain Systems, Inc. 43,494 4,785,210
Allegion PLC 81,469 8,862,198
Alpha PRO Tech Ltd. (a)(b) 10,785 150,774
American Woodmark Corp. (a) 15,409 1,439,355
Apogee Enterprises, Inc. 22,970 859,078
Armstrong Flooring, Inc. (a) 15,701 81,331
Armstrong World Industries, Inc. 42,974 3,677,715
Builders FirstSource, Inc. (a) 182,807 7,909,145
Carrier Global Corp. 718,234 26,237,088
Cornerstone Building Brands, Inc. (a) 39,315 447,798
CSW Industrials, Inc. 12,727 1,598,129
Fortune Brands Home & Security, Inc. 121,979 10,141,334
Gibraltar Industries, Inc. (a) 29,345 2,563,286
Griffon Corp. 40,659 1,000,211
Insteel Industries, Inc. 17,359 536,046
Jeld-Wen Holding, Inc. (a) 60,494 1,793,647
Johnson Controls International PLC 639,507 35,678,096
Lennox International, Inc. 30,825 8,623,910
Masco Corp. 229,584 12,218,460
Masonite International Corp. (a) 21,825 2,394,639
Owens Corning 96,061 7,782,862
PGT Innovations, Inc. (a) 54,117 1,276,620
Quanex Building Products Corp. 32,015 778,925
Resideo Technologies, Inc. (a) 123,377 2,963,516
Simpson Manufacturing Co. Ltd. 39,221 3,822,479
The AZEK Co., Inc. 109,553 4,832,383
Trane Technologies PLC 212,529 32,567,944
Trex Co., Inc. (a) 101,744 9,323,820
UFP Industries, Inc. 54,150 3,303,150
207,517,708
Commercial Services & Supplies - 0.5%
ABM Industries, Inc. 59,843 2,584,021
ACCO Brands Corp. 84,762 686,572
Acme United Corp. 2,371 83,056
Copyright © 2021 www.secdatabase.com. All Rights Reserved.Please Consider the Environment Before Printing This Document
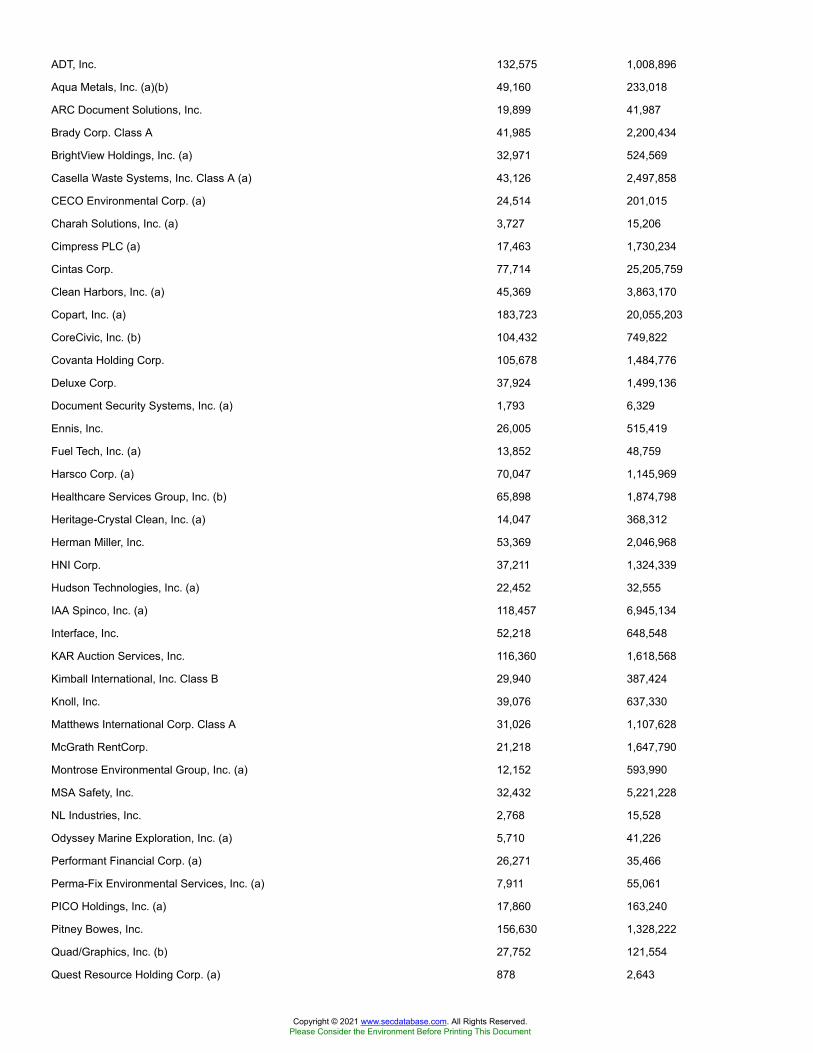
ADT, Inc. 132,575 1,008,896
Aqua Metals, Inc. (a)(b) 49,160 233,018
ARC Document Solutions, Inc. 19,899 41,987
Brady Corp. Class A 41,985 2,200,434
BrightView Holdings, Inc. (a) 32,971 524,569
Casella Waste Systems, Inc. Class A (a) 43,126 2,497,858
CECO Environmental Corp. (a) 24,514 201,015
Charah Solutions, Inc. (a) 3,727 15,206
Cimpress PLC (a) 17,463 1,730,234
Cintas Corp. 77,714 25,205,759
Clean Harbors, Inc. (a) 45,369 3,863,170
Copart, Inc. (a) 183,723 20,055,203
CoreCivic, Inc. (b) 104,432 749,822
Covanta Holding Corp. 105,678 1,484,776
Deluxe Corp. 37,924 1,499,136
Document Security Systems, Inc. (a) 1,793 6,329
Ennis, Inc. 26,005 515,419
Fuel Tech, Inc. (a) 13,852 48,759
Harsco Corp. (a) 70,047 1,145,969
Healthcare Services Group, Inc. (b) 65,898 1,874,798
Heritage-Crystal Clean, Inc. (a) 14,047 368,312
Herman Miller, Inc. 53,369 2,046,968
HNI Corp. 37,211 1,324,339
Hudson Technologies, Inc. (a) 22,452 32,555
IAA Spinco, Inc. (a) 118,457 6,945,134
Interface, Inc. 52,218 648,548
KAR Auction Services, Inc. 116,360 1,618,568
Kimball International, Inc. Class B 29,940 387,424
Knoll, Inc. 39,076 637,330
Matthews International Corp. Class A 31,026 1,107,628
McGrath RentCorp. 21,218 1,647,790
Montrose Environmental Group, Inc. (a) 12,152 593,990
MSA Safety, Inc. 32,432 5,221,228
NL Industries, Inc. 2,768 15,528
Odyssey Marine Exploration, Inc. (a) 5,710 41,226
Performant Financial Corp. (a) 26,271 35,466
Perma-Fix Environmental Services, Inc. (a) 7,911 55,061
PICO Holdings, Inc. (a) 17,860 163,240
Pitney Bowes, Inc. 156,630 1,328,222
Quad/Graphics, Inc. (b) 27,752 121,554
Quest Resource Holding Corp. (a) 878 2,643
Copyright © 2021 www.secdatabase.com. All Rights Reserved.Please Consider the Environment Before Printing This Document

R.R. Donnelley & Sons Co. 58,140 197,676
Recycling Asset Holdings, Inc. (a)(c) 478 17
Republic Services, Inc. 188,480 16,791,683
Rollins, Inc. 197,646 6,555,918
SP Plus Corp. (a) 18,865 625,375
Steelcase, Inc. Class A 75,396 1,051,020
Stericycle, Inc. (a) 81,922 5,314,280
Team, Inc. (a) 27,624 306,350
Tetra Tech, Inc. 47,321 6,547,807
The Brink's Co. 43,939 3,375,833
TOMI Environmental Solutions, Inc. (a)(b) 10,144 43,011
U.S. Ecology, Inc. (a) 30,878 1,179,848
UniFirst Corp. 13,768 3,335,849
Viad Corp. 17,824 745,756
Virco Manufacturing Co. (a) 791 2,452
VSE Corp. 6,870 264,907
Waste Management, Inc. 345,400 38,301,406
177,237,948
Construction & Engineering - 0.2%
AECOM (a) 134,149 7,765,886
Aegion Corp. (a) 24,806 641,235
Ameresco, Inc. Class A (a)(b) 17,640 1,007,597
API Group Corp. (a)(d) 124,775 2,308,338
Arcosa, Inc. 43,717 2,480,065
Argan, Inc. 15,285 764,556
Comfort Systems U.S.A., Inc. 33,470 2,073,132
Concrete Pumping Holdings, Inc. (a) 19,351 119,202
Construction Partners, Inc. Class A (a) 29,695 859,373
Dycom Industries, Inc. (a) 27,515 2,107,099
EMCOR Group, Inc. 49,081 4,779,017
Fluor Corp. (b) 111,845 1,919,260
Granite Construction, Inc. (b) 40,498 1,392,321
Great Lakes Dredge & Dock Corp. (a) 57,407 872,012
HC2 Holdings, Inc. (a) 41,773 146,206
IES Holdings, Inc. (a) 18,500 848,040
Infrastructure and Energy Alternatives, Inc. (a)(b) 9,666 161,132
iSun, Inc. (a)(b) 3,437 47,087
Jacobs Engineering Group, Inc. 115,702 13,314,986
Limbach Holdings, Inc. (a) 4,235 52,006
MasTec, Inc. (a) 49,923 4,330,820
Matrix Service Co. (a) 21,025 285,309
Copyright © 2021 www.secdatabase.com. All Rights Reserved.Please Consider the Environment Before Printing This Document

MYR Group, Inc. (a) 15,180 894,861
Northwest Pipe Co. (a) 7,886 268,361
NV5 Global, Inc. (a) 9,833 1,015,356
Orbital Energy Group, Inc. (a)(b) 26,296 163,035
Orion Group Holdings, Inc. (a) 21,541 125,584
Primoris Services Corp. 38,338 1,283,173
Quanta Services, Inc. 121,858 10,217,793
SG Blocks, Inc. (a)(b) 12,110 61,519
Sterling Construction Co., Inc. (a) 26,135 595,355
Tutor Perini Corp. (a) 35,018 514,765
Valmont Industries, Inc. 18,971 4,487,211
Willscot Mobile Mini Holdings (a) 152,954 4,241,414
72,143,106
Electrical Equipment - 0.7%
Acuity Brands, Inc. 32,399 3,994,797
Allied Motion Technologies, Inc. 8,140 395,116
American Superconductor Corp. (a) 21,801 518,646
AMETEK, Inc. 204,033 24,069,773
Atkore, Inc. (a) 41,693 2,820,531
Ault Global Holdings, Inc. (a) 4,896 19,829
AZZ, Inc. 23,171 1,183,806
Babcock & Wilcox Enterprises, Inc. (a) 53,263 377,102
Beam Global (a)(b) 5,197 219,002
Bloom Energy Corp. Class A (a) 103,353 2,948,661
Broadwind, Inc. (a) 14,244 99,566
Capstone Turbine Corp. (a)(b) 9,999 83,392
Eaton Corp. PLC 352,213 45,854,610
Emerson Electric Co. 528,312 45,382,001
Encore Wire Corp. 18,730 1,227,377
Energous Corp. (a)(b) 29,472 128,498
Energy Focus, Inc. (a)(b) 7,456 38,697
EnerSys 38,113 3,440,842
Espey Manufacturing & Electronics Corp. 594 11,464
Flux Power Holdings, Inc. (b) 6,814 87,764
FuelCell Energy, Inc. (a) 284,962 4,827,256
Generac Holdings, Inc. (a) 55,220 18,198,303
GrafTech International Ltd. 97,605 1,154,667
Hubbell, Inc. Class B 48,353 8,583,141
Ideal Power, Inc. (a) 1,124 19,299
LSI Industries, Inc. 22,994 207,406
nVent Electric PLC 149,883 3,935,928
Copyright © 2021 www.secdatabase.com. All Rights Reserved.Please Consider the Environment Before Printing This Document
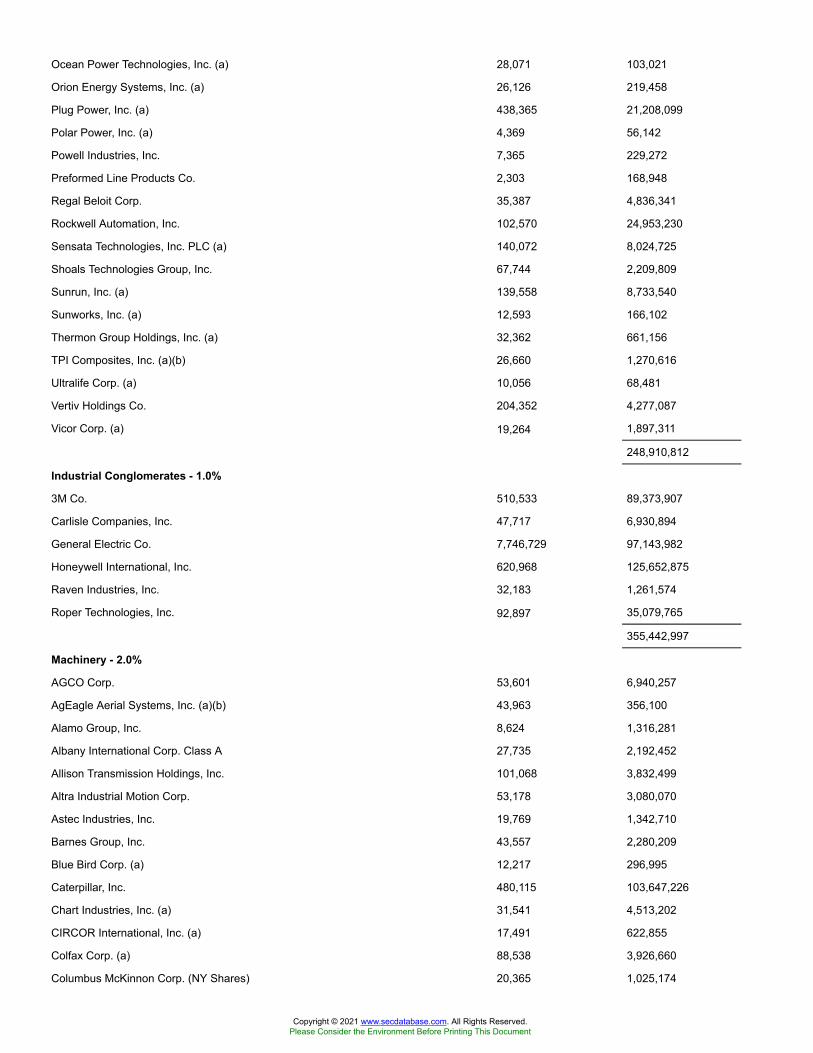
Ocean Power Technologies, Inc. (a) 28,071 103,021
Orion Energy Systems, Inc. (a) 26,126 219,458
Plug Power, Inc. (a) 438,365 21,208,099
Polar Power, Inc. (a) 4,369 56,142
Powell Industries, Inc. 7,365 229,272
Preformed Line Products Co. 2,303 168,948
Regal Beloit Corp. 35,387 4,836,341
Rockwell Automation, Inc. 102,570 24,953,230
Sensata Technologies, Inc. PLC (a) 140,072 8,024,725
Shoals Technologies Group, Inc. 67,744 2,209,809
Sunrun, Inc. (a) 139,558 8,733,540
Sunworks, Inc. (a) 12,593 166,102
Thermon Group Holdings, Inc. (a) 32,362 661,156
TPI Composites, Inc. (a)(b) 26,660 1,270,616
Ultralife Corp. (a) 10,056 68,481
Vertiv Holdings Co. 204,352 4,277,087
Vicor Corp. (a) 19,264 1,897,311
248,910,812
Industrial Conglomerates - 1.0%
3M Co. 510,533 89,373,907
Carlisle Companies, Inc. 47,717 6,930,894
General Electric Co. 7,746,729 97,143,982
Honeywell International, Inc. 620,968 125,652,875
Raven Industries, Inc. 32,183 1,261,574
Roper Technologies, Inc. 92,897 35,079,765
355,442,997
Machinery - 2.0%
AGCO Corp. 53,601 6,940,257
AgEagle Aerial Systems, Inc. (a)(b) 43,963 356,100
Alamo Group, Inc. 8,624 1,316,281
Albany International Corp. Class A 27,735 2,192,452
Allison Transmission Holdings, Inc. 101,068 3,832,499
Altra Industrial Motion Corp. 53,178 3,080,070
Astec Industries, Inc. 19,769 1,342,710
Barnes Group, Inc. 43,557 2,280,209
Blue Bird Corp. (a) 12,217 296,995
Caterpillar, Inc. 480,115 103,647,226
Chart Industries, Inc. (a) 31,541 4,513,202
CIRCOR International, Inc. (a) 17,491 622,855
Colfax Corp. (a) 88,538 3,926,660
Columbus McKinnon Corp. (NY Shares) 20,365 1,025,174
Copyright © 2021 www.secdatabase.com. All Rights Reserved.Please Consider the Environment Before Printing This Document
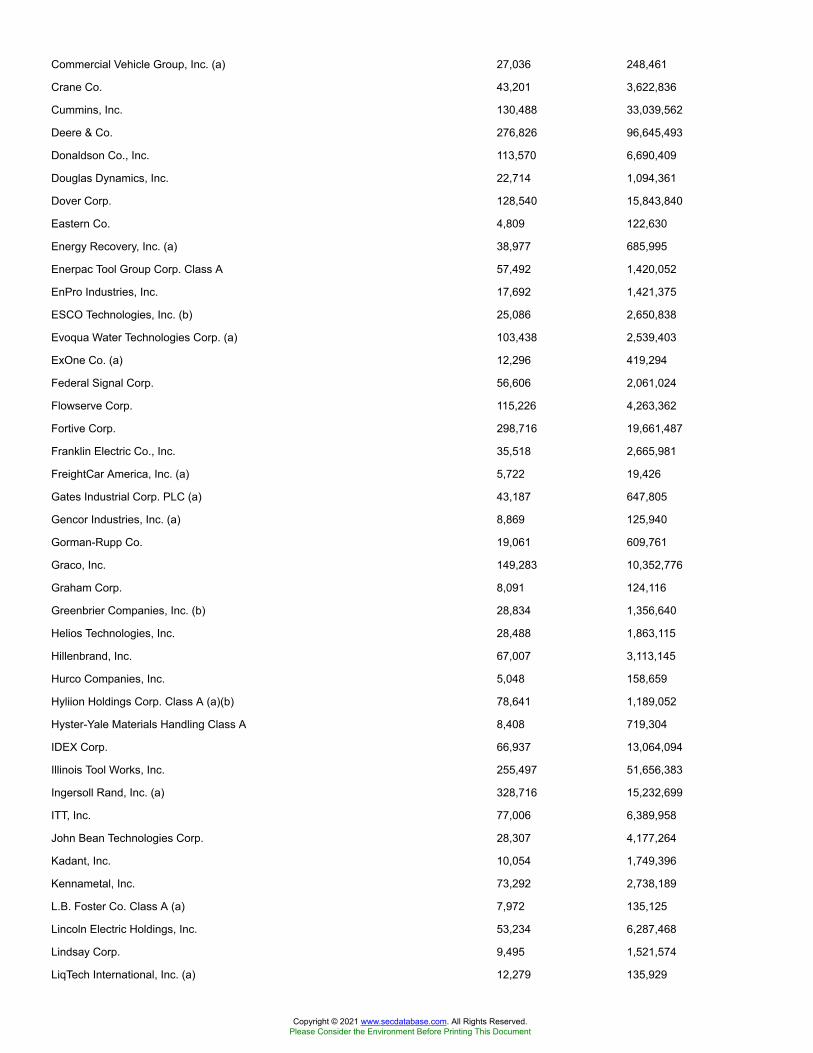
Commercial Vehicle Group, Inc. (a) 27,036 248,461
Crane Co. 43,201 3,622,836
Cummins, Inc. 130,488 33,039,562
Deere & Co. 276,826 96,645,493
Donaldson Co., Inc. 113,570 6,690,409
Douglas Dynamics, Inc. 22,714 1,094,361
Dover Corp. 128,540 15,843,840
Eastern Co. 4,809 122,630
Energy Recovery, Inc. (a) 38,977 685,995
Enerpac Tool Group Corp. Class A 57,492 1,420,052
EnPro Industries, Inc. 17,692 1,421,375
ESCO Technologies, Inc. (b) 25,086 2,650,838
Evoqua Water Technologies Corp. (a) 103,438 2,539,403
ExOne Co. (a) 12,296 419,294
Federal Signal Corp. 56,606 2,061,024
Flowserve Corp. 115,226 4,263,362
Fortive Corp. 298,716 19,661,487
Franklin Electric Co., Inc. 35,518 2,665,981
FreightCar America, Inc. (a) 5,722 19,426
Gates Industrial Corp. PLC (a) 43,187 647,805
Gencor Industries, Inc. (a) 8,869 125,940
Gorman-Rupp Co. 19,061 609,761
Graco, Inc. 149,283 10,352,776
Graham Corp. 8,091 124,116
Greenbrier Companies, Inc. (b) 28,834 1,356,640
Helios Technologies, Inc. 28,488 1,863,115
Hillenbrand, Inc. 67,007 3,113,145
Hurco Companies, Inc. 5,048 158,659
Hyliion Holdings Corp. Class A (a)(b) 78,641 1,189,052
Hyster-Yale Materials Handling Class A 8,408 719,304
IDEX Corp. 66,937 13,064,094
Illinois Tool Works, Inc. 255,497 51,656,383
Ingersoll Rand, Inc. (a) 328,716 15,232,699
ITT, Inc. 77,006 6,389,958
John Bean Technologies Corp. 28,307 4,177,264
Kadant, Inc. 10,054 1,749,396
Kennametal, Inc. 73,292 2,738,189
L.B. Foster Co. Class A (a) 7,972 135,125
Lincoln Electric Holdings, Inc. 53,234 6,287,468
Lindsay Corp. 9,495 1,521,574
LiqTech International, Inc. (a) 12,279 135,929
Copyright © 2021 www.secdatabase.com. All Rights Reserved.Please Consider the Environment Before Printing This Document
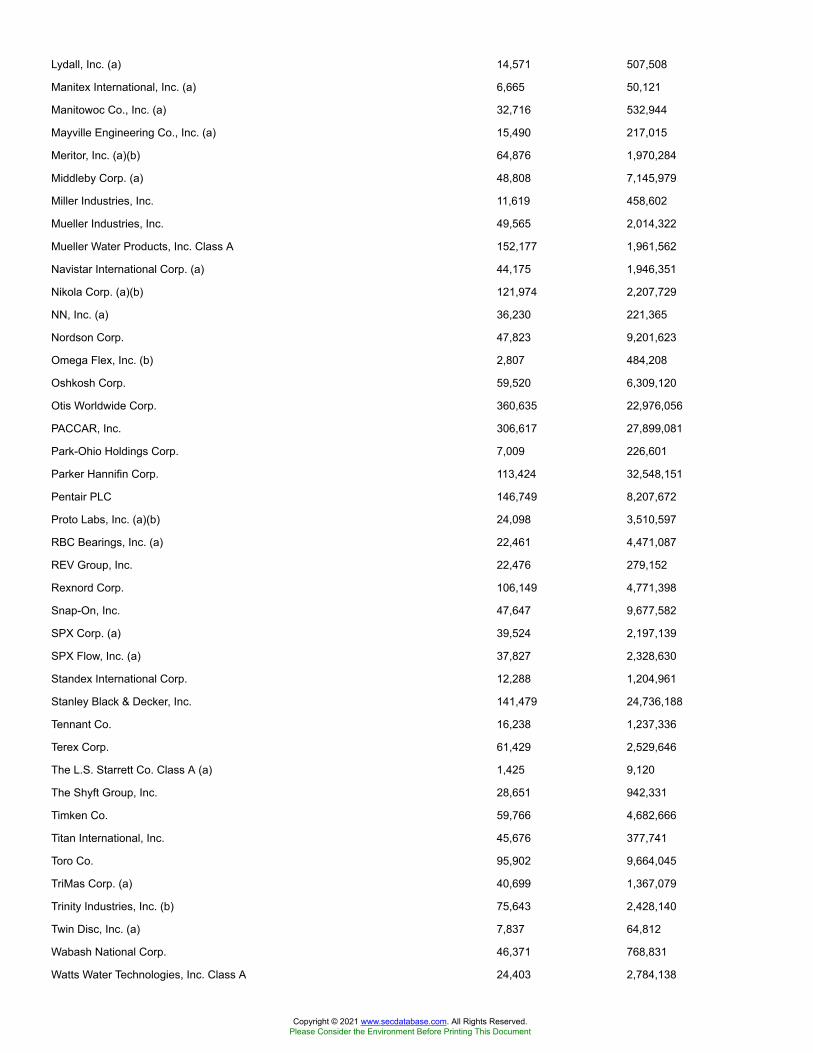
Lydall, Inc. (a) 14,571 507,508
Manitex International, Inc. (a) 6,665 50,121
Manitowoc Co., Inc. (a) 32,716 532,944
Mayville Engineering Co., Inc. (a) 15,490 217,015
Meritor, Inc. (a)(b) 64,876 1,970,284
Middleby Corp. (a) 48,808 7,145,979
Miller Industries, Inc. 11,619 458,602
Mueller Industries, Inc. 49,565 2,014,322
Mueller Water Products, Inc. Class A 152,177 1,961,562
Navistar International Corp. (a) 44,175 1,946,351
Nikola Corp. (a)(b) 121,974 2,207,729
NN, Inc. (a) 36,230 221,365
Nordson Corp. 47,823 9,201,623
Omega Flex, Inc. (b) 2,807 484,208
Oshkosh Corp. 59,520 6,309,120
Otis Worldwide Corp. 360,635 22,976,056
PACCAR, Inc. 306,617 27,899,081
Park-Ohio Holdings Corp. 7,009 226,601
Parker Hannifin Corp. 113,424 32,548,151
Pentair PLC 146,749 8,207,672
Proto Labs, Inc. (a)(b) 24,098 3,510,597
RBC Bearings, Inc. (a) 22,461 4,471,087
REV Group, Inc. 22,476 279,152
Rexnord Corp. 106,149 4,771,398
Snap-On, Inc. 47,647 9,677,582
SPX Corp. (a) 39,524 2,197,139
SPX Flow, Inc. (a) 37,827 2,328,630
Standex International Corp. 12,288 1,204,961
Stanley Black & Decker, Inc. 141,479 24,736,188
Tennant Co. 16,238 1,237,336
Terex Corp. 61,429 2,529,646
The L.S. Starrett Co. Class A (a) 1,425 9,120
The Shyft Group, Inc. 28,651 942,331
Timken Co. 59,766 4,682,666
Titan International, Inc. 45,676 377,741
Toro Co. 95,902 9,664,045
TriMas Corp. (a) 40,699 1,367,079
Trinity Industries, Inc. (b) 75,643 2,428,140
Twin Disc, Inc. (a) 7,837 64,812
Wabash National Corp. 46,371 768,831
Watts Water Technologies, Inc. Class A 24,403 2,784,138
Copyright © 2021 www.secdatabase.com. All Rights Reserved.Please Consider the Environment Before Printing This Document
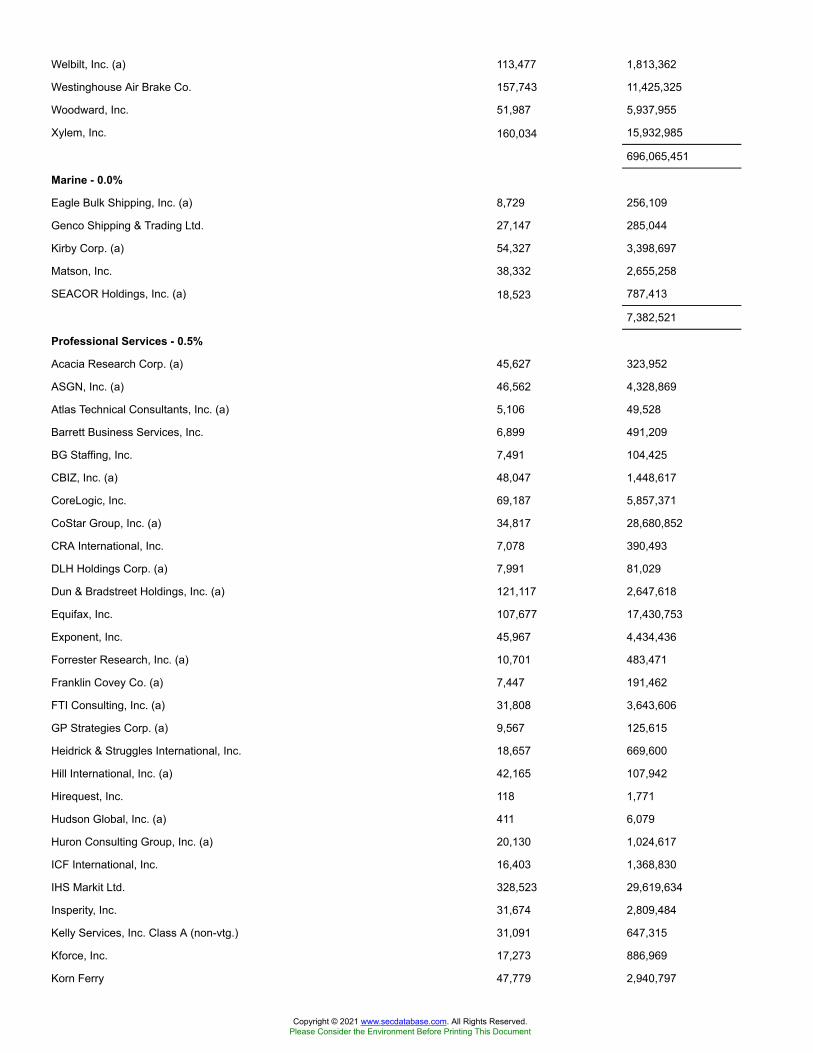
Welbilt, Inc. (a) 113,477 1,813,362
Westinghouse Air Brake Co. 157,743 11,425,325
Woodward, Inc. 51,987 5,937,955
Xylem, Inc. 160,034 15,932,985
696,065,451
Marine - 0.0%
Eagle Bulk Shipping, Inc. (a) 8,729 256,109
Genco Shipping & Trading Ltd. 27,147 285,044
Kirby Corp. (a) 54,327 3,398,697
Matson, Inc. 38,332 2,655,258
SEACOR Holdings, Inc. (a) 18,523 787,413
7,382,521
Professional Services - 0.5%
Acacia Research Corp. (a) 45,627 323,952
ASGN, Inc. (a) 46,562 4,328,869
Atlas Technical Consultants, Inc. (a) 5,106 49,528
Barrett Business Services, Inc. 6,899 491,209
BG Staffing, Inc. 7,491 104,425
CBIZ, Inc. (a) 48,047 1,448,617
CoreLogic, Inc. 69,187 5,857,371
CoStar Group, Inc. (a) 34,817 28,680,852
CRA International, Inc. 7,078 390,493
DLH Holdings Corp. (a) 7,991 81,029
Dun & Bradstreet Holdings, Inc. (a) 121,117 2,647,618
Equifax, Inc. 107,677 17,430,753
Exponent, Inc. 45,967 4,434,436
Forrester Research, Inc. (a) 10,701 483,471
Franklin Covey Co. (a) 7,447 191,462
FTI Consulting, Inc. (a) 31,808 3,643,606
GP Strategies Corp. (a) 9,567 125,615
Heidrick & Struggles International, Inc. 18,657 669,600
Hill International, Inc. (a) 42,165 107,942
Hirequest, Inc. 118 1,771
Hudson Global, Inc. (a) 411 6,079
Huron Consulting Group, Inc. (a) 20,130 1,024,617
ICF International, Inc. 16,403 1,368,830
IHS Markit Ltd. 328,523 29,619,634
Insperity, Inc. 31,674 2,809,484
Kelly Services, Inc. Class A (non-vtg.) 31,091 647,315
Kforce, Inc. 17,273 886,969
Korn Ferry 47,779 2,940,797
Copyright © 2021 www.secdatabase.com. All Rights Reserved.Please Consider the Environment Before Printing This Document
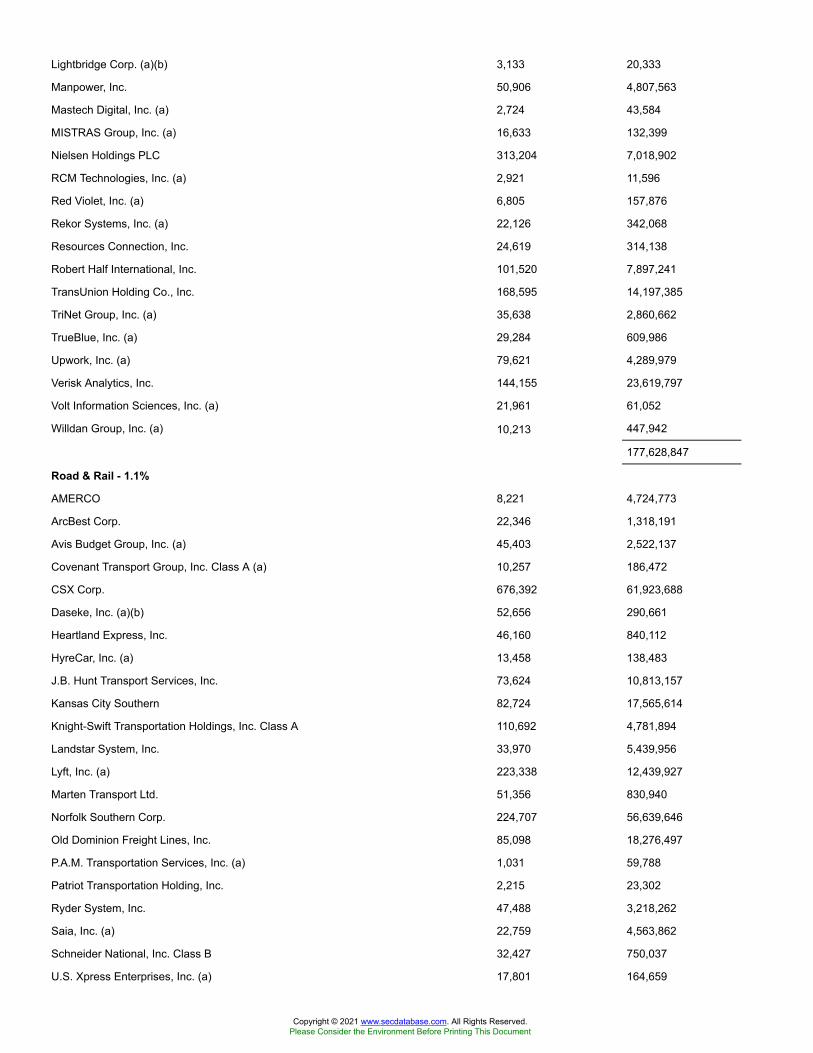
Lightbridge Corp. (a)(b) 3,133 20,333
Manpower, Inc. 50,906 4,807,563
Mastech Digital, Inc. (a) 2,724 43,584
MISTRAS Group, Inc. (a) 16,633 132,399
Nielsen Holdings PLC 313,204 7,018,902
RCM Technologies, Inc. (a) 2,921 11,596
Red Violet, Inc. (a) 6,805 157,876
Rekor Systems, Inc. (a) 22,126 342,068
Resources Connection, Inc. 24,619 314,138
Robert Half International, Inc. 101,520 7,897,241
TransUnion Holding Co., Inc. 168,595 14,197,385
TriNet Group, Inc. (a) 35,638 2,860,662
TrueBlue, Inc. (a) 29,284 609,986
Upwork, Inc. (a) 79,621 4,289,979
Verisk Analytics, Inc. 144,155 23,619,797
Volt Information Sciences, Inc. (a) 21,961 61,052
Willdan Group, Inc. (a) 10,213 447,942
177,628,847
Road & Rail - 1.1%
AMERCO 8,221 4,724,773
ArcBest Corp. 22,346 1,318,191
Avis Budget Group, Inc. (a) 45,403 2,522,137
Covenant Transport Group, Inc. Class A (a) 10,257 186,472
CSX Corp. 676,392 61,923,688
Daseke, Inc. (a)(b) 52,656 290,661
Heartland Express, Inc. 46,160 840,112
HyreCar, Inc. (a) 13,458 138,483
J.B. Hunt Transport Services, Inc. 73,624 10,813,157
Kansas City Southern 82,724 17,565,614
Knight-Swift Transportation Holdings, Inc. Class A 110,692 4,781,894
Landstar System, Inc. 33,970 5,439,956
Lyft, Inc. (a) 223,338 12,439,927
Marten Transport Ltd. 51,356 830,940
Norfolk Southern Corp. 224,707 56,639,646
Old Dominion Freight Lines, Inc. 85,098 18,276,497
P.A.M. Transportation Services, Inc. (a) 1,031 59,788
Patriot Transportation Holding, Inc. 2,215 23,302
Ryder System, Inc. 47,488 3,218,262
Saia, Inc. (a) 22,759 4,563,862
Schneider National, Inc. Class B 32,427 750,037
U.S. Xpress Enterprises, Inc. (a) 17,801 164,659
Copyright © 2021 www.secdatabase.com. All Rights Reserved.Please Consider the Environment Before Printing This Document
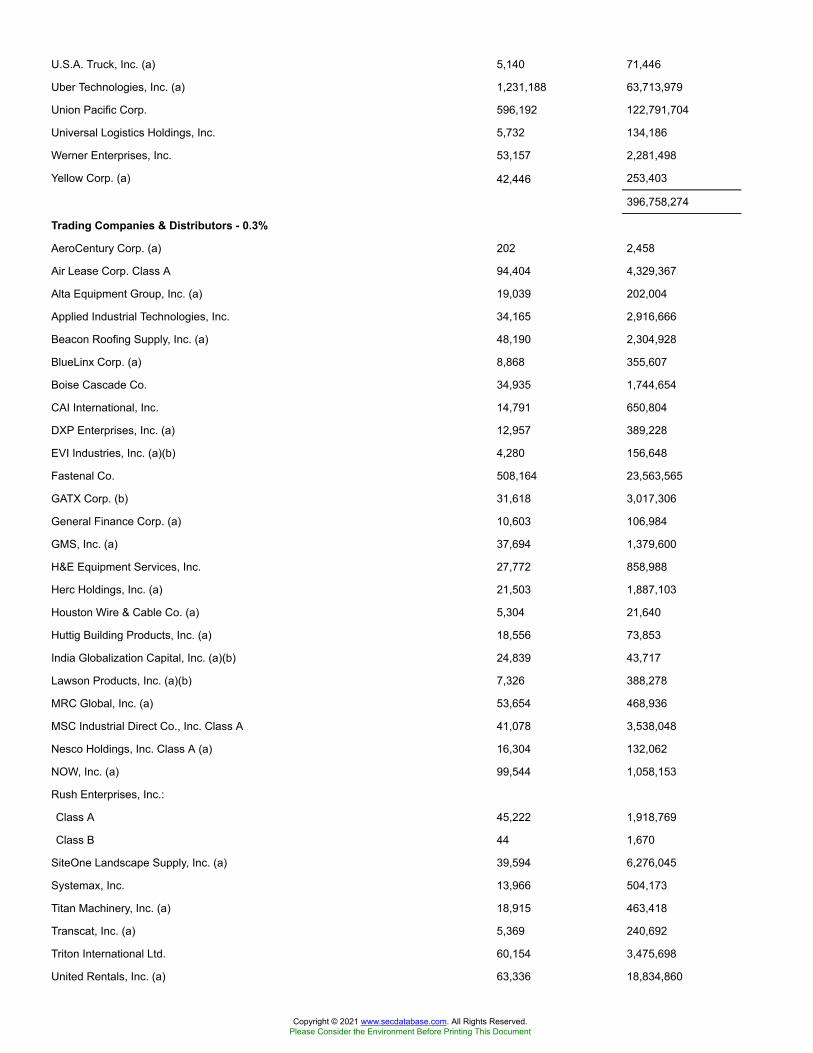
U.S.A. Truck, Inc. (a) 5,140 71,446
Uber Technologies, Inc. (a) 1,231,188 63,713,979
Union Pacific Corp. 596,192 122,791,704
Universal Logistics Holdings, Inc. 5,732 134,186
Werner Enterprises, Inc. 53,157 2,281,498
Yellow Corp. (a) 42,446 253,403
396,758,274
Trading Companies & Distributors - 0.3%
AeroCentury Corp. (a) 202 2,458
Air Lease Corp. Class A 94,404 4,329,367
Alta Equipment Group, Inc. (a) 19,039 202,004
Applied Industrial Technologies, Inc. 34,165 2,916,666
Beacon Roofing Supply, Inc. (a) 48,190 2,304,928
BlueLinx Corp. (a) 8,868 355,607
Boise Cascade Co. 34,935 1,744,654
CAI International, Inc. 14,791 650,804
DXP Enterprises, Inc. (a) 12,957 389,228
EVI Industries, Inc. (a)(b) 4,280 156,648
Fastenal Co. 508,164 23,563,565
GATX Corp. (b) 31,618 3,017,306
General Finance Corp. (a) 10,603 106,984
GMS, Inc. (a) 37,694 1,379,600
H&E Equipment Services, Inc. 27,772 858,988
Herc Holdings, Inc. (a) 21,503 1,887,103
Houston Wire & Cable Co. (a) 5,304 21,640
Huttig Building Products, Inc. (a) 18,556 73,853
India Globalization Capital, Inc. (a)(b) 24,839 43,717
Lawson Products, Inc. (a)(b) 7,326 388,278
MRC Global, Inc. (a) 53,654 468,936
MSC Industrial Direct Co., Inc. Class A 41,078 3,538,048
Nesco Holdings, Inc. Class A (a) 16,304 132,062
NOW, Inc. (a) 99,544 1,058,153
Rush Enterprises, Inc.:
Class A 45,222 1,918,769
Class B 44 1,670
SiteOne Landscape Supply, Inc. (a) 39,594 6,276,045
Systemax, Inc. 13,966 504,173
Titan Machinery, Inc. (a) 18,915 463,418
Transcat, Inc. (a) 5,369 240,692
Triton International Ltd. 60,154 3,475,698
United Rentals, Inc. (a) 63,336 18,834,860
Copyright © 2021 www.secdatabase.com. All Rights Reserved.Please Consider the Environment Before Printing This Document
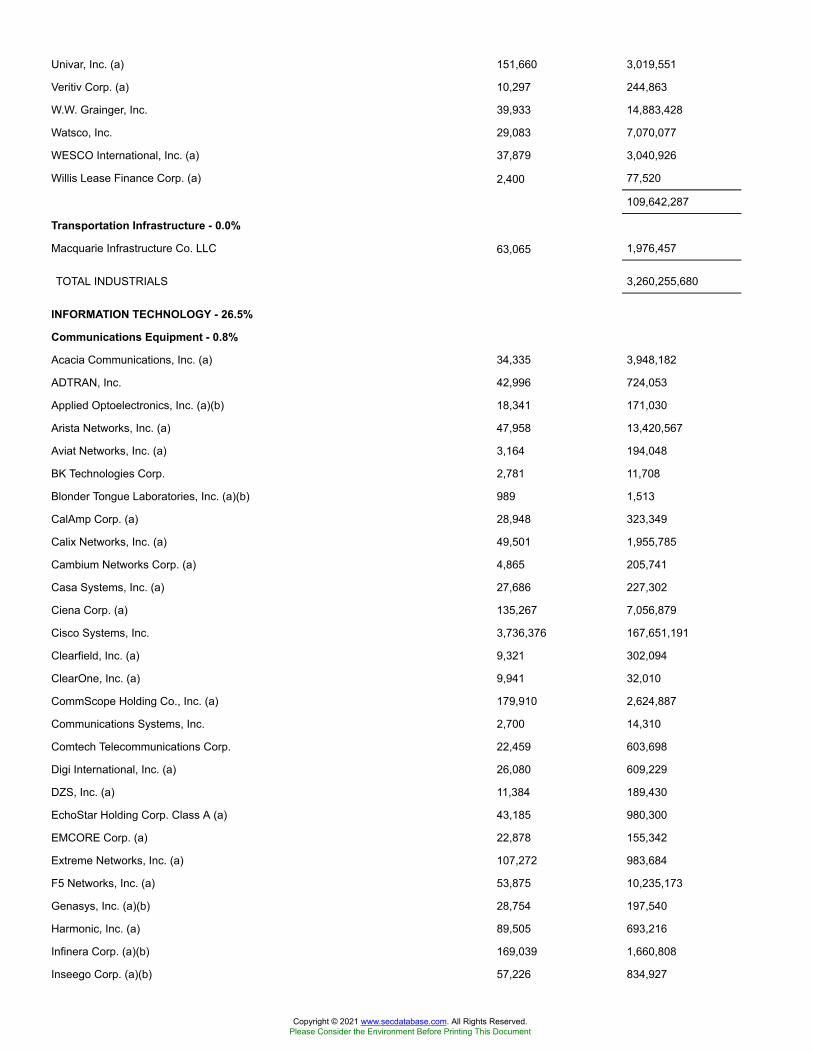
Univar, Inc. (a) 151,660 3,019,551
Veritiv Corp. (a) 10,297 244,863
W.W. Grainger, Inc. 39,933 14,883,428
Watsco, Inc. 29,083 7,070,077
WESCO International, Inc. (a) 37,879 3,040,926
Willis Lease Finance Corp. (a) 2,400 77,520
109,642,287
Transportation Infrastructure - 0.0%
Macquarie Infrastructure Co. LLC 63,065 1,976,457
TOTAL INDUSTRIALS 3,260,255,680
INFORMATION TECHNOLOGY - 26.5%
Communications Equipment - 0.8%
Acacia Communications, Inc. (a) 34,335 3,948,182
ADTRAN, Inc. 42,996 724,053
Applied Optoelectronics, Inc. (a)(b) 18,341 171,030
Arista Networks, Inc. (a) 47,958 13,420,567
Aviat Networks, Inc. (a) 3,164 194,048
BK Technologies Corp. 2,781 11,708
Blonder Tongue Laboratories, Inc. (a)(b) 989 1,513
CalAmp Corp. (a) 28,948 323,349
Calix Networks, Inc. (a) 49,501 1,955,785
Cambium Networks Corp. (a) 4,865 205,741
Casa Systems, Inc. (a) 27,686 227,302
Ciena Corp. (a) 135,267 7,056,879
Cisco Systems, Inc. 3,736,376 167,651,191
Clearfield, Inc. (a) 9,321 302,094
ClearOne, Inc. (a) 9,941 32,010
CommScope Holding Co., Inc. (a) 179,910 2,624,887
Communications Systems, Inc. 2,700 14,310
Comtech Telecommunications Corp. 22,459 603,698
Digi International, Inc. (a) 26,080 609,229
DZS, Inc. (a) 11,384 189,430
EchoStar Holding Corp. Class A (a) 43,185 980,300
EMCORE Corp. (a) 22,878 155,342
Extreme Networks, Inc. (a) 107,272 983,684
F5 Networks, Inc. (a) 53,875 10,235,173
Genasys, Inc. (a)(b) 28,754 197,540
Harmonic, Inc. (a) 89,505 693,216
Infinera Corp. (a)(b) 169,039 1,660,808
Inseego Corp. (a)(b) 57,226 834,927
Copyright © 2021 www.secdatabase.com. All Rights Reserved.Please Consider the Environment Before Printing This Document

Juniper Networks, Inc. 294,584 6,857,916
KVH Industries, Inc. (a) 13,247 180,954
Lantronix, Inc. (a) 14,398 67,383
Lumentum Holdings, Inc. (a) 67,480 6,073,200
Motorola Solutions, Inc. 150,132 26,345,163
NETGEAR, Inc. (a)(b) 25,947 1,037,880
NetScout Systems, Inc. (a) 66,379 1,873,215
Network-1 Security Solutions, Inc. 6,331 20,956
Optical Cable Corp. (a) 166 614
PC-Tel, Inc. 12,680 95,861
Plantronics, Inc. 33,992 1,376,336
Resonant, Inc. (a) 33,923 173,347
Ribbon Communications, Inc. (a) 104,530 903,139
Tessco Technologies, Inc. 4,410 30,914
Ubiquiti, Inc. (b) 6,668 2,126,559
ViaSat, Inc. (a)(b) 56,827 2,906,133
Viavi Solutions, Inc. (a) 209,429 3,389,608
Vislink Technologies, Inc. (a)(b) 22,741 73,681
Westell Technologies, Inc. Class A (a) 5,599 4,517
269,545,372
Electronic Equipment & Components - 0.9%
Airgain, Inc. (a) 8,355 195,674
Akoustis Technologies, Inc. (a)(b) 27,367 391,074
Amphenol Corp. Class A 265,128 33,321,287
Applied DNA Sciences, Inc. (a) 3,677 32,909
Arlo Technologies, Inc. (a) 68,838 479,112
Arrow Electronics, Inc. (a) 66,830 6,700,376
Avnet, Inc. 88,249 3,359,639
Badger Meter, Inc. (b) 25,684 2,789,026
Bel Fuse, Inc. Class B (non-vtg.) 9,471 168,110
Belden, Inc. 40,963 1,810,974
Benchmark Electronics, Inc. 31,536 895,622
CDW Corp. 126,679 19,874,668
Cemtrex, Inc. (a) 28,416 52,854
ClearSign Combustion Corp. (a) 30,692 145,173
Coda Octopus Group, Inc. (a)(b) 2,455 18,413
Cognex Corp. 154,098 12,726,954
Coherent, Inc. (a) 21,528 5,208,484
Corning, Inc. 675,940 25,847,946
CPS Technologies Corp. (a) 6,405 126,755
CTS Corp. 28,792 926,239
Copyright © 2021 www.secdatabase.com. All Rights Reserved.Please Consider the Environment Before Printing This Document

Daktronics, Inc. 29,851 161,494
Digital Ally, Inc. (a)(b) 15,010 28,819
Dolby Laboratories, Inc. Class A 56,972 5,562,176
eMagin Corp. (a) 54,556 208,949
ePlus, Inc. (a) 11,695 1,105,879
Fabrinet (a) 33,464 2,955,875
FARO Technologies, Inc. (a) 16,302 1,523,585
FLIR Systems, Inc. 115,086 6,145,592
Frequency Electronics, Inc. (a) 770 9,117
Identiv, Inc. (a) 16,455 183,309
IEC Electronics Corp. (a) 10,084 124,336
II-VI, Inc. (a) 90,519 7,630,752
Insight Enterprises, Inc. (a) 31,679 2,648,048
Intellicheck, Inc. (a) 16,349 198,967
IPG Photonics Corp. (a) 31,977 7,269,971
Iteris, Inc. (a) 36,087 198,839
Itron, Inc. (a) 36,114 4,234,005
Jabil, Inc. 118,595 5,119,746
KEY Tronic Corp. (a) 5,878 48,317
Keysight Technologies, Inc. (a) 163,672 23,162,861
Kimball Electronics, Inc. (a) 25,045 588,057
Knowles Corp. (a) 79,584 1,654,551
LGL Group, Inc. (a) 2,530 29,171
LGL Group, Inc. warrants 11/16/25 (a) 2,530 1,265
LightPath Technologies, Inc. Class A (a)(b) 20,018 79,071
Littelfuse, Inc. 21,722 5,652,499
Luna Innovations, Inc. (a)(b) 25,649 301,119
Methode Electronics, Inc. Class A 32,397 1,261,215
MicroVision, Inc. (a)(b) 132,038 1,963,405
MICT, Inc. (a) 45,401 119,405
MTS Systems Corp. 17,018 993,170
Napco Security Technolgies, Inc. (a) 9,269 288,544
National Instruments Corp. 116,835 5,187,474
Neonode, Inc. (a) 3,908 30,756
nLIGHT, Inc. (a) 30,311 1,155,455
Novanta, Inc. (a) 31,852 4,214,975
OSI Systems, Inc. (a) 14,651 1,386,278
Par Technology Corp. (a) 16,865 1,465,231
PC Connection, Inc. 8,831 406,314
Plexus Corp. (a) 27,222 2,286,104
Powerfleet, Inc. (a) 24,962 196,451
Copyright © 2021 www.secdatabase.com. All Rights Reserved.Please Consider the Environment Before Printing This Document
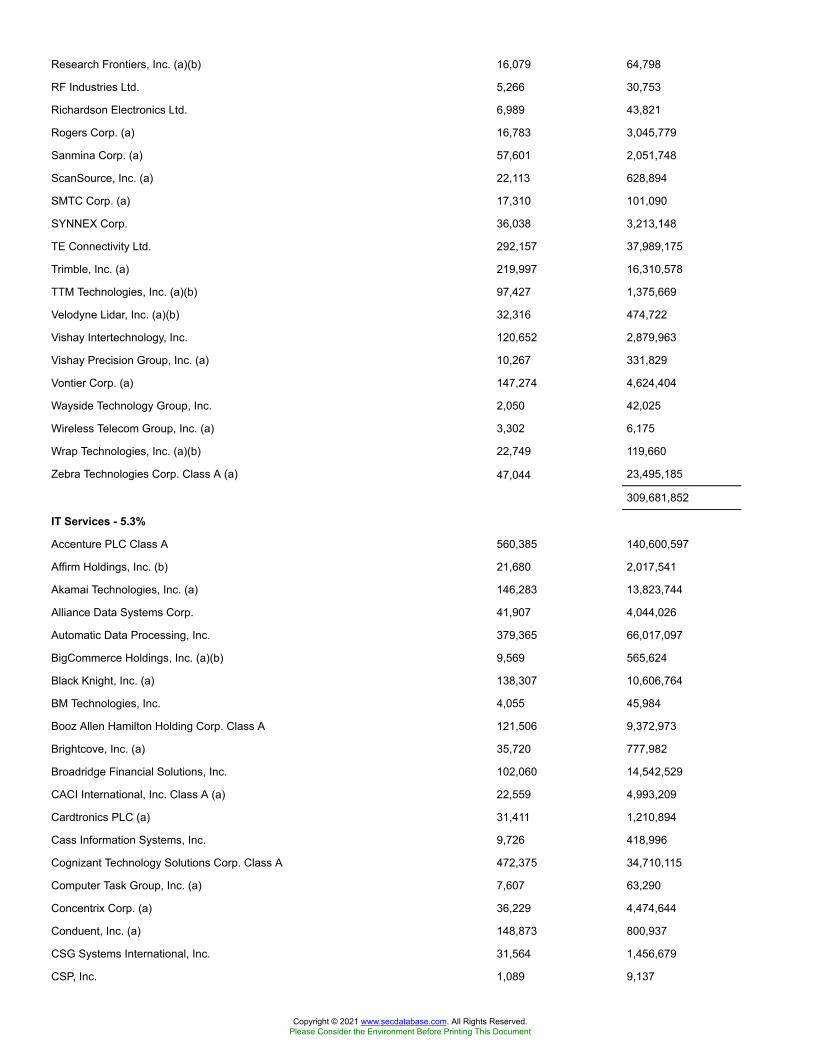
Research Frontiers, Inc. (a)(b) 16,079 64,798
RF Industries Ltd. 5,266 30,753
Richardson Electronics Ltd. 6,989 43,821
Rogers Corp. (a) 16,783 3,045,779
Sanmina Corp. (a) 57,601 2,051,748
ScanSource, Inc. (a) 22,113 628,894
SMTC Corp. (a) 17,310 101,090
SYNNEX Corp. 36,038 3,213,148
TE Connectivity Ltd. 292,157 37,989,175
Trimble, Inc. (a) 219,997 16,310,578
TTM Technologies, Inc. (a)(b) 97,427 1,375,669
Velodyne Lidar, Inc. (a)(b) 32,316 474,722
Vishay Intertechnology, Inc. 120,652 2,879,963
Vishay Precision Group, Inc. (a) 10,267 331,829
Vontier Corp. (a) 147,274 4,624,404
Wayside Technology Group, Inc. 2,050 42,025
Wireless Telecom Group, Inc. (a) 3,302 6,175
Wrap Technologies, Inc. (a)(b) 22,749 119,660
Zebra Technologies Corp. Class A (a) 47,044 23,495,185
309,681,852
IT Services - 5.3%
Accenture PLC Class A 560,385 140,600,597
Affirm Holdings, Inc. (b) 21,680 2,017,541
Akamai Technologies, Inc. (a) 146,283 13,823,744
Alliance Data Systems Corp. 41,907 4,044,026
Automatic Data Processing, Inc. 379,365 66,017,097
BigCommerce Holdings, Inc. (a)(b) 9,569 565,624
Black Knight, Inc. (a) 138,307 10,606,764
BM Technologies, Inc. 4,055 45,984
Booz Allen Hamilton Holding Corp. Class A 121,506 9,372,973
Brightcove, Inc. (a) 35,720 777,982
Broadridge Financial Solutions, Inc. 102,060 14,542,529
CACI International, Inc. Class A (a) 22,559 4,993,209
Cardtronics PLC (a) 31,411 1,210,894
Cass Information Systems, Inc. 9,726 418,996
Cognizant Technology Solutions Corp. Class A 472,375 34,710,115
Computer Task Group, Inc. (a) 7,607 63,290
Concentrix Corp. (a) 36,229 4,474,644
Conduent, Inc. (a) 148,873 800,937
CSG Systems International, Inc. 31,564 1,456,679
CSP, Inc. 1,089 9,137
Copyright © 2021 www.secdatabase.com. All Rights Reserved.Please Consider the Environment Before Printing This Document

DXC Technology Co. 227,290 5,732,254
EPAM Systems, Inc. (a) 49,377 18,447,741
Euronet Worldwide, Inc. (a) 46,203 6,944,773
EVERTEC, Inc. 54,247 2,110,208
EVO Payments, Inc. Class A (a) 40,400 1,028,584
Exela Technologies, Inc. (a) 37,593 81,201
ExlService Holdings, Inc. (a) 30,921 2,616,535
Fastly, Inc. Class A (a)(b) 74,837 5,506,506
Fidelity National Information Services, Inc. 548,429 75,683,202
Fiserv, Inc. (a) 507,979 58,605,537
FleetCor Technologies, Inc. (a) 73,710 20,440,520
Gartner, Inc. (a) 78,763 14,101,728
Genpact Ltd. 156,466 6,327,485
Global Payments, Inc. 264,525 52,373,305
GoDaddy, Inc. (a) 149,871 12,157,536
GreenSky, Inc. Class A (a) 50,460 268,447
Grid Dynamics Holdings, Inc. (a) 24,024 358,198
GTT Communications, Inc. (a)(b) 22,906 43,063
Hackett Group, Inc. 25,288 394,999
i3 Verticals, Inc. Class A (a) 15,841 525,921
IBM Corp. 787,317 93,635,611
Information Services Group, Inc. (a) 31,896 116,101
Innodata, Inc. (a) 16,295 95,326
Inpixon (a)(b) 31,695 40,253
International Money Express, Inc. (a) 23,580 347,333
Jack Henry & Associates, Inc. 67,299 9,989,864
KBR, Inc. 125,570 3,892,670
Leidos Holdings, Inc. 118,127 10,448,333
Limelight Networks, Inc. (a)(b) 104,707 342,392
Liveramp Holdings, Inc. (a) 57,879 3,655,638
ManTech International Corp. Class A 24,065 1,880,920
Marathon Patent Group, Inc. (a)(b) 41,996 1,266,179
MasterCard, Inc. Class A 778,126 275,339,885
Maximus, Inc. 54,343 4,416,999
MoneyGram International, Inc. (a) 51,313 342,258
MongoDB, Inc. Class A (a) 44,492 17,170,798
NIC, Inc. 59,413 2,062,225
Okta, Inc. (a) 106,576 27,864,295
Paya Holdings, Inc. (a) 51,829 625,058
Paychex, Inc. 282,713 25,746,673
PayPal Holdings, Inc. (a) 1,035,933 269,187,190
Copyright © 2021 www.secdatabase.com. All Rights Reserved.Please Consider the Environment Before Printing This Document

Paysign, Inc. (a)(b) 30,038 136,072
Perficient, Inc. (a) 29,317 1,632,664
Perspecta, Inc. 124,359 3,631,283
PFSweb, Inc. (a) 14,740 103,475
PRGX Global, Inc. (a) 15,949 121,691
Priority Technology Holdings, Inc. (a) 7,215 65,512
Rackspace Technology, Inc. (a) 29,563 621,414
Repay Holdings Corp. (a) 60,266 1,313,799
Sabre Corp. 284,901 4,185,196
Science Applications International Corp. 51,223 4,411,837
ServiceSource International, Inc. (a) 67,777 108,782
Shift4 Payments, Inc. 31,422 2,403,783
Snowflake Computing, Inc. (b) 28,941 7,511,347
Square, Inc. (a) 338,524 77,870,676
StarTek, Inc. (a) 9,134 74,077
Steel Connect, Inc. (a) 35,785 61,550
Switch, Inc. Class A 73,030 1,266,340
Sykes Enterprises, Inc. (a) 34,825 1,422,950
The Western Union Co. 366,554 8,511,384
Ttec Holdings, Inc. 16,104 1,354,991
Tucows, Inc. (a) 8,756 691,899
Twilio, Inc. Class A (a) 129,810 50,999,753
Unisys Corp. (a) 55,803 1,369,964
Usio, Inc. (a) 12,400 77,748
VeriSign, Inc. (a) 88,997 17,268,088
Verra Mobility Corp. (a) 121,990 1,738,358
Visa, Inc. Class A (b) 1,499,579 318,495,584
WEX, Inc. (a) 38,852 8,094,814
WidePoint Corp. (a) 6,632 70,299
1,858,381,836
Semiconductors & Semiconductor Equipment - 5.2%
ACM Research, Inc. (a) 9,050 879,298
Advanced Energy Industries, Inc. 33,503 3,499,388
Advanced Micro Devices, Inc.(a) 1,061,617 89,717,253
AEHR Test Systems (a) 18,714 52,399
Allegro MicroSystems LLC (a) 36,948 965,821
Alpha & Omega Semiconductor Ltd. (a) 18,423 648,305
Ambarella, Inc. (a) 30,102 3,386,174
Amkor Technology, Inc. 97,323 2,325,046
Amtech Systems, Inc. (a) 9,659 92,630
Analog Devices, Inc. 325,784 50,763,663
Copyright © 2021 www.secdatabase.com. All Rights Reserved.Please Consider the Environment Before Printing This Document
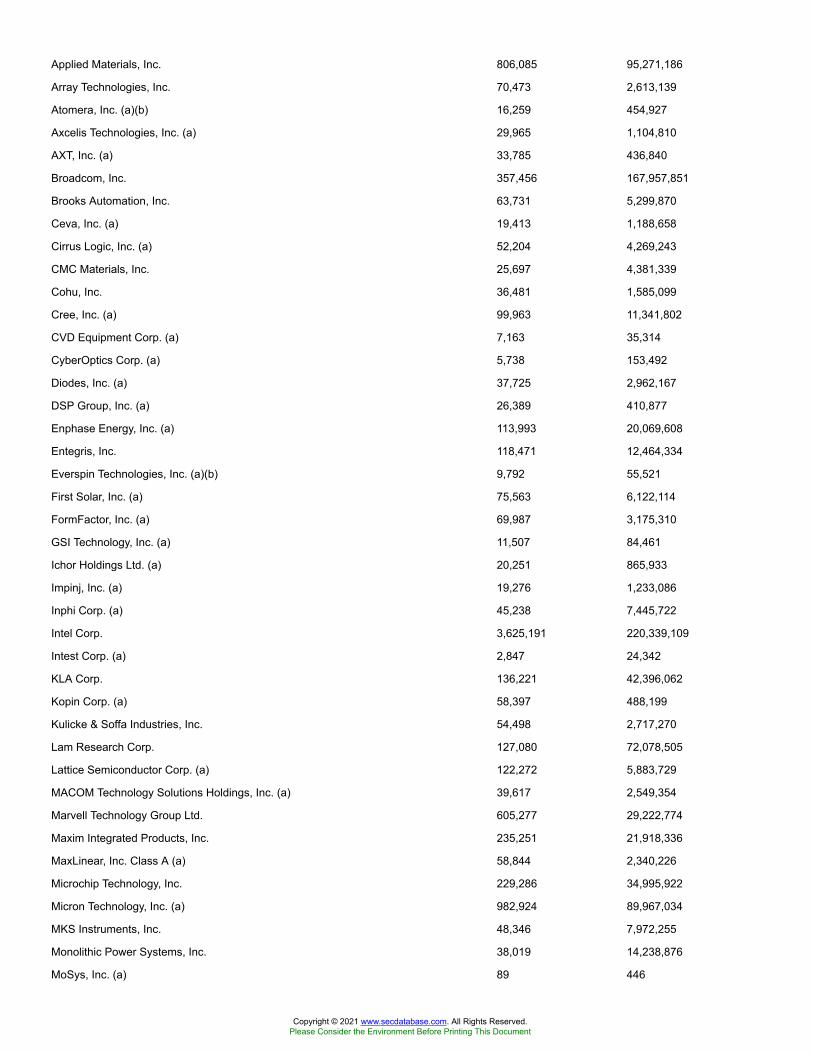
Applied Materials, Inc. 806,085 95,271,186
Array Technologies, Inc. 70,473 2,613,139
Atomera, Inc. (a)(b) 16,259 454,927
Axcelis Technologies, Inc. (a) 29,965 1,104,810
AXT, Inc. (a) 33,785 436,840
Broadcom, Inc. 357,456 167,957,851
Brooks Automation, Inc. 63,731 5,299,870
Ceva, Inc. (a) 19,413 1,188,658
Cirrus Logic, Inc. (a) 52,204 4,269,243
CMC Materials, Inc. 25,697 4,381,339
Cohu, Inc. 36,481 1,585,099
Cree, Inc. (a) 99,963 11,341,802
CVD Equipment Corp. (a) 7,163 35,314
CyberOptics Corp. (a) 5,738 153,492
Diodes, Inc. (a) 37,725 2,962,167
DSP Group, Inc. (a) 26,389 410,877
Enphase Energy, Inc. (a) 113,993 20,069,608
Entegris, Inc. 118,471 12,464,334
Everspin Technologies, Inc. (a)(b) 9,792 55,521
First Solar, Inc. (a) 75,563 6,122,114
FormFactor, Inc. (a) 69,987 3,175,310
GSI Technology, Inc. (a) 11,507 84,461
Ichor Holdings Ltd. (a) 20,251 865,933
Impinj, Inc. (a) 19,276 1,233,086
Inphi Corp. (a) 45,238 7,445,722
Intel Corp. 3,625,191 220,339,109
Intest Corp. (a) 2,847 24,342
KLA Corp. 136,221 42,396,062
Kopin Corp. (a) 58,397 488,199
Kulicke & Soffa Industries, Inc. 54,498 2,717,270
Lam Research Corp. 127,080 72,078,505
Lattice Semiconductor Corp. (a) 122,272 5,883,729
MACOM Technology Solutions Holdings, Inc. (a) 39,617 2,549,354
Marvell Technology Group Ltd. 605,277 29,222,774
Maxim Integrated Products, Inc. 235,251 21,918,336
MaxLinear, Inc. Class A (a) 58,844 2,340,226
Microchip Technology, Inc. 229,286 34,995,922
Micron Technology, Inc. (a) 982,924 89,967,034
MKS Instruments, Inc. 48,346 7,972,255
Monolithic Power Systems, Inc. 38,019 14,238,876
MoSys, Inc. (a) 89 446
Copyright © 2021 www.secdatabase.com. All Rights Reserved.Please Consider the Environment Before Printing This Document

NeoPhotonics Corp. (a) 46,343 445,356
NVE Corp. (b) 4,775 336,494
NVIDIA Corp. 547,167 300,164,873
NXP Semiconductors NV 246,834 45,059,547
ON Semiconductor Corp. (a) 371,234 14,949,593
Onto Innovation, Inc. (a) 43,634 2,725,380
PDF Solutions, Inc. (a) 27,073 497,060
Photronics, Inc. (a) 58,765 699,891
Pixelworks, Inc. (a) 27,639 99,224
Power Integrations, Inc. 52,952 4,679,368
Qorvo, Inc. (a) 103,402 18,067,431
Qualcomm, Inc. 999,366 136,103,656
QuickLogic Corp. (a) 6,639 59,087
Rambus, Inc. (a) 101,534 2,130,183
Rubicon Technology, Inc. (a) 738 7,461
Semtech Corp. (a) 56,895 4,170,972
Silicon Laboratories, Inc. (a) 38,612 6,013,433
SiTime Corp. (a) 11,094 1,080,888
Skyworks Solutions, Inc. 149,616 26,604,717
SMART Global Holdings, Inc. (a) 12,823 598,706
SolarEdge Technologies, Inc. (a) 45,950 13,707,345
SunPower Corp. (a)(b) 71,324 2,479,935
Synaptics, Inc. (a) 31,382 4,206,129
Teradyne, Inc. 149,266 19,197,100
Texas Instruments, Inc. 810,958 139,703,735
Ultra Clean Holdings, Inc. (a) 34,994 1,623,022
Universal Display Corp. 38,381 8,124,874
Veeco Instruments, Inc. (a) 43,027 925,081
Xilinx, Inc. 215,906 28,132,552
1,833,038,212
Software - 9.1%
2U, Inc. (a)(b) 65,237 2,585,342
8x8, Inc. (a) 96,298 3,294,355
A10 Networks, Inc. (a) 53,724 501,782
ACI Worldwide, Inc. (a) 102,091 3,906,002
Adobe, Inc. (a) 423,490 194,665,648
Agilysys, Inc. (a)(b) 18,421 1,097,707
Alarm.com Holdings, Inc. (a) 38,354 3,370,550
Altair Engineering, Inc. Class A (a) 37,098 2,284,866
Alteryx, Inc. Class A (a) 49,023 4,686,599
American Software, Inc. Class A 27,822 562,004
Copyright © 2021 www.secdatabase.com. All Rights Reserved.Please Consider the Environment Before Printing This Document
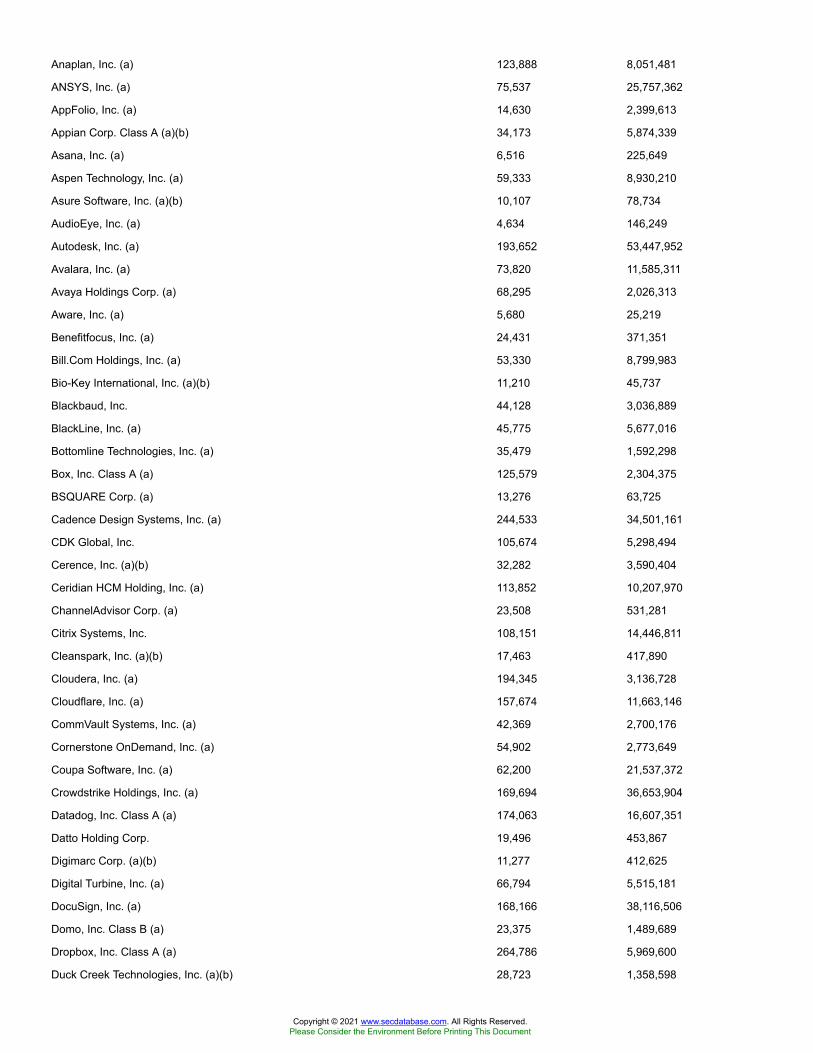
Anaplan, Inc. (a) 123,888 8,051,481
ANSYS, Inc. (a) 75,537 25,757,362
AppFolio, Inc. (a) 14,630 2,399,613
Appian Corp. Class A (a)(b) 34,173 5,874,339
Asana, Inc. (a) 6,516 225,649
Aspen Technology, Inc. (a) 59,333 8,930,210
Asure Software, Inc. (a)(b) 10,107 78,734
AudioEye, Inc. (a) 4,634 146,249
Autodesk, Inc. (a) 193,652 53,447,952
Avalara, Inc. (a) 73,820 11,585,311
Avaya Holdings Corp. (a) 68,295 2,026,313
Aware, Inc. (a) 5,680 25,219
Benefitfocus, Inc. (a) 24,431 371,351
Bill.Com Holdings, Inc. (a) 53,330 8,799,983
Bio-Key International, Inc. (a)(b) 11,210 45,737
Blackbaud, Inc. 44,128 3,036,889
BlackLine, Inc. (a) 45,775 5,677,016
Bottomline Technologies, Inc. (a) 35,479 1,592,298
Box, Inc. Class A (a) 125,579 2,304,375
BSQUARE Corp. (a) 13,276 63,725
Cadence Design Systems, Inc. (a) 244,533 34,501,161
CDK Global, Inc. 105,674 5,298,494
Cerence, Inc. (a)(b) 32,282 3,590,404
Ceridian HCM Holding, Inc. (a) 113,852 10,207,970
ChannelAdvisor Corp. (a) 23,508 531,281
Citrix Systems, Inc. 108,151 14,446,811
Cleanspark, Inc. (a)(b) 17,463 417,890
Cloudera, Inc. (a) 194,345 3,136,728
Cloudflare, Inc. (a) 157,674 11,663,146
CommVault Systems, Inc. (a) 42,369 2,700,176
Cornerstone OnDemand, Inc. (a) 54,902 2,773,649
Coupa Software, Inc. (a) 62,200 21,537,372
Crowdstrike Holdings, Inc. (a) 169,694 36,653,904
Datadog, Inc. Class A (a) 174,063 16,607,351
Datto Holding Corp. 19,496 453,867
Digimarc Corp. (a)(b) 11,277 412,625
Digital Turbine, Inc. (a) 66,794 5,515,181
DocuSign, Inc. (a) 168,166 38,116,506
Domo, Inc. Class B (a) 23,375 1,489,689
Dropbox, Inc. Class A (a) 264,786 5,969,600
Duck Creek Technologies, Inc. (a)(b) 28,723 1,358,598
Copyright © 2021 www.secdatabase.com. All Rights Reserved.Please Consider the Environment Before Printing This Document
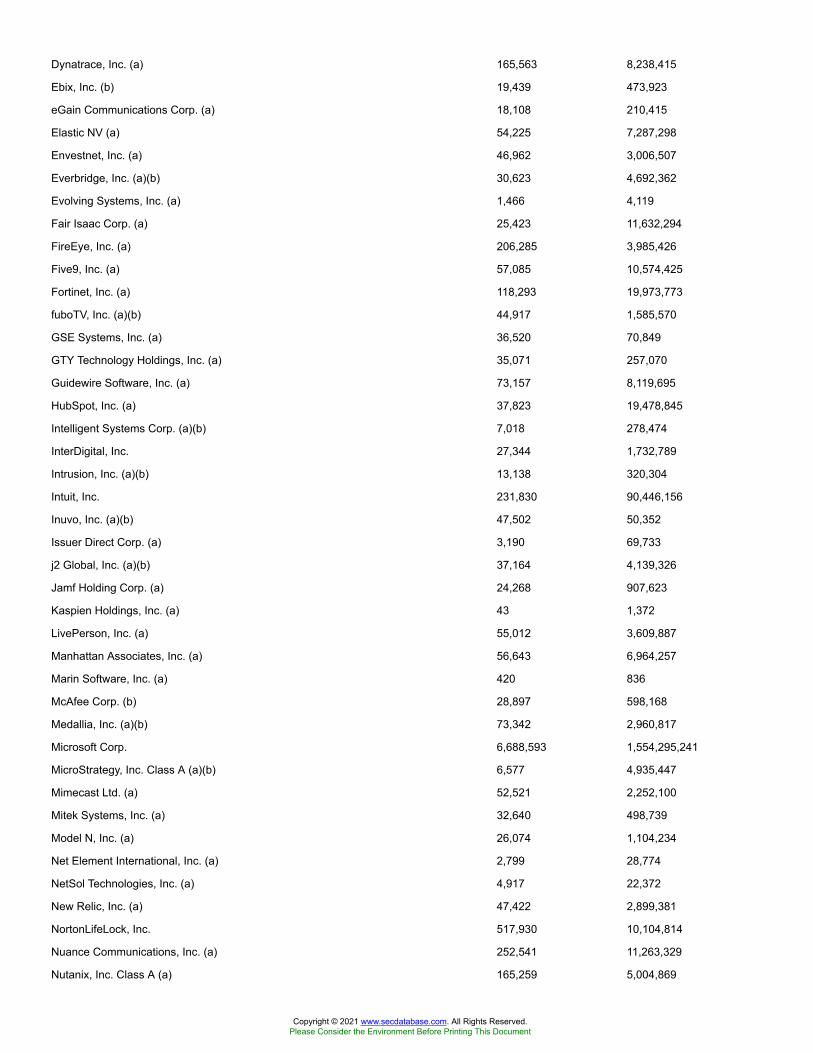
Dynatrace, Inc. (a) 165,563 8,238,415
Ebix, Inc. (b) 19,439 473,923
eGain Communications Corp. (a) 18,108 210,415
Elastic NV (a) 54,225 7,287,298
Envestnet, Inc. (a) 46,962 3,006,507
Everbridge, Inc. (a)(b) 30,623 4,692,362
Evolving Systems, Inc. (a) 1,466 4,119
Fair Isaac Corp. (a) 25,423 11,632,294
FireEye, Inc. (a) 206,285 3,985,426
Five9, Inc. (a) 57,085 10,574,425
Fortinet, Inc. (a) 118,293 19,973,773
fuboTV, Inc. (a)(b) 44,917 1,585,570
GSE Systems, Inc. (a) 36,520 70,849
GTY Technology Holdings, Inc. (a) 35,071 257,070
Guidewire Software, Inc. (a) 73,157 8,119,695
HubSpot, Inc. (a) 37,823 19,478,845
Intelligent Systems Corp. (a)(b) 7,018 278,474
InterDigital, Inc. 27,344 1,732,789
Intrusion, Inc. (a)(b) 13,138 320,304
Intuit, Inc. 231,830 90,446,156
Inuvo, Inc. (a)(b) 47,502 50,352
Issuer Direct Corp. (a) 3,190 69,733
j2 Global, Inc. (a)(b) 37,164 4,139,326
Jamf Holding Corp. (a) 24,268 907,623
Kaspien Holdings, Inc. (a) 43 1,372
LivePerson, Inc. (a) 55,012 3,609,887
Manhattan Associates, Inc. (a) 56,643 6,964,257
Marin Software, Inc. (a) 420 836
McAfee Corp. (b) 28,897 598,168
Medallia, Inc. (a)(b) 73,342 2,960,817
Microsoft Corp. 6,688,593 1,554,295,241
MicroStrategy, Inc. Class A (a)(b) 6,577 4,935,447
Mimecast Ltd. (a) 52,521 2,252,100
Mitek Systems, Inc. (a) 32,640 498,739
Model N, Inc. (a) 26,074 1,104,234
Net Element International, Inc. (a) 2,799 28,774
NetSol Technologies, Inc. (a) 4,917 22,372
New Relic, Inc. (a) 47,422 2,899,381
NortonLifeLock, Inc. 517,930 10,104,814
Nuance Communications, Inc. (a) 252,541 11,263,329
Nutanix, Inc. Class A (a) 165,259 5,004,869
Copyright © 2021 www.secdatabase.com. All Rights Reserved.Please Consider the Environment Before Printing This Document
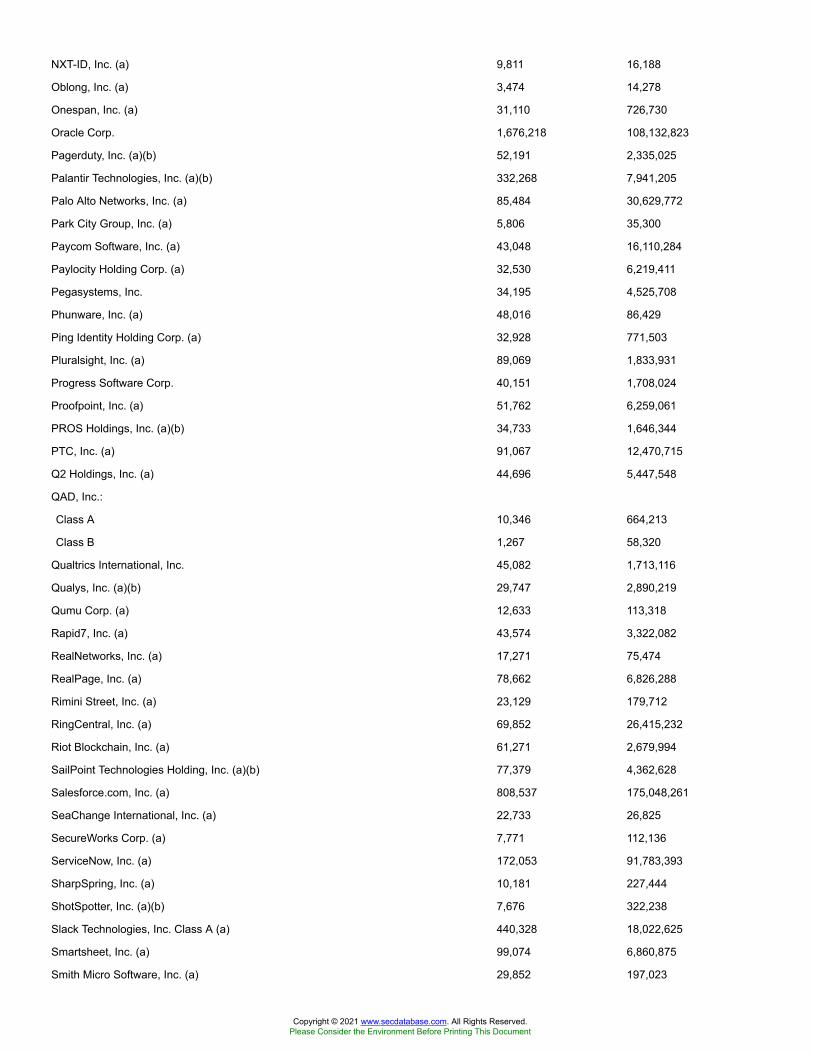
NXT-ID, Inc. (a) 9,811 16,188
Oblong, Inc. (a) 3,474 14,278
Onespan, Inc. (a) 31,110 726,730
Oracle Corp. 1,676,218 108,132,823
Pagerduty, Inc. (a)(b) 52,191 2,335,025
Palantir Technologies, Inc. (a)(b) 332,268 7,941,205
Palo Alto Networks, Inc. (a) 85,484 30,629,772
Park City Group, Inc. (a) 5,806 35,300
Paycom Software, Inc. (a) 43,048 16,110,284
Paylocity Holding Corp. (a) 32,530 6,219,411
Pegasystems, Inc. 34,195 4,525,708
Phunware, Inc. (a) 48,016 86,429
Ping Identity Holding Corp. (a) 32,928 771,503
Pluralsight, Inc. (a) 89,069 1,833,931
Progress Software Corp. 40,151 1,708,024
Proofpoint, Inc. (a) 51,762 6,259,061
PROS Holdings, Inc. (a)(b) 34,733 1,646,344
PTC, Inc. (a) 91,067 12,470,715
Q2 Holdings, Inc. (a) 44,696 5,447,548
QAD, Inc.:
Class A 10,346 664,213
Class B 1,267 58,320
Qualtrics International, Inc. 45,082 1,713,116
Qualys, Inc. (a)(b) 29,747 2,890,219
Qumu Corp. (a) 12,633 113,318
Rapid7, Inc. (a) 43,574 3,322,082
RealNetworks, Inc. (a) 17,271 75,474
RealPage, Inc. (a) 78,662 6,826,288
Rimini Street, Inc. (a) 23,129 179,712
RingCentral, Inc. (a) 69,852 26,415,232
Riot Blockchain, Inc. (a) 61,271 2,679,994
SailPoint Technologies Holding, Inc. (a)(b) 77,379 4,362,628
Salesforce.com, Inc. (a) 808,537 175,048,261
SeaChange International, Inc. (a) 22,733 26,825
SecureWorks Corp. (a) 7,771 112,136
ServiceNow, Inc. (a) 172,053 91,783,393
SharpSpring, Inc. (a) 10,181 227,444
ShotSpotter, Inc. (a)(b) 7,676 322,238
Slack Technologies, Inc. Class A (a) 440,328 18,022,625
Smartsheet, Inc. (a) 99,074 6,860,875
Smith Micro Software, Inc. (a) 29,852 197,023
Copyright © 2021 www.secdatabase.com. All Rights Reserved.Please Consider the Environment Before Printing This Document
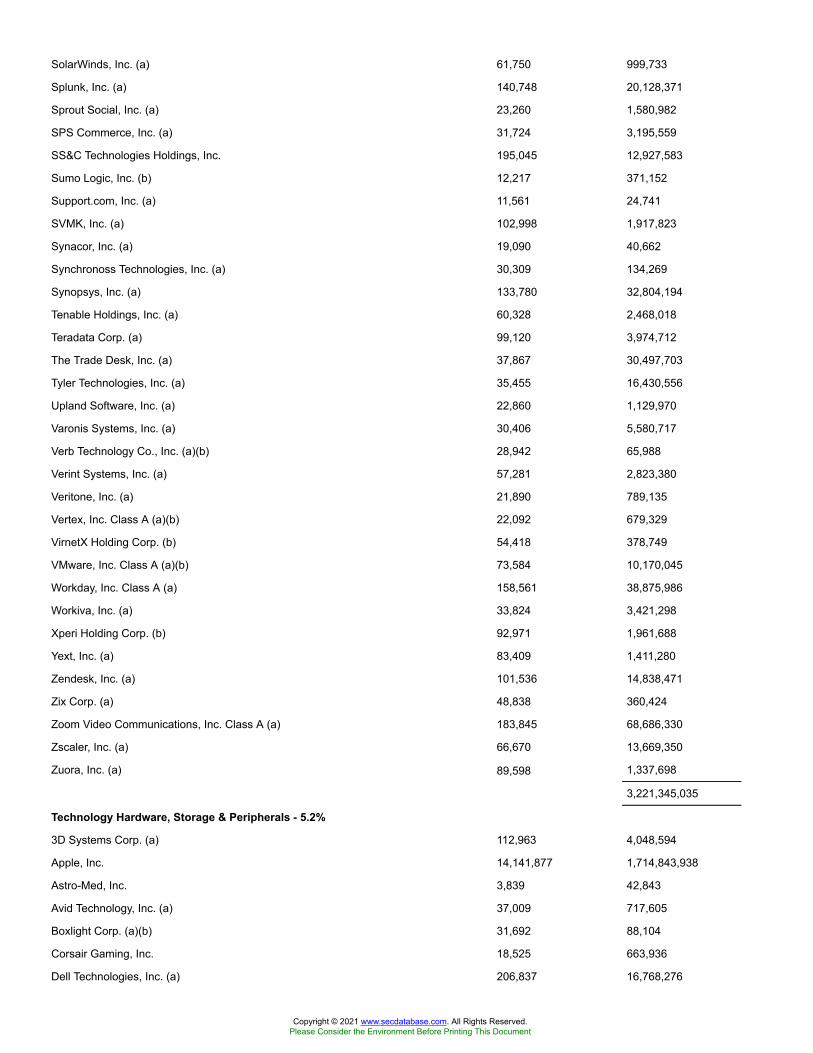
SolarWinds, Inc. (a) 61,750 999,733
Splunk, Inc. (a) 140,748 20,128,371
Sprout Social, Inc. (a) 23,260 1,580,982
SPS Commerce, Inc. (a) 31,724 3,195,559
SS&C Technologies Holdings, Inc. 195,045 12,927,583
Sumo Logic, Inc. (b) 12,217 371,152
Support.com, Inc. (a) 11,561 24,741
SVMK, Inc. (a) 102,998 1,917,823
Synacor, Inc. (a) 19,090 40,662
Synchronoss Technologies, Inc. (a) 30,309 134,269
Synopsys, Inc. (a) 133,780 32,804,194
Tenable Holdings, Inc. (a) 60,328 2,468,018
Teradata Corp. (a) 99,120 3,974,712
The Trade Desk, Inc. (a) 37,867 30,497,703
Tyler Technologies, Inc. (a) 35,455 16,430,556
Upland Software, Inc. (a) 22,860 1,129,970
Varonis Systems, Inc. (a) 30,406 5,580,717
Verb Technology Co., Inc. (a)(b) 28,942 65,988
Verint Systems, Inc. (a) 57,281 2,823,380
Veritone, Inc. (a) 21,890 789,135
Vertex, Inc. Class A (a)(b) 22,092 679,329
VirnetX Holding Corp. (b) 54,418 378,749
VMware, Inc. Class A (a)(b) 73,584 10,170,045
Workday, Inc. Class A (a) 158,561 38,875,986
Workiva, Inc. (a) 33,824 3,421,298
Xperi Holding Corp. (b) 92,971 1,961,688
Yext, Inc. (a) 83,409 1,411,280
Zendesk, Inc. (a) 101,536 14,838,471
Zix Corp. (a) 48,838 360,424
Zoom Video Communications, Inc. Class A (a) 183,845 68,686,330
Zscaler, Inc. (a) 66,670 13,669,350
Zuora, Inc. (a) 89,598 1,337,698
3,221,345,035
Technology Hardware, Storage & Peripherals - 5.2%
3D Systems Corp. (a) 112,963 4,048,594
Apple, Inc. 14,141,877 1,714,843,938
Astro-Med, Inc. 3,839 42,843
Avid Technology, Inc. (a) 37,009 717,605
Boxlight Corp. (a)(b) 31,692 88,104
Corsair Gaming, Inc. 18,525 663,936
Dell Technologies, Inc. (a) 206,837 16,768,276
Copyright © 2021 www.secdatabase.com. All Rights Reserved.Please Consider the Environment Before Printing This Document

Diebold Nixdorf, Inc. (a) 66,754 969,268
Eastman Kodak Co. (a)(b) 55,448 477,962
Hewlett Packard Enterprise Co. 1,142,109 16,629,107
HP, Inc. 1,216,061 35,229,287
Immersion Corp. (a) 17,776 176,160
Intevac, Inc. (a) 20,748 132,165
NCR Corp. (a) 113,778 3,954,923
NetApp, Inc. 196,905 12,326,253
One Stop Systems, Inc. (a)(b) 9,489 61,204
Pure Storage, Inc. Class A (a) 210,602 4,923,875
Quantum Corp. (a) 35,103 292,759
Seagate Technology LLC 196,673 14,402,364
Sonim Technologies, Inc. (a) 31,339 32,593
Super Micro Computer, Inc. (a) 38,850 1,267,676
Transact Technologies, Inc. (a) 3,227 34,174
Western Digital Corp. 275,464 18,877,548
Xerox Holdings Corp. 147,596 3,760,746
1,850,721,360
TOTAL INFORMATION TECHNOLOGY 9,342,713,667
MATERIALS - 2.8%
Chemicals - 1.8%
Advanced Emissions Solutions, Inc. 15,397 87,763
AdvanSix, Inc. (a) 24,081 669,452
AgroFresh Solutions, Inc. (a) 16,647 39,786
Air Products & Chemicals, Inc. 195,461 49,963,741
Albemarle Corp. U.S. 104,028 16,354,242
American Vanguard Corp. 21,886 427,215
Amyris, Inc. (a)(b) 137,940 1,903,572
Ashland Global Holdings, Inc. 47,598 4,003,944
Avient Corp. 80,495 3,478,994
Axalta Coating Systems Ltd. (a) 187,697 5,131,636
Balchem Corp. 29,694 3,544,276
Cabot Corp. 51,351 2,528,010
Celanese Corp. Class A 102,381 14,221,745
CF Industries Holdings, Inc. 191,771 8,683,391
Chase Corp. 6,986 752,252
Core Molding Technologies, Inc. (a) 5,722 69,522
Corteva, Inc. 659,243 29,764,821
Dow, Inc. 654,704 38,830,494
DuPont de Nemours, Inc. 471,040 33,123,533
Copyright © 2021 www.secdatabase.com. All Rights Reserved.Please Consider the Environment Before Printing This Document
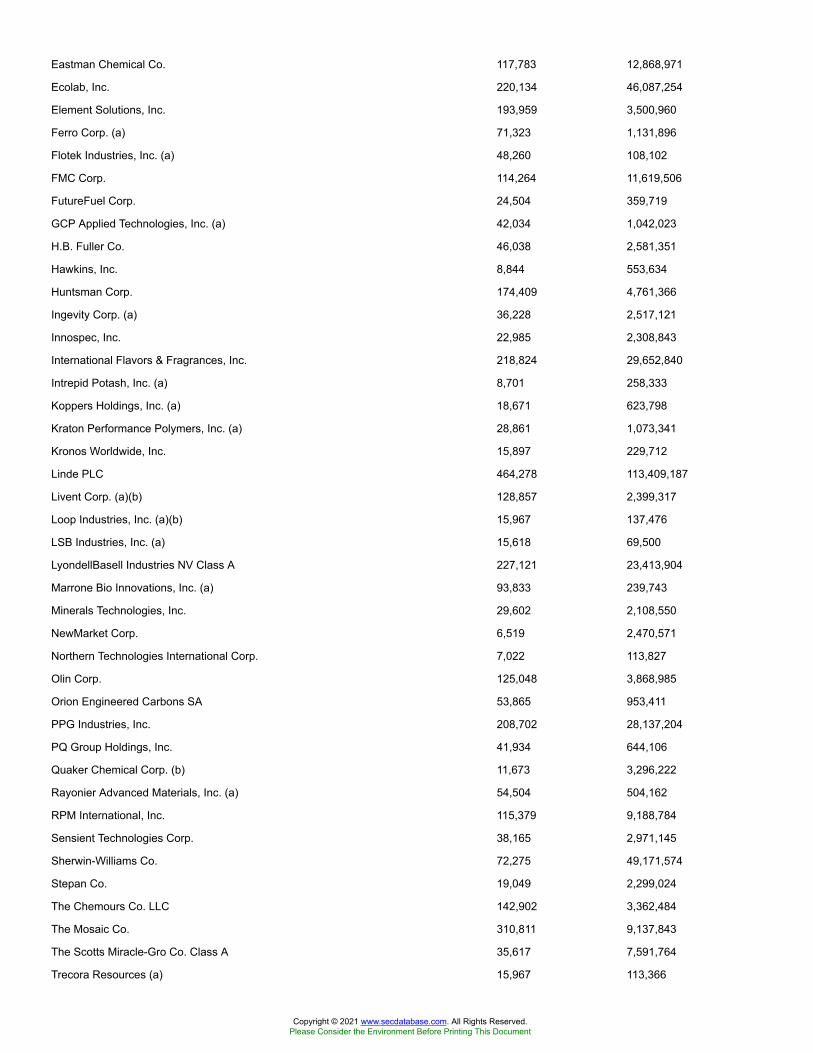
Eastman Chemical Co. 117,783 12,868,971
Ecolab, Inc. 220,134 46,087,254
Element Solutions, Inc. 193,959 3,500,960
Ferro Corp. (a) 71,323 1,131,896
Flotek Industries, Inc. (a) 48,260 108,102
FMC Corp. 114,264 11,619,506
FutureFuel Corp. 24,504 359,719
GCP Applied Technologies, Inc. (a) 42,034 1,042,023
H.B. Fuller Co. 46,038 2,581,351
Hawkins, Inc. 8,844 553,634
Huntsman Corp. 174,409 4,761,366
Ingevity Corp. (a) 36,228 2,517,121
Innospec, Inc. 22,985 2,308,843
International Flavors & Fragrances, Inc. 218,824 29,652,840
Intrepid Potash, Inc. (a) 8,701 258,333
Koppers Holdings, Inc. (a) 18,671 623,798
Kraton Performance Polymers, Inc. (a) 28,861 1,073,341
Kronos Worldwide, Inc. 15,897 229,712
Linde PLC 464,278 113,409,187
Livent Corp. (a)(b) 128,857 2,399,317
Loop Industries, Inc. (a)(b) 15,967 137,476
LSB Industries, Inc. (a) 15,618 69,500
LyondellBasell Industries NV Class A 227,121 23,413,904
Marrone Bio Innovations, Inc. (a) 93,833 239,743
Minerals Technologies, Inc. 29,602 2,108,550
NewMarket Corp. 6,519 2,470,571
Northern Technologies International Corp. 7,022 113,827
Olin Corp. 125,048 3,868,985
Orion Engineered Carbons SA 53,865 953,411
PPG Industries, Inc. 208,702 28,137,204
PQ Group Holdings, Inc. 41,934 644,106
Quaker Chemical Corp. (b) 11,673 3,296,222
Rayonier Advanced Materials, Inc. (a) 54,504 504,162
RPM International, Inc. 115,379 9,188,784
Sensient Technologies Corp. 38,165 2,971,145
Sherwin-Williams Co. 72,275 49,171,574
Stepan Co. 19,049 2,299,024
The Chemours Co. LLC 142,902 3,362,484
The Mosaic Co. 310,811 9,137,843
The Scotts Miracle-Gro Co. Class A 35,617 7,591,764
Trecora Resources (a) 15,967 113,366
Copyright © 2021 www.secdatabase.com. All Rights Reserved.Please Consider the Environment Before Printing This Document
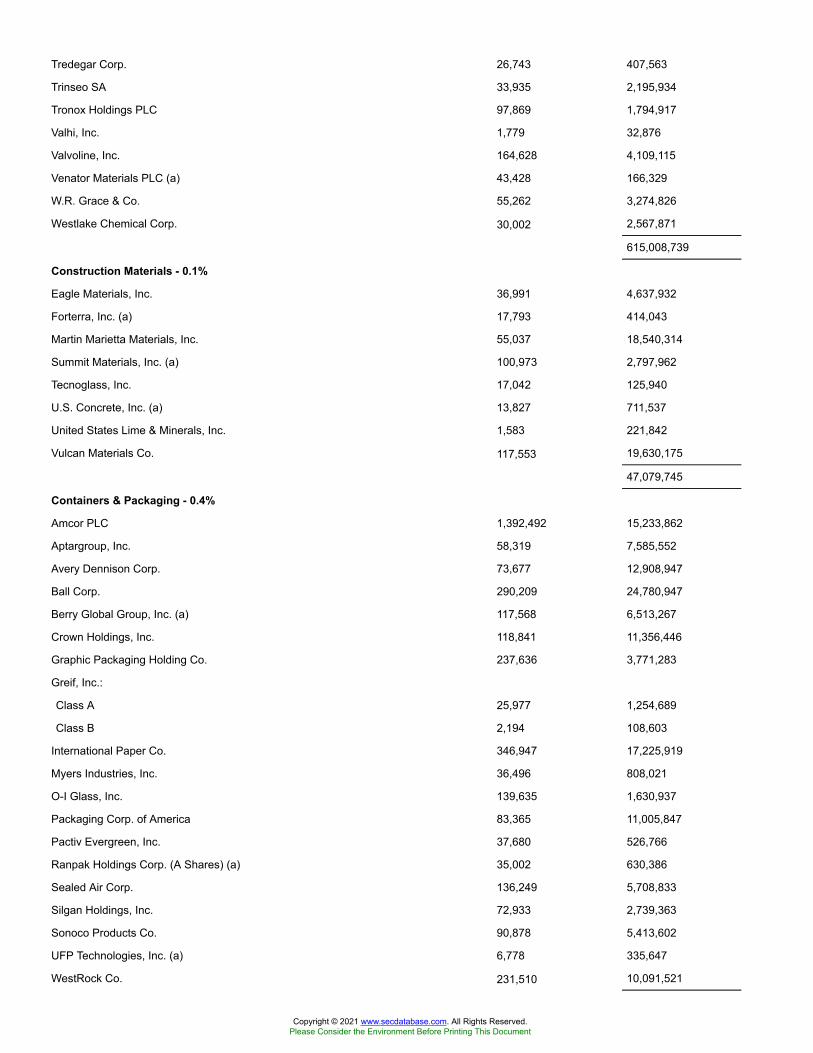
Tredegar Corp. 26,743 407,563
Trinseo SA 33,935 2,195,934
Tronox Holdings PLC 97,869 1,794,917
Valhi, Inc. 1,779 32,876
Valvoline, Inc. 164,628 4,109,115
Venator Materials PLC (a) 43,428 166,329
W.R. Grace & Co. 55,262 3,274,826
Westlake Chemical Corp. 30,002 2,567,871
615,008,739
Construction Materials - 0.1%
Eagle Materials, Inc. 36,991 4,637,932
Forterra, Inc. (a) 17,793 414,043
Martin Marietta Materials, Inc. 55,037 18,540,314
Summit Materials, Inc. (a) 100,973 2,797,962
Tecnoglass, Inc. 17,042 125,940
U.S. Concrete, Inc. (a) 13,827 711,537
United States Lime & Minerals, Inc. 1,583 221,842
Vulcan Materials Co. 117,553 19,630,175
47,079,745
Containers & Packaging - 0.4%
Amcor PLC 1,392,492 15,233,862
Aptargroup, Inc. 58,319 7,585,552
Avery Dennison Corp. 73,677 12,908,947
Ball Corp. 290,209 24,780,947
Berry Global Group, Inc. (a) 117,568 6,513,267
Crown Holdings, Inc. 118,841 11,356,446
Graphic Packaging Holding Co. 237,636 3,771,283
Greif, Inc.:
Class A 25,977 1,254,689
Class B 2,194 108,603
International Paper Co. 346,947 17,225,919
Myers Industries, Inc. 36,496 808,021
O-I Glass, Inc. 139,635 1,630,937
Packaging Corp. of America 83,365 11,005,847
Pactiv Evergreen, Inc. 37,680 526,766
Ranpak Holdings Corp. (A Shares) (a) 35,002 630,386
Sealed Air Corp. 136,249 5,708,833
Silgan Holdings, Inc. 72,933 2,739,363
Sonoco Products Co. 90,878 5,413,602
UFP Technologies, Inc. (a) 6,778 335,647
WestRock Co. 231,510 10,091,521
Copyright © 2021 www.secdatabase.com. All Rights Reserved.Please Consider the Environment Before Printing This Document
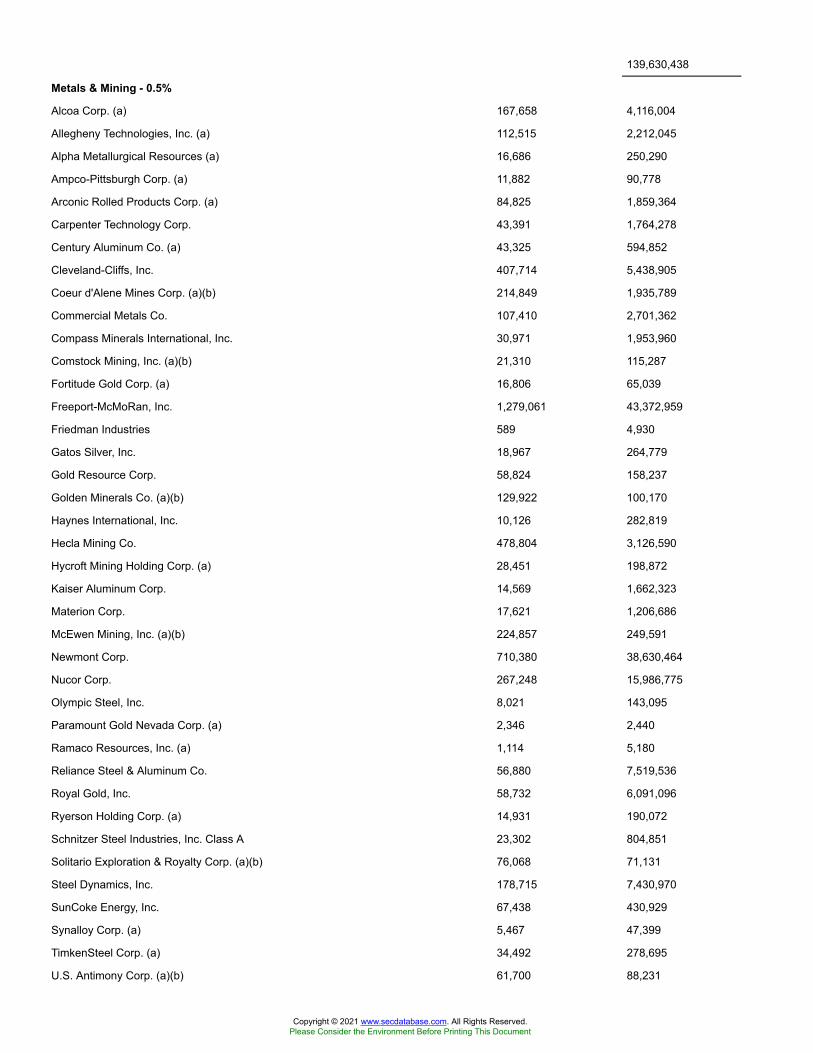
139,630,438
Metals & Mining - 0.5%
Alcoa Corp. (a) 167,658 4,116,004
Allegheny Technologies, Inc. (a) 112,515 2,212,045
Alpha Metallurgical Resources (a) 16,686 250,290
Ampco-Pittsburgh Corp. (a) 11,882 90,778
Arconic Rolled Products Corp. (a) 84,825 1,859,364
Carpenter Technology Corp. 43,391 1,764,278
Century Aluminum Co. (a) 43,325 594,852
Cleveland-Cliffs, Inc. 407,714 5,438,905
Coeur d'Alene Mines Corp. (a)(b) 214,849 1,935,789
Commercial Metals Co. 107,410 2,701,362
Compass Minerals International, Inc. 30,971 1,953,960
Comstock Mining, Inc. (a)(b) 21,310 115,287
Fortitude Gold Corp. (a) 16,806 65,039
Freeport-McMoRan, Inc. 1,279,061 43,372,959
Friedman Industries 589 4,930
Gatos Silver, Inc. 18,967 264,779
Gold Resource Corp. 58,824 158,237
Golden Minerals Co. (a)(b) 129,922 100,170
Haynes International, Inc. 10,126 282,819
Hecla Mining Co. 478,804 3,126,590
Hycroft Mining Holding Corp. (a) 28,451 198,872
Kaiser Aluminum Corp. 14,569 1,662,323
Materion Corp. 17,621 1,206,686
McEwen Mining, Inc. (a)(b) 224,857 249,591
Newmont Corp. 710,380 38,630,464
Nucor Corp. 267,248 15,986,775
Olympic Steel, Inc. 8,021 143,095
Paramount Gold Nevada Corp. (a) 2,346 2,440
Ramaco Resources, Inc. (a) 1,114 5,180
Reliance Steel & Aluminum Co. 56,880 7,519,536
Royal Gold, Inc. 58,732 6,091,096
Ryerson Holding Corp. (a) 14,931 190,072
Schnitzer Steel Industries, Inc. Class A 23,302 804,851
Solitario Exploration & Royalty Corp. (a)(b) 76,068 71,131
Steel Dynamics, Inc. 178,715 7,430,970
SunCoke Energy, Inc. 67,438 430,929
Synalloy Corp. (a) 5,467 47,399
TimkenSteel Corp. (a) 34,492 278,695
U.S. Antimony Corp. (a)(b) 61,700 88,231
Copyright © 2021 www.secdatabase.com. All Rights Reserved.Please Consider the Environment Before Printing This Document
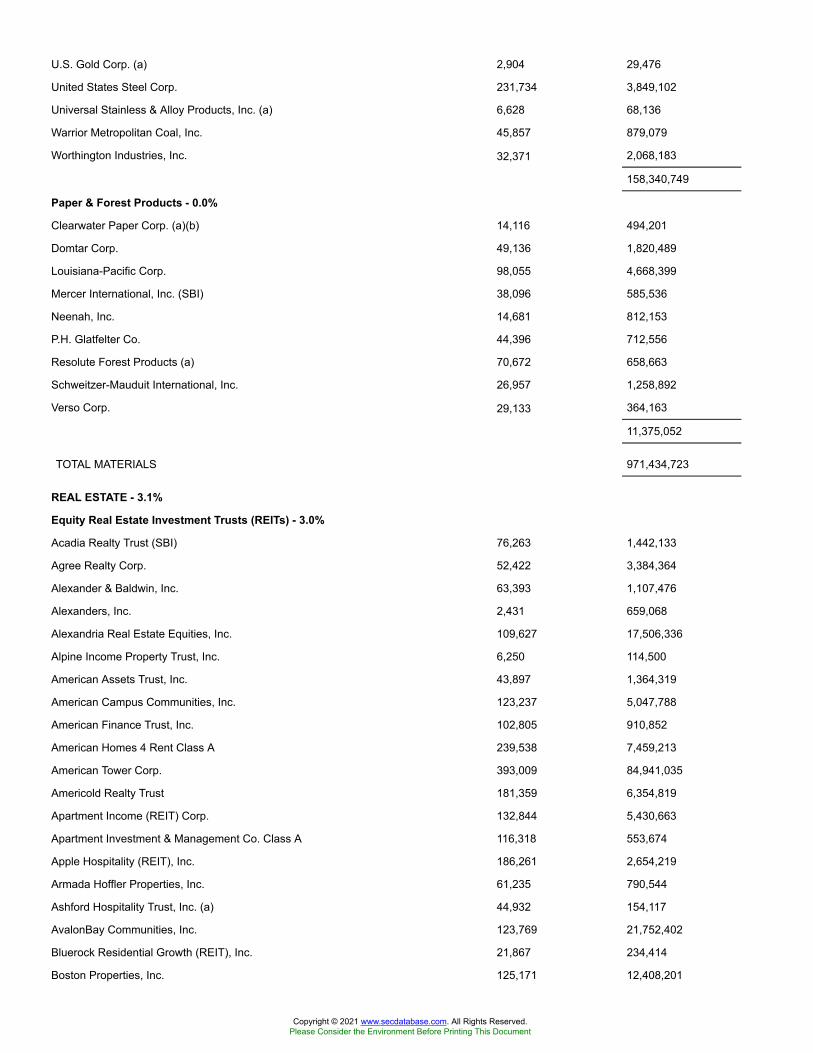
U.S. Gold Corp. (a) 2,904 29,476
United States Steel Corp. 231,734 3,849,102
Universal Stainless & Alloy Products, Inc. (a) 6,628 68,136
Warrior Metropolitan Coal, Inc. 45,857 879,079
Worthington Industries, Inc. 32,371 2,068,183
158,340,749
Paper & Forest Products - 0.0%
Clearwater Paper Corp. (a)(b) 14,116 494,201
Domtar Corp. 49,136 1,820,489
Louisiana-Pacific Corp. 98,055 4,668,399
Mercer International, Inc. (SBI) 38,096 585,536
Neenah, Inc. 14,681 812,153
P.H. Glatfelter Co. 44,396 712,556
Resolute Forest Products (a) 70,672 658,663
Schweitzer-Mauduit International, Inc. 26,957 1,258,892
Verso Corp. 29,133 364,163
11,375,052
TOTAL MATERIALS 971,434,723
REAL ESTATE - 3.1%
Equity Real Estate Investment Trusts (REITs) - 3.0%
Acadia Realty Trust (SBI) 76,263 1,442,133
Agree Realty Corp. 52,422 3,384,364
Alexander & Baldwin, Inc. 63,393 1,107,476
Alexanders, Inc. 2,431 659,068
Alexandria Real Estate Equities, Inc. 109,627 17,506,336
Alpine Income Property Trust, Inc. 6,250 114,500
American Assets Trust, Inc. 43,897 1,364,319
American Campus Communities, Inc. 123,237 5,047,788
American Finance Trust, Inc. 102,805 910,852
American Homes 4 Rent Class A 239,538 7,459,213
American Tower Corp. 393,009 84,941,035
Americold Realty Trust 181,359 6,354,819
Apartment Income (REIT) Corp. 132,844 5,430,663
Apartment Investment & Management Co. Class A 116,318 553,674
Apple Hospitality (REIT), Inc. 186,261 2,654,219
Armada Hoffler Properties, Inc. 61,235 790,544
Ashford Hospitality Trust, Inc. (a) 44,932 154,117
AvalonBay Communities, Inc. 123,769 21,752,402
Bluerock Residential Growth (REIT), Inc. 21,867 234,414
Boston Properties, Inc. 125,171 12,408,201
Copyright © 2021 www.secdatabase.com. All Rights Reserved.Please Consider the Environment Before Printing This Document
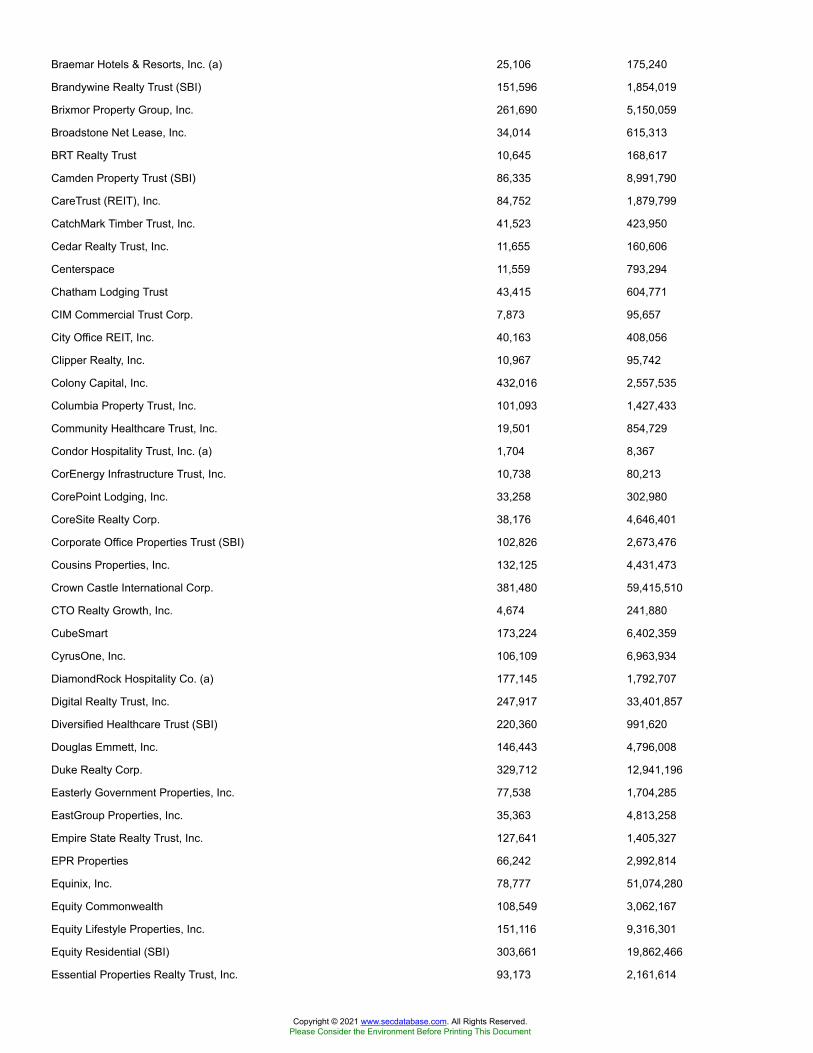
Braemar Hotels & Resorts, Inc. (a) 25,106 175,240
Brandywine Realty Trust (SBI) 151,596 1,854,019
Brixmor Property Group, Inc. 261,690 5,150,059
Broadstone Net Lease, Inc. 34,014 615,313
BRT Realty Trust 10,645 168,617
Camden Property Trust (SBI) 86,335 8,991,790
CareTrust (REIT), Inc. 84,752 1,879,799
CatchMark Timber Trust, Inc. 41,523 423,950
Cedar Realty Trust, Inc. 11,655 160,606
Centerspace 11,559 793,294
Chatham Lodging Trust 43,415 604,771
CIM Commercial Trust Corp. 7,873 95,657
City Office REIT, Inc. 40,163 408,056
Clipper Realty, Inc. 10,967 95,742
Colony Capital, Inc. 432,016 2,557,535
Columbia Property Trust, Inc. 101,093 1,427,433
Community Healthcare Trust, Inc. 19,501 854,729
Condor Hospitality Trust, Inc. (a) 1,704 8,367
CorEnergy Infrastructure Trust, Inc. 10,738 80,213
CorePoint Lodging, Inc. 33,258 302,980
CoreSite Realty Corp. 38,176 4,646,401
Corporate Office Properties Trust (SBI) 102,826 2,673,476
Cousins Properties, Inc. 132,125 4,431,473
Crown Castle International Corp. 381,480 59,415,510
CTO Realty Growth, Inc. 4,674 241,880
CubeSmart 173,224 6,402,359
CyrusOne, Inc. 106,109 6,963,934
DiamondRock Hospitality Co. (a) 177,145 1,792,707
Digital Realty Trust, Inc. 247,917 33,401,857
Diversified Healthcare Trust (SBI) 220,360 991,620
Douglas Emmett, Inc. 146,443 4,796,008
Duke Realty Corp. 329,712 12,941,196
Easterly Government Properties, Inc. 77,538 1,704,285
EastGroup Properties, Inc. 35,363 4,813,258
Empire State Realty Trust, Inc. 127,641 1,405,327
EPR Properties 66,242 2,992,814
Equinix, Inc. 78,777 51,074,280
Equity Commonwealth 108,549 3,062,167
Equity Lifestyle Properties, Inc. 151,116 9,316,301
Equity Residential (SBI) 303,661 19,862,466
Essential Properties Realty Trust, Inc. 93,173 2,161,614
Copyright © 2021 www.secdatabase.com. All Rights Reserved.Please Consider the Environment Before Printing This Document
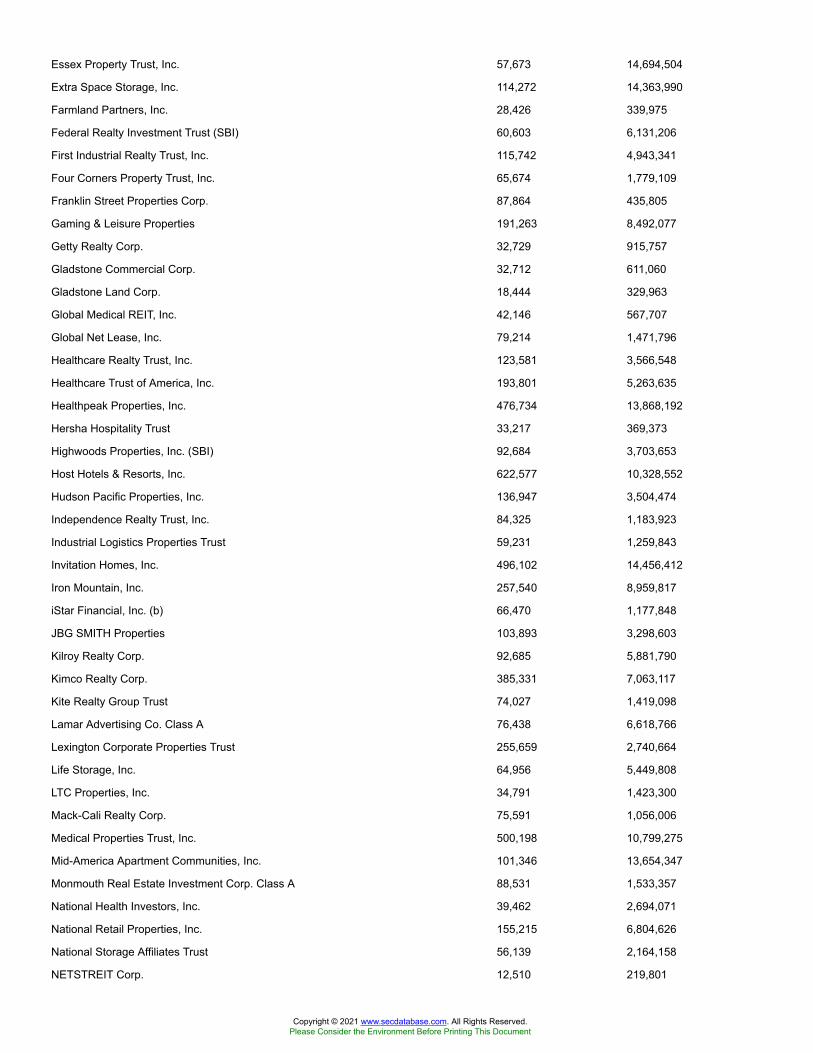
Essex Property Trust, Inc. 57,673 14,694,504
Extra Space Storage, Inc. 114,272 14,363,990
Farmland Partners, Inc. 28,426 339,975
Federal Realty Investment Trust (SBI) 60,603 6,131,206
First Industrial Realty Trust, Inc. 115,742 4,943,341
Four Corners Property Trust, Inc. 65,674 1,779,109
Franklin Street Properties Corp. 87,864 435,805
Gaming & Leisure Properties 191,263 8,492,077
Getty Realty Corp. 32,729 915,757
Gladstone Commercial Corp. 32,712 611,060
Gladstone Land Corp. 18,444 329,963
Global Medical REIT, Inc. 42,146 567,707
Global Net Lease, Inc. 79,214 1,471,796
Healthcare Realty Trust, Inc. 123,581 3,566,548
Healthcare Trust of America, Inc. 193,801 5,263,635
Healthpeak Properties, Inc. 476,734 13,868,192
Hersha Hospitality Trust 33,217 369,373
Highwoods Properties, Inc. (SBI) 92,684 3,703,653
Host Hotels & Resorts, Inc. 622,577 10,328,552
Hudson Pacific Properties, Inc. 136,947 3,504,474
Independence Realty Trust, Inc. 84,325 1,183,923
Industrial Logistics Properties Trust 59,231 1,259,843
Invitation Homes, Inc. 496,102 14,456,412
Iron Mountain, Inc. 257,540 8,959,817
iStar Financial, Inc. (b) 66,470 1,177,848
JBG SMITH Properties 103,893 3,298,603
Kilroy Realty Corp. 92,685 5,881,790
Kimco Realty Corp. 385,331 7,063,117
Kite Realty Group Trust 74,027 1,419,098
Lamar Advertising Co. Class A 76,438 6,618,766
Lexington Corporate Properties Trust 255,659 2,740,664
Life Storage, Inc. 64,956 5,449,808
LTC Properties, Inc. 34,791 1,423,300
Mack-Cali Realty Corp. 75,591 1,056,006
Medical Properties Trust, Inc. 500,198 10,799,275
Mid-America Apartment Communities, Inc. 101,346 13,654,347
Monmouth Real Estate Investment Corp. Class A 88,531 1,533,357
National Health Investors, Inc. 39,462 2,694,071
National Retail Properties, Inc. 155,215 6,804,626
National Storage Affiliates Trust 56,139 2,164,158
NETSTREIT Corp. 12,510 219,801
Copyright © 2021 www.secdatabase.com. All Rights Reserved.Please Consider the Environment Before Printing This Document
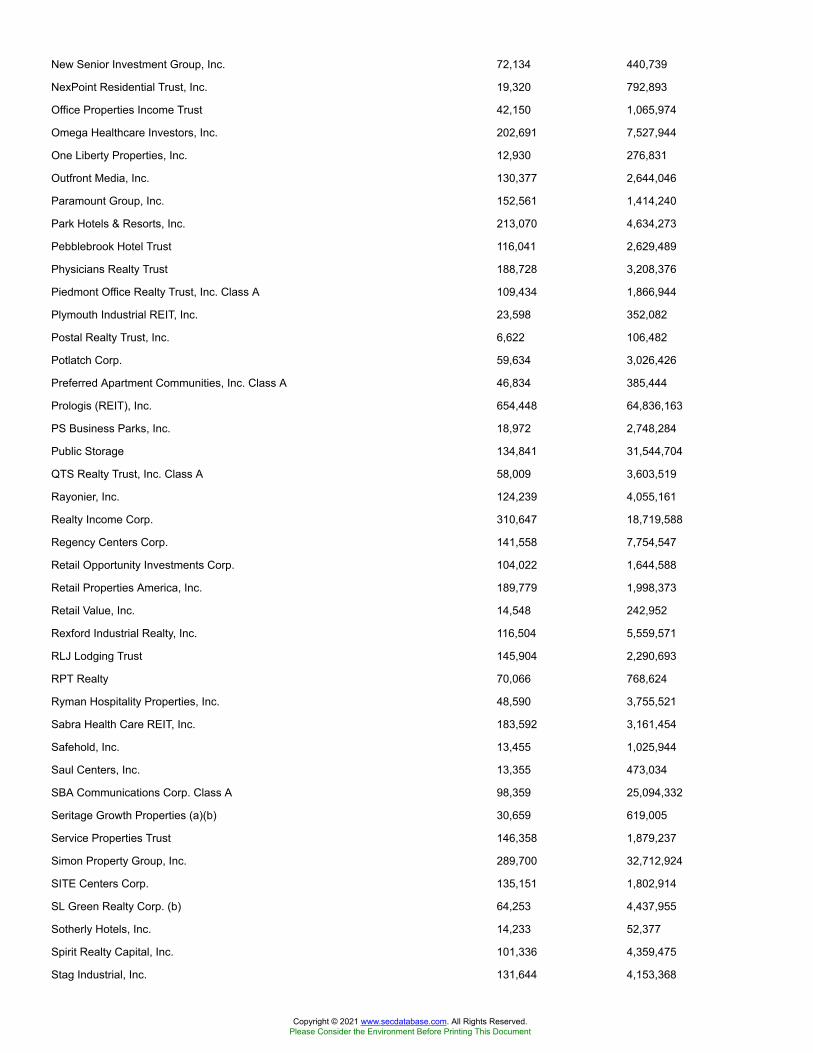
New Senior Investment Group, Inc. 72,134 440,739
NexPoint Residential Trust, Inc. 19,320 792,893
Office Properties Income Trust 42,150 1,065,974
Omega Healthcare Investors, Inc. 202,691 7,527,944
One Liberty Properties, Inc. 12,930 276,831
Outfront Media, Inc. 130,377 2,644,046
Paramount Group, Inc. 152,561 1,414,240
Park Hotels & Resorts, Inc. 213,070 4,634,273
Pebblebrook Hotel Trust 116,041 2,629,489
Physicians Realty Trust 188,728 3,208,376
Piedmont Office Realty Trust, Inc. Class A 109,434 1,866,944
Plymouth Industrial REIT, Inc. 23,598 352,082
Postal Realty Trust, Inc. 6,622 106,482
Potlatch Corp. 59,634 3,026,426
Preferred Apartment Communities, Inc. Class A 46,834 385,444
Prologis (REIT), Inc. 654,448 64,836,163
PS Business Parks, Inc. 18,972 2,748,284
Public Storage 134,841 31,544,704
QTS Realty Trust, Inc. Class A 58,009 3,603,519
Rayonier, Inc. 124,239 4,055,161
Realty Income Corp. 310,647 18,719,588
Regency Centers Corp. 141,558 7,754,547
Retail Opportunity Investments Corp. 104,022 1,644,588
Retail Properties America, Inc. 189,779 1,998,373
Retail Value, Inc. 14,548 242,952
Rexford Industrial Realty, Inc. 116,504 5,559,571
RLJ Lodging Trust 145,904 2,290,693
RPT Realty 70,066 768,624
Ryman Hospitality Properties, Inc. 48,590 3,755,521
Sabra Health Care REIT, Inc. 183,592 3,161,454
Safehold, Inc. 13,455 1,025,944
Saul Centers, Inc. 13,355 473,034
SBA Communications Corp. Class A 98,359 25,094,332
Seritage Growth Properties (a)(b) 30,659 619,005
Service Properties Trust 146,358 1,879,237
Simon Property Group, Inc. 289,700 32,712,924
SITE Centers Corp. 135,151 1,802,914
SL Green Realty Corp. (b) 64,253 4,437,955
Sotherly Hotels, Inc. 14,233 52,377
Spirit Realty Capital, Inc. 101,336 4,359,475
Stag Industrial, Inc. 131,644 4,153,368
Copyright © 2021 www.secdatabase.com. All Rights Reserved.Please Consider the Environment Before Printing This Document
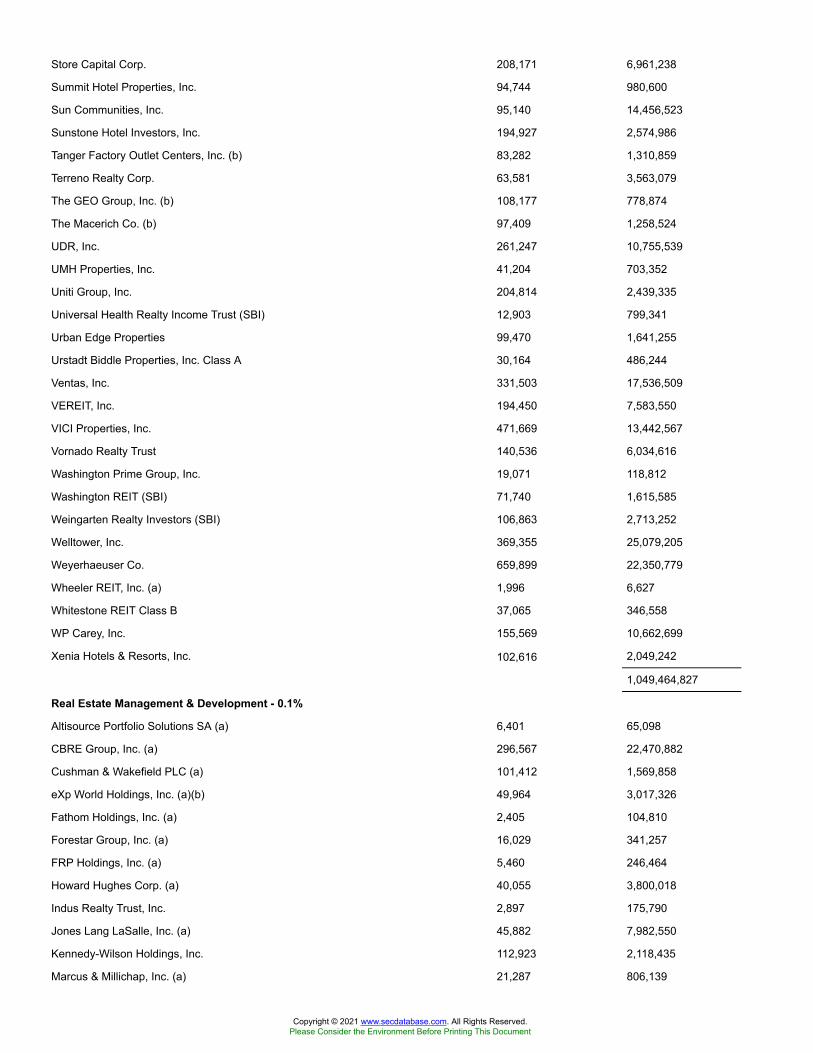
Store Capital Corp. 208,171 6,961,238
Summit Hotel Properties, Inc. 94,744 980,600
Sun Communities, Inc. 95,140 14,456,523
Sunstone Hotel Investors, Inc. 194,927 2,574,986
Tanger Factory Outlet Centers, Inc. (b) 83,282 1,310,859
Terreno Realty Corp. 63,581 3,563,079
The GEO Group, Inc. (b) 108,177 778,874
The Macerich Co. (b) 97,409 1,258,524
UDR, Inc. 261,247 10,755,539
UMH Properties, Inc. 41,204 703,352
Uniti Group, Inc. 204,814 2,439,335
Universal Health Realty Income Trust (SBI) 12,903 799,341
Urban Edge Properties 99,470 1,641,255
Urstadt Biddle Properties, Inc. Class A 30,164 486,244
Ventas, Inc. 331,503 17,536,509
VEREIT, Inc. 194,450 7,583,550
VICI Properties, Inc. 471,669 13,442,567
Vornado Realty Trust 140,536 6,034,616
Washington Prime Group, Inc. 19,071 118,812
Washington REIT (SBI) 71,740 1,615,585
Weingarten Realty Investors (SBI) 106,863 2,713,252
Welltower, Inc. 369,355 25,079,205
Weyerhaeuser Co. 659,899 22,350,779
Wheeler REIT, Inc. (a) 1,996 6,627
Whitestone REIT Class B 37,065 346,558
WP Carey, Inc. 155,569 10,662,699
Xenia Hotels & Resorts, Inc. 102,616 2,049,242
1,049,464,827
Real Estate Management & Development - 0.1%
Altisource Portfolio Solutions SA (a) 6,401 65,098
CBRE Group, Inc. (a) 296,567 22,470,882
Cushman & Wakefield PLC (a) 101,412 1,569,858
eXp World Holdings, Inc. (a)(b) 49,964 3,017,326
Fathom Holdings, Inc. (a) 2,405 104,810
Forestar Group, Inc. (a) 16,029 341,257
FRP Holdings, Inc. (a) 5,460 246,464
Howard Hughes Corp. (a) 40,055 3,800,018
Indus Realty Trust, Inc. 2,897 175,790
Jones Lang LaSalle, Inc. (a) 45,882 7,982,550
Kennedy-Wilson Holdings, Inc. 112,923 2,118,435
Marcus & Millichap, Inc. (a) 21,287 806,139
Copyright © 2021 www.secdatabase.com. All Rights Reserved.Please Consider the Environment Before Printing This Document
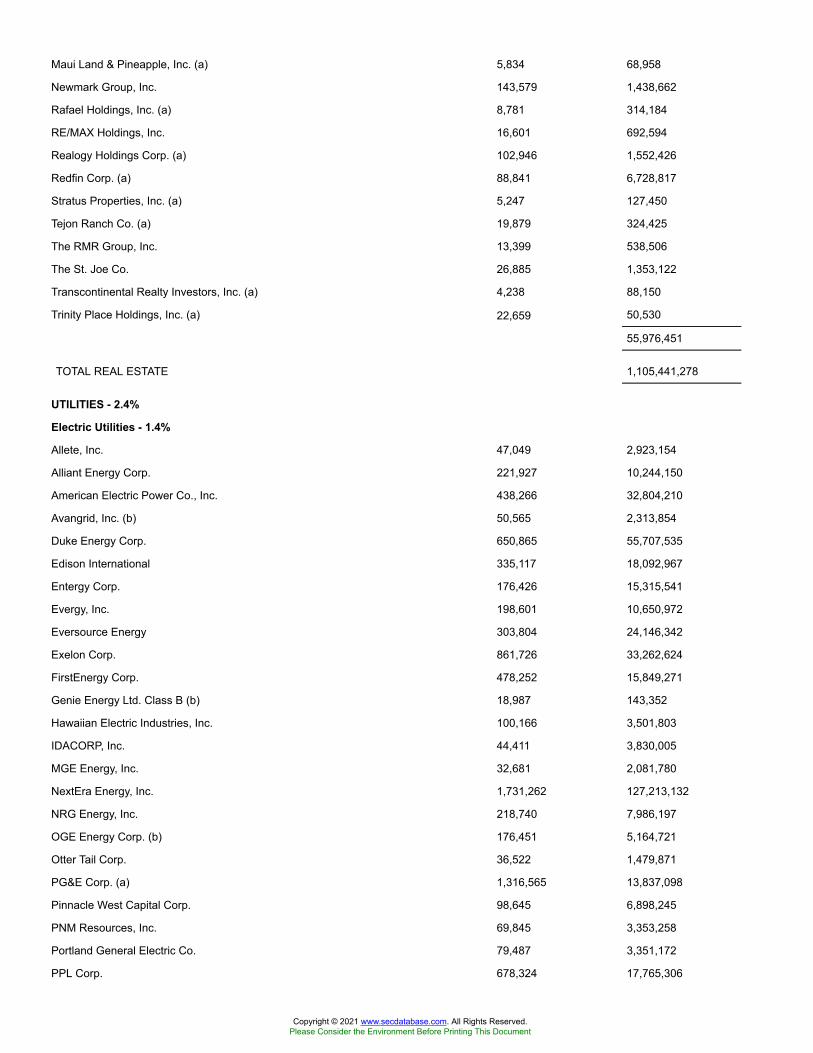
Maui Land & Pineapple, Inc. (a) 5,834 68,958
Newmark Group, Inc. 143,579 1,438,662
Rafael Holdings, Inc. (a) 8,781 314,184
RE/MAX Holdings, Inc. 16,601 692,594
Realogy Holdings Corp. (a) 102,946 1,552,426
Redfin Corp. (a) 88,841 6,728,817
Stratus Properties, Inc. (a) 5,247 127,450
Tejon Ranch Co. (a) 19,879 324,425
The RMR Group, Inc. 13,399 538,506
The St. Joe Co. 26,885 1,353,122
Transcontinental Realty Investors, Inc. (a) 4,238 88,150
Trinity Place Holdings, Inc. (a) 22,659 50,530
55,976,451
TOTAL REAL ESTATE 1,105,441,278
UTILITIES - 2.4%
Electric Utilities - 1.4%
Allete, Inc. 47,049 2,923,154
Alliant Energy Corp. 221,927 10,244,150
American Electric Power Co., Inc. 438,266 32,804,210
Avangrid, Inc. (b) 50,565 2,313,854
Duke Energy Corp. 650,865 55,707,535
Edison International 335,117 18,092,967
Entergy Corp. 176,426 15,315,541
Evergy, Inc. 198,601 10,650,972
Eversource Energy 303,804 24,146,342
Exelon Corp. 861,726 33,262,624
FirstEnergy Corp. 478,252 15,849,271
Genie Energy Ltd. Class B (b) 18,987 143,352
Hawaiian Electric Industries, Inc. 100,166 3,501,803
IDACORP, Inc. 44,411 3,830,005
MGE Energy, Inc. 32,681 2,081,780
NextEra Energy, Inc. 1,731,262 127,213,132
NRG Energy, Inc. 218,740 7,986,197
OGE Energy Corp. (b) 176,451 5,164,721
Otter Tail Corp. 36,522 1,479,871
PG&E Corp. (a) 1,316,565 13,837,098
Pinnacle West Capital Corp. 98,645 6,898,245
PNM Resources, Inc. 69,845 3,353,258
Portland General Electric Co. 79,487 3,351,172
PPL Corp. 678,324 17,765,306
Copyright © 2021 www.secdatabase.com. All Rights Reserved.Please Consider the Environment Before Printing This Document
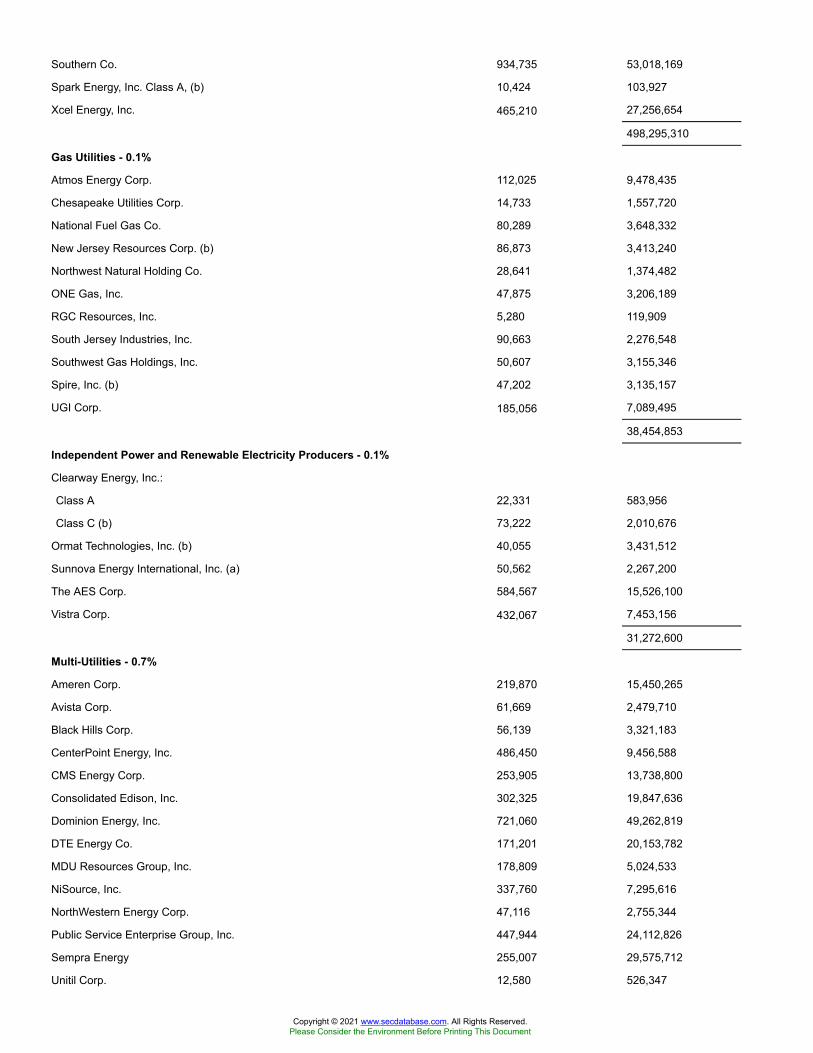
Southern Co. 934,735 53,018,169
Spark Energy, Inc. Class A, (b) 10,424 103,927
Xcel Energy, Inc. 465,210 27,256,654
498,295,310
Gas Utilities - 0.1%
Atmos Energy Corp. 112,025 9,478,435
Chesapeake Utilities Corp. 14,733 1,557,720
National Fuel Gas Co. 80,289 3,648,332
New Jersey Resources Corp. (b) 86,873 3,413,240
Northwest Natural Holding Co. 28,641 1,374,482
ONE Gas, Inc. 47,875 3,206,189
RGC Resources, Inc. 5,280 119,909
South Jersey Industries, Inc. 90,663 2,276,548
Southwest Gas Holdings, Inc. 50,607 3,155,346
Spire, Inc. (b) 47,202 3,135,157
UGI Corp. 185,056 7,089,495
38,454,853
Independent Power and Renewable Electricity Producers - 0.1%
Clearway Energy, Inc.:
Class A 22,331 583,956
Class C (b) 73,222 2,010,676
Ormat Technologies, Inc. (b) 40,055 3,431,512
Sunnova Energy International, Inc. (a) 50,562 2,267,200
The AES Corp. 584,567 15,526,100
Vistra Corp. 432,067 7,453,156
31,272,600
Multi-Utilities - 0.7%
Ameren Corp. 219,870 15,450,265
Avista Corp. 61,669 2,479,710
Black Hills Corp. 56,139 3,321,183
CenterPoint Energy, Inc. 486,450 9,456,588
CMS Energy Corp. 253,905 13,738,800
Consolidated Edison, Inc. 302,325 19,847,636
Dominion Energy, Inc. 721,060 49,262,819
DTE Energy Co. 171,201 20,153,782
MDU Resources Group, Inc. 178,809 5,024,533
NiSource, Inc. 337,760 7,295,616
NorthWestern Energy Corp. 47,116 2,755,344
Public Service Enterprise Group, Inc. 447,944 24,112,826
Sempra Energy 255,007 29,575,712
Unitil Corp. 12,580 526,347
Copyright © 2021 www.secdatabase.com. All Rights Reserved.Please Consider the Environment Before Printing This Document

WEC Energy Group, Inc. 280,805 22,644,115
225,645,276
Water Utilities - 0.1%
American States Water Co. (b) 33,674 2,459,886
American Water Works Co., Inc. 159,993 22,699,807
Artesian Resources Corp. Class A 7,843 290,191
Cadiz, Inc. (a) 30,774 334,513
California Water Service Group 46,500 2,555,175
Essential Utilities, Inc. 196,415 8,261,215
Global Water Resources, Inc. 9,437 163,543
Middlesex Water Co. 15,904 1,092,128
Pure Cycle Corp. (a) 21,890 257,426
SJW Corp. 23,230 1,456,056
York Water Co. (b) 13,659 568,351
40,138,291
TOTAL UTILITIES 833,806,330
TOTAL COMMON STOCKS
(Cost $26,935,894,206) 35,015,626,487
Principal Amount Value
U.S. Treasury Obligations - 0.0%
U.S. Treasury Bills, yield at date of purchase 0.04% 6/3/21 (e)
(Cost $4,999,471) 5,000,000 4,999,409
Shares Value
Money Market Funds - 2.4%
Fidelity Cash Central Fund 0.07% (f) 216,970,067 $217,013,461
Fidelity Securities Lending Cash Central Fund 0.08% (f)(g) 632,747,879 632,811,154
TOTAL MONEY MARKET FUNDS
(Cost $849,824,615) 849,824,615
TOTAL INVESTMENT IN SECURITIES - 101.8%
(Cost $27,790,718,292) 35,870,450,511
NET OTHER ASSETS (LIABILITIES) - (1.8)% (649,657,847)
NET ASSETS - 100% $35,220,792,664
Futures Contracts
Number ofcontracts
ExpirationDate
NotionalAmount Value
Unrealized Appreciation/(Depreciation)
Purchased
Equity Index Contracts
CME E-mini Russell 2000 Index Contracts(United States) 227
March2021 $24,960,920 $445,570 $445,570
Copyright © 2021 www.secdatabase.com. All Rights Reserved.Please Consider the Environment Before Printing This Document
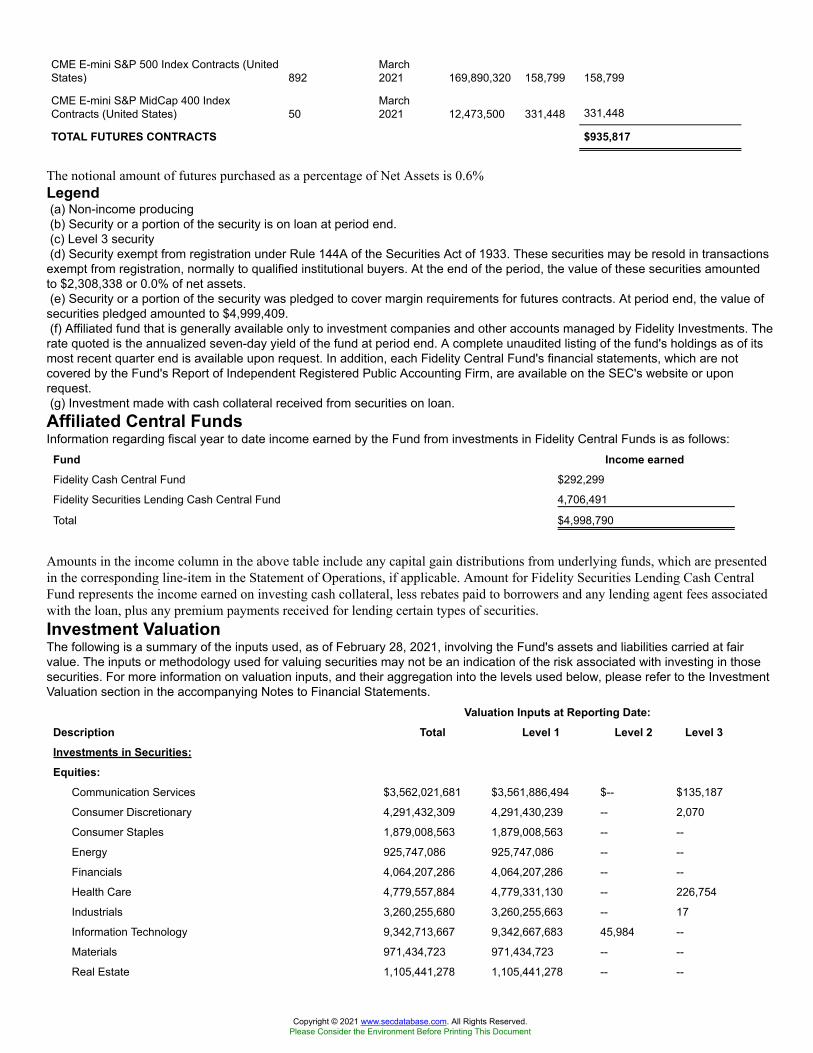
CME E-mini S&P 500 Index Contracts (UnitedStates) 892
March2021 169,890,320 158,799 158,799
CME E-mini S&P MidCap 400 IndexContracts (United States) 50
March2021 12,473,500 331,448 331,448
TOTAL FUTURES CONTRACTS $935,817
The notional amount of futures purchased as a percentage of Net Assets is 0.6%Legend(a) Non-income producing(b) Security or a portion of the security is on loan at period end.(c) Level 3 security(d) Security exempt from registration under Rule 144A of the Securities Act of 1933. These securities may be resold in transactions
exempt from registration, normally to qualified institutional buyers. At the end of the period, the value of these securities amountedto $2,308,338 or 0.0% of net assets.(e) Security or a portion of the security was pledged to cover margin requirements for futures contracts. At period end, the value of
securities pledged amounted to $4,999,409.(f) Affiliated fund that is generally available only to investment companies and other accounts managed by Fidelity Investments. The
rate quoted is the annualized seven-day yield of the fund at period end. A complete unaudited listing of the fund's holdings as of itsmost recent quarter end is available upon request. In addition, each Fidelity Central Fund's financial statements, which are notcovered by the Fund's Report of Independent Registered Public Accounting Firm, are available on the SEC's website or uponrequest.(g) Investment made with cash collateral received from securities on loan.Affiliated Central FundsInformation regarding fiscal year to date income earned by the Fund from investments in Fidelity Central Funds is as follows:
Fund Income earnedFidelity Cash Central Fund $292,299
Fidelity Securities Lending Cash Central Fund 4,706,491
Total $4,998,790
Amounts in the income column in the above table include any capital gain distributions from underlying funds, which are presentedin the corresponding line-item in the Statement of Operations, if applicable. Amount for Fidelity Securities Lending Cash CentralFund represents the income earned on investing cash collateral, less rebates paid to borrowers and any lending agent fees associatedwith the loan, plus any premium payments received for lending certain types of securities.Investment ValuationThe following is a summary of the inputs used, as of February 28, 2021, involving the Fund's assets and liabilities carried at fairvalue. The inputs or methodology used for valuing securities may not be an indication of the risk associated with investing in thosesecurities. For more information on valuation inputs, and their aggregation into the levels used below, please refer to the InvestmentValuation section in the accompanying Notes to Financial Statements.
Valuation Inputs at Reporting Date:Description Total Level 1 Level 2 Level 3Investments in Securities:Equities:
Communication Services $3,562,021,681 $3,561,886,494 $-- $135,187
Consumer Discretionary 4,291,432,309 4,291,430,239 -- 2,070
Consumer Staples 1,879,008,563 1,879,008,563 -- --
Energy 925,747,086 925,747,086 -- --
Financials 4,064,207,286 4,064,207,286 -- --
Health Care 4,779,557,884 4,779,331,130 -- 226,754
Industrials 3,260,255,680 3,260,255,663 -- 17
Information Technology 9,342,713,667 9,342,667,683 45,984 --
Materials 971,434,723 971,434,723 -- --
Real Estate 1,105,441,278 1,105,441,278 -- --
Copyright © 2021 www.secdatabase.com. All Rights Reserved.Please Consider the Environment Before Printing This Document
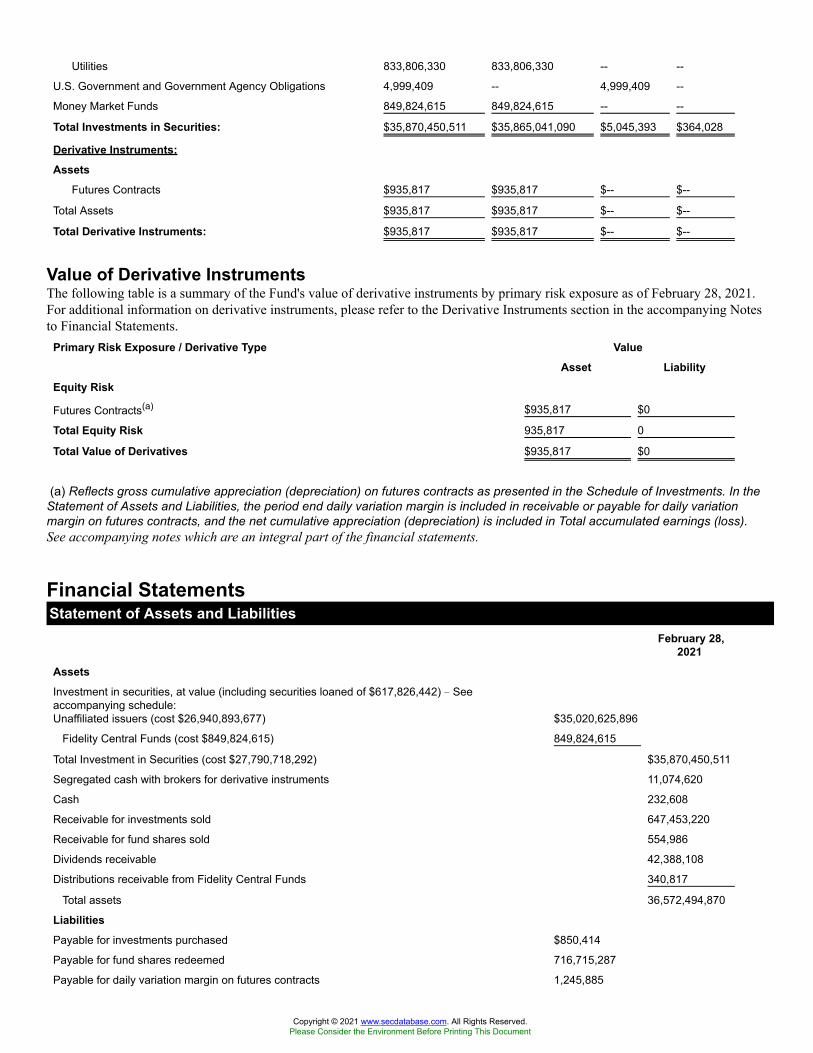
Utilities 833,806,330 833,806,330 -- --
U.S. Government and Government Agency Obligations 4,999,409 -- 4,999,409 --
Money Market Funds 849,824,615 849,824,615 -- --
Total Investments in Securities: $35,870,450,511 $35,865,041,090 $5,045,393 $364,028
Derivative Instruments:Assets
Futures Contracts $935,817 $935,817 $-- $--
Total Assets $935,817 $935,817 $-- $--
Total Derivative Instruments: $935,817 $935,817 $-- $--
Value of Derivative InstrumentsThe following table is a summary of the Fund's value of derivative instruments by primary risk exposure as of February 28, 2021.For additional information on derivative instruments, please refer to the Derivative Instruments section in the accompanying Notesto Financial Statements.
Primary Risk Exposure / Derivative Type ValueAsset Liability
Equity Risk
Futures Contracts(a) $935,817 $0
Total Equity Risk 935,817 0
Total Value of Derivatives $935,817 $0
(a) Reflects gross cumulative appreciation (depreciation) on futures contracts as presented in the Schedule of Investments. In theStatement of Assets and Liabilities, the period end daily variation margin is included in receivable or payable for daily variationmargin on futures contracts, and the net cumulative appreciation (depreciation) is included in Total accumulated earnings (loss).See accompanying notes which are an integral part of the financial statements.
Financial StatementsStatement of Assets and Liabilities
February 28,2021
AssetsInvestment in securities, at value (including securities loaned of $617,826,442) � Seeaccompanying schedule:Unaffiliated issuers (cost $26,940,893,677) $35,020,625,896
Fidelity Central Funds (cost $849,824,615) 849,824,615
Total Investment in Securities (cost $27,790,718,292) $35,870,450,511
Segregated cash with brokers for derivative instruments 11,074,620
Cash 232,608
Receivable for investments sold 647,453,220
Receivable for fund shares sold 554,986
Dividends receivable 42,388,108
Distributions receivable from Fidelity Central Funds 340,817
Total assets 36,572,494,870
LiabilitiesPayable for investments purchased $850,414
Payable for fund shares redeemed 716,715,287
Payable for daily variation margin on futures contracts 1,245,885
Copyright © 2021 www.secdatabase.com. All Rights Reserved.Please Consider the Environment Before Printing This Document
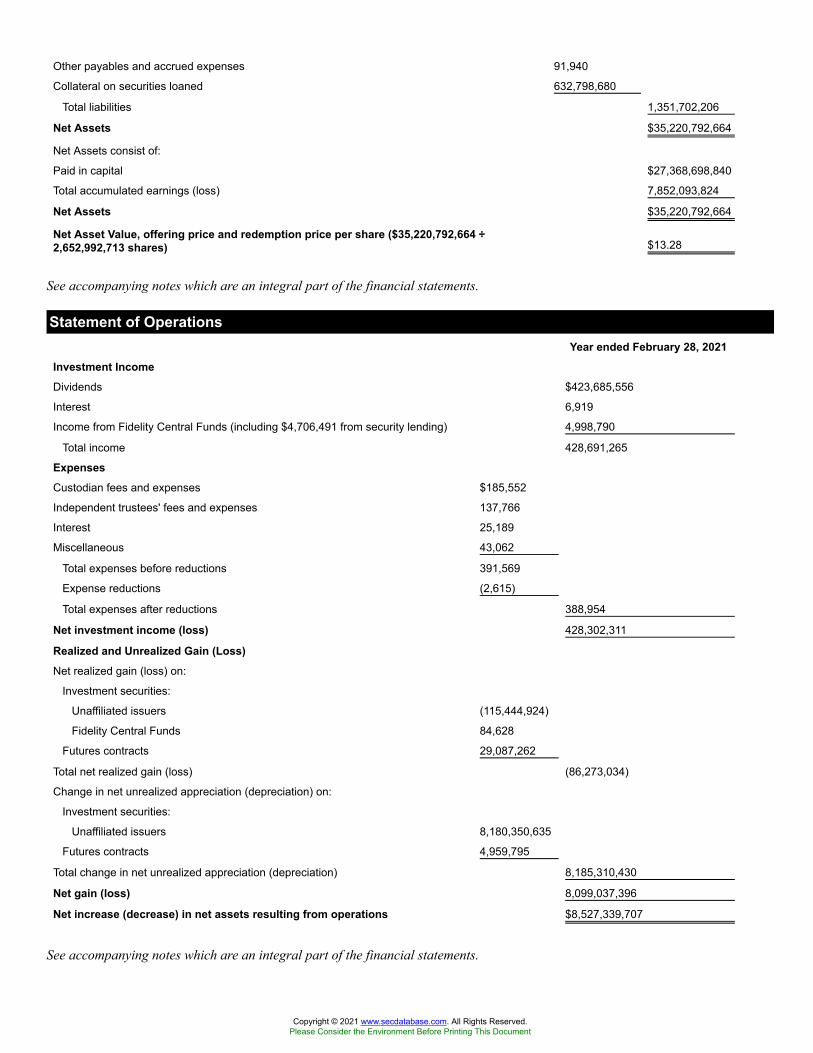
Other payables and accrued expenses 91,940
Collateral on securities loaned 632,798,680
Total liabilities 1,351,702,206
Net Assets $35,220,792,664
Net Assets consist of:
Paid in capital $27,368,698,840
Total accumulated earnings (loss) 7,852,093,824
Net Assets $35,220,792,664
Net Asset Value, offering price and redemption price per share ($35,220,792,664 ÷2,652,992,713 shares) $13.28
See accompanying notes which are an integral part of the financial statements.
Statement of OperationsYear ended February 28, 2021
Investment IncomeDividends $423,685,556
Interest 6,919
Income from Fidelity Central Funds (including $4,706,491 from security lending) 4,998,790
Total income 428,691,265
ExpensesCustodian fees and expenses $185,552
Independent trustees' fees and expenses 137,766
Interest 25,189
Miscellaneous 43,062
Total expenses before reductions 391,569
Expense reductions (2,615)
Total expenses after reductions 388,954
Net investment income (loss) 428,302,311
Realized and Unrealized Gain (Loss)Net realized gain (loss) on:
Investment securities:
Unaffiliated issuers (115,444,924)
Fidelity Central Funds 84,628
Futures contracts 29,087,262
Total net realized gain (loss) (86,273,034)
Change in net unrealized appreciation (depreciation) on:
Investment securities:
Unaffiliated issuers 8,180,350,635
Futures contracts 4,959,795
Total change in net unrealized appreciation (depreciation) 8,185,310,430
Net gain (loss) 8,099,037,396
Net increase (decrease) in net assets resulting from operations $8,527,339,707
See accompanying notes which are an integral part of the financial statements.
Copyright © 2021 www.secdatabase.com. All Rights Reserved.Please Consider the Environment Before Printing This Document
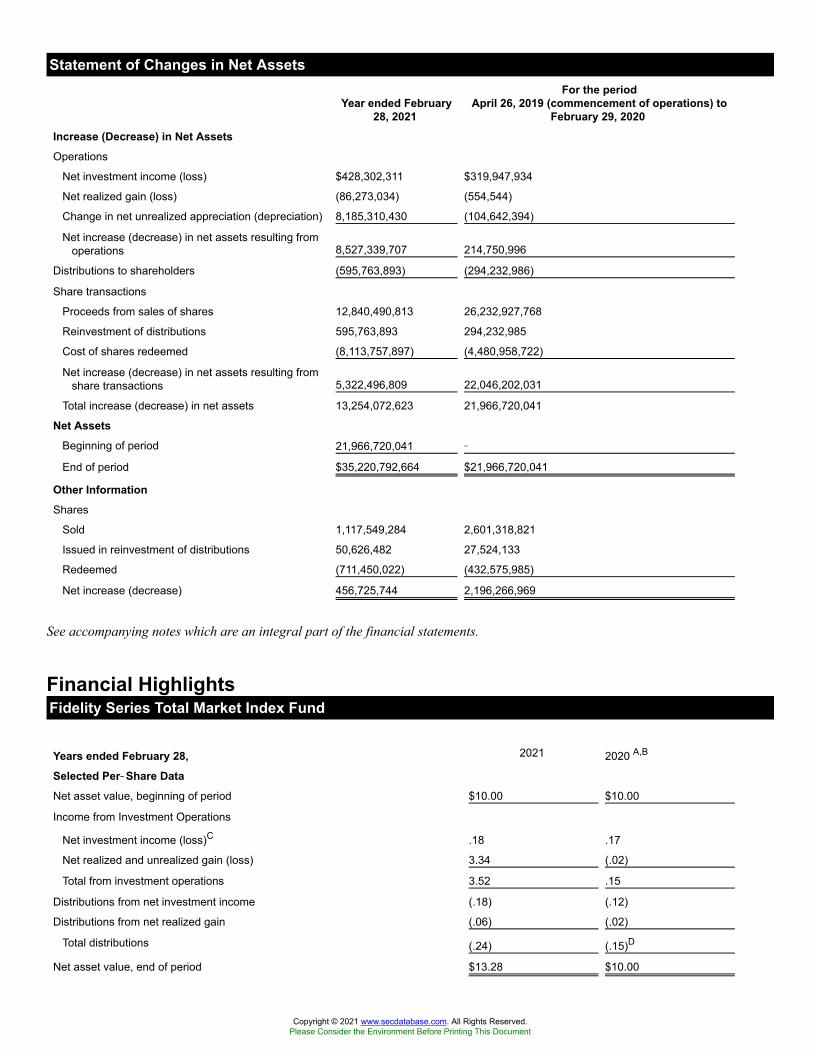
Statement of Changes in Net Assets
Year ended February28, 2021
For the periodApril 26, 2019 (commencement of operations) to
February 29, 2020Increase (Decrease) in Net AssetsOperations
Net investment income (loss) $428,302,311 $319,947,934
Net realized gain (loss) (86,273,034) (554,544)
Change in net unrealized appreciation (depreciation) 8,185,310,430 (104,642,394)
Net increase (decrease) in net assets resulting fromoperations 8,527,339,707 214,750,996
Distributions to shareholders (595,763,893) (294,232,986)
Share transactions
Proceeds from sales of shares 12,840,490,813 26,232,927,768
Reinvestment of distributions 595,763,893 294,232,985
Cost of shares redeemed (8,113,757,897) (4,480,958,722)
Net increase (decrease) in net assets resulting fromshare transactions 5,322,496,809 22,046,202,031
Total increase (decrease) in net assets 13,254,072,623 21,966,720,041
Net AssetsBeginning of period 21,966,720,041 �
End of period $35,220,792,664 $21,966,720,041
Other InformationShares
Sold 1,117,549,284 2,601,318,821
Issued in reinvestment of distributions 50,626,482 27,524,133
Redeemed (711,450,022) (432,575,985)
Net increase (decrease) 456,725,744 2,196,266,969
See accompanying notes which are an integral part of the financial statements.
Financial HighlightsFidelity Series Total Market Index Fund
Years ended February 28, 2021 2020 A,B
Selected Per��Share DataNet asset value, beginning of period $10.00 $10.00
Income from Investment Operations
Net investment income (loss)C .18 .17
Net realized and unrealized gain (loss) 3.34 (.02)
Total from investment operations 3.52 .15
Distributions from net investment income (.18) (.12)
Distributions from net realized gain (.06) (.02)
Total distributions (.24) (.15)D
Net asset value, end of period $13.28 $10.00
Copyright © 2021 www.secdatabase.com. All Rights Reserved.Please Consider the Environment Before Printing This Document
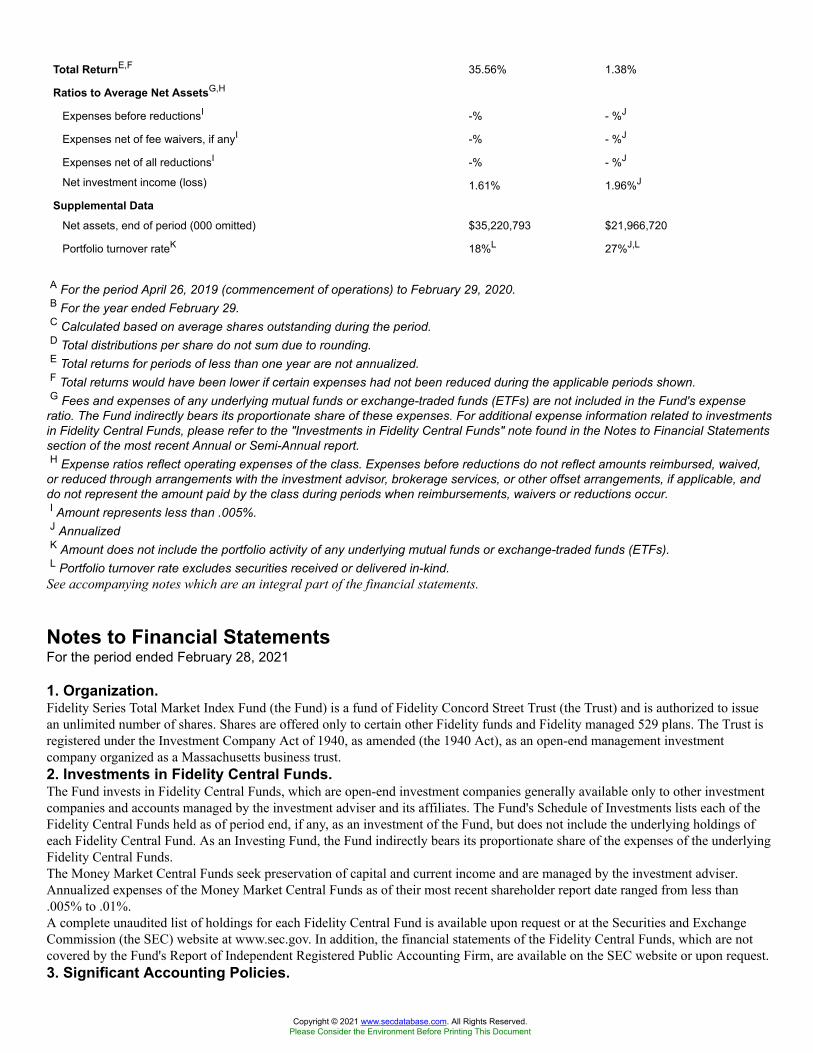
Total ReturnE,F 35.56% 1.38%
Ratios to Average Net AssetsG,H
Expenses before reductionsI -% - %J
Expenses net of fee waivers, if anyI -% - %J
Expenses net of all reductionsI -% - %J
Net investment income (loss) 1.61% 1.96%J
Supplemental DataNet assets, end of period (000 omitted) $35,220,793 $21,966,720
Portfolio turnover rateK 18%L 27%J,L
A For the period April 26, 2019 (commencement of operations) to February 29, 2020.B For the year ended February 29.C Calculated based on average shares outstanding during the period.D Total distributions per share do not sum due to rounding.E Total returns for periods of less than one year are not annualized.F Total returns would have been lower if certain expenses had not been reduced during the applicable periods shown.G Fees and expenses of any underlying mutual funds or exchange-traded funds (ETFs) are not included in the Fund's expense
ratio. The Fund indirectly bears its proportionate share of these expenses. For additional expense information related to investmentsin Fidelity Central Funds, please refer to the "Investments in Fidelity Central Funds" note found in the Notes to Financial Statementssection of the most recent Annual or Semi-Annual report.H Expense ratios reflect operating expenses of the class. Expenses before reductions do not reflect amounts reimbursed, waived,
or reduced through arrangements with the investment advisor, brokerage services, or other offset arrangements, if applicable, anddo not represent the amount paid by the class during periods when reimbursements, waivers or reductions occur.I Amount represents less than .005%.J AnnualizedK Amount does not include the portfolio activity of any underlying mutual funds or exchange-traded funds (ETFs).L Portfolio turnover rate excludes securities received or delivered in-kind.
See accompanying notes which are an integral part of the financial statements.
Notes to Financial StatementsFor the period ended February 28, 2021
1. Organization.Fidelity Series Total Market Index Fund (the Fund) is a fund of Fidelity Concord Street Trust (the Trust) and is authorized to issuean unlimited number of shares. Shares are offered only to certain other Fidelity funds and Fidelity managed 529 plans. The Trust isregistered under the Investment Company Act of 1940, as amended (the 1940 Act), as an open-end management investmentcompany organized as a Massachusetts business trust.2. Investments in Fidelity Central Funds.The Fund invests in Fidelity Central Funds, which are open-end investment companies generally available only to other investmentcompanies and accounts managed by the investment adviser and its affiliates. The Fund's Schedule of Investments lists each of theFidelity Central Funds held as of period end, if any, as an investment of the Fund, but does not include the underlying holdings ofeach Fidelity Central Fund. As an Investing Fund, the Fund indirectly bears its proportionate share of the expenses of the underlyingFidelity Central Funds.The Money Market Central Funds seek preservation of capital and current income and are managed by the investment adviser.Annualized expenses of the Money Market Central Funds as of their most recent shareholder report date ranged from less than.005% to .01%.A complete unaudited list of holdings for each Fidelity Central Fund is available upon request or at the Securities and ExchangeCommission (the SEC) website at www.sec.gov. In addition, the financial statements of the Fidelity Central Funds, which are notcovered by the Fund's Report of Independent Registered Public Accounting Firm, are available on the SEC website or upon request.3. Significant Accounting Policies.
Copyright © 2021 www.secdatabase.com. All Rights Reserved.Please Consider the Environment Before Printing This Document
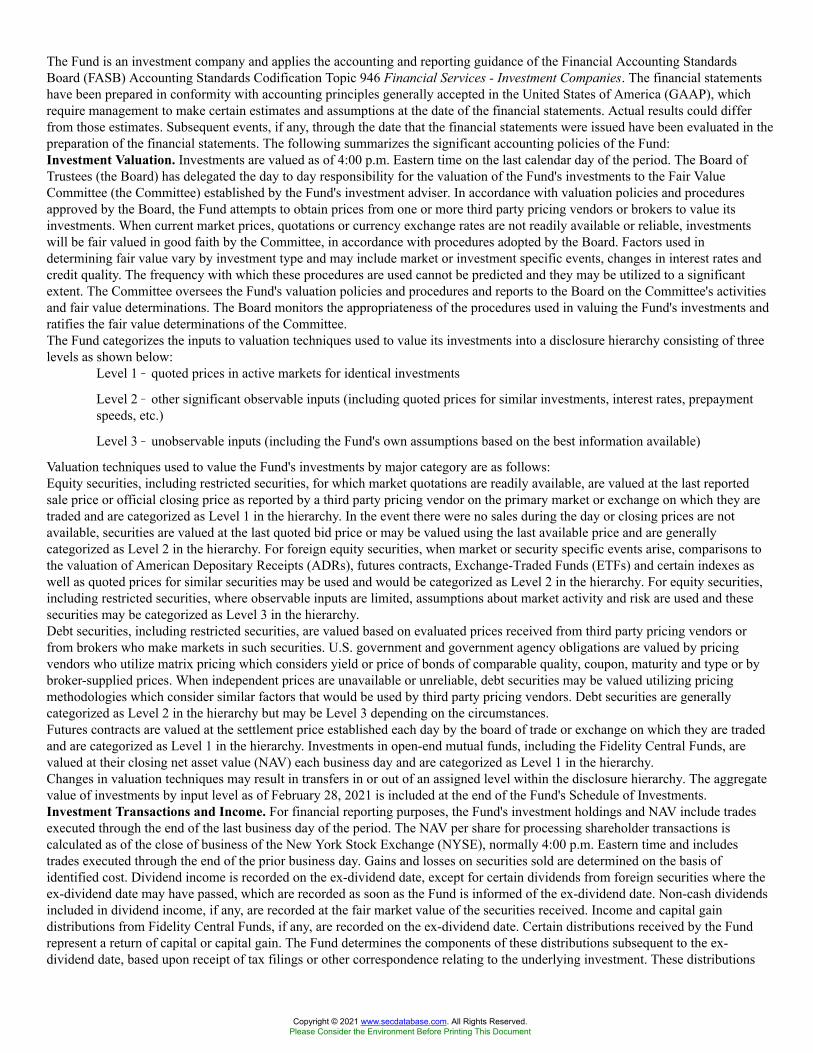
The Fund is an investment company and applies the accounting and reporting guidance of the Financial Accounting StandardsBoard (FASB) Accounting Standards Codification Topic 946 Financial Services - Investment Companies. The financial statementshave been prepared in conformity with accounting principles generally accepted in the United States of America (GAAP), whichrequire management to make certain estimates and assumptions at the date of the financial statements. Actual results could differfrom those estimates. Subsequent events, if any, through the date that the financial statements were issued have been evaluated in thepreparation of the financial statements. The following summarizes the significant accounting policies of the Fund:Investment Valuation. Investments are valued as of 4:00 p.m. Eastern time on the last calendar day of the period. The Board ofTrustees (the Board) has delegated the day to day responsibility for the valuation of the Fund's investments to the Fair ValueCommittee (the Committee) established by the Fund's investment adviser. In accordance with valuation policies and proceduresapproved by the Board, the Fund attempts to obtain prices from one or more third party pricing vendors or brokers to value itsinvestments. When current market prices, quotations or currency exchange rates are not readily available or reliable, investmentswill be fair valued in good faith by the Committee, in accordance with procedures adopted by the Board. Factors used indetermining fair value vary by investment type and may include market or investment specific events, changes in interest rates andcredit quality. The frequency with which these procedures are used cannot be predicted and they may be utilized to a significantextent. The Committee oversees the Fund's valuation policies and procedures and reports to the Board on the Committee's activitiesand fair value determinations. The Board monitors the appropriateness of the procedures used in valuing the Fund's investments andratifies the fair value determinations of the Committee.The Fund categorizes the inputs to valuation techniques used to value its investments into a disclosure hierarchy consisting of threelevels as shown below:
Level 1 � quoted prices in active markets for identical investments
Level 2 � other significant observable inputs (including quoted prices for similar investments, interest rates, prepaymentspeeds, etc.)
Level 3 � unobservable inputs (including the Fund's own assumptions based on the best information available)
Valuation techniques used to value the Fund's investments by major category are as follows:Equity securities, including restricted securities, for which market quotations are readily available, are valued at the last reportedsale price or official closing price as reported by a third party pricing vendor on the primary market or exchange on which they aretraded and are categorized as Level 1 in the hierarchy. In the event there were no sales during the day or closing prices are notavailable, securities are valued at the last quoted bid price or may be valued using the last available price and are generallycategorized as Level 2 in the hierarchy. For foreign equity securities, when market or security specific events arise, comparisons tothe valuation of American Depositary Receipts (ADRs), futures contracts, Exchange-Traded Funds (ETFs) and certain indexes aswell as quoted prices for similar securities may be used and would be categorized as Level 2 in the hierarchy. For equity securities,including restricted securities, where observable inputs are limited, assumptions about market activity and risk are used and thesesecurities may be categorized as Level 3 in the hierarchy.Debt securities, including restricted securities, are valued based on evaluated prices received from third party pricing vendors orfrom brokers who make markets in such securities. U.S. government and government agency obligations are valued by pricingvendors who utilize matrix pricing which considers yield or price of bonds of comparable quality, coupon, maturity and type or bybroker-supplied prices. When independent prices are unavailable or unreliable, debt securities may be valued utilizing pricingmethodologies which consider similar factors that would be used by third party pricing vendors. Debt securities are generallycategorized as Level 2 in the hierarchy but may be Level 3 depending on the circumstances.Futures contracts are valued at the settlement price established each day by the board of trade or exchange on which they are tradedand are categorized as Level 1 in the hierarchy. Investments in open-end mutual funds, including the Fidelity Central Funds, arevalued at their closing net asset value (NAV) each business day and are categorized as Level 1 in the hierarchy.Changes in valuation techniques may result in transfers in or out of an assigned level within the disclosure hierarchy. The aggregatevalue of investments by input level as of February 28, 2021 is included at the end of the Fund's Schedule of Investments.Investment Transactions and Income. For financial reporting purposes, the Fund's investment holdings and NAV include tradesexecuted through the end of the last business day of the period. The NAV per share for processing shareholder transactions iscalculated as of the close of business of the New York Stock Exchange (NYSE), normally 4:00 p.m. Eastern time and includestrades executed through the end of the prior business day. Gains and losses on securities sold are determined on the basis ofidentified cost. Dividend income is recorded on the ex-dividend date, except for certain dividends from foreign securities where theex-dividend date may have passed, which are recorded as soon as the Fund is informed of the ex-dividend date. Non-cash dividendsincluded in dividend income, if any, are recorded at the fair market value of the securities received. Income and capital gaindistributions from Fidelity Central Funds, if any, are recorded on the ex-dividend date. Certain distributions received by the Fundrepresent a return of capital or capital gain. The Fund determines the components of these distributions subsequent to the ex-dividend date, based upon receipt of tax filings or other correspondence relating to the underlying investment. These distributions
Copyright © 2021 www.secdatabase.com. All Rights Reserved.Please Consider the Environment Before Printing This Document
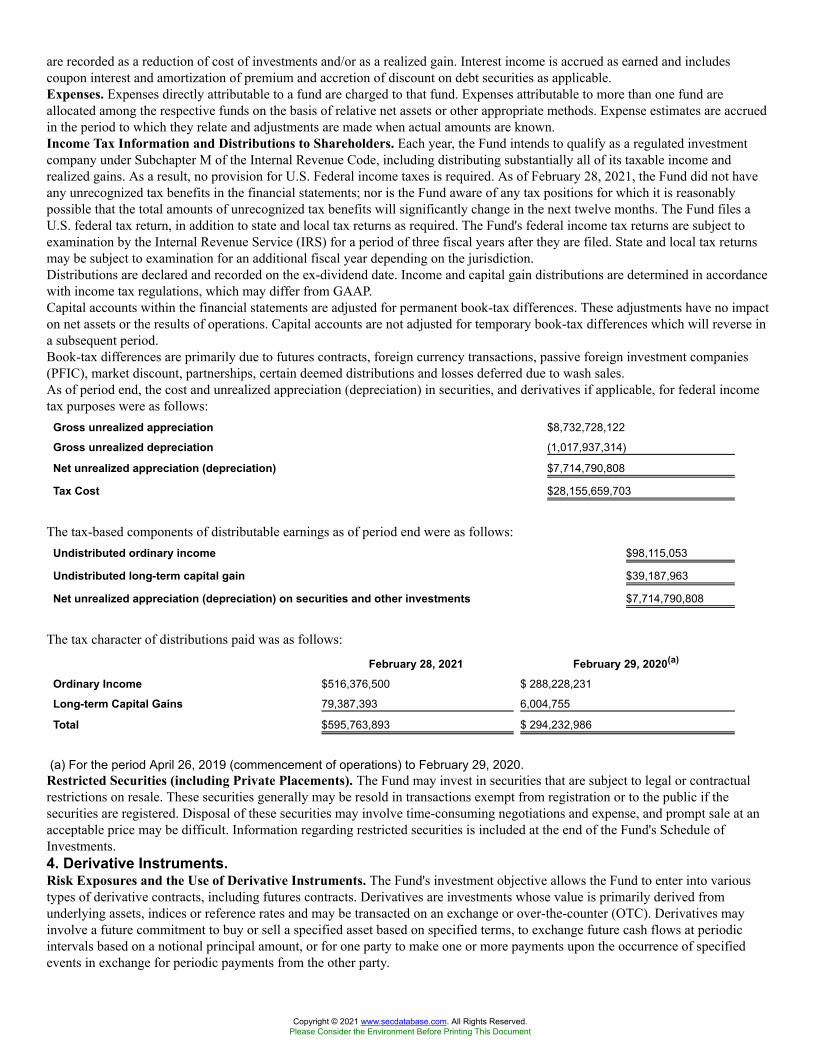
are recorded as a reduction of cost of investments and/or as a realized gain. Interest income is accrued as earned and includescoupon interest and amortization of premium and accretion of discount on debt securities as applicable.Expenses. Expenses directly attributable to a fund are charged to that fund. Expenses attributable to more than one fund areallocated among the respective funds on the basis of relative net assets or other appropriate methods. Expense estimates are accruedin the period to which they relate and adjustments are made when actual amounts are known.Income Tax Information and Distributions to Shareholders. Each year, the Fund intends to qualify as a regulated investmentcompany under Subchapter M of the Internal Revenue Code, including distributing substantially all of its taxable income andrealized gains. As a result, no provision for U.S. Federal income taxes is required. As of February 28, 2021, the Fund did not haveany unrecognized tax benefits in the financial statements; nor is the Fund aware of any tax positions for which it is reasonablypossible that the total amounts of unrecognized tax benefits will significantly change in the next twelve months. The Fund files aU.S. federal tax return, in addition to state and local tax returns as required. The Fund's federal income tax returns are subject toexamination by the Internal Revenue Service (IRS) for a period of three fiscal years after they are filed. State and local tax returnsmay be subject to examination for an additional fiscal year depending on the jurisdiction.Distributions are declared and recorded on the ex-dividend date. Income and capital gain distributions are determined in accordancewith income tax regulations, which may differ from GAAP.Capital accounts within the financial statements are adjusted for permanent book-tax differences. These adjustments have no impacton net assets or the results of operations. Capital accounts are not adjusted for temporary book-tax differences which will reverse ina subsequent period.Book-tax differences are primarily due to futures contracts, foreign currency transactions, passive foreign investment companies(PFIC), market discount, partnerships, certain deemed distributions and losses deferred due to wash sales.As of period end, the cost and unrealized appreciation (depreciation) in securities, and derivatives if applicable, for federal incometax purposes were as follows:
Gross unrealized appreciation $8,732,728,122
Gross unrealized depreciation (1,017,937,314)
Net unrealized appreciation (depreciation) $7,714,790,808
Tax Cost $28,155,659,703
The tax-based components of distributable earnings as of period end were as follows:Undistributed ordinary income $98,115,053
Undistributed long-term capital gain $39,187,963
Net unrealized appreciation (depreciation) on securities and other investments $7,714,790,808
The tax character of distributions paid was as follows:
February 28, 2021 February 29, 2020(a)
Ordinary Income $516,376,500 $ 288,228,231
Long-term Capital Gains 79,387,393 6,004,755
Total $595,763,893 $ 294,232,986
(a) For the period April 26, 2019 (commencement of operations) to February 29, 2020.Restricted Securities (including Private Placements). The Fund may invest in securities that are subject to legal or contractualrestrictions on resale. These securities generally may be resold in transactions exempt from registration or to the public if thesecurities are registered. Disposal of these securities may involve time-consuming negotiations and expense, and prompt sale at anacceptable price may be difficult. Information regarding restricted securities is included at the end of the Fund's Schedule ofInvestments.4. Derivative Instruments.Risk Exposures and the Use of Derivative Instruments. The Fund's investment objective allows the Fund to enter into varioustypes of derivative contracts, including futures contracts. Derivatives are investments whose value is primarily derived fromunderlying assets, indices or reference rates and may be transacted on an exchange or over-the-counter (OTC). Derivatives mayinvolve a future commitment to buy or sell a specified asset based on specified terms, to exchange future cash flows at periodicintervals based on a notional principal amount, or for one party to make one or more payments upon the occurrence of specifiedevents in exchange for periodic payments from the other party.
Copyright © 2021 www.secdatabase.com. All Rights Reserved.Please Consider the Environment Before Printing This Document
The Fund used derivatives to increase returns and to manage exposure to certain risks as defined below. The success of any strategyinvolving derivatives depends on analysis of numerous economic factors, and if the strategies for investment do not work asintended, the Fund may not achieve its objectives.The Fund's use of derivatives increased or decreased its exposure to the following risk:
EquityRisk
Equity risk relates to the fluctuations in the value of financial instruments as a result of changes in market prices (other than thosearising from interest rate risk or foreign exchange risk), whether caused by factors specific to an individual investment, its issuer,or all factors affecting all instruments traded in a market or market segment.
The Fund is also exposed to additional risks from investing in derivatives, such as liquidity risk and counterparty credit risk.Liquidity risk is the risk that the Fund will be unable to close out the derivative in the open market in a timely manner. Counterpartycredit risk is the risk that the counterparty will not be able to fulfill its obligation to the Fund. Counterparty credit risk related toexchange-traded futures contracts may be mitigated by the protection provided by the exchange on which they trade.Investing in derivatives may involve greater risks than investing in the underlying assets directly and, to varying degrees, mayinvolve risk of loss in excess of any initial investment and collateral received and amounts recognized in the Statement of Assets andLiabilities. In addition, there may be the risk that the change in value of the derivative contract does not correspond to the change invalue of the underlying instrument.Futures Contracts. A futures contract is an agreement between two parties to buy or sell a specified underlying instrument for afixed price at a specified future date. The Fund used futures contracts to manage its exposure to the stock market.Upon entering into a futures contract, a fund is required to deposit either cash or securities (initial margin) with a clearing broker inan amount equal to a certain percentage of the face value of the contract. Futures contracts are marked-to-market daily andsubsequent daily payments (variation margin) are made or received by a fund depending on the daily fluctuations in the value of thefutures contracts and are recorded as unrealized appreciation or (depreciation). This receivable and/or payable, if any, is included indaily variation margin on futures contracts in the Statement of Assets and Liabilities. Realized gain or (loss) is recorded upon theexpiration or closing of a futures contract. The net realized gain (loss) and change in net unrealized appreciation (depreciation) onfutures contracts during the period is presented in the Statement of Operations.Any open futures contracts at period end are presented in the Schedule of Investments under the caption "Futures Contracts". Thenotional amount at value reflects each contract's exposure to the underlying instrument or index at period end and is representativeof volume of activity during the period. Securities deposited to meet initial margin requirements are identified in the Schedule ofInvestments. Cash deposited to meet initial margin requirements is presented as segregated cash with brokers for derivativeinstruments in the Statement of Assets and Liabilities.5. Purchases and Sales of Investments.Purchases and sales of securities, other than short-term securities, U.S. government securities and in-kind transactions, are noted inthe table below.
Purchases ($) Sales ($)Fidelity Series Total Market Index Fund 9,588,310,940 4,670,295,707
Unaffiliated Exchanges In-Kind. During the period, the Fund received investments and cash valued at $301,553,789 in exchangefor 22,287,789 shares of the Fund. The amount of in-kind exchanges is included in share transactions in the accompanyingStatement of Changes in Net Assets.6. Fees and Other Transactions with Affiliates.Management Fee. Fidelity Management & Research Company LLC (the investment adviser) and its affiliates provide the Fundwith investment management related services for which the Fund does not pay a management fee. Under the management contract,the investment adviser or an affiliate pays all ordinary operating expenses of the Fund, except custody fees, fees and expenses of theindependent Trustees, and certain miscellaneous expenses such as proxy and shareholder meeting expenses.Sub-Adviser. Geode Capital Management, LLC (Geode), serves as sub-adviser for the Fund. Geode provides discretionaryinvestment advisory services to the Fund and is paid by the investment adviser for providing these services.Interfund Lending Program. Pursuant to an Exemptive Order issued by the SEC, the Fund, along with other registered investmentcompanies having management contracts with Fidelity Management & Research Company LLC (FMR), or other affiliated entitiesof FMR, may participate in an interfund lending program. This program provides an alternative credit facility allowing the Fund toborrow from, or lend money to, other participating affiliated funds. At period end, there were no interfund loans outstanding.Activity in this program during the period for which loans were outstanding was as follows:
Borrower orLender
Average LoanBalance
Weighted Average InterestRate
InterestExpense
Fidelity Series Total Market IndexFund Borrower $313,879,600 .29% $25,189
Copyright © 2021 www.secdatabase.com. All Rights Reserved.Please Consider the Environment Before Printing This Document
Interfund Trades. Funds may purchase from or sell securities to other Fidelity Funds under procedures adopted by the Board. Theprocedures have been designed to ensure these interfund trades are executed in accordance with Rule 17a-7 of the 1940 Act. Anyinterfund trades are included within the respective purchases and sales amounts shown in the Purchases and Sales of Investmentsnote.Prior Fiscal Year Affiliated Exchanges In-Kind. During the prior period, the Fund received investments and cash valued at$18,972,597,830 in exchange for 1,895,078,418 shares of the Fund. The amount of in-kind exchanges is included in sharetransactions in the accompanying Statement of Changes in Net Assets.7. Committed Line of Credit.Certain Funds participate with other funds managed by the investment adviser or an affiliate in a $4.25 billion credit facility (the"line of credit") to be utilized for temporary or emergency purposes to fund shareholder redemptions or for other short-term liquiditypurposes. The participating funds have agreed to pay commitment fees on their pro-rata portion of the line of credit, which arereflected in Miscellaneous expenses on the Statement of Operations, and are listed below. Effective during January 2021,commitment fees are borne by the investment advisor.
AmountFidelity Series Total Market Index Fund $43,038
During the period, there were no borrowings on this line of credit.8. Security Lending.Funds lend portfolio securities from time to time in order to earn additional income. Lending agents are used, including NationalFinancial Services (NFS), an affiliate of the investment adviser. Pursuant to a securities lending agreement, NFS will receive a fee,which is capped at 9.9% of a fund's daily lending revenue, for its services as lending agent. A fund may lend securities to certainqualified borrowers, including NFS. On the settlement date of the loan, a fund receives collateral (in the form of U.S. Treasuryobligations, letters of credit and/or cash) against the loaned securities and maintains collateral in an amount not less than 100% ofthe market value of the loaned securities during the period of the loan. The market value of the loaned securities is determined at theclose of business of a fund and any additional required collateral is delivered to a fund on the next business day. A fund or borrowermay terminate the loan at any time, and if the borrower defaults on its obligation to return the securities loaned because ofinsolvency or other reasons, a fund may apply collateral received from the borrower against the obligation. A fund may experiencedelays and costs in recovering the securities loaned. Any cash collateral received is invested in the Fidelity Securities Lending CashCentral Fund. Any loaned securities are identified as such in the Schedule of Investments, and the value of loaned securities andcash collateral at period end, as applicable, are presented in the Statement of Assets and Liabilities. Security lending incomerepresents the income earned on investing cash collateral, less rebates paid to borrowers and any lending agent fees associated withthe loan, plus any premium payments received for lending certain types of securities. Security lending income is presented in theStatement of Operations as a component of income from Fidelity Central Funds. Affiliated security lending activity, if any, was asfollows:
Total Security Lending IncomeFees Paid to NFS
Security Lending Income FromSecurities Loaned to NFS
Value of Securities Loaned toNFS at Period End
Fidelity Series TotalMarket Index Fund $476,829 $203,662 $3,277,945
9. Expense Reductions.Through arrangements with the Fund's custodian, credits realized as a result of certain uninvested cash balances were used to reducethe Fund's expenses by $2,615.10. Other.The Fund's organizational documents provide former and current trustees and officers with a limited indemnification againstliabilities arising in connection with the performance of their duties to the Fund. In the normal course of business, the Fund may alsoenter into contracts that provide general indemnifications. The Fund's maximum exposure under these arrangements is unknown asthis would be dependent on future claims that may be made against the Fund. The risk of material loss from such claims isconsidered remote.At the end of the period, mutual funds managed by the investment adviser or its affiliates were the owners of record of all of theoutstanding shares of the Fund.11. Coronavirus (COVID-19) Pandemic.An outbreak of COVID-19 first detected in China during December 2019 has since spread globally and was declared a pandemic bythe World Health Organization during March 2020. Developments that disrupt global economies and financial markets, such as theCOVID-19 pandemic, may magnify factors that affect the Fund's performance.
Copyright © 2021 www.secdatabase.com. All Rights Reserved.Please Consider the Environment Before Printing This Document
Report of Independent Registered Public Accounting FirmTo the Board of Trustees of Fidelity Concord Street Trust and Shareholders of Fidelity Series Total Market Index FundOpinion on the Financial StatementsWe have audited the accompanying statement of assets and liabilities, including the schedule of investments, of Fidelity Series TotalMarket Index Fund (one of the funds constituting Fidelity Concord Street Trust, referred to hereafter as the �Fund�) as of February28, 2021, the related statement of operations for the year ended February 28, 2021, and the statement of changes in net assets and thefinancial highlights for the year ended February 28, 2021 and for the period April 26, 2019 (commencement of operations) throughFebruary 29, 2020, including the related notes (collectively referred to as the �financial statements�). In our opinion, the financialstatements present fairly, in all material respects, the financial position of the Fund as of February 28, 2021, the results of itsoperations for the year ended February 28, 2021, and the changes in its net assets and the financial highlights for the year endedFebruary 28, 2021 and for the period April 26, 2019 (commencement of operations) through February 29, 2020 in conformity withaccounting principles generally accepted in the United States of America.Basis for OpinionThese financial statements are the responsibility of the Fund�s management. Our responsibility is to express an opinion on theFund�s financial statements based on our audits. We are a public accounting firm registered with the Public Company AccountingOversight Board (United States) (PCAOB) and are required to be independent with respect to the Fund in accordance with the U.S.federal securities laws and the applicable rules and regulations of the Securities and Exchange Commission and the PCAOB.We conducted our audits of these financial statements in accordance with the standards of the PCAOB. Those standards require thatwe plan and perform the audit to obtain reasonable assurance about whether the financial statements are free of materialmisstatement, whether due to error or fraud.Our audits included performing procedures to assess the risks of material misstatement of the financial statements, whether due toerror or fraud, and performing procedures that respond to those risks. Such procedures included examining, on a test basis, evidenceregarding the amounts and disclosures in the financial statements. Our audits also included evaluating the accounting principles usedand significant estimates made by management, as well as evaluating the overall presentation of the financial statements. Ourprocedures included confirmation of securities owned as of February 28, 2021 by correspondence with the custodian and brokers;when replies were not received from brokers, we performed other auditing procedures. We believe that our audits provide areasonable basis for our opinion./s/ PricewaterhouseCoopers LLPBoston, MassachusettsApril 15, 2021
We have served as the auditor of one or more investment companies in the Fidelity group of funds since 1932.
Trustees and OfficersThe Trustees, Members of the Advisory Board (if any), and officers of the trust and fund, as applicable, are listed below. The Boardof Trustees governs the fund and is responsible for protecting the interests of shareholders. The Trustees are experienced executiveswho meet periodically throughout the year to oversee the fund's activities, review contractual arrangements with companies thatprovide services to the fund, oversee management of the risks associated with such activities and contractual arrangements, andreview the fund's performance. Except for Jonathan Chiel, each of the Trustees oversees 309 funds. Mr. Chiel oversees 176 funds.The Trustees hold office without limit in time except that (a) any Trustee may resign; (b) any Trustee may be removed by writteninstrument, signed by at least two-thirds of the number of Trustees prior to such removal; (c) any Trustee who requests to be retiredor who has become incapacitated by illness or injury may be retired by written instrument signed by a majority of the other Trustees;and (d) any Trustee may be removed at any special meeting of shareholders by a two-thirds vote of the outstanding voting securitiesof the trust. Each Trustee who is not an interested person (as defined in the 1940 Act) of the trust and the fund is referred to hereinas an Independent Trustee. Each Independent Trustee shall retire not later than the last day of the calendar year in which his or her75th birthday occurs. The Independent Trustees may waive this mandatory retirement age policy with respect to individualTrustees. Officers and Advisory Board Members hold office without limit in time, except that any officer or Advisory BoardMember may resign or may be removed by a vote of a majority of the Trustees at any regular meeting or any special meeting of theTrustees. Except as indicated, each individual has held the office shown or other offices in the same company for the past fiveyears.The fund�s Statement of Additional Information (SAI) includes more information about the Trustees. To request a free copy, callFidelity at 1-800-544-8544.Experience, Skills, Attributes, and Qualifications of the Trustees. The Governance and Nominating Committee has adopted astatement of policy that describes the experience, qualifications, attributes, and skills that are necessary and desirable for potentialIndependent Trustee candidates (Statement of Policy). The Board believes that each Trustee satisfied at the time he or she was
Copyright © 2021 www.secdatabase.com. All Rights Reserved.Please Consider the Environment Before Printing This Document
initially elected or appointed a Trustee, and continues to satisfy, the standards contemplated by the Statement of Policy. TheGovernance and Nominating Committee also engages professional search firms to help identify potential Independent Trusteecandidates who have the experience, qualifications, attributes, and skills consistent with the Statement of Policy. From time to time,additional criteria based on the composition and skills of the current Independent Trustees, as well as experience or skills that maybe appropriate in light of future changes to board composition, business conditions, and regulatory or other developments, have alsobeen considered by the professional search firms and the Governance and Nominating Committee. In addition, the Board takes intoaccount the Trustees' commitment and participation in Board and committee meetings, as well as their leadership of standing and adhoc committees throughout their tenure.In determining that a particular Trustee was and continues to be qualified to serve as a Trustee, the Board has considered a variety ofcriteria, none of which, in isolation, was controlling. The Board believes that, collectively, the Trustees have balanced and diverseexperience, qualifications, attributes, and skills, which allow the Board to operate effectively in governing the fund and protectingthe interests of shareholders. Information about the specific experience, skills, attributes, and qualifications of each Trustee, which ineach case led to the Board's conclusion that the Trustee should serve (or continue to serve) as a trustee of the fund, is providedbelow.Board Structure and Oversight Function. Robert A. Lawrence is an interested person and currently serves as Acting Chairman.The Trustees have determined that an interested Chairman is appropriate and benefits shareholders because an interested Chairmanhas a personal and professional stake in the quality and continuity of services provided to the fund. Independent Trustees exercisetheir informed business judgment to appoint an individual of their choosing to serve as Chairman, regardless of whether the Trusteehappens to be independent or a member of management. The Independent Trustees have determined that they can act independentlyand effectively without having an Independent Trustee serve as Chairman and that a key structural component for assuring that theyare in a position to do so is for the Independent Trustees to constitute a substantial majority for the Board. The Independent Trusteesalso regularly meet in executive session. David M. Thomas serves as Lead Independent Trustee and as such (i) acts as a liaisonbetween the Independent Trustees and management with respect to matters important to the Independent Trustees and (ii) withmanagement prepares agendas for Board meetings.Fidelity® funds are overseen by different Boards of Trustees. The fund's Board oversees Fidelity's high income and certain equityfunds, and other Boards oversee Fidelity's investment-grade bond, money market, asset allocation, and other equity funds. The assetallocation funds may invest in Fidelity® funds overseen by the fund's Board. The use of separate Boards, each with its owncommittee structure, allows the Trustees of each group of Fidelity® funds to focus on the unique issues of the funds they oversee,including common research, investment, and operational issues. On occasion, the separate Boards establish joint committees toaddress issues of overlapping consequences for the Fidelity® funds overseen by each Board.The Trustees operate using a system of committees to facilitate the timely and efficient consideration of all matters of importance tothe Trustees, the fund, and fund shareholders and to facilitate compliance with legal and regulatory requirements and oversight ofthe fund's activities and associated risks. The Board, acting through its committees, has charged FMR and its affiliates with (i)identifying events or circumstances the occurrence of which could have demonstrably adverse effects on the fund's business and/orreputation; (ii) implementing processes and controls to lessen the possibility that such events or circumstances occur or to mitigatethe effects of such events or circumstances if they do occur; and (iii) creating and maintaining a system designed to evaluatecontinuously business and market conditions in order to facilitate the identification and implementation processes described in (i)and (ii) above. Because the day-to-day operations and activities of the fund are carried out by or through FMR, its affiliates, andother service providers, the fund's exposure to risks is mitigated but not eliminated by the processes overseen by the Trustees. Whileeach of the Board's committees has responsibility for overseeing different aspects of the fund's activities, oversight is exercisedprimarily through the Operations, Audit, and Compliance Committees. Appropriate personnel, including but not limited to thefund's Chief Compliance Officer (CCO), FMR's internal auditor, the independent accountants, the fund's Treasurer and portfoliomanagement personnel, make periodic reports to the Board's committees, as appropriate, including an annual review of Fidelity'srisk management program for the Fidelity® funds. The responsibilities of each standing committee, including their oversightresponsibilities, are described further under "Standing Committees of the Trustees."Interested Trustees*:Correspondence intended for a Trustee who is an interested person may be sent to Fidelity Investments, 245 Summer Street, Boston,Massachusetts 02210.Name, Year of Birth; Principal Occupations and Other Relevant Experience+Jonathan Chiel (1957)
Year of Election or Appointment: 2016TrusteeMr. Chiel also serves as Trustee of other Fidelity® funds. Mr. Chiel is Executive Vice President and General Counsel forFMR LLC (diversified financial services company, 2012-present). Previously, Mr. Chiel served as general counsel(2004-2012) and senior vice president and deputy general counsel (2000-2004) for John Hancock Financial Services; apartner with Choate, Hall & Stewart (1996-2000) (law firm); and an Assistant United States Attorney for the United States
Copyright © 2021 www.secdatabase.com. All Rights Reserved.Please Consider the Environment Before Printing This Document
Attorney�s Office of the District of Massachusetts (1986-95), including Chief of the Criminal Division (1993-1995). Mr. Chielis a director on the boards of the Boston Bar Foundation and the Maimonides School.
Bettina Doulton (1964)Year of Election or Appointment: 2021TrusteeMs. Doulton also serves as Trustee of other Fidelity® funds. Prior to her retirement, Ms. Doulton served in a variety ofpositions at Fidelity Investments, including as a managing director of research (2006-2007), portfolio manager to certainFidelity® funds (1993-2005), equity analyst and portfolio assistant (1990-1993), and research assistant (1987-1990). Ms.Doulton currently owns and operates Phi Builders + Architects and Cellardoor Winery. Previously, Ms. Doulton served as amember of the Board of Brown Capital Management, LLC (2013-2018).
Robert A. Lawrence (1952)Year of Election or Appointment: 2020TrusteeActing Chairman of the Board of TrusteesMr. Lawrence also serves as Trustee of other funds. Previously, Mr. Lawrence served as a Member of the Advisory Board ofcertain funds. Prior to his retirement in 2008, Mr. Lawrence served as Vice President of certain Fidelity® funds (2006-2008),Senior Vice President, Head of High Income Division of Fidelity Management & Research Company (investment adviserfirm, 2006-2008), and President of Fidelity Strategic Investments (investment adviser firm, 2002-2005).
* Determined to be an �Interested Trustee� by virtue of, among other things, his or her affiliation with the trust or various entitiesunder common control with FMR.+ The information includes the Trustee's principal occupation during the last five years and other information relating to the
experience, attributes, and skills relevant to the Trustee's qualifications to serve as a Trustee, which led to the conclusion that theTrustee should serve as a Trustee for the fund.Independent Trustees:Correspondence intended for an Independent Trustee may be sent to Fidelity Investments, P.O. Box 55235, Boston, Massachusetts02205-5235.Name, Year of Birth; Principal Occupations and Other Relevant Experience+Dennis J. Dirks (1948)
Year of Election or Appointment: 2005TrusteeMr. Dirks also serves as Trustee of other Fidelity® funds. Prior to his retirement in May 2003, Mr. Dirks served as ChiefOperating Officer and as a member of the Board of The Depository Trust & Clearing Corporation (financial marketsinfrastructure), President, Chief Operating Officer and a member of the Board of The Depository Trust Company (DTC),President and a member of the Board of the National Securities Clearing Corporation (NSCC), Chief Executive Officer anda member of the Board of the Government Securities Clearing Corporation and Chief Executive Officer and a member ofthe Board of the Mortgage-Backed Securities Clearing Corporation. Mr. Dirks currently serves as a member of the FinanceCommittee (2016-present) and Board (2017-present) and is Treasurer (2018-present) of the Asolo Repertory Theatre.
Donald F. Donahue (1950)Year of Election or Appointment: 2018TrusteeMr. Donahue also serves as Trustee of other Fidelity® funds. Mr. Donahue serves as President and Chief Executive Officerof Miranda Partners, LLC (risk consulting for the financial services industry, 2012-present). Previously, Mr. Donahue servedas Chief Executive Officer (2006-2012), Chief Operating Officer (2003-2006) and Managing Director, Customer Marketingand Development (1999-2003) of The Depository Trust & Clearing Corporation (financial markets infrastructure). Mr.Donahue currently serves as a member (2007-present) and Co-Chairman (2016-present) of the Board of United Way ofNew York, a member of the Board of NYC Leadership Academy (2012-present) and a member of the Board of Advisors ofRipple Labs, Inc. (financial services, 2015-present). Mr. Donahue previously served as a member of the Advisory Board ofcertain Fidelity® funds (2015-2018).
Vicki L. Fuller (1957)Year of Election or Appointment: 2020TrusteeMs. Fuller also serves as Trustee of other Fidelity® funds. Previously, Ms. Fuller served as a member of the Advisory Boardof certain Fidelity® funds (2018-2020), Chief Investment Officer of the New York State Common Retirement Fund(2012-2018) and held a variety of positions at AllianceBernstein L.P. (global asset management, 1985-2012), includingManaging Director (2006-2012) and Senior Vice President and Senior Portfolio Manager (2001-2006). Ms. Fuller currentlyserves as a member of the Board, Audit Committee and Nominating and Governance Committee of The WilliamsCompanies, Inc. (natural gas infrastructure, 2018-present), as a member of the Board, Audit Committee and Nominatingand Governance Committee of two Blackstone business development companies (2020-present) and as a member of theBoard of Treliant, LLC (consulting, 2019-present).
Patricia L. Kampling (1959)Year of Election or Appointment: 2020
Copyright © 2021 www.secdatabase.com. All Rights Reserved.Please Consider the Environment Before Printing This Document
TrusteeMs. Kampling also serves as Trustee of other Fidelity® funds. Prior to her retirement, Ms. Kampling served as Chairman ofthe Board and Chief Executive Officer (2012-2019), President and Chief Operating Officer (2011-2012) and Executive VicePresident and Chief Financial Officer (2010-2011) of Alliant Energy Corporation. Ms. Kampling currently serves as amember of the Board, Compensation Committee and Executive Committee and as Chair of the Audit Committee of Briggs &Stratton Corporation (manufacturing, 2011-present) and as a member of the Board, Audit, Finance and Risk Committee andSafety, Environmental, Technology and Operations Committee of American Water Works Company, Inc. (utilities company,2019-present). In addition, Ms. Kampling currently serves as a member of the Board of the Nature Conservancy, WisconsinChapter (2019-present). Previously, Ms. Kampling served as a Member of the Advisory Board of certain Fidelity® funds(2020), a member of the Board of Interstate Power and Light Company (2012-2019) and Wisconsin Power and LightCompany (2012-2019) (each a subsidiary of Alliant Energy Corporation) and as a member of the Board and WorkforceDevelopment Committee of the Business Roundtable (2018-2019).
Thomas A. Kennedy (1955)Year of Election or Appointment: 2021TrusteeMr. Kennedy also serves as Trustee of other Fidelity® funds. Previously, Mr. Kennedy served as a Member of the AdvisoryBoard of certain Fidelity® funds (2020) and held a variety of positions at Raytheon Company (aerospace and defense,1983-2020), including Chairman and Chief Executive Officer (2014-2020) and Executive Vice President and ChiefOperating Officer (2013-2014). Mr. Kennedy currently serves as Executive Chairman of the Board of Directors of RaytheonTechnologies Corporation (aerospace and defense, 2020-present). He is also a member of the Rutgers School ofEngineering Industry Advisory Board (2011-present) and a member of the UCLA Engineering Dean�s Executive Board(2016-present).
Garnett A. Smith (1947)Year of Election or Appointment: 2018TrusteeMr. Smith also serves as Trustee of other Fidelity® funds. Prior to his retirement, Mr. Smith served as Chairman and ChiefExecutive Officer (1990-1997) and President (1986-1990) of Inbrand Corp. (manufacturer of personal absorbent products).Prior to his employment with Inbrand Corp., he was employed by a retail fabric chain and North Carolina National Bank(now Bank of America). Mr. Smith previously served as a member of the Advisory Board of certain Fidelity® funds(2012-2013).
David M. Thomas (1949)Year of Election or Appointment: 2008TrusteeLead Independent TrusteeMr. Thomas also serves as Trustee of other Fidelity® funds. Previously, Mr. Thomas served as Executive Chairman(2005-2006) and Chairman and Chief Executive Officer (2000-2005) of IMS Health, Inc. (pharmaceutical and healthcareinformation solutions). Mr. Thomas currently serves as Non-Executive Chairman of the Board of Fortune Brands Home andSecurity (home and security products, 2011-present), and a member of the Board (2004-present) and Presiding Director(2013-present) of Interpublic Group of Companies, Inc. (marketing communication).
Susan Tomasky (1953)Year of Election or Appointment: 2020TrusteeMs. Tomasky also serves as Trustee of other Fidelity® funds. Prior to her retirement, Ms. Tomasky served in variousexecutive officer positions at American Electric Power Company, Inc. (1998-2011), including most recently as President ofAEP Transmission (2007-2011). Ms. Tomasky currently serves as a member of the Board and Sustainability Committee andas Chair of the Audit Committee of Marathon Petroleum Corporation (2018-present) and as a member of the Board,Corporate Governance Committee and Organization and Compensation Committee and as Chair of the Audit Committee ofPublic Service Enterprise Group, Inc. (utilities company, 2012-present). In addition, Ms. Tomasky currently serves as amember of the Board of the Columbus Regional Airport Authority (2007-present), as a member of the Board of the RoyalShakespeare Company � America (2009-present), as a member of the Board of the Columbus Association for thePerforming Arts (2011-present) and as a member of the Board of Kenyon College (2016-present). Previously, Ms. Tomaskyserved as a Member of the Advisory Board of certain Fidelity® funds (2020), a member of the Board (2011-2019) and asLead Independent Director (2015-2018) of Andeavor Corporation (previously Tesoro Corporation) (independent oil refinerand marketer) and as a member of the Board of Summit Midstream Partners LP (energy, 2012-2018).
Michael E. Wiley (1950)Year of Election or Appointment: 2020TrusteeMr. Wiley also serves as Trustee of other Fidelity® funds. Previously, Mr. Wiley served as a member of the Advisory Boardof certain Fidelity® funds (2018-2020), Chairman, President and CEO of Baker Hughes, Inc. (oilfield services, 2000-2004).Mr. Wiley also previously served as a member of the Board of Andeavor Corporation (independent oil refiner and marketer,
Copyright © 2021 www.secdatabase.com. All Rights Reserved.Please Consider the Environment Before Printing This Document
2005-2018), a member of the Board of Andeavor Logistics LP (natural resources logistics, 2015-2018) and a member of theBoard of High Point Resources (exploration and production, 2005-2020).
+ The information includes the Trustee's principal occupation during the last five years and other information relating to theexperience, attributes, and skills relevant to the Trustee's qualifications to serve as a Trustee, which led to the conclusion that theTrustee should serve as a Trustee for the fund.Advisory Board Members and Officers:Correspondence intended for a Member of the Advisory Board (if any) may be sent to Fidelity Investments, P.O. Box 55235,Boston, Massachusetts 02205-5235. Correspondence intended for an officer or Peter S. Lynch may be sent to Fidelity Investments,245 Summer Street, Boston, Massachusetts 02210. Officers appear below in alphabetical order.Name, Year of Birth; Principal OccupationNed C. Lautenbach (1944)
Year of Election or Appointment: 2021Member of the Advisory BoardMr. Lautenbach also serves as a Member of the Advisory Board of other Fidelity® funds. Mr. Lautenbach currently serves asChair of the Board of Governors, State University System of Florida (2013-present) and is a member of the Council onForeign Relations (1994-present). He is also a member and has in the past served as Chairman of the Board of Directors ofArtis-Naples (2012-present). Previously, Mr. Lautenbach served as a Trustee of certain Fidelity® funds (2000-2020) and amember and then Lead Director of the Board of Directors of Eaton Corporation (diversified industrial, 1997-2016). He wasalso a Partner at Clayton, Dubilier & Rice, LLC (private equity investment, 1998-2010); as well as Director of SonyCorporation (2006-2007). In addition, Mr. Lautenbach had a 30-year career with IBM (technology company), during whichtime he served as Senior Vice President and as a member of the Corporate Executive Committee (1968-1998).
Peter S. Lynch (1944)Year of Election or Appointment: 2003Member of the Advisory BoardMr. Lynch also serves as a Member of the Advisory Board of other Fidelity® funds. Mr. Lynch is Vice Chairman and aDirector of Fidelity Management & Research Company LLC (investment adviser firm). In addition, Mr. Lynch serves as aTrustee of Boston College and as the Chairman of the Inner-City Scholarship Fund. Previously, Mr. Lynch served as ViceChairman and a Director of FMR Co., Inc. (investment adviser firm) and on the Special Olympics International Board ofDirectors (1997-2006).
Craig S. Brown (1977)Year of Election or Appointment: 2019Assistant TreasurerMr. Brown also serves as Assistant Treasurer of other funds. Mr. Brown is an employee of Fidelity Investments(2013-present).
John J. Burke III (1964)Year of Election or Appointment: 2018Chief Financial OfficerMr. Burke also serves as Chief Financial Officer of other funds. Mr. Burke serves as Head of Investment Operations forFidelity Fund and Investment Operations (2018-present) and is an employee of Fidelity Investments (1998-present).Previously Mr. Burke served as head of Asset Management Investment Operations (2012-2018).
William C. Coffey (1969)Year of Election or Appointment: 2019Assistant SecretaryMr. Coffey also serves as Assistant Secretary of other funds. He is Senior Vice President and Deputy General Counsel ofFMR LLC (diversified financial services company, 2010-present), and is an employee of Fidelity Investments. Previously,Mr. Coffey served as Secretary and CLO of certain funds (2018-2019); CLO, Secretary, and Senior Vice President ofFidelity Management & Research Company and FMR Co., Inc. (investment adviser firms, 2018-2019); Secretary of FidelitySelectCo, LLC and Fidelity Investments Money Management, Inc. (investment adviser firms, 2018-2019); CLO of FidelityManagement & Research (Hong Kong) Limited, FMR Investment Management (UK) Limited, and Fidelity Management &Research (Japan) Limited (investment adviser firms, 2018-2019); and Assistant Secretary of certain funds (2009-2018).
Timothy M. Cohen (1969)Year of Election or Appointment: 2018Vice PresidentMr. Cohen also serves as Vice President of other funds. Mr. Cohen serves as Co-Head of Equity (2018-present), a Directorof Fidelity Management & Research (Japan) Limited (investment adviser firm, 2016-present), and is an employee of FidelityInvestments. Previously, Mr. Cohen served as Executive Vice President of Fidelity SelectCo, LLC (2019), Head of GlobalEquity Research (2016-2018), Chief Investment Officer - Equity and a Director of Fidelity Management & Research (U.K.)Inc. (investment adviser firm, 2013-2015) and as a Director of Fidelity Management & Research (Hong Kong) Limited(investment adviser firm, 2017).
Jonathan Davis (1968)Year of Election or Appointment: 2010Assistant Treasurer
Copyright © 2021 www.secdatabase.com. All Rights Reserved.Please Consider the Environment Before Printing This Document
Mr. Davis also serves as Assistant Treasurer of other funds. Mr. Davis serves as Assistant Treasurer of FMR Capital, Inc.(2017-present) and is an employee of Fidelity Investments. Previously, Mr. Davis served as Vice President and AssociateGeneral Counsel of FMR LLC (diversified financial services company, 2003-2010).
Laura M. Del Prato (1964)Year of Election or Appointment: 2018Assistant TreasurerMs. Del Prato also serves as an officer of other funds. Ms. Del Prato is an employee of Fidelity Investments (2017-present).Previously, Ms. Del Prato served as President and Treasurer of The North Carolina Capital Management Trust: CashPortfolio and Term Portfolio (2018-2020). Prior to joining Fidelity Investments, Ms. Del Prato served as a Managing Directorand Treasurer of the JPMorgan Mutual Funds (2014-2017). Prior to JPMorgan, Ms. Del Prato served as a partner at CohenFund Audit Services (accounting firm, 2012-2013) and KPMG LLP (accounting firm, 2004-2012).
Colm A. Hogan (1973)Year of Election or Appointment: 2020Assistant TreasurerMr. Hogan also serves as an officer of other funds. Mr. Hogan serves as Assistant Treasurer of FMR Capital, Inc.(2017-present) and is an employee of Fidelity Investments (2005-present). Previously, Mr. Hogan served as DeputyTreasurer of certain Fidelity® funds (2016-2020) and Assistant Treasurer of certain Fidelity® funds (2016-2018).
Pamela R. Holding (1964)Year of Election or Appointment: 2018Vice PresidentMs. Holding also serves as Vice President of other funds. Ms. Holding serves as Co-Head of Equity (2018-present) and isan employee of Fidelity Investments (2013-present). Previously, Ms. Holding served as Executive Vice President of FidelitySelectCo, LLC (2019) and as Chief Investment Officer of Fidelity Institutional Asset Management (2013-2018).
Cynthia Lo Bessette (1969)Year of Election or Appointment: 2019Secretary and Chief Legal Officer (CLO)Ms. Lo Bessette also serves as an officer of other funds. Ms. Lo Bessette serves as CLO, Secretary, and Senior VicePresident of Fidelity Management & Research Company LLC (investment adviser firm, 2019-present); and CLO of FidelityManagement & Research (Hong Kong) Limited, FMR Investment Management (UK) Limited, and Fidelity Management &Research (Japan) Limited (investment adviser firms, 2019-present). She is a Senior Vice President and Deputy GeneralCounsel of FMR LLC (diversified financial services company, 2019-present), and is an employee of Fidelity Investments.Previously, Ms. Lo Bessette served as CLO, Secretary, and Senior Vice President of FMR Co., Inc. (investment adviserfirm, 2019); Secretary of Fidelity SelectCo, LLC and Fidelity Investments Money Management, Inc. (investment adviserfirms, 2019). Prior to joining Fidelity Investments, Ms. Lo Bessette was Executive Vice President, General Counsel(2016-2019) and Senior Vice President, Deputy General Counsel (2015-2016) of OppenheimerFunds (investmentmanagement company) and Deputy Chief Legal Officer (2013-2015) of Jennison Associates LLC (investment adviser firm).
Chris Maher (1972)Year of Election or Appointment: 2020Deputy TreasurerMr. Maher also serves as an officer of other funds. Mr. Maher serves as Assistant Treasurer of FMR Capital, Inc.(2017-present), and is an employee of Fidelity Investments (2008-present). Previously, Mr. Maher served as AssistantTreasurer of certain funds (2013-2020); Vice President of Asset Management Compliance (2013), Vice President of theProgram Management Group of FMR (investment adviser firm, 2010-2013), and Vice President of Valuation Oversight(2008-2010).
Jason P. Pogorelec (1975)Year of Election or Appointment: 2020Chief Compliance OfficerMr. Pogorelec also serves as Chief Compliance Officer of other funds. Mr. Pogorelec is a senior Vice President of AssetManagement Compliance for Fidelity Investments and is an employee of Fidelity Investments (2006-present). Previously,Mr. Pogorelec served as Vice President, Associate General Counsel for Fidelity Investments (2010-2020) and AssistantSecretary of certain Fidelity funds (2015-2020).
Brett Segaloff (1972)Year of Election or Appointment: 2021Anti-Money Laundering (AML) OfficerMr. Segaloff also serves as an AML Officer of other funds and other related entities. He is Director, Anti-Money Laundering(2007-present) of FMR LLC (diversified financial services company) and is an employee of Fidelity Investments(1996-present).
Stacie M. Smith (1974)Year of Election or Appointment: 2016President and TreasurerMs. Smith also serves as an officer of other funds. Ms. Smith serves as Assistant Treasurer of FMR Capital, Inc.(2017-present), is an employee of Fidelity Investments (2009-present), and has served in other fund officer roles. Prior tojoining Fidelity Investments, Ms. Smith served as Senior Audit Manager of Ernst & Young LLP (accounting firm, 1996-2009).
Copyright © 2021 www.secdatabase.com. All Rights Reserved.Please Consider the Environment Before Printing This Document
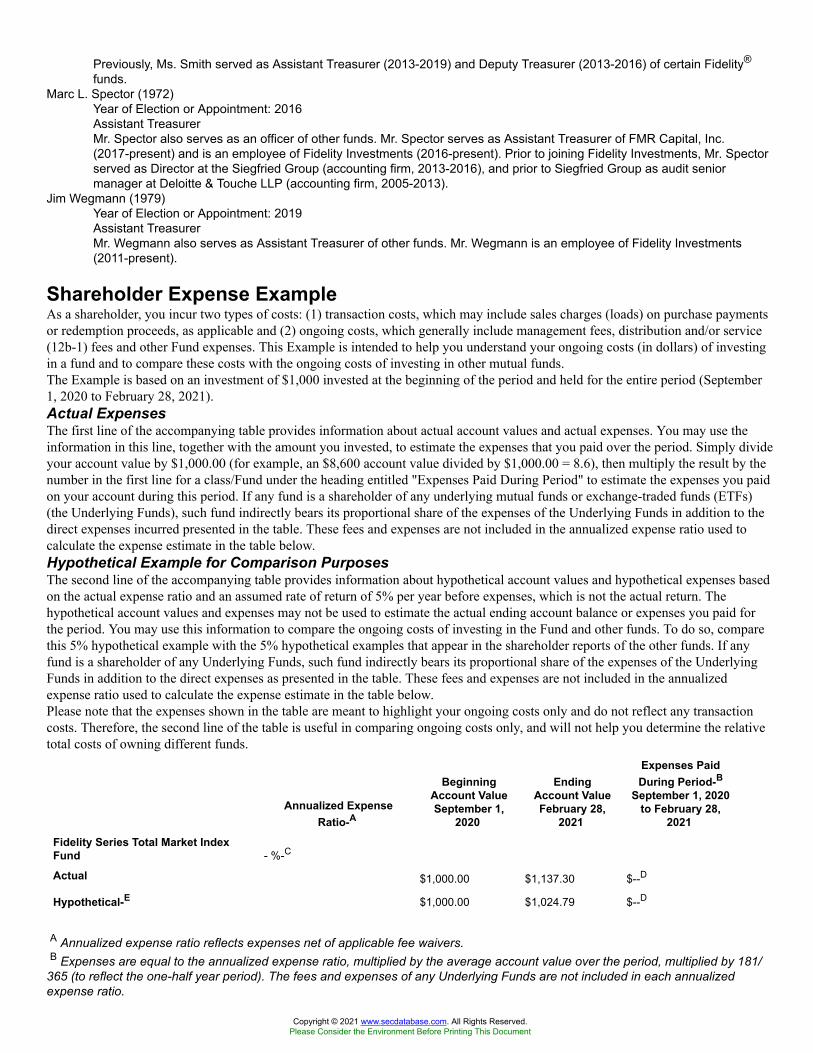
Previously, Ms. Smith served as Assistant Treasurer (2013-2019) and Deputy Treasurer (2013-2016) of certain Fidelity®
funds.Marc L. Spector (1972)
Year of Election or Appointment: 2016Assistant TreasurerMr. Spector also serves as an officer of other funds. Mr. Spector serves as Assistant Treasurer of FMR Capital, Inc.(2017-present) and is an employee of Fidelity Investments (2016-present). Prior to joining Fidelity Investments, Mr. Spectorserved as Director at the Siegfried Group (accounting firm, 2013-2016), and prior to Siegfried Group as audit seniormanager at Deloitte & Touche LLP (accounting firm, 2005-2013).
Jim Wegmann (1979)Year of Election or Appointment: 2019Assistant TreasurerMr. Wegmann also serves as Assistant Treasurer of other funds. Mr. Wegmann is an employee of Fidelity Investments(2011-present).
Shareholder Expense ExampleAs a shareholder, you incur two types of costs: (1) transaction costs, which may include sales charges (loads) on purchase paymentsor redemption proceeds, as applicable and (2) ongoing costs, which generally include management fees, distribution and/or service(12b-1) fees and other Fund expenses. This Example is intended to help you understand your ongoing costs (in dollars) of investingin a fund and to compare these costs with the ongoing costs of investing in other mutual funds.The Example is based on an investment of $1,000 invested at the beginning of the period and held for the entire period (September1, 2020 to February 28, 2021).Actual ExpensesThe first line of the accompanying table provides information about actual account values and actual expenses. You may use theinformation in this line, together with the amount you invested, to estimate the expenses that you paid over the period. Simply divideyour account value by $1,000.00 (for example, an $8,600 account value divided by $1,000.00 = 8.6), then multiply the result by thenumber in the first line for a class/Fund under the heading entitled "Expenses Paid During Period" to estimate the expenses you paidon your account during this period. If any fund is a shareholder of any underlying mutual funds or exchange-traded funds (ETFs)(the Underlying Funds), such fund indirectly bears its proportional share of the expenses of the Underlying Funds in addition to thedirect expenses incurred presented in the table. These fees and expenses are not included in the annualized expense ratio used tocalculate the expense estimate in the table below.Hypothetical Example for Comparison PurposesThe second line of the accompanying table provides information about hypothetical account values and hypothetical expenses basedon the actual expense ratio and an assumed rate of return of 5% per year before expenses, which is not the actual return. Thehypothetical account values and expenses may not be used to estimate the actual ending account balance or expenses you paid forthe period. You may use this information to compare the ongoing costs of investing in the Fund and other funds. To do so, comparethis 5% hypothetical example with the 5% hypothetical examples that appear in the shareholder reports of the other funds. If anyfund is a shareholder of any Underlying Funds, such fund indirectly bears its proportional share of the expenses of the UnderlyingFunds in addition to the direct expenses as presented in the table. These fees and expenses are not included in the annualizedexpense ratio used to calculate the expense estimate in the table below.Please note that the expenses shown in the table are meant to highlight your ongoing costs only and do not reflect any transactioncosts. Therefore, the second line of the table is useful in comparing ongoing costs only, and will not help you determine the relativetotal costs of owning different funds.
Annualized ExpenseRatio-A
BeginningAccount ValueSeptember 1,
2020
EndingAccount ValueFebruary 28,
2021
Expenses PaidDuring Period-B
September 1, 2020to February 28,
2021Fidelity Series Total Market IndexFund - %-C
Actual $1,000.00 $1,137.30 $--D
Hypothetical-E $1,000.00 $1,024.79 $--D
A Annualized expense ratio reflects expenses net of applicable fee waivers.B Expenses are equal to the annualized expense ratio, multiplied by the average account value over the period, multiplied by 181/
365 (to reflect the one-half year period). The fees and expenses of any Underlying Funds are not included in each annualizedexpense ratio.
Copyright © 2021 www.secdatabase.com. All Rights Reserved.Please Consider the Environment Before Printing This Document
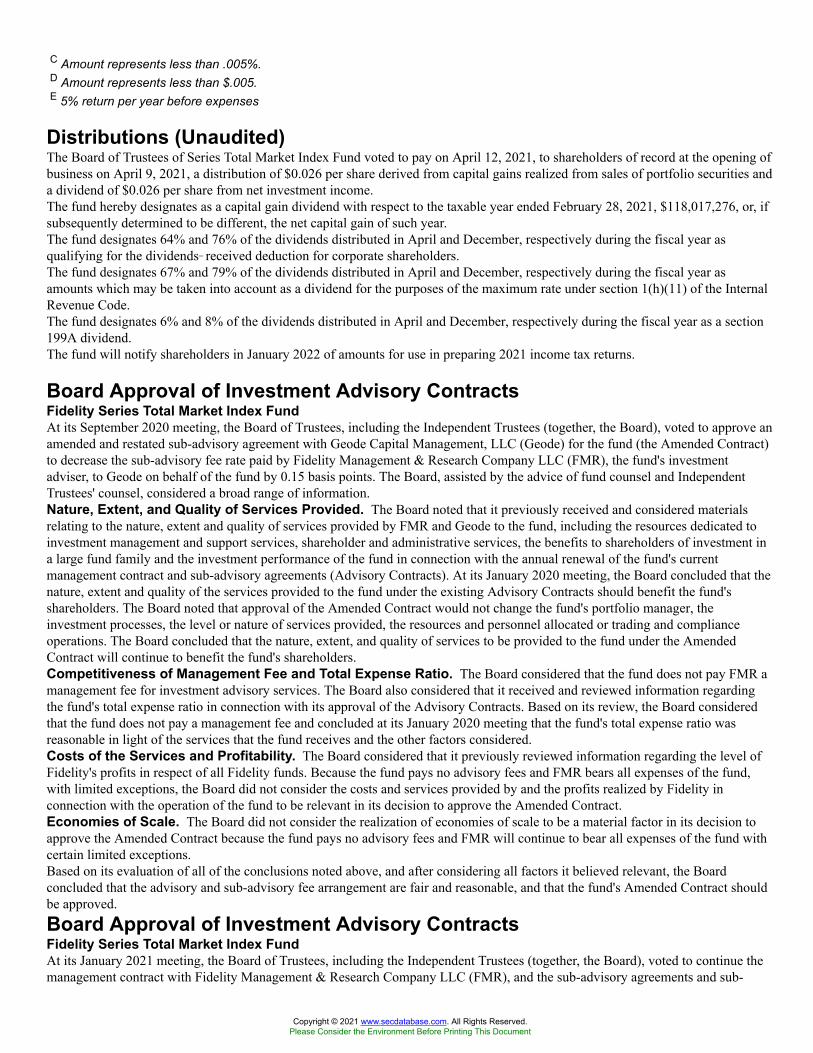
C Amount represents less than .005%.D Amount represents less than $.005.E 5% return per year before expenses
Distributions (Unaudited)The Board of Trustees of Series Total Market Index Fund voted to pay on April 12, 2021, to shareholders of record at the opening ofbusiness on April 9, 2021, a distribution of $0.026 per share derived from capital gains realized from sales of portfolio securities anda dividend of $0.026 per share from net investment income.The fund hereby designates as a capital gain dividend with respect to the taxable year ended February 28, 2021, $118,017,276, or, ifsubsequently determined to be different, the net capital gain of such year.The fund designates 64% and 76% of the dividends distributed in April and December, respectively during the fiscal year asqualifying for the dividends�received deduction for corporate shareholders.The fund designates 67% and 79% of the dividends distributed in April and December, respectively during the fiscal year asamounts which may be taken into account as a dividend for the purposes of the maximum rate under section 1(h)(11) of the InternalRevenue Code.The fund designates 6% and 8% of the dividends distributed in April and December, respectively during the fiscal year as a section199A dividend.The fund will notify shareholders in January 2022 of amounts for use in preparing 2021 income tax returns.
Board Approval of Investment Advisory ContractsFidelity Series Total Market Index FundAt its September 2020 meeting, the Board of Trustees, including the Independent Trustees (together, the Board), voted to approve anamended and restated sub-advisory agreement with Geode Capital Management, LLC (Geode) for the fund (the Amended Contract)to decrease the sub-advisory fee rate paid by Fidelity Management & Research Company LLC (FMR), the fund's investmentadviser, to Geode on behalf of the fund by 0.15 basis points. The Board, assisted by the advice of fund counsel and IndependentTrustees' counsel, considered a broad range of information.Nature, Extent, and Quality of Services Provided. The Board noted that it previously received and considered materialsrelating to the nature, extent and quality of services provided by FMR and Geode to the fund, including the resources dedicated toinvestment management and support services, shareholder and administrative services, the benefits to shareholders of investment ina large fund family and the investment performance of the fund in connection with the annual renewal of the fund's currentmanagement contract and sub-advisory agreements (Advisory Contracts). At its January 2020 meeting, the Board concluded that thenature, extent and quality of the services provided to the fund under the existing Advisory Contracts should benefit the fund'sshareholders. The Board noted that approval of the Amended Contract would not change the fund's portfolio manager, theinvestment processes, the level or nature of services provided, the resources and personnel allocated or trading and complianceoperations. The Board concluded that the nature, extent, and quality of services to be provided to the fund under the AmendedContract will continue to benefit the fund's shareholders.Competitiveness of Management Fee and Total Expense Ratio. The Board considered that the fund does not pay FMR amanagement fee for investment advisory services. The Board also considered that it received and reviewed information regardingthe fund's total expense ratio in connection with its approval of the Advisory Contracts. Based on its review, the Board consideredthat the fund does not pay a management fee and concluded at its January 2020 meeting that the fund's total expense ratio wasreasonable in light of the services that the fund receives and the other factors considered.Costs of the Services and Profitability. The Board considered that it previously reviewed information regarding the level ofFidelity's profits in respect of all Fidelity funds. Because the fund pays no advisory fees and FMR bears all expenses of the fund,with limited exceptions, the Board did not consider the costs and services provided by and the profits realized by Fidelity inconnection with the operation of the fund to be relevant in its decision to approve the Amended Contract.Economies of Scale. The Board did not consider the realization of economies of scale to be a material factor in its decision toapprove the Amended Contract because the fund pays no advisory fees and FMR will continue to bear all expenses of the fund withcertain limited exceptions.Based on its evaluation of all of the conclusions noted above, and after considering all factors it believed relevant, the Boardconcluded that the advisory and sub-advisory fee arrangement are fair and reasonable, and that the fund's Amended Contract shouldbe approved.Board Approval of Investment Advisory ContractsFidelity Series Total Market Index FundAt its January 2021 meeting, the Board of Trustees, including the Independent Trustees (together, the Board), voted to continue themanagement contract with Fidelity Management & Research Company LLC (FMR), and the sub-advisory agreements and sub-
Copyright © 2021 www.secdatabase.com. All Rights Reserved.Please Consider the Environment Before Printing This Document
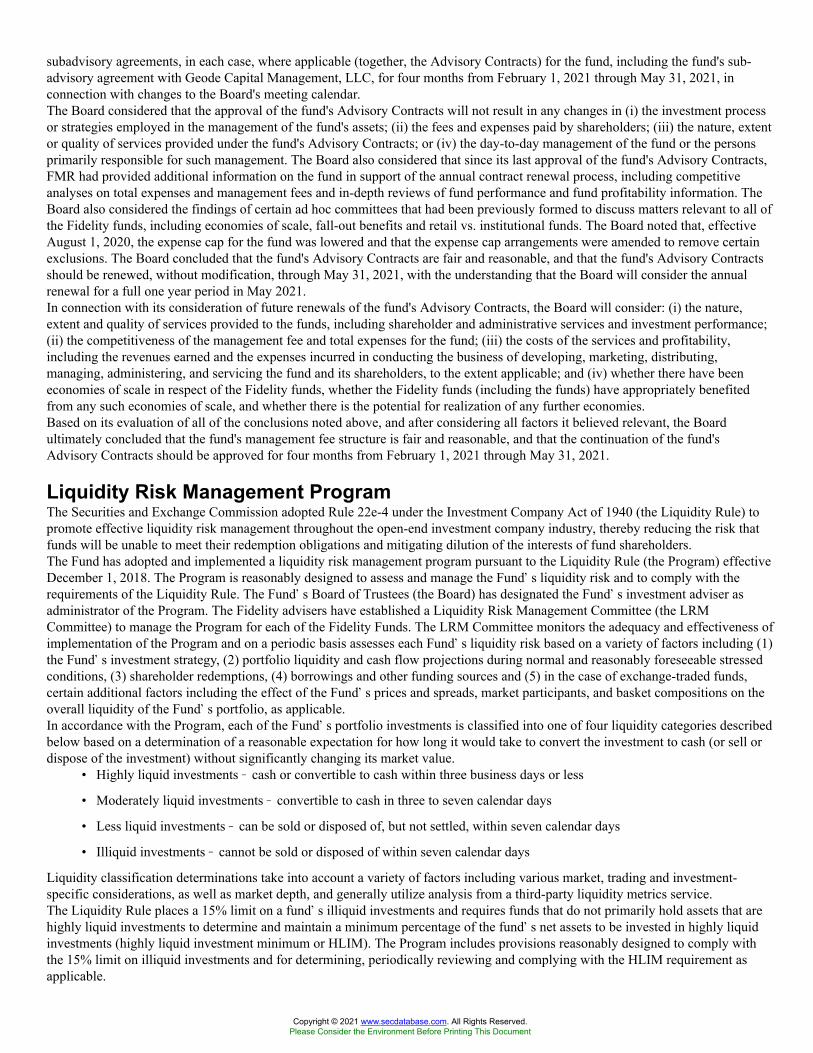
subadvisory agreements, in each case, where applicable (together, the Advisory Contracts) for the fund, including the fund's sub-advisory agreement with Geode Capital Management, LLC, for four months from February 1, 2021 through May 31, 2021, inconnection with changes to the Board's meeting calendar.The Board considered that the approval of the fund's Advisory Contracts will not result in any changes in (i) the investment processor strategies employed in the management of the fund's assets; (ii) the fees and expenses paid by shareholders; (iii) the nature, extentor quality of services provided under the fund's Advisory Contracts; or (iv) the day-to-day management of the fund or the personsprimarily responsible for such management. The Board also considered that since its last approval of the fund's Advisory Contracts,FMR had provided additional information on the fund in support of the annual contract renewal process, including competitiveanalyses on total expenses and management fees and in-depth reviews of fund performance and fund profitability information. TheBoard also considered the findings of certain ad hoc committees that had been previously formed to discuss matters relevant to all ofthe Fidelity funds, including economies of scale, fall-out benefits and retail vs. institutional funds. The Board noted that, effectiveAugust 1, 2020, the expense cap for the fund was lowered and that the expense cap arrangements were amended to remove certainexclusions. The Board concluded that the fund's Advisory Contracts are fair and reasonable, and that the fund's Advisory Contractsshould be renewed, without modification, through May 31, 2021, with the understanding that the Board will consider the annualrenewal for a full one year period in May 2021.In connection with its consideration of future renewals of the fund's Advisory Contracts, the Board will consider: (i) the nature,extent and quality of services provided to the funds, including shareholder and administrative services and investment performance;(ii) the competitiveness of the management fee and total expenses for the fund; (iii) the costs of the services and profitability,including the revenues earned and the expenses incurred in conducting the business of developing, marketing, distributing,managing, administering, and servicing the fund and its shareholders, to the extent applicable; and (iv) whether there have beeneconomies of scale in respect of the Fidelity funds, whether the Fidelity funds (including the funds) have appropriately benefitedfrom any such economies of scale, and whether there is the potential for realization of any further economies.Based on its evaluation of all of the conclusions noted above, and after considering all factors it believed relevant, the Boardultimately concluded that the fund's management fee structure is fair and reasonable, and that the continuation of the fund'sAdvisory Contracts should be approved for four months from February 1, 2021 through May 31, 2021.
Liquidity Risk Management ProgramThe Securities and Exchange Commission adopted Rule 22e-4 under the Investment Company Act of 1940 (the Liquidity Rule) topromote effective liquidity risk management throughout the open-end investment company industry, thereby reducing the risk thatfunds will be unable to meet their redemption obligations and mitigating dilution of the interests of fund shareholders.The Fund has adopted and implemented a liquidity risk management program pursuant to the Liquidity Rule (the Program) effectiveDecember 1, 2018. The Program is reasonably designed to assess and manage the Fund�s liquidity risk and to comply with therequirements of the Liquidity Rule. The Fund�s Board of Trustees (the Board) has designated the Fund�s investment adviser asadministrator of the Program. The Fidelity advisers have established a Liquidity Risk Management Committee (the LRMCommittee) to manage the Program for each of the Fidelity Funds. The LRM Committee monitors the adequacy and effectiveness ofimplementation of the Program and on a periodic basis assesses each Fund�s liquidity risk based on a variety of factors including (1)the Fund�s investment strategy, (2) portfolio liquidity and cash flow projections during normal and reasonably foreseeable stressedconditions, (3) shareholder redemptions, (4) borrowings and other funding sources and (5) in the case of exchange-traded funds,certain additional factors including the effect of the Fund�s prices and spreads, market participants, and basket compositions on theoverall liquidity of the Fund�s portfolio, as applicable.In accordance with the Program, each of the Fund�s portfolio investments is classified into one of four liquidity categories describedbelow based on a determination of a reasonable expectation for how long it would take to convert the investment to cash (or sell ordispose of the investment) without significantly changing its market value.
• Highly liquid investments � cash or convertible to cash within three business days or less
• Moderately liquid investments � convertible to cash in three to seven calendar days
• Less liquid investments � can be sold or disposed of, but not settled, within seven calendar days
• Illiquid investments � cannot be sold or disposed of within seven calendar days
Liquidity classification determinations take into account a variety of factors including various market, trading and investment-specific considerations, as well as market depth, and generally utilize analysis from a third-party liquidity metrics service.The Liquidity Rule places a 15% limit on a fund�s illiquid investments and requires funds that do not primarily hold assets that arehighly liquid investments to determine and maintain a minimum percentage of the fund�s net assets to be invested in highly liquidinvestments (highly liquid investment minimum or HLIM). The Program includes provisions reasonably designed to comply withthe 15% limit on illiquid investments and for determining, periodically reviewing and complying with the HLIM requirement asapplicable.
Copyright © 2021 www.secdatabase.com. All Rights Reserved.Please Consider the Environment Before Printing This Document
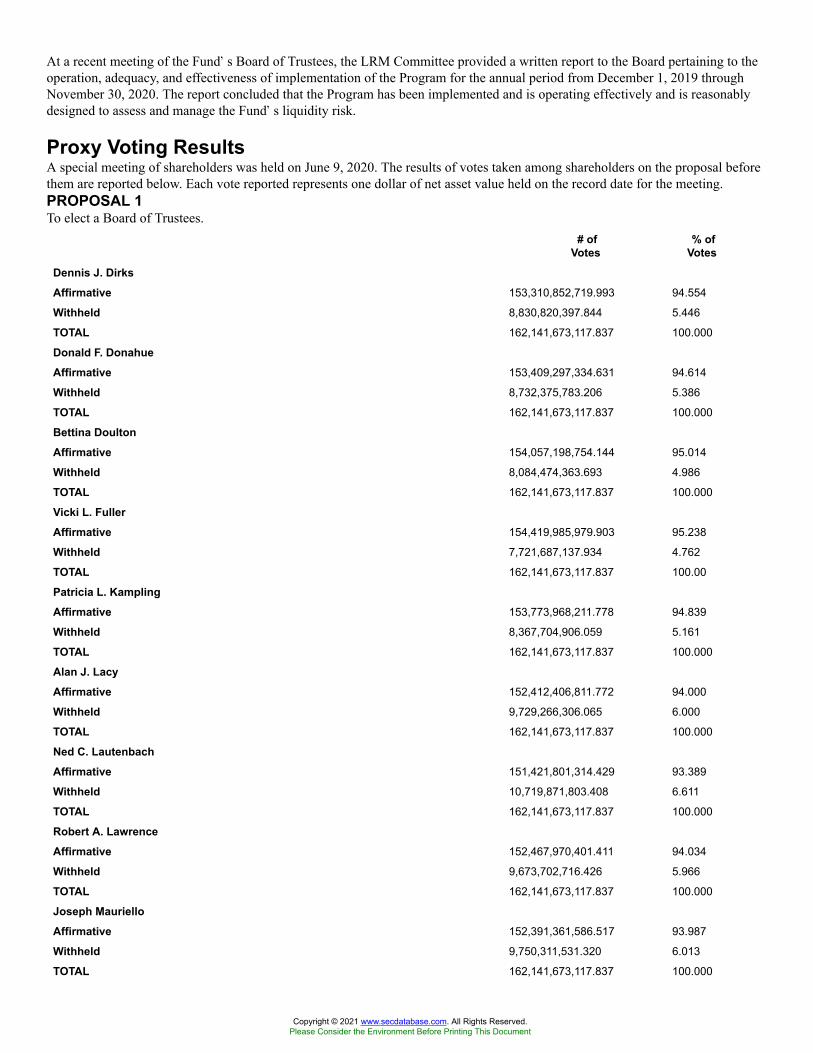
At a recent meeting of the Fund�s Board of Trustees, the LRM Committee provided a written report to the Board pertaining to theoperation, adequacy, and effectiveness of implementation of the Program for the annual period from December 1, 2019 throughNovember 30, 2020. The report concluded that the Program has been implemented and is operating effectively and is reasonablydesigned to assess and manage the Fund�s liquidity risk.
Proxy Voting ResultsA special meeting of shareholders was held on June 9, 2020. The results of votes taken among shareholders on the proposal beforethem are reported below. Each vote reported represents one dollar of net asset value held on the record date for the meeting.PROPOSAL 1To elect a Board of Trustees.
# ofVotes
% ofVotes
Dennis J. DirksAffirmative 153,310,852,719.993 94.554
Withheld 8,830,820,397.844 5.446
TOTAL 162,141,673,117.837 100.000
Donald F. DonahueAffirmative 153,409,297,334.631 94.614
Withheld 8,732,375,783.206 5.386
TOTAL 162,141,673,117.837 100.000
Bettina DoultonAffirmative 154,057,198,754.144 95.014
Withheld 8,084,474,363.693 4.986
TOTAL 162,141,673,117.837 100.000
Vicki L. FullerAffirmative 154,419,985,979.903 95.238
Withheld 7,721,687,137.934 4.762
TOTAL 162,141,673,117.837 100.00
Patricia L. KamplingAffirmative 153,773,968,211.778 94.839
Withheld 8,367,704,906.059 5.161
TOTAL 162,141,673,117.837 100.000
Alan J. LacyAffirmative 152,412,406,811.772 94.000
Withheld 9,729,266,306.065 6.000
TOTAL 162,141,673,117.837 100.000
Ned C. LautenbachAffirmative 151,421,801,314.429 93.389
Withheld 10,719,871,803.408 6.611
TOTAL 162,141,673,117.837 100.000
Robert A. LawrenceAffirmative 152,467,970,401.411 94.034
Withheld 9,673,702,716.426 5.966
TOTAL 162,141,673,117.837 100.000
Joseph MaurielloAffirmative 152,391,361,586.517 93.987
Withheld 9,750,311,531.320 6.013
TOTAL 162,141,673,117.837 100.000
Copyright © 2021 www.secdatabase.com. All Rights Reserved.Please Consider the Environment Before Printing This Document
Cornelia M. SmallAffirmative 153,101,624,672.870 94.425
Withheld 9,040,048,444.967 5.575
TOTAL 162,141,673,117.837 100.000
Garnett A. SmithAffirmative 152,502,318,423.900 94.055
Withheld 9,639,354,693.937 5.945
TOTAL 162,141,673,117.837 100.000
David M. ThomasAffirmative 152,608,626,434.284 94.121
Withheld 9,533,046,683.553 5.879
TOTAL 162,141,673,117.837 100.000
Susan TomaskyAffirmative 153,605,526,235.885 94.735
Withheld 8,536,146,881.952 5.265
TOTAL 162,141,673,117.837 100.000
Michael E. WileyAffirmative 152,567,303,629.801 94.095
Withheld 9,574,369,488.036 5.905
TOTAL 162,141,673,117.837 100.000
Proposal 1 reflects trust wide proposal and voting results.
STX-ANN-04211.9892981.101
Fidelity® 500 Index Fund
Annual ReportFebruary 28, 2021
Copyright © 2021 www.secdatabase.com. All Rights Reserved.Please Consider the Environment Before Printing This Document
ContentsNote to ShareholdersPerformanceManagement's Discussion of Fund PerformanceInvestment SummarySchedule of InvestmentsFinancial StatementsNotes to Financial StatementsReport of Independent Registered Public Accounting FirmTrustees and OfficersShareholder Expense Example
Copyright © 2021 www.secdatabase.com. All Rights Reserved.Please Consider the Environment Before Printing This Document

DistributionsBoard Approval of Investment Advisory ContractsLiquidity Risk Management ProgramProxy Voting Results
To view a fund's proxy voting guidelines and proxy voting record for the 12-month period ended June 30, visithttp://www.fidelity.com/proxyvotingresults or visit the Securities and Exchange Commission's (SEC) web site athttp://www.sec.gov.You may also call 1-800-544-8544 to request a free copy of the proxy voting guidelines.Standard & Poor's, S&P and S&P 500 are registered service marks of The McGraw-Hill Companies, Inc. and have been licensed foruse by Fidelity Distributors Corporation.Other third-party marks appearing herein are the property of their respective owners.All other marks appearing herein are registered or unregistered trademarks or service marks of FMR LLC or an affiliated company.© 2021 FMR LLC. All rights reserved.
This report and the financial statements contained herein are submitted for the general information of the shareholders of the Fund.This report is not authorized for distribution to prospective investors in the Fund unless preceded or accompanied by an effectiveprospectus.A fund files its complete schedule of portfolio holdings with the SEC for the first and third quarters of each fiscal year on Form N-PORT. Forms N-PORT are available on the SEC�s web site at http://www.sec.gov. A fund's Forms N-PORT may be reviewed andcopied at the SEC�s Public Reference Room in Washington, DC. Information regarding the operation of the SEC's Public ReferenceRoom may be obtained by calling 1-800-SEC-0330.For a complete list of a fund's portfolio holdings, view the most recent holdings listing, semiannual report, or annual report onFidelity's web site at http://www.fidelity.com, http://www.institutional.fidelity.com, or http://www.401k.com, as applicable.NOT FDIC INSURED ��MAY LOSE VALUE ��NO BANK GUARANTEENeither the Fund nor Fidelity Distributors Corporation is a bank.
Note to Shareholders:Early in 2020, the outbreak and spread of a new coronavirus emerged as a public health emergency that had a major influence onfinancial markets, primarily based on its impact on the global economy and the outlook for corporate earnings. The virus causes arespiratory disease known as COVID-19. On March 11, 2020 the World Health Organization declared the COVID-19 outbreak apandemic, citing sustained risk of further global spread.In the weeks following, as the crisis worsened, we witnessed an escalating human tragedy with wide-scale social and economicconsequences from coronavirus-containment measures. The outbreak of COVID-19 prompted a number of measures to limit thespread, including travel and border restrictions, quarantines, and restrictions on large gatherings. In turn, these resulted in lowerconsumer activity, diminished demand for a wide range of products and services, disruption in manufacturing and supply chains, and� given the wide variability in outcomes regarding the outbreak � significant market uncertainty and volatility. Amid the turmoil,global governments and central banks took unprecedented action to help support consumers, businesses, and the broader economies,and to limit disruption to financial systems.The situation continues to unfold, and the extent and duration of its impact on financial markets and the economy remain highlyuncertain. Extreme events such as the coronavirus crisis are �exogenous shocks� that can have significant adverse effects on mutualfunds and their investments. Although multiple asset classes may be affected by market disruption, the duration and impact may notbe the same for all types of assets.Fidelity is committed to helping you stay informed amid news about COVID-19 and during increased market volatility, and we�retaking extra steps to be responsive to customer needs. We encourage you to visit our websites, where we offer ongoing updates,commentary, and analysis on the markets and our funds.
Performance: The Bottom LineAverage annual total return reflects the change in the value of an investment, assuming reinvestment of distributions from dividendincome and capital gains (the profits earned upon the sale of securities that have grown in value, if any) and assuming a constant rateof performance each year. The hypothetical investment and the average annual total returns do not reflect the deduction of taxes that
Copyright © 2021 www.secdatabase.com. All Rights Reserved.Please Consider the Environment Before Printing This Document
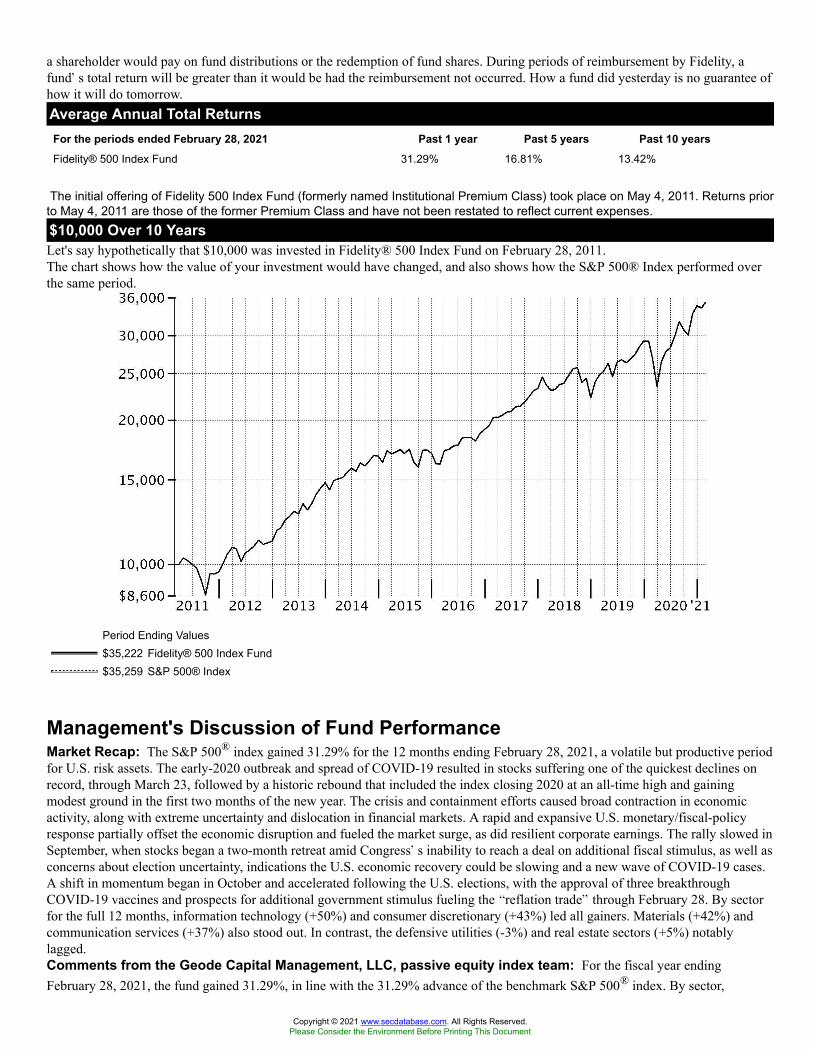
a shareholder would pay on fund distributions or the redemption of fund shares. During periods of reimbursement by Fidelity, afund�s total return will be greater than it would be had the reimbursement not occurred. How a fund did yesterday is no guarantee ofhow it will do tomorrow.Average Annual Total ReturnsFor the periods ended February 28, 2021 Past 1 year Past 5 years Past 10 yearsFidelity® 500 Index Fund 31.29% 16.81% 13.42%
The initial offering of Fidelity 500 Index Fund (formerly named Institutional Premium Class) took place on May 4, 2011. Returns priorto May 4, 2011 are those of the former Premium Class and have not been restated to reflect current expenses.$10,000 Over 10 YearsLet's say hypothetically that $10,000 was invested in Fidelity® 500 Index Fund on February 28, 2011.The chart shows how the value of your investment would have changed, and also shows how the S&P 500® Index performed overthe same period.
Period Ending Values$35,222 Fidelity® 500 Index Fund$35,259 S&P 500® Index
Management's Discussion of Fund PerformanceMarket Recap: The S&P 500® index gained 31.29% for the 12 months ending February 28, 2021, a volatile but productive periodfor U.S. risk assets. The early-2020 outbreak and spread of COVID-19 resulted in stocks suffering one of the quickest declines onrecord, through March 23, followed by a historic rebound that included the index closing 2020 at an all-time high and gainingmodest ground in the first two months of the new year. The crisis and containment efforts caused broad contraction in economicactivity, along with extreme uncertainty and dislocation in financial markets. A rapid and expansive U.S. monetary/fiscal-policyresponse partially offset the economic disruption and fueled the market surge, as did resilient corporate earnings. The rally slowed inSeptember, when stocks began a two-month retreat amid Congress�s inability to reach a deal on additional fiscal stimulus, as well asconcerns about election uncertainty, indications the U.S. economic recovery could be slowing and a new wave of COVID-19 cases.A shift in momentum began in October and accelerated following the U.S. elections, with the approval of three breakthroughCOVID-19 vaccines and prospects for additional government stimulus fueling the �reflation trade� through February 28. By sectorfor the full 12 months, information technology (+50%) and consumer discretionary (+43%) led all gainers. Materials (+42%) andcommunication services (+37%) also stood out. In contrast, the defensive utilities (-3%) and real estate sectors (+5%) notablylagged.Comments from the Geode Capital Management, LLC, passive equity index team: For the fiscal year endingFebruary 28, 2021, the fund gained 31.29%, in line with the 31.29% advance of the benchmark S&P 500® index. By sector,
Copyright © 2021 www.secdatabase.com. All Rights Reserved.Please Consider the Environment Before Printing This Document
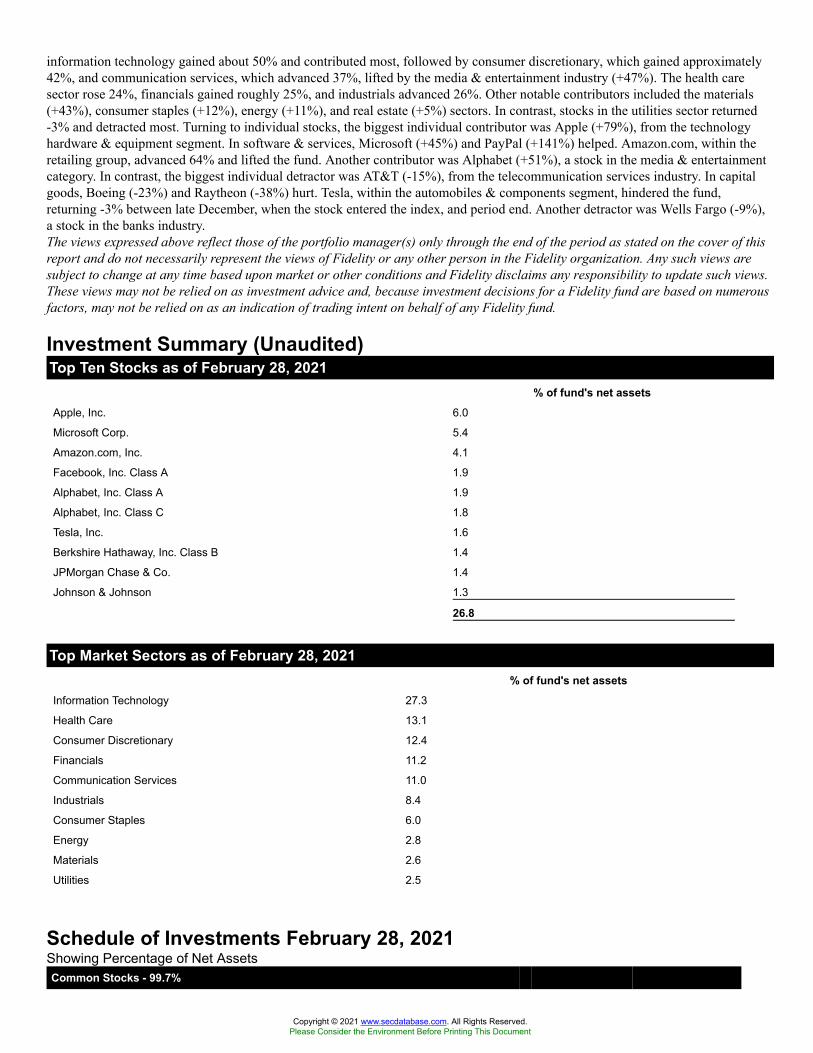
information technology gained about 50% and contributed most, followed by consumer discretionary, which gained approximately42%, and communication services, which advanced 37%, lifted by the media & entertainment industry (+47%). The health caresector rose 24%, financials gained roughly 25%, and industrials advanced 26%. Other notable contributors included the materials(+43%), consumer staples (+12%), energy (+11%), and real estate (+5%) sectors. In contrast, stocks in the utilities sector returned-3% and detracted most. Turning to individual stocks, the biggest individual contributor was Apple (+79%), from the technologyhardware & equipment segment. In software & services, Microsoft (+45%) and PayPal (+141%) helped. Amazon.com, within theretailing group, advanced 64% and lifted the fund. Another contributor was Alphabet (+51%), a stock in the media & entertainmentcategory. In contrast, the biggest individual detractor was AT&T (-15%), from the telecommunication services industry. In capitalgoods, Boeing (-23%) and Raytheon (-38%) hurt. Tesla, within the automobiles & components segment, hindered the fund,returning -3% between late December, when the stock entered the index, and period end. Another detractor was Wells Fargo (-9%),a stock in the banks industry.The views expressed above reflect those of the portfolio manager(s) only through the end of the period as stated on the cover of thisreport and do not necessarily represent the views of Fidelity or any other person in the Fidelity organization. Any such views aresubject to change at any time based upon market or other conditions and Fidelity disclaims any responsibility to update such views.These views may not be relied on as investment advice and, because investment decisions for a Fidelity fund are based on numerousfactors, may not be relied on as an indication of trading intent on behalf of any Fidelity fund.
Investment Summary (Unaudited)Top Ten Stocks as of February 28, 2021
% of fund's net assetsApple, Inc. 6.0
Microsoft Corp. 5.4
Amazon.com, Inc. 4.1
Facebook, Inc. Class A 1.9
Alphabet, Inc. Class A 1.9
Alphabet, Inc. Class C 1.8
Tesla, Inc. 1.6
Berkshire Hathaway, Inc. Class B 1.4
JPMorgan Chase & Co. 1.4
Johnson & Johnson 1.3
26.8
Top Market Sectors as of February 28, 2021% of fund's net assets
Information Technology 27.3
Health Care 13.1
Consumer Discretionary 12.4
Financials 11.2
Communication Services 11.0
Industrials 8.4
Consumer Staples 6.0
Energy 2.8
Materials 2.6
Utilities 2.5
Schedule of Investments February 28, 2021Showing Percentage of Net AssetsCommon Stocks - 99.7%
Copyright © 2021 www.secdatabase.com. All Rights Reserved.Please Consider the Environment Before Printing This Document
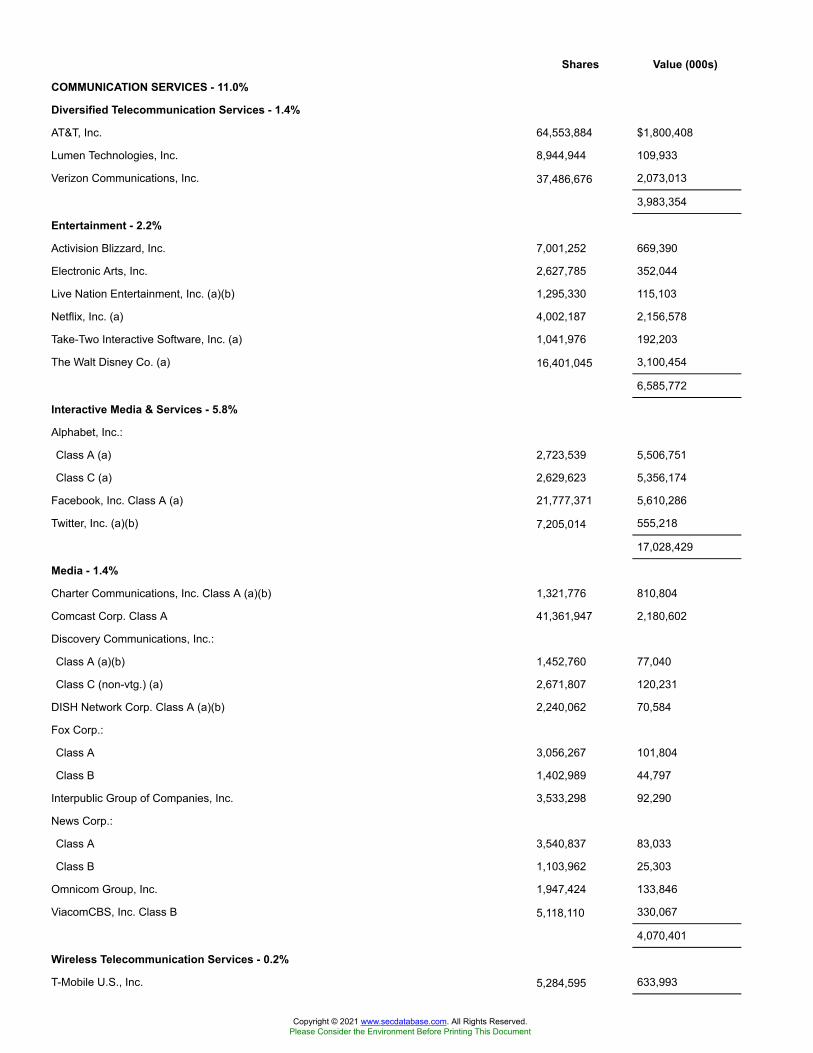
Shares Value (000s)
COMMUNICATION SERVICES - 11.0%
Diversified Telecommunication Services - 1.4%
AT&T, Inc. 64,553,884 $1,800,408
Lumen Technologies, Inc. 8,944,944 109,933
Verizon Communications, Inc. 37,486,676 2,073,013
3,983,354
Entertainment - 2.2%
Activision Blizzard, Inc. 7,001,252 669,390
Electronic Arts, Inc. 2,627,785 352,044
Live Nation Entertainment, Inc. (a)(b) 1,295,330 115,103
Netflix, Inc. (a) 4,002,187 2,156,578
Take-Two Interactive Software, Inc. (a) 1,041,976 192,203
The Walt Disney Co. (a) 16,401,045 3,100,454
6,585,772
Interactive Media & Services - 5.8%
Alphabet, Inc.:
Class A (a) 2,723,539 5,506,751
Class C (a) 2,629,623 5,356,174
Facebook, Inc. Class A (a) 21,777,371 5,610,286
Twitter, Inc. (a)(b) 7,205,014 555,218
17,028,429
Media - 1.4%
Charter Communications, Inc. Class A (a)(b) 1,321,776 810,804
Comcast Corp. Class A 41,361,947 2,180,602
Discovery Communications, Inc.:
Class A (a)(b) 1,452,760 77,040
Class C (non-vtg.) (a) 2,671,807 120,231
DISH Network Corp. Class A (a)(b) 2,240,062 70,584
Fox Corp.:
Class A 3,056,267 101,804
Class B 1,402,989 44,797
Interpublic Group of Companies, Inc. 3,533,298 92,290
News Corp.:
Class A 3,540,837 83,033
Class B 1,103,962 25,303
Omnicom Group, Inc. 1,947,424 133,846
ViacomCBS, Inc. Class B 5,118,110 330,067
4,070,401
Wireless Telecommunication Services - 0.2%
T-Mobile U.S., Inc. 5,284,595 633,993
Copyright © 2021 www.secdatabase.com. All Rights Reserved.Please Consider the Environment Before Printing This Document
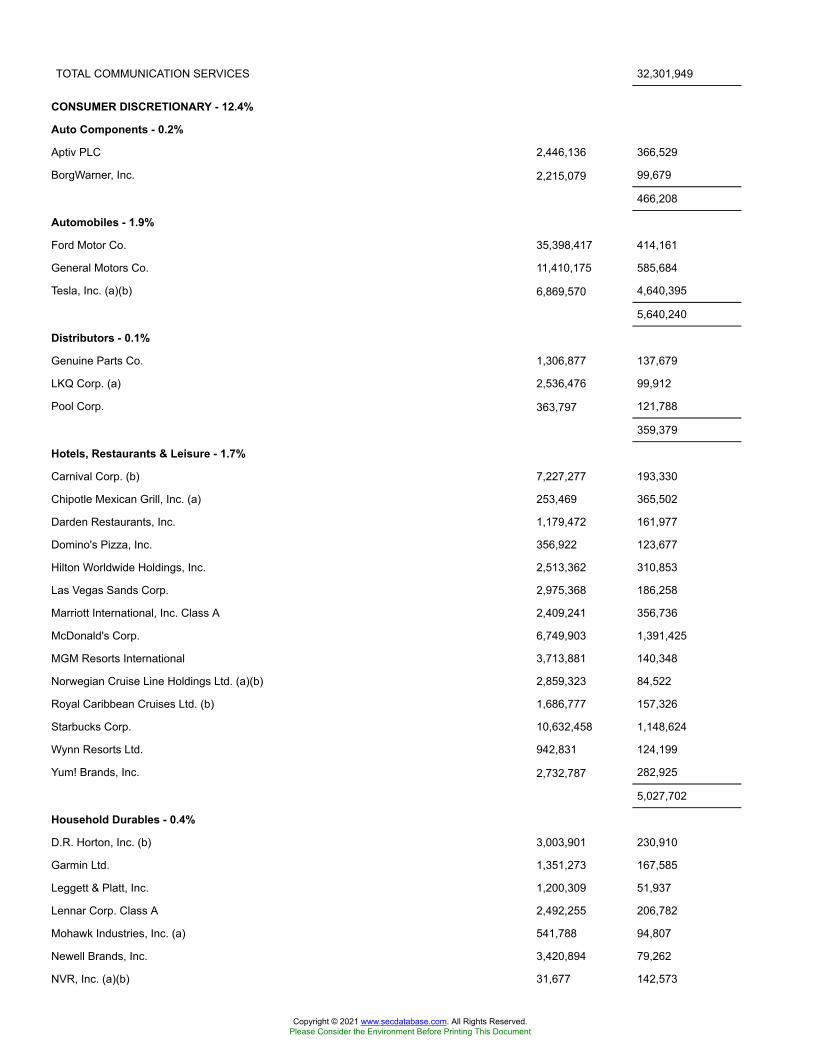
TOTAL COMMUNICATION SERVICES 32,301,949
CONSUMER DISCRETIONARY - 12.4%
Auto Components - 0.2%
Aptiv PLC 2,446,136 366,529
BorgWarner, Inc. 2,215,079 99,679
466,208
Automobiles - 1.9%
Ford Motor Co. 35,398,417 414,161
General Motors Co. 11,410,175 585,684
Tesla, Inc. (a)(b) 6,869,570 4,640,395
5,640,240
Distributors - 0.1%
Genuine Parts Co. 1,306,877 137,679
LKQ Corp. (a) 2,536,476 99,912
Pool Corp. 363,797 121,788
359,379
Hotels, Restaurants & Leisure - 1.7%
Carnival Corp. (b) 7,227,277 193,330
Chipotle Mexican Grill, Inc. (a) 253,469 365,502
Darden Restaurants, Inc. 1,179,472 161,977
Domino's Pizza, Inc. 356,922 123,677
Hilton Worldwide Holdings, Inc. 2,513,362 310,853
Las Vegas Sands Corp. 2,975,368 186,258
Marriott International, Inc. Class A 2,409,241 356,736
McDonald's Corp. 6,749,903 1,391,425
MGM Resorts International 3,713,881 140,348
Norwegian Cruise Line Holdings Ltd. (a)(b) 2,859,323 84,522
Royal Caribbean Cruises Ltd. (b) 1,686,777 157,326
Starbucks Corp. 10,632,458 1,148,624
Wynn Resorts Ltd. 942,831 124,199
Yum! Brands, Inc. 2,732,787 282,925
5,027,702
Household Durables - 0.4%
D.R. Horton, Inc. (b) 3,003,901 230,910
Garmin Ltd. 1,351,273 167,585
Leggett & Platt, Inc. 1,200,309 51,937
Lennar Corp. Class A 2,492,255 206,782
Mohawk Industries, Inc. (a) 541,788 94,807
Newell Brands, Inc. 3,420,894 79,262
NVR, Inc. (a)(b) 31,677 142,573
Copyright © 2021 www.secdatabase.com. All Rights Reserved.Please Consider the Environment Before Printing This Document
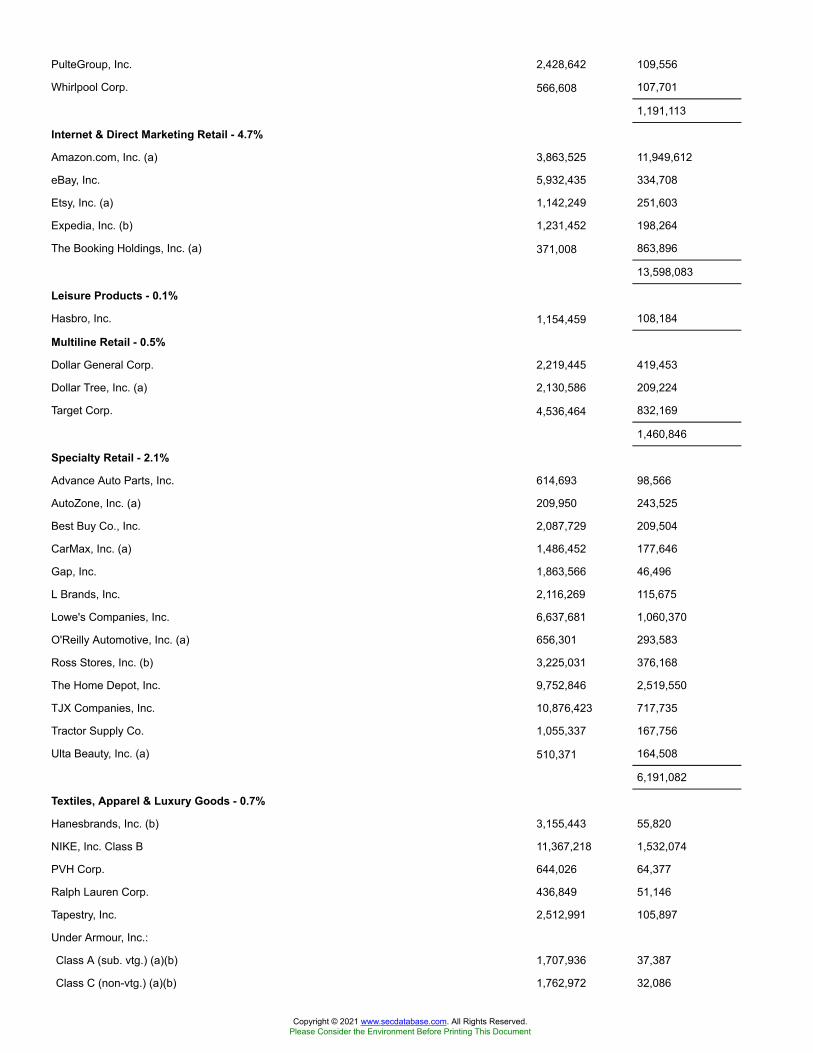
PulteGroup, Inc. 2,428,642 109,556
Whirlpool Corp. 566,608 107,701
1,191,113
Internet & Direct Marketing Retail - 4.7%
Amazon.com, Inc. (a) 3,863,525 11,949,612
eBay, Inc. 5,932,435 334,708
Etsy, Inc. (a) 1,142,249 251,603
Expedia, Inc. (b) 1,231,452 198,264
The Booking Holdings, Inc. (a) 371,008 863,896
13,598,083
Leisure Products - 0.1%
Hasbro, Inc. 1,154,459 108,184
Multiline Retail - 0.5%
Dollar General Corp. 2,219,445 419,453
Dollar Tree, Inc. (a) 2,130,586 209,224
Target Corp. 4,536,464 832,169
1,460,846
Specialty Retail - 2.1%
Advance Auto Parts, Inc. 614,693 98,566
AutoZone, Inc. (a) 209,950 243,525
Best Buy Co., Inc. 2,087,729 209,504
CarMax, Inc. (a) 1,486,452 177,646
Gap, Inc. 1,863,566 46,496
L Brands, Inc. 2,116,269 115,675
Lowe's Companies, Inc. 6,637,681 1,060,370
O'Reilly Automotive, Inc. (a) 656,301 293,583
Ross Stores, Inc. (b) 3,225,031 376,168
The Home Depot, Inc. 9,752,846 2,519,550
TJX Companies, Inc. 10,876,423 717,735
Tractor Supply Co. 1,055,337 167,756
Ulta Beauty, Inc. (a) 510,371 164,508
6,191,082
Textiles, Apparel & Luxury Goods - 0.7%
Hanesbrands, Inc. (b) 3,155,443 55,820
NIKE, Inc. Class B 11,367,218 1,532,074
PVH Corp. 644,026 64,377
Ralph Lauren Corp. 436,849 51,146
Tapestry, Inc. 2,512,991 105,897
Under Armour, Inc.:
Class A (sub. vtg.) (a)(b) 1,707,936 37,387
Class C (non-vtg.) (a)(b) 1,762,972 32,086
Copyright © 2021 www.secdatabase.com. All Rights Reserved.Please Consider the Environment Before Printing This Document
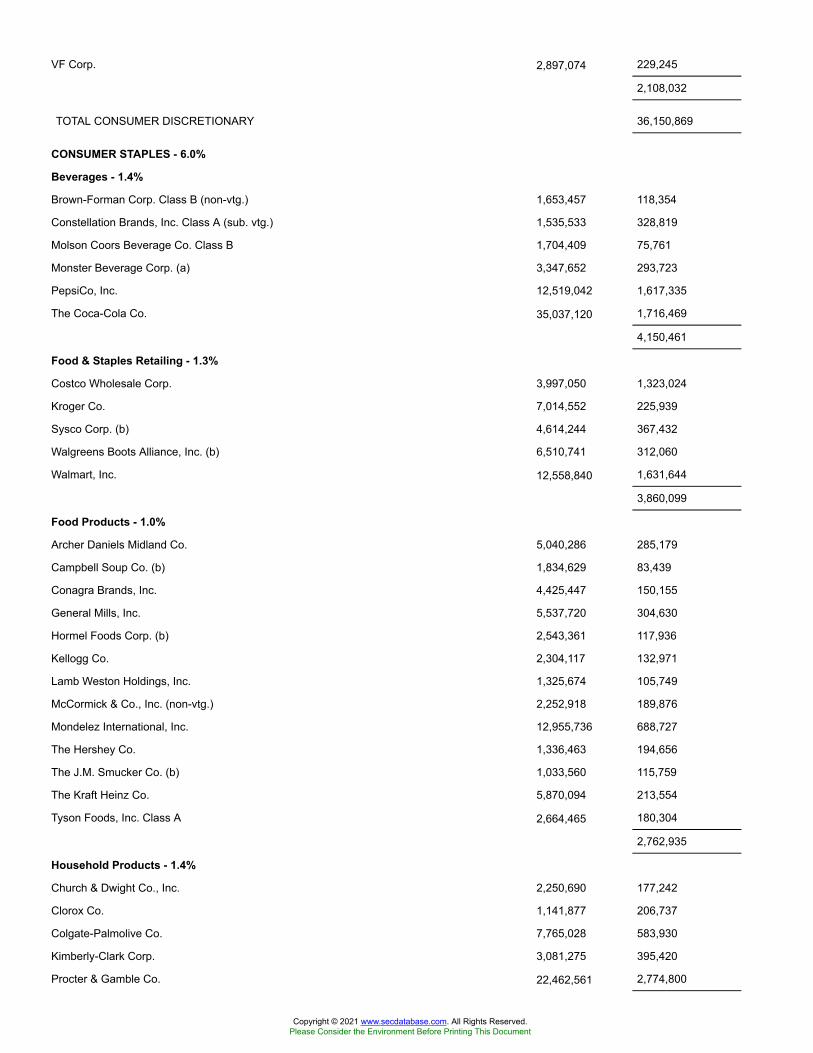
VF Corp. 2,897,074 229,245
2,108,032
TOTAL CONSUMER DISCRETIONARY 36,150,869
CONSUMER STAPLES - 6.0%
Beverages - 1.4%
Brown-Forman Corp. Class B (non-vtg.) 1,653,457 118,354
Constellation Brands, Inc. Class A (sub. vtg.) 1,535,533 328,819
Molson Coors Beverage Co. Class B 1,704,409 75,761
Monster Beverage Corp. (a) 3,347,652 293,723
PepsiCo, Inc. 12,519,042 1,617,335
The Coca-Cola Co. 35,037,120 1,716,469
4,150,461
Food & Staples Retailing - 1.3%
Costco Wholesale Corp. 3,997,050 1,323,024
Kroger Co. 7,014,552 225,939
Sysco Corp. (b) 4,614,244 367,432
Walgreens Boots Alliance, Inc. (b) 6,510,741 312,060
Walmart, Inc. 12,558,840 1,631,644
3,860,099
Food Products - 1.0%
Archer Daniels Midland Co. 5,040,286 285,179
Campbell Soup Co. (b) 1,834,629 83,439
Conagra Brands, Inc. 4,425,447 150,155
General Mills, Inc. 5,537,720 304,630
Hormel Foods Corp. (b) 2,543,361 117,936
Kellogg Co. 2,304,117 132,971
Lamb Weston Holdings, Inc. 1,325,674 105,749
McCormick & Co., Inc. (non-vtg.) 2,252,918 189,876
Mondelez International, Inc. 12,955,736 688,727
The Hershey Co. 1,336,463 194,656
The J.M. Smucker Co. (b) 1,033,560 115,759
The Kraft Heinz Co. 5,870,094 213,554
Tyson Foods, Inc. Class A 2,664,465 180,304
2,762,935
Household Products - 1.4%
Church & Dwight Co., Inc. 2,250,690 177,242
Clorox Co. 1,141,877 206,737
Colgate-Palmolive Co. 7,765,028 583,930
Kimberly-Clark Corp. 3,081,275 395,420
Procter & Gamble Co. 22,462,561 2,774,800
Copyright © 2021 www.secdatabase.com. All Rights Reserved.Please Consider the Environment Before Printing This Document
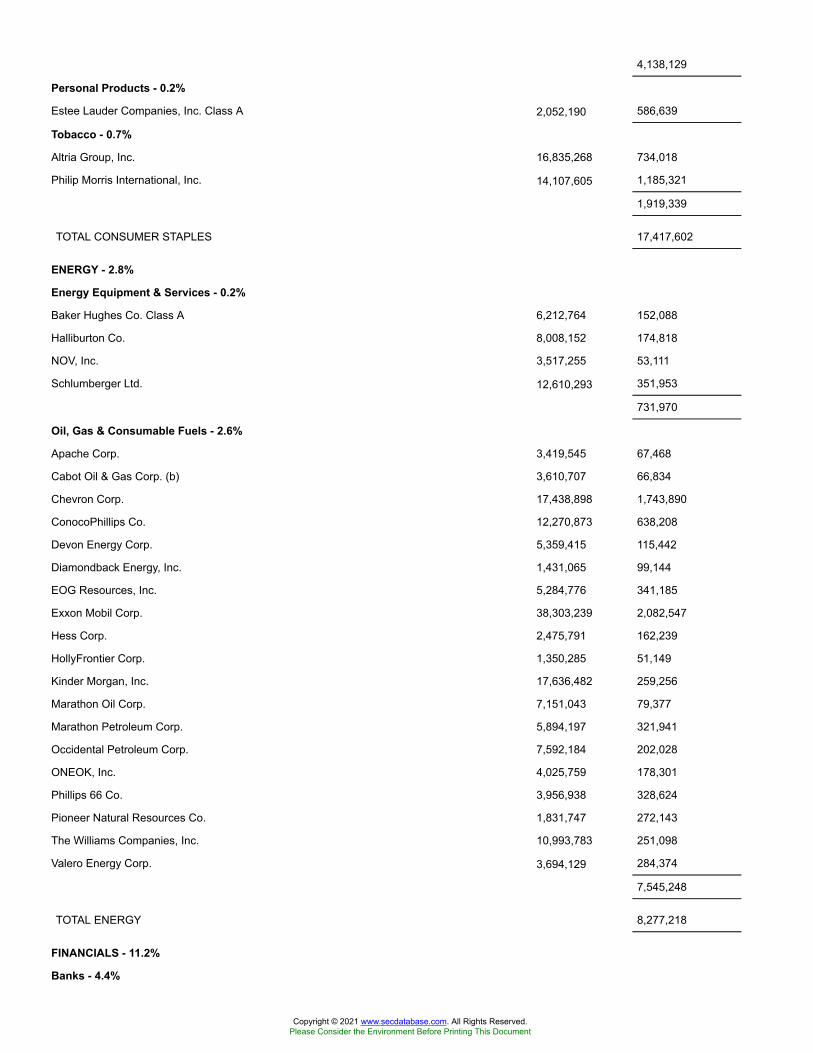
4,138,129
Personal Products - 0.2%
Estee Lauder Companies, Inc. Class A 2,052,190 586,639
Tobacco - 0.7%
Altria Group, Inc. 16,835,268 734,018
Philip Morris International, Inc. 14,107,605 1,185,321
1,919,339
TOTAL CONSUMER STAPLES 17,417,602
ENERGY - 2.8%
Energy Equipment & Services - 0.2%
Baker Hughes Co. Class A 6,212,764 152,088
Halliburton Co. 8,008,152 174,818
NOV, Inc. 3,517,255 53,111
Schlumberger Ltd. 12,610,293 351,953
731,970
Oil, Gas & Consumable Fuels - 2.6%
Apache Corp. 3,419,545 67,468
Cabot Oil & Gas Corp. (b) 3,610,707 66,834
Chevron Corp. 17,438,898 1,743,890
ConocoPhillips Co. 12,270,873 638,208
Devon Energy Corp. 5,359,415 115,442
Diamondback Energy, Inc. 1,431,065 99,144
EOG Resources, Inc. 5,284,776 341,185
Exxon Mobil Corp. 38,303,239 2,082,547
Hess Corp. 2,475,791 162,239
HollyFrontier Corp. 1,350,285 51,149
Kinder Morgan, Inc. 17,636,482 259,256
Marathon Oil Corp. 7,151,043 79,377
Marathon Petroleum Corp. 5,894,197 321,941
Occidental Petroleum Corp. 7,592,184 202,028
ONEOK, Inc. 4,025,759 178,301
Phillips 66 Co. 3,956,938 328,624
Pioneer Natural Resources Co. 1,831,747 272,143
The Williams Companies, Inc. 10,993,783 251,098
Valero Energy Corp. 3,694,129 284,374
7,545,248
TOTAL ENERGY 8,277,218
FINANCIALS - 11.2%
Banks - 4.4%
Copyright © 2021 www.secdatabase.com. All Rights Reserved.Please Consider the Environment Before Printing This Document
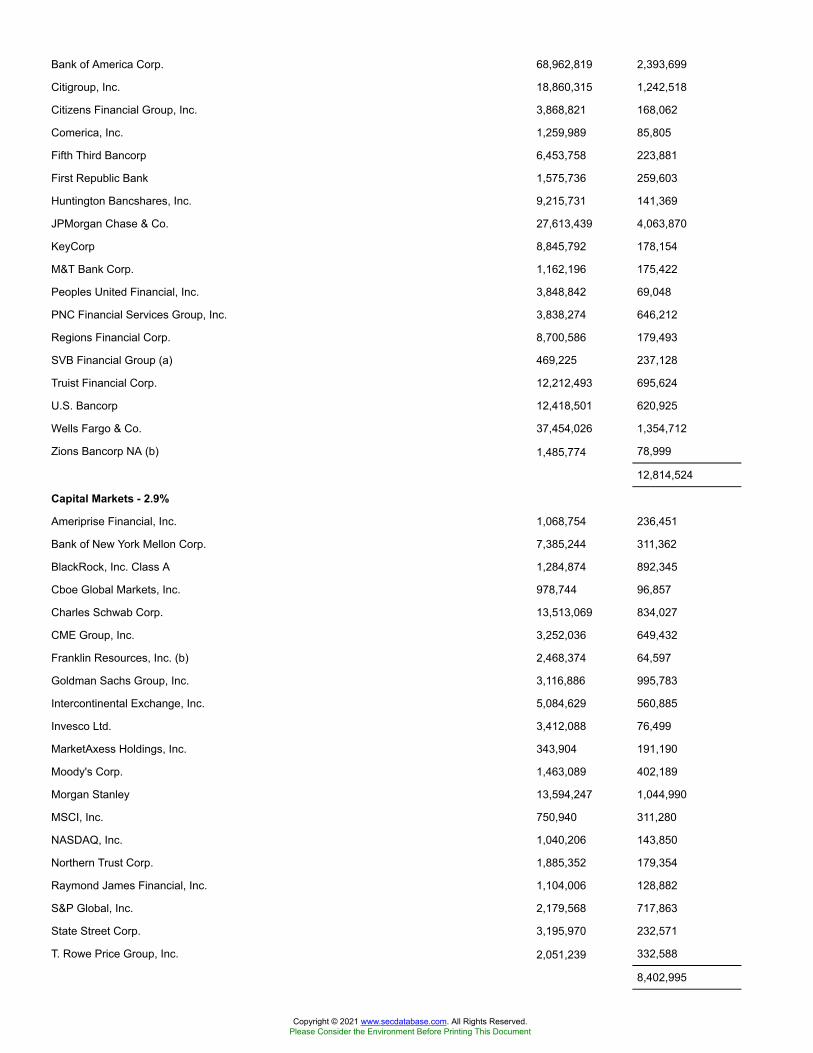
Bank of America Corp. 68,962,819 2,393,699
Citigroup, Inc. 18,860,315 1,242,518
Citizens Financial Group, Inc. 3,868,821 168,062
Comerica, Inc. 1,259,989 85,805
Fifth Third Bancorp 6,453,758 223,881
First Republic Bank 1,575,736 259,603
Huntington Bancshares, Inc. 9,215,731 141,369
JPMorgan Chase & Co. 27,613,439 4,063,870
KeyCorp 8,845,792 178,154
M&T Bank Corp. 1,162,196 175,422
Peoples United Financial, Inc. 3,848,842 69,048
PNC Financial Services Group, Inc. 3,838,274 646,212
Regions Financial Corp. 8,700,586 179,493
SVB Financial Group (a) 469,225 237,128
Truist Financial Corp. 12,212,493 695,624
U.S. Bancorp 12,418,501 620,925
Wells Fargo & Co. 37,454,026 1,354,712
Zions Bancorp NA (b) 1,485,774 78,999
12,814,524
Capital Markets - 2.9%
Ameriprise Financial, Inc. 1,068,754 236,451
Bank of New York Mellon Corp. 7,385,244 311,362
BlackRock, Inc. Class A 1,284,874 892,345
Cboe Global Markets, Inc. 978,744 96,857
Charles Schwab Corp. 13,513,069 834,027
CME Group, Inc. 3,252,036 649,432
Franklin Resources, Inc. (b) 2,468,374 64,597
Goldman Sachs Group, Inc. 3,116,886 995,783
Intercontinental Exchange, Inc. 5,084,629 560,885
Invesco Ltd. 3,412,088 76,499
MarketAxess Holdings, Inc. 343,904 191,190
Moody's Corp. 1,463,089 402,189
Morgan Stanley 13,594,247 1,044,990
MSCI, Inc. 750,940 311,280
NASDAQ, Inc. 1,040,206 143,850
Northern Trust Corp. 1,885,352 179,354
Raymond James Financial, Inc. 1,104,006 128,882
S&P Global, Inc. 2,179,568 717,863
State Street Corp. 3,195,970 232,571
T. Rowe Price Group, Inc. 2,051,239 332,588
8,402,995
Copyright © 2021 www.secdatabase.com. All Rights Reserved.Please Consider the Environment Before Printing This Document

Consumer Finance - 0.6%
American Express Co. (b) 5,908,353 799,164
Capital One Financial Corp. 4,143,524 498,010
Discover Financial Services 2,776,524 261,188
Synchrony Financial 4,918,397 190,244
1,748,606
Diversified Financial Services - 1.4%
Berkshire Hathaway, Inc. Class B (a) 17,629,791 4,240,141
Insurance - 1.9%
AFLAC, Inc. 5,917,957 283,411
Allstate Corp. 2,754,529 293,633
American International Group, Inc. 7,804,498 343,008
Aon PLC (b) 2,071,015 471,591
Arthur J. Gallagher & Co. 1,742,230 208,719
Assurant, Inc. 537,358 66,213
Chubb Ltd. (b) 4,088,935 664,779
Cincinnati Financial Corp. 1,355,525 132,665
Everest Re Group Ltd. 362,049 87,547
Globe Life, Inc. 872,276 81,471
Hartford Financial Services Group, Inc. 3,246,084 164,544
Lincoln National Corp. (b) 1,645,727 93,592
Loews Corp. 2,116,547 101,192
Marsh & McLennan Companies, Inc. (b) 4,594,604 529,390
MetLife, Inc. 6,929,684 399,150
Principal Financial Group, Inc. 2,314,528 130,956
Progressive Corp. 5,304,887 455,955
Prudential Financial, Inc. 3,587,334 311,094
The Travelers Companies, Inc. 2,294,707 333,880
Unum Group 1,844,959 48,855
W.R. Berkley Corp. 1,275,449 88,427
Willis Towers Watson PLC 1,167,741 257,650
5,547,722
TOTAL FINANCIALS 32,753,988
HEALTH CARE - 13.1%
Biotechnology - 1.8%
AbbVie, Inc. 15,993,293 1,723,117
Alexion Pharmaceuticals, Inc. (a) 1,982,500 302,827
Amgen, Inc. 5,273,824 1,186,188
Biogen, Inc. (a) 1,394,005 380,396
Gilead Sciences, Inc. 11,355,614 697,235
Copyright © 2021 www.secdatabase.com. All Rights Reserved.Please Consider the Environment Before Printing This Document

Incyte Corp. (a) 1,686,288 132,643
Regeneron Pharmaceuticals, Inc. (a) 949,891 427,992
Vertex Pharmaceuticals, Inc. (a) 2,355,664 500,696
5,351,094
Health Care Equipment & Supplies - 3.8%
Abbott Laboratories 16,055,691 1,923,151
Abiomed, Inc. (a) 409,373 132,862
Align Technology, Inc. (a) 650,009 368,627
Baxter International, Inc. 4,627,461 359,507
Becton, Dickinson & Co. 2,627,368 633,590
Boston Scientific Corp. (a) 12,971,670 503,041
Danaher Corp. 5,727,373 1,258,132
Dentsply Sirona, Inc. 1,979,873 105,072
DexCom, Inc. (a) 869,910 346,033
Edwards Lifesciences Corp. (a) 5,645,956 469,179
Hologic, Inc. (a)(b) 2,328,234 167,842
IDEXX Laboratories, Inc. (a)(b) 772,726 401,949
Intuitive Surgical, Inc. (a) 1,064,922 784,635
Medtronic PLC 12,193,492 1,426,273
ResMed, Inc. 1,312,774 253,077
STERIS PLC (b) 772,944 135,111
Stryker Corp. 2,961,708 718,777
Teleflex, Inc. 421,847 167,946
The Cooper Companies, Inc. 444,250 171,538
Varian Medical Systems, Inc. (a) 827,578 145,050
West Pharmaceutical Services, Inc. 669,699 187,951
Zimmer Biomet Holdings, Inc. 1,877,716 306,180
10,965,523
Health Care Providers & Services - 2.5%
AmerisourceBergen Corp. 1,332,205 134,846
Anthem, Inc. 2,252,990 683,084
Cardinal Health, Inc. 2,658,078 136,944
Centene Corp. (a) 5,252,346 307,472
Cigna Corp. 3,272,690 686,938
CVS Health Corp. 11,857,351 807,841
DaVita HealthCare Partners, Inc. (a) 669,636 68,390
HCA Holdings, Inc. 2,390,944 411,314
Henry Schein, Inc. (a) 1,293,397 79,997
Humana, Inc. 1,198,867 455,150
Laboratory Corp. of America Holdings (a) 882,339 211,682
McKesson Corp. 1,454,537 246,573
Copyright © 2021 www.secdatabase.com. All Rights Reserved.Please Consider the Environment Before Printing This Document
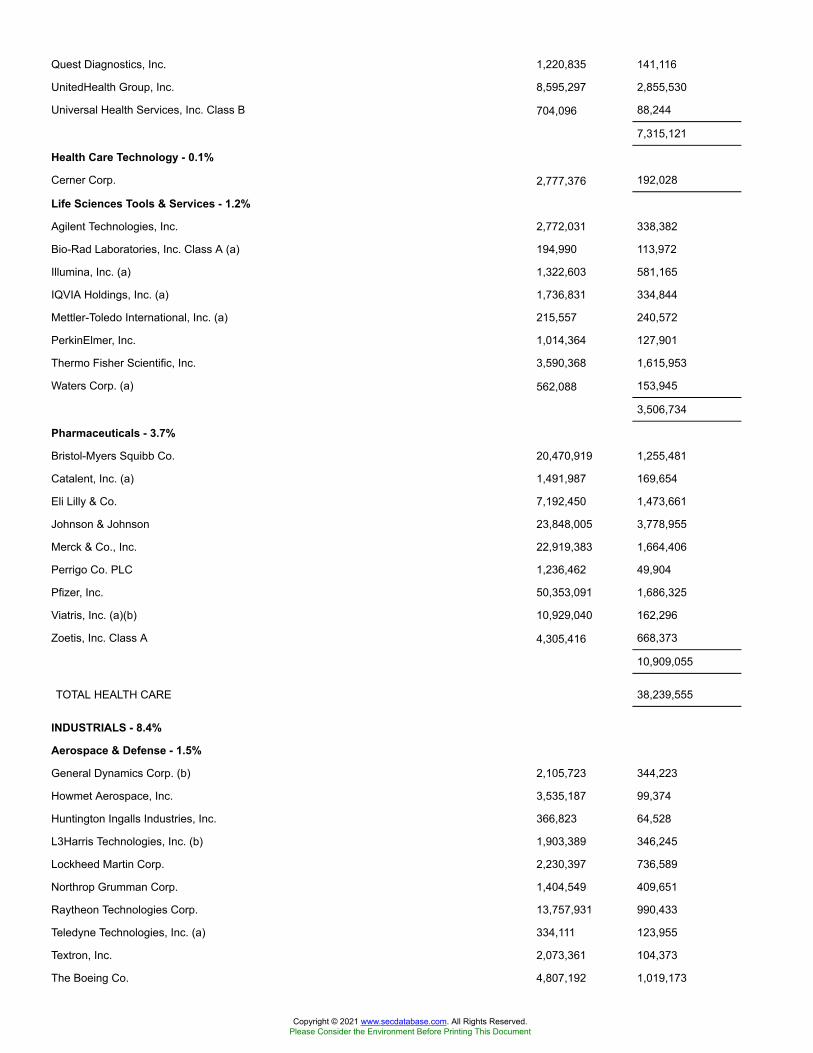
Quest Diagnostics, Inc. 1,220,835 141,116
UnitedHealth Group, Inc. 8,595,297 2,855,530
Universal Health Services, Inc. Class B 704,096 88,244
7,315,121
Health Care Technology - 0.1%
Cerner Corp. 2,777,376 192,028
Life Sciences Tools & Services - 1.2%
Agilent Technologies, Inc. 2,772,031 338,382
Bio-Rad Laboratories, Inc. Class A (a) 194,990 113,972
Illumina, Inc. (a) 1,322,603 581,165
IQVIA Holdings, Inc. (a) 1,736,831 334,844
Mettler-Toledo International, Inc. (a) 215,557 240,572
PerkinElmer, Inc. 1,014,364 127,901
Thermo Fisher Scientific, Inc. 3,590,368 1,615,953
Waters Corp. (a) 562,088 153,945
3,506,734
Pharmaceuticals - 3.7%
Bristol-Myers Squibb Co. 20,470,919 1,255,481
Catalent, Inc. (a) 1,491,987 169,654
Eli Lilly & Co. 7,192,450 1,473,661
Johnson & Johnson 23,848,005 3,778,955
Merck & Co., Inc. 22,919,383 1,664,406
Perrigo Co. PLC 1,236,462 49,904
Pfizer, Inc. 50,353,091 1,686,325
Viatris, Inc. (a)(b) 10,929,040 162,296
Zoetis, Inc. Class A 4,305,416 668,373
10,909,055
TOTAL HEALTH CARE 38,239,555
INDUSTRIALS - 8.4%
Aerospace & Defense - 1.5%
General Dynamics Corp. (b) 2,105,723 344,223
Howmet Aerospace, Inc. 3,535,187 99,374
Huntington Ingalls Industries, Inc. 366,823 64,528
L3Harris Technologies, Inc. (b) 1,903,389 346,245
Lockheed Martin Corp. 2,230,397 736,589
Northrop Grumman Corp. 1,404,549 409,651
Raytheon Technologies Corp. 13,757,931 990,433
Teledyne Technologies, Inc. (a) 334,111 123,955
Textron, Inc. 2,073,361 104,373
The Boeing Co. 4,807,192 1,019,173
Copyright © 2021 www.secdatabase.com. All Rights Reserved.Please Consider the Environment Before Printing This Document
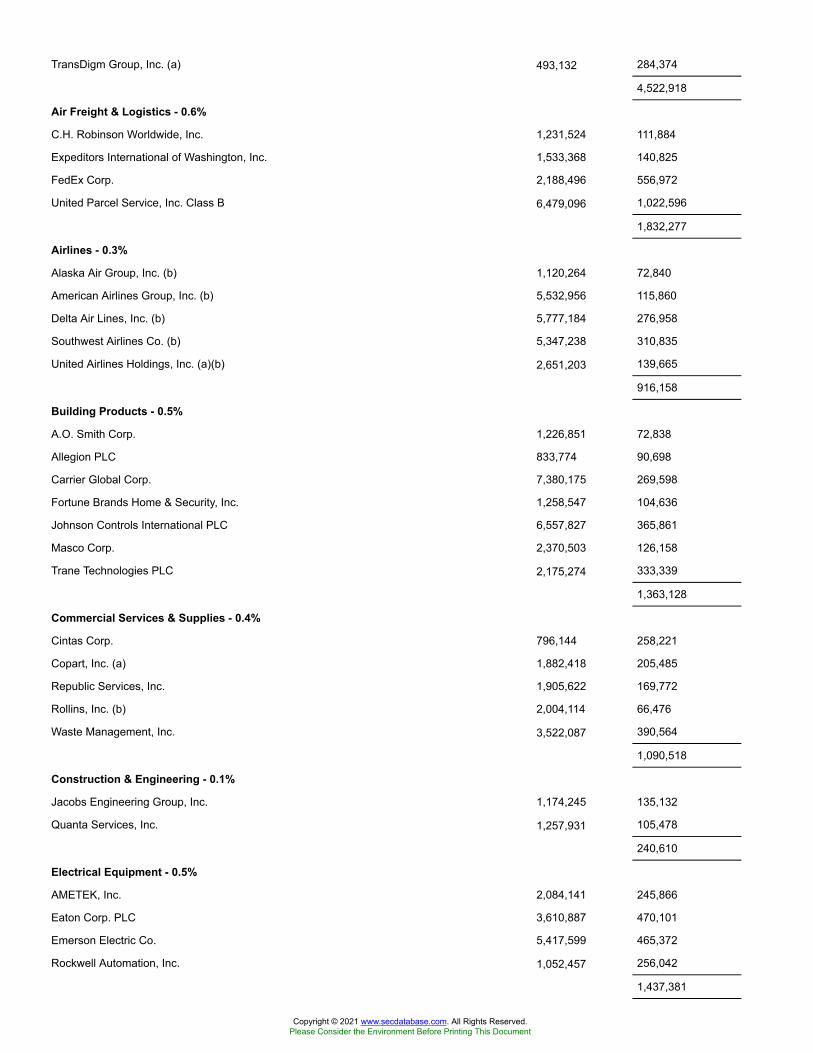
TransDigm Group, Inc. (a) 493,132 284,374
4,522,918
Air Freight & Logistics - 0.6%
C.H. Robinson Worldwide, Inc. 1,231,524 111,884
Expeditors International of Washington, Inc. 1,533,368 140,825
FedEx Corp. 2,188,496 556,972
United Parcel Service, Inc. Class B 6,479,096 1,022,596
1,832,277
Airlines - 0.3%
Alaska Air Group, Inc. (b) 1,120,264 72,840
American Airlines Group, Inc. (b) 5,532,956 115,860
Delta Air Lines, Inc. (b) 5,777,184 276,958
Southwest Airlines Co. (b) 5,347,238 310,835
United Airlines Holdings, Inc. (a)(b) 2,651,203 139,665
916,158
Building Products - 0.5%
A.O. Smith Corp. 1,226,851 72,838
Allegion PLC 833,774 90,698
Carrier Global Corp. 7,380,175 269,598
Fortune Brands Home & Security, Inc. 1,258,547 104,636
Johnson Controls International PLC 6,557,827 365,861
Masco Corp. 2,370,503 126,158
Trane Technologies PLC 2,175,274 333,339
1,363,128
Commercial Services & Supplies - 0.4%
Cintas Corp. 796,144 258,221
Copart, Inc. (a) 1,882,418 205,485
Republic Services, Inc. 1,905,622 169,772
Rollins, Inc. (b) 2,004,114 66,476
Waste Management, Inc. 3,522,087 390,564
1,090,518
Construction & Engineering - 0.1%
Jacobs Engineering Group, Inc. 1,174,245 135,132
Quanta Services, Inc. 1,257,931 105,478
240,610
Electrical Equipment - 0.5%
AMETEK, Inc. 2,084,141 245,866
Eaton Corp. PLC 3,610,887 470,101
Emerson Electric Co. 5,417,599 465,372
Rockwell Automation, Inc. 1,052,457 256,042
1,437,381
Copyright © 2021 www.secdatabase.com. All Rights Reserved.Please Consider the Environment Before Printing This Document
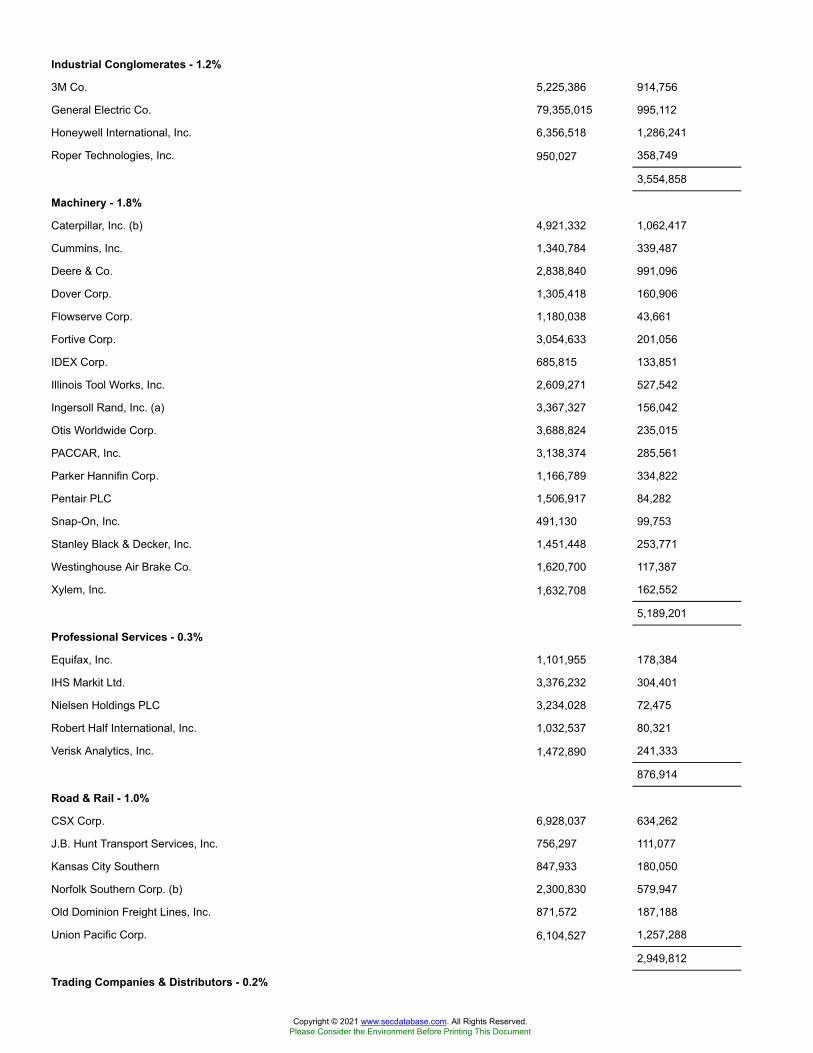
Industrial Conglomerates - 1.2%
3M Co. 5,225,386 914,756
General Electric Co. 79,355,015 995,112
Honeywell International, Inc. 6,356,518 1,286,241
Roper Technologies, Inc. 950,027 358,749
3,554,858
Machinery - 1.8%
Caterpillar, Inc. (b) 4,921,332 1,062,417
Cummins, Inc. 1,340,784 339,487
Deere & Co. 2,838,840 991,096
Dover Corp. 1,305,418 160,906
Flowserve Corp. 1,180,038 43,661
Fortive Corp. 3,054,633 201,056
IDEX Corp. 685,815 133,851
Illinois Tool Works, Inc. 2,609,271 527,542
Ingersoll Rand, Inc. (a) 3,367,327 156,042
Otis Worldwide Corp. 3,688,824 235,015
PACCAR, Inc. 3,138,374 285,561
Parker Hannifin Corp. 1,166,789 334,822
Pentair PLC 1,506,917 84,282
Snap-On, Inc. 491,130 99,753
Stanley Black & Decker, Inc. 1,451,448 253,771
Westinghouse Air Brake Co. 1,620,700 117,387
Xylem, Inc. 1,632,708 162,552
5,189,201
Professional Services - 0.3%
Equifax, Inc. 1,101,955 178,384
IHS Markit Ltd. 3,376,232 304,401
Nielsen Holdings PLC 3,234,028 72,475
Robert Half International, Inc. 1,032,537 80,321
Verisk Analytics, Inc. 1,472,890 241,333
876,914
Road & Rail - 1.0%
CSX Corp. 6,928,037 634,262
J.B. Hunt Transport Services, Inc. 756,297 111,077
Kansas City Southern 847,933 180,050
Norfolk Southern Corp. (b) 2,300,830 579,947
Old Dominion Freight Lines, Inc. 871,572 187,188
Union Pacific Corp. 6,104,527 1,257,288
2,949,812
Trading Companies & Distributors - 0.2%
Copyright © 2021 www.secdatabase.com. All Rights Reserved.Please Consider the Environment Before Printing This Document

Fastenal Co. 5,200,728 241,158
United Rentals, Inc. (a)(b) 653,484 194,333
W.W. Grainger, Inc. 408,386 152,210
587,701
TOTAL INDUSTRIALS 24,561,476
INFORMATION TECHNOLOGY - 27.3%
Communications Equipment - 0.8%
Arista Networks, Inc. (a) 493,493 138,099
Cisco Systems, Inc. 38,278,605 1,717,561
F5 Networks, Inc. (a) 558,057 106,020
Juniper Networks, Inc. 2,987,056 69,539
Motorola Solutions, Inc. 1,535,696 269,484
2,300,703
Electronic Equipment & Components - 0.7%
Amphenol Corp. Class A 2,710,022 340,596
CDW Corp. 1,295,317 203,222
Corning, Inc. 6,921,109 264,663
FLIR Systems, Inc. 1,188,033 63,441
IPG Photonics Corp. (a) 323,510 73,550
Keysight Technologies, Inc. (a) 1,678,619 237,558
TE Connectivity Ltd. 2,996,176 389,593
Trimble, Inc. (a)(b) 2,266,325 168,025
Vontier Corp. (a) 1,526,403 47,929
Zebra Technologies Corp. Class A (a)(b) 482,986 241,218
2,029,795
IT Services - 5.3%
Accenture PLC Class A (b) 5,739,426 1,440,022
Akamai Technologies, Inc. (a) 1,474,739 139,363
Automatic Data Processing, Inc. 3,884,593 675,997
Broadridge Financial Solutions, Inc. 1,047,384 149,242
Cognizant Technology Solutions Corp. Class A 4,843,272 355,884
DXC Technology Co. 2,304,700 58,125
Fidelity National Information Services, Inc. 5,621,143 775,718
Fiserv, Inc. (a) 5,209,000 600,962
FleetCor Technologies, Inc. (a) 755,532 209,517
Gartner, Inc. (a) 808,844 144,815
Global Payments, Inc. 2,711,671 536,884
IBM Corp. 8,072,017 960,005
Jack Henry & Associates, Inc. 691,341 102,623
Leidos Holdings, Inc. 1,211,919 107,194
Copyright © 2021 www.secdatabase.com. All Rights Reserved.Please Consider the Environment Before Printing This Document
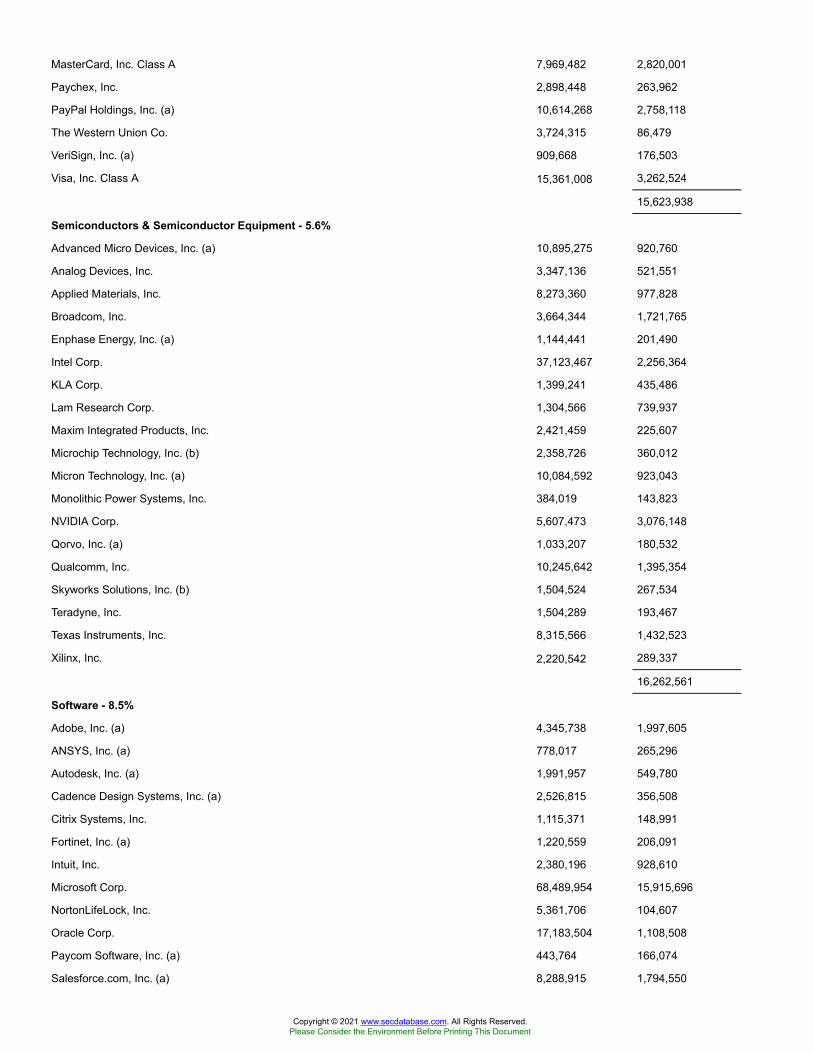
MasterCard, Inc. Class A 7,969,482 2,820,001
Paychex, Inc. 2,898,448 263,962
PayPal Holdings, Inc. (a) 10,614,268 2,758,118
The Western Union Co. 3,724,315 86,479
VeriSign, Inc. (a) 909,668 176,503
Visa, Inc. Class A 15,361,008 3,262,524
15,623,938
Semiconductors & Semiconductor Equipment - 5.6%
Advanced Micro Devices, Inc. (a) 10,895,275 920,760
Analog Devices, Inc. 3,347,136 521,551
Applied Materials, Inc. 8,273,360 977,828
Broadcom, Inc. 3,664,344 1,721,765
Enphase Energy, Inc. (a) 1,144,441 201,490
Intel Corp. 37,123,467 2,256,364
KLA Corp. 1,399,241 435,486
Lam Research Corp. 1,304,566 739,937
Maxim Integrated Products, Inc. 2,421,459 225,607
Microchip Technology, Inc. (b) 2,358,726 360,012
Micron Technology, Inc. (a) 10,084,592 923,043
Monolithic Power Systems, Inc. 384,019 143,823
NVIDIA Corp. 5,607,473 3,076,148
Qorvo, Inc. (a) 1,033,207 180,532
Qualcomm, Inc. 10,245,642 1,395,354
Skyworks Solutions, Inc. (b) 1,504,524 267,534
Teradyne, Inc. 1,504,289 193,467
Texas Instruments, Inc. 8,315,566 1,432,523
Xilinx, Inc. 2,220,542 289,337
16,262,561
Software - 8.5%
Adobe, Inc. (a) 4,345,738 1,997,605
ANSYS, Inc. (a) 778,017 265,296
Autodesk, Inc. (a) 1,991,957 549,780
Cadence Design Systems, Inc. (a) 2,526,815 356,508
Citrix Systems, Inc. 1,115,371 148,991
Fortinet, Inc. (a) 1,220,559 206,091
Intuit, Inc. 2,380,196 928,610
Microsoft Corp. 68,489,954 15,915,696
NortonLifeLock, Inc. 5,361,706 104,607
Oracle Corp. 17,183,504 1,108,508
Paycom Software, Inc. (a) 443,764 166,074
Salesforce.com, Inc. (a) 8,288,915 1,794,550
Copyright © 2021 www.secdatabase.com. All Rights Reserved.Please Consider the Environment Before Printing This Document

ServiceNow, Inc. (a) 1,767,396 942,835
Synopsys, Inc. (a) 1,382,555 339,016
Tyler Technologies, Inc. (a) 365,319 169,296
24,993,463
Technology Hardware, Storage & Peripherals - 6.4%
Apple, Inc. 144,776,948 17,555,642
Hewlett Packard Enterprise Co. 11,658,835 169,753
HP, Inc. 12,442,404 360,456
NetApp, Inc. 2,023,628 126,679
Seagate Technology LLC 2,024,949 148,287
Western Digital Corp. 2,756,132 188,878
Xerox Holdings Corp. 1,509,606 38,465
18,588,160
TOTAL INFORMATION TECHNOLOGY 79,798,620
MATERIALS - 2.6%
Chemicals - 1.8%
Air Products & Chemicals, Inc. 2,002,266 511,819
Albemarle Corp. U.S. 1,045,019 164,287
Celanese Corp. Class A 1,058,943 147,098
CF Industries Holdings, Inc. 1,937,849 87,746
Corteva, Inc. 6,749,043 304,719
Dow, Inc. 6,719,474 398,532
DuPont de Nemours, Inc. 4,859,569 341,725
Eastman Chemical Co. 1,227,194 134,083
Ecolab, Inc. 2,249,667 470,990
FMC Corp. 1,175,459 119,532
International Flavors & Fragrances, Inc. 2,252,710 305,265
Linde PLC 4,754,639 1,161,416
LyondellBasell Industries NV Class A 2,329,209 240,118
PPG Industries, Inc. 2,139,754 288,482
Sherwin-Williams Co. 740,499 503,791
The Mosaic Co. 3,125,074 91,877
5,271,480
Construction Materials - 0.1%
Martin Marietta Materials, Inc. 564,135 190,040
Vulcan Materials Co. 1,200,407 200,456
390,496
Containers & Packaging - 0.3%
Amcor PLC 14,208,760 155,444
Avery Dennison Corp. 755,677 132,402
Copyright © 2021 www.secdatabase.com. All Rights Reserved.Please Consider the Environment Before Printing This Document
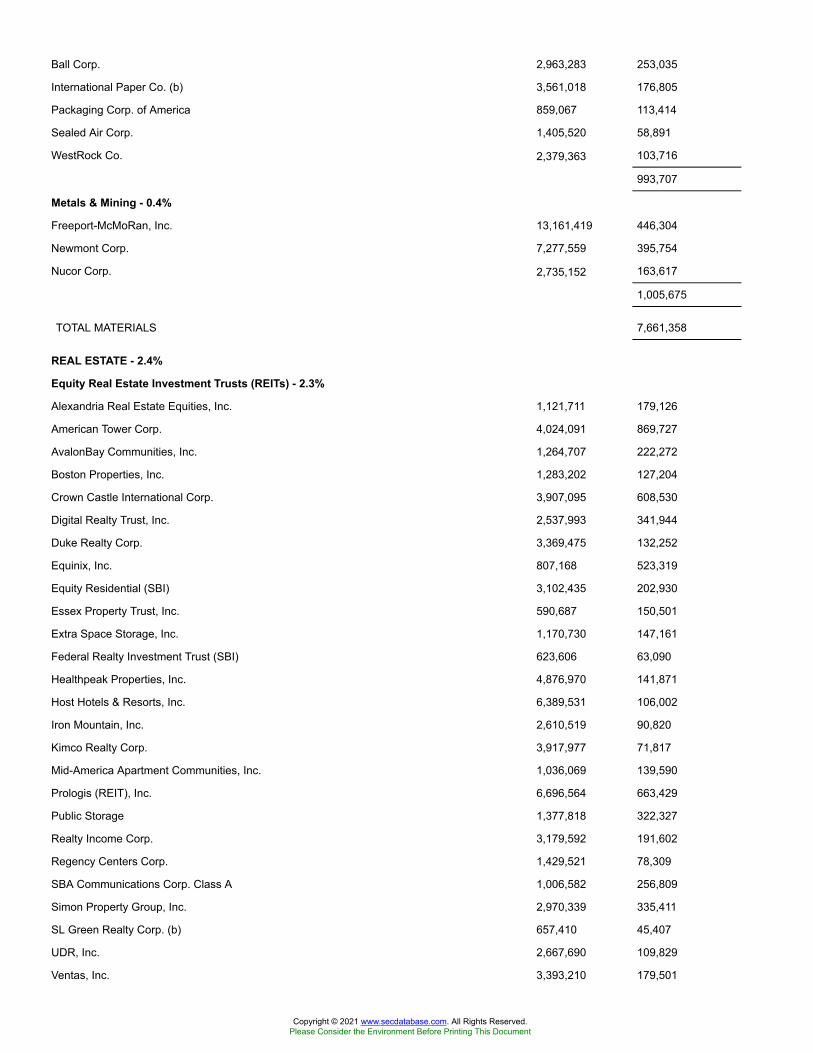
Ball Corp. 2,963,283 253,035
International Paper Co. (b) 3,561,018 176,805
Packaging Corp. of America 859,067 113,414
Sealed Air Corp. 1,405,520 58,891
WestRock Co. 2,379,363 103,716
993,707
Metals & Mining - 0.4%
Freeport-McMoRan, Inc. 13,161,419 446,304
Newmont Corp. 7,277,559 395,754
Nucor Corp. 2,735,152 163,617
1,005,675
TOTAL MATERIALS 7,661,358
REAL ESTATE - 2.4%
Equity Real Estate Investment Trusts (REITs) - 2.3%
Alexandria Real Estate Equities, Inc. 1,121,711 179,126
American Tower Corp. 4,024,091 869,727
AvalonBay Communities, Inc. 1,264,707 222,272
Boston Properties, Inc. 1,283,202 127,204
Crown Castle International Corp. 3,907,095 608,530
Digital Realty Trust, Inc. 2,537,993 341,944
Duke Realty Corp. 3,369,475 132,252
Equinix, Inc. 807,168 523,319
Equity Residential (SBI) 3,102,435 202,930
Essex Property Trust, Inc. 590,687 150,501
Extra Space Storage, Inc. 1,170,730 147,161
Federal Realty Investment Trust (SBI) 623,606 63,090
Healthpeak Properties, Inc. 4,876,970 141,871
Host Hotels & Resorts, Inc. 6,389,531 106,002
Iron Mountain, Inc. 2,610,519 90,820
Kimco Realty Corp. 3,917,977 71,817
Mid-America Apartment Communities, Inc. 1,036,069 139,590
Prologis (REIT), Inc. 6,696,564 663,429
Public Storage 1,377,818 322,327
Realty Income Corp. 3,179,592 191,602
Regency Centers Corp. 1,429,521 78,309
SBA Communications Corp. Class A 1,006,582 256,809
Simon Property Group, Inc. 2,970,339 335,411
SL Green Realty Corp. (b) 657,410 45,407
UDR, Inc. 2,667,690 109,829
Ventas, Inc. 3,393,210 179,501
Copyright © 2021 www.secdatabase.com. All Rights Reserved.Please Consider the Environment Before Printing This Document
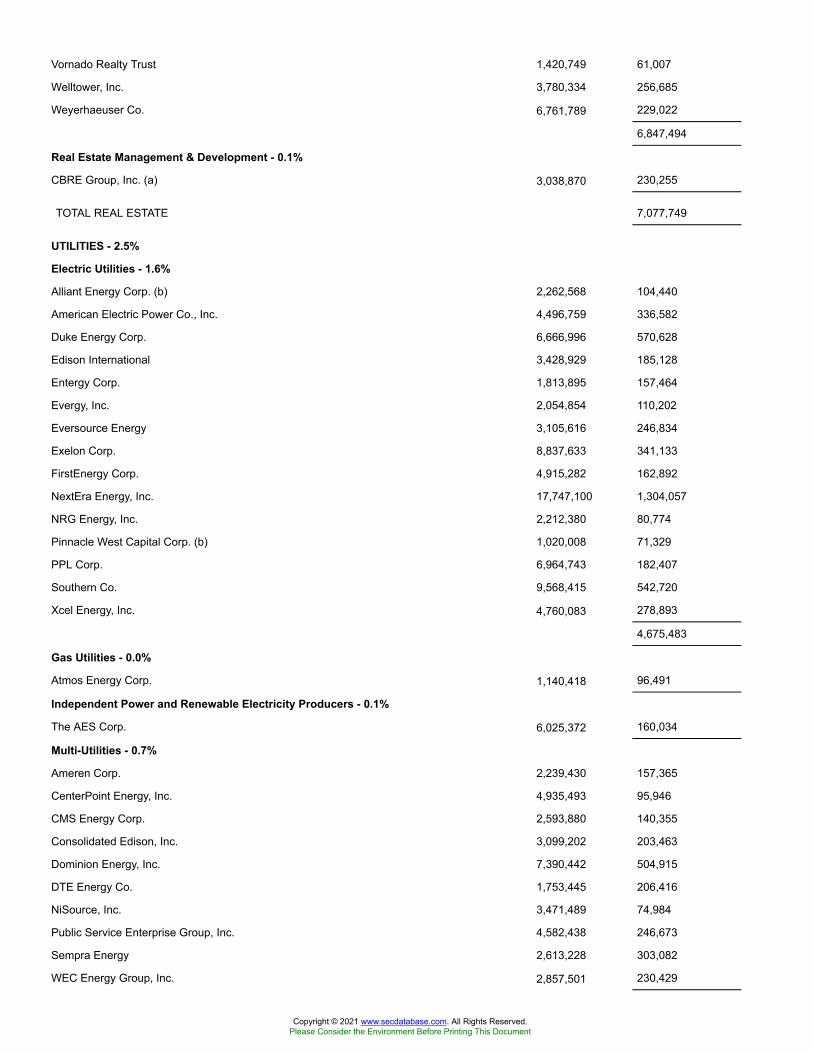
Vornado Realty Trust 1,420,749 61,007
Welltower, Inc. 3,780,334 256,685
Weyerhaeuser Co. 6,761,789 229,022
6,847,494
Real Estate Management & Development - 0.1%
CBRE Group, Inc. (a) 3,038,870 230,255
TOTAL REAL ESTATE 7,077,749
UTILITIES - 2.5%
Electric Utilities - 1.6%
Alliant Energy Corp. (b) 2,262,568 104,440
American Electric Power Co., Inc. 4,496,759 336,582
Duke Energy Corp. 6,666,996 570,628
Edison International 3,428,929 185,128
Entergy Corp. 1,813,895 157,464
Evergy, Inc. 2,054,854 110,202
Eversource Energy 3,105,616 246,834
Exelon Corp. 8,837,633 341,133
FirstEnergy Corp. 4,915,282 162,892
NextEra Energy, Inc. 17,747,100 1,304,057
NRG Energy, Inc. 2,212,380 80,774
Pinnacle West Capital Corp. (b) 1,020,008 71,329
PPL Corp. 6,964,743 182,407
Southern Co. 9,568,415 542,720
Xcel Energy, Inc. 4,760,083 278,893
4,675,483
Gas Utilities - 0.0%
Atmos Energy Corp. 1,140,418 96,491
Independent Power and Renewable Electricity Producers - 0.1%
The AES Corp. 6,025,372 160,034
Multi-Utilities - 0.7%
Ameren Corp. 2,239,430 157,365
CenterPoint Energy, Inc. 4,935,493 95,946
CMS Energy Corp. 2,593,880 140,355
Consolidated Edison, Inc. 3,099,202 203,463
Dominion Energy, Inc. 7,390,442 504,915
DTE Energy Co. 1,753,445 206,416
NiSource, Inc. 3,471,489 74,984
Public Service Enterprise Group, Inc. 4,582,438 246,673
Sempra Energy 2,613,228 303,082
WEC Energy Group, Inc. 2,857,501 230,429
Copyright © 2021 www.secdatabase.com. All Rights Reserved.Please Consider the Environment Before Printing This Document
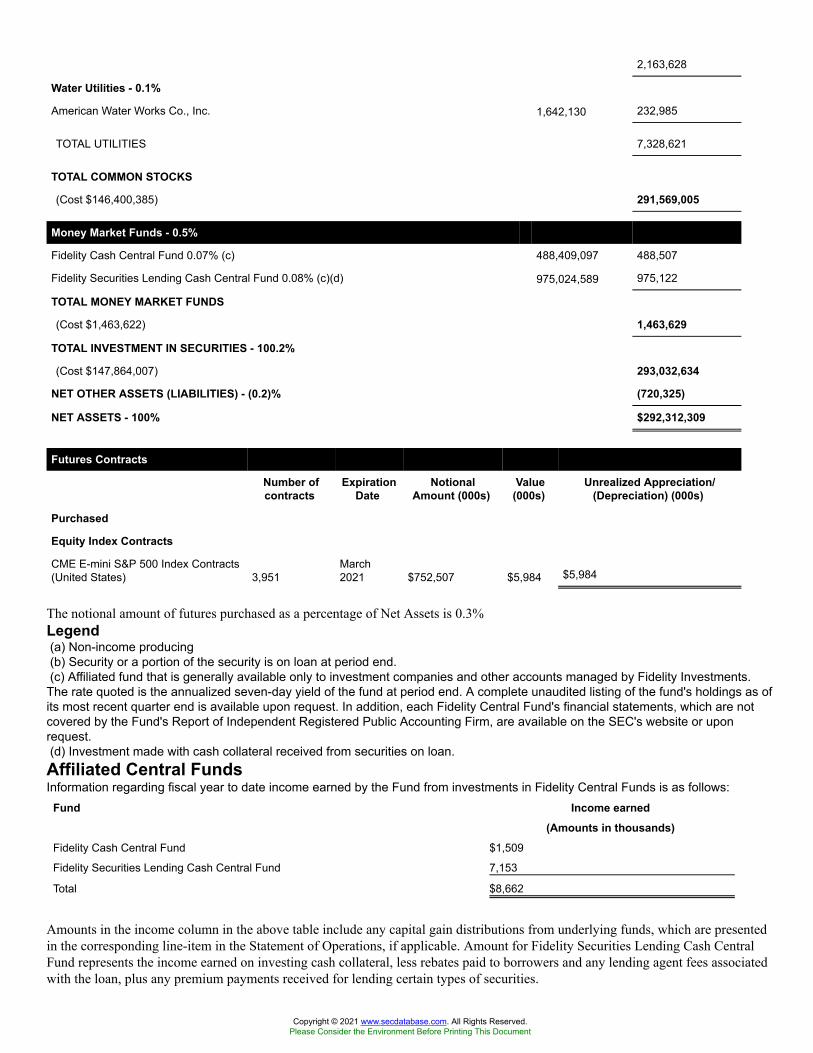
2,163,628
Water Utilities - 0.1%
American Water Works Co., Inc. 1,642,130 232,985
TOTAL UTILITIES 7,328,621
TOTAL COMMON STOCKS
(Cost $146,400,385) 291,569,005
Money Market Funds - 0.5%
Fidelity Cash Central Fund 0.07% (c) 488,409,097 488,507
Fidelity Securities Lending Cash Central Fund 0.08% (c)(d) 975,024,589 975,122
TOTAL MONEY MARKET FUNDS
(Cost $1,463,622) 1,463,629
TOTAL INVESTMENT IN SECURITIES - 100.2%
(Cost $147,864,007) 293,032,634
NET OTHER ASSETS (LIABILITIES) - (0.2)% (720,325)
NET ASSETS - 100% $292,312,309
Futures Contracts
Number ofcontracts
ExpirationDate
NotionalAmount (000s)
Value(000s)
Unrealized Appreciation/(Depreciation) (000s)
Purchased
Equity Index Contracts
CME E-mini S&P 500 Index Contracts(United States) 3,951
March2021 $752,507 $5,984 $5,984
The notional amount of futures purchased as a percentage of Net Assets is 0.3%Legend(a) Non-income producing(b) Security or a portion of the security is on loan at period end.(c) Affiliated fund that is generally available only to investment companies and other accounts managed by Fidelity Investments.
The rate quoted is the annualized seven-day yield of the fund at period end. A complete unaudited listing of the fund's holdings as ofits most recent quarter end is available upon request. In addition, each Fidelity Central Fund's financial statements, which are notcovered by the Fund's Report of Independent Registered Public Accounting Firm, are available on the SEC's website or uponrequest.(d) Investment made with cash collateral received from securities on loan.Affiliated Central FundsInformation regarding fiscal year to date income earned by the Fund from investments in Fidelity Central Funds is as follows:
Fund Income earned(Amounts in thousands)
Fidelity Cash Central Fund $1,509
Fidelity Securities Lending Cash Central Fund 7,153
Total $8,662
Amounts in the income column in the above table include any capital gain distributions from underlying funds, which are presentedin the corresponding line-item in the Statement of Operations, if applicable. Amount for Fidelity Securities Lending Cash CentralFund represents the income earned on investing cash collateral, less rebates paid to borrowers and any lending agent fees associatedwith the loan, plus any premium payments received for lending certain types of securities.
Copyright © 2021 www.secdatabase.com. All Rights Reserved.Please Consider the Environment Before Printing This Document
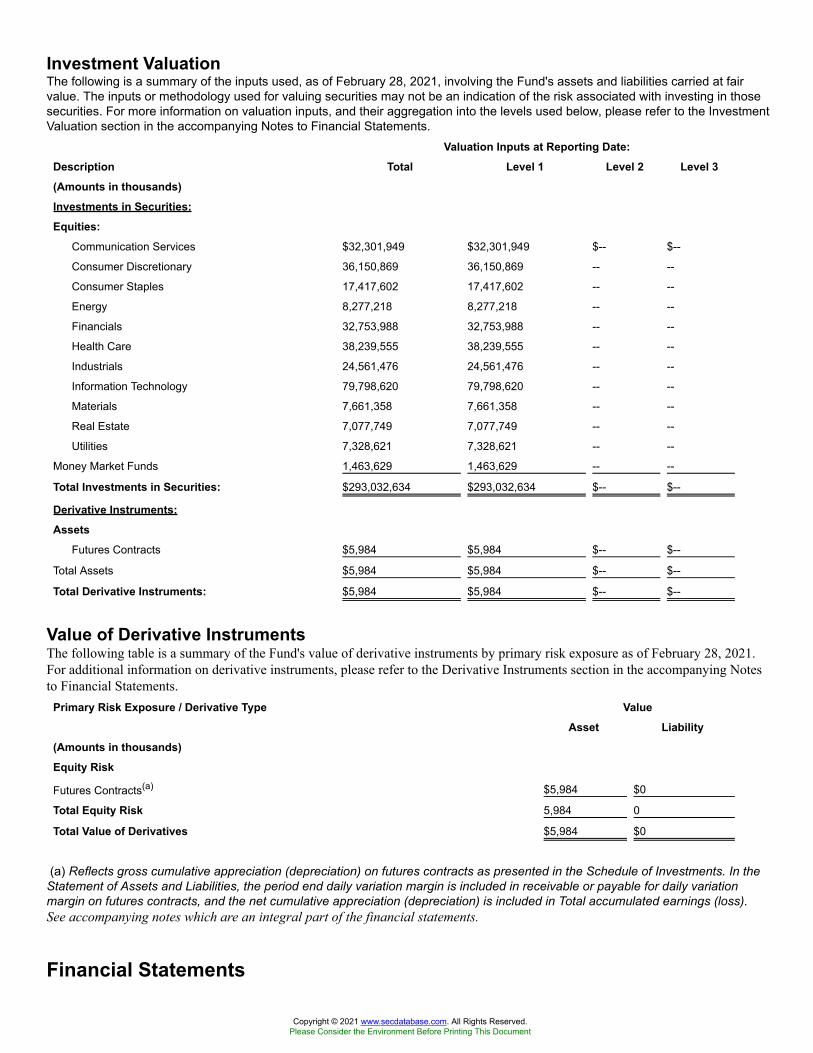
Investment ValuationThe following is a summary of the inputs used, as of February 28, 2021, involving the Fund's assets and liabilities carried at fairvalue. The inputs or methodology used for valuing securities may not be an indication of the risk associated with investing in thosesecurities. For more information on valuation inputs, and their aggregation into the levels used below, please refer to the InvestmentValuation section in the accompanying Notes to Financial Statements.
Valuation Inputs at Reporting Date:Description Total Level 1 Level 2 Level 3(Amounts in thousands)Investments in Securities:Equities:
Communication Services $32,301,949 $32,301,949 $-- $--
Consumer Discretionary 36,150,869 36,150,869 -- --
Consumer Staples 17,417,602 17,417,602 -- --
Energy 8,277,218 8,277,218 -- --
Financials 32,753,988 32,753,988 -- --
Health Care 38,239,555 38,239,555 -- --
Industrials 24,561,476 24,561,476 -- --
Information Technology 79,798,620 79,798,620 -- --
Materials 7,661,358 7,661,358 -- --
Real Estate 7,077,749 7,077,749 -- --
Utilities 7,328,621 7,328,621 -- --
Money Market Funds 1,463,629 1,463,629 -- --
Total Investments in Securities: $293,032,634 $293,032,634 $-- $--
Derivative Instruments:Assets
Futures Contracts $5,984 $5,984 $-- $--
Total Assets $5,984 $5,984 $-- $--
Total Derivative Instruments: $5,984 $5,984 $-- $--
Value of Derivative InstrumentsThe following table is a summary of the Fund's value of derivative instruments by primary risk exposure as of February 28, 2021.For additional information on derivative instruments, please refer to the Derivative Instruments section in the accompanying Notesto Financial Statements.
Primary Risk Exposure / Derivative Type ValueAsset Liability
(Amounts in thousands)Equity Risk
Futures Contracts(a) $5,984 $0
Total Equity Risk 5,984 0
Total Value of Derivatives $5,984 $0
(a) Reflects gross cumulative appreciation (depreciation) on futures contracts as presented in the Schedule of Investments. In theStatement of Assets and Liabilities, the period end daily variation margin is included in receivable or payable for daily variationmargin on futures contracts, and the net cumulative appreciation (depreciation) is included in Total accumulated earnings (loss).See accompanying notes which are an integral part of the financial statements.
Financial Statements
Copyright © 2021 www.secdatabase.com. All Rights Reserved.Please Consider the Environment Before Printing This Document
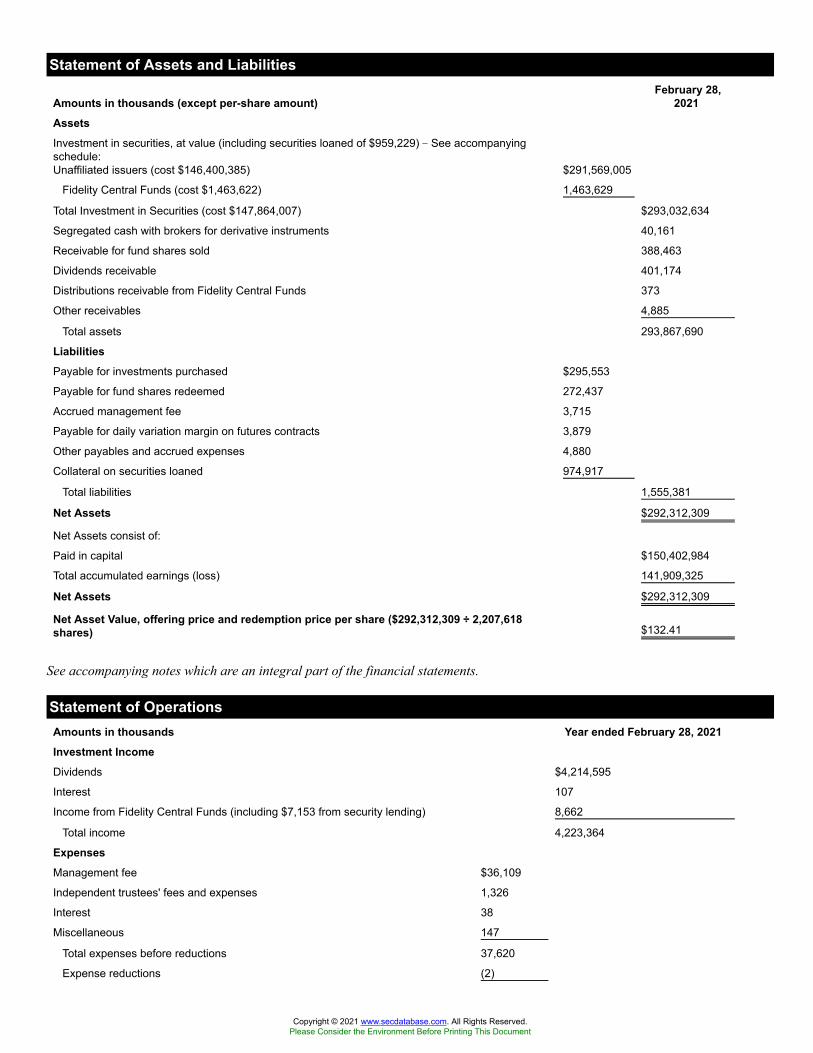
Statement of Assets and Liabilities
Amounts in thousands (except per-share amount)February 28,
2021AssetsInvestment in securities, at value (including securities loaned of $959,229) � See accompanyingschedule:Unaffiliated issuers (cost $146,400,385) $291,569,005
Fidelity Central Funds (cost $1,463,622) 1,463,629
Total Investment in Securities (cost $147,864,007) $293,032,634
Segregated cash with brokers for derivative instruments 40,161
Receivable for fund shares sold 388,463
Dividends receivable 401,174
Distributions receivable from Fidelity Central Funds 373
Other receivables 4,885
Total assets 293,867,690
LiabilitiesPayable for investments purchased $295,553
Payable for fund shares redeemed 272,437
Accrued management fee 3,715
Payable for daily variation margin on futures contracts 3,879
Other payables and accrued expenses 4,880
Collateral on securities loaned 974,917
Total liabilities 1,555,381
Net Assets $292,312,309
Net Assets consist of:
Paid in capital $150,402,984
Total accumulated earnings (loss) 141,909,325
Net Assets $292,312,309
Net Asset Value, offering price and redemption price per share ($292,312,309 ÷ 2,207,618shares) $132.41
See accompanying notes which are an integral part of the financial statements.
Statement of OperationsAmounts in thousands Year ended February 28, 2021Investment IncomeDividends $4,214,595
Interest 107
Income from Fidelity Central Funds (including $7,153 from security lending) 8,662
Total income 4,223,364
ExpensesManagement fee $36,109
Independent trustees' fees and expenses 1,326
Interest 38
Miscellaneous 147
Total expenses before reductions 37,620
Expense reductions (2)
Copyright © 2021 www.secdatabase.com. All Rights Reserved.Please Consider the Environment Before Printing This Document
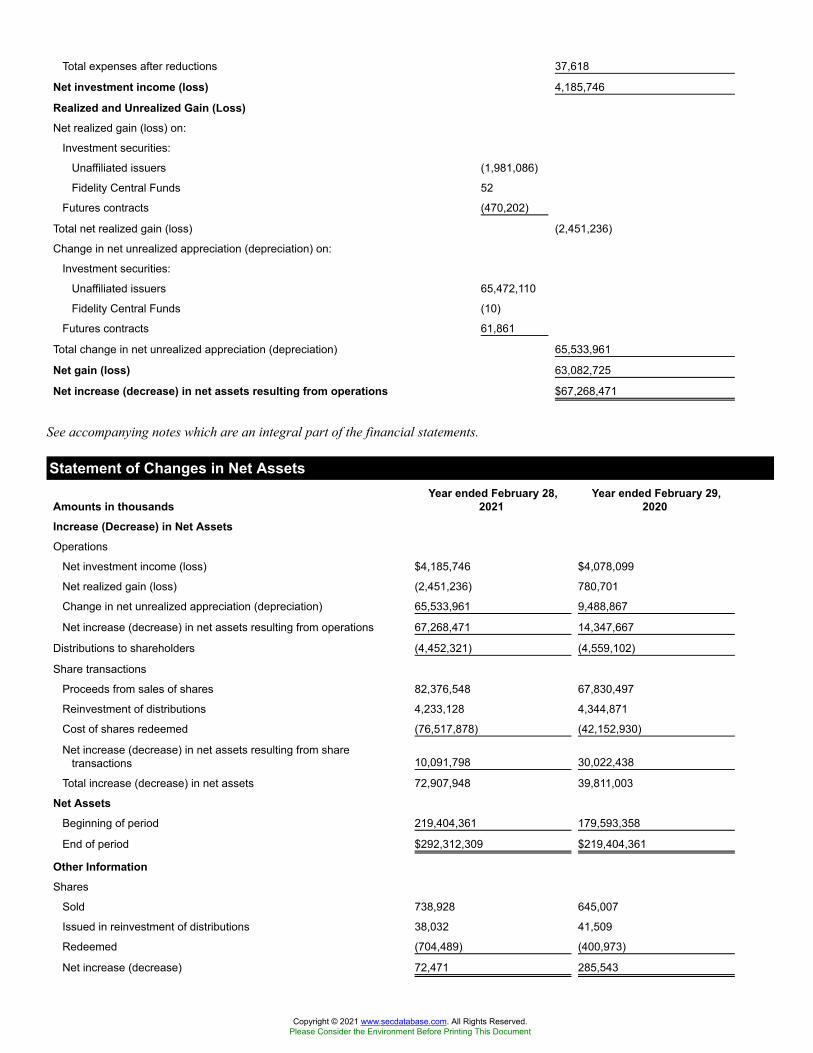
Total expenses after reductions 37,618
Net investment income (loss) 4,185,746
Realized and Unrealized Gain (Loss)Net realized gain (loss) on:
Investment securities:
Unaffiliated issuers (1,981,086)
Fidelity Central Funds 52
Futures contracts (470,202)
Total net realized gain (loss) (2,451,236)
Change in net unrealized appreciation (depreciation) on:
Investment securities:
Unaffiliated issuers 65,472,110
Fidelity Central Funds (10)
Futures contracts 61,861
Total change in net unrealized appreciation (depreciation) 65,533,961
Net gain (loss) 63,082,725
Net increase (decrease) in net assets resulting from operations $67,268,471
See accompanying notes which are an integral part of the financial statements.
Statement of Changes in Net Assets
Amounts in thousandsYear ended February 28,
2021Year ended February 29,
2020Increase (Decrease) in Net AssetsOperations
Net investment income (loss) $4,185,746 $4,078,099
Net realized gain (loss) (2,451,236) 780,701
Change in net unrealized appreciation (depreciation) 65,533,961 9,488,867
Net increase (decrease) in net assets resulting from operations 67,268,471 14,347,667
Distributions to shareholders (4,452,321) (4,559,102)
Share transactions
Proceeds from sales of shares 82,376,548 67,830,497
Reinvestment of distributions 4,233,128 4,344,871
Cost of shares redeemed (76,517,878) (42,152,930)
Net increase (decrease) in net assets resulting from sharetransactions 10,091,798 30,022,438
Total increase (decrease) in net assets 72,907,948 39,811,003
Net AssetsBeginning of period 219,404,361 179,593,358
End of period $292,312,309 $219,404,361
Other InformationShares
Sold 738,928 645,007
Issued in reinvestment of distributions 38,032 41,509
Redeemed (704,489) (400,973)
Net increase (decrease) 72,471 285,543
Copyright © 2021 www.secdatabase.com. All Rights Reserved.Please Consider the Environment Before Printing This Document
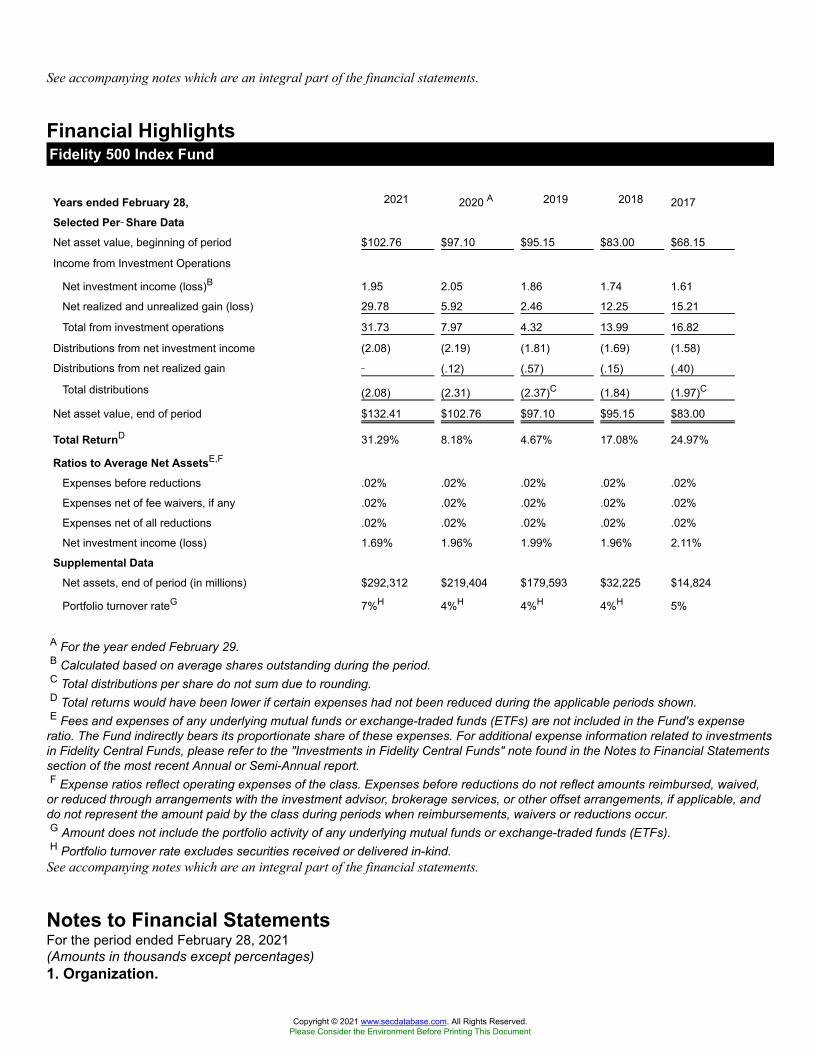
See accompanying notes which are an integral part of the financial statements.
Financial HighlightsFidelity 500 Index Fund
Years ended February 28, 2021 2020 A 2019 2018 2017
Selected Per��Share DataNet asset value, beginning of period $102.76 $97.10 $95.15 $83.00 $68.15
Income from Investment Operations
Net investment income (loss)B 1.95 2.05 1.86 1.74 1.61
Net realized and unrealized gain (loss) 29.78 5.92 2.46 12.25 15.21
Total from investment operations 31.73 7.97 4.32 13.99 16.82
Distributions from net investment income (2.08) (2.19) (1.81) (1.69) (1.58)
Distributions from net realized gain � (.12) (.57) (.15) (.40)
Total distributions (2.08) (2.31) (2.37)C (1.84) (1.97)C
Net asset value, end of period $132.41 $102.76 $97.10 $95.15 $83.00
Total ReturnD 31.29% 8.18% 4.67% 17.08% 24.97%
Ratios to Average Net AssetsE,F
Expenses before reductions .02% .02% .02% .02% .02%
Expenses net of fee waivers, if any .02% .02% .02% .02% .02%
Expenses net of all reductions .02% .02% .02% .02% .02%
Net investment income (loss) 1.69% 1.96% 1.99% 1.96% 2.11%
Supplemental DataNet assets, end of period (in millions) $292,312 $219,404 $179,593 $32,225 $14,824
Portfolio turnover rateG 7%H 4%H 4%H 4%H 5%
A For the year ended February 29.B Calculated based on average shares outstanding during the period.C Total distributions per share do not sum due to rounding.D Total returns would have been lower if certain expenses had not been reduced during the applicable periods shown.E Fees and expenses of any underlying mutual funds or exchange-traded funds (ETFs) are not included in the Fund's expense
ratio. The Fund indirectly bears its proportionate share of these expenses. For additional expense information related to investmentsin Fidelity Central Funds, please refer to the "Investments in Fidelity Central Funds" note found in the Notes to Financial Statementssection of the most recent Annual or Semi-Annual report.F Expense ratios reflect operating expenses of the class. Expenses before reductions do not reflect amounts reimbursed, waived,
or reduced through arrangements with the investment advisor, brokerage services, or other offset arrangements, if applicable, anddo not represent the amount paid by the class during periods when reimbursements, waivers or reductions occur.G Amount does not include the portfolio activity of any underlying mutual funds or exchange-traded funds (ETFs).H Portfolio turnover rate excludes securities received or delivered in-kind.
See accompanying notes which are an integral part of the financial statements.
Notes to Financial StatementsFor the period ended February 28, 2021(Amounts in thousands except percentages)1. Organization.
Copyright © 2021 www.secdatabase.com. All Rights Reserved.Please Consider the Environment Before Printing This Document
Fidelity 500 Index Fund (the Fund) is a fund of Fidelity Concord Street Trust (the Trust) and is authorized to issue an unlimitednumber of shares. Share transactions on the Statement of Changes in Net Assets may contain exchanges between affiliated funds.The Trust is registered under the Investment Company Act of 1940, as amended (the 1940 Act), as an open-end managementinvestment company organized as a Massachusetts business trust.2. Investments in Fidelity Central Funds.The Fund invests in Fidelity Central Funds, which are open-end investment companies generally available only to other investmentcompanies and accounts managed by the investment adviser and its affiliates. The Fund's Schedule of Investments lists each of theFidelity Central Funds held as of period end, if any, as an investment of the Fund, but does not include the underlying holdings ofeach Fidelity Central Fund. As an Investing Fund, the Fund indirectly bears its proportionate share of the expenses of the underlyingFidelity Central Funds.The Money Market Central Funds seek preservation of capital and current income and are managed by the investment adviser.Annualized expenses of the Money Market Central Funds as of their most recent shareholder report date ranged from less than.005% to .01%.A complete unaudited list of holdings for each Fidelity Central Fund is available upon request or at the Securities and ExchangeCommission (the SEC) website at www.sec.gov. In addition, the financial statements of the Fidelity Central Funds, which are notcovered by the Fund's Report of Independent Registered Public Accounting Firm, are available on the SEC website or upon request.3. Significant Accounting Policies.The Fund is an investment company and applies the accounting and reporting guidance of the Financial Accounting StandardsBoard (FASB) Accounting Standards Codification Topic 946 Financial Services - Investment Companies. The financial statementshave been prepared in conformity with accounting principles generally accepted in the United States of America (GAAP), whichrequire management to make certain estimates and assumptions at the date of the financial statements. Actual results could differfrom those estimates. Subsequent events, if any, through the date that the financial statements were issued have been evaluated in thepreparation of the financial statements. The following summarizes the significant accounting policies of the Fund:Investment Valuation. Investments are valued as of 4:00 p.m. Eastern time on the last calendar day of the period. The Board ofTrustees (the Board) has delegated the day to day responsibility for the valuation of the Fund's investments to the Fair ValueCommittee (the Committee) established by the Fund's investment adviser. In accordance with valuation policies and proceduresapproved by the Board, the Fund attempts to obtain prices from one or more third party pricing vendors or brokers to value itsinvestments. When current market prices, quotations or currency exchange rates are not readily available or reliable, investmentswill be fair valued in good faith by the Committee, in accordance with procedures adopted by the Board. Factors used indetermining fair value vary by investment type and may include market or investment specific events. The frequency with whichthese procedures are used cannot be predicted and they may be utilized to a significant extent. The Committee oversees the Fund'svaluation policies and procedures and reports to the Board on the Committee's activities and fair value determinations. The Boardmonitors the appropriateness of the procedures used in valuing the Fund's investments and ratifies the fair value determinations ofthe Committee.The Fund categorizes the inputs to valuation techniques used to value its investments into a disclosure hierarchy consisting of threelevels as shown below:
Level 1 � quoted prices in active markets for identical investments
Level 2 � other significant observable inputs (including quoted prices for similar investments, interest rates, prepaymentspeeds, etc.)
Level 3 � unobservable inputs (including the Fund's own assumptions based on the best information available)
Valuation techniques used to value the Fund's investments by major category are as follows:Equity securities, including restricted securities, for which market quotations are readily available, are valued at the last reportedsale price or official closing price as reported by a third party pricing vendor on the primary market or exchange on which they aretraded and are categorized as Level 1 in the hierarchy. In the event there were no sales during the day or closing prices are notavailable, securities are valued at the last quoted bid price or may be valued using the last available price and are generallycategorized as Level 2 in the hierarchy. For foreign equity securities, when market or security specific events arise, comparisons tothe valuation of American Depositary Receipts (ADRs), futures contracts, Exchange-Traded Funds (ETFs) and certain indexes aswell as quoted prices for similar securities may be used and would be categorized as Level 2 in the hierarchy. For equity securities,including restricted securities, where observable inputs are limited, assumptions about market activity and risk are used and thesesecurities may be categorized as Level 3 in the hierarchy.Futures contracts are valued at the settlement price established each day by the board of trade or exchange on which they are tradedand are categorized as Level 1 in the hierarchy. Investments in open-end mutual funds, including the Fidelity Central Funds, arevalued at their closing net asset value (NAV) each business day and are categorized as Level 1 in the hierarchy.Changes in valuation techniques may result in transfers in or out of an assigned level within the disclosure hierarchy. The aggregatevalue of investments by input level as of February 28, 2021 is included at the end of the Fund's Schedule of Investments.
Copyright © 2021 www.secdatabase.com. All Rights Reserved.Please Consider the Environment Before Printing This Document
Investment Transactions and Income. For financial reporting purposes, the Fund's investment holdings and NAV include tradesexecuted through the end of the last business day of the period. The NAV per share for processing shareholder transactions iscalculated as of the close of business of the New York Stock Exchange (NYSE), normally 4:00 p.m. Eastern time and includestrades executed through the end of the prior business day. Gains and losses on securities sold are determined on the basis ofidentified cost and include proceeds received from litigation. Dividend income is recorded on the ex-dividend date, except forcertain dividends from foreign securities where the ex-dividend date may have passed, which are recorded as soon as the Fund isinformed of the ex-dividend date. Non-cash dividends included in dividend income, if any, are recorded at the fair market value ofthe securities received. Income and capital gain distributions from Fidelity Central Funds, if any, are recorded on the ex-dividenddate. Certain distributions received by the Fund represent a return of capital or capital gain. The Fund determines the components ofthese distributions subsequent to the ex-dividend date, based upon receipt of tax filings or other correspondence relating to theunderlying investment. These distributions are recorded as a reduction of cost of investments and/or as a realized gain. Interestincome is accrued as earned and includes coupon interest and amortization of premium and accretion of discount on debt securitiesas applicable.Expenses. Expenses directly attributable to a fund are charged to that fund. Expenses attributable to more than one fund areallocated among the respective funds on the basis of relative net assets or other appropriate methods. Expense estimates are accruedin the period to which they relate and adjustments are made when actual amounts are known.Deferred Trustee Compensation. Under a Deferred Compensation Plan (the Plan) for certain Funds, certain independent Trusteeshave elected to defer receipt of a portion of their annual compensation. Deferred amounts are invested in affiliated mutual funds, aremarked-to-market and remain in a fund until distributed in accordance with the Plan. The investment of deferred amounts and theoffsetting payable to the Trustees presented below are included in the accompanying Statement of Assets and Liabilities in otherreceivables and other payables and accrued expenses, as applicable.
Fidelity 500 Index Fund $4,879
Income Tax Information and Distributions to Shareholders. Each year, the Fund intends to qualify as a regulated investmentcompany under Subchapter M of the Internal Revenue Code, including distributing substantially all of its taxable income andrealized gains. As a result, no provision for U.S. Federal income taxes is required. As of February 28, 2021, the Fund did not haveany unrecognized tax benefits in the financial statements; nor is the Fund aware of any tax positions for which it is reasonablypossible that the total amounts of unrecognized tax benefits will significantly change in the next twelve months. The Fund files aU.S. federal tax return, in addition to state and local tax returns as required. The Fund's federal income tax returns are subject toexamination by the Internal Revenue Service (IRS) for a period of three fiscal years after they are filed. State and local tax returnsmay be subject to examination for an additional fiscal year depending on the jurisdiction.Distributions are declared and recorded on the ex-dividend date. Income and capital gain distributions are determined in accordancewith income tax regulations, which may differ from GAAP.Capital accounts within the financial statements are adjusted for permanent book-tax differences. These adjustments have no impacton net assets or the results of operations. Capital accounts are not adjusted for temporary book-tax differences which will reverse ina subsequent period.Book-tax differences are primarily due to futures contracts, market discount, certain deemed distributions, redemptions in-kind,short-term gain distributions from the Underlying Funds, deferred trustees compensation, capital loss carryforwards and lossesdeferred due to wash sales.As of period end, the cost and unrealized appreciation (depreciation) in securities, and derivatives if applicable, for federal incometax purposes were as follows:
Gross unrealized appreciation $150,778,083
Gross unrealized depreciation (7,496,501)
Net unrealized appreciation (depreciation) $143,281,582
Tax Cost $149,751,052
The tax-based components of distributable earnings as of period end were as follows:Undistributed ordinary income $626,659
Capital loss carryforward $(1,994,036)
Net unrealized appreciation (depreciation) on securities and other investments $143,281,582
Copyright © 2021 www.secdatabase.com. All Rights Reserved.Please Consider the Environment Before Printing This Document
Capital loss carryforwards are only available to offset future capital gains of the Fund to the extent provided by regulations and maybe limited. The capital loss carryforward information presented below, including any applicable limitation, is estimated as of fiscalperiod end and is subject to adjustment.
No expiration
Short-term $(746,172)
Long-term (1,247,864)
Total capital loss carryforward $(1,994,036)
The tax character of distributions paid was as follows:February 28, 2021 February 29, 2020
Ordinary Income $4,452,321 $ 4,336,119
Long-term Capital Gains � 222,983
Total $4,452,321 $ 4,559,102
4. Derivative Instruments.Risk Exposures and the Use of Derivative Instruments. The Fund's investment objective allows the Fund to enter into varioustypes of derivative contracts, including futures contracts. Derivatives are investments whose value is primarily derived fromunderlying assets, indices or reference rates and may be transacted on an exchange or over-the-counter (OTC). Derivatives mayinvolve a future commitment to buy or sell a specified asset based on specified terms, to exchange future cash flows at periodicintervals based on a notional principal amount, or for one party to make one or more payments upon the occurrence of specifiedevents in exchange for periodic payments from the other party.The Fund used derivatives to increase returns and to manage exposure to certain risks as defined below. The success of any strategyinvolving derivatives depends on analysis of numerous economic factors, and if the strategies for investment do not work asintended, the Fund may not achieve its objectives.The Fund's use of derivatives increased or decreased its exposure to the following risk:
EquityRisk
Equity risk relates to the fluctuations in the value of financial instruments as a result of changes in market prices (other than thosearising from interest rate risk or foreign exchange risk), whether caused by factors specific to an individual investment, its issuer,or all factors affecting all instruments traded in a market or market segment.
The Fund is also exposed to additional risks from investing in derivatives, such as liquidity risk and counterparty credit risk.Liquidity risk is the risk that the Fund will be unable to close out the derivative in the open market in a timely manner. Counterpartycredit risk is the risk that the counterparty will not be able to fulfill its obligation to the Fund. Counterparty credit risk related toexchange-traded futures contracts may be mitigated by the protection provided by the exchange on which they trade.Investing in derivatives may involve greater risks than investing in the underlying assets directly and, to varying degrees, mayinvolve risk of loss in excess of any initial investment and collateral received and amounts recognized in the Statement of Assets andLiabilities. In addition, there may be the risk that the change in value of the derivative contract does not correspond to the change invalue of the underlying instrument.Futures Contracts. A futures contract is an agreement between two parties to buy or sell a specified underlying instrument for afixed price at a specified future date. The Fund used futures contracts to manage its exposure to the stock market.Upon entering into a futures contract, a fund is required to deposit either cash or securities (initial margin) with a clearing broker inan amount equal to a certain percentage of the face value of the contract. Futures contracts are marked-to-market daily andsubsequent daily payments (variation margin) are made or received by a fund depending on the daily fluctuations in the value of thefutures contracts and are recorded as unrealized appreciation or (depreciation). This receivable and/or payable, if any, is included indaily variation margin on futures contracts in the Statement of Assets and Liabilities. Realized gain or (loss) is recorded upon theexpiration or closing of a futures contract. The net realized gain (loss) and change in net unrealized appreciation (depreciation) onfutures contracts during the period is presented in the Statement of Operations.Any open futures contracts at period end are presented in the Schedule of Investments under the caption "Futures Contracts". Thenotional amount at value reflects each contract's exposure to the underlying instrument or index at period end and is representativeof volume of activity during the period. Cash deposited to meet initial margin requirements is presented as segregated cash withbrokers for derivative instruments in the Statement of Assets and Liabilities.5. Purchases and Sales of Investments.Purchases and sales of securities, other than short-term securities and in-kind transactions, are noted in the table below.
Copyright © 2021 www.secdatabase.com. All Rights Reserved.Please Consider the Environment Before Printing This Document
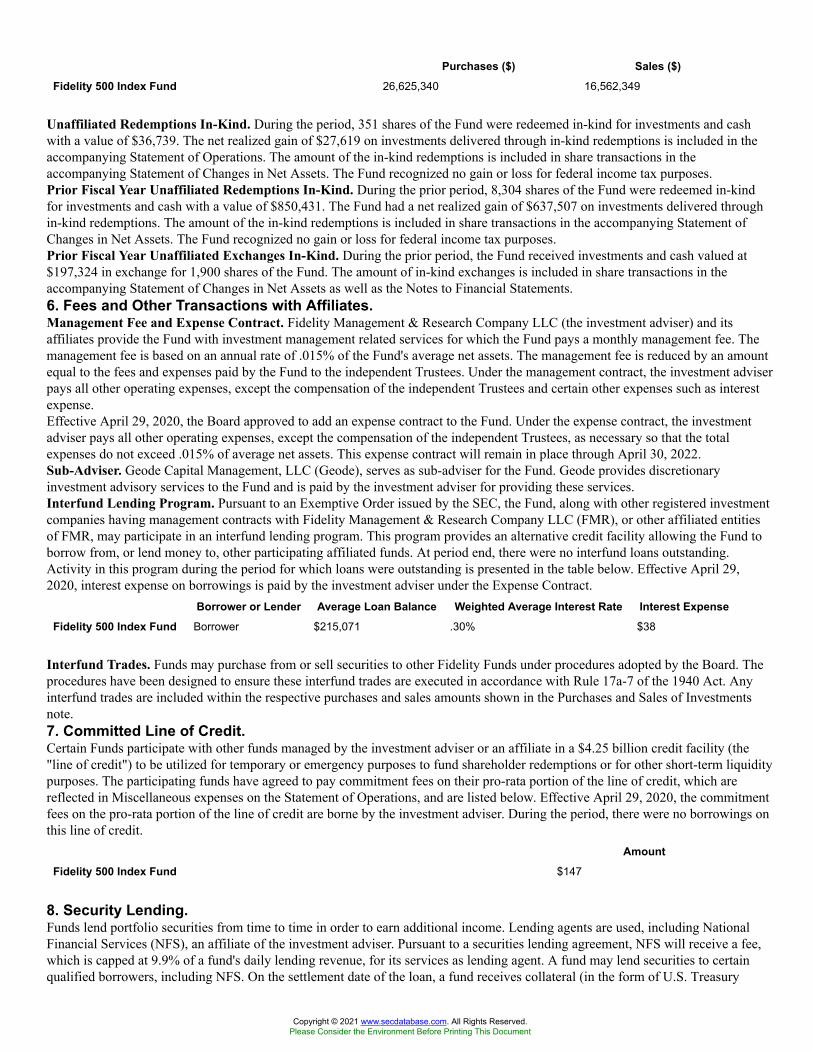
Purchases ($) Sales ($)Fidelity 500 Index Fund 26,625,340 16,562,349
Unaffiliated Redemptions In-Kind. During the period, 351 shares of the Fund were redeemed in-kind for investments and cashwith a value of $36,739. The net realized gain of $27,619 on investments delivered through in-kind redemptions is included in theaccompanying Statement of Operations. The amount of the in-kind redemptions is included in share transactions in theaccompanying Statement of Changes in Net Assets. The Fund recognized no gain or loss for federal income tax purposes.Prior Fiscal Year Unaffiliated Redemptions In-Kind. During the prior period, 8,304 shares of the Fund were redeemed in-kindfor investments and cash with a value of $850,431. The Fund had a net realized gain of $637,507 on investments delivered throughin-kind redemptions. The amount of the in-kind redemptions is included in share transactions in the accompanying Statement ofChanges in Net Assets. The Fund recognized no gain or loss for federal income tax purposes.Prior Fiscal Year Unaffiliated Exchanges In-Kind. During the prior period, the Fund received investments and cash valued at$197,324 in exchange for 1,900 shares of the Fund. The amount of in-kind exchanges is included in share transactions in theaccompanying Statement of Changes in Net Assets as well as the Notes to Financial Statements.6. Fees and Other Transactions with Affiliates.Management Fee and Expense Contract. Fidelity Management & Research Company LLC (the investment adviser) and itsaffiliates provide the Fund with investment management related services for which the Fund pays a monthly management fee. Themanagement fee is based on an annual rate of .015% of the Fund's average net assets. The management fee is reduced by an amountequal to the fees and expenses paid by the Fund to the independent Trustees. Under the management contract, the investment adviserpays all other operating expenses, except the compensation of the independent Trustees and certain other expenses such as interestexpense.Effective April 29, 2020, the Board approved to add an expense contract to the Fund. Under the expense contract, the investmentadviser pays all other operating expenses, except the compensation of the independent Trustees, as necessary so that the totalexpenses do not exceed .015% of average net assets. This expense contract will remain in place through April 30, 2022.Sub-Adviser. Geode Capital Management, LLC (Geode), serves as sub-adviser for the Fund. Geode provides discretionaryinvestment advisory services to the Fund and is paid by the investment adviser for providing these services.Interfund Lending Program. Pursuant to an Exemptive Order issued by the SEC, the Fund, along with other registered investmentcompanies having management contracts with Fidelity Management & Research Company LLC (FMR), or other affiliated entitiesof FMR, may participate in an interfund lending program. This program provides an alternative credit facility allowing the Fund toborrow from, or lend money to, other participating affiliated funds. At period end, there were no interfund loans outstanding.Activity in this program during the period for which loans were outstanding is presented in the table below. Effective April 29,2020, interest expense on borrowings is paid by the investment adviser under the Expense Contract.
Borrower or Lender Average Loan Balance Weighted Average Interest Rate Interest ExpenseFidelity 500 Index Fund Borrower $215,071 .30% $38
Interfund Trades. Funds may purchase from or sell securities to other Fidelity Funds under procedures adopted by the Board. Theprocedures have been designed to ensure these interfund trades are executed in accordance with Rule 17a-7 of the 1940 Act. Anyinterfund trades are included within the respective purchases and sales amounts shown in the Purchases and Sales of Investmentsnote.7. Committed Line of Credit.Certain Funds participate with other funds managed by the investment adviser or an affiliate in a $4.25 billion credit facility (the"line of credit") to be utilized for temporary or emergency purposes to fund shareholder redemptions or for other short-term liquiditypurposes. The participating funds have agreed to pay commitment fees on their pro-rata portion of the line of credit, which arereflected in Miscellaneous expenses on the Statement of Operations, and are listed below. Effective April 29, 2020, the commitmentfees on the pro-rata portion of the line of credit are borne by the investment adviser. During the period, there were no borrowings onthis line of credit.
AmountFidelity 500 Index Fund $147
8. Security Lending.Funds lend portfolio securities from time to time in order to earn additional income. Lending agents are used, including NationalFinancial Services (NFS), an affiliate of the investment adviser. Pursuant to a securities lending agreement, NFS will receive a fee,which is capped at 9.9% of a fund's daily lending revenue, for its services as lending agent. A fund may lend securities to certainqualified borrowers, including NFS. On the settlement date of the loan, a fund receives collateral (in the form of U.S. Treasury
Copyright © 2021 www.secdatabase.com. All Rights Reserved.Please Consider the Environment Before Printing This Document
obligations, letters of credit and/or cash) against the loaned securities and maintains collateral in an amount not less than 100% ofthe market value of the loaned securities during the period of the loan. The market value of the loaned securities is determined at theclose of business of a fund and any additional required collateral is delivered to a fund on the next business day. A fund or borrowermay terminate the loan at any time, and if the borrower defaults on its obligation to return the securities loaned because ofinsolvency or other reasons, a fund may apply collateral received from the borrower against the obligation. A fund may experiencedelays and costs in recovering the securities loaned. Any cash collateral received is invested in the Fidelity Securities Lending CashCentral Fund. Any loaned securities are identified as such in the Schedule of Investments, and the value of loaned securities andcash collateral at period end, as applicable, are presented in the Statement of Assets and Liabilities. Security lending incomerepresents the income earned on investing cash collateral, less rebates paid to borrowers and any lending agent fees associated withthe loan, plus any premium payments received for lending certain types of securities. Security lending income is presented in theStatement of Operations as a component of income from Fidelity Central Funds. Affiliated security lending activity, if any, was asfollows:
Total Security Lending IncomeFees Paid to NFS
Security Lending Income FromSecurities Loaned to NFS
Value of Securities Loaned toNFS at Period End
Fidelity 500Index Fund $681 $2 $�
9. Expense Reductions.Through arrangements with the Fund's custodian, credits realized as a result of certain uninvested cash balances were used to reducethe Fund's expenses by $2.10. Other.The Fund's organizational documents provide former and current trustees and officers with a limited indemnification againstliabilities arising in connection with the performance of their duties to the Fund. In the normal course of business, the Fund may alsoenter into contracts that provide general indemnifications. The Fund's maximum exposure under these arrangements is unknown asthis would be dependent on future claims that may be made against the Fund. The risk of material loss from such claims isconsidered remote.11. Coronavirus (COVID-19) Pandemic.An outbreak of COVID-19 first detected in China during December 2019 has since spread globally and was declared a pandemic bythe World Health Organization during March 2020. Developments that disrupt global economies and financial markets, such as theCOVID-19 pandemic, may magnify factors that affect the Fund's performance.
Report of Independent Registered Public Accounting FirmTo the Board of Trustees of Fidelity Concord Street Trust and Shareholders of Fidelity 500 Index FundOpinion on the Financial StatementsWe have audited the accompanying statement of assets and liabilities, including the schedule of investments, of Fidelity 500 IndexFund (one of the funds constituting Fidelity Concord Street Trust, referred to hereafter as the �Fund�) as of February 28, 2021, therelated statement of operations for the year ended February 28, 2021, the statement of changes in net assets for each of the two yearsin the period ended February 28, 2021, including the related notes, and the financial highlights for each of the five years in theperiod ended February 28, 2021 (collectively referred to as the �financial statements�). In our opinion, the financial statementspresent fairly, in all material respects, the financial position of the Fund as of February 28, 2021, the results of its operations for theyear then ended, the changes in its net assets for each of the two years in the period ended February 28, 2021 and the financialhighlights for each of the five years in the period ended February 28, 2021 in conformity with accounting principles generallyaccepted in the United States of America.Basis for OpinionThese financial statements are the responsibility of the Fund�s management. Our responsibility is to express an opinion on theFund�s financial statements based on our audits. We are a public accounting firm registered with the Public Company AccountingOversight Board (United States) (PCAOB) and are required to be independent with respect to the Fund in accordance with the U.S.federal securities laws and the applicable rules and regulations of the Securities and Exchange Commission and the PCAOB.We conducted our audits of these financial statements in accordance with the standards of the PCAOB. Those standards require thatwe plan and perform the audit to obtain reasonable assurance about whether the financial statements are free of materialmisstatement, whether due to error or fraud.Our audits included performing procedures to assess the risks of material misstatement of the financial statements, whether due toerror or fraud, and performing procedures that respond to those risks. Such procedures included examining, on a test basis, evidenceregarding the amounts and disclosures in the financial statements. Our audits also included evaluating the accounting principles usedand significant estimates made by management, as well as evaluating the overall presentation of the financial statements. Ourprocedures included confirmation of securities owned as of February 28, 2021 by correspondence with the custodian and brokers;
Copyright © 2021 www.secdatabase.com. All Rights Reserved.Please Consider the Environment Before Printing This Document
when replies were not received from brokers, we performed other auditing procedures. We believe that our audits provide areasonable basis for our opinion./s/ PricewaterhouseCoopers LLPBoston, MassachusettsApril 13, 2021
We have served as the auditor of one or more investment companies in the Fidelity group of funds since 1932.
Trustees and OfficersThe Trustees, Members of the Advisory Board (if any), and officers of the trust and fund, as applicable, are listed below. The Boardof Trustees governs the fund and is responsible for protecting the interests of shareholders. The Trustees are experienced executiveswho meet periodically throughout the year to oversee the fund's activities, review contractual arrangements with companies thatprovide services to the fund, oversee management of the risks associated with such activities and contractual arrangements, andreview the fund's performance. Except for Jonathan Chiel, each of the Trustees oversees 309 funds. Mr. Chiel oversees 176 funds.The Trustees hold office without limit in time except that (a) any Trustee may resign; (b) any Trustee may be removed by writteninstrument, signed by at least two-thirds of the number of Trustees prior to such removal; (c) any Trustee who requests to be retiredor who has become incapacitated by illness or injury may be retired by written instrument signed by a majority of the other Trustees;and (d) any Trustee may be removed at any special meeting of shareholders by a two-thirds vote of the outstanding voting securitiesof the trust. Each Trustee who is not an interested person (as defined in the 1940 Act) of the trust and the fund is referred to hereinas an Independent Trustee. Each Independent Trustee shall retire not later than the last day of the calendar year in which his or her75th birthday occurs. The Independent Trustees may waive this mandatory retirement age policy with respect to individualTrustees. Officers and Advisory Board Members hold office without limit in time, except that any officer or Advisory BoardMember may resign or may be removed by a vote of a majority of the Trustees at any regular meeting or any special meeting of theTrustees. Except as indicated, each individual has held the office shown or other offices in the same company for the past fiveyears.The fund�s Statement of Additional Information (SAI) includes more information about the Trustees. To request a free copy, callFidelity at 1-800-544-8544.Experience, Skills, Attributes, and Qualifications of the Trustees. The Governance and Nominating Committee has adopted astatement of policy that describes the experience, qualifications, attributes, and skills that are necessary and desirable for potentialIndependent Trustee candidates (Statement of Policy). The Board believes that each Trustee satisfied at the time he or she wasinitially elected or appointed a Trustee, and continues to satisfy, the standards contemplated by the Statement of Policy. TheGovernance and Nominating Committee also engages professional search firms to help identify potential Independent Trusteecandidates who have the experience, qualifications, attributes, and skills consistent with the Statement of Policy. From time to time,additional criteria based on the composition and skills of the current Independent Trustees, as well as experience or skills that maybe appropriate in light of future changes to board composition, business conditions, and regulatory or other developments, have alsobeen considered by the professional search firms and the Governance and Nominating Committee. In addition, the Board takes intoaccount the Trustees' commitment and participation in Board and committee meetings, as well as their leadership of standing and adhoc committees throughout their tenure.In determining that a particular Trustee was and continues to be qualified to serve as a Trustee, the Board has considered a variety ofcriteria, none of which, in isolation, was controlling. The Board believes that, collectively, the Trustees have balanced and diverseexperience, qualifications, attributes, and skills, which allow the Board to operate effectively in governing the fund and protectingthe interests of shareholders. Information about the specific experience, skills, attributes, and qualifications of each Trustee, which ineach case led to the Board's conclusion that the Trustee should serve (or continue to serve) as a trustee of the fund, is providedbelow.Board Structure and Oversight Function. Robert A. Lawrence is an interested person and currently serves as Acting Chairman.The Trustees have determined that an interested Chairman is appropriate and benefits shareholders because an interested Chairmanhas a personal and professional stake in the quality and continuity of services provided to the fund. Independent Trustees exercisetheir informed business judgment to appoint an individual of their choosing to serve as Chairman, regardless of whether the Trusteehappens to be independent or a member of management. The Independent Trustees have determined that they can act independentlyand effectively without having an Independent Trustee serve as Chairman and that a key structural component for assuring that theyare in a position to do so is for the Independent Trustees to constitute a substantial majority for the Board. The Independent Trusteesalso regularly meet in executive session. David M. Thomas serves as Lead Independent Trustee and as such (i) acts as a liaisonbetween the Independent Trustees and management with respect to matters important to the Independent Trustees and (ii) withmanagement prepares agendas for Board meetings.Fidelity® funds are overseen by different Boards of Trustees. The fund's Board oversees Fidelity's high income and certain equityfunds, and other Boards oversee Fidelity's investment-grade bond, money market, asset allocation, and other equity funds. The asset
Copyright © 2021 www.secdatabase.com. All Rights Reserved.Please Consider the Environment Before Printing This Document
allocation funds may invest in Fidelity® funds overseen by the fund's Board. The use of separate Boards, each with its owncommittee structure, allows the Trustees of each group of Fidelity® funds to focus on the unique issues of the funds they oversee,including common research, investment, and operational issues. On occasion, the separate Boards establish joint committees toaddress issues of overlapping consequences for the Fidelity® funds overseen by each Board.The Trustees operate using a system of committees to facilitate the timely and efficient consideration of all matters of importance tothe Trustees, the fund, and fund shareholders and to facilitate compliance with legal and regulatory requirements and oversight ofthe fund's activities and associated risks. The Board, acting through its committees, has charged FMR and its affiliates with (i)identifying events or circumstances the occurrence of which could have demonstrably adverse effects on the fund's business and/orreputation; (ii) implementing processes and controls to lessen the possibility that such events or circumstances occur or to mitigatethe effects of such events or circumstances if they do occur; and (iii) creating and maintaining a system designed to evaluatecontinuously business and market conditions in order to facilitate the identification and implementation processes described in (i)and (ii) above. Because the day-to-day operations and activities of the fund are carried out by or through FMR, its affiliates, andother service providers, the fund's exposure to risks is mitigated but not eliminated by the processes overseen by the Trustees. Whileeach of the Board's committees has responsibility for overseeing different aspects of the fund's activities, oversight is exercisedprimarily through the Operations, Audit, and Compliance Committees. Appropriate personnel, including but not limited to thefund's Chief Compliance Officer (CCO), FMR's internal auditor, the independent accountants, the fund's Treasurer and portfoliomanagement personnel, make periodic reports to the Board's committees, as appropriate, including an annual review of Fidelity'srisk management program for the Fidelity® funds. The responsibilities of each standing committee, including their oversightresponsibilities, are described further under "Standing Committees of the Trustees."Interested Trustees*:Correspondence intended for a Trustee who is an interested person may be sent to Fidelity Investments, 245 Summer Street, Boston,Massachusetts 02210.Name, Year of Birth; Principal Occupations and Other Relevant Experience+Jonathan Chiel (1957)
Year of Election or Appointment: 2016TrusteeMr. Chiel also serves as Trustee of other Fidelity® funds. Mr. Chiel is Executive Vice President and General Counsel forFMR LLC (diversified financial services company, 2012-present). Previously, Mr. Chiel served as general counsel(2004-2012) and senior vice president and deputy general counsel (2000-2004) for John Hancock Financial Services; apartner with Choate, Hall & Stewart (1996-2000) (law firm); and an Assistant United States Attorney for the United StatesAttorney�s Office of the District of Massachusetts (1986-95), including Chief of the Criminal Division (1993-1995). Mr. Chielis a director on the boards of the Boston Bar Foundation and the Maimonides School.
Bettina Doulton (1964)Year of Election or Appointment: 2021TrusteeMs. Doulton also serves as Trustee of other Fidelity® funds. Prior to her retirement, Ms. Doulton served in a variety ofpositions at Fidelity Investments, including as a managing director of research (2006-2007), portfolio manager to certainFidelity® funds (1993-2005), equity analyst and portfolio assistant (1990-1993), and research assistant (1987-1990). Ms.Doulton currently owns and operates Phi Builders + Architects and Cellardoor Winery. Previously, Ms. Doulton served as amember of the Board of Brown Capital Management, LLC (2013-2018).
Robert A. Lawrence (1952)Year of Election or Appointment: 2020TrusteeActing Chairman of the Board of TrusteesMr. Lawrence also serves as Trustee of other funds. Previously, Mr. Lawrence served as a Member of the Advisory Board ofcertain funds. Prior to his retirement in 2008, Mr. Lawrence served as Vice President of certain Fidelity® funds (2006-2008),Senior Vice President, Head of High Income Division of Fidelity Management & Research Company (investment adviserfirm, 2006-2008), and President of Fidelity Strategic Investments (investment adviser firm, 2002-2005).
* Determined to be an �Interested Trustee� by virtue of, among other things, his or her affiliation with the trust or various entitiesunder common control with FMR.+ The information includes the Trustee's principal occupation during the last five years and other information relating to the
experience, attributes, and skills relevant to the Trustee's qualifications to serve as a Trustee, which led to the conclusion that theTrustee should serve as a Trustee for the fund.Independent Trustees:Correspondence intended for an Independent Trustee may be sent to Fidelity Investments, P.O. Box 55235, Boston, Massachusetts02205-5235.Name, Year of Birth; Principal Occupations and Other Relevant Experience+Dennis J. Dirks (1948)
Year of Election or Appointment: 2005
Copyright © 2021 www.secdatabase.com. All Rights Reserved.Please Consider the Environment Before Printing This Document

TrusteeMr. Dirks also serves as Trustee of other Fidelity® funds. Prior to his retirement in May 2003, Mr. Dirks served as ChiefOperating Officer and as a member of the Board of The Depository Trust & Clearing Corporation (financial marketsinfrastructure), President, Chief Operating Officer and a member of the Board of The Depository Trust Company (DTC),President and a member of the Board of the National Securities Clearing Corporation (NSCC), Chief Executive Officer anda member of the Board of the Government Securities Clearing Corporation and Chief Executive Officer and a member ofthe Board of the Mortgage-Backed Securities Clearing Corporation. Mr. Dirks currently serves as a member of the FinanceCommittee (2016-present) and Board (2017-present) and is Treasurer (2018-present) of the Asolo Repertory Theatre.
Donald F. Donahue (1950)Year of Election or Appointment: 2018TrusteeMr. Donahue also serves as Trustee of other Fidelity® funds. Mr. Donahue serves as President and Chief Executive Officerof Miranda Partners, LLC (risk consulting for the financial services industry, 2012-present). Previously, Mr. Donahue servedas Chief Executive Officer (2006-2012), Chief Operating Officer (2003-2006) and Managing Director, Customer Marketingand Development (1999-2003) of The Depository Trust & Clearing Corporation (financial markets infrastructure). Mr.Donahue currently serves as a member (2007-present) and Co-Chairman (2016-present) of the Board of United Way ofNew York, a member of the Board of NYC Leadership Academy (2012-present) and a member of the Board of Advisors ofRipple Labs, Inc. (financial services, 2015-present). Mr. Donahue previously served as a member of the Advisory Board ofcertain Fidelity® funds (2015-2018).
Vicki L. Fuller (1957)Year of Election or Appointment: 2020TrusteeMs. Fuller also serves as Trustee of other Fidelity® funds. Previously, Ms. Fuller served as a member of the Advisory Boardof certain Fidelity® funds (2018-2020), Chief Investment Officer of the New York State Common Retirement Fund(2012-2018) and held a variety of positions at AllianceBernstein L.P. (global asset management, 1985-2012), includingManaging Director (2006-2012) and Senior Vice President and Senior Portfolio Manager (2001-2006). Ms. Fuller currentlyserves as a member of the Board, Audit Committee and Nominating and Governance Committee of The WilliamsCompanies, Inc. (natural gas infrastructure, 2018-present), as a member of the Board, Audit Committee and Nominatingand Governance Committee of two Blackstone business development companies (2020-present) and as a member of theBoard of Treliant, LLC (consulting, 2019-present).
Patricia L. Kampling (1959)Year of Election or Appointment: 2020TrusteeMs. Kampling also serves as Trustee of other Fidelity® funds. Prior to her retirement, Ms. Kampling served as Chairman ofthe Board and Chief Executive Officer (2012-2019), President and Chief Operating Officer (2011-2012) and Executive VicePresident and Chief Financial Officer (2010-2011) of Alliant Energy Corporation. Ms. Kampling currently serves as amember of the Board, Compensation Committee and Executive Committee and as Chair of the Audit Committee of Briggs &Stratton Corporation (manufacturing, 2011-present) and as a member of the Board, Audit, Finance and Risk Committee andSafety, Environmental, Technology and Operations Committee of American Water Works Company, Inc. (utilities company,2019-present). In addition, Ms. Kampling currently serves as a member of the Board of the Nature Conservancy, WisconsinChapter (2019-present). Previously, Ms. Kampling served as a Member of the Advisory Board of certain Fidelity® funds(2020), a member of the Board of Interstate Power and Light Company (2012-2019) and Wisconsin Power and LightCompany (2012-2019) (each a subsidiary of Alliant Energy Corporation) and as a member of the Board and WorkforceDevelopment Committee of the Business Roundtable (2018-2019).
Thomas A. Kennedy (1955)Year of Election or Appointment: 2021TrusteeMr. Kennedy also serves as Trustee of other Fidelity® funds. Previously, Mr. Kennedy served as a Member of the AdvisoryBoard of certain Fidelity® funds (2020) and held a variety of positions at Raytheon Company (aerospace and defense,1983-2020), including Chairman and Chief Executive Officer (2014-2020) and Executive Vice President and ChiefOperating Officer (2013-2014). Mr. Kennedy currently serves as Executive Chairman of the Board of Directors of RaytheonTechnologies Corporation (aerospace and defense, 2020-present). He is also a member of the Rutgers School ofEngineering Industry Advisory Board (2011-present) and a member of the UCLA Engineering Dean�s Executive Board(2016-present).
Garnett A. Smith (1947)Year of Election or Appointment: 2018TrusteeMr. Smith also serves as Trustee of other Fidelity® funds. Prior to his retirement, Mr. Smith served as Chairman and ChiefExecutive Officer (1990-1997) and President (1986-1990) of Inbrand Corp. (manufacturer of personal absorbent products).Prior to his employment with Inbrand Corp., he was employed by a retail fabric chain and North Carolina National Bank
Copyright © 2021 www.secdatabase.com. All Rights Reserved.Please Consider the Environment Before Printing This Document

(now Bank of America). Mr. Smith previously served as a member of the Advisory Board of certain Fidelity® funds(2012-2013).
David M. Thomas (1949)Year of Election or Appointment: 2008TrusteeLead Independent TrusteeMr. Thomas also serves as Trustee of other Fidelity® funds. Previously, Mr. Thomas served as Executive Chairman(2005-2006) and Chairman and Chief Executive Officer (2000-2005) of IMS Health, Inc. (pharmaceutical and healthcareinformation solutions). Mr. Thomas currently serves as Non-Executive Chairman of the Board of Fortune Brands Home andSecurity (home and security products, 2011-present), and a member of the Board (2004-present) and Presiding Director(2013-present) of Interpublic Group of Companies, Inc. (marketing communication).
Susan Tomasky (1953)Year of Election or Appointment: 2020TrusteeMs. Tomasky also serves as Trustee of other Fidelity® funds. Prior to her retirement, Ms. Tomasky served in variousexecutive officer positions at American Electric Power Company, Inc. (1998-2011), including most recently as President ofAEP Transmission (2007-2011). Ms. Tomasky currently serves as a member of the Board and Sustainability Committee andas Chair of the Audit Committee of Marathon Petroleum Corporation (2018-present) and as a member of the Board,Corporate Governance Committee and Organization and Compensation Committee and as Chair of the Audit Committee ofPublic Service Enterprise Group, Inc. (utilities company, 2012-present). In addition, Ms. Tomasky currently serves as amember of the Board of the Columbus Regional Airport Authority (2007-present), as a member of the Board of the RoyalShakespeare Company � America (2009-present), as a member of the Board of the Columbus Association for thePerforming Arts (2011-present) and as a member of the Board of Kenyon College (2016-present). Previously, Ms. Tomaskyserved as a Member of the Advisory Board of certain Fidelity® funds (2020), a member of the Board (2011-2019) and asLead Independent Director (2015-2018) of Andeavor Corporation (previously Tesoro Corporation) (independent oil refinerand marketer) and as a member of the Board of Summit Midstream Partners LP (energy, 2012-2018).
Michael E. Wiley (1950)Year of Election or Appointment: 2020TrusteeMr. Wiley also serves as Trustee of other Fidelity® funds. Previously, Mr. Wiley served as a member of the Advisory Boardof certain Fidelity® funds (2018-2020), Chairman, President and CEO of Baker Hughes, Inc. (oilfield services, 2000-2004).Mr. Wiley also previously served as a member of the Board of Andeavor Corporation (independent oil refiner and marketer,2005-2018), a member of the Board of Andeavor Logistics LP (natural resources logistics, 2015-2018) and a member of theBoard of High Point Resources (exploration and production, 2005-2020).
+ The information includes the Trustee's principal occupation during the last five years and other information relating to theexperience, attributes, and skills relevant to the Trustee's qualifications to serve as a Trustee, which led to the conclusion that theTrustee should serve as a Trustee for the fund.Advisory Board Members and Officers:Correspondence intended for a Member of the Advisory Board (if any) may be sent to Fidelity Investments, P.O. Box 55235,Boston, Massachusetts 02205-5235. Correspondence intended for an officer or Peter S. Lynch may be sent to Fidelity Investments,245 Summer Street, Boston, Massachusetts 02210. Officers appear below in alphabetical order.Name, Year of Birth; Principal OccupationNed C. Lautenbach (1944)
Year of Election or Appointment: 2021Member of the Advisory BoardMr. Lautenbach also serves as a Member of the Advisory Board of other Fidelity® funds. Mr. Lautenbach currently serves asChair of the Board of Governors, State University System of Florida (2013-present) and is a member of the Council onForeign Relations (1994-present). He is also a member and has in the past served as Chairman of the Board of Directors ofArtis-Naples (2012-present). Previously, Mr. Lautenbach served as a Trustee of certain Fidelity® funds (2000-2020) and amember and then Lead Director of the Board of Directors of Eaton Corporation (diversified industrial, 1997-2016). He wasalso a Partner at Clayton, Dubilier & Rice, LLC (private equity investment, 1998-2010); as well as Director of SonyCorporation (2006-2007). In addition, Mr. Lautenbach had a 30-year career with IBM (technology company), during whichtime he served as Senior Vice President and as a member of the Corporate Executive Committee (1968-1998).
Peter S. Lynch (1944)Year of Election or Appointment: 2003Member of the Advisory BoardMr. Lynch also serves as a Member of the Advisory Board of other Fidelity® funds. Mr. Lynch is Vice Chairman and aDirector of Fidelity Management & Research Company LLC (investment adviser firm). In addition, Mr. Lynch serves as aTrustee of Boston College and as the Chairman of the Inner-City Scholarship Fund. Previously, Mr. Lynch served as Vice
Copyright © 2021 www.secdatabase.com. All Rights Reserved.Please Consider the Environment Before Printing This Document
Chairman and a Director of FMR Co., Inc. (investment adviser firm) and on the Special Olympics International Board ofDirectors (1997-2006).
Craig S. Brown (1977)Year of Election or Appointment: 2019Assistant TreasurerMr. Brown also serves as Assistant Treasurer of other funds. Mr. Brown is an employee of Fidelity Investments(2013-present).
John J. Burke III (1964)Year of Election or Appointment: 2018Chief Financial OfficerMr. Burke also serves as Chief Financial Officer of other funds. Mr. Burke serves as Head of Investment Operations forFidelity Fund and Investment Operations (2018-present) and is an employee of Fidelity Investments (1998-present).Previously Mr. Burke served as head of Asset Management Investment Operations (2012-2018).
William C. Coffey (1969)Year of Election or Appointment: 2019Assistant SecretaryMr. Coffey also serves as Assistant Secretary of other funds. He is Senior Vice President and Deputy General Counsel ofFMR LLC (diversified financial services company, 2010-present), and is an employee of Fidelity Investments. Previously,Mr. Coffey served as Secretary and CLO of certain funds (2018-2019); CLO, Secretary, and Senior Vice President ofFidelity Management & Research Company and FMR Co., Inc. (investment adviser firms, 2018-2019); Secretary of FidelitySelectCo, LLC and Fidelity Investments Money Management, Inc. (investment adviser firms, 2018-2019); CLO of FidelityManagement & Research (Hong Kong) Limited, FMR Investment Management (UK) Limited, and Fidelity Management &Research (Japan) Limited (investment adviser firms, 2018-2019); and Assistant Secretary of certain funds (2009-2018).
Timothy M. Cohen (1969)Year of Election or Appointment: 2018Vice PresidentMr. Cohen also serves as Vice President of other funds. Mr. Cohen serves as Co-Head of Equity (2018-present), a Directorof Fidelity Management & Research (Japan) Limited (investment adviser firm, 2016-present), and is an employee of FidelityInvestments. Previously, Mr. Cohen served as Executive Vice President of Fidelity SelectCo, LLC (2019), Head of GlobalEquity Research (2016-2018), Chief Investment Officer - Equity and a Director of Fidelity Management & Research (U.K.)Inc. (investment adviser firm, 2013-2015) and as a Director of Fidelity Management & Research (Hong Kong) Limited(investment adviser firm, 2017).
Jonathan Davis (1968)Year of Election or Appointment: 2010Assistant TreasurerMr. Davis also serves as Assistant Treasurer of other funds. Mr. Davis serves as Assistant Treasurer of FMR Capital, Inc.(2017-present) and is an employee of Fidelity Investments. Previously, Mr. Davis served as Vice President and AssociateGeneral Counsel of FMR LLC (diversified financial services company, 2003-2010).
Laura M. Del Prato (1964)Year of Election or Appointment: 2018Assistant TreasurerMs. Del Prato also serves as an officer of other funds. Ms. Del Prato is an employee of Fidelity Investments (2017-present).Previously, Ms. Del Prato served as President and Treasurer of The North Carolina Capital Management Trust: CashPortfolio and Term Portfolio (2018-2020). Prior to joining Fidelity Investments, Ms. Del Prato served as a Managing Directorand Treasurer of the JPMorgan Mutual Funds (2014-2017). Prior to JPMorgan, Ms. Del Prato served as a partner at CohenFund Audit Services (accounting firm, 2012-2013) and KPMG LLP (accounting firm, 2004-2012).
Colm A. Hogan (1973)Year of Election or Appointment: 2020Assistant TreasurerMr. Hogan also serves as an officer of other funds. Mr. Hogan serves as Assistant Treasurer of FMR Capital, Inc.(2017-present) and is an employee of Fidelity Investments (2005-present). Previously, Mr. Hogan served as DeputyTreasurer of certain Fidelity® funds (2016-2020) and Assistant Treasurer of certain Fidelity® funds (2016-2018).
Pamela R. Holding (1964)Year of Election or Appointment: 2018Vice PresidentMs. Holding also serves as Vice President of other funds. Ms. Holding serves as Co-Head of Equity (2018-present) and isan employee of Fidelity Investments (2013-present). Previously, Ms. Holding served as Executive Vice President of FidelitySelectCo, LLC (2019) and as Chief Investment Officer of Fidelity Institutional Asset Management (2013-2018).
Cynthia Lo Bessette (1969)Year of Election or Appointment: 2019Secretary and Chief Legal Officer (CLO)Ms. Lo Bessette also serves as an officer of other funds. Ms. Lo Bessette serves as CLO, Secretary, and Senior VicePresident of Fidelity Management & Research Company LLC (investment adviser firm, 2019-present); and CLO of Fidelity
Copyright © 2021 www.secdatabase.com. All Rights Reserved.Please Consider the Environment Before Printing This Document
Management & Research (Hong Kong) Limited, FMR Investment Management (UK) Limited, and Fidelity Management &Research (Japan) Limited (investment adviser firms, 2019-present). She is a Senior Vice President and Deputy GeneralCounsel of FMR LLC (diversified financial services company, 2019-present), and is an employee of Fidelity Investments.Previously, Ms. Lo Bessette served as CLO, Secretary, and Senior Vice President of FMR Co., Inc. (investment adviserfirm, 2019); Secretary of Fidelity SelectCo, LLC and Fidelity Investments Money Management, Inc. (investment adviserfirms, 2019). Prior to joining Fidelity Investments, Ms. Lo Bessette was Executive Vice President, General Counsel(2016-2019) and Senior Vice President, Deputy General Counsel (2015-2016) of OppenheimerFunds (investmentmanagement company) and Deputy Chief Legal Officer (2013-2015) of Jennison Associates LLC (investment adviser firm).
Chris Maher (1972)Year of Election or Appointment: 2020Deputy TreasurerMr. Maher also serves as an officer of other funds. Mr. Maher serves as Assistant Treasurer of FMR Capital, Inc.(2017-present), and is an employee of Fidelity Investments (2008-present). Previously, Mr. Maher served as AssistantTreasurer of certain funds (2013-2020); Vice President of Asset Management Compliance (2013), Vice President of theProgram Management Group of FMR (investment adviser firm, 2010-2013), and Vice President of Valuation Oversight(2008-2010).
Jason P. Pogorelec (1975)Year of Election or Appointment: 2020Chief Compliance OfficerMr. Pogorelec also serves as Chief Compliance Officer of other funds. Mr. Pogorelec is a senior Vice President of AssetManagement Compliance for Fidelity Investments and is an employee of Fidelity Investments (2006-present). Previously,Mr. Pogorelec served as Vice President, Associate General Counsel for Fidelity Investments (2010-2020) and AssistantSecretary of certain Fidelity funds (2015-2020).
Brett Segaloff (1972)Year of Election or Appointment: 2021Anti-Money Laundering (AML) OfficerMr. Segaloff also serves as an AML Officer of other funds and other related entities. He is Director, Anti-Money Laundering(2007-present) of FMR LLC (diversified financial services company) and is an employee of Fidelity Investments(1996-present).
Stacie M. Smith (1974)Year of Election or Appointment: 2016President and TreasurerMs. Smith also serves as an officer of other funds. Ms. Smith serves as Assistant Treasurer of FMR Capital, Inc.(2017-present), is an employee of Fidelity Investments (2009-present), and has served in other fund officer roles. Prior tojoining Fidelity Investments, Ms. Smith served as Senior Audit Manager of Ernst & Young LLP (accounting firm, 1996-2009).Previously, Ms. Smith served as Assistant Treasurer (2013-2019) and Deputy Treasurer (2013-2016) of certain Fidelity®
funds.Marc L. Spector (1972)
Year of Election or Appointment: 2016Assistant TreasurerMr. Spector also serves as an officer of other funds. Mr. Spector serves as Assistant Treasurer of FMR Capital, Inc.(2017-present) and is an employee of Fidelity Investments (2016-present). Prior to joining Fidelity Investments, Mr. Spectorserved as Director at the Siegfried Group (accounting firm, 2013-2016), and prior to Siegfried Group as audit seniormanager at Deloitte & Touche LLP (accounting firm, 2005-2013).
Jim Wegmann (1979)Year of Election or Appointment: 2019Assistant TreasurerMr. Wegmann also serves as Assistant Treasurer of other funds. Mr. Wegmann is an employee of Fidelity Investments(2011-present).
Shareholder Expense ExampleAs a shareholder, you incur two types of costs: (1) transaction costs, which may include sales charges (loads) on purchase paymentsor redemption proceeds, as applicable and (2) ongoing costs, which generally include management fees, distribution and/or service(12b-1) fees and other Fund expenses. This Example is intended to help you understand your ongoing costs (in dollars) of investingin a fund and to compare these costs with the ongoing costs of investing in other mutual funds.The Example is based on an investment of $1,000 invested at the beginning of the period and held for the entire period (September1, 2020 to February 28, 2021).Actual ExpensesThe first line of the accompanying table provides information about actual account values and actual expenses. You may use theinformation in this line, together with the amount you invested, to estimate the expenses that you paid over the period. Simply divideyour account value by $1,000.00 (for example, an $8,600 account value divided by $1,000.00 = 8.6), then multiply the result by the
Copyright © 2021 www.secdatabase.com. All Rights Reserved.Please Consider the Environment Before Printing This Document
number in the first line for a class/Fund under the heading entitled "Expenses Paid During Period" to estimate the expenses you paidon your account during this period. If any fund is a shareholder of any underlying mutual funds or exchange-traded funds (ETFs)(the Underlying Funds), such fund indirectly bears its proportional share of the expenses of the Underlying Funds in addition to thedirect expenses incurred presented in the table. These fees and expenses are not included in the annualized expense ratio used tocalculate the expense estimate in the table below.Hypothetical Example for Comparison PurposesThe second line of the accompanying table provides information about hypothetical account values and hypothetical expenses basedon the actual expense ratio and an assumed rate of return of 5% per year before expenses, which is not the actual return. Thehypothetical account values and expenses may not be used to estimate the actual ending account balance or expenses you paid forthe period. You may use this information to compare the ongoing costs of investing in the Fund and other funds. To do so, comparethis 5% hypothetical example with the 5% hypothetical examples that appear in the shareholder reports of the other funds. If anyfund is a shareholder of any Underlying Funds, such fund indirectly bears its proportional share of the expenses of the UnderlyingFunds in addition to the direct expenses as presented in the table. These fees and expenses are not included in the annualizedexpense ratio used to calculate the expense estimate in the table below.Please note that the expenses shown in the table are meant to highlight your ongoing costs only and do not reflect any transactioncosts. Therefore, the second line of the table is useful in comparing ongoing costs only, and will not help you determine the relativetotal costs of owning different funds.
Annualized Expense Ratio-A
BeginningAccount Value
September 1, 2020
EndingAccount Value
February 28, 2021
Expenses PaidDuring Period-B
September 1, 2020to February 28, 2021
Fidelity 500 Index Fund .02%
Actual $1,000.00 $1,097.40 $.10
Hypothetical-C $1,000.00 $1,024.70 $.10
A Annualized expense ratio reflects expenses net of applicable fee waivers.B Expenses are equal to the annualized expense ratio, multiplied by the average account value over the period, multiplied by 181/
365 (to reflect the one-half year period). The fees and expenses of any Underlying Funds are not included in each annualizedexpense ratio.C 5% return per year before expenses
Distributions (Unaudited)A total of 0.01% of the dividends distributed during the fiscal year was derived from interest on U.S. Government securities whichis generally exempt from state income tax.The fund designates 93%, 89%, 89%, and 89% of the dividends distributed in April, July, October, and December, respectivelyduring the fiscal year as qualifying for the dividends�received deduction for corporate shareholders.The fund designates 99%, 94%, 94%, and 94% of the dividends distributed in April, July, October, and December, respectivelyduring the fiscal year as amounts which may be taken into account as a dividend for the purposes of the maximum rate under section1(h)(11) of the Internal Revenue Code.The fund designates 2%, 6%, 6%, and 6% of the dividends distributed in April, July, October, and December, respectively during thefiscal year as a section 199A dividend.The fund will notify shareholders in January 2022 of amounts for use in preparing 2021 income tax returns.
Board Approval of Investment Advisory ContractsFidelity 500 Index FundAt its September 2020 meeting, the Board of Trustees, including the Independent Trustees (together, the Board), voted to approve anamended and restated sub-advisory agreement with Geode Capital Management, LLC (Geode) for the fund (the Amended Contract)to decrease the sub-advisory fee rate paid by Fidelity Management & Research Company LLC (FMR), the fund's investmentadviser, to Geode on behalf of the fund by 0.05 basis points. The Board, assisted by the advice of fund counsel and IndependentTrustees' counsel, considered a broad range of information.Nature, Extent, and Quality of Services Provided. The Board noted that it previously received and considered materialsrelating to the nature, extent and quality of services provided by FMR and Geode to the fund, including the resources dedicated toinvestment management and support services, shareholder and administrative services, the benefits to shareholders of investment ina large fund family and the investment performance of the fund in connection with the annual renewal of the fund's currentmanagement contract and sub-advisory agreements (Advisory Contracts). At its January 2020 meeting, the Board concluded that the
Copyright © 2021 www.secdatabase.com. All Rights Reserved.Please Consider the Environment Before Printing This Document
nature, extent and quality of the services provided to the fund under the existing Advisory Contracts should benefit the fund'sshareholders. The Board noted that approval of the Amended Contract would not change the fund's portfolio manager, theinvestment processes, the level or nature of services provided, the resources and personnel allocated or trading and complianceoperations. The Board concluded that the nature, extent, and quality of services to be provided to the fund under the AmendedContract will continue to benefit the fund's shareholders.Competitiveness of Management Fee and Total Expense Ratio. The Board considered that it received and reviewedinformation regarding the fund's current management fee and total expense ratio compared to "mapped groups" of competitive fundsand classes in connection with the annual renewal of the Advisory Contracts. Based on its review, the Board concluded at its January2020 meeting that the fund's current management fee and total expenses are fair and reasonable in light of the services that the fundreceives and the other factors considered.Costs of the Services and Profitability. The Board considered that it previously reviewed information regarding the revenuesearned and the expenses incurred by FMR in providing services to the fund and the level of FMR's profitability. At its January 2020meeting, the Board concluded that it was satisfied that FMR's profitability in connection with the operation of the fund was notexcessive under the circumstances. Because the Board was approving an arrangement that would not result in any changes to themanagement fee rate, the Board did not consider the costs of the services provided by and the profits realized by FMR to besignificant factors in its decision to approve the Amended Contract.Economies of Scale. The Board considered that it previously received and reviewed information regarding whether there havebeen economies of scale in respect of the management of the Fidelity funds, whether the Fidelity funds (including the fund) haveappropriately benefited from any such economies of scale, and whether there is potential for realization of any further economies ofscale and that it concluded, at its January 2020 meeting, that economies of scale, if any, are being appropriately shared between fundshareholders and Fidelity. The Board did not consider economies of scale to be a significant factor in its decision to approve theAmended Contract because the proposed sub-advisory fee rate will be lower than the current sub-advisory fee rate.Based on its evaluation of all of the conclusions noted above, and after considering all factors it believed relevant, the Boardconcluded that the advisory and sub-advisory fee arrangement are fair and reasonable, and that the fund's Amended Contract shouldbe approved.Board Approval of Investment Advisory ContractsFidelity 500 Index FundAt its January 2021 meeting, the Board of Trustees, including the Independent Trustees (together, the Board), voted to continue themanagement contract with Fidelity Management & Research Company LLC (FMR), and the sub-advisory agreements and sub-subadvisory agreements, in each case, where applicable (together, the Advisory Contracts) for the fund, including the fund's sub-advisory agreement with Geode Capital Management, LLC, for four months from February 1, 2021 through May 31, 2021, inconnection with changes to the Board's meeting calendar.The Board considered that the approval of the fund's Advisory Contracts will not result in any changes in (i) the investment processor strategies employed in the management of the fund's assets; (ii) the fees and expenses paid by shareholders; (iii) the nature, extentor quality of services provided under the fund's Advisory Contracts; or (iv) the day-to-day management of the fund or the personsprimarily responsible for such management. The Board also considered that since its last approval of the fund's Advisory Contracts,FMR had provided additional information on the fund in support of the annual contract renewal process, including competitiveanalyses on total expenses and management fees and in-depth reviews of fund performance and fund profitability information. TheBoard also considered the findings of certain ad hoc committees that had been previously formed to discuss matters relevant to all ofthe Fidelity funds, including economies of scale, fall-out benefits and retail vs. institutional funds. The Board concluded that thefund's Advisory Contracts are fair and reasonable, and that the fund's Advisory Contracts should be renewed, without modification,through May 31, 2021, with the understanding that the Board will consider the annual renewal for a full one year period in May2021.In connection with its consideration of future renewals of the fund's Advisory Contracts, the Board will consider: (i) the nature,extent and quality of services provided to the funds, including shareholder and administrative services and investment performance;(ii) the competitiveness of the management fee and total expenses for the fund; (iii) the costs of the services and profitability,including the revenues earned and the expenses incurred in conducting the business of developing, marketing, distributing,managing, administering, and servicing the fund and its shareholders, to the extent applicable; and (iv) whether there have beeneconomies of scale in respect of the Fidelity funds, whether the Fidelity funds (including the fund) have appropriately benefitedfrom any such economies of scale, and whether there is the potential for realization of any further economies.Based on its evaluation of all of the conclusions noted above, and after considering all factors it believed relevant, the Boardultimately concluded that the fund's management fee structure is fair and reasonable, and that the continuation of the fund'sAdvisory Contracts should be approved for four months from February 1, 2021 through May 31, 2021.
Liquidity Risk Management Program
Copyright © 2021 www.secdatabase.com. All Rights Reserved.Please Consider the Environment Before Printing This Document
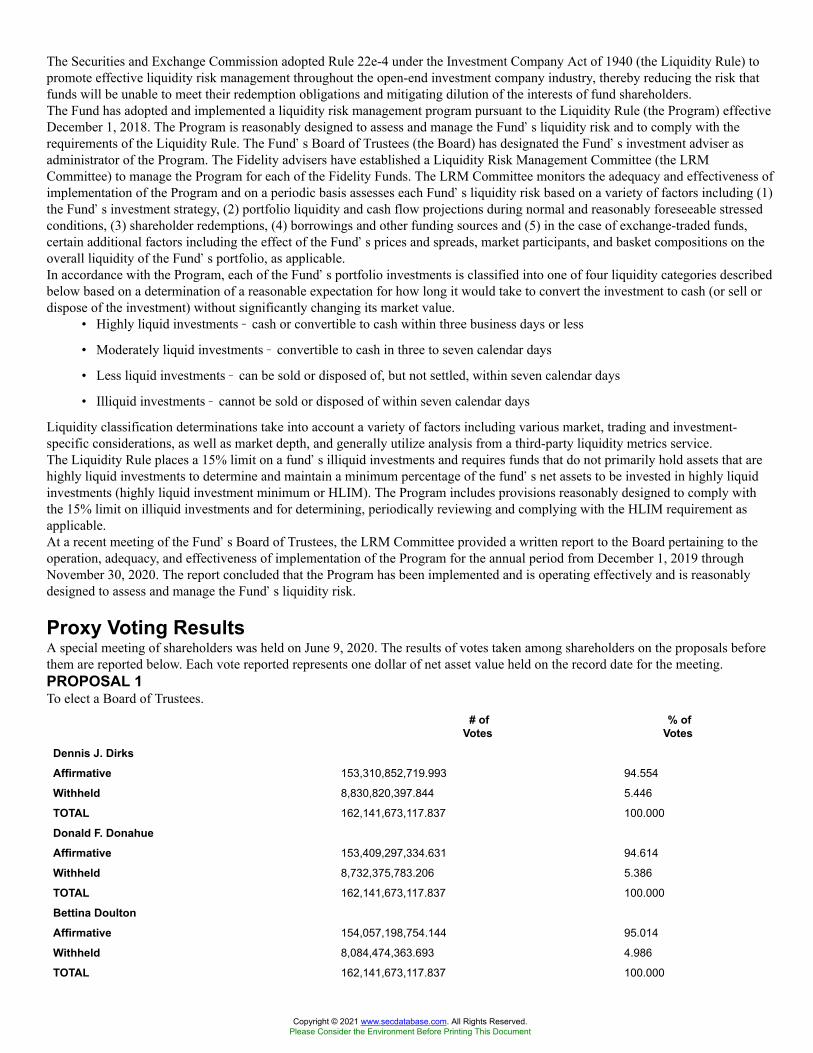
The Securities and Exchange Commission adopted Rule 22e-4 under the Investment Company Act of 1940 (the Liquidity Rule) topromote effective liquidity risk management throughout the open-end investment company industry, thereby reducing the risk thatfunds will be unable to meet their redemption obligations and mitigating dilution of the interests of fund shareholders.The Fund has adopted and implemented a liquidity risk management program pursuant to the Liquidity Rule (the Program) effectiveDecember 1, 2018. The Program is reasonably designed to assess and manage the Fund�s liquidity risk and to comply with therequirements of the Liquidity Rule. The Fund�s Board of Trustees (the Board) has designated the Fund�s investment adviser asadministrator of the Program. The Fidelity advisers have established a Liquidity Risk Management Committee (the LRMCommittee) to manage the Program for each of the Fidelity Funds. The LRM Committee monitors the adequacy and effectiveness ofimplementation of the Program and on a periodic basis assesses each Fund�s liquidity risk based on a variety of factors including (1)the Fund�s investment strategy, (2) portfolio liquidity and cash flow projections during normal and reasonably foreseeable stressedconditions, (3) shareholder redemptions, (4) borrowings and other funding sources and (5) in the case of exchange-traded funds,certain additional factors including the effect of the Fund�s prices and spreads, market participants, and basket compositions on theoverall liquidity of the Fund�s portfolio, as applicable.In accordance with the Program, each of the Fund�s portfolio investments is classified into one of four liquidity categories describedbelow based on a determination of a reasonable expectation for how long it would take to convert the investment to cash (or sell ordispose of the investment) without significantly changing its market value.
• Highly liquid investments � cash or convertible to cash within three business days or less
• Moderately liquid investments � convertible to cash in three to seven calendar days
• Less liquid investments � can be sold or disposed of, but not settled, within seven calendar days
• Illiquid investments � cannot be sold or disposed of within seven calendar days
Liquidity classification determinations take into account a variety of factors including various market, trading and investment-specific considerations, as well as market depth, and generally utilize analysis from a third-party liquidity metrics service.The Liquidity Rule places a 15% limit on a fund�s illiquid investments and requires funds that do not primarily hold assets that arehighly liquid investments to determine and maintain a minimum percentage of the fund�s net assets to be invested in highly liquidinvestments (highly liquid investment minimum or HLIM). The Program includes provisions reasonably designed to comply withthe 15% limit on illiquid investments and for determining, periodically reviewing and complying with the HLIM requirement asapplicable.At a recent meeting of the Fund�s Board of Trustees, the LRM Committee provided a written report to the Board pertaining to theoperation, adequacy, and effectiveness of implementation of the Program for the annual period from December 1, 2019 throughNovember 30, 2020. The report concluded that the Program has been implemented and is operating effectively and is reasonablydesigned to assess and manage the Fund�s liquidity risk.
Proxy Voting ResultsA special meeting of shareholders was held on June 9, 2020. The results of votes taken among shareholders on the proposals beforethem are reported below. Each vote reported represents one dollar of net asset value held on the record date for the meeting.PROPOSAL 1To elect a Board of Trustees.
# ofVotes
% ofVotes
Dennis J. DirksAffirmative 153,310,852,719.993 94.554
Withheld 8,830,820,397.844 5.446
TOTAL 162,141,673,117.837 100.000
Donald F. DonahueAffirmative 153,409,297,334.631 94.614
Withheld 8,732,375,783.206 5.386
TOTAL 162,141,673,117.837 100.000
Bettina DoultonAffirmative 154,057,198,754.144 95.014
Withheld 8,084,474,363.693 4.986
TOTAL 162,141,673,117.837 100.000
Copyright © 2021 www.secdatabase.com. All Rights Reserved.Please Consider the Environment Before Printing This Document
Vicki L. FullerAffirmative 154,419,985,979.903 95.238
Withheld 7,721,687,137.934 4.762
TOTAL 162,141,673,117.837 100.00
Patricia L. KamplingAffirmative 153,773,968,211.778 94.839
Withheld 8,367,704,906.059 5.161
TOTAL 162,141,673,117.837 100.000
Alan J. LacyAffirmative 152,412,406,811.772 94.000
Withheld 9,729,266,306.065 6.000
TOTAL 162,141,673,117.837 100.000
Ned C. LautenbachAffirmative 151,421,801,314.429 93.389
Withheld 10,719,871,803.408 6.611
TOTAL 162,141,673,117.837 100.000
Robert A. LawrenceAffirmative 152,467,970,401.411 94.034
Withheld 9,673,702,716.426 5.966
TOTAL 162,141,673,117.837 100.000
Joseph MaurielloAffirmative 152,391,361,586.517 93.987
Withheld 9,750,311,531.320 6.013
TOTAL 162,141,673,117.837 100.000
Cornelia M. SmallAffirmative 153,101,624,672.870 94.425
Withheld 9,040,048,444.967 5.575
TOTAL 162,141,673,117.837 100.000
Garnett A. SmithAffirmative 152,502,318,423.900 94.055
Withheld 9,639,354,693.937 5.945
TOTAL 162,141,673,117.837 100.000
David M. ThomasAffirmative 152,608,626,434.284 94.121
Withheld 9,533,046,683.553 5.879
TOTAL 162,141,673,117.837 100.000
Susan TomaskyAffirmative 153,605,526,235.885 94.735
Withheld 8,536,146,881.952 5.265
TOTAL 162,141,673,117.837 100.000
Michael E. WileyAffirmative 152,567,303,629.801 94.095
Withheld 9,574,369,488.036 5.905
TOTAL 162,141,673,117.837 100.000
PROPOSAL 5
Copyright © 2021 www.secdatabase.com. All Rights Reserved.Please Consider the Environment Before Printing This Document
A shareholder proposal to institute procedures to avoid holding investments in companies that contribute to genocide or crimesagainst humanity.
# ofVotes
% ofVotes
Affirmative 17,621,096,352.863 21.077
Against 56,638,734,904.910 67.748
Abstain 4,020,978,788.391 4.810
Broker Non-Vote 5,321,833,205.926 6.366
TOTAL 83,602,643,252.088 100.000
Proposal 1 reflects trust wide proposal and voting results.Proposal 5 was not approved by shareholders.
U5I-U5A-ANN-04211.925889.109
Fidelity Flex® FundsFidelity Flex® 500 Index Fund
Annual ReportFebruary 28, 2021
Copyright © 2021 www.secdatabase.com. All Rights Reserved.Please Consider the Environment Before Printing This Document

ContentsNote to ShareholdersPerformanceManagement's Discussion of Fund PerformanceInvestment SummarySchedule of InvestmentsFinancial StatementsNotes to Financial StatementsReport of Independent Registered Public Accounting FirmTrustees and OfficersShareholder Expense Example
Copyright © 2021 www.secdatabase.com. All Rights Reserved.Please Consider the Environment Before Printing This Document
DistributionsBoard Approval of Investment Advisory ContractsLiquidity Risk Management ProgramProxy Voting Results
To view a fund's proxy voting guidelines and proxy voting record for the 12-month period ended June 30, visithttp://www.fidelity.com/proxyvotingresults or visit the Securities and Exchange Commission's (SEC) web site athttp://www.sec.gov.You may also call 1-800-544-3455 (for managed account clients) or 1-800-835-5092 (for retirement plan participants) to request afree copy of the proxy voting guidelines.Standard & Poor's, S&P and S&P 500 are registered service marks of The McGraw-Hill Companies, Inc. and have been licensed foruse by Fidelity Distributors Corporation.Other third-party marks appearing herein are the property of their respective owners.All other marks appearing herein are registered or unregistered trademarks or service marks of FMR LLC or an affiliated company.© 2021 FMR LLC. All rights reserved.
This report and the financial statements contained herein are submitted for the general information of the shareholders of the Fund.This report is not authorized for distribution to prospective investors in the Fund unless preceded or accompanied by an effectiveprospectus.A fund files its complete schedule of portfolio holdings with the SEC for the first and third quarters of each fiscal year on Form N-PORT. Forms N-PORT are available on the SEC�s web site at http://www.sec.gov. A fund's Forms N-PORT may be reviewed andcopied at the SEC�s Public Reference Room in Washington, DC. Information regarding the operation of the SEC's Public ReferenceRoom may be obtained by calling 1-800-SEC-0330.For a complete list of a fund's portfolio holdings, view the most recent holdings listing, semiannual report, or annual report onFidelity's web site at http://www.fidelity.com, http://www.institutional.fidelity.com, or http://www.401k.com, as applicable.NOT FDIC INSURED ��MAY LOSE VALUE ��NO BANK GUARANTEENeither the Fund nor Fidelity Distributors Corporation is a bank.
Note to Shareholders:Early in 2020, the outbreak and spread of a new coronavirus emerged as a public health emergency that had a major influence onfinancial markets, primarily based on its impact on the global economy and the outlook for corporate earnings. The virus causes arespiratory disease known as COVID-19. On March 11, 2020 the World Health Organization declared the COVID-19 outbreak apandemic, citing sustained risk of further global spread.In the weeks following, as the crisis worsened, we witnessed an escalating human tragedy with wide-scale social and economicconsequences from coronavirus-containment measures. The outbreak of COVID-19 prompted a number of measures to limit thespread, including travel and border restrictions, quarantines, and restrictions on large gatherings. In turn, these resulted in lowerconsumer activity, diminished demand for a wide range of products and services, disruption in manufacturing and supply chains, and� given the wide variability in outcomes regarding the outbreak � significant market uncertainty and volatility. Amid the turmoil,global governments and central banks took unprecedented action to help support consumers, businesses, and the broader economies,and to limit disruption to financial systems.The situation continues to unfold, and the extent and duration of its impact on financial markets and the economy remain highlyuncertain. Extreme events such as the coronavirus crisis are �exogenous shocks� that can have significant adverse effects on mutualfunds and their investments. Although multiple asset classes may be affected by market disruption, the duration and impact may notbe the same for all types of assets.Fidelity is committed to helping you stay informed amid news about COVID-19 and during increased market volatility, and we�retaking extra steps to be responsive to customer needs. We encourage you to visit our websites, where we offer ongoing updates,commentary, and analysis on the markets and our funds.
Performance: The Bottom LineAverage annual total return reflects the change in the value of an investment, assuming reinvestment of distributions from dividendincome and capital gains (the profits earned upon the sale of securities that have grown in value, if any) and assuming a constant rate
Copyright © 2021 www.secdatabase.com. All Rights Reserved.Please Consider the Environment Before Printing This Document
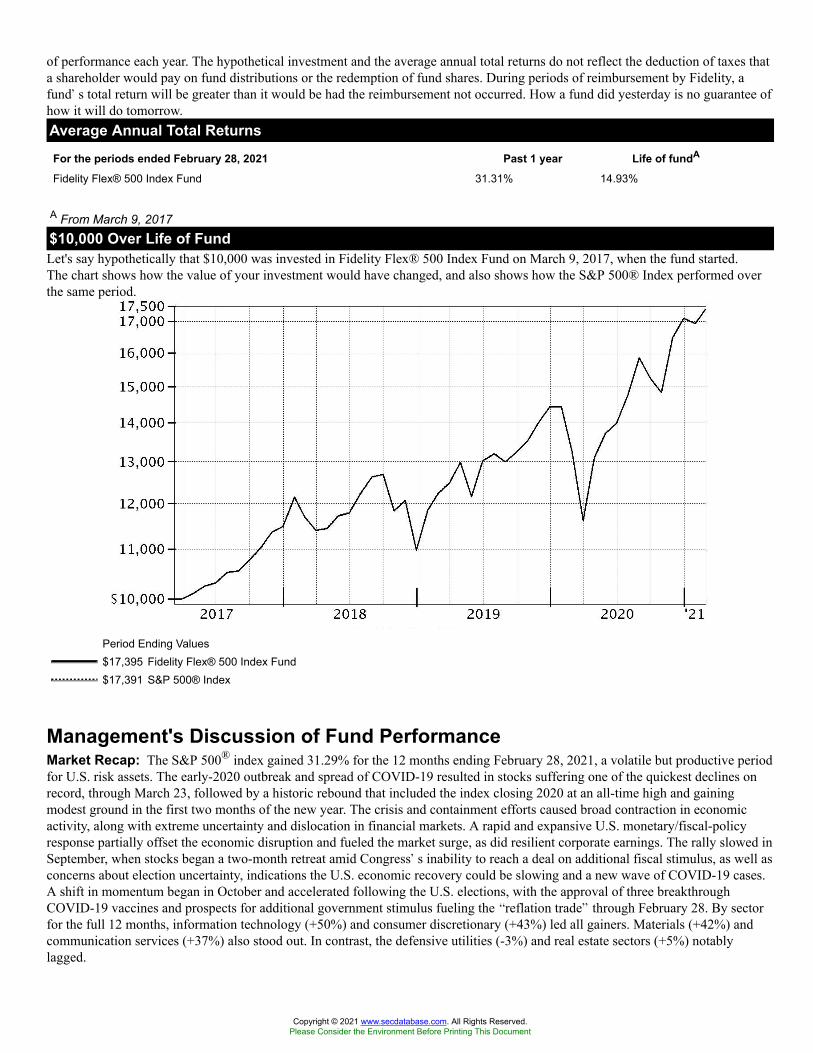
of performance each year. The hypothetical investment and the average annual total returns do not reflect the deduction of taxes thata shareholder would pay on fund distributions or the redemption of fund shares. During periods of reimbursement by Fidelity, afund�s total return will be greater than it would be had the reimbursement not occurred. How a fund did yesterday is no guarantee ofhow it will do tomorrow.Average Annual Total Returns
For the periods ended February 28, 2021 Past 1 year Life of fundA
Fidelity Flex® 500 Index Fund 31.31% 14.93%
A From March 9, 2017$10,000 Over Life of FundLet's say hypothetically that $10,000 was invested in Fidelity Flex® 500 Index Fund on March 9, 2017, when the fund started.The chart shows how the value of your investment would have changed, and also shows how the S&P 500® Index performed overthe same period.
Period Ending Values$17,395 Fidelity Flex® 500 Index Fund$17,391 S&P 500® Index
Management's Discussion of Fund PerformanceMarket Recap: The S&P 500® index gained 31.29% for the 12 months ending February 28, 2021, a volatile but productive periodfor U.S. risk assets. The early-2020 outbreak and spread of COVID-19 resulted in stocks suffering one of the quickest declines onrecord, through March 23, followed by a historic rebound that included the index closing 2020 at an all-time high and gainingmodest ground in the first two months of the new year. The crisis and containment efforts caused broad contraction in economicactivity, along with extreme uncertainty and dislocation in financial markets. A rapid and expansive U.S. monetary/fiscal-policyresponse partially offset the economic disruption and fueled the market surge, as did resilient corporate earnings. The rally slowed inSeptember, when stocks began a two-month retreat amid Congress�s inability to reach a deal on additional fiscal stimulus, as well asconcerns about election uncertainty, indications the U.S. economic recovery could be slowing and a new wave of COVID-19 cases.A shift in momentum began in October and accelerated following the U.S. elections, with the approval of three breakthroughCOVID-19 vaccines and prospects for additional government stimulus fueling the �reflation trade� through February 28. By sectorfor the full 12 months, information technology (+50%) and consumer discretionary (+43%) led all gainers. Materials (+42%) andcommunication services (+37%) also stood out. In contrast, the defensive utilities (-3%) and real estate sectors (+5%) notablylagged.
Copyright © 2021 www.secdatabase.com. All Rights Reserved.Please Consider the Environment Before Printing This Document
Comments from the Geode Capital Management, LLC, passive equity index team: For the fiscal year endingFebruary 28, 2021, the fund gained 31.31%, roughly in line with the 31.29% advance of the benchmark S&P 500® index. By sector,information technology gained about 50% and contributed most, followed by consumer discretionary, which gained roughly 42%,and communication services, which advanced 37%, lifted by the media & entertainment industry (+47%). The health care sectorrose 24%, financials gained roughly 25%, and industrials advanced 26%. Other notable contributors included the materials (+43%),consumer staples (+12%), energy (+11%), and real estate (+5%) sectors. In contrast, stocks in the utilities sector returned about -3%and detracted most. Turning to individual stocks, the biggest individual contributor was Apple (+79%), from the technologyhardware & equipment category. In software & services, Microsoft (+45%) and PayPal (+140%) helped. Amazon.com, within theretailing industry, advanced roughly 64% and lifted the fund. Another contributor was Alphabet (+51%), a stock in the media &entertainment group. In contrast, the biggest individual detractor was AT&T (-15%), from the telecommunication services segment.In capital goods, Boeing (-23%) and Raytheon (-38%) hurt. Tesla, within the automobiles & components segment, hindered thefund, returning -3% between late December, when the stock entered the index, and period end. Another detractor was Wells Fargo(-9%), a stock in the banks category.The views expressed above reflect those of the portfolio manager(s) only through the end of the period as stated on the cover of thisreport and do not necessarily represent the views of Fidelity or any other person in the Fidelity organization. Any such views aresubject to change at any time based upon market or other conditions and Fidelity disclaims any responsibility to update such views.These views may not be relied on as investment advice and, because investment decisions for a Fidelity fund are based on numerousfactors, may not be relied on as an indication of trading intent on behalf of any Fidelity fund.
Investment Summary (Unaudited)Top Ten Stocks as of February 28, 2021
% of fund's net assetsApple, Inc. 5.9
Microsoft Corp. 5.3
Amazon.com, Inc. 4.0
Facebook, Inc. Class A 1.9
Alphabet, Inc. Class A 1.8
Alphabet, Inc. Class C 1.8
Tesla, Inc. 1.6
Berkshire Hathaway, Inc. Class B 1.4
JPMorgan Chase & Co. 1.4
Johnson & Johnson 1.3
26.4
Top Market Sectors as of February 28, 2021% of fund's net assets
Information Technology 26.6
Health Care 12.8
Consumer Discretionary 12.1
Financials 10.9
Communication Services 10.8
Industrials 8.2
Consumer Staples 5.8
Energy 2.8
Materials 2.6
Utilities 2.4
Asset Allocation (% of fund's net assets)
As of February 28, 2021*
Copyright © 2021 www.secdatabase.com. All Rights Reserved.Please Consider the Environment Before Printing This Document
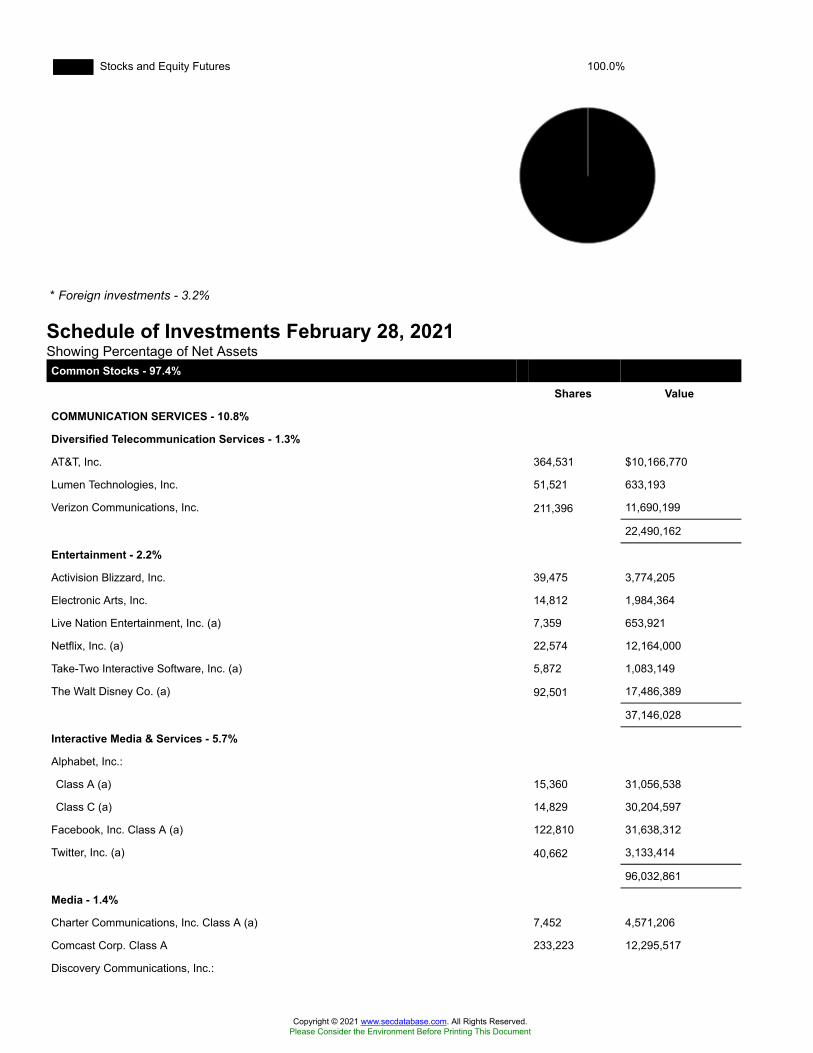
Stocks and Equity Futures 100.0%
* Foreign investments - 3.2%
Schedule of Investments February 28, 2021Showing Percentage of Net AssetsCommon Stocks - 97.4%
Shares Value
COMMUNICATION SERVICES - 10.8%
Diversified Telecommunication Services - 1.3%
AT&T, Inc. 364,531 $10,166,770
Lumen Technologies, Inc. 51,521 633,193
Verizon Communications, Inc. 211,396 11,690,199
22,490,162
Entertainment - 2.2%
Activision Blizzard, Inc. 39,475 3,774,205
Electronic Arts, Inc. 14,812 1,984,364
Live Nation Entertainment, Inc. (a) 7,359 653,921
Netflix, Inc. (a) 22,574 12,164,000
Take-Two Interactive Software, Inc. (a) 5,872 1,083,149
The Walt Disney Co. (a) 92,501 17,486,389
37,146,028
Interactive Media & Services - 5.7%
Alphabet, Inc.:
Class A (a) 15,360 31,056,538
Class C (a) 14,829 30,204,597
Facebook, Inc. Class A (a) 122,810 31,638,312
Twitter, Inc. (a) 40,662 3,133,414
96,032,861
Media - 1.4%
Charter Communications, Inc. Class A (a) 7,452 4,571,206
Comcast Corp. Class A 233,223 12,295,517
Discovery Communications, Inc.:
Copyright © 2021 www.secdatabase.com. All Rights Reserved.Please Consider the Environment Before Printing This Document
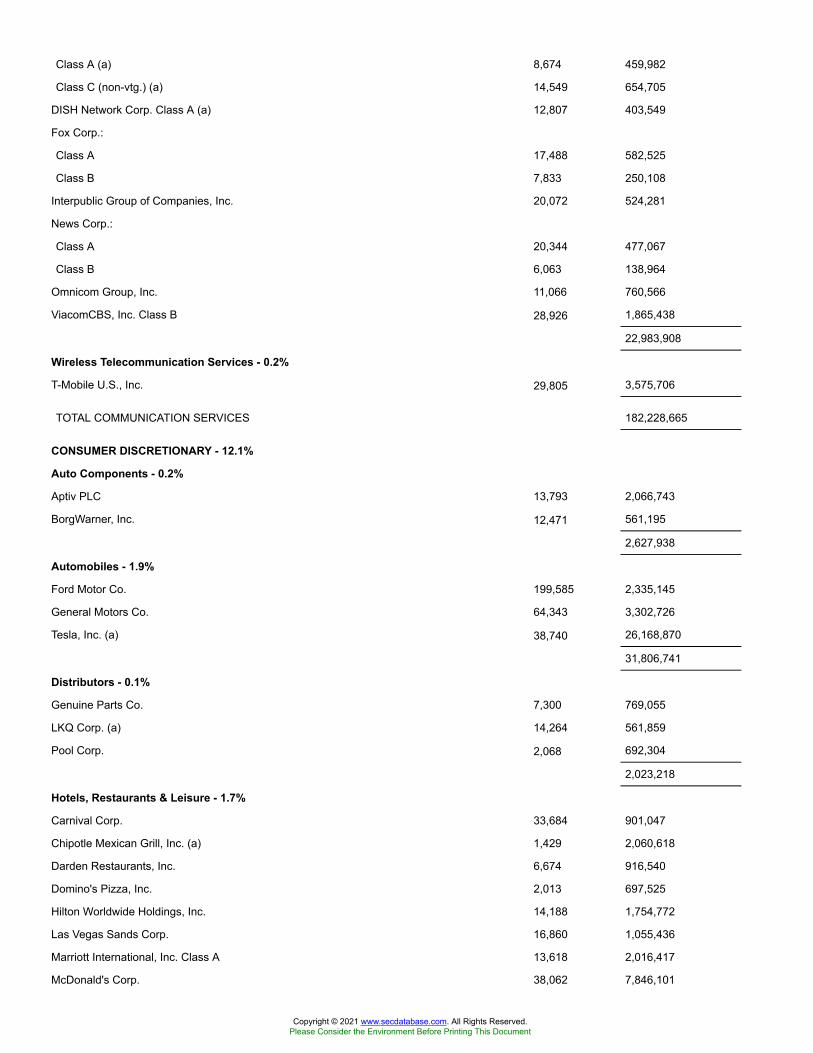
Class A (a) 8,674 459,982
Class C (non-vtg.) (a) 14,549 654,705
DISH Network Corp. Class A (a) 12,807 403,549
Fox Corp.:
Class A 17,488 582,525
Class B 7,833 250,108
Interpublic Group of Companies, Inc. 20,072 524,281
News Corp.:
Class A 20,344 477,067
Class B 6,063 138,964
Omnicom Group, Inc. 11,066 760,566
ViacomCBS, Inc. Class B 28,926 1,865,438
22,983,908
Wireless Telecommunication Services - 0.2%
T-Mobile U.S., Inc. 29,805 3,575,706
TOTAL COMMUNICATION SERVICES 182,228,665
CONSUMER DISCRETIONARY - 12.1%
Auto Components - 0.2%
Aptiv PLC 13,793 2,066,743
BorgWarner, Inc. 12,471 561,195
2,627,938
Automobiles - 1.9%
Ford Motor Co. 199,585 2,335,145
General Motors Co. 64,343 3,302,726
Tesla, Inc. (a) 38,740 26,168,870
31,806,741
Distributors - 0.1%
Genuine Parts Co. 7,300 769,055
LKQ Corp. (a) 14,264 561,859
Pool Corp. 2,068 692,304
2,023,218
Hotels, Restaurants & Leisure - 1.7%
Carnival Corp. 33,684 901,047
Chipotle Mexican Grill, Inc. (a) 1,429 2,060,618
Darden Restaurants, Inc. 6,674 916,540
Domino's Pizza, Inc. 2,013 697,525
Hilton Worldwide Holdings, Inc. 14,188 1,754,772
Las Vegas Sands Corp. 16,860 1,055,436
Marriott International, Inc. Class A 13,618 2,016,417
McDonald's Corp. 38,062 7,846,101
Copyright © 2021 www.secdatabase.com. All Rights Reserved.Please Consider the Environment Before Printing This Document

MGM Resorts International 21,132 798,578
Norwegian Cruise Line Holdings Ltd. (a)(b) 16,481 487,178
Royal Caribbean Cruises Ltd. 9,669 901,828
Starbucks Corp. 59,956 6,477,047
Wynn Resorts Ltd. 5,388 709,761
Yum! Brands, Inc. 15,424 1,596,847
28,219,695
Household Durables - 0.4%
D.R. Horton, Inc. 16,961 1,303,792
Garmin Ltd. 7,587 940,940
Leggett & Platt, Inc. 6,878 297,611
Lennar Corp. Class A 14,071 1,167,471
Mohawk Industries, Inc. (a) 3,016 527,770
Newell Brands, Inc. 19,029 440,902
NVR, Inc. (a) 179 805,650
PulteGroup, Inc. 13,667 616,518
Whirlpool Corp. 3,201 608,446
6,709,100
Internet & Direct Marketing Retail - 4.5%
Amazon.com, Inc. (a) 21,788 67,388,759
eBay, Inc. 33,432 1,886,233
Etsy, Inc. (a) 6,440 1,418,539
Expedia, Inc. 6,989 1,125,229
The Booking Holdings, Inc. (a) 2,093 4,873,571
76,692,331
Leisure Products - 0.0%
Hasbro, Inc. 6,571 615,768
Multiline Retail - 0.5%
Dollar General Corp. 12,516 2,365,399
Dollar Tree, Inc. (a) 11,979 1,176,338
Target Corp. 25,583 4,692,946
8,234,683
Specialty Retail - 2.1%
Advance Auto Parts, Inc. 3,458 554,490
AutoZone, Inc. (a) 1,189 1,379,145
Best Buy Co., Inc. 11,710 1,175,099
CarMax, Inc. (a) 8,421 1,006,394
Gap, Inc. 10,644 265,568
L Brands, Inc. 11,958 653,624
Lowe's Companies, Inc. 37,433 5,979,922
O'Reilly Automotive, Inc. (a) 3,709 1,659,147
Copyright © 2021 www.secdatabase.com. All Rights Reserved.Please Consider the Environment Before Printing This Document
Ross Stores, Inc. 18,188 2,121,448
The Home Depot, Inc. 55,001 14,208,958
TJX Companies, Inc. 61,340 4,047,827
Tractor Supply Co. 5,926 941,997
Ulta Beauty, Inc. (a) 2,863 922,831
34,916,450
Textiles, Apparel & Luxury Goods - 0.7%
Hanesbrands, Inc. 18,055 319,393
NIKE, Inc. Class B 64,101 8,639,533
PVH Corp. 3,701 369,952
Ralph Lauren Corp. 2,467 288,836
Tapestry, Inc. 14,149 596,239
Under Armour, Inc.:
Class A (sub. vtg.) (a) 10,436 228,444
Class C (non-vtg.) (a) 9,362 170,388
VF Corp. 16,326 1,291,876
11,904,661
TOTAL CONSUMER DISCRETIONARY 203,750,585
CONSUMER STAPLES - 5.8%
Beverages - 1.4%
Brown-Forman Corp. Class B (non-vtg.) 9,285 664,620
Constellation Brands, Inc. Class A (sub. vtg.) 8,699 1,862,804
Molson Coors Beverage Co. Class B 9,834 437,121
Monster Beverage Corp. (a) 18,912 1,659,339
PepsiCo, Inc. 70,603 9,121,202
The Coca-Cola Co. 197,935 9,696,836
23,441,922
Food & Staples Retailing - 1.3%
Costco Wholesale Corp. 22,536 7,459,416
Kroger Co. 39,772 1,281,056
Sysco Corp. 26,146 2,082,006
Walgreens Boots Alliance, Inc. 36,997 1,773,266
Walmart, Inc. 70,818 9,200,675
21,796,419
Food Products - 0.9%
Archer Daniels Midland Co. 28,660 1,621,583
Campbell Soup Co. 10,446 475,084
Conagra Brands, Inc. 25,176 854,222
General Mills, Inc. 31,523 1,734,080
Hormel Foods Corp. 14,537 674,081
Copyright © 2021 www.secdatabase.com. All Rights Reserved.Please Consider the Environment Before Printing This Document

Kellogg Co. 13,275 766,100
Lamb Weston Holdings, Inc. 7,591 605,534
McCormick & Co., Inc. (non-vtg.) 12,812 1,079,795
Mondelez International, Inc. 73,283 3,895,724
The Hershey Co. 7,545 1,098,929
The J.M. Smucker Co. 5,914 662,368
The Kraft Heinz Co. 28,359 1,031,700
Tyson Foods, Inc. Class A 15,199 1,028,516
15,527,716
Household Products - 1.4%
Church & Dwight Co., Inc. 12,737 1,003,039
Clorox Co. 6,419 1,162,160
Colgate-Palmolive Co. 43,757 3,290,526
Kimberly-Clark Corp. 17,356 2,227,295
Procter & Gamble Co. 126,686 15,649,522
23,332,542
Personal Products - 0.2%
Estee Lauder Companies, Inc. Class A 11,573 3,308,258
Tobacco - 0.6%
Altria Group, Inc. 90,299 3,937,036
Philip Morris International, Inc. 79,808 6,705,468
10,642,504
TOTAL CONSUMER STAPLES 98,049,361
ENERGY - 2.8%
Energy Equipment & Services - 0.3%
Baker Hughes Co. Class A 36,683 898,000
Halliburton Co. 47,149 1,029,263
NOV, Inc. 23,281 351,543
Schlumberger Ltd. 63,417 1,769,968
4,048,774
Oil, Gas & Consumable Fuels - 2.5%
Apache Corp. 20,022 395,034
Cabot Oil & Gas Corp. 20,617 381,621
Chevron Corp. 98,714 9,871,400
ConocoPhillips Co. 64,942 3,377,633
Devon Energy Corp. 31,331 674,870
Diamondback Energy, Inc. 8,324 576,687
EOG Resources, Inc. 30,235 1,951,972
Exxon Mobil Corp. 216,950 11,795,572
Hess Corp. 14,297 936,882
Copyright © 2021 www.secdatabase.com. All Rights Reserved.Please Consider the Environment Before Printing This Document
HollyFrontier Corp. 8,141 308,381
Kinder Morgan, Inc. 100,976 1,484,347
Marathon Oil Corp. 42,496 471,706
Marathon Petroleum Corp. 33,698 1,840,585
Occidental Petroleum Corp. 39,854 1,060,515
ONEOK, Inc. 23,049 1,020,840
Phillips 66 Co. 22,708 1,885,899
Pioneer Natural Resources Co. 10,445 1,551,814
The Williams Companies, Inc. 62,572 1,429,144
Valero Energy Corp. 21,145 1,627,742
42,642,644
TOTAL ENERGY 46,691,418
FINANCIALS - 10.9%
Banks - 4.3%
Bank of America Corp. 388,838 13,496,567
Citigroup, Inc. 106,378 7,008,183
Citizens Financial Group, Inc. 21,905 951,553
Comerica, Inc. 7,169 488,209
Fifth Third Bancorp 36,423 1,263,514
First Republic Bank 8,876 1,462,321
Huntington Bancshares, Inc. 52,028 798,110
JPMorgan Chase & Co. 155,712 22,916,135
KeyCorp 50,044 1,007,886
M&T Bank Corp. 6,580 993,185
Peoples United Financial, Inc. 22,067 395,882
PNC Financial Services Group, Inc. 21,627 3,641,122
Regions Financial Corp. 49,035 1,011,592
SVB Financial Group (a) 2,645 1,336,677
Truist Financial Corp. 68,874 3,923,063
U.S. Bancorp 69,970 3,498,500
Wells Fargo & Co. 211,365 7,645,072
Zions Bancorp NA 8,419 447,638
72,285,209
Capital Markets - 2.8%
Ameriprise Financial, Inc. 6,024 1,332,750
Bank of New York Mellon Corp. 41,650 1,755,964
BlackRock, Inc. Class A 7,246 5,032,347
Cboe Global Markets, Inc. 5,481 542,400
Charles Schwab Corp. 76,208 4,703,558
CME Group, Inc. 18,338 3,662,099
Copyright © 2021 www.secdatabase.com. All Rights Reserved.Please Consider the Environment Before Printing This Document

Franklin Resources, Inc. 13,857 362,638
Goldman Sachs Group, Inc. 17,577 5,615,500
Intercontinental Exchange, Inc. 28,671 3,162,698
Invesco Ltd. 19,400 434,948
MarketAxess Holdings, Inc. 1,930 1,072,964
Moody's Corp. 8,250 2,267,843
Morgan Stanley 76,657 5,892,624
MSCI, Inc. 4,235 1,755,492
NASDAQ, Inc. 5,892 814,805
Northern Trust Corp. 10,596 1,007,997
Raymond James Financial, Inc. 6,254 730,092
S&P Global, Inc. 12,291 4,048,164
State Street Corp. 18,109 1,317,792
T. Rowe Price Group, Inc. 11,563 1,874,825
47,387,500
Consumer Finance - 0.6%
American Express Co. 33,311 4,505,646
Capital One Financial Corp. 23,350 2,806,437
Discover Financial Services 15,705 1,477,369
Synchrony Financial 27,725 1,072,403
9,861,855
Diversified Financial Services - 1.4%
Berkshire Hathaway, Inc. Class B (a) 99,424 23,912,466
Insurance - 1.8%
AFLAC, Inc. 33,312 1,595,312
Allstate Corp. 15,540 1,656,564
American International Group, Inc. 44,205 1,942,810
Aon PLC 11,677 2,658,970
Arthur J. Gallagher & Co. 9,805 1,174,639
Assurant, Inc. 3,080 379,518
Chubb Ltd. 23,053 3,747,957
Cincinnati Financial Corp. 7,642 747,923
Everest Re Group Ltd. 2,038 492,809
Globe Life, Inc. 4,982 465,319
Hartford Financial Services Group, Inc. 18,281 926,664
Lincoln National Corp. 9,440 536,853
Loews Corp. 11,931 570,421
Marsh & McLennan Companies, Inc. 25,899 2,984,083
MetLife, Inc. 39,024 2,247,782
Principal Financial Group, Inc. 13,064 739,161
Progressive Corp. 29,907 2,570,507
Copyright © 2021 www.secdatabase.com. All Rights Reserved.Please Consider the Environment Before Printing This Document
Prudential Financial, Inc. 20,337 1,763,625
The Travelers Companies, Inc. 12,929 1,881,170
Unum Group 10,467 277,166
W.R. Berkley Corp. 7,158 496,264
Willis Towers Watson PLC 6,605 1,457,327
31,312,844
TOTAL FINANCIALS 184,759,874
HEALTH CARE - 12.8%
Biotechnology - 1.8%
AbbVie, Inc. 90,193 9,717,394
Alexion Pharmaceuticals, Inc. (a) 11,184 1,708,356
Amgen, Inc. 29,742 6,689,571
Biogen, Inc. (a) 7,861 2,145,110
Gilead Sciences, Inc. 64,033 3,931,626
Incyte Corp. (a) 9,510 748,057
Regeneron Pharmaceuticals, Inc. (a) 5,357 2,413,703
Vertex Pharmaceuticals, Inc. (a) 13,285 2,823,727
30,177,544
Health Care Equipment & Supplies - 3.7%
Abbott Laboratories 90,547 10,845,720
Abiomed, Inc. (a) 2,289 742,895
Align Technology, Inc. (a) 3,666 2,079,025
Baxter International, Inc. 26,089 2,026,854
Becton, Dickinson & Co. 14,816 3,572,878
Boston Scientific Corp. (a) 73,156 2,836,990
Danaher Corp. 32,301 7,095,561
Dentsply Sirona, Inc. 11,220 595,445
DexCom, Inc. (a) 4,906 1,951,509
Edwards Lifesciences Corp. (a) 31,840 2,645,904
Hologic, Inc. (a) 13,127 946,325
IDEXX Laboratories, Inc. (a) 4,357 2,266,381
Intuitive Surgical, Inc. (a) 6,006 4,425,221
Medtronic PLC 68,765 8,043,442
ResMed, Inc. 7,419 1,430,235
STERIS PLC 4,350 760,380
Stryker Corp. 16,703 4,053,651
Teleflex, Inc. 2,381 947,924
The Cooper Companies, Inc. 2,514 970,731
Varian Medical Systems, Inc. (a) 4,669 818,336
West Pharmaceutical Services, Inc. 3,761 1,055,525
Copyright © 2021 www.secdatabase.com. All Rights Reserved.Please Consider the Environment Before Printing This Document
Zimmer Biomet Holdings, Inc. 10,587 1,726,316
61,837,248
Health Care Providers & Services - 2.4%
AmerisourceBergen Corp. 7,565 765,729
Anthem, Inc. 12,706 3,852,332
Cardinal Health, Inc. 15,000 772,800
Centene Corp. (a) 29,620 1,733,955
Cigna Corp. 18,457 3,874,124
CVS Health Corp. 66,865 4,555,512
DaVita HealthCare Partners, Inc. (a) 3,718 379,719
HCA Holdings, Inc. 13,485 2,319,825
Henry Schein, Inc. (a) 7,239 447,732
Humana, Inc. 6,761 2,566,814
Laboratory Corp. of America Holdings (a) 4,984 1,195,711
McKesson Corp. 8,215 1,392,607
Quest Diagnostics, Inc. 6,858 792,716
UnitedHealth Group, Inc. 48,475 16,104,365
Universal Health Services, Inc. Class B 3,939 493,675
41,247,616
Health Care Technology - 0.1%
Cerner Corp. 15,567 1,076,302
Life Sciences Tools & Services - 1.2%
Agilent Technologies, Inc. 15,625 1,907,344
Bio-Rad Laboratories, Inc. Class A (a) 1,099 642,366
Illumina, Inc. (a) 7,458 3,277,120
IQVIA Holdings, Inc. (a) 9,792 1,887,800
Mettler-Toledo International, Inc. (a) 1,218 1,359,349
PerkinElmer, Inc. 5,727 722,117
Thermo Fisher Scientific, Inc. 20,248 9,113,220
Waters Corp. (a) 3,170 868,200
19,777,516
Pharmaceuticals - 3.6%
Bristol-Myers Squibb Co. 115,435 7,079,629
Catalent, Inc. (a) 8,347 949,137
Eli Lilly & Co. 40,561 8,310,543
Johnson & Johnson 134,486 21,310,652
Merck & Co., Inc. 129,239 9,385,336
Perrigo Co. PLC 7,087 286,031
Pfizer, Inc. 283,943 9,509,251
Viatris, Inc. (a) 61,817 917,982
Zoetis, Inc. Class A 24,277 3,768,761
Copyright © 2021 www.secdatabase.com. All Rights Reserved.Please Consider the Environment Before Printing This Document

61,517,322
TOTAL HEALTH CARE 215,633,548
INDUSTRIALS - 8.2%
Aerospace & Defense - 1.5%
General Dynamics Corp. 11,864 1,939,408
Howmet Aerospace, Inc. 19,882 558,883
Huntington Ingalls Industries, Inc. 2,083 366,421
L3Harris Technologies, Inc. 10,726 1,951,167
Lockheed Martin Corp. 12,574 4,152,564
Northrop Grumman Corp. 7,917 2,309,072
Raytheon Technologies Corp. 77,670 5,591,463
Teledyne Technologies, Inc. (a) 1,869 693,399
Textron, Inc. 11,801 594,062
The Boeing Co. 27,150 5,756,072
TransDigm Group, Inc. (a) 2,782 1,604,296
25,516,807
Air Freight & Logistics - 0.6%
C.H. Robinson Worldwide, Inc. 6,883 625,321
Expeditors International of Washington, Inc. 8,634 792,947
FedEx Corp. 12,343 3,141,294
United Parcel Service, Inc. Class B 36,542 5,767,424
10,326,986
Airlines - 0.3%
Alaska Air Group, Inc. 6,659 432,968
American Airlines Group, Inc. 25,724 538,661
Delta Air Lines, Inc. 33,601 1,610,832
Southwest Airlines Co. 30,458 1,770,524
United Airlines Holdings, Inc. (a) 15,467 814,802
5,167,787
Building Products - 0.4%
A.O. Smith Corp. 7,003 415,768
Allegion PLC 4,661 507,024
Carrier Global Corp. 41,708 1,523,593
Fortune Brands Home & Security, Inc. 7,091 589,546
Johnson Controls International PLC 36,967 2,062,389
Masco Corp. 13,474 717,086
Trane Technologies PLC 12,264 1,879,335
7,694,741
Commercial Services & Supplies - 0.4%
Cintas Corp. 4,499 1,459,206
Copyright © 2021 www.secdatabase.com. All Rights Reserved.Please Consider the Environment Before Printing This Document
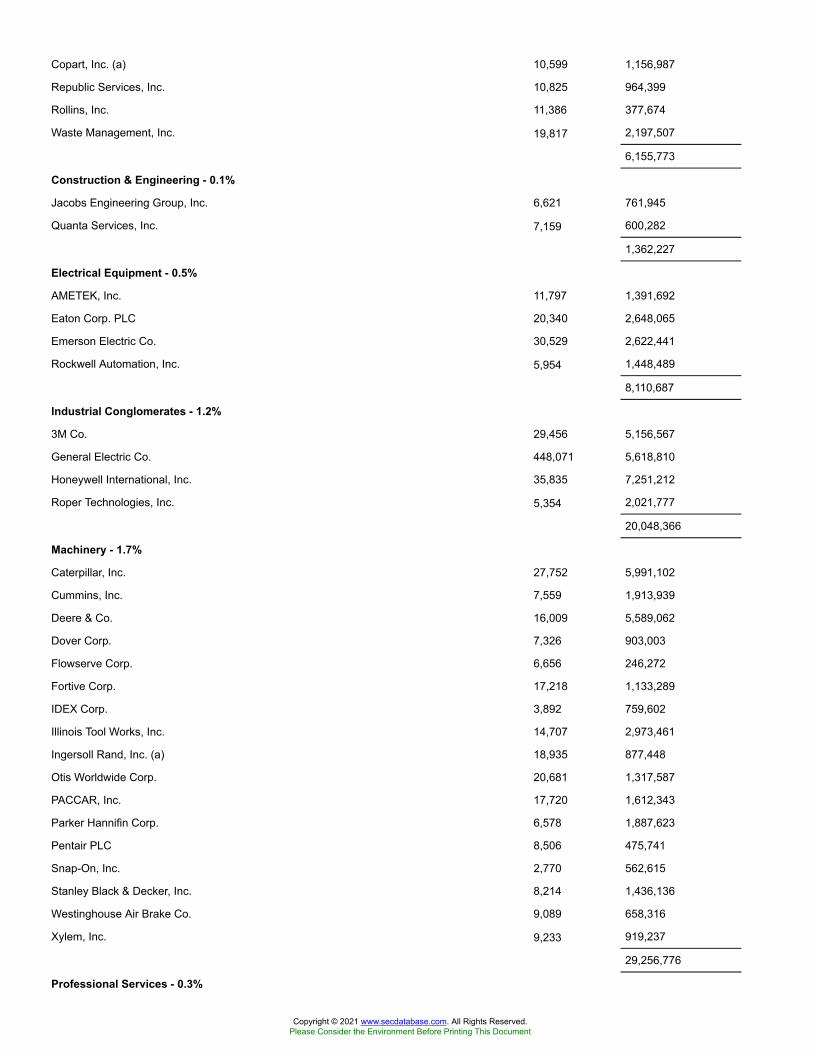
Copart, Inc. (a) 10,599 1,156,987
Republic Services, Inc. 10,825 964,399
Rollins, Inc. 11,386 377,674
Waste Management, Inc. 19,817 2,197,507
6,155,773
Construction & Engineering - 0.1%
Jacobs Engineering Group, Inc. 6,621 761,945
Quanta Services, Inc. 7,159 600,282
1,362,227
Electrical Equipment - 0.5%
AMETEK, Inc. 11,797 1,391,692
Eaton Corp. PLC 20,340 2,648,065
Emerson Electric Co. 30,529 2,622,441
Rockwell Automation, Inc. 5,954 1,448,489
8,110,687
Industrial Conglomerates - 1.2%
3M Co. 29,456 5,156,567
General Electric Co. 448,071 5,618,810
Honeywell International, Inc. 35,835 7,251,212
Roper Technologies, Inc. 5,354 2,021,777
20,048,366
Machinery - 1.7%
Caterpillar, Inc. 27,752 5,991,102
Cummins, Inc. 7,559 1,913,939
Deere & Co. 16,009 5,589,062
Dover Corp. 7,326 903,003
Flowserve Corp. 6,656 246,272
Fortive Corp. 17,218 1,133,289
IDEX Corp. 3,892 759,602
Illinois Tool Works, Inc. 14,707 2,973,461
Ingersoll Rand, Inc. (a) 18,935 877,448
Otis Worldwide Corp. 20,681 1,317,587
PACCAR, Inc. 17,720 1,612,343
Parker Hannifin Corp. 6,578 1,887,623
Pentair PLC 8,506 475,741
Snap-On, Inc. 2,770 562,615
Stanley Black & Decker, Inc. 8,214 1,436,136
Westinghouse Air Brake Co. 9,089 658,316
Xylem, Inc. 9,233 919,237
29,256,776
Professional Services - 0.3%
Copyright © 2021 www.secdatabase.com. All Rights Reserved.Please Consider the Environment Before Printing This Document
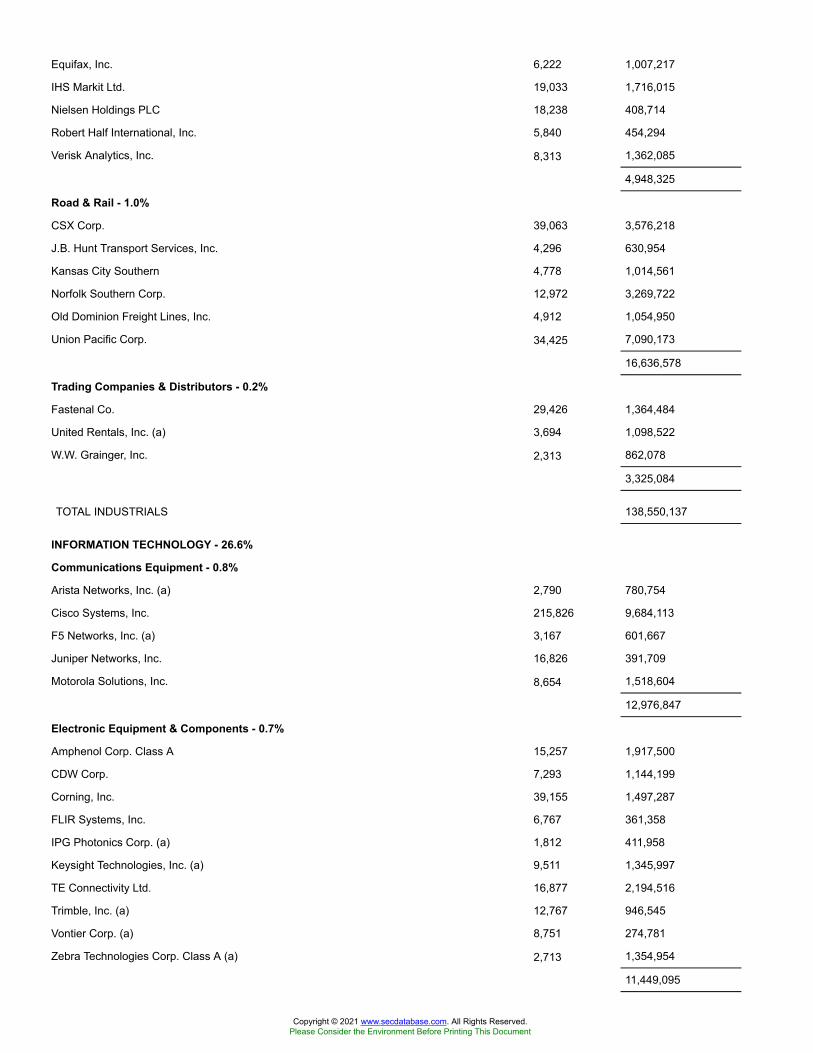
Equifax, Inc. 6,222 1,007,217
IHS Markit Ltd. 19,033 1,716,015
Nielsen Holdings PLC 18,238 408,714
Robert Half International, Inc. 5,840 454,294
Verisk Analytics, Inc. 8,313 1,362,085
4,948,325
Road & Rail - 1.0%
CSX Corp. 39,063 3,576,218
J.B. Hunt Transport Services, Inc. 4,296 630,954
Kansas City Southern 4,778 1,014,561
Norfolk Southern Corp. 12,972 3,269,722
Old Dominion Freight Lines, Inc. 4,912 1,054,950
Union Pacific Corp. 34,425 7,090,173
16,636,578
Trading Companies & Distributors - 0.2%
Fastenal Co. 29,426 1,364,484
United Rentals, Inc. (a) 3,694 1,098,522
W.W. Grainger, Inc. 2,313 862,078
3,325,084
TOTAL INDUSTRIALS 138,550,137
INFORMATION TECHNOLOGY - 26.6%
Communications Equipment - 0.8%
Arista Networks, Inc. (a) 2,790 780,754
Cisco Systems, Inc. 215,826 9,684,113
F5 Networks, Inc. (a) 3,167 601,667
Juniper Networks, Inc. 16,826 391,709
Motorola Solutions, Inc. 8,654 1,518,604
12,976,847
Electronic Equipment & Components - 0.7%
Amphenol Corp. Class A 15,257 1,917,500
CDW Corp. 7,293 1,144,199
Corning, Inc. 39,155 1,497,287
FLIR Systems, Inc. 6,767 361,358
IPG Photonics Corp. (a) 1,812 411,958
Keysight Technologies, Inc. (a) 9,511 1,345,997
TE Connectivity Ltd. 16,877 2,194,516
Trimble, Inc. (a) 12,767 946,545
Vontier Corp. (a) 8,751 274,781
Zebra Technologies Corp. Class A (a) 2,713 1,354,954
11,449,095
Copyright © 2021 www.secdatabase.com. All Rights Reserved.Please Consider the Environment Before Printing This Document

IT Services - 5.2%
Accenture PLC Class A 32,365 8,120,379
Akamai Technologies, Inc. (a) 8,275 781,988
Automatic Data Processing, Inc. 21,902 3,811,386
Broadridge Financial Solutions, Inc. 5,861 835,134
Cognizant Technology Solutions Corp. Class A 27,302 2,006,151
DXC Technology Co. 8,856 223,348
Fidelity National Information Services, Inc. 31,714 4,376,532
Fiserv, Inc. (a) 29,373 3,388,763
FleetCor Technologies, Inc. (a) 4,273 1,184,946
Gartner, Inc. (a) 4,598 823,226
Global Payments, Inc. 15,290 3,027,267
IBM Corp. 45,582 5,421,067
Jack Henry & Associates, Inc. 3,944 585,447
Leidos Holdings, Inc. 6,788 600,399
MasterCard, Inc. Class A 44,951 15,905,911
Paychex, Inc. 16,395 1,493,093
PayPal Holdings, Inc. (a) 59,859 15,554,361
The Western Union Co. 20,810 483,208
VeriSign, Inc. (a) 5,125 994,404
Visa, Inc. Class A 86,631 18,399,558
88,016,568
Semiconductors & Semiconductor Equipment - 5.4%
Advanced Micro Devices, Inc. (a) 61,443 5,192,548
Analog Devices, Inc. 18,869 2,940,168
Applied Materials, Inc. 46,655 5,514,154
Broadcom, Inc. 20,664 9,709,394
Enphase Energy, Inc. (a) 6,454 1,136,291
Intel Corp. 209,389 12,726,663
KLA Corp. 7,890 2,455,605
Lam Research Corp. 7,357 4,172,817
Maxim Integrated Products, Inc. 13,639 1,270,746
Microchip Technology, Inc. 13,299 2,029,826
Micron Technology, Inc. (a) 56,869 5,205,220
Monolithic Power Systems, Inc. 2,165 810,836
NVIDIA Corp. 31,623 17,347,745
Qorvo, Inc. (a) 5,832 1,019,025
Qualcomm, Inc. 57,778 7,868,786
Skyworks Solutions, Inc. 8,501 1,511,648
Teradyne, Inc. 8,448 1,086,497
Texas Instruments, Inc. 46,889 8,077,568
Copyright © 2021 www.secdatabase.com. All Rights Reserved.Please Consider the Environment Before Printing This Document
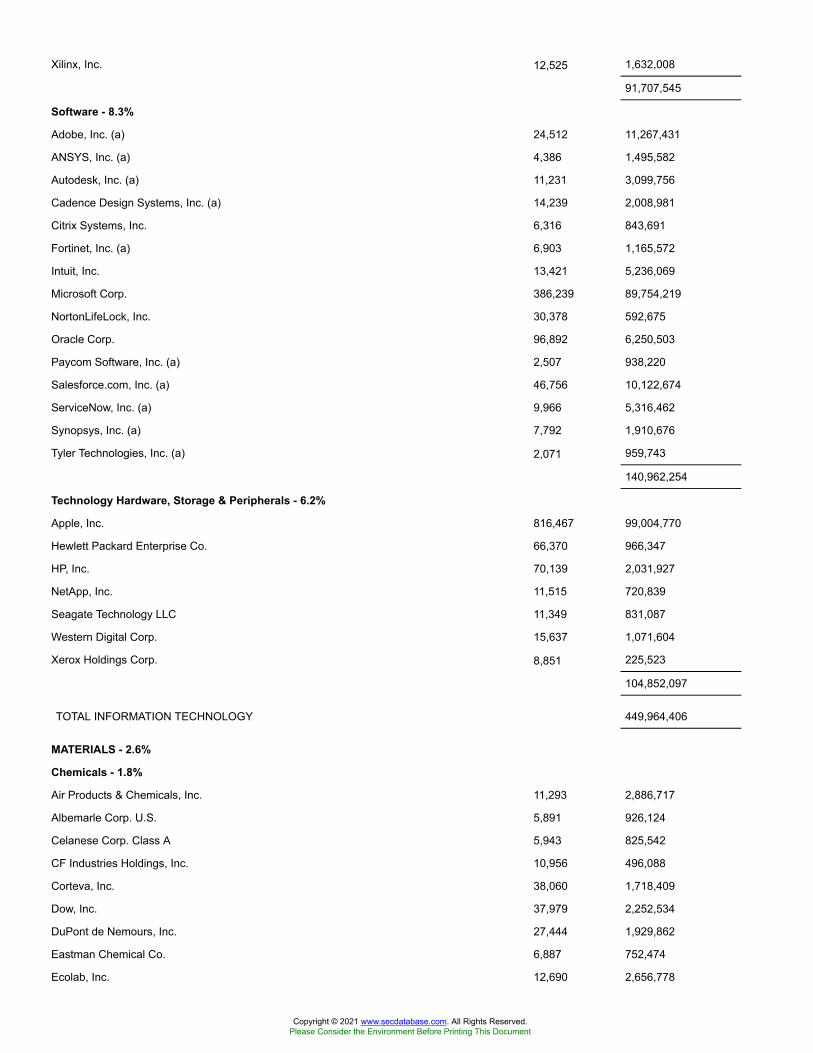
Xilinx, Inc. 12,525 1,632,008
91,707,545
Software - 8.3%
Adobe, Inc. (a) 24,512 11,267,431
ANSYS, Inc. (a) 4,386 1,495,582
Autodesk, Inc. (a) 11,231 3,099,756
Cadence Design Systems, Inc. (a) 14,239 2,008,981
Citrix Systems, Inc. 6,316 843,691
Fortinet, Inc. (a) 6,903 1,165,572
Intuit, Inc. 13,421 5,236,069
Microsoft Corp. 386,239 89,754,219
NortonLifeLock, Inc. 30,378 592,675
Oracle Corp. 96,892 6,250,503
Paycom Software, Inc. (a) 2,507 938,220
Salesforce.com, Inc. (a) 46,756 10,122,674
ServiceNow, Inc. (a) 9,966 5,316,462
Synopsys, Inc. (a) 7,792 1,910,676
Tyler Technologies, Inc. (a) 2,071 959,743
140,962,254
Technology Hardware, Storage & Peripherals - 6.2%
Apple, Inc. 816,467 99,004,770
Hewlett Packard Enterprise Co. 66,370 966,347
HP, Inc. 70,139 2,031,927
NetApp, Inc. 11,515 720,839
Seagate Technology LLC 11,349 831,087
Western Digital Corp. 15,637 1,071,604
Xerox Holdings Corp. 8,851 225,523
104,852,097
TOTAL INFORMATION TECHNOLOGY 449,964,406
MATERIALS - 2.6%
Chemicals - 1.8%
Air Products & Chemicals, Inc. 11,293 2,886,717
Albemarle Corp. U.S. 5,891 926,124
Celanese Corp. Class A 5,943 825,542
CF Industries Holdings, Inc. 10,956 496,088
Corteva, Inc. 38,060 1,718,409
Dow, Inc. 37,979 2,252,534
DuPont de Nemours, Inc. 27,444 1,929,862
Eastman Chemical Co. 6,887 752,474
Ecolab, Inc. 12,690 2,656,778
Copyright © 2021 www.secdatabase.com. All Rights Reserved.Please Consider the Environment Before Printing This Document
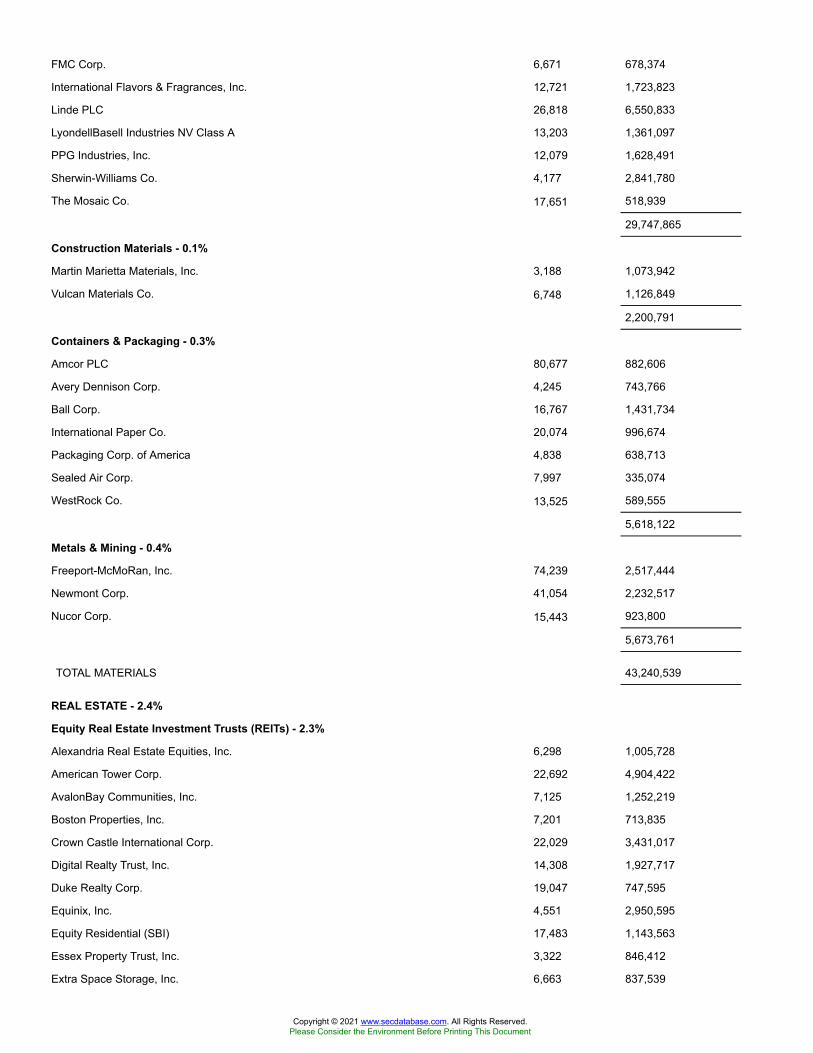
FMC Corp. 6,671 678,374
International Flavors & Fragrances, Inc. 12,721 1,723,823
Linde PLC 26,818 6,550,833
LyondellBasell Industries NV Class A 13,203 1,361,097
PPG Industries, Inc. 12,079 1,628,491
Sherwin-Williams Co. 4,177 2,841,780
The Mosaic Co. 17,651 518,939
29,747,865
Construction Materials - 0.1%
Martin Marietta Materials, Inc. 3,188 1,073,942
Vulcan Materials Co. 6,748 1,126,849
2,200,791
Containers & Packaging - 0.3%
Amcor PLC 80,677 882,606
Avery Dennison Corp. 4,245 743,766
Ball Corp. 16,767 1,431,734
International Paper Co. 20,074 996,674
Packaging Corp. of America 4,838 638,713
Sealed Air Corp. 7,997 335,074
WestRock Co. 13,525 589,555
5,618,122
Metals & Mining - 0.4%
Freeport-McMoRan, Inc. 74,239 2,517,444
Newmont Corp. 41,054 2,232,517
Nucor Corp. 15,443 923,800
5,673,761
TOTAL MATERIALS 43,240,539
REAL ESTATE - 2.4%
Equity Real Estate Investment Trusts (REITs) - 2.3%
Alexandria Real Estate Equities, Inc. 6,298 1,005,728
American Tower Corp. 22,692 4,904,422
AvalonBay Communities, Inc. 7,125 1,252,219
Boston Properties, Inc. 7,201 713,835
Crown Castle International Corp. 22,029 3,431,017
Digital Realty Trust, Inc. 14,308 1,927,717
Duke Realty Corp. 19,047 747,595
Equinix, Inc. 4,551 2,950,595
Equity Residential (SBI) 17,483 1,143,563
Essex Property Trust, Inc. 3,322 846,412
Extra Space Storage, Inc. 6,663 837,539
Copyright © 2021 www.secdatabase.com. All Rights Reserved.Please Consider the Environment Before Printing This Document
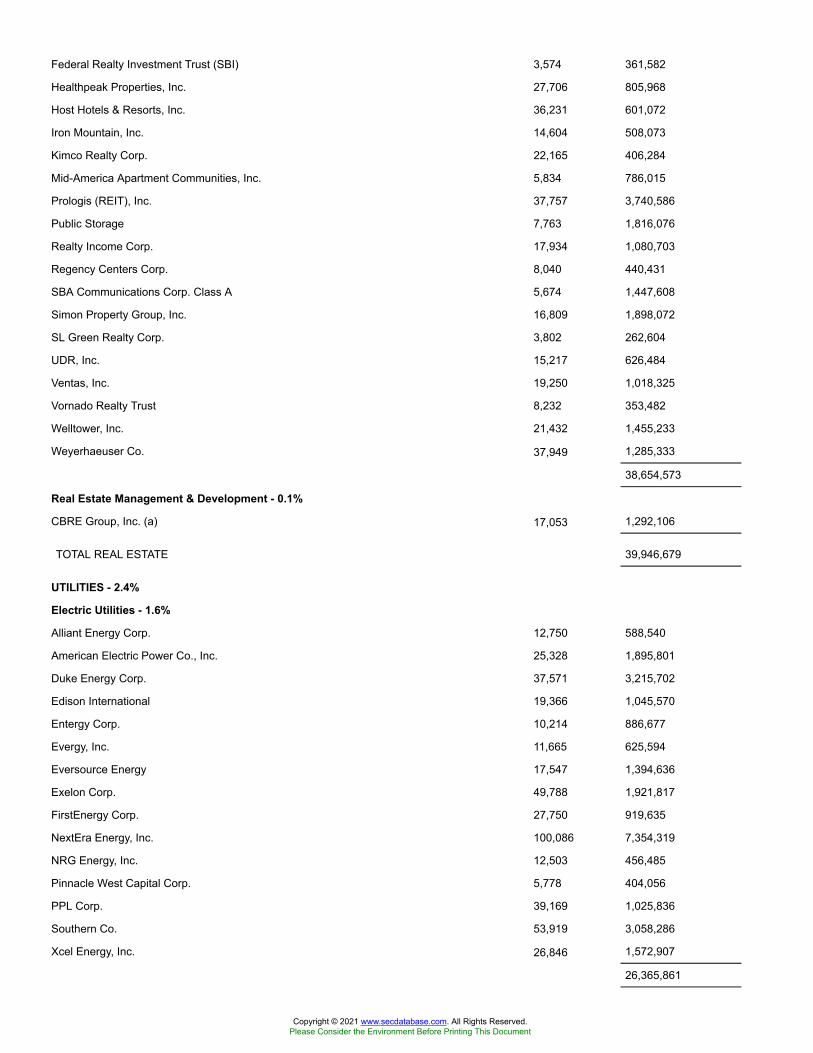
Federal Realty Investment Trust (SBI) 3,574 361,582
Healthpeak Properties, Inc. 27,706 805,968
Host Hotels & Resorts, Inc. 36,231 601,072
Iron Mountain, Inc. 14,604 508,073
Kimco Realty Corp. 22,165 406,284
Mid-America Apartment Communities, Inc. 5,834 786,015
Prologis (REIT), Inc. 37,757 3,740,586
Public Storage 7,763 1,816,076
Realty Income Corp. 17,934 1,080,703
Regency Centers Corp. 8,040 440,431
SBA Communications Corp. Class A 5,674 1,447,608
Simon Property Group, Inc. 16,809 1,898,072
SL Green Realty Corp. 3,802 262,604
UDR, Inc. 15,217 626,484
Ventas, Inc. 19,250 1,018,325
Vornado Realty Trust 8,232 353,482
Welltower, Inc. 21,432 1,455,233
Weyerhaeuser Co. 37,949 1,285,333
38,654,573
Real Estate Management & Development - 0.1%
CBRE Group, Inc. (a) 17,053 1,292,106
TOTAL REAL ESTATE 39,946,679
UTILITIES - 2.4%
Electric Utilities - 1.6%
Alliant Energy Corp. 12,750 588,540
American Electric Power Co., Inc. 25,328 1,895,801
Duke Energy Corp. 37,571 3,215,702
Edison International 19,366 1,045,570
Entergy Corp. 10,214 886,677
Evergy, Inc. 11,665 625,594
Eversource Energy 17,547 1,394,636
Exelon Corp. 49,788 1,921,817
FirstEnergy Corp. 27,750 919,635
NextEra Energy, Inc. 100,086 7,354,319
NRG Energy, Inc. 12,503 456,485
Pinnacle West Capital Corp. 5,778 404,056
PPL Corp. 39,169 1,025,836
Southern Co. 53,919 3,058,286
Xcel Energy, Inc. 26,846 1,572,907
26,365,861
Copyright © 2021 www.secdatabase.com. All Rights Reserved.Please Consider the Environment Before Printing This Document
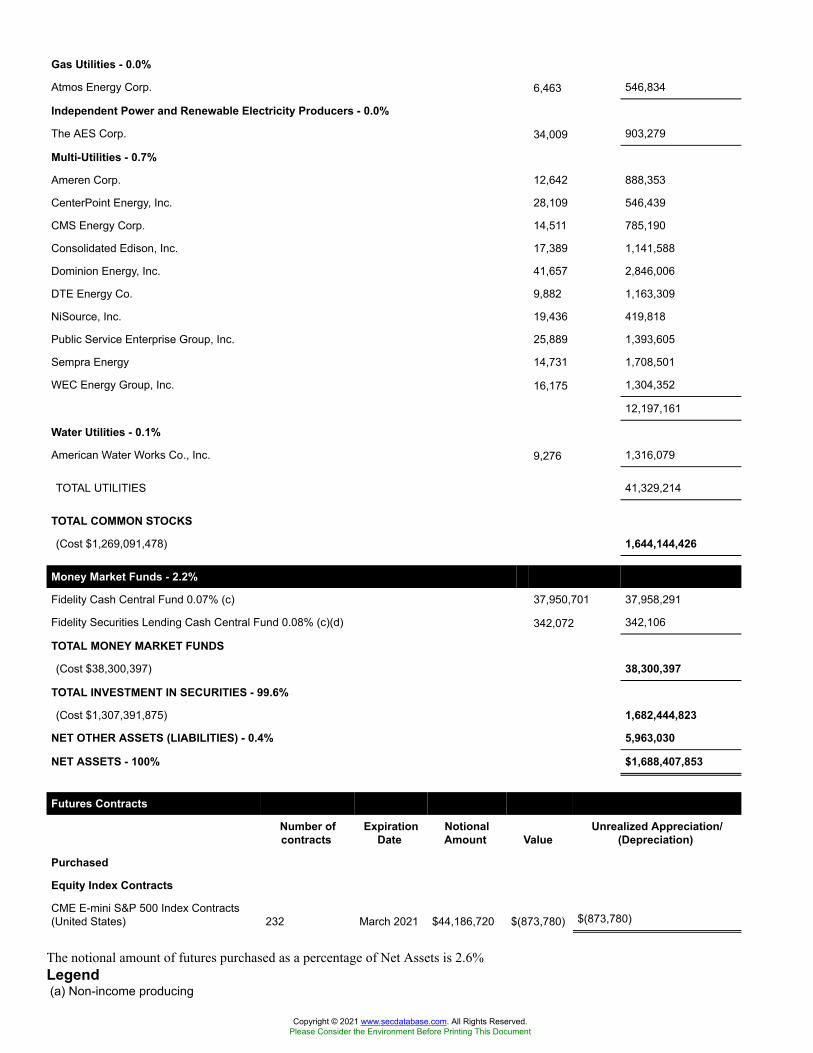
Gas Utilities - 0.0%
Atmos Energy Corp. 6,463 546,834
Independent Power and Renewable Electricity Producers - 0.0%
The AES Corp. 34,009 903,279
Multi-Utilities - 0.7%
Ameren Corp. 12,642 888,353
CenterPoint Energy, Inc. 28,109 546,439
CMS Energy Corp. 14,511 785,190
Consolidated Edison, Inc. 17,389 1,141,588
Dominion Energy, Inc. 41,657 2,846,006
DTE Energy Co. 9,882 1,163,309
NiSource, Inc. 19,436 419,818
Public Service Enterprise Group, Inc. 25,889 1,393,605
Sempra Energy 14,731 1,708,501
WEC Energy Group, Inc. 16,175 1,304,352
12,197,161
Water Utilities - 0.1%
American Water Works Co., Inc. 9,276 1,316,079
TOTAL UTILITIES 41,329,214
TOTAL COMMON STOCKS
(Cost $1,269,091,478) 1,644,144,426
Money Market Funds - 2.2%
Fidelity Cash Central Fund 0.07% (c) 37,950,701 37,958,291
Fidelity Securities Lending Cash Central Fund 0.08% (c)(d) 342,072 342,106
TOTAL MONEY MARKET FUNDS
(Cost $38,300,397) 38,300,397
TOTAL INVESTMENT IN SECURITIES - 99.6%
(Cost $1,307,391,875) 1,682,444,823
NET OTHER ASSETS (LIABILITIES) - 0.4% 5,963,030
NET ASSETS - 100% $1,688,407,853
Futures Contracts
Number ofcontracts
ExpirationDate
NotionalAmount Value
Unrealized Appreciation/(Depreciation)
Purchased
Equity Index Contracts
CME E-mini S&P 500 Index Contracts(United States) 232 March 2021 $44,186,720 $(873,780) $(873,780)
The notional amount of futures purchased as a percentage of Net Assets is 2.6%Legend(a) Non-income producing
Copyright © 2021 www.secdatabase.com. All Rights Reserved.Please Consider the Environment Before Printing This Document
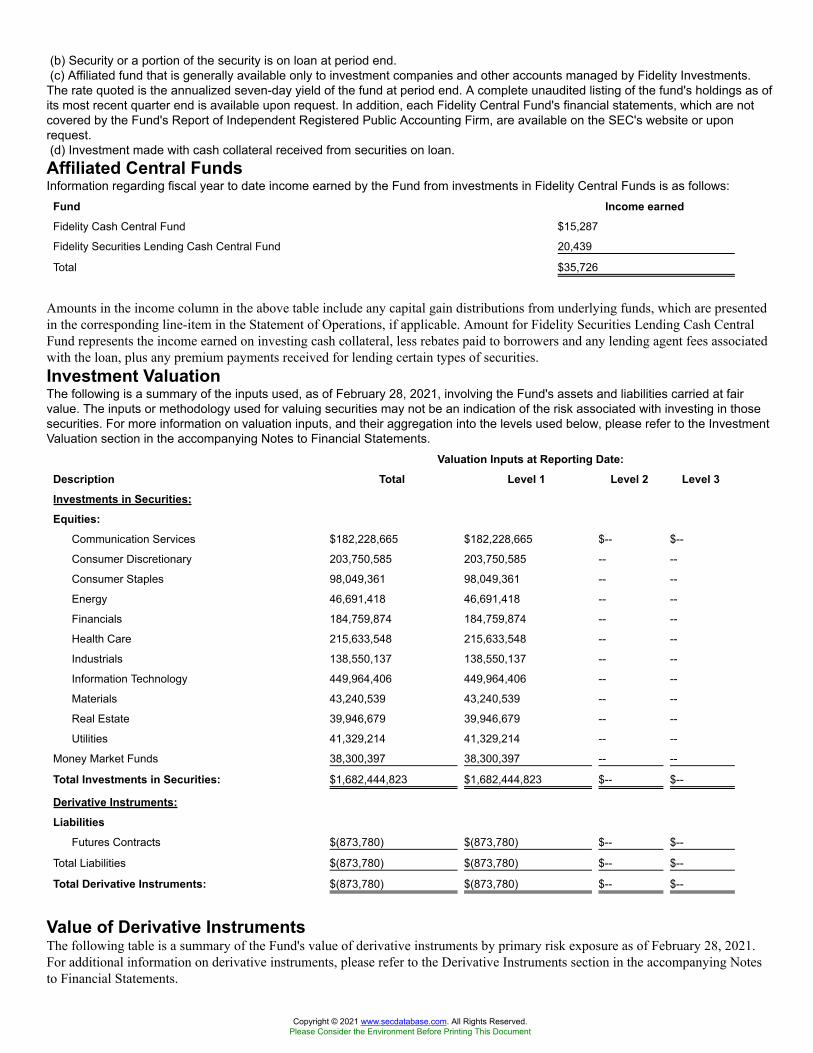
(b) Security or a portion of the security is on loan at period end.(c) Affiliated fund that is generally available only to investment companies and other accounts managed by Fidelity Investments.
The rate quoted is the annualized seven-day yield of the fund at period end. A complete unaudited listing of the fund's holdings as ofits most recent quarter end is available upon request. In addition, each Fidelity Central Fund's financial statements, which are notcovered by the Fund's Report of Independent Registered Public Accounting Firm, are available on the SEC's website or uponrequest.(d) Investment made with cash collateral received from securities on loan.Affiliated Central FundsInformation regarding fiscal year to date income earned by the Fund from investments in Fidelity Central Funds is as follows:
Fund Income earnedFidelity Cash Central Fund $15,287
Fidelity Securities Lending Cash Central Fund 20,439
Total $35,726
Amounts in the income column in the above table include any capital gain distributions from underlying funds, which are presentedin the corresponding line-item in the Statement of Operations, if applicable. Amount for Fidelity Securities Lending Cash CentralFund represents the income earned on investing cash collateral, less rebates paid to borrowers and any lending agent fees associatedwith the loan, plus any premium payments received for lending certain types of securities.Investment ValuationThe following is a summary of the inputs used, as of February 28, 2021, involving the Fund's assets and liabilities carried at fairvalue. The inputs or methodology used for valuing securities may not be an indication of the risk associated with investing in thosesecurities. For more information on valuation inputs, and their aggregation into the levels used below, please refer to the InvestmentValuation section in the accompanying Notes to Financial Statements.
Valuation Inputs at Reporting Date:Description Total Level 1 Level 2 Level 3Investments in Securities:Equities:
Communication Services $182,228,665 $182,228,665 $-- $--
Consumer Discretionary 203,750,585 203,750,585 -- --
Consumer Staples 98,049,361 98,049,361 -- --
Energy 46,691,418 46,691,418 -- --
Financials 184,759,874 184,759,874 -- --
Health Care 215,633,548 215,633,548 -- --
Industrials 138,550,137 138,550,137 -- --
Information Technology 449,964,406 449,964,406 -- --
Materials 43,240,539 43,240,539 -- --
Real Estate 39,946,679 39,946,679 -- --
Utilities 41,329,214 41,329,214 -- --
Money Market Funds 38,300,397 38,300,397 -- --
Total Investments in Securities: $1,682,444,823 $1,682,444,823 $-- $--
Derivative Instruments:Liabilities
Futures Contracts $(873,780) $(873,780) $-- $--
Total Liabilities $(873,780) $(873,780) $-- $--
Total Derivative Instruments: $(873,780) $(873,780) $-- $--
Value of Derivative InstrumentsThe following table is a summary of the Fund's value of derivative instruments by primary risk exposure as of February 28, 2021.For additional information on derivative instruments, please refer to the Derivative Instruments section in the accompanying Notesto Financial Statements.
Copyright © 2021 www.secdatabase.com. All Rights Reserved.Please Consider the Environment Before Printing This Document

Primary Risk Exposure / Derivative Type ValueAsset Liability
Equity Risk
Futures Contracts(a) $0 $(873,780)
Total Equity Risk 0 (873,780)
Total Value of Derivatives $0 $(873,780)
(a) Reflects gross cumulative appreciation (depreciation) on futures contracts as presented in the Schedule of Investments. In theStatement of Assets and Liabilities, the period end daily variation margin is included in receivable or payable for daily variationmargin on futures contracts, and the net cumulative appreciation (depreciation) is included in Total accumulated earnings (loss).See accompanying notes which are an integral part of the financial statements.
Financial StatementsStatement of Assets and Liabilities
February 28,2021
AssetsInvestment in securities, at value (including securities loaned of $342,896) � See accompanyingschedule:Unaffiliated issuers (cost $1,269,091,478) $1,644,144,426
Fidelity Central Funds (cost $38,300,397) 38,300,397
Total Investment in Securities (cost $1,307,391,875) $1,682,444,823
Segregated cash with brokers for derivative instruments 2,222,000
Cash 21
Receivable for fund shares sold 4,515,379
Dividends receivable 2,254,414
Interest receivable 139
Distributions receivable from Fidelity Central Funds 1,440
Total assets 1,691,438,216
LiabilitiesPayable for investments purchased $279,724
Payable for fund shares redeemed 2,185,567
Payable for daily variation margin on futures contracts 222,872
Collateral on securities loaned 342,200
Total liabilities 3,030,363
Net Assets $1,688,407,853
Net Assets consist of:
Paid in capital $1,320,106,144
Total accumulated earnings (loss) 368,301,709
Net Assets $1,688,407,853
Net Asset Value, offering price and redemption price per share ($1,688,407,853 ÷ 103,726,572shares) $16.28
See accompanying notes which are an integral part of the financial statements.
Statement of OperationsYear ended February 28, 2021
Copyright © 2021 www.secdatabase.com. All Rights Reserved.Please Consider the Environment Before Printing This Document

Investment IncomeDividends $20,241,597
Interest 533
Income from Fidelity Central Funds (including $20,439 from security lending) 35,726
Total income 20,277,856
ExpensesIndependent trustees' fees and expenses $6,001
Interest 65
Reports to shareholders 20,951
Commitment fees 2,412
Total expenses before reductions 29,429
Expense reductions (72)
Total expenses after reductions 29,357
Net investment income (loss) 20,248,499
Realized and Unrealized Gain (Loss)Net realized gain (loss) on:
Investment securities:
Unaffiliated issuers (9,374,272)
Fidelity Central Funds (826)
Futures contracts 3,055,211
Total net realized gain (loss) (6,319,887)
Change in net unrealized appreciation (depreciation) on:
Investment securities:
Unaffiliated issuers 323,523,908
Futures contracts (596,259)
Total change in net unrealized appreciation (depreciation) 322,927,649
Net gain (loss) 316,607,762
Net increase (decrease) in net assets resulting from operations $336,856,261
See accompanying notes which are an integral part of the financial statements.
Statement of Changes in Net AssetsYear ended February 28,
2021Year ended February 29,
2020Increase (Decrease) in Net AssetsOperations
Net investment income (loss) $20,248,499 $14,358,500
Net realized gain (loss) (6,319,887) 209,958
Change in net unrealized appreciation (depreciation) 322,927,649 26,969,641
Net increase (decrease) in net assets resulting from operations 336,856,261 41,538,099
Distributions to shareholders (20,318,634) (13,704,827)
Share transactions
Proceeds from sales of shares 994,146,861 471,638,049
Reinvestment of distributions 14,393,109 4,051,846
Cost of shares redeemed (483,146,638) (210,883,239)
Net increase (decrease) in net assets resulting from sharetransactions 525,393,332 264,806,656
Copyright © 2021 www.secdatabase.com. All Rights Reserved.Please Consider the Environment Before Printing This Document
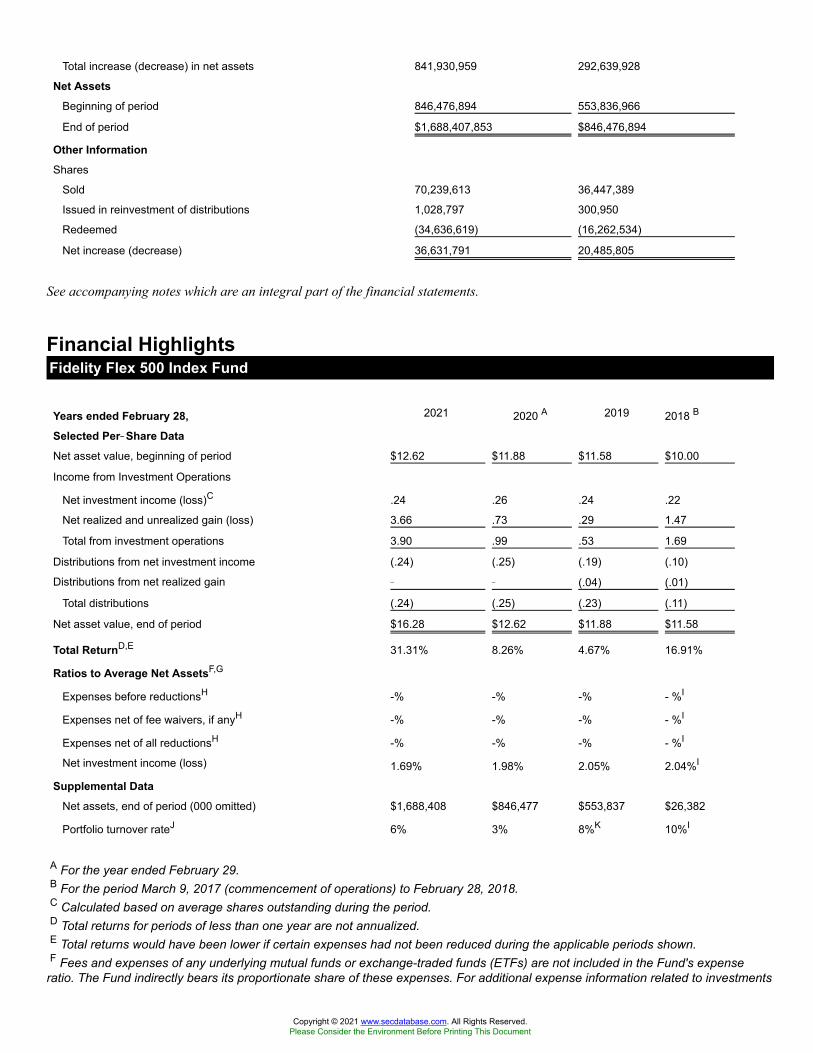
Total increase (decrease) in net assets 841,930,959 292,639,928
Net AssetsBeginning of period 846,476,894 553,836,966
End of period $1,688,407,853 $846,476,894
Other InformationShares
Sold 70,239,613 36,447,389
Issued in reinvestment of distributions 1,028,797 300,950
Redeemed (34,636,619) (16,262,534)
Net increase (decrease) 36,631,791 20,485,805
See accompanying notes which are an integral part of the financial statements.
Financial HighlightsFidelity Flex 500 Index Fund
Years ended February 28, 2021 2020 A 2019 2018 B
Selected Per��Share DataNet asset value, beginning of period $12.62 $11.88 $11.58 $10.00
Income from Investment Operations
Net investment income (loss)C .24 .26 .24 .22
Net realized and unrealized gain (loss) 3.66 .73 .29 1.47
Total from investment operations 3.90 .99 .53 1.69
Distributions from net investment income (.24) (.25) (.19) (.10)
Distributions from net realized gain � � (.04) (.01)
Total distributions (.24) (.25) (.23) (.11)
Net asset value, end of period $16.28 $12.62 $11.88 $11.58
Total ReturnD,E 31.31% 8.26% 4.67% 16.91%
Ratios to Average Net AssetsF,G
Expenses before reductionsH -% -% -% - %I
Expenses net of fee waivers, if anyH -% -% -% - %I
Expenses net of all reductionsH -% -% -% - %I
Net investment income (loss) 1.69% 1.98% 2.05% 2.04%I
Supplemental DataNet assets, end of period (000 omitted) $1,688,408 $846,477 $553,837 $26,382
Portfolio turnover rateJ 6% 3% 8%K 10%I
A For the year ended February 29.B For the period March 9, 2017 (commencement of operations) to February 28, 2018.C Calculated based on average shares outstanding during the period.D Total returns for periods of less than one year are not annualized.E Total returns would have been lower if certain expenses had not been reduced during the applicable periods shown.F Fees and expenses of any underlying mutual funds or exchange-traded funds (ETFs) are not included in the Fund's expense
ratio. The Fund indirectly bears its proportionate share of these expenses. For additional expense information related to investments
Copyright © 2021 www.secdatabase.com. All Rights Reserved.Please Consider the Environment Before Printing This Document
in Fidelity Central Funds, please refer to the "Investments in Fidelity Central Funds" note found in the Notes to Financial Statementssection of the most recent Annual or Semi-Annual report.G Expense ratios reflect operating expenses of the class. Expenses before reductions do not reflect amounts reimbursed, waived,
or reduced through arrangements with the investment advisor, brokerage services, or other offset arrangements, if applicable, anddo not represent the amount paid by the class during periods when reimbursements, waivers or reductions occur.H Amount represents less than .005%.I AnnualizedJ Amount does not include the portfolio activity of any underlying mutual funds or exchange-traded funds (ETFs).K Portfolio turnover rate excludes securities received or delivered in-kind.
See accompanying notes which are an integral part of the financial statements.
Notes to Financial StatementsFor the period ended February 28, 2021
1. Organization.Fidelity Flex 500 Index Fund (the Fund) is a fund of Fidelity Concord Street Trust (the Trust) and is authorized to issue an unlimitednumber of shares. Share transactions on the Statement of Changes in Net Assets may contain exchanges between affiliated funds.The Trust is registered under the Investment Company Act of 1940, as amended (the 1940 Act), as an open-end managementinvestment company organized as a Massachusetts business trust. The Fund is available only to certain fee-based accounts andadvisory programs offered by Fidelity.2. Investments in Fidelity Central Funds.The Fund invests in Fidelity Central Funds, which are open-end investment companies generally available only to other investmentcompanies and accounts managed by the investment adviser and its affiliates. The Fund's Schedule of Investments lists each of theFidelity Central Funds held as of period end, if any, as an investment of the Fund, but does not include the underlying holdings ofeach Fidelity Central Fund. As an Investing Fund, the Fund indirectly bears its proportionate share of the expenses of the underlyingFidelity Central Funds.The Money Market Central Funds seek preservation of capital and current income and are managed by the investment adviser.Annualized expenses of the Money Market Central Funds as of their most recent shareholder report date ranged from less than.005% to .01%.A complete unaudited list of holdings for each Fidelity Central Fund is available upon request or at the Securities and ExchangeCommission (the SEC) website at www.sec.gov. In addition, the financial statements of the Fidelity Central Funds, which are notcovered by the Fund's Report of Independent Registered Public Accounting Firm, are available on the SEC website or upon request.3. Significant Accounting Policies.The Fund is an investment company and applies the accounting and reporting guidance of the Financial Accounting StandardsBoard (FASB) Accounting Standards Codification Topic 946 Financial Services - Investment Companies. The financial statementshave been prepared in conformity with accounting principles generally accepted in the United States of America (GAAP), whichrequire management to make certain estimates and assumptions at the date of the financial statements. Actual results could differfrom those estimates. Subsequent events, if any, through the date that the financial statements were issued have been evaluated in thepreparation of the financial statements. The following summarizes the significant accounting policies of the Fund:Investment Valuation. Investments are valued as of 4:00 p.m. Eastern time on the last calendar day of the period. The Board ofTrustees (the Board) has delegated the day to day responsibility for the valuation of the Fund's investments to the Fair ValueCommittee (the Committee) established by the Fund's investment adviser. In accordance with valuation policies and proceduresapproved by the Board, the Fund attempts to obtain prices from one or more third party pricing vendors or brokers to value itsinvestments. When current market prices, quotations or currency exchange rates are not readily available or reliable, investmentswill be fair valued in good faith by the Committee, in accordance with procedures adopted by the Board. Factors used indetermining fair value vary by investment type and may include market or investment specific events. The frequency with whichthese procedures are used cannot be predicted and they may be utilized to a significant extent. The Committee oversees the Fund'svaluation policies and procedures and reports to the Board on the Committee's activities and fair value determinations. The Boardmonitors the appropriateness of the procedures used in valuing the Fund's investments and ratifies the fair value determinations ofthe Committee.The Fund categorizes the inputs to valuation techniques used to value its investments into a disclosure hierarchy consisting of threelevels as shown below:
Level 1 � quoted prices in active markets for identical investments
Copyright © 2021 www.secdatabase.com. All Rights Reserved.Please Consider the Environment Before Printing This Document
Level 2 � other significant observable inputs (including quoted prices for similar investments, interest rates, prepaymentspeeds, etc.)
Level 3 � unobservable inputs (including the Fund's own assumptions based on the best information available)
Valuation techniques used to value the Fund's investments by major category are as follows:Equity securities, including restricted securities, for which market quotations are readily available, are valued at the last reportedsale price or official closing price as reported by a third party pricing vendor on the primary market or exchange on which they aretraded and are categorized as Level 1 in the hierarchy. In the event there were no sales during the day or closing prices are notavailable, securities are valued at the last quoted bid price or may be valued using the last available price and are generallycategorized as Level 2 in the hierarchy. For foreign equity securities, when market or security specific events arise, comparisons tothe valuation of American Depositary Receipts (ADRs), futures contracts, Exchange-Traded Funds (ETFs) and certain indexes aswell as quoted prices for similar securities may be used and would be categorized as Level 2 in the hierarchy. For equity securities,including restricted securities, where observable inputs are limited, assumptions about market activity and risk are used and thesesecurities may be categorized as Level 3 in the hierarchy.Futures contracts are valued at the settlement price established each day by the board of trade or exchange on which they are tradedand are categorized as Level 1 in the hierarchy. Investments in open-end mutual funds, including the Fidelity Central Funds, arevalued at their closing net asset value (NAV) each business day and are categorized as Level 1 in the hierarchy.Changes in valuation techniques may result in transfers in or out of an assigned level within the disclosure hierarchy. The aggregatevalue of investments by input level as of February 28, 2021 is included at the end of the Fund's Schedule of Investments.Investment Transactions and Income. For financial reporting purposes, the Fund's investment holdings and NAV include tradesexecuted through the end of the last business day of the period. The NAV per share for processing shareholder transactions iscalculated as of the close of business of the New York Stock Exchange (NYSE), normally 4:00 p.m. Eastern time and includestrades executed through the end of the prior business day. Gains and losses on securities sold are determined on the basis ofidentified cost. Dividend income is recorded on the ex-dividend date, except for certain dividends from foreign securities where theex-dividend date may have passed, which are recorded as soon as the Fund is informed of the ex-dividend date. Non-cash dividendsincluded in dividend income, if any, are recorded at the fair market value of the securities received. Income and capital gaindistributions from Fidelity Central Funds, if any, are recorded on the ex-dividend date. Certain distributions received by the Fundrepresent a return of capital or capital gain. The Fund determines the components of these distributions subsequent to the ex-dividend date, based upon receipt of tax filings or other correspondence relating to the underlying investment. These distributionsare recorded as a reduction of cost of investments and/or as a realized gain. Interest income is accrued as earned and includescoupon interest and amortization of premium and accretion of discount on debt securities as applicable.Expenses. Expenses directly attributable to a fund are charged to that fund. Expenses attributable to more than one fund areallocated among the respective funds on the basis of relative net assets or other appropriate methods. Expense estimates are accruedin the period to which they relate and adjustments are made when actual amounts are known.Income Tax Information and Distributions to Shareholders. Each year, the Fund intends to qualify as a regulated investmentcompany under Subchapter M of the Internal Revenue Code, including distributing substantially all of its taxable income andrealized gains. As a result, no provision for U.S. Federal income taxes is required. As of February 28, 2021, the Fund did not haveany unrecognized tax benefits in the financial statements; nor is the Fund aware of any tax positions for which it is reasonablypossible that the total amounts of unrecognized tax benefits will significantly change in the next twelve months. The Fund files aU.S. federal tax return, in addition to state and local tax returns as required. The Fund's federal income tax returns are subject toexamination by the Internal Revenue Service (IRS) for a period of three fiscal years after they are filed. State and local tax returnsmay be subject to examination for an additional fiscal year depending on the jurisdiction.Distributions are declared and recorded on the ex-dividend date. Income and capital gain distributions are determined in accordancewith income tax regulations, which may differ from GAAP.Capital accounts within the financial statements are adjusted for permanent book-tax differences. These adjustments have no impacton net assets or the results of operations. Capital accounts are not adjusted for temporary book-tax differences which will reverse ina subsequent period.Book-tax differences are primarily due to futures contracts, short-term gain distributions from the Underlying Funds, marketdiscount, capital loss carryforwards, certain deemed distributions and losses deferred due to wash sales.As of period end, the cost and unrealized appreciation (depreciation) in securities, and derivatives if applicable, for federal incometax purposes were as follows:
Gross unrealized appreciation $410,168,598
Gross unrealized depreciation (44,839,437)
Net unrealized appreciation (depreciation) $365,329,161
Tax Cost $1,317,115,662
Copyright © 2021 www.secdatabase.com. All Rights Reserved.Please Consider the Environment Before Printing This Document
The tax-based components of distributable earnings as of period end were as follows:Undistributed ordinary income $3,492,506
Capital loss carryforward $(519,957)
Net unrealized appreciation (depreciation) on securities and other investments $365,329,161
Capital loss carryforwards are only available to offset future capital gains of the Fund to the extent provided by regulations and maybe limited. The capital loss carryforward information presented below, including any applicable limitation, is estimated as of fiscalperiod end and is subject to adjustment.
No expiration
Long-term $(519,957)
The tax character of distributions paid was as follows:February 28, 2021 February 29, 2020
Ordinary Income $20,318,634 $ 13,704,827
4. Derivative Instruments.Risk Exposures and the Use of Derivative Instruments. The Fund's investment objective allows the Fund to enter into varioustypes of derivative contracts, including futures contracts. Derivatives are investments whose value is primarily derived fromunderlying assets, indices or reference rates and may be transacted on an exchange or over-the-counter (OTC). Derivatives mayinvolve a future commitment to buy or sell a specified asset based on specified terms, to exchange future cash flows at periodicintervals based on a notional principal amount, or for one party to make one or more payments upon the occurrence of specifiedevents in exchange for periodic payments from the other party.The Fund used derivatives to increase returns and to manage exposure to certain risks as defined below. The success of any strategyinvolving derivatives depends on analysis of numerous economic factors, and if the strategies for investment do not work asintended, the Fund may not achieve its objectives.The Fund's use of derivatives increased or decreased its exposure to the following risk:
EquityRisk
Equity risk relates to the fluctuations in the value of financial instruments as a result of changes in market prices (other than thosearising from interest rate risk or foreign exchange risk), whether caused by factors specific to an individual investment, its issuer,or all factors affecting all instruments traded in a market or market segment.
The Fund is also exposed to additional risks from investing in derivatives, such as liquidity risk and counterparty credit risk.Liquidity risk is the risk that the Fund will be unable to close out the derivative in the open market in a timely manner. Counterpartycredit risk is the risk that the counterparty will not be able to fulfill its obligation to the Fund. Counterparty credit risk related toexchange-traded futures contracts may be mitigated by the protection provided by the exchange on which they trade.Investing in derivatives may involve greater risks than investing in the underlying assets directly and, to varying degrees, mayinvolve risk of loss in excess of any initial investment and collateral received and amounts recognized in the Statement of Assets andLiabilities. In addition, there may be the risk that the change in value of the derivative contract does not correspond to the change invalue of the underlying instrument.Futures Contracts. A futures contract is an agreement between two parties to buy or sell a specified underlying instrument for afixed price at a specified future date. The Fund used futures contracts to manage its exposure to the stock market.Upon entering into a futures contract, a fund is required to deposit either cash or securities (initial margin) with a clearing broker inan amount equal to a certain percentage of the face value of the contract. Futures contracts are marked-to-market daily andsubsequent daily payments (variation margin) are made or received by a fund depending on the daily fluctuations in the value of thefutures contracts and are recorded as unrealized appreciation or (depreciation). This receivable and/or payable, if any, is included indaily variation margin on futures contracts in the Statement of Assets and Liabilities. Realized gain or (loss) is recorded upon theexpiration or closing of a futures contract. The net realized gain (loss) and change in net unrealized appreciation (depreciation) onfutures contracts during the period is presented in the Statement of Operations.Any open futures contracts at period end are presented in the Schedule of Investments under the caption "Futures Contracts". Thenotional amount at value reflects each contract's exposure to the underlying instrument or index at period end and is representativeof volume of activity during the period. Cash deposited to meet initial margin requirements is presented as segregated cash withbrokers for derivative instruments in the Statement of Assets and Liabilities.
Copyright © 2021 www.secdatabase.com. All Rights Reserved.Please Consider the Environment Before Printing This Document
5. Purchases and Sales of Investments.Purchases and sales of securities, other than short-term securities, are noted in the table below.
Purchases ($) Sales ($)Fidelity Flex 500 Index Fund 569,272,080 74,673,335
6. Fees and Other Transactions with Affiliates.Management Fee. Fidelity Management & Research Company LLC (the investment adviser) and its affiliates provide the Fundwith investment management related services and the Fund does not pay any fees for these services. Under the managementcontract, the investment adviser or an affiliate pays all other expenses of the Fund, excluding fees and expenses of the independentTrustees, and certain miscellaneous expenses such as proxy and shareholder meeting expenses.Sub-Adviser. Geode Capital Management, LLC (Geode), serves as sub-adviser for the Fund. Geode provides discretionaryinvestment advisory services to the Fund and is paid by the investment adviser for providing these services.Interfund Lending Program. Pursuant to an Exemptive Order issued by the SEC, the Fund, along with other registered investmentcompanies having management contracts with Fidelity Management & Research Company LLC (FMR), or other affiliated entitiesof FMR, may participate in an interfund lending program. This program provides an alternative credit facility allowing the Fund toborrow from, or lend money to, other participating affiliated funds. At period end, there were no interfund loans outstanding.Activity in this program during the period for which loans were outstanding was as follows:
Borrower or Lender Average Loan Balance Weighted Average Interest Rate Interest ExpenseFidelity Flex 500 Index Fund Borrower $7,033,000 .34% $65
Interfund Trades. Funds may purchase from or sell securities to other Fidelity Funds under procedures adopted by the Board. Theprocedures have been designed to ensure these interfund trades are executed in accordance with Rule 17a-7 of the 1940 Act. Anyinterfund trades are included within the respective purchases and sales amounts shown in the Purchases and Sales of Investmentsnote.7. Committed Line of Credit.Certain Funds participate with other funds managed by the investment adviser or an affiliate in a $4.25 billion credit facility (the"line of credit") to be utilized for temporary or emergency purposes to fund shareholder redemptions or for other short-term liquiditypurposes. The participating funds have agreed to pay commitment fees on their pro-rata portion of the line of credit, which arereflected in Miscellaneous expenses on the Statement of Operations, and are listed below. Effective during January 2021,commitment fees are borne by the investment advisor.
AmountFidelity Flex 500 Index Fund $2,412
During the period, there were no borrowings on this line of credit.8. Security Lending.Funds lend portfolio securities through a lending agent from time to time in order to earn additional income. A fund may lendsecurities to certain qualified borrowers, including NFS. On the settlement date of the loan, a fund receives collateral (in the form ofU.S. Treasury obligations, letters of credit and/or cash) against the loaned securities and maintains collateral in an amount not lessthan 100% of the market value of the loaned securities during the period of the loan. The market value of the loaned securities isdetermined at the close of business of a fund and any additional required collateral is delivered to a fund on the next business day.The Fund or borrower may terminate the loan at any time, and if the borrower defaults on its obligation to return the securitiesloaned because of insolvency or other reasons, a fund may apply collateral received from the borrower against the obligation. Afund may experience delays and costs in recovering the securities loaned. Any cash collateral received is invested in the FidelitySecurities Lending Cash Central Fund. Any loaned securities are identified as such in the Schedule of Investments, and the value ofloaned securities and cash collateral at period end, as applicable, are presented in the Statement of Assets and Liabilities. Securitylending income represents the income earned on investing cash collateral, less rebates paid to borrowers and any lending agent feesassociated with the loan, plus any premium payments received for lending certain types of securities. Security lending income ispresented in the Statement of Operations as a component of income from Fidelity Central Funds.
Security Lending Income From Securities Loaned toNFS
Value of Securities Loaned to NFS at PeriodEnd
Fidelity Flex 500 IndexFund $10 $�
9. Expense Reductions.
Copyright © 2021 www.secdatabase.com. All Rights Reserved.Please Consider the Environment Before Printing This Document
Through arrangements with the Fund's custodian, credits realized as a result of certain uninvested cash balances were used to reducethe Fund's expenses by $72.10. Other.The Fund's organizational documents provide former and current trustees and officers with a limited indemnification againstliabilities arising in connection with the performance of their duties to the Fund. In the normal course of business, the Fund may alsoenter into contracts that provide general indemnifications. The Fund's maximum exposure under these arrangements is unknown asthis would be dependent on future claims that may be made against the Fund. The risk of material loss from such claims isconsidered remote.11. Coronavirus (COVID-19) Pandemic.An outbreak of COVID-19 first detected in China during December 2019 has since spread globally and was declared a pandemic bythe World Health Organization during March 2020. Developments that disrupt global economies and financial markets, such as theCOVID-19 pandemic, may magnify factors that affect the Fund's performance.
Report of Independent Registered Public Accounting FirmTo the Board of Trustees of Fidelity Concord Street Trust and Shareholders of Fidelity Flex 500 Index FundOpinion on the Financial Statements and Financial HighlightsWe have audited the accompanying statement of assets and liabilities of Fidelity Flex 500 Index Fund (the "Fund"), a fund ofFidelity Concord Street Trust, including the schedule of investments, as of February 28, 2021, the related statement of operations forthe year then ended, the statement of changes in net assets for each of the two years in the period then ended, the financial highlightsfor each of the three years in the period then ended and for the period from March 9, 2017 (commencement of operations) toFebruary 28, 2018, and the related notes. In our opinion, the financial statements and financial highlights present fairly, in allmaterial respects, the financial position of the Fund as of February 28, 2021, and the results of its operations for the year then ended,the changes in its net assets for each of the two years in the period then ended, and the financial highlights for each of the three yearsin the period then ended and for the period from March 9, 2017 (commencement of operations) to February 28, 2018, in conformitywith accounting principles generally accepted in the United States of America.Basis for OpinionThese financial statements and financial highlights are the responsibility of the Fund's management. Our responsibility is to expressan opinion on the Fund's financial statements and financial highlights based on our audits. We are a public accounting firmregistered with the Public Company Accounting Oversight Board (United States) (PCAOB) and are required to be independent withrespect to the Fund in accordance with the U.S. federal securities laws and the applicable rules and regulations of the Securities andExchange Commission and the PCAOB.We conducted our audits in accordance with the standards of the PCAOB. Those standards require that we plan and perform theaudit to obtain reasonable assurance about whether the financial statements and financial highlights are free of materialmisstatement, whether due to error or fraud. The Fund is not required to have, nor were we engaged to perform, an audit of itsinternal control over financial reporting. As part of our audits we are required to obtain an understanding of internal control overfinancial reporting but not for the purpose of expressing an opinion on the effectiveness of the Fund�s internal control over financialreporting. Accordingly, we express no such opinion.Our audits included performing procedures to assess the risks of material misstatement of the financial statements and financialhighlights, whether due to error or fraud, and performing procedures that respond to those risks. Such procedures includedexamining, on a test basis, evidence regarding the amounts and disclosures in the financial statements and financial highlights. Ouraudits also included evaluating the accounting principles used and significant estimates made by management, as well as evaluatingthe overall presentation of the financial statements and financial highlights. Our procedures included confirmation of securitiesowned as of February 28, 2021, by correspondence with the custodian and brokers; when replies were not received from brokers, weperformed other auditing procedures. We believe that our audits provide a reasonable basis for our opinion./s/ Deloitte & Touche LLPBoston, MassachusettsApril 13, 2021
We have served as the auditor of one or more of the Fidelity investment companies since 1999.
Trustees and OfficersThe Trustees, Members of the Advisory Board (if any), and officers of the trust and fund, as applicable, are listed below. The Boardof Trustees governs the fund and is responsible for protecting the interests of shareholders. The Trustees are experienced executiveswho meet periodically throughout the year to oversee the fund's activities, review contractual arrangements with companies thatprovide services to the fund, oversee management of the risks associated with such activities and contractual arrangements, andreview the fund's performance. Except for Jonathan Chiel, each of the Trustees oversees 309 funds. Mr. Chiel oversees 176 funds.
Copyright © 2021 www.secdatabase.com. All Rights Reserved.Please Consider the Environment Before Printing This Document
The Trustees hold office without limit in time except that (a) any Trustee may resign; (b) any Trustee may be removed by writteninstrument, signed by at least two-thirds of the number of Trustees prior to such removal; (c) any Trustee who requests to be retiredor who has become incapacitated by illness or injury may be retired by written instrument signed by a majority of the other Trustees;and (d) any Trustee may be removed at any special meeting of shareholders by a two-thirds vote of the outstanding voting securitiesof the trust. Each Trustee who is not an interested person (as defined in the 1940 Act) of the trust and the fund is referred to hereinas an Independent Trustee. Each Independent Trustee shall retire not later than the last day of the calendar year in which his or her75th birthday occurs. The Independent Trustees may waive this mandatory retirement age policy with respect to individualTrustees. Officers and Advisory Board Members hold office without limit in time, except that any officer or Advisory BoardMember may resign or may be removed by a vote of a majority of the Trustees at any regular meeting or any special meeting of theTrustees. Except as indicated, each individual has held the office shown or other offices in the same company for the past fiveyears.The fund�s Statement of Additional Information (SAI) includes more information about the Trustees. To request a free copy, callFidelity at 1-800-544-3455 (for managed account clients) or 1-800-835-5092 (for retirement plan participants).Experience, Skills, Attributes, and Qualifications of the Trustees. The Governance and Nominating Committee has adopted astatement of policy that describes the experience, qualifications, attributes, and skills that are necessary and desirable for potentialIndependent Trustee candidates (Statement of Policy). The Board believes that each Trustee satisfied at the time he or she wasinitially elected or appointed a Trustee, and continues to satisfy, the standards contemplated by the Statement of Policy. TheGovernance and Nominating Committee also engages professional search firms to help identify potential Independent Trusteecandidates who have the experience, qualifications, attributes, and skills consistent with the Statement of Policy. From time to time,additional criteria based on the composition and skills of the current Independent Trustees, as well as experience or skills that maybe appropriate in light of future changes to board composition, business conditions, and regulatory or other developments, have alsobeen considered by the professional search firms and the Governance and Nominating Committee. In addition, the Board takes intoaccount the Trustees' commitment and participation in Board and committee meetings, as well as their leadership of standing and adhoc committees throughout their tenure.In determining that a particular Trustee was and continues to be qualified to serve as a Trustee, the Board has considered a variety ofcriteria, none of which, in isolation, was controlling. The Board believes that, collectively, the Trustees have balanced and diverseexperience, qualifications, attributes, and skills, which allow the Board to operate effectively in governing the fund and protectingthe interests of shareholders. Information about the specific experience, skills, attributes, and qualifications of each Trustee, which ineach case led to the Board's conclusion that the Trustee should serve (or continue to serve) as a trustee of the fund, is providedbelow.Board Structure and Oversight Function. Robert A. Lawrence is an interested person and currently serves as Acting Chairman.The Trustees have determined that an interested Chairman is appropriate and benefits shareholders because an interested Chairmanhas a personal and professional stake in the quality and continuity of services provided to the fund. Independent Trustees exercisetheir informed business judgment to appoint an individual of their choosing to serve as Chairman, regardless of whether the Trusteehappens to be independent or a member of management. The Independent Trustees have determined that they can act independentlyand effectively without having an Independent Trustee serve as Chairman and that a key structural component for assuring that theyare in a position to do so is for the Independent Trustees to constitute a substantial majority for the Board. The Independent Trusteesalso regularly meet in executive session. David M. Thomas serves as Lead Independent Trustee and as such (i) acts as a liaisonbetween the Independent Trustees and management with respect to matters important to the Independent Trustees and (ii) withmanagement prepares agendas for Board meetings.Fidelity® funds are overseen by different Boards of Trustees. The fund's Board oversees Fidelity's high income and certain equityfunds, and other Boards oversee Fidelity's investment-grade bond, money market, asset allocation, and other equity funds. The assetallocation funds may invest in Fidelity® funds overseen by the fund's Board. The use of separate Boards, each with its owncommittee structure, allows the Trustees of each group of Fidelity® funds to focus on the unique issues of the funds they oversee,including common research, investment, and operational issues. On occasion, the separate Boards establish joint committees toaddress issues of overlapping consequences for the Fidelity® funds overseen by each Board.The Trustees operate using a system of committees to facilitate the timely and efficient consideration of all matters of importance tothe Trustees, the fund, and fund shareholders and to facilitate compliance with legal and regulatory requirements and oversight ofthe fund's activities and associated risks. The Board, acting through its committees, has charged FMR and its affiliates with (i)identifying events or circumstances the occurrence of which could have demonstrably adverse effects on the fund's business and/orreputation; (ii) implementing processes and controls to lessen the possibility that such events or circumstances occur or to mitigatethe effects of such events or circumstances if they do occur; and (iii) creating and maintaining a system designed to evaluatecontinuously business and market conditions in order to facilitate the identification and implementation processes described in (i)and (ii) above. Because the day-to-day operations and activities of the fund are carried out by or through FMR, its affiliates, andother service providers, the fund's exposure to risks is mitigated but not eliminated by the processes overseen by the Trustees. Whileeach of the Board's committees has responsibility for overseeing different aspects of the fund's activities, oversight is exercised
Copyright © 2021 www.secdatabase.com. All Rights Reserved.Please Consider the Environment Before Printing This Document
primarily through the Operations, Audit, and Compliance Committees. Appropriate personnel, including but not limited to thefund's Chief Compliance Officer (CCO), FMR's internal auditor, the independent accountants, the fund's Treasurer and portfoliomanagement personnel, make periodic reports to the Board's committees, as appropriate, including an annual review of Fidelity'srisk management program for the Fidelity® funds. The responsibilities of each standing committee, including their oversightresponsibilities, are described further under "Standing Committees of the Trustees."Interested Trustees*:Correspondence intended for a Trustee who is an interested person may be sent to Fidelity Investments, 245 Summer Street, Boston,Massachusetts 02210.Name, Year of Birth; Principal Occupations and Other Relevant Experience+Jonathan Chiel (1957)
Year of Election or Appointment: 2016TrusteeMr. Chiel also serves as Trustee of other Fidelity® funds. Mr. Chiel is Executive Vice President and General Counsel forFMR LLC (diversified financial services company, 2012-present). Previously, Mr. Chiel served as general counsel(2004-2012) and senior vice president and deputy general counsel (2000-2004) for John Hancock Financial Services; apartner with Choate, Hall & Stewart (1996-2000) (law firm); and an Assistant United States Attorney for the United StatesAttorney�s Office of the District of Massachusetts (1986-95), including Chief of the Criminal Division (1993-1995). Mr. Chielis a director on the boards of the Boston Bar Foundation and the Maimonides School.
Bettina Doulton (1964)Year of Election or Appointment: 2021TrusteeMs. Doulton also serves as Trustee of other Fidelity® funds. Prior to her retirement, Ms. Doulton served in a variety ofpositions at Fidelity Investments, including as a managing director of research (2006-2007), portfolio manager to certainFidelity® funds (1993-2005), equity analyst and portfolio assistant (1990-1993), and research assistant (1987-1990). Ms.Doulton currently owns and operates Phi Builders + Architects and Cellardoor Winery. Previously, Ms. Doulton served as amember of the Board of Brown Capital Management, LLC (2013-2018).
Robert A. Lawrence (1952)Year of Election or Appointment: 2020TrusteeActing Chairman of the Board of TrusteesMr. Lawrence also serves as Trustee of other funds. Previously, Mr. Lawrence served as a Member of the Advisory Board ofcertain funds. Prior to his retirement in 2008, Mr. Lawrence served as Vice President of certain Fidelity® funds (2006-2008),Senior Vice President, Head of High Income Division of Fidelity Management & Research Company (investment adviserfirm, 2006-2008), and President of Fidelity Strategic Investments (investment adviser firm, 2002-2005).
* Determined to be an �Interested Trustee� by virtue of, among other things, his or her affiliation with the trust or various entitiesunder common control with FMR.+ The information includes the Trustee's principal occupation during the last five years and other information relating to the
experience, attributes, and skills relevant to the Trustee's qualifications to serve as a Trustee, which led to the conclusion that theTrustee should serve as a Trustee for the fund.Independent Trustees:Correspondence intended for an Independent Trustee may be sent to Fidelity Investments, P.O. Box 55235, Boston, Massachusetts02205-5235.Name, Year of Birth; Principal Occupations and Other Relevant Experience+Dennis J. Dirks (1948)
Year of Election or Appointment: 2005TrusteeMr. Dirks also serves as Trustee of other Fidelity® funds. Prior to his retirement in May 2003, Mr. Dirks served as ChiefOperating Officer and as a member of the Board of The Depository Trust & Clearing Corporation (financial marketsinfrastructure), President, Chief Operating Officer and a member of the Board of The Depository Trust Company (DTC),President and a member of the Board of the National Securities Clearing Corporation (NSCC), Chief Executive Officer anda member of the Board of the Government Securities Clearing Corporation and Chief Executive Officer and a member ofthe Board of the Mortgage-Backed Securities Clearing Corporation. Mr. Dirks currently serves as a member of the FinanceCommittee (2016-present) and Board (2017-present) and is Treasurer (2018-present) of the Asolo Repertory Theatre.
Donald F. Donahue (1950)Year of Election or Appointment: 2018TrusteeMr. Donahue also serves as Trustee of other Fidelity® funds. Mr. Donahue serves as President and Chief Executive Officerof Miranda Partners, LLC (risk consulting for the financial services industry, 2012-present). Previously, Mr. Donahue servedas Chief Executive Officer (2006-2012), Chief Operating Officer (2003-2006) and Managing Director, Customer Marketingand Development (1999-2003) of The Depository Trust & Clearing Corporation (financial markets infrastructure). Mr.
Copyright © 2021 www.secdatabase.com. All Rights Reserved.Please Consider the Environment Before Printing This Document
Donahue currently serves as a member (2007-present) and Co-Chairman (2016-present) of the Board of United Way ofNew York, a member of the Board of NYC Leadership Academy (2012-present) and a member of the Board of Advisors ofRipple Labs, Inc. (financial services, 2015-present). Mr. Donahue previously served as a member of the Advisory Board ofcertain Fidelity® funds (2015-2018).
Vicki L. Fuller (1957)Year of Election or Appointment: 2020TrusteeMs. Fuller also serves as Trustee of other Fidelity® funds. Previously, Ms. Fuller served as a member of the Advisory Boardof certain Fidelity® funds (2018-2020), Chief Investment Officer of the New York State Common Retirement Fund(2012-2018) and held a variety of positions at AllianceBernstein L.P. (global asset management, 1985-2012), includingManaging Director (2006-2012) and Senior Vice President and Senior Portfolio Manager (2001-2006). Ms. Fuller currentlyserves as a member of the Board, Audit Committee and Nominating and Governance Committee of The WilliamsCompanies, Inc. (natural gas infrastructure, 2018-present), as a member of the Board, Audit Committee and Nominatingand Governance Committee of two Blackstone business development companies (2020-present) and as a member of theBoard of Treliant, LLC (consulting, 2019-present).
Patricia L. Kampling (1959)Year of Election or Appointment: 2020TrusteeMs. Kampling also serves as Trustee of other Fidelity® funds. Prior to her retirement, Ms. Kampling served as Chairman ofthe Board and Chief Executive Officer (2012-2019), President and Chief Operating Officer (2011-2012) and Executive VicePresident and Chief Financial Officer (2010-2011) of Alliant Energy Corporation. Ms. Kampling currently serves as amember of the Board, Compensation Committee and Executive Committee and as Chair of the Audit Committee of Briggs &Stratton Corporation (manufacturing, 2011-present) and as a member of the Board, Audit, Finance and Risk Committee andSafety, Environmental, Technology and Operations Committee of American Water Works Company, Inc. (utilities company,2019-present). In addition, Ms. Kampling currently serves as a member of the Board of the Nature Conservancy, WisconsinChapter (2019-present). Previously, Ms. Kampling served as a Member of the Advisory Board of certain Fidelity® funds(2020), a member of the Board of Interstate Power and Light Company (2012-2019) and Wisconsin Power and LightCompany (2012-2019) (each a subsidiary of Alliant Energy Corporation) and as a member of the Board and WorkforceDevelopment Committee of the Business Roundtable (2018-2019).
Thomas A. Kennedy (1955)Year of Election or Appointment: 2021TrusteeMr. Kennedy also serves as Trustee of other Fidelity® funds. Previously, Mr. Kennedy served as a Member of the AdvisoryBoard of certain Fidelity® funds (2020) and held a variety of positions at Raytheon Company (aerospace and defense,1983-2020), including Chairman and Chief Executive Officer (2014-2020) and Executive Vice President and ChiefOperating Officer (2013-2014). Mr. Kennedy currently serves as Executive Chairman of the Board of Directors of RaytheonTechnologies Corporation (aerospace and defense, 2020-present). He is also a member of the Rutgers School ofEngineering Industry Advisory Board (2011-present) and a member of the UCLA Engineering Dean�s Executive Board(2016-present).
Garnett A. Smith (1947)Year of Election or Appointment: 2018TrusteeMr. Smith also serves as Trustee of other Fidelity® funds. Prior to his retirement, Mr. Smith served as Chairman and ChiefExecutive Officer (1990-1997) and President (1986-1990) of Inbrand Corp. (manufacturer of personal absorbent products).Prior to his employment with Inbrand Corp., he was employed by a retail fabric chain and North Carolina National Bank(now Bank of America). Mr. Smith previously served as a member of the Advisory Board of certain Fidelity® funds(2012-2013).
David M. Thomas (1949)Year of Election or Appointment: 2008TrusteeLead Independent TrusteeMr. Thomas also serves as Trustee of other Fidelity® funds. Previously, Mr. Thomas served as Executive Chairman(2005-2006) and Chairman and Chief Executive Officer (2000-2005) of IMS Health, Inc. (pharmaceutical and healthcareinformation solutions). Mr. Thomas currently serves as Non-Executive Chairman of the Board of Fortune Brands Home andSecurity (home and security products, 2011-present), and a member of the Board (2004-present) and Presiding Director(2013-present) of Interpublic Group of Companies, Inc. (marketing communication).
Susan Tomasky (1953)Year of Election or Appointment: 2020TrusteeMs. Tomasky also serves as Trustee of other Fidelity® funds. Prior to her retirement, Ms. Tomasky served in variousexecutive officer positions at American Electric Power Company, Inc. (1998-2011), including most recently as President of
Copyright © 2021 www.secdatabase.com. All Rights Reserved.Please Consider the Environment Before Printing This Document

AEP Transmission (2007-2011). Ms. Tomasky currently serves as a member of the Board and Sustainability Committee andas Chair of the Audit Committee of Marathon Petroleum Corporation (2018-present) and as a member of the Board,Corporate Governance Committee and Organization and Compensation Committee and as Chair of the Audit Committee ofPublic Service Enterprise Group, Inc. (utilities company, 2012-present). In addition, Ms. Tomasky currently serves as amember of the Board of the Columbus Regional Airport Authority (2007-present), as a member of the Board of the RoyalShakespeare Company � America (2009-present), as a member of the Board of the Columbus Association for thePerforming Arts (2011-present) and as a member of the Board of Kenyon College (2016-present). Previously, Ms. Tomaskyserved as a Member of the Advisory Board of certain Fidelity® funds (2020), a member of the Board (2011-2019) and asLead Independent Director (2015-2018) of Andeavor Corporation (previously Tesoro Corporation) (independent oil refinerand marketer) and as a member of the Board of Summit Midstream Partners LP (energy, 2012-2018).
Michael E. Wiley (1950)Year of Election or Appointment: 2020TrusteeMr. Wiley also serves as Trustee of other Fidelity® funds. Previously, Mr. Wiley served as a member of the Advisory Boardof certain Fidelity® funds (2018-2020), Chairman, President and CEO of Baker Hughes, Inc. (oilfield services, 2000-2004).Mr. Wiley also previously served as a member of the Board of Andeavor Corporation (independent oil refiner and marketer,2005-2018), a member of the Board of Andeavor Logistics LP (natural resources logistics, 2015-2018) and a member of theBoard of High Point Resources (exploration and production, 2005-2020).
+ The information includes the Trustee's principal occupation during the last five years and other information relating to theexperience, attributes, and skills relevant to the Trustee's qualifications to serve as a Trustee, which led to the conclusion that theTrustee should serve as a Trustee for the fund.Advisory Board Members and Officers:Correspondence intended for a Member of the Advisory Board (if any) may be sent to Fidelity Investments, P.O. Box 55235,Boston, Massachusetts 02205-5235. Correspondence intended for an officer or Peter S. Lynch may be sent to Fidelity Investments,245 Summer Street, Boston, Massachusetts 02210. Officers appear below in alphabetical order.Name, Year of Birth; Principal OccupationNed C. Lautenbach (1944)
Year of Election or Appointment: 2021Member of the Advisory BoardMr. Lautenbach also serves as a Member of the Advisory Board of other Fidelity® funds. Mr. Lautenbach currently serves asChair of the Board of Governors, State University System of Florida (2013-present) and is a member of the Council onForeign Relations (1994-present). He is also a member and has in the past served as Chairman of the Board of Directors ofArtis-Naples (2012-present). Previously, Mr. Lautenbach served as a Trustee of certain Fidelity® funds (2000-2020) and amember and then Lead Director of the Board of Directors of Eaton Corporation (diversified industrial, 1997-2016). He wasalso a Partner at Clayton, Dubilier & Rice, LLC (private equity investment, 1998-2010); as well as Director of SonyCorporation (2006-2007). In addition, Mr. Lautenbach had a 30-year career with IBM (technology company), during whichtime he served as Senior Vice President and as a member of the Corporate Executive Committee (1968-1998).
Peter S. Lynch (1944)Year of Election or Appointment: 2003Member of the Advisory BoardMr. Lynch also serves as a Member of the Advisory Board of other Fidelity® funds. Mr. Lynch is Vice Chairman and aDirector of Fidelity Management & Research Company LLC (investment adviser firm). In addition, Mr. Lynch serves as aTrustee of Boston College and as the Chairman of the Inner-City Scholarship Fund. Previously, Mr. Lynch served as ViceChairman and a Director of FMR Co., Inc. (investment adviser firm) and on the Special Olympics International Board ofDirectors (1997-2006).
Craig S. Brown (1977)Year of Election or Appointment: 2019Assistant TreasurerMr. Brown also serves as Assistant Treasurer of other funds. Mr. Brown is an employee of Fidelity Investments(2013-present).
John J. Burke III (1964)Year of Election or Appointment: 2018Chief Financial OfficerMr. Burke also serves as Chief Financial Officer of other funds. Mr. Burke serves as Head of Investment Operations forFidelity Fund and Investment Operations (2018-present) and is an employee of Fidelity Investments (1998-present).Previously Mr. Burke served as head of Asset Management Investment Operations (2012-2018).
William C. Coffey (1969)Year of Election or Appointment: 2019Assistant SecretaryMr. Coffey also serves as Assistant Secretary of other funds. He is Senior Vice President and Deputy General Counsel ofFMR LLC (diversified financial services company, 2010-present), and is an employee of Fidelity Investments. Previously,
Copyright © 2021 www.secdatabase.com. All Rights Reserved.Please Consider the Environment Before Printing This Document

Mr. Coffey served as Secretary and CLO of certain funds (2018-2019); CLO, Secretary, and Senior Vice President ofFidelity Management & Research Company and FMR Co., Inc. (investment adviser firms, 2018-2019); Secretary of FidelitySelectCo, LLC and Fidelity Investments Money Management, Inc. (investment adviser firms, 2018-2019); CLO of FidelityManagement & Research (Hong Kong) Limited, FMR Investment Management (UK) Limited, and Fidelity Management &Research (Japan) Limited (investment adviser firms, 2018-2019); and Assistant Secretary of certain funds (2009-2018).
Timothy M. Cohen (1969)Year of Election or Appointment: 2018Vice PresidentMr. Cohen also serves as Vice President of other funds. Mr. Cohen serves as Co-Head of Equity (2018-present), a Directorof Fidelity Management & Research (Japan) Limited (investment adviser firm, 2016-present), and is an employee of FidelityInvestments. Previously, Mr. Cohen served as Executive Vice President of Fidelity SelectCo, LLC (2019), Head of GlobalEquity Research (2016-2018), Chief Investment Officer - Equity and a Director of Fidelity Management & Research (U.K.)Inc. (investment adviser firm, 2013-2015) and as a Director of Fidelity Management & Research (Hong Kong) Limited(investment adviser firm, 2017).
Jonathan Davis (1968)Year of Election or Appointment: 2010Assistant TreasurerMr. Davis also serves as Assistant Treasurer of other funds. Mr. Davis serves as Assistant Treasurer of FMR Capital, Inc.(2017-present) and is an employee of Fidelity Investments. Previously, Mr. Davis served as Vice President and AssociateGeneral Counsel of FMR LLC (diversified financial services company, 2003-2010).
Laura M. Del Prato (1964)Year of Election or Appointment: 2018Assistant TreasurerMs. Del Prato also serves as an officer of other funds. Ms. Del Prato is an employee of Fidelity Investments (2017-present).Previously, Ms. Del Prato served as President and Treasurer of The North Carolina Capital Management Trust: CashPortfolio and Term Portfolio (2018-2020). Prior to joining Fidelity Investments, Ms. Del Prato served as a Managing Directorand Treasurer of the JPMorgan Mutual Funds (2014-2017). Prior to JPMorgan, Ms. Del Prato served as a partner at CohenFund Audit Services (accounting firm, 2012-2013) and KPMG LLP (accounting firm, 2004-2012).
Colm A. Hogan (1973)Year of Election or Appointment: 2020Assistant TreasurerMr. Hogan also serves as an officer of other funds. Mr. Hogan serves as Assistant Treasurer of FMR Capital, Inc.(2017-present) and is an employee of Fidelity Investments (2005-present). Previously, Mr. Hogan served as DeputyTreasurer of certain Fidelity® funds (2016-2020) and Assistant Treasurer of certain Fidelity® funds (2016-2018).
Pamela R. Holding (1964)Year of Election or Appointment: 2018Vice PresidentMs. Holding also serves as Vice President of other funds. Ms. Holding serves as Co-Head of Equity (2018-present) and isan employee of Fidelity Investments (2013-present). Previously, Ms. Holding served as Executive Vice President of FidelitySelectCo, LLC (2019) and as Chief Investment Officer of Fidelity Institutional Asset Management (2013-2018).
Cynthia Lo Bessette (1969)Year of Election or Appointment: 2019Secretary and Chief Legal Officer (CLO)Ms. Lo Bessette also serves as an officer of other funds. Ms. Lo Bessette serves as CLO, Secretary, and Senior VicePresident of Fidelity Management & Research Company LLC (investment adviser firm, 2019-present); and CLO of FidelityManagement & Research (Hong Kong) Limited, FMR Investment Management (UK) Limited, and Fidelity Management &Research (Japan) Limited (investment adviser firms, 2019-present). She is a Senior Vice President and Deputy GeneralCounsel of FMR LLC (diversified financial services company, 2019-present), and is an employee of Fidelity Investments.Previously, Ms. Lo Bessette served as CLO, Secretary, and Senior Vice President of FMR Co., Inc. (investment adviserfirm, 2019); Secretary of Fidelity SelectCo, LLC and Fidelity Investments Money Management, Inc. (investment adviserfirms, 2019). Prior to joining Fidelity Investments, Ms. Lo Bessette was Executive Vice President, General Counsel(2016-2019) and Senior Vice President, Deputy General Counsel (2015-2016) of OppenheimerFunds (investmentmanagement company) and Deputy Chief Legal Officer (2013-2015) of Jennison Associates LLC (investment adviser firm).
Chris Maher (1972)Year of Election or Appointment: 2020Deputy TreasurerMr. Maher also serves as an officer of other funds. Mr. Maher serves as Assistant Treasurer of FMR Capital, Inc.(2017-present), and is an employee of Fidelity Investments (2008-present). Previously, Mr. Maher served as AssistantTreasurer of certain funds (2013-2020); Vice President of Asset Management Compliance (2013), Vice President of theProgram Management Group of FMR (investment adviser firm, 2010-2013), and Vice President of Valuation Oversight(2008-2010).
Jason P. Pogorelec (1975)Year of Election or Appointment: 2020
Copyright © 2021 www.secdatabase.com. All Rights Reserved.Please Consider the Environment Before Printing This Document

Chief Compliance OfficerMr. Pogorelec also serves as Chief Compliance Officer of other funds. Mr. Pogorelec is a senior Vice President of AssetManagement Compliance for Fidelity Investments and is an employee of Fidelity Investments (2006-present). Previously,Mr. Pogorelec served as Vice President, Associate General Counsel for Fidelity Investments (2010-2020) and AssistantSecretary of certain Fidelity funds (2015-2020).
Brett Segaloff (1972)Year of Election or Appointment: 2021Anti-Money Laundering (AML) OfficerMr. Segaloff also serves as an AML Officer of other funds and other related entities. He is Director, Anti-Money Laundering(2007-present) of FMR LLC (diversified financial services company) and is an employee of Fidelity Investments(1996-present).
Stacie M. Smith (1974)Year of Election or Appointment: 2016President and TreasurerMs. Smith also serves as an officer of other funds. Ms. Smith serves as Assistant Treasurer of FMR Capital, Inc.(2017-present), is an employee of Fidelity Investments (2009-present), and has served in other fund officer roles. Prior tojoining Fidelity Investments, Ms. Smith served as Senior Audit Manager of Ernst & Young LLP (accounting firm, 1996-2009).Previously, Ms. Smith served as Assistant Treasurer (2013-2019) and Deputy Treasurer (2013-2016) of certain Fidelity®
funds.Marc L. Spector (1972)
Year of Election or Appointment: 2016Assistant TreasurerMr. Spector also serves as an officer of other funds. Mr. Spector serves as Assistant Treasurer of FMR Capital, Inc.(2017-present) and is an employee of Fidelity Investments (2016-present). Prior to joining Fidelity Investments, Mr. Spectorserved as Director at the Siegfried Group (accounting firm, 2013-2016), and prior to Siegfried Group as audit seniormanager at Deloitte & Touche LLP (accounting firm, 2005-2013).
Jim Wegmann (1979)Year of Election or Appointment: 2019Assistant TreasurerMr. Wegmann also serves as Assistant Treasurer of other funds. Mr. Wegmann is an employee of Fidelity Investments(2011-present).
Shareholder Expense ExampleAs a shareholder, you incur two types of costs: (1) transaction costs, which may include sales charges (loads) on purchase paymentsor redemption proceeds, as applicable and (2) ongoing costs, which generally include management fees, distribution and/or service(12b-1) fees and other Fund expenses. This Example is intended to help you understand your ongoing costs (in dollars) of investingin a fund and to compare these costs with the ongoing costs of investing in other mutual funds.The Example is based on an investment of $1,000 invested at the beginning of the period and held for the entire period (September1, 2020 to February 28, 2021).Actual ExpensesThe first line of the accompanying table provides information about actual account values and actual expenses. You may use theinformation in this line, together with the amount you invested, to estimate the expenses that you paid over the period. Simply divideyour account value by $1,000.00 (for example, an $8,600 account value divided by $1,000.00 = 8.6), then multiply the result by thenumber in the first line for a class/Fund under the heading entitled "Expenses Paid During Period" to estimate the expenses you paidon your account during this period. If any fund is a shareholder of any underlying mutual funds or exchange-traded funds (ETFs)(the Underlying Funds), such fund indirectly bears its proportional share of the expenses of the Underlying Funds in addition to thedirect expenses incurred presented in the table. These fees and expenses are not included in the annualized expense ratio used tocalculate the expense estimate in the table below.Hypothetical Example for Comparison PurposesThe second line of the accompanying table provides information about hypothetical account values and hypothetical expenses basedon the actual expense ratio and an assumed rate of return of 5% per year before expenses, which is not the actual return. Thehypothetical account values and expenses may not be used to estimate the actual ending account balance or expenses you paid forthe period. You may use this information to compare the ongoing costs of investing in the Fund and other funds. To do so, comparethis 5% hypothetical example with the 5% hypothetical examples that appear in the shareholder reports of the other funds. If anyfund is a shareholder of any Underlying Funds, such fund indirectly bears its proportional share of the expenses of the UnderlyingFunds in addition to the direct expenses as presented in the table. These fees and expenses are not included in the annualizedexpense ratio used to calculate the expense estimate in the table below.
Copyright © 2021 www.secdatabase.com. All Rights Reserved.Please Consider the Environment Before Printing This Document
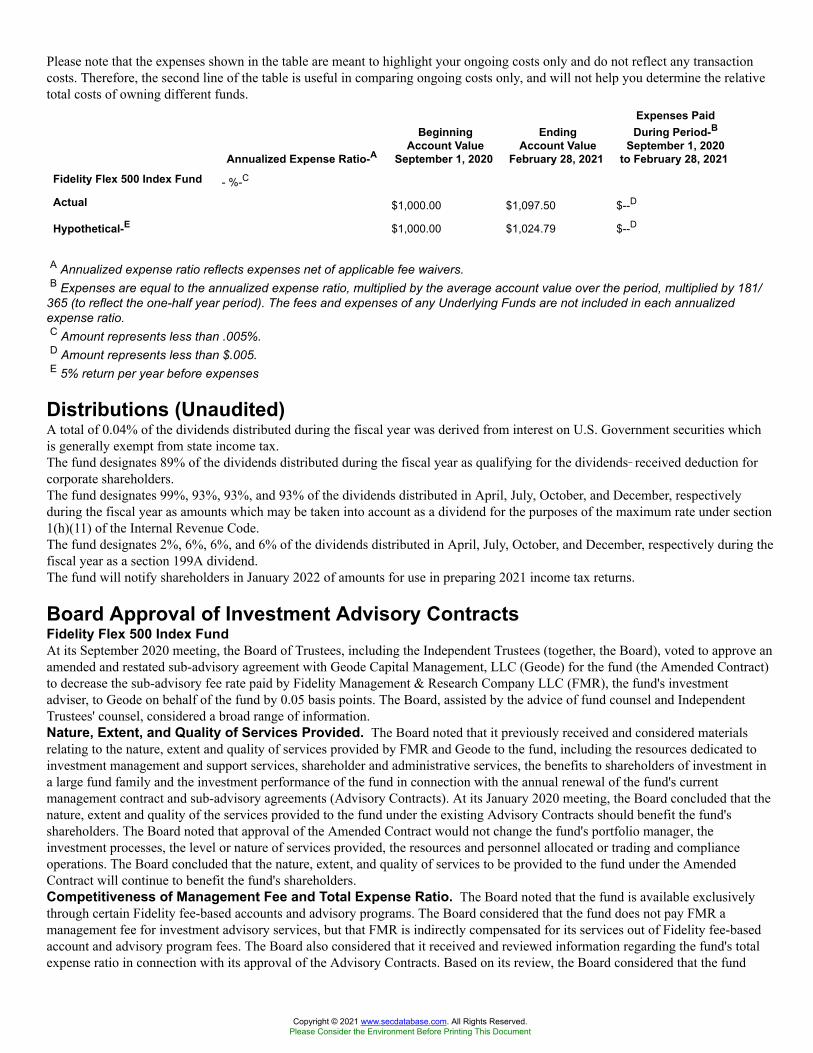
Please note that the expenses shown in the table are meant to highlight your ongoing costs only and do not reflect any transactioncosts. Therefore, the second line of the table is useful in comparing ongoing costs only, and will not help you determine the relativetotal costs of owning different funds.
Annualized Expense Ratio-A
BeginningAccount Value
September 1, 2020
EndingAccount Value
February 28, 2021
Expenses PaidDuring Period-B
September 1, 2020to February 28, 2021
Fidelity Flex 500 Index Fund - %-C
Actual $1,000.00 $1,097.50 $--D
Hypothetical-E $1,000.00 $1,024.79 $--D
A Annualized expense ratio reflects expenses net of applicable fee waivers.B Expenses are equal to the annualized expense ratio, multiplied by the average account value over the period, multiplied by 181/
365 (to reflect the one-half year period). The fees and expenses of any Underlying Funds are not included in each annualizedexpense ratio.C Amount represents less than .005%.D Amount represents less than $.005.E 5% return per year before expenses
Distributions (Unaudited)A total of 0.04% of the dividends distributed during the fiscal year was derived from interest on U.S. Government securities whichis generally exempt from state income tax.The fund designates 89% of the dividends distributed during the fiscal year as qualifying for the dividends�received deduction forcorporate shareholders.The fund designates 99%, 93%, 93%, and 93% of the dividends distributed in April, July, October, and December, respectivelyduring the fiscal year as amounts which may be taken into account as a dividend for the purposes of the maximum rate under section1(h)(11) of the Internal Revenue Code.The fund designates 2%, 6%, 6%, and 6% of the dividends distributed in April, July, October, and December, respectively during thefiscal year as a section 199A dividend.The fund will notify shareholders in January 2022 of amounts for use in preparing 2021 income tax returns.
Board Approval of Investment Advisory ContractsFidelity Flex 500 Index FundAt its September 2020 meeting, the Board of Trustees, including the Independent Trustees (together, the Board), voted to approve anamended and restated sub-advisory agreement with Geode Capital Management, LLC (Geode) for the fund (the Amended Contract)to decrease the sub-advisory fee rate paid by Fidelity Management & Research Company LLC (FMR), the fund's investmentadviser, to Geode on behalf of the fund by 0.05 basis points. The Board, assisted by the advice of fund counsel and IndependentTrustees' counsel, considered a broad range of information.Nature, Extent, and Quality of Services Provided. The Board noted that it previously received and considered materialsrelating to the nature, extent and quality of services provided by FMR and Geode to the fund, including the resources dedicated toinvestment management and support services, shareholder and administrative services, the benefits to shareholders of investment ina large fund family and the investment performance of the fund in connection with the annual renewal of the fund's currentmanagement contract and sub-advisory agreements (Advisory Contracts). At its January 2020 meeting, the Board concluded that thenature, extent and quality of the services provided to the fund under the existing Advisory Contracts should benefit the fund'sshareholders. The Board noted that approval of the Amended Contract would not change the fund's portfolio manager, theinvestment processes, the level or nature of services provided, the resources and personnel allocated or trading and complianceoperations. The Board concluded that the nature, extent, and quality of services to be provided to the fund under the AmendedContract will continue to benefit the fund's shareholders.Competitiveness of Management Fee and Total Expense Ratio. The Board noted that the fund is available exclusivelythrough certain Fidelity fee-based accounts and advisory programs. The Board considered that the fund does not pay FMR amanagement fee for investment advisory services, but that FMR is indirectly compensated for its services out of Fidelity fee-basedaccount and advisory program fees. The Board also considered that it received and reviewed information regarding the fund's totalexpense ratio in connection with its approval of the Advisory Contracts. Based on its review, the Board considered that the fund
Copyright © 2021 www.secdatabase.com. All Rights Reserved.Please Consider the Environment Before Printing This Document

does not pay a management fee and concluded at its January 2020 meeting that the fund's total expense ratio was reasonable in lightof the services that the fund receives and the other factors considered.Costs of the Services and Profitability. The Board considered that it previously reviewed information regarding the level ofFidelity's profits in respect of all Fidelity funds. Because the fund pays no advisory fees and FMR or an affiliate bears all expensesof the fund, with limited exceptions, the Board did not consider the costs and services provided by and the profits realized byFidelity in connection with the operation of the fund to be relevant in its decision to approve the Amended Contract.Economies of Scale. The Board did not consider the realization of economies of scale to be a material factor in its decision toapprove the Amended Contract because the fund pays no advisory fees and FMR will continue to bear all expenses of the fund withcertain limited exceptions.Based on its evaluation of all of the conclusions noted above, and after considering all factors it believed relevant, the Boardconcluded that the advisory and sub-advisory fee arrangement are fair and reasonable, and that the fund's Amended Contract shouldbe approved.Board Approval of Investment Advisory ContractsFidelity Flex 500 Index FundAt its January 2021 meeting, the Board of Trustees, including the Independent Trustees (together, the Board), voted to continue themanagement contract with Fidelity Management & Research Company LLC (FMR), and the sub-advisory agreements and sub-subadvisory agreements, in each case, where applicable (together, the Advisory Contracts) for the fund, including the fund's sub-advisory agreement with Geode Capital Management, LLC, for four months from February 1, 2021 through May 31, 2021, inconnection with changes to the Board's meeting calendar.The Board considered that the approval of the fund's Advisory Contracts will not result in any changes in (i) the investment processor strategies employed in the management of the fund's assets; (ii) the fees and expenses paid by shareholders; (iii) the nature, extentor quality of services provided under the fund's Advisory Contracts; or (iv) the day-to-day management of the fund or the personsprimarily responsible for such management. The Board also considered that since its last approval of the fund's Advisory Contracts,FMR had provided additional information on the fund in support of the annual contract renewal process, including competitiveanalyses on total expenses and management fees and in-depth reviews of fund performance and fund profitability information. TheBoard also considered the findings of certain ad hoc committees that had been previously formed to discuss matters relevant to all ofthe Fidelity funds, including economies of scale, fall-out benefits and retail vs. institutional funds. The Board concluded that thefund's Advisory Contracts are fair and reasonable, and that the fund's Advisory Contracts should be renewed, without modification,through May 31, 2021, with the understanding that the Board will consider the annual renewal for a full one year period in May2021.In connection with its consideration of future renewals of the fund's Advisory Contracts, the Board will consider: (i) the nature,extent and quality of services provided to the funds, including shareholder and administrative services and investment performance;(ii) the competitiveness of the management fee and total expenses for the fund; (iii) the costs of the services and profitability,including the revenues earned and the expenses incurred in conducting the business of developing, marketing, distributing,managing, administering, and servicing the fund and its shareholders, to the extent applicable; and (iv) whether there have beeneconomies of scale in respect of the Fidelity funds, whether the Fidelity funds (including the fund have appropriately benefited fromany such economies of scale, and whether there is the potential for realization of any further economies.Based on its evaluation of all of the conclusions noted above, and after considering all factors it believed relevant, the Boardultimately concluded that the fund's management fee structure is fair and reasonable, and that the continuation of the fund'sAdvisory Contracts should be approved for four months from February 1, 2021 through May 31, 2021.
Liquidity Risk Management ProgramThe Securities and Exchange Commission adopted Rule 22e-4 under the Investment Company Act of 1940 (the Liquidity Rule) topromote effective liquidity risk management throughout the open-end investment company industry, thereby reducing the risk thatfunds will be unable to meet their redemption obligations and mitigating dilution of the interests of fund shareholders.The Fund has adopted and implemented a liquidity risk management program pursuant to the Liquidity Rule (the Program) effectiveDecember 1, 2018. The Program is reasonably designed to assess and manage the Fund�s liquidity risk and to comply with therequirements of the Liquidity Rule. The Fund�s Board of Trustees (the Board) has designated the Fund�s investment adviser asadministrator of the Program. The Fidelity advisers have established a Liquidity Risk Management Committee (the LRMCommittee) to manage the Program for each of the Fidelity Funds. The LRM Committee monitors the adequacy and effectiveness ofimplementation of the Program and on a periodic basis assesses each Fund�s liquidity risk based on a variety of factors including (1)the Fund�s investment strategy, (2) portfolio liquidity and cash flow projections during normal and reasonably foreseeable stressedconditions, (3) shareholder redemptions, (4) borrowings and other funding sources and (5) in the case of exchange-traded funds,certain additional factors including the effect of the Fund�s prices and spreads, market participants, and basket compositions on theoverall liquidity of the Fund�s portfolio, as applicable.
Copyright © 2021 www.secdatabase.com. All Rights Reserved.Please Consider the Environment Before Printing This Document
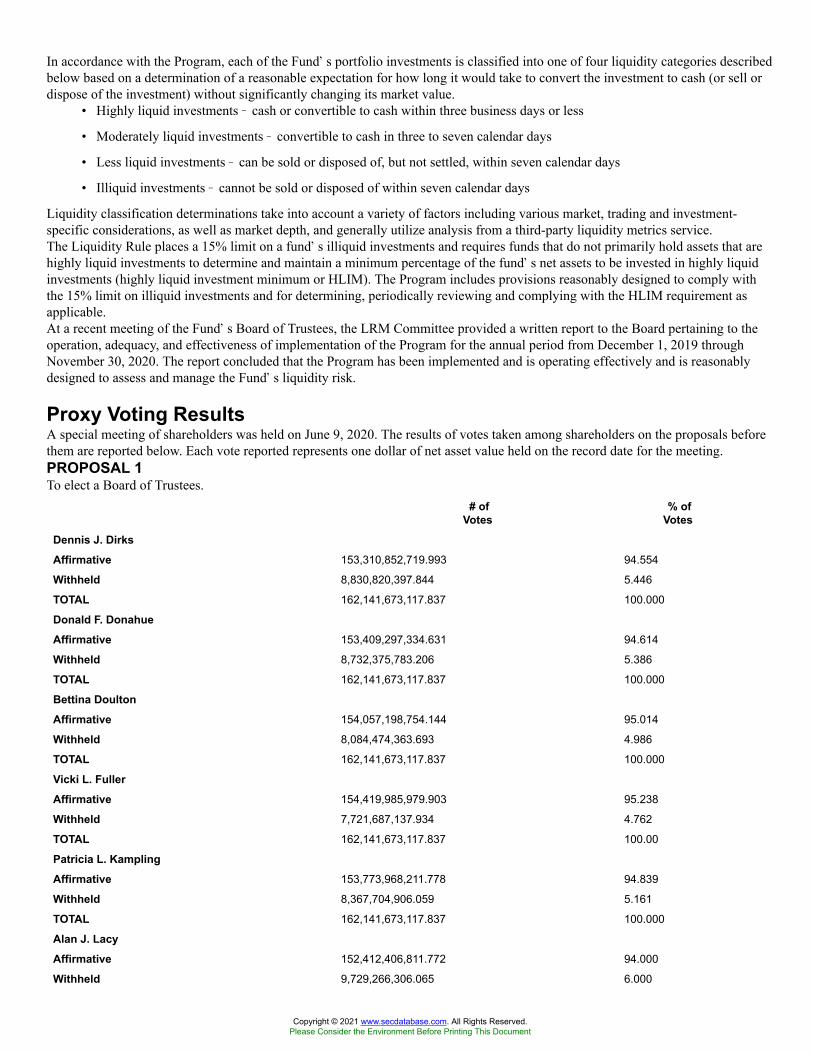
In accordance with the Program, each of the Fund�s portfolio investments is classified into one of four liquidity categories describedbelow based on a determination of a reasonable expectation for how long it would take to convert the investment to cash (or sell ordispose of the investment) without significantly changing its market value.
• Highly liquid investments � cash or convertible to cash within three business days or less
• Moderately liquid investments � convertible to cash in three to seven calendar days
• Less liquid investments � can be sold or disposed of, but not settled, within seven calendar days
• Illiquid investments � cannot be sold or disposed of within seven calendar days
Liquidity classification determinations take into account a variety of factors including various market, trading and investment-specific considerations, as well as market depth, and generally utilize analysis from a third-party liquidity metrics service.The Liquidity Rule places a 15% limit on a fund�s illiquid investments and requires funds that do not primarily hold assets that arehighly liquid investments to determine and maintain a minimum percentage of the fund�s net assets to be invested in highly liquidinvestments (highly liquid investment minimum or HLIM). The Program includes provisions reasonably designed to comply withthe 15% limit on illiquid investments and for determining, periodically reviewing and complying with the HLIM requirement asapplicable.At a recent meeting of the Fund�s Board of Trustees, the LRM Committee provided a written report to the Board pertaining to theoperation, adequacy, and effectiveness of implementation of the Program for the annual period from December 1, 2019 throughNovember 30, 2020. The report concluded that the Program has been implemented and is operating effectively and is reasonablydesigned to assess and manage the Fund�s liquidity risk.
Proxy Voting ResultsA special meeting of shareholders was held on June 9, 2020. The results of votes taken among shareholders on the proposals beforethem are reported below. Each vote reported represents one dollar of net asset value held on the record date for the meeting.PROPOSAL 1To elect a Board of Trustees.
# ofVotes
% ofVotes
Dennis J. DirksAffirmative 153,310,852,719.993 94.554
Withheld 8,830,820,397.844 5.446
TOTAL 162,141,673,117.837 100.000
Donald F. DonahueAffirmative 153,409,297,334.631 94.614
Withheld 8,732,375,783.206 5.386
TOTAL 162,141,673,117.837 100.000
Bettina DoultonAffirmative 154,057,198,754.144 95.014
Withheld 8,084,474,363.693 4.986
TOTAL 162,141,673,117.837 100.000
Vicki L. FullerAffirmative 154,419,985,979.903 95.238
Withheld 7,721,687,137.934 4.762
TOTAL 162,141,673,117.837 100.00
Patricia L. KamplingAffirmative 153,773,968,211.778 94.839
Withheld 8,367,704,906.059 5.161
TOTAL 162,141,673,117.837 100.000
Alan J. LacyAffirmative 152,412,406,811.772 94.000
Withheld 9,729,266,306.065 6.000
Copyright © 2021 www.secdatabase.com. All Rights Reserved.Please Consider the Environment Before Printing This Document
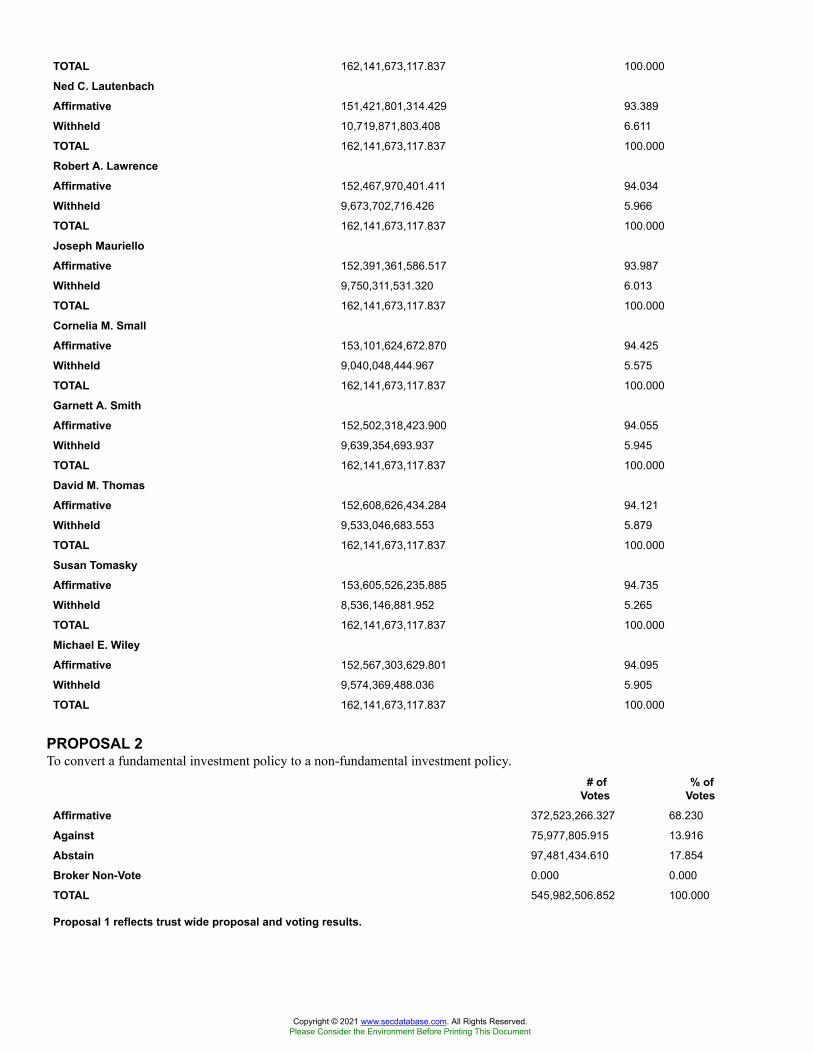
TOTAL 162,141,673,117.837 100.000
Ned C. LautenbachAffirmative 151,421,801,314.429 93.389
Withheld 10,719,871,803.408 6.611
TOTAL 162,141,673,117.837 100.000
Robert A. LawrenceAffirmative 152,467,970,401.411 94.034
Withheld 9,673,702,716.426 5.966
TOTAL 162,141,673,117.837 100.000
Joseph MaurielloAffirmative 152,391,361,586.517 93.987
Withheld 9,750,311,531.320 6.013
TOTAL 162,141,673,117.837 100.000
Cornelia M. SmallAffirmative 153,101,624,672.870 94.425
Withheld 9,040,048,444.967 5.575
TOTAL 162,141,673,117.837 100.000
Garnett A. SmithAffirmative 152,502,318,423.900 94.055
Withheld 9,639,354,693.937 5.945
TOTAL 162,141,673,117.837 100.000
David M. ThomasAffirmative 152,608,626,434.284 94.121
Withheld 9,533,046,683.553 5.879
TOTAL 162,141,673,117.837 100.000
Susan TomaskyAffirmative 153,605,526,235.885 94.735
Withheld 8,536,146,881.952 5.265
TOTAL 162,141,673,117.837 100.000
Michael E. WileyAffirmative 152,567,303,629.801 94.095
Withheld 9,574,369,488.036 5.905
TOTAL 162,141,673,117.837 100.000
PROPOSAL 2To convert a fundamental investment policy to a non-fundamental investment policy.
# ofVotes
% ofVotes
Affirmative 372,523,266.327 68.230
Against 75,977,805.915 13.916
Abstain 97,481,434.610 17.854
Broker Non-Vote 0.000 0.000
TOTAL 545,982,506.852 100.000
Proposal 1 reflects trust wide proposal and voting results.
Copyright © 2021 www.secdatabase.com. All Rights Reserved.Please Consider the Environment Before Printing This Document

Item 2.
Item 3.
Item 4.
Z5I-ANN-04211.9881571.103
Code of Ethics
As of the end of the period, February 28, 2021, Fidelity Concord Street Trust (the trust)has adopted a code of ethics, as defined in Item 2 of Form N-CSR, that applies to itsPresident and Treasurer and its Chief Financial Officer. A copy of the code of ethics isfiled as an exhibit to this Form N-CSR.
Audit Committee Financial Expert
The Board of Trustees of the trust has determined that Donald F. Donahue is an auditcommittee financial expert, as defined in Item 3 of Form N-CSR. Mr. Donahue isindependent for purposes of Item 3 of Form N-CSR.
Principal Accountant Fees and Services
Fees and Services
The following table presents fees billed by Deloitte & Touche LLP, the member firms ofDeloitte Touche Tohmatsu, and their respective affiliates (collectively, �DeloitteEntities�) in each of the last two fiscal years for services rendered to Fidelity Flex 500Index Fund (the �Fund�):
Services Billed by Deloitte Entities
February 28, 2021 FeesA
Audit FeesAudit-Related
Fees Tax Fees All Other FeesFidelity Flex 500 IndexFund $41,500 $- $8,600 $1,000
February 29, 2020 FeesA
Audit FeesAudit-Related
Fees Tax Fees All Other FeesFidelity Flex 500 IndexFund $45,300 $100 $8,600 $1,000
A Amounts may reflect rounding.
Copyright © 2021 www.secdatabase.com. All Rights Reserved.Please Consider the Environment Before Printing This Document

The following table presents fees billed by PricewaterhouseCoopers LLP (�PwC�) ineach of the last two fiscal years for services rendered to Fidelity 500 Index Fund, FidelityExtended Market Index Fund, Fidelity International Index Fund, Fidelity Series TotalMarket Index Fund and Fidelity Total Market Index Fund (the �Funds�):
Copyright © 2021 www.secdatabase.com. All Rights Reserved.Please Consider the Environment Before Printing This Document
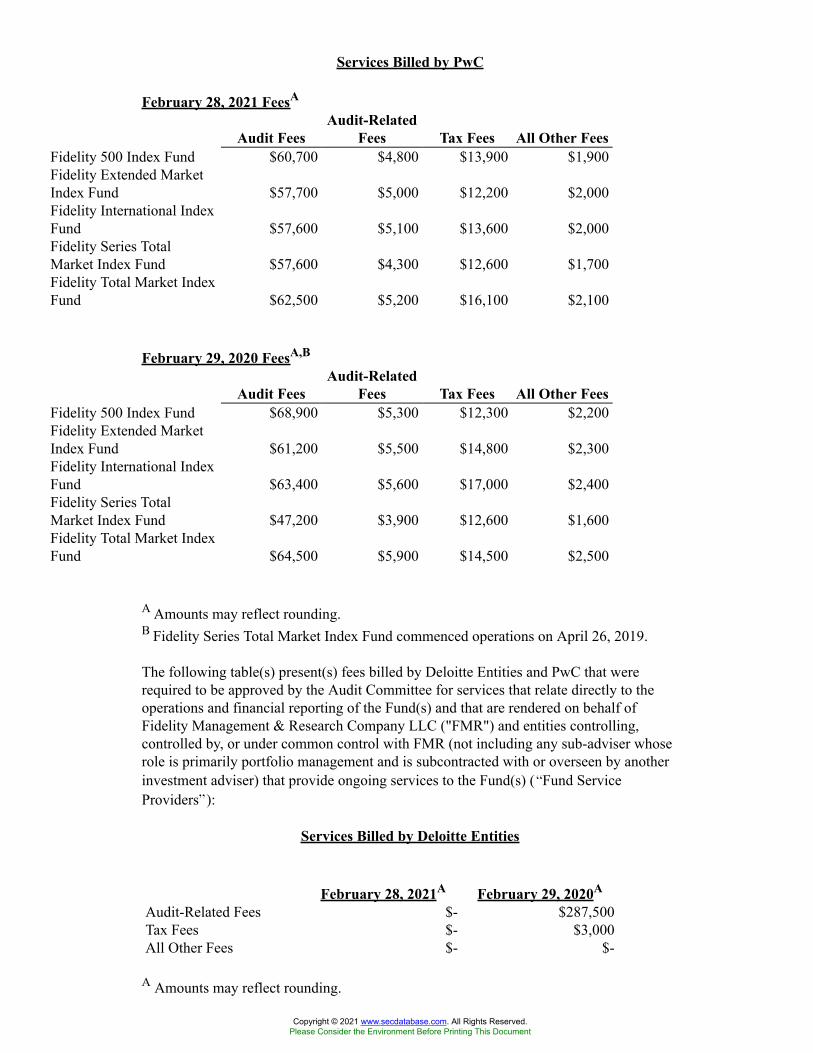
Services Billed by PwC
February 28, 2021 FeesA
Audit FeesAudit-Related
Fees Tax Fees All Other FeesFidelity 500 Index Fund $60,700 $4,800 $13,900 $1,900Fidelity Extended MarketIndex Fund $57,700 $5,000 $12,200 $2,000Fidelity International IndexFund $57,600 $5,100 $13,600 $2,000Fidelity Series TotalMarket Index Fund $57,600 $4,300 $12,600 $1,700Fidelity Total Market IndexFund $62,500 $5,200 $16,100 $2,100
February 29, 2020 FeesA,B
Audit FeesAudit-Related
Fees Tax Fees All Other FeesFidelity 500 Index Fund $68,900 $5,300 $12,300 $2,200Fidelity Extended MarketIndex Fund $61,200 $5,500 $14,800 $2,300Fidelity International IndexFund $63,400 $5,600 $17,000 $2,400Fidelity Series TotalMarket Index Fund $47,200 $3,900 $12,600 $1,600Fidelity Total Market IndexFund $64,500 $5,900 $14,500 $2,500
A Amounts may reflect rounding.B Fidelity Series Total Market Index Fund commenced operations on April 26, 2019.
The following table(s) present(s) fees billed by Deloitte Entities and PwC that wererequired to be approved by the Audit Committee for services that relate directly to theoperations and financial reporting of the Fund(s) and that are rendered on behalf ofFidelity Management & Research Company LLC ("FMR") and entities controlling,controlled by, or under common control with FMR (not including any sub-adviser whoserole is primarily portfolio management and is subcontracted with or overseen by anotherinvestment adviser) that provide ongoing services to the Fund(s) (�Fund ServiceProviders�):
Services Billed by Deloitte Entities
February 28, 2021A February 29, 2020A
Audit-Related Fees $- $287,500Tax Fees $- $3,000All Other Fees $- $-
A Amounts may reflect rounding.
Copyright © 2021 www.secdatabase.com. All Rights Reserved.Please Consider the Environment Before Printing This Document
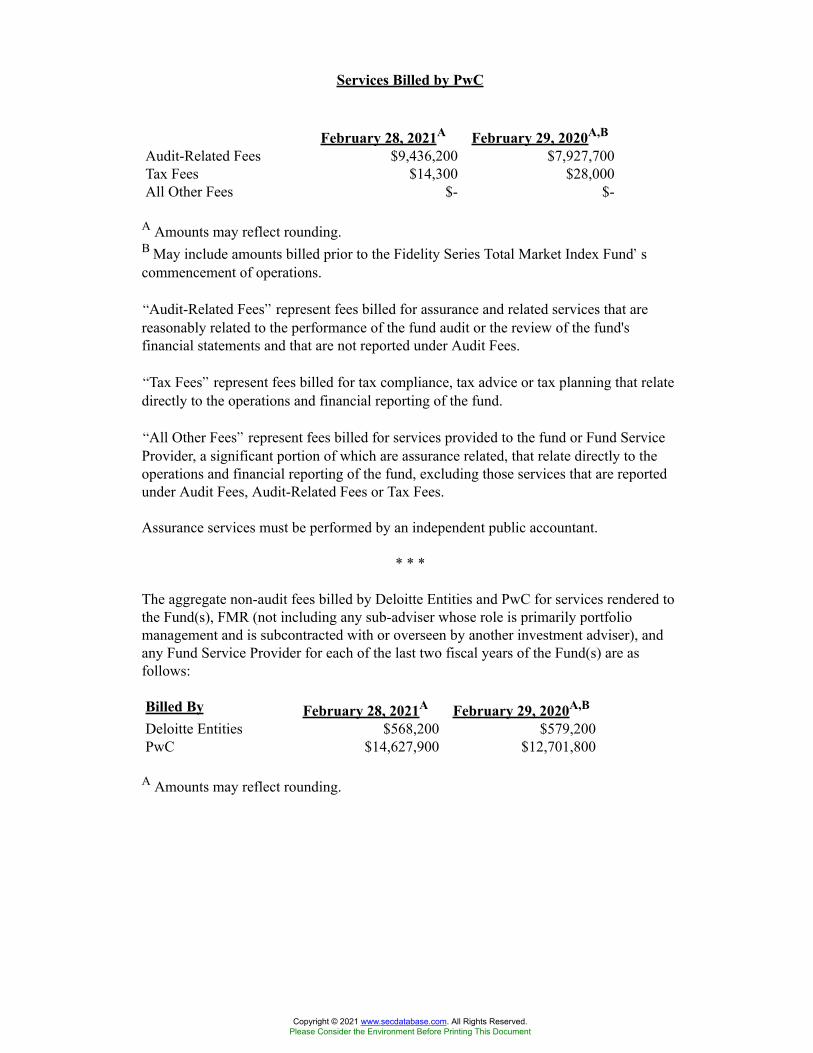
Services Billed by PwC
February 28, 2021A February 29, 2020A,B
Audit-Related Fees $9,436,200 $7,927,700Tax Fees $14,300 $28,000All Other Fees $- $-
A Amounts may reflect rounding.B May include amounts billed prior to the Fidelity Series Total Market Index Fund�scommencement of operations.
�Audit-Related Fees� represent fees billed for assurance and related services that arereasonably related to the performance of the fund audit or the review of the fund'sfinancial statements and that are not reported under Audit Fees.
�Tax Fees� represent fees billed for tax compliance, tax advice or tax planning that relatedirectly to the operations and financial reporting of the fund.
�All Other Fees� represent fees billed for services provided to the fund or Fund ServiceProvider, a significant portion of which are assurance related, that relate directly to theoperations and financial reporting of the fund, excluding those services that are reportedunder Audit Fees, Audit-Related Fees or Tax Fees.
Assurance services must be performed by an independent public accountant.
* * *
The aggregate non-audit fees billed by Deloitte Entities and PwC for services rendered tothe Fund(s), FMR (not including any sub-adviser whose role is primarily portfoliomanagement and is subcontracted with or overseen by another investment adviser), andany Fund Service Provider for each of the last two fiscal years of the Fund(s) are asfollows:
Billed By February 28, 2021A February 29, 2020A,B
Deloitte Entities $568,200 $579,200PwC $14,627,900 $12,701,800
A Amounts may reflect rounding.
Copyright © 2021 www.secdatabase.com. All Rights Reserved.Please Consider the Environment Before Printing This Document
B May include amounts billed prior to the Fidelity Series Total Market Index Fund�scommencement of operations.
The trust's Audit Committee has considered non-audit services that were not pre-approved that were provided by Deloitte Entities and PwC to Fund Service Providers tobe compatible with maintaining the independence of Deloitte Entities and PwC inits(their) audit of the Fund(s), taking into account representations from Deloitte Entitiesand PwC, in accordance with Public Company Accounting Oversight Board rules,regarding its independence from the Fund(s) and its(their) related entities and FMR�sreview of the appropriateness and permissibility under applicable law of such non-auditservices prior to their provision to the Fund(s) Service Providers.
Audit Committee Pre-Approval Policies and Procedures
The trust�s Audit Committee must pre-approve all audit and non-audit services providedby a fund�s independent registered public accounting firm relating to the operations orfinancial reporting of the fund. Prior to the commencement of any audit or non-auditservices to a fund, the Audit Committee reviews the services to determine whether theyare appropriate and permissible under applicable law.
The Audit Committee has adopted policies and procedures to, among other purposes,provide a framework for the Committee�s consideration of non-audit services by theaudit firms that audit the Fidelity funds. The policies and procedures require that anynon-audit service provided by a fund audit firm to a Fidelity fund and any non-auditservice provided by a fund auditor to a Fund Service Provider that relates directly to theoperations and financial reporting of a Fidelity fund (�Covered Service�) are subject toapproval by the Audit Committee before such service is provided.
All Covered Services must be approved in advance of provision of the service either: (i)by formal resolution of the Audit Committee, or (ii) by oral or written approval of theservice by the Chair of the Audit Committee (or if the Chair is unavailable, such othermember of the Audit Committee as may be designated by the Chair to act in the Chair�sabsence). The approval contemplated by (ii) above is permitted where the Treasurerdetermines that action on such an engagement is necessary before the next meeting of theAudit Committee.
Non-audit services provided by a fund audit firm to a Fund Service Provider that do notrelate directly to the operations and financial reporting of a Fidelity fund are reported tothe Audit Committee periodically.
Non-Audit Services Approved Pursuant to Rule 2-01(c)(7)(i)(C) and (ii) of Regulation S-X (�De Minimis Exception�)
There were no non-audit services approved or required to be approved by the AuditCommittee pursuant to the De Minimis Exception during the Fund�s(s�) last two fiscal
Copyright © 2021 www.secdatabase.com. All Rights Reserved.Please Consider the Environment Before Printing This Document
Item 5.
Item 6.
(a)
(b)
Item 7.
Item 8.
Item 9.
Item 10.
Item 11.
years relating to services provided to (i) the Fund(s) or (ii) any Fund Service Providerthat relate directly to the operations and financial reporting of the Fund(s).
Audit Committee of Listed Registrants
Not applicable.
Investments
Not applicable.
Not applicable.
Disclosure of Proxy Voting Policies and Procedures for Closed-EndManagement Investment Companies
Not applicable.
Portfolio Managers of Closed-End Management Investment Companies
Not applicable.
Purchase of Equity Securities by Closed-End Management InvestmentCompany and Affiliated Purchasers
Not applicable.
Submission of Matters to a Vote of Security Holders
There were no material changes to the procedures by which shareholders mayrecommend nominees to the trust�s Board of Trustees.
Controls and Procedures
(a)(i) The President and Treasurer and the Chief Financial Officer have concluded thatthe trust�s disclosure controls and procedures (as defined in Rule 30a-3(c) under theInvestment Company Act) provide reasonable assurances that material informationrelating to the trust is made known to them by the appropriate persons, based on theirevaluation of these controls and procedures as of a date within 90 days of the filing dateof this report.
(a)(ii) There was no change in the trust�s internal control over financial reporting (asdefined in Rule 30a-3(d) under the Investment Company Act) that occurred during theperiod covered by this report that has materially affected, or is reasonably likely tomaterially affect, the trust�s internal control over financial reporting.
Copyright © 2021 www.secdatabase.com. All Rights Reserved.Please Consider the Environment Before Printing This Document

Item 12.
Item 13.
Disclosure of Securities Lending Activities for Closed-End ManagementInvestment Companies
Not applicable.
Exhibits
(a) (1) Code of Ethics pursuant to Item 2 of Form N-CSR is filed and attachedhereto as EX-99.CODE ETH.
(a) (2) Certification pursuant to Rule 30a-2(a) under the Investment Company Actof 1940 (17 CFR 270.30a-2(a)) is filed and attached hereto as Exhibit99.CERT.
(a) (3) Not applicable.
(b) Certification pursuant to Rule 30a-2(b) under the Investment Company Actof 1940 (17 CFR 270.30a-2(b)) is furnished and attached hereto as Exhibit99.906CERT.
Copyright © 2021 www.secdatabase.com. All Rights Reserved.Please Consider the Environment Before Printing This Document

SIGNATURES
Pursuant to the requirements of the Securities Exchange Act of 1934 and the InvestmentCompany Act of 1940, the registrant has duly caused this report to be signed on its behalfby the undersigned, thereunto duly authorized.
Fidelity Concord Street Trust
By: /s/Stacie M. SmithStacie M. SmithPresident and Treasurer
Date: April 21, 2021
Pursuant to the requirements of the Securities Exchange Act of 1934 and the InvestmentCompany Act of 1940, this report has been signed below by the following persons onbehalf of the registrant and in the capacities and on the dates indicated.
By: /s/Stacie M. SmithStacie M. SmithPresident and Treasurer
Date: April 21, 2021
By: /s/John J. Burke IIIJohn J. Burke IIIChief Financial Officer
Date: April 21, 2021
Copyright © 2021 www.secdatabase.com. All Rights Reserved.Please Consider the Environment Before Printing This Document
1.2.
3.
4.
a.
b.
c.
d.
Exhibit EX-99.CERT
I, Stacie M. Smith, certify that:
I have reviewed this report on Form N-CSR of Fidelity Concord Street Trust;Based on my knowledge, this report does not contain any untrue statement of amaterial fact or omit to state a material fact necessary to make the statementsmade, in light of the circumstances under which such statements were made, notmisleading with respect to the period covered by this report;Based on my knowledge, the financial statements, and other financial informationincluded in this report, fairly present in all material respects the financialcondition, results of operations, changes in net assets, and cash flows (if thefinancial statements are required to include a statement of cash flows) of theregistrant as of, and for, the periods presented in this report;The registrant's other certifying officer(s) and I are responsible for establishingand maintaining disclosure controls and procedures (as defined in Rule 30a-3(c)under the Investment Company Act of 1940) and internal control over financialreporting (as defined in Rule 30a-3(d) under the Investment Company Act of1940) for the registrant and have:
Designed such disclosure controls and procedures, or caused such disclosurecontrols and procedures to be designed under our supervision, to ensure thatmaterial information relating to the registrant, including its consolidatedsubsidiaries, is made known to us by others within those entities,particularly during the period in which this report is being prepared;Designed such internal control over financial reporting, or caused suchinternal control over financial reporting to be designed under oursupervision, to provide reasonable assurance regarding the reliability offinancial reporting and the preparation of financial statements for externalpurposes in accordance with generally accepted accounting principles;Evaluated the effectiveness of the registrant's disclosure controls andprocedures and presented in this report our conclusions about theeffectiveness of the disclosure controls and procedures, as of a date within90 days prior to the filing date of this report based upon such evaluation;andDisclosed in this report any change in the registrant’s internal control overfinancial reporting that occurred during the period covered by this reportthat has materially affected, or is reasonably likely to materially affect, theregistrant’s internal control over financial reporting; and
Copyright © 2021 www.secdatabase.com. All Rights Reserved.Please Consider the Environment Before Printing This Document
5.
a.
b.
Date:
1.2.
3.
4.
a.
b.
c.
The registrant's other certifying officer(s) and I have disclosed to the registrant'sauditors and the audit committee of the registrant's board of directors (or personsperforming the equivalent functions):
All significant deficiencies and material weaknesses in the design oroperation of internal control over financial reporting which are reasonablylikely to adversely affect the registrant's ability to record, process,summarize, and report financial information; andAny fraud, whether or not material, that involves management or otheremployees who have a significant role in the registrant's internal controlover financial reporting.
April 21, 2021/s/Stacie M. SmithStacie M. SmithPresident and Treasurer
I, John J. Burke III, certify that:I have reviewed this report on Form N-CSR of Fidelity Concord Street Trust;Based on my knowledge, this report does not contain any untrue statement of amaterial fact or omit to state a material fact necessary to make the statementsmade, in light of the circumstances under which such statements were made, notmisleading with respect to the period covered by this report;Based on my knowledge, the financial statements, and other financial informationincluded in this report, fairly present in all material respects the financialcondition, results of operations, changes in net assets, and cash flows (if thefinancial statements are required to include a statement of cash flows) of theregistrant as of, and for, the periods presented in this report;The registrant's other certifying officer(s) and I are responsible for establishingand maintaining disclosure controls and procedures (as defined in Rule 30a-3(c)under the Investment Company Act of 1940) and internal control over financialreporting (as defined in Rule 30a-3(d) under the Investment Company Act of1940) for the registrant and have:
Designed such disclosure controls and procedures, or caused such disclosurecontrols and procedures to be designed under our supervision, to ensure thatmaterial information relating to the registrant, including its consolidatedsubsidiaries, is made known to us by others within those entities,particularly during the period in which this report is being prepared;Designed such internal control over financial reporting, or caused suchinternal control over financial reporting to be designed under oursupervision, to provide reasonable assurance regarding the reliability offinancial reporting and the preparation of financial statements for externalpurposes in accordance with generally accepted accounting principles;Evaluated the effectiveness of the registrant's disclosure controls andprocedures and presented in this report our conclusions about the
Copyright © 2021 www.secdatabase.com. All Rights Reserved.Please Consider the Environment Before Printing This Document
d.
5.
effectiveness of the disclosure controls and procedures, as of a date within90 days prior to the filing date of this report based upon such evaluation;andDisclosed in this report any change in the registrant’s internal control overfinancial reporting that occurred during the period covered by this reportthat has materially affected, or is reasonably likely to materially affect, theregistrant’s internal control over financial reporting; and
The registrant's other certifying officer(s) and I have disclosed to the registrant'sauditors and the audit committee of the registrant's board of directors (or personsperforming the equivalent functions):
Copyright © 2021 www.secdatabase.com. All Rights Reserved.Please Consider the Environment Before Printing This Document
a.
b.
Date:
All significant deficiencies and material weaknesses in the design oroperation of internal control over financial reporting which are reasonablylikely to adversely affect the registrant's ability to record, process,summarize, and report financial information; andAny fraud, whether or not material, that involves management or otheremployees who have a significant role in the registrant's internal controlover financial reporting.
April 21, 2021/s/John J. Burke IIIJohn J. Burke IIIChief Financial Officer
Copyright © 2021 www.secdatabase.com. All Rights Reserved.Please Consider the Environment Before Printing This Document

1.
2.
Exhibit EX-99.906CERT
Certification Pursuant to Section 906 of the Sarbanes-Oxley Act of 2002(subsections (a) and (b) of section 1350, chapter 63 of title 18, United States Code)
In connection with the attached Report of Fidelity Concord Street Trust (the “Trust”) onForm N-CSR to be filed with the Securities and Exchange Commission (the “Report”),each of the undersigned officers of the Trust does hereby certify that, to the best of suchofficer’s knowledge:
The Report fully complies with the requirements of 13(a) or 15(d) of theSecurities Exchange Act of 1934; and
The information contained in the Report fairly presents, in all material respects,the financial condition and results of operations of the Trust as of, and for, theperiods presented in the Report.
Dated: April 21, 2021
/s/Stacie M. SmithStacie M. SmithPresident and Treasurer
Dated: April 21, 2021
/s/John J. Burke IIIJohn J. Burke IIIChief Financial Officer
A signed original of this written statement required by Section 906, or other documentauthenticating, acknowledging, or otherwise adopting the signature that appears in typedform within the electronic version of this written statement required by Section 906, hasbeen provided to the Trust and will be retained by the Trust and furnished to theSecurities and Exchange Commission or its staff upon request.
Copyright © 2021 www.secdatabase.com. All Rights Reserved.Please Consider the Environment Before Printing This Document
·
·
··
·
II.
EXHIBIT EX-99.CODE ETH
FIDELITY FUNDS�� CODE OF ETHICS FORPRESIDENT, TREASURER AND PRINCIPAL ACCOUNTING OFFICER
I. Purposes of the Code/Covered Officers
This document constitutes the Code of Ethics (Code) adopted by the Fidelity Funds(Funds) pursuant to the provisions of Rule 30b2-1(a) under the Investment CompanyAct of 1940), which Rule implements Sections 406 of the Sarbanes-Oxley Act of2002 with respect to registered investment companies. The Code applies to theFidelity Funds� President and Treasurer, and Chief Financial Officer (CoveredOfficers). Fidelity�s Ethics Office, a part of Corporate Compliance Group within CoreCompliance, administers the Code.
The purposes of the Code are to deter wrongdoing and to promote, on the part of theCovered Officers:
honest and ethical conduct, including the ethical handling of actual orapparent conflicts of interest between personal and professional relationships;full, fair, accurate, timely and understandable disclosure in reports anddocuments that the Fidelity Funds submit to the Securities and ExchangeCommission (SEC), and in other public communications by a Fidelity Fund;compliance with applicable laws and governmental rules and regulations;the prompt internal reporting to an appropriate person or persons identified inthe Code of violations of the Code; andaccountability for adherence to the Code.
Each Covered Officer should adhere to a high standard of business ethics and shouldbe sensitive to situations that may give rise to actual as well as apparent conflicts ofinterest.
Covered Officers Should Handle EthicallyActual and Apparent Conflicts of Interest
Overview. A �conflict of interest� occurs when a Covered Officer�s private interestinterferes with the interests of, or his service to, the Fidelity Funds. For example, aconflict of interest would arise if a Covered Officer, or a member of his family,receives improper personal benefits as a result of his position with the Fidelity Funds.
Certain conflicts of interest arise out of the relationships between Covered Officersand the Fidelity Funds and already are subject to conflict of interest provisions in theInvestment Company Act of 1940 (Investment Company Act) and the InvestmentAdvisers Act of 1940 (Investment Advisers Act). For example, Covered Officers maynot individually engage in certain transactions (such as the purchase or sale ofsecurities or other property) with a Fidelity Fund because of their status as �affiliatedpersons� of the Fund. Separate compliance programs and procedures of the FidelityFunds, Fidelity Management & Research Company (FMR) and the other Fidelitycompanies are designed to prevent, or identify and correct, violations of theseprovisions. This Code does not, and is not intended to, repeat or replace theseprograms and procedures, and such conflicts fall outside of the parameters of thisCode.
Although typically not presenting an opportunity for improper personal benefit,conflicts arise from, or as a result of, the contractual relationship between theFidelity Funds and FMR (or another Fidelity company) of which the Covered Officers
Copyright © 2021 www.secdatabase.com. All Rights Reserved.Please Consider the Environment Before Printing This Document
·
·
·
·
·
·
·
·
are also officers or employees. As a result, this Code recognizes that the CoveredOfficers will, in the normal course of their duties (whether formally for the FidelityFunds, FMR or another Fidelity company), be involved in establishing policies andimplementing decisions that have different effects on the Fidelity Funds, FMR andother Fidelity companies. The participation of the Covered Officers in such activitiesis inherent in the contractual relationship between the Fidelity Funds and FMR (oranother Fidelity company), and is consistent with the performance by the CoveredOfficers of their duties as officers of the Fidelity Funds. Thus, if performed inconformity with the provisions of the Investment Company Act and the InvestmentAdvisers Act, such activities will be deemed to have been handled ethically. Inaddition, it is recognized by the Funds� Board of Trustees (Board) that the CoveredOfficers also may be officers or employees of one or more other Fidelity Fundscovered by this Code.
Other conflicts of interest are covered by the Code, even if such conflicts of interestare not subject to provisions in the Investment Company Act and the InvestmentAdvisers Act. The following list provides examples of conflicts of interest under theCode, but Covered Officers should keep in mind that these examples are notexhaustive. The overarching principle is that the personal interest of a CoveredOfficer should not be placed improperly before the interest of a Fidelity Fund.
* * *
Each Covered Officer must:
not use his or her personal influence or personal relationships improperly toinfluence investment decisions or financial reporting by any Fidelity Fundwhereby the Covered Officer would benefit personally to the detriment of anyFidelity Fund;not cause a Fidelity Fund to take action, or fail to take action, for theindividual personal benefit of the Covered Officer rather than the benefit ofthe Fidelity Fund;not engage in any outside business activity, including serving as a director ortrustee, that prevents the Covered Officer from devoting appropriate time andattention to the Covered Officer�s responsibilities with the Fidelity Funds;not have a consulting or employment relationship with any of the FidelityFunds� service providers that are not affiliated with Fidelity; andnot retaliate against any employee or Covered Officer for reports of actual orpotential misconduct, which are made in good faith.
With respect to other fact patterns, if a Covered Officer is in doubt, other potentialconflict of interest situations should be described immediately to the Fidelity EthicsOffice for resolution. Similarly, any questions a Covered Officer has generallyregarding the application or interpretation of the Code should be directed to theFidelity Ethics Office immediately.
III. Disclosure and Compliance
Each Covered Officer should familiarize himself with the disclosurerequirements generally applicable to the Fidelity Funds.Each Covered Officer should not knowingly misrepresent, or cause others tomisrepresent, facts about any Fidelity Fund to others, whether within oroutside Fidelity, including to the Board and auditors, and to governmentalregulators and self-regulatory organizations;Each Covered Officer should, to the extent appropriate within his area ofresponsibility, consult with other officers and employees of the Fidelity Funds,FMR and the Fidelity service providers, and with the Board�s ComplianceCommittee, with the goal of promoting full, fair, accurate, timely andunderstandable disclosure in the reports and documents the Fidelity Funds file
Copyright © 2021 www.secdatabase.com. All Rights Reserved.Please Consider the Environment Before Printing This Document
·
·
·
with, or submit to, the SEC and in other public communications made by theFidelity Funds; andIt is the responsibility of each Covered Officer to promote compliance with thestandards and restrictions imposed by applicable laws, rules and regulations.
IV. Reporting and Accountability
Each Covered Officer must:
upon receipt of the Code, and annually thereafter, submit to the Fidelity EthicsOffice an acknowledgement stating that he or she has received, read, andunderstands the Code; andnotify the Fidelity Ethics Office promptly if he or she knows of any violation ofthe Code. Failure to do so is itself a violation of this Code.
The Fidelity Ethics Office shall take all action it considers appropriate to investigateany actual or potential violations reported to it. Upon completion of theinvestigation, if necessary, the matter will be reviewed with senior management orother appropriate parties, and a determination will be made as to whether any actionshould be taken as detailed below. The Covered Officer will be informed of anyaction determined to be appropriate. The Fidelity Ethics Office will inform thePersonal Trading Committee of all Code violations and actions taken in response.Without implied limitation, appropriate remedial, disciplinary or preventive action
may include a written warning, a letter of censure, suspension, dismissal or, in theevent of criminal or other serious violations of law, notification of the SEC or otherappropriate law enforcement authorities. Additionally, other legal remedies may bepursued.
The policies and procedures described in the Code do not create any obligations toany person or entity other than the Fidelity Funds. The Code is intended solely forthe internal use by the Fidelity Funds and does not constitute a promise, contract oran admission by or on behalf of any Fidelity Fund as to any fact, circumstance, orlegal conclusion. The Fidelity Funds, the Fidelity companies and the Fidelity ChiefEthics Officer retain the discretion to decide whether the Code applies to a specificsituation, and how it should be interpreted.
V. Oversight
Material violations of this Code will be reported promptly by FMR to the Board�sCompliance Committee. In addition, at least once each year, FMR will provide awritten report to the Board, which describes any issues arising under the Code sincethe last report to the Board, including, but not limited to, information about materialviolations of the Code and action taken in response to the material violations.
VI. Other Policies and Procedures
This Code shall be the sole code of ethics adopted by the Fidelity Funds for purposesof Section 406 of the Sarbanes-Oxley Act and the rules and forms applicable toregistered investment companies thereunder. Other Fidelity policies or proceduresthat cover the behavior or activities of Covered Officers are separate requirementsapplying to the Covered Officers (and others), and are not part of this Code.
VII. Amendments
Any material amendments or changes to this Code must be approved or ratified by amajority vote of the Board, including a majority of the Trustees who are notinterested persons of the Fidelity Funds.
Copyright © 2021 www.secdatabase.com. All Rights Reserved.Please Consider the Environment Before Printing This Document

VIII. Records and Confidentiality
Records of any violation of the Code and of the actions taken as a result of suchviolations will be kept by the Fidelity Ethics Office. All reports and records preparedor maintained pursuant to this Code will be considered confidential and shall bemaintained and protected accordingly. Except as otherwise required by law or thisCode, such matters shall not be disclosed to anyone other than the Fidelity EthicsOffice, the Personal Trading Committee, the Board, appropriate personnel at therelevant Fidelity company or companies and the legal counsel of any or all of theforegoing.
Copyright © 2021 www.secdatabase.com. All Rights Reserved.Please Consider the Environment Before Printing This Document