Fidelity® Total Market Index Fund Institutional Class and ...
Upload
khangminh22Category
view
0download
0
Fidelity® Nasdaq Composite Index® Fund
Annual ReportNovember 30, 2020
Annual Report
Note to Shareholders 4Performance 5Management’s Discussion of Fund Performance
6
Investment Summary 7Schedule of Investments 9Financial Statements 76Notes to Financial Statements
80
Report of Independent Registered Public Accounting Firm
88
Trustees and Officers 89Shareholder Expense Example
99
Distributions 100Proxy Voting Results 101
To view a fund’s proxy voting guidelines and proxy voting record for the 12-month period ended June 30, visit http://www.fidelity.com/proxyvotingresults or visit the Securities and Exchange Commission’s (SEC) web site at http://www.sec.gov.You may also call 1-800-544-8544 to request a free copy of the proxy voting guidelines.Nasdaq®, OMX®, NASDAQ OMX®, Nasdaq Composite®, and The Nasdaq Stock Market®, Inc. are registered trademarks of The NASDAQ OMXGroup, Inc. (which with its Affiliates are the Corporations) and are licensed for use by Fidelity. The product has not been passed on by the Corporations as to its legality or suitability. The product is not issued, endorsed or sold by the Corporations. The Corporations make no warranties and bear no liability with respect to shares of the product.Standard & Poor’s, S&P and S&P 500 are registered service marks of The McGraw-Hill Companies, Inc. and have been licensed for use by Fidelity Distributors Corporation.Other third-party marks appearing herein are the property of their respective owners.All other marks appearing herein are registered or unregistered trademarks or service marks of FMR LLC or an affiliated company. © 2021 FMR LLC. All rights reserved.
Contents

Annual Report
This report and the financial statements contained herein are submitted for the general information of the shareholders of the Fund. This report is not authorized for distribution to prospective investors in the Fund unless preceded or accompanied by an effective prospectus.A fund files its complete schedule of portfolio holdings with the SEC for the first and third quarters of each fiscal year on Form N-PORT. Forms N-PORT are available on the SEC’s web site at http://www.sec.gov. A fund’s Forms N-PORT may be reviewed and copied at the SEC’s Public Reference Room in Washington, DC. Information regarding the operation of the SEC’s Public Reference Room may be obtained by calling 1-800-SEC-0330.For a complete list of a fund’s portfolio holdings, view the most recent holdings listing, semiannual report, or annual report on Fidelity’s web site at http://www.fidelity.com, http://www.institutional.fidelity.com, or http://www.401k.com, as applicable.NOT FDIC INSURED •MAY LOSE VALUE •NO BANK GUARANTEENeither the Fund nor Fidelity Distributors Corporation is a bank.

4Annual Report
Note to Shareholders:
Effective February 1, 2020, the fund may operate as a non-diversified fund, as defined under the Investment Company Act of 1940 (1940 Act), to the approximate extent the Index is non-diversified. The fund may therefore operate as non-diversified solely as a result of a change in relative market capitalization or index weighting of one or more constituents of the Index.
Early in 2020, the outbreak and spread of a new coronavirus emerged as a public health emergency that had a major influence on financial markets, primarily based on its impact on the global economy and the outlook for corporate earnings. The virus causes a respiratory disease known as COVID-19. On March 11, the World Health Organization declared the COVID-19 outbreak a pandemic, citing sustained risk of further global spread.
In the weeks following, as the crisis worsened, we witnessed an escalating human tragedy with wide-scale social and economic consequences from coronavirus-containment measures. The outbreak of COVID-19 prompted a number of measures to limit the spread, including travel and border restrictions, quarantines, and restrictions on large gatherings. In turn, these resulted in lower consumer activity, diminished demand for a wide range of products and services, disruption in manufacturing and supply chains, and – given the wide variability in outcomes regarding the outbreak – significant market uncertainty and volatility. Amid the turmoil, global governments and central banks took unprecedented action to help support consumers, businesses, and the broader economies, and to limit disruption to financial systems.
The situation continues to unfold, and the extent and duration of its impact on financial markets and the economy remain highly uncertain. Extreme events such as the coronavirus crisis are “exogenous shocks” that can have significant adverse effects on mutual funds and their investments. Although multiple asset classes may be affected by market disruption, the duration and impact may not be the same for all types of assets.
Fidelity is committed to helping you stay informed amid news about COVID-19 and during increased market volatility, and we’re taking extra steps to be responsive to customer needs. We encourage you to visit our websites, where we offer ongoing updates, commentary, and analysis on the markets and our funds.
5 Annual Report
Performance: The Bottom Line
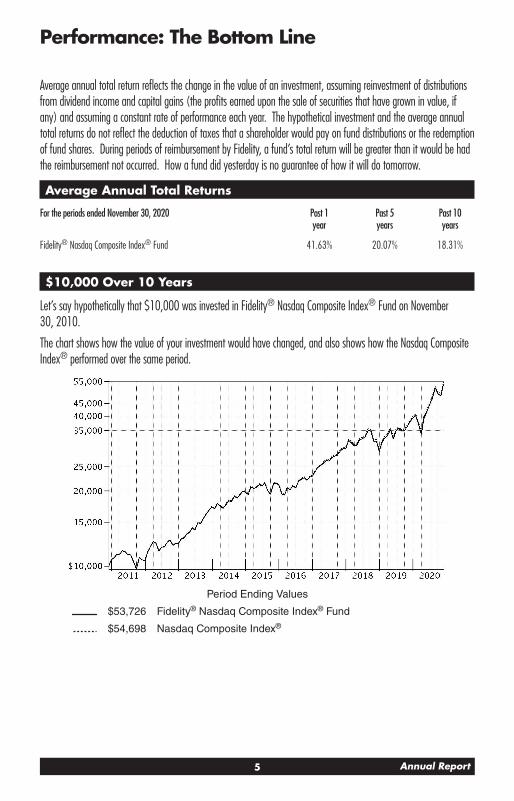
Average annual total return reflects the change in the value of an investment, assuming reinvestment of distributions from dividend income and capital gains (the profits earned upon the sale of securities that have grown in value, if any) and assuming a constant rate of performance each year. The hypothetical investment and the average annual total returns do not reflect the deduction of taxes that a shareholder would pay on fund distributions or the redemption of fund shares. During periods of reimbursement by Fidelity, a fund’s total return will be greater than it would be had the reimbursement not occurred. How a fund did yesterday is no guarantee of how it will do tomorrow.
Average Annual Total Returns
For the periods ended November 30, 2020 Past 1 year
Past 5 years
Past 10 years
Fidelity® Nasdaq Composite Index® Fund 41.63% 20.07% 18.31%
$10,000 Over 10 Years
Let’s say hypothetically that $10,000 was invested in Fidelity® Nasdaq Composite Index® Fund on November 30, 2010.
The chart shows how the value of your investment would have changed, and also shows how the Nasdaq Composite Index® performed over the same period.
Period Ending Values
$53,726 Fidelity® Nasdaq Composite Index® Fund
$54,698 Nasdaq Composite Index®

6Annual Report
Management’s Discussion of Fund PerformanceMarket Recap: The S&P 500® index gained 17.46% for the year ending November 30, 2020, a volatile period marked by a steep but brief decline due to the early-2020 outbreak and spread of the coronavirus, followed by a historic rebound. Declared a pandemic on March 11, the COVID-19 crisis and containment efforts caused broad contraction in economic activity, along with extreme uncertainty, volatility and dislocation in financial markets. A rapid and expansive U.S. monetary/fiscal-policy response provided a partial offset to the economic disruption and fueled a sharp uptrend beginning March 24. Other supporting factors included resilient corporate earnings, near-term potential for a COVID-19 vaccine breakthrough and traction on a broader economic reopening. The rally lasted until September 2, when the S&P 500 began a two-month retreat. The loss of momentum reflected Congress’s inability to reach a deal on additional fiscal stimulus, as well as concerns about election uncertainty, indications the U.S. economic recovery was stalling and a new wave of COVID-19 cases. November was a much different story, as investors reacted favorably to election results and encouraging updates on the efficacy of two COVID-19 vaccine candidates. The index rose 11%, one of its biggest monthly gains ever. By sector for the full year, information technol-ogy (+42%) and consumer discretionary (+34%) led, driven by a handful of large growth stocks. In contrast, energy shares (-33%) struggled along with global oil demand and pricing.
Comments from the Geode Capital Management, LLC, passive equity index team: For the fiscal year ending November 30, 2020, the fund gained 41.63%, roughly in line with the 42.06% advance of the benchmark NASDAQ Composite Index. By sector, information technology rose 51% and contributed most, followed by consumer discretionary, which gained 79%. The communication services sector rose about 34%, boosted by the media & entertainment industry (+33%); health care gained 27%; and industrials advanced 18%. Other notable contributors included the consumer staples (+13%), real estate (+13%), utilities (+4%), and materials (+7%) sectors. In contrast, stocks in the financials sector returned -6% and detracted most. This group was hampered by the banks (-13%) industry. Energy (-36%) also hurt. Turning to individual stocks, the top contributor was Apple (+79%), from the technology hardware & equipment group, followed by Amazon.com (+75%), within the retailing segment. In software & services, Microsoft advanced roughly 42%, and Alphabet (+34%), from the media & entertainment industry, also helped. Nvidia, within the semiconductors & semiconductor equipment category, rose approximately 146% and boosted the fund. In contrast, the biggest individual detractor was Intel (-15%), from the semicon-ductors & semiconductor equipment segment, followed by Walgreens Boots Alliance (-34%), which is in the food & staples retailing group. Within transportation, United Airlines Holdings returned -55% and hurt. Other detractors were Biogen (-20%), a stock in the pharmaceuticals, biotechnology & life sciences category, and CME (-11%), from the diversified financials industry.
The views expressed above reflect those of the portfolio manager(s) only through the end of the period as stated on the cover of this report and do not necessarily represent the views of Fidelity or any other person in the Fidelity organization. Any such views are subject to change at any time based upon market or other conditions and Fidelity disclaims any responsibility to update such views. These views may not be relied on as investment advice and, because investment decisions for a Fidelity fund are based on numerous factors, may not be relied on as an indication of trading intent on behalf of any Fidelity fund.

7 Annual Report
Investment Summary (Unaudited)
Top Ten Stocks as of November 30, 2020
% of fund’s net assets
Apple, Inc. 10.8Microsoft Corp. 8.6Amazon.com, Inc. 8.5Facebook, Inc. Class A 3.6Alphabet, Inc. Class C 3.1Tesla, Inc. 2.8Alphabet, Inc. Class A 2.8NVIDIA Corp. 1.8PayPal Holdings, Inc. 1.4Adobe, Inc. 1.2
44.6
Top Market Sectors as of November 30, 2020
% of fund’s net assets
Information Technology 42.0Consumer Discretionary 17.2Communication Services 16.7Health Care 10.4Financials 3.7Consumer Staples 3.7Industrials 3.5Real Estate 1.0Utilities 0.8Materials 0.3

8Annual Report
Investment Summary (Unaudited) – continued
Asset Allocation (% of fund’s net assets)
As of November 30, 2020 *
Stocks and Equity Futures 100.0%
* Foreign investments – 5.3%
9 Annual Report
See accompanying notes which are an integral part of the financial statements.
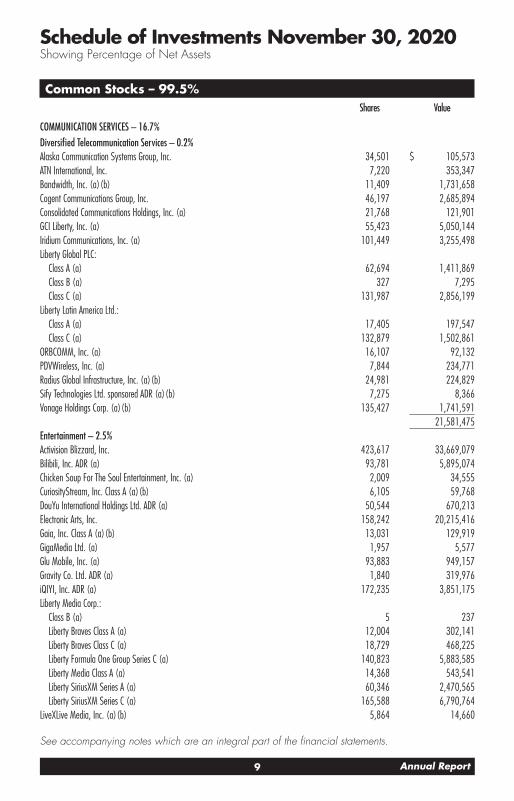
Common Stocks – 99.5%Shares Value
COMMUNICATION SERVICES – 16.7%Diversified Telecommunication Services – 0.2%Alaska Communication Systems Group, Inc. 34,501 $ 105,573ATN International, Inc. 7,220 353,347Bandwidth, Inc. (a) (b) 11,409 1,731,658Cogent Communications Group, Inc. 46,197 2,685,894Consolidated Communications Holdings, Inc. (a) 21,768 121,901GCI Liberty, Inc. (a) 55,423 5,050,144Iridium Communications, Inc. (a) 101,449 3,255,498Liberty Global PLC:
Class A (a) 62,694 1,411,869Class B (a) 327 7,295Class C (a) 131,987 2,856,199
Liberty Latin America Ltd.:Class A (a) 17,405 197,547Class C (a) 132,879 1,502,861
ORBCOMM, Inc. (a) 16,107 92,132PDVWireless, Inc. (a) 7,844 234,771Radius Global Infrastructure, Inc. (a) (b) 24,981 224,829Sify Technologies Ltd. sponsored ADR (a) (b) 7,275 8,366Vonage Holdings Corp. (a) (b) 135,427 1,741,591
21,581,475Entertainment – 2.5%Activision Blizzard, Inc. 423,617 33,669,079Bilibili, Inc. ADR (a) 93,781 5,895,074Chicken Soup For The Soul Entertainment, Inc. (a) 2,009 34,555CuriosityStream, Inc. Class A (a) (b) 6,105 59,768DouYu International Holdings Ltd. ADR (a) 50,544 670,213Electronic Arts, Inc. 158,242 20,215,416Gaia, Inc. Class A (a) (b) 13,031 129,919GigaMedia Ltd. (a) 1,957 5,577Glu Mobile, Inc. (a) 93,883 949,157Gravity Co. Ltd. ADR (a) 1,840 319,976iQIYI, Inc. ADR (a) 172,235 3,851,175Liberty Media Corp.:
Class B (a) 5 237Liberty Braves Class A (a) 12,004 302,141Liberty Braves Class C (a) 18,729 468,225Liberty Formula One Group Series C (a) 140,823 5,883,585Liberty Media Class A (a) 14,368 543,541Liberty SiriusXM Series A (a) 60,346 2,470,565Liberty SiriusXM Series C (a) 165,588 6,790,764
LiveXLive Media, Inc. (a) (b) 5,864 14,660
Schedule of Investments November 30, 2020Showing Percentage of Net Assets

10Annual Report
See accompanying notes which are an integral part of the financial statements.
Schedule of Investments – continued
Common Stocks – continuedShares Value
COMMUNICATION SERVICES – continuedEntertainment – continuedNeoGames SA 8,074 $ 176,982NetEase, Inc. ADR 196,324 17,741,800Netflix, Inc. (a) 239,722 117,631,585Reading International, Inc. Class A (a) 22,603 79,111Roku, Inc. Class A (a) 57,632 16,919,026Scienjoy Holding Corp. (a) (b) 3,917 35,057Sciplay Corp. (A Shares) (a) 14,091 209,815Take-Two Interactive Software, Inc. (a) 62,356 11,255,882The9 Ltd. sponsored ADR (a) (b) 904 2,667Warner Music Group Corp. Class A (b) 83,371 2,478,620Zynga, Inc. (a) 512,638 4,229,264
253,033,436Interactive Media & Services – 10.3%9F, Inc. ADR (a) (b) 109,500 192,720Alphabet, Inc.:
Class A (a) 162,620 285,300,528Class C (a) 180,546 317,894,564
ANGI Homeservices, Inc. Class A (a) 85,812 1,060,636Autoweb, Inc. (a) 8,678 27,943Baidu.com, Inc. sponsored ADR (a) 124,356 17,284,240BlueCity Holdings Ltd. ADR (a) (b) 1,014 13,983CarGurus, Inc. Class A (a) 84,823 2,124,816EverQuote, Inc. Class A (a) (b) 8,634 325,156Facebook, Inc. Class A (a) 1,303,671 361,077,757Fangdd Network Group Ltd. ADR (b) 7,385 53,098InterActiveCorp (a) 43,506 6,177,417Liberty TripAdvisor Holdings, Inc. (a) 18,769 51,615Luokung Technology Corp. (a) (b) 132,838 77,431Match Group, Inc. (a) (b) 146,788 20,434,357Momo, Inc. ADR 20,548 295,480Professional Diversity Network, Inc. (a) (b) 1,922 2,825QuinStreet, Inc. (a) 27,593 492,397Qutoutiao, Inc. ADR (a) (b) 26,923 75,384SINA Corp. (a) 14,305 619,836So-Young International, Inc. ADR (a) 28,082 358,046Sohu.Com Ltd. ADR (a) 8,555 157,070Super League Gaming, Inc. (a) (b) 5,685 10,915Travelzoo, Inc. (a) 6,862 64,846TripAdvisor, Inc. 96,716 2,524,288Trivago NV ADR (a) 79,936 175,060TrueCar, Inc. (a) 7,725 31,518

11 Annual Report
See accompanying notes which are an integral part of the financial statements.
Common Stocks – continuedShares Value
COMMUNICATION SERVICES – continuedInteractive Media & Services – continuedWeibo Corp. sponsored ADR (a) (b) 23,956 $ 1,012,141Yandex NV Series A (a) (b) 171,308 11,813,400YY, Inc. ADR 30,631 2,728,303Zillow Group, Inc.:
Class A (a) 31,480 3,473,818Class C (a) 89,644 9,664,520
Zoominfo Technologies, Inc. (b) 51,233 2,625,6911,048,221,799
Media – 2.7%AirMedia Group, Inc. ADR (a) (b) 5,468 6,562AMC Networks, Inc. Class A (a) (b) 419 13,814Beasley Broadcast Group, Inc. Class A 317,349 479,197Boston Omaha Corp. (a) 12,606 292,207Cardlytics, Inc. (a) (b) 15,328 1,819,127Charter Communications, Inc. Class A (a) 111,436 72,655,158Comcast Corp. Class A 2,483,667 124,779,430comScore, Inc. (a) 22,111 56,383Criteo SA sponsored ADR (a) 5,095 98,690Cumulus Media, Inc. (a) 7,419 65,065Daily Journal Corp. (a) (b) 984 265,680Discovery Communications, Inc.:
Class A (a) (b) 163,627 4,403,203Class B (a) 338 10,901Class C (non-vtg.) (a) 198,570 4,769,651
DISH Network Corp. Class A (a) 84,331 3,024,953E.W. Scripps Co. Class A (b) 19,673 251,027Fluent, Inc. (a) 50,041 172,141Fox Corp.:
Class A 89,480 2,580,603Class B 42,114 1,195,195
Hemisphere Media Group, Inc. (a) 14,863 159,926iClick Interactive Asia Group Ltd. (A Shares) ADR (a) (b) 23,395 168,210iHeartMedia, Inc. (a) 9,885 118,175Insignia Systems, Inc. (a) 12,723 13,359Liberty Broadband Corp.:
Class A (a) 15,530 2,434,638Class C (a) 88,858 13,981,806
Loral Space & Communications Ltd. 6,003 137,949Marchex, Inc. Class B (a) 34,542 74,611MDC Partners, Inc. Class A (a) 47,873 110,108Mediaco Holding, Inc. (a) (b) 911 2,259

12Annual Report
See accompanying notes which are an integral part of the financial statements.
Schedule of Investments – continued
Common Stocks – continuedShares Value
COMMUNICATION SERVICES – continuedMedia – continuedNews Corp.:
Class A 272,769 $ 4,814,373Class B 111,410 1,984,212
Nexstar Broadcasting Group, Inc. Class A 36,131 3,802,788Perion Network Ltd. (a) (b) 18,565 140,908Salem Communications Corp. Class A (b) 36,814 39,391Scholastic Corp. 9,643 228,732Sinclair Broadcast Group, Inc. Class A (b) 92,826 2,530,437Sirius XM Holdings, Inc. (b) 2,623,821 17,028,598TechTarget, Inc. (a) 17,130 899,325Tribune Publishing Co. 23,863 288,265TuanChe Ltd. ADR (A Shares) (a) 4,832 17,395Urban One, Inc.:
Class A (a) (b) 31,324 166,330Class D (non-vtg.) (a) 25,900 37,814
ViacomCBS, Inc.:Class A 18,690 681,811Class B (b) 218,342 7,703,106
WiMi Hologram Cloud, Inc. ADR (a) (b) 569 3,454274,506,967
Wireless Telecommunication Services – 1.0%Boingo Wireless, Inc. (a) 52,231 739,069Gogo, Inc. (a) 49,086 517,366Millicom International Cellular SA 49,970 1,969,817NII Holdings, Inc. (a) (c) 5,182 11,245Partner Communications Co. Ltd. ADR (a) (b) 3,584 17,884Shenandoah Telecommunications Co. 26,610 1,182,548Spok Holdings, Inc. 17,401 171,052T-Mobile U.S., Inc. 679,297 90,305,743VEON Ltd. sponsored ADR (b) 724,724 1,050,850Vodafone Group PLC sponsored ADR 56,194 931,697
96,897,271
TOTAL COMMUNICATION SERVICES 1,694,240,948
CONSUMER DISCRETIONARY – 17.2%Auto Components – 0.2%China Automotive Systems, Inc. (a) 14,729 154,655China XD Plastics Co. Ltd. (a) 32,740 38,961Dorman Products, Inc. (a) 17,959 1,658,873Fox Factory Holding Corp. (a) 22,482 1,962,004

13 Annual Report
See accompanying notes which are an integral part of the financial statements.
Common Stocks – continuedShares Value
CONSUMER DISCRETIONARY – continuedAuto Components – continuedGentex Corp. 128,883 $ 4,201,586Gentherm, Inc. (a) 16,475 936,769Kandi Technolgies, Inc. (a) (b) 33,690 328,814Motorcar Parts of America, Inc. (a) 12,691 255,343Patrick Industries, Inc. 13,038 821,916Strattec Security Corp. 1,858 82,309The Goodyear Tire & Rubber Co. 45,204 471,026Visteon Corp. (a) 15,401 1,861,211Workhorse Group, Inc. (a) (b) 69,202 1,755,655XPEL, Inc. (a) (b) 16,220 614,414
15,143,536Automobiles – 2.9%Arcimoto, Inc. (a) (b) 25,732 347,382DiamondPeak Holdings Corp. (a) 94,165 2,316,459DropCar, Inc. (a) (b) 10,975 81,105ElectraMeccanica Vehicles Corp. (a) (b) 41,034 306,524Li Auto, Inc. ADR (a) (b) 53,679 1,931,907Niu Technologies ADR (a) (b) 17,738 528,947Tesla, Inc. (a) 504,849 286,552,292
292,064,616Distributors – 0.1%Core-Mark Holding Co., Inc. 25,355 790,822Educational Development Corp. 7,795 122,615Funko, Inc. (a) (b) 68,918 605,100LKQ Corp. (a) 164,592 5,796,930Pool Corp. 21,780 7,538,276Weyco Group, Inc. 8,942 160,241
15,013,984Diversified Consumer Services – 0.1%Afya Ltd. (a) 26,135 693,100American Public Education, Inc. (a) 10,578 328,341Arco Platform Ltd. Class A (a) 6,119 267,706Aspen Group, Inc. (a) 13,497 163,989Career Education Corp. (a) 27,336 309,990Collectors Universe, Inc. 5,034 388,373Franchise Group, Inc. 22,084 591,630Frontdoor, Inc. (a) 46,359 2,194,635Grand Canyon Education, Inc. (a) 25,550 2,132,659Hailiang Education Group, Inc. ADR (a) 2,666 175,689Laureate Education, Inc. Class A (a) 104,318 1,481,316Lincoln Educational Services Corp. (a) 18,674 117,086

14Annual Report
See accompanying notes which are an integral part of the financial statements.
Schedule of Investments – continued
Common Stocks – continuedShares Value
CONSUMER DISCRETIONARY – continuedDiversified Consumer Services – continuedMeten EdtechX Education Group Ltd. (a) (b) 12,075 $ 34,897OneSpaWorld Holdings Ltd. (b) 7,219 63,816RISE Education Cayman Ltd. ADR (a) 9,767 63,095Select Interior Concepts, Inc. (a) 10,751 81,708Strategic Education, Inc. 23,150 2,173,554Tarena International, Inc. ADR (a) (b) 24,820 73,467Vasta Platform Ltd. (a) (b) 15,730 217,074Vitru Ltd. (a) 2,632 36,743Weight Watchers International, Inc. (a) 2,934 86,582Xpresspa Group, Inc. (a) (b) 47,091 77,229Zovio, Inc. (a) 16,099 59,888
11,812,567Hotels, Restaurants & Leisure – 1.5%Allied Esports Entertainment, Inc. (a) (b) 11,416 11,758BBQ Holdings, Inc. (a) 3,815 17,053BJ’s Restaurants, Inc. (b) 31,423 1,037,902Bloomin’ Brands, Inc. 97,417 1,704,798Caesars Entertainment, Inc. (a) 113,687 7,744,358Carrols Restaurant Group, Inc. (a) (b) 7,971 54,203Century Casinos, Inc. (a) 13,204 78,036Churchill Downs, Inc. 21,394 3,849,208Chuy’s Holdings, Inc. (a) 9,648 228,658Cracker Barrel Old Country Store, Inc. 20,181 2,816,864Dave & Buster’s Entertainment, Inc. 46,529 1,178,114Del Taco Restaurants, Inc. (a) 26,399 233,631Denny’s Corp. (a) 97,749 1,125,091DraftKings, Inc. Class A (a) 210,259 11,009,161Dunkin’ Brands Group, Inc. 44,959 4,780,940El Pollo Loco Holdings, Inc. (a) 11,056 173,248Esports Entertainment Group, Inc. (a) (b) 3,098 13,414Extended Stay America, Inc. unit 25,377 347,919FAT Brands, Inc. (a) (b) 4,334 26,567Fiesta Restaurant Group, Inc. (a) (b) 12,322 144,784Golden Entertainment, Inc. (a) 17,207 286,497Good Times Restaurants, Inc. (a) 9,092 14,820Hall of Fame Resort & Entertainment Co. (a) (b) 304,706 444,871Huazhu Group Ltd. ADR (b) 81,350 4,049,603Inspired Entertainment, Inc. (a) (b) 15,862 105,482Jack in the Box, Inc. 12,571 1,156,406Kura Sushi U.S.A., Inc. Class A (a) 4,116 67,791Lindblad Expeditions Holdings (a) 29,723 380,752

15 Annual Report
See accompanying notes which are an integral part of the financial statements.
Common Stocks – continuedShares Value
CONSUMER DISCRETIONARY – continuedHotels, Restaurants & Leisure – continuedMarriott International, Inc. Class A 164,672 $ 20,891,937Melco Crown Entertainment Ltd. sponsored ADR 75,235 1,364,011Monarch Casino & Resort, Inc. (a) 10,263 566,723Muscle Maker, Inc. (b) 183,449 390,746Nathan’s Famous, Inc. 3,678 208,910Noodles & Co. (a) 27,889 221,718Papa John’s International, Inc. 17,501 1,406,380Penn National Gaming, Inc. (a) 84,141 5,889,870Potbelly Corp. (a) 5,844 27,584Rave Restaurant Group, Inc. (a) 5,714 4,886RCI Hospitality Holdings, Inc. (b) 6,727 198,514Red Robin Gourmet Burgers, Inc. (a) 39,057 785,436Red Rock Resorts, Inc. 67,027 1,457,502Ruth’s Hospitality Group, Inc. 65,220 1,015,475Scientific Games Corp. Class A (a) (b) 48,429 1,805,433Starbucks Corp. 632,608 62,008,236Target Hospitality Corp. (a) 63,419 100,202Texas Roadhouse, Inc. Class A 37,484 2,841,287The Cheesecake Factory, Inc. (b) 7,030 263,484The ONE Group Hospitality, Inc. (a) (b) 5,319 17,712Tuniu Corp. Class A sponsored ADR (a) (b) 13,361 37,678Wendy’s Co. 121,893 2,680,427Wingstop, Inc. 16,208 2,063,440Wynn Resorts Ltd. 45,494 4,572,147
153,901,667Household Durables – 0.3%Bassett Furniture Industries, Inc. 4,416 69,331Cavco Industries, Inc. (a) 5,290 952,253Flexsteel Industries, Inc. 3,070 89,828Garmin Ltd. 103,465 12,080,573GoPro, Inc. Class A (a) 23,016 160,882Green Brick Partners, Inc. (a) 31,521 686,212Helen of Troy Ltd. (a) 13,721 2,771,505Hooker Furniture Corp. 6,220 188,279iRobot Corp. (a) (b) 14,636 1,147,901Legacy Housing Corp. (a) 10,184 151,742LGI Homes, Inc. (a) 14,209 1,535,282Lifetime Brands, Inc. 14,154 190,654Live Ventures, Inc. (a) 1,450 17,618Lovesac (a) (b) 7,926 252,681Mohawk Group Holdings, Inc. (a) 8,548 60,349
16Annual Report
See accompanying notes which are an integral part of the financial statements.
Schedule of Investments – continued
Common Stocks – continuedShares Value
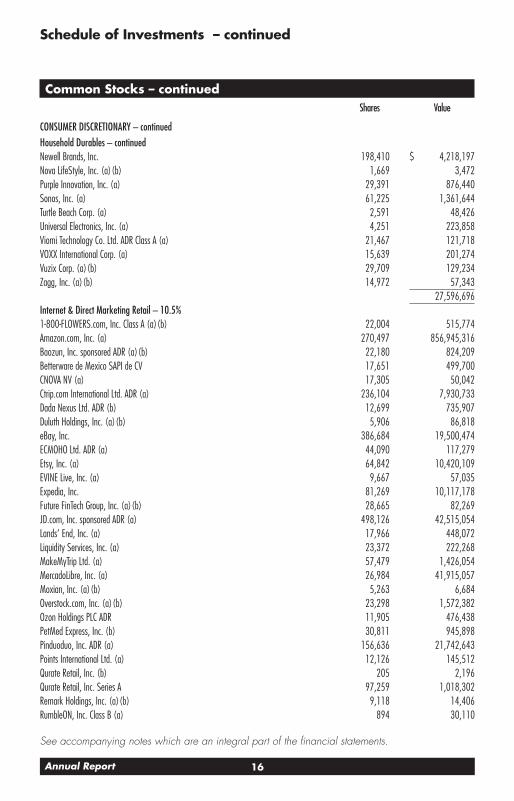
CONSUMER DISCRETIONARY – continuedHousehold Durables – continuedNewell Brands, Inc. 198,410 $ 4,218,197Nova LifeStyle, Inc. (a) (b) 1,669 3,472Purple Innovation, Inc. (a) 29,391 876,440Sonos, Inc. (a) 61,225 1,361,644Turtle Beach Corp. (a) 2,591 48,426Universal Electronics, Inc. (a) 4,251 223,858Viomi Technology Co. Ltd. ADR Class A (a) 21,467 121,718VOXX International Corp. (a) 15,639 201,274Vuzix Corp. (a) (b) 29,709 129,234Zagg, Inc. (a) (b) 14,972 57,343
27,596,696Internet & Direct Marketing Retail – 10.5%1-800-FLOWERS.com, Inc. Class A (a) (b) 22,004 515,774Amazon.com, Inc. (a) 270,497 856,945,316Baozun, Inc. sponsored ADR (a) (b) 22,180 824,209Betterware de Mexico SAPI de CV 17,651 499,700CNOVA NV (a) 17,305 50,042Ctrip.com International Ltd. ADR (a) 236,104 7,930,733Dada Nexus Ltd. ADR (b) 12,699 735,907Duluth Holdings, Inc. (a) (b) 5,906 86,818eBay, Inc. 386,684 19,500,474ECMOHO Ltd. ADR (a) 44,090 117,279Etsy, Inc. (a) 64,842 10,420,109EVINE Live, Inc. (a) 9,667 57,035Expedia, Inc. 81,269 10,117,178Future FinTech Group, Inc. (a) (b) 28,665 82,269JD.com, Inc. sponsored ADR (a) 498,126 42,515,054Lands’ End, Inc. (a) 17,966 448,072Liquidity Services, Inc. (a) 23,372 222,268MakeMyTrip Ltd. (a) 57,479 1,426,054MercadoLibre, Inc. (a) 26,984 41,915,057Moxian, Inc. (a) (b) 5,263 6,684Overstock.com, Inc. (a) (b) 23,298 1,572,382Ozon Holdings PLC ADR 11,905 476,438PetMed Express, Inc. (b) 30,811 945,898Pinduoduo, Inc. ADR (a) 156,636 21,742,643Points International Ltd. (a) 12,126 145,512Qurate Retail, Inc. (b) 205 2,196Qurate Retail, Inc. Series A 97,259 1,018,302Remark Holdings, Inc. (a) (b) 9,118 14,406RumbleON, Inc. Class B (a) 894 30,110

17 Annual Report
See accompanying notes which are an integral part of the financial statements.
Common Stocks – continuedShares Value
CONSUMER DISCRETIONARY – continuedInternet & Direct Marketing Retail – continuedSecoo Holding Ltd. ADR (a) 5,398 $ 16,842Stamps.com, Inc. (a) 8,607 1,613,468Stitch Fix, Inc. (a) (b) 32,100 1,300,050The Booking Holdings, Inc. (a) 22,661 45,966,705The RealReal, Inc. (a) (b) 11,232 155,563The Rubicon Project, Inc. (a) (b) 61,561 1,169,659Trxade Group, Inc. 75,509 441,728U.S. Auto Parts Network, Inc. (a) (b) 26,339 396,929Waitr Holdings, Inc. (a) 61,095 202,835Yatra Online, Inc. (a) 6,606 11,164Yunji, Inc. ADR (a) (b) 20,911 68,379
1,071,707,241Leisure Products – 0.3%American Outdoor Brands, Inc. (a) 7,566 105,054BRP, Inc. 23,180 1,322,404Clarus Corp. 16,429 236,578Escalade, Inc. 7,721 148,784Hasbro, Inc. (b) 75,697 7,042,092JAKKS Pacific, Inc. (a) (b) 60,002 307,210Johnson Outdoors, Inc. Class A 5,775 482,790Malibu Boats, Inc. Class A (a) 11,640 663,364Mattel, Inc. (a) 73,821 1,143,487MCBC Holdings, Inc. (a) 12,347 267,436Peloton Interactive, Inc. Class A (a) 123,285 14,344,210Smith & Wesson Brands, Inc. 30,266 476,992
26,540,401Multiline Retail – 0.2%Dollar Tree, Inc. (a) 128,357 14,021,719Ollie’s Bargain Outlet Holdings, Inc. (a) (b) 34,627 3,049,254
17,070,973Specialty Retail – 0.8%Academy Sports & Outdoors, Inc. (b) 37,607 618,635America’s Car Mart, Inc. (a) 3,745 391,353Bed Bath & Beyond, Inc. (b) 69,695 1,460,807Big 5 Sporting Goods Corp. (b) 11,018 105,002Blink Charging Co. (a) (b) 16,164 408,141Citi Trends, Inc. 7,084 240,077Conn’s, Inc. (a) 4,008 44,429DavidsTea, Inc. (a) (b) 21,923 38,365Destination XL Group, Inc. (a) 33,267 11,653Five Below, Inc. (a) 30,339 4,745,020

18Annual Report
See accompanying notes which are an integral part of the financial statements.
Schedule of Investments – continued
Common Stocks – continuedShares Value
CONSUMER DISCRETIONARY – continuedSpecialty Retail – continuedFrancesca’s Holdings Corp. (a) 9,748 $ 29,829GrowGeneration Corp. (a) (b) 24,594 864,971Hibbett Sports, Inc. (a) 10,340 425,594Kaixin Auto Holdings (a) (b) 31,869 206,830Kirkland’s, Inc. (a) (b) 5,829 83,296Lazydays Holdings, Inc. (a) 3,338 55,077Leslie’s, Inc. (b) 100,000 2,069,000LMP Automotive Holdings, Inc. (b) 4,452 120,427Monro, Inc. 4,638 218,032National Vision Holdings, Inc. (a) 44,963 1,924,866O’Reilly Automotive, Inc. (a) 40,019 17,706,006OneWater Marine, Inc. Class A 3,259 91,122Rent-A-Center, Inc. 30,235 1,022,548Ross Stores, Inc. 201,760 21,693,235Shoe Carnival, Inc. (b) 8,397 307,078Sleep Number Corp. (a) 15,250 1,058,198Sportsman’s Warehouse Holdings, Inc. (a) 25,040 348,807The Children’s Place Retail Stores, Inc. 23,207 997,437The ODP Corp. 5,616 161,011Tractor Supply Co. 63,166 8,894,404TravelCenters of America LLC (a) 7,299 237,509Ulta Beauty, Inc. (a) 30,555 8,414,847Urban Outfitters, Inc. (a) 75,215 2,059,387Vroom, Inc. (b) 39,656 1,422,064Winmark Corp. 2,110 379,800Zumiez, Inc. (a) 13,387 496,524
79,351,381Textiles, Apparel & Luxury Goods – 0.3%Charles & Colvard Ltd. (a) 22,010 25,752Columbia Sportswear Co. (b) 35,167 2,881,232Crocs, Inc. (a) 36,709 2,161,793Crown Crafts, Inc. 9,628 74,424Ever-Glory International Group, Inc. (a) 19,173 40,647G-III Apparel Group Ltd. (a) (b) 64,750 1,318,958Lakeland Industries, Inc. (a) 4,176 82,768lululemon athletica, Inc. (a) 67,328 24,926,172Naked Brand Group, Inc. (a) 153,762 31,352Rocky Brands, Inc. 7,111 206,219Sequential Brands Group, Inc. (a) (b) 5,009 52,044Steven Madden Ltd. 77,726 2,446,037
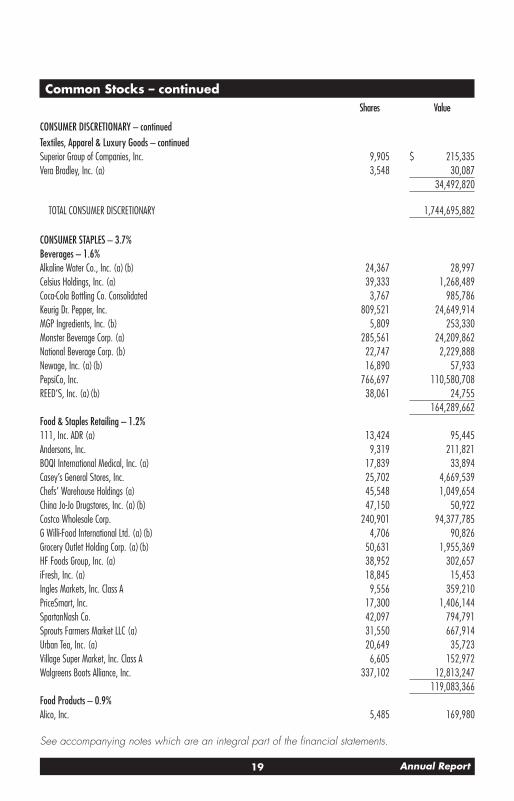
19 Annual Report
See accompanying notes which are an integral part of the financial statements.
Common Stocks – continuedShares Value
CONSUMER DISCRETIONARY – continuedTextiles, Apparel & Luxury Goods – continuedSuperior Group of Companies, Inc. 9,905 $ 215,335Vera Bradley, Inc. (a) 3,548 30,087
34,492,820
TOTAL CONSUMER DISCRETIONARY 1,744,695,882
CONSUMER STAPLES – 3.7%Beverages – 1.6%Alkaline Water Co., Inc. (a) (b) 24,367 28,997Celsius Holdings, Inc. (a) 39,333 1,268,489Coca-Cola Bottling Co. Consolidated 3,767 985,786Keurig Dr. Pepper, Inc. 809,521 24,649,914MGP Ingredients, Inc. (b) 5,809 253,330Monster Beverage Corp. (a) 285,561 24,209,862National Beverage Corp. (b) 22,747 2,229,888Newage, Inc. (a) (b) 16,890 57,933PepsiCo, Inc. 766,697 110,580,708REED’S, Inc. (a) (b) 38,061 24,755
164,289,662Food & Staples Retailing – 1.2%111, Inc. ADR (a) 13,424 95,445Andersons, Inc. 9,319 211,821BOQI International Medical, Inc. (a) 17,839 33,894Casey’s General Stores, Inc. 25,702 4,669,539Chefs’ Warehouse Holdings (a) 45,548 1,049,654China Jo-Jo Drugstores, Inc. (a) (b) 47,150 50,922Costco Wholesale Corp. 240,901 94,377,785G Willi-Food International Ltd. (a) (b) 4,706 90,826Grocery Outlet Holding Corp. (a) (b) 50,631 1,955,369HF Foods Group, Inc. (a) 38,952 302,657iFresh, Inc. (a) 18,845 15,453Ingles Markets, Inc. Class A 9,556 359,210PriceSmart, Inc. 17,300 1,406,144SpartanNash Co. 42,097 794,791Sprouts Farmers Market LLC (a) 31,550 667,914Urban Tea, Inc. (a) 20,649 35,723Village Super Market, Inc. Class A 6,605 152,972Walgreens Boots Alliance, Inc. 337,102 12,813,247
119,083,366Food Products – 0.9%Alico, Inc. 5,485 169,980

20Annual Report
See accompanying notes which are an integral part of the financial statements.
Schedule of Investments – continued
Common Stocks – continuedShares Value
CONSUMER STAPLES – continuedFood Products – continuedBeyond Meat, Inc. (a) (b) 34,032 $ 4,761,077Bridgford Foods Corp. (a) 3,580 66,767Cal-Maine Foods, Inc. (a) 16,323 638,719Calavo Growers, Inc. 8,661 620,387China Xiangtai Food Co. Ltd. (a) 30,160 25,636Farmer Brothers Co. (a) 17,421 77,523Freshpet, Inc. (a) 22,214 3,040,652Hostess Brands, Inc. Class A (a) 37,027 501,716J&J Snack Foods Corp. 16,959 2,465,669John B. Sanfilippo & Son, Inc. 5,270 391,087Lancaster Colony Corp. 14,900 2,523,017Landec Corp. (a) (b) 22,245 230,236Lifeway Foods, Inc. (a) 9,131 64,008Limoneira Co. 11,551 168,991Mission Produce, Inc. 23,163 311,542Mondelez International, Inc. 825,330 47,415,209Nuzee, Inc. (a) 6,728 91,972Origin Agritech Ltd. (a) (b) 3,770 36,871Pilgrim’s Pride Corp. (a) 88,263 1,667,288Pingtan Marine Enterprise Ltd. (a) (b) 41,107 73,993S&W Seed Co. (a) 18,677 48,747Sanderson Farms, Inc. 19,819 2,709,852Seneca Foods Corp. Class A (a) 5,752 240,894SunOpta, Inc. (a) 44,507 452,636Tattooed Chef, Inc. (a) (b) 73,672 1,122,761TDH Holdings, Inc. (a) 8,556 11,294The Hain Celestial Group, Inc. (a) (b) 40,272 1,550,472The Kraft Heinz Co. 507,952 16,731,939The Simply Good Foods Co. (a) 81,132 1,763,810Village Farms International, Inc. (a) 3,610 41,140Vital Farms, Inc. (a) (b) 21,832 647,100
90,662,985Household Products – 0.0%Central Garden & Pet Co. Class A (non-vtg.) (a) 30,266 1,116,513Ocean Bio-Chem, Inc. 6,206 82,230Reynolds Consumer Products, Inc. 113,330 3,438,432WD-40 Co. (b) 7,704 1,959,204
6,596,379Personal Products – 0.0%China SXT Pharmaceuticals, Inc. (a) 64,726 19,418DSwiss, Inc. (c) (d) 7,648 0

21 Annual Report
See accompanying notes which are an integral part of the financial statements.
Common Stocks – continuedShares Value
CONSUMER STAPLES – continuedPersonal Products – continuedGuardion Health Sciences, Inc. (a) 206,344 $ 54,268Happiness Biotech Group Ltd. (b) 6,115 11,924Inter Parfums, Inc. 18,006 977,906LifeVantage Corp. (a) 7,378 78,428Mannatech, Inc. 1,514 27,025MYOS Corp. (a) 1,229 21,385Natural Alternatives International, Inc. (a) 4,379 43,177Natural Health Trends Corp. 6,237 32,994Nature’s Sunshine Products, Inc. (a) 13,052 162,236Neptune Technologies & Bioressources, Inc. (a) 22,294 39,139Reliv International, Inc. (a) 131 489Summer Infant, Inc. (a) 1,330 22,078United-Guardian, Inc. 2,521 36,983Veru, Inc. (a) 43,597 132,535
1,659,985
TOTAL CONSUMER STAPLES 382,292,377
ENERGY – 0.2%Energy Equipment & Services – 0.0%CSI Compressco LP 45,237 41,166Dawson Geophysical Co. (a) 26,712 52,890DMC Global, Inc. 15,499 633,134ENGlobal Corp. (a) (b) 17,757 36,935Geospace Technologies Corp. (a) 18,589 115,438Gulf Island Fabrication, Inc. (a) 17,540 54,023KLX Energy Services Holdings, Inc. (a) 7,605 51,638Mammoth Energy Services, Inc. (a) 24,626 48,267Matrix Service Co. (a) 4,592 43,991MIND Technology, Inc. (a) 6,775 15,176NCS Multistage Holdings, Inc. (a) 43,968 44,847Patterson-UTI Energy, Inc. 249,626 1,075,888Profire Energy, Inc. (a) 47,414 43,151Recon Technology Ltd. (a) 16,084 20,909RigNet, Inc. (a) 10,717 57,657SAExploration Holdings, Inc.:
Series A warrants 7/27/21 (a) (d) 30 0Series B warrants 7/27/21 (a) (d) 30 0
2,335,110Oil, Gas & Consumable Fuels – 0.2%Abraxas Petroleum Corp. (a) (b) 32,637 77,023

22Annual Report
See accompanying notes which are an integral part of the financial statements.
Schedule of Investments – continued
Common Stocks – continuedShares Value
ENERGY – continuedOil, Gas & Consumable Fuels – continuedAemetis, Inc. (a) 19,156 $ 41,952Alliance Resource Partners LP 38,906 175,077American Resources Corp. (a) 26,610 47,898Amplify Energy Corp. New warrants 5/4/22 (a) 717 23Apache Corp. 297,945 3,840,511Berry Petroleum Corp. 25,779 98,991Blueknight Energy Partners LP 54,017 91,289Brooge Energy Ltd. (a) (b) 35,126 312,270Calumet Specialty Products Partners LP (a) 61,788 224,290Clean Energy Fuels Corp. (a) 191,243 870,156Diamondback Energy, Inc. 20,231 808,431Dorchester Minerals LP 21,696 238,439Falcon Minerals Corp. 40,018 92,041Gevo, Inc. (a) (b) 313,583 627,166Golar LNG Ltd. (a) 8,320 75,712Golar LNG Partners LP (b) 47,927 132,758Green Plains Partners LP 18,721 158,192Green Plains, Inc. 9,073 134,099Gulfport Energy Corp. (a) (b) 102,132 10,223Hallador Energy Co. 23,992 23,752Marine Petroleum Trust 339 1,112Martin Midstream Partners LP 28,709 46,509Mid-Con Energy Partners LP (a) 6,439 19,317National Energy Services Reunited Corp. (a) 46,953 410,369New Fortress Energy LLC 92,102 3,970,517Nextdecade Corp. (a) (b) 72,081 172,994Noble Midstream Partners LP 29,086 277,190Oasis Midstream Partners LP 25,674 271,117Oasis Petroleum, Inc. (a) 35,937 1,229,045Pacific Ethanol, Inc. (a) 38,730 237,415PDC Energy, Inc. (a) 19,280 322,362Penn Virginia Corp. (a) (b) 43,101 388,771PrimeEnergy Corp. (a) 938 57,509Rattler Midstream LP 48,425 401,443Renewable Energy Group, Inc. (a) 22,152 1,286,588StealthGas, Inc. (a) 34,922 77,876Tellurian, Inc. (a) (b) 15,535 23,147Top Ships, Inc. (a) (b) 111,765 130,765Torchlight Energy Resources, Inc. (a) (b) 84,218 32,289TORM PLC (b) 39,313 282,267TransGlobe Energy Corp. (a) 84,684 42,384

23 Annual Report
See accompanying notes which are an integral part of the financial statements.
Common Stocks – continuedShares Value
ENERGY – continuedOil, Gas & Consumable Fuels – continuedU.S. Energy Corp. (a) (b) 7,677 $ 31,015Vertex Energy, Inc. (a) (b) 69,021 51,766Westwater Resources, Inc. (a) (b) 11,890 78,474
17,922,534
TOTAL ENERGY 20,257,644
FINANCIALS – 3.7%Banks – 1.5%1st Constitution Bancorp 6,490 106,0471st Source Corp. 12,820 478,442ACNB Corp. 4,529 112,817Allegiance Bancshares, Inc. 13,633 431,621Amalgamated Bank 18,900 240,408American National Bankshares, Inc. 6,531 169,675American River Bankshares 3,500 38,745Ameris Bancorp 57,671 1,961,391Ames National Corp. 6,067 130,501Arrow Financial Corp. 9,726 289,446Atlantic Capital Bancshares, Inc. (a) 20,721 290,923Auburn National Bancorp., Inc. 307 12,851BancFirst Corp. 18,889 1,024,350Bancorp, Inc., Delaware (a) 36,694 432,989Bank First National Corp. (b) 3,233 223,594Bank of Commerce Holdings 11,306 106,389Bank of Marin Bancorp 9,882 342,905Bank OZK 21,912 612,660BankFinancial Corp. 14,628 118,048Bankwell Financial Group, Inc. 4,285 78,416Banner Corp. 9,863 407,638BayCom Corp. (a) 3,947 56,837BCB Bancorp, Inc. 9,394 95,537BOK Financial Corp. 25,925 1,735,679Boston Private Financial Holdings, Inc. 4,548 32,564Bridge Bancorp, Inc. 6,057 135,192Brookline Bancorp, Inc., Delaware 31,420 357,245Bryn Mawr Bank Corp. 10,749 320,535Business First Bancshares, Inc. 8,073 150,723C & F Financial Corp. 2,765 103,688Cambridge Bancorp 2,788 188,469Camden National Corp. 10,935 375,617

24Annual Report
See accompanying notes which are an integral part of the financial statements.
Schedule of Investments – continued
Common Stocks – continuedShares Value
FINANCIALS – continuedBanks – continuedCapital City Bank Group, Inc. 17,094 $ 389,230Capstar Financial Holdings, Inc. 13,933 167,893Carter Bankshares, Inc. 17,756 166,374Cathay General Bancorp 24,724 698,453CBTX, Inc. 13,467 295,601Central Valley Community Bancorp 8,707 124,075Century Bancorp, Inc. Class A (non-vtg.) 2,504 185,046Chemung Financial Corp. 4,490 150,640ChoiceOne Financial Services, Inc. 2,947 87,320Citizens Community Bancorp, Inc. 4,935 44,415Citizens Holding Co. 2,179 44,648City Holding Co. 9,999 656,834Civista Bancshares, Inc. 12,037 202,583CNB Financial Corp., Pennsylvania 11,686 229,980Coastal Financial Corp. of Washington (a) 544 10,728Codorus Valley Bancorp, Inc. 7,465 125,337Colony Bankcorp, Inc. 4,381 62,473Columbia Banking Systems, Inc. 23,517 743,372Commerce Bancshares, Inc. (b) 60,150 3,967,494Community Bankers Trust Corp. 16,444 106,886Community Financial Corp. 4,047 110,847Community Trust Bancorp, Inc. 12,339 417,675ConnectOne Bancorp, Inc. 16,385 290,506County Bancorp, Inc. 4,222 90,604CrossFirst Bankshares, Inc. (a) 26,193 238,356CVB Financial Corp. 76,652 1,455,621Eagle Bancorp Montana, Inc. 2,880 59,357Eagle Bancorp, Inc. 11,642 428,193East West Bancorp, Inc. 50,666 2,164,452Eastern Bankshares, Inc. (a) 96,300 1,425,240Enterprise Bancorp, Inc. 7,478 193,531Enterprise Financial Services Corp. 9,085 308,981Equity Bancshares, Inc. (a) 7,783 157,800Farmers & Merchants Bancorp, Inc. (b) 7,012 160,435Farmers National Banc Corp. 23,198 290,903Fidelity D & D Bancorp, Inc. 233 13,591Fifth Third Bancorp 483,269 12,246,036Financial Institutions, Inc. 9,689 193,877First Bancorp, North Carolina 46,936 1,472,852First Bancshares, Inc. 9,721 265,967First Bank Hamilton New Jersey 14,532 135,002

25 Annual Report
See accompanying notes which are an integral part of the financial statements.
Common Stocks – continuedShares Value
FINANCIALS – continuedBanks – continuedFirst Busey Corp. 27,899 $ 558,259First Capital, Inc. (b) 2,233 147,959First Choice Bancorp 731 12,083First Citizens Bancshares, Inc. 6,392 3,378,747First Community Bankshares, In 13,105 276,122First Community Corp. 3,875 66,883First Financial Bancorp, Ohio 34,467 553,195First Financial Bankshares, Inc. 75,901 2,536,611First Financial Corp., Indiana 8,773 332,234First Financial Northwest, Inc. 10,995 121,385First Foundation, Inc. 27,783 493,426First Guaranty Bancshares, Inc. 7,321 123,139First Hawaiian, Inc. 121,649 2,666,546First Internet Bancorp 8,630 220,755First Interstate Bancsystem, Inc. 23,864 908,025First Merchants Corp. 19,246 641,277First Mid-Illinois Bancshares, Inc. 11,244 337,882First Midwest Bancorp, Inc., Delaware 23,776 332,626First Northwest Bancorp 7,546 113,190First of Long Island Corp. 15,039 252,806Flushing Financial Corp. 10,637 151,045Fulton Financial Corp. 50,488 622,012German American Bancorp, Inc. 17,425 556,555Glacier Bancorp, Inc. (b) 51,627 2,104,833Great Southern Bancorp, Inc. 10,419 478,232Grupo Financiero Galicia SA sponsored ADR (b) 2,672 23,006Guaranty Bancshares, Inc. Texas 8,164 235,205Hancock Whitney Corp. 29,389 825,537Hanmi Financial Corp. 11,598 113,081HarborOne Bancorp, Inc. 42,787 419,740Hawthorn Bancshares, Inc. 2,650 58,300HBT Financial, Inc. 16,600 232,068Heartland Financial U.S.A., Inc. 18,176 708,500Heritage Commerce Corp. 20,515 172,736Heritage Financial Corp., Washington 15,826 368,271Home Bancshares, Inc. 63,673 1,178,587HomeTrust Bancshares, Inc. 11,346 193,222Hope Bancorp, Inc. 26,306 249,381Horizon Bancorp, Inc. Indiana 31,602 451,909Howard Bancorp, Inc. (a) 11,970 147,710Huntington Bancshares, Inc. 823,330 9,945,826

26Annual Report
See accompanying notes which are an integral part of the financial statements.
Schedule of Investments – continued
Common Stocks – continuedShares Value
FINANCIALS – continuedBanks – continuedIndependent Bank Corp. 10,908 $ 185,545Independent Bank Corp., Massachusetts 16,954 1,146,769Independent Bank Group, Inc. 21,860 1,226,565International Bancshares Corp. 30,142 976,902Investar Holding Corp. 8,715 141,706Investors Bancorp, Inc. 206,662 2,000,488Lakeland Bancorp, Inc. 23,940 287,759Lakeland Financial Corp. 13,946 708,317Landmark Bancorp, Inc. 2,648 65,882LCNB Corp. 12,147 179,776Live Oak Bancshares, Inc. 19,604 806,116Macatawa Bank Corp. 20,908 162,246Mercantil Bank Holding Corp. Class A (a) (b) 23,541 349,584Mercantile Bank Corp. 12,064 299,549Metrocity Bankshares, Inc. (b) 10,365 143,555Midland States Bancorp, Inc. 11,372 192,755MidWestOne Financial Group, Inc. 11,723 272,677National Bankshares, Inc. 4,034 121,504NBT Bancorp, Inc. 14,937 447,363Nicolet Bankshares, Inc. (a) 7,073 470,425Northeast Bank 7,547 164,374Northrim Bancorp, Inc. 5,057 160,661Norwood Financial Corp. 3,432 92,527Oak Valley Bancorp Oakdale California 5,385 96,499OceanFirst Financial Corp. 19,043 300,308Old National Bancorp, Indiana 128,083 2,027,554Old Point Financial Corp. 2,955 50,265Old Second Bancorp, Inc. 25,460 245,944Origin Bancorp, Inc. 13,756 353,667Orrstown Financial Services, Inc. 7,486 120,674Pacific Mercantile Bancorp (a) 11,962 59,810Pacific Premier Bancorp, Inc. (b) 74,920 2,159,194PacWest Bancorp 7,785 181,079Patriot National Bancorp, Inc. 1,781 13,963Peapack-Gladstone Financial Corp. 10,114 222,609Penns Woods Bancorp, Inc. 4,912 125,551People’s Utah Bancorp 12,757 349,542Peoples Bancorp of North Carolina 3,056 76,033Peoples Bancorp, Inc. 10,652 266,087Peoples Financial Services Corp. 4,449 168,261Peoples United Financial, Inc. (b) 438,404 5,436,210

27 Annual Report
See accompanying notes which are an integral part of the financial statements.
Common Stocks – continuedShares Value
FINANCIALS – continuedBanks – continuedPinnacle Financial Partners, Inc. 60,517 $ 3,277,601Popular, Inc. 75,775 3,677,361Preferred Bank, Los Angeles (b) 7,653 281,401Premier Financial Bancorp, Inc. 13,603 181,056Professional Holdings Corp. (A Shares) 2,286 32,461QCR Holdings, Inc. 11,391 397,204RBB Bancorp 8,755 129,924Red River Bancshares, Inc. 3,386 168,420Reliant Bancorp, Inc. 8,809 155,831Renasant Corp. 13,219 408,071Republic Bancorp, Inc., Kentucky Class A 13,488 476,126Republic First Bancorp, Inc. (a) 51,967 161,617S&T Bancorp, Inc. 12,247 274,210Salisbury Bancorp, Inc. 1,630 63,652Sandy Spring Bancorp, Inc. 24,020 707,629SB Financial Group, Inc. 4,486 76,800Seacoast Banking Corp., Florida (a) 28,597 722,360Select Bancorp, Inc. New (a) 8,656 79,202ServisFirst Bancshares, Inc. 28,308 1,069,476Shore Bancshares, Inc. 9,065 125,550Sierra Bancorp 9,675 212,850Signature Bank 14,424 1,618,229Simmons First National Corp. Class A 31,274 609,843SmartFinancial, Inc. 10,154 179,320Sound Financial Bancorp, Inc. 1,189 37,204South Plains Financial, Inc. 1,098 19,380South State Corp. 56,888 3,781,345Southern First Bancshares, Inc. (a) 4,670 148,973Southern National Bancorp of Virginia, Inc. 16,511 180,630Southside Bancshares, Inc. 20,855 613,137Spirit of Texas Bancshares, Inc. 8,516 133,020Stock Yards Bancorp, Inc. 13,953 555,888Summit Financial Group, Inc. 12,099 253,353Summit State Bank 3,403 44,681SVB Financial Group (a) 28,027 9,665,391TCF Financial Corp. 51,011 1,713,970Texas Capital Bancshares, Inc. (a) 14,697 821,562The Bank of Princeton 4,666 111,191The First Bancorp, Inc. 6,787 164,449TowneBank 24,119 524,588Trico Bancshares 20,207 661,981

28Annual Report
See accompanying notes which are an integral part of the financial statements.
Schedule of Investments – continued
Common Stocks – continuedShares Value
FINANCIALS – continuedBanks – continuedTriState Capital Holdings, Inc. (a) 10,477 $ 156,003Triumph Bancorp, Inc. (a) 13,714 623,164Trustmark Corp. 23,234 576,668UMB Financial Corp. 35,290 2,400,073Umpqua Holdings Corp. 206,171 2,863,715Union Bankshares Corp. 31,818 951,676Union Bankshares, Inc. 2,283 62,783United Bankshares, Inc., West Virginia (b) 34,186 1,000,966United Community Bank, Inc. 25,698 614,439United Security Bancshares, Inc. 3,641 31,167Unity Bancorp, Inc. 6,284 110,536Univest Corp. of Pennsylvania 13,955 255,516Valley National Bancorp 327,540 2,993,716Veritex Holdings, Inc. 45,089 977,980Washington Trust Bancorp, Inc. 8,141 320,104WesBanco, Inc. 27,506 787,497West Bancorp., Inc. 9,814 189,214Westamerica Bancorp. 15,600 859,872Wintrust Financial Corp. 52,901 2,882,575Zions Bancorp NA 171,248 6,608,460
157,689,412Capital Markets – 1.3%AGM Group Holdings, Inc. (a) 2,758 41,453B. Riley Financial, Inc. 17,946 648,568BGC Partners, Inc. Class A 32,371 134,016Blucora, Inc. (a) 8,679 113,174BMB Munai, Inc. (a) (b) 35,806 1,320,167Capital Southwest Corp. 12,254 211,749Capitala Finance Corp. (b) 3,110 38,844Carlyle Group LP 134,153 3,811,287China Finance Online Co. Ltd. ADR (a) (b) 1,817 17,825CM Finance, Inc. 12,109 60,787CME Group, Inc. 178,422 31,229,203Cowen Group, Inc. Class A (b) 17,974 430,657Crescent Capital BDC, Inc. 2,438 33,913Diamond Hill Investment Group, Inc. 1,217 166,510Diginex Ltd. (a) 3,967 35,584Focus Financial Partners, Inc. Class A (a) 26,519 1,050,418Futu Holdings Ltd. ADR (a) (b) 18,962 836,224Greenpro Capital Corp. (a) (b) 38,241 58,891Hamilton Lane, Inc. Class A 17,418 1,217,170

29 Annual Report
See accompanying notes which are an integral part of the financial statements.
Common Stocks – continuedShares Value
FINANCIALS – continuedCapital Markets – continuedHarvest Capital Credit Corp. 3,546 $ 20,390Hennessy Advisors, Inc. (b) 4,729 44,263Heritage Global, Inc. (a) (b) 2,821 4,796Horizon Technology Finance Corp. 6,016 75,020Interactive Brokers Group, Inc. 48,731 2,571,048INTL FCStone, Inc. (a) 11,087 683,181LPL Financial 44,104 4,003,320MarketAxess Holdings, Inc. 20,630 11,123,283Morningstar, Inc. 23,274 4,657,127New Mountain Finance Corp. 71,957 862,764Newtek Business Services Corp. (b) 17,267 311,324Northern Trust Corp. 138,571 12,903,732Open Lending Corp. (a) 63,770 1,793,212Puhui Wealth Investment Management Co. Ltd. (a) (b) 2,334 7,002SEI Investments Co. (b) 79,414 4,189,089Siebert Financial Corp. (a) 18,877 67,013Silvercrest Asset Management Group Class A 8,360 111,104StepStone Group, Inc. Class A 15,671 424,998T. Rowe Price Group, Inc. 125,251 17,962,246The NASDAQ OMX Group, Inc. 90,763 11,616,756Tradeweb Markets, Inc. Class A 49,619 2,959,773U.S. Global Investments, Inc. Class A 17,228 71,496Up Fintech Holdings Ltd. ADR (a) (b) 28,215 167,597Value Line, Inc. 5,984 164,500Victory Capital Holdings, Inc. 9,060 186,002Virtu Financial, Inc. Class A 68,389 1,558,585Virtus Investment Partners, Inc. 4,523 809,074WisdomTree Investments, Inc. 51,180 219,050XP, Inc. Class A (a) 192,367 7,888,971
128,913,156Consumer Finance – 0.1%360 Finance, Inc. ADR (a) 56,872 705,213Atlanticus Holdings Corp. (a) 10,424 156,360Bit Digital, Inc. (a) 20,105 162,247Consumer Portfolio Services, Inc. (a) 14,707 58,681Credit Acceptance Corp. (a) (b) 9,555 2,851,976Encore Capital Group, Inc. (a) 11,819 403,501EZCORP, Inc. (non-vtg.) Class A (a) 12,112 61,650First Cash Financial Services, Inc. 8,968 576,104LendingTree, Inc. (a) 7,091 1,812,318LexinFintech Holdings Ltd. ADR (a) (b) 43,393 324,146

30Annual Report
See accompanying notes which are an integral part of the financial statements.
Schedule of Investments – continued
Common Stocks – continuedShares Value
FINANCIALS – continuedConsumer Finance – continuedMedallion Financial Corp. (a) 5,018 $ 26,646Mogo, Inc. (a) 14,441 38,269Navient Corp. 212,389 1,990,085Nicholas Financial, Inc. (a) 5,880 44,688Oportun Financial Corp. (a) 16,861 285,120Pintec Technology Holdings Ltd. ADR (a) (b) 7,937 7,858PRA Group, Inc. (a) 21,049 876,270Senmiao Technology Ltd. (a) 16,727 23,418SLM Corp. 203,574 2,159,920World Acceptance Corp. (a) (b) 3,875 437,526
13,001,996Diversified Financial Services – 0.0%A-Mark Precious Metals, Inc. 4,846 148,239Alerus Financial Corp. 7,192 172,824China Internet Nationwide Financial Services, Inc. (a) (b) 16,721 40,465GWG Holdings, Inc. (a) (b) 4,350 33,060LM Funding America, Inc. (a) 30,394 21,276Marlin Business Services Corp. 10,171 105,677SWK Holdings Corp. (a) 2,664 34,525
556,066Insurance – 0.6%1347 Property Insurance Holdings, Inc. (a) 3,213 9,960American National Group, Inc. 12,502 1,059,920Amerisafe, Inc. 6,853 375,065Arch Capital Group Ltd. (a) 272,466 8,772,043Brighthouse Financial, Inc. (a) 6,428 225,623BRP Group, Inc. (a) 18,406 542,057Cincinnati Financial Corp. (b) 107,772 8,228,392Conifer Holdings, Inc. (a) 3,312 7,849Donegal Group, Inc. Class A 18,229 254,841eHealth, Inc. (a) (b) 12,527 951,927Enstar Group Ltd. (a) 9,955 1,884,282Erie Indemnity Co. Class A 25,008 5,642,055Fanhua, Inc. ADR (b) 18,931 269,577Fednat Holding Co. 9,090 51,268Global Indemnity Group LLC Class A (b) 7,184 192,172GoHealth, Inc. (a) (b) 3,896 41,064Goosehead Insurance 9,651 1,188,135Greenlight Capital Re, Ltd. (a) 10,467 80,701Hallmark Financial Services, Inc. (a) 856 2,765Investors Title Co. 1,165 198,050

31 Annual Report
See accompanying notes which are an integral part of the financial statements.
Common Stocks – continuedShares Value
FINANCIALS – continuedInsurance – continuedJames River Group Holdings Ltd. 16,877 $ 769,254Kingstone Companies, Inc. 5,340 35,404Kinsale Capital Group, Inc. 12,584 3,022,173Maiden Holdings Ltd. (a) 43,191 91,565National General Holdings Corp. 62,642 2,134,839National Western Life Group, Inc. 1,558 289,913NI Holdings, Inc. (a) 13,483 230,559Oxbridge Re Holdings Ltd. (a) (b) 5,511 9,258Palomar Holdings, Inc. (a) 12,892 852,161Principal Financial Group, Inc. 55,326 2,754,682Protective Insurance Corp. Class B 9,179 131,168Safety Insurance Group, Inc. 8,823 628,639Selective Insurance Group, Inc. 46,572 2,879,081Sirius International Insurance (a) 49,011 577,840State Auto Financial Corp. 21,446 322,119Tiptree, Inc. 24,571 125,066Trean Insurance Group, Inc. (a) 28,354 404,045Trupanion, Inc. (a) 19,633 1,990,394Unico American Corp. (a) 851 4,255United Fire Group, Inc. 12,395 271,079United Insurance Holdings Corp. 21,548 95,458Watford Holdings Ltd. (a) 11,708 406,502Willis Towers Watson PLC 67,214 13,993,283
61,996,483Mortgage Real Estate Investment Trusts – 0.0%AGNC Investment Corp. 211,223 3,227,487Manhattan Bridge Capital, Inc. (b) 7,113 34,783New York Mortgage Trust, Inc. 28,152 98,954
3,361,224Thrifts & Mortgage Finance – 0.2%America First Tax Exempt Investors LP 39,141 161,261Bogota Financial Corp. 8,810 77,088Broadway Financial Corp. (a) 9,122 15,690Capitol Federal Financial, Inc. 116,204 1,431,633Carver Bancorp, Inc. (a) (b) 1,018 7,319Columbia Financial, Inc. (a) 72,096 1,036,020Dime Community Bancshares, Inc. 21,887 316,267First Defiance Financial Corp. 24,001 497,061FS Bancorp, Inc. 3,075 164,513Greene County Bancorp, Inc. 4,298 108,353Hingham Institution for Savings 1,454 318,600

32Annual Report
See accompanying notes which are an integral part of the financial statements.
Schedule of Investments – continued
Common Stocks – continuedShares Value
FINANCIALS – continuedThrifts & Mortgage Finance – continuedHMN Financial, Inc. (a) 2,581 $ 41,709Home Bancorp, Inc. 7,434 208,524HomeStreet, Inc. 11,829 382,668Kearny Financial Corp. 30,045 297,145Luther Burbank Corp. 18,799 184,794Merchants Bancorp/IN 10,509 279,960Meridian Bancorp, Inc. Maryland 27,458 374,664Meta Financial Group, Inc. (b) 21,290 704,699MMA Capital Management, LLC (a) 4,253 105,942NMI Holdings, Inc. (a) 45,980 1,007,422Northfield Bancorp, Inc. 31,683 352,632Northwest Bancshares, Inc. 93,451 1,105,525PCSB Financial Corp. 16,016 245,205Provident Bancorp, Inc. 14,544 146,894Prudential Bancorp, Inc. 6,449 84,030Randolph Bancorp, Inc. (a) 3,346 57,217Riverview Bancorp, Inc. 15,015 79,279Severn Bancorp, Inc. 3,614 24,864Southern Missouri Bancorp, Inc. 6,368 192,377Sterling Bancorp, Inc. 11,912 46,576TFS Financial Corp. 152,470 2,622,484Timberland Bancorp, Inc. 5,704 135,926Trustco Bank Corp., New York 53,401 324,144Washington Federal, Inc. 28,547 667,143Waterstone Financial, Inc. 20,236 355,445Westfield Financial, Inc. 19,217 128,370WMI Holdings Corp. (a) 52,465 1,398,717WSFS Financial Corp. 29,890 1,139,706
16,827,866
TOTAL FINANCIALS 382,346,203
HEALTH CARE – 10.4%Biotechnology – 5.8%89Bio, Inc. (a) 11,203 302,593Abeona Therapeutics, Inc. (a) 147,737 239,334AC Immune SA (a) (b) 23,325 129,221ACADIA Pharmaceuticals, Inc. (a) 85,663 4,853,666Acceleron Pharma, Inc. (a) 32,990 3,895,129Acorda Therapeutics, Inc. (a) (b) 61,245 40,899Adamas Pharmaceuticals, Inc. (a) 5,327 24,131

33 Annual Report
See accompanying notes which are an integral part of the financial statements.
Common Stocks – continuedShares Value
HEALTH CARE – continuedBiotechnology – continuedAdaptimmune Therapeutics PLC sponsored ADR (a) 49,188 $ 246,432Aditx Therapeutics, Inc. (a) (b) 2,896 5,908Advaxis, Inc. (a) 156,245 46,092Adverum Biotechnologies, Inc. (a) 82,873 1,126,244Aeglea BioTherapeutics, Inc. (a) 27,375 234,330AEterna Zentaris, Inc. (a) 23,853 9,522Affimed NV (a) 115,256 615,467Agenus, Inc. (a) (b) 187,175 692,548Agios Pharmaceuticals, Inc. (a) (b) 23,023 1,066,425Aikido Pharma, Inc. (a) (b) 40,485 22,672Aileron Therapeutics, Inc. (a) 30,009 32,710Akero Therapeutics, Inc. (a) 19,689 566,649Akouos, Inc. (a) 19,469 402,619Albireo Pharma, Inc. (a) 10,788 401,421Aldeyra Therapeutics, Inc. (a) 19,620 137,929Alector, Inc. (a) 6,964 91,298Alexion Pharmaceuticals, Inc. (a) 104,018 12,701,638Aligos Therapeutics, Inc. 12,484 233,576Alkermes PLC (a) 30,478 556,528Allakos, Inc. (a) (b) 31,111 3,329,810Allena Pharmaceuticals, Inc. (a) (b) 34,198 46,167Allogene Therapeutics, Inc. (a) (b) 67,741 2,103,358Allovir, Inc. (a) 36,743 1,455,390Alnylam Pharmaceuticals, Inc. (a) 61,331 7,967,510Alpine Immune Sciences, Inc. (a) 13,564 132,385Alterity Therapeutics Ltd. ADR (a) (b) 12,128 18,435Altimmune, Inc. (a) (b) 16,374 200,254ALX Oncology Holdings, Inc. (a) 19,218 1,478,441Amarin Corp. PLC ADR (a) (b) 134,319 666,222Amgen, Inc. 324,249 71,996,248Amicus Therapeutics, Inc. (a) 141,900 3,248,091AnaptysBio, Inc. (a) 9,289 239,563Anavex Life Sciences Corp. (a) (b) 31,501 167,900Anika Therapeutics, Inc. (a) 7,769 293,668Anixa Biosciences, Inc. (a) 6,548 17,287Annexon, Inc. (a) 19,909 481,798AnPac Bio-Medical Science Co. Ltd. ADR (b) 49,980 286,885Apellis Pharmaceuticals, Inc. (a) 54,380 2,563,473Applied Genetic Technologies Corp. (a) 13,372 59,372Applied Molecular Transport, Inc. 19,852 616,008Applied Therapeutics, Inc. (a) 3,249 75,247

34Annual Report
See accompanying notes which are an integral part of the financial statements.
Schedule of Investments – continued
Common Stocks – continuedShares Value
HEALTH CARE – continuedBiotechnology – continuedAprea Therapeutics, Inc. (a) 2,254 $ 56,891Aptevo Therapeutics, Inc. (a) 3,717 162,544Aptinyx, Inc. (a) 78,584 311,978Aptorum Group Ltd. (a) (b) 16,827 44,423Aptose Biosciences, Inc. (a) 110,425 736,535AquaBounty Technologies, Inc. (a) (b) 28,451 165,016AquaMed Technologies, Inc. (a) (c) 19,156 0Aravive, Inc. (a) (b) 15,258 88,649Arbutus Biopharma Corp. (a) (b) 18,554 84,050ARCA Biopharma, Inc. (a) 17,417 73,848Arcturus Therapeutics Holdings, Inc. (a) 12,959 1,189,118Arcutis Biotherapeutics, Inc. (a) 11,829 320,802Ardelyx, Inc. (a) 56,480 355,824Arena Pharmaceuticals, Inc. (a) 30,005 1,976,429Argenx SE ADR (a) 14,558 4,175,526Arrowhead Pharmaceuticals, Inc. (a) (b) 56,293 3,520,001Ascendis Pharma A/S sponsored ADR (a) 25,684 4,333,661Atara Biotherapeutics, Inc. (a) 32,452 752,562Atea Pharmaceuticals, Inc. (b) 40,609 1,353,092Athenex, Inc. (a) (b) 73,171 997,321Athersys, Inc. (a) (b) 109,566 202,697Atossa Therapeutics, Inc. (a) 9,613 16,919Atreca, Inc. (a) (b) 9,203 143,015aTyr Pharma, Inc. (a) 5,845 25,484Aurinia Pharmaceuticals, Inc. (Canada) (a) 70,118 1,065,794Autolus Therapeutics Ltd. ADR (a) 15,783 165,564AVEO Pharmaceuticals, Inc. (a) 4,766 25,641Avid Bioservices, Inc. (a) 27,590 251,621Avidity Biosciences, Inc. 19,476 583,111Avita Therapeutics, Inc. (a) 6,986 151,037AVROBIO, Inc. (a) 22,707 312,675Axcella Health, Inc. (a) 20,100 114,570Beam Therapeutics, Inc. (b) 31,166 1,558,300BeiGene Ltd. ADR (a) 23,792 6,083,376Bellicum Pharmaceuticals, Inc. (a) (b) 2,921 10,778Benitec Biopharma, Inc. (a) 9,459 27,999Bicycle Therapeutics PLC ADR (a) (b) 3,735 79,780Bio Path Holdings, Inc. (a) (b) 15,100 53,454Biocept, Inc. (a) 6,683 30,875BioCryst Pharmaceuticals, Inc. (a) (b) 186,290 951,942Biogen, Inc. (a) 78,226 18,787,538

35 Annual Report
See accompanying notes which are an integral part of the financial statements.
Common Stocks – continuedShares Value
HEALTH CARE – continuedBiotechnology – continuedBioLine RX Ltd. sponsored ADR (a) (b) 132,033 $ 302,356BioMarin Pharmaceutical, Inc. (a) 78,005 6,138,994BioNTech SE ADR (a) (b) 28,877 3,587,678Biospecifics Technologies Corp. (a) 4,954 437,934BioXcel Therapeutics, Inc. (a) 12,737 560,428Black Diamond Therapeutics, Inc. (a) (b) 30,528 1,017,804bluebird bio, Inc. (a) 6,590 290,553Blueprint Medicines Corp. (a) 30,154 3,259,044BrainStorm Cell Therpeutic, Inc. (a) (b) 20,843 115,158Brickell Biotech, Inc. (a) 72,285 49,154Bridgebio Pharma, Inc. (a) (b) 68,494 3,441,139Burning Rock Biotech Ltd. ADR 7,416 211,578C4 Therapeutics, Inc. 35,275 1,206,405Cabaletta Bio, Inc. (a) 13,397 199,347Calithera Biosciences, Inc. (a) 11,132 54,658Calyxt, Inc. (a) 13,659 50,811Cancer Genetics, Inc. (a) 4,795 12,419Capricor Therapeutics, Inc. (a) (b) 9,339 39,224Cardiff Oncology, Inc. (a) 18,039 445,744CareDx, Inc. (a) 27,154 1,552,394CASI Pharmaceuticals, Inc. (a) 27,924 69,531Catabasis Pharmaceuticals, Inc. (a) 152,664 251,896Catalyst Biosciences, Inc. (a) 2,926 18,141Catalyst Pharmaceutical Partners, Inc. (a) 48,487 177,462Celldex Therapeutics, Inc. (a) (b) 21,862 491,895Cellectis SA sponsored ADR (a) (b) 10,776 273,387Cellular Biomedicine Group, Inc. (a) 13,951 256,559Celsion Corp. (a) 51,243 34,456Centogene NV (a) 11,156 139,896Cerevel Therapeutics Holdings (a) 17,686 249,726Checkmate Pharmaceuticals, Inc. 920 11,160Checkpoint Therapeutics, Inc. (a) 23,493 56,383ChemoCentryx, Inc. (a) 38,907 2,145,721Chimerix, Inc. (a) 38,096 143,622China Biologic Products Holdings, Inc. (a) 21,120 2,513,069Chinook Therapeutics, Inc. (a) 11,535 161,259Chinook Therapeutics, Inc. rights (a) (c) 11,497 575Cidara Therapeutics, Inc. (a) 10,074 23,573Clementia Pharmaceuticals, Inc. rights (a) (c) 21,066 28,439Cleveland Biolabs, Inc. (a) 5,822 18,281Cogent Biosciences, Inc. (a) (b) 4,867 47,745

36Annual Report
See accompanying notes which are an integral part of the financial statements.
Schedule of Investments – continued
Common Stocks – continuedShares Value
HEALTH CARE – continuedBiotechnology – continuedCogent Biosciences, Inc. rights (a) (c) 12,548 $ 0CohBar, Inc. (a) 15,928 21,503Coherus BioSciences, Inc. (a) (b) 80,788 1,491,346Compass Pathways PLC ADR 15,898 792,356Concert Pharmaceuticals, Inc. (a) 10,199 116,269Constellation Pharmaceuticals, Inc. (a) 7,416 187,921ContraFect Corp. (a) 10,656 67,346Corbus Pharmaceuticals Holdings, Inc. (a) (b) 229,220 279,648Cortexyme, Inc. (a) 16,512 802,483Corvus Pharmaceuticals, Inc. (a) (b) 17,851 71,225Crinetics Pharmaceuticals, Inc. (a) 9,984 133,486CRISPR Therapeutics AG (a) (b) 38,910 4,938,457CTI BioPharma Corp. (a) 59,493 214,175Cue Biopharma, Inc. (a) 15,106 211,257CureVac NV (a) (b) 96,617 10,161,210Curis, Inc. (a) 61,643 89,382Cyclacel Pharmaceuticals, Inc. (a) (b) 3,131 12,274Cytokinetics, Inc. (a) 63,639 1,069,135CytomX Therapeutics, Inc. (a) 8,268 62,175Deciphera Pharmaceuticals, Inc. (a) 41,415 2,559,447DelMar Pharmaceuticals, Inc. (a) 2,797 3,776Denali Therapeutics, Inc. (a) 62,970 3,839,281DermTech, Inc. (a) (b) 10,120 125,286DiaMedica Therapeutics, Inc. (a) 6,250 35,000Dicerna Pharmaceuticals, Inc. (a) 70,328 1,777,189Diffusion Pharmaceuticals, Inc. (a) 27,419 20,896Dyadic International, Inc. (a) 15,088 88,416Dynavax Technologies Corp. (a) (b) 137,371 697,845Dyne Therapeutics, Inc. 22,689 457,410Eagle Pharmaceuticals, Inc. (a) 3,698 168,259Edesa Biotech, Inc. (a) (b) 5,472 28,345Edge Therapeutics, Inc. (a) 11,050 23,868Editas Medicine, Inc. (a) (b) 60,649 1,855,253Eidos Therapeutics, Inc. (a) 21,772 2,004,330Eiger Biopharmaceuticals, Inc. (a) 38,989 356,359Enanta Pharmaceuticals, Inc. (a) 18,960 781,152Enlivex Therapeutics Ltd. (a) 6,306 53,349Enochian Biosciences, Inc. (a) (b) 23,627 68,518Entasis Therapeutics Holdings, Inc. (a) 26,360 48,502Epizyme, Inc. (a) 104,945 1,441,944Equillium, Inc. (a) 5,507 28,636

37 Annual Report
See accompanying notes which are an integral part of the financial statements.
Common Stocks – continuedShares Value
HEALTH CARE – continuedBiotechnology – continuedEsperion Therapeutics, Inc. (a) (b) 40,181 $ 1,137,926Essa Pharma, Inc. (a) 9,684 67,788Evelo Biosciences, Inc. (a) (b) 16,686 85,599Exact Sciences Corp. (a) 81,863 9,910,335Exelixis, Inc. (a) 146,353 2,804,123Exicure, Inc. (a) 46,150 71,994Fate Therapeutics, Inc. (a) 49,576 2,898,461Fennec Pharmaceuticals, Inc. (a) 17,500 136,850FibroGen, Inc. (a) 68,109 2,813,583Five Prime Therapeutics, Inc. (a) 11,696 219,885Flexion Therapeutics, Inc. (a) (b) 11,722 125,543Foghorn Therapeutics, Inc. 13,911 281,002Forma Therapeutics Holdings, Inc. (b) 23,264 1,017,567Forte Biosciences, Inc. (a) 4,227 148,495Fortress Biotech, Inc. (a) 66,246 182,177Forward Pharma A/S sponsored ADR (a) (b) 499 3,503Freeline Therapeutics Holdings PLC ADR (a) 17,896 284,546Frequency Therapeutics, Inc. (a) (b) 19,874 570,384Fusion Pharmaceuticals, Inc. (a) 23,089 311,932G1 Therapeutics, Inc. (a) (b) 74,714 1,364,278Galapagos Genomics NV sponsored ADR (a) (b) 9,791 1,200,475Galectin Therapeutics, Inc. (a) (b) 32,120 83,512Galecto, Inc. (b) 6,606 101,138Galera Therapeutics, Inc. (a) 10,228 111,690Galmed Pharmaceuticals Ltd. (a) 19,960 76,846Gamida Cell Ltd. (a) 18,175 130,860Generation Bio Co. 25,120 1,211,286Genetron Holdings Ltd. ADR (b) 8,457 115,692Genfit ADR (a) 3,215 17,715Genmab A/S ADR (a) 23,706 915,289Genocea Biosciences, Inc. (a) (b) 25,039 53,583Genprex, Inc. (a) (b) 21,698 70,085GeoVax Labs, Inc. (a) 8,300 24,070Geron Corp. (a) (b) 167,155 311,744Gilead Sciences, Inc. 597,426 36,245,835Global Blood Therapeutics, Inc. (a) (b) 50,228 2,305,967Gossamer Bio, Inc. (a) (b) 16,025 141,661Grifols SA ADR 111,693 2,069,671Gritstone Oncology, Inc. (a) 33,041 100,775Halozyme Therapeutics, Inc. (a) 77,948 3,047,767Harpoon Therapeutics, Inc. (a) 14,671 218,891

38Annual Report
See accompanying notes which are an integral part of the financial statements.
Schedule of Investments – continued
Common Stocks – continuedShares Value
HEALTH CARE – continuedBiotechnology – continuedHeron Therapeutics, Inc. (a) 95,418 $ 1,653,594Histogen, Inc. (a) 7,869 12,512Homology Medicines, Inc. (a) 963 9,476Hookipa Pharma, Inc. (a) (b) 13,294 154,210I-Mab ADR (b) 5,338 208,929Ideaya Biosciences, Inc. (a) 16,343 227,821Idera Pharmaceuticals, Inc. (a) 14,411 59,517IGM Biosciences, Inc. (a) 13,900 928,242Immatics NV (a) (b) 33,359 338,927Immunic, Inc. (a) 10,417 195,110ImmunoGen, Inc. (a) 96,951 528,383Immunovant, Inc. (a) 50,488 2,483,505Imv, Inc. (a) 26,492 102,810Incyte Corp. (a) 87,602 7,405,873Infinity Pharmaceuticals, Inc. (a) 17,815 35,630InflaRx NV (a) 4,464 18,436Inhibrx, Inc. (a) 20,085 552,739Inmune Bio, Inc. (a) (b) 6,841 60,748Inovio Pharmaceuticals, Inc. (a) (b) 76,907 939,804Inozyme Pharma, Inc. (a) (b) 11,206 291,580Insmed, Inc. (a) 55,664 2,171,453Intec Pharma Ltd. (a) (b) 15,089 49,643Intellia Therapeutics, Inc. (a) (b) 46,711 1,834,341Intercept Pharmaceuticals, Inc. (a) (b) 1,450 51,490Inventiva SA ADR (a) (b) 2,231 28,468Ionis Pharmaceuticals, Inc. (a) 60,258 3,044,837Iovance Biotherapeutics, Inc. (a) (b) 80,078 3,107,827Ironwood Pharmaceuticals, Inc. Class A (a) (b) 162,105 1,867,450iTeos Therapeutics, Inc. (a) 17,694 474,022Iveric Bio, Inc. (a) 50,254 342,732Jounce Therapeutics, Inc. (a) 6,019 43,036Kadmon Holdings, Inc. (a) 153,125 667,625KaloBios Pharmaceuticals, Inc. (a) (b) 25,102 238,469Kalvista Pharmaceuticals, Inc. (a) 14,657 274,232Kamada (a) (b) 24,022 162,869Karuna Therapeutics, Inc. (a) (b) 14,740 1,470,610Karyopharm Therapeutics, Inc. (a) 88,559 1,504,617Keros Therapeutics, Inc. 11,625 878,966Kezar Life Sciences, Inc. (a) 13,070 86,001Kindred Biosciences, Inc. (a) 19,079 74,217Kiniksa Pharmaceuticals Ltd. (a) 1,418 26,460

39 Annual Report
See accompanying notes which are an integral part of the financial statements.
Common Stocks – continuedShares Value
HEALTH CARE – continuedBiotechnology – continuedKodiak Sciences, Inc. (a) (b) 24,550 $ 3,355,249Kronos Bio, Inc. (b) 30,000 962,100Krystal Biotech, Inc. (a) (b) 18,798 1,032,762Kura Oncology, Inc. (a) 30,125 1,093,538Kymera Therapeutics, Inc. (a) 23,184 1,081,302La Jolla Pharmaceutical Co. (a) (b) 17,647 87,706Lantern Pharma, Inc. (a) 1,790 28,193Larimar Therapeutics, Inc. (a) 6,568 145,941Leap Therapeutics, Inc. (a) 28,305 45,288Ligand Pharmaceuticals, Inc.:
Class B (a) (b) 18,164 1,532,497General CVR (a) (c) 1,518 9Glucagon CVR (a) (c) 1,518 4rights (a) 1,518 6TR Beta CVR (a) 1,518 334
LogicBio Therapeutics, Inc. (a) (b) 19,478 135,762Macrogenics, Inc. (a) 30,046 693,161Madrigal Pharmaceuticals, Inc. (a) (b) 14,391 1,680,725Magenta Therapeutics, Inc. (a) 12,969 92,728MannKind Corp. (a) 90,009 268,227Marker Therapeutics, Inc. (a) 38,560 65,552MediciNova, Inc. (a) (b) 25,966 154,238MEI Pharma, Inc. (a) 53,702 154,662MeiraGTx Holdings PLC (a) (b) 11,233 158,610Mereo Biopharma Group PLC ADR (a) (b) 8,456 20,633Merrimack Pharmaceuticals, Inc. 2,337 9,161Mersana Therapeutics, Inc. (a) 38,414 978,789Merus BV (a) 11,919 204,172Mesoblast Ltd. sponsored ADR (a) (b) 7,548 113,899Metacrine, Inc. 1,230 9,742MiMedx Group, Inc. (a) (b) 52,329 351,128Minerva Neurosciences, Inc. (a) 7,475 29,078Miragen Therapeutics, Inc. rights (a) (c) 30,380 0Mirati Therapeutics, Inc. (a) 27,164 6,460,957Mirum Pharmaceuticals, Inc. (a) (b) 14,847 348,162Moderna, Inc. (a) (b) 214,275 32,728,364Molecular Templates, Inc. (a) 51,914 464,630Moleculin Biotech, Inc. (a) 11,373 8,871Monopar Therapeutics, Inc. (a) (b) 2,595 12,690Morphic Holding, Inc. (a) 17,376 545,085Morphosys AG sponsored ADR (a) (b) 7,201 201,556
40Annual Report
See accompanying notes which are an integral part of the financial statements.
Schedule of Investments – continued
Common Stocks – continuedShares Value
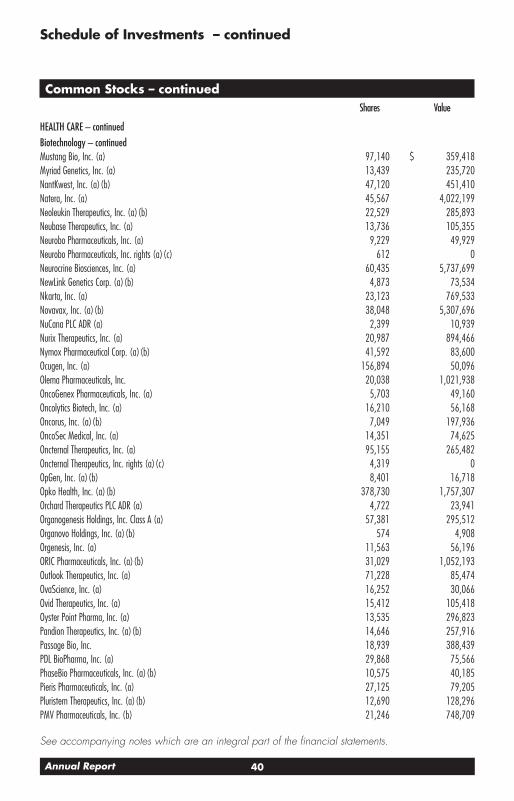
HEALTH CARE – continuedBiotechnology – continuedMustang Bio, Inc. (a) 97,140 $ 359,418Myriad Genetics, Inc. (a) 13,439 235,720NantKwest, Inc. (a) (b) 47,120 451,410Natera, Inc. (a) 45,567 4,022,199Neoleukin Therapeutics, Inc. (a) (b) 22,529 285,893Neubase Therapeutics, Inc. (a) 13,736 105,355Neurobo Pharmaceuticals, Inc. (a) 9,229 49,929Neurobo Pharmaceuticals, Inc. rights (a) (c) 612 0Neurocrine Biosciences, Inc. (a) 60,435 5,737,699NewLink Genetics Corp. (a) (b) 4,873 73,534Nkarta, Inc. (a) 23,123 769,533Novavax, Inc. (a) (b) 38,048 5,307,696NuCana PLC ADR (a) 2,399 10,939Nurix Therapeutics, Inc. (a) 20,987 894,466Nymox Pharmaceutical Corp. (a) (b) 41,592 83,600Ocugen, Inc. (a) 156,894 50,096Olema Pharmaceuticals, Inc. 20,038 1,021,938OncoGenex Pharmaceuticals, Inc. (a) 5,703 49,160Oncolytics Biotech, Inc. (a) 16,210 56,168Oncorus, Inc. (a) (b) 7,049 197,936OncoSec Medical, Inc. (a) 14,351 74,625Oncternal Therapeutics, Inc. (a) 95,155 265,482Oncternal Therapeutics, Inc. rights (a) (c) 4,319 0OpGen, Inc. (a) (b) 8,401 16,718Opko Health, Inc. (a) (b) 378,730 1,757,307Orchard Therapeutics PLC ADR (a) 4,722 23,941Organogenesis Holdings, Inc. Class A (a) 57,381 295,512Organovo Holdings, Inc. (a) (b) 574 4,908Orgenesis, Inc. (a) 11,563 56,196ORIC Pharmaceuticals, Inc. (a) (b) 31,029 1,052,193Outlook Therapeutics, Inc. (a) 71,228 85,474OvaScience, Inc. (a) 16,252 30,066Ovid Therapeutics, Inc. (a) 15,412 105,418Oyster Point Pharma, Inc. (a) 13,535 296,823Pandion Therapeutics, Inc. (a) (b) 14,646 257,916Passage Bio, Inc. 18,939 388,439PDL BioPharma, Inc. (a) 29,868 75,566PhaseBio Pharmaceuticals, Inc. (a) (b) 10,575 40,185Pieris Pharmaceuticals, Inc. (a) 27,125 79,205Pluristem Therapeutics, Inc. (a) (b) 12,690 128,296PMV Pharmaceuticals, Inc. (b) 21,246 748,709
41 Annual Report
See accompanying notes which are an integral part of the financial statements.
Common Stocks – continuedShares Value
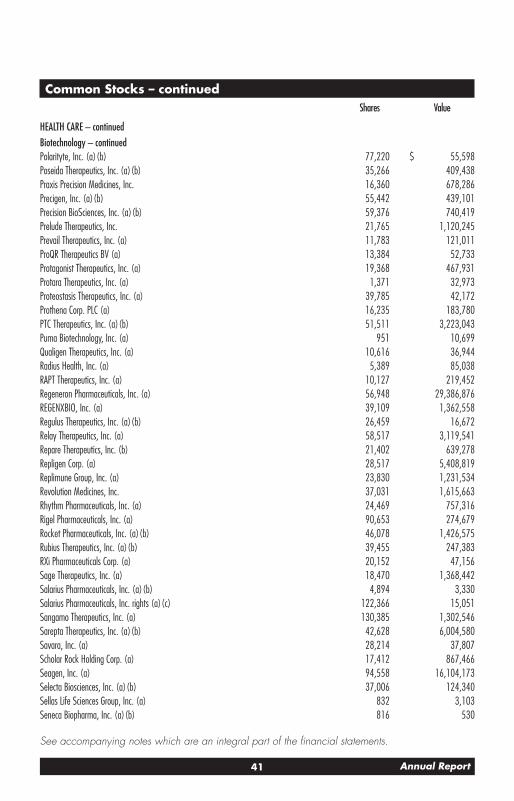
HEALTH CARE – continuedBiotechnology – continuedPolarityte, Inc. (a) (b) 77,220 $ 55,598Poseida Therapeutics, Inc. (a) (b) 35,266 409,438Praxis Precision Medicines, Inc. 16,360 678,286Precigen, Inc. (a) (b) 55,442 439,101Precision BioSciences, Inc. (a) (b) 59,376 740,419Prelude Therapeutics, Inc. 21,765 1,120,245Prevail Therapeutics, Inc. (a) 11,783 121,011ProQR Therapeutics BV (a) 13,384 52,733Protagonist Therapeutics, Inc. (a) 19,368 467,931Protara Therapeutics, Inc. (a) 1,371 32,973Proteostasis Therapeutics, Inc. (a) 39,785 42,172Prothena Corp. PLC (a) 16,235 183,780PTC Therapeutics, Inc. (a) (b) 51,511 3,223,043Puma Biotechnology, Inc. (a) 951 10,699Qualigen Therapeutics, Inc. (a) 10,616 36,944Radius Health, Inc. (a) 5,389 85,038RAPT Therapeutics, Inc. (a) 10,127 219,452Regeneron Pharmaceuticals, Inc. (a) 56,948 29,386,876REGENXBIO, Inc. (a) 39,109 1,362,558Regulus Therapeutics, Inc. (a) (b) 26,459 16,672Relay Therapeutics, Inc. (a) 58,517 3,119,541Repare Therapeutics, Inc. (b) 21,402 639,278Repligen Corp. (a) 28,517 5,408,819Replimune Group, Inc. (a) 23,830 1,231,534Revolution Medicines, Inc. 37,031 1,615,663Rhythm Pharmaceuticals, Inc. (a) 24,469 757,316Rigel Pharmaceuticals, Inc. (a) 90,653 274,679Rocket Pharmaceuticals, Inc. (a) (b) 46,078 1,426,575Rubius Therapeutics, Inc. (a) (b) 39,455 247,383RXi Pharmaceuticals Corp. (a) 20,152 47,156Sage Therapeutics, Inc. (a) 18,470 1,368,442Salarius Pharmaceuticals, Inc. (a) (b) 4,894 3,330Salarius Pharmaceuticals, Inc. rights (a) (c) 122,366 15,051Sangamo Therapeutics, Inc. (a) 130,385 1,302,546Sarepta Therapeutics, Inc. (a) (b) 42,628 6,004,580Savara, Inc. (a) 28,214 37,807Scholar Rock Holding Corp. (a) 17,412 867,466Seagen, Inc. (a) 94,558 16,104,173Selecta Biosciences, Inc. (a) (b) 37,006 124,340Sellas Life Sciences Group, Inc. (a) 832 3,103Seneca Biopharma, Inc. (a) (b) 816 530

42Annual Report
See accompanying notes which are an integral part of the financial statements.
Schedule of Investments – continued
Common Stocks – continuedShares Value
HEALTH CARE – continuedBiotechnology – continuedSeres Therapeutics, Inc. (a) (b) 50,993 $ 1,407,917Sesen Bio, Inc. (a) 72,060 89,354Shattuck Labs, Inc. 19,282 697,237Sierra Oncology, Inc. (a) (b) 5,958 83,055Sinovac Biotech Ltd. (a) (b) (c) 27,717 179,329Sio Gene Therapies, Inc. (a) (b) 47,869 118,715Soleno Therapeutics, Inc. (a) 41,457 81,256Solid Biosciences, Inc. (a) 49,160 162,720Soligenix, Inc. (a) 8,820 20,021Sonnet Biotherapeutics Holding (a) (b) 15,344 40,968Sorrento Therapeutics, Inc. (a) (b) 144,034 1,181,079Spectrum Pharmaceuticals, Inc. (a) 163,393 769,581Spero Therapeutics, Inc. (a) (b) 13,597 225,302Spring Bank Pharmaceuticals, Inc. (a) 1,855 13,041Springworks Therapeutics, Inc. (a) 25,705 1,682,135Spruce Biosciences, Inc. 9,565 274,037Stoke Therapeutics, Inc. (a) 18,470 962,102Summit Therapeutics, Inc. (a) 19,411 87,350Sunesis Pharmaceuticals, Inc. (a) (b) 25,585 47,588Surface Oncology, Inc. (a) 16,860 152,414Sutro Biopharma, Inc. (a) 21,776 372,370Syndax Pharmaceuticals, Inc. (a) 20,985 486,222Synlogic, Inc. (a) 45,366 106,156Syros Pharmaceuticals, Inc. (a) 8,318 67,792T2 Biosystems, Inc. (a) 17,801 19,759Taysha Gene Therapies, Inc. 9,667 218,668TCR2 Therapeutics, Inc. (a) 31,618 861,432Tenax Therapeutics, Inc. (a) 31,497 34,017TG Therapeutics, Inc. (a) 67,498 1,980,391Theratechnologies, Inc. (a) 44,667 103,181Tiziana Life Sciences PLC ADR (a) (b) 7,550 18,800Tobira Therapeutics, Inc. rights (a) (c) 6,103 54,195TONIX Pharmaceuticals Holding (a) 151,110 92,343TRACON Pharmaceuticals, Inc. (a) 2,539 25,492Translate Bio, Inc. (a) 36,666 814,719Travere Therapeutics, Inc. (a) 26,328 603,701Trevena, Inc. (a) (b) 67,495 169,412Trillium Therapeutics, Inc. (a) 46,726 940,594Turning Point Therapeutics, Inc. (a) 29,338 3,124,497Twist Bioscience Corp. (a) 24,579 2,746,457Tyme, Inc. (a) (b) 74,416 78,137
43 Annual Report
See accompanying notes which are an integral part of the financial statements.
Common Stocks – continuedShares Value
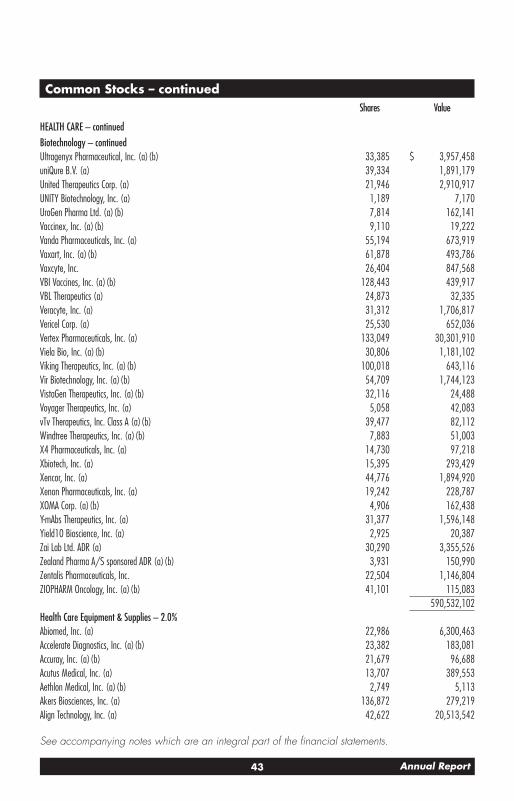
HEALTH CARE – continuedBiotechnology – continuedUltragenyx Pharmaceutical, Inc. (a) (b) 33,385 $ 3,957,458uniQure B.V. (a) 39,334 1,891,179United Therapeutics Corp. (a) 21,946 2,910,917UNITY Biotechnology, Inc. (a) 1,189 7,170UroGen Pharma Ltd. (a) (b) 7,814 162,141Vaccinex, Inc. (a) (b) 9,110 19,222Vanda Pharmaceuticals, Inc. (a) 55,194 673,919Vaxart, Inc. (a) (b) 61,878 493,786Vaxcyte, Inc. 26,404 847,568VBI Vaccines, Inc. (a) (b) 128,443 439,917VBL Therapeutics (a) 24,873 32,335Veracyte, Inc. (a) 31,312 1,706,817Vericel Corp. (a) 25,530 652,036Vertex Pharmaceuticals, Inc. (a) 133,049 30,301,910Viela Bio, Inc. (a) (b) 30,806 1,181,102Viking Therapeutics, Inc. (a) (b) 100,018 643,116Vir Biotechnology, Inc. (a) (b) 54,709 1,744,123VistaGen Therapeutics, Inc. (a) (b) 32,116 24,488Voyager Therapeutics, Inc. (a) 5,058 42,083vTv Therapeutics, Inc. Class A (a) (b) 39,477 82,112Windtree Therapeutics, Inc. (a) (b) 7,883 51,003X4 Pharmaceuticals, Inc. (a) 14,730 97,218Xbiotech, Inc. (a) 15,395 293,429Xencor, Inc. (a) 44,776 1,894,920Xenon Pharmaceuticals, Inc. (a) 19,242 228,787XOMA Corp. (a) (b) 4,906 162,438Y-mAbs Therapeutics, Inc. (a) 31,377 1,596,148Yield10 Bioscience, Inc. (a) 2,925 20,387Zai Lab Ltd. ADR (a) 30,290 3,355,526Zealand Pharma A/S sponsored ADR (a) (b) 3,931 150,990Zentalis Pharmaceuticals, Inc. 22,504 1,146,804ZIOPHARM Oncology, Inc. (a) (b) 41,101 115,083
590,532,102Health Care Equipment & Supplies – 2.0%Abiomed, Inc. (a) 22,986 6,300,463Accelerate Diagnostics, Inc. (a) (b) 23,382 183,081Accuray, Inc. (a) (b) 21,679 96,688Acutus Medical, Inc. (a) 13,707 389,553Aethlon Medical, Inc. (a) (b) 2,749 5,113Akers Biosciences, Inc. (a) 136,872 279,219Align Technology, Inc. (a) 42,622 20,513,542

44Annual Report
See accompanying notes which are an integral part of the financial statements.
Schedule of Investments – continued
Common Stocks – continuedShares Value
HEALTH CARE – continuedHealth Care Equipment & Supplies – continuedAllied Healthcare Products, Inc. (a) (b) 1,352 $ 6,855Alphatec Holdings, Inc. (a) (b) 71,376 749,448Angiodynamics, Inc. (a) 11,364 161,596Antares Pharma, Inc. (a) 98,062 305,953Aspira Women’s Health, Inc. (a) (b) 54,695 265,818Atricure, Inc. (a) 22,630 983,952Atrion Corp. 875 525,000Avinger, Inc. (a) 189,502 55,524AxoGen, Inc. (a) 18,275 261,150Axonics Modulation Technologies, Inc. (a) 21,996 965,404Bellerophon Therapeutics, Inc. (a) 4,969 35,578Beyond Air, Inc. (a) (b) 9,537 50,928BioLase Technology, Inc. (a) 104,396 31,413BioLife Solutions, Inc. (a) 14,169 509,942Biomerica, Inc. (a) (b) 5,860 40,727Bovie Medical Corp. (a) 18,122 138,633Cardiovascular Systems, Inc. (a) 37,593 1,295,455Cerus Corp. (a) 93,501 621,782Check Capital Ltd. (a) 91,492 35,682Chembio Diagnostics, Inc. (a) (b) 16,477 94,578Chf Solutions, Inc. (a) (b) 6,914 47,707Co.-Diagnostics, Inc. (a) (b) 796 9,329ConforMis, Inc. (a) (b) 88,612 56,756CryoPort, Inc. (a) 22,094 1,074,873Cutera, Inc. (a) 8,581 214,697CytoSorbents Corp. (a) (b) 9,214 77,305Dare Bioscience, Inc. (a) 29,994 44,391DarioHealth Corp. (a) 3,735 46,912Delcath Systems, Inc. (a) (b) 1,414 23,699Dentsply Sirona, Inc. 86,195 4,386,464DexCom, Inc. (a) 49,590 15,852,931Eargo, Inc. (a) (b) 17,665 885,193EDAP TMS SA sponsored ADR (a) (b) 26,884 106,998Ekso Bionics Holdings, Inc. (a) 3,126 17,912electroCore, Inc. (a) (b) 2,183 3,275ENDRA Life Sciences, Inc. (a) (b) 35,458 29,125Establishment Labs Holdings, Inc. (a) (b) 15,129 392,446Fonar Corp. (a) 3,366 64,661Genmark Diagnostics, Inc. (a) 39,684 530,575Heska Corp. (a) 5,373 671,625Hologic, Inc. (a) 140,478 9,711,244

45 Annual Report
See accompanying notes which are an integral part of the financial statements.
Common Stocks – continuedShares Value
HEALTH CARE – continuedHealth Care Equipment & Supplies – continuedICU Medical, Inc. (a) 9,803 $ 1,849,826IDEXX Laboratories, Inc. (a) 45,975 21,193,556Inari Medical, Inc. (b) 26,173 1,807,769InMode Ltd. (a) 18,100 779,748Innocoll Holdings PLC rights (a) (c) 9,257 0Inogen, Inc. (a) 5,245 183,942Insulet Corp. (a) 35,660 9,189,939Integra LifeSciences Holdings Corp. (a) 65,639 3,592,422IntriCon Corp. (a) 5,239 90,844Intuitive Surgical, Inc. (a) 63,994 46,462,844InVivo Therapeutics Holdings Corp. (a) 43,910 27,136IRadimed Corp. (a) 7,542 184,854iRhythm Technologies, Inc. (a) 14,941 3,653,224Iridex Corp. (a) 7,305 12,345Itamar Medical Ltd. ADR (a) 3,458 68,814Kewaunee Scientific Corp. (a) 1,782 16,947Lantheus Holdings, Inc. (a) 36,857 485,038Lantheus Holdings, Inc. rights (a) (c) 50,063 1LeMaitre Vascular, Inc. 13,069 514,788LENSAR, Inc. (a) 5,527 47,366Lianluo Smart Ltd. (a) 4,371 21,199LivaNova PLC (a) 9,595 507,096Masimo Corp. (a) 29,703 7,559,116Medigus Ltd. ADR (a) 7,664 22,379Meridian Bioscience, Inc. (a) 24,681 466,471Merit Medical Systems, Inc. (a) 31,052 1,710,034Mesa Laboratories, Inc. 2,822 766,907Microbot Medical, Inc. (a) (b) 2,681 21,823Misonix, Inc. (a) 8,900 124,066Motus GI Holdings, Inc. (a) 16,028 14,904MRI Interventions, Inc. (a) 5,816 62,231Nano-X Imaging Ltd. (a) (b) 24,613 1,508,777NanoVibronix, Inc. (a) 25,676 19,257Natus Medical, Inc. (a) 9,033 188,970Nemaura Medical, Inc. (a) 11,700 47,970Neogen Corp. (a) 28,328 2,102,504Neovasc, Inc. (a) 8,602 7,398Neuronetics, Inc. (a) 4,359 37,531Novocure Ltd. (a) 54,908 6,899,190NuVasive, Inc. (a) 47,632 2,206,314Obalon Therapeutics, Inc. (a) 4,977 4,629

46Annual Report
See accompanying notes which are an integral part of the financial statements.
Schedule of Investments – continued
Common Stocks – continuedShares Value
HEALTH CARE – continuedHealth Care Equipment & Supplies – continuedOraSure Technologies, Inc. (a) 26,013 $ 312,156Orthofix International NV (a) 6,911 254,048OrthoPediatrics Corp. (a) (b) 10,461 478,695Outset Medical, Inc. 22,924 1,467,136Oxford Immunotec Global PLC (a) 18,869 269,261PAVmed, Inc. (a) (b) 28,715 55,707Pro-Dex, Inc. (a) 4,179 157,214Profound Medical Corp. (a) 8,039 160,879Pulmonx Corp. 19,855 1,076,141Pulse Biosciences, Inc. (a) (b) 15,503 230,995Pulse Biosciences, Inc. warrants 5/14/25 (a) (b) 394 3,683Quidel Corp. (a) 22,786 4,444,409Quotient Ltd. (a) 16,992 117,924ReWalk Robotics Ltd. (a) (b) 29,639 39,420Rockwell Medical Technologies, Inc. (a) 1,138 1,195RTI Biologics, Inc. (a) (b) 26,089 58,961Sanara Medtech, Inc. (a) (b) 361 12,130Seaspine Holdings Corp. (a) 16,598 236,024Second Sight Medical Products, Inc. (a) 9,212 8,954Shockwave Medical, Inc. (a) 19,909 1,947,697SI-BONE, Inc. (a) 16,689 386,517Silk Road Medical, Inc. (a) 19,105 1,094,717Sintx Technologies, Inc. (a) 21,155 40,195SmileDirectClub, Inc. (a) 63,011 775,035Soliton, Inc. (a) 2,416 22,179Staar Surgical Co. (a) 24,713 1,761,296STRATA Skin Sciences, Inc. (a) 17,447 28,439SurModics, Inc. (a) 7,764 290,684Tactile Systems Technology, Inc. (a) (b) 22,719 979,416Tandem Diabetes Care, Inc. (a) 33,088 3,106,301Tela Bio, Inc. (a) 6,966 114,033Thermogenesis Holdings, Inc. (a) (b) 2,264 5,637Titan Medical, Inc. (a) 27,216 37,014TransMedics Group, Inc. (a) 15,332 227,987Trinity Biotech PLC sponsored ADR (a) (b) 13,909 66,346Utah Medical Products, Inc. 3,090 266,760Varex Imaging Corp. (a) 5,575 92,991Venus Concept, Inc. (a) 17,616 41,926ViewRay, Inc. (a) 59,355 227,923Viveve Medical, Inc. (a) 620 332

47 Annual Report
See accompanying notes which are an integral part of the financial statements.
Common Stocks – continuedShares Value
HEALTH CARE – continuedHealth Care Equipment & Supplies – continuedZosano Pharma Corp. (a) (b) 315,097 $ 207,901Zynex, Inc. (a) (b) 19,173 267,655
204,985,277Health Care Providers & Services – 0.5%1Life Healthcare, Inc. (a) 72,609 2,386,658Acadia Healthcare Co., Inc. (a) 49,395 2,096,818Addus HomeCare Corp. (a) 8,720 865,460Akumin, Inc. (a) 2,793 9,189Amedisys, Inc. (a) 17,506 4,285,294Apollo Medical Holdings, Inc. (a) 29,855 543,958Avalon GloboCare Corp. (a) (b) 32,090 40,433Biodesix, Inc. (a) 8,440 151,414BioScrip, Inc. (a) 90,256 1,421,532BioTelemetry, Inc. (a) 32,842 1,819,775Castle Biosciences, Inc. (a) (b) 10,479 498,381Corvel Corp. (a) 9,241 827,532Covetrus, Inc. (a) 22,041 595,438Cross Country Healthcare, Inc. (a) 3,876 33,721DFB Healthcare Acquisitions Co. (a) 31,126 929,422Digirad Corp. (a) (b) 11,004 33,232Exagen, Inc. (a) 7,907 117,498Five Star Senior Living, Inc. (a) 17,017 100,400Fulgent Genetics, Inc. (a) (b) 12,158 546,137Guardant Health, Inc. (a) 53,882 6,526,188HealthEquity, Inc. (a) 51,536 3,694,616Henry Schein, Inc. (a) 91,631 5,892,790IMAC Holdings, Inc. (a) (b) 247,581 277,291Interpace Diagnostics Group, Inc. (a) (b) 6,839 21,680LHC Group, Inc. (a) 17,061 3,349,416Magellan Health Services, Inc. (a) 12,422 981,959National Research Corp. Class A 13,880 712,183Ontrak, Inc. (a) 10,232 508,019Patterson Companies, Inc. 19,461 540,237Pennant Group, Inc. (a) 16,419 832,279PetIQ, Inc. Class A (a) 13,183 379,407Precipio, Inc. (a) (b) 9,820 22,095Premier, Inc. (b) 89,791 3,180,397Progenity, Inc. (b) 23,332 93,561Progyny, Inc. (a) 48,053 1,705,401Providence Service Corp. (a) 7,758 1,053,459Psychemedics Corp. 3,315 14,321

48Annual Report
See accompanying notes which are an integral part of the financial statements.
Schedule of Investments – continued
Common Stocks – continuedShares Value
HEALTH CARE – continuedHealth Care Providers & Services – continuedR1 RCM, Inc. (a) 62,602 $ 1,269,569RadNet, Inc. (a) 29,653 552,139Sharps Compliance Corp. (a) 8,144 64,745Surgery Partners, Inc. (a) 27,495 671,703The Ensign Group, Inc. 28,691 2,062,022The Joint Corp. (a) (b) 10,509 263,776Tivity Health, Inc. (a) 14,753 271,898Viemed Healthcare, Inc. (a) 19,429 190,146
52,433,589Health Care Technology – 0.3%Accolade, Inc. (a) (b) 39,659 2,058,699Allscripts Healthcare Solutions, Inc. (a) 84,902 1,161,459Cerner Corp. 164,498 12,311,030Change Healthcare, Inc. (a) (b) 213,764 3,661,777Codiak Biosciences, Inc. 1,106 14,389Computer Programs & Systems, Inc. 10,872 309,091Health Catalyst, Inc. (a) 21,831 778,275HealthStream, Inc. (a) 11,322 211,495HMS Holdings Corp. (a) 46,507 1,461,250HTG Molecular Diagnostics (a) (b) 12,929 70,204iCAD, Inc. (a) 15,927 159,589Inovalon Holdings, Inc. Class A (a) 40,659 759,104Medical Transcription Billing Corp. (a) 13,011 135,314NantHealth, Inc. (a) 52,489 120,725Nextgen Healthcare, Inc. (a) 34,173 606,229Omnicell, Inc. (a) (b) 22,695 2,379,571OptimizeRx Corp. (a) (b) 10,189 269,193Schrodinger, Inc. 29,129 2,026,796SCWorx, Corp. (a) (b) 13,282 27,892Simulations Plus, Inc. 10,258 574,140Streamline Health Solutions, Inc. (a) 14,467 22,135Tabula Rasa HealthCare, Inc. (a) (b) 28,439 980,008Telemynd, Inc. (a) (c) 92 9
30,098,374Life Sciences Tools & Services – 0.9%10X Genomics, Inc. (a) 42,448 6,499,213Adaptive Biotechnologies Corp. (a) (b) 73,547 3,546,436Berkeley Lights, Inc. (a) 34,709 2,875,988Bio-Techne Corp. 20,766 6,298,535BioNano Genomics, Inc. (a) (b) 161,210 78,993Bruker Corp. 81,945 4,147,236

49 Annual Report
See accompanying notes which are an integral part of the financial statements.
Common Stocks – continuedShares Value
HEALTH CARE – continuedLife Sciences Tools & Services – continuedChampions Oncology, Inc. (a) 12,118 $ 137,782ChromaDex, Inc. (a) 43,892 217,704Codexis, Inc. (a) 37,155 688,111Compugen Ltd. (a) (b) 42,343 543,684Fluidigm Corp. (a) (b) 20,566 128,743Genetic Technologies Ltd. ADR (a) (b) 2,511 7,960Harvard Bioscience, Inc. (a) 31,153 122,120ICON PLC (a) 28,384 5,531,474Illumina, Inc. (a) 78,880 25,406,459Luminex Corp. 52,242 1,239,703Maravai LifeSciences Holdings, Inc. 42,200 1,187,930Medpace Holdings, Inc. (a) 19,109 2,452,831Nanostring Technologies, Inc. (a) 23,058 1,144,599NeoGenomics, Inc. (a) 59,650 2,838,147Pacific Biosciences of California, Inc. (a) 96,221 1,521,254Personalis, Inc. (a) 21,619 595,171PPD, Inc. 189,132 6,619,620PRA Health Sciences, Inc. (a) 34,444 3,864,617Quanterix Corp. (a) 17,243 744,725Sotera Health Co. 147,739 3,997,817Syneos Health, Inc. (a) 56,349 3,710,018
86,146,870Pharmaceuticals – 0.9%A Menarini Industrie Farmaceut rights (a) (c) 32,407 11,199Acasti Pharma, Inc. (a) 174,593 50,632AcelRx Pharmaceuticals, Inc. (a) 11,428 17,142Acer Therapeutics, Inc. (a) (b) 7,869 21,168Aclaris Therapeutics, Inc. (a) 20,359 67,999Adamis Pharmaceuticals Corp. (a) (b) 103,311 44,765Adial Pharmaceuticals, Inc. (a) (b) 13,581 31,644Aerie Pharmaceuticals, Inc. (a) (b) 3,215 39,898Aerpio Pharmaceuticals, Inc. (a) 7,343 12,557Agile Therapeutics, Inc. (a) (b) 44,191 124,619Alimera Sciences, Inc. (a) 1,904 8,930Amphastar Pharmaceuticals, Inc. (a) 25,651 455,562Amryt Pharma PLC ADR (a) 2,283 28,538ANI Pharmaceuticals, Inc. (a) 4,140 122,378ANI Pharmaceuticals, Inc. rights (a) (c) 1,389 0Aphria, Inc. (a) 230,145 1,933,381Aquestive Therapeutics, Inc. (a) 47,492 335,294Artelo Biosciences, Inc. (a) 60,877 37,397

50Annual Report
See accompanying notes which are an integral part of the financial statements.
Schedule of Investments – continued
Common Stocks – continuedShares Value
HEALTH CARE – continuedPharmaceuticals – continuedArvinas Holding Co. LLC (a) 51,335 $ 1,242,307Assertio Holdings, Inc. (a) 157,522 66,159AstraZeneca PLC:
rights (a) (c) 3,011 0sponsored ADR 289,114 15,305,695
Athira Pharma, Inc. 15,959 397,379Auris Medical Holding AG (a) (b) 21,727 24,117Avadel Pharmaceuticals PLC sponsored ADR (a) (b) 34,552 248,083Avenue Therapeutics, Inc. (a) 12,483 42,317Axsome Therapeutics, Inc. (a) 20,551 1,489,742Aytu BioScience, Inc. (a) 68,642 60,666Baudax Bio, Inc. (a) 10,121 11,639Biodelivery Sciences International, Inc. (a) 60,538 230,044Biondvax Pharmaceuticals Ltd. ADR (a) (b) 13,768 44,884Calliditas Therapeutics AB ADR (a) 664 24,336Cara Therapeutics, Inc. (a) 49,325 723,598Cassava Sciences, Inc. (a) (b) 14,274 110,195Cerecor, Inc. (a) 36,389 90,973Citius Pharmaceuticals, Inc. (a) 31,000 31,930Clearside Biomedical, Inc. (a) (b) 30,229 60,760Cocrystal Pharma, Inc. (a) 39,771 85,905Collegium Pharmaceutical, Inc. (a) (b) 20,165 372,851ContraVir Pharmaceuticals, Inc. (a) (b) 19,726 32,942Corcept Therapeutics, Inc. (a) 63,549 1,438,749Cronos Group, Inc. (a) (b) 121,536 1,095,855Cumberland Pharmaceuticals, Inc. (a) 11,327 33,301CymaBay Therapeutics, Inc. (a) 15,586 116,895Dova Pharmaceuticals, Inc. rights (a) (c) 23,572 12,729Durect Corp. (a) 119,193 220,507Elanco Animal Health, Inc. rights (a) (c) 45,364 0Eloxx Pharmaceuticals, Inc. (a) 24,062 68,817Endo International PLC (a) 128,758 654,091Eton Pharmaceuticals, Inc. (a) (b) 8,215 65,227Evofem Biosciences, Inc. (a) 125,011 280,025Evoke Pharma, Inc. (a) 26,645 83,132Eyenovia, Inc. (a) 14,692 51,569Eyepoint Pharmaceuticals, Inc. (a) 160,853 87,665Fulcrum Therapeutics, Inc. (a) 7,160 81,839Graybug Vision, Inc. 8,809 228,065GW Pharmaceuticals PLC ADR (a) (b) 15,285 2,141,123Harmony Biosciences Holdings, Inc. (a) 30,748 1,329,851

51 Annual Report
See accompanying notes which are an integral part of the financial statements.
Common Stocks – continuedShares Value
HEALTH CARE – continuedPharmaceuticals – continuedHarrow Health, Inc. (a) 25,863 $ 148,712Horizon Therapeutics PLC (a) 118,887 8,373,211Hoth Therapeutics, Inc. (a) 2,601 4,474Hutchison China Meditech Ltd. sponsored ADR (a) (b) 27,969 867,039IMARA, Inc. (b) 11,348 289,487Innovate Biopharmaceuticals, Inc. (a) 103,112 100,142Innoviva, Inc. (a) 21,059 220,172Intersect ENT, Inc. (a) 10,097 193,156Intra-Cellular Therapies, Inc. (a) 43,711 1,033,328Iterum Therapeutics PLC (a) 33,113 24,232Jaguar Health, Inc. (a) 193,186 67,596Jazz Pharmaceuticals PLC (a) 37,021 5,209,225Kala Pharmaceuticals, Inc. (a) (b) 21,617 161,263Kaleido Biosciences, Inc. (a) (b) 22,138 174,447Kitov Pharma Ltd. ADR (a) 6,186 27,033Lipocine, Inc. (a) 29,085 46,536Lyra Therapeutics, Inc. 8,284 102,887Marinus Pharmaceuticals, Inc. (a) (b) 9,141 145,250MediWound Ltd. (a) 23,801 89,492Milestone Pharmaceuticals, Inc. (a) (b) 18,945 126,932Nektar Therapeutics (a) (b) 151,345 2,480,545Neos Therapeutics, Inc. (a) (b) 56,543 32,060NGM Biopharmaceuticals, Inc. (a) 38,910 922,167Novan, Inc. (a) 148,529 76,121Novus Therapeutics, Inc. (a) (b) 275 6,842Ocular Therapeutix, Inc. (a) 35,651 623,893Odonate Therapeutics, Inc. (a) 4,117 61,837Omeros Corp. (a) (b) 69,540 805,969Onconova Therapeutics, Inc. (a) (b) 183,366 53,176Opiant Pharmaceuticals, Inc. (a) 1,206 9,986OptiNose, Inc. (a) (b) 7,458 30,205Oramed Pharmaceuticals, Inc. (a) 16,957 72,237Osmotica Pharmaceuticals PLC (a) 35,219 215,540Otonomy, Inc. (a) 21,766 97,947Pacira Biosciences, Inc. (a) 19,182 1,162,237Paratek Pharmaceuticals, Inc. (a) 13,374 82,785Phathom Pharmaceuticals, Inc. (a) 14,416 617,293Phibro Animal Health Corp. Class A (b) 5,414 102,270Pliant Therapeutics, Inc. (b) 19,578 538,787PolyPid Ltd. (a) 7,628 90,697ProPhase Labs, Inc. (b) 2,909 30,486
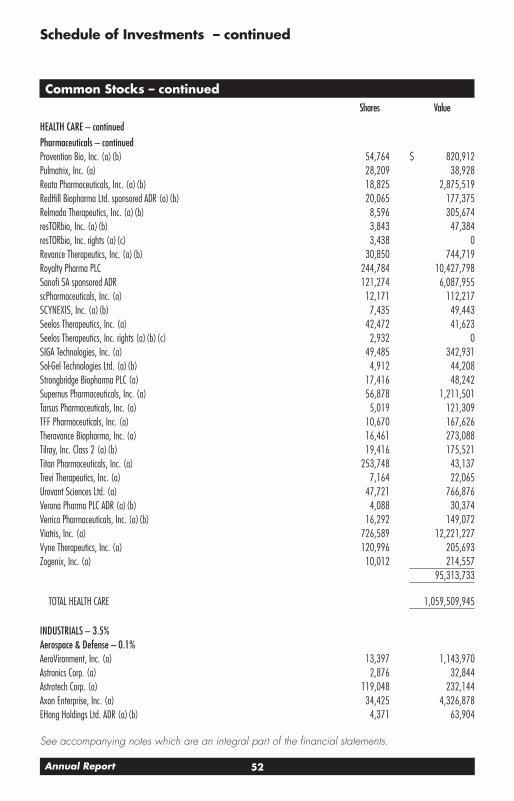
52Annual Report
See accompanying notes which are an integral part of the financial statements.
Schedule of Investments – continued
Common Stocks – continuedShares Value
HEALTH CARE – continuedPharmaceuticals – continuedProvention Bio, Inc. (a) (b) 54,764 $ 820,912Pulmatrix, Inc. (a) 28,209 38,928Reata Pharmaceuticals, Inc. (a) (b) 18,825 2,875,519RedHill Biopharma Ltd. sponsored ADR (a) (b) 20,065 177,375Relmada Therapeutics, Inc. (a) (b) 8,596 305,674resTORbio, Inc. (a) (b) 3,843 47,384resTORbio, Inc. rights (a) (c) 3,438 0Revance Therapeutics, Inc. (a) (b) 30,850 744,719Royalty Pharma PLC 244,784 10,427,798Sanofi SA sponsored ADR 121,274 6,087,955scPharmaceuticals, Inc. (a) 12,171 112,217SCYNEXIS, Inc. (a) (b) 7,435 49,443Seelos Therapeutics, Inc. (a) 42,472 41,623Seelos Therapeutics, Inc. rights (a) (b) (c) 2,932 0SIGA Technologies, Inc. (a) 49,485 342,931Sol-Gel Technologies Ltd. (a) (b) 4,912 44,208Strongbridge Biopharma PLC (a) 17,416 48,242Supernus Pharmaceuticals, Inc. (a) 56,878 1,211,501Tarsus Pharmaceuticals, Inc. (a) 5,019 121,309TFF Pharmaceuticals, Inc. (a) 10,670 167,626Theravance Biopharma, Inc. (a) 16,461 273,088Tilray, Inc. Class 2 (a) (b) 19,416 175,521Titan Pharmaceuticals, Inc. (a) 253,748 43,137Trevi Therapeutics, Inc. (a) 7,164 22,065Urovant Sciences Ltd. (a) 47,721 766,876Verona Pharma PLC ADR (a) (b) 4,088 30,374Verrica Pharmaceuticals, Inc. (a) (b) 16,292 149,072Viatris, Inc. (a) 726,589 12,221,227Vyne Therapeutics, Inc. (a) 120,996 205,693Zogenix, Inc. (a) 10,012 214,557
95,313,733
TOTAL HEALTH CARE 1,059,509,945
INDUSTRIALS – 3.5%Aerospace & Defense – 0.1%AeroVironment, Inc. (a) 13,397 1,143,970Astronics Corp. (a) 2,876 32,844Astrotech Corp. (a) 119,048 232,144Axon Enterprise, Inc. (a) 34,425 4,326,878EHang Holdings Ltd. ADR (a) (b) 4,371 63,904

53 Annual Report
See accompanying notes which are an integral part of the financial statements.
Common Stocks – continuedShares Value
INDUSTRIALS – continuedAerospace & Defense – continuedElbit Systems Ltd. 24,164 $ 3,063,029Innovative Solutions & Support, Inc. 5,109 34,077Kratos Defense & Security Solutions, Inc. (a) 107,791 2,281,935Mercury Systems, Inc. (a) 28,385 2,021,580PAE, Inc. (a) 54,512 523,860RADA Electronic Industries Ltd. (a) 29,760 222,307Sigma Labs, Inc. (a) 14,199 42,597TAT Technologies Ltd. (a) (b) 4,899 22,094
14,011,219Air Freight & Logistics – 0.2%Air Transport Services Group, Inc. (a) (b) 32,945 1,012,729Atlas Air Worldwide Holdings, Inc. (a) 11,877 662,855C.H. Robinson Worldwide, Inc. 72,396 6,803,052Echo Global Logistics, Inc. (a) 16,109 457,335Expeditors International of Washington, Inc. 89,786 8,024,175Forward Air Corp. 22,943 1,676,445Hub Group, Inc. Class A (a) 18,343 1,001,895
19,638,486Airlines – 0.2%Allegiant Travel Co. 16,902 2,876,551American Airlines Group, Inc. (b) 68,526 968,272Hawaiian Holdings, Inc. (b) 105,081 2,128,941JetBlue Airways Corp. (a) 338,184 5,103,197Mesa Air Group, Inc. (a) 61,731 393,844Ryanair Holdings PLC sponsored ADR (a) 57,925 6,010,877SkyWest, Inc. 52,842 2,268,507United Airlines Holdings, Inc. (a) (b) 34,626 1,559,901
21,310,090Building Products – 0.1%AAON, Inc. (b) 27,780 1,809,311American Woodmark Corp. (a) 14,177 1,240,629Antelope Enterprise Holdings L (a) (b) 14,016 33,919Apogee Enterprises, Inc. 4,805 126,083Applied UV, Inc. (b) 2,063 10,686Builders FirstSource, Inc. (a) 62,873 2,352,079Caesarstone Sdot-Yam Ltd. 12,795 152,772CSW Industrials, Inc. 7,438 798,023Dirtt Environmental Solutions Ltd. (a) 24,184 40,223Gibraltar Industries, Inc. (a) 18,047 1,181,357

54Annual Report
See accompanying notes which are an integral part of the financial statements.
Schedule of Investments – continued
Common Stocks – continuedShares Value
INDUSTRIALS – continuedBuilding Products – continuedInsteel Industries, Inc. 13,739 $ 317,783UFP Industries, Inc. 32,017 1,717,712
9,780,577Commercial Services & Supplies – 0.5%Aqua Metals, Inc. (a) (b) 12,858 16,715Casella Waste Systems, Inc. Class A (a) 26,160 1,574,309CECO Environmental Corp. (a) 21,695 160,543China Customer Relations Centers, Inc. (a) (b) 11,412 54,093China Recycling Energy Corp. (a) (b) 8,631 44,795Cimpress PLC (a) (b) 14,155 1,268,713Cintas Corp. 56,003 19,897,866Copart, Inc. (a) 126,853 14,645,179Healthcare Services Group, Inc. (b) 13,097 310,006Heritage-Crystal Clean, Inc. (a) 16,229 312,733Herman Miller, Inc. 55,253 1,969,217Hudson Technologies, Inc. (a) (b) 45,365 60,789IBEX Ltd. (a) 8,496 169,070Industrial Services of America, Inc. (a) (c) 694 24Interface, Inc. 3,768 31,444Kimball International, Inc. Class B 14,231 155,545Matthews International Corp. Class A 10,854 290,127McGrath RentCorp. 12,871 819,110Odyssey Marine Exploration, Inc. (a) (b) 6,411 44,236Performant Financial Corp. (a) 18,872 14,739Perma-Fix Environmental Services, Inc. (a) 7,647 49,094PICO Holdings, Inc. (a) 19,423 169,369SP Plus Corp. (a) 25,637 729,116Stericycle, Inc. (a) 29,445 2,074,106Tetra Tech, Inc. (b) 28,749 3,428,318U.S. Ecology, Inc. 10,164 344,458Virco Manufacturing Co. (a) 950 2,214VSE Corp. 7,604 260,057
48,895,985Construction & Engineering – 0.1%Aegion Corp. (a) 16,174 277,384Concrete Pumping Holdings, Inc. (a) 11,804 46,036Construction Partners, Inc. Class A (a) 16,492 433,740Great Lakes Dredge & Dock Corp. (a) 35,442 400,140IES Holdings, Inc. (a) 11,098 409,294Infrastructure and Energy Alternatives, Inc. (a) 7,758 98,915Limbach Holdings, Inc. (a) 6,648 78,779
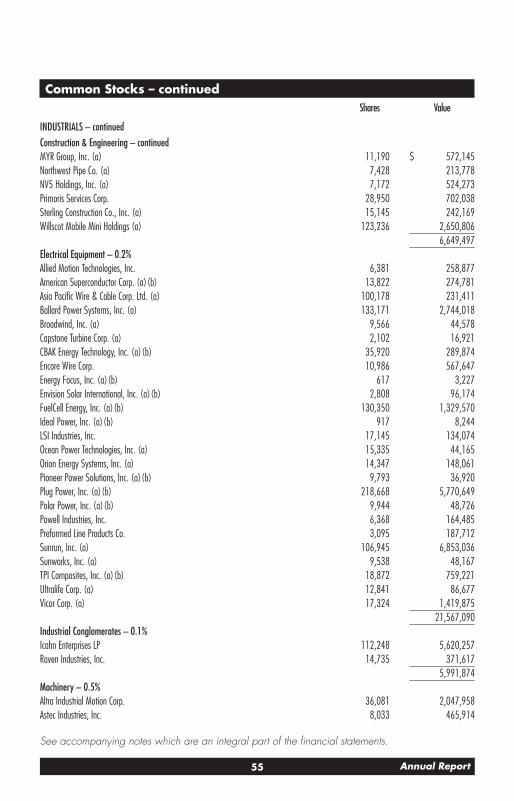
55 Annual Report
See accompanying notes which are an integral part of the financial statements.
Common Stocks – continuedShares Value
INDUSTRIALS – continuedConstruction & Engineering – continuedMYR Group, Inc. (a) 11,190 $ 572,145Northwest Pipe Co. (a) 7,428 213,778NV5 Holdings, Inc. (a) 7,172 524,273Primoris Services Corp. 28,950 702,038Sterling Construction Co., Inc. (a) 15,145 242,169Willscot Mobile Mini Holdings (a) 123,236 2,650,806
6,649,497Electrical Equipment – 0.2%Allied Motion Technologies, Inc. 6,381 258,877American Superconductor Corp. (a) (b) 13,822 274,781Asia Pacific Wire & Cable Corp. Ltd. (a) 100,178 231,411Ballard Power Systems, Inc. (a) 133,171 2,744,018Broadwind, Inc. (a) 9,566 44,578Capstone Turbine Corp. (a) 2,102 16,921CBAK Energy Technology, Inc. (a) (b) 35,920 289,874Encore Wire Corp. 10,986 567,647Energy Focus, Inc. (a) (b) 617 3,227Envision Solar International, Inc. (a) (b) 2,808 96,174FuelCell Energy, Inc. (a) (b) 130,350 1,329,570Ideal Power, Inc. (a) (b) 917 8,244LSI Industries, Inc. 17,145 134,074Ocean Power Technologies, Inc. (a) 15,335 44,165Orion Energy Systems, Inc. (a) 14,347 148,061Pioneer Power Solutions, Inc. (a) (b) 9,793 36,920Plug Power, Inc. (a) (b) 218,668 5,770,649Polar Power, Inc. (a) (b) 9,944 48,726Powell Industries, Inc. 6,368 164,485Preformed Line Products Co. 3,095 187,712Sunrun, Inc. (a) 106,945 6,853,036Sunworks, Inc. (a) 9,538 48,167TPI Composites, Inc. (a) (b) 18,872 759,221Ultralife Corp. (a) 12,841 86,677Vicor Corp. (a) 17,324 1,419,875
21,567,090Industrial Conglomerates – 0.1%Icahn Enterprises LP 112,248 5,620,257Raven Industries, Inc. 14,735 371,617
5,991,874Machinery – 0.5%Altra Industrial Motion Corp. 36,081 2,047,958Astec Industries, Inc. 8,033 465,914

56Annual Report
See accompanying notes which are an integral part of the financial statements.
Schedule of Investments – continued
Common Stocks – continuedShares Value
INDUSTRIALS – continuedMachinery – continuedBlue Bird Corp. (a) 16,718 $ 274,342Chart Industries, Inc. (a) 19,712 2,037,432Columbus McKinnon Corp. (NY Shares) 12,799 483,674Commercial Vehicle Group, Inc. (a) 21,200 150,732Eastern Co. 4,547 100,489Energy Recovery, Inc. (a) (b) 35,074 374,240ExOne Co. (a) (b) 14,851 177,024Franklin Electric Co., Inc. 25,745 1,740,105FreightCar America, Inc. (a) 31,571 83,663Gencor Industries, Inc. (a) 8,433 101,702Greenland Technologies Holding Corp. (a) 41,046 234,783GreenPower Motor Co., Inc. (a) 11,083 245,948Helios Technologies, Inc. 18,734 922,275Hurco Companies, Inc. 4,416 131,641Kornit Digital Ltd. (a) (b) 21,895 1,847,281L.B. Foster Co. Class A (a) 5,419 78,901Lincoln Electric Holdings, Inc. (b) 31,046 3,570,290LiqTech International, Inc. (a) (b) 14,828 107,355Manitex International, Inc. (a) 14,236 63,493MFRI, Inc. (a) 5,390 30,939Middleby Corp. (a) 30,137 4,098,331Nikola Corp. (a) (b) 195,700 3,994,237Nisun International Enterprise (a) (b) 9,549 140,370NN, Inc. (a) 12,701 79,572Nordson Corp. 31,036 6,325,447Omega Flex, Inc. (b) 5,482 776,909PACCAR, Inc. 186,741 16,257,671Park-Ohio Holdings Corp. 5,074 142,529RBC Bearings, Inc. (a) 13,629 2,301,120Taylor Devices, Inc. (a) 1,759 18,663The Shyft Group, Inc. 21,618 560,555TriMas Corp. (a) 25,565 683,352Twin Disc, Inc. (a) 9,749 59,956voxeljet AG ADR (a) 2,769 33,006Westport Fuel Systems, Inc. (a) (b) 70,640 278,322Woodward, Inc. 45,362 5,072,832
56,093,053Marine – 0.0%Capital Product Partners LP 7,939 61,130Castor Maritime, Inc. (a) 519,571 90,405Eagle Bulk Shipping, Inc. (a) (b) 7,191 133,968

57 Annual Report
See accompanying notes which are an integral part of the financial statements.
Common Stocks – continuedShares Value
INDUSTRIALS – continuedMarine – continuedEuroDry Ltd. (a) 46,301 $ 231,505Euroseas Ltd. (a) (b) 2,629 9,964Globus Maritime Ltd. (a) (b) 15,985 146,582Golden Ocean Group Ltd. (b) 72,309 308,036Grindrod Shipping Holdings Ltd. (a) 4,378 17,074Navios Maritime Containers LP (a) 14,453 38,590Performance Shipping, Inc. 54,073 294,157Pyxis Tankers, Inc. (a) 63,006 59,226Seanergy Martime Holdings Corp. (a) (b) 309,500 145,341Star Bulk Carriers Corp. (b) 36,448 299,238
1,835,216Professional Services – 0.5%51job, Inc. sponsored ADR (a) 18,304 1,290,432Acacia Research Corp. (a) 26,315 97,102ATIF Holdings Ltd. (a) 26,801 20,637Barrett Business Services, Inc. 3,985 265,839China Index Holdings Ltd. ADR (a) 10,675 22,204CoStar Group, Inc. (a) 21,360 19,449,775CRA International, Inc. 4,701 215,541DLH Holdings Corp. (a) 3,039 27,716Exponent, Inc. 27,708 2,300,041Forrester Research, Inc. (a) 10,756 445,298Headhunter Group PLC ADR 11,775 287,428Heidrick & Struggles International, Inc. 8,594 224,303Hudson Global, Inc. (a) 1,375 13,805Huron Consulting Group, Inc. (a) 8,685 382,748ICF International, Inc. 16,917 1,225,298Kelly Services, Inc. Class A (non-vtg.) 23,718 485,270Kforce, Inc. 10,845 445,187Lightbridge Corp. (a) (b) 11,392 36,796RCM Technologies, Inc. (a) 4,323 6,874Red Violet, Inc. (a) 8,743 234,050Rekor Systems, Inc. (a) (b) 14,618 69,289Resources Connection, Inc. 22,810 276,229ShiftPixy, Inc. (a) (b) 8,773 20,880Upwork, Inc. (a) 66,778 2,184,976Verisk Analytics, Inc. 87,769 17,405,470Willdan Group, Inc. (a) 7,660 297,821
47,731,009Road & Rail – 0.8%AMERCO 10,597 4,389,595

58Annual Report
See accompanying notes which are an integral part of the financial statements.
Schedule of Investments – continued
Common Stocks – continuedShares Value
INDUSTRIALS – continuedRoad & Rail – continuedArcBest Corp. 12,222 $ 512,224Avis Budget Group, Inc. (a) (b) 48,951 1,721,607Covenant Transport Group, Inc. Class A (a) (b) 2,880 53,251CSX Corp. 437,998 39,441,720Daseke, Inc. (a) (b) 7,813 52,738Heartland Express, Inc. 30,464 562,975HyreCar, Inc. (a) 8,351 59,209J.B. Hunt Transport Services, Inc. 56,666 7,665,776Landstar System, Inc. 20,175 2,651,399Lyft, Inc. (a) 53,165 2,029,308Marten Transport Ltd. 47,473 836,949Old Dominion Freight Lines, Inc. 63,492 12,911,733P.A.M. Transportation Services, Inc. (a) 3,501 161,396Patriot Transportation Holding, Inc. 1,759 17,696Saia, Inc. (a) 14,496 2,530,132Td Holdings, Inc. (a) 38,567 83,690U.S.A. Truck, Inc. (a) 5,235 46,382Universal Logistics Holdings, Inc. 18,181 391,073Werner Enterprises, Inc. (b) 37,001 1,479,670YRC Worldwide, Inc. (a) 7,569 45,490
77,644,013Trading Companies & Distributors – 0.2%Beacon Roofing Supply, Inc. (a) 24,524 892,428BMC Stock Holdings, Inc. (a) 36,928 1,807,256DXP Enterprises, Inc. (a) 5,460 114,988Fastenal Co. 309,732 15,316,247General Finance Corp. (a) 19,681 160,203H&E Equipment Services, Inc. 31,015 833,683HD Supply Holdings, Inc. (a) 86,919 4,848,342Houston Wire & Cable Co. (a) 7,080 18,620Huttig Building Products, Inc. (a) (b) 17,487 64,702Lawson Products, Inc. (a) 5,086 240,263Rush Enterprises, Inc.:
Class A 24,910 954,800Class B 6,706 227,937
Titan Machinery, Inc. (a) 11,661 213,046Transcat, Inc. (a) 4,527 143,506Willis Lease Finance Corp. (a) 3,842 123,751
25,959,772

59 Annual Report
See accompanying notes which are an integral part of the financial statements.
Common Stocks – continuedShares Value
INDUSTRIALS – continuedTransportation Infrastructure – 0.0%Grupo Aeroportuario Norte S.A.B. de CV ADR (a) 3,913 $ 182,189Sino-Global Shipping America Ltd. (a) 11,251 24,865
207,054
TOTAL INDUSTRIALS 357,314,935
INFORMATION TECHNOLOGY – 42.0%Communications Equipment – 1.2%Acacia Communications, Inc. (a) 21,456 1,495,054ADTRAN, Inc. 15,088 190,637Applied Optoelectronics, Inc. (a) (b) 30,567 254,012AudioCodes Ltd. (b) 17,081 477,756Aviat Networks, Inc. (a) 3,224 116,451CalAmp Corp. (a) 13,453 122,691Cambium Networks Corp. (a) 12,272 332,080Casa Systems, Inc. (a) 32,506 172,607Ceragon Networks Ltd. (a) (b) 40,973 110,627Cisco Systems, Inc. 2,194,260 94,397,065Clearfield, Inc. (a) 10,645 253,138ClearOne, Inc. (a) 5,022 12,806CommScope Holding Co., Inc. (a) 962 11,400Communications Systems, Inc. 4,332 18,714Comtech Telecommunications Corp. (b) 6,988 133,191Digi International, Inc. (a) 19,090 327,584Dzs, Inc. (a) 11,703 150,618EchoStar Holding Corp. Class A (a) 7,908 187,973EMCORE Corp. (a) 20,355 88,442Ericsson (B Shares) sponsored ADR 218,799 2,678,100EXFO, Inc. (sub. vtg.) (a) 13,715 40,130Extreme Networks, Inc. (a) 124,307 698,605F5 Networks, Inc. (a) 38,418 6,254,835Gilat Satellite Networks Ltd. 18,319 111,013Harmonic, Inc. (a) 60,290 393,694Infinera Corp. (a) 185,506 1,569,381Inseego Corp. (a) (b) 47,483 471,506InterDigital, Inc. 10,958 656,494Ituran Location & Control Ltd. 10,985 202,014KVH Industries, Inc. (a) 10,763 110,859Lantronix, Inc. (a) 15,008 63,934LRAD Corp. (a) 20,513 145,232Lumentum Holdings, Inc. (a) 42,547 3,675,210

60Annual Report
See accompanying notes which are an integral part of the financial statements.
Schedule of Investments – continued
Common Stocks – continuedShares Value
INFORMATION TECHNOLOGY – continuedCommunications Equipment – continuedNETGEAR, Inc. (a) 36,445 $ 1,159,315NetScout Systems, Inc. (a) 23,647 553,813PC-Tel, Inc. 11,312 71,152Radcom Ltd. (a) (b) 13,668 126,429Radware Ltd. (a) 27,517 693,704Resonant, Inc. (a) (b) 4,657 10,339Sierra Wireless, Inc. (a) (b) 8,504 124,158Silicom Ltd. (a) 4,848 188,490Siyata Mobile, Inc. 3,192 21,386Sonus Networks, Inc. (a) 59,234 406,345Tessco Technologies, Inc. 7,463 47,614UTStarcom Holdings Corp. (a) 45,592 51,975ViaSat, Inc. (a) (b) 9,361 318,274Viavi Solutions, Inc. (a) 221,790 3,004,146Westell Technologies, Inc. Class A (a) (b) 5,356 4,231xG Technology, Inc. (a) (b) 136,121 181,041
122,886,265Electronic Equipment & Components – 0.8%Airgain, Inc. (a) 3,450 45,816Akoustis Technologies, Inc. (a) (b) 20,020 152,352Applied DNA Sciences, Inc. (a) (b) 2,126 15,988Avnet, Inc. 16,431 498,681Bel Fuse, Inc.:
Class A 1,125 16,414Class B (non-vtg.) 5,258 77,082
CDW Corp. 86,017 11,224,358Cemtrex, Inc. (a) 30,161 44,035ClearSign Combustion Corp. (a) (b) 16,057 41,106Coda Octopus Group, Inc. (a) (b) 2,615 14,618Cognex Corp. 93,613 7,034,081Coherent, Inc. (a) 19,326 2,353,520CUI Global, Inc. (a) 30,446 43,233Daktronics, Inc. 31,984 144,248Data I/O Corp. (a) 15,054 60,969Deswell Industries, Inc. 1,758 5,186Digital Ally, Inc. (a) (b) 9,617 24,331ePlus, Inc. (a) 6,332 533,851FARO Technologies, Inc. (a) 11,137 736,378Flextronics International Ltd. (a) 276,831 4,492,967FLIR Systems, Inc. 88,628 3,389,135Frequency Electronics, Inc. (a) 5,274 54,850

61 Annual Report
See accompanying notes which are an integral part of the financial statements.
Common Stocks – continuedShares Value
INFORMATION TECHNOLOGY – continuedElectronic Equipment & Components – continuedHollysys Automation Technologies Ltd. 27,651 $ 348,679Identiv, Inc. (a) 9,058 62,410II-VI, Inc. (a) (b) 54,762 3,704,649Insight Enterprises, Inc. (a) 18,607 1,330,028Intellicheck, Inc. (a) 10,166 99,830IPG Photonics Corp. (a) 27,700 5,734,177Iteris, Inc. (a) (b) 22,008 107,399Itron, Inc. (a) 33,619 2,642,790KEY Tronic Corp. (a) 6,057 46,821Kimball Electronics, Inc. (a) 15,945 245,712LightPath Technologies, Inc. Class A (a) 12,016 37,370Littelfuse, Inc. 13,065 3,142,524Luna Innovations, Inc. (a) 21,826 218,806Magal Security Systems Ltd. (a) 12,188 48,874Micronet Enertec Technologies, Inc. (a) 3,711 5,975MicroVision, Inc. (a) (b) 70,772 163,483MTS Systems Corp. 3,966 138,929Napco Security Technolgies, Inc. (a) 11,834 360,937National Instruments Corp. 55,553 2,079,349Neonode, Inc. (a) (b) 1,574 12,041nLIGHT, Inc. (a) 4,317 129,596Novanta, Inc. (a) 19,056 2,286,339OSI Systems, Inc. (a) 9,520 838,712PC Connection, Inc. 15,743 718,668Perceptron, Inc. (a) 7,478 52,122Plexus Corp. (a) 16,687 1,246,686Powerfleet, Inc. (a) 19,674 135,357Research Frontiers, Inc. (a) 18,055 52,901Richardson Electronics Ltd. 7,825 35,682Sanmina Corp. (a) 60,736 1,932,316ScanSource, Inc. (a) 11,075 277,983SGOCO Technology Ltd. (a) (b) 1,818 2,363SMTC Corp. (a) 3,715 16,866Supercom Ltd. (a) (b) 8,931 10,807Trimble, Inc. (a) 135,750 8,127,353TTM Technologies, Inc. (a) 142,903 1,866,313Velodyne Lidar, Inc. (a) (b) 142,120 2,262,550Wayside Technology Group, Inc. 3,243 67,746Wrap Technologies, Inc. (a) (b) 16,175 93,006Zebra Technologies Corp. Class A (a) 28,794 10,896,225
82,583,573

62Annual Report
See accompanying notes which are an integral part of the financial statements.
Schedule of Investments – continued
Common Stocks – continuedShares Value
INFORMATION TECHNOLOGY – continuedIT Services – 3.7%21Vianet Group, Inc. ADR (a) 42,875 $ 1,215,078Akamai Technologies, Inc. (a) 88,515 9,162,188Alithya Group, Inc. (a) 7,624 18,450ALJ Regional Holdings, Inc. (a) 36,145 34,623Amdocs Ltd. 71,330 4,694,227AMERI Holdings, Inc. (a) 27,071 43,043American Virtual Cloud Technologies, Inc. (a) (b) 11,030 54,709Automatic Data Processing, Inc. 235,563 40,959,694BigCommerce Holdings, Inc. (a) (b) 34,605 2,791,239Brightcove, Inc. (a) 29,726 496,424Cardtronics PLC (a) (b) 48,418 1,175,589Cass Information Systems, Inc. 9,021 382,761China Information Technology, Inc. (a) (b) 3,739 11,329Chindata Group Holdings Ltd. ADR (a) 16,437 303,591CLPS, Inc. (a) (b) 3,495 11,464Cognizant Technology Solutions Corp. Class A 296,017 23,127,808Computer Task Group, Inc. (a) 19,062 131,337Conduent, Inc. (a) 207,650 876,283Crexendo, Inc. (a) (b) 4,855 32,092CSG Systems International, Inc. 17,233 747,568CSP, Inc. 2,765 22,203Endurance International Group Holdings, Inc. (a) 84,408 800,188Euronet Worldwide, Inc. (a) 35,940 4,831,774EVO Payments, Inc. Class A (a) 23,610 593,555Exela Technologies, Inc. (a) (b) 19,705 7,699ExlService Holdings, Inc. (a) 18,501 1,540,393Fiserv, Inc. (a) 378,197 43,560,730GDS Holdings Ltd. ADR (a) (b) 56,963 5,128,379Grid Dynamics Holdings, Inc. (a) 36,465 393,457Hackett Group, Inc. 16,264 228,997Information Services Group, Inc. (a) 25,958 78,393Innodata, Inc. (a) 4,465 23,218Inpixon (a) (b) 51,648 57,329International Money Express, Inc. (a) 22,487 353,945Jack Henry & Associates, Inc. 41,451 6,667,808Kingsoft Cloud Holdings Ltd. ADR 19,678 791,646Limelight Networks, Inc. (a) (b) 171,848 761,287ManTech International Corp. Class A 15,383 1,184,030Marathon Patent Group, Inc. (a) (b) 28,778 180,726ModusLink Global Solutions, Inc. (a) 32,364 29,192MoneyGram International, Inc. (a) 29,519 200,139

63 Annual Report
See accompanying notes which are an integral part of the financial statements.
Common Stocks – continuedShares Value
INFORMATION TECHNOLOGY – continuedIT Services – continuedMongoDB, Inc. Class A (a) 32,126 $ 9,230,121Net 1 UEPS Technologies, Inc. (a) 22,676 79,593NIC, Inc. 37,287 873,821Okta, Inc. (a) 65,202 15,977,098Paychex, Inc. 212,127 19,759,630PayPal Holdings, Inc. (a) 636,489 136,285,025Perficient, Inc. (a) (b) 17,809 810,844PFSweb, Inc. (a) 13,692 92,969PRG-Schultz International, Inc. (a) 16,378 109,077Priority Technology Holdings, Inc. (a) 4,051 19,769QIWI PLC Class B sponsored ADR 18,170 264,555Rackspace Technology, Inc. (a) 108,901 1,955,862Repay Holdings Corp. (a) 24,750 597,218Sabre Corp. 50,380 566,775ServiceSource International, Inc. (a) 61,161 94,188StoneCo Ltd. Class A (a) 120,949 8,855,886Sykes Enterprises, Inc. (a) 22,354 841,181Ttec Holdings, Inc. 25,100 1,698,266Tucows, Inc. (a) 6,556 475,310U.S.A. Technologies, Inc. (a) 6,900 58,650Usio, Inc. (a) 4,635 7,509VeriSign, Inc. (a) 57,154 11,471,951Verra Mobility Corp. (a) (b) 43,596 531,871Virtusa Corp. (a) 16,649 833,782Wix.com Ltd. (a) 30,009 7,665,199
372,860,735Semiconductors & Semiconductor Equipment – 10.1%ACM Research, Inc. (a) 7,664 633,200Advanced Energy Industries, Inc. (a) 21,417 2,065,884Advanced Micro Devices, Inc. (a) 637,506 59,071,306Allegro MicroSystems LLC (a) 100,000 2,395,000Alpha & Omega Semiconductor Ltd. (a) 13,400 332,856Ambarella, Inc. (a) 17,788 1,389,776Amkor Technology, Inc. 129,262 1,905,322Amtech Systems, Inc. (a) 9,588 59,158Analog Devices, Inc. 201,637 28,043,674Applied Materials, Inc. 497,204 41,009,386Array Technologies, Inc. 69,655 3,174,875ASML Holding NV 41,415 18,128,588Axcelis Technologies, Inc. (a) 20,252 546,399AXT, Inc. (a) 21,623 210,824

64Annual Report
See accompanying notes which are an integral part of the financial statements.
Schedule of Investments – continued
Common Stocks – continuedShares Value
INFORMATION TECHNOLOGY – continuedSemiconductors & Semiconductor Equipment – continuedBroadcom, Inc. 217,849 $ 87,483,801Brooks Automation, Inc. 40,001 2,919,673Camtek Ltd. (a) 23,975 451,929Canadian Solar, Inc. (a) (b) 33,568 1,435,368Ceva, Inc. (a) 12,199 479,177ChipMOS TECHNOLOGIES, Inc. sponsored ADR 5,716 125,923Cirrus Logic, Inc. (a) 31,458 2,519,786CMC Materials, Inc. 15,728 2,426,516Cohu, Inc. 26,067 740,042Cree, Inc. (a) (b) 59,632 5,390,136CVD Equipment Corp. (a) 4,263 20,121CyberOptics Corp. (a) 5,253 140,570Diodes, Inc. (a) 27,956 1,899,890DSP Group, Inc. (a) 16,168 272,107Enphase Energy, Inc. (a) (b) 67,496 9,217,929Entegris, Inc. 73,499 6,807,477Everspin Technologies, Inc. (a) 13,033 71,160First Solar, Inc. (a) 57,547 5,376,616FormFactor, Inc. (a) 41,276 1,692,316GSI Technology, Inc. (a) 15,609 103,644Himax Technologies, Inc. sponsored ADR (a) 15,887 104,695Ichor Holdings Ltd. (a) 26,345 840,406Impinj, Inc. (a) (b) 13,149 549,497Inphi Corp. (a) 26,900 4,172,997Intel Corp. 2,187,745 105,777,471KLA-Tencor Corp. 84,265 21,232,252Kopin Corp. (a) 16,323 32,646Kulicke & Soffa Industries, Inc. 36,135 1,100,311Lam Research Corp. 79,025 35,771,457Lattice Semiconductor Corp. (a) 73,568 3,078,821MACOM Technology Solutions Holdings, Inc. (a) 38,228 1,708,027Marvell Technology Group Ltd. 364,111 16,854,698Maxeon Solar Technologies Ltd. (a) (b) 40,131 979,999Maxim Integrated Products, Inc. 144,222 11,976,195Microchip Technology, Inc. 136,844 18,390,465Micron Technology, Inc. (a) 617,873 39,599,481MKS Instruments, Inc. 29,774 4,108,217Monolithic Power Systems, Inc. 24,470 7,829,421Nova Measuring Instruments Ltd. (a) 15,378 992,496NVE Corp. 2,373 121,474NVIDIA Corp. 334,614 179,373,181

65 Annual Report
See accompanying notes which are an integral part of the financial statements.
Common Stocks – continuedShares Value
INFORMATION TECHNOLOGY – continuedSemiconductors & Semiconductor Equipment – continuedNXP Semiconductors NV 152,103 $ 24,096,157O2Micro International Ltd. sponsored ADR (a) 16,202 102,883ON Semiconductor Corp. (a) 222,895 6,408,231PDF Solutions, Inc. (a) (b) 23,680 522,618Photronics, Inc. (a) 36,838 426,952Pixelworks, Inc. (a) 37,111 110,591Power Integrations, Inc. 31,971 2,282,410Qorvo, Inc. (a) 62,229 9,750,040Qualcomm, Inc. 612,447 90,133,825QuickLogic Corp. (a) 5,932 17,025Rambus, Inc. (a) (b) 63,437 997,230Rubicon Technology, Inc. (a) 443 3,854SemiLEDs Corp. (a) (b) 5,650 17,741Semtech Corp. (a) 36,094 2,435,262Silicon Laboratories, Inc. (a) 23,534 2,758,420Silicon Motion Technology Corp. sponsored ADR 10,574 419,576SiTime Corp. 9,292 808,125Skyworks Solutions, Inc. 90,593 12,789,014SMART Global Holdings, Inc. (a) (b) 12,953 397,528SolarEdge Technologies, Inc. (a) 26,876 7,470,990SPI Energy Co. Ltd. sponsored ADR (a) 6,033 67,509Summit Wireless Technologies, Inc. (a) (b) 94,657 250,841SunPower Corp. (a) (b) 83,815 1,857,340Synaptics, Inc. (a) 19,041 1,480,819Teradyne, Inc. 89,725 9,900,257Texas Instruments, Inc. 499,368 80,523,090Tower Semiconductor Ltd. (a) 62,102 1,519,015Ultra Clean Holdings, Inc. (a) 21,918 693,486Universal Display Corp. 25,521 5,845,330Veeco Instruments, Inc. (a) 28,870 479,819Xilinx, Inc. 133,035 19,363,244
1,027,063,858Software – 15.0%2U, Inc. (a) (b) 25,505 824,067Absolute Software Corp. 4,386 45,153ACI Worldwide, Inc. (a) 87,412 2,847,883Adobe, Inc. (a) 262,181 125,445,743Agilysys, Inc. (a) 15,296 571,459Agora, Inc. ADR (a) (b) 1,752 67,364Alarm.com Holdings, Inc. (a) 27,342 2,075,531Allot Ltd. (a) 21,262 207,517

66Annual Report
See accompanying notes which are an integral part of the financial statements.
Schedule of Investments – continued
Common Stocks – continuedShares Value
INFORMATION TECHNOLOGY – continuedSoftware – continuedAltair Engineering, Inc. Class A (a) 23,917 $ 1,289,126American Software, Inc. Class A 20,292 333,195ANSYS, Inc. (a) 46,906 15,857,042AppFolio, Inc. (a) (b) 9,525 1,551,908Appian Corp. Class A (a) (b) 21,083 2,951,620Aspen Technology, Inc. (a) 36,628 4,924,635Asure Software, Inc. (a) 12,380 95,821Atlassian Corp. PLC (a) 70,300 15,821,015AudioEye, Inc. (a) (b) 1,909 32,148Aurora Mobile Ltd. ADR (a) (b) 19,119 70,549Autodesk, Inc. (a) 119,534 33,497,013Aware, Inc. (a) 13,849 42,516Benefitfocus, Inc. (a) 4,508 64,870Bentley Systems, Inc. Class B 137,240 4,840,455Bio-Key International, Inc. (a) 10,259 35,599Blackbaud, Inc. 27,475 1,513,598BlackLine, Inc. (a) 31,175 3,831,408Bottomline Technologies, Inc. (a) 24,745 1,129,362BSQUARE Corp. (a) 7,925 11,174Cadence Design Systems, Inc. (a) 151,061 17,568,394CDK Global, Inc. 50,893 2,437,775Cerence, Inc. (a) (b) 19,181 1,740,676Check Point Software Technologies Ltd. (a) 76,150 8,961,332China Advanced Construction Materials Group, Inc. (a) 70,094 39,954Citrix Systems, Inc. 65,748 8,147,492Cleanspark, Inc. (a) (b) 10,666 116,259CommVault Systems, Inc. (a) 19,574 934,854Cornerstone OnDemand, Inc. (a) 59,059 2,607,455CounterPath Corp. (a) 5,042 14,773Coupa Software, Inc. (a) 36,418 11,978,244Crowdstrike Holdings, Inc. (a) 100,052 15,335,971CyberArk Software Ltd. (a) 28,656 3,291,715Cyren Ltd. (a) 13,132 12,344Datadog, Inc. Class A (a) 103,239 10,212,402Datasea, Inc. (a) (b) 10,484 23,379Descartes Systems Group, Inc. (Canada) (a) 45,706 2,710,263Digimarc Corp. (a) (b) 8,187 344,100Digital Turbine, Inc. (a) 46,817 2,105,829DocuSign, Inc. (a) 100,611 22,927,235Domo, Inc. Class B (a) 24,185 918,788Dropbox, Inc. Class A (a) 84,684 1,691,139

67 Annual Report
See accompanying notes which are an integral part of the financial statements.
Common Stocks – continuedShares Value
INFORMATION TECHNOLOGY – continuedSoftware – continuedDuck Creek Technologies, Inc. (a) (b) 70,005 $ 2,783,399Ebix, Inc. (b) 36,343 1,236,025eGain Communications Corp. (a) 19,235 218,125Everbridge, Inc. (a) (b) 19,371 2,458,955Evolving Systems, Inc. (a) 8,488 14,005FireEye, Inc. (a) 176,150 2,647,535Five9, Inc. (a) 36,083 5,600,082Fortinet, Inc. (a) 88,526 10,909,059GTY Govtech, Inc. (a) 34,702 124,233Ideanomics, Inc. (a) (b) 137,847 381,836Intrusion, Inc. (a) 5,872 71,169Intuit, Inc. 143,148 50,390,959j2 Global, Inc. (a) (b) 36,322 3,254,814Jamf Holding Corp. (a) (b) 23,249 736,993JFrog Ltd. (b) 49,426 3,477,613Kaspien Holdings, Inc. (a) 477 6,115LivePerson, Inc. (a) (b) 35,890 2,096,694Magic Software Enterprises Ltd. 32,843 542,895Manhattan Associates, Inc. (a) 34,299 3,506,730Marin Software, Inc. (a) 14,390 30,507Materialise NV ADR (a) (b) 10,543 459,253McAfee Corp. (b) 31,043 498,240Mercurity Fintech Holding, Inc. sponsored ADR (a) (b) 3,066 8,615Microsoft Corp. 4,086,075 874,706,075MicroStrategy, Inc. Class A (a) 4,548 1,558,918Mimecast Ltd. (a) 34,389 1,546,817Mitek Systems, Inc. (a) 28,300 333,374MMTEC, Inc. (a) 12,794 22,645MobileIron, Inc. (a) 54,646 384,708nCino, Inc. (a) (b) 38,200 3,112,918Net Element International, Inc. (a) 2,849 29,174NetSol Technologies, Inc. (a) 6,495 21,304NICE Systems Ltd. sponsored ADR (a) 25,508 6,216,810Nortonlifelock, Inc. 192,813 3,514,981Nuance Communications, Inc. (a) 154,878 6,679,888Nutanix, Inc. Class A (a) 80,033 2,192,104NXT-ID, Inc. (a) 34,241 14,385Onespan, Inc. (a) 24,175 478,182Open Text Corp. 180,666 7,975,346Opera Ltd. ADR (a) (b) 16,766 142,846Parametric Technology Corp. (a) 62,815 6,774,598
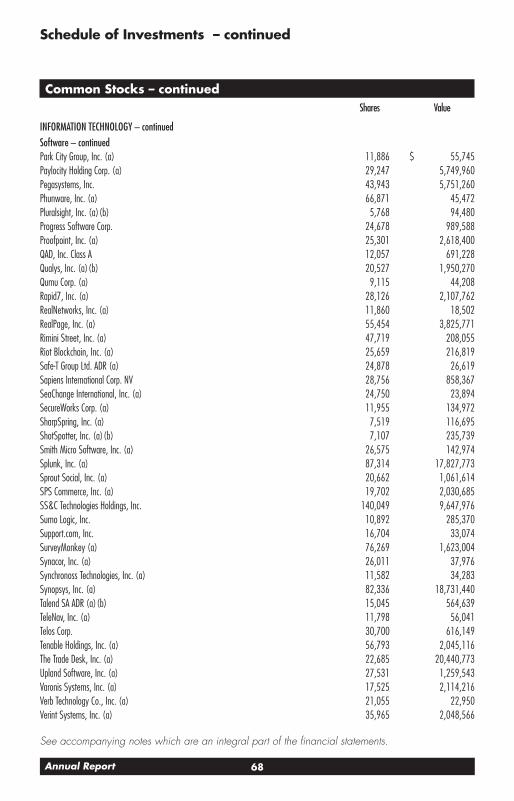
68Annual Report
See accompanying notes which are an integral part of the financial statements.
Schedule of Investments – continued
Common Stocks – continuedShares Value
INFORMATION TECHNOLOGY – continuedSoftware – continuedPark City Group, Inc. (a) 11,886 $ 55,745Paylocity Holding Corp. (a) 29,247 5,749,960Pegasystems, Inc. 43,943 5,751,260Phunware, Inc. (a) 66,871 45,472Pluralsight, Inc. (a) (b) 5,768 94,480Progress Software Corp. 24,678 989,588Proofpoint, Inc. (a) 25,301 2,618,400QAD, Inc. Class A 12,057 691,228Qualys, Inc. (a) (b) 20,527 1,950,270Qumu Corp. (a) 9,115 44,208Rapid7, Inc. (a) 28,126 2,107,762RealNetworks, Inc. (a) 11,860 18,502RealPage, Inc. (a) 55,454 3,825,771Rimini Street, Inc. (a) 47,719 208,055Riot Blockchain, Inc. (a) 25,659 216,819Safe-T Group Ltd. ADR (a) 24,878 26,619Sapiens International Corp. NV 28,756 858,367SeaChange International, Inc. (a) 24,750 23,894SecureWorks Corp. (a) 11,955 134,972SharpSpring, Inc. (a) 7,519 116,695ShotSpotter, Inc. (a) (b) 7,107 235,739Smith Micro Software, Inc. (a) 26,575 142,974Splunk, Inc. (a) 87,314 17,827,773Sprout Social, Inc. (a) 20,662 1,061,614SPS Commerce, Inc. (a) 19,702 2,030,685SS&C Technologies Holdings, Inc. 140,049 9,647,976Sumo Logic, Inc. 10,892 285,370Support.com, Inc. 16,704 33,074SurveyMonkey (a) 76,269 1,623,004Synacor, Inc. (a) 26,011 37,976Synchronoss Technologies, Inc. (a) 11,582 34,283Synopsys, Inc. (a) 82,336 18,731,440Talend SA ADR (a) (b) 15,045 564,639TeleNav, Inc. (a) 11,798 56,041Telos Corp. 30,700 616,149Tenable Holdings, Inc. (a) 56,793 2,045,116The Trade Desk, Inc. (a) 22,685 20,440,773Upland Software, Inc. (a) 27,531 1,259,543Varonis Systems, Inc. (a) 17,525 2,114,216Verb Technology Co., Inc. (a) 21,055 22,950Verint Systems, Inc. (a) 35,965 2,048,566

69 Annual Report
See accompanying notes which are an integral part of the financial statements.
Common Stocks – continuedShares Value
INFORMATION TECHNOLOGY – continuedSoftware – continuedVeritone, Inc. (a) (b) 13,431 $ 357,399Vertex, Inc. Class A (a) 12,543 316,585Workday, Inc. Class A (a) 97,008 21,806,428Xperi Holding Corp. (b) 94,551 1,804,033Zix Corp. (a) 20,785 149,652Zoom Video Communications, Inc. Class A (a) 98,764 47,244,747Zscaler, Inc. (a) 71,045 11,065,259
1,530,389,139Technology Hardware, Storage & Peripherals – 11.2%Apple, Inc. 9,241,927 1,100,251,408Astro-Med, Inc. 3,663 36,740Avid Technology, Inc. (a) 13,607 165,325Borqs Technologies, Inc. (a) (b) 30,264 32,988Boxlight Corp. (a) (b) 32,673 49,990Canaan, Inc. ADR (b) 85,617 428,085Corsair Gaming, Inc. (b) 50,700 1,925,586Ebang International Holdings, Inc. Class A (a) (b) 42,252 206,190Immersion Corp. (a) 18,807 160,988Intevac, Inc. (a) 24,594 148,056Logitech International SA (b) 91,716 8,281,955Nano Dimension Ltd. ADR (a) (b) 27,691 177,222NetApp, Inc. 153,895 8,204,142Quantum Corp. (a) 23,312 133,578Seagate Technology LLC (b) 172,392 10,138,374Sonim Technologies, Inc. (a) 55,130 35,217Stratasys Ltd. (a) (b) 1,227 20,982Super Micro Computer, Inc. (a) 28,899 815,241Transact Technologies, Inc. 6,575 55,493Western Digital Corp. 72,705 3,263,000
1,134,530,560
TOTAL INFORMATION TECHNOLOGY 4,270,314,130
MATERIALS – 0.3%Chemicals – 0.1%Advanced Emissions Solutions, Inc. 9,725 54,946AgroFresh Solutions, Inc. (a) 34,342 78,987Amyris, Inc. (a) 2,982 8,707Balchem Corp. 17,059 1,768,848Fuwei Films Holdings Co. Ltd. (a) (b) 5,412 30,740Gulf Resources, Inc. (a) 8,302 36,612

70Annual Report
See accompanying notes which are an integral part of the financial statements.
Schedule of Investments – continued
Common Stocks – continuedShares Value
MATERIALS – continuedChemicals – continuedHawkins, Inc. 5,991 $ 300,628Innospec, Inc. 19,477 1,602,762Loop Industries, Inc. (a) (b) 14,975 125,191Marrone Bio Innovations, Inc. (a) (b) 100,070 119,083Methanex Corp. 26,743 1,119,388Northern Technologies International Corp. 5,689 53,533
5,299,425Construction Materials – 0.0%Forterra, Inc. (a) 34,458 639,196Tecnoglass, Inc. 23,615 138,384U.S. Concrete, Inc. (a) 19,449 690,051United States Lime & Minerals, Inc. 3,255 360,329
1,827,960Containers & Packaging – 0.0%Pactiv Evergreen, Inc. 93,891 1,584,880Silgan Holdings, Inc. 58,583 1,980,105UFP Technologies, Inc. (a) 5,073 223,567
3,788,552Metals & Mining – 0.2%Century Aluminum Co. (a) 47,905 486,236China Natural Resources, Inc. (a) (b) 12,136 17,354Corvus Gold, Inc. (a) 19,001 46,380Ferroglobe PLC (a) 72,623 92,231Ferroglobe Representation & Warranty Insurance (a) (c) 23,476 0Haynes International, Inc. 3,064 64,926Hycroft Mining Holding Corp. (a) (b) 20,350 158,730Kaiser Aluminum Corp. 15,219 1,186,778Olympic Steel, Inc. 9,638 143,028Pan American Silver Corp. 114,657 3,385,821Ramaco Resources, Inc. (a) (b) 21,088 64,529Royal Gold, Inc. 35,679 3,941,459Schnitzer Steel Industries, Inc. Class A 9,312 238,573SSR Mining, Inc. (a) 67,349 1,246,685Steel Dynamics, Inc. 145,764 5,278,114Synalloy Corp. (a) 6,143 39,561Universal Stainless & Alloy Products, Inc. (a) 7,722 55,830ZK International Group Co. Ltd. (a) (b) 8,117 18,263
16,464,498

71 Annual Report
See accompanying notes which are an integral part of the financial statements.
Common Stocks – continuedShares Value
MATERIALS – continuedPaper & Forest Products – 0.0%Mercer International, Inc. (SBI) 32,688 $ 267,715
TOTAL MATERIALS 27,648,150
REAL ESTATE – 1.0%Equity Real Estate Investment Trusts (REITs) – 0.8%American Finance Trust, Inc. 95,992 708,421Brookfield Property REIT, Inc. Class A (b) 51,750 810,923CareTrust (REIT), Inc. 76,903 1,494,225CIM Commercial Trust Corp. 10,595 128,941CyrusOne, Inc. 63,239 4,421,038Diversified Healthcare Trust (SBI) 63,432 279,735Equinix, Inc. 48,007 33,498,805Gaming & Leisure Properties 119,805 4,976,700Gladstone Commercial Corp. 18,518 334,991Gladstone Land Corp. 13,642 198,491Global Self Storage, Inc. 5,948 23,673Government Properties Income Trust (b) 15,065 344,235Hospitality Properties Trust (SBI) 18,774 222,660Host Hotels & Resorts, Inc. 494,172 6,933,233Industrial Logistics Properties Trust 36,786 799,360Lamar Advertising Co. Class A 57,513 4,578,610Medalist Diversified (REIT), Inc. 12,929 29,478Potlatch Corp. 54,264 2,525,447Regency Centers Corp. 16,884 769,573Retail Opportunity Investments Corp. 144,860 1,880,283Sabra Health Care REIT, Inc. 211,080 3,478,598SBA Communications Corp. Class A 60,727 17,439,580Uniti Group, Inc. 24,455 251,397Wheeler REIT, Inc. (a) 15,634 46,277
86,174,674Real Estate Management & Development – 0.2%Altisource Portfolio Solutions SA (a) (b) 7,869 103,713Brookfield Property Partners LP 325,458 4,954,420China HGS Real Estate, Inc. (a) (b) 6,970 10,385Colliers International Group, Inc. 20,510 1,829,428Cresud S.A.C.I.F. y A. sponsored ADR (a) (b) 30,933 122,804eXp World Holdings, Inc. (a) 37,253 1,986,702Fathom Holdings, Inc. (a) 6,397 142,013FirstService Corp. 22,573 3,116,203FRP Holdings, Inc. (a) 6,217 284,676

72Annual Report
See accompanying notes which are an integral part of the financial statements.
Schedule of Investments – continued
Common Stocks – continuedShares Value
REAL ESTATE – continuedReal Estate Management & Development – continuedGriffin Industrial Realty, Inc. 3,439 $ 245,063Gyrodyne LLC (a) 1,080 17,950IRSA Propiedades Comerciales SA sponsored ADR 2,179 21,790Landmark Infrastructure Partners LP 12,077 123,185Newmark Group, Inc. 134,837 946,556Redfin Corp. (a) 54,418 2,606,078Stratus Properties, Inc. (a) 4,684 114,055The RMR Group, Inc. 5,557 205,831
16,830,852
TOTAL REAL ESTATE 103,005,526
UTILITIES – 0.8%Electric Utilities – 0.7%Alliant Energy Corp. 135,599 7,132,507American Electric Power Co., Inc. 302,219 25,655,371Exelon Corp. 428,447 17,596,318MGE Energy, Inc. 19,112 1,312,421Otter Tail Corp. 23,594 939,513Spark Energy, Inc. Class A, (b) 7,308 67,818Xcel Energy, Inc. 286,833 19,321,071
72,025,019Gas Utilities – 0.0%RGC Resources, Inc. 5,446 132,120Independent Power and Renewable Electricity Producers – 0.1%Atlantica Sustainable Infrastructure PLC (b) 83,293 2,864,446VivoPower International PLC (a) (b) 8,836 80,319
2,944,765Multi-Utilities – 0.0%NorthWestern Energy Corp. 42,084 2,440,872Water Utilities – 0.0%Artesian Resources Corp. Class A 6,205 229,399Cadiz, Inc. (a) (b) 22,934 230,257Consolidated Water Co., Inc. 7,912 86,716Global Water Resources, Inc. 15,552 200,310Middlesex Water Co. 10,863 744,007

73 Annual Report
See accompanying notes which are an integral part of the financial statements.
Common Stocks – continuedShares Value
UTILITIES – continuedWater Utilities – continuedPure Cycle Corp. (a) 17,704 $ 168,896York Water Co. 8,966 403,829
2,063,414
TOTAL UTILITIES 79,606,190
TOTAL COMMON STOCKS(Cost $4,450,187,581) 10,121,231,930
Money Market Funds – 3.4%
Fidelity Cash Central Fund 0.09% (e) 53,962,730 53,973,522Fidelity Securities Lending Cash Central Fund 0.09% (e) (f) 288,400,562 288,429,402
TOTAL MONEY MARKET FUNDS(Cost $342,402,924) 342,402,924
TOTAL INVESTMENT IN SECURITIES – 102.9%(Cost $4,792,590,505) 10,463,634,854
NET OTHER ASSETS (LIABILITIES) – (2.9)% (297,735,834)
NET ASSETS – 100% $10,165,899,020
Futures ContractsNumber
of contractsExpiration
DateNotional Amount
Value Unrealized Appreciation/ (Depreciation)
Purchased
Equity Index ContractsCME E-mini NASDAQ 100 Index Contracts (United
States) 192 Dec. 2020 $ 47,143,680 $ 2,627,370 $ 2,627,370
The notional amount of futures purchased as a percentage of Net Assets is 0.5%
For the period, the average monthly notional amount at value for futures contracts in the aggregate was $230,462,703.

74Annual Report
See accompanying notes which are an integral part of the financial statements.
Schedule of Investments – continued
Legend(a) Non-income producing
(b) Security or a portion of the security is on loan at period end.
(c) Level 3 security
(d) Security exempt from registration under Rule 144A of the Securities Act of 1933. These securities may be resold in transactions exempt from registration, normally to qualified institutional buyers. At the end of the period, the value of these securities amounted to $0 or 0.0% of net assets.
(e) Affiliated fund that is generally available only to investment companies and other accounts managed by Fidelity Investments. The rate quoted is the annualized seven-day yield of the fund at period end. A complete unaudited listing of the fund’s holdings as of its most recent quarter end is available upon request. In addition, each Fidelity Central Fund’s financial statements, which are not covered by the Fund’s Report of Independent Registered Public Accounting Firm, are available on the SEC’s website or upon request.
(f) Investment made with cash collateral received from securities on loan.
Affiliated Central FundsInformation regarding fiscal year to date income earned by the Fund from investments in Fidelity Central Funds is as follows:
Fund Income earnedFidelity Cash Central Fund $ 3,705,258Fidelity Securities Lending Cash Central Fund 13,576,296Total $ 17,281,554
Amounts in the income column in the above table include any capital gain distributions from underlying funds, which are presented in the corresponding line-item in the Statement of Operations, if applicable. Amount for Fidelity Securities Lending Cash Central Fund represents the income earned on investing cash collateral, less rebates paid to borrowers and any lending agent fees associated with the loan, plus any premium payments received for lending certain types of securities.
Investment ValuationThe following is a summary of the inputs used, as of November 30, 2020, involving the Fund’s assets and liabilities carried at fair value. The inputs or methodology used for valuing securities may not be an indication of the risk associated with investing in those securities. For more information on valuation inputs, and their aggregation into the levels used below, please refer to the Investment Valuation section in the accompanying Notes to Financial Statements.
Valuation Inputs at Reporting Date:Description Total Level 1 Level 2 Level 3Investments in Securities:Equities:
Communication Services $ 1,694,240,948 $ 1,694,229,703 $ — $ 11,245Consumer Discretionary 1,744,695,882 1,744,645,840 50,042 —Consumer Staples 382,292,377 382,292,377 — —Energy 20,257,644 20,257,644 — —Financials 382,346,203 382,346,203 — —Health Care 1,059,509,945 1,059,204,722 3,683 301,540Industrials 357,314,935 357,314,911 — 24Information Technology 4,270,314,130 4,270,314,130 — —Materials 27,648,150 27,648,150 — —Real Estate 103,005,526 103,005,526 — —Utilities 79,606,190 79,606,190 — —

75 Annual Report
See accompanying notes which are an integral part of the financial statements.
Valuation Inputs at Reporting Date:Description Total Level 1 Level 2 Level 3Money Market Funds $ 342,402,924 $ 342,402,924 $ — $ —Total Investments in Securities: $ 10,463,634,854 $ 10,463,268,320 $ 53,725 $ 312,809
Derivative Instruments:Assets
Futures Contracts $ 2,627,370 $ 2,627,370 $ — $ —Total Assets $ 2,627,370 $ 2,627,370 $ — $ —Total Derivative Instruments: $ 2,627,370 $ 2,627,370 $ — $ —
Value of Derivative InstrumentsThe following table is a summary of the Fund’s value of derivative instruments by primary risk exposure as of November 30, 2020. For additional information on derivative instruments, please refer to the Derivative Instruments section in the accompanying Notes to Financial Statements.
Primary Risk Exposure / Derivative Type ValueAsset Liability
Equity Risk Futures Contracts (a) $ 2,627,370 $ 0Total Equity Risk 2,627,370 0Total Value of Derivatives $ 2,627,370 $ 0
(a) Reflects gross cumulative appreciation (depreciation) on futures contracts as presented in the Schedule of Investments. In the Statement of Assets and Liabilities, the period end daily variation margin is included in receivable or payable for daily variation margin on futures contracts, and the net cumulative appreciation (depreciation) is included in Total accumulated earnings (loss).
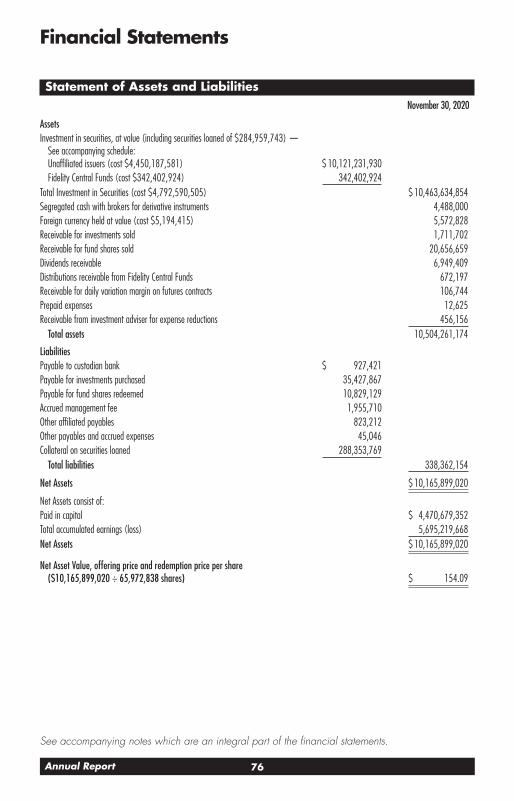
76Annual Report
See accompanying notes which are an integral part of the financial statements.
Financial Statements
Statement of Assets and LiabilitiesNovember 30, 2020
Assets Investment in securities, at value (including securities loaned of $284,959,743) —
See accompanying schedule: Unaffiliated issuers (cost $4,450,187,581) $ 10,121,231,930Fidelity Central Funds (cost $342,402,924) 342,402,924
Total Investment in Securities (cost $4,792,590,505) $ 10,463,634,854Segregated cash with brokers for derivative instruments 4,488,000Foreign currency held at value (cost $5,194,415) 5,572,828Receivable for investments sold 1,711,702Receivable for fund shares sold 20,656,659Dividends receivable 6,949,409Distributions receivable from Fidelity Central Funds 672,197Receivable for daily variation margin on futures contracts 106,744Prepaid expenses 12,625Receivable from investment adviser for expense reductions 456,156
Total assets 10,504,261,174
Liabilities Payable to custodian bank $ 927,421Payable for investments purchased 35,427,867Payable for fund shares redeemed 10,829,129Accrued management fee 1,955,710Other affiliated payables 823,212Other payables and accrued expenses 45,046Collateral on securities loaned 288,353,769
Total liabilities 338,362,154
Net Assets $ 10,165,899,020
Net Assets consist of: Paid in capital $ 4,470,679,352Total accumulated earnings (loss) 5,695,219,668Net Assets $ 10,165,899,020
Net Asset Value, offering price and redemption price per share ($10,165,899,020 ÷ 65,972,838 shares) $ 154.09

77 Annual Report
See accompanying notes which are an integral part of the financial statements.
Statement of OperationsYear ended November
30, 2020
Investment Income Dividends $ 75,759,688Interest 194,446Income from Fidelity Central Funds (including $13,576,296 from security lending) 17,281,554
Total income 93,235,688
Expenses Management fee $ 19,833,134Transfer agent fees 8,263,806Accounting fees 100,000Custodian fees and expenses 82,954Independent trustees’ fees and expenses 43,738Registration fees 266,258Audit 80,779Legal 41,253Interest 12,790Miscellaneous 104,605
Total expenses before reductions 28,829,317Expense reductions (4,751,126)Total expenses after reductions 24,078,191
Net investment income (loss) 69,157,497Realized and Unrealized Gain (Loss) Net realized gain (loss) on:
Investment securities: Unaffiliated issuers (165,815,499)Fidelity Central Funds 17,362
Foreign currency transactions (24,748)Futures contracts 204,345,781
Total net realized gain (loss) 38,522,896Change in net unrealized appreciation (depreciation) on:
Investment securities: Unaffiliated issuers 2,940,146,593Fidelity Central Funds (7,957)
Assets and liabilities in foreign currencies 381,699Futures contracts (67,131,825)
Total change in net unrealized appreciation (depreciation) 2,873,388,510Net gain (loss) 2,911,911,406Net increase (decrease) in net assets resulting from operations $ 2,981,068,903

78Annual Report
See accompanying notes which are an integral part of the financial statements.
Financial Statements – continued
Statement of Changes in Net AssetsYear ended
November 30, 2020
Year ended November 30,
2019Increase (Decrease) in Net Assets Operations
Net investment income (loss) $ 69,157,497 $ 70,969,977Net realized gain (loss) 38,522,896 116,514,654Change in net unrealized appreciation (depreciation) 2,873,388,510 974,694,074Net increase (decrease) in net assets resulting from operations 2,981,068,903 1,162,178,705
Distributions to shareholders (314,082,075) (101,247,668)Share transactions
Proceeds from sales of shares 3,001,514,559 1,368,442,356Reinvestment of distributions 298,187,514 96,704,103Cost of shares redeemed (2,955,078,158) (1,374,121,905)Net increase (decrease) in net assets resulting from share transactions 344,623,915 91,024,554Total increase (decrease) in net assets 3,011,610,743 1,151,955,591
Net Assets Beginning of period 7,154,288,277 6,002,332,686End of period $ 10,165,899,020 $ 7,154,288,277
Other Information Shares
Sold 24,570,358 13,650,276Issued in reinvestment of distributions 2,637,194 1,137,160Redeemed (24,222,462) (13,769,028)Net increase (decrease) 2,985,090 1,018,408

79 Annual Report
See accompanying notes which are an integral part of the financial statements.
Financial Highlights
Fidelity Nasdaq Composite Index Fund
Years ended November 30, 2020 2019 2018 2017 2016Selected Per–Share Data Net asset value, beginning of period $ 113.58 $ 96.86 $ 90.92 $ 70.45 $ 67.89Income from Investment Operations
Net investment income (loss) A 1.04 1.12 .89 .76 .78Net realized and unrealized gain (loss) 44.44 17.26 5.71 20.38 2.80Total from investment operations 45.48 18.38 6.60 21.14 3.58
Distributions from net investment income (1.11)B (.81) (.64) (.65) (.55)Distributions from net realized gain (3.86)B (.85) (.02) (.03) (.48)
Total distributions (4.97) (1.66) (.66) (.67)C (1.03)Redemption fees added to paid in capital A – – – –D .01Net asset value, end of period $ 154.09 $ 113.58 $ 96.86 $ 90.92 $ 70.45
Total Return E 41.63% 19.55% 7.30% 30.26% 5.43%Ratios to Average Net Assets F,G
Expenses before reductions .35% .35% .40% .41% .42%Expenses net of fee waivers, if any .29% .29% .29% .29% .29%Expenses net of all reductions .29% .29% .29% .29% .29%Net investment income (loss) .84% 1.10% .90% .94% 1.20%
Supplemental Data Net assets, end of period (000 omitted) $ 10,165,899 $ 7,154,288 $ 6,002,333 $ 4,899,784 $ 2,715,137Portfolio turnover rate H 17% 6% 15% 11% 4%
A Calculated based on average shares outstanding during the period.B The amounts shown reflect certain reclassifications related to book to tax differences that were made in the year shown.C Total distributions per share do not sum due to rounding.D Amount represents less than $.005 per share.E Total returns would have been lower if certain expenses had not been reduced during the applicable periods shown.F Fees and expenses of any underlying mutual funds or exchange-traded funds (ETFs) are not included in the Fund’s expense ratio. The
Fund indirectly bears its proportionate share of these expenses. For additional expense information related to investments in Fidelity Central Funds, please refer to the “Investments in Fidelity Central Funds” note found in the Notes to Financial Statements section of the most recent Annual or Semi-Annual report.
G Expense ratios reflect operating expenses of the class. Expenses before reductions do not reflect amounts reimbursed, waived, or reduced through arrangements with the investment advisor, brokerage services, or other offset arrangements, if applicable, and do not represent the amount paid by the class during periods when reimbursements, waivers or reductions occur.
H Amount does not include the portfolio activity of any underlying mutual funds or exchange-traded funds (ETFs).

80Annual Report
Notes to Financial StatementsFor the period ended November 30, 2020
1. Organization.
Fidelity Nasdaq Composite Index Fund (the Fund) is a fund of Fidelity Concord Street Trust (the Trust) and is authorized to issue an unlimited number of shares. Share transactions on the Statement of Changes in Net Assets may contain exchanges between affiliated funds. The Trust is registered under the Investment Company Act of 1940, as amended (the 1940 Act), as an open-end management investment company organized as a Massachusetts business trust. The Fund may operate as a non-diversified fund, as defined under the 1940 Act, to the approximate extent the Index is non-diversified.
Effective January 1, 2020:
Investment advisers Fidelity Investments Money Management, Inc., FMR Co., Inc., and Fidelity SelectCo, LLC, merged with and into Fidelity Management & Research Company. In connection with the merger transactions, the resulting, merged investment adviser was then redomiciled from Massachusetts to Delaware, changed its corporate structure from a corporation to a limited liability company, and changed its name to “Fidelity Management & Research Company LLC”.
Fidelity Investments Institutional Operations Company, Inc. converted from a Massachusetts corporation to a Massachusetts LLC, and changed its name to “Fidelity Investments Institutional Operations Company LLC”.
2. Investments in Fidelity Central Funds.
The Fund invests in Fidelity Central Funds, which are open-end investment companies generally available only to other investment companies and accounts managed by the investment adviser and its affiliates. The Fund’s Schedule of Investments lists each of the Fidelity Central Funds held as of period end, if any, as an investment of the Fund, but does not include the underlying holdings of each Fidelity Central Fund. As an Investing Fund, the Fund indirectly bears its proportionate share of the expenses of the underlying Fidelity Central Funds.
The Money Market Central Funds seek preservation of capital and current income and are managed by the investment adviser. Annualized expenses of the Money Market Central Funds as of their most recent shareholder report date ranged from less than .005% to .01%.
A complete unaudited list of holdings for each Fidelity Central Fund is available upon request or at the Securities and Exchange Commission (the SEC) website at www.sec.gov. In addition, the financial statements of the Fidelity Central Funds, which are not covered by the Fund’s Report of Independent Registered Public Accounting Firm, are available on the SEC website or upon request.
3. Significant Accounting Policies.
The Fund is an investment company and applies the accounting and reporting guidance of the Financial Accounting Standards Board (FASB) Accounting Standards Codification Topic 946 Financial Services – Investment Companies. The financial statements have been prepared in conformity with accounting principles generally accepted in the United States of America (GAAP), which require management to make certain estimates and assumptions at the date of the financial statements. Actual results could differ from those estimates. Subsequent events, if any, through the date that the financial statements were issued have been evaluated in the preparation of the financial statements. The following summarizes the significant accounting policies of the Fund:

81 Annual Report
Investment Valuation. Investments are valued as of 4:00 p.m. Eastern time on the last calendar day of the period. The Board of Trustees (the Board) has delegated the day to day responsibility for the valuation of the Fund’s invest-ments to the Fair Value Committee (the Committee) established by the Fund’s investment adviser. In accordance with valuation policies and procedures approved by the Board, the Fund attempts to obtain prices from one or more third party pricing vendors or brokers to value its investments. When current market prices, quotations or currency exchange rates are not readily available or reliable, investments will be fair valued in good faith by the Committee, in accordance with procedures adopted by the Board. Factors used in determining fair value vary by investment type and may include market or investment specific events. The frequency with which these procedures are used cannot be predicted and they may be utilized to a significant extent. The Committee oversees the Fund’s valuation policies and procedures and reports to the Board on the Committee’s activities and fair value determinations. The Board monitors the appropriateness of the procedures used in valuing the Fund’s investments and ratifies the fair value determinations of the Committee.
The Fund categorizes the inputs to valuation techniques used to value its investments into a disclosure hierarchy consisting of three levels as shown below:
Level 1 – quoted prices in active markets for identical investments
Level 2 – other significant observable inputs (including quoted prices for similar investments, interest rates, prepayment speeds, etc.)
Level 3 – unobservable inputs (including the Fund’s own assumptions based on the best information available)
Valuation techniques used to value the Fund’s investments by major category are as follows:
Equity securities, including restricted securities, for which market quotations are readily available, are valued at the last reported sale price or official closing price as reported by a third party pricing vendor on the primary market or exchange on which they are traded and are categorized as Level 1 in the hierarchy. In the event there were no sales during the day or closing prices are not available, securities are valued at the last quoted bid price or may be valued using the last available price and are generally categorized as Level 2 in the hierarchy. For foreign equity securities, when market or security specific events arise, comparisons to the valuation of American Depositary Receipts (ADRs), futures contracts, Exchange-Traded Funds (ETFs) and certain indexes as well as quoted prices for similar securities may be used and would be categorized as Level 2 in the hierarchy. For equity securities, including restricted securities, where observable inputs are limited, assumptions about market activity and risk are used and these securities may be categorized as Level 3 in the hierarchy.
Futures contracts are valued at the settlement price established each day by the board of trade or exchange on which they are traded and are categorized as Level 1 in the hierarchy. Investments in open-end mutual funds, including the Fidelity Central Funds, are valued at their closing net asset value (NAV) each business day and are categorized as Level 1 in the hierarchy.
Changes in valuation techniques may result in transfers in or out of an assigned level within the disclosure hierarchy. The aggregate value of investments by input level as of November 30, 2020 is included at the end of the Fund’s Schedule of Investments.

82Annual Report
Notes to Financial Statements – continued
Foreign Currency. Certain Funds may use foreign currency contracts to facilitate transactions in foreign-denominated securities. Gains and losses from these transactions may arise from changes in the value of the foreign currency or if the counterparties do not perform under the contracts’ terms.
Foreign-denominated assets, including investment securities, and liabilities are translated into U.S. dollars at the exchange rates at period end. Purchases and sales of investment securities, income and dividends received, and expenses denominated in foreign currencies are translated into U.S. dollars at the exchange rate in effect on the transaction date.
The effects of exchange rate fluctuations on investments are included with the net realized and unrealized gain (loss) on investment securities. Other foreign currency transactions resulting in realized and unrealized gain (loss) are disclosed separately.
Investment Transactions and Income. For financial reporting purposes, the Fund’s investment holdings and NAV include trades executed through the end of the last business day of the period. The NAV per share for processing shareholder transactions is calculated as of the close of business of the New York Stock Exchange (NYSE), normally 4:00 p.m. Eastern time and includes trades executed through the end of the prior business day. Gains and losses on securities sold are determined on the basis of identified cost and include proceeds received from litigation. Dividend income is recorded on the ex-dividend date, except for certain dividends from foreign securities where the ex-dividend date may have passed, which are recorded as soon as the Fund is informed of the ex-dividend date. Non-cash dividends included in dividend income, if any, are recorded at the fair market value of the securities received. Income and capital gain distributions from Fidelity Central Funds, if any, are recorded on the ex-dividend date. Certain distribu-tions received by the Fund represent a return of capital or capital gain. The Fund determines the components of these distributions subsequent to the ex-dividend date, based upon receipt of tax filings or other correspondence relating to the underlying investment. These distributions are recorded as a reduction of cost of investments and/or as a realized gain. Interest income is accrued as earned and includes coupon interest and amortization of premium and accretion of discount on debt securities as applicable. Investment income is recorded net of foreign taxes withheld where recovery of such taxes is uncertain.
Expenses. Expenses directly attributable to a fund are charged to that fund. Expenses attributable to more than one fund are allocated among the respective funds on the basis of relative net assets or other appropriate methods. Expense estimates are accrued in the period to which they relate and adjustments are made when actual amounts are known.
Income Tax Information and Distributions to Shareholders. Each year, the Fund intends to qualify as a regulated investment company under Subchapter M of the Internal Revenue Code, including distributing substantially all of its taxable income and realized gains. As a result, no provision for U.S. Federal income taxes is required. As of November 30, 2020, the Fund did not have any unrecognized tax benefits in the financial statements; nor is the Fund aware of any tax positions for which it is reasonably possible that the total amounts of unrecognized tax benefits will significantly change in the next twelve months. The Fund files a U.S. federal tax return, in addition to state and local tax returns as required. The Fund’s federal income tax returns are subject to examination by the Internal Revenue Service (IRS) for a period of three fiscal years after they are filed. State and local tax returns may be subject to examination for an additional fiscal year depending on the jurisdiction. Foreign taxes are provided for based on the Fund’s understanding of the tax rules and rates that exist in the foreign markets in which it invests.

83 Annual Report
Distributions are declared and recorded on the ex-dividend date. Income and capital gain distributions are determined in accordance with income tax regulations, which may differ from GAAP. These differences resulted in distribution reclassifications.
Capital accounts within the financial statements are adjusted for permanent book-tax differences. These adjustments have no impact on net assets or the results of operations. Capital accounts are not adjusted for temporary book-tax differences which will reverse in a subsequent period.
Book-tax differences are primarily due to futures contracts, foreign currency transactions, passive foreign investment companies (PFIC), market discount, partnerships, capital loss carryforwards and losses deferred due to wash sales.
As of period end, the cost and unrealized appreciation (depreciation) in securities, and derivatives if applicable, for federal income tax purposes were as follows:
Gross unrealized appreciation $ 5,796,635,704Gross unrealized depreciation (139,554,268)Net unrealized appreciation (depreciation) $ 5,657,081,436
Tax Cost $ 4,806,553,418
The tax-based components of distributable earnings as of period end were as follows:
Undistributed ordinary income $ 65,322,755
Capital loss carryforward $ (25,939,687)
Net unrealized appreciation (depreciation) on securities and other investments $ 5,655,836,600
Capital loss carryforwards are only available to offset future capital gains of the Fund to the extent provided by regulations and may be limited. The capital loss carryforward information presented below, including any applicable limitation, is estimated as of fiscal period end and is subject to adjustment.
No expiration Long-term $ (25,939,687)
Total capital loss carryforward $ (25,939,687)
The tax character of distributions paid was as follows:
November 30, 2020 November 30, 2019Ordinary Income $ 131,596,393 $ 49,221,004Long-term Capital Gains 182,485,682 52,026,664Total $ 314,082,075 $ 101,247,668
Restricted Securities (including Private Placements). The Fund may invest in securities that are subject to legal or contractual restrictions on resale. These securities generally may be resold in transactions exempt from registration or to the public if the securities are registered. Disposal of these securities may involve time-consuming negotiations and expense, and prompt sale at an acceptable price may be difficult.

84Annual Report
Notes to Financial Statements – continued
4. Derivative Instruments.
Risk Exposures and the Use of Derivative Instruments. The Fund’s investment objective allows the Fund to enter into various types of derivative contracts, including futures contracts. Derivatives are investments whose value is primarily derived from underlying assets, indices or reference rates and may be transacted on an exchange or over-the-counter (OTC). Derivatives may involve a future commitment to buy or sell a specified asset based on specified terms, to exchange future cash flows at periodic intervals based on a notional principal amount, or for one party to make one or more payments upon the occurrence of specified events in exchange for periodic payments from the other party.
The Fund used derivatives to increase returns and to manage exposure to certain risks as defined below. The success of any strategy involving derivatives depends on analysis of numerous economic factors, and if the strategies for investment do not work as intended, the Fund may not achieve its objectives.
The Fund’s use of derivatives increased or decreased its exposure to the following risk:
Equity Risk Equity risk relates to the fluctuations in the value of financial instruments as a result of changes in market prices (other than those arising from interest rate risk or foreign exchange risk), whether caused by factors specific to an individual investment, its issuer, or all factors affecting all instruments traded in a market or market segment.
The Fund is also exposed to additional risks from investing in derivatives, such as liquidity risk and counterparty credit risk. Liquidity risk is the risk that the Fund will be unable to close out the derivative in the open market in a timely manner. Counterparty credit risk is the risk that the counterparty will not be able to fulfill its obligation to the Fund. Counterparty credit risk related to exchange-traded futures contracts may be mitigated by the protection provided by the exchange on which they trade.
Investing in derivatives may involve greater risks than investing in the underlying assets directly and, to varying degrees, may involve risk of loss in excess of any initial investment and collateral received and amounts recognized in the Statement of Assets and Liabilities. In addition, there may be the risk that the change in value of the derivative contract does not correspond to the change in value of the underlying instrument.
Futures Contracts. A futures contract is an agreement between two parties to buy or sell a specified underlying instru-ment for a fixed price at a specified future date. The Fund used futures contracts to manage its exposure to the stock market.
Upon entering into a futures contract, a fund is required to deposit either cash or securities (initial margin) with a clearing broker in an amount equal to a certain percentage of the face value of the contract. Futures contracts are marked-to-market daily and subsequent daily payments (variation margin) are made or received by a fund depending on the daily fluctuations in the value of the futures contracts and are recorded as unrealized appreciation or (deprecia-tion). This receivable and/or payable, if any, is included in daily variation margin on futures contracts in the Statement of Assets and Liabilities. Realized gain or (loss) is recorded upon the expiration or closing of a futures contract. The net realized gain (loss) and change in net unrealized appreciation (depreciation) on futures contracts during the period is presented in the Statement of Operations.
Any open futures contracts at period end are presented in the Schedule of Investments under the caption “Futures Contracts”. The notional amount at value reflects each contract’s exposure to the underlying instrument or index

85 Annual Report
at period end. Cash deposited to meet initial margin requirements is presented as segregated cash with brokers for derivative instruments in the Statement of Assets and Liabilities.
5. Purchases and Sales of Investments.
Purchases and sales of securities, other than short-term securities, are noted in the table below.
Purchases ($) Sales ($)Fidelity Nasdaq Composite Index Fund 2,721,347,165 1,344,672,700
6. Fees and Other Transactions with Affiliates.
Management Fee. Fidelity Management & Research Company LLC (the investment adviser) and its affiliates provide the Fund with investment management related services for which the Fund pays a monthly management fee that is based on an annual rate of .24% of the Fund’s average net assets.
Sub-Adviser. Geode Capital Management, LLC (Geode), serves as sub-adviser for the Fund. Geode provides discre-tionary investment advisory services to the Fund and is paid by the investment adviser for providing these services.
Transfer Agent Fees. Fidelity Investments Institutional Operations Company LLC (FIIOC), an affiliate of the invest-ment adviser, is the Fund’s transfer, dividend disbursing and shareholder servicing agent. FIIOC receives an asset-based fee of .10% of the Fund’s average net assets. FIIOC pays for typesetting, printing and mailing of shareholder reports, except proxy statements.
Accounting Fees. Fidelity Service Company, Inc. (FSC), an affiliate of the investment adviser, maintains the Fund’s accounting records. The accounting fee is based on the level of average net assets for each month. For the period, the fees were equivalent to the following annual rates:
% of Average Net AssetsFidelity Nasdaq Composite Index Tracking Stock –(a)
(a) Amount represents less than .005%.
Interfund Lending Program. Pursuant to an Exemptive Order issued by the SEC, the Fund, along with other registered investment companies having management contracts with Fidelity Management & Research Company LLC (FMR), or other affiliated entities of FMR, may participate in an interfund lending program. This program provides an alternative credit facility allowing the Fund to borrow from, or lend money to, other participating affiliated funds. At period end, there were no interfund loans outstanding. Activity in this program during the period for which loans were outstanding was as follows:
Borrower or LenderAverage Loan
BalanceWeighted Average
Interest Rate Interest ExpenseFidelity Nasdaq Composite Index Fund Borrower $49,910,750 .77% $12,790

86Annual Report
Notes to Financial Statements – continued
Interfund Trades. Funds may purchase from or sell securities to other Fidelity Funds under procedures adopted by the Board. The procedures have been designed to ensure these interfund trades are executed in accordance with Rule 17a-7 of the 1940 Act. Interfund trades are included within the respective purchases and sales amounts shown in the Purchases and Sales of Investments note.
7. Committed Line of Credit.
Certain Funds participate with other funds managed by the investment adviser or an affiliate in a $4.25 billion credit facility (the “line of credit”) to be utilized for temporary or emergency purposes to fund shareholder redemptions or for other short-term liquidity purposes. The participating funds have agreed to pay commitment fees on their pro-rata portion of the line of credit, which are reflected in Miscellaneous expenses on the Statement of Operations, and are as follows:
AmountFidelity Nasdaq Composite Index Fund $ 18,193
During the period, there were no borrowings on this line of credit.
8. Security Lending.
Funds lend portfolio securities from time to time in order to earn additional income. Lending agents are used, including National Financial Services (NFS), an affiliate of the investment adviser. Pursuant to a securities lending agreement, NFS will receive a fee, which is capped at 9.9% of a fund’s daily lending revenue, for its services as lending agent. A fund may lend securities to certain qualified borrowers, including NFS. On the settlement date of the loan, a fund receives collateral (in the form of U.S. Treasury obligations, letters of credit and/or cash) against the loaned securities and maintains collateral in an amount not less than 100% of the market value of the loaned securities during the period of the loan. The market value of the loaned securities is determined at the close of business of a fund and any additional required collateral is delivered to a fund on the next business day. A fund or borrower may terminate the loan at any time, and if the borrower defaults on its obligation to return the securities loaned because of insolvency or other reasons, a fund may apply collateral received from the borrower against the obligation. A fund may experience delays and costs in recovering the securities loaned. Any cash collateral received is invested in the Fidelity Securities Lending Cash Central Fund. Any loaned securities are identified as such in the Schedule of Investments, and the value of loaned securities and cash collateral at period end, as applicable, are presented in the Statement of Assets and Liabilities. Security lending income represents the income earned on investing cash collateral, less rebates paid to bor-rowers and any lending agent fees associated with the loan, plus any premium payments received for lending certain types of securities. Security lending income is presented in the Statement of Operations as a component of income from Fidelity Central Funds. Affiliated security lending activity, if any, was as follows:
Total Security Lending Income Fees Paid to NFS
Security Lending Income From Securities Loaned
to NFSValue of Securities Loaned to
NFS at Period EndFidelity Nasdaq Composite Index Fund $ 1,319,415 $ 316,733 $ 2,886,238

87 Annual Report
9. Expense Reductions.
The investment adviser contractually agreed to reimburse the Fund to the extent annual operating expenses exceeded .29% of average net assets. This reimbursement will remain in place through March 31, 2022. Some expenses, for example the compensation of the independent Trustees, and certain miscellaneous expenses such as proxy and shareholder meeting expenses, are excluded from this reimbursement. During the period this reimbursement reduced the Fund’s expenses by $4,747,595.
In addition, through arrangements with the Fund’s custodian, credits realized as a result of certain uninvested cash balances were used to reduce the Fund’s expenses by $3,531.
10. Other.
The Fund’s organizational documents provide former and current trustees and officers with a limited indemnification against liabilities arising in connection with the performance of their duties to the Fund. In the normal course of busi-ness, the Fund may also enter into contracts that provide general indemnifications. The Fund’s maximum exposure under these arrangements is unknown as this would be dependent on future claims that may be made against the Fund. The risk of material loss from such claims is considered remote.
11. Coronavirus (COVID-19) Pandemic.
An outbreak of COVID-19 first detected in China during December 2019 has since spread globally and was declared a pandemic by the World Health Organization during March 2020. Developments that disrupt global economies and financial markets, such as the COVID-19 pandemic, may magnify factors that affect the Fund’s performance.

88Annual Report
Report of Independent Registered Public Accounting FirmTo the Board of Trustees of Fidelity Concord Street Trust and Shareholders of Fidelity Nasdaq Composite Index Fund:
Opinion on the Financial Statements and Financial HighlightsWe have audited the accompanying statement of assets and liabilities of Fidelity NASDAQ Composite Index Fund (the “Fund”), a fund of Fidelity Concord Street Trust, including the schedule of investments, as of November 30, 2020, the related statement of operations for the year then ended, the statement of changes in net assets for each of the two years in the period then ended, the financial highlights for each of the five years in the period then ended, and the related notes. In our opinion, the financial statements and financial highlights present fairly, in all material respects, the financial position of the Fund as of November 30, 2020, and the results of its operations for the year then ended, the changes in its net assets for each of the two years in the period then ended, and the financial high-lights for each of the five years in the period then ended in conformity with accounting principles generally accepted in the United States of America.
Basis for OpinionThese financial statements and financial highlights are the responsibility of the Fund’s management. Our responsibility is to express an opinion on the Fund’s financial statements and financial highlights based on our audits. We are a public accounting firm registered with the Public Company Accounting Oversight Board (United States) (PCAOB) and are required to be independent with respect to the Fund in accordance with the U.S. federal securities laws and the applicable rules and regulations of the Securities and Exchange Commission and the PCAOB.
We conducted our audits in accordance with the standards of the PCAOB. Those standards require that we plan and perform the audit to obtain reasonable assurance about whether the financial statements and financial highlights are free of material misstatement, whether due to error or fraud. The Fund is not required to have, nor were we engaged to perform, an audit of its internal control over financial reporting. As part of our audits we are required to obtain an understanding of internal control over financial reporting but not for the purpose of expressing an opinion on the effectiveness of the Fund’s internal control over financial reporting. Accordingly, we express no such opinion.
Our audits included performing procedures to assess the risks of material misstatement of the financial statements and financial highlights, whether due to error or fraud, and performing procedures that respond to those risks. Such proce-dures included examining, on a test basis, evidence regarding the amounts and disclosures in the financial statements and financial highlights. Our audits also included evaluating the accounting principles used and significant estimates made by management, as well as evaluating the overall presentation of the financial statements and financial high-lights. Our procedures included confirmation of securities owned as of November 30, 2020, by correspondence with the custodian and brokers; when replies were not received from brokers, we performed other auditing procedures. We believe that our audits provide a reasonable basis for our opinion.
/s/ Deloitte & Touche LLP Boston, Massachusetts January 12, 2021
We have served as the auditor of one or more of the Fidelity investment companies since 1999.

89 Annual Report
Trustees and Officers
The Trustees, Members of the Advisory Board (if any), and officers of the trust and fund, as applicable, are listed below. The Board of Trustees governs the fund and is responsible for protecting the interests of shareholders. The Trustees are experienced executives who meet periodically throughout the year to oversee the fund’s activities, review contractual arrangements with companies that provide services to the fund, oversee management of the risks associ-ated with such activities and contractual arrangements, and review the fund’s performance. Except for Jonathan Chiel, each of the Trustees oversees 305 funds. Mr. Chiel oversees 176 funds.
The Trustees hold office without limit in time except that (a) any Trustee may resign; (b) any Trustee may be removed by written instrument, signed by at least two-thirds of the number of Trustees prior to such removal; (c) any Trustee who requests to be retired or who has become incapacitated by illness or injury may be retired by written instrument signed by a majority of the other Trustees; and (d) any Trustee may be removed at any special meeting of sharehold-ers by a two-thirds vote of the outstanding voting securities of the trust. Each Trustee who is not an interested person (as defined in the 1940 Act) of the trust and the fund is referred to herein as an Independent Trustee. Each Independent Trustee shall retire not later than the last day of the calendar year in which his or her 75th birthday occurs. The Independent Trustees may waive this mandatory retirement age policy with respect to individual Trustees. Officers and Advisory Board Members hold office without limit in time, except that any officer or Advisory Board Member may resign or may be removed by a vote of a majority of the Trustees at any regular meeting or any special meeting of the Trustees. Except as indicated, each individual has held the office shown or other offices in the same company for the past five years.
The fund’s Statement of Additional Information (SAI) includes more information about the Trustees. To request a free copy, call Fidelity at 1-800-544-8544.
Experience, Skills, Attributes, and Qualifications of the Trustees. The Governance and Nominating Committee has adopted a statement of policy that describes the experience, qualifications, attributes, and skills that are necessary and desirable for potential Independent Trustee candidates (Statement of Policy). The Board believes that each Trustee satisfied at the time he or she was initially elected or appointed a Trustee, and continues to satisfy, the standards con-templated by the Statement of Policy. The Governance and Nominating Committee also engages professional search firms to help identify potential Independent Trustee candidates who have the experience, qualifications, attributes, and skills consistent with the Statement of Policy. From time to time, additional criteria based on the composition and skills of the current Independent Trustees, as well as experience or skills that may be appropriate in light of future changes to board composition, business conditions, and regulatory or other developments, have also been considered by the professional search firms and the Governance and Nominating Committee. In addition, the Board takes into account the Trustees’ commitment and participation in Board and committee meetings, as well as their leadership of standing and ad hoc committees throughout their tenure.
In determining that a particular Trustee was and continues to be qualified to serve as a Trustee, the Board has considered a variety of criteria, none of which, in isolation, was controlling. The Board believes that, collectively, the Trustees have balanced and diverse experience, qualifications, attributes, and skills, which allow the Board to operate effectively in governing the fund and protecting the interests of shareholders. Information about the specific experi-ence, skills, attributes, and qualifications of each Trustee, which in each case led to the Board’s conclusion that the Trustee should serve (or continue to serve) as a trustee of the fund, is provided below.
Board Structure and Oversight Function. Robert A. Lawrence is an interested person and currently serves as Acting Chairman. The Trustees have determined that an interested Chairman is appropriate and benefits shareholders because an interested Chairman has a personal and professional stake in the quality and continuity of services provided to the

90Annual Report
Trustees and Officers – continued
fund. Independent Trustees exercise their informed business judgment to appoint an individual of their choosing to serve as Chairman, regardless of whether the Trustee happens to be independent or a member of management. The Independent Trustees have determined that they can act independently and effectively without having an Independent Trustee serve as Chairman and that a key structural component for assuring that they are in a position to do so is for the Independent Trustees to constitute a substantial majority for the Board. The Independent Trustees also regularly meet in executive session. David M. Thomas serves as Lead Independent Trustee and as such (i) acts as a liaison between the Independent Trustees and management with respect to matters important to the Independent Trustees and (ii) with management prepares agendas for Board meetings.
Fidelity® funds are overseen by different Boards of Trustees. The fund’s Board oversees Fidelity’s high income and certain equity funds, and other Boards oversee Fidelity’s investment-grade bond, money market, asset allocation, and other equity funds. The asset allocation funds may invest in Fidelity® funds overseen by the fund’s Board. The use of separate Boards, each with its own committee structure, allows the Trustees of each group of Fidelity® funds to focus on the unique issues of the funds they oversee, including common research, investment, and operational issues. On occasion, the separate Boards establish joint committees to address issues of overlapping consequences for the Fidelity® funds overseen by each Board.
The Trustees operate using a system of committees to facilitate the timely and efficient consideration of all matters of importance to the Trustees, the fund, and fund shareholders and to facilitate compliance with legal and regulatory requirements and oversight of the fund’s activities and associated risks. The Board, acting through its committees, has charged FMR and its affiliates with (i) identifying events or circumstances the occurrence of which could have demon-strably adverse effects on the fund’s business and/or reputation; (ii) implementing processes and controls to lessen the possibility that such events or circumstances occur or to mitigate the effects of such events or circumstances if they do occur; and (iii) creating and maintaining a system designed to evaluate continuously business and market condi-tions in order to facilitate the identification and implementation processes described in (i) and (ii) above. Because the day-to-day operations and activities of the fund are carried out by or through FMR, its affiliates, and other service pro-viders, the fund’s exposure to risks is mitigated but not eliminated by the processes overseen by the Trustees. While each of the Board’s committees has responsibility for overseeing different aspects of the fund’s activities, oversight is exercised primarily through the Operations, Audit, and Compliance Committees. Appropriate personnel, including but not limited to the fund’s Chief Compliance Officer (CCO), FMR’s internal auditor, the independent accountants, the fund’s Treasurer and portfolio management personnel, make periodic reports to the Board’s committees, as appropri-ate, including an annual review of Fidelity’s risk management program for the Fidelity® funds. The responsibilities of each standing committee, including their oversight responsibilities, are described further under “Standing Committees of the Trustees.”
Interested Trustees*:
Correspondence intended for a Trustee who is an interested person may be sent to Fidelity Investments, 245 Summer Street, Boston, Massachusetts 02210.
Name, Year of Birth; Principal Occupations and Other Relevant Experience+
Jonathan Chiel (1957)
Year of Election or Appointment: 2016 Trustee

91 Annual Report
Mr. Chiel also serves as Trustee of other Fidelity® funds. Mr. Chiel is Executive Vice President and General Counsel for FMR LLC (diversified financial services company, 2012-present). Previously, Mr. Chiel served as general counsel (2004-2012) and senior vice president and deputy general counsel (2000-2004) for John Hancock Financial Services; a partner with Choate, Hall & Stewart (1996-2000) (law firm); and an Assistant United States Attorney for the United States Attorney’s Office of the District of Massachusetts (1986-95), including Chief of the Criminal Division (1993-1995). Mr. Chiel is a director on the boards of the Boston Bar Foundation and the Maimonides School.
Bettina Doulton (1964)
Year of Election or Appointment: 2021 Trustee
Ms. Doulton also serves as Trustee of other Fidelity® funds. Prior to her retirement, Ms. Doulton served in a variety of positions at Fidelity Investments, including as a managing director of research (2006-2007), portfolio manager to certain Fidelity® funds (1993-2005), equity analyst and portfolio assistant (1990-1993), and research assistant (1987-1990). Ms. Doulton currently owns and operates Phi Builders + Architects and Cellardoor Winery. Previously, Ms. Doulton served as a member of the Board of Brown Capital Management, LLC (2013-2018).
Robert A. Lawrence (1952)
Year of Election or Appointment: 2020 Trustee Acting Chairman of the Board of Trustees
Mr. Lawrence also serves as Trustee of other funds. Previously, Mr. Lawrence served as a Member of the Advisory Board of certain funds. Prior to his retirement in 2008, Mr. Lawrence served as Vice President of certain Fidelity® funds (2006-2008), Senior Vice President, Head of High Income Division of Fidelity Management & Research Company (investment adviser firm, 2006-2008), and President of Fidelity Strategic Investments (investment adviser firm, 2002-2005).
* Determined to be an “Interested Trustee” by virtue of, among other things, his or her affiliation with the trust or various entities under common control with FMR.
+ The information includes the Trustee’s principal occupation during the last five years and other information relating to the experience, attributes, and skills relevant to the Trustee’s qualifications to serve as a Trustee, which led to the conclusion that the Trustee should serve as a Trustee for the fund.
Independent Trustees:
Correspondence intended for an Independent Trustee may be sent to Fidelity Investments, P.O. Box 55235, Boston, Massachusetts 02205-5235.
Name, Year of Birth; Principal Occupations and Other Relevant Experience+
Dennis J. Dirks (1948)
Year of Election or Appointment: 2005 Trustee

92Annual Report
Trustees and Officers – continued
Mr. Dirks also serves as Trustee of other Fidelity® funds. Prior to his retirement in May 2003, Mr. Dirks served as Chief Operating Officer and as a member of the Board of The Depository Trust & Clearing Corporation (financial markets infrastructure), President, Chief Operating Officer and a member of the Board of The Depository Trust Company (DTC), President and a member of the Board of the National Securities Clearing Corporation (NSCC), Chief Executive Officer and a member of the Board of the Government Securities Clearing Corporation and Chief Executive Officer and a member of the Board of the Mortgage-Backed Securities Clearing Corporation. Mr. Dirks currently serves as a member of the Finance Committee (2016-present) and Board (2017-present) and is Treasurer (2018-present) of the Asolo Repertory Theatre.
Donald F. Donahue (1950)
Year of Election or Appointment: 2018 Trustee
Mr. Donahue also serves as Trustee of other Fidelity® funds. Mr. Donahue serves as President and Chief Executive Officer of Miranda Partners, LLC (risk consulting for the financial services industry, 2012-present). Previously, Mr. Donahue served as Chief Executive Officer (2006-2012), Chief Operating Officer (2003-2006) and Managing Director, Customer Marketing and Development (1999-2003) of The Depository Trust & Clearing Corporation (financial markets infrastructure). Mr. Donahue currently serves as a member (2007-present) and Co-Chairman (2016-present) of the Board of United Way of New York, a member of the Board of NYC Leadership Academy (2012-present) and a member of the Board of Advisors of Ripple Labs, Inc. (financial services, 2015-present). Mr. Donahue previously served as a member of the Advisory Board of certain Fidelity® funds (2015-2018).
Vicki L. Fuller (1957)
Year of Election or Appointment: 2020 Trustee
Ms. Fuller also serves as Trustee of other Fidelity® funds. Previously, Ms. Fuller served as a member of the Advisory Board of certain Fidelity® funds (2018-2020), Chief Investment Officer of the New York State Common Retirement Fund (2012-2018) and held a variety of positions at AllianceBernstein L.P. (global asset management, 1985-2012), including Managing Director (2006-2012) and Senior Vice President and Senior Portfolio Manager (2001-2006). Ms. Fuller currently serves as a member of the Board, Audit Committee and Nominating and Governance Committee of The Williams Companies, Inc. (natural gas infra-structure, 2018-present), as a member of the Board, Audit Committee and Nominating and Governance Committee of two Blackstone business development companies (2020-present) and as a member of the Board of Treliant, LLC (consulting, 2019-present).
Patricia L. Kampling (1959)
Year of Election or Appointment: 2020 Trustee
93 Annual Report
Ms. Kampling also serves as Trustee of other Fidelity® funds. Prior to her retirement, Ms. Kampling served as Chairman of the Board and Chief Executive Officer (2012-2019), President and Chief Operating Officer (2011-2012) and Executive Vice President and Chief Financial Officer (2010-2011) of Alliant Energy Corporation. Ms. Kampling currently serves as a member of the Board, Compensation Committee and Executive Committee and as Chair of the Audit Committee of Briggs & Stratton Corporation (manufactur-ing, 2011-present) and as a member of the Board, Audit, Finance and Risk Committee and Safety, Environmental, Technology and Operations Committee of American Water Works Company, Inc. (utilities company, 2019-present). In addition, Ms. Kampling currently serves as a member of the Board of the Nature Conservancy, Wisconsin Chapter (2019-present). Previously, Ms. Kampling served as a Member of the Advisory Board of certain Fidelity® funds (2020), a member of the Board of Interstate Power and Light Company (2012-2019) and Wisconsin Power and Light Company (2012-2019) (each a subsidiary of Alliant Energy Corporation) and as a member of the Board and Workforce Development Committee of the Business Roundtable (2018-2019).
Thomas A. Kennedy (1955)
Year of Election or Appointment: 2021 Trustee
Mr. Kennedy also serves as Trustee of other Fidelity® funds. Previously, Mr. Kennedy served as a Member of the Advisory Board of certain Fidelity® funds (2020) and held a variety of positions at Raytheon Company (aerospace and defense, 1983-2020), including Chairman and Chief Executive Officer (2014-2020) and Executive Vice President and Chief Operating Officer (2013-2014). Mr. Kennedy currently serves as Executive Chairman of the Board of Directors of Raytheon Technologies Corporation (aerospace and defense, 2020-present). He is also a member of the Rutgers School of Engineering Industry Advisory Board (2011-present) and a member of the UCLA Engineering Dean’s Executive Board (2016-present).
Garnett A. Smith (1947)
Year of Election or Appointment: 2018 Trustee
Mr. Smith also serves as Trustee of other Fidelity® funds. Prior to his retirement, Mr. Smith served as Chairman and Chief Executive Officer (1990-1997) and President (1986-1990) of Inbrand Corp. (manu-facturer of personal absorbent products). Prior to his employment with Inbrand Corp., he was employed by a retail fabric chain and North Carolina National Bank (now Bank of America). Mr. Smith previously served as a member of the Advisory Board of certain Fidelity® funds (2012-2013).
David M. Thomas (1949)
Year of Election or Appointment: 2008 Trustee Lead Independent Trustee
Mr. Thomas also serves as Trustee of other Fidelity® funds. Previously, Mr. Thomas served as Executive Chairman (2005-2006) and Chairman and Chief Executive Officer (2000-2005) of IMS Health, Inc. (pharmaceutical and healthcare information solutions). Mr. Thomas currently serves as Non-Executive Chairman of the Board of Fortune Brands Home and Security (home and security products, 2011-present), and a member of the Board (2004-present) and Presiding Director (2013-present) of Interpublic Group of Companies, Inc. (marketing communication).

94Annual Report
Trustees and Officers – continued
Susan Tomasky (1953)
Year of Election or Appointment: 2020 Trustee
Ms. Tomasky also serves as Trustee of other Fidelity® funds. Prior to her retirement, Ms. Tomasky served in various executive officer positions at American Electric Power Company, Inc. (1998-2011), includ-ing most recently as President of AEP Transmission (2007-2011). Ms. Tomasky currently serves as a member of the Board and Sustainability Committee and as Chair of the Audit Committee of Marathon Petroleum Corporation (2018-present) and as a member of the Board, Corporate Governance Committee and Organization and Compensation Committee and as Chair of the Audit Committee of Public Service Enterprise Group, Inc. (utilities company, 2012-present). In addition, Ms. Tomasky currently serves as a member of the Board of the Columbus Regional Airport Authority (2007-present), as a member of the Board of the Royal Shakespeare Company – America (2009-present), as a member of the Board of the Columbus Association for the Performing Arts (2011-present) and as a member of the Board of Kenyon College (2016-present). Previously, Ms. Tomasky served as a Member of the Advisory Board of certain Fidelity® funds (2020), a member of the Board (2011-2019) and as Lead Independent Director (2015-2018) of Andeavor Corporation (previously Tesoro Corporation) (independent oil refiner and marketer) and as a member of the Board of Summit Midstream Partners LP (energy, 2012-2018).
Michael E. Wiley (1950)
Year of Election or Appointment: 2020 Trustee
Mr. Wiley also serves as Trustee of other Fidelity® funds. Previously, Mr. Wiley served as a member of the Advisory Board of certain Fidelity® funds (2018-2020), Chairman, President and CEO of Baker Hughes, Inc. (oilfield services, 2000-2004). Mr. Wiley also previously served as a member of the Board of Andeavor Corporation (independent oil refiner and marketer, 2005-2018), a member of the Board of Andeavor Logistics LP (natural resources logistics, 2015-2018) and a member of the Board of High Point Resources (exploration and production, 2005-2020).
+ The information includes the Trustee’s principal occupation during the last five years and other information relating to the experience, attributes, and skills relevant to the Trustee’s qualifications to serve as a Trustee, which led to the conclusion that the Trustee should serve as a Trustee for the fund.
Advisory Board Members and Officers:
Correspondence intended for a Member of the Advisory Board (if any) may be sent to Fidelity Investments, P.O. Box 55235, Boston, Massachusetts 02205-5235. Correspondence intended for an officer or Peter S. Lynch may be sent to Fidelity Investments, 245 Summer Street, Boston, Massachusetts 02210. Officers appear below in alphabetical order.
Name, Year of Birth; Principal Occupation
Ned C. Lautenbach (1944)
Year of Election or Appointment: 2021 Member of the Advisory Board

95 Annual Report
Mr. Lautenbach also serves as a Member of the Advisory Board of other Fidelity® funds. Mr. Lautenbach currently serves as Chair of the Board of Governors, State University System of Florida (2013-present) and is a member of the Council on Foreign Relations (1994-present). He is also a member and has in the past served as Chairman of the Board of Directors of Artis-Naples (2012-present). Previously, Mr. Lautenbach served as a Trustee of certain Fidelity® funds (2000-2020) and a member and then Lead Director of the Board of Directors of Eaton Corporation (diversified industrial, 1997-2016). He was also a Partner at Clayton, Dubilier & Rice, LLC (private equity investment, 1998-2010); as well as Director of Sony Corporation (2006-2007). In addition, Mr. Lautenbach had a 30-year career with IBM (technol-ogy company), during which time he served as Senior Vice President and as a member of the Corporate Executive Committee (1968-1998).
Peter S. Lynch (1944)
Year of Election or Appointment: 2003 Member of the Advisory Board
Mr. Lynch also serves as a Member of the Advisory Board of other Fidelity® funds. Mr. Lynch is Vice Chairman and a Director of Fidelity Management & Research Company LLC (investment adviser firm). In addition, Mr. Lynch serves as a Trustee of Boston College and as the Chairman of the Inner-City Scholarship Fund. Previously, Mr. Lynch served as Vice Chairman and a Director of FMR Co., Inc. (investment adviser firm) and on the Special Olympics International Board of Directors (1997-2006).
Craig S. Brown (1977)
Year of Election or Appointment: 2019 Assistant Treasurer
Mr. Brown also serves as Assistant Treasurer of other funds. Mr. Brown is an employee of Fidelity Investments (2013-present).
John J. Burke III (1964)
Year of Election or Appointment: 2018 Chief Financial Officer
Mr. Burke also serves as Chief Financial Officer of other funds. Mr. Burke serves as Head of Investment Operations for Fidelity Fund and Investment Operations (2018-present) and is an employee of Fidelity Investments (1998-present). Previously Mr. Burke served as head of Asset Management Investment Operations (2012-2018).
William C. Coffey (1969)
Year of Election or Appointment: 2019 Assistant Secretary
96Annual Report
Trustees and Officers – continued
Mr. Coffey also serves as Assistant Secretary of other funds. He is Senior Vice President and Deputy General Counsel of FMR LLC (diversified financial services company, 2010-present), and is an employee of Fidelity Investments. Previously, Mr. Coffey served as Secretary and CLO of certain funds (2018-2019); CLO, Secretary, and Senior Vice President of Fidelity Management & Research Company and FMR Co., Inc. (investment adviser firms, 2018-2019); Secretary of Fidelity SelectCo, LLC and Fidelity Investments Money Management, Inc. (investment adviser firms, 2018-2019); CLO of Fidelity Management & Research (Hong Kong) Limited, FMR Investment Management (UK) Limited, and Fidelity Management & Research (Japan) Limited (investment adviser firms, 2018-2019); and Assistant Secretary of certain funds (2009-2018).
Timothy M. Cohen (1969)
Year of Election or Appointment: 2018 Vice President
Mr. Cohen also serves as Vice President of other funds. Mr. Cohen serves as Co-Head of Equity (2018-pres-ent), a Director of Fidelity Management & Research (Japan) Limited (investment adviser firm, 2016-pres-ent), and is an employee of Fidelity Investments. Previously, Mr. Cohen served as Executive Vice President of Fidelity SelectCo, LLC (2019), Head of Global Equity Research (2016-2018), Chief Investment Officer – Equity and a Director of Fidelity Management & Research (U.K.) Inc. (investment adviser firm, 2013-2015) and as a Director of Fidelity Management & Research (Hong Kong) Limited (investment adviser firm, 2017).
Jonathan Davis (1968)
Year of Election or Appointment: 2010 Assistant Treasurer
Mr. Davis also serves as Assistant Treasurer of other funds. Mr. Davis serves as Assistant Treasurer of FMR Capital, Inc. (2017-present) and is an employee of Fidelity Investments. Previously, Mr. Davis served as Vice President and Associate General Counsel of FMR LLC (diversified financial services company, 2003-2010).
Laura M. Del Prato (1964)
Year of Election or Appointment: 2018 Assistant Treasurer
Ms. Del Prato also serves as an officer of other funds. Ms. Del Prato is an employee of Fidelity Investments (2017-present). Previously, Ms. Del Prato served as President and Treasurer of The North Carolina Capital Management Trust: Cash Portfolio and Term Portfolio (2018-2020). Prior to joining Fidelity Investments, Ms. Del Prato served as a Managing Director and Treasurer of the JPMorgan Mutual Funds (2014-2017). Prior to JPMorgan, Ms. Del Prato served as a partner at Cohen Fund Audit Services (accounting firm, 2012-2013) and KPMG LLP (accounting firm, 2004-2012).
Colm A. Hogan (1973)
Year of Election or Appointment: 2020 Assistant Treasurer

97 Annual Report
Mr. Hogan also serves as an officer of other funds. Mr. Hogan serves as Assistant Treasurer of FMR Capital, Inc. (2017-present) and is an employee of Fidelity Investments (2005-present). Previously, Mr. Hogan served as Deputy Treasurer of certain Fidelity® funds (2016-2020) and Assistant Treasurer of certain Fidelity® funds (2016-2018).
Pamela R. Holding (1964)
Year of Election or Appointment: 2018 Vice President
Ms. Holding also serves as Vice President of other funds. Ms. Holding serves as Co-Head of Equity (2018-present) and is an employee of Fidelity Investments (2013-present). Previously, Ms. Holding served as Executive Vice President of Fidelity SelectCo, LLC (2019) and as Chief Investment Officer of Fidelity Institutional Asset Management (2013-2018).
Cynthia Lo Bessette (1969)
Year of Election or Appointment: 2019 Secretary and Chief Legal Officer (CLO)
Ms. Lo Bessette also serves as an officer of other funds. Ms. Lo Bessette serves as CLO, Secretary, and Senior Vice President of Fidelity Management & Research Company LLC (investment adviser firm, 2019-present); and CLO of Fidelity Management & Research (Hong Kong) Limited, FMR Investment Management (UK) Limited, and Fidelity Management & Research (Japan) Limited (investment adviser firms, 2019-present). She is a Senior Vice President and Deputy General Counsel of FMR LLC (diversified financial services company, 2019-present), and is an employee of Fidelity Investments. Previously, Ms. Lo Bessette served as CLO, Secretary, and Senior Vice President of FMR Co., Inc. (investment adviser firm, 2019); Secretary of Fidelity SelectCo, LLC and Fidelity Investments Money Management, Inc. (investment adviser firms, 2019). Prior to joining Fidelity Investments, Ms. Lo Bessette was Executive Vice President, General Counsel (2016-2019) and Senior Vice President, Deputy General Counsel (2015-2016) of OppenheimerFunds (investment management company) and Deputy Chief Legal Officer (2013-2015) of Jennison Associates LLC (investment adviser firm).
Chris Maher (1972)
Year of Election or Appointment: 2020 Deputy Treasurer
Mr. Maher also serves as an officer of other funds. Mr. Maher serves as Assistant Treasurer of FMR Capital, Inc. (2017-present), and is an employee of Fidelity Investments (2008-present). Previously, Mr. Maher served as Assistant Treasurer of certain funds (2013-2020); Vice President of Asset Management Compliance (2013), Vice President of the Program Management Group of FMR (investment adviser firm, 2010-2013), and Vice President of Valuation Oversight (2008-2010).
Jason P. Pogorelec (1975)
Year of Election or Appointment: 2020 Chief Compliance Officer
98Annual Report
Trustees and Officers – continued
Mr. Pogorelec also serves as Chief Compliance Officer of other funds. Mr. Pogorelec is a senior Vice President of Asset Management Compliance for Fidelity Investments and is an employee of Fidelity Investments (2006-present). Previously, Mr. Pogorelec served as Vice President, Associate General Counsel for Fidelity Investments (2010-2020) and Assistant Secretary of certain Fidelity funds (2015-2020).
Brett Segaloff (1972)
Year of Election or Appointment: 2021 Anti-Money Laundering (AML) Officer
Mr. Segaloff also serves as an AML Officer of other funds and other related entities. He is Director, Anti-Money Laundering (2007-present) of FMR LLC (diversified financial services company) and is an employee of Fidelity Investments (1996-present).
Stacie M. Smith (1974)
Year of Election or Appointment: 2016 President and Treasurer
Ms. Smith also serves as an officer of other funds. Ms. Smith serves as Assistant Treasurer of FMR Capital, Inc. (2017-present), is an employee of Fidelity Investments (2009-present), and has served in other fund officer roles. Prior to joining Fidelity Investments, Ms. Smith served as Senior Audit Manager of Ernst & Young LLP (accounting firm, 1996-2009). Previously, Ms. Smith served as Assistant Treasurer (2013-2019) and Deputy Treasurer (2013-2016) of certain Fidelity® funds.
Marc L. Spector (1972)
Year of Election or Appointment: 2016 Assistant Treasurer
Mr. Spector also serves as an officer of other funds. Mr. Spector serves as Assistant Treasurer of FMR Capital, Inc. (2017-present) and is an employee of Fidelity Investments (2016-present). Prior to joining Fidelity Investments, Mr. Spector served as Director at the Siegfried Group (accounting firm, 2013-2016), and prior to Siegfried Group as audit senior manager at Deloitte & Touche LLP (accounting firm, 2005-2013).
Jim Wegmann (1979)
Year of Election or Appointment: 2019 Assistant Treasurer
Mr. Wegmann also serves as Assistant Treasurer of other funds. Mr. Wegmann is an employee of Fidelity Investments (2011-present).

99 Annual Report
Shareholder Expense Example
As a shareholder, you incur two types of costs: (1) transaction costs, which may include sales charges (loads) on purchase payments or redemption proceeds, as applicable and (2) ongoing costs, which generally include manage-ment fees, distribution and/or service (12b-1) fees and other Fund expenses. This Example is intended to help you understand your ongoing costs (in dollars) of investing in a fund and to compare these costs with the ongoing costs of investing in other mutual funds.The Example is based on an investment of $1,000 invested at the beginning of the period and held for the entire period (June 1, 2020 to November 30, 2020).Actual ExpensesThe first line of the accompanying table provides information about actual account values and actual expenses. You may use the information in this line, together with the amount you invested, to estimate the expenses that you paid over the period. Simply divide your account value by $1,000.00 (for example, an $8,600 account value divided by $1,000.00 = 8.6), then multiply the result by the number in the first line for a class/Fund under the heading entitled “Expenses Paid During Period” to estimate the expenses you paid on your account during this period. If any fund is a shareholder of any underlying mutual funds or exchange-traded funds (ETFs) (the Underlying Funds), such fund indirectly bears its proportional share of the expenses of the Underlying Funds in addition to the direct expenses incurred presented in the table. These fees and expenses are not included in the annualized expense ratio used to calculate the expense estimate in the table below.Hypothetical Example for Comparison PurposesThe second line of the accompanying table provides information about hypothetical account values and hypothetical expenses based on the actual expense ratio and an assumed rate of return of 5% per year before expenses, which is not the actual return. The hypothetical account values and expenses may not be used to estimate the actual ending account balance or expenses you paid for the period. You may use this information to compare the ongoing costs of investing in the Fund and other funds. To do so, compare this 5% hypothetical example with the 5% hypothetical examples that appear in the shareholder reports of the other funds. If any fund is a shareholder of any Underlying Funds, such fund indirectly bears its proportional share of the expenses of the Underlying Funds in addition to the direct expenses as presented in the table. These fees and expenses are not included in the annualized expense ratio used to calculate the expense estimate in the table below.Please note that the expenses shown in the table are meant to highlight your ongoing costs only and do not reflect any transaction costs. Therefore, the second line of the table is useful in comparing ongoing costs only, and will not help you determine the relative total costs of owning different funds.
Annualized Expense Ratio- A
Beginning Account Value June 1, 2020
Ending Account Value
November 30, 2020
Expenses Paid During Period- B
June 1, 2020 to November 30, 2020
Fidelity Nasdaq Composite Index Fund .29%
Actual $1,000.00 $1,289.80 $1.66Hypothetical- C $1,000.00 $1,023.55 $1.47
A Annualized expense ratio reflects expenses net of applicable fee waivers.B Expenses are equal to the annualized expense ratio, multiplied by the average account value over the period, multiplied by 183/ 366
(to reflect the one-half year period). The fees and expenses of any Underlying Funds are not included in each annualized expense ratio.C 5% return per year before expenses

100Annual Report
Distributions (Unaudited)
A total of 1.24% of the dividends distributed during the fiscal year was derived from interest on U.S. Government securities which is generally exempt from state income tax.
The fund designates 40% of the dividends distributed during the fiscal year as qualifying for the dividends–received deduction for corporate shareholders.
The fund designates 43% of the dividends distributed during the fiscal year as amounts which may be taken into account as a dividend for purposes of the maximum rate under section 1(h)(11) of the Internal Revenue Code.
The fund designates 3% of the dividend distributed during the fiscal year as a section 199A dividend.
The fund will notify shareholders in January 2021 of amounts for use in preparing 2020 income tax returns.

101 Annual Report
Proxy Voting Results
A special meeting of shareholders was held on June 9, 2020. The results of votes taken among shareholders on the proposals before them are reported below. Each vote reported represents one dollar of net asset value held on the record date for the meeting.
PROPOSAL 1
To elect a Board of Trustees.
# of Votes
% of Votes
Dennis J. Dirks
Affirmative 153,310,852,719.993 94.554
Withheld 8,830,820,397.844 5.446
TOTAL 162,141,673,117.837 100.000
Donald F. Donahue
Affirmative 153,409,297,334.631 94.614
Withheld 8,732,375,783.206 5.386
TOTAL 162,141,673,117.837 100.000
Bettina Doulton
Affirmative 154,057,198,754.144 95.014
Withheld 8,084,474,363.693 4.986
TOTAL 162,141,673,117.837 100.000
Vicki L. Fuller
Affirmative 154,419,985,979.903 95.238
Withheld 7,721,687,137.934 4.762
TOTAL 162,141,673,117.837 100.00
Patricia L. Kampling
Affirmative 153,773,968,211.778 94.839
Withheld 8,367,704,906.059 5.161
TOTAL 162,141,673,117.837 100.000
Alan J. Lacy
Affirmative 152,412,406,811.772 94.000
Withheld 9,729,266,306.065 6.000
TOTAL 162,141,673,117.837 100.000
Ned C. Lautenbach
Affirmative 151,421,801,314.429 93.389
Withheld 10,719,871,803.408 6.611
TOTAL 162,141,673,117.837 100.000
Robert A. Lawrence
Affirmative 152,467,970,401.411 94.034
Withheld 9,673,702,716.426 5.966
TOTAL 162,141,673,117.837 100.000
Joseph Mauriello

102Annual Report
Proxy Voting Results – continued
# of Votes
% of Votes
Affirmative 152,391,361,586.517 93.987
Withheld 9,750,311,531.320 6.013
TOTAL 162,141,673,117.837 100.000
Cornelia M. Small
Affirmative 153,101,624,672.870 94.425
Withheld 9,040,048,444.967 5.575
TOTAL 162,141,673,117.837 100.000
Garnett A. Smith
Affirmative 152,502,318,423.900 94.055
Withheld 9,639,354,693.937 5.945
TOTAL 162,141,673,117.837 100.000
David M. Thomas
Affirmative 152,608,626,434.284 94.121
Withheld 9,533,046,683.553 5.879
TOTAL 162,141,673,117.837 100.000
Susan Tomasky
Affirmative 153,605,526,235.885 94.735
Withheld 8,536,146,881.952 5.265
TOTAL 162,141,673,117.837 100.000
Michael E. Wiley
Affirmative 152,567,303,629.801 94.095
Withheld 9,574,369,488.036 5.905
TOTAL 162,141,673,117.837 100.000
PROPOSAL 2
To convert a fundamental investment policy to a non-fundamental investment policy.
# of Votes
% of Votes
Affirmative 2,514,056,016.482 66.503
Against 675,277,219.986 17.863
Abstain 451,860,291.965 11.953
Broker Non-Vote 139,190,202.300 3.692
TOTAL 3,780,383,730.733 100.000
Proposal 1 reflects trust wide proposal and voting results.
Proposal 2 was not approved by shareholders.

103 Annual Report

EIF-ANN-0121 1.795539.117
Copyright © 2022 FDOKUMEN