Cognizant Technology Solutions Corp. (NASDAQ: CTSH)
33
Important disclosures appear on the last page of this report. 1 Krause Fund Research Fall 2016 Technology (Beta) Recommendation: Buy Analysts Wenlong Xu [email protected] Wenzhu Duan [email protected] Company Overview Cognizant Technology Solutions Co. provide information technology, consulting and business process services to businesses. By using its global delivery model, domain expertise, and portfolio of services, it helps businesses to combine digital technology in their operation and operate in a more efficient and innovative manner. In order to keep its competency, Cognizant adopted business strategies that focus on reinvestment, unique global delivery model, long-term customer relationship, and selective strategic acquisitions, joint ventures and strategic alliances. Stock Performance Highlights 52-week High $65.91 52-week Low $45.44 Beta Value 1.06 Average Daily Volume 1.143 m Share Highlights Market Capitalization $32.75 b Shares Outstanding 606.7 M Book Value per share $16.97 EPS 2015 $2.67 P/E Ratio 21.09 Dividend Yield N/A Dividend Payout Ratio N/A Company Performance Highlights ROA 10.98% ROE 16.33% Sales $13.26 b Financial Ratios Current Ratio 3.56 Debt to Equity 14% Cognizant Technology Solutions Corp. (NASDAQ: CTSH) December 4, 2016 Current Price $54.02 Target Price $75.50 Hard Time for CTSH As an IT service company, Cognizant is sensitive to the fluctuation of economic condition. This year is a hard year for Cognizant. The still-weak global economy slowed the growth of Cognizant. Based on the one-year stock performance, Cognizant’s stock price was mainly influenced by report result and legislation factors. Cognizant has outstanding financial conditions. According to its financial statement, it has a 14% debt to equity ratio, 2.91 current ratio and 0.41 debt to equity ratio. Those financial indicators show Cognizant has low credit risk. Worldwide, Cognizant leased 11.7 million square feet and owned 13.0 million square feet facilities in 24 countries. Those Facilities guarantees Cognizant’s abilities to attract new customers and maintain with relationship with old customers. Although Cognizant did not pay out any dividend and spend little on stock repurchase, Cognizant keeps obtaining the comparative advantages through acquisition. According to Cognizant’s Q3 report, Cognizant has around 4.8 billion cash on hand. In this year, Cognizant has already acquired six companies. Cognizant is able to adjust its focus on time. In 2014, Cognizant focused on the development of Healthcare segment and obtained substantially growth in the revenue from healthcare segment. This year, Cognizant began to focus on its Manufacturing segment, we believe Cognizant will get succeed in this industry segment. The hard time is temporary. We believe as long as the economic condition upturn, Cognizant’s stock price will also up rapidly. Therefore, the recommendation we offered is Buy. One Year Stock Performance (Soured from: Yahoo Finance Blue: CTSH Red: S&P 500)
-
Upload
khangminh22 -
Category
Documents
-
view
0 -
download
0
Transcript of Cognizant Technology Solutions Corp. (NASDAQ: CTSH)

Important disclosures appear on the last page of this report.
1
Krause Fund Research
Fall 2016
Technology (Beta)
Recommendation: Buy
Analysts
Wenlong Xu
Wenzhu Duan
Company Overview
Cognizant Technology Solutions Co. provide information
technology, consulting and business process services to
businesses. By using its global delivery model, domain
expertise, and portfolio of services, it helps businesses to
combine digital technology in their operation and operate in a
more efficient and innovative manner. In order to keep its
competency, Cognizant adopted business strategies that focus on
reinvestment, unique global delivery model, long-term customer
relationship, and selective strategic acquisitions, joint ventures
and strategic alliances.
Stock Performance Highlights 52-week High $65.91
52-week Low $45.44
Beta Value 1.06
Average Daily Volume 1.143 m
Share Highlights Market Capitalization $32.75 b
Shares Outstanding 606.7 M
Book Value per share $16.97
EPS 2015 $2.67
P/E Ratio 21.09
Dividend Yield N/A
Dividend Payout Ratio N/A
Company Performance Highlights ROA 10.98%
ROE 16.33%
Sales $13.26 b
Financial Ratios Current Ratio 3.56
Debt to Equity 14%
Cognizant Technology
Solutions Corp. (NASDAQ: CTSH)
December 4, 2016 Current Price $54.02
Target Price $75.50
Hard Time for CTSH
As an IT service company, Cognizant is sensitive to the
fluctuation of economic condition. This year is a hard year for
Cognizant. The still-weak global economy slowed the growth of
Cognizant.
Based on the one-year stock performance, Cognizant’s stock
price was mainly influenced by report result and legislation
factors.
Cognizant has outstanding financial conditions. According
to its financial statement, it has a 14% debt to equity ratio, 2.91
current ratio and 0.41 debt to equity ratio. Those financial
indicators show Cognizant has low credit risk.
Worldwide, Cognizant leased 11.7 million square feet and
owned 13.0 million square feet facilities in 24 countries. Those
Facilities guarantees Cognizant’s abilities to attract new
customers and maintain with relationship with old customers.
Although Cognizant did not pay out any dividend and spend
little on stock repurchase, Cognizant keeps obtaining the
comparative advantages through acquisition. According to
Cognizant’s Q3 report, Cognizant has around 4.8 billion cash on
hand. In this year, Cognizant has already acquired six
companies.
Cognizant is able to adjust its focus on time. In 2014,
Cognizant focused on the development of Healthcare segment
and obtained substantially growth in the revenue from healthcare
segment. This year, Cognizant began to focus on its
Manufacturing segment, we believe Cognizant will get succeed
in this industry segment.
The hard time is temporary. We believe as long as the
economic condition upturn, Cognizant’s stock price will also up
rapidly. Therefore, the recommendation we offered is Buy.
One Year Stock Performance
(Soured from: Yahoo Finance Blue: CTSH Red: S&P 500)

Important disclosures appear on the last page of this report.
2
Executive Summary Cognizant has rich distribution channels and many professional
staffs. In addition, Cognizant also provides more than 27
different kinds of personality service for the customers.
Therefore, the demand of IT service plays an important role in
Cognizant’s revenue growth. Although the number of data is
keeping rapid increase, the economic condition slows
Cognizant’s revenue growth down because of the bad
performance of finance industry and healthcare industry.
Furthermore, the majority employees for Cognizant are in India
and 21.4% of the company’s revenue are from foreign country,
the fluctuation of exchange rate would have negative impact on
Cognizant’s salaries expense and revenue stream as the
appreciation of U.S dollar. Therefore, the growth rate for
Cognizant in the following several years would not be kept in a
high level. However, compared with its peer, Cognizant has the
best performance. Although cognizant cannot offer high level
return, the growth rate for this company is stable. If there is a
diversification need or risk-avoiding demand, we recommend a
buy rating for Cognizant Technology Solutions Corp.
Macroeconomic Outlook
Gross Domestic Product
Soured from Factset and World Banki
Gross domestic product is all the finished goods and services
produced within a country’s border in a specific time period,
which is measured by currency. Based on the data in the past 10
years, IT is highly economically sensitive-- it’s more likely to
outperform during periods of economic growth. Historically,
Technology tracks closely with the direction of GDP growth. ii
GDP can be calculated by the function: Y= C+G+I+ (EX-IM).
This function will be used to analyze the GDP growth rate in this
passage. Based on this function, consumer spending(C),
government spending(G), investment(I) and national total net
exports(EX-IM) would be analyzed individually.
Sourced from Worldbankiii
Overview: Based on the World Bank database, from 1961 to
2015, the GDP growth rate in U.S ranges from -2.78% to 7.26%
and the median is 3.3%, which has a downward trend. In short
term, from 2010 to 2015, the GDP growth rate in U.S ranges
from 1.49 to 2.53 and the median is 2.33, which looks relative
flat.
Consumer spending: According to the previous data of consumer
spending, if there is no big problem with the economy, the
consumer spending will increase steady. In the next two years,
the projected consumer spending growth rate will range from
0.8% to 0.4%. The growth rate will decrease gradually. Because
high-tech sector is highly correlated with consumer spending. It
will be discussed more detailed in the following part.
Source from UsFederalBudgetsiv
Government spending: According to data from United States
Censes, the government spending will increase by 6.41% in FY
2016 and 5.46% in FY 2017.v The estimate growth rate looks
steady in the following five years from the chart offered below.
The forecasting is based on the historical tables in the current
presidential budget. We can see that the government has no plan
to implement restrictive fiscal policy.

Important disclosures appear on the last page of this report.
3
Source: Federal Reserve Bank of St. Louisvi
Investment: Investment activity is highly correlated with interest
rate. Based on the statistics offered by FRED, the interest rate is
close to historic low in recent years. From 2010 to now, the
effective federal fund rate ranges from 0.07% to 0.4%.
Generally, low federal rate will incentive investment activity,
but the non-farm employment rate is less than anticipated.
Softening foreign economy and domestic investment makes
Federal Reserve hold the federal fund rate in a low level. In this
condition, the federal fund rate can only increase. This may lead
investment activity weaker. On the other sides, the strengthening
dollar will also decrease the oversea investment on U.S.
NX: NX is the difference between export and import. NX is
highly correlated with exchange rate. Owing to the British
withdrawing from the EU and the emerging market transition,
such as China, U.S dollar become safety currency. However,
although this is a good news for oversea investment, it is a bad
news for net export. High tech industries are a strong industry
for U.S. Last year, U.S high-technology exports was 154.354
Billion, which account for 7% of U.S total export. Therefore, the
perspective for NX would be negative.
Overall, based on the flat growing consumer spending and
government spending, worse investment environment and
negative NX perspective, in short term, the GDP growth rate
will not have drastic change. Additionally, with the moderate
loose monetary policy and moderate fiscal policy. The GDP
growth rate will not decrease too much. Moreover, as the new
present coming into power, there will be more policies to
incentive the economy growth. Projected GDP growth rate
could be 2.8% to 3.5%. For the next 6 months, the GDP growth
rate should be around 3.0%. For the next two years, considering
bolster expectations for Fed rate, the GDP growth rate would
stay at 2.8%.
Consumer Spending
Consumer spending variable measures consumers’ total
consumption of goods and services using their disposable
personal income. In the information technology sector,
consumers are the main end-users of the technology hardware
and equipment. Besides, most semiconductors production is put
into the production of technology hardware and equipment. That
means, almost two third of technology products rely on the
consumption of consumers. A decrease in consumer spending
will tend to influence technology products purchasing more
because they are daily necessities. An increase in consumer
spending will benefit technology sector because it signals excess
money to spend on recreation supplies. Thus, it is important to
follow how much they spend on goods and services and how
much money available for them to spend as a whole.
Source: U.S. Bureau of Economic Analysisvii
As shown in the tables above, In the first quarter of 2016, the
consumer spending has grown 0.41% compare to the last quarter
of 2015. The second quarter of 2016 has seen 1.1% of growth in
consumer spending which is nearly twice than last quarter. The
consumer spending has seen a steady continuing growth in
recent ten years except for a sharp drop during the financial
crisis in 2008. Then, with the recovering and the growth of the
economy, consumer spending is continuing growing. The
quarterly growth rate in 2015 fell from 0.71% to 0.41%, which
shows a slowing growth in 2015. However, the doubled growth
rate in the second quarter of 2016 could be considered as a
signal of a continuing growth of consumer spending shortly. We
don’t think the next quarter of consumer spending growth would
be doubled again. We see the change as a one-time change. In
our opinion, we project the third quarter’s consumer spending
growth will decrease 0.10% which follows the decreasing trend
of 2015. As for the growth for the next two years, we assume the
quarterly growth rate would decrease at a speed of 0.1%
quarterly but never below 0.04% until there is another sharp
increase again in the economy. The reason is that we consider a
one-time sharp increase in consumer spending is reasonable after
a short period. For example, accumulated wealth allows
consumers to buy more during a specific of time. As shown in
figure 2.0, the disposable personal income sees a sharp increase
in the second quarter of 2016 which significantly support the
increase in consumer spending. However, the disposable
personal income is very unlikely to have a sharp increase again
within the two years.
Unemployment Rate
The rate of unemployment is the number of unemployed workers
divided by the total labor force. A low unemployment rate
indicates a strong economic growth. As discussed above,
technology sector usually outperforms market during an
economic growth period. As the chart indicated below, since
average unemployment rate reached its high point of 9.6% in
2010, it has been steadily decreased to 5.3% in 2015.viii From

Important disclosures appear on the last page of this report.
4
January to August 2016, unemployment rate fluctuates in the
range of 4.7% to 5%, reflecting a positive economic growth
from 2015 to 2016.
Decreasing unemployment rate implies an increasing demand of
labor, which lead to rising average income in the U.S. According
to the Bureau of Labor Statistics, the average hourly wage for
private companies increases from $25.12/hour (Aug. 2015) to
$25.73/hour (Aug. 2016). ix As mentioned in the consumer
spending section, increasing household income shows the
growth opportunity for the technology sector.
Source: Bureau of Labor Statisticsx
As the unemployment rate fluctuates during the first 8 months of
the year, we think it’s reasonable that it stays at 5% for next two
quarters. According to Goldman Sachs, it’s more than likely that
the Fed will increase interest rate this month.xi In the long run,
with a higher interest rate, the economic growth rate will slow
down. However, we do think that the U.S. economy will
continue to grow, but with a slower and a healthier outlook. As
an indicator of the economy growth rate, unemployment is likely
to follow the trend. We expect the unemployment rate to
decrease 0.2% per year for the upcoming 2-3 years. To sum up,
in short-term, the unemployment rate will keep at 4.9%/. In
long-term, the unemployment rate will keep decrease to 4.2%.
Federal Fund Rate
Source from: Factsetxii
According to the chart above, there is a reverse relationship
between Fed Fund rate and Market return. Because of the
recovery of the economy, the anticipation of the rise of Fed
Fund rate get stronger. The PMI index in Nov 2016 is 54.5,
this is a strong signal of economic recovery.
Source: Federal Reserve Bank of St. Louisxiii
Due to the Fed Fund rate is the historical low, the rate could
only be increase. Therefore, we believe the federal fund rate
will increase to 0.65~0.90 in December 2016. In the next
five years, we think the Federal Fund rate will increase to
3%, which is negative to the IT industry.
Capital Outlook
Source from: Yahoo Finance
xiv
The chart above shows the performances of S&P 500 and S&P
500 IT Sector. Historically, there is a strong positive relationship
between the IT sector and the U.S Equities. Based on top
technology companies’ performance, we regard the industry a
“high beta” play, which was 1.73 relative to S&P 500 index
beta. xv In other words, the IT sector outperforms the board
market during an upward trend and underperforms during a
downward trend. Therefore, in the long run, if we hold an
optimistic opinion on the overall market (S&P 500), then it is a
good choice to invest in the technology sector as its value will
increase better than the overall market. Therefore, we predict
that the IT sector will benefit from the low federal fund rate to
expand business in the short run period. Also, a slight increase in
the federal fund rate will increase some financial institutions’
revenues and profits, which in turn they will increase investment
and purchase on technology products or services. Thus, in the
long term, we think the IT sector will still outperform the stock
market and experience an upward trend. In order to better
analyze the capital market, we decide to choose IT sector (a high
Important disclosures appear on the last page of this report.
5
beat player) and Industries sector (has a similar beta with the
market) to compare the performance of the market. In the
following six months, we think the S$P 500 index will be at the
level of 2250. In long-term, the next five years, the index could
increase to 2300.
Industry Analysis
Overview
Data processing and hosting services is a sub-industry under the
IT services sector. Firms in this industry mainly provide
infrastructures and services to facilitate IT related activities.
They offer business process management, application services,
data storage and management, IT support, website hosting,
automated data entry service, network management, etc. The
picture below shows the percentage of revenue generated by
each product segment in 2016.
Source from: IBISWorldxvi
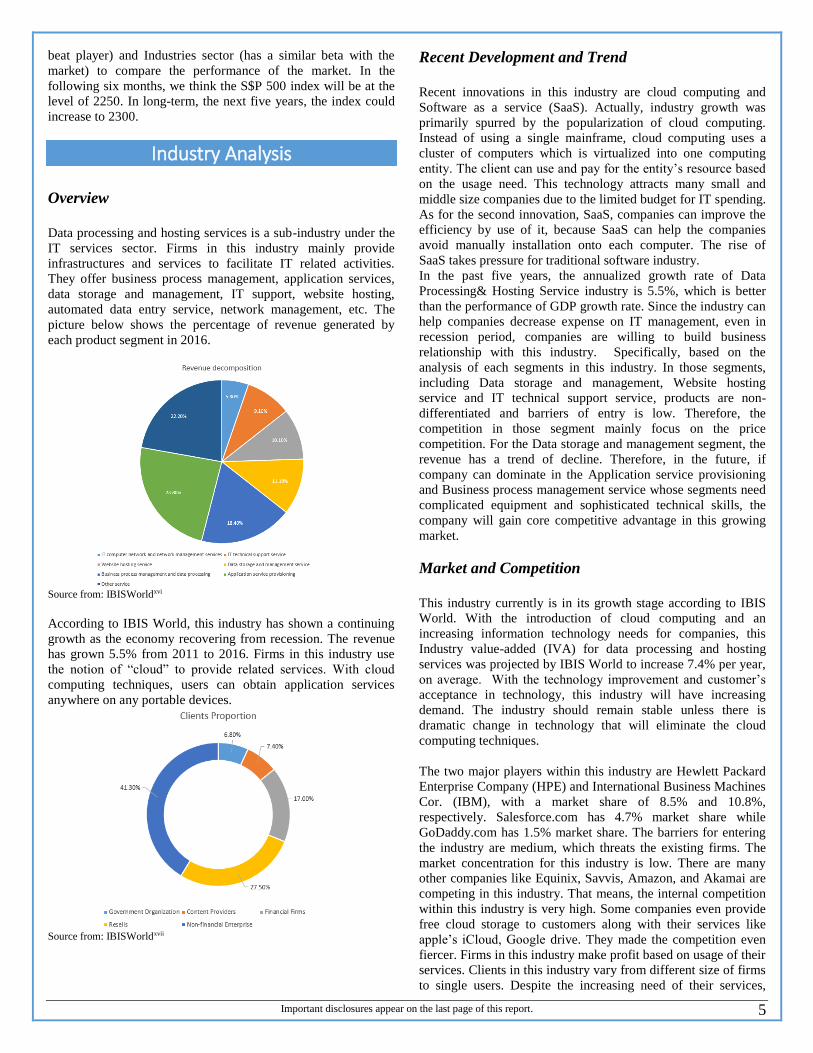
According to IBIS World, this industry has shown a continuing
growth as the economy recovering from recession. The revenue
has grown 5.5% from 2011 to 2016. Firms in this industry use
the notion of “cloud” to provide related services. With cloud
computing techniques, users can obtain application services
anywhere on any portable devices.
Source from: IBISWorldxvii
Recent Development and Trend
Recent innovations in this industry are cloud computing and
Software as a service (SaaS). Actually, industry growth was
primarily spurred by the popularization of cloud computing.
Instead of using a single mainframe, cloud computing uses a
cluster of computers which is virtualized into one computing
entity. The client can use and pay for the entity’s resource based
on the usage need. This technology attracts many small and
middle size companies due to the limited budget for IT spending.
As for the second innovation, SaaS, companies can improve the
efficiency by use of it, because SaaS can help the companies
avoid manually installation onto each computer. The rise of
SaaS takes pressure for traditional software industry.
In the past five years, the annualized growth rate of Data
Processing& Hosting Service industry is 5.5%, which is better
than the performance of GDP growth rate. Since the industry can
help companies decrease expense on IT management, even in
recession period, companies are willing to build business
relationship with this industry. Specifically, based on the
analysis of each segments in this industry. In those segments,
including Data storage and management, Website hosting
service and IT technical support service, products are non-
differentiated and barriers of entry is low. Therefore, the
competition in those segment mainly focus on the price
competition. For the Data storage and management segment, the
revenue has a trend of decline. Therefore, in the future, if
company can dominate in the Application service provisioning
and Business process management service whose segments need
complicated equipment and sophisticated technical skills, the
company will gain core competitive advantage in this growing
market.
Market and Competition
This industry currently is in its growth stage according to IBIS
World. With the introduction of cloud computing and an
increasing information technology needs for companies, this
Industry value-added (IVA) for data processing and hosting
services was projected by IBIS World to increase 7.4% per year,
on average. With the technology improvement and customer’s
acceptance in technology, this industry will have increasing
demand. The industry should remain stable unless there is
dramatic change in technology that will eliminate the cloud
computing techniques.
The two major players within this industry are Hewlett Packard
Enterprise Company (HPE) and International Business Machines
Cor. (IBM), with a market share of 8.5% and 10.8%,
respectively. Salesforce.com has 4.7% market share while
GoDaddy.com has 1.5% market share. The barriers for entering
the industry are medium, which threats the existing firms. The
market concentration for this industry is low. There are many
other companies like Equinix, Savvis, Amazon, and Akamai are
competing in this industry. That means, the internal competition
within this industry is very high. Some companies even provide
free cloud storage to customers along with their services like
apple’s iCloud, Google drive. They made the competition even
fiercer. Firms in this industry make profit based on usage of their
services. Clients in this industry vary from different size of firms
to single users. Despite the increasing need of their services,

Important disclosures appear on the last page of this report.
6
clients hold their decision in choosing their services. That
means, the bargaining power is highly controlled in their clients.
With many service providers, firms will have less pricing power,
meaning they have to compete for price in order to attract new
users and maintain old users.
Although there are no substitutes for these services, the external
competition in this industry is high. For instance, medium to
large clients like big firms and organizations may choose to
build their IT infrastructure and IT department depending on
their financial status. This external competition will significantly
influence the market because large users (non-financial
enterprise, financial firms, and government organizations)
accounts for 58.1% of the total market.
There are less supply threats within this industry. Without any
reliance on raw materials, it mainly depends on technology
advance like improvement in computer hardware as well as
technical expertise.
Better-positioned firms
In this industry, firms that mainly focus on application service
provisioning, business process management (BPO), and data
storage and management services are considered as better
positioned. Firstly, as shown in figure 2, 53.3% of revenue
generated in this industry is come from these three service
segments. Secondly, these services require service providers to
have complicated equipment and sophisticated technical skills.
Thus, big service providers are more likely to be selected by
large firms and companies, who are the major market in this
industry, due to their company scale and reputation. Thirdly,
they tend to build long-term relationship and sign long-term
contracts with business, meaning fewer threats in losing
customers. For example, for BPO services, businesses would not
end the relationship easily because one change or delay in
business process will influence the business as a whole. The
direct benefit for these service providers is they have customer
loyalty and pricing power. Also, businesses today want to be
more efficient in their business process and fear of falling behind
competitors. They are seeking these services actively. It also
gives potential development and sustainability to this industry.
Catalyst for Growth/Change
Number of mobile internet connections: Owing to the
popularization of smartphone since 2007, mobile broadband
connection has skyrocketed. In the past five years, from 2011 to
2015, the compound growth rate of mobile internet connections
is 13.1%. The number of mobile internet connections increase
from 130.72 million to 242.00 million. The increase of mobile
internet connections created a great many of data. Facing the
countless data, many companies seek help from third-party
provider. In the next five years, although the smartphone market
is about saturation, the estimated compound growth rate is
5.1%,xviii which offers a chance for Data Processing& Hosting
Service industry.
Percentage of services conduced online: This driver is the most
direct driver for this industry. This driver reflects “the increasing
use by consumers and businesses of the internet for services they
used pay for in a physical form”.xix This number increased from
7.05% to 12.68% from 2011 to 2015. Based on the perspective
of IBISWorld, this number will increase constantly from 12.68%
to 19.47% in 2020.
Key Investment Positive or Negatives
Investment Positive:
As the amount of data increasing, the requirement of IT
infrastructure becomes more complex, and professional.
Outsourcing the IT need is the best choice for many
new or large companies.
From 2008 to now, the growth rate for this industry is
positive, which has an annualized growth rate of 6.7%.
Even though in the 2008 financial crisis, this industry
has a growth rate of 9.3%.
Business processing outsourcing is cost saving for firms
and a new trend for today’s businesses, and many firms
will outsource their un-core business process to save
time and money.
Investment Negative:
In the past five years, the compound annualized growth
rate for this industry is 6.48%, which is under-
performance compared with S&P 500 Index.
The data safety is an unavoidable issue for this industry.
How the companies in this industry will protect the
client’s data from losing and stealing is an issue.
Technology changes fast and unpredictable. Adoption
of new computing technology may change the whole
industry.
Company Analysis
Overview and Business Description
Cognizant Technology Solutions Co. provide information
technology, consulting and business process services to
businesses. By using its global delivery model, domain
expertise, and portfolio of services, it helps businesses to
combine digital technology in their operation and operate in a
more efficient and innovative manner. In order to keep its
competency, Cognizant adopted business strategies that focus on
reinvestment, unique global delivery model, long-term customer
relationship, and selective strategic acquisitions, joint ventures
and strategic alliances.
The company reported a net income of $1623.6 million during
the fiscal year ended Dec. 2015. An increase of 12.8% over
2015. Cognizant recently releases its third-quarter net income of
444.4 million as of Sept.30, 2015. An increase of 11.9% over the
third quarter in 2015. Management projected its fiscal 2016
revenue to be in the range of $13.47 billion to $13.53 billion.
Important disclosures appear on the last page of this report.
7
Corporate Life Cycle
Cognizant is now in its established stage where company is
growing at a declining rate. As it shown in Figure 1 shows 10-
year sales growth of Cognizant from 2006 to 2016. The overall
sales growth of Cognizant from its four business segments has
seen an overall decline from 49.9% in 2006 to 21.0% in 2015
during the 10 years. However, due to rapidly changing in
Technology industry and service type, sales for Cognizant can
vary along with consumer’s acceptance, introduction of new
technology and products, and services’ time period. Cognizant
can proceed through the entire life cycle during the operation.
xx Figure 1. Sales Growth
Products & Markets
Cognizant uses its Cognizant BusinessCloud solution portfolio
and provides 28 products and platform to serve its clients.
Products including Assetserv, B2B Conflux, and CasKade, etc.
cover all of its business segments. Cognizant mainly divided its
market into four industry-oriented segments: Financial service,
Healthcare, Manufacturing/Retail/Logistic, Others.
Financial services segment including clients operating in retail
and commercial banking as well as insurance industries.
Healthcare including customers providing healthcare services.
Cognizant provides consulting services as well as technology
support to help companies operating in these four sectors to fully
adopt the advantage of technologies and provide better customer
experience and efficient management.
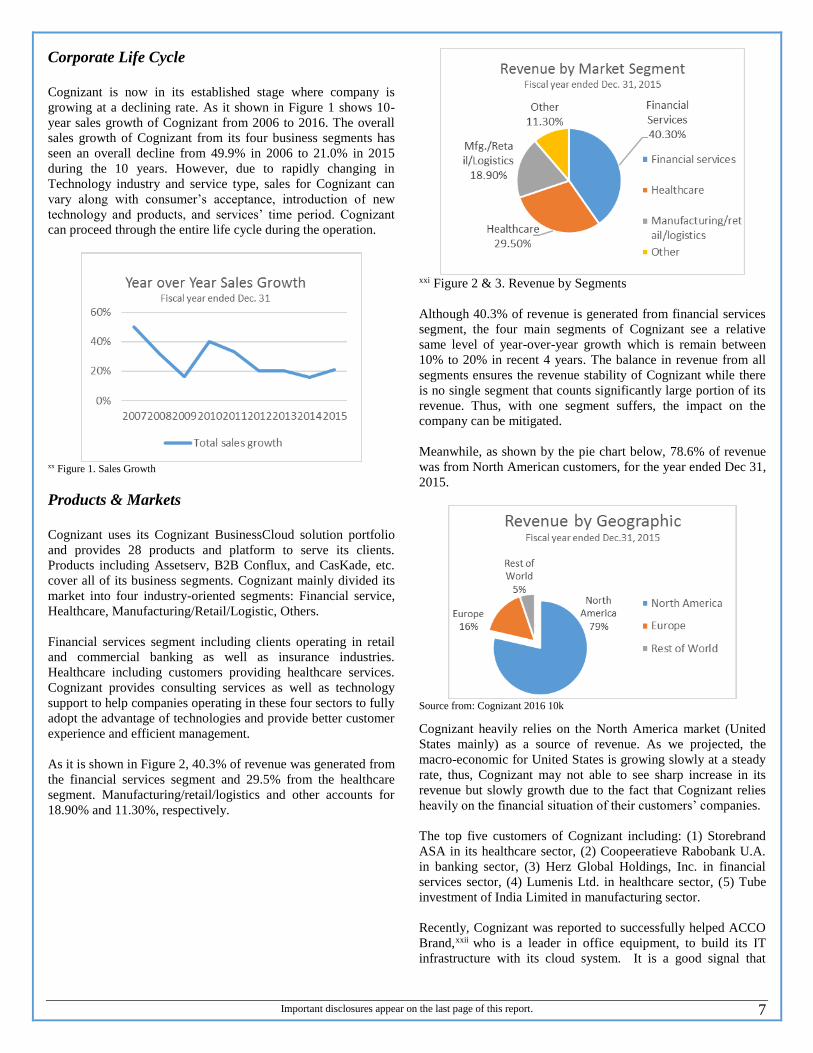
As it is shown in Figure 2, 40.3% of revenue was generated from
the financial services segment and 29.5% from the healthcare
segment. Manufacturing/retail/logistics and other accounts for
18.90% and 11.30%, respectively.
xxi Figure 2 & 3. Revenue by Segments
Although 40.3% of revenue is generated from financial services
segment, the four main segments of Cognizant see a relative
same level of year-over-year growth which is remain between
10% to 20% in recent 4 years. The balance in revenue from all
segments ensures the revenue stability of Cognizant while there
is no single segment that counts significantly large portion of its
revenue. Thus, with one segment suffers, the impact on the
company can be mitigated.
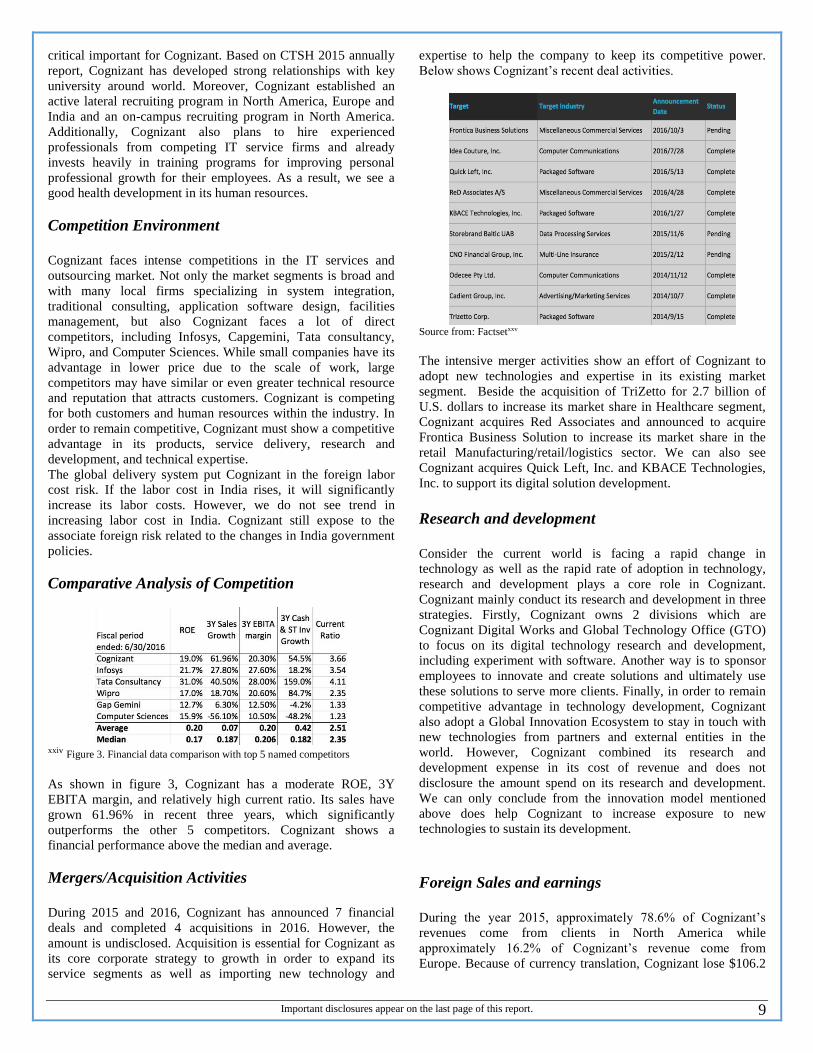
Meanwhile, as shown by the pie chart below, 78.6% of revenue
was from North American customers, for the year ended Dec 31,
2015.
Source from: Cognizant 2016 10k
Cognizant heavily relies on the North America market (United
States mainly) as a source of revenue. As we projected, the
macro-economic for United States is growing slowly at a steady
rate, thus, Cognizant may not able to see sharp increase in its
revenue but slowly growth due to the fact that Cognizant relies
heavily on the financial situation of their customers’ companies.
The top five customers of Cognizant including: (1) Storebrand
ASA in its healthcare sector, (2) Coopeeratieve Rabobank U.A.
in banking sector, (3) Herz Global Holdings, Inc. in financial
services sector, (4) Lumenis Ltd. in healthcare sector, (5) Tube
investment of India Limited in manufacturing sector.
Recently, Cognizant was reported to successfully helped ACCO
Brand,xxii who is a leader in office equipment, to build its IT
infrastructure with its cloud system. It is a good signal that

Important disclosures appear on the last page of this report.
8
Cognizant pays effort in developing relationship with other big
supplier in its business segments.
Marketing Strategy
Cognizant generates sales from direct selling using sales
representatives, referrals, and returning customers. Cognizant is
a B2B type operation. That means Cognizant heavily relies on its
sales representative to introduce their services and products in
order to build relationships. It highly relies on the capability of
their sales force in order to compete for new and returning
customers. The high dependence on sales force would increase
the risk of generating fewer sales with poor performance of sales
representative. The SG&A expense of Cognizant remains at a
constant level of around 20% of sales during 2011 to 2015. We
think the constant level of SG&A spending should be able for
Cognizant to sustain its current growth.
Revenue stream & cost structure
As a global leader in business and technology services,
Cognizant primary offers personalized service to the customers.
Price structures for Cognizant are based on expectations and
assumptions regarding the cost and complexity of work
performing. Cognizant predominantly contract to customers on a
time-and-materials basis or on a fixed-price basis. Fixed-price
contract accounts for around 36.5% revenue of Cognizant in
2015.
The cost of Cognizant mainly focuses on cost of revenue and
SG&A expense. Cost of revenue accounts for 72.4% of
operating expense and 59.9% of total revenue while SG&A
expense accounts for 24.4% of operating expense and 20.2% of
total revenue. The primarily cost for Cognizant is cost of
revenue.
Cognizant’s cost of revenue primarily consists of salaries,
incentive-based compensation, payroll taxes, employee benefits,
immigration and project-related travel for technology personnel,
subcontracting and sales commissions related to revenues. The
cost of revenue increased by 21.2% during 2015 as compared to
an increase of 16.6% during 2014. The increase mainly leaded
by the increase in compensation and benefits cost. Similarly, the
SG&A expenses includes salaries, incentive-based
compensation, stock-based compensation expense, payroll taxes,
employee benefits, immigration, travel, marketing,
communications, management, finance, administrative and
occupancy cost. Compensation and benefit cost also accounts for
the primarily increase in SG&A expense. Overall, human
resource accounts for huge expenditure of Cognizant. The
compensation and benefit, which includes incentive-based
compensation cost, increased rapidly.
The graph below shows the cash and cash equivalent balances
relative to cash used in share repurchases and debt.
Source from: Factsetxxiii
Cognizant holds 4949.5 millions of cash which consists 37.88%
of its total assets. Besides spending the cash on cost of services
(salaries, R&D), SG&A, Cognizant mainly uses its cash to do
merger & acquisitions and share repurchases to sustain the
growth of the company.
From Cognizant’s cost structure, we see a risk associate with
Cognizant’s acquisition. Although acquisitions might be able to
give Cognizant a short-term growth in its financial performance,
the ongoing performance of acquisition is subject to the risk of
the economy and management.
Distribution and Customer Support
The development and delivery centers and technical
professionals are positioned globally, primarily in India.
Cognizant holds global delivery centers that using the global
network to serve its clients. This strategy helps Cognizant avoid
various risks, including regulatory, economic and political
instability, potentially unfavorable tax etc. Additionally,
according to the corporation strategy, Cognizant plans to open
additional sales and marketing offices globally to support the
demand of their clients and markets.
Cognizant provide on-site, at local or in country, at regional, and
at global services delivery centers to ensure every touch with
customers. Currently, cognizant have 300 strategic clients been
served through its global delivery system.
Suppliers and raw materials
Cognizant has a total of 11 suppliers, including 4 technology
service companies, which are BlackLine, Inc., Information
Corporation, Interxion Holding N.V., and Jacada Ltd.; 3 finance
companies including Custodian REIT PLC, Ascendas India
Trust, and IRSA Inversiones. one producer manufacturing
company named Blue Star limited; one electronic technology
company named Top Image Systems Ltd.; one commercial
service company which is Medidate Solutions, Inc.; and the last
one is Tata Communications limited in communication. In the
sector of Technology Service, there are 4 suppliers, which means
Cognizant has plenty of suppliers in the Technology Service.
However, in other area, Cognizant has limited choice of their
suppliers.
There are no raw materials due to Cognizant is a service
company, what Cognizant offers to the clients are intellectual
property. Therefore, the ability to continually hire, assimilate,
motivate and retain the best talent possible in the industry is
Important disclosures appear on the last page of this report.
9
critical important for Cognizant. Based on CTSH 2015 annually
report, Cognizant has developed strong relationships with key
university around world. Moreover, Cognizant established an
active lateral recruiting program in North America, Europe and
India and an on-campus recruiting program in North America.
Additionally, Cognizant also plans to hire experienced
professionals from competing IT service firms and already
invests heavily in training programs for improving personal
professional growth for their employees. As a result, we see a
good health development in its human resources.
Competition Environment
Cognizant faces intense competitions in the IT services and
outsourcing market. Not only the market segments is broad and
with many local firms specializing in system integration,
traditional consulting, application software design, facilities
management, but also Cognizant faces a lot of direct
competitors, including Infosys, Capgemini, Tata consultancy,
Wipro, and Computer Sciences. While small companies have its
advantage in lower price due to the scale of work, large
competitors may have similar or even greater technical resource
and reputation that attracts customers. Cognizant is competing
for both customers and human resources within the industry. In
order to remain competitive, Cognizant must show a competitive
advantage in its products, service delivery, research and
development, and technical expertise.
The global delivery system put Cognizant in the foreign labor
cost risk. If the labor cost in India rises, it will significantly
increase its labor costs. However, we do not see trend in
increasing labor cost in India. Cognizant still expose to the
associate foreign risk related to the changes in India government
policies.
Comparative Analysis of Competition
xxiv Figure 3. Financial data comparison with top 5 named competitors
As shown in figure 3, Cognizant has a moderate ROE, 3Y
EBITA margin, and relatively high current ratio. Its sales have
grown 61.96% in recent three years, which significantly
outperforms the other 5 competitors. Cognizant shows a
financial performance above the median and average.
Mergers/Acquisition Activities
During 2015 and 2016, Cognizant has announced 7 financial
deals and completed 4 acquisitions in 2016. However, the
amount is undisclosed. Acquisition is essential for Cognizant as
its core corporate strategy to growth in order to expand its
service segments as well as importing new technology and
expertise to help the company to keep its competitive power.
Below shows Cognizant’s recent deal activities.
Source from: Factsetxxv
The intensive merger activities show an effort of Cognizant to
adopt new technologies and expertise in its existing market
segment. Beside the acquisition of TriZetto for 2.7 billion of
U.S. dollars to increase its market share in Healthcare segment,
Cognizant acquires Red Associates and announced to acquire
Frontica Business Solution to increase its market share in the
retail Manufacturing/retail/logistics sector. We can also see
Cognizant acquires Quick Left, Inc. and KBACE Technologies,
Inc. to support its digital solution development.
Research and development
Consider the current world is facing a rapid change in
technology as well as the rapid rate of adoption in technology,
research and development plays a core role in Cognizant.
Cognizant mainly conduct its research and development in three
strategies. Firstly, Cognizant owns 2 divisions which are
Cognizant Digital Works and Global Technology Office (GTO)
to focus on its digital technology research and development,
including experiment with software. Another way is to sponsor
employees to innovate and create solutions and ultimately use
these solutions to serve more clients. Finally, in order to remain
competitive advantage in technology development, Cognizant
also adopt a Global Innovation Ecosystem to stay in touch with
new technologies from partners and external entities in the
world. However, Cognizant combined its research and
development expense in its cost of revenue and does not
disclosure the amount spend on its research and development.
We can only conclude from the innovation model mentioned
above does help Cognizant to increase exposure to new
technologies to sustain its development.
Foreign Sales and earnings
During the year 2015, approximately 78.6% of Cognizant’s
revenues come from clients in North America while
approximately 16.2% of Cognizant’s revenue come from
Europe. Because of currency translation, Cognizant lose $106.2

Important disclosures appear on the last page of this report.
10
million net of tax. The fluctuations of exchange rate may cause a
number of adverse effects on the company.
Government regulation:
Government regulation can influence Cognizant’s business from
three aspects: off-shore outsourcing, immigration and
regulations of their client’s industry, such as financial service
industry and healthcare industry.
Considering offshore outsourcing may lead the loss of job
domestically, this issue is a topic of political discussion in the
U.S. If the economy gets worse, Cognizant would suffer from
the prohibition or limitation of offshore outsourcing. Many
professional employees are from developing country. If U.S has
restricted immigration policy, it will be harder for Cognizant
hiring their desire people. Financial service and healthcare
industry accounts for almost 60% of Cognizant’s revenue. The
profit decreases in those industry would negatively influence
Cognizant’s revenue.
Personnel
There are approximate 221700 employees in Cognizant at the
end of 2015, with 40800 persons in North America, 8600
persons in European region and 162500 persons in India. Based
on those number, the majority of employees are in India, which
saves a great many of salaries expense for Cognizant.
Additionally, the depreciation of Indian rupee in 2015 also bring
many benefits to Cognizant.
The average age of Cognizant’s Executive officers are 51.15
years old. Their rich management experience will help the
company development better. However, considering their age, it
may be hard for them to follow the rapid changes of current
technology.
Properties
Intellectual property is crucial for Cognizant. As of December
31, 2015, Cognizant have applied for a total of 596 trademark
registrations in 63 countries. In addition, they have also applied
for 115 U.S. and international patents.
The intangible assets of Cognizant at the end of 2015 is $864.3
million (excluding $2404.7 million goodwill), and deceased
9.37% in 2015. Compared with PPE, the PPE is $1271.4 million
at the end of 2015. The protection of intangible asset is very
important. Cognizant did a good work on it.
SWOT analysis
We summarized the strengths, weakness, opportunities and
threats base on our company analysis.
Strengths:
1. The global delivery system enables Cognizant to reduce the
cost of providing services as well as meet the needs of
customers globally.
2. Cognizant offers 18 services categories like cloud e
services, application services, and consulting in the four
business segment along with 28 existing products and
platforms to meet the demand of customers.
3. Cognizant has a strong financial performance with an
increasing in revenue and relatively steady growth in
revenue growth. With little debt generate, it gives investor a
signal that the financial condition is able to sustain the
growth of Cognizant in the foreseeable future.
Weaknesses:
1. Cognizant heavily relied on its U.S. market as mentioned
before. It makes Cognizant’s performance highly subject to
the change of economic condition of U.S.
2. The intense labor concentration in India makes Cognizant
expose to the risk associate in the foreign policy and foreign
management. The risk can relate to both labor cost and
litigation cost.
3. The intense competition in IT services decreases
Cognizant’s pricing power.
Opportunities:
1. The development of technology of cloud computing, IoS
(Internet of Things), and big data gives Cognizant potential
opportunities to utilize these technologies in developing its
digital solution to customers. Including their data platforms
and applications.
2. The trend of companies adopting new technologies to meet
the competitive environment has also give Cognizant an
opportunity to generate sales.
Threats:
1. High competition in IT services industry give Cognizant a
big pressure to increase its market share. Cognizant have
competitors like Accenture who also has a good financial
performance with effort in increasing their market share.
2. Cognizant is also subject to anti-outsourcing legislation due
to its labor and services centers all located in India. Based
on the new president Trump’s historical statement regards to
outsourcing,xxvi he strongly against outsourcing jobs which
cause American losing job opportunities. We foresee a
potential negative impact would be associated to Cognizant
with Trump in the House. However, it is hard to say
whether his political view can be implemented or not.

Important disclosures appear on the last page of this report.
11
Valuation Analysis
Valuation summary
We utilized four different models to project the future stock
price for Cognizant: (1) Discounted Cash Flow, (2) Economic
Profit, (3) Dividend Discount Model (DDM) and (4) Relative PS
valuation.
According to the Discounted Cash Flow and Economic Profit
model, the estimated stock price is $75.50. According to the
Dividend Discount Model, the projected stock price is $52.45.
According to the Relative PS valuation, the stock price that we
got is $55.81.
Although the stock price projected by the last two methods is
very close to the current stock price $53.95. We choose to use
the result projected by the DCF and EP model. There are several
reasons.
Firstly, according to the 10-K, we can know that Cognizant does
not plan to pay out dividend in the foreseeable future. Besides,
Cognizant also pays little on stock repurchase. Therefore,
Dividend Discount Model cannot totally represent the value
increased to shareholders. It will decrease the estimated stock
price.
Secondly, for the Relative PS valuation, we believe we cannot
get accurate answer from this method. We used Bloomberg to
search the peer companies. Revenue of the peer companies
obtained from North America accounts for at least 70% of their
total revenues. The revenue of peer companies obtained from IT
service industries accounts for at least 80% of their total
revenues. Besides, all of the peer companies are traded in
America exchange. However, although we have a set of pretty
good peer companies. It cannot reflect the actually condition.
Cognizant is a multination enterprise. 20% of its revenue is from
oversea. This makes its background complex. Moreover,
although most of peer companies’ revenue is from IT service,
they weighted not much. In short, because the diversity in this
industry, we cannot get accurate projection by use of PS
valuation model.
Generally, under this condition, DCF and EP methods can best
present the value added by the operation for shareholders.
Income Statement Assumptions
Revenue Decomposition
We identified Cognizant’s revenue by industries. Based on
Cognizant’s 10-K, the revenue was broken into four categories:
(1) financial service, (2) healthcare, (3)
manufacturing/retail/logistics, and (4) others. As Cognizant is a
service industry, the revenue growth is highly correlated to the
IT service demand of those categorized industries. The IT
service demand depends on the growth rate of data and the
specific segment industries. Additionally, although Cognizant is
a multinational enterprise, almost 80% of its revenue comes
from North America (substantially all relates to operations in the
United States). What follows is a forecast on the segments
revenue growth primarily based on the specific industries’ future
perspective in the U.S.
Financial service: Cognizant’s client in this segment includes
banking, investment firms and insurance companies. For the
year 2015, 40.3% of Cognizant’s revenue is from the financial
service segment. However, according to the data form Factset, in
the past five years, the annual growth rate for financial industry
is around 0.05%. Therefore, we believe it is unsustainable for
Cognizant to keep a growth rate like 20% or 30% in the past
several years. Based on the third quarterly report of Cognizant in
2016, revenue from financial service only grew 7.1% compared
with last Q3, due to the fact that banking customers were
negatively affected by the worse economic condition. We
estimate the continuous growth rate for Cognizant in the
financial service industries is 8%.
Healthcare: Healthcare is second biggest revenue source for
Cognizant. It accounts for 29.5% of Cognizant’s revenue in
2015. Cognizant mainly serves healthcare and life science
companies in the healthcare industries. Owing to the Affordable
Care Act, healthcare industries had a strong growth at the year of
2010. However, with the new President Trump coming into
power, the Act will be changed substantially (ABELSON, 2016). xxvii This change will lead healthcare industry into downturn.
Additionally, although in 2015 the revenue from healthcare
sector of Cognizant increased 36.4% compared with 2014, the
amount growth was contributed by the acquisition of TriZetto.
We don’t think the growth rate could last in the following six
years. Based on the Segment revenue statement, the acquisition
does not improve the marginal profits of healthcare segment. To
sum up, we expected the continuous growth rate for healthcare
segment will be around 10%.
Manufacturing/Retail/Logistics: This segments accounts for
18.9% revenue of Cognizant in 2015. The clients in this segment
includes industrial, automotive, process logistics, energy and
utilities, and retail. Considering the two acquisitions Cognizant
made during 2016 as mentioned before are belong to this
business sector, and also the advertisement of emphasis on
Logistics digital solutions on its website during the analysis
period. We foresee the intention of Cognizant to expand the
manufacturing/retail/logistic sector. The effect of acquisition,
without other influences, should be positively reflected in
revenue related to this sector. Thus we projected revenue growth
rate for this sector to increase to 15% in 2017 and then
increasing in slightly decreasing trend.
Other: This sector includes such disparate elements as
communications, information, media and entertainment, and
high technology. This segment accounts for less than 10% of
revenues. Therefore, for this part, we forecasted the revenue
stream based on the other three segments and the economic
condition. We think the continuous growth rate for this segment
is 10%.
Overall, the growth rate of total revenue will be 8.4% at the year
of 2021, with a trend of decline.

Important disclosures appear on the last page of this report.
12
Operating Expenses
Operating expenses includes (1) cost of revenues, (2) SG&A
expense, (3) Depreciation and amortization expense. Different
from the cost structure in other industries, Cognizant’s operating
cost accounts for almost its 80% revenues.
Cost of revenues: cost of revenues consists of salaries, incentive-
based compensation, stock-based compensation expense, payroll
taxes, employee benefits, immigration and project-related travel
for technical personnel subcontracting and sales commissions
related to revenues. Based on the historical data in the past 10
years, we can know that, the cost of revenue is stable at the level
of 56% as the percentage of revenues. Therefore, we projected
the cost of revenues by use of the average of past five years’ cost
of revenue as percentage of revenues, which is 59.07%.
SG&A expense: similar to cost of revenue, SG&A cost consists
of salaries, incentive-based compensation, stock-based
compensation expense, payroll taxes, employee benefits,
immigration, travel, marketing, communications, management,
finance, administrative and occupancy. Based on the historical
data in the past 10 years, we found SG&A expense keeps in a
stable level of 20% as the percentage of revenues. Therefore, we
projected the SG&A by use of the average of past five years’
SG&A expense as percentage of revenues, which is 21.61%.
Depreciation and Amortization: We projected depreciation as
percentage of the gross PPE the previous year. Based on the
historical data, the percentage is 14%.
Due to the acquisition, the intangible assets in 2014 increased
significantly compared with 2013. Therefore, in 2014 the
amortization also increased largely. In Cognizant 10-k, there is
the projected amortization in the following five years. The
amortization was projected by the data from 10-k.
In general, we estimated the operating cost for Cognizant will be
stable around 80 percentage of total revenues in the following
years.
Non-operating gain (expense)
Interest income: Interest income is driven by investment. We
multiplied the total investment by the 10-year T-bond rate to
forecast interest income.
Interest expense: Interest expense is driven by the debt. We
projected interest expense through multiplying the debt by the
cost of debt.
Foreign currency exchange gains(losses): this is a non-operating
account and full of uncertainty. In addition, this only accounts
for a little portion of revenues (losses). We did not forecast this
account.
Provision for income tax
Marginal tax rate: marginal tax rate is used to calculate the
provision for income tax. We forecasted marginal tax rate based
on the average of past five years’ data, which is 26.1%.
Balance Statement Assumption
Cash and cash equivalents: Cash and cash equivalents are
treated as plug account to forecast the cash flow.
Short-term investments: the growth rate for this account is 10-
year T-bond yield.
PPE: the projection of PPE is based on historical capital
expenditure and depreciation. According to the historical data,
the capital expenditure for the recent years has a slight decline
trend. Therefore, we estimated the capital in the following six
years will decrease by 2% per year. Additionally, PPE only
accounts a small portion of total asset, around 13% in the recent
five years.
Short-term and long-term debt: Throughout ten years, Cognizant
had short-term debt and long-term debt only in the years of 2014
and 2015. From the 10-k of FY15, we can know that the short-
term debt is from revolving facility and the long-term debt is for
the acquisition of TriZetto. Those activities do not occur too
often, so we project Cognizant will pay off the short-term debt in
the next year and long-term debt in 2019, based on the
summarizes of the long-term debt balances in 2016 10-k.
Common equity: the account common equity consists of
Additional paid-in capital and common stock. Common stock
was projected by the increase effect on ESOP and decrease
effect on share repurchase. The calculation process is provided
in the attached sheet labeled “share changes.”
Dividend: Cognizant has never declared or paid any cash
dividends on the class A common stock. For retaining any future
earnings to finance the growth of its business, Cognizant will not
pay any dividends in the foreseeable future.
Weighted Average Cost of Capital (WACC)
Cognizant’s weighted average cost of capital (WACC) was
calculated at 8.52% (see the attached document labeled “WACC
calculation” for calculation). The weight of Equity is 94.4% and
the weight of debt is 5.6%. The marginal tax rate is 26.1%,
which has been projected by calculating the tax provision.
Cost of Equity
Beta: from the Bloomberg system, we found the beta for
Cognizant is 1.06.
Risk free rate: we used 30-year T-bond yield as our risk free
rate, which is 2.52%.
Equity risk premium: we chose S&P 500 as our benchmark. By
use of the past 50 years’ monthly return, we got the historical
market return is 8.48%. Then, we subtracted the market return to
risk free rate and got the risk premium which is 5.96%.

Important disclosures appear on the last page of this report.
13
By use of the function: , we can
get the cost of equity is 8.84%
Cost of debt
The debt of Cognizant consists of three parts: (1) short-term
debt, (2) long-term debt and (3) PV of operating lease.
Cognizant does not issue any publically traded debt. Besides,
Cognizant’s competitors also do not have publically traded debt.
Because Cognizant’s debt is not publically available, in order to
find Cognizant’s debt, we need use the default risk premium.
According to Bloomberg, we know that the rating level for
Cognizant is A-. From the default premium table, we can know
that the default risk premium for Cognizant is 1.75%. Adding to
the risk free rate, we can get the cost of debt for Cognizant is
4.27%.
Sensitive Analysis We did six sensitive analyses which is shown in attached
document. Below we explained four sensitivity table: (1) CV
growth rate of ROIC vs. CV growth of NOPLAT, (2) SG&A
expense as % of sales vs. Cost of revenue as % of sales, (3)
Default risk premium vs. Equity risk premium, (4) Equity risk
premium to Risk free rate.
CV growth rate of ROIC to CV growth of NOPLAT
75.50$ 1.50% 1.75% 2.00% 2.25% 2.50%
38.0% 71.69 73.37 75.18 77.14 79.26
40.0% 71.80 73.51 75.35 77.33 79.48
42.0% 71.91 73.64 75.50 77.51 79.69
44.0% 72.00 73.75 75.63 77.67 79.87
46.0% 72.09 73.86 75.76 77.81 80.04
CV growth of ROIC
CV growth of NOPLAT
When the CV growth of NOPLAT keeps constant, the stock
price increases as the CV growth of ROIC increase. The range of
the stock price is from 75.18 to 75.76 while the range of CV
growth of ROIC is from 38% to 46%. When the CV growth of
ROIC keeps constant, the stock price increases as the CV growth
of NOPLAT increase. The range of the stock price is 71.91 to
79.69 while the range of CV growth of NOPLAT is from 1.5%
to 2.5%. It is obviously that compared with CV growth of ROIC,
the stock price is more sensitive to CV growth of NOPLAT.
SG&A expense as % of sales to Cost of revenue as % of sales
75.50$ 57.07% 58.07% 59.07% 60.07% 61.07%
19.61% 91.40 87.43 83.45 79.47 75.50
20.61% 87.43 83.45 79.47 75.50 71.52
21.61% 83.45 79.47 75.50 71.52 67.55
22.61% 79.47 75.50 71.52 67.55 63.57
23.61% 75.50 71.52 67.55 63.57 59.59
S&G expense as % of sales
Cost of revenue as % of sales
When cost of revenue as % sales keeps constant, the stock price
decrease rapidly as the SG&A expense as % of sales increase.
The stock price range is from 91.4 to 75.5 while the range of
SG&A is from 19.61% to 23.61%. On the other hand, when
SG&A expense as % of sales keeps constant, the stick price also
decreases rapidly as the cost of revenue as % of sales increase.
The SG&A expense as % of sales and Cost of revenue as % of
sales have the same impact on stock price. Additionally, the
stock price is highly sensitive to the two variables. 1% change
of either variable will makes around $4 change on stock price.
Therefore, the operating efficiency should be noticed to forecast
the stock price for Cognizant.
Default risk premium to Equity risk premium
75.50$ 5.76% 5.86% 5.96% 6.06% 6.16%
1.35% 78.07 76.83 75.63 74.47 73.34
1.55% 78.00 76.76 75.56 74.40 73.28
1.75% 77.93 76.69 75.50 74.34 73.21
1.95% 77.86 76.62 75.43 74.28 73.15
2.15% 77.78 76.56 75.37 74.21 73.09
Default risk premium
Equity risk premium
When the equity premium is held constant, if the default risk
premium changes from 1.55% to 1.95, the stock price will
decrease from 75.56 to 75.43. On the other hand, when the
default risk premium is held constant, if the equity risk premium
changes from 5.76% to 6.16%, the stock price will decrease
from 77.93 to 73.21. Therefore, compared with default risk
premium, the stock price is more sensitive to equity risk
premium. This is caused by the low leverage ratio for Cognizant.
Equity risk premium to Risk free rate
75.50$ 2.32% 2.42% 2.52% 2.62% 2.72%
5.76% 80.44 79.17 77.93 76.73 75.56
5.86% 79.13 77.89 76.69 75.53 74.40
5.96% 77.86 76.66 75.50 74.37 73.28
6.06% 76.63 75.46 74.34 73.25 72.19
6.16% 75.43 74.31 73.21 72.15 71.13
Equity risk premium
30 year T-bond yield (Risk free rate)
When the equity risk premium is held constant, 0.4% increase of
risk free rate will lead the stock price decrease from 77.86 to
73.28. On the other hand, when the risk free rate is held
constant, 0.4% increase of equity risk premium will lead the
stock price decrease from 77.93 to 73.21. Generally, the two
variables have the same effect on the stock price and the stock
price is sensitive to the two variables. The reason why this
happened is that Cognizant has a low beta, which is 1.06.
Therefore, the percentage change of equity premium and risk
free rate will lead the same change to stock price.

Important disclosures appear on the last page of this report.
14
Important Disclaimer
This report was created by students enrolled in the Security
Analysis (6F:112) class at the University of Iowa. The report
was originally created to offer an internal investment
recommendation for the University of Iowa Krause Fund and its
advisory board. The report also provides potential employers and
other interested parties an example of the students’ skills,
knowledge and abilities. Members of the Krause Fund are not
registered investment advisors, brokers or officially licensed
financial professionals. The investment advice contained in this
report does not represent an offer or solicitation to buy or sell
any of the securities mentioned. Unless otherwise noted, facts
and figures included in this report are from publicly available
sources. This report is not a complete compilation of data, and
its accuracy is not guaranteed. From time to time, the University
of Iowa, its faculty, staff, students, or the Krause Fund may hold
a financial interest in the companies mentioned in this report.

Important disclosures appear on the last page of this report.
15
Reference i Factset ii Erne, B., Teufel, A. (2010). Fisher Investments on
Technology. Hoboken, N.J: John Wiley & Sons. February
1, 2015. iii Worldbank iv http://www.usgovernmentspending.com/ v Usfederalbudget
<http://www.usfederalbudget.us/federal_budget_estimated> vi Federal Reserve Bank of St. Louis
<https://fred.stlouisfed.org/series/FEDFUNDS> vii U.S. Bureau of Economic Analysis
<http://www.tradingeconomics.com/united-states/disposable-
personal-income> viii Bureau of Labor Statistics <
http://data.bls.gov/timeseries/LNS14000000> ix Bureau of Labor Statistics <
http://www.bls.gov/opub/ee/2016/ces/summarytable_201608
.pdf> xhttp://data.bls.gov/timeseries/LNU04000000?years_option=
all_years&periods_option=specific_periods&periods=Annua
l+Data xi Fortune <http://fortune.com/2016/09/06/goldman-sachs-
interest-rates/> xii Factset xiii Federal Reserve Bank of St. Louis
<https://fred.stlouisfed.org/series/FEDFUNDS> xiv Factset xv Erne, B., Teufel, A. (2010). Fisher Investments on
Technology. Hoboken, N.J: John Wiley & Sons. February
1, 2015. xvi IBISWorld xvii IBISWorld xviiiIBISWorld<http://clients1.ibisworld.com.proxy.lib.uiowa.
edu/reports/us/industry/default.aspx?entid=1281> xixIBISWorld<http://clients1.ibisworld.com.proxy.lib.uiowa.e
du/reports/us/industry/default.aspx?entid=1281> xx Figure 1: obtained and generated from Factset xxi Figure 2: Cognizant 2016 proxy statement xxii Bloomberghttp://www.bloomberg.com/press-
releases/2016-11-10/cognizant-cloud-enables-office-product-
leader-acco-brands-it-infrastructure-and-builds-the-
foundation-for-digital-enterprise xxiii factset xxiv Figure 3: Financial data comparison. Data collected from
Factset. xxv Factset xxvi http://www.motherjones.com/politics/2016/03/donald-
trump-outsourcing-flip-flop xxviixxviixxviixxvii
xxvii http://www.motherjones.com/politics/2016/03/donald-
trump-outsourcing-flip-flop
ABELSONREED. The New York Times. nytimes:
http://www.nytimes.com/2016/11/12/business/insurers-
unprepared-for-obamacare-repeal.html?_r=0
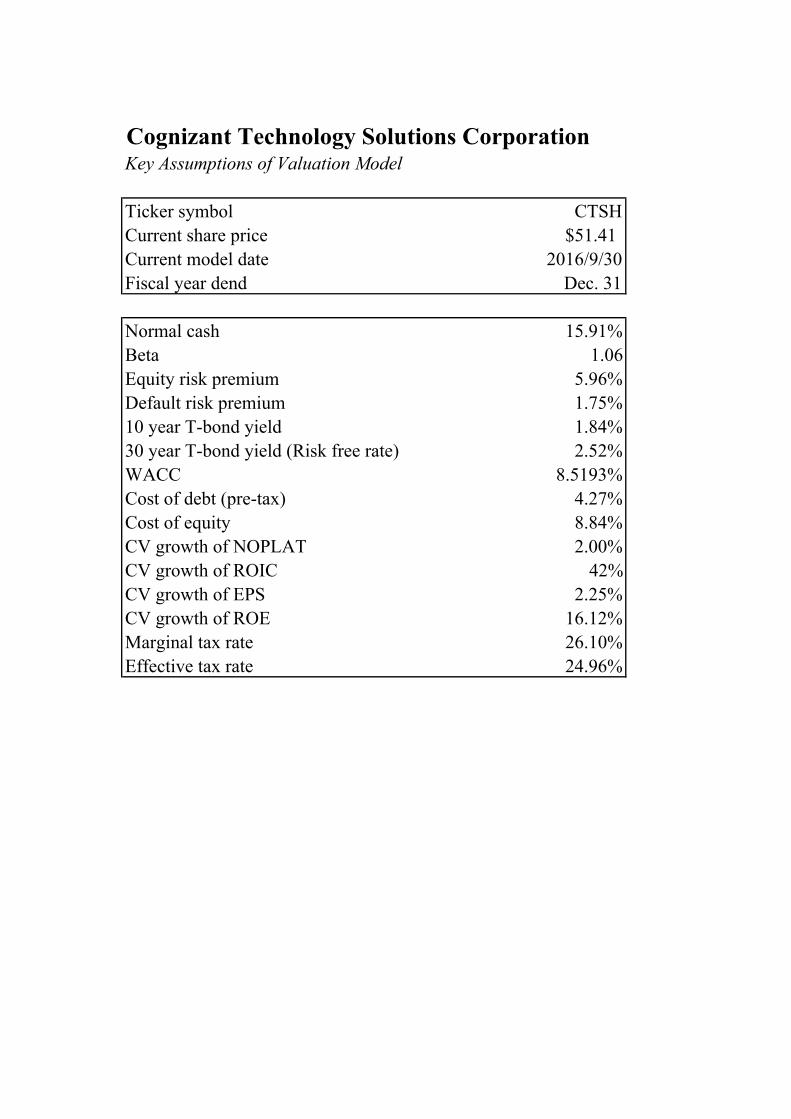
Cognizant Technology Solutions CorporationKey Assumptions of Valuation Model
Ticker symbol CTSHCurrent share price $51.41Current model date 2016/9/30Fiscal year dend Dec. 31
Normal cash 15.91%Beta 1.06Equity risk premium 5.96%Default risk premium 1.75%10 year T-bond yield 1.84%30 year T-bond yield (Risk free rate) 2.52%WACC 8.5193%Cost of debt (pre-tax) 4.27%Cost of equity 8.84%CV growth of NOPLAT 2.00%CV growth of ROIC 42%CV growth of EPS 2.25%CV growth of ROE 16.12%Marginal tax rate 26.10%Effective tax rate 24.96%

Cognizant Technology Solutions CorporationRevenue Decomposition(in millions) Fiscal Years Ending Dec. 31 2013 2014 2015 2016E 2017E 2018E 2019E 2020E 2021E
365 Days 365 Days 365 Days 366 Days 365 Days 365 Days 365 Days 366 Days 365 DaysRevenue By Industry
Financial Services 3,717.6 4,285.6 5,002.9 5703.3 6604.4 7555.5 8499.9 9417.9 10171.3YoY Growth 22.5% 15.3% 16.7% 14.0% 15.8% 14.4% 12.5% 10.8% 8.0%Healthcare 2,264.8 2,689.4 3,667.5 4034.3 4514.3 4988.3 5522.1 6101.9 6712.1YoY Growth 17.1% 18.7% 36.4% 10.0% 11.9% 10.5% 10.7% 10.5% 10.0%Manufacturing/Retail/Logistics 1,868.3 2,093.6 2,343.9 2653.3 3051.3 3524.2 4017.6 4560.0 5152.8YoY Growth 24.7% 12.1% 12.0% 13.2% 15.0% 15.5% 14.0% 13.5% 13.0%Other 992.5 1,194.1 1,401.7 1612.0 1839.2 2093.1 2363.1 2672.6 2939.9YoY Growth 13.1% 20.3% 17.4% 15.0% 14.1% 13.8% 12.9% 13.1% 10.0%Total 8843.2 10262.7 12416.0 14002.81 16009.28 18161.09 20402.67 22752.42 24976.11YoY Growth 20.4% 16.1% 21.0% 12.8% 14.3% 13.4% 12.3% 11.5% 9.8%
Segment operating profitFinancial Service 1,212.1 1,320.1 1,641.9Segment Profit Margin 32.6% 30.8% 32.8%Healthcare 829.9 851.0 1,200.0Segment Profit Margin 36.6% 31.6% 32.7%Manufacturing/Retail/Logistics 630.3 685.7 802.7Segment Profit Margin 33.7% 32.8% 34.2%Other 318.3 391.9 453.7Segment Profit Margin 32.1% 32.8% 32.4%
Total segment operating profit 2,990.6 3,248.7 4,098.3Less: unallocated costs 1,312.7 1,363.8 1,956.3Income from operations 1,677.9 1,884.9 2,142.0

Cognizant Technology Solutions CorporationIncome Statement (in millions, except per share data) Fiscal Years Ending Dec. 31 2013 2014 2015 2016E 2017E 2018E 2019E 2020E 2021ERevenues 8,843.19 10,262.70 12,416.00 14,002.81 16,009.28 18,161.09 20,402.67 22,752.42 24,976.11Operating expenses Cost of revenues exclusive of depreciation and amortization expense (5,265.47) (6,141.12) (7,440.20) (8,271.46) (9,456.68) (10,727.76) (12,051.86) (13,439.86) (14,753.39) Selling, general and administrative expenses (1,727.61) (2,037.02) (2,508.60) (3,026.01) (3,459.61) (3,924.61) (4,409.02) (4,916.80) (5,397.34) Depreciation expense (147.57) (165.99) (230.63) (178.00) (192.03) (203.32) (212.27) (219.22) (224.46) Amortization expense (24.64) (33.67) (94.57) (96.10) (93.20) (85.80) (83.50) (76.30) (78.60)Income from operations 1,677.91 1,884.90 2,142.00 2,431.25 2,807.76 3,219.60 3,646.02 4,100.25 4,522.32Other income (expense), net Interest income 48.90 62.44 83.70 91.07 113.90 148.27 177.80 226.85 282.72 Interest expense - (2.47) (17.70) (54.98) (34.16) (29.89) - - - Foreign currency exchange gains (losses), net (41.10) (20.38) (42.60) - - - - - - Other, net 2.20 (0.45) (1.80) - - - - - - Total other income (expense), net 10.00 39.15 21.60 36.09 79.74 118.38 177.80 226.85 282.72 Income before provision for income taxes 1,687.91 1,924.05 2,163.60 2,467.34 2,887.50 3,337.98 3,823.82 4,327.10 4,805.04 Provision for income taxes (459.34) (484.76) (540.00) (643.98) (753.64) (871.21) (998.02) (1,129.37) (1,254.12) Net income 1,228.57 1,439.29 1,623.60 1,823.36 2,133.86 2,466.77 2,825.81 3,197.72 3,550.93
Basic EPS 2.03 2.37 2.67 2.98 3.48 4.00 4.57 5.15 5.70 Weighted average number of common shares outstanding—Basic 604.10 608.10 609.10 611.50 613.90 616.30 618.70 621.10 623.50 Dividend per share - - - - - - - -

Cognizant Technology Solutions CorporationCommon Size Income Statement
Fiscal Years Ending Dec. 31 2013 2014 2015 2016E 2017E 2018E 2019E 2020E 2021ERevenues 100.00% 100.00% 100.00% 100.00% 100.00% 100.00% 100.00% 100.00% 100.00%Operating expenses Cost of revenues exclusive of depreciation and amortization expense -59.54% -59.84% -59.92% -59.07% -59.07% -59.07% -59.07% -59.07% -59.07% Selling, general and administrative expenses -19.54% -19.85% -20.20% -21.61% -21.61% -21.61% -21.61% -21.61% -21.61% Depreciation and amortization expense -0.28% -0.33% -0.76% -0.69% -0.58% -0.47% -0.41% -0.34% -0.31%Income from operations 18.97% 18.37% 17.25% 17.36% 17.54% 17.73% 17.87% 18.02% 18.11%Other income (expense), net Interest income 0.55% 0.61% 0.67% 0.65% 0.71% 0.82% 0.87% 1.00% 1.13% Interest expense 0.00% -0.02% -0.14% -0.39% -0.21% -0.16% 0.00% 0.00% 0.00% Foreign currency exchange gains (losses), net -0.46% -0.20% -0.34% 0.00% 0.00% 0.00% 0.00% 0.00% 0.00% Other, net 0.02% 0.00% -0.01% 0.00% 0.00% 0.00% 0.00% 0.00% 0.00%Total other income (expense), net 0.11% 0.38% 0.17% 0.26% 0.50% 0.65% 0.87% 1.00% 1.13%Income before provision for income taxes 19.09% 18.75% 17.43% 17.62% 18.04% 18.38% 18.74% 19.02% 19.24%Provision for income taxes -5.19% -4.72% -4.35% -4.60% -4.71% -4.80% -4.89% -4.96% -5.02%Net income 13.89% 14.02% 13.08% 13.02% 13.33% 13.58% 13.85% 14.05% 14.22%

Cognizant Technology Solutions CorporationBalance Sheet(in millions, except par values) Fiscal Years Ending Dec. 31 2013 2014 2015 2016E 2017E 2018E 2019E 2020E 2021E
AssetsCurrent assets: Cash and cash equivalents 2,213.01 2,010.10 2,125.20 3,313.72 5,129.23 6,679.99 9,290.73 12,271.28 15,384.58 Short-term investments 1,534.47 1,764.60 2,824.30 2,876.27 2,929.19 2,983.09 3,037.98 3,093.88 3,150.80 Trade accounts receivable, net 1,648.79 1,968.68 2,252.60 2,646.07 3,025.23 3,431.85 3,855.44 4,299.47 4,719.67 Unbilled accounts receivable 226.49 324.58 369.00 360.51 412.17 467.57 525.28 585.77 643.02 Deferred income tax assets, net 256.23 - - - - - - - - Other current assets 268.91 352.61 337.50 488.31 558.28 633.32 711.49 793.43 870.98 Total current assets 6,147.89 6,420.57 7,908.60 9,684.88 12,054.10 14,195.81 17,420.91 21,043.82 24,769.05Property and equipment, net 1,081.16 1,247.20 1,271.40 1,371.66 1,452.32 1,516.23 1,565.85 1,603.29 1,854.81Goodwill 444.24 2,413.56 2,404.70 2,404.70 2,404.70 2,404.70 2,404.70 2,404.70 2,404.70Intangible assets, net 131.27 953.75 864.30 871.21 878.18 885.21 892.29 899.43 906.63 Deferred income tax assets, net 147.15 234.20 347.80 392.15 447.92 512.39 586.25 669.82 762.62 Other noncurrent assets 183.01 209.66 268.60 272.63 276.72 280.87 285.08 289.36 293.70 Total assets 8,134.73 11,479.04 13,065.40 14,997.24 17,513.94 19,795.22 23,155.08 26,910.42 30,991.50
Liabilities and Stockholders' EquityCurrent liabilities: Accounts payable 113.39 145.69 165.30 187.43 214.28 243.09 273.09 304.54 334.31 Deferred revenue 182.89 224.11 323.70 418.49 478.46 542.76 609.76 679.98 746.44 Short-term debt - 700.00 406.30 - - - - - - Accrued expenses and other current liabilities 1,478.22 1,522.29 1,818.40 2,192.32 2,506.46 2,843.36 3,194.31 3,562.19 3,910.34 Total current liabilities 1,774.51 2,592.09 2,713.70 2,798.24 3,199.20 3,629.21 4,077.15 4,546.71 4,991.08 Deferred revenue, noncurrent - 81.00 49.30 - - - - - - Deferred income tax liabilities, net 21.17 11.80 3.30 - - - - - - Long-term debt - 937.50 881.20 800.00 700.00 - - - -Other noncurrent liabilities 203.25 116.42 139.80 251.72 287.78 326.47 366.76 409.00 448.97 Total liabilities 1,998.93 3,738.82 3,787.30 3,849.96 4,186.99 3,955.67 4,443.91 4,955.71 5,440.05 Stockholders' equity:
Preferred stock, $0.10 par value, 15.0 shares authorized, none issued - - - - - - - - - Common euqity 549.68 561.70 459.10 504.92 550.73 596.55 642.36 688.18 734.00 Retained earnings 5,862.37 7,301.60 8,925.20 10,748.56 12,882.42 15,349.19 18,175.00 21,372.73 24,923.65 Accumulated other comprehensive income (loss) (276.26) (123.07) (106.20) (106.20) (106.20) (106.20) (106.20) (106.20) (106.20)
Total stockholders' equity 6,135.79 7,740.23 9,278.10 11,147.28 13,326.96 15,839.54 18,711.16 21,954.71 25,551.45 Total liabilities and stockholders' equity 8,134.72 11,479.05 13,065.40 14,997.24 17,513.94 19,795.22 23,155.08 26,910.42 30,991.50

Cognizant Technology Solutions CorporationCommon Size Balance Sheet
Fiscal Years Ending Dec. 31 2013 2014 2015 2016E 2017E 2018E 2019E 2020E 2021E
AssetsCurrent assets: Cash and cash equivalents 25.03% 19.59% 17.12% 23.66% 32.04% 36.78% 45.54% 53.93% 61.60% Short-term investments 17.35% 17.19% 22.75% 20.54% 18.30% 16.43% 14.89% 13.60% 12.62% Trade accounts receivable, net 18.64% 19.18% 18.14% 18.90% 18.90% 18.90% 18.90% 18.90% 18.90% Unbilled accounts receivable 2.56% 3.16% 2.97% 2.57% 2.57% 2.57% 2.57% 2.57% 2.57% Deferred income tax assets, net 2.90% 0.00% 0.00% 0.00% 0.00% 0.00% 0.00% 0.00% 0.00% Other current assets 3.04% 3.44% 2.72% 3.49% 3.49% 3.49% 3.49% 3.49% 3.49% Total current assets 69.52% 62.56% 63.70% 69.16% 75.29% 78.17% 85.39% 92.49% 99.17%Property and equipment, net 12.23% 12.15% 10.24% 9.80% 9.07% 8.35% 7.67% 7.05% 7.43%Long-term investment 0.00% 0.00% 0.00% 0.00% 0.00% 0.00% 0.00% 0.00% 0.00%Goodwill 5.02% 23.52% 19.37% 17.17% 15.02% 13.24% 11.79% 10.57% 9.63%Intangible assets, net 1.48% 9.29% 6.96% 6.22% 5.49% 4.87% 4.37% 3.95% 3.63%Deferred income tax assets, net 1.66% 2.28% 2.80% 2.80% 2.80% 2.82% 2.87% 2.94% 3.05%Other noncurrent assets 2.07% 2.04% 2.16% 1.95% 1.73% 1.55% 1.40% 1.27% 1.18% Total assets 91.99% 111.85% 105.23% 107.10% 109.40% 109.00% 113.49% 118.27% 124.08%
Liabilities and Stockholders' EquityCurrent liabilities: Accounts payable 1.28% 1.42% 1.33% 1.34% 1.34% 1.34% 1.34% 1.34% 1.34% Deferred revenue 2.07% 1.95% 2.48% 2.79% 2.73% 2.74% 2.63% 2.53% 2.41% Short-term debt 0.00% 6.10% 3.11% 0.00% 0.00% 0.00% 0.00% 0.00% 0.00% Accrued expenses and other current liabilities 16.72% 13.26% 13.92% 14.62% 14.31% 14.36% 13.80% 13.24% 12.62% Total current liabilities 20.07% 22.58% 20.77% 18.66% 18.27% 18.33% 17.61% 16.90% 16.10%Deferred revenue, noncurrent 0.00% 0.71% 0.38% 0.00% 0.00% 0.00% 0.00% 0.00% 0.00%Deferred income tax liabilities, net 0.24% 0.10% 0.03% 0.00% 0.00% 0.00% 0.00% 0.00% 0.00%Long-term debt 0.00% 8.17% 6.74% 5.33% 4.00% 0.00% 0.00% 0.00% 0.00%Other noncurrent liabilities 2.30% 1.01% 1.07% 1.68% 1.64% 1.65% 1.58% 1.52% 1.45% Total liabilities 22.60% 36.43% 30.50% 27.49% 26.15% 21.78% 21.78% 21.78% 21.78%Stockholders' equity:
Preferred stock, $0.10 par value, 15.0 shares authorized, none issued 0.00% 0.00% 0.00% 0.00% 0.00% 0.00% 0.00% 0.00% 0.00%Common equity 6.22% 5.47% 3.70% 3.61% 3.44% 3.28% 3.15% 3.02% 2.94%Retained earnings 66.29% 71.15% 71.88% 76.76% 80.47% 84.52% 89.08% 93.94% 99.79%Accumulated other comprehensive income (loss) -3.12% -1.07% -0.81% -0.71% -0.61% -0.54% -0.46% -0.39% -0.34%
Total stockholders' equity 69.38% 75.42% 74.73% 79.61% 83.25% 87.22% 91.71% 96.49% 102.30% Total liabilities and stockholders' equity 91.99% 111.85% 105.23% 107.10% 109.40% 109.00% 113.49% 118.27% 124.08%

Cognizant Technology Solutions CorporationCash Flow Statement(in millions) Fiscal Years Ending Dec. 31 2006 2007 2008 2009 2010 2011 2012 2013 2014 2015Cash flows from operating activities:Net income 232.80 350.13 430.85 534.96 733.54 883.62 1,051.26 1,228.58 1,439.27 1,623.60Adjustments to reconcile net income to net cash provided by operating activities: Depreciation and amortization 34.16 53.92 74.80 89.37 110.17 124.18 156.59 179.93 208.07 330.00 Provision for doubtful accounts 1.51 3.56 8.47 3.35 5.95 4.58 5.08 3.57 4.68 10.20 Deferred income taxes 33.29 25.06 (5.03) (26.59) (51.91) (8.60) (117.91) (88.19) (99.58) (126.10) Stock-based compensation expense 29.93 35.92 43.90 44.82 56.98 90.23 107.36 118.80 134.83 192.00 Excess tax benefits on stock-based compensation plans (33.25) (42.27) (16.99) (31.56) (71.92) (39.14) (48.37) (30.58) (23.55) (33.70) Other - - 2.59 (6.10) (7.60) 46.04 2.50 52.54 30.28 48.60 Changes in assets and liabilities: Trade accounts receivable (102.33) (119.88) (168.40) (98.45) (278.42) (284.17) (158.60) (258.47) (259.33) (322.40) Other current assets (26.85) (34.23) (31.15) (42.78) (75.35) (99.22) (29.83) (74.67) (118.59) (32.50) Other noncurrent assets (8.42) (15.78) (9.98) (9.26) (24.30) (28.81) (36.69) (24.34) 19.12 (38.60) Accounts payable 10.82 10.55 19.28 6.68 18.60 (8.59) 32.77 (12.12) 25.68 19.40 Deferred revenues, current and noncurrent - - - - - - - 15.20 70.60 49.70 Other current and noncurrent liabilities 81.23 77.34 81.36 207.88 348.90 195.04 208.44 313.50 41.50 433.10 Net cash provided by operating activities 252.88 344.32 429.71 672.33 764.65 875.15 1,172.58 1,423.75 1,472.96 2,153.30
Cash flows from investing activities: Purchases of property and equipment (104.73) (182.47) (169.41) (76.64) (185.51) (288.22) (334.47) (261.63) (212.20) (272.80) Purchases of investments (488.16) (968.67) (135.20) (348.21) (934.19) (1,338.66) (1,428.51) (1,848.74) (2,497.30) (3,003.70) Proceeds from maturity or sale of investments 335.33 1,020.62 270.56 98.70 706.67 859.40 1,252.82 1,573.41 2,240.25 1,907.60 Business combinations, net of cash acquired (14.77) (146.82) (20.96) (68.61) (33.86) (82.80) (59.89) (193.81) (2,691.44) (1.70) Net cash (used in) investing activities (272.34) (277.34) (55.01) (394.76) (446.89) (850.28) (570.05) (730.76) (3,160.69) (1,370.60)
Cash flows from financing activities: Issuance of common stock under stock-based compensation plans 51.40 67.10 54.88 61.65 107.08 79.55 129.48 117.56 101.46 131.60 Excess tax benefits on stock-based compensation plans 33.25 42.27 16.99 31.56 71.92 39.14 48.37 30.58 23.55 33.70 Repurchases of common stock - (105.36) (27.84) (16.26) (59.00) (374.15) (520.85) (179.00) (248.32) (460.00) Proceeds from term loan borrowings - - - - - - - - 1,000.00 - Debt issuance costs - - - - - - - - (9.10) - Repayment of term loan borrowings and capital lease obligations - - - - - - - - (14.18) (53.40) Net change in notes outstanding under the revolving credit facility (1.75) - - - - - - - 650.00 (300.00) Net cash (used in) provided by financing activities 82.90 4.01 44.03 76.95 120.00 (255.46) (342.99) (30.87) 1,503.40 (648.10)
Effect of exchange rate changes on cash and cash equivalents 5.57 2.92 (23.51) 11.36 2.27 0.52 (0.38) (19.22) (18.58) (19.50)Increase (decrease) in cash and cash equivalents 69.00 73.91 395.22 365.86 440.04 (230.06) 259.17 642.91 (202.91) 115.10Cash and cash equivalents, beginning of year 196.94 265.94 339.85 735.07 1,100.93 1,540.97 1,310.91 1,570.08 2,213.01 2,010.10Cash and cash equivalents, end of period 265.94 339.85 735.07 1,100.93 1,540.97 1,310.91 1,570.08 2,212.99 2,010.10 2,125.20

Cognizant Technology Solutions CorporationCash Flow Statement (Forecast)(in millions, except par values) Fiscal Years Ending Dec. 31 2016E 2017E 2018E 2019E 2020E 2021ECash flows from operating activities:Net Income 1,823.36 2,133.86 2,466.77 2,825.81 3,197.72 3,550.93
Adjustments to reconcile net income to cash from operating activities:Depreciation expense 178.00 192.03 203.32 212.27 219.22 224.46 Amortization expense 96.10 93.20 85.80 83.50 76.30 78.60 Change in deferred income tax expense (47.65) (55.77) (64.47) (73.85) (83.57) (92.80)
Changes in assets and liabilities: Trade accounts receivable (393.47) (379.16) (406.62) (423.59) (444.03) (420.20) Unbilled account receivable 8.49 (51.66) (55.40) (57.71) (60.50) (57.25) Other current assets (150.81) (69.97) (75.04) (78.17) (81.94) (77.55) Accounts payable 22.13 26.86 28.80 30.00 31.45 29.76 Deferred revenues 45.49 59.97 64.31 66.99 70.22 66.46 Accrued expenses and other current liabilities 373.92 314.14 336.89 350.95 367.88 348.15 Other noncurrent liabilities 111.92 36.07 38.68 40.29 42.24 39.97
Net cash provided by operating activities 2,067.47 2,299.57 2,623.05 2,976.50 3,335.01 3,690.52
Cash flows from investing activities: Purchases of short-investments (51.97) (52.92) (53.90) (54.89) (55.90) (56.93) Purchases of property and equipment (278.26) (272.69) (267.24) (261.89) (256.65) (475.98)
Increase in intangible assets (103.01) (100.17) (92.83) (90.58) (83.44) (85.80) Increase in other noncurrent assets (4.03) (4.09) (4.15) (4.21) (4.28) (4.34)
Net cash (used in) investing activities (437.27) (429.87) (418.11) (411.58) (400.27) (623.04)
Cash flows from financing activities: Changes in short-term debt (406.30) - - - - - Payment of long-term debt (81.20) (100.00) (700.00) - - - Proceed from ESOP exercise 45.816 45.816 45.816 45.816 45.816 45.816Repurchases of common stock 0.00 0.00 0.00 0.00 0.00 0.00
Net cash (used in) provided by financing activities (441.68) (54.18) (654.18) 45.82 45.82 45.82
Increase (decrease) in cash and cash equivalents 1,188.52 1,815.51 1,550.76 2,610.74 2,980.56 3,113.30 Cash and cash equivalents, beginning of year 2,125.20 3,313.72 5,129.23 6,679.99 9,290.73 12,271.28 Cash and cash equivalents, end of period 3,313.72 5,129.23 6,679.99 9,290.73 12,271.28 15,384.58

Cognizant Technology Solutions CorporationValue Driver Estimation
Fiscal Years Ending Dec. 31 2013 2014 2015 2016E 2017E 2018E 2019E 2020E 2021EAssumptions: Marginal tax rate 26.80% 25.60% 26.10% 26.10% 26.10% 26.10% 26.10% 26.10% 26.10% Normal cash 15.91% 15.91% 15.91% 15.91% 15.91% 15.91% 15.91% 15.91% 15.91% Cost of debt 4.27% 4.27% 4.27% 4.27% 4.27% 4.27% 4.27% 4.27% 4.27%
NOPLAT CalculationNet revenues: 8,843.19 10,262.70 12,416.00 14,002.81 16,009.28 18,161.09 20,402.67 22,752.42 24,976.11Less: Cost of revenues (5,265.47) (6,141.12) (7,440.20) (8,271.46) (9,456.68) (10,727.76) (12,051.86) (13,439.86) (14,753.39)Less: SG&A expenses (1,727.61) (2,037.02) (2,508.60) (3,026.01) (3,459.61) (3,924.61) (4,409.02) (4,916.80) (5,397.34)Less: Depreciation & Amortization (24.64) (33.67) (94.57) (96.10) (93.20) (85.80) (83.50) (76.30) (78.60) Plus: Implied interset on operating leases 26.15 29.50 27.23 27.54 31.12 35.17 39.74 44.91 50.74
EBITA 1,851.63 2,080.38 2,399.86 2,636.78 3,030.92 3,458.09 3,898.04 4,364.37 4,797.53 Provision for income taxes 459.34 484.76 540.00 643.98 753.64 871.21 998.02 1,129.37 1,254.12
Plus:Tax shied on interest expense - 0.63 4.62 14.35 8.92 7.80 - - - Less: Tax on interest income (13.10) (15.99) (21.85) (23.77) (29.73) (38.70) (46.41) (59.21) (73.79) Plus: Tax shield on foreign currency exchange losses, net 11.01 5.22 11.12 - - - - - - Plus: Tax shield on opeating Leases Interest 7.01 7.55 7.11 7.19 8.12 9.18 10.37 11.72 13.24
Total Adjusted Taxes 464.26 482.18 541.00 641.74 740.95 849.49 961.98 1,081.89 1,193.57 Change in Deferred Taxes (4.27) 159.81 (122.10) (47.65) (55.77) (64.47) (73.85) (83.57) (92.80)
NOPLAT 1,383.10 1,758.02 1,736.76 1,947.39 2,234.20 2,544.13 2,862.20 3,198.91 3,511.15
Invested Captial CalculationNon-interest bearing current opearting assets:
Normal cash 1,407.26 1,633.15 1,975.82 2,228.33 2,547.63 2,890.06 3,246.77 3,620.70 3,974.57 Accounts receviable 1,648.79 1,968.68 2,252.60 2,646.07 3,025.23 3,431.85 3,855.44 4,299.47 4,719.67 Unbilled accounts receviable 226.49 324.58 369.00 360.51 412.17 467.57 525.28 585.77 643.02 Other current assets 268.91 352.61 337.50 488.31 558.28 633.32 711.49 793.43 870.98
Non-interest bearing current opearting assets 3,551.44 4,279.02 4,934.92 5,723.23 6,543.31 7,422.80 8,338.98 9,299.37 10,208.23 Non-interest bearing opearting current liabilities:
Accounts payable 113.39 145.69 165.30 187.43 214.28 243.09 273.09 304.54 334.31 Deferred revenue 182.89 224.11 323.70 418.49 478.46 542.76 609.76 679.98 746.44 Accrued expenses and other current liabilities 1,478.22 1,522.29 1,818.40 2,192.32 2,506.46 2,843.36 3,194.31 3,562.19 3,910.34
Non-interest bearing opearting current liabilities 1,774.51 1,892.09 2,307.40 2,798.24 3,199.20 3,629.21 4,077.15 4,546.71 4,991.08 Net opearting working captial 1,776.94 2,386.93 2,627.52 2,924.99 3,344.11 3,793.59 4,261.83 4,752.66 5,217.15 Plus: Net PPE 1,081.16 1,247.20 1,271.40 1,371.66 1,452.32 1,516.23 1,565.85 1,603.29 1,854.81 Plus: Other long-term opearting assets 982.34 1,774.47 1,644.76 1,784.82 1,879.66 1,985.53 2,103.83 2,236.17 2,384.36 PV of Operating Leases 690.76 637.71 570.80 645.00 728.85 823.60 930.67 1,051.66 1,188.37 Other noncurrent assets 160.31 183.01 209.66 268.60 272.63 276.72 280.87 285.08 289.36 Intangible assets, net 131.27 953.75 864.30 871.21 878.18 885.21 892.29 899.43 906.63 Less: Other Long-term Opearting Liabilities 203.25 197.42 189.10 251.72 287.78 326.47 366.76 409.00 448.97 Deferred revenue, noncurrent - 81.00 49.30 - - - - - - Other noncurrent liabilities 203.25 116.42 139.80 251.72 287.78 326.47 366.76 409.00 448.97 Invested Captial 3,637.19 5,211.18 5,354.58 5,829.75 6,388.31 6,968.89 7,564.75 8,183.11 9,007.34
Core Value Drivers
NOPLAT 1,383.10 1,758.02 1,736.76 1,947.39 2,234.20 2,544.13 2,862.20 3,198.91 3,511.15 Beginning Invested Captial 3,038.52 3,637.19 5,211.18 5,354.58 5,829.75 6,388.31 6,968.89 7,564.75 8,183.11 Return on Invested Captial (ROIC) 46% 48% 33% 36% 38% 40% 41% 42% 43%
NOPLAT 1,383.10 1,758.02 1,736.76 1,947.39 2,234.20 2,544.13 2,862.20 3,198.91 3,511.15 Less: Change in Invested Captial (598.67) (1,573.99) (143.40) (475.17) (558.56) (580.58) (595.86) (618.36) (824.23) Free Cash Flow (FCF) 784.43 184.02 1,593.36 1,472.22 1,675.63 1,963.55 2,266.34 2,580.55 2,686.92
Beginning Invested Captial 3,038.52 3,637.19 5,211.18 5,354.58 5,829.75 6,388.31 6,968.89 7,564.75 8,183.11 ROIC 46% 48% 33% 36% 38% 40% 41% 42% 43%WACC 8.52% 8.52% 8.52% 8.52% 8.52% 8.52% 8.52% 8.52% 8.52% Economic Profits (EP) 1,124.24 1,448.15 1,292.80 1,491.21 1,737.54 1,999.89 2,268.50 2,554.45 2,814.01

Cognizant Technology Solutions CorporationWeighted Average Cost of Capital (WACC) Estimation
Cost of EquityRisk-free rate (30 yr T-Bond) 2.52%Risk Premium 5.96%Beta 1.06
Cost of Equity 8.84%
Cost of DebtRating A-Default Premium 1.75%Risk-free rate 2.52%
Cost of Debt 4.27%
MV of Equity (mm) # of Shares (mm) 609.10 Share Price 51.41
MV of Equity 31,313.83
MV of DebtBV of Long-Term Debt 881.20BV of Short-term Debt 406.30PV of Operating leases 570.80
MV of Debt 1858.30
Total Value 33172.13 Weight of Equity 94.40% Weight of Debt 5.60%

Cognizant Technology Solutions CorporationDiscounted Cash Flow (DCF) and Economic Profit (EP) Valuation Models
Key Inputs: CV growth of NOPLAT 2.00% CV growth of ROIC 42% WACC 8.52% Cost of equity 8.84%
Fiscal Years Ending Dec. 31 2015 2016E 2017E 2018E 2019E 2020E (CV)2021E
DCF ModelNOPLAT 1,947.39 2,234.20 2,544.13 2,862.20 3,198.91 3,511.15 ROIC 36% 38% 40% 41% 42% 43%Capex (475.17) (558.56) (580.58) (595.86) (618.36) (824.23) Free cash flow 1,472.22 1,675.63 1,963.55 2,266.34 2,580.55 2,686.92 Continueing value 51,293.22
Periods to discount 1 2 3 4 5 5 Discount factor 0.92 0.85 0.78 0.72 0.66 0.66 PV of free cash flow 1,356.64 1,422.87 1,536.46 1,634.17 1,714.66 34,082.01
PV of operating assets 41746.81Excess cash 149.38Short-term investment 2824.30
PV of operating assets (570.80) Short-term debt (406.30)
Lont-term debt (881.20) Employee stock option (139.73)
Value of equity 42722.47Shares outstanding 609.10Intrinsic stock price as of 12/31/15 70.14$
EP ModelEconomic profit 1491.21 1737.54 1999.89 2268.50 2554.45 2814.01Continuing value 43110.11
Periods to discount 1 2 3 4 5 5Discount factor 0.92 0.85 0.78 0.72 0.66 0.66PV of economic profit 1374.15 1475.44 1564.89 1635.73 1697.32 28644.71
PV of economic profit 36392.23Plus: beginning IC 5,354.58 PV of operaing lease 41,746.81
Excess cash 149.38Short-term investment 2824.30
PV of operating assets (570.80) Short-term debt (406.30)
Lont-term debt (881.20) Employee stock option (139.73)
Value of equity 42722.47Shares outstanding 609.10Intrinsic stock price as of 12/31/15 70.14$
Intrinsic stock price as of 12/13/15 70.14$ Cost of equity 8.84%Elapsed Fraction 0.869Adjusted stock price as of 11/13/2016 75.497

Cognizant Technology Solutions CorporationDividend Discount Model (DDM) or Fundamental P/E Valuation Model
Fiscal Years Ending Dec. 31 2016E 2017E 2018E 2019E 2020E (CV)2021E
EPS 2.98$ 3.48$ 4.00$ 4.57$ 5.15$ 5.70$
Key Assumptions CV growth of EPS 2.25% CV growth of ROE 16.12% Cost of equity 8.84%
Future Cash Flows P/E Multiple (CV year) 13.06 EPS (CV Year) 5.70$ Future stock price 74.39 Dividends per share - - - - - - Periods to discount 5 Discount factor 0.65 Discounted Cash Flows 48.709$
Intrinsic value of stock as of 12/31/2015 48.71$ Cost of equity 8.84%Elapsed Fraction 0.929Adjusted stock price as of 11/13/2016 52.70

Cognizant Technology Solutions CorporationKey Management Ratios
Fiscal Years Ending Dec. 31 2013 2014 2015 2016E 2017E 2018E 2019E 2020E 2021E
Liquidity RatiosCurrent ratio Current asset / Current liabilities 3.46 2.48 2.91 3.46 3.77 3.91 4.27 4.63 4.96 Operating Cash Flow Ratio Cash flows from opearations / Current liabilities 0.80 0.57 0.79 0.74 0.72 0.72 0.73 0.73 0.74 Cash Ratio Cash and cash equivalents / Current liabilities 1.25 0.78 0.78 1.18 1.60 1.84 2.28 2.70 3.08
Activity or Asset-Management RatiosReceivables Turnover Net credit sales /Average accounts receivbale 5.91 5.67 5.88 5.72 5.65 5.63 5.60 5.58 5.54 Total Asset Turnover Revenues / Total assets 1.09 0.89 0.95 0.93 0.91 0.92 0.88 0.85 0.81
Financial Leverage RatiosDebt to Equity Ratio Total liabilities / Total stockholders' equity 0.33 0.48 0.41 0.35 0.31 0.25 0.24 0.23 0.21 Debt Ratio Total debt / Total assets 0.00 0.14 0.10 0.05 0.04 - - - - Interest Coverage Operating income / Interest expense - 763.73 121.02 44.22 82.19 107.71 - - -
Profitability RatiosGross Profit Margin (Revenue - cost of revenue)/ Revenue 0.40 0.40 0.40 0.41 0.41 0.41 0.41 0.41 0.41 Return on Assets Net income / Total assets 0.15 0.13 0.12 0.12 0.12 0.12 0.12 0.12 0.11 Return on Equity Net income / Stockholders' equity 0.20 0.19 0.17 0.16 0.16 0.16 0.15 0.15 0.14
Payout Policy RatiosDividend Yield Dividends per share/ Price per share 0.00 0.00 0.00 0.00 0.00 0.00 0.00 0.00 0.00

Cognizant Technology Solutions CorporationRelative Valuation Models
EPS EPSTicker Company Price 2016E 2017E P/E 16 P/E 17ACN Accenture $119.18 $5.93 $6.49 20.1 18.4 TCS.BO Tata Consultancy Services limited $31.35 $1.99 $2.15 15.8 14.6 CAP.PA Cap Gemini S.A. $78.62 $5.65 $6.13 13.9 12.8 VA7A.S Verisk Analytics Inc. Registere $83.13 $3.08 $3.35 27.0 24.8 CA CA, Inc. $32.07 $2.52 $2.62 12.7 12.3 INFY Infosys Limited $13.73 $0.93 $1.01 14.8 13.5
Average 17.4 16.1
CTSH Cognizant Technology Solutions Corporation$51.41 $2.98 $3.48 17.2 14.8
Implied Value: Relative P/E (EPS16) $ 51.79 Relative P/E (EPS17) 55.81$
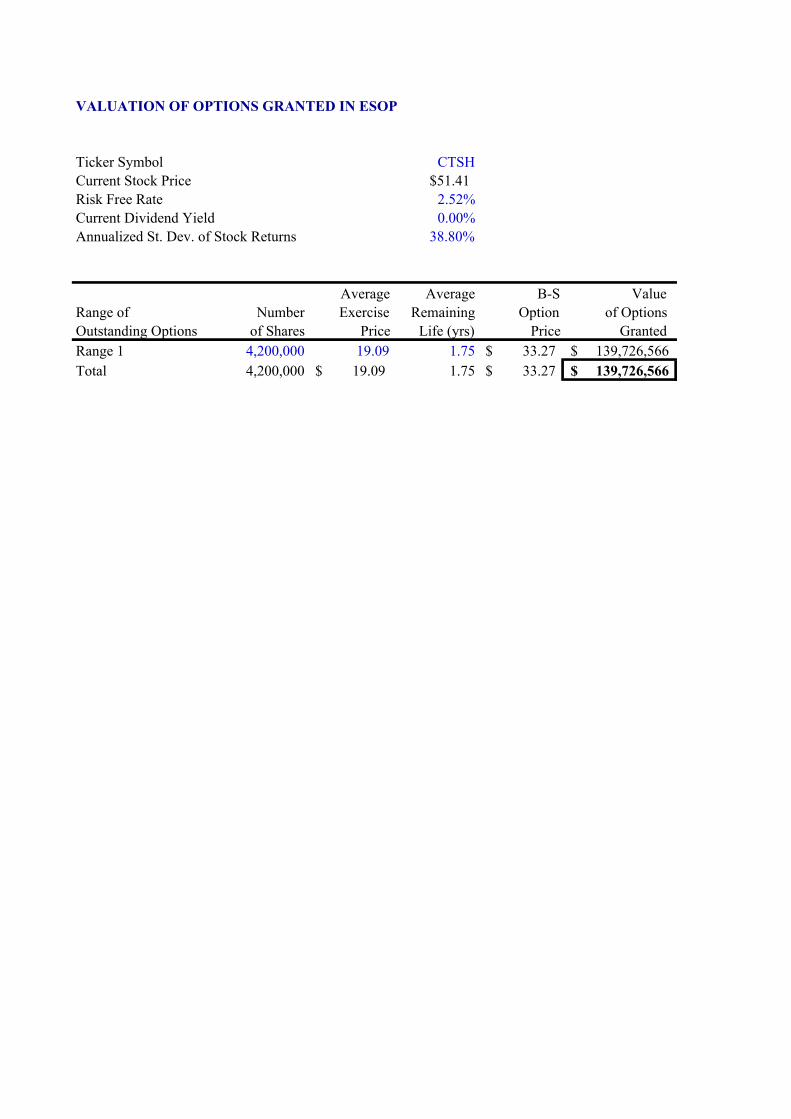
VALUATION OF OPTIONS GRANTED IN ESOP
Ticker Symbol CTSHCurrent Stock Price $51.41Risk Free Rate 2.52%Current Dividend Yield 0.00%Annualized St. Dev. of Stock Returns 38.80%
Average Average B-S ValueRange of Number Exercise Remaining Option of OptionsOutstanding Options of Shares Price Life (yrs) Price GrantedRange 1 4,200,000 19.09 1.75 33.27$ 139,726,566$ Total 4,200,000 19.09$ 1.75 33.27$ 139,726,566$

Effects of ESOP Exercise and Share Repurchases on Common Stock Balance Sheet Account and Number of Shares Outstanding
Number of Options Outstanding (shares): 4,200,000Average Time to Maturity (years): 1.75Expected Annual Number of Options Exercised: 2,400,000
Current Average Strike Price: 19.09$ Cost of Equity: 8.84%Current Stock Price: $51.41
2016E 2017E 2018E 2019E 2020E 2021E 2022E 2023E 2024E 2025EIncrease in Shares Outstanding: 2,400,000 2,400,000 2,400,000 2,400,000 2,400,000 2,400,000 2,400,000 2,400,000 2,400,000 2,400,000Average Strike Price: 19.09$ 19.09$ 19.09$ 19.09$ 19.09$ 19.09$ 19.09$ 19.09$ 19.09$ 19.09$ Increase in Common Stock Account: 45,816,000 45,816,000 45,816,000 45,816,000 45,816,000 45,816,000 45,816,000 45,816,000 45,816,000 45,816,000
Change in Treasury Stock 0 0 0 0 0 0 0 0 0 0Expected Price of Repurchased Shares: 51.41$ 55.95$ 60.90$ 66.28$ 72.14$ 78.51$ 85.45$ 93.00$ 101.22$ 110.17$ Number of Shares Repurchased: - - - - - - - - - -
Shares Outstanding (beginning of the year) 609,100,000 611,500,000 613,900,000 616,300,000 618,700,000 621,100,000 623,500,000 625,900,000 628,300,000 630,700,000Plus: Shares Issued Through ESOP 2,400,000 2,400,000 2,400,000 2,400,000 2,400,000 2,400,000 2,400,000 2,400,000 2,400,000 2,400,000Less: Shares Repurchased in Treasury - - - - - - - - - - Shares Outstanding (end of the year) 611,500,000 613,900,000 616,300,000 618,700,000 621,100,000 623,500,000 625,900,000 628,300,000 630,700,000 633,100,000

Present Value of Operating Lease Obligations (2015) Present Value of Operating Lease Obligations (2014) Present Value of Operating Lease Obligations (2013)
Operating Operating OperatingFiscal Years Ending Dec. 31 Leases Fiscal Years Ending Dec. 31 Leases Fiscal Years Ending Leases2016 134.2 2015 148.32 2014 135.7452017 117.4 2016 125.277 2015 119.3962018 95.6 2017 105.149 2016 96.7722019 86.2 2018 81.682 2017 55.4262020 64.8 2019 71.695 2018 187.434Thereafter 164.9 Thereafter 214.534 Thereafter 214.534Total Minimum Payments 663.1 Total Minimum Payments 746.657 Total Minimum Payments 809.307Less: Interest 92 Less: Interest 109 Less: Interest 119PV of Minimum Payments 571 PV of Minimum Payments 638 PV of Minimum Payments 691

75.498 1.50% 1.75% 2.00% 2.25% 2.50% 75.498 5.76% 5.86% 5.96% 6.06% 6.16%38.0% 71.69 73.37 75.18 77.14 79.26 1.35% 78.07 76.83 75.63 74.47 73.3440.0% 71.80 73.51 75.35 77.33 79.48 1.55% 78.00 76.76 75.56 74.40 73.2842.0% 71.91 73.64 75.50 77.51 79.69 1.75% 77.93 76.69 75.50 74.34 73.2144.0% 72.00 73.75 75.63 77.67 79.87 1.95% 77.86 76.62 75.43 74.28 73.1546.0% 72.09 73.86 75.76 77.81 80.04 2.15% 77.78 76.56 75.37 74.21 73.09
75.498 57.07% 58.07% 59.07% 60.07% 61.07% 75.498 57.07% 58.07% 59.07% 60.07% 61.07%24.1% 85.79 81.70 77.61 73.51 69.42 19.61% 91.40 87.43 83.45 79.47 75.5025.1% 84.62 80.59 76.55 72.52 68.48 20.61% 87.43 83.45 79.47 75.50 71.5226.1% 83.45 79.47 75.50 71.52 67.55 21.61% 83.45 79.47 75.50 71.52 67.5527.1% 82.28 78.36 74.44 70.53 66.61 22.61% 79.47 75.50 71.52 67.55 63.5728.1% 81.11 77.25 73.39 69.53 65.67 23.61% 75.50 71.52 67.55 63.57 59.59
75.498 2.27% 2.52% 2.77% 3.02% 3.27% 75.498 0.96 1.01 1.06 1.11 1.161.35% 78.62 75.63 72.86 70.30 67.90 1.35% 82.92 79.11 75.63 72.44 69.521.55% 78.54 75.56 72.80 70.24 67.85 1.55% 82.83 79.03 75.56 72.39 69.461.75% 78.47 75.50 72.74 70.19 67.80 1.75% 82.75 78.96 75.50 72.33 69.411.95% 78.40 75.43 72.68 70.13 67.75 1.95% 82.67 78.88 75.43 72.27 69.362.15% 78.33 75.37 72.62 70.08 67.71 2.15% 82.58 78.81 75.37 72.21 69.30
CV growth of NOPLAT Equity risk premium
CV growth of ROIC Default risk premium
Default risk premium Default risk premium
Cost of revenue as % of sales Cost of revenue as % of sales
Marginal tax rate S&G expense as % ofsales
Risk free rate Beta