Annual Report - Nasdaq
93
1 January 2021 – 31 December 2021 Annual Report
-
Upload
khangminh22 -
Category
Documents
-
view
1 -
download
0
Transcript of Annual Report - Nasdaq

1 January 2021 – 31 December 2021
Annual Report

2
Introduction
This is Cibus Nordic 3
The year in brief 4
Time line 5
CEO’s comments 7
Strategic focus 9
Business concept and goals 9
Cibus as an investment 10
Investing in Cibus 10
Share and shareholders 11
Dividend 13
Market overview 14
Property market 15
Operations 16
Earnings capacity 16
Tenants and lease structure 17
The property portfolio 18
Geographic locations 20
The impact of e-commerce on Cibus’s business model 21
Financing 22
Employees and corporate culture 23
Sustainability 25
EPRA 40
Risk and risk management 41
Corporate governance 46
Corporate Governance Report 46
Statutory Sustainability Report 54
Board of Directors, Management and Auditor 55
Financial statements 57
Administration Report 58
Consolidated income statement and statement of comprehensive income
62
Consolidated statement of financial position 63
Consolidated statement of changes in equity 64
Consolidated cash-flow statement 65
Parent Company income statement and statement of comprehensive income
66
Parent Company balance sheet 67
Parent Company statement of changes in equity 68
Parent Company cash flow statement 69
Accounting policies and notes 70
Auditor’s report 83
Definitions 87
Property list 89
Table of contents
K-Supermarket Lähde, Rajamäki

3
This is Cibus
The business concept of Cibus Nordic Real Estate AB (publ), “Cibus”, is to acquire, refine and develop high-quality properties in the Nordic region, with reputable grocery and supermarket chains as anchor tenants, to provide stable, cyclically
resilient and increasing dividends for our shareholders.
As of 31 December 2021, the Company owned a property portfolio with a total of 400 properties, of which 266 were located in Finland, 124 in Sweden and 10 in Norway. The total lettable area was 866,920 square metres. The largest tenants were Kesko (41% of net operating income), Tokmanni (22%), Coop (13%), S Group (9%) and Lidl (5%). An additional 8% of the properties are leased to other grocery retailers.
The property portfolio is spread out in strategic locations, mainly in southern and south-western Finland, southern and central Sweden and in southern Norway. The properties are, to a large extent, located in regions with good population growth.
The Company specialises in grocery and daily-goods anchored properties, which in general have two main characteristics that distinguish them from most other types of retail properties. These characteristics are the non-cyclical nature of the business and the resilience towards e-commerce. The portfolio comprises a strategic distribution network with delivery points for other goods traded online. These characteristics provide a higher level of stability and lower risk than other retail properties, which has been particularly evident during the Covid-19 pandemic.
The Company aims to deliver a stable and non-cyclical dividend level to its shareholders that also increases over time. This is achieved through good profitability in the underlying property portfolio, together with additional investments in new properties.
Grocery and daily-goods anchored properties are largely owned by institutions, grocery or daily-goods chains or a joint venture of both. Cibus offers investors the same opportunity to achieve a favourable yield from the stable cash flows of this segment.
The 2021 Annual General Meeting approved a dividend totalling EUR 0.94 per share, corresponding to a yield of 3.3% on the market price as of 31 December 2021 (SEK 290.80).
The Board of Directors intends to propose to the 2022 Annual General Meeting:
– That a new share class (D) be established, with a bonus issue being made to existing shareholders in connection with this.
– That the dividend be increased by 5% to EUR 0.99 per existing share, to be distributed to all share classes. Accordingly, current shareholders will receive a dividend equivalent to 0.99 EUR for each existing share held and divided between 12 dividend payment dates.
– All share classes are to receive monthly dividends.
1,500Property value, EUR million
867 Lettable area, m2 thousand
0.94Dividend per share, EUR
3.3Yield, %
I N T R O D U CT I O N
4
I N T R O D U CT I O N
The year in briefFull-year 2021
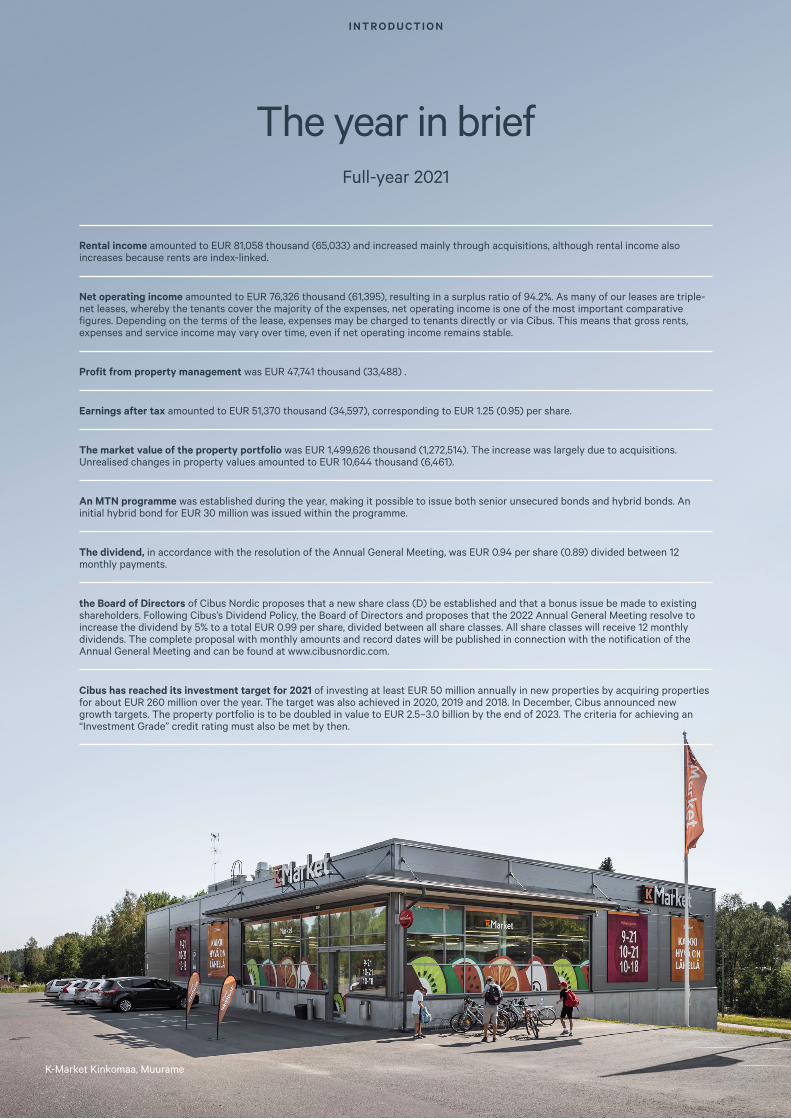
Rental income amounted to EUR 81,058 thousand (65,033) and increased mainly through acquisitions, although rental income also increases because rents are index-linked.
Net operating income amounted to EUR 76,326 thousand (61,395), resulting in a surplus ratio of 94.2%. As many of our leases are triple-net leases, whereby the tenants cover the majority of the expenses, net operating income is one of the most important comparative figures. Depending on the terms of the lease, expenses may be charged to tenants directly or via Cibus. This means that gross rents, expenses and service income may vary over time, even if net operating income remains stable.
Profit from property management was EUR 47,741 thousand (33,488) .
Earnings after tax amounted to EUR 51,370 thousand (34,597), corresponding to EUR 1.25 (0.95) per share.
The market value of the property portfolio was EUR 1,499,626 thousand (1,272,514). The increase was largely due to acquisitions. Unrealised changes in property values amounted to EUR 10,644 thousand (6,461).
An MTN programme was established during the year, making it possible to issue both senior unsecured bonds and hybrid bonds. An initial hybrid bond for EUR 30 million was issued within the programme.
The dividend, in accordance with the resolution of the Annual General Meeting, was EUR 0.94 per share (0.89) divided between 12 monthly payments.
the Board of Directors of Cibus Nordic proposes that a new share class (D) be established and that a bonus issue be made to existing shareholders. Following Cibus’s Dividend Policy, the Board of Directors and proposes that the 2022 Annual General Meeting resolve to increase the dividend by 5% to a total EUR 0.99 per share, divided between all share classes. All share classes will receive 12 monthly dividends. The complete proposal with monthly amounts and record dates will be published in connection with the notification of the Annual General Meeting and can be found at www.cibusnordic.com.
Cibus has reached its investment target for 2021 of investing at least EUR 50 million annually in new properties by acquiring properties for about EUR 260 million over the year. The target was also achieved in 2020, 2019 and 2018. In December, Cibus announced new growth targets. The property portfolio is to be doubled in value to EUR 2.5–3.0 billion by the end of 2023. The criteria for achieving an “Investment Grade” credit rating must also be met by then.
K-Market Kinkomaa, Muurame

5
I N T R O D U CT I O N
Time line
14 APRIL
On 14 April, it was announced that Cibus had acquired three properties in Sweden for SEK 34.5 million. ICA Sverige is the anchor tenant for all of the properties concerned.
15 APRIL
At the Annual General Meeting on 15 April 2021, Victoria Skoglund was elected as a new Board Member. Patrick Gylling was re-elected Chairman of the Board and Elisabeth Norman, Jonas Ahlblad and Stefan Gattberg were re-elected as Board Members.
29 APRIL
On 29 April, it was announced that Cibus had acquired a property in Rauma, Finland for EUR 5.3 million. Tokmanni is the anchor tenant.
14 MAY
On 14 April, it was announced that Cibus would acquire three properties in Finland for EUR 25.5 million. Lidl, Halpahalli and S Group are the anchor tenants.
26 MAY
On 26 May, Cibus announced that it had signed a collaboration agreement with Järntorget to jointly develop that part of Cibus’ Swedish property portfolio that is not used for daily goods retail. Through planning work, the aim of the agreement is to realise building rights for rental apartments in Cibus’s existing and future Swedish property portfolio.
27 MAY
On 27 May, it was announced that Cibus had been approved for listing on Nasdaq Stockholm. The first day of trading on Nasdaq Stockholm’s main list was Tuesday, 1 June 2021, and the final day of trading on Nasdaq First North Premier Growth Market was Monday, 31 May 2021.
28 MAY
On 28 May, Cibus published a prospectus in connection with the change of listing to Nasdaq Stockholm.
On 28 May, it was also announced that Cibus would make two further acquisitions in Finland for EUR 15.9 million. Tokmanni and S Group are the anchor tenants.
1 JUNE
On 1 June, it was announced that Cibus would acquire two properties in Sweden for EUR 4.5 million. ICA is the anchor tenant in all of these properties.
14 JUNE
On 14 June, it was announced that Cibus had published a basic prospectus regarding the newly-established MTN programme and is considering an issue of hybrid bonds.
15 JUNE
On 15 June, it was announced that Cibus would acquire a daily goods property in Finland for EUR 2.2 million. Kesko is the tenant.
16 JUNE
On 16 June, it was announced that Cibus had entered into an agreement to acquire 72 daily goods stores in Finland for EUR 71.6 million and had agreed to issue a private placement of 2,000,000 new shares to AB Sagax. Of these properties, 71 are leased to Kesko and one to S Group.
17 JUNE
On 17 June, Cibus issued hybrid bonds for EUR 30 million.
1 JULY
On 1 July, Cibus signed an agreement to acquire, and took possession of three properties in Sweden for EUR 4.1 million. Coop Sverige Fastigheter is the anchor tenant in all of these properties.
6 SEPTEMBER
On 6 September, it was announced that, as of 20 September 2021, the Cibus share will be included in the EPRA index, which is a leading global index for listed property investments.
24 SEPTEMBER
On 24 September, Cibus signed an acquisition of a total of five properties in Finland for EUR 5.2 million. S Group is the tenant in all of these properties.
30 SEPTEMBER
On 30 September, Cibus announced that it had purchased a portfolio of eight properties in south-eastern Norway for EUR 27.6 million. Cibus gained possession of the properties, which are fully let to Kiwi, Spar and Rema 1000, on 15 October 2021.
18 NOVEMBER
On 18 November, Cibus announced that it had signed an agreement to acquire a grocery store in Finland for EUR 6.8 million. S Group is the tenant.
2021

6
I N T R O D U CT I O N
29 NOVEMBER
On 29 November, Cibus announced that it had signed an agreement to acquire a food property currently under construction in Sweden for EUR 11.5 million. Cibus is scheduled to take possession of the property in the third quarter of 2022 when construction is complete. Willys is the tenant.
On the same date, it was announced that Cibus had signed an agreement to acquire Charlottenbergs Handelspark (comprising two separate properties) in Sweden for EUR 28.3 million. ICA and Lidl are tenants.
30 NOVEMBER
On 30 November, it was announced that Cibus had taken possession of a portfolio of 72 grocery stores in Finland from AB Sagax, the acquisition of which had been announced previously. In connection with Cibus taking possession of the properties, the Company paid part of the purchase consideration by means of a private placement of 2,000,000 shares.
On the same date, it was announced that the total number of shares and votes in Cibus had increased during November 2021 as a result of the private placement. Accordingly, the number of shares and votes in Cibus amounts to 42,000,000 and the share capital in Cibus amounts to EUR 420,000.
1 DECEMBER
On 1 December, Cibus updated its growth targets. Group Management and the Board of Directors estimate that the Company will be able to double the property value of its portfolio to EUR 2.5–3.0 billion, meeting the criteria for an investment grade credit rating by the end of 2023.
7 DECEMBER
On 7 December, it was announced that Cibus had implemented a private placement of 2,000,000 shares, raising SEK 492 million.
21 DECEMBER
On 21 December, Cibus made two acquisitions in Norway for EUR 13.4 million. Norgesgruppen and Rema 1000 are anchor tenants.
23 DECEMBER
On 23 December, Cibus acquired a portfolio of six properties in Norway for EUR 15.8 million. Coop, Kiwi and Rema 1000 are anchor tenants.
29 DECEMBER
On 29 December, Cibus acquires a grocery store completed in 2020 and another building under construction in Sweden for EUR 15.7 million. Coop is the anchor tenant.
30 DECEMBER
On 30 December, it was announced that the number of shares and votes in Cibus amounted to 44,000,000 and the share capital in Cibus amounted to EUR 440,000.
17 FEBRUARY
On 17 February, a press release was issued announcing the conclusions of the Extraordinary General Meeting that had been held on the same date. For the period up until the next Annual General Meeting, the Board of Directors was mandated to determine the issue of new shares, with or without preferential rights for the Company’s existing shareholders. The total number of shares that may be issued pursuant to this authorisation may not exceed 10% of the number of shares outstanding in the Company as per the date of the Extraordinary General Meeting, meaning that at most 4,400,000 shares may be issued.
On the same date, the Nomination Committee’s proposal to the Board of Directors was announced to the Annual General Meeting. The Nomination Committee proposed that Patrick Gylling, Elisabeth Norman, Victoria Skoglund and Stefan Gattberg be re-elected as Board Members of Cibus Nordic Real Estate AB and that Nils Styf be elected as a new Board Member. The Nomination Committee also proposes that Patrick Gylling be re-elected as Chairman of the Board.
2022
Timeline

7
Another eventful and successful year for Cibus
”Although this target is ambitious, given our market position, organisation and financing opportunities, it is clearly achievable.”— Sverker Källgården, CEO
CEO’s comments

8
Sustainability
We leave behind another year marked by Covid-19, community shut-downs and concerns among individuals and companies alike. At the time of writing, the conflict in Ukraine is ongoing, causing additional concerns around the world. Nonetheless, Cibus had an amazing year. We transitioned to the Nasdaq Stockholm’s main list, were included in the EPRA index, achieved strong growth and opened up a new market. The business concept has again proven sustainable, despite concerns prevailing in the market. Our tenants coped well, daily goods stores continued to show strong figures and our smaller, complementary tenants, such as pharmacies, hairdressers or restaurants survived the pandemic in an impressive way.
In the area of sustainability, we continued our efforts towards being climate neutral by 2030. Tokmanni continues to install solar panels on our roofs, and, at the end of the year, we had 39 such facilities, generating electricity equivalent to that consumed by slightly more than 2,600 apartments.
We have a green bond in the market, secured by some of our energy-efficient properties. Within the portfolio, the market value of our “green” properties was EUR 220 million at the end of the year.
We always strive to acquire modern, energy-efficient properties and, in 2021, we acquired several properties recently-completed or under construction, which will further increase the volume of “green” properties.
Being sustainable also entails Cibus providing support where it can. During the pandemic, we supported our smallest tenants with rent reductions of EUR 200 thousand when restrictions in Finland closed their operations. Now, in early 2022, we choose to support Ukraine with humanitarian aid through UNHCR with a donation of EUR 200 thousand.
Market
The market for properties in the grocery and daily goods segment has been favourable and remained unchanged during the pandemic mostly due to the nature of the segment as independent of the general economic trend. Cibus has grown in all markets and opened up another by taking the step into Norway during the autumn. On entering a new market, our ambition is always to become a market leader, meaning that we look forward to good growth in Norway, as well as in Sweden and Finland.
Denmark is a market in which we are interested and, as borders have opened and it has been easier to travel between the countries, we will actively be seeking out potential acquisitions throughout the Nordic region.
In the latter part of 2021, we have seen that the yield requirements for grocery and daily goods properties have decreased, particularly in Sweden and Norway. We can nonetheless achieve very favourable transactions for the Company and for our shareholders.
Organisation
Cibus’s business model allows us to maintain a small, efficient organisation as the Company grows. We employ key functions within the Company and outsource extensive property management services to partners. This model works very well and minimises our administrative costs.
To succeed in this, however, our employees must have superior expertise and professionalism. I am incredibly proud of the organisation and our employees who go to work every day to do their very best.
Growth
In 2021, Cibus continued its journey of strong growth, we have acquired properties for approximately EUR 260 million in Finland, Sweden and Norway.
During the autumn’s strategy work, new growth targets were set. The new target is to have grown the Company to a property value of EUR 2.5–3 billion by the end of 2023 and that we also meet the requirements for Investment Grade credit rating at that time. Although this target is ambitious, given our market position, organisation and financing opportunities, it is clearly achievable. We are the only listed company in our segment in the Nordic market and are the market leader as we are located in three out of four Nordic countries. We are active in the market, conducting both large and small transactions, making us an attractive buyer of grocery and daily goods properties.
FinancingCibus has a strong financial position. We are pleased with our beneficial, long-term partnerships with most Nordic banks and financial institutions. During the pandemic, they continued to support our journey of strong growth, providing additional credit on improved terms.
Over the year, we launched an MTN programme including both senior unsecured bonds and hybrid bonds. In connection with the launch of the programme, we issued our first hybrid bond, which was very well received. In 2022, we have the opportunity to refinance two of our outstanding bonds issued early in the pandemic, hopefully on better terms. Work on restructuring Cibus’s capital and debt side has begun with the objective of being able to reach an Investment Grade credit rating by the end of 2023 and to then also achieve further improved financing terms. Another aspect of these efforts entails the Board of Directors preparing a proposal to extend the Articles of Association with another class of shares, Class D.
During the year, two directed share issues were conducted in accordance with the mandate given to the Board of Directors by the Annual General Meeting. The first issue included two million shares used as partial payment to AB Sagax for a Finnish portfolio of 72 properties. The second issue comprised an additional two million shares on attractive terms as partial payment for acquisitions made in the second half of 2021. At the end of the year, Cibus had slightly more than 40,000 shareholders, with trade in the share being very good.
In summary, 2021 was an amazing year for Cibus. We have surpassed our growth targets, are now present in three out of four Nordic markets and the organisation is functioning very well. Accordingly, we look forward with confidence to 2022 and the opportunities opening up for Cibus.
Stockholm, 10 March 2022
Sverker Källgården
C E O ’ S C O M M E N T S

9
Business concept and goals
Cibus’s business concept is to acquire, develop and manage high-quality properties in the Nordics with reputable grocery and daily-goods chains as anchor tenants.
Goal
Cibus has two financial targets. These are: — To increase the dividend to shareholders by 5% annually. — For the net debt/equity ratio to be 55–65%. Moving forwards,
however, net debt will also be revised down to meet the criteria for an “Investment Grade” credit rating.
Given the current portfolio, business plan and growth rate, a 5% annual increase is considered a reasonable target for the foreseeable future. The dividend target has been set to reflect the Company’s strong cash flow and to provide its shareholders with a high and predictable return.
The purpose of the net debt/equity target is to ensure that financial risks are managed in an appropriate but reassuring manner.
Business concept
Cibus’s business concept is to create long-term growth and value gains through the acquisition, development and management of high-quality properties in the Nordic region with a clear focus on properties anchored by grocery and daily-goods chains. The main goal of the Company’s business concept is to secure and maintain the portfolio’s solid cash flow to thereby allow a favourable dividend to its shareholders irrespective of economic conditions. The strategy applied by the Company to reach this goal encompasses active and close tenant relationship management in combination with endeavouring to secure financially strong tenants in market-leading positions.
In general, grocery and daily-goods properties have two main characteristics that distinguish them from most, if not all, other types of retail properties. These characteristics are:
— Non-cyclical nature of the operations — Properties that benefit from e-commerce
Sustainability
Cibus takes a holistic view on sustainability. The Company is working for a healthier environment and social development and seeks to counteract social malpractices and corruption. This results in a better society and favours economic growth. In our property transactions, property management and other work, our deliberations always take into account the potential impact for a sustainable society. Sustainability work is conducted in three principal areas, which also constitute important commitments for Cibus.
3 long-term commitments
Read more on page 25 SUSTAINABILITY
by having a high level of commitment to tenants, offering innovative arrangements and by maintaining good order in the operations.
by making it easier for tenants to reduce their climate footprint and that of the end-consumers, and to achieve climate neutrality by 2030.
by providing marketplaces in urban areas and in smaller towns that offer end-consumers vibrant and secure local communities with reliable services, groceries and e-commerce deliveries.
S T R AT E G I C F O C U S
partner
the climate
marketplaces
Be a sustainable
Foster
Create accessible

10
Investing in Cibus
Cibus invests in and manages grocery and daily-goods properties in the Nordic region. The long-term objective is to provide a stable,
cyclically resilient and increasing return for shareholders.
The segment in which Cibus operates is generally stable and delivers a high yield. Groceries and food in particular are non-cyclical products that follow a stable trend over time.
Property portfolios with anchor tenants in groceries and daily-goods have been targeted by institutional investors in recent years.
With its stock market launch in 2018, Cibus opened this market up to institutional and private investors, as well as smaller-scale savers who are able to take advantage of the long-term stable and favourable yield that the segment can offer.
— The grocery and daily-goods industry is stable and predictable, as we also witnessed during the Covid-19 pandemic
— The grocery and daily-goods industry is resilient to the negative effects of e-commerce
— The network of stores forms a strategic distribution network that is ideal for post and other services, which provides an advantage with respect to e-commerce.
— E-commerce for food grew during the Covid-19 pandemic. The largest part of the increase was from so-called click-and-collect, where you shop online but pick the goods up at a store.
— A high and increasing monthly dividend, with a moderate LTV ratio of 57.8%.
— A weighted average unexpired lease term (WAULT) of 5.0 years.
— Market-leading, high-performance tenants, such as Kesko, S Group, Coop, Tokmanni and Lidl anchoring more than 90% of the portfolio properties.
— The length of the leases varies, and the expiration of the leases is thus evenly spread
— A large number of same-sized properties provide limited single-asset risk. No individual property accounts for more than 2.1% of the portfolio’s net operating income.
— Strict cost control given the high cost coverage
The investment highlights in terms of the general conditions of the segment as well as the specific characteristics of Cibus’s property portfolio can be summarised as follows:
C I B U S A S A N I N V E S T M E N T
10

11
Share and shareholders
Cibus is listed
Cibus has been listed on Nasdaq Stockholm MidCap since 1 June 2021. The final day for trading on Nasdaq First North Premier Growth Market Stockholm was 31 May 2021. The shares bear the ISIN code SE0010832204.
Share price performanceThe share value has risen by 100% since 31 December 2019. In SEK, the total yield over the same period and including the dividend was 113%. The shares have had a relatively high turnover, with shares trading with a weighted daily average of slightly more than SEK 35 million and with an average of about 2,300 trades per day in 2021.
Market cap
SEK 12.8 billion Market
Nasdaq Stockholm MidCap
Number of shareholders
41,000Number of ordinary shares
44,000,000
Closing rate
SEK 290.80ISIN
SE0010832204
C I B U S A S A N I N V E S T M E N T
MSEKSEK
175
200
125
100
150
225
250
275
0
10
20
30
60
50
40
300
Last price paid (SEK) Turnover (SEK)
31 Dec2019
31 Mar2020
30 Sep2020
30 Jun2020
31 Mar2021
30 Sep2021
30 Dec2021
30 Jun2021
31 Dec2020

12 12
Cibus’s shareholders
As of 31 December 2021, the Company had about 41,000 shareholders. The 15 largest shareholders hold approximately 42% of the votes. None of these shareholders has a holding amounting to 10% or more of the votes in Cibus as of 31 December 2021.
Shareholders as of 31 December 2021
Name No. of shares Percentage
Fjärde AP-fonden 3 2�4 8�3 7.3
AB Sagax 2,426,973 5.5
Columbia Threadneedle 2,257,879 5.�
Dragfast AB � 7�� ��� 4.2
Marjan Dragicevic � 632,��� 3.7
Avanza Pension � 322,845 3.�
BlackRock � 278,263 2.9
Sensor Fonder 946,��� 2.�
Länsförsäkringar Fonder 929,474 2.�
Nordnet Pensionsförsäkring 545,6�� �.2
Patrick Gylling 5��,��� �.�
Svenska Handelsbanken 376,8�� �.9
Nuveen Asset Management 37�,52� �.8
Handelsbanken Fonder 3�5,538 �.7
Familjen Kamprads stiftelse 3��,��� �.7
Total, 15 largest shareholders 18,116,706 41.6
Other 25,883,294 58.4
Total 44,000,000 100
Source: Modular Finance
12 Coop Kallebäck, Gothenburg

13
Dividend
By acquiring, refining and developing our properties in the grocery and daily-goods segments, we provide a stable and increasing dividend,
irrespective of economic fluctuations, to our shareholders.
Dividend Policy
The Company pays out monthly dividends, that are to increase by 5% annually for each Class A share. Should another share class (D) be established, it is proposed that this should provide a stable monthly return. The dividend targets have been set to reflect the Company’s strong cash flow and to provide its shareholders with a high and predictable return.
The recommendation to the Annual General Meeting by the Board of Directors regarding the dividend
The Board of Directors intends to propose to the 2022 Annual General Meeting:
— That a new share class (D) be established, with a bonus issue being made to existing shareholders in connection with this
— That the dividend be increased by 5% to EUR 0.99 per existing share, to be distributed to all share classes. Accordingly, current shareholders will receive a dividend equivalent to 0.99 EUR for each existing share held and divided between 12 dividend payment dates.
— All share classes are to receive monthly dividends.
C I B U S A S A N I N V E S T M E N T
13
Approved dividend
Q42019
0,21
Q22020
Monthly dividend payments
0,22
Q12020
0,22
Q32020
Q42020
0,22
0,07 0,07
0,080,07
0,080,22
0,080,23
Q12021
Q22021
0,07
0,08
0,080,23
0,07
0,08
0,080,23
Q32021
Q42021
Q12022
0,08
0,15
0,20
0,25
0,08
0,080,24
0,08
0,08
0,080,24
3.3% YIELD
(share price SEK 290.80)
13SPAR Hokksund

14
Market overview
The Nordic economy has recovered well following the initial shock of the Corona pandemic
Finland
Following the brief recession caused by the Corona crisis, the Finnish economy has recovered rapidly. The GDP forecasts for 2021 published in the fourth quarter of the year were at 2.3–3.5%, with the latest forecasts from January consistently at 3.0%, except for SEB which forecasts 3.5%. Compared with Eurostat’s forecast for GDP growth for the euro zone of 5.2% for 2021, growth in Finland has been low, although this is due to the milder decline in 2020. At that time, GDP in Finland decreased by 2.9%, which was significantly better than the decline of 5.9% in the euro zone. For 2022, growth in Finland is estimated at about 2.3–3.0%, impacted by global supply chain disruptions and high commodity prices.
At the end of 2021, the employment rate was 73.5%, the highest since the recession of the 1990s, which, besides economic growth, is also due to the rising share of part-time employees. According to the Bank of Finland, the improvement in employment will level off once peak economic growth has passed, and will also be hampered by a shortage of suitable labour.
During the Corona pandemic, Finland’s public debt increased significantly, with the government implementing economic measures to mitigate the effects of the recession in 2020 and early 2021. In 2020, the debt ratio rose by 10 percentage points to 69.5% of GDP, which was still below the euro zone averages, both for the level of indebtedness (97.3%) and for growth (above 13 percentage points).
Sweden
The recovery of the Swedish economy continues and Sweden is one of the wealthier countries in Europe to have performed well during the pandemic from a macroeconomic perspective. GDP growth has again increased, partly as a result of strong exports, growing household consumption and increasing equity investments. The recovery in the labour market continues, with the situation for parts of the economy normalising throughout 2021.
In Sweden, unemployment decreased over 2021, from 9.3% in January to 7.3% in December, according to Statistics Sweden. Following the initial Corona crisis, the SEK recovered quickly and was strong during the pandemic, although it lost against both the USD and the EUR in the fourth quarter of 2021.
Swedish GDP forecasts remain positive and, according to SEB’s report, growth will reach 4.6% for 2021, 3.0% for 2022 and 2.7% for 2023. The Swedish central bank is expected to leave the repo rate unchanged until 2023.
Norway
The recovery in the Norwegian economy picked up significantly in 2021 and economic development was strong over the year. GDP growth, which summed up to 3.7%, is almost back to the level prior to the Covid-19 outbreak and the pandemic becoming a fact. The Norwegian central bank expects continued high GDP growth in 2022, with the forecast being about 3.8%.
The easing, somewhat, of pandemic restrictions in the first half of 2021, contributed to increased domestic consumption and generally increased demand for goods and services. An underlying driving factor in the Norwegian economy is the oil price trend, with the increase for the 2021 full year ending up at about 35%. Employment growth gradually increased during the year, with open unemployment falling from 4.7% in 2020 to 4.4% in 2021.
In the wake of strong economic growth, the Norwegian central bank decided to raise its key interest rate by 0.25 percentage points in September and by 0.25 percentage points in December 2021. At the end of the 2021, the Norwegian key interest rate was 0.5%. The Norwegian central bank has announced further increases in its key interest rate for 2022. The expectation is a key interest rate of 1.25% at the end of 2022 and of 1.50% at the end of 2023.
Crisis in Ukraine
On 24 February 2022, Russia commenced a military invasion of Ukraine. In response, the EU and the US have imposed sanctions against Russia. It currently remains difficult to assess how the situation will affect macroeconomic developments and trends in the Nordic property markets.
Nordics, GDP growth
Year-on-year percentage change 2019 2020 2021 2022E 2023E
Finland 1.1 -3.3 3.5 3.0 1.6
Sweden 1.3 -2.6 4.6 3.0 2.7
Norway 0.9 -1.3 3.9 4.0 2.5
Denmark 2.9 -4.0 4.0 3.3 3.0
Source: SEB (February 2022)
C I B U S A S A N I N V E S T M E N T
15
C I B U S A S A N I N V E S T M E N T
Property market
New record volume in Nordic transaction market
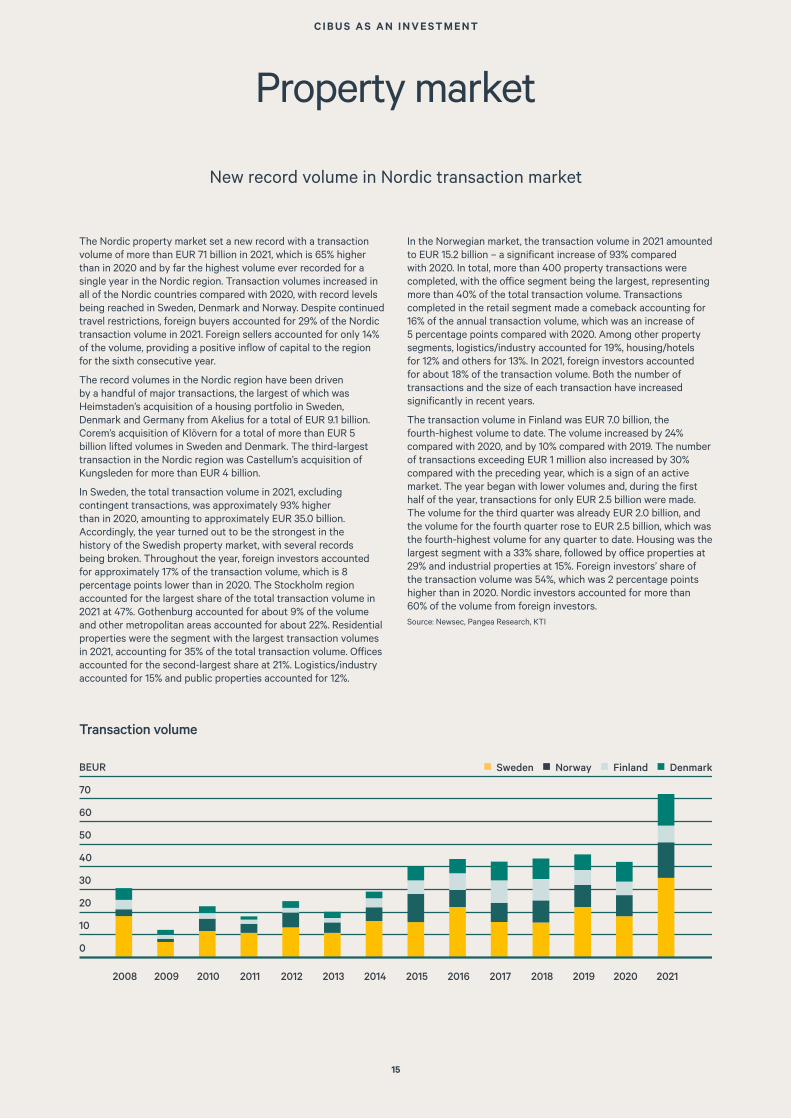
The Nordic property market set a new record with a transaction volume of more than EUR 71 billion in 2021, which is 65% higher than in 2020 and by far the highest volume ever recorded for a single year in the Nordic region. Transaction volumes increased in all of the Nordic countries compared with 2020, with record levels being reached in Sweden, Denmark and Norway. Despite continued travel restrictions, foreign buyers accounted for 29% of the Nordic transaction volume in 2021. Foreign sellers accounted for only 14% of the volume, providing a positive inflow of capital to the region for the sixth consecutive year.
The record volumes in the Nordic region have been driven by a handful of major transactions, the largest of which was Heimstaden’s acquisition of a housing portfolio in Sweden, Denmark and Germany from Akelius for a total of EUR 9.1 billion. Corem’s acquisition of Klövern for a total of more than EUR 5 billion lifted volumes in Sweden and Denmark. The third-largest transaction in the Nordic region was Castellum’s acquisition of Kungsleden for more than EUR 4 billion.
In Sweden, the total transaction volume in 2021, excluding contingent transactions, was approximately 93% higher than in 2020, amounting to approximately EUR 35.0 billion. Accordingly, the year turned out to be the strongest in the history of the Swedish property market, with several records being broken. Throughout the year, foreign investors accounted for approximately 17% of the transaction volume, which is 8 percentage points lower than in 2020. The Stockholm region accounted for the largest share of the total transaction volume in 2021 at 47%. Gothenburg accounted for about 9% of the volume and other metropolitan areas accounted for about 22%. Residential properties were the segment with the largest transaction volumes in 2021, accounting for 35% of the total transaction volume. Offices accounted for the second-largest share at 21%. Logistics/industry accounted for 15% and public properties accounted for 12%.
In the Norwegian market, the transaction volume in 2021 amounted to EUR 15.2 billion – a significant increase of 93% compared with 2020. In total, more than 400 property transactions were completed, with the office segment being the largest, representing more than 40% of the total transaction volume. Transactions completed in the retail segment made a comeback accounting for 16% of the annual transaction volume, which was an increase of 5 percentage points compared with 2020. Among other property segments, logistics/industry accounted for 19%, housing/hotels for 12% and others for 13%. In 2021, foreign investors accounted for about 18% of the transaction volume. Both the number of transactions and the size of each transaction have increased significantly in recent years.
The transaction volume in Finland was EUR 7.0 billion, the fourth-highest volume to date. The volume increased by 24% compared with 2020, and by 10% compared with 2019. The number of transactions exceeding EUR 1 million also increased by 30% compared with the preceding year, which is a sign of an active market. The year began with lower volumes and, during the first half of the year, transactions for only EUR 2.5 billion were made. The volume for the third quarter was already EUR 2.0 billion, and the volume for the fourth quarter rose to EUR 2.5 billion, which was the fourth-highest volume for any quarter to date. Housing was the largest segment with a 33% share, followed by office properties at 29% and industrial properties at 15%. Foreign investors’ share of the transaction volume was 54%, which was 2 percentage points higher than in 2020. Nordic investors accounted for more than 60% of the volume from foreign investors.Source: Newsec, Pangea Research, KTI
Transaction volume
0
2008
10
20
30
40
50
60
70
BEUR
2009 2010 2011 2012 2013 2014 2015 2016 2017 2018 202120202019
■ Sweden ■ Norway ■ Finland ■ Denmark

16
O P E R AT I O N S
Earnings capacity
The current earnings capacity for the coming 12 months is based on the property portfolio owned by Cibus as of 31 December 2021.
Current earnings capacity is not a forecast but should instead be considered a theoretical snapshot for the purpose of presenting income and expenses on an annual basis given the property holding, financing costs, capital structure and organisation at a given point in time. Earnings capacity does not include estimations for the forthcoming period regarding the development of rent, occupancy rate, property expenses, interest rates, changes in value or other items affecting earnings.
Current earnings capacity
Amounts in EUR thousand 31 Dec 2020
31 Mar 2021
30 Jun 2021
30 Sep 2021
31 Dec 2021*
Change (Dec ’21/Dec
’20)
Rental income 76,581 76,581 80,880 81,480 91,400
Property expenses -3,981 -3,981 -4,880 -5,230 -5,600
Net operating income 72,600 72,600 76,000 76,250 85,800
Central administration -4,895 -4,895 -5,275 -5,285 -5,850
Net financial expenses** -21,811 -21,811 -22,325 -22,416 -23,790
Profit from property management 45,894 45,894 48,400 48,549 56,160
Expenses, hybrid bond costs - - -1,275 -1,275 -1,275
Profit from property management plus expenses for hybrid bond
45,894 45,894 47,125 47,274 54,885
Profit from property management per share plus expenses for hybrid bond, EUR***
1.15 1.15 1.18 1.18 1.25 9%
*Includes all transactions where Cibus has taken possession of the property prior to or during December 2021. **In accordance with IFRS16, site leasehold fees are included among financial expenses. Financial expenses also include prepaid arrangement fees not affecting future cash flow.***A new share issue was implemented encompassing 2,000,000 shares in November 2021, and a further 2,000,000 shares being issued in December 2021. The number of shares subsequently totalled 44,000,000.
Comments regarding current earnings capacity
As of 31 December 2021, the earnings capacity for the next 12 months improved by 9% compared with the 12-month perspective as of 31 December 2020. This was a result of the acquisitions carried out by the Company and rent increases due to indexation.
The following information forms the basis for the estimated earnings capacity:
Rental income based on signed leases on an annual basis (including service charges and potential rental discounts) as well as other property-related income as of 31 December 2021 according to current lease agreements.
Property expenses based on a normal operating year with maintenance. Operating costs include property-related administration. Property tax is calculated based on the current tax values of the properties. Property tax included in the item “Property expenses”.
Central administration costs are calculated based on the current organisation and the current size of the property portfolio. Non-recurring costs are not included.
An exchange rate of SEK 10.20/EUR has been used in translating the figures for the Swedish operations, and for the Norwegian operations, an exchange rate of NOK 10.00/EUR has been used.
17
Tenants and lease structure
O P E R AT I O N S
Tenants
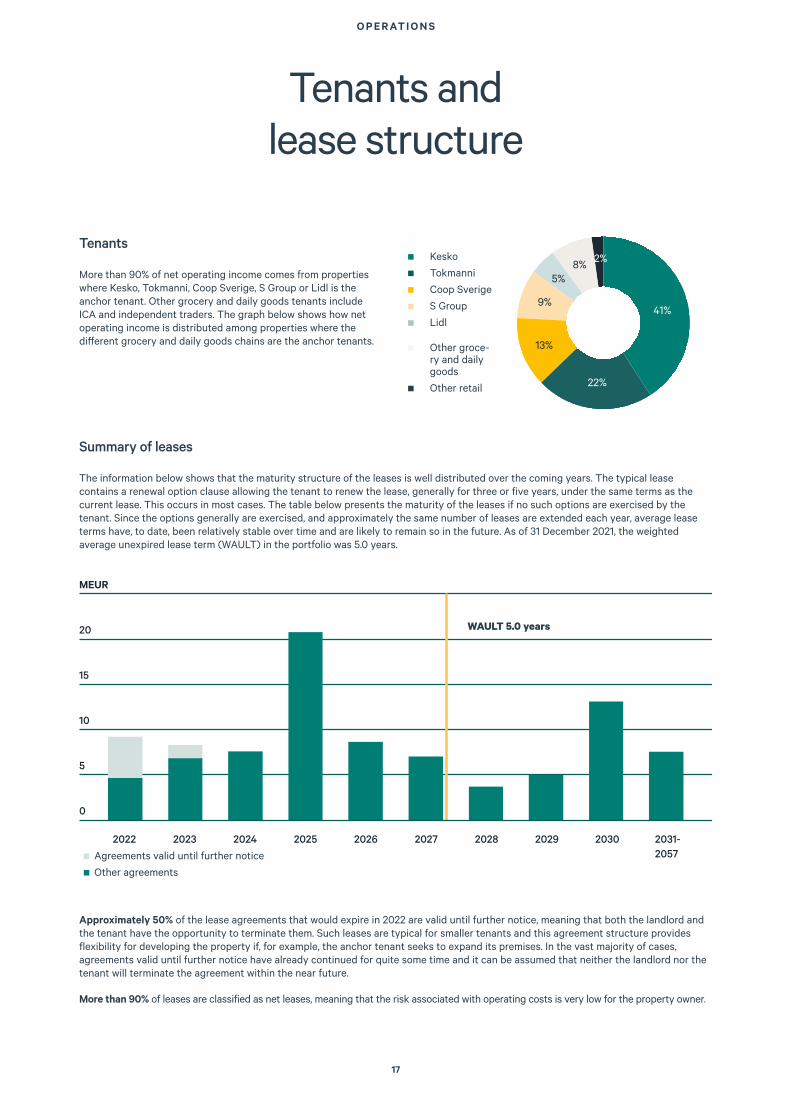
More than 90% of net operating income comes from properties where Kesko, Tokmanni, Coop Sverige, S Group or Lidl is the anchor tenant. Other grocery and daily goods tenants include ICA and independent traders. The graph below shows how net operating income is distributed among properties where the different grocery and daily goods chains are the anchor tenants.
■ Kesko■ Tokmanni■ Coop Sverige■ S Group■ Lidl
■ Other groce-ry and daily goods
■ Other retail
2%8%5%
9%
13%
22%
41%
Summary of leases
The information below shows that the maturity structure of the leases is well distributed over the coming years. The typical lease contains a renewal option clause allowing the tenant to renew the lease, generally for three or five years, under the same terms as the current lease. This occurs in most cases. The table below presents the maturity of the leases if no such options are exercised by the tenant. Since the options generally are exercised, and approximately the same number of leases are extended each year, average lease terms have, to date, been relatively stable over time and are likely to remain so in the future. As of 31 December 2021, the weighted average unexpired lease term (WAULT) in the portfolio was 5.0 years.
Approximately 50% of the lease agreements that would expire in 2022 are valid until further notice, meaning that both the landlord and the tenant have the opportunity to terminate them. Such leases are typical for smaller tenants and this agreement structure provides flexibility for developing the property if, for example, the anchor tenant seeks to expand its premises. In the vast majority of cases, agreements valid until further notice have already continued for quite some time and it can be assumed that neither the landlord nor the tenant will terminate the agreement within the near future.
More than 90% of leases are classified as net leases, meaning that the risk associated with operating costs is very low for the property owner.
0
5
10
15
20
MEUR
2031-2057
2025 2026 2027 2028 20302029202420232022
WAULT 5.0 years
■ Agreements valid until further notice ■ Other agreements

18
The property portfolio
O P E R AT I O N S
18
General overview
As of 31 December 2021, Cibus’s property portfolio comprised 400 store properties, located in various regions across Finland, Sweden and Norway. Approximately 84% of the portfolio’s net operating income on an annual basis comes from properties in Finland, 15% from properties in Sweden and 1% from properties in Norway.
More than 90% of the total rental income comes from properties anchored by five market-leading tenants: Kesko, Tokmanni, Coop Sverige, S Group and Lidl. All major tenants perceive the properties as well suited to their operations. Anchor tenants account for 87% of rental income from grocery and daily goods stores and have an average unexpired lease term of 5.5 years.
Anchor tenant No. of properties Lettable area, m2 Remaining term, years
Anchor tenant’s remaining
term, years
Anchor tenant’s share of rent
Kesko 155 293,117 3.8 4.2 92 %
Tokmanni 51 233,599 4.4 4.7 83%
Coop Sverige 113 121,786 7.9 8.1 98%
S Group 38 66,058 6.8 6.9 80%
Lidl 7 42,137 6.4 8.6 69%
Other grocery and daily goods 26 63,766 6.3 7.3 81%
Other retail 10 46,456 2.9 n/a n/a
Total portfolio 400 866,920 5.0 5.5 87%
Property portfolio in Finland
As of 31 December 2021, Cibus’s property portfolio in Finland comprised 266 store properties. As of 31 December 2021, the weighted average unexpired lease term (WAULT) in the property portfolio in Finland was 4.4 years.
About 90% of net operating income in Finland comes from properties where Kesko, Tokmanni, S Group or Lidl are the anchor tenants. Other grocery and daily goods tenants include HalpaHalli, for example. The anchor tenants accounted for slightly more than 87% of rental income from grocery and daily goods properties with a average term of 4.9 years.
The Group’s properties in Finland are located in more than 120 different towns, the majority in the southern and south-western part of the country. The property portfolio includes properties located in all of Finland’s ten largest cities, providing a healthy platform.
Property portfolio in Sweden
As of 31 December 2021, the Company owned a property portfolio of 124 properties in Sweden, with 144,800 m2 of lettable space. In Sweden, the average remaining lease term on the property portfolio at the end of 2021 was approximately 7.3 years. Of total net operating income in Sweden, 100% comes from properties in which Coop Sverige, ICA, Lidl or Axfood are anchor tenants, with an average remaining lease term of 7.8 years.
Most of the Swedish properties are located in southern and central Sweden. Most are categorised as medium-sized grocery stores, the type of store that accounts for the majority of the grocery and daily goods trade in Sweden.
Property portfolio in Norway
As of 31 December 2021, Cibus’s Norwegian property portfolio comprised 10 retail and grocery and daily goods properties with a lettable area of approximately 14,000 m2. At the end of 2021, the Norwegian portfolio’s average remaining lease term was 9.8 years. The largest tenants are Norgesgruppen (with retail brands including Kiwi, Spar and Meny) and Rema 1000. Together, these two anchor tenants account for more than 90% of annual rental income.
Most of the properties are located in southern Norway, in or adjacent to locations including Drammen, Halden, Kristiansand, Moss, Sandefjord and Stavanger.
19
O P E R AT I O N S
Portfolio diversification
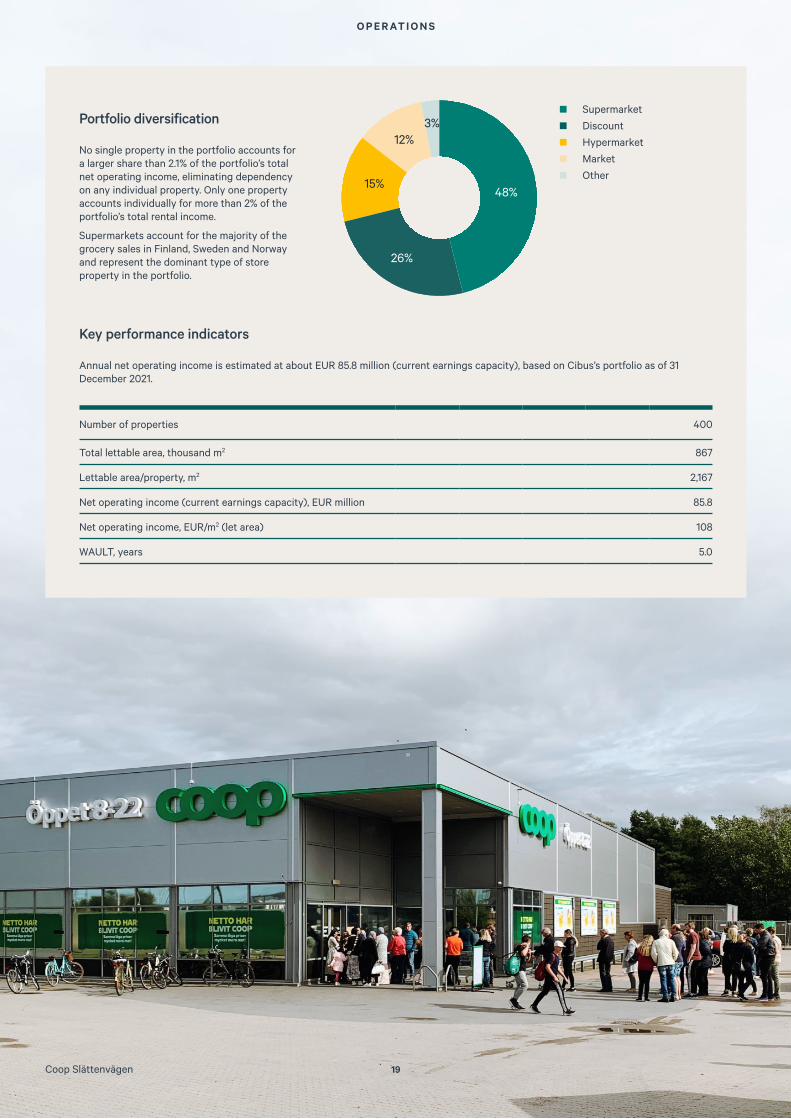
No single property in the portfolio accounts for a larger share than 2.1% of the portfolio’s total net operating income, eliminating dependency on any individual property. Only one property accounts individually for more than 2% of the portfolio’s total rental income.
Supermarkets account for the majority of the grocery sales in Finland, Sweden and Norway and represent the dominant type of store property in the portfolio.
Coop Slättenvägen
Key performance indicators
Annual net operating income is estimated at about EUR 85.8 million (current earnings capacity), based on Cibus’s portfolio as of 31 December 2021.
O P E R AT I O N S
3%12%
15%
26%
48%
Supermarket
Discount
Hypermarket
Market
Other
Number of properties 400
Total lettable area, thousand m2 867
Lettable area/property, m2 2,167
Net operating income (current earnings capacity), EUR million 85.8
Net operating income, EUR/m2 (let area) 108
WAULT, years 5.0
19
20
O P E R AT I O N S
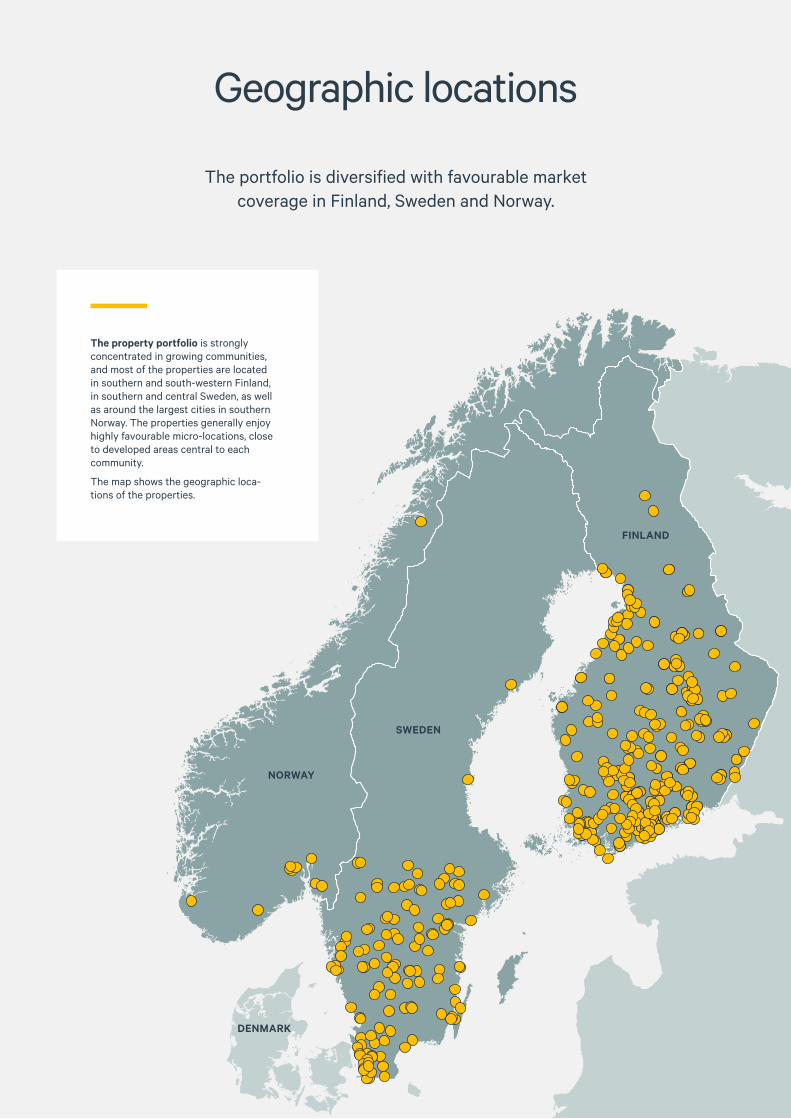
Geographic locations
The portfolio is diversified with favourable market coverage in Finland, Sweden and Norway.
FINLAND
SWEDEN
NORWAY
DENMARK
The property portfolio is strongly concentrated in growing communities, and most of the properties are located in southern and south-western Finland, in southern and central Sweden, as well as around the largest cities in southern Norway. The properties generally enjoy highly favourable micro-locations, close to developed areas central to each community.
The map shows the geographic loca-tions of the properties.

21
Physical retail is under pressure from e-commerce as an increasing number of consumers choose to shop online. According to the Swedish Retail and Wholesale Council, the retail segments that will be affected most by e-commerce are electronics and books, while the least affected segment is daily goods. This is confirmed by PostNord, which states that clothing and footwear, beauty and health products and consumer electronics are the segments where e-commerce has captured the largest market shares. One segment in which e-commerce has yet to break through is the grocery segment. This is because many grocery customers want to see the products they are purchasing and to make their own selection of the best items. It is also due to the low margins and high costs of packing and distributing foods, often chilled, to the customer, making it unprofitable for retailers to make home deliveries of such goods.
Customers who shop for food online are therefore notified when they can collect their purchases from a facility adjacent to the store, this is referred to as “click-and-collect”. E-commerce has increased during the Covid-19 pandemic. Customers shopping online are often required to collect their goods at a delivery point, in many cases a supermarket. This makes supermarkets a natural distribution network for other e-commerce sales, further increasing traffic to supermarkets. In Finland, Sweden and Denmark, pick-up occurs from parcel boxes installed at the entrance to the supermarket, while pick-up is generally handled manually in Norway. Parcel boxes represent a growing trend however and most indicators suggest that they will become more common throughout the Nordic region.
Source: Swedish Retail and Wholesale Council, HUI, PostNord, Finnish Grocery Trade Association (grocery sales)
The impact of e-commerce on Cibus’s business model
O P E R AT I O N S
Amazon’s impact on different types of retail
Source: Swedish Retail and Wholesale Council, HUI Research
Daily goods Furniture
Low High
Fashion Sports DIY Pharmacies Toys Books Electronics
The grocery and daily-goods market is resilient towards e-commerce and even benefits from e-commerce thanks to the distribution network that the stores provide.
22
F I N A N C I N G
Financing
As of 31 December 2021, the Group had secured bank loans of EUR 724 million with a weighted average floating interest margin of 1.7% and a weighted average loan maturity of 2.6 years. Cibus has pledged mortgages in the properties as collateral for the interest-bearing liabilities. In Cibus’s assessment, the collateral agreements have been entered on market terms.
Cibus has issued an unsecured green bond for SEK 600 million. The bond matures on 12 June 2023 and carries a floating coupon rate of 3m STIBOR + 4.75%.
Cibus has issued an unsecured bond for EUR 135 million. The bond matures on 18 September 2023 and carries a floating coupon rate of 3m EURIBOR + 4.5%.
Both unsecured bonds have been listed on the Nasdaq Stockholm Corporate Bond list since 20 July 2020.
The earlier EUR bond, maturing on 26 May 2021, was fully redeemed as of 9 July 2020.
In June 2021, Cibus established an MTN programme enabling both senior unsecured bonds and hybrid bonds. On 17 June, Cibus issued hybrid bonds for EUR 30 million under its newly-established MTN programme. The hybrid bonds have a perpetual maturity, with the first opportunity for redemption occurring after 5.25 years, and maturing with an interest rate of 3 months EURIBOR + 4.75%. The hybrid bonds have been listed on the Nasdaq Stockholm Corporate Bond list since 24 June 2021.
— The Group’s average tenor, excluding the hybrid bonds, amounts to 2.6 years.
— The first loan maturity date is in 1.5 years’ time.
— Of the Group’s bank loans, around 66% are hedged using interest-rate derivatives in the form of interest-rate caps.
— The LTV ratio including the unsecured bonds is 57.8%.
— The secured bank loan has an LTV of 48.3%.
Financing
Cibus is financed through ordinary shares from shareholders, secured loans from reputable major Nordic banks and institutes, two unsecured
bonds, as well as a hybrid bond loan.

23
Each employee has a considerable impact on Cibus’ development. Measured in terms of property values, Cibus is a large company. The Company has a small number of employees, however, as large areas of property services and simpler administrative tasks are outsourced. Its dependence on key skills requires Cibus to be able to attract, develop and retain employees who contribute optimally to the Company’s development and objectives.
Employees who thrive and develop strengthen the Company’s competitiveness. Employee interviews are conducted annually with the aim of developing employees and the organisation. In 2021, interviews were conducted with all employees employed at the beginning of the year. On average, each employee has received24 hours of training during the year.
A healthy working environment is characterised by healthy and satisfied employees and an absence of malpractices, such as discrimination. The responsibility for the working environment lies with Group Management. Sick leave during the year was 0.8 %, no work-related accidents occurred. During the pandemic, employees were protected by working from home to a great extent, applying flexible working hours and attending meetings online. Our workplaces have not contributed to contagion. Cibus offers employees annual wellness grants. During the year, no reports were received through the Company’s whistle-blower function, by means of which employees and others can anonymously report suspected violations of the law, instances of corruption, policy infringements and so forth, for these to then be investigated by an independent party.
An employee survey involving all employees was conducted in 2021, showing a very high degree of satisfaction and pride regarding Cibus in terms of the working environment and other personnel-related key eNPS performance indicators.
Competent employees and core values
E M P LOY E E S A N D O R GA N I S AT I O N
Satisfied and committed employees
Cibus’s corporate culture is characterised by a strong set of values, which contributes to the organisation’s development and is based on the core values of Commitment, Responsibility and Enjoyment.
Commitment
… is passion, energy and participation. We are passionate about what we do and make every effort to achieve results and targets.
Responsibility
…for us, responsibility entails ethics, honesty, transparency and respect. Business should be conducted in a fair and sustainable manner, with respect for our responsibility in relation to our most important stakeholders and to the society in which we operate.
Enjoyment
…for us, enjoyment is development, friendship and having fun at work. To be able to perform at your best, you need to enjoy your work and maintain a healthy balance between your private life and working life.
Organisation
Cibus’s organisation in its current structure was established in 2019 when three people were hired. In 2020, the organisation was expanded with four functions. The Company’s management team and senior executives include the CEO and CFO, as well as the CIO Sweden and CIO Finland. In 2021, one new employee was recruited and staff turnover was zero. At the end of the year, the workforce amounted to seven employees, of whom three were stationed in Finland.
Cibus strives for an even gender balance in the organisation. At the end of 2021, the age distribution among employees was 71% between 30 and 50 years and 29% over 50 years.

24
Business ethics and whistle-blower function
For us, business ethics means that our customers and partners must be treated professionally. We should always be perceived as straightforward and easy to work with. Returning customers and long-term leases with good cooperation with tenants is one of our focus areas.
Business ethics also plays a part in contributing to a sustainable society. Cibus maintains a Code of Conduct based on our core values of Commitment, Responsibility and Enjoyment. It describes the behaviour Cibus’ stakeholders can expect of Cibus’ employees.
The Code of Conduct also combats the risks of corruption, bribery and other violations.
Cibus has implemented a whistle-blower function that can be accessed through the Company’s website www.cibusnordic.com. This makes it possible to anonymously report suspicions of corruption or other offences via an independent external party.
Gender balance in the organisation
Full-year 2021 Full-year 2020
Women Men Women MenCibus, employees 29% 71% 40% 60%Cibus, senior executives 25% 75% 25% 75%Cibus, Board of Directors 40% 60% 40% 60%
5:5 Ensure full participation of women in leadership and decision-making
At the end of 2021, 40% of the members of Cibus’s Board of Directors were women.
25
Sustainability
S U S TA I N A B I L I T Y
Sustainable marketplaces as a business concept
Easily accessible and climate-smart marketplaces contribute to favourable development in society. With shops that are easy to reach and with services in safe environments, people have access to groceries, delivery points for goods bought online and to other services without having to make long car journeys. The environmental impact of the marketplace is reduced by heating and electricity being used efficiently and extracted from clean energy sources, such as solar panels, and by end-customers being offered various opportunities to minimise their overall environmental footprint.
At the end of 2021, Cibus’ property portfolio amounted to 400 properties with a total floor space of 867,000 m2. Properties with the five largest tenants, Kesko, Tokmanni, Coop Sverige, S Group and Lidl account for slightly more than 90% net operating income. In partnership with these leading Nordic grocery and daily goods chains, Cibus is developing its properties into sustainable marketplaces. Having tenants with their own ambitious sustainability aspirations and proven sustainable activities is a central component in Cibus’ strategy.
Responsibility and influence throughout the value chain
The objective is for the marketplaces and Cibus to make a positive contribution to the environment, people and society, while minimising their negative impact. Through collaborations, initiatives and active measures, Cibus is able to stimulate sustainable development, even in operations for which the Company does make the decisions.
In properties where the Company has little or no operational control, due to the formulation of the lease agreements, Cibus can stimulate a sustainable marketplace by choosing the right tenant and maintaining an ongoing dialogue with that tenant and supporting its sustainability work. Cibus’ ownership of marketplaces also contributes to the emergence of local marketplaces and vibrant communities that are accessible to people and that would not have been possible without financing.
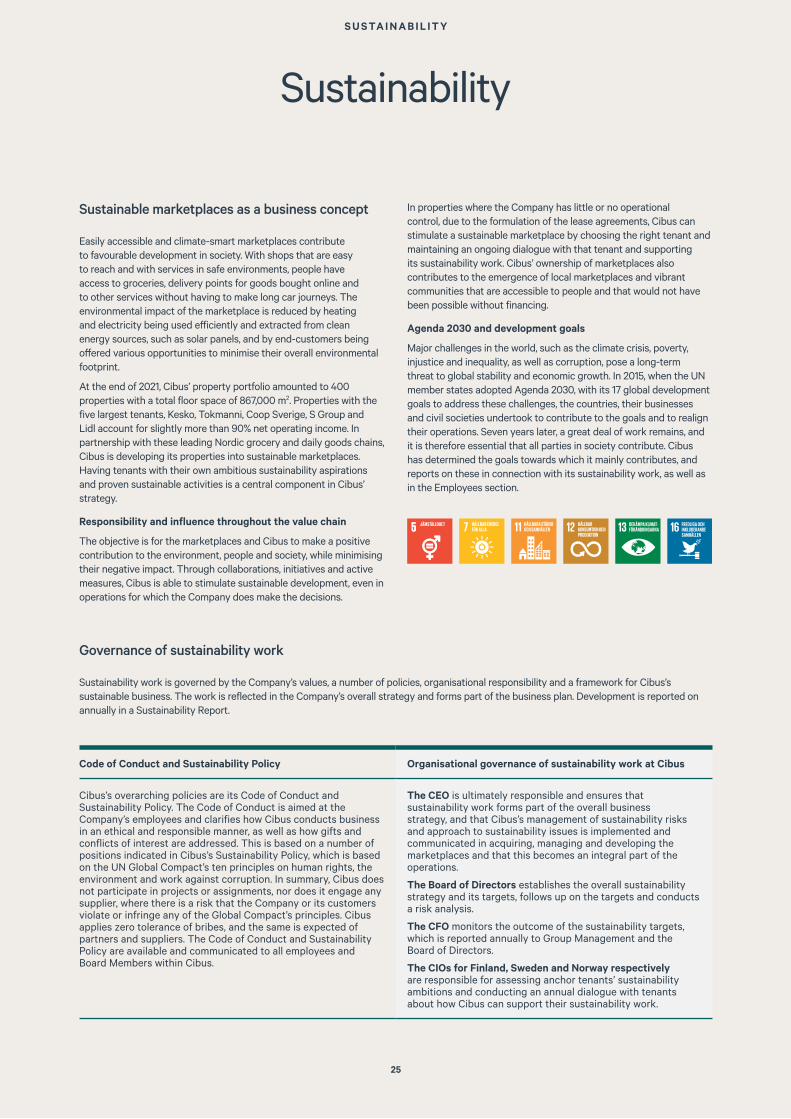
Agenda 2030 and development goals
Major challenges in the world, such as the climate crisis, poverty, injustice and inequality, as well as corruption, pose a long-term threat to global stability and economic growth. In 2015, when the UN member states adopted Agenda 2030, with its 17 global development goals to address these challenges, the countries, their businesses and civil societies undertook to contribute to the goals and to realign their operations. Seven years later, a great deal of work remains, and it is therefore essential that all parties in society contribute. Cibus has determined the goals towards which it mainly contributes, and reports on these in connection with its sustainability work, as well as in the Employees section.
Governance of sustainability work
Sustainability work is governed by the Company’s values, a number of policies, organisational responsibility and a framework for Cibus’s sustainable business. The work is reflected in the Company’s overall strategy and forms part of the business plan. Development is reported on annually in a Sustainability Report.
JÄMSTÄLLDHET
Code of Conduct and Sustainability Policy Organisational governance of sustainability work at Cibus
Cibus’s overarching policies are its Code of Conduct and Sustainability Policy. The Code of Conduct is aimed at the Company’s employees and clarifies how Cibus conducts business in an ethical and responsible manner, as well as how gifts and conflicts of interest are addressed. This is based on a number of positions indicated in Cibus’s Sustainability Policy, which is based on the UN Global Compact’s ten principles on human rights, the environment and work against corruption. In summary, Cibus does not participate in projects or assignments, nor does it engage any supplier, where there is a risk that the Company or its customers violate or infringe any of the Global Compact’s principles. Cibus applies zero tolerance of bribes, and the same is expected of partners and suppliers. The Code of Conduct and Sustainability Policy are available and communicated to all employees and Board Members within Cibus.
The CEO is ultimately responsible and ensures that sustainability work forms part of the overall business strategy, and that Cibus’s management of sustainability risks and approach to sustainability issues is implemented and communicated in acquiring, managing and developing the marketplaces and that this becomes an integral part of the operations.
The Board of Directors establishes the overall sustainability strategy and its targets, follows up on the targets and conducts a risk analysis.
The CFO monitors the outcome of the sustainability targets, which is reported annually to Group Management and the Board of Directors.
The CIOs for Finland, Sweden and Norway respectively are responsible for assessing anchor tenants’ sustainability ambitions and conducting an annual dialogue with tenants about how Cibus can support their sustainability work.

26
S U S TA I N A B I L I T Y
Stakeholders Expectations of Cibus Examples of dialogues
Customers/tenants Commitment, permit for redevelopment, renewable energy, confidentiality
Acquisitions, Customer meetings Annual sustainability dialogue Ongoing management
Local communities Access to societal functions, service, trade, climate-smart solutions
Acquisitions, Indirect engagement via tenants
End-consumers Access to public transport and local services, secure marketplaces, climate-smart solutions
Indirect engagement via tenants
Investors Transparent information, financial results, stable operations, ethical and secure transactions
Individual meetings and presentations for investors and the capital market, quarterly reports, Annual Report, Annual General Meeting
Board Transparent information, financial results, stable operations, ethical and secure transactions, climate
Board meetings, one of which each year is a strategy meeting
Media Transparent information Interviews, press releases, quarterly reports, Annual Report
Employees Good working environment, long-term employer, regulatory compliance, development opportunities,
Employee development interviews, business planning
Sustainability strategy
Cibus’s sustainability framework also serves as its strategy in this area The framework builds on the issues considered central by stakeholders and over which Cibus has influence. The issues have been organised into three focus areas, and for these areas Cibus has formulated clear ambitions and targets, governance and responsibility, as well as a plan of action for continuously improving sustainability work. Sustainability work is followed up annually by means of, for example, a number of established key performance indicators. The follow-up promotes transparency and ensures that sustainability work is further developed.
To meet the needs and views of stakeholders, Cibus regularly assesses and updates the material sustainability issues. In ongoing stakeholder dialogues, such as at customer meetings, employee interviews and investor meetings, Cibus actively addresses sustainability aspects to obtain information on how this work can be improved.
Cibus’s framework
The material sustainability issues have been structured in three focus areas. Cibus impacts sustainability work throughout the value chain.
SuppliersFocus areas
Be a sustainable partner
Take action for the climate
Create accessible marketplaces
Committed and present partner
Stable result, strong financial position
Transparent information
Energy efficient property portfolio
Develop marketplaces in urban areas and smaller towns
Transparent information
Create access to stores and services, secure local communities and environmental services
Ethical and secure transactions, counteract corruption, taxes
Reduces climate footprint around marketplaces and in proprietary operations
CIBUS’s own operations
CIBUS’s properties Tenants End
consumersSociety/general
public

27
Sustainability discussions with tenants
The anchor tenants in Cibus’s property portfolio are high-quality retail chains, such as Kesko, Tokmani, Coop Sverige, S Group and Lidl, with their own ambitious aspirations regarding their impact on the world around them and sustainability. Every year, Cibus holds special discussions with these tenants to increase the positive sustainability effect of the marketplaces on the environment and society and to minimise their negative footprint. These discussions are conducted with either the property or sustainability function at the grocery and daily goods chains. These sustainability discussions strengthen the bond between Cibus and its tenants and improve the opportunities for extended leases and new property acquisitions.
In 2021, Cibus held sustainability discussions with tenants corresponding to 82% of the leased space. This can be compared with 63% in the preceding year, when the number of discussions was affected by the Corona pandemic. A customer survey will be conducted in 2022.
Business ethics for greater trust
Cibus’s ability to serve long term as a stable and sound partner, and as a respectable property player, is crucial to the relationship with anchor tenants and the possibility of new acquisitions. With business operations with long-term leases and major grocery and daily goods chains as repeat customers, a high degree of integrity,
S U S TA I N A B I L I T Y
— Committed and present cooperative partner — Stable result, strong financial position — Ethical and secure transactions — Transparent information
Be a sustainable partner
To meet the right needs of the grocery and daily goods retailers who are Cibus’s anchor tenants, both in the business relationship and in supporting tenants’ own ambitious sustainability aspirations, the Company serves as a committed and present partner, offering tenants innovative arrangements. The long-term nature and credibility of the operations are safeguarded by good order in Cibus’s business activities, that is, by maintaining stable financial results and a strong financial position, ethical and safe business in all contexts, as well as transparent information for investors.
Long-term objective Earnings Value creation
Make it easier for tenants and end-customers to act sustainably.
sustainability discussions with Cibus’s tenants, share 2021: 82% 2020: 63%
Tenants: contributes to business needs, strengthens their sustainability work. End-customers: contributes to their sustainable actions.
A result that safeguards long-term stable operations for the benefit of tenants, society, investors and employees.
See the Administration Report. Tenants: stable partner. Investors: dividends. Employees: long-term employer. Community: stable and transparent taxpayer.
Be a respectable player in the property sector, conducting our operations ethically, without suspicion of corruption, tax arrangements or shortcomings in customers’ security/integrity.
No incidents regarding bribery or corruption in 2021.
Society, tenants, employees, investors: Zero tolerance regarding bribery and corruption, as well as a high level of business ethics contribute to credibility and strengthened growth and welfare.
Follow regulations and recommendations, and provide a transparent account of the business and its results.
Cibus 2021 Sustainability Report is the Company’s third consecutive report of this type.Annual reporting to GRESB and EPRA sustainability BPR Awards.
Investors, tenants, society: Increased focus on, and transparency surrounding, sustainability.
12:6 Encourage companies to apply sustainable methods and sustainability reporting.
Cibus prioritises tenants with transparent sustainability reporting. In 2021, all anchor tenants reported their sustainability work.
16:5 Combating corruption and bribery.
Cibus applies zero tolerance of corruption, and assesses all partners on the basis of this. In 2021, no corruption incidents were noted.

28
S U S TA I N A B I L I T Y
customer confidentiality and clear business ethical principles are essential cornerstones for Cibus. As there may never be any suspicions of irregularities or corruption, continuous deliberations address how and with whom the Company does business. Cibus’s reputation is also strongly associated with the ability to achieve set financial goals, conduct strategically beneficial transactions and provide transparent and accurate market information.
Cibus’s zero tolerance regarding bribery and corruption in its own operations, as well as among suppliers and partners, is explained in the Company’s Code of Conduct and Sustainability Policy. The Code is available and communicated to all employees and Board Members within Cibus. Cibus complies with the GDPR and applies a clear Data Management Policy. Since 2019, the Company maintains a whistle-blower function that can be accessed via the website www.cibusnordic.com, where both employees and outsiders can anonymously report suspicions of corruption and other rule violations via an external independent party.
Human rights
People all over the world are affected by the operations of companies and other societal entities, which are therefore responsible for ensuring that human rights are not violated. This responsibility extends beyond Cibus’s own operations and includes suppliers and partners, whom it continuously assesses. Through various initiatives, all anchor tenants in Cibus’s property portfolio actively counteract human rights violations in their grocery production chains.
Sustainability reporting
Cibus views ongoing sustainability reporting as a way of assessing and continuously improving its sustainability work. The 2021 Sustainability Report, produced in accordance with the Annual Accounts Act, is the Company’s third such report. Cibus also reports on sustainability through:
— Cibus Green Bond Investor Report 2021 https://www.cibusnordic.com/media/206507/cibus_green_bond_report_2021.pdf
— GRESB – Global Real Estate Sustainability Benchmark, which conducts a global review every year of sustainability work by more than a thousand property companies and funds.
— EPRA sBPR – European Public Real Estate Association, which works to improve and standardise property companies’ reporting of sustainability. In 2021, 166 European property companies were evaluated.

29
Green investments for a better climate
Climate change is one of the foremost threats to the world’s food supply and people’s opportunities to support themselves. In the long term, increased carbon dioxide emissions contribute to increased poverty in the world and to deteriorating conditions for growth, which affects everyone. Through heating and other consumption of electricity, the property sector is one of the world’s major consumers of energy. As long as energy is extracted from fossil fuels, this energy consumption poses a threat to the climate. Cibus’s own green energy investments and prioritisation of tenants with ambitious climate aspirations represent the Company’s principal contribution to creating climate-neutral marketplaces.
83% of Cibus’s property area is leased to anchor tenants with stated ambitions to reduce their overall climate footprint or to achieve climate neutrality by 2025 or 2030. Several have set climate goals compatible with the Paris Agreement’s 1.5 degree goal. The grocery and daily goods sector’s climate goals include their operations in commercial properties as well as merchandise and transport.
Cibus’s regular sustainability discussions with tenants facilitate faster permit applications in connection with, for example, extensions for renewable energy purposes or electric chargers in customer car parks. By the end of 2021, tenants had invested in solar panels on the roofs of 39 properties in Finland, generating 5,266 MWh of energy annually. Build-outs of additional solar panels are planned and discussions regarding further installations are being held with several tenants.
Cibus also makes its own green investments, with the goal of being completely climate neutral by 2030. At several properties in Sweden and Finland lighting has been replaced with LED lighting, bringing major energy savings. In lease agreements where Cibus is responsible for purchasing energy, all heating and electricity will be fossil-free as of 2022. During 2022, Cibus also intends to assess making its own investments in green energy sources and may ultimately become a supplier of green electricity to its customers. The large flat roofs on Cibus’s marketplaces are well suited to building out solar panels and do not crowd out other operations compared with building out on agricultural land, for example.
— Reduce the climate footprint surrounding marketplaces and in-house operations, achieving climate neutrality by 2030
— Energy-efficient property portfolioTake action for the climate
Cibus’s operations are to be climate neutral by 2030. This objective is to be achieved by facilitating and encouraging tenants’ investments in renewable energy, investments in properties with climate-intelligent tenants and with good accessibility for end-consumers, and through their own climate-fostering investments. Focus on investments in energy-efficient properties helps reduce energy demand and costs, as well as saving society’s energy resources.
Long-term objective Earnings Value creation
Climate-neutral operations by 2030, to be achieved by:– facilitate tenants’ investments in renewable energy,– Cibus invests in proprietary green energy sources,– Cibus invests in accessible marketplaces, minimising end-customers’ climate footprint.
Leased to tenants with stated ambitions of reducing their climate footprint or achieving climate neutrality 2021: 83% 2020: 79 %
Properties with solar panel in Cibus’s property portfolio 2021: 39 2020: 26
Internal operation: 2021: 6,580 kWh electricity consumption total 2021: 33.4 kWh/m2 2020: 29.3 kWh/m2 100% renewable electricity
Society, tenants, employees, investors: Contribute to reducing climate change around the world, which risks impacting economic growth, making groceries expensive and worsening living conditions for future generations and for people in vulnerable parts of the world.
Increase the properties’ energy efficiency and the share of renewable electricity used.
Properties with high energy efficiency (number and total value) 2021: 36, EUR 220 million 2020: 30, EUR 204 million
Community: Help reduce climate change. Tenants: Reduced electricity consumption, increased self-sufficiency in electricity.
7:2 Increase the share of renewable energy in the world.
Cibus contributes to increased expansion of solar cells on its properties by encouraging anchor tenants through sustainability discussions and by quickly approving plans to build-out. By 2021, 39 properties had solar cells installed.
13:1 Strengthen resilience to and adaptability to climate-related disasters.
Cibus’s investments in green electricity and reduced climate emissions around marketplaces help reduce climate risks.
S U S TA I N A B I L I T Y

30
Consumption, emissions and measurements
In most of its properties, Cibus lacks control of energy purchases, as well as of energy consumption, water usage, etc. that occur in the properties. Tenants consume energy for heating and property electricity for lighting and operation of refrigerators, for example. Consumption can partly be affected by energy-saving investments such as LED lighting, as well as technical overhauls and automated reading of electricity meters. Consumption of electricity and district heating per m2 in Cibus’s total Swedish and Finnish property holdings (like-for-like) increased by 15% in 2021. This is explained by an unusually high average temperature in the winter of 2020, while in 2021 it was more normal, resulting in higher heating costs compared with 2020. Adjacent to the properties, several tenants have installed charging stations for electric cars and Cibus generally always takes a positive view of requests to use land around its properties for environmentally beneficial purposes.
Water consumption amounted to 158 litres per m2 (160 litres like-for-like), which was an increase of 12% compared with 2020. Through technical overhauls and installation of automated reading of water meters, consumption can be reduced. Waste is always sorted at source, including sorting of food waste, paper and packaging.
The main carbon dioxide emissions in Cibus’s operations take place in Scope 3 according to the GHG protocol, that is, emissions resulting from heating and electricity consumption in properties where the purchases are made by the tenant and Cibus lacks operational control. In the Finnish property portfolio, Cibus in some cases supplies the tenant with district heating and electricity, which is reported in Scope 2. These purchases are determined by Cibus. In the absence of knowledge regarding actual energy sources, reported emissions in Scopes 2 and 3 are calculated based on national average emissions factors. Accordingly, the report takes renewable energy installed in the properties into account, but not the consumption of green energy, n or does it reflect Kesko’s and Tokmanni’s supply of electricity from partly-owned Finnish wind turbines or Coop’s choice of fossil-free electricity and district heating. Cibus reported total carbon dioxide emissions (Scopes 1, 2 and 3) increased by 44% in absolute numbers in 2021, which is mainly a result of the rapid rate at which Cibus has been acquiring new properties and therefore also of increased energy consumption among tenants. The intensity, that is, emissions/m2, increased, partly as a result of unusually high average temperatures in 2020.
The environmental footprint of Cibus’s internal operations consists mainly of heating and electricity consumption at the leased offices in Stockholm and Helsinki and in connection with business trips.
All purchased electricity is fossil-free and air travel is climate-compensated.
For detailed information on energy and water consumption, as well as carbon dioxide emissions, see “Sustainability indicators according to EPRA” on page 33.
CONSUMPTION, EMISSIONS AND MEASUREMENTS
Tonnes CO2 equivalents 2021 2020 2019
Scope 1 (mainly company cars) 3 2 1
Scope 2 (purchased energy for properties)
9,190 7,340 1)
Scope 3 (tenants’ purchased energy for Finnish, Swedish and Norwegian properties, as well as Cibus employees’ business trips)
18,534 11,960 17,415
Total 27,727 19,302 17,416
1) Emissions reported in Scope 3 for 2019 include Scopes 2 and 3
Energy-efficient properties and green financing
The property portfolio’s energy consumption is also affected by Cibus’s prioritisation of energy-certified properties in connection with acquisitions. When established in Norway in September 2021, where Cibus took over a total of 10 stores at the end of the year, the properties’ energy efficiency has been given special consideration together with their accessible locations for end-consumers.
Cibus has a green bond corresponding to EUR 59.6 million, issued in 2020. High-standard energy-certified properties in Cibus’s portfolio were pledged as security for the bond. At the end of 2021, Cibus owned properties with energy certification corresponding to European energy class EPC A and B, that is, A and B in Finland and A, B and C in Sweden, for a total value of EUR 220 million. This corresponds to 369% of the outstanding green bond, and 15% of the value of Cibus’s total property portfolio.
For more information on certified properties, see “Sustainability indicators according to EPRA” in the Annual Report on page 33.
S U S TA I N A B I L I T Y
Grocery and daily goods retailers with ambitious sustainability aspirations
In Cibus’s properties, grocery and daily goods retailers operate who have ambitious sustainability aspirations, both for the manufacturing chains of their products, as well as the environmental footprint of their marketplaces and goods transports. Below are some examples of their sustainability goals:
Kesko Climate goals: Carbon dioxide neutral by 2025 (SBTi)
Tokmanni Climate goals: -70% carbon dioxide emissions by 2025 (SBTi)
COOP Climate goals: -25% carbon dioxide emissions by 2025 (SBTi)
S Group Climate goals: -90% carbon dioxide emissions by 2030 (base year 2015)
Lidl Climate goals: -80% carbon dioxide emissions by 2030 (SBTi) SBTi – Goals approved by, or under approval by, the Science-Based Targets initiative, with 2015 as the base year.
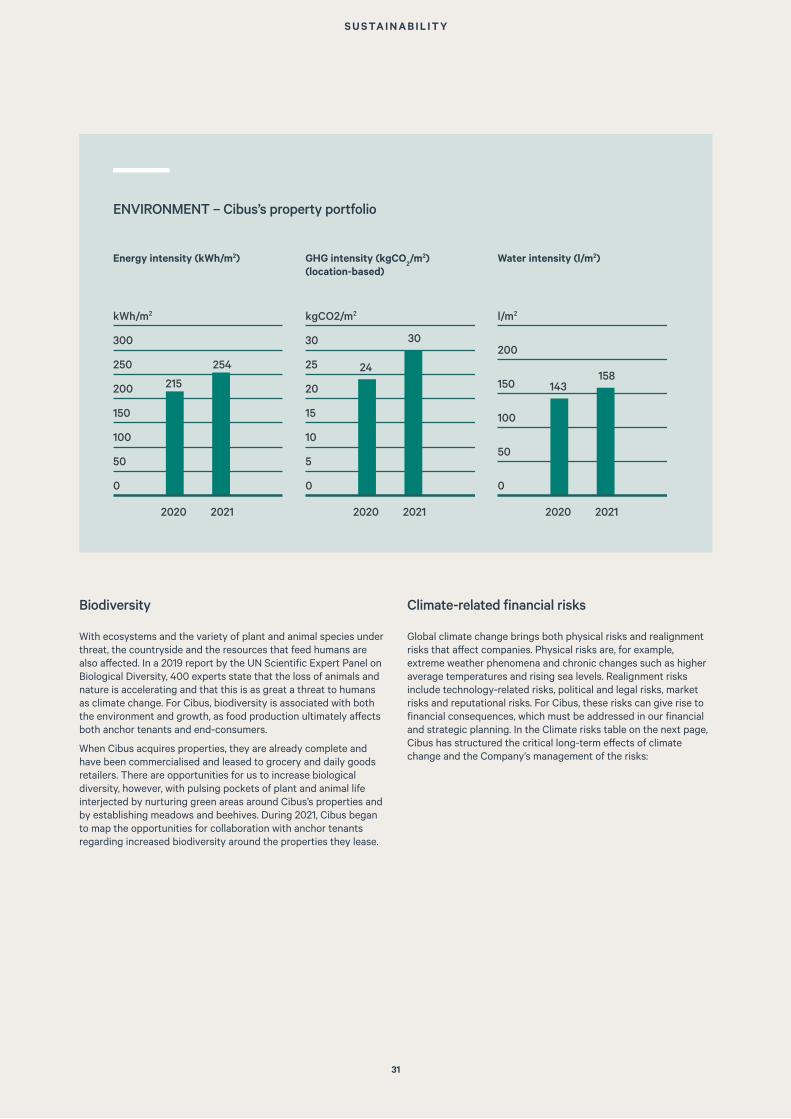
31
S U S TA I N A B I L I T Y
ENVIRONMENT – Cibus’s property portfolio
Energy intensity (kWh/m2) GHG intensity (kgCO2/m2)
(location-based)Water intensity (l/m2)
Biodiversity
With ecosystems and the variety of plant and animal species under threat, the countryside and the resources that feed humans are also affected. In a 2019 report by the UN Scientific Expert Panel on Biological Diversity, 400 experts state that the loss of animals and nature is accelerating and that this is as great a threat to humans as climate change. For Cibus, biodiversity is associated with both the environment and growth, as food production ultimately affects both anchor tenants and end-consumers.
When Cibus acquires properties, they are already complete and have been commercialised and leased to grocery and daily goods retailers. There are opportunities for us to increase biological diversity, however, with pulsing pockets of plant and animal life interjected by nurturing green areas around Cibus’s properties and by establishing meadows and beehives. During 2021, Cibus began to map the opportunities for collaboration with anchor tenants regarding increased biodiversity around the properties they lease.
Climate-related financial risks
Global climate change brings both physical risks and realignment risks that affect companies. Physical risks are, for example, extreme weather phenomena and chronic changes such as higher average temperatures and rising sea levels. Realignment risks include technology-related risks, political and legal risks, market risks and reputational risks. For Cibus, these risks can give rise to financial consequences, which must be addressed in our financial and strategic planning. In the Climate risks table on the next page, Cibus has structured the critical long-term effects of climate change and the Company’s management of the risks:
0
50
100
150
200
250
300
kWh/m2
2021
254
2020
215
0
5
10
15
20
25
30
kgCO2/m2
2021
30
2020
24
0
50
100
150
200
l/m2
2021
158
2020
143

32
S U S TA I N A B I L I T Y
The EU’s green taxonomy
As part of its climate and environment strategy, the EU has adopted a number of measures to channel capital into operations contributing to a greener economy. As of 2022, large companies of general interest (over 500 employees) within the EU will report the proportion of their revenues, expenses and investments that are covered by the EU’s green definition (“Green taxonomy”).
Initially, companies will report based on the taxonomy’s definition of two of the EU’s six overarching environmental goals: possible climate adaptations and climate improvements. In the following years, reporting will be expanded with green activities for water use, circularity, emissions and biodiversity. Companies will then also report the extent to which their activities meet the requirements of the taxonomy. For property companies, the taxonomy states, among other things, limits for what may be counted as energy-efficient properties.
Although Cibus’s property investments are defined within the taxonomy, the Company is not covered by the reporting requirement regarding more than 500 employees and is not reporting on 2021 based on the green taxonomy.
Climate risks
Realignment risks Financial effect Action Time perspective
Risk level
Legal and political – Carbon dioxide taxes, regulations, etc. that lead to higher energy costs.
On Cibus’s rental levels due to deteriorating profitability among anchor tenants.
Leasing to anchor tenants with ambitious climate aspirations, with a large proportion of fossil-free electricity supply, with investments in proprietary fossil-free energy supply.
short to medium term
high
On Cibus’s operating costs due to more expensive energy purchases.
A reduced share of leases in which Cibus is responsible for property heating, an increased share of purchases of green energy.
short to medium term
high
Cibus’s assets or investments are attributable to rising property prices for energy-efficient properties.
Increased growth contributes to the possibility of a better credit rating and lower financing costs.
medium term
low
Market – Higher property costs due to more expensive material costs, higher risks, etc.
On Cibus’s operating costs due to more expensive insurance, etc.
The growth of the property portfolio and increased diversification strengthen Cibus’s negotiating position.
medium term
medium
Reputation – Changed consumption patterns among end-consumers
On Cibus’s rental levels due to deteriorating profitability among anchor tenants.
Leasing to major anchor tenants with good profitability potential and with ambitious climate aspirations, which appeals to end-consumers.
short term high
Physical
Rising sea levels
On Cibus’s assets due to areas prone to flooding.
Acquisitions of properties outside risk areas
long term low
On Cibus’s overheads due to material damage.
Acquisitions of properties outside risk areas
long term low

33
S U S TA I N A B I L I T Y
Safe local communities
With investments in attractive grocery and daily goods stores adjacent to residential areas, public transport connections or in smaller communities, Cibus offers marketplaces that are high accessible for people and where they can safely conduct their business. End-consumers can walk, ride a bike or take public transport to these local communities, gaining access to services, groceries and e-commerce deliveries, as well as to municipal initiatives, such as collection points for sorted waste, etc. Cibus maintains an ongoing dialogue with anchor tenants about how to improve people’s security and needs. This involves transport and services that, for example, improve the security and attractiveness of the marketplace. Establishing an efficient stakeholder dialogue is essential in understanding the expectations and needs that exist in local communities. At the same time, Cibus has limited control over the security characteristics of the properties, and can only shed light on the importance of the issue in its sustainability discussions with tenants.
Benefiting society
As a rule, all requests to use empty areas of property for socially beneficial purposes are approved, as long as they do not impair the quality of the marketplace. In 2021, Cibus signed a partnership agreement with Järntorget to jointly develop the parts of Cibus’s Swedish property portfolio that is not used for grocery and daily goods retail. Through planning work, the aim of the agreement is to establish building rights for rental apartments in Cibus’s existing and future Swedish property portfolio. Where possible, these homes will be built of sustainable wood, using Järntorget subsidiary Bomodul’s flexible construction system, and all of the homes will carry the Nordic Swan ecolabel.
— Develop marketplaces in urban areas and in smaller towns — Create access to shops and services secure local communities and collection
points for sorted waste.Create accessible marketplaces
End-consumers need access to vibrant and safe local communities with grocery and daily goods stores, delivery points for goods purchased online, collection points for sorted waste and other services without having to make time-consuming trips or generate substantial climate impact. Cibus’s financing of marketplaces makes this possible.
Long-term objectives Earnings Value creation
Stimulate the development of marketplaces by owning properties leased to attractive grocery and daily goods chains.
Create accessible marketplaces for end-customers, with access to shops and services.
Properties owned in Finland, Sweden, Norway: 2021: 400, 867,000 m2 2020: 290, 744,000 m2
End-customers, Society: vibrant and safe local communities, access to groceries, service, e-commerce, recycling and other environmental services without time-consuming travel or a large climate footprint.
11:3 Inclusive and sustainable urbanisation
Cibus develops districts and smaller towns in which people have access to vibrant and safe local communities with grocery and daily goods shops, as well as services.

34
S U S TA I N A B I L I T Y
Table of contents, EPRA Sustainability Performance Measure
Environmental sustainability performance measures Page Part of Annual Report Tables below
Elec-Abs Total electricity consumption 29-31, 35 Sustainability-Acting for the climate X
Elec-LfL Total electricity consumption 29-31, 35 Sustainability-Acting for the climate X
DH&C-Abs Total district heating & cooling consumption 29-31, 35 Sustainability-Acting for the climate X
DH&C-LfL Total district heating & cooling consumption 29-31, 35 Sustainability-Acting for the climate X
Fuels-Abs Total fuel consumption 29-31, 35 Sustainability-Acting for the climate X
Fuels-LfL Total fuel consumption 29-31, 35 Sustainability-Acting for the climate X
Energy-Int Building energy intensity 29-31, 35 Sustainability-Acting for the climate X
GHG-Dir-Abs Total direct greenhouse gas (GHG) emissions 29-31, 36 Sustainability-Acting for the climate X
GGH-Indir-Abs Total indirect greenhouse gas (GHG) emissions 29-31, 36 Sustainability-Acting for the climate X
GHG-int Greenhouse gas (GHG) emissions intensity from building energy consumption
29-31, 36 Sustainability-Acting for the climate X
Water-Abs Total water consumption 29-31, 36 Sustainability-Acting for the climate X
Water-LfL Total water consumption 29-31, 36 Sustainability-Acting for the climate X
Water-Int Building water intensity 29-31, 36 Sustainability-Acting for the climate X
Waste-Abs Total weight of waste by disposal route 29-31, 37 Sustainability-Acting for the climate X
Waste-LfL Total weight of waste by disposal route 29-31, 37 Sustainability-Acting for the climate X
Cert-Tot Type and number of sustainability certified assets 29-31, 37 Sustainability-Acting for the climate X
Social performance measures
Diversity-Emp Employee gender diversity 23-24 Employees and organisation
Emp-Training Employee training and development 23-24 Employees and organisation
Emp-Dev Employee performance appraisals 23-24, 75 Employees and organisation, Administration Report, Note employees
Emp-Turnover Employee new hires and turnover 23-24 Employees and organisation
H&S-Emp Employee health and safety 23-24, 39 Employees and organisation X
H&S-Asset Asset health and safety assessment 33, 39 Sustainability – Sustainable marketplaces as a busi-ness concept
X
H&S-Comp Asset health and safety compliance 33, 39 Sustainability – Sustainable marketplaces as a busi-ness concept
X
Comty-Eng Community engagement, impact assessment and development programmes
33 Sustainability – Sustainable marketplaces as a busi-ness concept
Governance performance measures
Gov-Board Composition of the highest governance body 53 Corporate Governance Report
Gov-Select Process for nominating and selecting the highest governance body
48-49 Corporate Governance Report
Gov-Col Process for managing conflicts of interest 53 Corporate Governance Report
Sustainability indicators in accordance with EPRA
Cibus reports key sustainability performance indicators based on EPRA (European Public Real Estate Association) recommendations. In the area of the environment, key performance indicators are reported for energy, greenhouse gas emissions, water, waste, environmentally certified buildings, as well as for corporate governance and social impact. In the tables, “n/d” stands for “not disclosed”, that is, the data is not reported.
Organisational boundary – Cibus owns and manages retail properties with pre-existing long-term leases. Cibus lacks operational control over most of these assets, purchasing energy for tenants only at some of its properties in Finland and there being able to choose the source of the energy. The reporting includes energy consumption for heating and other property electricity in Cibus’s properties, regardless of whether Cibus has operational control or not. Tenants’ consumption of water and waste collection is also included in all of Cibus’s assets.
Coverage – Cibus works to report data for all assets. However, certain data are missing, such as for waste at most of the properties. Cibus indicates the proportion of properties included in each key performance indicator.
Estimation of landlord-obtained utility consumption – All data is based on actual measurements.
Third party assurance – Cibus’s sustainability report has been prepared in accordance with the Annual Accounts Act. The review only refers to the fact that a sustainability report has been prepared.
Normalisation – Cibus calculates intensity based on area in m2.
Segmental analysis – Cibus only owns retail properties. Sustainability data are reported for properties per country (Sweden, Finland and Norway).
Disclosure of own offices – Environmental and social indicators for Cibus’s own offices are reported separately from the property portfolio.
Narrative on performance – Explanations of developments in key sustainability figures appear in Cibus’s Sustainability Report and appear in the EPRA Index.
Location of EPRA Sustainability Performance Measures in companies’ report – Cibus reports EPRA sustainability data in a separate section below, as well as in the Sustainability Report.
Reporting period – Reporting pertains to calendar years.
Materiality – Cibus’s material sustainability issues are based on stakeholder feedback and appear in the section “Sustainable marketplaces as a business concept” in the Sustainability Report.

35
S U S TA I N A B I L I T Y
Energy – in assets
Total portfolio 1) Performance by country and assets
Absolute perfor-mance (Abs)
Like-for-Like performance (LfL)
Finland Sweden
EPRA Code
Indicator (Units)
2021 2020 2021 2020 % change
2021 (Abs)
2020 (Abs)
2021 (LfL)
2020 (LfL)
% change
(LfL)
2021 (Abs)
2020 (Abs)
2021 (LfL)
2020 (LfL)
% change
(LfL)
Elex-Abs, Elec-LfL
Electricity (MWh)
for landlord shared services
_ _ _ _ – _ _ _ _ – – – – – –
(sub)metered exclusively to tenants
35,417 33,054 34,122 33,054 3% 30,744 28,468 29,857 28,468 5% 4,673 4,586 4,265 4,586 -7%
Total landlord-obtained electricity
35,417 33,054 34,122 33,054 3% 30,744 28,468 29,857 28,468 5% 4,673 4,586 4,265 4,586 -7%
Tenant obtained electricity 122,515 88,413 95,742 88,413 8% 88,294 58,097 64,442 58,097 11% 34,221 30,316 31,300 30,316 3%
Proportion of landlord obtained electricity from renewable sources
n/d n/d n/d n/d 100% 100%
Proportion of tenant obtained electricity from renewable sources 2)
64% 64% 50% 46% 100% 100%
Proportion of tenant renewable self-generated electricity on-site
2,833 2,021 2,723 2,021 35% 2,833 2,021 2,723 2,021 35% – – – – –
DH&C-Abs, DH&C-LfL
District heating and cooling (MWh)
for landlord shared services
- - - - – - - - - – – – – – –
(sub)metered exclusively to tenants
34,169 23,808 34,169 23,808 44% 33,953 23,605 33,953 23,605 44% 216 203 216 203 6%
Total landlord-obtained district heating and cooling
34,169 23,808 34,169 23,808 44% 33,953 23,605 33,953 23,605 44% 216 203 216 203 6%
Tenant obtained district heating and cooling
38,480 25,486 32,374 25,486 27% 37,055 24,141 30,949 24,141 28% 1,425 1,345 1,425 1,345 6%
Proportion of land-lord-obtained district heating and cooling from renewable sources
n/d n/d n/d n/d 100% 100%
Proportion of te-nant-obtained district heating and cooling from renewable sources
n/d n/d n/d n/d 100% 100%
Fuels-Abs, Fuels-LfL
Fuels (MWh)
for landlord shared services
– – – – – – – – – – – – – – –
(sub)metered exclusively to tenants
– – – – – – – – – – – – – – –
Total landlord-obtained electricity
– – – – – – – – – – – – – – –
Tenant-obtained fuels 3,015 1,375 1,803 1,375 3,015 1,375 1,803 1,375 31% – – – – –
Proportion of land-lord-obtained fuels from renewable sources
n/d n/d n/d n/d – –
Proportion of te-nant-obtained fuels from renewable sources
n/d n/d n/d n/d – –
Total energy use 233,596 172,136 198,210 172,136 15% 193,061 135,686 161,004 135,686 19% 40,535 36,450 37,206 36,450 3%
Energy-Int
Energy intensity (kWh/m2/year)
Landlord-obtained energy 76 71 85 71 19% 84 76 93 76 21% 34 40 38 40 -6%
Tenant-obtained energy 178 144 161 144 12% 166 122 141 122 15% 246 267 276 267 3%
No of applicable proper-ties
Energy and associated GHG disclosure coverage
379 of 390
274 of 294
283 of 294
274 of 294
260 of 266
162 of 182
171 of 182
162 of 182
119 of 124
112 of 112
112 of 112
112 of 112
m2 of applicable proper-ties
Energy and associated GHG disclosure coverage
919,363 801,150 807,921 801,150 774,545 682,750 689,521 682,750 144,818 118,400 118,400 118,400
% of m2 Proportion of energy and associated GHG – estimated
0% 0% 0% 0% 0% 0% 0% 0% 11% 0% 0% 0%
NotesComments regarding energy consumption, see page 30.
1) In the second half of 2021, Cibus acquired 10 properties in Norway, not included in performance measures. 5 of 10 properties consumed 2,069 MWh, of which 25% was obtained from renewable sources.
2) Renewable energy sources for Finnish assets include energy for district heating and electricity.
EPRA Sustainability Performance Measures (Environment)
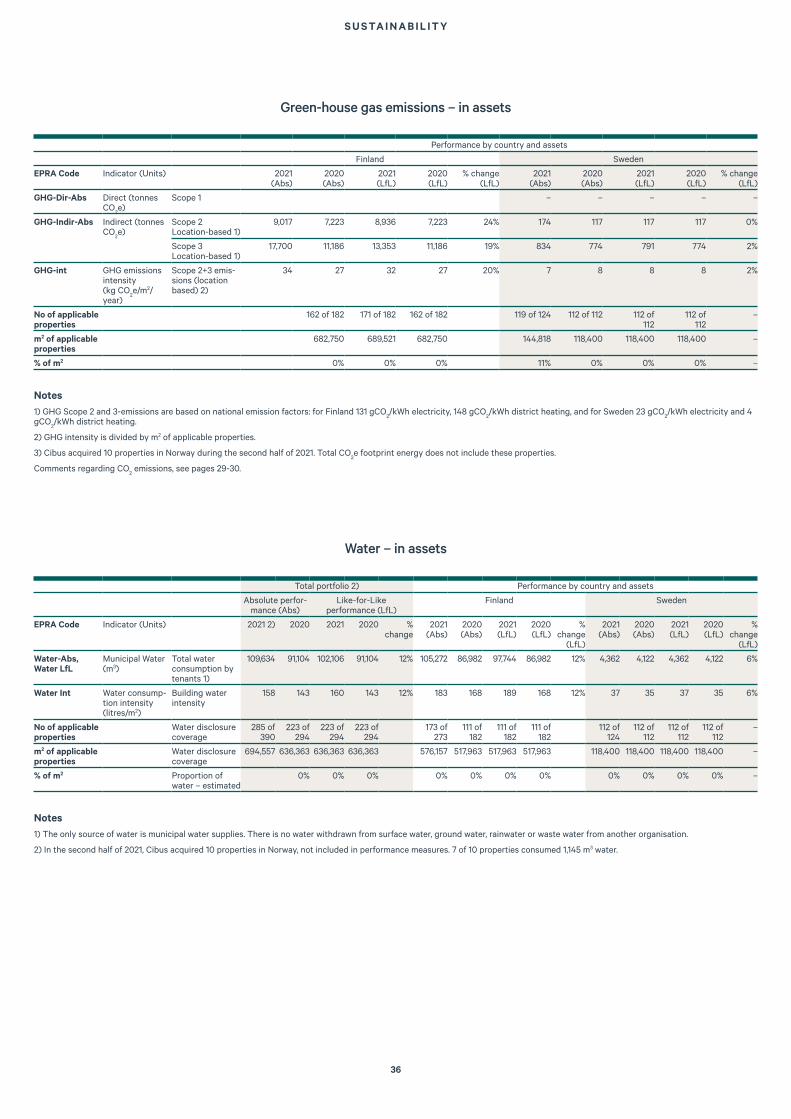
36
S U S TA I N A B I L I T Y
Water – in assets
Total portfolio 2) Performance by country and assets
Absolute perfor-mance (Abs)
Like-for-Like performance (LfL)
Finland Sweden
EPRA Code Indicator (Units) 2021 2) 2020 2021 2020 % change
2021 (Abs)
2020 (Abs)
2021 (LfL)
2020 (LfL)
% change
(LfL)
2021 (Abs)
2020 (Abs)
2021 (LfL)
2020 (LfL)
% change
(LfL)
Water-Abs, Water LfL
Municipal Water (m3)
Total water consumption by tenants 1)
109,634 91,104 102,106 91,104 12% 105,272 86,982 97,744 86,982 12% 4,362 4,122 4,362 4,122 6%
Water Int Water consump-tion intensity (litres/m2)
Building water intensity
158 143 160 143 12% 183 168 189 168 12% 37 35 37 35 6%
No of applicable properties
Water disclosure coverage
285 of 390
223 of 294
223 of 294
223 of 294
173 of 273
111 of 182
111 of 182
111 of 182
112 of 124
112 of 112
112 of 112
112 of 112
–
m2 of applicable properties
Water disclosure coverage
694,557 636,363 636,363 636,363 576,157 517,963 517,963 517,963 118,400 118,400 118,400 118,400 –
% of m2 Proportion of water – estimated
0% 0% 0% 0% 0% 0% 0% 0% 0% 0% 0% –
Notes1) The only source of water is municipal water supplies. There is no water withdrawn from surface water, ground water, rainwater or waste water from another organisation.
2) In the second half of 2021, Cibus acquired 10 properties in Norway, not included in performance measures. 7 of 10 properties consumed 1,145 m3 water.
Green-house gas emissions – in assets
Performance by country and assets
Finland Sweden
EPRA Code Indicator (Units) 2021 (Abs)
2020 (Abs)
2021 (LfL)
2020 (LfL)
% change (LfL)
2021 (Abs)
2020 (Abs)
2021 (LfL)
2020 (LfL)
% change (LfL)
GHG-Dir-Abs Direct (tonnes CO
2e)
Scope 1 – – – – –
GHG-Indir-Abs Indirect (tonnes CO
2e)
Scope 2 Location-based 1)
9,017 7,223 8,936 7,223 24% 174 117 117 117 0%
Scope 3 Location-based 1)
17,700 11,186 13,353 11,186 19% 834 774 791 774 2%
GHG-int GHG emissions intensity (kg CO
2e/m2/
year)
Scope 2+3 emis-sions (location based) 2)
34 27 32 27 20% 7 8 8 8 2%
No of applicable properties
162 of 182 171 of 182 162 of 182 119 of 124 112 of 112 112 of 112
112 of 112
–
m2 of applicable properties
682,750 689,521 682,750 144,818 118,400 118,400 118,400 –
% of m2 0% 0% 0% 11% 0% 0% 0% –
Notes1) GHG Scope 2 and 3-emissions are based on national emission factors: for Finland 131 gCO
2/kWh electricity, 148 gCO
2/kWh district heating, and for Sweden 23 gCO
2/kWh electricity and 4
gCO2/kWh district heating.
2) GHG intensity is divided by m2 of applicable properties.
3) Cibus acquired 10 properties in Norway during the second half of 2021. Total CO2e footprint energy does not include these properties.
Comments regarding CO2 emissions, see pages 29-30.

37
Waste – in assets
Total portfolio 1) Performance by country and assets
Absolute perfor-mance (Abs)
Like-for-Like performance (LfL)
Finland Sweden
EPRA Code Indicator (Units) 2021 1) 2020 2021 2020 % change
2021 (Abs)
2020 (Abs)
2021 (LfL)
2020 (LfL)
% change
(LfL)
2021 (Abs)
2020 (Abs)
2021 (LfL)
2020 (LfL)
% change
(LfL)
Waste-Abs Waste-LfL
Waste (tonnes) Total waste 347.7 496.52 347.7 496.52 -30% 347.7 496.52 347.7 496.52 -30% n/d n/d n/d n/d –
Proportion of hazardous waste
0 0 0 0 0 0 0 0 – n/d n/d n/d n/d –
Proportion non-hazardous waste
100% 100% 100% 100% 100% 100% 100% 100% – n/d n/d n/d n/d –
No of applicable properties
Waste disclosure coverage
17 of 294
17 of 294
17 of 294
17 of 273
17 of 182
17 of 182
17 of 182
0 0 0 0 –
m2 of applicable properties
Waste disclosure coverage
n/d n/d n/d n/d n/d n/d n/d 0 0 0 0 –
% of m2 Proportion of waste – esti-mated
0% 0% 0% 0% 0% 0% 0% 0% 0% 0% 0% 0% –
NotesAll waste is non-hazardous and sorted by tenants at source, including sorting of food waste, paper and packaging.
1) In the second half of 2021, Cibus acquired 10 properties in Norway, not included in total waste. 4 of 10 properties produced 132 tonnes of waste.
Certified assets
Total portfolio Performance by country and assets
Absolute performance (Abs) Finland 1) Sweden 1)
EPRA Code Indicator 2021 2020 2021 (Abs) 2020 (Abs) 2021 (Abs) 2020 (Abs)
Cert-Tot Number of sustainabili-ty-certified assets 1)
36 30 27 23 9 7
% of total number of assets
9% 10% 10% 13% 7% 6%
Certified area (’000 m2) 126,894 n/d 115,221 n/d 11,673 n/d
Certified area, share of total portfolio (%)
15% n/d 16% n/d 8% n/d
Value of sustainability-cer-tified assets, EUR million
220 204 195 191 25 13
% of total asset value 2) 15% 16% n/d n/d n/d n/d
Notes1) Certified assets include in Sweden: properties with energy class A, B and C, and in Finland: properties with EPC-certificate A and B.
2) Total asset value include assets in Sweden, Finland and Norway.
S U S TA I N A B I L I T Y

38
S U S TA I N A B I L I T Y
Energy – CIBUS
Headquarters = Cibus
Absolute performance (Abs)
EPRA Code Indicator (Units) 2021 2020
Elex-Abs, Elec-LfL
Electricity (MWh) Total consumed electricity 6.6 5.8
Proportion of electricity from renewable sources
100% 100%
DH&C-Abs, DH&C-LfL
District heating and coo-ling (MWh)
Total consumed district heating and cooling
not available 2) not available 2)
Proportion of district heating and cooling from renewable sources
-- --
Fuels-Abs, Fuels-LfL
Energy intensity (kWh/m2/year)
Total consumed fuels 0 0
Proportion of landlord-obtained fuels from renewable sources
0 0
Energy-Int Fuels (MWh) 33.4 29.3
No of applicable pro-perties
Energy and associated GHG disclosure coverage 4)
2/2 2/2
m2 applicable properties Energy and associated GHG disclosure coverage
197 197
% of m2 Proportion of energy and associated GHG – estimated
0% 0%
Green-house gas emissions – CIBUS
GHG-Dir-Abs Direct (tonnes CO2e) Scope 1
1)3 2
GHG-Indir-Abs Indirect (tonnes CO2e) Scope 2
2)0 0
Scope 3 3)
0 2
GHG-int GHG emissions intensity (kg CO
2e/m2/year
Scope 1 and 2 emissions 15 10
Notes1) GHG Scope 1 – emissions of company cars based on Volvo V60 D4, 1,000 kilometres driven, mixed driving.
2) GHG Scope 2 – district heating consumed in the offices in Sweden and Finland is included in the rent and not metered separately. Its GHG-impact is therefore not included.
3) GHG Scope 3 – includes emissions from its employees’ business travel, based on the ICAO method. Emissions from business travel are carbon offset via Fly Green Fund. During 2021, business travel resulted in 6.7 tonnes CO
2.

39
Health & safety
Corporate performance Performance by country and assets
Cibus Finland Sweden
EPRA Code Units Indicator Boundary 2021 2020 2021 2020 2021 2020
H&S-Emp Number of incidents per 2,000 hours worked
Injury rate Direct employees in Cibus 0 0
% of total number of worked hours
Lost day rate Direct employees in Cibus 0 0
% of total number of worked hours
Absentee rate Direct employees in Cibus 0.80% 0
Total number Fatalities Direct employees in Cibus 0 0
H&S assets % of assets Health and safety assess-ment
100% 100% 1) 1) 1) 1)
H&S-Comp Total numbers Number of incidents 0 0 1) 1) 1) 1)
NotesThe total number of hours worked in 2021 was approximately 14,000.
For more information about health and security among employees, please see ”Employees and Organisation” on pages 23-24.
1) Cibus has not identified nor been notified of any incidents at its assets adversely impacting the health and safety of customers or end-customers.
EPRA Sustainability Performance Measures (Social)
S U S TA I N A B I L I T Y

40
EPRA key performance indicators
Unless otherwise stated, in EUR thousands. 31 Dec 2021 31 Dec 2020
Profit for the year 51,370 34,597
Interest on hybrid bonds -993 -
Profit for the year incl. interest on hybrid bonds 50,377 34,597
Average No. of shares outstanding 40,284,932 36,459,344
Earnings per share, EUR 1.25 0.95
Exclusion of
– unrealised change in value of investment properties -10,644 -6,461
– unrealised change in value of interest-rate derivatives -980 357
– deferred tax on EPRA adjustments 2,395 1,257
Adjustments to calculate EPRA revenue -9,229 -4,847
EPRA result 41,148 29,750
EPRA earnings per share, EUR 1.02 0.82
Reported equity, excluding hybrid bonds 554,255 458,028
Reversal of derivatives 1,094 736
Reversal of deferred tax 26,486 16,646
Reversal of unpaid dividends 10,560 9,200
Sum EPRA NRV 592,395 484,610
No. of shares outstanding 44,000,000 40,000,000
EPRA NRV/share, EUR 13.5 12.1
Reported equity, excluding hybrid bonds 554,255 458,028
Reversal of derivatives 1,094 736
Reversal of assessed fair value of deferred tax 26,486 16,646
Reversal of unpaid dividends 10,560 9,200
Sum EPRA NTA 592,395 484,610
No. of shares outstanding 44,000,000 40,000,000
EPRA NTA/share, EUR 13.5 12.1
Reported equity, excluding hybrid bonds 554,255 458,028
Reversal of derivatives 1,094 736
Reversal of assessed fair value of deferred tax assets -4,675 -3,648
Reversal of unpaid dividends 10,560 9,200
Sum EPRA NDV 561,234 464,316
No. of shares outstanding 44,000,000 40,000,000
EPRA NDV/share, EUR 12.8 11.6
Estimated rental value for vacant space 5,114 3,241
Estimated rental value for entire portfolio 96,562 81,452
EPRA vacancy rate, % 5.3 4.0
EPRA key figures
EPRA (European Public Real Estate Association) is a common interest group for listed European property companies. Cibus has been a member of EPRA for several years. EPRA’s objective is to encourage greater investment in listed European property companies and to strive for common key figures and methods in accounting, financial reporting and corporate governance to provide high-quality information for investors and to increase comparability between different companies. Best practices also create a framework for discussion and decision-making on matters determining the future of the sector.
Cibus applies EPRA’s recommendations for financial reporting but also for sustainability reporting. Read more in Cibus’s statutory Sustainability Report on page 41.
E P R A
41
Financial risk management and financial instruments
Through its operations, the Group is exposed to various types of financial risks. These mainly relate to liquidity and financing risks which are described in a separate paragraph. The Company’s Board of Directors bears ultimate responsibility for the exposure to and management and follow-up of the Group’s financial risks. The Board of Directors monitors the frameworks that apply for exposure, management and follow-up of financial risks on an ongoing basis; see the “Liquidity, interest-rate, financing and currency risk” section below regarding the management of capital risk.
Liquidity, interest-rate, financing and currency risk
Liquidity risk pertains to the risk of the Group having problems with meeting its obligations in terms of its financial liabilities. The properties are almost fully let with an occupancy rate of 95% and, therefore, the Company depends on the tenants’ finances, financial positions and ability to pay, because the Company’s income consists entirely of rental income and attributable service income comprising re-invoiced operating costs. The Company’s risk profile is based on the counterparty and contract term, which results in short lease agreements having a different risk profile than longer lease agreements. Credit risk is managed by the Group continuously following up on overdue rent receivables. Ongoing liquidity forecasts are prepared to secure short- and long-term liquidity and to minimise liquidity risk.
Financing risk is the risk of the Group being unable to raise sufficient funding at a reasonable cost. The payment of interest and Operating costs is managed by the Group receiving rent payments on an ongoing basis.
As of 31 December 2021, the Group had bank loans of EUR 724,180 thousand (622,505) with an average weighted variable interest margin of 1.7% (1.7) + 3m EURIBOR, 3m NIBOR or 3m STIBOR (depending on the currency) and a weighted average tenor of 2.6 years (2.9). In addition to its bank loans, Cibus Nordic Real Estate AB (publ) has issued two unsecured bonds for a total of approximately EUR 193,680 thousand (94,778). One EUR bond of EUR 135,000 thousand matures on 18 September 2023 and carries a floating coupon rate of 3m EURIBOR + 4.50%. A green SEK bond of about EUR 58,680 thousand matures on 12 June 2023 and carries a floating coupon rate of 3m STIBOR + 4.75%. The bonds are listed on the Corporate Bond List Nasdaq Stockholm. Cibus also has a hybrid bond of EUR 30 million (0). Although the hybrid bond has a perpetual maturity, it may first be redeemed 5.25 years after the issue on 17 June 2021. The interest rate is 3m EURIBOR +4.75%. The hybrid bond has been listed on the Nasdaq Stockholm Corporate Bond list since 24 June 2021.
The Group has also contracted an interest-rate cap for a nominal amount of about EUR 495,500 thousand (379,400) and with a remaining tenor of about 2.6 years, which corresponds to the maturity of the bank loans.
The cost for the interest rate hedge is a consequence of the scope of the hedging, maturities and the choice of financial derivative. Changes in EURIBOR, STIBOR or NIBOR also entail changes in the relative cost for changes of interest rate maturity. On the maturity date, the Company will need to refinance its outstanding debt. The Board of Directors discusses ongoing needs for future financing. The Group’s ability to successfully refinance this debt is dependent on the general conditions in the financial markets at that time. Accordingly, at any given time, the Group may not have access to funding sources at advantageous terms, or at all. The Group’s ability to refinance its debt obligations at advantageous terms, or at all, may have a material adverse effect on the Group’s operations, financial position and earnings.
Interest-rate risk is defined as how the interest rate affects earnings and cash flow. Since the Group’s interest rates are essentially fixed for the duration of the loans, interest exposure is limited.
If the interest rate rises 1%, the negative effect on the Group’s profit before tax would be about EUR 7,814 thousand (3,529). If the increase in the interest rate was 2%, the negative effect would be about EUR 11,209 thousand (7,892). About 66% of the Company’s loans are interest-rate hedged with an interest-rate cap and, accordingly, interest-rate risk is limited. In EURIBOR, the interest rate ceiling is set at between 0% and 0.50%, in STIBOR at 0.25% and in NIBOR at 2.50%.
The terms and conditions for the Company’s external bond financing include covenants stipulating that the Group’s LTV ratio is not permitted to exceed 70% and that the Group’s interest coverage ratio must always be higher than 1.75. As of 31 December 2021, the Company met all of these covenants. If the Company does not meet these covenants, it would constitute a breach of the loan agreement.
The Group also has seven separate senior loans, which were entered into by four Finnish subsidiaries, two Swedish subsidiaries and one Norwegian subsidiary. These loan agreements contain additional covenants pertaining to the LTV ratio and the interest coverage ratio. As of 31 December 2021, all seven borrower companies met all of these covenants.
Otherwise, the Group’s loan agreements do not contain any separate conditions that could result in the payment dates becoming significantly earlier than those shown in the tables below.
The maturity breakdown of the contractual payment commitments pertaining to the Group’s and the Parent Company’s financial liabilities is presented in the following tables according to the loan terms as of 31 December 2021.
Group 31 Dec 2021
Within 3 months
Within 3–12
months
Within 1–3 years
Within 4–5 years
Borrowings 393 1,181 553,058 359,258
Derivatives 176 617 245 56
Interest rates 2,796 - - -
Interest rates 774 - - -
Other current liabilities
3,071 448 - -
Other non-current liabilities
12,143 - - 937
Total 19,353 2,246 553,303 360,251
Group 31 Dec 2020
Within 3 months
Within 3–12
months
Within 1–3 years
Within 4–5 years
Borrowings 266 1,802 665,427 145,469
Derivatives - - 379 357
Interest rates 470 460 696 -
Interest rates 438 - - -
Other current liabilities
13,564 359 - -
Other non-current liabilities
- - 67 7,862
Total 14,738 2,621 666,569 153,688
R I S K A N D R I S K M A N AG E M E N T

42
Parent Company 31 Dec 2021
Within 3 months
Within 3–12
months
Within 1–3 years
Within 4–5 years
Borrowings - - 192,391 -
Interest rates 298 - - -
Interest rates 336 - - -
Other current liabilities
58 - - -
Total 692 - 192,391 -
Parent Company 31 Dec 2020
Within 3 months
Within 3–12
months
Within 1–3 years
Within 4–5 years
Borrowings - - 192,715 -
Interest rates 324 - - 357
Interest rates 116
Other current liabilities
128 - - -
Total 568 - 192,715 357
To calculate the cash flows for credits and for the variable components in the interest rate ceilings, EURIBOR or STIBOR (depending on the currency) have been applied as per the balance sheet date.
The Group’s undertakings in terms of financial liabilities are covered by the cash flow from the contracted rental agreements. Ongoing liquidity forecasts are prepared to secure short- and long-term liquidity and to minimise liquidity risk.
Illustrated below are the changes in the Company’s financing activities pursuant to IAS 7 Statement of Cash Flows.
SUMMARY OF LIABILITIES ARISING FROM FINANCING ACTIVITIES
Group Borrowings Financial derivatives
Total
OB 1 Jan 2021 812,964 736 813,700
Borrowings raised 105,610 1,990 107,600
Repayment of debt -2,192 -652 -2,844
Non-cash items -2,492 -980 -3,472
CB 31 Dec 2021 913,890 1,094 914,984
Group Borrowings Financial derivatives
Total
OB 1 Jan 2020 538,028 2,163 540,191
Borrowings raised 454,923 -1,784 453,139
Repayment of debt -175,667 - -175,667
Non-cash items
-4,320 357 -3,963
CB 31 Dec 2020 812,964 736 813,700
Cibus’s Group currency is the Euro. If transactions are conducted in another currency, Cibus is exposed to a currency risk. In 2021, a properties were acquired in Norway, causing Cibus an exposure in NOK. Since 2020, Cibus has owned properties in Sweden and purchased additional properties during the year, giving an increased exposure in SEK. Cibus mainly manages currency risk by matching receivables and liabilities in the same currency. Cibus’s Board of Directors is able to approve the use of currency derivatives to minimise the Company’s currency exposure. As the currency exposure is not considered significant, no currency derivatives were being used as of 31 December 2021.
Credit and counterparty risk
Credit risk refers to the risk that a transaction counterparty causes a loss for the Group by failing to meet its contractual obligations. The Group’s credit risk exposure arises mainly with regard to rental receivables. The economic occupancy rate in the property portfolio is currently about 94.3%. Based on historical levels in the portfolio, this is in line with the expected long-term vacancy rate for the portfolio. The Company therefore depends on the tenants’ finances, financial positions and ability to pay, because the Company’s income consists entirely of rental income.
The Company’s risk profile is based on the counterparty and contract term, which results in short lease agreements having a different risk profile than longer lease agreements. Credit risk is managed by the Group continuously following up on overdue rent receivables.
The Group’s and the Parent Company’s maximum credit risk exposure is assessed as corresponding to the carrying amounts for all financial assets and is set out in the following table.
Group 31 Dec 2021 31 Dec 2020
Rental receivables 764 679
Other receivables 1,165 453
Cash and cash equivalents
51,054 36,783
Maximum exposure to credit risk
52,983 37,915
Parent Company 31 Dec 2021 31 Dec 2020
Other receivables 318 70
Cash and cash equivalents
30,996 22,598
Maximum exposure to credit risk
31,314 22,668
No significant effects arise from discounting based on current market conditions, since operating receivables and operating liabilities mature in less than three months. The credit risk on long-term loans has not changed significantly since the loans were raised. The risk attributable to financial counterparties is assessed as being limited.
MANAGEMENT OF CAPITAL RISK
The Group monitors the capital structure based on the debt/equity ratio, interest coverage ratio, LTV ratio and equity/assets ratio. See page 87 for definitions.
Group 31 Dec 2021 31 Dec 2020
Total liabilities 987,452 865,926
Equity 583,262 458,028
Debt/equity ratio, multiple 1.7 1.9
Group 31 Dec 2021 31 Dec 2020
Net operating income – Admin. costs + Financial income
69,976 54,909
Financial expenses 20,177 16,672Interest coverage ratio, multiple
3.5 3.3
R I S K A N D R I S K M A N AG E M E N T

43
Group 31 Dec 2021 31 Dec 2020
Net liabilities to credit institutions *
866,806 780,500
Market value of properties 1,499,626 1,272,514
Net debt LTV ratio % 57.8 61.3
* Adjusted for arrangement fees less cash and cash equivalents.
Group 31 Dec 2021 31 Dec 2020
Equity 583,262 458,028
Total assets 1,570,714 1,323,954
Equity/assets ratio, % 37.1 34.6
Categorisation of financial instruments
The carrying amounts for financial assets and liabilities broken down by valuation category in accordance with IFRS 9 are shown in the following table.
31 Dec 2021 Financial assets measured at
amortised cost
Financial liabilities measured at amortised
cost
Financial assets measured at fair
value through profit or loss
Financial liabilities measured at fair
value through profit or loss
Carrying amount
Financial assetsAccounts receivable 764 - - - 764
Other non-current receivables
55 - - - 55
Other receivables 1,165 - - - 1,165
Cash and cash equivalents 51,054 - - - 51,054
53,038 - - - 53,038Financial liabilities
Liabilities to credit institutions, non-current
- 911,494 - - 911,494
Financial derivatives - - - 1,094 1,094
Accounts payable - 774 - - 774
Other current liabilities - 3,519 - - 3,519
- 915,787 - 1,094 916,881
31 Dec 2020 Financial assets measured at
amortised cost
Financial liabilities measured at amortised
cost
Financial assets measured at fair
value through profit or loss
Financial liabilities measured at fair
value through profit or loss
Carrying amount
Financial assetsAccounts receivable 679 - - - 679
Other non-current receivables
36 - - - 36
Other receivables 453 - - - 453
Cash and cash equivalents 36,783 - - - 36,783
37,951 - - - 37,951Financial liabilities
Liabilities to credit institutions, non-current
- 810,202 - - 810,202
Financial derivatives - - - 736 736
Accounts payable - 438 - - 438
Other current liabilities - 3,739 - - 3,739
- 814,379 - 736 815,115
Fair value measurementThe Group holds financial instruments measured at fair value in the balance sheet. The financial instruments comprise the interest-rate cap, as described earlier. The Company’s investment properties are recognised at fair value in accordance with level 3 above. For more details, refer to the “Investment properties” section under Accounting Policies and Note 12. The fair value of the Company’s borrowings is assessed as corresponding to the carrying amount at the end of the financial year.
The Group’s interest-rate derivatives comprise an interest-rate cap with a total nominal amount of about EUR 495,500 thousand (379,400). At 31 December 2021, the value of the interest-rate cap was EUR 1,094 thousand (736). The entire amount has been recognised as an expense and a liability in the consolidated accounts. The derivative agreements (ISDA agreements) allow for netting of obligations toward the same counterparty.
The carrying amounts for other financial assets and financial liabilities are assessed as providing a good approximation of the fair values.
R I S K A N D R I S K M A N AG E M E N T

44
Risk managementCibus works continuously to acquire develop and manage
high-quality properties in the Nordics with reputable grocery and daily-goods chains as their anchor tenants.
Operations & organisation
RENTAL INCOME
Description risk Risk management
Cibus’s results are affected by the portfolio’s vacancy rate, customer losses and possibly by the loss of rental income. The (financial) letting ratio for the portfolio at the end of the period was slightly more than 94.4% and the weighted average unexpired lease term (WAULT) was 5.0 years. About 90% of the Company’s income stems from properties rented to five tenants in the grocery and daily-goods sector. The risk of vacancies, lost customers and a loss of rental income is impacted by tenants’ inclination to continue renting the property and by tenants’ financial positions as well as other external market factors.
To manage the risks, Cibus is creating a more diversified contract base, partly to continue retaining and improving existing relationships with the Group’s largest tenants, which are leaders in the grocery and daily-goods sector. Cibus continuously monitors the financial development of the Company’s tenants and assesses alternative tenants. By making niched investments in grocery and daily goods properties, Cibus is more resistant to the negative impact of e-commerce. To reduce the risk of tenant concentration, Cibus strives to be a strategic partner and not just a property manager.
OPERATING AND MAINTENANCE EXPENSES
The Group runs a risk of cost increases that are not compensated by regulation in the lease. This risk is limited, however, as 90% of all leases are triple-net agreements or net leases, meaning that the tenant, in addition to the rent, pays most of the costs incurred on the property. Even unforeseen maintenance needs pose a risk to operations. Active and ongoing maintenance is conducted to retain and improve the properties’ standard and to minimise the risk of needs for repair.
Active and ongoing maintenance is conducted to retain and improve the properties’ standard and to minimise the risk of needs for repair. Cibus works continuously with efficiency improvement in its property management – involving, for example, improved energy systems that reduce energy consumption and environmental impact. Cibus works with long-term maintenance planning for the properties to control maintenance costs and to avoid unforeseen damage and repairs. All properties are insured against damage.
TRANSACTION RELATED COSTS
Property acquisitions form a central part of Cibus’ strategy. To implement acquisitions, it is necessary for suitable investment objects within Cibus’ niche to be available for sale at reasonable price levels. Acquisitions can also be associated with risks associated with the seller and the acquired operations and property.
Cibus has a strong position in the transaction market for grocery and daily goods properties in the Nordic region. Cibus has a team with broad experience and solid knowledge of property transactions. The process of evaluating an acquisition is based on the property having an anchor tenant with a long-term lease. In preparation for an acquisition, the property and tenant are evaluated and a risk analysis is performed.
PROJECT DEVELOPMENT
In collaboration with tenants, Cibus is continuously adapting its properties their needs.
In connection with tenant adjustments, Cibus has opportunities to renegotiate leases in line with the scope of investment.

45
TAX
Changes in tax legislation and regulations can affect the taxation of properties and the Company. Altered tax rates and regulations in the Nordic region can affect earnings and key figures, as well as Cibus’ opportunities for growth. On 1 January 2019, rules limiting interest deductibles came into effect. The Swedish regulations entail a right to deduction of 30% of taxable EBITDA and a reduction of corporate income tax in two stages from 22% to 20.6% for 2021. The maximum interest expense that can always be deducted at Group level is TEUR 500. Similar rules concerning interest-rate restrictions also came into force in Finland, although with certain differences. The right to the deduction is limited to 25% of taxable EBITDA and the maximum amount of net interest expense that can always be deducted will be TEUR 500 per company. In Norway, rules regarding interest deductions are also applied. The rules concerning limits on interest deductibles have not materially affected the Group during the reporting period.
Cibus closely monitors political developments and continuously follows developments in the regulatory area to pick up on proposed rule changes at an early stage. This monitoring ensures that Cibus understands the effects of any rule changes in good time.
ENVIRONMENTAL RISKS
Properties impact the environment through, among other things, ongoing maintenance, tenant adjustments and the operations conducted in them. According to the Environmental Code, Cibus may be required to pay for measures necessitated by contamination or environmental damage. This can affect the Company’s earnings and key figures. Properties with a negative environmental profile in terms of, for example, energy consumption can be perceived as less attractive to tenants, generate higher energy costs relative to other properties and incur costs for upgrading.
Acquisitions of new properties are always preceded by environmental studies to elucidate the property’s environmental status. In this way, Cibus minimises the risk of acquiring properties with some form of environmental debt. Cibus works with the overall objective of reducing negative environmental impacts together with our tenants. Additional information on sustainability is provided on pages 25–39.
CHANGES IN VALUE OF PROPERTIES
The property portfolio is measured at fair value. Fair value is based on market valuations performed by independent valuation institutes, which were Newsec and Cushman & Wakefield for this reporting period. The value of the properties was largely influenced by the cash flows generated in the properties in terms of rental income, operating and maintenance expenses, administration costs and investments in the properties. Therefore, a risk exists in terms of changes in property values due to changes in cash flows as well as changes in yield requirements and the condition of the properties. Risk to the Company includes the risk of vacancies in the portfolio as a consequence of tenants terminating existing leases and the financial position of the tenants. In turn, the underlying factors influencing cash flows stem from current economic conditions as well as local external factors in terms of competition from other property owners and the geographic location that may affect the supply and demand equilibrium.
Cibus’s focus on offering active, tenant-centric management with the aim of creating good, long-term relationships with tenants creates favourable preconditions for sustaining a stable value trend for the property portfolio. The Company’s property development expertise enables the proactive management of risks pertaining to the properties’ values by securing the quality of the holdings.
Cibus’s property portfolio has a geographical spread in the Nordic region. Cibus’s strategy is to grow in the Nordic region to further increase its geographical spread and thus the market risk. Cibus’s focus on grocery and daily goods stores entails stable tenants and long-term leases. The market value of all Cibus’ properties is assessed every quarter by external independent property appraisers. However, the value is always ultimately determined by Cibus’s management.
INTERNAL PROCESSES AND CONTROL
Within the framework of its ongoing operations, Cibus can be affected negatively by faulty procedures, lack of control or irregularities within and outside the organisation.
Cibus monitors internal processes and checks compliance with regulations (further information is provided in the Corporate Governance Report on pages 46–53).
EMPLOYEES AND EXPERTISE
Cibus’ future development depends largely on the knowledge, experience and commitment of its employees. The Company has chosen to maintain a relatively small organisation with the aim of working quickly and efficiently, which can result in a certain dependence on individual employees and suppliers – in connection with the outsourcing of lease administration, for example.
Cibus works continuously to develop, train and strengthen the organisation with the aim of reducing its dependence on key individuals.
R I S K A N D R I S K M A N AG E M E N T

46
Starting point
Good corporate governance, risk management, internal control and management are key components in a successful business. These are prerequisites for Cibus’ capacity to continue to growing with capacity for dividends and are a hygiene factor in building trustful relationships with our investors and other stakeholders. The Corporate Governance Report pertains to the 2021 financial year. Cibus is listed on Nasdaq Stockholm, Mid Cap, which is an EU-regulated marketplace. The Company is included in the leading global index for property investments, EPRA. Cibus complies with applicable corporate governance laws, primarily the Swedish Companies Act and the Annual Accounts Act. The Company applies and follows the Swedish Code of Corporate Governance (the Company Code), which is available at www.bolagsstyrning.se and EPRA’s guidelines for best practice in sustainable reporting (EPRA sBPR) which are available at www.epra.com.
Corporate governance structure
Cibus’s decision-making bodies are the Annual General Meeting, the Board of Directors, the President and the Company’s auditor. At the ordinary General Meeting, which is to be held within six months of the end of the financial year (the Annual General Meeting), the shareholders appoint a Board of Directors and an auditor. The Board of Directors appoints the CEO. The auditor reviews the Annual accounts as well as the administration by the Board of Directors and the CEO. The Nomination Committee is tasked with proposing Board Members, the Chairman of the Board and the auditor for election by the Annual General Meeting.
Shares and shareholders
Shares and shareholders Information on Cibus’s shares and shareholders can be found on pages 11–12.
General Meeting
The General Meeting is Cibus’s highest decision-making body. Shareholders included in the share register on the record date and who have given notice of their participation in time, are entitled to attend the Annual General Meeting and to vote in person or via a proxy. At the Annual General Meeting, shareholders exercise their voting rights to make decisions regarding proposals from the Nomination Committee, the Board of Directors and the shareholders, as well as on key matters including the adoption of income statements and balance sheets, the approval of dividends and the election of the Board of Directors. In addition, auditors are elected, fees are determined and other statutory matters are addressed. At the Meeting, resolutions are normally approved by a simple majority. In certain matters, however, the Companies Act stipulates that a proposal must be approved by a greater proportion of the votes represented at the Meeting. In addition to the Annual General Meeting, which is held within six months of the end of the financial year, an Extraordinary General Meeting may be announced if the Board of Directors considers this to be necessary or if this is requested by a shareholder holding at least 10% of the shares.
Annual General Meeting April, 15, 2021
The Annual General Meeting of Cibus, primarily resolved the following:
— The Annual General Meeting approved the income statements and balance sheets for the Parent Company and the Group.
— The Annual General Meeting resolved to dispose of the profit for the year in accordance with the approved balance sheet and as proposed by the Board of Directors. Accordingly, the dividend was approved as follows:
— The Annual General Meeting approved a dividend of EUR 0.94 per share to shareholders.
— It was resolved that dividends will be paid monthly during the year in 12 instalments with an initial instalment of EUR 0.07 per share, the second of EUR 0.08 per share, the third of EUR 0.08 per share, the fourth of EUR 0.07 per share, the fifth of EUR 0.08 per share, the sixth of EUR 0.08 per share, the seventh of EUR 0.08 per share, the eighth of EUR 0.08 per share, the ninth of EUR 0.08 per share, the tenth of EUR 0.08 per share, the eleventh of EUR 0.08 per share and the twelfth of EUR 0.08 per share.
Corporate Governance Report
Cibus Nordic Real Estate AB
Shareholders
Annual General Meeting
Nomination Committee
Remuneration Committee
Audit Committee Board of Directors Auditors
CEO and managementGovernance documents,
internal control and management
C O R P O R AT E G OV E R N A N C E

47
— Reconciliation dates for dividends were set as 23 April 2021, 24 May 2021, 23 June 2021, 23 July 2021, 24 August 2021, 23 September 2021, 22 October 2021, 23 November 2021, 22 December 2021, 24 January 2022, 21 February 2022 and March 24, 2022.
— The dividend is expected to be paid on 30 April 2021, 31 May 2021, 30 June 2021, 30 July 2021, 31 August 2021, 30 September 2021, 29 October 2021, 30 November 2021, 30 December 2021, 31 January 2022, 28 February 2022 and 31 March 2022.
— In the event that the Board of Directors exercises the authorisation to decide on issues of new shares, this should be done in sufficient time that the newly issued shares are entered in the share register no later than the record date for dividends immediately following the aforementioned dates, the Annual General Meeting resolved that the dividends should be paid in such an amount that they still amount to the aforementioned amount per share, both for existing and new shares issued with the support of the authorisation. If the authorisation is not exercised within that time, no additional dividend shall be paid.
— The Annual General Meeting granted the Board Members and the President discharge from liability for the financial year 2020.
— The Annual General Meeting resolved that the number of Board Members shall amount to five (5) and re-elected Board Members Patrick Gylling, Elisabeth Norman, Jonas Ahlblad and Stefan Gattberg and elected Victoria Skoglund as a new member. The Annual General Meeting re-elected Patrick Gylling as Chairman of the Board.
— The Annual General Meeting re-elected the registered auditing company KPMG AB as the Company’s auditor.
— The Annual General Meeting resolved that Board fees shall be paid in the amount of EUR 2,375 per month to each of the Board Members and that fees shall be paid at EUR 4,750 per month to the Chairman of the Board.
— It was resolved, in accordance with the proposal by the Board of Directors, to authorise the Board of Directors to decide on a new share issue, with or without preferential rights for the Company’s existing shareholders. The total number of shares that may be issued under the authorisation shall be within the limits of the share capital as stated in the Articles of Association. The total number of shares that may be issued pursuant to this authorisation may not exceed 10% of the number of shares outstanding in the Company as per the date of the Extraordinary General Meeting.
— The Annual General Meeting also resolved to adopt a long-term incentive programme aimed at Group Management. The incentive programme comprises a warrant programme.
— To enable its commitments under the warrant programme, the Annual General Meeting further approved the issue of warrants and the transfer of warrants. A maximum of 120,000 warrants may be issued within the framework of the warrant programme.
— The Annual General Meeting resolved to amend the Nomination Committee’s instructions.
— The Annual General Meeting resolved to approve the remuneration report.
C O R P O R AT E G OV E R N A N C E
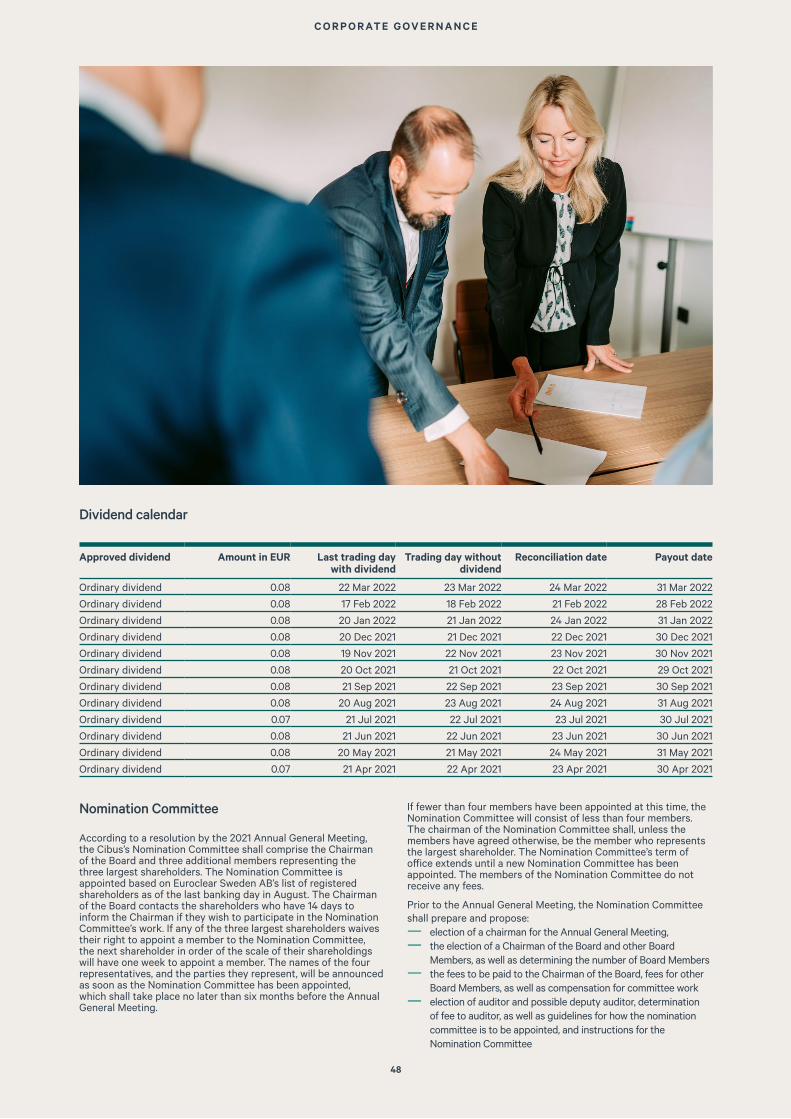
48
Nomination Committee
According to a resolution by the 2021 Annual General Meeting, the Cibus’s Nomination Committee shall comprise the Chairman of the Board and three additional members representing the three largest shareholders. The Nomination Committee is appointed based on Euroclear Sweden AB’s list of registered shareholders as of the last banking day in August. The Chairman of the Board contacts the shareholders who have 14 days to inform the Chairman if they wish to participate in the Nomination Committee’s work. If any of the three largest shareholders waives their right to appoint a member to the Nomination Committee, the next shareholder in order of the scale of their shareholdings will have one week to appoint a member. The names of the four representatives, and the parties they represent, will be announced as soon as the Nomination Committee has been appointed, which shall take place no later than six months before the Annual General Meeting.
If fewer than four members have been appointed at this time, the Nomination Committee will consist of less than four members. The chairman of the Nomination Committee shall, unless the members have agreed otherwise, be the member who represents the largest shareholder. The Nomination Committee’s term of office extends until a new Nomination Committee has been appointed. The members of the Nomination Committee do not receive any fees.
Prior to the Annual General Meeting, the Nomination Committee shall prepare and propose:
— election of a chairman for the Annual General Meeting, — the election of a Chairman of the Board and other Board
Members, as well as determining the number of Board Members — the fees to be paid to the Chairman of the Board, fees for other
Board Members, as well as compensation for committee work — election of auditor and possible deputy auditor, determination
of fee to auditor, as well as guidelines for how the nomination committee is to be appointed, and instructions for the Nomination Committee
C O R P O R AT E G OV E R N A N C E
Dividend calendar
Approved dividend Amount in EUR Last trading day with dividend
Trading day without dividend
Reconciliation date Payout date
Ordinary dividend 0.08 22 Mar 2022 23 Mar 2022 24 Mar 2022 31 Mar 2022
Ordinary dividend 0.08 17 Feb 2022 18 Feb 2022 21 Feb 2022 28 Feb 2022
Ordinary dividend 0.08 20 Jan 2022 21 Jan 2022 24 Jan 2022 31 Jan 2022
Ordinary dividend 0.08 20 Dec 2021 21 Dec 2021 22 Dec 2021 30 Dec 2021
Ordinary dividend 0.08 19 Nov 2021 22 Nov 2021 23 Nov 2021 30 Nov 2021
Ordinary dividend 0.08 20 Oct 2021 21 Oct 2021 22 Oct 2021 29 Oct 2021
Ordinary dividend 0.08 21 Sep 2021 22 Sep 2021 23 Sep 2021 30 Sep 2021
Ordinary dividend 0.08 20 Aug 2021 23 Aug 2021 24 Aug 2021 31 Aug 2021
Ordinary dividend 0.07 21 Jul 2021 22 Jul 2021 23 Jul 2021 30 Jul 2021
Ordinary dividend 0.08 21 Jun 2021 22 Jun 2021 23 Jun 2021 30 Jun 2021
Ordinary dividend 0.08 20 May 2021 21 May 2021 24 May 2021 31 May 2021
Ordinary dividend 0.07 21 Apr 2021 22 Apr 2021 23 Apr 2021 30 Apr 2021

49
The Nomination Committee has the right, at the Company’s expense, to hire recruitment consultants or other external consultants deemed necessary by the Nomination Committee to be able to fulfil its tasks. The Nomination Committee shall perform the tasks stipulated in the Swedish Code of Corporate Governance. The instructions to the Nomination Committee, adopted by the 2021 Annual General Meeting, can be found on Cibus’s website www.cibusnordic.com. Prior to the 2022 Annual General Meeting, the Nomination Committee comprises:
— Olof Nyström, appointed by Fjärde AP-fonden, — Markus Dragicevic, appointed by Dragfast AB — Johannes Wingborg, appointed by Länsförsäkringar
Fondförvaltning AB (publ) — Patrick Gylling, Chairman of the Board of Cibus Nordic Real
Estate (publ)
Olof Nyström, representative of Fjärde AP-fonden, has been appointed chairman of the Nomination Committee.
The Nomination Committee applies and adheres to provision 4.1 of the Company Code as its Diversity Policy in preparing its proposal regarding the Board of Directors. The aim of the Policy is that the Board of Directors should be appropriately composed in view of the Company’s operations, stage of development and other circumstances, and should be characterised by versatility and breadth in terms of expertise, experience and background and seeking an even gender distribution. At the 2021 Annual General Meeting, five members were elected, of whom two are women and three are men. As a basis for its proposal for the 2022 Annual General Meeting, the Nomination Committee makes an assessment of whether the Board of Directors is appropriate based on an annual assessment of the Board’s work and applying the Company Code.
The role and composition of the Board of Directors
The Board of Directors plays a central role in Cibus’ business model of acquiring, developing and managing high-quality properties in the Nordic region to generate yield for shareholders. After the Annual General Meeting, the Board of Directors is the Company’s highest decision-making body. The work of the Board of Directors is governed, among other things, by the Companies Act, the Articles of Association and the Board’s Rules of Procedure. The Board of Directors establishes goals and strategic guidelines for the Company’s sustainability work, is responsible for the CEO executing Board decisions and has ultimate responsibility for the Company’s internal control and risk management. The Audit Committee and the Remuneration Committee consist of the Board of Directors in its entirety. According to the Articles of Association, Cibus’ Board shall consist of a minimum of three and a maximum of eight ordinary members elected by the Annual General Meeting, without deputies. At the 2021 Annual General Meeting, five ordinary Board Members were elected. More information on the Board Members can be found in the table on page 53.
Cibus Nordic’s Board of Directors comprises: — Patrick Gylling, Chairman of the Board (re-elected) — Jonas Ahlblad (re-elected) — Elisabeth Norman (re-elected) — Stefan Gattberg (re-elected) — Victoria Skoglund (newly elected)
All Board Members are independent in relation to the Company and its major shareholders.
The work is based on the Board’s Rules of Procedure and follows an annual plan. Each meeting is based on an agenda and relevant background documentation distributed to the Board Members in advance of the meeting. In addition to the statutory Board meeting in conjunction with the Annual General Meeting, the Board of Directors normally meets ten times a year (ordinary meetings, including meetings in connection with the publication of interim and annual reports). Additional Board meetings are convened when necessary. In 2021, the Board of Directors held a total of 47 meetings, of which 34 were meetings held by mail. Among other things, the statutory Board meeting approved the Board’s Rules of Procedure, the instructions for the committees ( the Board of Directors in its entirety forms the Remuneration Committee and Audit Committee) and decisions on who may sign on the Company’s behalf and the annual plan for the Board’s work.
Board Committees
The Audit Committee and the Remuneration Committee comprise the Board in its entirety, as the Board considers this most appropriate, taking the size of the Company into account. The work within each committee is carried out in accordance with the committees’ instructions, which form part of the Board’s Rules of Procedure.
The work of the Audit and Remuneration Committees is handled in accordance with the Board’s annual plan for its ordinary Board meetings.
Remuneration Committee
Cibus’s Remuneration Committee consists of the Board of Directors in its entirety. The Remuneration Committee is a preparatory body for the Board of Directors and does not limit the Board’s responsibility for the administration of the Company and for the decisions made. The Committee’s tasks include preparing the Board of Directors’ proposal regarding guidelines for the remuneration of senior executives, monitoring and evaluating completed and ongoing programmes for variable remuneration and Cibus’s compliance with the guidelines for senior executives adopted by the Annual General Meeting. The Remuneration Committee’s work is recorded as a separate item in the minutes of the Board of Directors.
Audit Committee
Cibus’s Remuneration Committee consists of the Board of Directors in its entirety. The Audit Committee is a preparatory body for the Board of Directors and does not limit the Board’s responsibility for the administration of the Company and for the decisions made. The Committee’s work includes reviewing the Company’s financial reporting and the efficiency of the Company’s internal control and risk management. The Audit Committee’s work also focuses on the quality and accuracy of the Group’s financial reporting and related reporting. The Committee monitors how accounting principles and accounting requirements develop and discusses other significant issues related to the Company’s financial accounting. The Committee also evaluates the auditors’ work, qualifications and independence and follows up in particular on whether the auditor provides the Company with services other than auditing services. The work of the Audit Committee is recorded separately in the minutes of the Board of Directors.
The work of the Board of Directors
Ordinary Board meetings include several fixed agenda items. Reporting to the Board of Directors includes outlines of the development of the operations, the management of the properties, possible acquisition objects, analyses of risks, sustainability work, financial position and dividend capacity. All Board decisions are based on decision-making documentation and are made following discussions mediated by the Chairman of the Board. The work of the Board of Directors is evaluated annually in a structured process headed by the Chairman of the Board. The 2021 evaluation was conducted by means of a questionnaire with the aim of obtaining an understanding of Board Members’ views on the formats of the work of the Board of Directors, the composition of the Board of Directors, the performance of the Board of Directors and areas for improvement. The results of the evaluation have been presented and discussed by the Board of Directors. The conclusions from these evaluations and discussions have been reported orally to the Nomination Committee. The work of the Audit and Remuneration Committees is handled in accordance with the Board of Directors’ annual plan for its ordinary Board meetings.
The Chairman of the Board leads the work of the Board and follows the activities in dialogue with the CEO. The Chairman of the Board represents the Company in matters concerning shareholder structure and matters of specific importance. The assignment entails responsibility for ensuring that the work of the Board of Directors is well-organised and effective, that the Board of Directors fulfils its commitments and that it receives satisfactory information and decision-making documentation.
Remuneration to the Board of Directors
At the 2021 Annual General Meeting, it was decided that Board fees shall be paid in the amount of EUR 2,375 (2,250) per month to each Board Member and that fees shall be paid in the amount of EUR 4,750 (4,500) per month to the Chairman of the Board.
C O R P O R AT E G OV E R N A N C E

50
Safeguarding quality in financial reporting
The instructions to the CEO, as well as in Cibus’s Compliance & Procedures Manual, adopted annually by the Board of Directors, include detailed instructions on, among other things, which financial reports and what financial information should be provided to the Board of Directors. In addition to year-end reports, interim reports and annual reports, the Board of Directors reviews and evaluates extensive financial data regarding Cibus. The Board of Directors also processes information on risk assessments, disputes and any irregularities that may have an impact on Cibus’ financial position. The Board of Directors also reviews the most significant accounting principles applied in the Group regarding financial reporting and material changes in accounting principles, as well as reports on internal control and the processes for financial reporting.
The Company’s auditors report to the Board of Directors when necessary and at least twice annually, with at least one of these occasions not taking place under the Company’s management. In connection with the Board meeting addressing the annual accounts, the administration report, the proposed allocation of profits and the year-end report, the auditor submits an account of his/he observations and assessments from the audit conducted.
Audit
Cibus’s auditors review the annual accounts and the annual report, as well as the Company’s ongoing operations and procedures, and then comment on the financial reporting, as well as on the administration by the Board and the CEO. After each financial year, the auditors shall submit an audit report to the Annual General Meeting. Each year, the Company’s auditors report the observations from their audit and their assessments of the Company’s internal control to the Board of Directors in person. The 2021 Annual General Meeting re-elected auditing company KPMG as the Company’s auditor. KPMG named authorised auditor Mattias Johansson as the auditor in charge for the period up until the end of the next Annual General Meeting. At the 2021 Annual General Meeting, it was resolved that remuneration to the auditor should be paid in accordance with approved invoicing. In 2021, fees paid to the auditor totalled EUR 554 thousand for the entire Group.
The CEO and Group Management
The CEO leads the operations in accordance with the instructions to the CEO as adopted by the Board of Directors. The CEO is responsible for ensuring that the Board of Directors receives relevant information and the decision-making documentation required for the Board of Directors to be able to make well-founded decisions. In 2021, Group Management comprised the CEO, the CFO, the CIO Finland and the CIO Sweden. Group Management regularly discusses current issues and holds strategy days together with the Board of Directors at least once a year.
Remuneration of senior executivesIn 2021, a total of EUR 1,408 thousand (1,133) was paid in fixed remuneration to the Company’s senior executives (Group Management). The total gross remuneration paid to the CEO, including basic salary, pension premiums, as well as car and health insurance benefits, amounted to EUR 479 thousand (409) in 2021.
Guidelines for the remuneration of senior executives
The guidelines encompass the CEO, CFO and other members of Group Management. The guidelines do not cover remunerations determined by the Annual General Meeting.
The guidelines are applied to remunerations agreed, and to changes made to already agreed remunerations, after the adoption of the guidelines by the 2020 Annual General Meeting and no changes were decided at the 2021 Annual General Meeting. The 2021 Annual General Meeting resolved to approve the Company’s remuneration report for 2020.
How the guidelines foster the Company’s business strategy, long-term interests and sustainability
The Company’s business strategy is to acquire, develop and manage high-quality properties in the Nordic region with grocery and daily goods chains as their anchor tenants. The Company currently owns 400 properties in Finland, Sweden and Norway. For more information about the Company’s business strategy, please see page 9.
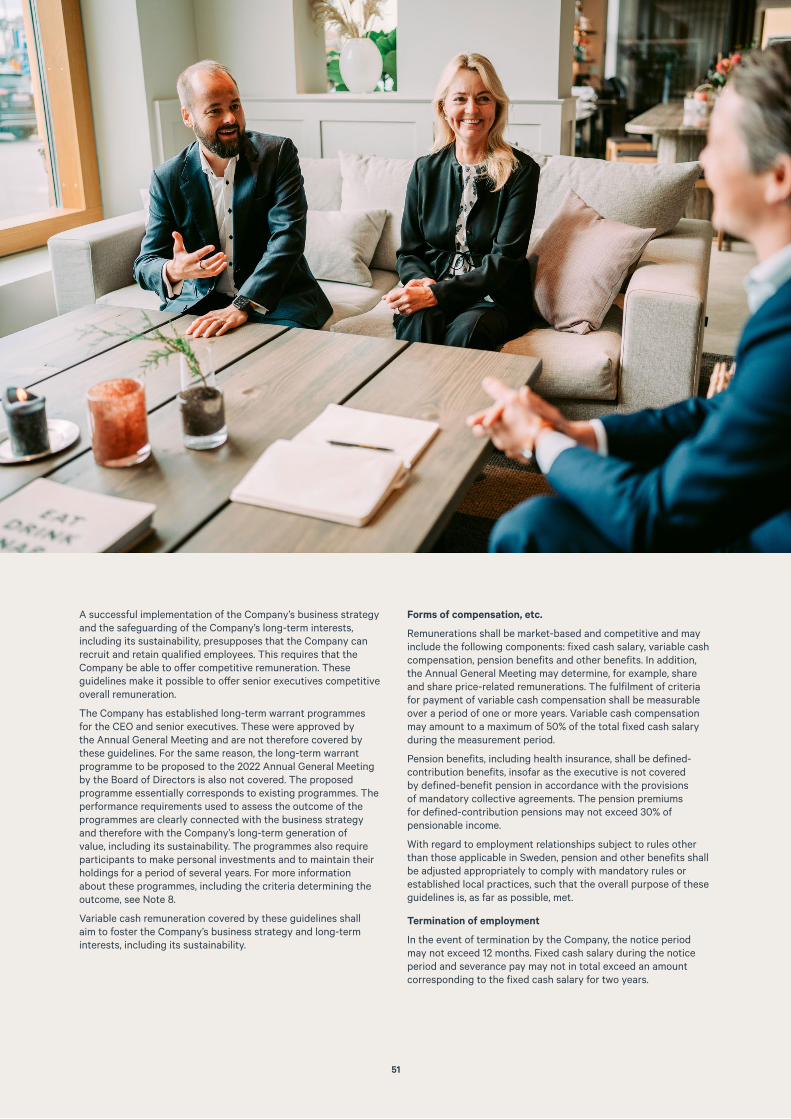
51
A successful implementation of the Company’s business strategy and the safeguarding of the Company’s long-term interests, including its sustainability, presupposes that the Company can recruit and retain qualified employees. This requires that the Company be able to offer competitive remuneration. These guidelines make it possible to offer senior executives competitive overall remuneration.
The Company has established long-term warrant programmes for the CEO and senior executives. These were approved by the Annual General Meeting and are not therefore covered by these guidelines. For the same reason, the long-term warrant programme to be proposed to the 2022 Annual General Meeting by the Board of Directors is also not covered. The proposed programme essentially corresponds to existing programmes. The performance requirements used to assess the outcome of the programmes are clearly connected with the business strategy and therefore with the Company’s long-term generation of value, including its sustainability. The programmes also require participants to make personal investments and to maintain their holdings for a period of several years. For more information about these programmes, including the criteria determining the outcome, see Note 8.
Variable cash remuneration covered by these guidelines shall aim to foster the Company’s business strategy and long-term interests, including its sustainability.
Forms of compensation, etc.
Remunerations shall be market-based and competitive and may include the following components: fixed cash salary, variable cash compensation, pension benefits and other benefits. In addition, the Annual General Meeting may determine, for example, share and share price-related remunerations. The fulfilment of criteria for payment of variable cash compensation shall be measurable over a period of one or more years. Variable cash compensation may amount to a maximum of 50% of the total fixed cash salary during the measurement period.
Pension benefits, including health insurance, shall be defined-contribution benefits, insofar as the executive is not covered by defined-benefit pension in accordance with the provisions of mandatory collective agreements. The pension premiums for defined-contribution pensions may not exceed 30% of pensionable income.
With regard to employment relationships subject to rules other than those applicable in Sweden, pension and other benefits shall be adjusted appropriately to comply with mandatory rules or established local practices, such that the overall purpose of these guidelines is, as far as possible, met.
Termination of employment
In the event of termination by the Company, the notice period may not exceed 12 months. Fixed cash salary during the notice period and severance pay may not in total exceed an amount corresponding to the fixed cash salary for two years.
52
In the event of termination by the executive, the notice period may not exceed six months, without entitlement to severance pay. Compensation may also be paid for any competition-limiting undertaking. This shall compensate for any loss of income and shall only be paid to the extent that the former executive is not entitled to severance pay. The compensation shall be based on the fixed cash salary at the time of termination and shall be paid during the period in which the undertaking to limit competition applies, which shall be a maximum of six months after the termination of employment.
Criteria for distribution of variable cash compensation
Variable cash compensation shall be linked to predetermined and measurable financial or non-financial criteria. It may also comprise individualised quantitative or qualitative targets. The criteria shall be designed so that they promote the Company’s business strategy and long-term interests, including its sustainability, by, for example, being clearly connected with the business strategy or by fostering the executive’s long-term development.
When the measurement period for fulfilling the criteria for payment of variable cash compensation has ended, it must be assessed and determined to what extent the criteria have been met. The Board of Directors is responsible for such an assessment with regard to variable cash remuneration to the CEO, and the CEO is responsible for the assessment in relation to other senior executives. The fulfilment of financial criteria shall be determined based on the financial information most recently published by the Company.
Salary and terms of employment for employees
In preparing the Board of Directors’ proposal for these remuneration guidelines, salaries and terms of employment for the Company’s employees have been taken into account in that information on employees’ total remuneration, remuneration components and the increase and rate of increase over time have formed part of the basis for the Board’s decisions in assessing the reasonableness of these guidelines and the limitations they impose.
The decision-making process for establishing, reviewing and implementing the guidelines
The Board of Directors shall prepare proposals for new guidelines when there is a need for significant changes and at least once every four years. The proposals shall be submitted for adoption by the Annual General Meeting. The guidelines shall apply until new guidelines have been adopted by the Annual General Meeting. The Board of Directors shall also monitor and assess programmes for variable remuneration for Group Management, the application of the guidelines on the remuneration of senior executives and applicable remuneration structures and levels within the Company. Neither the CEO nor other members of Group Management shall attend meetings at which the Board of Directors considers or determines remuneration-related matters, insofar as they are affected by those matters.
Deviations from the guidelines
The Board of Directors may decide to temporarily deviate entirely or in part from the guidelines if there are specific reasons for this in an individual case and if a deviation is necessary to meet the Company’s long-term interests, including its sustainability, or to safeguard the Company’s financial viability. A Remuneration Report is provided in Note 8.
Control documents and internal control
The Board bears the overall responsibility for ensuring that Cibus maintains satisfactory internal control. The CEO is responsible for ensuring that there is a satisfactory system of internal control covering all significant risks in the ongoing operations. In 2021, Cibus Nordic further developed procedures, processes and documentation for internal control, and evaluated and assessed internal efficiency.
The Company has been listed on the EU-regulated marketplace Nasdaq Stockholm since 1 June 2021. Each year, the Board of Directors adopts governance documents in the form of instructions for the CEO, and Cibus’s Compliance and Procedures manual.
Cibus’s Compliance and Procedures manual includes the Information Policy and Insider Policy, the Data Security Policy, the Data and Data Protection Policy, the Code of Conduct, the Sustainability Policy, the Environmental Policy, the Risk Policy, the Finance and Liquidity Policy, processes for regulatory compliance, and the instructions on financial reporting. The Rules of Procedure for the Board of Directors, the instructions for the Audit and Remuneration Committees, together with the instructions for the CEO, provide guidance and clarify which decisions are made by the Board of Directors and which are made by the CEO. Against the background of Cibus’ operations, organisational structure and how financial reporting is organised in other regards, the Board finds no need for a specific audit function in the form of internal audit.
The Board continuously assesses the financial reporting received each quarter in conjunction with Board meetings and includes the property portfolio, debt, dividend capacity and other important circumstances. The CEO and CFO, who report to the Board of Directors, are responsible for maintaining an effective control environment and the ongoing processes of internal control and risk management. The Board of Directors maintains an ongoing dialogue with the Company’s auditor regarding the scope and quality of the Company’s financial reporting, as well as an assessment of the efficiency of the internal control and governance..
Risk assessment
The Company continuously monitors risk and updates its analysis and assessment of risks that could lead to errors in the financial reporting. This is achieved mainly through documented processes for internal control and governance, as well as contacts between the CEO and CFO and the accounting/finance function. Once a year, Group Management conducts a workshop with the Board of Directors to identify the areas where risks of strategic, financial or operational errors are increased. In accordance with the Risk Policy, the Board of Directors analyses, at least once annually, the outcome of the Company’s risk assessment and risk management to ensure that it covers all significant risk areas. Sustainability issues are an ongoing part of the risk analysis and assessment.
Control activities
Cibus has established and documented internal processes and control activities that are both preventive and aimed at avoiding losses or errors in the financial reporting. Financial reports for the Group are prepared each quarter. These include detailed reviews of how each property is performing. They also include specific analyses of operating net, letting ratio, cost follow-up, investments, cash flow and financing. At these meetings, special emphasis is placed on reviewing any issues and safeguarding accurate financial reporting. Checks are performed at several levels in the Company to ensure that inaccuracies are rectified. The control environment is summarised in Cibus’s Compliance and Procedures Manual and involves how the operations are organised, the corporate culture, rules and guidelines, communication, documentation and follow-up. The main task of the management and its employees is, in part, to apply, assess and maintain Cibus’s control procedures and, in part, to perform internal control focused on business-critical issues. The Audit Committee evaluates and assesses internal efficiency. Each year, the Company’s auditor reviews a selection of controls and processes and reports any areas for improvement to Group Management and the Board of Directors. Nothing has emerged that indicates that the control system would not work as intended.

53
Information in accordance with EPRA’s guidelines on the composition of the Board of Directors
Cibus reports in accordance with EPRA’s guidelines for corporate governance (items 6.1–6.3, other reporting in accordance with EPRA’s guidelines can be found in the Sustainability Report on page 54)
Composition and competence of the Board of Directors
All Board Members in Cibus are independent in relation to major owners and the Company and none of the Board Members is active in the Company in any other role or in any other way than as a Board Member. The Company has five Board Members who have been engaged for an average of three years as Board Members in the Company. Of the five Board Members, one has special expertise in environmental and social issues. The experience and special areas of expertise of all Board Members are shown on page 55, where the Board of Directors is presented.
In accordance with the Swedish Code of Corporate Governance, it is the Nomination Committee that prepares and proposes elections to the Board of Directors, see the section on the Nomination Committee above.
Regardless of how they have been appointed, the members of the Nomination Committee shall safeguard the interests of all shareholders and not disclose, without being authorised to do so, matters emerging during the work of the Nomination Committee. Before accepting the assignment, a member of the Nomination Committee must carefully consider whether there is a conflict of interest or other circumstances that make it inappropriate for her/him to participate in the Nomination Committee. In accordance with the Swedish Code of Corporate Governance, the Board of Directors shall have a composition that is appropriate with regard to the Company’s operations, stage of development and other conditions, characterised by versatility and breadth regarding the competence, experience and background of the members elected by the Annual General Meeting. An even gender distribution must be sought. Cibus applies and follows the Swedish Code of Corporate Governance. In addition to industry experience, Cibus’s Board of Directors has expertise in the following areas: financial reporting, remuneration, corporate governance and sustainability issues.
The Company’s Board Members have no Board commitments or ownership interests in companies that are stakeholders or suppliers to Cibus. Cibus has no controlling principal and, for 2021, the Company reported no related-party transactions pertaining to Board Members, see Note 21.
Name Feature Elected year Independent of major shareholders, the Company and Group Management
Fees approved by AGM in EUR
Number of Board meetings, incl.
committeesPatrick Gylling Chairman of
the Board2018 Independent 4,750 47*
Elisabeth Norman Board Member 2018 Independent 2,375 47*
Jonas Ahlblad Board Member 2018 Independent 2,375 47*
Stefan Gattberg Board Member 2020 Independent 2,375 47*
Victoria Skoglund Board Member 2021 Independent 2,375 47*
*Of which, 34 Board meetings were held by mail.

54
C O R P O R AT E G OV E R N A N C E
In accordance with Chapter 6, Section 11 of the Annual Accounts Act, Cibus submits a Sustainability Report. The Sustainability Report refers to the operations of Cibus Nordic AB (publ) and its subsidiaries during the 2021 calendar year. This is Cibus’s third Sustainability Report, the previous report was published in April 2021. The Sustainability Report comprises pages 9 and 23–39 in Cibus’s 2021 Annual Report. For a more detailed account, see the table of contents below.
Table of contents – Statutory Sustainability Report
Business model Page Part of Annual Report
Material issues, stakeholders 9 Business concept and goals
Governance of sustainability work
25–33 Sustainability – all pages
Risks, risk management 27, 29, 32–33, 45Sustainability – all pages
Environment 29–32, 35–37 Sustainability – Take action for the climate, Sustainability indicators in accordance with EPRA
Social conditions 33 Sustainability – Create accessible marketplaces
Personnel, diversity 23–24, 39 Employees and organisation, Sustainability indicators in accordance with EPRA
Human rights 25, 28 Sustainability – Sustainable marketplaces as a business concept, be a sustainable partner
Anti-corruption, business ethics 27–28 Sustainability – Be a sustainable partner
Follow-up 23–39 Sustainability – all pages
Statutory Sustainability Report

55
Board of Directors and AuditorThe Board of Directors comprises Patrick Gylling (Chairman of the Board), Elisabeth Norman, Jonas Ahlblad, Victoria Skoglund and Stefan Gattberg
KPMG was elected as auditor with Mattias Johansson as the principal auditor
C O R P O R AT E G OV E R N A N C E
Patrick Gylling
Chairman of the Board since 2018
Master of Economics from Hanken School of EconomicsOther assignments: CEO of Sirius Capital Partners and Board Member Annuity Hereditas Ab Shareholding: 500,000 shares through Oriolidae Invest Ab
Elisabeth Norman
Board Member since 2018
BA from Uppsala UniversityOther assignments: Chairman of the Board of EHB Hyresbostäder AB, Chairman of the Board of Nivika Fastigheter AB (publ), Deputy Chairman of the Board of Sveriges Allmännytta, Board Member of Byggpartner i Dalarna AB (publ), Board Member of Örndalen Exploatering ABShareholding: 1,500 + 7,000 shares via Salsnecke Slott HB
Stefan Gattberg
Board Member since 2020
Law degree from Lund UniversityOther assignments: Partner at, and Board Member of Altaal AB, Chairman of the Board of Green Yield Nordic RE AB, Board Member of Altaal-X.Shareholding: 7,743 shares
Mattias Johansson
Principal auditor since 2019
Authorised Public Accountant The Annual General Meeting elected KPMG AB as auditing firm.
Jonas Ahlblad
Board Member since 2018
Master of Economics from Hanken School of EconomicsOther assignments: CIO at Sirius Capital PartnersShareholding: 110,000 shares via Salba Holding Oy
Victoria Skoglund
Board Member since 2021
Law degree from Stockholm UniversityOther assignments: Board Member of Bmondo AB, Gastroba Development AB and VIE SPAC AB and partner in Advokatfirman Lindahl.Shareholding: 1,500 shares

56
Group Management
Lauri Tiensuu
Head of Business development/CIO Finland since January 2020
MSc Engineering from Aalto University
Shareholding: 6,000 shares + 80,000 stock options
Peter Lövgren
CIO Sweden since August 2020
MSc Engineering from the Royal Institute of Technology
Shareholding: 1,000 shares + 80,000 stock options
Pia-Lena Olofsson
CFO & Head of IR since 2019
Executive MBA from Warwick Business School and MBA from University of Gothenburg
Shareholding: 5,000 shares + 120,000 stock options
Group Management comprises Sverker Källgården (CEO), Pia-Lena Olofsson (CFO & Head of IR),
Lauri Tiensuu (CIO Finland), Peter Lövgren (CIO Sweden)
C O R P O R AT E G OV E R N A N C E
Sverker Källgården
CEO since 2019
MSc Engineering from the Royal Institute of Technology
Shareholding: 5,000 shares + 186,600 stock options
5744
Financial statements

58
Annual Report for Cibus Nordic Real Estate AB (publ)
The Board of Directors and the CEO of Cibus Nordic Real Estate AB (publ) (hereinafter “Cibus”), registered in Stockholm, Sweden with company registration number 559135-0599, hereby present the consolidated financial statements and the Parent Company’s annual accounts for the financial year from 1 January 2021 until 31 December 2021. The Company’s reporting currency is euro and unless otherwise stated all amounts are in thousand euro (EUR thousands).
Operations
Cibus’ operations consist of acquiring, developing and managing high-quality properties in the Nordic region with reputable grocery and daily-goods chains as their anchor tenants. This is designed to generate stable, cyclically resilient and increasing dividends for the Company’s shareholders.
Business concept, goals and strategy
Cibus’s business concept is to create long-term growth and value gains through the acquisition, development and management of high-quality properties in the Nordic region with a clear focus on properties anchored by grocery and daily-goods chains. The main goal of the Company’s business concept is to secure and maintain the portfolio’s solid cash flow to thereby allow a favourable dividend to its shareholders irrespective of economic conditions.
The strategy applied by the Company to reach this goal encompasses active and close tenant relationship management in combination with endeavouring to secure financially strong tenants in market-leading positions.
Moreover, the Company endeavours to enter into long-term leases and to retain the diversified lease duration for the Company’s existing leases. Alongside the management of the existing property portfolio, the Company has formulated a clear investment strategy for continued growth in Finland and Sweden but also for expansion into the other Nordic countries.
Property portfolio and tenants
At 31 December 2021, the property portfolio comprised 400 properties with a total lettable area of slightly more than 866,920 m2. The market value was EUR 1,499,626 thousand. The holdings consisted solely of retail premises that are mainly used for the grocery and daily-goods sector. Approximately 84% of the portfolio’s net operating income on an annual basis stems from properties in Finland, 15% from properties in Sweden and 1% from properties in Norway. The overwhelming majority of the tenants comprise companies in the grocery and discount retail sector. More than 90% of net operating income comes from properties anchored by five market-leading tenants: Kesko, Tokmanni, Coop Sverige, S Group or Lidl. All major tenants perceive the properties as well suited to their operations. Anchor tenants account for 87% of rental income from grocery and daily-goods stores and have an average unexpired lease term of 5.5 years.
Cibus performs external valuations on all properties four times per year, at the end of each quarter. The properties are valued by an independent valuation institute at fair value, which is based on a market valuation. Newsec has performed the valuations for this reporting period.
Administration Report
F I N A N C I A L S TAT E M E N T S
Key financial ratios, group
Unless otherwise stated, in EUR thousands. Full-year 2021 Full-year 2020Rental income 81,058 65,033Net operating income 76,326 61,395Profit from property management 47,741 33,488Net earnings after tax 51,370 34,597No. of shares outstanding 44,000,000 40,000,000Average No. of shares outstanding 40,284,932 36,459,344Earnings per share, EUR1 1.25 0.95EPRA NRV/share, EUR 13.5 12.1EPRA NTA/share, EUR 13.5 12.1EPRA NDV/share, EUR 12.8 11.6Market value of properties 1,499,626 1,272,514Cash and cash equivalents 51,054 36,783Total assets 1,570,714 1,323,954Return on shareholders’ equity, % 9.9 8.7Senior debt LTV ratio, % 48.3 48.9Net debt LTV ratio, % 57.8 61.3Interest coverage ratio, multiple 3.5 3.3Equity/asset ratio, % 37.1 34.6Debt/equity ratio, multiple 1.7 1.9Surplus ratio, % 94.2 94.4Economic occupancy rate, % 94.3 95.3Proportion grocery and daily-goods stores, % 94.6 95.01Before and after dilution.

59
Performance analysis full-year 2021
INCOME
During 2021, the Group’s rental income amounted to EUR 81,058 thousand (65,033), corresponding to an increase of 25% compared with the corresponding period last year. Service income totalled EUR 12,696 thousand (9,346) and consisted largely of re-invoiced expenses. The economic occupancy rate was 94.3% (95.3). At 31 December 2021, the total annual rental value amounted to approximately EUR 94,754 thousand (81,452).
NET OPERATING INCOME
Operating expenses for the year amounted to EUR 17,428 thousand (12,984). Net operating income increased by 24% to EUR 76,326 thousand (61,395), resulting in a surplus ratio of 94.2% (94.4). As many leases are triple-net leases, whereby the tenants cover the majority of the expenses, net operating income is one of the most important comparative figures. Depending on the terms of the lease, expenses may be charged to tenants directly or via Cibus. This means that gross rents, expenses and service income may vary over time, even if net operating income remains relatively stable.
NET FINANCIAL ITEMS
Net financial items amounted to an expense of EUR 22,200 thousand (21,387) and consisted mainly of interest expenses for the year of EUR 19,289 thousand (16,083) but also an exchange rate difference of EUR 468 thousand (0). Net financial items also include limit fees, expenses for interest rate derivatives and site leasehold fees in accordance with IFRS 16. In addition to secured loans of EUR 724 million, two unsecured bonds have been issued in the amounts of SEK 600 million and EUR 135 million.
At the end of the year, average interest rate in the loan portfolio, including unsecured bonds and including margins and expenses for interest rate hedging, was 2.3% (2.4).
PROFIT FROM PROPERTY MANAGEMENT
Profit from property management for the year increased by 43% to EUR 47,741 thousand (33,488), corresponding to EUR 1.19 per share (0.92).
CHANGES IN PROPERTY VALUES
Including acquisitions, changes in property values amounted to EUR 227,112 thousand (397,701) from the opening balance of EUR 1,272,514 thousand (874,813) to the closing balance of EUR 1,499,626 thousand (1,272,514). EUR 10,644 thousand (6,461) of the changes in value are unrealised and a negative SEK 3,802 (403) constitutes an exchange rate effect. During the year, disbursements for acquisitions of properties were made in the amount of EUR 177,150 thousand (386,122) and EUR 40,742 thousand was disbursed through a non-cash issue, while divestments brought in EUR 0 thousand (270) and adjusted cost EUR 131 thousand (722). In addition, investments of EUR 2,247 thousand (4,262) have been made in the properties, of which about EUR 403 thousand (2,131) involved tenant adjustments that were implemented with a direct return in line with, or exceeding, the existing portfolio.
TAX
The nominal rate of corporation tax in Finland is 20%. Through fiscal depreciation on fittings and equipment, and on the buildings themselves, as well as through tax-loss carryforwards being exercised, a low effective tax expense was incurred for the year. The nominal rate of corporation tax in Sweden is 20.6% and in Norway it is 22%.
The loss carryforwards are estimated at about EUR 23,855 thousand (18,221). Tax assets attributable to these loss carryforwards have been recognised in the consolidated balance sheet in an amount of EUR 4,675 thousand (3,648) and in the Parent Company’s balance sheet in an amount of EUR 3,224 thousand (2,438). Cibus recognised total tax for the year of a negative EUR 7,995 thousand (4,995), of which current tax and deferred tax amounted to a negative EUR 81 thousand (21) and a negative EUR 7,914 thousand (4,974) respectively. The effective tax rate was 13.5% (12.6).
NET EARNINGS AFTER TAX
Profit for the year after tax amounted to EUR 51,370 thousand (34,597), corresponding to EUR 1.25 per share (0.95). Unrealised changes in property values totalling EUR 10,644 thousand (6,461) were included in profit.
Cash flow and financial position
Consolidated cash flow from operating activities amounted to EUR 53,261 thousand (45,925), corresponding to EUR 1.32 (1.26) per the average number of shares outstanding. Cash flow from investing activities was negative in the amount of EUR 179,675 thousand (392,290) and mainly involved acquisitions of properties during the year.
Cash flow from financing activities amounted to EUR 140,777 thousand (357,941). At the end of the year, cash and cash equivalents amounted to TEUR 51,054 (36,783), corresponding to EUR 1.16 per share (0.92). At 31 December 2021, Cibus had net interest-bearing liabilities, following deductions of cash and cash equivalents, of EUR 866,806 thousand (780,500). Capitalised borrowing costs amounted to EUR 3,969 thousand (4,265).
Financing
As of 31 December 2021, the Group had secured bank loans of EUR 724 million with a weighted average floating interest margin of 1.7% and a weighted average loan maturity of 2.6 years. Cibus has pledged mortgages in the properties as collateral for the interest-bearing liabilities. In Cibus’s assessment, the collateral agreements have been entered on market terms.
Cibus has issued an unsecured green bond for SEK 600 million. The bond matures on 12 June 2023 and carries a floating coupon rate of 3m STIBOR + 4.75%.
Cibus has issued an unsecured bond for EUR 135 million. The bond matures on 18 September 2023 and carries a floating coupon rate of 3m EURIBOR + 4.5%.
Both unsecured bonds have been listed on the Nasdaq Stockholm Corporate Bond list since 20 July 2020.
The earlier EUR bond, maturing on 26 May 2021, was fully redeemed as of 9 July 2020.
In June 2021, Cibus established an MTN programme enabling both senior unsecured bonds and hybrid bonds. On 17 June, Cibus issued hybrid bonds for EUR 30 million under its newly-established MTN programme. The hybrid bonds have a perpetual eternal maturity, with the first opportunity for redemption occurring after 5.25 years, and maturing with an interest rate of 3 months EURIBOR + 4.75%. The hybrid bonds have been listed on the Nasdaq Stockholm Corporate Bond list since 24 June 2021.
— The Group’s average tenor, excluding the hybrid bonds, amounts to 2.6 years.
— The first loan maturity date is in 1.5 years’ time. — Of the Group’s bank loans, around 66% are hedged using
interest-rate derivatives in the form of interest-rate caps. — The LTV ratio including the unsecured bonds is 57.8%. — The secured bank loan has an LTV of 48.3%.
For further information, see Note 9. For further information regarding financial risk management and financial instruments, see pages 41–45.
Legal structure
As of 31 December 2021, the Group comprised 376 limited companies with Cibus Nordic Real Estate AB (publ) as the Parent Company. All properties are owned by subsidiaries and 50 of the subsidiaries are mutual real estate companies (MRECs). This is the most common partnership arrangement in Finland that allows direct ownership of a specified part of a property.
F I N A N C I A L S TAT E M E N T S

60
Ownership structure
Cibus has been listed on Nasdaq Stockholm MidCap since 1 June 2021. The final day for trading on Nasdaq First North Premier Growth Market Stockholm was 31 May 2021. Cibus’s shares bear the ISIN code SE0010832204. As of 31 December 2021, the Company had about 41,000 shareholders. The 15 largest shareholders hold approximately 42% of the votes. None of these shareholders has a holding amounting to 10% or more of the votes in Cibus as of 31 December 2021.
SHAREHOLDERS AS OF 31 DECEMBER 2021
Name No. of shares PercentageFjärde AP-fonden 3,214,813 7.3
AB Sagax 2,426,973 5.5
Columbia Threadneedle 2,257,879 5.1
Dragfast AB 1,700,000 4.2
Marjan Dragicevic 1,632,000 3.7
Avanza Pension 1,322,845 3.0
BlackRock 1,278,263 2.9
Sensor Fonder 946,000 2.1
Länsförsäkringar Fonder 929,474 2.1
Nordnet Pensionsförsäkring 545,601 1.2
Patrick Gylling 500,000 1.1
Svenska Handelsbanken 376,800 0.9
Nuveen Asset Management 370,520 0.8
Handelsbanken Fonder 315,538 0.7
Familjen Kamprads stiftelse 300,000 0.7
Total, 15 largest shareholders 18,116,706 41.6
Other 25,883,294 58.4
Total 44,000,000 100Source: Modular Finance
Parent Company
Cibus Nordic Real Estate AB (publ) is the Parent Company of the Group and owns no properties directly. Its operations comprise owning shares, managing stock market-related issues and Group-wide business functions such as administration, transactions, management, legal issues, project development and finance. The Parent Company’s loss after tax for the year amounted to EUR 2,305 thousand (7,084).
Sustainability Report
For the Company’s Sustainability Report, see page 54.
Auditors
The 2021 Annual General Meeting elected the accounting firm KPMG AB as auditor. Authorised Public Accountant Mattias Johansson is Auditor-in-Charge for the Company.
Significant events during the period
FIRST QUARTER
No significant events have occurred during the first quarter.
SECOND QUARTER
On 14 April, it was announced that Cibus had acquired three properties in Sweden for SEK 34.5 million. ICA Sverige is the anchor tenant for all of the properties concerned.
At the Annual General Meeting on 15 April 2021, Victoria Skoglund was elected as a new Board member. Patrick Gylling was re-elected Chairman of the Board and Elisabeth Norman, Jonas Ahlblad and Stefan Gattberg were re-elected as Board members.
On 29 April, it was announced that Cibus had acquired a property in Rauma, Finland for EUR 5.3 million. Tokmanni is the anchor tenant.
On 14 April, it was announced that Cibus would acquire three properties in Finland for EUR 25.5 million. Lidl, Halpahalli and S Group are the anchor tenants.
On 26 May, Cibus announced that it had signed a collaboration agreement with Järntorget to jointly develop that part of Cibus’ Swedish property portfolio that is not used for daily-goods retail. Through planning work, the aim of the agreement is to establish building rights for rental apartments in Cibus’s existing and future Swedish property portfolio.
On 27 May, it was announced that Cibus had been approved for listing on Nasdaq Stockholm. The first day of trading on Nasdaq Stockholm’s main list was Tuesday, 1 June 2021, and the final day of trading on Nasdaq First North Premier Growth Market was Monday, 31 May 2021.
On 28 May, Cibus published a prospectus in connection with the change of listing to Nasdaq Stockholm.
On 28 May, it was also announced that Cibus would make two further acquisitions in Finland for EUR 15.9 million. Tokmanni and S Group are the anchor tenants.
On 1 June, it was announced that Cibus would acquire two properties in Sweden for EUR 4.5 million. ICA is the anchor tenant in all of these properties.
On 14 June, it was announced that Cibus had published a basic prospectus regarding the newly-established MTN programme and is considering an issue of hybrid bonds.
On 15 June, it was announced that Cibus would acquire a daily-goods property in Finland for EUR 2.2 million. Kesko is the tenant.
On 16 June, it was announced that Cibus had entered into an agreement to acquire 72 daily-goods stores in Finland for EUR 71.6 million and had agreed to issue a private placement of 2,000,000 new shares to AB Sagax. Of these properties, 71 are leased to Kesko and one to S Group.
On 17 June, Cibus issued hybrid bonds for EUR 30 million.
Third quarter
On 1 July, Cibus signed an agreement to acquire, and took possession of three properties in Sweden for EUR 4.1 million. Coop Sverige Fastigheter is the anchor tenant in all of these properties.
On 6 September, it was announced that, as of 20 September 2021, the Cibus share will be included in the EPRA index, which is a leading global index for listed property investments.
On 24 September, Cibus signed an acquisition of a total of five properties in Finland for EUR 5.2 million. S Group is the tenant in all of these properties.
On 30 September, Cibus announced that it had purchased a portfolio of eight properties in south-eastern Norway for EUR 27.6 million.
The properties are fully let to Kiwi, Spar and Rema1000, and Cibus took possession of them on 15 October 2021.
On 1 July, Cibus signed an agreement to acquire, and took possession of three properties in Sweden for EUR 4.1 million. Coop Sverige Fastigheter is the anchor tenant in all of these properties.
FOURTH QUARTER
On 18 November, Cibus announced that it had signed an agreement to acquire a grocery store in Finland for EUR 6.8 million. S Group is the tenant.
On 29 November, Cibus announced that it had signed an agreement to acquire a food property currently under construction in Sweden for EUR 11.5 million.
Cibus is scheduled to take possession of the property in the third quarter of 2022 when construction is complete. Willys is the tenant.
On the same date, it was announced that Cibus had signed an agreement to acquire Charlottenbergs Handelspark (comprising two separate properties) in Sweden for EUR 28.3 million. ICA and Lidl are anchor tenants.
On 30 November, it was announced that Cibus had taken possession of a portfolio of 72 grocery stores in Finland from AB Sagax, the acquisition of which had been announced previously. In connection with Cibus taking possession of the properties, the Company paid part of the purchase consideration by means of a private placement of 2,000,000 shares.
F I N A N C I A L S TAT E M E N T S

61
On the same date, it was announced that the total number of shares and votes in Cibus had increased during November 2021 as a result of the private placement. Accordingly, the number of shares and votes in Cibus amounts to 42,000,000 and the share capital in Cibus amounts to EUR 420,000.
On 1 December, Cibus updated its growth targets. Group Management and the Board of Directors estimate that the Company will be able to double the property value of its portfolio to EUR 2.5–3.0 billion, meeting the criteria for an investment grade credit rating by the end of 2023.
On 7 December, it was announced that Cibus had implemented a private placement of 2,000,000 shares, raising SEK 492 million.
On 21 December, Cibus made two acquisitions in Norway for EUR 13.4 million. Norgesgruppen and Rema 1000 are anchor tenants.
On 23 December, Cibus acquired a portfolio of six properties in Norway for EUR 15.8 million. Coop, Kiwi and Rema 1000 are anchor tenants.
On 29 December, Cibus acquired a grocery store completed in 2020 and another building under construction in Sweden for EUR 15.7 million. Coop is the anchor tenant.
On 30 December, it was announced that the number of shares and votes in Cibus amounts to 44,000,000 and the share capital in Cibus amounts to EUR 440,000.
Significant events after the end of the financial year
On 17 February 2022, a press release was issued announcing the conclusions of the Extraordinary General Meeting that had been held on the same date. For the period up until the next Annual General Meeting, the Board of Directors was mandated to determine the issue of new shares, with or without preferential rights for the Company’s existing shareholders. The total number of shares that may be issued pursuant to this authorisation may not exceed 10% of the number of shares outstanding in the Company as per the date of the Extraordinary General Meeting, meaning that at most 4,400,000 shares may be issued.
On the same date, the Nomination Committee’s proposal to the Board of Directors was announced to the Annual General Meeting. The Nomination Committee proposed that Patrick Gylling, Elisabeth Norman, Victoria Skoglund and Stefan Gattberg be re-elected as Board Members of Cibus Nordic Real Estate AB and that Nils Styf be elected as a new Board Member. The Nomination Committee also proposes that Patrick Gylling be re-elected as Chairman of the Board.
Risks and uncertainties
Through its operations, the Group is exposed to various types of financial risks. These mainly relate to liquidity and financing risks which are described on pages 41–45.
The Parent Company is indirectly affected by risks and uncertainties through its function in the Group.
Guidelines for senior executives
The guidelines encompass the CEO, CFO and other members of Group Management. The guidelines are applied to remunerations agreed, and to changes made to remunerations previously agreed, following the adoption of these guidelines by the 2020 Annual General Meeting. For more information, see pages 50–52.
Outlook
The income trend for the existing portfolio is expected to track inflation. Cibus’s strategy is to continuously improve the Company’s return through active management, high cost awareness, renegotiation of existing loans and add-on acquisitions.
Dividend and appropriation of profits
The Board of Directors has proposed that the Annual General Meeting approve a dividend of EUR 0.99 per share. The proposed dividend corresponds to a yield of 3.5% on the share price at 31 December 2021 (SEK 290.80).
Proposed appropriation of profit
Ahead of the Annual General Meeting on 20 April 2022, the Board of Directors proposes:
– That a new share class (D) be established, with a bonus issue being made to existing shareholders in connection with this
– That the dividend be increased by 5% to EUR 0.99 per existing share, to be distributed to all share classes. Accordingly, current shareholders will receive a dividend equivalent to 0.99 EUR for each existing share held and divided between 12 dividend payment dates.
– All share classes are to receive monthly dividends.
The complete resolution proposal, including amounts and payment dates will be published in connection with the notification of the Annual General Meeting.
THE FOLLOWING EARNINGS (EUR) ARE AT THE DISPOSAL OF THE ANNUAL GENERAL MEETING:
Unrestricted shareholders’ equity 429,967,003
Profit for the year -2,305,316
427,661,688
THE BOARD PROPOSES THAT THE EARNINGS BE APPROPRIATED AS FOLLOWS:
to be distributed to shareholders 43,560,000
to be carried forward 384,101,688
427,661,688
In the event that the Board makes maximum use of the authorisation it obtained from the Extraordinary General Meeting on 17 February 2022 and the possible authorisation from the 2022 Annual General Meeting that may be obtained for the Board of Directors to decide on a new share issue, a maximum dividend of EUR 10,164,000 will be distributed for the additional shares. Of the amount disposable as of 31 December 2021, at least EUR 373,937,668 will remain after dividends of a maximum total of EUR 53,724,000.
THE BOARD OF DIRECTORS’ STATEMENT ABOUT THE PROPOSED APPROPRIATION OF PROFITS
After taking into account the need for liquidity, the submitted budget and investment plans, it is the Board’s assessment that no indications exist that the proposed dividend would result in the Company’s and the Group’s equity becoming insufficient in relation to the nature, extent and risks of the business. The Board thus finds the proposed dividend justifiable pursuant to Chapter 17, Section 3 of the Swedish Companies Act.
Please refer to the following financial statements for other information about the Company’s performance and financial position.
F I N A N C I A L S TAT E M E N T S
Coronavirus
The Coronavirus has had a very limited negative impact on Cibus’s operations. We follow the recommendations issued by the Public Health Agency of Sweden and, naturally, we act with caution in our contacts with other companies, preferring to hold meetings by phone or video link, and keeping travel at a low level.
For our foremost tenants, grocery retailers, volumes have increased since the virus emerged because more people are eating at home. Grocery retail volumes are at normal levels and nothing indicates that our tenants will encounter difficulty paying their rent. Approximately 99% of the rent we had invoiced for the fourth quarter of 2021 has been paid, with the figure being over 99% for full-year 2021. Of our income, about 90% derives from the largest grocery and daily-goods chains in the Nordic countries.

62
Consolidated income statement and statement of comprehensive income
Amounts in EUR thousand Note Full-year 2021 Full-year 2020
Rental income 4 81,058 65,033
Service income 4 12,696 9,346
Operating expenses 5 -13,791 -10,023
Property tax -3,637 -2,961
Net operating income 6 76,326 61,395
Administrative expenses 7, 8 -6,385 -6,520
Net financial items 9 -22,200 -21,387
Profit from property management 47,741 33,488
Unrealised change in value of investment properties 12 10,644 6,461
Unrealised change in value of interest-rate derivatives 10 980 -357
Earnings before tax 59,365 39,592
Current tax 11 -81 -21
Deferred tax 11 -7,914 -4,974
Profit for the year 51,370 34,597
Average No. of shares outstanding 16 40,284,932 36,459,344
Earnings per share before and after dilution, EUR 16 1.25 0.95
Other comprehensive income
Items that have been reallocated or that can be reallocated to profit for the year
Translation differences for the year in the translation of foreign operations
-1,524 4,408
Total comprehensive income* 49,846 39,005
*Profit for the year and comprehensive income are entirely attributable to Parent Company shareholders.
F I N A N C I A L S TAT E M E N T S

63
Consolidated statement of financial position
Amounts in EUR thousand Note 31 Dec 2021 31 Dec 2020
ASSETS
Non-current assets
Investment properties 12 1,499,626 1,272,514
Right-of-use assets 13 9,649 8,218
Other tangible assets 55 36
Intangible assets 200 11
Deferred tax assets 11 4,675 3,648
Other non-current receivables 33 36
Total non-current assets 1,514,238 1,284,463
Current assets
Rental receivables 764 679
Other current receivables 1,165 453
Prepaid expenses and accrued income 14 3,493 1,576
Cash and cash equivalents 15 51,054 36,783
Total current assets 56,476 39,491
TOTAL ASSETS 1,570,714 1,323,954
SHAREHOLDERS’ EQUITY AND LIABILITIES
Equity
Share capital 16 440 400
Other contributed capital 507,496 422,275
Reserves 2,884 4,408
Profit brought forward, incl. profit for the year 43,435 30,945
Shareholders’ equity attributable to Parent company shareholders
554,255 458,028
Hybrid bond 17 29,007 -
Total shareholders’ equity 583,262 458,028
Non-current liabilities
Borrowings 18 911,494 810,202
Deferred tax liabilities 11 31,161 20,294
Interest rate derivatives 391 736
Other non-current liabilities 13 13,080 9,296
Total non-current liabilities 956,126 840,528
Current liabilities
Current portion of borrowing 18 2,396 2,762
Current portion interest rate derivatives 703 -
Accounts payable 774 438
Current tax liabilities 1,533 37
Other current liabilities 3,519 3,739
Accrued expenses and deferred income 19 22,401 18,422
Total current liabilities 31,326 25,398
Total liabilities 987,452 865,926
TOTAL SHAREHOLDERS’ EQUITY AND LIABILITIES 1,570,714 1,323,954
F I N A N C I A L S TAT E M E N T S

64
Consolidated statement of changes in equity
Amounts in EUR thousand
Equity attributable to Parent Company shareholders
Share capital Other contributed
capital
ReservesProfit brought forward, incl. profit for the
year
Total Hybrid bond Total shareholders’
equity
Opening equity, 1 Jan 2020
311 300,794 - 31,764 332,869 - 332,869
Profit for the year - - - 34,597 34,597 - 34,597
Other comprehensive income for the year
- - 4,408 - 4,408 - 4,408
Comprehensive income for the year
- - 4,408 34,597 39,005 - 39,005
New share issue 89 123,125 - - 123,214 - 123,214
Warrants - 54 - - 54 - 54
Issue expenses - -2,160 - - -2,160 - -2,160
Tax effect of issue costs - 462 - - 462 - 462
Dividend - - - -35,416 -35,416 - -35,416
Closing equity, 31 Dec 2020
400 422,275 4,408 30,945 458,028 - 458,028
Opening equity, 1 Jan 2021
400 422,275 4,408 30,945 458,028 - 458,028
Profit for the year - - - 51,370 51,370 - 51,370
Other comprehensive income for the year
- - -1,524 - -1,524 - -1,524
Comprehensive income for the year
- - -1,524 51,370 49,846 - 49,846
New share issue 20 48,048 - - 48,068 - 48,068
Non-cash issue 20 37,559 - - 37,579 - 37,579
Hybrid issue - - - - - 30,000 30,000
Warrants - 153 - - 153 - 153
Issue expenses - -670 - - -670 -430 -1,100
Tax effect of issue expenses - 131 - - 131 89 220
Dividend - - - -38,880 -38,880 -652 -39,532
Closing equity, 31 Dec 2021
440 507,496 2,884 43,435 554,255 29,007 583,262
F I N A N C I A L S TAT E M E N T S

65
Consolidated cash-flow statement
Amounts in EUR thousand Note Full-year 2021 Full-year 2020
Operating activities
Earnings before tax 59,365 39,592
Adjustments for non-cash items:
– Financial items 1,936 1,625
– Unrealised changes in value, investment properties -10,644 -6,461
– Unrealised changes in value, interest-rate derivatives -980 357
– Unrealised exchange rate differences -2,788 2,819
– Change in deferred tax 1,930 -
Tax paid - -609
Cash flow from operating activities before changes in working capital
48,819 37,323
Cash flow from changes in working capital
Change in current receivables 22,078 3,037
Change in current liabilities -17,636 5,565
Cash flow from operating activities 53,261 45,925
Investing activities
Property acquisitions 12 -177,150 -386,122
Property sales 12 - 270
Investments in current buildings 12 -2,247 -4,262
Other investments -278 -2,176
Cash flow from investing activities -179,675 -392,290
Financing activities
New share issue 48,088 123,214
Hybrid issue 30,000 -
Warrants 121 54
Issue expenses -1,107 -2,160
Dividends to shareholders -37,520 -39,587
Dividend, hybrid bond -652 -
Proceeds from borrowings 18 105,610 454,923
Repayment of debt 18 -2,192 -175,667
Loan arrangement fees 18 -1,571 -2,836
Cash flow from financing activities 140,777 357,941
Cash flow for the year 14,363 11,576
Cash and cash equivalents at the start of the year 36,783 24,746
Exchange rate difference in cash and cash equivalents -92 461
Cash and cash equivalents at the end of the year 51,054 36,783
F I N A N C I A L S TAT E M E N T S
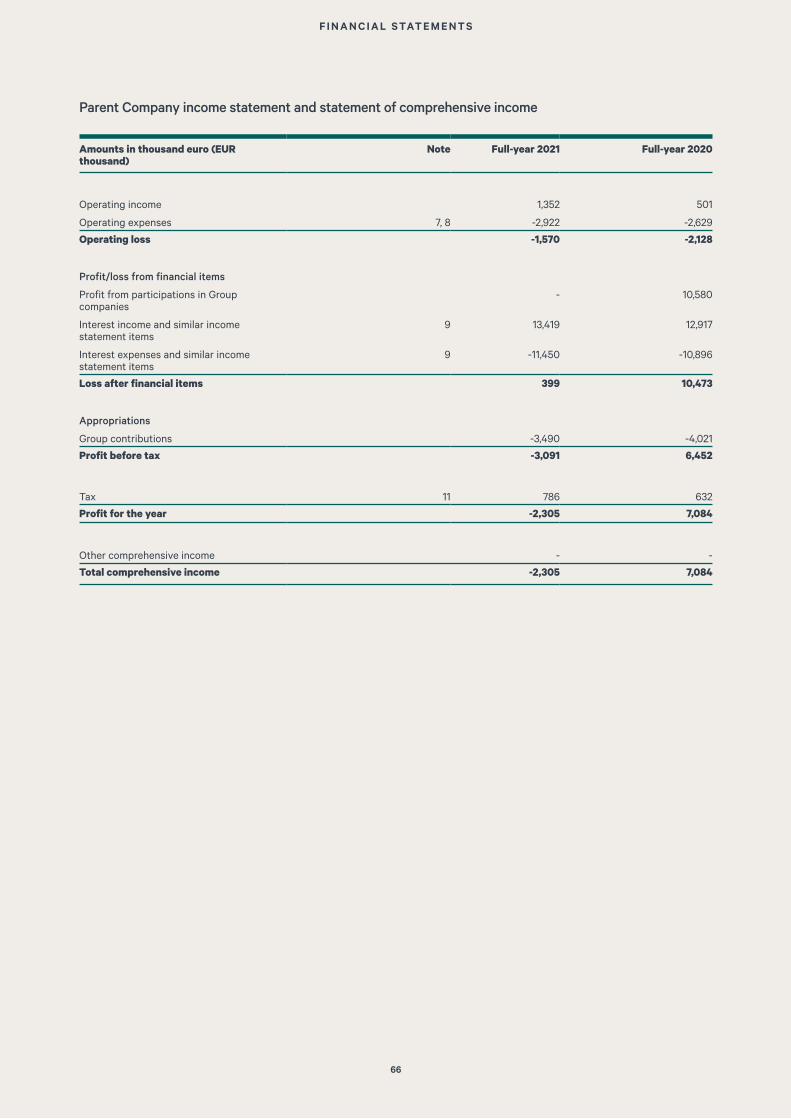
66
Parent Company income statement and statement of comprehensive income
Amounts in thousand euro (EUR thousand)
Note Full-year 2021 Full-year 2020
Operating income 1,352 501
Operating expenses 7, 8 -2,922 -2,629
Operating loss -1,570 -2,128
Profit/loss from financial items
Profit from participations in Group companies
- 10,580
Interest income and similar income statement items
9 13,419 12,917
Interest expenses and similar income statement items
9 -11,450 -10,896
Loss after financial items 399 10,473
Appropriations
Group contributions -3,490 -4,021
Profit before tax -3,091 6,452
Tax 11 786 632
Profit for the year -2,305 7,084
Other comprehensive income - -
Total comprehensive income -2,305 7,084
F I N A N C I A L S TAT E M E N T S

67
Parent Company Balance Sheet
Amounts in EUR thousand Note 31 Dec 2021 31 Dec 2020
ASSETS
Non-current assets
Capitalised software expenditure 200 17
Equipment 12 11
Shares in subsidiaries 20 128,599 128,594
Deferred tax assets 3,224 2,438
Non-current receivables from Group companies
473,904 374,363
Other non-current receivables 276 21
Total non-current assets 606,215 505,444
Current assets
Current receivables from Group companies 22,046 41,751
Other current receivables 318 70
Prepaid expenses and accrued income 14 63 27
Cash and cash equivalents 15 30,996 22,598
Total current assets 53,423 64,446
TOTAL ASSETS 659,638 569,890
SHAREHOLDERS’ EQUITY AND LIABILITIES
Equity
Share capital 16 440 400
Total restricted equity 440 400
Share premium reserve 17 536,350 422,275
Profit brought forward -106,384 -74,588
Profit for the year -2,305 7,084
Total unrestricted equity 427,661 354,771
Total shareholders’ equity 428,101 355,171
Non-current liabilities
Borrowings 18 192,391 193,073
Total non-current liabilities 192,391 193,073
Current liabilities
Current liabilities 27,709 11,840
Accounts payable 336 116
Other current liabilities 112 81
Accrued expenses and deferred income 19 10,989 9,609
Total current liabilities 39,146 21,646
TOTAL LIABILITIES 231,537 214,719
TOTAL SHAREHOLDERS’ EQUITY AND LIABILITIES
659,638 569,890
F I N A N C I A L S TAT E M E N T S

68
Parent Company statement of changes in equity
Amounts in EUR thousand Restricted shareholders’
equity
Unrestricted shareholders’ equity
Share capital Share premium reserve
Hybrid bond Profit brought forward, incl. profit for the
year
Total
Opening equity, 1 Jan 2020
311 300,794 - -39,174 261,931
Profit for the year - - - 7,084 7,084
Other comprehensive income for the year - - - - -
Comprehensive income for the year - - - 7,084 7,084
New share issue 89 123,125 - - 123,214
Warrants - 54 - - 54
Issue expenses - -2,160 - - -2,160
Tax effect of issue costs - 462 - - 462
Dividend - - - -35,414 -35,414
Closing equity, 31 Dec 2020
400 422,275 - -67,504 355,171
Opening equity, 1 Jan 2021
400 422,275 - -67,504 355,171
Profit for the year - - - -2,305 -2,305
Other comprehensive income for the year - - - - -
Comprehensive income for the year - - - -2,305 -2,305
New share issue 20 48,048 - - 48,068
Non-cash issue 20 37,559 - - 37,579
Hybrid issue - - 30,000 - 30,000
Warrants - - - - -
Issue expenses - -670 -430 - -1,100
Tax effect of issue expenses - 131 89 - 220
Dividend - - -652 -38,880 -39,532
Closing equity, 31 Dec 2021
440 507,343 29,007 -108,689 428,101
F I N A N C I A L S TAT E M E N T S

69
Parent Company cash-flow statement
Amounts in thousand euro (EUR thousand) Note Full-year 2021 Full-year 2020
Operating activities
Earnings before tax -3,091 6,452
Adjustments for non-cash items:
– Amortisation/depreciation 9 9
– Arrangement fees 780 790
– Unrealised exchange rate differences -179 -3,841
Tax paid - -
Cash flow from operating activities -2,481 3,410
before change in working capital
Cash flow from changes in working capital
Change in current receivables 35,289 -42,829
Change in current liabilities 264 6,518
Cash flow from operating activities 33,072 -32,901
Investing activities
Shareholder contributions paid - -55,569
Acquisitions of fixed assets -197 -14
Loans to subsidiaries -63,286 -43,000
Cash flow from investing activities -63,483 -98,583
Financing activities
New share issue 48,088 123,214
Hybrid issue 30,000 -
Warrants - 54
Issue expenses -1,107 -2,160
Dividends to shareholders -37,520 -35,414
Dividend, hybrid bond -652 -
Proceeds from borrowings - 194,778
Repayment of debt - -135,000
Loan arrangement fees - -1,099
Cash flow from financing activities 38,809 144,373
Cash flow for the year 8,398 12,889
Cash and cash equivalents at the start of the year 22,598 9,709Cash and cash equivalents at the end of the year 30,996 22,598
F I N A N C I A L S TAT E M E N T S

70
Note 1 General information
Cibus Nordic Real Estate AB (publ) with company registration number 559135-0599 is a limited company registered in Sweden and domiciled in Stockholm. The Company’s address is Kungsgatan 56, SE-111 22 Stockholm, Sweden. The operations of the Company and the subsidiaries (“the Group”) encompass owning and managing properties.
Note 2 Significant accounting policies
The consolidated financial statements for Cibus have been prepared in accordance with the EU-approved International Financial Reporting Standards (IFRS) together with the interpretations issued by the IFRS Interpretations Committee (IFRIC).
Moreover, the Swedish Annual Accounts Act and the Swedish Financial Reporting Board’s recommendation RFR 1, Supplementary Accounting Rules for Corporate Groups, have been applied. Assets and liabilities are recognised at cost, other than investment properties and interest-rate derivatives, which are measured at fair value. Subsidiaries are companies in which the Parent Company exercises a direct or indirect controlling influence over the operational or financial position. Cibus owns 100% of the capital and votes in 376 of its 426 subsidiaries and is a partner in 50 subsidiaries. The part-owned subsidiaries are Mutual Real Estate Companies (”MRECs”). An MREC is the most common company format for property ownership in Finland. In an MREC, each class of shares entitles the holder to exclusive possession of specific premises and no rights of possession to the other premises. This is set out in the articles of association of the various MRECs. Since the shareholder is letting the shareholder’s own premises, the rent accrues exclusively to the shareholder and not the MREC. The MREC is responsible for defraying the property’s operating costs and charges the shareholders a monthly fee to cover these costs with the aim of producing a zero net result. Standard practice at Cibus is to re-invoice the tenant for these costs. If the MREC has a debt, this debt is normally allocated to the respective owners in such a manner that allows each owner to pay its share of the debt. Accordingly, owners are not responsible for other owners’ share of the debt. The partners recognise their assets, liabilities, income and expenses as well as their shares of joint assets, liabilities, income and expenses.
The consolidated financial statements apply the acquisition method, which entails that acquisitions of subsidiaries and MRECs are regarded as a transaction whereby the Parent Company indirectly acquires the subsidiary’s assets and assumes its liabilities. From the acquisition date, the acquired company’s income and expenses, and identifiable assets and liabilities are included in the consolidated accounts. Intra-Group transactions, receivables and liabilities arising from intra-Group transactions are eliminated in their entirety.
Acquisitions within the Group are recognised in accordance with the acquisition method. The consideration paid comprises the fair value of the assets transferred, the liabilities incurred and issued equity. Acquisition-related costs are expensed as they are incurred. Identifiable assets acquired and liabilities assumed are measured initially at their fair values at the acquisition date.
The significant accounting policies that have been applied follow below.
NEW OR REVISED IFRS STANDARDS AND NEW INTERPRETATIONS 2021
The new and amended standards and interpretations that have been issued by the International Accounting Standards Board (IASB) and the IFRS Interpretations Committee (IFRIC) but that come into effect for financial years starting after 1 January 2022 are not currently deemed to have any effect on Cibus’ earnings or financial position.
VALUATION CRITERIA
Assets and liabilities are recognised at their historical cost, other than certain financial assets, liabilities and investment properties that are measured at fair value in the consolidated balance sheet.
Financial assets and liabilities measured at fair value consist of derivative instruments, valued at fair value via the consolidated income statement.
Investment properties are measured at fair value in accordance with IAS 40. The Group’s accounting principles have been applied consistently to the reporting and consolidation of parent companies and subsidiaries.
CLASSIFICATION
Fixed assets consist of amounts expected to be recovered or paid after more than 12 months from the balance sheet date.
Non-current liabilities consist of amounts that fall due for payment only after more than 12 months after the balance sheet date and other amounts for which the Company has an unconditional right to defer payment to a time that is more than 12 months after the balance sheet date. Other assets and liabilities are reported as current assets and current liabilities, respectively.
CONSOLIDATED ACCOUNTS
The consolidated accounts encompass the Parent Company Cibus Nordic Real Estate AB (publ) and the companies over which the Parent Company and its subsidiaries exercise a controlling influence. Controlling influence is obtained when the Parent Company:
— exercises an influence over the investee; — is exposed to, or is entitled to, variable returns from its
investment; and — can also affect the returns from the investee by means of its
influence.
Consolidation of a subsidiary is performed from the date on which the Parent Company gains a controlling influence and ceases on the date on which it no longer exercises a controlling influence over the subsidiary. This means that the income and expenses of subsidiaries acquired or disposed of during the current financial year are included in the Group’s income statement and other comprehensive income from the date on which the Parent Company gains controlling influence until the date on which the Parent Company ceases to exercise such control.
If necessary, adjustments are made to subsidiaries’ financial statements to align their accounting policies with those of the Group. All intra-Group assets and liabilities, equity, income and cash flows relating to transactions between Group companies are eliminated in full.
FUNCTIONAL CURRENCY AND REPORTING CURRENCY
The Parent Company’s functional currency is the euro, which is also the reporting currency for the Parent Company and for the Group. This means that the financial statements are presented in euros. All amounts are, unless otherwise stated, rounded to the nearest thousand. Profit/loss items in other currencies are restated at average exchange rates for the year. Balance sheet items in other currencies are restated at the exchange rate on the balance sheet date.
Accounting policies and notes

71
TRANSACTIONS IN FOREIGN CURRENCY
Transactions in foreign currency are restated in the functional currency at the exchange rate in effect on the transaction date. Functional currency is the currency in which the primary financial environments where the companies conduct their operations. Monetary assets and liabilities in foreign currency are restated in the functional currency at the exchange rate in effect on the balance-sheet date. Exchange rate differences arising in the translations are recognised in profit or loss. Non-monetary assets and liabilities recognised at historical cost are restated at the exchange rate on the transaction date. Non-monetary assets and liabilities measured at fair value are restated in the functional currency at the exchange rate in effect on the date of measurement at fair value.
FINANCIAL STATEMENTS OF FOREIGN OPERATIONS
Assets and liabilities in foreign operations, including consolidated surplus and deficit values, are translated from the functional operations of the foreign operations to the Group’s reporting currency, the euro, at the exchange rate prevailing on the balance sheet date. Income and expenses in a foreign operation are translated into the euro at an average exchange rate that is an approximation of the exchange rates that existed at the time of each transaction. Translation differences arising in connection with currency translations are recognised in Other comprehensive income, and are accumulated in a separate component in equity, designated as translation reserves. When the controlling influence over a foreign operation ceases, the accumulated translation differences attributable to the operation are realised, whereby they are reclassified from the translation reserve in equity to the profit for the year.
ASSET ACQUISITIONS
When acquisitions of subsidiaries involve acquisitions of net assets that do not constitute operations, the acquisition cost is allocated to the individual identifiable assets and liabilities based on their fair value at the time of acquisition. The cost is proportioned to acquired assets and assumed liabilities based on these fair values. Transaction expenses are added to the cost of the acquired net assets in connection with asset acquisitions. Deferred tax on temporary differences is not initially reported, see also the section on Taxes. Cibus reports deductions received for deferred tax as an unrealised change in the value of the property directly at the time of the acquisition. Changes in the value of contingent purchase considerations are added to the cost of the acquired assets.
SEGMENT REPORTING
Cibus reports its operations in the three national segments of Finland, Sweden and Norway. Of the total net operating income for 2021, 84% was attributable to Finland, 15% to Sweden and 1% to Norway. Of the total value of the properties, EUR 1,208,059 thousand was attributable to Finland, EUR 249,028 thousand to Sweden and EUR 42,539 to Norway. See Note 6 in this report for more information.
INCOME
Revenue, which from a recognition perspective is also referred to as income from operating leases, is notified in advance and allocated straight line in profit or loss based on the terms of the lease. Revenue is broken down into rental income and service income. The former encompasses customary rent imposed, including indexes and supplementary billing for any investments and property tax, while service income encompasses other supplementary billing for heating, cooling, waste and water, for example. Service income is recognised in the period in which the service is performed and delivered to the tenant. Rental and service income are paid in advance and prepayments of rent are recognised as deferred rental income. Rental and service income are paid in advance and prepayments of rent are recognised as deferred rental income. In cases where a lease entails a discounted rent during a certain period that is offset by a higher rent at other times, the effect is distributed over the term of the lease. In cases where a lease entails a discounted rent during a certain period that is offset by a higher rent at other times, the effect is distributed over the term of the lease.
THE GROUP AS LESSOR
The Group comprises the lessor for property leases pertaining to properties owned by the Group. The property leases are classed as operating leases. Lease payments on operating leases are expensed in a straight line over the lease term. In cases where a lease entails a discounted rent during a certain period that is offset by a higher rent at other times, the effect is distributed over the term of the lease.
BORROWING COSTS
Financial costs are recognised in the period in which they arise.
EMPLOYEE BENEFITS
The Group had six employees during the period. Employee benefits are recognised at the rate at which employees have provided services in exchange for employee benefits. Read more in the Corporate Governance Report with the Remuneration Guidelines on pages 50–52.
TAX
Total tax comprises current tax and deferred tax. Current tax is tax to be paid or received with regard to the current year. This include adjustments of current tax attributable to previous periods. Deferred tax is calculated using the balance-sheet method based on temporary differences between the carrying amounts and fiscal values of assets and liabilities. The deferred tax liability is recognised at the nominal amount of the difference between a property’s book value and fiscal value, and included in the statement of financial position. No deferred tax is recognised for temporary differences on the initial recognition of an asset as initial recognition has no effect on profit or loss.
AC C O U N T I N G P O L I C I E S A N D N OT E S

72
INVESTMENT PROPERTIES
All properties in the Group are classified as investment properties. They are classified as such because they are held for the purpose of generating rental income or for capital appreciation, or a combination of the two. Investment properties are initially recognised at cost, which includes all expenses directly attributable to the acquisition and is adjusted for deferred tax included in the purchase price. Thereafter, the investment properties are recognised at fair value. Gains and losses attributable to changes in the fair value of investment properties are recognised in profit or loss in the period in which they arise. Fair value is based on external market valuations that are performed quarterly.
The three measurement levels are defined as follows:
Level 1: Quoted (unadjusted) prices in active markets for identical assets or liabilities.
Level 2: Measurement model based on inputs other than quoted market prices included within Level 1 that are observable for the asset or liability, either directly (prices) or indirectly (derived prices).
Level 3: Measurement model when material inputs are based on unobservable inputs.
Investment properties are measured in accordance with level 3.
Additional expenditure is only included in the carrying amount when it is likely that the future economic benefits attributable to the item will accrue to the Group and that its cost can be measured reliably. All other costs for repairs and maintenance together with additional expenses are recognised in profit or loss in the period in which they arise.
Acquisitions of investment properties are recognised in conjunction with the transfer of control to the buyer. This occurs when possession of the properties is taken.
Income from property sales are normally recognised on the date when possession is taken. In the event that control of the asset has been transferred on a date prior to the date when possession is taken, the property sale is recognised in income on the previous date.
CASH-FLOW STATEMENT
The cash-flow statement shows the changes in the Group’s cash and cash equivalents during the financial year. The cash-flow statement has been prepared in accordance with the indirect method. The recognised cash flow includes only those transactions that entail inflows and outflows.
FINANCIAL INSTRUMENTS
A financial asset or financial liability is recognised in the statement of financial position when the Company becomes a party in accordance with the instrument’s contractual terms and conditions. A financial asset is de-recognised from the balance sheet when the contractual right to cash flows from the asset has expired or been settled, or when the Group loses control over the asset. A financial liability or part of a financial liability is de-recognised from the balance sheet when the contractual obligation is discharged or otherwise extinguished.
CLASSIFICATION AND MEASUREMENT
Financial assets are classified based on the business model used for the administration of the assets and the characteristics of the contractual cash flows. This refers to the way in which the contractual terms of the financial asset at set points in time give rise to cash flows comprising only payments of the principal and interest on the outstanding principal. If the financial asset is held within the framework of a business model whose aim is to collect contractual cash flows and the contractual terms of the financial asset at set points in time give rise to cash flows comprising only payments of the principal and interest on the outstanding principal, the asset is measured at amortised cost. (Hold to collect)
If the financial asset is held in a business model whose aim can be achieved both by collecting contractual cash flows and by selling financial assets, and the contractual terms of the financial asset at set points in time give rise to cash flows comprising only payments of the principal and interest on the outstanding principal, the asset is measured at fair value through other comprehensive income. (Hold to collect and sell)
For all other business models whose aim is speculative, where assets are held for trading or where the nature of the cash flows exclude other business models, assets are measured at fair value through profit or loss. (Other)
AMORTISED COST AND THE EFFECTIVE-INTEREST METHOD
Financial assets/liabilities valued at amortised cost are initially reported at fair value with additions/deductions for transaction expenses. Subsequent reporting is at amortised cost applying the effective interest method, in which transaction expenses are accrued as part of the interest income/expenses over the term of the instrument. The effective interest rate method is mainly relevant for the Group’s borrowing. Current receivables and liabilities of an operating nature are reported at nominal amounts, as discounting would have insignificant effects. Receivables are reduced by a reserve for expected credit losses (see impairment below).
IMPAIRMENT
For accounts receivable, certain simplifications may be applied that entail that the Group directly recognises expected credit losses over the remaining term of the asset.
The Group defines default as it being unlikely that the counterparty till fulfil its undertakings due to indicators of financial difficulties and missed payments. Notwithstanding the above, default is deemed to have taken place when the payment is 90 days past due. The Group writes off a receivable when it is deemed that there is no potential for further cash flows. The Group’s credit risk exposure arises mainly with regard to accounts receivable, other current receivables, and cash and cash equivalents. A simplified approach is used to calculate the credit losses on the Group’s accounts receivable. In calculating expected credit losses, accounts receivable have been analysed independently and assessed based on previous events, current conditions and forecasts of certain financial conditions. Cash and cash equivalents are encompassed by the general approach, under which an exemption for low credit risk is applied.
AC C O U N T I N G P O L I C I E S A N D N OT E S

73
INTEREST RATE DERIVATIVES
The total premium for the interest-rate cap was set when the derivative was procured and is paid each quarter during its tenor. Accordingly, the value of the interest-rate cap comprises a negative item, corresponding with the remaining part-payments, and a neutral or positive item arising from the interest-rate cap’s relation to the floating interest rate linked to the cap. The latter part of the value can never be negative. The interest rate derivatives are marked to market and the change in value is recognised in profit or loss. The Group measures all derivatives based on inputs in accordance with level 2 of the fair value hierarchy. In practice, this is carried out through reconciliation with a third party. The changes in value impact recognised profit and equity, but do not affect cash flow or the LTV ratio.
CASH AND CASH EQUIVALENTS
Cash and cash equivalents include cash and bank balances that can be easily converted to cash and that are subject to an insignificant risk of changes in value.
ACCOUNTS PAYABLE
Accounts payable are included in the category of financial liabilities measured at amortised cost. The expected maturity of accounts payable is short, and the liability is therefore recognised at a nominal amount with no discount.
BORROWINGS
External financing is classified as “Borrowings” and is valued at amortised cost using the effective-interest method. Transaction expenses when raising a loan are accrued in accordance with the effective interest method over the term of the loan as part of the interest expense.
PROVISIONS
A provision is recognised when the Group has an existing obligation (legal or informal) as a result of an actual event, and it is likely that an outflow of resources will be required to settle the obligation and the amount can be reliably estimated.
The amount of the provision constitutes the best estimate of the amount required to settle the existing obligation at the balance sheet date, after taking into account the risks and uncertainties associated with the obligation. When a provision is calculated by estimating the expected outflows required to settle the obligation, the carrying amount is to correspond to the present value of those outflows.
Where a third party is expected to compensate for part or all of the amount required to settle a provision, the indemnity is recognised separately as an asset in the statement of financial position when it is essentially certain that it will be received if the Company settles the obligation and the amount can be reliably estimated.
PARENT COMPANY ACCOUNTING POLICIES
The Parent Company applies the Swedish Annual Accounts Act and the Swedish Financial Reporting Board’s recommendation RFR 2, Accounting for Legal Entities. Application of RFR 2 entails that the Parent Company must apply all EU-adopted IFRS and statements as far as possible within the framework of the Swedish Annual Accounts Act and with regard to the relation between accounting and taxation. The differences between the accounting policies of the Parent Company and the Group are described below.
Financial instruments
The Parent Company does not apply IFRS 9 in legal entities. The Parent Company recognises financial assets and financial liabilities when it becomes a party to the contractual terms of the financial instrument.
On initial recognition, financial instruments are recognised at cost, which refers to the amount corresponding to the cost of the asset’s acquisition with the addition of transaction costs directly attributable to the acquisition.
The Parent Company recognises a loss allowance for expected credit losses on financial assets that are recognised as non-current assets and measured at amortised cost. The Parent Company reports change in expected credit losses for the year in profit or loss.
In calculating the net realisable value of financial assets recognised as current assets, the policies for impairment testing and loss risk reserves in IFRS 9 are to be applied.
A financial asset or financial liability is de-recognised from the balance sheet when the contractual right to cash flows from the asset has expired or been settled, or when the contractual obligation has been discharged or terminated.
CLASSIFICATION AND STRUCTURE
The Parent Company’s income statement and balance sheet follow the structure of the Swedish Annual Accounts Act. The principal difference in comparison with IAS 1 Presentation of Financial Statements applied in the layout of the Group’s financial statements is the presentation of financial income and expenses, non-current assets, equity and the occurrence of provisions under separate headings.
SUBSIDIARIES
Shares in subsidiaries are recognised at cost in the Parent Company’s financial statements.
GROUP CONTRIBUTIONS
A Group contribution from a subsidiary to the Parent Company is recognised as an appropriation under the alternative rule. Group contributions from the Parent Company to a subsidiary, or between Group companies, are recognised as an appropriation under the alternative rule.
DIVIDENDS
Dividends are reported as a liability after the Annual General Meeting has approved the dividend.
AC C O U N T I N G P O L I C I E S A N D N OT E S

74
Note 3 Important estimates and assessments
KEY SOURCES OF UNCERTAINTY IN ESTIMATES
Preparation of the accounts in accordance with IFRS and generally accepted accounting principles requires that management and the Board make assessments and assumptions that could significantly impact the Group’s earnings and financial position. These are based on experience and the assumptions that are considered reasonable in view of the prevailing circumstances. Actual outcomes may differ from these assessments and assumptions if the conditions change.
The most important future assumptions are detailed below as are other key sources of uncertainty in estimates at the balance sheet date, which entail a significant risk of causing material adjustments to the carrying amounts of assets and liabilities within the next financial year.
VALUATION OF PROPERTIES
By their nature, property and property-related assets are difficult to value due to the special nature of each property and the fact that it is not necessarily a liquid market. As a result, valuations can be subject to considerable uncertainty. There are no guarantees that the estimates arising from the valuation process will reflect the actual selling price. A future recession in the property market can significantly affect the value of property. The valuations are based on estimated future cash inflows and outflows, and on a discounting of these with respect to the risk-free interest rate and a mark-up. Accordingly, all of these factors comprise future assessments and are uncertain. Refer to Note 12 for more information.
ACQUISITION OF COMPANIES
On the acquisition of a company, the acquisition is assessed on the basis of whether it comprises an asset acquisition or a business combination. Companies that solely contain properties without any property management/administrative functions are normally classified as asset acquisitions.
LOSS CARRYFORWARDS
When valuing loss carryforwards, an assessment is made of the likelihood that the carryforwards can be utilised. Established loss carryforwards that can be offset with a high degree of certainty against future profits are used for calculating the deferred tax receivable. The loss carryforwards are estimated to amount to about EUR 23,855 thousand (18,221) as of 31 December 2021.
Note 4 Rental income
Group Full-year 2021
Full-year 2020
Rental income excl. additional charges
81,058 65,033
Operation 11,363 7,030
Property tax 670 1,130
Electricity 590 378
Other 73 808
Total 93,754 74,379
Maturity structure, rental value
31 Dec 2021 31 Dec 2020
Year 1 91,006 77,716
Year 2 81,787 72,231
Year 3 73,500 64,243
Year 4 65,912 57,811
Year 5 45,121 50,931
After year 5 36,471 33,545
The above table shows the minimum lease inflows, meaning rent (excluding additional rental charges) for the respective periods during the term of the lease.
Note 5 Operating costs
Group Full-year 2021 Full-year 2020
Property upkeep and service agreements
-1,848 -1,284
Technical administration -1,700 -1,148
Tariff-related costs -5,396 -3,622
Insurance premiums -587 -400
Ongoing maintenance -4,260 -3,569
Total -13,791 -10,023
Note 6 Segment information
Full-year 2021 Finland Sweden Norway Group
Rental income 68,845 11,847 366 81,058
Service income 11,930 735 31 12,696
Operating expenses
-13,672 -104 -15 -13,791
Property tax -2,912 -719 -6 -3,637
Net operating income
64,191 11,759 376 76,326
Carrying amount, invest-ment proper-ties
1,208,059 249,028 42,539 1,499,626
Full-year 2020 Finland Sweden Norway Group
Rental income 56,210 8,823 - 65,033
Service income 8,832 514 - 9,346
Operating expenses
-10,017 -6 - -10,023
Property tax -2,397 -564 - -2,961
Net operating income
52,628 8,767 - 61,395
Carrying amount, invest-ment proper-ties
1,070,370 202,144 - 1,272,514
AC C O U N T I N G P O L I C I E S A N D N OT E S
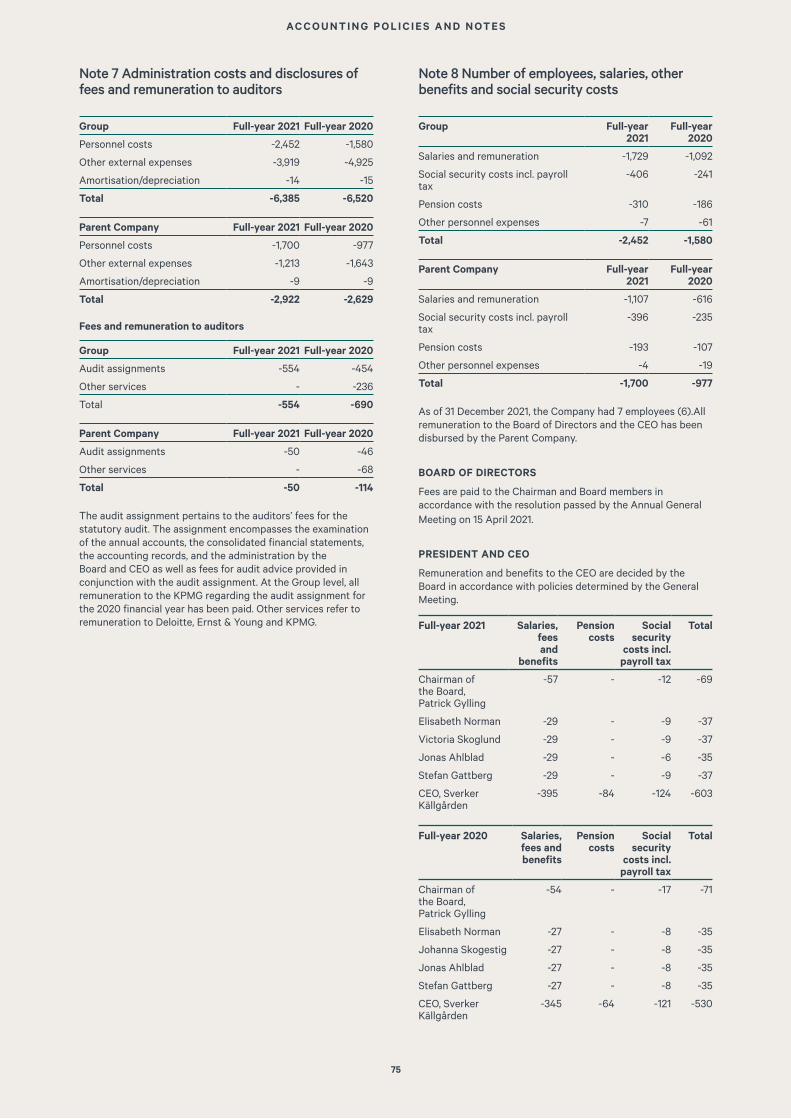
75
Note 7 Administration costs and disclosures of fees and remuneration to auditors
Group Full-year 2021 Full-year 2020
Personnel costs -2,452 -1,580
Other external expenses -3,919 -4,925
Amortisation/depreciation -14 -15
Total -6,385 -6,520
Parent Company Full-year 2021 Full-year 2020
Personnel costs -1,700 -977
Other external expenses -1,213 -1,643
Amortisation/depreciation -9 -9
Total -2,922 -2,629
Fees and remuneration to auditors
Group Full-year 2021 Full-year 2020
Audit assignments -554 -454
Other services - -236
Total -554 -690
Parent Company Full-year 2021 Full-year 2020
Audit assignments -50 -46
Other services - -68
Total -50 -114
The audit assignment pertains to the auditors’ fees for the statutory audit. The assignment encompasses the examination of the annual accounts, the consolidated financial statements, the accounting records, and the administration by the Board and CEO as well as fees for audit advice provided in conjunction with the audit assignment. At the Group level, all remuneration to the KPMG regarding the audit assignment for the 2020 financial year has been paid. Other services refer to remuneration to Deloitte, Ernst & Young and KPMG.
Note 8 Number of employees, salaries, other benefits and social security costs
Group Full-year 2021
Full-year 2020
Salaries and remuneration -1,729 -1,092
Social security costs incl. payroll tax
-406 -241
Pension costs -310 -186
Other personnel expenses -7 -61
Total -2,452 -1,580
Parent Company Full-year 2021
Full-year 2020
Salaries and remuneration -1,107 -616
Social security costs incl. payroll tax
-396 -235
Pension costs -193 -107
Other personnel expenses -4 -19
Total -1,700 -977
As of 31 December 2021, the Company had 7 employees (6).All remuneration to the Board of Directors and the CEO has been disbursed by the Parent Company.
BOARD OF DIRECTORS
Fees are paid to the Chairman and Board members in accordance with the resolution passed by the Annual General Meeting on 15 April 2021.
PRESIDENT AND CEO
Remuneration and benefits to the CEO are decided by the Board in accordance with policies determined by the General Meeting.
Full-year 2021 Salaries, fees and
benefits
Pension costs
Social security
costs incl. payroll tax
Total
Chairman of the Board, Patrick Gylling
-57 - -12 -69
Elisabeth Norman -29 - -9 -37
Victoria Skoglund -29 - -9 -37
Jonas Ahlblad -29 - -6 -35
Stefan Gattberg -29 - -9 -37
CEO, Sverker Källgården
-395 -84 -124 -603
Full-year 2020 Salaries, fees and benefits
Pension costs
Social security
costs incl. payroll tax
Total
Chairman of the Board, Patrick Gylling
-54 - -17 -71
Elisabeth Norman -27 - -8 -35
Johanna Skogestig -27 - -8 -35
Jonas Ahlblad -27 - -8 -35
Stefan Gattberg -27 - -8 -35
CEO, Sverker Källgården
-345 -64 -121 -530
AC C O U N T I N G P O L I C I E S A N D N OT E S

76
REMUNERATION REPORT 2021
Introduction
This remuneration report describes how Cibus Nordic Real Estate AB’s (publ) (“Cibus” or “the Company”) guidelines for remuneration to senior executives, adopted by the 2020 Annual General Meeting, have been applied during 2021. The report also contains specific information regarding remuneration to the Company’s President and CEO, Chief Financial Officer and other members of Group Management, as well as a summary of outstanding warrant programmes. The report has been prepared in accordance with the Swedish Companies Act and the Swedish Corporate Governance Board’s rules on remuneration to senior executives.
Guidelines for compensation
The Company’s business strategy is to acquire, develop and manage high-quality properties in the Nordic region with grocery and daily-goods chains as anchor tenants. The Company currently owns just over 400 properties in Finland, Sweden and Norway. For more information about the Company’s business strategy, please refer to Cibus’ latest annual report.
A successful implementation of the Company’s business strategy and the safeguarding of the Company’s long-term interests, including its sustainability, presupposes that the Company can recruit and retain qualified employees. This requires that the Company be able to offer competitive remuneration. These guidelines make it possible to offer senior executives competitive overall remuneration.
In accordance with the remuneration guidelines, remuneration to senior executives must be market-based and competitive, and may consist of the following components: fixed cash salary, variable cash compensation, pension benefits and other benefits. Variable cash compensation shall be linked to predetermined and measurable financial or non-financial criteria. It may also comprise individualised quantitative or qualitative targets. The criteria shall be designed so that they promote the Company’s business strategy and long-term interests, including its sustainability, by, for example, being clearly connected with the business strategy or by fostering the executive’s long-term development.
In 2021, the Company followed the applicable guidelines for remuneration to senior executives adopted by the 2020 Annual General Meeting. No deviations from the guidelines have been made and no deviations have been made from the decision-making process that according to the guidelines must be applied to determine the compensation. The auditor’s opinion on the Company’s compliance with the guidelines is available at www.cibusnordic.com. The Board has not reduced or reclaimed remuneration paid during the year.
In addition to the remuneration covered by the remuneration guidelines, the Company has offered senior executives the opportunity to subscribe for warrants. The Company intends to continue with this offer in the future as well. The programmes are decided by the Annual General Meeting and are therefore not covered by the guidelines for senior executives in Cibus.
Application of criteria for variable cash compensation in 2021
The variable cash compensation must be linked to predetermined and measurable criteria. When the measurement period for fulfilling the criteria for payment of variable cash compensation has ended, it must be assessed and determined to what extent the criteria have been met. The fulfilment of criteria for payment of variable cash compensation shall be measurable over a period of one or more years. The variable cash compensation may amount to a maximum of 50% of the total fixed cash salary during the measurement period. The Board is responsible for such an assessment with regard to variable cash remuneration to the CEO, and the CEO is responsible for the assessment in relation to other senior executives. The fulfilment of financial criteria shall be determined based on the financial information most recently published by the Company.
The targets for 2021 were as follows:
Be included in the EPRA index. The target was met on 20 September 2021.
Conduct transactions for SEK 400 million in Sweden. Was achieved on 29 December 2021.
In terms of size, become a market leader in ownership of grocery properties in the Nordic region. This target was not achieved in 2021.
Meeting each target gave a bonus equivalent to two months’ salary.
TOTAL REMUNERATION TO THE COMPANY’S SENIOR EXECUTIVES
Full year 2021 Senior executive
Fixed remunera-tion, EUR
Variable remuneration,
EUR
Pension, EUR
Other benefits,
EUR
Non-recurring items,
EUR
Total remuneration,
EUR
Proportion fixed and variable
remunera-tion,% 1
Sverker Källgården, CEO 280,097 103,515 84,029 11,137 – 478,778 76% / 24%
Pia-Lena Olofsson, CFO & Head of IR 225,470 85,400 60,877 8,954 – 380,701 75% / 25%
Lauri Tiensuu, CIO Finland 207,648 90,000 52,535 – - 350,183 74% / 26%
Peter Lövgren, CIO Sweden 138,134 29,576 30,389 258 – 198,357 85% / 15%
1 Pensions that in their entirety refer to fixed remuneration and are defined-contribution, have been reported as fixed remuneration.
AC C O U N T I N G P O L I C I E S A N D N OT E S

77
COMPARATIVE INFORMATION ON CHANGES IN REMUNERATION AND THE COMPANY’S RESULTS
2016/2017, +/- %
2017/2018, +/- %
2018/2019, +/- %
2019/2020, +/- %
2020/2021, +/- %
2021, EUR
Sverker Källgården1, CEO - - - +23.0% +17.1% 478,778
Pia-Lena Olofsson2, CFO & Head of IR - - - +132.9% +4.3% 380,701
Lauri Tiensuu, CIO Finland - - - - +15.0% 350,183
Peter Lövgren3, CIO Sweden - - - - +264.3% 198,357
Consolidated earnings before tax - - +115.6% +11.9% +49.9% 59,365,474
Average remuneration for other employees4 (full-time equivalents)
- - - +29.1% +133.4% 1,044,276
WARRANTS PROGRAMME 2019
Participants Sverker Källgården, CEO
Maximum number of warrants 186,600
Number of warrants subscribed 186,600
Number of warrants exercised -
Number of expired warrants -
Subscription price, SEK 120.7
Maximum dilution of shares/votes (approx. %)
0.4
Redemption periods 15 Apr 2022 – 15 Apr 2022 15 Aug 2022 – 15 Sep 2022 15 Oct 2022 – 15 Dec 2022 15 Jan 2023 – 15 Mar 2023 15 Apr 2023 – 15 Jun 2023
WARRANTS PROGRAMME 2020
Participants Pia-Lena Olofsson, CFO & Head of IR Lauri Tiensuu, CIO Finland Peter Lövgren, CIO Sweden
Maximum number of warrants 80,000 40,000 40,000
Number of warrants subscribed 80,000 40,000 40,000
Number of warrants exercised – – –
Number of warrants expired – – –
Subscription price, SEK 130.7 130.7 130.7
Maximum dilution of shares/votes (approx. %)
0.2 0.1 0.1
Redemption periods
17 Apr 2023 – 16 Jun 2023 14 Aug 2023 – 15 Sep 2023 16 Oct 2023 – 15 Dec 2023 15 Jan 2024 – 15 Mar 2024 15 Apr 2024 – 14 Jun 2024
17 Apr 2023 – 16 Jun 2023 14 Aug 2023 – 15 Sep 2023 16 Oct 2023 – 15 Dec 2023 15 Jan 2024 – 15 Mar 2024 15 Apr 2024 – 14 Jun 2024
17 Apr 2023 – 16 Jun 2023 14 Aug 2023 – 15 Sep 2023 16 Oct 2023 – 15 Dec 2023 15 Jan 2024 – 15 Mar 2024 15 Apr 2024 – 14 Jun 2024
WARRANTS PROGRAMME 2021
Participants Pia-Lena Olofsson, CFO & Head of IR Lauri Tiensuu, CIO Finland Peter Lövgren, CIO Sweden
Maximum number of warrants 40,000 40,000 40,000
Number of warrants subscribed 40,000 40,000 40,000
Number of warrants exercised - - -
Number of warrants expired - - -
Subscription price, SEK 203.5 203.5 203.5
Maximum dilution of shares/votes (approx. %)
0.1 0.1 0.1
Redemption period
15 Apr 2024 – 10 Jun 2024 12 Aug 2024 – 16 Sep 2024
14 Oct 2024 – 9 Dec 2024 13 Jan 2025 – 10 Mar 2025
14 Apr 2025 – 9 Jun 2025
15 Apr 2024 – 10 Jun 2024 12 Aug 2024 – 16 Sep 2024
14 Oct 2024 – 9 Dec 2024 13 Jan 2025 – 10 Mar 2025
14 Apr 2025 – 9 Jun 2025
15 Apr 2024 – 10 Jun 2024 12 Aug 2024 – 16 Sep 2024
14 Oct 2024 – 9 Dec 2024 13 Jan 2025 – 10 Mar 2025
14 Apr 2025 – 9 Jun 2025
1 CEO since 4 March 2019, meaning that remuneration in 2019 only covers part of the year. Thus, paid remuneration for 2019 does not cover the same length of employment as remuneration for 2020. 2 CFO & Head of IR since 6 May 2019, meaning compensation in 2019 only covers part of the year. Thus, paid remuneration for 2019 does not cover the same length of employment as remuneration for 2020.3 CIO Sweden since 10 August 2020, meaning that remuneration for 2020 only encompasses part of the year. Thus, the paid remuneration for 2020 does not cover the same length of employment as the remuneration for 2021. 4 Applies to employees in the Group excluding other members of Group Management.
OUTSTANDING WARRANT PROGRAMME
The Company has offered Group Management the opportunity to participate in warrants programmes, excluding the Company’s CEO, who has previously participated in a warrants programme established in connection with the CEO taking up his position at Cibus in early 2019. The purpose of the warrants programmes is to strengthen the connection between the work of Company Management and value generated for shareholders. The intention is for the warrants programmes will be recurring annually and approved by future Annual General Meetings on the basis of a proposal from the Company’s Board of Directors. Group Management paid fair value for the options and no personnel costs were reported for the programme.
AC C O U N T I N G P O L I C I E S A N D N OT E S
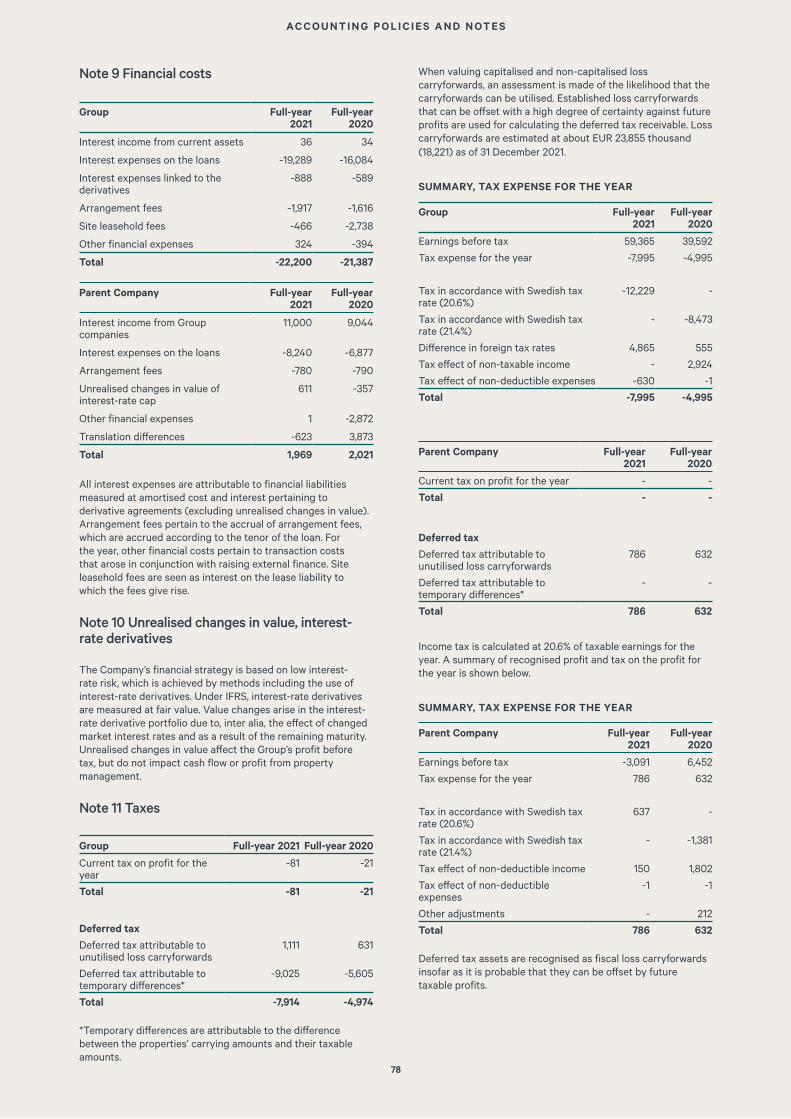
78
Note 9 Financial costs
Group Full-year 2021
Full-year 2020
Interest income from current assets 36 34
Interest expenses on the loans -19,289 -16,084
Interest expenses linked to the derivatives
-888 -589
Arrangement fees -1,917 -1,616
Site leasehold fees -466 -2,738
Other financial expenses 324 -394
Total -22,200 -21,387
Parent Company Full-year 2021
Full-year 2020
Interest income from Group companies
11,000 9,044
Interest expenses on the loans -8,240 -6,877
Arrangement fees -780 -790
Unrealised changes in value of interest-rate cap
611 -357
Other financial expenses 1 -2,872
Translation differences -623 3,873
Total 1,969 2,021
All interest expenses are attributable to financial liabilities measured at amortised cost and interest pertaining to derivative agreements (excluding unrealised changes in value). Arrangement fees pertain to the accrual of arrangement fees, which are accrued according to the tenor of the loan. For the year, other financial costs pertain to transaction costs that arose in conjunction with raising external finance. Site leasehold fees are seen as interest on the lease liability to which the fees give rise.
Note 10 Unrealised changes in value, interest-rate derivatives
The Company’s financial strategy is based on low interest-rate risk, which is achieved by methods including the use of interest-rate derivatives. Under IFRS, interest-rate derivatives are measured at fair value. Value changes arise in the interest-rate derivative portfolio due to, inter alia, the effect of changed market interest rates and as a result of the remaining maturity. Unrealised changes in value affect the Group’s profit before tax, but do not impact cash flow or profit from property management.
Note 11 Taxes
Group Full-year 2021 Full-year 2020
Current tax on profit for the year
-81 -21
Total -81 -21
Deferred taxDeferred tax attributable to unutilised loss carryforwards
1,111 631
Deferred tax attributable to temporary differences*
-9,025 -5,605
Total -7,914 -4,974
*Temporary differences are attributable to the difference between the properties’ carrying amounts and their taxable amounts.
When valuing capitalised and non-capitalised loss carryforwards, an assessment is made of the likelihood that the carryforwards can be utilised. Established loss carryforwards that can be offset with a high degree of certainty against future profits are used for calculating the deferred tax receivable. Loss carryforwards are estimated at about EUR 23,855 thousand (18,221) as of 31 December 2021.
SUMMARY, TAX EXPENSE FOR THE YEAR
Group Full-year 2021
Full-year 2020
Earnings before tax 59,365 39,592
Tax expense for the year -7,995 -4,995
Tax in accordance with Swedish tax rate (20.6%)
-12,229 -
Tax in accordance with Swedish tax rate (21.4%)
- -8,473
Difference in foreign tax rates 4,865 555
Tax effect of non-taxable income - 2,924
Tax effect of non-deductible expenses -630 -1
Total -7,995 -4,995
Parent Company Full-year 2021
Full-year 2020
Current tax on profit for the year - -
Total - -
Deferred taxDeferred tax attributable to unutilised loss carryforwards
786 632
Deferred tax attributable to temporary differences*
- -
Total 786 632
Income tax is calculated at 20.6% of taxable earnings for the year. A summary of recognised profit and tax on the profit for the year is shown below.
SUMMARY, TAX EXPENSE FOR THE YEAR
Parent Company Full-year 2021
Full-year 2020
Earnings before tax -3,091 6,452
Tax expense for the year 786 632
Tax in accordance with Swedish tax rate (20.6%)
637 -
Tax in accordance with Swedish tax rate (21.4%)
- -1,381
Tax effect of non-deductible income 150 1,802
Tax effect of non-deductible expenses
-1 -1
Other adjustments - 212
Total 786 632
Deferred tax assets are recognised as fiscal loss carryforwards insofar as it is probable that they can be offset by future taxable profits.
AC C O U N T I N G P O L I C I E S A N D N OT E S

79
Note 12 Investment properties
The Group owns 400 properties, which are measured at fair value. The Group recognises the investment properties at fair value. Fair value is based on market valuations. The properties are valued on the balance sheet date by an external, independent appraiser. The valuation on the balance sheet date, 31 December 2021, is based on the market valuation performed by the independent valuation institutes Newsec and Cushman & Wakefield.
Group 31 Dec 2021 31 Dec 2020
Opening balance 1,272,514 874,813
Property acquisitions 177,150 386,122
Acquisitions of properties through non-cash issue
40,742 -
Unrealised changes in value 10,644 6,461
Investments in current buildings 2,247 4,262
Property sales - -270
Exchange rate effect -3,802 403
Other 131 723
Closing balance 1,499,626 1,272,514
VALUATION ASSUMPTIONS
Fair value has been determined through the combined application of the local price method and return-based method. The return-based method is based on a cash flow analysis being prepared for each property. The cash flow analysis consists of an assessment of the present value of the property’s future net operating income over the calculation period and the present value of the property’s residual value at the end of the calculation period. The calculation period amounts to ten years and the residual value has been assessed through a perpetual capitalisation of an estimated market operating net the year after the end of the calculation period. The perpetual capitalisation takes place with a yield requirement that has been derived from the current transaction market for comparable properties, both direct and indirect (properties sold in companies) transactions have been taken into account. Expenses are expected to increase in line with inflation of 1–2% depending on the year. Investments have been assessed based on actual requirements.
Property tax is estimated based on the most recent tax assessment value. Long-term vacancies are estimated on the basis of the property’s location and condition. The cost of capital and yield requirement are based on the external valuers’ experience-based assessments of market return requirements.
Group 31 Dec 2021 31 Dec 2020Long-term inflation, % 2.0 2.0
Average cost of capital, % 7.7 7.7
Average 5.7 5.8
yield requirement, %
Average long-term vacancy, % 5.3 5.0
Sensitivity analysis Assumption Average (TEUR)Valuation parameters
Rental income +/- 10 % 176,279 / -146,404
Yield requirement +/- 0.25 % -49,077 / 84,862
Long-term vacancy rate +/- 2% -19,137 / 49,011
Note 13 Leasing
The Group holds several site leaseholds. These are recognised as right-of-use assets and lease liabilities as of 1 January 2019 when IFRS 16 came into effect. All site leaseholds are considered perpetual and no amortisations are made.
RIGHT-OF-USE ASSETS
Group 31 Dec 2021 31 Dec 2020
Site leaseholds 10,115 8,228
Site leasehold fees -466 -10
Closing balance 9,649 8,218
In addition to the financial liabilities whose un-discounted cash flows are presented in the table above, the Group holds leasehold agreements whose annual leasehold fees total EUR 9,649 thousand discounted. These leases are seen as perpetual from the Group’s perspective as the Group has no right to terminate the agreements. All leasehold agreements will be renegotiated, which will have an effect on the scale of the leasehold fees.
Note 14 prepaid expenses and accrued income
Group 31 Dec 2021 31 Dec 2020Prepaid expenses 3,493 1,576Closing balance 3,493 1,576
Parent Company 31 Dec 2021 31 Dec 2020Prepaid expenses 63 27Closing balance 63 27
Note 15 Cash and cash equivalents
Cash and cash equivalents consist of bank balances.
AC C O U N T I N G P O L I C I E S A N D N OT E S

80
Note 16 Equity
SHARE CAPITAL
All shares are of the same share class, are paid in full and entitle the holder to one vote. No shares have been reserved for assignment under option or other agreements. The closing balance of shares was 44,000,000 with a par value of EUR 0.01 per share.
EARNINGS PER SHARE
The earnings per share has been calculated by dividing the profit for the year attributable to Parent Company shareholders by the average number of shares outstanding for the period.
Group 31 Dec 2021 31 Dec 2020Earnings attributable to Parent Company shareholders, TEUR
51,370 34,597
No. of shares outstanding 44,000,000 40,000,000
Average No. of shares 40,284,932 36,459,344
UNRESTRICTED SHAREHOLDERS’ EQUITY
Unrestricted equity, meaning the amount available for distribution to the shareholders, comprises total equity less the share capital. Other contributed capital pertains to previously completed new share issues in conjunction with the acquisition of the properties.
Note 17 Hybrid bond
On 17 June, Cibus issued hybrid bonds for EUR 30 million under its newly-established MTN programme. The hybrid bonds have a perpetual eternal maturity, with the first opportunity for redemption occurring after 5.25 years, and maturing with an interest rate of 3 months EURIBOR + 4.75%. The hybrid bonds have been listed on the Nasdaq Stockholm Corporate Bond list since 24 June 2021.
Note 18 Borrowings
Group 31 Dec 2021 31 Dec 2020Opening balance 812,964 535,212Borrowings raised 105,610 454,923Repayment of debt -2,192 -175,667Arrangement fees -2,492 -1,504Closing balance 913,890 812,964
Parent Company 31 Dec 2021 31 Dec 2020Opening balance 193,073 134,036Borrowings raised - 194,778Repayment of debt - -135,000Arrangement fees -682 -741Closing balance 192,391 193,073
For further information regarding financial risk management and financial instruments, see pages 41–45.
Note 19 Accrued expenses and deferred income
Group 31 Dec 2021 31 Dec 2020Prepaid rent 3,917 3,712Accrued interest 2,769 2,157Accrued dividends 10,560 9,200Other 5,155 3,353Closing balance 22,401 18,422
Parent Company 31 Dec 2021 31 Dec 2020Accrued interest 298 324
Accrued dividends 10,560 9,200Other 131 85Closing balance 10,989 9,609
AC C O U N T I N G P O L I C I E S A N D N OT E S
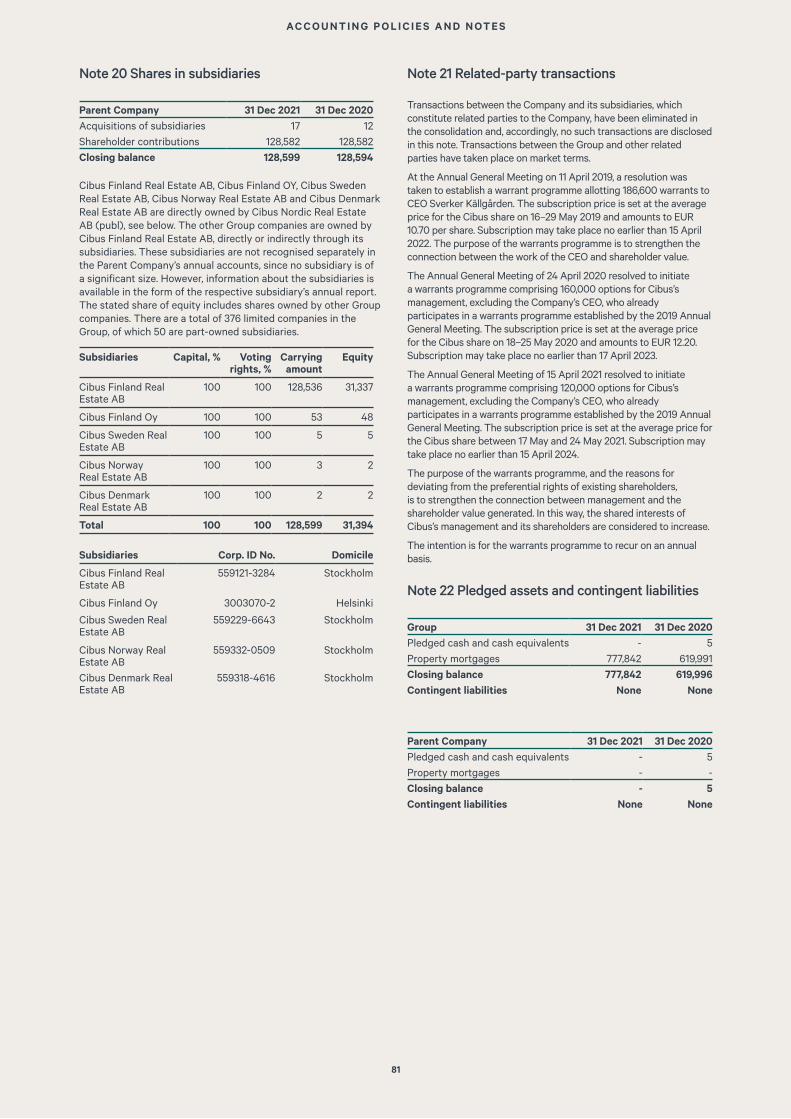
81
Note 20 Shares in subsidiaries
Parent Company 31 Dec 2021 31 Dec 2020Acquisitions of subsidiaries 17 12Shareholder contributions 128,582 128,582Closing balance 128,599 128,594
Cibus Finland Real Estate AB, Cibus Finland OY, Cibus Sweden Real Estate AB, Cibus Norway Real Estate AB and Cibus Denmark Real Estate AB are directly owned by Cibus Nordic Real Estate AB (publ), see below. The other Group companies are owned by Cibus Finland Real Estate AB, directly or indirectly through its subsidiaries. These subsidiaries are not recognised separately in the Parent Company’s annual accounts, since no subsidiary is of a significant size. However, information about the subsidiaries is available in the form of the respective subsidiary’s annual report. The stated share of equity includes shares owned by other Group companies. There are a total of 376 limited companies in the Group, of which 50 are part-owned subsidiaries.
Subsidiaries Capital, % Voting rights, %
Carrying amount
Equity
Cibus Finland Real Estate AB
100 100 128,536 31,337
Cibus Finland Oy 100 100 53 48
Cibus Sweden Real Estate AB
100 100 5 5
Cibus Norway Real Estate AB
100 100 3 2
Cibus Denmark Real Estate AB
100 100 2 2
Total 100 100 128,599 31,394
Subsidiaries Corp. ID No. Domicile
Cibus Finland Real Estate AB
559121-3284 Stockholm
Cibus Finland Oy 3003070-2 Helsinki
Cibus Sweden Real Estate AB
559229-6643 Stockholm
Cibus Norway Real Estate AB
559332-0509 Stockholm
Cibus Denmark Real Estate AB
559318-4616 Stockholm
Note 21 Related-party transactions
Transactions between the Company and its subsidiaries, which constitute related parties to the Company, have been eliminated in the consolidation and, accordingly, no such transactions are disclosed in this note. Transactions between the Group and other related parties have taken place on market terms.
At the Annual General Meeting on 11 April 2019, a resolution was taken to establish a warrant programme allotting 186,600 warrants to CEO Sverker Källgården. The subscription price is set at the average price for the Cibus share on 16–29 May 2019 and amounts to EUR 10.70 per share. Subscription may take place no earlier than 15 April 2022. The purpose of the warrants programme is to strengthen the connection between the work of the CEO and shareholder value.
The Annual General Meeting of 24 April 2020 resolved to initiate a warrants programme comprising 160,000 options for Cibus’s management, excluding the Company’s CEO, who already participates in a warrants programme established by the 2019 Annual General Meeting. The subscription price is set at the average price for the Cibus share on 18–25 May 2020 and amounts to EUR 12.20. Subscription may take place no earlier than 17 April 2023.
The Annual General Meeting of 15 April 2021 resolved to initiate a warrants programme comprising 120,000 options for Cibus’s management, excluding the Company’s CEO, who already participates in a warrants programme established by the 2019 Annual General Meeting. The subscription price is set at the average price for the Cibus share between 17 May and 24 May 2021. Subscription may take place no earlier than 15 April 2024.
The purpose of the warrants programme, and the reasons for deviating from the preferential rights of existing shareholders, is to strengthen the connection between management and the shareholder value generated. In this way, the shared interests of Cibus’s management and its shareholders are considered to increase.
The intention is for the warrants programme to recur on an annual basis.
Note 22 Pledged assets and contingent liabilities
Group 31 Dec 2021 31 Dec 2020Pledged cash and cash equivalents - 5Property mortgages 777,842 619,991Closing balance 777,842 619,996Contingent liabilities None None
Parent Company 31 Dec 2021 31 Dec 2020Pledged cash and cash equivalents - 5Property mortgages - -Closing balance - 5Contingent liabilities None None
AC C O U N T I N G P O L I C I E S A N D N OT E S
82
O P E R AT I O N S
Declaration by the Board
The Board of Directors and the CEO hereby certify that the report provides a fair and accurate overview of the Company’s and the Group’s operations, financial position and results, and describes the material risks and uncertainties faced by the Company and the companies included in the Group.
The Annual Report for Cibus Nordic Real Estate AB (publ) was adopted by the Board on 10 March 2022.
Patrick Gylling
Chairman
Elisabeth Norman
Board member
Victoria Skoglund
Board Member
Jonas Ahlblad
Board member
Stefan Gattberg
Board member
Sverker Källgården
CEO
Stockholm, 10 March 2022 Cibus Nordic Real Estate AB (publ) Corporate registration number 559135-0599
For further information, please contact
Sverker Källgården, CEO
[email protected] +46 761 444 888
Pia-Lena Olofsson, CFO
[email protected] +46 708 580 453
www.cibusnordic.com
Cibus Nordic Real Estate AB (publ) Kungsgatan 56 SE-111 22 Stockholm, Sweden
This Annual Report has been published in Swedish and English. In case of any discrepancy between versions, the Swedish version is to take precedence.
Reporting calendar
5 May 2022 Interim report Q1 21 Jul 2022 Interim report Q2 9 Nov 2022 Interim report Q3 23 Feb 2023 Year-end report
20 Apr 2022 Annual General Meeting
Our Auditors’ Report was submitted on 10 March 2022, KPMG AB
Mattias Johansson

83
Report on the annual accounts and consolidated accounts
OPINIONS
We have audited the annual accounts and consolidated accounts of Cibus Nordic Real Estate AB (publ) for the year 2021, except for the corporate governance statement on pages 35-40 and 42-43 and the sustainability report on pages 23-28 and 41. The annual accounts and consolidated accounts of the company are included on pages 45-69 and 30-34 in this document.
In our opinion, the annual accounts have been prepared in accordance with the Annual Accounts Act, and present fairly, in all material respects, the financial position of the parent company as of 31 December 2021 and its financial performance and cash flow for the year then ended in accordance with the Annual Accounts Act. The consolidated accounts have been prepared in accordance with the Annual Accounts Act and present fairly, in all material respects, the financial position of the group as of 31 December 2021 and their financial performance and cash flow for the year then ended in accordance with International Financial Reporting Standards (IFRS), as adopted by the EU, and the Annual Accounts Act. Our opinions do not cover the corporate governance statement on pages 35-40 and 42-43 and sustainability report on pages 23-28 and 41. The statutory administration report is consistent with the other parts of the annual accounts and consolidated accounts.
We therefore recommend that the general meeting of shareholders adopts the income statement and balance sheet for the parent company and the group.
Our opinions in this report on the the annual accounts and consolidated accounts are consistent with the content of the additional report that has been submitted to the parent company’s audit committee in accordance with the Audit Regulation (537/2014) Article 11.
BASIS FOR OPINIONS
We conducted our audit in accordance with International Standards on Auditing (ISA) and generally accepted auditing standards in Sweden. Our responsibilities under those standards are further described in the Auditor’s Responsibilities section. We are independent of the parent company and the group in accordance with professional ethics for accountants in Sweden and have otherwise fulfilled our ethical responsibilities in accordance with these requirements.This includes that, based on the best of our knowledge and belief, no prohibited services referred to in the Audit Regulation (537/2014) Article 5.1 have been provided to the audited company or, where applicable, its parent company or its controlled companies within the EU.
We believe that the audit evidence we have obtained is sufficient and appropriate to provide a basis for our opinions.
KEY AUDIT MATTERS
Key audit matters of the audit are those matters that, in our professional judgment, were of most significance in our audit of the annual accounts and consolidated accounts of the current period. These matters were addressed in the context of our audit of, and in forming our opinion thereon, the annual accounts and consolidated accounts as a whole, but we do not provide a separate opinion on these matters.
VALUATION OF INVESTMENT PROPERTIES
See disclosure 12 and accounting principles on page 59 in the annual account and consolidated accounts for detailed information and description of the matter.
DESCRIPTION OF KEY AUDIT MATTER
Investment properties are held at fair value in the Groups financial statements. The carrying value of these properties is EUR 1,272,514 thousand as per 31 December 2021, which represents 96% of to the Groups total assets.
The fair value of Investment properties has been determined based on valuations carried out by independent valuers.
Given investment properties significant share of the Groups total assets and the significant judgment and estimates required in the valuation process, valuation of Investment properties is a Key Audit Matter.
The risk is that the carrying value of Investment properties could be over-or underestimated and that deviations would directly influence the results of the period.
RESPONSE IN THE AUDIT
We have evaluated if the valuation methodology used is reasonable by comparing it to our experience of how other real estate companies and independent third party valuers work and which assumptions that are normal when valuing comparable objects.
We have assessed the competence and independence of third party valuers used and evaluated whether there could be circumstances that could influence scope or focus of the independent third party valuers’ engagement.
We have, on a sample basis, tested individual valuations. When doing so, we made use of available current market data from external sources, especially for yields, discount rates, rents and vacancies used.
We have checked the accuracy of disclosures on Investment properties given by the company in note 12 in the annual report, especially concerning elements of judgement and applied key assumptions.
Auditor’s Report
To the general meeting of the shareholders of Cibus Nordic Real Estate AB (publ), corp. id 559135-0599

84
OTHER INFORMATION THAN THE ANNUAL ACCOUNTS AND CONSOLIDATED ACCOUNTS
This document also contains other information than the annual accounts and consolidated accounts and is found on pages 1-29, 41 and 73-77. The other information comprises also of the remuneration report and is found on pages 63-64. The Board of Directors and the Managing Director are responsible for this other information.
Our opinion on the annual accounts and consolidated accounts does not cover this other information and we do not express any form of assurance conclusion regarding this other information.
In connection with our audit of the annual accounts and consolidated accounts, our responsibility is to read the information identified above and consider whether the information is materially inconsistent with the annual accounts and consolidated accounts. In this procedure we also take into account our knowledge otherwise obtained in the audit and assess whether the information otherwise appears to be materially misstated.
If we, based on the work performed concerning this information, conclude that there is a material misstatement of this other information, we are required to report that fact. We have nothing to report in this regard.
RESPONSIBILITIES OF THE BOARD OF DIRECTORS AND THE MANAGING DIRECTOR
The Board of Directors and the Managing Director are responsible for the preparation of the annual accounts and consolidated accounts and that they give a fair presentation in accordance with the Annual Accounts Act and, concerning the consolidated accounts, in accordance with IFRS as adopted by the EU. The Board of Directors and the Managing Director are also responsible for such internal control as they determine is necessary to enable the preparation of annual accounts and consolidated accounts that are free from material misstatement, whether due to fraud or error.
In preparing the annual accounts and consolidated accounts The Board of Directors and the Managing Director are responsible for the assessment of the company’s and the group’s ability to continue as a going concern. They disclose, as applicable, matters related to going concern and using the going concern basis of accounting. The going concern basis of accounting is however not applied if the Board of Directors and the Managing Director intend to liquidate the company, to cease operations, or has no realistic alternative but to do so.
The Audit Committee shall, without prejudice to the Board of Director’s responsibilities and tasks in general, among other things oversee the company’s financial reporting process.
AUDITOR’S RESPONSIBILITY
Our objectives are to obtain reasonable assurance about whether the annual accounts and consolidated accounts as a whole are free from material misstatement, whether due to fraud or error, and to issue an auditor’s report that includes our opinions. Reasonable assurance is a high level of assurance, but is not a guarantee that an audit conducted in accordance with ISAs and generally accepted auditing standards in Sweden will always detect a material misstatement when it exists. Misstatements can arise from fraud or error and are considered material if, individually or in the aggregate, they could reasonably be expected to influence the economic decisions of users taken on the basis of these annual accounts and consolidated accounts.
As part of an audit in accordance with ISAs, we exercise professional judgment and maintain professional scepticism throughout the audit. We also:
— Identify and assess the risks of material misstatement of the annual accounts and consolidated accounts, whether due to fraud or error, design and perform audit procedures responsive to those risks, and obtain audit evidence that is sufficient and appropriate to provide a basis for our opinions. The risk of not detecting a material misstatement resulting from fraud is higher than for one resulting from error, as fraud may involve collusion, forgery, intentional omissions, misrepresentations, or the override of internal control.
— Obtain an understanding of the company’s internal control relevant to our audit in order to design audit procedures that are appropriate in the circumstances, but not for the purpose of expressing an opinion on the effectiveness of the company’s internal control.
— Evaluate the appropriateness of accounting policies used and the reasonableness of accounting estimates and related disclosures made by the Board of Directors and the Managing Director.
— Conclude on the appropriateness of the Board of Directors’ and the Managing Director’s, use of the going concern basis of accounting in preparing the annual accounts and consolidated accounts. We also draw a conclusion, based on the audit evidence obtained, as to whether any material uncertainty exists related to events or conditions that may cast significant doubt on the company’s and the group’s ability to continue as a going concern. If we conclude that a material uncertainty exists, we are required to draw attention in our auditor’s report to the related disclosures in the annual accounts and consolidated accounts or, if such disclosures are inadequate, to modify our opinion about the annual accounts and consolidated accounts. Our conclusions are based on the audit evidence obtained up to the date of our auditor’s report. However, future events or conditions may cause a company and a group to cease to continue as a going concern.
— Evaluate the overall presentation, structure and content of the annual accounts and consolidated accounts, including the disclosures, and whether the annual accounts and consolidated accounts represent the underlying transactions and events in a manner that achieves fair presentation.
— Obtain sufficient and appropriate audit evidence regarding the financial information of the entities or business activities within the group to express an opinion on the consolidated accounts. We are responsible for the direction, supervision and performance of the group audit. We remain solely responsible for our opinions.
We must inform the Board of Directors of, among other matters, the planned scope and timing of the audit. We must also inform of significant audit findings during our audit, including any significant deficiencies in internal control that we identified.
We must also provide the Board of Directors with a statement that we have complied with relevant ethical requirements regarding independence, and to communicate with them all relationships and other matters that may reasonably be thought to bear on our independence, and where applicable, measures that have been taken to eliminate the threats or related safeguards.
From the matters communicated with the Board of Directors, we determine those matters that were of most significance in the audit of the annual accounts and consolidated accounts, including the most important assessed risks for material misstatement, and are therefore the key audit matters. We describe these matters in the auditor’s report unless law or regulation precludes disclosure about the matter.

85
Report on other legal and regulatory requirements
Auditor’s audit of the administration and the proposed appropriations of profit or loss
OPINIONS
In addition to our audit of the annual accounts and consolidated accounts, we have also audited the administration of the Board of Directors and the Managing Director of Cibus Nordic Real Estate AB (publ) for the year 2021 and the proposed appropriations of the company’s profit or loss.
We recommend to the general meeting of shareholders that the profit be appropriated in accordance with the proposal in the statutory administration report and that the members of the Board of Directors and the Managing Director be discharged from liability for the financial year.
BASIS FOR OPINIONS
We conducted the audit in accordance with generally accepted auditing standards in Sweden. Our responsibilities under those standards are further described in the Auditor’s Responsibilities section. We are independent of the parent company and the group in accordance with professional ethics for accountants in Sweden and have otherwise fulfilled our ethical responsibilities in accordance with these requirements.
We believe that the audit evidence we have obtained is sufficient and appropriate to provide a basis for our opinions.
RESPONSIBILITIES OF THE BOARD OF DIRECTORS AND THE MANAGING DIRECTOR
The Board of Directors is responsible for the proposal for appropriations of the company’s profit or loss. At the proposal of a dividend, this includes an assessment of whether the dividend is justifiable considering the requirements which the company’s and the group’s type of operations, size and risks place on the size of the parent company’s and the group’s equity, consolidation requirements, liquidity and position in general.
The Board of Directors is responsible for the company’s organization and the administration of the company’s affairs. This includes among other things continuous assessment of the company’s and the group’s financial situation and ensuring that the company’s organization is designed so that the accounting, management of assets and the company’s financial affairs otherwise are controlled in a reassuring manner.
The Managing Director shall manage the ongoing administration according to the Board of Directors’ guidelines and instructions and among other matters take measures that are necessary to fulfill the company’s accounting in accordance with law and handle the management of assets in a reassuring manner.
AUDITOR’S RESPONSIBILITY
Our objective concerning the audit of the administration, and thereby our opinion about discharge from liability, is to obtain audit evidence to assess with a reasonable degree of assurance whether any member of the Board of Directors or the Managing Director in any material respect:
— has undertaken any action or been guilty of any omission which can give rise to liability to the company, or
— in any other way has acted in contravention of the Companies Act, the Annual Accounts Act or the Articles of Association.
Our objective concerning the audit of the proposed appropriations of the company’s profit or loss, and thereby our opinion about this, is to assess with reasonable degree of assurance whether the proposal is in accordance with the Companies Act.
Reasonable assurance is a high level of assurance, but is not a guarantee that an audit conducted in accordance with generally accepted auditing standards in Sweden will always detect actions or omissions that can give rise to liability to the company, or that the proposed appropriations of the company’s profit or loss are not in accordance with the Companies Act.
As part of an audit in accordance with generally accepted auditing standards in Sweden, we exercise professional judgment and maintain professional scepticism throughout the audit. The examination of the administration and the proposed appropriations of the company’s profit or loss is based primarily on the audit of the accounts. Additional audit procedures performed are based on our professional judgment with starting point in risk and materiality. This means that we focus the examination on such actions, areas and relationships that are material for the operations and where deviations and violations would have particular importance for the company’s situation. We examine and test decisions undertaken, support for decisions, actions taken and other circumstances that are relevant to our opinion concerning discharge from liability. As a basis for our opinion on the Board of Directors’ proposed appropriations of the company’s profit or loss we examined the Board of Directors’ reasoned statement and a selection of supporting evidence in order to be able to assess whether the proposal is in accordance with the Companies Act.
The auditor’s examination of the Esef report
OPINION
In addition to our audit of the annual accounts and consolidated accounts, we have also examined that the Board of Directors and the Managing Director have prepared the annual accounts and consolidated accounts in a format that enables uniform electronic reporting (the Esef report) pursuant to Chapter 16, Section 4(a) of the Swedish Securities Market Act (2007:528) for Cibus Nordic Real Estate AB (publ) for year 2021.
Our examination and our opinion relate only to the statutory requirements.
In our opinion, the Esef report cQzfEF7adZ/oHbs= has been prepared in a format that, in all material respects, enables uniform electronic reporting.
BASIS FOR OPINION
We have performed the examination in accordance with FAR’s recommendation RevR 18 Examination of the Esef report. Our responsibility under this recommendation is described in more detail in the Auditors’ responsibility section. We are independent of Cibus Nordic Real Estate AB (publ) in accordance with professional ethics for accountants in Sweden and have otherwise fulfilled our ethical responsibilities in accordance with these requirements.
We believe that the evidence we have obtained is sufficient and appropriate to provide a basis for our opinion.
RESPONSIBILITIES OF THE BOARD OF DIRECTORS AND THE MANAGING DIRECTOR
The Board of Directors and the Managing Director are responsible for the preparation of the Esef report in accordance with the Chapter 16, Section 4(a) of the Swedish Securities Market Act (2007:528), and for such internal control that the Board of Directors and the Managing Director determine is necessary to prepare the Esef report without material misstatements, whether due to fraud or error.

86
AUDITOR’S RESPONSIBILITY
Our responsibility is to obtain reasonable assurance whether the Esef report is in all material respects prepared in a format that meets the requirements of Chapter 16, Section 4(a) of the Swedish Securities Market Act (2007:528), based on the procedures performed.
RevR 18 requires us to plan and execute procedures to achieve reasonable assurance that the Esef report is prepared in a format that meets these requirements.
Reasonable assurance is a high level of assurance, but it is not a guarantee that an engagement carried out according to RevR 18 and generally accepted auditing standards in Sweden will always detect a material misstatement when it exists. Misstatements can arise from fraud or error and are considered material if, individually or in aggregate, they could reasonably be expected to influence the economic decisions of users taken on the basis of the Esef report.
The audit firm applies ISQC 1 Quality Control for Firms that Perform Audits and Reviews of Financial Statements, and other Assurance and Related Services Engagements and accordingly maintains a comprehensive system of quality control, including documented policies and procedures regarding compliance with professional ethical requirements, professional standards and legal and regulatory requirements.
The examination involves obtaining evidence, through various procedures, that the Esef report has been prepared in a format that enables uniform electronic reporting of the annual accounts and consolidated accounts. The procedures selected depend on the auditor’s judgment, including the assessment of the risks of material misstatement in the report, whether due to fraud or error. In carrying out this risk assessment, and in order to design procedures that are appropriate in the circumstances, the auditor considers those elements of internal control that are relevant to the preparation of the Esef report by the Board of Directors and the Managing Director, but not for the purpose of expressing an opinion on the effectiveness of those internal controls. The examination also includes an evaluation of the appropriateness and reasonableness of the assumptions made by the Board of Directors and the Managing Director.
The procedures mainly include a technical validation of the Esef report, i.e. if the file containing the Esef report meets the technical specification set out in the Commission’s Delegated Regulation (EU) 2019/815 and a reconciliation of the Esef report with the audited annual accounts and consolidated accounts.
Furthermore, the procedures also include an assessment of whether the Esef report has been marked with iXBRL which enables a fair and complete machine-readable version of the consolidated statement of financial performance, financial position, changes in equity and cash flow.
THE AUDITOR’S EXAMINATION OF THE CORPORATE GOVERNANCE STATEMENT
The Board of Directors is responsible for that the corporate governance statement on pages 35-40 and 42-43 has been prepared in accordance with the Annual Accounts Act.
Our examination of the corporate governance statement is conducted in accordance with FAR´s auditing standard RevR 16 The auditor´s examination of the corporate governance statement. This means that our examination of the corporate governance statement is different and substantially less in scope than an audit conducted in accordance with International Standards on Auditing and generally accepted auditing standards in Sweden. We believe that the examination has provided us with sufficient basis for our opinions.
A corporate governance statement has been prepared. Disclosures in accordance with chapter 6 section 6 the second paragraph points 2-6 of the Annual Accounts Act and chapter 7 section 31 the second paragraph the same law are consistent with the other parts of the annual accounts and consolidated accounts and are in accordance with the Annual Accounts Act.
THE AUDITOR’S OPINION REGARDING THE STATUTORY SUSTAINABILITY REPORT
The Board of Directors is responsible for the sustainability report on pages 23-28 and 41, and that it is prepared in accordance with the Annual Accounts Act.
Our examination has been conducted in accordance with FAR:s auditing standard RevR 12 The auditor’s opinion regarding the statutory sustainability report. This means that our examination of the statutory sustainability report is different and substantially less in scope than an audit conducted in accordance with International Standards on Auditing and generally accepted auditing standards in Sweden. We believe that the examination has provided us with sufficient basis for our opinion.
A statutory sustainability report has been prepared.
KPMG AB, Box 382, 101 27, Stockholm, was appointed auditor of Cibus Nordic Real Estate AB (publ) by the general meeting of the shareholders on the 15 April 2021. KPMG AB or auditors operating at KPMG AB have been the company’s auditor since 2019.
Stockholm 10 March 2022 KPMG AB
Mattias Johansson Authorized Public Accountant
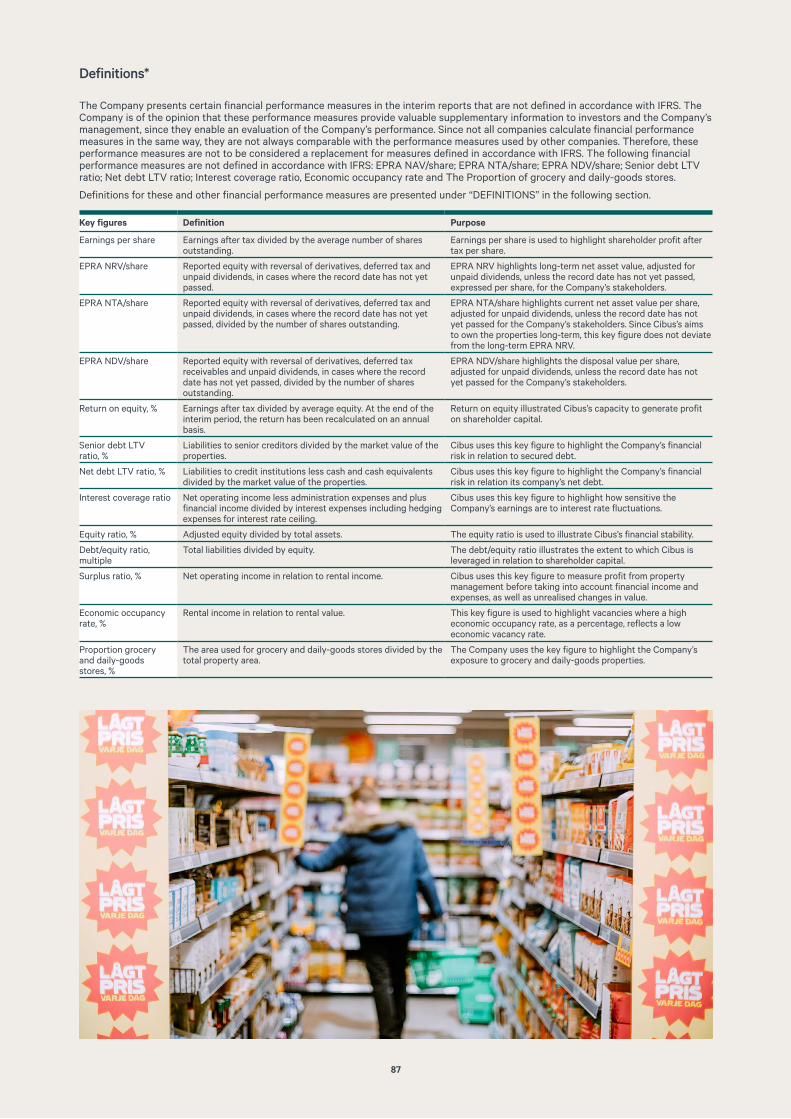
87
Definitions*
The Company presents certain financial performance measures in the interim reports that are not defined in accordance with IFRS. The Company is of the opinion that these performance measures provide valuable supplementary information to investors and the Company’s management, since they enable an evaluation of the Company’s performance. Since not all companies calculate financial performance measures in the same way, they are not always comparable with the performance measures used by other companies. Therefore, these performance measures are not to be considered a replacement for measures defined in accordance with IFRS. The following financial performance measures are not defined in accordance with IFRS: EPRA NAV/share; EPRA NTA/share; EPRA NDV/share; Senior debt LTV ratio; Net debt LTV ratio; Interest coverage ratio, Economic occupancy rate and The Proportion of grocery and daily-goods stores.
Definitions for these and other financial performance measures are presented under “DEFINITIONS” in the following section.
Key figures Definition Purpose
Earnings per share Earnings after tax divided by the average number of shares outstanding.
Earnings per share is used to highlight shareholder profit after tax per share.
EPRA NRV/share Reported equity with reversal of derivatives, deferred tax and unpaid dividends, in cases where the record date has not yet passed.
EPRA NRV highlights long-term net asset value, adjusted for unpaid dividends, unless the record date has not yet passed, expressed per share, for the Company’s stakeholders.
EPRA NTA/share Reported equity with reversal of derivatives, deferred tax and unpaid dividends, in cases where the record date has not yet passed, divided by the number of shares outstanding.
EPRA NTA/share highlights current net asset value per share, adjusted for unpaid dividends, unless the record date has not yet passed for the Company’s stakeholders. Since Cibus’s aims to own the properties long-term, this key figure does not deviate from the long-term EPRA NRV.
EPRA NDV/share Reported equity with reversal of derivatives, deferred tax receivables and unpaid dividends, in cases where the record date has not yet passed, divided by the number of shares outstanding.
EPRA NDV/share highlights the disposal value per share, adjusted for unpaid dividends, unless the record date has not yet passed for the Company’s stakeholders.
Return on equity, % Earnings after tax divided by average equity. At the end of the interim period, the return has been recalculated on an annual basis.
Return on equity illustrated Cibus’s capacity to generate profit on shareholder capital.
Senior debt LTV ratio, %
Liabilities to senior creditors divided by the market value of the properties.
Cibus uses this key figure to highlight the Company’s financial risk in relation to secured debt.
Net debt LTV ratio, % Liabilities to credit institutions less cash and cash equivalents divided by the market value of the properties.
Cibus uses this key figure to highlight the Company’s financial risk in relation its company’s net debt.
Interest coverage ratio Net operating income less administration expenses and plus financial income divided by interest expenses including hedging expenses for interest rate ceiling.
Cibus uses this key figure to highlight how sensitive the Company’s earnings are to interest rate fluctuations.
Equity ratio, % Adjusted equity divided by total assets. The equity ratio is used to illustrate Cibus’s financial stability.
Debt/equity ratio, multiple
Total liabilities divided by equity. The debt/equity ratio illustrates the extent to which Cibus is leveraged in relation to shareholder capital.
Surplus ratio, % Net operating income in relation to rental income. Cibus uses this key figure to measure profit from property management before taking into account financial income and expenses, as well as unrealised changes in value.
Economic occupancy rate, %
Rental income in relation to rental value. This key figure is used to highlight vacancies where a high economic occupancy rate, as a percentage, reflects a low economic vacancy rate.
Proportion grocery and daily-goods stores, %
The area used for grocery and daily-goods stores divided by the total property area.
The Company uses the key figure to highlight the Company’s exposure to grocery and daily-goods properties.

88
in EUR thousands, unless otherwise stated Full-year 2021 Full-year 2020
Reported equity, excluding hybrid bonds 554,255 458,028Reversal of derivatives 1,094 736Reversal of deferred tax 26,486 16,646Reversal of unpaid dividends 10,560 9,200Sum EPRA NRV 592,395 484,610No. of shares outstanding 44,000,000 40,000,000EPRA NRV/share, EUR 13.5 12.1
Reported equity, excluding hybrid bonds 554,255 458,028Reversal of derivatives 1,094 736Reversal of assessed fair value of deferred tax 26,486 16,646Reversal of unpaid dividends 10,560 9,200Sum EPRA NTA 592,395 484,610No. of shares outstanding 44,000,000 40,000,000EPRA NTA/share, EUR 13.5 12.1
Reported equity, excluding hybrid bonds 554,255 458,028Reversal of derivatives 1,094 736Reversal of assessed fair value of deferred tax assets -4,675 -3,648Reversal of unpaid dividends 10,560 9,200Sum EPRA NDV 561,234 464,316No. of shares outstanding 44,000,000 40,000,000EPRA NDV/share, EUR 12.8 11.6
Earnings after tax 51,370 34,597Average equity 520,645 395,449Return on shareholders’ equity, % 9.9 8.7
Liabilities to senior lenders 724,180 622,505Market value of properties 1,499,626 1,272,514Senior debt LTV ratio, % 48.3 48.9
Liabilities to credit institutions 917,860 817,283Cash and cash equivalents -51,054 -36,783Net debt 866,806 780,500Market value of properties 1,499,626 1,272,514Net debt LTV ratio, % 57.8 61.3
Net operating income 76,326 61,395Administrative expenses -6,385 -6,520Financial income 35 34Total 69,976 54,909Interest expenses including hedging expenses for interest rate caps 20,177 16,672Interest coverage ratio, multiple 3.5 3.3
Adjusted equity 583,262 458,028Total assets 1,570,714 1,323,954Equity/asset ratio, % 37.1 34.6
Total liabilities 987,452 865,926Equity 583,262 458,028Debt/equity ratio, multiple 1.7 1.9
Net operating income 76,326 61,395Rental income 81,058 65,033Surplus ratio, % 94.2 94.4
Rental income 81,058 65,033Rental value 85,917 68,214Economic occupancy rate, % 94.3 95.3
Grocery and daily-goods properties 820,464 706,646Total property area 866,920 744,039Proportion grocery and daily-goods stores, % 94.6 95.0
Reconciliation of alternative key figures

89
P R O P E R T I E S
Sweden
County Municipality Property designation Address Area
County of Västra Götaland Ale STARRKÄRR 1:68 Göteborgsvägen 90 1,150
County of Kronoberg Alvesta ARINGSÅS 19:25 Sjögatan 1 993
County of Västmanland Arboga PRÄSTGÄRDET 2:21 Fabriksgatan 1 1,050
County of Örebro Askersund MOTORN 3 Parkgatan 7 1,005
County of Skåne Bjuv ELEFANTEN 4 Norra Storgatan 16A 2,054
County of Kalmar Borgholm GÄSTGIVAREN 18 Storgatan 36 1,105
County of Västra Götaland Borås BYTTORPSKLINT 7 Kvibergsgatan 1 1,100
County of Västra Götaland Borås HOLMENS GÅRD 3 Hultagatan 49A 1,000
County of Skåne Burlöv ARLÖV 6:7 Dalbyvägen 65 1,050
County of Skåne Burlöv TÅGARP 21:146 Arlövsvägen 34 1,080
County of Jönköping Eksjö TÅGMÄSTAREN 1 Linnégatan 1 1,050
County of Södermanland Eskilstuna TORSHÄLLA 5:42 Eskilstunavägen 32 1,050
County of Skåne Eslöv LIPPIZANERN 2 Pål Klemeds Väg 1 906
County of Skåne Eslöv VITTSKÖVLE 2 Sextorpsvägen 2 1,050
County of Halland Falkenberg STRIDSHÄSTEN 1 Slättenvägen 2 1,023
County of Västra Götaland Falköping BOKTRYCKAREN 15 Dotorpsgatan 4 3180
County of Östergötland Finspång KJUSORNA 13 Norra Storängsvägen 2 1220
County of Södermanland Flen ORRESTA 2:153 Parkgatan 2 1,050
County of Jönköping Gislaved KROKODILEN 17 Järnvägsgatan 24 1,000
County of Jönköping Gislaved ÅTTERÅS 3:139 Södra Nissanstigen 7 1,050
County of Västra Götaland Gothenburg BACKA 39:1 Backa Kyrkogata 1 960
County of Västra Götaland Gothenburg BISKOPSGÅRDEN 830:907
Stackmolnsgatan 2 1038
County of Västra Götaland Gothenburg JÄRNBROTT 126:11 Marklandsgatan 59 825
County of Västra Götaland Gothenburg KALLEBÄCK 8:2 Ostgatan 11 856
County of Halland Halmstad FYLLINGE 20:481 Fyllingevägen 2 1,050
County of Halland Halmstad HUSAN 4 Carl Kuylenstjernas Väg 77 1,080
County of Värmland Hammarö MÖRMON 5:69 Åråsvägen 7 1,000
County of Skåne Helsingborg TROSSEN 1 Stabsgatan 1 1,050
County of Västra Götaland Herrljunga FLUGSVAMPEN 8 Horsbyvägen 16B 1,140
County of Västra Götaland Hjo KLAMMERN 3 Industrigatan 41 1,050
County of Kalmar Hultsfred KIOSKEN 2 Gärdesvägen 3 1,050
County of Skåne Hässleholm TRIANGELN 3 Götgatan 2 906
County of Skåne Hörby BORGVIK 1 Ringsjövägen 44 1,050
County of Skåne Höör FÖRRÅDET 1 Industrigatan 10 1,050
County of Jönköping Jönköping IMPORTEN 1 Norrhammarsvägen 56 1,050
County of Jönköping Jönköping TALLTITAN 1 Anders Blomstrands Väg 5 1,010
County of Jönköping Jönköping BERGET 1:25 Tahevägen 5 1,028
County of Kalmar Kalmar SYRENEN 10 Sandåsgatan 4 1,050
County of Kalmar Kalmar VISIRET 1 Ledungsvägen 7 1,100
County of Blekinge Karlshamn KVARNEN 1 Nyemöllervägen 3 1,000
County of Örebro Karlskoga SKOLGÄRDET 2 Skolgärdesvägen 2D 986
County of Värmland Karlstad KVARTERMÄSTAREN 4 Sanna Allé 2 1,050
County of Värmland Karlstad STRANDSLUTET 1 Våxnäsgatan 146 1,050
County of Södermanland Katrineholm VÄGSKÄLET 18 Vingåkersvägen 69 1,031
County of Skåne Kristianstad BRISEN 6 Nordanvägen 2 140
County of Värmland Kristinehamn KARLSHOLM 1:18 Oscarborgsgatan 6 1,050
County of Skåne Kävlinge SOCKERBRUKET 1 Bintjevägen 1 1,050
County of Västmanland Köping FYLGIA 3 Nygatan 2 1,050
County of Skåne Landskrona HERMELINEN 4 Östervångsplan 12 1,050
County of Skåne Landskrona RUTAN 1 Remigatan 2 1,050
County of Örebro Laxå BJURSNÄS 2:35 Ramundervägen 52A 1,316
County of Västra Götaland Lidköping GÖSEN 1 Garpgatan 11 1,050
County Municipality Property designation Address Area
County of Västra Götaland Lidköping MOSSTORVEN 1 Råda Mossevägen 2 1,050
County of Västra Götaland Lilla Edet CENTRALEN 5 Göteborgsvägen 42 967
County of Östergötland Linköping GRÄVLINGEN 1 Skäggetorps Centrum 2A 1,050
County of Östergötland Linköping RITBOKEN 1 Bronsåldersgatan 2 1,050
County of Kronoberg Ljungby BJÖRKEN 5 Hångervägen 1 1,046
County of Kronoberg Ljungby BJÖRKEN 5 Hångervägen 1 1,046
County of Skåne Lomma BJÄRRED 31:6 Lundavägen 1 825
County of Skåne Lund TROSSEN 1 Skansvägen 2 881
County of Skåne Lund VILDGÅSEN 5 Gässlingavägen 1 714
County of Skåne Malmö RIPAN 15 August Palms Plats 5 1,364
County of Skåne Malmö STORHÖG 3 Videdals Torg 1 1,222
County of Västra Götaland Mariestad BOFINKEN 1 Marieforsleden 2 1,136
County of Västra Götaland Mariestad INSEKTEN 27 Mariegärdes Väg 4 1,050
County of Kronoberg Markaryd MARKARYD 14:7 Drottninggatan 1A 1,468
County of Östergötland Mjölby HYVELN 8 Hallevadsgatan 2 1,050
County of Östergötland Motala BUGGEN 1 Östermalmsgatan 94 1,005
County of Jönköping Mullsjö SJÖRYD 1:141 Backgatan 1 1,124
County of Kalmar Mönsterås ÄNGEN 1 Blanka Ängars Väg 2 1,000
County of Kalmar Mörbylånga ALGUTSRUM 20:21 Brofästet Öland 2 1,050
County of Östergötland Norrköping GLUGGEN 2 Pressaregatan 2 1,050
County of Östergötland Norrköping HÄRBÄRGET 3 Reenstiernagatan 1 1,050
County of Östergötland Norrköping KONDUKTÖREN 3 Stockholmsvägen 54 153
County of Östergötland Norrköping KONDUKTÖREN 4 Stockholmsvägen 52 1,000
County of Kalmar Nybro KASSÖRSKAN 1 Hanemålavägen 6 1,094
County of Jönköping Nässjö BLOMBERG 12 Storgatan 23 872
County of Skåne Osby OSBY 192:106 Tegvägen 2 1,150
County of Kalmar Oskarshamn ALVARSBERG 4 Åsavägen 11 1,050
County of Södermanland Oxelösund LOKET 1 Folkegränd 1 1,050
County of Skåne Perstorp STENSÖTAN 8 Banvallsvägen 2 1,050
County of Skåne Sjöbo LAXEN 3 Södergatan 4 1,050
County of Västra Götaland Skövde TULPANEN 21 Henriksbergsgatan 18 1,050
County of Skåne Staffanstorp STANSTORP 1:534 Skånevägen 65 1,050
County of Västmanland Surahammar SURAHAMMAR 10:585 Elledningsvägen 2 1,129
County of Skåne Svalöv SÖDRA SVALÖV 9:237 Luggudevägen 24 1,025
County of Skåne Svedala SVEDALA 25:15 Börringevägen 4 1,061
County of Västra Götaland Svenljunga SVENLJUNGA 1:48 Prästgatan 12 1,050
County of Värmland Säffle SÄFFLE 3:3 Järnvägsgatan 14 1,050
County of Jönköping Sävsjö HANTVERKAREN 2 Hantverkaregatan 1 1,050
County of Stockholm Södertälje HAVREN 1 Klockarvägen 98 1,000
County of Blekinge Sölvesborg ISLAND 1 Järnvägsgatan 9 983
County of Västra Götaland Tibro SPARVEN 3 Centrumgatan 22 1,050
County of Skåne Trelleborg MACKEN 1 Hedvägen 185 950
County of Skåne Trelleborg TRÄDGÅRDSMÄSTA-REN 1
Engelbrektsgatan 66 1,386
County of Västra Götaland Trollhättan SILKESFJÄRILEN 8 Lextorpsvägen 992 1,050
County of Västra Götaland Töreboda SOLTOMTA 3 Skördevägen 4 975
County of Västra Götaland Ulricehamn STOCKROSEN 2 Parkgatan 14 1,050
County of Jönköping Vaggeryd GÖTASTRAND 1:18 Hammarvägen 1 1,050
County of Jönköping Vetlanda STATIONEN 1 Bangårdsgatan 5 1,050
County of Kalmar Vimmerby ABBORREN 21 Fiskaregatan 5 1,033
County of Västra Götaland Vårgårda SKÖVDE 1:177 Stationsgatan 3 1,050
County of Västra Götaland Vänersborg LINJALEN 3 Poppelvägen 10 1,100
County of Jönköping Värnamo SADELMAKAREN 2 Fredsgatan 2A 911

90
P R O P E R T I E S
Sweden
Norway
90 Kiwi Krokstadelva
County Municipality Property designation Address Area
County of Kalmar Västervik KOLVEN 2 Vapengränd 5 1,200
County of Kalmar Västervik RULLSTENEN 7 Vattentornsvägen 6 921
County of Västmanland Västerås ÄNGSVIOLEN 2 Bangatan 10 1,050
County of Kronoberg Växjö HÄLLEFLINTAN 1 Nydalavägen 21 1,058
County of Kronoberg Växjö ÖVERSKÖTAREN 1 Emil Lindells Väg 46 962
County of Skåne Ystad LOTSEN 8 Kommendörsgatan 3 1,050
County of Skåne Ängelholm PÅSKLILJAN 1 Landshövdingevägen 54 800
County of Örebro Örebro TEGELSLAGERIET 5 Lertagsgatan 1A 1,050
County of Örebro Örebro VINDFLÖJELN 7 Vaktelvägen 4 1,050
County of Södermanland Katrineholm LIDABACKE 1:42 Doktorvägen 1 1,430
County Municipality Property designation Address Area
Viken Halden Gnr 162, Bnr 1, Fnr 161 Iddeveien 29 1,300
Viken Moss Gnr 104, Bnr 52, Snr 1 Stasjonsveien 12A 1,033
Viken Drammen Gnr 230, Bnr 147, Snr 1 Bruveien 6 1,150
Viken Asker Gnr 214, Bnr 24, Snr 1 Spekkestadveien 80A 980
Viken Övre Eiker Gnr 77, Bnr 861, Snr 7/8 Stasjonsveien 73 1,253
County Municipality Property designation Address Area
County of Örebro Hällefors FJÄLLBO 10:1 Kyllevägen 12 544
County of Örebro Nora HÄSSJAN 19 Kolmästaregatan 23 801
County of Örebro Karlskoga BLÄSTERN 1 Sandviksvägen 14 1,053
County of Gävleborg Iggesund IGGESUND 14:279 Centralgatan 9 718
County of Södermanland Eskilstuna HILDERO 1:5 Tumbovägen2 794
County of Östergötland Boxholm BOXHOLM 17:1 Storgatan 12 1,964
County of Östergötland Kisa SVALAN 11 Västra vägen 1 1,700
County of Östergötland Norrköping PRESSAREN 7 Värmlandsgatan 43 808
County of Värmland Eda KLAVEN 1 Källgatan 10, etc. 10,479
County of Värmland Eda PENGEN 1 Källgatan 15 A, etc. 3,566
County Municipality Property designation Address Area
Vestfold Porsgrunn Gnr 69, Bnr 576, Snr 2 Bekkefaret 1 800
Vestfold Sandefjord Gnr 169, Bnr 51, Snr 1 Skiringssalveien 9A 1,114
Agder Arendal Gnr 507, Bnr 1267, Snr 2 Nyli Ringvei 21A 1,003
Salten Rognan Gnr 43, Bnr 269/949/950/1267/136
Kirkegatan 26 2,304
Rogaland Stavanger Gnr 4, Bnr 32, Snr 94/96/97/98
Hundvågsveien 47 3,099

91
County Municipality Property designation Address Area
Western Finland Aura 19-402-37-0, 19-423-3-225 Huuskantie 19 2,520
Greater Helsinki Espoo 49-30-104-2 Oxfotintie 1 503
Greater Helsinki Espoo 49-20-1-1 Kuurinmäki 1 595
Greater Helsinki Espoo 49-60-22-1 Lähderannantie 20 2,803
Greater Helsinki Espoo 49-55-41-2 Ullanmäentie 12 236
Greater Helsinki Espoo 49-54-110-4 Lansantie 23 408
Greater Helsinki Espoo 49-22-92-1, 49-22-93-1 Kuunkatu 3 2,859
Southern Finland Forssa 61-1-69-1, 61-1-69-2, 61-1-69-3 Kartanonkatu 11 9,005
Southern Finland Forssa 61-6-163-4 Miemolantie 2 5,443
Oulu Region Haapavesi 71-402-3-86, 71-402-3-239 Kansanpellontie 1 550
Western Finland Hämeenkyrö 108-421-11-408 Kyreltie 2 6,737
Southern Finland Hämeenlinna 109-593-3-43, 109-593-11-34 Tuulosentie 1(1) 11,090
Southern Finland Hämeenlinna 109-593-3-41, 109-593-7-4 Tuulosentie 1(2) 3,297
Southern Finland Hämeenlinna 109-6-63-1211 Viertokatu 33 335
Southern Finland Hämeenlinna 109-25-115-3 Karhitie 2 600
Southern Finland Hamina 75-2-276-6 Rautatienkatu 14 4,347
Southern Finland Hanko 78-4-461-26 Santalantie 26 2,940
Western Finland Harjavalta 79-202-5-2 Huovinkatu 4 2,718
Southern Finland Hattula 82-403-6-28, 82-403-6-42, 82-403-25-0
Tallitie 4 2,646
Oulu region Haukipudas 564-120-2553-2 Takomotie 2,901
Southern Finland Heinola 111-17-7-8 Vuohkalliontie 18 3,864
Southern Finland Heinola 111-7-24-2 Vuorikatu 2 600
Greater Helsinki Helsinki 91-432-6-3 Suomenlinna C6 432
Greater Helsinki Helsinki 91-10-582-11, 91-10-582-13 Junonkatu 6 343
Greater Helsinki Helsinki 91-16-700-2 Mannerheimintie 160 7,819
Greater Helsinki Helsinki 91-43-214-2 Roihuvuorentie 24 834
Greater Helsinki Helsinki 91-25-884-1 Käpyläntie 8 993
Greater Helsinki Helsinki 91-29-44-4 Tunnelitie 3-5 1,598
Greater Helsinki Helsinki 91-41-129-2-8 Nummitie 2 539
Greater Helsinki Helsinki 91-47-253-6-3 Rukatunturintie 2 1,008
Greater Helsinki Helsinki 91-40-176-7 Pertunpellontie 4 737
Greater Helsinki Helsinki 91-43-290-2 Hitsaajankatu 16 2,089
Greater Helsinki Helsinki 091-31-117-1 Heikkiläntie 4 2,780
Greater Helsinki Helsinki 91-54-274-1 Aurinkolahden Puistotie 2 360
Greater Helsinki Helsinki 91-38-309-1 Salpausseläntie 11 592
Greater Helsinki Helsinki 91-42-48-1 Kyösti Kallion tie 2 665
Greater Helsinki Helsinki 91-33-184-4, 91-33-186-2 Sitratie 7 601
Greater Helsinki Helsinki 91-54-224-1 Meri-Rastilan kuja 2 1,500
Greater Helsinki Helsinki 91-28-153-2 Kylänvanhimmantie 29 864
Greater Helsinki Helsinki 91-40-117-2 Palokuja 4 423
Greater Helsinki Helsinki 91-17-22-1-L1 Asemapäällikönkatu 3 2,017
Southern Finland Hollola 98-435-7-823 Keskikankaantie 4 6,264
Southern Finland Hollola 98-455-3-81 Tiilikankaantie 1 584
Greater Helsinki Hyvinkää 106-3-217-1 Munckinkatu 37 840
Greater Helsinki Hyvinkää 106-15-1460-2 Sillankorvankatu 66 451
Greater Helsinki Hyvinkää 106-11-1039-1 Jussilankatu 5 1,280
Oulu Region Ii 139-401-149-1, 139-401-149-2 Kisatie 1 1,052
Eastern Finland Iisalmi 140-4-24-6 Eteläntie 4 9,539
Eastern Finland Iisalmi 140-1-103-23 Meijerikatu 3 6,823
Eastern Finland Iisalmi 140-1-103-22 Pohjolankatu 21 4549
Eastern Finland Iisalmi 140-1-12-5 Satamakatu 10-12 5,570
Western Finland Ikaalinen 143-8-31-2 Karhoistentie 3 7,481
Western Finland Ilmajoki 145-419-6-209 Huhdantie 1 3,922
Eastern Finland Imatra 153-15-47-30 Vallinkoskentie 2 320
Eastern Finland Imatra 153-33-25-23 Joutsenonkatu 32 1,012
Western Finland Isojoki 151-402-38-3 Luukkaantie 1 919
County Municipality Property designation Address Area
Western Finland Jämsä 182-9-938-1, 182-414-6-67, 182-414-6-85, 182-414-37-0
Sirkankatu 2 2,900
Western Finland Jämsä 182-20-1-1, 182-413-1-308 Kauppakatu 8 590
Greater Helsinki Järvenpää 186-19-1906-11 Helsingintie 43 10,018
Greater Helsinki Järvenpää 186-25-2502-4 Vanhankyläntie 65 341
Greater Helsinki Järvenpää 186-9-971-2 Oksapolku 1 1,054
Greater Helsinki Järvenpää 186-8-820-1, 186-401-1-1646 Wärtsilänkatu 54 441
Western Finland Joutsa 172-402-4-676 Keskustie 1 4,756
Eastern Finland Juva 178-439-5-43 Tulostie 1 2,807
Eastern Finland Juva 178-420-20-10 Hiihtäjäntie 1 1,534
Western Finland Jyvaskyla 179-16-119-1 Runkotie 2 226
Western Finland Kaarina 202-5-5273-1, 202-407-1-75, 202-407-2-89
Hovirinnantie 5 8,317
Western Finland Kaarina 202-3-3218-1 Jännekatu 2-4 8,037
Oulu region Kajaani 205-8-71-6 Kehräämöntie 22 14,318
Oulu region Kajaani 205-8-71-7 Kehräämöntie 24 7,809
Oulu region Kajaani 205-5-26-17, 205-5-26-27, 205-8-11-12
Kasarminkatu 18 7,244
Oulu region Kajaani 205-4-10-4 Makkolankatu 10 429
Oulu Region Kalajoki 208-406-138-6 Kalajoentie 1 9,554
Western Finland Kangasala 211-407-3-158, 211-454-2-381 Puusepäntie 31 2,368
Western Finland Kangasala 211-452-4-290 Mäkirinteentie 4 12,650
Western Finland Karijoki 218-404-1-270 Kristiinantie 2 606
Southern Finland Karkkila 224-5-46-1 Huhdintie 10-12 1,152
Western Finland Kauhava 233-424-2-45, 233-424-2-50, 233-424-2-73, 233-424-2-221
Vanha Vaasantie 1 1,060
Western Finland Kaustinen 236-401-15-275 Terveystie 1 1,378
Northern Finland Kemi 240-1-138-4 Asemakatu 4 3,956
Northern Finland Kemi 240-4-435-3 Koivuharjunkatu 55 617
Northern Finland Kemijärvi 320-2-2097-5 Pelkosenniementie 4 308
Greater Helsinki Kerava 245-5-1148-8 Kerananpolku 1 1,649
Greater Helsinki Kerava 245-9-332-37 Peltomäenkatu 2-4 5,114
Western Finland Keuruu 249-410-63-15 Keuruuntie 17 2,088
Western Finland Keuruu 249-410-53-7 Tervantie 2 5,419
Greater Helsinki Kirkkonummi 257-1-103-1 Asematie 3 4,660
Greater Helsinki Kirkkonummi 257-488-1-117 Turuntie 563 310
Eastern Finland Kitee 260-423-9-87, 260-423-9-182 Kiteentie 75 2,734
Eastern Finland Kiuruvesi 263-405-102-1 Tulotie 10 3,755
Western Finland Kokemäki 271-104-27-5 Haapionkatu 19 2,075
Western Finland Kokkola 272-6-17-4 Mariankatu 35 790
Southern Finland Kotka 285-1-15-3 Keskuskatu 11 4,150
Southern Finland Kotka 285-6-606-10 Kotkantie 25 225
Southern Finland Kotka 285-10-1-4 Peurantie 5 486
Southern Finland Kotka 285-31-8-12 Karhulantie 35 A 2,765
Southern Finland Kotka 285-41-64-2 Turvalantie 31 298
Southern Finland Kotka 285-35-52-1 Pokakuja 1 437
Southern Finland Kouvola 286-33-3165-3 Spännärintie 2 4,600
Southern Finland Kouvola 286-21-514-10 Kiltatie 10 7,453
Southern Finland Kouvola 286-21-53-6, 286-21-53-8 Kauppakatu 1 9,124
Southern Finland Kouvola 286-463-8-29, 286-463-8-35, 286-463-8-37, 286-463-8-59
Kyminasemantie 6 664
Southern Finland Kouvola 286-21-58-2 Valtakatu 16 2,336
Oulu region Kuhmo 290-405-140-152, 290-405-140-153
Rajakatu 36 1,937
Eastern Finland Kuopio 297-12-5-1 Sammakkolammentie 6 1,562
Eastern Finland Kuopio 297-13-5-12 Volttikatu 4 9,115
Eastern Finland Kuopio 297-24-14-1, 297-24-38-1 Leväsentie 5 11,157
Eastern Finland Kuopio 297-24-1-8 Kartanonkatu 4B 3,025
Eastern Finland Kuopio 297-10-48-2 Kullervonkatu 20 384
P R O P E R T I E S
Finland

92
County Municipality Property designation Address Area
Eastern Finland Kuopio 297-5-13-5 Haapaniemenkatu 6 138
Eastern Finland Kuopio 297-9-27-1 Sandelsinkatu 1 315
Western Finland Kurikka 301-414-3-164, 301-414-3-165 Hahdonkuja 1 1,413
Southern Finland Lahti 398-3-3000-3 Kauppakatu 13 8,577
Southern Finland Lahti 398-13-443-1 Sipurantie2 567
Southern Finland Lahti 398-13-399-7 Alasenkatu 1 1,789
Southern Finland Lahti 398-1-22-109 Rautatienkatu 9 763
Southern Finland Lahti 398-4-4191-5 Lahdenkatu 48 698
Southern Finland Lahti 398-20-144-6 Eteläinen Liipolankatu 9 421
Western Finland Laitila 400-419-3-165 Garpintie 1 2,786
Eastern Finland Lapinlahti 402-412-85-15 Juhani Ahontie 13 1,934
Southern Finland Lappeenranta 405-56-36-1 Myllymäenkatu 35 3,766
Southern Finland Lappeenranta 405-34-98-1 Onninkatu 1 573
Southern Finland Lappeenranta 405-62-106-11 Merenlahdentie 16 515
Western Finland Lapua 408-7-761-5 Alangontie 4 8,448
Western Finland Laukaa 410-409-71-0-7, 410-409-8-1 Laukaantie 25 2,802
Eastern Finland Lieksa 422-1-4-12 Pielisentie 28 2,284
Oulu Region Liminka 425-402-53-29 Mutkalankaari 3 5,116
Southern Finland Lohja 444-11-85-1 Puistokatu 23 674
Southern Finland Lohja 444-422-1-211 Tietolantie 1 1,054
Western Finland Loimaa 430-401-2-93, 430-401-2-95 Hirvikoskentie 213 307
Western Finland Loimaa 430-477-6-31 Melliläntie 103 349
Southern Finland Loviisa 434-439-1-30 Heskerintie 17 5,295
Greater Helsinki Mäntsälä 505-407-4-51-9, 505-407-4-165, 505-407-4-184, 505-407-4-222
Maisalantie 9 4,544
Southern Finland Mäntsälä 505-407-2-595 Asemakatu 2 480
Western Finland Mänttä-Vilp-pula
508-1-119-2 Pohjaväreenkuja 1 4,233
Western Finland Mänttä-Vilp-pula
508-1-182-5 Puistokatu 10 383
Western Finland Mänttä-Vilp-pula
508-405-2-27 Runttimäentie 8 157
Eastern Finland Mäntyharju 507-413-12-367 Keskustie 18 2,712
Eastern Finland Mäntyharju 507-413-7-439 Reissutie 2 1,632
Eastern Finland Mikkeli 491-1-1-63 Porrassalmenkatu 33 796
Eastern Finland Mikkeli 491-9-39-1 Juvantie 13 486
Oulu Region Muhos 494-403-4-187, 494-403-4-30, 494-403-4-51
Valtatie 20 3,504
Western Finland Muurame 500-402-124-6 Setäläntie 3 10,747
Western Finland Muurame 500-402-1-641 Liikekuja 4 600
Western Finland Naantali 529-11-24-2-6 Venekuja 5 2,540
Western Finland Naantali 529-3-33-3 Alppilankatu 2 2,894
Southern Finland Nastola 532-409-1-921 Muurarintie 3 2,856
Southern Finland Nastola 398-34-505-1 Kauppakaari 1 9,990
Western Finland Nivala 535-404-21-322 Jyrkäntie 1 2,826
Western Finland Nokia 536-2-26-1 Kyyninkatu 22 3,690
Western Finland Nokia 536-14-95-4 Nuijamiestentie 9 8,819
Western Finland Nokia 536-13-10-1 Linnavuorentie 15 876
Eastern Finland Nurmes 541-134-14-3 Teollisuustie 20 2,397
Greater Helsinki Nurmijärvi 543-403-1-366-6, 543-403-8-641-4
Viirintie 8 4,988
Greater Helsinki Nurmijärvi 543-1-733-1 Kiljavantie 5 4,201
Greater Helsinki Nurmijärvi 543-404-4-0 Ketunkopintie 2 608
Greater Helsinki Nurmijärvi 543-414-2-250 Puistotie 3 495
Southern Finland Orimattila 560-418-163-2 Erkontie 3 3,402
Southern Finland Orimattila 560-418-26-51 Lahdentie 109 4,586
Western Finland Orivesi 562-416-13-0 Asematie 13 415
Western Finland Oulainen 563-2-1-4 Oulaistenkatu 15-17 1,948
Oulu region Oulu 564-22-1028-1 Isterintie 64 0
County Municipality Property designation Address Area
Oulu region Oulu 564-52-13-27 Valtatie 61 773
Oulu region Oulu 564-63-23-4 Järvenkorventie 4 450
Oulu region Oulu 564-86-7-2 Ruotutie 3 490
Oulu region Oulu 564-72-207-1 Taakakepintie 1 551
Oulu region Oulu 564-410-4-269 Kurtintie 2 278
Eastern Finland Outokumpu 309-9-901-4 Polvijärventie 4 2,242
Western Finland Parainen 445-34-1-1 Kirkkoesplanadi 32 3,648
Western Finland Parainen 445-14-24-4 Vapparintie 3 5,184
Eastern Finland Parikkala 580-404-2-67, 580-404-2-52, 580-404-2-58
Puistokatu 4 1,870
Northern Finland Pelkosenniemi 583-402-35-24, 583-402-35-21 Sodankyläntie 8 423
Western Finland Petäjävesi 592-404-43-2, 592-404-37-1 Asematie 6 708
Eastern Finland Pieksämäki 593-1-67-19 Keskuskatu 35 2,751
Eastern Finland Pieksämäki 593-4-21-2 Kuopiontie 24 586
Eastern Finland Pielavesi 595-422-17-60, 595-422-17-61, 595-422-60-71
Puustellintie 21 1,766
Eastern Finland Polvijärvi 607-414-5-159 Jääskeläntie 2 1,220
Western Finland Pori 609-5-15-1 Isolinnankatu 18 5,259
Western Finland Pori 609-50-21-2 Kotkantie 1 903
Western Finland Pori 609-61-12-12 Juhanintie 1 172
Southern Finland Porvoo 638-2-23-7 Runeberginkatu 33 7,911
Southern Finland Porvoo 638-12-901-2 Sammontie 1 2,256
Southern Finland Porvoo 638-417-1-887 Suolaketie 2 597
Oulu Region Pyhäjoki 625-405-4-329, 625-405-4-119, 625-405-4-294
Vanhatie 54 1,912
Oulu Region Pyhäntä 630-402-5-489 Kairantie 5 1,546
Oulu Region Raahe 678-12-45-18 Rantakatu 57 310
Oulu Region Raahe 678-413-2-173 Pajuniityntie 8 683
Oulu Region Raahe 678-415-83-4 Maunulantie 1 372
Oulu Region Raahe 678-412-1-181 Kirkkoluodontie 1 512
Southern Finland Raasepori 710-6-89-1 Raaseporintie 14 1,941
Southern Finland Raasepori 710-51-8-8 Ratakatu 59 3,252
Southern Finland Raasepori 710-8-117-5 Oikotie 4 3,129
Western Finland Raisio 680-2-201-5 Raisiontori 5 4,293
Western Finland Rauma 684-1-177-1 Kairakatu 2 4,624
Western Finland Rauma 684-414-3-49 Uotilan Vanhatie 37 225
Greater Helsinki Riihimäki 694-20-2046-1 Peltosaarenkatu 1 1,892
Greater Helsinki Riihimäki 694-2-222-1 Keskuskatu 15 6,031
Eastern Finland Ristiina 491-513-1-115 Kitereentie 1 790
Western Finland Rusko 704-404-4-155 Myllymäentie 2 1,235
Western Finland Saarijärvi 729-408-3-111 Jyväskyläntie 31 5,242
Western Finland Saarijärvi 729-408-3-102 Jyväskyläntie 31 1,286
Western Finland Salo 734-13-8-1 Kärkänkatu 18 486
Eastern Finland Savonlinna 740-3-6-8 Tulliportinkatu 6-10 11,071
Eastern Finland Savonlinna 740-19-81-4 Kartanonväylä 3 3,319
Eastern Finland Savonlinna 740-11-92-2 Ilokallionkatu 4 1,671
Eastern Finland Savonlinna 740-13-36-13 Pihlajavedentie 21 1,070
Western Finland Seinajoki 743-6-73-11 Väinämöinen 2 10,916
Western Finland Seinajoki 743-404-22-76 Valkiavuorentie 2 397
Oulu Region Siikajoki 748-418-4-191 Siikasavontie 9 802
Oulu Region Siikalatva 791-421-99-0, 791-421-100-0, 791-421-101-0
Pulkkilantie 2 1,960
Eastern Finland Siilinjärvi 749-405-63-2 Sorakuja 4 2,320
Eastern Finland Siilinjärvi 749-405-18-479 Siilinkoskentie 1 4,472
Northern Finland Simo 751-403-5-180 Ratatie 3 912
Eastern Finland Simpele 689-432-1-118, 689-432-1-119, 689-432-1-447
Roihankatu 8 1,700
Oulu region Sotkamo 765-401-6-358 Ratatie 37 4,326
Oulu region Suomussalmi 777-406-26-107 Risteentie 12 5,626
P R O P E R T I E S
Finland
93
County Municipality Property designation Address Area
Oulu Region Suomussalmi 777-406-3-166 Rahtimiehentie 1 430
Eastern Finland Suonenjoki 778-2-203-11 Rautalammintie 17 1,771
Western Finland Sysmä 781-417-19-3 Särkilahdentie 4 1,427
Southern Finland Sysmä 781-417-19-7 Ohrasaarentie 2 2,303
Western Finland Taalintehdas 322-494-1-105 Hertsbölentie 1 746
Eastern Finland Taivalkoski 832-408-4-59 Talonpojantie 1 843
Western Finland Tampere 837-323-5955-1 Peltolamminkatu 10 1,118
Western Finland Tampere 837-327-7628-1 Kokinpellonrinne 2 421
Western Finland Tampere 106-3-217-1 Pohtolankatu 47-49 690
Western Finland Tampere 837-233-3113-9 Ratakistonkatu 7 1,813
Western Finland Turku 853-87-12-3 Jäkärlän Puistokatu 20 695
Western Finland Turku 853-63-50-5 Jyrkkälänkatu 1 1,000
Western Finland Turku 853-26-3-4 Kirjurinkatu 3 1,154
Western Finland Turku 853-75-23-6 Vakka-Suomentie 82 467
Western Finland Turku 853-94-41-3 Gregorius IX tie 8-12 3,825
Western Finland Turku 853-66-64-5 Metallikatu 2 1,135
Western Finland Turku 853-35-46-3 Kataraistentie 7 1,899
Western Finland Turku 853-62-58-2 Kanslerintie 10 450
Greater Helsinki Tuusula 858-401-2-393 Sulantie 1 5,610
Greater Helsinki Tuusula 858-8-8509-1 Haukantie 2 2,242
Greater Helsinki Tuusula 858-3-7005-3 Vanha Valtatie 191 1,203
Western Finland Urjala 887-409-6-108, 887-409-6-107, 887-409-6-109, 887-409-6-251
Huhdintie 14 850
Western Finland Uusikaarlepyy 893-1-104-3 Sollefteåkatu 9 712
Western Finland Uusikaupunki 895-8-23-15 Ketunkalliontie 5 4,919
Western Finland Vaala 785-404-2-179 Vaalantie 26 1,565
Western Finland Vaasa 905-31-96-2 Kuusilahdentie 2 370
County Municipality Property designation Address Area
Western Finland Valkeakoski 908-4-10-12 Apiankatu 6 4,150
Western Finland Valkeakoski 908-2-23-9 Hakalantie 1 8,617
Western Finland Valkeakoski 908-15-5-5 Sointulantie 2 423
Eastern Finland Valtimo 911-402-10-58 Käpyläntie 2 1,154
Greater Helsinki Vantaa 92-14-1-3 Ulkoniitynkuja 4 2,381
Greater Helsinki Vantaa 092-73-250-24 Rekolantie 53-55 735
Greater Helsinki Vantaa 092-51-153-11 Hagelstamintie 26 607
Greater Helsinki Vantaa 092-83-111-3 Minkkikuja 4 2,270
Greater Helsinki Vantaa 92-94-19-18, 92-94-19-25 Laukkarinne 4-6 3,527
Greater Helsinki Vantaa 092-83-100-9 Mäyräkuja 2 1,818
Greater Helsinki Vantaa 92-61-118-2 Kielotie 20 3,794
Greater Helsinki Vantaa 92-16-140-1 Ukonkivenpolki 11 1,957
Eastern Finland Varkaus 915-5-200-9 Relanderinkatu 30 8,145
Eastern Finland Varkaus 915-5-296-7 Käsityökatu 22 5,197
Eastern Finland Varkaus 915-4-61-21 Savontie 42 702
Eastern Finland Varkaus 915-15-9001-4 Kurolantie 1 690
Eastern Finland Varkaus 915-13-1311-3 Kyllikinkatu 1 466
Western Finland Viitasaari 931-401-3-133 Postikuja 1 2,103
Western Finland Viitasaari 931-401-54-133 Haapaniementie 41 237
Western Finland Vimpeli 934-404-1-585 Pöntisentie 4 1,228
Western Finland Virrat 936-409-28-53, 936-409-28-255, 936-409-28-321
Asematie 2 3,135
Western Finland Ylivieska 977-10-25-1 Savarinkatu 2 6,274
Western Finland Ylöjärvi 980-428-2-292, 980-428-2-308-1
Mastontie 2 3,014
Western Finland Äänekoski 992-4-407-19 Puistokatu 12 456
P R O P E R T I E S
Finland
K-Market Sörnäistenniemi, Helsinki