
Marriott International (NASDAQ: MAR Company Report
23
November 13, 2019 1 Andrew Speen, [email protected] Andrea Sugano, [email protected] See important disclaimer at the end of this report. International Expansion and M&A Synergies Justify WH Valuation Investment Summary Our analysis indicated that Wyndham Hotels and Resorts (NYSE: WH) is undervalued, with an implied price per share 9% above its day close price (11/13). As this is within the +/- 10% threshold, we report a hold recommendation. Our equity valuation reflects two key findings for WH: 1. M&A focused on cost synergies. Management spends considerable time in earnings calls updating investors on $66M in cost synergies related to their recent La Quinta acquisition. We project SG&A costs to represent roughly 28% of 2019 revenues (the percentage over Q4 2018-Q3 2019), a decline from a 32.2% median over the past 3 years. This decline in SG&A as a percent of revenues generates an incremental $1.34B in equity value in our model (26% of current market cap). 2. A strategic international push. From Q1-Q3 2019, WH saw quarterly room count in Greater China grow by 8%, 9%, and 6% YOY, respectively. WH aims to increase its hotel count in Greater China by a third in the next 3-4 years. It has expanded even faster in Rest of Asia, with quarterly YOY growth at 25% in Q1 2019 and 22% in Q2 and again in Q3. We project that revenue from Greater China will more than double from 2018 to 2024 and Rest of Asia will roughly triple. If the room count in Greater China, Rest of Asia, EMEA, and Latin America grow at the same pace as projected in the U.S., we would see a $1.16B decline in equity value in our model (23% of current market cap). Key Risks 1. Strengthening hotel alternatives market. WH’s aim to make hotel travel possible for all people by targeting economy/midscale customers exposes it to risks from alternatives, which target similar customers. This could cause RevPAR to be materially less than the base case. 2. Declining macroeconomic factors. The probability of US recession by Treasury Spread is 29%. This will constrain growth for WH. 3. Competition in International Markets. WH is facing competition from established and newer hotels abroad, particularly OYO, which offers 500K rooms in China. 4. Inflated Costs due to International Expansion. WH achieved $66M in cost synergies via its La Quinta acquisition (20% of 2017 SG&A, the calendar year prior to acquisition). Poor M&A targets in WH’s international expansion could materially impact free cash flow. RECOMMENDATION: HOLD (NYSE:WH) Key Figures Date: November 13, 2019 Current Market Equity Value ($m): 5,149 Day Close Price ($/share): $54.10 Shares Out. (mm): 95.2 Number of Options (mm): 1.0 (est. value at $10.46/option) RSUs (mm) 1.0 Shares Sold Short (mm): 2.3 52 Week High/Low: 61.59/43.03 Estimated Company WACC: 7% Equity Valuation (net of options value): $5,643 [probability weighted by baseline of $6,430M (60% probability), upside $7,994M (10%), and downside $3,319 (30%) scenarios] Implied Price Per Share: $58.74 Implied Price per Share / Day Close Price = 109% Baseline Case: Equity Valuation / Mkt Cap = 125% Upside Case: Equity Valuation / Mkt Cap = 155% Downside Case: Equity Valuation / Mkt Cap = 64% Upside Case: Strong macroeconomic conditions from 2020-2024 and improved cost/revenue synergies from future M&A activity. Downside Case: Weak macroeconomic conditions from 2020- 2024 and burgeoning of hotel alternatives eating into RevPAR growth. Royalty Revenue by Geography WH Systemwide Room Composition by Region 0 100 200 300 400 500 600 Revenue Growth Index: 2017 = 100 United States Canada Greater China Rest of Asia EMEA Latin America 30% 35% 40% 45% 50% 55% 60% 65% 70% Q1 2014 Q2 2015 Q3 2016 Q4 2017 Q1 2019 Q2 2020 Q3 2021 Q4 2022 Q1 2024 United States Intl
-
Upload
khangminh22 -
Category
Documents
-
view
0 -
download
0
Transcript of Marriott International (NASDAQ: MAR Company Report
November 13, 2019 1
Andrew Speen, [email protected]
Andrea Sugano, [email protected]
See important disclaimer at the end of this report.
International Expansion and M&A
Synergies Justify WH Valuation
Investment Summary
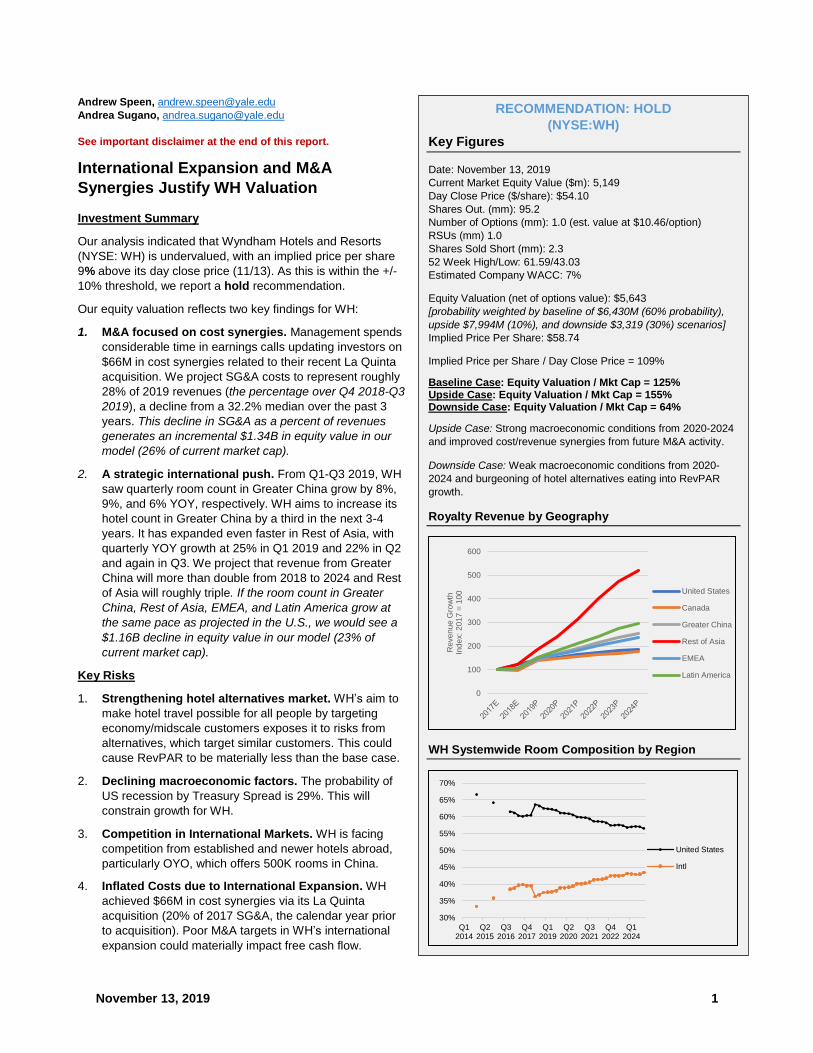
Our analysis indicated that Wyndham Hotels and Resorts
(NYSE: WH) is undervalued, with an implied price per share
9% above its day close price (11/13). As this is within the +/-
10% threshold, we report a hold recommendation.
Our equity valuation reflects two key findings for WH:
1. M&A focused on cost synergies. Management spends
considerable time in earnings calls updating investors on
$66M in cost synergies related to their recent La Quinta
acquisition. We project SG&A costs to represent roughly
28% of 2019 revenues (the percentage over Q4 2018-Q3
2019), a decline from a 32.2% median over the past 3
years. This decline in SG&A as a percent of revenues
generates an incremental $1.34B in equity value in our
model (26% of current market cap).
2. A strategic international push. From Q1-Q3 2019, WH
saw quarterly room count in Greater China grow by 8%,
9%, and 6% YOY, respectively. WH aims to increase its
hotel count in Greater China by a third in the next 3-4
years. It has expanded even faster in Rest of Asia, with
quarterly YOY growth at 25% in Q1 2019 and 22% in Q2
and again in Q3. We project that revenue from Greater
China will more than double from 2018 to 2024 and Rest
of Asia will roughly triple. If the room count in Greater
China, Rest of Asia, EMEA, and Latin America grow at
the same pace as projected in the U.S., we would see a
$1.16B decline in equity value in our model (23% of
current market cap).
Key Risks
1. Strengthening hotel alternatives market. WH’s aim to
make hotel travel possible for all people by targeting
economy/midscale customers exposes it to risks from
alternatives, which target similar customers. This could
cause RevPAR to be materially less than the base case.
2. Declining macroeconomic factors. The probability of
US recession by Treasury Spread is 29%. This will
constrain growth for WH.
3. Competition in International Markets. WH is facing
competition from established and newer hotels abroad,
particularly OYO, which offers 500K rooms in China.
4. Inflated Costs due to International Expansion. WH
achieved $66M in cost synergies via its La Quinta
acquisition (20% of 2017 SG&A, the calendar year prior
to acquisition). Poor M&A targets in WH’s international
expansion could materially impact free cash flow.
RECOMMENDATION: HOLD
(NYSE:WH)
Key Figures
Date: November 13, 2019
Current Market Equity Value ($m): 5,149
Day Close Price ($/share): $54.10
Shares Out. (mm): 95.2
Number of Options (mm): 1.0 (est. value at $10.46/option)
RSUs (mm) 1.0
Shares Sold Short (mm): 2.3
52 Week High/Low: 61.59/43.03
Estimated Company WACC: 7%
Equity Valuation (net of options value): $5,643
[probability weighted by baseline of $6,430M (60% probability),
upside $7,994M (10%), and downside $3,319 (30%) scenarios]
Implied Price Per Share: $58.74
Implied Price per Share / Day Close Price = 109%
Baseline Case: Equity Valuation / Mkt Cap = 125% Upside Case: Equity Valuation / Mkt Cap = 155% Downside Case: Equity Valuation / Mkt Cap = 64%
Upside Case: Strong macroeconomic conditions from 2020-2024
and improved cost/revenue synergies from future M&A activity.
Downside Case: Weak macroeconomic conditions from 2020-
2024 and burgeoning of hotel alternatives eating into RevPAR
growth.
Royalty Revenue by Geography
WH Systemwide Room Composition by Region
0
100
200
300
400
500
600
Reve
nu
e G
row
thIn
de
x:
20
17
= 1
00 United States
Canada
Greater China
Rest of Asia
EMEA
Latin America
30%
35%
40%
45%
50%
55%
60%
65%
70%
Q12014
Q22015
Q32016
Q42017
Q12019
Q22020
Q32021
Q42022
Q12024
United States
Intl

November 13, 2019 2
Contents 1. INTRODUCTION ....................................................................................................................................... 3
A. Investment Thesis ................................................................................................................................... 3
B. Recent M&A Activity ............................................................................................................................... 3
i. Spin-Off from Wyndham Worldwide Corporation ...................................................................................... 3
ii. M&A Activity .............................................................................................................................................. 3
a. 2018 La Quinta Acquisition ....................................................................................................................... 3
b. 2018 Knights Inn Divestiture ..................................................................................................................... 4
2. FIRM-LEVEL ANALYSIS.......................................................................................................................... 4
A. Business Segments ................................................................................................................................ 4
B. Asset Model ............................................................................................................................................. 5
C. Financial Statement Overview and Projections ................................................................................... 5
i. Revenue .................................................................................................................................................... 5
ii. Costs ....................................................................................................................................................... 10
D. Primary Risk Factors ............................................................................................................................ 11
iii. CONSTRUCTING DCF MODEL TO VALUE WH ................................................................................... 12
A. WACC ..................................................................................................................................................... 12
B. Determining Terminal Growth Rate ..................................................................................................... 13
C. Mid-Year Adjustment ............................................................................................................................ 13
D. Base Case and Upside/Downside Scenarios ..................................................................................... 13
iv. VALUATION ............................................................................................................................................ 17
vi. APPENDIX 1: Quarterly Systemwide Room Count ................................................................................. 19
vii. APPENDIX 2: Back-Testing Royalty Revenue Forecast ......................................................................... 22
viii. DISCLAIMER .......................................................................................................................................... 23

November 13, 2019 3
1. INTRODUCTION
A. Investment Thesis
As noted on the first page, we built two key observations into our financial model.
1. M&A focused on cost synergies. See Section B for additional information
2. A strong international push in expansion efforts, especially in Asia
B. Recent M&A Activity
i. Spin-Off from Wyndham Worldwide Corporation
On June 2, 2018, Wyndham Worldwide completed its spin-off of Wyndham Destinations
and created Wyndham Hotels & Resorts (hereafter “WH”), a new pure-play firm
focusing on franchising and hotel management.1 At quarter-end Q3 2019, WH had over
9.2k properties (only two of which it owns) and 822k rooms, making it the world’s largest
hotel franchisor.2 Per the WH website, WH aims to “mak[e] hotel travel possible for all”.
ii. M&A Activity
Per CEO Geoff Ballotti, acquisition has characterized WH’s historical growth, with 18 of
its 20 brands having been acquired. In the last 30 years, WH averaged one acquisition
every 18 months.3 WH targets established brands with growth potential, strategic fit, and
the ability to be immediately accretive to earnings.
a. 2018 La Quinta Acquisition
WH completed its acquisition of the upper midscale brand La Quinta on May 31,
2018 for $1.95b in cash. To gauge the magnitude of the acquisition, WH had
$2.162b in total assets as of Q1 2018.4 In 2018, WH’s net revenues increased by
46% compared to the prior year, but excluding the La Quinta acquisition, the
figure drops to 6%.5 In April 2019, WH completed its last major integration
milestone with its migration of La Quinta’s loyalty program and technology
platform. By Q3 2019, WH had achieved run-rate synergies of $68m annually, as
anticipated.6 Ballotti expects Wyndham to pursue acquisitions similar to the La
Quinta deal going forward.
1 Ting, Deanna. “Wyndham Hotels CEO on Life After Company Split: ‘La Quinta Will Be Transformational’.” Skift. June 3, 2018. 2 Wyndham Hotels & Resorts, 3rd Quarter 2019 Results, p. 2. 3 Ting, Deanna. “Wyndham Hotels CEO on Life After Company Split: ‘La Quinta Will Be Transformational’.” Skift. June 3, 2018. 4 Capital IQ 5 Wyndham Hotels & Resorts, FY 2018 Form 10K, p. 36. Because this figure comes from WH’s own filings and not the standardized data from Capital IQ, revenue figures for this statistic do not match those in financial model 6 Wyndham Hotels & Resorts, 3rd Quarter 2019 Results, p. 3.

November 13, 2019 4
Figure 1: La Quinta Acquisition Synergies
Source: Wyndham Hotels & Resorts Investor Presentation, October 2019, p. 46.
b. 2018 Knights Inn Divestiture
In 2018, WH sold Knights Inn (which had 362 North American Hotels) to Red
Lion for $27m cash. Per WH CMO Barry Goldstein, WH’s “‘economy brands have
fit in the mid to upper end of the economy segment… this was a play around
fitting in that segment and not the lower end of it.’”7
Different scenarios regarding WH’s future M&A strategy are built into our upside and
downside cases. Management believes all synergies regarding the La Quinta acquisition
have been achieved.8
2. FIRM-LEVEL ANALYSIS
A. Business Segments
WH operates two business segments: hotel franchising and hotel management. Its franchising
segment “licenses [the WH] lodging brands and provides related services to third-party hotel
owners and others,” while management segment “provides hotel management services for full-
service and limited-service hotels as well as two hotels that are owned by Wyndham”.9
Figure 2: WH Business Segment Breakdown as of Year-End 2018
% of Systemwide Rooms Business Segment Geographies % of System Rooms as of Q3 2019 (n=821.8k)
8% Hotel management United States: 62% Greater China: 18% Rest of Asia: 3% Europe, Middle East, and Africa: 8% Canada: 5% Latin America: 3%
92%
Hotel franchising
Source: Author calculations from room counts in Wyndham Hotels & Resorts, “System Size and RevPAR by Region and Chainscale,” Q3 2019.
7 Eisen, David. “Wyndham sells Knights Inn brand to Red Lion ahead of spin-off.” Hotel Management. April 4, 2018. 8 Wyndham Hotels & Resorts Investor Presentation, October 2019, p. 46. 9 Wyndham Hotels & Resorts, FY 2018 Form 10K, p. 35.
19
27
20
2
Amount ($ Millions)
Public Company Expenses
Technology, Sales, andMarketing Savings
Operating Cost Savings
Credit Card RevenueBenefits
November 13, 2019 5
B. Asset Model
WH is asset-light, owning just two properties. We do not expect WH to increase its owned
properties, which are currently intended to generate “cross-product interest by exposing [WH’s]
hotel guests to the vacation ownership product.” We believe this model is sustainable given
franchisee retention rates of 94% each year (with franchise contract agreements typically lasting
10-20 years), and a clear focus on franchisee satisfaction. Retention is aided by, e.g.,
“provid[ing]… hotel designs and prototypes to property owners and developers to help them
boost the returns they generate from their investments,” providing “fully integrated, turn-key
property management, reservations and revenue management systems that have capabilities
that were not previously affordable to hotels in the economy and midscale sectors,” investing in
e-commerce to “drive reservations to… franchisees,” offering global customer services centers,
and engaging in a “consultative” relationship with franchise.”10 Our model thus excludes real
estate risk and projects the owned property revenue will decline as a portion of total
revenue.
C. Financial Statement Overview and Projections
i. Revenue
Overview of Revenue Streams
WH has four revenue streams (stated below).11 We forecast each line item below based on a
combination of historical data and company statements. Royalty revenues are forecasted
by the geographic regions in Figure 2 above.
1. Royalties and franchise fees: Principal revenue source for franchising properties. They
comprise a percentage of the gross room revenues of each franchised hotel. They also
include royalties from managed properties (accounting for 2% of total line items in
2018).12 Franchise fees include the initial, non-refundable franchise fee, franchise
renewal fees, transfer fees, and early termination fees.
2. License and other revenues from former parent: Revenue recognition for the use of
trademarks (e.g., “Wyndham”) and the Wyndham Rewards loyalty program.
3. Marketing, reservation, and royalty revenues: This primarily includes cost
reimbursement revenues. As of Q3 2019, WH’s central reservation system reached 58%
globally and 71% domestically.13 They also include the fee revenue from an annual
franchisee conference. Such revenue is largely offset by marketing, reservation, and
royalty expenses, though WH has seen expenses exceed revenues since 2016, but we
expect these line items to converge at the terminal date.
4. Hotel management: For non-owned properties, includes base fees (% of revenue),
incentives fees (% profitability), and service fees (from accounting, design, construction,
10 Wyndham Hotels & Reports, FY 2018 Form 10K, p. 6. 11 We exclude the line item “cost reimbursement” from revenue since it is perfectly offset by “const reimbursement” expenses each year. 12 Author calculation. Data from Wyndham Hotels & Reports, FY 2018 Form 10K, p. F-19. 13 Wyndham Hotels & Resorts, Q3 2019 Earnings Call Transcript

November 13, 2019 6
purchasing services, technical assistance). For the two owned properties, revenues
include gross room revenue and fees from amenities.
Procedure for Revenue Forecast
Step 1: Forecast Royalties14
Royalty revenue is a function of the rooms in WH’s system, revenue per available room (or
“RevPAR,” the product of occupancy and average daily rates), and average royalty rates.
Formula 1: Royalty Revenue
𝑅𝑜𝑦𝑎𝑙𝑡𝑦 𝑅𝑒𝑣𝑒𝑛𝑢𝑒 = # 𝑅𝑜𝑜𝑚𝑠 𝑖𝑛 𝑆𝑦𝑠𝑡𝑒𝑚 ∗ 𝑅𝑒𝑣𝑃𝐴𝑅 ∗ 𝐴𝑣𝑒𝑟𝑎𝑔𝑒 𝑅𝑜𝑦𝑎𝑙𝑡𝑦 𝑅𝑎𝑡𝑒 ∗ 365 𝐷𝑎𝑦𝑠 𝑃𝑒𝑟 𝑌𝑒𝑎𝑟
RevPAR and royalty rates vary significantly by the region in which the hotel operates. Since
WH’s future room composition by region will not simply mirror its historical geographic
breakdown, we can’t use average historical numbers to forecast royalty revenue. We therefore
forecast the number of systemwide rooms, RevPAR, and average royalty rate by region.
Step 1A: Forecasting Systemwide Rooms
Instead of using the year-end room count figures generally provided in 10-Ks, we base our
forecast on an average of quarterly room counts by region for accuracy. Figure 3 breaks down
revenue room count growth by region. For quarterly systemwide room data, see Appendix 1.
Figure 3: Room Count by Region (Quarterly Average)
Total Rooms 2017 2018 2019P 2020P 2021P 2022P 2023P 2024P
United States 429,925 488,025 508,641 518,814 529,190 539,774 550,570 561,581
Annual Growth 13.5% 4.2% 2.0% 2.0% 2.0% 2.0% 2.0%
Canada 40,051 39,550 40,290 40,693 41,100 41,511 41,926 42,346
Annual Growth -1.3% 1.9% 1.0% 1.0% 1.0% 1.0% 1.0%
Greater China 136,777 140,625 151,184 164,541 176,550 188,559 199,819 207,846
Annual Growth 2.8% 7.5% 8.8% 7.3% 6.8% 6.0% 4.0%
Rest of Asia 16,781 20,825 25,543 31,259 38,241 46,780 52,873 55,713
Annual Growth 24.1% 22.7% 22.4% 22.3% 22.3% 13.0% 5.4%
EMEA 64,647 65,550 67,063 69,410 71,839 74,354 76,645 78,569
Annual Growth 1.4% 2.3% 3.5% 3.5% 3.5% 3.1% 2.5%
Latin America 23,857 26,300 28,671 31,039 33,564 36,289 38,564 40,151
Annual Growth 10.2% 9.0% 8.3% 8.1% 8.1% 6.3% 4.1%
Total 712,039 780,875 821,392 855,757 890,486 927,268 960,396 986,206
9.7% 5.2% 4.2% 4.1% 4.1% 3.6% 2.7% Total International 282,114 292,850 312,751 336,943 361,295 387,494 409,826 424,625
3.8% 6.8% 7.7% 7.2% 7.3% 5.8% 3.6% Note: 2017 room counts rely on an estimated value for Q1 2017 value is estimated by taking the YOY growth from Q2 2017 to Q2 2018 and making Q1
2017 to Q1 2018 growth equivalent.
14 Excluding marketing, reservation, and royalty revenue (which is offset by a roughly equivalent expense), royalties comprised 53% of total revenue in 2018.
November 13, 2019 7
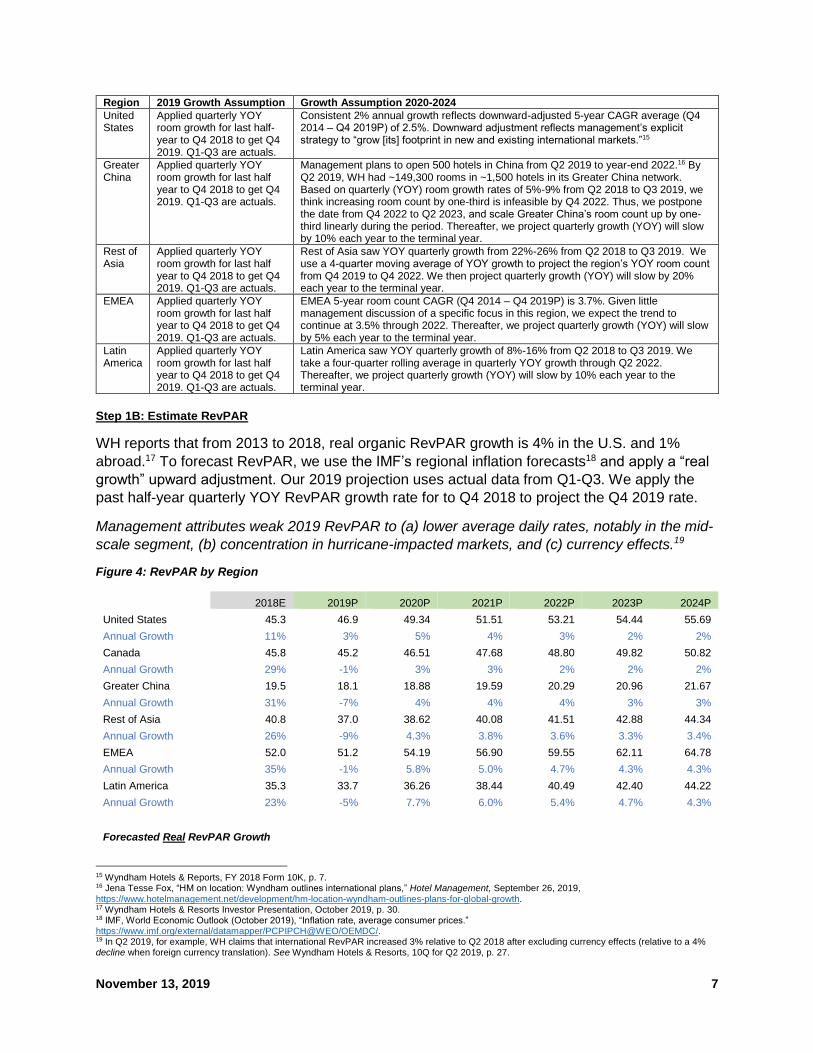
Region 2019 Growth Assumption Growth Assumption 2020-2024
United States
Applied quarterly YOY room growth for last half-year to Q4 2018 to get Q4 2019. Q1-Q3 are actuals.
Consistent 2% annual growth reflects downward-adjusted 5-year CAGR average (Q4 2014 – Q4 2019P) of 2.5%. Downward adjustment reflects management’s explicit strategy to “grow [its] footprint in new and existing international markets.”15
Greater China
Applied quarterly YOY room growth for last half year to Q4 2018 to get Q4 2019. Q1-Q3 are actuals.
Management plans to open 500 hotels in China from Q2 2019 to year-end 2022.16 By Q2 2019, WH had ~149,300 rooms in ~1,500 hotels in its Greater China network. Based on quarterly (YOY) room growth rates of 5%-9% from Q2 2018 to Q3 2019, we think increasing room count by one-third is infeasible by Q4 2022. Thus, we postpone the date from Q4 2022 to Q2 2023, and scale Greater China’s room count up by one-third linearly during the period. Thereafter, we project quarterly growth (YOY) will slow by 10% each year to the terminal year.
Rest of Asia
Applied quarterly YOY room growth for last half year to Q4 2018 to get Q4 2019. Q1-Q3 are actuals.
Rest of Asia saw YOY quarterly growth from 22%-26% from Q2 2018 to Q3 2019. We use a 4-quarter moving average of YOY growth to project the region’s YOY room count from Q4 2019 to Q4 2022. We then project quarterly growth (YOY) will slow by 20% each year to the terminal year.
EMEA Applied quarterly YOY room growth for last half year to Q4 2018 to get Q4 2019. Q1-Q3 are actuals.
EMEA 5-year room count CAGR (Q4 2014 – Q4 2019P) is 3.7%. Given little management discussion of a specific focus in this region, we expect the trend to continue at 3.5% through 2022. Thereafter, we project quarterly growth (YOY) will slow by 5% each year to the terminal year.
Latin America
Applied quarterly YOY room growth for last half year to Q4 2018 to get Q4 2019. Q1-Q3 are actuals.
Latin America saw YOY quarterly growth of 8%-16% from Q2 2018 to Q3 2019. We take a four-quarter rolling average in quarterly YOY growth through Q2 2022. Thereafter, we project quarterly growth (YOY) will slow by 10% each year to the terminal year.
Step 1B: Estimate RevPAR
WH reports that from 2013 to 2018, real organic RevPAR growth is 4% in the U.S. and 1%
abroad.17 To forecast RevPAR, we use the IMF’s regional inflation forecasts18 and apply a “real
growth” upward adjustment. Our 2019 projection uses actual data from Q1-Q3. We apply the
past half-year quarterly YOY RevPAR growth rate for to Q4 2018 to project the Q4 2019 rate.
Management attributes weak 2019 RevPAR to (a) lower average daily rates, notably in the mid-
scale segment, (b) concentration in hurricane-impacted markets, and (c) currency effects.19
Figure 4: RevPAR by Region
2018E 2019P 2020P 2021P 2022P 2023P 2024P
United States 45.3 46.9 49.34 51.51 53.21 54.44 55.69
Annual Growth 11% 3% 5% 4% 3% 2% 2%
Canada 45.8 45.2 46.51 47.68 48.80 49.82 50.82
Annual Growth 29% -1% 3% 3% 2% 2% 2%
Greater China 19.5 18.1 18.88 19.59 20.29 20.96 21.67
Annual Growth 31% -7% 4% 4% 4% 3% 3%
Rest of Asia 40.8 37.0 38.62 40.08 41.51 42.88 44.34
Annual Growth 26% -9% 4.3% 3.8% 3.6% 3.3% 3.4%
EMEA 52.0 51.2 54.19 56.90 59.55 62.11 64.78
Annual Growth 35% -1% 5.8% 5.0% 4.7% 4.3% 4.3%
Latin America 35.3 33.7 36.26 38.44 40.49 42.40 44.22
Annual Growth 23% -5% 7.7% 6.0% 5.4% 4.7% 4.3%
Forecasted Real RevPAR Growth
15 Wyndham Hotels & Reports, FY 2018 Form 10K, p. 7. 16 Jena Tesse Fox, “HM on location: Wyndham outlines international plans,” Hotel Management, September 26, 2019, https://www.hotelmanagement.net/development/hm-location-wyndham-outlines-plans-for-global-growth. 17 Wyndham Hotels & Resorts Investor Presentation, October 2019, p. 30. 18 IMF, World Economic Outlook (October 2019), “Inflation rate, average consumer prices.” https://www.imf.org/external/datamapper/PCPIPCH@WEO/OEMDC/. 19 In Q2 2019, for example, WH claims that international RevPAR increased 3% relative to Q2 2018 after excluding currency effects (relative to a 4% decline when foreign currency translation). See Wyndham Hotels & Resorts, 10Q for Q2 2019, p. 27.

November 13, 2019 8
U.S. 3.0% 2.0% 1.0% 0.0% 0.0%
International 1.0% 0.5% 0.3% 0.0% 0.0% Note: 2018 is an estimate given that WH does not report RevPAR by region on an annual basis (just on a quarterly basis). The estimate is a weighted
average of quarterly RevPAR figures by room count in each region. While the WH 10-K has an actual figure, this ensures the methodology is
consistent with our forecast. 2019 estimate uses actual data.
Step 1C: Estimate Royalty Rates
WH discloses average royalty rates annually world-wide. U.S. royalty rates exceed those for the
total company. To estimate the royalty rate for international locations we use this formula:
Formula 2: Estimated Quarterly International Royalty Rate
𝐸𝑠𝑡𝑖𝑚𝑎𝑡𝑒𝑑 𝑄𝑢𝑎𝑟𝑡𝑒𝑟𝑙𝑦 𝐼𝑛𝑡𝑙 𝑅𝑜𝑦𝑎𝑙𝑡𝑦 𝑅𝑎𝑡𝑒 =𝐺𝑙𝑜𝑏𝑎𝑙 𝑅𝑜𝑦𝑎𝑙𝑡𝑦 𝑅𝑎𝑡𝑒 − (𝑈𝑛𝑖𝑡𝑒𝑑 𝑅𝑜𝑦𝑎𝑙𝑡𝑦 𝑅𝑎𝑡𝑒 ∗ % 𝑅𝑜𝑜𝑚𝑠 𝑖𝑛 𝑈. 𝑆. )
% 𝑜𝑓 𝑅𝑜𝑜𝑚𝑠 𝑖𝑛 𝐼𝑛𝑡𝑙
Figure 5: Historical Quarterly Royalty Rates by Region
Quarterly Historicals
Note: Total International data are estimated by authors using Formula two. Missing room count data by region result is missing data points.
Source: Wyndham Hotels & Resorts, Quarterly Earnings Releases, Q2 2018 through Q3 2019.
Our 2019 projection is based on an average of quarterly royalty rates from Q1-Q3 actuals and a
Q4 projection. We projected Q4 2019 royalty rates by seeing the YOY growth in the average
royalty rate from the past half-year (i.e., Q2 2019 and Q3 2019 average versus Q2 2018 and Q3
2018 average) and applied this rate to Q4 2018 to arrive at a Q4 2019 projection. We then used
a two-year rolling average to project annual rates through 2024.
Figure 6: Annual Royalty Rates by Region with Projections
Royalty Fees 2015 2016 2017 2018 2019P 2020P 2021P 2022P 2023P 2024P
United States 4.37% 4.35% 4.45% 4.53% 4.53% 4.53% 4.53% 4.53% 4.53% 4.53%
International N/A N/A 2.46% 2.53% 2.73% 2.79% 2.84% 2.89% 2.93% 2.94%
Total Company 3.68% 3.65% 3.66% 3.78% 3.85% 3.85% 3.85% 3.85% 3.85% 3.85%
Source: 2015-2018 data from Wyndham Hotels & Resorts, Form 10-K for 2018, p. 32. Quarterly data for 2018 and 2019 (for 2019P) from Quarterly
Earnings releases.
Step 1D: Estimate Total Royalty Revenue
2.0%
2.5%
3.0%
3.5%
4.0%
4.5%
United States
Total International
Global

November 13, 2019 9
We estimate total royalty revenue using Formula 1 (p. 6), based on the projections stated
above. A back-testing of our royalty revenue estimate can be found in Appendix 2.
Step 2: Forecast Total Revenue and Other Line Items
We based our forecast of total revenue and other line items on historical data, with adjustments
to account for changes in its hotel network from M&A activity (e.g., La Quinta acquisition) and
strategic initiatives expressed by management (e.g., expansion of managed network).
Step 2A: Forecast Total Revenue
Total revenue has consistently been 33-34% of royalties/franchise fees (excluding initial
franchise fees). We apply a 2% increase to the royalty revenue generated in Step 1 to account
for additional franchise fees (e.g., renewal fees, transfer fees, and early termination fees), and
then apply this percentage to project total revenue. That is, total revenue for each year is
a function of royalties/franchise fees. That is:
Formula 3:
𝑻𝒐𝒕𝒂𝒍 𝑹𝒆𝒗𝒆𝒏𝒖𝒆 =𝑹𝒐𝒚𝒂𝒍𝒕𝒊𝒆𝒔 + 𝑭𝒓𝒂𝒏𝒄𝒉𝒊𝒔𝒆 𝑭𝒆𝒆𝒔
𝑹𝒐𝒍𝒍𝒊𝒏𝒈 𝑭𝒊𝒗𝒆 𝒀𝒆𝒂𝒓 𝑨𝒗𝒆𝒓𝒂𝒈𝒆 𝒐𝒇 𝑹𝒐𝒚𝒂𝒍𝒕𝒊𝒆𝒔 + 𝑭𝒓𝒂𝒏𝒄𝒉𝒊𝒔𝒆 𝑭𝒆𝒆𝒔 𝒂𝒔 % 𝒐𝒇 𝑻𝒐𝒕𝒂𝒍 𝑹𝒆𝒗𝒆𝒏𝒖𝒆
Step 2B: Forecast Other Line Items
Figure 7 defines each assumption. Figure 8 shows each revenue sub-item as a percentage of
total revenue through 2024.
Figure 7: Revenue Assumptions (Excluding Royalties)
Line Item as Percent of Total Revenue
Assumption
Initial Franchising Fee Will grow to 6% in 2019-20 and fall to 4% in 2024. 2019-2020 increase reflects all-time high in WH’s development pipeline (190k total rooms in Q3 2019).20
License and Other Revenues from Former Parent
2019 percentage based on LTM (Q4 2018-Q3 2019). Thereafter, we use a five-year moving average.
Marketing, Reservation, and Loyalty
2019 percentage based on LTM (Q4 2018-Q3 2019). Thereafter, we use a five-year moving average.
Hotel Management (1) Managed Properties (2) Owned Properties
2019 percentage set equal to 2018 percentage. Historical average not used since La Quinta acquisition expanded WH’s managed network by 279% from 116 hotels. Per management, “[h]otel management represents an attractive expansion opportunity to grow our asset light business and further penetrate the midscale and higher segments.”21 Management revenue is projected to increase, despite projected declines in the percentage of total revenue stemming from owned properties (given no expansion plans beyond the two properties).
Other Revenue Did not forecast. Represents a plug after subtracting total revenue from other line items.
20 Development pipeline figures are reported in each Quarterly Earnings Release. 21 Wyndham Hotels & Reports, FY 2018 Form 10K, p. 7.

November 13, 2019 10
Figure 8: Revenue Sub-Items as a Percentage of Total Revenue
2015 2016 2017 2018 2019P 2020P 2021P 2022P 2023P 2024P Royalties and Franchise Fees (Excl. Initial Fee) 33% 34% 34% 33% 33% 34% 34% 33% 33% 33%
United States (estimate/projection) 28% 27% 27% 26% 26% 26% 25% 25%
Canada (est./proj.) 1.3% 1.0% 1.2% 1.2% 1.2% 1.2% 1.1% 1.1%
Greater China (est./proj.)22 1.9% 1.6% 1.8% 2.0% 2.1% 2.2% 2.3% 2.4%
Rest of Asia (est./proj.) 0.5% 0.5% 0.6% 0.8% 0.9% 1.1% 1.2% 1.3%
EMEA (est./proj.) 2.3% 2.0% 2.3% 2.4% 2.5% 2.5% 2.6% 2.7%
Latin America(est./proj.) 0.6% 0.5% 0.7% 0.7% 0.8% 0.8% 0.9% 0.9%
Initial Franchising Fee 1.2% 1.9% 1.4% 1.6% 2.0% 2.0% 1.7% 1.7% 1.3% 1.3%
Initial Franchising Fee (% Royalty) 4% 6% 4% 5% 6.0% 6% 5% 5% 4% 4% License and other revenues from former
Parent 6% 7% 7% 9% 9% 8% 8% 8% 8% 8%
Marketing Reservation and Loyalty 40% 38% 37% 38% 39% 38% 38% 38% 38% 38%
Hotel Management 10% 11% 11% 10% 10% 10% 11% 11% 12% 12%
Hotel Management - owned prop 8.1% 7.7% 5.9% 5.2% 4.7% 4.4% 4.1% 3.9% 3.7%
Hotel Management - managed prop 2.6% 3.0% 3.8% 4.5% 5.9% 7.4% 8.9% 10.4% 11.8%
Other Revenue 10% 10% 10% 9% 7% 9% 8% 8% 7% 7%
Total 100% 100% 100% 100%
ii. Costs
Figure 9 shows our cost assumptions employed in our model with rationale.
Figure 9: Revenue Growth and Cost Breakdown
Historical Forecasts
2015 2016 2017 2018 2019P 2020P 2021P 2022P 2023P 2024P
Revenue Growth - -3.0% 1.8% 26.2% 17.6% 8.2% 7.9% 7.8% 5.4% 5.1% Based on revenue model
COGS/Rev 41% 30% 31% 31% 30.5% 30.6% 30.6% 30.6% 30.6% 30.6% 3-year moving avg COGS/Marketing, Res and Loyalty Res 102% 80% 84% 80% 85.0% 90.0% 95.0% 100.0% 100.0% 100.0%
Increase from 85% to 100%, reflecting long-term offset from cost reimbursement
SG&A/Rev 26% 32% 33% 31% 27.5% 27.5% 27.5% 27.5% 27.5% 27.5% LTM Average to reflect recent SG&A synergies from La Quinta
Other Operating Expenses/(Income) 0% 0% 0% 0% $0 $0 $0 $0 $0 $0 0%
D&A/Rev 7% 7% 7% 8% 7.5% 7.5% 7.6% 7.5% 7.5% 7.5% Three year moving average D&A / Capital Expenditure 1.31 1.74 1.63 1.36 1.30 1.24 1.18 1.12 1.06 1.00 Scaling linearly to 1 by terminal period Capital Expenditure/Rev 5% 4% 5% 6% 5% 5% 5% 5% 5% 5% Three year moving average
Total Assets $1,959 $1,983 $2,137 $4,976 $5,731 $6,263 $6,718 $7,139 $7,566 $7,903 Based on total asset/revenue projection
Total Assets / Sales 90% 99% 110% 388% 3.88 3.88 3.88 3.88 3.88 3.88 2018 value
Total Asset Growth 1.2% 7.8% 132.8% 15% 9% 7% 6% 6% 4% Based on Total Assets projections above
Net Working Capital / Assets -3% -2% -1% -4% -4% -4% -4% -4% -4% -4% 2018 value Net Working Capital ($49) ($42) ($31) ($187) ($215.39) ($235) ($252) ($268) ($284) ($297)
Used NWC/Assets percentage to derive NWC for each year
22 Support is added to our methodology for estimating royalties/franchise fee by region when WH CEO Geoff Ballotti asserts that China is less than 5% of our royalty fee income today. See Wyndham Hotels & Resorts, Q3 2019 Earnings Call Transcript. Our 2018 estimation puts China at roughly 4.8% of royalties and franchise fees (excl. initial fee) revenue.

November 13, 2019 11
D. Primary Risk Factors
• Growth of Hotel Alternatives. Hotel alternatives continue to be attractive to price-sensitive
and/or younger travelers, and may have a certain “stickiness” with demographic cohorts over
time.23 Increases in alternatives’ cost-effectiveness and/or availability relative to hotels
threatens WH, especially because WH targets a similar customer base (i.e., cost-sensitive
travelers). WH is addressing this risk by enhancing its marketing spending, WH presence, and
loyalty program. Wyndham Rewards has 77m members, and 40% of Wyndham guests are
Wyndham Rewards members.24 However, hotel alternatives like Airbnb diminishing the
effectiveness of this mitigation strategy by continuing to grow and innovate (e.g., Airbnb now
allows guests to earn Skymiles for their stays).25
• GDP Growth, Consumer Sentiment, and Factors Impacting Global Travel. Lower than
forecasted GDP growth rates and/or consumer sentiment could impact WH’s profitability.
Global trade and political tensions could also impact WH’s global expansion, especially given
WH’s targeting of the growing middle-class populations in emerging markets.
• Competition in International Markets. WH faces competition abroad from both established
chains, such as Marriott and Hyatt, as well as newer ones, such as the Indian hotel franchisor
OYO. OYO, in particular, is a threat because it, too, targets a similar customer base (i.e., one
which is generally price-sensitive). Founded in 2018, OYO “entered China in 2017 and rapidly
expanded its network to 10,000 hotels and more than 500,000 rooms in China by 2019.”26 OYO
offers lower nightly rates than comparable hotels, and we think it is possible that OYO’s
presence in China is not only reducing demand but also implicitly decrease RevPAR.
• Inflated Costs due to International Expansion. WH achieved $66M in cost synergies via La
Quinta (20% of 2017 SG&A, the calendar year prior to acquisition). Given WHs explicit
strategy to fuel earnings growth inorganically—averaging one brand acquisition every 18
months over the past 30 years27—poor M&A targets in WH’s international expansion could
materially impact free cash flow.
23 Hotel Alternatives: US. Mintel Group Ltd. July 2019. This report indicates that 35% of internet users aged 18+ who have stayed at a hotel or other paid accommodations in the last 12 months reported “alternatives are cheaper than hotels” as a reson why they “would stay in alternative accommodations rather than a hotel.” This percentage climbs to 43% for the younger age groups (18-24 and 25-34). 24 Wyndham Hotels & Resorts Investor Presentation, July 2019. p. 19. 25 Vora, Shivani. “Airbnb Enters the ‘Luxe’ Market.” The New York Times. June 25, 2019. 26 Grigorian, Greg. “Indian Hotel Operator OYO Faces Hurdles in China.” Pandaily. December 2, 2019. 27 http://www.hotelnewsnow.com/Articles/286136/Q1-Wyndham-nears-close-of-spinoff-La-Quinta-buy.

November 13, 2019 12
iii. CONSTRUCTING DCF MODEL TO VALUE WH
A. WACC
We used the WACC approach since net debt is not constant across time. The net debt as of Q4 2017 was $0.127B versus $2.1B as
of Q3 2019.28
Using the CAPM model, WH’s levered beta is 1.04 (since July 201729). There is significant uncertainty around the levered beta,
however, given the short-term horizon for total returns (WH debuted on the NYSE in May 2017). To verify this estimate’s reliability,
we look at a 6-month beta rolling average Figure 10) and a 95% confidence interval with robust standard errors (Figure 11). 6-month
rolling betas show a range of 0.90 to 1.11 and a 95% confidence interval shows 0.62 to 1.47.
Given the significant uncertainty regarding the WACC, we round up to 7% to fit more in line with our industry analysis
(WACC=7.25% for Marriott, Hilton, Extended Stay America, Hyatt, and Marriott Vacations). We also conduct a sensitivity
analysis with varying levels of WACC (see Figure 17).
Figure 10: 6-Month Rolling Beta of WH Figure 11: 95% Confidence Interval for Beta
The full WACC calculation is displayed in Figure 12.
28 Data from Capital IQ, accessed October 21, 2019. 29 WH began trading in May 2018, but the earliest monthly data available on COMPUTSTAT is July 2017.
0.6
0.7
0.8
0.9
1.0
1.1
1.2

November 13, 2019 13
Figure 12: WACC Calculation
Capital Structure
Debt to Total Capitalization 28%
Equity to Total Capitalization 72%
Cost of Debt Cost of Equity
Cost of Debt 3.13% Risk Free Rate 1.88%
ETR (2018) 27.4% Market Risk Premium 5.96%
After Tax Cost of Debt 2.27% Levered beta 1.04
Cost of Equity 8.10%
WACC 6.44 -- ROUND UP=7% Note: The Rf and market risk premium (Rm – Rf) is data are from Kenneth R. French’s data library. French notes, “Rm-Rf, the excess return on the market, value-weight return of all CRSP firms incorporated in
the US and listed on the NYSE, AMEX, or NASDAQ that have a CRSP share code of 10 or 11 at the beginning of month t, good shares and price data at the beginning of t, and good return data for t minus the
one-month Treasury bill rate (from Ibbotson Associates) See.https://mba.tuck.dartmouth.edu/pages/faculty/ken.french/data_library.html. Total returns are from Compustat Daily Updates – Security Monthly,
accessed November 13, 2019.
B. Determining Terminal Growth Rate
Recent OECD research projects the long-term real GDP growth rate will settle at 2%.30 The IMF (April 2019) estimates that by 2024,
global inflation (average consumer prices) will slow to 3.4% (versus an average of 5.6% since 1994).31 We assume inflation will slow
to the current long-run inflation projections of the IMF’s group of “Major Advanced Economies,”32 which is 2%. This suggests a long-
term global nominal GDP growth rate of 4%. Given the competitiveness of the hotels industry and rising threat from hotel
alternatives, we adjust our perpetuity growth rate to 2% to roughly match long-term inflation.
C. Mid-Year Adjustment
WH revenues are not heavily skewed towards fourth quarter, so we apply a mid-year adjustment to implicitly assuming all cash flows
are received at year-end. We therefore discount at June 30 of each year back to November 13, 2019.
D. Base Case and Upside/Downside Scenarios
WH forecasts are shown in Figure 13. Revenue and cost forecast assumptions are outlined in Section 2C. The assumptions
underlying these forecasts are outlined in Figure 9.
30 Yvan Guillemette and David Turner, “The Long View: Scenarios for the World Economy to 2060,” OECD, July 2018. 31 IMF, World Economic Outlook, April 2019, Data Mapper, https://www.imf.org/external/datamapper/PCPIPCH@WEO/WEOWORLD. 32 The G7: Canada, France, Germany, Italy, Japan, United Kingdom, United States

November 13, 2019 14
Figure 13: Base Case
Assumptions Target Price Date 11/13/2019 Report Date 11/13/2019 Mid-Year Adj. for FCF 2020-2024 TRUE
Cash Flows in Nominal or Real terms NOMINAL Effective Tax Rate 27.4% =2018 Effective Tax Rate
Future 2019 FCF (% of Total 2019 FCF) 13.33% =Faction of year remaining
WACC 7% Terminal Growth Rate 2%
Enterprise Value $8,756 =XNPV using WACC, FCF for XNPV Values, and Forecasts Dates from 11/13/2019 to 6/30/2024 in Green
Less: Net Debt $2,047 =Fair value of net debt as of Q3 2019
Less: Preferred Equity $0 Less: Total Minority Interest $0 Less: Deferred Tax Liability $273 =$383 deferred tax liabilities as of Q3 2019 assumed to be paid in five years
Equity Value $6,436 Current Market Capitalization ($mm) $5,149 =Market Cap as of 11/13/2019
Equity Value / Mkt Cap 125%
Historical Forecasts
Mid-Year Adjustment For DCF - - - 11/13/201
9 12/31/19 6/30/20 6/30/21 6/30/22 6/30/23 6/30/24
Year 2015 2016 2017 2018 2019 2020 2021 2022 2023 2024
Total Revenue $1,029 $998 $1,016 $1,282 $1,507 $1,640 $1,762 $1,886 $2,006 $2,103
Royalties and Franchise Fees (Exl. Initial Fee) $335 $335 $350 $421 $503 $547 $590 $632 $668 $703
United States (estimates/projections) N/A N/A $282 $349 $402 $432 $460 $484 $505 $527
Canada (est./proj.) N/A N/A $13 $13 $19 $20 $21 $22 $23 $24
Greater China (est./proj.) N/A N/A $19 $20 $28 $32 $37 $41 $46 $49
Rest of Asia (est./proj.) N/A N/A $5 $6 $10 $13 $16 $21 $25 $27
Europe, Middle East and Africa (est./proj.) N/A N/A $24 $25 $35 $39 $43 $48 $52 $56
Latin America (est./proj.) N/A N/A $7 $7 $10 $12 $14 $16 $18 $19
Initial Franchising Fee $12 $19 $14 $20 $30 $33 $30 $32 $27 $28
License and other revenues from former Parent $64 $64 $75 $111 $137 $124 $138 $153 $165 $172
Marketing Reservation and Royalty Rev $409 $375 $371 $491 $584 $626 $667 $715 $767 $803
Hotel Management $105 $107 $108 $124 $146 $167 $188 $211 $234 $256
Hotel Management - Owned prop $0 $81 $78 $75 $78 $77 $77 $77 $77 $77
Hotel Management - Managed prop $0 $26 $30 $49 $68 $90 $111 $133 $157 $179
Other Revenue $104 $97 $98 $115 $108 $143 $149 $144 $145 $142
COGS $418 $299 $312 $394 $497 $564 $634 $715 $767 $803
SG&A $267 $321 $332 $393 $414 $450 $484 $518 $551 $577
Other Operating Expenses/(Income) $0 $0 $0 $0 $0 $0 $0 $0 $0 $0
D&A $67 $73 $75 $99 $94 $102 $107 $105 $107 $107
EBIT $277 $305 $297 $396 $503 $525 $537 $548 $582 $616
EBIT(1-t) $166 $183 $281 $287 $365 $381 $390 $398 $422 $447
Plus: D&A $67 $73 $75 $99 $94 $102 $107 $105 $107 $107
Less: Capital Expenditure $51 $42 $46 $73 $73 $82 $91 $94 $102 $107
Less: Change in Net Working Capital $7 $11 ($156) ($33) ($19) ($18) ($18) ($18) ($14)
FCF - $207 $299 $469 $419 $420 $424 $427 $445 $461
Terminal Value $9,408
FCF for XNPV 0 $56 $420 $424 $427 $445 $9,869
Note: Royalties and Franchise Fee estimations are not available by region in 2015 and 2016 due to lack of data regarding RevPAR data in Greater China and Rest of Asia.

November 13, 2019 15
Figure 14: Upside Scenario - Rosy macroeconomic conditions 2020-2024 and improved cost/revenue synergies from future M&A activity
Royalty Revenue Growth 2020-2024 1.02 of baseline
SG&A/Rev 0.98 of baseline
Assumptions
Target Price Date 11/13/2019
Report Date 11/13/2019 Mid-Year Adj. for FCF 2020-2024 TRUE Cash Flows in Nominal or Real terms NOMINAL Effective Tax Rate 27.4% =2018 Effective Tax Rate
Future 2019 FCF (% of Total 2019 FCF) 13.33% =Faction of year remaining
WACC 7% Terminal Growth Rate 2%
Enterprise Value $10,314 =XNPV using WACC, FCF for XNPV Values, and Forecasts Dates from 11/13/2019 to 6/30/2024 in Green
Less: Net Debt $2,047 =Fair value of net debt as of Q3 2019
Less: Preferred Equity $0 Less: Total Minority Interest $0 Less: Deferred Tax Liability $273 =$383 deferred tax liabilities as of Q3 2019 assumed to be paid in five years
Equity Value $7,994 Current Market Capitalization ($mm) $5,149 =Market Cap as of 11/13/2019
Equity Value / Mkt Cap 155%
Historical Forecasts
Mid-Year Adjustment For DCF - - - 11/13/2019 12/31/2019 6/30/2020 6/30/2021 6/30/2022 6/30/2023 6/30/2024
Year 2015 2016 2017 2018 2019 2020 2021 2022 2023 2024
Total Revenue $1,029 $998 $1,016 $1,282 $1,507 $1,746 $1,885 $2,031 $2,140 $2,248
Royalties and Franchise Fees (Exl. Initial Fee) $335 $335 $350 $421 $503 $586 $632 $677 $716 $752
COGS $418 $299 $312 $394 $497 $560 $633 $719 $763 $802
SG&A $267 $321 $332 $393 $414 $470 $507 $547 $576 $605
Other Operating Expenses/(Income) $0 $0 $0 $0 $0 $0 $0 $0 $0 $0
D&A $67 $73 $75 $99 $94 $108 $115 $113 $114 $114
EBIT $277 $305 $297 $396 $503 $608 $630 $652 $686 $728
EBIT(1-t) $166 $183 $281 $287 $365 $441 $457 $473 $498 $528
Plus: D&A $67 $73 $75 $99 $94 $108 $115 $113 $114 $114
Less: Capital Expenditure $51 $42 $46 $73 $73 $88 $97 $101 $108 $114
Less: Change in Net Working Capital $7 $11 ($156) ($33) ($35) ($20) ($21) ($16) ($16)
FCF - $207 $299 $469 $419 $497 $495 $506 $520 $544
Terminal Value $11,098
FCF for XNPV 0 $56 $497 $495 $506 $520 $11,642

November 13, 2019 16
Figure 15: Downside Scenario - Weak macroeconomic conditions 2020-2024 and burgeoning of hotel alternatives eating into RevPAR growth
Revenue Growth 2020-2024 Royalty growth declines, as a percent of baseline values, by 2 p.p. per
year. Reaches 90% of baseline in 2024
SG&A/Rev Median of 2015-2017 (pre-acquisition) (32.2%)
Assumptions
Target Price Date 11/13/2019 Report Date 11/13/2019 Mid-Year Adj. for FCF 2020-2024 TRUE Cash Flows in Nominal or Real terms NOMINAL Effective Tax Rate 27.4% =2018 Effective Tax Rate
Future 2019 FCF (% of Total 2019 FCF) 13.33% =Faction of year remaining
WACC 7% Terminal Growth Rate 2%
Enterprise Value $5,639 =XNPV using WACC, FCF for XNPV Values, and Forecasts Dates from 11/13/2019 to 6/30/2024 in Green
Less: Net Debt $2,047 =Fair value of net debt as of Q3 2019
Less: Preferred Equity $0 Less: Total Minority Interest $0 Less: Deferred Tax Liability $273 =$383 deferred tax liabilities as of A3 2019 assumed to be paid in five years
Equity Value $3,319 Current Market Capitalization ($mm) $5,149 =Market Cap as of 11/13/2019
Equity Value / Mkt Cap 64%
Historical Forecasts
Mid-Year Adjustment For DCF - - - 11/13/2019 12/31/2019 6/30/2020 6/30/2021 6/30/2022 6/30/2023 6/30/2024
Year 2015 2016 2017 2018 2019 2020 2021 2022 2023 2024
Total Revenue $1,029 $998 $1,016 $1,282 $1,507 $1,598 $1,689 $1,783 $1,838 $1,889
Royalties and Franchise Fees (Exl. Initial Fee) $335 $335 $350 $421 $503 $536 $567 $594 $615 $632
COGS $418 $299 $312 $394 $497 $560 $633 $719 $763 $802
SG&A $267 $321 $332 $393 $414 $514 $543 $573 $591 $608
Other Operating Expenses/(Income) $0 $0 $0 $0 $0 $0 $0 $0 $0 $0
D&A $67 $73 $75 $99 $94 $99 $103 $99 $98 $96
EBIT $277 $305 $297 $396 $503 $425 $410 $391 $385 $384
EBIT(1-t) $166 $183 $281 $287 $365 $308 $298 $284 $280 $279
Plus: D&A $67 $73 $75 $99 $94 $99 $103 $99 $98 $96
Less: Capital Expenditure $51 $42 $46 $73 $73 $80 $87 $89 $93 $96
Less: Change in Net Working Capital $7 $11 ($156) ($33) ($13) ($13) ($14) ($8) ($7)
FCF - $207 $299 $469 $419 $340 $326 $308 $293 $286
Terminal Value $5,840
FCF for XNPV 0 $56 $340 $326 $308 $293 $6,126
November 13, 2019 17
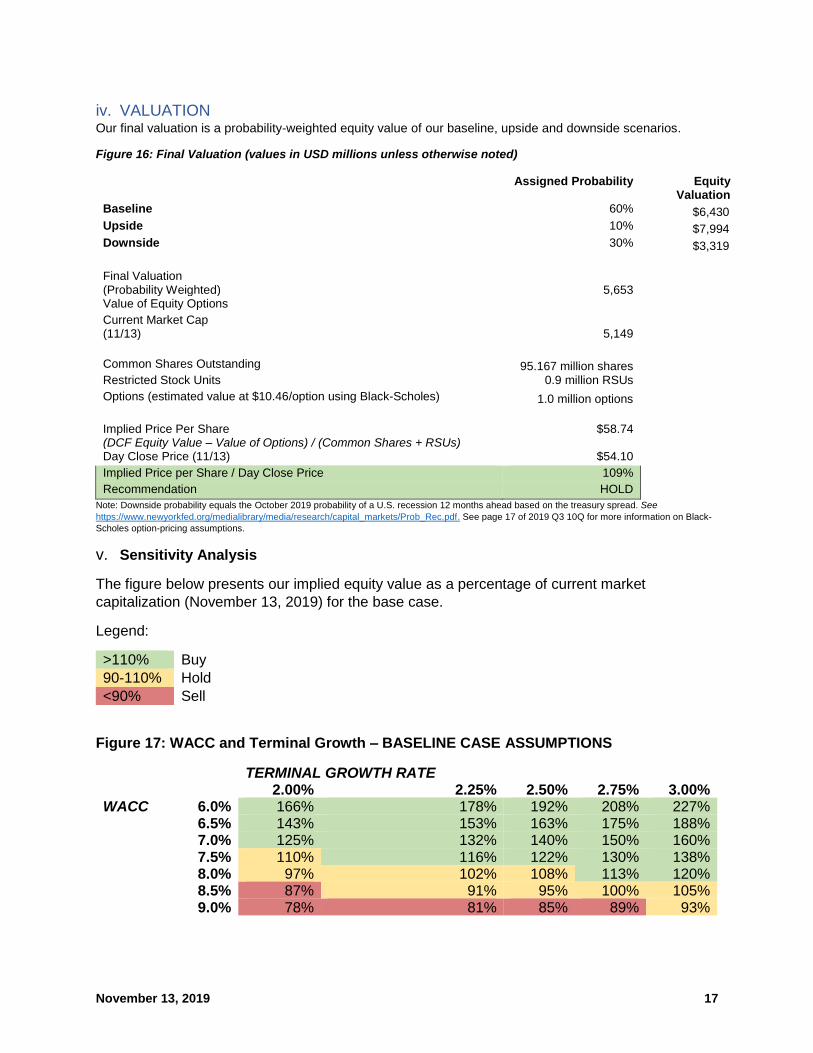
iv. VALUATION Our final valuation is a probability-weighted equity value of our baseline, upside and downside scenarios.
Figure 16: Final Valuation (values in USD millions unless otherwise noted)
Assigned Probability Equity
Valuation Baseline 60% $6,430 Upside 10% $7,994 Downside 30% $3,319
Final Valuation (Probability Weighted) 5,653 Value of Equity Options Current Market Cap (11/13) 5,149 Common Shares Outstanding 95.167 million shares Restricted Stock Units 0.9 million RSUs Options (estimated value at $10.46/option using Black-Scholes) 1.0 million options
Implied Price Per Share (DCF Equity Value – Value of Options) / (Common Shares + RSUs)
$58.74
Day Close Price (11/13) $54.10
Implied Price per Share / Day Close Price 109%
Recommendation HOLD
Note: Downside probability equals the October 2019 probability of a U.S. recession 12 months ahead based on the treasury spread. See
https://www.newyorkfed.org/medialibrary/media/research/capital_markets/Prob_Rec.pdf. See page 17 of 2019 Q3 10Q for more information on Black-
Scholes option-pricing assumptions.
v. Sensitivity Analysis
The figure below presents our implied equity value as a percentage of current market
capitalization (November 13, 2019) for the base case.
Legend:
>110% Buy
90-110% Hold
<90% Sell
Figure 17: WACC and Terminal Growth – BASELINE CASE ASSUMPTIONS
TERMINAL GROWTH RATE
2.00% 2.25% 2.50% 2.75% 3.00% WACC 6.0% 166% 178% 192% 208% 227%
6.5% 143% 153% 163% 175% 188% 7.0% 125% 132% 140% 150% 160% 7.5% 110% 116% 122% 130% 138% 8.0% 97% 102% 108% 113% 120% 8.5% 87% 91% 95% 100% 105% 9.0% 78% 81% 85% 89% 93%
November 13, 2019 18
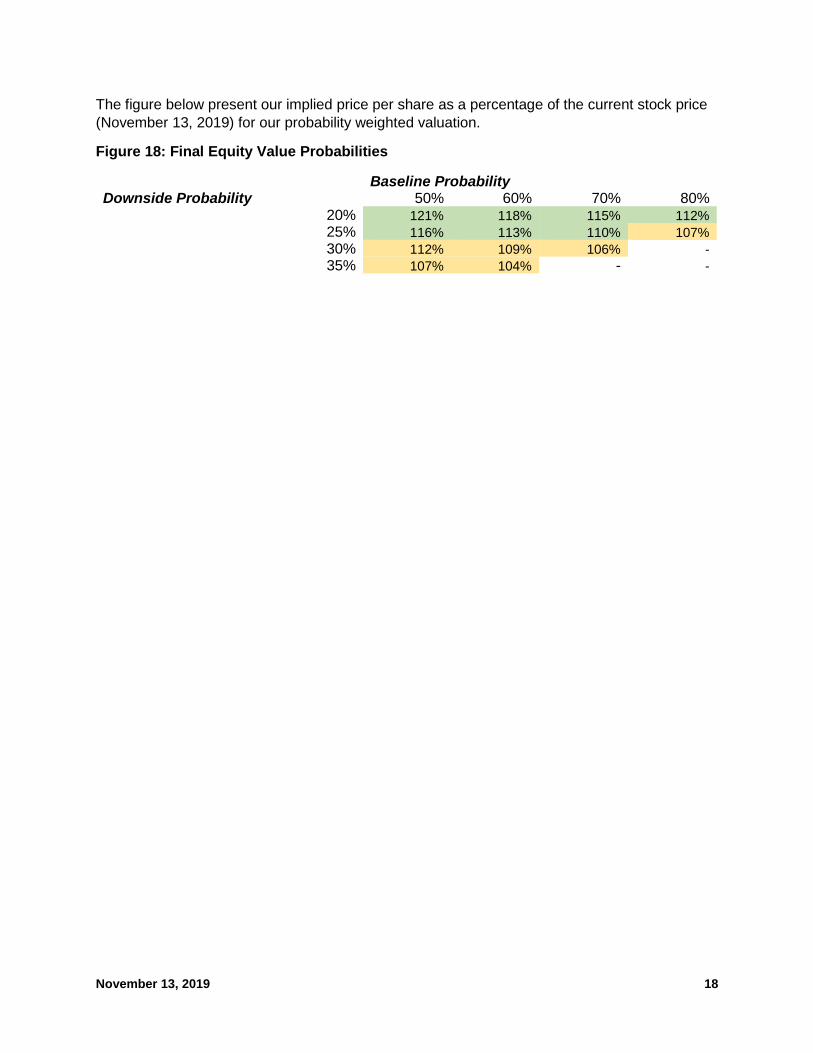
The figure below present our implied price per share as a percentage of the current stock price
(November 13, 2019) for our probability weighted valuation.
Figure 18: Final Equity Value Probabilities
Baseline Probability Downside Probability 50% 60% 70% 80%
20% 121% 118% 115% 112%
25% 116% 113% 110% 107%
30% 112% 109% 106% -
35% 107% 104% - -

November 13, 2019 19
vi. APPENDIX 1: Quarterly Systemwide Room Count33
2014-2017
Q1 2014
Q2 2014
Q3 2014
Q4 2014
Q1 2015
Q2 2015
Q3 2015
Q4 2015
Q1 2016
Q2 2016
Q3 2016
Q4 2016
Q1 2017
Q2 2017
Q3 2017
Q4 2017
United States 440,175 435,312 429,020 427,800 425,800 426,000 440,100
YOY Growth -1% -1% 3%
Greater China 96,474 112,788 134,739 136,600 136,300 138,900
YOY Growth 17% 19% 3%
Rest of Asia 13,156 13,940 13,326 15,900 16,900 18,900
YOY Growth 6% -4% 42%
EMEA 55,206 57,222 57,786 63,500 64,700 66,200
YOY Growth 4% 1% 15%
Canada 39,743 40,269 40,032 39,700 40,300 39,800
YOY Growth 1% -1% -1%
Latin America 16,072 18,511 22,704 24,200 24,300 24,300
YOY Growth 15% 23% 7%
Total International 220,651 242,730 268,587 279,900 282,500 288,100
YOY Growth 10% 11% 7%
Global 655,300 660,826 678,042 697,607 699,800 705,700 708,500 728,201
YOY Growth 3% 3% 4%
United States 66.6% 64.2% 61.5% 61.1% 60.3% 60.1% 60.4%
Intl 33.4% 35.8% 38.5% 0.0% 39.7% 39.9% 39.6%
33 Source: Data are from WH’s “System Size and RevPAR by Region and Chainscale” quarterly updates, 10Ks, and 10Qs.
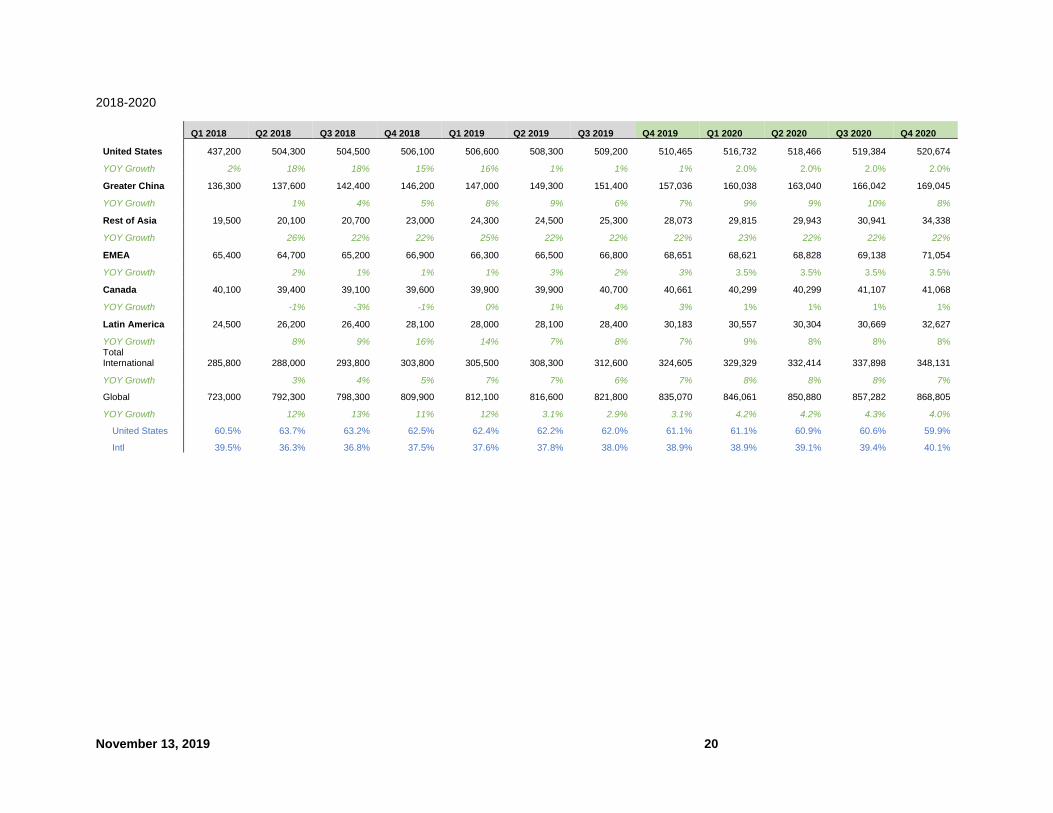
November 13, 2019 20
2018-2020
Q1 2018 Q2 2018 Q3 2018 Q4 2018 Q1 2019 Q2 2019 Q3 2019 Q4 2019 Q1 2020 Q2 2020 Q3 2020 Q4 2020
United States 437,200 504,300 504,500 506,100 506,600 508,300 509,200 510,465 516,732 518,466 519,384 520,674
YOY Growth 2% 18% 18% 15% 16% 1% 1% 1% 2.0% 2.0% 2.0% 2.0%
Greater China 136,300 137,600 142,400 146,200 147,000 149,300 151,400 157,036 160,038 163,040 166,042 169,045
YOY Growth 1% 4% 5% 8% 9% 6% 7% 9% 9% 10% 8%
Rest of Asia 19,500 20,100 20,700 23,000 24,300 24,500 25,300 28,073 29,815 29,943 30,941 34,338
YOY Growth 26% 22% 22% 25% 22% 22% 22% 23% 22% 22% 22%
EMEA 65,400 64,700 65,200 66,900 66,300 66,500 66,800 68,651 68,621 68,828 69,138 71,054
YOY Growth 2% 1% 1% 1% 3% 2% 3% 3.5% 3.5% 3.5% 3.5%
Canada 40,100 39,400 39,100 39,600 39,900 39,900 40,700 40,661 40,299 40,299 41,107 41,068
YOY Growth -1% -3% -1% 0% 1% 4% 3% 1% 1% 1% 1%
Latin America 24,500 26,200 26,400 28,100 28,000 28,100 28,400 30,183 30,557 30,304 30,669 32,627
YOY Growth 8% 9% 16% 14% 7% 8% 7% 9% 8% 8% 8% Total International 285,800 288,000 293,800 303,800 305,500 308,300 312,600 324,605 329,329 332,414 337,898 348,131
YOY Growth 3% 4% 5% 7% 7% 6% 7% 8% 8% 8% 7%
Global 723,000 792,300 798,300 809,900 812,100 816,600 821,800 835,070 846,061 850,880 857,282 868,805
YOY Growth 12% 13% 11% 12% 3.1% 2.9% 3.1% 4.2% 4.2% 4.3% 4.0%
United States 60.5% 63.7% 63.2% 62.5% 62.4% 62.2% 62.0% 61.1% 61.1% 60.9% 60.6% 59.9%
Intl 39.5% 36.3% 36.8% 37.5% 37.6% 37.8% 38.0% 38.9% 38.9% 39.1% 39.4% 40.1%
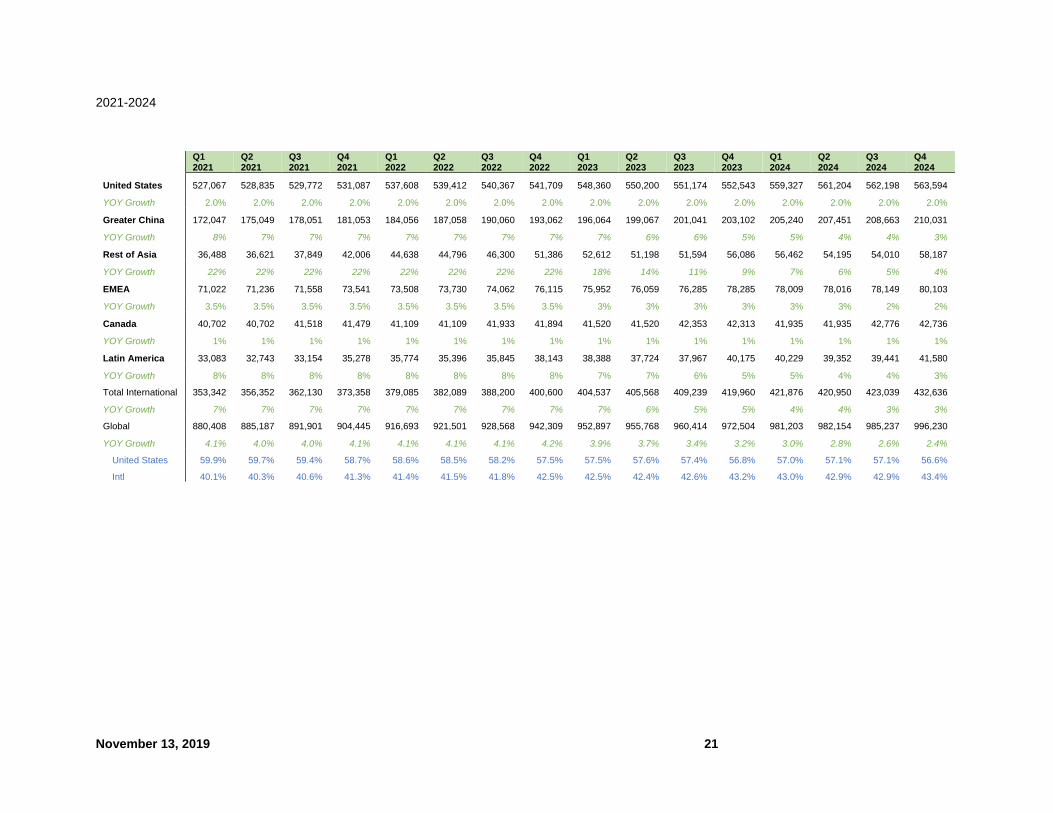
November 13, 2019 21
2021-2024
Q1 2021
Q2 2021
Q3 2021
Q4 2021
Q1 2022
Q2 2022
Q3 2022
Q4 2022
Q1 2023
Q2 2023
Q3 2023
Q4 2023
Q1 2024
Q2 2024
Q3 2024
Q4 2024
United States 527,067 528,835 529,772 531,087 537,608 539,412 540,367 541,709 548,360 550,200 551,174 552,543 559,327 561,204 562,198 563,594
YOY Growth 2.0% 2.0% 2.0% 2.0% 2.0% 2.0% 2.0% 2.0% 2.0% 2.0% 2.0% 2.0% 2.0% 2.0% 2.0% 2.0%
Greater China 172,047 175,049 178,051 181,053 184,056 187,058 190,060 193,062 196,064 199,067 201,041 203,102 205,240 207,451 208,663 210,031
YOY Growth 8% 7% 7% 7% 7% 7% 7% 7% 7% 6% 6% 5% 5% 4% 4% 3%
Rest of Asia 36,488 36,621 37,849 42,006 44,638 44,796 46,300 51,386 52,612 51,198 51,594 56,086 56,462 54,195 54,010 58,187
YOY Growth 22% 22% 22% 22% 22% 22% 22% 22% 18% 14% 11% 9% 7% 6% 5% 4%
EMEA 71,022 71,236 71,558 73,541 73,508 73,730 74,062 76,115 75,952 76,059 76,285 78,285 78,009 78,016 78,149 80,103
YOY Growth 3.5% 3.5% 3.5% 3.5% 3.5% 3.5% 3.5% 3.5% 3% 3% 3% 3% 3% 3% 2% 2%
Canada 40,702 40,702 41,518 41,479 41,109 41,109 41,933 41,894 41,520 41,520 42,353 42,313 41,935 41,935 42,776 42,736
YOY Growth 1% 1% 1% 1% 1% 1% 1% 1% 1% 1% 1% 1% 1% 1% 1% 1%
Latin America 33,083 32,743 33,154 35,278 35,774 35,396 35,845 38,143 38,388 37,724 37,967 40,175 40,229 39,352 39,441 41,580
YOY Growth 8% 8% 8% 8% 8% 8% 8% 8% 7% 7% 6% 5% 5% 4% 4% 3%
Total International 353,342 356,352 362,130 373,358 379,085 382,089 388,200 400,600 404,537 405,568 409,239 419,960 421,876 420,950 423,039 432,636
YOY Growth 7% 7% 7% 7% 7% 7% 7% 7% 7% 6% 5% 5% 4% 4% 3% 3%
Global 880,408 885,187 891,901 904,445 916,693 921,501 928,568 942,309 952,897 955,768 960,414 972,504 981,203 982,154 985,237 996,230
YOY Growth 4.1% 4.0% 4.0% 4.1% 4.1% 4.1% 4.1% 4.2% 3.9% 3.7% 3.4% 3.2% 3.0% 2.8% 2.6% 2.4%
United States 59.9% 59.7% 59.4% 58.7% 58.6% 58.5% 58.2% 57.5% 57.5% 57.6% 57.4% 56.8% 57.0% 57.1% 57.1% 56.6%
Intl 40.1% 40.3% 40.6% 41.3% 41.4% 41.5% 41.8% 42.5% 42.5% 42.4% 42.6% 43.2% 43.0% 42.9% 42.9% 43.4%
November 13, 2019 22
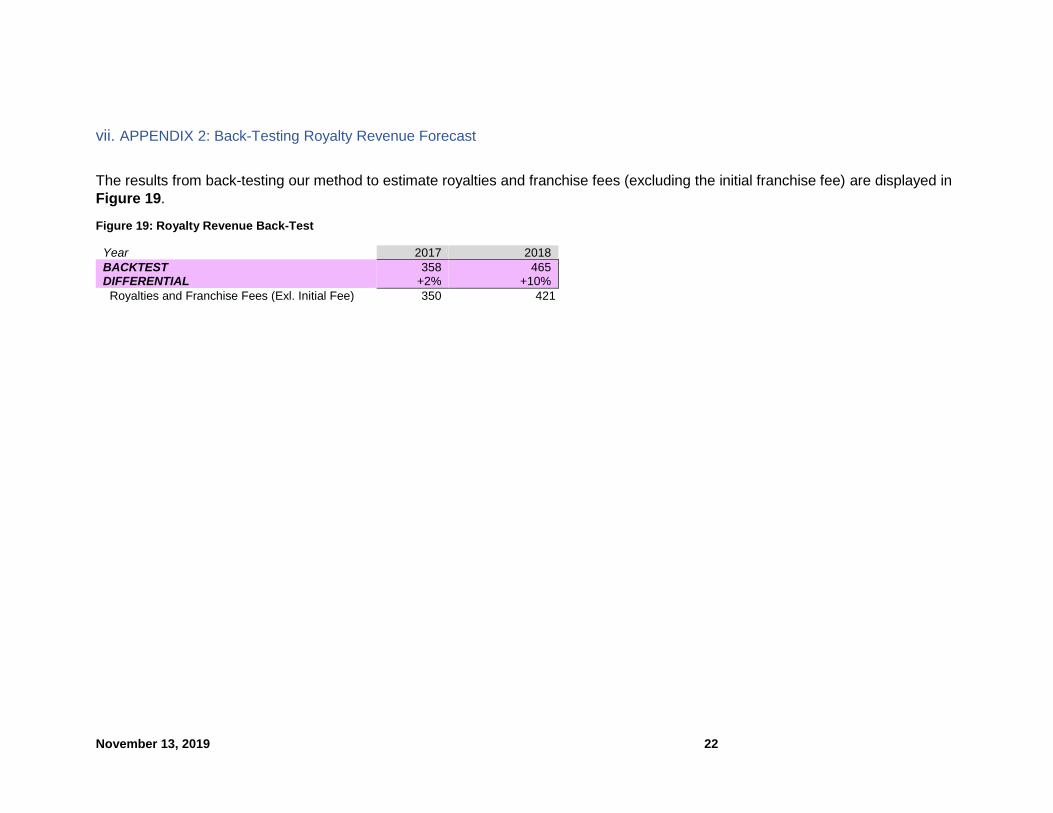
vii. APPENDIX 2: Back-Testing Royalty Revenue Forecast
The results from back-testing our method to estimate royalties and franchise fees (excluding the initial franchise fee) are displayed in
Figure 19.
Figure 19: Royalty Revenue Back-Test
Year 2017 2018
BACKTEST 358 465 DIFFERENTIAL +2% +10%
Royalties and Franchise Fees (Exl. Initial Fee) 350 421

November 13, 2019 23
viii. DISCLAIMER
Please read this statement before reading this report.
This report has been written by MBA students at Yale's School of Management in partial fulfillment of their course requirements. The
reports are student not professional, they are intended to serve solely as examples of student work at Yale’s School of Management.
They are not intended as investment advice. They are based on publicly available information and may not be a complete analyses
of all relevant data.
If you use these reports for any purpose, you do so at your own risk.
YALE UNIVERSITY, YALE SCHOOL OF MANAGEMENT, AND YALE UNIVERSITY’S OFFICERS, FELLOWS, FACULTY, STAFF,
AND STUDENTS MAKE NO REPRESENTATIONS OR WARRANTIES, EXPRESS OR IMPLIED, ABOUT THE ACCURACY OR
SUITABILITY FOR ANY USE OF THESE REPORTS, AND EXPRESSLY DISCLAIM RESPONSIBILITY FOR ANY LOSS OR
DAMAGE, DIRECT OR INDIRECT, CAUSED BY USE OF OR RELIANCE ON THESE REPORT