Fidelity® Total Market Index Fund Institutional Class and ...
132
Fidelity ® Total Market Index Fund Institutional Class and Institutional Premium Class Fidelity ® Extended Market Index Fund Institutional Premium Class Fidelity ® International Index Fund Institutional Class and Institutional Premium Class Annual Report February 28, 2018
-
Upload
khangminh22 -
Category
Documents
-
view
1 -
download
0
Transcript of Fidelity® Total Market Index Fund Institutional Class and ...

Fidelity® Total Market Index FundInstitutional Class and Institutional Premium ClassFidelity® Extended Market Index FundInstitutional Premium ClassFidelity® International Index FundInstitutional Class and Institutional Premium Class
Annual ReportFebruary 28, 2018

Annual Report
Fidelity® Total Market Index Fund 3 Performance4 Management’s Discussion of Fund
Performance5 Investment Summary6 Schedule of Investments
41 Financial StatementsFidelity® Extended Market Index Fund 48 Performance
49 Management’s Discussion of Fund Performance
50 Investment Summary51 Schedule of Investments83 Financial Statements
Fidelity® International Index Fund 88 Performance89 Management’s Discussion of Fund
Performance90 Investment Summary91 Schedule of Investments
105 Financial StatementsNotes to Financial Statements 112Report of Independent Registered Public Accounting Firm
121
Trustees and Officers 122Shareholder Expense Example 128Distributions 130
To view a fund’s proxy voting guidelines and proxy voting record for the 12-month period ended June 30, visit http://www.fidelity.com/proxyvotingresults or visit the Securities and Exchange Commission’s (SEC) web site at http://www.sec.gov.You may also call 1-800-544-8544 to request a free copy of the proxy voting guidelines.The funds or securities referred to herein are not sponsored, endorsed, or promoted by MSCI, and MSCI bears no liability with respect to any such funds or securities or any index on which such funds or securities are based. The prospectus contains a more detailed description of the limited relationship MSCI has with Fidelity and any related funds.Standard & Poor’s, S&P and S&P 500 are registered service marks of The McGraw-Hill Companies, Inc. and have been licensed for use by Fidelity Distributors Corporation.Other third-party marks appearing herein are the property of their respective owners.All other marks appearing herein are registered or unregistered trademarks or service marks of FMR LLC or an affiliated company. © 2018 FMR LLC. All rights reserved.
Contents
This report and the financial statements contained herein are submitted for the general information of the shareholders of the Funds. This report is not authorized for distribution to prospective investors in the Funds unless preceded or accompanied by an effective prospectus.A fund files its complete schedule of portfolio holdings with the SEC for the first and third quarters of each fiscal year on Form N-Q. Forms N-Q are available on the SEC’s web site at http://www.sec.gov. A fund’s Forms N-Q may be reviewed and copied at the SEC’s Public Reference Room in Washington, DC. Information regarding the operation of the SEC’s Public Reference Room may be obtained by calling 1-800-SEC-0330.For a complete list of a fund’s portfolio holdings, view the most recent holdings listing, semiannual report, or annual report on Fidelity’s web site at http://www.fidelity.com, http://www.institutional.fidelity.com, or http://www.401k.com, as applicable.NOT FDIC INSURED •MAY LOSE VALUE •NO BANK GUARANTEENeither the Funds nor Fidelity Distributors Corporation is a bank.

3 Annual Report
Fidelity® Total Market Index Fund
Performance: The Bottom LineAverage annual total return reflects the change in the value of an investment, assuming reinvestment of distributions from dividend income and capital gains (the profits earned upon the sale of securities that have grown in value, if any) and assuming a constant rate of performance each year. The hypothetical investment and the average annual total returns do not reflect the deduction of taxes that a shareholder would pay on fund distributions or the redemption of fund shares. During periods of reimbursement by Fidelity, a fund’s total return will be greater than it would be had the reimbursement not occurred. How a fund did yesterday is no guarantee of how it will do tomorrow.
Average Annual Total Returns
For the periods ended February 28, 2018 Past 1 year
Past 5 years
Past 10 years
Institutional Class 16.24% 14.32% 9.82%Institutional Premium Class 16.25% 14.33% 9.83%
The initial offering of Institutional Class shares took place on September 8, 2011. Returns prior to September 8, 2011 are those of Premium Class.
The initial offering of Institutional Premium Class shares took place on September 8, 2011. Returns prior to September 8, 2011 are those of Premium Class.
$10,000 Over 10 Years
Let’s say hypothetically that $10,000 was invested in Fidelity® Total Market Index Fund - Institutional Class on February 29, 2008.
The chart shows how the value of your investment would have changed, and also shows how the Dow Jones U.S. Total Stock Market IndexSM performed over the same period.
See above for additional information regarding the performance of Institutional Class.
Period Ending Values
$25,520 Fidelity® Total Market Index Fund - Institutional Class
$25,541 Dow Jones U.S. Total Stock Market IndexSM

4Annual Report
Fidelity® Total Market Index Fund
Management’s Discussion of Fund PerformanceMarket Recap: U.S. equities gained 17.10% for the 12 months ending February 28, 2018, as the S&P 500® index moved steadily higher throughout 2017 and into 2018 until sharply reversing course in February. The drop was in stark contrast to the low volatility seen throughout 2017, along with consumer sentiment and other market indicators that stayed positive. Investors remained decidedly upbeat as the calendar turned, and the index rose 5.73% in January. February was a decidedly different story, though, as volatility spiked amid fear that rising inflation and the potential for the economy to overheat would prompt the U.S. Federal Reserve to pick up the pace of interest rate hikes. The index returned -3.69% for the month, its first negative result since October 2016. For the full 12 months, growth stocks handily topped value, while large-caps bested small-caps. By sector, information technology fared best by far, gaining 36% amid strong earnings growth from several major index constituents. Consumer discretionary (+22%) also stood out, driven by retailers. Financials added 20%, riding the uptick in bond yields. Materials and industrials rose about 16% each, boosted by higher demand, especially from China. Conversely, notable laggards included the defensive telecommunication services (-5%) and utilities (-2%) sectors, while rising rates held back real estate (-3%).
Comments from Patrick Waddell, Senior Portfolio Manager of the Geode Capital Management, LLC, investment management team: For the fiscal year, the fund’s share classes performed closely in line with the 16.23% gain of the benchmark Dow Jones U.S. Total Stock Market IndexSM. In a strong market environment, an increasingly narrow slice of growth companies led the way, with many residing in the information technology sector, by far the top-performing group. Within this sector, software manufacturer Microsoft reported financial progress from its shift in business strategy toward cloud comput-ing and subscription-based software. Consumer electronics company Apple performed extremely well, as the firm continued to benefit from growing demand for its iPhone® mobile devices and other products. Social-media leader Facebook continued to generate substantial cash, especially from mobile-video advertising, while Alphabet also added significant value, as this parent company of internet search giant Google continued to report stronger-than-expected quarterly earnings. In the consumer discretionary sector, internet retailer Amazon.com also boosted results, driven by its strong financial performance. In contrast, industrial conglomerate General Electric detracted; the company faced a variety of business challenges and, late in 2017, cut its dividend. Several health care stocks also detracted, led by drugmakers Allergan and Merck as well as biotechnology firm Celgene.
The views expressed above reflect those of the portfolio manager(s) only through the end of the period as stated on the cover of this report and do not necessarily represent the views of Fidelity or any other person in the Fidelity organization. Any such views are subject to change at any time based upon market or other conditions and Fidelity disclaims any responsibility to update such views. These views may not be relied on as investment advice and, because investment decisions for a Fidelity fund are based on numerous factors, may not be relied on as an indication of trading intent on behalf of any Fidelity fund.

5 Annual Report
Fidelity® Total Market Index Fund
Investment Summary (Unaudited)
Top Ten Stocks as of February 28, 2018
% of fund’s net assets
Apple, Inc. 3.3Microsoft Corp. 2.6Amazon.com, Inc. 2.2Facebook, Inc. Class A 1.5JPMorgan Chase & Co. 1.5Berkshire Hathaway, Inc. Class B 1.4Johnson & Johnson 1.2Alphabet, Inc. Class C 1.2Alphabet, Inc. Class A 1.2Exxon Mobil Corp. 1.2
17.3
Top Market Sectors as of February 28, 2018
% of fund’s net assets
Information Technology 24.1Financials 15.3Health Care 13.4Consumer Discretionary 12.9Industrials 10.7Consumer Staples 6.7Energy 5.2Real Estate 3.5Materials 3.3Utilities 2.7

6Annual Report
See accompanying notes which are an integral part of the financial statements.
Common Stocks – 99.5%Shares Value
CONSUMER DISCRETIONARY – 12.9%Auto Components – 0.4%Adient PLC (a) 163,268 $ 10,132,412American Axle & Manufacturing Holdings, Inc. (a) (b) 171,619 2,533,096Aptiv PLC 472,306 43,135,707Autoliv, Inc. 158,295 22,705,835BorgWarner, Inc. 350,359 17,195,620Clean Diesel Technologies, Inc. (a) (b) 8,475 9,746Cooper Tire & Rubber Co. 91,978 2,883,510Cooper-Standard Holding, Inc. (b) 32,523 3,962,602Dana Holding Corp. 258,072 6,856,973Delphi Technologies PLC 153,523 7,330,723Dorman Products, Inc. (b) 55,243 3,811,767Fox Factory Holding Corp. (b) 67,039 2,517,314Gentex Corp. 513,627 11,664,469Gentherm, Inc. (b) 67,460 2,077,768Hertz Global Holdings, Inc. (a) (b) 142,032 2,583,562Horizon Global Corp. (b) 41,718 343,756LCI Industries (a) 43,682 4,774,443Lear Corp. 119,894 22,368,624Modine Manufacturing Co. (b) 88,001 2,024,023Motorcar Parts of America, Inc. (b) 32,435 661,025Shiloh Industries, Inc. (b) 23,634 172,292Standard Motor Products, Inc. 37,047 1,728,613Stoneridge, Inc. (b) 43,907 955,416Strattec Security Corp. 4,334 149,306Superior Industries International, Inc. 39,790 574,966Sypris Solutions, Inc. (b) 16,848 23,250Tenneco, Inc. 96,642 5,078,537The Goodyear Tire & Rubber Co. 444,992 12,878,068Tower International, Inc. 31,785 829,589UQM Technologies, Inc. (a) (b) 38,648 48,310Visteon Corp. (b) 57,388 7,106,930VOXX International Corp. (b) 39,260 212,004Workhorse Group, Inc. (a) (b) 43,808 140,624
199,470,880Automobiles – 0.5%Ford Motor Co. 6,929,195 73,518,759General Motors Co. 2,281,301 89,769,194Harley-Davidson, Inc. (a) 295,888 13,427,397REV Group, Inc. 43,502 1,174,554Tesla, Inc. (a) (b) 235,900 80,927,854Thor Industries, Inc. 87,219 11,251,251Winnebago Industries, Inc. (a) 53,916 2,348,042
272,417,051Distributors – 0.1%Core-Mark Holding Co., Inc. 91,667 1,876,423Educational Development Corp. (b) 2,866 55,457Genuine Parts Co. 259,367 23,820,265LKQ Corp. (b) 538,255 21,250,307Pool Corp. 71,179 9,824,837Weyco Group, Inc. 5,169 157,293
56,984,582Diversified Consumer Services – 0.2%Adtalem Global Education, Inc. (a) (b) 110,813 5,102,939American Public Education, Inc. (b) 24,607 756,665
Fidelity® Total Market Index Fund
Schedule of Investments February 28, 2018Showing Percentage of Net Assets
Shares Value
Ascent Capital Group, Inc. (b) 16,905 $ 114,954Bridgepoint Education, Inc. (b) 52,176 348,014Bright Horizons Family Solutions, Inc. (b) 96,748 9,246,206Cambium Learning Group, Inc. (b) 12,514 92,729Capella Education Co. 20,930 1,626,261Career Education Corp. (b) 109,234 1,445,166Carriage Services, Inc. 24,048 654,587Chegg, Inc. (a) (b) 135,548 2,698,761Collectors Universe, Inc. 6,416 99,897Graham Holdings Co. 8,772 5,088,637Grand Canyon Education, Inc. (b) 92,016 9,031,370H&R Block, Inc. (a) 368,351 9,330,331Houghton Mifflin Harcourt Co. (b) 170,821 1,161,583K12, Inc. (b) 59,099 882,348Laureate Education, Inc. Class A 104,594 1,398,422Liberty Tax, Inc. 8,571 67,282Lincoln Educational Services Corp. (b) 15,671 30,245National American University Holdings, Inc. 5,378 6,131Regis Corp. (b) 52,945 851,885Service Corp. International 332,704 12,453,111ServiceMaster Global Holdings, Inc. (b) 236,280 12,135,341Sotheby’s Class A (Ltd. vtg.) (a) (b) 77,436 3,575,994Strayer Education, Inc. (a) 17,939 1,608,052Universal Technical Institute, Inc. (b) 29,419 79,431Weight Watchers International, Inc. (a) (b) 50,480 3,413,458Xpresspa Group, Inc. (a) (b) 9,862 9,233
83,309,033Hotels, Restaurants & Leisure – 2.0%ARAMARK Holdings Corp. 436,128 18,190,899Belmond Ltd. Class A (b) 147,743 1,706,432BFC Financial Corp. Class A 157,194 1,355,012Biglari Holdings, Inc. (b) 2,475 1,037,545BJ’s Restaurants, Inc. 35,904 1,561,824Bloomin’ Brands, Inc. 181,456 4,189,819Bojangles’, Inc. (a) (b) 24,608 322,365Boyd Gaming Corp. 147,259 5,210,023Bravo Brio Restaurant Group, Inc. (b) 12,451 41,711Brinker International, Inc. 77,201 2,658,030Caesars Entertainment Corp. (b) 244,825 3,109,278Carnival Corp. 725,183 48,521,995Carrols Restaurant Group, Inc. (b) 61,598 791,534Century Casinos, Inc. (b) 44,390 353,788Chipotle Mexican Grill, Inc. (a) (b) 46,485 14,801,289Choice Hotels International, Inc. 66,238 5,242,738Churchill Downs, Inc. 20,269 5,233,456Chuy’s Holdings, Inc. (a) (b) 26,361 711,747Cracker Barrel Old Country Store, Inc. (a) 45,340 7,077,574Darden Restaurants, Inc. 217,553 20,056,211Dave & Buster’s Entertainment, Inc. (a) (b) 67,484 3,021,259Del Frisco’s Restaurant Group, Inc. (b) 37,615 626,290Del Taco Restaurants, Inc. (b) 75,328 949,133Denny’s Corp. (b) 117,334 1,764,703DineEquity, Inc. (a) 36,646 2,784,363Domino’s Pizza, Inc. 77,453 17,226,322Dover Downs Gaming & Entertainment, Inc. (b) 1,508 1,960Dover Motorsports, Inc. 9,993 20,985

7 Annual Report
See accompanying notes which are an integral part of the financial statements.
Common Stocks – continuedShares Value
CONSUMER DISCRETIONARY – continuedHotels, Restaurants & Leisure – continuedDrive Shack, Inc. (a) 86,128 $ 434,946Dunkin’ Brands Group, Inc. 169,532 10,153,271El Pollo Loco Holdings, Inc. (a) (b) 42,298 412,406Eldorado Resorts, Inc. (a) (b) 110,052 3,752,773Empire Resorts, Inc. (b) 4,022 93,310Extended Stay America, Inc. unit 338,299 6,776,129Famous Dave’s of America, Inc. (a) (b) 7,623 51,455Famous Dave’s of America, Inc. rights 2/16/18 (b) 1,631 5,301Fiesta Restaurant Group, Inc. (a) (b) 50,677 861,509Fogo de Chao, Inc. (b) 21,909 341,780Golden Entertainment, Inc. (b) 33,622 937,718Good Times Restaurants, Inc. (b) 7,939 20,641Habit Restaurants, Inc. Class A (a) (b) 36,946 319,583Hilton Grand Vacations, Inc. (b) 119,507 5,157,922Hilton Worldwide Holdings, Inc. 360,462 29,121,725Hyatt Hotels Corp. Class A 96,573 7,462,196ILG, Inc. 190,126 5,772,225International Speedway Corp. Class A 44,736 2,013,120J. Alexanders Holdings, Inc. (b) 20,559 203,534Jack in the Box, Inc. 50,437 4,543,365Jamba, Inc. (b) 19,136 164,952Kona Grill, Inc. (a) (b) 8,466 15,239La Quinta Holdings, Inc. (b) 128,968 2,434,916Las Vegas Sands Corp. 650,579 47,368,657Lindblad Expeditions Holdings (b) 22,275 205,153Luby’s, Inc. (b) 14,614 40,919Marcus Corp. 30,096 812,592Marriott International, Inc. Class A 542,087 76,548,105Marriott Vacations Worldwide Corp. 42,588 5,983,614McDonald’s Corp. 1,417,538 223,602,444MGM Mirage, Inc. 910,853 31,178,498Monarch Casino & Resort, Inc. (b) 16,794 709,211Nathan’s Famous, Inc. 3,561 231,643Noodles & Co. (a) (b) 28,579 177,190Norwegian Cruise Line Holdings Ltd. (b) 319,719 18,192,011Papa John’s International, Inc. (a) 42,981 2,481,723Papa Murphy’s Holdings, Inc. (a) (b) 22,690 107,778Penn National Gaming, Inc. (b) 158,816 4,226,094Pinnacle Entertainment, Inc. (b) 94,638 2,855,228Planet Fitness, Inc. (b) 146,994 5,435,838Playa Hotels & Resorts NV 140,860 1,419,869Potbelly Corp. (a) (b) 30,614 393,390Rave Restaurant Group, Inc. (a) (b) 9,079 13,800RCI Hospitality Holdings, Inc. 15,482 418,169Red Lion Hotels Corp. (b) 6,989 67,793Red Robin Gourmet Burgers, Inc. (a) (b) 21,139 1,134,107Red Rock Resorts, Inc. 129,298 4,331,483Royal Caribbean Cruises Ltd. 307,935 38,984,571Ruth’s Hospitality Group, Inc. 51,983 1,276,183Scientific Games Corp. Class A (b) 89,331 3,970,763SeaWorld Entertainment, Inc. (a) (b) 127,392 1,863,745Shake Shack, Inc. Class A (a) (b) 35,538 1,385,627Six Flags Entertainment Corp. (a) 140,263 8,989,456Sonic Corp. (a) 74,649 1,875,183
Shares Value
Speedway Motorsports, Inc. 23,497 $ 461,246Starbucks Corp. 2,532,044 144,579,712Texas Roadhouse, Inc. Class A 113,067 6,248,082The Cheesecake Factory, Inc. (a) 75,769 3,522,501Town Sports International Holdings, Inc. (b) 22,025 127,745U.S. Foods Holding Corp. (b) 254,997 8,514,350Vail Resorts, Inc. 73,708 15,174,266Wendy’s Co. 328,867 5,245,429Wingstop, Inc. 55,195 2,500,885Wyndham Worldwide Corp. 177,047 20,498,502Wynn Resorts Ltd. 142,014 23,787,345Yum! Brands, Inc. 599,523 48,789,182Zoe’s Kitchen, Inc. (a) (b) 27,188 404,557
1,015,752,940Household Durables – 0.5%AV Homes, Inc. (a) (b) 12,051 202,457Bassett Furniture Industries, Inc. 15,479 498,424Beazer Homes U.S.A., Inc. (b) 65,476 1,029,283Cavco Industries, Inc. (b) 13,938 2,217,536Century Communities, Inc. (b) 33,155 986,361Comstock Holding Companies, Inc. (a) (b) 1,496 2,513CSS Industries, Inc. 16,118 296,732D.R. Horton, Inc. 588,321 24,650,650Dixie Group, Inc. (b) 11,105 34,426Emerson Radio Corp. (b) 23,724 34,874Ethan Allen Interiors, Inc. 53,577 1,272,454Flexsteel Industries, Inc. 9,186 356,968Garmin Ltd. 197,296 11,687,815GoPro, Inc. Class A (a) (b) 180,736 972,360Green Brick Partners, Inc. (b) 37,398 377,720Hamilton Beach Brands Holding Co. Class A 20,505 507,909Helen of Troy Ltd. (b) 48,961 4,408,938Hooker Furniture Corp. 17,507 653,886Hovnanian Enterprises, Inc. Class A (b) 177,163 386,215Installed Building Products, Inc. (b) 34,760 2,076,910iRobot Corp. (a) (b) 50,514 3,432,426KB Home 197,346 5,476,352Koss Corp. (b) 2,669 5,285La-Z-Boy, Inc. 91,907 2,821,545Leggett & Platt, Inc. 240,653 10,458,779Lennar Corp.:
Class A (a) 498,161 28,185,949Class B 9,673 438,767
LGI Homes, Inc. (a) (b) 30,018 1,698,719Libbey, Inc. 30,735 192,708Lifetime Brands, Inc. 14,046 195,942M.D.C. Holdings, Inc. 80,659 2,232,641M/I Homes, Inc. 47,612 1,383,129Meritage Homes Corp. (b) 64,418 2,731,323Mohawk Industries, Inc. (b) 111,700 26,794,596New Home Co. LLC (b) 17,775 199,791Newell Brands, Inc. 881,492 22,645,529Nova LifeStyle, Inc. (a) (b) 26,136 59,590NVR, Inc. (b) 6,044 17,184,119PICO Holdings, Inc. 33,668 412,433PulteGroup, Inc. 477,718 13,409,544

8Annual Report
See accompanying notes which are an integral part of the financial statements.
Schedule of Investments – continued
Common Stocks – continuedShares Value
CONSUMER DISCRETIONARY – continuedHousehold Durables – continuedRoku, Inc. Class A (a) 38,803 $ 1,581,998Skyline Corp. (b) 21,741 465,040Stanley Furniture Co., Inc. (b) 5,699 3,647Taylor Morrison Home Corp. (b) 197,853 4,439,821Tempur Sealy International, Inc. (a) (b) 77,783 3,844,814Toll Brothers, Inc. 253,725 11,120,767TopBuild Corp. (b) 72,015 5,015,125TRI Pointe Homes, Inc. (a) (b) 267,734 4,104,362Tupperware Brands Corp. 98,214 4,817,397Turtle Beach Corp. (a) (b) 6,672 3,005Universal Electronics, Inc. (b) 25,010 1,237,995Vuzix Corp. (a) (b) 35,528 299,323Whirlpool Corp. 126,716 20,582,480William Lyon Homes, Inc. (b) 53,155 1,343,758Zagg, Inc. (b) 47,415 713,596
252,186,726Internet & Direct Marketing Retail – 3.1%1-800-FLOWERS.com, Inc. Class A (b) 52,658 613,466Amazon.com, Inc. (b) 712,306 1,077,327,210Blue Apron Holdings, Inc. Class A (a) 44,602 124,440Duluth Holdings, Inc. (a) (b) 12,299 206,869EVINE Live, Inc. (b) 71,405 80,688Expedia, Inc. 219,025 23,034,859FTD Companies, Inc. (b) 25,393 152,866Gaia, Inc. Class A (b) 12,609 162,026Groupon, Inc. (a) (b) 700,384 2,997,644Lands’ End, Inc. (a) (b) 26,352 474,336Liberty Expedia Holdings, Inc. (b) 99,495 3,906,174Liberty Interactive Corp. QVC Group:
(Venture Group) Series A (b) 144,556 7,736,637Series A (b) 847,274 24,460,800
Liberty TripAdvisor Holdings, Inc. (b) 119,998 1,247,979Netflix, Inc. (b) 770,061 224,380,374NutriSystem, Inc. (a) 50,522 1,553,552Overstock.com, Inc. (a) (b) 28,358 1,712,823PetMed Express, Inc. (a) 38,488 1,739,273Shutterfly, Inc. (b) 63,827 4,897,446The Booking Holdings, Inc. (b) 86,647 176,243,464TripAdvisor, Inc. (a) (b) 200,393 8,031,751U.S. Auto Parts Network, Inc. (b) 5,048 10,449Wayfair LLC Class A (a) (b) 75,406 5,837,933
1,566,933,059Leisure Products – 0.1%American Outdoor Brands Corp. (a) (b) 96,497 868,473Brunswick Corp. 157,212 8,992,526Callaway Golf Co. 178,654 2,765,564Clarus Corp. (b) 32,583 218,306Escalade, Inc. 7,022 85,317Hasbro, Inc. 204,900 19,582,293JAKKS Pacific, Inc. (a) (b) 19,661 43,254Johnson Outdoors, Inc. Class A 8,158 502,859Malibu Boats, Inc. Class A (b) 36,393 1,166,396Marine Products Corp. 11,741 167,661Mattel, Inc. (a) 607,515 9,659,489
Shares Value
MCBC Holdings, Inc. (b) 21,350 $ 523,289Nautilus, Inc. (b) 46,907 555,848Polaris Industries, Inc. 105,512 12,027,313Sturm, Ruger & Co., Inc. (a) 33,314 1,434,168Summer Infant, Inc. (b) 32,605 34,887Vista Outdoor, Inc. (b) 94,769 1,632,870
60,260,513Media – 2.7%A.H. Belo Corp. Class A 22,177 114,212AMC Entertainment Holdings, Inc. Class A (a) 98,115 1,471,725AMC Networks, Inc. Class A (a) (b) 101,098 5,314,722Ballantyne of Omaha, Inc. (b) 17,964 90,718Cable One, Inc. 8,311 5,659,459CBS Corp. Class B 648,125 34,331,181Central European Media Enterprises Ltd. Class A (a) (b) 116,862 520,036Charter Communications, Inc. Class A (b) 345,535 118,148,783Cinedigm Corp. (a) (b) 5,614 7,018Cinemark Holdings, Inc. 187,168 7,965,870Clear Channel Outdoor Holding, Inc. Class A 57,659 276,763Comcast Corp. Class A 8,312,426 300,992,945Daily Journal Corp. (a) (b) 644 146,194Discovery Communications, Inc.:
Class A (a) (b) 247,368 6,015,990Class C (non-vtg.) (a) (b) 376,024 8,641,032
DISH Network Corp. Class A (b) 409,075 17,054,337E.W. Scripps Co. Class A 104,171 1,434,435Emmis Communications Corp. Class A (b) 1,993 8,311Entercom Communications Corp. Class A 234,454 2,321,095Entravision Communication Corp. Class A 112,796 727,534Gannett Co., Inc. 225,017 2,259,171Global Eagle Entertainment, Inc. (a) (b) 84,431 113,982Gray Television, Inc. (b) 131,703 1,817,501Harte-Hanks, Inc. (b) 4,548 39,613Hemisphere Media Group, Inc. (a) (b) 10,964 122,797Insignia Systems, Inc. (b) 5,038 6,247Interpublic Group of Companies, Inc. 699,242 16,362,263John Wiley & Sons, Inc. Class A 79,959 5,137,366Lee Enterprises, Inc. (a) (b) 58,988 144,521Liberty Broadband Corp.:
Class A (b) 36,926 3,226,594Class C (b) 281,378 24,727,499
Liberty Global PLC:Class A (b) 390,939 12,173,840Class C (b) 1,083,957 32,551,229LiLAC Class A (b) (c) 77,452 1LiLAC Class C (b) (c) 214,602 2
Liberty Latin America Ltd. (a) (b) 214,602 4,388,611Liberty Latin America Ltd. Class A (a) (b) 77,452 1,603,256Liberty Media Corp.:
Liberty Braves Class A (b) 14,273 327,137Liberty Braves Class C (b) 68,302 1,568,214Liberty Formula One Group Series C (a) (b) 377,087 12,417,475Liberty Media Class A (a) (b) 28,511 900,092Liberty SiriusXM Series A (b) 131,422 5,513,153Liberty SiriusXM Series C (b) 332,617 13,890,086

9 Annual Report
See accompanying notes which are an integral part of the financial statements.
Common Stocks – continuedShares Value
CONSUMER DISCRETIONARY – continuedMedia – continuedLions Gate Entertainment Corp.:
Class A (a) 110,956 $ 3,133,397Class B (a) 201,823 5,416,929
Live Nation Entertainment, Inc. (b) 237,309 10,631,443Loral Space & Communications Ltd. (b) 20,272 898,050Meredith Corp. 69,172 3,963,556MSG Network, Inc. Class A (a) (b) 103,460 2,524,424National CineMedia, Inc. 108,730 818,737New Media Investment Group, Inc. 89,861 1,550,102News Corp.:
Class A 750,318 12,102,629Class B 130,013 2,132,213
Nexstar Broadcasting Group, Inc. Class A 84,997 6,073,036Omnicom Group, Inc. 414,352 31,586,053Reading International, Inc. Class A (b) 17,900 293,560Regal Entertainment Group Class A 191,111 4,393,642RLJ Entertainment, Inc. (b) 5,726 24,736Saga Communications, Inc. Class A 3,882 151,398Salem Communications Corp. Class A 10,842 44,994Scholastic Corp. 52,798 1,922,375Scripps Networks Interactive, Inc. Class A 175,533 15,773,395Sinclair Broadcast Group, Inc. Class A (a) 131,894 4,458,017Sirius XM Holdings, Inc. (a) 2,845,102 17,867,241Tegna, Inc. 379,485 4,880,177The Madison Square Garden Co. (b) 28,218 6,890,836The McClatchy Co. Class A (a) (b) 6,072 56,045The New York Times Co. Class A (a) 238,030 5,736,523The Walt Disney Co. 2,685,208 277,006,057Time Warner, Inc. 1,381,399 128,414,851Townsquare Media, Inc. (b) 1,285 8,944Tribune Media Co. Class A 130,115 5,421,892tronc, Inc. (b) 51,781 990,571Twenty-First Century Fox, Inc.:
Class A 1,810,082 66,647,219Class B 840,712 30,618,731
Urban One, Inc. Class D (non-vtg.) (b) 32,336 54,971Viacom, Inc. Class B (non-vtg.) 653,615 21,791,524World Wrestling Entertainment, Inc. Class A 69,670 2,657,911
1,327,469,189Multiline Retail – 0.5%Big Lots, Inc. (a) 72,215 4,058,483Dillard’s, Inc. Class A (a) 40,152 3,274,396Dollar General Corp. 465,251 44,008,092Dollar Tree, Inc. (b) 424,308 43,550,973Fred’s, Inc. Class A (a) 52,965 176,373JC Penney Corp., Inc. (a) (b) 535,524 2,318,819Kohl’s Corp. (a) 300,366 19,851,189Macy’s, Inc. (a) 538,389 15,834,020Nordstrom, Inc. (a) 216,898 11,129,036Ollie’s Bargain Outlet Holdings, Inc. (a) (b) 90,196 5,353,133Sears Holdings Corp. (a) (b) 98,150 237,523Target Corp. 964,632 72,742,899Tuesday Morning Corp. (a) (b) 61,992 195,275
222,730,211
Shares Value
Specialty Retail – 2.1%Aaron’s, Inc. Class A 106,680 $ 4,929,683Abercrombie & Fitch Co. Class A (a) 133,398 2,752,001Advance Auto Parts, Inc. 133,158 15,213,302America’s Car Mart, Inc. (b) 10,422 507,551American Eagle Outfitters, Inc. 303,607 5,850,507Armstrong Flooring, Inc. (b) 37,094 519,687Asbury Automotive Group, Inc. (b) 40,476 2,665,345Ascena Retail Group, Inc. (b) 266,405 604,739AutoNation, Inc. (a) (b) 112,063 5,626,683AutoZone, Inc. (b) 49,002 32,572,609Barnes & Noble Education, Inc. (b) 60,796 443,811Barnes & Noble, Inc. 82,041 369,185Bed Bath & Beyond, Inc. 241,299 5,173,451Best Buy Co., Inc. 458,363 33,203,816Big 5 Sporting Goods Corp. (a) 23,104 142,090Boot Barn Holdings, Inc. (a) (b) 24,133 425,223Build-A-Bear Workshop, Inc. (b) 15,205 138,366Burlington Stores, Inc. (b) 117,818 14,449,200Caleres, Inc. 81,369 2,279,146Camping World Holdings, Inc. 51,857 2,167,623CarMax, Inc. (a) (b) 321,347 19,897,806Cars.com, Inc. (a) 127,554 3,493,704Chico’s FAS, Inc. 231,778 2,327,051Christopher & Banks Corp. (b) 57,707 65,786Citi Trends, Inc. 19,731 437,239Conn’s, Inc. (a) (b) 47,233 1,544,519Destination Maternity Corp. (a) (b) 22,235 47,138Destination XL Group, Inc. (a) (b) 51,406 125,945Dick’s Sporting Goods, Inc. 145,373 4,654,843DSW, Inc. Class A (a) 144,844 2,840,391Express, Inc. (a) (b) 127,643 921,582Finish Line, Inc. Class A 63,867 678,268Five Below, Inc. (b) 100,983 6,750,714Floor & Decor Holdings, Inc. Class A 55,726 2,511,571Foot Locker, Inc. 223,548 10,263,089Francesca’s Holdings Corp. (a) (b) 57,702 300,627GameStop Corp. Class A 189,516 2,973,506Gap, Inc. 381,256 12,040,064Genesco, Inc. (a) (b) 32,141 1,263,141GNC Holdings, Inc. Class A (a) (b) 120,441 513,079Group 1 Automotive, Inc. 38,654 2,660,941Guess?, Inc. (a) 102,345 1,616,028Haverty Furniture Companies, Inc. 30,217 614,916Hibbett Sports, Inc. (a) (b) 34,547 889,585Home Depot, Inc. 2,080,776 379,263,042Kirkland’s, Inc. (b) 21,240 186,062L Brands, Inc. (a) 437,411 21,577,485Lithia Motors, Inc. Class A (sub. vtg.) 43,018 4,469,140Lowe’s Companies, Inc. 1,481,932 132,766,288Lumber Liquidators Holdings, Inc. (a) (b) 49,362 1,143,224MarineMax, Inc. (b) 36,815 769,434Michaels Companies, Inc. (b) 197,854 4,552,621Monro, Inc. 59,370 3,021,933Murphy U.S.A., Inc. (b) 58,955 4,428,110New York & Co., Inc. (b) 34,393 91,829

10Annual Report
See accompanying notes which are an integral part of the financial statements.
Schedule of Investments – continued
Common Stocks – continuedShares Value
CONSUMER DISCRETIONARY – continuedSpecialty Retail – continuedO’Reilly Automotive, Inc. (b) 152,541 $ 37,248,987Office Depot, Inc. 882,988 2,322,258Party City Holdco, Inc. (b) 50,325 727,196Penske Automotive Group, Inc. 71,056 3,254,365Pier 1 Imports, Inc. (a) 163,568 507,061Rent-A-Center, Inc. (a) 93,716 704,744RH (a) (b) 34,177 2,900,944Ross Stores, Inc. 687,980 53,724,358Sally Beauty Holdings, Inc. (a) (b) 228,422 3,846,626Sears Hometown & Outlet Stores, Inc. (a) (b) 10,000 21,000Shoe Carnival, Inc. (a) 21,330 498,269Signet Jewelers Ltd. (a) 116,151 5,840,072Sleep Number Corp. (b) 68,724 2,366,855Sonic Automotive, Inc. Class A (sub. vtg.) 40,396 791,762Sportsman’s Warehouse Holdings, Inc. (a) (b) 48,606 235,739Stage Stores, Inc. (a) 38,699 73,528Stein Mart, Inc. (a) 40,412 25,055Tailored Brands, Inc. (a) 94,987 2,223,646The Buckle, Inc. (a) 74,380 1,565,699The Cato Corp. Class A (sub. vtg.) 36,544 415,140The Children’s Place Retail Stores, Inc. 29,482 4,195,289The Container Store Group, Inc. (a) (b) 22,029 111,246Tiffany & Co., Inc. 181,968 18,386,047Tile Shop Holdings, Inc. 56,926 307,400Tilly’s, Inc. 14,113 184,175TJX Companies, Inc. 1,126,815 93,165,064Tractor Supply Co. 226,801 14,726,189Trans World Entertainment Corp. (b) 2,977 4,912Ulta Beauty, Inc. (a) 103,043 20,953,794Urban Outfitters, Inc. (b) 143,484 5,063,550Vitamin Shoppe, Inc. (a) (b) 45,231 169,616Williams-Sonoma, Inc. (a) 139,872 7,239,775Winmark Corp. 3,184 403,413Zumiez, Inc. (b) 31,066 612,000
1,046,550,493Textiles, Apparel & Luxury Goods – 0.7%Cadence Bancorp 36,501 1,000,857Carter’s, Inc. 82,628 9,641,035Cherokee, Inc. (b) 20,319 32,510Columbia Sportswear Co. 57,607 4,353,937Crocs, Inc. (b) 126,644 1,550,123Culp, Inc. 12,256 340,717Deckers Outdoor Corp. (a) (b) 55,355 5,235,476Delta Apparel, Inc. (b) 4,312 77,832Differential Brands Group, Inc. (b) 1,083 1,180Emerald Expositions Events, Inc. (a) 58,843 1,254,533Fossil Group, Inc. (a) (b) 73,701 986,119G-III Apparel Group Ltd. (a) (b) 69,854 2,578,311Hanesbrands, Inc. (a) 660,961 12,822,643Iconix Brand Group, Inc. (a) (b) 101,691 141,350J.Jill, Inc. (a) 24,557 211,436Lakeland Industries, Inc. (b) 6,813 89,591lululemon athletica, Inc. (b) 180,400 14,630,440Michael Kors Holdings Ltd. (b) 277,238 17,446,587
Shares Value
Movado Group, Inc. 39,217 $ 1,215,727NIKE, Inc. Class B 2,345,864 157,243,264Oxford Industries, Inc. 34,526 2,759,318Perry Ellis International, Inc. (b) 15,961 425,680PetIQ, Inc. Class A (a) 7,273 159,279PVH Corp. 132,712 19,147,687Ralph Lauren Corp. 95,682 10,126,983Rocky Brands, Inc. 8,326 153,198Sequential Brands Group, Inc. (a) (b) 82,806 163,956Skechers U.S.A., Inc. Class A (sub. vtg.) (b) 241,859 9,896,870Steven Madden Ltd. 106,426 4,672,101Superior Uniform Group, Inc. 11,974 300,547Switch, Inc. Class A (a) 123,979 1,712,150Tapestry, Inc. 505,893 25,755,013TPG RE Finance Trust, Inc. 18,406 341,063Under Armour, Inc.:
Class A (sub. vtg.) (a) (b) 312,447 5,180,371Class C (non-vtg.) (a) (b) 338,744 5,098,097
Unifi, Inc. (b) 22,047 771,645Vera Bradley, Inc. (b) 29,957 301,367VF Corp. 576,882 43,018,091Vince Holding Corp. (a) (b) 2,676 23,094Wolverine World Wide, Inc. 170,818 5,001,551
365,861,729
TOTAL CONSUMER DISCRETIONARY 6,469,926,406
CONSUMER STAPLES – 6.7%Beverages – 1.6%Boston Beer Co., Inc. Class A (a) (b) 14,791 2,411,673Brown-Forman Corp.:
Class A 46,010 3,128,680Class B (non-vtg.) 416,920 29,096,847
Castle Brands, Inc. (a) (b) 173,742 201,541Coca-Cola Bottling Co. Consolidated 9,702 1,810,490Constellation Brands, Inc. Class A (sub. vtg.) 303,380 65,372,322Craft Brew Alliance, Inc. (a) (b) 14,306 255,362Dr. Pepper Snapple Group, Inc. 326,210 37,921,913MGP Ingredients, Inc. 22,363 1,876,703Molson Coors Brewing Co. Class B 332,266 25,335,283Monster Beverage Corp. (b) 732,492 46,418,018National Beverage Corp. (a) 22,740 2,227,156New Age Beverages Corp. (a) 33,316 107,278PepsiCo, Inc. 2,533,173 277,965,073Primo Water Corp. (b) 40,649 495,105REED’S, Inc. (b) 1,830 2,654The Coca-Cola Co. 6,825,714 295,007,359
789,633,457Food & Staples Retailing – 1.5%Andersons, Inc. 52,768 1,849,518Casey’s General Stores, Inc. (a) 69,297 7,782,746Chefs’ Warehouse Holdings (a) (b) 34,201 771,233Costco Wholesale Corp. 777,620 148,447,658CVS Health Corp. 1,800,621 121,956,060Ingles Markets, Inc. Class A 21,439 690,336Kroger Co. 1,583,759 42,951,544

11 Annual Report
See accompanying notes which are an integral part of the financial statements.
Common Stocks – continuedShares Value
CONSUMER STAPLES – continuedFood & Staples Retailing – continuedNatural Grocers by Vitamin Cottage, Inc. (a) (b) 12,082 $ 83,970Performance Food Group Co. (b) 157,320 4,821,858PriceSmart, Inc. (a) 44,258 3,485,318Rite Aid Corp. (a) (b) 1,929,419 3,800,955Smart & Final Stores, Inc. (a) (b) 46,551 335,167SpartanNash Co. 61,272 1,027,531Sprouts Farmers Market LLC (b) 217,629 5,606,123SUPERVALU, Inc. (a) (b) 111,412 1,585,393Sysco Corp. 855,662 51,040,238United Natural Foods, Inc. (a) (b) 87,309 3,725,475Village Super Market, Inc. Class A 8,594 203,678Walgreens Boots Alliance, Inc. 1,549,802 106,765,860Walmart, Inc. 2,609,057 234,841,221Weis Markets, Inc. 29,625 1,104,124Welbilt, Inc. (b) 274,877 5,445,313
748,321,319Food Products – 1.2%Alico, Inc. 4,002 106,453Archer Daniels Midland Co. 1,004,015 41,686,703B&G Foods, Inc. Class A (a) 116,520 3,227,604Blue Buffalo Pet Products, Inc. (a) (b) 164,852 6,603,971Bunge Ltd. 249,786 18,841,358Cal-Maine Foods, Inc. (a) (b) 58,088 2,474,549Calavo Growers, Inc. (a) 26,199 2,236,085Campbell Soup Co. (a) 340,124 14,642,338Coffee Holding Co., Inc. (b) 3,401 14,828ConAgra Foods, Inc. 719,052 25,979,349Darling International, Inc. (b) 281,119 5,113,555Dean Foods Co. 156,497 1,356,829Farmer Brothers Co. (a) (b) 27,261 850,543Flowers Foods, Inc. 328,688 6,816,989Fresh Del Monte Produce, Inc. 62,230 2,904,896Freshpet, Inc. (a) (b) 33,847 676,940General Mills, Inc. 1,002,598 50,681,329Hormel Foods Corp. (a) 480,840 15,608,066Hostess Brands, Inc. Class A (a) (b) 143,616 1,757,860Ingredion, Inc. 126,693 16,551,174J&J Snack Foods Corp. 28,653 3,848,957John B. Sanfilippo & Son, Inc. (a) 17,222 994,398Kellogg Co. 443,496 29,359,435Lamb Weston Holdings, Inc. 251,898 13,625,163Lancaster Colony Corp. 37,363 4,421,537Landec Corp. (b) 35,757 464,841Lifeway Foods, Inc. (b) 1,962 13,263Limoneira Co. 13,723 293,809McCormick & Co., Inc. (non-vtg.) 210,732 22,501,963Mondelez International, Inc. 2,666,723 117,069,140Pilgrim’s Pride Corp. (a) (b) 94,260 2,375,352Pinnacle Foods, Inc. 202,857 10,946,164Post Holdings, Inc. (b) 113,903 8,631,569Sanderson Farms, Inc. 34,070 4,195,721Seaboard Corp. 460 1,863,920Seneca Foods Corp. Class A (b) 9,032 262,831Snyders-Lance, Inc. 158,344 7,898,199
Shares Value
The Hain Celestial Group, Inc. (a) (b) 182,275 $ 6,339,525The Hershey Co. 248,403 24,408,079The J.M. Smucker Co. 202,748 25,607,072The Kraft Heinz Co. 1,065,085 71,413,949The Simply Good Foods Co. 147,360 1,990,834Tootsie Roll Industries, Inc. (a) 47,006 1,570,000TreeHouse Foods, Inc. (a) (b) 96,338 3,662,771Tyson Foods, Inc. Class A 537,196 39,956,638
621,846,549Household Products – 1.2%Central Garden & Pet Co. Class A (non-vtg.) (b) 79,976 2,898,330Church & Dwight Co., Inc. 447,235 21,999,490Clorox Co. 229,135 29,576,746Colgate-Palmolive Co. 1,565,447 107,968,880Energizer Holdings, Inc. 108,084 5,888,416HRG Group, Inc. (b) 268,050 4,232,510Kimberly-Clark Corp. 629,814 69,858,969Oil-Dri Corp. of America 2,105 75,906Orchids Paper Products Co. (a) 12,438 133,087Procter & Gamble Co. 4,537,547 356,288,190Spectrum Brands Holdings, Inc. (a) 41,932 4,139,108WD-40 Co. (a) 27,338 3,409,049
606,468,681Personal Products – 0.2%Avon Products, Inc. (b) 750,697 1,974,333Coty, Inc. Class A 845,306 16,331,312Cyanotech Corp. (b) 2,300 11,960Edgewell Personal Care Co. (a) (b) 95,191 4,773,829elf Beauty, Inc. (a) (b) 35,801 660,170Estee Lauder Companies, Inc. Class A 397,082 54,972,032Herbalife Ltd. (a) (b) 106,702 9,827,254Inter Parfums, Inc. 29,691 1,258,898LifeVantage Corp. (b) 19,206 76,248Mannatech, Inc. 599 8,506MediFast, Inc. 36,423 2,323,423Natural Health Trends Corp. (a) 11,452 199,608Nature’s Sunshine Products, Inc. 6,985 78,581Nu Skin Enterprises, Inc. Class A 92,978 6,545,651Revlon, Inc. (a) (b) 25,388 500,144USANA Health Sciences, Inc. (b) 20,348 1,554,587Veru, Inc. (b) 11,731 16,306
101,112,842Tobacco – 1.0%22nd Century Group, Inc. (a) (b) 193,301 485,186Alliance One International, Inc. (b) 8,945 178,453Altria Group, Inc. 3,399,580 214,003,561Philip Morris International, Inc. 2,767,037 286,526,681Universal Corp. 48,780 2,397,537Vector Group Ltd. (a) 198,591 3,979,764
507,571,182
TOTAL CONSUMER STAPLES 3,374,954,030
ENERGY – 5.2%Energy Equipment & Services – 0.8%Archrock, Inc. 117,660 1,117,770

12Annual Report
See accompanying notes which are an integral part of the financial statements.
Schedule of Investments – continued
Common Stocks – continuedShares Value
ENERGY – continuedEnergy Equipment & Services – continuedAspen Aerogels, Inc. (b) 9,858 $ 45,347Baker Hughes, a GE Co. Class A 769,492 20,314,589Basic Energy Services, Inc. (b) 42,877 693,750Bristow Group, Inc. (a) 47,191 696,539C&J Energy Services, Inc. (b) 129,736 3,113,664Carbo Ceramics, Inc. (a) (b) 36,697 249,540Core Laboratories NV (a) 76,525 7,879,014Dawson Geophysical Co. (b) 19,081 105,136Diamond Offshore Drilling, Inc. (a) (b) 99,661 1,445,085Dril-Quip, Inc. (a) (b) 70,873 3,192,829ENGlobal Corp. (b) 5,637 4,453Ensco PLC Class A 738,074 3,277,049Era Group, Inc. (b) 30,759 290,673Exterran Corp. (b) 59,232 1,532,332Fairmount Santrol Holidings, Inc. (a) (b) 254,086 1,138,305Forum Energy Technologies, Inc. (a) (b) 122,886 1,388,612Frank’s International NV (a) 90,617 473,927Geospace Technologies Corp. (a) (b) 25,924 265,203Gulf Island Fabrication, Inc. 17,861 147,353Halliburton Co. 1,545,223 71,729,252Helix Energy Solutions Group, Inc. (b) 241,675 1,440,383Helmerich & Payne, Inc. (a) 187,432 12,098,736Hornbeck Offshore Services, Inc. (b) 41,835 135,127Independence Contract Drilling, Inc. (b) 45,769 189,941ION Geophysical Corp. (b) 10,360 291,116Key Energy Services, Inc. (b) 8,593 115,232Mammoth Energy Services, Inc. (a) (b) 11,194 293,059Matrix Service Co. (b) 47,813 683,726McDermott International, Inc. (b) 550,049 4,015,358Mitcham Industries, Inc. (b) 23,287 81,970Nabors Industries Ltd. 544,293 3,521,576National Oilwell Varco, Inc. 707,153 24,813,999Natural Gas Services Group, Inc. (b) 21,602 537,890NCS Multistage Holdings, Inc. (a) 41,493 606,628Newpark Resources, Inc. (b) 153,002 1,262,267Noble Corp. (a) (b) 421,660 1,636,041Oceaneering International, Inc. (a) 170,909 3,141,307Oil States International, Inc. (b) 89,813 2,209,400Parker Drilling Co. (b) 180,331 162,298Patterson-UTI Energy, Inc. 399,470 7,218,423PHI, Inc. (non-vtg.) (b) 18,377 181,013Pioneer Energy Services Corp. (b) 120,721 331,983Profire Energy, Inc. (a) (b) 14,213 30,274Ranger Energy Services, Inc. Class A 4,519 40,355RigNet, Inc. (b) 15,376 206,038Rowan Companies PLC (a) (b) 205,609 2,500,205RPC, Inc. (a) 112,587 2,211,209Schlumberger Ltd. 2,463,574 161,708,997SEACOR Holdings, Inc. (b) 30,397 1,261,779Smart Sand, Inc. (a) (b) 41,295 306,409Solaris Oilfield Infrastructure, Inc. Class A 42,266 711,337Superior Energy Services, Inc. (a) (b) 268,168 2,292,836Synthesis Energy Systems, Inc. (a) (b) 17,261 44,879TechnipFMC PLC 812,785 23,424,464
Shares Value
TETRA Technologies, Inc. (b) 186,418 $ 676,697Tidewater, Inc. (b) 55,017 1,376,525Transocean Ltd. (United States) (a) (b) 745,357 6,790,202U.S. Silica Holdings, Inc. 142,993 3,702,089Unit Corp. (b) 95,665 1,832,941Weatherford International PLC (a) (b) 1,832,295 4,818,936Willbros Group, Inc. (b) 69,552 65,949
398,070,016Oil, Gas & Consumable Fuels – 4.4%Abraxas Petroleum Corp. (b) 241,078 518,318Adams Resources & Energy, Inc. 2,090 82,555Aemetis, Inc. (b) 10,055 5,438Amyris, Inc. (a) (b) 23,308 123,299Anadarko Petroleum Corp. 968,693 55,254,249Andeavor 257,277 23,057,165Antero Resources Corp. (a) (b) 422,093 7,939,569Apache Corp. 688,256 23,503,942Approach Resources, Inc. (a) (b) 60,041 174,719Arch Coal, Inc. 42,349 4,053,223Barnwell Industries, Inc. (b) 2,847 5,609Bill Barrett Corp. (b) 185,582 840,686Bonanza Creek Energy, Inc. 37,069 1,039,044Cabot Oil & Gas Corp. 829,554 20,042,025California Resources Corp. (a) (b) 64,079 904,155Callon Petroleum Co. (a) (b) 334,854 3,539,407Camber Energy, Inc. (b) 376 33Carrizo Oil & Gas, Inc. (a) (b) 129,850 1,824,393Centennial Resource Development, Inc. Class A (a) (b) 293,522 5,600,400Cheniere Energy, Inc. (b) 396,039 20,799,968Chesapeake Energy Corp. (a) (b) 1,590,465 4,485,111Chevron Corp. 3,383,664 378,699,675Cimarex Energy Co. 170,015 16,336,741Clean Energy Fuels Corp. (b) 207,470 288,383Cloud Peak Energy, Inc. (b) 152,269 500,965CNX Resources Corp. (b) 363,329 5,838,697Comstock Resources, Inc. (a) (b) 24,083 164,728Concho Resources, Inc. (b) 262,962 39,654,670ConocoPhillips Co. 2,125,019 115,409,782CONSOL Energy, Inc. (b) 45,416 1,439,233Contango Oil & Gas Co. (b) 51,306 148,787Continental Resources, Inc. (a) (b) 146,908 6,979,599CVR Energy, Inc. (a) 23,933 708,895Delek U.S. Holdings, Inc. 132,947 4,536,152Denbury Resources, Inc. (a) (b) 776,911 1,701,435Devon Energy Corp. 955,387 29,301,719Diamondback Energy, Inc. (b) 170,639 21,268,445Dorian Lpg Ltd. (b) 48,796 357,187Earthstone Energy, Inc. (b) 37,545 345,414Eclipse Resources Corp. (b) 169,538 272,956Energen Corp. (b) 196,138 10,730,710Energy XXI Gulf Coast, Inc. 77,532 407,043EOG Resources, Inc. 1,036,351 105,106,718EP Energy Corp. (a) (b) 91,298 137,860EQT Corp. 438,857 22,078,896Evolution Petroleum Corp. 53,534 430,949Extraction Oil & Gas, Inc. (a) (b) 231,956 2,802,028

13 Annual Report
See accompanying notes which are an integral part of the financial statements.
Common Stocks – continuedShares Value
ENERGY – continuedOil, Gas & Consumable Fuels – continuedExxon Mobil Corp. 7,552,064 $ 571,993,327Gastar Exploration, Inc. (a) (b) 285,601 193,209Gener8 Maritime, Inc. (b) 186,799 1,036,734Gevo, Inc. (a) (b) 7,805 3,524Green Plains, Inc. 65,482 1,198,321Gulfport Energy Corp. (a) (b) 275,383 2,671,215Halcon Resources Corp. (a) (b) 292,167 1,767,610Hallador Energy Co. 29,822 196,825Hess Corp. 480,039 21,803,371HollyFrontier Corp. 309,150 13,240,895Houston American Energy Corp. (a) (b) 36,485 9,851International Seaways, Inc. (b) 72,136 1,173,653Isramco, Inc. (b) 123 12,903Jagged Peak Energy, Inc. (a) (b) 69,960 860,508Jones Energy, Inc. (a) 91,542 84,219Kinder Morgan, Inc. 3,438,195 55,698,759Kosmos Energy Ltd. (a) (b) 380,364 2,050,162Laredo Petroleum, Inc. (a) (b) 240,236 2,015,580Lilis Energy, Inc. (a) (b) 43,293 158,885Lonestar Resources U.S., Inc. (b) 18,853 75,601Marathon Oil Corp. 1,482,870 21,531,272Marathon Petroleum Corp. 877,770 56,229,946Matador Resources Co. (a) (b) 176,342 5,089,230Midstates Petroleum Co., Inc. (b) 37,462 504,988Murphy Oil Corp. (a) 294,440 7,464,054NACCO Industries, Inc. Class A 7,854 323,585Newfield Exploration Co. (b) 346,789 8,090,587Nextdecade Corp. (b) 29,373 174,769Noble Energy, Inc. 903,623 26,955,074Northern Oil & Gas, Inc. (a) (b) 93,777 194,118Oasis Petroleum, Inc. (b) 473,442 3,730,723Occidental Petroleum Corp. 1,358,030 89,086,768ONEOK, Inc. 728,810 41,053,867Overseas Shipholding Group, Inc. (b) 80,103 141,782Pacific Ethanol, Inc. (b) 51,285 210,269Panhandle Royalty Co. Class A 32,305 576,644Par Pacific Holdings, Inc. (b) 53,028 902,537Parsley Energy, Inc. Class A (b) 426,877 10,791,451PBF Energy, Inc. Class A 185,150 5,426,747PDC Energy, Inc. (b) 114,514 6,015,420Peabody Energy Corp. 204,690 8,332,930Penn Virginia Corp. (b) 26,001 969,837Petroquest Energy, Inc. (b) 17,737 25,009Phillips 66 Co. 748,257 67,619,985Pioneer Natural Resources Co. 305,075 51,932,917QEP Resources, Inc. (b) 417,391 3,597,910Range Resources Corp. (a) 384,238 5,106,523Renewable Energy Group, Inc. (a) (b) 62,786 696,925Resolute Energy Corp. (a) (b) 30,507 991,478Rex American Resources Corp. (b) 9,008 727,126Rex Energy Corp. (a) (b) 6,338 5,853Ring Energy, Inc. (b) 84,537 1,147,167RSP Permian, Inc. (b) 219,603 8,412,991Sanchez Energy Corp. (a) (b) 110,256 323,050
Shares Value
SandRidge Energy, Inc. (a) (b) 53,660 $ 754,460SemGroup Corp. Class A 110,250 2,447,550SilverBow Resources, Inc. (b) 9,186 255,095SM Energy Co. (a) 179,312 3,288,582Southwestern Energy Co. (b) 872,953 3,116,442Src Energy, Inc. (b) 408,694 3,625,116Stone Energy Corp. 44,486 1,346,146Targa Resources Corp. 382,414 17,074,785Tellurian, Inc. (a) (b) 102,357 893,577Tengasco, Inc. (b) 1,261 846The Williams Companies, Inc. 1,452,613 40,324,537Torchlight Energy Resources, Inc. (a) (b) 48,218 55,933TransAtlantic Petroleum Ltd. (b) 18,382 26,470U.S. Energy Corp. (a) (b) 2,263 2,897Ultra Petroleum Corp. (a) 342,191 1,262,685Uranium Energy Corp. (a) (b) 246,510 320,463VAALCO Energy, Inc. (b) 68,248 58,693Valero Energy Corp. 775,198 70,093,403Vertex Energy, Inc. (b) 17,824 16,220W&T Offshore, Inc. (b) 151,259 588,398Warrior Metropolitan Coal, Inc. 77,691 2,424,736Westmoreland Coal Co. (a) (b) 31,012 13,059Westwater Resources, Inc. (a) (b) 2,190 1,643Whiting Petroleum Corp. (a) (b) 153,187 4,168,218WildHorse Resource Development Corp. (a) (b) 44,975 763,676World Fuel Services Corp. 116,948 2,672,262WPX Energy, Inc. (b) 680,691 9,618,164Zion Oil & Gas, Inc. (a) (b) 91,553 371,705
2,215,655,420
TOTAL ENERGY 2,613,725,436
FINANCIALS – 15.3%Banks – 6.9%1st Source Corp. 33,223 1,638,558Access National Corp. 21,459 599,779ACNB Corp. 3,789 106,092Allegiance Bancshares, Inc. (b) 20,938 798,785American National Bankshares, Inc. 2,748 99,203Ameris Bancorp 68,985 3,666,553Ames National Corp. 2,652 70,411Arrow Financial Corp. 17,457 562,988Associated Banc-Corp. 292,694 7,229,542Atlantic Capital Bancshares, Inc. (b) 43,769 757,204Banc of California, Inc. 80,001 1,596,020BancFirst Corp. 35,422 1,886,222Bancorp, Inc., Delaware (b) 84,963 898,059BancorpSouth Bank 160,679 5,061,389Bank of America Corp. 17,253,192 553,827,463Bank of Commerce Holdings 29,023 313,448Bank of Hawaii Corp. 95,554 7,836,384Bank of Marin Bancorp 8,356 552,749Bank of the Ozarks, Inc. 240,055 11,976,344BankUnited, Inc. 186,241 7,490,613Banner Corp. 61,987 3,426,641Bar Harbor Bankshares 27,763 752,377
14Annual Report
See accompanying notes which are an integral part of the financial statements.
Schedule of Investments – continued
Common Stocks – continuedShares Value
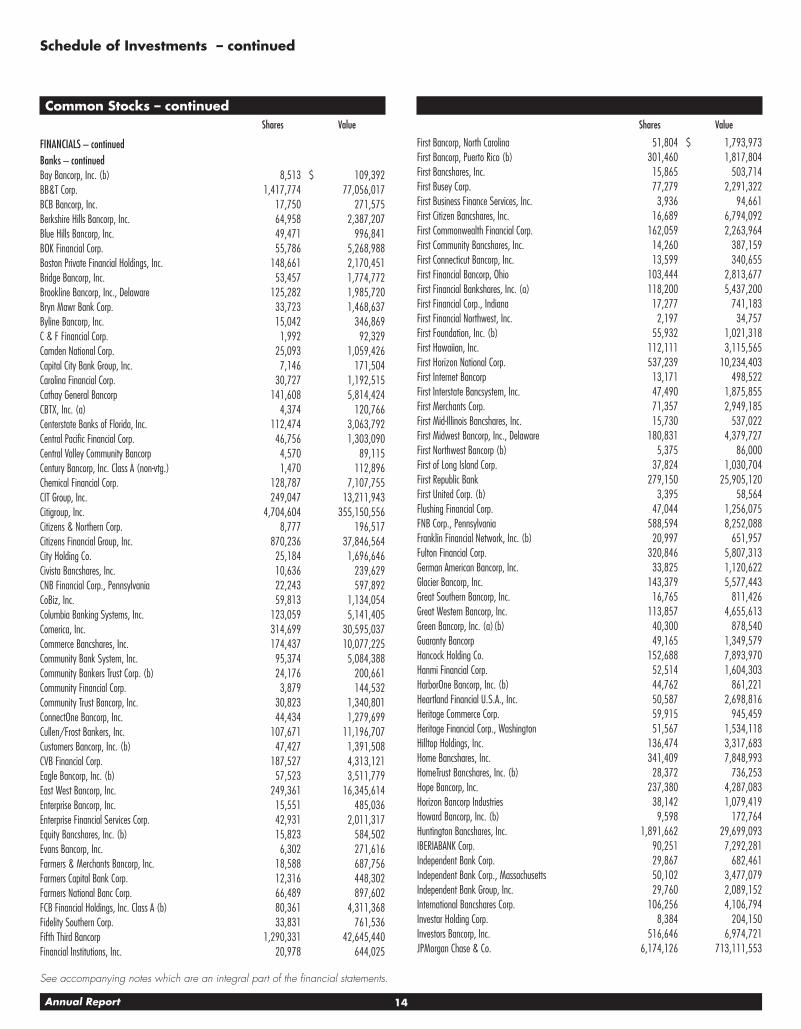
FINANCIALS – continuedBanks – continuedBay Bancorp, Inc. (b) 8,513 $ 109,392BB&T Corp. 1,417,774 77,056,017BCB Bancorp, Inc. 17,750 271,575Berkshire Hills Bancorp, Inc. 64,958 2,387,207Blue Hills Bancorp, Inc. 49,471 996,841BOK Financial Corp. 55,786 5,268,988Boston Private Financial Holdings, Inc. 148,661 2,170,451Bridge Bancorp, Inc. 53,457 1,774,772Brookline Bancorp, Inc., Delaware 125,282 1,985,720Bryn Mawr Bank Corp. 33,723 1,468,637Byline Bancorp, Inc. 15,042 346,869C & F Financial Corp. 1,992 92,329Camden National Corp. 25,093 1,059,426Capital City Bank Group, Inc. 7,146 171,504Carolina Financial Corp. 30,727 1,192,515Cathay General Bancorp 141,608 5,814,424CBTX, Inc. (a) 4,374 120,766Centerstate Banks of Florida, Inc. 112,474 3,063,792Central Pacific Financial Corp. 46,756 1,303,090Central Valley Community Bancorp 4,570 89,115Century Bancorp, Inc. Class A (non-vtg.) 1,470 112,896Chemical Financial Corp. 128,787 7,107,755CIT Group, Inc. 249,047 13,211,943Citigroup, Inc. 4,704,604 355,150,556Citizens & Northern Corp. 8,777 196,517Citizens Financial Group, Inc. 870,236 37,846,564City Holding Co. 25,184 1,696,646Civista Bancshares, Inc. 10,636 239,629CNB Financial Corp., Pennsylvania 22,243 597,892CoBiz, Inc. 59,813 1,134,054Columbia Banking Systems, Inc. 123,059 5,141,405Comerica, Inc. 314,699 30,595,037Commerce Bancshares, Inc. 174,437 10,077,225Community Bank System, Inc. 95,374 5,084,388Community Bankers Trust Corp. (b) 24,176 200,661Community Financial Corp. 3,879 144,532Community Trust Bancorp, Inc. 30,823 1,340,801ConnectOne Bancorp, Inc. 44,434 1,279,699Cullen/Frost Bankers, Inc. 107,671 11,196,707Customers Bancorp, Inc. (b) 47,427 1,391,508CVB Financial Corp. 187,527 4,313,121Eagle Bancorp, Inc. (b) 57,523 3,511,779East West Bancorp, Inc. 249,361 16,345,614Enterprise Bancorp, Inc. 15,551 485,036Enterprise Financial Services Corp. 42,931 2,011,317Equity Bancshares, Inc. (b) 15,823 584,502Evans Bancorp, Inc. 6,302 271,616Farmers & Merchants Bancorp, Inc. 18,588 687,756Farmers Capital Bank Corp. 12,316 448,302Farmers National Banc Corp. 66,489 897,602FCB Financial Holdings, Inc. Class A (b) 80,361 4,311,368Fidelity Southern Corp. 33,831 761,536Fifth Third Bancorp 1,290,331 42,645,440Financial Institutions, Inc. 20,978 644,025
Shares Value
First Bancorp, North Carolina 51,804 $ 1,793,973First Bancorp, Puerto Rico (b) 301,460 1,817,804First Bancshares, Inc. 15,865 503,714First Busey Corp. 77,279 2,291,322First Business Finance Services, Inc. 3,936 94,661First Citizen Bancshares, Inc. 16,689 6,794,092First Commonwealth Financial Corp. 162,059 2,263,964First Community Bancshares, Inc. 14,260 387,159First Connecticut Bancorp, Inc. 13,599 340,655First Financial Bancorp, Ohio 103,444 2,813,677First Financial Bankshares, Inc. (a) 118,200 5,437,200First Financial Corp., Indiana 17,277 741,183First Financial Northwest, Inc. 2,197 34,757First Foundation, Inc. (b) 55,932 1,021,318First Hawaiian, Inc. 112,111 3,115,565First Horizon National Corp. 537,239 10,234,403First Internet Bancorp 13,171 498,522First Interstate Bancsystem, Inc. 47,490 1,875,855First Merchants Corp. 71,357 2,949,185First Mid-Illinois Bancshares, Inc. 15,730 537,022First Midwest Bancorp, Inc., Delaware 180,831 4,379,727First Northwest Bancorp (b) 5,375 86,000First of Long Island Corp. 37,824 1,030,704First Republic Bank 279,150 25,905,120First United Corp. (b) 3,395 58,564Flushing Financial Corp. 47,044 1,256,075FNB Corp., Pennsylvania 588,594 8,252,088Franklin Financial Network, Inc. (b) 20,997 651,957Fulton Financial Corp. 320,846 5,807,313German American Bancorp, Inc. 33,825 1,120,622Glacier Bancorp, Inc. 143,379 5,577,443Great Southern Bancorp, Inc. 16,765 811,426Great Western Bancorp, Inc. 113,857 4,655,613Green Bancorp, Inc. (a) (b) 40,300 878,540Guaranty Bancorp 49,165 1,349,579Hancock Holding Co. 152,688 7,893,970Hanmi Financial Corp. 52,514 1,604,303HarborOne Bancorp, Inc. (b) 44,762 861,221Heartland Financial U.S.A., Inc. 50,587 2,698,816Heritage Commerce Corp. 59,915 945,459Heritage Financial Corp., Washington 51,567 1,534,118Hilltop Holdings, Inc. 136,474 3,317,683Home Bancshares, Inc. 341,409 7,848,993HomeTrust Bancshares, Inc. (b) 28,372 736,253Hope Bancorp, Inc. 237,380 4,287,083Horizon Bancorp Industries 38,142 1,079,419Howard Bancorp, Inc. (b) 9,598 172,764Huntington Bancshares, Inc. 1,891,662 29,699,093IBERIABANK Corp. 90,251 7,292,281Independent Bank Corp. 29,867 682,461Independent Bank Corp., Massachusetts 50,102 3,477,079Independent Bank Group, Inc. 29,760 2,089,152International Bancshares Corp. 106,256 4,106,794Investar Holding Corp. 8,384 204,150Investors Bancorp, Inc. 516,646 6,974,721JPMorgan Chase & Co. 6,174,126 713,111,553

15 Annual Report
See accompanying notes which are an integral part of the financial statements.
Common Stocks – continuedShares Value
FINANCIALS – continuedBanks – continuedKeyCorp 1,887,018 $ 39,872,690Lakeland Bancorp, Inc. 71,024 1,356,558Lakeland Financial Corp. 43,110 1,953,314LegacyTexas Financial Group, Inc. 83,607 3,502,297Live Oak Bancshares, Inc. 47,360 1,236,096M&T Bank Corp. 281,116 53,367,061Macatawa Bank Corp. 22,839 225,878MainSource Financial Group, Inc. 38,520 1,454,900MB Financial, Inc. 144,722 5,935,049MBT Financial Corp. 19,637 200,297Mercantile Bank Corp. 25,655 849,181Merchants Bancorp/IN 6,381 130,811Midland States Bancorp, Inc. 9,812 307,606Midsouth Bancorp, Inc. 23,289 291,113MidWestOne Financial Group, Inc. 15,589 496,042MutualFirst Financial, Inc. 20,181 720,462National Bank Holdings Corp. 47,060 1,533,685National Bankshares, Inc. (a) 5,803 231,250National Commerce Corp. (b) 21,772 935,107NBT Bancorp, Inc. 92,219 3,209,221Nicolet Bankshares, Inc. (b) 9,989 540,105Northeast Bancorp 10,393 228,126Northrim Bancorp, Inc. 6,518 216,724Norwood Financial Corp. 7,600 224,352OFG Bancorp (a) 71,939 773,344Ohio Valley Banc Corp. 3,608 141,253Old Line Bancshares, Inc. 8,031 254,021Old National Bancorp, Indiana 272,863 4,638,671Old Point Financial Corp. 1,881 47,213Old Second Bancorp, Inc. 36,720 504,900Opus Bank 31,202 875,216Orrstown Financial Services, Inc. 5,669 140,024Pacific Mercantile Bancorp (b) 10,321 85,148Pacific Premier Bancorp, Inc. (b) 71,645 3,012,672PacWest Bancorp 249,776 13,023,321Park National Corp. 26,938 2,721,277PCSB Financial Corp. 61,717 1,184,349Peapack-Gladstone Financial Corp. 27,837 918,064Penns Woods Bancorp, Inc. 3,854 156,511People’s Utah Bancorp 31,031 941,791Peoples Bancorp of North Carolina 4,241 118,112Peoples Bancorp, Inc. 27,844 960,340Peoples Financial Services Corp. 12,111 498,610Peoples United Financial, Inc. 659,838 12,629,299Pinnacle Financial Partners, Inc. 128,020 8,263,691PNC Financial Services Group, Inc. 849,955 134,003,905Popular, Inc. 183,067 7,690,645Preferred Bank, Los Angeles 21,681 1,351,377Premier Financial Bancorp, Inc. 4,507 79,413Prosperity Bancshares, Inc. 133,535 10,015,125QCR Holdings, Inc. 31,102 1,356,047Regions Financial Corp. 2,110,816 40,970,939Reliant Bancorp, Inc. (a) 8,584 204,213Renasant Corp. 83,390 3,482,366
Shares Value
Republic Bancorp, Inc., Kentucky Class A 18,205 $ 678,136Republic First Bancorp, Inc. (a) (b) 116,122 981,231S&T Bancorp, Inc. 72,150 2,847,039Sandy Spring Bancorp, Inc. 55,116 2,136,296Seacoast Banking Corp., Florida (b) 72,714 1,906,561ServisFirst Bancshares, Inc. 88,788 3,565,726Shore Bancshares, Inc. 6,745 114,800Sierra Bancorp 11,641 302,899Signature Bank (b) 99,740 14,580,991Simmons First National Corp. Class A 139,572 3,970,823SmartFinancial, Inc. (b) 7,194 156,973South State Corp. 66,819 5,793,207Southern First Bancshares, Inc. (b) 4,963 209,190Southern National Bancorp of Virginia, Inc. 38,866 597,759Southside Bancshares, Inc. 47,031 1,570,835State Bank Financial Corp. 66,178 1,915,191Sterling Bancorp 417,699 9,711,502Stock Yards Bancorp, Inc. 30,796 1,080,940Summit Financial Group, Inc. 7,690 184,176SunTrust Banks, Inc. 861,829 60,190,137SVB Financial Group (b) 96,352 23,989,721Synovus Financial Corp. 230,632 11,370,158TCF Financial Corp. 303,183 6,760,981Texas Capital Bancshares, Inc. (b) 86,508 7,803,022The First Bancorp, Inc. 17,759 478,783Tompkins Financial Corp. 24,657 1,892,178TowneBank 115,002 3,283,307Trico Bancshares 37,499 1,400,588TriState Capital Holdings, Inc. (b) 37,306 833,789Triumph Bancorp, Inc. (b) 32,105 1,314,700Trustmark Corp. 125,196 3,911,123Two River Bancorp 3,500 59,990U.S. Bancorp 2,824,836 153,558,085UMB Financial Corp. 85,559 6,245,807Umpqua Holdings Corp. 368,620 7,855,292Union Bankshares Corp. 104,822 3,918,246Union Bankshares, Inc. 1,824 93,571United Bankshares, Inc., West Virginia (a) 191,327 6,792,109United Community Bank, Inc. 132,387 4,092,082United Security Bancshares, California 5,985 61,047Unity Bancorp, Inc. 5,913 122,103Univest Corp. of Pennsylvania 57,919 1,586,981Valley National Bancorp 592,760 7,391,717Veritex Holdings, Inc. (b) 31,035 861,532Washington Trust Bancorp, Inc. 26,445 1,371,173Webster Financial Corp. 163,732 8,936,493Wells Fargo & Co. 7,895,137 461,154,952WesBanco, Inc. 85,305 3,515,419West Bancorp., Inc. 59,222 1,439,095Westamerica Bancorp. (a) 50,684 2,903,686Western Alliance Bancorp. (b) 173,471 10,141,115Wintrust Financial Corp. 92,607 7,826,218Zions Bancorporation 354,085 19,464,052
3,442,523,160Capital Markets – 3.0%Affiliated Managers Group, Inc. 100,052 18,945,847

16Annual Report
See accompanying notes which are an integral part of the financial statements.
Schedule of Investments – continued
Common Stocks – continuedShares Value
FINANCIALS – continuedCapital Markets – continuedAmeriprise Financial, Inc. 258,160 $ 40,386,550Arlington Asset Investment Corp. (a) 39,851 431,188Artisan Partners Asset Management, Inc. 93,464 3,154,410Ashford, Inc. (b) 1,254 124,083Associated Capital Group, Inc. 6,083 209,864B. Riley Financial, Inc. (a) 24,014 444,259Bank of New York Mellon Corp. 1,816,595 103,600,413BGC Partners, Inc. Class A 395,046 5,222,508BlackRock, Inc. Class A 219,677 120,697,134Brighthouse Financial, Inc. 167,673 9,099,614Cboe Global Markets, Inc. 209,341 23,448,285Charles Schwab Corp. 2,117,112 112,249,278CME Group, Inc. 606,478 100,772,384Cohen & Steers, Inc. 39,455 1,578,200Cowen Group, Inc. Class A (a) (b) 42,436 608,957Diamond Hill Investment Group, Inc. 5,350 1,096,911E*TRADE Financial Corp. (b) 466,118 24,345,343Eaton Vance Corp. (non-vtg.) 215,304 11,396,041Evercore, Inc. Class A 86,895 8,085,580FactSet Research Systems, Inc. 68,243 13,865,613Federated Investors, Inc. Class B (non-vtg.) (a) 166,109 5,411,831Financial Engines, Inc. 110,645 3,706,608Franklin Resources, Inc. 580,185 22,435,754Gain Capital Holdings, Inc. (a) 33,946 240,677GAMCO Investors, Inc. Class A 6,083 163,024Goldman Sachs Group, Inc. 621,663 163,453,853Great Elm Capital Group, Inc. (b) 8,360 30,932Greenhill & Co., Inc. 46,751 951,383Hamilton Lane, Inc. Class A 48,843 1,706,574Houlihan Lokey 45,634 2,118,330Institutional Financial Markets, Inc. 688 7,238Interactive Brokers Group, Inc. 119,445 8,289,483IntercontinentalExchange, Inc. 1,037,103 75,791,487INTL FCStone, Inc. (b) 23,975 950,609Invesco Ltd. 712,513 23,185,173Investment Technology Group, Inc. 55,680 1,103,578Janus Henderson Group PLC 330,000 11,662,200Ladenburg Thalmann Financial Services, Inc. 146,974 490,893Lazard Ltd. Class A 239,535 12,927,704Legg Mason, Inc. 154,159 6,152,486LPL Financial 183,282 11,779,534Manning & Napier, Inc. Class A 21,800 65,400MarketAxess Holdings, Inc. 66,734 13,506,962Moelis & Co. Class A 54,806 2,781,405Moody’s Corp. 299,863 50,041,137Morgan Stanley 2,471,769 138,468,499Morningstar, Inc. 35,957 3,360,182MSCI, Inc. 162,901 23,053,750Northern Trust Corp. 383,716 40,624,013Oppenheimer Holdings, Inc. Class A (non-vtg.) 13,547 359,673Piper Jaffray Companies 27,505 2,296,668PJT Partners, Inc. 43,421 2,075,958Pzena Investment Management, Inc. 4,972 54,095Raymond James Financial, Inc. 235,353 21,819,577
Shares Value
S&P Global, Inc. 453,957 $ 87,068,953Safeguard Scientifics, Inc. (b) 26,745 326,289SEI Investments Co. 229,425 16,709,023Silvercrest Asset Management Group Class A 6,008 90,721State Street Corp. 660,001 70,059,106Stifel Financial Corp. 118,002 7,536,788T. Rowe Price Group, Inc. 431,192 48,250,385TD Ameritrade Holding Corp. 484,165 27,839,488The NASDAQ OMX Group, Inc. 201,312 16,255,944TheStreet.com, Inc. (b) 3,696 4,509U.S. Global Investments, Inc. Class A (a) 7,637 25,966Vector Capital Corp. rights (b) (c) 4,280 0Virtu Financial, Inc. Class A (a) 77,143 2,291,147Virtus Investment Partners, Inc. 10,135 1,247,112Waddell & Reed Financial, Inc. Class A (a) 156,809 3,136,180Westwood Holdings Group, Inc. 10,927 593,773WisdomTree Investments, Inc. (a) 190,333 1,829,100
1,534,093,616Consumer Finance – 0.8%Ally Financial, Inc. 799,706 22,311,797American Express Co. 1,274,006 124,228,325Asta Funding, Inc. (b) 4,468 43,786Atlanticus Holdings Corp. (b) 35,598 78,316Capital One Financial Corp. 869,805 85,180,004Consumer Portfolio Services, Inc. (b) 11,930 45,215Credit Acceptance Corp. (a) (b) 21,395 6,732,793Discover Financial Services 653,137 51,486,790Elevate Credit, Inc. 13,402 95,690Encore Capital Group, Inc. (a) (b) 44,570 1,907,596Enova International, Inc. (b) 64,170 1,411,740EZCORP, Inc. (non-vtg.) Class A (a) (b) 86,606 1,125,878First Cash Financial Services, Inc. 90,535 6,672,430Green Dot Corp. Class A (b) 82,312 5,360,981Imperial Holdings, Inc. warrants 4/11/19 (b) 1,880 0LendingClub Corp. (b) 672,404 2,118,073Navient Corp. 480,094 6,222,018Nelnet, Inc. Class A 36,382 2,013,380Nicholas Financial, Inc. (b) 5,705 50,946OneMain Holdings, Inc. (b) 133,837 4,103,442PRA Group, Inc. (a) (b) 79,585 3,048,106Regional Management Corp. (b) 12,187 364,635Santander Consumer U.S.A. Holdings, Inc. 199,933 3,268,905SLM Corp. (b) 803,335 8,764,385Synchrony Financial 1,327,872 48,321,262World Acceptance Corp. (a) (b) 10,919 1,174,011
386,130,504Diversified Financial Services – 1.5%Acushnet Holdings Corp. (a) 81,949 1,736,499Alteryx, Inc. (a) 48,068 1,643,445At Home Group, Inc. (a) (b) 11,583 342,741Berkshire Hathaway, Inc. Class B (b) 3,416,712 707,942,726Cannae Holdings, Inc. (b) 119,032 2,187,808Cotiviti Holdings, Inc. (b) 64,469 2,160,356Donnelley Financial Solutions, Inc. (b) 58,021 1,004,344FB Financial Corp. (b) 19,661 777,199Granite Point Mortgage Trust, Inc. (a) 74,859 1,261,374

17 Annual Report
See accompanying notes which are an integral part of the financial statements.
Common Stocks – continuedShares Value
FINANCIALS – continuedDiversified Financial Services – continuedLeucadia National Corp. 564,714 $ 13,547,489Marlin Business Services Corp. 13,319 343,630On Deck Capital, Inc. (b) 61,562 319,507Sachem Capital Corp. 200 684Senseonics Holdings, Inc. (a) (b) 90,488 261,510Tiptree, Inc. 33,155 190,641Varex Imaging Corp. (a) (b) 67,867 2,367,880Voya Financial, Inc. 328,653 16,767,876
752,855,709Insurance – 2.7%AFLAC, Inc. 690,530 61,374,306Alleghany Corp. 29,171 17,682,002Allstate Corp. 633,395 58,437,023AMBAC Financial Group, Inc. (b) 77,952 1,180,973American Equity Investment Life Holding Co. 151,614 4,640,905American Financial Group, Inc. 124,528 14,046,758American International Group, Inc. 1,591,681 91,266,989American National Insurance Co. 20,619 2,410,361Amerisafe, Inc. 34,393 1,926,008AmTrust Financial Services, Inc. (a) 184,814 2,212,224Aon PLC 440,852 61,860,353Arch Capital Group Ltd. (b) 231,967 20,468,768Argo Group International Holdings, Ltd. 52,927 3,082,998Arthur J. Gallagher & Co. 313,018 21,632,674Aspen Insurance Holdings Ltd. 111,432 4,056,125Assurant, Inc. 94,584 8,084,094Assured Guaranty Ltd. 219,846 7,602,275Athene Holding Ltd. (b) 148,209 6,996,947Atlas Financial Holdings, Inc. (b) 9,356 164,198Axis Capital Holdings Ltd. 153,356 7,566,585Baldwin & Lyons, Inc. Class B 11,829 267,927Brown & Brown, Inc. 204,333 10,756,089Chubb Ltd. 824,941 117,075,627Cincinnati Financial Corp. 278,941 20,806,209Citizens, Inc. Class A (a) (b) 62,312 426,837CNA Financial Corp. 65,156 3,326,865CNO Financial Group, Inc. 290,469 6,547,171Crawford & Co. Class B 31,537 282,887Donegal Group, Inc. Class A 8,008 126,606eHealth, Inc. (b) 26,343 429,127EMC Insurance Group 8,724 227,696Employers Holdings, Inc. 59,823 2,342,070Enstar Group Ltd. (b) 18,704 3,703,392Erie Indemnity Co. Class A 40,854 4,725,582Everest Re Group Ltd. 73,791 17,727,550FBL Financial Group, Inc. Class A 16,450 1,067,605Federated National Holding Co. 19,431 300,209First Acceptance Corp. (b) 4,055 4,136First American Financial Corp. 199,779 11,593,175FNF Group 485,332 19,379,307Genworth Financial, Inc. Class A (b) 956,877 2,602,705Global Indemnity Ltd. 13,709 507,233Greenlight Capital Re, Ltd. (b) 42,022 689,161Hallmark Financial Services, Inc. (b) 10,337 101,613
Shares Value
Hanover Insurance Group, Inc. 74,612 $ 8,051,381Hartford Financial Services Group, Inc. 624,209 32,989,446HCI Group, Inc. (a) 13,167 455,973Health Insurance Innovations, Inc. (a) (b) 22,858 713,170Heritage Insurance Holdings, Inc. (a) 60,181 1,003,819Horace Mann Educators Corp. 74,869 3,080,859Independence Holding Co. 16,014 456,399Infinity Property & Casualty Corp. 20,622 2,432,365Investors Title Co. 1,086 209,055James River Group Holdings Ltd. 48,336 1,581,071Kemper Corp. 85,524 4,823,554Kingstone Companies, Inc. 9,045 172,760Kinsale Capital Group, Inc. 33,893 1,660,757Lincoln National Corp. 381,053 29,024,807Loews Corp. 488,564 24,100,862Maiden Holdings Ltd. 125,108 750,648Markel Corp. (b) 24,852 27,635,424Marsh & McLennan Companies, Inc. 902,556 74,930,199MBIA, Inc. (a) (b) 228,577 1,826,330Mercury General Corp. 75,263 3,435,003MetLife, Inc. 1,875,342 86,622,047National General Holdings Corp. 106,900 2,456,562National Western Life Group, Inc. 3,602 1,098,610Navigators Group, Inc. 43,776 2,359,526NI Holdings, Inc. 11,972 192,869Old Republic International Corp. 448,152 8,976,485Primerica, Inc. 78,573 7,660,868Principal Financial Group, Inc. 477,159 29,741,320ProAssurance Corp. 109,792 5,248,058Progressive Corp. 1,028,543 59,223,506Prudential Financial, Inc. 752,136 79,967,100Reinsurance Group of America, Inc. 113,457 17,448,552RenaissanceRe Holdings Ltd. 73,938 9,484,767RLI Corp. 76,037 4,623,050Safety Insurance Group, Inc. 27,828 1,985,528Selective Insurance Group, Inc. 108,704 6,179,822State Auto Financial Corp. 23,497 648,047Stewart Information Services Corp. 39,769 1,595,930The Travelers Companies, Inc. 482,280 67,036,920Third Point Reinsurance Ltd. (b) 151,089 2,100,137Torchmark Corp. 190,445 16,258,290Trupanion, Inc. (a) (b) 32,968 976,842United Fire Group, Inc. 36,055 1,603,726United Insurance Holdings Corp. 29,576 578,211Universal Insurance Holdings, Inc. 52,834 1,548,036Unum Group 398,123 20,288,348Validus Holdings Ltd. 153,622 10,390,992W.R. Berkley Corp. 176,033 12,037,137White Mountains Insurance Group Ltd. 8,265 6,668,615Willis Group Holdings PLC 233,572 36,881,019WMI Holdings Corp. (b) 391,046 504,449XL Group Ltd. 452,595 19,149,294
1,362,577,890Mortgage Real Estate Investment Trusts – 0.2%AG Mortgage Investment Trust, Inc. 38,728 633,590AGNC Investment Corp. 704,418 12,637,259

18Annual Report
See accompanying notes which are an integral part of the financial statements.
Schedule of Investments – continued
Common Stocks – continuedShares Value
FINANCIALS – continuedMortgage Real Estate Investment Trusts – continuedAmerican Capital Mortgage Investment Corp. 77,847 $ 1,323,399Annaly Capital Management, Inc. 2,041,014 20,471,370Anworth Mortgage Asset Corp. 251,516 1,146,913Apollo Commercial Real Estate Finance, Inc. (a) 157,668 2,879,018Arbor Realty Trust, Inc. 80,640 690,278Ares Commercial Real Estate Corp. 39,618 488,094Armour Residential REIT, Inc. 61,211 1,311,140Blackstone Mortgage Trust, Inc. (a) 177,482 5,510,816Capstead Mortgage Corp. 189,470 1,582,075Cherry Hill Mortgage Investment Corp. 12,023 193,811Chimera Investment Corp. 351,948 5,898,648CYS Investments, Inc. 308,884 1,952,147Dynex Capital, Inc. 68,104 409,986Ellington Residential Mortgage REIT 15,540 164,724Five Oaks Investment Corp. 6,106 19,722Great Ajax Corp. 14,698 190,780Hannon Armstrong Sustainable Infrastructure Capital, Inc. (a) 96,779 1,703,310Invesco Mortgage Capital, Inc. 180,605 2,775,899KKR Real Estate Finance Trust, Inc. (a) 46,076 903,090Ladder Capital Corp. Class A 150,953 2,229,576MFA Financial, Inc. 709,807 5,053,826New Residential Investment Corp. 591,562 9,541,895New York Mortgage Trust, Inc. (a) 227,021 1,250,886Orchid Island Capital, Inc. (a) 73,768 530,392Owens Realty Mortgage, Inc. 54,252 767,666PennyMac Mortgage Investment Trust 137,871 2,298,310Redwood Trust, Inc. 147,922 2,167,057Resource Capital Corp. (a) 40,594 352,762Starwood Property Trust, Inc. 494,344 10,010,466Two Harbors Investment Corp. 324,272 4,763,556Western Asset Mortgage Capital Corp. (a) 88,849 783,648ZAIS Financial Corp. 18,554 256,045
102,892,154Real Estate Management & Development – 0.0%The RMR Group, Inc. 10,073 632,584Thrifts & Mortgage Finance – 0.2%Atlantic Coast Financial Corp. (b) 165,307 1,710,927BankFinancial Corp. 19,300 309,379Bear State Financial, Inc. 13,571 139,238Beneficial Bancorp, Inc. 178,014 2,670,210BofI Holding, Inc. (a) (b) 104,951 3,903,128BSB Bancorp, Inc. (b) 6,958 201,782Capitol Federal Financial, Inc. 280,441 3,502,708Charter Financial Corp. 26,857 533,111Clifton Bancorp, Inc. 32,703 504,280Dime Community Bancshares, Inc. 51,879 933,822Entegra Financial Corp. (b) 3,030 85,143ESSA Bancorp, Inc. 4,298 62,622Essent Group Ltd. (b) 146,912 6,624,262Farmer Mac Class C (non-vtg.) 17,857 1,358,203First Defiance Financial Corp. 13,178 701,201Flagstar Bancorp, Inc. (b) 37,206 1,311,884FS Bancorp, Inc. 3,111 168,927Hingham Institution for Savings 2,103 420,621
Shares Value
Home Bancorp, Inc. 7,195 $ 298,593HomeStreet, Inc. (b) 54,010 1,550,087Impac Mortgage Holdings, Inc. (a) (b) 22,924 204,024Kearny Financial Corp. 157,909 2,052,817Lendingtree, Inc. (a) (b) 13,423 4,677,916Malvern Bancorp, Inc. (b) 6,089 145,223Meridian Bancorp, Inc. Maryland 112,706 2,259,755Meta Financial Group, Inc. 16,728 1,796,587MGIC Investment Corp. (b) 655,087 9,033,650Nationstar Mortgage Holdings, Inc. (a) (b) 63,329 1,084,192New York Community Bancorp, Inc. 878,574 11,966,178NMI Holdings, Inc. (b) 95,441 1,894,504Northfield Bancorp, Inc. 77,835 1,207,999Northwest Bancshares, Inc. 218,925 3,592,559OceanFirst Financial Corp. 74,436 1,926,404Ocwen Financial Corp. (a) (b) 179,422 653,096Oritani Financial Corp. 122,108 1,904,885PennyMac Financial Services, Inc. (b) 35,269 821,768PHH Corp. (b) 94,843 1,003,439Poage Bankshares, Inc. 2,365 45,053Provident Financial Holdings, Inc. 3,066 55,863Provident Financial Services, Inc. 124,224 3,090,693Radian Group, Inc. 389,840 7,999,517Riverview Bancorp, Inc. 6,875 59,400Security National Financial Corp. Class A 12,342 62,327SI Financial Group, Inc. 3,746 53,942Southern Missouri Bancorp, Inc. 5,377 181,850Territorial Bancorp, Inc. 13,244 395,598TFS Financial Corp. 190,147 2,787,555Timberland Bancorp, Inc. 5,034 143,721Trustco Bank Corp., New York 154,057 1,309,485United Community Financial Corp. 43,226 399,408United Financial Bancorp, Inc. New 84,987 1,325,797Walker & Dunlop, Inc. 49,313 2,383,297Washington Federal, Inc. 157,606 5,468,928Waterstone Financial, Inc. 41,772 718,478Westfield Financial, Inc. 33,310 331,435WSFS Financial Corp. 55,306 2,638,096
102,665,567
TOTAL FINANCIALS 7,684,371,184
HEALTH CARE – 13.4%Biotechnology – 3.2%AbbVie, Inc. 2,840,341 328,996,698Abeona Therapeutics, Inc. (a) (b) 62,198 861,442ACADIA Pharmaceuticals, Inc. (a) (b) 184,318 4,592,283Acceleron Pharma, Inc. (b) 65,396 2,742,054Achaogen, Inc. (a) (b) 54,118 564,451Achillion Pharmaceuticals, Inc. (b) 199,588 648,661Acorda Therapeutics, Inc. (a) (b) 83,616 1,985,880Actinium Pharmaceuticals, Inc. (b) 38,656 16,622Actinium Pharmaceuticals, Inc. rights 3/2/18 (b) 38,656 0Adamas Pharmaceuticals, Inc. (a) (b) 32,378 791,642Aduro Biotech, Inc. (a) (b) 43,288 270,550Advaxis, Inc. (a) (b) 48,573 90,346

19 Annual Report
See accompanying notes which are an integral part of the financial statements.
Common Stocks – continuedShares Value
HEALTH CARE – continuedBiotechnology – continuedAdverum Biotechnologies, Inc. (b) 47,524 $ 329,104Aevi Genomic Medicine, Inc. (b) 41,669 79,171Agenus, Inc. (a) (b) 138,167 744,720Agios Pharmaceuticals, Inc. (a) (b) 84,674 6,806,943Aimmune Therapeutics, Inc. (b) 39,537 1,284,953Akebia Therapeutics, Inc. (b) 89,194 1,275,474Albireo Pharma, Inc. (b) 12,458 421,080Alder Biopharmaceuticals, Inc. (a) (b) 108,499 1,508,136Aldeyra Therapeutics, Inc. (b) 18,140 149,655Alexion Pharmaceuticals, Inc. (b) 395,371 46,436,324Alkermes PLC (a) (b) 275,487 15,724,798Alnylam Pharmaceuticals, Inc. (b) 146,046 17,548,887Alpine Immune Sciences, Inc. (b) 12,084 106,218Altimmune, Inc. (a) 5,138 8,118AMAG Pharmaceuticals, Inc. (a) (b) 54,744 1,152,361Amgen, Inc. 1,289,837 237,033,345Amicus Therapeutics, Inc. (a) (b) 319,110 4,390,954AnaptysBio, Inc. (b) 24,919 3,059,056Anavex Life Sciences Corp. (b) 58,538 138,150Anthera Pharmaceuticals, Inc. (a) (b) 7,268 15,626Apellis Pharmaceuticals, Inc. (b) 66,063 1,210,935Applied Genetic Technologies Corp. (b) 14,097 54,273Aptevo Therapeutics, Inc. (b) 19,070 60,452AquaBounty Technologies, Inc. (a) (b) 1,372 3,348Aquinox Pharmaceuticals, Inc. (b) 27,880 403,981Ardelyx, Inc. (b) 45,094 242,380Arena Pharmaceuticals, Inc. (b) 64,716 2,509,039Argos Therapeutics, Inc. (a) (b) 988 1,275ArQule, Inc. (b) 65,290 109,034Array BioPharma, Inc. (b) 377,912 6,545,436Arrowhead Pharmaceuticals, Inc. (b) 223,439 1,447,885Asterias Biotherapeutics, Inc. (a) (b) 24,436 52,537Atara Biotherapeutics, Inc. (a) (b) 57,948 2,232,447Athersys, Inc. (a) (b) 185,212 253,740aTyr Pharma, Inc. (b) 6,529 19,261Audentes Therapeutics, Inc. (a) (b) 45,264 1,524,944AVEO Pharmaceuticals, Inc. (b) 164,980 471,843Avid Bioservices, Inc. (a) (b) 55,462 136,437Bellicum Pharmaceuticals, Inc. (a) (b) 35,938 249,769Biocept, Inc. (a) (b) 7,092 2,482BioCryst Pharmaceuticals, Inc. (a) (b) 155,643 773,546Biogen, Inc. (b) 375,785 108,598,107Biohaven Pharmaceutical Holding Co. Ltd. 57,394 1,945,083BioMarin Pharmaceutical, Inc. (b) 316,105 25,658,243Biospecifics Technologies Corp. (b) 19,816 802,548BioTime, Inc. (a) (b) 346,441 907,675Bioverativ, Inc. (b) 198,019 20,728,629bluebird bio, Inc. (a) (b) 86,019 17,289,819Blueprint Medicines Corp. (b) 68,023 5,888,071BrainStorm Cell Therpeutic, Inc. (a) (b) 15,396 47,266Calithera Biosciences, Inc. (b) 45,690 351,813Calyxt, Inc. (a) 10,855 199,406Cancer Genetics, Inc. (a) (b) 9,725 16,533Capricor Therapeutics, Inc. (a) (b) 23,875 43,453
Shares Value
Cara Therapeutics, Inc. (a) (b) 41,713 $ 583,148CareDx, Inc. (b) 24,292 141,379Cascadian Therapeutics, Inc. (b) 116,607 1,162,572CASI Pharmaceuticals, Inc. (b) 56,460 195,352Catalyst Biosciences, Inc. (b) 17,969 454,616Catalyst Pharmaceutical Partners, Inc. (b) 206,783 659,638Cel-Sci Corp. (a) (b) 3,253 5,823Celgene Corp. (b) 1,398,303 121,820,157Celldex Therapeutics, Inc. (a) (b) 215,095 483,964Cellular Biomedicine Group, Inc. (a) (b) 8,068 123,844Celsion Corp. (a) (b) 762 1,631ChemoCentryx, Inc. (b) 36,062 350,523Chiasma, Inc. (a) (b) 8,745 13,555Chimerix, Inc. (b) 63,824 310,185Cidara Therapeutics, Inc. (a) (b) 2,782 18,639Cleveland Biolabs, Inc. (a) (b) 1,776 6,269Clovis Oncology, Inc. (a) (b) 83,622 4,855,930Coherus BioSciences, Inc. (a) (b) 71,178 704,662Conatus Pharmaceuticals, Inc. (a) (b) 36,543 190,024Concert Pharmaceuticals, Inc. (b) 25,754 563,498Corbus Pharmaceuticals Holdings, Inc. (b) 68,638 507,921Corvus Pharmaceuticals, Inc. (b) 10,405 85,217CTI BioPharma Corp. (b) 19,153 76,995Curis, Inc. (b) 179,000 88,605Cyclacel Pharmaceuticals, Inc. (a) (b) 960 1,469Cytokinetics, Inc. (b) 76,663 594,138CytomX Therapeutics, Inc. (b) 55,930 1,661,680Cytori Therapeutics, Inc. (b) 10,777 3,717CytRx Corp. (a) (b) 40,644 63,405Deciphera Pharmaceuticals, Inc. (b) 58,947 1,474,854Dicerna Pharmaceuticals, Inc. (b) 41,758 532,832Dyax Corp. rights 12/31/19 (b) (c) 200,675 694,336Dynavax Technologies Corp. (a) (b) 88,051 1,422,024Eagle Pharmaceuticals, Inc. (a) (b) 14,894 836,149Edge Therapeutics, Inc. (a) (b) 50,398 758,490Editas Medicine, Inc. (a) (b) 65,587 2,403,108Eiger Biopharmaceuticals, Inc. (a) (b) 1,065 9,851Eleven Biotherapeutics, Inc. (a) (b) 6,105 5,800Emergent BioSolutions, Inc. (b) 56,205 2,793,389Enanta Pharmaceuticals, Inc. (b) 25,666 2,017,861Epizyme, Inc. (a) (b) 85,772 1,518,164Esperion Therapeutics, Inc. (a) (b) 35,029 2,816,682Exact Sciences Corp. (a) (b) 206,961 9,232,530Exelixis, Inc. (b) 513,354 13,244,533Fate Therapeutics, Inc. (a) (b) 88,933 1,001,386Fibrocell Science, Inc. (b) 12,960 7,192FibroGen, Inc. (b) 150,576 8,296,738Five Prime Therapeutics, Inc. (a) (b) 76,988 1,636,765Flexion Therapeutics, Inc. (a) (b) 59,552 1,510,239Fortress Biotech, Inc. (a) (b) 43,908 187,048Foundation Medicine, Inc. (a) (b) 24,382 2,017,611Galectin Therapeutics, Inc. (b) 56,076 230,472Genocea Biosciences, Inc. (b) 32,032 32,032Genomic Health, Inc. (b) 30,953 990,496GenVec, Inc. rights (c) 814 0Geron Corp. (a) (b) 277,780 641,672
20Annual Report
See accompanying notes which are an integral part of the financial statements.
Schedule of Investments – continued
Common Stocks – continuedShares Value
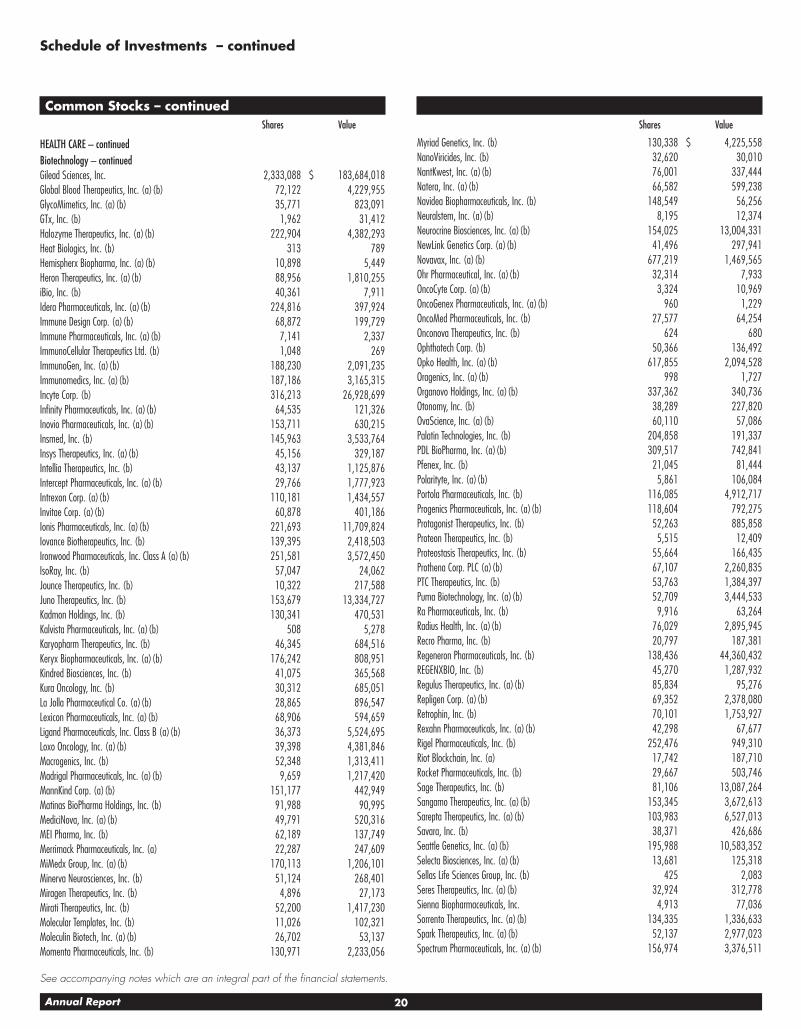
HEALTH CARE – continuedBiotechnology – continuedGilead Sciences, Inc. 2,333,088 $ 183,684,018Global Blood Therapeutics, Inc. (a) (b) 72,122 4,229,955GlycoMimetics, Inc. (a) (b) 35,771 823,091GTx, Inc. (b) 1,962 31,412Halozyme Therapeutics, Inc. (a) (b) 222,904 4,382,293Heat Biologics, Inc. (b) 313 789Hemispherx Biopharma, Inc. (a) (b) 10,898 5,449Heron Therapeutics, Inc. (a) (b) 88,956 1,810,255iBio, Inc. (b) 40,361 7,911Idera Pharmaceuticals, Inc. (a) (b) 224,816 397,924Immune Design Corp. (a) (b) 68,872 199,729Immune Pharmaceuticals, Inc. (a) (b) 7,141 2,337ImmunoCellular Therapeutics Ltd. (b) 1,048 269ImmunoGen, Inc. (a) (b) 188,230 2,091,235Immunomedics, Inc. (a) (b) 187,186 3,165,315Incyte Corp. (b) 316,213 26,928,699Infinity Pharmaceuticals, Inc. (a) (b) 64,535 121,326Inovio Pharmaceuticals, Inc. (a) (b) 153,711 630,215Insmed, Inc. (b) 145,963 3,533,764Insys Therapeutics, Inc. (a) (b) 45,156 329,187Intellia Therapeutics, Inc. (b) 43,137 1,125,876Intercept Pharmaceuticals, Inc. (a) (b) 29,766 1,777,923Intrexon Corp. (a) (b) 110,181 1,434,557Invitae Corp. (a) (b) 60,878 401,186Ionis Pharmaceuticals, Inc. (a) (b) 221,693 11,709,824Iovance Biotherapeutics, Inc. (b) 139,395 2,418,503Ironwood Pharmaceuticals, Inc. Class A (a) (b) 251,581 3,572,450IsoRay, Inc. (b) 57,047 24,062Jounce Therapeutics, Inc. (b) 10,322 217,588Juno Therapeutics, Inc. (b) 153,679 13,334,727Kadmon Holdings, Inc. (b) 130,341 470,531Kalvista Pharmaceuticals, Inc. (a) (b) 508 5,278Karyopharm Therapeutics, Inc. (b) 46,345 684,516Keryx Biopharmaceuticals, Inc. (a) (b) 176,242 808,951Kindred Biosciences, Inc. (b) 41,075 365,568Kura Oncology, Inc. (b) 30,312 685,051La Jolla Pharmaceutical Co. (a) (b) 28,865 896,547Lexicon Pharmaceuticals, Inc. (a) (b) 68,906 594,659Ligand Pharmaceuticals, Inc. Class B (a) (b) 36,373 5,524,695Loxo Oncology, Inc. (a) (b) 39,398 4,381,846Macrogenics, Inc. (b) 52,348 1,313,411Madrigal Pharmaceuticals, Inc. (a) (b) 9,659 1,217,420MannKind Corp. (a) (b) 151,177 442,949Matinas BioPharma Holdings, Inc. (b) 91,988 90,995MediciNova, Inc. (a) (b) 49,791 520,316MEI Pharma, Inc. (b) 62,189 137,749Merrimack Pharmaceuticals, Inc. (a) 22,287 247,609MiMedx Group, Inc. (a) (b) 170,113 1,206,101Minerva Neurosciences, Inc. (b) 51,124 268,401Miragen Therapeutics, Inc. (b) 4,896 27,173Mirati Therapeutics, Inc. (b) 52,200 1,417,230Molecular Templates, Inc. (b) 11,026 102,321Moleculin Biotech, Inc. (a) (b) 26,702 53,137Momenta Pharmaceuticals, Inc. (b) 130,971 2,233,056
Shares Value
Myriad Genetics, Inc. (b) 130,338 $ 4,225,558NanoViricides, Inc. (b) 32,620 30,010NantKwest, Inc. (a) (b) 76,001 337,444Natera, Inc. (a) (b) 66,582 599,238Navidea Biopharmaceuticals, Inc. (b) 148,549 56,256Neuralstem, Inc. (a) (b) 8,195 12,374Neurocrine Biosciences, Inc. (a) (b) 154,025 13,004,331NewLink Genetics Corp. (a) (b) 41,496 297,941Novavax, Inc. (a) (b) 677,219 1,469,565Ohr Pharmaceutical, Inc. (a) (b) 32,314 7,933OncoCyte Corp. (a) (b) 3,324 10,969OncoGenex Pharmaceuticals, Inc. (a) (b) 960 1,229OncoMed Pharmaceuticals, Inc. (b) 27,577 64,254Onconova Therapeutics, Inc. (b) 624 680Ophthotech Corp. (b) 50,366 136,492Opko Health, Inc. (a) (b) 617,855 2,094,528Oragenics, Inc. (a) (b) 998 1,727Organovo Holdings, Inc. (a) (b) 337,362 340,736Otonomy, Inc. (b) 38,289 227,820OvaScience, Inc. (a) (b) 60,110 57,086Palatin Technologies, Inc. (b) 204,858 191,337PDL BioPharma, Inc. (a) (b) 309,517 742,841Pfenex, Inc. (b) 21,045 81,444Polarityte, Inc. (a) (b) 5,861 106,084Portola Pharmaceuticals, Inc. (b) 116,085 4,912,717Progenics Pharmaceuticals, Inc. (a) (b) 118,604 792,275Protagonist Therapeutics, Inc. (b) 52,263 885,858Proteon Therapeutics, Inc. (b) 5,515 12,409Proteostasis Therapeutics, Inc. (b) 55,664 166,435Prothena Corp. PLC (a) (b) 67,107 2,260,835PTC Therapeutics, Inc. (b) 53,763 1,384,397Puma Biotechnology, Inc. (a) (b) 52,709 3,444,533Ra Pharmaceuticals, Inc. (b) 9,916 63,264Radius Health, Inc. (a) (b) 76,029 2,895,945Recro Pharma, Inc. (b) 20,797 187,381Regeneron Pharmaceuticals, Inc. (b) 138,436 44,360,432REGENXBIO, Inc. (b) 45,270 1,287,932Regulus Therapeutics, Inc. (a) (b) 85,834 95,276Repligen Corp. (a) (b) 69,352 2,378,080Retrophin, Inc. (b) 70,101 1,753,927Rexahn Pharmaceuticals, Inc. (a) (b) 42,298 67,677Rigel Pharmaceuticals, Inc. (b) 252,476 949,310Riot Blockchain, Inc. (a) 17,742 187,710Rocket Pharmaceuticals, Inc. (b) 29,667 503,746Sage Therapeutics, Inc. (b) 81,106 13,087,264Sangamo Therapeutics, Inc. (a) (b) 153,345 3,672,613Sarepta Therapeutics, Inc. (a) (b) 103,983 6,527,013Savara, Inc. (b) 38,371 426,686Seattle Genetics, Inc. (a) (b) 195,988 10,583,352Selecta Biosciences, Inc. (a) (b) 13,681 125,318Sellas Life Sciences Group, Inc. (b) 425 2,083Seres Therapeutics, Inc. (a) (b) 32,924 312,778Sienna Biopharmaceuticals, Inc. 4,913 77,036Sorrento Therapeutics, Inc. (a) (b) 134,335 1,336,633Spark Therapeutics, Inc. (a) (b) 52,137 2,977,023Spectrum Pharmaceuticals, Inc. (a) (b) 156,974 3,376,511

21 Annual Report
See accompanying notes which are an integral part of the financial statements.
Common Stocks – continuedShares Value
HEALTH CARE – continuedBiotechnology – continuedSpring Bank Pharmaceuticals, Inc. (a) (b) 9,145 $ 117,056Stemline Therapeutics, Inc. (b) 50,071 858,718Sunesis Pharmaceuticals, Inc. (a) (b) 5,440 36,992Syndax Pharmaceuticals, Inc. (a) (b) 33,111 299,323Synergy Pharmaceuticals, Inc. (a) (b) 387,288 700,991Synthetic Biologics, Inc. (a) (b) 84,770 30,517Syros Pharmaceuticals, Inc. (a) (b) 16,253 171,307T2 Biosystems, Inc. (b) 38,996 204,729Tenax Therapeutics, Inc. (b) 68 316TESARO, Inc. (a) (b) 70,613 3,899,956TG Therapeutics, Inc. (a) (b) 86,621 1,212,694Tocagen, Inc. (a) 8,584 93,566TONIX Pharmaceuticals Holding (b) 1,717 6,044TRACON Pharmaceuticals, Inc. (a) (b) 4,111 9,147Trevena, Inc. (a) (b) 130,021 232,738Trovagene, Inc. (b) 33,847 10,300Ultragenyx Pharmaceutical, Inc. (a) (b) 73,571 3,517,430United Therapeutics Corp. (b) 76,764 8,893,109Vanda Pharmaceuticals, Inc. (b) 83,623 1,576,294Vaxart, Inc. (b) 4,190 23,380Veracyte, Inc. (b) 15,721 94,640Verastem, Inc. (a) (b) 47,048 143,967Vericel Corp. (b) 55,972 447,776Versartis, Inc. (b) 37,706 60,330Vertex Pharmaceuticals, Inc. (b) 449,075 74,559,922Vical, Inc. (a) (b) 6,566 10,046Viking Therapeutics, Inc. (a) (b) 45,570 285,268Vital Therapies, Inc. (a) (b) 39,707 212,432Voyager Therapeutics, Inc. (b) 39,765 1,142,448Xbiotech, Inc. (a) (b) 36,998 178,330Xencor, Inc. (a) (b) 68,832 2,108,324XOMA Corp. (a) (b) 11,543 309,814Zafgen, Inc. (b) 24,672 193,922ZIOPHARM Oncology, Inc. (a) (b) 222,939 831,562
1,602,349,295Health Care Equipment & Supplies – 2.8%Abaxis, Inc. 48,645 3,243,162Abbott Laboratories 3,097,648 186,881,104Abiomed, Inc. (b) 72,969 19,568,826Accuray, Inc. (a) (b) 142,393 790,281Align Technology, Inc. (b) 132,621 34,815,665Alliqua Biomedical, Inc. (a) (b) 439 746Alphatec Holdings, Inc. (a) (b) 3,066 9,781Amedica Corp. (a) (b) 5,750 12,190Analogic Corp. 26,933 2,248,906Angiodynamics, Inc. (b) 68,576 1,117,103Anika Therapeutics, Inc. (a) (b) 30,719 1,598,924Antares Pharma, Inc. (a) (b) 242,616 533,755Apollo Endosurgery, Inc. (b) 102 671Atricure, Inc. (b) 57,842 1,022,068Atrion Corp. 3,083 1,815,579Avinger, Inc. (b) 780 866AxoGen, Inc. (a) (b) 51,587 1,506,340Baxter International, Inc. 888,498 60,231,279
Shares Value
Becton, Dickinson & Co. 470,168 $ 104,386,699Bellerophon Therapeutics, Inc. (a) (b) 16,556 31,953BioLase Technology, Inc. (b) 31,172 12,936Boston Scientific Corp. (b) 2,422,300 66,031,898Bovie Medical Corp. (b) 10,849 26,797Cantel Medical Corp. 62,489 7,268,096Cardiovascular Systems, Inc. (b) 58,185 1,383,639Cerus Corp. (b) 223,482 956,503Cesca Therapeutics, Inc. (b) 793 2,220Cogentix Medical, Inc. (b) 1,160 3,584ConforMis, Inc. (b) 87,736 119,321CONMED Corp. 42,831 2,592,560Corindus Vascular Robotics, Inc. (a) (b) 178,714 178,714Cryolife, Inc. (b) 57,983 1,098,778CryoPort, Inc. (b) 52,805 478,413Cutera, Inc. (b) 27,491 1,238,470CytoSorbents Corp. (a) (b) 36,870 289,430Danaher Corp. 1,095,015 107,070,567Dare Bioscience, Inc. (b) 2,822 3,612Dentsply Sirona, Inc. 408,169 22,881,954DexCom, Inc. (a) (b) 155,867 8,750,373Edwards Lifesciences Corp. (b) 376,862 50,375,144Ekso Bionics Holdings, Inc. (a) (b) 113,321 173,381Endologix, Inc. (a) (b) 127,100 510,942Entellus Medical, Inc. (b) 19,089 458,136Fonar Corp. (b) 7,275 179,693Genmark Diagnostics, Inc. (a) (b) 107,242 441,837Glaukos Corp. (a) (b) 76,149 2,383,464Globus Medical, Inc. (b) 136,679 6,511,388Haemonetics Corp. (b) 91,218 6,467,356Halyard Health, Inc. (a) (b) 83,663 4,131,279Heska Corp. (b) 12,153 826,161Hill-Rom Holdings, Inc. 119,559 10,002,306Hologic, Inc. (b) 485,517 18,852,625ICU Medical, Inc. (b) 27,698 6,405,163IDEXX Laboratories, Inc. (b) 157,334 29,457,645Inogen, Inc. (b) 30,117 3,638,736Insulet Corp. (b) 102,824 7,721,054Integer Holdings Corp. (b) 45,898 2,343,093Integra LifeSciences Holdings Corp. (b) 123,165 6,494,490Intuitive Surgical, Inc. (b) 198,870 84,808,112Invacare Corp. (a) 57,619 991,047InVivo Therapeutics Holdings Corp. (a) (b) 46,249 21,737Invuity, Inc. (a) (b) 16,779 69,633IRadimed Corp. (a) (b) 3,077 40,001iRhythm Technologies, Inc. (b) 31,977 1,987,371Iridex Corp. (b) 4,871 28,203K2M Group Holdings, Inc. (b) 70,159 1,452,993Kewaunee Scientific Corp. 1,376 40,936Lantheus Holdings, Inc. (b) 45,045 689,189LeMaitre Vascular, Inc. 28,069 975,678LivaNova PLC (b) 75,176 6,746,294Masimo Corp. (b) 82,311 7,204,682Medtronic PLC 2,409,421 192,488,644Meridian Bioscience, Inc. 73,595 1,026,650Merit Medical Systems, Inc. (b) 93,532 4,255,706

22Annual Report
See accompanying notes which are an integral part of the financial statements.
Schedule of Investments – continued
Common Stocks – continuedShares Value
HEALTH CARE – continuedHealth Care Equipment & Supplies – continuedMicrobot Medical, Inc. (a) (b) 7,285 $ 6,015Misonix, Inc. (b) 7,938 80,174Natus Medical, Inc. (b) 56,909 1,772,715Neogen Corp. (b) 89,594 5,220,642Nevro Corp. (a) (b) 56,879 4,614,024NuVasive, Inc. (b) 91,382 4,419,234Nuvectra Corp. (b) 13,499 144,034NxStage Medical, Inc. (b) 108,037 2,515,101OraSure Technologies, Inc. (b) 97,410 1,681,297Orthofix International NV (b) 32,172 1,801,954Penumbra, Inc. (a) (b) 54,930 5,943,426Precision Therapeutics, Inc. (a) (b) 19,298 21,807Pulse Biosciences, Inc. (a) (b) 10,423 192,826Quidel Corp. (b) 49,569 2,162,200ReShape Lifesciences, Inc. (a) (b) 13,109 20,450ResMed, Inc. 264,553 25,203,964Retractable Technologies, Inc. (b) 5,248 4,733Rockwell Medical Technologies, Inc. (a) (b) 83,284 485,546RTI Biologics, Inc. (b) 100,701 427,979Seaspine Holdings Corp. (b) 11,601 117,286Second Sight Medical Products, Inc. (a) (b) 20,882 31,114Sientra, Inc. (a) (b) 27,954 266,961Staar Surgical Co. (b) 44,365 696,531Steris PLC 151,004 13,786,665STRATA Skin Sciences, Inc. (a) (b) 803 1,052Stryker Corp. 567,920 92,093,907SurModics, Inc. (b) 19,525 587,703Synergetics U.S.A., Inc. (b) (c) 19,727 0Tactile Systems Technology, Inc. (a) (b) 22,275 720,819Tandem Diabetes Care, Inc. (b) 2,577 8,143Teleflex, Inc. 79,265 19,802,775The Cooper Companies, Inc. 86,956 20,045,097TransEnterix, Inc. (a) (b) 189,128 359,343Utah Medical Products, Inc. 13,511 1,198,426Varian Medical Systems, Inc. (b) 173,004 20,646,297Vermillion, Inc. (b) 12,449 18,674ViewRay, Inc. (a) (b) 55,513 461,313Viveve Medical, Inc. (a) (b) 22,359 96,814West Pharmaceutical Services, Inc. 131,675 11,484,694Wright Medical Group NV (a) (b) 185,020 3,765,157Zimmer Biomet Holdings, Inc. 357,412 41,549,145Zosano Pharma Corp. (a) (b) 1,743 10,876
1,384,871,445Health Care Providers & Services – 2.5%AAC Holdings, Inc. (b) 12,779 120,889Acadia Healthcare Co., Inc. (a) (b) 159,970 6,094,857Aceto Corp. 47,837 342,991Addus HomeCare Corp. (b) 10,897 374,312Aetna, Inc. 580,371 102,760,489Almost Family, Inc. (b) 19,278 1,136,438Amedisys, Inc. (b) 47,206 2,795,067American Renal Associates Holdings, Inc. (a) (b) 16,913 335,216AmerisourceBergen Corp. 288,729 27,475,452AMN Healthcare Services, Inc. (a) (b) 87,493 4,868,985
Shares Value
Anthem, Inc. 458,586 $ 107,941,973BioScrip, Inc. (a) (b) 230,699 729,009BioTelemetry, Inc. (a) (b) 51,243 1,655,149Brookdale Senior Living, Inc. (b) 326,054 2,129,133Caladrius Biosciences, Inc. (a) (b) 9,530 45,458Capital Senior Living Corp. (b) 37,012 436,371Cardinal Health, Inc. 563,757 39,017,622Centene Corp. (b) 308,276 31,265,352Chemed Corp. 28,374 7,366,742Cigna Corp. 437,196 85,642,324Civitas Solutions, Inc. (b) 27,734 360,542Community Health Systems, Inc. (a) (b) 198,155 1,014,554Corvel Corp. (b) 17,696 866,219Cross Country Healthcare, Inc. (b) 55,702 721,341DaVita HealthCare Partners, Inc. (b) 272,889 19,653,466Diplomat Pharmacy, Inc. (a) (b) 79,924 1,665,616Envision Healthcare Corp. (a) (b) 209,359 8,060,322Express Scripts Holding Co. (b) 1,010,917 76,273,688Five Star Sr Living, Inc. (b) 70,113 101,664G1 Therapeutics, Inc. (a) 15,149 342,216Genesis HealthCare, Inc. Class A (a) (b) 27,157 36,119HCA Holdings, Inc. 510,253 50,642,610HealthEquity, Inc. (a) (b) 87,917 5,062,261HealthSouth Corp. 185,114 9,859,172Henry Schein, Inc. (a) (b) 292,912 19,387,845Humana, Inc. 255,189 69,365,474Innovative Industrial Properties, Inc. (a) 8,937 223,068Interpace Diagnostics Group, Inc. (b) 136 137Kindred Healthcare, Inc. 151,684 1,395,493Laboratory Corp. of America Holdings (b) 180,588 31,187,548LHC Group, Inc. (b) 27,965 1,800,387LifePoint Hospitals, Inc. (b) 65,814 3,034,025Magellan Health Services, Inc. (b) 46,615 4,703,454McKesson Corp. 371,948 55,505,800MEDNAX, Inc. (b) 163,523 8,990,495Molina Healthcare, Inc. (a) (b) 76,753 5,549,242National Healthcare Corp. 18,256 1,071,080National Research Corp. Class A 13,259 375,230National Vision Holdings, Inc. (a) 40,783 1,409,460OptiNose, Inc. (a) 7,311 129,478Owens & Minor, Inc. 118,083 1,937,742Patterson Companies, Inc. (a) 151,081 4,771,138Premier, Inc. (a) (b) 101,239 3,356,073Providence Service Corp. (b) 20,443 1,299,357Psychemedics Corp. 2,724 57,831Quest Diagnostics, Inc. 242,385 24,977,774Quorum Health Corp. (a) (b) 41,687 247,621R1 RCM, Inc. (b) 178,635 1,171,846RadNet, Inc. (b) 43,227 432,270Select Medical Holdings Corp. (b) 195,741 3,542,912Sharps Compliance Corp. (b) 12,687 57,599Surgery Partners, Inc. (a) (b) 43,549 690,252Tenet Healthcare Corp. (a) (b) 137,153 2,825,352The Ensign Group, Inc. 86,615 2,312,621Tivity Health, Inc. (a) (b) 70,816 2,729,957Triple-S Management Corp. (a) (b) 37,106 901,676

23 Annual Report
See accompanying notes which are an integral part of the financial statements.
Common Stocks – continuedShares Value
HEALTH CARE – continuedHealth Care Providers & Services – continuedU.S. Physical Therapy, Inc. 21,775 $ 1,687,563UnitedHealth Group, Inc. 1,725,707 390,285,895Universal Health Services, Inc. Class B 153,265 17,502,863Wellcare Health Plans, Inc. (b) 78,093 15,143,014
1,277,253,191Health Care Technology – 0.2%Allscripts Healthcare Solutions, Inc. (b) 329,763 4,573,813athenahealth, Inc. (a) (b) 70,807 9,894,570Castlight Health, Inc. Class B (b) 83,641 296,926Cerner Corp. (b) 557,423 35,764,260Computer Programs & Systems, Inc. (a) 21,937 653,723Evolent Health, Inc. (a) (b) 108,849 1,594,638HealthStream, Inc. 41,650 1,006,264HMS Holdings Corp. (b) 165,285 2,651,171HTG Molecular Diagnostics (a) (b) 63,917 293,379iCAD, Inc. (b) 14,864 50,984Inovalon Holdings, Inc. Class A (a) (b) 119,481 1,433,772Medidata Solutions, Inc. (a) (b) 105,887 6,952,540NantHealth, Inc. (a) (b) 56,729 171,322Omnicell, Inc. (b) 64,294 2,806,433Quality Systems, Inc. (b) 91,673 1,150,496Simulations Plus, Inc. (a) 6,008 93,424Tabula Rasa HealthCare, Inc. (b) 25,588 826,748Teladoc, Inc. (a) (b) 89,288 3,580,449Veeva Systems, Inc. Class A (b) 198,680 13,847,996Vocera Communications, Inc. (b) 55,152 1,516,680
89,159,588Life Sciences Tools & Services – 0.8%Accelerate Diagnostics, Inc. (a) (b) 47,182 1,240,887Agilent Technologies, Inc. 562,569 38,586,608Bio-Rad Laboratories, Inc. Class A (b) 35,877 9,688,225Bio-Techne Corp. 69,291 9,793,590Bruker Corp. 188,235 5,769,403Cambrex Corp. (a) (b) 66,661 3,463,039Charles River Laboratories International, Inc. (b) 96,615 10,300,125ChromaDex, Inc. (a) (b) 56,591 308,421Enzo Biochem, Inc. (b) 66,443 420,584Fluidigm Corp. (a) (b) 38,600 261,322Harvard Bioscience, Inc. (b) 18,919 88,919Illumina, Inc. (b) 259,440 59,157,509INC Research Holdings, Inc. Class A (b) 96,345 4,036,856Luminex Corp. 75,617 1,482,849Medpace Holdings, Inc. (b) 21,051 674,685Mettler-Toledo International, Inc. (b) 45,150 27,822,333Nanostring Technologies, Inc. (b) 34,593 221,741NeoGenomics, Inc. (a) (b) 100,476 843,998Pacific Biosciences of California, Inc. (a) (b) 161,679 384,796PerkinElmer, Inc. 212,888 16,251,870PRA Health Sciences, Inc. (b) 84,500 7,098,000pSivida Corp. (a) (b) 25,265 26,528Quintiles Transnational Holdings, Inc. (b) 261,746 25,737,484Thermo Fisher Scientific, Inc. 712,686 148,652,046Waters Corp. (b) 138,492 28,341,003
400,652,821
Shares Value
Pharmaceuticals – 3.9%AcelRx Pharmaceuticals, Inc. (a) (b) 65,025 $ 117,045Acer Therapeutics, Inc. (a) (b) 68 1,219Aclaris Therapeutics, Inc. (a) (b) 40,572 809,006Adamis Pharmaceuticals Corp. (a) (b) 36,542 109,626Aerie Pharmaceuticals, Inc. (a) (b) 62,847 3,214,624Agile Therapeutics, Inc. (b) 87,068 316,057Akcea Therapeutics, Inc. (a) 49,223 835,314Akorn, Inc. (b) 157,581 2,669,422Alimera Sciences, Inc. (a) (b) 22,049 28,664Allergan PLC 592,460 91,369,181Amphastar Pharmaceuticals, Inc. (b) 63,932 1,173,792Ampio Pharmaceuticals, Inc. (a) (b) 168,674 374,456ANI Pharmaceuticals, Inc. (b) 15,497 992,893ANI Pharmaceuticals, Inc. rights (b) (c) 21,445 0Apricus Biosciences, Inc. (a) (b) 5,725 5,267Aradigm Corp. (a) (b) 17,241 19,482Aratana Therapeutics, Inc. (b) 51,608 191,982Assembly Biosciences, Inc. (b) 27,699 1,571,641AstraZeneca PLC rights (b) (c) 7,692 0Athenex, Inc. (a) 67,984 1,076,867Avexis, Inc. (b) 55,578 6,876,666Axsome Therapeutics, Inc. (a) (b) 21,511 54,853Bio Path Holdings, Inc. (a) (b) 16,664 28,162Biodelivery Sciences International, Inc. (b) 170,623 383,902BioPharmX Corp. (a) (b) 64,864 16,534Bristol-Myers Squibb Co. 2,912,213 192,788,501Catalent, Inc. (b) 252,886 10,557,991Clearside Biomedical, Inc. (b) 19,198 124,019Collegium Pharmaceutical, Inc. (a) (b) 32,296 774,781ContraVir Pharmaceuticals, Inc. (a) (b) 80,626 20,157Corcept Therapeutics, Inc. (a) (b) 170,298 2,586,827Corium International, Inc. (a) (b) 42,043 546,559CorMedix, Inc. (a) (b) 48,587 14,090Cumberland Pharmaceuticals, Inc. (b) 7,158 47,386CymaBay Therapeutics, Inc. (b) 115,491 1,719,661DepoMed, Inc. (a) (b) 97,171 667,565Dermira, Inc. (b) 70,654 1,816,514Dova Pharmaceuticals, Inc. 7,001 211,850Durect Corp. (b) 198,076 241,653Egalet Corp. (a) (b) 12,340 9,329Eli Lilly & Co. 1,729,069 133,172,894Endo International PLC (b) 391,608 2,469,088Endocyte, Inc. (b) 47,373 280,922Evofem Biosciences, Inc. (a) (b) 1,682 11,892Flex Pharma, Inc. (a) (b) 10,224 41,918Gemphire Therapeutics, Inc. (a) (b) 6,333 43,001Horizon Pharma PLC (b) 293,612 4,280,863Impax Laboratories, Inc. (a) (b) 130,689 2,666,056Imprimis Pharmaceuticals, Inc. (a) (b) 10,757 19,578Innoviva, Inc. (a) (b) 134,795 2,090,670Intersect ENT, Inc. (b) 61,422 2,263,401Intra-Cellular Therapies, Inc. (b) 80,685 1,562,868Jazz Pharmaceuticals PLC (b) 106,557 15,429,454Johnson & Johnson 4,785,260 621,509,569Juniper Pharmaceuticals, Inc. (b) 11,831 99,380
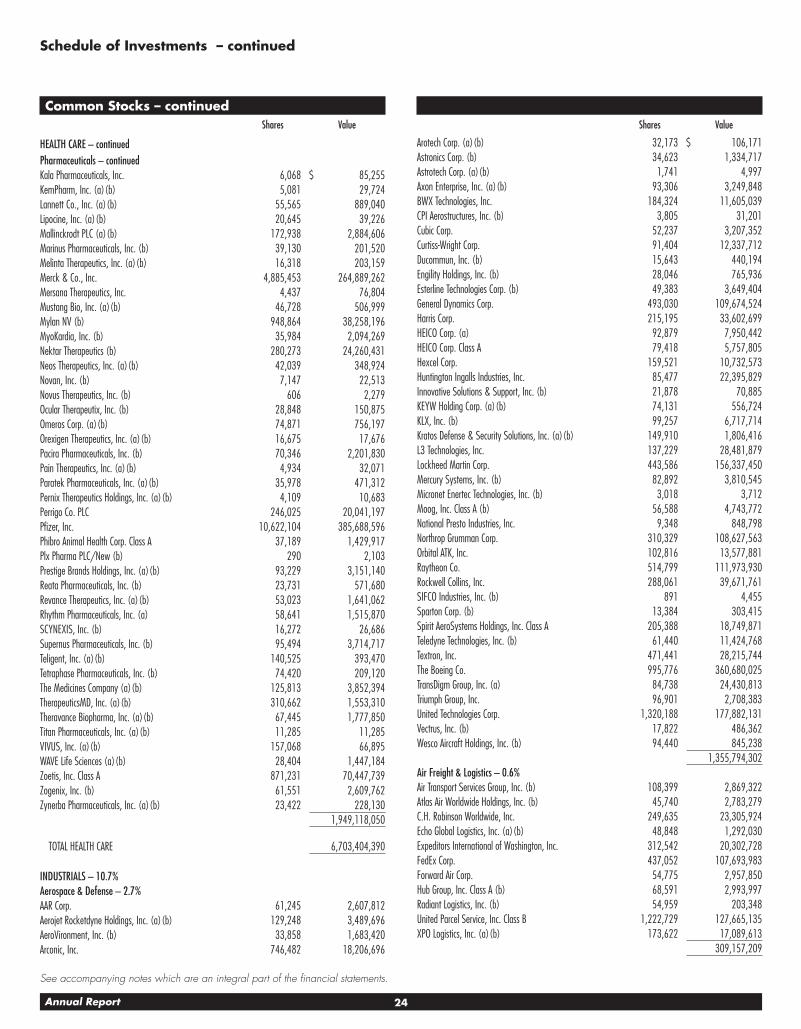
24Annual Report
See accompanying notes which are an integral part of the financial statements.
Schedule of Investments – continued
Common Stocks – continuedShares Value
HEALTH CARE – continuedPharmaceuticals – continuedKala Pharmaceuticals, Inc. 6,068 $ 85,255KemPharm, Inc. (a) (b) 5,081 29,724Lannett Co., Inc. (a) (b) 55,565 889,040Lipocine, Inc. (a) (b) 20,645 39,226Mallinckrodt PLC (a) (b) 172,938 2,884,606Marinus Pharmaceuticals, Inc. (b) 39,130 201,520Melinta Therapeutics, Inc. (a) (b) 16,318 203,159Merck & Co., Inc. 4,885,453 264,889,262Mersana Therapeutics, Inc. 4,437 76,804Mustang Bio, Inc. (a) (b) 46,728 506,999Mylan NV (b) 948,864 38,258,196MyoKardia, Inc. (b) 35,984 2,094,269Nektar Therapeutics (b) 280,273 24,260,431Neos Therapeutics, Inc. (a) (b) 42,039 348,924Novan, Inc. (b) 7,147 22,513Novus Therapeutics, Inc. (b) 606 2,279Ocular Therapeutix, Inc. (b) 28,848 150,875Omeros Corp. (a) (b) 74,871 756,197Orexigen Therapeutics, Inc. (a) (b) 16,675 17,676Pacira Pharmaceuticals, Inc. (b) 70,346 2,201,830Pain Therapeutics, Inc. (a) (b) 4,934 32,071Paratek Pharmaceuticals, Inc. (a) (b) 35,978 471,312Pernix Therapeutics Holdings, Inc. (a) (b) 4,109 10,683Perrigo Co. PLC 246,025 20,041,197Pfizer, Inc. 10,622,104 385,688,596Phibro Animal Health Corp. Class A 37,189 1,429,917Plx Pharma PLC/New (b) 290 2,103Prestige Brands Holdings, Inc. (a) (b) 93,229 3,151,140Reata Pharmaceuticals, Inc. (b) 23,731 571,680Revance Therapeutics, Inc. (a) (b) 53,023 1,641,062Rhythm Pharmaceuticals, Inc. (a) 58,641 1,515,870SCYNEXIS, Inc. (b) 16,272 26,686Supernus Pharmaceuticals, Inc. (b) 95,494 3,714,717Teligent, Inc. (a) (b) 140,525 393,470Tetraphase Pharmaceuticals, Inc. (b) 74,420 209,120The Medicines Company (a) (b) 125,813 3,852,394TherapeuticsMD, Inc. (a) (b) 310,662 1,553,310Theravance Biopharma, Inc. (a) (b) 67,445 1,777,850Titan Pharmaceuticals, Inc. (a) (b) 11,285 11,285VIVUS, Inc. (a) (b) 157,068 66,895WAVE Life Sciences (a) (b) 28,404 1,447,184Zoetis, Inc. Class A 871,231 70,447,739Zogenix, Inc. (b) 61,551 2,609,762Zynerba Pharmaceuticals, Inc. (a) (b) 23,422 228,130
1,949,118,050
TOTAL HEALTH CARE 6,703,404,390
INDUSTRIALS – 10.7%Aerospace & Defense – 2.7%AAR Corp. 61,245 2,607,812Aerojet Rocketdyne Holdings, Inc. (a) (b) 129,248 3,489,696AeroVironment, Inc. (b) 33,858 1,683,420Arconic, Inc. 746,482 18,206,696
Shares Value
Arotech Corp. (a) (b) 32,173 $ 106,171Astronics Corp. (b) 34,623 1,334,717Astrotech Corp. (a) (b) 1,741 4,997Axon Enterprise, Inc. (a) (b) 93,306 3,249,848BWX Technologies, Inc. 184,324 11,605,039CPI Aerostructures, Inc. (b) 3,805 31,201Cubic Corp. 52,237 3,207,352Curtiss-Wright Corp. 91,404 12,337,712Ducommun, Inc. (b) 15,643 440,194Engility Holdings, Inc. (b) 28,046 765,936Esterline Technologies Corp. (b) 49,383 3,649,404General Dynamics Corp. 493,030 109,674,524Harris Corp. 215,195 33,602,699HEICO Corp. (a) 92,879 7,950,442HEICO Corp. Class A 79,418 5,757,805Hexcel Corp. 159,521 10,732,573Huntington Ingalls Industries, Inc. 85,477 22,395,829Innovative Solutions & Support, Inc. (b) 21,878 70,885KEYW Holding Corp. (a) (b) 74,131 556,724KLX, Inc. (b) 99,257 6,717,714Kratos Defense & Security Solutions, Inc. (a) (b) 149,910 1,806,416L3 Technologies, Inc. 137,229 28,481,879Lockheed Martin Corp. 443,586 156,337,450Mercury Systems, Inc. (b) 82,892 3,810,545Micronet Enertec Technologies, Inc. (b) 3,018 3,712Moog, Inc. Class A (b) 56,588 4,743,772National Presto Industries, Inc. 9,348 848,798Northrop Grumman Corp. 310,329 108,627,563Orbital ATK, Inc. 102,816 13,577,881Raytheon Co. 514,799 111,973,930Rockwell Collins, Inc. 288,061 39,671,761SIFCO Industries, Inc. (b) 891 4,455Sparton Corp. (b) 13,384 303,415Spirit AeroSystems Holdings, Inc. Class A 205,388 18,749,871Teledyne Technologies, Inc. (b) 61,440 11,424,768Textron, Inc. 471,441 28,215,744The Boeing Co. 995,776 360,680,025TransDigm Group, Inc. (a) 84,738 24,430,813Triumph Group, Inc. 96,901 2,708,383United Technologies Corp. 1,320,188 177,882,131Vectrus, Inc. (b) 17,822 486,362Wesco Aircraft Holdings, Inc. (b) 94,440 845,238
1,355,794,302Air Freight & Logistics – 0.6%Air Transport Services Group, Inc. (b) 108,399 2,869,322Atlas Air Worldwide Holdings, Inc. (b) 45,740 2,783,279C.H. Robinson Worldwide, Inc. 249,635 23,305,924Echo Global Logistics, Inc. (a) (b) 48,848 1,292,030Expeditors International of Washington, Inc. 312,542 20,302,728FedEx Corp. 437,052 107,693,983Forward Air Corp. 54,775 2,957,850Hub Group, Inc. Class A (b) 68,591 2,993,997Radiant Logistics, Inc. (b) 54,959 203,348United Parcel Service, Inc. Class B 1,222,729 127,665,135XPO Logistics, Inc. (a) (b) 173,622 17,089,613
309,157,209

25 Annual Report
See accompanying notes which are an integral part of the financial statements.
Common Stocks – continuedShares Value
INDUSTRIALS – continuedAirlines – 0.5%Alaska Air Group, Inc. 224,427 $ 14,475,542Allegiant Travel Co. 23,703 3,941,809American Airlines Group, Inc. 752,694 40,833,650Delta Air Lines, Inc. 1,156,783 62,350,604Hawaiian Holdings, Inc. 101,162 3,641,832JetBlue Airways Corp. (b) 563,310 11,857,676SkyWest, Inc. 97,566 5,346,617Southwest Airlines Co. 971,297 56,179,818Spirit Airlines, Inc. (a) (b) 120,068 4,783,509United Continental Holdings, Inc. (b) 449,262 30,455,471
233,866,528Building Products – 0.4%A.O. Smith Corp. 253,397 16,265,553AAON, Inc. 75,766 2,784,401Advanced Drain Systems, Inc. Del 80,409 2,054,450Allegion PLC 176,014 14,804,538American Woodmark Corp. (b) 24,566 3,154,274Apogee Enterprises, Inc. 47,950 2,068,563Armstrong World Industries, Inc. (b) 90,282 5,444,005Builders FirstSource, Inc. (b) 193,311 3,707,705Continental Building Products, Inc. (b) 69,835 1,899,512CSW Industrials, Inc. (b) 25,190 1,154,962Fortune Brands Home & Security, Inc. 271,625 16,476,773GCP Applied Technologies, Inc. (b) 121,060 3,722,595Gibraltar Industries, Inc. (b) 56,316 1,954,165GMS, Inc. (b) 62,105 1,922,771Griffon Corp. 59,127 1,105,675Insteel Industries, Inc. 29,073 821,022Jeld-Wen Holding, Inc. (b) 116,721 3,637,026Johnson Controls International PLC 1,640,360 60,480,073Lennox International, Inc. 69,294 14,179,631Masco Corp. 583,457 23,991,752Masonite International Corp. (b) 51,336 3,134,063NCI Building Systems, Inc. (b) 83,177 1,355,785Owens Corning 191,219 15,546,105Patrick Industries, Inc. (b) 41,845 2,571,375PGT, Inc. (b) 80,695 1,412,163Ply Gem Holdings, Inc. (b) 36,381 785,830Quanex Building Products Corp. 55,487 929,407Simpson Manufacturing Co. Ltd. 82,104 4,541,993Tecogen, Inc. New (a) (b) 2,274 5,048Trex Co., Inc. (b) 51,288 5,303,179Universal Forest Products, Inc. 108,543 3,575,406USG Corp. (b) 158,171 5,286,075
226,075,875Commercial Services & Supplies – 0.5%ABM Industries, Inc. 102,806 3,614,659ACCO Brands Corp. 198,147 2,506,560ADS Waste Holdings, Inc. (b) 88,843 1,988,306Aqua Metals, Inc. (a) (b) 20,623 47,639ARC Document Solutions, Inc. (b) 46,203 98,412Brady Corp. Class A 89,558 3,349,469Casella Waste Systems, Inc. Class A (b) 64,851 1,648,512CECO Environmental Corp. 40,679 167,191
Shares Value
Cenveo, Inc. (a) (b) 13,016 $ 1,105Cintas Corp. 149,849 25,573,230Clean Harbors, Inc. (b) 97,820 4,884,153Copart, Inc. (b) 375,195 17,562,878Covanta Holding Corp. (a) 226,728 3,389,584Deluxe Corp. 89,557 6,358,547Ennis, Inc. 34,279 668,441Essendant, Inc. 58,461 464,180Evoqua Water Technologies Corp. (a) (b) 64,611 1,479,592Fuel Tech, Inc. (b) 51,934 56,608Healthcare Services Group, Inc. 134,240 6,098,523Heritage-Crystal Clean, Inc. (b) 21,763 435,260Herman Miller, Inc. 110,582 3,969,894HNI Corp. 80,621 2,981,365Hudson Technologies, Inc. (a) (b) 56,393 343,997Industrial Services of America, Inc. (b) 1,620 3,467InnerWorkings, Inc. (b) 70,031 646,386Interface, Inc. 108,800 2,632,960Intersections, Inc. (a) (b) 12,865 25,987KAR Auction Services, Inc. 267,155 14,447,742Kimball International, Inc. Class B 57,328 941,899Knoll, Inc. 98,653 2,098,349LSC Communications, Inc. 57,687 839,923Matthews International Corp. Class A 55,558 2,847,348McGrath RentCorp. 40,724 2,061,449Mobile Mini, Inc. 87,122 3,654,768Msa Safety, Inc. 64,315 5,185,718Multi-Color Corp. 24,885 1,576,465NL Industries, Inc. (b) 6,707 53,991Odyssey Marine Exploration, Inc. (a) (b) 5,346 22,721Performant Financial Corp. (b) 31,038 82,871Perma-Fix Environmental Services, Inc. (b) 6,937 27,054Pitney Bowes, Inc. 320,489 3,974,064Quad/Graphics, Inc. 51,478 1,358,504Quest Resource Holding Corp. (a) (b) 2,977 6,371R.R. Donnelley & Sons Co. 111,816 843,093Republic Services, Inc. 404,127 27,149,252Rollins, Inc. 184,695 9,284,618SP Plus Corp. (b) 38,199 1,375,164Steelcase, Inc. Class A 153,375 2,093,569Stericycle, Inc. (b) 146,361 9,172,444Team, Inc. (a) (b) 59,115 966,530Tetra Tech, Inc. 99,334 4,862,399The Brink’s Co. 87,934 6,463,149U.S. Ecology, Inc. 34,516 1,825,896UniFirst Corp. 28,960 4,497,488Viad Corp. 33,828 1,760,747Virco Manufacturing Co. 2,682 12,069VSE Corp. 10,794 523,509Waste Management, Inc. 717,379 61,924,155
262,930,224Construction & Engineering – 0.2%AECOM (b) 308,868 10,967,903Aegion Corp. (b) 54,146 1,243,192Ameresco, Inc. Class A (b) 38,199 311,322Argan, Inc. 22,803 910,980
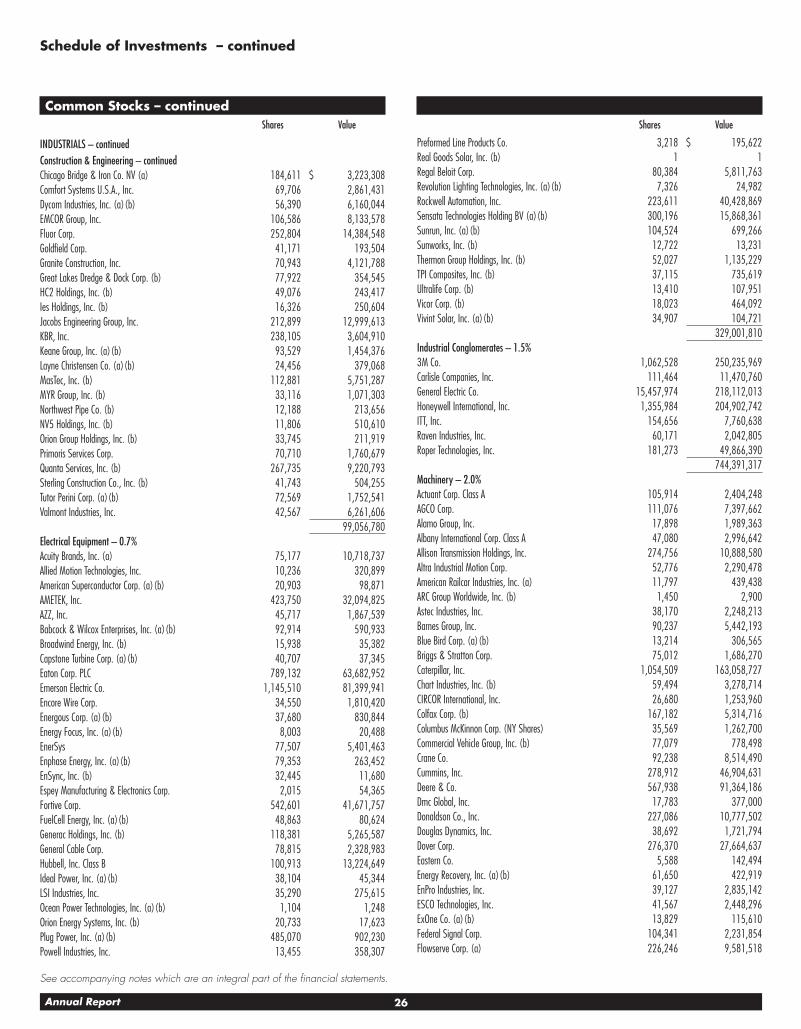
26Annual Report
See accompanying notes which are an integral part of the financial statements.
Schedule of Investments – continued
Common Stocks – continuedShares Value
INDUSTRIALS – continuedConstruction & Engineering – continuedChicago Bridge & Iron Co. NV (a) 184,611 $ 3,223,308Comfort Systems U.S.A., Inc. 69,706 2,861,431Dycom Industries, Inc. (a) (b) 56,390 6,160,044EMCOR Group, Inc. 106,586 8,133,578Fluor Corp. 252,804 14,384,548Goldfield Corp. 41,171 193,504Granite Construction, Inc. 70,943 4,121,788Great Lakes Dredge & Dock Corp. (b) 77,922 354,545HC2 Holdings, Inc. (b) 49,076 243,417Ies Holdings, Inc. (b) 16,326 250,604Jacobs Engineering Group, Inc. 212,899 12,999,613KBR, Inc. 238,105 3,604,910Keane Group, Inc. (a) (b) 93,529 1,454,376Layne Christensen Co. (a) (b) 24,456 379,068MasTec, Inc. (b) 112,881 5,751,287MYR Group, Inc. (b) 33,116 1,071,303Northwest Pipe Co. (b) 12,188 213,656NV5 Holdings, Inc. (b) 11,806 510,610Orion Group Holdings, Inc. (b) 33,745 211,919Primoris Services Corp. 70,710 1,760,679Quanta Services, Inc. (b) 267,735 9,220,793Sterling Construction Co., Inc. (b) 41,743 504,255Tutor Perini Corp. (a) (b) 72,569 1,752,541Valmont Industries, Inc. 42,567 6,261,606
99,056,780Electrical Equipment – 0.7%Acuity Brands, Inc. (a) 75,177 10,718,737Allied Motion Technologies, Inc. 10,236 320,899American Superconductor Corp. (a) (b) 20,903 98,871AMETEK, Inc. 423,750 32,094,825AZZ, Inc. 45,717 1,867,539Babcock & Wilcox Enterprises, Inc. (a) (b) 92,914 590,933Broadwind Energy, Inc. (b) 15,938 35,382Capstone Turbine Corp. (a) (b) 40,707 37,345Eaton Corp. PLC 789,132 63,682,952Emerson Electric Co. 1,145,510 81,399,941Encore Wire Corp. 34,550 1,810,420Energous Corp. (a) (b) 37,680 830,844Energy Focus, Inc. (a) (b) 8,003 20,488EnerSys 77,507 5,401,463Enphase Energy, Inc. (a) (b) 79,353 263,452EnSync, Inc. (b) 32,445 11,680Espey Manufacturing & Electronics Corp. 2,015 54,365Fortive Corp. 542,601 41,671,757FuelCell Energy, Inc. (a) (b) 48,863 80,624Generac Holdings, Inc. (b) 118,381 5,265,587General Cable Corp. 78,815 2,328,983Hubbell, Inc. Class B 100,913 13,224,649Ideal Power, Inc. (a) (b) 38,104 45,344LSI Industries, Inc. 35,290 275,615Ocean Power Technologies, Inc. (a) (b) 1,104 1,248Orion Energy Systems, Inc. (b) 20,733 17,623Plug Power, Inc. (a) (b) 485,070 902,230Powell Industries, Inc. 13,455 358,307
Shares Value
Preformed Line Products Co. 3,218 $ 195,622Real Goods Solar, Inc. (b) 1 1Regal Beloit Corp. 80,384 5,811,763Revolution Lighting Technologies, Inc. (a) (b) 7,326 24,982Rockwell Automation, Inc. 223,611 40,428,869Sensata Technologies Holding BV (a) (b) 300,196 15,868,361Sunrun, Inc. (a) (b) 104,524 699,266Sunworks, Inc. (b) 12,722 13,231Thermon Group Holdings, Inc. (b) 52,027 1,135,229TPI Composites, Inc. (b) 37,115 735,619Ultralife Corp. (b) 13,410 107,951Vicor Corp. (b) 18,023 464,092Vivint Solar, Inc. (a) (b) 34,907 104,721
329,001,810Industrial Conglomerates – 1.5%3M Co. 1,062,528 250,235,969Carlisle Companies, Inc. 111,464 11,470,760General Electric Co. 15,457,974 218,112,013Honeywell International, Inc. 1,355,984 204,902,742ITT, Inc. 154,656 7,760,638Raven Industries, Inc. 60,171 2,042,805Roper Technologies, Inc. 181,273 49,866,390
744,391,317Machinery – 2.0%Actuant Corp. Class A 105,914 2,404,248AGCO Corp. 111,076 7,397,662Alamo Group, Inc. 17,898 1,989,363Albany International Corp. Class A 47,080 2,996,642Allison Transmission Holdings, Inc. 274,756 10,888,580Altra Industrial Motion Corp. 52,776 2,290,478American Railcar Industries, Inc. (a) 11,797 439,438ARC Group Worldwide, Inc. (b) 1,450 2,900Astec Industries, Inc. 38,170 2,248,213Barnes Group, Inc. 90,237 5,442,193Blue Bird Corp. (a) (b) 13,214 306,565Briggs & Stratton Corp. 75,012 1,686,270Caterpillar, Inc. 1,054,509 163,058,727Chart Industries, Inc. (b) 59,494 3,278,714CIRCOR International, Inc. 26,680 1,253,960Colfax Corp. (b) 167,182 5,314,716Columbus McKinnon Corp. (NY Shares) 35,569 1,262,700Commercial Vehicle Group, Inc. (b) 77,079 778,498Crane Co. 92,238 8,514,490Cummins, Inc. 278,912 46,904,631Deere & Co. 567,938 91,364,186Dmc Global, Inc. 17,783 377,000Donaldson Co., Inc. 227,086 10,777,502Douglas Dynamics, Inc. 38,692 1,721,794Dover Corp. 276,370 27,664,637Eastern Co. 5,588 142,494Energy Recovery, Inc. (a) (b) 61,650 422,919EnPro Industries, Inc. 39,127 2,835,142ESCO Technologies, Inc. 41,567 2,448,296ExOne Co. (a) (b) 13,829 115,610Federal Signal Corp. 104,341 2,231,854Flowserve Corp. (a) 226,246 9,581,518

27 Annual Report
See accompanying notes which are an integral part of the financial statements.
Common Stocks – continuedShares Value
INDUSTRIALS – continuedMachinery – continuedFranklin Electric Co., Inc. 72,585 $ 2,841,703FreightCar America, Inc. 19,411 287,089Gardner Denver Holdings, Inc. 127,416 4,078,586Gencor Industries, Inc. (b) 2,773 44,784Global Brass & Copper Holdings, Inc. 34,001 962,228Gorman-Rupp Co. 28,251 753,737Graco, Inc. 301,980 13,392,813Graham Corp. 12,124 245,026Greenbrier Companies, Inc. (a) 47,653 2,468,425Hardinge, Inc. 14,874 272,938Harsco Corp. (b) 144,208 2,920,212Hillenbrand, Inc. 122,624 5,383,194Hurco Companies, Inc. 6,325 264,701Hyster-Yale Materials Handling Class A 17,565 1,250,452IDEX Corp. 136,430 18,663,624Illinois Tool Works, Inc. 551,374 89,013,819Ingersoll-Rand PLC 450,473 40,002,002Jason Industries, Inc. (b) 13,118 28,728John Bean Technologies Corp. 55,934 6,194,691Kadant, Inc. 18,429 1,758,127Kennametal, Inc. 136,498 5,623,718Key Technology, Inc. (b) 6,453 172,489L.B. Foster Co. Class A (b) 13,680 357,732Lincoln Electric Holdings, Inc. 106,698 9,340,343Lindsay Corp. 21,677 1,917,114Lydall, Inc. (b) 28,864 1,389,802Manitex International, Inc. (b) 11,053 115,946Manitowoc Co., Inc. (b) 62,652 1,862,017Meritor, Inc. (b) 154,933 3,795,859Middleby Corp. (b) 99,566 11,972,812Milacron Holdings Corp. (b) 88,730 1,901,484Miller Industries, Inc. 16,197 394,397Mueller Industries, Inc. 105,921 2,805,847Mueller Water Products, Inc. Class A 293,253 3,225,783Navistar International Corp. New (b) 114,244 4,263,586NN, Inc. 43,595 1,041,921Nordson Corp. 91,551 12,274,243Omega Flex, Inc. 8,251 460,571Oshkosh Corp. 134,738 10,634,870PACCAR, Inc. 623,624 44,645,242Park-Ohio Holdings Corp. 13,382 533,273Parker Hannifin Corp. 233,558 41,683,096Pentair PLC 293,393 20,153,165ProPetro Holding Corp. (a) 100,689 1,624,114Proto Labs, Inc. (a) (b) 43,461 4,735,076RBC Bearings, Inc. (b) 45,770 5,515,285Rexnord Corp. (b) 169,317 4,906,807Snap-On, Inc. 100,280 15,966,582Spartan Motors, Inc. 58,691 865,692SPX Corp. (b) 68,191 2,129,605SPX Flow, Inc. (b) 81,195 3,959,068Standex International Corp. 20,721 1,991,288Stanley Black & Decker, Inc. 274,254 43,658,494Sun Hydraulics Corp. 47,081 2,444,446
Shares Value
Tennant Co. 30,833 $ 1,985,645Terex Corp. 170,082 7,061,805The L.S. Starrett Co. Class A 4,836 41,106Timken Co. 116,166 5,088,071Titan International, Inc. 99,148 1,275,043Toro Co. 191,913 12,199,909TriMas Corp. (b) 79,624 2,062,262Trinity Industries, Inc. 263,641 8,605,242Twin Disc, Inc. (b) 8,286 198,201Wabash National Corp. (a) 105,115 2,296,763WABCO Holdings, Inc. (b) 90,070 12,426,958Wabtec Corp. 159,121 12,942,902Watts Water Technologies, Inc. Class A 51,551 3,892,101Woodward, Inc. 106,719 7,558,907Xerium Technologies, Inc. (b) 10,544 61,366Xylem, Inc. 322,928 24,083,970
979,110,837Marine – 0.0%Genco Shipping & Trading Ltd. (b) 10,301 141,742Kirby Corp. (a) (b) 95,289 7,146,675Matson, Inc. 69,658 1,985,253
9,273,670Professional Services – 0.4%Acacia Research Corp. (b) 73,187 252,495Barrett Business Services, Inc. 8,858 658,061BG Staffing, Inc. 5,516 90,738CBIZ, Inc. (b) 94,868 1,712,367Cogint, Inc. (a) (b) 74,077 192,600CRA International, Inc. 15,589 779,294Dun & Bradstreet Corp. 69,069 8,636,388Equifax, Inc. 211,226 23,868,538Exponent, Inc. 49,089 3,816,670Forrester Research, Inc. 17,100 692,550Franklin Covey Co. (b) 19,900 515,410FTI Consulting, Inc. (b) 78,630 3,749,865GP Strategies Corp. (b) 22,618 498,727Heidrick & Struggles International, Inc. 29,141 769,322Hill International, Inc. (b) 55,142 306,038Hudson Global, Inc. (b) 13,947 27,336Huron Consulting Group, Inc. (b) 39,007 1,365,245ICF International, Inc. 34,131 1,945,467IHS Markit Ltd. (b) 644,418 30,319,867Insperity, Inc. 64,534 4,214,070Kelly Services, Inc. Class A (non-vtg.) 51,237 1,510,979Kforce, Inc. 36,597 1,013,737Korn/Ferry International 104,534 4,381,020Manpower, Inc. 124,187 14,711,192Marathon Patent Group, Inc. (b) 2,210 4,928Mastech Digital, Inc. (b) 373 4,331MISTRAS Group, Inc. (b) 29,557 582,864Navigant Consulting, Inc. (b) 75,747 1,505,850Nielsen Holdings PLC 596,445 19,462,000On Assignment, Inc. (b) 91,637 7,027,642RCM Technologies, Inc. 9,908 63,015Resources Connection, Inc. 51,824 805,863Robert Half International, Inc. 226,789 12,942,848

28Annual Report
See accompanying notes which are an integral part of the financial statements.
Schedule of Investments – continued
Common Stocks – continuedShares Value
INDUSTRIALS – continuedProfessional Services – continuedRPX Corp. 97,220 $ 975,117TransUnion Holding Co., Inc. (b) 264,102 15,072,301TriNet Group, Inc. (b) 78,552 3,705,298TrueBlue, Inc. (b) 75,110 2,042,992Verisk Analytics, Inc. (b) 274,495 28,050,644Volt Information Sciences, Inc. (b) 6,248 25,304WageWorks, Inc. (b) 80,292 4,211,315Willdan Group, Inc. (b) 10,974 230,125
202,740,413Road & Rail – 0.9%AMERCO 12,690 4,365,360ArcBest Corp. 43,696 1,446,338Avis Budget Group, Inc. (a) (b) 143,156 6,467,788Celadon Group, Inc. (a) 62,978 242,465Covenant Transport Group, Inc. Class A (b) 19,818 511,701CSX Corp. 1,590,684 85,451,544Daseke, Inc. (a) (b) 65,652 660,459Genesee & Wyoming, Inc. Class A (b) 108,225 7,524,884Heartland Express, Inc. (a) 91,092 1,778,116J.B. Hunt Transport Services, Inc. 153,808 18,237,015Kansas City Southern 182,352 18,789,550Knight-Swift Transportation Holdings, Inc. Class A 220,755 10,631,561Landstar System, Inc. 76,087 8,278,266Marten Transport Ltd. 73,518 1,591,665Norfolk Southern Corp. 507,550 70,590,054Old Dominion Freight Lines, Inc. 117,920 16,381,446P.A.M. Transportation Services, Inc. (b) 3,193 110,190Patriot Transportation Holding, Inc. (b) 1,280 24,704Roadrunner Transportation Systems, Inc. (b) 43,638 167,134Ryder System, Inc. 90,251 6,531,465Saia, Inc. (b) 46,535 3,380,768Schneider National, Inc. Class B (a) 73,442 1,899,210U.S.A. Truck, Inc. (b) 7,889 201,643Union Pacific Corp. 1,399,994 182,349,219Universal Logistics Holdings, Inc. 12,296 271,742Werner Enterprises, Inc. 93,918 3,498,446YRC Worldwide, Inc. (b) 47,961 418,220
451,800,953Trading Companies & Distributors – 0.3%AeroCentury Corp. (b) 688 10,320Air Lease Corp. Class A 168,551 7,360,622Aircastle Ltd. 96,241 1,874,775Applied Industrial Technologies, Inc. 73,619 5,182,778Beacon Roofing Supply, Inc. (b) 124,749 6,600,470BlueLinx Corp. (b) 2,338 35,351BMC Stock Holdings, Inc. (b) 96,728 1,813,650CAI International, Inc. (b) 29,270 591,254DXP Enterprises, Inc. (b) 27,205 809,077EnviroStar, Inc. (a) 2,922 100,809Fastenal Co. (a) 510,029 27,908,787GATX Corp. 67,450 4,650,003H&E Equipment Services, Inc. 49,244 1,856,006HD Supply Holdings, Inc. (b) 339,883 12,320,759Herc Holdings, Inc. (b) 48,522 3,164,120
Shares Value
Houston Wire & Cable Co. (b) 15,647 $ 108,747Huttig Building Products, Inc. (a) (b) 22,831 117,580Kaman Corp. 48,613 2,976,088Lawson Products, Inc. (b) 6,300 147,735MRC Global, Inc. (b) 173,407 2,866,418MSC Industrial Direct Co., Inc. Class A 88,439 7,736,644Nexeo Solutions, Inc. (b) 103,751 963,847Now, Inc. (a) (b) 176,983 1,679,569Rush Enterprises, Inc. Class A (b) 64,888 2,758,389SiteOne Landscape Supply, Inc. (a) (b) 67,882 4,672,997Titan Machinery, Inc. (b) 39,035 778,358Triton International Ltd. 82,257 2,345,970United Rentals, Inc. (b) 148,956 26,080,706Univar, Inc. (b) 216,684 6,242,666Veritiv Corp. (b) 19,444 471,517W.W. Grainger, Inc. (a) 93,921 24,565,038Watsco, Inc. 53,435 8,836,546WESCO International, Inc. (b) 82,412 5,130,147Willis Lease Finance Corp. (b) 2,668 72,836
172,830,579Transportation Infrastructure – 0.0%Macquarie Infrastructure Co. LLC 140,425 5,687,213SEACOR Marine Holdings, Inc. (a) 30,560 517,075
6,204,288
TOTAL INDUSTRIALS 5,382,234,785
INFORMATION TECHNOLOGY – 24.1%Communications Equipment – 1.2%ADTRAN, Inc. 98,876 1,547,409Aerohive Networks, Inc. (b) 130,171 545,416Applied Optoelectronics, Inc. (a) (b) 31,585 882,169Arista Networks, Inc. (b) 84,821 22,879,617Arris International PLC (b) 323,592 8,251,596Aviat Networks, Inc. (b) 5,550 93,074Black Box Corp. 16,753 33,506Blonder Tongue Laboratories, Inc. (b) 3,352 2,145CalAmp Corp. (b) 63,415 1,483,911Calix Networks, Inc. (b) 55,272 362,032Carvana Co. Class A (a) 26,177 524,587Ciena Corp. (b) 268,224 6,214,750Cisco Systems, Inc. 8,792,054 393,708,178Clearfield, Inc. (a) (b) 16,017 216,230CommScope Holding Co., Inc. (b) 341,527 13,220,510Communications Systems, Inc. 4,311 14,701Comtech Telecommunications Corp. 38,555 852,066Dasan Zhone Solutions, Inc. (b) 1,172 12,646Digi International, Inc. (b) 37,099 387,685EchoStar Holding Corp. Class A (b) 92,247 5,352,171EMCORE Corp. (b) 50,451 267,390Extreme Networks, Inc. (b) 245,320 2,799,101F5 Networks, Inc. (b) 110,573 16,422,302Finisar Corp. (a) (b) 193,129 3,476,322Harmonic, Inc. (b) 134,269 406,164Infinera Corp. (a) (b) 259,331 2,580,343InterDigital, Inc. 59,150 4,246,970

29 Annual Report
See accompanying notes which are an integral part of the financial statements.
Common Stocks – continuedShares Value
INFORMATION TECHNOLOGY – continuedCommunications Equipment – continuedJuniper Networks, Inc. 682,219 $ 17,505,740KVH Industries, Inc. (b) 23,641 241,138Lantronix, Inc. (b) 71 166Lumentum Holdings, Inc. (a) (b) 113,449 6,920,389Motorola Solutions, Inc. 289,289 30,708,027NETGEAR, Inc. (b) 57,212 3,189,569NetScout Systems, Inc. (a) (b) 150,999 4,009,023Network-1 Security Solutions, Inc. 21,477 55,840Oclaro, Inc. (a) (b) 327,153 2,345,687Optical Cable Corp. (b) 564 1,354Palo Alto Networks, Inc. (b) 164,266 28,478,796Parkervision, Inc. (a) (b) 10,028 8,223PC-Tel, Inc. 11,999 84,113Plantronics, Inc. 61,152 3,304,654Quantenna Communications, Inc. (a) (b) 27,725 381,219Relm Wireless Corp. 9,436 33,498Resonant, Inc. (a) (b) 2,385 9,540Sonus Networks, Inc. (b) 82,074 531,840Tessco Technologies, Inc. 7,287 161,407Ubiquiti Networks, Inc. (a) (b) 44,626 2,838,214ViaSat, Inc. (a) (b) 93,287 6,510,500Viavi Solutions, Inc. (b) 389,051 3,742,671Westell Technologies, Inc. Class A (b) 18,994 61,541
597,906,140Electronic Equipment & Components – 0.9%Amphenol Corp. Class A 543,408 49,662,057Anixter International, Inc. (b) 51,288 3,874,808Applied DNA Sciences, Inc. (a) (b) 18,968 27,504Arrow Electronics, Inc. (b) 174,121 14,204,791Avnet, Inc. 219,819 9,386,271AVX Corp. 141,087 2,440,805Badger Meter, Inc. 74,053 3,524,923Bel Fuse, Inc. Class B (non-vtg.) 13,939 241,145Belden, Inc. 76,472 5,561,809Benchmark Electronics, Inc. 89,057 2,671,710Cardtronics PLC (b) 76,739 1,717,419CDW Corp. 273,056 19,913,974ClearSign Combustion Corp. (a) (b) 7,019 15,793Cognex Corp. 309,382 16,616,907Coherent, Inc. (b) 43,325 9,061,857Control4 Corp. (b) 35,202 846,256Corning, Inc. 1,571,612 45,702,477CTS Corp. 48,442 1,244,959CUI Global, Inc. (a) (b) 26,608 75,833Daktronics, Inc. 49,334 439,566Dell Technologies, Inc. (b) 371,700 27,613,593Dolby Laboratories, Inc. Class A 108,648 7,013,228Echelon Corp. (b) 3,219 15,161Electro Scientific Industries, Inc. (a) (b) 113,580 2,036,489eMagin Corp. (a) (b) 5,084 7,626ePlus, Inc. (b) 25,477 1,950,264Fabrinet 63,037 1,900,566FARO Technologies, Inc. (b) 33,227 1,972,022Fitbit, Inc. (a) (b) 275,332 1,316,087
Shares Value
FLIR Systems, Inc. 248,934 $ 12,222,659Frequency Electronics, Inc. (b) 2,550 23,562I. D. Systems Inc. (a) (b) 6,071 44,379Identiv, Inc. (b) 10,618 41,092IEC Electronics Corp. (b) 86 363II-VI, Inc. (a) (b) 95,705 3,684,643Insight Enterprises, Inc. (b) 62,606 2,186,828Intellicheck, Inc. (b) 545 1,395IntriCon Corp. (b) 4,355 81,003IPG Photonics Corp. (b) 66,641 16,369,695Iteris, Inc. (a) (b) 32,677 182,011Itron, Inc. (b) 55,882 3,911,740Jabil, Inc. 305,429 8,274,072KEMET Corp. (b) 79,365 1,426,983KEY Tronic Corp. (b) 6,483 46,548Keysight Technologies, Inc. (b) 331,556 15,586,448Kimball Electronics, Inc. (b) 30,376 527,024Knowles Corp. (a) (b) 178,238 2,573,757LightPath Technologies, Inc. Class A (b) 376 801Littelfuse, Inc. 43,846 9,098,045LRAD Corp. (b) 56,581 122,215Luna Innovations, Inc. (b) 1,444 3,841Maxwell Technologies, Inc. (a) (b) 38,769 220,596Mesa Laboratories, Inc. 4,836 633,516Methode Electronics, Inc. Class A 72,142 2,846,002MicroVision, Inc. (a) (b) 117,860 129,646MTS Systems Corp. (a) 29,288 1,433,648National Instruments Corp. 204,510 10,340,026Neonode, Inc. (a) (b) 33,197 16,270NetList, Inc. (a) (b) 104,599 30,909Novanta, Inc. (b) 69,461 3,879,397OSI Systems, Inc. (b) 28,365 1,790,966Park Electrochemical Corp. 28,127 478,722PC Connection, Inc. 26,383 655,090PC Mall, Inc. (b) 8,716 61,884Perceptron, Inc. (b) 13,154 120,359Plexus Corp. (b) 72,969 4,401,490RadiSys Corp. (b) 34,231 29,439Research Frontiers, Inc. (a) (b) 16,855 15,675RF Industries Ltd. 5,778 18,201Richardson Electronics Ltd. 23,707 190,367Rogers Corp. (b) 31,193 4,283,423Sanmina Corp. (b) 138,110 3,804,931ScanSource, Inc. (b) 40,769 1,335,185SYNNEX Corp. 50,673 6,265,716Systemax, Inc. 23,392 668,309TE Connectivity Ltd. 615,918 63,494,987Tech Data Corp. (b) 64,965 6,713,483Trimble, Inc. (b) 442,297 16,776,325TTM Technologies, Inc. (a) (b) 152,901 2,470,880Universal Display Corp. 75,720 9,828,456VeriFone Systems, Inc. (b) 198,885 3,301,491Vishay Intertechnology, Inc. 233,503 4,296,455Vishay Precision Group, Inc. (b) 17,938 537,243Wayside Technology Group, Inc. 1,232 17,248

30Annual Report
See accompanying notes which are an integral part of the financial statements.
Schedule of Investments – continued
Common Stocks – continuedShares Value
INFORMATION TECHNOLOGY – continuedElectronic Equipment & Components – continuedWireless Telecom Group, Inc. (b) 11,200 $ 23,408Zebra Technologies Corp. Class A (b) 97,337 13,446,133
472,020,880Internet Software & Services – 4.6%2U, Inc. (a) (b) 117,669 9,740,640Akamai Technologies, Inc. (b) 294,471 19,865,014Alarm.com Holdings, Inc. (a) (b) 76,969 2,781,275Alphabet, Inc.:
Class A (b) 524,987 579,543,649Class C (b) 542,365 599,166,886
Amber Road, Inc. (b) 55,819 507,953ANGI Homeservices, Inc. Class A (a) (b) 79,036 1,168,942AppFolio, Inc. (b) 18,857 756,166Apptio, Inc. Class A (b) 10,079 291,283Autoweb, Inc. (b) 9,434 66,604Benefitfocus, Inc. (a) (b) 38,811 939,226BlackLine, Inc. (a) (b) 64,906 2,855,864Blucora, Inc. (b) 88,148 2,053,848Box, Inc. Class A (b) 216,524 5,209,567Brightcove, Inc. (b) 59,246 405,835BroadVision, Inc. (b) 490 1,372Carbonite, Inc. (a) (b) 40,379 1,136,669Care.com, Inc. (b) 25,585 457,460CarGurus, Inc. Class A (a) 63,394 2,046,358ChannelAdvisor Corp. (b) 32,537 287,952Cloudera, Inc. 138,832 2,644,750CommerceHub, Inc.:
Series A (a) (b) 21,320 422,562Series C (b) 54,178 1,032,091
Cornerstone OnDemand, Inc. (b) 104,237 4,273,717CoStar Group, Inc. (b) 65,165 22,294,901Coupa Software, Inc. (b) 54,059 2,411,031Determine, Inc. (b) 552 845DHI Group, Inc. (b) 141,360 233,244eBay, Inc. (b) 1,720,569 73,743,587eGain Communications Corp. (b) 8,558 66,325Endurance International Group Holdings, Inc. (a) (b) 119,063 869,160Envestnet, Inc. (b) 83,097 4,578,645Etsy, Inc. (b) 195,696 4,953,066Facebook, Inc. Class A (b) 4,244,505 756,880,132Five9, Inc. (b) 92,098 2,796,095GlowPoint, Inc. (b) 18,770 5,179GoDaddy, Inc. (b) 179,895 10,759,520Gogo, Inc. (a) (b) 109,584 995,023GrubHub, Inc. (a) (b) 156,062 15,514,123GTT Communications, Inc. (a) (b) 62,973 3,249,407Hortonworks, Inc. (b) 79,816 1,435,092IAC/InterActiveCorp (b) 133,418 19,867,274Instructure, Inc. (b) 89,214 3,871,888Internap Network Services Corp. (b) 24,920 324,458Inuvo, Inc. (b) 9,640 8,385iPass, Inc. (b) 33,662 13,640j2 Global, Inc. 83,229 6,160,611Leaf Group Ltd. (b) 19,244 148,179
Shares Value
Limelight Networks, Inc. (b) 172,777 $ 698,019Liquidity Services, Inc. (b) 37,923 259,773LivePerson, Inc. (b) 99,233 1,433,917LogMeIn, Inc. 94,017 10,863,664Marchex, Inc. Class B 28,685 91,792Marin Software, Inc. (b) 1,425 11,115Match Group, Inc. (a) (b) 103,238 4,134,682MeetMe, Inc. (a) (b) 113,904 298,428MINDBODY, Inc. (a) (b) 51,352 1,830,699MongoDB, Inc. Class A 53,983 1,738,792MuleSoft, Inc. Class A (a) 80,667 2,490,997New Relic, Inc. (b) 99,630 7,151,441NIC, Inc. 110,917 1,497,380Nutanix, Inc. Class A (a) (b) 104,635 3,813,946Okta, Inc. 80,156 3,093,220Ominto, Inc. (a) (b) 11,014 37,117Pandora Media, Inc. (a) (b) 408,712 1,802,420Q2 Holdings, Inc. (b) 56,898 2,591,704QuinStreet, Inc. (b) 48,878 641,768Qumu Corp. (b) 6,017 11,492Quotient Technology, Inc. (b) 132,658 1,744,453Reis, Inc. 8,134 156,580Remark Holdings, Inc. (a) (b) 26,781 200,322SecureWorks Corp. (b) 18,872 186,267Shutterstock, Inc. (a) (b) 29,764 1,495,641SPS Commerce, Inc. (b) 30,117 1,807,622Stamps.com, Inc. (a) (b) 29,462 5,628,715Support.com, Inc. (b) 39,218 107,457Synacor, Inc. (b) 20,037 40,074TechTarget, Inc. (b) 23,593 407,687Telaria, Inc. (b) 40,833 157,207The Trade Desk, Inc. (a) (b) 37,435 2,106,093Travelzoo, Inc. (b) 5,383 34,451TrueCar, Inc. (b) 124,192 1,377,289Twilio, Inc. Class A (a) (b) 121,473 4,149,518Twitter, Inc. (b) 1,147,274 36,552,150VeriSign, Inc. (a) (b) 147,930 17,162,839Veritone, Inc. (a) 11,539 160,969Web.com Group, Inc. (a) (b) 88,964 1,601,352XO Group, Inc. (b) 81,695 1,574,263Yelp, Inc. (b) 147,397 6,420,613Yext, Inc. (a) 22,445 285,052Zillow Group, Inc.:
Class A (b) 72,361 3,440,042Class C (a) (b) 192,635 9,182,910
2,309,307,425IT Services – 4.1%Accenture PLC Class A 1,096,975 176,623,945Acxiom Corp. (b) 136,727 3,742,218Alliance Data Systems Corp. 90,040 21,696,038Automatic Data Processing, Inc. 788,044 90,877,234Blackhawk Network Holdings, Inc. (b) 106,476 4,764,801Booz Allen Hamilton Holding Corp. Class A 266,230 10,098,104Broadridge Financial Solutions, Inc. 205,695 20,647,664CACI International, Inc. Class A (b) 43,520 6,486,656Cass Information Systems, Inc. 16,566 970,105

31 Annual Report
See accompanying notes which are an integral part of the financial statements.
Common Stocks – continuedShares Value
INFORMATION TECHNOLOGY – continuedIT Services – continuedCognizant Technology Solutions Corp. Class A 1,047,041 $ 85,878,303Computer Task Group, Inc. (b) 11,646 92,819Conduent, Inc. (b) 334,916 6,329,912Convergys Corp. 164,874 3,826,726CoreLogic, Inc. (b) 146,089 6,647,050CSG Systems International, Inc. 60,961 2,845,659CSP, Inc. 3,696 43,391CSRA, Inc. 290,218 11,762,536DST Systems, Inc. 112,242 9,335,167DXC Technology Co. 505,715 51,856,016Edgewater Technology, Inc. (b) 2,875 19,004EPAM Systems, Inc. (b) 87,104 9,853,204Euronet Worldwide, Inc. (b) 99,267 8,424,790Everi Holdings, Inc. (b) 99,354 740,187EVERTEC, Inc. 105,730 1,712,826ExlService Holdings, Inc. (b) 59,903 3,415,669Fidelity National Information Services, Inc. 590,554 57,390,038First Data Corp. Class A (b) 808,392 12,627,083Fiserv, Inc. (b) 370,976 53,194,249FleetCor Technologies, Inc. (b) 158,984 31,785,671Gartner, Inc. (b) 164,540 18,660,481Genpact Ltd. 264,705 8,303,796Global Payments, Inc. 281,234 31,889,123Hackett Group, Inc. 39,872 718,892Helios and Matheson Analytics, Inc. (a) (b) 30,142 143,476IBM Corp. 1,531,835 238,705,848Information Services Group, Inc. (b) 18,000 75,960Innodata, Inc. (b) 14,010 16,252Jack Henry & Associates, Inc. 139,152 16,322,530Leidos Holdings, Inc. 255,738 16,190,773ManTech International Corp. Class A 47,385 2,671,092MasterCard, Inc. Class A 1,650,260 290,049,698Mattersight Corp. (a) (b) 9,437 22,177Maximus, Inc. 120,295 8,057,359ModusLink Global Solutions, Inc. (b) 31,030 72,921MoneyGram International, Inc. (b) 66,937 718,234Paychex, Inc. 568,619 37,034,155PayPal Holdings, Inc. (b) 2,005,100 159,224,991Perficient, Inc. (b) 51,600 1,004,652PFSweb, Inc. (b) 22,457 160,792Presidio, Inc. (a) 95,619 1,397,950PRG-Schultz International, Inc. (b) 36,569 274,268Sabre Corp. (a) 375,253 8,619,561Science Applications International Corp. 74,228 5,373,365ServiceSource International, Inc. (b) 93,929 343,780Square, Inc. (a) (b) 475,824 21,911,695StarTek, Inc. (b) 15,709 169,657Sykes Enterprises, Inc. (b) 77,094 2,240,352Syntel, Inc. (a) (b) 71,654 1,923,910Teradata Corp. (a) (b) 220,606 8,122,713The Western Union Co. 833,977 16,529,424Total System Services, Inc. 300,351 26,415,870Travelport Worldwide Ltd. 241,707 3,444,325Ttec Holdings, Inc. 29,721 1,059,554
Shares Value
Unisys Corp. (a) (b) 94,015 $ 1,052,968Virtusa Corp. (b) 48,896 2,333,317Visa, Inc. Class A 3,219,554 395,811,969WEX, Inc. (b) 68,406 10,230,117WidePoint Corp. (b) 71,654 32,961Worldpay, Inc. (b) 526,125 42,763,440
2,073,781,463Semiconductors & Semiconductor Equipment – 3.9%Acacia Communications, Inc. (a) (b) 33,173 1,283,795Adesto Technologies Corp. (b) 10,383 66,970Advanced Energy Industries, Inc. (b) 70,933 4,704,277Advanced Micro Devices, Inc. (a) (b) 1,457,245 17,647,237AEHR Test Systems (b) 18,931 43,352Alpha & Omega Semiconductor Ltd. (b) 32,383 497,727Amkor Technology, Inc. (b) 223,902 2,250,215Amtech Systems, Inc. (b) 13,719 104,127Analog Devices, Inc. 653,157 58,882,104Applied Materials, Inc. 1,889,989 108,844,467Aquantia Corp. (a) (b) 25,937 357,931Axcelis Technologies, Inc. (b) 55,214 1,349,982AXT, Inc. (a) (b) 68,422 511,454Broadcom Ltd. 722,904 178,166,920Brooks Automation, Inc. 126,012 3,365,781Cabot Microelectronics Corp. 44,714 4,556,357Cavium, Inc. (b) 121,049 10,778,203Ceva, Inc. (b) 37,331 1,371,914Cirrus Logic, Inc. (b) 115,056 5,098,131Cohu, Inc. 83,996 1,682,440Cree, Inc. (a) (b) 179,530 6,791,620CVD Equipment Corp. (a) (b) 24,298 214,065CyberOptics Corp. (a) (b) 9,251 151,716Cypress Semiconductor Corp. 603,136 10,536,786Diodes, Inc. (b) 66,747 2,009,085DSP Group, Inc. (b) 64,723 786,384Entegris, Inc. 244,281 8,110,129Experi Corp. 89,409 1,971,468First Solar, Inc. (b) 142,742 8,971,335FormFactor, Inc. (b) 123,711 1,620,614GSI Technology, Inc. (b) 18,344 138,681Ichor Holdings Ltd. (a) (b) 29,846 771,221Impinj, Inc. (a) (b) 40,581 517,002Inphi Corp. (a) (b) 81,649 2,265,760Integrated Device Technology, Inc. (b) 240,699 7,302,808Intel Corp. 8,335,907 410,876,856Intermolecular, Inc. (b) 6,975 10,114Intest Corp. (b) 2,175 16,748KLA-Tencor Corp. 280,508 31,784,361Kopin Corp. (a) (b) 88,411 270,538Kulicke & Soffa Industries, Inc. (b) 125,107 2,914,993Lam Research Corp. 284,554 54,594,530Lattice Semiconductor Corp. (b) 220,983 1,328,108M/A-COM Technology Solutions Holdings, Inc. (a) (b) 79,684 1,700,457Marvell Technology Group Ltd. 752,545 17,677,282Maxim Integrated Products, Inc. 498,516 30,379,565MaxLinear, Inc. Class A (b) 115,923 2,634,930Microchip Technology, Inc. (a) 410,203 36,479,353

32Annual Report
See accompanying notes which are an integral part of the financial statements.
Schedule of Investments – continued
Common Stocks – continuedShares Value
INFORMATION TECHNOLOGY – continuedSemiconductors & Semiconductor Equipment – continuedMicron Technology, Inc. (b) 2,048,082 $ 99,966,882Microsemi Corp. (b) 218,164 14,158,844MKS Instruments, Inc. 93,742 10,438,172Monolithic Power Systems, Inc. 69,641 8,152,175MoSys, Inc. (b) 6,042 8,580Nanometrics, Inc. (b) 47,602 1,256,217NeoPhotonics Corp. (a) (b) 44,702 271,341NVE Corp. 7,985 555,037NVIDIA Corp. 1,078,334 260,956,828ON Semiconductor Corp. (b) 776,853 18,582,324PDF Solutions, Inc. (a) (b) 47,788 532,358Photronics, Inc. (b) 101,617 792,613Pixelworks, Inc. (b) 39,177 172,379Power Integrations, Inc. 52,203 3,508,042Qorvo, Inc. (b) 226,420 18,274,358Qualcomm, Inc. 2,626,174 170,701,310QuickLogic Corp. (a) (b) 142,208 228,955Rambus, Inc. (b) 201,505 2,561,129Rubicon Technology, Inc. (b) 2,504 18,054Rudolph Technologies, Inc. (b) 69,669 1,849,712Semtech Corp. (b) 131,349 4,419,894Sigma Designs, Inc. (b) 63,510 381,060Silicon Laboratories, Inc. (b) 78,252 7,316,562Skyworks Solutions, Inc. 330,946 36,155,851SMART Global Holdings, Inc. 13,359 463,824SolarEdge Technologies, Inc. (b) 61,683 3,087,234SunPower Corp. (a) (b) 97,783 693,281Synaptics, Inc. (a) (b) 66,113 3,072,271Teradyne, Inc. 378,289 17,174,321Texas Instruments, Inc. 1,752,599 189,894,102Ultra Clean Holdings, Inc. (a) (b) 60,588 1,166,925Veeco Instruments, Inc. (b) 86,705 1,573,696Versum Materials, Inc. 198,986 7,366,462Xcerra Corp. (b) 98,441 984,410Xilinx, Inc. 448,766 31,974,578
1,963,099,674Software – 5.6%8x8, Inc. (b) 162,409 2,963,964A10 Networks, Inc. (b) 73,118 459,181ACI Worldwide, Inc. (b) 200,153 4,733,618Activision Blizzard, Inc. 1,345,611 98,404,532Adobe Systems, Inc. (b) 877,013 183,409,729Agilysys, Inc. (b) 38,149 426,124Altair Engineering, Inc. Class A (b) 83,373 2,194,377American Software, Inc. Class A 55,166 686,265ANSYS, Inc. (b) 151,566 24,241,466Appian Corp. Class A (a) 19,112 516,788Aspen Technology, Inc. (b) 131,521 10,163,943Asure Software, Inc. (a) (b) 8,721 124,274Autodesk, Inc. (b) 385,200 45,249,444Black Knight, Inc. (b) 194,802 9,282,315Blackbaud, Inc. 87,315 8,951,534Bottomline Technologies, Inc. (b) 62,280 2,365,394BSQUARE Corp. (b) 11,182 40,814
Shares Value
CA Technologies, Inc. 560,057 $ 19,658,001Cadence Design Systems, Inc. (b) 495,754 19,220,383Callidus Software, Inc. (b) 115,529 4,147,491CDK Global, Inc. 250,362 17,194,862Citrix Systems, Inc. (b) 260,051 23,924,692CommVault Systems, Inc. (b) 75,089 3,908,382Datawatch Corp. (b) 9,730 90,976Digimarc Corp. (a) (b) 18,523 479,746Digital Turbine, Inc. (b) 41,910 94,298Document Security Systems, Inc. (b) 4,956 5,452Ebix, Inc. 42,676 3,582,650Electronic Arts, Inc. (b) 545,224 67,444,209Ellie Mae, Inc. (a) (b) 59,098 5,240,220Everbridge, Inc. (b) 29,747 949,227Evolving Systems, Inc. (b) 4,973 27,103Fair Isaac Corp. 53,660 9,118,980FireEye, Inc. (a) (b) 313,727 5,204,731Forescout Technologies, Inc. (b) 43,159 1,285,275Fortinet, Inc. (b) 260,319 13,138,300Glu Mobile, Inc. (b) 173,754 644,627GSE Systems, Inc. (b) 388 1,300Guidewire Software, Inc. (a) (b) 129,374 10,391,320HubSpot, Inc. (a) (b) 62,149 6,901,646Imperva, Inc. (b) 51,764 2,414,791Inseego Corp. (b) 35,452 66,295Intuit, Inc. 430,269 71,794,685Manhattan Associates, Inc. (a) (b) 127,067 5,349,521Microsoft Corp. 13,733,451 1,287,785,700MicroStrategy, Inc. Class A (b) 16,727 2,140,721Mitek Systems, Inc. (b) 45,058 344,694MobileIron, Inc. (b) 70,668 339,206Model N, Inc. (b) 64,636 1,105,276Monotype Imaging Holdings, Inc. 66,977 1,614,146NetSol Technologies, Inc. (b) 10,165 48,284Nuance Communications, Inc. (b) 461,370 7,409,602Oracle Corp. 5,423,242 274,795,672Parametric Technology Corp. (b) 208,715 15,394,818Park City Group, Inc. (a) (b) 18,083 187,159Paycom Software, Inc. (a) (b) 99,850 9,877,162Paylocity Holding Corp. (b) 45,248 2,116,249Pegasystems, Inc. 63,152 3,662,816Progress Software Corp. 78,882 3,697,199Proofpoint, Inc. (b) 76,136 8,159,495PROS Holdings, Inc. (a) (b) 55,472 1,739,047QAD, Inc.:
Class A 10,065 452,925Class B 4,298 149,570
Qualys, Inc. (b) 57,308 4,243,657Rapid7, Inc. (b) 37,409 987,972RealNetworks, Inc. (b) 28,670 79,703RealPage, Inc. (b) 107,924 5,639,029Red Hat, Inc. (b) 313,447 46,202,088RingCentral, Inc. (b) 118,298 7,411,370Rosetta Stone, Inc. (b) 22,826 312,488Salesforce.com, Inc. (b) 1,212,331 140,933,479SeaChange International, Inc. (b) 36,866 113,547

33 Annual Report
See accompanying notes which are an integral part of the financial statements.
Common Stocks – continuedShares Value
INFORMATION TECHNOLOGY – continuedSoftware – continuedServiceNow, Inc. (b) 306,489 $ 49,347,794SITO Mobile Ltd. (b) 17,979 93,671Smith Micro Software, Inc. (a) (b) 10,363 22,384Snap, Inc. Class A (a) (b) 409,280 7,088,730Sonic Foundry, Inc. (b) 155 364Splunk, Inc. (b) 244,410 22,779,012SS&C Technologies Holdings, Inc. 313,011 15,500,305Symantec Corp. 1,101,352 28,954,544Synchronoss Technologies, Inc. (a) (b) 70,331 656,892Synopsys, Inc. (b) 265,684 22,495,464Tableau Software, Inc. (b) 110,209 9,000,769Take-Two Interactive Software, Inc. (b) 202,290 22,630,182TeleNav, Inc. (b) 46,856 255,365The Rubicon Project, Inc. (b) 59,339 95,536TiVo Corp. 211,366 3,170,490Tyler Technologies, Inc. (b) 60,606 12,309,685Ultimate Software Group, Inc. (a) (b) 52,907 12,616,203Upland Software, Inc. (b) 13,813 329,578Varonis Systems, Inc. (b) 31,174 1,750,420Vasco Data Security International, Inc. (b) 48,861 588,775Verint Systems, Inc. (b) 117,045 4,553,051VirnetX Holding Corp. (a) (b) 93,723 360,834VMware, Inc. Class A (a) (b) 124,928 16,459,264Workday, Inc. Class A (b) 240,214 30,427,907Workiva, Inc. (b) 43,324 985,621Zedge, Inc. (b) 14,921 49,239Zendesk, Inc. (b) 202,958 8,763,726Zix Corp. (b) 69,803 282,702Zynga, Inc. (b) 1,392,357 4,817,555
2,789,822,061Technology Hardware, Storage & Peripherals – 3.8%3D Systems Corp. (a) (b) 198,011 1,881,105Apple, Inc. 9,145,246 1,628,951,144Astro-Med, Inc. 4,606 61,951Avid Technology, Inc. (a) (b) 38,570 184,750Concurrent Computer Corp. 6,675 35,711CPI Card Group (a) 4,456 11,363Cray, Inc. (b) 76,017 1,657,171Diebold Nixdorf, Inc. (a) 123,985 1,946,565Eastman Kodak Co. (a) (b) 64,018 336,095Electronics for Imaging, Inc. (b) 82,143 2,249,897Everspin Technologies, Inc. (a) (b) 9,978 76,731Hewlett Packard Enterprise Co. 2,841,574 52,824,861HP, Inc. 2,987,991 69,889,109Immersion Corp. (a) (b) 59,681 691,703Intevac, Inc. (b) 29,097 176,037ITUS Corp. (a) (b) 25,229 83,003NCR Corp. (b) 216,399 7,141,167NetApp, Inc. 473,434 28,666,429Pure Storage, Inc. Class A (a) (b) 209,911 4,548,771Quantum Corp. (a) (b) 41,835 153,116Seagate Technology LLC (a) 513,334 27,412,036Super Micro Computer, Inc. (a) (b) 65,674 1,188,699Transact Technologies, Inc. 3,411 47,242
Shares Value
U.S.A. Technologies, Inc. (a) (b) 68,908 $ 561,600Western Digital Corp. 529,836 46,116,925Xerox Corp. 410,942 12,459,761Xplore Technologies Corp. (b) 2,067 6,346
1,889,359,288
TOTAL INFORMATION TECHNOLOGY 12,095,296,931
MATERIALS – 3.3%Chemicals – 2.2%A. Schulman, Inc. 54,023 2,368,909Advanced Emissions Solutions, Inc. (a) 57,241 551,803AdvanSix, Inc. (b) 52,136 2,155,824AgroFresh Solutions, Inc. (b) 38,931 301,326Air Products & Chemicals, Inc. 385,828 62,037,284Albemarle Corp. U.S. 198,982 19,983,762American Vanguard Corp. 44,829 874,166Ashland Global Holdings, Inc. 107,479 7,611,663Axalta Coating Systems Ltd. (b) 400,178 12,325,482Balchem Corp. 57,069 4,294,442Cabot Corp. 106,306 6,397,495Calgon Carbon Corp. 83,129 1,766,491Celanese Corp. Class A 246,718 24,883,977CF Industries Holdings, Inc. 413,542 17,054,472Chase Corp. 19,479 2,025,816Codexis, Inc. (b) 54,787 523,216Core Molding Technologies, Inc. 10,858 197,616DowDuPont, Inc. 4,167,789 292,995,567Eastman Chemical Co. 259,233 26,203,272Ecolab, Inc. 467,194 60,945,457Ferro Corp. (b) 133,620 2,858,132Flotek Industries, Inc. (a) (b) 98,612 586,741FMC Corp. 235,247 18,462,185FutureFuel Corp. 37,844 453,750H.B. Fuller Co. 88,055 4,437,091Hawkins, Inc. 13,930 466,655Huntsman Corp. 374,240 12,076,725Ingevity Corp. (b) 80,091 5,999,617Innophos Holdings, Inc. 32,175 1,337,193Innospec, Inc. 41,822 2,716,339International Flavors & Fragrances, Inc. 145,054 20,488,878Intrepid Potash, Inc. (a) (b) 199,844 661,484KMG Chemicals, Inc. 19,191 1,150,884Koppers Holdings, Inc. (b) 34,144 1,379,418Kraton Performance Polymers, Inc. (b) 55,754 2,364,527Kronos Worldwide, Inc. 34,238 734,405LSB Industries, Inc. (a) (b) 28,693 214,337LyondellBasell Industries NV Class A 580,455 62,816,840Marrone Bio Innovations, Inc. (a) (b) 15,737 17,468Minerals Technologies, Inc. 69,103 4,747,376Monsanto Co. 778,073 95,990,866NewMarket Corp. 16,721 6,987,873Olin Corp. 290,042 9,426,365OMNOVA Solutions, Inc. (b) 62,393 630,169Platform Specialty Products Corp. (b) 374,823 3,913,152PolyOne Corp. 144,671 5,976,359

34Annual Report
See accompanying notes which are an integral part of the financial statements.
Schedule of Investments – continued
Common Stocks – continuedShares Value
MATERIALS – continuedChemicals – continuedPPG Industries, Inc. 447,686 $ 50,337,814PQ Group Holdings, Inc. 137,063 1,836,644Praxair, Inc. 503,951 75,466,662Quaker Chemical Corp. 22,939 3,269,496Rayonier Advanced Materials, Inc. 82,695 1,684,497RPM International, Inc. 250,289 12,456,884Senomyx, Inc. (b) 66,138 78,704Sensient Technologies Corp. 86,306 6,209,717Sherwin-Williams Co. 146,294 58,748,745Stepan Co. 34,404 2,755,760The Chemours Co. LLC 326,423 15,508,357The Mosaic Co. 610,934 16,079,783The Scotts Miracle-Gro Co. Class A (a) 77,671 6,977,963Trecora Resources (b) 28,770 319,347Tredegar Corp. 71,882 1,146,518Trinseo SA 75,141 5,981,224Tronox Ltd. Class A 158,750 2,901,950Valhi, Inc. 35,553 202,297Valvoline, Inc. 351,998 8,064,274Venator Materials PLC 82,940 1,587,472W.R. Grace & Co. 118,963 7,872,971Westlake Chemical Corp. 64,435 6,975,733Yield10 Bioscience, Inc. (b) 693 1,053
1,098,856,734Construction Materials – 0.1%Eagle Materials, Inc. 85,683 8,588,007Forterra, Inc. (b) 32,917 233,382Foundation Building Materials, Inc. 21,184 290,009Martin Marietta Materials, Inc. 109,383 22,306,475Summit Materials, Inc. 195,061 6,169,779U.S. Concrete, Inc. (a) (b) 26,762 1,946,936United States Lime & Minerals, Inc. 4,018 286,122Vulcan Materials Co. 235,118 27,680,442
67,501,152Containers & Packaging – 0.4%Aptargroup, Inc. 119,670 10,700,891Avery Dennison Corp. 154,788 18,288,202Ball Corp. 620,858 24,803,277Bemis Co., Inc. 175,245 7,726,552Berry Global Group, Inc. (b) 227,608 12,381,875Crown Holdings, Inc. (b) 233,058 11,615,611Graphic Packaging Holding Co. 529,162 8,101,470Greif, Inc. Class A 63,236 3,640,497International Paper Co. 730,930 43,556,119Myers Industries, Inc. 29,894 566,491Owens-Illinois, Inc. (b) 287,201 6,192,054Packaging Corp. of America 166,963 19,901,990Sealed Air Corp. 328,644 13,924,646Silgan Holdings, Inc. 135,972 3,868,403Sonoco Products Co. 183,166 8,786,473UFP Technologies, Inc. (b) 14,187 403,620WestRock Co. 453,830 29,843,861
224,302,032
Shares Value
Metals & Mining – 0.5%AK Steel Holding Corp. (a) (b) 525,512 $ 2,711,642Alcoa Corp. (b) 299,210 13,455,474Allegheny Technologies, Inc. (a) (b) 218,111 5,651,256Ampco-Pittsburgh Corp. 10,414 106,223Atkore International Group, Inc. (b) 52,989 1,151,981Carpenter Technology Corp. 80,027 4,076,575Century Aluminum Co. (b) 86,859 1,654,664Cliffs Natural Resources, Inc. (a) (b) 491,448 3,454,879Coeur d’Alene Mines Corp. (b) 321,230 2,457,410Commercial Metals Co. 192,032 4,666,378Compass Minerals International, Inc. 56,608 3,413,462Comstock Mining, Inc. (a) (b) 11,344 3,517Freeport-McMoRan, Inc. (b) 2,385,782 44,375,545Friedman Industries 2,001 12,126General Moly, Inc. (b) 60,513 23,782Gold Resource Corp. 109,163 444,293Golden Minerals Co. (a) (b) 71,014 26,630Haynes International, Inc. 18,364 763,942Hecla Mining Co. 683,190 2,500,475Kaiser Aluminum Corp. 27,980 2,808,353Materion Corp. 35,727 1,800,641McEwen Mining, Inc. (a) 403,016 785,881Newmont Mining Corp. 957,989 36,595,180Nucor Corp. 558,044 36,496,078Olympic Steel, Inc. 12,703 286,199Paramount Gold Nevada Corp. (b) 7,958 10,107Pershing Gold Corp. (a) (b) 31,696 69,097Reliance Steel & Aluminum Co. 131,422 11,850,322Royal Gold, Inc. 120,358 9,721,316Ryerson Holding Corp. (a) (b) 30,039 303,394Schnitzer Steel Industries, Inc. Class A 47,241 1,606,194Solitario Exploration & Royalty Corp. (b) 18,115 9,601Steel Dynamics, Inc. 449,332 20,781,605SunCoke Energy, Inc. (b) 99,267 1,060,172Synalloy Corp. 8,615 118,026TimkenSteel Corp. (a) (b) 69,807 1,142,043U.S. Antimony Corp. (b) 24,962 6,865U.S. Gold Corp. 46 83United States Steel Corp. 307,753 13,390,333Universal Stainless & Alloy Products, Inc. (b) 6,659 169,072Worthington Industries, Inc. 90,980 4,024,955
233,985,771Paper & Forest Products – 0.1%Boise Cascade Co. 63,767 2,569,810Clearwater Paper Corp. (b) 35,821 1,346,870Domtar Corp. 128,751 5,762,895Kapstone Paper & Packaging Corp. 150,928 5,265,878Louisiana-Pacific Corp. 261,592 7,455,372Mercer International, Inc. (SBI) 69,702 920,066Neenah, Inc. 30,046 2,303,026P.H. Glatfelter Co. 69,408 1,416,617Resolute Forest Products (b) 146,819 1,189,234

35 Annual Report
See accompanying notes which are an integral part of the financial statements.
Common Stocks – continuedShares Value
MATERIALS – continuedPaper & Forest Products – continuedSchweitzer-Mauduit International, Inc. 57,402 $ 2,250,732Verso Corp. (b) 59,171 1,037,859
31,518,359
TOTAL MATERIALS 1,656,164,048
REAL ESTATE – 3.5%Equity Real Estate Investment Trusts (REITs) – 3.3%Acadia Realty Trust (SBI) 161,267 3,883,309Agree Realty Corp. 50,269 2,367,670Alexander & Baldwin, Inc. 155,313 3,415,333Alexanders, Inc. 6,764 2,471,092Alexandria Real Estate Equities, Inc. (a) 179,252 21,745,060American Assets Trust, Inc. 89,595 2,841,953American Campus Communities, Inc. 238,326 8,694,132American Homes 4 Rent Class A 437,349 8,392,727American Tower Corp. 762,823 106,284,129Apartment Investment & Management Co. Class A 262,560 10,150,570Apple Hospitality (REIT), Inc. 366,638 6,229,180Armada Hoffler Properties, Inc. 88,352 1,155,644Ashford Hospitality Prime, Inc. 47,533 408,784Ashford Hospitality Trust, Inc. 123,613 681,108AvalonBay Communities, Inc. 243,609 38,007,876Bluerock Residential Growth (REIT), Inc. (a) 90,320 680,110Boston Properties, Inc. 278,059 33,052,873Brandywine Realty Trust (SBI) 276,702 4,333,153Brixmor Property Group, Inc. 560,616 8,711,973BRT Realty Trust (a) 189,164 1,974,872Camden Property Trust (SBI) 177,479 14,146,851CareTrust (REIT), Inc. 143,665 1,903,561CatchMark Timber Trust, Inc. 100,692 1,317,051CBL & Associates Properties, Inc. (a) 283,674 1,313,411Cedar Realty Trust, Inc. 134,023 532,071Chatham Lodging Trust 76,647 1,394,209Chesapeake Lodging Trust 98,722 2,552,951CIM Commercial Trust Corp. 6,057 95,095City Office REIT, Inc. 67,579 678,493Clipper Realty, Inc. (a) 6,962 61,962Colony NorthStar, Inc. (a) 946,716 7,365,450Columbia Property Trust, Inc. 198,850 4,142,046Community Healthcare Trust, Inc. 41,798 983,925Condor Hospitality Trust, Inc. 108 1,101CorEnergy Infrastructure Trust, Inc. (a) 14,135 507,022CoreSite Realty Corp. 56,759 5,326,832Corporate Office Properties Trust (SBI) 181,324 4,525,847Corrections Corp. of America 203,536 4,231,513Cousins Properties, Inc. 673,063 5,613,345Crown Castle International Corp. 720,166 79,261,470CubeSmart 309,180 8,289,116CyrusOne, Inc. 170,561 8,510,994DCT Industrial Trust, Inc. 187,037 10,352,498DDR Corp. 536,213 4,182,461DiamondRock Hospitality Co. 332,744 3,420,608Digital Realty Trust, Inc. 362,140 36,445,770
Shares Value
Douglas Emmett, Inc. 264,925 $ 9,471,069Duke Realty Corp. 634,902 15,726,523Easterly Government Properties, Inc. 64,416 1,226,481EastGroup Properties, Inc. 54,382 4,406,573Education Realty Trust, Inc. 129,203 4,023,381Empire State Realty Trust, Inc. 295,222 4,977,443EPR Properties 106,196 6,120,075Equinix, Inc. 138,885 54,456,809Equity Commonwealth (b) 213,360 6,277,051Equity Lifestyle Properties, Inc. 165,789 14,027,407Equity Residential (SBI) 645,605 36,302,369Essex Property Trust, Inc. 116,687 26,118,051Extra Space Storage, Inc. 218,411 18,575,856Farmland Partners, Inc. (a) 105,443 792,931Federal Realty Investment Trust (SBI) 126,706 14,436,882First Industrial Realty Trust, Inc. 184,151 5,161,753Forest City Realty Trust, Inc. Class A 477,333 10,152,873Four Corners Property Trust, Inc. 103,212 2,266,536Franklin Street Properties Corp. 176,797 1,430,288Front Yard Residential Corp. Class B 86,977 912,389Gaming & Leisure Properties 346,079 11,510,588General Growth Properties, Inc. 1,108,954 23,476,556Getty Realty Corp. 48,238 1,138,417Gladstone Commercial Corp. 76,606 1,295,407Gladstone Land Corp. (a) 8,000 99,680Global Medical REIT, Inc. 12,930 84,045Global Net Lease, Inc. 110,110 1,722,120Government Properties Income Trust 163,137 2,238,240Gramercy Property Trust 276,707 5,990,707HCP, Inc. 814,733 17,630,822Healthcare Realty Trust, Inc. 262,572 6,971,287Healthcare Trust of America, Inc. 387,197 9,621,845Hersha Hospitality Trust 71,283 1,197,554Highwoods Properties, Inc. (SBI) 185,987 7,999,301Hospitality Properties Trust (SBI) 292,755 7,447,687Host Hotels & Resorts, Inc. 1,297,018 24,072,654Hudson Pacific Properties, Inc. 285,636 9,017,529Independence Realty Trust, Inc. 140,119 1,193,814InfraReit, Inc. 82,809 1,543,560Investors Real Estate Trust 202,786 942,955Invitation Homes, Inc. 524,758 11,413,487Iron Mountain, Inc. 505,986 15,918,320iStar Financial, Inc. (a) (b) 102,599 1,036,250JBG SMITH Properties 174,423 5,694,911Jernigan Capital, Inc. (a) 21,201 358,085Kilroy Realty Corp. 169,012 11,509,717Kimco Realty Corp. 744,326 11,135,117Kite Realty Group Trust 145,444 2,202,022Lamar Advertising Co. Class A 144,792 9,624,324LaSalle Hotel Properties (SBI) (a) 187,702 4,604,330Lexington Corporate Properties Trust 399,211 3,177,720Liberty Property Trust (SBI) 243,797 9,571,470Life Storage, Inc. 80,608 6,332,564LTC Properties, Inc. 62,032 2,292,082Mack-Cali Realty Corp. 154,097 2,602,698MedEquities Realty Trust, Inc. 56,982 551,016

36Annual Report
See accompanying notes which are an integral part of the financial statements.
Schedule of Investments – continued
Common Stocks – continuedShares Value
REAL ESTATE – continuedEquity Real Estate Investment Trusts (REITs) – continuedMedical Properties Trust, Inc. 636,344 $ 7,801,577Mid-America Apartment Communities, Inc. 212,495 18,236,321Monmouth Real Estate Investment Corp. Class A 122,224 1,725,803National Health Investors, Inc. 85,662 5,556,894National Retail Properties, Inc. 290,818 10,830,062National Storage Affiliates Trust 88,997 2,183,096New Senior Investment Group, Inc. 149,321 1,206,514NexPoint Residential Trust, Inc. 32,020 772,002NorthStar Realty Europe Corp. 77,758 799,352Omega Healthcare Investors, Inc. (a) 333,230 8,490,700One Liberty Properties, Inc. 42,541 925,692Outfront Media, Inc. 245,927 5,043,963Paramount Group, Inc. 362,269 5,053,653Park Hotels & Resorts, Inc. 279,908 7,274,809Pebblebrook Hotel Trust (a) 119,218 4,054,604Pennsylvania Real Estate Investment Trust (SBI) 105,464 1,101,044Physicians Realty Trust 319,999 4,598,386Piedmont Office Realty Trust, Inc. Class A 250,343 4,496,160Potlatch Corp. 95,771 4,898,687Power (REIT) (b) 718 4,380Preferred Apartment Communities, Inc. Class A 51,100 711,823Prologis, Inc. 934,899 56,729,671PS Business Parks, Inc. 42,672 4,730,618Public Storage 265,011 51,528,739QTS Realty Trust, Inc. Class A 89,309 2,882,001Quality Care Properties, Inc. (b) 156,460 1,938,539RAIT Financial Trust 116,629 20,993Ramco-Gershenson Properties Trust (SBI) 128,503 1,513,765Rayonier, Inc. 230,983 7,851,112Realty Income Corp. 518,221 25,486,109Regency Centers Corp. 260,327 15,127,602Retail Opportunity Investments Corp. 266,398 4,571,390Retail Properties America, Inc. 409,657 4,899,498Rexford Industrial Realty, Inc. 121,774 3,287,898RLJ Lodging Trust 302,558 5,993,674Ryman Hospitality Properties, Inc. 91,162 6,286,532Sabra Health Care REIT, Inc. 302,193 5,101,018Safety Income and Growth, Inc. 12,370 215,485Saul Centers, Inc. 23,905 1,169,672SBA Communications Corp. Class A (b) 208,263 32,753,522Select Income REIT 130,864 2,377,799Senior Housing Properties Trust (SBI) 425,667 6,444,598Seritage Growth Properties (a) 43,689 1,651,444Simon Property Group, Inc. 554,703 85,152,458SL Green Realty Corp. 183,660 17,800,327Sotherly Hotels, Inc. 2,721 16,516Spirit Realty Capital, Inc. 831,107 6,482,635Stag Industrial, Inc. 147,627 3,361,467Store Capital Corp. 322,243 7,682,273Summit Hotel Properties, Inc. 229,907 3,027,875Sun Communities, Inc. 147,103 12,880,339Sunstone Hotel Investors, Inc. 363,918 5,251,337Tanger Factory Outlet Centers, Inc. (a) 158,086 3,528,480Taubman Centers, Inc. (a) 102,172 5,972,975
Shares Value
Terreno Realty Corp. 83,145 $ 2,769,560The GEO Group, Inc. 214,441 4,567,593The Macerich Co. 198,583 11,704,482TIER REIT, Inc. 108,647 2,018,661UDR, Inc. 504,145 16,949,355UMH Properties, Inc. 79,886 932,270Uniti Group, Inc. (a) 283,932 4,358,356Universal Health Realty Income Trust (SBI) 38,916 2,154,390Urban Edge Properties 187,255 4,040,963Urstadt Biddle Properties, Inc. Class A 92,798 1,625,821Ventas, Inc. 628,317 30,360,277VEREIT, Inc. 1,684,858 11,541,277Vornado Realty Trust 319,886 21,262,822Washington Prime Group, Inc. 352,285 2,307,467Washington REIT (SBI) 128,414 3,246,306Weingarten Realty Investors (SBI) 218,157 5,918,599Welltower, Inc. 660,268 34,664,070Weyerhaeuser Co. 1,360,641 47,663,254Wheeler REIT, Inc. (a) 6,770 33,985Whitestone REIT Class B 105,336 1,299,846WP Carey, Inc. 200,512 12,014,679Xenia Hotels & Resorts, Inc. 170,955 3,362,685
1,656,999,423Real Estate Management & Development – 0.2%Altisource Portfolio Solutions SA (a) (b) 18,423 490,052Boston Omaha Corp. (a) 13,217 330,161CBRE Group, Inc. (b) 515,797 24,113,510Consolidated-Tomoka Land Co. 6,987 432,705Forestar Group, Inc. (a) (b) 22,360 552,292FRP Holdings, Inc. (b) 3,842 200,745HFF, Inc. 59,609 2,721,747Howard Hughes Corp. (b) 67,898 8,703,845Jones Lang LaSalle, Inc. 79,229 12,724,970Kennedy-Wilson Holdings, Inc. 231,676 3,787,903Marcus & Millichap, Inc. (b) 19,559 612,197Maui Land & Pineapple, Inc. (b) 31,310 347,541RE/MAX Holdings, Inc. 27,266 1,507,810Realogy Holdings Corp. (a) 241,978 6,182,538Redfin Corp. (a) 13,655 281,156Stratus Properties, Inc. 12,801 380,190Tejon Ranch Co. (b) 25,315 560,727The St. Joe Co. (a) (b) 125,813 2,214,309Transcontinental Realty Investors, Inc. (a) (b) 20,697 618,426Trinity Place Holdings, Inc. (b) 7,019 42,114
66,804,938
TOTAL REAL ESTATE 1,723,804,361
TELECOMMUNICATION SERVICES – 1.7%Diversified Telecommunication Services – 1.6%Alaska Communication Systems Group, Inc. (b) 135,810 286,559Altice U.S.A., Inc. Class A (a) 135,431 2,464,844AT&T, Inc. 10,935,125 396,945,038Atlantic Tele-Network, Inc. 20,159 1,207,524CenturyLink, Inc. 1,752,129 30,960,119Cincinnati Bell, Inc. (b) 75,163 1,213,882

37 Annual Report
See accompanying notes which are an integral part of the financial statements.
Common Stocks – continuedShares Value
TELECOMMUNICATION SERVICES – continuedDiversified Telecommunication Services – continuedCogent Communications Group, Inc. 79,491 $ 3,406,189Consolidated Communications Holdings, Inc. (a) 126,066 1,457,323Frontier Communications Corp. (a) 131,607 925,197Gci Liberty, Inc. Class A (b) 49,805 1,915,002Globalstar, Inc. (a) (b) 800,187 760,658Hawaiian Telcom Holdco, Inc. (b) 18,678 526,159IDT Corp. Class B 44,765 540,761Iridium Communications, Inc. (a) (b) 166,538 1,948,495Ooma, Inc. (b) 37,459 398,938ORBCOMM, Inc. (b) 123,895 1,288,508Pareteum Corp. (a) (b) 88,901 202,694PDVWireless, Inc. (b) 18,833 606,423Verizon Communications, Inc. 7,307,894 348,878,860Vonage Holdings Corp. (b) 383,634 3,893,885WideOpenWest, Inc. (a) 35,967 347,441Windstream Holdings, Inc. (a) 322,467 509,498Zayo Group Holdings, Inc. (b) 326,134 11,691,904
812,375,901Wireless Telecommunication Services – 0.1%Airgain, Inc. (a) (b) 9,732 88,853Boingo Wireless, Inc. (b) 75,566 2,000,232NII Holdings, Inc. (b) 134,717 173,785Shenandoah Telecommunications Co. 83,137 2,726,894Spok Holdings, Inc. 43,148 670,951Sprint Corp. (a) (b) 1,210,354 6,281,737T-Mobile U.S., Inc. (b) 515,607 31,250,940Telephone & Data Systems, Inc. 160,373 4,496,859U.S. Cellular Corp. (b) 27,310 1,053,893
48,744,144
TOTAL TELECOMMUNICATION SERVICES 861,120,045
UTILITIES – 2.7%Electric Utilities – 1.5%Allete, Inc. 92,545 6,306,942Alliant Energy Corp. 399,095 15,425,022American Electric Power Co., Inc. 860,400 56,425,032Duke Energy Corp. 1,241,630 93,544,404Edison International 575,291 34,856,882El Paso Electric Co. 80,794 3,926,588Entergy Corp. 331,899 25,164,582Eversource Energy 554,857 31,626,849Exelon Corp. 1,701,682 63,030,301FirstEnergy Corp. (a) 790,189 25,546,810Genie Energy Ltd. Class B 24,074 107,129Great Plains Energy, Inc. 385,148 11,227,064Hawaiian Electric Industries, Inc. 219,652 7,239,730IDACORP, Inc. 102,567 8,313,055MGE Energy, Inc. 67,317 3,534,143NextEra Energy, Inc. 831,821 126,561,565OGE Energy Corp. 377,699 11,837,087Otter Tail Corp. 81,371 3,238,566PG&E Corp. 910,308 37,404,556Pinnacle West Capital Corp. 195,406 15,038,446
Shares Value
PNM Resources, Inc. 139,589 $ 4,913,533Portland General Electric Co. 147,815 5,872,690PPL Corp. 1,196,554 34,281,272Southern Co. 1,778,878 76,598,487Spark Energy, Inc. Class A, (a) 24,582 228,613Vistra Energy Corp. (a) (b) 550,902 10,439,593Westar Energy, Inc. 261,746 12,754,883Xcel Energy, Inc. 913,603 39,540,738
764,984,562Gas Utilities – 0.2%Atmos Energy Corp. 195,837 15,762,920Chesapeake Utilities Corp. 27,662 1,843,672National Fuel Gas Co. 154,938 7,658,585New Jersey Resources Corp. 144,194 5,493,791Northwest Natural Gas Co. 56,327 2,937,453ONE Gas, Inc. 93,649 5,955,140RGC Resources, Inc. 6,537 163,098South Jersey Industries, Inc. 141,912 3,719,514Southwest Gas Holdings, Inc. 84,261 5,551,115Spire, Inc. 89,693 6,081,185UGI Corp. 304,467 13,119,483WGL Holdings, Inc. 90,512 7,536,029
75,821,985Independent Power and Renewable Electricity Producers – 0.1%Calpine Corp. (b) 640,548 9,749,141Dynegy, Inc. (a) (b) 219,293 2,681,953NRG Energy, Inc. 543,641 14,058,556NRG Yield, Inc.:
Class A 44,523 684,764Class C 119,926 1,876,842
Ormat Technologies, Inc. 63,023 3,943,979Pattern Energy Group, Inc. (a) 148,509 2,757,812Terraform Power, Inc. 78,899 908,127The AES Corp. 1,153,730 12,541,045U.S. Geothermal, Inc. (b) 27,201 145,525
49,347,744Multi-Utilities – 0.8%Ameren Corp. 427,084 23,190,661Avangrid, Inc. 122,071 5,922,885Avista Corp. 128,677 6,154,621Black Hills Corp. (a) 93,372 4,742,364CenterPoint Energy, Inc. 737,121 19,939,123CMS Energy Corp. 470,546 19,974,678Consolidated Edison, Inc. 544,257 40,759,407Dominion Resources, Inc. 1,140,248 84,458,169DTE Energy Co. 311,193 31,362,031MDU Resources Group, Inc. 350,842 9,223,636NiSource, Inc. 563,680 13,037,918NorthWestern Energy Corp. 81,275 4,151,527Public Service Enterprise Group, Inc. 894,940 43,341,944SCANA Corp. 249,382 9,892,984Sempra Energy (a) 441,376 48,101,156Unitil Corp. 55,250 2,322,710Vectren Corp. 162,155 9,769,839WEC Energy Group, Inc. 555,778 33,302,218
409,647,871

38Annual Report
See accompanying notes which are an integral part of the financial statements.
Schedule of Investments – continued
Common Stocks – continuedShares Value
UTILITIES – continuedWater Utilities – 0.1%American States Water Co. 72,116 $ 3,830,802American Water Works Co., Inc. 327,203 25,966,830Aqua America, Inc. 336,537 11,506,200AquaVenture Holdings Ltd. (a) (b) 20,099 258,272Artesian Resources Corp. Class A 60,277 1,994,566Cadiz, Inc. (a) (b) 46,921 649,856California Water Service Group 83,616 3,173,227Connecticut Water Service, Inc. 31,367 1,619,478Middlesex Water Co. 39,650 1,405,196Pure Cycle Corp. (b) 17,116 136,072Select Energy Services, Inc. Class A (a) 42,457 609,683SJW Corp. 29,404 1,556,648York Water Co. 40,150 1,128,215
53,835,045
TOTAL UTILITIES 1,353,637,207
TOTAL COMMON STOCKS(Cost $30,418,769,296) 49,918,638,823
U.S. Treasury Obligations – 0.0%Principal Amount
U.S. Treasury Bills, yield at date of purchase 1.18% 6/21/18 (d)(Cost $4,981,800) $ 5,000,000 4,974,411
Money Market Funds – 4.0%Shares
Fidelity Cash Central Fund, 1.41% (e) 183,772,741 183,809,495Fidelity Securities Lending Cash Central Fund 1.42% (e) (f) 1,811,974,383 1,812,155,580
TOTAL MONEY MARKET FUNDS(Cost $1,995,853,757) 1,995,965,075
TOTAL INVESTMENT IN SECURITIES – 103.5%(Cost $32,419,604,853) 51,919,578,309
NET OTHER ASSETS (LIABILITIES) – (3.5)% (1,746,884,503)NET ASSETS – 100% $50,172,693,806
Futures ContractsNumber
of contractsExpiration
DateNotional Amount
Value Unrealized Appreciation/ (Depreciation)
Purchased
Equity Index ContractsCME E-mini Russell 2000 Index Contracts (United States) 418 March 2018 $ 31,584,080 $ 80,593 $ 80,593CME E-mini S&P 500 Index Contracts (United States) 1,588 March 2018 215,523,360 4,021,280 4,021,280

39 Annual Report
See accompanying notes which are an integral part of the financial statements.
Futures Contracts – continuedNumber
of contractsExpiration
DateNotional Amount
Value Unrealized Appreciation/ (Depreciation)
Equity Index Contracts – continuedCME E-mini S&P MidCap 400 Index Contracts (United States) 84 March 2018 $ 15,661,800 $ 65,318 $ 65,318
TOTAL FUTURES CONTRACTS $ 4,167,191
The notional amount of futures purchased as a percentage of Net Assets is 0.5%
Legend(a) Security or a portion of the security is on loan at period end.
(b) Non-income producing
(c) Level 3 security
(d) Security or a portion of the security was pledged to cover margin requirements for futures contracts. At period end, the value of securities pledged amounted to $4,974,411.
(e) Affiliated fund that is generally available only to investment companies and other accounts managed by Fidelity Investments. The rate quoted is the annualized seven-day yield of the fund at period end. A complete unaudited listing of the fund’s holdings as of its most recent quarter end is available upon request. In addition, each Fidelity Central Fund’s financial statements, which are not covered by the Fund’s Report of Independent Registered Public Accounting Firm, are available on the SEC’s website or upon request.
(f) Investment made with cash collateral received from securities on loan.
Affiliated Central FundsInformation regarding fiscal year to date income earned by the Fund from investments in Fidelity Central Funds is as follows:
Fund Income earnedFidelity Cash Central Fund $ 1,727,937Fidelity Securities Lending Cash Central Fund 11,878,010Total $ 13,605,947
Amounts in the income column in the above table include any capital gain distributions from underlying funds, which are presented in the corresponding line-item in the Statement of Operations if applicable.
Investment ValuationThe following is a summary of the inputs used, as of February 28, 2018, involving the Fund’s assets and liabilities carried at fair value. The inputs or methodology used for valuing securities may not be an indication of the risk associated with investing in those securities. For more information on valuation inputs, and their aggregation into the levels used below, please refer to the Investment Valuation section in the accompanying Notes to Financial Statements.
Valuation Inputs at Reporting Date:Description Total Level 1 Level 2 Level 3Investments in Securities:Equities:
Consumer Discretionary $ 6,469,926,406 $ 6,469,921,102 $ 5,301 $ 3Consumer Staples 3,374,954,030 3,374,954,030 — —Energy 2,613,725,436 2,613,725,436 — —Financials 7,684,371,184 7,684,371,184 — —Health Care 6,703,404,390 6,702,710,054 — 694,336Industrials 5,382,234,785 5,382,234,785 — —Information Technology 12,095,296,931 12,095,296,931 — —Materials 1,656,164,048 1,656,164,048 — —Real Estate 1,723,804,361 1,723,804,361 — —Telecommunication Services 861,120,045 861,120,045 — —Utilities 1,353,637,207 1,353,637,207 — —
U.S. Government and Government Agency Obligations 4,974,411 — 4,974,411 —Money Market Funds 1,995,965,075 1,995,965,075 — —Total Investments in Securities: $ 51,919,578,309 $ 51,913,904,258 $ 4,979,712 $ 694,339
Derivative Instruments:Assets
Futures Contracts $ 4,167,191 $ 4,167,191 $ — $ —Total Assets $ 4,167,191 $ 4,167,191 $ — $ —Total Derivative Instruments: $ 4,167,191 $ 4,167,191 $ — $ —

40Annual Report
See accompanying notes which are an integral part of the financial statements.
Schedule of Investments – continued
Value of Derivative InstrumentsThe following table is a summary of the Fund’s value of derivative instruments by primary risk exposure as of February 28, 2018. For additional information on derivative instruments, please refer to the Derivative Instruments section in the accompanying Notes to Financial Statements.
Primary Risk Exposure / Derivative Type ValueAsset Liability
Equity Risk Futures Contracts (a) $ 4,167,191 $ 0Total Equity Risk 4,167,191 0Total Value of Derivatives $ 4,167,191 $ 0
(a) Reflects gross cumulative appreciation (depreciation) on futures contracts as presented in the Schedule of Investments. In the Statement of Assets and Liabilities, the period end daily variation margin is included in receivable or payable for daily variation margin on futures contracts, and the net cumulative appreciation (depreciation) is included in net unrealized appreciation (depreciation).

41 Annual Report
See accompanying notes which are an integral part of the financial statements.
Fidelity® Total Market Index Fund
Financial StatementsStatement of Assets and Liabilities
February 28, 2018
Assets Investment in securities, at value (including securities loaned of $1,744,344,442) — See accompanying schedule:
Unaffiliated issuers (cost $30,423,751,096) $ 49,923,613,234Fidelity Central Funds (cost $1,995,853,757) 1,995,965,075
Total Investment in Securities (cost $32,419,604,853) $ 51,919,578,309Segregated cash with brokers for derivative instruments 6,905,340Cash 56,078Receivable for fund shares sold 27,115,291Dividends receivable 84,161,725Distributions receivable from Fidelity Central Funds 1,135,239Other receivables 831,877
Total assets 52,039,783,859Liabilities Payable for fund shares redeemed $ 49,675,092Accrued management fee 624,376Payable for daily variation margin on futures contracts 3,513,058Other affiliated payables 546,913Other payables and accrued expenses 824,191Collateral on securities loaned 1,811,906,423
Total liabilities 1,867,090,053
Net Assets $ 50,172,693,806
Net Assets consist of: Paid in capital $ 30,643,613,148Undistributed net investment income 165,503,274Accumulated undistributed net realized gain (loss) on investments and foreign currency transactions (140,563,263)Net unrealized appreciation (depreciation) on investments 19,504,140,647Net Assets $ 50,172,693,806
Investor Class: Net Asset Value, offering price and redemption price per share ($794,446,174 ÷ 10,259,722 shares) $ 77.43
Premium Class: Net Asset Value, offering price and redemption price per share ($27,441,887,361 ÷ 354,373,823 shares) $ 77.44
Institutional Class: Net Asset Value, offering price and redemption price per share ($3,341,899,045 ÷ 43,161,353 shares) $ 77.43
Institutional Premium Class: Net Asset Value, offering price and redemption price per share ($6,114,863,776 ÷ 78,980,256 shares) $ 77.42
Class F: Net Asset Value, offering price and redemption price per share ($12,479,597,450 ÷ 161,141,098 shares) $ 77.45

42Annual Report
See accompanying notes which are an integral part of the financial statements.
Financial Statements – continued
Statement of OperationsYear ended February
28, 2018
Investment Income Dividends $ 831,259,421Interest 100,453Income from Fidelity Central Funds (including $11,878,010 from security lending) 13,605,947
Total income 844,965,821Expenses Management fee $ 6,755,245Transfer agent fees 7,117,387Independent trustees’ fees and expenses 167,399Legal 14,538Miscellaneous 130,935
Total expenses before reductions 14,185,504Expense reductions (14,565) 14,170,939
Net investment income (loss) 830,794,882
Realized and Unrealized Gain (Loss) Net realized gain (loss) on:
Investment securities: Unaffiliated issuers 269,171,497Fidelity Central Funds 77,651
Foreign currency transactions 102Futures contracts 41,722,764
Total net realized gain (loss) 310,972,014Change in net unrealized appreciation (depreciation) on:
Investment securities: Unaffiliated issuers 5,671,121,681Fidelity Central Funds (187,492)
Futures contracts (5,481,555)Total change in net unrealized appreciation (depreciation) 5,665,452,634Net gain (loss) 5,976,424,648Net increase (decrease) in net assets resulting from operations $ 6,807,219,530
Statement of Changes in Net AssetsYear ended
February 28, 2018
Year ended February 28,
2017Increase (Decrease) in Net Assets Operations
Net investment income (loss) $ 830,794,882 $ 693,855,123Net realized gain (loss) 310,972,014 214,952,729Change in net unrealized appreciation (depreciation) 5,665,452,634 7,091,127,790Net increase (decrease) in net assets resulting from operations 6,807,219,530 7,999,935,642
Distributions to shareholders from net investment income (778,723,850) (649,892,693)Distributions to shareholders from net realized gain (315,859,948) (218,645,122)
Total distributions (1,094,583,798) (868,537,815)Share transactions – net increase (decrease) 4,369,390,868 3,500,265,848Redemption fees – 257,287
Total increase (decrease) in net assets 10,082,026,600 10,631,920,962Net Assets
Beginning of period 40,090,667,206 29,458,746,244End of period $ 50,172,693,806 $ 40,090,667,206
Other Information Undistributed net investment income end of period $ 165,503,274 $ 113,906,017

43 Annual Report
See accompanying notes which are an integral part of the financial statements.
Financial Highlights
Fidelity Total Market Index Fund Investor Class
Years ended February 28, 2018 2017 2016 A 2015 2014Selected Per–Share Data Net asset value, beginning of period $ 68.20 $ 55.32 $ 61.58 $ 54.91 $ 44.05Income from Investment Operations
Net investment income (loss) B 1.30 1.20 1.13 1.10 .92Net realized and unrealized gain (loss) 9.65 13.20 (5.97) 6.51 10.74
Total from investment operations 10.95 14.40 (4.84) 7.61 11.66Distributions from net investment income (1.21) (1.13) (1.11) (.94) (.80)Distributions from net realized gain (.51) (.39) (.31) – –
Total distributions (1.72) (1.52) (1.42) (.94) (.80)Redemption fees added to paid in capital B – –C –C –C –C
Net asset value, end of period $ 77.43 $ 68.20 $ 55.32 $ 61.58 $ 54.91
Total Return D 16.16% 26.22% (7.96)% 13.94% 26.62%Ratios to Average Net Assets E,F
Expenses before reductions .09% .09% .10% .10% .10%Expenses net of fee waivers, if any .09% .09% .10% .10% .10%Expenses net of all reductions .09% .09% .10% .10% .10%Net investment income (loss) 1.79% 1.96% 1.90% 1.91% 1.85%
Supplemental Data Net assets, end of period (000 omitted) $ 794,446 $ 736,989 $ 1,932,568 $ 1,943,259 $ 1,694,212Portfolio turnover rate G 2% 4% 3% 2% 2%
A For the year ended February 29.B Calculated based on average shares outstanding during the period.C Amount represents less than $.005 per share.D Total returns would have been lower if certain expenses had not been reduced during the applicable periods shown.E Fees and expenses of any underlying Fidelity Central Funds are not included in the Fund’s expense ratio. The Fund indirectly bears its proportionate share of the expenses of any underlying Fidelity Central Funds.F Expense ratios reflect operating expenses of the class. Expenses before reductions do not reflect amounts reimbursed by the investment adviser or reductions from expense offset arrangements and do not represent the amount paid
by the class during periods when reimbursements or reductions occur. Expenses net of fee waivers reflect expenses after reimbursement by the investment adviser but prior to reductions from expense offset arrangements. Expenses net of all reductions represent the net expenses paid by the class.
G Amount does not include the portfolio activity of any underlying Fidelity Central Funds.

44Annual Report
See accompanying notes which are an integral part of the financial statements.
Financial Highlights – continued
Fidelity Total Market Index Fund Premium Class
Years ended February 28, 2018 2017 2016 A 2015 2014Selected Per–Share Data Net asset value, beginning of period $ 68.20 $ 55.32 $ 61.59 $ 54.91 $ 44.06Income from Investment Operations
Net investment income (loss) B 1.34 1.25 1.16 1.13 .94Net realized and unrealized gain (loss) 9.66 13.18 (5.98) 6.52 10.73
Total from investment operations 11.00 14.43 (4.82) 7.65 11.67Distributions from net investment income (1.25) (1.16) (1.14) (.97) (.82)Distributions from net realized gain (.51) (.39) (.31) – –
Total distributions (1.76) (1.55) (1.45) (.97) (.82)Redemption fees added to paid in capital B – –C –C –C –C
Net asset value, end of period $ 77.44 $ 68.20 $ 55.32 $ 61.59 $ 54.91
Total Return D 16.23% 26.28% (7.92)% 14.02% 26.65%Ratios to Average Net Assets E,F
Expenses before reductions .04% .05% .07% .07% .07%Expenses net of fee waivers, if any .04% .05% .05% .05% .06%Expenses net of all reductions .04% .05% .05% .05% .06%Net investment income (loss) 1.84% 2.00% 1.95% 1.96% 1.89%
Supplemental Data Net assets, end of period (000 omitted) $ 27,441,887 $ 23,288,507 $ 18,866,595 $ 18,860,117 $ 14,943,835Portfolio turnover rate G 2% 4% 3% 2% 2%
A For the year ended February 29.B Calculated based on average shares outstanding during the period.C Amount represents less than $.005 per share.D Total returns would have been lower if certain expenses had not been reduced during the applicable periods shown.E Fees and expenses of any underlying Fidelity Central Funds are not included in the Fund’s expense ratio. The Fund indirectly bears its proportionate share of the expenses of any underlying Fidelity Central Funds.F Expense ratios reflect operating expenses of the class. Expenses before reductions do not reflect amounts reimbursed by the investment adviser or reductions from expense offset arrangements and do not represent the amount paid
by the class during periods when reimbursements or reductions occur. Expenses net of fee waivers reflect expenses after reimbursement by the investment adviser but prior to reductions from expense offset arrangements. Expenses net of all reductions represent the net expenses paid by the class.
G Amount does not include the portfolio activity of any underlying Fidelity Central Funds.

45 Annual Report
See accompanying notes which are an integral part of the financial statements.
Fidelity Total Market Index Fund Institutional Class
Years ended February 28, 2018 2017 2016 A 2015 2014Selected Per–Share Data Net asset value, beginning of period $ 68.19 $ 55.31 $ 61.58 $ 54.91 $ 44.05Income from Investment Operations
Net investment income (loss) B 1.34 1.26 1.17 1.13 .94Net realized and unrealized gain (loss) 9.66 13.18 (5.98) 6.52 10.75
Total from investment operations 11.00 14.44 (4.81) 7.65 11.69Distributions from net investment income (1.25) (1.16) (1.15) (.98) (.83)Distributions from net realized gain (.51) (.39) (.31) – –
Total distributions (1.76) (1.56)C (1.46) (.98) (.83)Redemption fees added to paid in capital B – –D –D –D –D
Net asset value, end of period $ 77.43 $ 68.19 $ 55.31 $ 61.58 $ 54.91
Total Return E 16.24% 26.30% (7.92)% 14.01% 26.69%Ratios to Average Net Assets F,G
Expenses before reductions .03% .05% .07% .07% .07%Expenses net of fee waivers, if any .03% .04% .04% .04% .05%Expenses net of all reductions .03% .04% .04% .04% .05%Net investment income (loss) 1.85% 2.01% 1.96% 1.97% 1.90%
Supplemental Data Net assets, end of period (000 omitted) $ 3,341,899 $ 2,345,441 $ 1,199,719 $ 1,307,281 $ 1,254,047Portfolio turnover rate H 2% 4% 3% 2% 2%
A For the year ended February 29.B Calculated based on average shares outstanding during the period.C Total distributions of $1.56 per share is comprised of distributions from net investment income of $1.162 and distributions from net realized gain of $.393 per share.D Amount represents less than $.005 per share.E Total returns would have been lower if certain expenses had not been reduced during the applicable periods shown.F Fees and expenses of any underlying Fidelity Central Funds are not included in the Fund’s expense ratio. The Fund indirectly bears its proportionate share of the expenses of any underlying Fidelity Central Funds.G Expense ratios reflect operating expenses of the class. Expenses before reductions do not reflect amounts reimbursed by the investment adviser or reductions from expense offset arrangements and do not represent the amount paid
by the class during periods when reimbursements or reductions occur. Expenses net of fee waivers reflect expenses after reimbursement by the investment adviser but prior to reductions from expense offset arrangements. Expenses net of all reductions represent the net expenses paid by the class.
H Amount does not include the portfolio activity of any underlying Fidelity Central Funds.

46Annual Report
See accompanying notes which are an integral part of the financial statements.
Financial Highlights – continued
Fidelity Total Market Index Fund Institutional Premium Class
Years ended February 28, 2018 2017 2016 A 2015 2014Selected Per–Share Data Net asset value, beginning of period $ 68.19 $ 55.31 $ 61.58 $ 54.90 $ 44.05Income from Investment Operations
Net investment income (loss) B 1.36 1.28 1.17 1.14 .95Net realized and unrealized gain (loss) 9.65 13.17 (5.98) 6.52 10.73
Total from investment operations 11.01 14.45 (4.81) 7.66 11.68Distributions from net investment income (1.27) (1.17) (1.15) (.98) (.83)Distributions from net realized gain (.51) (.39) (.31) – –
Total distributions (1.78) (1.57)C (1.46) (.98) (.83)Redemption fees added to paid in capital B – –D –D –D –D
Net asset value, end of period $ 77.42 $ 68.19 $ 55.31 $ 61.58 $ 54.90
Total Return E 16.25% 26.32% (7.91)% 14.04% 26.67%Ratios to Average Net Assets F,G
Expenses before reductions .02% .02% .05% .05% .06%Expenses net of fee waivers, if any .02% .02% .04% .04% .05%Expenses net of all reductions .02% .02% .04% .04% .05%Net investment income (loss) 1.86% 2.02% 1.97% 1.97% 1.90%
Supplemental Data Net assets, end of period (000 omitted) $ 6,114,864 $ 4,684,669 $ 800,304 $ 1,022,585 $ 740,877Portfolio turnover rate H 2% 4% 3% 2% 2%
A For the year ended February 29.B Calculated based on average shares outstanding during the period.C Total distributions of $1.57 per share is comprised of distributions from net investment income of $1.173 and distributions from net realized gain of $.393 per share.D Amount represents less than $.005 per share.E Total returns would have been lower if certain expenses had not been reduced during the applicable periods shown.F Fees and expenses of any underlying Fidelity Central Funds are not included in the Fund’s expense ratio. The Fund indirectly bears its proportionate share of the expenses of any underlying Fidelity Central Funds.G Expense ratios reflect operating expenses of the class. Expenses before reductions do not reflect amounts reimbursed by the investment adviser or reductions from expense offset arrangements and do not represent the amount paid
by the class during periods when reimbursements or reductions occur. Expenses net of fee waivers reflect expenses after reimbursement by the investment adviser but prior to reductions from expense offset arrangements. Expenses net of all reductions represent the net expenses paid by the class.
H Amount does not include the portfolio activity of any underlying Fidelity Central Funds.

47 Annual Report
See accompanying notes which are an integral part of the financial statements.
Fidelity Total Market Index Fund Class F
Years ended February 28, 2018 2017 2016 A 2015 2014Selected Per–Share Data Net asset value, beginning of period $ 68.21 $ 55.32 $ 61.59 $ 54.92 $ 44.06Income from Investment Operations
Net investment income (loss) B 1.36 1.26 1.17 1.14 .95Net realized and unrealized gain (loss) 9.66 13.20 (5.98) 6.51 10.74
Total from investment operations 11.02 14.46 (4.81) 7.65 11.69Distributions from net investment income (1.27) (1.17) (1.15) (.98) (.83)Distributions from net realized gain (.51) (.39) (.31) – –
Total distributions (1.78) (1.57)C (1.46) (.98) (.83)Redemption fees added to paid in capital B – –D –D –D –D
Net asset value, end of period $ 77.45 $ 68.21 $ 55.32 $ 61.59 $ 54.92
Total Return E 16.26% 26.33% (7.91)% 14.01% 26.69%Ratios to Average Net Assets F,G
Expenses before reductions .02% .02% .04% .04% .05%Expenses net of fee waivers, if any .02% .02% .04% .04% .05%Expenses net of all reductions .02% .02% .04% .04% .05%Net investment income (loss) 1.86% 2.02% 1.97% 1.97% 1.90%
Supplemental Data Net assets, end of period (000 omitted) $ 12,479,597 $ 9,035,061 $ 6,659,560 $ 6,368,808 $ 5,088,489Portfolio turnover rate H 2% 4% 3% 2% 2%
A For the year ended February 29.B Calculated based on average shares outstanding during the period.C Total distributions of $1.57 per share is comprised of distributions from net investment income of $1.173 and distributions from net realized gain of $.393 per share.D Amount represents less than $.005 per share.E Total returns would have been lower if certain expenses had not been reduced during the applicable periods shown.F Fees and expenses of any underlying Fidelity Central Funds are not included in the Fund’s expense ratio. The Fund indirectly bears its proportionate share of the expenses of any underlying Fidelity Central Funds.G Expense ratios reflect operating expenses of the class. Expenses before reductions do not reflect amounts reimbursed by the investment adviser or reductions from expense offset arrangements and do not represent the amount paid
by the class during periods when reimbursements or reductions occur. Expenses net of fee waivers reflect expenses after reimbursement by the investment adviser but prior to reductions from expense offset arrangements. Expenses net of all reductions represent the net expenses paid by the class.
H Amount does not include the portfolio activity of any underlying Fidelity Central Funds.

48Annual Report
Fidelity® Extended Market Index Fund
Performance: The Bottom LineAverage annual total return reflects the change in the value of an investment, assuming reinvestment of distributions from dividend income and capital gains (the profits earned upon the sale of securities that have grown in value, if any) and assuming a constant rate of performance each year. The hypothetical investment and the average annual total returns do not reflect the deduction of taxes that a shareholder would pay on fund distributions or the redemption of fund shares. During periods of reimbursement by Fidelity, a fund’s total return will be greater than it would be had the reimbursement not occurred. How a fund did yesterday is no guarantee of how it will do tomorrow.
Average Annual Total Returns
For the periods ended February 28, 2018 Past 1 year
Past 5 years
Past 10 years
Institutional Premium Class 12.35% 12.71% 10.17%
The initial offering of Institutional Premium Class shares took place on September 8, 2011. Returns prior to September 8, 2011 are those of Premium Class.
$10,000 Over 10 Years
Let’s say hypothetically that $10,000 was invested in Fidelity® Extended Market Index Fund - Institutional Premium Class on February 29, 2008.
The chart shows how the value of your investment would have changed, and also shows how the Dow Jones U.S. Completion Total Stock Market IndexSM performed over the same period.
See above for additional information regarding the performance of Institutional Premium Class.
Period Ending Values
$26,347 Fidelity® Extended Market Index Fund - Institutional Premium Class
$25,985 Dow Jones U.S. Completion Total Stock Market IndexSM

49 Annual Report
Fidelity® Extended Market Index Fund
Management’s Discussion of Fund PerformanceMarket Recap: U.S. equities gained 17.10% for the 12 months ending February 28, 2018, as the S&P 500® index moved steadily higher throughout 2017 and into 2018 until sharply reversing course in February. The drop was in stark contrast to the low volatility seen throughout 2017, along with consumer sentiment and other market indicators that stayed positive. Investors remained decidedly upbeat as the calendar turned, and the index rose 5.73% in January. February was a decidedly different story, though, as volatility spiked amid fear that rising inflation and the potential for the economy to overheat would prompt the U.S. Federal Reserve to pick up the pace of interest rate hikes. The index returned -3.69% for the month, its first negative result since October 2016. For the full 12 months, growth stocks handily topped value, while large-caps bested small-caps. By sector, information technology fared best by far, gaining 36% amid strong earnings growth from several major index constituents. Consumer discretionary (+22%) also stood out, driven by retailers. Financials added 20%, riding the uptick in bond yields. Materials and industrials rose about 16% each, boosted by higher demand, especially from China. Conversely, notable laggards included the defensive telecommunication services (-5%) and utilities (-2%) sectors, while rising rates held back real estate (-3%).
Comments from Patrick Waddell, Senior Portfolio Manager of the Geode Capital Management, LLC, investment management team: For the fiscal year, the fund’s share classes performed closely in line with the 12.23% gain of the benchmark Dow Jones U.S. Completion Total Stock Market IndexSM. In a strong market environment, most sectors gained ground, led by information technology. Here, the top individual contributor was ServiceNow, a cloud-computing company that generated strong financial results for much of the period. Twitter also fared well, as the social-media company reported better-than-expected earnings in February along with its first-ever net profit. Other information technology contributors included computer networking company Arista Networks, business software firm Workday and video-game maker Take-Two Interactive Software. Elsewhere, a position in biopharmaceutical manufacturer Nektar Therapeutics added value, as investors saw good potential with several of the company’s drugs in development. In contrast, the biggest individual detractor was pharmaceutical company Tesaro, which faced questions about the financial prospects for the company’s ovarian cancer drug. Drug store chain Rite Aid struggled, as the company’s anticipated merger with Walgreens Boots Alliance fell apart and Rite Aid reported weak financial results. Real estate investment trust Colony NorthStar also notably detracted.
The views expressed above reflect those of the portfolio manager(s) only through the end of the period as stated on the cover of this report and do not necessarily represent the views of Fidelity or any other person in the Fidelity organization. Any such views are subject to change at any time based upon market or other conditions and Fidelity disclaims any responsibility to update such views. These views may not be relied on as investment advice and, because investment decisions for a Fidelity fund are based on numerous factors, may not be relied on as an indication of trading intent on behalf of any Fidelity fund.
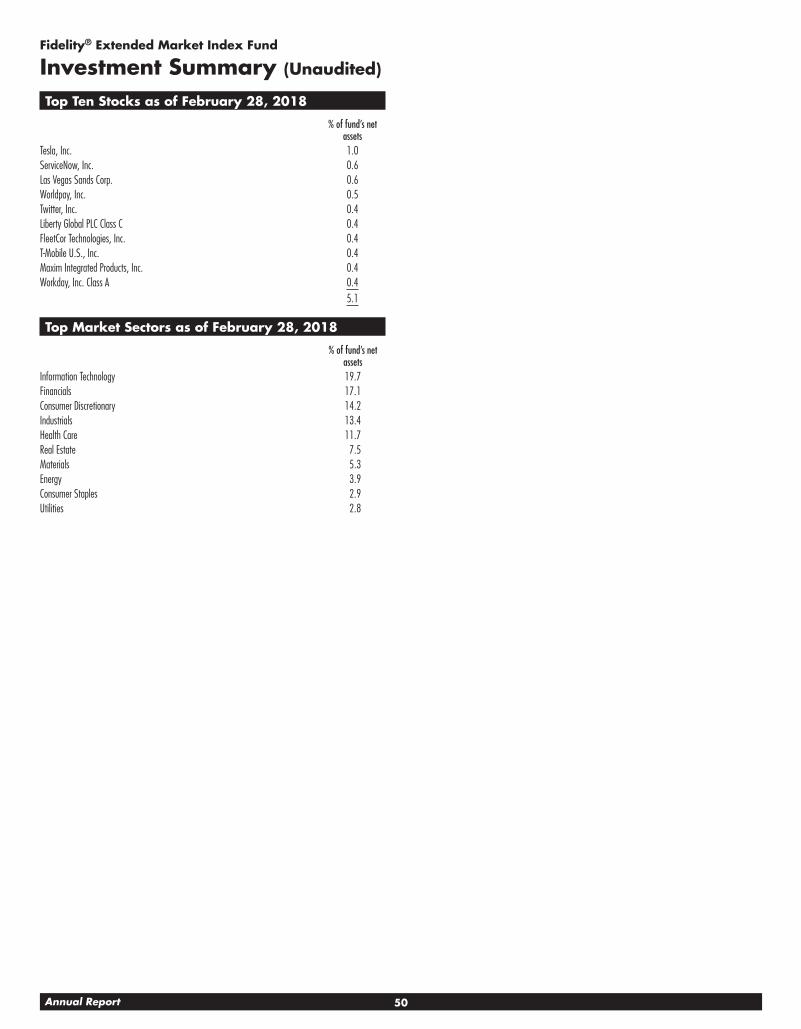
50Annual Report
Fidelity® Extended Market Index Fund
Investment Summary (Unaudited)
Top Ten Stocks as of February 28, 2018
% of fund’s net assets
Tesla, Inc. 1.0ServiceNow, Inc. 0.6Las Vegas Sands Corp. 0.6Worldpay, Inc. 0.5Twitter, Inc. 0.4Liberty Global PLC Class C 0.4FleetCor Technologies, Inc. 0.4T-Mobile U.S., Inc. 0.4Maxim Integrated Products, Inc. 0.4Workday, Inc. Class A 0.4
5.1
Top Market Sectors as of February 28, 2018
% of fund’s net assets
Information Technology 19.7Financials 17.1Consumer Discretionary 14.2Industrials 13.4Health Care 11.7Real Estate 7.5Materials 5.3Energy 3.9Consumer Staples 2.9Utilities 2.8

51 Annual Report
See accompanying notes which are an integral part of the financial statements.
Common Stocks – 99.5%Shares Value
CONSUMER DISCRETIONARY – 14.2%Auto Components – 1.4%Adient PLC (a) 406,986 $ 25,257,551American Axle & Manufacturing Holdings, Inc. (a) (b) 417,770 6,166,285Autoliv, Inc. 377,379 54,131,244Clean Diesel Technologies, Inc. (a) (b) 23,558 27,092Cooper Tire & Rubber Co. 225,046 7,055,192Cooper-Standard Holding, Inc. (b) 69,845 8,509,915Dana Holding Corp. 616,715 16,386,118Delphi Technologies PLC 390,000 18,622,500Dorman Products, Inc. (a) (b) 133,826 9,233,994Fox Factory Holding Corp. (b) 172,805 6,488,828Gentex Corp. 1,245,441 28,283,965Gentherm, Inc. (b) 162,500 5,005,000Hertz Global Holdings, Inc. (a) (b) 366,664 6,669,618Horizon Global Corp. (a) (b) 106,337 876,217LCI Industries (a) 109,508 11,969,224Lear Corp. 292,973 54,659,973Modine Manufacturing Co. (b) 218,308 5,021,084Motorcar Parts of America, Inc. (a) (b) 89,786 1,829,839Shiloh Industries, Inc. (b) 60,236 439,120Standard Motor Products, Inc. 91,465 4,267,757Stoneridge, Inc. (b) 118,638 2,581,563Strattec Security Corp. 16,381 564,325Superior Industries International, Inc. 103,889 1,501,196Sypris Solutions, Inc. (a) (b) 33,998 46,917Tenneco, Inc. 222,528 11,693,846Tower International, Inc. 98,181 2,562,524Unique Fabricating, Inc. (a) 9,604 73,951UQM Technologies, Inc. (a) (b) 137,888 172,360Visteon Corp. (b) 136,876 16,950,724VOXX International Corp. (a) (b) 83,482 450,803Workhorse Group, Inc. (a) (b) 97,973 314,493
307,813,218Automobiles – 1.1%REV Group, Inc. 121,004 3,267,108Tesla, Inc. (a) (b) 579,194 198,698,230Thor Industries, Inc. 214,174 27,628,446Winnebago Industries, Inc. (a) 126,381 5,503,893
235,097,677Distributors – 0.1%Core-Mark Holding Co., Inc. 203,246 4,160,446Educational Development Corp. (a) (b) 16,502 319,314Pool Corp. 174,729 24,117,844Weyco Group, Inc. 21,447 652,632
29,250,236Diversified Consumer Services – 0.8%Adtalem Global Education, Inc. (a) (b) 268,167 12,349,090American Public Education, Inc. (b) 68,815 2,116,061Ascent Capital Group, Inc. (b) 47,464 322,755Bridgepoint Education, Inc. (b) 128,232 855,307Bright Horizons Family Solutions, Inc. (b) 230,858 22,063,099Cambium Learning Group, Inc. (b) 48,546 359,726Capella Education Co. 52,862 4,107,377Career Education Corp. (a) (b) 286,747 3,793,663Carriage Services, Inc. 65,607 1,785,823
Fidelity® Extended Market Index Fund
Schedule of Investments February 28, 2018Showing Percentage of Net Assets
Shares Value
Chegg, Inc. (a) (b) 364,425 $ 7,255,702Collectors Universe, Inc. 21,093 328,418Graham Holdings Co. 20,435 11,854,344Grand Canyon Education, Inc. (b) 211,525 20,761,179Houghton Mifflin Harcourt Co. (b) 463,566 3,152,249K12, Inc. (b) 163,022 2,433,918Laureate Education, Inc. Class A 166,957 2,232,215Liberty Tax, Inc. 35,449 278,275Lincoln Educational Services Corp. (b) 84,172 162,452National American University Holdings, Inc. 23,237 26,490Regis Corp. (b) 160,027 2,574,834Service Corp. International 816,847 30,574,583ServiceMaster Global Holdings, Inc. (b) 590,210 30,313,186Sotheby’s Class A (Ltd. vtg.) (a) (b) 163,511 7,550,938Strayer Education, Inc. (a) 46,164 4,138,141Universal Technical Institute, Inc. (b) 87,539 236,355Weight Watchers International, Inc. (a) (b) 122,175 8,261,474Xpresspa Group, Inc. (a) (b) 94,034 88,035
179,975,689Hotels, Restaurants & Leisure – 3.2%ARAMARK Holdings Corp. 1,054,837 43,997,251Ark Restaurants Corp. 8,457 212,017Belmond Ltd. Class A (b) 384,579 4,441,887BFC Financial Corp. Class A 347,741 2,997,527Biglari Holdings, Inc. (b) 4,573 1,917,047BJ’s Restaurants, Inc. 81,295 3,536,333Bloomin’ Brands, Inc. 400,875 9,256,204Bojangles’, Inc. (a) (b) 82,760 1,084,156Boyd Gaming Corp. (a) 358,495 12,683,553Bravo Brio Restaurant Group, Inc. (b) 63,389 212,353Brinker International, Inc. 200,590 6,906,314Caesars Entertainment Corp. (b) 609,335 7,738,555Carrols Restaurant Group, Inc. (b) 153,011 1,966,191Century Casinos, Inc. (b) 119,428 951,841Chanticleer Holdings, Inc. (a) (b) 9,214 34,737Choice Hotels International, Inc. 159,255 12,605,033Churchill Downs, Inc. 49,709 12,834,864Chuy’s Holdings, Inc. (a) (b) 82,228 2,220,156Cracker Barrel Old Country Store, Inc. (a) 103,152 16,102,027Dave & Buster’s Entertainment, Inc. (a) (b) 177,643 7,953,077Del Frisco’s Restaurant Group, Inc. (b) 105,058 1,749,216Del Taco Restaurants, Inc. (b) 157,923 1,989,830Denny’s Corp. (b) 305,760 4,598,630DineEquity, Inc. (a) 83,053 6,310,367Diversified Restaurant Holdings, Inc. (b) 54,865 82,846Domino’s Pizza, Inc. 190,327 42,330,628Dover Downs Gaming & Entertainment, Inc. (b) 28,631 37,220Dover Motorsports, Inc. 22,686 47,641Drive Shack, Inc. (a) 278,628 1,407,071Dunkin’ Brands Group, Inc. (a) 394,262 23,612,351El Pollo Loco Holdings, Inc. (a) (b) 97,361 949,270Eldorado Resorts, Inc. (a) (b) 266,119 9,074,658Empire Resorts, Inc. (a) (b) 9,364 217,245Extended Stay America, Inc. unit 842,220 16,869,667Famous Dave’s of America, Inc. (a) (b) 21,114 142,520Famous Dave’s of America, Inc. rights 2/16/18 (b) 4,518 14,684

52Annual Report
See accompanying notes which are an integral part of the financial statements.
Schedule of Investments – continued
Common Stocks – continuedShares Value
CONSUMER DISCRETIONARY – continuedHotels, Restaurants & Leisure – continuedFiesta Restaurant Group, Inc. (a) (b) 118,712 $ 2,018,104Flanigans Enterprises, Inc. 1,120 25,648Fogo de Chao, Inc. (b) 44,064 687,398Full House Resorts, Inc. (b) 24,413 75,680Gaming Partners International Corp. 1,584 15,761Golden Entertainment, Inc. (b) 66,026 1,841,465Good Times Restaurants, Inc. (b) 41,006 106,616Habit Restaurants, Inc. Class A (a) (b) 85,475 739,359Hilton Grand Vacations, Inc. (b) 281,435 12,146,735Hyatt Hotels Corp. Class A 214,211 16,552,084ILG, Inc. 459,436 13,948,477Inspired Entertainment, Inc. (b) 66,874 361,120International Speedway Corp. Class A 111,755 5,028,975J. Alexanders Holdings, Inc. (b) 59,031 584,407Jack in the Box, Inc. 125,889 11,340,081Jamba, Inc. (a) (b) 61,744 532,233Kona Grill, Inc. (a) (b) 43,155 77,679La Quinta Holdings, Inc. (b) 357,487 6,749,355Las Vegas Sands Corp. 1,587,524 115,587,622Lindblad Expeditions Holdings (b) 93,954 865,316Luby’s, Inc. (b) 54,955 153,874Marcus Corp. 82,737 2,233,899Marriott Vacations Worldwide Corp. 103,126 14,489,203Monarch Casino & Resort, Inc. (b) 52,952 2,236,163Nathan’s Famous, Inc. 14,327 931,971Noodles & Co. (a) (b) 86,399 535,674Papa John’s International, Inc. (a) 111,690 6,448,981Papa Murphy’s Holdings, Inc. (a) (b) 43,281 205,585Peak Resorts, Inc. 18,903 96,405Penn National Gaming, Inc. (a) (b) 363,673 9,677,339Pinnacle Entertainment, Inc. (b) 234,934 7,087,959Planet Fitness, Inc. (a) (b) 379,585 14,037,053Playa Hotels & Resorts NV 248,744 2,507,340Potbelly Corp. (a) (b) 111,393 1,431,400Rave Restaurant Group, Inc. (a) (b) 27,514 41,821RCI Hospitality Holdings, Inc. 40,834 1,102,926Red Lion Hotels Corp. (b) 96,281 933,926Red Robin Gourmet Burgers, Inc. (a) (b) 59,222 3,177,260Red Rock Resorts, Inc. 301,209 10,090,502Ruth’s Hospitality Group, Inc. 146,679 3,600,969Scientific Games Corp. Class A (a) (b) 233,346 10,372,230SeaWorld Entertainment, Inc. (a) (b) 290,191 4,245,494Shake Shack, Inc. Class A (a) (b) 79,162 3,086,526Six Flags Entertainment Corp. (a) 339,645 21,767,848Sonic Corp. (a) 170,770 4,289,742Speedway Motorsports, Inc. 53,351 1,047,280Texas Roadhouse, Inc. Class A 285,480 15,775,625The Cheesecake Factory, Inc. (a) 183,437 8,527,986The ONE Group Hospitality, Inc. (b) 65 167Town Sports International Holdings, Inc. (b) 85,244 494,415U.S. Foods Holding Corp. (b) 614,029 20,502,428Vail Resorts, Inc. 174,965 36,020,045Wendy’s Co. 779,789 12,437,635
Shares Value
Wingstop, Inc. (a) 128,314 $ 5,813,907Zoe’s Kitchen, Inc. (a) (b) 85,967 1,279,189
675,049,849Household Durables – 1.1%AV Homes, Inc. (a) (b) 49,463 830,978Bassett Furniture Industries, Inc. (a) 45,391 1,461,590Beazer Homes U.S.A., Inc. (b) 147,094 2,312,318Cavco Industries, Inc. (b) 38,060 6,055,346Century Communities, Inc. (b) 96,185 2,861,504Comstock Holding Companies, Inc. (a) (b) 5,354 8,995CSS Industries, Inc. 33,658 619,644Dixie Group, Inc. (b) 53,047 164,446Emerson Radio Corp. (b) 24,397 35,864Ethan Allen Interiors, Inc. (a) 110,848 2,632,640Flexsteel Industries, Inc. 28,089 1,091,539GoPro, Inc. Class A (a) (b) 465,357 2,503,621Green Brick Partners, Inc. (b) 103,995 1,050,350Hamilton Beach Brands Holding Co. Class A 31,902 790,213Helen of Troy Ltd. (b) 120,394 10,841,480Hooker Furniture Corp. 52,315 1,953,965Hovnanian Enterprises, Inc. Class A (a) (b) 581,482 1,267,631Installed Building Products, Inc. (b) 92,267 5,512,953iRobot Corp. (a) (b) 121,600 8,262,720KB Home 365,917 10,154,197Koss Corp. (b) 1,389 2,750La-Z-Boy, Inc. 214,088 6,572,502LGI Homes, Inc. (a) (b) 76,645 4,337,341Libbey, Inc. 91,140 571,448Lifetime Brands, Inc. 49,962 696,970Live Ventures, Inc. (a) (b) 13,691 180,584M.D.C. Holdings, Inc. 188,668 5,222,330M/I Homes, Inc. 121,588 3,532,131Meritage Homes Corp. (b) 167,482 7,101,237New Home Co. LLC (b) 57,074 641,512Nova LifeStyle, Inc. (a) (b) 96,346 219,669NVR, Inc. (b) 15,197 43,207,654PICO Holdings, Inc. 106,751 1,307,700Roku, Inc. Class A (a) 80,616 3,286,714Skyline Corp. (b) 30,617 654,898Stanley Furniture Co., Inc. (b) 37,789 24,185Taylor Morrison Home Corp. (b) 485,787 10,901,060Tempur Sealy International, Inc. (a) (b) 203,491 10,058,560Toll Brothers, Inc. 635,192 27,840,465TopBuild Corp. (a) (b) 158,223 11,018,650TRI Pointe Homes, Inc. (a) (b) 664,807 10,191,491Tupperware Brands Corp. 222,339 10,905,728Turtle Beach Corp. (a) (b) 43,489 19,587Universal Electronics, Inc. (b) 65,853 3,259,724Vuzix Corp. (a) (b) 89,185 751,384William Lyon Homes, Inc. (b) 122,476 3,096,193Zagg, Inc. (b) 120,643 1,815,677
227,830,138Internet & Direct Marketing Retail – 0.7%1-800-FLOWERS.com, Inc. Class A (b) 131,286 1,529,482Blue Apron Holdings, Inc. Class A (a) 112,197 313,030CafePress, Inc. (b) 18,875 28,690

53 Annual Report
See accompanying notes which are an integral part of the financial statements.
Common Stocks – continuedShares Value
CONSUMER DISCRETIONARY – continuedInternet & Direct Marketing Retail – continuedDuluth Holdings, Inc. (a) (b) 51,478 $ 865,860EVINE Live, Inc. (b) 206,333 233,156FTD Companies, Inc. (b) 73,961 445,245Gaia, Inc. Class A (a) (b) 64,695 831,331Groupon, Inc. (a) (b) 1,741,845 7,455,097JRJR Networks (b) 44,389 5,327Lands’ End, Inc. (a) (b) 81,251 1,462,518Liberty Expedia Holdings, Inc. (b) 237,560 9,326,606Liberty Interactive Corp. QVC Group:
(Venture Group) Series A (b) 357,061 19,109,905Series A (b) 2,077,370 59,973,672
Liberty TripAdvisor Holdings, Inc. (b) 317,071 3,297,538NutriSystem, Inc. (a) 134,203 4,126,742Overstock.com, Inc. (a) (b) 70,098 4,233,919PetMed Express, Inc. (a) 87,890 3,971,749Shutterfly, Inc. (b) 143,690 11,025,334U.S. Auto Parts Network, Inc. (b) 62,757 129,907Wayfair LLC Class A (a) (b) 183,204 14,183,654
142,548,762Leisure Products – 0.4%American Outdoor Brands Corp. (a) (b) 238,806 2,149,254Brunswick Corp. 384,600 21,999,120Callaway Golf Co. 417,114 6,456,925Clarus Corp. (b) 93,828 628,648Escalade, Inc. 33,614 408,410JAKKS Pacific, Inc. (a) (b) 79,564 175,041Johnson Outdoors, Inc. Class A 25,505 1,572,128Malibu Boats, Inc. Class A (b) 91,166 2,921,870Marine Products Corp. 25,214 360,056MCBC Holdings, Inc. (b) 72,487 1,776,656Nautilus, Inc. (a) (b) 142,013 1,682,854Polaris Industries, Inc. 252,797 28,816,330Sturm, Ruger & Co., Inc. (a) 80,609 3,470,217Summer Infant, Inc. (b) 37,416 40,035Vista Outdoor, Inc. (a) (b) 251,298 4,329,865
76,787,409Media – 2.7%A.H. Belo Corp. Class A 70,842 364,836Alliance MMA, Inc. (a) (b) 31,107 18,135AMC Entertainment Holdings, Inc. Class A (a) 233,263 3,498,945AMC Networks, Inc. Class A (a) (b) 217,004 11,407,900Ballantyne of Omaha, Inc. (b) 47,765 241,213Beasley Broadcast Group, Inc. Class A 8,569 89,975Cable One, Inc. (a) 19,851 13,517,737Central European Media Enterprises Ltd. Class A (a) (b) 338,460 1,506,147Cinedigm Corp. (a) (b) 23,731 29,664Cinemark Holdings, Inc. 457,328 19,463,880Clear Channel Outdoor Holding, Inc. Class A 153,163 735,182Daily Journal Corp. (a) (b) 4,313 979,094E.W. Scripps Co. Class A 235,451 3,242,160Emmis Communications Corp. Class A (b) 24,761 103,253Entercom Communications Corp. Class A 581,977 5,761,572Entravision Communication Corp. Class A 281,006 1,812,489Gannett Co., Inc. (a) 490,323 4,922,843
Shares Value
Global Eagle Entertainment, Inc. (a) (b) 223,324 $ 301,487Gray Television, Inc. (b) 335,576 4,630,949Harte-Hanks, Inc. (b) 20,540 178,903Hemisphere Media Group, Inc. (a) (b) 63,069 706,373Insignia Systems, Inc. (b) 22,896 28,391John Wiley & Sons, Inc. Class A 200,001 12,850,064Lee Enterprises, Inc. (a) (b) 197,525 483,936Liberty Broadband Corp.:
Class A (a) (b) 145,932 12,751,538Class C (b) 630,925 55,445,689
Liberty Global PLC:Class A (b) 950,148 29,587,609Class C (b) 2,612,222 78,445,027LiLAC Class A (b) (c) 207,797 2LiLAC Class C (b) (c) 525,800 5
Liberty Latin America Ltd. (a) (b) 485,337 9,925,142Liberty Latin America Ltd. Class A (a) (b) 195,971 4,056,607Liberty Media Corp.:
Liberty Braves Class A (b) 47,693 1,093,124Liberty Braves Class C (b) 135,237 3,105,042Liberty Formula One Group Series C (a) (b) 881,278 29,020,485Liberty Media Class A (a) (b) 107,303 3,387,556Liberty SiriusXM Series A (b) 444,601 18,651,012Liberty SiriusXM Series C (b) 653,816 27,303,356
Lions Gate Entertainment Corp.:Class A (a) 231,377 6,534,086Class B (a) 534,582 14,348,181
Live Nation Entertainment, Inc. (a) (b) 585,477 26,229,370Loral Space & Communications Ltd. (b) 55,105 2,441,152Meredith Corp. 169,145 9,692,009MSG Network, Inc. Class A (a) (b) 271,644 6,628,114National CineMedia, Inc. 276,368 2,081,051New Media Investment Group, Inc. 232,428 4,009,383Nexstar Broadcasting Group, Inc. Class A (a) 194,550 13,900,598NTN Communications, Inc. (a) (b) 21,179 136,107Reading International, Inc. Class A (b) 68,862 1,129,337Regal Entertainment Group Class A 496,782 11,421,018RLJ Entertainment, Inc. (b) 85,916 371,157Saga Communications, Inc. Class A 17,390 678,210Salem Communications Corp. Class A 38,916 161,501Scholastic Corp. 123,800 4,507,558Sinclair Broadcast Group, Inc. Class A (a) 327,919 11,083,662Sirius XM Holdings, Inc. (a) 6,421,605 40,327,679Social Reality, Inc. (a) (b) 35,322 151,178SPAR Group, Inc. (a) (b) 145,742 180,720Tegna, Inc. 913,578 11,748,613The Madison Square Garden Co. (b) 71,493 17,458,591The McClatchy Co. Class A (a) (b) 20,839 192,344The New York Times Co. Class A (a) 552,872 13,324,215Townsquare Media, Inc. (b) 40,471 281,678Tribune Media Co. Class A 294,928 12,289,650tronc, Inc. (b) 102,477 1,960,385Urban One, Inc. Class D (non-vtg.) (b) 114,506 194,660World Wrestling Entertainment, Inc. Class A 172,093 6,565,348
579,674,877

54Annual Report
See accompanying notes which are an integral part of the financial statements.
Schedule of Investments – continued
Common Stocks – continuedShares Value
CONSUMER DISCRETIONARY – continuedMultiline Retail – 0.2%Big Lots, Inc. (a) 182,362 $ 10,248,744Dillard’s, Inc. Class A (a) 91,580 7,468,349Fred’s, Inc. Class A (a) 148,273 493,749JC Penney Corp., Inc. (a) (b) 1,335,725 5,783,689Ollie’s Bargain Outlet Holdings, Inc. (a) (b) 220,206 13,069,226Sears Holdings Corp. (a) (b) 140,214 339,318Tuesday Morning Corp. (a) (b) 195,077 614,493
38,017,568Specialty Retail – 1.7%Aaron’s, Inc. Class A 271,667 12,553,732Abercrombie & Fitch Co. Class A (a) 295,790 6,102,148America’s Car Mart, Inc. (a) (b) 32,877 1,601,110American Eagle Outfitters, Inc. 731,020 14,086,755Appliance Recycling Centers of America, Inc. (b) 2,967 2,647Armstrong Flooring, Inc. (b) 109,555 1,534,866Asbury Automotive Group, Inc. (b) 81,261 5,351,037Ascena Retail Group, Inc. (a) (b) 736,486 1,671,823AutoNation, Inc. (a) (b) 257,806 12,944,439Barnes & Noble Education, Inc. (b) 156,009 1,138,866Barnes & Noble, Inc. 244,408 1,099,836Bed Bath & Beyond, Inc. 621,375 13,322,280Big 5 Sporting Goods Corp. (a) 77,948 479,380Boot Barn Holdings, Inc. (a) (b) 82,162 1,447,694Build-A-Bear Workshop, Inc. (b) 62,129 565,374Burlington Stores, Inc. (b) 297,692 36,508,947Caleres, Inc. 190,445 5,334,364Camping World Holdings, Inc. 132,643 5,544,477Cars.com, Inc. (a) 310,000 8,490,900Chico’s FAS, Inc. 580,288 5,826,092Christopher & Banks Corp. (a) (b) 142,357 162,287Citi Trends, Inc. 69,557 1,541,383Conn’s, Inc. (a) (b) 117,866 3,854,218Destination Maternity Corp. (a) (b) 47,814 101,366Destination XL Group, Inc. (a) (b) 165,015 404,287DGSE Companies, Inc. (b) 6,929 6,444Dick’s Sporting Goods, Inc. 364,585 11,674,012DSW, Inc. Class A (a) 313,027 6,138,459Express, Inc. (a) (b) 356,884 2,576,702Finish Line, Inc. Class A 173,876 1,846,563Five Below, Inc. (a) (b) 241,023 16,112,388Floor & Decor Holdings, Inc. Class A 141,914 6,396,064Francesca’s Holdings Corp. (a) (b) 164,101 854,966GameStop Corp. Class A (a) 436,723 6,852,184Genesco, Inc. (a) (b) 88,725 3,486,893GNC Holdings, Inc. Class A (a) (b) 311,587 1,327,361Group 1 Automotive, Inc. 86,339 5,943,577Guess?, Inc. (a) 272,830 4,307,986Haverty Furniture Companies, Inc. 84,810 1,725,884Hibbett Sports, Inc. (a) (b) 86,934 2,238,551Kirkland’s, Inc. (a) (b) 64,776 567,438Lithia Motors, Inc. Class A (sub. vtg.) 106,249 11,038,209Lumber Liquidators Holdings, Inc. (a) (b) 125,749 2,912,347MarineMax, Inc. (a) (b) 99,981 2,089,603Michaels Companies, Inc. (b) 481,990 11,090,590
Shares Value
Monro, Inc. 145,692 $ 7,415,723Murphy U.S.A., Inc. (a) (b) 141,450 10,624,310New York & Co., Inc. (a) (b) 123,907 330,832Office Depot, Inc. 2,224,588 5,850,666Party City Holdco, Inc. (a) (b) 133,755 1,932,760Penske Automotive Group, Inc. (a) 150,049 6,872,244Pier 1 Imports, Inc. (a) 336,151 1,042,068Rent-A-Center, Inc. (a) 229,748 1,727,705RH (a) (b) 83,279 7,068,722Sally Beauty Holdings, Inc. (a) (b) 570,798 9,612,238Sears Hometown & Outlet Stores, Inc. (a) (b) 48,309 101,449Shoe Carnival, Inc. (a) 49,855 1,164,613Sleep Number Corp. (a) (b) 173,444 5,973,411Sonic Automotive, Inc. Class A (sub. vtg.) 108,440 2,125,424Sportsman’s Warehouse Holdings, Inc. (a) (b) 149,566 725,395Stage Stores, Inc. (a) 128,267 243,707Stein Mart, Inc. (a) 120,516 74,720Tailored Brands, Inc. (a) 222,120 5,199,829Tandy Leather Factory, Inc. (b) 3,074 22,440The Buckle, Inc. (a) 134,493 2,831,078The Cato Corp. Class A (sub. vtg.) (a) 111,693 1,268,832The Children’s Place Retail Stores, Inc. (a) 75,392 10,728,282The Container Store Group, Inc. (a) (b) 75,281 380,169Tile Shop Holdings, Inc. 146,904 793,282Tilly’s, Inc. 54,153 706,697Trans World Entertainment Corp. (b) 29,120 48,048Urban Outfitters, Inc. (a) (b) 348,443 12,296,553Vitamin Shoppe, Inc. (a) (b) 110,328 413,730Williams-Sonoma, Inc. (a) 338,101 17,500,108Winmark Corp. 8,782 1,112,679Zumiez, Inc. (b) 83,973 1,654,268
358,698,511Textiles, Apparel & Luxury Goods – 0.8%Cadence Bancorp 120,621 3,307,428Carter’s, Inc. 205,824 24,015,544Charles & Colvard Ltd. (b) 45,090 60,872Cherokee, Inc. (a) (b) 51,314 82,102Columbia Sportswear Co. 130,612 9,871,655Crocs, Inc. (a) (b) 323,197 3,955,931Crown Crafts, Inc. 2,227 14,476Culp, Inc. 41,594 1,156,313Deckers Outdoor Corp. (a) (b) 140,381 13,277,235Delta Apparel, Inc. (b) 25,490 460,095Differential Brands Group, Inc. (b) 22,419 24,437Emerald Expositions Events, Inc. (a) 82,412 1,757,024Forward Industries, Inc. (NY Shares) (a) (b) 18,823 29,552Fossil Group, Inc. (a) (b) 194,100 2,597,058G-III Apparel Group Ltd. (a) (b) 185,691 6,853,855Iconix Brand Group, Inc. (a) (b) 274,433 381,462J.Jill, Inc. (a) 85,367 735,010Lakeland Industries, Inc. (b) 24,535 322,635lululemon athletica, Inc. (b) 419,090 33,988,199Movado Group, Inc. 67,327 2,087,137Naked Brand Group, Inc. (a) (b) 34,817 43,173Oxford Industries, Inc. 78,189 6,248,865Perry Ellis International, Inc. (b) 55,257 1,473,704

55 Annual Report
See accompanying notes which are an integral part of the financial statements.
Common Stocks – continuedShares Value
CONSUMER DISCRETIONARY – continuedTextiles, Apparel & Luxury Goods – continuedPetIQ, Inc. Class A (a) 29,585 $ 647,912Rocky Brands, Inc. 27,150 499,560Sequential Brands Group, Inc. (a) (b) 184,989 366,278Skechers U.S.A., Inc. Class A (sub. vtg.) (b) 591,448 24,202,052Steven Madden Ltd. 235,735 10,348,767Superior Uniform Group, Inc. 30,551 766,830Switch, Inc. Class A (a) 157,300 2,172,313TPG RE Finance Trust, Inc. 37,985 703,862Unifi, Inc. (b) 66,649 2,332,715Vera Bradley, Inc. (b) 96,199 967,762Vince Holding Corp. (a) (b) 10,506 90,667Wolverine World Wide, Inc. 422,919 12,383,068
168,225,548
TOTAL CONSUMER DISCRETIONARY 3,018,969,482
CONSUMER STAPLES – 2.9%Beverages – 0.1%Boston Beer Co., Inc. Class A (a) (b) 39,293 6,406,724Castle Brands, Inc. (a) (b) 356,392 413,415Celsius Holdings, Inc. (a) (b) 63,452 338,834Coca-Cola Bottling Co. Consolidated 20,918 3,903,508Craft Brew Alliance, Inc. (a) (b) 39,325 701,951Crystal Rock Holdings, Inc. (b) 4,384 4,231MGP Ingredients, Inc. (a) 57,126 4,794,014National Beverage Corp. (a) 51,760 5,069,374New Age Beverages Corp. (a) 91,718 295,332Primo Water Corp. (b) 117,562 1,431,905REED’S, Inc. (a) (b) 71,901 104,256
23,463,544Food & Staples Retailing – 0.5%Andersons, Inc. 121,250 4,249,813Casey’s General Stores, Inc. (a) 167,344 18,794,405Chefs’ Warehouse Holdings (a) (b) 91,247 2,057,620Ingles Markets, Inc. Class A 63,051 2,030,242Natural Grocers by Vitamin Cottage, Inc. (a) (b) 42,822 297,613Performance Food Group Co. (b) 362,361 11,106,365PriceSmart, Inc. (a) 104,263 8,210,711Rite Aid Corp. (a) (b) 4,669,312 9,198,545Smart & Final Stores, Inc. (a) (b) 132,210 951,912SpartanNash Co. 166,314 2,789,086Sprouts Farmers Market LLC (a) (b) 548,325 14,124,852SUPERVALU, Inc. (a) (b) 168,596 2,399,121United Natural Foods, Inc. (a) (b) 226,117 9,648,412Village Super Market, Inc. Class A 36,569 866,685Weis Markets, Inc. 76,401 2,847,465Welbilt, Inc. (a) (b) 619,869 12,279,605
101,852,452Food Products – 1.7%Alico, Inc. 12,666 336,916Arcadia Biosciences, Inc. (a) (b) 1,314 5,834B&G Foods, Inc. Class A (a) 293,722 8,136,099Blue Buffalo Pet Products, Inc. (a) (b) 411,859 16,499,072Bunge Ltd. 612,181 46,176,813
Shares Value
Cal-Maine Foods, Inc. (a) (b) 130,643 $ 5,565,392Calavo Growers, Inc. (a) 71,364 6,090,917Coffee Holding Co., Inc. (b) 18,940 82,578Darling International, Inc. (b) 719,937 13,095,654Dean Foods Co. 392,749 3,405,134Farmer Brothers Co. (a) (b) 44,548 1,389,898Flowers Foods, Inc. 806,962 16,736,392Fresh Del Monte Produce, Inc. 149,108 6,960,361Freshpet, Inc. (a) (b) 101,869 2,037,380Hostess Brands, Inc. Class A (a) (b) 359,610 4,401,626Ingredion, Inc. 310,017 40,500,621J&J Snack Foods Corp. 66,678 8,956,856John B. Sanfilippo & Son, Inc. (a) 39,021 2,253,073Lamb Weston Holdings, Inc. 633,771 34,280,673Lancaster Colony Corp. 85,473 10,114,875Landec Corp. (b) 116,866 1,519,258Lifeway Foods, Inc. (b) 27,446 185,535Limoneira Co. 47,312 1,012,950Pilgrim’s Pride Corp. (a) (b) 230,703 5,813,716Pinnacle Foods, Inc. 512,295 27,643,438Post Holdings, Inc. (a) (b) 284,857 21,586,463RiceBran Technologies (a) (b) 15,640 22,834Rocky Mountain Chocolate Factory, Inc. 3,001 36,612S&W Seed Co. (a) (b) 44,806 156,821Sanderson Farms, Inc. (a) 87,851 10,818,851Seaboard Corp. 1,198 4,854,296Seneca Foods Corp. Class A (b) 30,121 876,521Snyders-Lance, Inc. 372,666 18,588,580The Hain Celestial Group, Inc. (a) (b) 455,320 15,836,030The Simply Good Foods Co. 224,458 3,032,428Tootsie Roll Industries, Inc. (a) 89,305 2,982,787TreeHouse Foods, Inc. (a) (b) 250,906 9,539,446
351,532,730Household Products – 0.2%Central Garden & Pet Co. Class A (non-vtg.) (b) 203,188 7,363,533Energizer Holdings, Inc. (a) 264,403 14,404,675Funko, Inc. (b) 39,428 290,979HRG Group, Inc. (b) 665,285 10,504,850Ocean Bio-Chem, Inc. 26,292 100,698Oil-Dri Corp. of America 22,679 817,805Orchids Paper Products Co. (a) 40,696 435,447Spectrum Brands Holdings, Inc. (a) 102,963 10,163,478WD-40 Co. (a) 62,119 7,746,239
51,827,704Personal Products – 0.3%Avon Products, Inc. (a) (b) 1,906,557 5,014,245CCA Industries, Inc. (b) 3,083 9,542Cyanotech Corp. (b) 3,808 19,802Edgewell Personal Care Co. (a) (b) 241,185 12,095,428elf Beauty, Inc. (a) (b) 94,232 1,737,638Herbalife Ltd. (a) (b) 267,648 24,650,381Inter Parfums, Inc. 80,161 3,398,826LifeVantage Corp. (b) 58,439 232,003Mannatech, Inc. 4,519 64,170MediFast, Inc. 49,586 3,163,091MYOS Corp. (a) (b) 849 1,146

56Annual Report
See accompanying notes which are an integral part of the financial statements.
Schedule of Investments – continued
Common Stocks – continuedShares Value
CONSUMER STAPLES – continuedPersonal Products – continuedNatural Alternatives International, Inc. (a) (b) 20,104 $ 237,227Natural Health Trends Corp. (a) 30,893 538,465Nature’s Sunshine Products, Inc. 31,943 359,359Nu Skin Enterprises, Inc. Class A 218,397 15,375,149Reliv International, Inc. (b) 1,527 8,246Revlon, Inc. (a) (b) 48,893 963,192United-Guardian, Inc. 6,016 109,190USANA Health Sciences, Inc. (b) 50,628 3,867,979Veru, Inc. (a) (b) 72,631 100,957
71,946,036Tobacco – 0.1%22nd Century Group, Inc. (a) (b) 469,061 1,177,343Alliance One International, Inc. (b) 33,481 667,946Turning Point Brands, Inc. 29,381 614,063Universal Corp. 111,115 5,461,302Vector Group Ltd. (a) 472,197 9,462,828
17,383,482
TOTAL CONSUMER STAPLES 618,005,948
ENERGY – 3.9%Energy Equipment & Services – 1.0%Archrock, Inc. 312,295 2,966,803Aspen Aerogels, Inc. (b) 85,012 391,055Basic Energy Services, Inc. (b) 100,658 1,628,646Bristow Group, Inc. (a) 142,536 2,103,831C&J Energy Services, Inc. (b) 281,497 6,755,928Carbo Ceramics, Inc. (a) (b) 90,902 618,134Core Laboratories NV (a) 193,563 19,929,246Dawson Geophysical Co. (b) 84,323 464,620Diamond Offshore Drilling, Inc. (a) (b) 274,267 3,976,872Dril-Quip, Inc. (a) (b) 165,265 7,445,188EcoStim Energy Solutions, Inc. (a) (b) 45,860 57,784ENGlobal Corp. (b) 49,530 39,129Ensco PLC Class A 1,894,663 8,412,304Enservco Corp. (a) (b) 77,749 64,547Era Group, Inc. (b) 75,717 715,526Exterran Corp. (b) 145,701 3,769,285Fairmount Santrol Holidings, Inc. (a) (b) 671,947 3,010,323Forum Energy Technologies, Inc. (a) (b) 327,259 3,698,027Frank’s International NV (a) 285,074 1,490,937Geospace Technologies Corp. (a) (b) 53,804 550,415Gulf Island Fabrication, Inc. 51,115 421,699Helix Energy Solutions Group, Inc. (b) 603,189 3,595,006Hornbeck Offshore Services, Inc. (a) (b) 148,293 478,986Independence Contract Drilling, Inc. (b) 127,230 528,005ION Geophysical Corp. (b) 31,686 890,377Key Energy Services, Inc. (a) (b) 47,309 634,414Mammoth Energy Services, Inc. (a) (b) 54,380 1,423,668Matrix Service Co. (b) 116,892 1,671,556McDermott International, Inc. (a) (b) 1,235,190 9,016,887Mitcham Industries, Inc. (b) 40,926 144,060Nabors Industries Ltd. 1,367,496 8,847,699Natural Gas Services Group, Inc. (b) 52,753 1,313,550
Shares Value
NCS Multistage Holdings, Inc. (a) 47,450 $ 693,719Newpark Resources, Inc. (b) 403,139 3,325,897Noble Corp. (a) (b) 1,084,172 4,206,587Oceaneering International, Inc. (a) 426,515 7,839,346Oil States International, Inc. (a) (b) 226,051 5,560,855Parker Drilling Co. (a) (b) 571,982 514,784Patterson-UTI Energy, Inc. 970,750 17,541,453PHI, Inc. (non-vtg.) (b) 46,438 457,414Pioneer Energy Services Corp. (b) 318,662 876,321Profire Energy, Inc. (a) (b) 83,066 176,931Ranger Energy Services, Inc. Class A (a) 21,054 188,012RigNet, Inc. (b) 52,479 703,219Rowan Companies PLC (a) (b) 478,498 5,818,536RPC, Inc. (a) 264,838 5,201,418SAExploration Holdings, Inc.:
warrants 7/27/21 (b) (d) 42 1warrants 7/27/21 (b) (d) 42 1
SEACOR Holdings, Inc. (b) 76,124 3,159,907Smart Sand, Inc. (a) (b) 101,936 756,365Solaris Oilfield Infrastructure, Inc. Class A (a) 90,825 1,528,585Superior Energy Services, Inc. (a) (b) 660,904 5,650,729Synthesis Energy Systems, Inc. (a) (b) 30,883 80,296TETRA Technologies, Inc. (b) 540,634 1,962,501Tidewater, Inc. (a) (b) 97,490 2,439,200Transocean Ltd. (United States) (a) (b) 1,818,690 16,568,266U.S. Silica Holdings, Inc. 358,072 9,270,484Unit Corp. (a) (b) 236,049 4,522,699Weatherford International PLC (a) (b) 4,314,428 11,346,946Willbros Group, Inc. (b) 307,483 291,555
207,736,534Oil, Gas & Consumable Fuels – 2.9%Abraxas Petroleum Corp. (b) 679,559 1,461,052Adams Resources & Energy, Inc. 9,909 391,406Aemetis, Inc. (a) (b) 44,295 23,955Amyris, Inc. (a) (b) 126,154 667,355Antero Resources Corp. (a) (b) 942,494 17,728,312Approach Resources, Inc. (a) (b) 211,859 616,510Arch Coal, Inc. 106,552 10,198,092Barnwell Industries, Inc. (b) 11,298 22,257Bill Barrett Corp. (b) 443,093 2,007,211Bonanza Creek Energy, Inc. 89,749 2,515,664California Resources Corp. (a) (b) 172,583 2,435,146Callon Petroleum Co. (a) (b) 838,173 8,859,489Carrizo Oil & Gas, Inc. (a) (b) 334,669 4,702,099Centennial Resource Development, Inc. Class A (a) (b) 763,211 14,562,066Centrus Energy Corp. Class A (a) (b) 22,164 78,979Cheniere Energy, Inc. (b) 882,325 46,339,709Clean Energy Fuels Corp. (b) 502,335 698,246Cloud Peak Energy, Inc. (b) 350,207 1,152,181CNX Resources Corp. (a) (b) 898,514 14,439,120Comstock Resources, Inc. (a) (b) 59,844 409,333CONSOL Energy, Inc. (a) (b) 112,314 3,559,231Contango Oil & Gas Co. (b) 88,353 256,224Continental Resources, Inc. (a) (b) 370,274 17,591,718CVR Energy, Inc. (a) 67,664 2,004,208Delek U.S. Holdings, Inc. 318,600 10,870,632
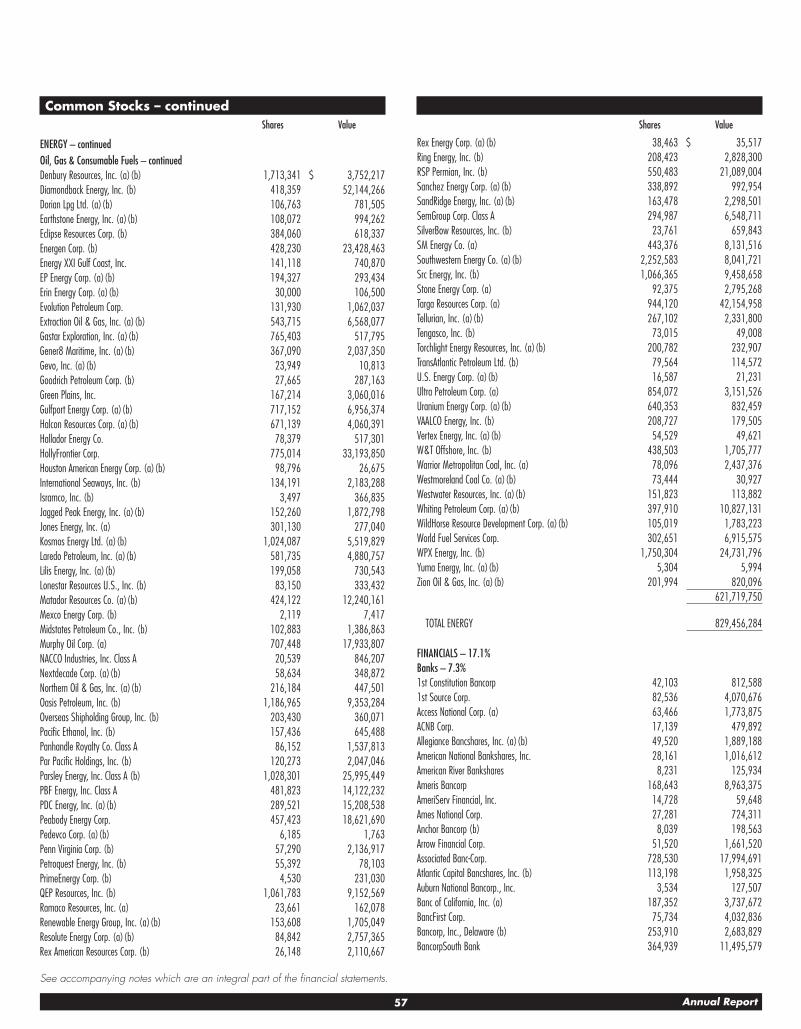
57 Annual Report
See accompanying notes which are an integral part of the financial statements.
Common Stocks – continuedShares Value
ENERGY – continuedOil, Gas & Consumable Fuels – continuedDenbury Resources, Inc. (a) (b) 1,713,341 $ 3,752,217Diamondback Energy, Inc. (b) 418,359 52,144,266Dorian Lpg Ltd. (a) (b) 106,763 781,505Earthstone Energy, Inc. (a) (b) 108,072 994,262Eclipse Resources Corp. (b) 384,060 618,337Energen Corp. (b) 428,230 23,428,463Energy XXI Gulf Coast, Inc. 141,118 740,870EP Energy Corp. (a) (b) 194,327 293,434Erin Energy Corp. (a) (b) 30,000 106,500Evolution Petroleum Corp. 131,930 1,062,037Extraction Oil & Gas, Inc. (a) (b) 543,715 6,568,077Gastar Exploration, Inc. (a) (b) 765,403 517,795Gener8 Maritime, Inc. (a) (b) 367,090 2,037,350Gevo, Inc. (a) (b) 23,949 10,813Goodrich Petroleum Corp. (b) 27,665 287,163Green Plains, Inc. 167,214 3,060,016Gulfport Energy Corp. (a) (b) 717,152 6,956,374Halcon Resources Corp. (a) (b) 671,139 4,060,391Hallador Energy Co. 78,379 517,301HollyFrontier Corp. 775,014 33,193,850Houston American Energy Corp. (a) (b) 98,796 26,675International Seaways, Inc. (b) 134,191 2,183,288Isramco, Inc. (b) 3,497 366,835Jagged Peak Energy, Inc. (a) (b) 152,260 1,872,798Jones Energy, Inc. (a) 301,130 277,040Kosmos Energy Ltd. (a) (b) 1,024,087 5,519,829Laredo Petroleum, Inc. (a) (b) 581,735 4,880,757Lilis Energy, Inc. (a) (b) 199,058 730,543Lonestar Resources U.S., Inc. (b) 83,150 333,432Matador Resources Co. (a) (b) 424,122 12,240,161Mexco Energy Corp. (b) 2,119 7,417Midstates Petroleum Co., Inc. (b) 102,883 1,386,863Murphy Oil Corp. (a) 707,448 17,933,807NACCO Industries, Inc. Class A 20,539 846,207Nextdecade Corp. (a) (b) 58,634 348,872Northern Oil & Gas, Inc. (a) (b) 216,184 447,501Oasis Petroleum, Inc. (b) 1,186,965 9,353,284Overseas Shipholding Group, Inc. (b) 203,430 360,071Pacific Ethanol, Inc. (b) 157,436 645,488Panhandle Royalty Co. Class A 86,152 1,537,813Par Pacific Holdings, Inc. (b) 120,273 2,047,046Parsley Energy, Inc. Class A (b) 1,028,301 25,995,449PBF Energy, Inc. Class A 481,823 14,122,232PDC Energy, Inc. (a) (b) 289,521 15,208,538Peabody Energy Corp. 457,423 18,621,690Pedevco Corp. (a) (b) 6,185 1,763Penn Virginia Corp. (b) 57,290 2,136,917Petroquest Energy, Inc. (b) 55,392 78,103PrimeEnergy Corp. (b) 4,530 231,030QEP Resources, Inc. (b) 1,061,783 9,152,569Ramaco Resources, Inc. (a) 23,661 162,078Renewable Energy Group, Inc. (a) (b) 153,608 1,705,049Resolute Energy Corp. (a) (b) 84,842 2,757,365Rex American Resources Corp. (b) 26,148 2,110,667
Shares Value
Rex Energy Corp. (a) (b) 38,463 $ 35,517Ring Energy, Inc. (b) 208,423 2,828,300RSP Permian, Inc. (b) 550,483 21,089,004Sanchez Energy Corp. (a) (b) 338,892 992,954SandRidge Energy, Inc. (a) (b) 163,478 2,298,501SemGroup Corp. Class A 294,987 6,548,711SilverBow Resources, Inc. (b) 23,761 659,843SM Energy Co. (a) 443,376 8,131,516Southwestern Energy Co. (a) (b) 2,252,583 8,041,721Src Energy, Inc. (b) 1,066,365 9,458,658Stone Energy Corp. (a) 92,375 2,795,268Targa Resources Corp. (a) 944,120 42,154,958Tellurian, Inc. (a) (b) 267,102 2,331,800Tengasco, Inc. (b) 73,015 49,008Torchlight Energy Resources, Inc. (a) (b) 200,782 232,907TransAtlantic Petroleum Ltd. (b) 79,564 114,572U.S. Energy Corp. (a) (b) 16,587 21,231Ultra Petroleum Corp. (a) 854,072 3,151,526Uranium Energy Corp. (a) (b) 640,353 832,459VAALCO Energy, Inc. (b) 208,727 179,505Vertex Energy, Inc. (a) (b) 54,529 49,621W&T Offshore, Inc. (b) 438,503 1,705,777Warrior Metropolitan Coal, Inc. (a) 78,096 2,437,376Westmoreland Coal Co. (a) (b) 73,444 30,927Westwater Resources, Inc. (a) (b) 151,823 113,882Whiting Petroleum Corp. (a) (b) 397,910 10,827,131WildHorse Resource Development Corp. (a) (b) 105,019 1,783,223World Fuel Services Corp. 302,651 6,915,575WPX Energy, Inc. (b) 1,750,304 24,731,796Yuma Energy, Inc. (a) (b) 5,304 5,994Zion Oil & Gas, Inc. (a) (b) 201,994 820,096
621,719,750
TOTAL ENERGY 829,456,284
FINANCIALS – 17.1%Banks – 7.3%1st Constitution Bancorp 42,103 812,5881st Source Corp. 82,536 4,070,676Access National Corp. (a) 63,466 1,773,875ACNB Corp. 17,139 479,892Allegiance Bancshares, Inc. (a) (b) 49,520 1,889,188American National Bankshares, Inc. 28,161 1,016,612American River Bankshares 8,231 125,934Ameris Bancorp 168,643 8,963,375AmeriServ Financial, Inc. 14,728 59,648Ames National Corp. 27,281 724,311Anchor Bancorp (b) 8,039 198,563Arrow Financial Corp. 51,520 1,661,520Associated Banc-Corp. 728,530 17,994,691Atlantic Capital Bancshares, Inc. (b) 113,198 1,958,325Auburn National Bancorp., Inc. 3,534 127,507Banc of California, Inc. (a) 187,352 3,737,672BancFirst Corp. 75,734 4,032,836Bancorp, Inc., Delaware (b) 253,910 2,683,829BancorpSouth Bank 364,939 11,495,579

58Annual Report
See accompanying notes which are an integral part of the financial statements.
Schedule of Investments – continued
Common Stocks – continuedShares Value
FINANCIALS – continuedBanks – continuedBank of Commerce Holdings 98,321 $ 1,061,867Bank of Hawaii Corp. 189,608 15,549,752Bank of Marin Bancorp 24,262 1,604,931Bank of South Carolina Corp. 10,268 195,605Bank of the Ozarks, Inc. 514,623 25,674,541BankUnited, Inc. 459,001 18,461,020Bankwell Financial Group, Inc. 40,974 1,282,486Banner Corp. 148,258 8,195,702Bar Harbor Bankshares 62,421 1,691,609Bay Bancorp, Inc. (b) 27,291 350,689BCB Bancorp, Inc. 55,365 847,085Berkshire Hills Bancorp, Inc. 171,589 6,305,896Blue Hills Bancorp, Inc. 123,079 2,480,042BOK Financial Corp. 113,609 10,730,370Boston Private Financial Holdings, Inc. 373,066 5,446,764Bridge Bancorp, Inc. 80,834 2,683,689Brookline Bancorp, Inc., Delaware 346,551 5,492,833Bryn Mawr Bank Corp. 85,920 3,741,816Byline Bancorp, Inc. 22,464 518,020C & F Financial Corp. 11,407 528,714Camden National Corp. 73,144 3,088,140Capital City Bank Group, Inc. 62,630 1,503,120Capstar Financial Holdings, Inc. (a) (b) 10,727 204,028Carolina Financial Corp. 75,533 2,931,436Cathay General Bancorp 328,046 13,469,569CB Financial Services, Inc. 34,610 1,014,073CBTX, Inc. (a) 4,372 120,711Centerstate Banks of Florida, Inc. 299,561 8,160,042Central Pacific Financial Corp. 137,108 3,821,200Central Valley Community Bancorp 61,456 1,198,392Century Bancorp, Inc. Class A (non-vtg.) 8,372 642,970Chemical Financial Corp. 313,725 17,314,483Chemung Financial Corp. 14,797 632,128CIT Group, Inc. 572,454 30,368,685Citizens & Northern Corp. 49,346 1,104,857Citizens First Corp. 14,760 351,288Citizens Holding Co. 12,650 278,300City Holding Co. (a) 75,888 5,112,575Civista Bancshares, Inc. 34,892 786,117CNB Financial Corp., Pennsylvania 61,173 1,644,330CoBiz, Inc. 220,514 4,180,945Codorus Valley Bancorp, Inc. 34,938 914,327Colony Bankcorp, Inc. 4,518 64,382Columbia Banking Systems, Inc. 327,723 13,692,267Commerce Bancshares, Inc. 402,855 23,272,933Community Bank System, Inc. (a) 229,368 12,227,608Community Bankers Trust Corp. (b) 171,891 1,426,695Community Financial Corp. 16,726 623,211Community Trust Bancorp, Inc. 84,178 3,661,743ConnectOne Bancorp, Inc. 128,046 3,687,725County Bancorp, Inc. 25,129 671,949Cullen/Frost Bankers, Inc. 248,658 25,857,945Customers Bancorp, Inc. (b) 124,000 3,638,160CVB Financial Corp. (a) 459,319 10,564,337
Shares Value
DNB Financial Corp. 4,951 $ 166,601Eagle Bancorp, Inc. (b) 141,344 8,629,051East West Bancorp, Inc. 623,075 40,842,566Enterprise Bancorp, Inc. 37,217 1,160,798Enterprise Financial Services Corp. 105,839 4,958,557Equity Bancshares, Inc. (b) 46,376 1,713,129Evans Bancorp, Inc. 17,239 743,001Farmers & Merchants Bancorp, Inc. 29,551 1,093,387Farmers Capital Bank Corp. 34,947 1,272,071Farmers National Banc Corp. 109,961 1,484,474FCB Financial Holdings, Inc. Class A (b) 195,326 10,479,240Fidelity Southern Corp. 97,915 2,204,067Financial Institutions, Inc. 63,631 1,953,472First Bancorp, North Carolina 137,059 4,746,353First Bancorp, Puerto Rico (b) 807,302 4,868,031First Bancshares, Inc. (a) 40,497 1,285,780First Bank Hamilton New Jersey 51,342 711,087First Busey Corp. 190,257 5,641,120First Business Finance Services, Inc. 37,553 903,150First Citizen Bancshares, Inc. 38,653 15,735,636First Commonwealth Financial Corp. 453,163 6,330,687First Community Bancshares, Inc. 65,716 1,784,189First Community Corp. 50,202 1,061,772First Connecticut Bancorp, Inc. 63,853 1,599,518First Financial Bancorp, Ohio 270,931 7,369,323First Financial Bankshares, Inc. (a) 298,155 13,715,130First Financial Corp., Indiana 56,581 2,427,325First Financial Northwest, Inc. 38,725 612,630First Foundation, Inc. (b) 140,403 2,563,759First Hawaiian, Inc. 246,186 6,841,509First Horizon National Corp. 1,359,119 25,891,217First Internet Bancorp 38,971 1,475,052First Interstate Bancsystem, Inc. 106,677 4,213,742First Merchants Corp. 189,960 7,851,047First Mid-Illinois Bancshares, Inc. 32,501 1,109,584First Midwest Bancorp, Inc., Delaware 455,826 11,040,106First Northwest Bancorp (b) 29,480 471,680First of Long Island Corp. 95,119 2,591,993First Republic Bank (a) 684,438 63,515,846First United Corp. (b) 16,427 283,366Flushing Financial Corp. 128,655 3,435,089FNB Corp., Pennsylvania 1,383,233 19,392,927Franklin Financial Network, Inc. (b) 55,816 1,733,087Fulton Financial Corp. 783,300 14,177,730German American Bancorp, Inc. (a) 94,092 3,117,268Glacier Bancorp, Inc. (a) 342,242 13,313,214Glen Burnie Bancorp 18,661 223,932Great Southern Bancorp, Inc. 44,239 2,141,168Great Western Bancorp, Inc. 265,155 10,842,188Green Bancorp, Inc. (a) (b) 96,487 2,103,417Guaranty Bancorp 113,057 3,103,415Guaranty Bancshares, Inc. Texas 6,893 245,046Hancock Holding Co. 371,874 19,225,886Hanmi Financial Corp. 139,169 4,251,613HarborOne Bancorp, Inc. (b) 139,543 2,684,807Hawthorn Bancshares, Inc. 48,188 973,398

59 Annual Report
See accompanying notes which are an integral part of the financial statements.
Common Stocks – continuedShares Value
FINANCIALS – continuedBanks – continuedHeartland Financial U.S.A., Inc. 124,040 $ 6,617,534Heritage Commerce Corp. 159,503 2,516,957Heritage Financial Corp., Washington 134,310 3,995,723Hilltop Holdings, Inc. 332,356 8,079,574Home Bancshares, Inc. 696,348 16,009,041HomeTrust Bancshares, Inc. (b) 82,069 2,129,691Hope Bancorp, Inc. 575,341 10,390,658Horizon Bancorp Industries 102,046 2,887,902Howard Bancorp, Inc. (b) 32,517 585,306IBERIABANK Corp. 231,135 18,675,708Independent Bank Corp. 96,933 2,214,919Independent Bank Corp., Massachusetts 121,955 8,463,677Independent Bank Group, Inc. 78,392 5,503,118International Bancshares Corp. 244,180 9,437,557Investar Holding Corp. 29,136 709,462Investors Bancorp, Inc. 1,095,450 14,788,575Lakeland Bancorp, Inc. 201,190 3,842,729Lakeland Financial Corp. (a) 114,291 5,178,525Landmark Bancorp, Inc. 39 1,127LCNB Corp. 38,996 721,426LegacyTexas Financial Group, Inc. 185,316 7,762,887Live Oak Bancshares, Inc. 117,643 3,070,482Macatawa Bank Corp. 91,347 903,422MainSource Financial Group, Inc. 119,416 4,510,342MB Financial, Inc. 366,215 15,018,477MBT Financial Corp. 69,241 706,258Mercantile Bank Corp. 67,865 2,246,332Merchants Bancorp/IN 43,731 896,486Metropolitan Bank Holding Corp. (b) 17,426 774,063Mid Penn Bancorp, Inc. 28,255 904,160Middlefield Banc Corp. 24,755 1,188,240Midland States Bancorp, Inc. 36,485 1,143,805Midsouth Bancorp, Inc. 59,250 740,625MidWestOne Financial Group, Inc. 42,159 1,341,499MutualFirst Financial, Inc. 16,479 588,300National Bank Holdings Corp. 125,498 4,089,980National Bankshares, Inc. (a) 27,586 1,099,302National Commerce Corp. (b) 52,018 2,234,173NBT Bancorp, Inc. 212,914 7,409,407Nicolet Bankshares, Inc. (b) 29,711 1,606,474Northeast Bancorp 47,101 1,033,867Northrim Bancorp, Inc. 32,754 1,089,071Norwood Financial Corp. (a) 26,148 771,889OFG Bancorp (a) 196,849 2,116,127Ohio Valley Banc Corp. (a) 14,494 567,440Old Line Bancshares, Inc. (a) 34,320 1,085,542Old National Bancorp, Indiana 597,389 10,155,613Old Point Financial Corp. 8,603 215,935Old Second Bancorp, Inc. 127,732 1,756,315Opus Bank 75,669 2,122,515Orrstown Financial Services, Inc. 28,866 712,990Pacific Mercantile Bancorp (b) 76,145 628,196Pacific Premier Bancorp, Inc. (b) 172,208 7,241,346PacWest Bancorp 559,706 29,183,071
Shares Value
Park National Corp. 60,841 $ 6,146,158Parke Bancorp, Inc. 9,617 199,553Patriot National Bancorp, Inc. 1,402 26,288PCSB Financial Corp. 71,701 1,375,942Peapack-Gladstone Financial Corp. 71,026 2,342,437Penns Woods Bancorp, Inc. 18,934 768,910People’s Utah Bancorp 68,752 2,086,623Peoples Bancorp of North Carolina 31,329 872,513Peoples Bancorp, Inc. 86,252 2,974,831Peoples Financial Services Corp. 28,276 1,164,123Pinnacle Financial Partners, Inc. 321,651 20,762,572Popular, Inc. 447,330 18,792,333Porter Bancorp, Inc. (b) 9,892 145,412Preferred Bank, Los Angeles 57,012 3,553,558Premier Financial Bancorp, Inc. 21,201 373,562Prosperity Bancshares, Inc. (a) 299,604 22,470,300QCR Holdings, Inc. 57,990 2,528,364Reliant Bancorp, Inc. (a) 23,562 560,540Renasant Corp. 194,858 8,137,270Republic Bancorp, Inc., Kentucky Class A 38,600 1,437,850Republic First Bancorp, Inc. (a) (b) 238,609 2,016,246S&T Bancorp, Inc. 162,604 6,416,354Sandy Spring Bancorp, Inc. 148,381 5,751,248SB Financial Group, Inc. 532 9,863Seacoast Banking Corp., Florida (a) (b) 190,645 4,998,712Select Bancorp, Inc. New (b) 98 1,279ServisFirst Bancshares, Inc. 208,931 8,390,669Shore Bancshares, Inc. 42,320 720,286Sierra Bancorp 45,562 1,185,523Signature Bank (b) 233,286 34,104,080Simmons First National Corp. Class A 347,982 9,900,088SmartFinancial, Inc. (b) 29,546 644,694South State Corp. 164,630 14,273,421Southern First Bancshares, Inc. (b) 41,478 1,748,298Southern National Bancorp of Virginia, Inc. 84,680 1,302,378Southside Bancshares, Inc. 125,401 4,188,393State Bank Financial Corp. 174,436 5,048,178Sterling Bancorp 958,956 22,295,727Stock Yards Bancorp, Inc. 114,773 4,028,532Summit Financial Group, Inc. 28,736 688,227Sussex Bancorp 2,925 84,971SVB Financial Group (b) 228,369 56,859,314Synovus Financial Corp. 498,901 24,595,819TCF Financial Corp. 740,226 16,507,040Texas Capital Bancshares, Inc. (b) 212,422 19,160,464The Bank of Princeton 9,024 293,551The First Bancorp, Inc. 40,384 1,088,753Tompkins Financial Corp. 56,854 4,362,976TowneBank 279,152 7,969,790Trico Bancshares 98,612 3,683,158TriState Capital Holdings, Inc. (b) 98,771 2,207,532Triumph Bancorp, Inc. (b) 84,832 3,473,870Trustmark Corp. 310,132 9,688,524Two River Bancorp (a) 43,275 741,734UMB Financial Corp. 196,225 14,324,425Umpqua Holdings Corp. 950,712 20,259,673

60Annual Report
See accompanying notes which are an integral part of the financial statements.
Schedule of Investments – continued
Common Stocks – continuedShares Value
FINANCIALS – continuedBanks – continuedUnion Bankshares Corp. 242,805 $ 9,076,051Union Bankshares, Inc. (a) 26,240 1,346,112United Bancorp, Inc. 41,665 495,814United Bankshares, Inc., West Virginia (a) 460,054 16,331,917United Community Bank, Inc. 313,340 9,685,339United Security Bancshares, Inc. 8,545 98,695United Security Bancshares, California 21,338 217,648Unity Bancorp, Inc. 57,145 1,180,044Univest Corp. of Pennsylvania 131,713 3,608,936Valley National Bancorp (a) 1,161,215 14,480,351Veritex Holdings, Inc. (b) 77,906 2,162,671Village Bank & Trust Financial Corp. (b) 8,883 284,256Washington Trust Bancorp, Inc. 65,779 3,410,641Webster Financial Corp. 391,391 21,362,121WesBanco, Inc. 196,002 8,077,242West Bancorp., Inc. 62,916 1,528,859Westamerica Bancorp. (a) 121,474 6,959,245Western Alliance Bancorp. (b) 417,250 24,392,435Wintrust Financial Corp. 238,161 20,126,986
1,543,408,086Capital Markets – 2.5%Arlington Asset Investment Corp. (a) 120,828 1,307,359Artisan Partners Asset Management, Inc. 201,289 6,793,504Ashford, Inc. (b) 4,486 443,890Associated Capital Group, Inc. 20,662 712,839B. Riley Financial, Inc. (a) 77,782 1,438,967BGC Partners, Inc. Class A 1,045,996 13,828,067Cohen & Steers, Inc. 93,396 3,735,840Cowen Group, Inc. Class A (a) (b) 119,709 1,717,824Diamond Hill Investment Group, Inc. 13,288 2,724,439Eaton Vance Corp. (non-vtg.) 509,314 26,957,990Evercore, Inc. Class A 168,569 15,685,345FactSet Research Systems, Inc. 170,272 34,595,865Federated Investors, Inc. Class B (non-vtg.) (a) 412,409 13,436,285Financial Engines, Inc. (a) 276,738 9,270,723Gain Capital Holdings, Inc. (a) 115,932 821,958GAMCO Investors, Inc. Class A 17,907 479,908Great Elm Capital Group, Inc. (b) 111,763 413,523Greenhill & Co., Inc. 111,740 2,273,909Hamilton Lane, Inc. Class A (a) 59,581 2,081,760Hennessy Advisors, Inc. 9,352 173,573Houlihan Lokey 117,501 5,454,396Institutional Financial Markets, Inc. 1,681 17,684Interactive Brokers Group, Inc. 310,620 21,557,028INTL FCStone, Inc. (b) 71,146 2,820,939Investment Technology Group, Inc. 144,928 2,872,473Janus Henderson Group PLC (a) 784,712 27,731,722Ladenburg Thalmann Financial Services, Inc. 402,412 1,344,056Lazard Ltd. Class A 567,826 30,645,569Legg Mason, Inc. 363,618 14,511,994LPL Financial 391,944 25,190,241Manning & Napier, Inc. Class A 54,262 162,786MarketAxess Holdings, Inc. 164,852 33,366,045Medley Management, Inc. 32,708 199,519
Shares Value
Moelis & Co. Class A 139,192 $ 7,063,994Morningstar, Inc. 86,170 8,052,587MSCI, Inc. 393,277 55,656,561National Holdings Corp. (b) 3,483 13,758National Holdings Corp. warrants 1/18/22 (b) 3,483 3,901Oppenheimer Holdings, Inc. Class A (non-vtg.) 40,209 1,067,549Piper Jaffray Companies 64,129 5,354,772PJT Partners, Inc. 73,261 3,502,608Pzena Investment Management, Inc. 58,015 631,203Safeguard Scientifics, Inc. (b) 85,673 1,045,211SEI Investments Co. 560,967 40,855,227Siebert Financial Corp. (a) (b) 13,255 101,533Silvercrest Asset Management Group Class A 17,895 270,215Stifel Financial Corp. 294,566 18,813,930TD Ameritrade Holding Corp. 1,181,483 67,935,273TheStreet.com, Inc. (b) 85,257 104,014U.S. Global Investments, Inc. Class A (a) 36,632 124,549Value Line, Inc. 13,155 244,420Vector Capital Corp. rights (b) (c) 49,572 1Virtu Financial, Inc. Class A (a) 185,825 5,519,003Virtus Investment Partners, Inc. 31,891 3,924,188Waddell & Reed Financial, Inc. Class A (a) 368,027 7,360,540Westwood Holdings Group, Inc. 31,636 1,719,100WisdomTree Investments, Inc. (a) 492,911 4,736,875Zais Group Holdings, Inc. (b) 22,211 89,510
538,958,542Consumer Finance – 0.8%Ally Financial, Inc. 1,912,195 53,350,241Asta Funding, Inc. (b) 34,989 342,892Atlanticus Holdings Corp. (b) 33,601 73,922Consumer Portfolio Services, Inc. (b) 87,449 331,432Credit Acceptance Corp. (a) (b) 55,452 17,450,190Elevate Credit, Inc. 77,759 555,199Encore Capital Group, Inc. (a) (b) 104,445 4,470,246Enova International, Inc. (b) 146,158 3,215,476EZCORP, Inc. (non-vtg.) Class A (a) (b) 228,360 2,968,680First Cash Financial Services, Inc. 214,308 15,794,500Green Dot Corp. Class A (b) 203,057 13,225,102Imperial Holdings, Inc. warrants 4/11/19 (b) 3,852 0LendingClub Corp. (a) (b) 1,639,001 5,162,853Nelnet, Inc. Class A 84,547 4,678,831Nicholas Financial, Inc. (b) 73,640 657,605OneMain Holdings, Inc. (b) 315,529 9,674,119PRA Group, Inc. (a) (b) 202,706 7,763,640Regional Management Corp. (b) 42,651 1,276,118Santander Consumer U.S.A. Holdings, Inc. 500,124 8,177,027SLM Corp. (b) 1,903,618 20,768,472World Acceptance Corp. (a) (b) 25,904 2,785,198
172,721,743Diversified Financial Services – 0.4%A-Mark Precious Metals, Inc. 15,543 171,128Acushnet Holdings Corp. (a) 186,547 3,952,931Alteryx, Inc. (a) 105,818 3,617,917At Home Group, Inc. (a) (b) 29,095 860,921Cannae Holdings, Inc. (b) 291,196 5,352,182Cotiviti Holdings, Inc. (b) 165,909 5,559,611
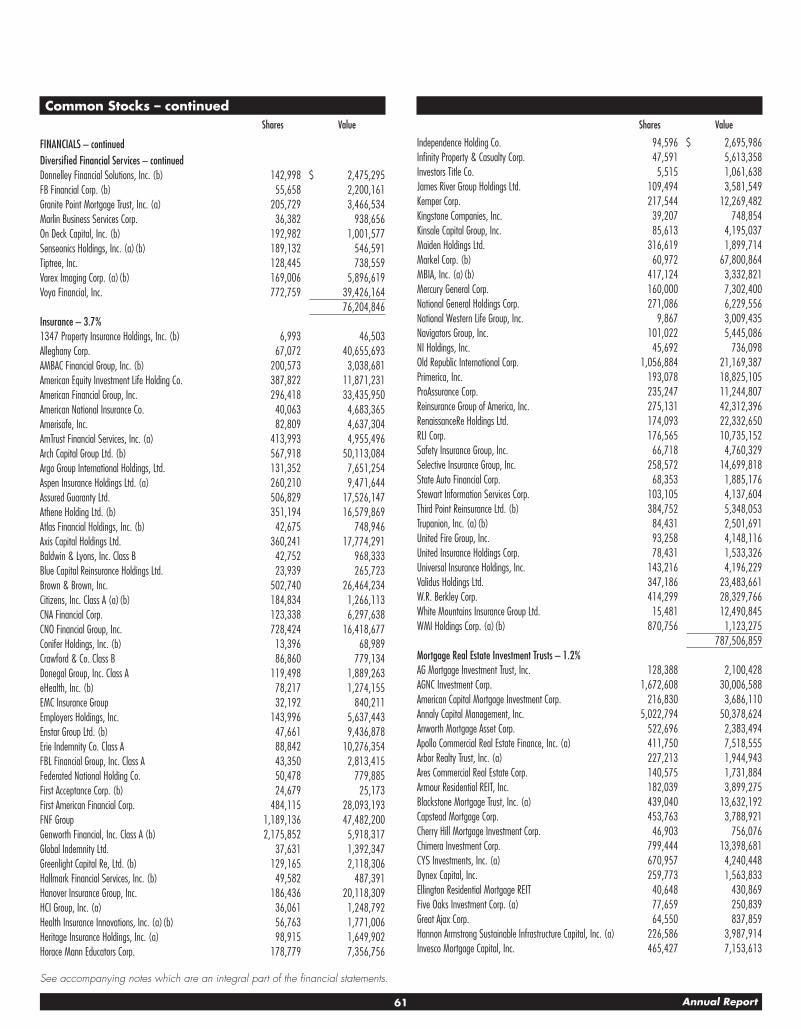
61 Annual Report
See accompanying notes which are an integral part of the financial statements.
Common Stocks – continuedShares Value
FINANCIALS – continuedDiversified Financial Services – continuedDonnelley Financial Solutions, Inc. (b) 142,998 $ 2,475,295FB Financial Corp. (b) 55,658 2,200,161Granite Point Mortgage Trust, Inc. (a) 205,729 3,466,534Marlin Business Services Corp. 36,382 938,656On Deck Capital, Inc. (b) 192,982 1,001,577Senseonics Holdings, Inc. (a) (b) 189,132 546,591Tiptree, Inc. 128,445 738,559Varex Imaging Corp. (a) (b) 169,006 5,896,619Voya Financial, Inc. 772,759 39,426,164
76,204,846Insurance – 3.7%1347 Property Insurance Holdings, Inc. (b) 6,993 46,503Alleghany Corp. 67,072 40,655,693AMBAC Financial Group, Inc. (b) 200,573 3,038,681American Equity Investment Life Holding Co. 387,822 11,871,231American Financial Group, Inc. 296,418 33,435,950American National Insurance Co. 40,063 4,683,365Amerisafe, Inc. 82,809 4,637,304AmTrust Financial Services, Inc. (a) 413,993 4,955,496Arch Capital Group Ltd. (b) 567,918 50,113,084Argo Group International Holdings, Ltd. 131,352 7,651,254Aspen Insurance Holdings Ltd. (a) 260,210 9,471,644Assured Guaranty Ltd. 506,829 17,526,147Athene Holding Ltd. (b) 351,194 16,579,869Atlas Financial Holdings, Inc. (b) 42,675 748,946Axis Capital Holdings Ltd. 360,241 17,774,291Baldwin & Lyons, Inc. Class B 42,752 968,333Blue Capital Reinsurance Holdings Ltd. 23,939 265,723Brown & Brown, Inc. 502,740 26,464,234Citizens, Inc. Class A (a) (b) 184,834 1,266,113CNA Financial Corp. 123,338 6,297,638CNO Financial Group, Inc. 728,424 16,418,677Conifer Holdings, Inc. (b) 13,396 68,989Crawford & Co. Class B 86,860 779,134Donegal Group, Inc. Class A 119,498 1,889,263eHealth, Inc. (b) 78,217 1,274,155EMC Insurance Group 32,192 840,211Employers Holdings, Inc. 143,996 5,637,443Enstar Group Ltd. (b) 47,661 9,436,878Erie Indemnity Co. Class A 88,842 10,276,354FBL Financial Group, Inc. Class A 43,350 2,813,415Federated National Holding Co. 50,478 779,885First Acceptance Corp. (b) 24,679 25,173First American Financial Corp. 484,115 28,093,193FNF Group 1,189,136 47,482,200Genworth Financial, Inc. Class A (b) 2,175,852 5,918,317Global Indemnity Ltd. 37,631 1,392,347Greenlight Capital Re, Ltd. (b) 129,165 2,118,306Hallmark Financial Services, Inc. (b) 49,582 487,391Hanover Insurance Group, Inc. 186,436 20,118,309HCI Group, Inc. (a) 36,061 1,248,792Health Insurance Innovations, Inc. (a) (b) 56,763 1,771,006Heritage Insurance Holdings, Inc. (a) 98,915 1,649,902Horace Mann Educators Corp. 178,779 7,356,756
Shares Value
Independence Holding Co. 94,596 $ 2,695,986Infinity Property & Casualty Corp. 47,591 5,613,358Investors Title Co. 5,515 1,061,638James River Group Holdings Ltd. 109,494 3,581,549Kemper Corp. 217,544 12,269,482Kingstone Companies, Inc. 39,207 748,854Kinsale Capital Group, Inc. 85,613 4,195,037Maiden Holdings Ltd. 316,619 1,899,714Markel Corp. (b) 60,972 67,800,864MBIA, Inc. (a) (b) 417,124 3,332,821Mercury General Corp. 160,000 7,302,400National General Holdings Corp. 271,086 6,229,556National Western Life Group, Inc. 9,867 3,009,435Navigators Group, Inc. 101,022 5,445,086NI Holdings, Inc. 45,692 736,098Old Republic International Corp. 1,056,884 21,169,387Primerica, Inc. 193,078 18,825,105ProAssurance Corp. 235,247 11,244,807Reinsurance Group of America, Inc. 275,131 42,312,396RenaissanceRe Holdings Ltd. 174,093 22,332,650RLI Corp. 176,565 10,735,152Safety Insurance Group, Inc. 66,718 4,760,329Selective Insurance Group, Inc. 258,572 14,699,818State Auto Financial Corp. 68,353 1,885,176Stewart Information Services Corp. 103,105 4,137,604Third Point Reinsurance Ltd. (b) 384,752 5,348,053Trupanion, Inc. (a) (b) 84,431 2,501,691United Fire Group, Inc. 93,258 4,148,116United Insurance Holdings Corp. 78,431 1,533,326Universal Insurance Holdings, Inc. 143,216 4,196,229Validus Holdings Ltd. 347,186 23,483,661W.R. Berkley Corp. 414,299 28,329,766White Mountains Insurance Group Ltd. 15,481 12,490,845WMI Holdings Corp. (a) (b) 870,756 1,123,275
787,506,859Mortgage Real Estate Investment Trusts – 1.2%AG Mortgage Investment Trust, Inc. 128,388 2,100,428AGNC Investment Corp. 1,672,608 30,006,588American Capital Mortgage Investment Corp. 216,830 3,686,110Annaly Capital Management, Inc. 5,022,794 50,378,624Anworth Mortgage Asset Corp. 522,696 2,383,494Apollo Commercial Real Estate Finance, Inc. (a) 411,750 7,518,555Arbor Realty Trust, Inc. (a) 227,213 1,944,943Ares Commercial Real Estate Corp. 140,575 1,731,884Armour Residential REIT, Inc. 182,039 3,899,275Blackstone Mortgage Trust, Inc. (a) 439,040 13,632,192Capstead Mortgage Corp. 453,763 3,788,921Cherry Hill Mortgage Investment Corp. 46,903 756,076Chimera Investment Corp. 799,444 13,398,681CYS Investments, Inc. (a) 670,957 4,240,448Dynex Capital, Inc. 259,773 1,563,833Ellington Residential Mortgage REIT 40,648 430,869Five Oaks Investment Corp. (a) 77,659 250,839Great Ajax Corp. 64,550 837,859Hannon Armstrong Sustainable Infrastructure Capital, Inc. (a) 226,586 3,987,914Invesco Mortgage Capital, Inc. 465,427 7,153,613

62Annual Report
See accompanying notes which are an integral part of the financial statements.
Schedule of Investments – continued
Common Stocks – continuedShares Value
FINANCIALS – continuedMortgage Real Estate Investment Trusts – continuedKKR Real Estate Finance Trust, Inc. (a) 54,773 $ 1,073,551Ladder Capital Corp. Class A 400,395 5,913,834MFA Financial, Inc. 1,734,837 12,352,039New Residential Investment Corp. 1,414,917 22,822,611New York Mortgage Trust, Inc. (a) 504,041 2,777,266Orchid Island Capital, Inc. (a) 226,923 1,631,576Owens Realty Mortgage, Inc. 37,687 533,271PennyMac Mortgage Investment Trust 278,340 4,639,928Redwood Trust, Inc. 353,007 5,171,553Resource Capital Corp. (a) 146,355 1,271,825Starwood Property Trust, Inc. 1,116,701 22,613,195Two Harbors Investment Corp. 758,863 11,147,697Western Asset Mortgage Capital Corp. (a) 191,198 1,686,366ZAIS Financial Corp. 54,249 748,636
248,074,494Real Estate Management & Development – 0.0%The RMR Group, Inc. 33,925 2,130,490Thrifts & Mortgage Finance – 1.2%Atlantic Coast Financial Corp. (b) 167,823 1,736,968BankFinancial Corp. 75,843 1,215,763Bear State Financial, Inc. 45,612 467,979Beneficial Bancorp, Inc. 357,084 5,356,260BofI Holding, Inc. (a) (b) 247,172 9,192,327BSB Bancorp, Inc. (b) 29,828 865,012Capitol Federal Financial, Inc. 608,106 7,595,244Charter Financial Corp. 65,398 1,298,150Citizens Community Bancorp, Inc. 15,634 217,313Clifton Bancorp, Inc. 102,761 1,584,575Dime Community Bancshares, Inc. 152,632 2,747,376Elmira Savings Bank 185 3,737Entegra Financial Corp. (b) 77,977 2,191,154ESSA Bancorp, Inc. 32,482 473,263Essent Group Ltd. (b) 364,284 16,425,566Farmer Mac Class C (non-vtg.) 44,156 3,358,505First Capital, Inc. 12,982 484,488First Defiance Financial Corp. 41,293 2,197,201Flagstar Bancorp, Inc. (a) (b) 95,859 3,379,988FS Bancorp, Inc. 11,187 607,454Greene County Bancorp, Inc. (a) 2,032 74,066Hamilton Bancorp, Inc. (b) 69 1,018Hingham Institution for Savings 8,459 1,691,885HMN Financial, Inc. (b) 3,871 72,194Home Bancorp, Inc. 20,571 853,697Home Federal Bancorp, Inc. 31 899HomeStreet, Inc. (b) 121,978 3,500,769HopFed Bancorp, Inc. 18,100 278,197Impac Mortgage Holdings, Inc. (a) (b) 65,855 586,110Kearny Financial Corp. 384,435 4,997,655Lendingtree, Inc. (a) (b) 33,035 11,512,698Malvern Bancorp, Inc. (b) 64,070 1,528,070Meridian Bancorp, Inc. Maryland 249,020 4,992,851Meta Financial Group, Inc. 40,463 4,345,726MGIC Investment Corp. (b) 1,616,930 22,297,465Nationstar Mortgage Holdings, Inc. (a) (b) 130,517 2,234,451
Shares Value
New York Community Bancorp, Inc. (a) 2,102,857 $ 28,640,912NMI Holdings, Inc. (b) 243,001 4,823,570Northfield Bancorp, Inc. 220,790 3,426,661Northwest Bancshares, Inc. 450,358 7,390,375OceanFirst Financial Corp. 183,978 4,761,351Ocwen Financial Corp. (a) (b) 486,099 1,769,400Oritani Financial Corp. 189,634 2,958,290PB Bancorp, Inc. 7,070 73,175PennyMac Financial Services, Inc. (b) 92,156 2,147,235PHH Corp. (b) 142,773 1,510,538Poage Bankshares, Inc. 6,654 126,759Provident Bancorp, Inc. (b) 84,161 1,952,535Provident Financial Holdings, Inc. 21,795 397,105Provident Financial Services, Inc. 266,158 6,622,011Prudential Bancorp, Inc. 82,322 1,435,696Radian Group, Inc. 941,759 19,324,895Riverview Bancorp, Inc. 146,681 1,267,324Security National Financial Corp. Class A 40,643 205,247SI Financial Group, Inc. 23,177 333,749Southern Missouri Bancorp, Inc. 20,482 692,701Territorial Bancorp, Inc. 30,643 915,306TFS Financial Corp. 279,196 4,093,013Timberland Bancorp, Inc. 27,057 772,477Trustco Bank Corp., New York 425,565 3,617,303United Community Bancorp, Inc. 1,461 29,293United Community Financial Corp. 251,020 2,319,425United Financial Bancorp, Inc. New 220,063 3,432,983Walker & Dunlop, Inc. 124,586 6,021,241Washington Federal, Inc. 382,695 13,279,517Waterstone Financial, Inc. 133,580 2,297,576Westfield Financial, Inc. 126,385 1,257,531WSFS Financial Corp. 141,318 6,740,869
255,002,137
TOTAL FINANCIALS 3,624,007,197
HEALTH CARE – 11.7%Biotechnology – 5.0%Abeona Therapeutics, Inc. (a) (b) 131,889 1,826,663ACADIA Pharmaceuticals, Inc. (a) (b) 437,926 10,910,926Acceleron Pharma, Inc. (a) (b) 173,903 7,291,753Achaogen, Inc. (a) (b) 136,730 1,426,094Achillion Pharmaceuticals, Inc. (b) 658,720 2,140,840Acorda Therapeutics, Inc. (a) (b) 203,958 4,844,003Actinium Pharmaceuticals, Inc. (b) 152,593 65,615Actinium Pharmaceuticals, Inc. rights 3/2/18 (b) 152,593 2Adamas Pharmaceuticals, Inc. (a) (b) 77,177 1,886,978ADMA Biologics, Inc. (a) (b) 107,827 404,351Aduro Biotech, Inc. (a) (b) 132,877 830,481Advaxis, Inc. (a) (b) 152,732 284,082Adverum Biotechnologies, Inc. (b) 64,927 449,619Aeglea BioTherapeutics, Inc. (b) 23,707 171,876Aevi Genomic Medicine, Inc. (a) (b) 125,878 239,168Agenus, Inc. (a) (b) 343,477 1,851,341Agios Pharmaceuticals, Inc. (a) (b) 208,873 16,791,300Aimmune Therapeutics, Inc. (a) (b) 100,406 3,263,195

63 Annual Report
See accompanying notes which are an integral part of the financial statements.
Common Stocks – continuedShares Value
HEALTH CARE – continuedBiotechnology – continuedAkebia Therapeutics, Inc. (b) 213,244 $ 3,049,389Albireo Pharma, Inc. (b) 29,888 1,010,214Alder Biopharmaceuticals, Inc. (a) (b) 268,419 3,731,024Aldeyra Therapeutics, Inc. (b) 74,826 617,315Alkermes PLC (a) (b) 676,267 38,601,320Alnylam Pharmaceuticals, Inc. (b) 358,528 43,080,724Alpine Immune Sciences, Inc. (b) 17,943 157,719Altimmune, Inc. (a) 24,817 39,211AMAG Pharmaceuticals, Inc. (a) (b) 152,392 3,207,852Amicus Therapeutics, Inc. (a) (b) 724,108 9,963,726AmpliPhi Biosciences Corp. (a) (b) 37,449 52,803AnaptysBio, Inc. (b) 63,793 7,831,229Anavex Life Sciences Corp. (a) (b) 157,620 371,983Anthera Pharmaceuticals, Inc. (a) (b) 20,053 43,114Apellis Pharmaceuticals, Inc. (a) (b) 59,247 1,085,998Applied Genetic Technologies Corp. (b) 47,677 183,556Aptevo Therapeutics, Inc. (b) 62,747 198,908AquaBounty Technologies, Inc. (a) (b) 3,959 9,660Aquinox Pharmaceuticals, Inc. (b) 82,558 1,196,265ARCA Biopharma, Inc. (b) 7,333 5,940Ardelyx, Inc. (a) (b) 161,390 867,471Arena Pharmaceuticals, Inc. (b) 170,928 6,626,879Argos Therapeutics, Inc. (a) (b) 4,760 6,140ArQule, Inc. (b) 223,720 373,612Array BioPharma, Inc. (a) (b) 875,498 15,163,625Arrowhead Pharmaceuticals, Inc. (a) (b) 358,619 2,323,851Asterias Biotherapeutics, Inc. (a) (b) 102,523 220,424Atara Biotherapeutics, Inc. (a) (b) 144,776 5,577,495Athersys, Inc. (a) (b) 484,446 663,691aTyr Pharma, Inc. (b) 94,162 277,778Audentes Therapeutics, Inc. (a) (b) 118,856 4,004,259AVEO Pharmaceuticals, Inc. (a) (b) 440,743 1,260,525Avid Bioservices, Inc. (a) (b) 149,057 366,680Bellicum Pharmaceuticals, Inc. (a) (b) 116,886 812,358Biocept, Inc. (a) (b) 60,281 21,098BioCryst Pharmaceuticals, Inc. (a) (b) 421,163 2,093,180Biohaven Pharmaceutical Holding Co. Ltd. 48,945 1,658,746BioMarin Pharmaceutical, Inc. (b) 770,433 62,536,047Biospecifics Technologies Corp. (b) 20,059 812,390BioTime, Inc. (a) (b) 571,875 1,498,313Bioverativ, Inc. (b) 474,406 49,660,820bluebird bio, Inc. (a) (b) 214,045 43,023,045Blueprint Medicines Corp. (a) (b) 169,546 14,675,902BrainStorm Cell Therpeutic, Inc. (a) (b) 60,624 186,116Calithera Biosciences, Inc. (b) 115,170 886,809Calyxt, Inc. (a) 38,557 708,292Cancer Genetics, Inc. (a) (b) 68,198 115,937Capricor Therapeutics, Inc. (a) (b) 40,820 74,292Cara Therapeutics, Inc. (a) (b) 115,679 1,617,192CareDx, Inc. (a) (b) 99,948 581,697Cascadian Therapeutics, Inc. (b) 213,713 2,130,719CASI Pharmaceuticals, Inc. (a) (b) 168,604 583,370Catabasis Pharmaceuticals, Inc. (b) 76,612 131,773Catalyst Biosciences, Inc. (b) 27,548 696,964
Shares Value
Catalyst Pharmaceutical Partners, Inc. (a) (b) 403,697 $ 1,287,793Cel-Sci Corp. (a) (b) 34,386 61,551Celldex Therapeutics, Inc. (a) (b) 565,434 1,272,227Cellectar Biosciences, Inc. (a) (b) 4,485 5,247Cellular Biomedicine Group, Inc. (a) (b) 29,329 450,200Celsion Corp. (a) (b) 4,287 9,174ChemoCentryx, Inc. (b) 96,267 935,715Chiasma, Inc. (a) (b) 30,058 46,590Chimerix, Inc. (b) 181,661 882,872Cidara Therapeutics, Inc. (a) (b) 38,754 259,652Cleveland Biolabs, Inc. (a) (b) 10,000 35,300Clovis Oncology, Inc. (a) (b) 216,220 12,555,895Coherus BioSciences, Inc. (a) (b) 190,032 1,881,317Conatus Pharmaceuticals, Inc. (a) (b) 122,869 638,919Concert Pharmaceuticals, Inc. (b) 59,495 1,301,751ContraFect Corp. (b) 299,050 505,395Corbus Pharmaceuticals Holdings, Inc. (a) (b) 211,811 1,567,401Corvus Pharmaceuticals, Inc. (b) 34,606 283,423CTI BioPharma Corp. (b) 81,379 327,144Curis, Inc. (b) 574,786 284,519Cyclacel Pharmaceuticals, Inc. (a) (b) 17,747 27,153Cytokinetics, Inc. (a) (b) 224,644 1,740,991CytomX Therapeutics, Inc. (b) 127,044 3,774,477Cytori Therapeutics, Inc. (b) 155,538 53,645CytRx Corp. (a) (b) 105,625 164,775Deciphera Pharmaceuticals, Inc. (b) 36,860 922,237Dicerna Pharmaceuticals, Inc. (b) 104,825 1,337,567Dyax Corp. rights 12/31/19 (b) (c) 559,523 1,935,950Dynavax Technologies Corp. (a) (b) 240,272 3,880,393Eagle Pharmaceuticals, Inc. (a) (b) 35,982 2,020,029Edge Therapeutics, Inc. (a) (b) 82,791 1,246,005Editas Medicine, Inc. (a) (b) 162,203 5,943,118Eiger Biopharmaceuticals, Inc. (a) (b) 17,311 160,127Eleven Biotherapeutics, Inc. (a) (b) 33,461 31,788Emergent BioSolutions, Inc. (b) 154,700 7,688,590Enanta Pharmaceuticals, Inc. (b) 64,072 5,037,341Epizyme, Inc. (a) (b) 219,257 3,880,849Esperion Therapeutics, Inc. (a) (b) 87,171 7,009,420Exact Sciences Corp. (a) (b) 525,198 23,429,083Exelixis, Inc. (b) 1,235,453 31,874,687Fate Therapeutics, Inc. (a) (b) 193,154 2,174,914Fibrocell Science, Inc. (a) (b) 41,836 23,215FibroGen, Inc. (b) 332,801 18,337,335Five Prime Therapeutics, Inc. (a) (b) 136,056 2,892,551Flexion Therapeutics, Inc. (a) (b) 152,615 3,870,316Fortress Biotech, Inc. (a) (b) 160,408 683,338Foundation Medicine, Inc. (a) (b) 65,132 5,389,673Galectin Therapeutics, Inc. (a) (b) 122,625 503,989Genocea Biosciences, Inc. (a) (b) 97,488 97,488Genomic Health, Inc. (b) 92,757 2,968,224GenVec, Inc. rights (c) 14,247 0Geron Corp. (a) (b) 680,058 1,570,934Global Blood Therapeutics, Inc. (a) (b) 176,624 10,358,998GlycoMimetics, Inc. (a) (b) 105,049 2,417,177GTx, Inc. (a) (b) 30,934 495,253Halozyme Therapeutics, Inc. (a) (b) 580,040 11,403,586

64Annual Report
See accompanying notes which are an integral part of the financial statements.
Schedule of Investments – continued
Common Stocks – continuedShares Value
HEALTH CARE – continuedBiotechnology – continuedHeat Biologics, Inc. (a) (b) 7,670 $ 19,328Hemispherx Biopharma, Inc. (a) (b) 63,934 31,967Heron Therapeutics, Inc. (a) (b) 238,302 4,849,446Histogenics Corp. (b) 270 697iBio, Inc. (b) 302,306 59,252Idera Pharmaceuticals, Inc. (a) (b) 695,354 1,230,777Immucell Corp. (b) 6,741 48,737Immune Design Corp. (a) (b) 137,453 398,614Immune Pharmaceuticals, Inc. (a) (b) 15,214 4,980ImmunoCellular Therapeutics Ltd. (a) (b) 6,339 1,628ImmunoGen, Inc. (a) (b) 436,830 4,853,181Immunomedics, Inc. (a) (b) 478,949 8,099,028Infinity Pharmaceuticals, Inc. (a) (b) 236,483 444,588Inovio Pharmaceuticals, Inc. (a) (b) 369,930 1,516,713Insmed, Inc. (a) (b) 342,316 8,287,470Insys Therapeutics, Inc. (a) (b) 118,023 860,388Intellia Therapeutics, Inc. (b) 91,763 2,395,014Intercept Pharmaceuticals, Inc. (a) (b) 77,905 4,653,266Intrexon Corp. (a) (b) 268,982 3,502,146Invitae Corp. (a) (b) 144,337 951,181Ionis Pharmaceuticals, Inc. (a) (b) 548,921 28,994,007Iovance Biotherapeutics, Inc. (b) 312,345 5,419,186Ironwood Pharmaceuticals, Inc. Class A (a) (b) 584,864 8,305,069IsoRay, Inc. (a) (b) 212,731 89,730Jounce Therapeutics, Inc. (a) (b) 34,622 729,832Juno Therapeutics, Inc. (b) 381,268 33,082,624Kadmon Holdings, Inc. (a) (b) 333,503 1,203,946Kalvista Pharmaceuticals, Inc. (a) (b) 15,341 159,393Karyopharm Therapeutics, Inc. (b) 138,951 2,052,306Keryx Biopharmaceuticals, Inc. (a) (b) 467,581 2,146,197Kindred Biosciences, Inc. (b) 105,425 938,283Kura Oncology, Inc. (a) (b) 82,876 1,872,998La Jolla Pharmaceutical Co. (a) (b) 76,532 2,377,084Lexicon Pharmaceuticals, Inc. (a) (b) 206,977 1,786,212Ligand Pharmaceuticals, Inc.:
Class B (a) (b) 92,224 14,007,903General CVR (b) 26,087 339Glucagon CVR (b) 26,087 1,565rights (b) 26,087 261TR Beta CVR (b) 26,087 339
Loxo Oncology, Inc. (a) (b) 97,414 10,834,385Macrogenics, Inc. (a) (b) 144,717 3,630,950Madrigal Pharmaceuticals, Inc. (a) (b) 25,774 3,248,555MannKind Corp. (a) (b) 354,577 1,038,911Matinas BioPharma Holdings, Inc. (a) (b) 314,745 311,346MediciNova, Inc. (a) (b) 111,867 1,169,010MEI Pharma, Inc. (b) 122,276 270,841Merrimack Pharmaceuticals, Inc. (a) 58,611 651,168MiMedx Group, Inc. (a) (b) 454,353 3,221,363Minerva Neurosciences, Inc. (a) (b) 138,621 727,760Miragen Therapeutics, Inc. (b) 49,077 272,377Mirati Therapeutics, Inc. (a) (b) 121,254 3,292,046Molecular Templates, Inc. (b) 23,056 213,960Moleculin Biotech, Inc. (a) (b) 58,888 117,187
Shares Value
Momenta Pharmaceuticals, Inc. (b) 341,255 $ 5,818,398Myriad Genetics, Inc. (b) 304,682 9,877,790NanoViricides, Inc. (b) 143,363 131,894NantKwest, Inc. (a) (b) 116,232 516,070Natera, Inc. (a) (b) 159,428 1,434,852Navidea Biopharmaceuticals, Inc. (b) 571,658 216,487Neuralstem, Inc. (a) (b) 67,699 102,225Neurocrine Biosciences, Inc. (a) (b) 387,470 32,714,092NewLink Genetics Corp. (a) (b) 120,304 863,783Novavax, Inc. (a) (b) 1,386,707 3,009,154Ohr Pharmaceutical, Inc. (a) (b) 235,847 57,900OncoCyte Corp. (a) (b) 11,637 38,402OncoGenex Pharmaceuticals, Inc. (a) (b) 8,143 10,423OncoMed Pharmaceuticals, Inc. (b) 79,764 185,850Onconova Therapeutics, Inc. (b) 3,480 3,793OncoSec Medical, Inc. (a) (b) 52,231 94,538OpGen, Inc. (a) (b) 1,643 3,631Ophthotech Corp. (a) (b) 123,408 334,436Opko Health, Inc. (a) (b) 1,647,022 5,583,405Oragenics, Inc. (a) (b) 7,997 13,835Organovo Holdings, Inc. (a) (b) 401,186 405,198Otonomy, Inc. (b) 111,539 663,657OvaScience, Inc. (a) (b) 154,817 147,030Ovid Therapeutics, Inc. 11,573 76,266Palatin Technologies, Inc. (a) (b) 634,919 593,014PDL BioPharma, Inc. (a) (b) 697,561 1,674,146Pfenex, Inc. (b) 65,771 254,534Polarityte, Inc. (a) (b) 24,635 445,894Portola Pharmaceuticals, Inc. (b) 290,102 12,277,117Progenics Pharmaceuticals, Inc. (a) (b) 305,792 2,042,691Protagonist Therapeutics, Inc. (b) 54,125 917,419Proteon Therapeutics, Inc. (a) (b) 24,275 54,619Proteostasis Therapeutics, Inc. (b) 109,237 326,619Prothena Corp. PLC (a) (b) 168,821 5,687,579PTC Therapeutics, Inc. (b) 148,089 3,813,292Puma Biotechnology, Inc. (a) (b) 132,836 8,680,833Ra Pharmaceuticals, Inc. (b) 39,576 252,495Radius Health, Inc. (a) (b) 182,539 6,952,911Recro Pharma, Inc. (b) 59,391 535,113REGENXBIO, Inc. (b) 122,384 3,481,825Regulus Therapeutics, Inc. (a) (b) 368,835 409,407Repligen Corp. (a) (b) 161,329 5,531,971Retrophin, Inc. (b) 173,921 4,351,503Rexahn Pharmaceuticals, Inc. (a) (b) 103,785 166,056Rigel Pharmaceuticals, Inc. (b) 627,646 2,359,949Riot Blockchain, Inc. (a) 42,506 449,713Rocket Pharmaceuticals, Inc. (a) (b) 50,811 862,771RXi Pharmaceuticals Corp. (a) (b) 2,663 7,430Sage Therapeutics, Inc. (b) 198,916 32,097,086Sangamo Therapeutics, Inc. (a) (b) 367,310 8,797,075Sarepta Therapeutics, Inc. (a) (b) 266,434 16,724,062Savara, Inc. (a) (b) 104,216 1,158,882Seattle Genetics, Inc. (a) (b) 455,324 24,587,496Selecta Biosciences, Inc. (a) (b) 40,673 372,565Sellas Life Sciences Group, Inc. (b) 1,097 5,375Seres Therapeutics, Inc. (a) (b) 92,614 879,833
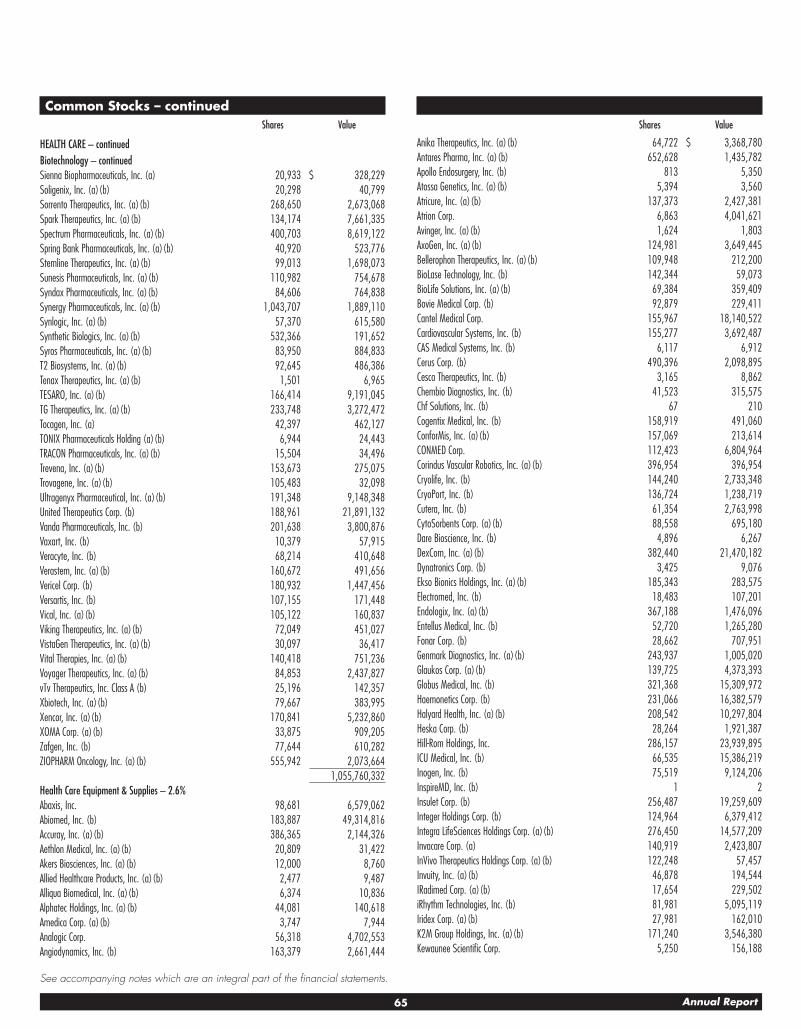
65 Annual Report
See accompanying notes which are an integral part of the financial statements.
Common Stocks – continuedShares Value
HEALTH CARE – continuedBiotechnology – continuedSienna Biopharmaceuticals, Inc. (a) 20,933 $ 328,229Soligenix, Inc. (a) (b) 20,298 40,799Sorrento Therapeutics, Inc. (a) (b) 268,650 2,673,068Spark Therapeutics, Inc. (a) (b) 134,174 7,661,335Spectrum Pharmaceuticals, Inc. (a) (b) 400,703 8,619,122Spring Bank Pharmaceuticals, Inc. (a) (b) 40,920 523,776Stemline Therapeutics, Inc. (a) (b) 99,013 1,698,073Sunesis Pharmaceuticals, Inc. (a) (b) 110,982 754,678Syndax Pharmaceuticals, Inc. (a) (b) 84,606 764,838Synergy Pharmaceuticals, Inc. (a) (b) 1,043,707 1,889,110Synlogic, Inc. (a) (b) 57,370 615,580Synthetic Biologics, Inc. (a) (b) 532,366 191,652Syros Pharmaceuticals, Inc. (a) (b) 83,950 884,833T2 Biosystems, Inc. (a) (b) 92,645 486,386Tenax Therapeutics, Inc. (a) (b) 1,501 6,965TESARO, Inc. (a) (b) 166,414 9,191,045TG Therapeutics, Inc. (a) (b) 233,748 3,272,472Tocagen, Inc. (a) 42,397 462,127TONIX Pharmaceuticals Holding (a) (b) 6,944 24,443TRACON Pharmaceuticals, Inc. (a) (b) 15,504 34,496Trevena, Inc. (a) (b) 153,673 275,075Trovagene, Inc. (a) (b) 105,483 32,098Ultragenyx Pharmaceutical, Inc. (a) (b) 191,348 9,148,348United Therapeutics Corp. (b) 188,961 21,891,132Vanda Pharmaceuticals, Inc. (b) 201,638 3,800,876Vaxart, Inc. (b) 10,379 57,915Veracyte, Inc. (b) 68,214 410,648Verastem, Inc. (a) (b) 160,672 491,656Vericel Corp. (b) 180,932 1,447,456Versartis, Inc. (b) 107,155 171,448Vical, Inc. (a) (b) 105,122 160,837Viking Therapeutics, Inc. (a) (b) 72,049 451,027VistaGen Therapeutics, Inc. (a) (b) 30,097 36,417Vital Therapies, Inc. (a) (b) 140,418 751,236Voyager Therapeutics, Inc. (a) (b) 84,853 2,437,827vTv Therapeutics, Inc. Class A (b) 25,196 142,357Xbiotech, Inc. (a) (b) 79,667 383,995Xencor, Inc. (a) (b) 170,841 5,232,860XOMA Corp. (a) (b) 33,875 909,205Zafgen, Inc. (b) 77,644 610,282ZIOPHARM Oncology, Inc. (a) (b) 555,942 2,073,664
1,055,760,332Health Care Equipment & Supplies – 2.6%Abaxis, Inc. 98,681 6,579,062Abiomed, Inc. (b) 183,887 49,314,816Accuray, Inc. (a) (b) 386,365 2,144,326Aethlon Medical, Inc. (a) (b) 20,809 31,422Akers Biosciences, Inc. (a) (b) 12,000 8,760Allied Healthcare Products, Inc. (a) (b) 2,477 9,487Alliqua Biomedical, Inc. (a) (b) 6,374 10,836Alphatec Holdings, Inc. (a) (b) 44,081 140,618Amedica Corp. (a) (b) 3,747 7,944Analogic Corp. 56,318 4,702,553Angiodynamics, Inc. (b) 163,379 2,661,444
Shares Value
Anika Therapeutics, Inc. (a) (b) 64,722 $ 3,368,780Antares Pharma, Inc. (a) (b) 652,628 1,435,782Apollo Endosurgery, Inc. (b) 813 5,350Atossa Genetics, Inc. (a) (b) 5,394 3,560Atricure, Inc. (a) (b) 137,373 2,427,381Atrion Corp. 6,863 4,041,621Avinger, Inc. (a) (b) 1,624 1,803AxoGen, Inc. (a) (b) 124,981 3,649,445Bellerophon Therapeutics, Inc. (a) (b) 109,948 212,200BioLase Technology, Inc. (b) 142,344 59,073BioLife Solutions, Inc. (a) (b) 69,384 359,409Bovie Medical Corp. (b) 92,879 229,411Cantel Medical Corp. 155,967 18,140,522Cardiovascular Systems, Inc. (b) 155,277 3,692,487CAS Medical Systems, Inc. (b) 6,117 6,912Cerus Corp. (b) 490,396 2,098,895Cesca Therapeutics, Inc. (b) 3,165 8,862Chembio Diagnostics, Inc. (b) 41,523 315,575Chf Solutions, Inc. (b) 67 210Cogentix Medical, Inc. (b) 158,919 491,060ConforMis, Inc. (a) (b) 157,069 213,614CONMED Corp. 112,423 6,804,964Corindus Vascular Robotics, Inc. (a) (b) 396,954 396,954Cryolife, Inc. (b) 144,240 2,733,348CryoPort, Inc. (b) 136,724 1,238,719Cutera, Inc. (b) 61,354 2,763,998CytoSorbents Corp. (a) (b) 88,558 695,180Dare Bioscience, Inc. (b) 4,896 6,267DexCom, Inc. (a) (b) 382,440 21,470,182Dynatronics Corp. (b) 3,425 9,076Ekso Bionics Holdings, Inc. (a) (b) 185,343 283,575Electromed, Inc. (b) 18,483 107,201Endologix, Inc. (a) (b) 367,188 1,476,096Entellus Medical, Inc. (b) 52,720 1,265,280Fonar Corp. (b) 28,662 707,951Genmark Diagnostics, Inc. (a) (b) 243,937 1,005,020Glaukos Corp. (a) (b) 139,725 4,373,393Globus Medical, Inc. (b) 321,368 15,309,972Haemonetics Corp. (b) 231,066 16,382,579Halyard Health, Inc. (a) (b) 208,542 10,297,804Heska Corp. (b) 28,264 1,921,387Hill-Rom Holdings, Inc. 286,157 23,939,895ICU Medical, Inc. (b) 66,535 15,386,219Inogen, Inc. (b) 75,519 9,124,206InspireMD, Inc. (b) 1 2Insulet Corp. (b) 256,487 19,259,609Integer Holdings Corp. (b) 124,964 6,379,412Integra LifeSciences Holdings Corp. (a) (b) 276,450 14,577,209Invacare Corp. (a) 140,919 2,423,807InVivo Therapeutics Holdings Corp. (a) (b) 122,248 57,457Invuity, Inc. (a) (b) 46,878 194,544IRadimed Corp. (a) (b) 17,654 229,502iRhythm Technologies, Inc. (b) 81,981 5,095,119Iridex Corp. (a) (b) 27,981 162,010K2M Group Holdings, Inc. (a) (b) 171,240 3,546,380Kewaunee Scientific Corp. 5,250 156,188

66Annual Report
See accompanying notes which are an integral part of the financial statements.
Schedule of Investments – continued
Common Stocks – continuedShares Value
HEALTH CARE – continuedHealth Care Equipment & Supplies – continuedLantheus Holdings, Inc. (b) 130,409 $ 1,995,258LeMaitre Vascular, Inc. (a) 72,373 2,515,685LivaNova PLC (b) 190,428 17,089,009Masimo Corp. (b) 206,801 18,101,292Meridian Bioscience, Inc. 201,601 2,812,334Merit Medical Systems, Inc. (b) 223,509 10,169,660Microbot Medical, Inc. (a) (b) 28,915 23,875Milestone Scientific, Inc. (a) (b) 45,410 42,286Misonix, Inc. (b) 18,363 185,466Myomo, Inc. (a) (b) 17,261 79,573Natus Medical, Inc. (b) 138,561 4,316,175Neogen Corp. (b) 226,529 13,199,845NeuroMetrix, Inc. (b) 820 1,082Nevro Corp. (a) (b) 121,252 9,835,962NuVasive, Inc. (b) 223,826 10,824,225Nuvectra Corp. (b) 35,935 383,426NxStage Medical, Inc. (b) 290,694 6,767,356OraSure Technologies, Inc. (b) 273,729 4,724,563Orthofix International NV (b) 79,952 4,478,112Penumbra, Inc. (a) (b) 132,026 14,285,213Precision Therapeutics, Inc. (a) (b) 27,737 31,343Presbia PLC (a) (b) 14,898 47,376Pulse Biosciences, Inc. (a) (b) 23,721 438,839Quidel Corp. (b) 128,607 5,609,837ReShape Lifesciences, Inc. (a) (b) 13,409 20,918Retractable Technologies, Inc. (b) 36,514 32,932Rockwell Medical Technologies, Inc. (a) (b) 202,763 1,182,108RTI Biologics, Inc. (b) 250,898 1,066,317Seaspine Holdings Corp. (b) 41,314 417,685Second Sight Medical Products, Inc. (a) (b) 63,760 95,002Sientra, Inc. (a) (b) 58,832 561,846Staar Surgical Co. (a) (b) 117,470 1,844,279Steris PLC 372,054 33,968,530STRATA Skin Sciences, Inc. (a) (b) 1,434 1,879SurModics, Inc. (b) 57,901 1,742,820Synergetics U.S.A., Inc. (b) (c) 76,412 1Tactile Systems Technology, Inc. (a) (b) 63,267 2,047,320Tandem Diabetes Care, Inc. (b) 14,419 45,564Teleflex, Inc. 196,337 49,050,873TransEnterix, Inc. (a) (b) 481,032 913,961Utah Medical Products, Inc. 15,694 1,392,058Vermillion, Inc. (b) 65,547 98,321ViewRay, Inc. (a) (b) 155,862 1,295,213Viveve Medical, Inc. (a) (b) 46,102 199,622VolitionRx Ltd. (a) (b) 100,890 308,723West Pharmaceutical Services, Inc. 324,899 28,337,691Wright Medical Group NV (a) (b) 463,079 9,423,658Zosano Pharma Corp. (a) (b) 6,692 41,758
558,200,596Health Care Providers & Services – 1.4%AAC Holdings, Inc. (a) (b) 40,868 386,611Acadia Healthcare Co., Inc. (a) (b) 358,376 13,654,126Aceto Corp. 135,992 975,063Addus HomeCare Corp. (b) 31,856 1,094,254
Shares Value
Almost Family, Inc. (b) 53,272 $ 3,140,384Amedisys, Inc. (b) 127,069 7,523,755American Renal Associates Holdings, Inc. (a) (b) 50,577 1,002,436American Shared Hospital Services (b) 115 293AMN Healthcare Services, Inc. (a) (b) 210,133 11,693,901BioScrip, Inc. (a) (b) 579,496 1,831,207BioTelemetry, Inc. (a) (b) 133,878 4,324,259Brookdale Senior Living, Inc. (b) 828,354 5,409,152Caladrius Biosciences, Inc. (a) (b) 17,378 82,893Capital Senior Living Corp. (a) (b) 114,940 1,355,143Chemed Corp. 70,081 18,195,130Civitas Solutions, Inc. (b) 72,322 940,186Community Health Systems, Inc. (a) (b) 505,186 2,586,552Corvel Corp. (b) 44,212 2,164,177Cross Country Healthcare, Inc. (b) 157,552 2,040,298Digirad Corp. 52,208 107,026Diplomat Pharmacy, Inc. (a) (b) 211,259 4,402,638Diversicare Healthcare Services, Inc. 13,755 120,494Five Star Sr Living, Inc. (b) 200,855 291,240G1 Therapeutics, Inc. (a) 40,872 923,298Genesis HealthCare, Inc. Class A (a) (b) 122,459 162,870HealthEquity, Inc. (a) (b) 223,919 12,893,256HealthSouth Corp. 428,366 22,814,773InfuSystems Holdings, Inc. (b) 46,642 104,945Innovative Industrial Properties, Inc. 15,197 379,317Interpace Diagnostics Group, Inc. (a) (b) 84,688 85,535Kindred Healthcare, Inc. 383,129 3,524,787LHC Group, Inc. (b) 69,410 4,468,616LifePoint Hospitals, Inc. (a) (b) 174,674 8,052,471Magellan Health Services, Inc. (b) 106,342 10,729,908MEDNAX, Inc. (b) 409,734 22,527,175Molina Healthcare, Inc. (a) (b) 190,323 13,760,353National Healthcare Corp. 53,157 3,118,721National Research Corp. Class A 41,327 1,169,554National Vision Holdings, Inc. (a) 71,396 2,467,446OptiNose, Inc. (a) 47,069 833,592Owens & Minor, Inc. 254,146 4,170,536Premier, Inc. (a) (b) 253,088 8,389,867Providence Service Corp. (b) 55,715 3,541,245Psychemedics Corp. 24,573 521,685Quorum Health Corp. (a) (b) 123,157 731,553R1 RCM, Inc. (a) (b) 331,964 2,177,684RadNet, Inc. (b) 138,775 1,387,750Select Medical Holdings Corp. (b) 473,830 8,576,323Sharps Compliance Corp. (b) 38,932 176,751SunLink Health Systems, Inc. (b) 10,217 14,712Surgery Partners, Inc. (a) (b) 85,904 1,361,578Tenet Healthcare Corp. (a) (b) 349,778 7,205,427The Ensign Group, Inc. (a) 210,263 5,614,022Tivity Health, Inc. (a) (b) 145,588 5,612,417Triple-S Management Corp. (a) (b) 101,083 2,456,317U.S. Physical Therapy, Inc. 56,068 4,345,270Wellcare Health Plans, Inc. (b) 192,786 37,383,133
285,004,105Health Care Technology – 0.6%Allscripts Healthcare Solutions, Inc. (b) 768,411 10,657,861

67 Annual Report
See accompanying notes which are an integral part of the financial statements.
Common Stocks – continuedShares Value
HEALTH CARE – continuedHealth Care Technology – continuedArrhythmia Research Technology, Inc. (b) 9,913 $ 35,588athenahealth, Inc. (a) (b) 174,789 24,425,015Castlight Health, Inc. Class B (a) (b) 314,462 1,116,340Computer Programs & Systems, Inc. (a) 49,251 1,467,680Evolent Health, Inc. (a) (b) 269,471 3,947,750HealthStream, Inc. 115,141 2,781,807HMS Holdings Corp. (b) 371,818 5,963,961HTG Molecular Diagnostics (a) (b) 114,333 524,788iCAD, Inc. (b) 51,129 175,372Inovalon Holdings, Inc. Class A (a) (b) 288,458 3,461,496Medical Transcription Billing Corp. (a) (b) 30,694 121,548Medidata Solutions, Inc. (a) (b) 255,197 16,756,235NantHealth, Inc. (a) (b) 151,574 457,753Omnicell, Inc. (b) 163,472 7,135,553Quality Systems, Inc. (b) 196,746 2,469,162Simulations Plus, Inc. (a) 44,648 694,276Streamline Health Solutions, Inc. (a) (b) 74,551 138,665Tabula Rasa HealthCare, Inc. (a) (b) 53,720 1,735,693Teladoc, Inc. (a) (b) 226,627 9,087,743Veeva Systems, Inc. Class A (b) 502,517 35,025,435Vocera Communications, Inc. (b) 130,621 3,592,078
131,771,799Life Sciences Tools & Services – 0.6%Accelerate Diagnostics, Inc. (a) (b) 114,176 3,002,829Bio-Rad Laboratories, Inc. Class A (b) 88,156 23,805,646Bio-Techne Corp. 165,492 23,390,639Bioanalytical Systems, Inc. (b) 4,687 7,593Bruker Corp. 448,968 13,760,869Cambrex Corp. (a) (b) 141,044 7,327,236Charles River Laboratories International, Inc. (b) 205,418 21,899,613ChromaDex, Inc. (a) (b) 94,205 513,417Enzo Biochem, Inc. (b) 184,150 1,165,670Fluidigm Corp. (a) (b) 119,521 809,157Harvard Bioscience, Inc. (b) 111,418 523,665INC Research Holdings, Inc. Class A (b) 249,175 10,440,433Luminex Corp. 173,959 3,411,336Medpace Holdings, Inc. (b) 50,905 1,631,505Nanostring Technologies, Inc. (b) 75,121 481,526NeoGenomics, Inc. (a) (b) 236,614 1,987,558Pacific Biosciences of California, Inc. (a) (b) 415,712 989,395PRA Health Sciences, Inc. (b) 220,042 18,483,528pSivida Corp. (a) (b) 200,166 210,174
133,841,789Pharmaceuticals – 1.5%AcelRx Pharmaceuticals, Inc. (a) (b) 126,457 227,623Acer Therapeutics, Inc. (b) 3,397 60,874Aclaris Therapeutics, Inc. (a) (b) 104,312 2,079,981Adamis Pharmaceuticals Corp. (a) (b) 122,410 367,230Aerie Pharmaceuticals, Inc. (a) (b) 164,168 8,397,193Agile Therapeutics, Inc. (a) (b) 73,763 267,760Akcea Therapeutics, Inc. (a) 77,026 1,307,131Akorn, Inc. (a) (b) 405,401 6,867,493Alimera Sciences, Inc. (a) (b) 102,415 133,140Amphastar Pharmaceuticals, Inc. (a) (b) 158,581 2,911,547
Shares Value
Ampio Pharmaceuticals, Inc. (a) (b) 318,736 $ 707,594ANI Pharmaceuticals, Inc. (b) 38,941 2,494,950ANI Pharmaceuticals, Inc. rights (b) (c) 58,183 1Apricus Biosciences, Inc. (a) (b) 18,299 16,835Aradigm Corp. (a) (b) 45,769 51,719Aratana Therapeutics, Inc. (b) 155,922 580,030Assembly Biosciences, Inc. (a) (b) 73,589 4,175,440AstraZeneca PLC rights (b) (c) 21,542 0Athenex, Inc. (a) 166,750 2,641,320Avexis, Inc. (b) 137,449 17,006,565Axsome Therapeutics, Inc. (a) (b) 61,057 155,695Bio Path Holdings, Inc. (a) (b) 34,608 58,488Biodelivery Sciences International, Inc. (b) 266,001 598,502BioPharmX Corp. (a) (b) 259,103 66,045Catalent, Inc. (b) 584,885 24,418,949Cerecor, Inc. (a) (b) 45,961 214,178Clearside Biomedical, Inc. (b) 56,066 362,186Collegium Pharmaceutical, Inc. (a) (b) 93,624 2,246,040ContraVir Pharmaceuticals, Inc. (a) (b) 235,301 58,825Corcept Therapeutics, Inc. (a) (b) 414,651 6,298,549Corium International, Inc. (a) (b) 110,775 1,440,075CorMedix, Inc. (a) (b) 246,421 71,462Cumberland Pharmaceuticals, Inc. (b) 33,632 222,644CymaBay Therapeutics, Inc. (b) 249,982 3,722,232DepoMed, Inc. (a) (b) 279,603 1,920,873Dermira, Inc. (a) (b) 147,210 3,784,769Dova Pharmaceuticals, Inc. (a) 26,016 787,244Durect Corp. (b) 600,826 733,008Egalet Corp. (a) (b) 55,293 41,802Endo International PLC (a) (b) 888,794 5,603,846Endocyte, Inc. (a) (b) 169,216 1,003,451Evofem Biosciences, Inc. (a) (b) 3,247 22,956Evoke Pharma, Inc. (a) (b) 15,864 30,935Flex Pharma, Inc. (a) (b) 43,126 176,817Gemphire Therapeutics, Inc. (a) (b) 23,191 157,467Horizon Pharma PLC (b) 727,591 10,608,277Impax Laboratories, Inc. (a) (b) 325,117 6,632,387Imprimis Pharmaceuticals, Inc. (a) (b) 47,994 87,349Innoviva, Inc. (a) (b) 340,069 5,274,470Intersect ENT, Inc. (b) 117,996 4,348,153Intra-Cellular Therapies, Inc. (b) 203,119 3,934,415Jaguar Health, Inc. (b) 27,742 4,097Jazz Pharmaceuticals PLC (a) (b) 264,208 38,257,318Juniper Pharmaceuticals, Inc. (b) 42,963 360,889Kala Pharmaceuticals, Inc. (a) 26,201 368,124KemPharm, Inc. (a) (b) 54,249 317,357Lannett Co., Inc. (a) (b) 132,787 2,124,592Lipocine, Inc. (a) (b) 73,787 140,195Mallinckrodt PLC (a) (b) 417,514 6,964,134Marinus Pharmaceuticals, Inc. (b) 116,446 599,697Melinta Therapeutics, Inc. (a) (b) 84,105 1,047,107Mersana Therapeutics, Inc. (a) 32,098 555,616MyoKardia, Inc. (a) (b) 87,793 5,109,553Nektar Therapeutics (a) (b) 688,387 59,586,779Neos Therapeutics, Inc. (a) (b) 97,688 810,810NovaBay Pharmaceuticals, Inc. (a) (b) 5,692 19,894
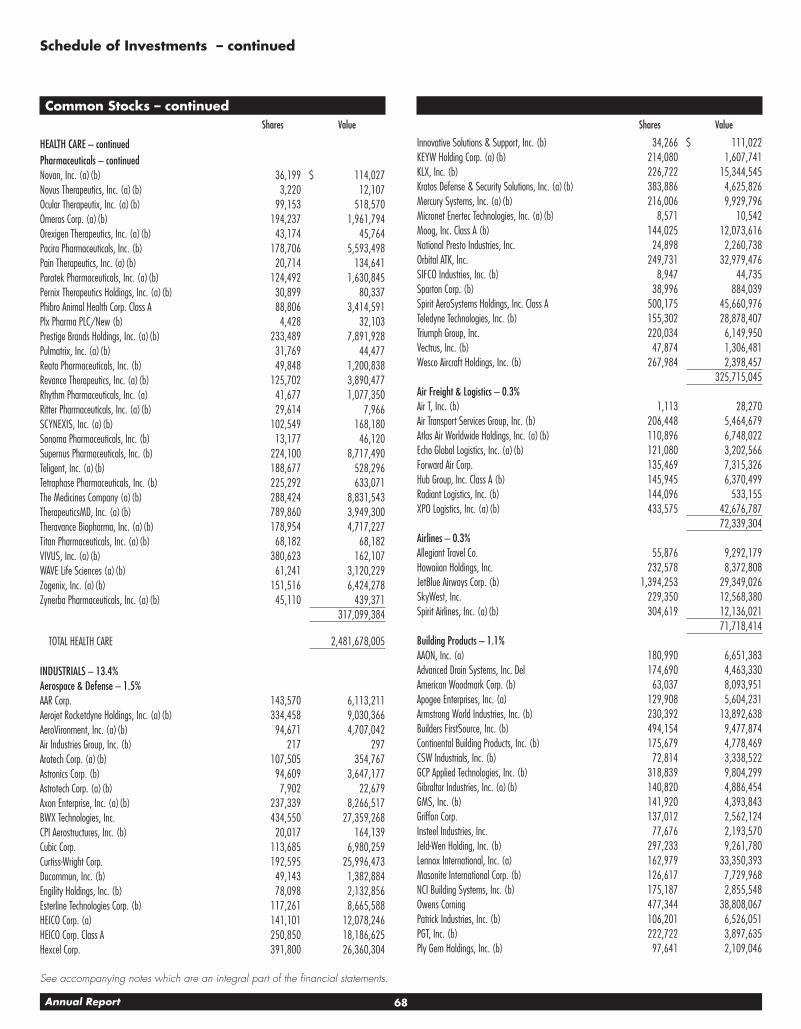
68Annual Report
See accompanying notes which are an integral part of the financial statements.
Schedule of Investments – continued
Common Stocks – continuedShares Value
HEALTH CARE – continuedPharmaceuticals – continuedNovan, Inc. (a) (b) 36,199 $ 114,027Novus Therapeutics, Inc. (a) (b) 3,220 12,107Ocular Therapeutix, Inc. (a) (b) 99,153 518,570Omeros Corp. (a) (b) 194,237 1,961,794Orexigen Therapeutics, Inc. (a) (b) 43,174 45,764Pacira Pharmaceuticals, Inc. (b) 178,706 5,593,498Pain Therapeutics, Inc. (a) (b) 20,714 134,641Paratek Pharmaceuticals, Inc. (a) (b) 124,492 1,630,845Pernix Therapeutics Holdings, Inc. (a) (b) 30,899 80,337Phibro Animal Health Corp. Class A 88,806 3,414,591Plx Pharma PLC/New (b) 4,428 32,103Prestige Brands Holdings, Inc. (a) (b) 233,489 7,891,928Pulmatrix, Inc. (a) (b) 31,769 44,477Reata Pharmaceuticals, Inc. (b) 49,848 1,200,838Revance Therapeutics, Inc. (a) (b) 125,702 3,890,477Rhythm Pharmaceuticals, Inc. (a) 41,677 1,077,350Ritter Pharmaceuticals, Inc. (a) (b) 29,614 7,966SCYNEXIS, Inc. (a) (b) 102,549 168,180Sonoma Pharmaceuticals, Inc. (b) 13,177 46,120Supernus Pharmaceuticals, Inc. (b) 224,100 8,717,490Teligent, Inc. (a) (b) 188,677 528,296Tetraphase Pharmaceuticals, Inc. (b) 225,292 633,071The Medicines Company (a) (b) 288,424 8,831,543TherapeuticsMD, Inc. (a) (b) 789,860 3,949,300Theravance Biopharma, Inc. (a) (b) 178,954 4,717,227Titan Pharmaceuticals, Inc. (a) (b) 68,182 68,182VIVUS, Inc. (a) (b) 380,623 162,107WAVE Life Sciences (a) (b) 61,241 3,120,229Zogenix, Inc. (a) (b) 151,516 6,424,278Zynerba Pharmaceuticals, Inc. (a) (b) 45,110 439,371
317,099,384
TOTAL HEALTH CARE 2,481,678,005
INDUSTRIALS – 13.4%Aerospace & Defense – 1.5%AAR Corp. 143,570 6,113,211Aerojet Rocketdyne Holdings, Inc. (a) (b) 334,458 9,030,366AeroVironment, Inc. (a) (b) 94,671 4,707,042Air Industries Group, Inc. (b) 217 297Arotech Corp. (a) (b) 107,505 354,767Astronics Corp. (b) 94,609 3,647,177Astrotech Corp. (a) (b) 7,902 22,679Axon Enterprise, Inc. (a) (b) 237,339 8,266,517BWX Technologies, Inc. 434,550 27,359,268CPI Aerostructures, Inc. (b) 20,017 164,139Cubic Corp. 113,685 6,980,259Curtiss-Wright Corp. 192,595 25,996,473Ducommun, Inc. (b) 49,143 1,382,884Engility Holdings, Inc. (b) 78,098 2,132,856Esterline Technologies Corp. (b) 117,261 8,665,588HEICO Corp. (a) 141,101 12,078,246HEICO Corp. Class A 250,850 18,186,625Hexcel Corp. 391,800 26,360,304
Shares Value
Innovative Solutions & Support, Inc. (b) 34,266 $ 111,022KEYW Holding Corp. (a) (b) 214,080 1,607,741KLX, Inc. (b) 226,722 15,344,545Kratos Defense & Security Solutions, Inc. (a) (b) 383,886 4,625,826Mercury Systems, Inc. (a) (b) 216,006 9,929,796Micronet Enertec Technologies, Inc. (a) (b) 8,571 10,542Moog, Inc. Class A (b) 144,025 12,073,616National Presto Industries, Inc. 24,898 2,260,738Orbital ATK, Inc. 249,731 32,979,476SIFCO Industries, Inc. (b) 8,947 44,735Sparton Corp. (b) 38,996 884,039Spirit AeroSystems Holdings, Inc. Class A 500,175 45,660,976Teledyne Technologies, Inc. (b) 155,302 28,878,407Triumph Group, Inc. 220,034 6,149,950Vectrus, Inc. (b) 47,874 1,306,481Wesco Aircraft Holdings, Inc. (b) 267,984 2,398,457
325,715,045Air Freight & Logistics – 0.3%Air T, Inc. (b) 1,113 28,270Air Transport Services Group, Inc. (b) 206,448 5,464,679Atlas Air Worldwide Holdings, Inc. (a) (b) 110,896 6,748,022Echo Global Logistics, Inc. (a) (b) 121,080 3,202,566Forward Air Corp. 135,469 7,315,326Hub Group, Inc. Class A (b) 145,945 6,370,499Radiant Logistics, Inc. (b) 144,096 533,155XPO Logistics, Inc. (a) (b) 433,575 42,676,787
72,339,304Airlines – 0.3%Allegiant Travel Co. 55,876 9,292,179Hawaiian Holdings, Inc. 232,578 8,372,808JetBlue Airways Corp. (b) 1,394,253 29,349,026SkyWest, Inc. 229,350 12,568,380Spirit Airlines, Inc. (a) (b) 304,619 12,136,021
71,718,414Building Products – 1.1%AAON, Inc. (a) 180,990 6,651,383Advanced Drain Systems, Inc. Del 174,690 4,463,330American Woodmark Corp. (b) 63,037 8,093,951Apogee Enterprises, Inc. (a) 129,908 5,604,231Armstrong World Industries, Inc. (b) 230,392 13,892,638Builders FirstSource, Inc. (b) 494,154 9,477,874Continental Building Products, Inc. (b) 175,679 4,778,469CSW Industrials, Inc. (b) 72,814 3,338,522GCP Applied Technologies, Inc. (b) 318,839 9,804,299Gibraltar Industries, Inc. (a) (b) 140,820 4,886,454GMS, Inc. (b) 141,920 4,393,843Griffon Corp. 137,012 2,562,124Insteel Industries, Inc. 77,676 2,193,570Jeld-Wen Holding, Inc. (b) 297,233 9,261,780Lennox International, Inc. (a) 162,979 33,350,393Masonite International Corp. (b) 126,617 7,729,968NCI Building Systems, Inc. (b) 175,187 2,855,548Owens Corning 477,344 38,808,067Patrick Industries, Inc. (b) 106,201 6,526,051PGT, Inc. (b) 222,722 3,897,635Ply Gem Holdings, Inc. (b) 97,641 2,109,046

69 Annual Report
See accompanying notes which are an integral part of the financial statements.
Common Stocks – continuedShares Value
INDUSTRIALS – continuedBuilding Products – continuedQuanex Building Products Corp. 151,050 $ 2,530,088Simpson Manufacturing Co. Ltd. 185,915 10,284,818Tecogen, Inc. New (a) (b) 6,158 13,671Trex Co., Inc. (b) 128,907 13,328,984Universal Forest Products, Inc. 270,889 8,923,084USG Corp. (a) (b) 390,106 13,037,343
232,797,164Commercial Services & Supplies – 1.6%ABM Industries, Inc. (a) 247,365 8,697,353ACCO Brands Corp. 475,103 6,010,053Acme United Corp. 1,357 31,890ADS Waste Holdings, Inc. (b) 190,695 4,267,754Amrep Corp. (b) 2,745 20,889Aqua Metals, Inc. (a) (b) 65,324 150,898ARC Document Solutions, Inc. (b) 152,363 324,533Avalon Holdings Corp. Class A (b) 128 271Brady Corp. Class A 217,590 8,137,866Casella Waste Systems, Inc. Class A (b) 167,872 4,267,306CECO Environmental Corp. 121,214 498,190Cemtrex, Inc. (a) 35,054 86,233Cenveo, Inc. (a) (b) 3,247 276Clean Harbors, Inc. (a) (b) 226,019 11,285,129Command Security Corp. (b) 4,127 13,371CompX International, Inc. Class A 729 9,951Copart, Inc. (a) (b) 873,039 40,866,956Covanta Holding Corp. (a) 578,029 8,641,534Deluxe Corp. 211,910 15,045,610Ecology & Environment, Inc. Class A 5,634 63,383Ennis, Inc. 117,199 2,285,381Essendant, Inc. 162,977 1,294,037Evoqua Water Technologies Corp. (a) (b) 125,642 2,877,202Fuel Tech, Inc. (a) (b) 72,552 79,082Healthcare Services Group, Inc. (a) 321,337 14,598,340Heritage-Crystal Clean, Inc. (b) 68,983 1,379,660Herman Miller, Inc. 257,061 9,228,490HNI Corp. 197,609 7,307,581Hudson Technologies, Inc. (a) (b) 168,025 1,024,953Industrial Services of America, Inc. (a) (b) 12,843 27,484InnerWorkings, Inc. (a) (b) 199,597 1,842,280Interface, Inc. 269,580 6,523,836Intersections, Inc. (a) (b) 42,827 86,511KAR Auction Services, Inc. 586,122 31,697,478Kimball International, Inc. Class B 162,059 2,662,629Knoll, Inc. 222,691 4,736,638LSC Communications, Inc. 153,886 2,240,580Matthews International Corp. Class A 146,544 7,510,380McGrath RentCorp. 106,286 5,380,197Mobile Mini, Inc. 195,778 8,212,887Msa Safety, Inc. 148,568 11,979,038Multi-Color Corp. 61,479 3,894,695NL Industries, Inc. (b) 19,361 155,856Odyssey Marine Exploration, Inc. (a) (b) 21,390 90,908Performant Financial Corp. (b) 101,625 271,339Perma-Fix Environmental Services, Inc. (b) 24,334 94,903
Shares Value
Pitney Bowes, Inc. 812,456 $ 10,074,454Quad/Graphics, Inc. 135,690 3,580,859Quest Resource Holding Corp. (a) (b) 36,362 77,815R.R. Donnelley & Sons Co. (a) 314,030 2,367,786Rollins, Inc. (a) 411,689 20,695,606SP Plus Corp. (b) 98,466 3,544,776Steelcase, Inc. Class A 394,969 5,391,327Team, Inc. (a) (b) 135,303 2,212,204Tetra Tech, Inc. 247,371 12,108,810The Brink’s Co. 221,768 16,299,948U.S. Ecology, Inc. 96,736 5,117,334UniFirst Corp. 69,376 10,774,093Viad Corp. 92,139 4,795,835Virco Manufacturing Co. 17,110 76,995VSE Corp. 36,031 1,747,504
334,767,157Construction & Engineering – 0.7%AECOM (a) (b) 680,688 24,171,231Aegion Corp. (b) 149,994 3,443,862Ameresco, Inc. Class A (b) 69,482 566,278Argan, Inc. 64,740 2,586,363Chicago Bridge & Iron Co. NV (a) 449,351 7,845,668Comfort Systems U.S.A., Inc. 169,941 6,976,078Dycom Industries, Inc. (a) (b) 136,274 14,886,572EMCOR Group, Inc. 252,024 19,231,951Goldfield Corp. 101,619 477,609Granite Construction, Inc. 173,570 10,084,417Great Lakes Dredge & Dock Corp. (b) 250,064 1,137,791HC2 Holdings, Inc. (b) 149,409 741,069Ies Holdings, Inc. (a) (b) 36,498 560,244KBR, Inc. 609,808 9,232,493Keane Group, Inc. (a) (b) 231,306 3,596,808Layne Christensen Co. (a) (b) 94,105 1,458,628MasTec, Inc. (a) (b) 290,091 14,780,136MYR Group, Inc. (b) 77,211 2,497,776Northwest Pipe Co. (a) (b) 42,043 737,014NV5 Holdings, Inc. (b) 35,335 1,528,239Orion Group Holdings, Inc. (b) 118,649 745,116Primoris Services Corp. 176,834 4,403,167Sterling Construction Co., Inc. (b) 119,336 1,441,579Tutor Perini Corp. (a) (b) 176,871 4,271,435Valmont Industries, Inc. 100,670 14,808,557
152,210,081Electrical Equipment – 0.7%Allied Motion Technologies, Inc. 28,596 896,485American Electric Technologies, Inc. (b) 11,601 15,661American Superconductor Corp. (a) (b) 66,860 316,248AZZ, Inc. 113,590 4,640,152Babcock & Wilcox Enterprises, Inc. (a) (b) 206,668 1,314,408Broadwind Energy, Inc. (b) 61,516 136,566Capstone Turbine Corp. (a) (b) 132,915 121,936Encore Wire Corp. 89,061 4,666,796Energous Corp. (a) (b) 80,549 1,776,105Energy Focus, Inc. (a) (b) 31,432 80,466EnerSys 181,222 12,629,361Enphase Energy, Inc. (a) (b) 263,005 873,177

70Annual Report
See accompanying notes which are an integral part of the financial statements.
Schedule of Investments – continued
Common Stocks – continuedShares Value
INDUSTRIALS – continuedElectrical Equipment – continuedEnSync, Inc. (a) (b) 116,581 $ 41,969Espey Manufacturing & Electronics Corp. 5,358 144,559FuelCell Energy, Inc. (a) (b) 287,289 474,027Generac Holdings, Inc. (b) 272,065 12,101,451General Cable Corp. 217,021 6,412,971Hubbell, Inc. Class B 237,891 31,175,616Ideal Power, Inc. (a) (b) 18,012 21,434LSI Industries, Inc. 102,850 803,259Ocean Power Technologies, Inc. (a) (b) 72,243 81,635Orion Energy Systems, Inc. (a) (b) 83,634 71,089Plug Power, Inc. (a) (b) 1,047,949 1,949,185Polar Power, Inc. (b) 7,315 31,016Powell Industries, Inc. 39,054 1,040,008Preformed Line Products Co. 11,919 724,556Real Goods Solar, Inc. (a) (b) 43,365 49,436Regal Beloit Corp. 191,491 13,844,799Revolution Lighting Technologies, Inc. (a) (b) 38,380 130,876Sensata Technologies Holding BV (a) (b) 742,799 39,264,355Sunrun, Inc. (a) (b) 291,244 1,948,422Sunworks, Inc. (a) (b) 47,552 49,454Thermon Group Holdings, Inc. (a) (b) 144,076 3,143,738TPI Composites, Inc. (a) (b) 67,536 1,338,564Ultralife Corp. (b) 43,594 350,932Vicor Corp. (b) 66,375 1,709,156Vivint Solar, Inc. (a) (b) 111,777 335,331
144,705,199Industrial Conglomerates – 0.3%Carlisle Companies, Inc. 268,782 27,660,356ITT, Inc. 380,102 19,073,518Raven Industries, Inc. 161,156 5,471,246
52,205,120Machinery – 3.7%Actuant Corp. Class A (a) 270,996 6,151,609AGCO Corp. 285,060 18,984,996Alamo Group, Inc. 43,276 4,810,127Albany International Corp. Class A 129,645 8,251,904Allison Transmission Holdings, Inc. (a) 585,792 23,214,937Altra Industrial Motion Corp. 134,206 5,824,540American Railcar Industries, Inc. (a) 34,464 1,283,784ARC Group Worldwide, Inc. (b) 25,827 51,654Art’s-Way Manufacturing Co., Inc. (b) 9,831 26,052Astec Industries, Inc. 88,018 5,184,260Barnes Group, Inc. 219,896 13,261,928Blue Bird Corp. (a) (b) 45,864 1,064,045Briggs & Stratton Corp. 195,366 4,391,828Chart Industries, Inc. (b) 134,764 7,426,844Chicago Rivet & Machine Co. 772 25,476CIRCOR International, Inc. 73,485 3,453,795Colfax Corp. (b) 426,944 13,572,550Columbus McKinnon Corp. (NY Shares) 93,121 3,305,796Commercial Vehicle Group, Inc. (b) 112,254 1,133,765Crane Co. 218,753 20,193,089Dmc Global, Inc. 55,020 1,166,424Donaldson Co., Inc. 563,910 26,763,169
Shares Value
Douglas Dynamics, Inc. 103,727 $ 4,615,852Eastern Co. 27,488 700,944Energy Recovery, Inc. (a) (b) 154,766 1,061,695EnPro Industries, Inc. 93,453 6,771,604ESCO Technologies, Inc. 113,837 6,704,999ExOne Co. (a) (b) 41,005 342,802Federal Signal Corp. 258,672 5,532,994Franklin Electric Co., Inc. 171,998 6,733,722FreightCar America, Inc. 54,073 799,740Gardner Denver Holdings, Inc. 306,019 9,795,668Gencor Industries, Inc. (b) 30,519 492,882Global Brass & Copper Holdings, Inc. 97,132 2,748,836Gorman-Rupp Co. 78,540 2,095,447Graco, Inc. 730,926 32,416,568Graham Corp. 37,894 765,838Greenbrier Companies, Inc. (a) 126,722 6,564,200Hardinge, Inc. 38,805 712,072Harsco Corp. (a) (b) 358,982 7,269,386Hillenbrand, Inc. 279,706 12,279,093Hurco Companies, Inc. 24,930 1,043,321Hyster-Yale Materials Handling Class A 43,248 3,078,825IDEX Corp. 330,952 45,274,234Jason Industries, Inc. (b) 35,118 76,908John Bean Technologies Corp. 138,280 15,314,510Kadant, Inc. 49,681 4,739,567Kennametal, Inc. 349,940 14,417,528Key Technology, Inc. (b) 12,346 330,009L.B. Foster Co. Class A (b) 42,631 1,114,801Lincoln Electric Holdings, Inc. 262,162 22,949,661Lindsay Corp. 47,752 4,223,187LiqTech International, Inc. (b) 90,569 27,352Lydall, Inc. (b) 78,806 3,794,509Manitex International, Inc. (b) 52,326 548,900Manitowoc Co., Inc. (a) (b) 157,256 4,673,648Meritor, Inc. (b) 383,168 9,387,616MFRI, Inc. (b) 13,428 118,166Middleby Corp. (a) (b) 241,176 29,001,414Milacron Holdings Corp. (b) 212,412 4,551,989Miller Industries, Inc. 43,433 1,057,594Mueller Industries, Inc. 262,365 6,950,049Mueller Water Products, Inc. Class A 699,067 7,689,737Navistar International Corp. New (b) 284,930 10,633,588NN, Inc. 117,774 2,814,799Nordson Corp. 222,384 29,815,023Omega Flex, Inc. 25,039 1,397,677Oshkosh Corp. 324,588 25,619,731Park-Ohio Holdings Corp. 37,253 1,484,532ProPetro Holding Corp. (a) 257,099 4,147,007Proto Labs, Inc. (a) (b) 109,903 11,973,932RBC Bearings, Inc. (b) 108,095 13,025,448Rexnord Corp. (b) 455,567 13,202,332Spartan Motors, Inc. 147,713 2,178,767SPX Corp. (b) 185,849 5,804,064SPX Flow, Inc. (b) 182,759 8,911,329Standex International Corp. 58,129 5,586,197Sun Hydraulics Corp. 120,806 6,272,248

71 Annual Report
See accompanying notes which are an integral part of the financial statements.
Common Stocks – continuedShares Value
INDUSTRIALS – continuedMachinery – continuedTaylor Devices, Inc. (b) 3,820 $ 42,096Tennant Co. 79,161 5,097,968Terex Corp. 342,872 14,236,045The L.S. Starrett Co. Class A 20,536 174,556Timken Co. 288,913 12,654,389Titan International, Inc. 216,636 2,785,939Toro Co. 471,250 29,957,363TriMas Corp. (b) 200,113 5,182,927Trinity Industries, Inc. 660,688 21,564,856Twin Disc, Inc. (b) 35,431 847,510Wabash National Corp. (a) 259,988 5,680,738WABCO Holdings, Inc. (b) 219,565 30,293,383Wabtec Corp. (a) 368,467 29,971,106Watts Water Technologies, Inc. Class A 123,812 9,347,806Woodward, Inc. 242,722 17,191,999WSI Industries, Inc. (b) 5,668 29,474Xerium Technologies, Inc. (b) 47,721 277,736
786,513,004Marine – 0.1%Genco Shipping & Trading Ltd. (a) (b) 38,097 524,215Kirby Corp. (a) (b) 233,439 17,507,925Matson, Inc. 186,660 5,319,810
23,351,950Professional Services – 1.0%Acacia Research Corp. (b) 246,355 849,925Barrett Business Services, Inc. 30,306 2,251,433BG Staffing, Inc. 29,747 489,338CBIZ, Inc. (b) 258,362 4,663,434Cogint, Inc. (a) (b) 182,373 474,170CRA International, Inc. 36,975 1,848,380DLH Holdings Corp. (b) 2,300 13,455Dun & Bradstreet Corp. 159,849 19,987,519Exponent, Inc. 117,241 9,115,488Forrester Research, Inc. 46,079 1,866,200Franklin Covey Co. (b) 52,794 1,367,365FTI Consulting, Inc. (b) 161,738 7,713,285General Employment Enterprises, Inc. (a) (b) 3,794 9,978GP Strategies Corp. (b) 68,198 1,503,766Heidrick & Struggles International, Inc. 82,403 2,175,439Hill International, Inc. (b) 149,735 831,029Hudson Global, Inc. (b) 74,637 146,289Huron Consulting Group, Inc. (b) 98,046 3,431,610ICF International, Inc. 87,475 4,986,075Insperity, Inc. 162,713 10,625,159Kelly Services, Inc. Class A (non-vtg.) 143,305 4,226,064Kforce, Inc. 107,981 2,991,074Korn/Ferry International 239,918 10,054,963Lightbridge Corp. (a) (b) 12,874 17,380Manpower, Inc. 284,085 33,652,709Marathon Patent Group, Inc. (a) (b) 7,456 16,627Mastech Digital, Inc. (b) 3,140 36,455MISTRAS Group, Inc. (b) 76,579 1,510,138Navigant Consulting, Inc. (b) 207,969 4,134,424On Assignment, Inc. (b) 213,162 16,347,394
Shares Value
RCM Technologies, Inc. 26,829 $ 170,632Resources Connection, Inc. 147,742 2,297,388RPX Corp. 226,854 2,275,346Spherix, Inc. (a) (b) 4,801 6,577TransUnion Holding Co., Inc. (b) 650,392 37,117,871TriNet Group, Inc. (b) 182,827 8,623,950TrueBlue, Inc. (b) 193,372 5,259,718Volt Information Sciences, Inc. (a) (b) 57,341 232,231WageWorks, Inc. (b) 175,258 9,192,282Willdan Group, Inc. (b) 32,802 687,858
213,200,418Road & Rail – 0.9%AMERCO 29,540 10,161,760ArcBest Corp. 116,882 3,868,794Avis Budget Group, Inc. (a) (b) 313,221 14,151,325Celadon Group, Inc. (a) 115,770 445,715Covenant Transport Group, Inc. Class A (b) 52,825 1,363,942Daseke, Inc. (a) (b) 186,635 1,877,548Genesee & Wyoming, Inc. Class A (a) (b) 266,723 18,545,250Heartland Express, Inc. (a) 226,325 4,417,864Knight-Swift Transportation Holdings, Inc. Class A 552,917 26,628,483Landstar System, Inc. 181,957 19,796,922Marten Transport Ltd. 176,402 3,819,103Old Dominion Freight Lines, Inc. 295,744 41,084,756P.A.M. Transportation Services, Inc. (b) 12,026 415,017Patriot Transportation Holding, Inc. (b) 5,823 112,384Roadrunner Transportation Systems, Inc. (b) 119,733 458,577Ryder System, Inc. 228,598 16,543,637Saia, Inc. (b) 114,875 8,345,669Schneider National, Inc. Class B (a) 132,107 3,416,287U.S.A. Truck, Inc. (b) 31,657 809,153Universal Logistics Holdings, Inc. 36,649 809,943Werner Enterprises, Inc. (a) 192,509 7,170,960YRC Worldwide, Inc. (b) 143,374 1,250,221
185,493,310Trading Companies & Distributors – 1.1%AeroCentury Corp. (b) 740 11,100Air Lease Corp. Class A 411,432 17,967,235Aircastle Ltd. 248,136 4,833,689Applied Industrial Technologies, Inc. 170,883 12,030,163Beacon Roofing Supply, Inc. (b) 297,548 15,743,265BlueLinx Corp. (b) 35,372 534,825BMC Stock Holdings, Inc. (b) 269,547 5,054,006CAI International, Inc. (b) 69,862 1,411,212DXP Enterprises, Inc. (b) 67,444 2,005,785EnviroStar, Inc. (a) 8,419 290,456GATX Corp. 167,377 11,538,970General Finance Corp. (b) 1,148 8,093H&E Equipment Services, Inc. 137,617 5,186,785HD Supply Holdings, Inc. (b) 811,072 29,401,360Herc Holdings, Inc. (b) 123,012 8,021,613Houston Wire & Cable Co. (b) 69,133 480,474Huttig Building Products, Inc. (a) (b) 74,305 382,671Kaman Corp. 123,042 7,532,631Lawson Products, Inc. (b) 23,255 545,330MRC Global, Inc. (b) 424,109 7,010,522

72Annual Report
See accompanying notes which are an integral part of the financial statements.
Schedule of Investments – continued
Common Stocks – continuedShares Value
INDUSTRIALS – continuedTrading Companies & Distributors – continuedMSC Industrial Direct Co., Inc. Class A 191,970 $ 16,793,536Nexeo Solutions, Inc. (b) 267,934 2,489,107Now, Inc. (a) (b) 469,634 4,456,827Rush Enterprises, Inc. Class A (b) 149,998 6,376,415SiteOne Landscape Supply, Inc. (a) (b) 175,170 12,058,703Titan Machinery, Inc. (a) (b) 86,033 1,715,498Transcat, Inc. (b) 4,785 75,125Triton International Ltd. 203,270 5,797,260Univar, Inc. (b) 502,002 14,462,678Veritiv Corp. (a) (b) 49,470 1,199,648Watsco, Inc. 132,532 21,916,817WESCO International, Inc. (b) 206,108 12,830,223Willis Lease Finance Corp. (b) 19,324 527,545
230,689,567Transportation Infrastructure – 0.1%Macquarie Infrastructure Co. LLC 341,680 13,838,040SEACOR Marine Holdings, Inc. (a) 70,798 1,197,902
15,035,942
TOTAL INDUSTRIALS 2,840,741,675
INFORMATION TECHNOLOGY – 19.7%Communications Equipment – 1.6%ADTRAN, Inc. 213,624 3,343,216Aerohive Networks, Inc. (a) (b) 133,582 559,709Applied Optoelectronics, Inc. (a) (b) 84,145 2,350,170Arista Networks, Inc. (b) 204,500 55,161,830Arris International PLC (b) 773,261 19,718,156Aviat Networks, Inc. (b) 18,281 306,572Black Box Corp. 75,745 151,490CalAmp Corp. (b) 157,687 3,689,876Calix Networks, Inc. (b) 184,979 1,211,612Carvana Co. Class A (a) 74,689 1,496,768Ciena Corp. (a) (b) 619,880 14,362,620Clearfield, Inc. (a) (b) 45,932 620,082ClearOne, Inc. 17,545 140,360CommScope Holding Co., Inc. (b) 846,108 32,752,841Communications Systems, Inc. 9,294 31,693Comtech Telecommunications Corp. 104,409 2,307,439Dasan Zhone Solutions, Inc. (b) 16,898 182,329Digi International, Inc. (b) 109,744 1,146,825EchoStar Holding Corp. Class A (b) 217,069 12,594,343EMCORE Corp. (b) 119,065 631,045Extreme Networks, Inc. (b) 506,123 5,774,863Finisar Corp. (a) (b) 493,602 8,884,836Harmonic, Inc. (b) 354,615 1,072,710Infinera Corp. (a) (b) 641,831 6,386,218InterDigital, Inc. 153,242 11,002,776KVH Industries, Inc. (b) 54,401 554,890Lantronix, Inc. (b) 2,994 7,006Lumentum Holdings, Inc. (a) (b) 270,512 16,501,232NETGEAR, Inc. (a) (b) 139,140 7,757,055NetScout Systems, Inc. (a) (b) 384,748 10,215,059Network-1 Security Solutions, Inc. 45,735 118,911
Shares Value
Oclaro, Inc. (a) (b) 733,188 $ 5,256,958Optical Cable Corp. (b) 11,466 27,518Palo Alto Networks, Inc. (b) 401,769 69,654,692Parkervision, Inc. (a) (b) 61,411 50,357PC-Tel, Inc. 66,388 465,380Plantronics, Inc. 152,688 8,251,260Quantenna Communications, Inc. (a) (b) 87,200 1,199,000Relm Wireless Corp. 69,394 246,349Resonant, Inc. (a) (b) 27,972 111,888Sonus Networks, Inc. (b) 234,277 1,518,115Technical Communications Corp. (b) 2,835 21,971Tessco Technologies, Inc. 22,372 495,540Ubiquiti Networks, Inc. (a) (b) 101,202 6,436,447ViaSat, Inc. (a) (b) 237,802 16,596,202Viavi Solutions, Inc. (b) 994,806 9,570,034Westell Technologies, Inc. Class A (b) 37,506 121,519xG Technology, Inc. (a) (b) 3,437 4,881
341,062,643Electronic Equipment & Components – 3.4%ADDvantage Technologies Group, Inc. (b) 11,928 15,626Akoustis Technologies, Inc. (a) (b) 45,754 263,543Anixter International, Inc. (b) 129,093 9,752,976Applied DNA Sciences, Inc. (a) (b) 85,045 123,315Arrow Electronics, Inc. (b) 376,939 30,750,684Avnet, Inc. 508,522 21,713,889AVX Corp. 233,323 4,036,488Badger Meter, Inc. 128,072 6,096,227Bel Fuse, Inc. Class B (non-vtg.) 44,160 763,968Belden, Inc. (a) 185,976 13,526,034Benchmark Electronics, Inc. 225,726 6,771,780Cardtronics PLC (b) 198,745 4,447,913CDW Corp. 666,920 48,638,476ClearSign Combustion Corp. (a) (b) 63,125 142,031Cognex Corp. 752,952 40,441,052Coherent, Inc. (a) (b) 107,707 22,527,996Control4 Corp. (b) 85,484 2,055,035CTS Corp. 140,891 3,620,899CUI Global, Inc. (a) (b) 87,433 249,184Daktronics, Inc. 173,183 1,543,061Data I/O Corp. (b) 25,864 211,568Dell Technologies, Inc. (b) 885,871 65,811,357Digital Ally, Inc. (a) (b) 15,000 38,250Dolby Laboratories, Inc. Class A 259,973 16,781,257DPW Holdings, Inc. (a) (b) 73,169 109,754Dynasil Corp. of America (b) 9,408 11,760Echelon Corp. (b) 10,844 51,075Electro Scientific Industries, Inc. (a) (b) 147,096 2,637,431eMagin Corp. (a) (b) 60,537 90,806ePlus, Inc. (b) 62,413 4,777,715Fabrinet (a) 169,751 5,117,993FARO Technologies, Inc. (b) 72,512 4,303,587Fitbit, Inc. (a) (b) 784,586 3,750,321Frequency Electronics, Inc. (b) 18,354 169,591I. D. Systems Inc. (b) 43,008 314,388Identiv, Inc. (b) 39,930 154,529IEC Electronics Corp. (b) 18,101 76,386

73 Annual Report
See accompanying notes which are an integral part of the financial statements.
Common Stocks – continuedShares Value
INFORMATION TECHNOLOGY – continuedElectronic Equipment & Components – continuedII-VI, Inc. (a) (b) 237,086 $ 9,127,811Image Sensing Systems, Inc. (b) 9,763 28,801Insight Enterprises, Inc. (b) 156,429 5,464,065Intellicheck, Inc. (a) (b) 10,716 27,433IntriCon Corp. (b) 8,644 160,778IPG Photonics Corp. (b) 163,377 40,131,926Iteris, Inc. (a) (b) 124,948 695,960Itron, Inc. (b) 150,507 10,535,490Jabil, Inc. 773,220 20,946,530KEMET Corp. (b) 214,730 3,860,845KEY Tronic Corp. (b) 23,864 171,344Keysight Technologies, Inc. (b) 813,324 38,234,361Kimball Electronics, Inc. (b) 122,862 2,131,656Knowles Corp. (a) (b) 397,367 5,737,979LGL Group, Inc. (b) 5,265 28,431LightPath Technologies, Inc. Class A (a) (b) 76,597 163,152Littelfuse, Inc. 108,302 22,472,665LRAD Corp. (b) 77,211 166,776Luna Innovations, Inc. (b) 137,097 364,678Maxwell Technologies, Inc. (a) (b) 125,294 712,923Mesa Laboratories, Inc. 15,120 1,980,720Methode Electronics, Inc. Class A 168,150 6,633,518MicroVision, Inc. (a) (b) 347,500 382,250MTS Systems Corp. (a) 77,902 3,813,303Napco Security Technolgies, Inc. (b) 36,465 368,297National Instruments Corp. 473,206 23,925,295Neonode, Inc. (a) (b) 121,979 59,782NetList, Inc. (a) (b) 140,493 41,516Novanta, Inc. (b) 142,511 7,959,239OSI Systems, Inc. (b) 73,067 4,613,450Par Technology Corp. (b) 27,309 301,491Park Electrochemical Corp. 84,819 1,443,619PC Connection, Inc. 76,692 1,904,262PC Mall, Inc. (a) (b) 33,187 235,628Perceptron, Inc. (b) 33,349 305,143Plexus Corp. (b) 155,046 9,352,375RadiSys Corp. (a) (b) 140,804 121,091Research Frontiers, Inc. (a) (b) 71,977 66,939RF Industries Ltd. 13,982 44,043Richardson Electronics Ltd. 36,856 295,954Rogers Corp. (b) 80,748 11,088,315Sanmina Corp. (b) 318,204 8,766,520ScanSource, Inc. (b) 112,049 3,669,605Sigmatron International, Inc. (b) 11,463 81,387Superconductor Technologies, Inc. (a) (b) 28,045 33,654SYNNEX Corp. 128,283 15,862,193Systemax, Inc. 60,715 1,734,628Tech Data Corp. (b) 151,995 15,707,163Trimble, Inc. (b) 1,099,740 41,713,138TTM Technologies, Inc. (a) (b) 403,944 6,527,735Universal Display Corp. (a) 182,658 23,709,008VeriFone Systems, Inc. (b) 501,200 8,319,920Vishay Intertechnology, Inc. 581,346 10,696,766Vishay Precision Group, Inc. (b) 49,281 1,475,966
Shares Value
Wayside Technology Group, Inc. 13,442 $ 188,188Wireless Telecom Group, Inc. (b) 35,461 74,113Zebra Technologies Corp. Class A (b) 230,610 31,856,465
728,404,228Internet Software & Services – 2.9%2U, Inc. (a) (b) 226,144 18,720,200Alarm.com Holdings, Inc. (a) (b) 109,154 3,944,280Amber Road, Inc. (b) 59,273 539,384ANGI Homeservices, Inc. Class A (a) (b) 238,590 3,528,746AppFolio, Inc. (b) 48,668 1,951,587Apptio, Inc. Class A (b) 37,569 1,085,744Autoweb, Inc. (b) 47,015 331,926Benefitfocus, Inc. (a) (b) 103,236 2,498,311BlackLine, Inc. (a) (b) 130,609 5,746,796Blucora, Inc. (b) 212,805 4,958,357Box, Inc. Class A (a) (b) 536,583 12,910,187Bridgeline Digital, Inc. (a) (b) 970 1,785Brightcove, Inc. (b) 145,383 995,874BroadVision, Inc. (b) 7,417 20,768Carbonite, Inc. (a) (b) 99,504 2,801,038Care.com, Inc. (b) 70,954 1,268,658CarGurus, Inc. Class A (a) 44,814 1,446,596ChannelAdvisor Corp. (b) 104,787 927,365Cloudera, Inc. 355,227 6,767,074CommerceHub, Inc.:
Series A (a) (b) 53,243 1,055,276Series C (b) 122,837 2,340,045
Cornerstone OnDemand, Inc. (b) 231,027 9,472,107CoStar Group, Inc. (b) 157,457 53,870,763Coupa Software, Inc. (a) (b) 113,776 5,074,410Determine, Inc. (a) (b) 72,810 111,399DHI Group, Inc. (b) 207,864 342,976eGain Communications Corp. (b) 49,320 382,230Endurance International Group Holdings, Inc. (a) (b) 330,404 2,411,949Envestnet, Inc. (b) 192,768 10,621,517Etsy, Inc. (b) 491,863 12,449,053Five9, Inc. (b) 238,014 7,226,105GlowPoint, Inc. (a) (b) 321,954 88,827GoDaddy, Inc. (b) 446,545 26,707,856Gogo, Inc. (a) (b) 269,962 2,451,255GrubHub, Inc. (a) (b) 377,700 37,547,157GTT Communications, Inc. (a) (b) 144,172 7,439,275Hortonworks, Inc. (b) 213,426 3,837,399IAC/InterActiveCorp (b) 331,141 49,310,206Instructure, Inc. (b) 85,826 3,724,848Internap Network Services Corp. (a) (b) 60,871 792,540Inuvo, Inc. (a) (b) 97,208 84,552iPass, Inc. (b) 412,177 167,014Issuer Direct Corp. 35,897 667,684Izea, Inc. (a) (b) 24,901 89,146j2 Global, Inc. 213,118 15,774,994Leaf Group Ltd. (b) 42,441 326,796Limelight Networks, Inc. (b) 392,986 1,587,663Liquidity Services, Inc. (b) 96,138 658,545LivePerson, Inc. (b) 236,704 3,420,373LogMeIn, Inc. 229,690 26,540,680
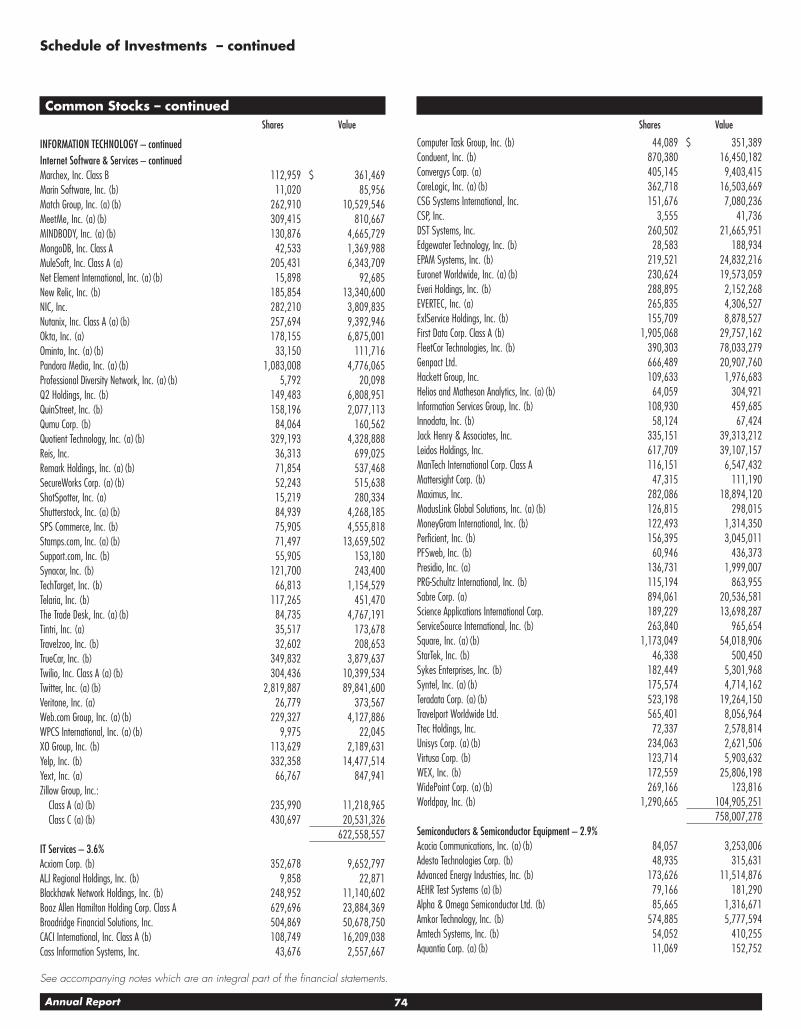
74Annual Report
See accompanying notes which are an integral part of the financial statements.
Schedule of Investments – continued
Common Stocks – continuedShares Value
INFORMATION TECHNOLOGY – continuedInternet Software & Services – continuedMarchex, Inc. Class B 112,959 $ 361,469Marin Software, Inc. (b) 11,020 85,956Match Group, Inc. (a) (b) 262,910 10,529,546MeetMe, Inc. (a) (b) 309,415 810,667MINDBODY, Inc. (a) (b) 130,876 4,665,729MongoDB, Inc. Class A 42,533 1,369,988MuleSoft, Inc. Class A (a) 205,431 6,343,709Net Element International, Inc. (a) (b) 15,898 92,685New Relic, Inc. (b) 185,854 13,340,600NIC, Inc. 282,210 3,809,835Nutanix, Inc. Class A (a) (b) 257,694 9,392,946Okta, Inc. (a) 178,155 6,875,001Ominto, Inc. (a) (b) 33,150 111,716Pandora Media, Inc. (a) (b) 1,083,008 4,776,065Professional Diversity Network, Inc. (a) (b) 5,792 20,098Q2 Holdings, Inc. (b) 149,483 6,808,951QuinStreet, Inc. (b) 158,196 2,077,113Qumu Corp. (b) 84,064 160,562Quotient Technology, Inc. (a) (b) 329,193 4,328,888Reis, Inc. 36,313 699,025Remark Holdings, Inc. (a) (b) 71,854 537,468SecureWorks Corp. (a) (b) 52,243 515,638ShotSpotter, Inc. (a) 15,219 280,334Shutterstock, Inc. (a) (b) 84,939 4,268,185SPS Commerce, Inc. (b) 75,905 4,555,818Stamps.com, Inc. (a) (b) 71,497 13,659,502Support.com, Inc. (b) 55,905 153,180Synacor, Inc. (b) 121,700 243,400TechTarget, Inc. (b) 66,813 1,154,529Telaria, Inc. (b) 117,265 451,470The Trade Desk, Inc. (a) (b) 84,735 4,767,191Tintri, Inc. (a) 35,517 173,678Travelzoo, Inc. (b) 32,602 208,653TrueCar, Inc. (b) 349,832 3,879,637Twilio, Inc. Class A (a) (b) 304,436 10,399,534Twitter, Inc. (a) (b) 2,819,887 89,841,600Veritone, Inc. (a) 26,779 373,567Web.com Group, Inc. (a) (b) 229,327 4,127,886WPCS International, Inc. (a) (b) 9,975 22,045XO Group, Inc. (b) 113,629 2,189,631Yelp, Inc. (b) 332,358 14,477,514Yext, Inc. (a) 66,767 847,941Zillow Group, Inc.:
Class A (a) (b) 235,990 11,218,965Class C (a) (b) 430,697 20,531,326
622,558,557IT Services – 3.6%Acxiom Corp. (b) 352,678 9,652,797ALJ Regional Holdings, Inc. (b) 9,858 22,871Blackhawk Network Holdings, Inc. (b) 248,952 11,140,602Booz Allen Hamilton Holding Corp. Class A 629,696 23,884,369Broadridge Financial Solutions, Inc. 504,869 50,678,750CACI International, Inc. Class A (b) 108,749 16,209,038Cass Information Systems, Inc. 43,676 2,557,667
Shares Value
Computer Task Group, Inc. (b) 44,089 $ 351,389Conduent, Inc. (b) 870,380 16,450,182Convergys Corp. (a) 405,145 9,403,415CoreLogic, Inc. (a) (b) 362,718 16,503,669CSG Systems International, Inc. 151,676 7,080,236CSP, Inc. 3,555 41,736DST Systems, Inc. 260,502 21,665,951Edgewater Technology, Inc. (b) 28,583 188,934EPAM Systems, Inc. (b) 219,521 24,832,216Euronet Worldwide, Inc. (a) (b) 230,624 19,573,059Everi Holdings, Inc. (b) 288,895 2,152,268EVERTEC, Inc. (a) 265,835 4,306,527ExlService Holdings, Inc. (b) 155,709 8,878,527First Data Corp. Class A (b) 1,905,068 29,757,162FleetCor Technologies, Inc. (b) 390,303 78,033,279Genpact Ltd. 666,489 20,907,760Hackett Group, Inc. 109,633 1,976,683Helios and Matheson Analytics, Inc. (a) (b) 64,059 304,921Information Services Group, Inc. (b) 108,930 459,685Innodata, Inc. (b) 58,124 67,424Jack Henry & Associates, Inc. 335,151 39,313,212Leidos Holdings, Inc. 617,709 39,107,157ManTech International Corp. Class A 116,151 6,547,432Mattersight Corp. (b) 47,315 111,190Maximus, Inc. 282,086 18,894,120ModusLink Global Solutions, Inc. (a) (b) 126,815 298,015MoneyGram International, Inc. (b) 122,493 1,314,350Perficient, Inc. (b) 156,395 3,045,011PFSweb, Inc. (b) 60,946 436,373Presidio, Inc. (a) 136,731 1,999,007PRG-Schultz International, Inc. (b) 115,194 863,955Sabre Corp. (a) 894,061 20,536,581Science Applications International Corp. 189,229 13,698,287ServiceSource International, Inc. (b) 263,840 965,654Square, Inc. (a) (b) 1,173,049 54,018,906StarTek, Inc. (b) 46,338 500,450Sykes Enterprises, Inc. (b) 182,449 5,301,968Syntel, Inc. (a) (b) 175,574 4,714,162Teradata Corp. (a) (b) 523,198 19,264,150Travelport Worldwide Ltd. 565,401 8,056,964Ttec Holdings, Inc. 72,337 2,578,814Unisys Corp. (a) (b) 234,063 2,621,506Virtusa Corp. (b) 123,714 5,903,632WEX, Inc. (b) 172,559 25,806,198WidePoint Corp. (a) (b) 269,166 123,816Worldpay, Inc. (b) 1,290,665 104,905,251
758,007,278Semiconductors & Semiconductor Equipment – 2.9%Acacia Communications, Inc. (a) (b) 84,057 3,253,006Adesto Technologies Corp. (b) 48,935 315,631Advanced Energy Industries, Inc. (b) 173,626 11,514,876AEHR Test Systems (a) (b) 79,166 181,290Alpha & Omega Semiconductor Ltd. (b) 85,665 1,316,671Amkor Technology, Inc. (b) 574,885 5,777,594Amtech Systems, Inc. (b) 54,052 410,255Aquantia Corp. (a) (b) 11,069 152,752

75 Annual Report
See accompanying notes which are an integral part of the financial statements.
Common Stocks – continuedShares Value
INFORMATION TECHNOLOGY – continuedSemiconductors & Semiconductor Equipment – continuedAxcelis Technologies, Inc. (b) 136,897 $ 3,347,132AXT, Inc. (a) (b) 166,392 1,243,780Brooks Automation, Inc. 309,179 8,258,171Cabot Microelectronics Corp. 112,529 11,466,705Cavium, Inc. (b) 301,103 26,810,211Ceva, Inc. (b) 96,147 3,533,402Cirrus Logic, Inc. (b) 278,826 12,354,780Cohu, Inc. 124,418 2,492,093Cree, Inc. (a) (b) 430,758 16,295,575CVD Equipment Corp. (a) (b) 12,898 113,631CyberOptics Corp. (a) (b) 32,417 531,639Cypress Semiconductor Corp. 1,445,132 25,246,456Diodes, Inc. (b) 175,145 5,271,865DSP Group, Inc. (b) 100,061 1,215,741Entegris, Inc. 624,256 20,725,299Experi Corp. 219,637 4,842,996First Solar, Inc. (b) 355,630 22,351,346FormFactor, Inc. (b) 335,308 4,392,535GSI Technology, Inc. (b) 65,735 496,957Ichor Holdings Ltd. (a) (b) 77,562 2,004,202Impinj, Inc. (a) (b) 78,484 999,886Inphi Corp. (a) (b) 183,601 5,094,928Integrated Device Technology, Inc. (a) (b) 583,008 17,688,463Intermolecular, Inc. (b) 45,789 66,394Intest Corp. (b) 34,005 261,839Kopin Corp. (a) (b) 265,387 812,084Kulicke & Soffa Industries, Inc. (b) 322,075 7,504,348Lattice Semiconductor Corp. (b) 557,001 3,347,576M/A-COM Technology Solutions Holdings, Inc. (a) (b) 178,869 3,817,064Marvell Technology Group Ltd. 1,862,119 43,741,175Maxim Integrated Products, Inc. 1,225,535 74,684,103MaxLinear, Inc. Class A (a) (b) 267,497 6,080,207Microsemi Corp. (b) 510,128 33,107,307MKS Instruments, Inc. 236,952 26,384,605Monolithic Power Systems, Inc. 168,144 19,682,937MoSys, Inc. (b) 16,576 23,538Nanometrics, Inc. (b) 114,026 3,009,146NeoPhotonics Corp. (a) (b) 134,183 814,491NVE Corp. 22,496 1,563,697ON Semiconductor Corp. (b) 1,836,419 43,927,142PDF Solutions, Inc. (a) (b) 125,323 1,396,098Photronics, Inc. (b) 325,040 2,535,312Pixelworks, Inc. (b) 116,018 510,479Power Integrations, Inc. 133,482 8,969,990QuickLogic Corp. (a) (b) 369,431 594,784Rambus, Inc. (a) (b) 500,137 6,356,741Rubicon Technology, Inc. (b) 8,619 62,143Rudolph Technologies, Inc. (b) 151,615 4,025,378Semtech Corp. (b) 294,874 9,922,510Sigma Designs, Inc. (b) 171,877 1,031,262Silicon Laboratories, Inc. (b) 185,619 17,355,377SMART Global Holdings, Inc. 25,016 868,556SolarEdge Technologies, Inc. (a) (b) 160,009 8,008,450SunPower Corp. (a) (b) 261,809 1,856,226
Shares Value
Synaptics, Inc. (a) (b) 152,288 $ 7,076,823Teradyne, Inc. 855,273 38,829,394Ultra Clean Holdings, Inc. (a) (b) 167,517 3,226,377Veeco Instruments, Inc. (a) (b) 215,377 3,909,093Versum Materials, Inc. 475,479 17,602,233Xcerra Corp. (b) 232,794 2,327,940
624,992,687Software – 5.0%8x8, Inc. (b) 410,878 7,498,524A10 Networks, Inc. (b) 208,779 1,311,132ACI Worldwide, Inc. (b) 520,908 12,319,474Agilysys, Inc. (b) 66,316 740,750Altair Engineering, Inc. Class A (b) 95,779 2,520,903American Software, Inc. Class A 107,380 1,335,807Appian Corp. Class A (a) 48,671 1,316,064Aspen Technology, Inc. (b) 314,763 24,324,885Asure Software, Inc. (a) (b) 45,600 649,800Aware, Inc. (b) 24,496 101,658Black Knight, Inc. (b) 490,927 23,392,672Blackbaud, Inc. 211,453 21,678,162Bottomline Technologies, Inc. (b) 161,367 6,128,719BSQUARE Corp. (b) 35,898 131,028Callidus Software, Inc. (b) 301,934 10,839,431CDK Global, Inc. 566,462 38,904,610CommVault Systems, Inc. (b) 189,332 9,854,731Datawatch Corp. (b) 55,025 514,484Digimarc Corp. (a) (b) 49,238 1,275,264Digital Turbine, Inc. (a) (b) 162,229 365,015Document Security Systems, Inc. (a) (b) 20,445 22,490Ebix, Inc. 97,592 8,192,848Ellie Mae, Inc. (a) (b) 151,578 13,440,421Everbridge, Inc. (a) (b) 72,030 2,298,477Evolving Systems, Inc. (b) 27,515 149,957Fair Isaac Corp. 131,581 22,360,875Finjan Holdings, Inc. (a) (b) 51,830 148,234FireEye, Inc. (a) (b) 773,070 12,825,231Forescout Technologies, Inc. (a) (b) 31,195 928,987Fortinet, Inc. (b) 651,073 32,859,654Globalscape, Inc. 29,423 102,392Glu Mobile, Inc. (b) 469,639 1,742,361GSE Systems, Inc. (b) 33,148 111,046Guidewire Software, Inc. (a) (b) 330,952 26,582,065HubSpot, Inc. (a) (b) 150,615 16,725,796Imperva, Inc. (b) 142,946 6,668,431Inseego Corp. (a) (b) 164,641 307,879Majesco (b) 52,545 283,743MAM Software Group, Inc. (b) 1,188 9,005Manhattan Associates, Inc. (a) (b) 302,968 12,754,953MicroStrategy, Inc. Class A (b) 41,918 5,364,666Mitek Systems, Inc. (b) 143,423 1,097,186MobileIron, Inc. (b) 232,155 1,114,344Model N, Inc. (b) 101,356 1,733,188Monotype Imaging Holdings, Inc. 186,670 4,498,747NetSol Technologies, Inc. (b) 37,185 176,629Nuance Communications, Inc. (b) 1,161,938 18,660,724NXT-ID, Inc. (a) (b) 61,104 150,927

76Annual Report
See accompanying notes which are an integral part of the financial statements.
Schedule of Investments – continued
Common Stocks – continuedShares Value
INFORMATION TECHNOLOGY – continuedSoftware – continuedParametric Technology Corp. (b) 500,926 $ 36,948,302Park City Group, Inc. (a) (b) 65,748 680,492Paycom Software, Inc. (a) (b) 208,990 20,673,291Paylocity Holding Corp. (a) (b) 120,332 5,627,928Pegasystems, Inc. 160,353 9,300,474Progress Software Corp. 208,266 9,761,427Proofpoint, Inc. (b) 198,535 21,276,996PROS Holdings, Inc. (a) (b) 119,895 3,758,708QAD, Inc.:
Class A 27,311 1,228,995Class B 24,367 847,972
Qualys, Inc. (b) 139,869 10,357,299Rapid7, Inc. (b) 93,620 2,472,504RealNetworks, Inc. (b) 90,666 252,051RealPage, Inc. (b) 260,377 13,604,698RingCentral, Inc. (a) (b) 283,227 17,744,172Rosetta Stone, Inc. (b) 76,625 1,048,996SeaChange International, Inc. (b) 126,310 389,035ServiceNow, Inc. (b) 752,153 121,104,155SITO Mobile Ltd. (a) (b) 75,644 394,105Smith Micro Software, Inc. (a) (b) 33,232 71,781Snap, Inc. Class A (a) (b) 1,030,776 17,853,040Sonic Foundry, Inc. (a) (b) 57,013 133,981Splunk, Inc. (b) 608,701 56,730,933SS&C Technologies Holdings, Inc. 749,638 37,122,074Synchronoss Technologies, Inc. (a) (b) 187,568 1,751,885Tableau Software, Inc. (b) 274,175 22,391,872Take-Two Interactive Software, Inc. (b) 496,850 55,582,610TeleNav, Inc. (b) 140,738 767,022The Rubicon Project, Inc. (b) 165,320 266,165TiVo Corp. 536,011 8,040,165Tyler Technologies, Inc. (a) (b) 151,625 30,796,554Ultimate Software Group, Inc. (a) (b) 122,850 29,294,811Upland Software, Inc. (b) 49,341 1,177,276Varonis Systems, Inc. (b) 87,494 4,912,788Vasco Data Security International, Inc. (b) 142,853 1,721,379Verint Systems, Inc. (b) 279,739 10,881,847VirnetX Holding Corp. (a) (b) 229,099 882,031VMware, Inc. Class A (a) (b) 294,915 38,855,051Workday, Inc. Class A (a) (b) 584,729 74,067,622Workiva, Inc. (b) 105,864 2,408,406Zedge, Inc. (b) 23,011 75,936Zendesk, Inc. (b) 440,398 19,016,386Zix Corp. (b) 279,934 1,133,733Zynga, Inc. (b) 3,445,768 11,922,357
1,061,843,674Technology Hardware, Storage & Peripherals – 0.3%3D Systems Corp. (a) (b) 500,415 4,753,943Astro-Med, Inc. 83,410 1,121,865Avid Technology, Inc. (a) (b) 153,041 733,066Concurrent Computer Corp. 30,661 164,036CPI Card Group (a) 14,431 36,799Cray, Inc. (b) 180,540 3,935,772Diebold Nixdorf, Inc. (a) 324,176 5,089,563
Shares Value
Eastman Kodak Co. (a) (b) 162,328 $ 852,222Electronics for Imaging, Inc. (b) 200,011 5,478,301Everspin Technologies, Inc. (a) (b) 23,347 179,538Immersion Corp. (a) (b) 128,551 1,489,906InfoSonics Corp. (a) (b) 8,388 12,414Intevac, Inc. (b) 82,658 500,081ITUS Corp. (a) (b) 62,373 205,207NCR Corp. (a) (b) 528,783 17,449,839Pure Storage, Inc. Class A (a) (b) 496,294 10,754,691Qualstar Corp. (a) (b) 11,989 114,495Quantum Corp. (a) (b) 142,708 522,311Super Micro Computer, Inc. (a) (b) 168,100 3,042,610Transact Technologies, Inc. 28,331 392,384U.S.A. Technologies, Inc. (a) (b) 214,765 1,750,335Xplore Technologies Corp. (a) (b) 14,878 45,675
58,625,053
TOTAL INFORMATION TECHNOLOGY 4,195,494,120
MATERIALS – 5.3%Chemicals – 2.5%A. Schulman, Inc. 132,201 5,797,014Advanced Emissions Solutions, Inc. (a) 87,173 840,348AdvanSix, Inc. (b) 135,795 5,615,123AgroFresh Solutions, Inc. (a) (b) 117,138 906,648American Vanguard Corp. 114,501 2,232,770Ashland Global Holdings, Inc. 270,600 19,163,892Axalta Coating Systems Ltd. (b) 949,929 29,257,813Balchem Corp. 143,958 10,832,840Cabot Corp. 272,744 16,413,734Calgon Carbon Corp. 227,771 4,840,134Celanese Corp. Class A 589,019 59,408,456Chase Corp. 32,113 3,339,752Codexis, Inc. (a) (b) 168,410 1,608,316Core Molding Technologies, Inc. 30,292 551,314Ferro Corp. (b) 370,398 7,922,813Flotek Industries, Inc. (a) (b) 269,684 1,604,620FutureFuel Corp. 104,409 1,251,864H.B. Fuller Co. 222,503 11,211,926Hawkins, Inc. 43,846 1,468,841Huntsman Corp. 919,578 29,674,782Ingevity Corp. (b) 185,743 13,914,008Innophos Holdings, Inc. 85,582 3,556,788Innospec, Inc. 107,399 6,975,565Intrepid Potash, Inc. (a) (b) 459,412 1,520,654KMG Chemicals, Inc. 51,368 3,080,539Koppers Holdings, Inc. (b) 93,218 3,766,007Kraton Performance Polymers, Inc. (b) 139,732 5,926,034Kronos Worldwide, Inc. 100,083 2,146,780LSB Industries, Inc. (a) (b) 92,483 690,848MagneGas Corp. (b) 490 524Marrone Bio Innovations, Inc. (a) (b) 53,732 59,643Minerals Technologies, Inc. 157,600 10,827,120NewMarket Corp. 41,139 17,192,399Northern Technologies International Corp. 5,288 117,658Olin Corp. 728,795 23,685,838
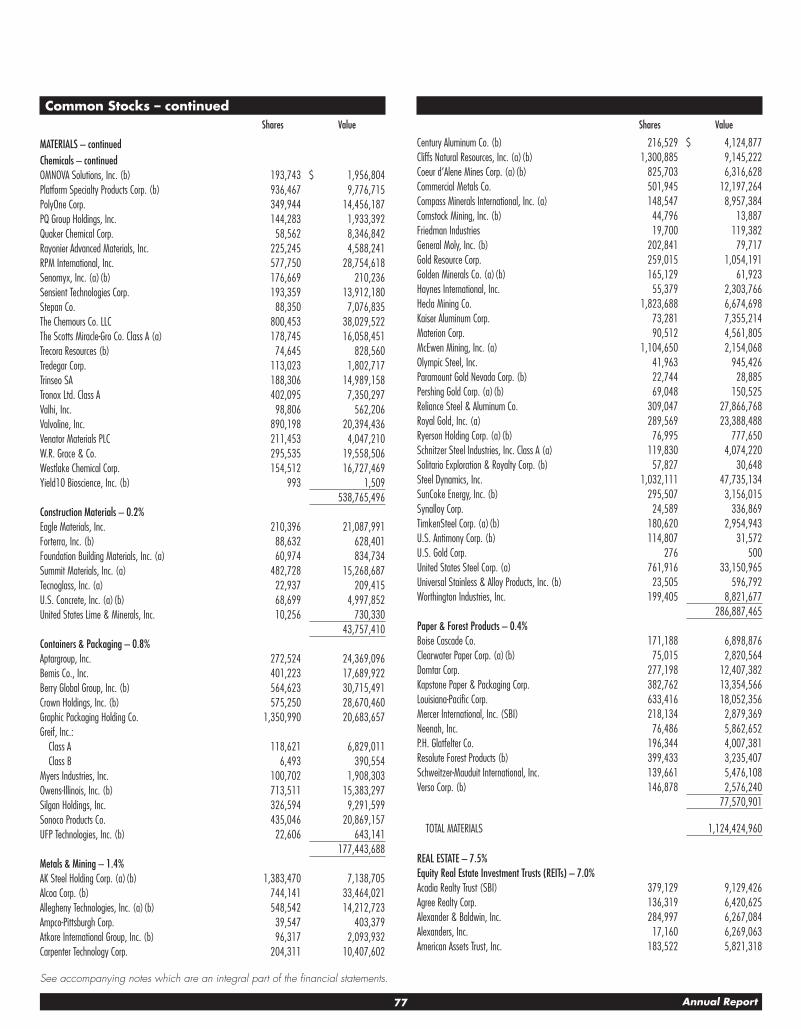
77 Annual Report
See accompanying notes which are an integral part of the financial statements.
Common Stocks – continuedShares Value
MATERIALS – continuedChemicals – continuedOMNOVA Solutions, Inc. (b) 193,743 $ 1,956,804Platform Specialty Products Corp. (b) 936,467 9,776,715PolyOne Corp. 349,944 14,456,187PQ Group Holdings, Inc. 144,283 1,933,392Quaker Chemical Corp. 58,562 8,346,842Rayonier Advanced Materials, Inc. 225,245 4,588,241RPM International, Inc. 577,750 28,754,618Senomyx, Inc. (a) (b) 176,669 210,236Sensient Technologies Corp. 193,359 13,912,180Stepan Co. 88,350 7,076,835The Chemours Co. LLC 800,453 38,029,522The Scotts Miracle-Gro Co. Class A (a) 178,745 16,058,451Trecora Resources (b) 74,645 828,560Tredegar Corp. 113,023 1,802,717Trinseo SA 188,306 14,989,158Tronox Ltd. Class A 402,095 7,350,297Valhi, Inc. 98,806 562,206Valvoline, Inc. 890,198 20,394,436Venator Materials PLC 211,453 4,047,210W.R. Grace & Co. 295,535 19,558,506Westlake Chemical Corp. 154,512 16,727,469Yield10 Bioscience, Inc. (b) 993 1,509
538,765,496Construction Materials – 0.2%Eagle Materials, Inc. 210,396 21,087,991Forterra, Inc. (b) 88,632 628,401Foundation Building Materials, Inc. (a) 60,974 834,734Summit Materials, Inc. (a) 482,728 15,268,687Tecnoglass, Inc. (a) 22,937 209,415U.S. Concrete, Inc. (a) (b) 68,699 4,997,852United States Lime & Minerals, Inc. 10,256 730,330
43,757,410Containers & Packaging – 0.8%Aptargroup, Inc. 272,524 24,369,096Bemis Co., Inc. 401,223 17,689,922Berry Global Group, Inc. (b) 564,623 30,715,491Crown Holdings, Inc. (b) 575,250 28,670,460Graphic Packaging Holding Co. 1,350,990 20,683,657Greif, Inc.:
Class A 118,621 6,829,011Class B 6,493 390,554
Myers Industries, Inc. 100,702 1,908,303Owens-Illinois, Inc. (b) 713,511 15,383,297Silgan Holdings, Inc. 326,594 9,291,599Sonoco Products Co. 435,046 20,869,157UFP Technologies, Inc. (b) 22,606 643,141
177,443,688Metals & Mining – 1.4%AK Steel Holding Corp. (a) (b) 1,383,470 7,138,705Alcoa Corp. (b) 744,141 33,464,021Allegheny Technologies, Inc. (a) (b) 548,542 14,212,723Ampco-Pittsburgh Corp. 39,547 403,379Atkore International Group, Inc. (b) 96,317 2,093,932Carpenter Technology Corp. 204,311 10,407,602
Shares Value
Century Aluminum Co. (b) 216,529 $ 4,124,877Cliffs Natural Resources, Inc. (a) (b) 1,300,885 9,145,222Coeur d’Alene Mines Corp. (a) (b) 825,703 6,316,628Commercial Metals Co. 501,945 12,197,264Compass Minerals International, Inc. (a) 148,547 8,957,384Comstock Mining, Inc. (b) 44,796 13,887Friedman Industries 19,700 119,382General Moly, Inc. (b) 202,841 79,717Gold Resource Corp. 259,015 1,054,191Golden Minerals Co. (a) (b) 165,129 61,923Haynes International, Inc. 55,379 2,303,766Hecla Mining Co. 1,823,688 6,674,698Kaiser Aluminum Corp. 73,281 7,355,214Materion Corp. 90,512 4,561,805McEwen Mining, Inc. (a) 1,104,650 2,154,068Olympic Steel, Inc. 41,963 945,426Paramount Gold Nevada Corp. (b) 22,744 28,885Pershing Gold Corp. (a) (b) 69,048 150,525Reliance Steel & Aluminum Co. 309,047 27,866,768Royal Gold, Inc. (a) 289,569 23,388,488Ryerson Holding Corp. (a) (b) 76,995 777,650Schnitzer Steel Industries, Inc. Class A (a) 119,830 4,074,220Solitario Exploration & Royalty Corp. (b) 57,827 30,648Steel Dynamics, Inc. 1,032,111 47,735,134SunCoke Energy, Inc. (b) 295,507 3,156,015Synalloy Corp. 24,589 336,869TimkenSteel Corp. (a) (b) 180,620 2,954,943U.S. Antimony Corp. (b) 114,807 31,572U.S. Gold Corp. 276 500United States Steel Corp. (a) 761,916 33,150,965Universal Stainless & Alloy Products, Inc. (b) 23,505 596,792Worthington Industries, Inc. 199,405 8,821,677
286,887,465Paper & Forest Products – 0.4%Boise Cascade Co. 171,188 6,898,876Clearwater Paper Corp. (a) (b) 75,015 2,820,564Domtar Corp. 277,198 12,407,382Kapstone Paper & Packaging Corp. 382,762 13,354,566Louisiana-Pacific Corp. 633,416 18,052,356Mercer International, Inc. (SBI) 218,134 2,879,369Neenah, Inc. 76,486 5,862,652P.H. Glatfelter Co. 196,344 4,007,381Resolute Forest Products (b) 399,433 3,235,407Schweitzer-Mauduit International, Inc. 139,661 5,476,108Verso Corp. (b) 146,878 2,576,240
77,570,901
TOTAL MATERIALS 1,124,424,960
REAL ESTATE – 7.5%Equity Real Estate Investment Trusts (REITs) – 7.0%Acadia Realty Trust (SBI) 379,129 9,129,426Agree Realty Corp. 136,319 6,420,625Alexander & Baldwin, Inc. 284,997 6,267,084Alexanders, Inc. 17,160 6,269,063American Assets Trust, Inc. 183,522 5,821,318

78Annual Report
See accompanying notes which are an integral part of the financial statements.
Schedule of Investments – continued
Common Stocks – continuedShares Value
REAL ESTATE – continuedEquity Real Estate Investment Trusts (REITs) – continuedAmerican Campus Communities, Inc. 602,325 $ 21,972,816American Homes 4 Rent Class A 1,089,629 20,909,981Apple Hospitality (REIT), Inc. 896,637 15,233,863Armada Hoffler Properties, Inc. 205,517 2,688,162Ashford Hospitality Prime, Inc. 140,879 1,211,559Ashford Hospitality Trust, Inc. 392,393 2,162,085Bluerock Residential Growth (REIT), Inc. (a) 99,613 750,086Brandywine Realty Trust (SBI) 758,602 11,879,707Brixmor Property Group, Inc. 1,333,510 20,722,745BRT Realty Trust 19,147 199,895Camden Property Trust (SBI) 400,190 31,899,145CareTrust (REIT), Inc. 342,138 4,533,329CatchMark Timber Trust, Inc. 209,362 2,738,455CBL & Associates Properties, Inc. (a) 749,524 3,470,296Cedar Realty Trust, Inc. 355,338 1,410,692Chatham Lodging Trust 195,655 3,558,964Chesapeake Lodging Trust 260,111 6,726,470CIM Commercial Trust Corp. 63,757 1,000,985City Office REIT, Inc. 155,160 1,557,806Clipper Realty, Inc. (a) 59,208 526,951Colony NorthStar, Inc. 2,347,701 18,265,114Columbia Property Trust, Inc. 533,336 11,109,389Community Healthcare Trust, Inc. 85,890 2,021,851Condor Hospitality Trust, Inc. 253 2,578CorEnergy Infrastructure Trust, Inc. (a) 54,615 1,959,040CoreSite Realty Corp. 150,575 14,131,464Corporate Office Properties Trust (SBI) 439,692 10,974,712Corrections Corp. of America 519,234 10,794,875Cousins Properties, Inc. 1,801,872 15,027,612CubeSmart 796,149 21,344,755CyrusOne, Inc. 401,180 20,018,882DCT Industrial Trust, Inc. 402,784 22,294,094DDR Corp. 1,323,905 10,326,459DiamondRock Hospitality Co. 875,675 9,001,939Douglas Emmett, Inc. 685,657 24,512,238Easterly Government Properties, Inc. 182,955 3,483,463EastGroup Properties, Inc. 153,161 12,410,636Education Realty Trust, Inc. 331,935 10,336,456Empire State Realty Trust, Inc. 572,025 9,644,342EPR Properties 273,354 15,753,391Equity Commonwealth (b) 529,516 15,578,361Equity Lifestyle Properties, Inc. 381,293 32,261,201Farmland Partners, Inc. (a) 138,179 1,039,106First Industrial Realty Trust, Inc. 517,843 14,515,139Forest City Realty Trust, Inc. Class A 1,162,290 24,721,908Four Corners Property Trust, Inc. 285,265 6,264,419Franklin Street Properties Corp. 501,603 4,057,968Front Yard Residential Corp. Class B 242,358 2,542,335Gaming & Leisure Properties 867,725 28,860,534Getty Realty Corp. 151,343 3,571,695Gladstone Commercial Corp. 120,539 2,038,314Gladstone Land Corp. (a) 66,704 831,132Global Medical REIT, Inc. 88,447 574,906Global Net Lease, Inc. 302,208 4,726,533
Shares Value
Global Self Storage, Inc. 70,475 $ 303,747Government Properties Income Trust 448,891 6,158,785Gramercy Property Trust 696,409 15,077,255Healthcare Realty Trust, Inc. 545,003 14,469,830Healthcare Trust of America, Inc. 893,070 22,192,790Hersha Hospitality Trust 156,489 2,629,015Highwoods Properties, Inc. (SBI) 440,192 18,932,658Hospitality Properties Trust (SBI) 726,155 18,473,383Hudson Pacific Properties, Inc. 662,816 20,925,101Independence Realty Trust, Inc. 358,182 3,051,711InfraReit, Inc. 171,970 3,205,521Investors Real Estate Trust 543,680 2,528,112Invitation Homes, Inc. 1,226,161 26,669,002iStar Financial, Inc. (a) (b) 297,566 3,005,417JBG SMITH Properties 412,054 13,453,563Jernigan Capital, Inc. (a) 66,747 1,127,357Kilroy Realty Corp. 422,033 28,740,447Kite Realty Group Trust 379,543 5,746,281Lamar Advertising Co. Class A 366,955 24,391,499LaSalle Hotel Properties (SBI) (a) 491,738 12,062,333Lexington Corporate Properties Trust 992,662 7,901,590Liberty Property Trust (SBI) 633,650 24,877,099Life Storage, Inc. 203,317 15,972,584LTC Properties, Inc. 177,746 6,567,715Mack-Cali Realty Corp. 396,996 6,705,262MedEquities Realty Trust, Inc. 143,153 1,384,290Medical Properties Trust, Inc. 1,584,903 19,430,911Monmouth Real Estate Investment Corp. Class A 324,781 4,585,908National Health Investors, Inc. 182,751 11,855,057National Retail Properties, Inc. 671,278 24,998,393National Storage Affiliates Trust 225,401 5,529,087New Senior Investment Group, Inc. 367,840 2,972,147NexPoint Residential Trust, Inc. 104,953 2,530,417NorthStar Realty Europe Corp. 240,392 2,471,230Omega Healthcare Investors, Inc. (a) 864,330 22,023,128One Liberty Properties, Inc. 69,690 1,516,454Outfront Media, Inc. 614,289 12,599,067Paramount Group, Inc. 892,331 12,448,017Park Hotels & Resorts, Inc. 693,876 18,033,837Pebblebrook Hotel Trust (a) 298,039 10,136,306Pennsylvania Real Estate Investment Trust (SBI) 312,388 3,261,331Physicians Realty Trust 790,880 11,364,946Piedmont Office Realty Trust, Inc. Class A 620,721 11,148,149Potlatch Corp. 255,083 13,047,495Power (REIT) (b) 1,227 7,485Preferred Apartment Communities, Inc. Class A 157,449 2,193,265PS Business Parks, Inc. 91,263 10,117,416QTS Realty Trust, Inc. Class A 222,120 7,167,812Quality Care Properties, Inc. (b) 407,304 5,046,497RAIT Financial Trust 359,168 64,650Ramco-Gershenson Properties Trust (SBI) 344,393 4,056,950Rayonier, Inc. 570,556 19,393,198Regional Health Properties, Inc. (b) 40,556 9,097Retail Opportunity Investments Corp. 501,177 8,600,197Retail Properties America, Inc. 1,007,557 12,050,382Rexford Industrial Realty, Inc. 344,582 9,303,714
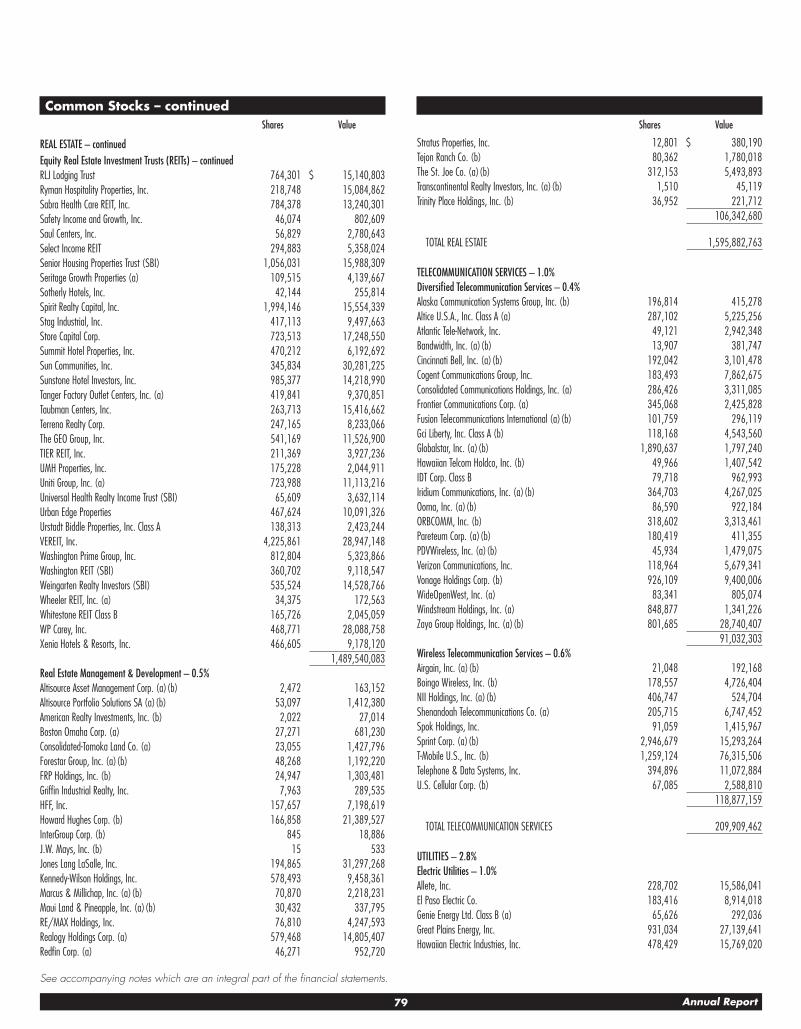
79 Annual Report
See accompanying notes which are an integral part of the financial statements.
Common Stocks – continuedShares Value
REAL ESTATE – continuedEquity Real Estate Investment Trusts (REITs) – continuedRLJ Lodging Trust 764,301 $ 15,140,803Ryman Hospitality Properties, Inc. 218,748 15,084,862Sabra Health Care REIT, Inc. 784,378 13,240,301Safety Income and Growth, Inc. 46,074 802,609Saul Centers, Inc. 56,829 2,780,643Select Income REIT 294,883 5,358,024Senior Housing Properties Trust (SBI) 1,056,031 15,988,309Seritage Growth Properties (a) 109,515 4,139,667Sotherly Hotels, Inc. 42,144 255,814Spirit Realty Capital, Inc. 1,994,146 15,554,339Stag Industrial, Inc. 417,113 9,497,663Store Capital Corp. 723,513 17,248,550Summit Hotel Properties, Inc. 470,212 6,192,692Sun Communities, Inc. 345,834 30,281,225Sunstone Hotel Investors, Inc. 985,377 14,218,990Tanger Factory Outlet Centers, Inc. (a) 419,841 9,370,851Taubman Centers, Inc. 263,713 15,416,662Terreno Realty Corp. 247,165 8,233,066The GEO Group, Inc. 541,169 11,526,900TIER REIT, Inc. 211,369 3,927,236UMH Properties, Inc. 175,228 2,044,911Uniti Group, Inc. (a) 723,988 11,113,216Universal Health Realty Income Trust (SBI) 65,609 3,632,114Urban Edge Properties 467,624 10,091,326Urstadt Biddle Properties, Inc. Class A 138,313 2,423,244VEREIT, Inc. 4,225,861 28,947,148Washington Prime Group, Inc. 812,804 5,323,866Washington REIT (SBI) 360,702 9,118,547Weingarten Realty Investors (SBI) 535,524 14,528,766Wheeler REIT, Inc. (a) 34,375 172,563Whitestone REIT Class B 165,726 2,045,059WP Carey, Inc. 468,771 28,088,758Xenia Hotels & Resorts, Inc. 466,605 9,178,120
1,489,540,083Real Estate Management & Development – 0.5%Altisource Asset Management Corp. (a) (b) 2,472 163,152Altisource Portfolio Solutions SA (a) (b) 53,097 1,412,380American Realty Investments, Inc. (b) 2,022 27,014Boston Omaha Corp. (a) 27,271 681,230Consolidated-Tomoka Land Co. (a) 23,055 1,427,796Forestar Group, Inc. (a) (b) 48,268 1,192,220FRP Holdings, Inc. (b) 24,947 1,303,481Griffin Industrial Realty, Inc. 7,963 289,535HFF, Inc. 157,657 7,198,619Howard Hughes Corp. (b) 166,858 21,389,527InterGroup Corp. (b) 845 18,886J.W. Mays, Inc. (b) 15 533Jones Lang LaSalle, Inc. 194,865 31,297,268Kennedy-Wilson Holdings, Inc. 578,493 9,458,361Marcus & Millichap, Inc. (a) (b) 70,870 2,218,231Maui Land & Pineapple, Inc. (a) (b) 30,432 337,795RE/MAX Holdings, Inc. 76,810 4,247,593Realogy Holdings Corp. (a) 579,468 14,805,407Redfin Corp. (a) 46,271 952,720
Shares Value
Stratus Properties, Inc. 12,801 $ 380,190Tejon Ranch Co. (b) 80,362 1,780,018The St. Joe Co. (a) (b) 312,153 5,493,893Transcontinental Realty Investors, Inc. (a) (b) 1,510 45,119Trinity Place Holdings, Inc. (b) 36,952 221,712
106,342,680
TOTAL REAL ESTATE 1,595,882,763
TELECOMMUNICATION SERVICES – 1.0%Diversified Telecommunication Services – 0.4%Alaska Communication Systems Group, Inc. (b) 196,814 415,278Altice U.S.A., Inc. Class A (a) 287,102 5,225,256Atlantic Tele-Network, Inc. 49,121 2,942,348Bandwidth, Inc. (a) (b) 13,907 381,747Cincinnati Bell, Inc. (a) (b) 192,042 3,101,478Cogent Communications Group, Inc. 183,493 7,862,675Consolidated Communications Holdings, Inc. (a) 286,426 3,311,085Frontier Communications Corp. (a) 345,068 2,425,828Fusion Telecommunications International (a) (b) 101,759 296,119Gci Liberty, Inc. Class A (b) 118,168 4,543,560Globalstar, Inc. (a) (b) 1,890,637 1,797,240Hawaiian Telcom Holdco, Inc. (b) 49,966 1,407,542IDT Corp. Class B 79,718 962,993Iridium Communications, Inc. (a) (b) 364,703 4,267,025Ooma, Inc. (a) (b) 86,590 922,184ORBCOMM, Inc. (b) 318,602 3,313,461Pareteum Corp. (a) (b) 180,419 411,355PDVWireless, Inc. (a) (b) 45,934 1,479,075Verizon Communications, Inc. 118,964 5,679,341Vonage Holdings Corp. (b) 926,109 9,400,006WideOpenWest, Inc. (a) 83,341 805,074Windstream Holdings, Inc. (a) 848,877 1,341,226Zayo Group Holdings, Inc. (a) (b) 801,685 28,740,407
91,032,303Wireless Telecommunication Services – 0.6%Airgain, Inc. (a) (b) 21,048 192,168Boingo Wireless, Inc. (b) 178,557 4,726,404NII Holdings, Inc. (a) (b) 406,747 524,704Shenandoah Telecommunications Co. (a) 205,715 6,747,452Spok Holdings, Inc. 91,059 1,415,967Sprint Corp. (a) (b) 2,946,679 15,293,264T-Mobile U.S., Inc. (b) 1,259,124 76,315,506Telephone & Data Systems, Inc. 394,896 11,072,884U.S. Cellular Corp. (b) 67,085 2,588,810
118,877,159
TOTAL TELECOMMUNICATION SERVICES 209,909,462
UTILITIES – 2.8%Electric Utilities – 1.0%Allete, Inc. 228,702 15,586,041El Paso Electric Co. 183,416 8,914,018Genie Energy Ltd. Class B (a) 65,626 292,036Great Plains Energy, Inc. 931,034 27,139,641Hawaiian Electric Industries, Inc. 478,429 15,769,020

80Annual Report
See accompanying notes which are an integral part of the financial statements.
Schedule of Investments – continued
Common Stocks – continuedShares Value
UTILITIES – continuedElectric Utilities – continuedIDACORP, Inc. 225,165 $ 18,249,623MGE Energy, Inc. 160,385 8,420,213OGE Energy Corp. 863,990 27,077,447Otter Tail Corp. 180,897 7,199,701PNM Resources, Inc. 349,871 12,315,459Portland General Electric Co. 390,160 15,501,057Spark Energy, Inc. Class A, (a) 73,657 685,010Vistra Energy Corp. (a) (b) 1,226,874 23,249,262Westar Energy, Inc. 620,477 30,235,844
210,634,372Gas Utilities – 0.9%Atmos Energy Corp. 464,171 37,361,124Chesapeake Utilities Corp. 72,373 4,823,660National Fuel Gas Co. (a) 370,005 18,289,347New Jersey Resources Corp. 377,291 14,374,787Northwest Natural Gas Co. 130,419 6,801,351ONE Gas, Inc. 231,055 14,692,787RGC Resources, Inc. 50,846 1,268,608South Jersey Industries, Inc. (a) 364,014 9,540,807Southwest Gas Holdings, Inc. 211,554 13,937,178Spire, Inc. 213,151 14,451,638UGI Corp. 749,832 32,310,261WGL Holdings, Inc. 215,742 17,962,679
185,814,227Independent Power and Renewable Electricity Producers – 0.2%Calpine Corp. (b) 1,549,543 23,584,044Dynegy, Inc. (a) (b) 572,559 7,002,397NRG Yield, Inc.:
Class A 127,027 1,953,675Class C 303,396 4,748,147
Ormat Technologies, Inc. (a) 158,007 9,888,078Pattern Energy Group, Inc. (a) 399,547 7,419,588Terraform Power, Inc. 205,447 2,364,695U.S. Geothermal, Inc. (b) 61,820 330,737
57,291,361Multi-Utilities – 0.4%Avangrid, Inc. 243,479 11,813,601Avista Corp. 266,178 12,731,294Black Hills Corp. (a) 230,314 11,697,648MDU Resources Group, Inc. 853,767 22,445,534NorthWestern Energy Corp. 211,618 10,809,447Unitil Corp. 68,493 2,879,446Vectren Corp. 361,163 21,760,071
94,137,041Water Utilities – 0.3%American States Water Co. 163,100 8,663,872Aqua America, Inc. 774,751 26,488,737AquaVenture Holdings Ltd. (a) (b) 49,986 642,320Artesian Resources Corp. Class A 30,130 997,002Cadiz, Inc. (a) (b) 100,305 1,389,224California Water Service Group 217,369 8,249,154Connecticut Water Service, Inc. 54,452 2,811,357Middlesex Water Co. 74,490 2,639,926Pure Cycle Corp. (b) 69,664 553,829
Shares Value
Select Energy Services, Inc. Class A (a) 97,515 $ 1,400,315SJW Corp. 73,319 3,881,508York Water Co. 57,282 1,609,624
59,326,868
TOTAL UTILITIES 607,203,869
TOTAL COMMON STOCKS(Cost $14,926,420,121) 21,145,773,765
U.S. Treasury Obligations – 0.0%Principal Amount
U.S. Treasury Bills, yield at date of purchase 1.18% 6/21/18 (e)(Cost $5,978,160) $ 6,000,000 5,969,293
Money Market Funds – 19.1%Shares
Fidelity Cash Central Fund, 1.41% (f) 85,267,446 85,284,499Fidelity Securities Lending Cash Central Fund 1.42% (f) (g) 3,966,301,692 3,966,698,322
TOTAL MONEY MARKET FUNDS(Cost $4,051,982,821) 4,051,982,821
TOTAL INVESTMENT IN SECURITIES – 118.6%(Cost $18,984,381,102) 25,203,725,879
NET OTHER ASSETS (LIABILITIES) – (18.6)% (3,944,394,767)NET ASSETS – 100% $21,259,331,112

81 Annual Report
See accompanying notes which are an integral part of the financial statements.
Futures ContractsNumber
of contractsExpiration
DateNotional Amount
Value Unrealized Appreciation/ (Depreciation)
Purchased
Equity Index ContractsCME E-mini Russell 2000 Index Contracts (United States) 1,040 March 2018 $ 78,582,400 $ (855,827) $ (855,827)CME E-mini S&P MidCap 400 Index Contracts (United States) 281 March 2018 52,392,450 (542,706) (542,706)
TOTAL FUTURES CONTRACTS $ (1,398,533)
The notional amount of futures purchased as a percentage of Net Assets is 0.6%
Legend(a) Security or a portion of the security is on loan at period end.
(b) Non-income producing
(c) Level 3 security
(d) Security exempt from registration under Rule 144A of the Securities Act of 1933. These securities may be resold in transactions exempt from registration, normally to qualified institutional buyers. At the end of the period, the value of these securities amounted to $2 or 0.0% of net assets.
(e) Security or a portion of the security was pledged to cover margin requirements for futures contracts. At period end, the value of securities pledged amounted to $4,587,402.
(f) Affiliated fund that is generally available only to investment companies and other accounts managed by Fidelity Investments. The rate quoted is the annualized seven-day yield of the fund at period end. A complete unaudited listing of the fund’s holdings as of its most recent quarter end is available upon request. In addition, each Fidelity Central Fund’s financial statements, which are not covered by the Fund’s Report of Independent Registered Public Accounting Firm, are available on the SEC’s website or upon request.
(g) Investment made with cash collateral received from securities on loan.
Affiliated Central FundsInformation regarding fiscal year to date income earned by the Fund from investments in Fidelity Central Funds is as follows:
Fund Income earnedFidelity Cash Central Fund $ 608,045Fidelity Securities Lending Cash Central Fund 30,959,618Total $ 31,567,663
Amounts in the income column in the above table include any capital gain distributions from underlying funds, which are presented in the corresponding line-item in the Statement of Operations if applicable.
Investment ValuationThe following is a summary of the inputs used, as of February 28, 2018, involving the Fund’s assets and liabilities carried at fair value. The inputs or methodology used for valuing securities may not be an indication of the risk associated with investing in those securities. For more information on valuation inputs, and their aggregation into the levels used below, please refer to the Investment Valuation section in the accompanying Notes to Financial Statements.
Valuation Inputs at Reporting Date:Description Total Level 1 Level 2 Level 3Investments in Securities:Equities:
Consumer Discretionary $ 3,018,969,482 $ 3,018,954,791 $ 14,684 $ 7Consumer Staples 618,005,948 618,005,948 — —Energy 829,456,284 829,456,282 2 —Financials 3,624,007,197 3,624,007,196 — 1Health Care 2,481,678,005 2,479,741,373 680 1,935,952Industrials 2,840,741,675 2,840,741,675 — —Information Technology 4,195,494,120 4,195,494,120 — —Materials 1,124,424,960 1,124,424,960 — —Real Estate 1,595,882,763 1,595,882,763 — —Telecommunication Services 209,909,462 209,909,462 — —Utilities 607,203,869 607,203,869 — —
U.S. Government and Government Agency Obligations 5,969,293 — 5,969,293 —Money Market Funds 4,051,982,821 4,051,982,821 — —Total Investments in Securities: $ 25,203,725,879 $ 25,195,805,260 $ 5,984,659 $ 1,935,960
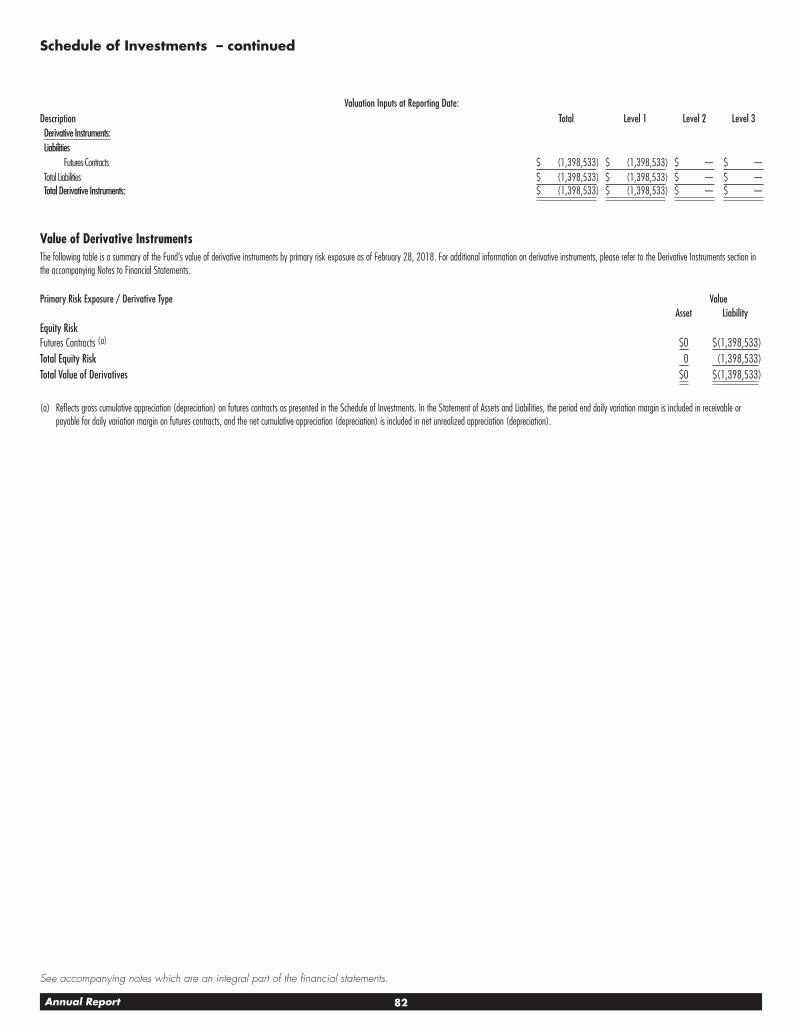
82Annual Report
See accompanying notes which are an integral part of the financial statements.
Schedule of Investments – continued
Valuation Inputs at Reporting Date:Description Total Level 1 Level 2 Level 3Derivative Instruments:Liabilities
Futures Contracts $ (1,398,533) $ (1,398,533) $ — $ —Total Liabilities $ (1,398,533) $ (1,398,533) $ — $ —Total Derivative Instruments: $ (1,398,533) $ (1,398,533) $ — $ —
Value of Derivative InstrumentsThe following table is a summary of the Fund’s value of derivative instruments by primary risk exposure as of February 28, 2018. For additional information on derivative instruments, please refer to the Derivative Instruments section in the accompanying Notes to Financial Statements.
Primary Risk Exposure / Derivative Type ValueAsset Liability
Equity Risk Futures Contracts (a) $ 0 $ (1,398,533)Total Equity Risk 0 (1,398,533)Total Value of Derivatives $ 0 $ (1,398,533)
(a) Reflects gross cumulative appreciation (depreciation) on futures contracts as presented in the Schedule of Investments. In the Statement of Assets and Liabilities, the period end daily variation margin is included in receivable or payable for daily variation margin on futures contracts, and the net cumulative appreciation (depreciation) is included in net unrealized appreciation (depreciation).

83 Annual Report
See accompanying notes which are an integral part of the financial statements.
Fidelity® Extended Market Index Fund
Financial StatementsStatement of Assets and Liabilities
February 28, 2018
Assets Investment in securities, at value (including securities loaned of $3,808,596,227) — See accompanying schedule:
Unaffiliated issuers (cost $14,932,398,281) $ 21,151,743,058Fidelity Central Funds (cost $4,051,982,821) 4,051,982,821
Total Investment in Securities (cost $18,984,381,102) $ 25,203,725,879Cash 120,774Receivable for investments sold 12,299,413Receivable for fund shares sold 13,394,973Dividends receivable 15,302,301Distributions receivable from Fidelity Central Funds 2,587,435Other receivables 33,811
Total assets 25,247,464,586Liabilities Payable for fund shares redeemed $ 18,231,720Accrued management fee 801,339Payable for daily variation margin on futures contracts 1,725,194Other affiliated payables 400,099Collateral on securities loaned 3,966,975,122
Total liabilities 3,988,133,474
Net Assets $ 21,259,331,112
Net Assets consist of: Paid in capital $ 15,083,128,642Undistributed net investment income 19,277,934Accumulated undistributed net realized gain (loss) on investments and foreign currency transactions (61,021,708)Net unrealized appreciation (depreciation) on investments 6,217,946,244Net Assets $ 21,259,331,112
Investor Class: Net Asset Value, offering price and redemption price per share ($688,755,583 ÷ 11,164,114 shares) $ 61.69
Premium Class: Net Asset Value, offering price and redemption price per share ($17,585,374,700 ÷ 285,032,048 shares) $ 61.70
Institutional Premium Class: Net Asset Value, offering price and redemption price per share ($2,985,200,829 ÷ 48,399,350 shares) $ 61.68

84Annual Report
See accompanying notes which are an integral part of the financial statements.
Financial Statements – continued
Statement of OperationsYear ended February
28, 2018
Investment Income Dividends $ 255,748,685Interest 55,180Income from Fidelity Central Funds (including $30,959,618 from security lending) 31,567,663
Total income 287,371,528Expenses Management fee $ 9,138,325Transfer agent fees 4,642,905Independent trustees’ fees and expenses 76,508Legal 7,915Interest 21,631Miscellaneous 60,635
Total expenses before reductions 13,947,919Expense reductions (32,928) 13,914,991
Net investment income (loss) 273,456,537
Realized and Unrealized Gain (Loss) Net realized gain (loss) on:
Investment securities: Unaffiliated issuers 737,340,476Fidelity Central Funds (173,034)
Foreign currency transactions 310Futures contracts 7,897,918
Total net realized gain (loss) 745,065,670Change in net unrealized appreciation (depreciation) on:
Investment securities: Unaffiliated issuers 1,348,355,423Fidelity Central Funds (115,568)
Futures contracts (3,861,045)Total change in net unrealized appreciation (depreciation) 1,344,378,810Net gain (loss) 2,089,444,480Net increase (decrease) in net assets resulting from operations $ 2,362,901,017
Statement of Changes in Net AssetsYear ended
February 28, 2018
Year ended February 28,
2017Increase (Decrease) in Net Assets Operations
Net investment income (loss) $ 273,456,537 $ 249,578,137Net realized gain (loss) 745,065,670 737,078,558Change in net unrealized appreciation (depreciation) 1,344,378,810 3,647,100,185Net increase (decrease) in net assets resulting from operations 2,362,901,017 4,633,756,880
Distributions to shareholders from net investment income (264,767,116) (236,121,884)Distributions to shareholders from net realized gain (891,671,964) (605,807,215)
Total distributions (1,156,439,080) (841,929,099)Share transactions – net increase (decrease) 795,717,146 1,125,097,806Redemption fees – 367,317
Total increase (decrease) in net assets 2,002,179,083 4,917,292,904Net Assets
Beginning of period 19,257,152,029 14,339,859,125End of period $ 21,259,331,112 $ 19,257,152,029
Other Information Undistributed net investment income end of period $ 19,277,934 $ 34,722,404

85 Annual Report
See accompanying notes which are an integral part of the financial statements.
Financial Highlights
Fidelity Extended Market Index Fund Investor Class
Years ended February 28, 2018 2017 2016 A 2015 2014Selected Per–Share Data Net asset value, beginning of period $ 58.10 $ 46.00 $ 57.40 $ 55.29 $ 43.12Income from Investment Operations
Net investment income (loss) B .79 .77 .75 .74 .67Net realized and unrealized gain (loss) 6.25 14.00 (8.99) 3.62 13.09
Total from investment operations 7.04 14.77 (8.24) 4.36 13.76Distributions from net investment income (.77) (.74) (.71) (.70) (.54)Distributions from net realized gain (2.67) (1.93) (2.45) (1.55) (1.06)
Total distributions (3.45)C (2.67) (3.16) (2.25) (1.60)Redemption fees added to paid in capital B – –D –D –D .01Net asset value, end of period $ 61.69 $ 58.10 $ 46.00 $ 57.40 $ 55.29
Total Return E 12.29% 32.50% (14.86)% 8.23% 32.38%Ratios to Average Net Assets F,G
Expenses before reductions .10% .10% .10% .10% .10%Expenses net of fee waivers, if any .10% .10% .10% .10% .10%Expenses net of all reductions .10% .10% .10% .10% .10%Net investment income (loss) 1.32% 1.47% 1.39% 1.36% 1.35%
Supplemental Data Net assets, end of period (000 omitted) $ 688,756 $ 815,223 $ 1,392,793 $ 1,992,558 $ 1,803,152Portfolio turnover rate H 11% 12% 12%I 7% 14%
A For the year ended February 29.B Calculated based on average shares outstanding during the period.C Total distributions of $3.45 per share is comprised of distributions from net investment income of $.774 and distributions from net realized gain of $2.674 per share.D Amount represents less than $.005 per share.E Total returns would have been lower if certain expenses had not been reduced during the applicable periods shown.F Fees and expenses of any underlying Fidelity Central Funds are not included in the Fund’s expense ratio. The Fund indirectly bears its proportionate share of the expenses of any underlying Fidelity Central Funds.G Expense ratios reflect operating expenses of the class. Expenses before reductions do not reflect amounts reimbursed by the investment adviser or reductions from expense offset arrangements and do not represent the amount paid
by the class during periods when reimbursements or reductions occur. Expenses net of fee waivers reflect expenses after reimbursement by the investment adviser but prior to reductions from expense offset arrangements. Expenses net of all reductions represent the net expenses paid by the class.
H Amount does not include the portfolio activity of any underlying Fidelity Central Funds.I Portfolio turnover rate excludes securities received or delivered in-kind.

86Annual Report
See accompanying notes which are an integral part of the financial statements.
Financial Highlights – continued
Fidelity Extended Market Index Fund Premium Class
Years ended February 28, 2018 2017 2016 A 2015 2014Selected Per–Share Data Net asset value, beginning of period $ 58.11 $ 46.00 $ 57.40 $ 55.30 $ 43.12Income from Investment Operations
Net investment income (loss) B .81 .80 .77 .76 .68Net realized and unrealized gain (loss) 6.25 13.99 (8.99) 3.61 13.11
Total from investment operations 7.06 14.79 (8.22) 4.37 13.79Distributions from net investment income (.79) (.75) (.73) (.72) (.56)Distributions from net realized gain (2.67) (1.93) (2.45) (1.55) (1.06)
Total distributions (3.47)C (2.68) (3.18) (2.27) (1.62)Redemption fees added to paid in capital B – –D –D –D .01Net asset value, end of period $ 61.70 $ 58.11 $ 46.00 $ 57.40 $ 55.30
Total Return E 12.32% 32.56% (14.83)% 8.24% 32.44%Ratios to Average Net Assets F,G
Expenses before reductions .07% .07% .07% .07% .07%Expenses net of fee waivers, if any .07% .07% .07% .07% .07%Expenses net of all reductions .07% .07% .07% .07% .07%Net investment income (loss) 1.35% 1.49% 1.42% 1.39% 1.38%
Supplemental Data Net assets, end of period (000 omitted) $ 17,585,375 $ 16,222,551 $ 11,837,818 $ 13,356,931 $ 12,280,754Portfolio turnover rate H 11% 12% 12%I 7% 14%
A For the year ended February 29.B Calculated based on average shares outstanding during the period.C Total distributions of $3.47 per share is comprised of distributions from net investment income of $.793 and distributions from net realized gain of $2.674 per share.D Amount represents less than $.005 per share.E Total returns would have been lower if certain expenses had not been reduced during the applicable periods shown.F Fees and expenses of any underlying Fidelity Central Funds are not included in the Fund’s expense ratio. The Fund indirectly bears its proportionate share of the expenses of any underlying Fidelity Central Funds.G Expense ratios reflect operating expenses of the class. Expenses before reductions do not reflect amounts reimbursed by the investment adviser or reductions from expense offset arrangements and do not represent the amount paid
by the class during periods when reimbursements or reductions occur. Expenses net of fee waivers reflect expenses after reimbursement by the investment adviser but prior to reductions from expense offset arrangements. Expenses net of all reductions represent the net expenses paid by the class.
H Amount does not include the portfolio activity of any underlying Fidelity Central Funds.I Portfolio turnover rate excludes securities received or delivered in-kind.

87 Annual Report
See accompanying notes which are an integral part of the financial statements.
Fidelity Extended Market Index Fund Institutional Premium Class
Years ended February 28, 2018 2017 2016 A 2015 2014Selected Per–Share Data Net asset value, beginning of period $ 58.09 $ 45.99 $ 57.39 $ 55.28 $ 43.11Income from Investment Operations
Net investment income (loss) B .83 .81 .76 .76 .72Net realized and unrealized gain (loss) 6.24 13.98 (8.98) 3.63 13.06
Total from investment operations 7.07 14.79 (8.22) 4.39 13.78Distributions from net investment income (.81) (.76) (.73) (.72) (.56)Distributions from net realized gain (2.67) (1.93) (2.45) (1.55) (1.06)
Total distributions (3.48) (2.69) (3.18) (2.28)C (1.62)Redemption fees added to paid in capital B – –D –D –D .01Net asset value, end of period $ 61.68 $ 58.09 $ 45.99 $ 57.39 $ 55.28
Total Return E 12.35% 32.58% (14.83)% 8.27% 32.44%Ratios to Average Net Assets F,G
Expenses before reductions .05% .05% .07% .07% .07%Expenses net of fee waivers, if any .05% .05% .06% .06% .06%Expenses net of all reductions .05% .05% .06% .06% .06%Net investment income (loss) 1.37% 1.52% 1.43% 1.40% 1.39%
Supplemental Data Net assets, end of period (000 omitted) $ 2,985,201 $ 2,219,377 $ 1,109,249 $ 754,325 $ 95,747Portfolio turnover rate H 11% 12% 12%I 7% 14%
A For the year ended February 29.B Calculated based on average shares outstanding during the period.C Total distributions of $2.28 per share is comprised of distributions from net investment income of $.722 and distributions from net realized gain of $1.553 per share.D Amount represents less than $.005 per share.E Total returns would have been lower if certain expenses had not been reduced during the applicable periods shown.F Fees and expenses of any underlying Fidelity Central Funds are not included in the Fund’s expense ratio. The Fund indirectly bears its proportionate share of the expenses of any underlying Fidelity Central Funds.G Expense ratios reflect operating expenses of the class. Expenses before reductions do not reflect amounts reimbursed by the investment adviser or reductions from expense offset arrangements and do not represent the amount paid
by the class during periods when reimbursements or reductions occur. Expenses net of fee waivers reflect expenses after reimbursement by the investment adviser but prior to reductions from expense offset arrangements. Expenses net of all reductions represent the net expenses paid by the class.
H Amount does not include the portfolio activity of any underlying Fidelity Central Funds.I Portfolio turnover rate excludes securities received or delivered in-kind.

88Annual Report
Fidelity® International Index Fund
Performance: The Bottom LineAverage annual total return reflects the change in the value of an investment, assuming reinvestment of distributions from dividend income and capital gains (the profits earned upon the sale of securities that have grown in value, if any) and assuming a constant rate of performance each year. The hypothetical investment and the average annual total returns do not reflect the deduction of taxes that a shareholder would pay on fund distributions or the redemption of fund shares. During periods of reimbursement by Fidelity, a fund’s total return will be greater than it would be had the reimbursement not occurred. How a fund did yesterday is no guarantee of how it will do tomorrow.
Average Annual Total Returns
For the periods ended February 28, 2018 Past 1 year
Past 5 years
Past 10 years
Institutional Class 19.78% 7.11% 3.01%Institutional Premium Class 19.82% 7.12% 3.02%
The initial offering of Institutional Class shares took place on September 8, 2011. Returns prior to September 8, 2011 are those of Premium Class.
The initial offering of Institutional Premium Class shares took place on September 8, 2011. Returns prior to September 8, 2011 are those of Premium Class.
$10,000 Over 10 Years
Let’s say hypothetically that $10,000 was invested in Fidelity® International Index Fund - Institutional Class on February 29, 2008.
The chart shows how the value of your investment would have changed, and also shows how the MSCI EAFE Index performed over the same period.
See above for additional information regarding the performance of Institutional Class.
Period Ending Values
$13,458 Fidelity® International Index Fund - Institutional Class
$13,406 MSCI EAFE Index

89 Annual Report
Fidelity® International Index Fund
Management’s Discussion of Fund PerformanceMarket Recap: Stocks entered 2018 reinforced by accelerating corporate earnings, synchronous global economic growth and optimism around U.S. tax reform. Volatility spiked in February, though, amid fear that interest rates could rise faster than expected. Nevertheless, the MSCI World ex USA Index gained 19.12% for the 12 months ending February 28, 2018, aided partly by a generally weak U.S. dollar. Within the index, growth- led value-oriented stocks, and small-caps bested large-caps. Certain election results in continental Europe (+24%) suggested ebbing political risk there, whereas bumpy Brexit negotiations and sterling strength hindered the U.K. (+15%). Central-bank accommodation helped Japan (+22%) overcome recent yen strength and outperform the rest of the Asia-Pacific group (+15%). Meanwhile, commodity-price volatility weighed on Canada (+7%). Sector-wise, information technology (+36%) was lifted by software, semiconductor and internet-related names. Financials (+21%) rode rising interest rates that, at the same time, hurt real estate (+14%) and three other “bond proxy” sectors: consumer staples (+12%), utilities (+12%) and telecom services (+8%). Demand from China aided materials (+24%) and industrials (+24%). Energy (+14%) and health care (+10%) rallied from early-period difficulty. Elsewhere, the MSCI Emerging Markets Index rose 30.97% for the year, notably supported by China plus Brazil, Russia and India.
Comments from Patrick Waddell, Senior Portfolio Manager of the Geode Capital Management, LLC, investment management team: For the year, the fund’s share classes returned roughly 20%, close to in line with the 20.37% gain of the benchmark MSCI EAFE Index. (The fund may use fair-value pricing techniques to better reflect the value of foreign securities whose prices may be stale due to differences in market-closure times and dates around the world. Fair-value pricing is an adjustment process that attempts to best represent the value of fund holdings as of the close of trading in U.S. markets, accounting for any major changes occurring after the close of foreign markets. The MSCI EAFE does not engage in fair-value pricing; differences between fund and index pricing methodologies may cause short-term discrepancies in performance, which tend to smooth out over time.) Against a strong market backdrop for international stocks, every sector and nearly every country represented in the MSCI EAFE gained solid ground this period. Several financial stocks added meaningful value this period, including British multinational bank HSBC Holdings – the second-largest position in the index, on average, this period – and insurers Allianz and AIA Group, based in Germany and Hong Kong, respectively. In the energy sector, where a higher oil price helped spur stock gains, U.K.-based energy giant Royal Dutch Shell gained strongly. Other notable contributors included Japanese automaker Toyota Motor and Danish pharmaceutical company Novo-Nordisk. Other drugmakers did not fare well this period, reflecting a variety of company-specific factors. These included Israel’s Teva Pharmaceutical Industries, U.K.-based GlaxoSmithKline and Jersey-registered, Irish-headquartered Shire. Elsewhere, British tobacco company Imperial Brands struggled for the year.
The views expressed above reflect those of the portfolio manager(s) only through the end of the period as stated on the cover of this report and do not necessarily represent the views of Fidelity or any other person in the Fidelity organization. Any such views are subject to change at any time based upon market or other conditions and Fidelity disclaims any responsibility to update such views. These views may not be relied on as investment advice and, because investment decisions for a Fidelity fund are based on numerous factors, may not be relied on as an indication of trading intent on behalf of any Fidelity fund.

90Annual Report
Fidelity® International Index Fund
Investment Summary (Unaudited)
Top Ten Stocks as of February 28, 2018
% of fund’s net assets
Nestle SA (Reg. S) (Switzerland, Food Products) 1.6HSBC Holdings PLC (United Kingdom) (United Kingdom, Banks) 1.3Novartis AG (Switzerland, Pharmaceuticals) 1.2Toyota Motor Corp. (Japan, Automobiles) 1.2Roche Holding AG (participation certificate) (Switzerland, Pharmaceuticals) 1.1Royal Dutch Shell PLC Class A (United Kingdom) (United Kingdom, Oil, Gas &
Consumable Fuels) 0.9Total SA (France, Oil, Gas & Consumable Fuels) 0.9British American Tobacco PLC (United Kingdom) (United Kingdom, Tobacco) 0.9BP PLC (United Kingdom, Oil, Gas & Consumable Fuels) 0.8Royal Dutch Shell PLC Class B (United Kingdom) (United Kingdom, Oil, Gas &
Consumable Fuels) 0.810.7
Top Market Sectors as of February 28, 2018
% of fund’s net assets
Financials 21.3Industrials 14.2Consumer Discretionary 12.2Consumer Staples 10.6Health Care 9.7Materials 7.8Information Technology 6.8Energy 5.2Telecommunication Services 3.8Real Estate 3.6
Geographic Diversification (% of fund’s net assets)
As of February 28, 2018
Japan 24.3%
United Kingdom 15.5%
France 9.9%
Germany 9.4%
Switzerland 7.8%
Australia 6.6%
Netherlands 4.5%
Spain 3.2%
Sweden 2.6%
Other* 16.2%* Includes Short-Term investments and Net Other Assets (Liabilities).
Percentages are based on country or territory of incorporation and include the effect of futures contracts, options and swaps, as applicable. Foreign currency contracts and other assets and liabilities are included within United States of America, as applicable.
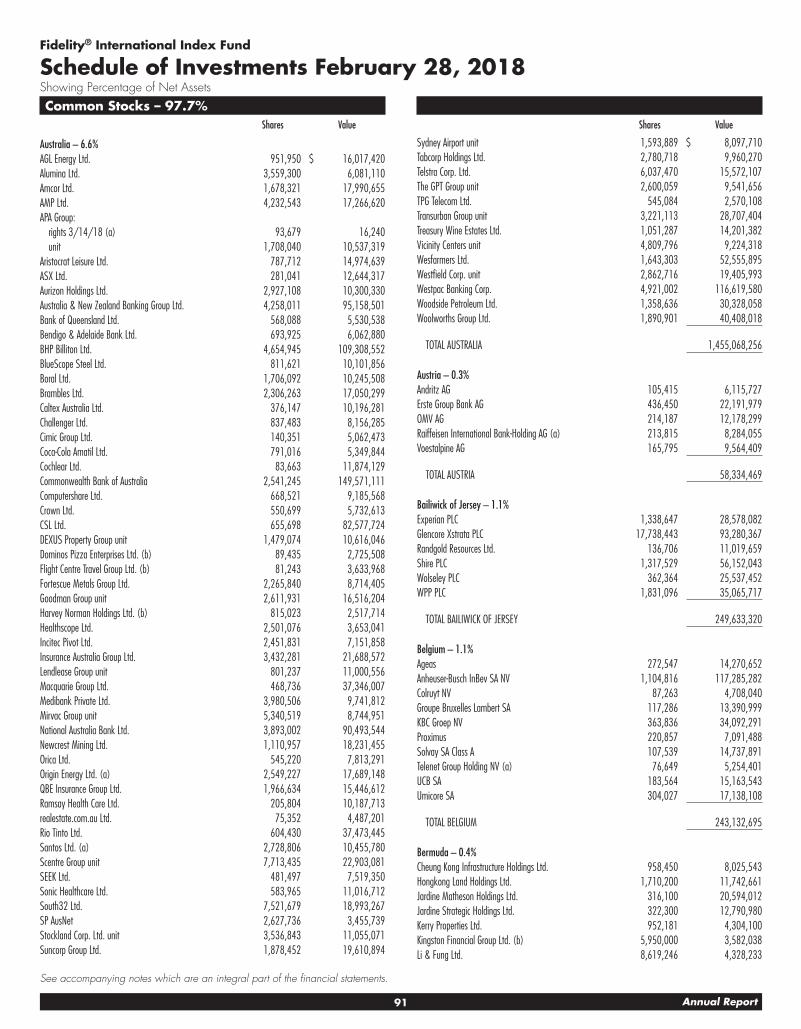
91 Annual Report
See accompanying notes which are an integral part of the financial statements.
Common Stocks – 97.7%Shares Value
Australia – 6.6%AGL Energy Ltd. 951,950 $ 16,017,420Alumina Ltd. 3,559,300 6,081,110Amcor Ltd. 1,678,321 17,990,655AMP Ltd. 4,232,543 17,266,620APA Group:
rights 3/14/18 (a) 93,679 16,240unit 1,708,040 10,537,319
Aristocrat Leisure Ltd. 787,712 14,974,639ASX Ltd. 281,041 12,644,317Aurizon Holdings Ltd. 2,927,108 10,300,330Australia & New Zealand Banking Group Ltd. 4,258,011 95,158,501Bank of Queensland Ltd. 568,088 5,530,538Bendigo & Adelaide Bank Ltd. 693,925 6,062,880BHP Billiton Ltd. 4,654,945 109,308,552BlueScope Steel Ltd. 811,621 10,101,856Boral Ltd. 1,706,092 10,245,508Brambles Ltd. 2,306,263 17,050,299Caltex Australia Ltd. 376,147 10,196,281Challenger Ltd. 837,483 8,156,285Cimic Group Ltd. 140,351 5,062,473Coca-Cola Amatil Ltd. 791,016 5,349,844Cochlear Ltd. 83,663 11,874,129Commonwealth Bank of Australia 2,541,245 149,571,111Computershare Ltd. 668,521 9,185,568Crown Ltd. 550,699 5,732,613CSL Ltd. 655,698 82,577,724DEXUS Property Group unit 1,479,074 10,616,046Dominos Pizza Enterprises Ltd. (b) 89,435 2,725,508Flight Centre Travel Group Ltd. (b) 81,243 3,633,968Fortescue Metals Group Ltd. 2,265,840 8,714,405Goodman Group unit 2,611,931 16,516,204Harvey Norman Holdings Ltd. (b) 815,023 2,517,714Healthscope Ltd. 2,501,076 3,653,041Incitec Pivot Ltd. 2,451,831 7,151,858Insurance Australia Group Ltd. 3,432,281 21,688,572Lendlease Group unit 801,237 11,000,556Macquarie Group Ltd. 468,736 37,346,007Medibank Private Ltd. 3,980,506 9,741,812Mirvac Group unit 5,340,519 8,744,951National Australia Bank Ltd. 3,893,002 90,493,544Newcrest Mining Ltd. 1,110,957 18,231,455Orica Ltd. 545,220 7,813,291Origin Energy Ltd. (a) 2,549,227 17,689,148QBE Insurance Group Ltd. 1,966,634 15,446,612Ramsay Health Care Ltd. 205,804 10,187,713realestate.com.au Ltd. 75,352 4,487,201Rio Tinto Ltd. 604,430 37,473,445Santos Ltd. (a) 2,728,806 10,455,780Scentre Group unit 7,713,435 22,903,081SEEK Ltd. 481,497 7,519,350Sonic Healthcare Ltd. 583,965 11,016,712South32 Ltd. 7,521,679 18,993,267SP AusNet 2,627,736 3,455,739Stockland Corp. Ltd. unit 3,536,843 11,055,071Suncorp Group Ltd. 1,878,452 19,610,894
Fidelity® International Index Fund
Schedule of Investments February 28, 2018Showing Percentage of Net Assets
Shares Value
Sydney Airport unit 1,593,889 $ 8,097,710Tabcorp Holdings Ltd. 2,780,718 9,960,270Telstra Corp. Ltd. 6,037,470 15,572,107The GPT Group unit 2,600,059 9,541,656TPG Telecom Ltd. 545,084 2,570,108Transurban Group unit 3,221,113 28,707,404Treasury Wine Estates Ltd. 1,051,287 14,201,382Vicinity Centers unit 4,809,796 9,224,318Wesfarmers Ltd. 1,643,303 52,555,895Westfield Corp. unit 2,862,716 19,405,993Westpac Banking Corp. 4,921,002 116,619,580Woodside Petroleum Ltd. 1,358,636 30,328,058Woolworths Group Ltd. 1,890,901 40,408,018
TOTAL AUSTRALIA 1,455,068,256
Austria – 0.3%Andritz AG 105,415 6,115,727Erste Group Bank AG 436,450 22,191,979OMV AG 214,187 12,178,299Raiffeisen International Bank-Holding AG (a) 213,815 8,284,055Voestalpine AG 165,795 9,564,409
TOTAL AUSTRIA 58,334,469
Bailiwick of Jersey – 1.1%Experian PLC 1,338,647 28,578,082Glencore Xstrata PLC 17,738,443 93,280,367Randgold Resources Ltd. 136,706 11,019,659Shire PLC 1,317,529 56,152,043Wolseley PLC 362,364 25,537,452WPP PLC 1,831,096 35,065,717
TOTAL BAILIWICK OF JERSEY 249,633,320
Belgium – 1.1%Ageas 272,547 14,270,652Anheuser-Busch InBev SA NV 1,104,816 117,285,282Colruyt NV 87,263 4,708,040Groupe Bruxelles Lambert SA 117,286 13,390,999KBC Groep NV 363,836 34,092,291Proximus 220,857 7,091,488Solvay SA Class A 107,539 14,737,891Telenet Group Holding NV (a) 76,649 5,254,401UCB SA 183,564 15,163,543Umicore SA 304,027 17,138,108
TOTAL BELGIUM 243,132,695
Bermuda – 0.4%Cheung Kong Infrastructure Holdings Ltd. 958,450 8,025,543Hongkong Land Holdings Ltd. 1,710,200 11,742,661Jardine Matheson Holdings Ltd. 316,100 20,594,012Jardine Strategic Holdings Ltd. 322,300 12,790,980Kerry Properties Ltd. 952,181 4,304,100Kingston Financial Group Ltd. (b) 5,950,000 3,582,038Li & Fung Ltd. 8,619,246 4,328,233

92Annual Report
See accompanying notes which are an integral part of the financial statements.
Schedule of Investments – continued
Common Stocks – continuedShares Value
Bermuda – continuedNWS Holdings Ltd. 2,245,104 $ 4,217,143Shangri-La Asia Ltd. 1,803,380 4,025,814Yue Yuen Industrial (Holdings) Ltd. 1,071,500 4,579,701
TOTAL BERMUDA 78,190,225
British Virgin Islands – 0.0%First Pacific Co. Ltd. 3,136,665 1,946,534
Cayman Islands – 0.7%ASM Pacific Technology Ltd. 440,529 6,265,967Cheung Kong Property Holdings Ltd. 3,750,925 32,229,039CK Hutchison Holdings Ltd. 3,912,925 48,904,652Melco Crown Entertainment Ltd. sponsored ADR 356,199 9,777,663MGM China Holdings Ltd. 1,380,000 4,043,253Minth Group Ltd. 1,068,000 6,267,452Sands China Ltd. 3,512,400 19,593,505WH Group Ltd. (c) 12,775,500 15,734,370Wharf Real Estate Investment Co. Ltd. 1,766,585 11,889,048Wynn Macau Ltd. 2,256,000 7,862,133
TOTAL CAYMAN ISLANDS 162,567,082
Denmark – 1.8%A.P. Moller - Maersk A/S:
Series A 5,457 8,514,544Series B 9,486 15,408,862
Carlsberg A/S Series B 155,260 18,982,741Christian Hansen Holding A/S 143,904 11,952,856Coloplast A/S Series B 172,619 14,587,996Danske Bank A/S 1,086,804 43,619,412DONG Energy A/S (c) 274,756 17,104,638DSV de Sammensluttede Vognmaend A/S 275,584 21,584,861Genmab A/S (a) 84,361 17,156,551H Lundbeck A/S 101,490 5,314,612ISS Holdings A/S 240,971 8,730,294Novo Nordisk A/S Series B 2,703,728 139,866,451Novozymes A/S Series B 328,312 16,873,340Pandora A/S 155,186 16,180,546TDC A/S 1,171,891 9,542,421Tryg A/S 173,570 4,116,818Vestas Wind Systems A/S 312,487 22,583,760William Demant Holding A/S (a) 169,459 6,056,229
TOTAL DENMARK 398,176,932
Finland – 1.0%Elisa Corp. (A Shares) 205,414 8,823,810Fortum Corp. 645,476 14,177,082Kone Oyj (B Shares) 490,234 25,386,542Metso Corp. 162,611 5,193,606Neste Oyj 186,304 13,640,400Nokia Corp. 8,467,750 49,359,705Nokian Tyres PLC 168,297 7,714,232Orion Oyj (B Shares) 151,872 4,946,430
Shares Value
Sampo Oyj (A Shares) 648,272 $ 36,689,111Stora Enso Oyj (R Shares) 800,066 14,129,438UPM-Kymmene Corp. 773,371 26,459,981Wartsila Corp. 214,784 15,111,231
TOTAL FINLAND 221,631,568
France – 9.7%Accor SA 272,657 15,715,201Aeroports de Paris 42,879 8,670,326Air Liquide SA 300,247 37,503,112Alstom SA 224,120 9,434,371Amundi SA (c) 87,480 7,131,031Arkema SA 99,007 12,920,278Atos Origin SA 137,360 18,069,529AXA SA 2,815,532 88,179,828BIC SA 41,503 4,354,274bioMerieux SA 60,035 4,617,986BNP Paribas SA 1,629,450 128,841,463Bollore SA 1,266,823 7,159,722Bollore SA (a) 6,825 37,806Bouygues SA 313,637 15,866,279Bureau Veritas SA 382,298 10,016,657Capgemini SA 233,119 29,057,191Carrefour SA 842,756 19,321,028Casino Guichard Perrachon SA 79,530 4,308,146CNP Assurances 247,975 6,009,309Compagnie de St. Gobain 724,880 41,027,358Credit Agricole SA 1,651,319 28,295,698Danone SA 875,146 69,798,553Dassault Aviation SA 3,600 6,240,096Dassault Systemes SA 187,946 24,247,268Edenred SA 325,183 11,409,330EDF SA (a) 200,740 2,608,576EDF SA 640,256 8,302,175Eiffage SA 106,904 11,572,539ENGIE 2,646,455 41,275,065Essilor International SA 301,147 39,440,310Eurazeo SA 63,232 6,034,909Eutelsat Communications 253,540 5,923,180Faurecia SA 109,534 9,158,255Fonciere des Regions 48,425 5,052,287Gecina SA 71,115 12,454,210Groupe Eurotunnel SA 674,781 8,678,980Hermes International SCA 45,898 24,683,309ICADE 48,798 4,718,944Iliad SA 38,177 8,951,001Imerys SA 51,629 5,266,065Ingenico SA 85,366 7,406,316Ipsen SA 54,550 7,991,004JCDecaux SA 106,929 4,144,639Kering SA 109,872 51,559,553Klepierre SA 319,663 13,168,614L’Oreal SA (a) 201,944 43,402,005L’Oreal SA 162,909 35,028,660Lagardere S.C.A. (Reg.) 170,393 5,002,599

93 Annual Report
See accompanying notes which are an integral part of the financial statements.
Common Stocks – continuedShares Value
France – continuedLegrand SA 385,731 $ 30,240,598LVMH Moet Hennessy - Louis Vuitton SA 404,328 120,933,307Michelin CGDE Series B 248,331 38,169,640Natixis SA 1,370,441 11,739,600Orange SA 2,893,530 48,953,156Pernod Ricard SA 307,894 50,456,591Peugeot Citroen SA 852,934 19,245,502Publicis Groupe SA 300,570 22,605,588Remy Cointreau SA 32,913 4,474,651Renault SA 278,662 30,226,424Rexel SA 437,418 7,682,384Safran SA 483,752 53,377,091Sanofi SA 1,648,618 130,158,196Schneider Electric SA 821,874 71,230,848SCOR SE 251,701 10,671,254SEB SA 32,537 6,637,603Societe Generale Series A 1,112,834 63,230,838Sodexo SA 46,656 5,729,042Sodexo SA 84,696 10,394,341SR Teleperformance SA 83,941 11,953,688Suez Environnement SA 532,925 7,319,258Thales SA 153,618 17,073,889Total SA 3,483,254 198,123,205Ubisoft Entertainment SA (a) 90,141 7,412,845Unibail-Rodamco 144,763 33,682,552Valeo SA 347,560 22,475,988Veolia Environnement SA 695,272 16,886,846VINCI SA 735,540 72,627,398Vivendi SA 1,501,795 38,617,081Wendel SA 40,490 7,017,433Zodiac Aerospace 251,743 7,669,871
TOTAL FRANCE 2,147,071,743
Germany – 8.9%adidas AG 273,034 60,494,498Allianz SE 646,999 150,292,244Axel Springer Verlag AG 69,934 6,297,197BASF AG 1,331,858 139,138,623Bayer AG 1,199,239 139,946,602Bayerische Motoren Werke AG (BMW) 480,316 50,464,359Beiersdorf AG 145,310 15,900,416Brenntag AG 224,347 13,985,149Commerzbank AG (a) 1,544,279 23,859,911Continental AG 159,492 43,580,498Covestro AG (c) 234,938 26,503,450Daimler AG (Germany) (b) 1,395,893 119,190,613Deutsche Bank AG 2,997,099 47,774,873Deutsche Borse AG 279,899 37,218,658Deutsche Lufthansa AG 342,248 11,427,683Deutsche Post AG 1,407,464 64,210,273Deutsche Telekom AG 4,833,541 77,658,999Deutsche Wohnen AG (Bearer) 514,121 21,201,573Drillisch AG 76,772 5,902,029E.ON AG 3,189,910 32,344,060
Shares Value
Evonik Industries AG 235,752 $ 8,680,401Fraport AG Frankfurt Airport Services Worldwide 60,614 6,185,175Fresenius Medical Care AG & Co. KGaA 312,404 32,960,264Fresenius SE & Co. KGaA 603,098 49,003,351GEA Group AG 265,944 12,571,419Hannover Reuck SE 87,099 11,847,108HeidelbergCement Finance AG 215,760 21,651,284Henkel AG & Co. KGaA 150,659 18,113,470Hochtief AG (b) 27,660 4,646,170Hugo Boss AG 91,626 8,155,596Infineon Technologies AG 1,647,958 44,598,341Innogy SE (c) 201,201 8,024,510K&S AG 277,847 7,737,427KION Group AG 102,206 8,716,941Lanxess AG 133,212 11,053,423Linde AG (a) 28,948 6,423,530Linde AG 240,387 50,525,611MAN SE 51,418 5,863,201Merck KGaA 187,492 18,683,707Metro Wholesale & Food Specialist AG (b) 261,428 5,098,699MTU Aero Engines Holdings AG 75,604 12,625,267Muenchener Rueckversicherungs AG 224,857 50,280,299OSRAM Licht AG 144,771 11,430,563ProSiebenSat.1 Media AG 338,599 13,391,431RWE AG 752,719 14,961,253SAP SE 1,425,225 148,735,672Schaeffler AG 240,463 3,894,965Siemens AG 1,109,287 145,361,916Symrise AG 179,232 14,535,677Telefonica Deutschland Holding AG 1,083,778 4,988,109Thyssenkrupp AG 631,457 17,097,093TUI AG 269,735 5,696,355TUI AG (GB) 369,830 7,816,811Uniper SE 290,517 8,822,085United Internet AG 178,801 12,120,562Volkswagen AG 46,731 9,283,136Vonovia SE 703,126 32,055,050Wirecard AG 170,265 20,259,657Zalando SE (a) (b) 160,683 9,144,558
TOTAL GERMANY 1,970,431,795
Hong Kong – 2.4%AIA Group Ltd. 17,510,200 145,310,020Bank of East Asia Ltd. 1,797,249 7,892,273BOC Hong Kong (Holdings) Ltd. 5,366,066 26,967,102CLP Holdings Ltd. 2,381,657 24,089,016Galaxy Entertainment Group Ltd. 3,434,000 29,791,944Hang Lung Group Ltd. 1,293,000 4,366,184Hang Lung Properties Ltd. 2,934,423 6,974,634Hang Seng Bank Ltd. 1,108,801 27,490,509Henderson Land Development Co. Ltd. 1,747,407 11,289,624Hong Kong & China Gas Co. Ltd. 12,177,384 24,029,217Hong Kong Exchanges and Clearing Ltd. 1,708,106 61,187,852Hysan Development Co. Ltd. 915,677 5,291,907Link (REIT) 3,188,808 27,108,032

94Annual Report
See accompanying notes which are an integral part of the financial statements.
Schedule of Investments – continued
Common Stocks – continuedShares Value
Hong Kong – continuedMTR Corp. Ltd. 2,168,327 $ 11,443,926New World Development Co. Ltd. 8,581,786 12,979,006PCCW Ltd. 6,217,863 3,532,701Power Assets Holdings Ltd. 2,017,176 17,113,936Sino Land Ltd. 4,574,470 8,058,280SJM Holdings Ltd. 2,898,000 2,760,488Sun Hung Kai Properties Ltd. 2,097,676 34,798,311Swire Pacific Ltd. (A Shares) 723,384 7,271,679Swire Properties Ltd. 1,696,200 5,779,766Techtronic Industries Co. Ltd. 2,001,500 12,557,401Wharf Holdings Ltd. 1,750,585 6,503,968Wheelock and Co. Ltd. 1,190,000 8,626,147
TOTAL HONG KONG 533,213,923
Ireland – 0.6%AIB Group PLC 1,172,956 7,771,715Bank Ireland Group PLC 1,330,602 12,430,698CRH PLC 1,215,046 39,928,619DCC PLC (United Kingdom) 129,567 11,791,963James Hardie Industries PLC CDI 641,938 11,269,182Kerry Group PLC Class A 229,449 22,888,827Paddy Power Betfair PLC (Ireland) 116,294 13,495,784Ryanair Holdings PLC (a) 243,332 4,794,587
TOTAL IRELAND 124,371,375
Isle of Man – 0.0%Genting Singapore PLC 8,724,759 7,580,014
Israel – 0.5%Azrieli Group 61,843 3,053,163Bank Hapoalim BM (Reg.) 1,554,784 11,131,625Bank Leumi le-Israel BM 2,106,767 12,769,570Bezeq The Israel Telecommunication Corp. Ltd. 2,977,841 4,563,708Check Point Software Technologies Ltd. (a) (b) 189,657 19,703,466Elbit Systems Ltd. (Israel) 34,136 4,876,221Frutarom Industries Ltd. 55,821 5,136,139Israel Chemicals Ltd. 1,013,704 4,348,797Mizrahi Tefahot Bank Ltd. 200,430 3,712,552NICE Systems Ltd. 79,089 7,709,122NICE Systems Ltd. sponsored ADR 8,453 816,475Teva Pharmaceutical Industries Ltd. sponsored ADR (b) 1,325,058 24,805,086
TOTAL ISRAEL 102,625,924
Italy – 1.9%Assicurazioni Generali SpA 1,812,098 33,899,510Atlantia SpA 658,524 20,228,889Davide Campari-Milano SpA 846,156 6,056,251Enel SpA 11,791,605 68,447,515Eni SpA 3,687,391 61,228,657Intesa Sanpaolo SpA 19,525,999 73,257,578Intesa Sanpaolo SpA (Risparmio Shares) 1,372,189 5,445,191Leonardo SpA 583,444 6,245,553
Shares Value
Luxottica Group SpA 246,485 $ 14,782,322Mediobanca SpA 893,097 10,657,085Poste Italiane SpA (c) 755,662 6,487,993Prysmian SpA 297,293 9,335,862Recordati SpA 152,346 5,446,251Snam Rete Gas SpA 3,304,042 14,790,746Telecom Italia SpA (a) 16,374,682 14,696,094Terna SpA 2,048,515 11,354,624UniCredit SpA 2,904,914 61,263,716Unipolsai SpA 1,418,417 3,401,875
TOTAL ITALY 427,025,712
Japan – 24.3%ABC-MART, Inc. 47,300 2,998,341ACOM Co. Ltd. (a) 583,200 2,626,991AEON Co. Ltd. 887,400 14,950,513AEON Financial Service Co. Ltd. 164,700 3,827,311AEON MALL Co. Ltd. 166,840 3,471,218Air Water, Inc. 214,400 4,236,397Aisin Seiki Co. Ltd. 256,700 14,939,167Ajinomoto Co., Inc. 789,566 14,407,003Alfresa Holdings Corp. 271,300 6,064,324All Nippon Airways Ltd. 167,000 6,688,185Alps Electric Co. Ltd. 286,200 7,802,004Amada Holdings Co. Ltd. 494,500 6,584,457Aozora Bank Ltd. 171,900 7,014,394Asahi Glass Co. Ltd. 290,635 12,003,344Asahi Group Holdings 561,203 28,697,263Asahi Kasei Corp. 1,831,127 23,465,874Asics Corp. 233,000 3,682,601Astellas Pharma, Inc. 3,000,300 44,077,271Bandai Namco Holdings, Inc. 289,150 9,337,322Bank of Kyoto Ltd. 88,400 4,882,593Benesse Holdings, Inc. 104,400 3,737,078Bridgestone Corp. 943,379 41,876,207Brother Industries Ltd. 341,000 8,480,481Calbee, Inc. 114,900 3,826,091Canon, Inc. 1,548,044 58,994,130Casio Computer Co. Ltd. 282,800 4,157,124Central Japan Railway Co. 209,000 38,819,212Chiba Bank Ltd. 1,010,674 8,295,505Chubu Electric Power Co., Inc. 936,264 12,720,562Chugai Pharmaceutical Co. Ltd. 325,325 16,767,330Chugoku Electric Power Co., Inc. 399,000 4,656,047Coca-Cola West Co. Ltd. 178,600 6,761,329Concordia Financial Group Ltd. 1,781,384 10,309,660Credit Saison Co. Ltd. 226,552 3,888,846CYBERDYNE, Inc. (a) (b) 142,500 2,119,964Dai Nippon Printing Co. Ltd. 374,221 7,817,971Dai-ichi Mutual Life Insurance Co. 1,564,100 30,626,839Daicel Chemical Industries Ltd. 407,300 4,640,521Daifuku Co. Ltd. 142,700 9,309,567Daiichi Sankyo Kabushiki Kaisha 822,670 29,133,683Daikin Industries Ltd. 361,394 42,458,905Dainippon Sumitomo Pharma Co. Ltd. 230,900 3,513,078

95 Annual Report
See accompanying notes which are an integral part of the financial statements.
Common Stocks – continuedShares Value
Japan – continuedDaito Trust Construction Co. Ltd. 100,463 $ 16,637,691Daiwa House Industry Co. Ltd. 821,384 30,430,850Daiwa House REIT Investment Corp. 2,092 5,015,830Daiwa Securities Group, Inc. 2,343,985 15,582,406DeNA Co. Ltd. 153,600 2,796,540DENSO Corp. 691,038 40,334,393Dentsu, Inc. 314,100 14,425,722Disco Corp. 41,400 9,649,643Don Quijote Holdings Co. Ltd. 171,200 9,588,763East Japan Railway Co. 475,300 44,588,844Eisai Co. Ltd. 387,178 20,493,875Electric Power Development Co. Ltd. 211,480 5,362,350FamilyMart Co. Ltd. 118,800 8,959,100Fanuc Corp. 281,172 71,050,022Fast Retailing Co. Ltd. 76,900 30,319,426Fuji Electric Co. Ltd. 810,153 6,130,593Fujifilm Holdings Corp. 597,205 24,886,868Fujitsu Ltd. 2,854,075 17,031,977Fukuoka Financial Group, Inc. 1,124,300 5,728,792Hakuhodo DY Holdings, Inc. 339,600 4,902,675Hamamatsu Photonics K.K. 205,400 8,167,914Hankyu Hanshin Holdings, Inc. 351,000 13,077,689Hikari Tsushin, Inc. 30,800 4,428,070Hino Motors Ltd. 373,800 4,905,401Hirose Electric Co. Ltd. 46,612 6,927,520Hisamitsu Pharmaceutical Co., Inc. 89,400 6,414,615Hitachi Chemical Co. Ltd. 149,400 3,318,190Hitachi Construction Machinery Co. Ltd. 156,300 6,621,623Hitachi High-Technologies Corp. 99,200 4,814,042Hitachi Ltd. 7,011,271 53,019,968Hitachi Metals Ltd. 311,000 3,957,790Honda Motor Co. Ltd. 2,495,560 90,245,141Hoshizaki Corp. 78,900 7,110,215Hoya Corp. 559,416 29,411,403Hulic Co. Ltd. 431,100 4,789,133Idemitsu Kosan Co. Ltd. 196,300 7,454,777IHI Corp. 224,218 7,592,315Iida Group Holdings Co. Ltd. 212,800 4,002,452INPEX Corp. 1,379,500 16,507,409Isetan Mitsukoshi Holdings Ltd. 490,887 5,759,368Isuzu Motors Ltd. 802,000 12,547,223Itochu Corp. 2,169,386 41,701,153J. Front Retailing Co. Ltd. 355,000 6,424,777Japan Airlines Co. Ltd. 168,100 6,406,656Japan Airport Terminal Co. Ltd. 67,600 2,547,531Japan Exchange Group, Inc. 758,700 13,050,293Japan Post Bank Co. Ltd. 585,300 7,981,099Japan Post Holdings Co. Ltd. 2,283,800 27,519,475Japan Prime Realty Investment Corp. 1,211 4,168,212Japan Real Estate Investment Corp. 1,795 9,273,704Japan Retail Fund Investment Corp. 3,866 7,427,075Japan Tobacco, Inc. 1,595,500 45,275,702JFE Holdings, Inc. 756,675 17,395,198JGC Corp. 301,517 6,883,785JSR Corp. 277,216 6,669,564
Shares Value
JTEKT Corp. 321,500 $ 4,943,275JX Holdings, Inc. 4,474,000 26,836,598Kajima Corp. 1,306,317 12,437,359Kakaku.com, Inc. 202,400 3,422,780Kamigumi Co. Ltd. 168,831 3,689,955Kaneka Corp. 401,559 4,065,450Kansai Electric Power Co., Inc. 1,023,436 12,430,926Kansai Paint Co. Ltd. 295,400 7,414,700Kao Corp. 717,450 52,370,180Kawasaki Heavy Industries Ltd. 216,794 7,855,787KDDI Corp. 2,626,700 64,504,620Keihan Electric Railway Co., Ltd. 140,100 4,375,859Keihin Electric Express Railway Co. Ltd. 338,030 6,032,892Keio Corp. 167,482 7,313,267Keisei Electric Railway Co. 200,400 6,531,389Keyence Corp. 141,124 85,464,774Kikkoman Corp. 212,649 8,422,559Kintetsu Group Holdings Co. Ltd. 261,410 10,029,645Kirin Holdings Co. Ltd. 1,259,356 32,499,788Kobe Steel Ltd. (a) 447,300 4,911,132Koito Manufacturing Co. Ltd. 163,800 11,302,117Komatsu Ltd. 1,339,245 48,561,193Konami Holdings Corp. 135,200 7,120,179Konica Minolta, Inc. 687,300 6,311,536Kose Corp. 43,900 8,166,548Kubota Corp. 1,530,164 27,689,439Kuraray Co. Ltd. 513,686 8,927,426Kurita Water Industries Ltd. 144,500 4,416,733Kyocera Corp. 465,704 27,466,832Kyowa Hakko Kirin Co., Ltd. 375,689 7,875,434Kyushu Electric Power Co., Inc. 620,370 6,940,434Kyushu Financial Group, Inc. 506,800 2,813,321Kyushu Railway Co. 232,000 7,127,836Lawson, Inc. 73,316 4,786,316LINE Corp. (a) 64,600 2,608,276Lion Corp. 323,600 6,049,063LIXIL Group Corp. 384,059 9,365,769M3, Inc. 306,200 11,871,122Mabuchi Motor Co. Ltd. 70,842 3,619,711Makita Corp. 325,400 15,393,547Marubeni Corp. 2,392,344 18,227,923Marui Group Co. Ltd. 288,949 5,534,845Maruichi Steel Tube Ltd. 81,400 2,551,027Mazda Motor Corp. 826,700 11,455,142McDonald’s Holdings Co. (Japan) Ltd. 96,900 4,323,575Mebuki Financial Group, Inc. 1,448,510 5,806,628Medipal Holdings Corp. 247,100 5,025,998Meiji Holdings Co. Ltd. 177,658 12,962,811Minebea Mitsumi, Inc. 558,900 12,641,234Misumi Group, Inc. 412,100 11,847,358Mitsubishi Chemical Holdings Corp. 2,075,675 20,941,256Mitsubishi Corp. 2,190,202 61,358,962Mitsubishi Electric Corp. 2,802,806 47,276,328Mitsubishi Estate Co. Ltd. 1,815,523 31,643,417Mitsubishi Gas Chemical Co., Inc. 259,433 6,416,608Mitsubishi Heavy Industries Ltd. 464,825 18,916,156

96Annual Report
See accompanying notes which are an integral part of the financial statements.
Schedule of Investments – continued
Common Stocks – continuedShares Value
Japan – continuedMitsubishi Materials Corp. 161,493 $ 5,040,656Mitsubishi Motors Corp. of Japan 973,000 7,638,288Mitsubishi Tanabe Pharma Corp. 326,600 6,956,676Mitsubishi UFJ Financial Group, Inc. 17,293,030 121,805,974Mitsubishi UFJ Lease & Finance Co. Ltd. 651,300 4,121,720Mitsui & Co. Ltd. 2,473,923 44,837,213Mitsui Chemicals, Inc. 266,236 8,078,744Mitsui Fudosan Co. Ltd. 1,294,077 30,958,372Mitsui OSK Lines Ltd. 165,028 5,142,189mixi, Inc. 63,000 2,541,196Mizuho Financial Group, Inc. 34,986,000 64,603,672MS&AD Insurance Group Holdings, Inc. 688,584 21,249,236Murata Manufacturing Co. Ltd. 277,754 38,686,598Nabtesco Corp. 162,400 6,972,463Nagoya Railroad Co. Ltd. 265,500 6,771,063NEC Corp. 378,554 11,486,940New Hampshire Foods Ltd. 264,740 5,930,972Nexon Co. Ltd. (a) 289,300 10,424,185NGK Insulators Ltd. 380,009 7,047,002NGK Spark Plug Co. Ltd. 230,900 5,832,463Nidec Corp. 345,884 55,234,339Nikon Corp. 492,438 10,001,800Nintendo Co. Ltd. 164,396 74,941,520Nippon Building Fund, Inc. 1,938 10,528,188Nippon Electric Glass Co. Ltd. 123,300 3,724,464Nippon Express Co. Ltd. 115,454 7,719,477Nippon Paint Holdings Co. Ltd. 235,300 8,527,710Nippon Prologis REIT, Inc. 2,674 6,034,701Nippon Steel & Sumitomo Metal Corp. 1,101,663 26,045,881Nippon Telegraph & Telephone Corp. 1,003,300 46,599,882Nippon Yusen KK (a) 235,457 5,087,032Nissan Chemical Industries Co. Ltd. 174,100 6,874,974Nissan Motor Co. Ltd. 3,365,348 35,271,366Nisshin Seifun Group, Inc. 286,523 5,657,885Nissin Food Holdings Co. Ltd. 84,923 5,778,376Nitori Holdings Co. Ltd. 116,200 19,500,121Nitto Denko Corp. 239,494 19,662,650NKSJ Holdings, Inc. 512,203 19,589,664NOK Corp. 138,800 2,958,342Nomura Holdings, Inc. 5,267,847 32,067,357Nomura Real Estate Holdings, Inc. 179,400 4,309,607Nomura Real Estate Master Fund, Inc. 5,465 7,485,467Nomura Research Institute Ltd. 190,555 8,534,477NSK Ltd. 556,276 8,252,548NTT Data Corp. 910,200 9,407,189NTT DOCOMO, Inc. 1,979,600 50,642,770Obayashi Corp. 945,304 10,667,543OBIC Co. Ltd. 93,500 7,759,037Odakyu Electric Railway Co. Ltd. 429,800 8,727,294Oji Holdings Corp. 1,243,352 8,102,653Olympus Corp. 422,829 16,910,784OMRON Corp. 279,460 16,446,893Ono Pharmaceutical Co. Ltd. 591,100 17,214,359Oracle Corp. Japan 55,100 4,256,711Oriental Land Co. Ltd. 316,424 30,747,028
Shares Value
ORIX Corp. 1,920,680 $ 34,004,871Osaka Gas Co. Ltd. 545,705 10,762,989Otsuka Corp. 76,100 7,054,205Otsuka Holdings Co. Ltd. 566,400 28,403,374Panasonic Corp. 3,201,273 49,830,846Park24 Co. Ltd. 159,500 3,833,924Pola Orbis Holdings, Inc. 133,100 5,580,103Rakuten, Inc. 1,356,000 12,329,516Recruit Holdings Co. Ltd. 1,598,600 38,658,077Renesas Electronics Corp. (a) 969,300 11,084,684Resona Holdings, Inc. 3,204,300 18,152,725Ricoh Co. Ltd. 1,021,670 10,966,908Rinnai Corp. 48,500 4,335,525ROHM Co. Ltd. 137,244 14,415,219Ryohin Keikaku Co. Ltd. 34,700 11,882,162Sankyo Co. Ltd. (Gunma) 65,300 2,341,025Santen Pharmaceutical Co. Ltd. 528,100 8,407,120SBI Holdings, Inc. Japan 291,560 6,662,592Secom Co. Ltd. 304,667 21,789,429Sega Sammy Holdings, Inc. 252,900 3,668,819Seibu Holdings, Inc. 320,500 5,447,722Seiko Epson Corp. 403,200 7,694,430Sekisui Chemical Co. Ltd. 582,193 10,907,597Sekisui House Ltd. 851,067 14,841,791Seven & i Holdings Co. Ltd. 1,092,800 45,615,409Seven Bank Ltd. 853,900 2,930,966Sharp Corp. (a) (b) 216,700 7,527,531Shimadzu Corp. 362,800 9,293,300Shimamura Co. Ltd. 32,100 3,816,562SHIMANO, Inc. 107,700 15,543,278SHIMIZU Corp. 799,416 7,415,632Shin-Etsu Chemical Co. Ltd. 564,062 59,263,378Shinsei Bank Ltd. 239,800 3,765,772Shionogi & Co. Ltd. 429,891 22,377,249Shiseido Co. Ltd. 550,950 33,041,134Shizuoka Bank Ltd. 744,274 7,483,816Showa Shell Sekiyu K.K. 275,500 3,537,277SMC Corp. 83,071 34,622,081SoftBank Corp. 1,197,230 98,648,005Sohgo Security Services Co., Ltd. 103,400 4,861,872Sony Corp. 1,833,985 92,414,799Sony Financial Holdings, Inc. 253,000 4,663,907Stanley Electric Co. Ltd. 203,125 7,918,618Start Today Co. Ltd. 269,800 6,968,963Subaru Corp. 892,400 31,298,036Sumco Corp. 338,200 8,946,761Sumitomo Chemical Co. Ltd. 2,284,334 14,084,458Sumitomo Corp. 1,722,442 30,215,004Sumitomo Electric Industries Ltd. 1,093,906 17,255,474Sumitomo Heavy Industries Ltd. 169,364 6,597,750Sumitomo Metal Mining Co. Ltd. 358,332 16,640,257Sumitomo Mitsui Financial Group, Inc. 1,949,000 84,239,011Sumitomo Mitsui Trust Holdings, Inc. 481,672 19,343,022Sumitomo Realty & Development Co. Ltd. 518,000 18,760,757Sumitomo Rubber Industries Ltd. 254,900 4,858,630Sundrug Co. Ltd. 108,000 4,979,872
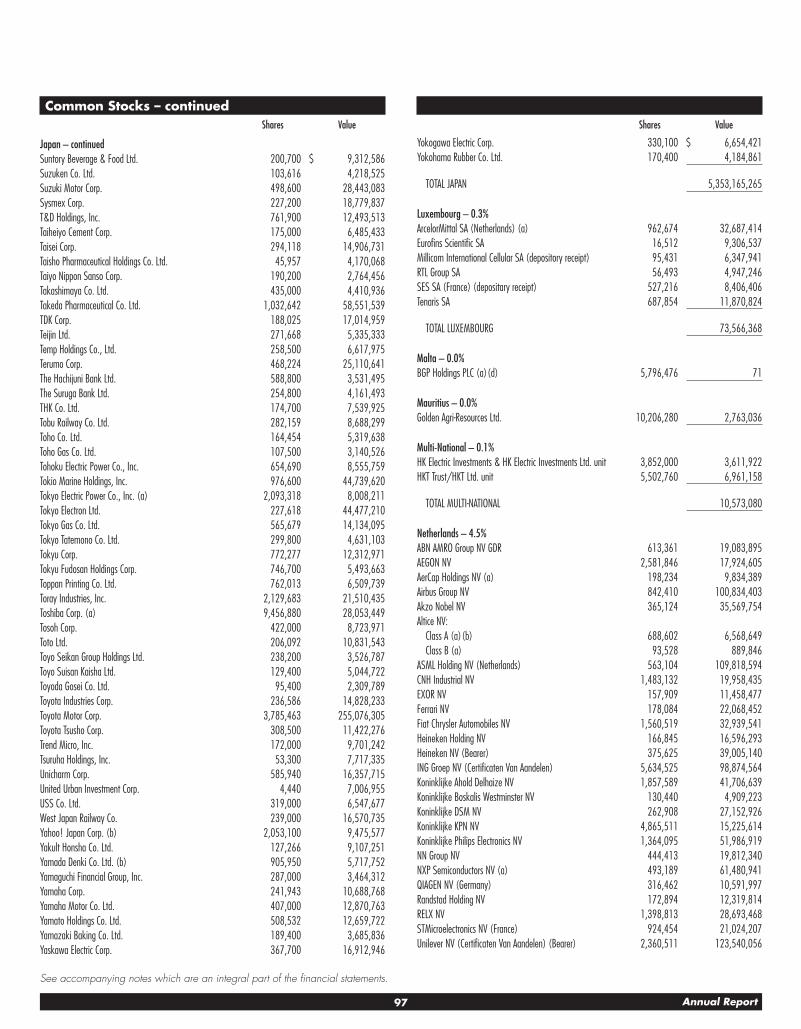
97 Annual Report
See accompanying notes which are an integral part of the financial statements.
Common Stocks – continuedShares Value
Japan – continuedSuntory Beverage & Food Ltd. 200,700 $ 9,312,586Suzuken Co. Ltd. 103,616 4,218,525Suzuki Motor Corp. 498,600 28,443,083Sysmex Corp. 227,200 18,779,837T&D Holdings, Inc. 761,900 12,493,513Taiheiyo Cement Corp. 175,000 6,485,433Taisei Corp. 294,118 14,906,731Taisho Pharmaceutical Holdings Co. Ltd. 45,957 4,170,068Taiyo Nippon Sanso Corp. 190,200 2,764,456Takashimaya Co. Ltd. 435,000 4,410,936Takeda Pharmaceutical Co. Ltd. 1,032,642 58,551,539TDK Corp. 188,025 17,014,959Teijin Ltd. 271,668 5,335,333Temp Holdings Co., Ltd. 258,500 6,617,975Terumo Corp. 468,224 25,110,641The Hachijuni Bank Ltd. 588,800 3,531,495The Suruga Bank Ltd. 254,800 4,161,493THK Co. Ltd. 174,700 7,539,925Tobu Railway Co. Ltd. 282,159 8,688,299Toho Co. Ltd. 164,454 5,319,638Toho Gas Co. Ltd. 107,500 3,140,526Tohoku Electric Power Co., Inc. 654,690 8,555,759Tokio Marine Holdings, Inc. 976,600 44,739,620Tokyo Electric Power Co., Inc. (a) 2,093,318 8,008,211Tokyo Electron Ltd. 227,618 44,477,210Tokyo Gas Co. Ltd. 565,679 14,134,095Tokyo Tatemono Co. Ltd. 299,800 4,631,103Tokyu Corp. 772,277 12,312,971Tokyu Fudosan Holdings Corp. 746,700 5,493,663Toppan Printing Co. Ltd. 762,013 6,509,739Toray Industries, Inc. 2,129,683 21,510,435Toshiba Corp. (a) 9,456,880 28,053,449Tosoh Corp. 422,000 8,723,971Toto Ltd. 206,092 10,831,543Toyo Seikan Group Holdings Ltd. 238,200 3,526,787Toyo Suisan Kaisha Ltd. 129,400 5,044,722Toyoda Gosei Co. Ltd. 95,400 2,309,789Toyota Industries Corp. 236,586 14,828,233Toyota Motor Corp. 3,785,463 255,076,305Toyota Tsusho Corp. 308,500 11,422,276Trend Micro, Inc. 172,000 9,701,242Tsuruha Holdings, Inc. 53,300 7,717,335Unicharm Corp. 585,940 16,357,715United Urban Investment Corp. 4,440 7,006,955USS Co. Ltd. 319,000 6,547,677West Japan Railway Co. 239,000 16,570,735Yahoo! Japan Corp. (b) 2,053,100 9,475,577Yakult Honsha Co. Ltd. 127,266 9,107,251Yamada Denki Co. Ltd. (b) 905,950 5,717,752Yamaguchi Financial Group, Inc. 287,000 3,464,312Yamaha Corp. 241,943 10,688,768Yamaha Motor Co. Ltd. 407,000 12,870,763Yamato Holdings Co. Ltd. 508,532 12,659,722Yamazaki Baking Co. Ltd. 189,400 3,685,836Yaskawa Electric Corp. 367,700 16,912,946
Shares Value
Yokogawa Electric Corp. 330,100 $ 6,654,421Yokohama Rubber Co. Ltd. 170,400 4,184,861
TOTAL JAPAN 5,353,165,265
Luxembourg – 0.3%ArcelorMittal SA (Netherlands) (a) 962,674 32,687,414Eurofins Scientific SA 16,512 9,306,537Millicom International Cellular SA (depository receipt) 95,431 6,347,941RTL Group SA 56,493 4,947,246SES SA (France) (depositary receipt) 527,216 8,406,406Tenaris SA 687,854 11,870,824
TOTAL LUXEMBOURG 73,566,368
Malta – 0.0%BGP Holdings PLC (a) (d) 5,796,476 71
Mauritius – 0.0%Golden Agri-Resources Ltd. 10,206,280 2,763,036
Multi-National – 0.1%HK Electric Investments & HK Electric Investments Ltd. unit 3,852,000 3,611,922HKT Trust/HKT Ltd. unit 5,502,760 6,961,158
TOTAL MULTI-NATIONAL 10,573,080
Netherlands – 4.5%ABN AMRO Group NV GDR 613,361 19,083,895AEGON NV 2,581,846 17,924,605AerCap Holdings NV (a) 198,234 9,834,389Airbus Group NV 842,410 100,834,403Akzo Nobel NV 365,124 35,569,754Altice NV:
Class A (a) (b) 688,602 6,568,649Class B (a) 93,528 889,846
ASML Holding NV (Netherlands) 563,104 109,818,594CNH Industrial NV 1,483,132 19,958,435EXOR NV 157,909 11,458,477Ferrari NV 178,084 22,068,452Fiat Chrysler Automobiles NV 1,560,519 32,939,541Heineken Holding NV 166,845 16,596,293Heineken NV (Bearer) 375,625 39,005,140ING Groep NV (Certificaten Van Aandelen) 5,634,525 98,874,564Koninklijke Ahold Delhaize NV 1,857,589 41,706,639Koninklijke Boskalis Westminster NV 130,440 4,909,223Koninklijke DSM NV 262,908 27,152,926Koninklijke KPN NV 4,865,511 15,225,614Koninklijke Philips Electronics NV 1,364,095 51,986,919NN Group NV 444,413 19,812,340NXP Semiconductors NV (a) 493,189 61,480,941QIAGEN NV (Germany) 316,462 10,591,997Randstad Holding NV 172,894 12,319,814RELX NV 1,398,813 28,693,468STMicroelectronics NV (France) 924,454 21,024,207Unilever NV (Certificaten Van Aandelen) (Bearer) 2,360,511 123,540,056

98Annual Report
See accompanying notes which are an integral part of the financial statements.
Schedule of Investments – continued
Common Stocks – continuedShares Value
Netherlands – continuedVopak NV 101,732 $ 4,785,714Wolters Kluwer NV 430,120 21,787,267
TOTAL NETHERLANDS 986,442,162
New Zealand – 0.2%Auckland International Airport Ltd. 1,382,859 6,432,701Fisher & Paykel Healthcare Corp. 824,166 8,202,562Fletcher Building Ltd. 1,005,484 4,720,759Mercury Nz Ltd. 995,996 2,277,050Meridian Energy Ltd. 1,868,984 3,774,152Ryman Healthcare Group Ltd. 585,495 4,509,726Spark New Zealand Ltd. 2,667,188 6,453,597
TOTAL NEW ZEALAND 36,370,547
Norway – 0.7%DNB ASA 1,416,395 27,783,071Gjensidige Forsikring ASA 289,019 5,273,652Marine Harvest ASA (b) 606,095 11,674,974Norsk Hydro ASA 1,949,907 13,101,436Orkla ASA 1,186,379 13,007,723Schibsted ASA (B Shares) 140,999 3,425,319Statoil ASA 1,676,412 38,157,683Telenor ASA 1,088,353 24,424,242Yara International ASA 258,385 11,417,307
TOTAL NORWAY 148,265,407
Papua New Guinea – 0.1%Oil Search Ltd. ADR 1,992,787 11,515,392
Portugal – 0.1%Banco Espirito Santo SA (Reg.) (a) (d) 2,598,658 32Energias de Portugal SA 3,461,710 11,571,568Galp Energia SGPS SA Class B 729,083 13,131,622Jeronimo Martins SGPS SA 364,646 7,563,884
TOTAL PORTUGAL 32,267,106
Singapore – 1.3%Ascendas Real Estate Investment Trust 3,619,183 7,207,548CapitaCommercial Trust (REIT) 3,670,753 4,767,006CapitaLand Ltd. 3,701,937 10,066,559CapitaMall Trust 3,592,500 5,467,711City Developments Ltd. 591,500 5,655,579ComfortDelgro Corp. Ltd. 3,131,584 4,774,998DBS Group Holdings Ltd. 2,603,208 55,945,007Hutchison Port Holdings Trust 7,547,300 2,736,687Jardine Cycle & Carriage Ltd. 143,530 3,999,840Keppel Corp. Ltd. 2,113,200 12,653,633Oversea-Chinese Banking Corp. Ltd. 4,563,886 44,660,615Sembcorp Industries Ltd. 1,430,530 3,421,329Singapore Airlines Ltd. 778,925 6,490,324Singapore Airport Terminal Service Ltd. 975,400 3,814,926Singapore Exchange Ltd. 1,158,600 6,565,073
Shares Value
Singapore Press Holdings Ltd. 2,320,321 $ 4,533,238Singapore Technologies Engineering Ltd. 2,266,761 5,808,192Singapore Telecommunications Ltd. 11,852,327 30,084,544StarHub Ltd. 876,200 1,646,214Suntec (REIT) 3,642,100 5,408,476United Overseas Bank Ltd. 1,940,460 40,646,672UOL Group Ltd. 727,450 4,640,998Wilmar International Ltd. 2,327,200 5,637,100Yangzijiang Shipbuilding Holdings Ltd. 3,432,700 3,873,765
TOTAL SINGAPORE 280,506,034
Spain – 3.2%Abertis Infraestructuras SA 1,005,102 23,984,931ACS Actividades de Construccion y Servicios SA 347,967 11,927,898Aena Sme SA 97,865 19,875,695Amadeus IT Holding SA Class A 636,409 46,722,490Banco Bilbao Vizcaya Argentaria SA 9,670,887 80,458,426Banco de Sabadell SA 7,760,659 16,212,446Banco Santander SA (Spain) 23,400,699 160,401,765Bankia SA 1,781,121 8,469,730Bankinter SA 973,459 10,699,096CaixaBank SA 5,206,069 25,276,781Enagas SA 328,557 8,545,577Endesa SA 458,382 9,622,612Ferrovial SA 705,953 15,234,156Gamesa Corporacion Tecnologica SA (b) 344,230 5,447,236Gas Natural SDG SA 509,512 11,657,135Grifols SA 433,485 11,851,988Iberdrola SA 8,422,956 61,987,249Inditex SA 1,581,649 47,886,269International Consolidated Airlines Group SA 143,034 1,203,638International Consolidated Airlines Group SA CDI 740,550 6,207,950MAPFRE SA (Reg.) 1,574,960 5,284,732Red Electrica Corporacion SA 629,428 12,246,667Repsol SA 1,817,073 32,284,753Telefonica SA 6,776,442 65,771,609
TOTAL SPAIN 699,260,829
Sweden – 2.6%Alfa Laval AB 423,805 10,180,340ASSA ABLOY AB (B Shares) 1,453,305 32,457,787Atlas Copco AB:
(A Shares) 973,477 41,409,006(B Shares) 565,920 21,395,291
Boliden AB 396,096 14,005,108Electrolux AB (B Shares) 349,988 11,490,105Essity AB Class B 878,959 24,056,915Getinge AB (B Shares) 330,509 4,160,993H&M Hennes & Mauritz AB (B Shares) (b) 1,376,792 22,717,293Hexagon AB (B Shares) 374,927 21,919,216Husqvarna AB (B Shares) 601,141 6,415,256ICA Gruppen AB (b) 118,036 4,210,950Industrivarden AB (C Shares) 241,249 5,755,067Investor AB (B Shares) 660,141 29,652,342
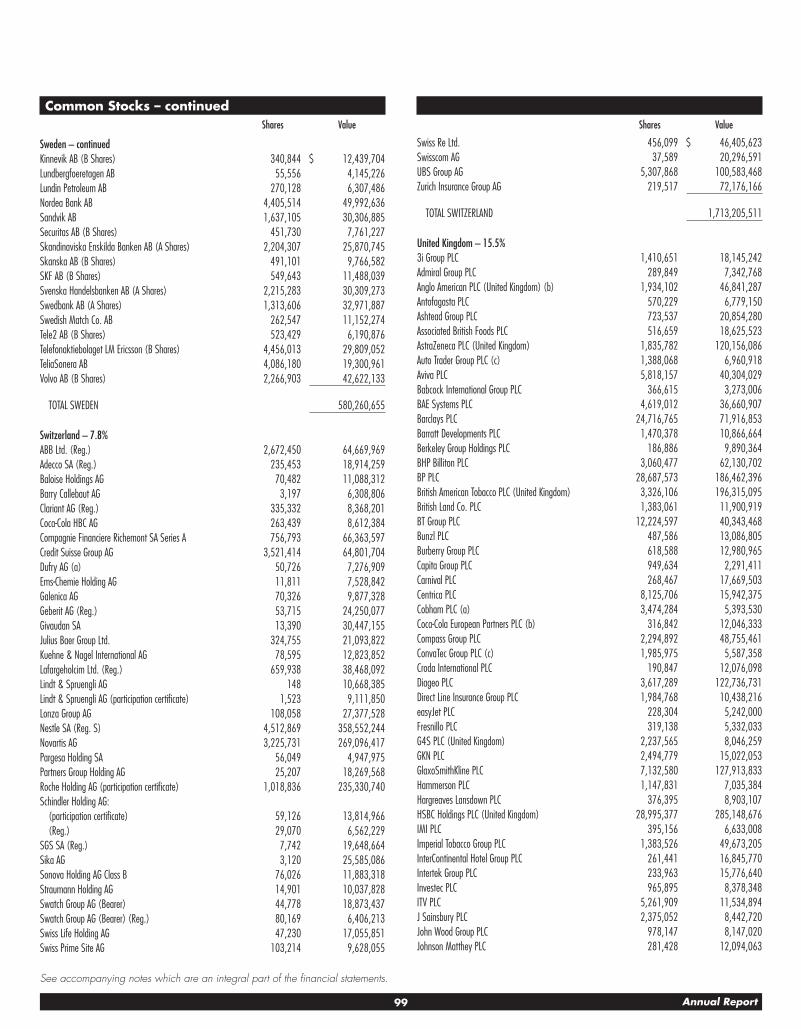
99 Annual Report
See accompanying notes which are an integral part of the financial statements.
Common Stocks – continuedShares Value
Sweden – continuedKinnevik AB (B Shares) 340,844 $ 12,439,704Lundbergfoeretagen AB 55,556 4,145,226Lundin Petroleum AB 270,128 6,307,486Nordea Bank AB 4,405,514 49,992,636Sandvik AB 1,637,105 30,306,885Securitas AB (B Shares) 451,730 7,761,227Skandinaviska Enskilda Banken AB (A Shares) 2,204,307 25,870,745Skanska AB (B Shares) 491,101 9,766,582SKF AB (B Shares) 549,643 11,488,039Svenska Handelsbanken AB (A Shares) 2,215,283 30,309,273Swedbank AB (A Shares) 1,313,606 32,971,887Swedish Match Co. AB 262,547 11,152,274Tele2 AB (B Shares) 523,429 6,190,876Telefonaktiebolaget LM Ericsson (B Shares) 4,456,013 29,809,052TeliaSonera AB 4,086,180 19,300,961Volvo AB (B Shares) 2,266,903 42,622,133
TOTAL SWEDEN 580,260,655
Switzerland – 7.8%ABB Ltd. (Reg.) 2,672,450 64,669,969Adecco SA (Reg.) 235,453 18,914,259Baloise Holdings AG 70,482 11,088,312Barry Callebaut AG 3,197 6,308,806Clariant AG (Reg.) 335,332 8,368,201Coca-Cola HBC AG 263,439 8,612,384Compagnie Financiere Richemont SA Series A 756,793 66,363,597Credit Suisse Group AG 3,521,414 64,801,704Dufry AG (a) 50,726 7,276,909Ems-Chemie Holding AG 11,811 7,528,842Galenica AG 70,326 9,877,328Geberit AG (Reg.) 53,715 24,250,077Givaudan SA 13,390 30,447,155Julius Baer Group Ltd. 324,755 21,093,822Kuehne & Nagel International AG 78,595 12,823,852Lafargeholcim Ltd. (Reg.) 659,938 38,468,092Lindt & Spruengli AG 148 10,668,385Lindt & Spruengli AG (participation certificate) 1,523 9,111,850Lonza Group AG 108,058 27,377,528Nestle SA (Reg. S) 4,512,869 358,552,244Novartis AG 3,225,731 269,096,417Pargesa Holding SA 56,049 4,947,975Partners Group Holding AG 25,207 18,269,568Roche Holding AG (participation certificate) 1,018,836 235,330,740Schindler Holding AG:
(participation certificate) 59,126 13,814,966(Reg.) 29,070 6,562,229
SGS SA (Reg.) 7,742 19,648,664Sika AG 3,120 25,585,086Sonova Holding AG Class B 76,026 11,883,318Straumann Holding AG 14,901 10,037,828Swatch Group AG (Bearer) 44,778 18,873,437Swatch Group AG (Bearer) (Reg.) 80,169 6,406,213Swiss Life Holding AG 47,230 17,055,851Swiss Prime Site AG 103,214 9,628,055
Shares Value
Swiss Re Ltd. 456,099 $ 46,405,623Swisscom AG 37,589 20,296,591UBS Group AG 5,307,868 100,583,468Zurich Insurance Group AG 219,517 72,176,166
TOTAL SWITZERLAND 1,713,205,511
United Kingdom – 15.5%3i Group PLC 1,410,651 18,145,242Admiral Group PLC 289,849 7,342,768Anglo American PLC (United Kingdom) (b) 1,934,102 46,841,287Antofagasta PLC 570,229 6,779,150Ashtead Group PLC 723,537 20,854,280Associated British Foods PLC 516,659 18,625,523AstraZeneca PLC (United Kingdom) 1,835,782 120,156,086Auto Trader Group PLC (c) 1,388,068 6,960,918Aviva PLC 5,818,157 40,304,029Babcock International Group PLC 366,615 3,273,006BAE Systems PLC 4,619,012 36,660,907Barclays PLC 24,716,765 71,916,853Barratt Developments PLC 1,470,378 10,866,664Berkeley Group Holdings PLC 186,886 9,890,364BHP Billiton PLC 3,060,477 62,130,702BP PLC 28,687,573 186,462,396British American Tobacco PLC (United Kingdom) 3,326,106 196,315,095British Land Co. PLC 1,383,061 11,900,919BT Group PLC 12,224,597 40,343,468Bunzl PLC 487,586 13,086,805Burberry Group PLC 618,588 12,980,965Capita Group PLC 949,634 2,291,411Carnival PLC 268,467 17,669,503Centrica PLC 8,125,706 15,942,375Cobham PLC (a) 3,474,284 5,393,530Coca-Cola European Partners PLC (b) 316,842 12,046,333Compass Group PLC 2,294,892 48,755,461ConvaTec Group PLC (c) 1,985,975 5,587,358Croda International PLC 190,847 12,076,098Diageo PLC 3,617,289 122,736,731Direct Line Insurance Group PLC 1,984,768 10,438,216easyJet PLC 228,304 5,242,000Fresnillo PLC 319,138 5,332,033G4S PLC (United Kingdom) 2,237,565 8,046,259GKN PLC 2,494,779 15,022,053GlaxoSmithKline PLC 7,132,580 127,913,833Hammerson PLC 1,147,831 7,035,384Hargreaves Lansdown PLC 376,395 8,903,107HSBC Holdings PLC (United Kingdom) 28,995,377 285,148,676IMI PLC 395,156 6,633,008Imperial Tobacco Group PLC 1,383,526 49,673,205InterContinental Hotel Group PLC 261,441 16,845,770Intertek Group PLC 233,963 15,776,640Investec PLC 965,895 8,378,348ITV PLC 5,261,909 11,534,894J Sainsbury PLC 2,375,052 8,442,720John Wood Group PLC 978,147 8,147,020Johnson Matthey PLC 281,428 12,094,063

100Annual Report
See accompanying notes which are an integral part of the financial statements.
Schedule of Investments – continued
Common Stocks – continuedShares Value
United Kingdom – continuedKingfisher PLC 3,147,559 $ 15,491,641Land Securities Group PLC 1,075,330 13,664,819Legal & General Group PLC 8,644,990 31,143,035Lloyds Banking Group PLC 104,361,038 98,603,656London Stock Exchange Group PLC 452,547 24,985,829Marks & Spencer Group PLC 2,346,547 9,502,625Mediclinic International PLC (b) 537,156 4,359,588Meggitt PLC 1,124,640 6,970,196Merlin Entertainments PLC (c) 1,037,153 4,846,341Micro Focus International PLC 631,368 17,813,941Mondi PLC 533,101 13,867,782National Grid PLC 4,904,558 49,636,210Next PLC 212,362 14,162,391Old Mutual PLC 7,154,271 24,988,804Pearson PLC 1,172,481 11,807,569Persimmon PLC 447,495 15,997,293Prudential PLC 3,750,319 93,971,987Reckitt Benckiser Group PLC 969,206 76,932,102RELX PLC 1,540,458 31,584,629Rio Tinto PLC 1,759,377 94,310,997Rolls-Royce Holdings PLC 2,402,104 27,629,969Royal Bank of Scotland Group PLC (a) 5,203,988 19,073,584Royal Dutch Shell PLC:
Class A (United Kingdom) 6,589,181 208,093,840Class B (United Kingdom) 5,432,683 172,320,451
Royal Mail PLC 1,310,691 10,095,744RSA Insurance Group PLC 1,485,800 12,885,750Sage Group PLC 1,568,456 14,872,221Schroders PLC 179,192 8,449,617Scottish & Southern Energy PLC 1,472,795 24,750,513Segro PLC 1,457,504 11,440,868Severn Trent PLC 342,262 8,015,601SKY PLC 1,494,770 27,597,725Smith & Nephew PLC 1,267,356 22,126,598Smiths Group PLC 574,798 12,551,169St. James’s Place Capital PLC 769,508 12,163,450Standard Chartered PLC (United Kingdom) 4,779,446 52,989,833Standard Life PLC 3,886,410 19,631,741Taylor Wimpey PLC 4,745,100 12,092,029Tesco PLC 11,876,650 34,364,688The Weir Group PLC 326,810 9,118,945Travis Perkins PLC 363,969 6,406,634Unilever PLC 1,799,496 92,526,808United Utilities Group PLC 984,654 9,016,003Vodafone Group PLC 38,591,613 107,886,474Vodafone Group PLC sponsored ADR 8,775 248,420Whitbread PLC 266,315 14,193,851WM Morrison Supermarkets PLC 3,227,157 10,011,225
TOTAL UNITED KINGDOM 3,410,138,642
TOTAL COMMON STOCKS(Cost $19,076,521,716) 21,519,301,672
Nonconvertible Preferred Stocks – 0.7%Shares Value
France – 0.2%Air Liquide SA (a) 320,692 $ 40,155,059
Germany – 0.5%Bayerische Motoren Werke AG (BMW) (non-vtg.) 79,521 7,180,837Fuchs Petrolub AG 101,396 5,738,025Henkel AG & Co. KGaA 258,134 34,245,713Porsche Automobil Holding SE (Germany) 222,119 18,502,418Volkswagen AG 269,471 52,422,469
TOTAL GERMANY 118,089,462
Italy – 0.0%Telecom Italia SpA (Risparmio Shares) 8,919,992 6,792,783
TOTAL NONCONVERTIBLE PREFERRED STOCKS(Cost $126,126,933) 165,037,304
Government Obligations – 0.2%Principal Amount
United States of America – 0.2%U.S. Treasury Bills, yield at date of purchase 1.34% to 1.43%
3/22/18 to 5/31/18 (e)(Cost $36,917,792) $ 37,000,000 36,909,039
Money Market Funds – 2.6%Shares
Fidelity Cash Central Fund, 1.41% (f) 277,889,727 277,945,305Fidelity Securities Lending Cash Central Fund 1.42% (f) (g) 297,568,625 297,598,382
TOTAL MONEY MARKET FUNDS(Cost $575,557,850) 575,543,687
TOTAL INVESTMENT IN SECURITIES – 101.2%(Cost $19,815,124,291) 22,296,791,702
NET OTHER ASSETS (LIABILITIES) – (1.2)% (262,367,014)NET ASSETS – 100% $22,034,424,688

101 Annual Report
See accompanying notes which are an integral part of the financial statements.
Futures ContractsNumber
of contractsExpiration
DateNotional Amount
Value Unrealized Appreciation/ (Depreciation)
Purchased
Equity Index ContractsASX SPI 200 Index Contracts (Australia) 6 March 2018 $ 701,244 $ (16) $ (16)Eurex Dax Index Contracts (Germany) 1 March 2018 379,191 806 806Eurex Euro Stoxx 50 Index Contracts (Germany) 45 March 2018 1,887,462 (94) (94)Euronext CAC 40 10 Index Contracts (France) 5 March 2018 324,459 216 216HKFE Hang Seng Index Contracts (Hong Kong) 1 March 2018 198,265 (4) (4)ICE E-mini MSCI EAFE Index Contracts (United States) 3,447 March 2018 350,990,775 (16,921,755) (16,921,755)ICE FTSE 100 Index Contracts (United Kingdom) 15 March 2018 1,492,205 827 827MSCI Sing IX ETS Index Contracts (Singapore) 5 March 2018 151,217 (1,340) (1,340)OMX Stockholm 30 Index Contracts (Sweden) 12 March 2018 227,662 (387) (387)TSE TOPIX Index Contracts (Japan) 11 March 2018 1,822,766 (16,828) (16,828)
TOTAL FUTURES CONTRACTS $ (16,938,575)
The notional amount of futures purchased as a percentage of Net Assets is 1.6%
Forward Foreign Currency ContractsCurrency
PurchasedCurrency
SoldCounterparty Settlement
DateUnrealized
Appreciation/ (Depreciation)
JPY 730,000,000 USD 6,502,176 Goldman Sachs Bank USA 3/9/18 $ 343,420JPY 300,000,000 USD 2,681,325 Goldman Sachs Bank USA 3/9/18 131,934JPY 1,140,000,000 USD 10,167,832 Goldman Sachs Bank USA 3/9/18 522,551JPY 280,000,000 USD 2,489,969 Goldman Sachs Bank USA 3/9/18 135,739JPY 380,000,000 USD 3,394,554 Goldman Sachs Bank USA 3/9/18 168,907JPY 300,000,000 USD 2,697,361 Goldman Sachs Bank USA 3/9/18 115,897JPY 320,000,000 USD 2,884,817 Goldman Sachs Bank USA 3/9/18 115,993JPY 570,000,000 USD 5,162,436 Goldman Sachs Bank USA 3/9/18 182,756JPY 760,000,000 USD 6,881,795 Goldman Sachs Bank USA 3/9/18 245,127JPY 400,000,000 USD 3,666,872 Goldman Sachs Bank USA 3/9/18 84,140JPY 570,000,000 USD 5,251,549 Goldman Sachs Bank USA 3/9/18 93,642JPY 290,000,000 USD 2,660,385 Goldman Sachs Bank USA 3/9/18 59,099JPY 190,000,000 USD 1,739,600 Goldman Sachs Bank USA 3/9/18 42,130JPY 350,000,000 USD 3,197,597 Goldman Sachs Bank USA 3/9/18 84,538JPY 60,000,000 USD 550,400 Goldman Sachs Bank USA 3/9/18 12,252JPY 230,000,000 USD 2,053,689 Goldman Sachs Bank USA 3/9/18 103,143
USD 3,381,834 JPY 370,000,000 Goldman Sachs Bank USA 3/9/18 (87,852)USD 34,899,503 JPY 3,700,000,000 Goldman Sachs Bank USA 3/9/18 202,645USD 26,033,022 JPY 2,800,000,000 Goldman Sachs Bank USA 3/9/18 (224,059)AUD 1,100,000 USD 836,215 Goldman Sachs Bank USA 3/16/18 18,171AUD 4,000,000 USD 3,059,228 Goldman Sachs Bank USA 3/16/18 47,628AUD 2,800,000 USD 2,147,135 Goldman Sachs Bank USA 3/16/18 27,664AUD 900,000 USD 707,526 Goldman Sachs Bank USA 3/16/18 (8,483)AUD 1,300,000 USD 1,016,636 Goldman Sachs Bank USA 3/16/18 (6,908)AUD 1,300,000 USD 1,019,454 Goldman Sachs Bank USA 3/16/18 (9,725)AUD 1,200,000 USD 946,928 Goldman Sachs Bank USA 3/16/18 (14,872)AUD 1,900,000 USD 1,519,856 Goldman Sachs Bank USA 3/16/18 (44,099)AUD 1,900,000 USD 1,519,848 Goldman Sachs Bank USA 3/16/18 (44,091)AUD 1,700,000 USD 1,368,769 Goldman Sachs Bank USA 3/16/18 (48,355)AUD 200,000 USD 161,807 Goldman Sachs Bank USA 3/16/18 (6,465)AUD 2,500,000 USD 2,021,238 Goldman Sachs Bank USA 3/16/18 (79,453)AUD 1,200,000 USD 966,898 Goldman Sachs Bank USA 3/16/18 (34,841)

102Annual Report
See accompanying notes which are an integral part of the financial statements.
Schedule of Investments – continued
Forward Foreign Currency Contracts – continuedCurrency
PurchasedCurrency
SoldCounterparty Settlement
DateUnrealized
Appreciation/ (Depreciation)
AUD 1,700,000 USD 1,344,209 Goldman Sachs Bank USA 3/16/18 $ (23,795)AUD 600,000 USD 468,709 Goldman Sachs Bank USA 3/16/18 (2,680)AUD 1,000,000 USD 766,424 Goldman Sachs Bank USA 3/16/18 10,290EUR 2,300,000 USD 2,737,028 Goldman Sachs Bank USA 3/16/18 72,246EUR 7,200,000 USD 8,509,068 Goldman Sachs Bank USA 3/16/18 285,180EUR 10,300,000 USD 12,219,189 Goldman Sachs Bank USA 3/16/18 361,472EUR 2,400,000 USD 2,905,027 Goldman Sachs Bank USA 3/16/18 26,389EUR 3,500,000 USD 4,192,836 Goldman Sachs Bank USA 3/16/18 82,146EUR 3,100,000 USD 3,714,491 Goldman Sachs Bank USA 3/16/18 71,921EUR 2,700,000 USD 3,268,377 Goldman Sachs Bank USA 3/16/18 29,466EUR 1,900,000 USD 2,338,153 Goldman Sachs Bank USA 3/16/18 (17,449)EUR 5,500,000 USD 6,752,048 Goldman Sachs Bank USA 3/16/18 (34,219)EUR 3,200,000 USD 3,933,728 Goldman Sachs Bank USA 3/16/18 (25,173)EUR 1,700,000 USD 2,098,846 Goldman Sachs Bank USA 3/16/18 (22,426)EUR 700,000 USD 871,394 Goldman Sachs Bank USA 3/16/18 (16,398)EUR 3,000,000 USD 3,715,872 Goldman Sachs Bank USA 3/16/18 (51,602)EUR 6,100,000 USD 7,611,037 Goldman Sachs Bank USA 3/16/18 (160,355)EUR 2,700,000 USD 3,356,934 Goldman Sachs Bank USA 3/16/18 (59,091)EUR 700,000 USD 877,546 Goldman Sachs Bank USA 3/16/18 (22,550)EUR 4,700,000 USD 5,832,714 Goldman Sachs Bank USA 3/16/18 (92,024)EUR 1,500,000 USD 1,843,875 Goldman Sachs Bank USA 3/16/18 (11,740)EUR 2,100,000 USD 2,495,161 Goldman Sachs Bank USA 3/16/18 69,828GBP 1,500,000 USD 2,018,334 Goldman Sachs Bank USA 3/16/18 48,200GBP 3,800,000 USD 5,088,451 Goldman Sachs Bank USA 3/16/18 146,769GBP 5,900,000 USD 7,912,230 Goldman Sachs Bank USA 3/16/18 216,137GBP 1,400,000 USD 1,900,842 Goldman Sachs Bank USA 3/16/18 27,923GBP 1,700,000 USD 2,301,127 Goldman Sachs Bank USA 3/16/18 40,945GBP 1,800,000 USD 2,432,047 Goldman Sachs Bank USA 3/16/18 47,794GBP 1,800,000 USD 2,443,018 Goldman Sachs Bank USA 3/16/18 36,823GBP 3,600,000 USD 5,019,088 Goldman Sachs Bank USA 3/16/18 (59,406)GBP 3,200,000 USD 4,451,997 Goldman Sachs Bank USA 3/16/18 (43,391)GBP 1,800,000 USD 2,567,437 Goldman Sachs Bank USA 3/16/18 (87,596)GBP 300,000 USD 420,487 Goldman Sachs Bank USA 3/16/18 (7,180)GBP 3,400,000 USD 4,830,560 Goldman Sachs Bank USA 3/16/18 (146,416)GBP 1,300,000 USD 1,848,166 Goldman Sachs Bank USA 3/16/18 (57,170)GBP 600,000 USD 856,083 Goldman Sachs Bank USA 3/16/18 (29,469)GBP 2,500,000 USD 3,493,268 Goldman Sachs Bank USA 3/16/18 (49,044)GBP 800,000 USD 1,111,838 Goldman Sachs Bank USA 3/16/18 (9,686)GBP 1,300,000 USD 1,748,549 Goldman Sachs Bank USA 3/16/18 42,447SEK 3,100,000 USD 371,772 Goldman Sachs Bank USA 3/16/18 2,740SEK 6,400,000 USD 761,414 Goldman Sachs Bank USA 3/16/18 11,773SEK 11,000,000 USD 1,304,896 Goldman Sachs Bank USA 3/16/18 24,020SEK 6,000,000 USD 732,188 Goldman Sachs Bank USA 3/16/18 (7,325)SEK 3,100,000 USD 379,704 Goldman Sachs Bank USA 3/16/18 (5,192)SEK 3,400,000 USD 420,274 Goldman Sachs Bank USA 3/16/18 (9,518)SEK 4,800,000 USD 599,548 Goldman Sachs Bank USA 3/16/18 (19,657)SEK 8,400,000 USD 1,064,445 Goldman Sachs Bank USA 3/16/18 (49,637)SEK 7,700,000 USD 982,078 Goldman Sachs Bank USA 3/16/18 (51,837)SEK 2,600,000 USD 330,098 Goldman Sachs Bank USA 3/16/18 (15,991)SEK 1,700,000 USD 211,306 Goldman Sachs Bank USA 3/16/18 (5,928)SEK 2,600,000 USD 310,591 Goldman Sachs Bank USA 3/16/18 3,517USD 11,191,847 AUD 14,100,000 Goldman Sachs Bank USA 3/16/18 240,179USD 8,740,704 AUD 11,200,000 Goldman Sachs Bank USA 3/16/18 41,507
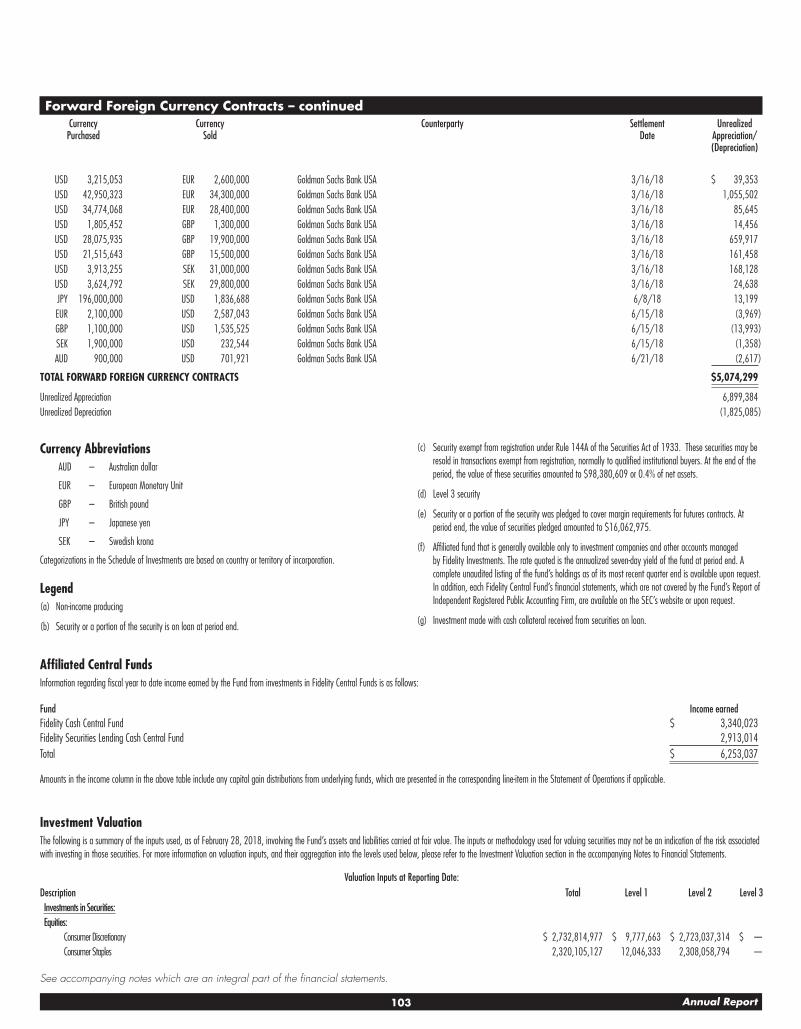
103 Annual Report
See accompanying notes which are an integral part of the financial statements.
Forward Foreign Currency Contracts – continuedCurrency
PurchasedCurrency
SoldCounterparty Settlement
DateUnrealized
Appreciation/ (Depreciation)
USD 3,215,053 EUR 2,600,000 Goldman Sachs Bank USA 3/16/18 $ 39,353USD 42,950,323 EUR 34,300,000 Goldman Sachs Bank USA 3/16/18 1,055,502USD 34,774,068 EUR 28,400,000 Goldman Sachs Bank USA 3/16/18 85,645USD 1,805,452 GBP 1,300,000 Goldman Sachs Bank USA 3/16/18 14,456USD 28,075,935 GBP 19,900,000 Goldman Sachs Bank USA 3/16/18 659,917USD 21,515,643 GBP 15,500,000 Goldman Sachs Bank USA 3/16/18 161,458USD 3,913,255 SEK 31,000,000 Goldman Sachs Bank USA 3/16/18 168,128USD 3,624,792 SEK 29,800,000 Goldman Sachs Bank USA 3/16/18 24,638JPY 196,000,000 USD 1,836,688 Goldman Sachs Bank USA 6/8/18 13,199EUR 2,100,000 USD 2,587,043 Goldman Sachs Bank USA 6/15/18 (3,969)GBP 1,100,000 USD 1,535,525 Goldman Sachs Bank USA 6/15/18 (13,993)SEK 1,900,000 USD 232,544 Goldman Sachs Bank USA 6/15/18 (1,358)AUD 900,000 USD 701,921 Goldman Sachs Bank USA 6/21/18 (2,617)
TOTAL FORWARD FOREIGN CURRENCY CONTRACTS $ 5,074,299
Unrealized Appreciation 6,899,384Unrealized Depreciation (1,825,085)
Currency AbbreviationsAUD – Australian dollar
EUR – European Monetary Unit
GBP – British pound
JPY – Japanese yen
SEK – Swedish krona
Categorizations in the Schedule of Investments are based on country or territory of incorporation.
Legend(a) Non-income producing
(b) Security or a portion of the security is on loan at period end.
(c) Security exempt from registration under Rule 144A of the Securities Act of 1933. These securities may be resold in transactions exempt from registration, normally to qualified institutional buyers. At the end of the period, the value of these securities amounted to $98,380,609 or 0.4% of net assets.
(d) Level 3 security
(e) Security or a portion of the security was pledged to cover margin requirements for futures contracts. At period end, the value of securities pledged amounted to $16,062,975.
(f) Affiliated fund that is generally available only to investment companies and other accounts managed by Fidelity Investments. The rate quoted is the annualized seven-day yield of the fund at period end. A complete unaudited listing of the fund’s holdings as of its most recent quarter end is available upon request. In addition, each Fidelity Central Fund’s financial statements, which are not covered by the Fund’s Report of Independent Registered Public Accounting Firm, are available on the SEC’s website or upon request.
(g) Investment made with cash collateral received from securities on loan.
Affiliated Central FundsInformation regarding fiscal year to date income earned by the Fund from investments in Fidelity Central Funds is as follows:
Fund Income earnedFidelity Cash Central Fund $ 3,340,023Fidelity Securities Lending Cash Central Fund 2,913,014Total $ 6,253,037
Amounts in the income column in the above table include any capital gain distributions from underlying funds, which are presented in the corresponding line-item in the Statement of Operations if applicable.
Investment ValuationThe following is a summary of the inputs used, as of February 28, 2018, involving the Fund’s assets and liabilities carried at fair value. The inputs or methodology used for valuing securities may not be an indication of the risk associated with investing in those securities. For more information on valuation inputs, and their aggregation into the levels used below, please refer to the Investment Valuation section in the accompanying Notes to Financial Statements.
Valuation Inputs at Reporting Date:Description Total Level 1 Level 2 Level 3Investments in Securities:Equities:
Consumer Discretionary $ 2,732,814,977 $ 9,777,663 $ 2,723,037,314 $ —Consumer Staples 2,320,105,127 12,046,333 2,308,058,794 —
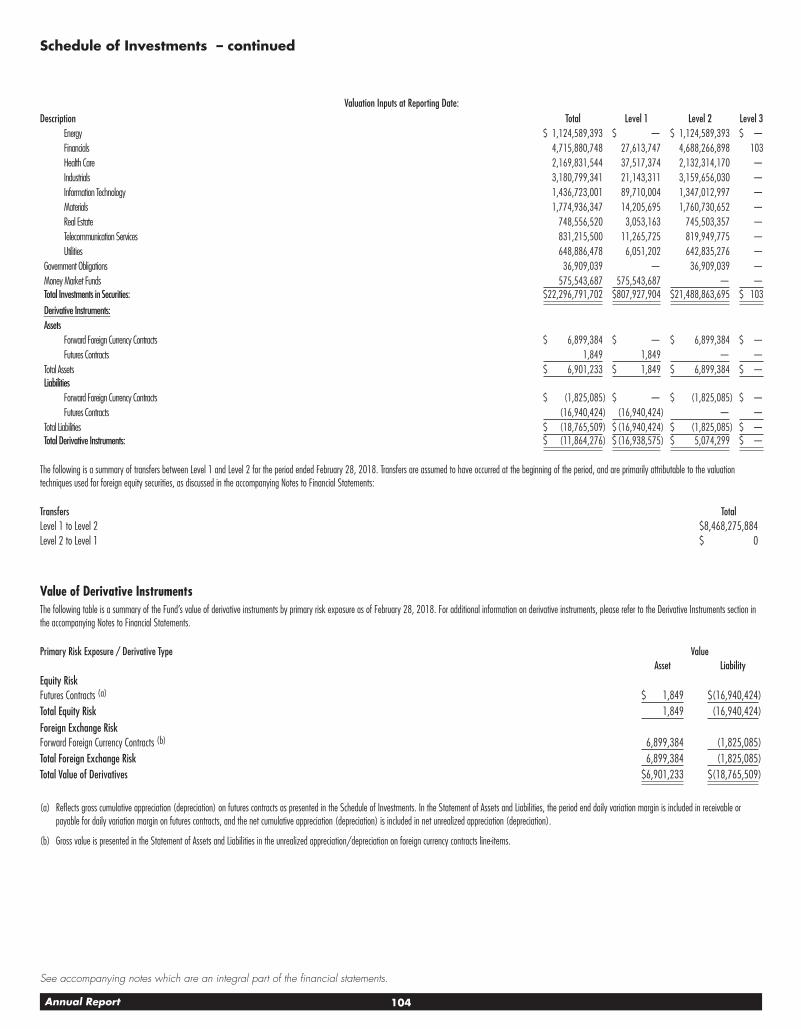
104Annual Report
See accompanying notes which are an integral part of the financial statements.
Schedule of Investments – continued
Valuation Inputs at Reporting Date:Description Total Level 1 Level 2 Level 3
Energy $ 1,124,589,393 $ — $ 1,124,589,393 $ —Financials 4,715,880,748 27,613,747 4,688,266,898 103Health Care 2,169,831,544 37,517,374 2,132,314,170 —Industrials 3,180,799,341 21,143,311 3,159,656,030 —Information Technology 1,436,723,001 89,710,004 1,347,012,997 —Materials 1,774,936,347 14,205,695 1,760,730,652 —Real Estate 748,556,520 3,053,163 745,503,357 —Telecommunication Services 831,215,500 11,265,725 819,949,775 —Utilities 648,886,478 6,051,202 642,835,276 —
Government Obligations 36,909,039 — 36,909,039 —Money Market Funds 575,543,687 575,543,687 — —Total Investments in Securities: $ 22,296,791,702 $ 807,927,904 $ 21,488,863,695 $ 103
Derivative Instruments:Assets
Forward Foreign Currency Contracts $ 6,899,384 $ — $ 6,899,384 $ —Futures Contracts 1,849 1,849 — —
Total Assets $ 6,901,233 $ 1,849 $ 6,899,384 $ —Liabilities
Forward Foreign Currency Contracts $ (1,825,085) $ — $ (1,825,085) $ —Futures Contracts (16,940,424) (16,940,424) — —
Total Liabilities $ (18,765,509) $ (16,940,424) $ (1,825,085) $ —Total Derivative Instruments: $ (11,864,276) $ (16,938,575) $ 5,074,299 $ —
The following is a summary of transfers between Level 1 and Level 2 for the period ended February 28, 2018. Transfers are assumed to have occurred at the beginning of the period, and are primarily attributable to the valuation techniques used for foreign equity securities, as discussed in the accompanying Notes to Financial Statements:
Transfers TotalLevel 1 to Level 2 $ 8,468,275,884Level 2 to Level 1 $ 0
Value of Derivative InstrumentsThe following table is a summary of the Fund’s value of derivative instruments by primary risk exposure as of February 28, 2018. For additional information on derivative instruments, please refer to the Derivative Instruments section in the accompanying Notes to Financial Statements.
Primary Risk Exposure / Derivative Type ValueAsset Liability
Equity Risk Futures Contracts (a) $ 1,849 $ (16,940,424)Total Equity Risk 1,849 (16,940,424)Foreign Exchange Risk Forward Foreign Currency Contracts (b) 6,899,384 (1,825,085)Total Foreign Exchange Risk 6,899,384 (1,825,085)Total Value of Derivatives $ 6,901,233 $ (18,765,509)
(a) Reflects gross cumulative appreciation (depreciation) on futures contracts as presented in the Schedule of Investments. In the Statement of Assets and Liabilities, the period end daily variation margin is included in receivable or payable for daily variation margin on futures contracts, and the net cumulative appreciation (depreciation) is included in net unrealized appreciation (depreciation).
(b) Gross value is presented in the Statement of Assets and Liabilities in the unrealized appreciation/depreciation on foreign currency contracts line-items.

105 Annual Report
See accompanying notes which are an integral part of the financial statements.
Fidelity® International Index Fund
Financial StatementsStatement of Assets and Liabilities
February 28, 2018
Assets Investment in securities, at value (including securities loaned of $280,758,461) — See accompanying schedule:
Unaffiliated issuers (cost $19,239,566,441) $ 21,721,248,015Fidelity Central Funds (cost $575,557,850) 575,543,687
Total Investment in Securities (cost $19,815,124,291) $ 22,296,791,702Foreign currency held at value (cost $4,996,227) 4,988,200Receivable for investments sold 623,842Unrealized appreciation on forward foreign currency contracts 6,899,384Receivable for fund shares sold 53,918,066Dividends receivable 93,279,996Distributions receivable from Fidelity Central Funds 676,424Other receivables 484
Total assets 22,457,178,098Liabilities Payable for investments purchased $ 106,186,715Unrealized depreciation on forward foreign currency contracts 1,825,085Payable for fund shares redeemed 12,742,496Accrued management fee 846,679Payable for daily variation margin on futures contracts 3,305,971Other affiliated payables 224,248Other payables and accrued expenses 25,432Collateral on securities loaned 297,596,784
Total liabilities 422,753,410
Net Assets $ 22,034,424,688
Net Assets consist of: Paid in capital $ 19,984,433,611Undistributed net investment income 16,444,387Accumulated undistributed net realized gain (loss) on investments and foreign currency transactions (438,764,034)Net unrealized appreciation (depreciation) on investments and assets and liabilities in foreign currencies 2,472,310,724Net Assets $ 22,034,424,688
Investor Class: Net Asset Value, offering price and redemption price per share ($692,387,948 ÷ 16,073,375 shares) $ 43.08
Premium Class: Net Asset Value, offering price and redemption price per share ($11,462,485,706 ÷ 266,057,656 shares) $ 43.08
Institutional Class: Net Asset Value, offering price and redemption price per share ($3,065,012,477 ÷ 71,132,447 shares) $ 43.09
Institutional Premium Class: Net Asset Value, offering price and redemption price per share ($6,814,538,557 ÷ 158,156,886 shares) $ 43.09

106Annual Report
See accompanying notes which are an integral part of the financial statements.
Financial Statements – continued
Statement of OperationsYear ended February
28, 2018
Investment Income Dividends $ 594,530,351Interest 177,313Income from Fidelity Central Funds (including $2,913,014 from security lending) 6,253,037
Income before foreign taxes withheld 600,960,701Less foreign taxes withheld (52,671,907)
Total income 548,288,794Expenses Management fee $ 9,301,258Transfer agent fees 3,254,815Independent trustees’ fees and expenses 73,075Miscellaneous 56,726
Total expenses before reductions 12,685,874Expense reductions (1,190) 12,684,684
Net investment income (loss) 535,604,110
Realized and Unrealized Gain (Loss) Net realized gain (loss) on:
Investment securities: Unaffiliated issuers 56,303,228Redemptions in-kind with affiliated entities 320,859,246Fidelity Central Funds (1,498)
Forward foreign currency contracts 2,896,331Foreign currency transactions 1,740,537Futures contracts 64,894,294
Total net realized gain (loss) 446,692,138Change in net unrealized appreciation (depreciation) on:
Investment securities: Unaffiliated issuers 2,385,863,193Fidelity Central Funds (14,142)
Forward foreign currency contracts 4,745,850Assets and liabilities in foreign currencies 5,515,927Futures contracts (18,753,143)
Total change in net unrealized appreciation (depreciation) 2,377,357,685Net gain (loss) 2,824,049,823Net increase (decrease) in net assets resulting from operations $ 3,359,653,933

107 Annual Report
See accompanying notes which are an integral part of the financial statements.
Statement of Changes in Net AssetsYear ended
February 28, 2018
Year ended February 28,
2017Increase (Decrease) in Net Assets Operations
Net investment income (loss) $ 535,604,110 $ 460,796,868Net realized gain (loss) 446,692,138 27,754,673Change in net unrealized appreciation (depreciation) 2,377,357,685 1,696,026,072Net increase (decrease) in net assets resulting from operations 3,359,653,933 2,184,577,613
Distributions to shareholders from net investment income (492,684,873) (439,896,097)Distributions to shareholders from net realized gain (29,746,994) (13,514,538)
Total distributions (522,431,867) (453,410,635)Share transactions – net increase (decrease) 2,878,191,351 983,873,064Redemption fees – 491,955
Total increase (decrease) in net assets 5,715,413,417 2,715,531,997Net Assets
Beginning of period 16,319,011,271 13,603,479,274End of period $ 22,034,424,688 $ 16,319,011,271
Other Information Undistributed net investment income end of period $ 16,444,387 $ 11,169,228

108Annual Report
See accompanying notes which are an integral part of the financial statements.
Financial Highlights
Fidelity International Index Fund Investor Class
Years ended February 28, 2018 2017 2016 A 2015 2014Selected Per–Share Data Net asset value, beginning of period $ 36.88 $ 32.81 $ 39.75 $ 41.19 $ 35.31Income from Investment Operations
Net investment income (loss) B 1.08 1.06 1.11 1.13 1.35C
Net realized and unrealized gain (loss) 6.15 4.05 (7.10) (1.31) 5.53Total from investment operations 7.23 5.11 (5.99) (.18) 6.88Distributions from net investment income (.97) (1.01) (.95) (1.26) (.96)Distributions from net realized gain (.06) (.03) – – (.04)
Total distributions (1.03) (1.04) (.95) (1.26) (1.00)Redemption fees added to paid in capital B – –D –D –D –D
Net asset value, end of period $ 43.08 $ 36.88 $ 32.81 $ 39.75 $ 41.19
Total Return E 19.65% 15.72% (15.24)% (.29)% 19.66%Ratios to Average Net Assets F,G
Expenses before reductions .17% .19% .20% .20% .20%Expenses net of fee waivers, if any .17% .19% .20% .20% .20%Expenses net of all reductions .17% .19% .20% .20% .20%Net investment income (loss) 2.60% 2.97% 2.92% 2.83% 3.52%C
Supplemental Data Net assets, end of period (000 omitted) $ 692,388 $ 740,317 $ 2,652,101 $ 2,972,698 $ 2,640,165Portfolio turnover rate H 2%I 2% 1%I 1% 2%
A For the year ended February 29.B Calculated based on average shares outstanding during the period.C Net Investment income per share reflects a large, non-recurring dividend which amounted to $.27 per share. Excluding this non-recurring dividend, the ratio of net investment income (loss) to average net assets would have
been 2.82%.D Amount represents less than $.005 per share.E Total returns would have been lower if certain expenses had not been reduced during the applicable periods shown.F Fees and expenses of any underlying Fidelity Central Funds are not included in the Fund’s expense ratio. The Fund indirectly bears its proportionate share of the expenses of any underlying Fidelity Central Funds.G Expense ratios reflect operating expenses of the class. Expenses before reductions do not reflect amounts reimbursed by the investment adviser or reductions from expense offset arrangements and do not represent the amount paid
by the class during periods when reimbursements or reductions occur. Expenses net of fee waivers reflect expenses after reimbursement by the investment adviser but prior to reductions from expense offset arrangements. Expenses net of all reductions represent the net expenses paid by the class.
H Amount does not include the portfolio activity of any underlying Fidelity Central Funds.I Portfolio turnover rate excludes securities received or delivered in-kind.

109 Annual Report
See accompanying notes which are an integral part of the financial statements.
Fidelity International Index Fund Premium Class
Years ended February 28, 2018 2017 2016 A 2015 2014Selected Per–Share Data Net asset value, beginning of period $ 36.88 $ 32.82 $ 39.76 $ 41.20 $ 35.31Income from Investment Operations
Net investment income (loss) B 1.12 1.10 1.14 1.17 1.38C
Net realized and unrealized gain (loss) 6.15 4.03 (7.10) (1.32) 5.54Total from investment operations 7.27 5.13 (5.96) (.15) 6.92Distributions from net investment income (1.01) (1.04) (.98) (1.29) (.99)Distributions from net realized gain (.06) (.03) – – (.04)
Total distributions (1.07) (1.07) (.98) (1.29) (1.03)Redemption fees added to paid in capital B – –D –D –D –D
Net asset value, end of period $ 43.08 $ 36.88 $ 32.82 $ 39.76 $ 41.20
Total Return E 19.77% 15.80% (15.17)% (.21)% 19.79%Ratios to Average Net Assets F,G
Expenses before reductions .07% .11% .17% .17% .17%Expenses net of fee waivers, if any .07% .09% .12% .12% .12%Expenses net of all reductions .07% .09% .12% .12% .12%Net investment income (loss) 2.70% 3.07% 3.00% 2.91% 3.60%C
Supplemental Data Net assets, end of period (000 omitted) $ 11,462,486 $ 8,719,903 $ 7,677,907 $ 8,304,964 $ 7,201,814Portfolio turnover rate H 2%I 2% 1%I 1% 2%
A For the year ended February 29.B Calculated based on average shares outstanding during the period.C Net Investment income per share reflects a large, non-recurring dividend which amounted to $.27 per share. Excluding this non-recurring dividend, the ratio of net investment income (loss) to average net assets would have
been 2.90%.D Amount represents less than $.005 per share.E Total returns would have been lower if certain expenses had not been reduced during the applicable periods shown.F Fees and expenses of any underlying Fidelity Central Funds are not included in the Fund’s expense ratio. The Fund indirectly bears its proportionate share of the expenses of any underlying Fidelity Central Funds.G Expense ratios reflect operating expenses of the class. Expenses before reductions do not reflect amounts reimbursed by the investment adviser or reductions from expense offset arrangements and do not represent the amount paid
by the class during periods when reimbursements or reductions occur. Expenses net of fee waivers reflect expenses after reimbursement by the investment adviser but prior to reductions from expense offset arrangements. Expenses net of all reductions represent the net expenses paid by the class.
H Amount does not include the portfolio activity of any underlying Fidelity Central Funds.I Portfolio turnover rate excludes securities received or delivered in-kind.

110Annual Report
See accompanying notes which are an integral part of the financial statements.
Financial Highlights – continued
Fidelity International Index Fund Institutional Class
Years ended February 28, 2018 2017 2016 A 2015 2014Selected Per–Share Data Net asset value, beginning of period $ 36.89 $ 32.82 $ 39.76 $ 41.20 $ 35.31Income from Investment Operations
Net investment income (loss) B 1.13 1.11 1.16 1.18 1.40C
Net realized and unrealized gain (loss) 6.15 4.04 (7.10) (1.31) 5.54Total from investment operations 7.28 5.15 (5.94) (.13) 6.94Distributions from net investment income (1.02) (1.05) (1.00) (1.31) (1.01)Distributions from net realized gain (.06) (.03) – – (.04)
Total distributions (1.08) (1.08) (1.00) (1.31) (1.05)Redemption fees added to paid in capital B – –D –D –D –D
Net asset value, end of period $ 43.09 $ 36.89 $ 32.82 $ 39.76 $ 41.20
Total Return E 19.78% 15.87% (15.13)% (.16)% 19.85%Ratios to Average Net Assets F,G
Expenses before reductions .05% .07% .10% .10% .10%Expenses net of fee waivers, if any .05% .06% .07% .07% .07%Expenses net of all reductions .05% .06% .07% .07% .07%Net investment income (loss) 2.72% 3.10% 3.05% 2.96% 3.65%C
Supplemental Data Net assets, end of period (000 omitted) $ 3,065,012 $ 2,097,193 $ 1,539,389 $ 1,994,854 $ 1,595,562Portfolio turnover rate H 2%I 2% 1%I 1% 2%
A For the year ended February 29.B Calculated based on average shares outstanding during the period.C Net Investment income per share reflects a large, non-recurring dividend which amounted to $.27 per share. Excluding this non-recurring dividend, the ratio of net investment income (loss) to average net assets would have
been 2.95%.D Amount represents less than $.005 per share.E Total returns would have been lower if certain expenses had not been reduced during the applicable periods shown.F Fees and expenses of any underlying Fidelity Central Funds are not included in the Fund’s expense ratio. The Fund indirectly bears its proportionate share of the expenses of any underlying Fidelity Central Funds.G Expense ratios reflect operating expenses of the class. Expenses before reductions do not reflect amounts reimbursed by the investment adviser or reductions from expense offset arrangements and do not represent the amount paid
by the class during periods when reimbursements or reductions occur. Expenses net of fee waivers reflect expenses after reimbursement by the investment adviser but prior to reductions from expense offset arrangements. Expenses net of all reductions represent the net expenses paid by the class.
H Amount does not include the portfolio activity of any underlying Fidelity Central Funds.I Portfolio turnover rate excludes securities received or delivered in-kind.

111 Annual Report
See accompanying notes which are an integral part of the financial statements.
Fidelity International Index Fund Institutional Premium Class
Years ended February 28, 2018 2017 2016 A 2015 2014Selected Per–Share Data Net asset value, beginning of period $ 36.88 $ 32.82 $ 39.76 $ 41.20 $ 35.31Income from Investment Operations
Net investment income (loss) B 1.13 1.11 1.16 1.19 1.41C
Net realized and unrealized gain (loss) 6.16 4.04 (7.10) (1.32) 5.53Total from investment operations 7.29 5.15 (5.94) (.13) 6.94Distributions from net investment income (1.02) (1.06) (1.00) (1.31) (1.01)Distributions from net realized gain (.06) (.03) – – (.04)
Total distributions (1.08) (1.09) (1.00) (1.31) (1.05)Redemption fees added to paid in capital B – –D –D –D –D
Net asset value, end of period $ 43.09 $ 36.88 $ 32.82 $ 39.76 $ 41.20
Total Return E 19.82% 15.85% (15.12)% (.15)% 19.86%Ratios to Average Net Assets F,G
Expenses before reductions .05% .06% .08% .08% .08%Expenses net of fee waivers, if any .05% .05% .06% .06% .06%Expenses net of all reductions .05% .05% .06% .06% .06%Net investment income (loss) 2.72% 3.11% 3.06% 2.97% 3.66%C
Supplemental Data Net assets, end of period (000 omitted) $ 6,814,539 $ 4,761,598 $ 1,734,082 $ 1,797,254 $ 1,651,834Portfolio turnover rate H 2%I 2% 1%I 1% 2%
A For the year ended February 29.B Calculated based on average shares outstanding during the period.C Net Investment income per share reflects a large, non-recurring dividend which amounted to $.27 per share. Excluding this non-recurring dividend, the ratio of net investment income (loss) to average net assets would have
been 2.96%.D Amount represents less than $.005 per share.E Total returns would have been lower if certain expenses had not been reduced during the applicable periods shown.F Fees and expenses of any underlying Fidelity Central Funds are not included in the Fund’s expense ratio. The Fund indirectly bears its proportionate share of the expenses of any underlying Fidelity Central Funds.G Expense ratios reflect operating expenses of the class. Expenses before reductions do not reflect amounts reimbursed by the investment adviser or reductions from expense offset arrangements and do not represent the amount paid
by the class during periods when reimbursements or reductions occur. Expenses net of fee waivers reflect expenses after reimbursement by the investment adviser but prior to reductions from expense offset arrangements. Expenses net of all reductions represent the net expenses paid by the class.
H Amount does not include the portfolio activity of any underlying Fidelity Central Funds.I Portfolio turnover rate excludes securities received or delivered in-kind.
112Annual Report
Notes to Financial StatementsFor the period ended February 28, 2018
1. Organization.
Fidelity Total Market Index Fund, Fidelity Extended Market Index Fund and Fidelity International Index Fund (the Funds) are funds of Fidelity Concord Street Trust (the Trust). Each Fund is authorized to issue an unlimited number of shares. The Trust is registered under the Investment Company Act of 1940, as amended (the 1940 Act), as an open-end management investment company organized as a Massachusetts business trust. Fidelity Total Market Index Fund offers Investor Class, Premium Class, Institutional Class, Institutional Premium Class and Class F shares. Fidelity Extended Market Index Fund offers Investor Class, Premium Class and Institutional Premium Class shares. Fidelity International Index Fund offers Investor Class, Premium Class, Institutional Class and Institutional Premium Class shares, each of which has equal rights as to assets and voting privileges. Each class has exclusive voting rights with respect to matters that affect that class. Each Fund offers conversion privileges between share classes within each Fund to eligible shareholders. Class F shares of the Fund are only available for purchase by mutual funds for which Fidelity Management & Research Company (FMR) or an affiliate serves as investment manager.
2. Investments in Fidelity Central Funds.
The Funds invest in Fidelity Central Funds, which are open-end investment companies generally available only to other investment companies and accounts managed by the investment adviser and its affiliates. The Funds’ Schedules of Investments list each of the Fidelity Central Funds held as of period end, if any, as an investment of each Fund, but do not include the underlying holdings of each Fidelity Central Fund. As an Investing Fund, each Fund indirectly bears its proportionate share of the expenses of the underlying Fidelity Central Funds.
The Money Market Central Funds seek preservation of capital and current income and are managed by Fidelity Investments Money Management, Inc. (FIMM), an affiliate of the investment adviser. Annualized expenses of the Money Market Central Funds as of their most recent shareholder report date are less than .005%.
A complete unaudited list of holdings for each Fidelity Central Fund is available upon request or at the Securities and Exchange Commission (the SEC) website at www.sec.gov. In addition, the financial statements of the Fidelity Central Funds, which are not covered by the Funds’ Report of Independent Registered Public Accounting Firm, are available on the SEC website or upon request.
3. Significant Accounting Policies.
Each Fund is an investment company and applies the accounting and reporting guidance of the Financial Accounting Standards Board (FASB) Accounting Standards Codification Topic 946 Financial Services – Investments Companies. The financial statements have been prepared in conformity with accounting principles generally accepted in the United States of America (GAAP), which require management to make certain estimates and assumptions at the date of the financial statements. Actual results could differ from those estimates. Subsequent events, if any, through the date that the financial statements were issued have been evaluated in the preparation of the financial statements. The following summarizes the significant accounting policies of the Funds:
Investment Valuation. Investments are valued as of 4:00 p.m. Eastern time on the last calendar day of the period. The Board of Trustees (the Board) has delegated the day to day responsibility for the valuation of each Fund’s investments to the Fair Value Committee (the Committee) established by each Fund’s investment adviser. In accordance with valuation policies and procedures approved by the Board, each Fund attempts to obtain prices from one or more third party pricing vendors or brokers to value its investments. When current market prices, quotations or currency exchange rates are not readily available or reliable, investments will be fair valued in good faith by the Committee, in accordance with procedures adopted by the Board. Factors used in determining fair value vary by investment type and may include market or investment specific events, changes in interest rates and credit quality. The frequency with which these procedures are used cannot be predicted and they may be utilized to a significant extent. The Committee oversees each Fund’s valuation policies and procedures and reports to the Board on the Committee’s activities and fair value determinations. The Board monitors the appropriateness of the procedures used in valuing each Fund’s investments and ratifies the fair value determinations of the Committee.
Each Fund categorizes the inputs to valuation techniques used to value its investments into a disclosure hierarchy consisting of three levels as shown below:
Level 1 – quoted prices in active markets for identical investments
Level 2 – other significant observable inputs (including quoted prices for similar investments, interest rates, prepayment speeds, etc.)
Level 3 – unobservable inputs (including the Fund’s own assumptions based on the best information available)
Valuation techniques used to value each Fund’s investments by major category are as follows:
Equity securities, including restricted securities, for which market quotations are readily available, are valued at the last reported sale price or official closing price as reported by a third party pricing vendor on the primary market or exchange on which they are traded and are categorized as Level 1 in the hierarchy. In the event there were no sales during the day or closing prices are not available, securities are valued at the last quoted bid price or may be valued using the last available price and are generally categorized as Level 2 in the hierarchy. For foreign equity securities, when market or security specific events arise, comparisons to the valuation of American Depositary Receipts (ADRs), futures contracts, Exchange-Traded Funds (ETFs) and certain indexes as well as quoted prices for similar securities may be used and would be categorized as Level 2 in the hierarchy. Utilizing these techniques may result in transfers between Level 1 and Level 2. For equity securities, including restricted securities, where observable inputs are limited, assumptions about market activity and risk are used and these securities may be categorized as Level 3 in the hierarchy.
Debt securities, including restricted securities, are valued based on evaluated prices received from third party pricing vendors or from brokers who make markets in such securities. U.S. government and government agency obligations are valued by pricing vendors who utilize matrix pricing which considers yield or price of bonds of comparable quality, coupon, maturity and type or by broker-supplied prices. When independent prices are unavailable or unreliable, debt securities may be valued utilizing pricing methodologies which consider similar factors that would be used by third party pricing vendors. Debt securities are generally categorized as Level 2 in the hierarchy but may be Level 3 depending on the circumstances.
The U.S. dollar value of foreign currency contracts is determined using currency exchange rates supplied by a pricing service and are categorized as Level 2 in the hierarchy. Futures contracts are valued at the settlement price established each day by the board of trade or exchange on which they are traded and are categorized as Level 1 in the hierarchy. Investments in open-end mutual funds, including the Fidelity Central Funds, are valued at their closing net asset value (NAV) each business day and are categorized as Level 1 in the hierarchy.
113 Annual Report
Changes in valuation techniques may result in transfers in or out of an assigned level within the disclosure hierarchy. The aggregate value of investments by input level as of February 28, 2018, including information on transfers between Levels 1 and 2, is included at the end of each applicable Fund’s Schedule of Investments.
Foreign Currency. Foreign-denominated assets, including investment securities, and liabilities are translated into U.S. dollars at the exchange rates at period end. Purchases and sales of invest-ment securities, income and dividends received and expenses denominated in foreign currencies are translated into U.S. dollars at the exchange rate in effect on the transaction date.
The effects of exchange rate fluctuations on investments are included with the net realized and unrealized gain (loss) on investment securities. Other foreign currency transactions resulting in real-ized and unrealized gain (loss) are disclosed separately.
Realized gains and losses on foreign currency transactions arise from the disposition of foreign currency, realized changes in the value of foreign currency between the trade and settlement dates on security transactions, and the difference between the amounts of dividends, interest and foreign withholding taxes recorded on transaction date and the U.S. dollar equivalent of the amounts actually received or paid. Unrealized gains and losses on assets and liabilities in foreign currencies arise from changes in the value of foreign currency, and from assets and liabilities denominated in foreign currencies, other than investments, which are held at period end.
Investment Transactions and Income. For financial reporting purposes, the Funds’ investment holdings and NAV include trades executed through the end of the last business day of the period. The NAV per share for processing shareholder transactions is calculated as of the close of business of the New York Stock Exchange (NYSE), normally 4:00 p.m. Eastern time and includes trades executed through the end of the prior business day. Gains and losses on securities sold are determined on the basis of identified cost and includes proceeds received from litigation. Dividend income is recorded on the ex-dividend date, except for certain dividends from foreign securities where the ex-dividend date may have passed, which are recorded as soon as the Funds are informed of the ex-dividend date. Non-cash dividends included in dividend income, if any, are recorded at the fair market value of the securities received. Income and capital gain distributions from Fidelity Central Funds, if any, are recorded on the ex-dividend date. Certain distributions received by the Funds represent a return of capital or capital gain. The Funds determine the components of these distribu-tions subsequent to the ex-dividend date, based upon receipt of tax filings or other correspondence relating to the underlying investment. These distributions are recorded as a reduction of cost of investments and/or as a realized gain. Interest income is accrued as earned and includes coupon interest and amortization of premium and accretion of discount on debt securities as applicable. Investment income is recorded net of foreign taxes withheld where recovery of such taxes is uncertain.
Class Allocations and Expenses. Investment income, realized and unrealized capital gains and losses, common expenses of each Fund, and certain fund-level expense reductions, if any, are allocated daily on a pro-rata basis to each class based on the relative net assets of each class to the total net assets of each Fund. Each class differs with respect to transfer agent fees incurred. Certain expense reductions may also differ by class. For the reporting period, the allocated portion of income and expenses to each class as a percent of its average net assets may vary due to the timing of recording these transactions in relation to fluctuating net assets of the classes. Expenses directly attributable to a fund are charged to that fund. Expenses attributable to more than one fund are allocated among the respective funds on the basis of relative net assets or other appropriate methods. Expense estimates are accrued in the period to which they relate and adjustments are made when actual amounts are known.
Deferred Trustee Compensation. Under a Deferred Compensation Plan (the Plan) for Fidelity Total Market Index Fund, independent Trustees may elect to defer receipt of a portion of their annual compensation. Deferred amounts are invested in a cross-section of Fidelity funds, are marked-to-market and remain in the Fund until distributed in accordance with the Plan. The investment of deferred amounts and the offsetting payable to the Trustees are included in the accompanying Statement of Assets and Liabilities.
Income Tax Information and Distributions to Shareholders. Each year, each Fund intends to qualify as a regulated investment company under Subchapter M of the Internal Revenue Code, including distributing substantially all of its taxable income and realized gains. As a result, no provision for U.S. Federal income taxes is required. As of February 28, 2018, each Fund did not have any unrecognized tax benefits in the financial statements; nor is each Fund aware of any tax positions for which it is reasonably possible that the total amounts of unrecognized tax benefits will significantly change in the next twelve months. Each Fund files a U.S. federal tax return, in addition to state and local tax returns as required. Each Fund’s federal income tax returns are subject to examination by the Internal Revenue Service (IRS) for a period of three fiscal years after they are filed. State and local tax returns may be subject to examination for an additional fiscal year depending on the jurisdiction. Foreign taxes are provided for based on each Fund’s understanding of the tax rules and rates that exist in the foreign markets in which it invests.
Distributions are declared and recorded on the ex-dividend date. Income dividends and capital gain distributions are declared separately for each class. Income and capital gain distributions are determined in accordance with income tax regulations, which may differ from GAAP. In addition, the Funds claimed a portion of the payment made to redeeming shareholders as a distribution for income tax purposes.
Capital accounts within the financial statements are adjusted for permanent book-tax differences. These adjustments have no impact on net assets or the results of operations. Capital accounts are not adjusted for temporary book-tax differences which will reverse in a subsequent period.
Book-tax differences are primarily due to futures contracts, foreign currency transactions, passive foreign investment companies (PFIC), market discount, redemptions in kind, partnerships, deferred trustees compensation, capital loss carryforwards, expiring capital loss carryforwards, certain deemed distributions and losses deferred due to wash sales and excise tax regulations.
As of period end, the cost and unrealized appreciation (depreciation) in securities, and derivatives if applicable, for federal income tax purposes were as follows for each Fund:
Tax costGross unrealized
appreciationGross unrealized
depreciation
Net unrealized appreciation
(depreciation)Fidelity Total Market Index $ 32,566,122,202 $ 21,566,678,395 $ (2,213,222,288) $ 19,353,456,107Fidelity Extended Market Index 19,043,393,725 8,254,631,831 (2,094,299,677) 6,160,332,154Fidelity International Index 19,931,969,224 4,834,875,961 (2,470,273,352) 2,364,602,609

114Annual Report
Notes to Financial Statements – continued
The tax-based components of distributable earnings as of period end were as follows for each Fund:
Undistributed ordinary income
Undistributed long-term capital gain Capital loss carryforward
Net unrealized appreciation
(depreciation) on securities and other
investmentsFidelity Total Market Index $ 166,295,610 $ 10,153,127 $ – $ 19,353,456,107Fidelity Extended Market Index 19,239,714 – – 6,160,332,154Fidelity International Index 21,638,812 – (338,757,934) 2,367,110,198
Capital loss carryforwards are only available to offset future capital gains of the Funds to the extent provided by regulations and may be limited. Under the Regulated Investment Company Modernization Act of 2010 (the Act), the Funds are permitted to carry forward capital losses incurred in taxable years beginning after December 22, 2010 for an unlimited period and such capital losses are required to be used prior to any losses that expire. The capital loss carryforward information presented below, including any applicable limitation, is estimated as of fiscal period end and is subject to adjustment.
Fiscal year of expiration2019 Total with expiration
Fidelity International Index (49,793,394) (49,793,394)
No expiration
Short-term Long-term Total no expirationTotal capital loss
carryfowardFidelity International Index (–) (288,964,540) (288,964,540) (338,757,934)
Fidelity Extended Market Index intends to elect to defer to its next fiscal year $3,369,398 of capital losses recognized during the period November 1, 2017 to February 28, 2018.
The tax character of distributions paid was as follows:
February 28, 2018Ordinary Income Long-term Capital Gains Total
Fidelity Total Market Index $ 812,794,970 $ 281,788,828 $ 1,094,583,798Fidelity Extended Market Index 272,772,146 883,666,934 1,156,439,080Fidelity International Index 522,431,867 – 522,431,867
February 28, 2017Ordinary Income Long-term Capital Gains Total
Fidelity Total Market Index $ 661,174,259 $ 207,363,556 $ 868,537,815Fidelity Extended Market Index 248,067,868 593,861,231 841,929,099Fidelity International Index 453,410,634 – 453,410,634
Restricted Securities. The Funds may invest in securities that are subject to legal or contractual restrictions on resale. These securities generally may be resold in transactions exempt from registra-tion or to the public if the securities are registered. Disposal of these securities may involve time-consuming negotiations and expense, and prompt sale at an acceptable price may be difficult. Information regarding restricted securities is included at the end of each applicable Fund’s Schedule of Investments.
4. Derivative Instruments.
Risk Exposures and the Use of Derivative Instruments. The Funds’ investment objective allows the Funds to enter into various types of derivative contracts, including futures contracts and forward foreign currency contracts. Derivatives are investments whose value is primarily derived from underlying assets, indices or reference rates and may be transacted on an exchange or over-the-counter (OTC). Derivatives may involve a future commitment to buy or sell a specified asset based on specified terms, to exchange future cash flows at periodic intervals based on a notional principal amount, or for one party to make one or more payments upon the occurrence of specified events in exchange for periodic payments from the other party.
The Funds used derivatives to increase returns and to manage exposure to certain risks as defined below. The success of any strategy involving derivatives depends on analysis of numerous economic factors, and if the strategies for investment do not work as intended, the Funds may not achieve their objectives.

115 Annual Report
The Funds’ use of derivatives increased or decreased their exposure to the following risks:
Equity Risk Equity risk relates to the fluctuations in the value of financial instruments as a result of changes in market prices (other than those arising from interest rate risk or foreign exchange risk), whether caused by factors specific to an individual investment, its issuer, or all factors affecting all instruments traded in a market or market segment.
Foreign Exchange Risk Foreign exchange rate risk relates to fluctuations in the value of an asset or liability due to changes in currency exchange rates.
The Funds are also exposed to additional risks from investing in derivatives, such as liquidity risk and counterparty credit risk. Liquidity risk is the risk that the Funds will be unable to close out the derivative in the open market in a timely manner. Counterparty credit risk is the risk that the counterparty will not be able to fulfill its obligation to the Funds. Counterparty credit risk related to exchange-traded futures contracts may be mitigated by the protection provided by the exchange on which they trade.
Investing in derivatives may involve greater risks than investing in the underlying assets directly and, to varying degrees, may involve risk of loss in excess of any initial investment and collateral received and amounts recognized in the Statement of Assets and Liabilities. In addition, there may be the risk that the change in value of the derivative contract does not correspond to the change in value of the underlying instrument.
Net Realized Gain (Loss) and Change in Net Unrealized Appreciation (Depreciation) on Derivatives. The table below, which reflects the impacts of derivatives on the financial performance of the Funds, summarizes the net realized gain (loss) and change in net unrealized appreciation (depreciation) for derivatives during the period as presented in the Statement of Operations.
Primary Risk Exposure / Derivative Type Net Realized Gain (Loss)
Change in Net Unrealized Appreciation
(Depreciation)Fidelity Total Market IndexEquity Risk Futures Contracts $ 41,722,764 $ (5,481,555)Total Equity Risk 41,722,764 (5,481,555)Totals $ 41,722,764 $ (5,481,555)
Fidelity Extended Market Index Equity Risk Futures Contracts $ 7,897,918 $ (3,861,045)Total Equity Risk 7,897,918 (3,861,045)Totals $ 7,897,918 $ (3,861,045)
Fidelity International Index Equity Risk Futures Contracts $ 64,894,294 $ (18,753,143)Total Equity Risk 64,894,294 (18,753,143)Foreign Exchange Risk Forward Foreign Currency Contracts $ 2,896,331 $ 4,745,850Total Foreign Exchange Risk 2,896,331 4,745,850Totals $ 67,790,625 $ (14,007,293)
A summary of the value of derivatives by primary risk exposure as of period end, if any, is included at the end of the Schedule of Investments.
Forward Foreign Currency Contracts. Forward foreign currency contracts represent obligations to purchase or sell foreign currency on a specified future date at a price fixed at the time the contracts are entered into. Fidelity International Index Fund used forward foreign currency contracts to facilitate transactions in foreign-denominated securities and to manage exposure to certain foreign currencies.
Forward foreign currency contracts are valued daily and fluctuations in exchange rates on open contracts are recorded as unrealized appreciation or (depreciation) and reflected in the Statement of Assets and Liabilities. When the contract is closed, the Funds realize a gain or loss equal to the difference between the closing value and the value at the time it was opened. The net realized gain (loss) and change in net unrealized appreciation (depreciation) on forward foreign currency contracts during the period is presented in the Statement of Operations.
Any open forward foreign currency contracts at period end are presented in the Schedule of Investments under the caption “Forward Foreign Currency Contracts.” The contract amount and unreal-ized appreciation (depreciation) reflects each contract’s exposure to the underlying currency at period end and are representative of volume of activity during the period.
Futures Contracts. A futures contract is an agreement between two parties to buy or sell a specified underlying instrument for a fixed price at a specified future date. The Funds used futures contracts to manage their exposure to the stock market.

116Annual Report
Notes to Financial Statements – continued
Upon entering into a futures contract, a fund is required to deposit either cash or securities (initial margin) with a clearing broker in an amount equal to a certain percentage of the face value of the contract. Futures contracts are marked-to-market daily and subsequent daily payments (variation margin) are made or received by a fund depending on the daily fluctuations in the value of the futures contracts and are recorded as unrealized appreciation or (depreciation). This receivable and/or payable, if any, is included in daily variation margin on futures contracts in the Statement of Assets and Liabilities. Realized gain or (loss) is recorded upon the expiration or closing of a futures contract. The net realized gain (loss) and change in net unrealized appreciation (depreciation) on futures contracts during the period is presented in the Statement of Operations.
Any open futures contracts at period end are presented in the Schedule of Investments under the caption “Futures Contracts”. The notional amount at value reflects each contract’s exposure to the underlying instrument or index at period end and is representative of volume of activity during the period. Securities deposited to meet initial margin requirements are identified in the Schedule of Investments. Cash deposited to meet initial margin requirements is presented as segregated cash with brokers for derivative instruments in the Statement of Assets and Liabilities.
5. Purchases and Sales of Investments.
Purchases and sales of securities, other than short-term securities and in-kind transactions, are noted in the table below.
Purchases ($) Sales ($)Fidelity Total Market Index 5,253,936,917 806,206,356Fidelity Extended Market Index 2,856,636,057 2,221,800,257Fidelity International Index 3,763,092,914 365,146,314
Exchanges In-Kind. During the period, investments and cash received in-kind through subscriptions totaled $172,362,566 in exchange for 4,418,420 shares of Fidelity International Index. The amount of in-kind exchanges is included in share transactions in the accompanying Statement of Changes in Net Assets as well as the Notes to Financial Statements. The Fund recognized no gain or loss for federal income tax purposes.
6. Fees and Other Transactions with Affiliates.
Management Fee and Expense Contract. Fidelity Management & Research Company (the investment adviser) and its affiliates provide the Funds with investment management related services for which the Funds pay a monthly management fee. The management fee is based on an annual rate of .015% and .045% of Fidelity Total Market Index Fund and Fidelity Extended Market Index Fund’s average net assets, respectively. Effective August 1, 2017, the Board approved an amendment to the management contract to reduce the management fee from an annual rate of .05% to .045% of Fidelity International Index Fund’s average net assets. Under the management contract, the investment adviser pays all other fund-level expenses, except the compensation of the independent Trustees and certain other expenses such as interest expense, including commitment fees. For the reporting period, the total annual management fee rate was .047% of Fidelity International Index Fund’s average net assets.
Effective August 1, 2017, the Board also approved an amendment to the expense contract. Under the expense contract, the investment adviser pays class-level expenses as necessary so that the total expenses do not exceed certain amounts of each class’ average net assets on an annual basis with certain exceptions, as noted in the following table:
Investor Class Premium Class Institutional ClassInstitutional Premium
Class Class FFidelity Total Market Index Fund .09% .035% .030% .015% .015%Fidelity Extended Market Index Fund .10% .07% n/a .045% n/aFidelity International Index Fund .16% .06% .05% .045% n/a
Prior to August 1, 2017, the investment adviser paid class-level expenses as necessary so that the total expenses did not exceed certain amounts as noted in the following table:
Investor Class Premium Class Institutional ClassInstitutional Premium
Class Class FFidelity Total Market Index Fund .09% .045% .035% .015% .015%Fidelity Extended Market Index Fund .10% .07% n/a .045% n/aFidelity International Index Fund .19% .08% .06% .05% n/a
Sub-Adviser. Geode Capital Management, LLC (Geode), serves as sub-adviser for the Funds. Geode provides discretionary investment advisory services to the Funds and is paid by the investment adviser for providing these services.
Transfer Agent Fees. Fidelity Investments Institutional Operations Company, Inc. (FIIOC), an affiliate of the investment adviser, is the transfer, dividend disbursing and shareholder servicing agent for each class of the Funds. FIIOC receives transfer agent fees at annual rates based on class-level average net assets noted in the table below. FIIOC receives no fees for providing transfer agency services to Class F. FIIOC pays for typesetting, printing and mailing of shareholder reports, except proxy statements. Effective August 1, 2017, under the amended expense contract, each class pays all or a portion of the transfer agent fees at an annual rate based on class-level average net assets as noted in the following table:

117 Annual Report
Received by FIIOCPaid by Class Effective
August 1, 2017Paid by Class Prior to
August 1, 2017Fidelity Total Market Index Investor Class .075% .075% .075%Premium Class .045% .02% .030%Institutional Class .035% .015% .02%Institutional Premium Class .015% –% –%Fidelity Extended Market Index Investor Class .075% .055% .055%Premium Class .045% .025% .025%Institutional Premium Class .015% –% –%Fidelity International Index Investor Class .21% .115% .14%Premium Class .11% .015% .03%Institutional Class .035% .005% .01%Institutional Premium Class .015% –% –%
For the period, the total transfer agent fees paid by each applicable class were as follows:
Amount% of Class-Level Average
Net AssetsFidelity Total Market Index Investor Class $ 575,374 .075Premium Class 6,084,353 .024Institutional Class 457,660 .017Institutional Premium Class – –
$ 7,117,387
Fidelity Extended Market Index Investor Class $ 419,597 .055Premium Class 4,223,308 .025Institutional Premium Class – –
$ 4,642,905
Fidelity International Index Investor Class $ 902,982 .126Premium Class 2,163,056 .021Institutional Class 188,777 .007Institutional Premium Class – –
$ 3,254,815
Interfund Lending Program. Pursuant to an Exemptive Order issued by the SEC, the Funds, along with other registered investment companies having management contracts with Fidelity Management & Research Company (FMR) or other affiliated entities of FMR, may participate in an interfund lending program. This program provides an alternative credit facility allowing the funds to borrow from, or lend money to, other participating affiliated funds. At period end, there were no interfund loans outstanding. Each applicable fund’s activity in this program during the period for which loans were outstanding was as follows:
Borrower or Lender
Average Loan Balance
Weighted Average
Interest RateInterest Expense
Fidelity Extended Market Index Borrower $22,219,522 1.52% $21,631
Interfund Trades. The Funds may purchase from or sell securities to other Fidelity Funds under procedures adopted by the Board. The procedures have been designed to ensure these interfund trades are executed in accordance with Rule 17a-7 of the 1940 Act. Interfund trades are included within the respective purchases and sales amounts shown in the Purchases and Sales of Investments note.
Redemption In-Kind. During the period, 14,197,390 shares of the Fidelity International Index held by an affiliated entity were redeemed in kind for cash and investments with a value of $621,987,635. The net realized gain of $320,859,246 on securities delivered through the in-kind redemption is included in the accompanying Statement of Operations. The amount of in-kind redemptions is included in share transactions in the accompanying Statement of Changes in Net Assets as well as the Notes to Financial Statements. The Fund recognized no gain or loss for federal income tax purposes.

118Annual Report
Notes to Financial Statements – continued
7. Committed Line of Credit.
Certain Funds participate with other funds managed by the investment adviser or an affiliate in a $4.25 billion credit facility (the “line of credit”) to be utilized for temporary or emergency purposes to fund shareholder redemptions or for other short-term liquidity purposes. The participating funds have agreed to pay commitment fees on their pro-rata portion of the line of credit, which are reflected in Miscellaneous expenses on the Statement of Operations, and are as follows:
Fidelity Total Market Index $ 130,935Fidelity Extended Market Index 60,635Fidelity International Index 56,726
During the period, the Funds did not borrow on this line of credit.
8. Security Lending.
Certain Funds lend portfolio securities through a lending agent from time to time in order to earn additional income. On the settlement date of the loan, each applicable Fund receives collateral (in the form of U.S. Treasury obligations, letters of credit and/or cash) against the loaned securities and maintains collateral in an amount not less than 100% of the market value of the loaned securities during the period of the loan. The market value of the loaned securities is determined at the close of business of the Funds and any additional required collateral is delivered to the Funds on the next business day. The Funds or borrower may terminate the loan at any time, and if the borrower defaults on its obligation to return the securities loaned because of insolvency or other reasons, the Funds may apply collateral received from the borrower against the obligation. The Funds may experience delays and costs in recovering the securities loaned. Any cash collateral received is invested in the Fidelity Securities Lending Cash Central Fund. The value of loaned securities and cash collateral at period end are disclosed on each applicable Fund’s Statement of Assets and Liabilities. Security lending income represents the income earned on investing cash collateral, less rebates paid to borrowers and any lending agent fees associated with the loan, plus any premium payments received for lending certain types of securities. Security lending income is presented on each applicable Fund’s Statement of Operations as a component of income from Fidelity Central Funds.
9. Expense Reductions.
Through arrangements with each applicable Fund’s custodian, credits realized as a result of certain uninvested cash balances were used to reduce each applicable Fund’s expenses as noted in the table below.
Management fee reduction
Fidelity Total Market Index $ 14,565Fidelity Extended Market Index 32,928Fidelity International Index 1,190
10. Distributions to Shareholders.
Distributions to shareholders of each class were as follows:
Year ended February 28, 2018
Year ended February 28, 2017
Fidelity Total Market Index From net investment income Investor Class $ 12,586,670 $ 16,896,705Premium Class 435,270,799 378,185,569Institutional Class 44,873,287 34,361,091Institutional Premium Class 94,317,041 64,762,437Class F 191,676,053 155,686,891Total $ 778,723,850 $ 649,892,693
From net realized gain Investor Class $ 5,321,710 $ 7,085,516Premium Class 177,589,449 129,533,088Institutional Class 18,221,313 11,106,621Institutional Premium Class 37,888,601 19,355,949Class F 76,838,875 51,563,948Total $ 315,859,948 $ 218,645,122
Fidelity Extended Market Index From net investment income Investor Class $ 9,206,140 $ 11,793,290

119 Annual Report
Year ended February 28, 2018
Year ended February 28, 2017
Premium Class 220,109,370 197,507,483Institutional Premium Class 35,451,606 26,821,111Total $ 264,767,116 $ 236,121,884
From net realized gain Investor Class $ 32,438,665 $ 32,816,744Premium Class 743,291,615 506,502,591Institutional Premium Class 115,941,684 66,487,880Total $ 891,671,964 $ 605,807,215
Fidelity International Index From net investment income Investor Class $ 15,703,123 $ 24,076,149Premium Class 258,467,735 233,531,573Institutional Class 65,473,787 59,351,711Institutional Premium Class 153,040,228 122,936,664Total $ 492,684,873 $ 439,896,097
From net realized gain Investor Class $ 986,439 $ 671,052Premium Class 15,621,751 7,150,508Institutional Class 3,939,343 1,834,835Institutional Premium Class 9,199,461 3,858,143Total $ 29,746,994 $ 13,514,538
11. Share Transactions.
Share transactions for each class were as follows and may contain automatic conversions between classes or exchanges between affiliated funds:
Shares Shares Dollars DollarsYear
ended February 28,
2018
Year ended
February 28, 2017
Year ended
February 28, 2018
Year ended
February 28, 2017
Fidelity Total Market Index Investor Class Shares sold 6,491,579 8,795,818 $ 473,077,417 $ 548,532,660Reinvestment of distributions 227,908 367,701 16,995,879 23,024,663Shares redeemed (7,266,119) (33,293,575) (529,723,284) (2,016,144,611)Net increase (decrease) (546,632) (24,130,056) $ (39,649,988) $ (1,444,587,288)
Premium Class Shares sold 59,682,692 72,938,672 $ 4,353,636,860 $ 4,593,828,256Reinvestment of distributions 7,372,266 7,020,226 550,334,111 448,347,863Shares redeemed (54,136,097) (79,548,075) (3,981,489,838) (4,899,234,191)Net increase (decrease) 12,918,861 410,823 $ 922,481,133 $ 142,941,928
Institutional Class Shares sold 17,997,705 18,325,311 $ 1,330,831,506 $ 1,130,684,794Reinvestment of distributions 732,368 632,945 54,656,693 40,590,795Shares redeemed (9,961,881) (6,254,614) (724,114,212) (386,019,299)Net increase (decrease) 8,768,192 12,703,642 $ 661,373,987 $ 785,256,290
Institutional Premium Class Shares sold 19,386,022 61,769,845 $ 1,424,547,920 $ 3,765,300,121Reinvestment of distributions 1,770,295 1,300,415 132,205,306 84,118,042Shares redeemed (10,876,497) (8,839,371) (794,477,913) (559,041,660)Net increase (decrease) 10,279,820 54,230,889 $ 762,275,313 $ 3,290,376,503
Class F Shares sold 36,022,682 31,179,343 $ 2,617,551,668 $ 1,951,312,863Reinvestment of distributions 3,591,887 3,238,153 268,514,928 207,250,839

120Annual Report
Notes to Financial Statements – continued
Shares Shares Dollars DollarsYear
ended February 28,
2018
Year ended
February 28, 2017
Year ended
February 28, 2018
Year ended
February 28, 2017
Shares redeemed (10,934,635) (22,327,967) (823,156,173) (1,432,285,287)Net increase (decrease) 28,679,934 12,089,529 $ 2,062,910,423 $ 726,278,415
Fidelity Extended Market Index Investor Class Shares sold 3,991,694 6,711,795 $ 239,037,979 $ 357,617,521Reinvestment of distributions 675,931 807,669 40,774,046 43,536,543Shares redeemed (7,533,841) (23,767,851) (452,172,226) (1,235,806,632)Net increase (decrease) (2,866,216) (16,248,387) $ (172,360,201) $ (834,652,568)
Premium Class Shares sold 63,342,564 66,990,107 $ 3,816,914,744 $ 3,630,840,281Reinvestment of distributions 15,232,360 12,308,792 921,328,809 673,965,867Shares redeemed (72,724,257) (57,455,289) (4,378,600,164) (3,070,052,457)Net increase (decrease) 5,850,667 21,843,610 $ 359,643,389 $ 1,234,753,691
Institutional Premium Class Shares sold 17,002,258 18,428,166 $ 1,011,348,990 $ 957,133,137Reinvestment of distributions 2,498,579 1,695,786 151,393,120 93,308,991Shares redeemed (9,306,004) (6,038,878) (554,308,152) (325,445,445)Net increase (decrease) 10,194,833 14,085,074 $ 608,433,958 $ 724,996,683
Fidelity International Index Investor Class Shares sold 9,622,744 15,676,836 $ 397,671,186 $ 556,901,003Reinvestment of distributions 369,295 670,347 15,632,929 23,634,187Shares redeemed (13,994,223) (77,100,723) (573,236,825) (2,682,763,685)Net increase (decrease) (4,002,184) (60,753,540) $ (159,932,710) $ (2,102,228,495)
Premium Class Shares sold 82,469,511 67,826,776 $ 3,438,872,823 $ 2,420,149,137Reinvestment of distributions 5,894,175 6,241,945 249,347,695 219,796,690Shares redeemed (58,740,308) (71,605,542) (2,455,289,015) (2,541,773,239)Net increase (decrease) 29,623,378 2,463,179 $ 1,232,931,503 $ 98,172,588
Institutional Class Shares sold 40,718,664 31,906,258 $ 1,697,292,859 $ 1,129,449,528Reinvestment of distributions 1,587,399 1,737,812 67,153,832 61,183,600Shares redeemed (28,030,811) (23,692,151) (1,191,741,771) (837,030,962)Net increase (decrease) 14,275,252 9,951,919 $ 572,704,920 $ 353,602,166
Institutional Premium Class Shares sold 81,804,104(a) 94,972,931 $ 3,495,868,171(a) $ 3,303,416,370Reinvestment of distributions 3,827,749 3,602,030 161,918,344 126,794,046Shares redeemed (56,573,887)(b) (22,317,015) (2,425,298,877)(b) (795,883,611)Net increase (decrease) 29,057,966 76,257,946 $ 1,232,487,638 $ 2,634,326,805
(a) Amount includes in-kind exchanges (see the Exchanges In-Kind note for additional details).(b) Amount includes in-kind redemptions (see the Redemptions In-Kind note for additional details).
12. Other.
The Funds’ organizational documents provide former and current trustees and officers with a limited indemnification against liabilities arising in connection with the performance of their duties to the Funds. In the normal course of business, the Funds may also enter into contracts that provide general indemnifications. The Funds’ maximum exposure under these arrangements is unknown as this would be dependent on future claims that may be made against the Funds. The risk of material loss from such claims is considered remote.
At the end of the period, mutual funds managed by the investment adviser or its affiliates were the owners of record, in the aggregate, of approximately 25% of the total outstanding shares of the Fidelity Total Market Index Fund.

121 Annual Report
Report of Independent Registered Public Accounting Firm
To the Trustees of Fidelity Concord Street Trust and the Shareholders of Fidelity Total Market Index Fund, Fidelity Extended Market Index Fund and Fidelity International Index Fund:
Opinions on the Financial StatementsWe have audited the accompanying statements of assets and liabilities, including the schedules of investments, of Fidelity Total Market Index Fund, Fidelity Extended Market Index Fund and Fidelity International Index Fund (each of the funds constituting Fidelity Concord Street Trust, hereafter collectively referred to as the “Funds”) as of February 28, 2018, the related statements of operations for the year ended February 28, 2018 the statements of changes in net assets for each of the two years in the period ended February 28, 2018 including the related notes, and the financial highlights for each of the five years in the period ended February 28, 2018 (collectively referred to as the “financial statements”). In our opinion, the financial statements present fairly, in all material respects, the financial position of each of the Funds as of February 28, 2018, the results of each of their operations for the year then ended, the changes in each of their net assets for each of the two years in the period ended February 28, 2018 and each of the financial highlights for each of the five years in the period ended February 28, 2018 in conformity with accounting principles generally accepted in the United States of America.
Basis for OpinionsThese financial statements are the responsibility of the Funds’ management. Our responsibility is to express an opinion on the Funds’ financial statements based on our audits. We are a public accounting firm registered with the Public Company Accounting Oversight Board (United States) (“PCAOB”) and are required to be independent with respect to the Funds in accordance with the U.S. federal securities laws and the applicable rules and regulations of the Securities and Exchange Commission and the PCAOB.
We conducted our audits of these financial statements in accordance with the standards of the PCAOB. Those standards require that we plan and perform the audits to obtain reasonable assurance about whether the financial statements are free of material misstatement, whether due to error or fraud.
Our audits included performing procedures to assess the risks of material misstatement of the financial statements, whether due to error or fraud, and performing procedures that respond to those risks. Such procedures included examining, on a test basis, evidence regarding the amounts and disclosures in the financial statements. Our audits also included evaluating the accounting principles used and significant estimates made by management, as well as evaluating the overall presentation of the financial statements. Our procedures included confirmation of securities owned as of February 28, 2018 by correspondence with the custodians and brokers; when replies were not received from brokers, we performed other auditing procedures. We believe that our audits provide a reasonable basis for our opinions.
PricewaterhouseCoopers LLP Boston, Massachusetts April 18, 2018
We have served as the auditor of one or more investment companies in the Fidelity group of funds since 1932.

122Annual Report
Trustees and Officers
The Trustees, Members of the Advisory Board (if any), and officers of the trust and funds, as applicable, are listed below. The Board of Trustees governs each fund and is responsible for protecting the interests of shareholders. The Trustees are experienced executives who meet periodically throughout the year to oversee each fund’s activities, review contractual arrangements with companies that provide services to each fund, oversee management of the risks associated with such activities and contractual arrangements, and review each fund’s performance. Except for Jonathan Chiel and Michael E. Wiley, each of the Trustees oversees 281 funds. Mr. Chiel oversees 145 funds. Mr. Wiley oversees 193 funds.
The Trustees hold office without limit in time except that (a) any Trustee may resign; (b) any Trustee may be removed by written instrument, signed by at least two-thirds of the number of Trustees prior to such removal; (c) any Trustee who requests to be retired or who has become incapacitated by illness or injury may be retired by written instrument signed by a majority of the other Trustees; and (d) any Trustee may be removed at any special meeting of shareholders by a two-thirds vote of the outstanding voting securities of the trust. Each Trustee who is not an interested person (as defined in the 1940 Act) of the trust and the funds is referred to herein as an Independent Trustee. Each Independent Trustee shall retire not later than the last day of the calendar year in which his or her 75th birthday occurs. The Independent Trustees may waive this mandatory retirement age policy with respect to individual Trustees. Officers and Advisory Board Members hold office without limit in time, except that any officer or Advisory Board Member may resign or may be removed by a vote of a majority of the Trustees at any regular meeting or any special meeting of the Trustees. Except as indicated, each individual has held the office shown or other offices in the same company for the past five years.
Each fund’s Statement of Additional Information (SAI) includes more information about the Trustees. To request a free copy, call Fidelity at 1-800-544-8544.
Experience, Skills, Attributes, and Qualifications of the Trustees. The Governance and Nominating Committee has adopted a statement of policy that describes the experience, qualifications, attributes, and skills that are necessary and desirable for potential Independent Trustee candidates (Statement of Policy). The Board believes that each Trustee satisfied at the time he or she was initially elected or appointed a Trustee, and continues to satisfy, the standards contemplated by the Statement of Policy. The Governance and Nominating Committee also engages professional search firms to help identify potential Independent Trustee candidates who have the experience, qualifications, attributes, and skills consistent with the Statement of Policy. From time to time, additional criteria based on the composition and skills of the current Independent Trustees, as well as experience or skills that may be appropriate in light of future changes to board composition, business conditions, and regulatory or other developments, have also been considered by the professional search firms and the Governance and Nominating Committee. In addition, the Board takes into account the Trustees’ commitment and participation in Board and committee meetings, as well as their leadership of standing and ad hoc committees throughout their tenure.
In determining that a particular Trustee was and continues to be qualified to serve as a Trustee, the Board has considered a variety of criteria, none of which, in isolation, was controlling. The Board believes that, collectively, the Trustees have balanced and diverse experience, qualifications, attributes, and skills, which allow the Board to operate effectively in governing each fund and protecting the interests of shareholders. Information about the specific experience, skills, attributes, and qualifications of each Trustee, which in each case led to the Board’s conclusion that the Trustee should serve (or continue to serve) as a trustee of the funds, is provided below.
Board Structure and Oversight Function. James C. Curvey is an interested person and currently serves as Chairman. The Trustees have determined that an interested Chairman is appropriate and benefits shareholders because an interested Chairman has a personal and professional stake in the quality and continuity of services provided to the funds. Independent Trustees exercise their informed business judgment to appoint an individual of their choosing to serve as Chairman, regardless of whether the Trustee happens to be independent or a member of management. The Independent Trustees have determined that they can act independently and effectively without having an Independent Trustee serve as Chairman and that a key structural component for assuring that they are in a position to do so is for the Independent Trustees to constitute a substantial majority for the Board. The Independent Trustees also regularly meet in executive session. Ned C. Lautenbach serves as Chairman of the Independent Trustees and as such (i) acts as a liaison between the Independent Trustees and management with respect to matters important to the Independent Trustees and (ii) with management prepares agendas for Board meetings.
Fidelity® funds are overseen by different Boards of Trustees. The funds’ Board oversees Fidelity’s high income and certain equity funds, and other Boards oversee Fidelity’s investment-grade bond, money market, asset allocation, and other equity funds. The asset allocation funds may invest in Fidelity® funds overseen by the funds’ Board. The use of separate Boards, each with its own committee structure, allows the Trustees of each group of Fidelity® funds to focus on the unique issues of the funds they oversee, including common research, investment, and operational issues. On occasion, the separate Boards establish joint committees to address issues of overlapping consequences for the Fidelity® funds overseen by each Board.
The Trustees operate using a system of committees to facilitate the timely and efficient consideration of all matters of importance to the Trustees, each fund, and fund shareholders and to facilitate compliance with legal and regulatory requirements and oversight of the funds’ activities and associated risks. The Board, acting through its committees, has charged FMR and its affiliates with (i) identifying events or circumstances the occurrence of which could have demonstrably adverse effects on the funds’ business and/or reputation; (ii) implementing processes and controls to lessen the possibility that such events or circumstances occur or to mitigate the effects of such events or circumstances if they do occur; and (iii) creating and maintaining a system designed to evaluate continuously business and market conditions in order to facilitate the identification and implementation processes described in (i) and (ii) above. Because the day-to-day operations and activities of the funds are carried out by or through FMR, its affiliates, and other service providers, the funds’ exposure to risks is mitigated but not eliminated by the processes overseen by the Trustees. While each of the Board’s committees has responsibility for overseeing different aspects of the funds’ activities, oversight is exercised primarily through the Operations, Audit, and Compliance Committees. In addition, the Independent Trustees have worked with Fidelity to enhance the Board’s oversight of investment and financial risks, legal and regulatory risks, technology risks, and operational risks, including the development of additional risk reporting to the Board. Appropriate personnel, including but not limited to the funds’ Chief Compliance Officer (CCO), FMR’s internal auditor, the independent accountants, the funds’ Treasurer and portfolio management personnel, make periodic reports to the Board’s committees, as appropriate, including an annual review of Fidelity’s risk management program for the Fidelity®funds. The responsibilities of each standing committee, including their oversight responsibilities, are described further under “Standing Committees of the Trustees.”
Interested Trustees*:
Correspondence intended for a Trustee who is an interested person may be sent to Fidelity Investments, 245 Summer Street, Boston, Massachusetts 02210.
Name, Year of Birth; Principal Occupations and Other Relevant Experience+
Jonathan Chiel (1957)
Year of Election or Appointment: 2016 Trustee

123 Annual Report
Mr. Chiel also serves as Trustee of other Fidelity® funds. Mr. Chiel is Executive Vice President and General Counsel for FMR LLC (diversified financial services company, 2012-present). Previously, Mr. Chiel served as general counsel (2004-2012) and senior vice president and deputy general counsel (2000-2004) for John Hancock Financial Services; a partner with Choate, Hall & Stewart (1996-2000) (law firm); and an Assistant United States Attorney for the United States Attorney’s Office of the District of Massachusetts (1986-95), including Chief of the Criminal Division (1993-1995). Mr. Chiel is a director on the boards of the Boston Bar Foundation and the Maimonides School.
James C. Curvey (1935)
Year of Election or Appointment: 2007 Trustee Chairman of the Board of Trustees
Mr. Curvey also serves as Trustee of other Fidelity® funds. Mr. Curvey is a Director of Fidelity Research & Analysis Co. (investment adviser firm, 2009-present), and Vice Chairman (2007-present) and Director of FMR LLC (diversified financial services company). In addition, Mr. Curvey serves as an Overseer for the Boston Symphony Orchestra and a member of the board of Artis-Naples, Naples, Florida, and as a Trustee for Brewster Academy, Wolfeboro, New Hampshire. Previously, Mr. Curvey served as a Director of Fidelity Investments Money Management, Inc. (investment adviser firm, 2009-2014) and a Director of FMR and FMR Co., Inc. (investment adviser firms, 2007-2014).
Charles S. Morrison (1960)
Year of Election or Appointment: 2014 Trustee
Mr. Morrison also serves as Trustee of other funds. He serves as President of Fidelity SelectCo, LLC (investment adviser firm, 2017-present) and Fidelity Management & Research Company (FMR) (investment adviser firm, 2016-present), a Director of Fidelity Investments Money Management, Inc. (FIMM) (investment adviser firm, 2014-present), Director of Fidelity SelectCo, LLC (investment adviser firm, 2014-present), President, Asset Management (2014-present), and is an employee of Fidelity Investments. Previously, Mr. Morrison served as Vice President of Fidelity’s Fixed Income and Asset Allocation Funds (2012-2014), President, Fixed Income (2011-2014), Vice President of Fidelity’s Money Market Funds (2005-2009), President, Money Market Group Leader of FMR (investment adviser firm, 2009), and Senior Vice President, Money Market Group of FMR (2004-2009). Mr. Morrison also served as Vice President of Fidelity’s Bond Funds (2002-2005), certain Balanced Funds (2002-2005), and certain Asset Allocation Funds (2002-2007), and as Senior Vice President (2002-2005) of Fidelity’s Bond Division.
* Determined to be an “Interested Trustee” by virtue of, among other things, his or her affiliation with the trust or various entities under common control with FMR.
+ The information includes the Trustee’s principal occupation during the last five years and other information relating to the experience, attributes, and skills relevant to the Trustee’s qualifications to serve as a Trustee, which led to the conclusion that the Trustee should serve as a Trustee for each fund.
Independent Trustees:
Correspondence intended for an Independent Trustee may be sent to Fidelity Investments, P.O. Box 55235, Boston, Massachusetts 02205-5235.
Name, Year of Birth; Principal Occupations and Other Relevant Experience+
Dennis J. Dirks (1948)
Year of Election or Appointment: 2005 Trustee
Mr. Dirks also serves as Trustee of other Fidelity® funds. Prior to his retirement in May 2003, Mr. Dirks was Chief Operating Officer and a member of the Board of The Depository Trust & Clearing Corporation (DTCC). He also served as President, Chief Operating Officer, and Board member of The Depository Trust Company (DTC) and President and Board member of the National Securities Clearing Corporation (NSCC). In addition, Mr. Dirks served as Chief Executive Officer and Board member of the Government Securities Clearing Corporation, Chief Executive Officer and Board member of the Mortgage-Backed Securities Clearing Corporation, as a Trustee and a member of the Finance Committee of Manhattan College (2005-2008), as a Trustee and a member of the Finance Committee of AHRC of Nassau County (2006-2008), as a member of the Independent Directors Council (IDC) Governing Council (2010-2015), and as a member of the Board of Directors for The Brookville Center for Children’s Services, Inc. (2009-2017). Mr. Dirks is a member of the Finance Committee (2016-present) and Board of Directors (2017-present) of the Asolo Repertory Theatre.
Donald F. Donahue (1950)
Year of Election or Appointment: 2018 Trustee
Mr. Donahue also serves as a Trustee of other Fidelity® funds. Mr. Donahue is President and Chief Executive Officer of Miranda Partners, LLC (risk consulting for the financial services industry, 2012-present). Previously, Mr. Donahue served as a Member of the Advisory Board of certain Fidelity® funds (2015-2018) and Chief Executive Officer (2006-2012), Chief Operating Officer (2003-2006), and Managing Director, Customer Marketing and Development (1999-2003) of The Depository Trust & Clearing Corporation (financial markets infrastructure). Mr. Donahue serves as a Member (2007-present) and Co-Chairman (2016-present) of the Board of Directors of United Way of New York, Member of the Board of Directors of NYC Leadership Academy (2012-present) and Member of the Board of Advisors of Ripple Labs, Inc. (financial services, 2015-present). He also served as Chairman (2010-2012) and Member of the Board of Directors (2012-2013) of Omgeo, LLC (financial services), Treasurer of United Way of New York (2012-2016), and Member of the Board of Directors of XBRL US (financial services non-profit, 2009-2012) and the International Securities Services Association (2009-2012).

124Annual Report
Trustees and Officers – continued
Alan J. Lacy (1953)
Year of Election or Appointment: 2008 Trustee
Mr. Lacy also serves as Trustee of other Fidelity® funds. Mr. Lacy serves as a Director of Bristol-Myers Squibb Company (global pharmaceuticals, 2008-present). He is a Trustee of the California Chapter of The Nature Conservancy (2015-present) and a Director of the Center for Advanced Study in the Behavioral Sciences at Stanford University (2015-present). In addition, Mr. Lacy served as Senior Adviser (2007-2014) of Oak Hill Capital Partners, L.P. (private equity) and also served as Chief Executive Officer (2005) and Vice Chairman (2005-2006) of Sears Holdings Corporation (retail) and Chief Executive Officer and Chairman of the Board of Sears, Roebuck and Co. (retail, 2000-2005). Previously, Mr. Lacy served as Chairman (2014-2017) and a member (2010-2017) of the Board of Directors of Dave & Buster’s Entertainment, Inc. (restaurant and entertainment complexes), as Chairman (2008-2011) and a member (2006-2015) of the Board of Trustees of the National Parks Conservation Association, and as a member of the Board of Directors for The Hillman Companies, Inc. (hardware wholesalers, 2010-2014), Earth Fare, Inc. (retail grocery, 2010-2014), and The Western Union Company (global money transfer, 2006-2011).
Ned C. Lautenbach (1944)
Year of Election or Appointment: 2000 Trustee Chairman of the Independent Trustees
Mr. Lautenbach also serves as Trustee of other Fidelity® funds. Mr. Lautenbach currently serves as Vice Chair of the Board of Governors, State University System of Florida (2013-present) and is a member of the Council on Foreign Relations (1994-present). He is also a member and has most recently served as Chairman of the Board of Directors of Artis-Naples (2012-present). Previously, Mr. Lautenbach served as a member and then Lead Director of the Board of Directors of Eaton Corporation (diversified industrial, 1997-2016). He was also a Partner and Advisory Partner at Clayton, Dubilier & Rice, LLC (private equity investment, 1998-2010), as well as a Director of Sony Corporation (2006-2007). In addition, Mr. Lautenbach also had a 30-year career with IBM (technology company) during which time he served as Senior Vice President and a member of the Corporate Executive Committee (1968-1998).
Joseph Mauriello (1944)
Year of Election or Appointment: 2008 Trustee
Mr. Mauriello also serves as Trustee of other Fidelity® funds. Prior to his retirement in January 2006, Mr. Mauriello served in numerous senior management positions including Deputy Chairman and Chief Operating Officer (2004-2005), and Vice Chairman of Financial Services (2002-2004) of KPMG LLP US (professional services, 1965-2005). Mr. Mauriello currently serves as a member of the Board of Directors of XL Group plc. (global insurance and re-insurance, 2006-present) and the Independent Directors Council (IDC) Governing Council (2015-pres-ent). Previously, Mr. Mauriello served as a Director of the Hamilton Funds of the Bank of New York (2006-2007) and of Arcadia Resources Inc. (health care services and products, 2007-2012).
Cornelia M. Small (1944)
Year of Election or Appointment: 2005 Trustee
Ms. Small also serves as Trustee of other Fidelity® funds. Ms. Small is a member of the Board of Directors (2009-present) and Chair of the Investment Committee (2010-present) of the Teagle Foundation. Ms. Small also serves on the Investment Committee of the Berkshire Taconic Community Foundation (2008-present). Previously, Ms. Small served as Chairperson (2002-2008) and a member of the Investment Committee and Chairperson (2008-2012) and a member of the Board of Trustees of Smith College. In addition, Ms. Small served as Chief Investment Officer, Director of Global Equity Investments, and a member of the Board of Directors of Scudder, Stevens & Clark and Scudder Kemper Investments.
Garnett A. Smith (1947)
Year of Election or Appointment: 2018 Trustee
Mr. Smith also serves as Trustee of other Fidelity® funds. Prior to Mr. Smith’s retirement, he served as Chairman and Chief Executive Officer of Inbrand Corp. (manufacturer of personal absorbent products, 1990-1997). He also served as President (1986-1990) of Inbrand Corp. Prior to his employment with Inbrand Corp., he was employed by a retail fabric chain and North Carolina National Bank. In addition, Mr. Smith served as a Member of the Advisory Board of certain Fidelity® funds (2012-2013) and as a board member of the Jackson Hole Land Trust (2009-2012).
David M. Thomas (1949)
Year of Election or Appointment: 2008 Trustee
Mr. Thomas also serves as Trustee of other Fidelity® funds. Mr. Thomas serves as Non-Executive Chairman of the Board of Directors of Fortune Brands Home and Security (home and security products, 2011-present), as a member of the Board of Directors (2004-present) and Presiding Director (2013-present) of Interpublic Group of Companies, Inc. (marketing communication), and as a member of the Board of Trustees of the University of Florida (2013-present). Previously, Mr. Thomas served as Executive Chairman (2005-2006) and Chairman and Chief Executive Officer (2000-2005) of IMS Health, Inc. (pharmaceutical and healthcare information solutions), and a Director of Fortune Brands, Inc. (consumer products, 2000-2011).
+ The information includes the Trustee’s principal occupation during the last five years and other information relating to the experience, attributes, and skills relevant to the Trustee’s qualifications to serve as a Trustee, which led to the conclusion that the Trustee should serve as a Trustee for each fund.

125 Annual Report
Advisory Board Members and Officers:
Correspondence intended for a Member of the Advisory Board (if any) may be sent to Fidelity Investments, P.O. Box 55235, Boston, Massachusetts 02205-5235. Correspondence intended for an officer or Peter S. Lynch may be sent to Fidelity Investments, 245 Summer Street, Boston, Massachusetts 02210. Officers appear below in alphabetical order.
Name, Year of Birth; Principal Occupation
Peter S. Lynch (1944)
Year of Election or Appointment: 2003 Member of the Advisory Board
Mr. Lynch also serves as Member of the Advisory Board of other Fidelity® funds. Mr. Lynch is Vice Chairman and a Director of FMR (investment adviser firm) and FMR Co., Inc. (investment adviser firm). In addition, Mr. Lynch serves as a Trustee of Boston College and as the Chairman of the Inner-City Scholarship Fund. Previously, Mr. Lynch served on the Special Olympics International Board of Directors (1997-2006).
William S. Stavropoulos (1939)
Year of Election or Appointment: 2018 Member of the Advisory Board
Mr. Stavropoulos also serves as Member of the Advisory Board of other Fidelity® funds. Mr. Stavropoulos serves as President and Founder of the Michigan Baseball Foundation, the Great Lakes Loons (2007-present). Mr. Stavropoulos is Chairman Emeritus of the Board of Directors of The Dow Chemical Company, where he previously served in numerous senior management positions, including President, CEO (1995-2000; 2002-2004), Chairman of the Executive Committee (2000-2006), and as a member of the Board of Directors (1990-2006). Currently, Mr. Stavropoulos is Chairman of the Board of Directors of Univar Inc. (global distributor of commodity and specialty chemicals), a Director of Teradata Corporation (data warehousing and technol-ogy solutions), and a member of the Advisory Board for Metalmark Capital LLC (private equity investment, 2005-present). Mr. Stavropoulos is an operating advisor to Clayton, Dubilier & Rice, LLC (private equity investment). In addition, Mr. Stavropoulos is a member of the University of Notre Dame Advisory Council for the College of Science, a Trustee of the Rollin L. Gerstacker Foundation, and a Director of Artis-Naples in Naples, Florida. Previously, Mr. Stavropoulos served as Trustee of certain Fidelity® funds (2001-2018) and as a Director of Chemical Financial Corporation (bank holding company, 1993-2012) and Tyco International, Ltd. (multinational manufacturing and services, 2007-2012).
Carol B. Tomé (1957)
Year of Election or Appointment: 2018 Member of the Advisory Board
Ms. Tomé also serves as Member of the Advisory Board of other Fidelity® funds. Ms. Tomé is Chief Financial Officer (2001-present) and Executive Vice President of Corporate Services (2007-present) of The Home Depot, Inc. (home improvement retailer) and a Director (2003-present) and Chair of the Audit Committee (2004-present) of United Parcel Service, Inc. (package delivery and supply chain management). Previously, Ms. Tomé served as Trustee of certain Fidelity® funds (2017), Senior Vice President of Finance and Accounting/Treasurer (2000-2007) and Vice President and Treasurer (1995-2000) of The Home Depot, Inc. and Chair of the Board (2010-2012), Vice Chair of the Board (2009 and 2013), and a Director (2008-2013) of the Federal Reserve Bank of Atlanta. Ms. Tomé is also a director or trustee of many community and professional organizations.
Elizabeth Paige Baumann (1968)
Year of Election or Appointment: 2017 Anti-Money Laundering (AML) Officer
Ms. Baumann also serves as AML Officer of other funds. She is Chief AML Officer (2012-present) and Senior Vice President (2014-present) of FMR LLC (diversified financial services company) and is an employee of Fidelity Investments. Previously, Ms. Baumann served as AML Officer of the funds (2012-2016), and Vice President (2007-2014) and Deputy Anti-Money Laundering Officer (2007-2012) of FMR LLC.
Marc R. Bryant (1966)
Year of Election or Appointment: 2015 Secretary and Chief Legal Officer (CLO)
Mr. Bryant also serves as Secretary and CLO of other funds. Mr. Bryant serves as CLO, Secretary, and Senior Vice President of Fidelity Management & Research Company (investment adviser firm, 2015-present) and FMR Co., Inc. (investment adviser firm, 2015-present); Secretary of Fidelity SelectCo, LLC (investment adviser firm, 2015-present) and Fidelity Investments Money Management, Inc. (investment adviser firm, 2015-present); and CLO of Fidelity Management & Research (Hong Kong) Limited and FMR Investment Management (UK) Limited (investment adviser firms, 2015-present) and Fidelity Management & Research (Japan) Limited (investment adviser firm, 2016-present). He is Senior Vice President and Deputy General Counsel of FMR LLC (diversified financial services company). Previously, Mr. Bryant served as Secretary and CLO of Fidelity Rutland Square Trust II (2010-2014) and Assistant Secretary of Fidelity’s Fixed Income and Asset Allocation Funds (2013-2015). Prior to joining Fidelity Investments, Mr. Bryant served as a Senior Vice President and the Head of Global Retail Legal for AllianceBernstein L.P. (2006-2010), and as the General Counsel for ProFund Advisors LLC (2001-2006).
William C. Coffey (1969)
Year of Election or Appointment: 2009 Assistant Secretary
Mr. Coffey also serves as Assistant Secretary of other funds. He is Senior Vice President and Deputy General Counsel of FMR LLC (diversified financial services company, 2010-present), and is an employee of Fidelity Investments. Previously, Mr. Coffey served as Vice President and Associate General Counsel of FMR LLC (2005-2009).

126Annual Report
Trustees and Officers – continued
Jonathan Davis (1968)
Year of Election or Appointment: 2010 Assistant Treasurer
Mr. Davis also serves as Assistant Treasurer of other funds. Mr. Davis serves as Assistant Treasurer of FMR Capital, Inc. (2017-present) and is an employee of Fidelity Investments. Previously, Mr. Davis served as Vice President and Associate General Counsel of FMR LLC (diversified financial services company, 2003-2010).
Adrien E. Deberghes (1967)
Year of Election or Appointment: 2016 Assistant Treasurer
Mr. Deberghes also serves as an officer of other funds. He serves as Assistant Treasurer of FMR Capital, Inc. (2017-present), Executive Vice President of Fidelity Investments Money Management, Inc. (FIMM) (investment adviser firm, 2016-present), and is an employee of Fidelity Investments (2008-present). Previously, Mr. Deberghes served as President and Treasurer of certain Fidelity® funds (2013-2018). Prior to joining Fidelity Investments, Mr. Deberghes was Senior Vice President of Mutual Fund Administration at State Street Corporation (2007-2008), Senior Director of Mutual Fund Administration at Investors Bank & Trust (2005-2007), and Director of Finance for Dunkin’ Brands (2000-2005). Previously, Mr. Deberghes served in other fund officer roles.
Joseph DeSantis (1959)
Year of Election or Appointment: 2017 Vice President
Mr. DeSantis also serves as Vice President of other funds. Mr. DeSantis serves as a Director of Fidelity Management & Research (Japan) Limited (investment adviser firm, 2016-present), Chief Investment Officer, Equities (2010-present) and is an employee of Fidelity Investments.
Stephanie J. Dorsey (1969)
Year of Election or Appointment: 2010 Assistant Treasurer
Ms. Dorsey also serves as an officer of other funds. Ms. Dorsey serves as Assistant Treasurer of FMR Capital, Inc. (2017-present), is an employee of Fidelity Investments (2008-present), and has served in other fund officer roles. Prior to joining Fidelity Investments, Ms. Dorsey served as Treasurer (2004-2008) of the JPMorgan Mutual Funds and Vice President (2004-2008) of JPMorgan Chase Bank.
Howard J. Galligan III (1966)
Year of Election or Appointment: 2014 Chief Financial Officer
Mr. Galligan also serves as Chief Financial Officer of other funds. Mr. Galligan serves as President of Fidelity Pricing and Cash Management Services (FPCMS) (2014-present) and as a Director of Strategic Advisers LLC (investment adviser firm, 2008-present). Previously, Mr. Galligan served as Chief Administrative Officer of Asset Management (2011-2014) and Chief Operating Officer and Senior Vice President of Investment Support for Strategic Advisers, Inc. (2003-2011).
Brian B. Hogan (1964)
Year of Election or Appointment: 2009 Vice President
Mr. Hogan also serves as Trustee or Vice President of other funds. Mr. Hogan serves as Head of Fidelity Investments’ Investment Solutions and Innovation organization (2018-present), and as a Director of FMR Investment Management (UK) Limited (investment adviser firm, 2015-present) and Fidelity SelectCo, LLC (investment adviser firm, 2014-present). Previously, Mr. Hogan served as Trustee of certain Fidelity® funds (2014-2018), President of the Equity Division of FMR (investment adviser firm, 2009-2018), Senior Vice President, Equity Research of FMR (2006-2009), and as a portfolio manager. Mr. Brian B. Hogan is not related to Mr. Colm A. Hogan.
Colm A. Hogan (1973)
Year of Election or Appointment: 2016 Deputy Treasurer
Mr. Hogan also serves as an officer of other funds. Mr. Hogan serves as Assistant Treasurer of FMR Capital, Inc. (2017-present) and is an employee of Fidelity Investments (2005-present). Previously, Mr. Hogan served as Assistant Treasurer of certain Fidelity®funds (2016-2018). Mr. Colm A. Hogan is not related to Mr. Brian B. Hogan.
Chris Maher (1972)
Year of Election or Appointment: 2013 Assistant Treasurer
Mr. Maher serves as Assistant Treasurer of other funds. Mr. Maher is Vice President of Valuation Oversight, serves as Assistant Treasurer of FMR Capital, Inc. (2017-present), and is an employee of Fidelity Investments. Previously, Mr. Maher served as Vice President of Asset Management Compliance (2013), Vice President of the Program Management Group of FMR (investment adviser firm, 2010-2013), and Vice President of Valuation Oversight (2008-2010).

127 Annual Report
Rieco E. Mello (1969)
Year of Election or Appointment: 2017 Assistant Treasurer
Mr. Mello also serves as Assistant Treasurer of other funds. Mr. Mello serves as Assistant Treasurer of FMR Capital, Inc. (2017-present) and is an employee of Fidelity Investments (1995-present).
Melissa M. Reilly (1971)
Year of Election or Appointment: 2014 Vice President of certain Equity Funds
Ms. Reilly also serves as Vice President of other funds. Ms. Reilly is an employee of Fidelity Investments (2004-present).
Kenneth B. Robins (1969)
Year of Election or Appointment: 2016 Chief Compliance Officer
Mr. Robins also serves as an officer of other funds. Mr. Robins serves as Compliance Officer of Fidelity Management & Research Company and FMR Co., Inc. (investment adviser firms, 2016-present) and is an employee of Fidelity Investments (2004-present). Previously, Mr. Robins served as Executive Vice President of Fidelity Investments Money Management, Inc. (invest-ment adviser firm, 2013-2016) and served in other fund officer roles.
Stacie M. Smith (1974)
Year of Election or Appointment: 2016 President and Treasurer
Ms. Smith also serves as an officer of other funds. Ms. Smith serves as Assistant Treasurer of FMR Capital, Inc. (2017-present), is an employee of Fidelity Investments (2009-present), and has served in other fund officer roles. Prior to joining Fidelity Investments, Ms. Smith served as Senior Audit Manager of Ernst & Young LLP (accounting firm, 1996-2009). Previously, Ms. Smith served as Assistant Treasurer (2013-2018) and Deputy Treasurer (2013-2016) of certain Fidelity® funds.
Marc L. Spector (1972)
Year of Election or Appointment: 2016 Assistant Treasurer
Mr. Spector also serves as an officer of other funds. Mr. Spector serves as Assistant Treasurer of FMR Capital, Inc. (2017-present) and is an employee of Fidelity Investments (2016-present). Prior to joining Fidelity Investments, Mr. Spector served as Director at the Siegfried Group (accounting firm, 2013-2016), and prior to Siegfried Group as audit senior manager at Deloitte & Touche (accounting firm, 2005-2013).
Renee Stagnone (1975)
Year of Election or Appointment: 2016 Assistant Treasurer
Ms. Stagnone also serves as an officer of other funds. Ms. Stagnone serves as Assistant Treasurer of FMR Capital, Inc. (2017-present) and is an employee of Fidelity Investments (1997-pres-ent). Previously, Ms. Stagnone served as Deputy Treasurer of certain Fidelity® funds (2013-2016).
Michael E. Wiley (1950)
Year of Election or Appointment: 2018 Member of the Advisory Board
Mr. Wiley also serves as Trustee or Member of the Advisory Board of other Fidelity® funds. Mr. Wiley serves as a Director of Andeavor Corporation (independent oil refiner and marketer, 2005-present), a Director of Andeavor Logistics LP (natural resources logistics, 2015-present), and a Director of Bill Barrett Corporation (exploration and production, 2005-present). In addi-tion, Mr. Wiley also serves as a Director of Post Oak Bank (privately-held bank, 2004-present). Previously, Mr. Wiley served as a Trustee of other Fidelity® funds (2008-2013), as a Director of Asia Pacific Exploration Consolidated (international oil and gas exploration and production, 2008-2013), as a member of the Board of Trustees of the University of Tulsa (2000-2006; 2007-2010), as a Senior Energy Advisor of Katzenbach Partners, LLC (consulting, 2006-2007), as an Advisory Director of Riverstone Holdings (private investment), Chairman, President, and CEO of Baker Hughes, Inc. (oilfield services, 2000-2004), and as Director of Spinnaker Exploration Company (exploration and production, 2001-2005).

128Annual Report
Shareholder Expense Example
As a shareholder of a Fund, you incur two types of costs: (1) transaction costs, and (2) ongoing costs, including management fees and other Fund expenses. This Example is intended to help you understand your ongoing costs (in dollars) of investing in the Funds and to compare these costs with the ongoing costs of investing in other mutual funds.The Example is based on an investment of $1,000 invested at the beginning of the period and held for the entire period (September 1, 2017 to February 28, 2018).Actual ExpensesThe first line of the accompanying table for each Class of each fund provides information about actual account values and actual expenses. You may use the information in this line, together with the amount you invested, to estimate the expenses that you paid over the period. Simply divide your account value by $1,000.00 (for example, an $8,600 account value divided by $1,000.00 = 8.6), then multiply the result by the number in the first line for a Class of the fund under the heading entitled “Expenses Paid During Period” to estimate the expenses you paid on your account during this period. A small balance maintenance fee of $12.00 that is charged once a year may apply for certain accounts with a value of less than $2,000. This fee is not included in the table below. If it was, the estimate of expenses you paid during the period would be higher, and your ending account value lower, by this amount. In addition, each Fund, as a shareholder in the underly-ing Fidelity Central Funds, will indirectly bear its pro-rata share of the fees and expenses incurred by the underlying Fidelity Central Funds. These fees and expenses are not included in the Fund’s annualized expense ratio used to calculate the expense estimate in the table below.Hypothetical Example for Comparison PurposesThe second line of the accompanying table for each Class of each fund provides information about hypothetical account values and hypothetical expenses based on a Class’ actual expense ratio and an assumed rate of return of 5% per year before expenses, which is not the Class’ actual return. The hypothetical account values and expenses may not be used to estimate the actual ending account balance or expenses you paid for the period. You may use this information to compare the ongoing costs of investing in the Fund and other funds. To do so, compare this 5% hypothetical example with the 5% hypothetical examples that appear in the shareholder reports of the other funds. A small balance maintenance fee of $12.00 that is charged once a year may apply for certain accounts with a value of less than $2,000. This fee is not included in the table below. If it was, the estimate of expenses you paid during the period would be higher, and your ending account value lower, by this amount. In addition, each Fund, as a shareholder in the underlying Fidelity Central Funds, will indirectly bear its pro-rata share of the fees and expenses incurred by the underlying Fidelity Central Funds. These fees and expenses are not included in the Fund’s annualized expense ratio used to calculate the expense estimate in the table below.Please note that the expenses shown in the table are meant to highlight your ongoing costs only and do not reflect any transaction costs. Therefore, the second line of the table is useful in compar-ing ongoing costs only, and will not help you determine the relative total costs of owning different funds.
Annualized Expense Ratio- A
Beginning Account Value
September 1, 2017
Ending Account Value
February 28, 2018
Expenses Paid During Period- B
September 1, 2017 to February 28, 2018
Fidelity Total Market IndexInvestor Class .09%Actual $1,000.00 $1,104.20 $.47Hypothetical- C $1,000.00 $1,024.35 $.45Premium Class .04%Actual $1,000.00 $1,104.50 $.21Hypothetical- C $1,000.00 $1,024.60 $.20Institutional Class .03%Actual $1,000.00 $1,104.60 $.16Hypothetical- C $1,000.00 $1,024.65 $.15Institutional Premium Class .02%Actual $1,000.00 $1,104.50 $.10Hypothetical- C $1,000.00 $1,024.70 $.10Class F .02%Actual $1,000.00 $1,104.70 $.10Hypothetical- C $1,000.00 $1,024.70 $.10Fidelity Extended Market IndexInvestor Class .10%Actual $1,000.00 $1,086.70 $.52Hypothetical- C $1,000.00 $1,024.30 $.50Premium Class .07%Actual $1,000.00 $1,086.90 $.36Hypothetical- C $1,000.00 $1,024.45 $.35Institutional Premium Class .05%Actual $1,000.00 $1,087.00 $.26Hypothetical- C $1,000.00 $1,024.55 $.25Fidelity International IndexInvestor Class .16%Actual $1,000.00 $1,060.80 $.82Hypothetical- C $1,000.00 $1,024.00 $.80Premium Class .06%Actual $1,000.00 $1,061.40 $.31Hypothetical- C $1,000.00 $1,024.50 $.30

129 Annual Report
Annualized Expense Ratio- A
Beginning Account Value
September 1, 2017
Ending Account Value
February 28, 2018
Expenses Paid During Period- B
September 1, 2017 to February 28, 2018
Institutional Class .05%Actual $1,000.00 $1,061.40 $.26Hypothetical- C $1,000.00 $1,024.55 $.25Institutional Premium Class .05%Actual $1,000.00 $1,061.50 $.26Hypothetical- C $1,000.00 $1,024.55 $.25
A Annualized expense ratio reflects expenses net of applicable fee waivers.B Expenses are equal to each Class’ annualized expense ratio, multiplied by the average account value over the period, multiplied by 181/ 365 (to reflect the one-half year period).C 5% return per year before expenses

130Annual Report
Distributions (Unaudited)
The Board of Trustees of each fund voted to pay to shareholders of record at the opening of business on record date, the following distributions per share derived from capital gains realized from sales of portfolio securities and dividends derived from net investment income:
Pay Date Record Date Dividends Capital GainsFidelity Total Market Index Fund Investor Class 04/12/18 04/11/18 $ 0.24100 $ 0.016Premium Class 04/12/18 04/11/18 $ 0.25250 $ 0.016Institutional Class 04/12/18 04/11/18 $ 0.25355 $ 0.016Institutional Premium Class 04/12/18 04/11/18 $ 0.25668 $ 0.016Class F 04/12/18 04/11/18 $ 0.25669 $ 0.016Fidelity Extended Market Index Fund Investor Class 04/12/18 04/11/18 $ 0.05200 $ 0.000Premium Class 04/12/18 04/11/18 $ 0.05713 $ 0.000Institutional Premium Class 04/12/18 04/11/18 $ 0.06140 $ 0.000Fidelity International Index Fund Investor Class 04/12/18 04/11/18 $ 0.03100 $ 0.000Premium Class 04/12/18 04/11/18 $ 0.04292 $ 0.000Institutional Class 04/12/18 04/11/18 $ 0.04411 $ 0.000Institutional Premium Class 04/12/18 04/11/18 $ 0.04470 $ 0.000
The funds hereby designate as capital gain dividend the amounts noted below for the taxable year ended February 28, 2018, or, if subsequently determined to be different, the net capital gain of such year.
Fidelity Total Market Index Fund $ 273,258,299Fidelity Extended Market Index Fund $ 690,246,611
A percentage of the dividends distributed during the fiscal year for the following funds qualify for the dividends–received deduction for corporate shareholders:
April 2017 December 2017Fidelity Total Market Index Fund Investor Class 93% 92%Premium Class 89% 89%Institutional Class 89% 89%Institutional Premium Class 87% 88%Class F 87% 88%Fidelity Extended Market Index Fund Investor Class 63% 63%Premium Class 60% 61%Institutional Premium Class 58% 60%
A percentage of the dividends distributed during the fiscal year for the following funds may be taken into account as a dividend for purposes of the maximum rate under section 1(h)(11) of the Internal Revenue Code.
April 2017 December 2017Fidelity Total Market Index Fund Investor Class 98% 97%Premium Class 94% 94%Institutional Class 94% 94%Institutional Premium Class 92% 93%Class F 92% 93%Fidelity Extended Market Index Fund Investor Class 61% 66%Premium Class 58% 65%Institutional Premium Class 56% 64%Fidelity International Index Fund Investor Class 100% 86%Premium Class 100% 83%Institutional Class 100% 83%Institutional Premium Class 97% 83%

131 Annual Report
The amounts per share which represent income derived from sources within, and taxes paid to, foreign countries or possessions of the United States are as follows:
Pay Date Income TaxesFidelity International Index Fund Investor Class 04/13/17 $ 0.0208 $ 0.0058Investor Class 12/18/17 $ 1.0064 $ 0.0883Premium Class 04/13/17 $ 0.0324 $ 0.0058Premium Class 12/18/17 $ 1.0352 $ 0.0883Institutional Class 04/13/17 $ 0.0345 $ 0.0058Institutional Class 12/18/17 $ 1.0380 $ 0.0883Institutional Premium Class 04/13/17 $ 0.0356 $ 0.0058Institutional Premium Class 12/18/17 $ 1.0395 $ 0.0883
The funds will notify shareholders in January 2019 of amounts for use in preparing 2018 income tax returns.

SIF-I-ANN-0418 1.929379.106