KBC Equity Fund - TeleTrader.com
1252
Semi-Annual report as at 30 th June 2013 KBC Equity Fund Public open-ended investment company under Belgian law (bevek) with a variable number of units/shares opting for Investments complying with the conditions of Directive 2009/65/EC UCITS No subscriptions will be accepted on the basis of this report. Subscriptions will only be valid if effected after a free copy of the key investor information or prospectus has been provided.
-
Upload
khangminh22 -
Category
Documents
-
view
2 -
download
0
Transcript of KBC Equity Fund - TeleTrader.com
Semi-Annual report as at 30th June 2013
KBC Equity Fund
Public open-ended investment company under Belgian law (bevek) with a variable number of units/shares opting for Investments
complying with the conditions of Directive 2009/65/EC UCITS
No subscriptions will be accepted on the basis of this report. Subscriptions will only be valid if
effected after a free copy of the key investor information or prospectus has been provided.
TABLE OF CONTENTS
1. General information on the bevek
1.1. Organization of the bevek
1.2. Management report 1.2.1. Information for shareholders 1.2.2. General market overview
1.3. Aggregate balance sheet
1.4. Aggregate profit and loss account
1.5. Summary of recognition and valuation rules
1.5.1. Summary of the rules 1.5.2. Exchange Rates
SWI
Schreibmaschinentext
SWI
Schreibmaschinentext
SWI
Schreibmaschinentext
No notification has been submitted for the sub-fund CSOB Akciovy Fond Dividendovych Firem and consequently this sub-fund must not be publicly marketed in Germany.
SWI
Schreibmaschinentext
SWI
Schreibmaschinentext
SWI
Schreibmaschinentext
SWI
Schreibmaschinentext
SWI
Schreibmaschinentext
SWI
Schreibmaschinentext
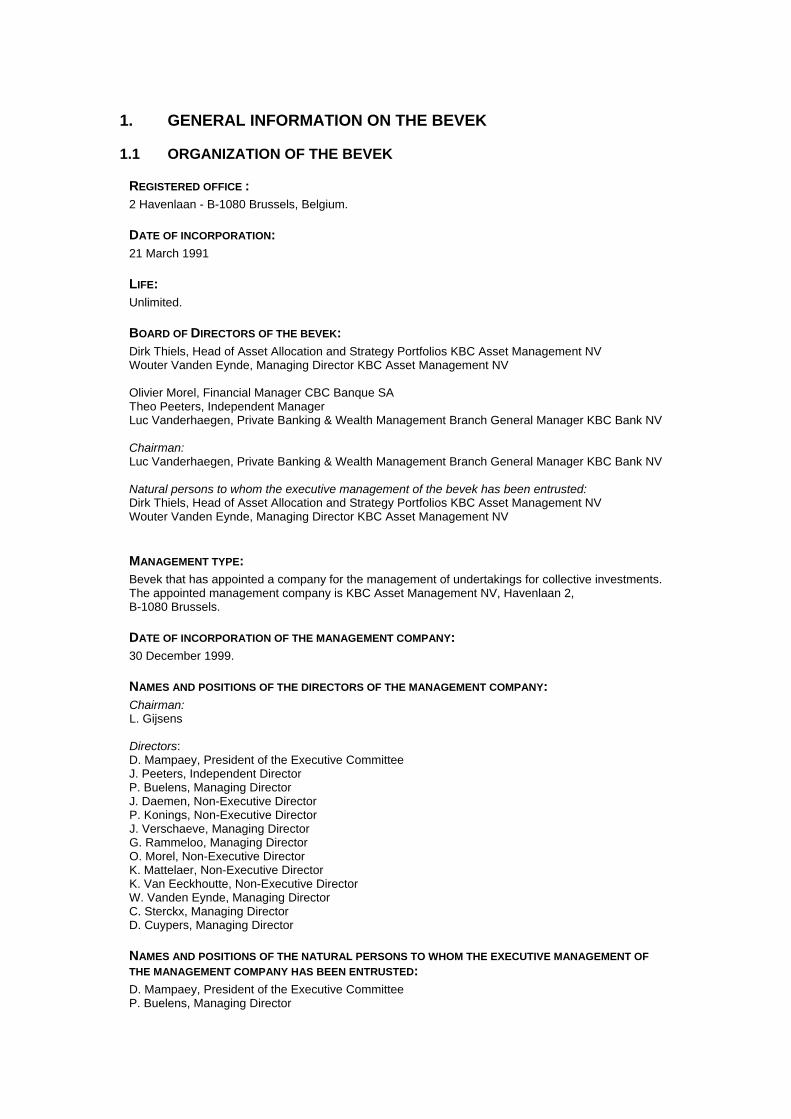
1. GENERAL INFORMATION ON THE BEVEK
1.1 ORGANIZATION OF THE BEVEK
REGISTERED OFFICE : 2 Havenlaan - B-1080 Brussels, Belgium.
DATE OF INCORPORATION: 21 March 1991
LIFE: Unlimited.
BOARD OF DIRECTORS OF THE BEVEK: Dirk Thiels, Head of Asset Allocation and Strategy Portfolios KBC Asset Management NV Wouter Vanden Eynde, Managing Director KBC Asset Management NV Olivier Morel, Financial Manager CBC Banque SA Theo Peeters, Independent Manager Luc Vanderhaegen, Private Banking & Wealth Management Branch General Manager KBC Bank NV
Chairman: Luc Vanderhaegen, Private Banking & Wealth Management Branch General Manager KBC Bank NV Natural persons to whom the executive management of the bevek has been entrusted: Dirk Thiels, Head of Asset Allocation and Strategy Portfolios KBC Asset Management NV Wouter Vanden Eynde, Managing Director KBC Asset Management NV
MANAGEMENT TYPE: Bevek that has appointed a company for the management of undertakings for collective investments. The appointed management company is KBC Asset Management NV, Havenlaan 2, B-1080 Brussels.
DATE OF INCORPORATION OF THE MANAGEMENT COMPANY: 30 December 1999.
NAMES AND POSITIONS OF THE DIRECTORS OF THE MANAGEMENT COMPANY: Chairman: L. Gijsens Directors: D. Mampaey, President of the Executive Committee J. Peeters, Independent Director P. Buelens, Managing Director J. Daemen, Non-Executive Director P. Konings, Non-Executive Director J. Verschaeve, Managing Director G. Rammeloo, Managing Director O. Morel, Non-Executive Director K. Mattelaer, Non-Executive Director K. Van Eeckhoutte, Non-Executive Director W. Vanden Eynde, Managing Director C. Sterckx, Managing Director D. Cuypers, Managing Director
NAMES AND POSITIONS OF THE NATURAL PERSONS TO WHOM THE EXECUTIVE MANAGEMENT OF
THE MANAGEMENT COMPANY HAS BEEN ENTRUSTED: D. Mampaey, President of the Executive Committee P. Buelens, Managing Director
J. Verschaeve, Managing Director G. Rammeloo, Managing Director W. Vanden Eynde, Managing Director C. Sterckx, Managing Director D. Cuypers, Managing Director These persons may also be directors of various beveks.
AUDITOR OF THE MANAGEMENT COMPANY: Ernst & Young Bedrijfsrevisoren BCVBA, represented by Christel Weymeersch, Company Auditor and auditor recognized by the Belgian Financial Services and Markets Authority, De Kleetlaan 2, 1831 Diegem.
STATUS OF THE BEVEK: Bevek with various sub-funds that has opted for investments complying with the conditions of Directive 2009/65/EC and which, as far as its operations and investments are concerned, is governed by the Act of 3 August 2012 on certain forms of collective management of investment portfolios.
FINANCIAL PORTFOLIO MANAGEMENT: In this regard, please see ‘Information concerning the sub-fund’.
FINANCIAL-SERVICES PROVIDERS: The financial services providers in Belgium are: KBC Bank NV, Havenlaan 2, B-1080 Brussels CBC Banque SA, Grand Place 5, B-1000 Brussels
CUSTODIAN: KBC Bank N.V., 2 Havenlaan - B-1080 Brussels, Belgium.
ADMINISTRATION AND ACCOUNTING MANAGEMENT: KBC Asset Management N.V., 2 Havenlaan - B-1080 Brussels, Belgium.
ACCREDITED AUDITOR OF THE BEVEK: Deloitte Bedrijfsrevisoren BV o.v.v.e. CVBA, in the form of a CVBA (co-operative limited liability company), Berkenlaan 8b, B-1831 Diegem, represented by partner Frank Verhaegen, company auditor and auditor recognised by the Belgian Financial Services and Markets Authority.
DISTRIBUTOR: KBC Asset Management S.A., 5, Place de la Gare, L-1616 Luxembourg.
PROMOTER: KBC
LIST OF SUB-FUNDS OF KBC EQUITY FUND
1. America
2. Belgium
3. BRIC
4. Buyback America
5. Buyback Europe
6. Central Europe
7. Commodities & Materials
8. Consumer Durables
9. CSOB Akciovy Fond Dividendovych Firem
10. CSOB BRIC
11. Eastern Europe
12. Euro Cyclicals
13. Euro Finance
14. Euro Non Cyclicals
15. Euro Telecom & Technology
16. Europe
17. Eurozone
18. Fallen Angels
19. Finance
20. Flanders
21. Food & Personal Products
22. Global Leaders
23. Growth by Innovation
24. High Dividend
25. High Dividend Eurozone
26. High Dividend New Markets
27. High Dividend North America
28. Industrials & Infrastructure
29. Japan
30. Latin America
31. Luxury & Tourism
32. Medical Technologies
33. New Asia
34. New Markets
35. New Shares
36. Oil
37. Pacific
38. Pharma
39. Pharma Growth
40. Quant EMU
41. Quant Europe
42. Quant Global 1
43. Satellites
44. SRI Equity
45. Technology
46. Telecom
47. Trends
48. Turkey
49. US Small Caps
50. Utilities
51. World
SHARE CLASSES The characteristics of the different share classes are given in the prospectus. The following sub-funds have a share class called ‘Classic Shares’:
America

Buyback America
Buyback Europe
Central Europe
Commodities & Materials
Consumer Durables
Eastern Europe
Euro Cyclicals
Euro Finance
Euro Non Cyclicals
Euro Telecom & Technology
Eurozone
Finance
Food & Personal Products
Global Leaders
Growth by Innovation
High Dividend
High Dividend Eurozone
High Dividend New Markets
High Dividend North America
Industrials & Infrastructure
Japan
Luxury & Tourism
Medical Technologies
Millennium
New Asia
New Markets
Oil
Pacific
Pharma
Pharma Growth
Quant EMU
Quant Europe
Quant Global 1
Satellites
SRI Equity
Technology
Telecom
Turkey
US Small Caps The following sub-funds have a share class called ‘Institutional Shares’:
SRI Equity
The following sub-funds have a share class called ‘Institutional B Shares’:
America
Buyback America
Buyback Europe

Central Europe
Commodities & Materials
Consumer Durables
Eastern Europe
Euro Cyclicals
Euro Finance
Euro Non Cyclicals
Euro Telecom & Technology
Eurozone
Finance
Food & Personal Products
Global Leaders
Growth by Innovation
High Dividend
High Dividend Eurozone
High Dividend New Markets
High Dividend North America
Industrials & Infrastructure
Japan
Luxury & Tourism
Medical Technologies
Millennium
New Asia
New Markets
Oil
Pacific
Pharma
Pharma Growth
Quant EMU
Quant Europe
Quant Global 1
Satellites
SRI Equity
Technology
Telecom
Turkey
US Small Caps
In the event of discrepancies between the Dutch and the other language versions of the (Semi-)Annual report, the Dutch will prevail.

1.2 MANAGEMENT REPORT
1.2.1 INFORMATION FOR THE SHAREHOLDERS
Not applicable.
1.2.2 GENERAL MARKET OVERVIEW
General investment climate 1 January – 30 June 2013 Doubts about the sustainability of the economic recovery continued to shape investor sentiment. The debt crisis in Europe continued unabated, although the European Central Bank (ECB) managed to convince the market that it had the crisis under control. Major steps were taken in the United States to reform the federal budget, seemingly without adversely affecting economic growth too much. Fortunately, strong economic growth in Asia created export opportunities for American and European businesses. The economic tightrope Although more jobs have been created than lost in the US since 2010, the rate of employment growth remained on the thin side for some considerable time. The situation began to improve in the recent reporting period, with the result that the jobless rate has declined more markedly. Pay has remained virtually flat, barely rising ahead of inflation. Taken together, these two factors ensured that household purchasing power only grew to a very limited extent and so contributed very modestly to economic growth. The latter was therefore limited (+1.6% growth year-on-year in the four quarters to the first three months of 2013). Real GDP in the EMU contracted by an annualised 1.1%. The austerity programme and credit restrictions pushed Southern Europe into a deep recession. Germany played its traditional role as the driver for European economic growth to a lesser extent than in the recent past. Greater divergence within Europe resulted primarily in a further decline in unemployment in Germany and an alarmingly rapid rise in unemployment in countries such as Greece, Spain and Portugal. Belgium was closer to the strong core of the euro area. The weak growth in the Western economies was not without its impact on the export performance in emerging countries. In recent years, however, domestic demand (due to a rapidly growing middle class with a high consumption rate) and intra-regional trade within Asia have been playing an increasingly important role. The region is better armed to deal with financial crises than it was in the past. Public finances are healthy, the balance of payments is generally neutral (China actually has an astronomical surplus) and the internal savings buffer is high. Asia’s economic development no longer depends on fickle foreign capital. Thanks to the contribution by the emerging markets the growth of world GDP held up in 2012–13 (estimated at 2–2.5%). Stemming the euro crisis There have been no significant bankruptcies in the business sector in recent years. The solvency and liquidity of non-financial companies have seldom been as strong as they are at present. A new feature of this cycle is that government paper, which had previously been seen as entirely risk-free, also started to be tainted with a degree of credit risk. Greece, Ireland, Portugal and Cyprus were no longer able to finance their sovereign debt through the usual channels and are now under the curatorship of the ECB, EU and IMF troika. Private bondholders were obliged to accept a rescheduling of Greek government debt. In Cyprus deposit holders are being required to help defray the cost of cleaning up the banking sector. Italy and Spain were frequently in the firing line. Spain has already applied for European assistance for the recapitalisation of its banks. During all these storms euro area
leaders have tried to reform the rules of the game of the monetary union, but it takes a lot of time and effort to get 17 parties singing from the same hymn sheet. The ESM became operational after much delay. The new budget treaty, which came into force on 1 January 2013, is already being questioned. The competitiveness pact does not include any solid commitments. The negotiations on the formation of a banking union have been tricky. So it is no wonder that the eurosceptics are having a field day. As inherently loyal investors in government bonds, European banks were highly sensitive to the consequences of the euro crisis and the write-downs on their bond portfolios, as they had already seen their capital base seriously eroded in the 2008–09 credit crisis. The euro crisis could easily have ended up therefore as a systemic crisis, something that the ECB wanted to avoid at all costs. Various programmes were launched to ensure and accelerate the provision of liquidity to the sector. The ECB deployed its bazooka in September 2012: the OMT (Outright Monetary Transactions) programme. The ECB is prepared to buy up (short-dated) bonds of under-fire countries for an unlimited period and in unlimited quantities, provided a number of conditions are met. The most important of these is that the government in question submits a formal request for a bailout under the ESM. That explains why, almost a year later, the OMT programme has yet to launch. The financial markets have not however been disturbed by this. For them the setting up of the European bazooka was enough in itself to regard the euro crisis as having been averted. At least for the time being. Public finances have gone off the rails not only in the EMU, but also in the UK and the US. The budget debate in the US had reached a political impasse. The ideological divisions between Republicans and Democrats long prevented a compromise. Decisions were postponed, and so 31 December 2012 became an important deadline. A whole series of tax cuts and other temporary support measures from the past would then lapse. In total these involved a sum of 550 billion USD. Extending all the measures again was not feasible in budgetary terms, while allowing them all to expire was economic suicide. The fiscal cliff was averted on 1 January 2013 by means of an agreement in Congress: half the stimulus measures were made permanent or were extended for a further twelve months, while the other half lapsed. This has not been the only measure involving tightening of budgetary policy in 2013: on 1 March, automatic spending cuts came into effect under which Federal expenditure will be pruned by 85 billion USD each year for a period of ten years. Since no budget has been approved in the current financial year, the federal administrations have only been assigned budgets equal to the expenditure in the previous financial year. That too is automatically leading to more frugal management. New record for corporate earnings The recovery in corporate earnings as from Q4 2009 was just as impressive as the decline in earnings during the recession. So although the economic recovery in the West may be modest, the same has certainly not been true of corporate earnings. After going from negative to positive in the last quarter of 2009, earnings per share of the S&P 500 companies as a whole rose by an average 48% in 2010, by 14% in 2011 and by 4.8% in 2012. The lacklustre economic situation in the West was not an obstacle to a strong increase in turnover. The emerging economies, which are booming, are becoming an increasingly significant market outlet for Western companies. However, the improved earnings were due more to a sharp reduction in (wage) cost pressure than to increased turnover, at least until the first quarter of 2012. Expensive commodities: more than a gauge of the economic recovery The Arab Spring and the conflict in Libya pushed up the price of Brent crude to 126 USD per barrel at the end of April 2011. In the past two years, the supply and demand situation (weak global demand and high stocks, increasing supply) has depressed oil prices, but this was offset by increased geopolitical tension (embargo on Iranian oil exports). At the end of June 2013 the price of a barrel of crude oil was 102.60 USD. The steep price rises on most other commodity markets had already come to an end. The prices of many industrial metals and agricultural products peaked around mid-February
2011. This was followed by a correction of 20–30%. This too could be interpreted as a sign of increasing doubts about the economy. Inflation cooled as a result. In the US the annual increase in the consumer price index fell from a peak of 3.9% in September 2011 to 1.6% in May 2013. Inflation in the EMU dipped from 3% to 1.4% in the same period. A policy of (almost) free money and other unconventional measures The US central bank (the Fed) had already cut its key rate very early on in the crisis. Since December 2008 the rate has been a symbolic 0.25%. The ECB waited much longer before cutting rates. When Mario Draghi took the helm at the ECB on 1 November 2011, the die was cast in favour of monetary easing. The ECB’s key rate is 0.50% at present. This interest rate policy failed to place the economic recovery on a sustainable basis. The Fed therefore explored the scope for other measures, intervening directly on the bond markets and buying up large amounts of debt paper in an attempt to keep the long-term rate low, as well. The ECB dragged its feet, and only followed the Fed’s example much later. The intensification of the euro crisis in fact left the ECB no other choice. Bond markets volatile Increasing doubts about the economy and the ongoing euro crisis have pushed US and German bond rates down since March 2011. This trend continued in 2012 and well into spring 2013 too. On 1 June 2012, US and German ten-year rates hit lows of 1.45% and 1.15% respectively. Ten-year rates continued to move around these low levels (lower than inflation) for almost an entire year. Yields on government bonds then shot up in June, after Fed Chairman Ben Bernanke floated the idea at the end of May of beginning to scale down quantitative easing. At the end of the period under review, ten-year yields stood at 2.48% in the US and 1.78% in Germany. Bond portfolios were restructured en masse. Debt paper issued by under-fire European governments was dumped, in spite of the international guarantees, and replaced by German paper. In the course of 2012 Spanish government bonds were the most targeted. The Belgian-German rate spread also suffered from the tensions in the euro area at times. The days when Belgium could borrow money at the same terms as Germany are long gone. The Belgian-German rate spread, which peaked on 25 November 2011 at 365 basis points, fell by more than the euro area average during the period under review. On 30 June, bond investors were satisfied with a premium of 90 basis points for their ‘Belgium risk’. The health of the European banks is closely linked to the euro crisis. Pessimism about the intractability of the euro problems and optimism about an ultimate and radical breakthrough produced alternating waves of panic and relief concerning the solvency of European banks. This was in turn reflected in highly erratic movements in the rates at which banks were able to obtain funding in the bond market. Similarly the interest-rate premiums for non-financial debtors suffered from the credit risk fears. The fact that these companies could in most cases boast cast-iron balance sheets was not always taken into account. In brief, even though credit spreads have narrowed substantially in recent months, they are still on the high side. Every reserve currency has its problems In a year marked by problems in keeping the EMU from imploding, the EUR/USD exchange rate was no more volatile than at other times. The euro was trading at USD 1.30 at the end of June 2013, which is roughly the same rate as 2012 year-end. Of course the US dollar also has its problems. The dollar’s image as the global reserve currency suffered as a result of QE2, QE3 and TWIST, acronyms for the purely monetary financing of budget deficits that were increasing to irresponsible levels. The rise of the yen – a notable feature in recent years – was finally halted. The Japanese government’s policy of talking down the currency bore fruit. At the end of June 2013 the yen was already 12.5% lower against the USD than at 2012 year-end, when the Abe
government came to power – a state of affairs regarded by other Asian countries as a looming currency war. The Australian dollar (-10.8%), Norwegian krone (-6.3%), Polish zloty (-5.6%), sterling (-5.1%) and Canadian dollar (-4.3%) all fell substantially against the euro in 2013. Consolidation of the stock-market rally The initial phase of the economic recovery went hand in hand with a fine stock-market rally, leaving the S&P 500 75% higher at the end of April 2010 than its low point on 9 March 2009. Since then, the equity markets have struggled to find fresh impetus. The euro crisis and fear that the European banking sector would collapse naturally continued to cast a dark cloud over the market. On top of this, the stock markets were affected by vacillating sentiment about the economic situation. This was also true in recent months. In the first three months of 2012 the markets were buoyed up by relative economic optimism. In April/May 2012 the markets ran out of steam but from early June 2012 there was a further fine rally that disregarded the deteriorating economic signals. Jitters were sparked at the end of the reporting period by comments from the Fed Chairman (signalling the imminent end of quantitative easing?) and concerns about China (local authority debt problems). Overall, the MSCI All Countries (the broadest global index) was up 7.9% in euro terms on 30 June 2013 compared to year-end 2012. Among the traditional markets, Western Europe (MSCI Europe return index over the same period: +4.1%) was unable to continue the catch-up process begun in 2012. Fear that the EMU’s problems entailed a systemic risk nevertheless faded from the market. Europe’s cheaper valuation (compared to the US) was unable to offer any support either. European corporate earnings fell well short of expectations since the first quarter of 2012. They have displayed a downward trend, in sharp contrast with developments in other regions. Wall Street ended June substantially higher than 2012 year-end (S&P 500: +12.6%, Dow Jones: +13.8%). The BEL 20 (+2.0%) performed more or less in line with the other European markets. Delhaize made a strong comeback, after the supermarket chain’s share had suffered badly in 2011 and 2012 from problems with its US operations. The bank stocks KBC and Delta Lloyd also recorded fine performances. Belgacom, Unicore and the biotech firm Thrombogenics, which had triumphantly joined the BEL 20 in 2012, were the biggest disappointments. The Brussels stock exchange welcomed Bpost in June. Japan was ultimately an outperformer (+10.0% in euros), despite the steep depreciation of the yen. The winds of change have been blowing through Tokyo since the advent of the Abe government in December. The prospect of fresh tax stimuli, a cheaper yen and large-scale money creation have contributed to an atmosphere of optimism about the economy, something very rare in this country, which has been struggling with defeatism for many years. The emerging regions performed downright badly. The Asian emerging markets (-4.3%) were unable to capitalise on their role as the growth engine of the world economy. Confidence indicators began to decline in mid-2012, breaking through barriers that pointed to a serious economic slowdown. That failed to materialise but it was sufficient to perpetuate the doubts concerning the growth narrative in the region. This was further exacerbated by concerns about Chinese local authority debt levels, an overheating Chinese housing market and fear of a credit crisis – especially when the Chinese interbank rate shot up to 30% within the space of a few days in June. Stock-market valuations remain favourable, especially given the high growth forecasts, sound macroeconomic balance and a banking sector that was barely – if at all – affected by the credit crisis. Latin America (-13.4%) was hit by an economic slowdown. The link to the commodity markets is always at the fore in this region. Eastern Europe (-10.5%) was also a disappointment. Russia was likewise not immune to the weakness of European economic growth. Oil prices below 100 USD per barrel mean trouble for Russian state finances. The Turkish stock market suffered from street protests against increasing Islamisation.

There were significant differences in the returns of the various sectors. The best performing sectors included Financials, Pharmaceuticals and Consumer Discretionary. Materials, Technology and Energy lagged behind. The outperformance of Banks may be attributed to the quantitative easing programmes undertaken by the central banks. By this we mean the Fed’s QE3 programme, and especially the announcement by the ECB of its OMT programme, which took the heat out of the euro crisis. Pharmaceuticals had been shunned for a long time due to a lack of product innovation, patent expiry and the reforms to healthcare insurance in the US. In recent months, however, investors began to focus more on the sector’s response to these challenges: restructuring operations and the sell-off of non-strategic divisions. The car industry has risen from the ashes, in the US and the European luxury segment at least. Demand from the emerging markets is also strong, despite the slowdown in Chinese growth, where German luxury marques generate 50% of their profits. In spite of the slow growth, advertising budgets have also held up surprisingly well. The rise of the e-book and ongoing breakthrough of digital television continue undiminished. More and more media companies are successfully exploiting these trends. Mining companies lost ground on excessive expectations concerning commodity prices. A failed stock market flotation by Facebook and the giant leaps made by Apple meant that price trends in the Technology sector differed from what might have been expected on the basis of the fundamentals. The oil companies suffered from the vagaries of the oil market, the political instability in the Middle East and frequent accidents. The Real Estate sector (+3.0%) eased up a little in 2013 compared to its strong performance in 2012. The financial turbulence in 2007–08 forced real estate companies to clean up their balance sheets. This accordingly provided the sector with a sound base to make the most of the recovery. The traditional discount against the intrinsic value at which the sector normally trades consequently disappeared, leaving the sector somewhat overvalued. Outlook The US and European barometers measuring confidence among business leaders peaked in spring 2011 at record levels, but have slipped heavily over the past two years. In the US they are in the twilight zone between recession and expansion. We are expecting US growth to remain positive but modest (around 2% y-o-y in the coming quarters) as pay increases are barely keeping pace with inflation and budgetary policy has now finally (and probably for many years) struck down the path of austerity. The fragile recovery of the housing market and corporate investment could be sustained. How strong the growth proves to be will depend largely on the dynamic of the labour market. In recent months employment in the US has grown by around 200 000 new jobs each month. This will need to continue in order to achieve +2% growth in 2013 and in 2014. Confidence indicators in Europe are well below freezing point. The budgetary plans, tighter lending policy of the banks and major uncertainty among consumers and producers will continue to depress growth. 2013 will see a contraction of GDP in Europe. Recovery is not expected until the first half of 2014. Deflation or depression scenarios, which are currently dominating bond market sentiment, are not however justified. The foundations for more sustainable growth in 2014 and beyond have been laid in recent years. US households have trimmed back their debt level significantly, the savings rate has already increased considerably and loan servicing (instalments and interest payments combined) now accounts for only 8% of household budgets (the lowest level in 15 years – it was still 14% three years ago). Households are gradually moving towards a position where they can spend more of their money on consumption. The explosive growth in earnings between 2009 and 2012 bolstered companies’ already substantial cash positions. During the crisis investments were scaled back heavily, with the foundations being laid for a catch-up process. In the US, Republicans and Democrats may have totally different views about the required budgetary policy, but a common thread throughout the negotiations in recent months has
been that the federal finances need to be reformed step by step and that a tighter budgetary policy than in the recent past will need to be implemented in the years ahead. Tighter also than the average budgetary policy in the EMU. This is being counterbalanced by extremely accommodating monetary policy. The Fed is making unprecedented cash injections with its programme for purchasing government bonds and other debt paper. In doing so, the Fed wants to prevent the banks from being preoccupied with their own solvency and hence imposing unduly strict lending conditions, which would undermine economic growth. These cash injections will either find their way into the real economy or generate inflationary expectations. In any case they will keep long rates low and banish any fears of deflation. Economic growth in Europe will remain below par. Sky-high unemployment and the euro crisis are undermining consumer confidence and the banks’ willingness to provide ready access to credit. The ECB’s monetary policy is also much less aggressive than the Fed’s. In contrast, real wage rises (however limited) will be somewhat higher in Europe than in the US. Today’s world is one of two-speed economies. The mature industrialised economies (US, Europe, Japan) still find themselves in a low-growth environment, with no underlying inflationary pressure, persistently low interest rates and runaway public finances. The picture in the emerging markets is altogether different. The strong economic growth has already created inflationary pressure in Asia. Appropriate monetary policy is therefore required: sometimes restrictive (as in 2011) and at other times stimulatory (as at present). Monetary policy in China and elsewhere in Asia is highly geared to preventing asset-price inflation. Countries are not only deploying the interest-rate weapon to this end, they are also actively intervening in the credit and housing markets. One of the major challenges for this decade will be the further development of consumption in China and the rest of Asia. That could help bring about a more balanced economic world order: it will not only reduce the region’s dependence on exports but, at least as importantly, will have an effect on international capital flows. More consumption in China will mean lower savings and higher imports, including from the US and Europe. That will help the West to ‘grow out’ of its debt problems. Time is of the essence for the euro area. Everyone knows that the EMU is not a perfect monetary union. In its twelve-year history, little has been done to improve its internal operation. National autonomy was sacrosanct. The crisis brought the realisation that ‘economic governance’, as it is now called in Eurospeak, needs to be tackled as a matter of urgency. In concrete terms, this involves measures such as supranational supervision of banks (to be in place by the beginning of 2015), strict monitoring and sanctioning of budgetary policy (a huge challenge given the emergence of austerity fatigue), monitoring of pay policy and harmonising European taxation (a big taboo). The capital base of banks will need to be strengthened further to ensure the stability of the financial system, so that there is a sufficient buffer to offset reserves and unforeseen write-downs. This will remain high on the agenda in the current and following years. A great many measures have already been taken in this context. Examples include the almost 2 000 billion euros that were set aside in the space of two years to ensure the smooth funding of European governments; the introduction of stress tests to establish whether the banks have sufficient capital to cope with a new and serious crisis; the gradual introduction of new and stricter capital requirements under Basel III; and making ESM reserves available for direct loans to ailing European banks. Maintaining a (virtually) zero money market rate also fits with this. There is no urgent macroeconomic reason to adopt a more restrictive policy so long as the economic situation in the West remains weak and there is no sign of any real inflationary pressure. The central banks are conducting a policy of low interest rates and have totally given up their resistance to quantitative easing measures. They are intervening directly on the capital markets on a large scale. By buying bonds and other debt instruments, they are
having a direct influence on the bond yield in certain market segments, ensuring secondary trading (for instance, in paper issued by governments in which the market could lose confidence) and flooding the financial system with cash. The ECB, too, is now firmly set on this path. Concern about inflation has given way to worries about the economic situation and stemming the euro crisis. The ECB is probably still striving for a normal short rate of 3% for the euro area (its official target for inflation in the euro area is 2%), but that has now become a very long-term objective and is totally ruled out in the short term. The ECB is more likely to cut than raise the key rate in the coming months, inasmuch as this is still feasible. The first rate hike is not expected until the second half of 2014 at the soonest. In our opinion, the central banks in the US, the UK and Japan will wait even longer before raising their key rates. The US Federal Reserve has already officially postponed the earliest date for a rate hike to mid-2015. The official stance is that the key rate will not be increased so long as unemployment (currently 7.6% of the working population) remains above 6.5%. Bond yields may well have bottomed out, at least as regards issues of German Bunds or US Treasuries. It would be logical for yields to increase again from the current record lows, on the back of an improved economic environment (or an ongoing reduction in the downside risks to growth). As a result, the market might, in the coming months, start to anticipate tighter monetary policy in 2014 or 2015. A number of unconventional measures will first be withdrawn in the US; only after that can the market begin to anticipate a normalisation of the key rate. This rate increase need not, however, be very big. The measures taken by the central banks are also keeping the short end of the yield curve artificially low. If necessary, they will not hesitate to intervene actively in market segments where yields threaten to head too rapidly in the wrong direction. The default risk premium in the corporate bond market has fallen very steeply in recent years. It remains relatively high, both by historical standards and considering that most companies have a healthy financial structure and only limited funding requirements. There is therefore still some potential for a narrowing of spreads. Rate spreads in the euro area will probably remain volatile for a long time yet due to the many problems that have yet to be solved. Thanks to the continuing strength of the emerging markets, the global economy could post growth of 2.5–3% in 2013 and 2014. This is one of the reasons why corporate earnings could continue to grow in the coming quarters at a rate of 5–10%. It seems paradoxical that companies have emerged as the winners from the 2008–09 crisis. They are now reaping the benefits of the considerable restructuring measures pushed through during the recession. Cost controls go beyond (one-off and in some cases spectacular) restructuring measures and have now become an integral part of business culture. The recession of 2008–09 caused companies to be even more aware of risks (i.e. money, and hence costs). Investment projects are subject to a more thorough profitability study. A combination of debt reduction and low interest rates has resulted in a steep drop in financial charges. Globalisation (pressure of relocation) and ongoing high unemployment have made employees powerless to demand high pay increases. Maintaining purchasing power is now about all that is on offer. There is no question of real wage rises. In brief, every one-cent increase in revenue translates (almost) entirely into an extra cent of profit, rather than into higher pay. Money market rates will not increase rapidly and bond yields are close to their historical lows. Everything seems to point to shares being the most attractive investment option for the months ahead. The lack of alternatives is not, of course, sufficient reason to increase the market valuation. For that to happen, investors will need to be more predisposed to taking risk. The current valuation of equities continues to discount a number of very pessimistic scenarios. Based on forecast earnings for the coming 12 months, the price-earnings ratio is 14.5 for the US S&P 500 index and 11.4 for the MSCI Europe. That is 25–30% lower than the historical average. Equities are certainly dirt-cheap compared with bonds. The earnings yield – the inverse of the price/earnings ratio – is currently 8.8% for

the MSCI Europe, an unprecedented premium of 700 basis points above German bond yields. Edited to 4 July 2013
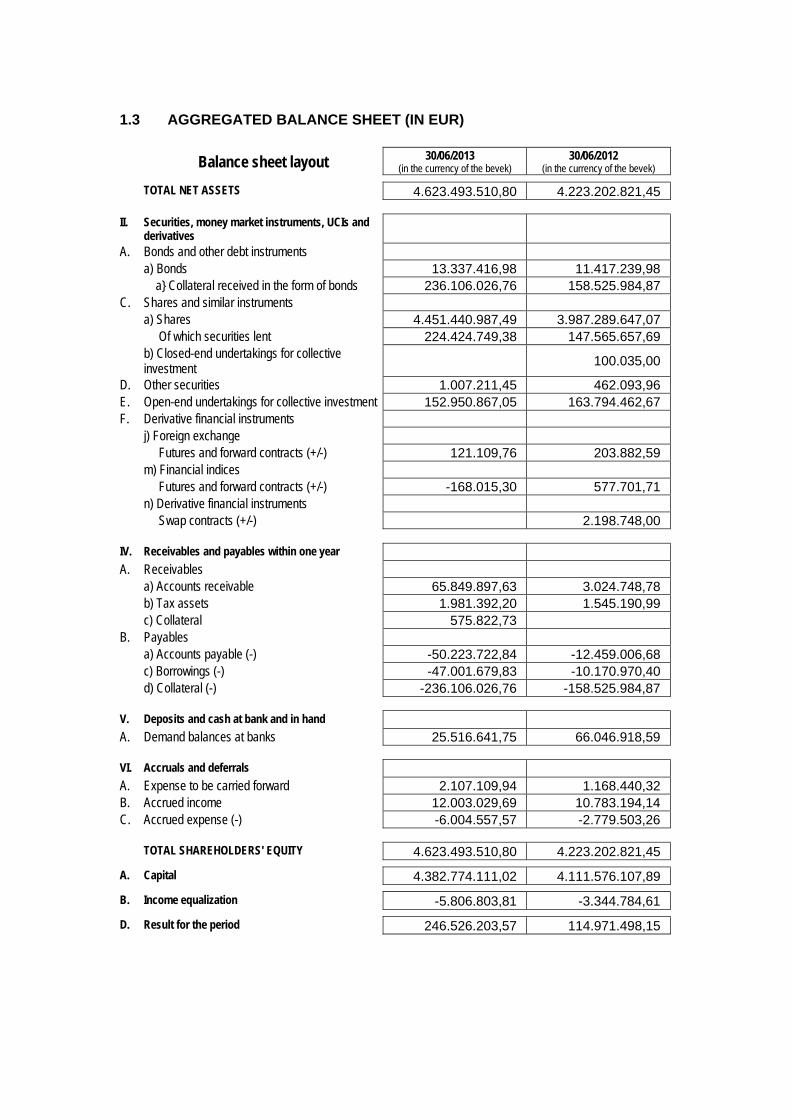
1.3 AGGREGATED BALANCE SHEET (IN EUR)
Balance sheet layout 30/06/2013 (in the currency of the bevek)
30/06/2012 (in the currency of the bevek)
TOTAL NET ASSETS 4.623.493.510,80 4.223.202.821,45
II. Securities, money market instruments, UCIs and derivatives
A. Bonds and other debt instruments a) Bonds 13.337.416,98 11.417.239,98 a} Collateral received in the form of bonds 236.106.026,76 158.525.984,87 C. Shares and similar instruments a) Shares 4.451.440.987,49 3.987.289.647,07 Of which securities lent 224.424.749,38 147.565.657,69 b) Closed-end undertakings for collective
investment 100.035,00
D. Other securities 1.007.211,45 462.093,96 E. Open-end undertakings for collective investment 152.950.867,05 163.794.462,67 F. Derivative financial instruments j) Foreign exchange Futures and forward contracts (+/-) 121.109,76 203.882,59 m) Financial indices Futures and forward contracts (+/-) -168.015,30 577.701,71 n) Derivative financial instruments Swap contracts (+/-) 2.198.748,00
IV. Receivables and payables within one year A. Receivables a) Accounts receivable 65.849.897,63 3.024.748,78 b) Tax assets 1.981.392,20 1.545.190,99 c) Collateral 575.822,73 B. Payables a) Accounts payable (-) -50.223.722,84 -12.459.006,68 c) Borrowings (-) -47.001.679,83 -10.170.970,40 d) Collateral (-) -236.106.026,76 -158.525.984,87
V. Deposits and cash at bank and in hand A. Demand balances at banks 25.516.641,75 66.046.918,59
VI. Accruals and deferrals A. Expense to be carried forward 2.107.109,94 1.168.440,32 B. Accrued income 12.003.029,69 10.783.194,14 C. Accrued expense (-) -6.004.557,57 -2.779.503,26
TOTAL SHAREHOLDERS' EQUITY 4.623.493.510,80 4.223.202.821,45
A. Capital 4.382.774.111,02 4.111.576.107,89
B. Income equalization -5.806.803,81 -3.344.784,61
D. Result for the period 246.526.203,57 114.971.498,15
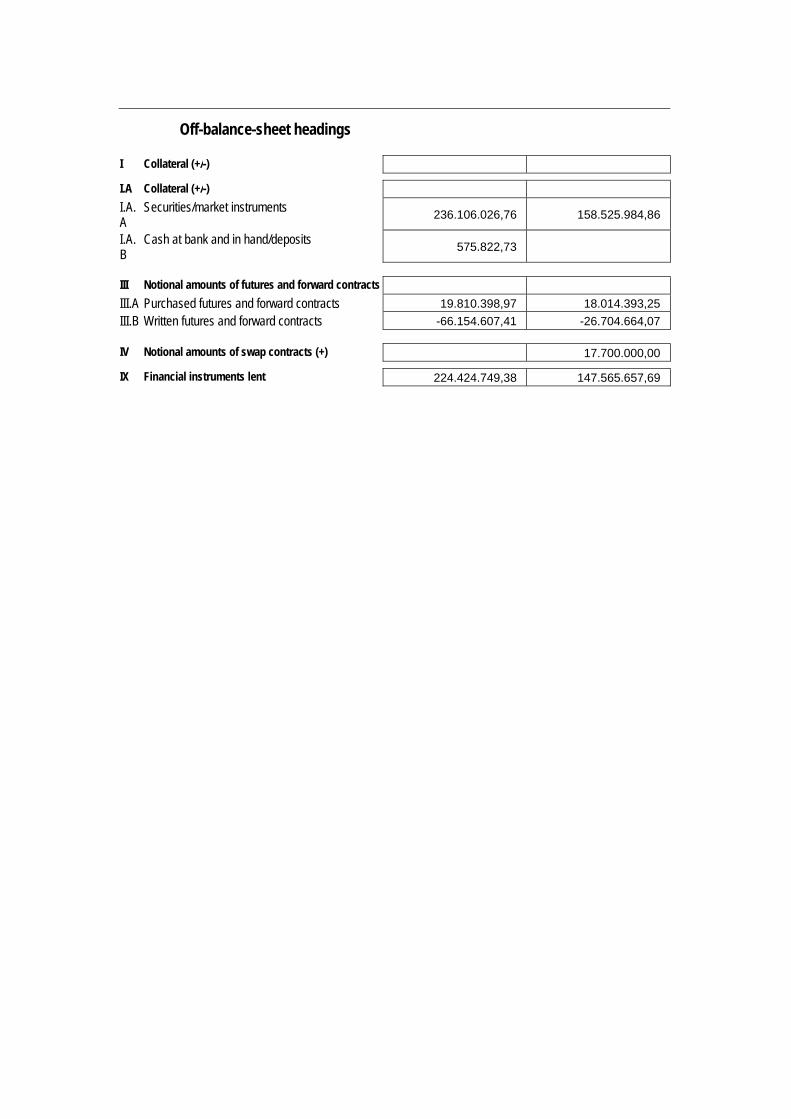
Off-balance-sheet headings
I Collateral (+/-)
I.A Collateral (+/-)
I.A.A
Securities/market instruments 236.106.026,76 158.525.984,86
I.A.B
Cash at bank and in hand/deposits 575.822,73
III Notional amounts of futures and forward contracts
III.A Purchased futures and forward contracts 19.810.398,97 18.014.393,25
III.B Written futures and forward contracts -66.154.607,41 -26.704.664,07
IV Notional amounts of swap contracts (+) 17.700.000,00
IX Financial instruments lent 224.424.749,38 147.565.657,69
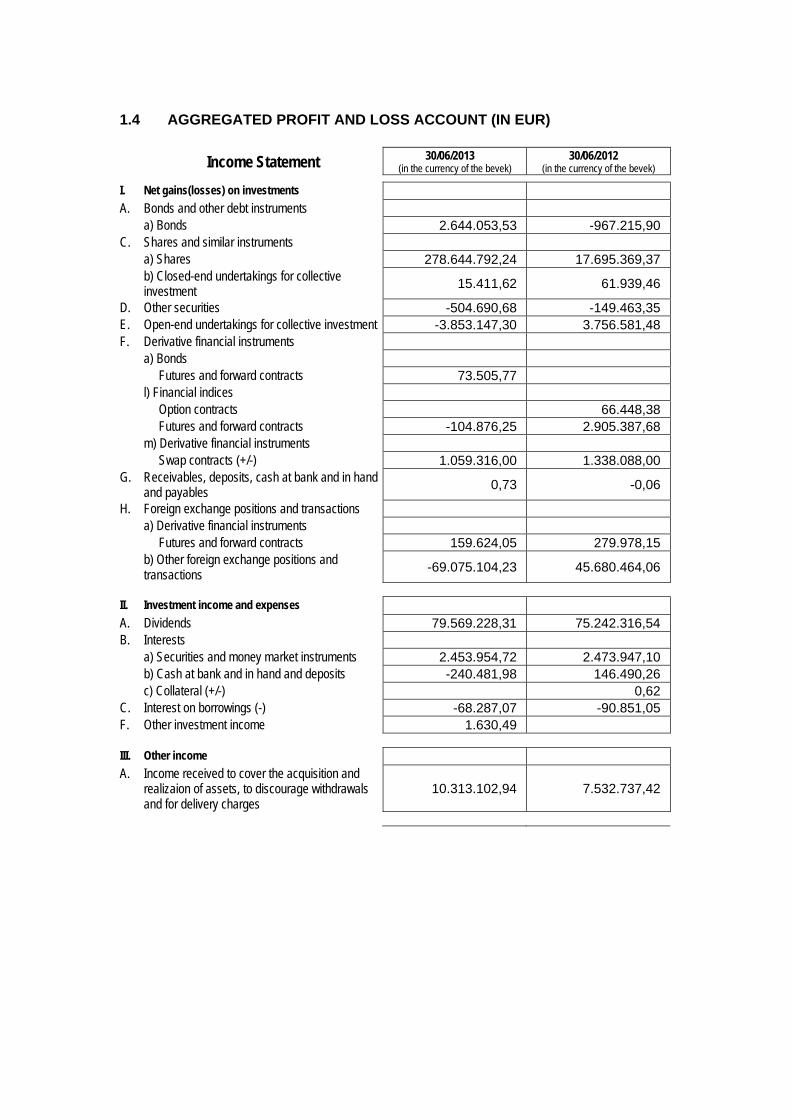
1.4 AGGREGATED PROFIT AND LOSS ACCOUNT (IN EUR)
Income Statement 30/06/2013 (in the currency of the bevek)
30/06/2012 (in the currency of the bevek)
I. Net gains(losses) on investments A. Bonds and other debt instruments a) Bonds 2.644.053,53 -967.215,90 C. Shares and similar instruments a) Shares 278.644.792,24 17.695.369,37 b) Closed-end undertakings for collective
investment 15.411,62 61.939,46
D. Other securities -504.690,68 -149.463,35 E. Open-end undertakings for collective investment -3.853.147,30 3.756.581,48 F. Derivative financial instruments a) Bonds Futures and forward contracts 73.505,77 l) Financial indices Option contracts 66.448,38 Futures and forward contracts -104.876,25 2.905.387,68 m) Derivative financial instruments Swap contracts (+/-) 1.059.316,00 1.338.088,00 G. Receivables, deposits, cash at bank and in hand
and payables 0,73 -0,06
H. Foreign exchange positions and transactions a) Derivative financial instruments Futures and forward contracts 159.624,05 279.978,15 b) Other foreign exchange positions and
transactions -69.075.104,23 45.680.464,06
II. Investment income and expenses A. Dividends 79.569.228,31 75.242.316,54 B. Interests a) Securities and money market instruments 2.453.954,72 2.473.947,10 b) Cash at bank and in hand and deposits -240.481,98 146.490,26 c) Collateral (+/-) 0,62 C. Interest on borrowings (-) -68.287,07 -90.851,05 F. Other investment income 1.630,49
III. Other income A. Income received to cover the acquisition and
realizaion of assets, to discourage withdrawals and for delivery charges
10.313.102,94 7.532.737,42

IV. Operating expenses A. Investment transaction and delivery costs (-) -8.384.559,63 -7.841.333,86 B. Financial expenses (-) -72.952,92 -29.528,62 C. Custodian's fee (-) -1.691.861,96 -1.128.783,80 D. Manager's fee (-) a) Financial management -38.719.696,50 -27.325.123,67 b) Administration and accounting management -2.647.623,05 -2.060.056,23 E. Administrative expenses (-) -10.312,24 -10.177,76 F. Formation and organisation expenses (-) -128.768,80 -252.797,48 G. Remuneration, social security charges and
pension -869,01 -346,71
H. Services and sundry goods (-) -656.438,39 -416.924,35 J. Taxes -724.468,76 -518.766,08 K. Other expenses (-) -1.524.277,97 -1.416.881,46
Income and expenditure for the period Subtotal II + III + IV 37.467.318,11 44.303.920,90
V. Profit (loss) on ordinary activities before tax 246.526.203,57 114.971.498,15
VII. Result for the period 246.526.203,57 114.971.498,15
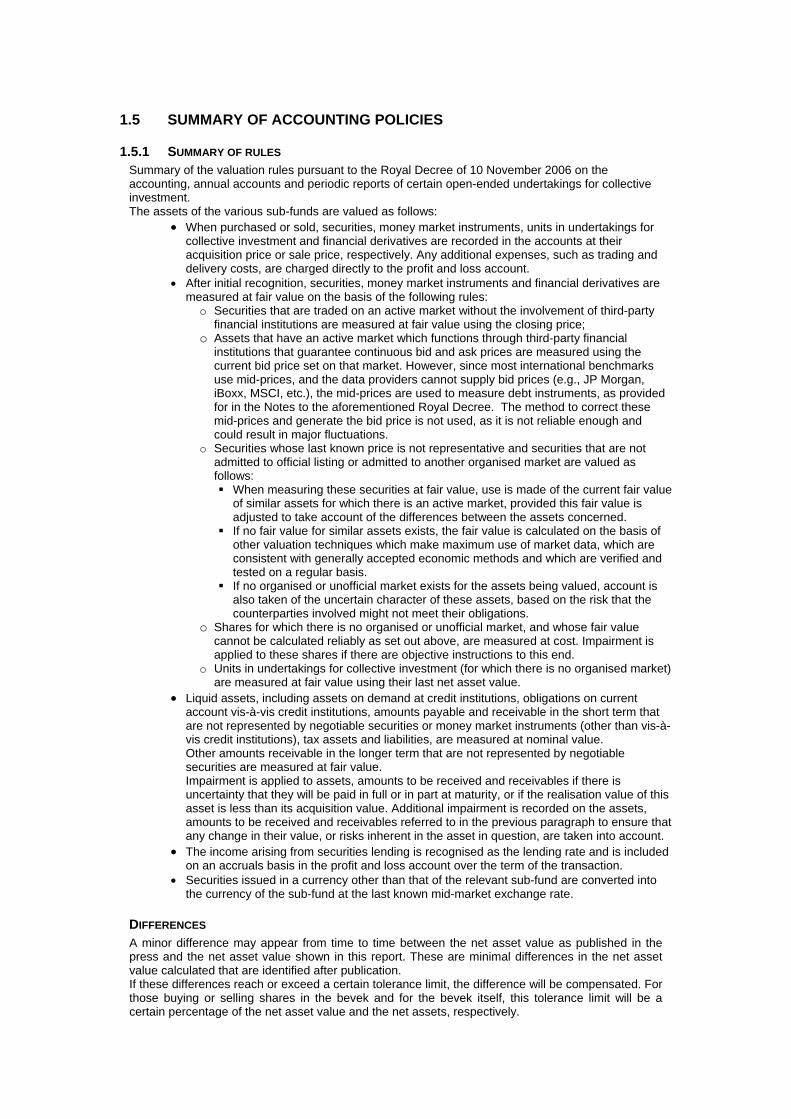
1.5 SUMMARY OF ACCOUNTING POLICIES
1.5.1 SUMMARY OF RULES Summary of the valuation rules pursuant to the Royal Decree of 10 November 2006 on the accounting, annual accounts and periodic reports of certain open-ended undertakings for collective investment. The assets of the various sub-funds are valued as follows:
When purchased or sold, securities, money market instruments, units in undertakings for collective investment and financial derivatives are recorded in the accounts at their acquisition price or sale price, respectively. Any additional expenses, such as trading and delivery costs, are charged directly to the profit and loss account.
After initial recognition, securities, money market instruments and financial derivatives are measured at fair value on the basis of the following rules:
o Securities that are traded on an active market without the involvement of third-party financial institutions are measured at fair value using the closing price;
o Assets that have an active market which functions through third-party financial institutions that guarantee continuous bid and ask prices are measured using the current bid price set on that market. However, since most international benchmarks use mid-prices, and the data providers cannot supply bid prices (e.g., JP Morgan, iBoxx, MSCI, etc.), the mid-prices are used to measure debt instruments, as provided for in the Notes to the aforementioned Royal Decree. The method to correct these mid-prices and generate the bid price is not used, as it is not reliable enough and could result in major fluctuations.
o Securities whose last known price is not representative and securities that are not admitted to official listing or admitted to another organised market are valued as follows: When measuring these securities at fair value, use is made of the current fair value
of similar assets for which there is an active market, provided this fair value is adjusted to take account of the differences between the assets concerned.
If no fair value for similar assets exists, the fair value is calculated on the basis of other valuation techniques which make maximum use of market data, which are consistent with generally accepted economic methods and which are verified and tested on a regular basis.
If no organised or unofficial market exists for the assets being valued, account is also taken of the uncertain character of these assets, based on the risk that the counterparties involved might not meet their obligations.
o Shares for which there is no organised or unofficial market, and whose fair value cannot be calculated reliably as set out above, are measured at cost. Impairment is applied to these shares if there are objective instructions to this end.
o Units in undertakings for collective investment (for which there is no organised market) are measured at fair value using their last net asset value.
Liquid assets, including assets on demand at credit institutions, obligations on current account vis-à-vis credit institutions, amounts payable and receivable in the short term that are not represented by negotiable securities or money market instruments (other than vis-à-vis credit institutions), tax assets and liabilities, are measured at nominal value. Other amounts receivable in the longer term that are not represented by negotiable securities are measured at fair value. Impairment is applied to assets, amounts to be received and receivables if there is uncertainty that they will be paid in full or in part at maturity, or if the realisation value of this asset is less than its acquisition value. Additional impairment is recorded on the assets, amounts to be received and receivables referred to in the previous paragraph to ensure that any change in their value, or risks inherent in the asset in question, are taken into account.
The income arising from securities lending is recognised as the lending rate and is included on an accruals basis in the profit and loss account over the term of the transaction.
Securities issued in a currency other than that of the relevant sub-fund are converted into the currency of the sub-fund at the last known mid-market exchange rate.
DIFFERENCES A minor difference may appear from time to time between the net asset value as published in the press and the net asset value shown in this report. These are minimal differences in the net asset value calculated that are identified after publication. If these differences reach or exceed a certain tolerance limit, the difference will be compensated. For those buying or selling shares in the bevek and for the bevek itself, this tolerance limit will be a certain percentage of the net asset value and the net assets, respectively.

This tolerance limit is: o money market funds: 0.25% o bond funds, balanced funds and funds offering capital guarantee: 0.50% o equity funds: 1% o other funds (real estate funds, etc.): 0.50%
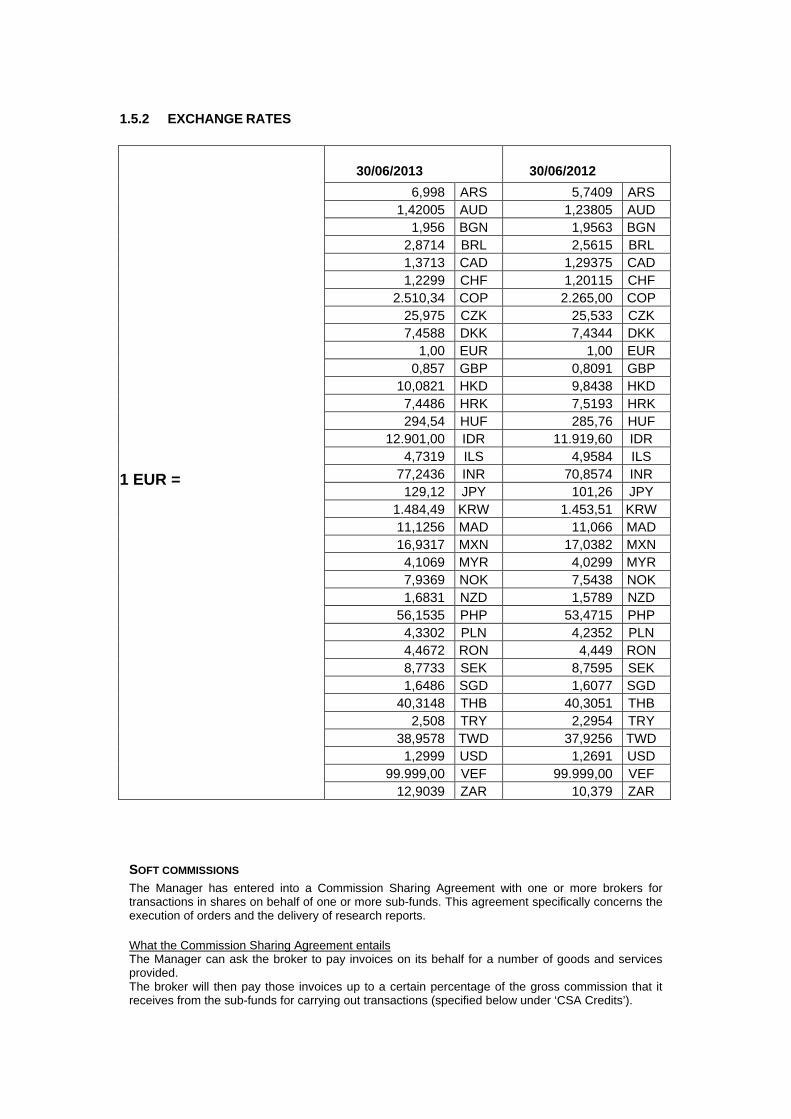
1.5.2 EXCHANGE RATES
1 EUR =
30/06/2013 30/06/2012
6,998 ARS 5,7409 ARS 1,42005 AUD 1,23805 AUD
1,956 BGN 1,9563 BGN 2,8714 BRL 2,5615 BRL 1,3713 CAD 1,29375 CAD 1,2299 CHF 1,20115 CHF
2.510,34 COP 2.265,00 COP 25,975 CZK 25,533 CZK 7,4588 DKK 7,4344 DKK
1,00 EUR 1,00 EUR 0,857 GBP 0,8091 GBP
10,0821 HKD 9,8438 HKD 7,4486 HRK 7,5193 HRK 294,54 HUF 285,76 HUF
12.901,00 IDR 11.919,60 IDR 4,7319 ILS 4,9584 ILS
77,2436 INR 70,8574 INR 129,12 JPY 101,26 JPY
1.484,49 KRW 1.453,51 KRW 11,1256 MAD 11,066 MAD 16,9317 MXN 17,0382 MXN 4,1069 MYR 4,0299 MYR 7,9369 NOK 7,5438 NOK 1,6831 NZD 1,5789 NZD
56,1535 PHP 53,4715 PHP 4,3302 PLN 4,2352 PLN 4,4672 RON 4,449 RON 8,7733 SEK 8,7595 SEK 1,6486 SGD 1,6077 SGD
40,3148 THB 40,3051 THB 2,508 TRY 2,2954 TRY
38,9578 TWD 37,9256 TWD 1,2999 USD 1,2691 USD
99.999,00 VEF 99.999,00 VEF 12,9039 ZAR 10,379 ZAR
SOFT COMMISSIONS The Manager has entered into a Commission Sharing Agreement with one or more brokers for transactions in shares on behalf of one or more sub-funds. This agreement specifically concerns the execution of orders and the delivery of research reports. What the Commission Sharing Agreement entails The Manager can ask the broker to pay invoices on its behalf for a number of goods and services provided. The broker will then pay those invoices up to a certain percentage of the gross commission that it receives from the sub-funds for carrying out transactions (specified below under ‘CSA Credits’).

N.B.: Only goods and services that assist the manager in managing the sub-funds in the interest of the bevek can be covered by a Commission Sharing Agreement. Goods and services eligible for a Commission Sharing Agreement: Research and advisory services Portfolio valuation and analysis Performance measurement Market price services Computer hardware associated with specialised computer software or research services Dedicated telephone lines Seminar fees, where the subject matter is of relevance to the provision of investment services Publications, where the subject matter is of relevance to the provision of investment services.
Broker
Commission gross
in EUR
paid during the period:
1‐01‐13
‐
30‐06‐13
CSA Credits
in EUR
accrued during the period:
1‐01‐13
‐
30‐06‐13 Percentage
CITI 902,292 542,386 60.11%
CSFBSAS 584,184 312,984 53.58%
DEUTSCHE 263,068 129,559 49.25%
EQ MACQUARIE 444,982 239,300 53.78%
HSBC 69,789 19,201 27.51%
INSTINET 794,607 430,206 54.14%
JP MORGAN 4,457 2,228 50.00%
MERRILL 489,711 280,379 57.25%
MORGAN STANLEY 345,585 167,695 48.52%
SOCGEN 15,299 6,035 39.44%
UBSWDR 395,519 198,950 50.30%
WOOD 11,064 1,855 16.76%

Semi-Annual report as at 30th June 2013
TABLE OF CONTENTS
2. Information on KBC Equity Fund CSOB Akciovy Fond Dividendovych Firem
2.1. Management report 2.1.1. Launch date and subscription price 2.1.2. Stock exchange listing 2.1.3. Aim and distinctive features of the investment policy 2.1.4. Financial portfolio management 2.1.5. Distributors 2.1.6. Index and benchmark 2.1.7. Policy conducted during the financial year 2.1.8. Future policy 2.1.9. Synthetic risk and reward indicator (SRRI)
2.2. Balance sheet
2.3. Profit and loss account
2.4. Composition of the assets and key figures
2.4.1. Composition of the assets 2.4.2. Change in the composition of the assets 2.4.3. Value of commitments in respect of financial derivatives positions 2.4.4. Evolution of the number of subscriptions, repayments and the net asset value 2.4.5. Return figures 2.4.6. Expenses 2.4.7. Notes to the financial statements and other data

2 INFORMATION ON KBC EQUITY FUND CSOB AKCIOVY FOND DIVIDENDOVYCH FIREM
2.1 MANAGEMENT REPORT
2.1.1 LAUNCH DATE AND SUBSCRIPTION PRICE Launch date: 28 September 2012 Initial subscription price: 1000 CZK Currency: CZK
2.1.2 STOCK EXCHANGE LISTING Not applicable.
2.1.3 GOAL AND KEY PRINCIPLES OF THE INVESTMENT POLICY
SUB-FUND’S OBJECT: The main objective of this sub-fund is to generate the highest possible return for its shareholders by investing directly or indirectly in transferable securities. This is reflected in its pursuit of capital gains and income. To this end, the assets are invested, either directly or indirectly via correlated financial instruments, primarily in shares.
SUB-FUND’S INVESTMENT POLICY:
PERMITTED ASSET CLASSES: The sub-fund may invest in securities, money market instruments, units in undertakings for collective investment, deposits, financial derivatives, liquid assets and all other instruments insofar as permitted by the applicable laws and regulations and consistent with the sub-fund’s object The sub-fund shall invest no more than 10% of its assets in units of other undertakings for collective investment.
RESTRICTIONS OF THE INVESTMENT POLICY: The investment policy will be implemented within the limits set by law and regulations. The sub-fund may borrow up to 10% of its net assets, insofar as these are short-term borrowings aimed at solving temporary liquidity problems.
PERMITTED DERIVATIVES TRANSACTIONS: Derivates may be used either for hedging purposes or to achieve investment objectives. Changes will be made to the investments at regular intervals to comply with the sub-fund's investment strategy. In addition, listed and unlisted derivates may be used to achieve the objectives: these may be forward contracts, options or swaps on securities, indices, currencies or interest rates or other transactions involving derivatives. Unlisted derivatives transactions will only be concluded with prime financial institutions specialised in such transactions. Such derivatives may also be used to hedge the assets against exchange-rate fluctuations. Subject to the applicable laws and regulations and the articles of association, the sub-fund always seeks to conclude the most effective transactions. All costs associated with the transactions will be charged to the sub-fund and all income generated will be paid to the sub-fund. If the transactions result in a risk in respect of the counterparty, this risk can be hedged by using a margin management system that ensures that the sub-fund is the beneficiary of security (collateral) in the form of cash or investment grade bonds. When calculating the value of the bonds, a margin will be applied that varies depending on the residual term to maturity and the currency in which the bond in question is denominated. The relationship with the counterparty or counterparties is governed by standard international agreements.
STRATEGY SELECTED
KBC Equity Fund CSOB Akciovy Fond Dividendovych Firem aims to generate a return by investing at least 75% of its assets in shares with a high dividend yield. All regions, sectors and themes may be taken into consideration. The rest of the assets will be invested in bonds, debt instruments, money market instruments and deposits.
LENDING FINANCIAL INSTRUMENTS: The sub-fund may lend financial instruments within the limits set by law and regulations. This lending does not affect the sub-fund’s risk profile since: - it takes place within the framework of a securities lending system managed by a principal. In
addition, the sub-fund has a relationship only with the principal of the securities lending system which acts as counterparty and to which title of the loaned securities is transferred. The choice of principal is subject to strict selection criteria. The return of securities similar to the securities that have been lent is guaranteed by the principal.
- through a margin management system, the sub-fund is always guaranteed financial security, the actual value of which always exceeds the actual value of the securities that have been lent, in case the principal does not return similar securities.
The return of securities similar to the securities that have been lent can be requested at any time, which means that the lending of securities does not affect the management of the sub-fund's assets. By lending securities, the sub-fund can generate an additional return. The principal pays a fee to the management company. After deducting the fee for the margin management and clearing services of KBC Bank, most of this fee is paid to the sub-fund. The relationship with the counterparty or counterparties is governed by standard international agreements. More information is provided on the terms and conditions governing securities lending in the annual or half-yearly report for the sub-fund.
VOLATILITY OF THE NET ASSET VALUE: The volatility of the net asset value may be high due to the composition of the portfolio.
GENERAL STRATEGY FOR HEDGING THE EXCHANGE RATE RISK: In order to protect its assets against exchange rate fluctuations and within the limitations laid down in the articles of association, the sub-fund may perform transactions relating to the sale of forward currency contracts, as well as the sale of call options and the purchase of put options on currencies. The transactions in question may relate solely to contracts traded on a regulated market that operates regularly, is recognised and is open to the public or that are traded with a recognised, prime financial institution specialising in such transactions and dealing in the over-the-counter (OTC) market in options. With the same objective, the sub-fund may also sell currencies forward or exchange them in private transactions with prime financial institutions specialising in such transactions. The hedging objective of the aforementioned transactions suggests that there is a direct link between these transactions and the assets to be hedged, which implies that the transactions carried out in a particular currency may in principle not exceed, in terms of volume, either the valuation value of all the assets in the same currency or the holding period of those assets.
SOCIAL, ETHICAL AND ENVIRONMENTAL ASPECTS:
No manufacturers of controversial weapons whose use over the past five decades, according to the international consensus, has led to disproportionate human suffering among the civilian population will be included in the portfolio of investments. This involves the manufacturers of anti-personnel mines, cluster bombs and munitions and weapons containing depleted uranium. In this way, the sub-fund seeks to reflect not only simple financial reality but also the social reality of the sector or region in question.
THE EUROPEAN SAVINGS DIRECTIVE AND TAX ON DEBT CLAIM RETURNS OBTAINED THROUGH THE
REDEMPTION OF OWN UNITS OR IN THE EVENT OF FULL OR PARTIAL DISTRIBUTION OF EQUITY
CAPITAL. The following information is of a general character and is not intended to cover all aspects of an investment in a UCITS. In certain cases entirely different rules might even apply. Moreover, both tax law and the interpretation of it can change. Investors who wish to have more information about the tax implications – in both Belgium and abroad – of acquiring, holding and transferring units should seek the advice of their usual financial and tax advisers. This UCITS shall invest a maximum of 15% of its assets directly or indirectly in debt instruments as intended by the European Savings Directive. A. European Savings Directive (Directive 2003/48/EC)
The European Savings Directive has been implemented in Belgium. Since this UCITS invests a maximum of 15% of its assets directly or indirectly in debt claims as intended by the European Savings Directive, the income of this UCITS does not fall within the scope of this directive. B. Tax on debt claim returns obtained through the redemption of own units or in the event of full or partial distribution of equity capital (Article 19bis Income Tax Code 1992). The income from this UCITS is not subject to the tax on debt instrument returns as intended by Article 19bis, Income Tax Code 1992.
2.1.4 FINANCIAL PORTFOLIO MANAGEMENT The management company has delegated the intellectual management, to KBC Fund Management Limited, Joshua Dawson House, Dawson Street , Dublin 2, IRELAND..
2.1.5 DISTRIBUTORS KBC Asset Management S.A., 5, Place de la Gare, L-1616 Luxembourg.
2.1.6 INDEX AND BENCHMARK See ‘Sub-fund’s investment policy’.
2.1.7 POLICY PERSUED DURING THE FINANCIAL YEAR The theme of high dividend investing fluctuated in performance during January but ended the month slightly ahead of the broad market. Fading sovereign debt risks in Europe and progress on the US fiscal cliff enabled equity markets to continue the good run they’ve enjoyed since mid 2012. All regions contributed similarly to the overall return with every market in the developed world having positive returns (in local currency). In February the theme performed in line with global markets. Most of the positive market returns were generated in the North American and Pacific Basin regions. European markets were much more muted with the political gridlock in Italy taking market participants by surprise and contributed to an overall “risk-off” mood amongst European investors. The theme of high dividend performed well during the month of March and in most regions other than the Pacific Basin. The financial uncertainty surrounding Cyprus contributed to weaker returns for most European countries and the defensive nature of the theme contributed solidly. Most value styles and especially the theme of high dividend performed well during the month of April. The developed market indices generally rallied in April on increased intervention by the Bank of Japan and speculation of further action by the ECB. In May the global equity index continued with positive gains on stronger than expected macroeconomic data. Rate cuts in Europe, Australia, Korea and Israel also supported market performance. The positively performing equity markets experienced since the start of the year were derailed during the month of June as global markets sank on the back of the hawkish FOMC meeting which increased fears that tapering was on the near horizon. With the slowdown in market returns, the theme of high dividends was generally positive during the month of June and outperformed in all regions except for the Pacific Region where it was a strong detractor from performance.
2.1.8 FUTURE POLICY While the mood in markets changed during June we do not see it as the commencement of a new bear market. Equity markets have been supported by global central banks providing significant liquidity support but also by improving macroeconomic fundamentals. Over time the level of liquidity support provided by central banks was likely to be reduced as the economic recovery became more self sustaining, the Federal Reserve is more confident that such a point has been reached. However self sustaining economic growth will enhance revenue growth and markets are already on the cheap side of good value. In the high dividend portfolios at stock selection level, we will continue to emphasise companies with strong fundamentals, i.e. balance sheet, cash flow and management Investors are likely to continue to reward companies that manage their balance sheet in an efficient manner with a continuing focus on companies that generate superior returns on assets, high quality earnings and robust free cash flow.
2.1.9 SYNTHETIC RISK AND REWARD INDICATOR 6 on a scale of 1 (lowest risk) to 7 (highest risk). The value of a share can decrease or increase and the investor may not get back the amount invested. In accordance with Commission Regulation (EU) No. 583/2010, a synthetic risk and reward indicator has been calculated. This indicator provides a quantitative measure of the sub-fund's potential return and the risk involved, calculated in the currency in which the sub-fund is denominated. It is given as a figure between 1 and 7. The higher the figure, the greater the potential return, but also the more difficult it is to predict this return. Losses are possible too. The lowest figure does not mean that the investment is entirely free of risk. However, it does indicate that, compared with the higher figures, this product will generally provide a lower, but more predictable return. The synthetic risk and reward indicator is assessed regularly and can therefore go up or down based on data from the past. Data from the past is not always a reliable indicator of future risk and return.
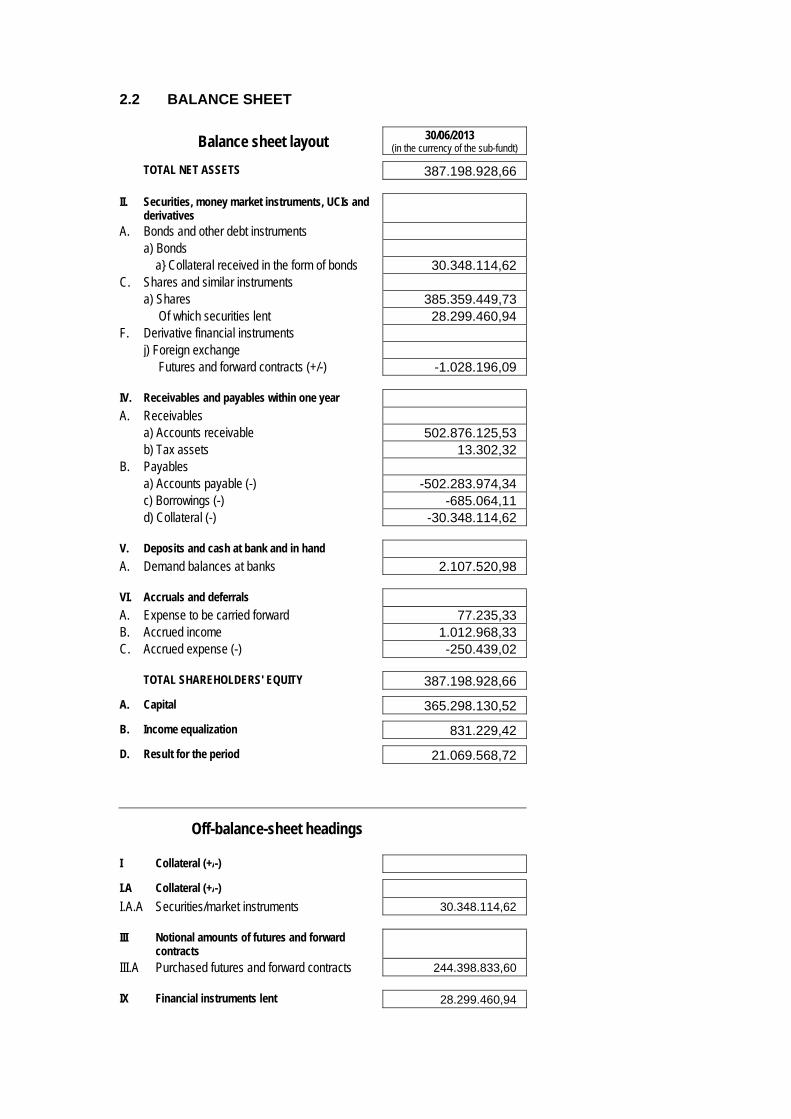
2.2 BALANCE SHEET
Balance sheet layout 30/06/2013 (in the currency of the sub-fundt)
TOTAL NET ASSETS 387.198.928,66
II. Securities, money market instruments, UCIs and derivatives
A. Bonds and other debt instruments a) Bonds a} Collateral received in the form of bonds 30.348.114,62 C. Shares and similar instruments a) Shares 385.359.449,73 Of which securities lent 28.299.460,94 F. Derivative financial instruments j) Foreign exchange Futures and forward contracts (+/-) -1.028.196,09
IV. Receivables and payables within one year A. Receivables a) Accounts receivable 502.876.125,53 b) Tax assets 13.302,32 B. Payables a) Accounts payable (-) -502.283.974,34 c) Borrowings (-) -685.064,11 d) Collateral (-) -30.348.114,62
V. Deposits and cash at bank and in hand A. Demand balances at banks 2.107.520,98
VI. Accruals and deferrals A. Expense to be carried forward 77.235,33 B. Accrued income 1.012.968,33 C. Accrued expense (-) -250.439,02
TOTAL SHAREHOLDERS' EQUITY 387.198.928,66
A. Capital 365.298.130,52
B. Income equalization 831.229,42
D. Result for the period 21.069.568,72
Off-balance-sheet headings
I Collateral (+/-)
I.A Collateral (+/-)
I.A.A Securities/market instruments 30.348.114,62
III Notional amounts of futures and forward contracts
III.A Purchased futures and forward contracts 244.398.833,60
IX Financial instruments lent 28.299.460,94

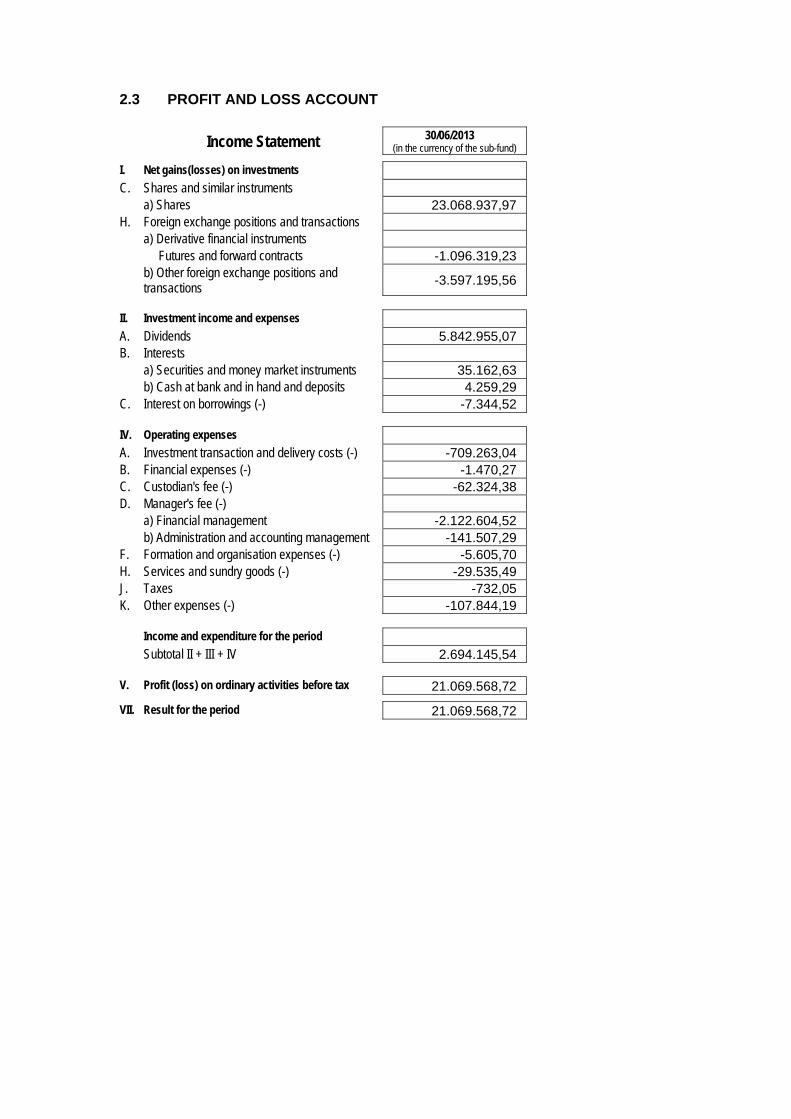
2.3 PROFIT AND LOSS ACCOUNT
Income Statement 30/06/2013 (in the currency of the sub-fund)
I. Net gains(losses) on investments C. Shares and similar instruments a) Shares 23.068.937,97 H. Foreign exchange positions and transactions a) Derivative financial instruments Futures and forward contracts -1.096.319,23 b) Other foreign exchange positions and
transactions -3.597.195,56
II. Investment income and expenses A. Dividends 5.842.955,07 B. Interests a) Securities and money market instruments 35.162,63 b) Cash at bank and in hand and deposits 4.259,29 C. Interest on borrowings (-) -7.344,52
IV. Operating expenses A. Investment transaction and delivery costs (-) -709.263,04 B. Financial expenses (-) -1.470,27 C. Custodian's fee (-) -62.324,38 D. Manager's fee (-) a) Financial management -2.122.604,52 b) Administration and accounting management -141.507,29 F. Formation and organisation expenses (-) -5.605,70 H. Services and sundry goods (-) -29.535,49 J. Taxes -732,05 K. Other expenses (-) -107.844,19
Income and expenditure for the period Subtotal II + III + IV 2.694.145,54
V. Profit (loss) on ordinary activities before tax 21.069.568,72
VII. Result for the period 21.069.568,72
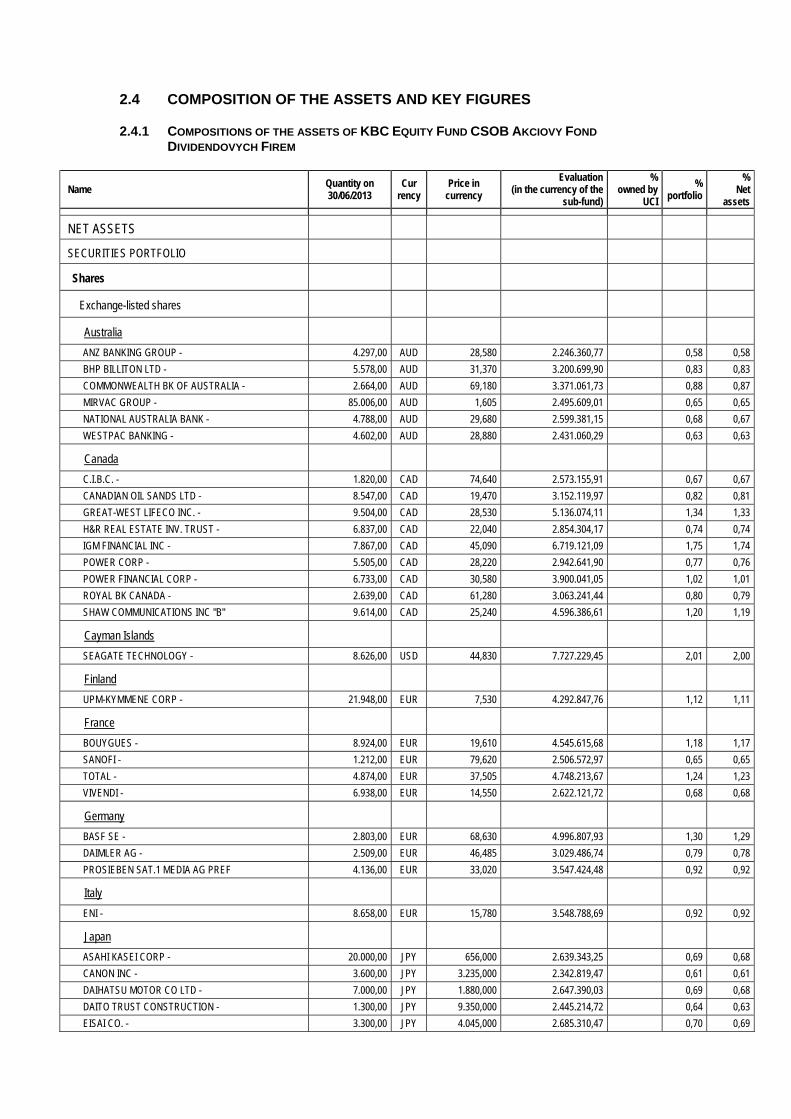
2.4 COMPOSITION OF THE ASSETS AND KEY FIGURES
2.4.1 COMPOSITIONS OF THE ASSETS OF KBC EQUITY FUND CSOB AKCIOVY FOND
DIVIDENDOVYCH FIREM
Name Quantity on 30/06/2013
Cur rency
Price in currency
Evaluation (in the currency of the
sub-fund)
% owned by
UCI
% portfolio
% Net
assets
NET ASSETS
SECURITIES PORTFOLIO
Shares
Exchange-listed shares
Australia
ANZ BANKING GROUP - 4.297,00 AUD 28,580 2.246.360,77 0,58 0,58
BHP BILLITON LTD - 5.578,00 AUD 31,370 3.200.699,90 0,83 0,83
COMMONWEALTH BK OF AUSTRALIA - 2.664,00 AUD 69,180 3.371.061,73 0,88 0,87
MIRVAC GROUP - 85.006,00 AUD 1,605 2.495.609,01 0,65 0,65
NATIONAL AUSTRALIA BANK - 4.788,00 AUD 29,680 2.599.381,15 0,68 0,67
WESTPAC BANKING - 4.602,00 AUD 28,880 2.431.060,29 0,63 0,63
Canada
C.I.B.C. - 1.820,00 CAD 74,640 2.573.155,91 0,67 0,67
CANADIAN OIL SANDS LTD - 8.547,00 CAD 19,470 3.152.119,97 0,82 0,81
GREAT-WEST LIFECO INC. - 9.504,00 CAD 28,530 5.136.074,11 1,34 1,33
H&R REAL ESTATE INV. TRUST - 6.837,00 CAD 22,040 2.854.304,17 0,74 0,74
IGM FINANCIAL INC - 7.867,00 CAD 45,090 6.719.121,09 1,75 1,74
POWER CORP - 5.505,00 CAD 28,220 2.942.641,90 0,77 0,76
POWER FINANCIAL CORP - 6.733,00 CAD 30,580 3.900.041,05 1,02 1,01
ROYAL BK CANADA - 2.639,00 CAD 61,280 3.063.241,44 0,80 0,79
SHAW COMMUNICATIONS INC "B" 9.614,00 CAD 25,240 4.596.386,61 1,20 1,19
Cayman Islands
SEAGATE TECHNOLOGY - 8.626,00 USD 44,830 7.727.229,45 2,01 2,00
Finland
UPM-KYMMENE CORP - 21.948,00 EUR 7,530 4.292.847,76 1,12 1,11
France
BOUYGUES - 8.924,00 EUR 19,610 4.545.615,68 1,18 1,17
SANOFI - 1.212,00 EUR 79,620 2.506.572,97 0,65 0,65
TOTAL - 4.874,00 EUR 37,505 4.748.213,67 1,24 1,23
VIVENDI - 6.938,00 EUR 14,550 2.622.121,72 0,68 0,68
Germany
BASF SE - 2.803,00 EUR 68,630 4.996.807,93 1,30 1,29
DAIMLER AG - 2.509,00 EUR 46,485 3.029.486,74 0,79 0,78
PROSIEBEN SAT.1 MEDIA AG PREF 4.136,00 EUR 33,020 3.547.424,48 0,92 0,92
Italy
ENI - 8.658,00 EUR 15,780 3.548.788,69 0,92 0,92
Japan
ASAHI KASEI CORP - 20.000,00 JPY 656,000 2.639.343,25 0,69 0,68
CANON INC - 3.600,00 JPY 3.235,000 2.342.819,47 0,61 0,61
DAIHATSU MOTOR CO LTD - 7.000,00 JPY 1.880,000 2.647.390,03 0,69 0,68
DAITO TRUST CONSTRUCTION - 1.300,00 JPY 9.350,000 2.445.214,72 0,64 0,63
EISAI CO. - 3.300,00 JPY 4.045,000 2.685.310,47 0,70 0,69
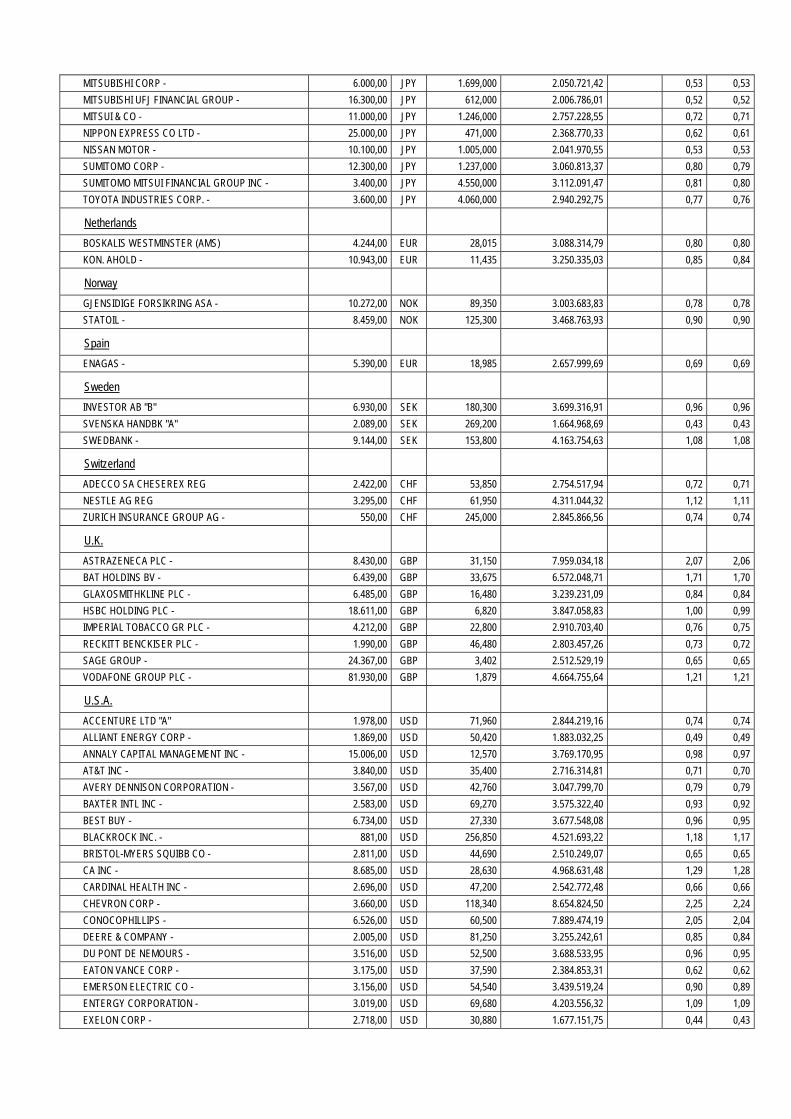
MITSUBISHI CORP - 6.000,00 JPY 1.699,000 2.050.721,42 0,53 0,53
MITSUBISHI UFJ FINANCIAL GROUP - 16.300,00 JPY 612,000 2.006.786,01 0,52 0,52
MITSUI & CO - 11.000,00 JPY 1.246,000 2.757.228,55 0,72 0,71
NIPPON EXPRESS CO LTD - 25.000,00 JPY 471,000 2.368.770,33 0,62 0,61
NISSAN MOTOR - 10.100,00 JPY 1.005,000 2.041.970,55 0,53 0,53
SUMITOMO CORP - 12.300,00 JPY 1.237,000 3.060.813,37 0,80 0,79
SUMITOMO MITSUI FINANCIAL GROUP INC - 3.400,00 JPY 4.550,000 3.112.091,47 0,81 0,80
TOYOTA INDUSTRIES CORP. - 3.600,00 JPY 4.060,000 2.940.292,75 0,77 0,76
Netherlands
BOSKALIS WESTMINSTER (AMS) 4.244,00 EUR 28,015 3.088.314,79 0,80 0,80
KON. AHOLD - 10.943,00 EUR 11,435 3.250.335,03 0,85 0,84
Norway
GJENSIDIGE FORSIKRING ASA - 10.272,00 NOK 89,350 3.003.683,83 0,78 0,78
STATOIL - 8.459,00 NOK 125,300 3.468.763,93 0,90 0,90
Spain
ENAGAS - 5.390,00 EUR 18,985 2.657.999,69 0,69 0,69
Sweden
INVESTOR AB "B" 6.930,00 SEK 180,300 3.699.316,91 0,96 0,96
SVENSKA HANDBK "A" 2.089,00 SEK 269,200 1.664.968,69 0,43 0,43
SWEDBANK - 9.144,00 SEK 153,800 4.163.754,63 1,08 1,08
Switzerland
ADECCO SA CHESEREX REG 2.422,00 CHF 53,850 2.754.517,94 0,72 0,71
NESTLE AG REG 3.295,00 CHF 61,950 4.311.044,32 1,12 1,11
ZURICH INSURANCE GROUP AG - 550,00 CHF 245,000 2.845.866,56 0,74 0,74
U.K.
ASTRAZENECA PLC - 8.430,00 GBP 31,150 7.959.034,18 2,07 2,06
BAT HOLDINS BV - 6.439,00 GBP 33,675 6.572.048,71 1,71 1,70
GLAXOSMITHKLINE PLC - 6.485,00 GBP 16,480 3.239.231,09 0,84 0,84
HSBC HOLDING PLC - 18.611,00 GBP 6,820 3.847.058,83 1,00 0,99
IMPERIAL TOBACCO GR PLC - 4.212,00 GBP 22,800 2.910.703,40 0,76 0,75
RECKITT BENCKISER PLC - 1.990,00 GBP 46,480 2.803.457,26 0,73 0,72
SAGE GROUP - 24.367,00 GBP 3,402 2.512.529,19 0,65 0,65
VODAFONE GROUP PLC - 81.930,00 GBP 1,879 4.664.755,64 1,21 1,21
U.S.A.
ACCENTURE LTD "A" 1.978,00 USD 71,960 2.844.219,16 0,74 0,74
ALLIANT ENERGY CORP - 1.869,00 USD 50,420 1.883.032,25 0,49 0,49
ANNALY CAPITAL MANAGEMENT INC - 15.006,00 USD 12,570 3.769.170,95 0,98 0,97
AT&T INC - 3.840,00 USD 35,400 2.716.314,81 0,71 0,70
AVERY DENNISON CORPORATION - 3.567,00 USD 42,760 3.047.799,70 0,79 0,79
BAXTER INTL INC - 2.583,00 USD 69,270 3.575.322,40 0,93 0,92
BEST BUY - 6.734,00 USD 27,330 3.677.548,08 0,96 0,95
BLACKROCK INC. - 881,00 USD 256,850 4.521.693,22 1,18 1,17
BRISTOL-MYERS SQUIBB CO - 2.811,00 USD 44,690 2.510.249,07 0,65 0,65
CA INC - 8.685,00 USD 28,630 4.968.631,48 1,29 1,28
CARDINAL HEALTH INC - 2.696,00 USD 47,200 2.542.772,48 0,66 0,66
CHEVRON CORP - 3.660,00 USD 118,340 8.654.824,50 2,25 2,24
CONOCOPHILLIPS - 6.526,00 USD 60,500 7.889.474,19 2,05 2,04
DEERE & COMPANY - 2.005,00 USD 81,250 3.255.242,61 0,85 0,84
DU PONT DE NEMOURS - 3.516,00 USD 52,500 3.688.533,95 0,96 0,95
EATON VANCE CORP - 3.175,00 USD 37,590 2.384.853,31 0,62 0,62
EMERSON ELECTRIC CO - 3.156,00 USD 54,540 3.439.519,24 0,90 0,89
ENTERGY CORPORATION - 3.019,00 USD 69,680 4.203.556,32 1,09 1,09
EXELON CORP - 2.718,00 USD 30,880 1.677.151,75 0,44 0,43
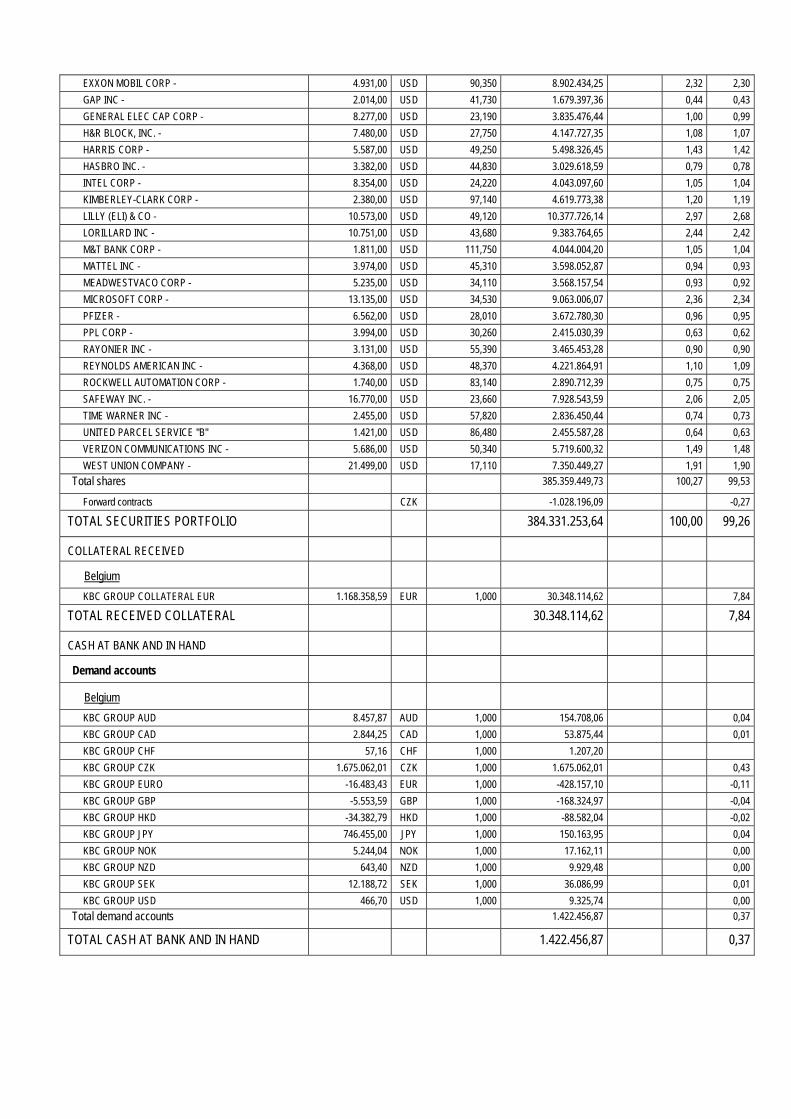
EXXON MOBIL CORP - 4.931,00 USD 90,350 8.902.434,25 2,32 2,30
GAP INC - 2.014,00 USD 41,730 1.679.397,36 0,44 0,43
GENERAL ELEC CAP CORP - 8.277,00 USD 23,190 3.835.476,44 1,00 0,99
H&R BLOCK, INC. - 7.480,00 USD 27,750 4.147.727,35 1,08 1,07
HARRIS CORP - 5.587,00 USD 49,250 5.498.326,45 1,43 1,42
HASBRO INC. - 3.382,00 USD 44,830 3.029.618,59 0,79 0,78
INTEL CORP - 8.354,00 USD 24,220 4.043.097,60 1,05 1,04
KIMBERLEY-CLARK CORP - 2.380,00 USD 97,140 4.619.773,38 1,20 1,19
LILLY (ELI) & CO - 10.573,00 USD 49,120 10.377.726,14 2,97 2,68
LORILLARD INC - 10.751,00 USD 43,680 9.383.764,65 2,44 2,42
M&T BANK CORP - 1.811,00 USD 111,750 4.044.004,20 1,05 1,04
MATTEL INC - 3.974,00 USD 45,310 3.598.052,87 0,94 0,93
MEADWESTVACO CORP - 5.235,00 USD 34,110 3.568.157,54 0,93 0,92
MICROSOFT CORP - 13.135,00 USD 34,530 9.063.006,07 2,36 2,34
PFIZER - 6.562,00 USD 28,010 3.672.780,30 0,96 0,95
PPL CORP - 3.994,00 USD 30,260 2.415.030,39 0,63 0,62
RAYONIER INC - 3.131,00 USD 55,390 3.465.453,28 0,90 0,90
REYNOLDS AMERICAN INC - 4.368,00 USD 48,370 4.221.864,91 1,10 1,09
ROCKWELL AUTOMATION CORP - 1.740,00 USD 83,140 2.890.712,39 0,75 0,75
SAFEWAY INC. - 16.770,00 USD 23,660 7.928.543,59 2,06 2,05
TIME WARNER INC - 2.455,00 USD 57,820 2.836.450,44 0,74 0,73
UNITED PARCEL SERVICE "B" 1.421,00 USD 86,480 2.455.587,28 0,64 0,63
VERIZON COMMUNICATIONS INC - 5.686,00 USD 50,340 5.719.600,32 1,49 1,48
WEST UNION COMPANY - 21.499,00 USD 17,110 7.350.449,27 1,91 1,90
Total shares 385.359.449,73 100,27 99,53
Forward contracts CZK -1.028.196,09 -0,27
TOTAL SECURITIES PORTFOLIO 384.331.253,64 100,00 99,26
COLLATERAL RECEIVED
Belgium
KBC GROUP COLLATERAL EUR 1.168.358,59 EUR 1,000 30.348.114,62 7,84
TOTAL RECEIVED COLLATERAL 30.348.114,62 7,84
CASH AT BANK AND IN HAND
Demand accounts
Belgium
KBC GROUP AUD 8.457,87 AUD 1,000 154.708,06 0,04
KBC GROUP CAD 2.844,25 CAD 1,000 53.875,44 0,01
KBC GROUP CHF 57,16 CHF 1,000 1.207,20
KBC GROUP CZK 1.675.062,01 CZK 1,000 1.675.062,01 0,43
KBC GROUP EURO -16.483,43 EUR 1,000 -428.157,10 -0,11
KBC GROUP GBP -5.553,59 GBP 1,000 -168.324,97 -0,04
KBC GROUP HKD -34.382,79 HKD 1,000 -88.582,04 -0,02
KBC GROUP JPY 746.455,00 JPY 1,000 150.163,95 0,04
KBC GROUP NOK 5.244,04 NOK 1,000 17.162,11 0,00
KBC GROUP NZD 643,40 NZD 1,000 9.929,48 0,00
KBC GROUP SEK 12.188,72 SEK 1,000 36.086,99 0,01
KBC GROUP USD 466,70 USD 1,000 9.325,74 0,00
Total demand accounts 1.422.456,87 0,37
TOTAL CASH AT BANK AND IN HAND 1.422.456,87 0,37
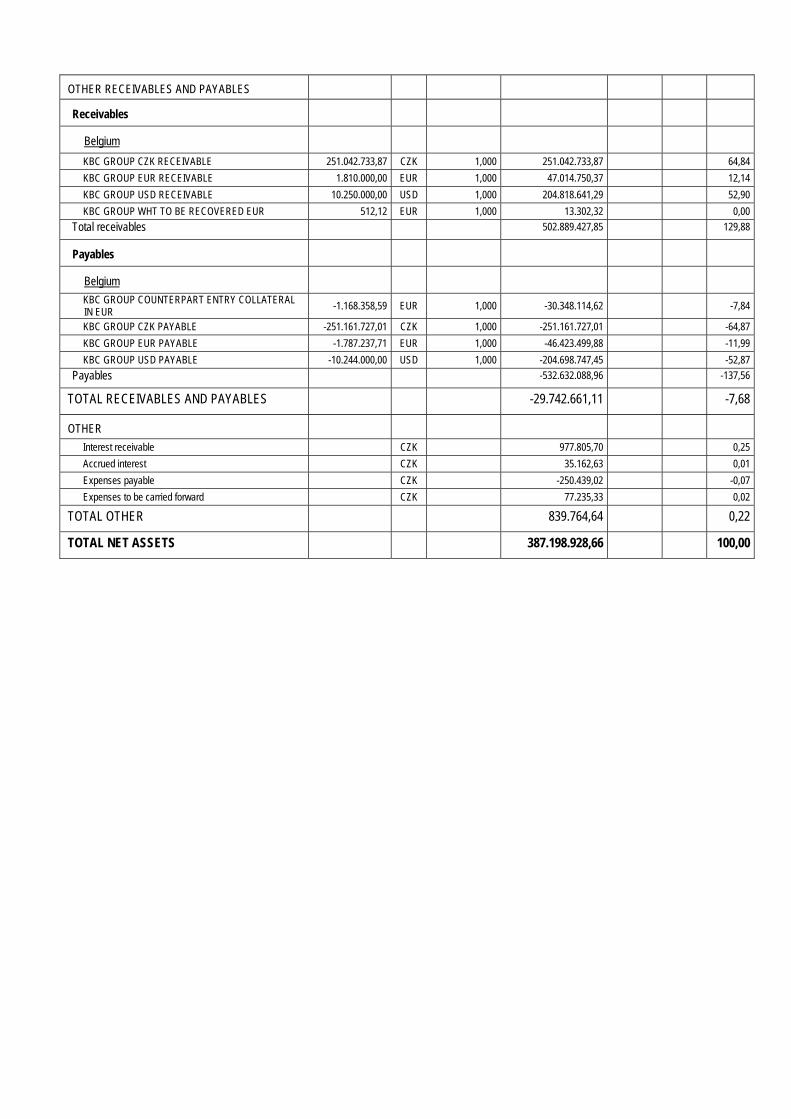
OTHER RECEIVABLES AND PAYABLES
Receivables
Belgium
KBC GROUP CZK RECEIVABLE 251.042.733,87 CZK 1,000 251.042.733,87 64,84
KBC GROUP EUR RECEIVABLE 1.810.000,00 EUR 1,000 47.014.750,37 12,14
KBC GROUP USD RECEIVABLE 10.250.000,00 USD 1,000 204.818.641,29 52,90
KBC GROUP WHT TO BE RECOVERED EUR 512,12 EUR 1,000 13.302,32 0,00
Total receivables 502.889.427,85 129,88
Payables
Belgium
KBC GROUP COUNTERPART ENTRY COLLATERAL IN EUR
-1.168.358,59 EUR 1,000 -30.348.114,62 -7,84
KBC GROUP CZK PAYABLE -251.161.727,01 CZK 1,000 -251.161.727,01 -64,87
KBC GROUP EUR PAYABLE -1.787.237,71 EUR 1,000 -46.423.499,88 -11,99
KBC GROUP USD PAYABLE -10.244.000,00 USD 1,000 -204.698.747,45 -52,87
Payables -532.632.088,96 -137,56
TOTAL RECEIVABLES AND PAYABLES -29.742.661,11 -7,68
OTHER
Interest receivable CZK 977.805,70 0,25
Accrued interest CZK 35.162,63 0,01
Expenses payable CZK -250.439,02 -0,07
Expenses to be carried forward CZK 77.235,33 0,02
TOTAL OTHER 839.764,64 0,22
TOTAL NET ASSETS 387.198.928,66 100,00
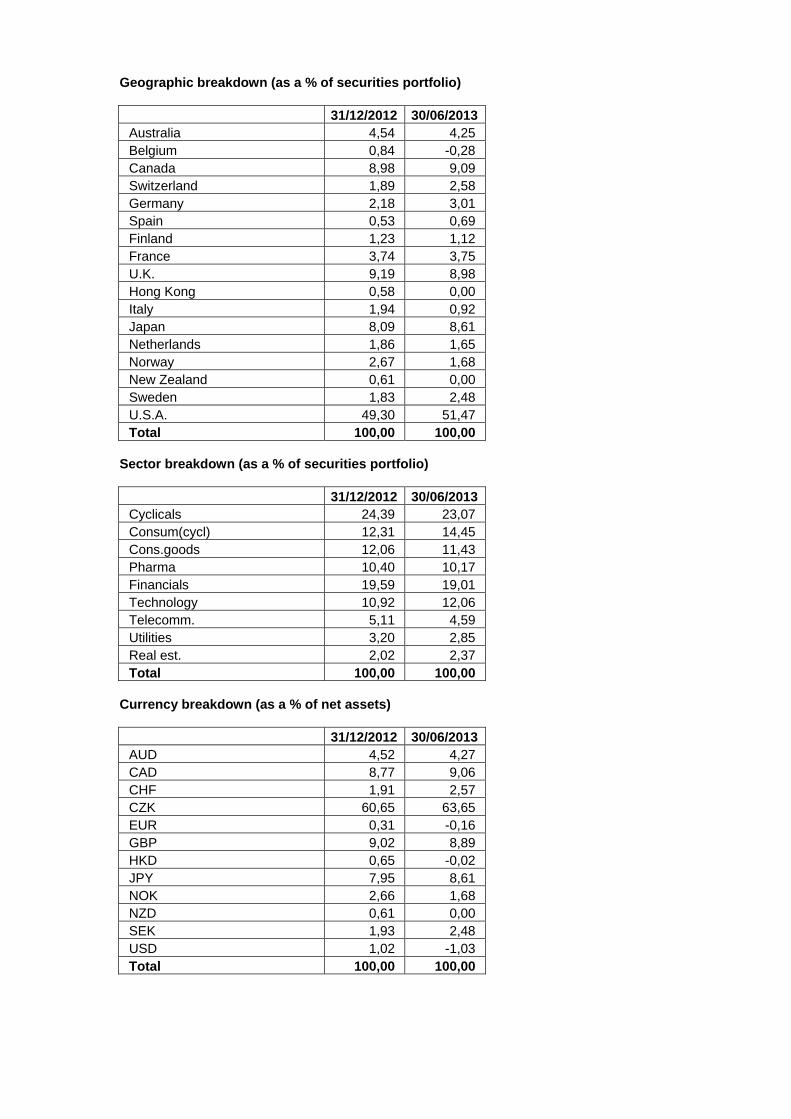
Geographic breakdown (as a % of securities portfolio)
31/12/2012 30/06/2013Australia 4,54 4,25 Belgium 0,84 -0,28 Canada 8,98 9,09 Switzerland 1,89 2,58 Germany 2,18 3,01 Spain 0,53 0,69 Finland 1,23 1,12 France 3,74 3,75 U.K. 9,19 8,98 Hong Kong 0,58 0,00 Italy 1,94 0,92 Japan 8,09 8,61 Netherlands 1,86 1,65 Norway 2,67 1,68 New Zealand 0,61 0,00 Sweden 1,83 2,48 U.S.A. 49,30 51,47 Total 100,00 100,00
Sector breakdown (as a % of securities portfolio)
31/12/2012 30/06/2013Cyclicals 24,39 23,07 Consum(cycl) 12,31 14,45 Cons.goods 12,06 11,43 Pharma 10,40 10,17 Financials 19,59 19,01 Technology 10,92 12,06 Telecomm. 5,11 4,59 Utilities 3,20 2,85 Real est. 2,02 2,37 Total 100,00 100,00
Currency breakdown (as a % of net assets)
31/12/2012 30/06/2013AUD 4,52 4,27 CAD 8,77 9,06 CHF 1,91 2,57 CZK 60,65 63,65 EUR 0,31 -0,16 GBP 9,02 8,89 HKD 0,65 -0,02 JPY 7,95 8,61 NOK 2,66 1,68 NZD 0,61 0,00 SEK 1,93 2,48 USD 1,02 -1,03 Total 100,00 100,00
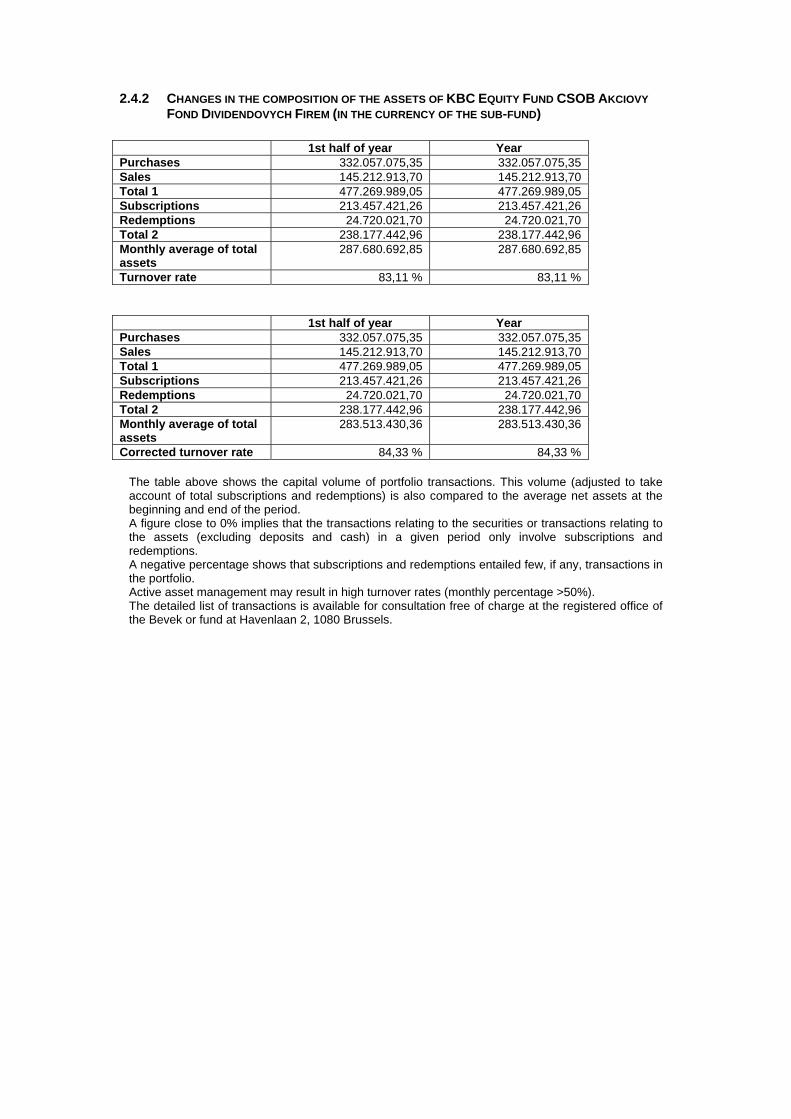
2.4.2 CHANGES IN THE COMPOSITION OF THE ASSETS OF KBC EQUITY FUND CSOB AKCIOVY
FOND DIVIDENDOVYCH FIREM (IN THE CURRENCY OF THE SUB-FUND)
1st half of year YearPurchases 332.057.075,35 332.057.075,35 Sales 145.212.913,70 145.212.913,70 Total 1 477.269.989,05 477.269.989,05 Subscriptions 213.457.421,26 213.457.421,26 Redemptions 24.720.021,70 24.720.021,70 Total 2 238.177.442,96 238.177.442,96 Monthly average of total assets
287.680.692,85 287.680.692,85
Turnover rate 83,11 % 83,11 %
1st half of year YearPurchases 332.057.075,35 332.057.075,35 Sales 145.212.913,70 145.212.913,70 Total 1 477.269.989,05 477.269.989,05 Subscriptions 213.457.421,26 213.457.421,26 Redemptions 24.720.021,70 24.720.021,70 Total 2 238.177.442,96 238.177.442,96 Monthly average of total assets
283.513.430,36 283.513.430,36
Corrected turnover rate 84,33 % 84,33 %
The table above shows the capital volume of portfolio transactions. This volume (adjusted to take account of total subscriptions and redemptions) is also compared to the average net assets at the beginning and end of the period. A figure close to 0% implies that the transactions relating to the securities or transactions relating to the assets (excluding deposits and cash) in a given period only involve subscriptions and redemptions. A negative percentage shows that subscriptions and redemptions entailed few, if any, transactions in the portfolio. Active asset management may result in high turnover rates (monthly percentage >50%). The detailed list of transactions is available for consultation free of charge at the registered office of the Bevek or fund at Havenlaan 2, 1080 Brussels.
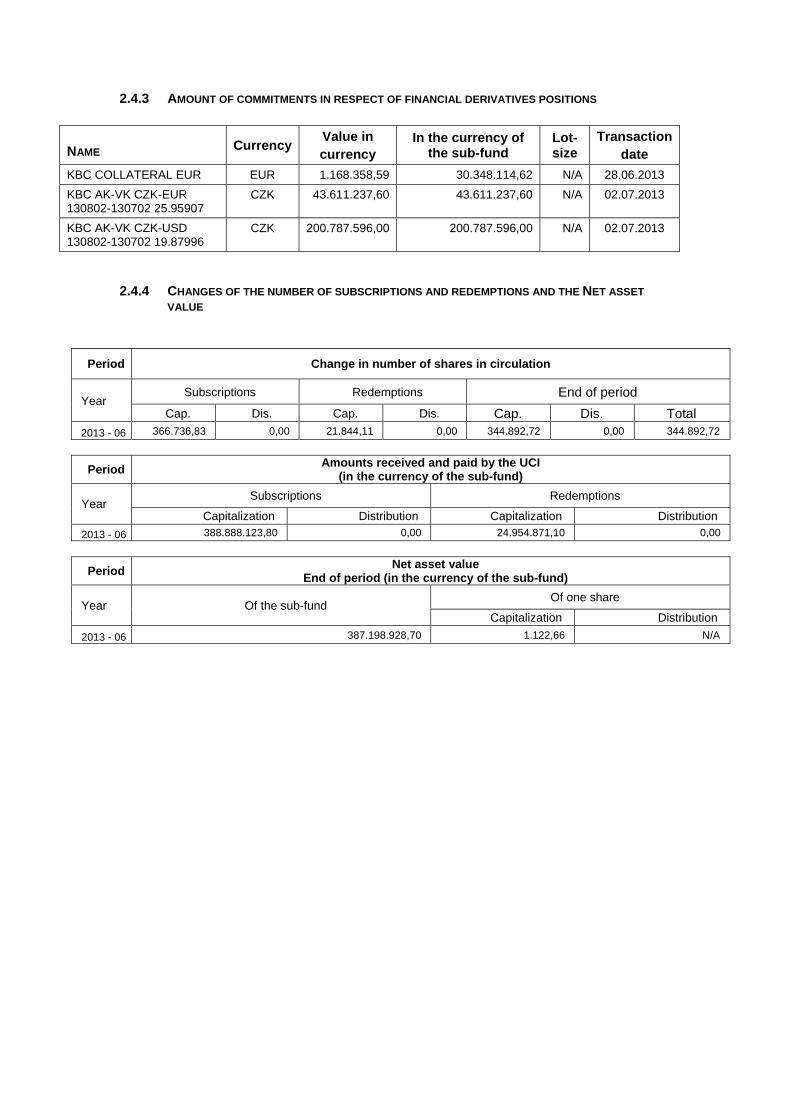
2.4.3 AMOUNT OF COMMITMENTS IN RESPECT OF FINANCIAL DERIVATIVES POSITIONS
NAME Currency Value in currency
In the currency of the sub-fund
Lot-size
Transactiondate
KBC COLLATERAL EUR EUR 1.168.358,59 30.348.114,62 N/A 28.06.2013
KBC AK-VK CZK-EUR 130802-130702 25.95907
CZK 43.611.237,60 43.611.237,60 N/A 02.07.2013
KBC AK-VK CZK-USD 130802-130702 19.87996
CZK 200.787.596,00 200.787.596,00 N/A 02.07.2013
2.4.4 CHANGES OF THE NUMBER OF SUBSCRIPTIONS AND REDEMPTIONS AND THE NET ASSET
VALUE
Period Change in number of shares in circulation
Year Subscriptions Redemptions End of period
Cap. Dis. Cap. Dis. Cap. Dis. Total 2013 - 06 366.736,83 0,00 21.844,11 0,00 344.892,72 0,00 344.892,72
Period Amounts received and paid by the UCI
(in the currency of the sub-fund)
Year Subscriptions Redemptions
Capitalization Distribution Capitalization Distribution
2013 - 06 388.888.123,80 0,00 24.954.871,10 0,00
Period Net asset value
End of period (in the currency of the sub-fund)
Year Of the sub-fund Of one share
Capitalization Distribution
2013 - 06 387.198.928,70 1.122,66 N/A
2.4.5 PERFORMANCE FIGURES
Cap Div
ISIN code Cur-
rency
1 Year 3 Years* 5 Years* 10 Years* Since launch*
Share classes
Bench mark
Share classes
Bench mark
Share classes
Bench mark
Share classes
Bench mark
Launch Date
Share classes
CAP BE6239644220 EUR 01/10/2012
CAP BE6239644220 CZK 01/10/2012
Risk warning: Past performance is not a guide to future performance. * Return on annual basis.

The bar chart shows the performance for full financial years. The figures do not take account of any restructuring. Calculated in CZK and in EUR. the return is calculated as the change in the net asset value between two dates expressed
as a percentage. In the case of units that pay dividends, the dividend is incorporated geometrically in the return.
Calculation method for date D, where NAV stands for net asset value: Capitalisation units (CAP) Return on date D over a period of X years:
[NAV(D) / NAV(Y)] ^ [1 / X] - 1 where Y = D-X
Return on date D since the start date S of the unit: [NAV(D) / NAV(S)] ^ [1 / F] - 1 where F = 1 if the unit has existed for less than one year on date D where F = (D-S) / 365.25 if the unit has existed for longer than one year on date D
Distribution units (DIV) Return on date D over a period of X years:
[ C * NAV(D) / NAV(Y)] ^ [1 / X] - 1 where Y = D-X
Return on date D since the start date S of the unit: [ C * NAV(D) / NAV(S)] ^ [1 / F] - 1 where F = 1 if the unit has existed for less than one year on date D where F = (D-S) / 365.25 if the unit has existed for longer than one year on date D
where C is a factor that is determined for all N dividends between the calculation date D and the reference date. For dividend i on date Di with value Wi:
Ci = [Wi / NAV(Di)] + 1 i = 1 ... N
from which C = C0 * .... * CN. If the interval between the two dates exceeds one year, the ordinary return calculation is
converted into a return on an annual basis by taking the nth square root of 1 plus the total return of the unit.
The return figures shown above do not take account of the fees and charges associated with the issue and redemption of units.
These are the performance figures for capitalisation and distribution shares.
2.4.6 COSTS Ongoing charges: * Distribution: not applicable Capitalization: not applicable * The following costs have not been included in the ongoing charges: - Interest payments on loans taken out - Payments in respect of financial derivatives - Fees and charges paid directly by the investor - Any soft commissions
FEE-SHARING AGREEMENTS AND REBATES: The management company may share its fee with the distributor, and institutional and/or professional parties. In principle, the percentage share amounts to between 35% and 60% if the distributor is an entity of KBC Group NV or to between 35% and 70% if the distributor is not an entity of KBC Group NV. However, in a small number of cases, the distributor’s fee is less than 35%. Investors may, on request, obtain more information on these cases. If the management company invests the assets of the undertaking for collective investment in units of undertakings for collective investment that are not managed by an entity of KBC Group NV, and receives a fee for doing so, it will pay this fee to the undertaking for collective investment. Fee-sharing does not affect the amount of the management fee paid by the sub-fund to the management company. This management fee is subject to the limitations laid down in the articles of association. The limitations may only be amended after approval by the general meeting of shareholders. The management company has concluded a distribution agreement with the distributor in order to facilitate the wider distribution of the sub-fund's units by using multiple distribution channels. It is in the interests of the holders of units, the sub-fund and of the distributor for the largest possible number of units to be sold and for the assets of the sub-fund to be maximised in this way. In this respect, there is therefore no question of any conflict of interest.
2.4.7 NOTES TO THE FINANCIAL STATEMENTS AND OTHER DATA Fee for managing the investment portfolio: 1.5% per annum calculated on the basis of the average total net assets of the sub-fund, no management fee is charged on assets assets invested in investment undertakings managed by a financial institution of the KBC group. KBC Fund Management Limited receives a fee from the management company of max. 1.5% calculated on that part of the portfolio that it manages, without the total management fee received by the management company being exceeded. The administration agent’s fee is payable at the end of each month and is calculated on the basis of the average total net assets of the sub-fund. Auditor's fee: 1 700 EUR per year. This fee is not including VAT and can be indexed on an annual basis in accordance with the decisions of the general meeting. The custody fee is calculated on the value of the securities held in custody by the custodian on the final banking day of the preceding calendar year, except on those assets invested in investment undertakings managed by a financial institution of the KBC group. The custody fee is paid at the beginning of the calendar year. Social, ethical and environmental aspects: No manufacturers of controversial weapons whose use over the past five decades, according to the international consensus, has led to disproportionate human suffering among the civilian population will be included in the portfolio of investments. This involves the manufacturers of anti-personnel mines, cluster bombs and munitions and weapons containing depleted uranium. In this way, the sub-fund seeks to reflect not only simple financial reality but also the social reality of the sector or region in question. Exercising voting rights. If necessary, relevant and in the interest of the shareholders, the management company will exercise the voting rights attached to the shares in the Bevek’s portfolio. The management company will adhere to the following criteria when determining how it stands relative to the items on the agenda that are put to the vote: - Shareholder value may not be adversely affected. - Corporate governance rules, especially with regard to the rights of minority shareholders, must be
respected. - The minimum standards with regard to sustainable business and corporate social responsibility
must be met. The list of companies for which voting rights are exercised is available at the registered office of the Bevek.
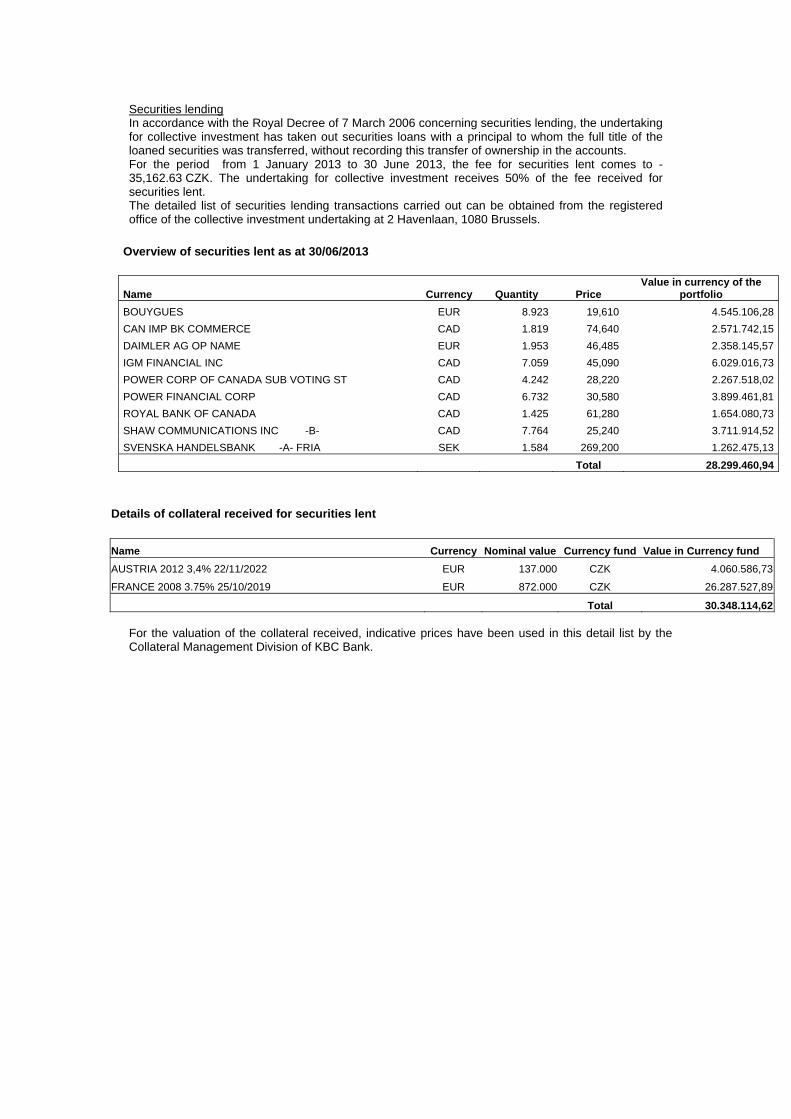
Securities lending In accordance with the Royal Decree of 7 March 2006 concerning securities lending, the undertaking for collective investment has taken out securities loans with a principal to whom the full title of the loaned securities was transferred, without recording this transfer of ownership in the accounts. For the period from 1 January 2013 to 30 June 2013, the fee for securities lent comes to -35,162.63 CZK. The undertaking for collective investment receives 50% of the fee received for securities lent. The detailed list of securities lending transactions carried out can be obtained from the registered office of the collective investment undertaking at 2 Havenlaan, 1080 Brussels.
Overview of securities lent as at 30/06/2013
Name Currency Quantity Price Value in currency of the
portfolio
BOUYGUES EUR 8.923 19,610 4.545.106,28
CAN IMP BK COMMERCE CAD 1.819 74,640 2.571.742,15
DAIMLER AG OP NAME EUR 1.953 46,485 2.358.145,57
IGM FINANCIAL INC CAD 7.059 45,090 6.029.016,73
POWER CORP OF CANADA SUB VOTING ST CAD 4.242 28,220 2.267.518,02
POWER FINANCIAL CORP CAD 6.732 30,580 3.899.461,81
ROYAL BANK OF CANADA CAD 1.425 61,280 1.654.080,73
SHAW COMMUNICATIONS INC -B- CAD 7.764 25,240 3.711.914,52
SVENSKA HANDELSBANK -A- FRIA SEK 1.584 269,200 1.262.475,13
Total 28.299.460,94
Details of collateral received for securities lent
Name Currency Nominal value Currency fund Value in Currency fund
AUSTRIA 2012 3,4% 22/11/2022 EUR 137.000 CZK 4.060.586,73
FRANCE 2008 3.75% 25/10/2019 EUR 872.000 CZK 26.287.527,89
Total 30.348.114,62 For the valuation of the collateral received, indicative prices have been used in this detail list by the Collateral Management Division of KBC Bank.
Semi-Annual report as at 30th June 2013
TABLE OF CONTENTS
2. Information on KBC Equity Fund SRI Equity
2.1. Management report 2.1.1. Launch date and subscription price 2.1.2. Stock exchange listing 2.1.3. Aim and distinctive features of the investment policy 2.1.4. Financial portfolio management 2.1.5. Distributors 2.1.6. Index and benchmark 2.1.7. Policy conducted during the financial year 2.1.8. Future policy 2.1.9. Synthetic risk and reward indicator (SRRI)
2.2. Balance sheet
2.3. Profit and loss account
2.4. Composition of the assets and key figures
2.4.1. Composition of the assets 2.4.2. Change in the composition of the assets 2.4.3. Value of commitments in respect of financial derivatives positions 2.4.4. Evolution of the number of subscriptions, repayments and the net asset value 2.4.5. Return figures 2.4.6. Expenses 2.4.7. Notes to the financial statements and other data


2 INFORMATION ON KBC EQUITY FUND SRI EQUITY
2.1 MANAGEMENT REPORT
2.1.1 LAUNCH DATE AND SUBSCRIPTION PRICE Classic Shares : Launch date: 6 May 2011 Initial subscription price: 1000 EUR Currency: EUR Institutional B Shares : Launch date: 25 November 2011 Initial subscription price: 870.05 EUR Currency: EUR Institutional Shares : Launch date: 6 May 2011 Initial subscription price: 1000 EUR Currency: EUR
2.1.2 STOCK EXCHANGE LISTING Not applicable.
2.1.3 GOAL AND KEY PRINCIPLES OF THE INVESTMENT POLICY
SUB-FUND’S OBJECT: The main objective of this sub-fund is to generate the highest possible return for its shareholders by investing directly or indirectly in transferable securities. This is reflected in its pursuit of capital gains and income. To this end, the assets are invested, either directly or indirectly via correlated financial instruments, primarily in shares.
SUB-FUND’S INVESTMENT POLICY:
PERMITTED ASSET CLASSES: The sub-fund may invest in securities, money market instruments, units in undertakings for collective investment, deposits, financial derivatives, liquid assets and all other instruments insofar as permitted by the applicable laws and regulations and consistent with the sub-fund’s object The sub-fund shall invest no more than 10% of its assets in units of other undertakings for collective investment.
RESTRICTIONS OF THE INVESTMENT POLICY: The investment policy will be implemented within the limits set by law and regulations. The sub-fund may borrow up to 10% of its net assets, insofar as these are short-term borrowings aimed at solving temporary liquidity problems.
PERMITTED DERIVATIVES TRANSACTIONS: Derivates may be used either for hedging purposes or to achieve investment objectives. Changes will be made to the investments at regular intervals to comply with the sub-fund's investment strategy. In addition, listed and unlisted derivates may be used to achieve the objectives: these may be forward contracts, options or swaps on securities, indices, currencies or interest rates or other transactions involving derivatives. Unlisted derivatives transactions will only be concluded with prime financial institutions specialised in such transactions. Such derivatives may also be used to hedge the assets against exchange-rate fluctuations. Subject to the applicable laws and regulations and the articles of association, the sub-fund always seeks to conclude the most effective transactions. All costs associated with the transactions will be charged to the sub-fund and all income generated will be paid to the sub-fund. If the transactions result in a risk in respect of the counterparty, this risk can be hedged by using a margin management system that ensures that the sub-fund is the beneficiary of security (collateral) in the form of cash or investment grade bonds. When calculating the value of the bonds, a margin will be applied that varies depending on the residual term to maturity and the currency in which the bond in question is denominated.
The relationship with the counterparty or counterparties is governed by standard international agreements.
STRATEGY SELECTED
The assets are invested primarily in an international basket of shares. The shares must satisfy the following requirements. The companies must be best-in-class in terms of sustainability. They must therefore be screened according to the following criteria: 1) Long-term business policy 2) Corporate governance 3) Impact on the environment 4) Internal social policy 5) Respect for human rights and international labour standards. Each criterion is subdivided into measurable indicators. The requirements, criteria and indicators are set by KBC Asset Management in consultation with the External Advisory Board for Sustainability Analysis. Their relevance is constantly reviewed and the sustainability analysis methodology may be adapted subject to the approval of the External Advisory Board for Sustainability Analysis. The shares are screened by the KBC Asset Management Sustainable Investment Department in consultation with the External Advisory Board for Sustainability Analysis. The autonomy of the External Advisory Board for Sustainability Analysis responsible for the sustainability screening ensures that companies are screened objectively and that the sustainability screening is reliable. The External Advisory Board for Sustainability Analysis monitors the quality of KBC Asset Management's methodology and research. Details of this procedure can be found at http:/www.kbc.be/sustainable investment.
LENDING FINANCIAL INSTRUMENTS: The sub-fund may lend financial instruments within the limits set by law and regulations. This lending does not affect the sub-fund’s risk profile since: - it takes place within the framework of a securities lending system managed by a principal. In
addition, the sub-fund has a relationship only with the principal of the securities lending system which acts as counterparty and to which title of the loaned securities is transferred. The choice of principal is subject to strict selection criteria. The return of securities similar to the securities that have been lent is guaranteed by the principal.
- through a margin management system, the sub-fund is always guaranteed financial security, the actual value of which always exceeds the actual value of the securities that have been lent, in case the principal does not return similar securities.
The return of securities similar to the securities that have been lent can be requested at any time, which means that the lending of securities does not affect the management of the sub-fund's assets. By lending securities, the sub-fund can generate an additional return. The principal pays a fee to the management company. After deducting the fee for the margin management and clearing services of KBC Bank, most of this fee is paid to the sub-fund. The relationship with the counterparty or counterparties is governed by standard international agreements. More information is provided on the terms and conditions governing securities lending in the annual or half-yearly report for the sub-fund.
VOLATILITY OF THE NET ASSET VALUE: The volatility of the net asset value may be high due to the composition of the portfolio.
GENERAL STRATEGY FOR HEDGING THE EXCHANGE RATE RISK: In order to protect its assets against exchange rate fluctuations and within the limitations laid down in the articles of association, the sub-fund may perform transactions relating to the sale of forward currency contracts, as well as the sale of call options and the purchase of put options on currencies. The transactions in question may relate solely to contracts traded on a regulated market that operates regularly, is recognised and is open to the public or that are traded with a recognised, prime financial institution specialising in such transactions and dealing in the over-the-counter (OTC)
market in options. With the same objective, the sub-fund may also sell currencies forward or exchange them in private transactions with prime financial institutions specialising in such transactions. The hedging objective of the aforementioned transactions suggests that there is a direct link between these transactions and the assets to be hedged, which implies that the transactions carried out in a particular currency may in principle not exceed, in terms of volume, either the valuation value of all the assets in the same currency or the holding period of those assets.
SOCIAL, ETHICAL AND ENVIRONMENTAL ASPECTS:
No manufacturers of controversial weapons whose use over the past five decades, according to the international consensus, has led to disproportionate human suffering among the civilian population will be included in the portfolio of investments. This involves the manufacturers of anti-personnel mines, cluster bombs and munitions and weapons containing depleted uranium. In this way, the sub-fund seeks to reflect not only simple financial reality but also the social reality of the sector or region in question.
THE EUROPEAN SAVINGS DIRECTIVE AND TAX ON DEBT CLAIM RETURNS OBTAINED THROUGH THE
REDEMPTION OF OWN UNITS OR IN THE EVENT OF FULL OR PARTIAL DISTRIBUTION OF EQUITY
CAPITAL. The following information is of a general character and is not intended to cover all aspects of an investment in a UCITS. In certain cases entirely different rules might even apply. Moreover, both tax law and the interpretation of it can change. Investors who wish to have more information about the tax implications – in both Belgium and abroad – of acquiring, holding and transferring units should seek the advice of their usual financial and tax advisers. This UCITS shall invest a maximum of 15% of its assets directly or indirectly in debt instruments as intended by the European Savings Directive. A. European Savings Directive (Directive 2003/48/EC) The European Savings Directive has been implemented in Belgium. Since this UCITS invests a maximum of 15% of its assets directly or indirectly in debt claims as intended by the European Savings Directive, the income of this UCITS does not fall within the scope of this directive. B. Tax on debt claim returns obtained through the redemption of own units or in the event of full or partial distribution of equity capital (Article 19bis Income Tax Code 1992). The income from this UCITS is not subject to the tax on debt instrument returns as intended by Article 19bis, Income Tax Code 1992.
2.1.4 FINANCIAL PORTFOLIO MANAGEMENT There is no delegation of the portfolio.
2.1.5 DISTRIBUTORS KBC Asset Management S.A., 5, Place de la Gare, L-1616 Luxembourg.
2.1.6 INDEX AND BENCHMARK See ‘Sub-fund’s investment policy’.
2.1.7 POLICY PERSUED DURING THE FINANCIAL YEAR Doubts about the sustainability of the economic recovery continued to shape investor sentiment. The debt crisis in Europe continued unabated, although the European Central Bank (ECB) managed to convince the market that it had the crisis under control. Major steps were taken in the United States to reform the federal budget, seemingly without adversely affecting economic growth too much. Fortunately, strong economic growth in Asia created export opportunities for American and European businesses. The weak growth in the Western economies was not without its impact on the export performance in emerging countries. In recent years, however, domestic demand (due to a rapidly growing middle class with a high consumption rate) and intra-regional trade within Asia have been playing an increasingly important role. The region is better armed to deal with financial crises than it was in the past. Public finances are healthy, the balance of payments is generally neutral (China actually has an astronomical surplus) and the internal savings buffer is high. Asia’s economic development no longer depends on fickle foreign capital. Thanks to the contribution by the emerging markets the growth of world GDP held up in 2012–13 (estimated at 2–2.5%). There were significant differences in the returns of the various sectors. The best performing sectors included Financials, Pharmaceuticals and Consumer Discretionary. Materials, Technology and Energy lagged behind. The outperformance of Banks may be attributed to the quantitative easing programmes undertaken by the central banks. By this we mean the Fed’s QE3 programme, and especially the announcement by the ECB of its OMT programme, which took the heat out of the euro crisis. Pharmaceuticals had been shunned for a long time due to a lack of product innovation, patent expiry and the reforms to healthcare insurance in the US. In recent months, however, investors began to focus more on the sector’s response to these challenges: restructuring operations and the sell-off of non-strategic divisions. The car industry has risen from the ashes, in the US and the European luxury segment at least. Demand from the emerging markets is also strong, despite the slowdown in Chinese growth, where German luxury marques generate 50% of their profits. In spite of the slow growth, advertising budgets have also held up surprisingly well. The rise of the e-book and ongoing breakthrough of digital television continue undiminished. More and more media companies are successfully exploiting these trends. Mining companies lost ground on excessive expectations concerning commodity prices. A failed stock market flotation by Facebook and the giant leaps made by Apple meant that price trends in the Technology sector differed from what might have been expected on the basis of the fundamentals. Oil companies suffered from the vagaries of the oil market, the political instability in the Middle East and frequent accidents. The Real Estate sector (+3.0%) eased up a little in 2013 compared to its strong performance in 2012. The financial turbulence in 2007–08 forced real estate companies to clean up their balance sheets. This accordingly provided the sector with a sound base to make the most of the recovery. The traditional discount against the intrinsic value at which the sector normally trades consequently disappeared, leaving the sector somewhat overvalued.
2.1.8 FUTURE POLICY Today’s world is one of two-speed economies. The mature industrialised economies (US, Europe, Japan) still find themselves in a low-growth environment, with no underlying inflationary pressure, persistently low interest rates and runaway public finances. The picture in the emerging markets is altogether different. The strong economic growth has already created inflationary pressure in Asia. Appropriate monetary policy is therefore required: sometimes restrictive (as in 2011) and at other times stimulatory (as at present). Monetary policy in China and elsewhere in Asia is highly geared to preventing asset-price inflation. This does not just involve the interest-rate weapon; there was also active intervention in the credit market and the housing market. One of the major challenges for this decade will be the further development of consumption in China and the rest of Asia. That could help bring about a more balanced economic world order: it will not only reduce the region’s dependence on exports but, at least as importantly, will have an effect on international capital flows. More consumption in China will mean lower savings and higher imports, including from the US and Europe. That will help the West to ‘grow out’ of its debt problems.
2.1.9 SYNTHETIC RISK AND REWARD INDICATOR Classic Shares: 6 on a scale of 1 (lowest risk) to 7 (highest risk). Institutional B Shares: 6 on a scale of 1 (lowest risk) to 7 (highest risk). Institutional Shares: 6 on a scale of 1 (lowest risk) to 7 (highest risk). The value of a share can decrease or increase and the investor may not get back the amount invested.

In accordance with Commission Regulation (EU) No. 583/2010, a synthetic risk and reward indicator has been calculated. This indicator provides a quantitative measure of the sub-fund's potential return and the risk involved, calculated in the currency in which the sub-fund is denominated. It is given as a figure between 1 and 7. The higher the figure, the greater the potential return, but also the more difficult it is to predict this return. Losses are possible too. The lowest figure does not mean that the investment is entirely free of risk. However, it does indicate that, compared with the higher figures, this product will generally provide a lower, but more predictable return. The synthetic risk and reward indicator is assessed regularly and can therefore go up or down based on data from the past. Data from the past is not always a reliable indicator of future risk and return.
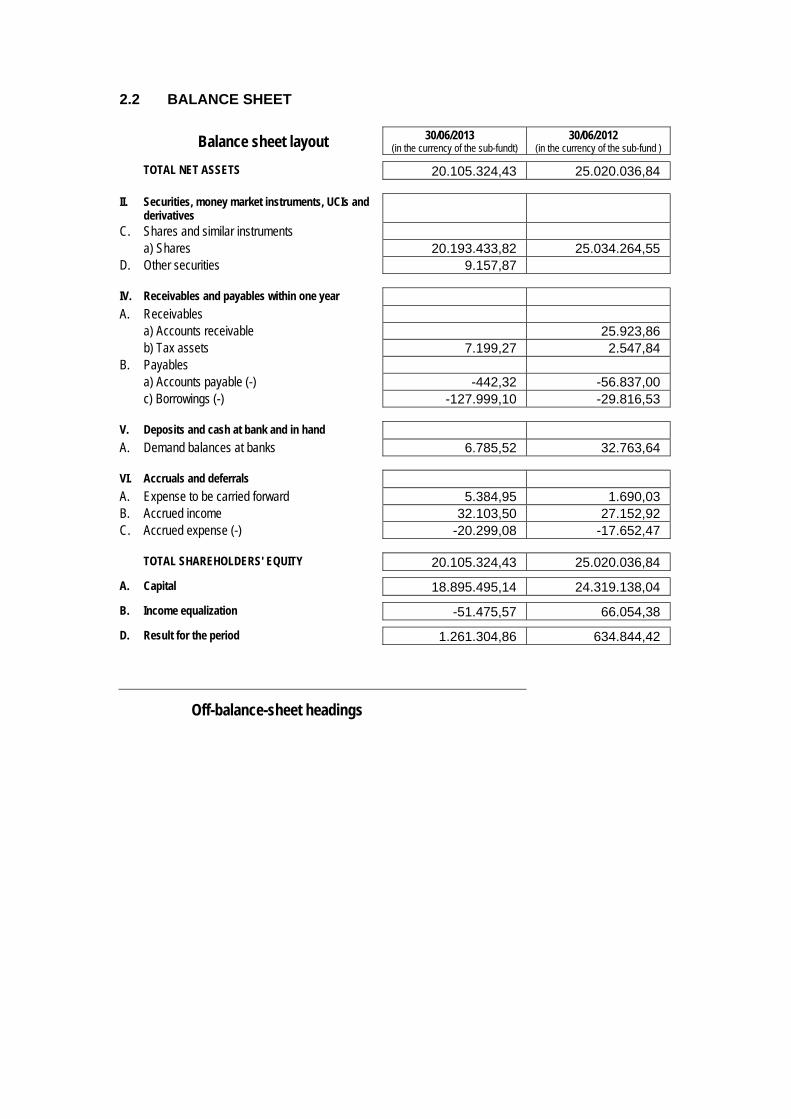
2.2 BALANCE SHEET
Balance sheet layout 30/06/2013 (in the currency of the sub-fundt)
30/06/2012 (in the currency of the sub-fund )
TOTAL NET ASSETS 20.105.324,43 25.020.036,84
II. Securities, money market instruments, UCIs and derivatives
C. Shares and similar instruments a) Shares 20.193.433,82 25.034.264,55 D. Other securities 9.157,87
IV. Receivables and payables within one year A. Receivables a) Accounts receivable 25.923,86 b) Tax assets 7.199,27 2.547,84 B. Payables a) Accounts payable (-) -442,32 -56.837,00 c) Borrowings (-) -127.999,10 -29.816,53
V. Deposits and cash at bank and in hand A. Demand balances at banks 6.785,52 32.763,64
VI. Accruals and deferrals A. Expense to be carried forward 5.384,95 1.690,03 B. Accrued income 32.103,50 27.152,92 C. Accrued expense (-) -20.299,08 -17.652,47
TOTAL SHAREHOLDERS' EQUITY 20.105.324,43 25.020.036,84
A. Capital 18.895.495,14 24.319.138,04
B. Income equalization -51.475,57 66.054,38
D. Result for the period 1.261.304,86 634.844,42
Off-balance-sheet headings
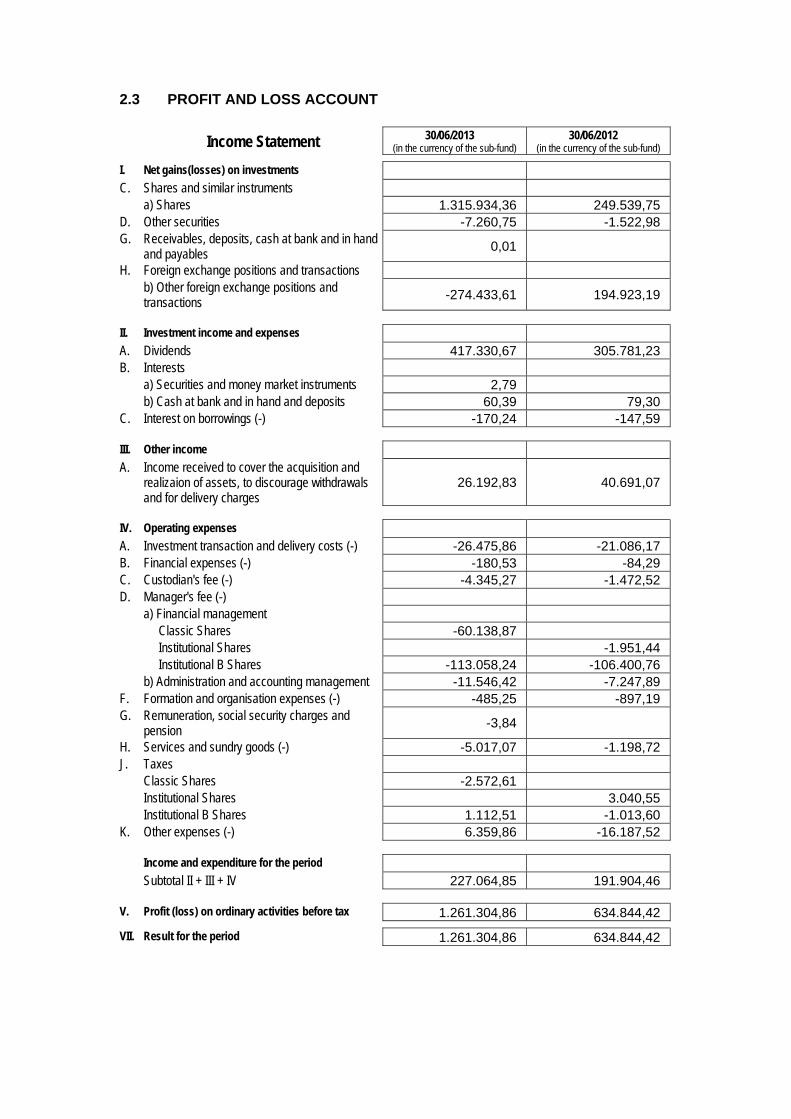
2.3 PROFIT AND LOSS ACCOUNT
Income Statement 30/06/2013 (in the currency of the sub-fund)
30/06/2012 (in the currency of the sub-fund)
I. Net gains(losses) on investments C. Shares and similar instruments a) Shares 1.315.934,36 249.539,75 D. Other securities -7.260,75 -1.522,98 G. Receivables, deposits, cash at bank and in hand
and payables 0,01
H. Foreign exchange positions and transactions b) Other foreign exchange positions and
transactions -274.433,61 194.923,19
II. Investment income and expenses A. Dividends 417.330,67 305.781,23 B. Interests a) Securities and money market instruments 2,79 b) Cash at bank and in hand and deposits 60,39 79,30 C. Interest on borrowings (-) -170,24 -147,59
III. Other income A. Income received to cover the acquisition and
realizaion of assets, to discourage withdrawals and for delivery charges
26.192,83 40.691,07
IV. Operating expenses A. Investment transaction and delivery costs (-) -26.475,86 -21.086,17 B. Financial expenses (-) -180,53 -84,29 C. Custodian's fee (-) -4.345,27 -1.472,52 D. Manager's fee (-) a) Financial management Classic Shares -60.138,87 Institutional Shares -1.951,44 Institutional B Shares -113.058,24 -106.400,76 b) Administration and accounting management -11.546,42 -7.247,89 F. Formation and organisation expenses (-) -485,25 -897,19 G. Remuneration, social security charges and
pension -3,84
H. Services and sundry goods (-) -5.017,07 -1.198,72 J. Taxes Classic Shares -2.572,61 Institutional Shares 3.040,55 Institutional B Shares 1.112,51 -1.013,60 K. Other expenses (-) 6.359,86 -16.187,52
Income and expenditure for the period Subtotal II + III + IV 227.064,85 191.904,46
V. Profit (loss) on ordinary activities before tax 1.261.304,86 634.844,42
VII. Result for the period 1.261.304,86 634.844,42
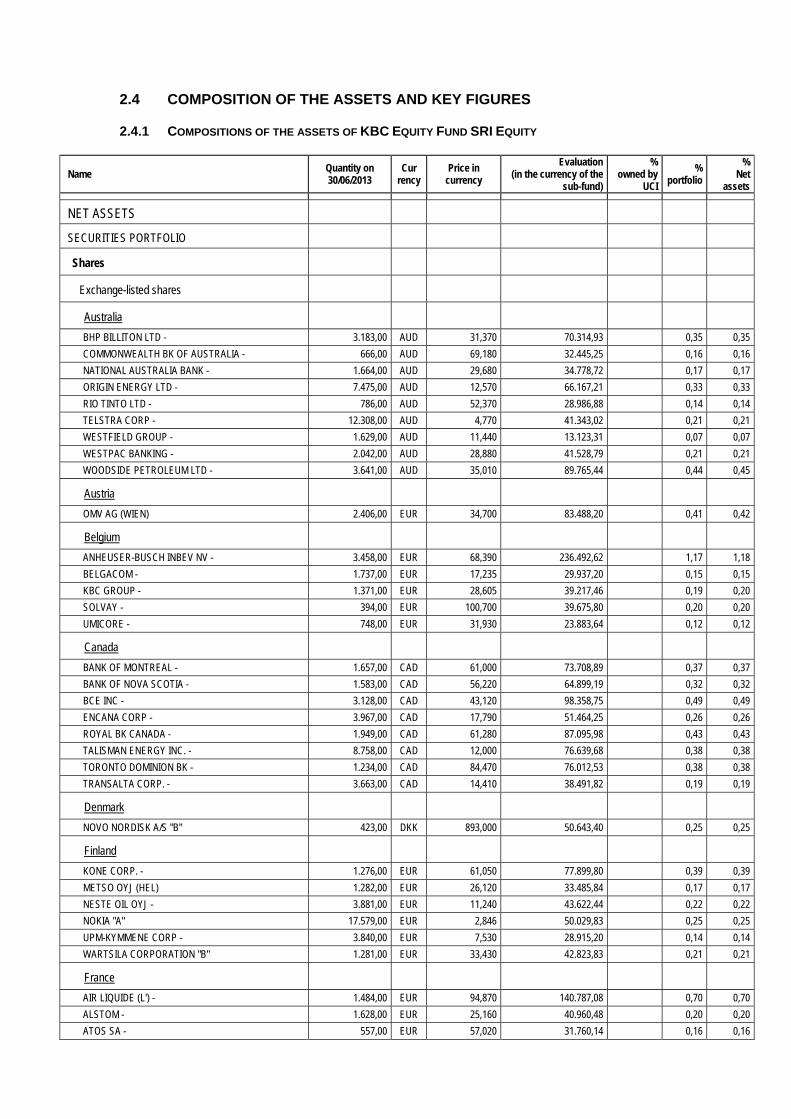
2.4 COMPOSITION OF THE ASSETS AND KEY FIGURES
2.4.1 COMPOSITIONS OF THE ASSETS OF KBC EQUITY FUND SRI EQUITY
Name Quantity on 30/06/2013
Cur rency
Price in currency
Evaluation (in the currency of the
sub-fund)
% owned by
UCI
% portfolio
% Net
assets
NET ASSETS
SECURITIES PORTFOLIO
Shares
Exchange-listed shares
Australia
BHP BILLITON LTD - 3.183,00 AUD 31,370 70.314,93 0,35 0,35
COMMONWEALTH BK OF AUSTRALIA - 666,00 AUD 69,180 32.445,25 0,16 0,16
NATIONAL AUSTRALIA BANK - 1.664,00 AUD 29,680 34.778,72 0,17 0,17
ORIGIN ENERGY LTD - 7.475,00 AUD 12,570 66.167,21 0,33 0,33
RIO TINTO LTD - 786,00 AUD 52,370 28.986,88 0,14 0,14
TELSTRA CORP - 12.308,00 AUD 4,770 41.343,02 0,21 0,21
WESTFIELD GROUP - 1.629,00 AUD 11,440 13.123,31 0,07 0,07
WESTPAC BANKING - 2.042,00 AUD 28,880 41.528,79 0,21 0,21
WOODSIDE PETROLEUM LTD - 3.641,00 AUD 35,010 89.765,44 0,44 0,45
Austria
OMV AG (WIEN) 2.406,00 EUR 34,700 83.488,20 0,41 0,42
Belgium
ANHEUSER-BUSCH INBEV NV - 3.458,00 EUR 68,390 236.492,62 1,17 1,18
BELGACOM - 1.737,00 EUR 17,235 29.937,20 0,15 0,15
KBC GROUP - 1.371,00 EUR 28,605 39.217,46 0,19 0,20
SOLVAY - 394,00 EUR 100,700 39.675,80 0,20 0,20
UMICORE - 748,00 EUR 31,930 23.883,64 0,12 0,12
Canada
BANK OF MONTREAL - 1.657,00 CAD 61,000 73.708,89 0,37 0,37
BANK OF NOVA SCOTIA - 1.583,00 CAD 56,220 64.899,19 0,32 0,32
BCE INC - 3.128,00 CAD 43,120 98.358,75 0,49 0,49
ENCANA CORP - 3.967,00 CAD 17,790 51.464,25 0,26 0,26
ROYAL BK CANADA - 1.949,00 CAD 61,280 87.095,98 0,43 0,43
TALISMAN ENERGY INC. - 8.758,00 CAD 12,000 76.639,68 0,38 0,38
TORONTO DOMINION BK - 1.234,00 CAD 84,470 76.012,53 0,38 0,38
TRANSALTA CORP. - 3.663,00 CAD 14,410 38.491,82 0,19 0,19
Denmark
NOVO NORDISK A/S "B" 423,00 DKK 893,000 50.643,40 0,25 0,25
Finland
KONE CORP. - 1.276,00 EUR 61,050 77.899,80 0,39 0,39
METSO OYJ (HEL) 1.282,00 EUR 26,120 33.485,84 0,17 0,17
NESTE OIL OYJ - 3.881,00 EUR 11,240 43.622,44 0,22 0,22
NOKIA "A" 17.579,00 EUR 2,846 50.029,83 0,25 0,25
UPM-KYMMENE CORP - 3.840,00 EUR 7,530 28.915,20 0,14 0,14
WARTSILA CORPORATION "B" 1.281,00 EUR 33,430 42.823,83 0,21 0,21
France
AIR LIQUIDE (L') - 1.484,00 EUR 94,870 140.787,08 0,70 0,70
ALSTOM - 1.628,00 EUR 25,160 40.960,48 0,20 0,20
ATOS SA - 557,00 EUR 57,020 31.760,14 0,16 0,16
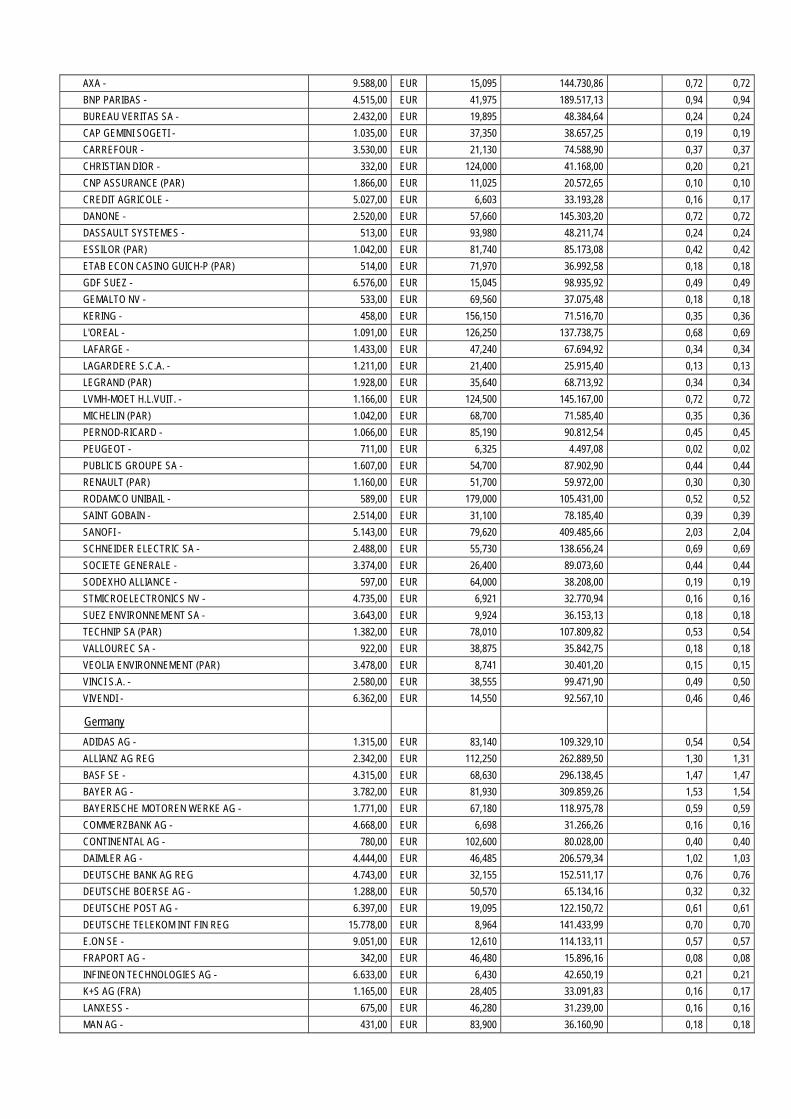
AXA - 9.588,00 EUR 15,095 144.730,86 0,72 0,72
BNP PARIBAS - 4.515,00 EUR 41,975 189.517,13 0,94 0,94
BUREAU VERITAS SA - 2.432,00 EUR 19,895 48.384,64 0,24 0,24
CAP GEMINI SOGETI - 1.035,00 EUR 37,350 38.657,25 0,19 0,19
CARREFOUR - 3.530,00 EUR 21,130 74.588,90 0,37 0,37
CHRISTIAN DIOR - 332,00 EUR 124,000 41.168,00 0,20 0,21
CNP ASSURANCE (PAR) 1.866,00 EUR 11,025 20.572,65 0,10 0,10
CREDIT AGRICOLE - 5.027,00 EUR 6,603 33.193,28 0,16 0,17
DANONE - 2.520,00 EUR 57,660 145.303,20 0,72 0,72
DASSAULT SYSTEMES - 513,00 EUR 93,980 48.211,74 0,24 0,24
ESSILOR (PAR) 1.042,00 EUR 81,740 85.173,08 0,42 0,42
ETAB ECON CASINO GUICH-P (PAR) 514,00 EUR 71,970 36.992,58 0,18 0,18
GDF SUEZ - 6.576,00 EUR 15,045 98.935,92 0,49 0,49
GEMALTO NV - 533,00 EUR 69,560 37.075,48 0,18 0,18
KERING - 458,00 EUR 156,150 71.516,70 0,35 0,36
L'OREAL - 1.091,00 EUR 126,250 137.738,75 0,68 0,69
LAFARGE - 1.433,00 EUR 47,240 67.694,92 0,34 0,34
LAGARDERE S.C.A. - 1.211,00 EUR 21,400 25.915,40 0,13 0,13
LEGRAND (PAR) 1.928,00 EUR 35,640 68.713,92 0,34 0,34
LVMH-MOET H.L.VUIT. - 1.166,00 EUR 124,500 145.167,00 0,72 0,72
MICHELIN (PAR) 1.042,00 EUR 68,700 71.585,40 0,35 0,36
PERNOD-RICARD - 1.066,00 EUR 85,190 90.812,54 0,45 0,45
PEUGEOT - 711,00 EUR 6,325 4.497,08 0,02 0,02
PUBLICIS GROUPE SA - 1.607,00 EUR 54,700 87.902,90 0,44 0,44
RENAULT (PAR) 1.160,00 EUR 51,700 59.972,00 0,30 0,30
RODAMCO UNIBAIL - 589,00 EUR 179,000 105.431,00 0,52 0,52
SAINT GOBAIN - 2.514,00 EUR 31,100 78.185,40 0,39 0,39
SANOFI - 5.143,00 EUR 79,620 409.485,66 2,03 2,04
SCHNEIDER ELECTRIC SA - 2.488,00 EUR 55,730 138.656,24 0,69 0,69
SOCIETE GENERALE - 3.374,00 EUR 26,400 89.073,60 0,44 0,44
SODEXHO ALLIANCE - 597,00 EUR 64,000 38.208,00 0,19 0,19
STMICROELECTRONICS NV - 4.735,00 EUR 6,921 32.770,94 0,16 0,16
SUEZ ENVIRONNEMENT SA - 3.643,00 EUR 9,924 36.153,13 0,18 0,18
TECHNIP SA (PAR) 1.382,00 EUR 78,010 107.809,82 0,53 0,54
VALLOUREC SA - 922,00 EUR 38,875 35.842,75 0,18 0,18
VEOLIA ENVIRONNEMENT (PAR) 3.478,00 EUR 8,741 30.401,20 0,15 0,15
VINCI S.A. - 2.580,00 EUR 38,555 99.471,90 0,49 0,50
VIVENDI - 6.362,00 EUR 14,550 92.567,10 0,46 0,46
Germany
ADIDAS AG - 1.315,00 EUR 83,140 109.329,10 0,54 0,54
ALLIANZ AG REG 2.342,00 EUR 112,250 262.889,50 1,30 1,31
BASF SE - 4.315,00 EUR 68,630 296.138,45 1,47 1,47
BAYER AG - 3.782,00 EUR 81,930 309.859,26 1,53 1,54
BAYERISCHE MOTOREN WERKE AG - 1.771,00 EUR 67,180 118.975,78 0,59 0,59
COMMERZBANK AG - 4.668,00 EUR 6,698 31.266,26 0,16 0,16
CONTINENTAL AG - 780,00 EUR 102,600 80.028,00 0,40 0,40
DAIMLER AG - 4.444,00 EUR 46,485 206.579,34 1,02 1,03
DEUTSCHE BANK AG REG 4.743,00 EUR 32,155 152.511,17 0,76 0,76
DEUTSCHE BOERSE AG - 1.288,00 EUR 50,570 65.134,16 0,32 0,32
DEUTSCHE POST AG - 6.397,00 EUR 19,095 122.150,72 0,61 0,61
DEUTSCHE TELEKOM INT FIN REG 15.778,00 EUR 8,964 141.433,99 0,70 0,70
E.ON SE - 9.051,00 EUR 12,610 114.133,11 0,57 0,57
FRAPORT AG - 342,00 EUR 46,480 15.896,16 0,08 0,08
INFINEON TECHNOLOGIES AG - 6.633,00 EUR 6,430 42.650,19 0,21 0,21
K+S AG (FRA) 1.165,00 EUR 28,405 33.091,83 0,16 0,17
LANXESS - 675,00 EUR 46,280 31.239,00 0,16 0,16
MAN AG - 431,00 EUR 83,900 36.160,90 0,18 0,18
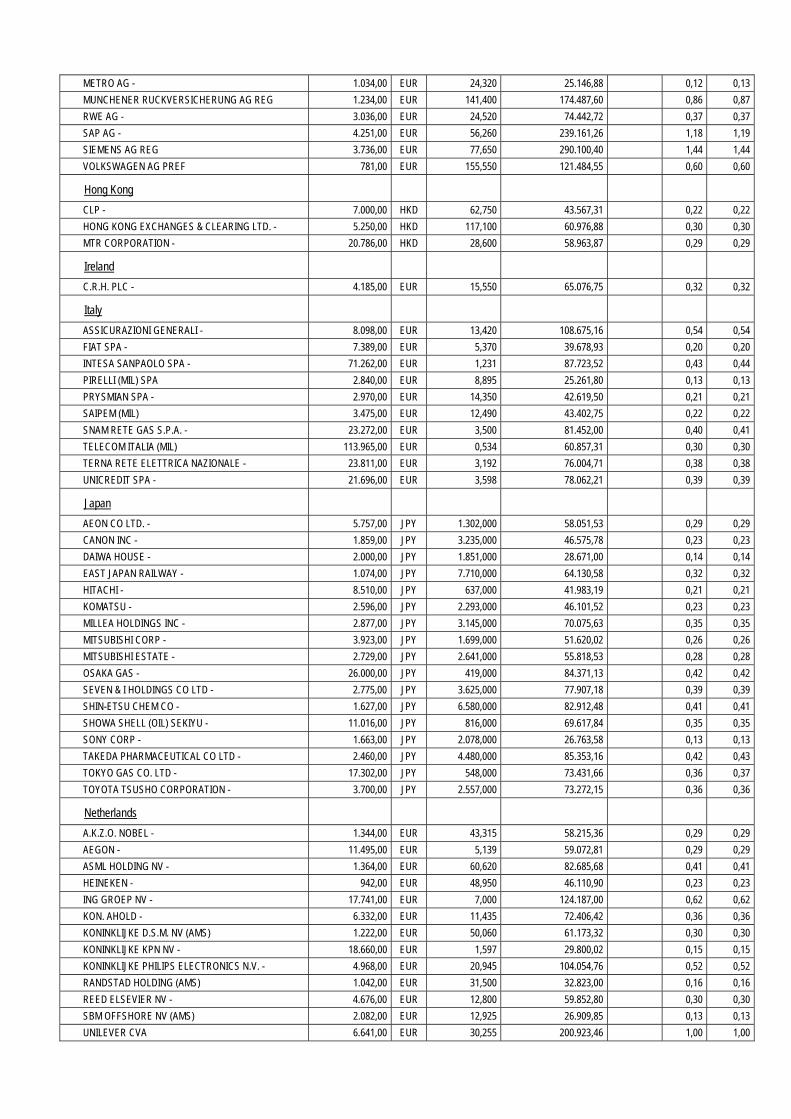
METRO AG - 1.034,00 EUR 24,320 25.146,88 0,12 0,13
MUNCHENER RUCKVERSICHERUNG AG REG 1.234,00 EUR 141,400 174.487,60 0,86 0,87
RWE AG - 3.036,00 EUR 24,520 74.442,72 0,37 0,37
SAP AG - 4.251,00 EUR 56,260 239.161,26 1,18 1,19
SIEMENS AG REG 3.736,00 EUR 77,650 290.100,40 1,44 1,44
VOLKSWAGEN AG PREF 781,00 EUR 155,550 121.484,55 0,60 0,60
Hong Kong
CLP - 7.000,00 HKD 62,750 43.567,31 0,22 0,22
HONG KONG EXCHANGES & CLEARING LTD. - 5.250,00 HKD 117,100 60.976,88 0,30 0,30
MTR CORPORATION - 20.786,00 HKD 28,600 58.963,87 0,29 0,29
Ireland
C.R.H. PLC - 4.185,00 EUR 15,550 65.076,75 0,32 0,32
Italy
ASSICURAZIONI GENERALI - 8.098,00 EUR 13,420 108.675,16 0,54 0,54
FIAT SPA - 7.389,00 EUR 5,370 39.678,93 0,20 0,20
INTESA SANPAOLO SPA - 71.262,00 EUR 1,231 87.723,52 0,43 0,44
PIRELLI (MIL) SPA 2.840,00 EUR 8,895 25.261,80 0,13 0,13
PRYSMIAN SPA - 2.970,00 EUR 14,350 42.619,50 0,21 0,21
SAIPEM (MIL) 3.475,00 EUR 12,490 43.402,75 0,22 0,22
SNAM RETE GAS S.P.A. - 23.272,00 EUR 3,500 81.452,00 0,40 0,41
TELECOM ITALIA (MIL) 113.965,00 EUR 0,534 60.857,31 0,30 0,30
TERNA RETE ELETTRICA NAZIONALE - 23.811,00 EUR 3,192 76.004,71 0,38 0,38
UNICREDIT SPA - 21.696,00 EUR 3,598 78.062,21 0,39 0,39
Japan
AEON CO LTD. - 5.757,00 JPY 1.302,000 58.051,53 0,29 0,29
CANON INC - 1.859,00 JPY 3.235,000 46.575,78 0,23 0,23
DAIWA HOUSE - 2.000,00 JPY 1.851,000 28.671,00 0,14 0,14
EAST JAPAN RAILWAY - 1.074,00 JPY 7.710,000 64.130,58 0,32 0,32
HITACHI - 8.510,00 JPY 637,000 41.983,19 0,21 0,21
KOMATSU - 2.596,00 JPY 2.293,000 46.101,52 0,23 0,23
MILLEA HOLDINGS INC - 2.877,00 JPY 3.145,000 70.075,63 0,35 0,35
MITSUBISHI CORP - 3.923,00 JPY 1.699,000 51.620,02 0,26 0,26
MITSUBISHI ESTATE - 2.729,00 JPY 2.641,000 55.818,53 0,28 0,28
OSAKA GAS - 26.000,00 JPY 419,000 84.371,13 0,42 0,42
SEVEN & I HOLDINGS CO LTD - 2.775,00 JPY 3.625,000 77.907,18 0,39 0,39
SHIN-ETSU CHEM CO - 1.627,00 JPY 6.580,000 82.912,48 0,41 0,41
SHOWA SHELL (OIL) SEKIYU - 11.016,00 JPY 816,000 69.617,84 0,35 0,35
SONY CORP - 1.663,00 JPY 2.078,000 26.763,58 0,13 0,13
TAKEDA PHARMACEUTICAL CO LTD - 2.460,00 JPY 4.480,000 85.353,16 0,42 0,43
TOKYO GAS CO. LTD - 17.302,00 JPY 548,000 73.431,66 0,36 0,37
TOYOTA TSUSHO CORPORATION - 3.700,00 JPY 2.557,000 73.272,15 0,36 0,36
Netherlands
A.K.Z.O. NOBEL - 1.344,00 EUR 43,315 58.215,36 0,29 0,29
AEGON - 11.495,00 EUR 5,139 59.072,81 0,29 0,29
ASML HOLDING NV - 1.364,00 EUR 60,620 82.685,68 0,41 0,41
HEINEKEN - 942,00 EUR 48,950 46.110,90 0,23 0,23
ING GROEP NV - 17.741,00 EUR 7,000 124.187,00 0,62 0,62
KON. AHOLD - 6.332,00 EUR 11,435 72.406,42 0,36 0,36
KONINKLIJKE D.S.M. NV (AMS) 1.222,00 EUR 50,060 61.173,32 0,30 0,30
KONINKLIJKE KPN NV - 18.660,00 EUR 1,597 29.800,02 0,15 0,15
KONINKLIJKE PHILIPS ELECTRONICS N.V. - 4.968,00 EUR 20,945 104.054,76 0,52 0,52
RANDSTAD HOLDING (AMS) 1.042,00 EUR 31,500 32.823,00 0,16 0,16
REED ELSEVIER NV - 4.676,00 EUR 12,800 59.852,80 0,30 0,30
SBM OFFSHORE NV (AMS) 2.082,00 EUR 12,925 26.909,85 0,13 0,13
UNILEVER CVA 6.641,00 EUR 30,255 200.923,46 1,00 1,00
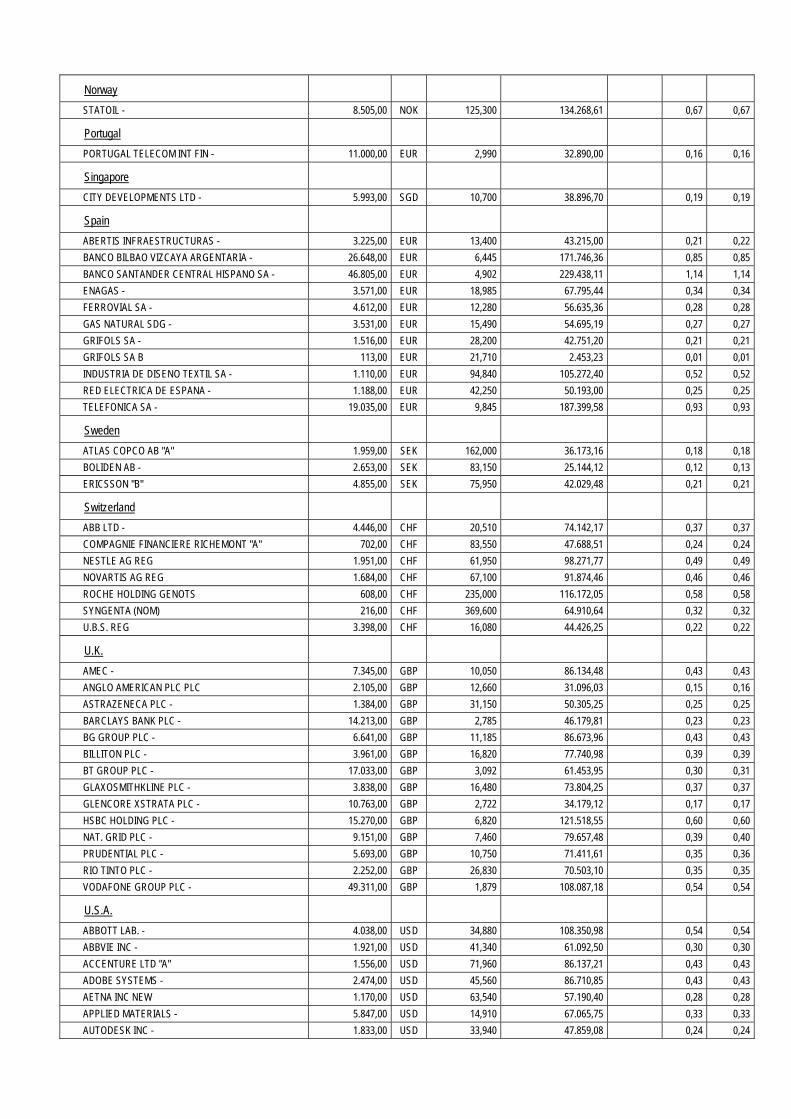
Norway
STATOIL - 8.505,00 NOK 125,300 134.268,61 0,67 0,67
Portugal
PORTUGAL TELECOM INT FIN - 11.000,00 EUR 2,990 32.890,00 0,16 0,16
Singapore
CITY DEVELOPMENTS LTD - 5.993,00 SGD 10,700 38.896,70 0,19 0,19
Spain
ABERTIS INFRAESTRUCTURAS - 3.225,00 EUR 13,400 43.215,00 0,21 0,22
BANCO BILBAO VIZCAYA ARGENTARIA - 26.648,00 EUR 6,445 171.746,36 0,85 0,85
BANCO SANTANDER CENTRAL HISPANO SA - 46.805,00 EUR 4,902 229.438,11 1,14 1,14
ENAGAS - 3.571,00 EUR 18,985 67.795,44 0,34 0,34
FERROVIAL SA - 4.612,00 EUR 12,280 56.635,36 0,28 0,28
GAS NATURAL SDG - 3.531,00 EUR 15,490 54.695,19 0,27 0,27
GRIFOLS SA - 1.516,00 EUR 28,200 42.751,20 0,21 0,21
GRIFOLS SA B 113,00 EUR 21,710 2.453,23 0,01 0,01
INDUSTRIA DE DISENO TEXTIL SA - 1.110,00 EUR 94,840 105.272,40 0,52 0,52
RED ELECTRICA DE ESPANA - 1.188,00 EUR 42,250 50.193,00 0,25 0,25
TELEFONICA SA - 19.035,00 EUR 9,845 187.399,58 0,93 0,93
Sweden
ATLAS COPCO AB "A" 1.959,00 SEK 162,000 36.173,16 0,18 0,18
BOLIDEN AB - 2.653,00 SEK 83,150 25.144,12 0,12 0,13
ERICSSON "B" 4.855,00 SEK 75,950 42.029,48 0,21 0,21
Switzerland
ABB LTD - 4.446,00 CHF 20,510 74.142,17 0,37 0,37
COMPAGNIE FINANCIERE RICHEMONT "A" 702,00 CHF 83,550 47.688,51 0,24 0,24
NESTLE AG REG 1.951,00 CHF 61,950 98.271,77 0,49 0,49
NOVARTIS AG REG 1.684,00 CHF 67,100 91.874,46 0,46 0,46
ROCHE HOLDING GENOTS 608,00 CHF 235,000 116.172,05 0,58 0,58
SYNGENTA (NOM) 216,00 CHF 369,600 64.910,64 0,32 0,32
U.B.S. REG 3.398,00 CHF 16,080 44.426,25 0,22 0,22
U.K.
AMEC - 7.345,00 GBP 10,050 86.134,48 0,43 0,43
ANGLO AMERICAN PLC PLC 2.105,00 GBP 12,660 31.096,03 0,15 0,16
ASTRAZENECA PLC - 1.384,00 GBP 31,150 50.305,25 0,25 0,25
BARCLAYS BANK PLC - 14.213,00 GBP 2,785 46.179,81 0,23 0,23
BG GROUP PLC - 6.641,00 GBP 11,185 86.673,96 0,43 0,43
BILLITON PLC - 3.961,00 GBP 16,820 77.740,98 0,39 0,39
BT GROUP PLC - 17.033,00 GBP 3,092 61.453,95 0,30 0,31
GLAXOSMITHKLINE PLC - 3.838,00 GBP 16,480 73.804,25 0,37 0,37
GLENCORE XSTRATA PLC - 10.763,00 GBP 2,722 34.179,12 0,17 0,17
HSBC HOLDING PLC - 15.270,00 GBP 6,820 121.518,55 0,60 0,60
NAT. GRID PLC - 9.151,00 GBP 7,460 79.657,48 0,39 0,40
PRUDENTIAL PLC - 5.693,00 GBP 10,750 71.411,61 0,35 0,36
RIO TINTO PLC - 2.252,00 GBP 26,830 70.503,10 0,35 0,35
VODAFONE GROUP PLC - 49.311,00 GBP 1,879 108.087,18 0,54 0,54
U.S.A.
ABBOTT LAB. - 4.038,00 USD 34,880 108.350,98 0,54 0,54
ABBVIE INC - 1.921,00 USD 41,340 61.092,50 0,30 0,30
ACCENTURE LTD "A" 1.556,00 USD 71,960 86.137,21 0,43 0,43
ADOBE SYSTEMS - 2.474,00 USD 45,560 86.710,85 0,43 0,43
AETNA INC NEW 1.170,00 USD 63,540 57.190,40 0,28 0,28
APPLIED MATERIALS - 5.847,00 USD 14,910 67.065,75 0,33 0,33
AUTODESK INC - 1.833,00 USD 33,940 47.859,08 0,24 0,24
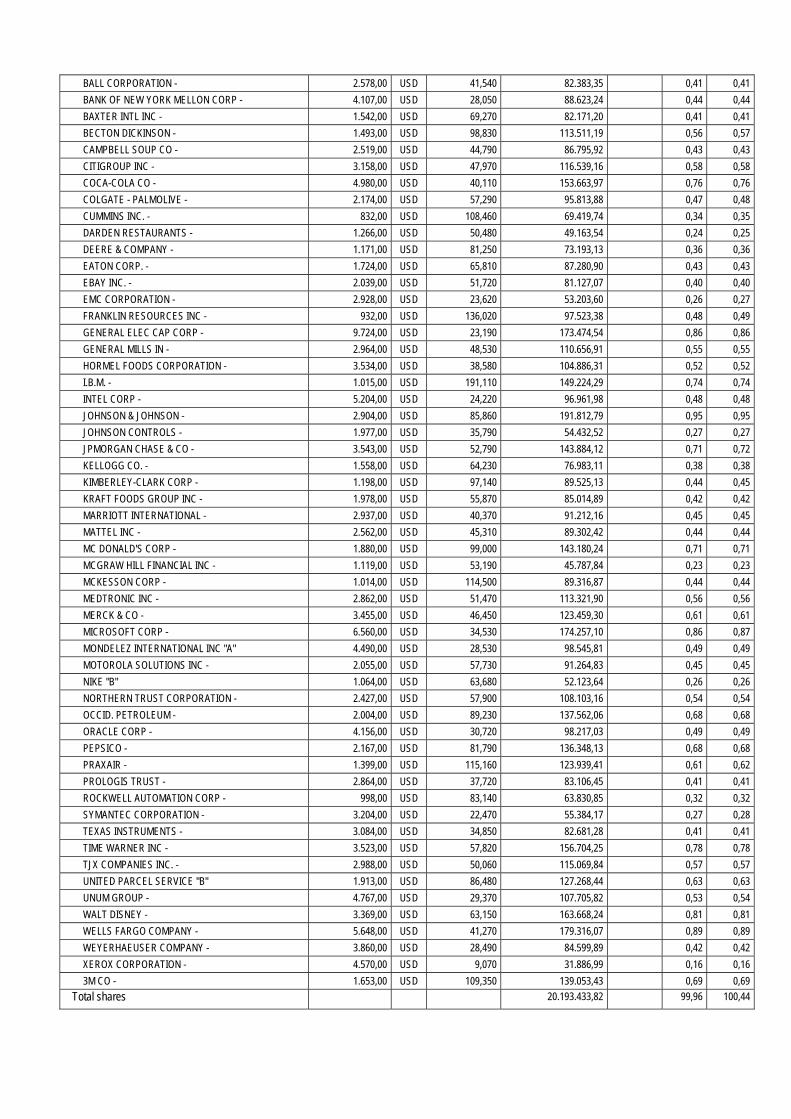
BALL CORPORATION - 2.578,00 USD 41,540 82.383,35 0,41 0,41
BANK OF NEW YORK MELLON CORP - 4.107,00 USD 28,050 88.623,24 0,44 0,44
BAXTER INTL INC - 1.542,00 USD 69,270 82.171,20 0,41 0,41
BECTON DICKINSON - 1.493,00 USD 98,830 113.511,19 0,56 0,57
CAMPBELL SOUP CO - 2.519,00 USD 44,790 86.795,92 0,43 0,43
CITIGROUP INC - 3.158,00 USD 47,970 116.539,16 0,58 0,58
COCA-COLA CO - 4.980,00 USD 40,110 153.663,97 0,76 0,76
COLGATE - PALMOLIVE - 2.174,00 USD 57,290 95.813,88 0,47 0,48
CUMMINS INC. - 832,00 USD 108,460 69.419,74 0,34 0,35
DARDEN RESTAURANTS - 1.266,00 USD 50,480 49.163,54 0,24 0,25
DEERE & COMPANY - 1.171,00 USD 81,250 73.193,13 0,36 0,36
EATON CORP. - 1.724,00 USD 65,810 87.280,90 0,43 0,43
EBAY INC. - 2.039,00 USD 51,720 81.127,07 0,40 0,40
EMC CORPORATION - 2.928,00 USD 23,620 53.203,60 0,26 0,27
FRANKLIN RESOURCES INC - 932,00 USD 136,020 97.523,38 0,48 0,49
GENERAL ELEC CAP CORP - 9.724,00 USD 23,190 173.474,54 0,86 0,86
GENERAL MILLS IN - 2.964,00 USD 48,530 110.656,91 0,55 0,55
HORMEL FOODS CORPORATION - 3.534,00 USD 38,580 104.886,31 0,52 0,52
I.B.M. - 1.015,00 USD 191,110 149.224,29 0,74 0,74
INTEL CORP - 5.204,00 USD 24,220 96.961,98 0,48 0,48
JOHNSON & JOHNSON - 2.904,00 USD 85,860 191.812,79 0,95 0,95
JOHNSON CONTROLS - 1.977,00 USD 35,790 54.432,52 0,27 0,27
JPMORGAN CHASE & CO - 3.543,00 USD 52,790 143.884,12 0,71 0,72
KELLOGG CO. - 1.558,00 USD 64,230 76.983,11 0,38 0,38
KIMBERLEY-CLARK CORP - 1.198,00 USD 97,140 89.525,13 0,44 0,45
KRAFT FOODS GROUP INC - 1.978,00 USD 55,870 85.014,89 0,42 0,42
MARRIOTT INTERNATIONAL - 2.937,00 USD 40,370 91.212,16 0,45 0,45
MATTEL INC - 2.562,00 USD 45,310 89.302,42 0,44 0,44
MC DONALD'S CORP - 1.880,00 USD 99,000 143.180,24 0,71 0,71
MCGRAW HILL FINANCIAL INC - 1.119,00 USD 53,190 45.787,84 0,23 0,23
MCKESSON CORP - 1.014,00 USD 114,500 89.316,87 0,44 0,44
MEDTRONIC INC - 2.862,00 USD 51,470 113.321,90 0,56 0,56
MERCK & CO - 3.455,00 USD 46,450 123.459,30 0,61 0,61
MICROSOFT CORP - 6.560,00 USD 34,530 174.257,10 0,86 0,87
MONDELEZ INTERNATIONAL INC "A" 4.490,00 USD 28,530 98.545,81 0,49 0,49
MOTOROLA SOLUTIONS INC - 2.055,00 USD 57,730 91.264,83 0,45 0,45
NIKE "B" 1.064,00 USD 63,680 52.123,64 0,26 0,26
NORTHERN TRUST CORPORATION - 2.427,00 USD 57,900 108.103,16 0,54 0,54
OCCID. PETROLEUM - 2.004,00 USD 89,230 137.562,06 0,68 0,68
ORACLE CORP - 4.156,00 USD 30,720 98.217,03 0,49 0,49
PEPSICO - 2.167,00 USD 81,790 136.348,13 0,68 0,68
PRAXAIR - 1.399,00 USD 115,160 123.939,41 0,61 0,62
PROLOGIS TRUST - 2.864,00 USD 37,720 83.106,45 0,41 0,41
ROCKWELL AUTOMATION CORP - 998,00 USD 83,140 63.830,85 0,32 0,32
SYMANTEC CORPORATION - 3.204,00 USD 22,470 55.384,17 0,27 0,28
TEXAS INSTRUMENTS - 3.084,00 USD 34,850 82.681,28 0,41 0,41
TIME WARNER INC - 3.523,00 USD 57,820 156.704,25 0,78 0,78
TJX COMPANIES INC. - 2.988,00 USD 50,060 115.069,84 0,57 0,57
UNITED PARCEL SERVICE "B" 1.913,00 USD 86,480 127.268,44 0,63 0,63
UNUM GROUP - 4.767,00 USD 29,370 107.705,82 0,53 0,54
WALT DISNEY - 3.369,00 USD 63,150 163.668,24 0,81 0,81
WELLS FARGO COMPANY - 5.648,00 USD 41,270 179.316,07 0,89 0,89
WEYERHAEUSER COMPANY - 3.860,00 USD 28,490 84.599,89 0,42 0,42
XEROX CORPORATION - 4.570,00 USD 9,070 31.886,99 0,16 0,16
3M CO - 1.653,00 USD 109,350 139.053,43 0,69 0,69
Total shares 20.193.433,82 99,96 100,44
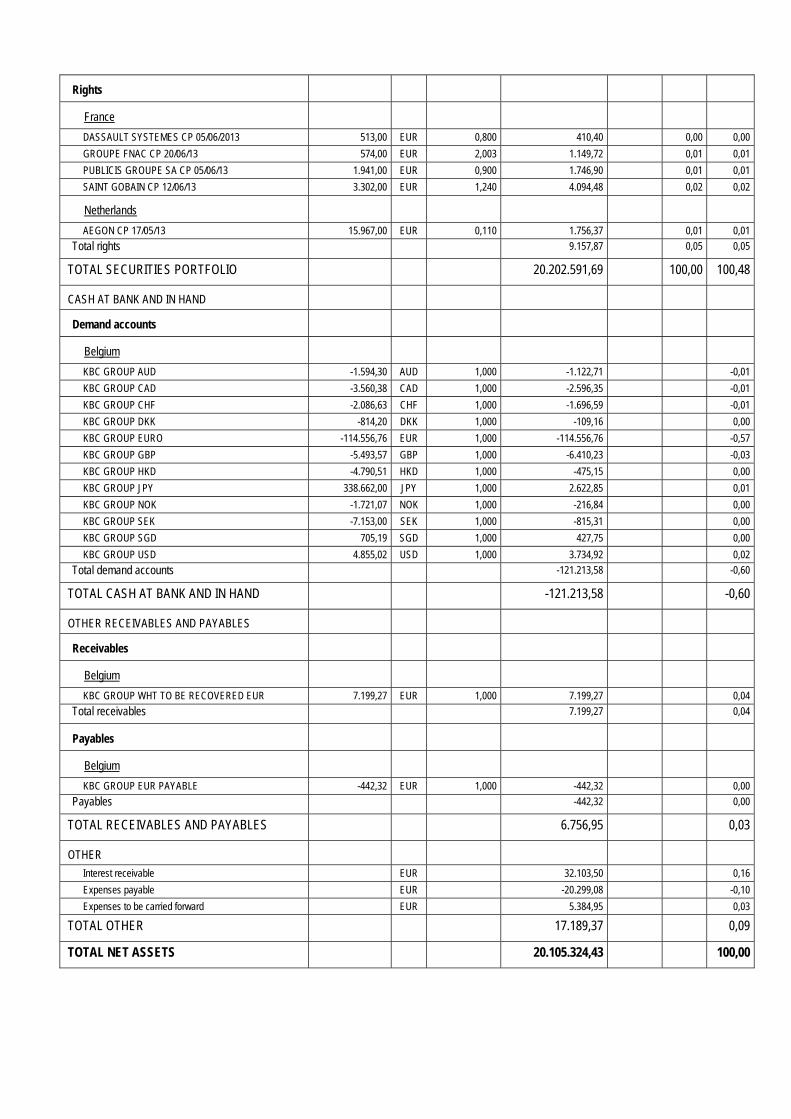
Rights
France
DASSAULT SYSTEMES CP 05/06/2013 513,00 EUR 0,800 410,40 0,00 0,00
GROUPE FNAC CP 20/06/13 574,00 EUR 2,003 1.149,72 0,01 0,01
PUBLICIS GROUPE SA CP 05/06/13 1.941,00 EUR 0,900 1.746,90 0,01 0,01
SAINT GOBAIN CP 12/06/13 3.302,00 EUR 1,240 4.094,48 0,02 0,02
Netherlands
AEGON CP 17/05/13 15.967,00 EUR 0,110 1.756,37 0,01 0,01
Total rights 9.157,87 0,05 0,05
TOTAL SECURITIES PORTFOLIO 20.202.591,69 100,00 100,48
CASH AT BANK AND IN HAND
Demand accounts
Belgium
KBC GROUP AUD -1.594,30 AUD 1,000 -1.122,71 -0,01
KBC GROUP CAD -3.560,38 CAD 1,000 -2.596,35 -0,01
KBC GROUP CHF -2.086,63 CHF 1,000 -1.696,59 -0,01
KBC GROUP DKK -814,20 DKK 1,000 -109,16 0,00
KBC GROUP EURO -114.556,76 EUR 1,000 -114.556,76 -0,57
KBC GROUP GBP -5.493,57 GBP 1,000 -6.410,23 -0,03
KBC GROUP HKD -4.790,51 HKD 1,000 -475,15 0,00
KBC GROUP JPY 338.662,00 JPY 1,000 2.622,85 0,01
KBC GROUP NOK -1.721,07 NOK 1,000 -216,84 0,00
KBC GROUP SEK -7.153,00 SEK 1,000 -815,31 0,00
KBC GROUP SGD 705,19 SGD 1,000 427,75 0,00
KBC GROUP USD 4.855,02 USD 1,000 3.734,92 0,02
Total demand accounts -121.213,58 -0,60
TOTAL CASH AT BANK AND IN HAND -121.213,58 -0,60
OTHER RECEIVABLES AND PAYABLES
Receivables
Belgium
KBC GROUP WHT TO BE RECOVERED EUR 7.199,27 EUR 1,000 7.199,27 0,04
Total receivables 7.199,27 0,04
Payables
Belgium
KBC GROUP EUR PAYABLE -442,32 EUR 1,000 -442,32 0,00
Payables -442,32 0,00
TOTAL RECEIVABLES AND PAYABLES 6.756,95 0,03
OTHER
Interest receivable EUR 32.103,50 0,16
Expenses payable EUR -20.299,08 -0,10
Expenses to be carried forward EUR 5.384,95 0,03
TOTAL OTHER 17.189,37 0,09
TOTAL NET ASSETS 20.105.324,43 100,00
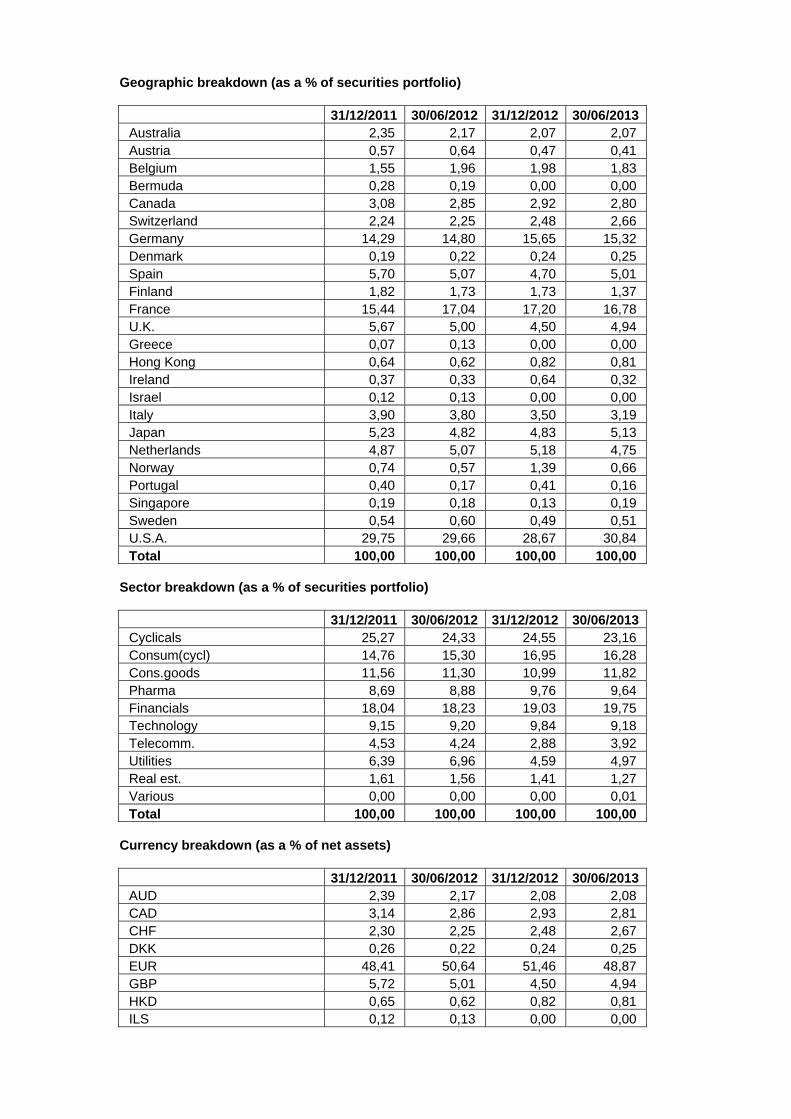
Geographic breakdown (as a % of securities portfolio)
31/12/2011 30/06/2012 31/12/2012 30/06/2013 Australia 2,35 2,17 2,07 2,07 Austria 0,57 0,64 0,47 0,41 Belgium 1,55 1,96 1,98 1,83 Bermuda 0,28 0,19 0,00 0,00 Canada 3,08 2,85 2,92 2,80 Switzerland 2,24 2,25 2,48 2,66 Germany 14,29 14,80 15,65 15,32 Denmark 0,19 0,22 0,24 0,25 Spain 5,70 5,07 4,70 5,01 Finland 1,82 1,73 1,73 1,37 France 15,44 17,04 17,20 16,78 U.K. 5,67 5,00 4,50 4,94 Greece 0,07 0,13 0,00 0,00 Hong Kong 0,64 0,62 0,82 0,81 Ireland 0,37 0,33 0,64 0,32 Israel 0,12 0,13 0,00 0,00 Italy 3,90 3,80 3,50 3,19 Japan 5,23 4,82 4,83 5,13 Netherlands 4,87 5,07 5,18 4,75 Norway 0,74 0,57 1,39 0,66 Portugal 0,40 0,17 0,41 0,16 Singapore 0,19 0,18 0,13 0,19 Sweden 0,54 0,60 0,49 0,51 U.S.A. 29,75 29,66 28,67 30,84 Total 100,00 100,00 100,00 100,00
Sector breakdown (as a % of securities portfolio)
31/12/2011 30/06/2012 31/12/2012 30/06/2013 Cyclicals 25,27 24,33 24,55 23,16 Consum(cycl) 14,76 15,30 16,95 16,28 Cons.goods 11,56 11,30 10,99 11,82 Pharma 8,69 8,88 9,76 9,64 Financials 18,04 18,23 19,03 19,75 Technology 9,15 9,20 9,84 9,18 Telecomm. 4,53 4,24 2,88 3,92 Utilities 6,39 6,96 4,59 4,97 Real est. 1,61 1,56 1,41 1,27 Various 0,00 0,00 0,00 0,01 Total 100,00 100,00 100,00 100,00
Currency breakdown (as a % of net assets)
31/12/2011 30/06/2012 31/12/2012 30/06/2013 AUD 2,39 2,17 2,08 2,08 CAD 3,14 2,86 2,93 2,81 CHF 2,30 2,25 2,48 2,67 DKK 0,26 0,22 0,24 0,25 EUR 48,41 50,64 51,46 48,87 GBP 5,72 5,01 4,50 4,94 HKD 0,65 0,62 0,82 0,81 ILS 0,12 0,13 0,00 0,00
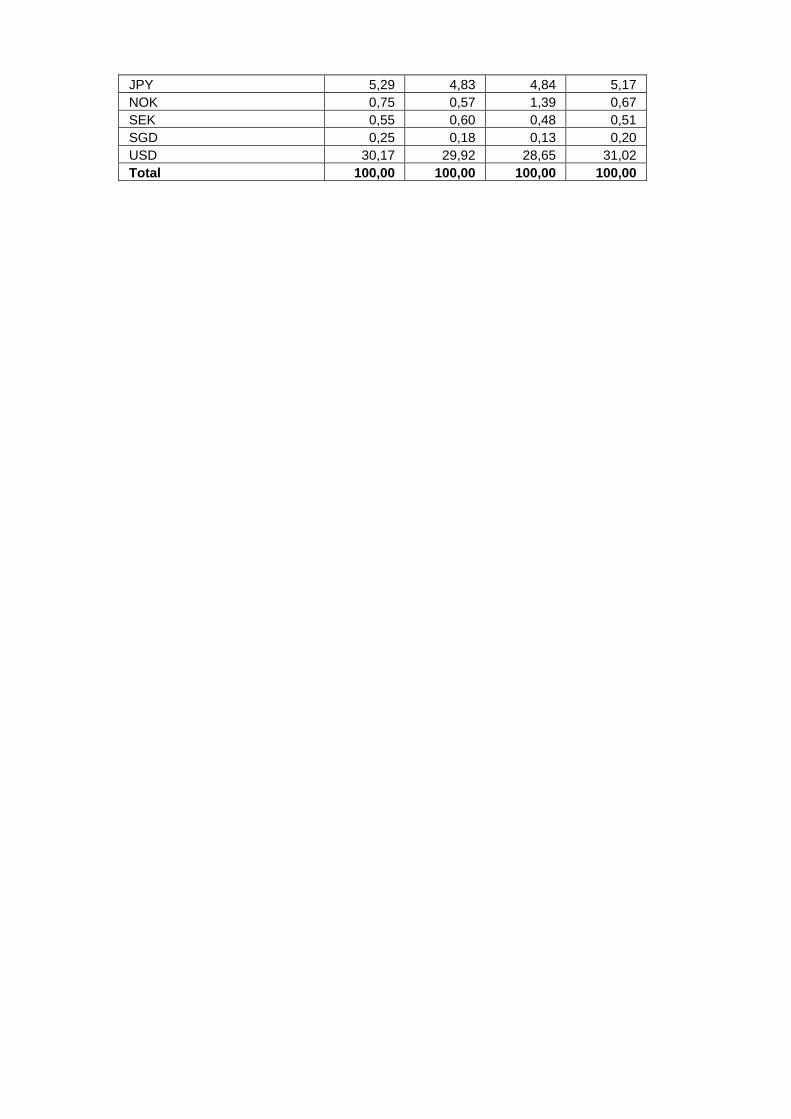
JPY 5,29 4,83 4,84 5,17 NOK 0,75 0,57 1,39 0,67 SEK 0,55 0,60 0,48 0,51 SGD 0,25 0,18 0,13 0,20 USD 30,17 29,92 28,65 31,02 Total 100,00 100,00 100,00 100,00

2.4.2 CHANGES IN THE COMPOSITION OF THE ASSETS OF KBC EQUITY FUND SRI EQUITY (IN THE
CURRENCY OF THE SUB-FUND)
1st half of year YearPurchases 6.306.442,75 6.306.442,75 Sales 11.504.265,11 11.504.265,11 Total 1 17.810.707,86 17.810.707,86 Subscriptions 5.907.067,54 5.907.067,54 Redemptions 11.346.488,88 11.346.488,88 Total 2 17.253.556,42 17.253.556,42 Monthly average of total assets
23.355.235,56 23.355.235,56
Turnover rate 2,38 % 2,38 %
1st half of year YearPurchases 6.306.442,75 6.306.442,75 Sales 11.504.265,11 11.504.265,11 Total 1 17.810.707,86 17.810.707,86 Subscriptions 5.907.067,54 5.907.067,54 Redemptions 11.346.488,88 11.346.488,88 Total 2 17.253.556,42 17.253.556,42 Monthly average of total assets
27.609.090,39 27.609.090,39
Corrected turnover rate 2,02 % 2,02 %
The table above shows the capital volume of portfolio transactions. This volume (adjusted to take account of total subscriptions and redemptions) is also compared to the average net assets at the beginning and end of the period. A figure close to 0% implies that the transactions relating to the securities or transactions relating to the assets (excluding deposits and cash) in a given period only involve subscriptions and redemptions. A negative percentage shows that subscriptions and redemptions entailed few, if any, transactions in the portfolio. Active asset management may result in high turnover rates (monthly percentage >50%). The detailed list of transactions is available for consultation free of charge at the registered office of the Bevek or fund at Havenlaan 2, 1080 Brussels.

2.4.3 AMOUNT OF COMMITMENTS IN RESPECT OF FINANCIAL DERIVATIVES POSITIONS Nil
2.4.4 CHANGES OF THE NUMBER OF SUBSCRIPTIONS AND REDEMPTIONS AND THE NET ASSET
VALUE
Classic Shares
Period Change in number of shares in circulation
Year Subscriptions Redemptions End of period
Cap. Dis. Cap. Dis. Cap. Dis. Total
2013 - 06 7.800,00 0,00 290,00 0,00 7.510,00 0,00 7.510,00
Period Amounts received and paid by the UCI
(in the currency of the class)
Year Subscriptions Redemptions
Capitalization Distribution Capitalization Distribution
2013 - 06 7.469.748,00 0,00 320.215,10 0,00
Period Net asset value
End of period (in the currency of the class)
Year Of the class Of one share
Capitalization Distribution
2013 - 06 7.872.717,36 1.048,30 N/A
Institutional Shares
Period Change in number of shares in circulation
Year Subscriptions Redemptions End of period
Cap. Dis. Cap. Dis. Cap. Dis. Total 2011 - 06 8.544,00 0,00 309,00 0,00 8.235,00 0,00 8.235,00
2012 - 06 14.218,00 0,00 22.453,00 0,00 0,00 0,00 0,00
Period Amounts received and paid by the UCI
(in the currency of the class)
Year Subscriptions Redemptions
Capitalization Distribution Capitalization Distribution
2011 - 06 8.544.000,00 0,00 304.099,26 0,00
2012 - 06 12.760.593,91 0,00 18.688.304,29 0,00
Period Net asset value
End of period (in the currency of the class)
Year Of the class Of one share
Capitalization Distribution
2011 - 06 7.938.971,68 964,05 N/A
Institutional B Shares
Period Change in number of shares in circulation
Year Subscriptions Redemptions End of period
Cap. Dis. Cap. Dis. Cap. Dis. Total
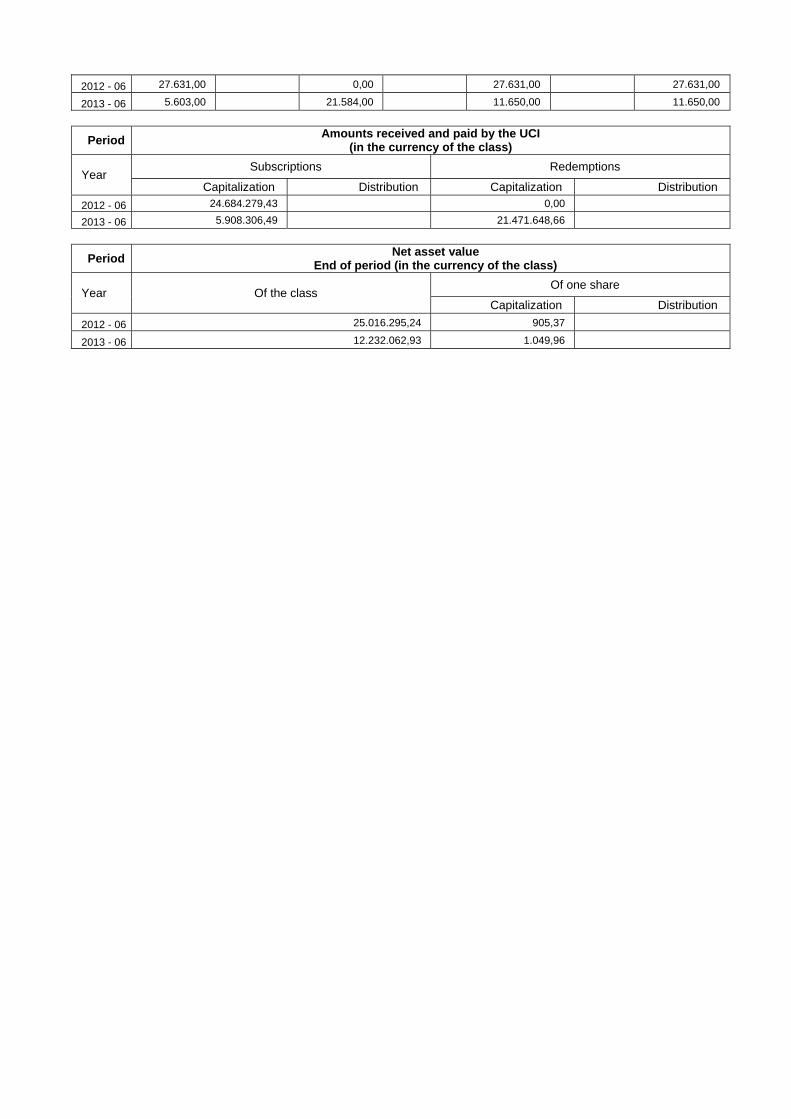
2012 - 06 27.631,00 0,00 27.631,00 27.631,00
2013 - 06 5.603,00 21.584,00 11.650,00 11.650,00
Period Amounts received and paid by the UCI
(in the currency of the class)
Year Subscriptions Redemptions
Capitalization Distribution Capitalization Distribution
2012 - 06 24.684.279,43 0,00
2013 - 06 5.908.306,49 21.471.648,66
Period Net asset value
End of period (in the currency of the class)
Year Of the class Of one share
Capitalization Distribution
2012 - 06 25.016.295,24 905,37
2013 - 06 12.232.062,93 1.049,96
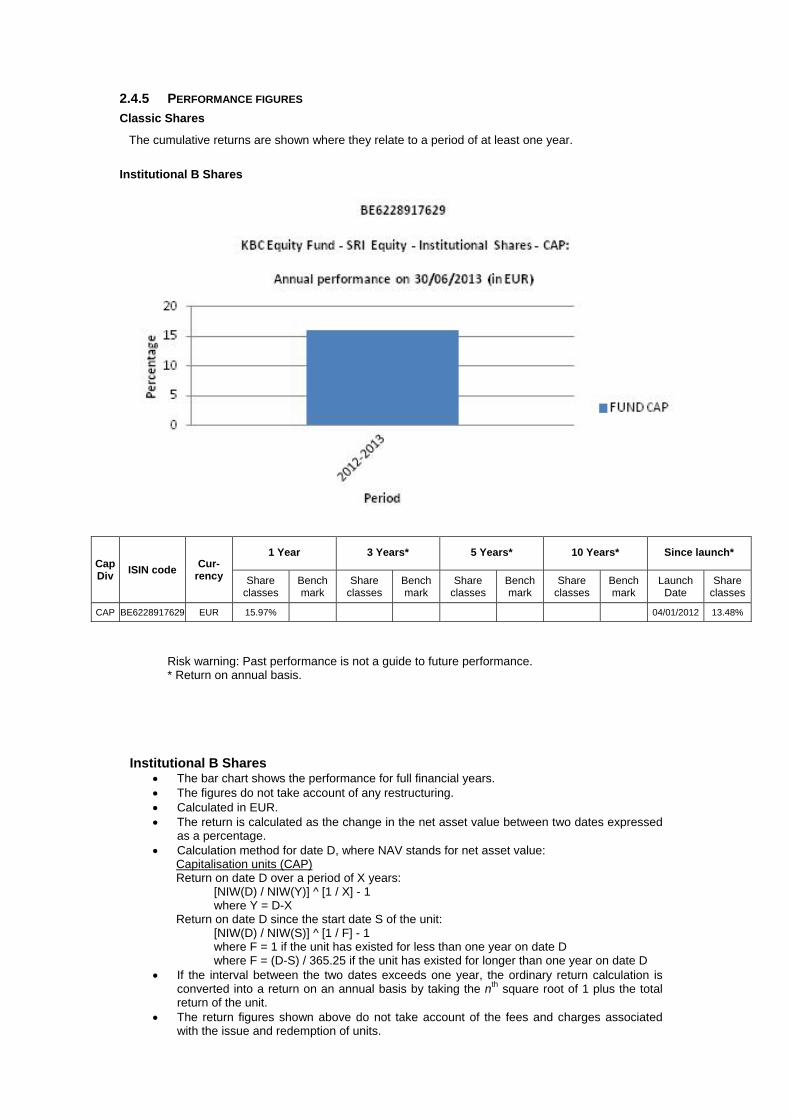
2.4.5 PERFORMANCE FIGURES
Classic Shares
The cumulative returns are shown where they relate to a period of at least one year.
Institutional B Shares
Cap Div
ISIN code Cur-
rency
1 Year 3 Years* 5 Years* 10 Years* Since launch*
Share classes
Bench mark
Share classes
Bench mark
Share classes
Bench mark
Share classes
Bench mark
Launch Date
Share classes
CAP BE6228917629 EUR 15.97% 04/01/2012 13.48%
Risk warning: Past performance is not a guide to future performance. * Return on annual basis.
Institutional B Shares The bar chart shows the performance for full financial years. The figures do not take account of any restructuring. Calculated in EUR. The return is calculated as the change in the net asset value between two dates expressed
as a percentage. Calculation method for date D, where NAV stands for net asset value:
Capitalisation units (CAP) Return on date D over a period of X years:
[NIW(D) / NIW(Y)] ^ [1 / X] - 1 where Y = D-X
Return on date D since the start date S of the unit: [NIW(D) / NIW(S)] ^ [1 / F] - 1 where F = 1 if the unit has existed for less than one year on date D where F = (D-S) / 365.25 if the unit has existed for longer than one year on date D
If the interval between the two dates exceeds one year, the ordinary return calculation is converted into a return on an annual basis by taking the nth square root of 1 plus the total return of the unit.
The return figures shown above do not take account of the fees and charges associated with the issue and redemption of units.

These are the performance figures for capitalization shares.
2.4.6 COSTS Ongoing Charges: * Classic Shares Distribution: not applicable Classic Shares Capitalization: 1.227% Institutional B Shares Capitalization: 1.608% Institutional Shares Distribution: not applicable Institutional Shares Capitalization: not applicable * The following costs have not been included in the ongoing charges: - Interest payments on loans taken out - Payments in respect of financial derivatives - Fees and charges paid directly by the investor - Any soft commissions
SOFT COMMISSIONS Not applicable.
FEE-SHARING AGREEMENTS AND REBATES: The management company may share its fee with the distributor, and institutional and/or professional parties. In principle, the percentage share amounts to between 35% and 60% if the distributor is an entity of KBC Group NV or to between 35% and 70% if the distributor is not an entity of KBC Group NV. However, in a small number of cases, the distributor’s fee is less than 35%. Investors may, on request, obtain more information on these cases. If the management company invests the assets of the undertaking for collective investment in units of undertakings for collective investment that are not managed by an entity of KBC Group NV, and receives a fee for doing so, it will pay this fee to the undertaking for collective investment. Fee-sharing does not affect the amount of the management fee paid by the sub-fund to the management company. This management fee is subject to the limitations laid down in the articles of association. The limitations may only be amended after approval by the general meeting of shareholders. The management company has concluded a distribution agreement with the distributor in order to facilitate the wider distribution of the sub-fund's units by using multiple distribution channels. It is in the interests of the holders of units, the sub-fund and of the distributor for the largest possible number of units to be sold and for the assets of the sub-fund to be maximised in this way. In this respect, there is therefore no question of any conflict of interest.
2.4.7 NOTES TO THE FINANCIAL STATEMENTS AND OTHER DATA Fee for managing the investment portfolio: 1.5% per annum (0.1% of which for the sustainability screening referred to in the prospectus) calculated on the basis of the average total net assets of the sub-fund, no management fee is charged on assets assets invested in investment undertakings managed by a financial institution of the KBC group. The administration agent’s fee is payable at the end of each month and is calculated on the basis of the average total net assets of the sub-fund. Auditor's fee: 1 700 EUR per year. This fee is not including VAT and can be indexed on an annual basis in accordance with the decisions of the general meeting. The custody fee is calculated on the value of the securities held in custody by the custodian on the final banking day of the preceding calendar year, except on those assets invested in investment undertakings managed by a financial institution of the KBC group. The custody fee is paid at the beginning of the calendar year. Social, ethical and environmental aspects: No manufacturers of controversial weapons whose use over the past five decades, according to the international consensus, has led to disproportionate human suffering among the civilian population will be included in the portfolio of investments. This involves the manufacturers of anti-personnel mines, cluster bombs and munitions and weapons containing depleted uranium. In this way, the sub-fund seeks to reflect not only simple financial reality but also the social reality of the sector or region in question. Exercising voting rights. If necessary, relevant and in the interest of the shareholders, the management company will exercise the voting rights attached to the shares in the Bevek’s portfolio. The management company will adhere to the following criteria when determining how it stands relative to the items on the agenda that are put to the vote:

- Shareholder value may not be adversely affected. - Corporate governance rules, especially with regard to the rights of minority shareholders, must be
respected. - The minimum standards with regard to sustainable business and corporate social responsibility
must be met. The list of companies for which voting rights are exercised is available at the registered office of the Bevek.

Semi-Annual report as at 30th June 2013
TABLE OF CONTENTS
2. Information on KBC Equity Fund Industrials & Infrastructure
2.1. Management report 2.1.1. Launch date and subscription price 2.1.2. Stock exchange listing 2.1.3. Aim and distinctive features of the investment policy 2.1.4. Financial portfolio management 2.1.5. Distributors 2.1.6. Index and benchmark 2.1.7. Policy conducted during the financial year 2.1.8. Future policy 2.1.9. Synthetic risk and reward indicator (SRRI)
2.2. Balance sheet
2.3. Profit and loss account
2.4. Composition of the assets and key figures
2.4.1. Composition of the assets 2.4.2. Change in the composition of the assets 2.4.3. Value of commitments in respect of financial derivatives positions 2.4.4. Evolution of the number of subscriptions, repayments and the net asset value 2.4.5. Return figures 2.4.6. Expenses 2.4.7. Notes to the financial statements and other data

2 INFORMATION ON KBC EQUITY FUND INDUSTRIALS & INFRASTRUCTURE
2.1 MANAGEMENT REPORT
2.1.1 LAUNCH DATE AND SUBSCRIPTION PRICE Classic Shares : Launch date: 28 February 2011 Initial subscription price: 200 EUR Currency: EUR Institutional B Shares : Launch date: 25 November 2011 Initial subscription price: 164.25 EUR Currency: EUR
2.1.2 STOCK EXCHANGE LISTING Not applicable.
2.1.3 GOAL AND KEY PRINCIPLES OF THE INVESTMENT POLICY
SUB-FUND’S OBJECT: The main objective of this sub-fund is to generate the highest possible return for its shareholders by investing directly or indirectly in transferable securities. This is reflected in its pursuit of capital gains and income. To this end, the assets are invested, either directly or indirectly via correlated financial instruments, primarily in shares.
SUB-FUND’S INVESTMENT POLICY:
PERMITTED ASSET CLASSES: The sub-fund may invest in securities, money market instruments, units in undertakings for collective investment, deposits, financial derivatives, liquid assets and all other instruments insofar as permitted by the applicable laws and regulations and consistent with the sub-fund’s object The sub-fund shall invest no more than 10% of its assets in units of other undertakings for collective investment.
RESTRICTIONS OF THE INVESTMENT POLICY: The investment policy will be implemented within the limits set by law and regulations. The sub-fund may borrow up to 10% of its net assets, insofar as these are short-term borrowings aimed at solving temporary liquidity problems.
PERMITTED DERIVATIVES TRANSACTIONS: Derivates may be used either for hedging purposes or to achieve investment objectives. Changes will be made to the investments at regular intervals to comply with the sub-fund's investment strategy. In addition, listed and unlisted derivates may be used to achieve the objectives: these may be forward contracts, options or swaps on securities, indices, currencies or interest rates or other transactions involving derivatives. Unlisted derivatives transactions will only be concluded with prime financial institutions specialised in such transactions. Such derivatives may also be used to hedge the assets against exchange-rate fluctuations. Subject to the applicable laws and regulations and the articles of association, the sub-fund always seeks to conclude the most effective transactions. All costs associated with the transactions will be charged to the sub-fund and all income generated will be paid to the sub-fund. If the transactions result in a risk in respect of the counterparty, this risk can be hedged by using a margin management system that ensures that the sub-fund is the beneficiary of security (collateral) in the form of cash or investment grade bonds. When calculating the value of the bonds, a margin will be applied that varies depending on the residual term to maturity and the currency in which the bond in question is denominated. The relationship with the counterparty or counterparties is governed by standard international agreements.
Strategy selected
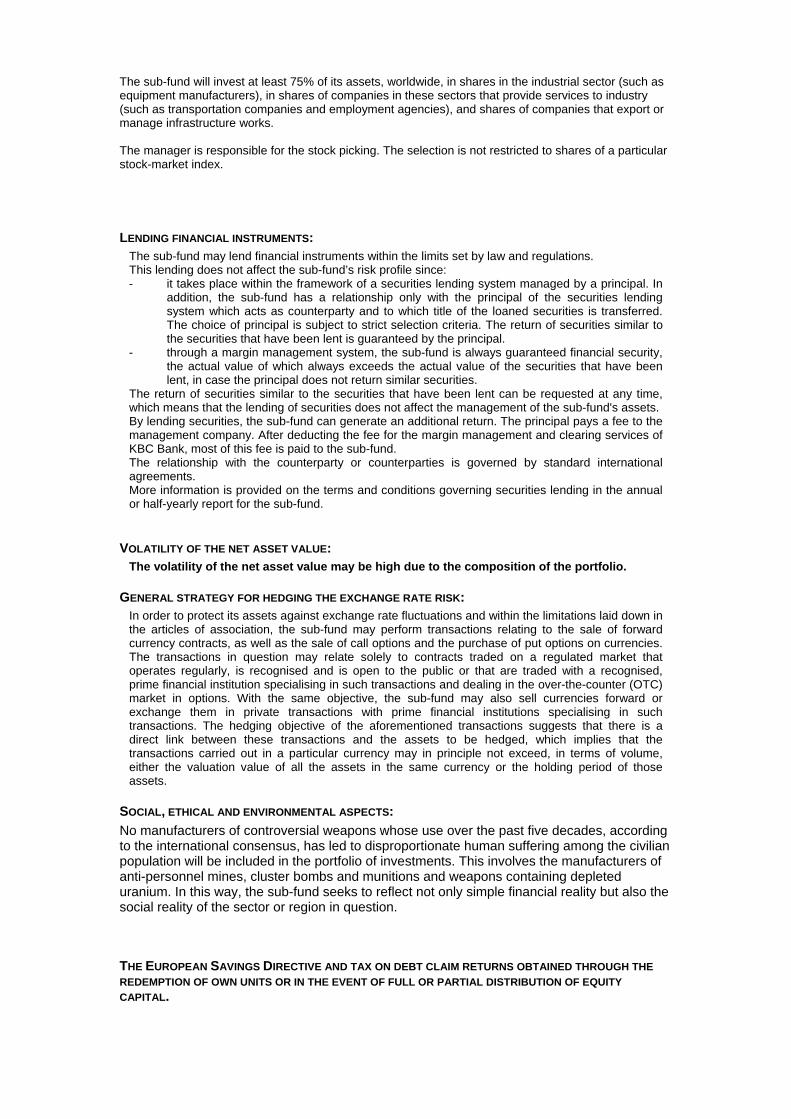
The sub-fund will invest at least 75% of its assets, worldwide, in shares in the industrial sector (such as equipment manufacturers), in shares of companies in these sectors that provide services to industry (such as transportation companies and employment agencies), and shares of companies that export or manage infrastructure works. The manager is responsible for the stock picking. The selection is not restricted to shares of a particular stock-market index.
LENDING FINANCIAL INSTRUMENTS: The sub-fund may lend financial instruments within the limits set by law and regulations. This lending does not affect the sub-fund’s risk profile since: - it takes place within the framework of a securities lending system managed by a principal. In
addition, the sub-fund has a relationship only with the principal of the securities lending system which acts as counterparty and to which title of the loaned securities is transferred. The choice of principal is subject to strict selection criteria. The return of securities similar to the securities that have been lent is guaranteed by the principal.
- through a margin management system, the sub-fund is always guaranteed financial security, the actual value of which always exceeds the actual value of the securities that have been lent, in case the principal does not return similar securities.
The return of securities similar to the securities that have been lent can be requested at any time, which means that the lending of securities does not affect the management of the sub-fund's assets. By lending securities, the sub-fund can generate an additional return. The principal pays a fee to the management company. After deducting the fee for the margin management and clearing services of KBC Bank, most of this fee is paid to the sub-fund. The relationship with the counterparty or counterparties is governed by standard international agreements. More information is provided on the terms and conditions governing securities lending in the annual or half-yearly report for the sub-fund.
VOLATILITY OF THE NET ASSET VALUE: The volatility of the net asset value may be high due to the composition of the portfolio.
GENERAL STRATEGY FOR HEDGING THE EXCHANGE RATE RISK: In order to protect its assets against exchange rate fluctuations and within the limitations laid down in the articles of association, the sub-fund may perform transactions relating to the sale of forward currency contracts, as well as the sale of call options and the purchase of put options on currencies. The transactions in question may relate solely to contracts traded on a regulated market that operates regularly, is recognised and is open to the public or that are traded with a recognised, prime financial institution specialising in such transactions and dealing in the over-the-counter (OTC) market in options. With the same objective, the sub-fund may also sell currencies forward or exchange them in private transactions with prime financial institutions specialising in such transactions. The hedging objective of the aforementioned transactions suggests that there is a direct link between these transactions and the assets to be hedged, which implies that the transactions carried out in a particular currency may in principle not exceed, in terms of volume, either the valuation value of all the assets in the same currency or the holding period of those assets.
SOCIAL, ETHICAL AND ENVIRONMENTAL ASPECTS:
No manufacturers of controversial weapons whose use over the past five decades, according to the international consensus, has led to disproportionate human suffering among the civilian population will be included in the portfolio of investments. This involves the manufacturers of anti-personnel mines, cluster bombs and munitions and weapons containing depleted uranium. In this way, the sub-fund seeks to reflect not only simple financial reality but also the social reality of the sector or region in question.
THE EUROPEAN SAVINGS DIRECTIVE AND TAX ON DEBT CLAIM RETURNS OBTAINED THROUGH THE
REDEMPTION OF OWN UNITS OR IN THE EVENT OF FULL OR PARTIAL DISTRIBUTION OF EQUITY
CAPITAL.

The following information is of a general character and is not intended to cover all aspects of an investment in a UCITS. In certain cases entirely different rules might even apply. Moreover, both tax law and the interpretation of it can change. Investors who wish to have more information about the tax implications – in both Belgium and abroad – of acquiring, holding and transferring units should seek the advice of their usual financial and tax advisers. This UCITS shall invest a maximum of 15% of its assets directly or indirectly in debt instruments as intended by the European Savings Directive. A. European Savings Directive (Directive 2003/48/EC) The European Savings Directive has been implemented in Belgium. Since this UCITS invests a maximum of 15% of its assets directly or indirectly in debt claims as intended by the European Savings Directive, the income of this UCITS does not fall within the scope of this directive. B. Tax on debt claim returns obtained through the redemption of own units or in the event of full or partial distribution of equity capital (Article 19bis Income Tax Code 1992). The income from this UCITS is not subject to the tax on debt instrument returns as intended by Article 19bis, Income Tax Code 1992.
2.1.4 FINANCIAL PORTFOLIO MANAGEMENT There is no delegation of the portfolio.
2.1.5 DISTRIBUTORS KBC Asset Management S.A., 5, Place de la Gare, L-1616 Luxembourg.
2.1.6 INDEX AND BENCHMARK See ‘Sub-fund’s investment policy’.
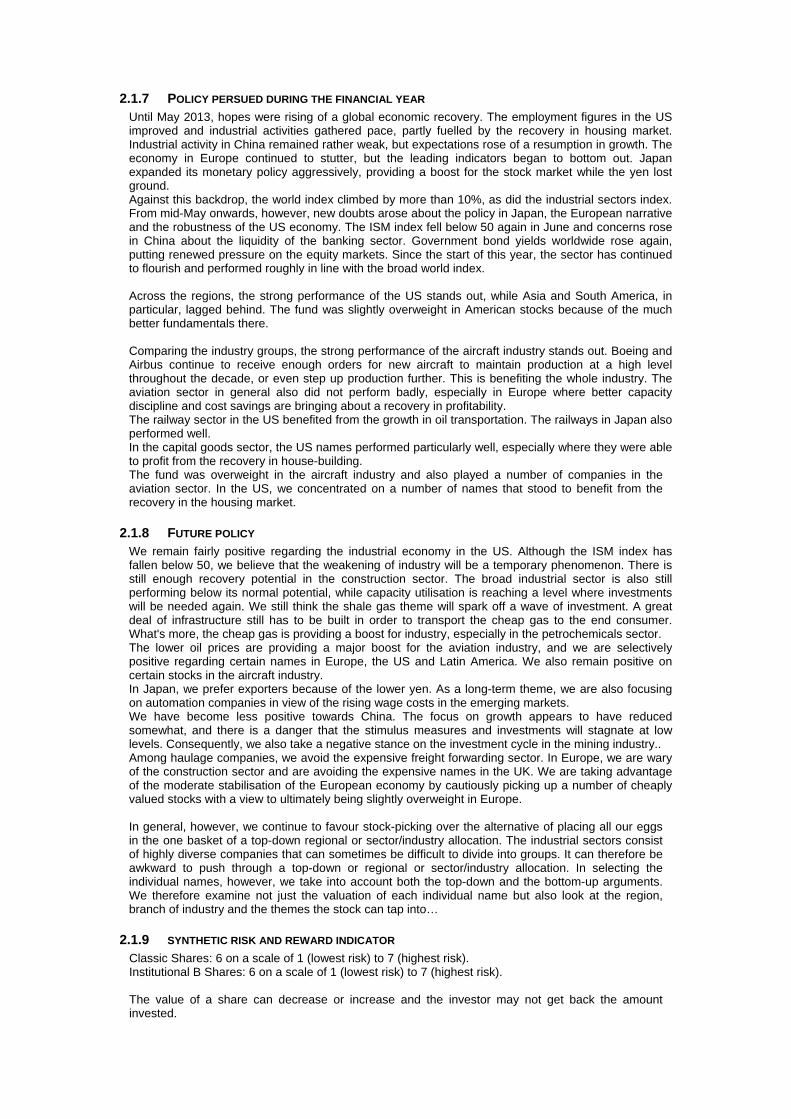
2.1.7 POLICY PERSUED DURING THE FINANCIAL YEAR Until May 2013, hopes were rising of a global economic recovery. The employment figures in the US improved and industrial activities gathered pace, partly fuelled by the recovery in housing market. Industrial activity in China remained rather weak, but expectations rose of a resumption in growth. The economy in Europe continued to stutter, but the leading indicators began to bottom out. Japan expanded its monetary policy aggressively, providing a boost for the stock market while the yen lost ground. Against this backdrop, the world index climbed by more than 10%, as did the industrial sectors index. From mid-May onwards, however, new doubts arose about the policy in Japan, the European narrative and the robustness of the US economy. The ISM index fell below 50 again in June and concerns rose in China about the liquidity of the banking sector. Government bond yields worldwide rose again, putting renewed pressure on the equity markets. Since the start of this year, the sector has continued to flourish and performed roughly in line with the broad world index. Across the regions, the strong performance of the US stands out, while Asia and South America, in particular, lagged behind. The fund was slightly overweight in American stocks because of the much better fundamentals there. Comparing the industry groups, the strong performance of the aircraft industry stands out. Boeing and Airbus continue to receive enough orders for new aircraft to maintain production at a high level throughout the decade, or even step up production further. This is benefiting the whole industry. The aviation sector in general also did not perform badly, especially in Europe where better capacity discipline and cost savings are bringing about a recovery in profitability. The railway sector in the US benefited from the growth in oil transportation. The railways in Japan also performed well. In the capital goods sector, the US names performed particularly well, especially where they were able to profit from the recovery in house-building. The fund was overweight in the aircraft industry and also played a number of companies in the aviation sector. In the US, we concentrated on a number of names that stood to benefit from the recovery in the housing market.
2.1.8 FUTURE POLICY We remain fairly positive regarding the industrial economy in the US. Although the ISM index has fallen below 50, we believe that the weakening of industry will be a temporary phenomenon. There is still enough recovery potential in the construction sector. The broad industrial sector is also still performing below its normal potential, while capacity utilisation is reaching a level where investments will be needed again. We still think the shale gas theme will spark off a wave of investment. A great deal of infrastructure still has to be built in order to transport the cheap gas to the end consumer. What's more, the cheap gas is providing a boost for industry, especially in the petrochemicals sector. The lower oil prices are providing a major boost for the aviation industry, and we are selectively positive regarding certain names in Europe, the US and Latin America. We also remain positive on certain stocks in the aircraft industry. In Japan, we prefer exporters because of the lower yen. As a long-term theme, we are also focusing on automation companies in view of the rising wage costs in the emerging markets. We have become less positive towards China. The focus on growth appears to have reduced somewhat, and there is a danger that the stimulus measures and investments will stagnate at low levels. Consequently, we also take a negative stance on the investment cycle in the mining industry.. Among haulage companies, we avoid the expensive freight forwarding sector. In Europe, we are wary of the construction sector and are avoiding the expensive names in the UK. We are taking advantage of the moderate stabilisation of the European economy by cautiously picking up a number of cheaply valued stocks with a view to ultimately being slightly overweight in Europe. In general, however, we continue to favour stock-picking over the alternative of placing all our eggs in the one basket of a top-down regional or sector/industry allocation. The industrial sectors consist of highly diverse companies that can sometimes be difficult to divide into groups. It can therefore be awkward to push through a top-down or regional or sector/industry allocation. In selecting the individual names, however, we take into account both the top-down and the bottom-up arguments. We therefore examine not just the valuation of each individual name but also look at the region, branch of industry and the themes the stock can tap into…
2.1.9 SYNTHETIC RISK AND REWARD INDICATOR Classic Shares: 6 on a scale of 1 (lowest risk) to 7 (highest risk). Institutional B Shares: 6 on a scale of 1 (lowest risk) to 7 (highest risk). The value of a share can decrease or increase and the investor may not get back the amount invested.

In accordance with Commission Regulation (EU) No. 583/2010, a synthetic risk and reward indicator has been calculated. This indicator provides a quantitative measure of the sub-fund's potential return and the risk involved, calculated in the currency in which the sub-fund is denominated. It is given as a figure between 1 and 7. The higher the figure, the greater the potential return, but also the more difficult it is to predict this return. Losses are possible too. The lowest figure does not mean that the investment is entirely free of risk. However, it does indicate that, compared with the higher figures, this product will generally provide a lower, but more predictable return. The synthetic risk and reward indicator is assessed regularly and can therefore go up or down based on data from the past. Data from the past is not always a reliable indicator of future risk and return.
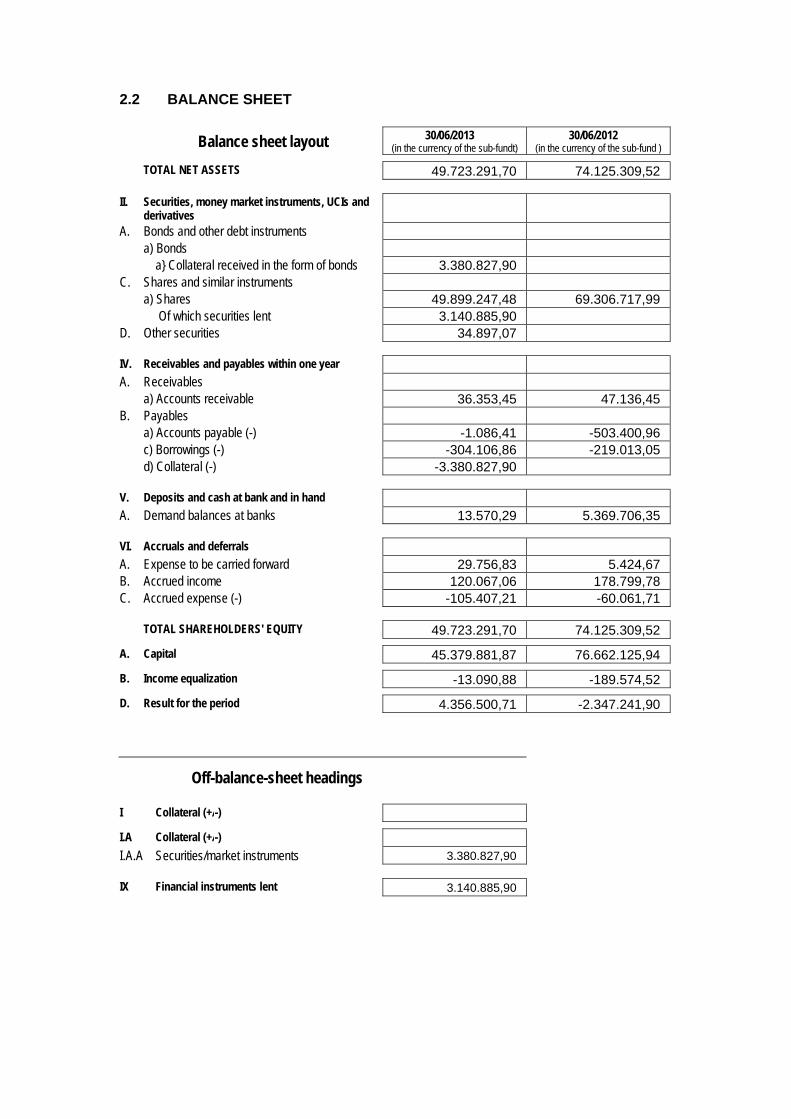
2.2 BALANCE SHEET
Balance sheet layout 30/06/2013 (in the currency of the sub-fundt)
30/06/2012 (in the currency of the sub-fund )
TOTAL NET ASSETS 49.723.291,70 74.125.309,52
II. Securities, money market instruments, UCIs and derivatives
A. Bonds and other debt instruments a) Bonds a} Collateral received in the form of bonds 3.380.827,90 C. Shares and similar instruments a) Shares 49.899.247,48 69.306.717,99 Of which securities lent 3.140.885,90 D. Other securities 34.897,07
IV. Receivables and payables within one year A. Receivables a) Accounts receivable 36.353,45 47.136,45 B. Payables a) Accounts payable (-) -1.086,41 -503.400,96 c) Borrowings (-) -304.106,86 -219.013,05 d) Collateral (-) -3.380.827,90
V. Deposits and cash at bank and in hand A. Demand balances at banks 13.570,29 5.369.706,35
VI. Accruals and deferrals A. Expense to be carried forward 29.756,83 5.424,67 B. Accrued income 120.067,06 178.799,78 C. Accrued expense (-) -105.407,21 -60.061,71
TOTAL SHAREHOLDERS' EQUITY 49.723.291,70 74.125.309,52
A. Capital 45.379.881,87 76.662.125,94
B. Income equalization -13.090,88 -189.574,52
D. Result for the period 4.356.500,71 -2.347.241,90
Off-balance-sheet headings
I Collateral (+/-)
I.A Collateral (+/-)
I.A.A Securities/market instruments 3.380.827,90
IX Financial instruments lent 3.140.885,90
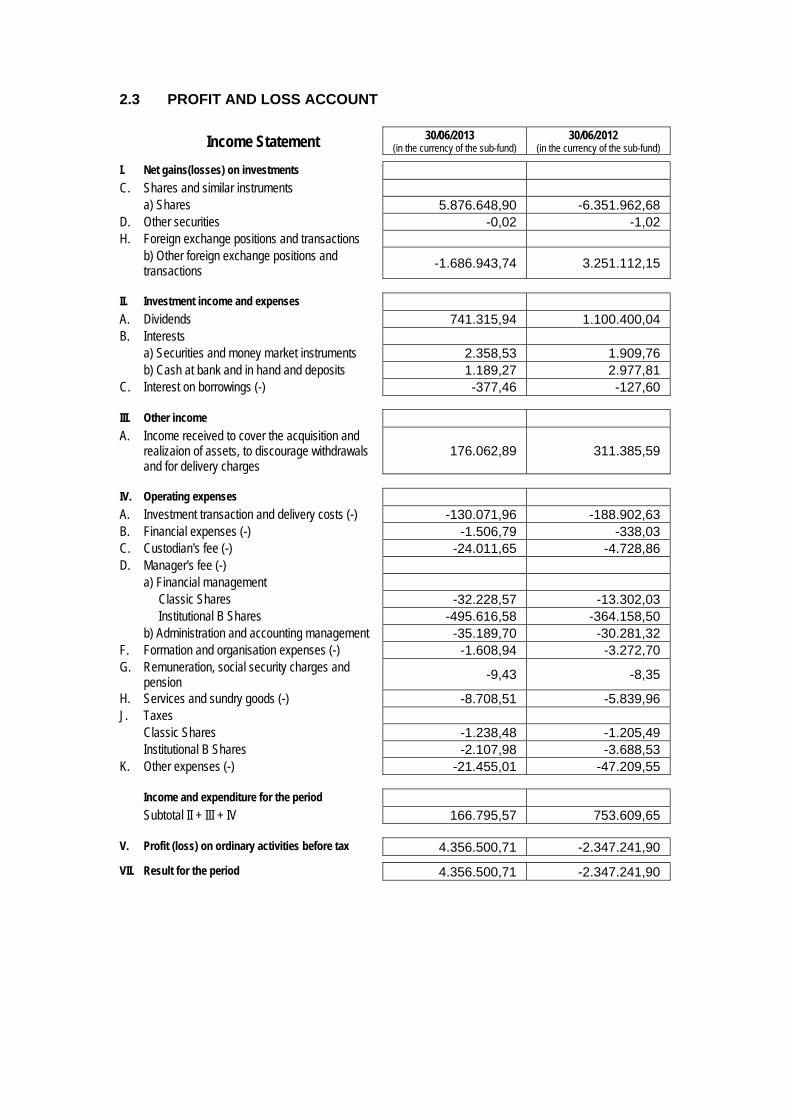
2.3 PROFIT AND LOSS ACCOUNT
Income Statement 30/06/2013 (in the currency of the sub-fund)
30/06/2012 (in the currency of the sub-fund)
I. Net gains(losses) on investments C. Shares and similar instruments a) Shares 5.876.648,90 -6.351.962,68 D. Other securities -0,02 -1,02 H. Foreign exchange positions and transactions b) Other foreign exchange positions and
transactions -1.686.943,74 3.251.112,15
II. Investment income and expenses A. Dividends 741.315,94 1.100.400,04 B. Interests a) Securities and money market instruments 2.358,53 1.909,76 b) Cash at bank and in hand and deposits 1.189,27 2.977,81 C. Interest on borrowings (-) -377,46 -127,60
III. Other income A. Income received to cover the acquisition and
realizaion of assets, to discourage withdrawals and for delivery charges
176.062,89 311.385,59
IV. Operating expenses A. Investment transaction and delivery costs (-) -130.071,96 -188.902,63 B. Financial expenses (-) -1.506,79 -338,03 C. Custodian's fee (-) -24.011,65 -4.728,86 D. Manager's fee (-) a) Financial management Classic Shares -32.228,57 -13.302,03 Institutional B Shares -495.616,58 -364.158,50 b) Administration and accounting management -35.189,70 -30.281,32 F. Formation and organisation expenses (-) -1.608,94 -3.272,70 G. Remuneration, social security charges and
pension -9,43 -8,35
H. Services and sundry goods (-) -8.708,51 -5.839,96 J. Taxes Classic Shares -1.238,48 -1.205,49 Institutional B Shares -2.107,98 -3.688,53 K. Other expenses (-) -21.455,01 -47.209,55
Income and expenditure for the period Subtotal II + III + IV 166.795,57 753.609,65
V. Profit (loss) on ordinary activities before tax 4.356.500,71 -2.347.241,90
VII. Result for the period 4.356.500,71 -2.347.241,90
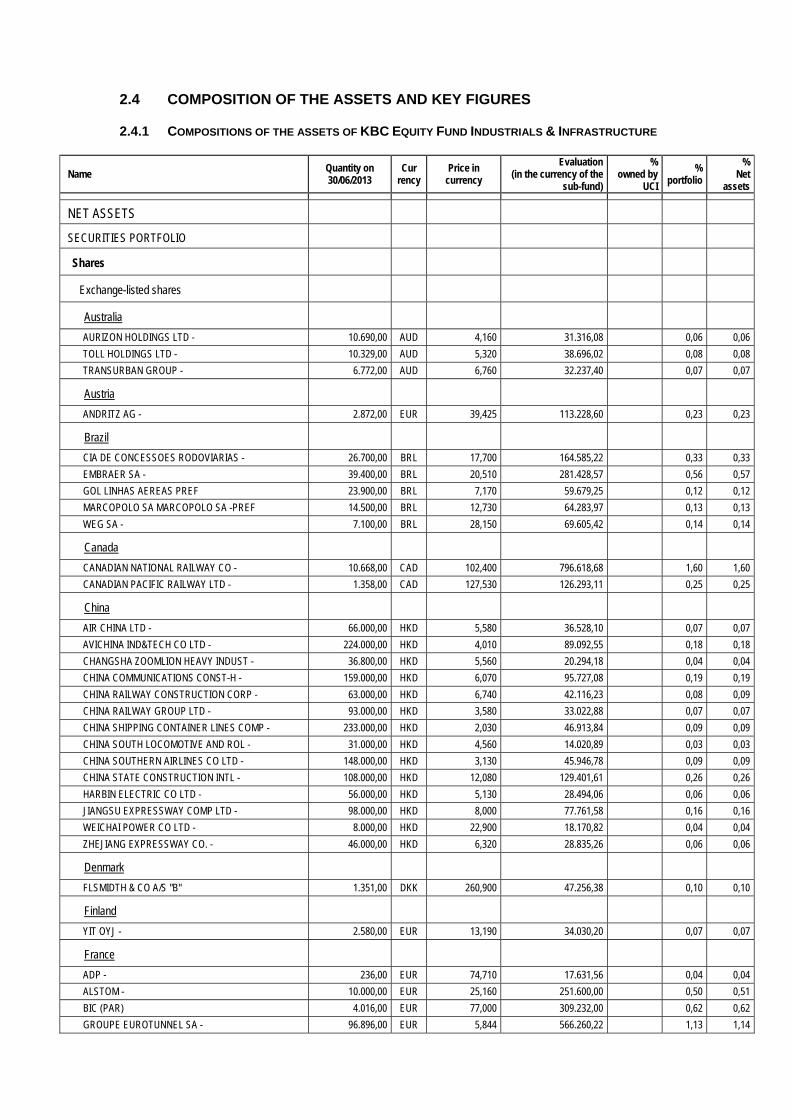
2.4 COMPOSITION OF THE ASSETS AND KEY FIGURES
2.4.1 COMPOSITIONS OF THE ASSETS OF KBC EQUITY FUND INDUSTRIALS & INFRASTRUCTURE
Name Quantity on 30/06/2013
Cur rency
Price in currency
Evaluation (in the currency of the
sub-fund)
% owned by
UCI
% portfolio
% Net
assets
NET ASSETS
SECURITIES PORTFOLIO
Shares
Exchange-listed shares
Australia
AURIZON HOLDINGS LTD - 10.690,00 AUD 4,160 31.316,08 0,06 0,06
TOLL HOLDINGS LTD - 10.329,00 AUD 5,320 38.696,02 0,08 0,08
TRANSURBAN GROUP - 6.772,00 AUD 6,760 32.237,40 0,07 0,07
Austria
ANDRITZ AG - 2.872,00 EUR 39,425 113.228,60 0,23 0,23
Brazil
CIA DE CONCESSOES RODOVIARIAS - 26.700,00 BRL 17,700 164.585,22 0,33 0,33
EMBRAER SA - 39.400,00 BRL 20,510 281.428,57 0,56 0,57
GOL LINHAS AEREAS PREF 23.900,00 BRL 7,170 59.679,25 0,12 0,12
MARCOPOLO SA MARCOPOLO SA -PREF 14.500,00 BRL 12,730 64.283,97 0,13 0,13
WEG SA - 7.100,00 BRL 28,150 69.605,42 0,14 0,14
Canada
CANADIAN NATIONAL RAILWAY CO - 10.668,00 CAD 102,400 796.618,68 1,60 1,60
CANADIAN PACIFIC RAILWAY LTD - 1.358,00 CAD 127,530 126.293,11 0,25 0,25
China
AIR CHINA LTD - 66.000,00 HKD 5,580 36.528,10 0,07 0,07
AVICHINA IND&TECH CO LTD - 224.000,00 HKD 4,010 89.092,55 0,18 0,18
CHANGSHA ZOOMLION HEAVY INDUST - 36.800,00 HKD 5,560 20.294,18 0,04 0,04
CHINA COMMUNICATIONS CONST-H - 159.000,00 HKD 6,070 95.727,08 0,19 0,19
CHINA RAILWAY CONSTRUCTION CORP - 63.000,00 HKD 6,740 42.116,23 0,08 0,09
CHINA RAILWAY GROUP LTD - 93.000,00 HKD 3,580 33.022,88 0,07 0,07
CHINA SHIPPING CONTAINER LINES COMP - 233.000,00 HKD 2,030 46.913,84 0,09 0,09
CHINA SOUTH LOCOMOTIVE AND ROL - 31.000,00 HKD 4,560 14.020,89 0,03 0,03
CHINA SOUTHERN AIRLINES CO LTD - 148.000,00 HKD 3,130 45.946,78 0,09 0,09
CHINA STATE CONSTRUCTION INTL - 108.000,00 HKD 12,080 129.401,61 0,26 0,26
HARBIN ELECTRIC CO LTD - 56.000,00 HKD 5,130 28.494,06 0,06 0,06
JIANGSU EXPRESSWAY COMP LTD - 98.000,00 HKD 8,000 77.761,58 0,16 0,16
WEICHAI POWER CO LTD - 8.000,00 HKD 22,900 18.170,82 0,04 0,04
ZHEJIANG EXPRESSWAY CO. - 46.000,00 HKD 6,320 28.835,26 0,06 0,06
Denmark
FLSMIDTH & CO A/S "B" 1.351,00 DKK 260,900 47.256,38 0,10 0,10
Finland
YIT OYJ - 2.580,00 EUR 13,190 34.030,20 0,07 0,07
France
ADP - 236,00 EUR 74,710 17.631,56 0,04 0,04
ALSTOM - 10.000,00 EUR 25,160 251.600,00 0,50 0,51
BIC (PAR) 4.016,00 EUR 77,000 309.232,00 0,62 0,62
GROUPE EUROTUNNEL SA - 96.896,00 EUR 5,844 566.260,22 1,13 1,14
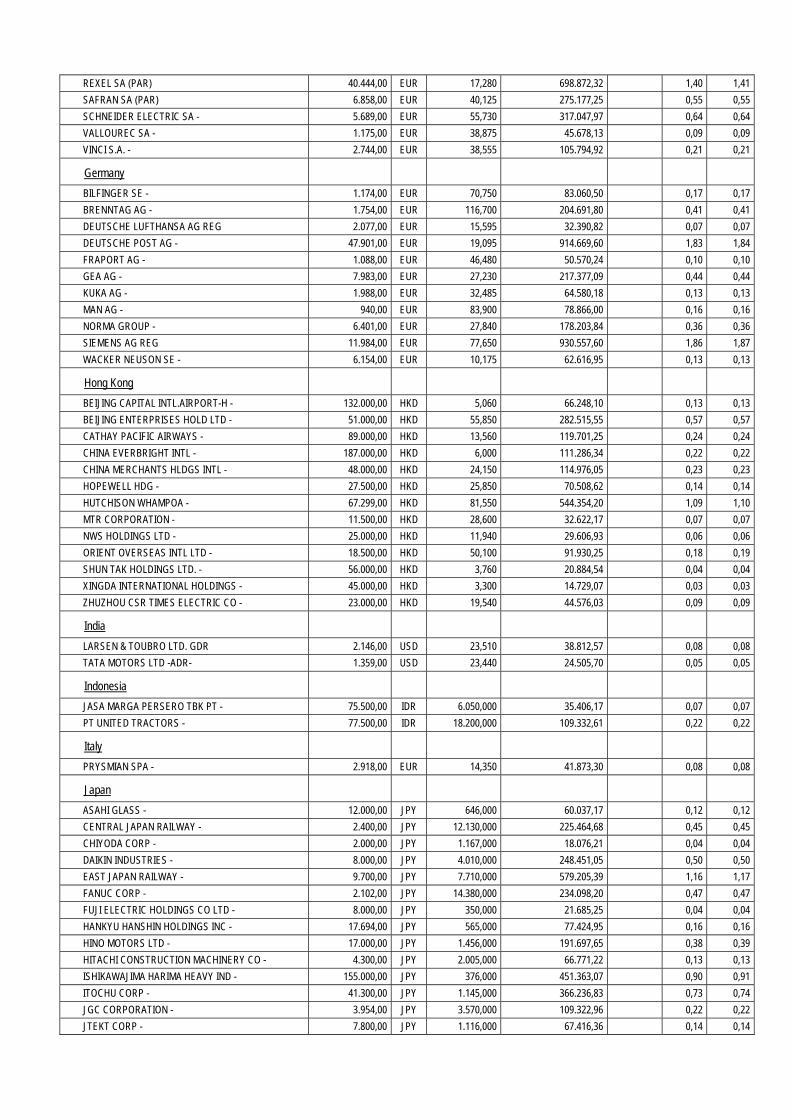
REXEL SA (PAR) 40.444,00 EUR 17,280 698.872,32 1,40 1,41
SAFRAN SA (PAR) 6.858,00 EUR 40,125 275.177,25 0,55 0,55
SCHNEIDER ELECTRIC SA - 5.689,00 EUR 55,730 317.047,97 0,64 0,64
VALLOUREC SA - 1.175,00 EUR 38,875 45.678,13 0,09 0,09
VINCI S.A. - 2.744,00 EUR 38,555 105.794,92 0,21 0,21
Germany
BILFINGER SE - 1.174,00 EUR 70,750 83.060,50 0,17 0,17
BRENNTAG AG - 1.754,00 EUR 116,700 204.691,80 0,41 0,41
DEUTSCHE LUFTHANSA AG REG 2.077,00 EUR 15,595 32.390,82 0,07 0,07
DEUTSCHE POST AG - 47.901,00 EUR 19,095 914.669,60 1,83 1,84
FRAPORT AG - 1.088,00 EUR 46,480 50.570,24 0,10 0,10
GEA AG - 7.983,00 EUR 27,230 217.377,09 0,44 0,44
KUKA AG - 1.988,00 EUR 32,485 64.580,18 0,13 0,13
MAN AG - 940,00 EUR 83,900 78.866,00 0,16 0,16
NORMA GROUP - 6.401,00 EUR 27,840 178.203,84 0,36 0,36
SIEMENS AG REG 11.984,00 EUR 77,650 930.557,60 1,86 1,87
WACKER NEUSON SE - 6.154,00 EUR 10,175 62.616,95 0,13 0,13
Hong Kong
BEIJING CAPITAL INTL.AIRPORT-H - 132.000,00 HKD 5,060 66.248,10 0,13 0,13
BEIJING ENTERPRISES HOLD LTD - 51.000,00 HKD 55,850 282.515,55 0,57 0,57
CATHAY PACIFIC AIRWAYS - 89.000,00 HKD 13,560 119.701,25 0,24 0,24
CHINA EVERBRIGHT INTL - 187.000,00 HKD 6,000 111.286,34 0,22 0,22
CHINA MERCHANTS HLDGS INTL - 48.000,00 HKD 24,150 114.976,05 0,23 0,23
HOPEWELL HDG - 27.500,00 HKD 25,850 70.508,62 0,14 0,14
HUTCHISON WHAMPOA - 67.299,00 HKD 81,550 544.354,20 1,09 1,10
MTR CORPORATION - 11.500,00 HKD 28,600 32.622,17 0,07 0,07
NWS HOLDINGS LTD - 25.000,00 HKD 11,940 29.606,93 0,06 0,06
ORIENT OVERSEAS INTL LTD - 18.500,00 HKD 50,100 91.930,25 0,18 0,19
SHUN TAK HOLDINGS LTD. - 56.000,00 HKD 3,760 20.884,54 0,04 0,04
XINGDA INTERNATIONAL HOLDINGS - 45.000,00 HKD 3,300 14.729,07 0,03 0,03
ZHUZHOU CSR TIMES ELECTRIC CO - 23.000,00 HKD 19,540 44.576,03 0,09 0,09
India
LARSEN & TOUBRO LTD. GDR 2.146,00 USD 23,510 38.812,57 0,08 0,08
TATA MOTORS LTD -ADR- 1.359,00 USD 23,440 24.505,70 0,05 0,05
Indonesia
JASA MARGA PERSERO TBK PT - 75.500,00 IDR 6.050,000 35.406,17 0,07 0,07
PT UNITED TRACTORS - 77.500,00 IDR 18.200,000 109.332,61 0,22 0,22
Italy
PRYSMIAN SPA - 2.918,00 EUR 14,350 41.873,30 0,08 0,08
Japan
ASAHI GLASS - 12.000,00 JPY 646,000 60.037,17 0,12 0,12
CENTRAL JAPAN RAILWAY - 2.400,00 JPY 12.130,000 225.464,68 0,45 0,45
CHIYODA CORP - 2.000,00 JPY 1.167,000 18.076,21 0,04 0,04
DAIKIN INDUSTRIES - 8.000,00 JPY 4.010,000 248.451,05 0,50 0,50
EAST JAPAN RAILWAY - 9.700,00 JPY 7.710,000 579.205,39 1,16 1,17
FANUC CORP - 2.102,00 JPY 14.380,000 234.098,20 0,47 0,47
FUJI ELECTRIC HOLDINGS CO LTD - 8.000,00 JPY 350,000 21.685,25 0,04 0,04
HANKYU HANSHIN HOLDINGS INC - 17.694,00 JPY 565,000 77.424,95 0,16 0,16
HINO MOTORS LTD - 17.000,00 JPY 1.456,000 191.697,65 0,38 0,39
HITACHI CONSTRUCTION MACHINERY CO - 4.300,00 JPY 2.005,000 66.771,22 0,13 0,13
ISHIKAWAJIMA HARIMA HEAVY IND - 155.000,00 JPY 376,000 451.363,07 0,90 0,91
ITOCHU CORP - 41.300,00 JPY 1.145,000 366.236,83 0,73 0,74
JGC CORPORATION - 3.954,00 JPY 3.570,000 109.322,96 0,22 0,22
JTEKT CORP - 7.800,00 JPY 1.116,000 67.416,36 0,14 0,14
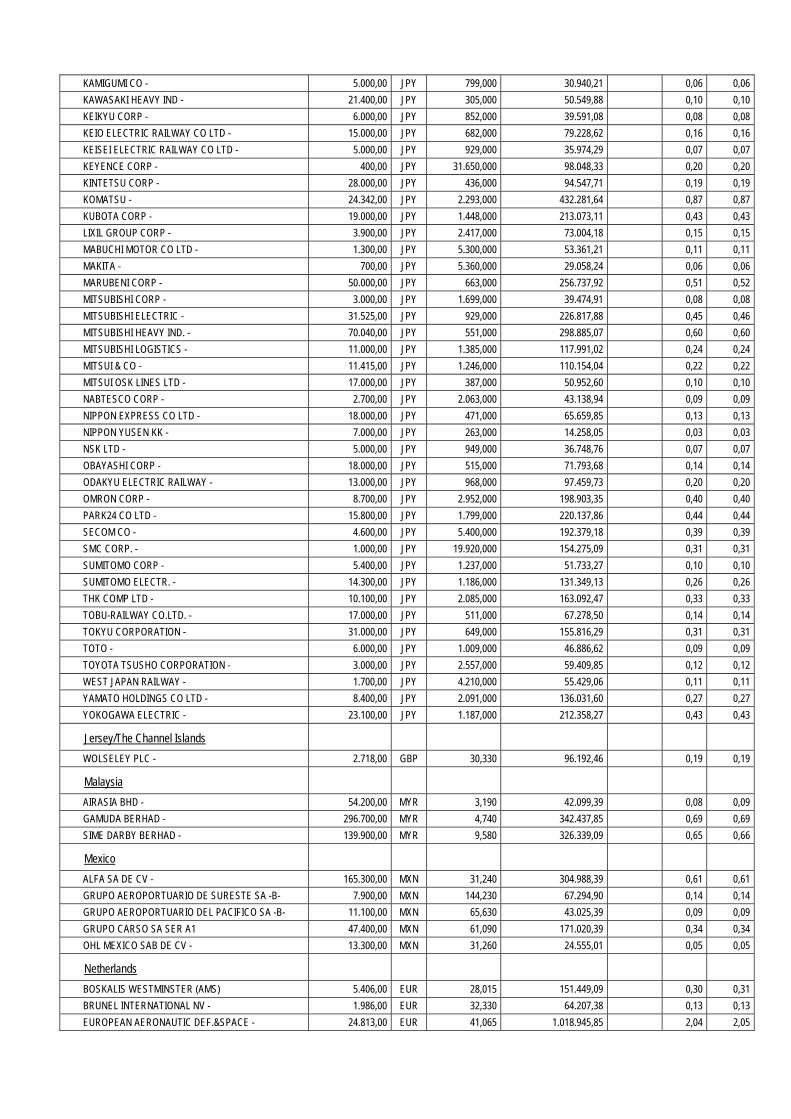
KAMIGUMI CO - 5.000,00 JPY 799,000 30.940,21 0,06 0,06
KAWASAKI HEAVY IND - 21.400,00 JPY 305,000 50.549,88 0,10 0,10
KEIKYU CORP - 6.000,00 JPY 852,000 39.591,08 0,08 0,08
KEIO ELECTRIC RAILWAY CO LTD - 15.000,00 JPY 682,000 79.228,62 0,16 0,16
KEISEI ELECTRIC RAILWAY CO LTD - 5.000,00 JPY 929,000 35.974,29 0,07 0,07
KEYENCE CORP - 400,00 JPY 31.650,000 98.048,33 0,20 0,20
KINTETSU CORP - 28.000,00 JPY 436,000 94.547,71 0,19 0,19
KOMATSU - 24.342,00 JPY 2.293,000 432.281,64 0,87 0,87
KUBOTA CORP - 19.000,00 JPY 1.448,000 213.073,11 0,43 0,43
LIXIL GROUP CORP - 3.900,00 JPY 2.417,000 73.004,18 0,15 0,15
MABUCHI MOTOR CO LTD - 1.300,00 JPY 5.300,000 53.361,21 0,11 0,11
MAKITA - 700,00 JPY 5.360,000 29.058,24 0,06 0,06
MARUBENI CORP - 50.000,00 JPY 663,000 256.737,92 0,51 0,52
MITSUBISHI CORP - 3.000,00 JPY 1.699,000 39.474,91 0,08 0,08
MITSUBISHI ELECTRIC - 31.525,00 JPY 929,000 226.817,88 0,45 0,46
MITSUBISHI HEAVY IND. - 70.040,00 JPY 551,000 298.885,07 0,60 0,60
MITSUBISHI LOGISTICS - 11.000,00 JPY 1.385,000 117.991,02 0,24 0,24
MITSUI & CO - 11.415,00 JPY 1.246,000 110.154,04 0,22 0,22
MITSUI OSK LINES LTD - 17.000,00 JPY 387,000 50.952,60 0,10 0,10
NABTESCO CORP - 2.700,00 JPY 2.063,000 43.138,94 0,09 0,09
NIPPON EXPRESS CO LTD - 18.000,00 JPY 471,000 65.659,85 0,13 0,13
NIPPON YUSEN KK - 7.000,00 JPY 263,000 14.258,05 0,03 0,03
NSK LTD - 5.000,00 JPY 949,000 36.748,76 0,07 0,07
OBAYASHI CORP - 18.000,00 JPY 515,000 71.793,68 0,14 0,14
ODAKYU ELECTRIC RAILWAY - 13.000,00 JPY 968,000 97.459,73 0,20 0,20
OMRON CORP - 8.700,00 JPY 2.952,000 198.903,35 0,40 0,40
PARK24 CO LTD - 15.800,00 JPY 1.799,000 220.137,86 0,44 0,44
SECOM CO - 4.600,00 JPY 5.400,000 192.379,18 0,39 0,39
SMC CORP. - 1.000,00 JPY 19.920,000 154.275,09 0,31 0,31
SUMITOMO CORP - 5.400,00 JPY 1.237,000 51.733,27 0,10 0,10
SUMITOMO ELECTR. - 14.300,00 JPY 1.186,000 131.349,13 0,26 0,26
THK COMP LTD - 10.100,00 JPY 2.085,000 163.092,47 0,33 0,33
TOBU-RAILWAY CO.LTD. - 17.000,00 JPY 511,000 67.278,50 0,14 0,14
TOKYU CORPORATION - 31.000,00 JPY 649,000 155.816,29 0,31 0,31
TOTO - 6.000,00 JPY 1.009,000 46.886,62 0,09 0,09
TOYOTA TSUSHO CORPORATION - 3.000,00 JPY 2.557,000 59.409,85 0,12 0,12
WEST JAPAN RAILWAY - 1.700,00 JPY 4.210,000 55.429,06 0,11 0,11
YAMATO HOLDINGS CO LTD - 8.400,00 JPY 2.091,000 136.031,60 0,27 0,27
YOKOGAWA ELECTRIC - 23.100,00 JPY 1.187,000 212.358,27 0,43 0,43
Jersey/The Channel Islands
WOLSELEY PLC - 2.718,00 GBP 30,330 96.192,46 0,19 0,19
Malaysia
AIRASIA BHD - 54.200,00 MYR 3,190 42.099,39 0,08 0,09
GAMUDA BERHAD - 296.700,00 MYR 4,740 342.437,85 0,69 0,69
SIME DARBY BERHAD - 139.900,00 MYR 9,580 326.339,09 0,65 0,66
Mexico
ALFA SA DE CV - 165.300,00 MXN 31,240 304.988,39 0,61 0,61
GRUPO AEROPORTUARIO DE SURESTE SA -B- 7.900,00 MXN 144,230 67.294,90 0,14 0,14
GRUPO AEROPORTUARIO DEL PACIFICO SA -B- 11.100,00 MXN 65,630 43.025,39 0,09 0,09
GRUPO CARSO SA SER A1 47.400,00 MXN 61,090 171.020,39 0,34 0,34
OHL MEXICO SAB DE CV - 13.300,00 MXN 31,260 24.555,01 0,05 0,05
Netherlands
BOSKALIS WESTMINSTER (AMS) 5.406,00 EUR 28,015 151.449,09 0,30 0,31
BRUNEL INTERNATIONAL NV - 1.986,00 EUR 32,330 64.207,38 0,13 0,13
EUROPEAN AERONAUTIC DEF.&SPACE - 24.813,00 EUR 41,065 1.018.945,85 2,04 2,05

KONINKLIJKE PHILIPS ELECTRONICS N.V. - 34.045,00 EUR 20,945 713.072,53 1,43 1,43
New Zealand
AUCKLAND INTL AIRPORT LTD - 20.237,00 NZD 2,970 35.710,23 0,07 0,07
Norway
KONGSBERG GRUPPEN AS - 8.870,00 NOK 110,000 122.932,13 0,25 0,25
Philippines
ABOITIZ EQUITY VENTURES INC - 33.100,00 PHP 50,200 29.590,68 0,06 0,06
INTERNATIONAL CONTAINER TERMIN - 16.300,00 PHP 87,000 25.253,99 0,05 0,05
SM INVESTMENTS CORP - 4.520,00 PHP 1.070,000 86.128,20 0,17 0,17
Singapore
COMFORTDELGRO CORP LTD - 27.000,00 SGD 1,835 30.052,77 0,06 0,06
SEMBCORP INDUSTRIES LTD - 21.865,00 SGD 4,950 65.650,70 0,13 0,13
SINGAPORE AIRLINES LTD - 2.000,00 SGD 10,140 12.301,35 0,03 0,03
South Africa
BIDVEST GROUP LTD - 3.473,00 ZAR 244,950 65.926,68 0,13 0,13
South Korea
CJ CORP - 440,00 KRW 113.500,000 33.641,18 0,07 0,07
DAELIM INDUSTRIAL CO - 443,00 KRW 86.800,000 25.902,77 0,05 0,05
HUYNDAI ENGINEERING & CONSTRUCTION - 936,00 KRW 55.900,000 35.246,04 0,07 0,07
HYUNDAI HEAVY INDUSTRIES - 174,00 KRW 183.500,000 21.508,40 0,04 0,04
S-1 CORPORATION - 2.560,00 KRW 62.800,000 108.298,47 0,22 0,22
SK CORP LTD - 860,00 KRW 169.500,000 98.195,34 0,20 0,20
Sweden
ASSA ABLOY AB "B" 4.434,00 SEK 262,800 132.818,35 0,27 0,27
SCANIA B 4.782,00 SEK 134,300 73.201,94 0,15 0,15
Switzerland
ABB LTD - 69.847,00 CHF 20,510 1.164.779,23 2,33 2,34
ADECCO SA CHESEREX REG 2.167,00 CHF 53,850 94.880,03 0,19 0,19
FLUGHAFEN ZUERICH AG - 1.613,00 CHF 474,500 622.301,41 1,25 1,25
SGS SA (REG) 185,00 CHF 2.029,000 305.199,61 0,61 0,61
Taiwan
AIRTAC INTERNATIONAL GROUP - 9.630,00 TWD 143,000 35.348,25 0,07 0,07
WANHAI LINES LINES LTD - 50,00 TWD 15,450 19,83
Thailand
AIRPORTS OF THAILAND PCL LOCAL 35.500,00 THB 168,500 148.376,03 0,30 0,30
Turkey
KOC HOLDING A.S. - 6.855,00 TRY 9,260 25.309,93 0,05 0,05
TAV HAVALIMANLARI HOLD - 3.528,00 TRY 11,300 15.895,69 0,03 0,03
TURK HAVA YOLLARI AO - 76.809,00 TRY 7,500 229.691,99 0,46 0,46
U.K.
AGGREKO PLC - 1.515,00 GBP 16,420 29.027,19 0,06 0,06
ASHTEAD GROUP PLC - 7.388,00 GBP 6,455 55.647,07 0,11 0,11
BABCOCK INTERNATIONAL GROUP - 3.190,00 GBP 11,030 41.056,83 0,08 0,08
BAE SYSTEMS PLC - 1.386,00 GBP 3,830 6.194,14 0,01 0,01
BALFOUR BEATTY PLC - 3.668,00 GBP 2,384 10.203,63 0,02 0,02
BUNZL - 864,00 GBP 12,800 12.904,55 0,03 0,03
EASYJET PLC - 1.399,00 GBP 12,960 21.156,41 0,04 0,04
EXPERIAN GROUP LTD - 67.864,00 GBP 11,430 905.117,29 1,81 1,82
GKN "NEW" 5.157,00 GBP 3,013 18.130,74 0,04 0,04
GROUP 4 SECURICOR PLC - 7.056,00 GBP 2,304 18.969,69 0,04 0,04
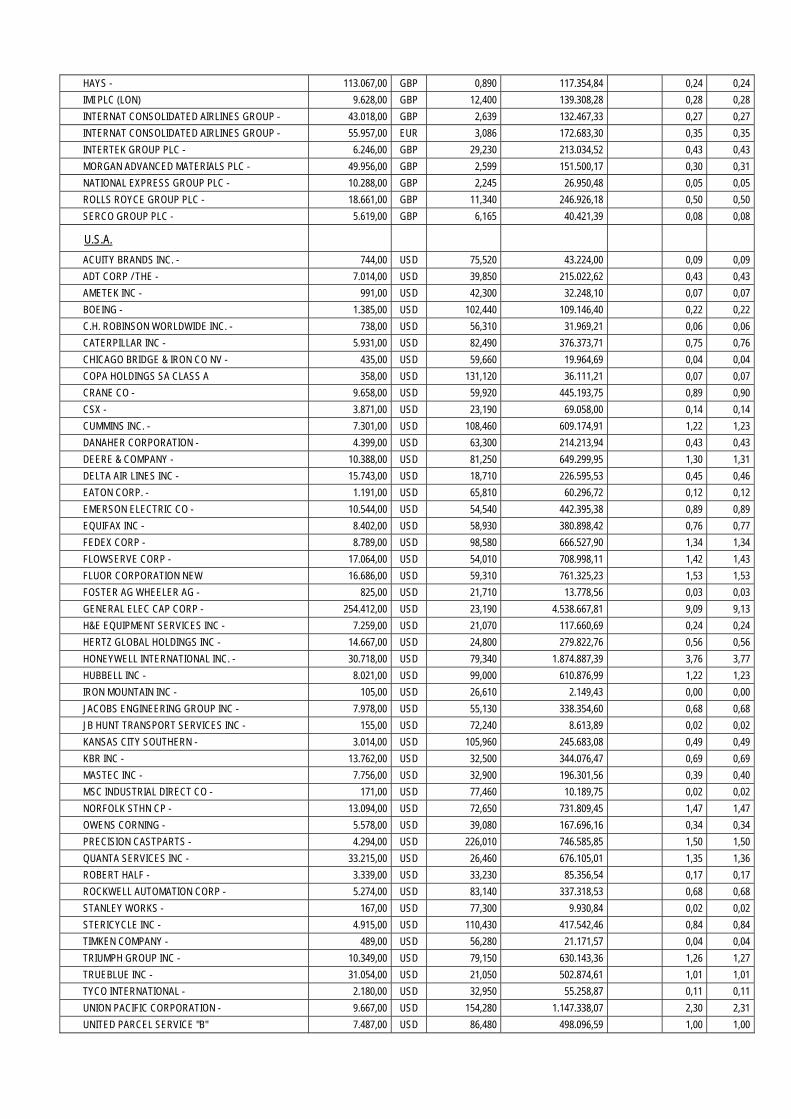
HAYS - 113.067,00 GBP 0,890 117.354,84 0,24 0,24
IMI PLC (LON) 9.628,00 GBP 12,400 139.308,28 0,28 0,28
INTERNAT CONSOLIDATED AIRLINES GROUP - 43.018,00 GBP 2,639 132.467,33 0,27 0,27
INTERNAT CONSOLIDATED AIRLINES GROUP - 55.957,00 EUR 3,086 172.683,30 0,35 0,35
INTERTEK GROUP PLC - 6.246,00 GBP 29,230 213.034,52 0,43 0,43
MORGAN ADVANCED MATERIALS PLC - 49.956,00 GBP 2,599 151.500,17 0,30 0,31
NATIONAL EXPRESS GROUP PLC - 10.288,00 GBP 2,245 26.950,48 0,05 0,05
ROLLS ROYCE GROUP PLC - 18.661,00 GBP 11,340 246.926,18 0,50 0,50
SERCO GROUP PLC - 5.619,00 GBP 6,165 40.421,39 0,08 0,08
U.S.A.
ACUITY BRANDS INC. - 744,00 USD 75,520 43.224,00 0,09 0,09
ADT CORP / THE - 7.014,00 USD 39,850 215.022,62 0,43 0,43
AMETEK INC - 991,00 USD 42,300 32.248,10 0,07 0,07
BOEING - 1.385,00 USD 102,440 109.146,40 0,22 0,22
C.H. ROBINSON WORLDWIDE INC. - 738,00 USD 56,310 31.969,21 0,06 0,06
CATERPILLAR INC - 5.931,00 USD 82,490 376.373,71 0,75 0,76
CHICAGO BRIDGE & IRON CO NV - 435,00 USD 59,660 19.964,69 0,04 0,04
COPA HOLDINGS SA CLASS A 358,00 USD 131,120 36.111,21 0,07 0,07
CRANE CO - 9.658,00 USD 59,920 445.193,75 0,89 0,90
CSX - 3.871,00 USD 23,190 69.058,00 0,14 0,14
CUMMINS INC. - 7.301,00 USD 108,460 609.174,91 1,22 1,23
DANAHER CORPORATION - 4.399,00 USD 63,300 214.213,94 0,43 0,43
DEERE & COMPANY - 10.388,00 USD 81,250 649.299,95 1,30 1,31
DELTA AIR LINES INC - 15.743,00 USD 18,710 226.595,53 0,45 0,46
EATON CORP. - 1.191,00 USD 65,810 60.296,72 0,12 0,12
EMERSON ELECTRIC CO - 10.544,00 USD 54,540 442.395,38 0,89 0,89
EQUIFAX INC - 8.402,00 USD 58,930 380.898,42 0,76 0,77
FEDEX CORP - 8.789,00 USD 98,580 666.527,90 1,34 1,34
FLOWSERVE CORP - 17.064,00 USD 54,010 708.998,11 1,42 1,43
FLUOR CORPORATION NEW 16.686,00 USD 59,310 761.325,23 1,53 1,53
FOSTER AG WHEELER AG - 825,00 USD 21,710 13.778,56 0,03 0,03
GENERAL ELEC CAP CORP - 254.412,00 USD 23,190 4.538.667,81 9,09 9,13
H&E EQUIPMENT SERVICES INC - 7.259,00 USD 21,070 117.660,69 0,24 0,24
HERTZ GLOBAL HOLDINGS INC - 14.667,00 USD 24,800 279.822,76 0,56 0,56
HONEYWELL INTERNATIONAL INC. - 30.718,00 USD 79,340 1.874.887,39 3,76 3,77
HUBBELL INC - 8.021,00 USD 99,000 610.876,99 1,22 1,23
IRON MOUNTAIN INC - 105,00 USD 26,610 2.149,43 0,00 0,00
JACOBS ENGINEERING GROUP INC - 7.978,00 USD 55,130 338.354,60 0,68 0,68
JB HUNT TRANSPORT SERVICES INC - 155,00 USD 72,240 8.613,89 0,02 0,02
KANSAS CITY SOUTHERN - 3.014,00 USD 105,960 245.683,08 0,49 0,49
KBR INC - 13.762,00 USD 32,500 344.076,47 0,69 0,69
MASTEC INC - 7.756,00 USD 32,900 196.301,56 0,39 0,40
MSC INDUSTRIAL DIRECT CO - 171,00 USD 77,460 10.189,75 0,02 0,02
NORFOLK STHN CP - 13.094,00 USD 72,650 731.809,45 1,47 1,47
OWENS CORNING - 5.578,00 USD 39,080 167.696,16 0,34 0,34
PRECISION CASTPARTS - 4.294,00 USD 226,010 746.585,85 1,50 1,50
QUANTA SERVICES INC - 33.215,00 USD 26,460 676.105,01 1,35 1,36
ROBERT HALF - 3.339,00 USD 33,230 85.356,54 0,17 0,17
ROCKWELL AUTOMATION CORP - 5.274,00 USD 83,140 337.318,53 0,68 0,68
STANLEY WORKS - 167,00 USD 77,300 9.930,84 0,02 0,02
STERICYCLE INC - 4.915,00 USD 110,430 417.542,46 0,84 0,84
TIMKEN COMPANY - 489,00 USD 56,280 21.171,57 0,04 0,04
TRIUMPH GROUP INC - 10.349,00 USD 79,150 630.143,36 1,26 1,27
TRUEBLUE INC - 31.054,00 USD 21,050 502.874,61 1,01 1,01
TYCO INTERNATIONAL - 2.180,00 USD 32,950 55.258,87 0,11 0,11
UNION PACIFIC CORPORATION - 9.667,00 USD 154,280 1.147.338,07 2,30 2,31
UNITED PARCEL SERVICE "B" 7.487,00 USD 86,480 498.096,59 1,00 1,00
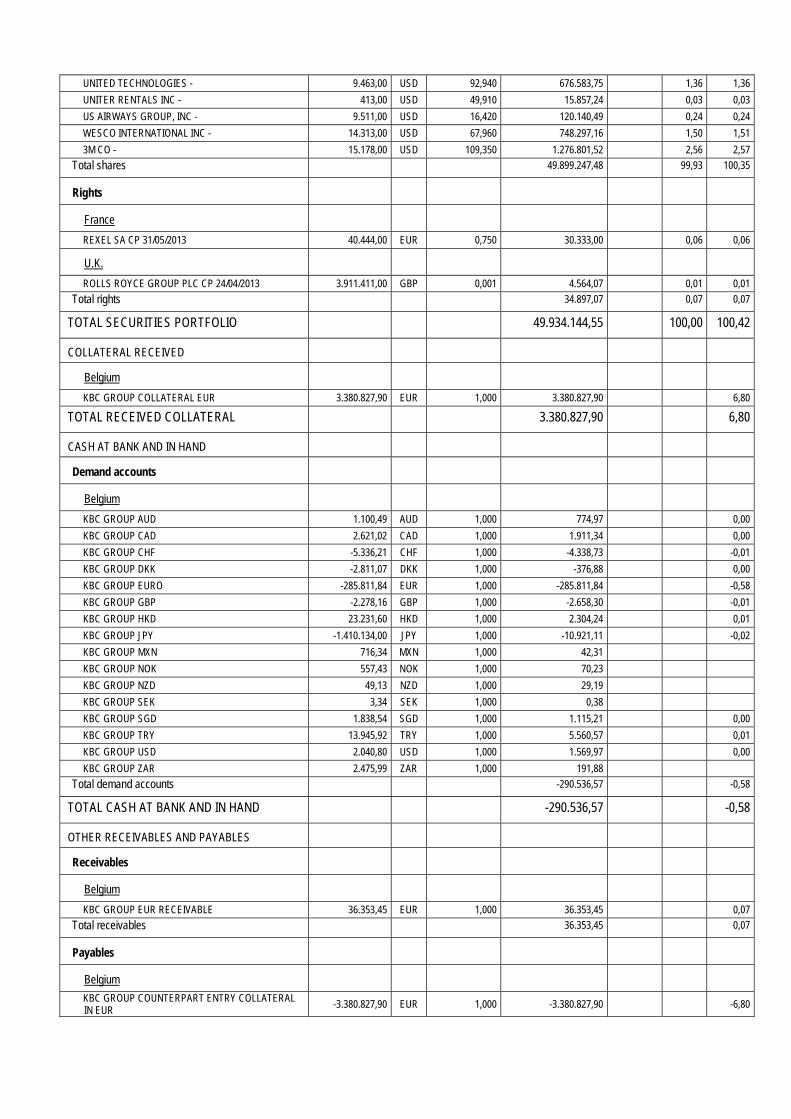
UNITED TECHNOLOGIES - 9.463,00 USD 92,940 676.583,75 1,36 1,36
UNITER RENTALS INC - 413,00 USD 49,910 15.857,24 0,03 0,03
US AIRWAYS GROUP, INC - 9.511,00 USD 16,420 120.140,49 0,24 0,24
WESCO INTERNATIONAL INC - 14.313,00 USD 67,960 748.297,16 1,50 1,51
3M CO - 15.178,00 USD 109,350 1.276.801,52 2,56 2,57
Total shares 49.899.247,48 99,93 100,35
Rights
France
REXEL SA CP 31/05/2013 40.444,00 EUR 0,750 30.333,00 0,06 0,06
U.K.
ROLLS ROYCE GROUP PLC CP 24/04/2013 3.911.411,00 GBP 0,001 4.564,07 0,01 0,01
Total rights 34.897,07 0,07 0,07
TOTAL SECURITIES PORTFOLIO 49.934.144,55 100,00 100,42
COLLATERAL RECEIVED
Belgium
KBC GROUP COLLATERAL EUR 3.380.827,90 EUR 1,000 3.380.827,90 6,80
TOTAL RECEIVED COLLATERAL 3.380.827,90 6,80
CASH AT BANK AND IN HAND
Demand accounts
Belgium
KBC GROUP AUD 1.100,49 AUD 1,000 774,97 0,00
KBC GROUP CAD 2.621,02 CAD 1,000 1.911,34 0,00
KBC GROUP CHF -5.336,21 CHF 1,000 -4.338,73 -0,01
KBC GROUP DKK -2.811,07 DKK 1,000 -376,88 0,00
KBC GROUP EURO -285.811,84 EUR 1,000 -285.811,84 -0,58
KBC GROUP GBP -2.278,16 GBP 1,000 -2.658,30 -0,01
KBC GROUP HKD 23.231,60 HKD 1,000 2.304,24 0,01
KBC GROUP JPY -1.410.134,00 JPY 1,000 -10.921,11 -0,02
KBC GROUP MXN 716,34 MXN 1,000 42,31
KBC GROUP NOK 557,43 NOK 1,000 70,23
KBC GROUP NZD 49,13 NZD 1,000 29,19
KBC GROUP SEK 3,34 SEK 1,000 0,38
KBC GROUP SGD 1.838,54 SGD 1,000 1.115,21 0,00
KBC GROUP TRY 13.945,92 TRY 1,000 5.560,57 0,01
KBC GROUP USD 2.040,80 USD 1,000 1.569,97 0,00
KBC GROUP ZAR 2.475,99 ZAR 1,000 191,88
Total demand accounts -290.536,57 -0,58
TOTAL CASH AT BANK AND IN HAND -290.536,57 -0,58
OTHER RECEIVABLES AND PAYABLES
Receivables
Belgium
KBC GROUP EUR RECEIVABLE 36.353,45 EUR 1,000 36.353,45 0,07
Total receivables 36.353,45 0,07
Payables
Belgium
KBC GROUP COUNTERPART ENTRY COLLATERAL IN EUR
-3.380.827,90 EUR 1,000 -3.380.827,90 -6,80

KBC GROUP EUR PAYABLE -1.086,41 EUR 1,000 -1.086,41 0,00
Payables -3.381.914,31 -6,80
TOTAL RECEIVABLES AND PAYABLES -3.345.560,86 -6,73
OTHER
Interest receivable EUR 116.538,48 0,23
Accrued interest EUR 3.528,58 0,01
Expenses payable EUR -105.407,21 -0,21
Expenses to be carried forward EUR 29.756,83 0,06
TOTAL OTHER 44.416,68 0,09
TOTAL NET ASSETS 49.723.291,70 100,00
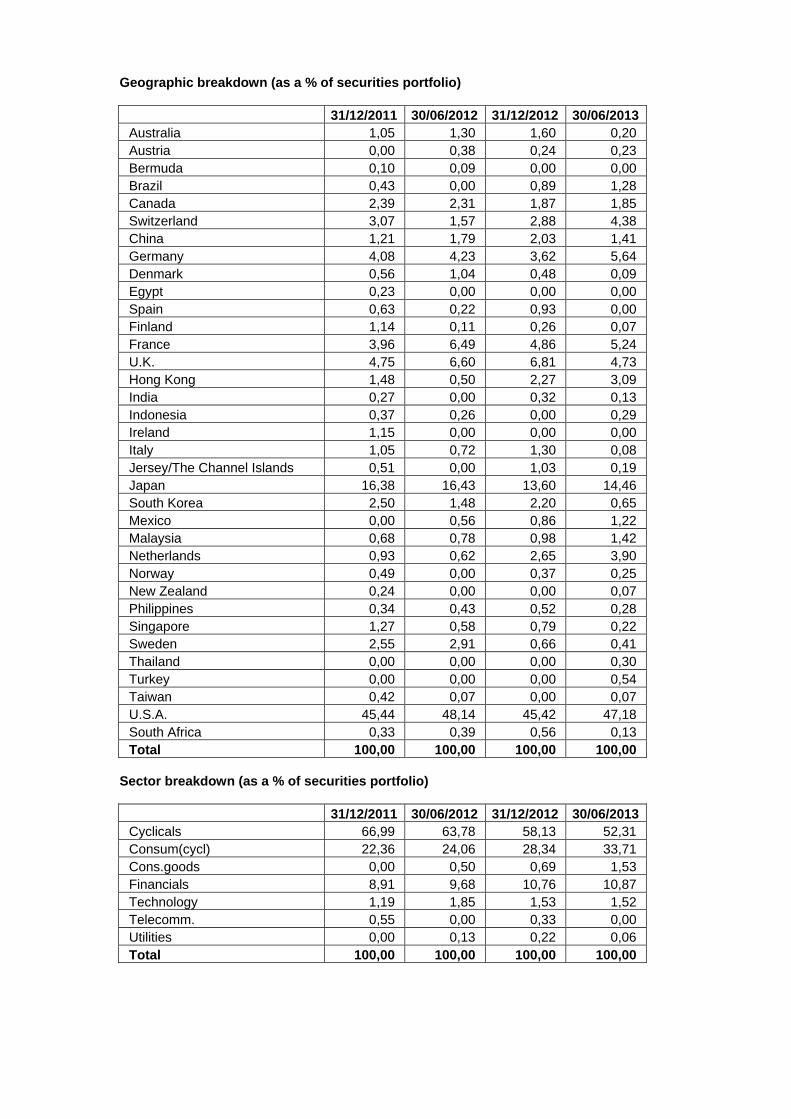
Geographic breakdown (as a % of securities portfolio)
31/12/2011 30/06/2012 31/12/2012 30/06/2013 Australia 1,05 1,30 1,60 0,20 Austria 0,00 0,38 0,24 0,23 Bermuda 0,10 0,09 0,00 0,00 Brazil 0,43 0,00 0,89 1,28 Canada 2,39 2,31 1,87 1,85 Switzerland 3,07 1,57 2,88 4,38 China 1,21 1,79 2,03 1,41 Germany 4,08 4,23 3,62 5,64 Denmark 0,56 1,04 0,48 0,09 Egypt 0,23 0,00 0,00 0,00 Spain 0,63 0,22 0,93 0,00 Finland 1,14 0,11 0,26 0,07 France 3,96 6,49 4,86 5,24 U.K. 4,75 6,60 6,81 4,73 Hong Kong 1,48 0,50 2,27 3,09 India 0,27 0,00 0,32 0,13 Indonesia 0,37 0,26 0,00 0,29 Ireland 1,15 0,00 0,00 0,00 Italy 1,05 0,72 1,30 0,08 Jersey/The Channel Islands 0,51 0,00 1,03 0,19 Japan 16,38 16,43 13,60 14,46 South Korea 2,50 1,48 2,20 0,65 Mexico 0,00 0,56 0,86 1,22 Malaysia 0,68 0,78 0,98 1,42 Netherlands 0,93 0,62 2,65 3,90 Norway 0,49 0,00 0,37 0,25 New Zealand 0,24 0,00 0,00 0,07 Philippines 0,34 0,43 0,52 0,28 Singapore 1,27 0,58 0,79 0,22 Sweden 2,55 2,91 0,66 0,41 Thailand 0,00 0,00 0,00 0,30 Turkey 0,00 0,00 0,00 0,54 Taiwan 0,42 0,07 0,00 0,07 U.S.A. 45,44 48,14 45,42 47,18 South Africa 0,33 0,39 0,56 0,13 Total 100,00 100,00 100,00 100,00
Sector breakdown (as a % of securities portfolio)
31/12/2011 30/06/2012 31/12/2012 30/06/2013 Cyclicals 66,99 63,78 58,13 52,31 Consum(cycl) 22,36 24,06 28,34 33,71 Cons.goods 0,00 0,50 0,69 1,53 Financials 8,91 9,68 10,76 10,87 Technology 1,19 1,85 1,53 1,52 Telecomm. 0,55 0,00 0,33 0,00 Utilities 0,00 0,13 0,22 0,06 Total 100,00 100,00 100,00 100,00

Currency breakdown (as a % of net assets)
31/12/2011 30/06/2012 31/12/2012 30/06/2013 AUD 1,06 1,23 1,56 0,21 BRL 0,43 0,00 0,87 1,29 CAD 2,38 2,18 1,83 1,86 CHF 3,05 1,20 3,09 4,39 DKK 0,56 0,99 0,46 0,09 EUR 12,58 16,64 15,22 15,09 GBP 5,22 6,25 7,66 4,60 HKD 2,71 2,18 4,48 4,53 IDR 0,37 0,24 0,00 0,29 JPY 16,27 15,41 13,21 14,52 KRW 2,48 1,38 2,14 0,65 MXN 0,00 0,52 0,84 1,23 MYR 0,68 0,73 0,95 1,43 NOK 0,52 0,00 0,36 0,25 NZD 0,24 0,00 0,00 0,07 PHP 0,34 0,40 0,50 0,28 SEK 2,53 2,72 1,04 0,41 SGD 1,36 1,30 0,77 0,22 THB 0,00 0,00 0,00 0,30 TRY 0,00 0,00 0,00 0,56 TWD 0,42 0,07 0,00 0,07 USD 46,47 46,20 44,48 47,53 ZAR 0,33 0,36 0,54 0,13 Total 100,00 100,00 100,00 100,00

2.4.2 CHANGES IN THE COMPOSITION OF THE ASSETS OF KBC EQUITY FUND INDUSTRIALS &
INFRASTRUCTURE (IN THE CURRENCY OF THE SUB-FUND)
1st half of year YearPurchases 54.260.629,66 54.260.629,66 Sales 75.811.602,53 75.811.602,53 Total 1 130.072.232,19 130.072.232,19 Subscriptions 49.112.440,60 49.112.440,60 Redemptions 72.807.594,69 72.807.594,69 Total 2 121.920.035,29 121.920.035,29 Monthly average of total assets
71.571.706,84 71.571.706,84
Turnover rate 11,39 % 11,39 %
1st half of year YearPurchases 54.260.629,66 54.260.629,66 Sales 75.811.602,53 75.811.602,53 Total 1 130.072.232,19 130.072.232,19 Subscriptions 49.112.440,60 49.112.440,60 Redemptions 72.807.594,69 72.807.594,69 Total 2 121.920.035,29 121.920.035,29 Monthly average of total assets
76.835.032,01 76.835.032,01
Corrected turnover rate 10,61 % 10,61 %
The table above shows the capital volume of portfolio transactions. This volume (adjusted to take account of total subscriptions and redemptions) is also compared to the average net assets at the beginning and end of the period. A figure close to 0% implies that the transactions relating to the securities or transactions relating to the assets (excluding deposits and cash) in a given period only involve subscriptions and redemptions. A negative percentage shows that subscriptions and redemptions entailed few, if any, transactions in the portfolio. Active asset management may result in high turnover rates (monthly percentage >50%). The detailed list of transactions is available for consultation free of charge at the registered office of the Bevek or fund at Havenlaan 2, 1080 Brussels.
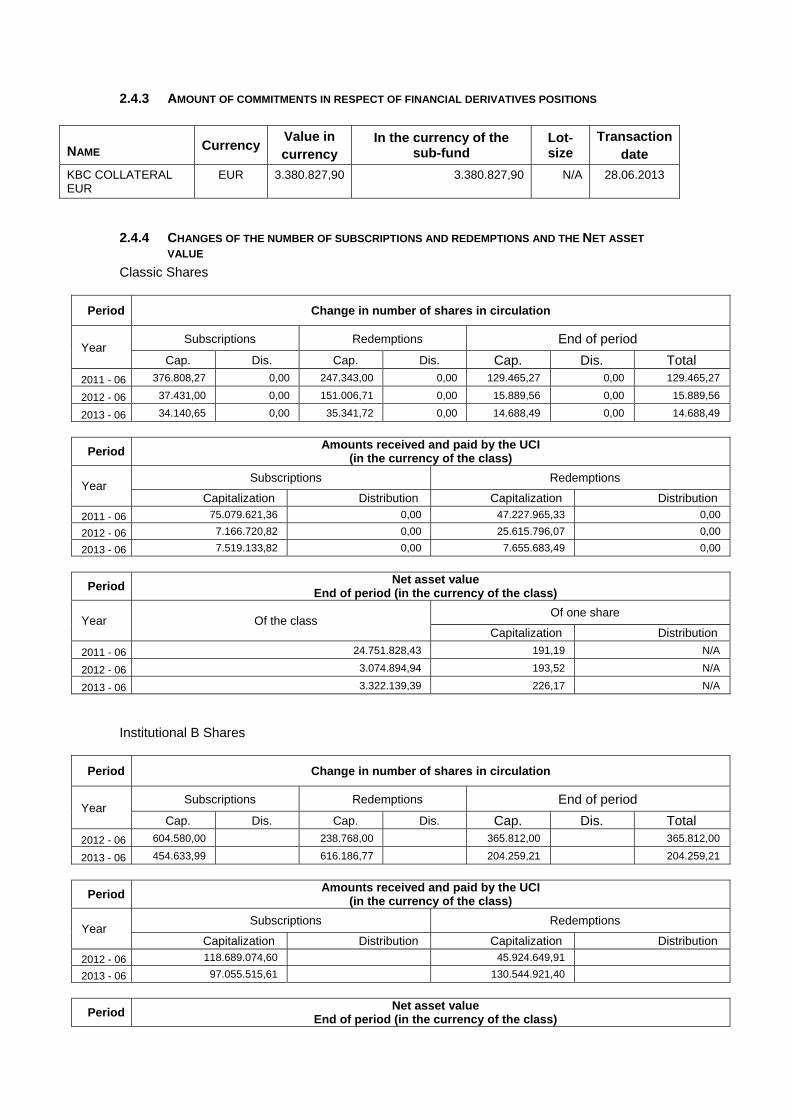
2.4.3 AMOUNT OF COMMITMENTS IN RESPECT OF FINANCIAL DERIVATIVES POSITIONS
NAME Currency Value in currency
In the currency of the sub-fund
Lot-size
Transactiondate
KBC COLLATERAL EUR
EUR 3.380.827,90 3.380.827,90 N/A 28.06.2013
2.4.4 CHANGES OF THE NUMBER OF SUBSCRIPTIONS AND REDEMPTIONS AND THE NET ASSET
VALUE
Classic Shares
Period Change in number of shares in circulation
Year Subscriptions Redemptions End of period
Cap. Dis. Cap. Dis. Cap. Dis. Total
2011 - 06 376.808,27 0,00 247.343,00 0,00 129.465,27 0,00 129.465,27
2012 - 06 37.431,00 0,00 151.006,71 0,00 15.889,56 0,00 15.889,56
2013 - 06 34.140,65 0,00 35.341,72 0,00 14.688,49 0,00 14.688,49
Period Amounts received and paid by the UCI
(in the currency of the class)
Year Subscriptions Redemptions
Capitalization Distribution Capitalization Distribution
2011 - 06 75.079.621,36 0,00 47.227.965,33 0,00
2012 - 06 7.166.720,82 0,00 25.615.796,07 0,00
2013 - 06 7.519.133,82 0,00 7.655.683,49 0,00
Period Net asset value
End of period (in the currency of the class)
Year Of the class Of one share
Capitalization Distribution
2011 - 06 24.751.828,43 191,19 N/A
2012 - 06 3.074.894,94 193,52 N/A
2013 - 06 3.322.139,39 226,17 N/A
Institutional B Shares
Period Change in number of shares in circulation
Year Subscriptions Redemptions End of period
Cap. Dis. Cap. Dis. Cap. Dis. Total 2012 - 06 604.580,00 238.768,00 365.812,00 365.812,00
2013 - 06 454.633,99 616.186,77 204.259,21 204.259,21
Period Amounts received and paid by the UCI
(in the currency of the class)
Year Subscriptions Redemptions
Capitalization Distribution Capitalization Distribution
2012 - 06 118.689.074,60 45.924.649,91
2013 - 06 97.055.515,61 130.544.921,40
Period Net asset value
End of period (in the currency of the class)

Year Of the class Of one share
Capitalization Distribution
2012 - 06 71.050.414,60 194,23
2013 - 06 46.401.152,34 227,17
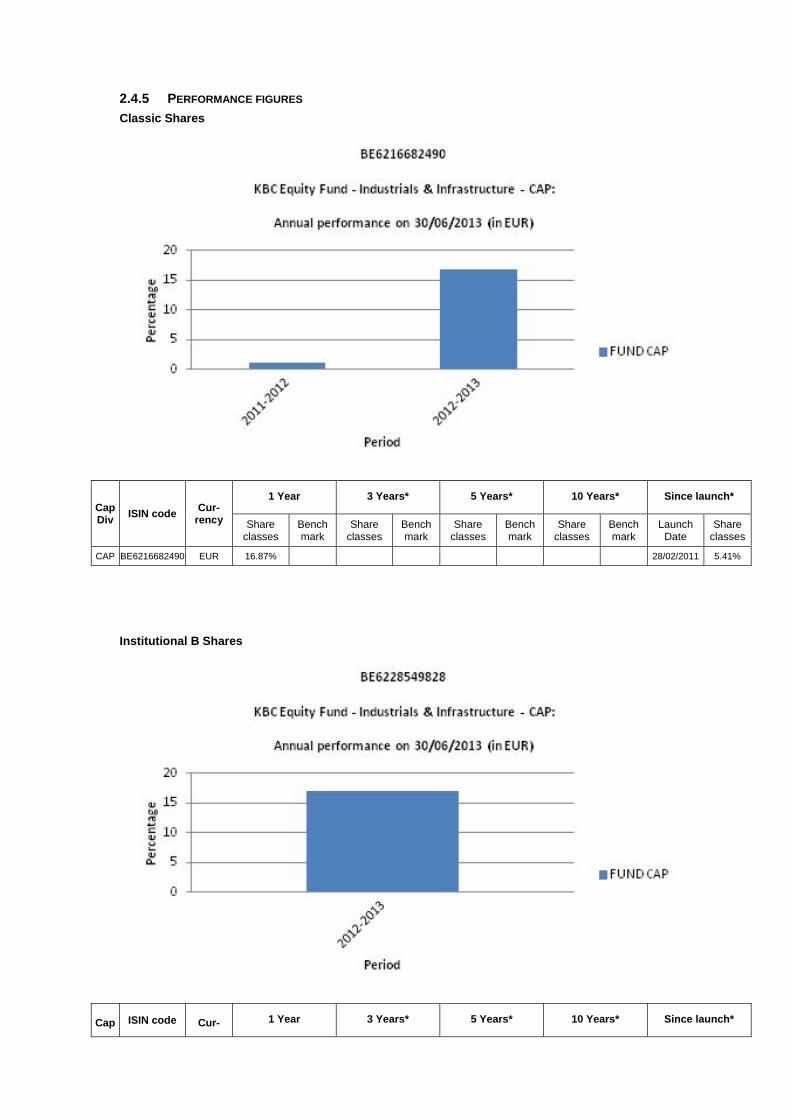
2.4.5 PERFORMANCE FIGURES
Classic Shares
Cap Div
ISIN code Cur-
rency
1 Year 3 Years* 5 Years* 10 Years* Since launch*
Share classes
Bench mark
Share classes
Bench mark
Share classes
Bench mark
Share classes
Bench mark
Launch Date
Share classes
CAP BE6216682490 EUR 16.87% 28/02/2011 5.41%
Institutional B Shares
Cap ISIN code Cur- 1 Year 3 Years* 5 Years* 10 Years* Since launch*
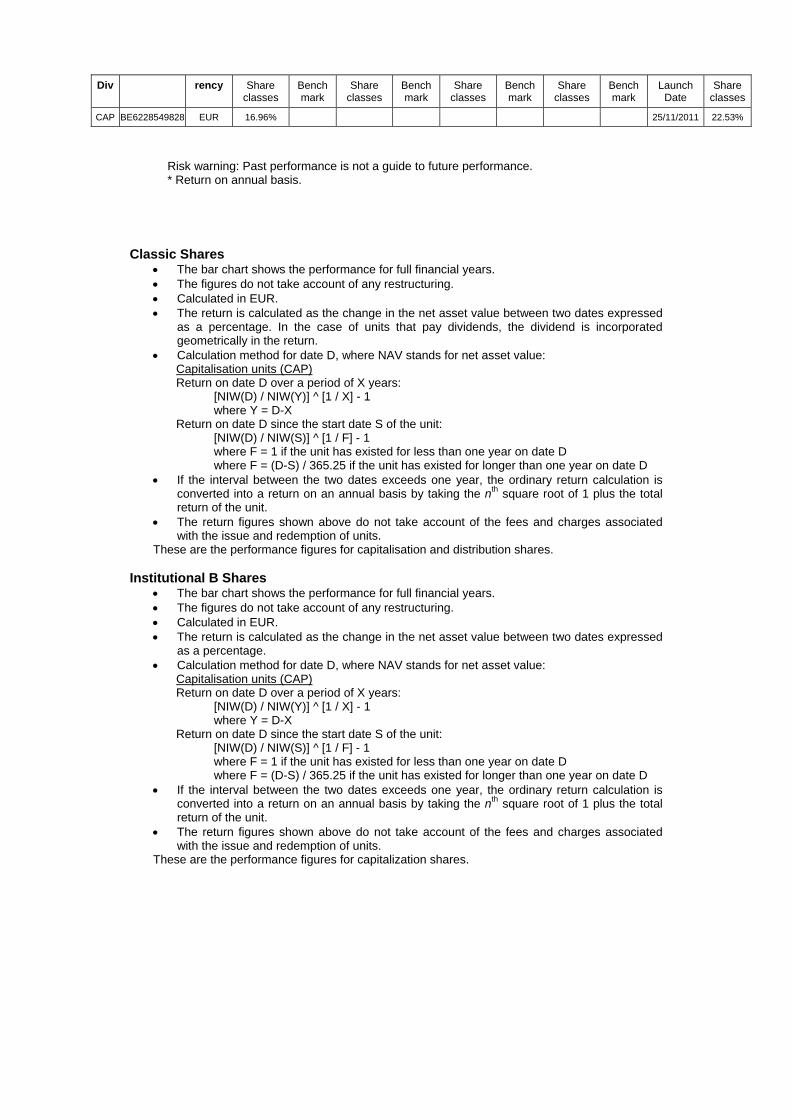
Div rency Share classes
Bench mark
Share classes
Bench mark
Share classes
Bench mark
Share classes
Bench mark
Launch Date
Share classes
CAP BE6228549828 EUR 16.96% 25/11/2011 22.53%
Risk warning: Past performance is not a guide to future performance. * Return on annual basis.
Classic Shares The bar chart shows the performance for full financial years. The figures do not take account of any restructuring. Calculated in EUR. The return is calculated as the change in the net asset value between two dates expressed
as a percentage. In the case of units that pay dividends, the dividend is incorporated geometrically in the return.
Calculation method for date D, where NAV stands for net asset value: Capitalisation units (CAP) Return on date D over a period of X years:
[NIW(D) / NIW(Y)] ^ [1 / X] - 1 where Y = D-X
Return on date D since the start date S of the unit: [NIW(D) / NIW(S)] ^ [1 / F] - 1 where F = 1 if the unit has existed for less than one year on date D where F = (D-S) / 365.25 if the unit has existed for longer than one year on date D
If the interval between the two dates exceeds one year, the ordinary return calculation is converted into a return on an annual basis by taking the nth square root of 1 plus the total return of the unit.
The return figures shown above do not take account of the fees and charges associated with the issue and redemption of units.
These are the performance figures for capitalisation and distribution shares.
Institutional B Shares The bar chart shows the performance for full financial years. The figures do not take account of any restructuring. Calculated in EUR. The return is calculated as the change in the net asset value between two dates expressed
as a percentage. Calculation method for date D, where NAV stands for net asset value:
Capitalisation units (CAP) Return on date D over a period of X years:
[NIW(D) / NIW(Y)] ^ [1 / X] - 1 where Y = D-X
Return on date D since the start date S of the unit: [NIW(D) / NIW(S)] ^ [1 / F] - 1 where F = 1 if the unit has existed for less than one year on date D where F = (D-S) / 365.25 if the unit has existed for longer than one year on date D
If the interval between the two dates exceeds one year, the ordinary return calculation is converted into a return on an annual basis by taking the nth square root of 1 plus the total return of the unit.
The return figures shown above do not take account of the fees and charges associated with the issue and redemption of units.
These are the performance figures for capitalization shares.

2.4.6 COSTS Ongoing Charges: * Classic Shares Distribution: not applicable Classic Shares Capitalization: 1.764% Institutional B Shares Capitalization: 1.639% * The following costs have not been included in the ongoing charges: - Interest payments on loans taken out - Payments in respect of financial derivatives - Fees and charges paid directly by the investor - Any soft commissions
SOFT COMMISSIONS The management company or the appointed manager, as the case may be, is the recipient of soft commissions. The recipient has laid down an internal policy as regards accepting soft commissions and avoiding possible conflicts of interest in this respect, and has put appropriate internal controls in place to ensure this policy is observed. For more information, please see the ‘General’ section of the annual report.
Broker
Commission gross
in EUR
paid during the period:
1‐01‐13
‐
30‐06‐13
CSA Credits
in EUR
accrued during the period:
1‐01‐13
‐
30‐06‐13 Percentage
CITI 30,979 15,335 49.50%
CSFBSAS 5,053 1,716 33.96%
DEUTSCHE 605 288 47.52%
EQ MACQUARIE 3,942 1,966 49.89%
HSBC 984 287 29.20%
INSTINET 22,672 11,246 49.61%
MERRILL 2,267 1,086 47.91%
MORGAN STANLEY 10,413 5,114 49.11%
SOCGEN 675 263 38.91%
UBSWDR 3,443 1,538 44.68%
FEE-SHARING AGREEMENTS AND REBATES: The management company may share its fee with the distributor, and institutional and/or professional parties. In principle, the percentage share amounts to between 35% and 60% if the distributor is an entity of KBC Group NV or to between 35% and 70% if the distributor is not an entity of KBC Group NV. However, in a small number of cases, the distributor’s fee is less than 35%. Investors may, on request, obtain more information on these cases. If the management company invests the assets of the undertaking for collective investment in units of undertakings for collective investment that are not managed by an entity of KBC Group NV, and receives a fee for doing so, it will pay this fee to the undertaking for collective investment. Fee-sharing does not affect the amount of the management fee paid by the sub-fund to the management company. This management fee is subject to the limitations laid down in the articles of association. The limitations may only be amended after approval by the general meeting of shareholders. The management company has concluded a distribution agreement with the distributor in order to facilitate the wider distribution of the sub-fund's units by using multiple distribution channels. It is in the interests of the holders of units, the sub-fund and of the distributor for the largest possible number of units to be sold and for the assets of the sub-fund to be maximised in this way. In this respect, there is therefore no question of any conflict of interest.
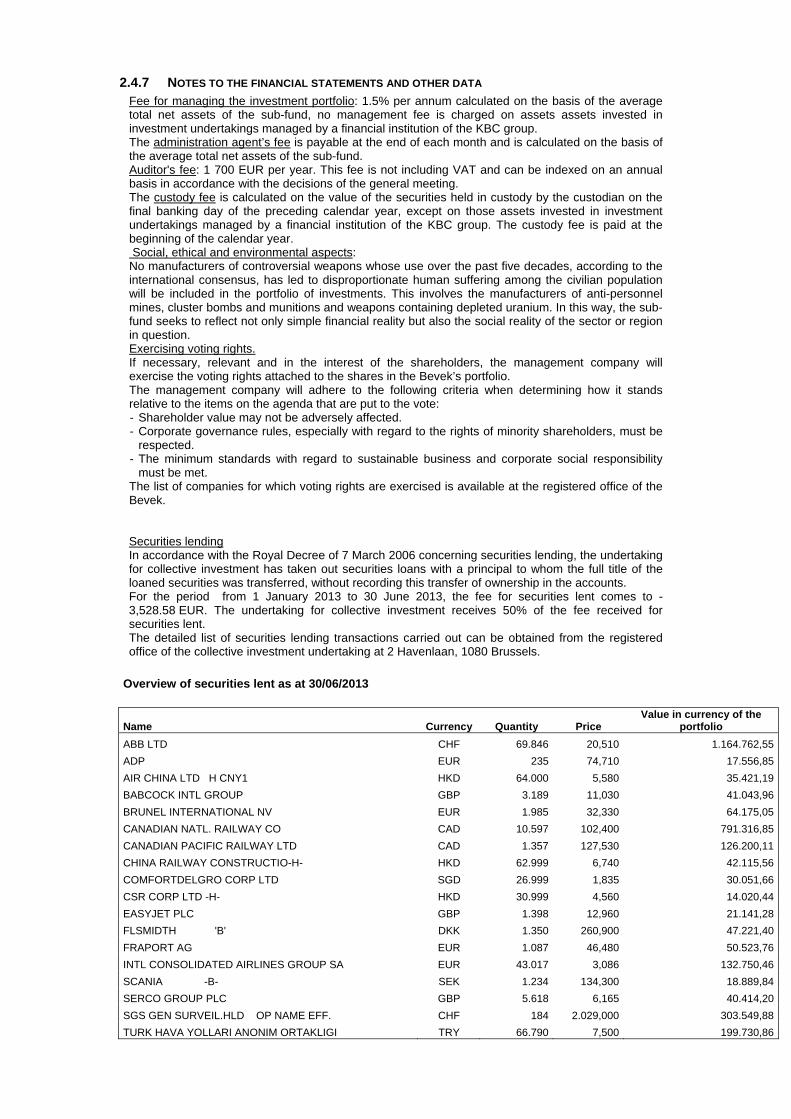
2.4.7 NOTES TO THE FINANCIAL STATEMENTS AND OTHER DATA Fee for managing the investment portfolio: 1.5% per annum calculated on the basis of the average total net assets of the sub-fund, no management fee is charged on assets assets invested in investment undertakings managed by a financial institution of the KBC group. The administration agent’s fee is payable at the end of each month and is calculated on the basis of the average total net assets of the sub-fund. Auditor's fee: 1 700 EUR per year. This fee is not including VAT and can be indexed on an annual basis in accordance with the decisions of the general meeting. The custody fee is calculated on the value of the securities held in custody by the custodian on the final banking day of the preceding calendar year, except on those assets invested in investment undertakings managed by a financial institution of the KBC group. The custody fee is paid at the beginning of the calendar year. Social, ethical and environmental aspects: No manufacturers of controversial weapons whose use over the past five decades, according to the international consensus, has led to disproportionate human suffering among the civilian population will be included in the portfolio of investments. This involves the manufacturers of anti-personnel mines, cluster bombs and munitions and weapons containing depleted uranium. In this way, the sub-fund seeks to reflect not only simple financial reality but also the social reality of the sector or region in question. Exercising voting rights. If necessary, relevant and in the interest of the shareholders, the management company will exercise the voting rights attached to the shares in the Bevek’s portfolio. The management company will adhere to the following criteria when determining how it stands relative to the items on the agenda that are put to the vote: - Shareholder value may not be adversely affected. - Corporate governance rules, especially with regard to the rights of minority shareholders, must be
respected. - The minimum standards with regard to sustainable business and corporate social responsibility
must be met. The list of companies for which voting rights are exercised is available at the registered office of the Bevek. Securities lending In accordance with the Royal Decree of 7 March 2006 concerning securities lending, the undertaking for collective investment has taken out securities loans with a principal to whom the full title of the loaned securities was transferred, without recording this transfer of ownership in the accounts. For the period from 1 January 2013 to 30 June 2013, the fee for securities lent comes to -3,528.58 EUR. The undertaking for collective investment receives 50% of the fee received for securities lent. The detailed list of securities lending transactions carried out can be obtained from the registered office of the collective investment undertaking at 2 Havenlaan, 1080 Brussels.
Overview of securities lent as at 30/06/2013
Name Currency Quantity Price Value in currency of the
portfolio
ABB LTD CHF 69.846 20,510 1.164.762,55
ADP EUR 235 74,710 17.556,85
AIR CHINA LTD H CNY1 HKD 64.000 5,580 35.421,19
BABCOCK INTL GROUP GBP 3.189 11,030 41.043,96
BRUNEL INTERNATIONAL NV EUR 1.985 32,330 64.175,05
CANADIAN NATL. RAILWAY CO CAD 10.597 102,400 791.316,85
CANADIAN PACIFIC RAILWAY LTD CAD 1.357 127,530 126.200,11
CHINA RAILWAY CONSTRUCTIO-H- HKD 62.999 6,740 42.115,56
COMFORTDELGRO CORP LTD SGD 26.999 1,835 30.051,66
CSR CORP LTD -H- HKD 30.999 4,560 14.020,44
EASYJET PLC GBP 1.398 12,960 21.141,28
FLSMIDTH 'B' DKK 1.350 260,900 47.221,40
FRAPORT AG EUR 1.087 46,480 50.523,76
INTL CONSOLIDATED AIRLINES GROUP SA EUR 43.017 3,086 132.750,46
SCANIA -B- SEK 1.234 134,300 18.889,84
SERCO GROUP PLC GBP 5.618 6,165 40.414,20
SGS GEN SURVEIL.HLD OP NAME EFF. CHF 184 2.029,000 303.549,88
TURK HAVA YOLLARI ANONIM ORTAKLIGI TRY 66.790 7,500 199.730,86
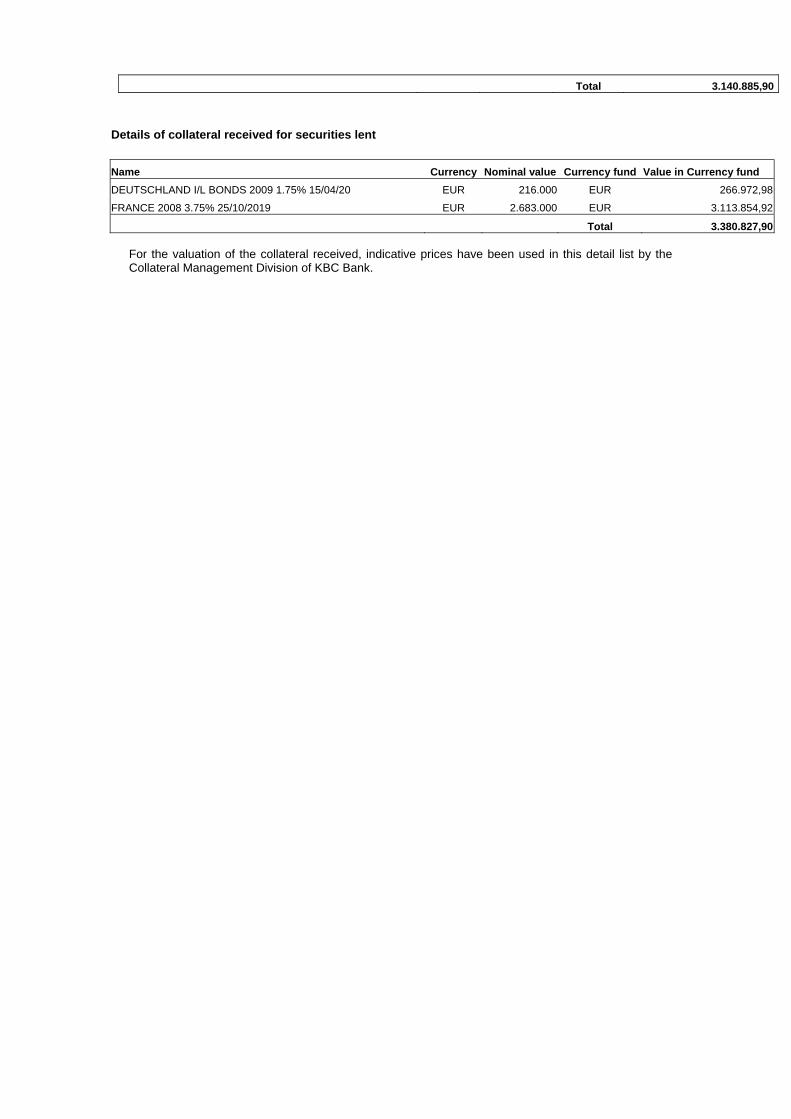
Total 3.140.885,90
Details of collateral received for securities lent
Name Currency Nominal value Currency fund Value in Currency fund
DEUTSCHLAND I/L BONDS 2009 1.75% 15/04/20 EUR 216.000 EUR 266.972,98
FRANCE 2008 3.75% 25/10/2019 EUR 2.683.000 EUR 3.113.854,92
Total 3.380.827,90 For the valuation of the collateral received, indicative prices have been used in this detail list by the Collateral Management Division of KBC Bank.

Semi-Annual report as at 30th June 2013
TABLE OF CONTENTS
2. Information on KBC Equity Fund Turkey
2.1. Management report 2.1.1. Launch date and subscription price 2.1.2. Stock exchange listing 2.1.3. Aim and distinctive features of the investment policy 2.1.4. Financial portfolio management 2.1.5. Distributors 2.1.6. Index and benchmark 2.1.7. Policy conducted during the financial year 2.1.8. Future policy 2.1.9. Synthetic risk and reward indicator (SRRI)
2.2. Balance sheet
2.3. Profit and loss account
2.4. Composition of the assets and key figures
2.4.1. Composition of the assets 2.4.2. Change in the composition of the assets 2.4.3. Value of commitments in respect of financial derivatives positions 2.4.4. Evolution of the number of subscriptions, repayments and the net asset value 2.4.5. Return figures 2.4.6. Expenses 2.4.7. Notes to the financial statements and other data

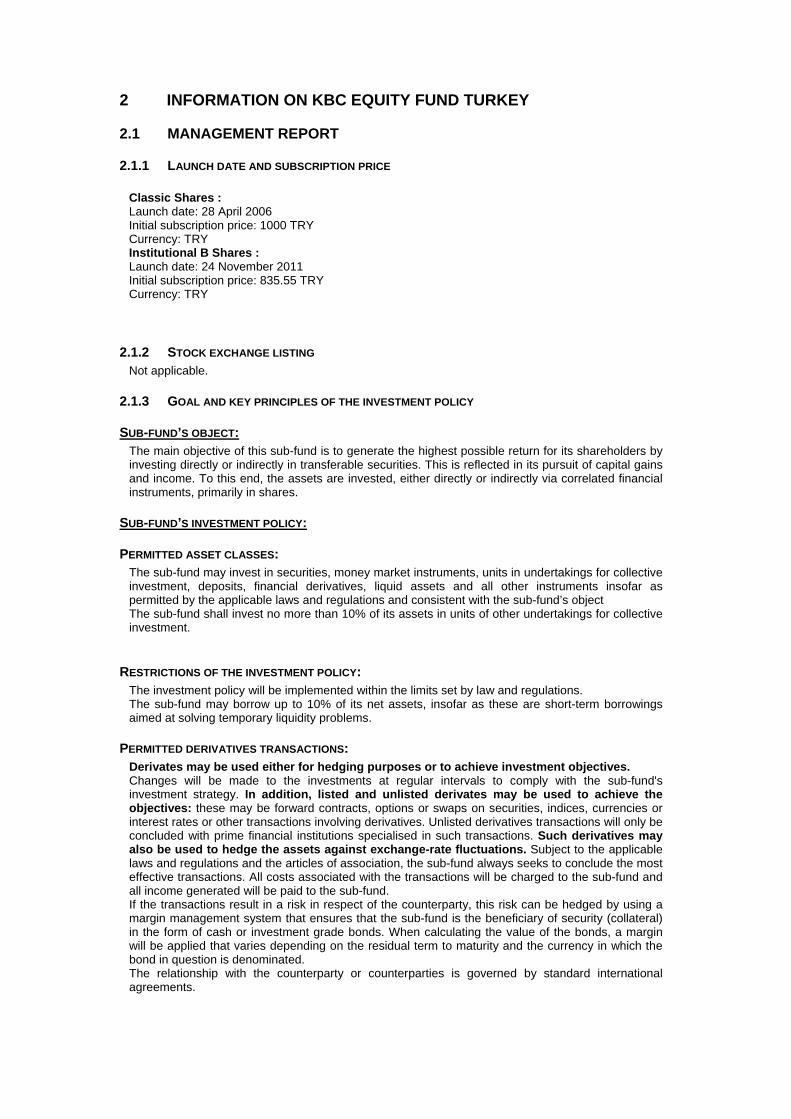
2 INFORMATION ON KBC EQUITY FUND TURKEY
2.1 MANAGEMENT REPORT
2.1.1 LAUNCH DATE AND SUBSCRIPTION PRICE Classic Shares : Launch date: 28 April 2006 Initial subscription price: 1000 TRY Currency: TRY Institutional B Shares : Launch date: 24 November 2011 Initial subscription price: 835.55 TRY Currency: TRY
2.1.2 STOCK EXCHANGE LISTING Not applicable.
2.1.3 GOAL AND KEY PRINCIPLES OF THE INVESTMENT POLICY
SUB-FUND’S OBJECT: The main objective of this sub-fund is to generate the highest possible return for its shareholders by investing directly or indirectly in transferable securities. This is reflected in its pursuit of capital gains and income. To this end, the assets are invested, either directly or indirectly via correlated financial instruments, primarily in shares.
SUB-FUND’S INVESTMENT POLICY:
PERMITTED ASSET CLASSES: The sub-fund may invest in securities, money market instruments, units in undertakings for collective investment, deposits, financial derivatives, liquid assets and all other instruments insofar as permitted by the applicable laws and regulations and consistent with the sub-fund’s object The sub-fund shall invest no more than 10% of its assets in units of other undertakings for collective investment.
RESTRICTIONS OF THE INVESTMENT POLICY: The investment policy will be implemented within the limits set by law and regulations. The sub-fund may borrow up to 10% of its net assets, insofar as these are short-term borrowings aimed at solving temporary liquidity problems.
PERMITTED DERIVATIVES TRANSACTIONS: Derivates may be used either for hedging purposes or to achieve investment objectives. Changes will be made to the investments at regular intervals to comply with the sub-fund's investment strategy. In addition, listed and unlisted derivates may be used to achieve the objectives: these may be forward contracts, options or swaps on securities, indices, currencies or interest rates or other transactions involving derivatives. Unlisted derivatives transactions will only be concluded with prime financial institutions specialised in such transactions. Such derivatives may also be used to hedge the assets against exchange-rate fluctuations. Subject to the applicable laws and regulations and the articles of association, the sub-fund always seeks to conclude the most effective transactions. All costs associated with the transactions will be charged to the sub-fund and all income generated will be paid to the sub-fund. If the transactions result in a risk in respect of the counterparty, this risk can be hedged by using a margin management system that ensures that the sub-fund is the beneficiary of security (collateral) in the form of cash or investment grade bonds. When calculating the value of the bonds, a margin will be applied that varies depending on the residual term to maturity and the currency in which the bond in question is denominated. The relationship with the counterparty or counterparties is governed by standard international agreements.
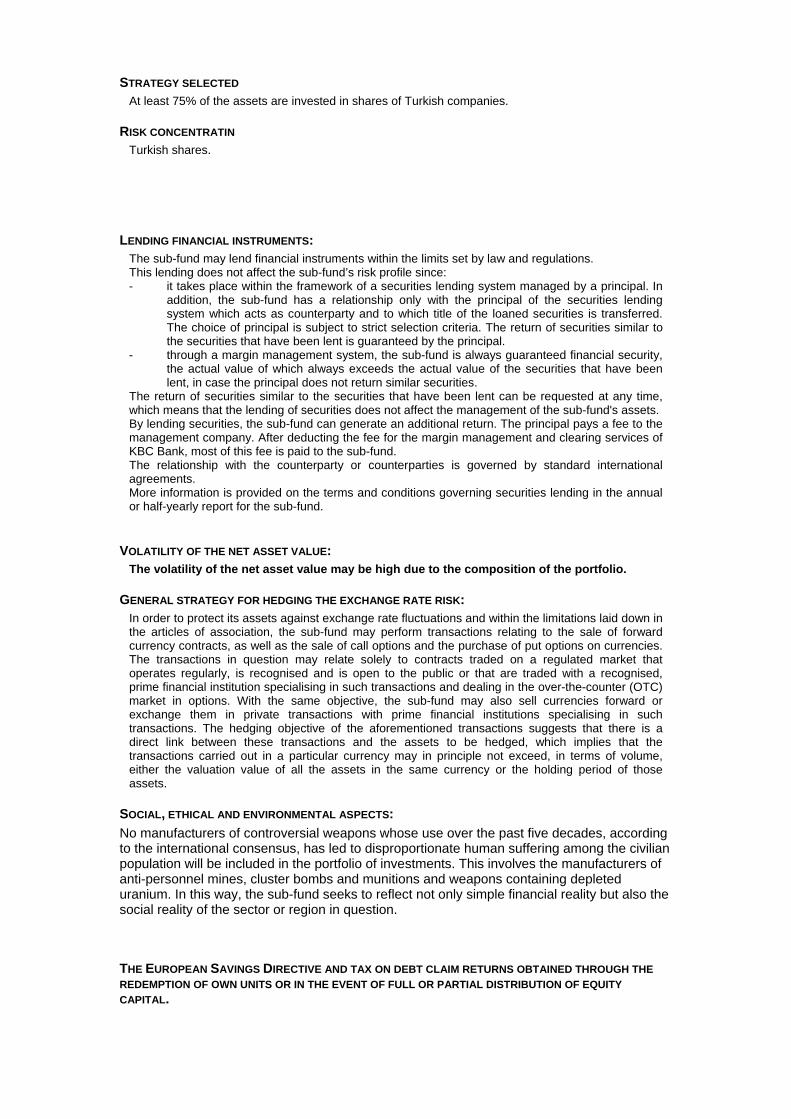
STRATEGY SELECTED At least 75% of the assets are invested in shares of Turkish companies.
RISK CONCENTRATIN Turkish shares.
LENDING FINANCIAL INSTRUMENTS: The sub-fund may lend financial instruments within the limits set by law and regulations. This lending does not affect the sub-fund’s risk profile since: - it takes place within the framework of a securities lending system managed by a principal. In
addition, the sub-fund has a relationship only with the principal of the securities lending system which acts as counterparty and to which title of the loaned securities is transferred. The choice of principal is subject to strict selection criteria. The return of securities similar to the securities that have been lent is guaranteed by the principal.
- through a margin management system, the sub-fund is always guaranteed financial security, the actual value of which always exceeds the actual value of the securities that have been lent, in case the principal does not return similar securities.
The return of securities similar to the securities that have been lent can be requested at any time, which means that the lending of securities does not affect the management of the sub-fund's assets. By lending securities, the sub-fund can generate an additional return. The principal pays a fee to the management company. After deducting the fee for the margin management and clearing services of KBC Bank, most of this fee is paid to the sub-fund. The relationship with the counterparty or counterparties is governed by standard international agreements. More information is provided on the terms and conditions governing securities lending in the annual or half-yearly report for the sub-fund.
VOLATILITY OF THE NET ASSET VALUE: The volatility of the net asset value may be high due to the composition of the portfolio.
GENERAL STRATEGY FOR HEDGING THE EXCHANGE RATE RISK: In order to protect its assets against exchange rate fluctuations and within the limitations laid down in the articles of association, the sub-fund may perform transactions relating to the sale of forward currency contracts, as well as the sale of call options and the purchase of put options on currencies. The transactions in question may relate solely to contracts traded on a regulated market that operates regularly, is recognised and is open to the public or that are traded with a recognised, prime financial institution specialising in such transactions and dealing in the over-the-counter (OTC) market in options. With the same objective, the sub-fund may also sell currencies forward or exchange them in private transactions with prime financial institutions specialising in such transactions. The hedging objective of the aforementioned transactions suggests that there is a direct link between these transactions and the assets to be hedged, which implies that the transactions carried out in a particular currency may in principle not exceed, in terms of volume, either the valuation value of all the assets in the same currency or the holding period of those assets.
SOCIAL, ETHICAL AND ENVIRONMENTAL ASPECTS:
No manufacturers of controversial weapons whose use over the past five decades, according to the international consensus, has led to disproportionate human suffering among the civilian population will be included in the portfolio of investments. This involves the manufacturers of anti-personnel mines, cluster bombs and munitions and weapons containing depleted uranium. In this way, the sub-fund seeks to reflect not only simple financial reality but also the social reality of the sector or region in question.
THE EUROPEAN SAVINGS DIRECTIVE AND TAX ON DEBT CLAIM RETURNS OBTAINED THROUGH THE
REDEMPTION OF OWN UNITS OR IN THE EVENT OF FULL OR PARTIAL DISTRIBUTION OF EQUITY
CAPITAL.
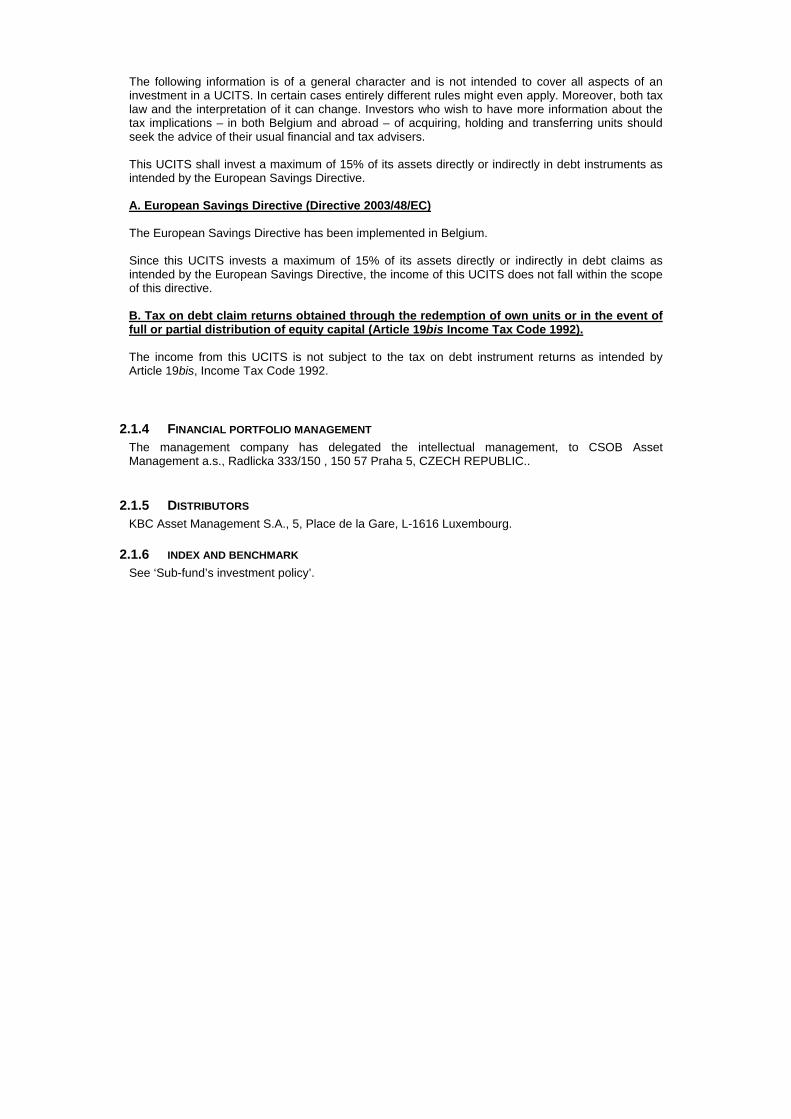
The following information is of a general character and is not intended to cover all aspects of an investment in a UCITS. In certain cases entirely different rules might even apply. Moreover, both tax law and the interpretation of it can change. Investors who wish to have more information about the tax implications – in both Belgium and abroad – of acquiring, holding and transferring units should seek the advice of their usual financial and tax advisers. This UCITS shall invest a maximum of 15% of its assets directly or indirectly in debt instruments as intended by the European Savings Directive. A. European Savings Directive (Directive 2003/48/EC) The European Savings Directive has been implemented in Belgium. Since this UCITS invests a maximum of 15% of its assets directly or indirectly in debt claims as intended by the European Savings Directive, the income of this UCITS does not fall within the scope of this directive. B. Tax on debt claim returns obtained through the redemption of own units or in the event of full or partial distribution of equity capital (Article 19bis Income Tax Code 1992). The income from this UCITS is not subject to the tax on debt instrument returns as intended by Article 19bis, Income Tax Code 1992.
2.1.4 FINANCIAL PORTFOLIO MANAGEMENT The management company has delegated the intellectual management, to CSOB Asset Management a.s., Radlicka 333/150 , 150 57 Praha 5, CZECH REPUBLIC..
2.1.5 DISTRIBUTORS KBC Asset Management S.A., 5, Place de la Gare, L-1616 Luxembourg.
2.1.6 INDEX AND BENCHMARK See ‘Sub-fund’s investment policy’.

2.1.7 POLICY PERSUED DURING THE FINANCIAL YEAR Turkish market experienced very high volatility in the first half of the year. The year started very well for Turkey. After Fitch upgraded the country to an investment grade at the end of the last year, investors were awaiting other rating agencies to follow. Strong 3% real growth, falling inflation to 6 – 7 % range and unemployment close to its historical lows brought Turkey to sweet spot for investors. Improved outlook and higher credit rating also led to falling bond rates, which increased attractiveness of Turkish equities further. Turkish market became one of the best markets worldwide, which increased nearly 20 % by mid May YTD. Unfortunately, one of the risks we have been pointing out in the past year became a real concern. Liberal part of the Turkish population, tired of step-by-step islamisation, gathered together in protests against Prime Minister Erdogan late May. Interestingly, spark for such protests became relatively innocent happening against construction and cutting trees in Gezi park, a park in the very centre of Istanbul. Clashes between young people and police reminded investors that Turkey is an emerging country despite the recent positive sentiment and rating hikes. Therefore, country risk premium started to rise again, leading to a jump in Turkish bond yields and demanded discount for Turkish equities. On top of that, In June, US FED announced that it can limit its bond purchases in the second half of the year and completely stop the QE program in the first half of 2014 should the US economy improve. Fears of end of cheap money period sent lower commodities and riskier emerging markets, Turkish market being no exemption. Money outflow are riskier for countries running current account (C/A) deficit, which is the case for Turkey. The turnover in sentiment was very swift bringing Turkish indices YTD into the red territory. We based our strategy for Turkish market on bottoming domestic consumption, growing construction sector and falling interest rates. Main beneficiaries of these assumptions were financial and real-estate sector, aviation, construction and consumer sectors. We weren’t much fond of Telecommunication and Utilities sector. Our strategy slightly changed during second quarter, we decreased exposure to the financial sector due to its rich valuation. On the other hand, we increased exposure to other industrial sectors. When aggregated, all positions representing over 5% of the assets came to more than 40% (40.44%) of the assets. The situation is now being rectified in the interests of the investors.
2.1.8 FUTURE POLICY Increased political risks make Turkey even more volatile. Moreover, high C/A deficit financed by short portfolio money is a risk should the liquidity dry in the market. Therefore, investors are awaiting more details from FED and its plans regarding QE. Even though political risks may be higher in the near term, we think that the events may be exaggerated. Turkish middle class has increased and substantially grown rich in the last decade. That is naturally bringing higher demand for more freedom rights. The government will have to eventually reflect it as there are presidential elections next year and parliamentary in 2015. Moreover, Turkish companies may report decent earnings growth in following quarters supporting Turkish story once again.
2.1.9 SYNTHETIC RISK AND REWARD INDICATOR Classic Shares: 7 on a scale of 1 (lowest risk) to 7 (highest risk). Institutional B Shares: 7 on a scale of 1 (lowest risk) to 7 (highest risk). The value of a share can decrease or increase and the investor may not get back the amount invested. In accordance with Commission Regulation (EU) No. 583/2010, a synthetic risk and reward indicator has been calculated. This indicator provides a quantitative measure of the sub-fund's potential return and the risk involved, calculated in the currency in which the sub-fund is denominated. It is given as a figure between 1 and 7. The higher the figure, the greater the potential return, but also the more difficult it is to predict this return. Losses are possible too. The lowest figure does not mean that the investment is entirely free of risk. However, it does indicate that, compared with the higher figures, this product will generally provide a lower, but more predictable return. The synthetic risk and reward indicator is assessed regularly and can therefore go up or down based on data from the past. Data from the past is not always a reliable indicator of future risk and return.
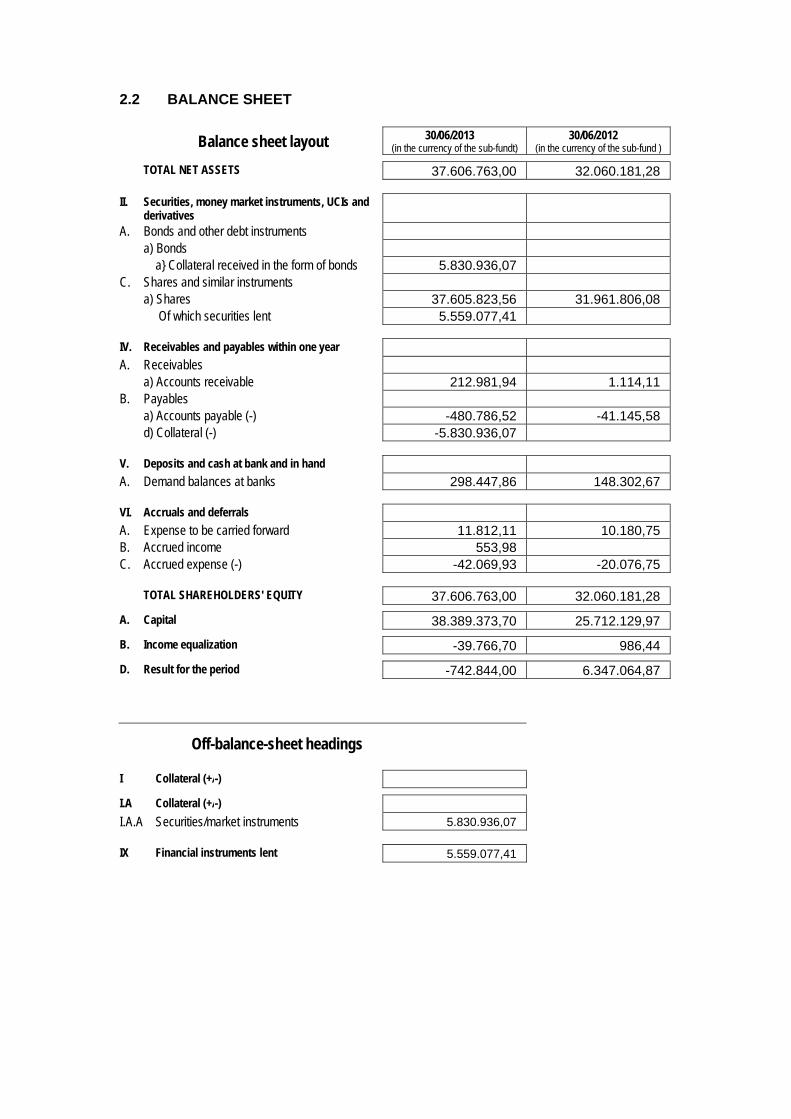
2.2 BALANCE SHEET
Balance sheet layout 30/06/2013 (in the currency of the sub-fundt)
30/06/2012 (in the currency of the sub-fund )
TOTAL NET ASSETS 37.606.763,00 32.060.181,28
II. Securities, money market instruments, UCIs and derivatives
A. Bonds and other debt instruments a) Bonds a} Collateral received in the form of bonds 5.830.936,07 C. Shares and similar instruments a) Shares 37.605.823,56 31.961.806,08 Of which securities lent 5.559.077,41
IV. Receivables and payables within one year A. Receivables a) Accounts receivable 212.981,94 1.114,11 B. Payables a) Accounts payable (-) -480.786,52 -41.145,58 d) Collateral (-) -5.830.936,07
V. Deposits and cash at bank and in hand A. Demand balances at banks 298.447,86 148.302,67
VI. Accruals and deferrals A. Expense to be carried forward 11.812,11 10.180,75 B. Accrued income 553,98 C. Accrued expense (-) -42.069,93 -20.076,75
TOTAL SHAREHOLDERS' EQUITY 37.606.763,00 32.060.181,28
A. Capital 38.389.373,70 25.712.129,97
B. Income equalization -39.766,70 986,44
D. Result for the period -742.844,00 6.347.064,87
Off-balance-sheet headings
I Collateral (+/-)
I.A Collateral (+/-)
I.A.A Securities/market instruments 5.830.936,07
IX Financial instruments lent 5.559.077,41
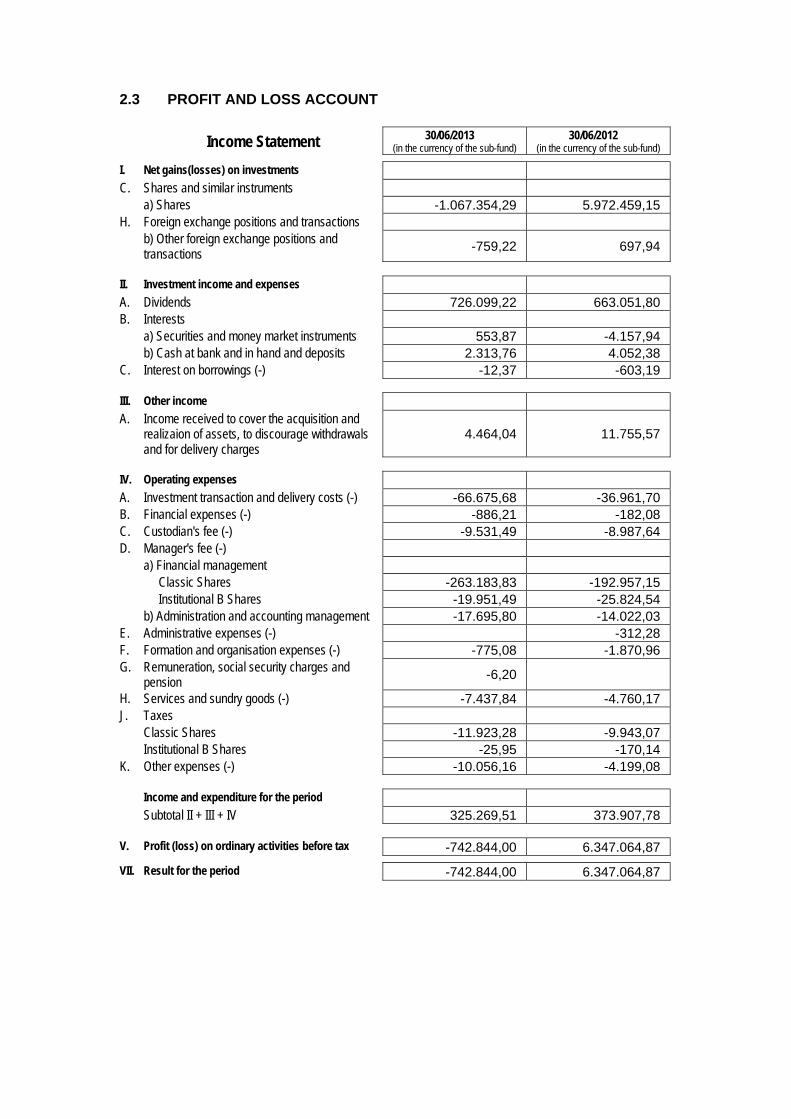
2.3 PROFIT AND LOSS ACCOUNT
Income Statement 30/06/2013 (in the currency of the sub-fund)
30/06/2012 (in the currency of the sub-fund)
I. Net gains(losses) on investments C. Shares and similar instruments a) Shares -1.067.354,29 5.972.459,15 H. Foreign exchange positions and transactions b) Other foreign exchange positions and
transactions -759,22 697,94
II. Investment income and expenses A. Dividends 726.099,22 663.051,80 B. Interests a) Securities and money market instruments 553,87 -4.157,94 b) Cash at bank and in hand and deposits 2.313,76 4.052,38 C. Interest on borrowings (-) -12,37 -603,19
III. Other income A. Income received to cover the acquisition and
realizaion of assets, to discourage withdrawals and for delivery charges
4.464,04 11.755,57
IV. Operating expenses A. Investment transaction and delivery costs (-) -66.675,68 -36.961,70 B. Financial expenses (-) -886,21 -182,08 C. Custodian's fee (-) -9.531,49 -8.987,64 D. Manager's fee (-) a) Financial management Classic Shares -263.183,83 -192.957,15 Institutional B Shares -19.951,49 -25.824,54 b) Administration and accounting management -17.695,80 -14.022,03 E. Administrative expenses (-) -312,28 F. Formation and organisation expenses (-) -775,08 -1.870,96 G. Remuneration, social security charges and
pension -6,20
H. Services and sundry goods (-) -7.437,84 -4.760,17 J. Taxes Classic Shares -11.923,28 -9.943,07 Institutional B Shares -25,95 -170,14 K. Other expenses (-) -10.056,16 -4.199,08
Income and expenditure for the period Subtotal II + III + IV 325.269,51 373.907,78
V. Profit (loss) on ordinary activities before tax -742.844,00 6.347.064,87
VII. Result for the period -742.844,00 6.347.064,87
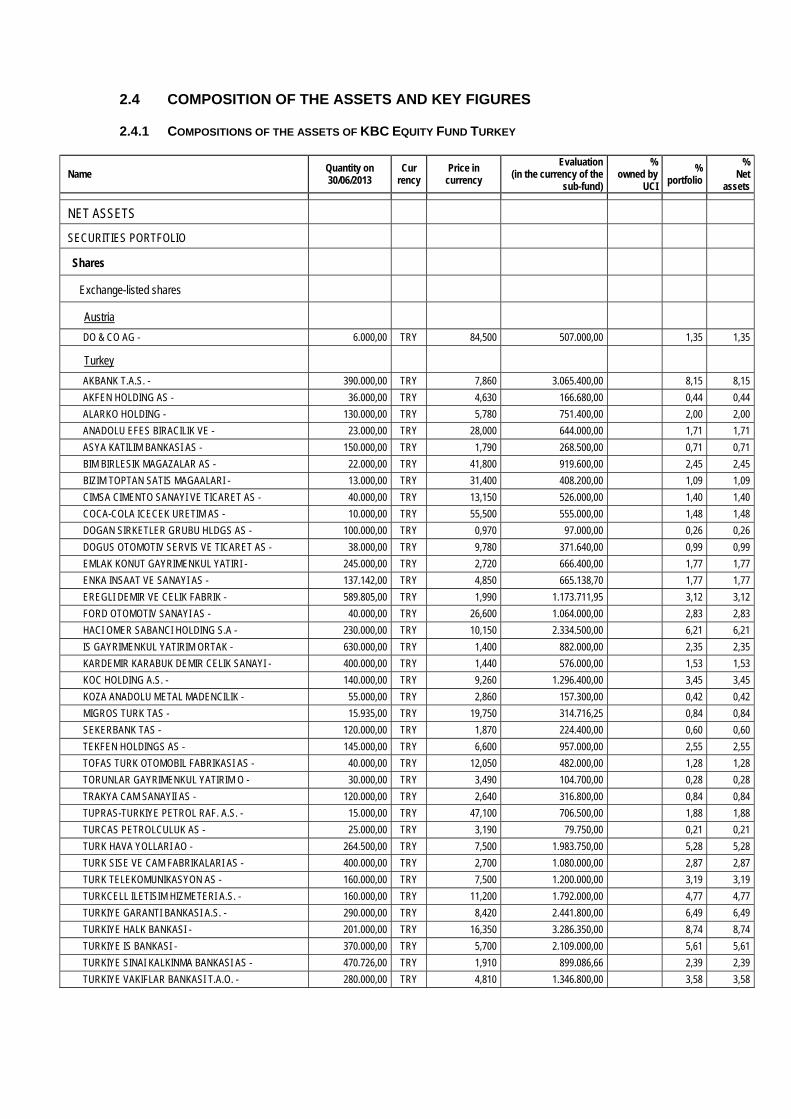
2.4 COMPOSITION OF THE ASSETS AND KEY FIGURES
2.4.1 COMPOSITIONS OF THE ASSETS OF KBC EQUITY FUND TURKEY
Name Quantity on 30/06/2013
Cur rency
Price in currency
Evaluation (in the currency of the
sub-fund)
% owned by
UCI
% portfolio
% Net
assets
NET ASSETS
SECURITIES PORTFOLIO
Shares
Exchange-listed shares
Austria
DO & CO AG - 6.000,00 TRY 84,500 507.000,00 1,35 1,35
Turkey
AKBANK T.A.S. - 390.000,00 TRY 7,860 3.065.400,00 8,15 8,15
AKFEN HOLDING AS - 36.000,00 TRY 4,630 166.680,00 0,44 0,44
ALARKO HOLDING - 130.000,00 TRY 5,780 751.400,00 2,00 2,00
ANADOLU EFES BIRACILIK VE - 23.000,00 TRY 28,000 644.000,00 1,71 1,71
ASYA KATILIM BANKASI AS - 150.000,00 TRY 1,790 268.500,00 0,71 0,71
BIM BIRLESIK MAGAZALAR AS - 22.000,00 TRY 41,800 919.600,00 2,45 2,45
BIZIM TOPTAN SATIS MAGAALARI - 13.000,00 TRY 31,400 408.200,00 1,09 1,09
CIMSA CIMENTO SANAYI VE TICARET AS - 40.000,00 TRY 13,150 526.000,00 1,40 1,40
COCA-COLA ICECEK URETIM AS - 10.000,00 TRY 55,500 555.000,00 1,48 1,48
DOGAN SIRKETLER GRUBU HLDGS AS - 100.000,00 TRY 0,970 97.000,00 0,26 0,26
DOGUS OTOMOTIV SERVIS VE TICARET AS - 38.000,00 TRY 9,780 371.640,00 0,99 0,99
EMLAK KONUT GAYRIMENKUL YATIRI - 245.000,00 TRY 2,720 666.400,00 1,77 1,77
ENKA INSAAT VE SANAYI AS - 137.142,00 TRY 4,850 665.138,70 1,77 1,77
EREGLI DEMIR VE CELIK FABRIK - 589.805,00 TRY 1,990 1.173.711,95 3,12 3,12
FORD OTOMOTIV SANAYI AS - 40.000,00 TRY 26,600 1.064.000,00 2,83 2,83
HACI OMER SABANCI HOLDING S.A - 230.000,00 TRY 10,150 2.334.500,00 6,21 6,21
IS GAYRIMENKUL YATIRIM ORTAK - 630.000,00 TRY 1,400 882.000,00 2,35 2,35
KARDEMIR KARABUK DEMIR CELIK SANAYI - 400.000,00 TRY 1,440 576.000,00 1,53 1,53
KOC HOLDING A.S. - 140.000,00 TRY 9,260 1.296.400,00 3,45 3,45
KOZA ANADOLU METAL MADENCILIK - 55.000,00 TRY 2,860 157.300,00 0,42 0,42
MIGROS TURK TAS - 15.935,00 TRY 19,750 314.716,25 0,84 0,84
SEKERBANK TAS - 120.000,00 TRY 1,870 224.400,00 0,60 0,60
TEKFEN HOLDINGS AS - 145.000,00 TRY 6,600 957.000,00 2,55 2,55
TOFAS TURK OTOMOBIL FABRIKASI AS - 40.000,00 TRY 12,050 482.000,00 1,28 1,28
TORUNLAR GAYRIMENKUL YATIRIM O - 30.000,00 TRY 3,490 104.700,00 0,28 0,28
TRAKYA CAM SANAYII AS - 120.000,00 TRY 2,640 316.800,00 0,84 0,84
TUPRAS-TURKIYE PETROL RAF. A.S. - 15.000,00 TRY 47,100 706.500,00 1,88 1,88
TURCAS PETROLCULUK AS - 25.000,00 TRY 3,190 79.750,00 0,21 0,21
TURK HAVA YOLLARI AO - 264.500,00 TRY 7,500 1.983.750,00 5,28 5,28
TURK SISE VE CAM FABRIKALARI AS - 400.000,00 TRY 2,700 1.080.000,00 2,87 2,87
TURK TELEKOMUNIKASYON AS - 160.000,00 TRY 7,500 1.200.000,00 3,19 3,19
TURKCELL ILETISIM HIZMETERI A.S. - 160.000,00 TRY 11,200 1.792.000,00 4,77 4,77
TURKIYE GARANTI BANKASI A.S. - 290.000,00 TRY 8,420 2.441.800,00 6,49 6,49
TURKIYE HALK BANKASI - 201.000,00 TRY 16,350 3.286.350,00 8,74 8,74
TURKIYE IS BANKASI - 370.000,00 TRY 5,700 2.109.000,00 5,61 5,61
TURKIYE SINAI KALKINMA BANKASI AS - 470.726,00 TRY 1,910 899.086,66 2,39 2,39
TURKIYE VAKIFLAR BANKASI T.A.O. - 280.000,00 TRY 4,810 1.346.800,00 3,58 3,58
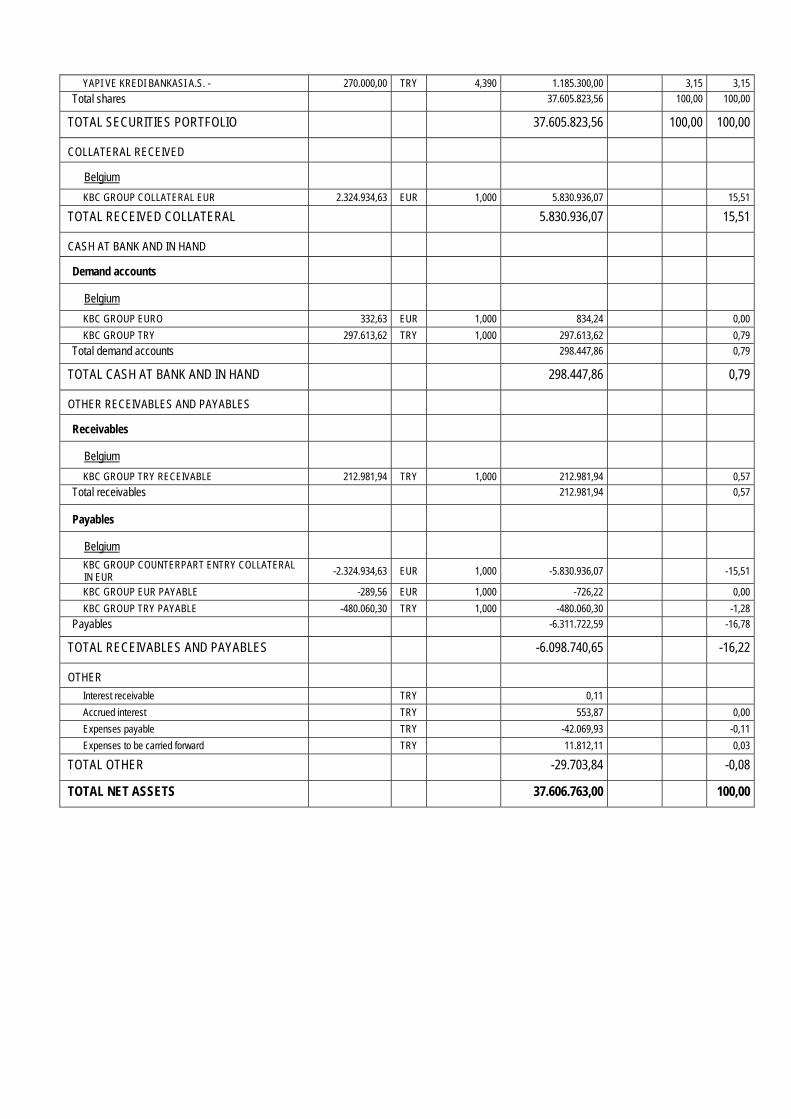
YAPI VE KREDI BANKASI A.S. - 270.000,00 TRY 4,390 1.185.300,00 3,15 3,15
Total shares 37.605.823,56 100,00 100,00
TOTAL SECURITIES PORTFOLIO 37.605.823,56 100,00 100,00
COLLATERAL RECEIVED
Belgium
KBC GROUP COLLATERAL EUR 2.324.934,63 EUR 1,000 5.830.936,07 15,51
TOTAL RECEIVED COLLATERAL 5.830.936,07 15,51
CASH AT BANK AND IN HAND
Demand accounts
Belgium
KBC GROUP EURO 332,63 EUR 1,000 834,24 0,00
KBC GROUP TRY 297.613,62 TRY 1,000 297.613,62 0,79
Total demand accounts 298.447,86 0,79
TOTAL CASH AT BANK AND IN HAND 298.447,86 0,79
OTHER RECEIVABLES AND PAYABLES
Receivables
Belgium
KBC GROUP TRY RECEIVABLE 212.981,94 TRY 1,000 212.981,94 0,57
Total receivables 212.981,94 0,57
Payables
Belgium
KBC GROUP COUNTERPART ENTRY COLLATERAL IN EUR -2.324.934,63 EUR 1,000 -5.830.936,07 -15,51
KBC GROUP EUR PAYABLE -289,56 EUR 1,000 -726,22 0,00
KBC GROUP TRY PAYABLE -480.060,30 TRY 1,000 -480.060,30 -1,28
Payables -6.311.722,59 -16,78
TOTAL RECEIVABLES AND PAYABLES -6.098.740,65 -16,22
OTHER
Interest receivable TRY 0,11
Accrued interest TRY 553,87 0,00
Expenses payable TRY -42.069,93 -0,11
Expenses to be carried forward TRY 11.812,11 0,03
TOTAL OTHER -29.703,84 -0,08
TOTAL NET ASSETS 37.606.763,00 100,00
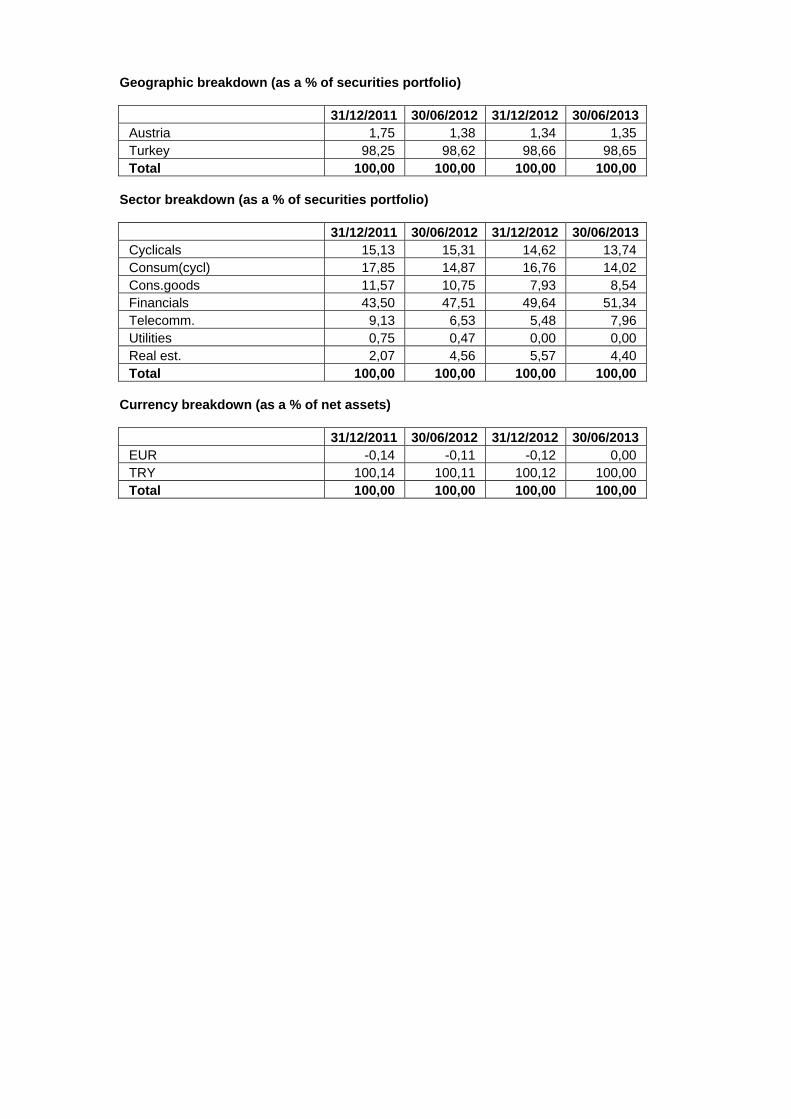
Geographic breakdown (as a % of securities portfolio)
31/12/2011 30/06/2012 31/12/2012 30/06/2013 Austria 1,75 1,38 1,34 1,35 Turkey 98,25 98,62 98,66 98,65 Total 100,00 100,00 100,00 100,00
Sector breakdown (as a % of securities portfolio)
31/12/2011 30/06/2012 31/12/2012 30/06/2013 Cyclicals 15,13 15,31 14,62 13,74 Consum(cycl) 17,85 14,87 16,76 14,02 Cons.goods 11,57 10,75 7,93 8,54 Financials 43,50 47,51 49,64 51,34 Telecomm. 9,13 6,53 5,48 7,96 Utilities 0,75 0,47 0,00 0,00 Real est. 2,07 4,56 5,57 4,40 Total 100,00 100,00 100,00 100,00
Currency breakdown (as a % of net assets)
31/12/2011 30/06/2012 31/12/2012 30/06/2013 EUR -0,14 -0,11 -0,12 0,00 TRY 100,14 100,11 100,12 100,00 Total 100,00 100,00 100,00 100,00

2.4.2 CHANGES IN THE COMPOSITION OF THE ASSETS OF KBC EQUITY FUND TURKEY (IN THE
CURRENCY OF THE SUB-FUND)
1st half of year YearPurchases 22.378.949,30 22.378.949,30 Sales 10.478.878,95 10.478.878,95 Total 1 32.857.828,25 32.857.828,25 Subscriptions 21.692.963,22 21.692.963,22 Redemptions 10.132.903,84 10.132.903,84 Total 2 31.825.867,06 31.825.867,06 Monthly average of total assets
35.699.771,40 35.699.771,40
Turnover rate 2,89 % 2,89 %
1st half of year YearPurchases 22.378.949,30 22.378.949,30 Sales 10.478.878,95 10.478.878,95 Total 1 32.857.828,25 32.857.828,25 Subscriptions 21.692.963,22 21.692.963,22 Redemptions 10.132.903,84 10.132.903,84 Total 2 31.825.867,06 31.825.867,06 Monthly average of total assets
35.695.648,22 35.695.648,22
Corrected turnover rate 2,89 % 2,89 %
The table above shows the capital volume of portfolio transactions. This volume (adjusted to take account of total subscriptions and redemptions) is also compared to the average net assets at the beginning and end of the period. A figure close to 0% implies that the transactions relating to the securities or transactions relating to the assets (excluding deposits and cash) in a given period only involve subscriptions and redemptions. A negative percentage shows that subscriptions and redemptions entailed few, if any, transactions in the portfolio. Active asset management may result in high turnover rates (monthly percentage >50%). The detailed list of transactions is available for consultation free of charge at the registered office of the Bevek or fund at Havenlaan 2, 1080 Brussels.
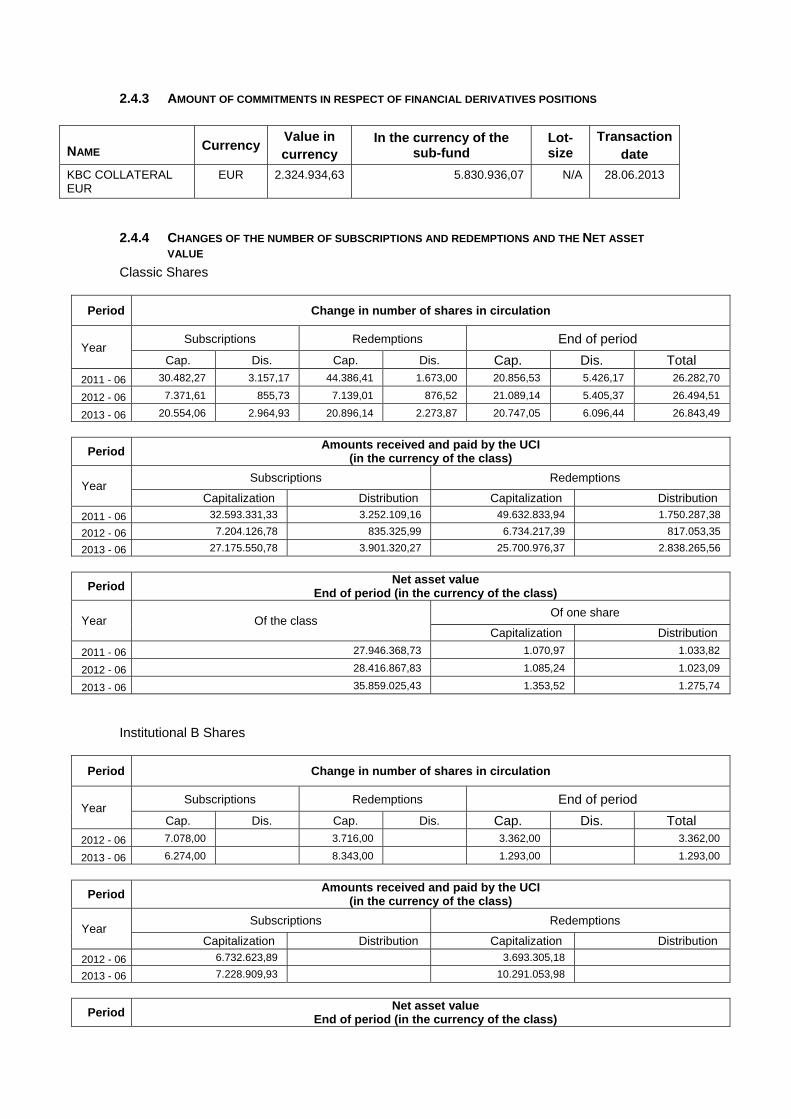
2.4.3 AMOUNT OF COMMITMENTS IN RESPECT OF FINANCIAL DERIVATIVES POSITIONS
NAME Currency Value in currency
In the currency of the sub-fund
Lot-size
Transactiondate
KBC COLLATERAL EUR
EUR 2.324.934,63 5.830.936,07 N/A 28.06.2013
2.4.4 CHANGES OF THE NUMBER OF SUBSCRIPTIONS AND REDEMPTIONS AND THE NET ASSET
VALUE
Classic Shares
Period Change in number of shares in circulation
Year Subscriptions Redemptions End of period
Cap. Dis. Cap. Dis. Cap. Dis. Total
2011 - 06 30.482,27 3.157,17 44.386,41 1.673,00 20.856,53 5.426,17 26.282,70
2012 - 06 7.371,61 855,73 7.139,01 876,52 21.089,14 5.405,37 26.494,51
2013 - 06 20.554,06 2.964,93 20.896,14 2.273,87 20.747,05 6.096,44 26.843,49
Period Amounts received and paid by the UCI
(in the currency of the class)
Year Subscriptions Redemptions
Capitalization Distribution Capitalization Distribution
2011 - 06 32.593.331,33 3.252.109,16 49.632.833,94 1.750.287,38
2012 - 06 7.204.126,78 835.325,99 6.734.217,39 817.053,35
2013 - 06 27.175.550,78 3.901.320,27 25.700.976,37 2.838.265,56
Period Net asset value
End of period (in the currency of the class)
Year Of the class Of one share
Capitalization Distribution
2011 - 06 27.946.368,73 1.070,97 1.033,82
2012 - 06 28.416.867,83 1.085,24 1.023,09
2013 - 06 35.859.025,43 1.353,52 1.275,74
Institutional B Shares
Period Change in number of shares in circulation
Year Subscriptions Redemptions End of period
Cap. Dis. Cap. Dis. Cap. Dis. Total 2012 - 06 7.078,00 3.716,00 3.362,00 3.362,00
2013 - 06 6.274,00 8.343,00 1.293,00 1.293,00
Period Amounts received and paid by the UCI
(in the currency of the class)
Year Subscriptions Redemptions
Capitalization Distribution Capitalization Distribution
2012 - 06 6.732.623,89 3.693.305,18
2013 - 06 7.228.909,93 10.291.053,98
Period Net asset value
End of period (in the currency of the class)

Year Of the class Of one share
Capitalization Distribution
2012 - 06 3.643.313,45 1.083,67
2013 - 06 1.747.737,57 1.351,69
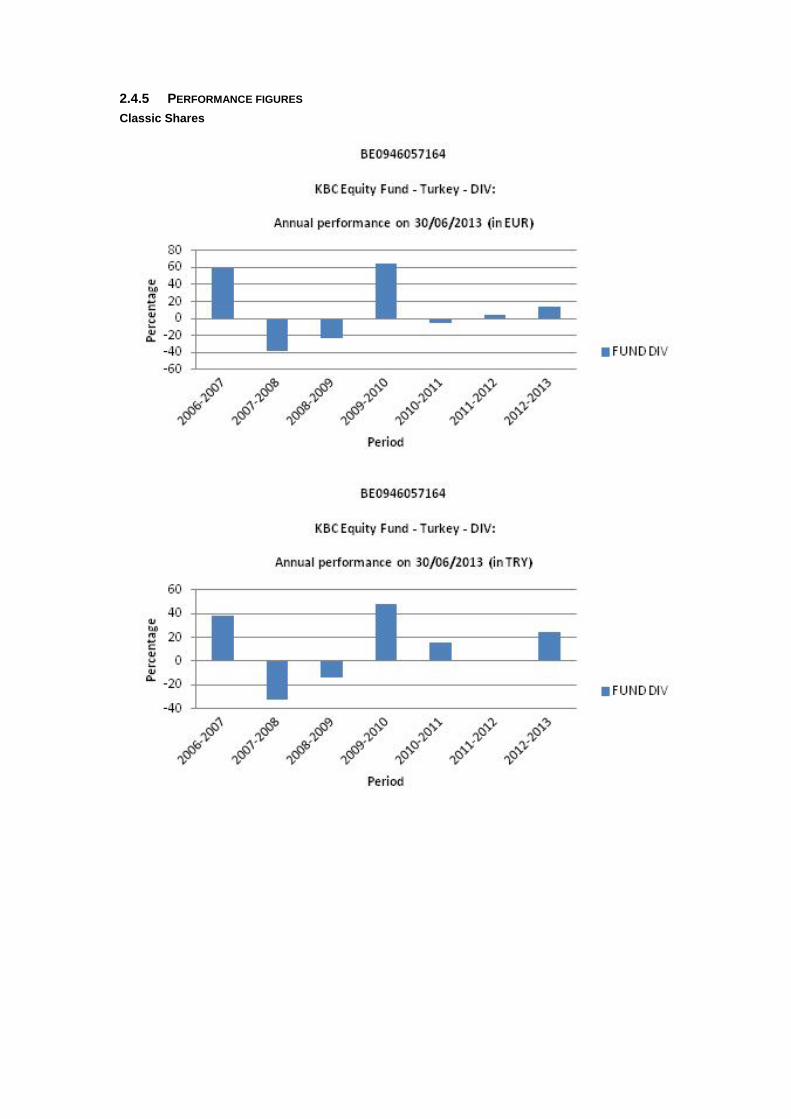
2.4.5 PERFORMANCE FIGURES
Classic Shares
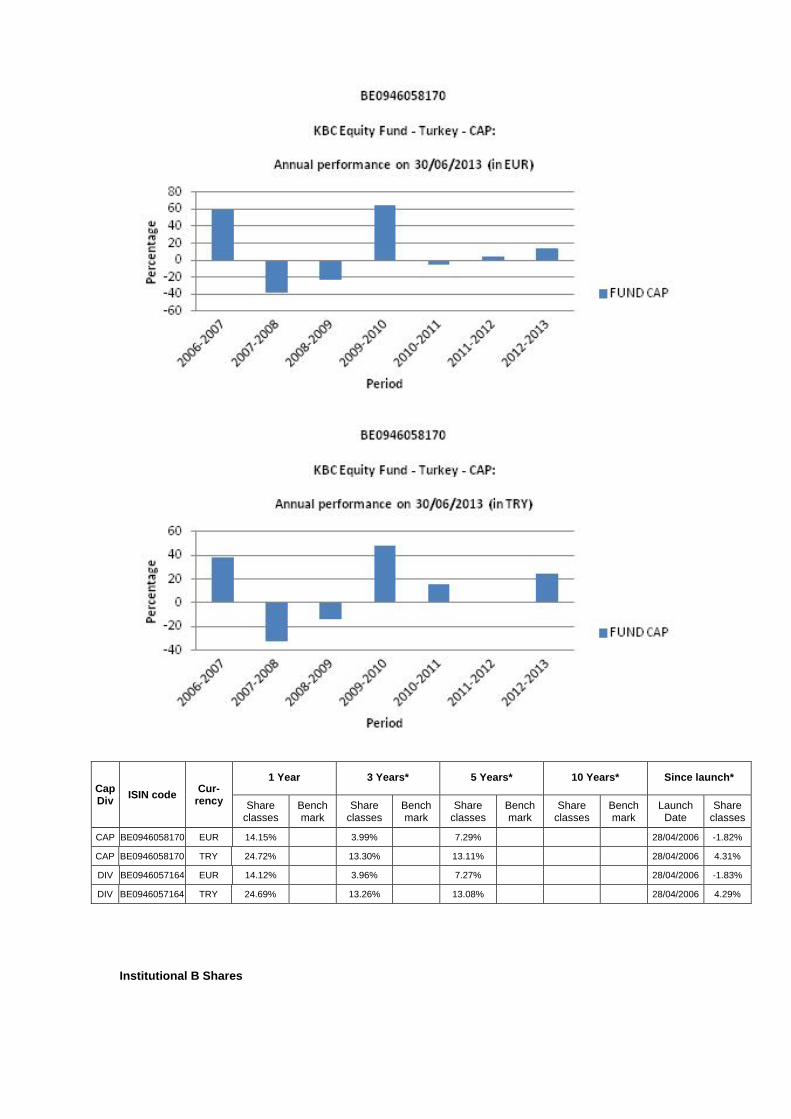
Cap Div
ISIN code Cur-
rency
1 Year 3 Years* 5 Years* 10 Years* Since launch*
Share classes
Bench mark
Share classes
Bench mark
Share classes
Bench mark
Share classes
Bench mark
Launch Date
Share classes
CAP BE0946058170 EUR 14.15% 3.99% 7.29% 28/04/2006 -1.82%
CAP BE0946058170 TRY 24.72% 13.30% 13.11% 28/04/2006 4.31%
DIV BE0946057164 EUR 14.12% 3.96% 7.27% 28/04/2006 -1.83%
DIV BE0946057164 TRY 24.69% 13.26% 13.08% 28/04/2006 4.29%
Institutional B Shares

Cap Div
ISIN code Cur-
rency
1 Year 3 Years* 5 Years* 10 Years* Since launch*
Share classes
Bench mark
Share classes
Bench mark
Share classes
Bench mark
Share classes
Bench mark
Launch Date
Share classes
CAP BE6228909543 EUR 14.16% 24/11/2011 34.66%
CAP BE6228909543 TRY 24.73% 24/11/2011 35.05%
Risk warning: Past performance is not a guide to future performance. * Return on annual basis.
Classic Shares The bar chart shows the performance for full financial years. The figures do not take account of any restructuring. Calculated in TRY and in EUR.

The return is calculated as the change in the net asset value between two dates expressed as a percentage. In the case of units that pay dividends, the dividend is incorporated geometrically in the return.
Calculation method for date D, where NAV stands for net asset value: Capitalisation units (CAP) Return on date D over a period of X years:
[NIW(D) / NIW(Y)] ^ [1 / X] - 1 where Y = D-X
Return on date D since the start date S of the unit: [NIW(D) / NIW(S)] ^ [1 / F] - 1 where F = 1 if the unit has existed for less than one year on date D where F = (D-S) / 365.25 if the unit has existed for longer than one year on date D
Distribution units (DIV) Return on date D over a period of X years:
[ C * NIW(D) / NIW(Y)] ^ [1 / X] - 1 where Y = D-X
Return on date D since the start date S of the unit: [ C * NIW(D) / NIW(S)] ^ [1 / F] - 1 where F = 1 if the unit has existed for less than one year on date D where F = (D-S) / 365.25 if the unit has existed for longer than one year on date D where C is a factor that is determined for all N dividends between the calculation date D and the reference date.
For dividend i on date Di with value Wi: Ci = [Wi / NIW(Di)] + 1 i = 1 ... N from whichC = C0 * .... * CN.
If the interval between the two dates exceeds one year, the ordinary return calculation is converted into a return on an annual basis by taking the nth square root of 1 plus the total return of the unit.
The return figures shown above do not take account of the fees and charges associated with the issue and redemption of units.
These are the performance figures for capitalisation and distribution shares.
Institutional B Shares The bar chart shows the performance for full financial years. The figures do not take account of any restructuring. Calculated in TRY and in EUR. The return is calculated as the change in the net asset value between two dates expressed
as a percentage. Calculation method for date D, where NAV stands for net asset value:
Capitalisation units (CAP) Return on date D over a period of X years:
[NIW(D) / NIW(Y)] ^ [1 / X] - 1 where Y = D-X
Return on date D since the start date S of the unit: [NIW(D) / NIW(S)] ^ [1 / F] - 1 where F = 1 if the unit has existed for less than one year on date D where F = (D-S) / 365.25 if the unit has existed for longer than one year on date D
If the interval between the two dates exceeds one year, the ordinary return calculation is converted into a return on an annual basis by taking the nth square root of 1 plus the total return of the unit.
The return figures shown above do not take account of the fees and charges associated with the issue and redemption of units.
These are the performance figures for capitalization shares.

2.4.6 COSTS Ongoing Charges: * Classic Shares Distribution: 1.893% Classic Shares Capitalization: 1.887% Institutional B Shares Capitalization: 1.876% * The following costs have not been included in the ongoing charges: - Interest payments on loans taken out - Payments in respect of financial derivatives - Fees and charges paid directly by the investor - Any soft commissions
SOFT COMMISSIONS The management company or the appointed manager, as the case may be, is the recipient of soft commissions. The recipient has laid down an internal policy as regards accepting soft commissions and avoiding possible conflicts of interest in this respect, and has put appropriate internal controls in place to ensure this policy is observed. For more information, please see the ‘General’ section of the annual report.
Broker
Commission gross
in EUR
paid during the period:
1‐01‐13
‐
30‐06‐13
CSA Credits
in EUR
accrued during the period:
1‐01‐13
‐
30‐06‐13 Percentage
HSBC 12,725 2,121 16.67%
FEE-SHARING AGREEMENTS AND REBATES: The management company may share its fee with the distributor, and institutional and/or professional parties. In principle, the percentage share amounts to between 35% and 60% if the distributor is an entity of KBC Group NV or to between 35% and 70% if the distributor is not an entity of KBC Group NV. However, in a small number of cases, the distributor’s fee is less than 35%. Investors may, on request, obtain more information on these cases. If the management company invests the assets of the undertaking for collective investment in units of undertakings for collective investment that are not managed by an entity of KBC Group NV, and receives a fee for doing so, it will pay this fee to the undertaking for collective investment. Fee-sharing does not affect the amount of the management fee paid by the sub-fund to the management company. This management fee is subject to the limitations laid down in the articles of association. The limitations may only be amended after approval by the general meeting of shareholders. The management company has concluded a distribution agreement with the distributor in order to facilitate the wider distribution of the sub-fund's units by using multiple distribution channels. It is in the interests of the holders of units, the sub-fund and of the distributor for the largest possible number of units to be sold and for the assets of the sub-fund to be maximised in this way. In this respect, there is therefore no question of any conflict of interest.
2.4.7 NOTES TO THE FINANCIAL STATEMENTS AND OTHER DATA Fee for managing the investment portfolio: 1.6% per annum calculated on the basis of the average total net assets of the sub-fund, no management fee is charged on assets assets invested in investment undertakings managed by a financial institution of the KBC group. CSOB Asset Management a.s. receives a fee from the management company of max. 1.6% calculated on that part of the portfolio that it manages, without the total management fee received by the management company being exceeded. The administration agent’s fee is payable at the end of each month and is calculated on the basis of the average total net assets of the sub-fund. Auditor's fee: 1 700 EUR per year. This fee is not including VAT and can be indexed on an annual basis in accordance with the decisions of the general meeting. The custody fee is calculated on the value of the securities held in custody by the custodian on the final banking day of the preceding calendar year, except on those assets invested in investment
undertakings managed by a financial institution of the KBC group. The custody fee is paid at the beginning of the calendar year. Social, ethical and environmental aspects: No manufacturers of controversial weapons whose use over the past five decades, according to the international consensus, has led to disproportionate human suffering among the civilian population will be included in the portfolio of investments. This involves the manufacturers of anti-personnel mines, cluster bombs and munitions and weapons containing depleted uranium. In this way, the sub-fund seeks to reflect not only simple financial reality but also the social reality of the sector or region in question. Exercising voting rights. If necessary, relevant and in the interest of the shareholders, the management company will exercise the voting rights attached to the shares in the Bevek’s portfolio. The management company will adhere to the following criteria when determining how it stands relative to the items on the agenda that are put to the vote: - Shareholder value may not be adversely affected. - Corporate governance rules, especially with regard to the rights of minority shareholders, must be
respected. - The minimum standards with regard to sustainable business and corporate social responsibility
must be met. The list of companies for which voting rights are exercised is available at the registered office of the Bevek. Securities lending In accordance with the Royal Decree of 7 March 2006 concerning securities lending, the undertaking for collective investment has taken out securities loans with a principal to whom the full title of the loaned securities was transferred, without recording this transfer of ownership in the accounts. For the period from 1 January 2013 to 30 June 2013, the fee for securities lent comes to -553.87 TRY. The undertaking for collective investment receives 50% of the fee received for securities lent. The detailed list of securities lending transactions carried out can be obtained from the registered office of the collective investment undertaking at 2 Havenlaan, 1080 Brussels.
Overview of securities lent as at 30/06/2013
Name Currency Quantity Price Value in currency of the
portfolio
DOGAN SIRKETLER GRUBU HOLDINGS A.S. TRY 49.339 0,970 47.858,83
EMLAK KONUT GAYRIMENKUL YATIR.ORTA TRY 50.000 2,720 136.000,01
HACI OMER SABANCI HOLDING TRY 179.627 10,150 1.823.214,05
SEKERBANK TRY 91.188 1,870 170.521,55
TORUNLAR GAYRIMENKUL YATIRIM ORTAKL TRY 29.999 3,490 104.696,51
TURK HAVA YOLLARI ANONIM ORTAKLIGI TRY 229.999 7,500 1.724.992,49
TURKIYE IS BANKASI -C- TRY 105.222 5,700 599.765,40
YAPI VE KREDI BANKASI TRY 216.863 4,390 952.028,57
Total 5.559.077,41
Details of collateral received for securities lent
Name Currency Nominal value Currency fund Value in Currency fund
BUNDESREPUB.DTL. AN 2005 3 1/2% 04/01/16 EUR 949.000 TRY 2.614.554,86
FRANCE 2008 3.75% 25/10/2019 EUR 1.105.000 TRY 3.216.381,21
Total 5.830.936,07 For the valuation of the collateral received, indicative prices have been used in this detail list by the Collateral Management Division of KBC Bank.

Semi-Annual report as at 30th June 2013
TABLE OF CONTENTS
2. Information on KBC Equity Fund Euro Non Cyclicals
2.1. Management report 2.1.1. Launch date and subscription price 2.1.2. Stock exchange listing 2.1.3. Aim and distinctive features of the investment policy 2.1.4. Financial portfolio management 2.1.5. Distributors 2.1.6. Index and benchmark 2.1.7. Policy conducted during the financial year 2.1.8. Future policy 2.1.9. Synthetic risk and reward indicator (SRRI)
2.2. Balance sheet
2.3. Profit and loss account
2.4. Composition of the assets and key figures
2.4.1. Composition of the assets 2.4.2. Change in the composition of the assets 2.4.3. Value of commitments in respect of financial derivatives positions 2.4.4. Evolution of the number of subscriptions, repayments and the net asset value 2.4.5. Return figures 2.4.6. Expenses 2.4.7. Notes to the financial statements and other data

2 INFORMATION ON KBC EQUITY FUND EURO NON CYCLICALS
2.1 MANAGEMENT REPORT
2.1.1 LAUNCH DATE AND SUBSCRIPTION PRICE Classic Shares : Launch date: 4 February 2011 Initial subscription price: 200 EUR Currency: EUR Institutional B Shares : Launch date: 24 November 2011 Initial subscription price: 188.43 EUR Currency: EUR
2.1.2 STOCK EXCHANGE LISTING Not applicable.
2.1.3 GOAL AND KEY PRINCIPLES OF THE INVESTMENT POLICY
SUB-FUND’S OBJECT: The main objective of this sub-fund is to generate the highest possible return for its shareholders by investing directly or indirectly in transferable securities. This is reflected in its pursuit of capital gains and income. To this end, the assets are invested, either directly or indirectly via correlated financial instruments, primarily in shares.Correlated financial instruments refer to certificates representing securities, such as American Depository Receipts (ADRs), Global Depository Receipts (GDRs) or futures on equity indices.
SUB-FUND’S INVESTMENT POLICY:
PERMITTED ASSET CLASSES: The sub-fund may invest in securities, money market instruments, units in undertakings for collective investment, deposits, financial derivatives, liquid assets and all other instruments insofar as permitted by the applicable laws and regulations and consistent with the sub-fund’s object The sub-fund shall invest no more than 10% of its assets in units of other undertakings for collective investment.
RESTRICTIONS OF THE INVESTMENT POLICY: The investment policy will be implemented within the limits set by law and regulations. The sub-fund may borrow up to 10% of its net assets, insofar as these are short-term borrowings aimed at solving temporary liquidity problems.
PERMITTED DERIVATIVES TRANSACTIONS: Derivates may be used either for hedging purposes or to achieve investment objectives. Changes will be made to the investments at regular intervals to comply with the sub-fund's investment strategy. In addition, listed and unlisted derivates may be used to achieve the objectives: these may be forward contracts, options or swaps on securities, indices, currencies or interest rates or other transactions involving derivatives. Unlisted derivatives transactions will only be concluded with prime financial institutions specialised in such transactions. Such derivatives may also be used to hedge the assets against exchange-rate fluctuations. Subject to the applicable laws and regulations and the articles of association, the sub-fund always seeks to conclude the most effective transactions. All costs associated with the transactions will be charged to the sub-fund and all income generated will be paid to the sub-fund. If the transactions result in a risk in respect of the counterparty, this risk can be hedged by using a margin management system that ensures that the sub-fund is the beneficiary of security (collateral) in the form of cash or investment grade bonds. When calculating the value of the bonds, a margin will be applied that varies depending on the residual term to maturity and the currency in which the bond in question is denominated. The relationship with the counterparty or counterparties is governed by standard international agreements.
Strategy selected The sub-fund will invest at least 75% of its assets in European shares in defensive sectors that are less sensitive to the economic cycle, such as the food industry, utility companies and the healthcare sector. The sub-fund is actively managed, which means that the manager is responsible for the stock picking and is not bound by a specific benchmark index.
LENDING FINANCIAL INSTRUMENTS: The sub-fund may lend financial instruments within the limits set by law and regulations. This lending does not affect the sub-fund’s risk profile since: - it takes place within the framework of a securities lending system managed by a principal. In
addition, the sub-fund has a relationship only with the principal of the securities lending system which acts as counterparty and to which title of the loaned securities is transferred. The choice of principal is subject to strict selection criteria. The return of securities similar to the securities that have been lent is guaranteed by the principal.
- through a margin management system, the sub-fund is always guaranteed financial security, the actual value of which always exceeds the actual value of the securities that have been lent, in case the principal does not return similar securities.
The return of securities similar to the securities that have been lent can be requested at any time, which means that the lending of securities does not affect the management of the sub-fund's assets. By lending securities, the sub-fund can generate an additional return. The principal pays a fee to the management company. After deducting the fee for the margin management and clearing services of KBC Bank, most of this fee is paid to the sub-fund. The relationship with the counterparty or counterparties is governed by standard international agreements. More information is provided on the terms and conditions governing securities lending in the annual or half-yearly report for the sub-fund.
VOLATILITY OF THE NET ASSET VALUE: The volatility of the net asset value may be high due to the composition of the portfolio.
GENERAL STRATEGY FOR HEDGING THE EXCHANGE RATE RISK: In order to protect its assets against exchange rate fluctuations and within the limitations laid down in the articles of association, the sub-fund may perform transactions relating to the sale of forward currency contracts, as well as the sale of call options and the purchase of put options on currencies. The transactions in question may relate solely to contracts traded on a regulated market that operates regularly, is recognised and is open to the public or that are traded with a recognised, prime financial institution specialising in such transactions and dealing in the over-the-counter (OTC) market in options. With the same objective, the sub-fund may also sell currencies forward or exchange them in private transactions with prime financial institutions specialising in such transactions. The hedging objective of the aforementioned transactions suggests that there is a direct link between these transactions and the assets to be hedged, which implies that the transactions carried out in a particular currency may in principle not exceed, in terms of volume, either the valuation value of all the assets in the same currency or the holding period of those assets.
SOCIAL, ETHICAL AND ENVIRONMENTAL ASPECTS:
No manufacturers of controversial weapons whose use over the past five decades, according to the international consensus, has led to disproportionate human suffering among the civilian population will be included in the portfolio of investments. This involves the manufacturers of anti-personnel mines, cluster bombs and munitions and weapons containing depleted uranium. In this way, the sub-fund seeks to reflect not only simple financial reality but also the social reality of the sector or region in question.
THE EUROPEAN SAVINGS DIRECTIVE AND TAX ON DEBT CLAIM RETURNS OBTAINED THROUGH THE
REDEMPTION OF OWN UNITS OR IN THE EVENT OF FULL OR PARTIAL DISTRIBUTION OF EQUITY
CAPITAL. The following information is of a general character and is not intended to cover all aspects of an investment in a UCITS. In certain cases entirely different rules might even apply. Moreover, both tax

law and the interpretation of it can change. Investors who wish to have more information about the tax implications – in both Belgium and abroad – of acquiring, holding and transferring units should seek the advice of their usual financial and tax advisers. This UCITS shall invest a maximum of 15% of its assets directly or indirectly in debt instruments as intended by the European Savings Directive. A. European Savings Directive (Directive 2003/48/EC) The European Savings Directive has been implemented in Belgium. Since this UCITS invests a maximum of 15% of its assets directly or indirectly in debt claims as intended by the European Savings Directive, the income of this UCITS does not fall within the scope of this directive. B. Tax on debt claim returns obtained through the redemption of own units or in the event of full or partial distribution of equity capital (Article 19bis Income Tax Code 1992). The income from this UCITS is not subject to the tax on debt instrument returns as intended by Article 19bis, Income Tax Code 1992.
2.1.4 FINANCIAL PORTFOLIO MANAGEMENT There is no delegation of the portfolio.
2.1.5 DISTRIBUTORS KBC Asset Management S.A., 5, Place de la Gare, L-1616 Luxembourg.
2.1.6 INDEX AND BENCHMARK See ‘Sub-fund’s investment policy’.

2.1.7 POLICY PERSUED DURING THE FINANCIAL YEAR Real GDP in the EMU contracted by an annualised 1.1%. The austerity programme and credit restrictions pushed Southern Europe into a deep recession. Germany played its traditional role as the driver for European economic growth to a lesser extent than in the recent past. Greater divergence within Europe resulted primarily in a further decline in unemployment in Germany and an alarmingly rapid rise in unemployment in countries such as Greece, Spain and Portugal. Belgium was closer to the strong core of the euro area. Among the traditional markets, Western Europe (MSCI Europe return index over the same period: +4.1%) was unable to continue the catch-up process begun in 2012. Fear that the EMU’s problems entailed a systemic risk nevertheless faded from the market. Europe’s cheaper valuation (compared to the US) was unable to offer any support either. European corporate earnings fell well short of expectations since the first quarter of 2012. They show a downward trend, in stark contrast to developments in other regions. Wall Street was much higher at the end of June than at the end of 2012 (S&P 500: +12.6%, Dow Jones: +13.8%).
2.1.8 FUTURE POLICY Confidence indicators in Europe are well below freezing point. The budgetary plans, tighter lending policy of the banks and major uncertainty among consumers and producers will continue to depress growth. 2013 will see a contraction of GDP in Europe. Recovery is not expected until the first half of 2014. Deflation or depression scenarios, which are currently dominating bond market sentiment, are not however justified. Economic growth in Europe will remain below par. The towering unemployment and the euro crisis are undermining consumer confidence and the banks’ willingness to provide ready access to credit. The ECB’s monetary policy is also much less aggressive than the Fed's. In contrast, real wage rises (however limited) will be somewhat higher in Europe than in the US. Time is of the essence for the euro area. Everyone knows that the EMU is not a perfect monetary union. In its twelve-year history, little has been done to improve its internal operation. National autonomy was sacrosanct. The crisis brought the realisation that ‘economic governance’, as it is now called in Eurospeak, needs to be tackled as a matter of urgency. In concrete terms, this involves measures such as supranational supervision of banks (scheduled to be in place by early 2015), strict monitoring and sanctioning of budgetary policy (a huge challenge given the emergence of austerity fatigue), monitoring of pay policy and harmonising European taxation (a big taboo).
2.1.9 SYNTHETIC RISK AND REWARD INDICATOR Classic Shares: 6 on a scale of 1 (lowest risk) to 7 (highest risk). Institutional B Shares: 6 on a scale of 1 (lowest risk) to 7 (highest risk). The value of a share can decrease or increase and the investor may not get back the amount invested. In accordance with Commission Regulation (EU) No. 583/2010, a synthetic risk and reward indicator has been calculated. This indicator provides a quantitative measure of the sub-fund's potential return and the risk involved, calculated in the currency in which the sub-fund is denominated. It is given as a figure between 1 and 7. The higher the figure, the greater the potential return, but also the more difficult it is to predict this return. Losses are possible too. The lowest figure does not mean that the investment is entirely free of risk. However, it does indicate that, compared with the higher figures, this product will generally provide a lower, but more predictable return. The synthetic risk and reward indicator is assessed regularly and can therefore go up or down based on data from the past. Data from the past is not always a reliable indicator of future risk and return.
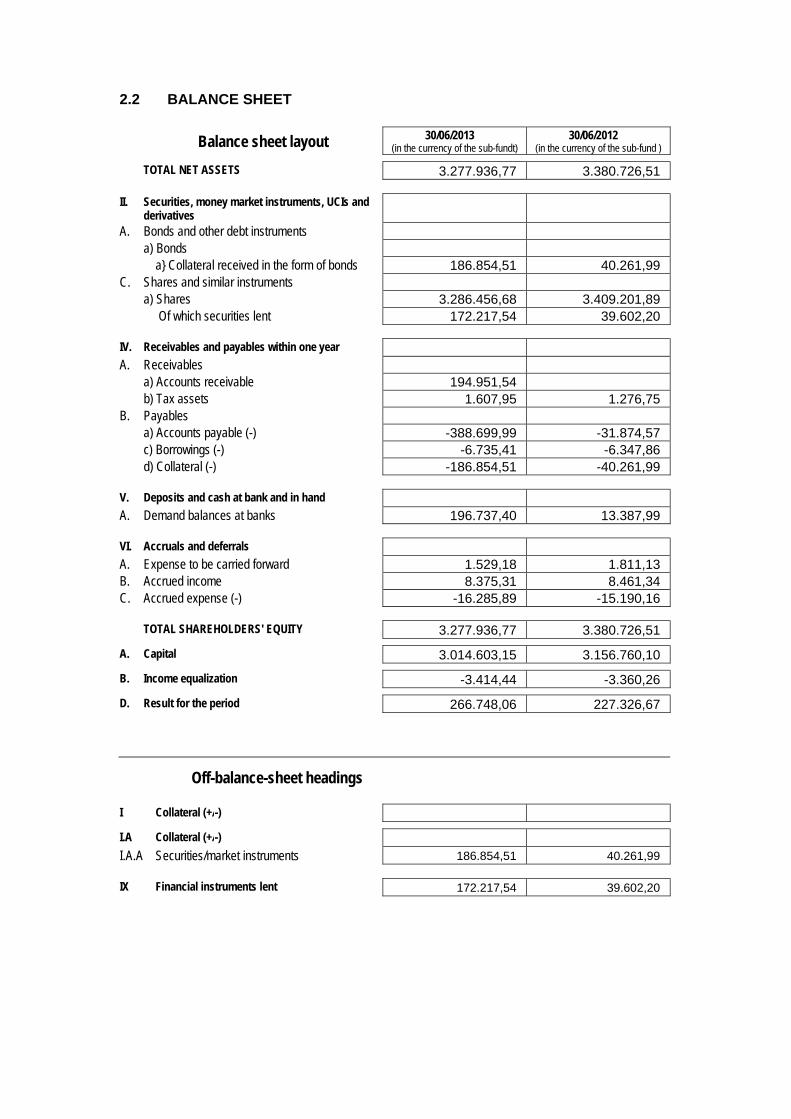
2.2 BALANCE SHEET
Balance sheet layout 30/06/2013 (in the currency of the sub-fundt)
30/06/2012 (in the currency of the sub-fund )
TOTAL NET ASSETS 3.277.936,77 3.380.726,51
II. Securities, money market instruments, UCIs and derivatives
A. Bonds and other debt instruments a) Bonds a} Collateral received in the form of bonds 186.854,51 40.261,99 C. Shares and similar instruments a) Shares 3.286.456,68 3.409.201,89 Of which securities lent 172.217,54 39.602,20
IV. Receivables and payables within one year A. Receivables a) Accounts receivable 194.951,54 b) Tax assets 1.607,95 1.276,75 B. Payables a) Accounts payable (-) -388.699,99 -31.874,57 c) Borrowings (-) -6.735,41 -6.347,86 d) Collateral (-) -186.854,51 -40.261,99
V. Deposits and cash at bank and in hand A. Demand balances at banks 196.737,40 13.387,99
VI. Accruals and deferrals A. Expense to be carried forward 1.529,18 1.811,13 B. Accrued income 8.375,31 8.461,34 C. Accrued expense (-) -16.285,89 -15.190,16
TOTAL SHAREHOLDERS' EQUITY 3.277.936,77 3.380.726,51
A. Capital 3.014.603,15 3.156.760,10
B. Income equalization -3.414,44 -3.360,26
D. Result for the period 266.748,06 227.326,67
Off-balance-sheet headings
I Collateral (+/-)
I.A Collateral (+/-)
I.A.A Securities/market instruments 186.854,51 40.261,99
IX Financial instruments lent 172.217,54 39.602,20

2.3 PROFIT AND LOSS ACCOUNT
Income Statement 30/06/2013 (in the currency of the sub-fund)
30/06/2012 (in the currency of the sub-fund)
I. Net gains(losses) on investments C. Shares and similar instruments a) Shares 284.921,20 125.460,17 D. Other securities -270,46 H. Foreign exchange positions and transactions b) Other foreign exchange positions and
transactions -64.144,47 42.648,39
II. Investment income and expenses A. Dividends 79.416,82 87.436,70 B. Interests a) Securities and money market instruments 1.269,08 906,90 b) Cash at bank and in hand and deposits 7,83 18,94 C. Interest on borrowings (-) -56,69 -252,37
IV. Operating expenses A. Investment transaction and delivery costs (-) -1.228,95 -1.007,66 B. Financial expenses (-) -132,96 -26,61 C. Custodian's fee (-) -1.230,81 -1.683,65 D. Manager's fee (-) a) Financial management Classic Shares -26.338,07 -22.330,98 b) Administration and accounting management -1.755,82 -1.681,68 E. Administrative expenses (-) -38,35 F. Formation and organisation expenses (-) -63,92 -388,73 H. Services and sundry goods (-) -1.876,35 -324,09 J. Taxes Classic Shares -1.231,19 -1.304,34 K. Other expenses (-) -769,29 126,14
Income and expenditure for the period Subtotal II + III + IV 45.971,33 59.488,57
V. Profit (loss) on ordinary activities before tax 266.748,06 227.326,67
VII. Result for the period 266.748,06 227.326,67
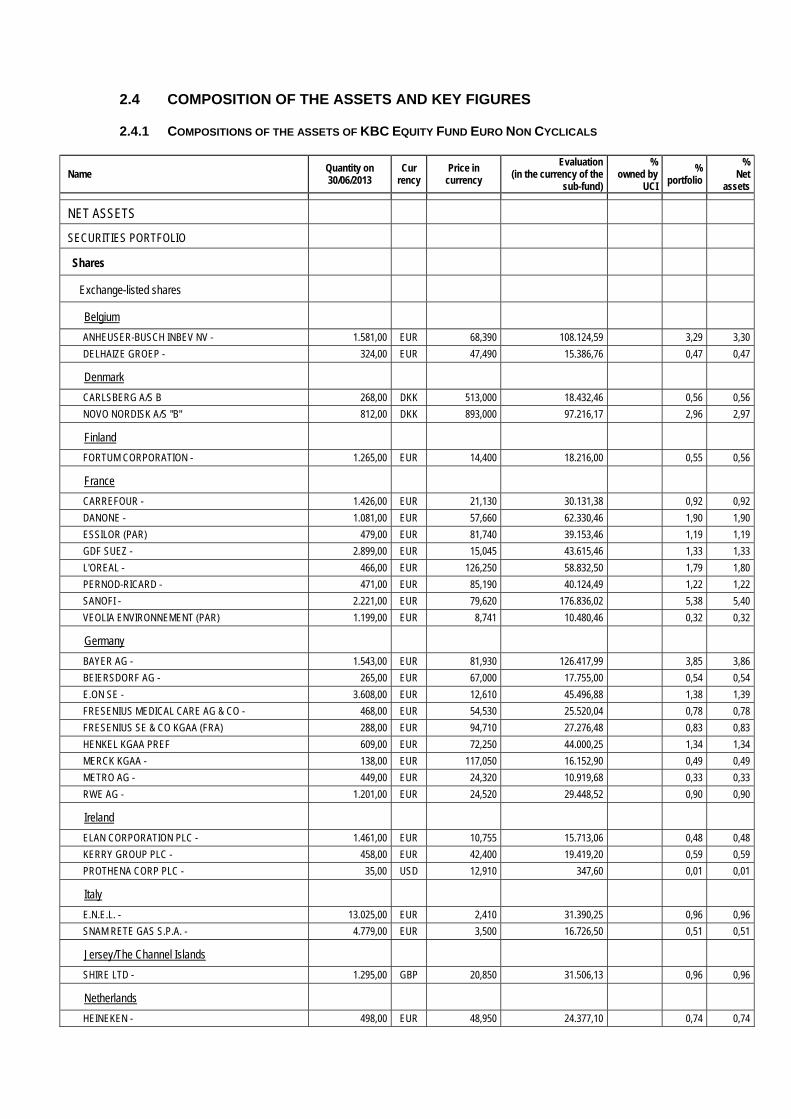
2.4 COMPOSITION OF THE ASSETS AND KEY FIGURES
2.4.1 COMPOSITIONS OF THE ASSETS OF KBC EQUITY FUND EURO NON CYCLICALS
Name Quantity on 30/06/2013
Cur rency
Price in currency
Evaluation (in the currency of the
sub-fund)
% owned by
UCI
% portfolio
% Net
assets
NET ASSETS
SECURITIES PORTFOLIO
Shares
Exchange-listed shares
Belgium
ANHEUSER-BUSCH INBEV NV - 1.581,00 EUR 68,390 108.124,59 3,29 3,30
DELHAIZE GROEP - 324,00 EUR 47,490 15.386,76 0,47 0,47
Denmark
CARLSBERG A/S B 268,00 DKK 513,000 18.432,46 0,56 0,56
NOVO NORDISK A/S "B" 812,00 DKK 893,000 97.216,17 2,96 2,97
Finland
FORTUM CORPORATION - 1.265,00 EUR 14,400 18.216,00 0,55 0,56
France
CARREFOUR - 1.426,00 EUR 21,130 30.131,38 0,92 0,92
DANONE - 1.081,00 EUR 57,660 62.330,46 1,90 1,90
ESSILOR (PAR) 479,00 EUR 81,740 39.153,46 1,19 1,19
GDF SUEZ - 2.899,00 EUR 15,045 43.615,46 1,33 1,33
L'OREAL - 466,00 EUR 126,250 58.832,50 1,79 1,80
PERNOD-RICARD - 471,00 EUR 85,190 40.124,49 1,22 1,22
SANOFI - 2.221,00 EUR 79,620 176.836,02 5,38 5,40
VEOLIA ENVIRONNEMENT (PAR) 1.199,00 EUR 8,741 10.480,46 0,32 0,32
Germany
BAYER AG - 1.543,00 EUR 81,930 126.417,99 3,85 3,86
BEIERSDORF AG - 265,00 EUR 67,000 17.755,00 0,54 0,54
E.ON SE - 3.608,00 EUR 12,610 45.496,88 1,38 1,39
FRESENIUS MEDICAL CARE AG & CO - 468,00 EUR 54,530 25.520,04 0,78 0,78
FRESENIUS SE & CO KGAA (FRA) 288,00 EUR 94,710 27.276,48 0,83 0,83
HENKEL KGAA PREF 609,00 EUR 72,250 44.000,25 1,34 1,34
MERCK KGAA - 138,00 EUR 117,050 16.152,90 0,49 0,49
METRO AG - 449,00 EUR 24,320 10.919,68 0,33 0,33
RWE AG - 1.201,00 EUR 24,520 29.448,52 0,90 0,90
Ireland
ELAN CORPORATION PLC - 1.461,00 EUR 10,755 15.713,06 0,48 0,48
KERRY GROUP PLC - 458,00 EUR 42,400 19.419,20 0,59 0,59
PROTHENA CORP PLC - 35,00 USD 12,910 347,60 0,01 0,01
Italy
E.N.E.L. - 13.025,00 EUR 2,410 31.390,25 0,96 0,96
SNAM RETE GAS S.P.A. - 4.779,00 EUR 3,500 16.726,50 0,51 0,51
Jersey/The Channel Islands
SHIRE LTD - 1.295,00 GBP 20,850 31.506,13 0,96 0,96
Netherlands
HEINEKEN - 498,00 EUR 48,950 24.377,10 0,74 0,74
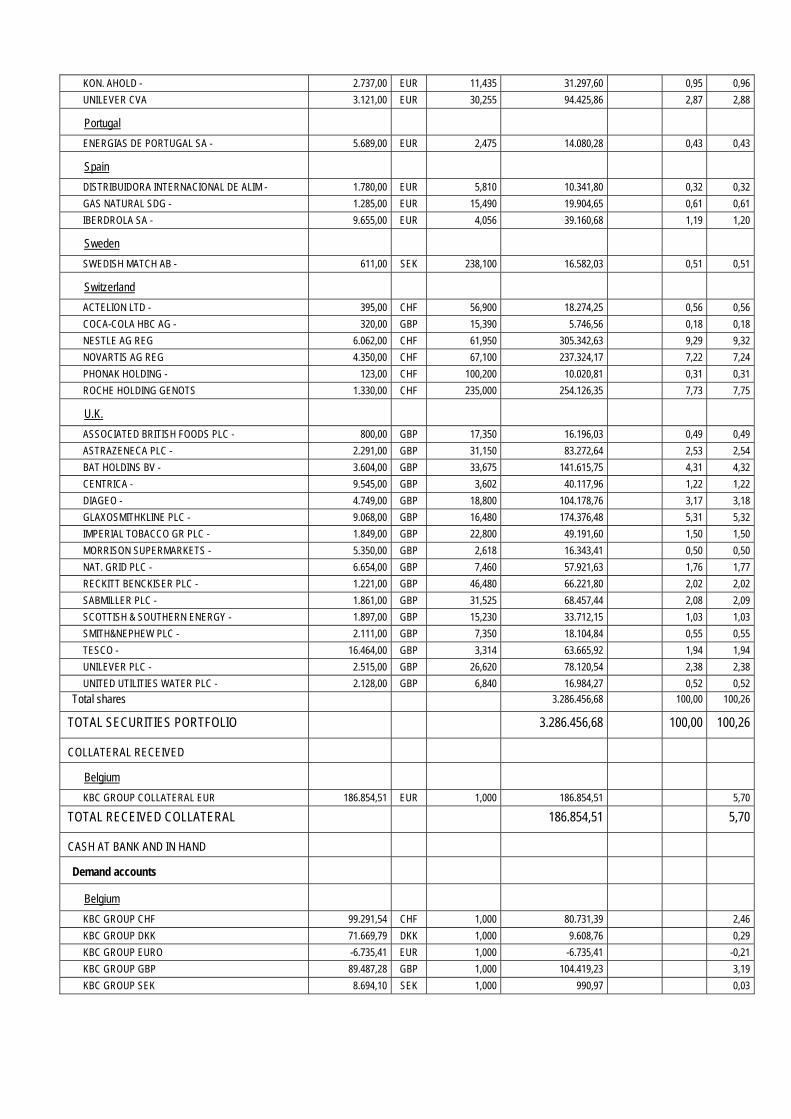
KON. AHOLD - 2.737,00 EUR 11,435 31.297,60 0,95 0,96
UNILEVER CVA 3.121,00 EUR 30,255 94.425,86 2,87 2,88
Portugal
ENERGIAS DE PORTUGAL SA - 5.689,00 EUR 2,475 14.080,28 0,43 0,43
Spain
DISTRIBUIDORA INTERNACIONAL DE ALIM - 1.780,00 EUR 5,810 10.341,80 0,32 0,32
GAS NATURAL SDG - 1.285,00 EUR 15,490 19.904,65 0,61 0,61
IBERDROLA SA - 9.655,00 EUR 4,056 39.160,68 1,19 1,20
Sweden
SWEDISH MATCH AB - 611,00 SEK 238,100 16.582,03 0,51 0,51
Switzerland
ACTELION LTD - 395,00 CHF 56,900 18.274,25 0,56 0,56
COCA-COLA HBC AG - 320,00 GBP 15,390 5.746,56 0,18 0,18
NESTLE AG REG 6.062,00 CHF 61,950 305.342,63 9,29 9,32
NOVARTIS AG REG 4.350,00 CHF 67,100 237.324,17 7,22 7,24
PHONAK HOLDING - 123,00 CHF 100,200 10.020,81 0,31 0,31
ROCHE HOLDING GENOTS 1.330,00 CHF 235,000 254.126,35 7,73 7,75
U.K.
ASSOCIATED BRITISH FOODS PLC - 800,00 GBP 17,350 16.196,03 0,49 0,49
ASTRAZENECA PLC - 2.291,00 GBP 31,150 83.272,64 2,53 2,54
BAT HOLDINS BV - 3.604,00 GBP 33,675 141.615,75 4,31 4,32
CENTRICA - 9.545,00 GBP 3,602 40.117,96 1,22 1,22
DIAGEO - 4.749,00 GBP 18,800 104.178,76 3,17 3,18
GLAXOSMITHKLINE PLC - 9.068,00 GBP 16,480 174.376,48 5,31 5,32
IMPERIAL TOBACCO GR PLC - 1.849,00 GBP 22,800 49.191,60 1,50 1,50
MORRISON SUPERMARKETS - 5.350,00 GBP 2,618 16.343,41 0,50 0,50
NAT. GRID PLC - 6.654,00 GBP 7,460 57.921,63 1,76 1,77
RECKITT BENCKISER PLC - 1.221,00 GBP 46,480 66.221,80 2,02 2,02
SABMILLER PLC - 1.861,00 GBP 31,525 68.457,44 2,08 2,09
SCOTTISH & SOUTHERN ENERGY - 1.897,00 GBP 15,230 33.712,15 1,03 1,03
SMITH&NEPHEW PLC - 2.111,00 GBP 7,350 18.104,84 0,55 0,55
TESCO - 16.464,00 GBP 3,314 63.665,92 1,94 1,94
UNILEVER PLC - 2.515,00 GBP 26,620 78.120,54 2,38 2,38
UNITED UTILITIES WATER PLC - 2.128,00 GBP 6,840 16.984,27 0,52 0,52
Total shares 3.286.456,68 100,00 100,26
TOTAL SECURITIES PORTFOLIO 3.286.456,68 100,00 100,26
COLLATERAL RECEIVED
Belgium
KBC GROUP COLLATERAL EUR 186.854,51 EUR 1,000 186.854,51 5,70
TOTAL RECEIVED COLLATERAL 186.854,51 5,70
CASH AT BANK AND IN HAND
Demand accounts
Belgium
KBC GROUP CHF 99.291,54 CHF 1,000 80.731,39 2,46
KBC GROUP DKK 71.669,79 DKK 1,000 9.608,76 0,29
KBC GROUP EURO -6.735,41 EUR 1,000 -6.735,41 -0,21
KBC GROUP GBP 89.487,28 GBP 1,000 104.419,23 3,19
KBC GROUP SEK 8.694,10 SEK 1,000 990,97 0,03

KBC GROUP USD 1.283,07 USD 1,000 987,05 0,03
Total demand accounts 190.001,99 5,80
TOTAL CASH AT BANK AND IN HAND 190.001,99 5,80
OTHER RECEIVABLES AND PAYABLES
Receivables
Belgium
KBC GROUP EUR RECEIVABLE 194.951,54 EUR 1,000 194.951,54 5,95
KBC GROUP WHT TO BE RECOVERED EUR 1.607,95 EUR 1,000 1.607,95 0,05
Total receivables 196.559,49 6,00
Payables
Belgium
KBC GROUP CHF PAYABLE -97.000,00 CHF 1,000 -78.868,20 -2,41 KBC GROUP COUNTERPART ENTRY COLLATERAL IN EUR
-186.854,51 EUR 1,000 -186.854,51 -5,70
KBC GROUP DKK PAYABLE -70.000,00 DKK 1,000 -9.384,89 -0,29
KBC GROUP EUR PAYABLE -197.763,12 EUR 1,000 -197.763,12 -6,03
KBC GROUP GBP PAYABLE -88.000,00 GBP 1,000 -102.683,78 -3,13
Payables -575.554,50 -17,56
TOTAL RECEIVABLES AND PAYABLES -378.995,01 -11,56
OTHER
Interest receivable EUR 7.548,95 0,23
Accrued interest EUR 826,36 0,03
Expenses payable EUR -16.285,89 -0,50
Expenses to be carried forward EUR 1.529,18 0,05
TOTAL OTHER -6.381,40 -0,20
TOTAL NET ASSETS 3.277.936,77 100,00
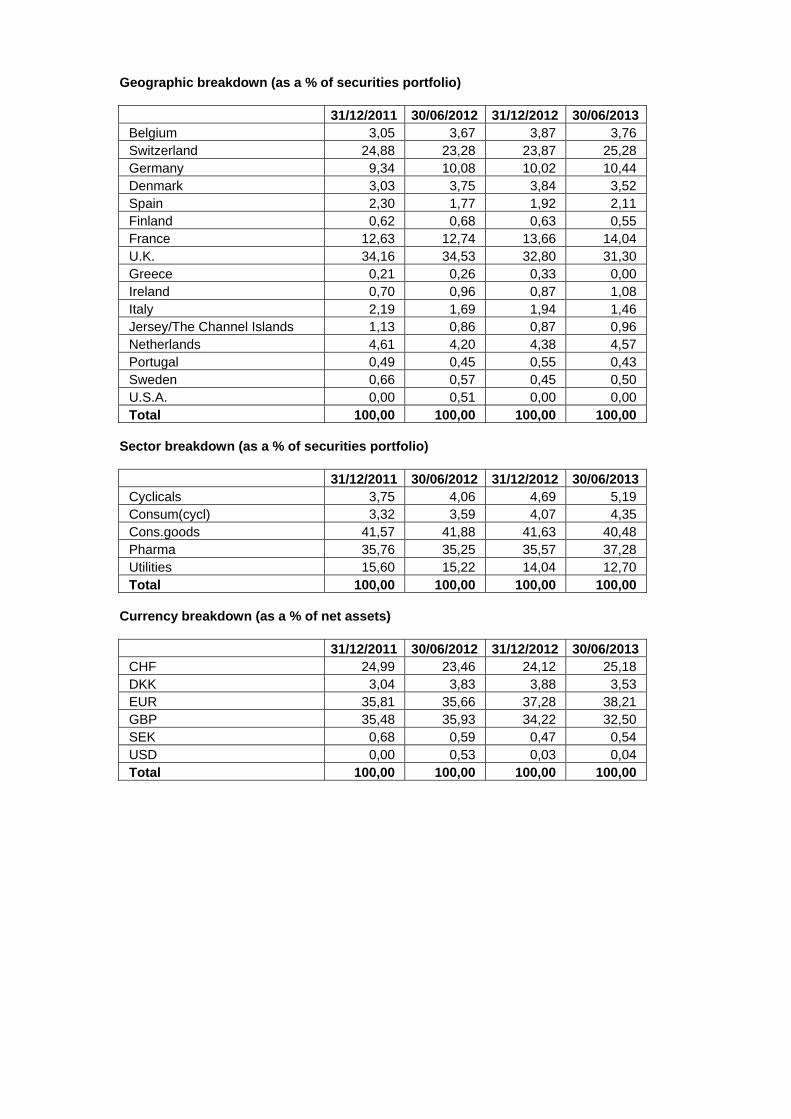
Geographic breakdown (as a % of securities portfolio)
31/12/2011 30/06/2012 31/12/2012 30/06/2013 Belgium 3,05 3,67 3,87 3,76 Switzerland 24,88 23,28 23,87 25,28 Germany 9,34 10,08 10,02 10,44 Denmark 3,03 3,75 3,84 3,52 Spain 2,30 1,77 1,92 2,11 Finland 0,62 0,68 0,63 0,55 France 12,63 12,74 13,66 14,04 U.K. 34,16 34,53 32,80 31,30 Greece 0,21 0,26 0,33 0,00 Ireland 0,70 0,96 0,87 1,08 Italy 2,19 1,69 1,94 1,46 Jersey/The Channel Islands 1,13 0,86 0,87 0,96 Netherlands 4,61 4,20 4,38 4,57 Portugal 0,49 0,45 0,55 0,43 Sweden 0,66 0,57 0,45 0,50 U.S.A. 0,00 0,51 0,00 0,00 Total 100,00 100,00 100,00 100,00
Sector breakdown (as a % of securities portfolio)
31/12/2011 30/06/2012 31/12/2012 30/06/2013 Cyclicals 3,75 4,06 4,69 5,19 Consum(cycl) 3,32 3,59 4,07 4,35 Cons.goods 41,57 41,88 41,63 40,48 Pharma 35,76 35,25 35,57 37,28 Utilities 15,60 15,22 14,04 12,70 Total 100,00 100,00 100,00 100,00
Currency breakdown (as a % of net assets)
31/12/2011 30/06/2012 31/12/2012 30/06/2013 CHF 24,99 23,46 24,12 25,18 DKK 3,04 3,83 3,88 3,53 EUR 35,81 35,66 37,28 38,21 GBP 35,48 35,93 34,22 32,50 SEK 0,68 0,59 0,47 0,54 USD 0,00 0,53 0,03 0,04 Total 100,00 100,00 100,00 100,00
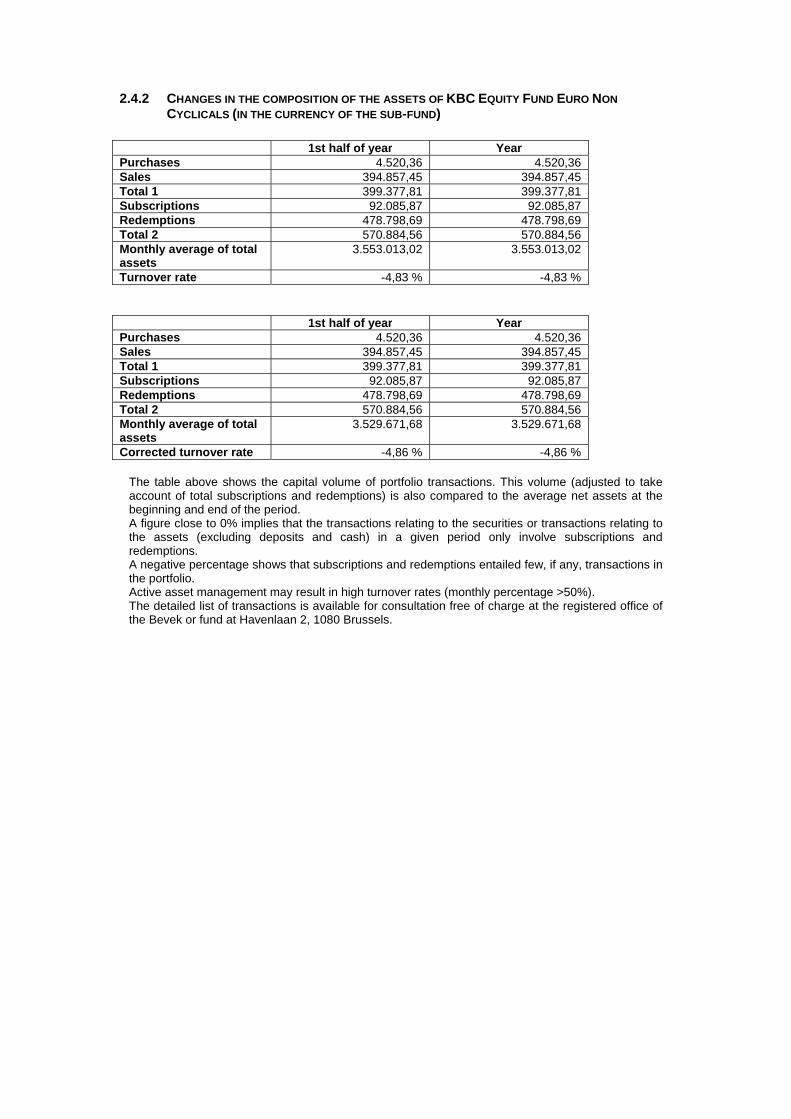
2.4.2 CHANGES IN THE COMPOSITION OF THE ASSETS OF KBC EQUITY FUND EURO NON
CYCLICALS (IN THE CURRENCY OF THE SUB-FUND)
1st half of year YearPurchases 4.520,36 4.520,36 Sales 394.857,45 394.857,45 Total 1 399.377,81 399.377,81 Subscriptions 92.085,87 92.085,87 Redemptions 478.798,69 478.798,69 Total 2 570.884,56 570.884,56 Monthly average of total assets
3.553.013,02 3.553.013,02
Turnover rate -4,83 % -4,83 %
1st half of year YearPurchases 4.520,36 4.520,36 Sales 394.857,45 394.857,45 Total 1 399.377,81 399.377,81 Subscriptions 92.085,87 92.085,87 Redemptions 478.798,69 478.798,69 Total 2 570.884,56 570.884,56 Monthly average of total assets
3.529.671,68 3.529.671,68
Corrected turnover rate -4,86 % -4,86 %
The table above shows the capital volume of portfolio transactions. This volume (adjusted to take account of total subscriptions and redemptions) is also compared to the average net assets at the beginning and end of the period. A figure close to 0% implies that the transactions relating to the securities or transactions relating to the assets (excluding deposits and cash) in a given period only involve subscriptions and redemptions. A negative percentage shows that subscriptions and redemptions entailed few, if any, transactions in the portfolio. Active asset management may result in high turnover rates (monthly percentage >50%). The detailed list of transactions is available for consultation free of charge at the registered office of the Bevek or fund at Havenlaan 2, 1080 Brussels.

2.4.3 AMOUNT OF COMMITMENTS IN RESPECT OF FINANCIAL DERIVATIVES POSITIONS
NAME Currency Value in currency
In the currency of the sub-fund
Lot-size
Transactiondate
KBC COLLATERAL EUR
EUR 186.854,51 186.854,51 N/A 28.06.2013
2.4.4 CHANGES OF THE NUMBER OF SUBSCRIPTIONS AND REDEMPTIONS AND THE NET ASSET
VALUE
Classic Shares
Period Change in number of shares in circulation
Year Subscriptions Redemptions End of period
Cap. Dis. Cap. Dis. Cap. Dis. Total
2011 - 06 367.413,45 24.722,74 353.812,85 21.097,49 13.600,60 3.625,25 17.225,85
2012 - 06 232,09 3.200,00 2.048,41 3.481,87 11.784,28 3.343,38 15.127,66
2013 - 06 748,96 26,00 1.710,43 1.363,34 10.822,81 2.006,04 12.828,85
Period Amounts received and paid by the UCI
(in the currency of the class)
Year Subscriptions Redemptions
Capitalization Distribution Capitalization Distribution
2011 - 06 645.763,61 18.427,47 68.208.947,54 4.447.785,18
2012 - 06 49.429,67 585.184,00 424.280,01 736.664,54
2013 - 06 185.110,51 6.196,10 423.319,33 335.229,54
Period Net asset value
End of period (in the currency of the class)
Year Of the class Of one share
Capitalization Distribution
2011 - 06 3.528.438,72 204,83 204,83
2012 - 06 3.380.726,51 223,48 223,47
2013 - 06 3.277.936,77 256,09 252,42
Institutional B Shares
Change in number of shares in circulation: Nil
Amounts received and paid by the UCI: Nil
Net asset value: Nil
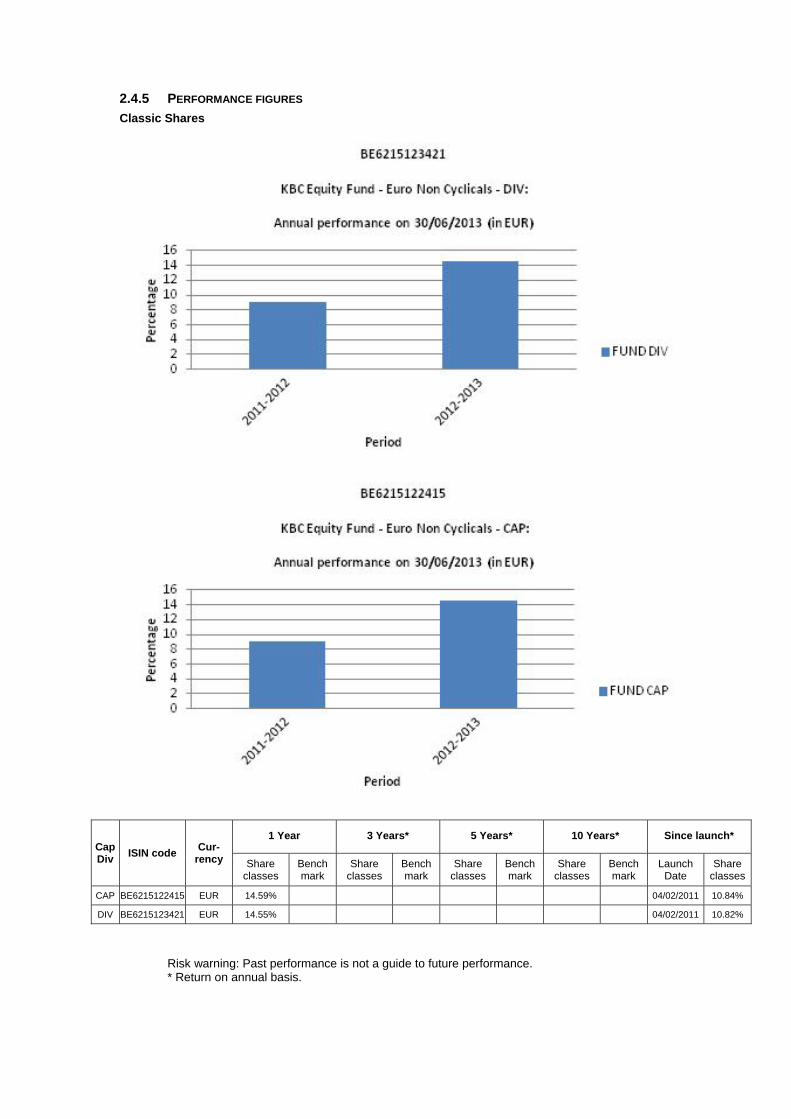
2.4.5 PERFORMANCE FIGURES
Classic Shares
Cap Div
ISIN code Cur-
rency
1 Year 3 Years* 5 Years* 10 Years* Since launch*
Share classes
Bench mark
Share classes
Bench mark
Share classes
Bench mark
Share classes
Bench mark
Launch Date
Share classes
CAP BE6215122415 EUR 14.59% 04/02/2011 10.84%
DIV BE6215123421 EUR 14.55% 04/02/2011 10.82%
Risk warning: Past performance is not a guide to future performance. * Return on annual basis.

Classic Shares
The bar chart shows the performance for full financial years. The figures do not take account of any restructuring. Calculated in EUR. The return is calculated as the change in the net asset value between two dates expressed
as a percentage. In the case of units that pay dividends, the dividend is incorporated geometrically in the return.
Calculation method for date D, where NAV stands for net asset value: Capitalisation units (CAP) Return on date D over a period of X years:
[NIW(D) / NIW(Y)] ^ [1 / X] - 1 where Y = D-X
Return on date D since the start date S of the unit: [NIW(D) / NIW(S)] ^ [1 / F] - 1 where F = 1 if the unit has existed for less than one year on date D where F = (D-S) / 365.25 if the unit has existed for longer than one year on date D
Distribution units (DIV) Return on date D over a period of X years:
[ C * NIW(D) / NIW(Y)] ^ [1 / X] - 1 where Y = D-X
Return on date D since the start date S of the unit: [ C * NIW(D) / NIW(S)] ^ [1 / F] - 1 where F = 1 if the unit has existed for less than one year on date D where F = (D-S) / 365.25 if the unit has existed for longer than one year on date D where C is a factor that is determined for all N dividends between the calculation date D and the reference date.
For dividend i on date Di with value Wi: Ci = [Wi / NIW(Di)] + 1 i = 1 ... N from whichC = C0 * .... * CN.
If the interval between the two dates exceeds one year, the ordinary return calculation is converted into a return on an annual basis by taking the nth square root of 1 plus the total return of the unit.
The return figures shown above do not take account of the fees and charges associated with the issue and redemption of units.
These are the performance figures for capitalisation and distribution shares.
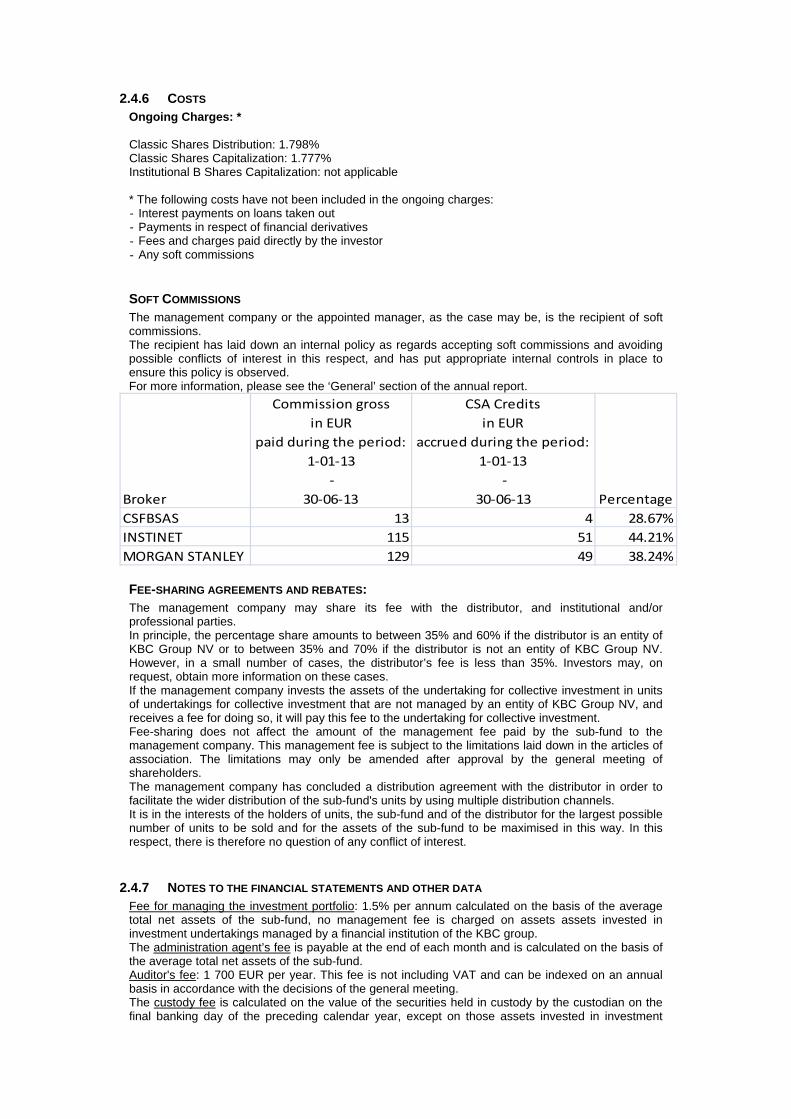
2.4.6 COSTS Ongoing Charges: * Classic Shares Distribution: 1.798% Classic Shares Capitalization: 1.777% Institutional B Shares Capitalization: not applicable * The following costs have not been included in the ongoing charges: - Interest payments on loans taken out - Payments in respect of financial derivatives - Fees and charges paid directly by the investor - Any soft commissions
SOFT COMMISSIONS The management company or the appointed manager, as the case may be, is the recipient of soft commissions. The recipient has laid down an internal policy as regards accepting soft commissions and avoiding possible conflicts of interest in this respect, and has put appropriate internal controls in place to ensure this policy is observed. For more information, please see the ‘General’ section of the annual report.
Broker
Commission gross
in EUR
paid during the period:
1‐01‐13
‐
30‐06‐13
CSA Credits
in EUR
accrued during the period:
1‐01‐13
‐
30‐06‐13 Percentage
CSFBSAS 13 4 28.67%
INSTINET 115 51 44.21%
MORGAN STANLEY 129 49 38.24%
FEE-SHARING AGREEMENTS AND REBATES: The management company may share its fee with the distributor, and institutional and/or professional parties. In principle, the percentage share amounts to between 35% and 60% if the distributor is an entity of KBC Group NV or to between 35% and 70% if the distributor is not an entity of KBC Group NV. However, in a small number of cases, the distributor’s fee is less than 35%. Investors may, on request, obtain more information on these cases. If the management company invests the assets of the undertaking for collective investment in units of undertakings for collective investment that are not managed by an entity of KBC Group NV, and receives a fee for doing so, it will pay this fee to the undertaking for collective investment. Fee-sharing does not affect the amount of the management fee paid by the sub-fund to the management company. This management fee is subject to the limitations laid down in the articles of association. The limitations may only be amended after approval by the general meeting of shareholders. The management company has concluded a distribution agreement with the distributor in order to facilitate the wider distribution of the sub-fund's units by using multiple distribution channels. It is in the interests of the holders of units, the sub-fund and of the distributor for the largest possible number of units to be sold and for the assets of the sub-fund to be maximised in this way. In this respect, there is therefore no question of any conflict of interest.
2.4.7 NOTES TO THE FINANCIAL STATEMENTS AND OTHER DATA Fee for managing the investment portfolio: 1.5% per annum calculated on the basis of the average total net assets of the sub-fund, no management fee is charged on assets assets invested in investment undertakings managed by a financial institution of the KBC group. The administration agent’s fee is payable at the end of each month and is calculated on the basis of the average total net assets of the sub-fund. Auditor's fee: 1 700 EUR per year. This fee is not including VAT and can be indexed on an annual basis in accordance with the decisions of the general meeting. The custody fee is calculated on the value of the securities held in custody by the custodian on the final banking day of the preceding calendar year, except on those assets invested in investment
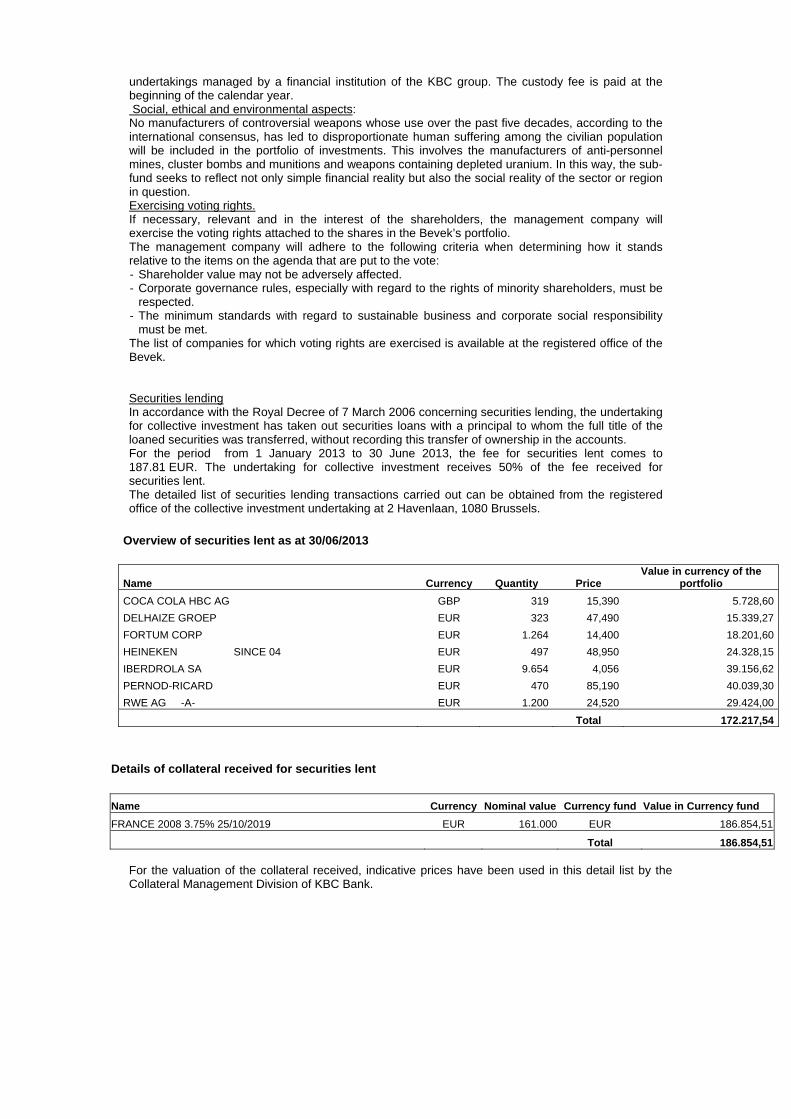
undertakings managed by a financial institution of the KBC group. The custody fee is paid at the beginning of the calendar year. Social, ethical and environmental aspects: No manufacturers of controversial weapons whose use over the past five decades, according to the international consensus, has led to disproportionate human suffering among the civilian population will be included in the portfolio of investments. This involves the manufacturers of anti-personnel mines, cluster bombs and munitions and weapons containing depleted uranium. In this way, the sub-fund seeks to reflect not only simple financial reality but also the social reality of the sector or region in question. Exercising voting rights. If necessary, relevant and in the interest of the shareholders, the management company will exercise the voting rights attached to the shares in the Bevek’s portfolio. The management company will adhere to the following criteria when determining how it stands relative to the items on the agenda that are put to the vote: - Shareholder value may not be adversely affected. - Corporate governance rules, especially with regard to the rights of minority shareholders, must be
respected. - The minimum standards with regard to sustainable business and corporate social responsibility
must be met. The list of companies for which voting rights are exercised is available at the registered office of the Bevek. Securities lending In accordance with the Royal Decree of 7 March 2006 concerning securities lending, the undertaking for collective investment has taken out securities loans with a principal to whom the full title of the loaned securities was transferred, without recording this transfer of ownership in the accounts. For the period from 1 January 2013 to 30 June 2013, the fee for securities lent comes to 187.81 EUR. The undertaking for collective investment receives 50% of the fee received for securities lent. The detailed list of securities lending transactions carried out can be obtained from the registered office of the collective investment undertaking at 2 Havenlaan, 1080 Brussels.
Overview of securities lent as at 30/06/2013
Name Currency Quantity Price Value in currency of the
portfolio
COCA COLA HBC AG GBP 319 15,390 5.728,60
DELHAIZE GROEP EUR 323 47,490 15.339,27
FORTUM CORP EUR 1.264 14,400 18.201,60
HEINEKEN SINCE 04 EUR 497 48,950 24.328,15
IBERDROLA SA EUR 9.654 4,056 39.156,62
PERNOD-RICARD EUR 470 85,190 40.039,30
RWE AG -A- EUR 1.200 24,520 29.424,00
Total 172.217,54
Details of collateral received for securities lent
Name Currency Nominal value Currency fund Value in Currency fund
FRANCE 2008 3.75% 25/10/2019 EUR 161.000 EUR 186.854,51
Total 186.854,51 For the valuation of the collateral received, indicative prices have been used in this detail list by the Collateral Management Division of KBC Bank.
Semi-Annual report as at 30th June 2013
TABLE OF CONTENTS
2. Information on KBC Equity Fund Pharma
2.1. Management report 2.1.1. Launch date and subscription price 2.1.2. Stock exchange listing 2.1.3. Aim and distinctive features of the investment policy 2.1.4. Financial portfolio management 2.1.5. Distributors 2.1.6. Index and benchmark 2.1.7. Policy conducted during the financial year 2.1.8. Future policy 2.1.9. Synthetic risk and reward indicator (SRRI)
2.2. Balance sheet
2.3. Profit and loss account
2.4. Composition of the assets and key figures
2.4.1. Composition of the assets 2.4.2. Change in the composition of the assets 2.4.3. Value of commitments in respect of financial derivatives positions 2.4.4. Evolution of the number of subscriptions, repayments and the net asset value 2.4.5. Return figures 2.4.6. Expenses 2.4.7. Notes to the financial statements and other data


2 INFORMATION ON KBC EQUITY FUND PHARMA
2.1 MANAGEMENT REPORT
2.1.1 LAUNCH DATE AND SUBSCRIPTION PRICE Classic Shares : Launch date: 27 February 1998 Initial subscription price: 20000 BEF Currency: EUR Institutional B Shares : Launch date: 25 November 2011 Initial subscription price: 576.88 EUR Currency: EUR
2.1.2 STOCK EXCHANGE LISTING Not applicable.
2.1.3 GOAL AND KEY PRINCIPLES OF THE INVESTMENT POLICY
SUB-FUND’S OBJECT: The main objective of this sub-fund is to generate the highest possible return for its shareholders by investing directly or indirectly in transferable securities. This is reflected in its pursuit of capital gains and income. To this end, the assets are invested, either directly or indirectly via correlated financial instruments, primarily in shares.
SUB-FUND’S INVESTMENT POLICY:
PERMITTED ASSET CLASSES: The sub-fund may invest in securities, money market instruments, units in undertakings for collective investment, deposits, financial derivatives, liquid assets and all other instruments insofar as permitted by the applicable laws and regulations and consistent with the sub-fund’s object The sub-fund shall invest no more than 10% of its assets in units of other undertakings for collective investment.
RESTRICTIONS OF THE INVESTMENT POLICY: The investment policy will be implemented within the limits set by law and regulations. The sub-fund may borrow up to 10% of its net assets, insofar as these are short-term borrowings aimed at solving temporary liquidity problems.
PERMITTED DERIVATIVES TRANSACTIONS: Derivates may be used either for hedging purposes or to achieve investment objectives. Changes will be made to the investments at regular intervals to comply with the sub-fund's investment strategy. In addition, listed and unlisted derivates may be used to achieve the objectives: these may be forward contracts, options or swaps on securities, indices, currencies or interest rates or other transactions involving derivatives. Unlisted derivatives transactions will only be concluded with prime financial institutions specialised in such transactions. Such derivatives may also be used to hedge the assets against exchange-rate fluctuations. Subject to the applicable laws and regulations and the articles of association, the sub-fund always seeks to conclude the most effective transactions. All costs associated with the transactions will be charged to the sub-fund and all income generated will be paid to the sub-fund. If the transactions result in a risk in respect of the counterparty, this risk can be hedged by using a margin management system that ensures that the sub-fund is the beneficiary of security (collateral) in the form of cash or investment grade bonds. When calculating the value of the bonds, a margin will be applied that varies depending on the residual term to maturity and the currency in which the bond in question is denominated. The relationship with the counterparty or counterparties is governed by standard international agreements.
STRATEGY SELECTED At least 75% of the assets are invested in shares of companies in the pharmaceutical and healthcare sector where conditions are such as to allow accelerated economic growth in the short or medium term.
LENDING FINANCIAL INSTRUMENTS: The sub-fund may lend financial instruments within the limits set by law and regulations. This lending does not affect the sub-fund’s risk profile since: - it takes place within the framework of a securities lending system managed by a principal. In
addition, the sub-fund has a relationship only with the principal of the securities lending system which acts as counterparty and to which title of the loaned securities is transferred. The choice of principal is subject to strict selection criteria. The return of securities similar to the securities that have been lent is guaranteed by the principal.
- through a margin management system, the sub-fund is always guaranteed financial security, the actual value of which always exceeds the actual value of the securities that have been lent, in case the principal does not return similar securities.
The return of securities similar to the securities that have been lent can be requested at any time, which means that the lending of securities does not affect the management of the sub-fund's assets. By lending securities, the sub-fund can generate an additional return. The principal pays a fee to the management company. After deducting the fee for the margin management and clearing services of KBC Bank, most of this fee is paid to the sub-fund. The relationship with the counterparty or counterparties is governed by standard international agreements. More information is provided on the terms and conditions governing securities lending in the annual or half-yearly report for the sub-fund.
VOLATILITY OF THE NET ASSET VALUE: The volatility of the net asset value may be high due to the composition of the portfolio.
GENERAL STRATEGY FOR HEDGING THE EXCHANGE RATE RISK: In order to protect its assets against exchange rate fluctuations and within the limitations laid down in the articles of association, the sub-fund may perform transactions relating to the sale of forward currency contracts, as well as the sale of call options and the purchase of put options on currencies. The transactions in question may relate solely to contracts traded on a regulated market that operates regularly, is recognised and is open to the public or that are traded with a recognised, prime financial institution specialising in such transactions and dealing in the over-the-counter (OTC) market in options. With the same objective, the sub-fund may also sell currencies forward or exchange them in private transactions with prime financial institutions specialising in such transactions. The hedging objective of the aforementioned transactions suggests that there is a direct link between these transactions and the assets to be hedged, which implies that the transactions carried out in a particular currency may in principle not exceed, in terms of volume, either the valuation value of all the assets in the same currency or the holding period of those assets.
SOCIAL, ETHICAL AND ENVIRONMENTAL ASPECTS:
No manufacturers of controversial weapons whose use over the past five decades, according to the international consensus, has led to disproportionate human suffering among the civilian population will be included in the portfolio of investments. This involves the manufacturers of anti-personnel mines, cluster bombs and munitions and weapons containing depleted uranium. In this way, the sub-fund seeks to reflect not only simple financial reality but also the social reality of the sector or region in question.
THE EUROPEAN SAVINGS DIRECTIVE AND TAX ON DEBT CLAIM RETURNS OBTAINED THROUGH THE
REDEMPTION OF OWN UNITS OR IN THE EVENT OF FULL OR PARTIAL DISTRIBUTION OF EQUITY
CAPITAL. The following information is of a general character and is not intended to cover all aspects of an investment in a UCITS. In certain cases entirely different rules might even apply. Moreover, both tax law and the interpretation of it can change. Investors who wish to have more information about the

tax implications – in both Belgium and abroad – of acquiring, holding and transferring units should seek the advice of their usual financial and tax advisers. This UCITS shall invest a maximum of 15% of its assets directly or indirectly in debt instruments as intended by the European Savings Directive. A. European Savings Directive (Directive 2003/48/EC) The European Savings Directive has been implemented in Belgium. Since this UCITS invests a maximum of 15% of its assets directly or indirectly in debt claims as intended by the European Savings Directive, the income of this UCITS does not fall within the scope of this directive. B. Tax on debt claim returns obtained through the redemption of own units or in the event of full or partial distribution of equity capital (Article 19bis Income Tax Code 1992). The income from this UCITS is not subject to the tax on debt instrument returns as intended by Article 19bis, Income Tax Code 1992.
2.1.4 FINANCIAL PORTFOLIO MANAGEMENT There is no delegation of the portfolio.
2.1.5 DISTRIBUTORS KBC Asset Management S.A., 5, Place de la Gare, L-1616 Luxembourg.
2.1.6 INDEX AND BENCHMARK See ‘Sub-fund’s investment policy’.
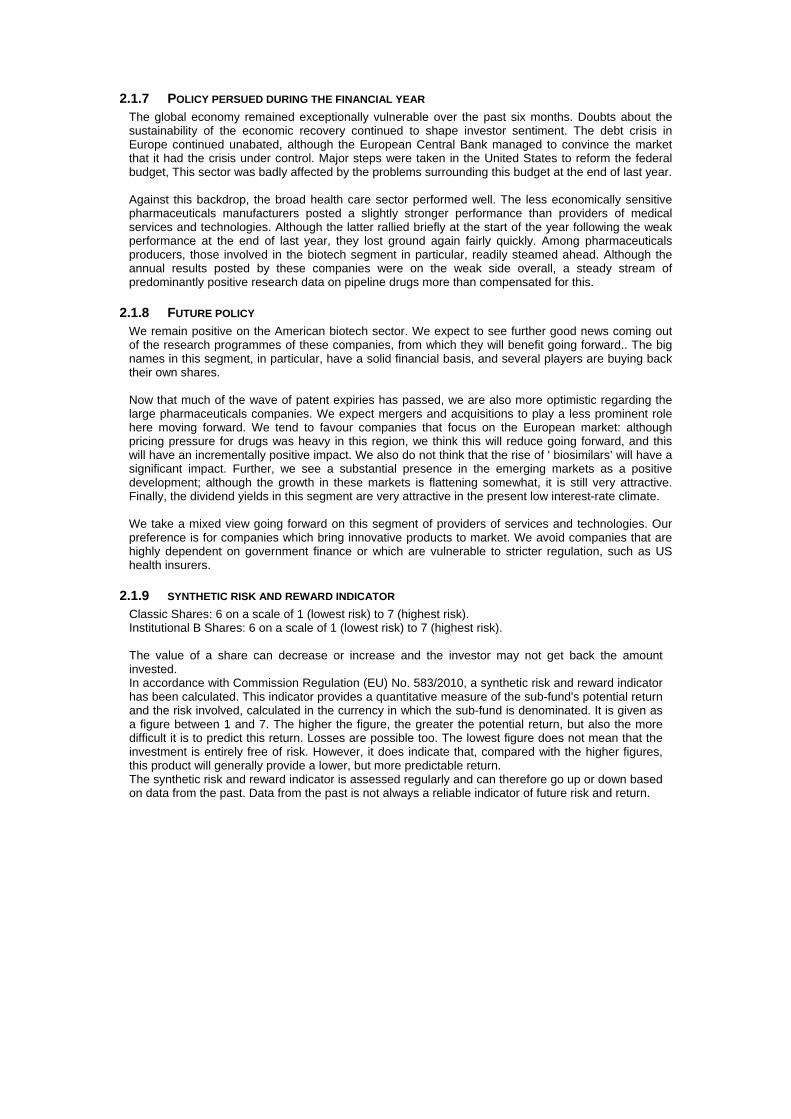
2.1.7 POLICY PERSUED DURING THE FINANCIAL YEAR The global economy remained exceptionally vulnerable over the past six months. Doubts about the sustainability of the economic recovery continued to shape investor sentiment. The debt crisis in Europe continued unabated, although the European Central Bank managed to convince the market that it had the crisis under control. Major steps were taken in the United States to reform the federal budget, This sector was badly affected by the problems surrounding this budget at the end of last year. Against this backdrop, the broad health care sector performed well. The less economically sensitive pharmaceuticals manufacturers posted a slightly stronger performance than providers of medical services and technologies. Although the latter rallied briefly at the start of the year following the weak performance at the end of last year, they lost ground again fairly quickly. Among pharmaceuticals producers, those involved in the biotech segment in particular, readily steamed ahead. Although the annual results posted by these companies were on the weak side overall, a steady stream of predominantly positive research data on pipeline drugs more than compensated for this.
2.1.8 FUTURE POLICY We remain positive on the American biotech sector. We expect to see further good news coming out of the research programmes of these companies, from which they will benefit going forward.. The big names in this segment, in particular, have a solid financial basis, and several players are buying back their own shares. Now that much of the wave of patent expiries has passed, we are also more optimistic regarding the large pharmaceuticals companies. We expect mergers and acquisitions to play a less prominent role here moving forward. We tend to favour companies that focus on the European market: although pricing pressure for drugs was heavy in this region, we think this will reduce going forward, and this will have an incrementally positive impact. We also do not think that the rise of ' biosimilars’ will have a significant impact. Further, we see a substantial presence in the emerging markets as a positive development; although the growth in these markets is flattening somewhat, it is still very attractive. Finally, the dividend yields in this segment are very attractive in the present low interest-rate climate. We take a mixed view going forward on this segment of providers of services and technologies. Our preference is for companies which bring innovative products to market. We avoid companies that are highly dependent on government finance or which are vulnerable to stricter regulation, such as US health insurers.
2.1.9 SYNTHETIC RISK AND REWARD INDICATOR Classic Shares: 6 on a scale of 1 (lowest risk) to 7 (highest risk). Institutional B Shares: 6 on a scale of 1 (lowest risk) to 7 (highest risk). The value of a share can decrease or increase and the investor may not get back the amount invested. In accordance with Commission Regulation (EU) No. 583/2010, a synthetic risk and reward indicator has been calculated. This indicator provides a quantitative measure of the sub-fund's potential return and the risk involved, calculated in the currency in which the sub-fund is denominated. It is given as a figure between 1 and 7. The higher the figure, the greater the potential return, but also the more difficult it is to predict this return. Losses are possible too. The lowest figure does not mean that the investment is entirely free of risk. However, it does indicate that, compared with the higher figures, this product will generally provide a lower, but more predictable return. The synthetic risk and reward indicator is assessed regularly and can therefore go up or down based on data from the past. Data from the past is not always a reliable indicator of future risk and return.
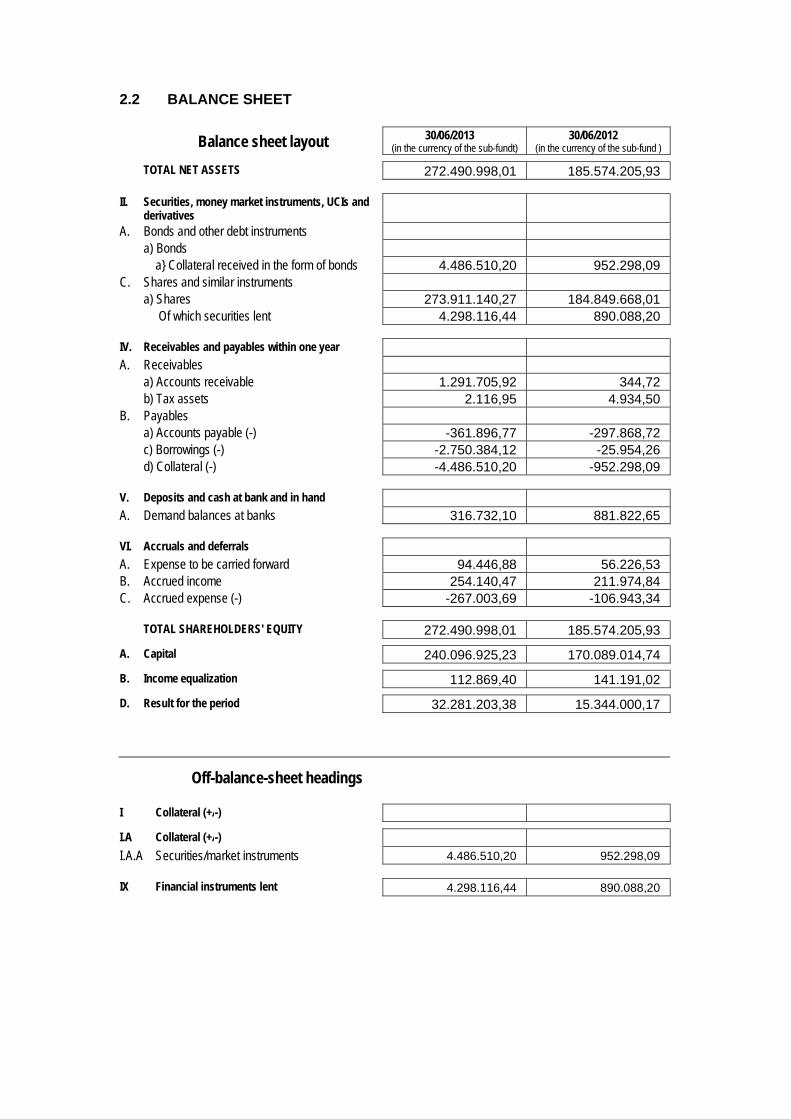
2.2 BALANCE SHEET
Balance sheet layout 30/06/2013 (in the currency of the sub-fundt)
30/06/2012 (in the currency of the sub-fund )
TOTAL NET ASSETS 272.490.998,01 185.574.205,93
II. Securities, money market instruments, UCIs and derivatives
A. Bonds and other debt instruments a) Bonds a} Collateral received in the form of bonds 4.486.510,20 952.298,09 C. Shares and similar instruments a) Shares 273.911.140,27 184.849.668,01 Of which securities lent 4.298.116,44 890.088,20
IV. Receivables and payables within one year A. Receivables a) Accounts receivable 1.291.705,92 344,72 b) Tax assets 2.116,95 4.934,50 B. Payables a) Accounts payable (-) -361.896,77 -297.868,72 c) Borrowings (-) -2.750.384,12 -25.954,26 d) Collateral (-) -4.486.510,20 -952.298,09
V. Deposits and cash at bank and in hand A. Demand balances at banks 316.732,10 881.822,65
VI. Accruals and deferrals A. Expense to be carried forward 94.446,88 56.226,53 B. Accrued income 254.140,47 211.974,84 C. Accrued expense (-) -267.003,69 -106.943,34
TOTAL SHAREHOLDERS' EQUITY 272.490.998,01 185.574.205,93
A. Capital 240.096.925,23 170.089.014,74
B. Income equalization 112.869,40 141.191,02
D. Result for the period 32.281.203,38 15.344.000,17
Off-balance-sheet headings
I Collateral (+/-)
I.A Collateral (+/-)
I.A.A Securities/market instruments 4.486.510,20 952.298,09
IX Financial instruments lent 4.298.116,44 890.088,20

2.3 PROFIT AND LOSS ACCOUNT
Income Statement 30/06/2013 (in the currency of the sub-fund)
30/06/2012 (in the currency of the sub-fund)
I. Net gains(losses) on investments C. Shares and similar instruments a) Shares 33.766.302,52 12.353.082,65 b) Closed-end undertakings for collective
investment 27.878,94
D. Other securities -1.384,76 1.920,07 H. Foreign exchange positions and transactions b) Other foreign exchange positions and
transactions -2.427.411,20 2.082.146,46
II. Investment income and expenses A. Dividends 2.908.052,04 2.173.479,04 B. Interests a) Securities and money market instruments 122.695,47 28.445,31 b) Cash at bank and in hand and deposits -2.602,73 2.350,26 C. Interest on borrowings (-) -830,52 -1.159,97
III. Other income A. Income received to cover the acquisition and
realizaion of assets, to discourage withdrawals and for delivery charges
503.664,43 323.394,99
IV. Operating expenses A. Investment transaction and delivery costs (-) -292.161,60 -407.559,29 B. Financial expenses (-) -1.852,71 -1.251,20 C. Custodian's fee (-) -76.190,98 -51.536,93 D. Manager's fee (-) a) Financial management Classic Shares -597.888,55 -475.361,92 Institutional B Shares -1.333.512,66 -534.501,95 b) Administration and accounting management -128.760,17 -71.225,98 E. Administrative expenses (-) -217,46 -142,99 F. Formation and organisation expenses (-) -5.910,19 -8.295,11 G. Remuneration, social security charges and
pension -50,46 -12,48
H. Services and sundry goods (-) -30.411,75 -13.768,79 J. Taxes Classic Shares -33.246,84 -26.780,15 Institutional B Shares -7.661,84 -5.699,06 K. Other expenses (-) -79.416,66 -51.401,73
Income and expenditure for the period Subtotal II + III + IV 943.696,82 878.972,05
V. Profit (loss) on ordinary activities before tax 32.281.203,38 15.344.000,17
VII. Result for the period 32.281.203,38 15.344.000,17
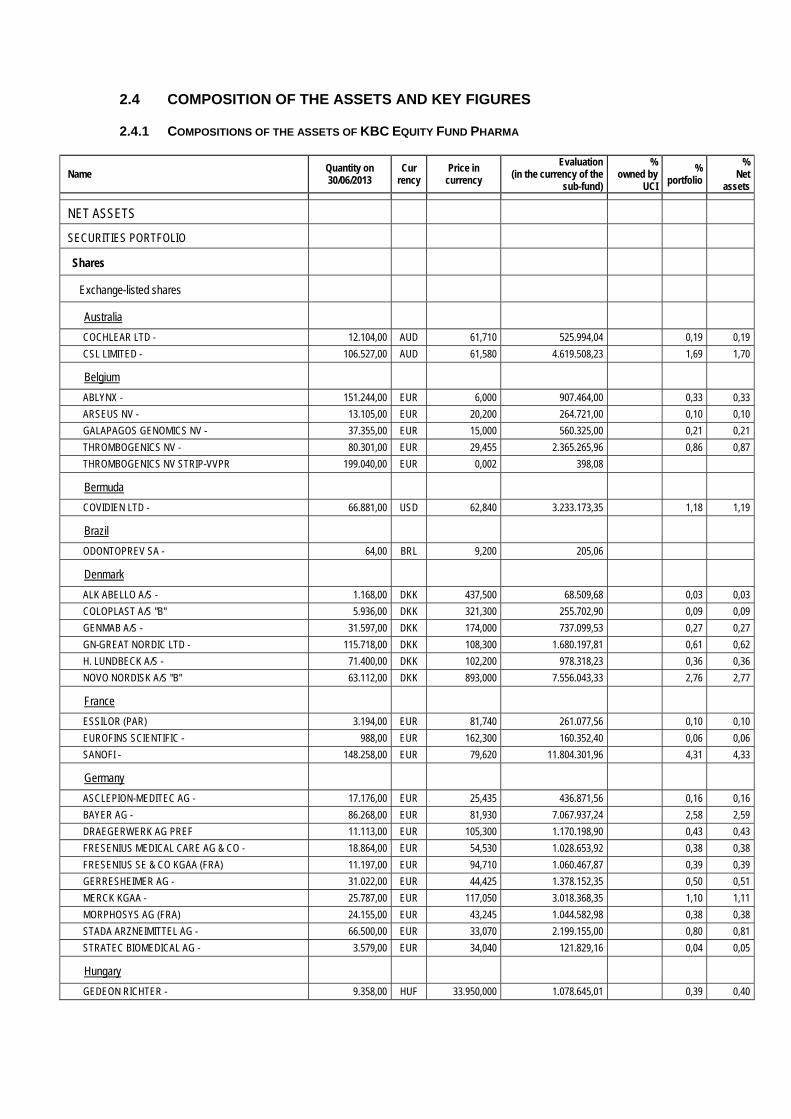
2.4 COMPOSITION OF THE ASSETS AND KEY FIGURES
2.4.1 COMPOSITIONS OF THE ASSETS OF KBC EQUITY FUND PHARMA
Name Quantity on 30/06/2013
Cur rency
Price in currency
Evaluation (in the currency of the
sub-fund)
% owned by
UCI
% portfolio
% Net
assets
NET ASSETS
SECURITIES PORTFOLIO
Shares
Exchange-listed shares
Australia
COCHLEAR LTD - 12.104,00 AUD 61,710 525.994,04 0,19 0,19
CSL LIMITED - 106.527,00 AUD 61,580 4.619.508,23 1,69 1,70
Belgium
ABLYNX - 151.244,00 EUR 6,000 907.464,00 0,33 0,33
ARSEUS NV - 13.105,00 EUR 20,200 264.721,00 0,10 0,10
GALAPAGOS GENOMICS NV - 37.355,00 EUR 15,000 560.325,00 0,21 0,21
THROMBOGENICS NV - 80.301,00 EUR 29,455 2.365.265,96 0,86 0,87
THROMBOGENICS NV STRIP-VVPR 199.040,00 EUR 0,002 398,08
Bermuda
COVIDIEN LTD - 66.881,00 USD 62,840 3.233.173,35 1,18 1,19
Brazil
ODONTOPREV SA - 64,00 BRL 9,200 205,06
Denmark
ALK ABELLO A/S - 1.168,00 DKK 437,500 68.509,68 0,03 0,03
COLOPLAST A/S "B" 5.936,00 DKK 321,300 255.702,90 0,09 0,09
GENMAB A/S - 31.597,00 DKK 174,000 737.099,53 0,27 0,27
GN-GREAT NORDIC LTD - 115.718,00 DKK 108,300 1.680.197,81 0,61 0,62
H. LUNDBECK A/S - 71.400,00 DKK 102,200 978.318,23 0,36 0,36
NOVO NORDISK A/S "B" 63.112,00 DKK 893,000 7.556.043,33 2,76 2,77
France
ESSILOR (PAR) 3.194,00 EUR 81,740 261.077,56 0,10 0,10
EUROFINS SCIENTIFIC - 988,00 EUR 162,300 160.352,40 0,06 0,06
SANOFI - 148.258,00 EUR 79,620 11.804.301,96 4,31 4,33
Germany
ASCLEPION-MEDITEC AG - 17.176,00 EUR 25,435 436.871,56 0,16 0,16
BAYER AG - 86.268,00 EUR 81,930 7.067.937,24 2,58 2,59
DRAEGERWERK AG PREF 11.113,00 EUR 105,300 1.170.198,90 0,43 0,43
FRESENIUS MEDICAL CARE AG & CO - 18.864,00 EUR 54,530 1.028.653,92 0,38 0,38
FRESENIUS SE & CO KGAA (FRA) 11.197,00 EUR 94,710 1.060.467,87 0,39 0,39
GERRESHEIMER AG - 31.022,00 EUR 44,425 1.378.152,35 0,50 0,51
MERCK KGAA - 25.787,00 EUR 117,050 3.018.368,35 1,10 1,11
MORPHOSYS AG (FRA) 24.155,00 EUR 43,245 1.044.582,98 0,38 0,38
STADA ARZNEIMITTEL AG - 66.500,00 EUR 33,070 2.199.155,00 0,80 0,81
STRATEC BIOMEDICAL AG - 3.579,00 EUR 34,040 121.829,16 0,04 0,05
Hungary
GEDEON RICHTER - 9.358,00 HUF 33.950,000 1.078.645,01 0,39 0,40
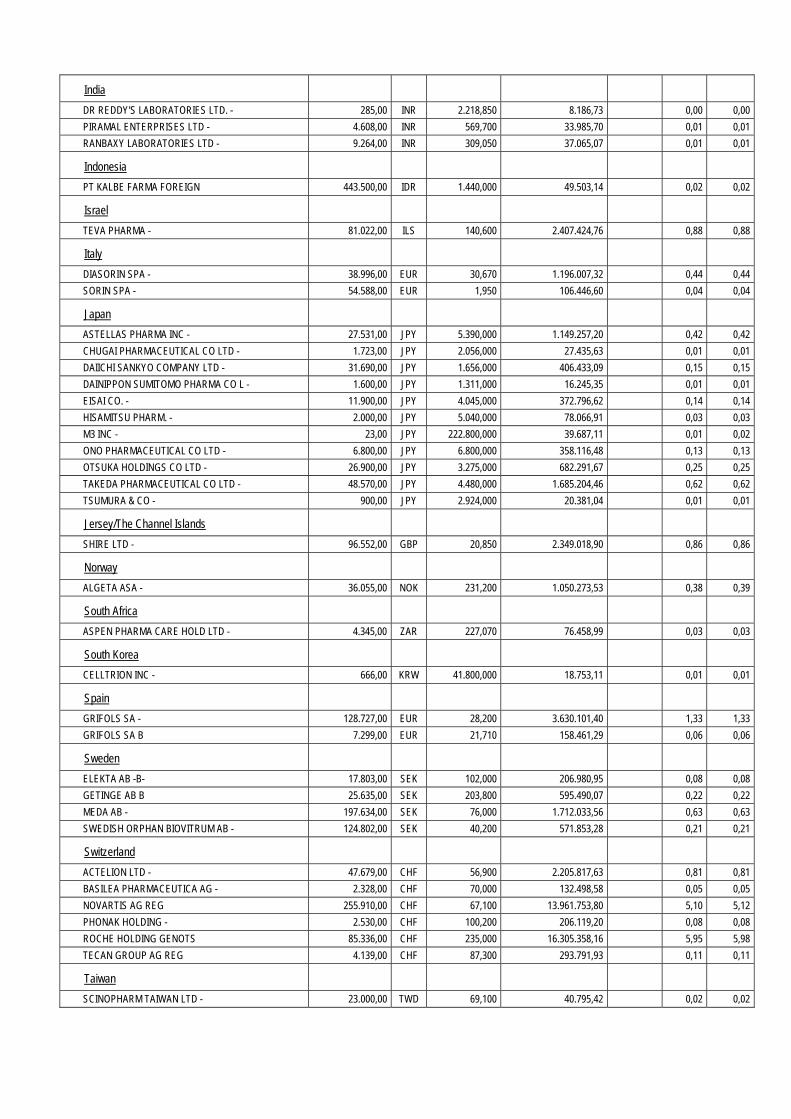
India
DR REDDY'S LABORATORIES LTD. - 285,00 INR 2.218,850 8.186,73 0,00 0,00
PIRAMAL ENTERPRISES LTD - 4.608,00 INR 569,700 33.985,70 0,01 0,01
RANBAXY LABORATORIES LTD - 9.264,00 INR 309,050 37.065,07 0,01 0,01
Indonesia
PT KALBE FARMA FOREIGN 443.500,00 IDR 1.440,000 49.503,14 0,02 0,02
Israel
TEVA PHARMA - 81.022,00 ILS 140,600 2.407.424,76 0,88 0,88
Italy
DIASORIN SPA - 38.996,00 EUR 30,670 1.196.007,32 0,44 0,44
SORIN SPA - 54.588,00 EUR 1,950 106.446,60 0,04 0,04
Japan
ASTELLAS PHARMA INC - 27.531,00 JPY 5.390,000 1.149.257,20 0,42 0,42
CHUGAI PHARMACEUTICAL CO LTD - 1.723,00 JPY 2.056,000 27.435,63 0,01 0,01
DAIICHI SANKYO COMPANY LTD - 31.690,00 JPY 1.656,000 406.433,09 0,15 0,15
DAINIPPON SUMITOMO PHARMA CO L - 1.600,00 JPY 1.311,000 16.245,35 0,01 0,01
EISAI CO. - 11.900,00 JPY 4.045,000 372.796,62 0,14 0,14
HISAMITSU PHARM. - 2.000,00 JPY 5.040,000 78.066,91 0,03 0,03
M3 INC - 23,00 JPY 222.800,000 39.687,11 0,01 0,02
ONO PHARMACEUTICAL CO LTD - 6.800,00 JPY 6.800,000 358.116,48 0,13 0,13
OTSUKA HOLDINGS CO LTD - 26.900,00 JPY 3.275,000 682.291,67 0,25 0,25
TAKEDA PHARMACEUTICAL CO LTD - 48.570,00 JPY 4.480,000 1.685.204,46 0,62 0,62
TSUMURA & CO - 900,00 JPY 2.924,000 20.381,04 0,01 0,01
Jersey/The Channel Islands
SHIRE LTD - 96.552,00 GBP 20,850 2.349.018,90 0,86 0,86
Norway
ALGETA ASA - 36.055,00 NOK 231,200 1.050.273,53 0,38 0,39
South Africa
ASPEN PHARMA CARE HOLD LTD - 4.345,00 ZAR 227,070 76.458,99 0,03 0,03
South Korea
CELLTRION INC - 666,00 KRW 41.800,000 18.753,11 0,01 0,01
Spain
GRIFOLS SA - 128.727,00 EUR 28,200 3.630.101,40 1,33 1,33
GRIFOLS SA B 7.299,00 EUR 21,710 158.461,29 0,06 0,06
Sweden
ELEKTA AB -B- 17.803,00 SEK 102,000 206.980,95 0,08 0,08
GETINGE AB B 25.635,00 SEK 203,800 595.490,07 0,22 0,22
MEDA AB - 197.634,00 SEK 76,000 1.712.033,56 0,63 0,63
SWEDISH ORPHAN BIOVITRUM AB - 124.802,00 SEK 40,200 571.853,28 0,21 0,21
Switzerland
ACTELION LTD - 47.679,00 CHF 56,900 2.205.817,63 0,81 0,81
BASILEA PHARMACEUTICA AG - 2.328,00 CHF 70,000 132.498,58 0,05 0,05
NOVARTIS AG REG 255.910,00 CHF 67,100 13.961.753,80 5,10 5,12
PHONAK HOLDING - 2.530,00 CHF 100,200 206.119,20 0,08 0,08
ROCHE HOLDING GENOTS 85.336,00 CHF 235,000 16.305.358,16 5,95 5,98
TECAN GROUP AG REG 4.139,00 CHF 87,300 293.791,93 0,11 0,11
Taiwan
SCINOPHARM TAIWAN LTD - 23.000,00 TWD 69,100 40.795,42 0,02 0,02
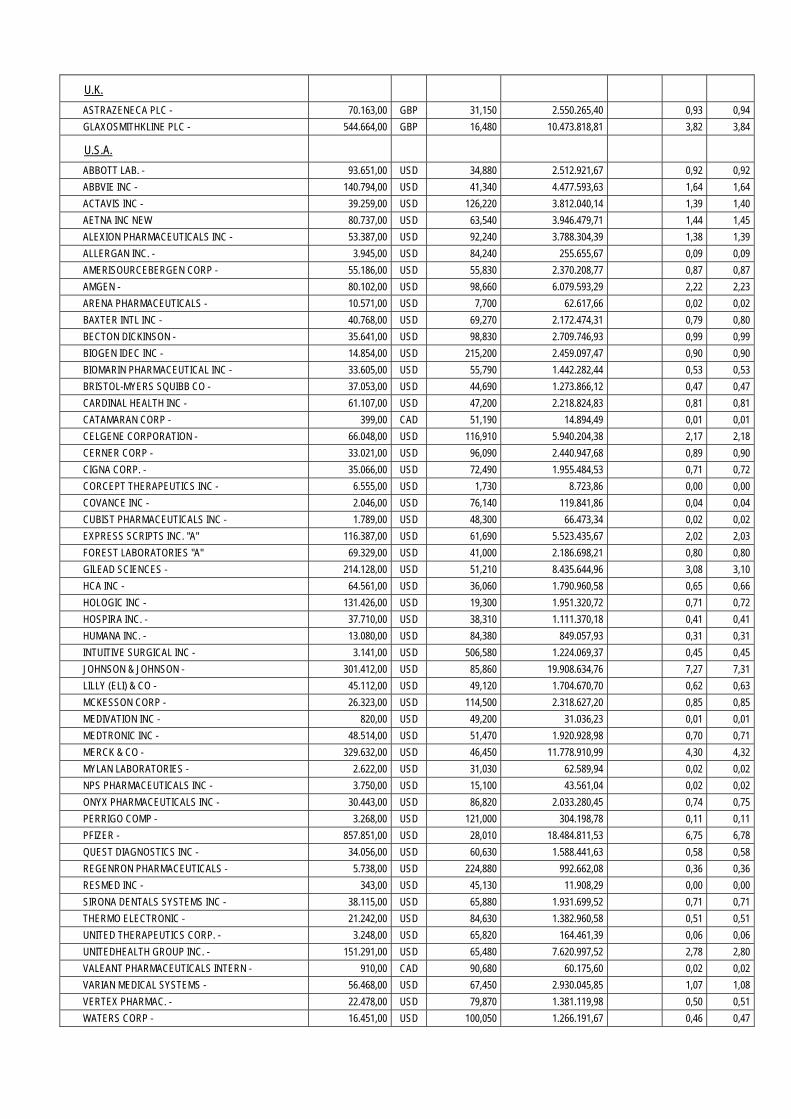
U.K.
ASTRAZENECA PLC - 70.163,00 GBP 31,150 2.550.265,40 0,93 0,94
GLAXOSMITHKLINE PLC - 544.664,00 GBP 16,480 10.473.818,81 3,82 3,84
U.S.A.
ABBOTT LAB. - 93.651,00 USD 34,880 2.512.921,67 0,92 0,92
ABBVIE INC - 140.794,00 USD 41,340 4.477.593,63 1,64 1,64
ACTAVIS INC - 39.259,00 USD 126,220 3.812.040,14 1,39 1,40
AETNA INC NEW 80.737,00 USD 63,540 3.946.479,71 1,44 1,45
ALEXION PHARMACEUTICALS INC - 53.387,00 USD 92,240 3.788.304,39 1,38 1,39
ALLERGAN INC. - 3.945,00 USD 84,240 255.655,67 0,09 0,09
AMERISOURCEBERGEN CORP - 55.186,00 USD 55,830 2.370.208,77 0,87 0,87
AMGEN - 80.102,00 USD 98,660 6.079.593,29 2,22 2,23
ARENA PHARMACEUTICALS - 10.571,00 USD 7,700 62.617,66 0,02 0,02
BAXTER INTL INC - 40.768,00 USD 69,270 2.172.474,31 0,79 0,80
BECTON DICKINSON - 35.641,00 USD 98,830 2.709.746,93 0,99 0,99
BIOGEN IDEC INC - 14.854,00 USD 215,200 2.459.097,47 0,90 0,90
BIOMARIN PHARMACEUTICAL INC - 33.605,00 USD 55,790 1.442.282,44 0,53 0,53
BRISTOL-MYERS SQUIBB CO - 37.053,00 USD 44,690 1.273.866,12 0,47 0,47
CARDINAL HEALTH INC - 61.107,00 USD 47,200 2.218.824,83 0,81 0,81
CATAMARAN CORP - 399,00 CAD 51,190 14.894,49 0,01 0,01
CELGENE CORPORATION - 66.048,00 USD 116,910 5.940.204,38 2,17 2,18
CERNER CORP - 33.021,00 USD 96,090 2.440.947,68 0,89 0,90
CIGNA CORP. - 35.066,00 USD 72,490 1.955.484,53 0,71 0,72
CORCEPT THERAPEUTICS INC - 6.555,00 USD 1,730 8.723,86 0,00 0,00
COVANCE INC - 2.046,00 USD 76,140 119.841,86 0,04 0,04
CUBIST PHARMACEUTICALS INC - 1.789,00 USD 48,300 66.473,34 0,02 0,02
EXPRESS SCRIPTS INC. "A" 116.387,00 USD 61,690 5.523.435,67 2,02 2,03
FOREST LABORATORIES "A" 69.329,00 USD 41,000 2.186.698,21 0,80 0,80
GILEAD SCIENCES - 214.128,00 USD 51,210 8.435.644,96 3,08 3,10
HCA INC - 64.561,00 USD 36,060 1.790.960,58 0,65 0,66
HOLOGIC INC - 131.426,00 USD 19,300 1.951.320,72 0,71 0,72
HOSPIRA INC. - 37.710,00 USD 38,310 1.111.370,18 0,41 0,41
HUMANA INC. - 13.080,00 USD 84,380 849.057,93 0,31 0,31
INTUITIVE SURGICAL INC - 3.141,00 USD 506,580 1.224.069,37 0,45 0,45
JOHNSON & JOHNSON - 301.412,00 USD 85,860 19.908.634,76 7,27 7,31
LILLY (ELI) & CO - 45.112,00 USD 49,120 1.704.670,70 0,62 0,63
MCKESSON CORP - 26.323,00 USD 114,500 2.318.627,20 0,85 0,85
MEDIVATION INC - 820,00 USD 49,200 31.036,23 0,01 0,01
MEDTRONIC INC - 48.514,00 USD 51,470 1.920.928,98 0,70 0,71
MERCK & CO - 329.632,00 USD 46,450 11.778.910,99 4,30 4,32
MYLAN LABORATORIES - 2.622,00 USD 31,030 62.589,94 0,02 0,02
NPS PHARMACEUTICALS INC - 3.750,00 USD 15,100 43.561,04 0,02 0,02
ONYX PHARMACEUTICALS INC - 30.443,00 USD 86,820 2.033.280,45 0,74 0,75
PERRIGO COMP - 3.268,00 USD 121,000 304.198,78 0,11 0,11
PFIZER - 857.851,00 USD 28,010 18.484.811,53 6,75 6,78
QUEST DIAGNOSTICS INC - 34.056,00 USD 60,630 1.588.441,63 0,58 0,58
REGENRON PHARMACEUTICALS - 5.738,00 USD 224,880 992.662,08 0,36 0,36
RESMED INC - 343,00 USD 45,130 11.908,29 0,00 0,00
SIRONA DENTALS SYSTEMS INC - 38.115,00 USD 65,880 1.931.699,52 0,71 0,71
THERMO ELECTRONIC - 21.242,00 USD 84,630 1.382.960,58 0,51 0,51
UNITED THERAPEUTICS CORP. - 3.248,00 USD 65,820 164.461,39 0,06 0,06
UNITEDHEALTH GROUP INC. - 151.291,00 USD 65,480 7.620.997,52 2,78 2,80
VALEANT PHARMACEUTICALS INTERN - 910,00 CAD 90,680 60.175,60 0,02 0,02
VARIAN MEDICAL SYSTEMS - 56.468,00 USD 67,450 2.930.045,85 1,07 1,08
VERTEX PHARMAC. - 22.478,00 USD 79,870 1.381.119,98 0,50 0,51
WATERS CORP - 16.451,00 USD 100,050 1.266.191,67 0,46 0,47

WELLPOINT INC - 31.619,00 USD 81,840 1.990.690,79 0,73 0,73
Unlisted shares
U.S.A.
ALTEA THERAPEUTICS - 344.827,00 USD 0,000 0,26
METABOLEX PREF B1 477.806,00 USD 0,000 0,37
Total shares 273.911.140,27 100,00 100,52
TOTAL SECURITIES PORTFOLIO 273.911.140,27 100,00 100,52
COLLATERAL RECEIVED
Belgium
KBC GROUP COLLATERAL EUR 4.486.510,20 EUR 1,000 4.486.510,20 1,65
TOTAL RECEIVED COLLATERAL 4.486.510,20 1,65
CASH AT BANK AND IN HAND
Demand accounts
Belgium
KBC GROUP AUD 165,91 AUD 1,000 116,83
KBC GROUP CAD 3.297,11 CAD 1,000 2.404,37 0,00
KBC GROUP CHF -63.585,94 CHF 1,000 -51.700,09 -0,02
KBC GROUP CZK 5,38 CZK 1,000 0,21
KBC GROUP DKK 643,02 DKK 1,000 86,21
KBC GROUP EURO -2.653.965,48 EUR 1,000 -2.653.965,48 -0,97
KBC GROUP GBP -1.624,52 GBP 1,000 -1.895,59 0,00
KBC GROUP HKD 16.604,52 HKD 1,000 1.646,93 0,00
KBC GROUP JPY 40.293.713,00 JPY 1,000 312.064,07 0,12
KBC GROUP NOK -1.586,52 NOK 1,000 -199,89
KBC GROUP NZD 548,80 NZD 1,000 326,06
KBC GROUP SEK 766,94 SEK 1,000 87,42
KBC GROUP USD -54.242,78 USD 1,000 -41.728,43 -0,02
KBC GROUP ZAR -11.544,34 ZAR 1,000 -894,64
Total demand accounts -2.433.652,02 -0,89
TOTAL CASH AT BANK AND IN HAND -2.433.652,02 -0,89
OTHER RECEIVABLES AND PAYABLES
Receivables
Belgium
KBC GROUP EUR RECEIVABLE 173.551,62 EUR 1,000 173.551,62 0,06
KBC GROUP ILS TE ONTVANGEN 4.989.468,46 ILS 1,000 1.054.432,35 0,39
KBC GROUP INR TE ONTVANGEN 4.112.733,33 INR 1,000 53.243,68 0,02
KBC GROUP USD RECEIVABLE 13.620,70 USD 1,000 10.478,27 0,00
KBC GROUP WHT TO BE RECOVERED EUR 2.116,95 EUR 1,000 2.116,95 0,00
Total receivables 1.293.822,87 0,48
Payables
Belgium
KBC GROUP COUNTERPART ENTRY COLLATERAL IN EUR
-4.486.510,20 EUR 1,000 -4.486.510,20 -1,65
KBC GROUP EUR PAYABLE -361.896,77 EUR 1,000 -361.896,77 -0,13
Payables -4.848.406,97 -1,78
TOTAL RECEIVABLES AND PAYABLES -3.554.584,10 -1,30
OTHER
Interest receivable EUR 232.696,26 0,09
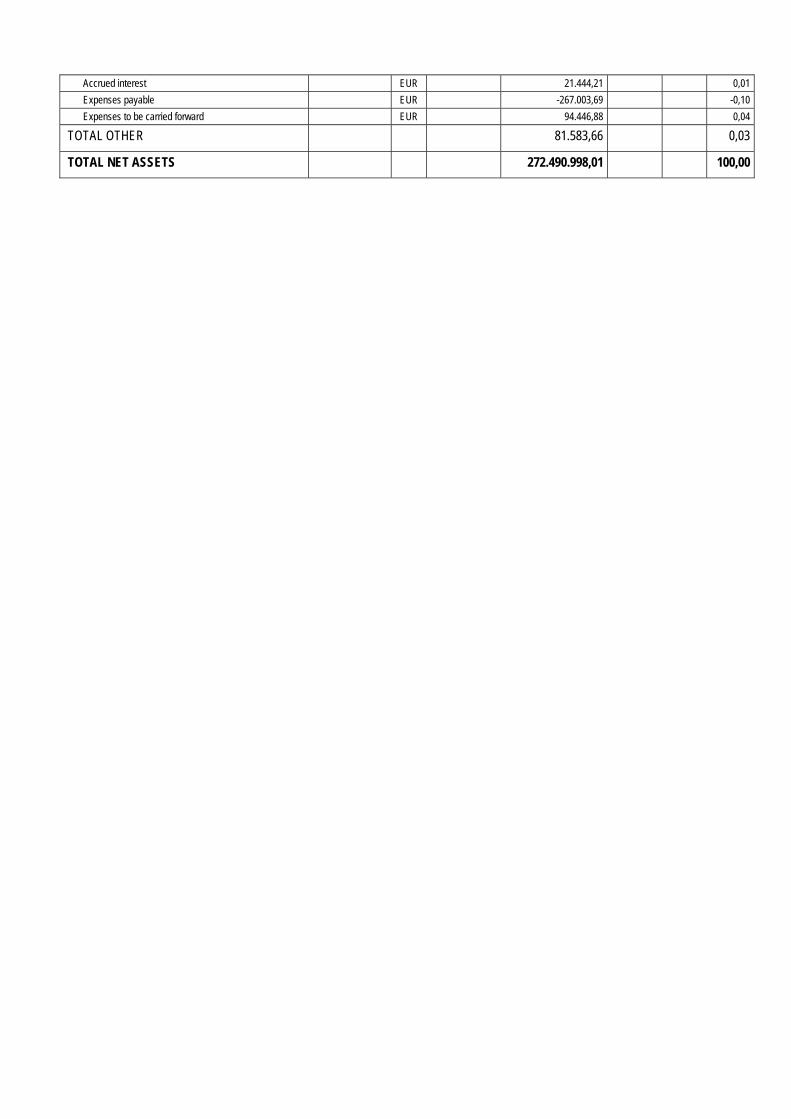
Accrued interest EUR 21.444,21 0,01
Expenses payable EUR -267.003,69 -0,10
Expenses to be carried forward EUR 94.446,88 0,04
TOTAL OTHER 81.583,66 0,03
TOTAL NET ASSETS 272.490.998,01 100,00
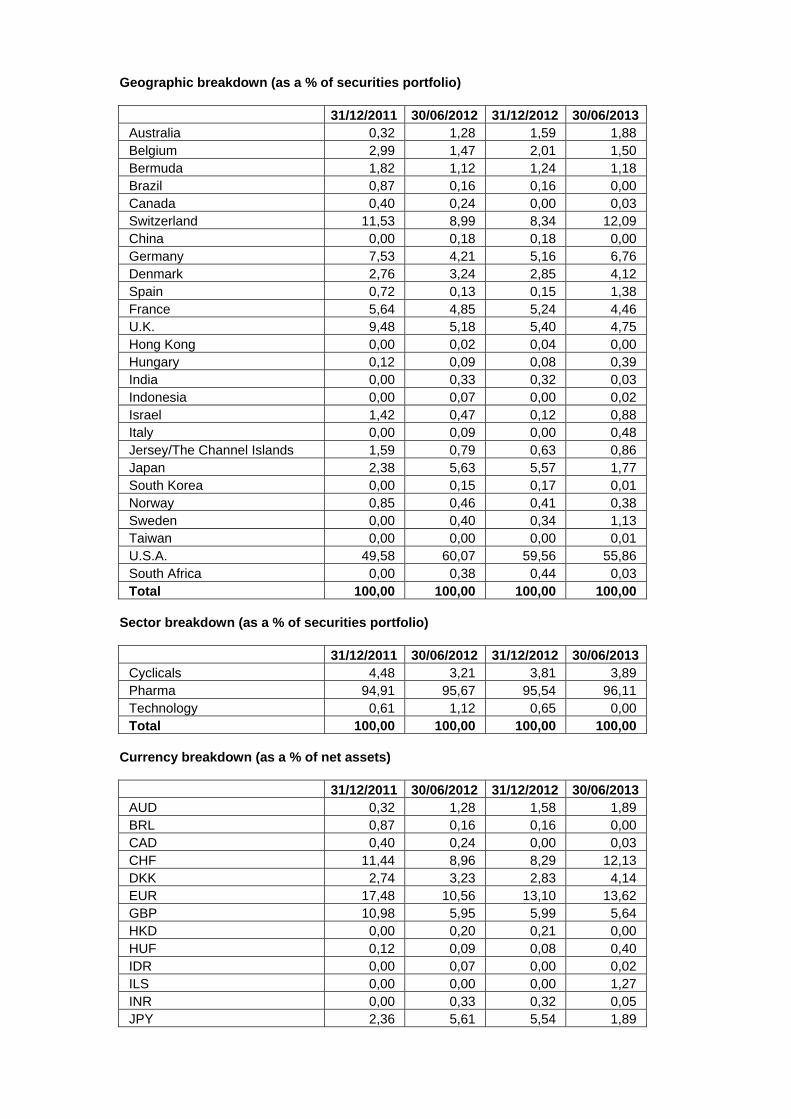
Geographic breakdown (as a % of securities portfolio)
31/12/2011 30/06/2012 31/12/2012 30/06/2013 Australia 0,32 1,28 1,59 1,88 Belgium 2,99 1,47 2,01 1,50 Bermuda 1,82 1,12 1,24 1,18 Brazil 0,87 0,16 0,16 0,00 Canada 0,40 0,24 0,00 0,03 Switzerland 11,53 8,99 8,34 12,09 China 0,00 0,18 0,18 0,00 Germany 7,53 4,21 5,16 6,76 Denmark 2,76 3,24 2,85 4,12 Spain 0,72 0,13 0,15 1,38 France 5,64 4,85 5,24 4,46 U.K. 9,48 5,18 5,40 4,75 Hong Kong 0,00 0,02 0,04 0,00 Hungary 0,12 0,09 0,08 0,39 India 0,00 0,33 0,32 0,03 Indonesia 0,00 0,07 0,00 0,02 Israel 1,42 0,47 0,12 0,88 Italy 0,00 0,09 0,00 0,48 Jersey/The Channel Islands 1,59 0,79 0,63 0,86 Japan 2,38 5,63 5,57 1,77 South Korea 0,00 0,15 0,17 0,01 Norway 0,85 0,46 0,41 0,38 Sweden 0,00 0,40 0,34 1,13 Taiwan 0,00 0,00 0,00 0,01 U.S.A. 49,58 60,07 59,56 55,86 South Africa 0,00 0,38 0,44 0,03 Total 100,00 100,00 100,00 100,00
Sector breakdown (as a % of securities portfolio)
31/12/2011 30/06/2012 31/12/2012 30/06/2013 Cyclicals 4,48 3,21 3,81 3,89 Pharma 94,91 95,67 95,54 96,11 Technology 0,61 1,12 0,65 0,00 Total 100,00 100,00 100,00 100,00
Currency breakdown (as a % of net assets)
31/12/2011 30/06/2012 31/12/2012 30/06/2013 AUD 0,32 1,28 1,58 1,89 BRL 0,87 0,16 0,16 0,00 CAD 0,40 0,24 0,00 0,03 CHF 11,44 8,96 8,29 12,13 DKK 2,74 3,23 2,83 4,14 EUR 17,48 10,56 13,10 13,62 GBP 10,98 5,95 5,99 5,64 HKD 0,00 0,20 0,21 0,00 HUF 0,12 0,09 0,08 0,40 IDR 0,00 0,07 0,00 0,02 ILS 0,00 0,00 0,00 1,27 INR 0,00 0,33 0,32 0,05 JPY 2,36 5,61 5,54 1,89
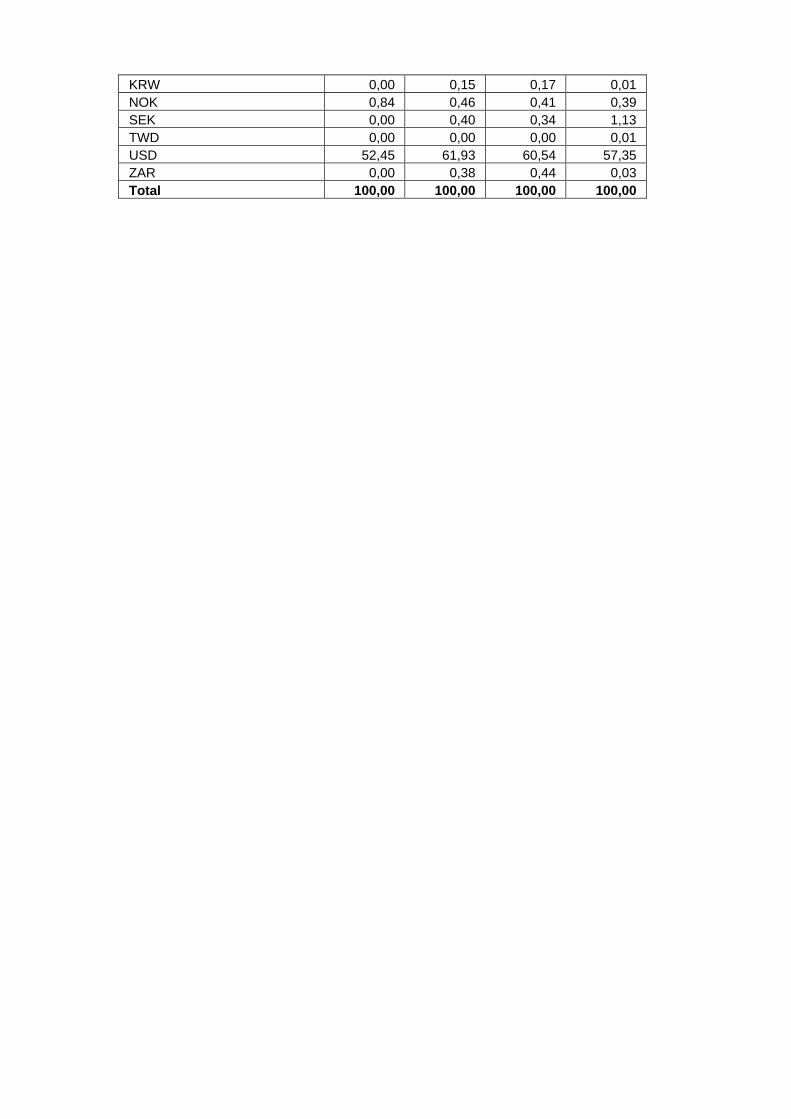
KRW 0,00 0,15 0,17 0,01 NOK 0,84 0,46 0,41 0,39 SEK 0,00 0,40 0,34 1,13 TWD 0,00 0,00 0,00 0,01 USD 52,45 61,93 60,54 57,35 ZAR 0,00 0,38 0,44 0,03 Total 100,00 100,00 100,00 100,00

2.4.2 CHANGES IN THE COMPOSITION OF THE ASSETS OF KBC EQUITY FUND PHARMA (IN THE
CURRENCY OF THE SUB-FUND)
1st half of year YearPurchases 215.339.292,62 215.339.292,62 Sales 186.769.871,45 186.769.871,45 Total 1 402.109.164,07 402.109.164,07 Subscriptions 173.012.552,53 173.012.552,53 Redemptions 147.558.587,43 147.558.587,43 Total 2 320.571.139,96 320.571.139,96 Monthly average of total assets
261.245.849,15 261.245.849,15
Turnover rate 31,21 % 31,21 %
1st half of year YearPurchases 215.339.292,62 215.339.292,62 Sales 186.769.871,45 186.769.871,45 Total 1 402.109.164,07 402.109.164,07 Subscriptions 173.012.552,53 173.012.552,53 Redemptions 147.558.587,43 147.558.587,43 Total 2 320.571.139,96 320.571.139,96 Monthly average of total assets
268.208.361,94 268.208.361,94
Corrected turnover rate 30,40 % 30,40 %
The table above shows the capital volume of portfolio transactions. This volume (adjusted to take account of total subscriptions and redemptions) is also compared to the average net assets at the beginning and end of the period. A figure close to 0% implies that the transactions relating to the securities or transactions relating to the assets (excluding deposits and cash) in a given period only involve subscriptions and redemptions. A negative percentage shows that subscriptions and redemptions entailed few, if any, transactions in the portfolio. Active asset management may result in high turnover rates (monthly percentage >50%). The detailed list of transactions is available for consultation free of charge at the registered office of the Bevek or fund at Havenlaan 2, 1080 Brussels.

2.4.3 AMOUNT OF COMMITMENTS IN RESPECT OF FINANCIAL DERIVATIVES POSITIONS
NAME Currency Value in currency
In the currency of the sub-fund
Lot-size
Transactiondate
KBC COLLATERAL EUR
EUR 4.486.510,20 4.486.510,20 N/A 28.06.2013
2.4.4 CHANGES OF THE NUMBER OF SUBSCRIPTIONS AND REDEMPTIONS AND THE NET ASSET
VALUE
Classic Shares
Period Change in number of shares in circulation
Year Subscriptions Redemptions End of period
Cap. Dis. Cap. Dis. Cap. Dis. Total
2011 - 06 110.272,45 652,00 96.052,21 5.572,00 200.399,29 22.675,83 223.075,12
2012 - 06 67.773,65 496,23 185.744,16 3.905,50 82.428,79 19.266,55 101.695,34
2013 - 06 25.122,91 12.407,97 32.262,41 3.168,73 75.289,29 28.505,79 103.795,08
Period Amounts received and paid by the UCI
(in the currency of the class)
Year Subscriptions Redemptions
Capitalization Distribution Capitalization Distribution
2011 - 06 66.575.874,93 341.450,40 56.906.243,07 2.978.793,57
2012 - 06 42.010.486,39 277.958,03 110.348.932,10 2.242.201,88
2013 - 06 20.663.018,77 9.915.315,68 26.562.547,23 2.217.313,00
Period Net asset value
End of period (in the currency of the class)
Year Of the class Of one share
Capitalization Distribution
2011 - 06 137.205.011,81 621,99 553,84
2012 - 06 71.253.786,44 716,03 634,90
2013 - 06 87.349.275,99 869,59 767,51
Institutional B Shares
Period Change in number of shares in circulation
Year Subscriptions Redemptions End of period
Cap. Dis. Cap. Dis. Cap. Dis. Total 2012 - 06 249.767,00 90.240,00 159.527,00 159.527,00
2013 - 06 286.504,63 233.354,72 212.676,92 212.676,92
Period Amounts received and paid by the UCI
(in the currency of the class)
Year Subscriptions Redemptions
Capitalization Distribution Capitalization Distribution
2012 - 06 162.984.720,90 61.451.043,96
2013 - 06 236.082.945,40 190.835.423,50
Period Net asset value
End of period (in the currency of the class)

Year Of the class Of one share
Capitalization Distribution
2012 - 06 114.320.419,50 716,62
2013 - 06 185.141.722,00 870,53
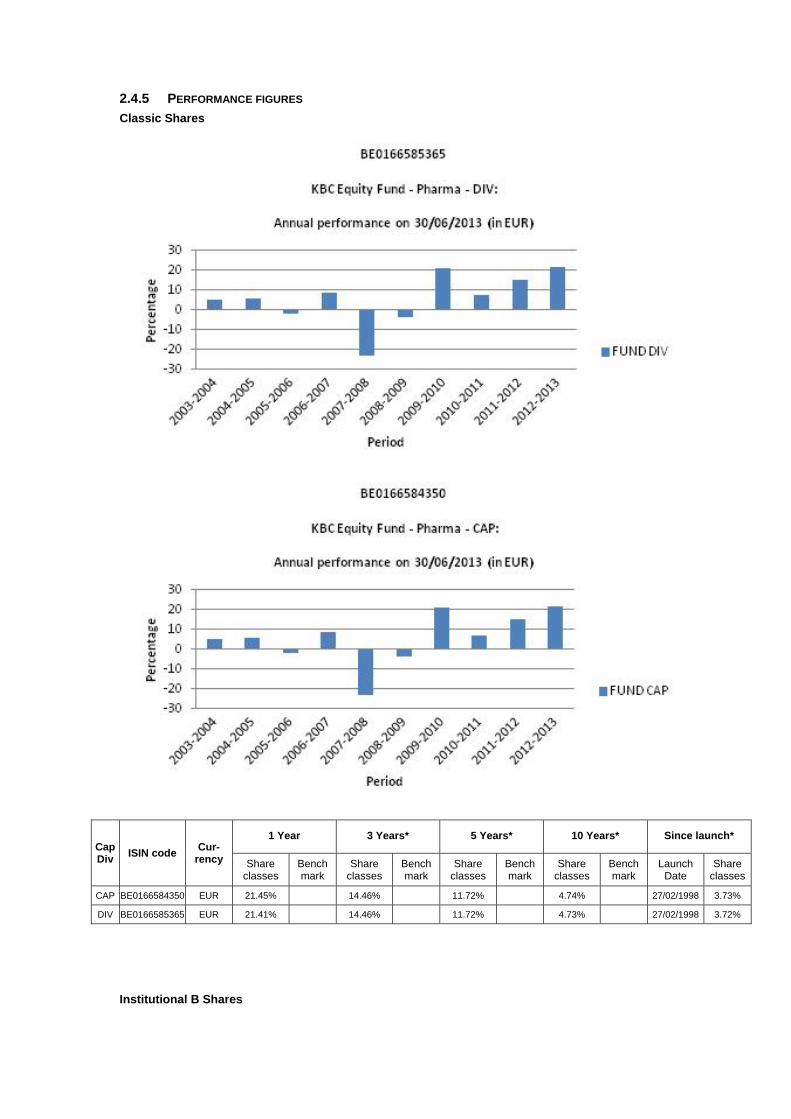
2.4.5 PERFORMANCE FIGURES
Classic Shares
Cap Div
ISIN code Cur-
rency
1 Year 3 Years* 5 Years* 10 Years* Since launch*
Share classes
Bench mark
Share classes
Bench mark
Share classes
Bench mark
Share classes
Bench mark
Launch Date
Share classes
CAP BE0166584350 EUR 21.45% 14.46% 11.72% 4.74% 27/02/1998 3.73%
DIV BE0166585365 EUR 21.41% 14.46% 11.72% 4.73% 27/02/1998 3.72%
Institutional B Shares
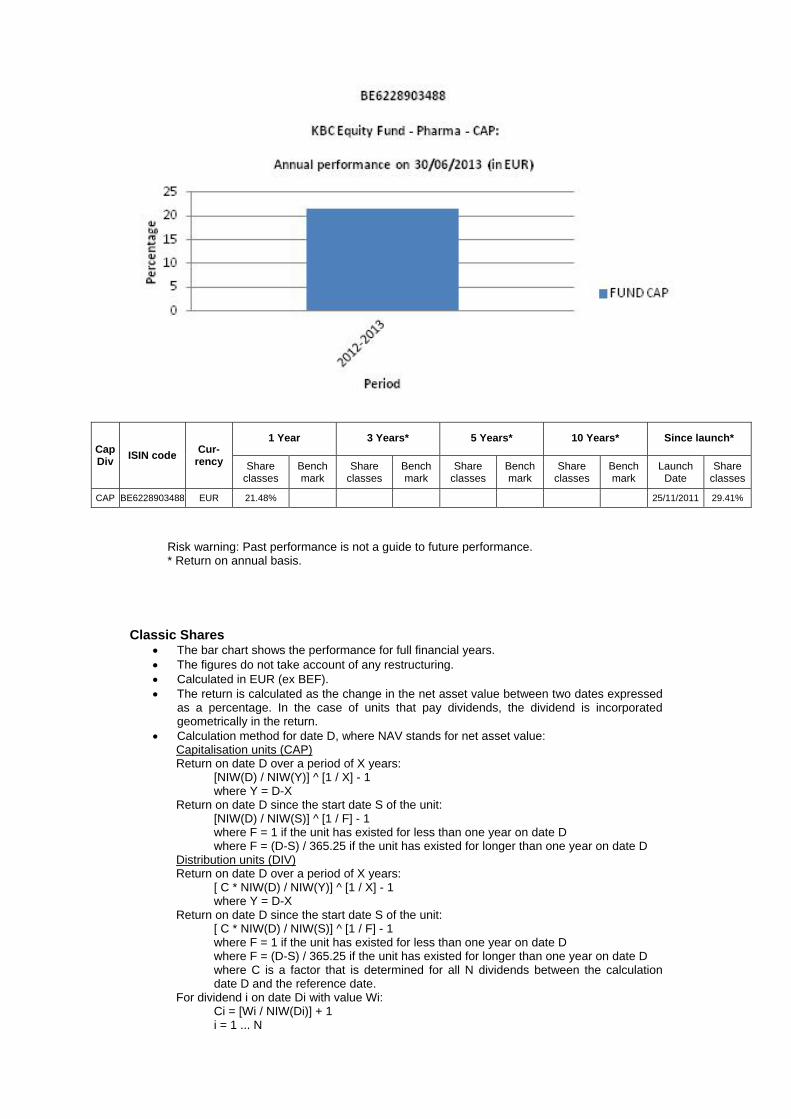
Cap Div
ISIN code Cur-
rency
1 Year 3 Years* 5 Years* 10 Years* Since launch*
Share classes
Bench mark
Share classes
Bench mark
Share classes
Bench mark
Share classes
Bench mark
Launch Date
Share classes
CAP BE6228903488 EUR 21.48% 25/11/2011 29.41%
Risk warning: Past performance is not a guide to future performance. * Return on annual basis.
Classic Shares The bar chart shows the performance for full financial years. The figures do not take account of any restructuring. Calculated in EUR (ex BEF). The return is calculated as the change in the net asset value between two dates expressed
as a percentage. In the case of units that pay dividends, the dividend is incorporated geometrically in the return.
Calculation method for date D, where NAV stands for net asset value: Capitalisation units (CAP) Return on date D over a period of X years:
[NIW(D) / NIW(Y)] ^ [1 / X] - 1 where Y = D-X
Return on date D since the start date S of the unit: [NIW(D) / NIW(S)] ^ [1 / F] - 1 where F = 1 if the unit has existed for less than one year on date D where F = (D-S) / 365.25 if the unit has existed for longer than one year on date D
Distribution units (DIV) Return on date D over a period of X years:
[ C * NIW(D) / NIW(Y)] ^ [1 / X] - 1 where Y = D-X
Return on date D since the start date S of the unit: [ C * NIW(D) / NIW(S)] ^ [1 / F] - 1 where F = 1 if the unit has existed for less than one year on date D where F = (D-S) / 365.25 if the unit has existed for longer than one year on date D where C is a factor that is determined for all N dividends between the calculation date D and the reference date.
For dividend i on date Di with value Wi: Ci = [Wi / NIW(Di)] + 1 i = 1 ... N

from whichC = C0 * .... * CN. If the interval between the two dates exceeds one year, the ordinary return calculation is
converted into a return on an annual basis by taking the nth square root of 1 plus the total return of the unit.
The return figures shown above do not take account of the fees and charges associated with the issue and redemption of units.
These are the performance figures for capitalisation and distribution shares.
Institutional B Shares The bar chart shows the performance for full financial years. The figures do not take account of any restructuring. Calculated in EUR. The return is calculated as the change in the net asset value between two dates expressed
as a percentage. Calculation method for date D, where NAV stands for net asset value:
Capitalisation units (CAP) Return on date D over a period of X years:
[NIW(D) / NIW(Y)] ^ [1 / X] - 1 where Y = D-X
Return on date D since the start date S of the unit: [NIW(D) / NIW(S)] ^ [1 / F] - 1 where F = 1 if the unit has existed for less than one year on date D where F = (D-S) / 365.25 if the unit has existed for longer than one year on date D
If the interval between the two dates exceeds one year, the ordinary return calculation is converted into a return on an annual basis by taking the nth square root of 1 plus the total return of the unit.
The return figures shown above do not take account of the fees and charges associated with the issue and redemption of units.
These are the performance figures for capitalization shares.

2.4.6 COSTS Ongoing Charges: * Classic Shares Distribution: 1.763% Classic Shares Capitalization: 1.726% Institutional B Shares Capitalization: 1.712% * The following costs have not been included in the ongoing charges: - Interest payments on loans taken out - Payments in respect of financial derivatives - Fees and charges paid directly by the investor - Any soft commissions
SOFT COMMISSIONS The management company or the appointed manager, as the case may be, is the recipient of soft commissions. The recipient has laid down an internal policy as regards accepting soft commissions and avoiding possible conflicts of interest in this respect, and has put appropriate internal controls in place to ensure this policy is observed. For more information, please see the ‘General’ section of the annual report.
Broker
Commission gross
in EUR
paid during the period:
1‐01‐13
‐
30‐06‐13
CSA Credits
in EUR
accrued during the period:
1‐01‐13
‐
30‐06‐13 Percentage
CITI 45,520 31,803 69.87%
CSFBSAS 65,317 52,847 80.91%
DEUTSCHE 7,271 3,636 50.00%
INSTINET 52,511 25,866 49.26%
MERRILL 9,454 4,860 51.40%
MORGAN STANLEY 6,615 3,373 50.99%
UBSWDR 3,924 1,962 50.00%
FEE-SHARING AGREEMENTS AND REBATES: The management company may share its fee with the distributor, and institutional and/or professional parties. In principle, the percentage share amounts to between 35% and 60% if the distributor is an entity of KBC Group NV or to between 35% and 70% if the distributor is not an entity of KBC Group NV. However, in a small number of cases, the distributor’s fee is less than 35%. Investors may, on request, obtain more information on these cases. If the management company invests the assets of the undertaking for collective investment in units of undertakings for collective investment that are not managed by an entity of KBC Group NV, and receives a fee for doing so, it will pay this fee to the undertaking for collective investment. Fee-sharing does not affect the amount of the management fee paid by the sub-fund to the management company. This management fee is subject to the limitations laid down in the articles of association. The limitations may only be amended after approval by the general meeting of shareholders. The management company has concluded a distribution agreement with the distributor in order to facilitate the wider distribution of the sub-fund's units by using multiple distribution channels. It is in the interests of the holders of units, the sub-fund and of the distributor for the largest possible number of units to be sold and for the assets of the sub-fund to be maximised in this way. In this respect, there is therefore no question of any conflict of interest.
2.4.7 NOTES TO THE FINANCIAL STATEMENTS AND OTHER DATA Fee for managing the investment portfolio: 1.5% per annum calculated on the basis of the average total net assets of the sub-fund, no management fee is charged on assets assets invested in investment undertakings managed by a financial institution of the KBC group.
The administration agent’s fee is payable at the end of each month and is calculated on the basis of the average total net assets of the sub-fund. Auditor's fee: 1 700 EUR per year. This fee is not including VAT and can be indexed on an annual basis in accordance with the decisions of the general meeting. The custody fee is calculated on the value of the securities held in custody by the custodian on the final banking day of the preceding calendar year, except on those assets invested in investment undertakings managed by a financial institution of the KBC group. The custody fee is paid at the beginning of the calendar year. Social, ethical and environmental aspects: No manufacturers of controversial weapons whose use over the past five decades, according to the international consensus, has led to disproportionate human suffering among the civilian population will be included in the portfolio of investments. This involves the manufacturers of anti-personnel mines, cluster bombs and munitions and weapons containing depleted uranium. In this way, the sub-fund seeks to reflect not only simple financial reality but also the social reality of the sector or region in question. Exercising voting rights. If necessary, relevant and in the interest of the shareholders, the management company will exercise the voting rights attached to the shares in the Bevek’s portfolio. The management company will adhere to the following criteria when determining how it stands relative to the items on the agenda that are put to the vote: - Shareholder value may not be adversely affected. - Corporate governance rules, especially with regard to the rights of minority shareholders, must be
respected. - The minimum standards with regard to sustainable business and corporate social responsibility
must be met. The list of companies for which voting rights are exercised is available at the registered office of the Bevek. Securities lending In accordance with the Royal Decree of 7 March 2006 concerning securities lending, the undertaking for collective investment has taken out securities loans with a principal to whom the full title of the loaned securities was transferred, without recording this transfer of ownership in the accounts. For the period from 1 January 2013 to 30 June 2013, the fee for securities lent comes to 86,338.43 EUR. The undertaking for collective investment receives 50% of the fee received for securities lent. The detailed list of securities lending transactions carried out can be obtained from the registered office of the collective investment undertaking at 2 Havenlaan, 1080 Brussels.
Overview of securities lent as at 30/06/2013
Name Currency Quantity Price Value in currency of the
portfolio
CELLTRION INC KRW 664 41.800,000 18.696,74
ELEKTA AB -B- FRIA SEK 17.802 102,000 206.969,33
EUROFINS SCIENTIFIC EUR 987 162,300 160.190,10
GRIFOLS SA EUR 128.726 28,200 3.630.073,20
H. LUNDBECK AS DKK 10.201 102,200 139.773,45
SHIRE PLC GBP 5.109 20,850 124.297,14
TSUMURA AND CO INC JPY 800 2.924,000 18.116,48
Total 4.298.116,44
Details of collateral received for securities lent
Name Currency Nominal value Currency fund Value in Currency fund
AUSTRIA 2012 3,4% 22/11/2022 EUR 390.000 EUR 445.017,69
BUNDESSCHATZANWEISUNGEN 2013 0.25% 13/03/15 EUR 1.889.000 EUR 1.893.618,60
FRANCE 2008 3.75% 25/10/2019 EUR 555.000 EUR 644.125,78
NETHERLANDS 2011 1% 15/01/2014 EUR 7.000 EUR 7.069,16
NETHERLANDS 2012 1.25% 15/01/18 EUR 1.474.000 EUR 1.496.678,97
Total 4.486.510,20

For the valuation of the collateral received, indicative prices have been used in this detail list by the Collateral Management Division of KBC Bank.

Semi-Annual report as at 30th June 2013
TABLE OF CONTENTS
2. Information on KBC Equity Fund America
2.1. Management report 2.1.1. Launch date and subscription price 2.1.2. Stock exchange listing 2.1.3. Aim and distinctive features of the investment policy 2.1.4. Financial portfolio management 2.1.5. Distributors 2.1.6. Index and benchmark 2.1.7. Policy conducted during the financial year 2.1.8. Future policy 2.1.9. Synthetic risk and reward indicator (SRRI)
2.2. Balance sheet
2.3. Profit and loss account
2.4. Composition of the assets and key figures
2.4.1. Composition of the assets 2.4.2. Change in the composition of the assets 2.4.3. Value of commitments in respect of financial derivatives positions 2.4.4. Evolution of the number of subscriptions, repayments and the net asset value 2.4.5. Return figures 2.4.6. Expenses 2.4.7. Notes to the financial statements and other data

2 INFORMATION ON KBC EQUITY FUND AMERICA
2.1 MANAGEMENT REPORT
2.1.1 LAUNCH DATE AND SUBSCRIPTION PRICE Classic Shares : Launch date: 17 April 1991 Initial subscription price: 500 USD Currency: USD Institutional B Shares : Launch date: 25 November 2011 Initial subscription price: 1230.35 USD Currency: USD CZK : Launch date: 28 June 2013 Initial subscription price: 1000 CZK Currency: CZK
2.1.2 STOCK EXCHANGE LISTING Not applicable.
2.1.3 GOAL AND KEY PRINCIPLES OF THE INVESTMENT POLICY
SUB-FUND’S OBJECT: The main objective of this sub-fund is to generate the highest possible return for its shareholders by investing directly or indirectly in transferable securities. This is reflected in its pursuit of capital gains and income. To this end, the assets are invested, either directly or indirectly via correlated financial instruments, primarily in shares.
SUB-FUND’S INVESTMENT POLICY:
PERMITTED ASSET CLASSES: The sub-fund may invest in securities, money market instruments, units in undertakings for collective investment, deposits, financial derivatives, liquid assets and all other instruments insofar as permitted by the applicable laws and regulations and consistent with the sub-fund’s object The sub-fund shall invest no more than 10% of its assets in units of other undertakings for collective investment.
RESTRICTIONS OF THE INVESTMENT POLICY: The investment policy will be implemented within the limits set by law and regulations. The sub-fund may borrow up to 10% of its net assets, insofar as these are short-term borrowings aimed at solving temporary liquidity problems.
PERMITTED DERIVATIVES TRANSACTIONS: Derivates may be used either for hedging purposes or to achieve investment objectives. Changes will be made to the investments at regular intervals to comply with the sub-fund's investment strategy. In addition, listed and unlisted derivates may be used to achieve the objectives: these may be forward contracts, options or swaps on securities, indices, currencies or interest rates or other transactions involving derivatives. Unlisted derivatives transactions will only be concluded with prime financial institutions specialised in such transactions. Such derivatives may also be used to hedge the assets against exchange-rate fluctuations. Subject to the applicable laws and regulations and the articles of association, the sub-fund always seeks to conclude the most effective transactions. All costs associated with the transactions will be charged to the sub-fund and all income generated will be paid to the sub-fund. If the transactions result in a risk in respect of the counterparty, this risk can be hedged by using a margin management system that ensures that the sub-fund is the beneficiary of security (collateral) in the form of cash or investment grade bonds. When calculating the value of the bonds, a margin will be applied that varies depending on the residual term to maturity and the currency in which the bond in question is denominated.
The relationship with the counterparty or counterparties is governed by standard international agreements.
STRATEGY SELECTED At least 75% of these assets are invested in shares of American and Canadian companies.
LENDING FINANCIAL INSTRUMENTS: The sub-fund may lend financial instruments within the limits set by law and regulations. This lending does not affect the sub-fund’s risk profile since: - it takes place within the framework of a securities lending system managed by a principal. In
addition, the sub-fund has a relationship only with the principal of the securities lending system which acts as counterparty and to which title of the loaned securities is transferred. The choice of principal is subject to strict selection criteria. The return of securities similar to the securities that have been lent is guaranteed by the principal.
- through a margin management system, the sub-fund is always guaranteed financial security, the actual value of which always exceeds the actual value of the securities that have been lent, in case the principal does not return similar securities.
The return of securities similar to the securities that have been lent can be requested at any time, which means that the lending of securities does not affect the management of the sub-fund's assets. By lending securities, the sub-fund can generate an additional return. The principal pays a fee to the management company. After deducting the fee for the margin management and clearing services of KBC Bank, most of this fee is paid to the sub-fund. The relationship with the counterparty or counterparties is governed by standard international agreements. More information is provided on the terms and conditions governing securities lending in the annual or half-yearly report for the sub-fund.
VOLATILITY OF THE NET ASSET VALUE: The volatility of the net asset value may be high due to the composition of the portfolio.
GENERAL STRATEGY FOR HEDGING THE EXCHANGE RATE RISK: In order to protect its assets against exchange rate fluctuations and within the limitations laid down in the articles of association, the sub-fund may perform transactions relating to the sale of forward currency contracts, as well as the sale of call options and the purchase of put options on currencies. The transactions in question may relate solely to contracts traded on a regulated market that operates regularly, is recognised and is open to the public or that are traded with a recognised, prime financial institution specialising in such transactions and dealing in the over-the-counter (OTC) market in options. With the same objective, the sub-fund may also sell currencies forward or exchange them in private transactions with prime financial institutions specialising in such transactions. The hedging objective of the aforementioned transactions suggests that there is a direct link between these transactions and the assets to be hedged, which implies that the transactions carried out in a particular currency may in principle not exceed, in terms of volume, either the valuation value of all the assets in the same currency or the holding period of those assets.
SOCIAL, ETHICAL AND ENVIRONMENTAL ASPECTS:
No manufacturers of controversial weapons whose use over the past five decades, according to the international consensus, has led to disproportionate human suffering among the civilian population will be included in the portfolio of investments. This involves the manufacturers of anti-personnel mines, cluster bombs and munitions and weapons containing depleted uranium. In this way, the sub-fund seeks to reflect not only simple financial reality but also the social reality of the sector or region in question.
THE EUROPEAN SAVINGS DIRECTIVE AND TAX ON DEBT CLAIM RETURNS OBTAINED THROUGH THE
REDEMPTION OF OWN UNITS OR IN THE EVENT OF FULL OR PARTIAL DISTRIBUTION OF EQUITY
CAPITAL. The following information is of a general character and is not intended to cover all aspects of an investment in a UCITS. In certain cases entirely different rules might even apply. Moreover, both tax law and the interpretation of it can change. Investors who wish to have more information about the

tax implications – in both Belgium and abroad – of acquiring, holding and transferring units should seek the advice of their usual financial and tax advisers. This UCITS shall invest a maximum of 15% of its assets directly or indirectly in debt instruments as intended by the European Savings Directive. A. European Savings Directive (Directive 2003/48/EC) The European Savings Directive has been implemented in Belgium. Since this UCITS invests a maximum of 15% of its assets directly or indirectly in debt claims as intended by the European Savings Directive, the income of this UCITS does not fall within the scope of this directive. B. Tax on debt claim returns obtained through the redemption of own units or in the event of full or partial distribution of equity capital (Article 19bis Income Tax Code 1992). The income from this UCITS is not subject to the tax on debt instrument returns as intended by Article 19bis, Income Tax Code 1992.
2.1.4 FINANCIAL PORTFOLIO MANAGEMENT There is no delegation of the portfolio.
2.1.5 DISTRIBUTORS KBC Asset Management S.A., 5, Place de la Gare, L-1616 Luxembourg.
2.1.6 INDEX AND BENCHMARK See ‘Sub-fund’s investment policy’.
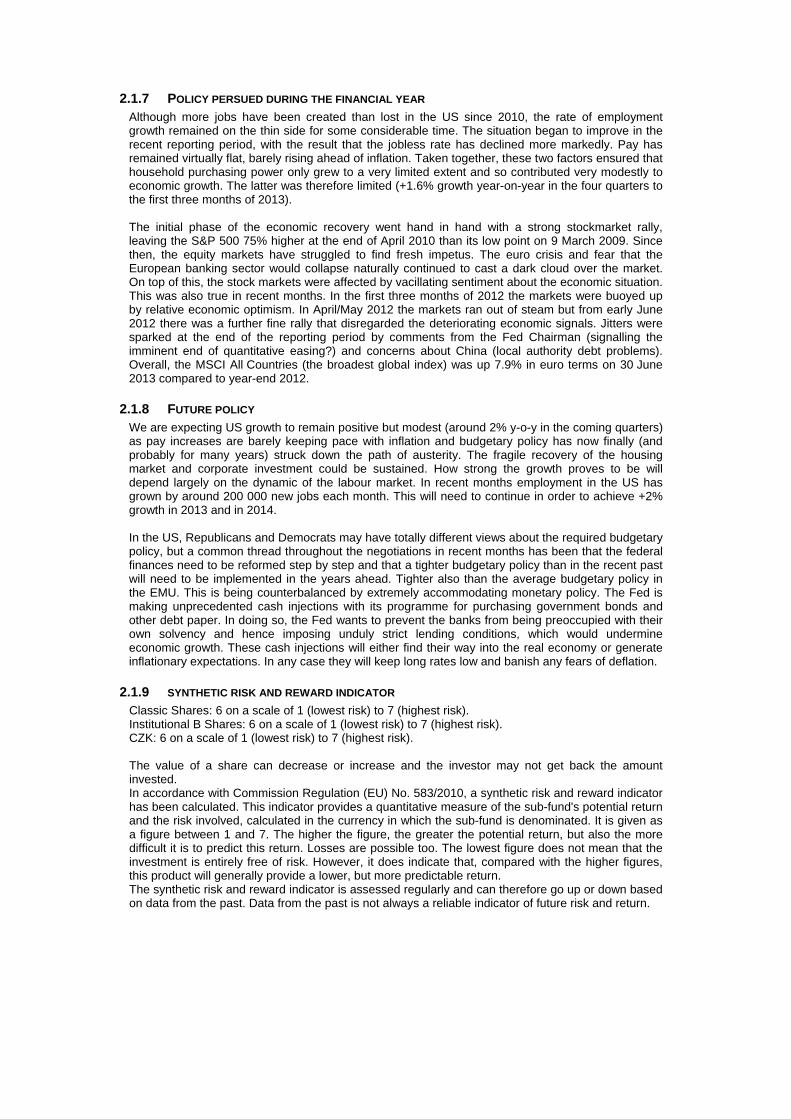
2.1.7 POLICY PERSUED DURING THE FINANCIAL YEAR Although more jobs have been created than lost in the US since 2010, the rate of employment growth remained on the thin side for some considerable time. The situation began to improve in the recent reporting period, with the result that the jobless rate has declined more markedly. Pay has remained virtually flat, barely rising ahead of inflation. Taken together, these two factors ensured that household purchasing power only grew to a very limited extent and so contributed very modestly to economic growth. The latter was therefore limited (+1.6% growth year-on-year in the four quarters to the first three months of 2013). The initial phase of the economic recovery went hand in hand with a strong stockmarket rally, leaving the S&P 500 75% higher at the end of April 2010 than its low point on 9 March 2009. Since then, the equity markets have struggled to find fresh impetus. The euro crisis and fear that the European banking sector would collapse naturally continued to cast a dark cloud over the market. On top of this, the stock markets were affected by vacillating sentiment about the economic situation. This was also true in recent months. In the first three months of 2012 the markets were buoyed up by relative economic optimism. In April/May 2012 the markets ran out of steam but from early June 2012 there was a further fine rally that disregarded the deteriorating economic signals. Jitters were sparked at the end of the reporting period by comments from the Fed Chairman (signalling the imminent end of quantitative easing?) and concerns about China (local authority debt problems). Overall, the MSCI All Countries (the broadest global index) was up 7.9% in euro terms on 30 June 2013 compared to year-end 2012.
2.1.8 FUTURE POLICY We are expecting US growth to remain positive but modest (around 2% y-o-y in the coming quarters) as pay increases are barely keeping pace with inflation and budgetary policy has now finally (and probably for many years) struck down the path of austerity. The fragile recovery of the housing market and corporate investment could be sustained. How strong the growth proves to be will depend largely on the dynamic of the labour market. In recent months employment in the US has grown by around 200 000 new jobs each month. This will need to continue in order to achieve +2% growth in 2013 and in 2014. In the US, Republicans and Democrats may have totally different views about the required budgetary policy, but a common thread throughout the negotiations in recent months has been that the federal finances need to be reformed step by step and that a tighter budgetary policy than in the recent past will need to be implemented in the years ahead. Tighter also than the average budgetary policy in the EMU. This is being counterbalanced by extremely accommodating monetary policy. The Fed is making unprecedented cash injections with its programme for purchasing government bonds and other debt paper. In doing so, the Fed wants to prevent the banks from being preoccupied with their own solvency and hence imposing unduly strict lending conditions, which would undermine economic growth. These cash injections will either find their way into the real economy or generate inflationary expectations. In any case they will keep long rates low and banish any fears of deflation.
2.1.9 SYNTHETIC RISK AND REWARD INDICATOR Classic Shares: 6 on a scale of 1 (lowest risk) to 7 (highest risk). Institutional B Shares: 6 on a scale of 1 (lowest risk) to 7 (highest risk). CZK: 6 on a scale of 1 (lowest risk) to 7 (highest risk). The value of a share can decrease or increase and the investor may not get back the amount invested. In accordance with Commission Regulation (EU) No. 583/2010, a synthetic risk and reward indicator has been calculated. This indicator provides a quantitative measure of the sub-fund's potential return and the risk involved, calculated in the currency in which the sub-fund is denominated. It is given as a figure between 1 and 7. The higher the figure, the greater the potential return, but also the more difficult it is to predict this return. Losses are possible too. The lowest figure does not mean that the investment is entirely free of risk. However, it does indicate that, compared with the higher figures, this product will generally provide a lower, but more predictable return. The synthetic risk and reward indicator is assessed regularly and can therefore go up or down based on data from the past. Data from the past is not always a reliable indicator of future risk and return.

2.2 BALANCE SHEET
Balance sheet layout 30/06/2013 (in the currency of the sub-fundt)
30/06/2012 (in the currency of the sub-fund )
TOTAL NET ASSETS 307.890.301,58 276.853.322,68
II. Securities, money market instruments, UCIs and derivatives
A. Bonds and other debt instruments a) Bonds 2.376.218,24 1.985.783,11 a} Collateral received in the form of bonds 1.008.330,56 1.297.256,60 C. Shares and similar instruments a) Shares 304.922.108,31 275.363.360,54 Of which securities lent 913.534,79 1.191.309,01 F. Derivative financial instruments m) Financial indices Futures and forward contracts (+/-) 5.750,00
IV. Receivables and payables within one year A. Receivables a) Accounts receivable 4.467.521,36 29.665,32 B. Payables a) Accounts payable (-) -4.252.179,38 -357.935,22 c) Borrowings (-) -546.683,06 -1.460.547,31 d) Collateral (-) -1.008.330,56 -1.297.256,60
V. Deposits and cash at bank and in hand A. Demand balances at banks 885.789,49 1.164.470,86
VI. Accruals and deferrals A. Expense to be carried forward 166.658,88 65.783,32 B. Accrued income 250.612,67 210.658,19 C. Accrued expense (-) -374.490,33 -147.916,13
TOTAL SHAREHOLDERS' EQUITY 307.901.305,78 276.853.322,68
A. Capital 254.695.905,90 265.520.025,61
B. Income equalization 74.672,26 -59.830,81
D. Result for the period 53.130.727,62 11.393.127,88
Off-balance-sheet headings
I Collateral (+/-)
I.A Collateral (+/-)
I.A.A Securities/market instruments 1.008.330,56 1.297.256,60
III Notional amounts of futures and forward contracts
III.A Purchased futures and forward contracts 3.998.250,00
IX Financial instruments lent 913.534,79 1.191.309,01

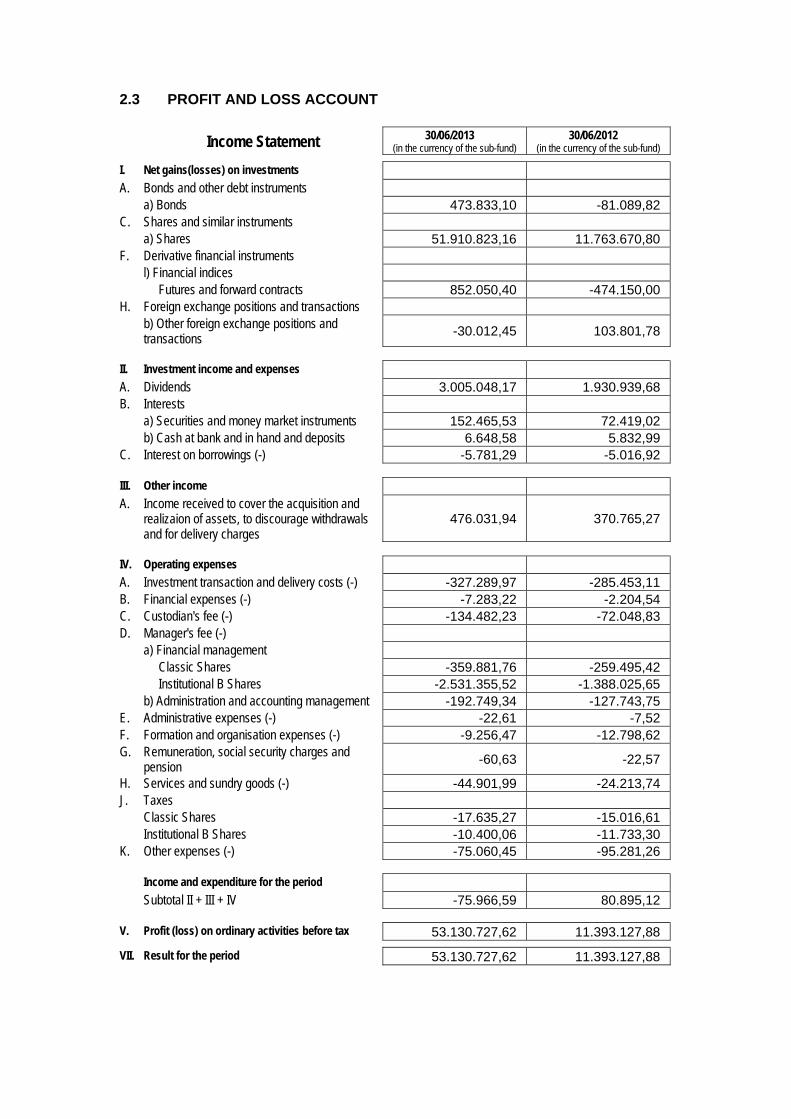
2.3 PROFIT AND LOSS ACCOUNT
Income Statement 30/06/2013 (in the currency of the sub-fund)
30/06/2012 (in the currency of the sub-fund)
I. Net gains(losses) on investments A. Bonds and other debt instruments a) Bonds 473.833,10 -81.089,82 C. Shares and similar instruments a) Shares 51.910.823,16 11.763.670,80 F. Derivative financial instruments l) Financial indices Futures and forward contracts 852.050,40 -474.150,00 H. Foreign exchange positions and transactions b) Other foreign exchange positions and
transactions -30.012,45 103.801,78
II. Investment income and expenses A. Dividends 3.005.048,17 1.930.939,68 B. Interests a) Securities and money market instruments 152.465,53 72.419,02 b) Cash at bank and in hand and deposits 6.648,58 5.832,99 C. Interest on borrowings (-) -5.781,29 -5.016,92
III. Other income A. Income received to cover the acquisition and
realizaion of assets, to discourage withdrawals and for delivery charges
476.031,94 370.765,27
IV. Operating expenses A. Investment transaction and delivery costs (-) -327.289,97 -285.453,11 B. Financial expenses (-) -7.283,22 -2.204,54 C. Custodian's fee (-) -134.482,23 -72.048,83 D. Manager's fee (-) a) Financial management Classic Shares -359.881,76 -259.495,42 Institutional B Shares -2.531.355,52 -1.388.025,65 b) Administration and accounting management -192.749,34 -127.743,75 E. Administrative expenses (-) -22,61 -7,52 F. Formation and organisation expenses (-) -9.256,47 -12.798,62 G. Remuneration, social security charges and
pension -60,63 -22,57
H. Services and sundry goods (-) -44.901,99 -24.213,74 J. Taxes Classic Shares -17.635,27 -15.016,61 Institutional B Shares -10.400,06 -11.733,30 K. Other expenses (-) -75.060,45 -95.281,26
Income and expenditure for the period Subtotal II + III + IV -75.966,59 80.895,12
V. Profit (loss) on ordinary activities before tax 53.130.727,62 11.393.127,88
VII. Result for the period 53.130.727,62 11.393.127,88
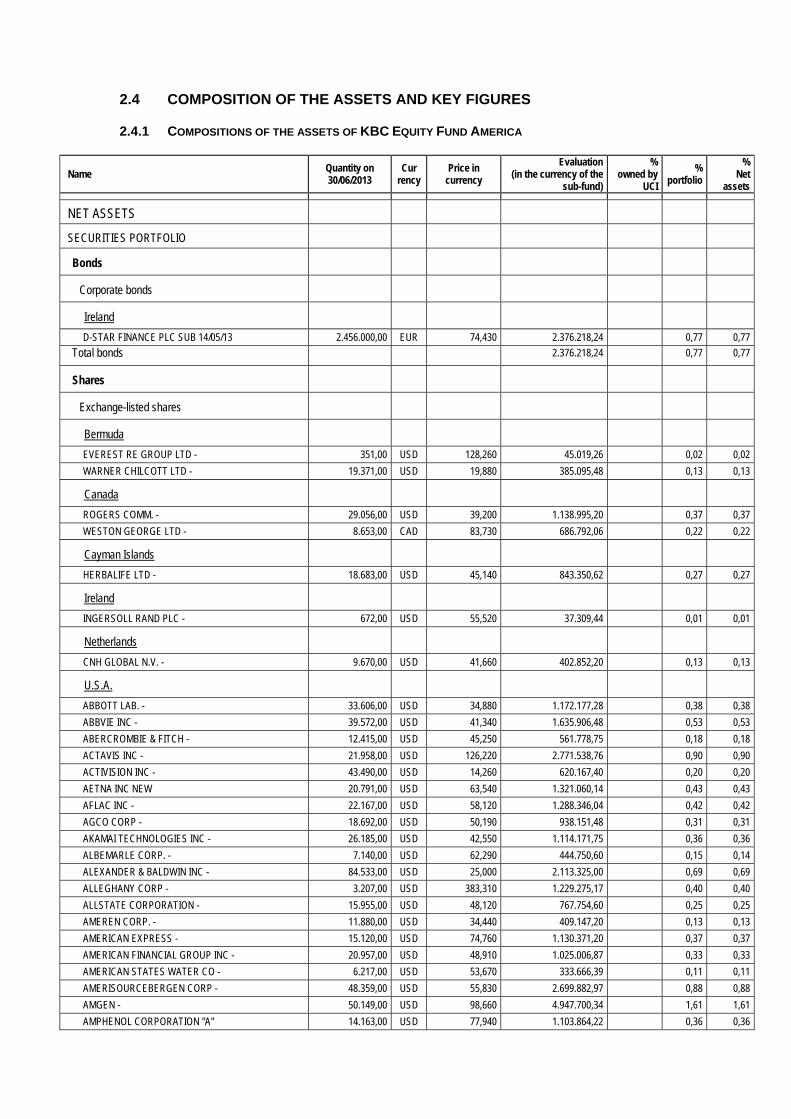
2.4 COMPOSITION OF THE ASSETS AND KEY FIGURES
2.4.1 COMPOSITIONS OF THE ASSETS OF KBC EQUITY FUND AMERICA
Name Quantity on 30/06/2013
Cur rency
Price in currency
Evaluation (in the currency of the
sub-fund)
% owned by
UCI
% portfolio
% Net
assets
NET ASSETS
SECURITIES PORTFOLIO
Bonds
Corporate bonds
Ireland
D-STAR FINANCE PLC SUB 14/05/13 2.456.000,00 EUR 74,430 2.376.218,24 0,77 0,77
Total bonds 2.376.218,24 0,77 0,77
Shares
Exchange-listed shares
Bermuda
EVEREST RE GROUP LTD - 351,00 USD 128,260 45.019,26 0,02 0,02
WARNER CHILCOTT LTD - 19.371,00 USD 19,880 385.095,48 0,13 0,13
Canada
ROGERS COMM. - 29.056,00 USD 39,200 1.138.995,20 0,37 0,37
WESTON GEORGE LTD - 8.653,00 CAD 83,730 686.792,06 0,22 0,22
Cayman Islands
HERBALIFE LTD - 18.683,00 USD 45,140 843.350,62 0,27 0,27
Ireland
INGERSOLL RAND PLC - 672,00 USD 55,520 37.309,44 0,01 0,01
Netherlands
CNH GLOBAL N.V. - 9.670,00 USD 41,660 402.852,20 0,13 0,13
U.S.A.
ABBOTT LAB. - 33.606,00 USD 34,880 1.172.177,28 0,38 0,38
ABBVIE INC - 39.572,00 USD 41,340 1.635.906,48 0,53 0,53
ABERCROMBIE & FITCH - 12.415,00 USD 45,250 561.778,75 0,18 0,18
ACTAVIS INC - 21.958,00 USD 126,220 2.771.538,76 0,90 0,90
ACTIVISION INC - 43.490,00 USD 14,260 620.167,40 0,20 0,20
AETNA INC NEW 20.791,00 USD 63,540 1.321.060,14 0,43 0,43
AFLAC INC - 22.167,00 USD 58,120 1.288.346,04 0,42 0,42
AGCO CORP - 18.692,00 USD 50,190 938.151,48 0,31 0,31
AKAMAI TECHNOLOGIES INC - 26.185,00 USD 42,550 1.114.171,75 0,36 0,36
ALBEMARLE CORP. - 7.140,00 USD 62,290 444.750,60 0,15 0,14
ALEXANDER & BALDWIN INC - 84.533,00 USD 25,000 2.113.325,00 0,69 0,69
ALLEGHANY CORP - 3.207,00 USD 383,310 1.229.275,17 0,40 0,40
ALLSTATE CORPORATION - 15.955,00 USD 48,120 767.754,60 0,25 0,25
AMEREN CORP. - 11.880,00 USD 34,440 409.147,20 0,13 0,13
AMERICAN EXPRESS - 15.120,00 USD 74,760 1.130.371,20 0,37 0,37
AMERICAN FINANCIAL GROUP INC - 20.957,00 USD 48,910 1.025.006,87 0,33 0,33
AMERICAN STATES WATER CO - 6.217,00 USD 53,670 333.666,39 0,11 0,11
AMERISOURCEBERGEN CORP - 48.359,00 USD 55,830 2.699.882,97 0,88 0,88
AMGEN - 50.149,00 USD 98,660 4.947.700,34 1,61 1,61
AMPHENOL CORPORATION "A" 14.163,00 USD 77,940 1.103.864,22 0,36 0,36
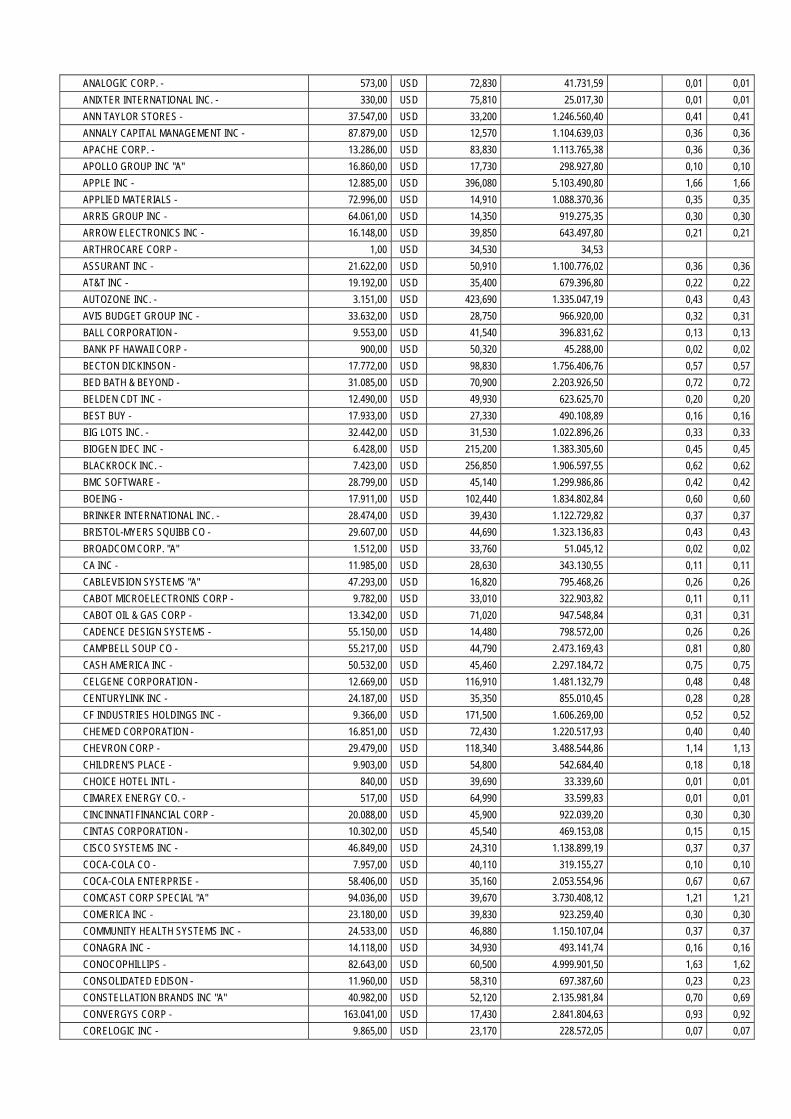
ANALOGIC CORP. - 573,00 USD 72,830 41.731,59 0,01 0,01
ANIXTER INTERNATIONAL INC. - 330,00 USD 75,810 25.017,30 0,01 0,01
ANN TAYLOR STORES - 37.547,00 USD 33,200 1.246.560,40 0,41 0,41
ANNALY CAPITAL MANAGEMENT INC - 87.879,00 USD 12,570 1.104.639,03 0,36 0,36
APACHE CORP. - 13.286,00 USD 83,830 1.113.765,38 0,36 0,36
APOLLO GROUP INC "A" 16.860,00 USD 17,730 298.927,80 0,10 0,10
APPLE INC - 12.885,00 USD 396,080 5.103.490,80 1,66 1,66
APPLIED MATERIALS - 72.996,00 USD 14,910 1.088.370,36 0,35 0,35
ARRIS GROUP INC - 64.061,00 USD 14,350 919.275,35 0,30 0,30
ARROW ELECTRONICS INC - 16.148,00 USD 39,850 643.497,80 0,21 0,21
ARTHROCARE CORP - 1,00 USD 34,530 34,53
ASSURANT INC - 21.622,00 USD 50,910 1.100.776,02 0,36 0,36
AT&T INC - 19.192,00 USD 35,400 679.396,80 0,22 0,22
AUTOZONE INC. - 3.151,00 USD 423,690 1.335.047,19 0,43 0,43
AVIS BUDGET GROUP INC - 33.632,00 USD 28,750 966.920,00 0,32 0,31
BALL CORPORATION - 9.553,00 USD 41,540 396.831,62 0,13 0,13
BANK PF HAWAII CORP - 900,00 USD 50,320 45.288,00 0,02 0,02
BECTON DICKINSON - 17.772,00 USD 98,830 1.756.406,76 0,57 0,57
BED BATH & BEYOND - 31.085,00 USD 70,900 2.203.926,50 0,72 0,72
BELDEN CDT INC - 12.490,00 USD 49,930 623.625,70 0,20 0,20
BEST BUY - 17.933,00 USD 27,330 490.108,89 0,16 0,16
BIG LOTS INC. - 32.442,00 USD 31,530 1.022.896,26 0,33 0,33
BIOGEN IDEC INC - 6.428,00 USD 215,200 1.383.305,60 0,45 0,45
BLACKROCK INC. - 7.423,00 USD 256,850 1.906.597,55 0,62 0,62
BMC SOFTWARE - 28.799,00 USD 45,140 1.299.986,86 0,42 0,42
BOEING - 17.911,00 USD 102,440 1.834.802,84 0,60 0,60
BRINKER INTERNATIONAL INC. - 28.474,00 USD 39,430 1.122.729,82 0,37 0,37
BRISTOL-MYERS SQUIBB CO - 29.607,00 USD 44,690 1.323.136,83 0,43 0,43
BROADCOM CORP. "A" 1.512,00 USD 33,760 51.045,12 0,02 0,02
CA INC - 11.985,00 USD 28,630 343.130,55 0,11 0,11
CABLEVISION SYSTEMS "A" 47.293,00 USD 16,820 795.468,26 0,26 0,26
CABOT MICROELECTRONIS CORP - 9.782,00 USD 33,010 322.903,82 0,11 0,11
CABOT OIL & GAS CORP - 13.342,00 USD 71,020 947.548,84 0,31 0,31
CADENCE DESIGN SYSTEMS - 55.150,00 USD 14,480 798.572,00 0,26 0,26
CAMPBELL SOUP CO - 55.217,00 USD 44,790 2.473.169,43 0,81 0,80
CASH AMERICA INC - 50.532,00 USD 45,460 2.297.184,72 0,75 0,75
CELGENE CORPORATION - 12.669,00 USD 116,910 1.481.132,79 0,48 0,48
CENTURYLINK INC - 24.187,00 USD 35,350 855.010,45 0,28 0,28
CF INDUSTRIES HOLDINGS INC - 9.366,00 USD 171,500 1.606.269,00 0,52 0,52
CHEMED CORPORATION - 16.851,00 USD 72,430 1.220.517,93 0,40 0,40
CHEVRON CORP - 29.479,00 USD 118,340 3.488.544,86 1,14 1,13
CHILDREN'S PLACE - 9.903,00 USD 54,800 542.684,40 0,18 0,18
CHOICE HOTEL INTL - 840,00 USD 39,690 33.339,60 0,01 0,01
CIMAREX ENERGY CO. - 517,00 USD 64,990 33.599,83 0,01 0,01
CINCINNATI FINANCIAL CORP - 20.088,00 USD 45,900 922.039,20 0,30 0,30
CINTAS CORPORATION - 10.302,00 USD 45,540 469.153,08 0,15 0,15
CISCO SYSTEMS INC - 46.849,00 USD 24,310 1.138.899,19 0,37 0,37
COCA-COLA CO - 7.957,00 USD 40,110 319.155,27 0,10 0,10
COCA-COLA ENTERPRISE - 58.406,00 USD 35,160 2.053.554,96 0,67 0,67
COMCAST CORP SPECIAL "A" 94.036,00 USD 39,670 3.730.408,12 1,21 1,21
COMERICA INC - 23.180,00 USD 39,830 923.259,40 0,30 0,30
COMMUNITY HEALTH SYSTEMS INC - 24.533,00 USD 46,880 1.150.107,04 0,37 0,37
CONAGRA INC - 14.118,00 USD 34,930 493.141,74 0,16 0,16
CONOCOPHILLIPS - 82.643,00 USD 60,500 4.999.901,50 1,63 1,62
CONSOLIDATED EDISON - 11.960,00 USD 58,310 697.387,60 0,23 0,23
CONSTELLATION BRANDS INC "A" 40.982,00 USD 52,120 2.135.981,84 0,70 0,69
CONVERGYS CORP - 163.041,00 USD 17,430 2.841.804,63 0,93 0,92
CORELOGIC INC - 9.865,00 USD 23,170 228.572,05 0,07 0,07
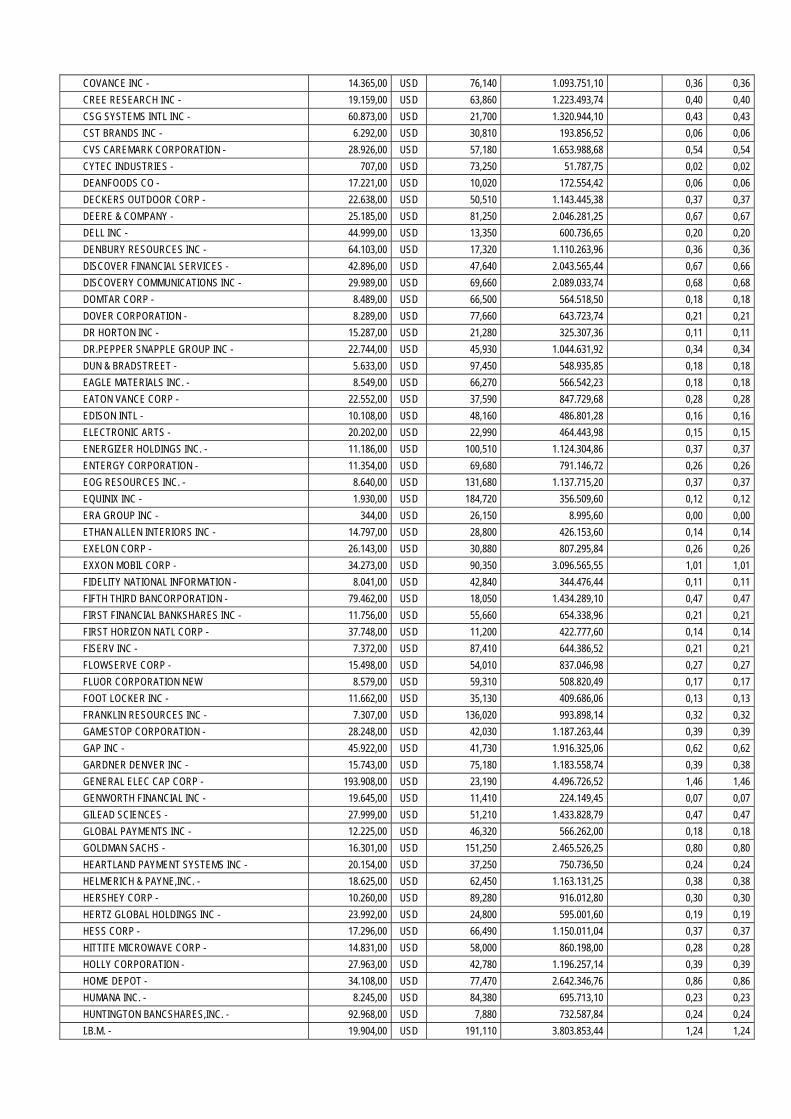
COVANCE INC - 14.365,00 USD 76,140 1.093.751,10 0,36 0,36
CREE RESEARCH INC - 19.159,00 USD 63,860 1.223.493,74 0,40 0,40
CSG SYSTEMS INTL INC - 60.873,00 USD 21,700 1.320.944,10 0,43 0,43
CST BRANDS INC - 6.292,00 USD 30,810 193.856,52 0,06 0,06
CVS CAREMARK CORPORATION - 28.926,00 USD 57,180 1.653.988,68 0,54 0,54
CYTEC INDUSTRIES - 707,00 USD 73,250 51.787,75 0,02 0,02
DEANFOODS CO - 17.221,00 USD 10,020 172.554,42 0,06 0,06
DECKERS OUTDOOR CORP - 22.638,00 USD 50,510 1.143.445,38 0,37 0,37
DEERE & COMPANY - 25.185,00 USD 81,250 2.046.281,25 0,67 0,67
DELL INC - 44.999,00 USD 13,350 600.736,65 0,20 0,20
DENBURY RESOURCES INC - 64.103,00 USD 17,320 1.110.263,96 0,36 0,36
DISCOVER FINANCIAL SERVICES - 42.896,00 USD 47,640 2.043.565,44 0,67 0,66
DISCOVERY COMMUNICATIONS INC - 29.989,00 USD 69,660 2.089.033,74 0,68 0,68
DOMTAR CORP - 8.489,00 USD 66,500 564.518,50 0,18 0,18
DOVER CORPORATION - 8.289,00 USD 77,660 643.723,74 0,21 0,21
DR HORTON INC - 15.287,00 USD 21,280 325.307,36 0,11 0,11
DR.PEPPER SNAPPLE GROUP INC - 22.744,00 USD 45,930 1.044.631,92 0,34 0,34
DUN & BRADSTREET - 5.633,00 USD 97,450 548.935,85 0,18 0,18
EAGLE MATERIALS INC. - 8.549,00 USD 66,270 566.542,23 0,18 0,18
EATON VANCE CORP - 22.552,00 USD 37,590 847.729,68 0,28 0,28
EDISON INTL - 10.108,00 USD 48,160 486.801,28 0,16 0,16
ELECTRONIC ARTS - 20.202,00 USD 22,990 464.443,98 0,15 0,15
ENERGIZER HOLDINGS INC. - 11.186,00 USD 100,510 1.124.304,86 0,37 0,37
ENTERGY CORPORATION - 11.354,00 USD 69,680 791.146,72 0,26 0,26
EOG RESOURCES INC. - 8.640,00 USD 131,680 1.137.715,20 0,37 0,37
EQUINIX INC - 1.930,00 USD 184,720 356.509,60 0,12 0,12
ERA GROUP INC - 344,00 USD 26,150 8.995,60 0,00 0,00
ETHAN ALLEN INTERIORS INC - 14.797,00 USD 28,800 426.153,60 0,14 0,14
EXELON CORP - 26.143,00 USD 30,880 807.295,84 0,26 0,26
EXXON MOBIL CORP - 34.273,00 USD 90,350 3.096.565,55 1,01 1,01
FIDELITY NATIONAL INFORMATION - 8.041,00 USD 42,840 344.476,44 0,11 0,11
FIFTH THIRD BANCORPORATION - 79.462,00 USD 18,050 1.434.289,10 0,47 0,47
FIRST FINANCIAL BANKSHARES INC - 11.756,00 USD 55,660 654.338,96 0,21 0,21
FIRST HORIZON NATL CORP - 37.748,00 USD 11,200 422.777,60 0,14 0,14
FISERV INC - 7.372,00 USD 87,410 644.386,52 0,21 0,21
FLOWSERVE CORP - 15.498,00 USD 54,010 837.046,98 0,27 0,27
FLUOR CORPORATION NEW 8.579,00 USD 59,310 508.820,49 0,17 0,17
FOOT LOCKER INC - 11.662,00 USD 35,130 409.686,06 0,13 0,13
FRANKLIN RESOURCES INC - 7.307,00 USD 136,020 993.898,14 0,32 0,32
GAMESTOP CORPORATION - 28.248,00 USD 42,030 1.187.263,44 0,39 0,39
GAP INC - 45.922,00 USD 41,730 1.916.325,06 0,62 0,62
GARDNER DENVER INC - 15.743,00 USD 75,180 1.183.558,74 0,39 0,38
GENERAL ELEC CAP CORP - 193.908,00 USD 23,190 4.496.726,52 1,46 1,46
GENWORTH FINANCIAL INC - 19.645,00 USD 11,410 224.149,45 0,07 0,07
GILEAD SCIENCES - 27.999,00 USD 51,210 1.433.828,79 0,47 0,47
GLOBAL PAYMENTS INC - 12.225,00 USD 46,320 566.262,00 0,18 0,18
GOLDMAN SACHS - 16.301,00 USD 151,250 2.465.526,25 0,80 0,80
HEARTLAND PAYMENT SYSTEMS INC - 20.154,00 USD 37,250 750.736,50 0,24 0,24
HELMERICH & PAYNE,INC. - 18.625,00 USD 62,450 1.163.131,25 0,38 0,38
HERSHEY CORP - 10.260,00 USD 89,280 916.012,80 0,30 0,30
HERTZ GLOBAL HOLDINGS INC - 23.992,00 USD 24,800 595.001,60 0,19 0,19
HESS CORP - 17.296,00 USD 66,490 1.150.011,04 0,37 0,37
HITTITE MICROWAVE CORP - 14.831,00 USD 58,000 860.198,00 0,28 0,28
HOLLY CORPORATION - 27.963,00 USD 42,780 1.196.257,14 0,39 0,39
HOME DEPOT - 34.108,00 USD 77,470 2.642.346,76 0,86 0,86
HUMANA INC. - 8.245,00 USD 84,380 695.713,10 0,23 0,23
HUNTINGTON BANCSHARES,INC. - 92.968,00 USD 7,880 732.587,84 0,24 0,24
I.B.M. - 19.904,00 USD 191,110 3.803.853,44 1,24 1,24
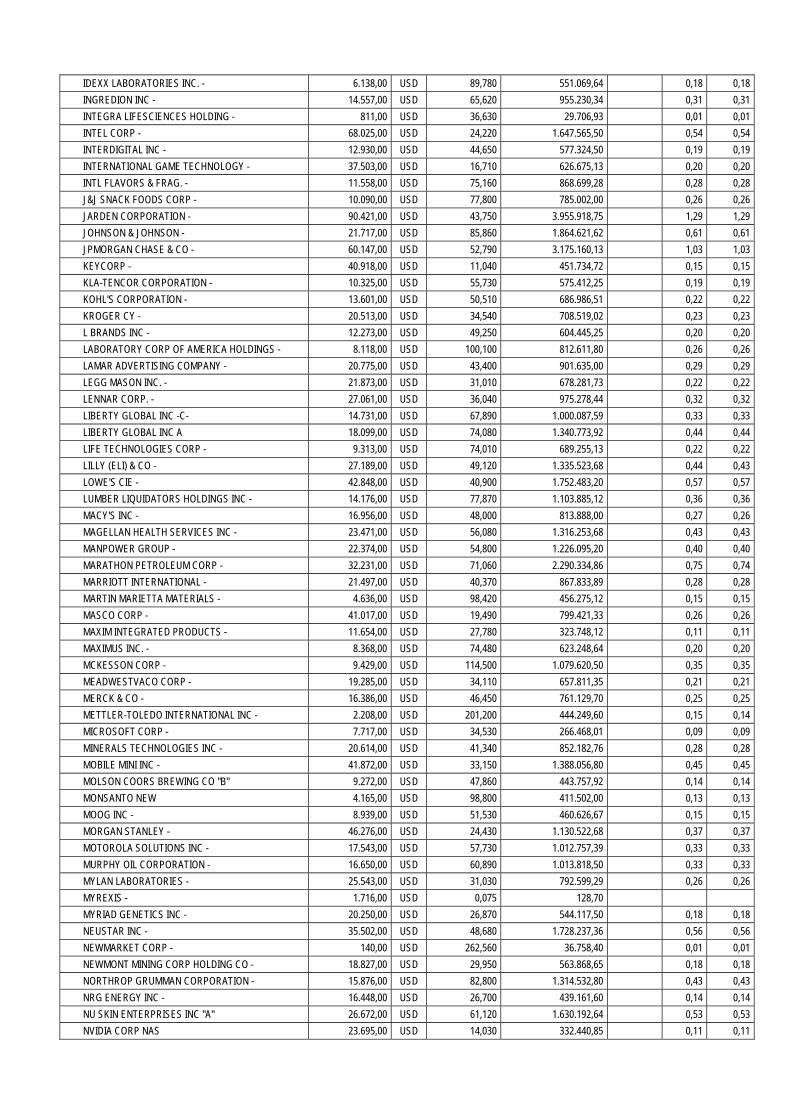
IDEXX LABORATORIES INC. - 6.138,00 USD 89,780 551.069,64 0,18 0,18
INGREDION INC - 14.557,00 USD 65,620 955.230,34 0,31 0,31
INTEGRA LIFESCIENCES HOLDING - 811,00 USD 36,630 29.706,93 0,01 0,01
INTEL CORP - 68.025,00 USD 24,220 1.647.565,50 0,54 0,54
INTERDIGITAL INC - 12.930,00 USD 44,650 577.324,50 0,19 0,19
INTERNATIONAL GAME TECHNOLOGY - 37.503,00 USD 16,710 626.675,13 0,20 0,20
INTL FLAVORS & FRAG. - 11.558,00 USD 75,160 868.699,28 0,28 0,28
J&J SNACK FOODS CORP - 10.090,00 USD 77,800 785.002,00 0,26 0,26
JARDEN CORPORATION - 90.421,00 USD 43,750 3.955.918,75 1,29 1,29
JOHNSON & JOHNSON - 21.717,00 USD 85,860 1.864.621,62 0,61 0,61
JPMORGAN CHASE & CO - 60.147,00 USD 52,790 3.175.160,13 1,03 1,03
KEYCORP - 40.918,00 USD 11,040 451.734,72 0,15 0,15
KLA-TENCOR CORPORATION - 10.325,00 USD 55,730 575.412,25 0,19 0,19
KOHL'S CORPORATION - 13.601,00 USD 50,510 686.986,51 0,22 0,22
KROGER CY - 20.513,00 USD 34,540 708.519,02 0,23 0,23
L BRANDS INC - 12.273,00 USD 49,250 604.445,25 0,20 0,20
LABORATORY CORP OF AMERICA HOLDINGS - 8.118,00 USD 100,100 812.611,80 0,26 0,26
LAMAR ADVERTISING COMPANY - 20.775,00 USD 43,400 901.635,00 0,29 0,29
LEGG MASON INC. - 21.873,00 USD 31,010 678.281,73 0,22 0,22
LENNAR CORP. - 27.061,00 USD 36,040 975.278,44 0,32 0,32
LIBERTY GLOBAL INC -C- 14.731,00 USD 67,890 1.000.087,59 0,33 0,33
LIBERTY GLOBAL INC A 18.099,00 USD 74,080 1.340.773,92 0,44 0,44
LIFE TECHNOLOGIES CORP - 9.313,00 USD 74,010 689.255,13 0,22 0,22
LILLY (ELI) & CO - 27.189,00 USD 49,120 1.335.523,68 0,44 0,43
LOWE'S CIE - 42.848,00 USD 40,900 1.752.483,20 0,57 0,57
LUMBER LIQUIDATORS HOLDINGS INC - 14.176,00 USD 77,870 1.103.885,12 0,36 0,36
MACY'S INC - 16.956,00 USD 48,000 813.888,00 0,27 0,26
MAGELLAN HEALTH SERVICES INC - 23.471,00 USD 56,080 1.316.253,68 0,43 0,43
MANPOWER GROUP - 22.374,00 USD 54,800 1.226.095,20 0,40 0,40
MARATHON PETROLEUM CORP - 32.231,00 USD 71,060 2.290.334,86 0,75 0,74
MARRIOTT INTERNATIONAL - 21.497,00 USD 40,370 867.833,89 0,28 0,28
MARTIN MARIETTA MATERIALS - 4.636,00 USD 98,420 456.275,12 0,15 0,15
MASCO CORP - 41.017,00 USD 19,490 799.421,33 0,26 0,26
MAXIM INTEGRATED PRODUCTS - 11.654,00 USD 27,780 323.748,12 0,11 0,11
MAXIMUS INC. - 8.368,00 USD 74,480 623.248,64 0,20 0,20
MCKESSON CORP - 9.429,00 USD 114,500 1.079.620,50 0,35 0,35
MEADWESTVACO CORP - 19.285,00 USD 34,110 657.811,35 0,21 0,21
MERCK & CO - 16.386,00 USD 46,450 761.129,70 0,25 0,25
METTLER-TOLEDO INTERNATIONAL INC - 2.208,00 USD 201,200 444.249,60 0,15 0,14
MICROSOFT CORP - 7.717,00 USD 34,530 266.468,01 0,09 0,09
MINERALS TECHNOLOGIES INC - 20.614,00 USD 41,340 852.182,76 0,28 0,28
MOBILE MINI INC - 41.872,00 USD 33,150 1.388.056,80 0,45 0,45
MOLSON COORS BREWING CO "B" 9.272,00 USD 47,860 443.757,92 0,14 0,14
MONSANTO NEW 4.165,00 USD 98,800 411.502,00 0,13 0,13
MOOG INC - 8.939,00 USD 51,530 460.626,67 0,15 0,15
MORGAN STANLEY - 46.276,00 USD 24,430 1.130.522,68 0,37 0,37
MOTOROLA SOLUTIONS INC - 17.543,00 USD 57,730 1.012.757,39 0,33 0,33
MURPHY OIL CORPORATION - 16.650,00 USD 60,890 1.013.818,50 0,33 0,33
MYLAN LABORATORIES - 25.543,00 USD 31,030 792.599,29 0,26 0,26
MYREXIS - 1.716,00 USD 0,075 128,70
MYRIAD GENETICS INC - 20.250,00 USD 26,870 544.117,50 0,18 0,18
NEUSTAR INC - 35.502,00 USD 48,680 1.728.237,36 0,56 0,56
NEWMARKET CORP - 140,00 USD 262,560 36.758,40 0,01 0,01
NEWMONT MINING CORP HOLDING CO - 18.827,00 USD 29,950 563.868,65 0,18 0,18
NORTHROP GRUMMAN CORPORATION - 15.876,00 USD 82,800 1.314.532,80 0,43 0,43
NRG ENERGY INC - 16.448,00 USD 26,700 439.161,60 0,14 0,14
NU SKIN ENTERPRISES INC "A" 26.672,00 USD 61,120 1.630.192,64 0,53 0,53
NVIDIA CORP NAS 23.695,00 USD 14,030 332.440,85 0,11 0,11
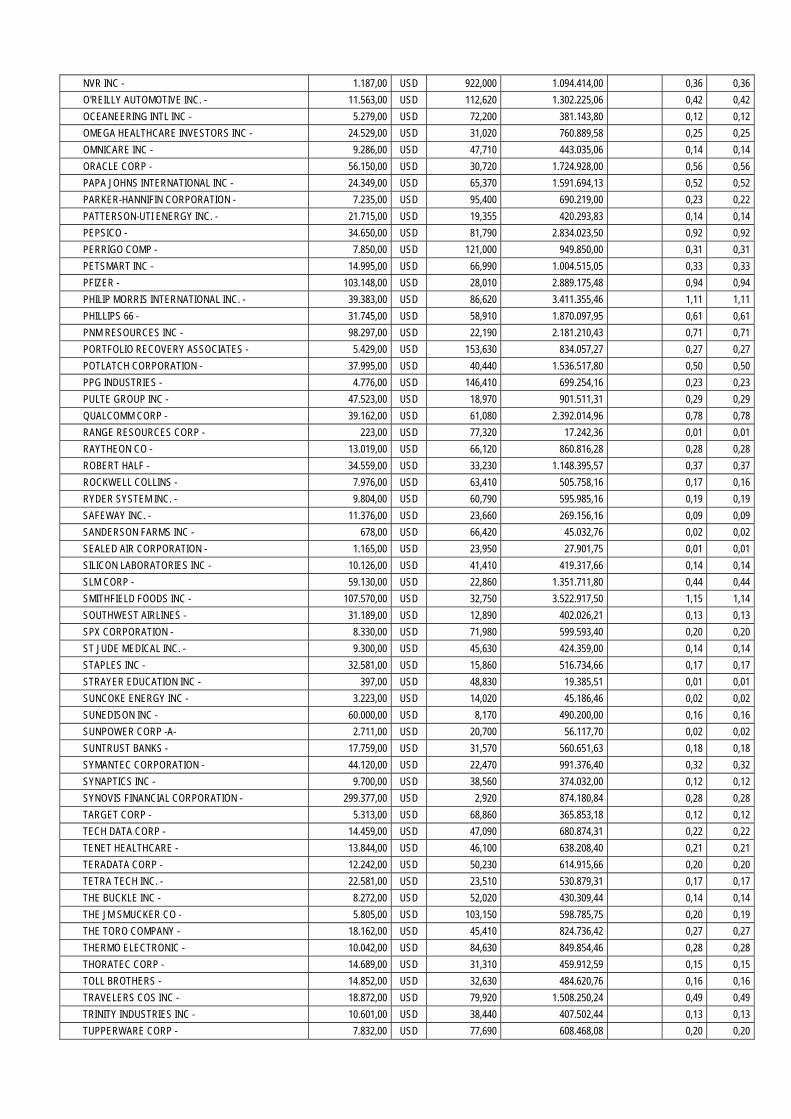
NVR INC - 1.187,00 USD 922,000 1.094.414,00 0,36 0,36
O'REILLY AUTOMOTIVE INC. - 11.563,00 USD 112,620 1.302.225,06 0,42 0,42
OCEANEERING INTL INC - 5.279,00 USD 72,200 381.143,80 0,12 0,12
OMEGA HEALTHCARE INVESTORS INC - 24.529,00 USD 31,020 760.889,58 0,25 0,25
OMNICARE INC - 9.286,00 USD 47,710 443.035,06 0,14 0,14
ORACLE CORP - 56.150,00 USD 30,720 1.724.928,00 0,56 0,56
PAPA JOHNS INTERNATIONAL INC - 24.349,00 USD 65,370 1.591.694,13 0,52 0,52
PARKER-HANNIFIN CORPORATION - 7.235,00 USD 95,400 690.219,00 0,23 0,22
PATTERSON-UTI ENERGY INC. - 21.715,00 USD 19,355 420.293,83 0,14 0,14
PEPSICO - 34.650,00 USD 81,790 2.834.023,50 0,92 0,92
PERRIGO COMP - 7.850,00 USD 121,000 949.850,00 0,31 0,31
PETSMART INC - 14.995,00 USD 66,990 1.004.515,05 0,33 0,33
PFIZER - 103.148,00 USD 28,010 2.889.175,48 0,94 0,94
PHILIP MORRIS INTERNATIONAL INC. - 39.383,00 USD 86,620 3.411.355,46 1,11 1,11
PHILLIPS 66 - 31.745,00 USD 58,910 1.870.097,95 0,61 0,61
PNM RESOURCES INC - 98.297,00 USD 22,190 2.181.210,43 0,71 0,71
PORTFOLIO RECOVERY ASSOCIATES - 5.429,00 USD 153,630 834.057,27 0,27 0,27
POTLATCH CORPORATION - 37.995,00 USD 40,440 1.536.517,80 0,50 0,50
PPG INDUSTRIES - 4.776,00 USD 146,410 699.254,16 0,23 0,23
PULTE GROUP INC - 47.523,00 USD 18,970 901.511,31 0,29 0,29
QUALCOMM CORP - 39.162,00 USD 61,080 2.392.014,96 0,78 0,78
RANGE RESOURCES CORP - 223,00 USD 77,320 17.242,36 0,01 0,01
RAYTHEON CO - 13.019,00 USD 66,120 860.816,28 0,28 0,28
ROBERT HALF - 34.559,00 USD 33,230 1.148.395,57 0,37 0,37
ROCKWELL COLLINS - 7.976,00 USD 63,410 505.758,16 0,17 0,16
RYDER SYSTEM INC. - 9.804,00 USD 60,790 595.985,16 0,19 0,19
SAFEWAY INC. - 11.376,00 USD 23,660 269.156,16 0,09 0,09
SANDERSON FARMS INC - 678,00 USD 66,420 45.032,76 0,02 0,02
SEALED AIR CORPORATION - 1.165,00 USD 23,950 27.901,75 0,01 0,01
SILICON LABORATORIES INC - 10.126,00 USD 41,410 419.317,66 0,14 0,14
SLM CORP - 59.130,00 USD 22,860 1.351.711,80 0,44 0,44
SMITHFIELD FOODS INC - 107.570,00 USD 32,750 3.522.917,50 1,15 1,14
SOUTHWEST AIRLINES - 31.189,00 USD 12,890 402.026,21 0,13 0,13
SPX CORPORATION - 8.330,00 USD 71,980 599.593,40 0,20 0,20
ST JUDE MEDICAL INC. - 9.300,00 USD 45,630 424.359,00 0,14 0,14
STAPLES INC - 32.581,00 USD 15,860 516.734,66 0,17 0,17
STRAYER EDUCATION INC - 397,00 USD 48,830 19.385,51 0,01 0,01
SUNCOKE ENERGY INC - 3.223,00 USD 14,020 45.186,46 0,02 0,02
SUNEDISON INC - 60.000,00 USD 8,170 490.200,00 0,16 0,16
SUNPOWER CORP -A- 2.711,00 USD 20,700 56.117,70 0,02 0,02
SUNTRUST BANKS - 17.759,00 USD 31,570 560.651,63 0,18 0,18
SYMANTEC CORPORATION - 44.120,00 USD 22,470 991.376,40 0,32 0,32
SYNAPTICS INC - 9.700,00 USD 38,560 374.032,00 0,12 0,12
SYNOVIS FINANCIAL CORPORATION - 299.377,00 USD 2,920 874.180,84 0,28 0,28
TARGET CORP - 5.313,00 USD 68,860 365.853,18 0,12 0,12
TECH DATA CORP - 14.459,00 USD 47,090 680.874,31 0,22 0,22
TENET HEALTHCARE - 13.844,00 USD 46,100 638.208,40 0,21 0,21
TERADATA CORP - 12.242,00 USD 50,230 614.915,66 0,20 0,20
TETRA TECH INC. - 22.581,00 USD 23,510 530.879,31 0,17 0,17
THE BUCKLE INC - 8.272,00 USD 52,020 430.309,44 0,14 0,14
THE JM SMUCKER CO - 5.805,00 USD 103,150 598.785,75 0,20 0,19
THE TORO COMPANY - 18.162,00 USD 45,410 824.736,42 0,27 0,27
THERMO ELECTRONIC - 10.042,00 USD 84,630 849.854,46 0,28 0,28
THORATEC CORP - 14.689,00 USD 31,310 459.912,59 0,15 0,15
TOLL BROTHERS - 14.852,00 USD 32,630 484.620,76 0,16 0,16
TRAVELERS COS INC - 18.872,00 USD 79,920 1.508.250,24 0,49 0,49
TRINITY INDUSTRIES INC - 10.601,00 USD 38,440 407.502,44 0,13 0,13
TUPPERWARE CORP - 7.832,00 USD 77,690 608.468,08 0,20 0,20
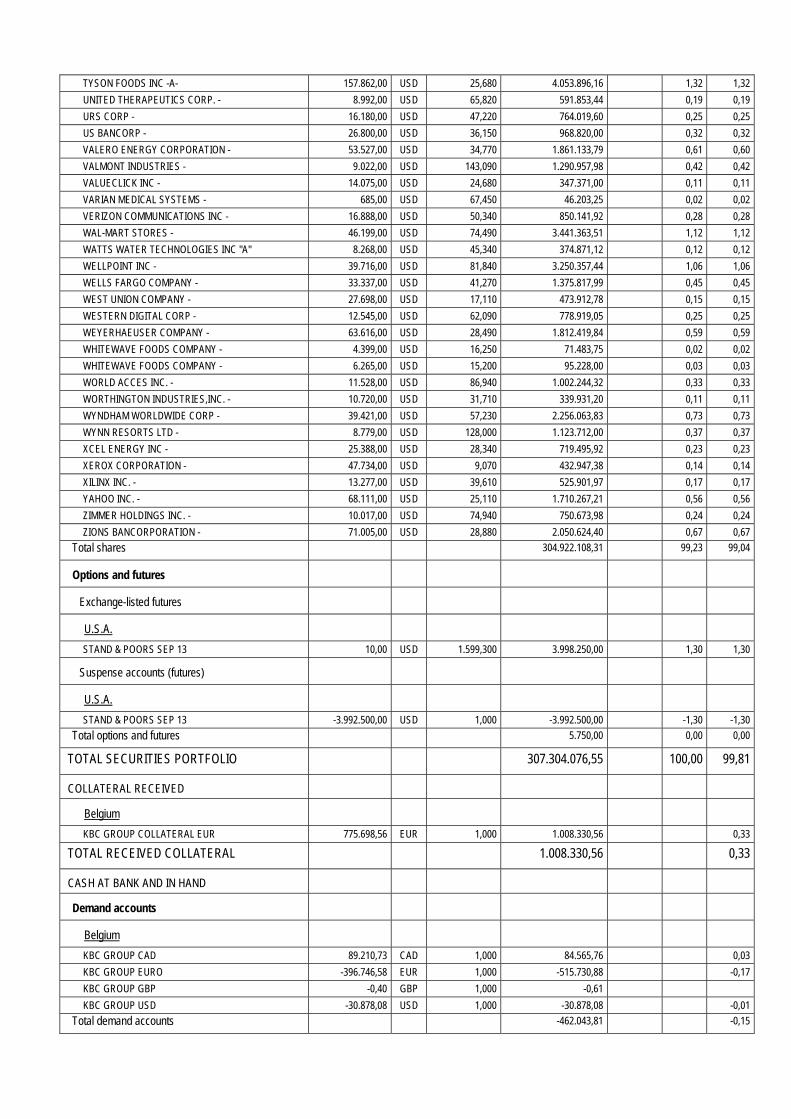
TYSON FOODS INC -A- 157.862,00 USD 25,680 4.053.896,16 1,32 1,32
UNITED THERAPEUTICS CORP. - 8.992,00 USD 65,820 591.853,44 0,19 0,19
URS CORP - 16.180,00 USD 47,220 764.019,60 0,25 0,25
US BANCORP - 26.800,00 USD 36,150 968.820,00 0,32 0,32
VALERO ENERGY CORPORATION - 53.527,00 USD 34,770 1.861.133,79 0,61 0,60
VALMONT INDUSTRIES - 9.022,00 USD 143,090 1.290.957,98 0,42 0,42
VALUECLICK INC - 14.075,00 USD 24,680 347.371,00 0,11 0,11
VARIAN MEDICAL SYSTEMS - 685,00 USD 67,450 46.203,25 0,02 0,02
VERIZON COMMUNICATIONS INC - 16.888,00 USD 50,340 850.141,92 0,28 0,28
WAL-MART STORES - 46.199,00 USD 74,490 3.441.363,51 1,12 1,12
WATTS WATER TECHNOLOGIES INC "A" 8.268,00 USD 45,340 374.871,12 0,12 0,12
WELLPOINT INC - 39.716,00 USD 81,840 3.250.357,44 1,06 1,06
WELLS FARGO COMPANY - 33.337,00 USD 41,270 1.375.817,99 0,45 0,45
WEST UNION COMPANY - 27.698,00 USD 17,110 473.912,78 0,15 0,15
WESTERN DIGITAL CORP - 12.545,00 USD 62,090 778.919,05 0,25 0,25
WEYERHAEUSER COMPANY - 63.616,00 USD 28,490 1.812.419,84 0,59 0,59
WHITEWAVE FOODS COMPANY - 4.399,00 USD 16,250 71.483,75 0,02 0,02
WHITEWAVE FOODS COMPANY - 6.265,00 USD 15,200 95.228,00 0,03 0,03
WORLD ACCES INC. - 11.528,00 USD 86,940 1.002.244,32 0,33 0,33
WORTHINGTON INDUSTRIES,INC. - 10.720,00 USD 31,710 339.931,20 0,11 0,11
WYNDHAM WORLDWIDE CORP - 39.421,00 USD 57,230 2.256.063,83 0,73 0,73
WYNN RESORTS LTD - 8.779,00 USD 128,000 1.123.712,00 0,37 0,37
XCEL ENERGY INC - 25.388,00 USD 28,340 719.495,92 0,23 0,23
XEROX CORPORATION - 47.734,00 USD 9,070 432.947,38 0,14 0,14
XILINX INC. - 13.277,00 USD 39,610 525.901,97 0,17 0,17
YAHOO INC. - 68.111,00 USD 25,110 1.710.267,21 0,56 0,56
ZIMMER HOLDINGS INC. - 10.017,00 USD 74,940 750.673,98 0,24 0,24
ZIONS BANCORPORATION - 71.005,00 USD 28,880 2.050.624,40 0,67 0,67
Total shares 304.922.108,31 99,23 99,04
Options and futures
Exchange-listed futures
U.S.A.
STAND & POORS SEP 13 10,00 USD 1.599,300 3.998.250,00 1,30 1,30
Suspense accounts (futures)
U.S.A.
STAND & POORS SEP 13 -3.992.500,00 USD 1,000 -3.992.500,00 -1,30 -1,30
Total options and futures 5.750,00 0,00 0,00
TOTAL SECURITIES PORTFOLIO 307.304.076,55 100,00 99,81
COLLATERAL RECEIVED
Belgium
KBC GROUP COLLATERAL EUR 775.698,56 EUR 1,000 1.008.330,56 0,33
TOTAL RECEIVED COLLATERAL 1.008.330,56 0,33
CASH AT BANK AND IN HAND
Demand accounts
Belgium
KBC GROUP CAD 89.210,73 CAD 1,000 84.565,76 0,03
KBC GROUP EURO -396.746,58 EUR 1,000 -515.730,88 -0,17
KBC GROUP GBP -0,40 GBP 1,000 -0,61
KBC GROUP USD -30.878,08 USD 1,000 -30.878,08 -0,01
Total demand accounts -462.043,81 -0,15

Managed futures accounts
Belgium
KBC GROUP EURO FUT REK -41,61 EUR 1,000 -54,09
KBC GROUP FUT. REK. HKD -30,14 HKD 1,000 -3,89
KBC GROUP FUT.REK.GBP -1,71 GBP 1,000 -2,59
KBC GROUP JPY FUT REK -1.283,29 JPY 1,000 -12,92
KBC GROUP USD FUT REK 801.223,73 USD 1,000 801.223,73 0,26
Total managed futures accounts 801.150,24 0,26
TOTAL CASH AT BANK AND IN HAND 339.106,43 0,11
OTHER RECEIVABLES AND PAYABLES
Receivables
Belgium
KBC GROUP USD RECEIVABLE 4.467.521,36 USD 1,000 4.467.521,36 1,45
Total receivables 4.467.521,36 1,45
Payables
Belgium
KBC GROUP COUNTERPART ENTRY COLLATERAL IN EUR
-775.698,56 EUR 1,000 -1.008.330,56 -0,33
KBC GROUP CZK PAYABLE -84.700.000,00 CZK 1,000 -4.238.749,95 -1,38
KBC GROUP EUR PAYABLE -5.346,80 EUR 1,000 -6.950,31 0,00
KBC GROUP USD PAYABLE -6.479,12 USD 1,000 -6.479,12 0,00
Payables -5.260.509,94 -1,71
TOTAL RECEIVABLES AND PAYABLES -792.988,58 -0,26
OTHER
Interest receivable USD 249.201,14 0,08
Accrued interest USD 1.411,53
Expenses payable USD -374.490,73 -0,12
Expenses to be carried forward USD 166.658,88 0,05
TOTAL OTHER 42.780,82 0,01
TOTAL NET ASSETS 307.901.305,78 100,00
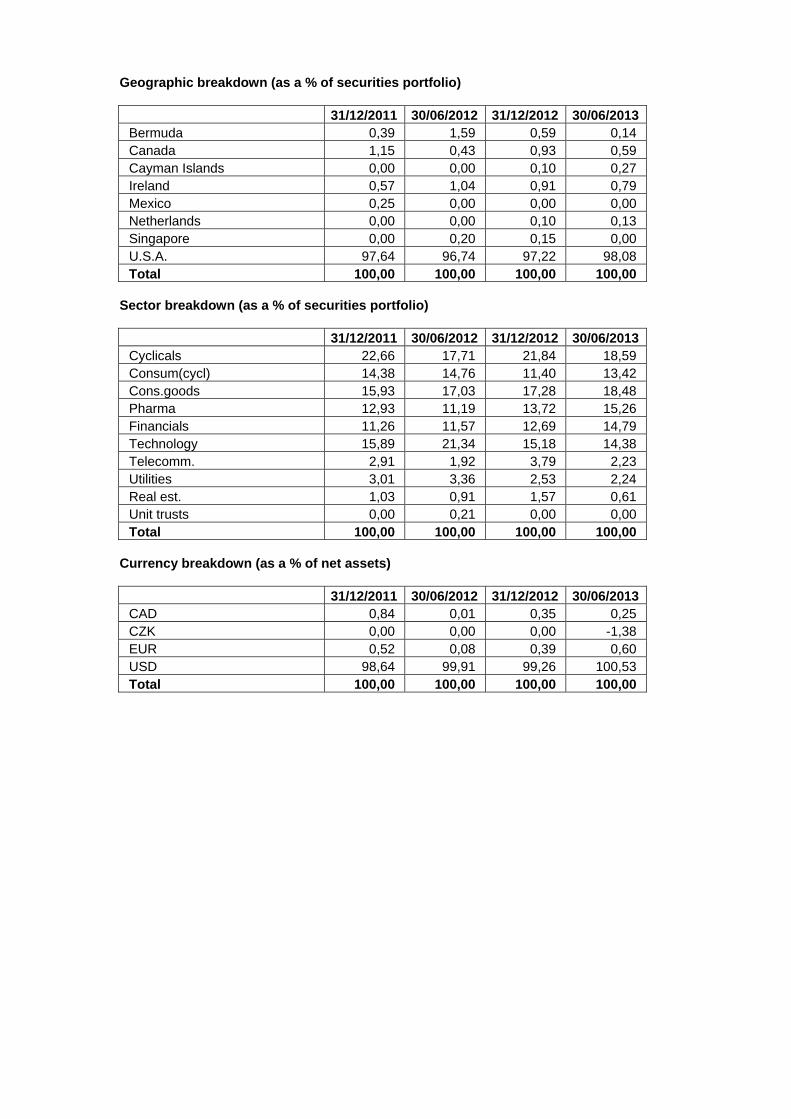
Geographic breakdown (as a % of securities portfolio)
31/12/2011 30/06/2012 31/12/2012 30/06/2013 Bermuda 0,39 1,59 0,59 0,14 Canada 1,15 0,43 0,93 0,59 Cayman Islands 0,00 0,00 0,10 0,27 Ireland 0,57 1,04 0,91 0,79 Mexico 0,25 0,00 0,00 0,00 Netherlands 0,00 0,00 0,10 0,13 Singapore 0,00 0,20 0,15 0,00 U.S.A. 97,64 96,74 97,22 98,08 Total 100,00 100,00 100,00 100,00
Sector breakdown (as a % of securities portfolio)
31/12/2011 30/06/2012 31/12/2012 30/06/2013 Cyclicals 22,66 17,71 21,84 18,59 Consum(cycl) 14,38 14,76 11,40 13,42 Cons.goods 15,93 17,03 17,28 18,48 Pharma 12,93 11,19 13,72 15,26 Financials 11,26 11,57 12,69 14,79 Technology 15,89 21,34 15,18 14,38 Telecomm. 2,91 1,92 3,79 2,23 Utilities 3,01 3,36 2,53 2,24 Real est. 1,03 0,91 1,57 0,61 Unit trusts 0,00 0,21 0,00 0,00 Total 100,00 100,00 100,00 100,00
Currency breakdown (as a % of net assets)
31/12/2011 30/06/2012 31/12/2012 30/06/2013 CAD 0,84 0,01 0,35 0,25 CZK 0,00 0,00 0,00 -1,38 EUR 0,52 0,08 0,39 0,60 USD 98,64 99,91 99,26 100,53 Total 100,00 100,00 100,00 100,00

2.4.2 CHANGES IN THE COMPOSITION OF THE ASSETS OF KBC EQUITY FUND AMERICA (IN THE
CURRENCY OF THE SUB-FUND)
1st half of year YearPurchases 273.252.577,43 273.252.577,43 Sales 392.985.640,29 392.985.640,29 Total 1 666.238.217,72 666.238.217,72 Subscriptions 159.671.701,63 159.671.701,63 Redemptions 310.137.680,49 310.137.680,49 Total 2 469.809.382,12 469.809.382,12 Monthly average of total assets
392.474.198,69 392.474.198,69
Turnover rate 50,05 % 50,05 %
1st half of year YearPurchases 273.252.577,43 273.252.577,43 Sales 392.985.640,29 392.985.640,29 Total 1 666.238.217,72 666.238.217,72 Subscriptions 159.671.701,63 159.671.701,63 Redemptions 310.137.680,49 310.137.680,49 Total 2 469.809.382,12 469.809.382,12 Monthly average of total assets
389.964.137,30 389.964.137,30
Corrected turnover rate 50,37 % 50,37 %
The table above shows the capital volume of portfolio transactions. This volume (adjusted to take account of total subscriptions and redemptions) is also compared to the average net assets at the beginning and end of the period. A figure close to 0% implies that the transactions relating to the securities or transactions relating to the assets (excluding deposits and cash) in a given period only involve subscriptions and redemptions. A negative percentage shows that subscriptions and redemptions entailed few, if any, transactions in the portfolio. Active asset management may result in high turnover rates (monthly percentage >50%). The detailed list of transactions is available for consultation free of charge at the registered office of the Bevek or fund at Havenlaan 2, 1080 Brussels.

2.4.3 AMOUNT OF COMMITMENTS IN RESPECT OF FINANCIAL DERIVATIVES POSITIONS
NAME Currency Value in currency
In the currency of the sub-fund
Lot-size
Transactiondate
KBC COLLATERAL EUR
EUR 775.698,56 1.008.330,56 N/A 28.06.2013
STPOORS 13/09/2013
USD 3.998.250,00 3.998.250,00 250,00 28.06.2013
2.4.4 CHANGES OF THE NUMBER OF SUBSCRIPTIONS AND REDEMPTIONS AND THE NET ASSET
VALUE
Classic Shares
Period Change in number of shares in circulation
Year Subscriptions Redemptions End of period
Cap. Dis. Cap. Dis. Cap. Dis. Total
2011 - 06 538.325,56 4.796,90 573.129,62 4.945,00 463.756,36 3.583,33 467.339,69
2012 - 06 146.585,99 507,00 584.444,18 1.250,00 25.898,18 2.840,33 28.738,50
2013 - 06 16.195,73 649,00 15.964,27 639,00 26.129,64 2.850,33 28.979,96
Period Amounts received and paid by the UCI
(in the currency of the class)
Year Subscriptions Redemptions
Capitalization Distribution Capitalization Distribution
2011 - 06 699.791.450,10 5.125.465,28 744.681.038,00 5.526.505,19
2012 - 06 197.236.154,20 575.427,54 742.912.221,20 1.365.290,31
2013 - 06 26.004.275,17 865.978,83 25.776.469,89 814.694,51
Period Net asset value
End of period (in the currency of the class)
Year Of the class Of one share
Capitalization Distribution
2011 - 06 659.724.358,44 1.413,87 1.125,00
2012 - 06 40.563.129,98 1.440,69 1.144,86
2013 - 06 49.273.284,85 1.735,53 1.376,83
Institutional B Shares
Period Change in number of shares in circulation
Year Subscriptions Redemptions End of period
Cap. Dis. Cap. Dis. Cap. Dis. Total 2012 - 06 330.010,00 166.168,00 163.842,00 163.842,00
2013 - 06 251.600,00 266.639,00 148.803,00 148.803,00
Period Amounts received and paid by the UCI
(in the currency of the class)
Year Subscriptions Redemptions
Capitalization Distribution Capitalization Distribution
2012 - 06 446.048.247,50 228.196.502,70
2013 - 06 393.858.762,60 433.758.645,30
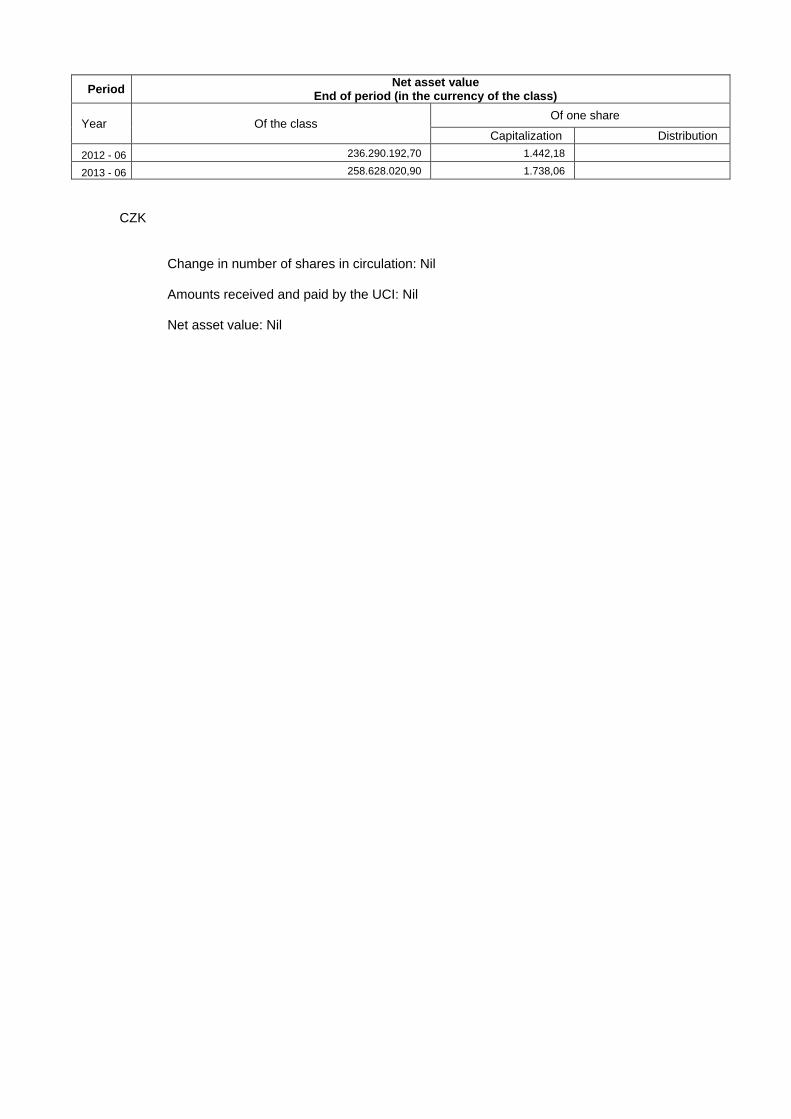
Period Net asset value
End of period (in the currency of the class)
Year Of the class Of one share
Capitalization Distribution
2012 - 06 236.290.192,70 1.442,18
2013 - 06 258.628.020,90 1.738,06
CZK
Change in number of shares in circulation: Nil
Amounts received and paid by the UCI: Nil
Net asset value: Nil
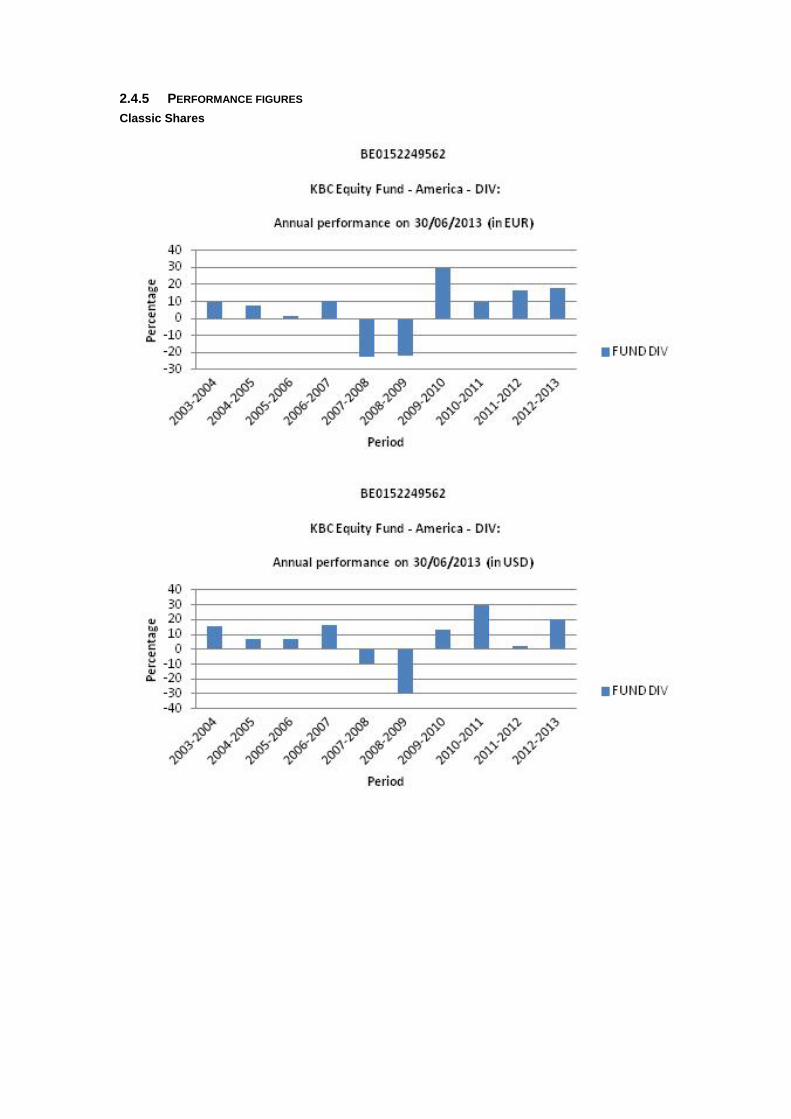
2.4.5 PERFORMANCE FIGURES
Classic Shares
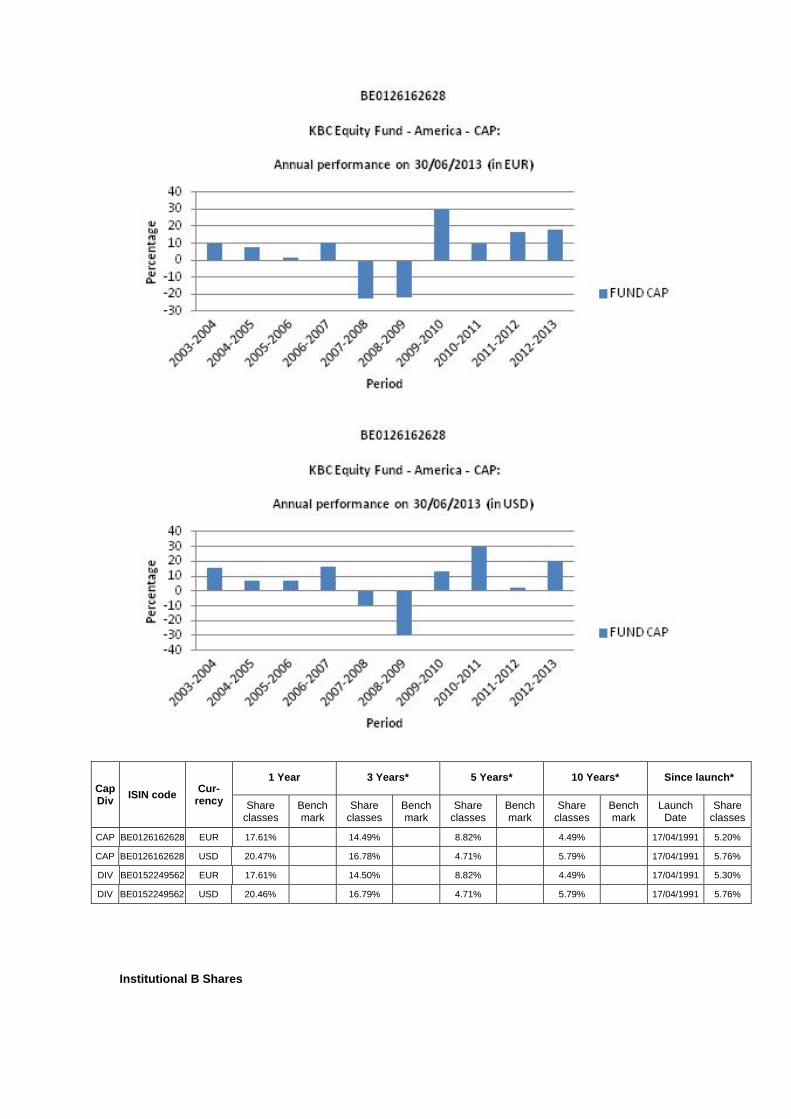
Cap Div
ISIN code Cur-
rency
1 Year 3 Years* 5 Years* 10 Years* Since launch*
Share classes
Bench mark
Share classes
Bench mark
Share classes
Bench mark
Share classes
Bench mark
Launch Date
Share classes
CAP BE0126162628 EUR 17.61% 14.49% 8.82% 4.49% 17/04/1991 5.20%
CAP BE0126162628 USD 20.47% 16.78% 4.71% 5.79% 17/04/1991 5.76%
DIV BE0152249562 EUR 17.61% 14.50% 8.82% 4.49% 17/04/1991 5.30%
DIV BE0152249562 USD 20.46% 16.79% 4.71% 5.79% 17/04/1991 5.76%
Institutional B Shares

Cap Div
ISIN code Cur-
rency
1 Year 3 Years* 5 Years* 10 Years* Since launch*
Share classes
Bench mark
Share classes
Bench mark
Share classes
Bench mark
Share classes
Bench mark
Launch Date
Share classes
CAP BE6228535686 EUR 17.66% 25/11/2011 25.77%
CAP BE6228535686 USD 20.52% 25/11/2011 24.19%
Risk warning: Past performance is not a guide to future performance. * Return on annual basis.
Classic Shares The bar chart shows the performance for full financial years. The figures do not take account of any restructuring.

Calculated in USD and in EUR. The return is calculated as the change in the net asset value between two dates expressed
as a percentage. In the case of units that pay dividends, the dividend is incorporated geometrically in the return.
Calculation method for date D, where NAV stands for net asset value: Capitalisation units (CAP) Return on date D over a period of X years:
[NIW(D) / NIW(Y)] ^ [1 / X] - 1 where Y = D-X
Return on date D since the start date S of the unit: [NIW(D) / NIW(S)] ^ [1 / F] - 1 where F = 1 if the unit has existed for less than one year on date D where F = (D-S) / 365.25 if the unit has existed for longer than one year on date D
Distribution units (DIV) Return on date D over a period of X years:
[ C * NIW(D) / NIW(Y)] ^ [1 / X] - 1 where Y = D-X
Return on date D since the start date S of the unit: [ C * NIW(D) / NIW(S)] ^ [1 / F] - 1 where F = 1 if the unit has existed for less than one year on date D where F = (D-S) / 365.25 if the unit has existed for longer than one year on date D where C is a factor that is determined for all N dividends between the calculation date D and the reference date.
For dividend i on date Di with value Wi: Ci = [Wi / NIW(Di)] + 1 i = 1 ... N from whichC = C0 * .... * CN.
If the interval between the two dates exceeds one year, the ordinary return calculation is converted into a return on an annual basis by taking the nth square root of 1 plus the total return of the unit.
The return figures shown above do not take account of the fees and charges associated with the issue and redemption of units.
These are the performance figures for capitalisation and distribution shares.
Institutional B Shares The bar chart shows the performance for full financial years. The figures do not take account of any restructuring. Calculated in USD and in EUR. The return is calculated as the change in the net asset value between two dates expressed
as a percentage. Calculation method for date D, where NAV stands for net asset value:
Capitalisation units (CAP) Return on date D over a period of X years:
[NIW(D) / NIW(Y)] ^ [1 / X] - 1 where Y = D-X
Return on date D since the start date S of the unit: [NIW(D) / NIW(S)] ^ [1 / F] - 1 where F = 1 if the unit has existed for less than one year on date D where F = (D-S) / 365.25 if the unit has existed for longer than one year on date D
If the interval between the two dates exceeds one year, the ordinary return calculation is converted into a return on an annual basis by taking the nth square root of 1 plus the total return of the unit.
The return figures shown above do not take account of the fees and charges associated with the issue and redemption of units.
These are the performance figures for capitalization shares.
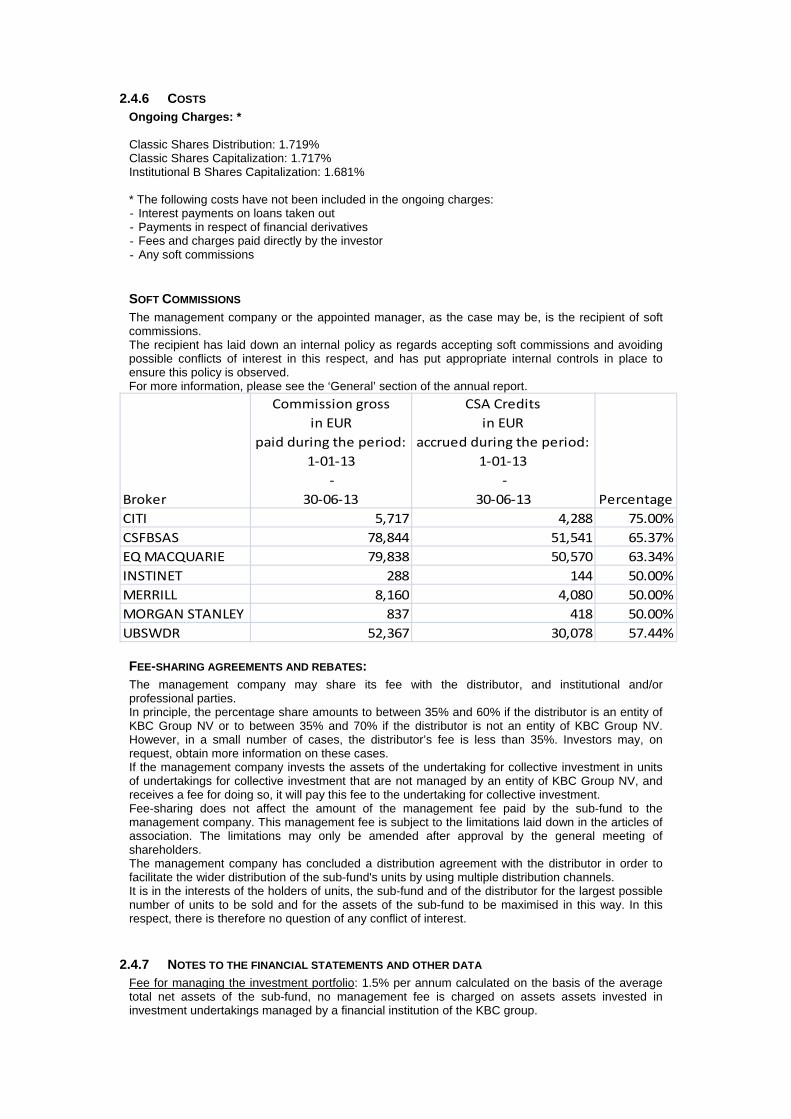
2.4.6 COSTS Ongoing Charges: * Classic Shares Distribution: 1.719% Classic Shares Capitalization: 1.717% Institutional B Shares Capitalization: 1.681% * The following costs have not been included in the ongoing charges: - Interest payments on loans taken out - Payments in respect of financial derivatives - Fees and charges paid directly by the investor - Any soft commissions
SOFT COMMISSIONS The management company or the appointed manager, as the case may be, is the recipient of soft commissions. The recipient has laid down an internal policy as regards accepting soft commissions and avoiding possible conflicts of interest in this respect, and has put appropriate internal controls in place to ensure this policy is observed. For more information, please see the ‘General’ section of the annual report.
Broker
Commission gross
in EUR
paid during the period:
1‐01‐13
‐
30‐06‐13
CSA Credits
in EUR
accrued during the period:
1‐01‐13
‐
30‐06‐13 Percentage
CITI 5,717 4,288 75.00%
CSFBSAS 78,844 51,541 65.37%
EQ MACQUARIE 79,838 50,570 63.34%
INSTINET 288 144 50.00%
MERRILL 8,160 4,080 50.00%
MORGAN STANLEY 837 418 50.00%
UBSWDR 52,367 30,078 57.44%
FEE-SHARING AGREEMENTS AND REBATES: The management company may share its fee with the distributor, and institutional and/or professional parties. In principle, the percentage share amounts to between 35% and 60% if the distributor is an entity of KBC Group NV or to between 35% and 70% if the distributor is not an entity of KBC Group NV. However, in a small number of cases, the distributor’s fee is less than 35%. Investors may, on request, obtain more information on these cases. If the management company invests the assets of the undertaking for collective investment in units of undertakings for collective investment that are not managed by an entity of KBC Group NV, and receives a fee for doing so, it will pay this fee to the undertaking for collective investment. Fee-sharing does not affect the amount of the management fee paid by the sub-fund to the management company. This management fee is subject to the limitations laid down in the articles of association. The limitations may only be amended after approval by the general meeting of shareholders. The management company has concluded a distribution agreement with the distributor in order to facilitate the wider distribution of the sub-fund's units by using multiple distribution channels. It is in the interests of the holders of units, the sub-fund and of the distributor for the largest possible number of units to be sold and for the assets of the sub-fund to be maximised in this way. In this respect, there is therefore no question of any conflict of interest.
2.4.7 NOTES TO THE FINANCIAL STATEMENTS AND OTHER DATA Fee for managing the investment portfolio: 1.5% per annum calculated on the basis of the average total net assets of the sub-fund, no management fee is charged on assets assets invested in investment undertakings managed by a financial institution of the KBC group.

The administration agent’s fee is payable at the end of each month and is calculated on the basis of the average total net assets of the sub-fund. Auditor's fee: 1 700 EUR per year. This fee is not including VAT and can be indexed on an annual basis in accordance with the decisions of the general meeting. The custody fee is calculated on the value of the securities held in custody by the custodian on the final banking day of the preceding calendar year, except on those assets invested in investment undertakings managed by a financial institution of the KBC group. The custody fee is paid at the beginning of the calendar year. Social, ethical and environmental aspects: No manufacturers of controversial weapons whose use over the past five decades, according to the international consensus, has led to disproportionate human suffering among the civilian population will be included in the portfolio of investments. This involves the manufacturers of anti-personnel mines, cluster bombs and munitions and weapons containing depleted uranium. In this way, the sub-fund seeks to reflect not only simple financial reality but also the social reality of the sector or region in question. Exercising voting rights. If necessary, relevant and in the interest of the shareholders, the management company will exercise the voting rights attached to the shares in the Bevek’s portfolio. The management company will adhere to the following criteria when determining how it stands relative to the items on the agenda that are put to the vote: - Shareholder value may not be adversely affected. - Corporate governance rules, especially with regard to the rights of minority shareholders, must be
respected. - The minimum standards with regard to sustainable business and corporate social responsibility
must be met. The list of companies for which voting rights are exercised is available at the registered office of the Bevek. Financial derivatives on financial indices The following financial indices were used as the underlying for financial derivatives: The S&P 500 is an equity index computed by Standard & Poor’s that is made up of 500 shares. The dividend is not reinvested. The S&P 500 serves primarily as a continuous indicator of market trends on the US stock markets. The value of the S&P 500 index is calculated on the basis of the market value of the shares of 500 companies at a given point in time, compared to the market value of the shares of 500 similar companies during the reference period from 1941 to 1943. The index is published daily in L’Echo, De Tijd, The Financial Times and The Wall Street Journal Europe. Standard & Poor’s has all proprietary rights with repect to the index. In no way Standard & Poor’s endorses, sponsors or is otherwise involved in the issue and offering the shares of this undertaking for collective investment. Standard & Poor’s disclaims any liability for the issue and offering of the shares of this undertaking for collective investment The value and, if available for distribution, the composition of the aforementioned financial indices may be obtained from the branches providing the financial service. Securities lending In accordance with the Royal Decree of 7 March 2006 concerning securities lending, the undertaking for collective investment has taken out securities loans with a principal to whom the full title of the loaned securities was transferred, without recording this transfer of ownership in the accounts. For the period from 1 January 2013 to 30 June 2013, the fee for securities lent comes to 6,919.11 USD. The undertaking for collective investment receives 50% of the fee received for securities lent. The detailed list of securities lending transactions carried out can be obtained from the registered office of the collective investment undertaking at 2 Havenlaan, 1080 Brussels.
Overview of securities lent as at 30/06/2013
Name Currency Quantity Price Value in currency of the portfolio
GEORGE WESTON LTD CAD 1.300 83,730 103.181,51
HERBALIFE LTD USD 17.952 45,140 810.353,28
Total 913.534,79
Details of collateral received for securities lent
Name Currency Nominal value Currency fund Value in Currency fund
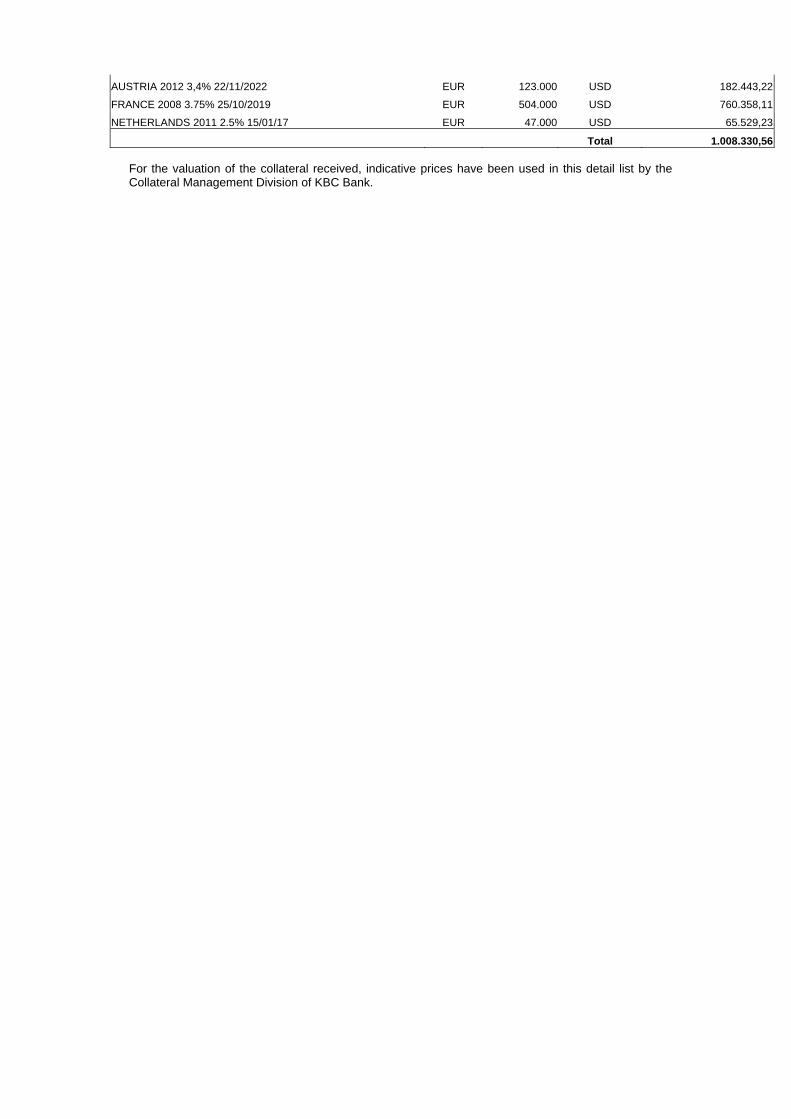
AUSTRIA 2012 3,4% 22/11/2022 EUR 123.000 USD 182.443,22
FRANCE 2008 3.75% 25/10/2019 EUR 504.000 USD 760.358,11
NETHERLANDS 2011 2.5% 15/01/17 EUR 47.000 USD 65.529,23
Total 1.008.330,56 For the valuation of the collateral received, indicative prices have been used in this detail list by the Collateral Management Division of KBC Bank.

Semi-Annual report as at 30th June 2013
TABLE OF CONTENTS
2. Information on KBC Equity Fund World
2.1. Management report 2.1.1. Launch date and subscription price 2.1.2. Stock exchange listing 2.1.3. Aim and distinctive features of the investment policy 2.1.4. Financial portfolio management 2.1.5. Distributors 2.1.6. Index and benchmark 2.1.7. Policy conducted during the financial year 2.1.8. Future policy 2.1.9. Synthetic risk and reward indicator (SRRI)
2.2. Balance sheet
2.3. Profit and loss account
2.4. Composition of the assets and key figures
2.4.1. Composition of the assets 2.4.2. Change in the composition of the assets 2.4.3. Value of commitments in respect of financial derivatives positions 2.4.4. Evolution of the number of subscriptions, repayments and the net asset value 2.4.5. Return figures 2.4.6. Expenses 2.4.7. Notes to the financial statements and other data

2 INFORMATION ON KBC EQUITY FUND WORLD
2.1 MANAGEMENT REPORT
2.1.1 LAUNCH DATE AND SUBSCRIPTION PRICE Launch date: 5 April 1991 Initial subscription price: 11741 BEF Currency: EUR
2.1.2 STOCK EXCHANGE LISTING Not applicable.
2.1.3 GOAL AND KEY PRINCIPLES OF THE INVESTMENT POLICY
SUB-FUND’S OBJECT: The main objective of this sub-fund is to generate the highest possible return for its shareholders by investing directly or indirectly in transferable securities. This is reflected in its pursuit of capital gains and income. To this end, the assets are invested, either directly or indirectly via correlated financial instruments, primarily in shares.
SUB-FUND’S INVESTMENT POLICY:
PERMITTED ASSET CLASSES: The sub-fund may invest in securities, money market instruments, units in undertakings for collective investment, deposits, financial derivatives, liquid assets and all other instruments insofar as permitted by the applicable laws and regulations and consistent with the sub-fund’s object
RESTRICTIONS OF THE INVESTMENT POLICY: The investment policy will be implemented within the limits set by law and regulations. The sub-fund may borrow up to 10% of its net assets, insofar as these are short-term borrowings aimed at solving temporary liquidity problems.
PERMITTED DERIVATIVES TRANSACTIONS: Derivates may be used either for hedging purposes or to achieve investment objectives. Changes will be made to the investments at regular intervals to comply with the sub-fund's investment strategy. In addition, listed and unlisted derivates may be used to achieve the objectives: these may be forward contracts, options or swaps on securities, indices, currencies or interest rates or other transactions involving derivatives. Unlisted derivatives transactions will only be concluded with prime financial institutions specialised in such transactions. Such derivatives may also be used to hedge the assets against exchange-rate fluctuations. Subject to the applicable laws and regulations and the articles of association, the sub-fund always seeks to conclude the most effective transactions. All costs associated with the transactions will be charged to the sub-fund and all income generated will be paid to the sub-fund. If the transactions result in a risk in respect of the counterparty, this risk can be hedged by using a margin management system that ensures that the sub-fund is the beneficiary of security (collateral) in the form of cash or investment grade bonds. When calculating the value of the bonds, a margin will be applied that varies depending on the residual term to maturity and the currency in which the bond in question is denominated. The relationship with the counterparty or counterparties is governed by standard international agreements.
STRATEGY SELECTED At least 75% of the assets are invested in an international basket of shares.
INVESTMENTS PRIMARILY IN ASSETS OTHER THAN SECURITIES OR MONEY MARKET INSTRUMENTS The sub-fund will invest primarily in permitted assets other than securities or money market instruments, including units in other UCIs.

LENDING FINANCIAL INSTRUMENTS: The sub-fund may lend financial instruments within the limits set by law and regulations. This lending does not affect the sub-fund’s risk profile since: - it takes place within the framework of a securities lending system managed by a principal. In
addition, the sub-fund has a relationship only with the principal of the securities lending system which acts as counterparty and to which title of the loaned securities is transferred. The choice of principal is subject to strict selection criteria. The return of securities similar to the securities that have been lent is guaranteed by the principal.
- through a margin management system, the sub-fund is always guaranteed financial security, the actual value of which always exceeds the actual value of the securities that have been lent, in case the principal does not return similar securities.
The return of securities similar to the securities that have been lent can be requested at any time, which means that the lending of securities does not affect the management of the sub-fund's assets. By lending securities, the sub-fund can generate an additional return. The principal pays a fee to the management company. After deducting the fee for the margin management and clearing services of KBC Bank, most of this fee is paid to the sub-fund. The relationship with the counterparty or counterparties is governed by standard international agreements. More information is provided on the terms and conditions governing securities lending in the annual or half-yearly report for the sub-fund.
VOLATILITY OF THE NET ASSET VALUE: The volatility of the net asset value may be high due to the composition of the portfolio.
GENERAL STRATEGY FOR HEDGING THE EXCHANGE RATE RISK: In order to protect its assets against exchange rate fluctuations and within the limitations laid down in the articles of association, the sub-fund may perform transactions relating to the sale of forward currency contracts, as well as the sale of call options and the purchase of put options on currencies. The transactions in question may relate solely to contracts traded on a regulated market that operates regularly, is recognised and is open to the public or that are traded with a recognised, prime financial institution specialising in such transactions and dealing in the over-the-counter (OTC) market in options. With the same objective, the sub-fund may also sell currencies forward or exchange them in private transactions with prime financial institutions specialising in such transactions. The hedging objective of the aforementioned transactions suggests that there is a direct link between these transactions and the assets to be hedged, which implies that the transactions carried out in a particular currency may in principle not exceed, in terms of volume, either the valuation value of all the assets in the same currency or the holding period of those assets.
SOCIAL, ETHICAL AND ENVIRONMENTAL ASPECTS:
No manufacturers of controversial weapons whose use over the past five decades, according to the international consensus, has led to disproportionate human suffering among the civilian population will be included in the portfolio of investments. This involves the manufacturers of anti-personnel mines, cluster bombs and munitions and weapons containing depleted uranium. In this way, the sub-fund seeks to reflect not only simple financial reality but also the social reality of the sector or region in question.
THE EUROPEAN SAVINGS DIRECTIVE AND TAX ON DEBT CLAIM RETURNS OBTAINED THROUGH THE
REDEMPTION OF OWN UNITS OR IN THE EVENT OF FULL OR PARTIAL DISTRIBUTION OF EQUITY
CAPITAL. The following information is of a general character and is not intended to cover all aspects of an investment in a UCITS. In certain cases entirely different rules might even apply. Moreover, both tax law and the interpretation of it can change. Investors who wish to have more information about the tax implications – in both Belgium and abroad – of acquiring, holding and transferring units should seek the advice of their usual financial and tax advisers. This UCITS shall invest a maximum of 15% of its assets directly or indirectly in debt instruments as intended by the European Savings Directive. A. European Savings Directive (Directive 2003/48/EC) The European Savings Directive has been implemented in Belgium.
Since this UCITS invests a maximum of 15% of its assets directly or indirectly in debt claims as intended by the European Savings Directive, the income of this UCITS does not fall within the scope of this directive. B. Tax on debt claim returns obtained through the redemption of own units or in the event of full or partial distribution of equity capital (Article 19bis Income Tax Code 1992). The income from this UCITS is not subject to the tax on debt instrument returns as intended by Article 19bis, Income Tax Code 1992.
2.1.4 FINANCIAL PORTFOLIO MANAGEMENT There is no delegation of the portfolio.
2.1.5 DISTRIBUTORS KBC Asset Management S.A., 5, Place de la Gare, L-1616 Luxembourg.
2.1.6 INDEX AND BENCHMARK See ‘Sub-fund’s investment policy’.
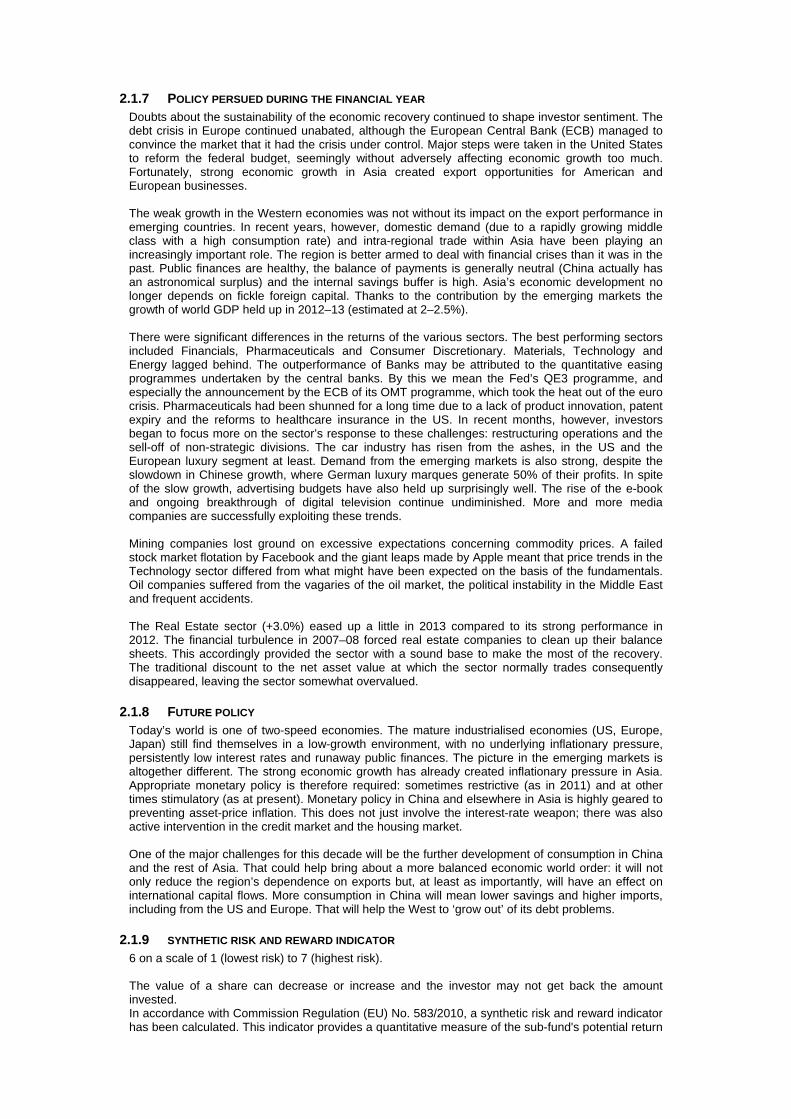
2.1.7 POLICY PERSUED DURING THE FINANCIAL YEAR Doubts about the sustainability of the economic recovery continued to shape investor sentiment. The debt crisis in Europe continued unabated, although the European Central Bank (ECB) managed to convince the market that it had the crisis under control. Major steps were taken in the United States to reform the federal budget, seemingly without adversely affecting economic growth too much. Fortunately, strong economic growth in Asia created export opportunities for American and European businesses. The weak growth in the Western economies was not without its impact on the export performance in emerging countries. In recent years, however, domestic demand (due to a rapidly growing middle class with a high consumption rate) and intra-regional trade within Asia have been playing an increasingly important role. The region is better armed to deal with financial crises than it was in the past. Public finances are healthy, the balance of payments is generally neutral (China actually has an astronomical surplus) and the internal savings buffer is high. Asia’s economic development no longer depends on fickle foreign capital. Thanks to the contribution by the emerging markets the growth of world GDP held up in 2012–13 (estimated at 2–2.5%). There were significant differences in the returns of the various sectors. The best performing sectors included Financials, Pharmaceuticals and Consumer Discretionary. Materials, Technology and Energy lagged behind. The outperformance of Banks may be attributed to the quantitative easing programmes undertaken by the central banks. By this we mean the Fed’s QE3 programme, and especially the announcement by the ECB of its OMT programme, which took the heat out of the euro crisis. Pharmaceuticals had been shunned for a long time due to a lack of product innovation, patent expiry and the reforms to healthcare insurance in the US. In recent months, however, investors began to focus more on the sector’s response to these challenges: restructuring operations and the sell-off of non-strategic divisions. The car industry has risen from the ashes, in the US and the European luxury segment at least. Demand from the emerging markets is also strong, despite the slowdown in Chinese growth, where German luxury marques generate 50% of their profits. In spite of the slow growth, advertising budgets have also held up surprisingly well. The rise of the e-book and ongoing breakthrough of digital television continue undiminished. More and more media companies are successfully exploiting these trends. Mining companies lost ground on excessive expectations concerning commodity prices. A failed stock market flotation by Facebook and the giant leaps made by Apple meant that price trends in the Technology sector differed from what might have been expected on the basis of the fundamentals. Oil companies suffered from the vagaries of the oil market, the political instability in the Middle East and frequent accidents. The Real Estate sector (+3.0%) eased up a little in 2013 compared to its strong performance in 2012. The financial turbulence in 2007–08 forced real estate companies to clean up their balance sheets. This accordingly provided the sector with a sound base to make the most of the recovery. The traditional discount to the net asset value at which the sector normally trades consequently disappeared, leaving the sector somewhat overvalued.
2.1.8 FUTURE POLICY Today’s world is one of two-speed economies. The mature industrialised economies (US, Europe, Japan) still find themselves in a low-growth environment, with no underlying inflationary pressure, persistently low interest rates and runaway public finances. The picture in the emerging markets is altogether different. The strong economic growth has already created inflationary pressure in Asia. Appropriate monetary policy is therefore required: sometimes restrictive (as in 2011) and at other times stimulatory (as at present). Monetary policy in China and elsewhere in Asia is highly geared to preventing asset-price inflation. This does not just involve the interest-rate weapon; there was also active intervention in the credit market and the housing market. One of the major challenges for this decade will be the further development of consumption in China and the rest of Asia. That could help bring about a more balanced economic world order: it will not only reduce the region’s dependence on exports but, at least as importantly, will have an effect on international capital flows. More consumption in China will mean lower savings and higher imports, including from the US and Europe. That will help the West to ‘grow out’ of its debt problems.
2.1.9 SYNTHETIC RISK AND REWARD INDICATOR 6 on a scale of 1 (lowest risk) to 7 (highest risk). The value of a share can decrease or increase and the investor may not get back the amount invested. In accordance with Commission Regulation (EU) No. 583/2010, a synthetic risk and reward indicator has been calculated. This indicator provides a quantitative measure of the sub-fund's potential return

and the risk involved, calculated in the currency in which the sub-fund is denominated. It is given as a figure between 1 and 7. The higher the figure, the greater the potential return, but also the more difficult it is to predict this return. Losses are possible too. The lowest figure does not mean that the investment is entirely free of risk. However, it does indicate that, compared with the higher figures, this product will generally provide a lower, but more predictable return. The synthetic risk and reward indicator is assessed regularly and can therefore go up or down based on data from the past. Data from the past is not always a reliable indicator of future risk and return.

2.2 BALANCE SHEET
Balance sheet layout 30/06/2013 (in the currency of the sub-fundt)
30/06/2012 (in the currency of the sub-fund )
TOTAL NET ASSETS 85.041.227,89 89.271.206,96
II. Securities, money market instruments, UCIs and derivatives
A. Bonds and other debt instruments a) Bonds 1.233.814,30 1.055.964,10 C. Shares and similar instruments a) Shares 0,06 1.106.203,59 E. Open-end undertakings for collective investment 83.661.595,13 86.509.752,48 F. Derivative financial instruments j) Foreign exchange Futures and forward contracts (+/-) 175,72 m) Financial indices Futures and forward contracts (+/-) -30.690,00 51.142,98
IV. Receivables and payables within one year A. Receivables a) Accounts receivable 11.034,23 59.359,97 c) Collateral 101.302,72 B. Payables a) Accounts payable (-) -79.261,78 -97.433,53 c) Borrowings (-) -934.547,79
V. Deposits and cash at bank and in hand A. Demand balances at banks 213.827,73 1.583.625,21
VI. Accruals and deferrals A. Expense to be carried forward 897,92 1.995,45 B. Accrued income 260,27 C. Accrued expense (-) -71.468,14 -65.115,75
TOTAL SHAREHOLDERS' EQUITY 85.041.227,89 89.271.206,96
A. Capital 78.839.708,31 84.716.367,38
B. Income equalization -244,64 -1.817,65
D. Result for the period 6.201.764,22 4.556.657,23
Off-balance-sheet headings
I Collateral (+/-)
I.A Collateral (+/-)
I.A.B Cash at bank and in hand/deposits 101.302,72
III Notional amounts of futures and forward contracts
III.A Purchased futures and forward contracts 1.497.740,95 1.053.044,45

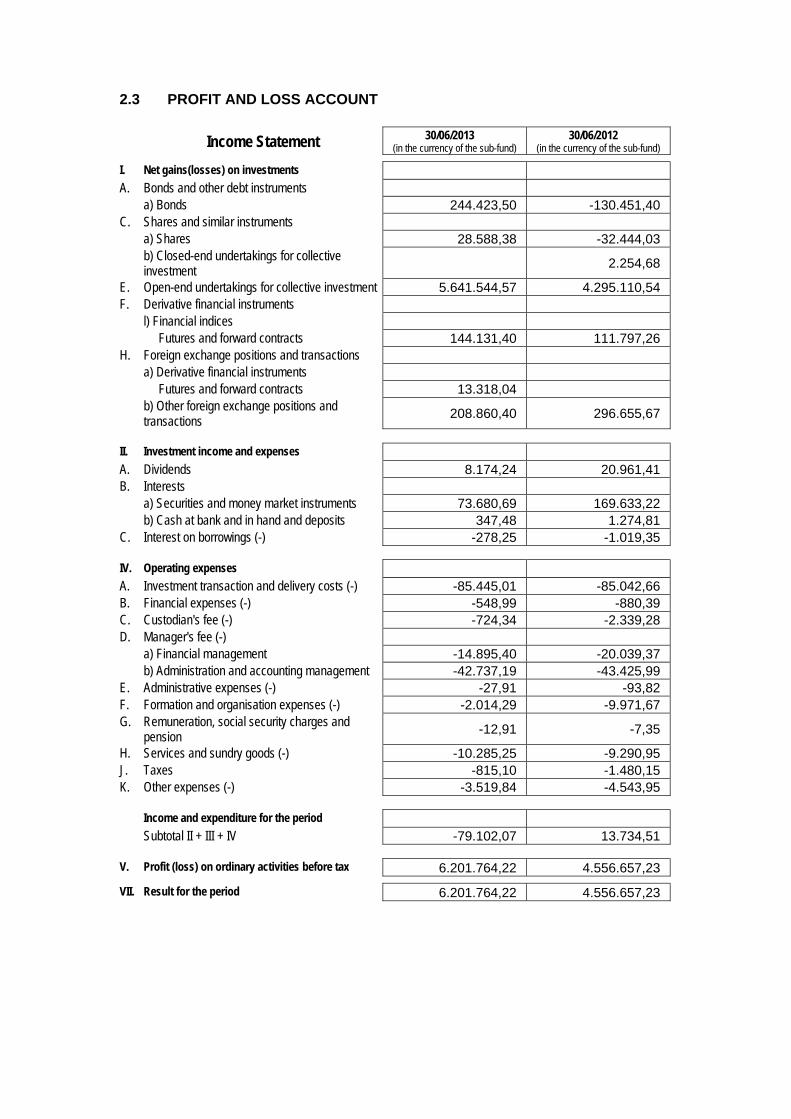
2.3 PROFIT AND LOSS ACCOUNT
Income Statement 30/06/2013 (in the currency of the sub-fund)
30/06/2012 (in the currency of the sub-fund)
I. Net gains(losses) on investments A. Bonds and other debt instruments a) Bonds 244.423,50 -130.451,40 C. Shares and similar instruments a) Shares 28.588,38 -32.444,03 b) Closed-end undertakings for collective
investment 2.254,68
E. Open-end undertakings for collective investment 5.641.544,57 4.295.110,54 F. Derivative financial instruments l) Financial indices Futures and forward contracts 144.131,40 111.797,26 H. Foreign exchange positions and transactions a) Derivative financial instruments Futures and forward contracts 13.318,04 b) Other foreign exchange positions and
transactions 208.860,40 296.655,67
II. Investment income and expenses A. Dividends 8.174,24 20.961,41 B. Interests a) Securities and money market instruments 73.680,69 169.633,22 b) Cash at bank and in hand and deposits 347,48 1.274,81 C. Interest on borrowings (-) -278,25 -1.019,35
IV. Operating expenses A. Investment transaction and delivery costs (-) -85.445,01 -85.042,66 B. Financial expenses (-) -548,99 -880,39 C. Custodian's fee (-) -724,34 -2.339,28 D. Manager's fee (-) a) Financial management -14.895,40 -20.039,37 b) Administration and accounting management -42.737,19 -43.425,99 E. Administrative expenses (-) -27,91 -93,82 F. Formation and organisation expenses (-) -2.014,29 -9.971,67 G. Remuneration, social security charges and
pension -12,91 -7,35
H. Services and sundry goods (-) -10.285,25 -9.290,95 J. Taxes -815,10 -1.480,15 K. Other expenses (-) -3.519,84 -4.543,95
Income and expenditure for the period Subtotal II + III + IV -79.102,07 13.734,51
V. Profit (loss) on ordinary activities before tax 6.201.764,22 4.556.657,23
VII. Result for the period 6.201.764,22 4.556.657,23
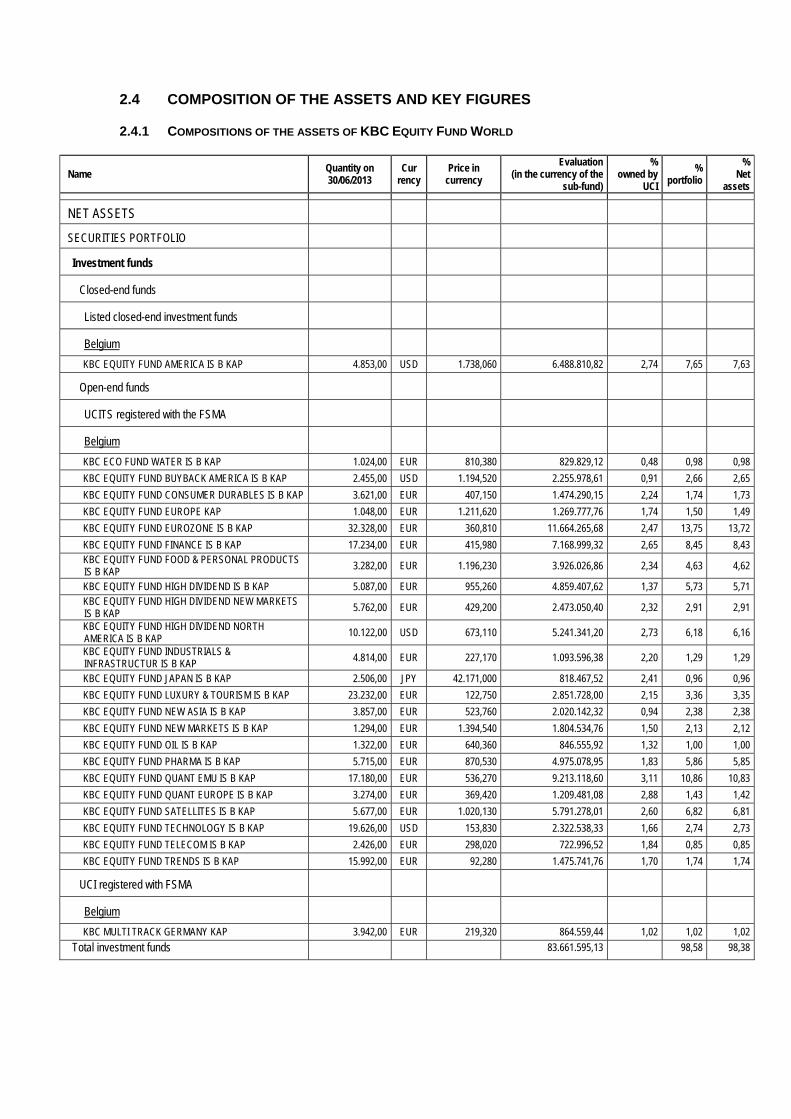
2.4 COMPOSITION OF THE ASSETS AND KEY FIGURES
2.4.1 COMPOSITIONS OF THE ASSETS OF KBC EQUITY FUND WORLD
Name Quantity on 30/06/2013
Cur rency
Price in currency
Evaluation (in the currency of the
sub-fund)
% owned by
UCI
% portfolio
% Net
assets
NET ASSETS
SECURITIES PORTFOLIO
Investment funds
Closed-end funds
Listed closed-end investment funds
Belgium
KBC EQUITY FUND AMERICA IS B KAP 4.853,00 USD 1.738,060 6.488.810,82 2,74 7,65 7,63
Open-end funds
UCITS registered with the FSMA
Belgium
KBC ECO FUND WATER IS B KAP 1.024,00 EUR 810,380 829.829,12 0,48 0,98 0,98
KBC EQUITY FUND BUYBACK AMERICA IS B KAP 2.455,00 USD 1.194,520 2.255.978,61 0,91 2,66 2,65
KBC EQUITY FUND CONSUMER DURABLES IS B KAP 3.621,00 EUR 407,150 1.474.290,15 2,24 1,74 1,73
KBC EQUITY FUND EUROPE KAP 1.048,00 EUR 1.211,620 1.269.777,76 1,74 1,50 1,49
KBC EQUITY FUND EUROZONE IS B KAP 32.328,00 EUR 360,810 11.664.265,68 2,47 13,75 13,72
KBC EQUITY FUND FINANCE IS B KAP 17.234,00 EUR 415,980 7.168.999,32 2,65 8,45 8,43 KBC EQUITY FUND FOOD & PERSONAL PRODUCTS IS B KAP 3.282,00 EUR 1.196,230 3.926.026,86 2,34 4,63 4,62
KBC EQUITY FUND HIGH DIVIDEND IS B KAP 5.087,00 EUR 955,260 4.859.407,62 1,37 5,73 5,71 KBC EQUITY FUND HIGH DIVIDEND NEW MARKETS IS B KAP 5.762,00 EUR 429,200 2.473.050,40 2,32 2,91 2,91
KBC EQUITY FUND HIGH DIVIDEND NORTH AMERICA IS B KAP 10.122,00 USD 673,110 5.241.341,20 2,73 6,18 6,16
KBC EQUITY FUND INDUSTRIALS & INFRASTRUCTUR IS B KAP
4.814,00 EUR 227,170 1.093.596,38 2,20 1,29 1,29
KBC EQUITY FUND JAPAN IS B KAP 2.506,00 JPY 42.171,000 818.467,52 2,41 0,96 0,96
KBC EQUITY FUND LUXURY & TOURISM IS B KAP 23.232,00 EUR 122,750 2.851.728,00 2,15 3,36 3,35
KBC EQUITY FUND NEW ASIA IS B KAP 3.857,00 EUR 523,760 2.020.142,32 0,94 2,38 2,38
KBC EQUITY FUND NEW MARKETS IS B KAP 1.294,00 EUR 1.394,540 1.804.534,76 1,50 2,13 2,12
KBC EQUITY FUND OIL IS B KAP 1.322,00 EUR 640,360 846.555,92 1,32 1,00 1,00
KBC EQUITY FUND PHARMA IS B KAP 5.715,00 EUR 870,530 4.975.078,95 1,83 5,86 5,85
KBC EQUITY FUND QUANT EMU IS B KAP 17.180,00 EUR 536,270 9.213.118,60 3,11 10,86 10,83
KBC EQUITY FUND QUANT EUROPE IS B KAP 3.274,00 EUR 369,420 1.209.481,08 2,88 1,43 1,42
KBC EQUITY FUND SATELLITES IS B KAP 5.677,00 EUR 1.020,130 5.791.278,01 2,60 6,82 6,81
KBC EQUITY FUND TECHNOLOGY IS B KAP 19.626,00 USD 153,830 2.322.538,33 1,66 2,74 2,73
KBC EQUITY FUND TELECOM IS B KAP 2.426,00 EUR 298,020 722.996,52 1,84 0,85 0,85
KBC EQUITY FUND TRENDS IS B KAP 15.992,00 EUR 92,280 1.475.741,76 1,70 1,74 1,74
UCI registered with FSMA
Belgium
KBC MULTI TRACK GERMANY KAP 3.942,00 EUR 219,320 864.559,44 1,02 1,02 1,02
Total investment funds 83.661.595,13 98,58 98,38
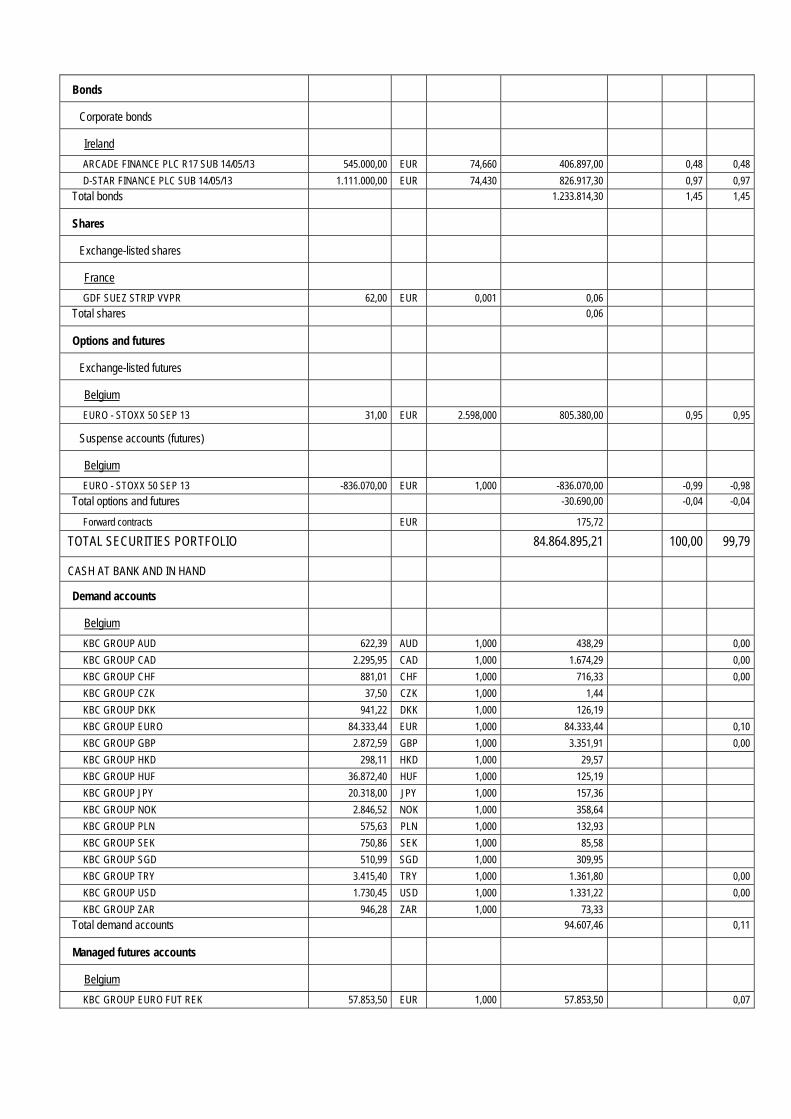
Bonds
Corporate bonds
Ireland
ARCADE FINANCE PLC R17 SUB 14/05/13 545.000,00 EUR 74,660 406.897,00 0,48 0,48
D-STAR FINANCE PLC SUB 14/05/13 1.111.000,00 EUR 74,430 826.917,30 0,97 0,97
Total bonds 1.233.814,30 1,45 1,45
Shares
Exchange-listed shares
France
GDF SUEZ STRIP VVPR 62,00 EUR 0,001 0,06
Total shares 0,06
Options and futures
Exchange-listed futures
Belgium
EURO - STOXX 50 SEP 13 31,00 EUR 2.598,000 805.380,00 0,95 0,95
Suspense accounts (futures)
Belgium
EURO - STOXX 50 SEP 13 -836.070,00 EUR 1,000 -836.070,00 -0,99 -0,98
Total options and futures -30.690,00 -0,04 -0,04
Forward contracts EUR 175,72
TOTAL SECURITIES PORTFOLIO 84.864.895,21 100,00 99,79
CASH AT BANK AND IN HAND
Demand accounts
Belgium
KBC GROUP AUD 622,39 AUD 1,000 438,29 0,00
KBC GROUP CAD 2.295,95 CAD 1,000 1.674,29 0,00
KBC GROUP CHF 881,01 CHF 1,000 716,33 0,00
KBC GROUP CZK 37,50 CZK 1,000 1,44
KBC GROUP DKK 941,22 DKK 1,000 126,19
KBC GROUP EURO 84.333,44 EUR 1,000 84.333,44 0,10
KBC GROUP GBP 2.872,59 GBP 1,000 3.351,91 0,00
KBC GROUP HKD 298,11 HKD 1,000 29,57
KBC GROUP HUF 36.872,40 HUF 1,000 125,19
KBC GROUP JPY 20.318,00 JPY 1,000 157,36
KBC GROUP NOK 2.846,52 NOK 1,000 358,64
KBC GROUP PLN 575,63 PLN 1,000 132,93
KBC GROUP SEK 750,86 SEK 1,000 85,58
KBC GROUP SGD 510,99 SGD 1,000 309,95
KBC GROUP TRY 3.415,40 TRY 1,000 1.361,80 0,00
KBC GROUP USD 1.730,45 USD 1,000 1.331,22 0,00
KBC GROUP ZAR 946,28 ZAR 1,000 73,33
Total demand accounts 94.607,46 0,11
Managed futures accounts
Belgium
KBC GROUP EURO FUT REK 57.853,50 EUR 1,000 57.853,50 0,07
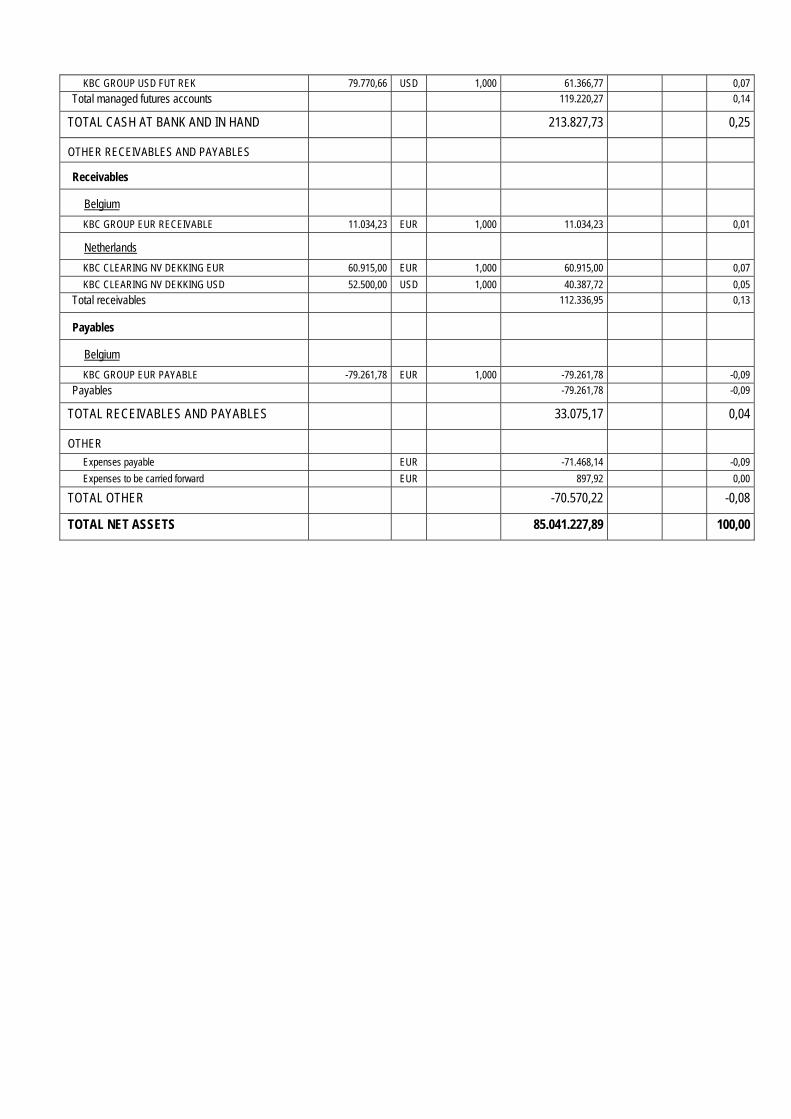
KBC GROUP USD FUT REK 79.770,66 USD 1,000 61.366,77 0,07
Total managed futures accounts 119.220,27 0,14
TOTAL CASH AT BANK AND IN HAND 213.827,73 0,25
OTHER RECEIVABLES AND PAYABLES
Receivables
Belgium
KBC GROUP EUR RECEIVABLE 11.034,23 EUR 1,000 11.034,23 0,01
Netherlands
KBC CLEARING NV DEKKING EUR 60.915,00 EUR 1,000 60.915,00 0,07
KBC CLEARING NV DEKKING USD 52.500,00 USD 1,000 40.387,72 0,05
Total receivables 112.336,95 0,13
Payables
Belgium
KBC GROUP EUR PAYABLE -79.261,78 EUR 1,000 -79.261,78 -0,09
Payables -79.261,78 -0,09
TOTAL RECEIVABLES AND PAYABLES 33.075,17 0,04
OTHER
Expenses payable EUR -71.468,14 -0,09
Expenses to be carried forward EUR 897,92 0,00
TOTAL OTHER -70.570,22 -0,08
TOTAL NET ASSETS 85.041.227,89 100,00

Geographic breakdown (as a % of securities portfolio)
31/12/2011 30/06/2012 31/12/2012 30/06/2013 Argentinia 0,00 0,01 0,00 0,00 Australia 1,54 0,90 1,38 0,99 Austria 0,25 0,27 0,28 0,25 Belgium 2,47 3,50 4,71 1,75 Bermuda 0,36 0,36 0,28 0,39 Brazil 1,32 1,05 1,05 0,93 Canada 1,77 1,31 1,68 1,51 Switzerland 2,45 1,98 1,98 2,49 Chile 0,08 0,15 0,17 0,15 China 1,81 1,84 1,92 1,77 Colombia 0,23 0,17 0,15 0,07 Czech Republic 0,16 0,07 0,06 0,05 Cayman Islands 0,18 0,32 0,28 0,20 Cyprus 0,01 0,02 0,00 0,00 Germany 8,64 12,69 10,88 11,02 Denmark 0,42 0,51 0,60 0,36 Egypt 0,01 0,00 0,00 0,01 Spain 3,19 3,53 3,33 2,78 Finland 0,83 0,44 0,61 0,50 France 8,73 10,87 9,63 8,84 U.K. 7,24 6,02 5,36 4,86 Greece 0,08 0,06 0,07 0,07 Hong Kong 1,39 1,37 1,23 1,22 Hungary 0,03 0,01 0,01 0,03 India 0,78 0,80 0,64 0,77 Indonesia 0,34 0,47 0,31 0,49 Ireland 3,30 1,80 1,57 2,21 Israel 0,06 0,04 0,02 0,07 Italy 2,21 3,09 2,28 1,94 Jersey/The Channel Islands 0,21 0,15 0,20 0,17 Japan 3,74 3,11 3,98 5,95 South Korea 2,26 2,32 2,05 1,74 Luxembourg 0,49 0,43 0,37 0,09 Mexico 0,42 0,44 0,46 0,45 Malaysia 0,58 0,62 0,42 0,50 Netherlands 3,50 3,62 3,28 3,64 Norway 0,45 0,45 0,43 0,17 New Zealand 0,02 0,01 0,03 0,05 Peru 0,11 0,09 0,10 0,02 Philippines 0,14 0,20 0,16 0,18 Papua New Guinea 0,00 0,00 0,00 0,01 Poland 0,23 0,12 0,14 0,09 Portugal 0,27 0,09 0,09 0,31 Romania 0,01 0,00 0,00 0,00 Russia 1,42 0,50 0,50 0,26 Singapore 0,33 0,25 0,28 0,20 Slovenia 0,01 0,00 0,00 0,00 Sweden 0,87 0,80 1,14 0,75 Thailand 0,23 0,38 0,35 0,52 Turkey 0,24 0,33 0,28 0,24 Taiwan 1,88 1,88 1,60 1,30 U.S.A. 32,03 29,88 33,00 37,13

South Africa 0,66 0,65 0,66 0,50 Zaire 0,02 0,03 0,00 0,01 Total 100,00 100,00 100,00 100,00
Sector breakdown (as a % of securities portfolio)
31/12/2011 30/06/2012 31/12/2012 30/06/2013 Cyclicals 25,73 25,07 23,34 20,82 Consum(cycl) 10,14 12,09 10,28 15,87 Cons.goods 11,91 12,63 11,49 13,40 Pharma 8,80 8,77 9,35 11,17 Financials 21,43 20,56 24,56 20,45 Technology 10,83 11,86 12,42 10,41 Telecomm. 6,46 4,18 4,21 3,14 Utilities 3,48 3,61 3,02 2,76 Real est. 1,17 1,13 1,31 1,95 Governm. 0,01 0,01 0,00 0,00 Unit trusts 0,01 0,02 0,00 0,00 Various 0,03 0,07 0,02 0,03 Total 100,00 100,00 100,00 100,00
Currency breakdown (as a % of net assets)
31/12/2011 30/06/2012 31/12/2012 30/06/2013 AUD 1,56 0,90 1,37 0,91 BRL 1,27 1,04 1,02 0,86 CAD 3,15 2,51 2,85 1,43 CHF 2,48 1,74 2,03 2,42 CNY 0,18 0,03 0,04 0,03 COP 0,04 0,02 0,00 0,01 CZK 0,17 0,07 0,06 -0,05 DKK 0,42 0,51 0,60 0,33 EUR 34,52 41,06 35,02 33,99 GBP 6,80 5,15 5,34 5,05 HKD 3,07 3,48 3,36 3,12 HUF 0,03 0,01 0,01 0,03 IDR 0,43 0,50 0,31 0,53 ILS 0,00 0,01 0,01 0,08 INR 0,62 0,71 0,59 0,67 JPY 3,66 3,14 3,97 4,16 KRW 2,24 2,31 2,03 1,76 MXN 0,31 0,42 0,40 0,40 MYR 0,58 0,60 0,41 0,51 NOK 0,45 0,44 0,45 0,21 NZD 0,03 0,01 0,03 0,05 PHP 0,14 0,20 0,16 0,19 PLN 0,23 0,12 0,14 0,09 RON 0,01 0,00 0,00 0,00 SEK 0,88 0,79 1,10 0,74 SGD 0,30 0,25 0,28 0,20 THB 0,26 0,38 0,35 0,54 TRY 0,24 0,33 0,28 0,24 TWD 1,82 1,88 1,53 1,38 USD 33,43 30,71 35,59 39,61 ZAR 0,68 0,68 0,67 0,51

Total 100,00 100,00 100,00 100,00

2.4.2 CHANGES IN THE COMPOSITION OF THE ASSETS OF KBC EQUITY FUND WORLD (IN THE
CURRENCY OF THE SUB-FUND)
1st half of year YearPurchases 23.394.703,53 23.394.703,53 Sales 27.879.455,20 27.879.455,20 Total 1 51.274.158,72 51.274.158,72 Subscriptions 973.681,60 973.681,60 Redemptions 5.470.474,27 5.470.474,27 Total 2 6.444.155,87 6.444.155,87 Monthly average of total assets
86.914.024,39 86.914.024,39
Turnover rate 51,58 % 51,58 %
1st half of year YearPurchases 23.394.703,53 23.394.703,53 Sales 27.879.455,20 27.879.455,20 Total 1 51.274.158,72 51.274.158,72 Subscriptions 973.681,60 973.681,60 Redemptions 5.470.474,27 5.470.474,27 Total 2 6.444.155,87 6.444.155,87 Monthly average of total assets
86.708.450,07 86.708.450,07
Corrected turnover rate 51,70 % 51,70 %
The table above shows the capital volume of portfolio transactions. This volume (adjusted to take account of total subscriptions and redemptions) is also compared to the average net assets at the beginning and end of the period. A figure close to 0% implies that the transactions relating to the securities or transactions relating to the assets (excluding deposits and cash) in a given period only involve subscriptions and redemptions. A negative percentage shows that subscriptions and redemptions entailed few, if any, transactions in the portfolio. Active asset management may result in high turnover rates (monthly percentage >50%). The detailed list of transactions is available for consultation free of charge at the registered office of the Bevek or fund at Havenlaan 2, 1080 Brussels.
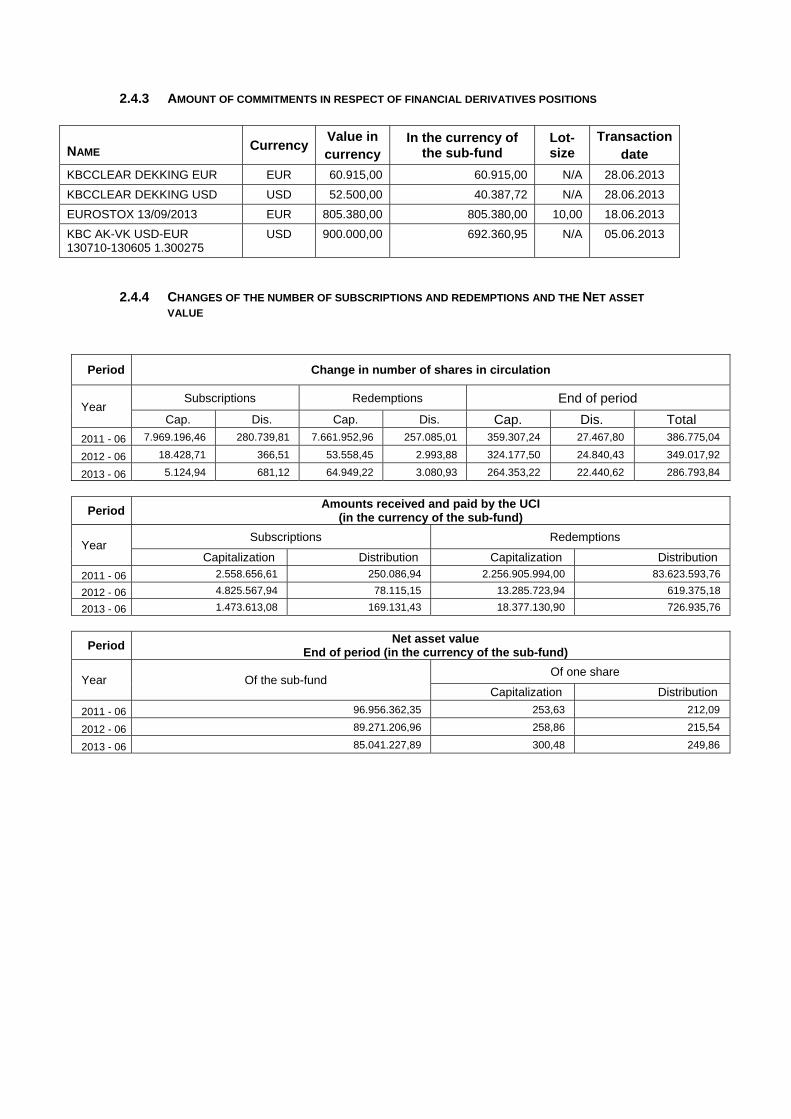
2.4.3 AMOUNT OF COMMITMENTS IN RESPECT OF FINANCIAL DERIVATIVES POSITIONS
NAME Currency Value in currency
In the currency of the sub-fund
Lot-size
Transactiondate
KBCCLEAR DEKKING EUR EUR 60.915,00 60.915,00 N/A 28.06.2013
KBCCLEAR DEKKING USD USD 52.500,00 40.387,72 N/A 28.06.2013
EUROSTOX 13/09/2013 EUR 805.380,00 805.380,00 10,00 18.06.2013
KBC AK-VK USD-EUR 130710-130605 1.300275
USD 900.000,00 692.360,95 N/A 05.06.2013
2.4.4 CHANGES OF THE NUMBER OF SUBSCRIPTIONS AND REDEMPTIONS AND THE NET ASSET
VALUE
Period Change in number of shares in circulation
Year Subscriptions Redemptions End of period
Cap. Dis. Cap. Dis. Cap. Dis. Total 2011 - 06 7.969.196,46 280.739,81 7.661.952,96 257.085,01 359.307,24 27.467,80 386.775,04
2012 - 06 18.428,71 366,51 53.558,45 2.993,88 324.177,50 24.840,43 349.017,92
2013 - 06 5.124,94 681,12 64.949,22 3.080,93 264.353,22 22.440,62 286.793,84
Period Amounts received and paid by the UCI
(in the currency of the sub-fund)
Year Subscriptions Redemptions
Capitalization Distribution Capitalization Distribution
2011 - 06 2.558.656,61 250.086,94 2.256.905.994,00 83.623.593,76
2012 - 06 4.825.567,94 78.115,15 13.285.723,94 619.375,18
2013 - 06 1.473.613,08 169.131,43 18.377.130,90 726.935,76
Period Net asset value
End of period (in the currency of the sub-fund)
Year Of the sub-fund Of one share
Capitalization Distribution
2011 - 06 96.956.362,35 253,63 212,09
2012 - 06 89.271.206,96 258,86 215,54
2013 - 06 85.041.227,89 300,48 249,86

2.4.5 PERFORMANCE FIGURES
Cap Div
ISIN code Cur-
rency
1 Year 3 Years* 5 Years* 10 Years* Since launch*
Share classes
Bench mark
Share classes
Bench mark
Share classes
Bench mark
Share classes
Bench mark
Launch Date
Share classes
CAP BE6213775529 EUR 16.08% 8.85% 3.05% 2.84% 05/04/1991 3.25%
DIV BE6213776535 EUR 16.06% 8.86% 3.05% 2.84% 05/04/1991 2.80%
Risk warning: Past performance is not a guide to future performance. * Return on annual basis.

The bar chart shows the performance for full financial years. The figures do not take account of any restructuring. Calculated in EUR (ex BEF). the return is calculated as the change in the net asset value between two dates expressed
as a percentage. In the case of units that pay dividends, the dividend is incorporated geometrically in the return.
Calculation method for date D, where NAV stands for net asset value: Capitalisation units (CAP) Return on date D over a period of X years:
[NAV(D) / NAV(Y)] ^ [1 / X] - 1 where Y = D-X
Return on date D since the start date S of the unit: [NAV(D) / NAV(S)] ^ [1 / F] - 1 where F = 1 if the unit has existed for less than one year on date D where F = (D-S) / 365.25 if the unit has existed for longer than one year on date D
Distribution units (DIV) Return on date D over a period of X years:
[ C * NAV(D) / NAV(Y)] ^ [1 / X] - 1 where Y = D-X
Return on date D since the start date S of the unit: [ C * NAV(D) / NAV(S)] ^ [1 / F] - 1 where F = 1 if the unit has existed for less than one year on date D where F = (D-S) / 365.25 if the unit has existed for longer than one year on date D
where C is a factor that is determined for all N dividends between the calculation date D and the reference date. For dividend i on date Di with value Wi:
Ci = [Wi / NAV(Di)] + 1 i = 1 ... N
from which C = C0 * .... * CN. If the interval between the two dates exceeds one year, the ordinary return calculation is
converted into a return on an annual basis by taking the nth square root of 1 plus the total return of the unit.
The return figures shown above do not take account of the fees and charges associated with the issue and redemption of units.
These are the performance figures for capitalisation and distribution shares.

2.4.6 COSTS Ongoing charges: * Distribution: 2.031% Capitalization: 2.019% * The following costs have not been included in the ongoing charges: - Interest payments on loans taken out - Payments in respect of financial derivatives - Fees and charges paid directly by the investor - Any soft commissions
SOFT COMMISSIONS The management company or the appointed manager, as the case may be, is the recipient of soft commissions. The recipient has laid down an internal policy as regards accepting soft commissions and avoiding possible conflicts of interest in this respect, and has put appropriate internal controls in place to ensure this policy is observed. For more information, please see the ‘General’ section of the annual report.
Broker
Commission gross
in EUR
paid during the period:
1‐01‐13
‐
30‐06‐13
CSA Credits
in EUR
accrued during the period:
1‐01‐13
‐
30‐06‐13 Percentage
CSFBSAS 748 321 42.93%
FEE-SHARING AGREEMENTS AND REBATES: The management company may share its fee with the distributor, and institutional and/or professional parties. In principle, the percentage share amounts to between 35% and 60% if the distributor is an entity of KBC Group NV or to between 35% and 70% if the distributor is not an entity of KBC Group NV. However, in a small number of cases, the distributor’s fee is less than 35%. Investors may, on request, obtain more information on these cases. If the management company invests the assets of the undertaking for collective investment in units of undertakings for collective investment that are not managed by an entity of KBC Group NV, and receives a fee for doing so, it will pay this fee to the undertaking for collective investment. Fee-sharing does not affect the amount of the management fee paid by the sub-fund to the management company. This management fee is subject to the limitations laid down in the articles of association. The limitations may only be amended after approval by the general meeting of shareholders. The management company has concluded a distribution agreement with the distributor in order to facilitate the wider distribution of the sub-fund's units by using multiple distribution channels. It is in the interests of the holders of units, the sub-fund and of the distributor for the largest possible number of units to be sold and for the assets of the sub-fund to be maximised in this way. In this respect, there is therefore no question of any conflict of interest.
2.4.7 NOTES TO THE FINANCIAL STATEMENTS AND OTHER DATA Fee for managing the investment portfolio: 1.5% per annum calculated on the basis of the average total net assets of the sub-fund, no management fee is charged on assets assets invested in investment undertakings managed by a financial institution of the KBC group. The administration agent’s fee is payable at the end of each month and is calculated on the basis of the average total net assets of the sub-fund. Auditor's fee: 1 700 EUR per year. This fee is not including VAT and can be indexed on an annual basis in accordance with the decisions of the general meeting. The custody fee is calculated on the value of the securities held in custody by the custodian on the final banking day of the preceding calendar year, except on those assets invested in investment undertakings managed by a financial institution of the KBC group. The custody fee is paid at the beginning of the calendar year. Social, ethical and environmental aspects: No manufacturers of controversial weapons whose use over the past five decades, according to the international consensus, has led to disproportionate human suffering among the civilian population will be included in the portfolio of investments. This involves the manufacturers of anti-personnel

mines, cluster bombs and munitions and weapons containing depleted uranium. In this way, the sub-fund seeks to reflect not only simple financial reality but also the social reality of the sector or region in question. Exercising voting rights. If necessary, relevant and in the interest of the shareholders, the management company will exercise the voting rights attached to the shares in the Bevek’s portfolio. The management company will adhere to the following criteria when determining how it stands relative to the items on the agenda that are put to the vote: - Shareholder value may not be adversely affected. - Corporate governance rules, especially with regard to the rights of minority shareholders, must be
respected. - The minimum standards with regard to sustainable business and corporate social responsibility
must be met. The list of companies for which voting rights are exercised is available at the registered office of the Bevek. Financial derivatives on financial indices The following financial indices were used as the underlying for financial derivatives: The Euro Stoxx 50 is a weighted equity index computed by Stoxx Ltd. The dividend is not reinvested. The main purpose of this index is to provide a continuous indication of market trends on the European stock markets. The base value of the index is 1000, calculated on the basis of the underlying prices recorded on 31 December 1991. The Euro Stoxx 50 consists solely of shares from countries participating in the Economic and Monetary Union, with the exception of Luxembourg. On 10 April 1998, the following stock exchanges were included in the index: Austria (Vienna), Belgium (Brussels), Finland (Helsinki), France (Paris), Germany (Frankfurt), Italy (Milan), Ireland (Dublin), the Netherlands (Amsterdam), Portugal (Lisbon) and Spain (Madrid). The index consists of the 50 largest European shares in terms of shares that are freely negotiable, and the shares are accordingly weighted on the basis of this criterion. The Euro Stoxx 50 is published daily in L’Echo, De Tijd, The Financial Times and The Wall Street Journal Europe. Stoxx Limited has all proprietary rights with repect to the index. In no way Stoxx Limited endorses, sponsors or is otherwise involved in the issue and offering the shares of this undertaking for collective investment. Stoxx Limited disclaims any liability for the issue and offering of the shares of this undertaking for collective investment. The value and, if available for distribution, the composition of the aforementioned financial indices may be obtained from the branches providing the financial service.
Name Maximum management
fee KBC Equity Fund-America-Institutional B Shares 1,50
KBC Eco Fund-Water-Institutional B Shares 1,50
KBC Equity Fund-Buyback America-Institutional B Shares 1,50
KBC Equity Fund-Consumer Durables-Institutional B Shares 1,50
KBC Equity Fund-Europe 1,50
KBC Equity Fund-Eurozone-Institutional B Shares 1,50
KBC Equity Fund-Finance-Institutional B Shares 1,50
KBC Equity Fund-Food & Personal Products-Institutional B Shares
1,50
KBC Equity Fund-High Dividend-Institutional B Shares 1,50
KBC Equity Fund-High Dividend New Markets-Institutional B Shares
1,50
KBC Equity Fund-High Dividend North America-Institutional B Shares
1,50
KBC Equity Fund-Industrials & Infrastructure-Institutional B Shares
1,50
KBC Equity Fund-Japan-Institutional B Shares 1,50
KBC Equity Fund-Luxury & Tourism-Institutional B Shares 1,50
KBC Equity Fund-New Asia-Institutional B Shares 1,60
KBC Equity Fund-New Markets-Institutional B Shares 1,60
KBC Equity Fund-Oil-Institutional B Shares 1,50
KBC Equity Fund-Pharma-Institutional B Shares 1,50
KBC Equity Fund-Quant EMU-Institutional B Shares 1,50

KBC Equity Fund-Quant Europe-Institutional B Shares 1,50
KBC Equity Fund-Satellites-Institutional B Shares 1,50
KBC Equity Fund-Technology-Institutional B Shares 1,50
KBC Equity Fund-Telecom-Institutional B Shares 1,50
KBC Equity Fund-Trends-Institutional B Shares 1,50
KBC Multi Track-Germany 0,70
KBC Equity Fund-World 1,50

Semi-Annual report as at 30th June 2013
TABLE OF CONTENTS
2. Information on KBC Equity Fund Europe
2.1. Management report 2.1.1. Launch date and subscription price 2.1.2. Stock exchange listing 2.1.3. Aim and distinctive features of the investment policy 2.1.4. Financial portfolio management 2.1.5. Distributors 2.1.6. Index and benchmark 2.1.7. Policy conducted during the financial year 2.1.8. Future policy 2.1.9. Synthetic risk and reward indicator (SRRI)
2.2. Balance sheet
2.3. Profit and loss account
2.4. Composition of the assets and key figures
2.4.1. Composition of the assets 2.4.2. Change in the composition of the assets 2.4.3. Value of commitments in respect of financial derivatives positions 2.4.4. Evolution of the number of subscriptions, repayments and the net asset value 2.4.5. Return figures 2.4.6. Expenses 2.4.7. Notes to the financial statements and other data

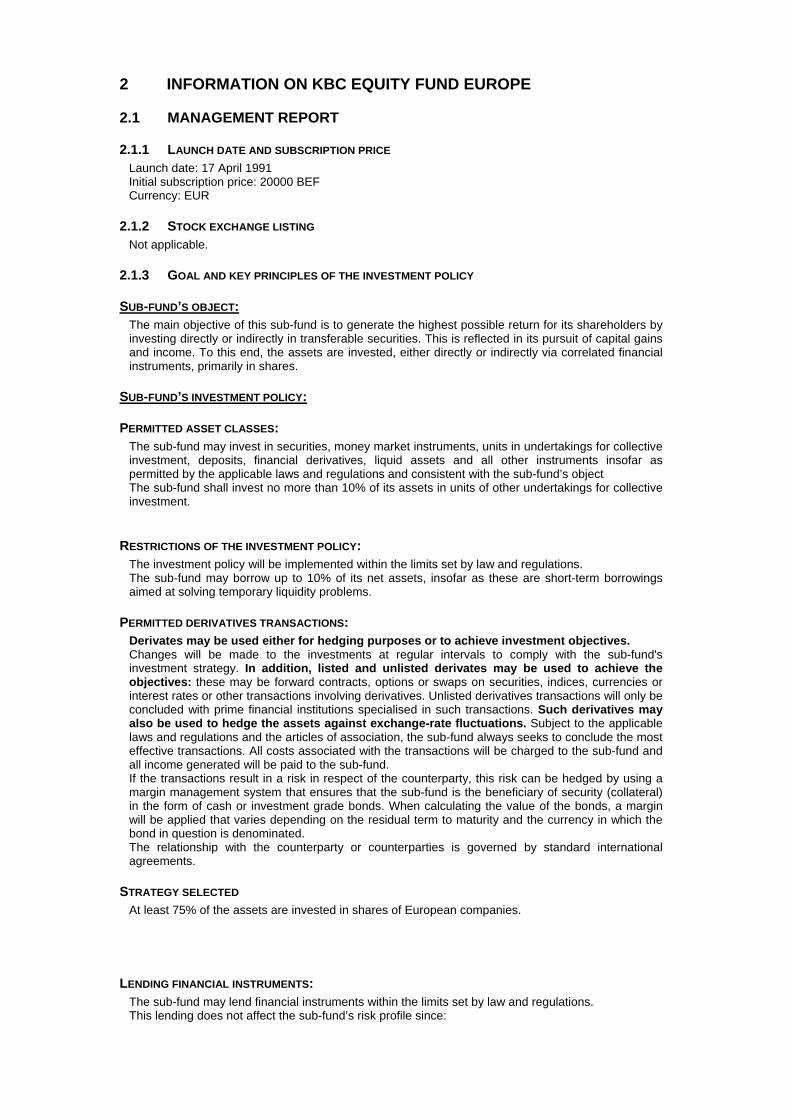
2 INFORMATION ON KBC EQUITY FUND EUROPE
2.1 MANAGEMENT REPORT
2.1.1 LAUNCH DATE AND SUBSCRIPTION PRICE Launch date: 17 April 1991 Initial subscription price: 20000 BEF Currency: EUR
2.1.2 STOCK EXCHANGE LISTING Not applicable.
2.1.3 GOAL AND KEY PRINCIPLES OF THE INVESTMENT POLICY
SUB-FUND’S OBJECT: The main objective of this sub-fund is to generate the highest possible return for its shareholders by investing directly or indirectly in transferable securities. This is reflected in its pursuit of capital gains and income. To this end, the assets are invested, either directly or indirectly via correlated financial instruments, primarily in shares.
SUB-FUND’S INVESTMENT POLICY:
PERMITTED ASSET CLASSES: The sub-fund may invest in securities, money market instruments, units in undertakings for collective investment, deposits, financial derivatives, liquid assets and all other instruments insofar as permitted by the applicable laws and regulations and consistent with the sub-fund’s object The sub-fund shall invest no more than 10% of its assets in units of other undertakings for collective investment.
RESTRICTIONS OF THE INVESTMENT POLICY: The investment policy will be implemented within the limits set by law and regulations. The sub-fund may borrow up to 10% of its net assets, insofar as these are short-term borrowings aimed at solving temporary liquidity problems.
PERMITTED DERIVATIVES TRANSACTIONS: Derivates may be used either for hedging purposes or to achieve investment objectives. Changes will be made to the investments at regular intervals to comply with the sub-fund's investment strategy. In addition, listed and unlisted derivates may be used to achieve the objectives: these may be forward contracts, options or swaps on securities, indices, currencies or interest rates or other transactions involving derivatives. Unlisted derivatives transactions will only be concluded with prime financial institutions specialised in such transactions. Such derivatives may also be used to hedge the assets against exchange-rate fluctuations. Subject to the applicable laws and regulations and the articles of association, the sub-fund always seeks to conclude the most effective transactions. All costs associated with the transactions will be charged to the sub-fund and all income generated will be paid to the sub-fund. If the transactions result in a risk in respect of the counterparty, this risk can be hedged by using a margin management system that ensures that the sub-fund is the beneficiary of security (collateral) in the form of cash or investment grade bonds. When calculating the value of the bonds, a margin will be applied that varies depending on the residual term to maturity and the currency in which the bond in question is denominated. The relationship with the counterparty or counterparties is governed by standard international agreements.
STRATEGY SELECTED At least 75% of the assets are invested in shares of European companies.
LENDING FINANCIAL INSTRUMENTS: The sub-fund may lend financial instruments within the limits set by law and regulations. This lending does not affect the sub-fund’s risk profile since:

- it takes place within the framework of a securities lending system managed by a principal. In addition, the sub-fund has a relationship only with the principal of the securities lending system which acts as counterparty and to which title of the loaned securities is transferred. The choice of principal is subject to strict selection criteria. The return of securities similar to the securities that have been lent is guaranteed by the principal.
- through a margin management system, the sub-fund is always guaranteed financial security, the actual value of which always exceeds the actual value of the securities that have been lent, in case the principal does not return similar securities.
The return of securities similar to the securities that have been lent can be requested at any time, which means that the lending of securities does not affect the management of the sub-fund's assets. By lending securities, the sub-fund can generate an additional return. The principal pays a fee to the management company. After deducting the fee for the margin management and clearing services of KBC Bank, most of this fee is paid to the sub-fund. The relationship with the counterparty or counterparties is governed by standard international agreements. More information is provided on the terms and conditions governing securities lending in the annual or half-yearly report for the sub-fund.
VOLATILITY OF THE NET ASSET VALUE: The volatility of the net asset value may be high due to the composition of the portfolio.
GENERAL STRATEGY FOR HEDGING THE EXCHANGE RATE RISK: In order to protect its assets against exchange rate fluctuations and within the limitations laid down in the articles of association, the sub-fund may perform transactions relating to the sale of forward currency contracts, as well as the sale of call options and the purchase of put options on currencies. The transactions in question may relate solely to contracts traded on a regulated market that operates regularly, is recognised and is open to the public or that are traded with a recognised, prime financial institution specialising in such transactions and dealing in the over-the-counter (OTC) market in options. With the same objective, the sub-fund may also sell currencies forward or exchange them in private transactions with prime financial institutions specialising in such transactions. The hedging objective of the aforementioned transactions suggests that there is a direct link between these transactions and the assets to be hedged, which implies that the transactions carried out in a particular currency may in principle not exceed, in terms of volume, either the valuation value of all the assets in the same currency or the holding period of those assets.
SOCIAL, ETHICAL AND ENVIRONMENTAL ASPECTS:
No manufacturers of controversial weapons whose use over the past five decades, according to the international consensus, has led to disproportionate human suffering among the civilian population will be included in the portfolio of investments. This involves the manufacturers of anti-personnel mines, cluster bombs and munitions and weapons containing depleted uranium. In this way, the sub-fund seeks to reflect not only simple financial reality but also the social reality of the sector or region in question.
THE EUROPEAN SAVINGS DIRECTIVE AND TAX ON DEBT CLAIM RETURNS OBTAINED THROUGH THE
REDEMPTION OF OWN UNITS OR IN THE EVENT OF FULL OR PARTIAL DISTRIBUTION OF EQUITY
CAPITAL. The following information is of a general character and is not intended to cover all aspects of an investment in a UCITS. In certain cases entirely different rules might even apply. Moreover, both tax law and the interpretation of it can change. Investors who wish to have more information about the tax implications – in both Belgium and abroad – of acquiring, holding and transferring units should seek the advice of their usual financial and tax advisers. This UCITS shall invest a maximum of 15% of its assets directly or indirectly in debt instruments as intended by the European Savings Directive. A. European Savings Directive (Directive 2003/48/EC) The European Savings Directive has been implemented in Belgium. Since this UCITS invests a maximum of 15% of its assets directly or indirectly in debt claims as intended by the European Savings Directive, the income of this UCITS does not fall within the scope of this directive.
B. Tax on debt claim returns obtained through the redemption of own units or in the event of full or partial distribution of equity capital (Article 19bis Income Tax Code 1992). The income from this UCITS is not subject to the tax on debt instrument returns as intended by Article 19bis, Income Tax Code 1992.
2.1.4 FINANCIAL PORTFOLIO MANAGEMENT There is no delegation of the portfolio.
2.1.5 DISTRIBUTORS KBC Asset Management S.A., 5, Place de la Gare, L-1616 Luxembourg.
2.1.6 INDEX AND BENCHMARK See ‘Sub-fund’s investment policy’.

2.1.7 POLICY PERSUED DURING THE FINANCIAL YEAR Doubts about the sustainability of the economic recovery continue to dominate investment sentiment. The debt crisis in Europe continued unabated, although the European Central Bank (ECB) managed to convince the market that it had the crisis under control. Real GDP in the EMU contracted by an annualised 1.1%. The austerity programme and credit restrictions pushed Southern Europe into a deep recession. Germany played its traditional role as the driver for European economic growth to a lesser extent than in the recent past. Greater divergence within Europe resulted primarily in a further decline in unemployment in Germany and an alarmingly rapid rise in unemployment in countries such as Greece, Spain and Portugal. Belgium was closer to the strong core of the euro area. There have been no significant bankruptcies in the business sector in recent years. The solvency and liquidity of non-financial companies have seldom been as strong as they are at present. A new feature of this cycle is that government paper, which had previously been seen as entirely risk-free, also started to be tainted with a degree of credit risk. Greece, Ireland, Portugal and Cyprus were no longer able to finance their sovereign debt through the usual channels and are under the curatorship of the troika (ECB, EU and IMF). Private bondholders were obliged to accept a rescheduling of the Greek government debt. In Cyprus deposit holders are being required to help defray the cost of cleaning up the banking sector. Italy and Spain were frequently in the firing line. Spain has already applied for European assistance for the recapitalisation of its banks. During all these storms the euro leaders have tried to reform the rules of the game of the monetary union, but it takes a lot of time and effort to get 17 parties singing from the same hymn sheet. The ESM became operational after much delay. The new budget treaty, which came into force on 1 January 2013, is already being questioned. The recovery in corporate earnings as from Q4 2009 was just as impressive as the decline in earnings during the recession. So although the economic recovery in the West may be modest, the same was certainly not true of corporate earnings. After going from negative to positive in the last quarter of 2009, earnings per share of the S&P 500 companies as a whole rose by an average 48% in 2010, by 14% in 2011 and by 4.8% in 2012. The lacklustre economic situation in the West was not an obstacle to a strong increase in turnover. The emerging economies, which are booming, are becoming an increasingly significant market outlet for Western companies. However, the improved earnings were due more to a sharp reduction in (wage) cost pressure than to increased turnover, at least until the first quarter of 2012. In the light of the difficult economic climate in Europe, we have opted to build up our holdings in defensive sectors such as consumer staples, pharmaceuticals and consumer discretionary at the expense of more cyclical sectors such as industrials, materials and energy.
2.1.8 FUTURE POLICY The confidence indicators in Europe are well below freezing point. The budgetary plans, tighter lending policy of the banks and major uncertainty among consumers and producers will continue to depress growth. 2013 will see a contraction of GDP in Europe. Recovery is not expected until the first half of 2014. Deflation or depression scenarios, which are currently dominating bond market sentiment, are not however justified. Today’s world is one of two-speed economies. The mature industrialised economies (US, Europe, Japan) still find themselves in a low-growth environment, with no underlying inflationary pressure, persistently low interest rates and runaway public finances. The picture in the emerging markets is altogether different. The strong economic growth has already created inflationary pressure in Asia. Appropriate monetary policy is therefore required: sometimes restrictive (as in 2011) and at other times stimulatory (as at present). Monetary policy in China and elsewhere in Asia is highly geared to preventing asset-price inflation. This does not just involve the interest-rate weapon; there was also active intervention in the credit market and the housing market. Time is of the essence for the euro area. Everyone knows that the EMU is not a perfect monetary union. In its twelve-year history, little has been done to improve its internal operation. National autonomy was sacrosanct. The crisis brought the realisation that economic governance, as it is now called in Eurospeak, needs to be tackled as a matter of urgency. In concrete terms, this involves measures such as supranational supervision of banks (scheduled to be in place by early 2015), strict monitoring and sanctioning of budgetary policy (a huge challenge given the emergence of austerity fatigue), monitoring of pay policy and harmonising European taxation (a big taboo). In view of the uncertain climate, we are still not inclined to make a switch to the more cyclical sectors.
2.1.9 SYNTHETIC RISK AND REWARD INDICATOR 6 on a scale of 1 (lowest risk) to 7 (highest risk). The value of a share can decrease or increase and the investor may not get back the amount invested. In accordance with Commission Regulation (EU) No. 583/2010, a synthetic risk and reward indicator has been calculated. This indicator provides a quantitative measure of the sub-fund's potential return and the risk involved, calculated in the currency in which the sub-fund is denominated. It is given as a figure between 1 and 7. The higher the figure, the greater the potential return, but also the more

difficult it is to predict this return. Losses are possible too. The lowest figure does not mean that the investment is entirely free of risk. However, it does indicate that, compared with the higher figures, this product will generally provide a lower, but more predictable return. The synthetic risk and reward indicator is assessed regularly and can therefore go up or down based on data from the past. Data from the past is not always a reliable indicator of future risk and return.
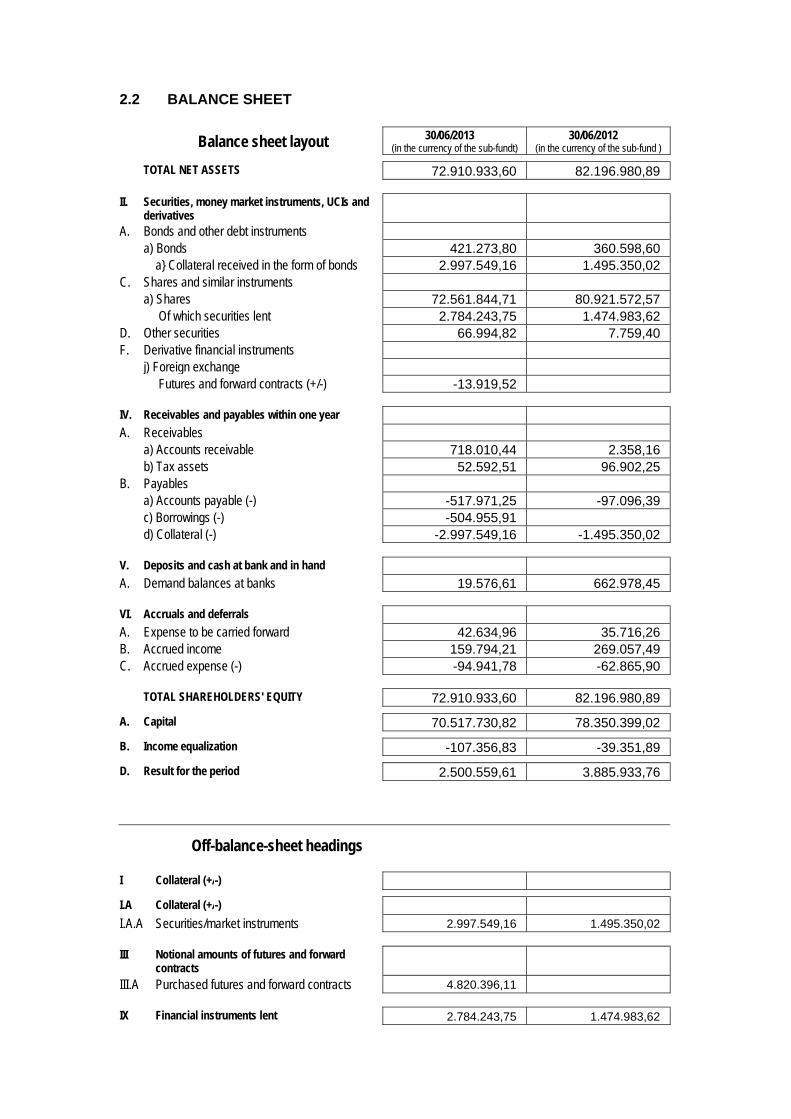
2.2 BALANCE SHEET
Balance sheet layout 30/06/2013 (in the currency of the sub-fundt)
30/06/2012 (in the currency of the sub-fund )
TOTAL NET ASSETS 72.910.933,60 82.196.980,89
II. Securities, money market instruments, UCIs and derivatives
A. Bonds and other debt instruments a) Bonds 421.273,80 360.598,60 a} Collateral received in the form of bonds 2.997.549,16 1.495.350,02 C. Shares and similar instruments a) Shares 72.561.844,71 80.921.572,57 Of which securities lent 2.784.243,75 1.474.983,62 D. Other securities 66.994,82 7.759,40 F. Derivative financial instruments j) Foreign exchange Futures and forward contracts (+/-) -13.919,52
IV. Receivables and payables within one year A. Receivables a) Accounts receivable 718.010,44 2.358,16 b) Tax assets 52.592,51 96.902,25 B. Payables a) Accounts payable (-) -517.971,25 -97.096,39 c) Borrowings (-) -504.955,91 d) Collateral (-) -2.997.549,16 -1.495.350,02
V. Deposits and cash at bank and in hand A. Demand balances at banks 19.576,61 662.978,45
VI. Accruals and deferrals A. Expense to be carried forward 42.634,96 35.716,26 B. Accrued income 159.794,21 269.057,49 C. Accrued expense (-) -94.941,78 -62.865,90
TOTAL SHAREHOLDERS' EQUITY 72.910.933,60 82.196.980,89
A. Capital 70.517.730,82 78.350.399,02
B. Income equalization -107.356,83 -39.351,89
D. Result for the period 2.500.559,61 3.885.933,76
Off-balance-sheet headings
I Collateral (+/-)
I.A Collateral (+/-)
I.A.A Securities/market instruments 2.997.549,16 1.495.350,02
III Notional amounts of futures and forward contracts
III.A Purchased futures and forward contracts 4.820.396,11
IX Financial instruments lent 2.784.243,75 1.474.983,62

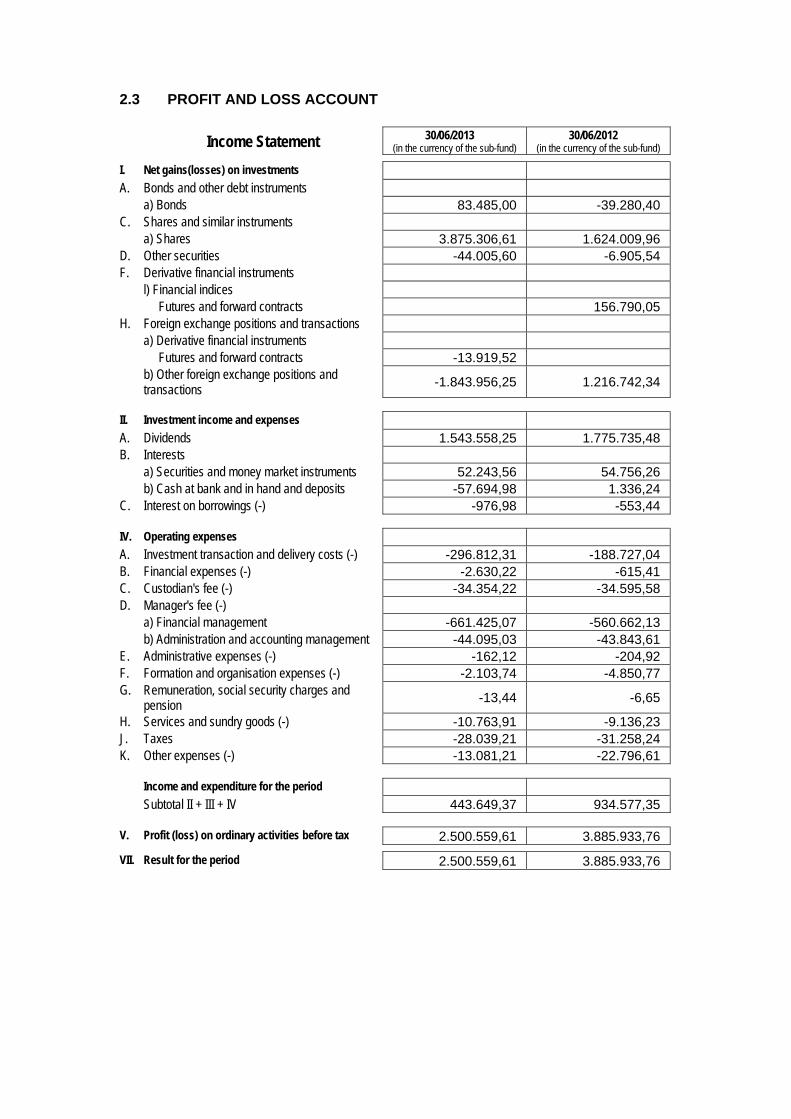
2.3 PROFIT AND LOSS ACCOUNT
Income Statement 30/06/2013 (in the currency of the sub-fund)
30/06/2012 (in the currency of the sub-fund)
I. Net gains(losses) on investments A. Bonds and other debt instruments a) Bonds 83.485,00 -39.280,40 C. Shares and similar instruments a) Shares 3.875.306,61 1.624.009,96 D. Other securities -44.005,60 -6.905,54 F. Derivative financial instruments l) Financial indices Futures and forward contracts 156.790,05 H. Foreign exchange positions and transactions a) Derivative financial instruments Futures and forward contracts -13.919,52 b) Other foreign exchange positions and
transactions -1.843.956,25 1.216.742,34
II. Investment income and expenses A. Dividends 1.543.558,25 1.775.735,48 B. Interests a) Securities and money market instruments 52.243,56 54.756,26 b) Cash at bank and in hand and deposits -57.694,98 1.336,24 C. Interest on borrowings (-) -976,98 -553,44
IV. Operating expenses A. Investment transaction and delivery costs (-) -296.812,31 -188.727,04 B. Financial expenses (-) -2.630,22 -615,41 C. Custodian's fee (-) -34.354,22 -34.595,58 D. Manager's fee (-) a) Financial management -661.425,07 -560.662,13 b) Administration and accounting management -44.095,03 -43.843,61 E. Administrative expenses (-) -162,12 -204,92 F. Formation and organisation expenses (-) -2.103,74 -4.850,77 G. Remuneration, social security charges and
pension -13,44 -6,65
H. Services and sundry goods (-) -10.763,91 -9.136,23 J. Taxes -28.039,21 -31.258,24 K. Other expenses (-) -13.081,21 -22.796,61
Income and expenditure for the period Subtotal II + III + IV 443.649,37 934.577,35
V. Profit (loss) on ordinary activities before tax 2.500.559,61 3.885.933,76
VII. Result for the period 2.500.559,61 3.885.933,76
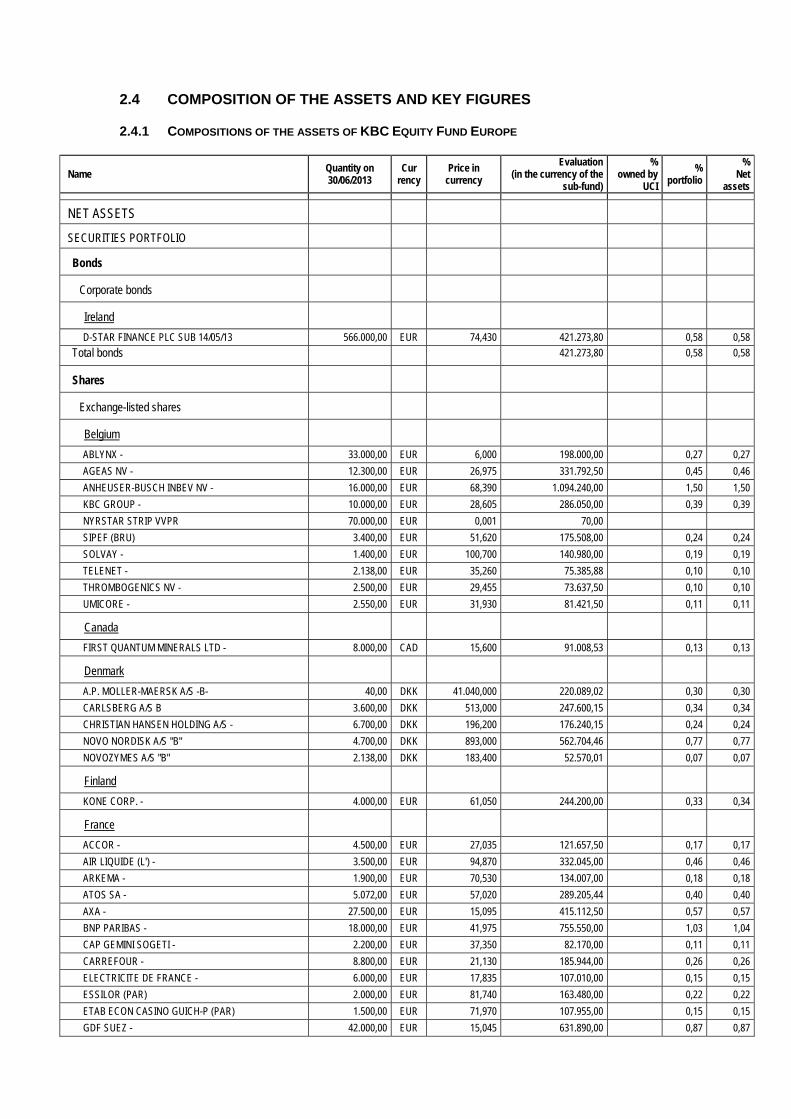
2.4 COMPOSITION OF THE ASSETS AND KEY FIGURES
2.4.1 COMPOSITIONS OF THE ASSETS OF KBC EQUITY FUND EUROPE
Name Quantity on 30/06/2013
Cur rency
Price in currency
Evaluation (in the currency of the
sub-fund)
% owned by
UCI
% portfolio
% Net
assets
NET ASSETS
SECURITIES PORTFOLIO
Bonds
Corporate bonds
Ireland
D-STAR FINANCE PLC SUB 14/05/13 566.000,00 EUR 74,430 421.273,80 0,58 0,58
Total bonds 421.273,80 0,58 0,58
Shares
Exchange-listed shares
Belgium
ABLYNX - 33.000,00 EUR 6,000 198.000,00 0,27 0,27
AGEAS NV - 12.300,00 EUR 26,975 331.792,50 0,45 0,46
ANHEUSER-BUSCH INBEV NV - 16.000,00 EUR 68,390 1.094.240,00 1,50 1,50
KBC GROUP - 10.000,00 EUR 28,605 286.050,00 0,39 0,39
NYRSTAR STRIP VVPR 70.000,00 EUR 0,001 70,00
SIPEF (BRU) 3.400,00 EUR 51,620 175.508,00 0,24 0,24
SOLVAY - 1.400,00 EUR 100,700 140.980,00 0,19 0,19
TELENET - 2.138,00 EUR 35,260 75.385,88 0,10 0,10
THROMBOGENICS NV - 2.500,00 EUR 29,455 73.637,50 0,10 0,10
UMICORE - 2.550,00 EUR 31,930 81.421,50 0,11 0,11
Canada
FIRST QUANTUM MINERALS LTD - 8.000,00 CAD 15,600 91.008,53 0,13 0,13
Denmark
A.P. MOLLER-MAERSK A/S -B- 40,00 DKK 41.040,000 220.089,02 0,30 0,30
CARLSBERG A/S B 3.600,00 DKK 513,000 247.600,15 0,34 0,34
CHRISTIAN HANSEN HOLDING A/S - 6.700,00 DKK 196,200 176.240,15 0,24 0,24
NOVO NORDISK A/S "B" 4.700,00 DKK 893,000 562.704,46 0,77 0,77
NOVOZYMES A/S "B" 2.138,00 DKK 183,400 52.570,01 0,07 0,07
Finland
KONE CORP. - 4.000,00 EUR 61,050 244.200,00 0,33 0,34
France
ACCOR - 4.500,00 EUR 27,035 121.657,50 0,17 0,17
AIR LIQUIDE (L') - 3.500,00 EUR 94,870 332.045,00 0,46 0,46
ARKEMA - 1.900,00 EUR 70,530 134.007,00 0,18 0,18
ATOS SA - 5.072,00 EUR 57,020 289.205,44 0,40 0,40
AXA - 27.500,00 EUR 15,095 415.112,50 0,57 0,57
BNP PARIBAS - 18.000,00 EUR 41,975 755.550,00 1,03 1,04
CAP GEMINI SOGETI - 2.200,00 EUR 37,350 82.170,00 0,11 0,11
CARREFOUR - 8.800,00 EUR 21,130 185.944,00 0,26 0,26
ELECTRICITE DE FRANCE - 6.000,00 EUR 17,835 107.010,00 0,15 0,15
ESSILOR (PAR) 2.000,00 EUR 81,740 163.480,00 0,22 0,22
ETAB ECON CASINO GUICH-P (PAR) 1.500,00 EUR 71,970 107.955,00 0,15 0,15
GDF SUEZ - 42.000,00 EUR 15,045 631.890,00 0,87 0,87
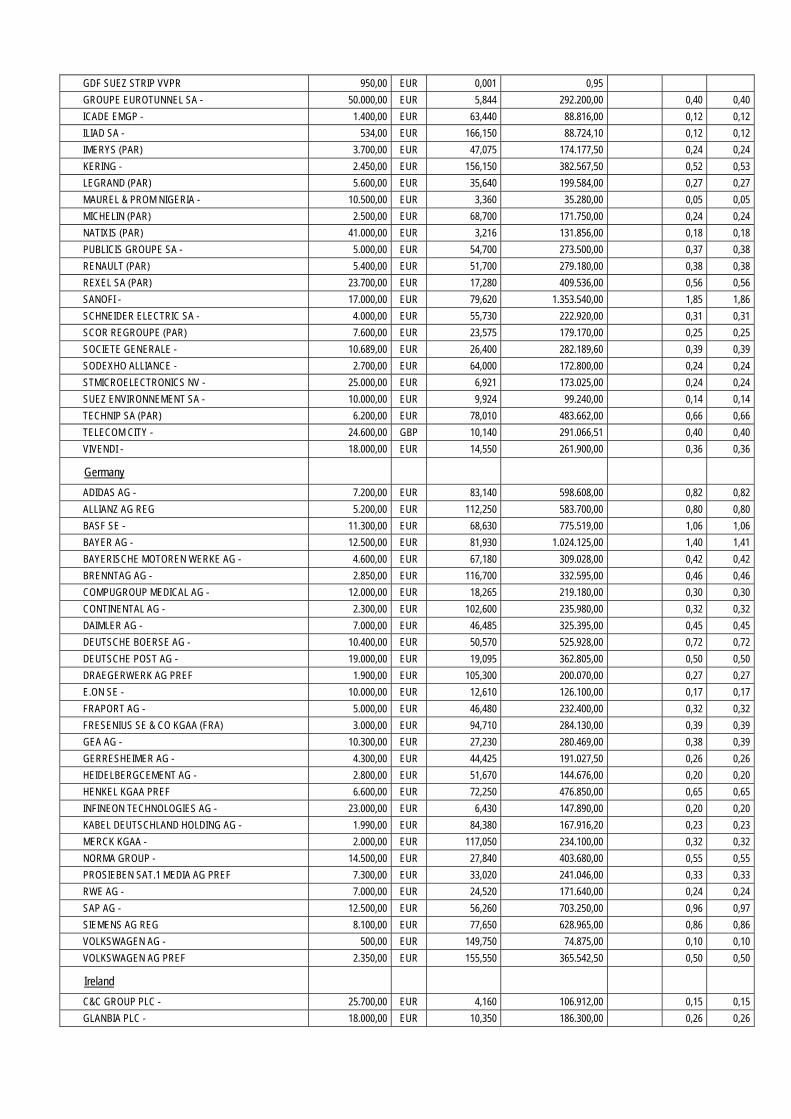
GDF SUEZ STRIP VVPR 950,00 EUR 0,001 0,95
GROUPE EUROTUNNEL SA - 50.000,00 EUR 5,844 292.200,00 0,40 0,40
ICADE EMGP - 1.400,00 EUR 63,440 88.816,00 0,12 0,12
ILIAD SA - 534,00 EUR 166,150 88.724,10 0,12 0,12
IMERYS (PAR) 3.700,00 EUR 47,075 174.177,50 0,24 0,24
KERING - 2.450,00 EUR 156,150 382.567,50 0,52 0,53
LEGRAND (PAR) 5.600,00 EUR 35,640 199.584,00 0,27 0,27
MAUREL & PROM NIGERIA - 10.500,00 EUR 3,360 35.280,00 0,05 0,05
MICHELIN (PAR) 2.500,00 EUR 68,700 171.750,00 0,24 0,24
NATIXIS (PAR) 41.000,00 EUR 3,216 131.856,00 0,18 0,18
PUBLICIS GROUPE SA - 5.000,00 EUR 54,700 273.500,00 0,37 0,38
RENAULT (PAR) 5.400,00 EUR 51,700 279.180,00 0,38 0,38
REXEL SA (PAR) 23.700,00 EUR 17,280 409.536,00 0,56 0,56
SANOFI - 17.000,00 EUR 79,620 1.353.540,00 1,85 1,86
SCHNEIDER ELECTRIC SA - 4.000,00 EUR 55,730 222.920,00 0,31 0,31
SCOR REGROUPE (PAR) 7.600,00 EUR 23,575 179.170,00 0,25 0,25
SOCIETE GENERALE - 10.689,00 EUR 26,400 282.189,60 0,39 0,39
SODEXHO ALLIANCE - 2.700,00 EUR 64,000 172.800,00 0,24 0,24
STMICROELECTRONICS NV - 25.000,00 EUR 6,921 173.025,00 0,24 0,24
SUEZ ENVIRONNEMENT SA - 10.000,00 EUR 9,924 99.240,00 0,14 0,14
TECHNIP SA (PAR) 6.200,00 EUR 78,010 483.662,00 0,66 0,66
TELECOM CITY - 24.600,00 GBP 10,140 291.066,51 0,40 0,40
VIVENDI - 18.000,00 EUR 14,550 261.900,00 0,36 0,36
Germany
ADIDAS AG - 7.200,00 EUR 83,140 598.608,00 0,82 0,82
ALLIANZ AG REG 5.200,00 EUR 112,250 583.700,00 0,80 0,80
BASF SE - 11.300,00 EUR 68,630 775.519,00 1,06 1,06
BAYER AG - 12.500,00 EUR 81,930 1.024.125,00 1,40 1,41
BAYERISCHE MOTOREN WERKE AG - 4.600,00 EUR 67,180 309.028,00 0,42 0,42
BRENNTAG AG - 2.850,00 EUR 116,700 332.595,00 0,46 0,46
COMPUGROUP MEDICAL AG - 12.000,00 EUR 18,265 219.180,00 0,30 0,30
CONTINENTAL AG - 2.300,00 EUR 102,600 235.980,00 0,32 0,32
DAIMLER AG - 7.000,00 EUR 46,485 325.395,00 0,45 0,45
DEUTSCHE BOERSE AG - 10.400,00 EUR 50,570 525.928,00 0,72 0,72
DEUTSCHE POST AG - 19.000,00 EUR 19,095 362.805,00 0,50 0,50
DRAEGERWERK AG PREF 1.900,00 EUR 105,300 200.070,00 0,27 0,27
E.ON SE - 10.000,00 EUR 12,610 126.100,00 0,17 0,17
FRAPORT AG - 5.000,00 EUR 46,480 232.400,00 0,32 0,32
FRESENIUS SE & CO KGAA (FRA) 3.000,00 EUR 94,710 284.130,00 0,39 0,39
GEA AG - 10.300,00 EUR 27,230 280.469,00 0,38 0,39
GERRESHEIMER AG - 4.300,00 EUR 44,425 191.027,50 0,26 0,26
HEIDELBERGCEMENT AG - 2.800,00 EUR 51,670 144.676,00 0,20 0,20
HENKEL KGAA PREF 6.600,00 EUR 72,250 476.850,00 0,65 0,65
INFINEON TECHNOLOGIES AG - 23.000,00 EUR 6,430 147.890,00 0,20 0,20
KABEL DEUTSCHLAND HOLDING AG - 1.990,00 EUR 84,380 167.916,20 0,23 0,23
MERCK KGAA - 2.000,00 EUR 117,050 234.100,00 0,32 0,32
NORMA GROUP - 14.500,00 EUR 27,840 403.680,00 0,55 0,55
PROSIEBEN SAT.1 MEDIA AG PREF 7.300,00 EUR 33,020 241.046,00 0,33 0,33
RWE AG - 7.000,00 EUR 24,520 171.640,00 0,24 0,24
SAP AG - 12.500,00 EUR 56,260 703.250,00 0,96 0,97
SIEMENS AG REG 8.100,00 EUR 77,650 628.965,00 0,86 0,86
VOLKSWAGEN AG - 500,00 EUR 149,750 74.875,00 0,10 0,10
VOLKSWAGEN AG PREF 2.350,00 EUR 155,550 365.542,50 0,50 0,50
Ireland
C&C GROUP PLC - 25.700,00 EUR 4,160 106.912,00 0,15 0,15
GLANBIA PLC - 18.000,00 EUR 10,350 186.300,00 0,26 0,26
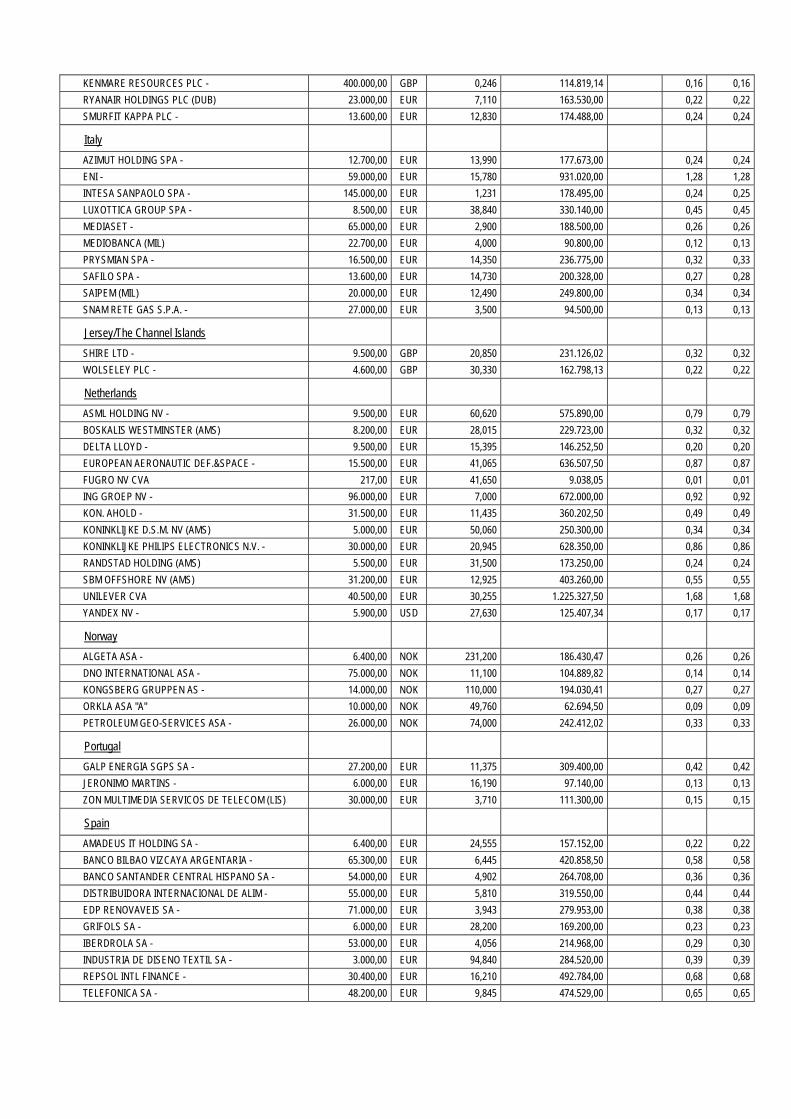
KENMARE RESOURCES PLC - 400.000,00 GBP 0,246 114.819,14 0,16 0,16
RYANAIR HOLDINGS PLC (DUB) 23.000,00 EUR 7,110 163.530,00 0,22 0,22
SMURFIT KAPPA PLC - 13.600,00 EUR 12,830 174.488,00 0,24 0,24
Italy
AZIMUT HOLDING SPA - 12.700,00 EUR 13,990 177.673,00 0,24 0,24
ENI - 59.000,00 EUR 15,780 931.020,00 1,28 1,28
INTESA SANPAOLO SPA - 145.000,00 EUR 1,231 178.495,00 0,24 0,25
LUXOTTICA GROUP SPA - 8.500,00 EUR 38,840 330.140,00 0,45 0,45
MEDIASET - 65.000,00 EUR 2,900 188.500,00 0,26 0,26
MEDIOBANCA (MIL) 22.700,00 EUR 4,000 90.800,00 0,12 0,13
PRYSMIAN SPA - 16.500,00 EUR 14,350 236.775,00 0,32 0,33
SAFILO SPA - 13.600,00 EUR 14,730 200.328,00 0,27 0,28
SAIPEM (MIL) 20.000,00 EUR 12,490 249.800,00 0,34 0,34
SNAM RETE GAS S.P.A. - 27.000,00 EUR 3,500 94.500,00 0,13 0,13
Jersey/The Channel Islands
SHIRE LTD - 9.500,00 GBP 20,850 231.126,02 0,32 0,32
WOLSELEY PLC - 4.600,00 GBP 30,330 162.798,13 0,22 0,22
Netherlands
ASML HOLDING NV - 9.500,00 EUR 60,620 575.890,00 0,79 0,79
BOSKALIS WESTMINSTER (AMS) 8.200,00 EUR 28,015 229.723,00 0,32 0,32
DELTA LLOYD - 9.500,00 EUR 15,395 146.252,50 0,20 0,20
EUROPEAN AERONAUTIC DEF.&SPACE - 15.500,00 EUR 41,065 636.507,50 0,87 0,87
FUGRO NV CVA 217,00 EUR 41,650 9.038,05 0,01 0,01
ING GROEP NV - 96.000,00 EUR 7,000 672.000,00 0,92 0,92
KON. AHOLD - 31.500,00 EUR 11,435 360.202,50 0,49 0,49
KONINKLIJKE D.S.M. NV (AMS) 5.000,00 EUR 50,060 250.300,00 0,34 0,34
KONINKLIJKE PHILIPS ELECTRONICS N.V. - 30.000,00 EUR 20,945 628.350,00 0,86 0,86
RANDSTAD HOLDING (AMS) 5.500,00 EUR 31,500 173.250,00 0,24 0,24
SBM OFFSHORE NV (AMS) 31.200,00 EUR 12,925 403.260,00 0,55 0,55
UNILEVER CVA 40.500,00 EUR 30,255 1.225.327,50 1,68 1,68
YANDEX NV - 5.900,00 USD 27,630 125.407,34 0,17 0,17
Norway
ALGETA ASA - 6.400,00 NOK 231,200 186.430,47 0,26 0,26
DNO INTERNATIONAL ASA - 75.000,00 NOK 11,100 104.889,82 0,14 0,14
KONGSBERG GRUPPEN AS - 14.000,00 NOK 110,000 194.030,41 0,27 0,27
ORKLA ASA "A" 10.000,00 NOK 49,760 62.694,50 0,09 0,09
PETROLEUM GEO-SERVICES ASA - 26.000,00 NOK 74,000 242.412,02 0,33 0,33
Portugal
GALP ENERGIA SGPS SA - 27.200,00 EUR 11,375 309.400,00 0,42 0,42
JERONIMO MARTINS - 6.000,00 EUR 16,190 97.140,00 0,13 0,13
ZON MULTIMEDIA SERVICOS DE TELECOM (LIS) 30.000,00 EUR 3,710 111.300,00 0,15 0,15
Spain
AMADEUS IT HOLDING SA - 6.400,00 EUR 24,555 157.152,00 0,22 0,22
BANCO BILBAO VIZCAYA ARGENTARIA - 65.300,00 EUR 6,445 420.858,50 0,58 0,58
BANCO SANTANDER CENTRAL HISPANO SA - 54.000,00 EUR 4,902 264.708,00 0,36 0,36
DISTRIBUIDORA INTERNACIONAL DE ALIM - 55.000,00 EUR 5,810 319.550,00 0,44 0,44
EDP RENOVAVEIS SA - 71.000,00 EUR 3,943 279.953,00 0,38 0,38
GRIFOLS SA - 6.000,00 EUR 28,200 169.200,00 0,23 0,23
IBERDROLA SA - 53.000,00 EUR 4,056 214.968,00 0,29 0,30
INDUSTRIA DE DISENO TEXTIL SA - 3.000,00 EUR 94,840 284.520,00 0,39 0,39
REPSOL INTL FINANCE - 30.400,00 EUR 16,210 492.784,00 0,68 0,68
TELEFONICA SA - 48.200,00 EUR 9,845 474.529,00 0,65 0,65
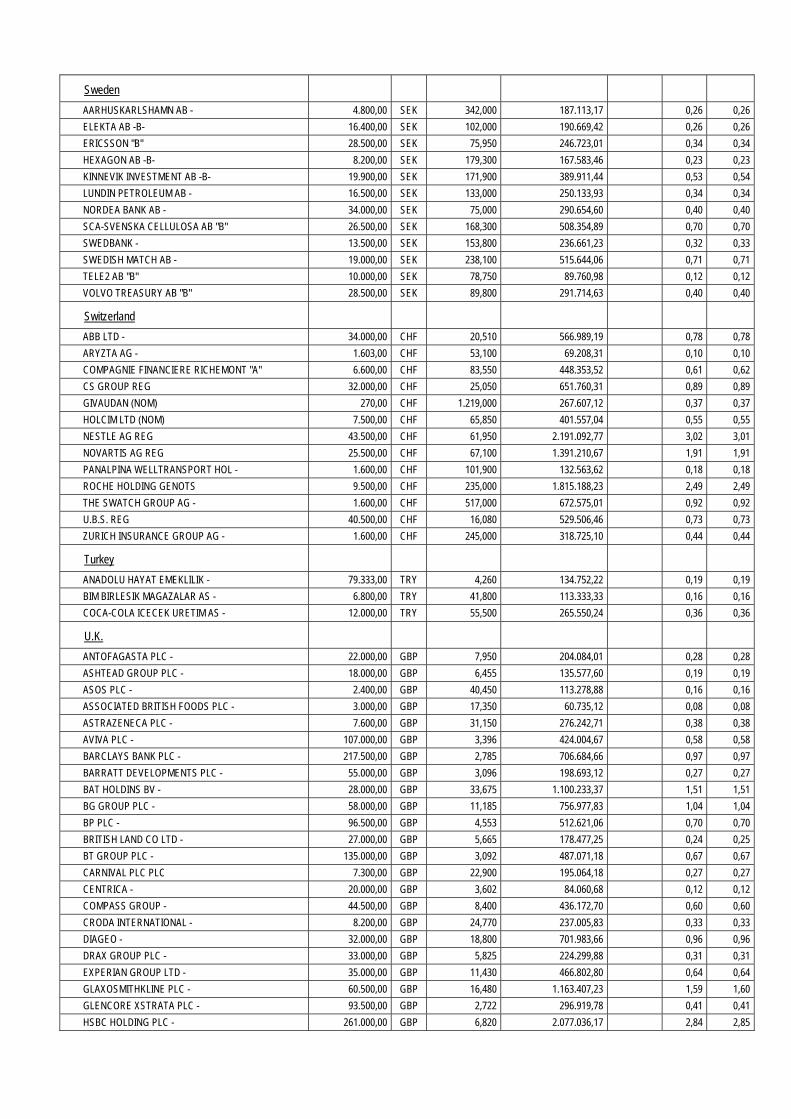
Sweden
AARHUSKARLSHAMN AB - 4.800,00 SEK 342,000 187.113,17 0,26 0,26
ELEKTA AB -B- 16.400,00 SEK 102,000 190.669,42 0,26 0,26
ERICSSON "B" 28.500,00 SEK 75,950 246.723,01 0,34 0,34
HEXAGON AB -B- 8.200,00 SEK 179,300 167.583,46 0,23 0,23
KINNEVIK INVESTMENT AB -B- 19.900,00 SEK 171,900 389.911,44 0,53 0,54
LUNDIN PETROLEUM AB - 16.500,00 SEK 133,000 250.133,93 0,34 0,34
NORDEA BANK AB - 34.000,00 SEK 75,000 290.654,60 0,40 0,40
SCA-SVENSKA CELLULOSA AB "B" 26.500,00 SEK 168,300 508.354,89 0,70 0,70
SWEDBANK - 13.500,00 SEK 153,800 236.661,23 0,32 0,33
SWEDISH MATCH AB - 19.000,00 SEK 238,100 515.644,06 0,71 0,71
TELE2 AB "B" 10.000,00 SEK 78,750 89.760,98 0,12 0,12
VOLVO TREASURY AB "B" 28.500,00 SEK 89,800 291.714,63 0,40 0,40
Switzerland
ABB LTD - 34.000,00 CHF 20,510 566.989,19 0,78 0,78
ARYZTA AG - 1.603,00 CHF 53,100 69.208,31 0,10 0,10
COMPAGNIE FINANCIERE RICHEMONT "A" 6.600,00 CHF 83,550 448.353,52 0,61 0,62
CS GROUP REG 32.000,00 CHF 25,050 651.760,31 0,89 0,89
GIVAUDAN (NOM) 270,00 CHF 1.219,000 267.607,12 0,37 0,37
HOLCIM LTD (NOM) 7.500,00 CHF 65,850 401.557,04 0,55 0,55
NESTLE AG REG 43.500,00 CHF 61,950 2.191.092,77 3,02 3,01
NOVARTIS AG REG 25.500,00 CHF 67,100 1.391.210,67 1,91 1,91
PANALPINA WELLTRANSPORT HOL - 1.600,00 CHF 101,900 132.563,62 0,18 0,18
ROCHE HOLDING GENOTS 9.500,00 CHF 235,000 1.815.188,23 2,49 2,49
THE SWATCH GROUP AG - 1.600,00 CHF 517,000 672.575,01 0,92 0,92
U.B.S. REG 40.500,00 CHF 16,080 529.506,46 0,73 0,73
ZURICH INSURANCE GROUP AG - 1.600,00 CHF 245,000 318.725,10 0,44 0,44
Turkey
ANADOLU HAYAT EMEKLILIK - 79.333,00 TRY 4,260 134.752,22 0,19 0,19
BIM BIRLESIK MAGAZALAR AS - 6.800,00 TRY 41,800 113.333,33 0,16 0,16
COCA-COLA ICECEK URETIM AS - 12.000,00 TRY 55,500 265.550,24 0,36 0,36
U.K.
ANTOFAGASTA PLC - 22.000,00 GBP 7,950 204.084,01 0,28 0,28
ASHTEAD GROUP PLC - 18.000,00 GBP 6,455 135.577,60 0,19 0,19
ASOS PLC - 2.400,00 GBP 40,450 113.278,88 0,16 0,16
ASSOCIATED BRITISH FOODS PLC - 3.000,00 GBP 17,350 60.735,12 0,08 0,08
ASTRAZENECA PLC - 7.600,00 GBP 31,150 276.242,71 0,38 0,38
AVIVA PLC - 107.000,00 GBP 3,396 424.004,67 0,58 0,58
BARCLAYS BANK PLC - 217.500,00 GBP 2,785 706.684,66 0,97 0,97
BARRATT DEVELOPMENTS PLC - 55.000,00 GBP 3,096 198.693,12 0,27 0,27
BAT HOLDINS BV - 28.000,00 GBP 33,675 1.100.233,37 1,51 1,51
BG GROUP PLC - 58.000,00 GBP 11,185 756.977,83 1,04 1,04
BP PLC - 96.500,00 GBP 4,553 512.621,06 0,70 0,70
BRITISH LAND CO LTD - 27.000,00 GBP 5,665 178.477,25 0,24 0,25
BT GROUP PLC - 135.000,00 GBP 3,092 487.071,18 0,67 0,67
CARNIVAL PLC PLC 7.300,00 GBP 22,900 195.064,18 0,27 0,27
CENTRICA - 20.000,00 GBP 3,602 84.060,68 0,12 0,12
COMPASS GROUP - 44.500,00 GBP 8,400 436.172,70 0,60 0,60
CRODA INTERNATIONAL - 8.200,00 GBP 24,770 237.005,83 0,33 0,33
DIAGEO - 32.000,00 GBP 18,800 701.983,66 0,96 0,96
DRAX GROUP PLC - 33.000,00 GBP 5,825 224.299,88 0,31 0,31
EXPERIAN GROUP LTD - 35.000,00 GBP 11,430 466.802,80 0,64 0,64
GLAXOSMITHKLINE PLC - 60.500,00 GBP 16,480 1.163.407,23 1,59 1,60
GLENCORE XSTRATA PLC - 93.500,00 GBP 2,722 296.919,78 0,41 0,41
HSBC HOLDING PLC - 261.000,00 GBP 6,820 2.077.036,17 2,84 2,85
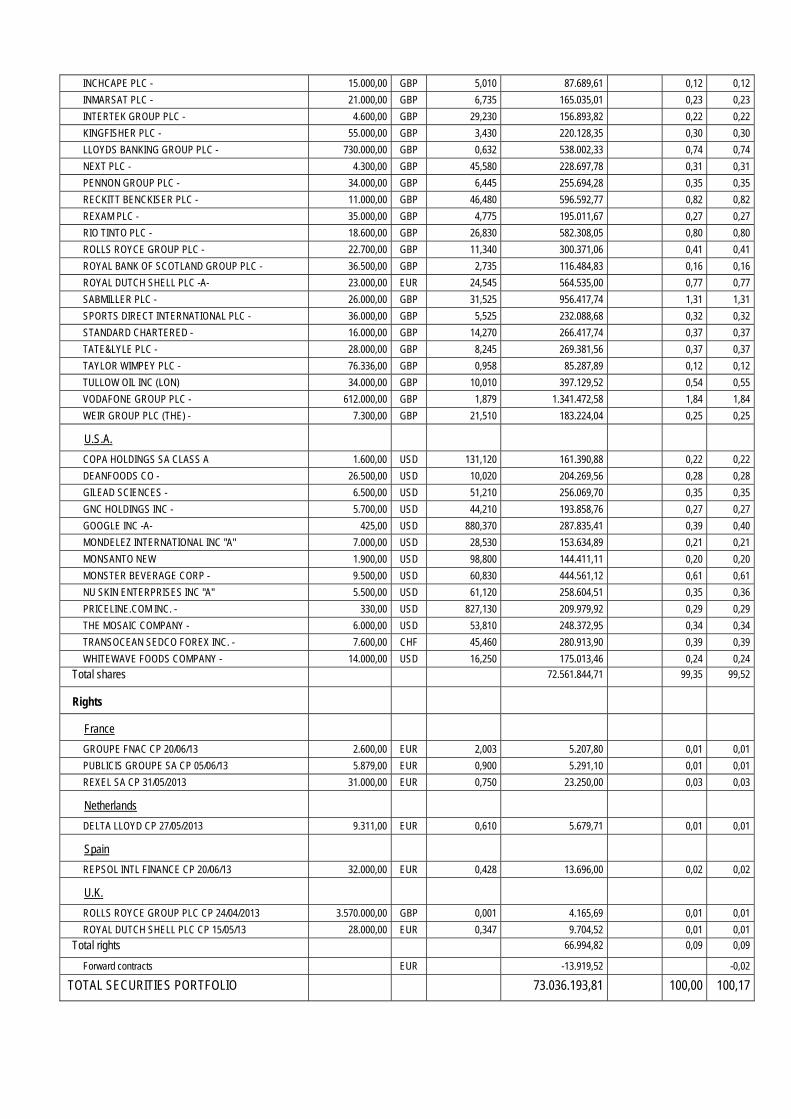
INCHCAPE PLC - 15.000,00 GBP 5,010 87.689,61 0,12 0,12
INMARSAT PLC - 21.000,00 GBP 6,735 165.035,01 0,23 0,23
INTERTEK GROUP PLC - 4.600,00 GBP 29,230 156.893,82 0,22 0,22
KINGFISHER PLC - 55.000,00 GBP 3,430 220.128,35 0,30 0,30
LLOYDS BANKING GROUP PLC - 730.000,00 GBP 0,632 538.002,33 0,74 0,74
NEXT PLC - 4.300,00 GBP 45,580 228.697,78 0,31 0,31
PENNON GROUP PLC - 34.000,00 GBP 6,445 255.694,28 0,35 0,35
RECKITT BENCKISER PLC - 11.000,00 GBP 46,480 596.592,77 0,82 0,82
REXAM PLC - 35.000,00 GBP 4,775 195.011,67 0,27 0,27
RIO TINTO PLC - 18.600,00 GBP 26,830 582.308,05 0,80 0,80
ROLLS ROYCE GROUP PLC - 22.700,00 GBP 11,340 300.371,06 0,41 0,41
ROYAL BANK OF SCOTLAND GROUP PLC - 36.500,00 GBP 2,735 116.484,83 0,16 0,16
ROYAL DUTCH SHELL PLC -A- 23.000,00 EUR 24,545 564.535,00 0,77 0,77
SABMILLER PLC - 26.000,00 GBP 31,525 956.417,74 1,31 1,31
SPORTS DIRECT INTERNATIONAL PLC - 36.000,00 GBP 5,525 232.088,68 0,32 0,32
STANDARD CHARTERED - 16.000,00 GBP 14,270 266.417,74 0,37 0,37
TATE&LYLE PLC - 28.000,00 GBP 8,245 269.381,56 0,37 0,37
TAYLOR WIMPEY PLC - 76.336,00 GBP 0,958 85.287,89 0,12 0,12
TULLOW OIL INC (LON) 34.000,00 GBP 10,010 397.129,52 0,54 0,55
VODAFONE GROUP PLC - 612.000,00 GBP 1,879 1.341.472,58 1,84 1,84
WEIR GROUP PLC (THE) - 7.300,00 GBP 21,510 183.224,04 0,25 0,25
U.S.A.
COPA HOLDINGS SA CLASS A 1.600,00 USD 131,120 161.390,88 0,22 0,22
DEANFOODS CO - 26.500,00 USD 10,020 204.269,56 0,28 0,28
GILEAD SCIENCES - 6.500,00 USD 51,210 256.069,70 0,35 0,35
GNC HOLDINGS INC - 5.700,00 USD 44,210 193.858,76 0,27 0,27
GOOGLE INC -A- 425,00 USD 880,370 287.835,41 0,39 0,40
MONDELEZ INTERNATIONAL INC "A" 7.000,00 USD 28,530 153.634,89 0,21 0,21
MONSANTO NEW 1.900,00 USD 98,800 144.411,11 0,20 0,20
MONSTER BEVERAGE CORP - 9.500,00 USD 60,830 444.561,12 0,61 0,61
NU SKIN ENTERPRISES INC "A" 5.500,00 USD 61,120 258.604,51 0,35 0,36
PRICELINE.COM INC. - 330,00 USD 827,130 209.979,92 0,29 0,29
THE MOSAIC COMPANY - 6.000,00 USD 53,810 248.372,95 0,34 0,34
TRANSOCEAN SEDCO FOREX INC. - 7.600,00 CHF 45,460 280.913,90 0,39 0,39
WHITEWAVE FOODS COMPANY - 14.000,00 USD 16,250 175.013,46 0,24 0,24
Total shares 72.561.844,71 99,35 99,52
Rights
France
GROUPE FNAC CP 20/06/13 2.600,00 EUR 2,003 5.207,80 0,01 0,01
PUBLICIS GROUPE SA CP 05/06/13 5.879,00 EUR 0,900 5.291,10 0,01 0,01
REXEL SA CP 31/05/2013 31.000,00 EUR 0,750 23.250,00 0,03 0,03
Netherlands
DELTA LLOYD CP 27/05/2013 9.311,00 EUR 0,610 5.679,71 0,01 0,01
Spain
REPSOL INTL FINANCE CP 20/06/13 32.000,00 EUR 0,428 13.696,00 0,02 0,02
U.K.
ROLLS ROYCE GROUP PLC CP 24/04/2013 3.570.000,00 GBP 0,001 4.165,69 0,01 0,01
ROYAL DUTCH SHELL PLC CP 15/05/13 28.000,00 EUR 0,347 9.704,52 0,01 0,01
Total rights 66.994,82 0,09 0,09
Forward contracts EUR -13.919,52 -0,02
TOTAL SECURITIES PORTFOLIO 73.036.193,81 100,00 100,17
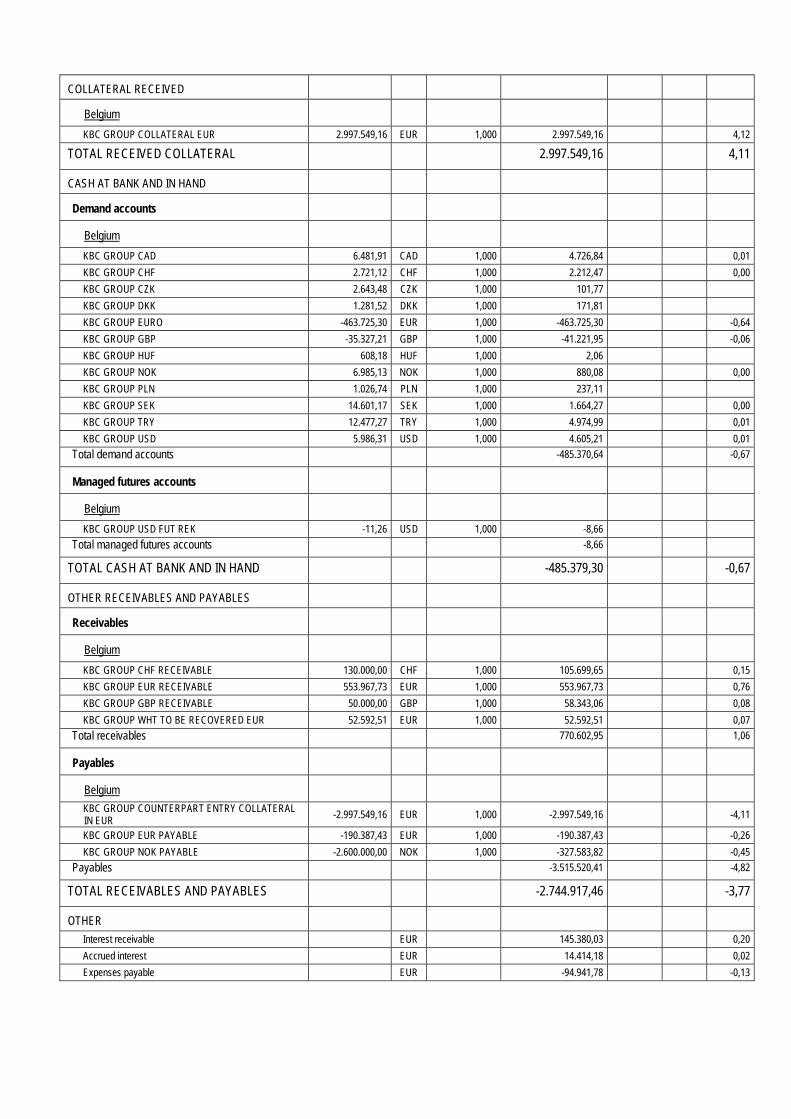
COLLATERAL RECEIVED
Belgium
KBC GROUP COLLATERAL EUR 2.997.549,16 EUR 1,000 2.997.549,16 4,12
TOTAL RECEIVED COLLATERAL 2.997.549,16 4,11
CASH AT BANK AND IN HAND
Demand accounts
Belgium
KBC GROUP CAD 6.481,91 CAD 1,000 4.726,84 0,01
KBC GROUP CHF 2.721,12 CHF 1,000 2.212,47 0,00
KBC GROUP CZK 2.643,48 CZK 1,000 101,77
KBC GROUP DKK 1.281,52 DKK 1,000 171,81
KBC GROUP EURO -463.725,30 EUR 1,000 -463.725,30 -0,64
KBC GROUP GBP -35.327,21 GBP 1,000 -41.221,95 -0,06
KBC GROUP HUF 608,18 HUF 1,000 2,06
KBC GROUP NOK 6.985,13 NOK 1,000 880,08 0,00
KBC GROUP PLN 1.026,74 PLN 1,000 237,11
KBC GROUP SEK 14.601,17 SEK 1,000 1.664,27 0,00
KBC GROUP TRY 12.477,27 TRY 1,000 4.974,99 0,01
KBC GROUP USD 5.986,31 USD 1,000 4.605,21 0,01
Total demand accounts -485.370,64 -0,67
Managed futures accounts
Belgium
KBC GROUP USD FUT REK -11,26 USD 1,000 -8,66
Total managed futures accounts -8,66
TOTAL CASH AT BANK AND IN HAND -485.379,30 -0,67
OTHER RECEIVABLES AND PAYABLES
Receivables
Belgium
KBC GROUP CHF RECEIVABLE 130.000,00 CHF 1,000 105.699,65 0,15
KBC GROUP EUR RECEIVABLE 553.967,73 EUR 1,000 553.967,73 0,76
KBC GROUP GBP RECEIVABLE 50.000,00 GBP 1,000 58.343,06 0,08
KBC GROUP WHT TO BE RECOVERED EUR 52.592,51 EUR 1,000 52.592,51 0,07
Total receivables 770.602,95 1,06
Payables
Belgium
KBC GROUP COUNTERPART ENTRY COLLATERAL IN EUR -2.997.549,16 EUR 1,000 -2.997.549,16 -4,11
KBC GROUP EUR PAYABLE -190.387,43 EUR 1,000 -190.387,43 -0,26
KBC GROUP NOK PAYABLE -2.600.000,00 NOK 1,000 -327.583,82 -0,45
Payables -3.515.520,41 -4,82
TOTAL RECEIVABLES AND PAYABLES -2.744.917,46 -3,77
OTHER
Interest receivable EUR 145.380,03 0,20
Accrued interest EUR 14.414,18 0,02
Expenses payable EUR -94.941,78 -0,13

Expenses to be carried forward EUR 42.634,96 0,06
TOTAL OTHER 107.487,39 0,15
TOTAL NET ASSETS 72.910.933,60 100,00
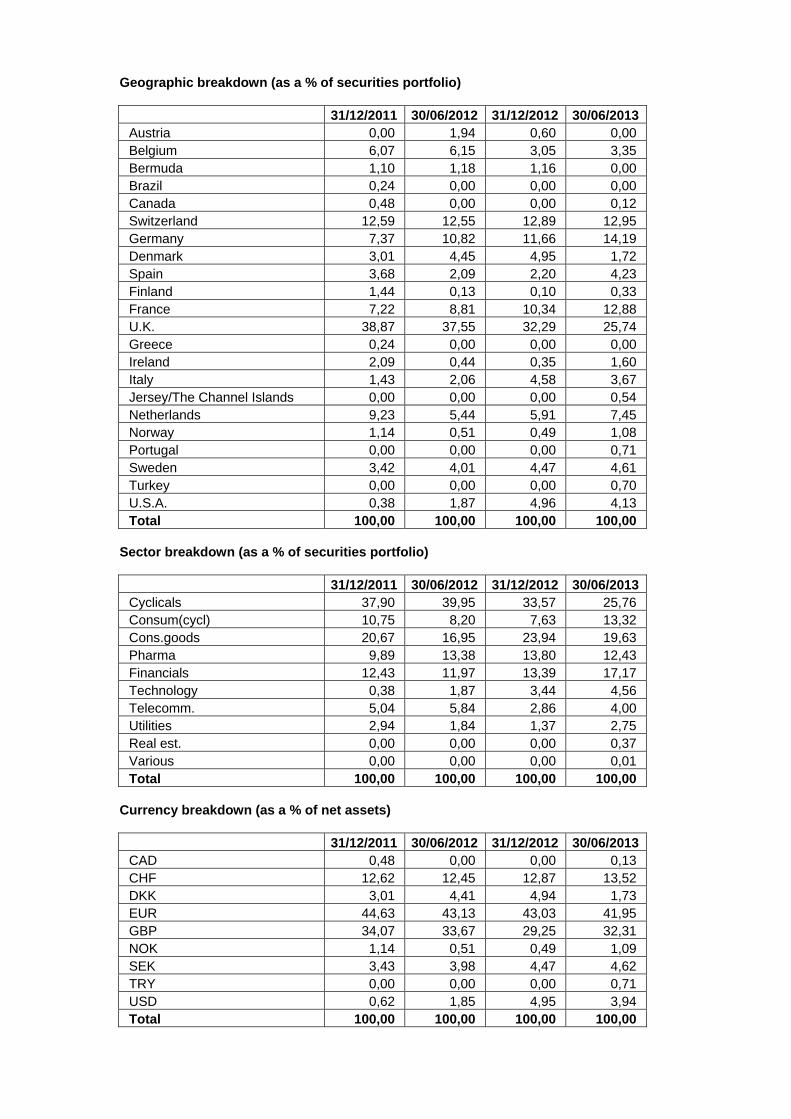
Geographic breakdown (as a % of securities portfolio)
31/12/2011 30/06/2012 31/12/2012 30/06/2013 Austria 0,00 1,94 0,60 0,00 Belgium 6,07 6,15 3,05 3,35 Bermuda 1,10 1,18 1,16 0,00 Brazil 0,24 0,00 0,00 0,00 Canada 0,48 0,00 0,00 0,12 Switzerland 12,59 12,55 12,89 12,95 Germany 7,37 10,82 11,66 14,19 Denmark 3,01 4,45 4,95 1,72 Spain 3,68 2,09 2,20 4,23 Finland 1,44 0,13 0,10 0,33 France 7,22 8,81 10,34 12,88 U.K. 38,87 37,55 32,29 25,74 Greece 0,24 0,00 0,00 0,00 Ireland 2,09 0,44 0,35 1,60 Italy 1,43 2,06 4,58 3,67 Jersey/The Channel Islands 0,00 0,00 0,00 0,54 Netherlands 9,23 5,44 5,91 7,45 Norway 1,14 0,51 0,49 1,08 Portugal 0,00 0,00 0,00 0,71 Sweden 3,42 4,01 4,47 4,61 Turkey 0,00 0,00 0,00 0,70 U.S.A. 0,38 1,87 4,96 4,13 Total 100,00 100,00 100,00 100,00
Sector breakdown (as a % of securities portfolio)
31/12/2011 30/06/2012 31/12/2012 30/06/2013 Cyclicals 37,90 39,95 33,57 25,76 Consum(cycl) 10,75 8,20 7,63 13,32 Cons.goods 20,67 16,95 23,94 19,63 Pharma 9,89 13,38 13,80 12,43 Financials 12,43 11,97 13,39 17,17 Technology 0,38 1,87 3,44 4,56 Telecomm. 5,04 5,84 2,86 4,00 Utilities 2,94 1,84 1,37 2,75 Real est. 0,00 0,00 0,00 0,37 Various 0,00 0,00 0,00 0,01 Total 100,00 100,00 100,00 100,00
Currency breakdown (as a % of net assets)
31/12/2011 30/06/2012 31/12/2012 30/06/2013 CAD 0,48 0,00 0,00 0,13 CHF 12,62 12,45 12,87 13,52 DKK 3,01 4,41 4,94 1,73 EUR 44,63 43,13 43,03 41,95 GBP 34,07 33,67 29,25 32,31 NOK 1,14 0,51 0,49 1,09 SEK 3,43 3,98 4,47 4,62 TRY 0,00 0,00 0,00 0,71 USD 0,62 1,85 4,95 3,94 Total 100,00 100,00 100,00 100,00


2.4.2 CHANGES IN THE COMPOSITION OF THE ASSETS OF KBC EQUITY FUND EUROPE (IN THE
CURRENCY OF THE SUB-FUND)
1st half of year YearPurchases 89.057.303,78 89.057.303,78 Sales 114.493.771,99 114.493.771,99 Total 1 203.551.075,77 203.551.075,77 Subscriptions 25.968.660,99 25.968.660,99 Redemptions 52.024.291,04 52.024.291,04 Total 2 77.992.952,03 77.992.952,03 Monthly average of total assets
89.813.708,14 89.813.708,14
Turnover rate 139,80 % 139,80 %
1st half of year YearPurchases 89.057.303,78 89.057.303,78 Sales 114.493.771,99 114.493.771,99 Total 1 203.551.075,77 203.551.075,77 Subscriptions 25.968.660,99 25.968.660,99 Redemptions 52.024.291,04 52.024.291,04 Total 2 77.992.952,03 77.992.952,03 Monthly average of total assets
90.093.010,26 90.093.010,26
Corrected turnover rate 139,36 % 139,36 %
The table above shows the capital volume of portfolio transactions. This volume (adjusted to take account of total subscriptions and redemptions) is also compared to the average net assets at the beginning and end of the period. A figure close to 0% implies that the transactions relating to the securities or transactions relating to the assets (excluding deposits and cash) in a given period only involve subscriptions and redemptions. A negative percentage shows that subscriptions and redemptions entailed few, if any, transactions in the portfolio. Active asset management may result in high turnover rates (monthly percentage >50%). The detailed list of transactions is available for consultation free of charge at the registered office of the Bevek or fund at Havenlaan 2, 1080 Brussels.
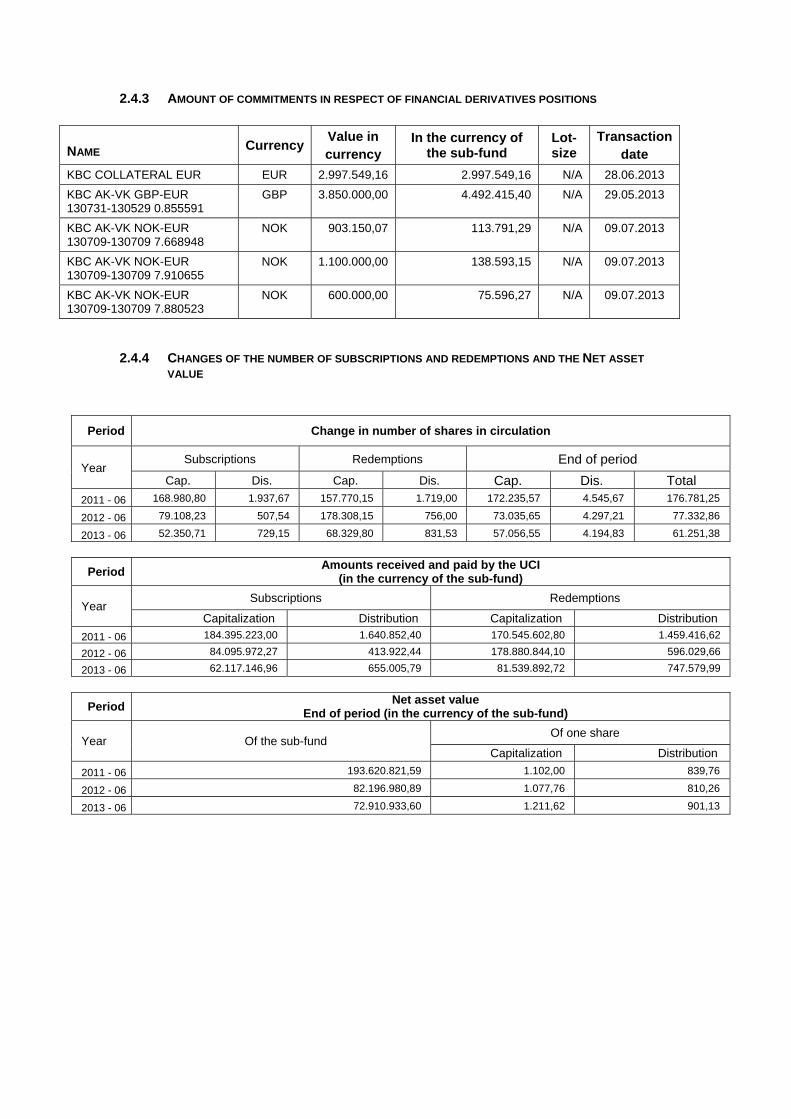
2.4.3 AMOUNT OF COMMITMENTS IN RESPECT OF FINANCIAL DERIVATIVES POSITIONS
NAME Currency Value in currency
In the currency of the sub-fund
Lot-size
Transactiondate
KBC COLLATERAL EUR EUR 2.997.549,16 2.997.549,16 N/A 28.06.2013
KBC AK-VK GBP-EUR 130731-130529 0.855591
GBP 3.850.000,00 4.492.415,40 N/A 29.05.2013
KBC AK-VK NOK-EUR 130709-130709 7.668948
NOK 903.150,07 113.791,29 N/A 09.07.2013
KBC AK-VK NOK-EUR 130709-130709 7.910655
NOK 1.100.000,00 138.593,15 N/A 09.07.2013
KBC AK-VK NOK-EUR 130709-130709 7.880523
NOK 600.000,00 75.596,27 N/A 09.07.2013
2.4.4 CHANGES OF THE NUMBER OF SUBSCRIPTIONS AND REDEMPTIONS AND THE NET ASSET
VALUE
Period Change in number of shares in circulation
Year Subscriptions Redemptions End of period
Cap. Dis. Cap. Dis. Cap. Dis. Total 2011 - 06 168.980,80 1.937,67 157.770,15 1.719,00 172.235,57 4.545,67 176.781,25
2012 - 06 79.108,23 507,54 178.308,15 756,00 73.035,65 4.297,21 77.332,86
2013 - 06 52.350,71 729,15 68.329,80 831,53 57.056,55 4.194,83 61.251,38
Period Amounts received and paid by the UCI
(in the currency of the sub-fund)
Year Subscriptions Redemptions
Capitalization Distribution Capitalization Distribution
2011 - 06 184.395.223,00 1.640.852,40 170.545.602,80 1.459.416,62
2012 - 06 84.095.972,27 413.922,44 178.880.844,10 596.029,66
2013 - 06 62.117.146,96 655.005,79 81.539.892,72 747.579,99
Period Net asset value
End of period (in the currency of the sub-fund)
Year Of the sub-fund Of one share
Capitalization Distribution
2011 - 06 193.620.821,59 1.102,00 839,76
2012 - 06 82.196.980,89 1.077,76 810,26
2013 - 06 72.910.933,60 1.211,62 901,13
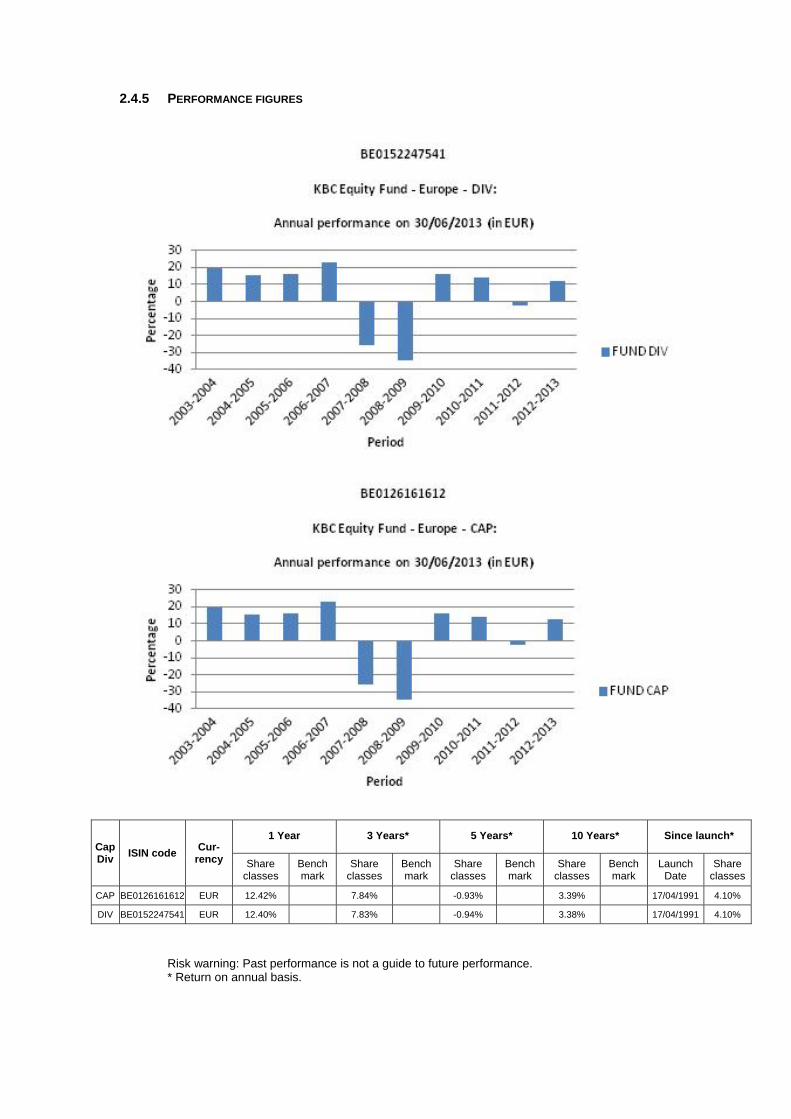
2.4.5 PERFORMANCE FIGURES
Cap Div
ISIN code Cur-
rency
1 Year 3 Years* 5 Years* 10 Years* Since launch*
Share classes
Bench mark
Share classes
Bench mark
Share classes
Bench mark
Share classes
Bench mark
Launch Date
Share classes
CAP BE0126161612 EUR 12.42% 7.84% -0.93% 3.39% 17/04/1991 4.10%
DIV BE0152247541 EUR 12.40% 7.83% -0.94% 3.38% 17/04/1991 4.10%
Risk warning: Past performance is not a guide to future performance. * Return on annual basis.

The bar chart shows the performance for full financial years. The figures do not take account of any restructuring. Calculated in EUR (ex BEF). the return is calculated as the change in the net asset value between two dates expressed
as a percentage. In the case of units that pay dividends, the dividend is incorporated geometrically in the return.
Calculation method for date D, where NAV stands for net asset value: Capitalisation units (CAP) Return on date D over a period of X years:
[NAV(D) / NAV(Y)] ^ [1 / X] - 1 where Y = D-X
Return on date D since the start date S of the unit: [NAV(D) / NAV(S)] ^ [1 / F] - 1 where F = 1 if the unit has existed for less than one year on date D where F = (D-S) / 365.25 if the unit has existed for longer than one year on date D
Distribution units (DIV) Return on date D over a period of X years:
[ C * NAV(D) / NAV(Y)] ^ [1 / X] - 1 where Y = D-X
Return on date D since the start date S of the unit: [ C * NAV(D) / NAV(S)] ^ [1 / F] - 1 where F = 1 if the unit has existed for less than one year on date D where F = (D-S) / 365.25 if the unit has existed for longer than one year on date D
where C is a factor that is determined for all N dividends between the calculation date D and the reference date. For dividend i on date Di with value Wi:
Ci = [Wi / NAV(Di)] + 1 i = 1 ... N
from which C = C0 * .... * CN. If the interval between the two dates exceeds one year, the ordinary return calculation is
converted into a return on an annual basis by taking the nth square root of 1 plus the total return of the unit.
The return figures shown above do not take account of the fees and charges associated with the issue and redemption of units.
These are the performance figures for capitalisation and distribution shares.
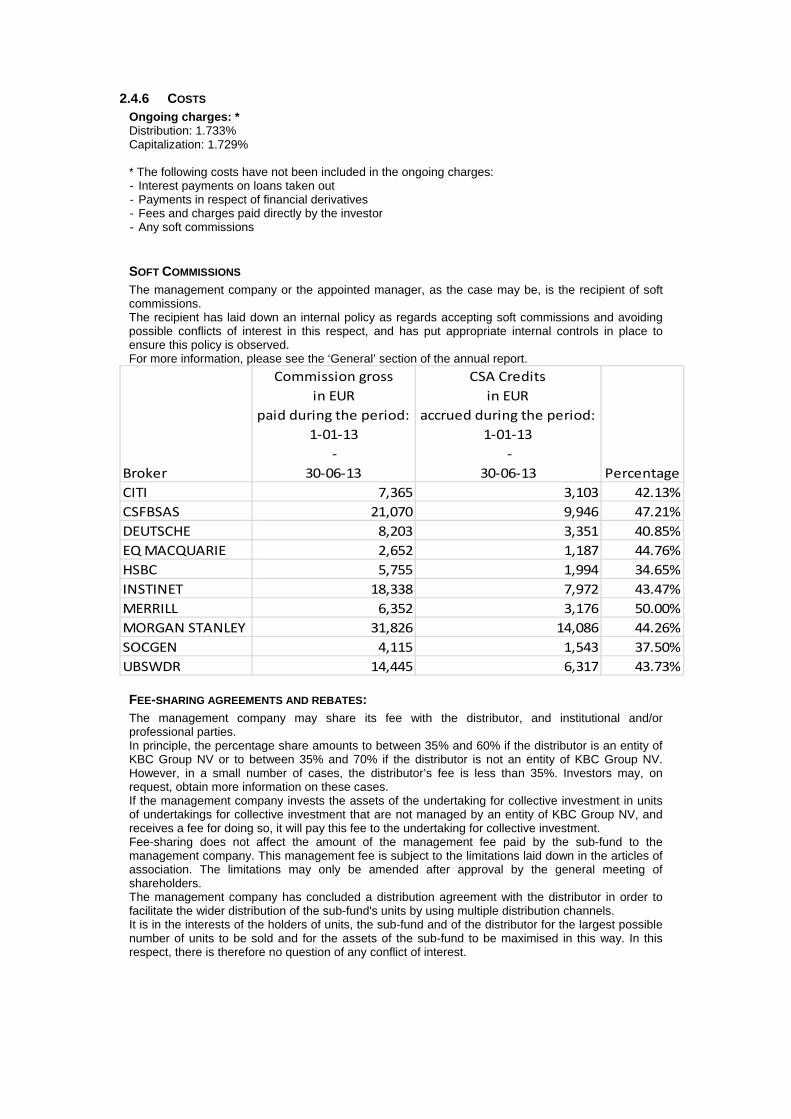
2.4.6 COSTS Ongoing charges: * Distribution: 1.733% Capitalization: 1.729% * The following costs have not been included in the ongoing charges: - Interest payments on loans taken out - Payments in respect of financial derivatives - Fees and charges paid directly by the investor - Any soft commissions
SOFT COMMISSIONS The management company or the appointed manager, as the case may be, is the recipient of soft commissions. The recipient has laid down an internal policy as regards accepting soft commissions and avoiding possible conflicts of interest in this respect, and has put appropriate internal controls in place to ensure this policy is observed. For more information, please see the ‘General’ section of the annual report.
Broker
Commission gross
in EUR
paid during the period:
1‐01‐13
‐
30‐06‐13
CSA Credits
in EUR
accrued during the period:
1‐01‐13
‐
30‐06‐13 Percentage
CITI 7,365 3,103 42.13%
CSFBSAS 21,070 9,946 47.21%
DEUTSCHE 8,203 3,351 40.85%
EQ MACQUARIE 2,652 1,187 44.76%
HSBC 5,755 1,994 34.65%
INSTINET 18,338 7,972 43.47%
MERRILL 6,352 3,176 50.00%
MORGAN STANLEY 31,826 14,086 44.26%
SOCGEN 4,115 1,543 37.50%
UBSWDR 14,445 6,317 43.73%
FEE-SHARING AGREEMENTS AND REBATES: The management company may share its fee with the distributor, and institutional and/or professional parties. In principle, the percentage share amounts to between 35% and 60% if the distributor is an entity of KBC Group NV or to between 35% and 70% if the distributor is not an entity of KBC Group NV. However, in a small number of cases, the distributor’s fee is less than 35%. Investors may, on request, obtain more information on these cases. If the management company invests the assets of the undertaking for collective investment in units of undertakings for collective investment that are not managed by an entity of KBC Group NV, and receives a fee for doing so, it will pay this fee to the undertaking for collective investment. Fee-sharing does not affect the amount of the management fee paid by the sub-fund to the management company. This management fee is subject to the limitations laid down in the articles of association. The limitations may only be amended after approval by the general meeting of shareholders. The management company has concluded a distribution agreement with the distributor in order to facilitate the wider distribution of the sub-fund's units by using multiple distribution channels. It is in the interests of the holders of units, the sub-fund and of the distributor for the largest possible number of units to be sold and for the assets of the sub-fund to be maximised in this way. In this respect, there is therefore no question of any conflict of interest.

2.4.7 NOTES TO THE FINANCIAL STATEMENTS AND OTHER DATA Fee for managing the investment portfolio: 1.5% per annum calculated on the basis of the average total net assets of the sub-fund, no management fee is charged on assets assets invested in investment undertakings managed by a financial institution of the KBC group. The administration agent’s fee is payable at the end of each month and is calculated on the basis of the average total net assets of the sub-fund. Auditor's fee: 1 700 EUR per year. This fee is not including VAT and can be indexed on an annual basis in accordance with the decisions of the general meeting. The custody fee is calculated on the value of the securities held in custody by the custodian on the final banking day of the preceding calendar year, except on those assets invested in investment undertakings managed by a financial institution of the KBC group. The custody fee is paid at the beginning of the calendar year. Social, ethical and environmental aspects: No manufacturers of controversial weapons whose use over the past five decades, according to the international consensus, has led to disproportionate human suffering among the civilian population will be included in the portfolio of investments. This involves the manufacturers of anti-personnel mines, cluster bombs and munitions and weapons containing depleted uranium. In this way, the sub-fund seeks to reflect not only simple financial reality but also the social reality of the sector or region in question. Exercising voting rights. If necessary, relevant and in the interest of the shareholders, the management company will exercise the voting rights attached to the shares in the Bevek’s portfolio. The management company will adhere to the following criteria when determining how it stands relative to the items on the agenda that are put to the vote: - Shareholder value may not be adversely affected. - Corporate governance rules, especially with regard to the rights of minority shareholders, must be
respected. - The minimum standards with regard to sustainable business and corporate social responsibility
must be met. The list of companies for which voting rights are exercised is available at the registered office of the Bevek. Securities lending In accordance with the Royal Decree of 7 March 2006 concerning securities lending, the undertaking for collective investment has taken out securities loans with a principal to whom the full title of the loaned securities was transferred, without recording this transfer of ownership in the accounts. For the period from 1 January 2013 to 30 June 2013, the fee for securities lent comes to 8,594.01 EUR. The undertaking for collective investment receives 50% of the fee received for securities lent. The detailed list of securities lending transactions carried out can be obtained from the registered office of the collective investment undertaking at 2 Havenlaan, 1080 Brussels.
Overview of securities lent as at 30/06/2013
Name Currency Quantity Price Value in currency of the
portfolio
ANTOFAGASTA PLC GBP 21.999 7,950 204.074,74
CHRISTIAN HANSEN HOLDING A/S DKK 6.699 196,200 176.213,84
ELEKTA AB -B- FRIA SEK 16.399 102,000 190.657,79
FRAPORT AG EUR 4.999 46,480 232.353,52
GLANBIA PLC EUR 17.736 10,350 183.567,60
GRIFOLS SA EUR 5.999 28,200 169.171,80
HEIDELBERGCEMENT EUR 2.799 51,670 144.624,33
HOLCIM LTD OP NAME EFF. CHF 7.499 65,850 401.503,50
IBERDROLA SA EUR 52.999 4,056 214.963,94
KONE OY -B- NW 2005 EUR 3.999 61,050 244.138,95
LUXOTTICA GROUP SPA EUR 8.499 38,840 330.101,16
TRANSOCEAN LTD CHF 7.599 45,460 280.876,93
TULLOW OIL PLC GBP 1.027 10,010 11.995,65
Total 2.784.243,75
Details of collateral received for securities lent
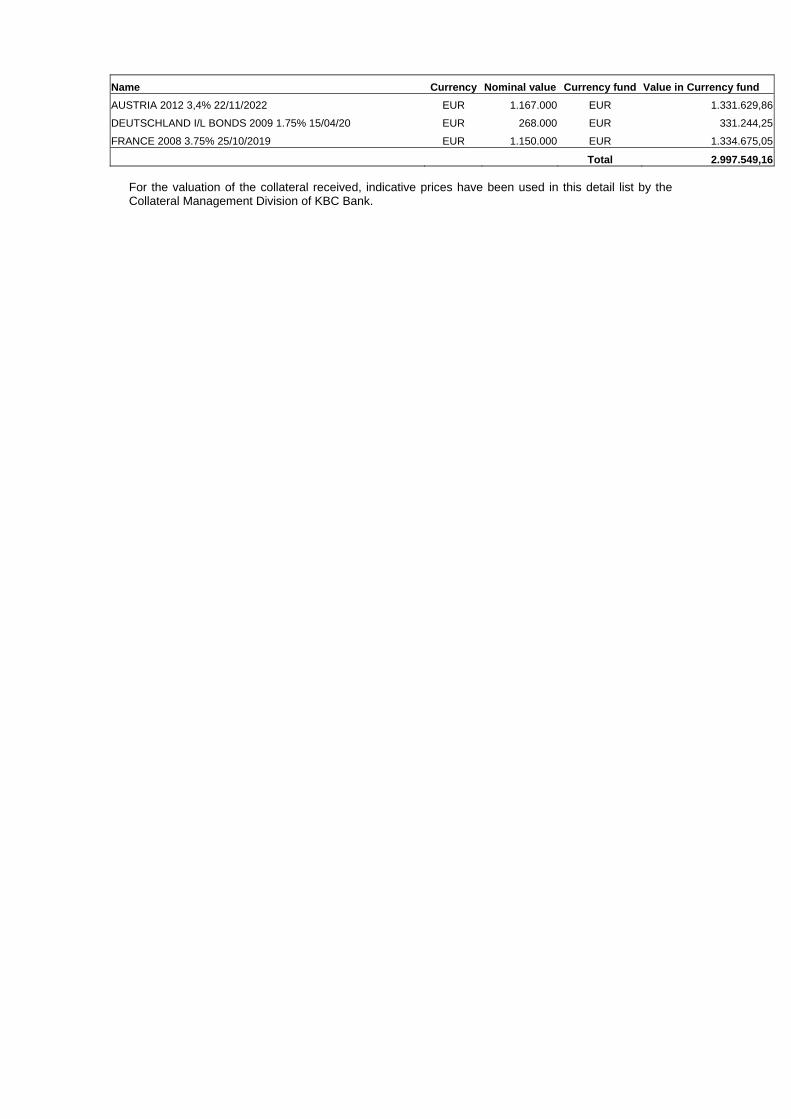
Name Currency Nominal value Currency fund Value in Currency fund
AUSTRIA 2012 3,4% 22/11/2022 EUR 1.167.000 EUR 1.331.629,86
DEUTSCHLAND I/L BONDS 2009 1.75% 15/04/20 EUR 268.000 EUR 331.244,25
FRANCE 2008 3.75% 25/10/2019 EUR 1.150.000 EUR 1.334.675,05
Total 2.997.549,16 For the valuation of the collateral received, indicative prices have been used in this detail list by the Collateral Management Division of KBC Bank.

Semi-Annual report as at 30th June 2013
TABLE OF CONTENTS
2. Information on KBC Equity Fund Food & Personal Products
2.1. Management report 2.1.1. Launch date and subscription price 2.1.2. Stock exchange listing 2.1.3. Aim and distinctive features of the investment policy 2.1.4. Financial portfolio management 2.1.5. Distributors 2.1.6. Index and benchmark 2.1.7. Policy conducted during the financial year 2.1.8. Future policy 2.1.9. Synthetic risk and reward indicator (SRRI)
2.2. Balance sheet
2.3. Profit and loss account
2.4. Composition of the assets and key figures
2.4.1. Composition of the assets 2.4.2. Change in the composition of the assets 2.4.3. Value of commitments in respect of financial derivatives positions 2.4.4. Evolution of the number of subscriptions, repayments and the net asset value 2.4.5. Return figures 2.4.6. Expenses 2.4.7. Notes to the financial statements and other data


2 INFORMATION ON KBC EQUITY FUND FOOD & PERSONAL PRODUCTS
2.1 MANAGEMENT REPORT
2.1.1 LAUNCH DATE AND SUBSCRIPTION PRICE Classic Shares : Launch date: 26 February 1999 Initial subscription price: 500 EUR Currency: EUR Institutional B Shares : Launch date: 25 November 2011 Initial subscription price: 887.07 EUR Currency: EUR
2.1.2 STOCK EXCHANGE LISTING Not applicable.
2.1.3 GOAL AND KEY PRINCIPLES OF THE INVESTMENT POLICY
SUB-FUND’S OBJECT: The main objective of this sub-fund is to generate the highest possible return for its shareholders by investing directly or indirectly in transferable securities. This is reflected in its pursuit of capital gains and income. To this end, the assets are invested, either directly or indirectly via correlated financial instruments, primarily in shares.
SUB-FUND’S INVESTMENT POLICY:
PERMITTED ASSET CLASSES: The sub-fund may invest in securities, money market instruments, units in undertakings for collective investment, deposits, financial derivatives, liquid assets and all other instruments insofar as permitted by the applicable laws and regulations and consistent with the sub-fund’s object The sub-fund shall invest no more than 10% of its assets in units of other undertakings for collective investment.
RESTRICTIONS OF THE INVESTMENT POLICY: The investment policy will be implemented within the limits set by law and regulations. The sub-fund may borrow up to 10% of its net assets, insofar as these are short-term borrowings aimed at solving temporary liquidity problems.
PERMITTED DERIVATIVES TRANSACTIONS: Derivates may be used either for hedging purposes or to achieve investment objectives. Changes will be made to the investments at regular intervals to comply with the sub-fund's investment strategy. In addition, listed and unlisted derivates may be used to achieve the objectives: these may be forward contracts, options or swaps on securities, indices, currencies or interest rates or other transactions involving derivatives. Unlisted derivatives transactions will only be concluded with prime financial institutions specialised in such transactions. Such derivatives may also be used to hedge the assets against exchange-rate fluctuations. Subject to the applicable laws and regulations and the articles of association, the sub-fund always seeks to conclude the most effective transactions. All costs associated with the transactions will be charged to the sub-fund and all income generated will be paid to the sub-fund. If the transactions result in a risk in respect of the counterparty, this risk can be hedged by using a margin management system that ensures that the sub-fund is the beneficiary of security (collateral) in the form of cash or investment grade bonds. When calculating the value of the bonds, a margin will be applied that varies depending on the residual term to maturity and the currency in which the bond in question is denominated. The relationship with the counterparty or counterparties is governed by standard international agreements.

STRATEGY SELECTED The assets are for at least 85% invested in shares of companies chiefly from the 1) food retailing, 2) food, beverages and tobacco and 3) household and personal products sectors. As a result, the entire Consumer Staples sector is considered. The regional allocation may change from time to time. In principle, the sub-fund invests worldwide. No more than 15% of the assets are invested in shares from other sectors and other instruments to the extent that they are permitted under the applicable regulations.
LENDING FINANCIAL INSTRUMENTS: The sub-fund may lend financial instruments within the limits set by law and regulations. This lending does not affect the sub-fund’s risk profile since: - it takes place within the framework of a securities lending system managed by a principal. In
addition, the sub-fund has a relationship only with the principal of the securities lending system which acts as counterparty and to which title of the loaned securities is transferred. The choice of principal is subject to strict selection criteria. The return of securities similar to the securities that have been lent is guaranteed by the principal.
- through a margin management system, the sub-fund is always guaranteed financial security, the actual value of which always exceeds the actual value of the securities that have been lent, in case the principal does not return similar securities.
The return of securities similar to the securities that have been lent can be requested at any time, which means that the lending of securities does not affect the management of the sub-fund's assets. By lending securities, the sub-fund can generate an additional return. The principal pays a fee to the management company. After deducting the fee for the margin management and clearing services of KBC Bank, most of this fee is paid to the sub-fund. The relationship with the counterparty or counterparties is governed by standard international agreements. More information is provided on the terms and conditions governing securities lending in the annual or half-yearly report for the sub-fund.
GENERAL STRATEGY FOR HEDGING THE EXCHANGE RATE RISK: In order to protect its assets against exchange rate fluctuations and within the limitations laid down in the articles of association, the sub-fund may perform transactions relating to the sale of forward currency contracts, as well as the sale of call options and the purchase of put options on currencies. The transactions in question may relate solely to contracts traded on a regulated market that operates regularly, is recognised and is open to the public or that are traded with a recognised, prime financial institution specialising in such transactions and dealing in the over-the-counter (OTC) market in options. With the same objective, the sub-fund may also sell currencies forward or exchange them in private transactions with prime financial institutions specialising in such transactions. The hedging objective of the aforementioned transactions suggests that there is a direct link between these transactions and the assets to be hedged, which implies that the transactions carried out in a particular currency may in principle not exceed, in terms of volume, either the valuation value of all the assets in the same currency or the holding period of those assets.
SOCIAL, ETHICAL AND ENVIRONMENTAL ASPECTS:
No manufacturers of controversial weapons whose use over the past five decades, according to the international consensus, has led to disproportionate human suffering among the civilian population will be included in the portfolio of investments. This involves the manufacturers of anti-personnel mines, cluster bombs and munitions and weapons containing depleted uranium. In this way, the sub-fund seeks to reflect not only simple financial reality but also the social reality of the sector or region in question.
THE EUROPEAN SAVINGS DIRECTIVE AND TAX ON DEBT CLAIM RETURNS OBTAINED THROUGH THE
REDEMPTION OF OWN UNITS OR IN THE EVENT OF FULL OR PARTIAL DISTRIBUTION OF EQUITY
CAPITAL. The following information is of a general character and is not intended to cover all aspects of an investment in a UCITS. In certain cases entirely different rules might even apply. Moreover, both tax law and the interpretation of it can change. Investors who wish to have more information about the

tax implications – in both Belgium and abroad – of acquiring, holding and transferring units should seek the advice of their usual financial and tax advisers. This UCITS shall invest a maximum of 15% of its assets directly or indirectly in debt instruments as intended by the European Savings Directive. A. European Savings Directive (Directive 2003/48/EC) The European Savings Directive has been implemented in Belgium. Since this UCITS invests a maximum of 15% of its assets directly or indirectly in debt claims as intended by the European Savings Directive, the income of this UCITS does not fall within the scope of this directive. B. Tax on debt claim returns obtained through the redemption of own units or in the event of full or partial distribution of equity capital (Article 19bis Income Tax Code 1992). The income from this UCITS is not subject to the tax on debt instrument returns as intended by Article 19bis, Income Tax Code 1992.
2.1.4 FINANCIAL PORTFOLIO MANAGEMENT There is no delegation of the portfolio.
2.1.5 DISTRIBUTORS KBC Asset Management S.A., 5, Place de la Gare, L-1616 Luxembourg.
2.1.6 INDEX AND BENCHMARK See ‘Sub-fund’s investment policy’.
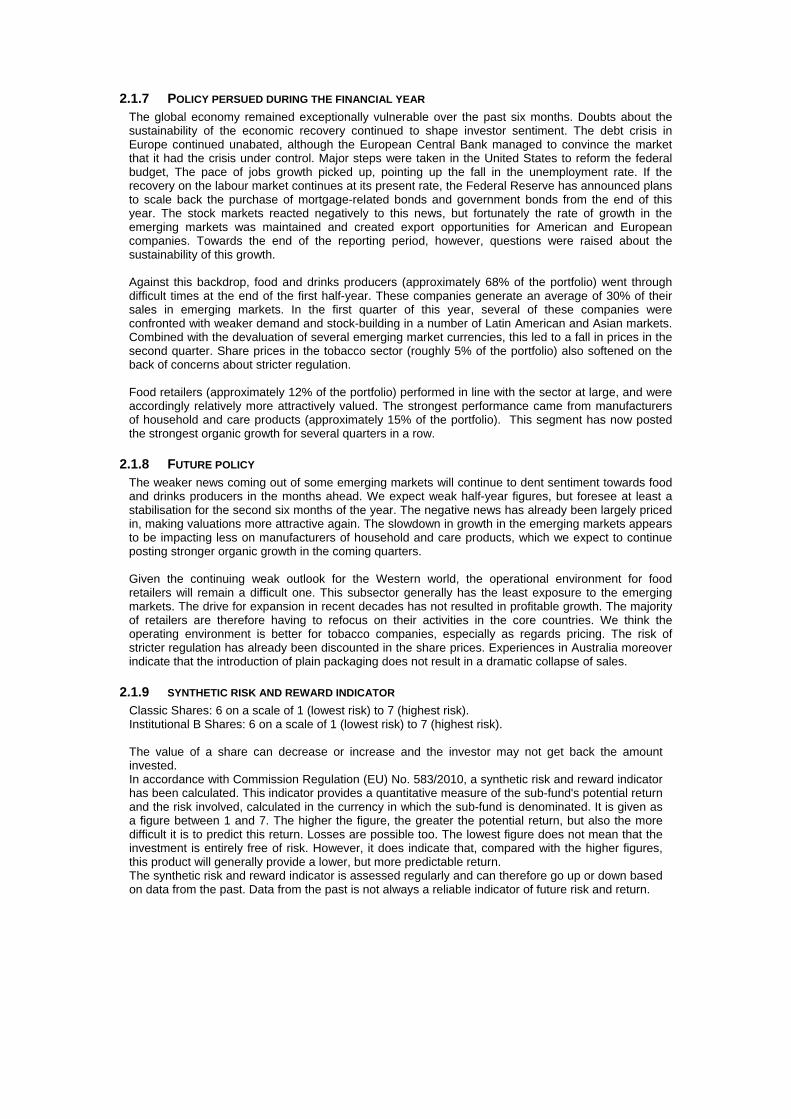
2.1.7 POLICY PERSUED DURING THE FINANCIAL YEAR The global economy remained exceptionally vulnerable over the past six months. Doubts about the sustainability of the economic recovery continued to shape investor sentiment. The debt crisis in Europe continued unabated, although the European Central Bank managed to convince the market that it had the crisis under control. Major steps were taken in the United States to reform the federal budget, The pace of jobs growth picked up, pointing up the fall in the unemployment rate. If the recovery on the labour market continues at its present rate, the Federal Reserve has announced plans to scale back the purchase of mortgage-related bonds and government bonds from the end of this year. The stock markets reacted negatively to this news, but fortunately the rate of growth in the emerging markets was maintained and created export opportunities for American and European companies. Towards the end of the reporting period, however, questions were raised about the sustainability of this growth. Against this backdrop, food and drinks producers (approximately 68% of the portfolio) went through difficult times at the end of the first half-year. These companies generate an average of 30% of their sales in emerging markets. In the first quarter of this year, several of these companies were confronted with weaker demand and stock-building in a number of Latin American and Asian markets. Combined with the devaluation of several emerging market currencies, this led to a fall in prices in the second quarter. Share prices in the tobacco sector (roughly 5% of the portfolio) also softened on the back of concerns about stricter regulation. Food retailers (approximately 12% of the portfolio) performed in line with the sector at large, and were accordingly relatively more attractively valued. The strongest performance came from manufacturers of household and care products (approximately 15% of the portfolio). This segment has now posted the strongest organic growth for several quarters in a row.
2.1.8 FUTURE POLICY The weaker news coming out of some emerging markets will continue to dent sentiment towards food and drinks producers in the months ahead. We expect weak half-year figures, but foresee at least a stabilisation for the second six months of the year. The negative news has already been largely priced in, making valuations more attractive again. The slowdown in growth in the emerging markets appears to be impacting less on manufacturers of household and care products, which we expect to continue posting stronger organic growth in the coming quarters. Given the continuing weak outlook for the Western world, the operational environment for food retailers will remain a difficult one. This subsector generally has the least exposure to the emerging markets. The drive for expansion in recent decades has not resulted in profitable growth. The majority of retailers are therefore having to refocus on their activities in the core countries. We think the operating environment is better for tobacco companies, especially as regards pricing. The risk of stricter regulation has already been discounted in the share prices. Experiences in Australia moreover indicate that the introduction of plain packaging does not result in a dramatic collapse of sales.
2.1.9 SYNTHETIC RISK AND REWARD INDICATOR Classic Shares: 6 on a scale of 1 (lowest risk) to 7 (highest risk). Institutional B Shares: 6 on a scale of 1 (lowest risk) to 7 (highest risk). The value of a share can decrease or increase and the investor may not get back the amount invested. In accordance with Commission Regulation (EU) No. 583/2010, a synthetic risk and reward indicator has been calculated. This indicator provides a quantitative measure of the sub-fund's potential return and the risk involved, calculated in the currency in which the sub-fund is denominated. It is given as a figure between 1 and 7. The higher the figure, the greater the potential return, but also the more difficult it is to predict this return. Losses are possible too. The lowest figure does not mean that the investment is entirely free of risk. However, it does indicate that, compared with the higher figures, this product will generally provide a lower, but more predictable return. The synthetic risk and reward indicator is assessed regularly and can therefore go up or down based on data from the past. Data from the past is not always a reliable indicator of future risk and return.
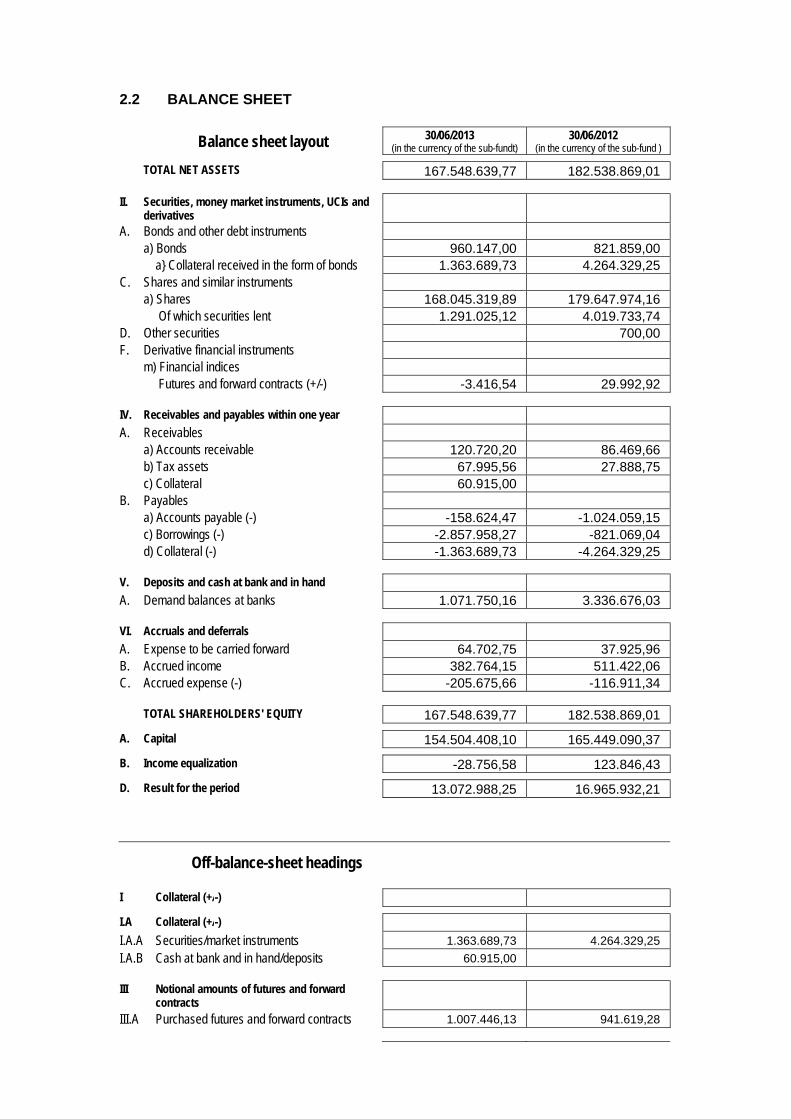
2.2 BALANCE SHEET
Balance sheet layout 30/06/2013 (in the currency of the sub-fundt)
30/06/2012 (in the currency of the sub-fund )
TOTAL NET ASSETS 167.548.639,77 182.538.869,01
II. Securities, money market instruments, UCIs and derivatives
A. Bonds and other debt instruments a) Bonds 960.147,00 821.859,00 a} Collateral received in the form of bonds 1.363.689,73 4.264.329,25 C. Shares and similar instruments a) Shares 168.045.319,89 179.647.974,16 Of which securities lent 1.291.025,12 4.019.733,74 D. Other securities 700,00 F. Derivative financial instruments m) Financial indices Futures and forward contracts (+/-) -3.416,54 29.992,92
IV. Receivables and payables within one year A. Receivables a) Accounts receivable 120.720,20 86.469,66 b) Tax assets 67.995,56 27.888,75 c) Collateral 60.915,00 B. Payables a) Accounts payable (-) -158.624,47 -1.024.059,15 c) Borrowings (-) -2.857.958,27 -821.069,04 d) Collateral (-) -1.363.689,73 -4.264.329,25
V. Deposits and cash at bank and in hand A. Demand balances at banks 1.071.750,16 3.336.676,03
VI. Accruals and deferrals A. Expense to be carried forward 64.702,75 37.925,96 B. Accrued income 382.764,15 511.422,06 C. Accrued expense (-) -205.675,66 -116.911,34
TOTAL SHAREHOLDERS' EQUITY 167.548.639,77 182.538.869,01
A. Capital 154.504.408,10 165.449.090,37
B. Income equalization -28.756,58 123.846,43
D. Result for the period 13.072.988,25 16.965.932,21
Off-balance-sheet headings
I Collateral (+/-)
I.A Collateral (+/-)
I.A.A Securities/market instruments 1.363.689,73 4.264.329,25
I.A.B Cash at bank and in hand/deposits 60.915,00
III Notional amounts of futures and forward contracts
III.A Purchased futures and forward contracts 1.007.446,13 941.619,28

IX Financial instruments lent 1.291.025,12 4.019.733,74
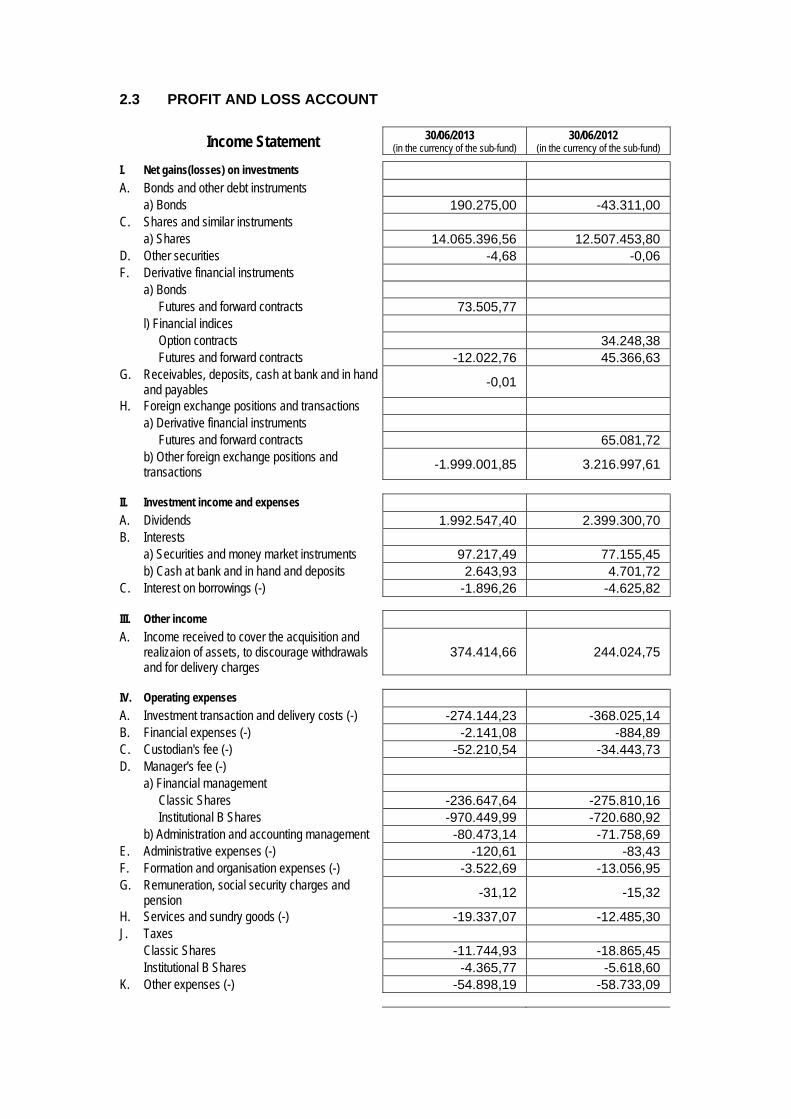
2.3 PROFIT AND LOSS ACCOUNT
Income Statement 30/06/2013 (in the currency of the sub-fund)
30/06/2012 (in the currency of the sub-fund)
I. Net gains(losses) on investments A. Bonds and other debt instruments a) Bonds 190.275,00 -43.311,00 C. Shares and similar instruments a) Shares 14.065.396,56 12.507.453,80 D. Other securities -4,68 -0,06 F. Derivative financial instruments a) Bonds Futures and forward contracts 73.505,77 l) Financial indices Option contracts 34.248,38 Futures and forward contracts -12.022,76 45.366,63 G. Receivables, deposits, cash at bank and in hand
and payables -0,01
H. Foreign exchange positions and transactions a) Derivative financial instruments Futures and forward contracts 65.081,72 b) Other foreign exchange positions and
transactions -1.999.001,85 3.216.997,61
II. Investment income and expenses A. Dividends 1.992.547,40 2.399.300,70 B. Interests a) Securities and money market instruments 97.217,49 77.155,45 b) Cash at bank and in hand and deposits 2.643,93 4.701,72 C. Interest on borrowings (-) -1.896,26 -4.625,82
III. Other income A. Income received to cover the acquisition and
realizaion of assets, to discourage withdrawals and for delivery charges
374.414,66 244.024,75
IV. Operating expenses A. Investment transaction and delivery costs (-) -274.144,23 -368.025,14 B. Financial expenses (-) -2.141,08 -884,89 C. Custodian's fee (-) -52.210,54 -34.443,73 D. Manager's fee (-) a) Financial management Classic Shares -236.647,64 -275.810,16 Institutional B Shares -970.449,99 -720.680,92 b) Administration and accounting management -80.473,14 -71.758,69 E. Administrative expenses (-) -120,61 -83,43 F. Formation and organisation expenses (-) -3.522,69 -13.056,95 G. Remuneration, social security charges and
pension -31,12 -15,32
H. Services and sundry goods (-) -19.337,07 -12.485,30 J. Taxes Classic Shares -11.744,93 -18.865,45 Institutional B Shares -4.365,77 -5.618,60 K. Other expenses (-) -54.898,19 -58.733,09

Income and expenditure for the period Subtotal II + III + IV 754.840,22 1.140.095,13
V. Profit (loss) on ordinary activities before tax 13.072.988,25 16.965.932,21
VII. Result for the period 13.072.988,25 16.965.932,21
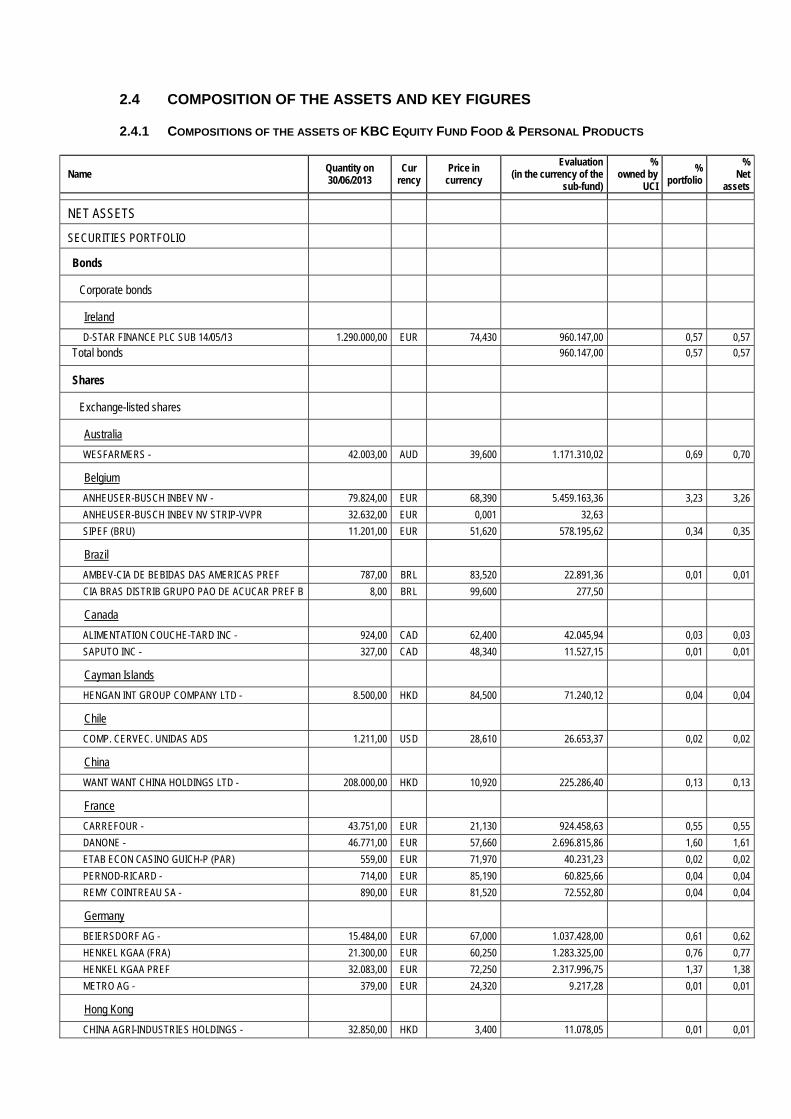
2.4 COMPOSITION OF THE ASSETS AND KEY FIGURES
2.4.1 COMPOSITIONS OF THE ASSETS OF KBC EQUITY FUND FOOD & PERSONAL PRODUCTS
Name Quantity on 30/06/2013
Cur rency
Price in currency
Evaluation (in the currency of the
sub-fund)
% owned by
UCI
% portfolio
% Net
assets
NET ASSETS
SECURITIES PORTFOLIO
Bonds
Corporate bonds
Ireland
D-STAR FINANCE PLC SUB 14/05/13 1.290.000,00 EUR 74,430 960.147,00 0,57 0,57
Total bonds 960.147,00 0,57 0,57
Shares
Exchange-listed shares
Australia
WESFARMERS - 42.003,00 AUD 39,600 1.171.310,02 0,69 0,70
Belgium
ANHEUSER-BUSCH INBEV NV - 79.824,00 EUR 68,390 5.459.163,36 3,23 3,26
ANHEUSER-BUSCH INBEV NV STRIP-VVPR 32.632,00 EUR 0,001 32,63
SIPEF (BRU) 11.201,00 EUR 51,620 578.195,62 0,34 0,35
Brazil
AMBEV-CIA DE BEBIDAS DAS AMERICAS PREF 787,00 BRL 83,520 22.891,36 0,01 0,01
CIA BRAS DISTRIB GRUPO PAO DE ACUCAR PREF B 8,00 BRL 99,600 277,50
Canada
ALIMENTATION COUCHE-TARD INC - 924,00 CAD 62,400 42.045,94 0,03 0,03
SAPUTO INC - 327,00 CAD 48,340 11.527,15 0,01 0,01
Cayman Islands
HENGAN INT GROUP COMPANY LTD - 8.500,00 HKD 84,500 71.240,12 0,04 0,04
Chile
COMP. CERVEC. UNIDAS ADS 1.211,00 USD 28,610 26.653,37 0,02 0,02
China
WANT WANT CHINA HOLDINGS LTD - 208.000,00 HKD 10,920 225.286,40 0,13 0,13
France
CARREFOUR - 43.751,00 EUR 21,130 924.458,63 0,55 0,55
DANONE - 46.771,00 EUR 57,660 2.696.815,86 1,60 1,61
ETAB ECON CASINO GUICH-P (PAR) 559,00 EUR 71,970 40.231,23 0,02 0,02
PERNOD-RICARD - 714,00 EUR 85,190 60.825,66 0,04 0,04
REMY COINTREAU SA - 890,00 EUR 81,520 72.552,80 0,04 0,04
Germany
BEIERSDORF AG - 15.484,00 EUR 67,000 1.037.428,00 0,61 0,62
HENKEL KGAA (FRA) 21.300,00 EUR 60,250 1.283.325,00 0,76 0,77
HENKEL KGAA PREF 32.083,00 EUR 72,250 2.317.996,75 1,37 1,38
METRO AG - 379,00 EUR 24,320 9.217,28 0,01 0,01
Hong Kong
CHINA AGRI-INDUSTRIES HOLDINGS - 32.850,00 HKD 3,400 11.078,05 0,01 0,01
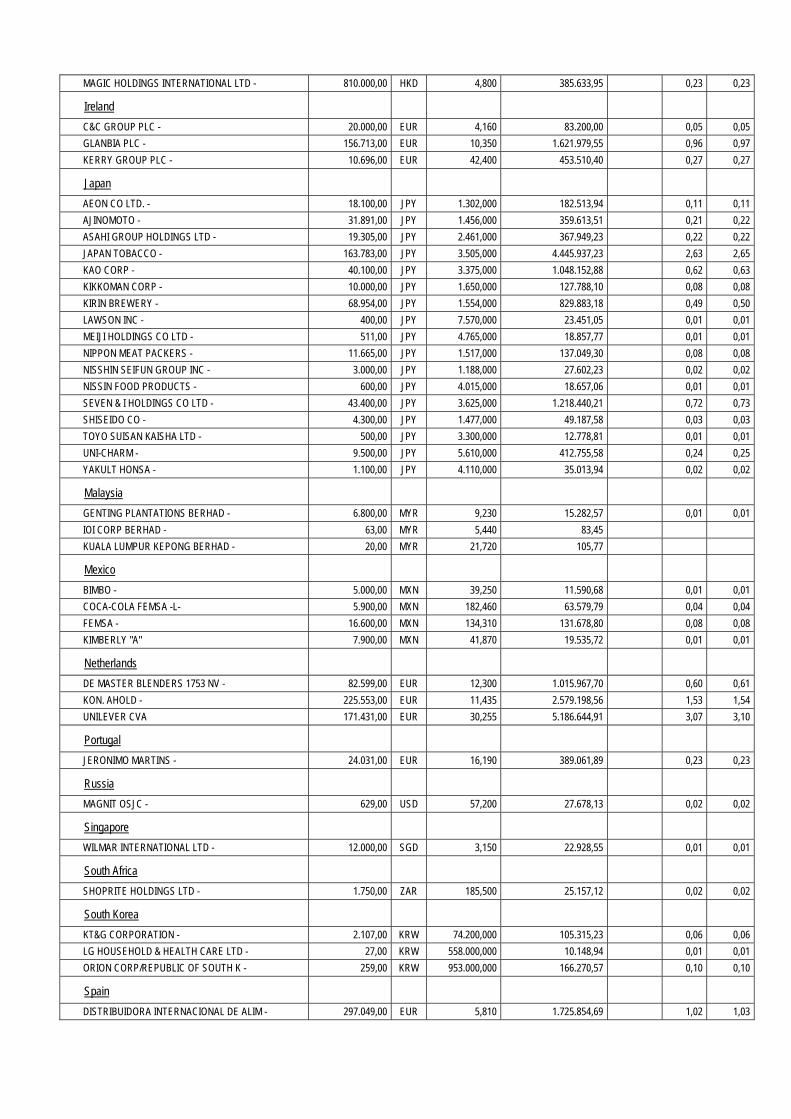
MAGIC HOLDINGS INTERNATIONAL LTD - 810.000,00 HKD 4,800 385.633,95 0,23 0,23
Ireland
C&C GROUP PLC - 20.000,00 EUR 4,160 83.200,00 0,05 0,05
GLANBIA PLC - 156.713,00 EUR 10,350 1.621.979,55 0,96 0,97
KERRY GROUP PLC - 10.696,00 EUR 42,400 453.510,40 0,27 0,27
Japan
AEON CO LTD. - 18.100,00 JPY 1.302,000 182.513,94 0,11 0,11
AJINOMOTO - 31.891,00 JPY 1.456,000 359.613,51 0,21 0,22
ASAHI GROUP HOLDINGS LTD - 19.305,00 JPY 2.461,000 367.949,23 0,22 0,22
JAPAN TOBACCO - 163.783,00 JPY 3.505,000 4.445.937,23 2,63 2,65
KAO CORP - 40.100,00 JPY 3.375,000 1.048.152,88 0,62 0,63
KIKKOMAN CORP - 10.000,00 JPY 1.650,000 127.788,10 0,08 0,08
KIRIN BREWERY - 68.954,00 JPY 1.554,000 829.883,18 0,49 0,50
LAWSON INC - 400,00 JPY 7.570,000 23.451,05 0,01 0,01
MEIJI HOLDINGS CO LTD - 511,00 JPY 4.765,000 18.857,77 0,01 0,01
NIPPON MEAT PACKERS - 11.665,00 JPY 1.517,000 137.049,30 0,08 0,08
NISSHIN SEIFUN GROUP INC - 3.000,00 JPY 1.188,000 27.602,23 0,02 0,02
NISSIN FOOD PRODUCTS - 600,00 JPY 4.015,000 18.657,06 0,01 0,01
SEVEN & I HOLDINGS CO LTD - 43.400,00 JPY 3.625,000 1.218.440,21 0,72 0,73
SHISEIDO CO - 4.300,00 JPY 1.477,000 49.187,58 0,03 0,03
TOYO SUISAN KAISHA LTD - 500,00 JPY 3.300,000 12.778,81 0,01 0,01
UNI-CHARM - 9.500,00 JPY 5.610,000 412.755,58 0,24 0,25
YAKULT HONSA - 1.100,00 JPY 4.110,000 35.013,94 0,02 0,02
Malaysia
GENTING PLANTATIONS BERHAD - 6.800,00 MYR 9,230 15.282,57 0,01 0,01
IOI CORP BERHAD - 63,00 MYR 5,440 83,45
KUALA LUMPUR KEPONG BERHAD - 20,00 MYR 21,720 105,77
Mexico
BIMBO - 5.000,00 MXN 39,250 11.590,68 0,01 0,01
COCA-COLA FEMSA -L- 5.900,00 MXN 182,460 63.579,79 0,04 0,04
FEMSA - 16.600,00 MXN 134,310 131.678,80 0,08 0,08
KIMBERLY "A" 7.900,00 MXN 41,870 19.535,72 0,01 0,01
Netherlands
DE MASTER BLENDERS 1753 NV - 82.599,00 EUR 12,300 1.015.967,70 0,60 0,61
KON. AHOLD - 225.553,00 EUR 11,435 2.579.198,56 1,53 1,54
UNILEVER CVA 171.431,00 EUR 30,255 5.186.644,91 3,07 3,10
Portugal
JERONIMO MARTINS - 24.031,00 EUR 16,190 389.061,89 0,23 0,23
Russia
MAGNIT OSJC - 629,00 USD 57,200 27.678,13 0,02 0,02
Singapore
WILMAR INTERNATIONAL LTD - 12.000,00 SGD 3,150 22.928,55 0,01 0,01
South Africa
SHOPRITE HOLDINGS LTD - 1.750,00 ZAR 185,500 25.157,12 0,02 0,02
South Korea
KT&G CORPORATION - 2.107,00 KRW 74.200,000 105.315,23 0,06 0,06
LG HOUSEHOLD & HEALTH CARE LTD - 27,00 KRW 558.000,000 10.148,94 0,01 0,01
ORION CORP/REPUBLIC OF SOUTH K - 259,00 KRW 953.000,000 166.270,57 0,10 0,10
Spain
DISTRIBUIDORA INTERNACIONAL DE ALIM - 297.049,00 EUR 5,810 1.725.854,69 1,02 1,03
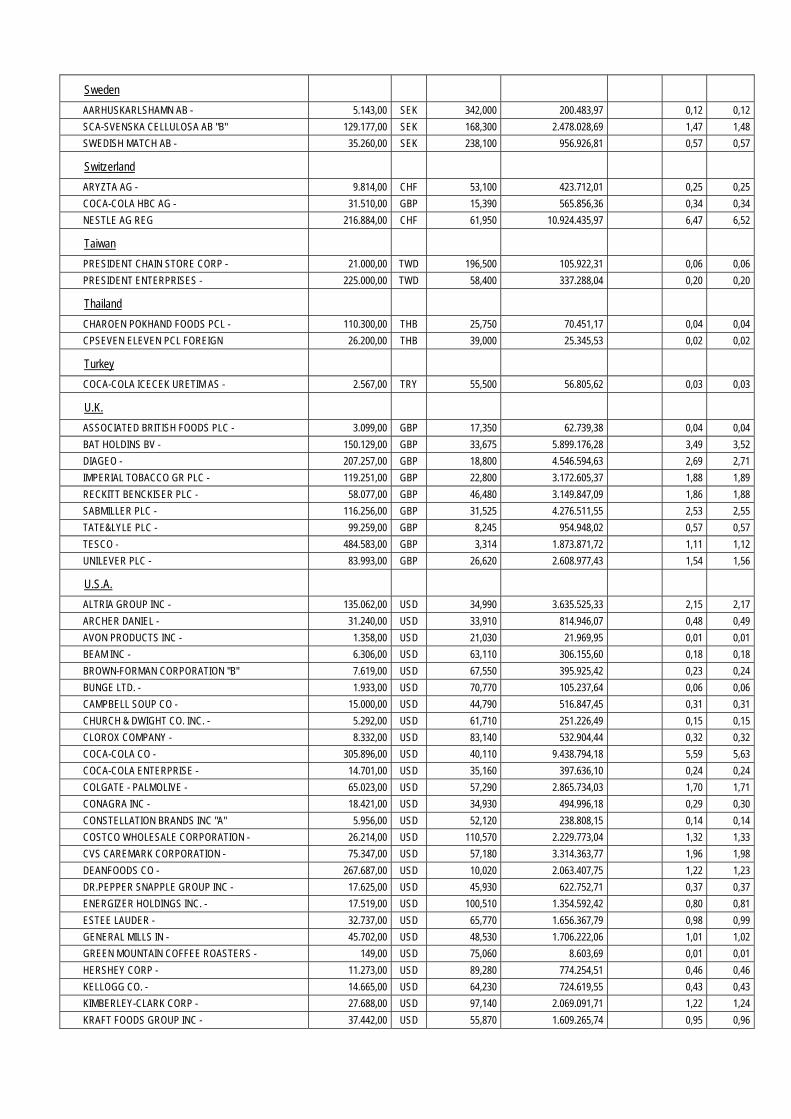
Sweden
AARHUSKARLSHAMN AB - 5.143,00 SEK 342,000 200.483,97 0,12 0,12
SCA-SVENSKA CELLULOSA AB "B" 129.177,00 SEK 168,300 2.478.028,69 1,47 1,48
SWEDISH MATCH AB - 35.260,00 SEK 238,100 956.926,81 0,57 0,57
Switzerland
ARYZTA AG - 9.814,00 CHF 53,100 423.712,01 0,25 0,25
COCA-COLA HBC AG - 31.510,00 GBP 15,390 565.856,36 0,34 0,34
NESTLE AG REG 216.884,00 CHF 61,950 10.924.435,97 6,47 6,52
Taiwan
PRESIDENT CHAIN STORE CORP - 21.000,00 TWD 196,500 105.922,31 0,06 0,06
PRESIDENT ENTERPRISES - 225.000,00 TWD 58,400 337.288,04 0,20 0,20
Thailand
CHAROEN POKHAND FOODS PCL - 110.300,00 THB 25,750 70.451,17 0,04 0,04
CPSEVEN ELEVEN PCL FOREIGN 26.200,00 THB 39,000 25.345,53 0,02 0,02
Turkey
COCA-COLA ICECEK URETIM AS - 2.567,00 TRY 55,500 56.805,62 0,03 0,03
U.K.
ASSOCIATED BRITISH FOODS PLC - 3.099,00 GBP 17,350 62.739,38 0,04 0,04
BAT HOLDINS BV - 150.129,00 GBP 33,675 5.899.176,28 3,49 3,52
DIAGEO - 207.257,00 GBP 18,800 4.546.594,63 2,69 2,71
IMPERIAL TOBACCO GR PLC - 119.251,00 GBP 22,800 3.172.605,37 1,88 1,89
RECKITT BENCKISER PLC - 58.077,00 GBP 46,480 3.149.847,09 1,86 1,88
SABMILLER PLC - 116.256,00 GBP 31,525 4.276.511,55 2,53 2,55
TATE&LYLE PLC - 99.259,00 GBP 8,245 954.948,02 0,57 0,57
TESCO - 484.583,00 GBP 3,314 1.873.871,72 1,11 1,12
UNILEVER PLC - 83.993,00 GBP 26,620 2.608.977,43 1,54 1,56
U.S.A.
ALTRIA GROUP INC - 135.062,00 USD 34,990 3.635.525,33 2,15 2,17
ARCHER DANIEL - 31.240,00 USD 33,910 814.946,07 0,48 0,49
AVON PRODUCTS INC - 1.358,00 USD 21,030 21.969,95 0,01 0,01
BEAM INC - 6.306,00 USD 63,110 306.155,60 0,18 0,18
BROWN-FORMAN CORPORATION "B" 7.619,00 USD 67,550 395.925,42 0,23 0,24
BUNGE LTD. - 1.933,00 USD 70,770 105.237,64 0,06 0,06
CAMPBELL SOUP CO - 15.000,00 USD 44,790 516.847,45 0,31 0,31
CHURCH & DWIGHT CO. INC. - 5.292,00 USD 61,710 251.226,49 0,15 0,15
CLOROX COMPANY - 8.332,00 USD 83,140 532.904,44 0,32 0,32
COCA-COLA CO - 305.896,00 USD 40,110 9.438.794,18 5,59 5,63
COCA-COLA ENTERPRISE - 14.701,00 USD 35,160 397.636,10 0,24 0,24
COLGATE - PALMOLIVE - 65.023,00 USD 57,290 2.865.734,03 1,70 1,71
CONAGRA INC - 18.421,00 USD 34,930 494.996,18 0,29 0,30
CONSTELLATION BRANDS INC "A" 5.956,00 USD 52,120 238.808,15 0,14 0,14
COSTCO WHOLESALE CORPORATION - 26.214,00 USD 110,570 2.229.773,04 1,32 1,33
CVS CAREMARK CORPORATION - 75.347,00 USD 57,180 3.314.363,77 1,96 1,98
DEANFOODS CO - 267.687,00 USD 10,020 2.063.407,75 1,22 1,23
DR.PEPPER SNAPPLE GROUP INC - 17.625,00 USD 45,930 622.752,71 0,37 0,37
ENERGIZER HOLDINGS INC. - 17.519,00 USD 100,510 1.354.592,42 0,80 0,81
ESTEE LAUDER - 32.737,00 USD 65,770 1.656.367,79 0,98 0,99
GENERAL MILLS IN - 45.702,00 USD 48,530 1.706.222,06 1,01 1,02
GREEN MOUNTAIN COFFEE ROASTERS - 149,00 USD 75,060 8.603,69 0,01 0,01
HERSHEY CORP - 11.273,00 USD 89,280 774.254,51 0,46 0,46
KELLOGG CO. - 14.665,00 USD 64,230 724.619,55 0,43 0,43
KIMBERLEY-CLARK CORP - 27.688,00 USD 97,140 2.069.091,71 1,22 1,24
KRAFT FOODS GROUP INC - 37.442,00 USD 55,870 1.609.265,74 0,95 0,96

KROGER CY - 29.275,00 USD 34,540 777.874,07 0,46 0,46
LORILLARD INC - 19.847,00 USD 43,680 666.910,50 0,40 0,40
MCCORMICK & COMPANY - 1.556,00 USD 70,360 84.221,99 0,05 0,05
MEAD JOHNSON NUTRITION CO - 48.576,00 USD 79,230 2.960.748,12 1,75 1,77
MOLSON COORS BREWING CO "B" 19.431,00 USD 47,860 715.414,77 0,42 0,43
MONDELEZ INTERNATIONAL INC "A" 158.548,00 USD 28,530 3.479.786,48 2,06 2,08
MONSTER BEVERAGE CORP - 54.125,00 USD 60,830 2.532.828,49 1,50 1,51
NU SKIN ENTERPRISES INC "A" 199,00 USD 61,120 9.356,78 0,01 0,01
PEPSICO - 117.943,00 USD 81,790 7.421.000,05 4,39 4,43
PHILIP MORRIS INTERNATIONAL INC. - 139.041,00 USD 86,620 9.265.121,49 5,48 5,53
PROCTER & GAMBLE - 139.091,00 USD 76,990 8.238.030,69 4,88 4,92
REYNOLDS AMERICAN INC - 17.335,00 USD 48,370 645.044,96 0,38 0,39
SYSCO CORPORATION - 23.843,00 USD 34,160 626.568,87 0,37 0,37
THE JM SMUCKER CO - 5.958,00 USD 103,150 472.780,75 0,28 0,28
TYSON FOODS INC -A- 20.582,00 USD 25,680 406.604,94 0,24 0,24
WAL-MART STORES - 122.888,00 USD 74,490 7.042.024,09 4,17 4,20
WALGREEN COMPANY - 43.861,00 USD 44,200 1.491.388,72 0,88 0,89
WHOLE FOODS MARKET INC. - 24.000,00 USD 51,480 950.473,11 0,56 0,57
Total shares 168.045.319,89 99,43 100,30
Options and futures
Exchange-listed futures
Switzerland
NESTLE AG SEP 13 200,00 CHF 61,953 1.007.446,13 0,60 0,60
Suspense accounts (futures)
Switzerland
NESTLE AG SEP 13 -1.243.260,00 CHF 1,000 -1.010.862,67 -0,60 -0,60
Total options and futures -3.416,54 0,00 0,00
TOTAL SECURITIES PORTFOLIO 169.002.050,35 100,00 100,87
COLLATERAL RECEIVED
Belgium
KBC GROUP COLLATERAL EUR 1.363.689,73 EUR 1,000 1.363.689,73 0,81
TOTAL RECEIVED COLLATERAL 1.363.689,73 0,81
CASH AT BANK AND IN HAND
Demand accounts
Belgium
KBC GROUP AUD 2.850,80 AUD 1,000 2.007,53 0,00
KBC GROUP CAD -630,07 CAD 1,000 -459,47
KBC GROUP CHF 1.022.112,02 CHF 1,000 831.052,95 0,50
KBC GROUP DKK -38.081,29 DKK 1,000 -5.105,55 0,00
KBC GROUP EURO -2.773.893,92 EUR 1,000 -2.773.893,92 -1,66
KBC GROUP GBP -6.790,74 GBP 1,000 -7.923,85 -0,01
KBC GROUP HKD 1.927,45 HKD 1,000 191,18
KBC GROUP JPY -1.387.074,00 JPY 1,000 -10.742,52 -0,01
KBC GROUP MXN -119.382,23 MXN 1,000 -7.050,81 0,00
KBC GROUP NOK 54.473,09 NOK 1,000 6.863,27 0,00
KBC GROUP PLN 525,85 PLN 1,000 121,44
KBC GROUP SEK 501,74 SEK 1,000 57,19
KBC GROUP SGD 1.148,15 SGD 1,000 696,44
KBC GROUP TRY 249,88 TRY 1,000 99,63
KBC GROUP USD 66.542,73 USD 1,000 51.190,65 0,03
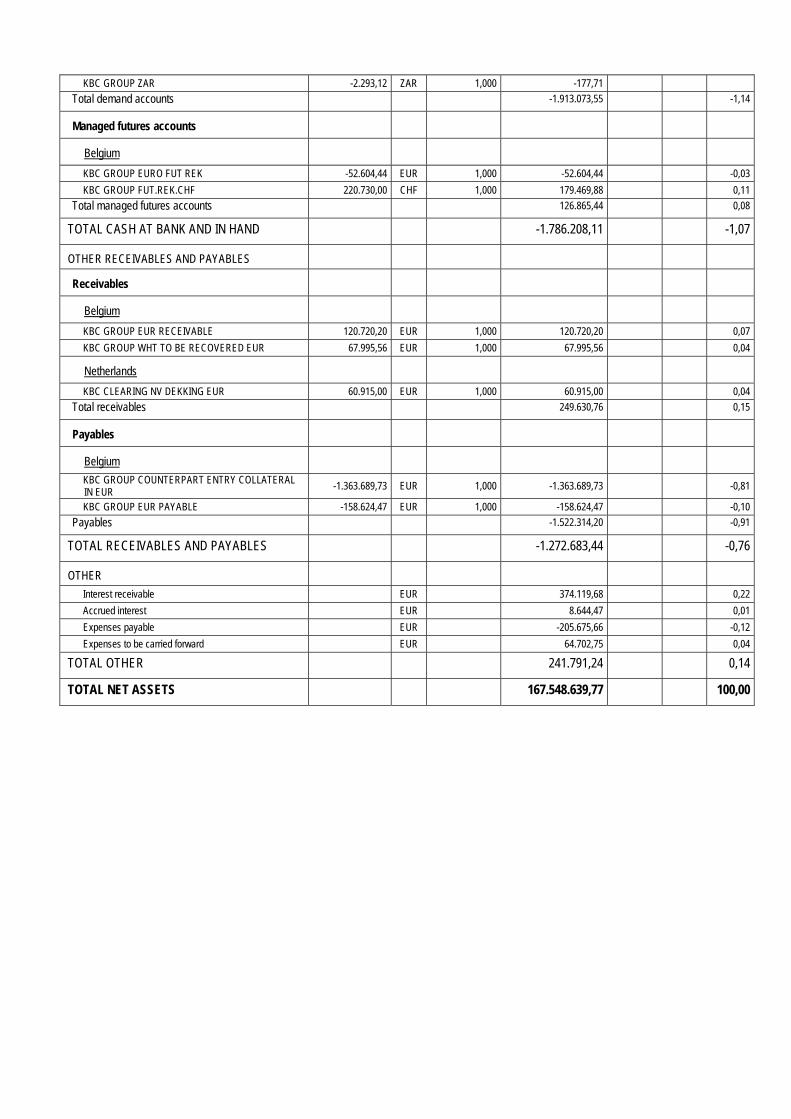
KBC GROUP ZAR -2.293,12 ZAR 1,000 -177,71
Total demand accounts -1.913.073,55 -1,14
Managed futures accounts
Belgium
KBC GROUP EURO FUT REK -52.604,44 EUR 1,000 -52.604,44 -0,03
KBC GROUP FUT.REK.CHF 220.730,00 CHF 1,000 179.469,88 0,11
Total managed futures accounts 126.865,44 0,08
TOTAL CASH AT BANK AND IN HAND -1.786.208,11 -1,07
OTHER RECEIVABLES AND PAYABLES
Receivables
Belgium
KBC GROUP EUR RECEIVABLE 120.720,20 EUR 1,000 120.720,20 0,07
KBC GROUP WHT TO BE RECOVERED EUR 67.995,56 EUR 1,000 67.995,56 0,04
Netherlands
KBC CLEARING NV DEKKING EUR 60.915,00 EUR 1,000 60.915,00 0,04
Total receivables 249.630,76 0,15
Payables
Belgium
KBC GROUP COUNTERPART ENTRY COLLATERAL IN EUR
-1.363.689,73 EUR 1,000 -1.363.689,73 -0,81
KBC GROUP EUR PAYABLE -158.624,47 EUR 1,000 -158.624,47 -0,10
Payables -1.522.314,20 -0,91
TOTAL RECEIVABLES AND PAYABLES -1.272.683,44 -0,76
OTHER
Interest receivable EUR 374.119,68 0,22
Accrued interest EUR 8.644,47 0,01
Expenses payable EUR -205.675,66 -0,12
Expenses to be carried forward EUR 64.702,75 0,04
TOTAL OTHER 241.791,24 0,14
TOTAL NET ASSETS 167.548.639,77 100,00
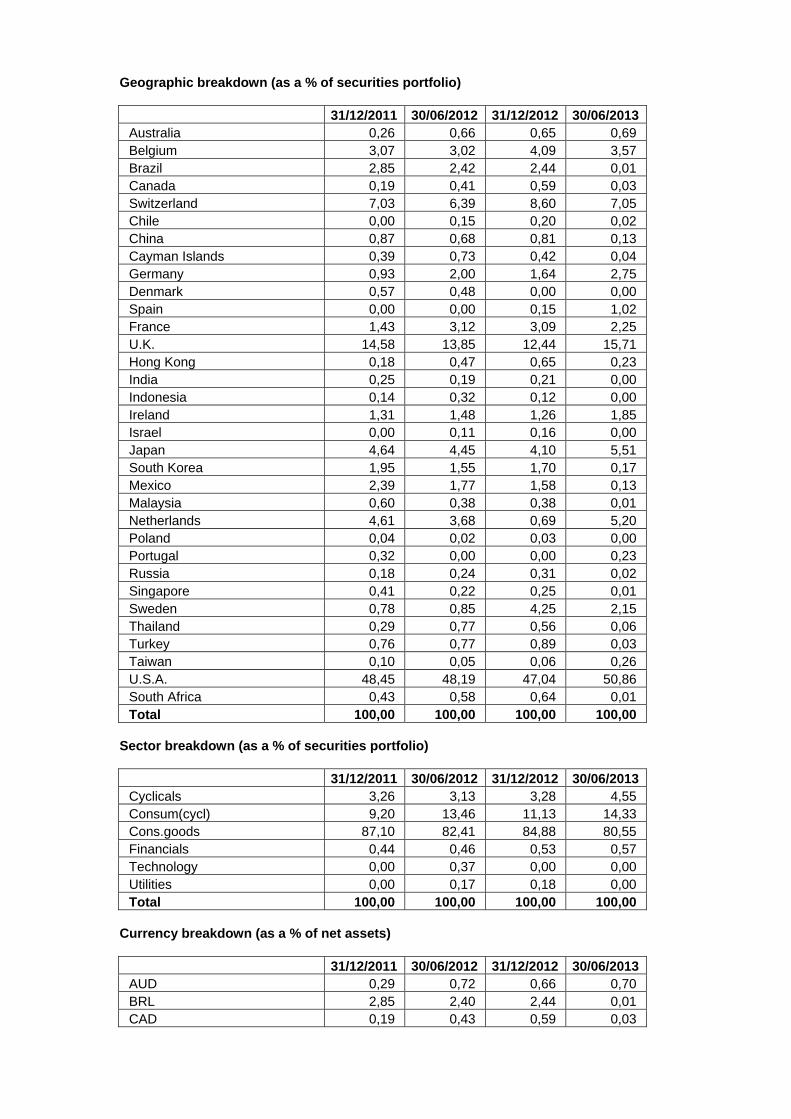
Geographic breakdown (as a % of securities portfolio)
31/12/2011 30/06/2012 31/12/2012 30/06/2013 Australia 0,26 0,66 0,65 0,69 Belgium 3,07 3,02 4,09 3,57 Brazil 2,85 2,42 2,44 0,01 Canada 0,19 0,41 0,59 0,03 Switzerland 7,03 6,39 8,60 7,05 Chile 0,00 0,15 0,20 0,02 China 0,87 0,68 0,81 0,13 Cayman Islands 0,39 0,73 0,42 0,04 Germany 0,93 2,00 1,64 2,75 Denmark 0,57 0,48 0,00 0,00 Spain 0,00 0,00 0,15 1,02 France 1,43 3,12 3,09 2,25 U.K. 14,58 13,85 12,44 15,71 Hong Kong 0,18 0,47 0,65 0,23 India 0,25 0,19 0,21 0,00 Indonesia 0,14 0,32 0,12 0,00 Ireland 1,31 1,48 1,26 1,85 Israel 0,00 0,11 0,16 0,00 Japan 4,64 4,45 4,10 5,51 South Korea 1,95 1,55 1,70 0,17 Mexico 2,39 1,77 1,58 0,13 Malaysia 0,60 0,38 0,38 0,01 Netherlands 4,61 3,68 0,69 5,20 Poland 0,04 0,02 0,03 0,00 Portugal 0,32 0,00 0,00 0,23 Russia 0,18 0,24 0,31 0,02 Singapore 0,41 0,22 0,25 0,01 Sweden 0,78 0,85 4,25 2,15 Thailand 0,29 0,77 0,56 0,06 Turkey 0,76 0,77 0,89 0,03 Taiwan 0,10 0,05 0,06 0,26 U.S.A. 48,45 48,19 47,04 50,86 South Africa 0,43 0,58 0,64 0,01 Total 100,00 100,00 100,00 100,00
Sector breakdown (as a % of securities portfolio)
31/12/2011 30/06/2012 31/12/2012 30/06/2013 Cyclicals 3,26 3,13 3,28 4,55 Consum(cycl) 9,20 13,46 11,13 14,33 Cons.goods 87,10 82,41 84,88 80,55 Financials 0,44 0,46 0,53 0,57 Technology 0,00 0,37 0,00 0,00 Utilities 0,00 0,17 0,18 0,00 Total 100,00 100,00 100,00 100,00
Currency breakdown (as a % of net assets)
31/12/2011 30/06/2012 31/12/2012 30/06/2013 AUD 0,29 0,72 0,66 0,70 BRL 2,85 2,40 2,44 0,01 CAD 0,19 0,43 0,59 0,03
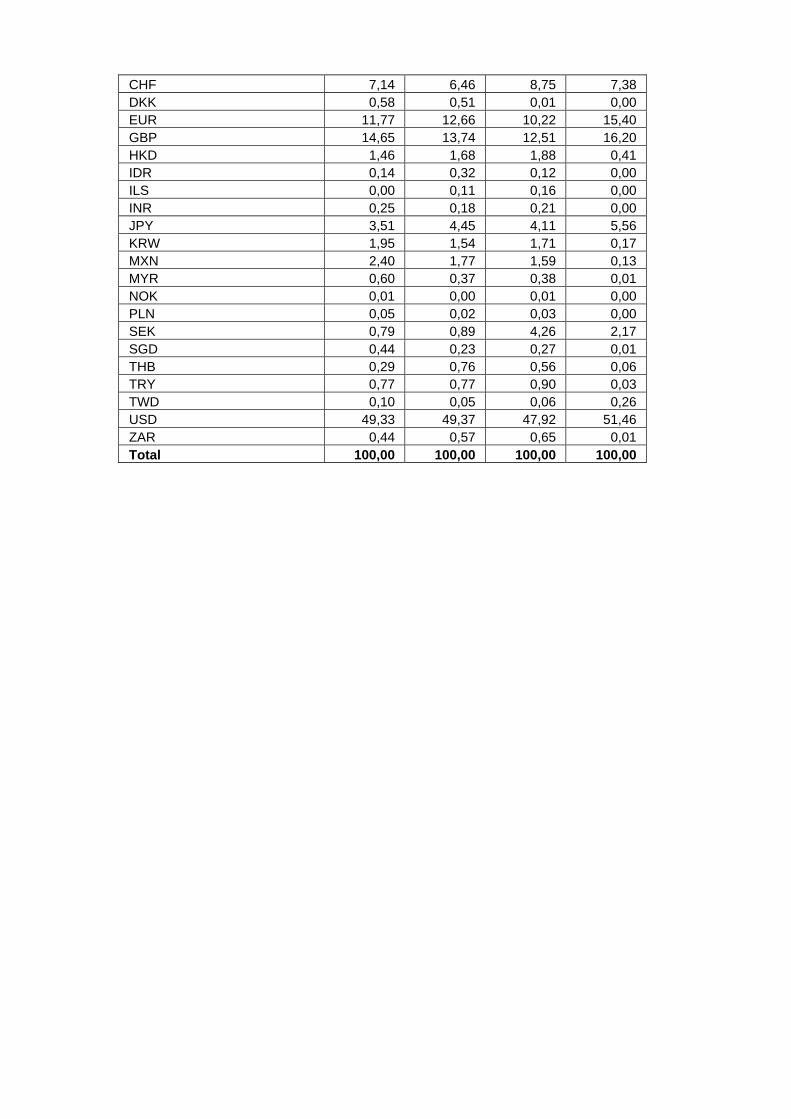
CHF 7,14 6,46 8,75 7,38 DKK 0,58 0,51 0,01 0,00 EUR 11,77 12,66 10,22 15,40 GBP 14,65 13,74 12,51 16,20 HKD 1,46 1,68 1,88 0,41 IDR 0,14 0,32 0,12 0,00 ILS 0,00 0,11 0,16 0,00 INR 0,25 0,18 0,21 0,00 JPY 3,51 4,45 4,11 5,56 KRW 1,95 1,54 1,71 0,17 MXN 2,40 1,77 1,59 0,13 MYR 0,60 0,37 0,38 0,01 NOK 0,01 0,00 0,01 0,00 PLN 0,05 0,02 0,03 0,00 SEK 0,79 0,89 4,26 2,17 SGD 0,44 0,23 0,27 0,01 THB 0,29 0,76 0,56 0,06 TRY 0,77 0,77 0,90 0,03 TWD 0,10 0,05 0,06 0,26 USD 49,33 49,37 47,92 51,46 ZAR 0,44 0,57 0,65 0,01 Total 100,00 100,00 100,00 100,00

2.4.2 CHANGES IN THE COMPOSITION OF THE ASSETS OF KBC EQUITY FUND FOOD & PERSONAL
PRODUCTS (IN THE CURRENCY OF THE SUB-FUND)
1st half of year YearPurchases 112.358.224,99 112.358.224,99 Sales 102.141.771,63 102.141.771,63 Total 1 214.499.996,62 214.499.996,62 Subscriptions 121.691.584,06 121.691.584,06 Redemptions 113.135.430,11 113.135.430,11 Total 2 234.827.014,17 234.827.014,17 Monthly average of total assets
162.390.987,50 162.390.987,50
Turnover rate -12,52 % -12,52 %
1st half of year YearPurchases 112.358.224,99 112.358.224,99 Sales 102.141.771,63 102.141.771,63 Total 1 214.499.996,62 214.499.996,62 Subscriptions 121.691.584,06 121.691.584,06 Redemptions 113.135.430,11 113.135.430,11 Total 2 234.827.014,17 234.827.014,17 Monthly average of total assets
148.817.757,87 148.817.757,87
Corrected turnover rate -13,66 % -13,66 %
The table above shows the capital volume of portfolio transactions. This volume (adjusted to take account of total subscriptions and redemptions) is also compared to the average net assets at the beginning and end of the period. A figure close to 0% implies that the transactions relating to the securities or transactions relating to the assets (excluding deposits and cash) in a given period only involve subscriptions and redemptions. A negative percentage shows that subscriptions and redemptions entailed few, if any, transactions in the portfolio. Active asset management may result in high turnover rates (monthly percentage >50%). The detailed list of transactions is available for consultation free of charge at the registered office of the Bevek or fund at Havenlaan 2, 1080 Brussels.
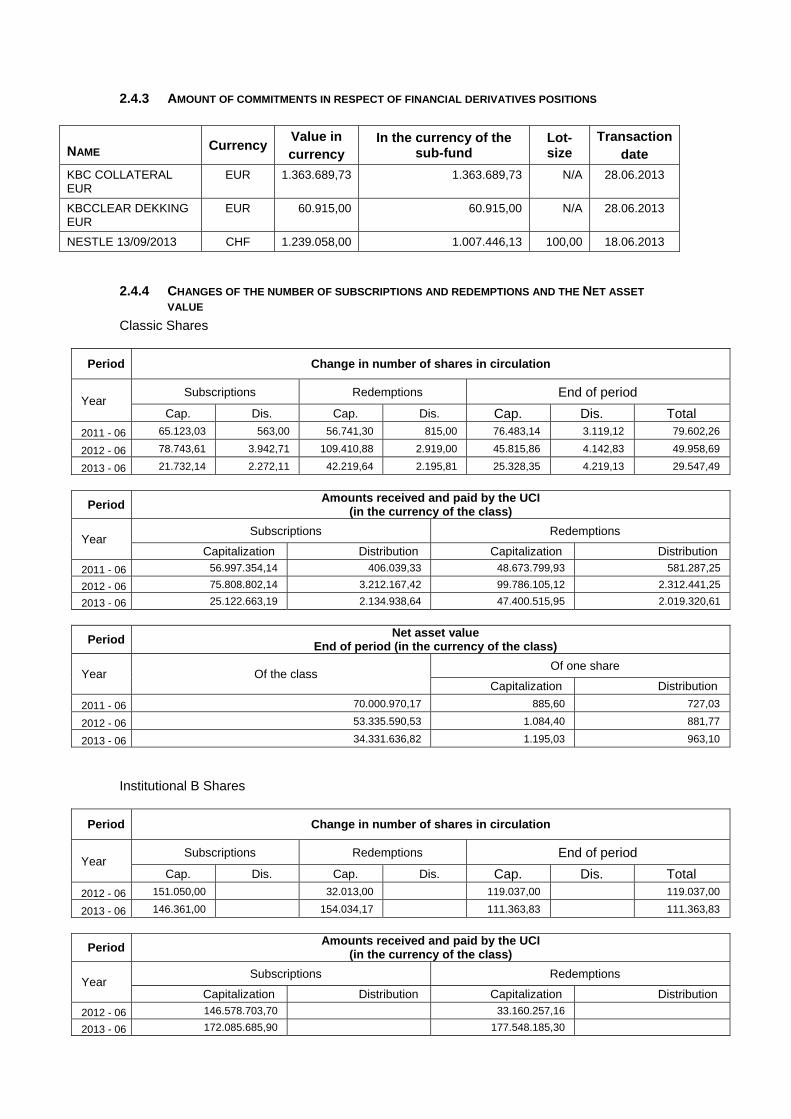
2.4.3 AMOUNT OF COMMITMENTS IN RESPECT OF FINANCIAL DERIVATIVES POSITIONS
NAME Currency Value in currency
In the currency of the sub-fund
Lot-size
Transactiondate
KBC COLLATERAL EUR
EUR 1.363.689,73 1.363.689,73 N/A 28.06.2013
KBCCLEAR DEKKING EUR
EUR 60.915,00 60.915,00 N/A 28.06.2013
NESTLE 13/09/2013 CHF 1.239.058,00 1.007.446,13 100,00 18.06.2013
2.4.4 CHANGES OF THE NUMBER OF SUBSCRIPTIONS AND REDEMPTIONS AND THE NET ASSET
VALUE
Classic Shares
Period Change in number of shares in circulation
Year Subscriptions Redemptions End of period
Cap. Dis. Cap. Dis. Cap. Dis. Total 2011 - 06 65.123,03 563,00 56.741,30 815,00 76.483,14 3.119,12 79.602,26
2012 - 06 78.743,61 3.942,71 109.410,88 2.919,00 45.815,86 4.142,83 49.958,69
2013 - 06 21.732,14 2.272,11 42.219,64 2.195,81 25.328,35 4.219,13 29.547,49
Period Amounts received and paid by the UCI
(in the currency of the class)
Year Subscriptions Redemptions
Capitalization Distribution Capitalization Distribution
2011 - 06 56.997.354,14 406.039,33 48.673.799,93 581.287,25
2012 - 06 75.808.802,14 3.212.167,42 99.786.105,12 2.312.441,25
2013 - 06 25.122.663,19 2.134.938,64 47.400.515,95 2.019.320,61
Period Net asset value
End of period (in the currency of the class)
Year Of the class Of one share
Capitalization Distribution
2011 - 06 70.000.970,17 885,60 727,03
2012 - 06 53.335.590,53 1.084,40 881,77
2013 - 06 34.331.636,82 1.195,03 963,10
Institutional B Shares
Period Change in number of shares in circulation
Year Subscriptions Redemptions End of period
Cap. Dis. Cap. Dis. Cap. Dis. Total 2012 - 06 151.050,00 32.013,00 119.037,00 119.037,00
2013 - 06 146.361,00 154.034,17 111.363,83 111.363,83
Period Amounts received and paid by the UCI
(in the currency of the class)
Year Subscriptions Redemptions
Capitalization Distribution Capitalization Distribution
2012 - 06 146.578.703,70 33.160.257,16
2013 - 06 172.085.685,90 177.548.185,30
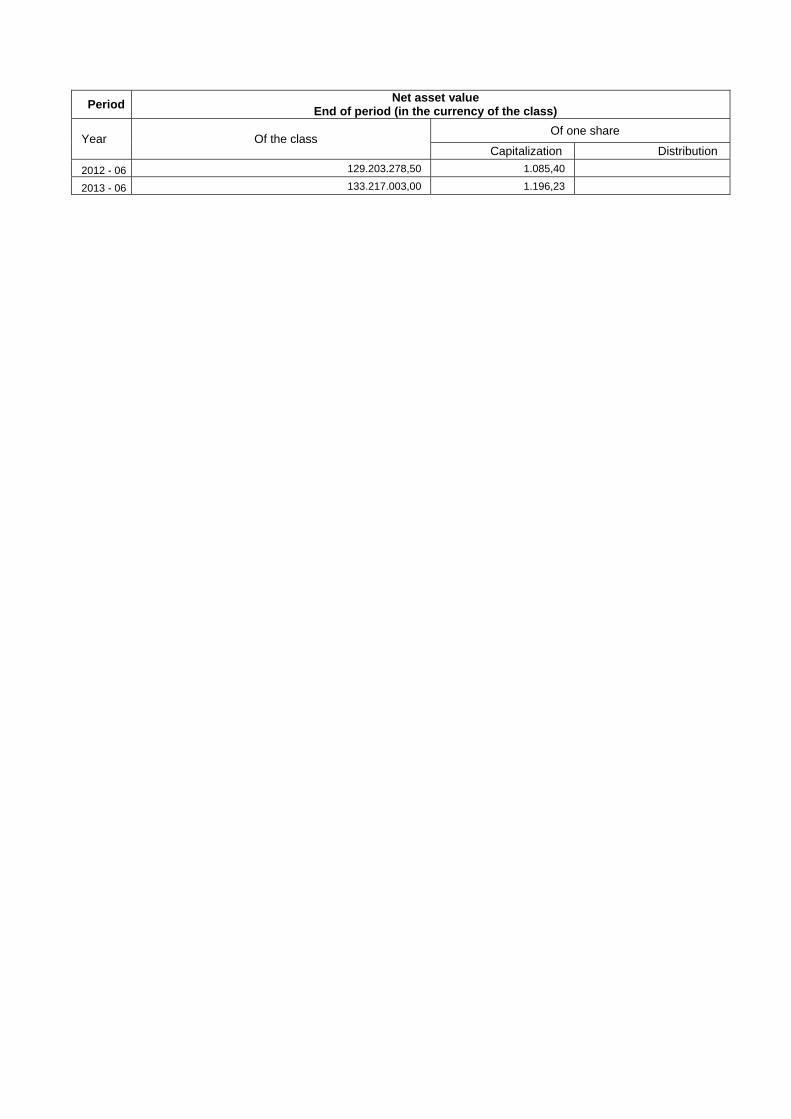
Period Net asset value
End of period (in the currency of the class)
Year Of the class Of one share
Capitalization Distribution
2012 - 06 129.203.278,50 1.085,40
2013 - 06 133.217.003,00 1.196,23
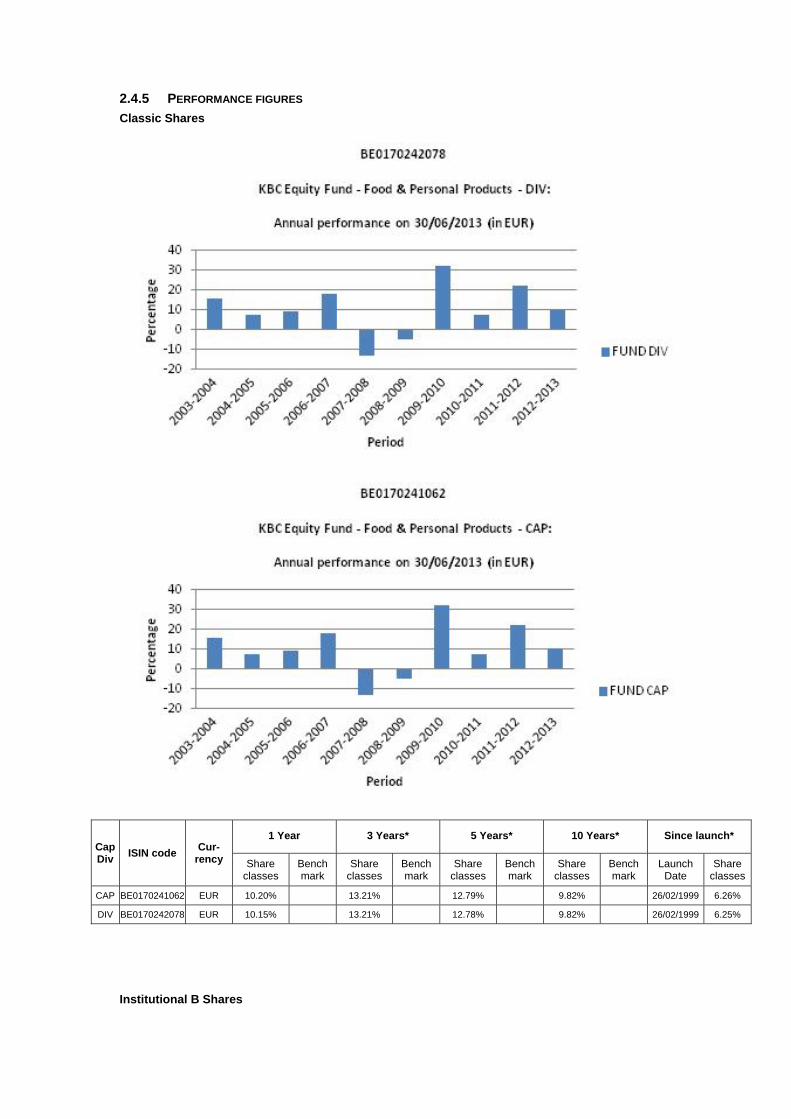
2.4.5 PERFORMANCE FIGURES
Classic Shares
Cap Div
ISIN code Cur-
rency
1 Year 3 Years* 5 Years* 10 Years* Since launch*
Share classes
Bench mark
Share classes
Bench mark
Share classes
Bench mark
Share classes
Bench mark
Launch Date
Share classes
CAP BE0170241062 EUR 10.20% 13.21% 12.79% 9.82% 26/02/1999 6.26%
DIV BE0170242078 EUR 10.15% 13.21% 12.78% 9.82% 26/02/1999 6.25%
Institutional B Shares

Cap Div
ISIN code Cur-
rency
1 Year 3 Years* 5 Years* 10 Years* Since launch*
Share classes
Bench mark
Share classes
Bench mark
Share classes
Bench mark
Share classes
Bench mark
Launch Date
Share classes
CAP BE6228545784 EUR 10.21% 25/11/2011 20.60%
Risk warning: Past performance is not a guide to future performance. * Return on annual basis.
Classic Shares The bar chart shows the performance for full financial years. The figures do not take account of any restructuring. Calculated in EUR. The return is calculated as the change in the net asset value between two dates expressed
as a percentage. In the case of units that pay dividends, the dividend is incorporated geometrically in the return.
Calculation method for date D, where NAV stands for net asset value: Capitalisation units (CAP) Return on date D over a period of X years:
[NIW(D) / NIW(Y)] ^ [1 / X] - 1 where Y = D-X
Return on date D since the start date S of the unit: [NIW(D) / NIW(S)] ^ [1 / F] - 1 where F = 1 if the unit has existed for less than one year on date D where F = (D-S) / 365.25 if the unit has existed for longer than one year on date D
Distribution units (DIV) Return on date D over a period of X years:
[ C * NIW(D) / NIW(Y)] ^ [1 / X] - 1 where Y = D-X
Return on date D since the start date S of the unit: [ C * NIW(D) / NIW(S)] ^ [1 / F] - 1 where F = 1 if the unit has existed for less than one year on date D where F = (D-S) / 365.25 if the unit has existed for longer than one year on date D where C is a factor that is determined for all N dividends between the calculation date D and the reference date.
For dividend i on date Di with value Wi: Ci = [Wi / NIW(Di)] + 1 i = 1 ... N

from whichC = C0 * .... * CN. If the interval between the two dates exceeds one year, the ordinary return calculation is
converted into a return on an annual basis by taking the nth square root of 1 plus the total return of the unit.
The return figures shown above do not take account of the fees and charges associated with the issue and redemption of units.
These are the performance figures for capitalisation and distribution shares.
Institutional B Shares The bar chart shows the performance for full financial years. The figures do not take account of any restructuring. Calculated in EUR. The return is calculated as the change in the net asset value between two dates expressed
as a percentage. Calculation method for date D, where NAV stands for net asset value:
Capitalisation units (CAP) Return on date D over a period of X years:
[NIW(D) / NIW(Y)] ^ [1 / X] - 1 where Y = D-X
Return on date D since the start date S of the unit: [NIW(D) / NIW(S)] ^ [1 / F] - 1 where F = 1 if the unit has existed for less than one year on date D where F = (D-S) / 365.25 if the unit has existed for longer than one year on date D
If the interval between the two dates exceeds one year, the ordinary return calculation is converted into a return on an annual basis by taking the nth square root of 1 plus the total return of the unit.
The return figures shown above do not take account of the fees and charges associated with the issue and redemption of units.
These are the performance figures for capitalization shares.
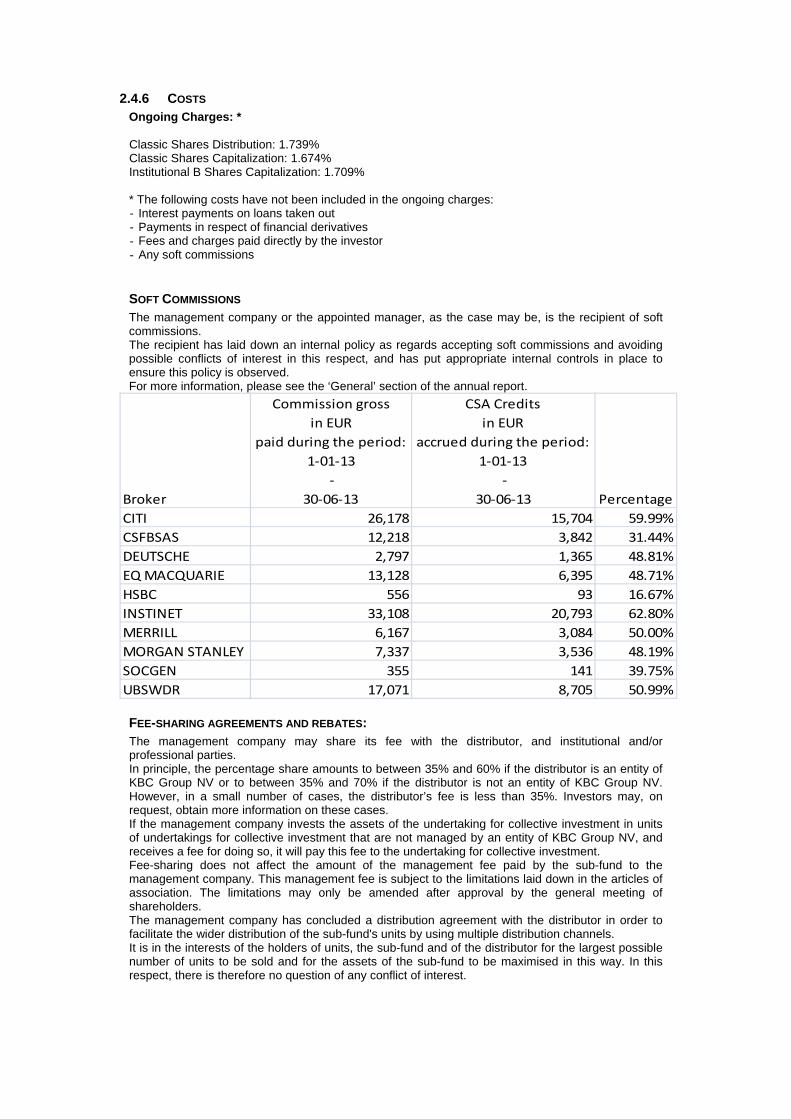
2.4.6 COSTS Ongoing Charges: * Classic Shares Distribution: 1.739% Classic Shares Capitalization: 1.674% Institutional B Shares Capitalization: 1.709% * The following costs have not been included in the ongoing charges: - Interest payments on loans taken out - Payments in respect of financial derivatives - Fees and charges paid directly by the investor - Any soft commissions
SOFT COMMISSIONS The management company or the appointed manager, as the case may be, is the recipient of soft commissions. The recipient has laid down an internal policy as regards accepting soft commissions and avoiding possible conflicts of interest in this respect, and has put appropriate internal controls in place to ensure this policy is observed. For more information, please see the ‘General’ section of the annual report.
Broker
Commission gross
in EUR
paid during the period:
1‐01‐13
‐
30‐06‐13
CSA Credits
in EUR
accrued during the period:
1‐01‐13
‐
30‐06‐13 Percentage
CITI 26,178 15,704 59.99%
CSFBSAS 12,218 3,842 31.44%
DEUTSCHE 2,797 1,365 48.81%
EQ MACQUARIE 13,128 6,395 48.71%
HSBC 556 93 16.67%
INSTINET 33,108 20,793 62.80%
MERRILL 6,167 3,084 50.00%
MORGAN STANLEY 7,337 3,536 48.19%
SOCGEN 355 141 39.75%
UBSWDR 17,071 8,705 50.99%
FEE-SHARING AGREEMENTS AND REBATES: The management company may share its fee with the distributor, and institutional and/or professional parties. In principle, the percentage share amounts to between 35% and 60% if the distributor is an entity of KBC Group NV or to between 35% and 70% if the distributor is not an entity of KBC Group NV. However, in a small number of cases, the distributor’s fee is less than 35%. Investors may, on request, obtain more information on these cases. If the management company invests the assets of the undertaking for collective investment in units of undertakings for collective investment that are not managed by an entity of KBC Group NV, and receives a fee for doing so, it will pay this fee to the undertaking for collective investment. Fee-sharing does not affect the amount of the management fee paid by the sub-fund to the management company. This management fee is subject to the limitations laid down in the articles of association. The limitations may only be amended after approval by the general meeting of shareholders. The management company has concluded a distribution agreement with the distributor in order to facilitate the wider distribution of the sub-fund's units by using multiple distribution channels. It is in the interests of the holders of units, the sub-fund and of the distributor for the largest possible number of units to be sold and for the assets of the sub-fund to be maximised in this way. In this respect, there is therefore no question of any conflict of interest.
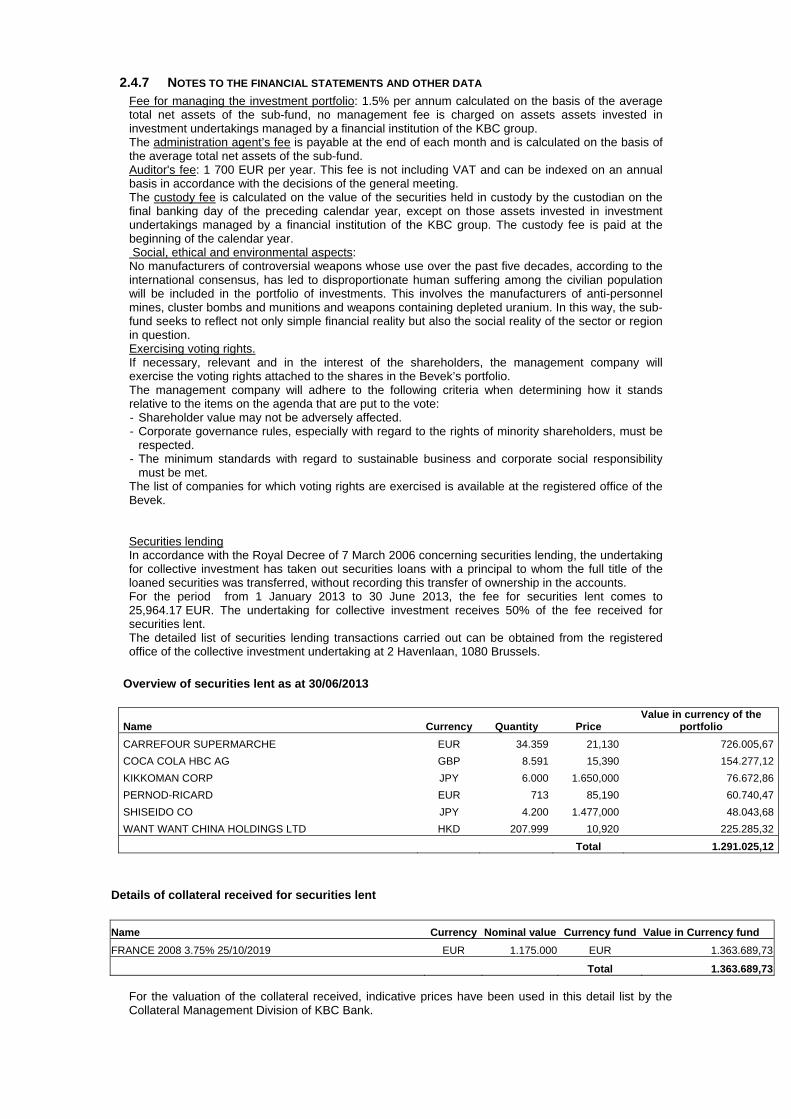
2.4.7 NOTES TO THE FINANCIAL STATEMENTS AND OTHER DATA Fee for managing the investment portfolio: 1.5% per annum calculated on the basis of the average total net assets of the sub-fund, no management fee is charged on assets assets invested in investment undertakings managed by a financial institution of the KBC group. The administration agent’s fee is payable at the end of each month and is calculated on the basis of the average total net assets of the sub-fund. Auditor's fee: 1 700 EUR per year. This fee is not including VAT and can be indexed on an annual basis in accordance with the decisions of the general meeting. The custody fee is calculated on the value of the securities held in custody by the custodian on the final banking day of the preceding calendar year, except on those assets invested in investment undertakings managed by a financial institution of the KBC group. The custody fee is paid at the beginning of the calendar year. Social, ethical and environmental aspects: No manufacturers of controversial weapons whose use over the past five decades, according to the international consensus, has led to disproportionate human suffering among the civilian population will be included in the portfolio of investments. This involves the manufacturers of anti-personnel mines, cluster bombs and munitions and weapons containing depleted uranium. In this way, the sub-fund seeks to reflect not only simple financial reality but also the social reality of the sector or region in question. Exercising voting rights. If necessary, relevant and in the interest of the shareholders, the management company will exercise the voting rights attached to the shares in the Bevek’s portfolio. The management company will adhere to the following criteria when determining how it stands relative to the items on the agenda that are put to the vote: - Shareholder value may not be adversely affected. - Corporate governance rules, especially with regard to the rights of minority shareholders, must be
respected. - The minimum standards with regard to sustainable business and corporate social responsibility
must be met. The list of companies for which voting rights are exercised is available at the registered office of the Bevek. Securities lending In accordance with the Royal Decree of 7 March 2006 concerning securities lending, the undertaking for collective investment has taken out securities loans with a principal to whom the full title of the loaned securities was transferred, without recording this transfer of ownership in the accounts. For the period from 1 January 2013 to 30 June 2013, the fee for securities lent comes to 25,964.17 EUR. The undertaking for collective investment receives 50% of the fee received for securities lent. The detailed list of securities lending transactions carried out can be obtained from the registered office of the collective investment undertaking at 2 Havenlaan, 1080 Brussels.
Overview of securities lent as at 30/06/2013
Name Currency Quantity Price Value in currency of the
portfolio
CARREFOUR SUPERMARCHE EUR 34.359 21,130 726.005,67
COCA COLA HBC AG GBP 8.591 15,390 154.277,12
KIKKOMAN CORP JPY 6.000 1.650,000 76.672,86
PERNOD-RICARD EUR 713 85,190 60.740,47
SHISEIDO CO JPY 4.200 1.477,000 48.043,68
WANT WANT CHINA HOLDINGS LTD HKD 207.999 10,920 225.285,32
Total 1.291.025,12
Details of collateral received for securities lent
Name Currency Nominal value Currency fund Value in Currency fund
FRANCE 2008 3.75% 25/10/2019 EUR 1.175.000 EUR 1.363.689,73
Total 1.363.689,73 For the valuation of the collateral received, indicative prices have been used in this detail list by the Collateral Management Division of KBC Bank.

Semi-Annual report as at 30th June 2013
TABLE OF CONTENTS
2. Information on KBC Equity Fund Medical Technologies
2.1. Management report 2.1.1. Launch date and subscription price 2.1.2. Stock exchange listing 2.1.3. Aim and distinctive features of the investment policy 2.1.4. Financial portfolio management 2.1.5. Distributors 2.1.6. Index and benchmark 2.1.7. Policy conducted during the financial year 2.1.8. Future policy 2.1.9. Synthetic risk and reward indicator (SRRI)
2.2. Balance sheet
2.3. Profit and loss account
2.4. Composition of the assets and key figures
2.4.1. Composition of the assets 2.4.2. Change in the composition of the assets 2.4.3. Value of commitments in respect of financial derivatives positions 2.4.4. Evolution of the number of subscriptions, repayments and the net asset value 2.4.5. Return figures 2.4.6. Expenses 2.4.7. Notes to the financial statements and other data


2 INFORMATION ON KBC EQUITY FUND MEDICAL TECHNOLOGIES
2.1 MANAGEMENT REPORT
2.1.1 LAUNCH DATE AND SUBSCRIPTION PRICE Classic Shares : Launch date: 30 April 1999 Initial subscription price: 1000 USD Currency: USD Institutional B Shares : Launch date: 25 November 2011 Initial subscription price: 1493.22 USD Currency: USD
2.1.2 STOCK EXCHANGE LISTING Not applicable.
2.1.3 GOAL AND KEY PRINCIPLES OF THE INVESTMENT POLICY
SUB-FUND’S OBJECT: The main objective of this sub-fund is to generate the highest possible return for its shareholders by investing directly or indirectly in transferable securities. This is reflected in its pursuit of capital gains and income. To this end, the assets are invested, either directly or indirectly via correlated financial instruments, primarily in shares.
SUB-FUND’S INVESTMENT POLICY:
PERMITTED ASSET CLASSES: The sub-fund may invest in securities, money market instruments, units in undertakings for collective investment, deposits, financial derivatives, liquid assets and all other instruments insofar as permitted by the applicable laws and regulations and consistent with the sub-fund’s object The sub-fund shall invest no more than 10% of its assets in units of other undertakings for collective investment.
RESTRICTIONS OF THE INVESTMENT POLICY: The investment policy will be implemented within the limits set by law and regulations. The sub-fund may borrow up to 10% of its net assets, insofar as these are short-term borrowings aimed at solving temporary liquidity problems.
PERMITTED DERIVATIVES TRANSACTIONS: Derivates may be used either for hedging purposes or to achieve investment objectives. Changes will be made to the investments at regular intervals to comply with the sub-fund's investment strategy. In addition, listed and unlisted derivates may be used to achieve the objectives: these may be forward contracts, options or swaps on securities, indices, currencies or interest rates or other transactions involving derivatives. Unlisted derivatives transactions will only be concluded with prime financial institutions specialised in such transactions. Such derivatives may also be used to hedge the assets against exchange-rate fluctuations. Subject to the applicable laws and regulations and the articles of association, the sub-fund always seeks to conclude the most effective transactions. All costs associated with the transactions will be charged to the sub-fund and all income generated will be paid to the sub-fund. If the transactions result in a risk in respect of the counterparty, this risk can be hedged by using a margin management system that ensures that the sub-fund is the beneficiary of security (collateral) in the form of cash or investment grade bonds. When calculating the value of the bonds, a margin will be applied that varies depending on the residual term to maturity and the currency in which the bond in question is denominated. The relationship with the counterparty or counterparties is governed by standard international agreements.
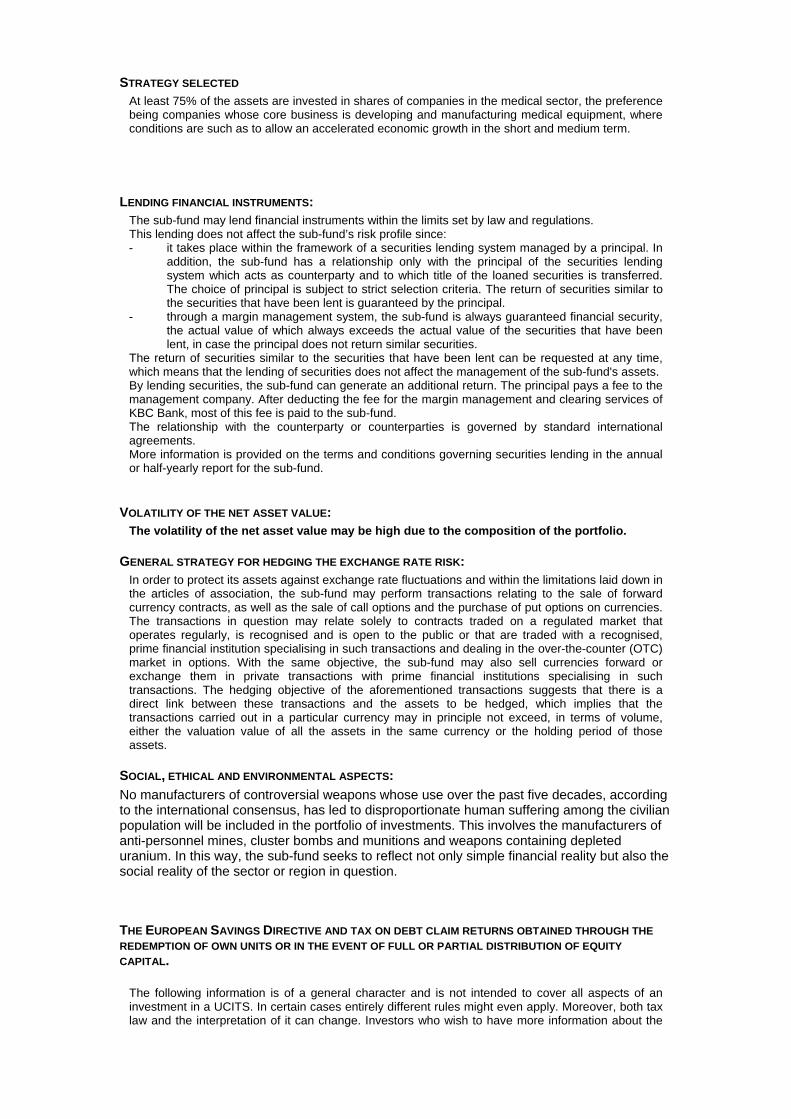
STRATEGY SELECTED At least 75% of the assets are invested in shares of companies in the medical sector, the preference being companies whose core business is developing and manufacturing medical equipment, where conditions are such as to allow an accelerated economic growth in the short and medium term.
LENDING FINANCIAL INSTRUMENTS: The sub-fund may lend financial instruments within the limits set by law and regulations. This lending does not affect the sub-fund’s risk profile since: - it takes place within the framework of a securities lending system managed by a principal. In
addition, the sub-fund has a relationship only with the principal of the securities lending system which acts as counterparty and to which title of the loaned securities is transferred. The choice of principal is subject to strict selection criteria. The return of securities similar to the securities that have been lent is guaranteed by the principal.
- through a margin management system, the sub-fund is always guaranteed financial security, the actual value of which always exceeds the actual value of the securities that have been lent, in case the principal does not return similar securities.
The return of securities similar to the securities that have been lent can be requested at any time, which means that the lending of securities does not affect the management of the sub-fund's assets. By lending securities, the sub-fund can generate an additional return. The principal pays a fee to the management company. After deducting the fee for the margin management and clearing services of KBC Bank, most of this fee is paid to the sub-fund. The relationship with the counterparty or counterparties is governed by standard international agreements. More information is provided on the terms and conditions governing securities lending in the annual or half-yearly report for the sub-fund.
VOLATILITY OF THE NET ASSET VALUE: The volatility of the net asset value may be high due to the composition of the portfolio.
GENERAL STRATEGY FOR HEDGING THE EXCHANGE RATE RISK: In order to protect its assets against exchange rate fluctuations and within the limitations laid down in the articles of association, the sub-fund may perform transactions relating to the sale of forward currency contracts, as well as the sale of call options and the purchase of put options on currencies. The transactions in question may relate solely to contracts traded on a regulated market that operates regularly, is recognised and is open to the public or that are traded with a recognised, prime financial institution specialising in such transactions and dealing in the over-the-counter (OTC) market in options. With the same objective, the sub-fund may also sell currencies forward or exchange them in private transactions with prime financial institutions specialising in such transactions. The hedging objective of the aforementioned transactions suggests that there is a direct link between these transactions and the assets to be hedged, which implies that the transactions carried out in a particular currency may in principle not exceed, in terms of volume, either the valuation value of all the assets in the same currency or the holding period of those assets.
SOCIAL, ETHICAL AND ENVIRONMENTAL ASPECTS:
No manufacturers of controversial weapons whose use over the past five decades, according to the international consensus, has led to disproportionate human suffering among the civilian population will be included in the portfolio of investments. This involves the manufacturers of anti-personnel mines, cluster bombs and munitions and weapons containing depleted uranium. In this way, the sub-fund seeks to reflect not only simple financial reality but also the social reality of the sector or region in question.
THE EUROPEAN SAVINGS DIRECTIVE AND TAX ON DEBT CLAIM RETURNS OBTAINED THROUGH THE
REDEMPTION OF OWN UNITS OR IN THE EVENT OF FULL OR PARTIAL DISTRIBUTION OF EQUITY
CAPITAL. The following information is of a general character and is not intended to cover all aspects of an investment in a UCITS. In certain cases entirely different rules might even apply. Moreover, both tax law and the interpretation of it can change. Investors who wish to have more information about the

tax implications – in both Belgium and abroad – of acquiring, holding and transferring units should seek the advice of their usual financial and tax advisers. This UCITS shall invest a maximum of 15% of its assets directly or indirectly in debt instruments as intended by the European Savings Directive. A. European Savings Directive (Directive 2003/48/EC) The European Savings Directive has been implemented in Belgium. Since this UCITS invests a maximum of 15% of its assets directly or indirectly in debt claims as intended by the European Savings Directive, the income of this UCITS does not fall within the scope of this directive. B. Tax on debt claim returns obtained through the redemption of own units or in the event of full or partial distribution of equity capital (Article 19bis Income Tax Code 1992). The income from this UCITS is not subject to the tax on debt instrument returns as intended by Article 19bis, Income Tax Code 1992.
2.1.4 FINANCIAL PORTFOLIO MANAGEMENT There is no delegation of the portfolio.
2.1.5 DISTRIBUTORS KBC Asset Management S.A., 5, Place de la Gare, L-1616 Luxembourg.
2.1.6 INDEX AND BENCHMARK See ‘Sub-fund’s investment policy’.
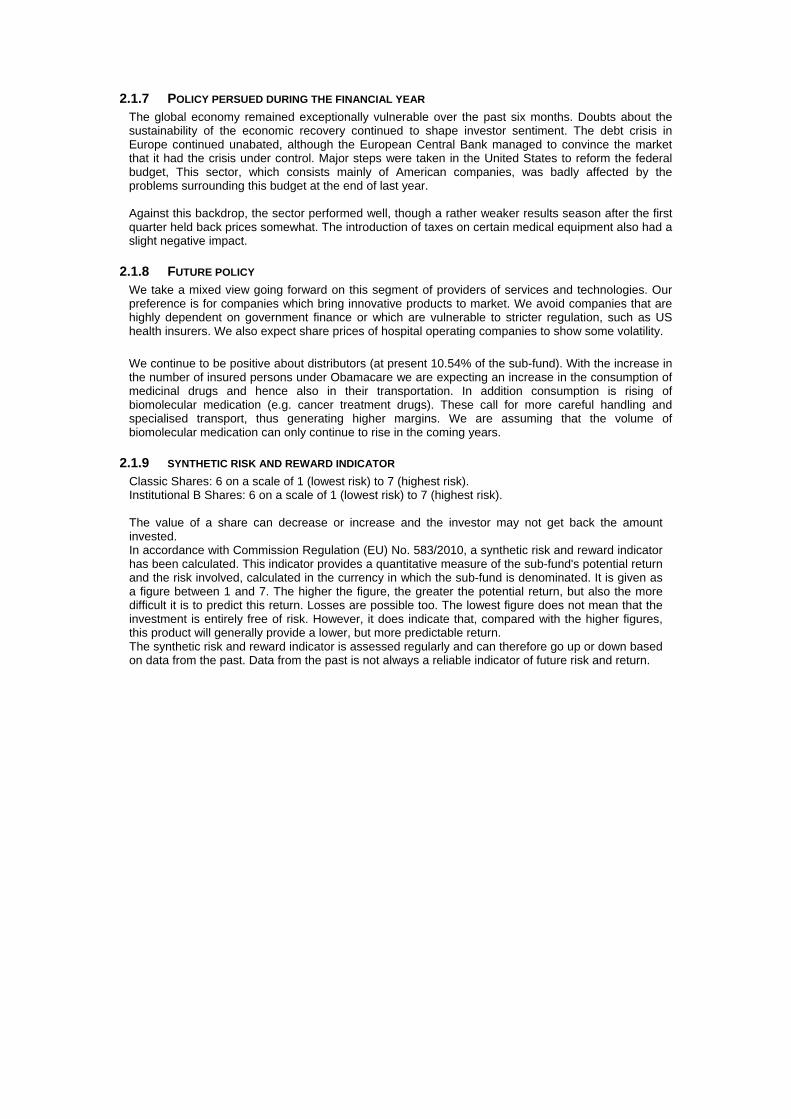
2.1.7 POLICY PERSUED DURING THE FINANCIAL YEAR The global economy remained exceptionally vulnerable over the past six months. Doubts about the sustainability of the economic recovery continued to shape investor sentiment. The debt crisis in Europe continued unabated, although the European Central Bank managed to convince the market that it had the crisis under control. Major steps were taken in the United States to reform the federal budget, This sector, which consists mainly of American companies, was badly affected by the problems surrounding this budget at the end of last year. Against this backdrop, the sector performed well, though a rather weaker results season after the first quarter held back prices somewhat. The introduction of taxes on certain medical equipment also had a slight negative impact.
2.1.8 FUTURE POLICY We take a mixed view going forward on this segment of providers of services and technologies. Our preference is for companies which bring innovative products to market. We avoid companies that are highly dependent on government finance or which are vulnerable to stricter regulation, such as US health insurers. We also expect share prices of hospital operating companies to show some volatility.
We continue to be positive about distributors (at present 10.54% of the sub-fund). With the increase in the number of insured persons under Obamacare we are expecting an increase in the consumption of medicinal drugs and hence also in their transportation. In addition consumption is rising of biomolecular medication (e.g. cancer treatment drugs). These call for more careful handling and specialised transport, thus generating higher margins. We are assuming that the volume of biomolecular medication can only continue to rise in the coming years.
2.1.9 SYNTHETIC RISK AND REWARD INDICATOR Classic Shares: 6 on a scale of 1 (lowest risk) to 7 (highest risk). Institutional B Shares: 6 on a scale of 1 (lowest risk) to 7 (highest risk). The value of a share can decrease or increase and the investor may not get back the amount invested. In accordance with Commission Regulation (EU) No. 583/2010, a synthetic risk and reward indicator has been calculated. This indicator provides a quantitative measure of the sub-fund's potential return and the risk involved, calculated in the currency in which the sub-fund is denominated. It is given as a figure between 1 and 7. The higher the figure, the greater the potential return, but also the more difficult it is to predict this return. Losses are possible too. The lowest figure does not mean that the investment is entirely free of risk. However, it does indicate that, compared with the higher figures, this product will generally provide a lower, but more predictable return. The synthetic risk and reward indicator is assessed regularly and can therefore go up or down based on data from the past. Data from the past is not always a reliable indicator of future risk and return.

2.2 BALANCE SHEET
Balance sheet layout 30/06/2013 (in the currency of the sub-fundt)
30/06/2012 (in the currency of the sub-fund )
TOTAL NET ASSETS 56.074.891,16 13.933.606,87
II. Securities, money market instruments, UCIs and derivatives
C. Shares and similar instruments a) Shares 56.093.760,26 13.929.998,58
IV. Receivables and payables within one year A. Receivables a) Accounts receivable 5.677.631,49 1.609,41 b) Tax assets 675,23 420,41 B. Payables a) Accounts payable (-) -2.634.108,52 -17.250,94 c) Borrowings (-) -4.647.508,48 -7.181,04
V. Deposits and cash at bank and in hand A. Demand balances at banks 1.680.811,43 16.614,07
VI. Accruals and deferrals A. Expense to be carried forward 6.994,27 5.461,26 B. Accrued income 37.165,96 13.602,90 C. Accrued expense (-) -140.530,48 -9.667,78
TOTAL SHAREHOLDERS' EQUITY 56.074.891,16 13.933.606,87
A. Capital 40.410.006,82 12.389.515,46
B. Income equalization 173.378,83 8.253,84
D. Result for the period 15.491.505,51 1.535.837,57
Off-balance-sheet headings
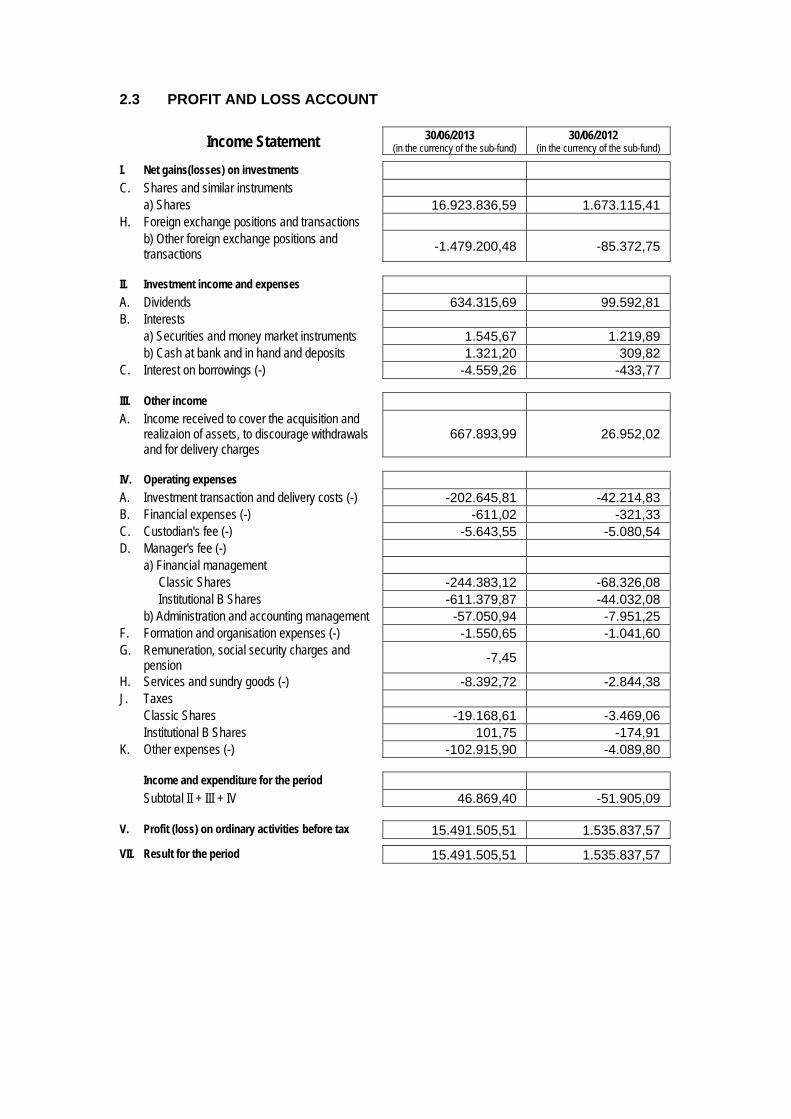
2.3 PROFIT AND LOSS ACCOUNT
Income Statement 30/06/2013 (in the currency of the sub-fund)
30/06/2012 (in the currency of the sub-fund)
I. Net gains(losses) on investments C. Shares and similar instruments a) Shares 16.923.836,59 1.673.115,41 H. Foreign exchange positions and transactions b) Other foreign exchange positions and
transactions -1.479.200,48 -85.372,75
II. Investment income and expenses A. Dividends 634.315,69 99.592,81 B. Interests a) Securities and money market instruments 1.545,67 1.219,89 b) Cash at bank and in hand and deposits 1.321,20 309,82 C. Interest on borrowings (-) -4.559,26 -433,77
III. Other income A. Income received to cover the acquisition and
realizaion of assets, to discourage withdrawals and for delivery charges
667.893,99 26.952,02
IV. Operating expenses A. Investment transaction and delivery costs (-) -202.645,81 -42.214,83 B. Financial expenses (-) -611,02 -321,33 C. Custodian's fee (-) -5.643,55 -5.080,54 D. Manager's fee (-) a) Financial management Classic Shares -244.383,12 -68.326,08 Institutional B Shares -611.379,87 -44.032,08 b) Administration and accounting management -57.050,94 -7.951,25 F. Formation and organisation expenses (-) -1.550,65 -1.041,60 G. Remuneration, social security charges and
pension -7,45
H. Services and sundry goods (-) -8.392,72 -2.844,38 J. Taxes Classic Shares -19.168,61 -3.469,06 Institutional B Shares 101,75 -174,91 K. Other expenses (-) -102.915,90 -4.089,80
Income and expenditure for the period Subtotal II + III + IV 46.869,40 -51.905,09
V. Profit (loss) on ordinary activities before tax 15.491.505,51 1.535.837,57
VII. Result for the period 15.491.505,51 1.535.837,57

2.4 COMPOSITION OF THE ASSETS AND KEY FIGURES
2.4.1 COMPOSITIONS OF THE ASSETS OF KBC EQUITY FUND MEDICAL TECHNOLOGIES
Name Quantity on 30/06/2013
Cur rency
Price in currency
Evaluation (in the currency of the
sub-fund)
% owned by
UCI
% portfolio
% Net
assets
NET ASSETS
SECURITIES PORTFOLIO
Shares
Exchange-listed shares
Australia
COCHLEAR LTD - 9.868,00 AUD 61,710 557.430,84 0,99 0,99
RAMSAY HEALTH CARE LTD - 7.798,00 AUD 35,810 255.619,43 0,46 0,46
SONIC HEALTHCARE LTD - 8.870,00 AUD 14,810 120.249,97 0,21 0,21
Belgium
ARSEUS NV - 8.781,00 EUR 20,200 230.571,32 0,41 0,41
Bermuda
COVIDIEN LTD - 37.694,00 USD 62,840 2.368.690,96 4,22 4,22
Brazil
ODONTOPREV SA - 79,00 BRL 9,200 329,03 0,00 0,00
QUALICORP SA - 1.500,00 BRL 16,900 11.476,10 0,02 0,02
Denmark
COLOPLAST A/S "B" 638,00 DKK 321,300 35.725,01 0,06 0,06
GN-GREAT NORDIC LTD - 29.698,00 DKK 108,300 560.527,13 1,00 1,00
France
BIOMERIEUX - 996,00 EUR 74,440 96.377,50 0,17 0,17
ESSILOR (PAR) 18.976,00 EUR 81,740 2.016.272,60 3,59 3,60
Germany
ASCLEPION-MEDITEC AG - 13.918,00 EUR 25,435 460.170,23 0,82 0,82
DRAEGERWERK AG PREF 7.291,00 EUR 105,300 997.988,22 1,78 1,78
FRESENIUS MEDICAL CARE AG & CO - 13.761,00 EUR 54,530 975.428,49 1,74 1,74
FRESENIUS SE & CO KGAA (FRA) 9.755,00 EUR 94,710 1.200.972,48 2,14 2,14
STRATEC BIOMEDICAL AG - 731,00 EUR 34,040 32.345,72 0,06 0,06
Hong Kong
SHANGAI PHARMACEUTICALS HOLDING - 45.500,00 HKD 14,540 85.297,19 0,15 0,15
Italy
DIASORIN SPA - 14.097,00 EUR 30,670 562.018,25 1,00 1,00
SORIN SPA - 53.949,00 EUR 1,950 136.750,20 0,24 0,24
Japan
ALFRESA HOLDINGS CORP - 2.500,00 JPY 5.310,000 133.644,46 0,24 0,24
MEDICEO PALTAC HOLD CO LTD - 10.300,00 JPY 1.344,000 139.364,74 0,25 0,25
MIRACA HOLDINGS INC - 3.300,00 JPY 4.560,000 151.493,92 0,27 0,27
M3 INC - 33,00 JPY 222.800,000 74.019,40 0,13 0,13
OLYMPUS CORP - 3.000,00 JPY 3.015,000 91.059,44 0,16 0,16
SUZUKEN CO LTD - 4.400,00 JPY 3.340,000 147.950,20 0,26 0,26
SYSMEX CORP - 3.800,00 JPY 6.490,000 248.281,71 0,44 0,44
TERUMO CORP. - 4.500,00 JPY 4.935,000 223.571,32 0,40 0,40
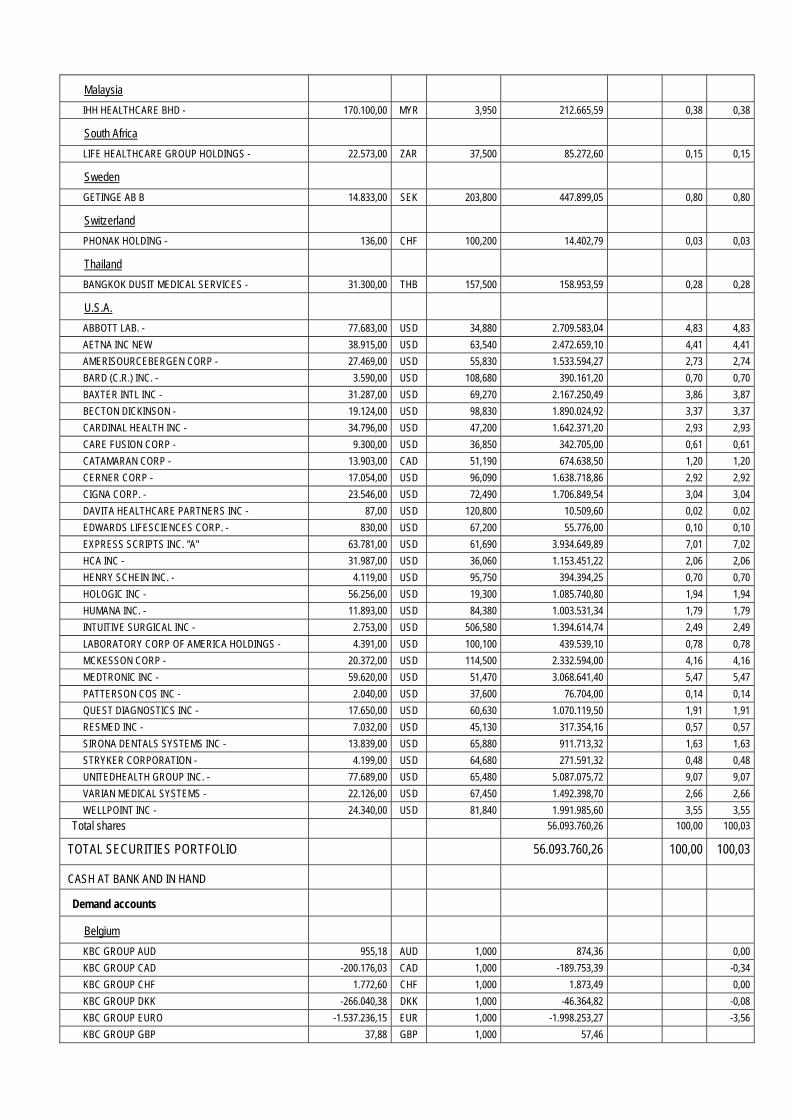
Malaysia
IHH HEALTHCARE BHD - 170.100,00 MYR 3,950 212.665,59 0,38 0,38
South Africa
LIFE HEALTHCARE GROUP HOLDINGS - 22.573,00 ZAR 37,500 85.272,60 0,15 0,15
Sweden
GETINGE AB B 14.833,00 SEK 203,800 447.899,05 0,80 0,80
Switzerland
PHONAK HOLDING - 136,00 CHF 100,200 14.402,79 0,03 0,03
Thailand
BANGKOK DUSIT MEDICAL SERVICES - 31.300,00 THB 157,500 158.953,59 0,28 0,28
U.S.A.
ABBOTT LAB. - 77.683,00 USD 34,880 2.709.583,04 4,83 4,83
AETNA INC NEW 38.915,00 USD 63,540 2.472.659,10 4,41 4,41
AMERISOURCEBERGEN CORP - 27.469,00 USD 55,830 1.533.594,27 2,73 2,74
BARD (C.R.) INC. - 3.590,00 USD 108,680 390.161,20 0,70 0,70
BAXTER INTL INC - 31.287,00 USD 69,270 2.167.250,49 3,86 3,87
BECTON DICKINSON - 19.124,00 USD 98,830 1.890.024,92 3,37 3,37
CARDINAL HEALTH INC - 34.796,00 USD 47,200 1.642.371,20 2,93 2,93
CARE FUSION CORP - 9.300,00 USD 36,850 342.705,00 0,61 0,61
CATAMARAN CORP - 13.903,00 CAD 51,190 674.638,50 1,20 1,20
CERNER CORP - 17.054,00 USD 96,090 1.638.718,86 2,92 2,92
CIGNA CORP. - 23.546,00 USD 72,490 1.706.849,54 3,04 3,04
DAVITA HEALTHCARE PARTNERS INC - 87,00 USD 120,800 10.509,60 0,02 0,02
EDWARDS LIFESCIENCES CORP. - 830,00 USD 67,200 55.776,00 0,10 0,10
EXPRESS SCRIPTS INC. "A" 63.781,00 USD 61,690 3.934.649,89 7,01 7,02
HCA INC - 31.987,00 USD 36,060 1.153.451,22 2,06 2,06
HENRY SCHEIN INC. - 4.119,00 USD 95,750 394.394,25 0,70 0,70
HOLOGIC INC - 56.256,00 USD 19,300 1.085.740,80 1,94 1,94
HUMANA INC. - 11.893,00 USD 84,380 1.003.531,34 1,79 1,79
INTUITIVE SURGICAL INC - 2.753,00 USD 506,580 1.394.614,74 2,49 2,49
LABORATORY CORP OF AMERICA HOLDINGS - 4.391,00 USD 100,100 439.539,10 0,78 0,78
MCKESSON CORP - 20.372,00 USD 114,500 2.332.594,00 4,16 4,16
MEDTRONIC INC - 59.620,00 USD 51,470 3.068.641,40 5,47 5,47
PATTERSON COS INC - 2.040,00 USD 37,600 76.704,00 0,14 0,14
QUEST DIAGNOSTICS INC - 17.650,00 USD 60,630 1.070.119,50 1,91 1,91
RESMED INC - 7.032,00 USD 45,130 317.354,16 0,57 0,57
SIRONA DENTALS SYSTEMS INC - 13.839,00 USD 65,880 911.713,32 1,63 1,63
STRYKER CORPORATION - 4.199,00 USD 64,680 271.591,32 0,48 0,48
UNITEDHEALTH GROUP INC. - 77.689,00 USD 65,480 5.087.075,72 9,07 9,07
VARIAN MEDICAL SYSTEMS - 22.126,00 USD 67,450 1.492.398,70 2,66 2,66
WELLPOINT INC - 24.340,00 USD 81,840 1.991.985,60 3,55 3,55
Total shares 56.093.760,26 100,00 100,03
TOTAL SECURITIES PORTFOLIO 56.093.760,26 100,00 100,03
CASH AT BANK AND IN HAND
Demand accounts
Belgium
KBC GROUP AUD 955,18 AUD 1,000 874,36 0,00
KBC GROUP CAD -200.176,03 CAD 1,000 -189.753,39 -0,34
KBC GROUP CHF 1.772,60 CHF 1,000 1.873,49 0,00
KBC GROUP DKK -266.040,38 DKK 1,000 -46.364,82 -0,08
KBC GROUP EURO -1.537.236,15 EUR 1,000 -1.998.253,27 -3,56
KBC GROUP GBP 37,88 GBP 1,000 57,46

KBC GROUP HKD 361,54 HKD 1,000 46,61
KBC GROUP JPY 166.436.210,00 JPY 1,000 1.675.576,44 2,99
KBC GROUP NOK -6,17 NOK 1,000 -1,01
KBC GROUP NZD 109,44 NZD 1,000 84,52
KBC GROUP SEK -3.038.251,52 SEK 1,000 -450.163,92 -0,80
KBC GROUP SGD 761,57 SGD 1,000 600,49 0,00
KBC GROUP USD -1.962.972,07 USD 1,000 -1.962.972,07 -3,50
KBC GROUP ZAR 16.856,41 ZAR 1,000 1.698,06 0,00
Total demand accounts -2.966.697,05 -5,29
TOTAL CASH AT BANK AND IN HAND -2.966.697,05 -5,29
OTHER RECEIVABLES AND PAYABLES
Receivables
Belgium
KBC GROUP CAD RECEIVABLE 200.000,00 CAD 1,000 189.586,52 0,34
KBC GROUP DKK RECEIVABLE 260.000,00 DKK 1,000 45.312,11 0,08
KBC GROUP EUR RECEIVABLE 1.470.000,00 EUR 1,000 1.910.853,00 3,41
KBC GROUP SEK RECEIVABLE 3.043.000,00 SEK 1,000 450.867,48 0,80
KBC GROUP USD RECEIVABLE 3.081.012,38 USD 1,000 3.081.012,38 5,49
KBC GROUP WHT TO BE RECOVERED EUR 519,45 EUR 1,000 675,23 0,00
Total receivables 5.678.306,72 10,13
Payables
Belgium
KBC GROUP EUR PAYABLE -655,55 EUR 1,000 -852,15 0,00
KBC GROUP USD PAYABLE -2.633.256,37 USD 1,000 -2.633.256,37 -4,70
Payables -2.634.108,52 -4,70
TOTAL RECEIVABLES AND PAYABLES 3.044.198,20 5,43
OTHER
Interest receivable USD 35.226,01 0,06
Accrued interest USD 1.939,95 0,00
Expenses payable USD -140.530,48 -0,25
Expenses to be carried forward USD 6.994,27 0,01
TOTAL OTHER -96.370,25 -0,17
TOTAL NET ASSETS 56.074.891,16 100,00

Geographic breakdown (as a % of securities portfolio)
31/12/2011 30/06/2012 31/12/2012 30/06/2013 Australia 1,30 1,88 2,43 1,66 Belgium 1,50 0,00 0,00 0,41 Bermuda 4,48 3,79 4,71 4,22 Brazil 0,35 0,69 0,88 0,02 Canada 0,00 0,99 0,00 1,20 Switzerland 1,24 1,19 0,00 0,03 China 0,00 0,66 0,65 0,00 Germany 5,96 5,49 7,01 6,54 Denmark 0,40 0,00 0,00 1,06 France 1,77 3,18 3,76 3,77 U.K. 3,35 0,73 1,16 0,00 Hong Kong 0,00 0,10 0,18 0,15 Italy 0,00 0,44 0,00 1,25 Japan 3,43 3,42 3,76 2,16 Malaysia 0,00 0,00 0,00 0,38 Sweden 0,00 1,94 1,68 0,80 Thailand 0,00 0,00 0,00 0,28 U.S.A. 76,22 74,63 72,77 75,92 South Africa 0,00 0,87 1,01 0,15 Total 100,00 100,00 100,00 100,00
Sector breakdown (as a % of securities portfolio)
31/12/2011 30/06/2012 31/12/2012 30/06/2013 Cyclicals 1,49 0,00 0,00 0,00 Pharma 98,51 100,00 100,00 100,00 Total 100,00 100,00 100,00 100,00
Currency breakdown (as a % of net assets)
31/12/2011 30/06/2012 31/12/2012 30/06/2013 AUD 1,27 1,88 2,34 1,66 BRL 0,35 0,69 0,85 0,02 CAD 0,01 0,99 0,00 1,20 CHF 1,21 1,19 0,00 0,03 DKK 0,39 0,00 0,00 1,06 EUR 8,91 8,99 10,29 11,79 GBP 3,27 0,68 1,12 0,00 HKD 0,00 0,75 0,81 0,15 JPY 3,35 3,42 3,63 5,14 MYR 0,00 0,00 0,00 0,38 SEK 0,00 1,95 1,62 0,80 THB 0,00 0,00 0,00 0,28 USD 81,24 78,59 78,37 77,34 ZAR 0,00 0,87 0,97 0,15 Total 100,00 100,00 100,00 100,00

2.4.2 CHANGES IN THE COMPOSITION OF THE ASSETS OF KBC EQUITY FUND MEDICAL
TECHNOLOGIES (IN THE CURRENCY OF THE SUB-FUND)
1st half of year YearPurchases 237.258.112,26 237.258.112,26 Sales 212.442.366,76 212.442.366,76 Total 1 449.700.479,02 449.700.479,02 Subscriptions 252.850.460,09 252.850.460,09 Redemptions 228.201.557,09 228.201.557,09 Total 2 481.052.017,18 481.052.017,18 Monthly average of total assets
113.324.475,58 113.324.475,58
Turnover rate -27,66 % -27,66 %
1st half of year YearPurchases 237.258.112,26 237.258.112,26 Sales 212.442.366,76 212.442.366,76 Total 1 449.700.479,02 449.700.479,02 Subscriptions 252.850.460,09 252.850.460,09 Redemptions 228.201.557,09 228.201.557,09 Total 2 481.052.017,18 481.052.017,18 Monthly average of total assets
112.730.711,43 112.730.711,43
Corrected turnover rate -27,81 % -27,81 %
The table above shows the capital volume of portfolio transactions. This volume (adjusted to take account of total subscriptions and redemptions) is also compared to the average net assets at the beginning and end of the period. A figure close to 0% implies that the transactions relating to the securities or transactions relating to the assets (excluding deposits and cash) in a given period only involve subscriptions and redemptions. A negative percentage shows that subscriptions and redemptions entailed few, if any, transactions in the portfolio. Active asset management may result in high turnover rates (monthly percentage >50%). The detailed list of transactions is available for consultation free of charge at the registered office of the Bevek or fund at Havenlaan 2, 1080 Brussels.

2.4.3 AMOUNT OF COMMITMENTS IN RESPECT OF FINANCIAL DERIVATIVES POSITIONS Nil
2.4.4 CHANGES OF THE NUMBER OF SUBSCRIPTIONS AND REDEMPTIONS AND THE NET ASSET
VALUE
Classic Shares
Period Change in number of shares in circulation
Year Subscriptions Redemptions End of period
Cap. Dis. Cap. Dis. Cap. Dis. Total
2011 - 06 6.533,63 211,00 9.281,57 369,99 8.714,61 737,00 9.451,61
2012 - 06 2.137,95 175,00 5.896,90 255,00 4.955,66 657,00 5.612,66
2013 - 06 16.905,41 17.308,05 4.291,96 9.841,64 17.569,11 8.123,41 25.692,52
Period Amounts received and paid by the UCI
(in the currency of the class)
Year Subscriptions Redemptions
Capitalization Distribution Capitalization Distribution
2011 - 06 11.046.500,07 310.147,68 15.110.926,99 536.365,79
2012 - 06 3.720.932,35 279.340,80 9.295.563,70 413.768,29
2013 - 06 33.575.585,06 32.646.584,43 8.500.211,91 19.394.157,52
Period Net asset value
End of period (in the currency of the class)
Year Of the class Of one share
Capitalization Distribution
2011 - 06 16.991.331,65 1.803,99 1.723,56
2012 - 06 9.797.078,00 1.754,72 1.676,22
2013 - 06 51.866.474,80 2.048,23 1.954,95
Institutional B Shares
Period Change in number of shares in circulation
Year Subscriptions Redemptions End of period
Cap. Dis. Cap. Dis. Cap. Dis. Total 2012 - 06 6.737,00 4.381,00 2.356,00 2.356,00
2013 - 06 101.817,00 102.126,00 2.047,00 2.047,00
Period Amounts received and paid by the UCI
(in the currency of the class)
Year Subscriptions Redemptions
Capitalization Distribution Capitalization Distribution
2012 - 06 10.944.543,42 7.575.630,46
2013 - 06 195.593.840,70 207.765.320,80
Period Net asset value
End of period (in the currency of the class)
Year Of the class Of one share
Capitalization Distribution
2012 - 06 4.136.528,87 1.755,74
2013 - 06 4.208.416,36 2.055,89


2.4.5 PERFORMANCE FIGURES
Classic Shares
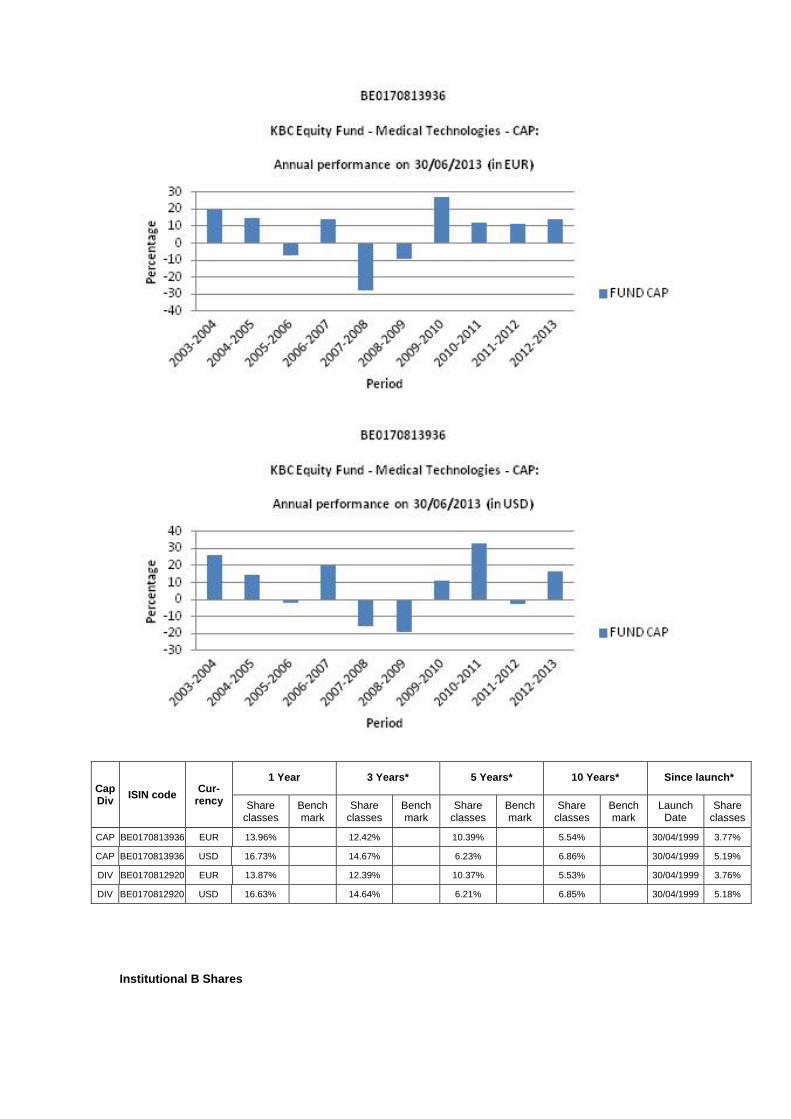
Cap Div
ISIN code Cur-
rency
1 Year 3 Years* 5 Years* 10 Years* Since launch*
Share classes
Bench mark
Share classes
Bench mark
Share classes
Bench mark
Share classes
Bench mark
Launch Date
Share classes
CAP BE0170813936 EUR 13.96% 12.42% 10.39% 5.54% 30/04/1999 3.77%
CAP BE0170813936 USD 16.73% 14.67% 6.23% 6.86% 30/04/1999 5.19%
DIV BE0170812920 EUR 13.87% 12.39% 10.37% 5.53% 30/04/1999 3.76%
DIV BE0170812920 USD 16.63% 14.64% 6.21% 6.85% 30/04/1999 5.18%
Institutional B Shares
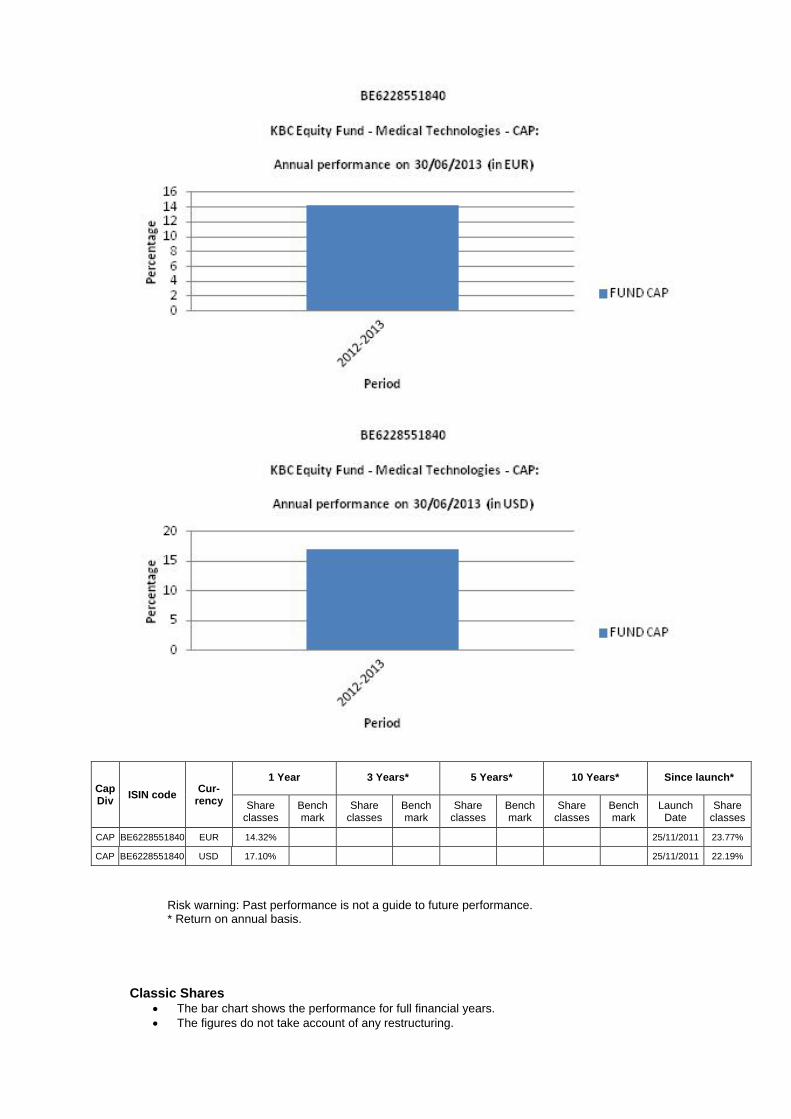
Cap Div
ISIN code Cur-
rency
1 Year 3 Years* 5 Years* 10 Years* Since launch*
Share classes
Bench mark
Share classes
Bench mark
Share classes
Bench mark
Share classes
Bench mark
Launch Date
Share classes
CAP BE6228551840 EUR 14.32% 25/11/2011 23.77%
CAP BE6228551840 USD 17.10% 25/11/2011 22.19%
Risk warning: Past performance is not a guide to future performance. * Return on annual basis.
Classic Shares The bar chart shows the performance for full financial years. The figures do not take account of any restructuring.
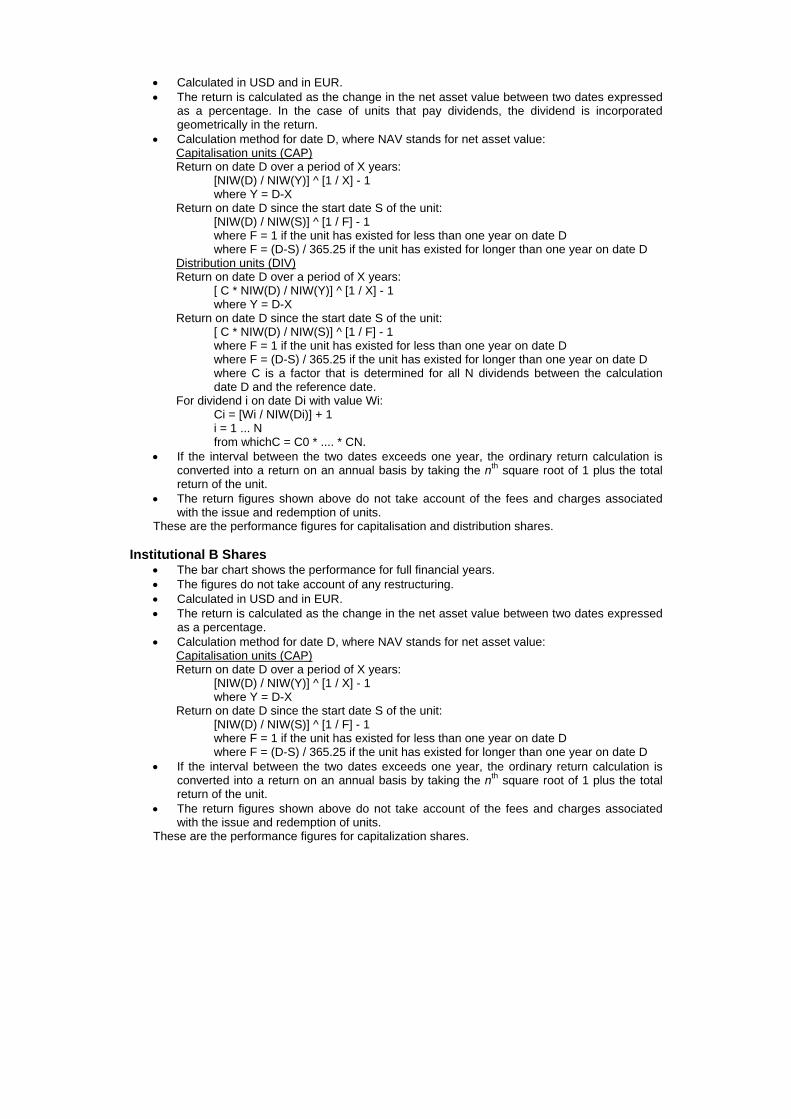
Calculated in USD and in EUR. The return is calculated as the change in the net asset value between two dates expressed
as a percentage. In the case of units that pay dividends, the dividend is incorporated geometrically in the return.
Calculation method for date D, where NAV stands for net asset value: Capitalisation units (CAP) Return on date D over a period of X years:
[NIW(D) / NIW(Y)] ^ [1 / X] - 1 where Y = D-X
Return on date D since the start date S of the unit: [NIW(D) / NIW(S)] ^ [1 / F] - 1 where F = 1 if the unit has existed for less than one year on date D where F = (D-S) / 365.25 if the unit has existed for longer than one year on date D
Distribution units (DIV) Return on date D over a period of X years:
[ C * NIW(D) / NIW(Y)] ^ [1 / X] - 1 where Y = D-X
Return on date D since the start date S of the unit: [ C * NIW(D) / NIW(S)] ^ [1 / F] - 1 where F = 1 if the unit has existed for less than one year on date D where F = (D-S) / 365.25 if the unit has existed for longer than one year on date D where C is a factor that is determined for all N dividends between the calculation date D and the reference date.
For dividend i on date Di with value Wi: Ci = [Wi / NIW(Di)] + 1 i = 1 ... N from whichC = C0 * .... * CN.
If the interval between the two dates exceeds one year, the ordinary return calculation is converted into a return on an annual basis by taking the nth square root of 1 plus the total return of the unit.
The return figures shown above do not take account of the fees and charges associated with the issue and redemption of units.
These are the performance figures for capitalisation and distribution shares.
Institutional B Shares The bar chart shows the performance for full financial years. The figures do not take account of any restructuring. Calculated in USD and in EUR. The return is calculated as the change in the net asset value between two dates expressed
as a percentage. Calculation method for date D, where NAV stands for net asset value:
Capitalisation units (CAP) Return on date D over a period of X years:
[NIW(D) / NIW(Y)] ^ [1 / X] - 1 where Y = D-X
Return on date D since the start date S of the unit: [NIW(D) / NIW(S)] ^ [1 / F] - 1 where F = 1 if the unit has existed for less than one year on date D where F = (D-S) / 365.25 if the unit has existed for longer than one year on date D
If the interval between the two dates exceeds one year, the ordinary return calculation is converted into a return on an annual basis by taking the nth square root of 1 plus the total return of the unit.
The return figures shown above do not take account of the fees and charges associated with the issue and redemption of units.
These are the performance figures for capitalization shares.

2.4.6 COSTS Ongoing Charges: * Classic Shares Distribution: 2.017% Classic Shares Capitalization: 1.856% Institutional B Shares Capitalization: 1.819% * The following costs have not been included in the ongoing charges: - Interest payments on loans taken out - Payments in respect of financial derivatives - Fees and charges paid directly by the investor - Any soft commissions
SOFT COMMISSIONS The management company or the appointed manager, as the case may be, is the recipient of soft commissions. The recipient has laid down an internal policy as regards accepting soft commissions and avoiding possible conflicts of interest in this respect, and has put appropriate internal controls in place to ensure this policy is observed. For more information, please see the ‘General’ section of the annual report.
Broker
Commission gross
in EUR
paid during the period:
1‐01‐13
‐
30‐06‐13
CSA Credits
in EUR
accrued during the period:
1‐01‐13
‐
30‐06‐13 Percentage
CITI 51,213 37,545 73.31%
CSFBSAS 39,376 19,472 49.45%
DEUTSCHE 1,645 822 50.00%
EQ MACQUARIE 2,883 1,519 52.68%
INSTINET 17,779 9,016 50.71%
MERRILL 11,732 9,038 77.04%
MORGAN STANLEY 2,695 1,342 49.81%
SOCGEN 20 9 44.44%
UBSWDR 2,227 1,113 50.00%
FEE-SHARING AGREEMENTS AND REBATES: The management company may share its fee with the distributor, and institutional and/or professional parties. In principle, the percentage share amounts to between 35% and 60% if the distributor is an entity of KBC Group NV or to between 35% and 70% if the distributor is not an entity of KBC Group NV. However, in a small number of cases, the distributor’s fee is less than 35%. Investors may, on request, obtain more information on these cases. If the management company invests the assets of the undertaking for collective investment in units of undertakings for collective investment that are not managed by an entity of KBC Group NV, and receives a fee for doing so, it will pay this fee to the undertaking for collective investment. Fee-sharing does not affect the amount of the management fee paid by the sub-fund to the management company. This management fee is subject to the limitations laid down in the articles of association. The limitations may only be amended after approval by the general meeting of shareholders. The management company has concluded a distribution agreement with the distributor in order to facilitate the wider distribution of the sub-fund's units by using multiple distribution channels. It is in the interests of the holders of units, the sub-fund and of the distributor for the largest possible number of units to be sold and for the assets of the sub-fund to be maximised in this way. In this respect, there is therefore no question of any conflict of interest.
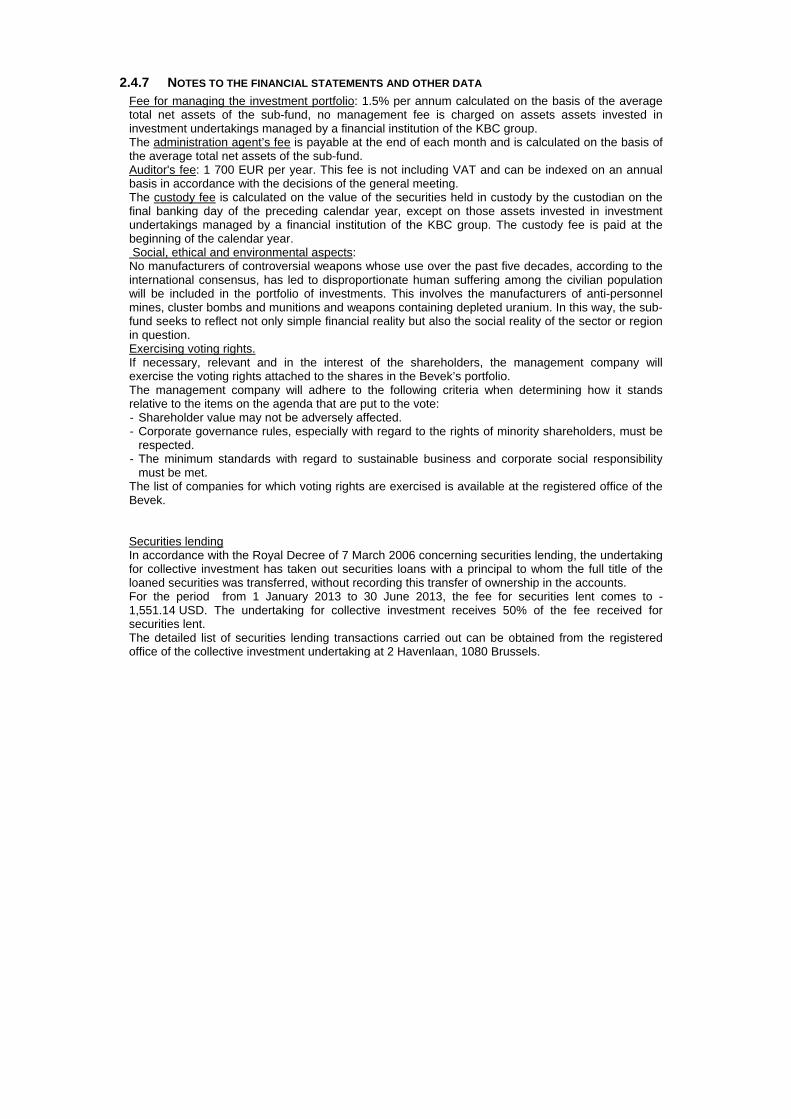
2.4.7 NOTES TO THE FINANCIAL STATEMENTS AND OTHER DATA Fee for managing the investment portfolio: 1.5% per annum calculated on the basis of the average total net assets of the sub-fund, no management fee is charged on assets assets invested in investment undertakings managed by a financial institution of the KBC group. The administration agent’s fee is payable at the end of each month and is calculated on the basis of the average total net assets of the sub-fund. Auditor's fee: 1 700 EUR per year. This fee is not including VAT and can be indexed on an annual basis in accordance with the decisions of the general meeting. The custody fee is calculated on the value of the securities held in custody by the custodian on the final banking day of the preceding calendar year, except on those assets invested in investment undertakings managed by a financial institution of the KBC group. The custody fee is paid at the beginning of the calendar year. Social, ethical and environmental aspects: No manufacturers of controversial weapons whose use over the past five decades, according to the international consensus, has led to disproportionate human suffering among the civilian population will be included in the portfolio of investments. This involves the manufacturers of anti-personnel mines, cluster bombs and munitions and weapons containing depleted uranium. In this way, the sub-fund seeks to reflect not only simple financial reality but also the social reality of the sector or region in question. Exercising voting rights. If necessary, relevant and in the interest of the shareholders, the management company will exercise the voting rights attached to the shares in the Bevek’s portfolio. The management company will adhere to the following criteria when determining how it stands relative to the items on the agenda that are put to the vote: - Shareholder value may not be adversely affected. - Corporate governance rules, especially with regard to the rights of minority shareholders, must be
respected. - The minimum standards with regard to sustainable business and corporate social responsibility
must be met. The list of companies for which voting rights are exercised is available at the registered office of the Bevek. Securities lending In accordance with the Royal Decree of 7 March 2006 concerning securities lending, the undertaking for collective investment has taken out securities loans with a principal to whom the full title of the loaned securities was transferred, without recording this transfer of ownership in the accounts. For the period from 1 January 2013 to 30 June 2013, the fee for securities lent comes to -1,551.14 USD. The undertaking for collective investment receives 50% of the fee received for securities lent. The detailed list of securities lending transactions carried out can be obtained from the registered office of the collective investment undertaking at 2 Havenlaan, 1080 Brussels.

Semi-Annual report as at 30th June 2013
TABLE OF CONTENTS
2. Information on KBC Equity Fund Eastern Europe
2.1. Management report 2.1.1. Launch date and subscription price 2.1.2. Stock exchange listing 2.1.3. Aim and distinctive features of the investment policy 2.1.4. Financial portfolio management 2.1.5. Distributors 2.1.6. Index and benchmark 2.1.7. Policy conducted during the financial year 2.1.8. Future policy 2.1.9. Synthetic risk and reward indicator (SRRI)
2.2. Balance sheet
2.3. Profit and loss account
2.4. Composition of the assets and key figures
2.4.1. Composition of the assets 2.4.2. Change in the composition of the assets 2.4.3. Value of commitments in respect of financial derivatives positions 2.4.4. Evolution of the number of subscriptions, repayments and the net asset value 2.4.5. Return figures 2.4.6. Expenses 2.4.7. Notes to the financial statements and other data


2 INFORMATION ON KBC EQUITY FUND EASTERN EUROPE
2.1 MANAGEMENT REPORT
2.1.1 LAUNCH DATE AND SUBSCRIPTION PRICE Classic Shares : Launch date: 6 October 1995 Initial subscription price: 20000 BEF Currency: EUR Institutional B Shares : Launch date: 24 November 2011 Initial subscription price: 1218.24 EUR Currency: EUR
2.1.2 STOCK EXCHANGE LISTING Not applicable.
2.1.3 GOAL AND KEY PRINCIPLES OF THE INVESTMENT POLICY
SUB-FUND’S OBJECT: The main objective of this sub-fund is to generate the highest possible return for its shareholders by investing directly or indirectly in transferable securities. This is reflected in its pursuit of capital gains and income. To this end, the assets are invested, either directly or indirectly via correlated financial instruments, primarily in shares.
SUB-FUND’S INVESTMENT POLICY:
PERMITTED ASSET CLASSES: The sub-fund may invest in securities, money market instruments, units in undertakings for collective investment, deposits, financial derivatives, liquid assets and all other instruments insofar as permitted by the applicable laws and regulations and consistent with the sub-fund’s object The sub-fund shall invest no more than 10% of its assets in units of other undertakings for collective investment.
RESTRICTIONS OF THE INVESTMENT POLICY: The investment policy will be implemented within the limits set by law and regulations. The sub-fund may borrow up to 10% of its net assets, insofar as these are short-term borrowings aimed at solving temporary liquidity problems.
PERMITTED DERIVATIVES TRANSACTIONS: Derivates may be used either for hedging purposes or to achieve investment objectives. Changes will be made to the investments at regular intervals to comply with the sub-fund's investment strategy. In addition, listed and unlisted derivates may be used to achieve the objectives: these may be forward contracts, options or swaps on securities, indices, currencies or interest rates or other transactions involving derivatives. Unlisted derivatives transactions will only be concluded with prime financial institutions specialised in such transactions. Such derivatives may also be used to hedge the assets against exchange-rate fluctuations. Subject to the applicable laws and regulations and the articles of association, the sub-fund always seeks to conclude the most effective transactions. All costs associated with the transactions will be charged to the sub-fund and all income generated will be paid to the sub-fund. If the transactions result in a risk in respect of the counterparty, this risk can be hedged by using a margin management system that ensures that the sub-fund is the beneficiary of security (collateral) in the form of cash or investment grade bonds. When calculating the value of the bonds, a margin will be applied that varies depending on the residual term to maturity and the currency in which the bond in question is denominated. The relationship with the counterparty or counterparties is governed by standard international agreements.

STRATEGY SELECTED At least 75% of the assets are invested in shares of companies in Central and Eastern European countries where conditions are such as to ensure accelerated economic growth in the short or medium term.
RISK CONCENTRATION Shares of Central and Eastern Europe.
LENDING FINANCIAL INSTRUMENTS: The sub-fund may lend financial instruments within the limits set by law and regulations. This lending does not affect the sub-fund’s risk profile since: - it takes place within the framework of a securities lending system managed by a principal. In
addition, the sub-fund has a relationship only with the principal of the securities lending system which acts as counterparty and to which title of the loaned securities is transferred. The choice of principal is subject to strict selection criteria. The return of securities similar to the securities that have been lent is guaranteed by the principal.
- through a margin management system, the sub-fund is always guaranteed financial security, the actual value of which always exceeds the actual value of the securities that have been lent, in case the principal does not return similar securities.
The return of securities similar to the securities that have been lent can be requested at any time, which means that the lending of securities does not affect the management of the sub-fund's assets. By lending securities, the sub-fund can generate an additional return. The principal pays a fee to the management company. After deducting the fee for the margin management and clearing services of KBC Bank, most of this fee is paid to the sub-fund. The relationship with the counterparty or counterparties is governed by standard international agreements. More information is provided on the terms and conditions governing securities lending in the annual or half-yearly report for the sub-fund.
VOLATILITY OF THE NET ASSET VALUE: The volatility of the net asset value may be high due to the composition of the portfolio.
GENERAL STRATEGY FOR HEDGING THE EXCHANGE RATE RISK: In order to protect its assets against exchange rate fluctuations and within the limitations laid down in the articles of association, the sub-fund may perform transactions relating to the sale of forward currency contracts, as well as the sale of call options and the purchase of put options on currencies. The transactions in question may relate solely to contracts traded on a regulated market that operates regularly, is recognised and is open to the public or that are traded with a recognised, prime financial institution specialising in such transactions and dealing in the over-the-counter (OTC) market in options. With the same objective, the sub-fund may also sell currencies forward or exchange them in private transactions with prime financial institutions specialising in such transactions. The hedging objective of the aforementioned transactions suggests that there is a direct link between these transactions and the assets to be hedged, which implies that the transactions carried out in a particular currency may in principle not exceed, in terms of volume, either the valuation value of all the assets in the same currency or the holding period of those assets.
SOCIAL, ETHICAL AND ENVIRONMENTAL ASPECTS:
No manufacturers of controversial weapons whose use over the past five decades, according to the international consensus, has led to disproportionate human suffering among the civilian population will be included in the portfolio of investments. This involves the manufacturers of anti-personnel mines, cluster bombs and munitions and weapons containing depleted uranium. In this way, the sub-fund seeks to reflect not only simple financial reality but also the social reality of the sector or region in question.
THE EUROPEAN SAVINGS DIRECTIVE AND TAX ON DEBT CLAIM RETURNS OBTAINED THROUGH THE
REDEMPTION OF OWN UNITS OR IN THE EVENT OF FULL OR PARTIAL DISTRIBUTION OF EQUITY
CAPITAL.

The following information is of a general character and is not intended to cover all aspects of an investment in a UCITS. In certain cases entirely different rules might even apply. Moreover, both tax law and the interpretation of it can change. Investors who wish to have more information about the tax implications – in both Belgium and abroad – of acquiring, holding and transferring units should seek the advice of their usual financial and tax advisers. This UCITS shall invest a maximum of 15% of its assets directly or indirectly in debt instruments as intended by the European Savings Directive. A. European Savings Directive (Directive 2003/48/EC) The European Savings Directive has been implemented in Belgium. Since this UCITS invests a maximum of 15% of its assets directly or indirectly in debt claims as intended by the European Savings Directive, the income of this UCITS does not fall within the scope of this directive. B. Tax on debt claim returns obtained through the redemption of own units or in the event of full or partial distribution of equity capital (Article 19bis Income Tax Code 1992). The income from this UCITS is not subject to the tax on debt instrument returns as intended by Article 19bis, Income Tax Code 1992.
2.1.4 FINANCIAL PORTFOLIO MANAGEMENT The management company has delegated the intellectual management, to CSOB Asset Management a.s., Radlicka 333/150 , 150 57 Praha 5, CZECH REPUBLIC..
2.1.5 DISTRIBUTORS KBC Asset Management S.A., 5, Place de la Gare, L-1616 Luxembourg.
2.1.6 INDEX AND BENCHMARK See ‘Sub-fund’s investment policy’.
2.1.7 POLICY PERSUED DURING THE FINANCIAL YEAR Eastern Europe, similar to other emerging markets, unfortunately decoupled from developed equities. Eastern European markets tumbled in the first half of 2013, while developed markets enjoyed relatively strong growth with US taking the lead. Central European countries struggle with weak European demand as it is the main target of their exports. Czech Republic and Hungary has been already in recession since last year. Polish economy, an island of growth in the region, has slowed down significantly too. Political risks also increased in the region bringing uncertainty into taxation and pension systems. On top of that, rising expectations of QE (quantitative easing) exit have brought outflow to emerging markets. In June, US FED announced that it can limit its bond purchases in the second half of the year and completely stop the QE program in the first half of 2014 should the US economy improve. Fears of end of cheap money period sent lower commodities and riskier emerging markets, Central Europe being no exemption. Turkish market experienced very high volatility in the first half of the year. The year started very well for Turkey. After Fitch upgraded the country to an investment grade at the end of the last year, investors were awaiting other rating agencies to follow. Strong 3% real GDP growth, falling inflation to 6 – 7 % range and unemployment close to its historical lows brought Turkey to a sweet spot. Improved outlook and higher credit rating also led to falling bond rates, which increased attractiveness of Turkish equities further. Turkish market became one of the best markets worldwide increasing nearly 20 % by mid May YTD. Unfortunately soon after, one of the risks we have been pointing out in the past year became a real concern. Liberal part of the Turkish population, tired of step-by-step islamisation, gathered together in protests against Prime Minister Erdogan. Interestingly, spark for such protests became relatively innocent happening against construction and cutting trees in Gezi park, a park in the very centre of Istanbul. Clashes between young people and police reminded investors that Turkey is an emerging country despite the recent positive sentiment and rating hikes. Therefore, country risk premium started to rise again, leading to a jump in Turkish bond yields and demanded discount for Turkish equities. Already mentioned QE exit hit Turkish equities second time. Money outflow are riskier for countries running current account deficit, which is the case for Turkey. The turnover in sentiment was very swift bringing Turkish indices YTD into the red territory. The Russian index soared when oil prices rose to above 118 USD/barrel at the beginning of the year. Then the Brent underwent a correction, shortly falling even below 100 USD, and Russian stocks fell, recording a half-year loss of about 10%. The market P/E fell to 5.0x. The sentiment was weak, and not just because of lower commodity prices. Foreign investors were abandoning the Russian story as corporate governance in some state-controlled companies has deteriorated. Additionally, the Russian index reacted negatively to the ongoing recession in Europe as well as the Cypriot banking crisis.
2.1.8 FUTURE POLICY There are several things to watch. Investors will be awaiting more details from FED and its plans regarding QE. Abundant liquidity has worked in favour of emerging markets so far. Central European markets will depend on Euro zone development. Improvement in European economies may revive also Central European markets. In Poland, changes in Polish pension system will be crucial as it may drain the liquidity out of the equity market in some scenarios. In Turkey, increased political risks make the country even more volatile. Moreover, high C/A deficit financed by short portfolio money is a risk should the liquidity run dry in the market. Even though political risks may be higher in the near term, we think that the events may be exaggerated. Turkish middle class has increased and substantially grown in wealth in the last decade. That is naturally bringing higher demand for more freedom rights. The government will have to eventually reflect it as there are presidential elections next year and parliamentary in 2015. Moreover, Turkish companies may report decent earnings growth in following quarters supporting Turkish story once again. Russia is likely suffering from the so called middle-income trap that strikes countries with GDP per capita of around 16 000 USD. It is the first BRIC country to reach this phase. Unless the Russian government implements some significant reforms of its deteriorating economic model, the potential economic growth will, at best, linger around 2% - 3% annually. Nonetheless, The Russian stock market has one appealing benefit – the dividend yield. Since the state-controlled companies are ordered to pay out at least 25 % of net income, the market dividend yield is above 4 %. Other than that, the oil price is to be watched. Fresh unrest in Egypt moves oil price higher, investors may eye a spill-over to other countries.
2.1.9 SYNTHETIC RISK AND REWARD INDICATOR Classic Shares: 7 on a scale of 1 (lowest risk) to 7 (highest risk). Institutional B Shares: 7 on a scale of 1 (lowest risk) to 7 (highest risk).

The value of a share can decrease or increase and the investor may not get back the amount invested. In accordance with Commission Regulation (EU) No. 583/2010, a synthetic risk and reward indicator has been calculated. This indicator provides a quantitative measure of the sub-fund's potential return and the risk involved, calculated in the currency in which the sub-fund is denominated. It is given as a figure between 1 and 7. The higher the figure, the greater the potential return, but also the more difficult it is to predict this return. Losses are possible too. The lowest figure does not mean that the investment is entirely free of risk. However, it does indicate that, compared with the higher figures, this product will generally provide a lower, but more predictable return. The synthetic risk and reward indicator is assessed regularly and can therefore go up or down based on data from the past. Data from the past is not always a reliable indicator of future risk and return.
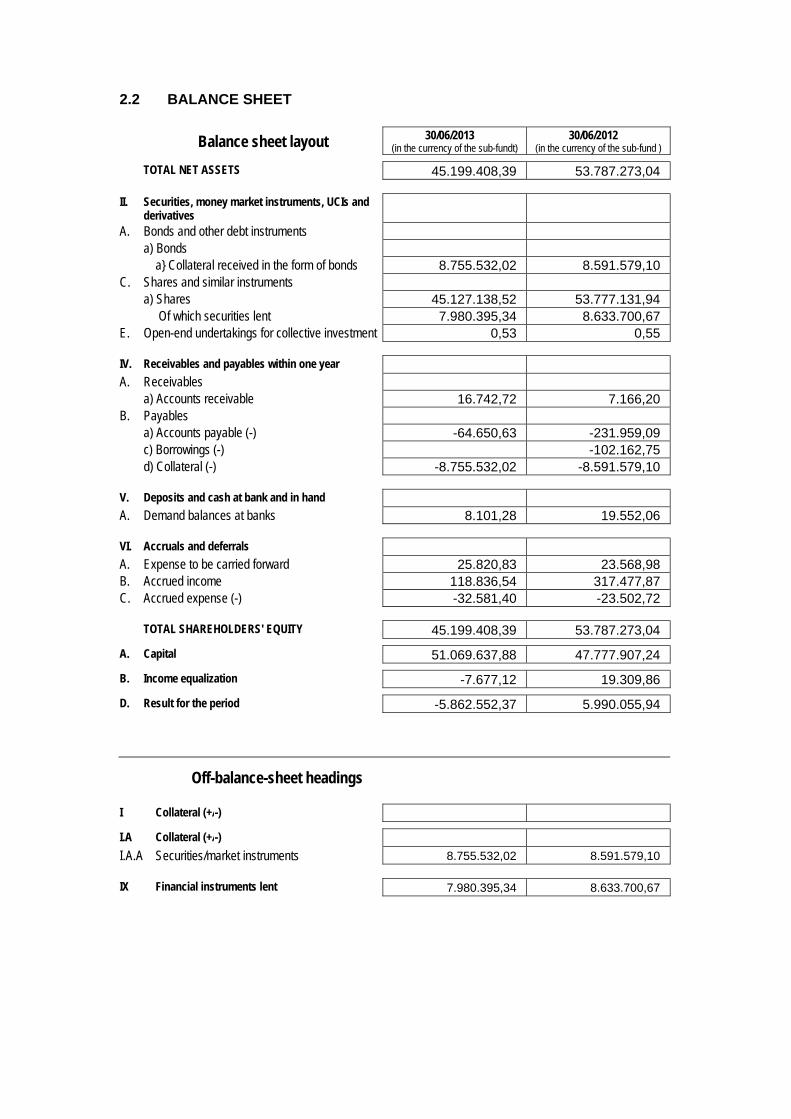
2.2 BALANCE SHEET
Balance sheet layout 30/06/2013 (in the currency of the sub-fundt)
30/06/2012 (in the currency of the sub-fund )
TOTAL NET ASSETS 45.199.408,39 53.787.273,04
II. Securities, money market instruments, UCIs and derivatives
A. Bonds and other debt instruments a) Bonds a} Collateral received in the form of bonds 8.755.532,02 8.591.579,10 C. Shares and similar instruments a) Shares 45.127.138,52 53.777.131,94 Of which securities lent 7.980.395,34 8.633.700,67 E. Open-end undertakings for collective investment 0,53 0,55
IV. Receivables and payables within one year A. Receivables a) Accounts receivable 16.742,72 7.166,20 B. Payables a) Accounts payable (-) -64.650,63 -231.959,09 c) Borrowings (-) -102.162,75 d) Collateral (-) -8.755.532,02 -8.591.579,10
V. Deposits and cash at bank and in hand A. Demand balances at banks 8.101,28 19.552,06
VI. Accruals and deferrals A. Expense to be carried forward 25.820,83 23.568,98 B. Accrued income 118.836,54 317.477,87 C. Accrued expense (-) -32.581,40 -23.502,72
TOTAL SHAREHOLDERS' EQUITY 45.199.408,39 53.787.273,04
A. Capital 51.069.637,88 47.777.907,24
B. Income equalization -7.677,12 19.309,86
D. Result for the period -5.862.552,37 5.990.055,94
Off-balance-sheet headings
I Collateral (+/-)
I.A Collateral (+/-)
I.A.A Securities/market instruments 8.755.532,02 8.591.579,10
IX Financial instruments lent 7.980.395,34 8.633.700,67
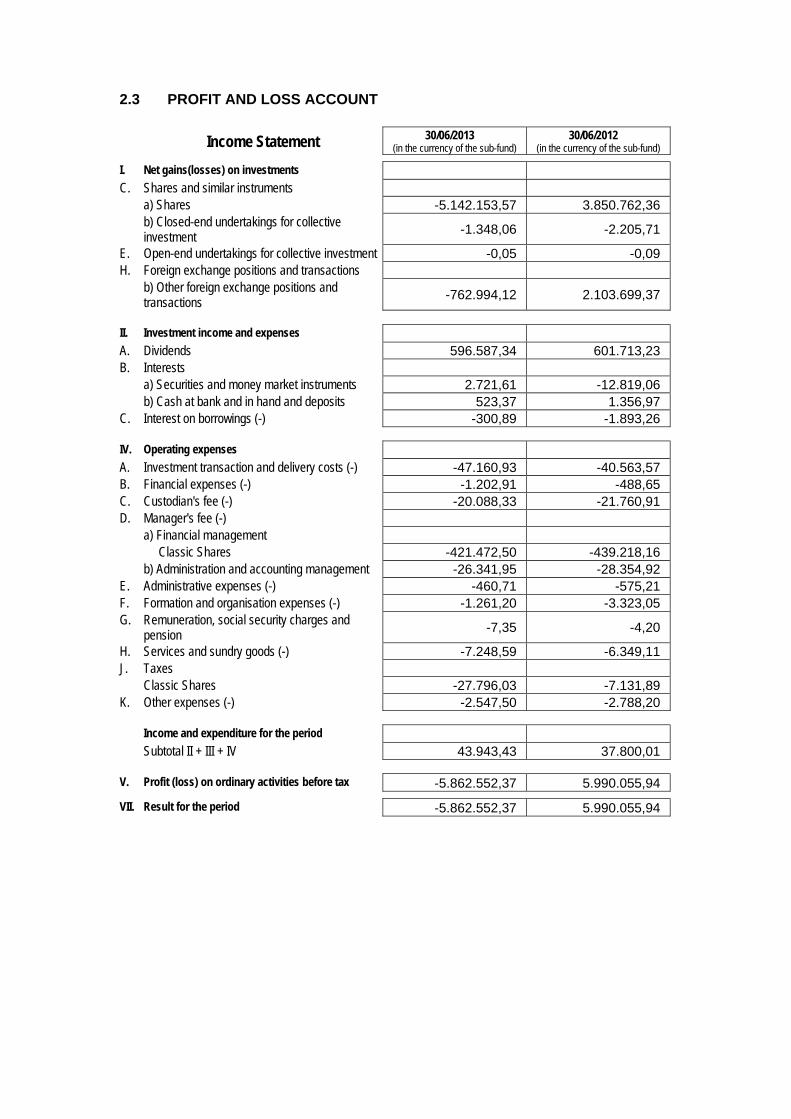
2.3 PROFIT AND LOSS ACCOUNT
Income Statement 30/06/2013 (in the currency of the sub-fund)
30/06/2012 (in the currency of the sub-fund)
I. Net gains(losses) on investments C. Shares and similar instruments a) Shares -5.142.153,57 3.850.762,36 b) Closed-end undertakings for collective
investment -1.348,06 -2.205,71
E. Open-end undertakings for collective investment -0,05 -0,09 H. Foreign exchange positions and transactions b) Other foreign exchange positions and
transactions -762.994,12 2.103.699,37
II. Investment income and expenses A. Dividends 596.587,34 601.713,23 B. Interests a) Securities and money market instruments 2.721,61 -12.819,06 b) Cash at bank and in hand and deposits 523,37 1.356,97 C. Interest on borrowings (-) -300,89 -1.893,26
IV. Operating expenses A. Investment transaction and delivery costs (-) -47.160,93 -40.563,57 B. Financial expenses (-) -1.202,91 -488,65 C. Custodian's fee (-) -20.088,33 -21.760,91 D. Manager's fee (-) a) Financial management Classic Shares -421.472,50 -439.218,16 b) Administration and accounting management -26.341,95 -28.354,92 E. Administrative expenses (-) -460,71 -575,21 F. Formation and organisation expenses (-) -1.261,20 -3.323,05 G. Remuneration, social security charges and
pension -7,35 -4,20
H. Services and sundry goods (-) -7.248,59 -6.349,11 J. Taxes Classic Shares -27.796,03 -7.131,89 K. Other expenses (-) -2.547,50 -2.788,20
Income and expenditure for the period Subtotal II + III + IV 43.943,43 37.800,01
V. Profit (loss) on ordinary activities before tax -5.862.552,37 5.990.055,94
VII. Result for the period -5.862.552,37 5.990.055,94
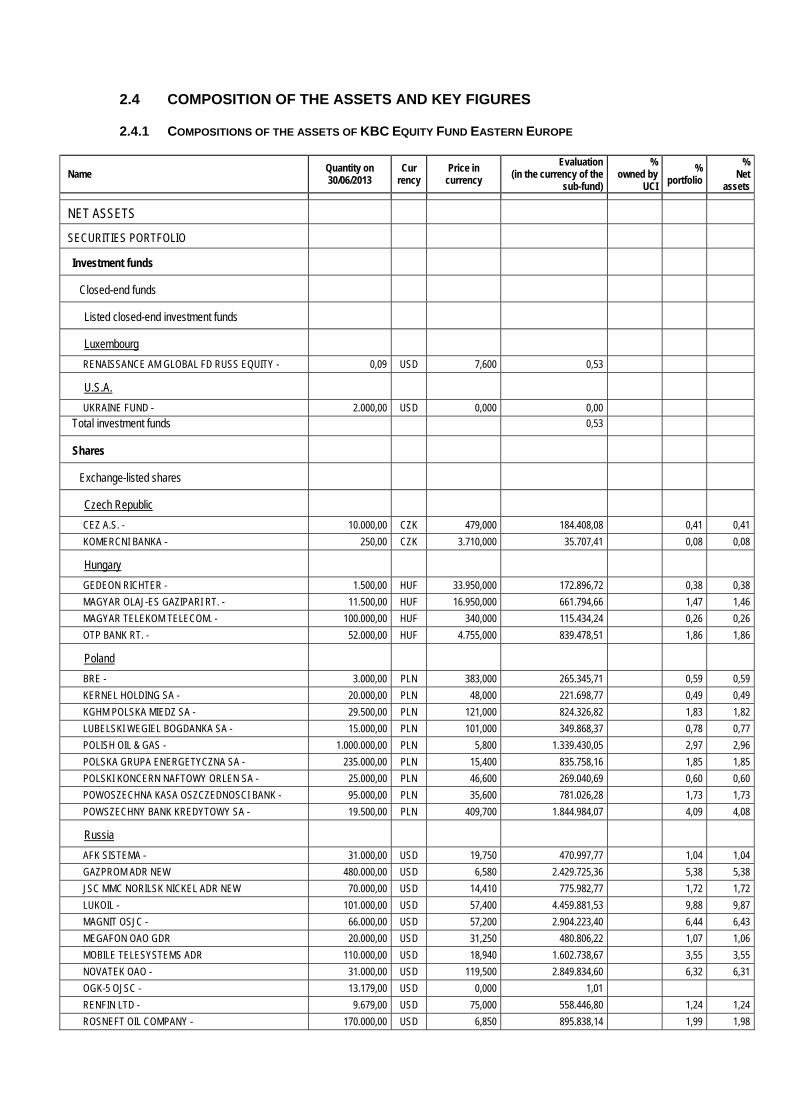
2.4 COMPOSITION OF THE ASSETS AND KEY FIGURES
2.4.1 COMPOSITIONS OF THE ASSETS OF KBC EQUITY FUND EASTERN EUROPE
Name Quantity on 30/06/2013
Cur rency
Price in currency
Evaluation (in the currency of the
sub-fund)
% owned by
UCI
% portfolio
% Net
assets
NET ASSETS
SECURITIES PORTFOLIO
Investment funds
Closed-end funds
Listed closed-end investment funds
Luxembourg
RENAISSANCE AM GLOBAL FD RUSS EQUITY - 0,09 USD 7,600 0,53
U.S.A.
UKRAINE FUND - 2.000,00 USD 0,000 0,00
Total investment funds 0,53
Shares
Exchange-listed shares
Czech Republic
CEZ A.S. - 10.000,00 CZK 479,000 184.408,08 0,41 0,41
KOMERCNI BANKA - 250,00 CZK 3.710,000 35.707,41 0,08 0,08
Hungary
GEDEON RICHTER - 1.500,00 HUF 33.950,000 172.896,72 0,38 0,38
MAGYAR OLAJ-ES GAZIPARI RT. - 11.500,00 HUF 16.950,000 661.794,66 1,47 1,46
MAGYAR TELEKOM TELECOM. - 100.000,00 HUF 340,000 115.434,24 0,26 0,26
OTP BANK RT. - 52.000,00 HUF 4.755,000 839.478,51 1,86 1,86
Poland
BRE - 3.000,00 PLN 383,000 265.345,71 0,59 0,59
KERNEL HOLDING SA - 20.000,00 PLN 48,000 221.698,77 0,49 0,49
KGHM POLSKA MIEDZ SA - 29.500,00 PLN 121,000 824.326,82 1,83 1,82
LUBELSKI WEGIEL BOGDANKA SA - 15.000,00 PLN 101,000 349.868,37 0,78 0,77
POLISH OIL & GAS - 1.000.000,00 PLN 5,800 1.339.430,05 2,97 2,96
POLSKA GRUPA ENERGETYCZNA SA - 235.000,00 PLN 15,400 835.758,16 1,85 1,85
POLSKI KONCERN NAFTOWY ORLEN SA - 25.000,00 PLN 46,600 269.040,69 0,60 0,60
POWOSZECHNA KASA OSZCZEDNOSCI BANK - 95.000,00 PLN 35,600 781.026,28 1,73 1,73
POWSZECHNY BANK KREDYTOWY SA - 19.500,00 PLN 409,700 1.844.984,07 4,09 4,08
Russia
AFK SISTEMA - 31.000,00 USD 19,750 470.997,77 1,04 1,04
GAZPROM ADR NEW 480.000,00 USD 6,580 2.429.725,36 5,38 5,38
JSC MMC NORILSK NICKEL ADR NEW 70.000,00 USD 14,410 775.982,77 1,72 1,72
LUKOIL - 101.000,00 USD 57,400 4.459.881,53 9,88 9,87
MAGNIT OSJC - 66.000,00 USD 57,200 2.904.223,40 6,44 6,43
MEGAFON OAO GDR 20.000,00 USD 31,250 480.806,22 1,07 1,06
MOBILE TELESYSTEMS ADR 110.000,00 USD 18,940 1.602.738,67 3,55 3,55
NOVATEK OAO - 31.000,00 USD 119,500 2.849.834,60 6,32 6,31
OGK-5 OJSC - 13.179,00 USD 0,000 1,01
RENFIN LTD - 9.679,00 USD 75,000 558.446,80 1,24 1,24
ROSNEFT OIL COMPANY - 170.000,00 USD 6,850 895.838,14 1,99 1,98

ROSTELECOM SPON ADR NEW 14.000,00 USD 16,040 172.751,75 0,38 0,38
SBERBANK OF RUSSIA ADR 480.000,00 USD 11,390 4.205.861,99 9,32 9,31
SEVERSTAL - 100.000,00 USD 6,370 490.037,70 1,09 1,08
SURGUTNEFTEGAZ OIL ADR NEW 270.000,00 USD 7,840 1.628.432,96 3,61 3,60
TATNEFT - 25.000,00 USD 36,330 698.707,59 1,55 1,55
TGK-5 REG S - 5.437,00 USD 0,000 0,42
TMK OAO - 30.000,00 USD 11,500 265.405,03 0,59 0,59
URALKALI - 30.000,00 USD 33,100 763.904,92 1,69 1,69
VTB BANK OSJC-GDR-REG S/WI - 60.000,00 USD 2,840 131.087,01 0,29 0,29
Turkey
AKBANK T.A.S. - 388.000,00 TRY 7,860 1.215.980,86 2,70 2,69
ALARKO HOLDING - 140.000,00 TRY 5,780 322.647,53 0,72 0,71
ASYA KATILIM BANKASI AS - 100.000,00 TRY 1,790 71.371,61 0,16 0,16
BIZIM TOPTAN SATIS MAGAALARI - 15.000,00 TRY 31,400 187.799,04 0,42 0,42
EMLAK KONUT GAYRIMENKUL YATIRI - 400.000,00 TRY 2,720 433.811,80 0,96 0,96
ENKA INSAAT VE SANAYI AS - 79.999,00 TRY 4,850 154.703,01 0,34 0,34
EREGLI DEMIR VE CELIK FABRIK - 585.074,00 TRY 1,990 464.233,36 1,03 1,03
FORD OTOMOTIV SANAYI AS - 30.000,00 TRY 26,600 318.181,82 0,71 0,70
HACI OMER SABANCI HOLDING S.A - 150.000,00 TRY 10,150 607.057,42 1,35 1,34
IS GAYRIMENKUL YATIRIM ORTAK - 189.000,00 TRY 1,400 105.502,39 0,23 0,23
KOC HOLDING A.S. - 80.000,00 TRY 9,260 295.374,80 0,66 0,65
TOFAS TURK OTOMOBIL FABRIKASI AS - 30.000,00 TRY 12,050 144.138,76 0,32 0,32
TURK HAVA YOLLARI AO - 230.000,00 TRY 7,500 687.799,04 1,52 1,52
TURK SISE VE CAM FABRIKALARI AS - 455.000,00 TRY 2,700 489.832,54 1,09 1,08
TURK TELEKOMUNIKASYON AS - 50.000,00 TRY 7,500 149.521,53 0,33 0,33
TURKCELL ILETISIM HIZMETERI A.S. - 205.000,00 TRY 11,200 915.470,49 2,03 2,03
TURKIYE GARANTI BANKASI A.S. - 210.000,00 TRY 8,420 705.023,92 1,56 1,56
TURKIYE HALK BANKASI - 230.000,00 TRY 16,350 1.499.401,91 3,32 3,32
TURKIYE IS BANKASI - 322.000,00 TRY 5,700 731.818,18 1,62 1,62
TURKIYE SINAI KALKINMA BANKASI AS - 371.426,00 TRY 1,910 282.864,30 0,63 0,63
TURKIYE VAKIFLAR BANKASI T.A.O. - 290.000,00 TRY 4,810 556.180,22 1,23 1,23
YAPI VE KREDI BANKASI A.S. - 150.000,00 TRY 4,390 262.559,81 0,58 0,58
Total shares 45.127.138,52 100,00 99,84
TOTAL SECURITIES PORTFOLIO 45.127.139,05 100,00 99,84
COLLATERAL RECEIVED
Belgium
KBC GROUP COLLATERAL EUR 8.755.532,02 EUR 1,000 8.755.532,02 19,37
TOTAL RECEIVED COLLATERAL 8.755.532,02 19,37
CASH AT BANK AND IN HAND
Demand accounts
Belgium
KBC GROUP CZK 2.633,54 CZK 1,000 101,39
KBC GROUP EURO 918,54 EUR 1,000 918,54 0,00
KBC GROUP GBP 1.313,56 GBP 1,000 1.532,74 0,00
KBC GROUP HUF 6.312,51 HUF 1,000 21,43
KBC GROUP NEW BULGAARSE LEVA 1,28 BGN 1,000 0,65
KBC GROUP PLN 48,74 PLN 1,000 11,26
KBC GROUP RON 1,45 RON 1,000 0,32
KBC GROUP TRY 1.021,40 TRY 1,000 407,26 0,00
KBC GROUP USD 6.639,49 USD 1,000 5.107,69 0,01
Total demand accounts 8.101,28 0,02
TOTAL CASH AT BANK AND IN HAND 8.101,28 0,02
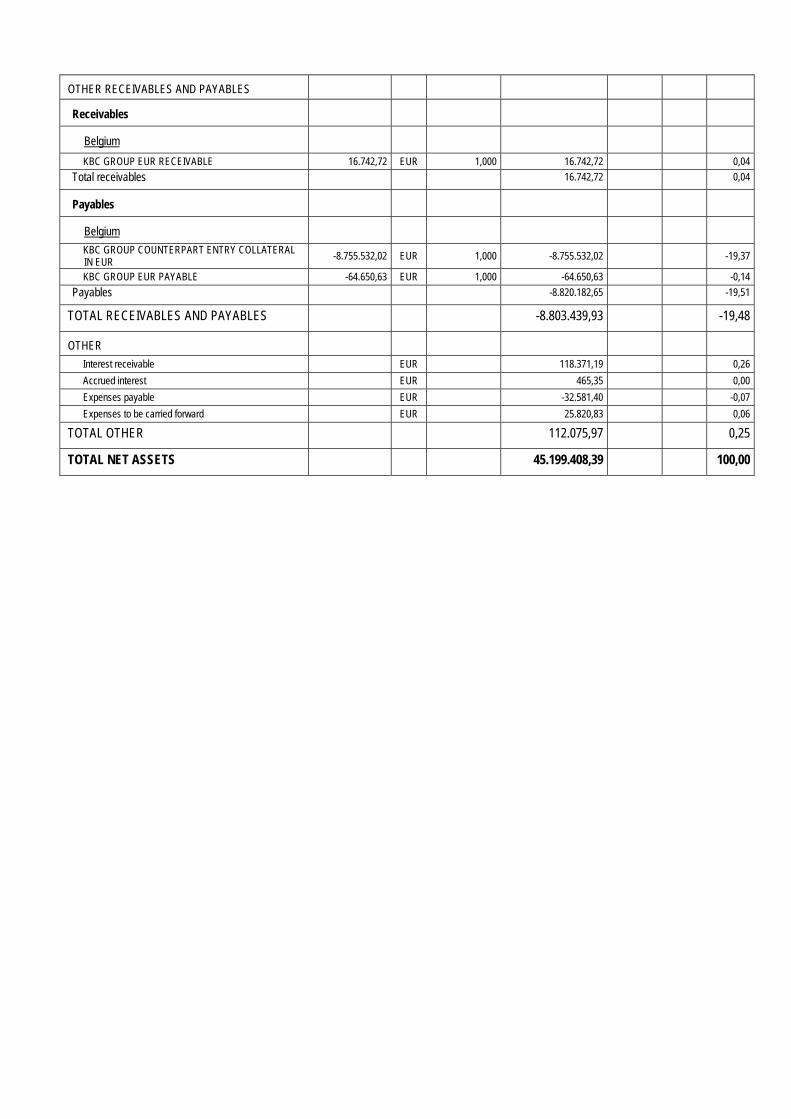
OTHER RECEIVABLES AND PAYABLES
Receivables
Belgium
KBC GROUP EUR RECEIVABLE 16.742,72 EUR 1,000 16.742,72 0,04
Total receivables 16.742,72 0,04
Payables
Belgium
KBC GROUP COUNTERPART ENTRY COLLATERAL IN EUR
-8.755.532,02 EUR 1,000 -8.755.532,02 -19,37
KBC GROUP EUR PAYABLE -64.650,63 EUR 1,000 -64.650,63 -0,14
Payables -8.820.182,65 -19,51
TOTAL RECEIVABLES AND PAYABLES -8.803.439,93 -19,48
OTHER
Interest receivable EUR 118.371,19 0,26
Accrued interest EUR 465,35 0,00
Expenses payable EUR -32.581,40 -0,07
Expenses to be carried forward EUR 25.820,83 0,06
TOTAL OTHER 112.075,97 0,25
TOTAL NET ASSETS 45.199.408,39 100,00
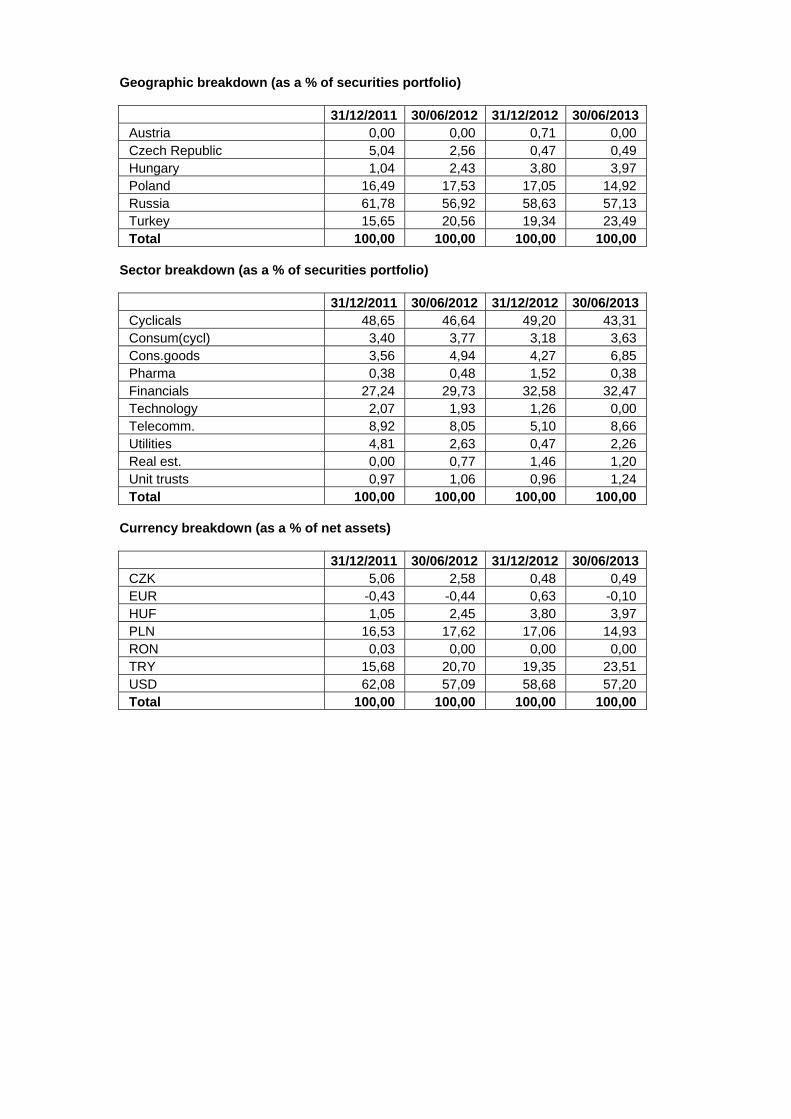
Geographic breakdown (as a % of securities portfolio)
31/12/2011 30/06/2012 31/12/2012 30/06/2013 Austria 0,00 0,00 0,71 0,00 Czech Republic 5,04 2,56 0,47 0,49 Hungary 1,04 2,43 3,80 3,97 Poland 16,49 17,53 17,05 14,92 Russia 61,78 56,92 58,63 57,13 Turkey 15,65 20,56 19,34 23,49 Total 100,00 100,00 100,00 100,00
Sector breakdown (as a % of securities portfolio)
31/12/2011 30/06/2012 31/12/2012 30/06/2013 Cyclicals 48,65 46,64 49,20 43,31 Consum(cycl) 3,40 3,77 3,18 3,63 Cons.goods 3,56 4,94 4,27 6,85 Pharma 0,38 0,48 1,52 0,38 Financials 27,24 29,73 32,58 32,47 Technology 2,07 1,93 1,26 0,00 Telecomm. 8,92 8,05 5,10 8,66 Utilities 4,81 2,63 0,47 2,26 Real est. 0,00 0,77 1,46 1,20 Unit trusts 0,97 1,06 0,96 1,24 Total 100,00 100,00 100,00 100,00
Currency breakdown (as a % of net assets)
31/12/2011 30/06/2012 31/12/2012 30/06/2013 CZK 5,06 2,58 0,48 0,49 EUR -0,43 -0,44 0,63 -0,10 HUF 1,05 2,45 3,80 3,97 PLN 16,53 17,62 17,06 14,93 RON 0,03 0,00 0,00 0,00 TRY 15,68 20,70 19,35 23,51 USD 62,08 57,09 58,68 57,20 Total 100,00 100,00 100,00 100,00

2.4.2 CHANGES IN THE COMPOSITION OF THE ASSETS OF KBC EQUITY FUND EASTERN EUROPE
(IN THE CURRENCY OF THE SUB-FUND)
1st half of year YearPurchases 12.104.015,87 12.104.015,87 Sales 18.221.745,00 18.221.745,00 Total 1 30.325.760,87 30.325.760,87 Subscriptions 2.233.604,47 2.233.604,47 Redemptions 8.090.003,11 8.090.003,11 Total 2 10.323.607,58 10.323.607,58 Monthly average of total assets
53.650.265,50 53.650.265,50
Turnover rate 37,28 % 37,28 %
1st half of year YearPurchases 12.104.015,87 12.104.015,87 Sales 18.221.745,00 18.221.745,00 Total 1 30.325.760,87 30.325.760,87 Subscriptions 2.233.604,47 2.233.604,47 Redemptions 8.090.003,11 8.090.003,11 Total 2 10.323.607,58 10.323.607,58 Monthly average of total assets
53.521.763,06 53.521.763,06
Corrected turnover rate 37,37 % 37,37 %
The table above shows the capital volume of portfolio transactions. This volume (adjusted to take account of total subscriptions and redemptions) is also compared to the average net assets at the beginning and end of the period. A figure close to 0% implies that the transactions relating to the securities or transactions relating to the assets (excluding deposits and cash) in a given period only involve subscriptions and redemptions. A negative percentage shows that subscriptions and redemptions entailed few, if any, transactions in the portfolio. Active asset management may result in high turnover rates (monthly percentage >50%). The detailed list of transactions is available for consultation free of charge at the registered office of the Bevek or fund at Havenlaan 2, 1080 Brussels.
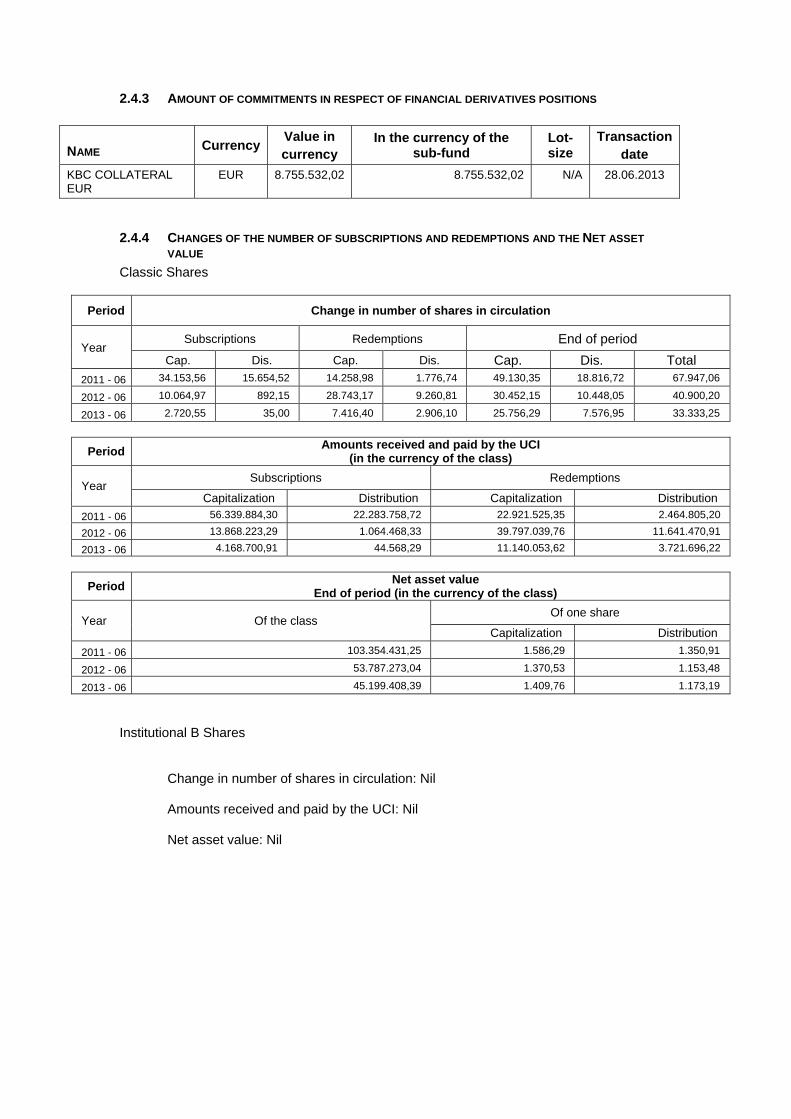
2.4.3 AMOUNT OF COMMITMENTS IN RESPECT OF FINANCIAL DERIVATIVES POSITIONS
NAME Currency Value in currency
In the currency of the sub-fund
Lot-size
Transactiondate
KBC COLLATERAL EUR
EUR 8.755.532,02 8.755.532,02 N/A 28.06.2013
2.4.4 CHANGES OF THE NUMBER OF SUBSCRIPTIONS AND REDEMPTIONS AND THE NET ASSET
VALUE
Classic Shares
Period Change in number of shares in circulation
Year Subscriptions Redemptions End of period
Cap. Dis. Cap. Dis. Cap. Dis. Total
2011 - 06 34.153,56 15.654,52 14.258,98 1.776,74 49.130,35 18.816,72 67.947,06
2012 - 06 10.064,97 892,15 28.743,17 9.260,81 30.452,15 10.448,05 40.900,20
2013 - 06 2.720,55 35,00 7.416,40 2.906,10 25.756,29 7.576,95 33.333,25
Period Amounts received and paid by the UCI
(in the currency of the class)
Year Subscriptions Redemptions
Capitalization Distribution Capitalization Distribution
2011 - 06 56.339.884,30 22.283.758,72 22.921.525,35 2.464.805,20
2012 - 06 13.868.223,29 1.064.468,33 39.797.039,76 11.641.470,91
2013 - 06 4.168.700,91 44.568,29 11.140.053,62 3.721.696,22
Period Net asset value
End of period (in the currency of the class)
Year Of the class Of one share
Capitalization Distribution
2011 - 06 103.354.431,25 1.586,29 1.350,91
2012 - 06 53.787.273,04 1.370,53 1.153,48
2013 - 06 45.199.408,39 1.409,76 1.173,19
Institutional B Shares
Change in number of shares in circulation: Nil
Amounts received and paid by the UCI: Nil
Net asset value: Nil
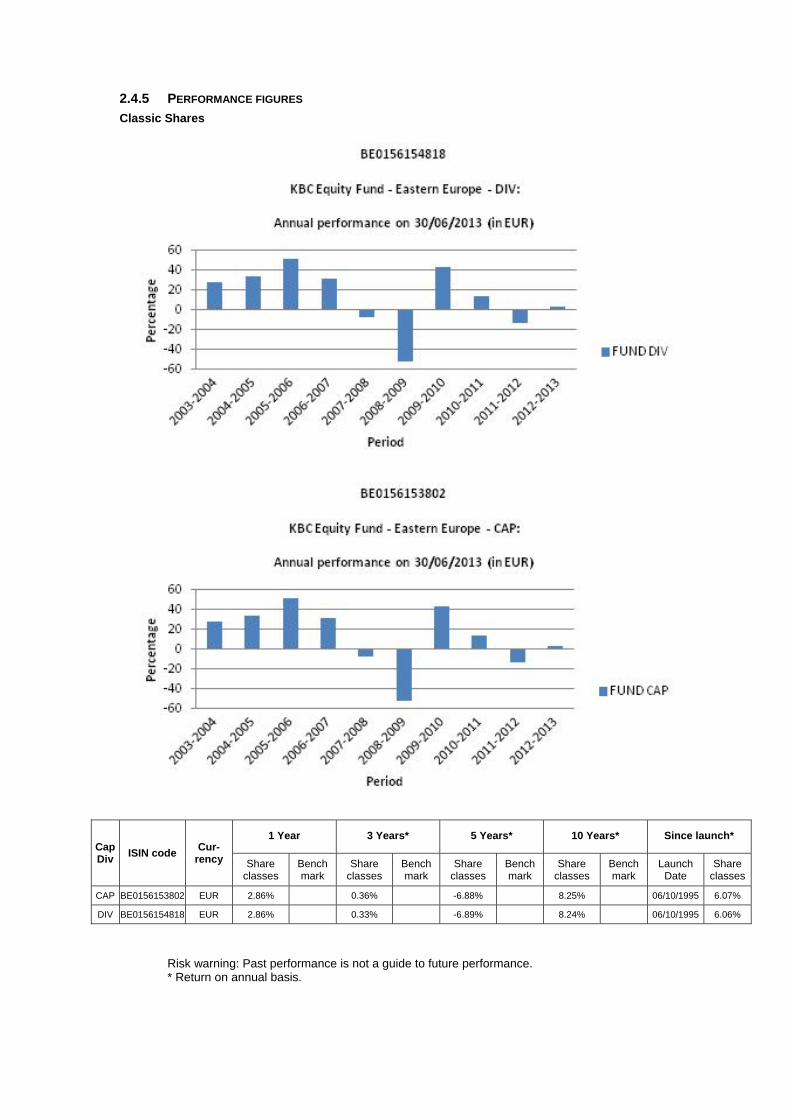
2.4.5 PERFORMANCE FIGURES
Classic Shares
Cap Div
ISIN code Cur-
rency
1 Year 3 Years* 5 Years* 10 Years* Since launch*
Share classes
Bench mark
Share classes
Bench mark
Share classes
Bench mark
Share classes
Bench mark
Launch Date
Share classes
CAP BE0156153802 EUR 2.86% 0.36% -6.88% 8.25% 06/10/1995 6.07%
DIV BE0156154818 EUR 2.86% 0.33% -6.89% 8.24% 06/10/1995 6.06%
Risk warning: Past performance is not a guide to future performance. * Return on annual basis.

Classic Shares
The bar chart shows the performance for full financial years. The figures do not take account of any restructuring. Calculated in EUR (ex BEF). The return is calculated as the change in the net asset value between two dates expressed
as a percentage. In the case of units that pay dividends, the dividend is incorporated geometrically in the return.
Calculation method for date D, where NAV stands for net asset value: Capitalisation units (CAP) Return on date D over a period of X years:
[NIW(D) / NIW(Y)] ^ [1 / X] - 1 where Y = D-X
Return on date D since the start date S of the unit: [NIW(D) / NIW(S)] ^ [1 / F] - 1 where F = 1 if the unit has existed for less than one year on date D where F = (D-S) / 365.25 if the unit has existed for longer than one year on date D
Distribution units (DIV) Return on date D over a period of X years:
[ C * NIW(D) / NIW(Y)] ^ [1 / X] - 1 where Y = D-X
Return on date D since the start date S of the unit: [ C * NIW(D) / NIW(S)] ^ [1 / F] - 1 where F = 1 if the unit has existed for less than one year on date D where F = (D-S) / 365.25 if the unit has existed for longer than one year on date D where C is a factor that is determined for all N dividends between the calculation date D and the reference date.
For dividend i on date Di with value Wi: Ci = [Wi / NIW(Di)] + 1 i = 1 ... N from whichC = C0 * .... * CN.
If the interval between the two dates exceeds one year, the ordinary return calculation is converted into a return on an annual basis by taking the nth square root of 1 plus the total return of the unit.
The return figures shown above do not take account of the fees and charges associated with the issue and redemption of units.
These are the performance figures for capitalisation and distribution shares.

2.4.6 COSTS Ongoing Charges: * Classic Shares Distribution: 1.863% Classic Shares Capitalization: 1.865% Institutional B Shares Capitalization: not applicable * The following costs have not been included in the ongoing charges: - Interest payments on loans taken out - Payments in respect of financial derivatives - Fees and charges paid directly by the investor - Any soft commissions
SOFT COMMISSIONS The management company or the appointed manager, as the case may be, is the recipient of soft commissions. The recipient has laid down an internal policy as regards accepting soft commissions and avoiding possible conflicts of interest in this respect, and has put appropriate internal controls in place to ensure this policy is observed. For more information, please see the ‘General’ section of the annual report.
Broker
Commission gross
in EUR
paid during the period:
1‐01‐13
‐
30‐06‐13
CSA Credits
in EUR
accrued during the period:
1‐01‐13
‐
30‐06‐13 Percentage
CITI 2,508 1,194 47.60%
CSFBSAS 1,998 697 34.91%
DEUTSCHE 611 129 21.05%
EQ MACQUARIE 29 12 42.85%
HSBC 8,157 1,444 17.70%
INSTINET 397 170 42.86%
MORGAN STANLEY 2,693 1,152 42.78%
UBSWDR 72 31 42.86%
WOOD 2,823 471 16.67%
FEE-SHARING AGREEMENTS AND REBATES: The management company may share its fee with the distributor, and institutional and/or professional parties. In principle, the percentage share amounts to between 35% and 60% if the distributor is an entity of KBC Group NV or to between 35% and 70% if the distributor is not an entity of KBC Group NV. However, in a small number of cases, the distributor’s fee is less than 35%. Investors may, on request, obtain more information on these cases. If the management company invests the assets of the undertaking for collective investment in units of undertakings for collective investment that are not managed by an entity of KBC Group NV, and receives a fee for doing so, it will pay this fee to the undertaking for collective investment. Fee-sharing does not affect the amount of the management fee paid by the sub-fund to the management company. This management fee is subject to the limitations laid down in the articles of association. The limitations may only be amended after approval by the general meeting of shareholders. The management company has concluded a distribution agreement with the distributor in order to facilitate the wider distribution of the sub-fund's units by using multiple distribution channels. It is in the interests of the holders of units, the sub-fund and of the distributor for the largest possible number of units to be sold and for the assets of the sub-fund to be maximised in this way. In this respect, there is therefore no question of any conflict of interest.
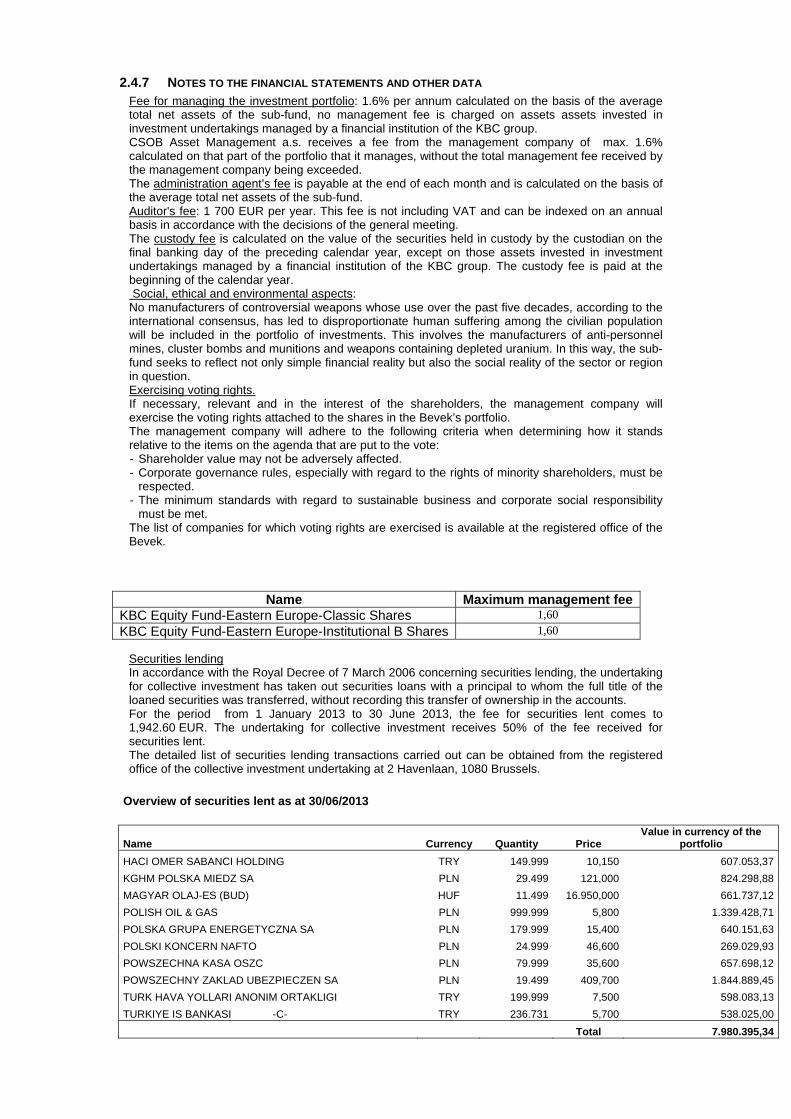
2.4.7 NOTES TO THE FINANCIAL STATEMENTS AND OTHER DATA Fee for managing the investment portfolio: 1.6% per annum calculated on the basis of the average total net assets of the sub-fund, no management fee is charged on assets assets invested in investment undertakings managed by a financial institution of the KBC group. CSOB Asset Management a.s. receives a fee from the management company of max. 1.6% calculated on that part of the portfolio that it manages, without the total management fee received by the management company being exceeded. The administration agent’s fee is payable at the end of each month and is calculated on the basis of the average total net assets of the sub-fund. Auditor's fee: 1 700 EUR per year. This fee is not including VAT and can be indexed on an annual basis in accordance with the decisions of the general meeting. The custody fee is calculated on the value of the securities held in custody by the custodian on the final banking day of the preceding calendar year, except on those assets invested in investment undertakings managed by a financial institution of the KBC group. The custody fee is paid at the beginning of the calendar year. Social, ethical and environmental aspects: No manufacturers of controversial weapons whose use over the past five decades, according to the international consensus, has led to disproportionate human suffering among the civilian population will be included in the portfolio of investments. This involves the manufacturers of anti-personnel mines, cluster bombs and munitions and weapons containing depleted uranium. In this way, the sub-fund seeks to reflect not only simple financial reality but also the social reality of the sector or region in question. Exercising voting rights. If necessary, relevant and in the interest of the shareholders, the management company will exercise the voting rights attached to the shares in the Bevek’s portfolio. The management company will adhere to the following criteria when determining how it stands relative to the items on the agenda that are put to the vote: - Shareholder value may not be adversely affected. - Corporate governance rules, especially with regard to the rights of minority shareholders, must be
respected. - The minimum standards with regard to sustainable business and corporate social responsibility
must be met. The list of companies for which voting rights are exercised is available at the registered office of the Bevek.
Name Maximum management fee KBC Equity Fund-Eastern Europe-Classic Shares 1,60
KBC Equity Fund-Eastern Europe-Institutional B Shares 1,60
Securities lending In accordance with the Royal Decree of 7 March 2006 concerning securities lending, the undertaking for collective investment has taken out securities loans with a principal to whom the full title of the loaned securities was transferred, without recording this transfer of ownership in the accounts. For the period from 1 January 2013 to 30 June 2013, the fee for securities lent comes to 1,942.60 EUR. The undertaking for collective investment receives 50% of the fee received for securities lent. The detailed list of securities lending transactions carried out can be obtained from the registered office of the collective investment undertaking at 2 Havenlaan, 1080 Brussels.
Overview of securities lent as at 30/06/2013
Name Currency Quantity Price Value in currency of the
portfolio
HACI OMER SABANCI HOLDING TRY 149.999 10,150 607.053,37
KGHM POLSKA MIEDZ SA PLN 29.499 121,000 824.298,88
MAGYAR OLAJ-ES (BUD) HUF 11.499 16.950,000 661.737,12
POLISH OIL & GAS PLN 999.999 5,800 1.339.428,71
POLSKA GRUPA ENERGETYCZNA SA PLN 179.999 15,400 640.151,63
POLSKI KONCERN NAFTO PLN 24.999 46,600 269.029,93
POWSZECHNA KASA OSZC PLN 79.999 35,600 657.698,12
POWSZECHNY ZAKLAD UBEZPIECZEN SA PLN 19.499 409,700 1.844.889,45
TURK HAVA YOLLARI ANONIM ORTAKLIGI TRY 199.999 7,500 598.083,13
TURKIYE IS BANKASI -C- TRY 236.731 5,700 538.025,00
Total 7.980.395,34

Details of collateral received for securities lent
Name Currency Nominal value Currency fund Value in Currency fund
AUSTRIA 2012 3,4% 22/11/2022 EUR 479.000 EUR 546.573,01
FLEMISH COMMUNITY - 09/14 3.75% 31/03 EUR 6.700.000 EUR 6.938.225,20
BUNDESSCHATZANWEISUNGEN 2013 0.25% 13/03/15 EUR 115.000 EUR 115.281,18
FRANCE 2008 3.75% 25/10/2019 EUR 637.000 EUR 739.293,92
NETHERLANDS 2011 2.5% 15/01/17 EUR 388.000 EUR 416.158,71
Total 8.755.532,02 For the valuation of the collateral received, indicative prices have been used in this detail list by the Collateral Management Division of KBC Bank.

Semi-Annual report as at 30th June 2013
TABLE OF CONTENTS
2. Information on KBC Equity Fund Commodities & Materials
2.1. Management report 2.1.1. Launch date and subscription price 2.1.2. Stock exchange listing 2.1.3. Aim and distinctive features of the investment policy 2.1.4. Financial portfolio management 2.1.5. Distributors 2.1.6. Index and benchmark 2.1.7. Policy conducted during the financial year 2.1.8. Future policy 2.1.9. Synthetic risk and reward indicator (SRRI)
2.2. Balance sheet
2.3. Profit and loss account
2.4. Composition of the assets and key figures
2.4.1. Composition of the assets 2.4.2. Change in the composition of the assets 2.4.3. Value of commitments in respect of financial derivatives positions 2.4.4. Evolution of the number of subscriptions, repayments and the net asset value 2.4.5. Return figures 2.4.6. Expenses 2.4.7. Notes to the financial statements and other data

2 INFORMATION ON KBC EQUITY FUND COMMODITIES & MATERIALS
2.1 MANAGEMENT REPORT
2.1.1 LAUNCH DATE AND SUBSCRIPTION PRICE Classic Shares : Launch date: 25 June 1999 Initial subscription price: 500 EUR Currency: EUR Institutional B Shares : Launch date: 24 November 2011 Initial subscription price: 414.27 EUR Currency: EUR
2.1.2 STOCK EXCHANGE LISTING Not applicable.
2.1.3 GOAL AND KEY PRINCIPLES OF THE INVESTMENT POLICY
SUB-FUND’S OBJECT: The main objective of this sub-fund is to generate the highest possible return for its shareholders by investing directly or indirectly in transferable securities. This is reflected in its pursuit of capital gains and income. To this end, the assets are invested, either directly or indirectly via correlated financial instruments, primarily in shares.
SUB-FUND’S INVESTMENT POLICY:
PERMITTED ASSET CLASSES: The sub-fund may invest in securities, money market instruments, units in undertakings for collective investment, deposits, financial derivatives, liquid assets and all other instruments insofar as permitted by the applicable laws and regulations and consistent with the sub-fund’s object The sub-fund shall invest no more than 10% of its assets in units of other undertakings for collective investment.
RESTRICTIONS OF THE INVESTMENT POLICY: The investment policy will be implemented within the limits set by law and regulations. The sub-fund may borrow up to 10% of its net assets, insofar as these are short-term borrowings aimed at solving temporary liquidity problems.
PERMITTED DERIVATIVES TRANSACTIONS: Derivates may be used either for hedging purposes or to achieve investment objectives. Changes will be made to the investments at regular intervals to comply with the sub-fund's investment strategy. In addition, listed and unlisted derivates may be used to achieve the objectives: these may be forward contracts, options or swaps on securities, indices, currencies or interest rates or other transactions involving derivatives. Unlisted derivatives transactions will only be concluded with prime financial institutions specialised in such transactions. Such derivatives may also be used to hedge the assets against exchange-rate fluctuations. Subject to the applicable laws and regulations and the articles of association, the sub-fund always seeks to conclude the most effective transactions. All costs associated with the transactions will be charged to the sub-fund and all income generated will be paid to the sub-fund. If the transactions result in a risk in respect of the counterparty, this risk can be hedged by using a margin management system that ensures that the sub-fund is the beneficiary of security (collateral) in the form of cash or investment grade bonds. When calculating the value of the bonds, a margin will be applied that varies depending on the residual term to maturity and the currency in which the bond in question is denominated. The relationship with the counterparty or counterparties is governed by standard international agreements.

STRATEGY SELECTED The assets are primarily invested in shares of industrial groups in the Materials sector. The Materials sector includes steel, iron, paper, non-ferrous metals, chemicals and construction materials. The sub-fund focuses on what are known as 'highly cyclical materials', which are therefore more sensitive to market fluctuations. The regional allocation may change from time to time. In principle, the sub-fund invests worldwide.
LENDING FINANCIAL INSTRUMENTS: The sub-fund may lend financial instruments within the limits set by law and regulations. This lending does not affect the sub-fund’s risk profile since: - it takes place within the framework of a securities lending system managed by a principal. In
addition, the sub-fund has a relationship only with the principal of the securities lending system which acts as counterparty and to which title of the loaned securities is transferred. The choice of principal is subject to strict selection criteria. The return of securities similar to the securities that have been lent is guaranteed by the principal.
- through a margin management system, the sub-fund is always guaranteed financial security, the actual value of which always exceeds the actual value of the securities that have been lent, in case the principal does not return similar securities.
The return of securities similar to the securities that have been lent can be requested at any time, which means that the lending of securities does not affect the management of the sub-fund's assets. By lending securities, the sub-fund can generate an additional return. The principal pays a fee to the management company. After deducting the fee for the margin management and clearing services of KBC Bank, most of this fee is paid to the sub-fund. The relationship with the counterparty or counterparties is governed by standard international agreements. More information is provided on the terms and conditions governing securities lending in the annual or half-yearly report for the sub-fund.
VOLATILITY OF THE NET ASSET VALUE: The volatility of the net asset value may be high due to the composition of the portfolio.
GENERAL STRATEGY FOR HEDGING THE EXCHANGE RATE RISK: In order to protect its assets against exchange rate fluctuations and within the limitations laid down in the articles of association, the sub-fund may perform transactions relating to the sale of forward currency contracts, as well as the sale of call options and the purchase of put options on currencies. The transactions in question may relate solely to contracts traded on a regulated market that operates regularly, is recognised and is open to the public or that are traded with a recognised, prime financial institution specialising in such transactions and dealing in the over-the-counter (OTC) market in options. With the same objective, the sub-fund may also sell currencies forward or exchange them in private transactions with prime financial institutions specialising in such transactions. The hedging objective of the aforementioned transactions suggests that there is a direct link between these transactions and the assets to be hedged, which implies that the transactions carried out in a particular currency may in principle not exceed, in terms of volume, either the valuation value of all the assets in the same currency or the holding period of those assets.
SOCIAL, ETHICAL AND ENVIRONMENTAL ASPECTS:
No manufacturers of controversial weapons whose use over the past five decades, according to the international consensus, has led to disproportionate human suffering among the civilian population will be included in the portfolio of investments. This involves the manufacturers of anti-personnel mines, cluster bombs and munitions and weapons containing depleted uranium. In this way, the sub-fund seeks to reflect not only simple financial reality but also the social reality of the sector or region in question.

THE EUROPEAN SAVINGS DIRECTIVE AND TAX ON DEBT CLAIM RETURNS OBTAINED THROUGH THE
REDEMPTION OF OWN UNITS OR IN THE EVENT OF FULL OR PARTIAL DISTRIBUTION OF EQUITY
CAPITAL. The following information is of a general character and is not intended to cover all aspects of an investment in a UCITS. In certain cases entirely different rules might even apply. Moreover, both tax law and the interpretation of it can change. Investors who wish to have more information about the tax implications – in both Belgium and abroad – of acquiring, holding and transferring units should seek the advice of their usual financial and tax advisers. This UCITS shall invest a maximum of 15% of its assets directly or indirectly in debt instruments as intended by the European Savings Directive. A. European Savings Directive (Directive 2003/48/EC) The European Savings Directive has been implemented in Belgium. Since this UCITS invests a maximum of 15% of its assets directly or indirectly in debt claims as intended by the European Savings Directive, the income of this UCITS does not fall within the scope of this directive. B. Tax on debt claim returns obtained through the redemption of own units or in the event of full or partial distribution of equity capital (Article 19bis Income Tax Code 1992). The income from this UCITS is not subject to the tax on debt instrument returns as intended by Article 19bis, Income Tax Code 1992.
2.1.4 FINANCIAL PORTFOLIO MANAGEMENT There is no delegation of the portfolio.
2.1.5 DISTRIBUTORS KBC Asset Management S.A., 5, Place de la Gare, L-1616 Luxembourg.
2.1.6 INDEX AND BENCHMARK See ‘Sub-fund’s investment policy’.
2.1.7 POLICY PERSUED DURING THE FINANCIAL YEAR Materials experienced a difficult quarter. The hope that had persisted since last November for an economic revival in the US and for new investment in the construction sector in China, turned to anxiety. In the US, there was a failure to reach agreement on the budget and spending cuts were automatically implemented. In Europe, two important sectors for Materials – construction and the car market – remained weak. In China, which is the most important market for the Materials sector, the overarching fear is that there will be less demand for materials than expected now that the government has indicated its desire to shift the economy from an investment-oriented model to a consumption-oriented one. Japanese shares in the sector made nice gains, due primarily to the yen, which fell sharply in value on account of the very flexible monetary policy being pursued by the Japanese central bank.
2.1.8 FUTURE POLICY The outlook for the sector is not exactly bright. The time of ever-increasing raw material prices seems to have passed and mining companies will need to adapt to this new environment. The consequence of a decline in an underlying commodity was well illustrated in the case of gold-mining companies. Their shares would appear to be in free-fall now that the price of gold is too low for many companies to extract this commodity at a profit. We expect times to remain tough for mining companies because many commodities are oversupplied. Pessimism also reigns in the steel sector, which continues to be plagued by overcapacity. The situation looks to be somewhat better in the main for chemical companies. US chemical players, in particular, are capitalising on the low price of gas, which they use as a commodity. In the fund, we will continue to invest in this theme, because we think that these companies will maintain their structural advantage over their competitors in the coming years. Other positive elements are rising car sales outside Europe and the recovery of the housing market in the US, where it still has a long way to go. Turning on the money tap in Japan should stimulate growth in a country that has been plagued by deflation.
2.1.9 SYNTHETIC RISK AND REWARD INDICATOR Classic Shares: 7 on a scale of 1 (lowest risk) to 7 (highest risk). Institutional B Shares: 7 on a scale of 1 (lowest risk) to 7 (highest risk). The value of a share can decrease or increase and the investor may not get back the amount invested. In accordance with Commission Regulation (EU) No. 583/2010, a synthetic risk and reward indicator has been calculated. This indicator provides a quantitative measure of the sub-fund's potential return and the risk involved, calculated in the currency in which the sub-fund is denominated. It is given as a figure between 1 and 7. The higher the figure, the greater the potential return, but also the more difficult it is to predict this return. Losses are possible too. The lowest figure does not mean that the investment is entirely free of risk. However, it does indicate that, compared with the higher figures, this product will generally provide a lower, but more predictable return. The synthetic risk and reward indicator is assessed regularly and can therefore go up or down based on data from the past. Data from the past is not always a reliable indicator of future risk and return.

2.2 BALANCE SHEET
Balance sheet layout 30/06/2013 (in the currency of the sub-fundt)
30/06/2012 (in the currency of the sub-fund )
TOTAL NET ASSETS 22.237.288,03 65.614.229,71
II. Securities, money market instruments, UCIs and derivatives
A. Bonds and other debt instruments a) Bonds a} Collateral received in the form of bonds 2.150.367,63 5.258.395,24 C. Shares and similar instruments a) Shares 22.460.903,58 64.513.906,48 Of which securities lent 2.010.281,62 4.615.222,85 D. Other securities 7.616,00 19.124,00
IV. Receivables and payables within one year A. Receivables a) Accounts receivable 3.621,46 2.278,78 b) Tax assets 19.669,41 14.050,79 B. Payables a) Accounts payable (-) -69.841,56 -578.332,12 c) Borrowings (-) -240.652,20 d) Collateral (-) -2.150.367,63 -5.258.395,24
V. Deposits and cash at bank and in hand A. Demand balances at banks 26.875,83 1.583.025,30
VI. Accruals and deferrals A. Expense to be carried forward 42.102,14 22.648,12 B. Accrued income 85.381,64 95.074,05 C. Accrued expense (-) -98.388,27 -57.545,69
TOTAL SHAREHOLDERS' EQUITY 22.237.288,03 65.614.229,71
A. Capital 33.423.556,86 71.117.288,39
B. Income equalization -224.366,32 -137.105,08
D. Result for the period -10.961.902,51 -5.365.953,60
Off-balance-sheet headings
I Collateral (+/-)
I.A Collateral (+/-)
I.A.A Securities/market instruments 2.150.367,63 5.258.395,24
IX Financial instruments lent 2.010.281,62 4.615.222,85

2.3 PROFIT AND LOSS ACCOUNT
Income Statement 30/06/2013 (in the currency of the sub-fund)
30/06/2012 (in the currency of the sub-fund)
I. Net gains(losses) on investments C. Shares and similar instruments a) Shares -9.023.793,92 -7.091.907,41 D. Other securities 544,52 -45.291,63 H. Foreign exchange positions and transactions b) Other foreign exchange positions and
transactions -2.315.785,49 1.257.532,18
II. Investment income and expenses A. Dividends 945.896,97 1.113.228,75 B. Interests a) Securities and money market instruments 61.183,63 15.995,08 b) Cash at bank and in hand and deposits -4.296,40 6.519,24 c) Collateral (+/-) 0,31 C. Interest on borrowings (-) -1.029,13 -2.321,46
III. Other income A. Income received to cover the acquisition and
realizaion of assets, to discourage withdrawals and for delivery charges
125.940,15 158.060,91
IV. Operating expenses A. Investment transaction and delivery costs (-) -119.362,15 -108.270,23 B. Financial expenses (-) -1.712,99 -602,69 C. Custodian's fee (-) -33.870,42 -25.175,30 D. Manager's fee (-) a) Financial management Classic Shares -168.084,18 -185.084,81 Institutional B Shares -365.988,06 -358.733,85 b) Administration and accounting management -35.604,76 -41.140,07 E. Administrative expenses (-) -180,92 -26,36 F. Formation and organisation expenses (-) -1.827,84 -8.612,19 G. Remuneration, social security charges and
pension -3,60 -6,16
H. Services and sundry goods (-) -8.641,21 -8.029,79 J. Taxes Classic Shares -6.541,38 -9.141,05 Institutional B Shares 308,77 -2.051,63 K. Other expenses (-) -9.054,10 -30.895,44
Income and expenditure for the period Subtotal II + III + IV 377.132,38 513.713,26
V. Profit (loss) on ordinary activities before tax -10.961.902,51 -5.365.953,60
VII. Result for the period -10.961.902,51 -5.365.953,60
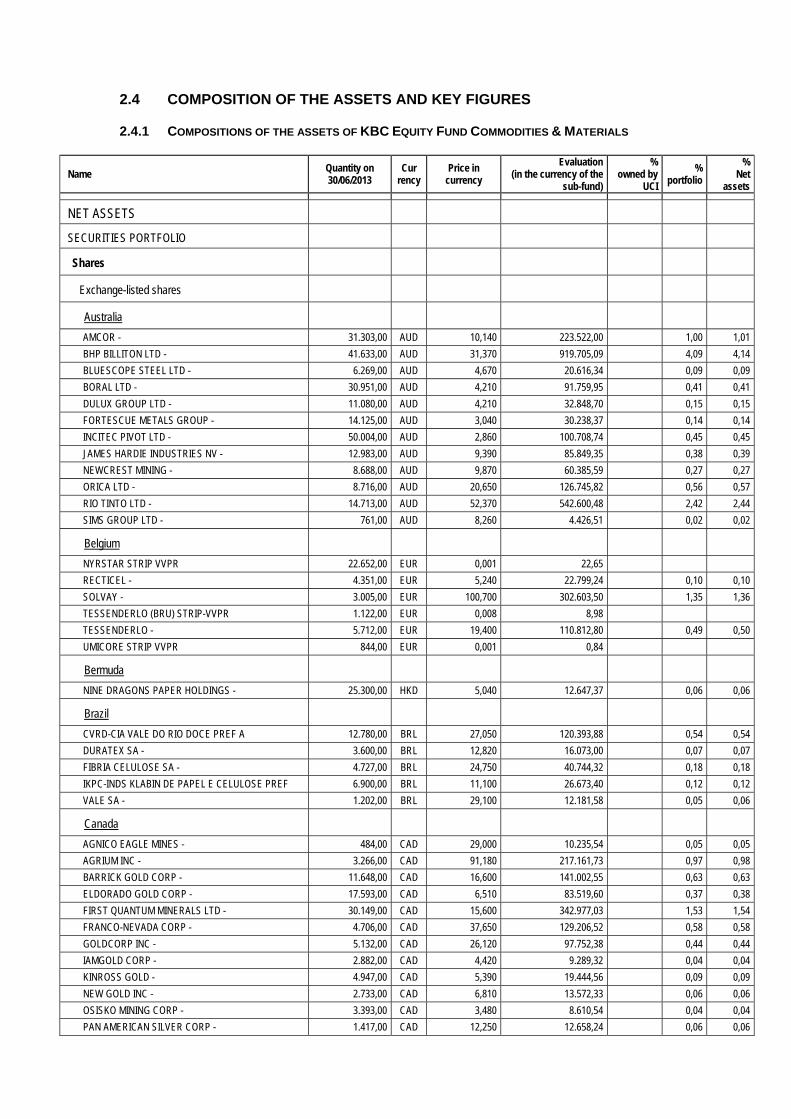
2.4 COMPOSITION OF THE ASSETS AND KEY FIGURES
2.4.1 COMPOSITIONS OF THE ASSETS OF KBC EQUITY FUND COMMODITIES & MATERIALS
Name Quantity on 30/06/2013
Cur rency
Price in currency
Evaluation (in the currency of the
sub-fund)
% owned by
UCI
% portfolio
% Net
assets
NET ASSETS
SECURITIES PORTFOLIO
Shares
Exchange-listed shares
Australia
AMCOR - 31.303,00 AUD 10,140 223.522,00 1,00 1,01
BHP BILLITON LTD - 41.633,00 AUD 31,370 919.705,09 4,09 4,14
BLUESCOPE STEEL LTD - 6.269,00 AUD 4,670 20.616,34 0,09 0,09
BORAL LTD - 30.951,00 AUD 4,210 91.759,95 0,41 0,41
DULUX GROUP LTD - 11.080,00 AUD 4,210 32.848,70 0,15 0,15
FORTESCUE METALS GROUP - 14.125,00 AUD 3,040 30.238,37 0,14 0,14
INCITEC PIVOT LTD - 50.004,00 AUD 2,860 100.708,74 0,45 0,45
JAMES HARDIE INDUSTRIES NV - 12.983,00 AUD 9,390 85.849,35 0,38 0,39
NEWCREST MINING - 8.688,00 AUD 9,870 60.385,59 0,27 0,27
ORICA LTD - 8.716,00 AUD 20,650 126.745,82 0,56 0,57
RIO TINTO LTD - 14.713,00 AUD 52,370 542.600,48 2,42 2,44
SIMS GROUP LTD - 761,00 AUD 8,260 4.426,51 0,02 0,02
Belgium
NYRSTAR STRIP VVPR 22.652,00 EUR 0,001 22,65
RECTICEL - 4.351,00 EUR 5,240 22.799,24 0,10 0,10
SOLVAY - 3.005,00 EUR 100,700 302.603,50 1,35 1,36
TESSENDERLO (BRU) STRIP-VVPR 1.122,00 EUR 0,008 8,98
TESSENDERLO - 5.712,00 EUR 19,400 110.812,80 0,49 0,50
UMICORE STRIP VVPR 844,00 EUR 0,001 0,84
Bermuda
NINE DRAGONS PAPER HOLDINGS - 25.300,00 HKD 5,040 12.647,37 0,06 0,06
Brazil
CVRD-CIA VALE DO RIO DOCE PREF A 12.780,00 BRL 27,050 120.393,88 0,54 0,54
DURATEX SA - 3.600,00 BRL 12,820 16.073,00 0,07 0,07
FIBRIA CELULOSE SA - 4.727,00 BRL 24,750 40.744,32 0,18 0,18
IKPC-INDS KLABIN DE PAPEL E CELULOSE PREF 6.900,00 BRL 11,100 26.673,40 0,12 0,12
VALE SA - 1.202,00 BRL 29,100 12.181,58 0,05 0,06
Canada
AGNICO EAGLE MINES - 484,00 CAD 29,000 10.235,54 0,05 0,05
AGRIUM INC - 3.266,00 CAD 91,180 217.161,73 0,97 0,98
BARRICK GOLD CORP - 11.648,00 CAD 16,600 141.002,55 0,63 0,63
ELDORADO GOLD CORP - 17.593,00 CAD 6,510 83.519,60 0,37 0,38
FIRST QUANTUM MINERALS LTD - 30.149,00 CAD 15,600 342.977,03 1,53 1,54
FRANCO-NEVADA CORP - 4.706,00 CAD 37,650 129.206,52 0,58 0,58
GOLDCORP INC - 5.132,00 CAD 26,120 97.752,38 0,44 0,44
IAMGOLD CORP - 2.882,00 CAD 4,420 9.289,32 0,04 0,04
KINROSS GOLD - 4.947,00 CAD 5,390 19.444,56 0,09 0,09
NEW GOLD INC - 2.733,00 CAD 6,810 13.572,33 0,06 0,06
OSISKO MINING CORP - 3.393,00 CAD 3,480 8.610,54 0,04 0,04
PAN AMERICAN SILVER CORP - 1.417,00 CAD 12,250 12.658,24 0,06 0,06
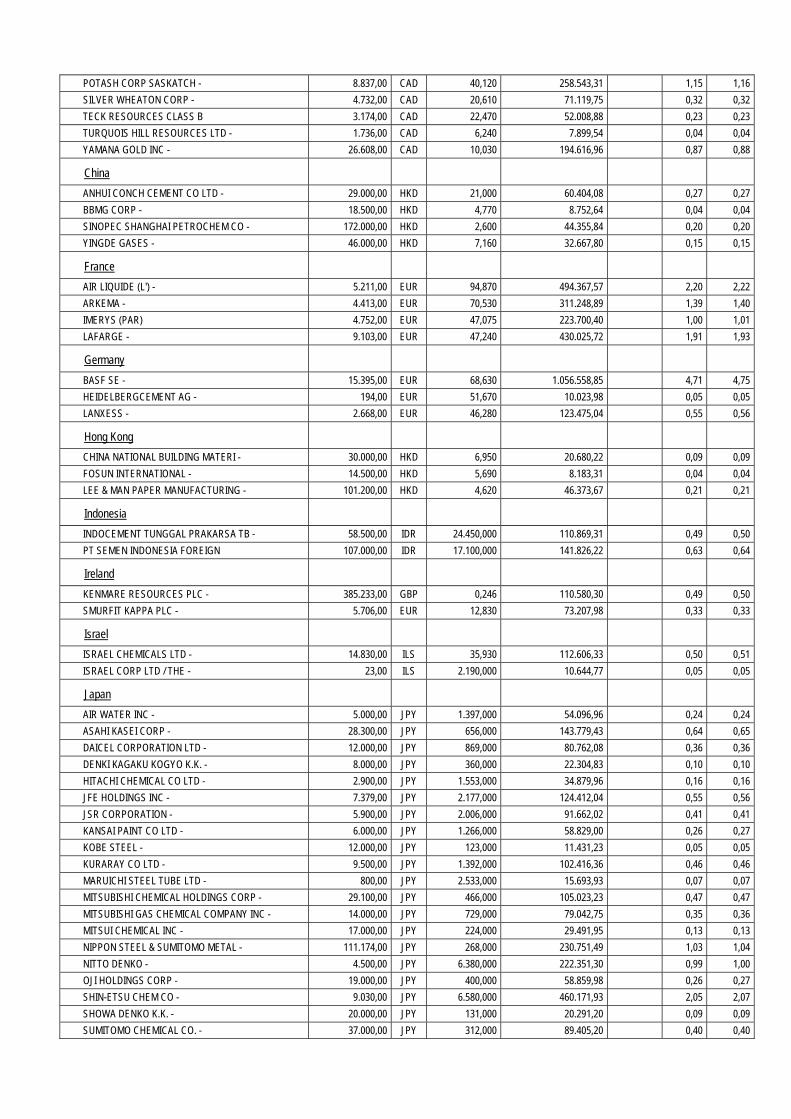
POTASH CORP SASKATCH - 8.837,00 CAD 40,120 258.543,31 1,15 1,16
SILVER WHEATON CORP - 4.732,00 CAD 20,610 71.119,75 0,32 0,32
TECK RESOURCES CLASS B 3.174,00 CAD 22,470 52.008,88 0,23 0,23
TURQUOIS HILL RESOURCES LTD - 1.736,00 CAD 6,240 7.899,54 0,04 0,04
YAMANA GOLD INC - 26.608,00 CAD 10,030 194.616,96 0,87 0,88
China
ANHUI CONCH CEMENT CO LTD - 29.000,00 HKD 21,000 60.404,08 0,27 0,27
BBMG CORP - 18.500,00 HKD 4,770 8.752,64 0,04 0,04
SINOPEC SHANGHAI PETROCHEM CO - 172.000,00 HKD 2,600 44.355,84 0,20 0,20
YINGDE GASES - 46.000,00 HKD 7,160 32.667,80 0,15 0,15
France
AIR LIQUIDE (L') - 5.211,00 EUR 94,870 494.367,57 2,20 2,22
ARKEMA - 4.413,00 EUR 70,530 311.248,89 1,39 1,40
IMERYS (PAR) 4.752,00 EUR 47,075 223.700,40 1,00 1,01
LAFARGE - 9.103,00 EUR 47,240 430.025,72 1,91 1,93
Germany
BASF SE - 15.395,00 EUR 68,630 1.056.558,85 4,71 4,75
HEIDELBERGCEMENT AG - 194,00 EUR 51,670 10.023,98 0,05 0,05
LANXESS - 2.668,00 EUR 46,280 123.475,04 0,55 0,56
Hong Kong
CHINA NATIONAL BUILDING MATERI - 30.000,00 HKD 6,950 20.680,22 0,09 0,09
FOSUN INTERNATIONAL - 14.500,00 HKD 5,690 8.183,31 0,04 0,04
LEE & MAN PAPER MANUFACTURING - 101.200,00 HKD 4,620 46.373,67 0,21 0,21
Indonesia
INDOCEMENT TUNGGAL PRAKARSA TB - 58.500,00 IDR 24.450,000 110.869,31 0,49 0,50
PT SEMEN INDONESIA FOREIGN 107.000,00 IDR 17.100,000 141.826,22 0,63 0,64
Ireland
KENMARE RESOURCES PLC - 385.233,00 GBP 0,246 110.580,30 0,49 0,50
SMURFIT KAPPA PLC - 5.706,00 EUR 12,830 73.207,98 0,33 0,33
Israel
ISRAEL CHEMICALS LTD - 14.830,00 ILS 35,930 112.606,33 0,50 0,51
ISRAEL CORP LTD / THE - 23,00 ILS 2.190,000 10.644,77 0,05 0,05
Japan
AIR WATER INC - 5.000,00 JPY 1.397,000 54.096,96 0,24 0,24
ASAHI KASEI CORP - 28.300,00 JPY 656,000 143.779,43 0,64 0,65
DAICEL CORPORATION LTD - 12.000,00 JPY 869,000 80.762,08 0,36 0,36
DENKI KAGAKU KOGYO K.K. - 8.000,00 JPY 360,000 22.304,83 0,10 0,10
HITACHI CHEMICAL CO LTD - 2.900,00 JPY 1.553,000 34.879,96 0,16 0,16
JFE HOLDINGS INC - 7.379,00 JPY 2.177,000 124.412,04 0,55 0,56
JSR CORPORATION - 5.900,00 JPY 2.006,000 91.662,02 0,41 0,41
KANSAI PAINT CO LTD - 6.000,00 JPY 1.266,000 58.829,00 0,26 0,27
KOBE STEEL - 12.000,00 JPY 123,000 11.431,23 0,05 0,05
KURARAY CO LTD - 9.500,00 JPY 1.392,000 102.416,36 0,46 0,46
MARUICHI STEEL TUBE LTD - 800,00 JPY 2.533,000 15.693,93 0,07 0,07
MITSUBISHI CHEMICAL HOLDINGS CORP - 29.100,00 JPY 466,000 105.023,23 0,47 0,47
MITSUBISHI GAS CHEMICAL COMPANY INC - 14.000,00 JPY 729,000 79.042,75 0,35 0,36
MITSUI CHEMICAL INC - 17.000,00 JPY 224,000 29.491,95 0,13 0,13
NIPPON STEEL & SUMITOMO METAL - 111.174,00 JPY 268,000 230.751,49 1,03 1,04
NITTO DENKO - 4.500,00 JPY 6.380,000 222.351,30 0,99 1,00
OJI HOLDINGS CORP - 19.000,00 JPY 400,000 58.859,98 0,26 0,27
SHIN-ETSU CHEM CO - 9.030,00 JPY 6.580,000 460.171,93 2,05 2,07
SHOWA DENKO K.K. - 20.000,00 JPY 131,000 20.291,20 0,09 0,09
SUMITOMO CHEMICAL CO. - 37.000,00 JPY 312,000 89.405,20 0,40 0,40
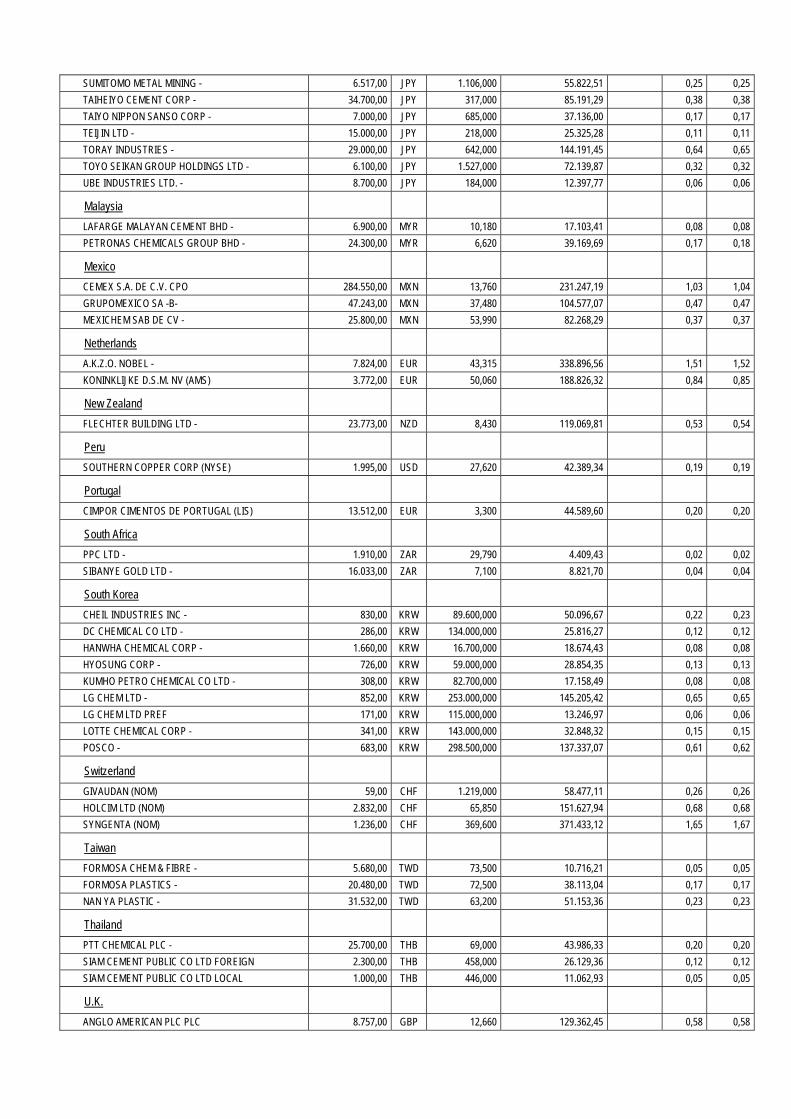
SUMITOMO METAL MINING - 6.517,00 JPY 1.106,000 55.822,51 0,25 0,25
TAIHEIYO CEMENT CORP - 34.700,00 JPY 317,000 85.191,29 0,38 0,38
TAIYO NIPPON SANSO CORP - 7.000,00 JPY 685,000 37.136,00 0,17 0,17
TEIJIN LTD - 15.000,00 JPY 218,000 25.325,28 0,11 0,11
TORAY INDUSTRIES - 29.000,00 JPY 642,000 144.191,45 0,64 0,65
TOYO SEIKAN GROUP HOLDINGS LTD - 6.100,00 JPY 1.527,000 72.139,87 0,32 0,32
UBE INDUSTRIES LTD. - 8.700,00 JPY 184,000 12.397,77 0,06 0,06
Malaysia
LAFARGE MALAYAN CEMENT BHD - 6.900,00 MYR 10,180 17.103,41 0,08 0,08
PETRONAS CHEMICALS GROUP BHD - 24.300,00 MYR 6,620 39.169,69 0,17 0,18
Mexico
CEMEX S.A. DE C.V. CPO 284.550,00 MXN 13,760 231.247,19 1,03 1,04
GRUPOMEXICO SA -B- 47.243,00 MXN 37,480 104.577,07 0,47 0,47
MEXICHEM SAB DE CV - 25.800,00 MXN 53,990 82.268,29 0,37 0,37
Netherlands
A.K.Z.O. NOBEL - 7.824,00 EUR 43,315 338.896,56 1,51 1,52
KONINKLIJKE D.S.M. NV (AMS) 3.772,00 EUR 50,060 188.826,32 0,84 0,85
New Zealand
FLECHTER BUILDING LTD - 23.773,00 NZD 8,430 119.069,81 0,53 0,54
Peru
SOUTHERN COPPER CORP (NYSE) 1.995,00 USD 27,620 42.389,34 0,19 0,19
Portugal
CIMPOR CIMENTOS DE PORTUGAL (LIS) 13.512,00 EUR 3,300 44.589,60 0,20 0,20
South Africa
PPC LTD - 1.910,00 ZAR 29,790 4.409,43 0,02 0,02
SIBANYE GOLD LTD - 16.033,00 ZAR 7,100 8.821,70 0,04 0,04
South Korea
CHEIL INDUSTRIES INC - 830,00 KRW 89.600,000 50.096,67 0,22 0,23
DC CHEMICAL CO LTD - 286,00 KRW 134.000,000 25.816,27 0,12 0,12
HANWHA CHEMICAL CORP - 1.660,00 KRW 16.700,000 18.674,43 0,08 0,08
HYOSUNG CORP - 726,00 KRW 59.000,000 28.854,35 0,13 0,13
KUMHO PETRO CHEMICAL CO LTD - 308,00 KRW 82.700,000 17.158,49 0,08 0,08
LG CHEM LTD - 852,00 KRW 253.000,000 145.205,42 0,65 0,65
LG CHEM LTD PREF 171,00 KRW 115.000,000 13.246,97 0,06 0,06
LOTTE CHEMICAL CORP - 341,00 KRW 143.000,000 32.848,32 0,15 0,15
POSCO - 683,00 KRW 298.500,000 137.337,07 0,61 0,62
Switzerland
GIVAUDAN (NOM) 59,00 CHF 1.219,000 58.477,11 0,26 0,26
HOLCIM LTD (NOM) 2.832,00 CHF 65,850 151.627,94 0,68 0,68
SYNGENTA (NOM) 1.236,00 CHF 369,600 371.433,12 1,65 1,67
Taiwan
FORMOSA CHEM & FIBRE - 5.680,00 TWD 73,500 10.716,21 0,05 0,05
FORMOSA PLASTICS - 20.480,00 TWD 72,500 38.113,04 0,17 0,17
NAN YA PLASTIC - 31.532,00 TWD 63,200 51.153,36 0,23 0,23
Thailand
PTT CHEMICAL PLC - 25.700,00 THB 69,000 43.986,33 0,20 0,20
SIAM CEMENT PUBLIC CO LTD FOREIGN 2.300,00 THB 458,000 26.129,36 0,12 0,12
SIAM CEMENT PUBLIC CO LTD LOCAL 1.000,00 THB 446,000 11.062,93 0,05 0,05
U.K.
ANGLO AMERICAN PLC PLC 8.757,00 GBP 12,660 129.362,45 0,58 0,58
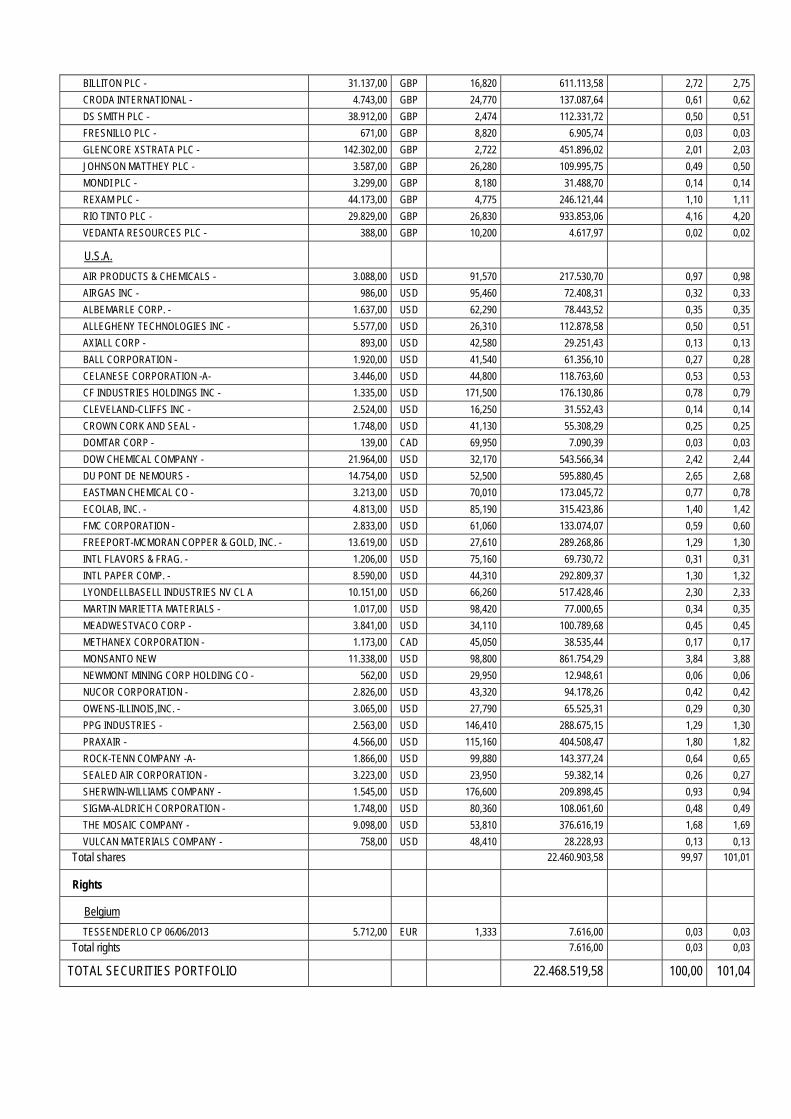
BILLITON PLC - 31.137,00 GBP 16,820 611.113,58 2,72 2,75
CRODA INTERNATIONAL - 4.743,00 GBP 24,770 137.087,64 0,61 0,62
DS SMITH PLC - 38.912,00 GBP 2,474 112.331,72 0,50 0,51
FRESNILLO PLC - 671,00 GBP 8,820 6.905,74 0,03 0,03
GLENCORE XSTRATA PLC - 142.302,00 GBP 2,722 451.896,02 2,01 2,03
JOHNSON MATTHEY PLC - 3.587,00 GBP 26,280 109.995,75 0,49 0,50
MONDI PLC - 3.299,00 GBP 8,180 31.488,70 0,14 0,14
REXAM PLC - 44.173,00 GBP 4,775 246.121,44 1,10 1,11
RIO TINTO PLC - 29.829,00 GBP 26,830 933.853,06 4,16 4,20
VEDANTA RESOURCES PLC - 388,00 GBP 10,200 4.617,97 0,02 0,02
U.S.A.
AIR PRODUCTS & CHEMICALS - 3.088,00 USD 91,570 217.530,70 0,97 0,98
AIRGAS INC - 986,00 USD 95,460 72.408,31 0,32 0,33
ALBEMARLE CORP. - 1.637,00 USD 62,290 78.443,52 0,35 0,35
ALLEGHENY TECHNOLOGIES INC - 5.577,00 USD 26,310 112.878,58 0,50 0,51
AXIALL CORP - 893,00 USD 42,580 29.251,43 0,13 0,13
BALL CORPORATION - 1.920,00 USD 41,540 61.356,10 0,27 0,28
CELANESE CORPORATION -A- 3.446,00 USD 44,800 118.763,60 0,53 0,53
CF INDUSTRIES HOLDINGS INC - 1.335,00 USD 171,500 176.130,86 0,78 0,79
CLEVELAND-CLIFFS INC - 2.524,00 USD 16,250 31.552,43 0,14 0,14
CROWN CORK AND SEAL - 1.748,00 USD 41,130 55.308,29 0,25 0,25
DOMTAR CORP - 139,00 CAD 69,950 7.090,39 0,03 0,03
DOW CHEMICAL COMPANY - 21.964,00 USD 32,170 543.566,34 2,42 2,44
DU PONT DE NEMOURS - 14.754,00 USD 52,500 595.880,45 2,65 2,68
EASTMAN CHEMICAL CO - 3.213,00 USD 70,010 173.045,72 0,77 0,78
ECOLAB, INC. - 4.813,00 USD 85,190 315.423,86 1,40 1,42
FMC CORPORATION - 2.833,00 USD 61,060 133.074,07 0,59 0,60
FREEPORT-MCMORAN COPPER & GOLD, INC. - 13.619,00 USD 27,610 289.268,86 1,29 1,30
INTL FLAVORS & FRAG. - 1.206,00 USD 75,160 69.730,72 0,31 0,31
INTL PAPER COMP. - 8.590,00 USD 44,310 292.809,37 1,30 1,32
LYONDELLBASELL INDUSTRIES NV CL A 10.151,00 USD 66,260 517.428,46 2,30 2,33
MARTIN MARIETTA MATERIALS - 1.017,00 USD 98,420 77.000,65 0,34 0,35
MEADWESTVACO CORP - 3.841,00 USD 34,110 100.789,68 0,45 0,45
METHANEX CORPORATION - 1.173,00 CAD 45,050 38.535,44 0,17 0,17
MONSANTO NEW 11.338,00 USD 98,800 861.754,29 3,84 3,88
NEWMONT MINING CORP HOLDING CO - 562,00 USD 29,950 12.948,61 0,06 0,06
NUCOR CORPORATION - 2.826,00 USD 43,320 94.178,26 0,42 0,42
OWENS-ILLINOIS,INC. - 3.065,00 USD 27,790 65.525,31 0,29 0,30
PPG INDUSTRIES - 2.563,00 USD 146,410 288.675,15 1,29 1,30
PRAXAIR - 4.566,00 USD 115,160 404.508,47 1,80 1,82
ROCK-TENN COMPANY -A- 1.866,00 USD 99,880 143.377,24 0,64 0,65
SEALED AIR CORPORATION - 3.223,00 USD 23,950 59.382,14 0,26 0,27
SHERWIN-WILLIAMS COMPANY - 1.545,00 USD 176,600 209.898,45 0,93 0,94
SIGMA-ALDRICH CORPORATION - 1.748,00 USD 80,360 108.061,60 0,48 0,49
THE MOSAIC COMPANY - 9.098,00 USD 53,810 376.616,19 1,68 1,69
VULCAN MATERIALS COMPANY - 758,00 USD 48,410 28.228,93 0,13 0,13
Total shares 22.460.903,58 99,97 101,01
Rights
Belgium
TESSENDERLO CP 06/06/2013 5.712,00 EUR 1,333 7.616,00 0,03 0,03
Total rights 7.616,00 0,03 0,03
TOTAL SECURITIES PORTFOLIO 22.468.519,58 100,00 101,04
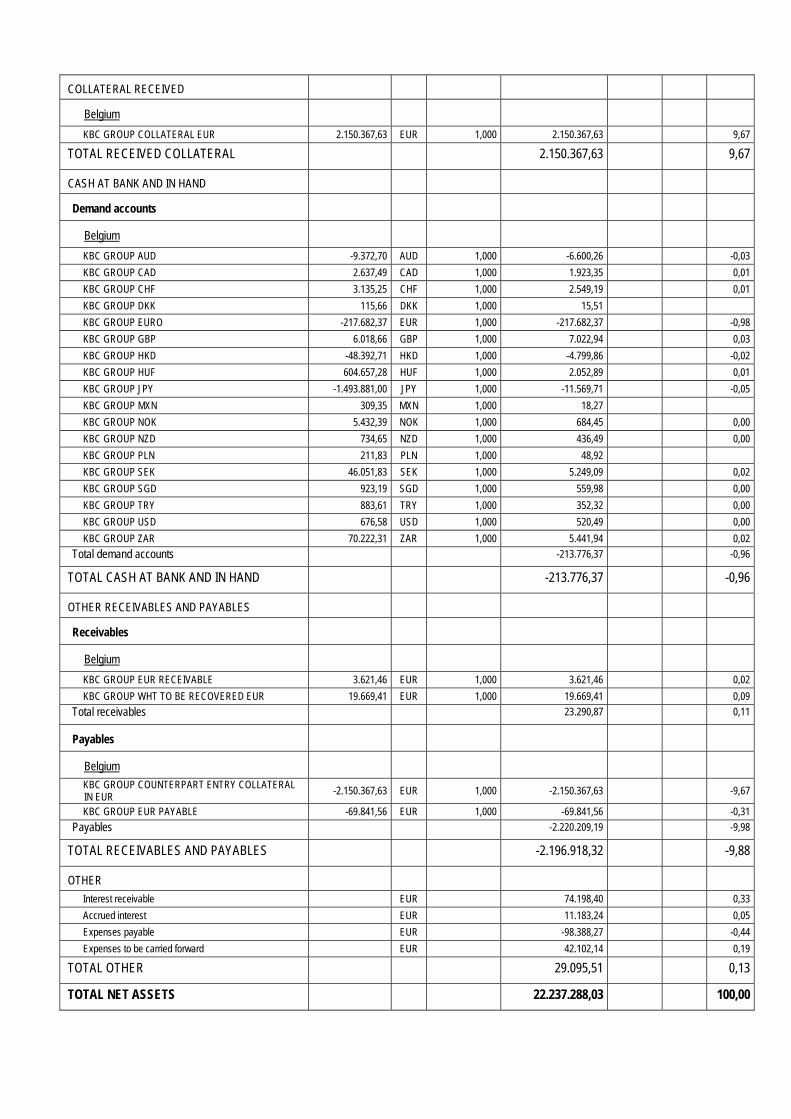
COLLATERAL RECEIVED
Belgium
KBC GROUP COLLATERAL EUR 2.150.367,63 EUR 1,000 2.150.367,63 9,67
TOTAL RECEIVED COLLATERAL 2.150.367,63 9,67
CASH AT BANK AND IN HAND
Demand accounts
Belgium
KBC GROUP AUD -9.372,70 AUD 1,000 -6.600,26 -0,03
KBC GROUP CAD 2.637,49 CAD 1,000 1.923,35 0,01
KBC GROUP CHF 3.135,25 CHF 1,000 2.549,19 0,01
KBC GROUP DKK 115,66 DKK 1,000 15,51
KBC GROUP EURO -217.682,37 EUR 1,000 -217.682,37 -0,98
KBC GROUP GBP 6.018,66 GBP 1,000 7.022,94 0,03
KBC GROUP HKD -48.392,71 HKD 1,000 -4.799,86 -0,02
KBC GROUP HUF 604.657,28 HUF 1,000 2.052,89 0,01
KBC GROUP JPY -1.493.881,00 JPY 1,000 -11.569,71 -0,05
KBC GROUP MXN 309,35 MXN 1,000 18,27
KBC GROUP NOK 5.432,39 NOK 1,000 684,45 0,00
KBC GROUP NZD 734,65 NZD 1,000 436,49 0,00
KBC GROUP PLN 211,83 PLN 1,000 48,92
KBC GROUP SEK 46.051,83 SEK 1,000 5.249,09 0,02
KBC GROUP SGD 923,19 SGD 1,000 559,98 0,00
KBC GROUP TRY 883,61 TRY 1,000 352,32 0,00
KBC GROUP USD 676,58 USD 1,000 520,49 0,00
KBC GROUP ZAR 70.222,31 ZAR 1,000 5.441,94 0,02
Total demand accounts -213.776,37 -0,96
TOTAL CASH AT BANK AND IN HAND -213.776,37 -0,96
OTHER RECEIVABLES AND PAYABLES
Receivables
Belgium
KBC GROUP EUR RECEIVABLE 3.621,46 EUR 1,000 3.621,46 0,02
KBC GROUP WHT TO BE RECOVERED EUR 19.669,41 EUR 1,000 19.669,41 0,09
Total receivables 23.290,87 0,11
Payables
Belgium
KBC GROUP COUNTERPART ENTRY COLLATERAL IN EUR
-2.150.367,63 EUR 1,000 -2.150.367,63 -9,67
KBC GROUP EUR PAYABLE -69.841,56 EUR 1,000 -69.841,56 -0,31
Payables -2.220.209,19 -9,98
TOTAL RECEIVABLES AND PAYABLES -2.196.918,32 -9,88
OTHER
Interest receivable EUR 74.198,40 0,33
Accrued interest EUR 11.183,24 0,05
Expenses payable EUR -98.388,27 -0,44
Expenses to be carried forward EUR 42.102,14 0,19
TOTAL OTHER 29.095,51 0,13
TOTAL NET ASSETS 22.237.288,03 100,00
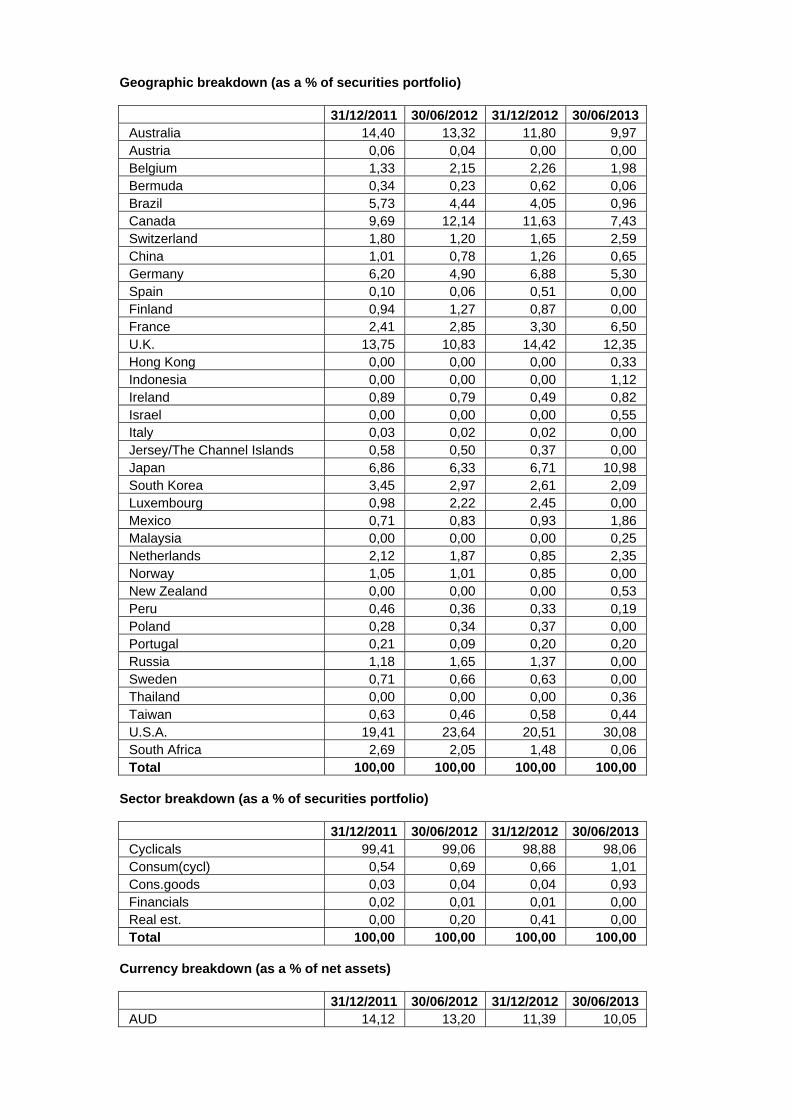
Geographic breakdown (as a % of securities portfolio)
31/12/2011 30/06/2012 31/12/2012 30/06/2013 Australia 14,40 13,32 11,80 9,97 Austria 0,06 0,04 0,00 0,00 Belgium 1,33 2,15 2,26 1,98 Bermuda 0,34 0,23 0,62 0,06 Brazil 5,73 4,44 4,05 0,96 Canada 9,69 12,14 11,63 7,43 Switzerland 1,80 1,20 1,65 2,59 China 1,01 0,78 1,26 0,65 Germany 6,20 4,90 6,88 5,30 Spain 0,10 0,06 0,51 0,00 Finland 0,94 1,27 0,87 0,00 France 2,41 2,85 3,30 6,50 U.K. 13,75 10,83 14,42 12,35 Hong Kong 0,00 0,00 0,00 0,33 Indonesia 0,00 0,00 0,00 1,12 Ireland 0,89 0,79 0,49 0,82 Israel 0,00 0,00 0,00 0,55 Italy 0,03 0,02 0,02 0,00 Jersey/The Channel Islands 0,58 0,50 0,37 0,00 Japan 6,86 6,33 6,71 10,98 South Korea 3,45 2,97 2,61 2,09 Luxembourg 0,98 2,22 2,45 0,00 Mexico 0,71 0,83 0,93 1,86 Malaysia 0,00 0,00 0,00 0,25 Netherlands 2,12 1,87 0,85 2,35 Norway 1,05 1,01 0,85 0,00 New Zealand 0,00 0,00 0,00 0,53 Peru 0,46 0,36 0,33 0,19 Poland 0,28 0,34 0,37 0,00 Portugal 0,21 0,09 0,20 0,20 Russia 1,18 1,65 1,37 0,00 Sweden 0,71 0,66 0,63 0,00 Thailand 0,00 0,00 0,00 0,36 Taiwan 0,63 0,46 0,58 0,44 U.S.A. 19,41 23,64 20,51 30,08 South Africa 2,69 2,05 1,48 0,06 Total 100,00 100,00 100,00 100,00
Sector breakdown (as a % of securities portfolio)
31/12/2011 30/06/2012 31/12/2012 30/06/2013 Cyclicals 99,41 99,06 98,88 98,06 Consum(cycl) 0,54 0,69 0,66 1,01 Cons.goods 0,03 0,04 0,04 0,93 Financials 0,02 0,01 0,01 0,00 Real est. 0,00 0,20 0,41 0,00 Total 100,00 100,00 100,00 100,00
Currency breakdown (as a % of net assets)
31/12/2011 30/06/2012 31/12/2012 30/06/2013 AUD 14,12 13,20 11,39 10,05
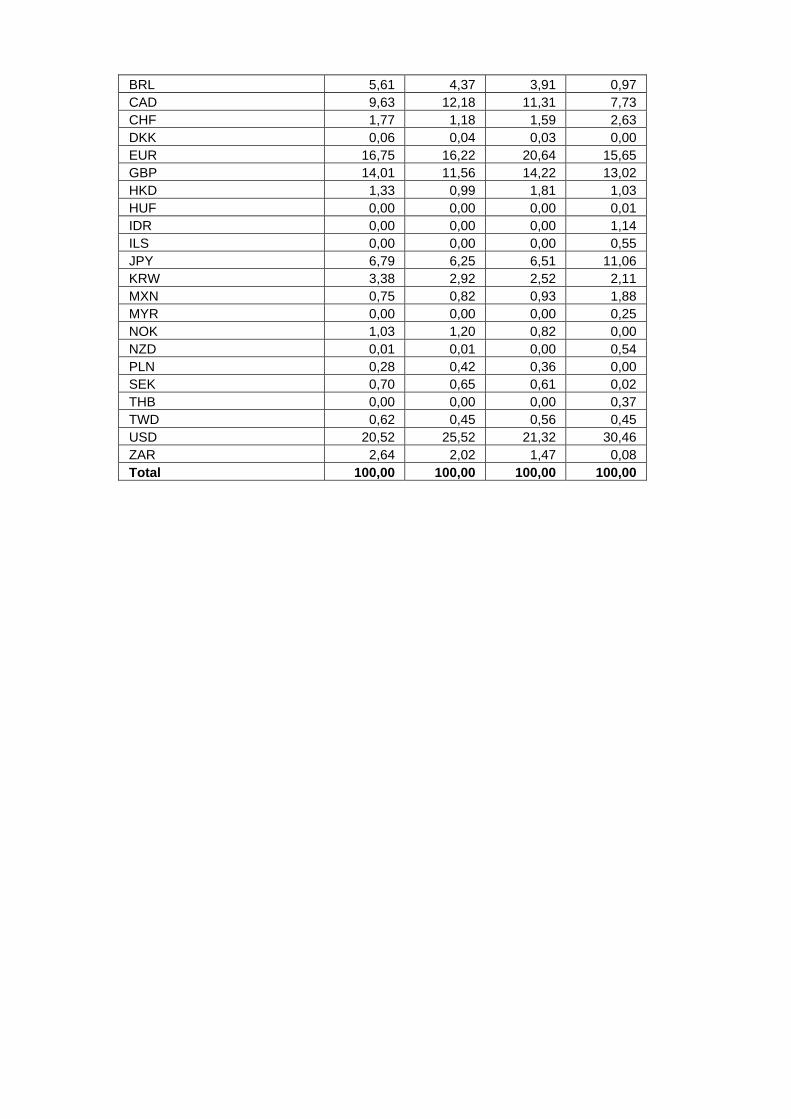
BRL 5,61 4,37 3,91 0,97 CAD 9,63 12,18 11,31 7,73 CHF 1,77 1,18 1,59 2,63 DKK 0,06 0,04 0,03 0,00 EUR 16,75 16,22 20,64 15,65 GBP 14,01 11,56 14,22 13,02 HKD 1,33 0,99 1,81 1,03 HUF 0,00 0,00 0,00 0,01 IDR 0,00 0,00 0,00 1,14 ILS 0,00 0,00 0,00 0,55 JPY 6,79 6,25 6,51 11,06 KRW 3,38 2,92 2,52 2,11 MXN 0,75 0,82 0,93 1,88 MYR 0,00 0,00 0,00 0,25 NOK 1,03 1,20 0,82 0,00 NZD 0,01 0,01 0,00 0,54 PLN 0,28 0,42 0,36 0,00 SEK 0,70 0,65 0,61 0,02 THB 0,00 0,00 0,00 0,37 TWD 0,62 0,45 0,56 0,45 USD 20,52 25,52 21,32 30,46 ZAR 2,64 2,02 1,47 0,08 Total 100,00 100,00 100,00 100,00

2.4.2 CHANGES IN THE COMPOSITION OF THE ASSETS OF KBC EQUITY FUND COMMODITIES &
MATERIALS (IN THE CURRENCY OF THE SUB-FUND)
1st half of year YearPurchases 35.276.785,31 35.276.785,31 Sales 96.576.142,99 96.576.142,99 Total 1 131.852.928,30 131.852.928,30 Subscriptions 20.646.997,12 20.646.997,12 Redemptions 85.638.571,14 85.638.571,14 Total 2 106.285.568,26 106.285.568,26 Monthly average of total assets
73.133.207,07 73.133.207,07
Turnover rate 34,96 % 34,96 %
1st half of year YearPurchases 35.276.785,31 35.276.785,31 Sales 96.576.142,99 96.576.142,99 Total 1 131.852.928,30 131.852.928,30 Subscriptions 20.646.997,12 20.646.997,12 Redemptions 85.638.571,14 85.638.571,14 Total 2 106.285.568,26 106.285.568,26 Monthly average of total assets
77.441.647,86 77.441.647,86
Corrected turnover rate 33,02 % 33,02 %
The table above shows the capital volume of portfolio transactions. This volume (adjusted to take account of total subscriptions and redemptions) is also compared to the average net assets at the beginning and end of the period. A figure close to 0% implies that the transactions relating to the securities or transactions relating to the assets (excluding deposits and cash) in a given period only involve subscriptions and redemptions. A negative percentage shows that subscriptions and redemptions entailed few, if any, transactions in the portfolio. Active asset management may result in high turnover rates (monthly percentage >50%). The detailed list of transactions is available for consultation free of charge at the registered office of the Bevek or fund at Havenlaan 2, 1080 Brussels.

2.4.3 AMOUNT OF COMMITMENTS IN RESPECT OF FINANCIAL DERIVATIVES POSITIONS
NAME Currency Value in currency
In the currency of the sub-fund
Lot-size
Transactiondate
KBC COLLATERAL EUR
EUR 2.150.367,63 2.150.367,63 N/A 28.06.2013
2.4.4 CHANGES OF THE NUMBER OF SUBSCRIPTIONS AND REDEMPTIONS AND THE NET ASSET
VALUE
Classic Shares
Period Change in number of shares in circulation
Year Subscriptions Redemptions End of period
Cap. Dis. Cap. Dis. Cap. Dis. Total
2011 - 06 432.722,51 41.949,55 562.940,93 23.904,00 264.329,17 21.386,52 285.715,69
2012 - 06 29.472,34 2.344,57 252.793,87 7.032,00 41.007,64 16.699,09 57.706,73
2013 - 06 11.623,49 3.495,00 21.899,61 7.037,52 30.731,52 13.156,57 43.888,09
Period Amounts received and paid by the UCI
(in the currency of the class)
Year Subscriptions Redemptions
Capitalization Distribution Capitalization Distribution
2011 - 06 217.476.840,50 18.979.208,03 290.768.916,40 10.408.535,13
2012 - 06 14.286.765,37 984.206,06 124.014.540,00 2.772.377,89
2013 - 06 5.456.423,33 1.391.524,82 9.885.294,16 2.714.763,50
Period Net asset value
End of period (in the currency of the class)
Year Of the class Of one share
Capitalization Distribution
2011 - 06 147.899.383,35 523,30 447,81
2012 - 06 24.235.956,09 438,70 374,03
2013 - 06 17.407.465,52 415,81 351,85
Institutional B Shares
Period Change in number of shares in circulation
Year Subscriptions Redemptions End of period
Cap. Dis. Cap. Dis. Cap. Dis. Total 2012 - 06 164.578,45 70.336,45 94.242,00 94.242,00
2013 - 06 210.633,35 293.276,34 11.599,01 11.599,01
Period Amounts received and paid by the UCI
(in the currency of the class)
Year Subscriptions Redemptions
Capitalization Distribution Capitalization Distribution
2012 - 06 77.406.909,81 31.227.951,09
2013 - 06 99.135.172,01 130.222.919,40
Period Net asset value
End of period (in the currency of the class)

Year Of the class Of one share
Capitalization Distribution
2012 - 06 41.378.273,62 439,06
2013 - 06 4.829.822,52 416,40
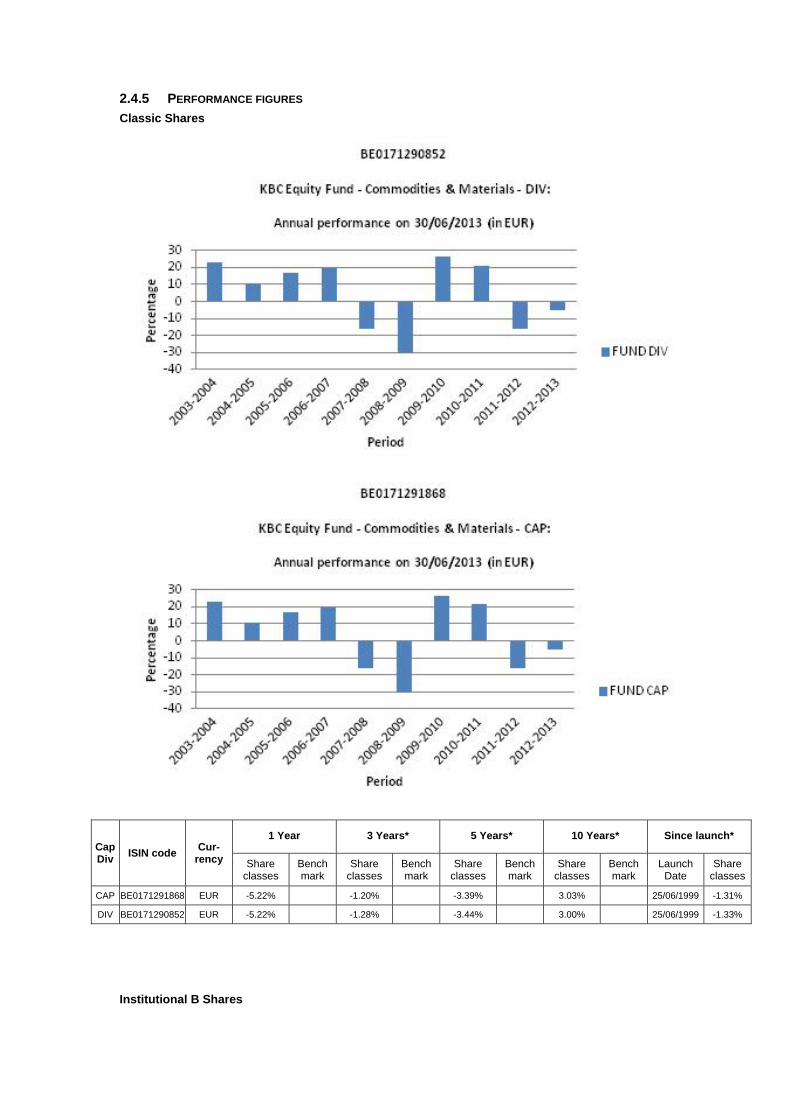
2.4.5 PERFORMANCE FIGURES
Classic Shares
Cap Div
ISIN code Cur-
rency
1 Year 3 Years* 5 Years* 10 Years* Since launch*
Share classes
Bench mark
Share classes
Bench mark
Share classes
Bench mark
Share classes
Bench mark
Launch Date
Share classes
CAP BE0171291868 EUR -5.22% -1.20% -3.39% 3.03% 25/06/1999 -1.31%
DIV BE0171290852 EUR -5.22% -1.28% -3.44% 3.00% 25/06/1999 -1.33%
Institutional B Shares

Cap Div
ISIN code Cur-
rency
1 Year 3 Years* 5 Years* 10 Years* Since launch*
Share classes
Bench mark
Share classes
Bench mark
Share classes
Bench mark
Share classes
Bench mark
Launch Date
Share classes
CAP BE6228540736 EUR -5.16% 24/11/2011 0.32%
Risk warning: Past performance is not a guide to future performance. * Return on annual basis.
Classic Shares The bar chart shows the performance for full financial years. The figures do not take account of any restructuring. Calculated in EUR. The return is calculated as the change in the net asset value between two dates expressed
as a percentage. In the case of units that pay dividends, the dividend is incorporated geometrically in the return.
Calculation method for date D, where NAV stands for net asset value: Capitalisation units (CAP) Return on date D over a period of X years:
[NIW(D) / NIW(Y)] ^ [1 / X] - 1 where Y = D-X
Return on date D since the start date S of the unit: [NIW(D) / NIW(S)] ^ [1 / F] - 1 where F = 1 if the unit has existed for less than one year on date D where F = (D-S) / 365.25 if the unit has existed for longer than one year on date D
Distribution units (DIV) Return on date D over a period of X years:
[ C * NIW(D) / NIW(Y)] ^ [1 / X] - 1 where Y = D-X
Return on date D since the start date S of the unit: [ C * NIW(D) / NIW(S)] ^ [1 / F] - 1 where F = 1 if the unit has existed for less than one year on date D where F = (D-S) / 365.25 if the unit has existed for longer than one year on date D where C is a factor that is determined for all N dividends between the calculation date D and the reference date.
For dividend i on date Di with value Wi: Ci = [Wi / NIW(Di)] + 1 i = 1 ... N

from whichC = C0 * .... * CN. If the interval between the two dates exceeds one year, the ordinary return calculation is
converted into a return on an annual basis by taking the nth square root of 1 plus the total return of the unit.
The return figures shown above do not take account of the fees and charges associated with the issue and redemption of units.
These are the performance figures for capitalisation and distribution shares.
Institutional B Shares The bar chart shows the performance for full financial years. The figures do not take account of any restructuring. Calculated in EUR. The return is calculated as the change in the net asset value between two dates expressed
as a percentage. Calculation method for date D, where NAV stands for net asset value:
Capitalisation units (CAP) Return on date D over a period of X years:
[NIW(D) / NIW(Y)] ^ [1 / X] - 1 where Y = D-X
Return on date D since the start date S of the unit: [NIW(D) / NIW(S)] ^ [1 / F] - 1 where F = 1 if the unit has existed for less than one year on date D where F = (D-S) / 365.25 if the unit has existed for longer than one year on date D
If the interval between the two dates exceeds one year, the ordinary return calculation is converted into a return on an annual basis by taking the nth square root of 1 plus the total return of the unit.
The return figures shown above do not take account of the fees and charges associated with the issue and redemption of units.
These are the performance figures for capitalization shares.

2.4.6 COSTS Ongoing Charges: * Classic Shares Distribution: 1.774% Classic Shares Capitalization: 1.767% Institutional B Shares Capitalization: 1.735% * The following costs have not been included in the ongoing charges: - Interest payments on loans taken out - Payments in respect of financial derivatives - Fees and charges paid directly by the investor - Any soft commissions
SOFT COMMISSIONS The management company or the appointed manager, as the case may be, is the recipient of soft commissions. The recipient has laid down an internal policy as regards accepting soft commissions and avoiding possible conflicts of interest in this respect, and has put appropriate internal controls in place to ensure this policy is observed. For more information, please see the ‘General’ section of the annual report.
Broker
Commission gross
in EUR
paid during the period:
1‐01‐13
‐
30‐06‐13
CSA Credits
in EUR
accrued during the period:
1‐01‐13
‐
30‐06‐13 Percentage
CITI 8,439 5,791 68.63%
CSFBSAS 7,136 1,295 18.14%
EQ MACQUARIE 403 199 49.37%
INSTINET 44,237 27,418 61.98%
MERRILL 6,220 3,313 53.27%
MORGAN STANLEY 1,801 882 48.96%
FEE-SHARING AGREEMENTS AND REBATES: The management company may share its fee with the distributor, and institutional and/or professional parties. In principle, the percentage share amounts to between 35% and 60% if the distributor is an entity of KBC Group NV or to between 35% and 70% if the distributor is not an entity of KBC Group NV. However, in a small number of cases, the distributor’s fee is less than 35%. Investors may, on request, obtain more information on these cases. If the management company invests the assets of the undertaking for collective investment in units of undertakings for collective investment that are not managed by an entity of KBC Group NV, and receives a fee for doing so, it will pay this fee to the undertaking for collective investment. Fee-sharing does not affect the amount of the management fee paid by the sub-fund to the management company. This management fee is subject to the limitations laid down in the articles of association. The limitations may only be amended after approval by the general meeting of shareholders. The management company has concluded a distribution agreement with the distributor in order to facilitate the wider distribution of the sub-fund's units by using multiple distribution channels. It is in the interests of the holders of units, the sub-fund and of the distributor for the largest possible number of units to be sold and for the assets of the sub-fund to be maximised in this way. In this respect, there is therefore no question of any conflict of interest.
2.4.7 NOTES TO THE FINANCIAL STATEMENTS AND OTHER DATA Fee for managing the investment portfolio: 1.5% per annum calculated on the basis of the average total net assets of the sub-fund, no management fee is charged on assets assets invested in investment undertakings managed by a financial institution of the KBC group. The administration agent’s fee is payable at the end of each month and is calculated on the basis of the average total net assets of the sub-fund.
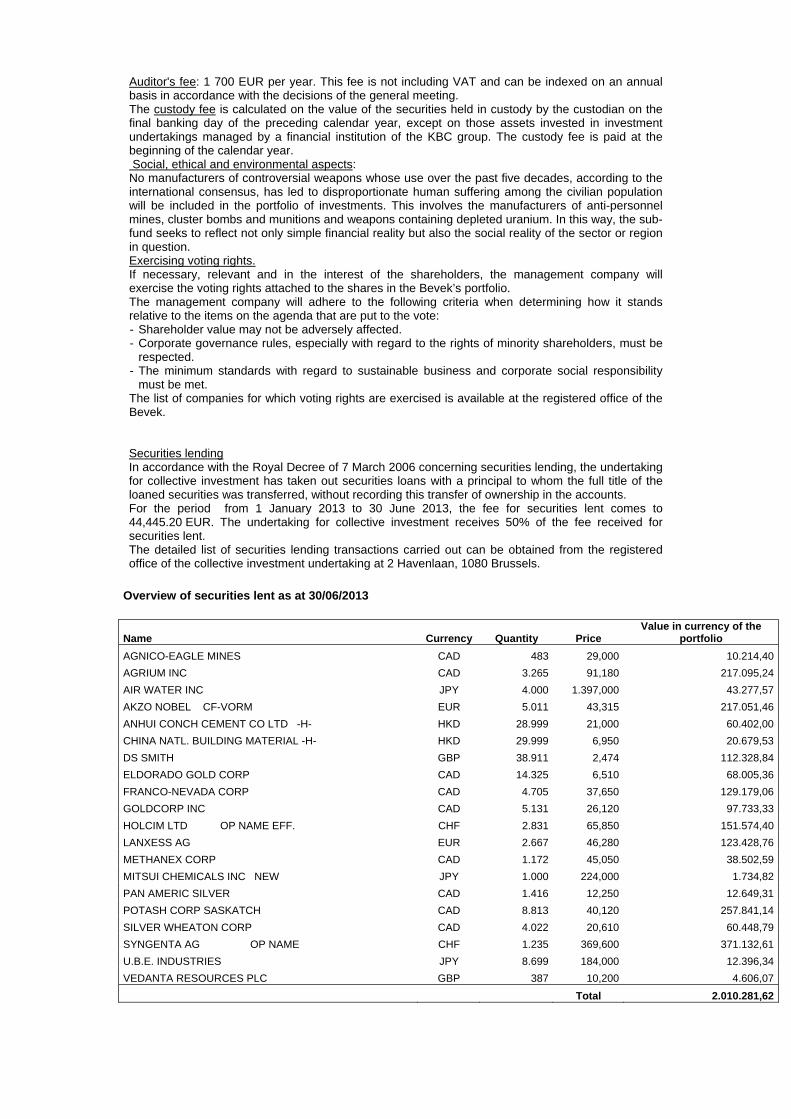
Auditor's fee: 1 700 EUR per year. This fee is not including VAT and can be indexed on an annual basis in accordance with the decisions of the general meeting. The custody fee is calculated on the value of the securities held in custody by the custodian on the final banking day of the preceding calendar year, except on those assets invested in investment undertakings managed by a financial institution of the KBC group. The custody fee is paid at the beginning of the calendar year. Social, ethical and environmental aspects: No manufacturers of controversial weapons whose use over the past five decades, according to the international consensus, has led to disproportionate human suffering among the civilian population will be included in the portfolio of investments. This involves the manufacturers of anti-personnel mines, cluster bombs and munitions and weapons containing depleted uranium. In this way, the sub-fund seeks to reflect not only simple financial reality but also the social reality of the sector or region in question. Exercising voting rights. If necessary, relevant and in the interest of the shareholders, the management company will exercise the voting rights attached to the shares in the Bevek’s portfolio. The management company will adhere to the following criteria when determining how it stands relative to the items on the agenda that are put to the vote: - Shareholder value may not be adversely affected. - Corporate governance rules, especially with regard to the rights of minority shareholders, must be
respected. - The minimum standards with regard to sustainable business and corporate social responsibility
must be met. The list of companies for which voting rights are exercised is available at the registered office of the Bevek. Securities lending In accordance with the Royal Decree of 7 March 2006 concerning securities lending, the undertaking for collective investment has taken out securities loans with a principal to whom the full title of the loaned securities was transferred, without recording this transfer of ownership in the accounts. For the period from 1 January 2013 to 30 June 2013, the fee for securities lent comes to 44,445.20 EUR. The undertaking for collective investment receives 50% of the fee received for securities lent. The detailed list of securities lending transactions carried out can be obtained from the registered office of the collective investment undertaking at 2 Havenlaan, 1080 Brussels.
Overview of securities lent as at 30/06/2013
Name Currency Quantity Price Value in currency of the
portfolio
AGNICO-EAGLE MINES CAD 483 29,000 10.214,40
AGRIUM INC CAD 3.265 91,180 217.095,24
AIR WATER INC JPY 4.000 1.397,000 43.277,57
AKZO NOBEL CF-VORM EUR 5.011 43,315 217.051,46
ANHUI CONCH CEMENT CO LTD -H- HKD 28.999 21,000 60.402,00
CHINA NATL. BUILDING MATERIAL -H- HKD 29.999 6,950 20.679,53
DS SMITH GBP 38.911 2,474 112.328,84
ELDORADO GOLD CORP CAD 14.325 6,510 68.005,36
FRANCO-NEVADA CORP CAD 4.705 37,650 129.179,06
GOLDCORP INC CAD 5.131 26,120 97.733,33
HOLCIM LTD OP NAME EFF. CHF 2.831 65,850 151.574,40
LANXESS AG EUR 2.667 46,280 123.428,76
METHANEX CORP CAD 1.172 45,050 38.502,59
MITSUI CHEMICALS INC NEW JPY 1.000 224,000 1.734,82
PAN AMERIC SILVER CAD 1.416 12,250 12.649,31
POTASH CORP SASKATCH CAD 8.813 40,120 257.841,14
SILVER WHEATON CORP CAD 4.022 20,610 60.448,79
SYNGENTA AG OP NAME CHF 1.235 369,600 371.132,61
U.B.E. INDUSTRIES JPY 8.699 184,000 12.396,34
VEDANTA RESOURCES PLC GBP 387 10,200 4.606,07
Total 2.010.281,62
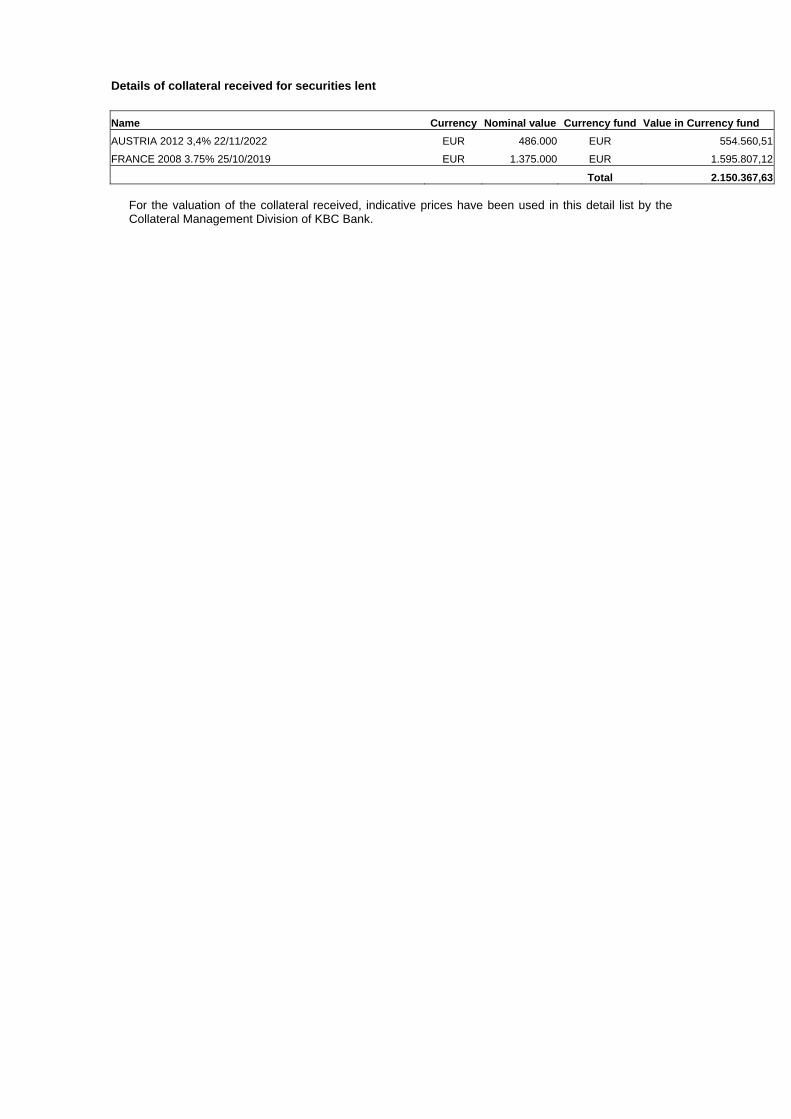
Details of collateral received for securities lent
Name Currency Nominal value Currency fund Value in Currency fund
AUSTRIA 2012 3,4% 22/11/2022 EUR 486.000 EUR 554.560,51
FRANCE 2008 3.75% 25/10/2019 EUR 1.375.000 EUR 1.595.807,12
Total 2.150.367,63 For the valuation of the collateral received, indicative prices have been used in this detail list by the Collateral Management Division of KBC Bank.

Semi-Annual report as at 30th June 2013
TABLE OF CONTENTS
2. Information on KBC Equity Fund High Dividend New Markets
2.1. Management report 2.1.1. Launch date and subscription price 2.1.2. Stock exchange listing 2.1.3. Aim and distinctive features of the investment policy 2.1.4. Financial portfolio management 2.1.5. Distributors 2.1.6. Index and benchmark 2.1.7. Policy conducted during the financial year 2.1.8. Future policy 2.1.9. Synthetic risk and reward indicator (SRRI)
2.2. Balance sheet
2.3. Profit and loss account
2.4. Composition of the assets and key figures
2.4.1. Composition of the assets 2.4.2. Change in the composition of the assets 2.4.3. Value of commitments in respect of financial derivatives positions 2.4.4. Evolution of the number of subscriptions, repayments and the net asset value 2.4.5. Return figures 2.4.6. Expenses 2.4.7. Notes to the financial statements and other data


2 INFORMATION ON KBC EQUITY FUND HIGH DIVIDEND NEW MARKETS
2.1 MANAGEMENT REPORT
2.1.1 LAUNCH DATE AND SUBSCRIPTION PRICE Classic Shares : Launch date: 28 September 2007 Initial subscription price: 500 EUR Currency: EUR Institutional B Shares : Launch date: 24 November 2011 Initial subscription price: 370.52 EUR Currency: EUR
2.1.2 STOCK EXCHANGE LISTING Not applicable.
2.1.3 GOAL AND KEY PRINCIPLES OF THE INVESTMENT POLICY
SUB-FUND’S OBJECT: The main objective of this sub-fund is to generate the highest possible return for its shareholders by investing directly or indirectly in transferable securities. This is reflected in its pursuit of capital gains and income. To this end, the assets are invested, either directly or indirectly via correlated financial instruments, primarily in shares.
SUB-FUND’S INVESTMENT POLICY:
PERMITTED ASSET CLASSES: The sub-fund may invest in securities, money market instruments, units in undertakings for collective investment, deposits, financial derivatives, liquid assets and all other instruments insofar as permitted by the applicable laws and regulations and consistent with the sub-fund’s object The sub-fund shall invest no more than 10% of its assets in units of other undertakings for collective investment.
RESTRICTIONS OF THE INVESTMENT POLICY: The investment policy will be implemented within the limits set by law and regulations. The sub-fund may borrow up to 10% of its net assets, insofar as these are short-term borrowings aimed at solving temporary liquidity problems.
PERMITTED DERIVATIVES TRANSACTIONS: Derivates may be used either for hedging purposes or to achieve investment objectives. Changes will be made to the investments at regular intervals to comply with the sub-fund's investment strategy. In addition, listed and unlisted derivates may be used to achieve the objectives: these may be forward contracts, options or swaps on securities, indices, currencies or interest rates or other transactions involving derivatives. Unlisted derivatives transactions will only be concluded with prime financial institutions specialised in such transactions. Such derivatives may also be used to hedge the assets against exchange-rate fluctuations. Subject to the applicable laws and regulations and the articles of association, the sub-fund always seeks to conclude the most effective transactions. All costs associated with the transactions will be charged to the sub-fund and all income generated will be paid to the sub-fund. If the transactions result in a risk in respect of the counterparty, this risk can be hedged by using a margin management system that ensures that the sub-fund is the beneficiary of security (collateral) in the form of cash or investment grade bonds. When calculating the value of the bonds, a margin will be applied that varies depending on the residual term to maturity and the currency in which the bond in question is denominated. The relationship with the counterparty or counterparties is governed by standard international agreements.
Derivatives may be used to partially hedge the open exchange risk in relation to the reference currency (euro). Where appropriate, they may therefore limit the foreign exchange risk expressed in euros, and hence the market risk and performance risk too. To the extent that derivatives are used, it concerns liquid and readily negotiable instruments. They do not, therefore, affect the liquidity risk. To the extent that derivatives are used, they are used to carry out the investment policy and within the limits of the investment strategy. They do not affect the market, performance and concentration risks or the risks associated with external factors or of any kind.
Strategy selected The assets are invested primarily in shares with a high dividend yield of companies in countries where conditions are such as to ensure accelerated economic growth in the short or medium term, more specifically countries in Asia, Latin America, Central Europe and Eastern Europe. Risk concentration Emerging market shares.
LENDING FINANCIAL INSTRUMENTS: The sub-fund may lend financial instruments within the limits set by law and regulations. This lending does not affect the sub-fund’s risk profile since: - it takes place within the framework of a securities lending system managed by a principal. In
addition, the sub-fund has a relationship only with the principal of the securities lending system which acts as counterparty and to which title of the loaned securities is transferred. The choice of principal is subject to strict selection criteria. The return of securities similar to the securities that have been lent is guaranteed by the principal.
- through a margin management system, the sub-fund is always guaranteed financial security, the actual value of which always exceeds the actual value of the securities that have been lent, in case the principal does not return similar securities.
The return of securities similar to the securities that have been lent can be requested at any time, which means that the lending of securities does not affect the management of the sub-fund's assets. By lending securities, the sub-fund can generate an additional return. The principal pays a fee to the management company. After deducting the fee for the margin management and clearing services of KBC Bank, most of this fee is paid to the sub-fund. The relationship with the counterparty or counterparties is governed by standard international agreements. More information is provided on the terms and conditions governing securities lending in the annual or half-yearly report for the sub-fund.
VOLATILITY OF THE NET ASSET VALUE: The volatility of the net asset value may be high due to the composition of the portfolio.
GENERAL STRATEGY FOR HEDGING THE EXCHANGE RATE RISK: In order to protect its assets against exchange rate fluctuations and within the limitations laid down in the articles of association, the sub-fund may perform transactions relating to the sale of forward currency contracts, as well as the sale of call options and the purchase of put options on currencies. The transactions in question may relate solely to contracts traded on a regulated market that operates regularly, is recognised and is open to the public or that are traded with a recognised, prime financial institution specialising in such transactions and dealing in the over-the-counter (OTC) market in options. With the same objective, the sub-fund may also sell currencies forward or exchange them in private transactions with prime financial institutions specialising in such transactions. The hedging objective of the aforementioned transactions suggests that there is a direct link between these transactions and the assets to be hedged, which implies that the transactions carried out in a particular currency may in principle not exceed, in terms of volume, either the valuation value of all the assets in the same currency or the holding period of those assets.
SOCIAL, ETHICAL AND ENVIRONMENTAL ASPECTS:
No manufacturers of controversial weapons whose use over the past five decades, according to the international consensus, has led to disproportionate human suffering among the civilian
population will be included in the portfolio of investments. This involves the manufacturers of anti-personnel mines, cluster bombs and munitions and weapons containing depleted uranium. In this way, the sub-fund seeks to reflect not only simple financial reality but also the social reality of the sector or region in question.
THE EUROPEAN SAVINGS DIRECTIVE AND TAX ON DEBT CLAIM RETURNS OBTAINED THROUGH THE
REDEMPTION OF OWN UNITS OR IN THE EVENT OF FULL OR PARTIAL DISTRIBUTION OF EQUITY
CAPITAL. The following information is of a general character and is not intended to cover all aspects of an investment in a UCITS. In certain cases entirely different rules might even apply. Moreover, both tax law and the interpretation of it can change. Investors who wish to have more information about the tax implications – in both Belgium and abroad – of acquiring, holding and transferring units should seek the advice of their usual financial and tax advisers. This UCITS shall invest a maximum of 15% of its assets directly or indirectly in debt instruments as intended by the European Savings Directive. A. European Savings Directive (Directive 2003/48/EC) The European Savings Directive has been implemented in Belgium. Since this UCITS invests a maximum of 15% of its assets directly or indirectly in debt claims as intended by the European Savings Directive, the income of this UCITS does not fall within the scope of this directive. B. Tax on debt claim returns obtained through the redemption of own units or in the event of full or partial distribution of equity capital (Article 19bis Income Tax Code 1992). The income from this UCITS is not subject to the tax on debt instrument returns as intended by Article 19bis, Income Tax Code 1992.
2.1.4 FINANCIAL PORTFOLIO MANAGEMENT The management company has delegated the intellectual management, to KBC Fund Management Limited, Joshua Dawson House, Dawson Street , Dublin 2, IRELAND.. KBC Fund Management Limited has delegated the intellectual management, to Kleinwort Benson Investors Dublin Ltd, Joshua Dawson House Dawson Street , Dublin 2, IRELAND.
2.1.5 DISTRIBUTORS KBC Asset Management S.A., 5, Place de la Gare, L-1616 Luxembourg.
2.1.6 INDEX AND BENCHMARK See ‘Sub-fund’s investment policy’.

2.1.7 POLICY PERSUED DURING THE FINANCIAL YEAR During Q1 the strategy outperformed the broad market by a solid margin. The majority of this out-performance came in January when emerging markets declined and the defensive nature of the portfolio became more popular as investors moved to safety. The majority of this out performance was wiped out the further we went into the quarter as market sentiment improved slightly along with absolute returns. When looking at styles we don’t just concentrate on how high dividend performs. We look at a number of styles to gauge what is working in the markets. Q1 highlighted a number of styles that would have been unfavourable to the performance of the strategy. Among the best performing styles in emerging markets were high price momentum, high issue of common equity and low return on equity. These are typically styles we wouldn’t have exposure to. The strategy is built much more from a quality/income/value point of view, looking for companies with solid balance sheets, efficient capital management and secure/growing dividends. The theme of high dividend underperformed also during Q1, however the all-regional and all-industry group approach within the strategy added value to performance.
Q2 was an exceptionally difficult period for emerging market investors as markets tumbled. The strategy outperformed strongly over these three months. The downside protection provided by the strategy was particularly evident in June as investors responded to deteriorating economic conditions across the region and began to discount the likely impact of Federal Reserve tapering on liquidity conditions in emerging markets. Disappointing economic data from China added to the air of uncertainty as did attempts by the Chinese authorities to control the level of risk taking within the shadow banking system. Commodity price weakness coupled with currency depreciation created particular difficulties for commodity exporters such as Brazil, South Africa and Indonesia. Given the heightened level of uncertainty across the region it came as no surprise that investors flocked to defensive sectors and companies generating consistent earnings. Factors such as high return on equity, high dividend yield and low common equity issuance performed strongly over the quarter. The focus on yield and quality characteristics enabled the strategy to generate outperformance during Q2.
2.1.8 FUTURE POLICY While the mood in markets changed during June we do not see it as the commencement of a new bear market. Equity markets have been supported by global central banks providing significant liquidity support but also by improving macroeconomic fundamentals. Over time the level of liquidity support provided by central banks was likely to be reduced as the economic recovery became more self sustaining, the Federal Reserve is more confident that such a point has been reached. However self sustaining economic growth will enhance revenue growth and markets are already on the cheap side of good value. In the high dividend portfolios at stock selection level, we will continue to emphasise companies with strong fundamentals, i.e. balance sheet, cash flow and management Investors are likely to continue to reward companies that manage their balance sheet in an efficient manner with a continuing focus on companies that generate superior returns on assets, high quality earnings and robust free cash flow.
2.1.9 SYNTHETIC RISK AND REWARD INDICATOR Classic Shares: 6 on a scale of 1 (lowest risk) to 7 (highest risk). Institutional B Shares: 7 on a scale of 1 (lowest risk) to 7 (highest risk). The value of a share can decrease or increase and the investor may not get back the amount invested. In accordance with Commission Regulation (EU) No. 583/2010, a synthetic risk and reward indicator has been calculated. This indicator provides a quantitative measure of the sub-fund's potential return and the risk involved, calculated in the currency in which the sub-fund is denominated. It is given as a figure between 1 and 7. The higher the figure, the greater the potential return, but also the more difficult it is to predict this return. Losses are possible too. The lowest figure does not mean that the investment is entirely free of risk. However, it does indicate that, compared with the higher figures, this product will generally provide a lower, but more predictable return. The synthetic risk and reward indicator is assessed regularly and can therefore go up or down based on data from the past. Data from the past is not always a reliable indicator of future risk and return.

2.2 BALANCE SHEET
Balance sheet layout 30/06/2013 (in the currency of the sub-fundt)
30/06/2012 (in the currency of the sub-fund )
TOTAL NET ASSETS 106.749.131,77 163.483.161,41
II. Securities, money market instruments, UCIs and derivatives
A. Bonds and other debt instruments a) Bonds a} Collateral received in the form of bonds 5.220.477,84 8.715.995,70 C. Shares and similar instruments a) Shares 98.565.315,04 158.698.173,31 Of which securities lent 4.714.884,49 7.933.024,77 D. Other securities 708,02 E. Open-end undertakings for collective investment 6.334.700,02 5.468.070,96
IV. Receivables and payables within one year A. Receivables a) Accounts receivable 4.238.240,35 1.422.819,21 B. Payables a) Accounts payable (-) -1.667.889,15 -951.795,27 c) Borrowings (-) -4.166.157,62 -3.482.024,56 d) Collateral (-) -5.220.477,84 -8.715.995,70
V. Deposits and cash at bank and in hand A. Demand balances at banks 2.475.804,44 1.339.692,68
VI. Accruals and deferrals A. Expense to be carried forward 90.220,34 41.601,19 B. Accrued income 1.050.476,86 1.039.263,37 C. Accrued expense (-) -171.578,51 -93.347,50
TOTAL SHAREHOLDERS' EQUITY 106.749.131,77 163.483.161,41
A. Capital 119.707.786,48 161.257.110,47
B. Income equalization -334.171,75 -138.877,07
D. Result for the period -12.624.482,96 2.364.928,01
Off-balance-sheet headings
I Collateral (+/-)
I.A Collateral (+/-)
I.A.A Securities/market instruments 5.220.477,84 8.715.995,70
IX Financial instruments lent 4.714.884,49 7.933.024,77

2.3 PROFIT AND LOSS ACCOUNT
Income Statement 30/06/2013 (in the currency of the sub-fund)
30/06/2012 (in the currency of the sub-fund)
I. Net gains(losses) on investments C. Shares and similar instruments a) Shares -10.395.594,76 -2.170.972,24 D. Other securities -22,76 35,15 E. Open-end undertakings for collective investment -519.140,63 -121.527,05 G. Receivables, deposits, cash at bank and in hand
and payables 0,23 -0,06
H. Foreign exchange positions and transactions b) Other foreign exchange positions and
transactions -3.587.234,25 2.144.925,19
II. Investment income and expenses A. Dividends 3.197.545,38 3.908.126,17 B. Interests a) Securities and money market instruments 51.162,14 23.528,76 b) Cash at bank and in hand and deposits 4.712,99 10.817,97 C. Interest on borrowings (-) -10.274,73 -15.057,52
III. Other income A. Income received to cover the acquisition and
realizaion of assets, to discourage withdrawals and for delivery charges
518.637,68 416.901,21
IV. Operating expenses A. Investment transaction and delivery costs (-) -428.961,17 -394.621,48 B. Financial expenses (-) -19.750,55 -985,67 C. Custodian's fee (-) -72.451,42 -39.212,13 D. Manager's fee (-) a) Financial management Classic Shares -168.763,43 -166.419,83 Institutional B Shares -1.047.323,28 -1.053.577,33 b) Administration and accounting management -84.386,17 -81.481,09 E. Administrative expenses (-) -437,23 -404,30 F. Formation and organisation expenses (-) -4.475,56 -8.045,07 G. Remuneration, social security charges and
pension -21,48 -13,77
H. Services and sundry goods (-) -20.783,46 -15.067,58 J. Taxes Classic Shares -7.078,16 -7.200,62 Institutional B Shares -3.878,61 -6.607,40 K. Other expenses (-) -25.963,73 -58.213,30
Income and expenditure for the period Subtotal II + III + IV 1.877.509,21 2.512.467,02
V. Profit (loss) on ordinary activities before tax -12.624.482,96 2.364.928,01
VII. Result for the period -12.624.482,96 2.364.928,01
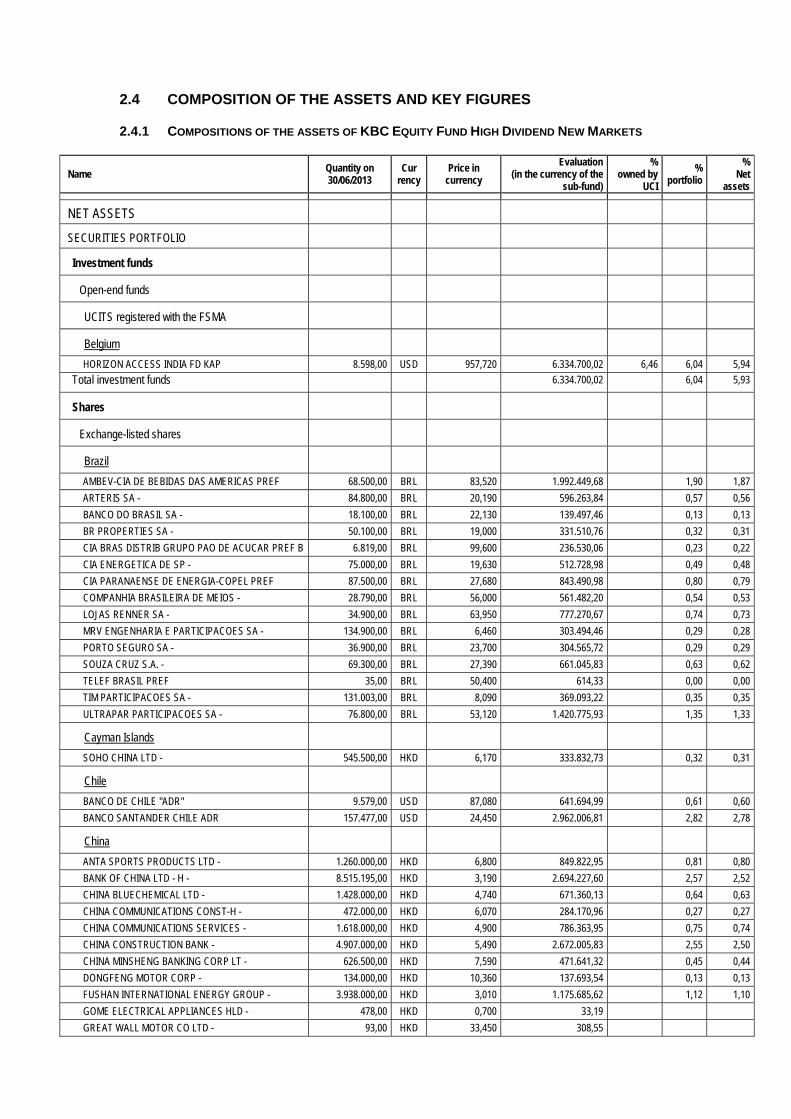
2.4 COMPOSITION OF THE ASSETS AND KEY FIGURES
2.4.1 COMPOSITIONS OF THE ASSETS OF KBC EQUITY FUND HIGH DIVIDEND NEW MARKETS
Name Quantity on 30/06/2013
Cur rency
Price in currency
Evaluation (in the currency of the
sub-fund)
% owned by
UCI
% portfolio
% Net
assets
NET ASSETS
SECURITIES PORTFOLIO
Investment funds
Open-end funds
UCITS registered with the FSMA
Belgium
HORIZON ACCESS INDIA FD KAP 8.598,00 USD 957,720 6.334.700,02 6,46 6,04 5,94
Total investment funds 6.334.700,02 6,04 5,93
Shares
Exchange-listed shares
Brazil
AMBEV-CIA DE BEBIDAS DAS AMERICAS PREF 68.500,00 BRL 83,520 1.992.449,68 1,90 1,87
ARTERIS SA - 84.800,00 BRL 20,190 596.263,84 0,57 0,56
BANCO DO BRASIL SA - 18.100,00 BRL 22,130 139.497,46 0,13 0,13
BR PROPERTIES SA - 50.100,00 BRL 19,000 331.510,76 0,32 0,31
CIA BRAS DISTRIB GRUPO PAO DE ACUCAR PREF B 6.819,00 BRL 99,600 236.530,06 0,23 0,22
CIA ENERGETICA DE SP - 75.000,00 BRL 19,630 512.728,98 0,49 0,48
CIA PARANAENSE DE ENERGIA-COPEL PREF 87.500,00 BRL 27,680 843.490,98 0,80 0,79
COMPANHIA BRASILEIRA DE MEIOS - 28.790,00 BRL 56,000 561.482,20 0,54 0,53
LOJAS RENNER SA - 34.900,00 BRL 63,950 777.270,67 0,74 0,73
MRV ENGENHARIA E PARTICIPACOES SA - 134.900,00 BRL 6,460 303.494,46 0,29 0,28
PORTO SEGURO SA - 36.900,00 BRL 23,700 304.565,72 0,29 0,29
SOUZA CRUZ S.A. - 69.300,00 BRL 27,390 661.045,83 0,63 0,62
TELEF BRASIL PREF 35,00 BRL 50,400 614,33 0,00 0,00
TIM PARTICIPACOES SA - 131.003,00 BRL 8,090 369.093,22 0,35 0,35
ULTRAPAR PARTICIPACOES SA - 76.800,00 BRL 53,120 1.420.775,93 1,35 1,33
Cayman Islands
SOHO CHINA LTD - 545.500,00 HKD 6,170 333.832,73 0,32 0,31
Chile
BANCO DE CHILE "ADR" 9.579,00 USD 87,080 641.694,99 0,61 0,60
BANCO SANTANDER CHILE ADR 157.477,00 USD 24,450 2.962.006,81 2,82 2,78
China
ANTA SPORTS PRODUCTS LTD - 1.260.000,00 HKD 6,800 849.822,95 0,81 0,80
BANK OF CHINA LTD - H - 8.515.195,00 HKD 3,190 2.694.227,60 2,57 2,52
CHINA BLUECHEMICAL LTD - 1.428.000,00 HKD 4,740 671.360,13 0,64 0,63
CHINA COMMUNICATIONS CONST-H - 472.000,00 HKD 6,070 284.170,96 0,27 0,27
CHINA COMMUNICATIONS SERVICES - 1.618.000,00 HKD 4,900 786.363,95 0,75 0,74
CHINA CONSTRUCTION BANK - 4.907.000,00 HKD 5,490 2.672.005,83 2,55 2,50
CHINA MINSHENG BANKING CORP LT - 626.500,00 HKD 7,590 471.641,32 0,45 0,44
DONGFENG MOTOR CORP - 134.000,00 HKD 10,360 137.693,54 0,13 0,13
FUSHAN INTERNATIONAL ENERGY GROUP - 3.938.000,00 HKD 3,010 1.175.685,62 1,12 1,10
GOME ELECTRICAL APPLIANCES HLD - 478,00 HKD 0,700 33,19
GREAT WALL MOTOR CO LTD - 93,00 HKD 33,450 308,55
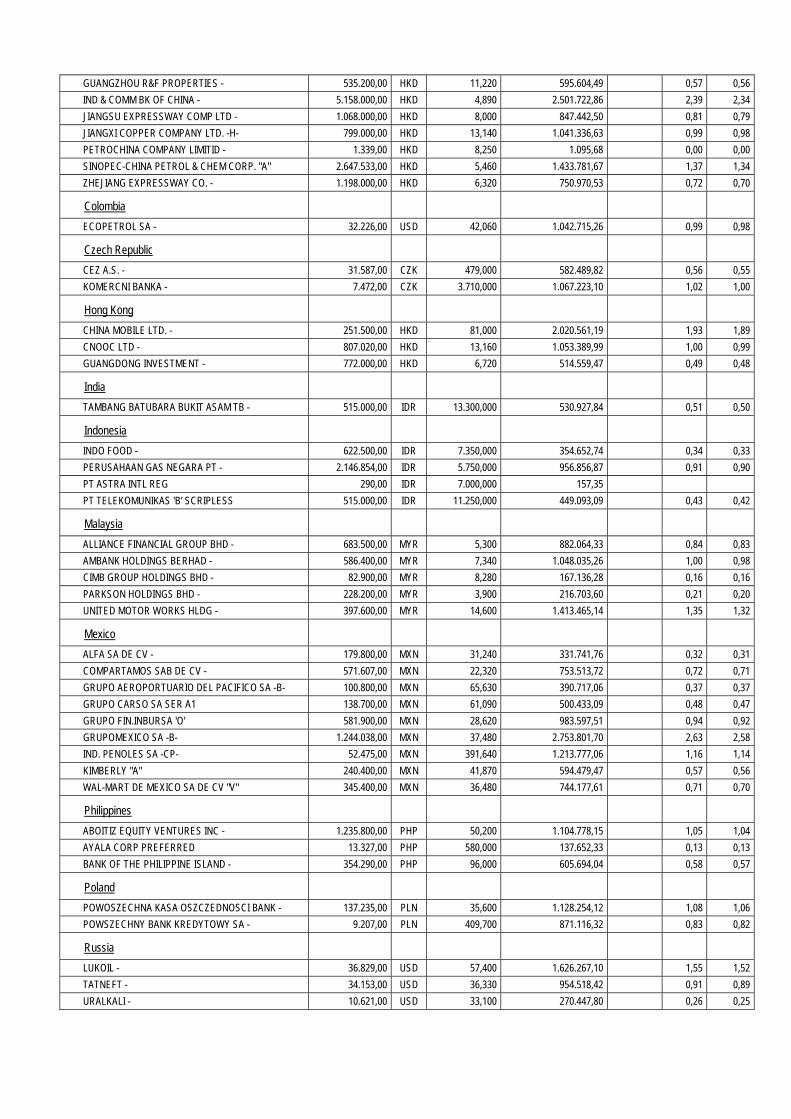
GUANGZHOU R&F PROPERTIES - 535.200,00 HKD 11,220 595.604,49 0,57 0,56
IND & COMM BK OF CHINA - 5.158.000,00 HKD 4,890 2.501.722,86 2,39 2,34
JIANGSU EXPRESSWAY COMP LTD - 1.068.000,00 HKD 8,000 847.442,50 0,81 0,79
JIANGXI COPPER COMPANY LTD. -H- 799.000,00 HKD 13,140 1.041.336,63 0,99 0,98
PETROCHINA COMPANY LIMITID - 1.339,00 HKD 8,250 1.095,68 0,00 0,00
SINOPEC-CHINA PETROL & CHEM CORP. "A" 2.647.533,00 HKD 5,460 1.433.781,67 1,37 1,34
ZHEJIANG EXPRESSWAY CO. - 1.198.000,00 HKD 6,320 750.970,53 0,72 0,70
Colombia
ECOPETROL SA - 32.226,00 USD 42,060 1.042.715,26 0,99 0,98
Czech Republic
CEZ A.S. - 31.587,00 CZK 479,000 582.489,82 0,56 0,55
KOMERCNI BANKA - 7.472,00 CZK 3.710,000 1.067.223,10 1,02 1,00
Hong Kong
CHINA MOBILE LTD. - 251.500,00 HKD 81,000 2.020.561,19 1,93 1,89
CNOOC LTD - 807.020,00 HKD 13,160 1.053.389,99 1,00 0,99
GUANGDONG INVESTMENT - 772.000,00 HKD 6,720 514.559,47 0,49 0,48
India
TAMBANG BATUBARA BUKIT ASAM TB - 515.000,00 IDR 13.300,000 530.927,84 0,51 0,50
Indonesia
INDO FOOD - 622.500,00 IDR 7.350,000 354.652,74 0,34 0,33
PERUSAHAAN GAS NEGARA PT - 2.146.854,00 IDR 5.750,000 956.856,87 0,91 0,90
PT ASTRA INTL REG 290,00 IDR 7.000,000 157,35
PT TELEKOMUNIKAS 'B' SCRIPLESS 515.000,00 IDR 11.250,000 449.093,09 0,43 0,42
Malaysia
ALLIANCE FINANCIAL GROUP BHD - 683.500,00 MYR 5,300 882.064,33 0,84 0,83
AMBANK HOLDINGS BERHAD - 586.400,00 MYR 7,340 1.048.035,26 1,00 0,98
CIMB GROUP HOLDINGS BHD - 82.900,00 MYR 8,280 167.136,28 0,16 0,16
PARKSON HOLDINGS BHD - 228.200,00 MYR 3,900 216.703,60 0,21 0,20
UNITED MOTOR WORKS HLDG - 397.600,00 MYR 14,600 1.413.465,14 1,35 1,32
Mexico
ALFA SA DE CV - 179.800,00 MXN 31,240 331.741,76 0,32 0,31
COMPARTAMOS SAB DE CV - 571.607,00 MXN 22,320 753.513,72 0,72 0,71
GRUPO AEROPORTUARIO DEL PACIFICO SA -B- 100.800,00 MXN 65,630 390.717,06 0,37 0,37
GRUPO CARSO SA SER A1 138.700,00 MXN 61,090 500.433,09 0,48 0,47
GRUPO FIN.INBURSA 'O' 581.900,00 MXN 28,620 983.597,51 0,94 0,92
GRUPOMEXICO SA -B- 1.244.038,00 MXN 37,480 2.753.801,70 2,63 2,58
IND. PENOLES SA -CP- 52.475,00 MXN 391,640 1.213.777,06 1,16 1,14
KIMBERLY "A" 240.400,00 MXN 41,870 594.479,47 0,57 0,56
WAL-MART DE MEXICO SA DE CV "V" 345.400,00 MXN 36,480 744.177,61 0,71 0,70
Philippines
ABOITIZ EQUITY VENTURES INC - 1.235.800,00 PHP 50,200 1.104.778,15 1,05 1,04
AYALA CORP PREFERRED 13.327,00 PHP 580,000 137.652,33 0,13 0,13
BANK OF THE PHILIPPINE ISLAND - 354.290,00 PHP 96,000 605.694,04 0,58 0,57
Poland
POWOSZECHNA KASA OSZCZEDNOSCI BANK - 137.235,00 PLN 35,600 1.128.254,12 1,08 1,06
POWSZECHNY BANK KREDYTOWY SA - 9.207,00 PLN 409,700 871.116,32 0,83 0,82
Russia
LUKOIL - 36.829,00 USD 57,400 1.626.267,10 1,55 1,52
TATNEFT - 34.153,00 USD 36,330 954.518,42 0,91 0,89
URALKALI - 10.621,00 USD 33,100 270.447,80 0,26 0,25
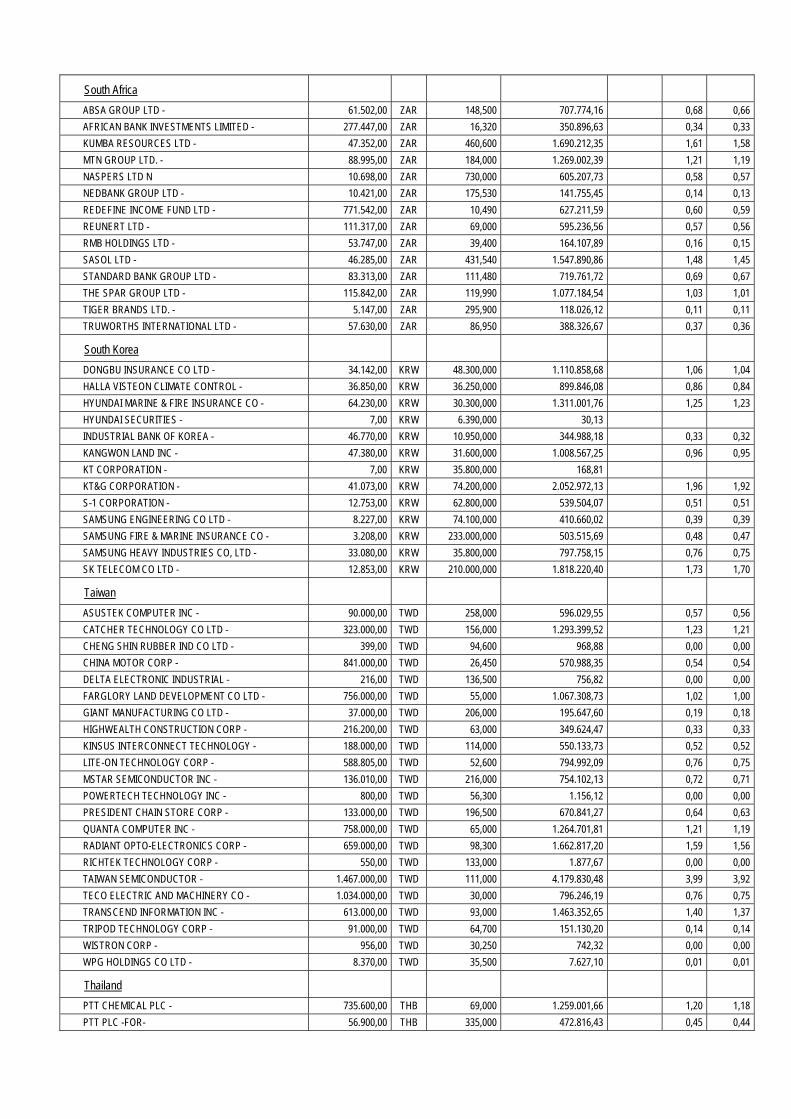
South Africa
ABSA GROUP LTD - 61.502,00 ZAR 148,500 707.774,16 0,68 0,66
AFRICAN BANK INVESTMENTS LIMITED - 277.447,00 ZAR 16,320 350.896,63 0,34 0,33
KUMBA RESOURCES LTD - 47.352,00 ZAR 460,600 1.690.212,35 1,61 1,58
MTN GROUP LTD. - 88.995,00 ZAR 184,000 1.269.002,39 1,21 1,19
NASPERS LTD N 10.698,00 ZAR 730,000 605.207,73 0,58 0,57
NEDBANK GROUP LTD - 10.421,00 ZAR 175,530 141.755,45 0,14 0,13
REDEFINE INCOME FUND LTD - 771.542,00 ZAR 10,490 627.211,59 0,60 0,59
REUNERT LTD - 111.317,00 ZAR 69,000 595.236,56 0,57 0,56
RMB HOLDINGS LTD - 53.747,00 ZAR 39,400 164.107,89 0,16 0,15
SASOL LTD - 46.285,00 ZAR 431,540 1.547.890,86 1,48 1,45
STANDARD BANK GROUP LTD - 83.313,00 ZAR 111,480 719.761,72 0,69 0,67
THE SPAR GROUP LTD - 115.842,00 ZAR 119,990 1.077.184,54 1,03 1,01
TIGER BRANDS LTD. - 5.147,00 ZAR 295,900 118.026,12 0,11 0,11
TRUWORTHS INTERNATIONAL LTD - 57.630,00 ZAR 86,950 388.326,67 0,37 0,36
South Korea
DONGBU INSURANCE CO LTD - 34.142,00 KRW 48.300,000 1.110.858,68 1,06 1,04
HALLA VISTEON CLIMATE CONTROL - 36.850,00 KRW 36.250,000 899.846,08 0,86 0,84
HYUNDAI MARINE & FIRE INSURANCE CO - 64.230,00 KRW 30.300,000 1.311.001,76 1,25 1,23
HYUNDAI SECURITIES - 7,00 KRW 6.390,000 30,13
INDUSTRIAL BANK OF KOREA - 46.770,00 KRW 10.950,000 344.988,18 0,33 0,32
KANGWON LAND INC - 47.380,00 KRW 31.600,000 1.008.567,25 0,96 0,95
KT CORPORATION - 7,00 KRW 35.800,000 168,81
KT&G CORPORATION - 41.073,00 KRW 74.200,000 2.052.972,13 1,96 1,92
S-1 CORPORATION - 12.753,00 KRW 62.800,000 539.504,07 0,51 0,51
SAMSUNG ENGINEERING CO LTD - 8.227,00 KRW 74.100,000 410.660,02 0,39 0,39
SAMSUNG FIRE & MARINE INSURANCE CO - 3.208,00 KRW 233.000,000 503.515,69 0,48 0,47
SAMSUNG HEAVY INDUSTRIES CO, LTD - 33.080,00 KRW 35.800,000 797.758,15 0,76 0,75
SK TELECOM CO LTD - 12.853,00 KRW 210.000,000 1.818.220,40 1,73 1,70
Taiwan
ASUSTEK COMPUTER INC - 90.000,00 TWD 258,000 596.029,55 0,57 0,56
CATCHER TECHNOLOGY CO LTD - 323.000,00 TWD 156,000 1.293.399,52 1,23 1,21
CHENG SHIN RUBBER IND CO LTD - 399,00 TWD 94,600 968,88 0,00 0,00
CHINA MOTOR CORP - 841.000,00 TWD 26,450 570.988,35 0,54 0,54
DELTA ELECTRONIC INDUSTRIAL - 216,00 TWD 136,500 756,82 0,00 0,00
FARGLORY LAND DEVELOPMENT CO LTD - 756.000,00 TWD 55,000 1.067.308,73 1,02 1,00
GIANT MANUFACTURING CO LTD - 37.000,00 TWD 206,000 195.647,60 0,19 0,18
HIGHWEALTH CONSTRUCTION CORP - 216.200,00 TWD 63,000 349.624,47 0,33 0,33
KINSUS INTERCONNECT TECHNOLOGY - 188.000,00 TWD 114,000 550.133,73 0,52 0,52
LITE-ON TECHNOLOGY CORP - 588.805,00 TWD 52,600 794.992,09 0,76 0,75
MSTAR SEMICONDUCTOR INC - 136.010,00 TWD 216,000 754.102,13 0,72 0,71
POWERTECH TECHNOLOGY INC - 800,00 TWD 56,300 1.156,12 0,00 0,00
PRESIDENT CHAIN STORE CORP - 133.000,00 TWD 196,500 670.841,27 0,64 0,63
QUANTA COMPUTER INC - 758.000,00 TWD 65,000 1.264.701,81 1,21 1,19
RADIANT OPTO-ELECTRONICS CORP - 659.000,00 TWD 98,300 1.662.817,20 1,59 1,56
RICHTEK TECHNOLOGY CORP - 550,00 TWD 133,000 1.877,67 0,00 0,00
TAIWAN SEMICONDUCTOR - 1.467.000,00 TWD 111,000 4.179.830,48 3,99 3,92
TECO ELECTRIC AND MACHINERY CO - 1.034.000,00 TWD 30,000 796.246,19 0,76 0,75
TRANSCEND INFORMATION INC - 613.000,00 TWD 93,000 1.463.352,65 1,40 1,37
TRIPOD TECHNOLOGY CORP - 91.000,00 TWD 64,700 151.130,20 0,14 0,14
WISTRON CORP - 956,00 TWD 30,250 742,32 0,00 0,00
WPG HOLDINGS CO LTD - 8.370,00 TWD 35,500 7.627,10 0,01 0,01
Thailand
PTT CHEMICAL PLC - 735.600,00 THB 69,000 1.259.001,66 1,20 1,18
PTT PLC -FOR- 56.900,00 THB 335,000 472.816,43 0,45 0,44
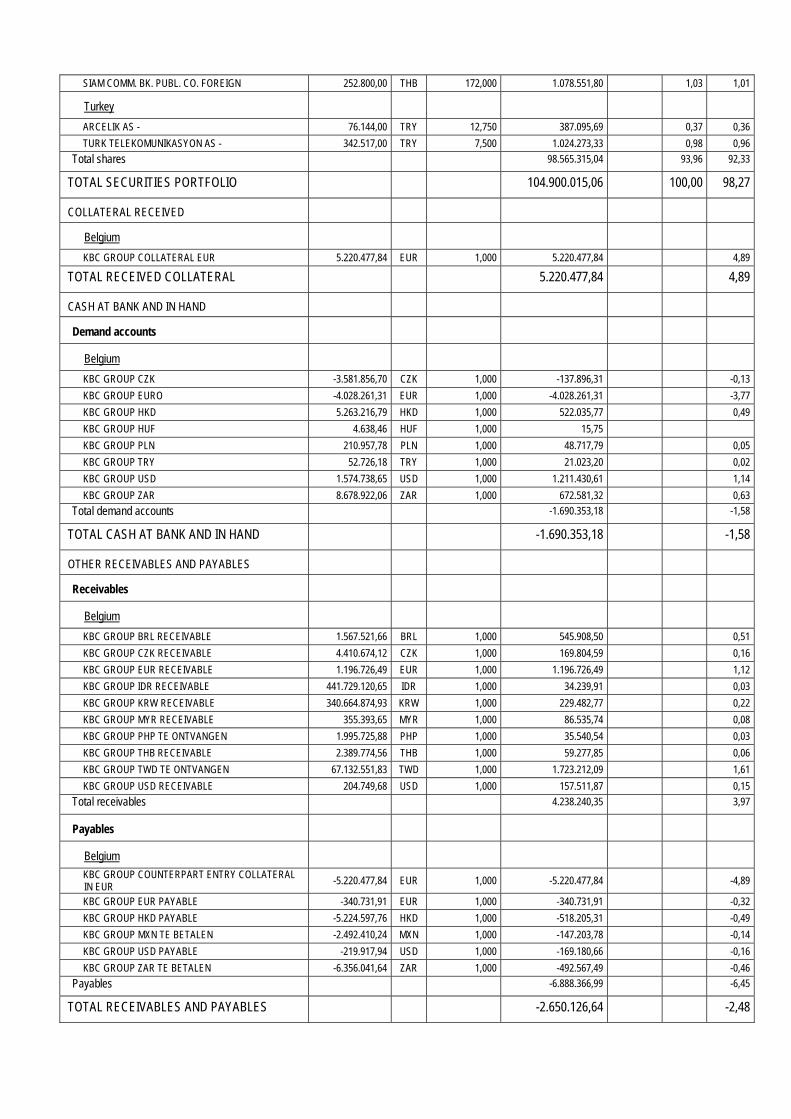
SIAM COMM. BK. PUBL. CO. FOREIGN 252.800,00 THB 172,000 1.078.551,80 1,03 1,01
Turkey
ARCELIK AS - 76.144,00 TRY 12,750 387.095,69 0,37 0,36
TURK TELEKOMUNIKASYON AS - 342.517,00 TRY 7,500 1.024.273,33 0,98 0,96
Total shares 98.565.315,04 93,96 92,33
TOTAL SECURITIES PORTFOLIO 104.900.015,06 100,00 98,27
COLLATERAL RECEIVED
Belgium
KBC GROUP COLLATERAL EUR 5.220.477,84 EUR 1,000 5.220.477,84 4,89
TOTAL RECEIVED COLLATERAL 5.220.477,84 4,89
CASH AT BANK AND IN HAND
Demand accounts
Belgium
KBC GROUP CZK -3.581.856,70 CZK 1,000 -137.896,31 -0,13
KBC GROUP EURO -4.028.261,31 EUR 1,000 -4.028.261,31 -3,77
KBC GROUP HKD 5.263.216,79 HKD 1,000 522.035,77 0,49
KBC GROUP HUF 4.638,46 HUF 1,000 15,75
KBC GROUP PLN 210.957,78 PLN 1,000 48.717,79 0,05
KBC GROUP TRY 52.726,18 TRY 1,000 21.023,20 0,02
KBC GROUP USD 1.574.738,65 USD 1,000 1.211.430,61 1,14
KBC GROUP ZAR 8.678.922,06 ZAR 1,000 672.581,32 0,63
Total demand accounts -1.690.353,18 -1,58
TOTAL CASH AT BANK AND IN HAND -1.690.353,18 -1,58
OTHER RECEIVABLES AND PAYABLES
Receivables
Belgium
KBC GROUP BRL RECEIVABLE 1.567.521,66 BRL 1,000 545.908,50 0,51
KBC GROUP CZK RECEIVABLE 4.410.674,12 CZK 1,000 169.804,59 0,16
KBC GROUP EUR RECEIVABLE 1.196.726,49 EUR 1,000 1.196.726,49 1,12
KBC GROUP IDR RECEIVABLE 441.729.120,65 IDR 1,000 34.239,91 0,03
KBC GROUP KRW RECEIVABLE 340.664.874,93 KRW 1,000 229.482,77 0,22
KBC GROUP MYR RECEIVABLE 355.393,65 MYR 1,000 86.535,74 0,08
KBC GROUP PHP TE ONTVANGEN 1.995.725,88 PHP 1,000 35.540,54 0,03
KBC GROUP THB RECEIVABLE 2.389.774,56 THB 1,000 59.277,85 0,06
KBC GROUP TWD TE ONTVANGEN 67.132.551,83 TWD 1,000 1.723.212,09 1,61
KBC GROUP USD RECEIVABLE 204.749,68 USD 1,000 157.511,87 0,15
Total receivables 4.238.240,35 3,97
Payables
Belgium
KBC GROUP COUNTERPART ENTRY COLLATERAL IN EUR
-5.220.477,84 EUR 1,000 -5.220.477,84 -4,89
KBC GROUP EUR PAYABLE -340.731,91 EUR 1,000 -340.731,91 -0,32
KBC GROUP HKD PAYABLE -5.224.597,76 HKD 1,000 -518.205,31 -0,49
KBC GROUP MXN TE BETALEN -2.492.410,24 MXN 1,000 -147.203,78 -0,14
KBC GROUP USD PAYABLE -219.917,94 USD 1,000 -169.180,66 -0,16
KBC GROUP ZAR TE BETALEN -6.356.041,64 ZAR 1,000 -492.567,49 -0,46
Payables -6.888.366,99 -6,45
TOTAL RECEIVABLES AND PAYABLES -2.650.126,64 -2,48
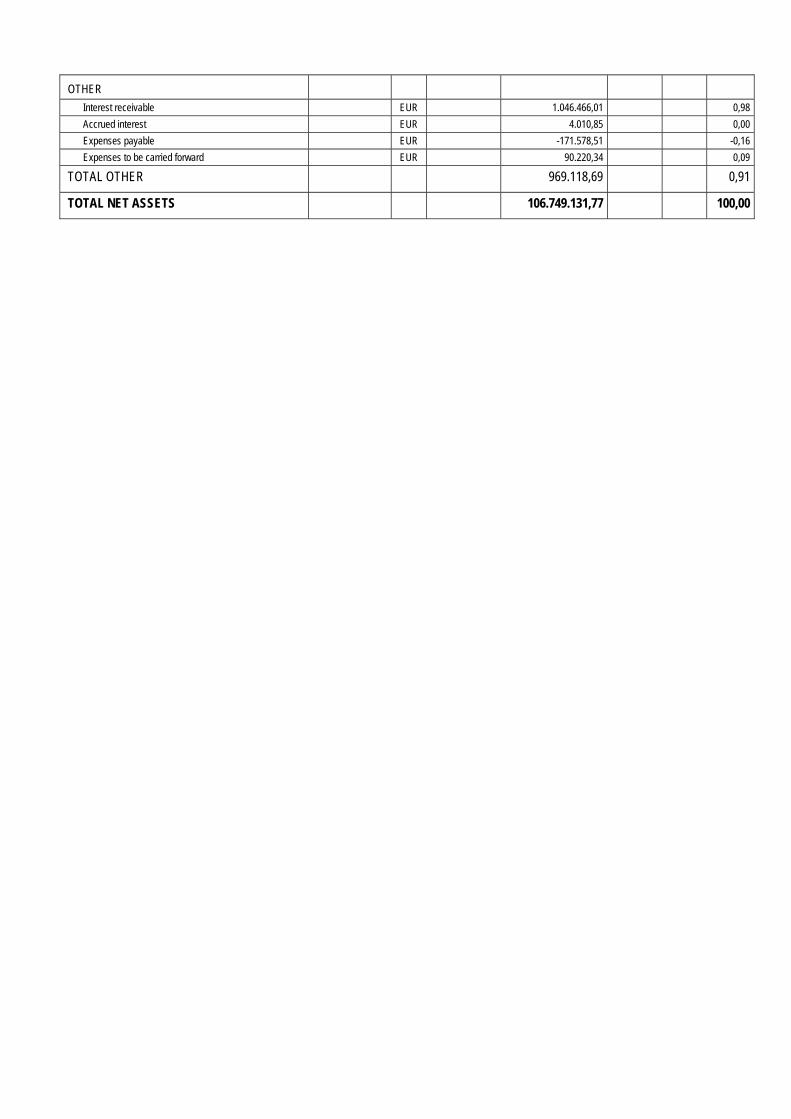
OTHER
Interest receivable EUR 1.046.466,01 0,98
Accrued interest EUR 4.010,85 0,00
Expenses payable EUR -171.578,51 -0,16
Expenses to be carried forward EUR 90.220,34 0,09
TOTAL OTHER 969.118,69 0,91
TOTAL NET ASSETS 106.749.131,77 100,00
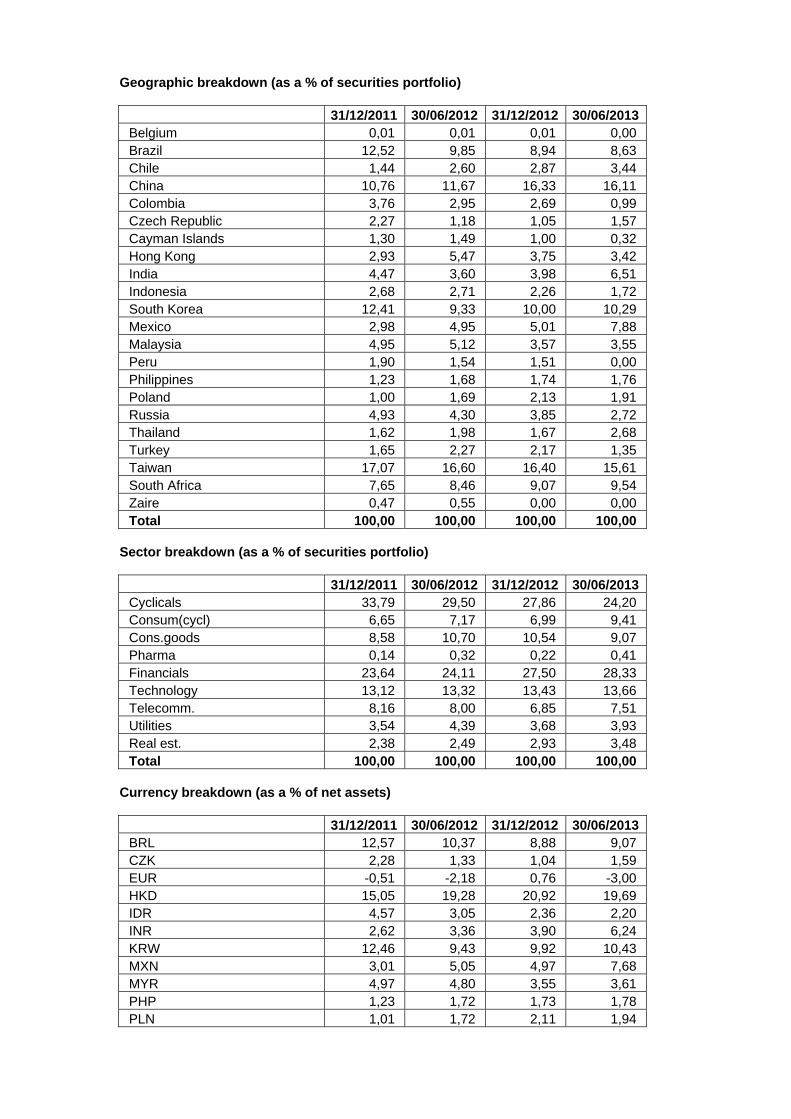
Geographic breakdown (as a % of securities portfolio)
31/12/2011 30/06/2012 31/12/2012 30/06/2013 Belgium 0,01 0,01 0,01 0,00 Brazil 12,52 9,85 8,94 8,63 Chile 1,44 2,60 2,87 3,44 China 10,76 11,67 16,33 16,11 Colombia 3,76 2,95 2,69 0,99 Czech Republic 2,27 1,18 1,05 1,57 Cayman Islands 1,30 1,49 1,00 0,32 Hong Kong 2,93 5,47 3,75 3,42 India 4,47 3,60 3,98 6,51 Indonesia 2,68 2,71 2,26 1,72 South Korea 12,41 9,33 10,00 10,29 Mexico 2,98 4,95 5,01 7,88 Malaysia 4,95 5,12 3,57 3,55 Peru 1,90 1,54 1,51 0,00 Philippines 1,23 1,68 1,74 1,76 Poland 1,00 1,69 2,13 1,91 Russia 4,93 4,30 3,85 2,72 Thailand 1,62 1,98 1,67 2,68 Turkey 1,65 2,27 2,17 1,35 Taiwan 17,07 16,60 16,40 15,61 South Africa 7,65 8,46 9,07 9,54 Zaire 0,47 0,55 0,00 0,00 Total 100,00 100,00 100,00 100,00
Sector breakdown (as a % of securities portfolio)
31/12/2011 30/06/2012 31/12/2012 30/06/2013 Cyclicals 33,79 29,50 27,86 24,20 Consum(cycl) 6,65 7,17 6,99 9,41 Cons.goods 8,58 10,70 10,54 9,07 Pharma 0,14 0,32 0,22 0,41 Financials 23,64 24,11 27,50 28,33 Technology 13,12 13,32 13,43 13,66 Telecomm. 8,16 8,00 6,85 7,51 Utilities 3,54 4,39 3,68 3,93 Real est. 2,38 2,49 2,93 3,48 Total 100,00 100,00 100,00 100,00
Currency breakdown (as a % of net assets)
31/12/2011 30/06/2012 31/12/2012 30/06/2013 BRL 12,57 10,37 8,88 9,07 CZK 2,28 1,33 1,04 1,59 EUR -0,51 -2,18 0,76 -3,00 HKD 15,05 19,28 20,92 19,69 IDR 4,57 3,05 2,36 2,20 INR 2,62 3,36 3,90 6,24 KRW 12,46 9,43 9,92 10,43 MXN 3,01 5,05 4,97 7,68 MYR 4,97 4,80 3,55 3,61 PHP 1,23 1,72 1,73 1,78 PLN 1,01 1,72 2,11 1,94

THB 1,63 2,00 1,66 2,71 TRY 1,65 2,36 2,15 1,35 TWD 17,14 17,13 16,26 17,11 USD 12,15 11,38 10,78 7,97 ZAR 8,17 9,20 9,01 9,63 Total 100,00 100,00 100,00 100,00

2.4.2 CHANGES IN THE COMPOSITION OF THE ASSETS OF KBC EQUITY FUND HIGH DIVIDEND NEW
MARKETS (IN THE CURRENCY OF THE SUB-FUND)
1st half of year YearPurchases 71.195.788,74 71.195.788,74 Sales 163.303.920,67 163.303.920,67 Total 1 234.499.709,41 234.499.709,41 Subscriptions 54.904.642,05 54.904.642,05 Redemptions 147.864.353,39 147.864.353,39 Total 2 202.768.995,44 202.768.995,44 Monthly average of total assets
172.828.670,08 172.828.670,08
Turnover rate 18,36 % 18,36 %
1st half of year YearPurchases 71.195.788,74 71.195.788,74 Sales 163.303.920,67 163.303.920,67 Total 1 234.499.709,41 234.499.709,41 Subscriptions 54.904.642,05 54.904.642,05 Redemptions 147.864.353,39 147.864.353,39 Total 2 202.768.995,44 202.768.995,44 Monthly average of total assets
152.948.587,53 152.948.587,53
Corrected turnover rate 20,75 % 20,75 %
The table above shows the capital volume of portfolio transactions. This volume (adjusted to take account of total subscriptions and redemptions) is also compared to the average net assets at the beginning and end of the period. A figure close to 0% implies that the transactions relating to the securities or transactions relating to the assets (excluding deposits and cash) in a given period only involve subscriptions and redemptions. A negative percentage shows that subscriptions and redemptions entailed few, if any, transactions in the portfolio. Active asset management may result in high turnover rates (monthly percentage >50%). The detailed list of transactions is available for consultation free of charge at the registered office of the Bevek or fund at Havenlaan 2, 1080 Brussels.

2.4.3 AMOUNT OF COMMITMENTS IN RESPECT OF FINANCIAL DERIVATIVES POSITIONS
NAME Currency Value in currency
In the currency of the sub-fund
Lot-size
Transactiondate
KBC COLLATERAL EUR
EUR 5.220.477,84 5.220.477,84 N/A 28.06.2013
2.4.4 CHANGES OF THE NUMBER OF SUBSCRIPTIONS AND REDEMPTIONS AND THE NET ASSET
VALUE
Classic Shares
Period Change in number of shares in circulation
Year Subscriptions Redemptions End of period
Cap. Dis. Cap. Dis. Cap. Dis. Total
2011 - 06 562.274,78 9.649,03 388.402,52 1.812,00 361.019,07 13.960,46 374.979,53
2012 - 06 109.355,76 1.156,95 431.210,14 4.149,35 39.164,69 10.968,06 50.132,75
2013 - 06 22.874,77 2.037,97 26.565,25 2.530,22 35.474,21 10.475,81 45.950,02
Period Amounts received and paid by the UCI
(in the currency of the class)
Year Subscriptions Redemptions
Capitalization Distribution Capitalization Distribution
2011 - 06 248.653.074,40 4.193.246,34 169.879.581,40 772.333,17
2012 - 06 44.784.929,17 445.373,10 163.226.714,90 1.618.811,58
2013 - 06 10.388.753,59 870.204,79 11.595.638,18 1.063.851,08
Period Net asset value
End of period (in the currency of the class)
Year Of the class Of one share
Capitalization Distribution
2011 - 06 163.585.171,48 436,84 421,08
2012 - 06 20.965.577,76 423,34 399,85
2013 - 06 19.394.048,24 429,64 396,43
Institutional B Shares
Period Change in number of shares in circulation
Year Subscriptions Redemptions End of period
Cap. Dis. Cap. Dis. Cap. Dis. Total 2012 - 06 505.467,00 169.143,00 336.324,00 336.324,00
2013 - 06 372.949,21 506.241,70 203.031,51 203.031,51
Period Amounts received and paid by the UCI
(in the currency of the class)
Year Subscriptions Redemptions
Capitalization Distribution Capitalization Distribution
2012 - 06 207.394.122,60 71.272.570,57
2013 - 06 167.767.704,60 226.558.971,80
Period Net asset value
End of period (in the currency of the class)

Year Of the class Of one share
Capitalization Distribution
2012 - 06 142.517.583,70 423,75
2013 - 06 87.355.083,52 430,25
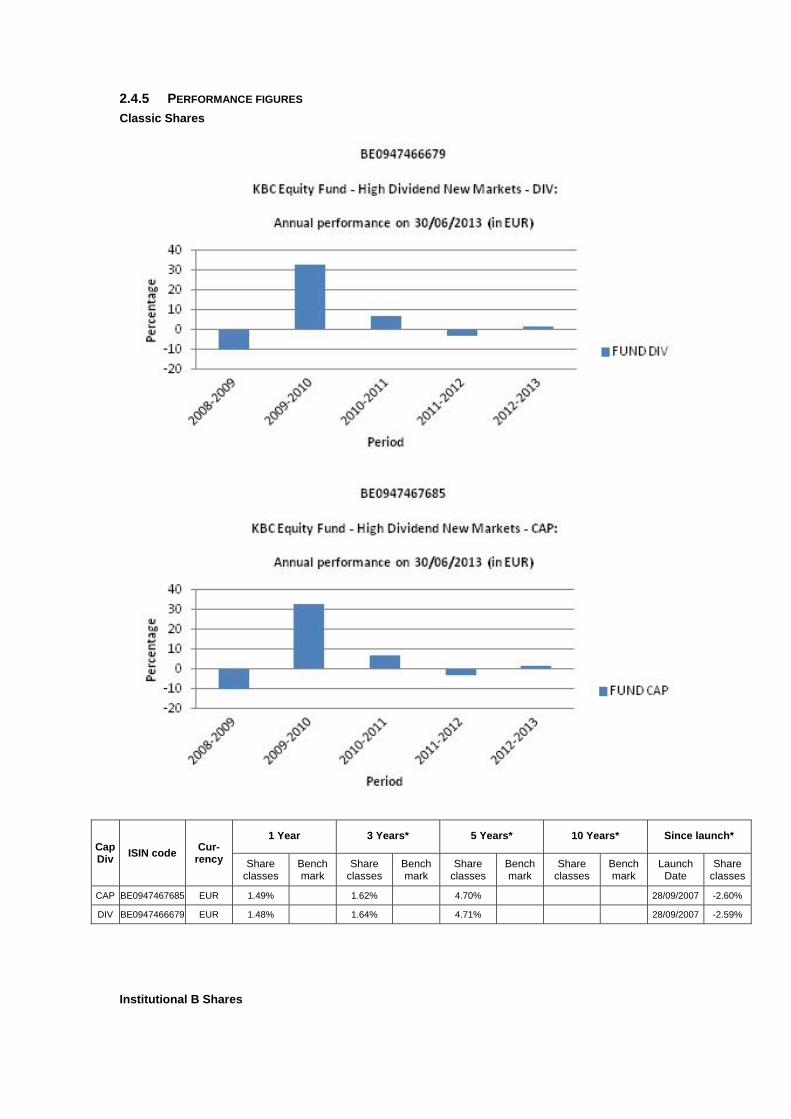
2.4.5 PERFORMANCE FIGURES
Classic Shares
Cap Div
ISIN code Cur-
rency
1 Year 3 Years* 5 Years* 10 Years* Since launch*
Share classes
Bench mark
Share classes
Bench mark
Share classes
Bench mark
Share classes
Bench mark
Launch Date
Share classes
CAP BE0947467685 EUR 1.49% 1.62% 4.70% 28/09/2007 -2.60%
DIV BE0947466679 EUR 1.48% 1.64% 4.71% 28/09/2007 -2.59%
Institutional B Shares
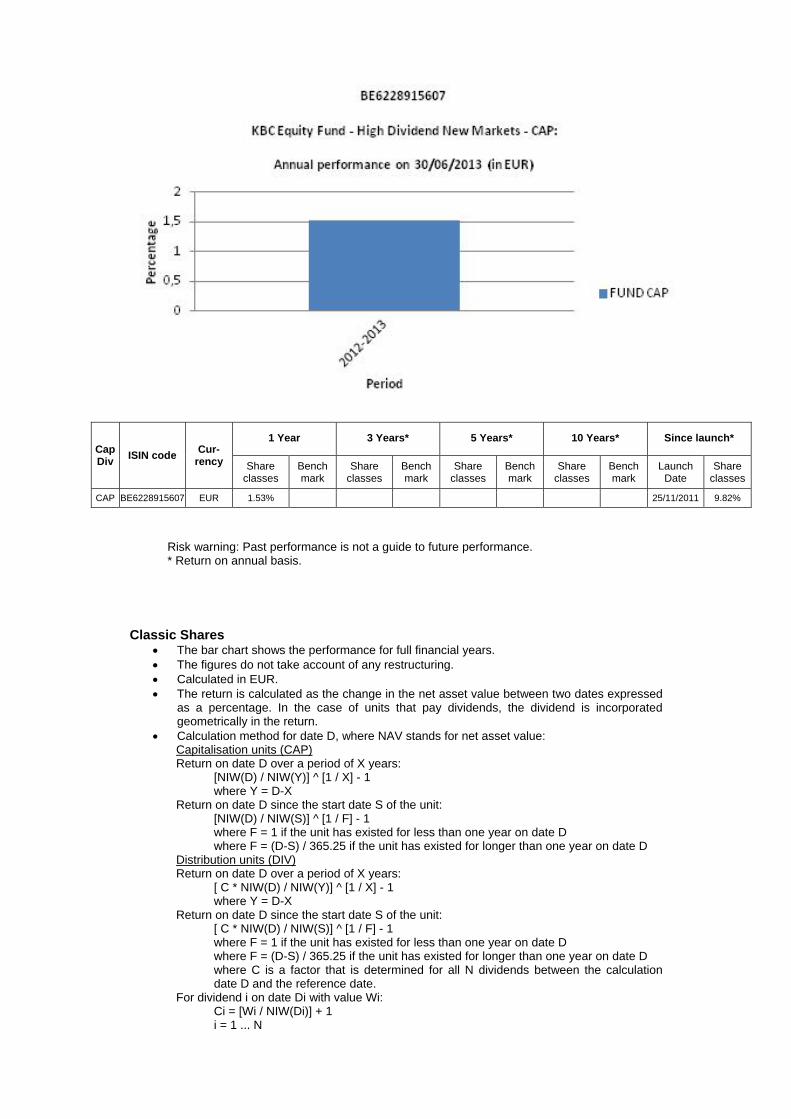
Cap Div
ISIN code Cur-
rency
1 Year 3 Years* 5 Years* 10 Years* Since launch*
Share classes
Bench mark
Share classes
Bench mark
Share classes
Bench mark
Share classes
Bench mark
Launch Date
Share classes
CAP BE6228915607 EUR 1.53% 25/11/2011 9.82%
Risk warning: Past performance is not a guide to future performance. * Return on annual basis.
Classic Shares The bar chart shows the performance for full financial years. The figures do not take account of any restructuring. Calculated in EUR. The return is calculated as the change in the net asset value between two dates expressed
as a percentage. In the case of units that pay dividends, the dividend is incorporated geometrically in the return.
Calculation method for date D, where NAV stands for net asset value: Capitalisation units (CAP) Return on date D over a period of X years:
[NIW(D) / NIW(Y)] ^ [1 / X] - 1 where Y = D-X
Return on date D since the start date S of the unit: [NIW(D) / NIW(S)] ^ [1 / F] - 1 where F = 1 if the unit has existed for less than one year on date D where F = (D-S) / 365.25 if the unit has existed for longer than one year on date D
Distribution units (DIV) Return on date D over a period of X years:
[ C * NIW(D) / NIW(Y)] ^ [1 / X] - 1 where Y = D-X
Return on date D since the start date S of the unit: [ C * NIW(D) / NIW(S)] ^ [1 / F] - 1 where F = 1 if the unit has existed for less than one year on date D where F = (D-S) / 365.25 if the unit has existed for longer than one year on date D where C is a factor that is determined for all N dividends between the calculation date D and the reference date.
For dividend i on date Di with value Wi: Ci = [Wi / NIW(Di)] + 1 i = 1 ... N

from whichC = C0 * .... * CN. If the interval between the two dates exceeds one year, the ordinary return calculation is
converted into a return on an annual basis by taking the nth square root of 1 plus the total return of the unit.
The return figures shown above do not take account of the fees and charges associated with the issue and redemption of units.
These are the performance figures for capitalisation and distribution shares.
Institutional B Shares The bar chart shows the performance for full financial years. The figures do not take account of any restructuring. Calculated in EUR. The return is calculated as the change in the net asset value between two dates expressed
as a percentage. Calculation method for date D, where NAV stands for net asset value:
Capitalisation units (CAP) Return on date D over a period of X years:
[NIW(D) / NIW(Y)] ^ [1 / X] - 1 where Y = D-X
Return on date D since the start date S of the unit: [NIW(D) / NIW(S)] ^ [1 / F] - 1 where F = 1 if the unit has existed for less than one year on date D where F = (D-S) / 365.25 if the unit has existed for longer than one year on date D
If the interval between the two dates exceeds one year, the ordinary return calculation is converted into a return on an annual basis by taking the nth square root of 1 plus the total return of the unit.
The return figures shown above do not take account of the fees and charges associated with the issue and redemption of units.
These are the performance figures for capitalization shares.

2.4.6 COSTS Ongoing Charges: * Classic Shares Distribution: 1.877% Classic Shares Capitalization: 1.871% Institutional B Shares Capitalization: 1.81% * The following costs have not been included in the ongoing charges: - Interest payments on loans taken out - Payments in respect of financial derivatives - Fees and charges paid directly by the investor - Any soft commissions
SOFT COMMISSIONS The management company or the appointed manager, as the case may be, is the recipient of soft commissions. The recipient has laid down an internal policy as regards accepting soft commissions and avoiding possible conflicts of interest in this respect, and has put appropriate internal controls in place to ensure this policy is observed. For more information, please see the ‘General’ section of the annual report.
Broker
Commission gross
in EUR
paid during the period:
1‐01‐13
‐
30‐06‐13
CSA Credits
in EUR
accrued during the period:
1‐01‐13
‐
30‐06‐13 Percentage
CITI 88,609 44,313 50.01%
CSFBSAS 11,108 5,377 48.40%
DEUTSCHE 930 465 50.00%
EQ MACQUARIE 491 246 50.00%
HSBC 1,773 296 16.67%
INSTINET 20,018 8,610 43.01%
MERRILL 6,115 2,915 47.67%
MORGAN STANLEY 6,149 2,427 39.47%
UBSWDR 1,293 647 50.00%
WOOD 1,070 178 16.67%
FEE-SHARING AGREEMENTS AND REBATES: The management company may share its fee with the distributor, and institutional and/or professional parties. In principle, the percentage share amounts to between 35% and 60% if the distributor is an entity of KBC Group NV or to between 35% and 70% if the distributor is not an entity of KBC Group NV. However, in a small number of cases, the distributor’s fee is less than 35%. Investors may, on request, obtain more information on these cases. If the management company invests the assets of the undertaking for collective investment in units of undertakings for collective investment that are not managed by an entity of KBC Group NV, and receives a fee for doing so, it will pay this fee to the undertaking for collective investment. Fee-sharing does not affect the amount of the management fee paid by the sub-fund to the management company. This management fee is subject to the limitations laid down in the articles of association. The limitations may only be amended after approval by the general meeting of shareholders. The management company has concluded a distribution agreement with the distributor in order to facilitate the wider distribution of the sub-fund's units by using multiple distribution channels. It is in the interests of the holders of units, the sub-fund and of the distributor for the largest possible number of units to be sold and for the assets of the sub-fund to be maximised in this way. In this respect, there is therefore no question of any conflict of interest.
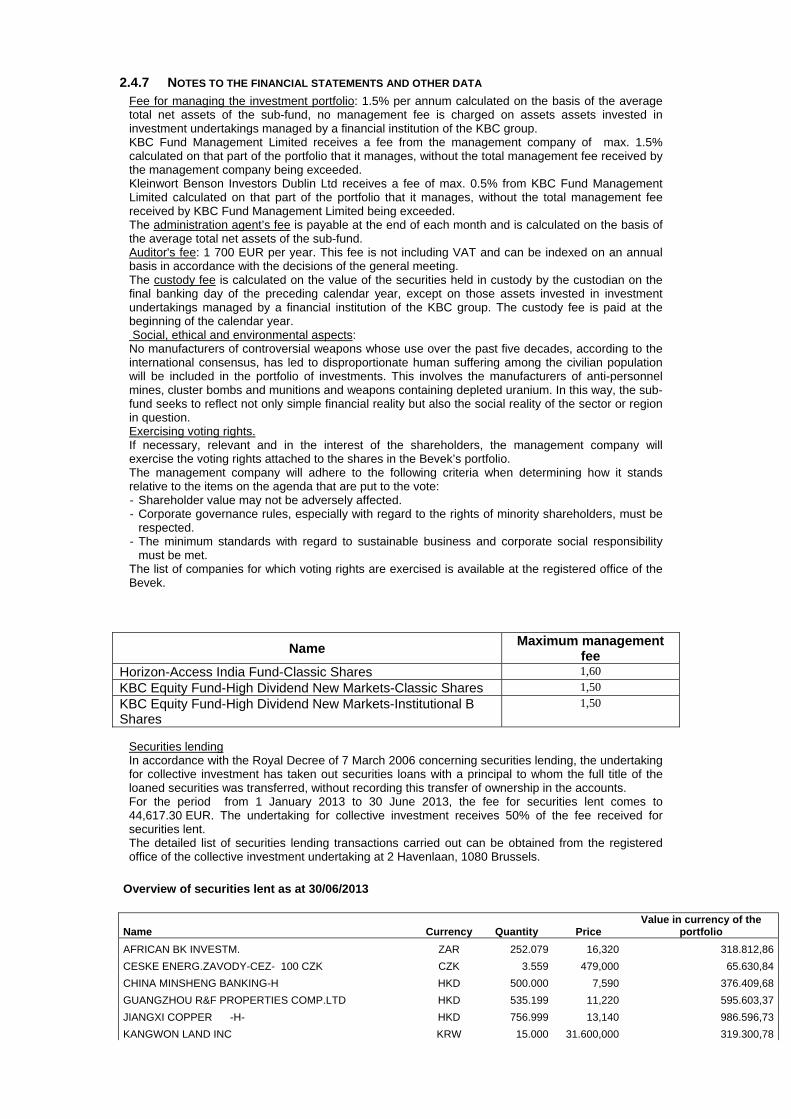
2.4.7 NOTES TO THE FINANCIAL STATEMENTS AND OTHER DATA Fee for managing the investment portfolio: 1.5% per annum calculated on the basis of the average total net assets of the sub-fund, no management fee is charged on assets assets invested in investment undertakings managed by a financial institution of the KBC group. KBC Fund Management Limited receives a fee from the management company of max. 1.5% calculated on that part of the portfolio that it manages, without the total management fee received by the management company being exceeded. Kleinwort Benson Investors Dublin Ltd receives a fee of max. 0.5% from KBC Fund Management Limited calculated on that part of the portfolio that it manages, without the total management fee received by KBC Fund Management Limited being exceeded. The administration agent’s fee is payable at the end of each month and is calculated on the basis of the average total net assets of the sub-fund. Auditor's fee: 1 700 EUR per year. This fee is not including VAT and can be indexed on an annual basis in accordance with the decisions of the general meeting. The custody fee is calculated on the value of the securities held in custody by the custodian on the final banking day of the preceding calendar year, except on those assets invested in investment undertakings managed by a financial institution of the KBC group. The custody fee is paid at the beginning of the calendar year. Social, ethical and environmental aspects: No manufacturers of controversial weapons whose use over the past five decades, according to the international consensus, has led to disproportionate human suffering among the civilian population will be included in the portfolio of investments. This involves the manufacturers of anti-personnel mines, cluster bombs and munitions and weapons containing depleted uranium. In this way, the sub-fund seeks to reflect not only simple financial reality but also the social reality of the sector or region in question. Exercising voting rights. If necessary, relevant and in the interest of the shareholders, the management company will exercise the voting rights attached to the shares in the Bevek’s portfolio. The management company will adhere to the following criteria when determining how it stands relative to the items on the agenda that are put to the vote: - Shareholder value may not be adversely affected. - Corporate governance rules, especially with regard to the rights of minority shareholders, must be
respected. - The minimum standards with regard to sustainable business and corporate social responsibility
must be met. The list of companies for which voting rights are exercised is available at the registered office of the Bevek.
Name Maximum management
fee Horizon-Access India Fund-Classic Shares 1,60
KBC Equity Fund-High Dividend New Markets-Classic Shares 1,50
KBC Equity Fund-High Dividend New Markets-Institutional B Shares
1,50
Securities lending In accordance with the Royal Decree of 7 March 2006 concerning securities lending, the undertaking for collective investment has taken out securities loans with a principal to whom the full title of the loaned securities was transferred, without recording this transfer of ownership in the accounts. For the period from 1 January 2013 to 30 June 2013, the fee for securities lent comes to 44,617.30 EUR. The undertaking for collective investment receives 50% of the fee received for securities lent. The detailed list of securities lending transactions carried out can be obtained from the registered office of the collective investment undertaking at 2 Havenlaan, 1080 Brussels.
Overview of securities lent as at 30/06/2013
Name Currency Quantity Price Value in currency of the
portfolio
AFRICAN BK INVESTM. ZAR 252.079 16,320 318.812,86
CESKE ENERG.ZAVODY-CEZ- 100 CZK CZK 3.559 479,000 65.630,84
CHINA MINSHENG BANKING-H HKD 500.000 7,590 376.409,68
GUANGZHOU R&F PROPERTIES COMP.LTD HKD 535.199 11,220 595.603,37
JIANGXI COPPER -H- HKD 756.999 13,140 986.596,73
KANGWON LAND INC KRW 15.000 31.600,000 319.300,78

POWSZECHNA KASA OSZC PLN 134.423 35,600 1.105.135,74
POWSZECHNY ZAKLAD UBEZPIECZEN SA PLN 8.766 409,700 829.391,30
TIGER BRANDS LTD ZAR 5.146 295,900 118.003,19
Total 4.714.884,49

Semi-Annual report as at 30th June 2013
TABLE OF CONTENTS
2. Information on KBC Equity Fund Buyback Europe
2.1. Management report 2.1.1. Launch date and subscription price 2.1.2. Stock exchange listing 2.1.3. Aim and distinctive features of the investment policy 2.1.4. Financial portfolio management 2.1.5. Distributors 2.1.6. Index and benchmark 2.1.7. Policy conducted during the financial year 2.1.8. Future policy 2.1.9. Synthetic risk and reward indicator (SRRI)
2.2. Balance sheet
2.3. Profit and loss account
2.4. Composition of the assets and key figures
2.4.1. Composition of the assets 2.4.2. Change in the composition of the assets 2.4.3. Value of commitments in respect of financial derivatives positions 2.4.4. Evolution of the number of subscriptions, repayments and the net asset value 2.4.5. Return figures 2.4.6. Expenses 2.4.7. Notes to the financial statements and other data


2 INFORMATION ON KBC EQUITY FUND BUYBACK EUROPE
2.1 MANAGEMENT REPORT
2.1.1 LAUNCH DATE AND SUBSCRIPTION PRICE Classic Shares : Launch date: 30 June 2000 Initial subscription price: 500 EUR Currency: EUR Institutional B Shares : Launch date: 24 November 2011 Initial subscription price: 459.08 EUR Currency: EUR
2.1.2 STOCK EXCHANGE LISTING Not applicable.
2.1.3 GOAL AND KEY PRINCIPLES OF THE INVESTMENT POLICY
SUB-FUND’S OBJECT: The main objective of this sub-fund is to generate the highest possible return for its shareholders by investing directly or indirectly in transferable securities. This is reflected in its pursuit of capital gains and income. To this end, the assets are invested, either directly or indirectly via correlated financial instruments, primarily in shares.
SUB-FUND’S INVESTMENT POLICY:
PERMITTED ASSET CLASSES: The sub-fund may invest in securities, money market instruments, units in undertakings for collective investment, deposits, financial derivatives, liquid assets and all other instruments insofar as permitted by the applicable laws and regulations and consistent with the sub-fund’s object The sub-fund shall invest no more than 10% of its assets in units of other undertakings for collective investment.
RESTRICTIONS OF THE INVESTMENT POLICY: The investment policy will be implemented within the limits set by law and regulations. The sub-fund may borrow up to 10% of its net assets, insofar as these are short-term borrowings aimed at solving temporary liquidity problems.
PERMITTED DERIVATIVES TRANSACTIONS: Derivates may be used either for hedging purposes or to achieve investment objectives. Changes will be made to the investments at regular intervals to comply with the sub-fund's investment strategy. In addition, listed and unlisted derivates may be used to achieve the objectives: these may be forward contracts, options or swaps on securities, indices, currencies or interest rates or other transactions involving derivatives. Unlisted derivatives transactions will only be concluded with prime financial institutions specialised in such transactions. Such derivatives may also be used to hedge the assets against exchange-rate fluctuations. Subject to the applicable laws and regulations and the articles of association, the sub-fund always seeks to conclude the most effective transactions. All costs associated with the transactions will be charged to the sub-fund and all income generated will be paid to the sub-fund. If the transactions result in a risk in respect of the counterparty, this risk can be hedged by using a margin management system that ensures that the sub-fund is the beneficiary of security (collateral) in the form of cash or investment grade bonds. When calculating the value of the bonds, a margin will be applied that varies depending on the residual term to maturity and the currency in which the bond in question is denominated. The relationship with the counterparty or counterparties is governed by standard international agreements.
STRATEGY SELECTED A least 75% of the assets are invested in shares of European companies with a policy of share buy-backs. More specifically, this involves companies whose buy-back policy may be considered as an indicator of a capital gain on the investment in the short or medium term.
RISK CONCENTRATION Shares of European companies with a policy of share buy-backs.
LENDING FINANCIAL INSTRUMENTS: The sub-fund may lend financial instruments within the limits set by law and regulations. This lending does not affect the sub-fund’s risk profile since: - it takes place within the framework of a securities lending system managed by a principal. In
addition, the sub-fund has a relationship only with the principal of the securities lending system which acts as counterparty and to which title of the loaned securities is transferred. The choice of principal is subject to strict selection criteria. The return of securities similar to the securities that have been lent is guaranteed by the principal.
- through a margin management system, the sub-fund is always guaranteed financial security, the actual value of which always exceeds the actual value of the securities that have been lent, in case the principal does not return similar securities.
The return of securities similar to the securities that have been lent can be requested at any time, which means that the lending of securities does not affect the management of the sub-fund's assets. By lending securities, the sub-fund can generate an additional return. The principal pays a fee to the management company. After deducting the fee for the margin management and clearing services of KBC Bank, most of this fee is paid to the sub-fund. The relationship with the counterparty or counterparties is governed by standard international agreements. More information is provided on the terms and conditions governing securities lending in the annual or half-yearly report for the sub-fund.
VOLATILITY OF THE NET ASSET VALUE: The volatility of the net asset value may be high due to the composition of the portfolio.
GENERAL STRATEGY FOR HEDGING THE EXCHANGE RATE RISK: In order to protect its assets against exchange rate fluctuations and within the limitations laid down in the articles of association, the sub-fund may perform transactions relating to the sale of forward currency contracts, as well as the sale of call options and the purchase of put options on currencies. The transactions in question may relate solely to contracts traded on a regulated market that operates regularly, is recognised and is open to the public or that are traded with a recognised, prime financial institution specialising in such transactions and dealing in the over-the-counter (OTC) market in options. With the same objective, the sub-fund may also sell currencies forward or exchange them in private transactions with prime financial institutions specialising in such transactions. The hedging objective of the aforementioned transactions suggests that there is a direct link between these transactions and the assets to be hedged, which implies that the transactions carried out in a particular currency may in principle not exceed, in terms of volume, either the valuation value of all the assets in the same currency or the holding period of those assets.
SOCIAL, ETHICAL AND ENVIRONMENTAL ASPECTS:
No manufacturers of controversial weapons whose use over the past five decades, according to the international consensus, has led to disproportionate human suffering among the civilian population will be included in the portfolio of investments. This involves the manufacturers of anti-personnel mines, cluster bombs and munitions and weapons containing depleted uranium. In this way, the sub-fund seeks to reflect not only simple financial reality but also the social reality of the sector or region in question.
THE EUROPEAN SAVINGS DIRECTIVE AND TAX ON DEBT CLAIM RETURNS OBTAINED THROUGH THE
REDEMPTION OF OWN UNITS OR IN THE EVENT OF FULL OR PARTIAL DISTRIBUTION OF EQUITY
CAPITAL.

The following information is of a general character and is not intended to cover all aspects of an investment in a UCITS. In certain cases entirely different rules might even apply. Moreover, both tax law and the interpretation of it can change. Investors who wish to have more information about the tax implications – in both Belgium and abroad – of acquiring, holding and transferring units should seek the advice of their usual financial and tax advisers. This UCITS shall invest a maximum of 15% of its assets directly or indirectly in debt instruments as intended by the European Savings Directive. A. European Savings Directive (Directive 2003/48/EC) The European Savings Directive has been implemented in Belgium. Since this UCITS invests a maximum of 15% of its assets directly or indirectly in debt claims as intended by the European Savings Directive, the income of this UCITS does not fall within the scope of this directive. B. Tax on debt claim returns obtained through the redemption of own units or in the event of full or partial distribution of equity capital (Article 19bis Income Tax Code 1992). The income from this UCITS is not subject to the tax on debt instrument returns as intended by Article 19bis, Income Tax Code 1992.
2.1.4 FINANCIAL PORTFOLIO MANAGEMENT The management company has delegated the intellectual management, to KBC Fund Management Limited, Joshua Dawson House, Dawson Street , Dublin 2, IRELAND..
2.1.5 DISTRIBUTORS KBC Asset Management S.A., 5, Place de la Gare, L-1616 Luxembourg.
2.1.6 INDEX AND BENCHMARK See ‘Sub-fund’s investment policy’.
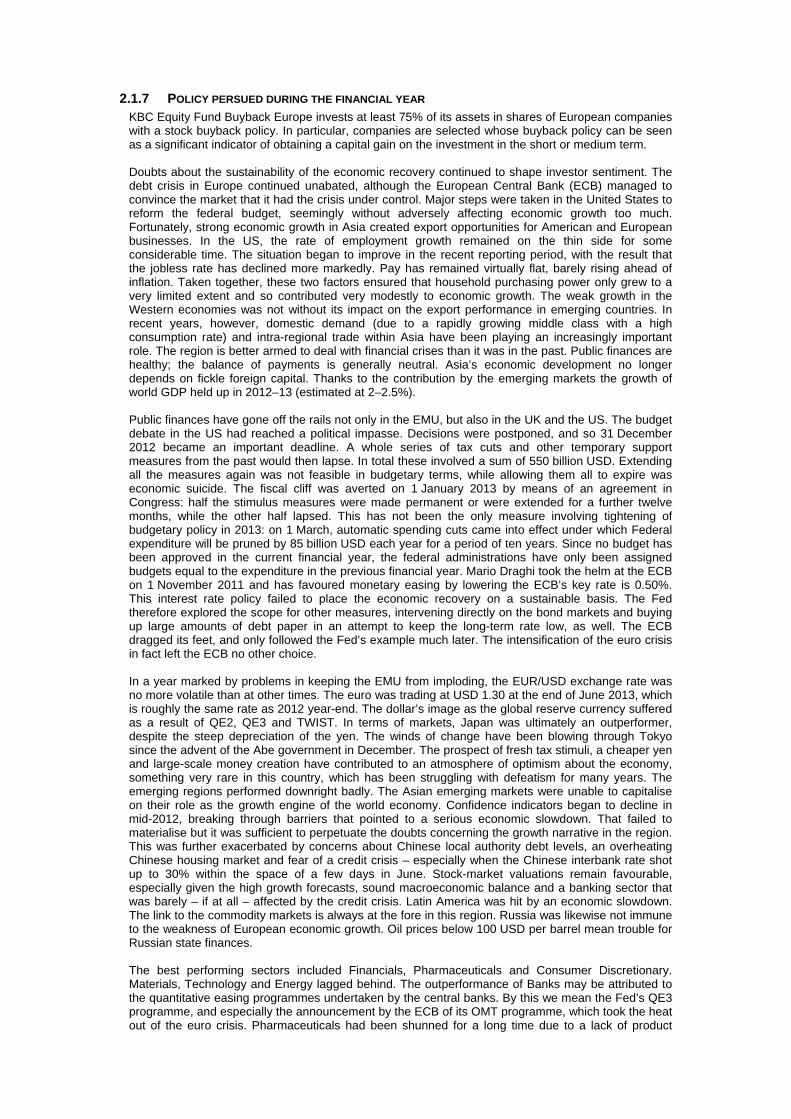
2.1.7 POLICY PERSUED DURING THE FINANCIAL YEAR KBC Equity Fund Buyback Europe invests at least 75% of its assets in shares of European companies with a stock buyback policy. In particular, companies are selected whose buyback policy can be seen as a significant indicator of obtaining a capital gain on the investment in the short or medium term. Doubts about the sustainability of the economic recovery continued to shape investor sentiment. The debt crisis in Europe continued unabated, although the European Central Bank (ECB) managed to convince the market that it had the crisis under control. Major steps were taken in the United States to reform the federal budget, seemingly without adversely affecting economic growth too much. Fortunately, strong economic growth in Asia created export opportunities for American and European businesses. In the US, the rate of employment growth remained on the thin side for some considerable time. The situation began to improve in the recent reporting period, with the result that the jobless rate has declined more markedly. Pay has remained virtually flat, barely rising ahead of inflation. Taken together, these two factors ensured that household purchasing power only grew to a very limited extent and so contributed very modestly to economic growth. The weak growth in the Western economies was not without its impact on the export performance in emerging countries. In recent years, however, domestic demand (due to a rapidly growing middle class with a high consumption rate) and intra-regional trade within Asia have been playing an increasingly important role. The region is better armed to deal with financial crises than it was in the past. Public finances are healthy; the balance of payments is generally neutral. Asia’s economic development no longer depends on fickle foreign capital. Thanks to the contribution by the emerging markets the growth of world GDP held up in 2012–13 (estimated at 2–2.5%). Public finances have gone off the rails not only in the EMU, but also in the UK and the US. The budget debate in the US had reached a political impasse. Decisions were postponed, and so 31 December 2012 became an important deadline. A whole series of tax cuts and other temporary support measures from the past would then lapse. In total these involved a sum of 550 billion USD. Extending all the measures again was not feasible in budgetary terms, while allowing them all to expire was economic suicide. The fiscal cliff was averted on 1 January 2013 by means of an agreement in Congress: half the stimulus measures were made permanent or were extended for a further twelve months, while the other half lapsed. This has not been the only measure involving tightening of budgetary policy in 2013: on 1 March, automatic spending cuts came into effect under which Federal expenditure will be pruned by 85 billion USD each year for a period of ten years. Since no budget has been approved in the current financial year, the federal administrations have only been assigned budgets equal to the expenditure in the previous financial year. Mario Draghi took the helm at the ECB on 1 November 2011 and has favoured monetary easing by lowering the ECB’s key rate is 0.50%. This interest rate policy failed to place the economic recovery on a sustainable basis. The Fed therefore explored the scope for other measures, intervening directly on the bond markets and buying up large amounts of debt paper in an attempt to keep the long-term rate low, as well. The ECB dragged its feet, and only followed the Fed’s example much later. The intensification of the euro crisis in fact left the ECB no other choice. In a year marked by problems in keeping the EMU from imploding, the EUR/USD exchange rate was no more volatile than at other times. The euro was trading at USD 1.30 at the end of June 2013, which is roughly the same rate as 2012 year-end. The dollar’s image as the global reserve currency suffered as a result of QE2, QE3 and TWIST. In terms of markets, Japan was ultimately an outperformer, despite the steep depreciation of the yen. The winds of change have been blowing through Tokyo since the advent of the Abe government in December. The prospect of fresh tax stimuli, a cheaper yen and large-scale money creation have contributed to an atmosphere of optimism about the economy, something very rare in this country, which has been struggling with defeatism for many years. The emerging regions performed downright badly. The Asian emerging markets were unable to capitalise on their role as the growth engine of the world economy. Confidence indicators began to decline in mid-2012, breaking through barriers that pointed to a serious economic slowdown. That failed to materialise but it was sufficient to perpetuate the doubts concerning the growth narrative in the region. This was further exacerbated by concerns about Chinese local authority debt levels, an overheating Chinese housing market and fear of a credit crisis – especially when the Chinese interbank rate shot up to 30% within the space of a few days in June. Stock-market valuations remain favourable, especially given the high growth forecasts, sound macroeconomic balance and a banking sector that was barely – if at all – affected by the credit crisis. Latin America was hit by an economic slowdown. The link to the commodity markets is always at the fore in this region. Russia was likewise not immune to the weakness of European economic growth. Oil prices below 100 USD per barrel mean trouble for Russian state finances. The best performing sectors included Financials, Pharmaceuticals and Consumer Discretionary. Materials, Technology and Energy lagged behind. The outperformance of Banks may be attributed to the quantitative easing programmes undertaken by the central banks. By this we mean the Fed’s QE3 programme, and especially the announcement by the ECB of its OMT programme, which took the heat out of the euro crisis. Pharmaceuticals had been shunned for a long time due to a lack of product
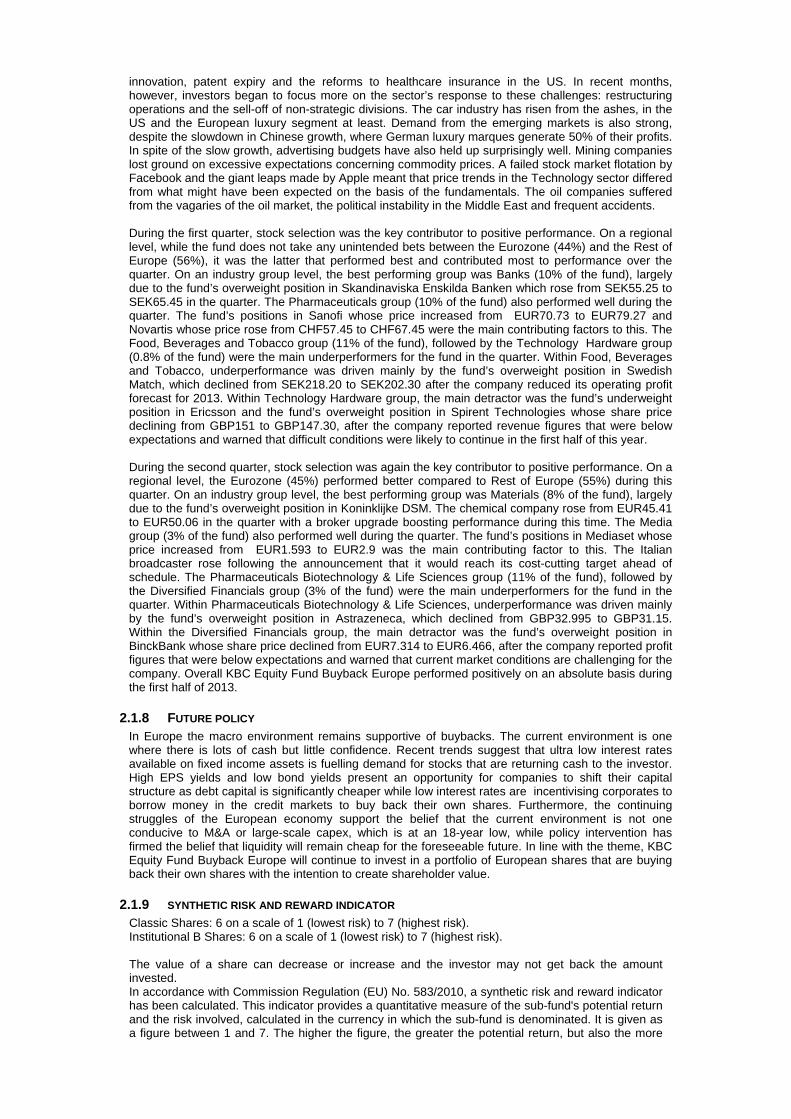
innovation, patent expiry and the reforms to healthcare insurance in the US. In recent months, however, investors began to focus more on the sector’s response to these challenges: restructuring operations and the sell-off of non-strategic divisions. The car industry has risen from the ashes, in the US and the European luxury segment at least. Demand from the emerging markets is also strong, despite the slowdown in Chinese growth, where German luxury marques generate 50% of their profits. In spite of the slow growth, advertising budgets have also held up surprisingly well. Mining companies lost ground on excessive expectations concerning commodity prices. A failed stock market flotation by Facebook and the giant leaps made by Apple meant that price trends in the Technology sector differed from what might have been expected on the basis of the fundamentals. The oil companies suffered from the vagaries of the oil market, the political instability in the Middle East and frequent accidents. During the first quarter, stock selection was the key contributor to positive performance. On a regional level, while the fund does not take any unintended bets between the Eurozone (44%) and the Rest of Europe (56%), it was the latter that performed best and contributed most to performance over the quarter. On an industry group level, the best performing group was Banks (10% of the fund), largely due to the fund’s overweight position in Skandinaviska Enskilda Banken which rose from SEK55.25 to SEK65.45 in the quarter. The Pharmaceuticals group (10% of the fund) also performed well during the quarter. The fund’s positions in Sanofi whose price increased from EUR70.73 to EUR79.27 and Novartis whose price rose from CHF57.45 to CHF67.45 were the main contributing factors to this. The Food, Beverages and Tobacco group (11% of the fund), followed by the Technology Hardware group (0.8% of the fund) were the main underperformers for the fund in the quarter. Within Food, Beverages and Tobacco, underperformance was driven mainly by the fund’s overweight position in Swedish Match, which declined from SEK218.20 to SEK202.30 after the company reduced its operating profit forecast for 2013. Within Technology Hardware group, the main detractor was the fund’s underweight position in Ericsson and the fund’s overweight position in Spirent Technologies whose share price declining from GBP151 to GBP147.30, after the company reported revenue figures that were below expectations and warned that difficult conditions were likely to continue in the first half of this year. During the second quarter, stock selection was again the key contributor to positive performance. On a regional level, the Eurozone (45%) performed better compared to Rest of Europe (55%) during this quarter. On an industry group level, the best performing group was Materials (8% of the fund), largely due to the fund’s overweight position in Koninklijke DSM. The chemical company rose from EUR45.41 to EUR50.06 in the quarter with a broker upgrade boosting performance during this time. The Media group (3% of the fund) also performed well during the quarter. The fund’s positions in Mediaset whose price increased from EUR1.593 to EUR2.9 was the main contributing factor to this. The Italian broadcaster rose following the announcement that it would reach its cost-cutting target ahead of schedule. The Pharmaceuticals Biotechnology & Life Sciences group (11% of the fund), followed by the Diversified Financials group (3% of the fund) were the main underperformers for the fund in the quarter. Within Pharmaceuticals Biotechnology & Life Sciences, underperformance was driven mainly by the fund’s overweight position in Astrazeneca, which declined from GBP32.995 to GBP31.15. Within the Diversified Financials group, the main detractor was the fund’s overweight position in BinckBank whose share price declined from EUR7.314 to EUR6.466, after the company reported profit figures that were below expectations and warned that current market conditions are challenging for the company. Overall KBC Equity Fund Buyback Europe performed positively on an absolute basis during the first half of 2013.
2.1.8 FUTURE POLICY In Europe the macro environment remains supportive of buybacks. The current environment is one where there is lots of cash but little confidence. Recent trends suggest that ultra low interest rates available on fixed income assets is fuelling demand for stocks that are returning cash to the investor. High EPS yields and low bond yields present an opportunity for companies to shift their capital structure as debt capital is significantly cheaper while low interest rates are incentivising corporates to borrow money in the credit markets to buy back their own shares. Furthermore, the continuing struggles of the European economy support the belief that the current environment is not one conducive to M&A or large-scale capex, which is at an 18-year low, while policy intervention has firmed the belief that liquidity will remain cheap for the foreseeable future. In line with the theme, KBC Equity Fund Buyback Europe will continue to invest in a portfolio of European shares that are buying back their own shares with the intention to create shareholder value.
2.1.9 SYNTHETIC RISK AND REWARD INDICATOR Classic Shares: 6 on a scale of 1 (lowest risk) to 7 (highest risk). Institutional B Shares: 6 on a scale of 1 (lowest risk) to 7 (highest risk). The value of a share can decrease or increase and the investor may not get back the amount invested. In accordance with Commission Regulation (EU) No. 583/2010, a synthetic risk and reward indicator has been calculated. This indicator provides a quantitative measure of the sub-fund's potential return and the risk involved, calculated in the currency in which the sub-fund is denominated. It is given as a figure between 1 and 7. The higher the figure, the greater the potential return, but also the more

difficult it is to predict this return. Losses are possible too. The lowest figure does not mean that the investment is entirely free of risk. However, it does indicate that, compared with the higher figures, this product will generally provide a lower, but more predictable return. The synthetic risk and reward indicator is assessed regularly and can therefore go up or down based on data from the past. Data from the past is not always a reliable indicator of future risk and return.

2.2 BALANCE SHEET
Balance sheet layout 30/06/2013 (in the currency of the sub-fundt)
30/06/2012 (in the currency of the sub-fund )
TOTAL NET ASSETS 67.109.251,26 82.672.403,14
II. Securities, money market instruments, UCIs and derivatives
A. Bonds and other debt instruments a) Bonds 591.718,50 506.494,50 a} Collateral received in the form of bonds 6.024.333,15 2.853.313,98 C. Shares and similar instruments a) Shares 66.192.921,57 81.749.058,74 Of which securities lent 5.590.267,26 2.729.470,23 D. Other securities 24.360,42 545,34 F. Derivative financial instruments j) Foreign exchange Futures and forward contracts (+/-) -741,40 m) Financial indices Futures and forward contracts (+/-) 19.692,77
IV. Receivables and payables within one year A. Receivables a) Accounts receivable 13.590,83 17.091,90 b) Tax assets 28.562,54 11.982,30 c) Collateral 100.333,36 B. Payables a) Accounts payable (-) -90.700,69 -838.052,37 d) Collateral (-) -6.024.333,15 -2.853.313,98
V. Deposits and cash at bank and in hand A. Demand balances at banks 118.140,82 979.053,64
VI. Accruals and deferrals A. Expense to be carried forward 38.491,82 37.454,49 B. Accrued income 167.810,75 246.304,69 C. Accrued expense (-) -75.978,66 -56.481,46
TOTAL SHAREHOLDERS' EQUITY 67.109.251,26 82.672.403,14
A. Capital 61.701.172,01 78.617.189,09
B. Income equalization -210.570,83 -46.311,52
D. Result for the period 5.618.650,08 4.101.525,57
Off-balance-sheet headings
I Collateral (+/-)
I.A Collateral (+/-)
I.A.A Securities/market instruments 6.024.333,15 2.853.313,98
I.A.B Cash at bank and in hand/deposits 100.333,36

III Notional amounts of futures and forward contracts
III.A Purchased futures and forward contracts 771.031,53
IX Financial instruments lent 5.590.267,26 2.729.470,23

2.3 PROFIT AND LOSS ACCOUNT
Income Statement 30/06/2013 (in the currency of the sub-fund)
30/06/2012 (in the currency of the sub-fund)
I. Net gains(losses) on investments A. Bonds and other debt instruments a) Bonds 117.262,50 -55.173,00 C. Shares and similar instruments a) Shares 5.860.683,20 981.974,80 D. Other securities -0,30 -31.254,30 F. Derivative financial instruments l) Financial indices Futures and forward contracts 39.620,34 321.110,54 H. Foreign exchange positions and transactions a) Derivative financial instruments Futures and forward contracts 754,92 -492,62 b) Other foreign exchange positions and
transactions -1.841.666,85 1.258.050,67
II. Investment income and expenses A. Dividends 2.131.043,30 2.332.940,16 B. Interests a) Securities and money market instruments 78.266,27 84.580,81 b) Cash at bank and in hand and deposits 393,70 755,45 C. Interest on borrowings (-) -2.143,55 -2.061,15
III. Other income A. Income received to cover the acquisition and
realizaion of assets, to discourage withdrawals and for delivery charges
48.793,89 176.829,51
IV. Operating expenses A. Investment transaction and delivery costs (-) -86.493,92 -205.203,04 B. Financial expenses (-) -461,00 -757,16 C. Custodian's fee (-) -31.007,25 -34.758,04 D. Manager's fee (-) a) Financial management Classic Shares -469.972,20 -438.059,74 Institutional B Shares -143.070,79 -175.697,56 b) Administration and accounting management -40.869,48 -44.429,52 E. Administrative expenses (-) -749,06 -962,57 F. Formation and organisation expenses (-) -2.035,96 -5.116,26 G. Remuneration, social security charges and
pension -11,70 -6,67
H. Services and sundry goods (-) -10.495,03 -9.522,06 J. Taxes Classic Shares -22.310,84 -24.374,88 Institutional B Shares -266,89 -1.100,10 K. Other expenses (-) -6.613,22 -25.747,70
Income and expenditure for the period Subtotal II + III + IV 1.441.996,27 1.627.309,48
V. Profit (loss) on ordinary activities before tax 5.618.650,08 4.101.525,57
VII. Result for the period 5.618.650,08 4.101.525,57

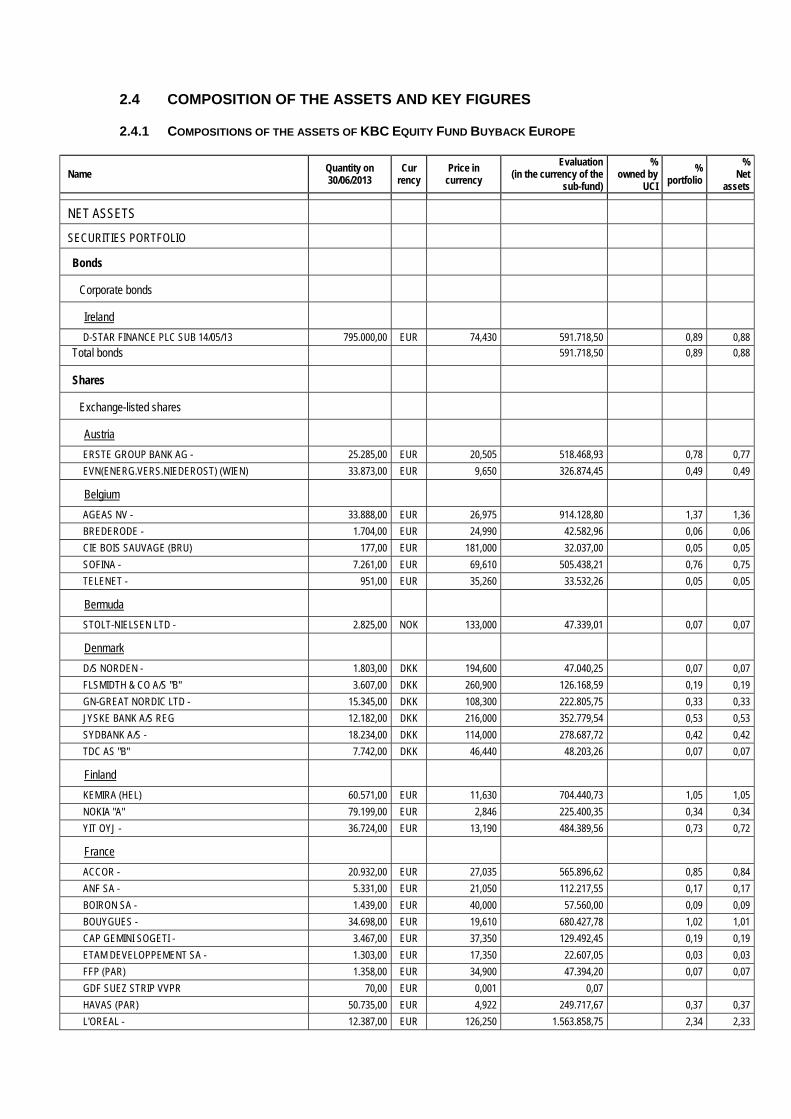
2.4 COMPOSITION OF THE ASSETS AND KEY FIGURES
2.4.1 COMPOSITIONS OF THE ASSETS OF KBC EQUITY FUND BUYBACK EUROPE
Name Quantity on 30/06/2013
Cur rency
Price in currency
Evaluation (in the currency of the
sub-fund)
% owned by
UCI
% portfolio
% Net
assets
NET ASSETS
SECURITIES PORTFOLIO
Bonds
Corporate bonds
Ireland
D-STAR FINANCE PLC SUB 14/05/13 795.000,00 EUR 74,430 591.718,50 0,89 0,88
Total bonds 591.718,50 0,89 0,88
Shares
Exchange-listed shares
Austria
ERSTE GROUP BANK AG - 25.285,00 EUR 20,505 518.468,93 0,78 0,77
EVN(ENERG.VERS.NIEDEROST) (WIEN) 33.873,00 EUR 9,650 326.874,45 0,49 0,49
Belgium
AGEAS NV - 33.888,00 EUR 26,975 914.128,80 1,37 1,36
BREDERODE - 1.704,00 EUR 24,990 42.582,96 0,06 0,06
CIE BOIS SAUVAGE (BRU) 177,00 EUR 181,000 32.037,00 0,05 0,05
SOFINA - 7.261,00 EUR 69,610 505.438,21 0,76 0,75
TELENET - 951,00 EUR 35,260 33.532,26 0,05 0,05
Bermuda
STOLT-NIELSEN LTD - 2.825,00 NOK 133,000 47.339,01 0,07 0,07
Denmark
D/S NORDEN - 1.803,00 DKK 194,600 47.040,25 0,07 0,07
FLSMIDTH & CO A/S "B" 3.607,00 DKK 260,900 126.168,59 0,19 0,19
GN-GREAT NORDIC LTD - 15.345,00 DKK 108,300 222.805,75 0,33 0,33
JYSKE BANK A/S REG 12.182,00 DKK 216,000 352.779,54 0,53 0,53
SYDBANK A/S - 18.234,00 DKK 114,000 278.687,72 0,42 0,42
TDC AS "B" 7.742,00 DKK 46,440 48.203,26 0,07 0,07
Finland
KEMIRA (HEL) 60.571,00 EUR 11,630 704.440,73 1,05 1,05
NOKIA "A" 79.199,00 EUR 2,846 225.400,35 0,34 0,34
YIT OYJ - 36.724,00 EUR 13,190 484.389,56 0,73 0,72
France
ACCOR - 20.932,00 EUR 27,035 565.896,62 0,85 0,84
ANF SA - 5.331,00 EUR 21,050 112.217,55 0,17 0,17
BOIRON SA - 1.439,00 EUR 40,000 57.560,00 0,09 0,09
BOUYGUES - 34.698,00 EUR 19,610 680.427,78 1,02 1,01
CAP GEMINI SOGETI - 3.467,00 EUR 37,350 129.492,45 0,19 0,19
ETAM DEVELOPPEMENT SA - 1.303,00 EUR 17,350 22.607,05 0,03 0,03
FFP (PAR) 1.358,00 EUR 34,900 47.394,20 0,07 0,07
GDF SUEZ STRIP VVPR 70,00 EUR 0,001 0,07
HAVAS (PAR) 50.735,00 EUR 4,922 249.717,67 0,37 0,37
L'OREAL - 12.387,00 EUR 126,250 1.563.858,75 2,34 2,33
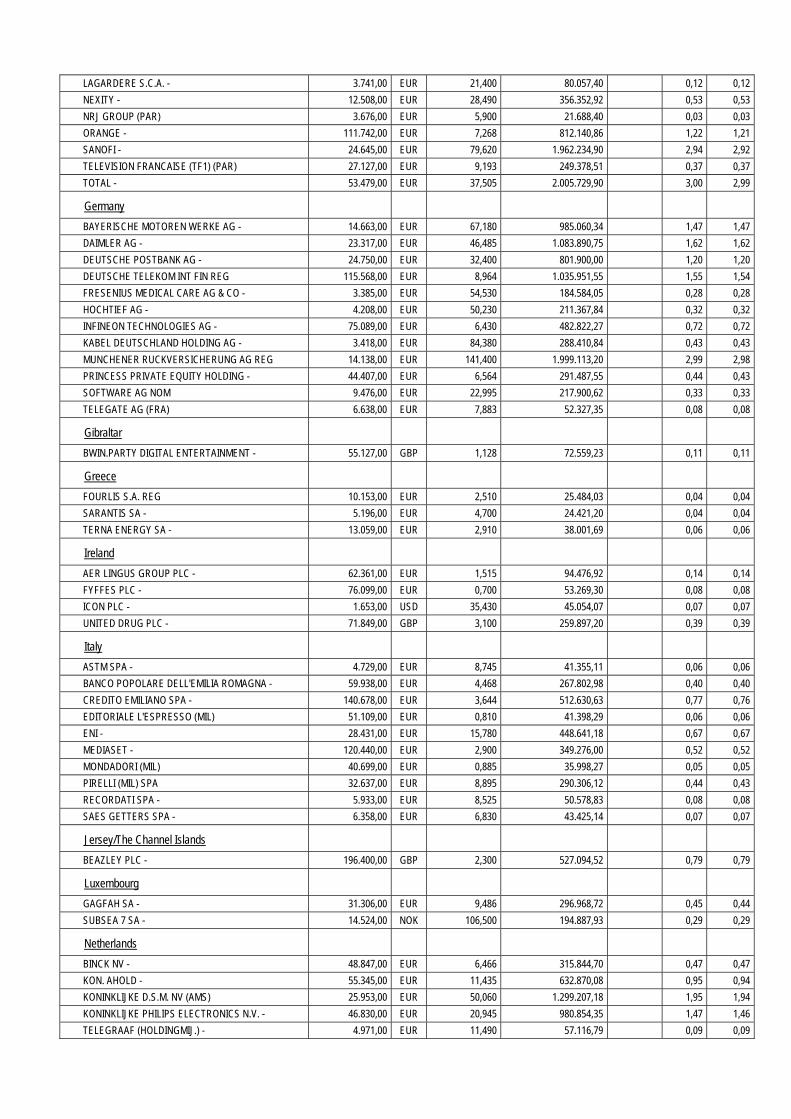
LAGARDERE S.C.A. - 3.741,00 EUR 21,400 80.057,40 0,12 0,12
NEXITY - 12.508,00 EUR 28,490 356.352,92 0,53 0,53
NRJ GROUP (PAR) 3.676,00 EUR 5,900 21.688,40 0,03 0,03
ORANGE - 111.742,00 EUR 7,268 812.140,86 1,22 1,21
SANOFI - 24.645,00 EUR 79,620 1.962.234,90 2,94 2,92
TELEVISION FRANCAISE (TF1) (PAR) 27.127,00 EUR 9,193 249.378,51 0,37 0,37
TOTAL - 53.479,00 EUR 37,505 2.005.729,90 3,00 2,99
Germany
BAYERISCHE MOTOREN WERKE AG - 14.663,00 EUR 67,180 985.060,34 1,47 1,47
DAIMLER AG - 23.317,00 EUR 46,485 1.083.890,75 1,62 1,62
DEUTSCHE POSTBANK AG - 24.750,00 EUR 32,400 801.900,00 1,20 1,20
DEUTSCHE TELEKOM INT FIN REG 115.568,00 EUR 8,964 1.035.951,55 1,55 1,54
FRESENIUS MEDICAL CARE AG & CO - 3.385,00 EUR 54,530 184.584,05 0,28 0,28
HOCHTIEF AG - 4.208,00 EUR 50,230 211.367,84 0,32 0,32
INFINEON TECHNOLOGIES AG - 75.089,00 EUR 6,430 482.822,27 0,72 0,72
KABEL DEUTSCHLAND HOLDING AG - 3.418,00 EUR 84,380 288.410,84 0,43 0,43
MUNCHENER RUCKVERSICHERUNG AG REG 14.138,00 EUR 141,400 1.999.113,20 2,99 2,98
PRINCESS PRIVATE EQUITY HOLDING - 44.407,00 EUR 6,564 291.487,55 0,44 0,43
SOFTWARE AG NOM 9.476,00 EUR 22,995 217.900,62 0,33 0,33
TELEGATE AG (FRA) 6.638,00 EUR 7,883 52.327,35 0,08 0,08
Gibraltar
BWIN.PARTY DIGITAL ENTERTAINMENT - 55.127,00 GBP 1,128 72.559,23 0,11 0,11
Greece
FOURLIS S.A. REG 10.153,00 EUR 2,510 25.484,03 0,04 0,04
SARANTIS SA - 5.196,00 EUR 4,700 24.421,20 0,04 0,04
TERNA ENERGY SA - 13.059,00 EUR 2,910 38.001,69 0,06 0,06
Ireland
AER LINGUS GROUP PLC - 62.361,00 EUR 1,515 94.476,92 0,14 0,14
FYFFES PLC - 76.099,00 EUR 0,700 53.269,30 0,08 0,08
ICON PLC - 1.653,00 USD 35,430 45.054,07 0,07 0,07
UNITED DRUG PLC - 71.849,00 GBP 3,100 259.897,20 0,39 0,39
Italy
ASTM SPA - 4.729,00 EUR 8,745 41.355,11 0,06 0,06
BANCO POPOLARE DELL'EMILIA ROMAGNA - 59.938,00 EUR 4,468 267.802,98 0,40 0,40
CREDITO EMILIANO SPA - 140.678,00 EUR 3,644 512.630,63 0,77 0,76
EDITORIALE L'ESPRESSO (MIL) 51.109,00 EUR 0,810 41.398,29 0,06 0,06
ENI - 28.431,00 EUR 15,780 448.641,18 0,67 0,67
MEDIASET - 120.440,00 EUR 2,900 349.276,00 0,52 0,52
MONDADORI (MIL) 40.699,00 EUR 0,885 35.998,27 0,05 0,05
PIRELLI (MIL) SPA 32.637,00 EUR 8,895 290.306,12 0,44 0,43
RECORDATI SPA - 5.933,00 EUR 8,525 50.578,83 0,08 0,08
SAES GETTERS SPA - 6.358,00 EUR 6,830 43.425,14 0,07 0,07
Jersey/The Channel Islands
BEAZLEY PLC - 196.400,00 GBP 2,300 527.094,52 0,79 0,79
Luxembourg
GAGFAH SA - 31.306,00 EUR 9,486 296.968,72 0,45 0,44
SUBSEA 7 SA - 14.524,00 NOK 106,500 194.887,93 0,29 0,29
Netherlands
BINCK NV - 48.847,00 EUR 6,466 315.844,70 0,47 0,47
KON. AHOLD - 55.345,00 EUR 11,435 632.870,08 0,95 0,94
KONINKLIJKE D.S.M. NV (AMS) 25.953,00 EUR 50,060 1.299.207,18 1,95 1,94
KONINKLIJKE PHILIPS ELECTRONICS N.V. - 46.830,00 EUR 20,945 980.854,35 1,47 1,46
TELEGRAAF (HOLDINGMIJ.) - 4.971,00 EUR 11,490 57.116,79 0,09 0,09
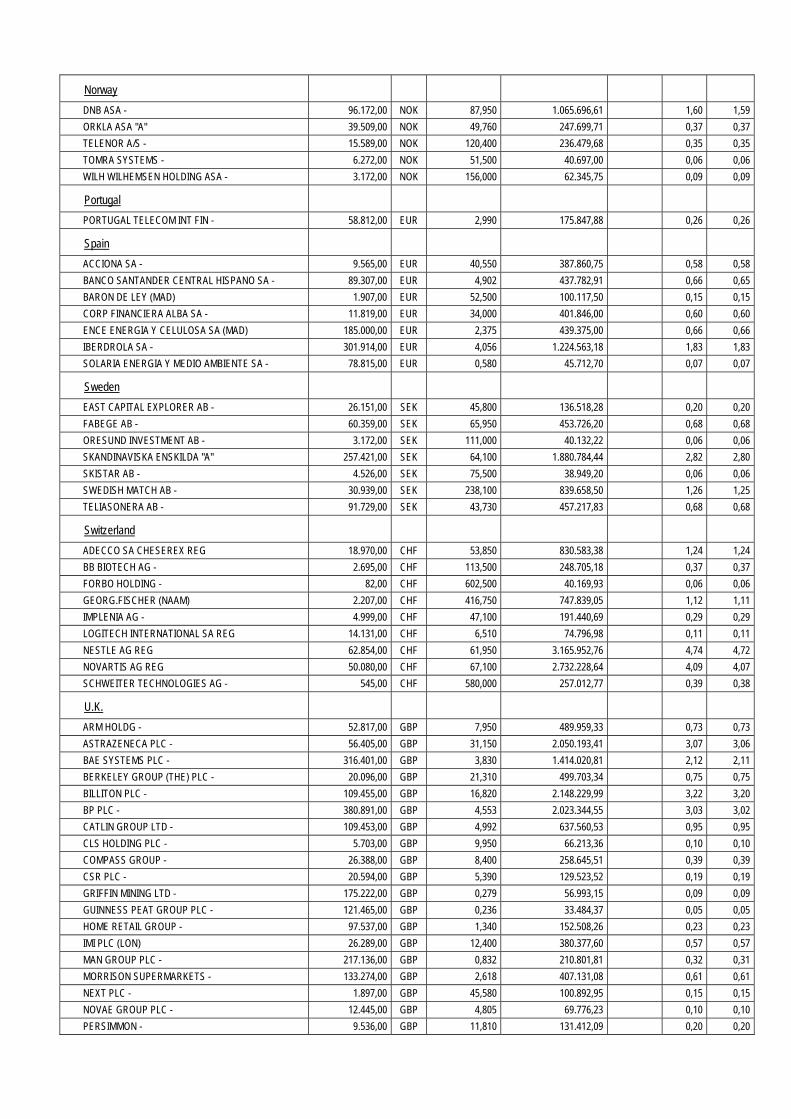
Norway
DNB ASA - 96.172,00 NOK 87,950 1.065.696,61 1,60 1,59
ORKLA ASA "A" 39.509,00 NOK 49,760 247.699,71 0,37 0,37
TELENOR A/S - 15.589,00 NOK 120,400 236.479,68 0,35 0,35
TOMRA SYSTEMS - 6.272,00 NOK 51,500 40.697,00 0,06 0,06
WILH WILHEMSEN HOLDING ASA - 3.172,00 NOK 156,000 62.345,75 0,09 0,09
Portugal
PORTUGAL TELECOM INT FIN - 58.812,00 EUR 2,990 175.847,88 0,26 0,26
Spain
ACCIONA SA - 9.565,00 EUR 40,550 387.860,75 0,58 0,58
BANCO SANTANDER CENTRAL HISPANO SA - 89.307,00 EUR 4,902 437.782,91 0,66 0,65
BARON DE LEY (MAD) 1.907,00 EUR 52,500 100.117,50 0,15 0,15
CORP FINANCIERA ALBA SA - 11.819,00 EUR 34,000 401.846,00 0,60 0,60
ENCE ENERGIA Y CELULOSA SA (MAD) 185.000,00 EUR 2,375 439.375,00 0,66 0,66
IBERDROLA SA - 301.914,00 EUR 4,056 1.224.563,18 1,83 1,83
SOLARIA ENERGIA Y MEDIO AMBIENTE SA - 78.815,00 EUR 0,580 45.712,70 0,07 0,07
Sweden
EAST CAPITAL EXPLORER AB - 26.151,00 SEK 45,800 136.518,28 0,20 0,20
FABEGE AB - 60.359,00 SEK 65,950 453.726,20 0,68 0,68
ORESUND INVESTMENT AB - 3.172,00 SEK 111,000 40.132,22 0,06 0,06
SKANDINAVISKA ENSKILDA "A" 257.421,00 SEK 64,100 1.880.784,44 2,82 2,80
SKISTAR AB - 4.526,00 SEK 75,500 38.949,20 0,06 0,06
SWEDISH MATCH AB - 30.939,00 SEK 238,100 839.658,50 1,26 1,25
TELIASONERA AB - 91.729,00 SEK 43,730 457.217,83 0,68 0,68
Switzerland
ADECCO SA CHESEREX REG 18.970,00 CHF 53,850 830.583,38 1,24 1,24
BB BIOTECH AG - 2.695,00 CHF 113,500 248.705,18 0,37 0,37
FORBO HOLDING - 82,00 CHF 602,500 40.169,93 0,06 0,06
GEORG.FISCHER (NAAM) 2.207,00 CHF 416,750 747.839,05 1,12 1,11
IMPLENIA AG - 4.999,00 CHF 47,100 191.440,69 0,29 0,29
LOGITECH INTERNATIONAL SA REG 14.131,00 CHF 6,510 74.796,98 0,11 0,11
NESTLE AG REG 62.854,00 CHF 61,950 3.165.952,76 4,74 4,72
NOVARTIS AG REG 50.080,00 CHF 67,100 2.732.228,64 4,09 4,07
SCHWEITER TECHNOLOGIES AG - 545,00 CHF 580,000 257.012,77 0,39 0,38
U.K.
ARM HOLDG - 52.817,00 GBP 7,950 489.959,33 0,73 0,73
ASTRAZENECA PLC - 56.405,00 GBP 31,150 2.050.193,41 3,07 3,06
BAE SYSTEMS PLC - 316.401,00 GBP 3,830 1.414.020,81 2,12 2,11
BERKELEY GROUP (THE) PLC - 20.096,00 GBP 21,310 499.703,34 0,75 0,75
BILLITON PLC - 109.455,00 GBP 16,820 2.148.229,99 3,22 3,20
BP PLC - 380.891,00 GBP 4,553 2.023.344,55 3,03 3,02
CATLIN GROUP LTD - 109.453,00 GBP 4,992 637.560,53 0,95 0,95
CLS HOLDING PLC - 5.703,00 GBP 9,950 66.213,36 0,10 0,10
COMPASS GROUP - 26.388,00 GBP 8,400 258.645,51 0,39 0,39
CSR PLC - 20.594,00 GBP 5,390 129.523,52 0,19 0,19
GRIFFIN MINING LTD - 175.222,00 GBP 0,279 56.993,15 0,09 0,09
GUINNESS PEAT GROUP PLC - 121.465,00 GBP 0,236 33.484,37 0,05 0,05
HOME RETAIL GROUP - 97.537,00 GBP 1,340 152.508,26 0,23 0,23
IMI PLC (LON) 26.289,00 GBP 12,400 380.377,60 0,57 0,57
MAN GROUP PLC - 217.136,00 GBP 0,832 210.801,81 0,32 0,31
MORRISON SUPERMARKETS - 133.274,00 GBP 2,618 407.131,08 0,61 0,61
NEXT PLC - 1.897,00 GBP 45,580 100.892,95 0,15 0,15
NOVAE GROUP PLC - 12.445,00 GBP 4,805 69.776,23 0,10 0,10
PERSIMMON - 9.536,00 GBP 11,810 131.412,09 0,20 0,20
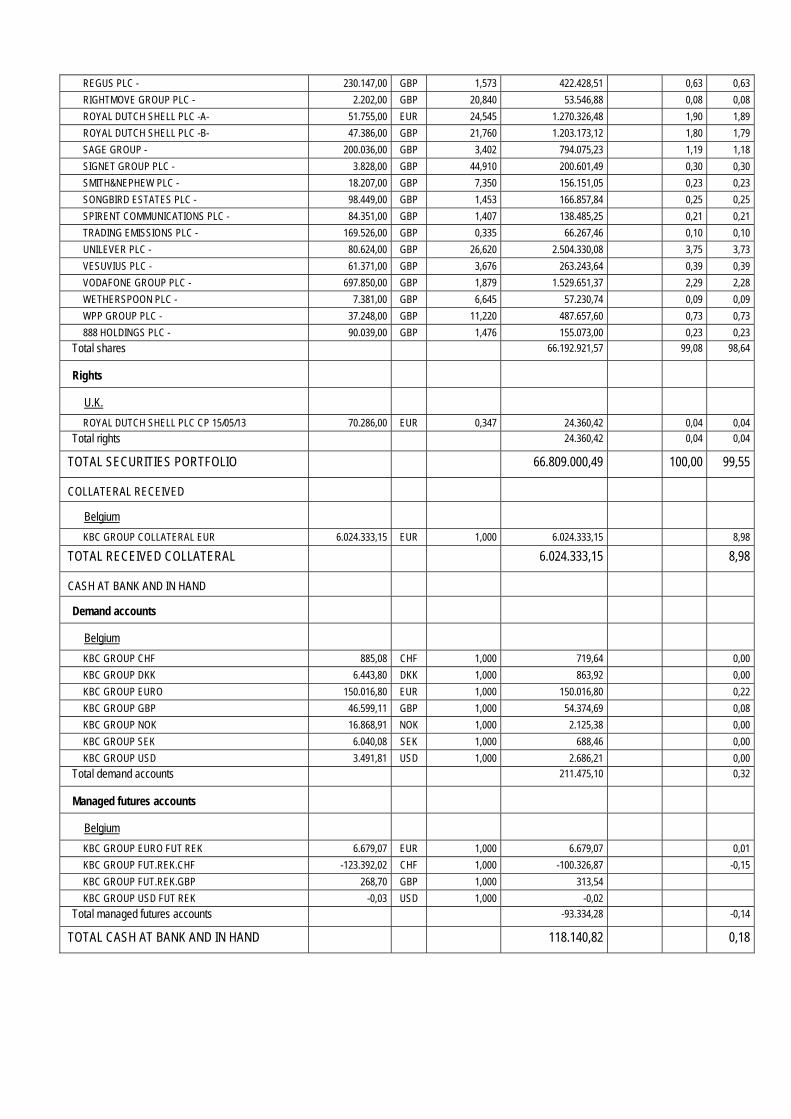
REGUS PLC - 230.147,00 GBP 1,573 422.428,51 0,63 0,63
RIGHTMOVE GROUP PLC - 2.202,00 GBP 20,840 53.546,88 0,08 0,08
ROYAL DUTCH SHELL PLC -A- 51.755,00 EUR 24,545 1.270.326,48 1,90 1,89
ROYAL DUTCH SHELL PLC -B- 47.386,00 GBP 21,760 1.203.173,12 1,80 1,79
SAGE GROUP - 200.036,00 GBP 3,402 794.075,23 1,19 1,18
SIGNET GROUP PLC - 3.828,00 GBP 44,910 200.601,49 0,30 0,30
SMITH&NEPHEW PLC - 18.207,00 GBP 7,350 156.151,05 0,23 0,23
SONGBIRD ESTATES PLC - 98.449,00 GBP 1,453 166.857,84 0,25 0,25
SPIRENT COMMUNICATIONS PLC - 84.351,00 GBP 1,407 138.485,25 0,21 0,21
TRADING EMISSIONS PLC - 169.526,00 GBP 0,335 66.267,46 0,10 0,10
UNILEVER PLC - 80.624,00 GBP 26,620 2.504.330,08 3,75 3,73
VESUVIUS PLC - 61.371,00 GBP 3,676 263.243,64 0,39 0,39
VODAFONE GROUP PLC - 697.850,00 GBP 1,879 1.529.651,37 2,29 2,28
WETHERSPOON PLC - 7.381,00 GBP 6,645 57.230,74 0,09 0,09
WPP GROUP PLC - 37.248,00 GBP 11,220 487.657,60 0,73 0,73
888 HOLDINGS PLC - 90.039,00 GBP 1,476 155.073,00 0,23 0,23
Total shares 66.192.921,57 99,08 98,64
Rights
U.K.
ROYAL DUTCH SHELL PLC CP 15/05/13 70.286,00 EUR 0,347 24.360,42 0,04 0,04
Total rights 24.360,42 0,04 0,04
TOTAL SECURITIES PORTFOLIO 66.809.000,49 100,00 99,55
COLLATERAL RECEIVED
Belgium
KBC GROUP COLLATERAL EUR 6.024.333,15 EUR 1,000 6.024.333,15 8,98
TOTAL RECEIVED COLLATERAL 6.024.333,15 8,98
CASH AT BANK AND IN HAND
Demand accounts
Belgium
KBC GROUP CHF 885,08 CHF 1,000 719,64 0,00
KBC GROUP DKK 6.443,80 DKK 1,000 863,92 0,00
KBC GROUP EURO 150.016,80 EUR 1,000 150.016,80 0,22
KBC GROUP GBP 46.599,11 GBP 1,000 54.374,69 0,08
KBC GROUP NOK 16.868,91 NOK 1,000 2.125,38 0,00
KBC GROUP SEK 6.040,08 SEK 1,000 688,46 0,00
KBC GROUP USD 3.491,81 USD 1,000 2.686,21 0,00
Total demand accounts 211.475,10 0,32
Managed futures accounts
Belgium
KBC GROUP EURO FUT REK 6.679,07 EUR 1,000 6.679,07 0,01
KBC GROUP FUT.REK.CHF -123.392,02 CHF 1,000 -100.326,87 -0,15
KBC GROUP FUT.REK.GBP 268,70 GBP 1,000 313,54
KBC GROUP USD FUT REK -0,03 USD 1,000 -0,02
Total managed futures accounts -93.334,28 -0,14
TOTAL CASH AT BANK AND IN HAND 118.140,82 0,18
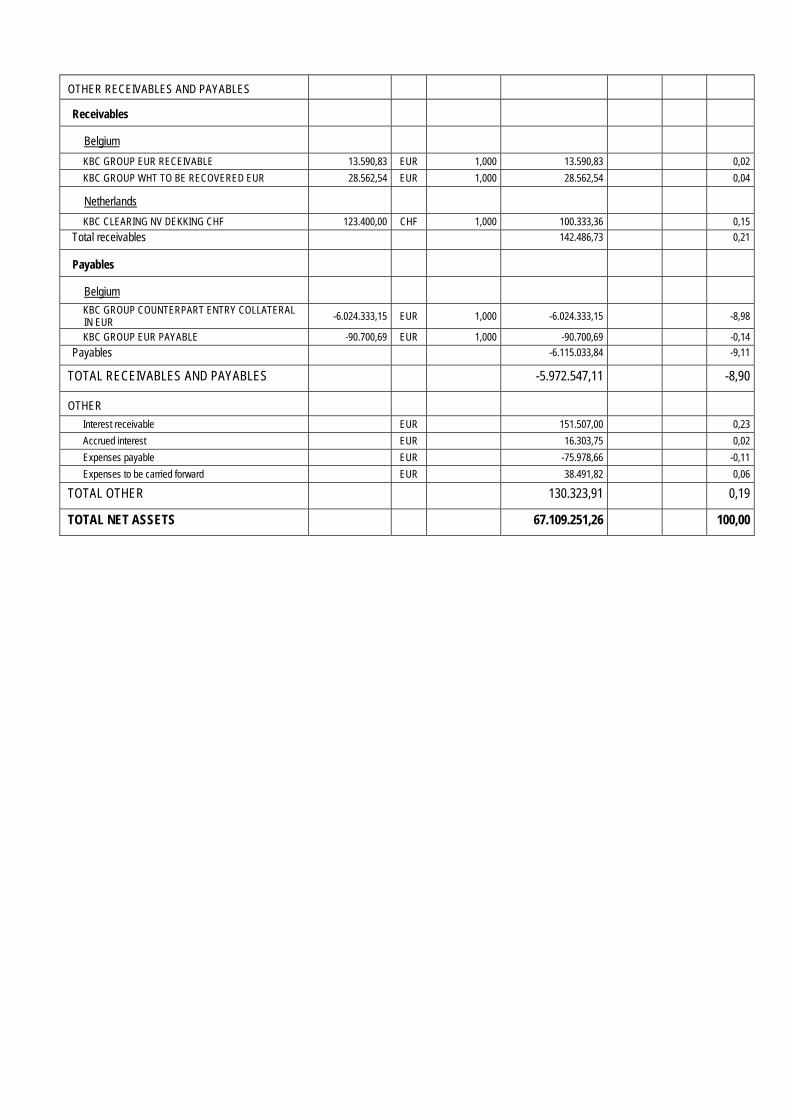
OTHER RECEIVABLES AND PAYABLES
Receivables
Belgium
KBC GROUP EUR RECEIVABLE 13.590,83 EUR 1,000 13.590,83 0,02
KBC GROUP WHT TO BE RECOVERED EUR 28.562,54 EUR 1,000 28.562,54 0,04
Netherlands
KBC CLEARING NV DEKKING CHF 123.400,00 CHF 1,000 100.333,36 0,15
Total receivables 142.486,73 0,21
Payables
Belgium
KBC GROUP COUNTERPART ENTRY COLLATERAL IN EUR -6.024.333,15 EUR 1,000 -6.024.333,15 -8,98
KBC GROUP EUR PAYABLE -90.700,69 EUR 1,000 -90.700,69 -0,14
Payables -6.115.033,84 -9,11
TOTAL RECEIVABLES AND PAYABLES -5.972.547,11 -8,90
OTHER
Interest receivable EUR 151.507,00 0,23
Accrued interest EUR 16.303,75 0,02
Expenses payable EUR -75.978,66 -0,11
Expenses to be carried forward EUR 38.491,82 0,06
TOTAL OTHER 130.323,91 0,19
TOTAL NET ASSETS 67.109.251,26 100,00
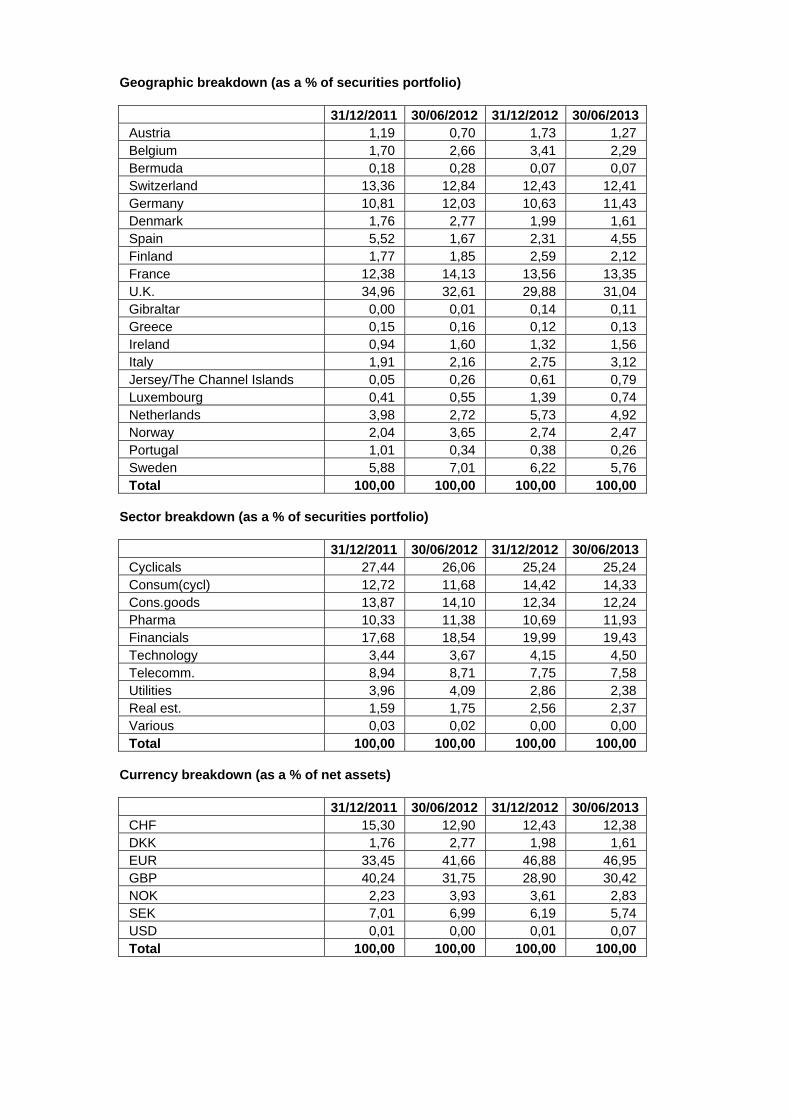
Geographic breakdown (as a % of securities portfolio)
31/12/2011 30/06/2012 31/12/2012 30/06/2013 Austria 1,19 0,70 1,73 1,27 Belgium 1,70 2,66 3,41 2,29 Bermuda 0,18 0,28 0,07 0,07 Switzerland 13,36 12,84 12,43 12,41 Germany 10,81 12,03 10,63 11,43 Denmark 1,76 2,77 1,99 1,61 Spain 5,52 1,67 2,31 4,55 Finland 1,77 1,85 2,59 2,12 France 12,38 14,13 13,56 13,35 U.K. 34,96 32,61 29,88 31,04 Gibraltar 0,00 0,01 0,14 0,11 Greece 0,15 0,16 0,12 0,13 Ireland 0,94 1,60 1,32 1,56 Italy 1,91 2,16 2,75 3,12 Jersey/The Channel Islands 0,05 0,26 0,61 0,79 Luxembourg 0,41 0,55 1,39 0,74 Netherlands 3,98 2,72 5,73 4,92 Norway 2,04 3,65 2,74 2,47 Portugal 1,01 0,34 0,38 0,26 Sweden 5,88 7,01 6,22 5,76 Total 100,00 100,00 100,00 100,00
Sector breakdown (as a % of securities portfolio)
31/12/2011 30/06/2012 31/12/2012 30/06/2013 Cyclicals 27,44 26,06 25,24 25,24 Consum(cycl) 12,72 11,68 14,42 14,33 Cons.goods 13,87 14,10 12,34 12,24 Pharma 10,33 11,38 10,69 11,93 Financials 17,68 18,54 19,99 19,43 Technology 3,44 3,67 4,15 4,50 Telecomm. 8,94 8,71 7,75 7,58 Utilities 3,96 4,09 2,86 2,38 Real est. 1,59 1,75 2,56 2,37 Various 0,03 0,02 0,00 0,00 Total 100,00 100,00 100,00 100,00
Currency breakdown (as a % of net assets)
31/12/2011 30/06/2012 31/12/2012 30/06/2013 CHF 15,30 12,90 12,43 12,38 DKK 1,76 2,77 1,98 1,61 EUR 33,45 41,66 46,88 46,95 GBP 40,24 31,75 28,90 30,42 NOK 2,23 3,93 3,61 2,83 SEK 7,01 6,99 6,19 5,74 USD 0,01 0,00 0,01 0,07 Total 100,00 100,00 100,00 100,00

2.4.2 CHANGES IN THE COMPOSITION OF THE ASSETS OF KBC EQUITY FUND BUYBACK EUROPE
(IN THE CURRENCY OF THE SUB-FUND)
1st half of year YearPurchases 20.773.202,72 20.773.202,72 Sales 45.193.628,70 45.193.628,70 Total 1 65.966.831,42 65.966.831,42 Subscriptions 10.344.615,66 10.344.615,66 Redemptions 35.829.998,03 35.829.998,03 Total 2 46.174.613,69 46.174.613,69 Monthly average of total assets
83.309.431,47 83.309.431,47
Turnover rate 23,76 % 23,76 %
1st half of year YearPurchases 20.773.202,72 20.773.202,72 Sales 45.193.628,70 45.193.628,70 Total 1 65.966.831,42 65.966.831,42 Subscriptions 10.344.615,66 10.344.615,66 Redemptions 35.829.998,03 35.829.998,03 Total 2 46.174.613,69 46.174.613,69 Monthly average of total assets
82.149.245,55 82.149.245,55
Corrected turnover rate 24,09 % 24,09 %
The table above shows the capital volume of portfolio transactions. This volume (adjusted to take account of total subscriptions and redemptions) is also compared to the average net assets at the beginning and end of the period. A figure close to 0% implies that the transactions relating to the securities or transactions relating to the assets (excluding deposits and cash) in a given period only involve subscriptions and redemptions. A negative percentage shows that subscriptions and redemptions entailed few, if any, transactions in the portfolio. Active asset management may result in high turnover rates (monthly percentage >50%). The detailed list of transactions is available for consultation free of charge at the registered office of the Bevek or fund at Havenlaan 2, 1080 Brussels.

2.4.3 AMOUNT OF COMMITMENTS IN RESPECT OF FINANCIAL DERIVATIVES POSITIONS
NAME Currency Value in currency
In the currency of the sub-fund
Lot-size
Transactiondate
KBC COLLATERAL EUR
EUR 6.024.333,15 6.024.333,15 N/A 28.06.2013
KBCCLEAR DEKKING CHF
CHF 123.400,00 100.333,36 N/A 28.06.2013
2.4.4 CHANGES OF THE NUMBER OF SUBSCRIPTIONS AND REDEMPTIONS AND THE NET ASSET
VALUE
Classic Shares
Period Change in number of shares in circulation
Year Subscriptions Redemptions End of period
Cap. Dis. Cap. Dis. Cap. Dis. Total
2011 - 06 270.526,45 5.205,00 169.716,21 5.878,00 256.541,29 27.573,16 284.114,45
2012 - 06 39.813,76 1.885,68 198.104,34 5.101,65 98.250,71 24.357,19 122.607,89
2013 - 06 6.237,62 3.585,00 29.375,79 4.144,00 75.112,53 23.798,19 98.910,72
Period Amounts received and paid by the UCI
(in the currency of the class)
Year Subscriptions Redemptions
Capitalization Distribution Capitalization Distribution
2011 - 06 155.512.650,00 2.446.653,46 94.849.322,08 2.708.923,57
2012 - 06 20.935.234,68 819.008,51 96.921.434,89 2.109.102,36
2013 - 06 3.789.402,71 1.703.732,28 17.641.375,49 1.946.205,55
Period Net asset value
End of period (in the currency of the class)
Year Of the class Of one share
Capitalization Distribution
2011 - 06 157.550.288,46 565,53 452,16
2012 - 06 62.339.916,03 531,27 416,39
2013 - 06 59.099.043,22 632,40 487,34
Institutional B Shares
Period Change in number of shares in circulation
Year Subscriptions Redemptions End of period
Cap. Dis. Cap. Dis. Cap. Dis. Total 2012 - 06 123.597,00 85.361,00 38.236,00 38.236,00
2013 - 06 50.078,00 75.661,00 12.653,00 12.653,00
Period Amounts received and paid by the UCI
(in the currency of the class)
Year Subscriptions Redemptions
Capitalization Distribution Capitalization Distribution
2012 - 06 63.648.050,03 45.964.150,38
2013 - 06 29.539.948,05 45.359.131,89

Period Net asset value
End of period (in the currency of the class)
Year Of the class Of one share
Capitalization Distribution
2012 - 06 20.332.487,11 531,76
2013 - 06 8.010.208,04 633,07

2.4.5 PERFORMANCE FIGURES
Classic Shares
Cap Div
ISIN code Cur-
rency
1 Year 3 Years* 5 Years* 10 Years* Since launch*
Share classes
Bench mark
Share classes
Bench mark
Share classes
Bench mark
Share classes
Bench mark
Launch Date
Share classes
CAP BE0174407016 EUR 19.04% 7.14% 2.01% 5.48% 30/06/2000 1.82%
DIV BE0174406976 EUR 18.99% 7.14% 2.01% 5.47% 30/06/2000 1.81%
Institutional B Shares

Cap Div
ISIN code Cur-
rency
1 Year 3 Years* 5 Years* 10 Years* Since launch*
Share classes
Bench mark
Share classes
Bench mark
Share classes
Bench mark
Share classes
Bench mark
Launch Date
Share classes
CAP BE6228537708 EUR 19.05% 24/11/2011 22.26%
Risk warning: Past performance is not a guide to future performance. * Return on annual basis.
Classic Shares The bar chart shows the performance for full financial years. The figures do not take account of any restructuring. Calculated in EUR. The return is calculated as the change in the net asset value between two dates expressed
as a percentage. In the case of units that pay dividends, the dividend is incorporated geometrically in the return.
Calculation method for date D, where NAV stands for net asset value: Capitalisation units (CAP) Return on date D over a period of X years:
[NIW(D) / NIW(Y)] ^ [1 / X] - 1 where Y = D-X
Return on date D since the start date S of the unit: [NIW(D) / NIW(S)] ^ [1 / F] - 1 where F = 1 if the unit has existed for less than one year on date D where F = (D-S) / 365.25 if the unit has existed for longer than one year on date D
Distribution units (DIV) Return on date D over a period of X years:
[ C * NIW(D) / NIW(Y)] ^ [1 / X] - 1 where Y = D-X
Return on date D since the start date S of the unit: [ C * NIW(D) / NIW(S)] ^ [1 / F] - 1 where F = 1 if the unit has existed for less than one year on date D where F = (D-S) / 365.25 if the unit has existed for longer than one year on date D where C is a factor that is determined for all N dividends between the calculation date D and the reference date.
For dividend i on date Di with value Wi: Ci = [Wi / NIW(Di)] + 1 i = 1 ... N

from whichC = C0 * .... * CN. If the interval between the two dates exceeds one year, the ordinary return calculation is
converted into a return on an annual basis by taking the nth square root of 1 plus the total return of the unit.
The return figures shown above do not take account of the fees and charges associated with the issue and redemption of units.
These are the performance figures for capitalisation and distribution shares.
Institutional B Shares The bar chart shows the performance for full financial years. The figures do not take account of any restructuring. Calculated in EUR. The return is calculated as the change in the net asset value between two dates expressed
as a percentage. Calculation method for date D, where NAV stands for net asset value:
Capitalisation units (CAP) Return on date D over a period of X years:
[NIW(D) / NIW(Y)] ^ [1 / X] - 1 where Y = D-X
Return on date D since the start date S of the unit: [NIW(D) / NIW(S)] ^ [1 / F] - 1 where F = 1 if the unit has existed for less than one year on date D where F = (D-S) / 365.25 if the unit has existed for longer than one year on date D
If the interval between the two dates exceeds one year, the ordinary return calculation is converted into a return on an annual basis by taking the nth square root of 1 plus the total return of the unit.
The return figures shown above do not take account of the fees and charges associated with the issue and redemption of units.
These are the performance figures for capitalization shares.
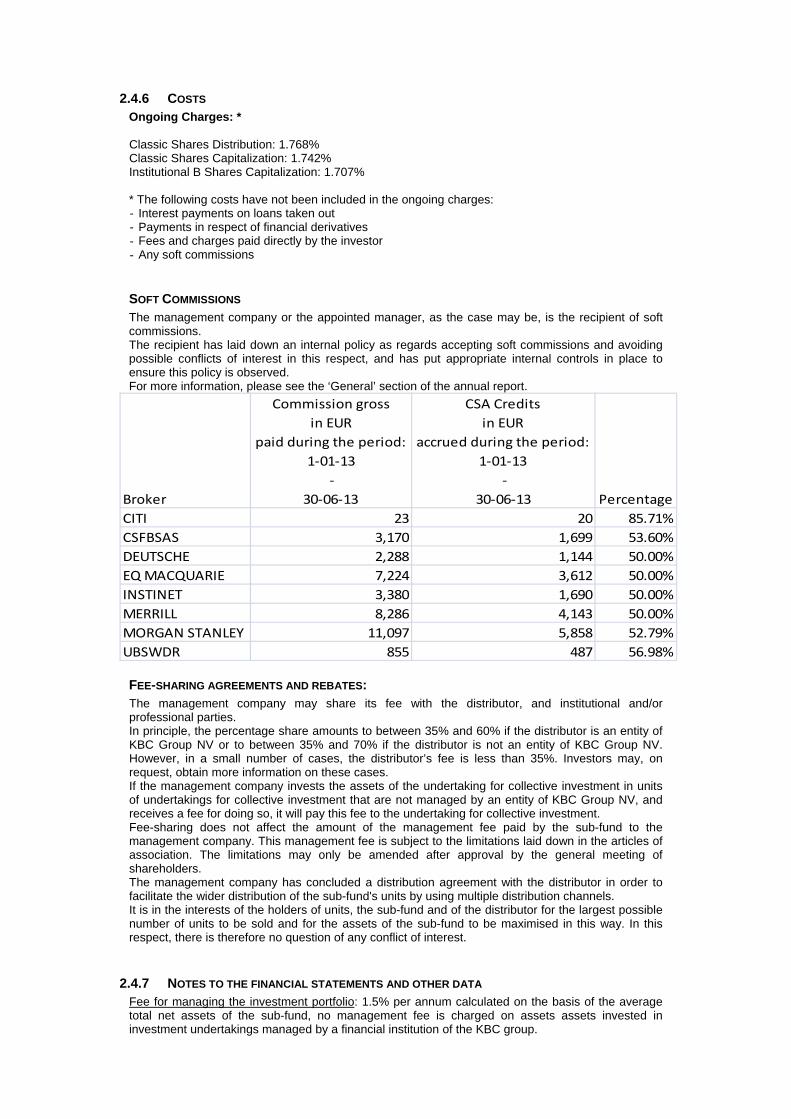
2.4.6 COSTS Ongoing Charges: * Classic Shares Distribution: 1.768% Classic Shares Capitalization: 1.742% Institutional B Shares Capitalization: 1.707% * The following costs have not been included in the ongoing charges: - Interest payments on loans taken out - Payments in respect of financial derivatives - Fees and charges paid directly by the investor - Any soft commissions
SOFT COMMISSIONS The management company or the appointed manager, as the case may be, is the recipient of soft commissions. The recipient has laid down an internal policy as regards accepting soft commissions and avoiding possible conflicts of interest in this respect, and has put appropriate internal controls in place to ensure this policy is observed. For more information, please see the ‘General’ section of the annual report.
Broker
Commission gross
in EUR
paid during the period:
1‐01‐13
‐
30‐06‐13
CSA Credits
in EUR
accrued during the period:
1‐01‐13
‐
30‐06‐13 Percentage
CITI 23 20 85.71%
CSFBSAS 3,170 1,699 53.60%
DEUTSCHE 2,288 1,144 50.00%
EQ MACQUARIE 7,224 3,612 50.00%
INSTINET 3,380 1,690 50.00%
MERRILL 8,286 4,143 50.00%
MORGAN STANLEY 11,097 5,858 52.79%
UBSWDR 855 487 56.98%
FEE-SHARING AGREEMENTS AND REBATES: The management company may share its fee with the distributor, and institutional and/or professional parties. In principle, the percentage share amounts to between 35% and 60% if the distributor is an entity of KBC Group NV or to between 35% and 70% if the distributor is not an entity of KBC Group NV. However, in a small number of cases, the distributor’s fee is less than 35%. Investors may, on request, obtain more information on these cases. If the management company invests the assets of the undertaking for collective investment in units of undertakings for collective investment that are not managed by an entity of KBC Group NV, and receives a fee for doing so, it will pay this fee to the undertaking for collective investment. Fee-sharing does not affect the amount of the management fee paid by the sub-fund to the management company. This management fee is subject to the limitations laid down in the articles of association. The limitations may only be amended after approval by the general meeting of shareholders. The management company has concluded a distribution agreement with the distributor in order to facilitate the wider distribution of the sub-fund's units by using multiple distribution channels. It is in the interests of the holders of units, the sub-fund and of the distributor for the largest possible number of units to be sold and for the assets of the sub-fund to be maximised in this way. In this respect, there is therefore no question of any conflict of interest.
2.4.7 NOTES TO THE FINANCIAL STATEMENTS AND OTHER DATA Fee for managing the investment portfolio: 1.5% per annum calculated on the basis of the average total net assets of the sub-fund, no management fee is charged on assets assets invested in investment undertakings managed by a financial institution of the KBC group.
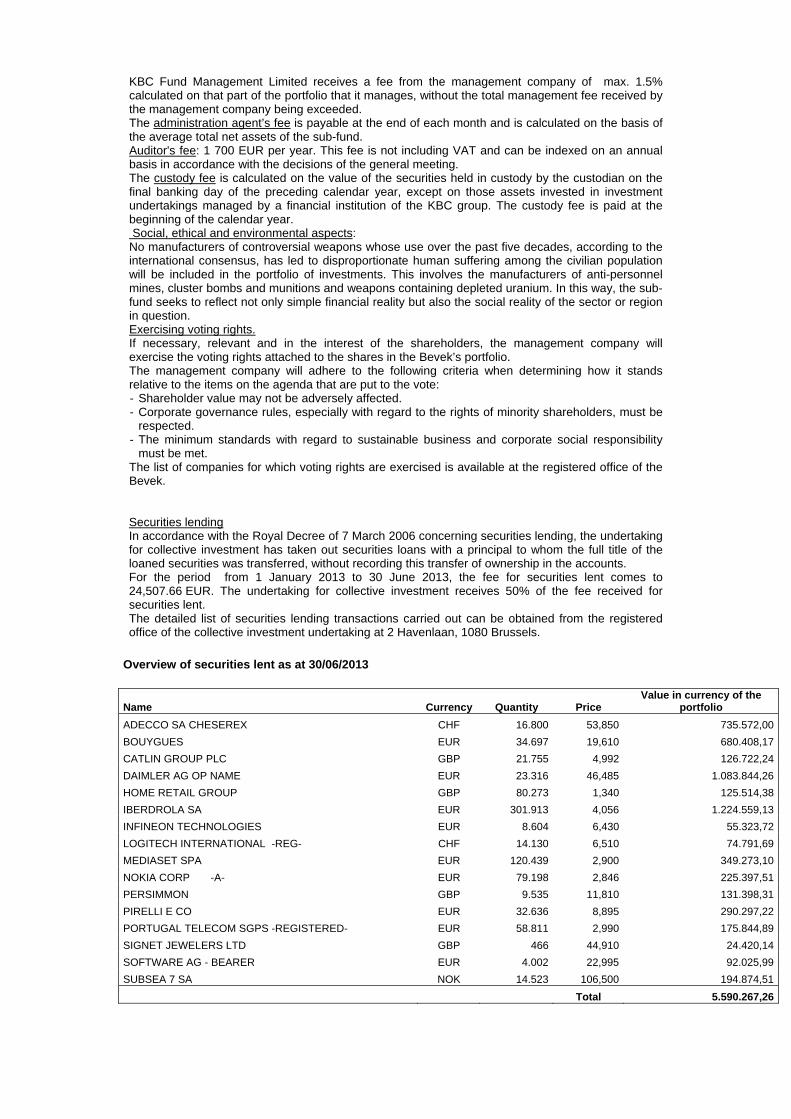
KBC Fund Management Limited receives a fee from the management company of max. 1.5% calculated on that part of the portfolio that it manages, without the total management fee received by the management company being exceeded. The administration agent’s fee is payable at the end of each month and is calculated on the basis of the average total net assets of the sub-fund. Auditor's fee: 1 700 EUR per year. This fee is not including VAT and can be indexed on an annual basis in accordance with the decisions of the general meeting. The custody fee is calculated on the value of the securities held in custody by the custodian on the final banking day of the preceding calendar year, except on those assets invested in investment undertakings managed by a financial institution of the KBC group. The custody fee is paid at the beginning of the calendar year. Social, ethical and environmental aspects: No manufacturers of controversial weapons whose use over the past five decades, according to the international consensus, has led to disproportionate human suffering among the civilian population will be included in the portfolio of investments. This involves the manufacturers of anti-personnel mines, cluster bombs and munitions and weapons containing depleted uranium. In this way, the sub-fund seeks to reflect not only simple financial reality but also the social reality of the sector or region in question. Exercising voting rights. If necessary, relevant and in the interest of the shareholders, the management company will exercise the voting rights attached to the shares in the Bevek’s portfolio. The management company will adhere to the following criteria when determining how it stands relative to the items on the agenda that are put to the vote: - Shareholder value may not be adversely affected. - Corporate governance rules, especially with regard to the rights of minority shareholders, must be
respected. - The minimum standards with regard to sustainable business and corporate social responsibility
must be met. The list of companies for which voting rights are exercised is available at the registered office of the Bevek. Securities lending In accordance with the Royal Decree of 7 March 2006 concerning securities lending, the undertaking for collective investment has taken out securities loans with a principal to whom the full title of the loaned securities was transferred, without recording this transfer of ownership in the accounts. For the period from 1 January 2013 to 30 June 2013, the fee for securities lent comes to 24,507.66 EUR. The undertaking for collective investment receives 50% of the fee received for securities lent. The detailed list of securities lending transactions carried out can be obtained from the registered office of the collective investment undertaking at 2 Havenlaan, 1080 Brussels.
Overview of securities lent as at 30/06/2013
Name Currency Quantity Price Value in currency of the
portfolio
ADECCO SA CHESEREX CHF 16.800 53,850 735.572,00
BOUYGUES EUR 34.697 19,610 680.408,17
CATLIN GROUP PLC GBP 21.755 4,992 126.722,24
DAIMLER AG OP NAME EUR 23.316 46,485 1.083.844,26
HOME RETAIL GROUP GBP 80.273 1,340 125.514,38
IBERDROLA SA EUR 301.913 4,056 1.224.559,13
INFINEON TECHNOLOGIES EUR 8.604 6,430 55.323,72
LOGITECH INTERNATIONAL -REG- CHF 14.130 6,510 74.791,69
MEDIASET SPA EUR 120.439 2,900 349.273,10
NOKIA CORP -A- EUR 79.198 2,846 225.397,51
PERSIMMON GBP 9.535 11,810 131.398,31
PIRELLI E CO EUR 32.636 8,895 290.297,22
PORTUGAL TELECOM SGPS -REGISTERED- EUR 58.811 2,990 175.844,89
SIGNET JEWELERS LTD GBP 466 44,910 24.420,14
SOFTWARE AG - BEARER EUR 4.002 22,995 92.025,99
SUBSEA 7 SA NOK 14.523 106,500 194.874,51
Total 5.590.267,26
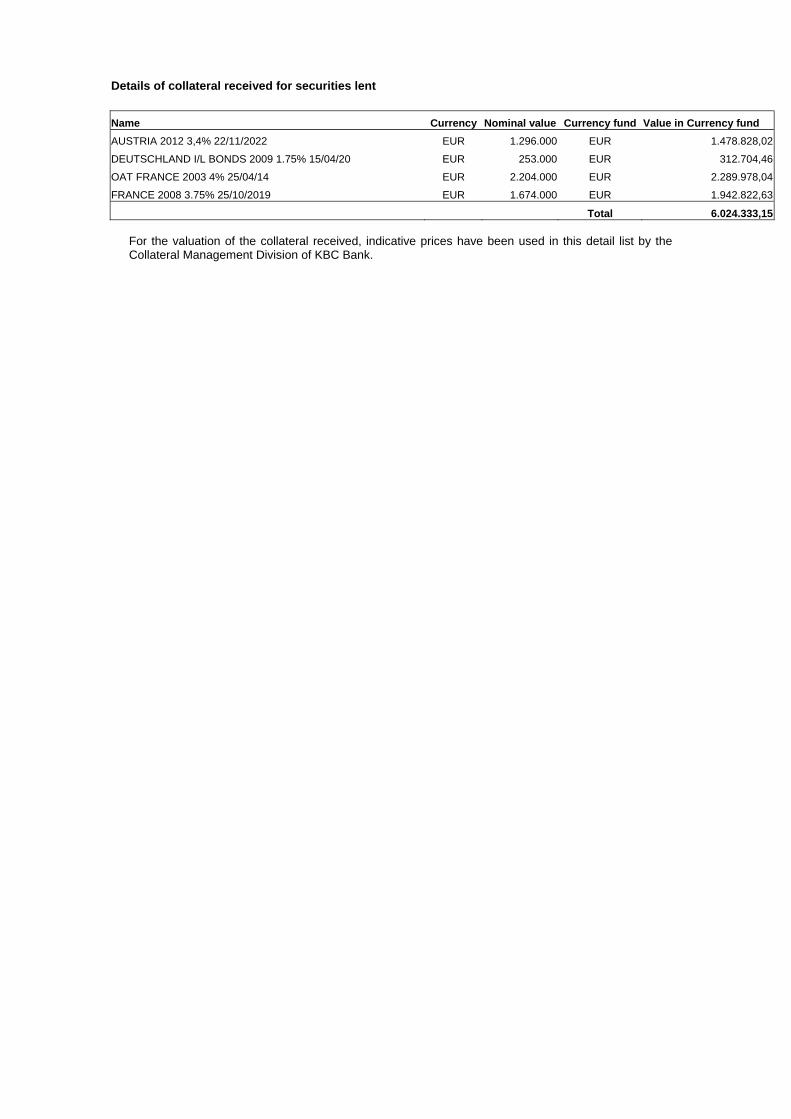
Details of collateral received for securities lent
Name Currency Nominal value Currency fund Value in Currency fund
AUSTRIA 2012 3,4% 22/11/2022 EUR 1.296.000 EUR 1.478.828,02
DEUTSCHLAND I/L BONDS 2009 1.75% 15/04/20 EUR 253.000 EUR 312.704,46
OAT FRANCE 2003 4% 25/04/14 EUR 2.204.000 EUR 2.289.978,04
FRANCE 2008 3.75% 25/10/2019 EUR 1.674.000 EUR 1.942.822,63
Total 6.024.333,15 For the valuation of the collateral received, indicative prices have been used in this detail list by the Collateral Management Division of KBC Bank.

Semi-Annual report as at 30th June 2013
TABLE OF CONTENTS
2. Information on KBC Equity Fund New Shares
2.1. Management report 2.1.1. Launch date and subscription price 2.1.2. Stock exchange listing 2.1.3. Aim and distinctive features of the investment policy 2.1.4. Financial portfolio management 2.1.5. Distributors 2.1.6. Index and benchmark 2.1.7. Policy conducted during the financial year 2.1.8. Future policy 2.1.9. Synthetic risk and reward indicator (SRRI)
2.2. Balance sheet
2.3. Profit and loss account
2.4. Composition of the assets and key figures
2.4.1. Composition of the assets 2.4.2. Change in the composition of the assets 2.4.3. Value of commitments in respect of financial derivatives positions 2.4.4. Evolution of the number of subscriptions, repayments and the net asset value 2.4.5. Return figures 2.4.6. Expenses 2.4.7. Notes to the financial statements and other data

2 INFORMATION ON KBC EQUITY FUND NEW SHARES
2.1 MANAGEMENT REPORT
2.1.1 LAUNCH DATE AND SUBSCRIPTION PRICE Launch date: 1 April 1999 Initial subscription price: 500 EUR Currency: EUR
2.1.2 STOCK EXCHANGE LISTING Not applicable.
2.1.3 GOAL AND KEY PRINCIPLES OF THE INVESTMENT POLICY
SUB-FUND’S OBJECT: The main objective of this sub-fund is to generate the highest possible return for its shareholders by investing directly or indirectly in transferable securities. This is reflected in its pursuit of capital gains and income. To this end, the assets are invested, either directly or indirectly via correlated financial instruments, primarily in shares.
SUB-FUND’S INVESTMENT POLICY:
PERMITTED ASSET CLASSES: The sub-fund may invest in securities, money market instruments, units in undertakings for collective investment, deposits, financial derivatives, liquid assets and all other instruments insofar as permitted by the applicable laws and regulations and consistent with the sub-fund’s object The sub-fund shall invest no more than 10% of its assets in units of other undertakings for collective investment.
RESTRICTIONS OF THE INVESTMENT POLICY: The investment policy will be implemented within the limits set by law and regulations. The sub-fund may borrow up to 10% of its net assets, insofar as these are short-term borrowings aimed at solving temporary liquidity problems.
PERMITTED DERIVATIVES TRANSACTIONS: Derivates may be used either for hedging purposes or to achieve investment objectives. Changes will be made to the investments at regular intervals to comply with the sub-fund's investment strategy. In addition, listed and unlisted derivates may be used to achieve the objectives: these may be forward contracts, options or swaps on securities, indices, currencies or interest rates or other transactions involving derivatives. Unlisted derivatives transactions will only be concluded with prime financial institutions specialised in such transactions. Such derivatives may also be used to hedge the assets against exchange-rate fluctuations. Subject to the applicable laws and regulations and the articles of association, the sub-fund always seeks to conclude the most effective transactions. All costs associated with the transactions will be charged to the sub-fund and all income generated will be paid to the sub-fund. If the transactions result in a risk in respect of the counterparty, this risk can be hedged by using a margin management system that ensures that the sub-fund is the beneficiary of security (collateral) in the form of cash or investment grade bonds. When calculating the value of the bonds, a margin will be applied that varies depending on the residual term to maturity and the currency in which the bond in question is denominated. The relationship with the counterparty or counterparties is governed by standard international agreements.
STRATEGY SELECTED At least 75% of the assets are invested in shares that have been admitted for listing on a regulated market, where conditions are such as to allow accelerated economic growth in the short or medium term.
RISK CONCENTRATION Recently listed shares.

LENDING FINANCIAL INSTRUMENTS: The sub-fund may lend financial instruments within the limits set by law and regulations. This lending does not affect the sub-fund’s risk profile since: - it takes place within the framework of a securities lending system managed by a principal. In
addition, the sub-fund has a relationship only with the principal of the securities lending system which acts as counterparty and to which title of the loaned securities is transferred. The choice of principal is subject to strict selection criteria. The return of securities similar to the securities that have been lent is guaranteed by the principal.
- through a margin management system, the sub-fund is always guaranteed financial security, the actual value of which always exceeds the actual value of the securities that have been lent, in case the principal does not return similar securities.
The return of securities similar to the securities that have been lent can be requested at any time, which means that the lending of securities does not affect the management of the sub-fund's assets. By lending securities, the sub-fund can generate an additional return. The principal pays a fee to the management company. After deducting the fee for the margin management and clearing services of KBC Bank, most of this fee is paid to the sub-fund. The relationship with the counterparty or counterparties is governed by standard international agreements. More information is provided on the terms and conditions governing securities lending in the annual or half-yearly report for the sub-fund.
VOLATILITY OF THE NET ASSET VALUE: The volatility of the net asset value may be high due to the composition of the portfolio.
GENERAL STRATEGY FOR HEDGING THE EXCHANGE RATE RISK: In order to protect its assets against exchange rate fluctuations and within the limitations laid down in the articles of association, the sub-fund may perform transactions relating to the sale of forward currency contracts, as well as the sale of call options and the purchase of put options on currencies. The transactions in question may relate solely to contracts traded on a regulated market that operates regularly, is recognised and is open to the public or that are traded with a recognised, prime financial institution specialising in such transactions and dealing in the over-the-counter (OTC) market in options. With the same objective, the sub-fund may also sell currencies forward or exchange them in private transactions with prime financial institutions specialising in such transactions. The hedging objective of the aforementioned transactions suggests that there is a direct link between these transactions and the assets to be hedged, which implies that the transactions carried out in a particular currency may in principle not exceed, in terms of volume, either the valuation value of all the assets in the same currency or the holding period of those assets.
SOCIAL, ETHICAL AND ENVIRONMENTAL ASPECTS:
No manufacturers of controversial weapons whose use over the past five decades, according to the international consensus, has led to disproportionate human suffering among the civilian population will be included in the portfolio of investments. This involves the manufacturers of anti-personnel mines, cluster bombs and munitions and weapons containing depleted uranium. In this way, the sub-fund seeks to reflect not only simple financial reality but also the social reality of the sector or region in question.
THE EUROPEAN SAVINGS DIRECTIVE AND TAX ON DEBT CLAIM RETURNS OBTAINED THROUGH THE
REDEMPTION OF OWN UNITS OR IN THE EVENT OF FULL OR PARTIAL DISTRIBUTION OF EQUITY
CAPITAL. The following information is of a general character and is not intended to cover all aspects of an investment in a UCITS. In certain cases entirely different rules might even apply. Moreover, both tax law and the interpretation of it can change. Investors who wish to have more information about the tax implications – in both Belgium and abroad – of acquiring, holding and transferring units should seek the advice of their usual financial and tax advisers. This UCITS shall invest a maximum of 15% of its assets directly or indirectly in debt instruments as intended by the European Savings Directive. A. European Savings Directive (Directive 2003/48/EC) The European Savings Directive has been implemented in Belgium.

Since this UCITS invests a maximum of 15% of its assets directly or indirectly in debt claims as intended by the European Savings Directive, the income of this UCITS does not fall within the scope of this directive. B. Tax on debt claim returns obtained through the redemption of own units or in the event of full or partial distribution of equity capital (Article 19bis Income Tax Code 1992). The income from this UCITS is not subject to the tax on debt instrument returns as intended by Article 19bis, Income Tax Code 1992.
2.1.4 FINANCIAL PORTFOLIO MANAGEMENT The management company has delegated the intellectual management, to KBC Fund Management Limited, Joshua Dawson House, Dawson Street , Dublin 2, IRELAND..
2.1.5 DISTRIBUTORS KBC Asset Management S.A., 5, Place de la Gare, L-1616 Luxembourg.
2.1.6 INDEX AND BENCHMARK See ‘Sub-fund’s investment policy’.
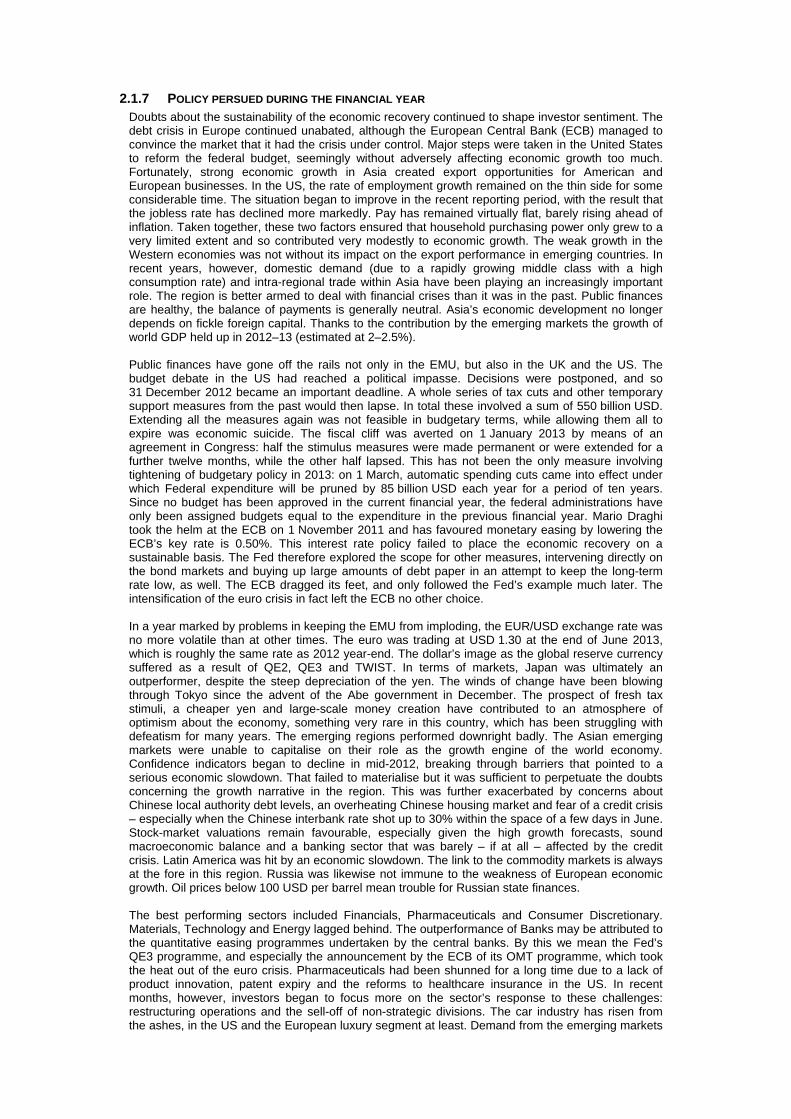
2.1.7 POLICY PERSUED DURING THE FINANCIAL YEAR Doubts about the sustainability of the economic recovery continued to shape investor sentiment. The debt crisis in Europe continued unabated, although the European Central Bank (ECB) managed to convince the market that it had the crisis under control. Major steps were taken in the United States to reform the federal budget, seemingly without adversely affecting economic growth too much. Fortunately, strong economic growth in Asia created export opportunities for American and European businesses. In the US, the rate of employment growth remained on the thin side for some considerable time. The situation began to improve in the recent reporting period, with the result that the jobless rate has declined more markedly. Pay has remained virtually flat, barely rising ahead of inflation. Taken together, these two factors ensured that household purchasing power only grew to a very limited extent and so contributed very modestly to economic growth. The weak growth in the Western economies was not without its impact on the export performance in emerging countries. In recent years, however, domestic demand (due to a rapidly growing middle class with a high consumption rate) and intra-regional trade within Asia have been playing an increasingly important role. The region is better armed to deal with financial crises than it was in the past. Public finances are healthy, the balance of payments is generally neutral. Asia’s economic development no longer depends on fickle foreign capital. Thanks to the contribution by the emerging markets the growth of world GDP held up in 2012–13 (estimated at 2–2.5%). Public finances have gone off the rails not only in the EMU, but also in the UK and the US. The budget debate in the US had reached a political impasse. Decisions were postponed, and so 31 December 2012 became an important deadline. A whole series of tax cuts and other temporary support measures from the past would then lapse. In total these involved a sum of 550 billion USD. Extending all the measures again was not feasible in budgetary terms, while allowing them all to expire was economic suicide. The fiscal cliff was averted on 1 January 2013 by means of an agreement in Congress: half the stimulus measures were made permanent or were extended for a further twelve months, while the other half lapsed. This has not been the only measure involving tightening of budgetary policy in 2013: on 1 March, automatic spending cuts came into effect under which Federal expenditure will be pruned by 85 billion USD each year for a period of ten years. Since no budget has been approved in the current financial year, the federal administrations have only been assigned budgets equal to the expenditure in the previous financial year. Mario Draghi took the helm at the ECB on 1 November 2011 and has favoured monetary easing by lowering the ECB’s key rate is 0.50%. This interest rate policy failed to place the economic recovery on a sustainable basis. The Fed therefore explored the scope for other measures, intervening directly on the bond markets and buying up large amounts of debt paper in an attempt to keep the long-term rate low, as well. The ECB dragged its feet, and only followed the Fed’s example much later. The intensification of the euro crisis in fact left the ECB no other choice. In a year marked by problems in keeping the EMU from imploding, the EUR/USD exchange rate was no more volatile than at other times. The euro was trading at USD 1.30 at the end of June 2013, which is roughly the same rate as 2012 year-end. The dollar’s image as the global reserve currency suffered as a result of QE2, QE3 and TWIST. In terms of markets, Japan was ultimately an outperformer, despite the steep depreciation of the yen. The winds of change have been blowing through Tokyo since the advent of the Abe government in December. The prospect of fresh tax stimuli, a cheaper yen and large-scale money creation have contributed to an atmosphere of optimism about the economy, something very rare in this country, which has been struggling with defeatism for many years. The emerging regions performed downright badly. The Asian emerging markets were unable to capitalise on their role as the growth engine of the world economy. Confidence indicators began to decline in mid-2012, breaking through barriers that pointed to a serious economic slowdown. That failed to materialise but it was sufficient to perpetuate the doubts concerning the growth narrative in the region. This was further exacerbated by concerns about Chinese local authority debt levels, an overheating Chinese housing market and fear of a credit crisis – especially when the Chinese interbank rate shot up to 30% within the space of a few days in June. Stock-market valuations remain favourable, especially given the high growth forecasts, sound macroeconomic balance and a banking sector that was barely – if at all – affected by the credit crisis. Latin America was hit by an economic slowdown. The link to the commodity markets is always at the fore in this region. Russia was likewise not immune to the weakness of European economic growth. Oil prices below 100 USD per barrel mean trouble for Russian state finances. The best performing sectors included Financials, Pharmaceuticals and Consumer Discretionary. Materials, Technology and Energy lagged behind. The outperformance of Banks may be attributed to the quantitative easing programmes undertaken by the central banks. By this we mean the Fed’s QE3 programme, and especially the announcement by the ECB of its OMT programme, which took the heat out of the euro crisis. Pharmaceuticals had been shunned for a long time due to a lack of product innovation, patent expiry and the reforms to healthcare insurance in the US. In recent months, however, investors began to focus more on the sector’s response to these challenges: restructuring operations and the sell-off of non-strategic divisions. The car industry has risen from the ashes, in the US and the European luxury segment at least. Demand from the emerging markets

is also strong, despite the slowdown in Chinese growth, where German luxury marques generate 50% of their profits. In spite of the slow growth, advertising budgets have also held up surprisingly well. Mining companies lost ground on excessive expectations concerning commodity prices. A failed stock market flotation by Facebook and the giant leaps made by Apple meant that price trends in the Technology sector differed from what might have been expected on the basis of the fundamentals. The oil companies suffered from the vagaries of the oil market, the political instability in the Middle East and frequent accidents. The IPO market has been relatively quiet in 2013, but activity did pick up somewhat in Q2 with an improved pipeline of transactions that could launch post-summer. Telecoms, Financials and Real Estate have been dominating the market. In terms of performance of KBC Equity Fund New Shares, first quarter performance was positive on an absolute basis. On an allocation level, the best performing industry group was Real Estate (3.9% of the fund), largely due to positive performance of Daiwa House REIT Investment, which was added to the portfolio at the end of last year. The international book was oversubscribed by around 10x, dominated by real estate and long only funds, with no price sensitivity. The issuer agreed to increase the international tranche from 15% to 20% of base offering size (5,000 units shifted from domestic tranche to international tranche). Domestic coverage was around 3 to 4x. The Materials industry group (5.5% of the fund) was the next largest contributor to performance over the first quarter, with CHR Hansen Holdings being the key driver of this performance. The largest detractors from performance were Pharma. Biotechnology & Life Sciences and Insurance industry groups, which made up 1.8% and 8.2% of the fund respectively. Within Parma, ThromboGenics was the most significant detractor from performance over the first quarter, pulling back after a stellar run in 2012, on the back of winning approval to produce Jetra, a vision-restoring injection. Sony Financial Holdings was the worst performer within Insurance over the period. On a regional basis, the Asia Pacific region (19.9% of the fund) was the main detractor from performance, while the North American region (45.7% of the fund) contributed positively over the period. Performance of in the second quarter was negative on an absolute basis. Diversified Financials (7.1% of the fund) was the main outperformer over the quarter. Within the sector, outperformance was driven by the fund’s overweight position in CME Group. CME Group, the world’s leading and most diverse derivatives marketplace, reported experiencing new records in daily trading volumes. Software & Services (9.9% of the fund) was the second best outperformer over the period. Within the sector, outperformance was driven by the fund’s overweight position in Amadeus IT Holding. The company reported 1Q13 results in May beating expectations on profitability, EPS grew at 6%, 5% ahead of consensus. The Materials industry group (5.5% of the fund) was again the second best performer in the second quarter, with Ternium SA being the key driver of this performance. Latin America’s second-largest steelmaker rose the most in more than 15 months after saying it would not buy a steel plant from ThyseenKrupp AG in Rio de Janeiro, Brazil. The largest detractors from performance were Commercial & Professional Services (7.4% of the fund) and Energy (8.6% of the fund). The former was largely driven by poor performance of Moleskine SPA, which listed at the beginning of the quarter. Within the Energy group poor performance was driven largely by our overweight position in Impexmetal S.A. Looking at performance on a regional basis, the Emerging Markets segment (17.0% of the fund) was the main contributor to performance, while the Pan Europe area (28.9% of the fund) was the most significant detractor from performance. Overall KBC Equity Fund New Shares performed positively on an absolute basis over the first half of 2013.
2.1.8 FUTURE POLICY In the US they are in the twilight zone between recession and expansion. We are expecting US growth to remain positive but modest (around 2% y-o-y in the coming quarters) as pay increases are barely keeping pace with inflation and budgetary policy has now finally struck down the path of austerity. The fragile recovery of the housing market and corporate investment could be sustained. How strong the growth proves to be will depend largely on the dynamic of the labour market. In recent months employment in the US has grown by around 200,000 new jobs each month. This will need to continue in order to achieve +2% growth in 2013 and in 2014. Confidence indicators in Europe are well below freezing point. The budgetary plans, tighter lending policy of the banks and major uncertainty among consumers and producers will continue to depress growth. 2013 will see a contraction of GDP in Europe. Recovery is not expected until the first half of 2014. Deflation or depression scenarios, which are currently dominating bond market sentiment, are not however justified. The foundations for more sustainable growth in 2014 and beyond have been laid in recent years. US households have trimmed back their debt level significantly, the savings rate has already increased considerably and loan servicing (instalments and interest payments combined) now accounts for only 8% of household budgets (the lowest level in 15 years). Households are gradually moving towards a position where they can spend more of their money on consumption. Economic growth in Europe will remain below par. Sky-high unemployment and the euro crisis are undermining
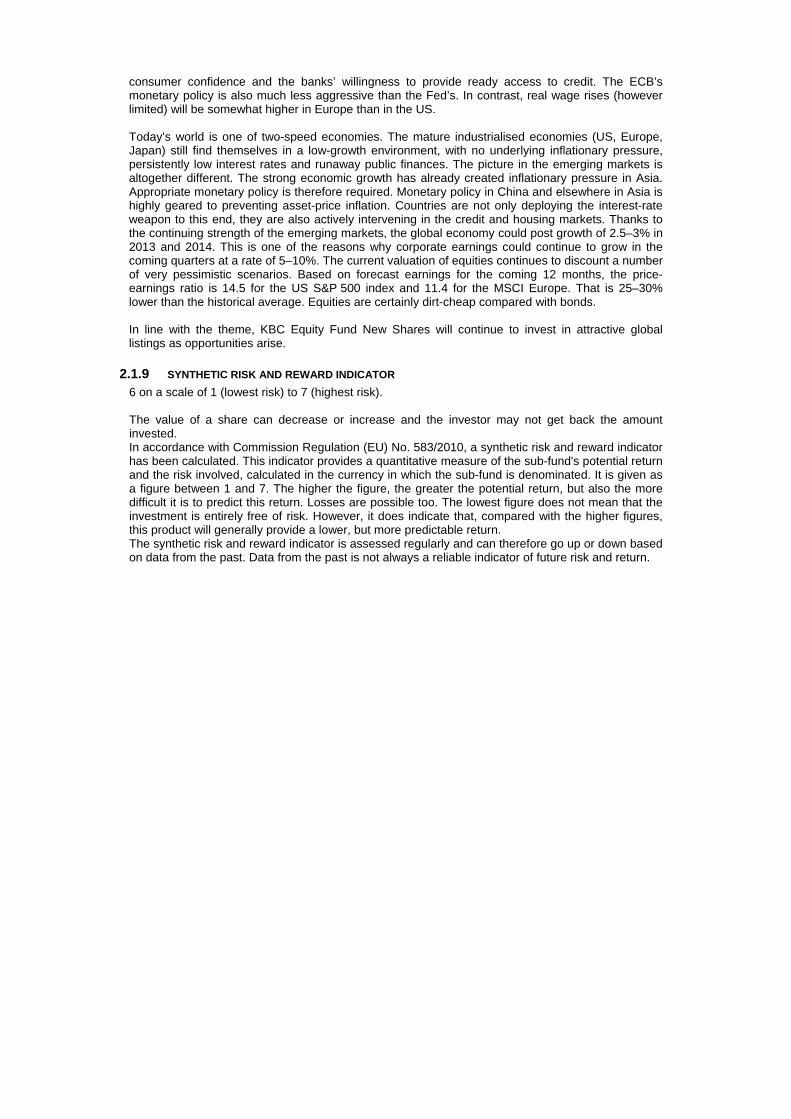
consumer confidence and the banks’ willingness to provide ready access to credit. The ECB’s monetary policy is also much less aggressive than the Fed’s. In contrast, real wage rises (however limited) will be somewhat higher in Europe than in the US. Today’s world is one of two-speed economies. The mature industrialised economies (US, Europe, Japan) still find themselves in a low-growth environment, with no underlying inflationary pressure, persistently low interest rates and runaway public finances. The picture in the emerging markets is altogether different. The strong economic growth has already created inflationary pressure in Asia. Appropriate monetary policy is therefore required. Monetary policy in China and elsewhere in Asia is highly geared to preventing asset-price inflation. Countries are not only deploying the interest-rate weapon to this end, they are also actively intervening in the credit and housing markets. Thanks to the continuing strength of the emerging markets, the global economy could post growth of 2.5–3% in 2013 and 2014. This is one of the reasons why corporate earnings could continue to grow in the coming quarters at a rate of 5–10%. The current valuation of equities continues to discount a number of very pessimistic scenarios. Based on forecast earnings for the coming 12 months, the price-earnings ratio is 14.5 for the US S&P 500 index and 11.4 for the MSCI Europe. That is 25–30% lower than the historical average. Equities are certainly dirt-cheap compared with bonds. In line with the theme, KBC Equity Fund New Shares will continue to invest in attractive global listings as opportunities arise.
2.1.9 SYNTHETIC RISK AND REWARD INDICATOR 6 on a scale of 1 (lowest risk) to 7 (highest risk). The value of a share can decrease or increase and the investor may not get back the amount invested. In accordance with Commission Regulation (EU) No. 583/2010, a synthetic risk and reward indicator has been calculated. This indicator provides a quantitative measure of the sub-fund's potential return and the risk involved, calculated in the currency in which the sub-fund is denominated. It is given as a figure between 1 and 7. The higher the figure, the greater the potential return, but also the more difficult it is to predict this return. Losses are possible too. The lowest figure does not mean that the investment is entirely free of risk. However, it does indicate that, compared with the higher figures, this product will generally provide a lower, but more predictable return. The synthetic risk and reward indicator is assessed regularly and can therefore go up or down based on data from the past. Data from the past is not always a reliable indicator of future risk and return.
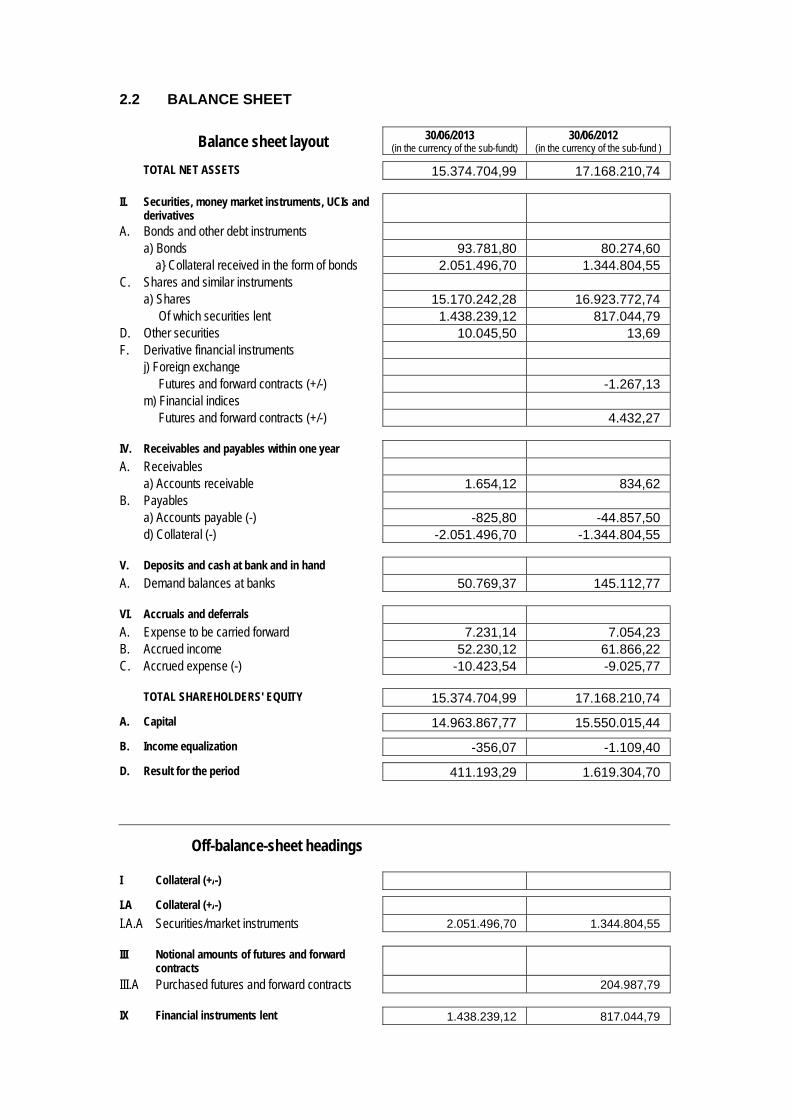
2.2 BALANCE SHEET
Balance sheet layout 30/06/2013 (in the currency of the sub-fundt)
30/06/2012 (in the currency of the sub-fund )
TOTAL NET ASSETS 15.374.704,99 17.168.210,74
II. Securities, money market instruments, UCIs and derivatives
A. Bonds and other debt instruments a) Bonds 93.781,80 80.274,60 a} Collateral received in the form of bonds 2.051.496,70 1.344.804,55 C. Shares and similar instruments a) Shares 15.170.242,28 16.923.772,74 Of which securities lent 1.438.239,12 817.044,79 D. Other securities 10.045,50 13,69 F. Derivative financial instruments j) Foreign exchange Futures and forward contracts (+/-) -1.267,13 m) Financial indices Futures and forward contracts (+/-) 4.432,27
IV. Receivables and payables within one year A. Receivables a) Accounts receivable 1.654,12 834,62 B. Payables a) Accounts payable (-) -825,80 -44.857,50 d) Collateral (-) -2.051.496,70 -1.344.804,55
V. Deposits and cash at bank and in hand A. Demand balances at banks 50.769,37 145.112,77
VI. Accruals and deferrals A. Expense to be carried forward 7.231,14 7.054,23 B. Accrued income 52.230,12 61.866,22 C. Accrued expense (-) -10.423,54 -9.025,77
TOTAL SHAREHOLDERS' EQUITY 15.374.704,99 17.168.210,74
A. Capital 14.963.867,77 15.550.015,44
B. Income equalization -356,07 -1.109,40
D. Result for the period 411.193,29 1.619.304,70
Off-balance-sheet headings
I Collateral (+/-)
I.A Collateral (+/-)
I.A.A Securities/market instruments 2.051.496,70 1.344.804,55
III Notional amounts of futures and forward contracts
III.A Purchased futures and forward contracts 204.987,79
IX Financial instruments lent 1.438.239,12 817.044,79

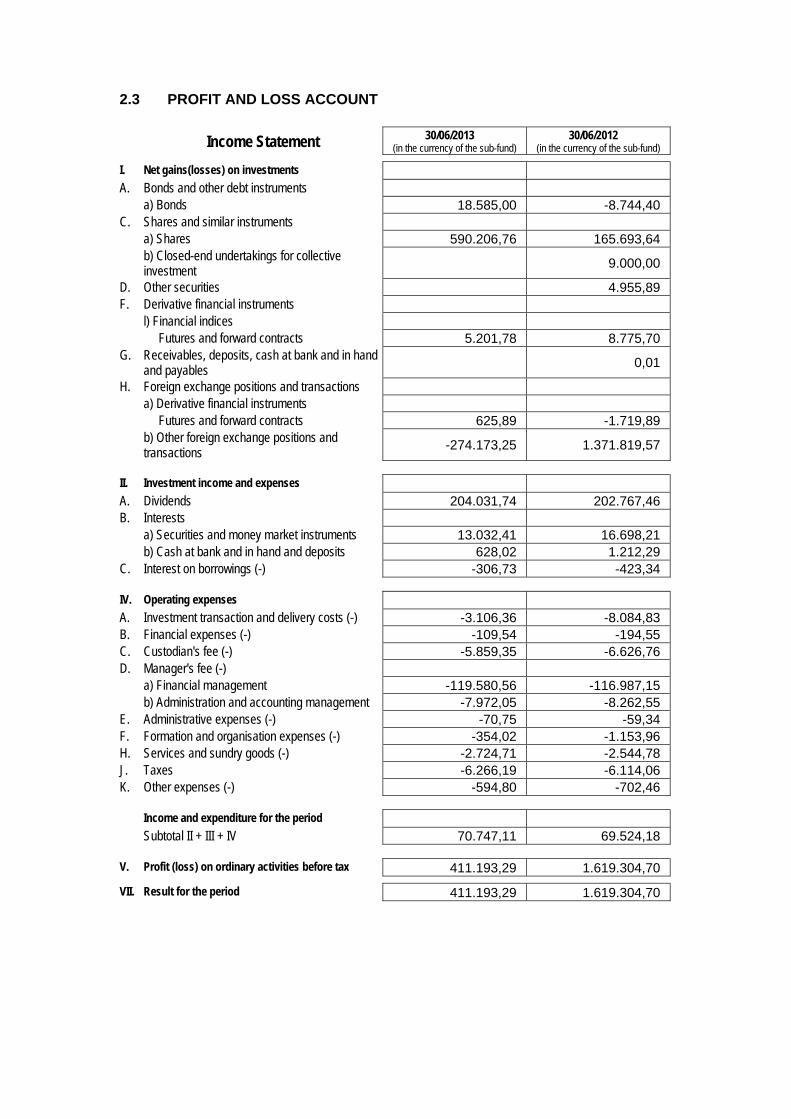
2.3 PROFIT AND LOSS ACCOUNT
Income Statement 30/06/2013 (in the currency of the sub-fund)
30/06/2012 (in the currency of the sub-fund)
I. Net gains(losses) on investments A. Bonds and other debt instruments a) Bonds 18.585,00 -8.744,40 C. Shares and similar instruments a) Shares 590.206,76 165.693,64 b) Closed-end undertakings for collective
investment 9.000,00
D. Other securities 4.955,89 F. Derivative financial instruments l) Financial indices Futures and forward contracts 5.201,78 8.775,70 G. Receivables, deposits, cash at bank and in hand
and payables 0,01
H. Foreign exchange positions and transactions a) Derivative financial instruments Futures and forward contracts 625,89 -1.719,89 b) Other foreign exchange positions and
transactions -274.173,25 1.371.819,57
II. Investment income and expenses A. Dividends 204.031,74 202.767,46 B. Interests a) Securities and money market instruments 13.032,41 16.698,21 b) Cash at bank and in hand and deposits 628,02 1.212,29 C. Interest on borrowings (-) -306,73 -423,34
IV. Operating expenses A. Investment transaction and delivery costs (-) -3.106,36 -8.084,83 B. Financial expenses (-) -109,54 -194,55 C. Custodian's fee (-) -5.859,35 -6.626,76 D. Manager's fee (-) a) Financial management -119.580,56 -116.987,15 b) Administration and accounting management -7.972,05 -8.262,55 E. Administrative expenses (-) -70,75 -59,34 F. Formation and organisation expenses (-) -354,02 -1.153,96 H. Services and sundry goods (-) -2.724,71 -2.544,78 J. Taxes -6.266,19 -6.114,06 K. Other expenses (-) -594,80 -702,46
Income and expenditure for the period Subtotal II + III + IV 70.747,11 69.524,18
V. Profit (loss) on ordinary activities before tax 411.193,29 1.619.304,70
VII. Result for the period 411.193,29 1.619.304,70
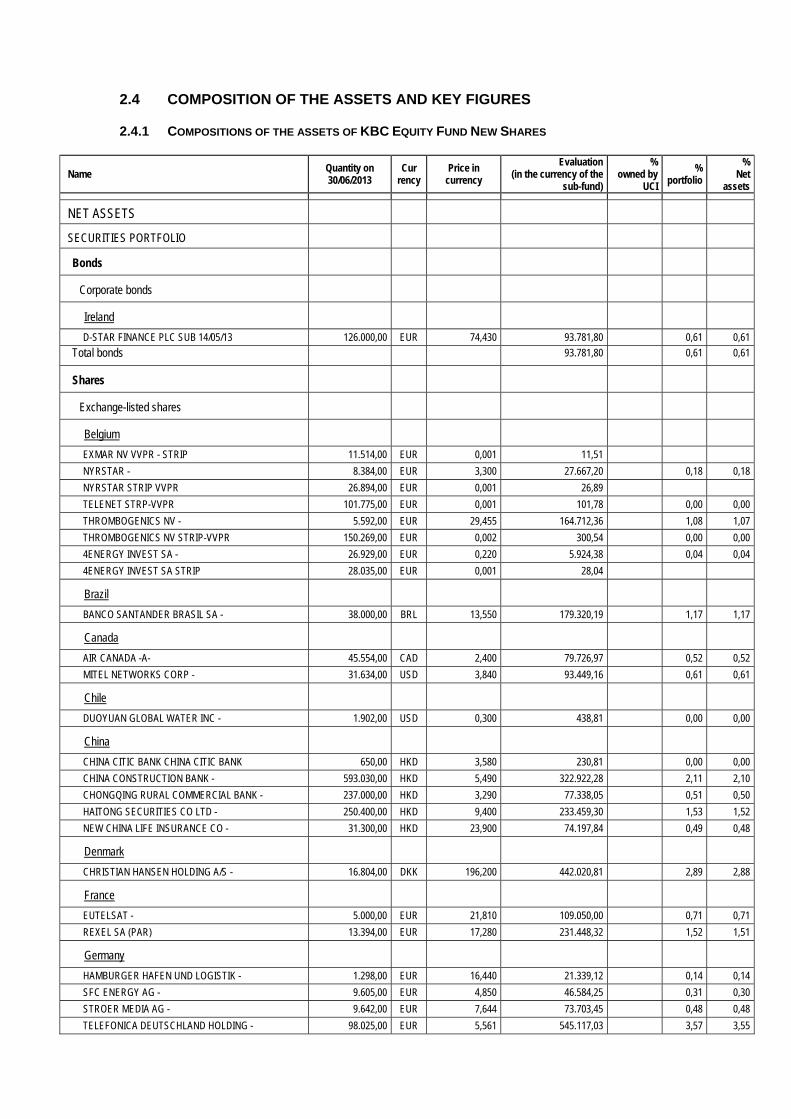
2.4 COMPOSITION OF THE ASSETS AND KEY FIGURES
2.4.1 COMPOSITIONS OF THE ASSETS OF KBC EQUITY FUND NEW SHARES
Name Quantity on 30/06/2013
Cur rency
Price in currency
Evaluation (in the currency of the
sub-fund)
% owned by
UCI
% portfolio
% Net
assets
NET ASSETS
SECURITIES PORTFOLIO
Bonds
Corporate bonds
Ireland
D-STAR FINANCE PLC SUB 14/05/13 126.000,00 EUR 74,430 93.781,80 0,61 0,61
Total bonds 93.781,80 0,61 0,61
Shares
Exchange-listed shares
Belgium
EXMAR NV VVPR - STRIP 11.514,00 EUR 0,001 11,51
NYRSTAR - 8.384,00 EUR 3,300 27.667,20 0,18 0,18
NYRSTAR STRIP VVPR 26.894,00 EUR 0,001 26,89
TELENET STRP-VVPR 101.775,00 EUR 0,001 101,78 0,00 0,00
THROMBOGENICS NV - 5.592,00 EUR 29,455 164.712,36 1,08 1,07
THROMBOGENICS NV STRIP-VVPR 150.269,00 EUR 0,002 300,54 0,00 0,00
4ENERGY INVEST SA - 26.929,00 EUR 0,220 5.924,38 0,04 0,04
4ENERGY INVEST SA STRIP 28.035,00 EUR 0,001 28,04
Brazil
BANCO SANTANDER BRASIL SA - 38.000,00 BRL 13,550 179.320,19 1,17 1,17
Canada
AIR CANADA -A- 45.554,00 CAD 2,400 79.726,97 0,52 0,52
MITEL NETWORKS CORP - 31.634,00 USD 3,840 93.449,16 0,61 0,61
Chile
DUOYUAN GLOBAL WATER INC - 1.902,00 USD 0,300 438,81 0,00 0,00
China
CHINA CITIC BANK CHINA CITIC BANK 650,00 HKD 3,580 230,81 0,00 0,00
CHINA CONSTRUCTION BANK - 593.030,00 HKD 5,490 322.922,28 2,11 2,10
CHONGQING RURAL COMMERCIAL BANK - 237.000,00 HKD 3,290 77.338,05 0,51 0,50
HAITONG SECURITIES CO LTD - 250.400,00 HKD 9,400 233.459,30 1,53 1,52
NEW CHINA LIFE INSURANCE CO - 31.300,00 HKD 23,900 74.197,84 0,49 0,48
Denmark
CHRISTIAN HANSEN HOLDING A/S - 16.804,00 DKK 196,200 442.020,81 2,89 2,88
France
EUTELSAT - 5.000,00 EUR 21,810 109.050,00 0,71 0,71
REXEL SA (PAR) 13.394,00 EUR 17,280 231.448,32 1,52 1,51
Germany
HAMBURGER HAFEN UND LOGISTIK - 1.298,00 EUR 16,440 21.339,12 0,14 0,14
SFC ENERGY AG - 9.605,00 EUR 4,850 46.584,25 0,31 0,30
STROER MEDIA AG - 9.642,00 EUR 7,644 73.703,45 0,48 0,48
TELEFONICA DEUTSCHLAND HOLDING - 98.025,00 EUR 5,561 545.117,03 3,57 3,55
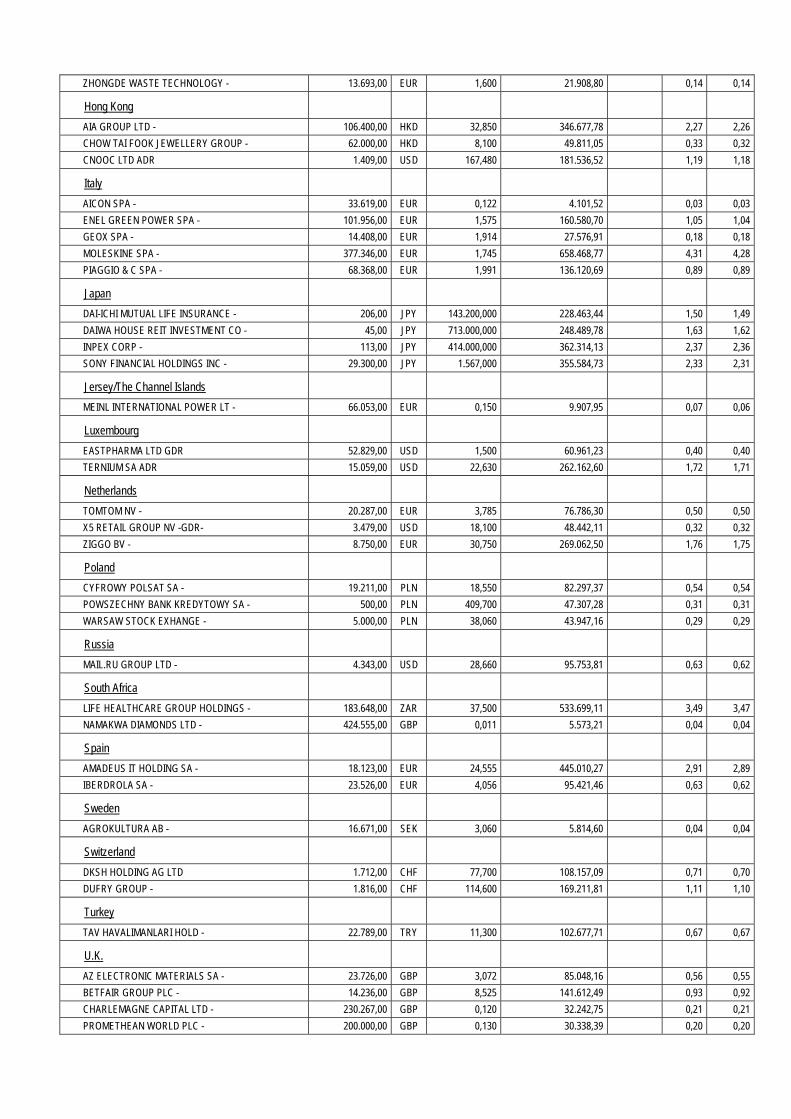
ZHONGDE WASTE TECHNOLOGY - 13.693,00 EUR 1,600 21.908,80 0,14 0,14
Hong Kong
AIA GROUP LTD - 106.400,00 HKD 32,850 346.677,78 2,27 2,26
CHOW TAI FOOK JEWELLERY GROUP - 62.000,00 HKD 8,100 49.811,05 0,33 0,32
CNOOC LTD ADR 1.409,00 USD 167,480 181.536,52 1,19 1,18
Italy
AICON SPA - 33.619,00 EUR 0,122 4.101,52 0,03 0,03
ENEL GREEN POWER SPA - 101.956,00 EUR 1,575 160.580,70 1,05 1,04
GEOX SPA - 14.408,00 EUR 1,914 27.576,91 0,18 0,18
MOLESKINE SPA - 377.346,00 EUR 1,745 658.468,77 4,31 4,28
PIAGGIO & C SPA - 68.368,00 EUR 1,991 136.120,69 0,89 0,89
Japan
DAI-ICHI MUTUAL LIFE INSURANCE - 206,00 JPY 143.200,000 228.463,44 1,50 1,49
DAIWA HOUSE REIT INVESTMENT CO - 45,00 JPY 713.000,000 248.489,78 1,63 1,62
INPEX CORP - 113,00 JPY 414.000,000 362.314,13 2,37 2,36
SONY FINANCIAL HOLDINGS INC - 29.300,00 JPY 1.567,000 355.584,73 2,33 2,31
Jersey/The Channel Islands
MEINL INTERNATIONAL POWER LT - 66.053,00 EUR 0,150 9.907,95 0,07 0,06
Luxembourg
EASTPHARMA LTD GDR 52.829,00 USD 1,500 60.961,23 0,40 0,40
TERNIUM SA ADR 15.059,00 USD 22,630 262.162,60 1,72 1,71
Netherlands
TOMTOM NV - 20.287,00 EUR 3,785 76.786,30 0,50 0,50
X5 RETAIL GROUP NV -GDR- 3.479,00 USD 18,100 48.442,11 0,32 0,32
ZIGGO BV - 8.750,00 EUR 30,750 269.062,50 1,76 1,75
Poland
CYFROWY POLSAT SA - 19.211,00 PLN 18,550 82.297,37 0,54 0,54
POWSZECHNY BANK KREDYTOWY SA - 500,00 PLN 409,700 47.307,28 0,31 0,31
WARSAW STOCK EXHANGE - 5.000,00 PLN 38,060 43.947,16 0,29 0,29
Russia
MAIL.RU GROUP LTD - 4.343,00 USD 28,660 95.753,81 0,63 0,62
South Africa
LIFE HEALTHCARE GROUP HOLDINGS - 183.648,00 ZAR 37,500 533.699,11 3,49 3,47
NAMAKWA DIAMONDS LTD - 424.555,00 GBP 0,011 5.573,21 0,04 0,04
Spain
AMADEUS IT HOLDING SA - 18.123,00 EUR 24,555 445.010,27 2,91 2,89
IBERDROLA SA - 23.526,00 EUR 4,056 95.421,46 0,63 0,62
Sweden
AGROKULTURA AB - 16.671,00 SEK 3,060 5.814,60 0,04 0,04
Switzerland
DKSH HOLDING AG LTD 1.712,00 CHF 77,700 108.157,09 0,71 0,70
DUFRY GROUP - 1.816,00 CHF 114,600 169.211,81 1,11 1,10
Turkey
TAV HAVALIMANLARI HOLD - 22.789,00 TRY 11,300 102.677,71 0,67 0,67
U.K.
AZ ELECTRONIC MATERIALS SA - 23.726,00 GBP 3,072 85.048,16 0,56 0,55
BETFAIR GROUP PLC - 14.236,00 GBP 8,525 141.612,49 0,93 0,92
CHARLEMAGNE CAPITAL LTD - 230.267,00 GBP 0,120 32.242,75 0,21 0,21
PROMETHEAN WORLD PLC - 200.000,00 GBP 0,130 30.338,39 0,20 0,20

U.S.A.
ACCURIDE CORP - 237,00 USD 5,060 922,55 0,01 0,01
ADECOAGRO SA - 1.000,00 USD 6,250 4.808,06 0,03 0,03
AMERICAN WATER WORKS INC. - 23.071,00 USD 41,230 731.761,93 4,80 4,76
BUNGE LTD. - 13.223,00 USD 70,770 719.895,15 4,71 4,68
CLOUD PEAK ENERGY INC - 16.922,00 USD 16,480 214.535,40 1,41 1,40
CME GROUP INC - 9.366,00 USD 75,950 547.232,63 3,58 3,56
DOLLAR GENERAL CORPORATION - 16.765,00 USD 50,430 650.403,07 4,26 4,23
DOUGLAS EMMET INC - 9.111,00 USD 24,950 174.874,57 1,15 1,14
DRESSE-RAND GROUP INC - 11.341,00 USD 59,980 523.296,55 3,43 3,40
ENERGY RECOVERY INC - 30.035,00 USD 4,130 95.426,23 0,63 0,62
FACEBOOK INC - 3.720,00 USD 24,860 71.143,32 0,47 0,46
FINANCIAL ENGINES INC - 9.664,00 USD 45,590 338.935,12 2,22 2,20
FORTINET INC - 600,00 USD 17,500 8.077,54 0,05 0,05
GEN.MOTORS - 1.000,00 USD 33,310 25.625,05 0,17 0,17
HCA INC - 12.764,00 USD 36,060 354.080,96 2,32 2,30
LOGMEIN INC - 2.500,00 USD 24,460 47.042,08 0,31 0,31
MEAD JOHNSON NUTRITION CO - 10.560,00 USD 79,230 643.640,90 4,21 4,19
MISTRAS GROUP INC - 21.857,00 USD 17,580 295.596,63 1,94 1,92
QIHOO 360 TECHNOLOHY CO LTD - 3.000,00 USD 46,170 106.554,35 0,70 0,69
REALD INC - 910,00 USD 13,900 9.730,75 0,06 0,06
SUNSTONE HOTEL INVESTORS INC - 22.730,00 USD 12,080 211.230,40 1,38 1,37
VISA INC - 4.439,00 USD 182,750 624.068,97 4,09 4,06
VMWARE INC CLASS A - 4.191,00 USD 66,990 215.982,07 1,41 1,41
VYCON INC - 400.000,00 GBP 0,015 7.001,17 0,05 0,05
WINDSTREAM CORP - 48.251,00 USD 7,710 286.187,56 1,87 1,86
Total shares 15.170.242,28 99,32 98,67
Rights
France
REXEL SA CP 31/05/2013 13.394,00 EUR 0,750 10.045,50 0,07 0,07
Total rights 10.045,50 0,07 0,07
TOTAL SECURITIES PORTFOLIO 15.274.069,58 100,00 99,35
COLLATERAL RECEIVED
Belgium
KBC GROUP COLLATERAL EUR 2.051.496,70 EUR 1,000 2.051.496,70 13,34
TOTAL RECEIVED COLLATERAL 2.051.496,70 13,34
CASH AT BANK AND IN HAND
Demand accounts
Belgium
KBC GROUP AUD 4.978,65 AUD 1,000 3.505,97 0,02
KBC GROUP CAD 7.374,60 CAD 1,000 5.377,82 0,04
KBC GROUP CHF 8.910,61 CHF 1,000 7.244,99 0,05
KBC GROUP DKK 6.710,24 DKK 1,000 899,64 0,01
KBC GROUP EURO 5.304,59 EUR 1,000 5.304,59 0,04
KBC GROUP GBP 1.223,96 GBP 1,000 1.428,19 0,01
KBC GROUP HKD 11.834,11 HKD 1,000 1.173,77 0,01
KBC GROUP JPY 30.570,00 JPY 1,000 236,76 0,00
KBC GROUP MAD 54.081,55 MAD 1,000 4.861,00 0,03
KBC GROUP NOK 64,00 NOK 1,000 8,06
KBC GROUP PLN 82,60 PLN 1,000 19,08
KBC GROUP SEK 28.100,22 SEK 1,000 3.202,92 0,02
KBC GROUP SGD 1.430,28 SGD 1,000 867,57 0,01
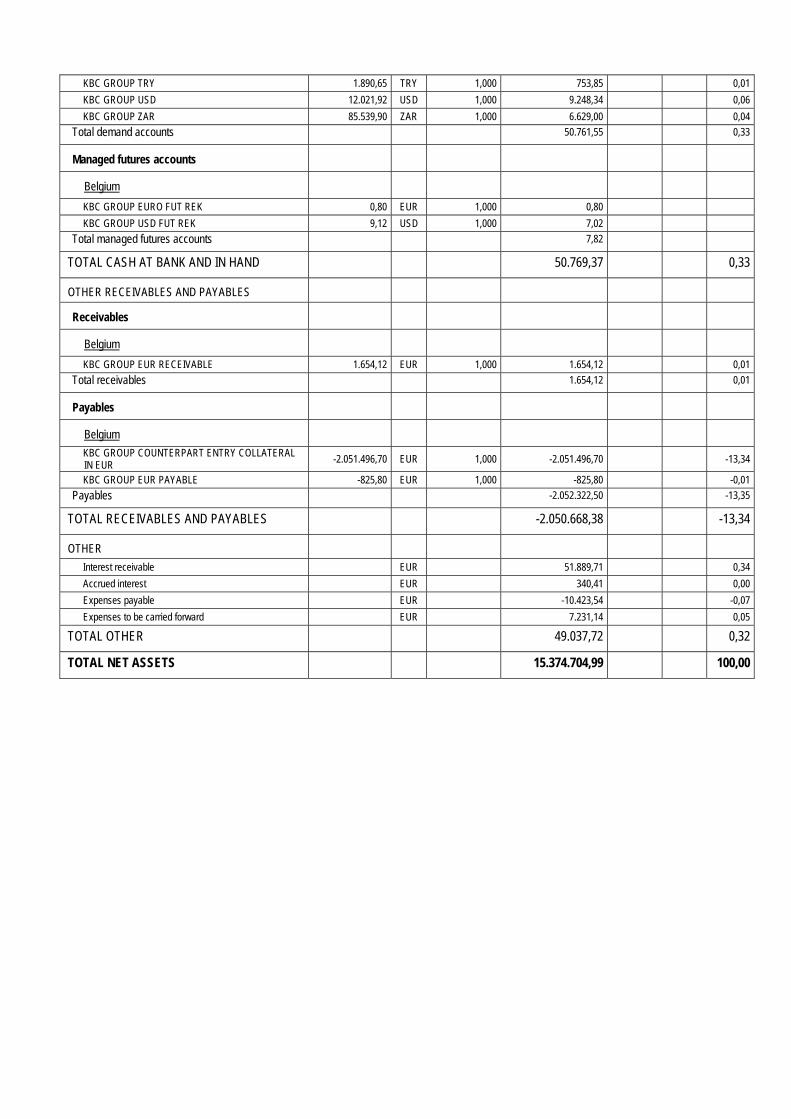
KBC GROUP TRY 1.890,65 TRY 1,000 753,85 0,01
KBC GROUP USD 12.021,92 USD 1,000 9.248,34 0,06
KBC GROUP ZAR 85.539,90 ZAR 1,000 6.629,00 0,04
Total demand accounts 50.761,55 0,33
Managed futures accounts
Belgium
KBC GROUP EURO FUT REK 0,80 EUR 1,000 0,80
KBC GROUP USD FUT REK 9,12 USD 1,000 7,02
Total managed futures accounts 7,82
TOTAL CASH AT BANK AND IN HAND 50.769,37 0,33
OTHER RECEIVABLES AND PAYABLES
Receivables
Belgium
KBC GROUP EUR RECEIVABLE 1.654,12 EUR 1,000 1.654,12 0,01
Total receivables 1.654,12 0,01
Payables
Belgium
KBC GROUP COUNTERPART ENTRY COLLATERAL IN EUR -2.051.496,70 EUR 1,000 -2.051.496,70 -13,34
KBC GROUP EUR PAYABLE -825,80 EUR 1,000 -825,80 -0,01
Payables -2.052.322,50 -13,35
TOTAL RECEIVABLES AND PAYABLES -2.050.668,38 -13,34
OTHER
Interest receivable EUR 51.889,71 0,34
Accrued interest EUR 340,41 0,00
Expenses payable EUR -10.423,54 -0,07
Expenses to be carried forward EUR 7.231,14 0,05
TOTAL OTHER 49.037,72 0,32
TOTAL NET ASSETS 15.374.704,99 100,00
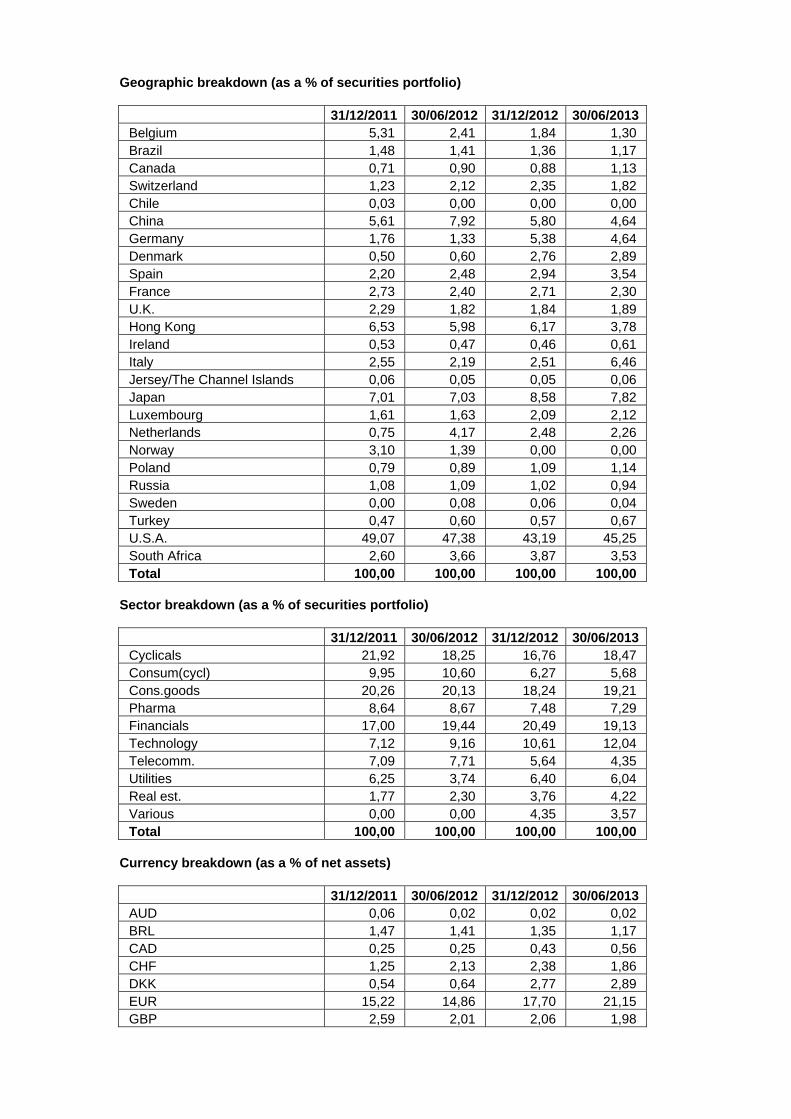
Geographic breakdown (as a % of securities portfolio)
31/12/2011 30/06/2012 31/12/2012 30/06/2013 Belgium 5,31 2,41 1,84 1,30 Brazil 1,48 1,41 1,36 1,17 Canada 0,71 0,90 0,88 1,13 Switzerland 1,23 2,12 2,35 1,82 Chile 0,03 0,00 0,00 0,00 China 5,61 7,92 5,80 4,64 Germany 1,76 1,33 5,38 4,64 Denmark 0,50 0,60 2,76 2,89 Spain 2,20 2,48 2,94 3,54 France 2,73 2,40 2,71 2,30 U.K. 2,29 1,82 1,84 1,89 Hong Kong 6,53 5,98 6,17 3,78 Ireland 0,53 0,47 0,46 0,61 Italy 2,55 2,19 2,51 6,46 Jersey/The Channel Islands 0,06 0,05 0,05 0,06 Japan 7,01 7,03 8,58 7,82 Luxembourg 1,61 1,63 2,09 2,12 Netherlands 0,75 4,17 2,48 2,26 Norway 3,10 1,39 0,00 0,00 Poland 0,79 0,89 1,09 1,14 Russia 1,08 1,09 1,02 0,94 Sweden 0,00 0,08 0,06 0,04 Turkey 0,47 0,60 0,57 0,67 U.S.A. 49,07 47,38 43,19 45,25 South Africa 2,60 3,66 3,87 3,53 Total 100,00 100,00 100,00 100,00
Sector breakdown (as a % of securities portfolio)
31/12/2011 30/06/2012 31/12/2012 30/06/2013 Cyclicals 21,92 18,25 16,76 18,47 Consum(cycl) 9,95 10,60 6,27 5,68 Cons.goods 20,26 20,13 18,24 19,21 Pharma 8,64 8,67 7,48 7,29 Financials 17,00 19,44 20,49 19,13 Technology 7,12 9,16 10,61 12,04 Telecomm. 7,09 7,71 5,64 4,35 Utilities 6,25 3,74 6,40 6,04 Real est. 1,77 2,30 3,76 4,22 Various 0,00 0,00 4,35 3,57 Total 100,00 100,00 100,00 100,00
Currency breakdown (as a % of net assets)
31/12/2011 30/06/2012 31/12/2012 30/06/2013 AUD 0,06 0,02 0,02 0,02 BRL 1,47 1,41 1,35 1,17 CAD 0,25 0,25 0,43 0,56 CHF 1,25 2,13 2,38 1,86 DKK 0,54 0,64 2,77 2,89 EUR 15,22 14,86 17,70 21,15 GBP 2,59 2,01 2,06 1,98

HKD 9,61 10,98 10,42 7,22 JPY 7,04 7,03 8,55 7,80 MAD 0,03 0,03 0,03 0,03 NOK 3,12 1,40 0,05 0,00 PLN 0,85 0,90 1,14 1,13 SEK 0,02 0,10 0,08 0,06 SGD 0,01 0,01 0,01 0,01 TRY 0,51 0,65 0,59 0,67 USD 55,01 54,00 48,70 49,92 ZAR 2,42 3,58 3,72 3,53 Total 100,00 100,00 100,00 100,00

2.4.2 CHANGES IN THE COMPOSITION OF THE ASSETS OF KBC EQUITY FUND NEW SHARES (IN
THE CURRENCY OF THE SUB-FUND)
1st half of year YearPurchases 910.590,33 910.590,33 Sales 2.314.372,89 2.314.372,89 Total 1 3.224.963,22 3.224.963,22 Subscriptions 77.938,02 77.938,02 Redemptions 1.516.705,70 1.516.705,70 Total 2 1.594.643,72 1.594.643,72 Monthly average of total assets
16.219.644,88 16.219.644,88
Turnover rate 10,05 % 10,05 %
1st half of year YearPurchases 910.590,33 910.590,33 Sales 2.314.372,89 2.314.372,89 Total 1 3.224.963,22 3.224.963,22 Subscriptions 77.938,02 77.938,02 Redemptions 1.516.705,70 1.516.705,70 Total 2 1.594.643,72 1.594.643,72 Monthly average of total assets
16.011.780,56 16.011.780,56
Corrected turnover rate 10,18 % 10,18 %
The table above shows the capital volume of portfolio transactions. This volume (adjusted to take account of total subscriptions and redemptions) is also compared to the average net assets at the beginning and end of the period. A figure close to 0% implies that the transactions relating to the securities or transactions relating to the assets (excluding deposits and cash) in a given period only involve subscriptions and redemptions. A negative percentage shows that subscriptions and redemptions entailed few, if any, transactions in the portfolio. Active asset management may result in high turnover rates (monthly percentage >50%). The detailed list of transactions is available for consultation free of charge at the registered office of the Bevek or fund at Havenlaan 2, 1080 Brussels.
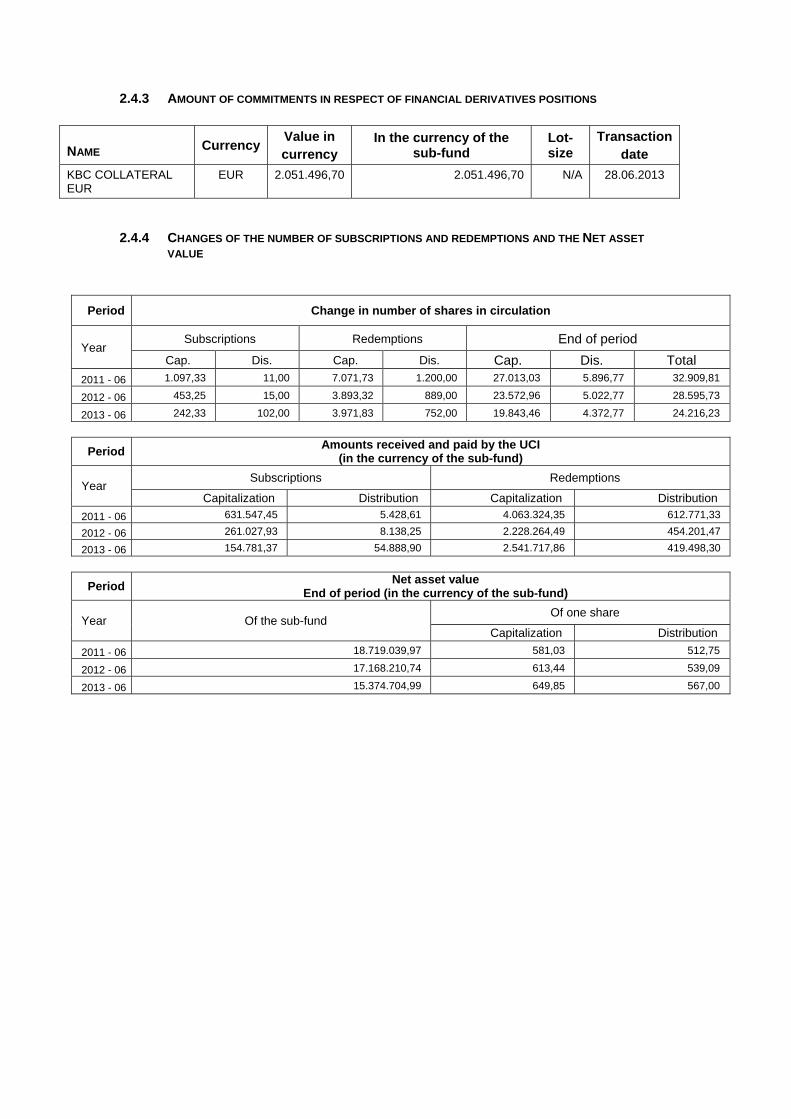
2.4.3 AMOUNT OF COMMITMENTS IN RESPECT OF FINANCIAL DERIVATIVES POSITIONS
NAME Currency Value in currency
In the currency of the sub-fund
Lot-size
Transactiondate
KBC COLLATERAL EUR
EUR 2.051.496,70 2.051.496,70 N/A 28.06.2013
2.4.4 CHANGES OF THE NUMBER OF SUBSCRIPTIONS AND REDEMPTIONS AND THE NET ASSET
VALUE
Period Change in number of shares in circulation
Year Subscriptions Redemptions End of period
Cap. Dis. Cap. Dis. Cap. Dis. Total
2011 - 06 1.097,33 11,00 7.071,73 1.200,00 27.013,03 5.896,77 32.909,81
2012 - 06 453,25 15,00 3.893,32 889,00 23.572,96 5.022,77 28.595,73
2013 - 06 242,33 102,00 3.971,83 752,00 19.843,46 4.372,77 24.216,23
Period Amounts received and paid by the UCI
(in the currency of the sub-fund)
Year Subscriptions Redemptions
Capitalization Distribution Capitalization Distribution
2011 - 06 631.547,45 5.428,61 4.063.324,35 612.771,33
2012 - 06 261.027,93 8.138,25 2.228.264,49 454.201,47
2013 - 06 154.781,37 54.888,90 2.541.717,86 419.498,30
Period Net asset value
End of period (in the currency of the sub-fund)
Year Of the sub-fund Of one share
Capitalization Distribution
2011 - 06 18.719.039,97 581,03 512,75
2012 - 06 17.168.210,74 613,44 539,09
2013 - 06 15.374.704,99 649,85 567,00
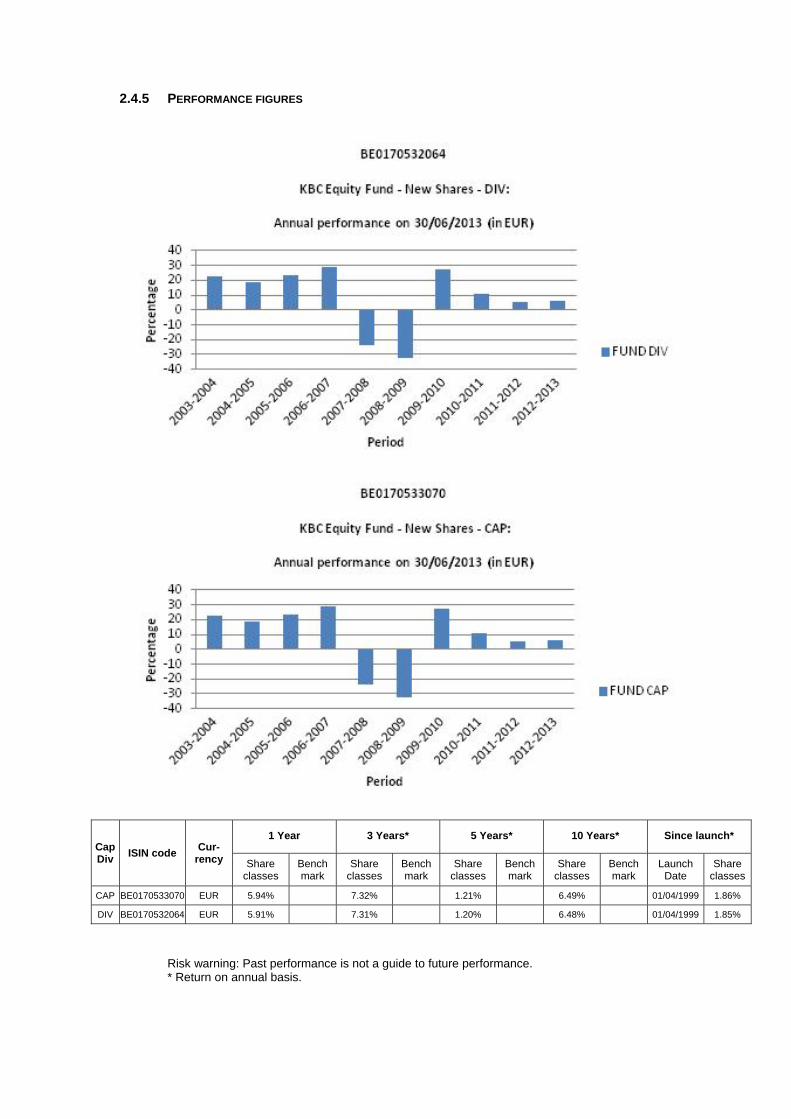
2.4.5 PERFORMANCE FIGURES
Cap Div
ISIN code Cur-
rency
1 Year 3 Years* 5 Years* 10 Years* Since launch*
Share classes
Bench mark
Share classes
Bench mark
Share classes
Bench mark
Share classes
Bench mark
Launch Date
Share classes
CAP BE0170533070 EUR 5.94% 7.32% 1.21% 6.49% 01/04/1999 1.86%
DIV BE0170532064 EUR 5.91% 7.31% 1.20% 6.48% 01/04/1999 1.85%
Risk warning: Past performance is not a guide to future performance. * Return on annual basis.

The bar chart shows the performance for full financial years. The figures do not take account of any restructuring. Calculated in EUR. the return is calculated as the change in the net asset value between two dates expressed
as a percentage. In the case of units that pay dividends, the dividend is incorporated geometrically in the return.
Calculation method for date D, where NAV stands for net asset value: Capitalisation units (CAP) Return on date D over a period of X years:
[NAV(D) / NAV(Y)] ^ [1 / X] - 1 where Y = D-X
Return on date D since the start date S of the unit: [NAV(D) / NAV(S)] ^ [1 / F] - 1 where F = 1 if the unit has existed for less than one year on date D where F = (D-S) / 365.25 if the unit has existed for longer than one year on date D
Distribution units (DIV) Return on date D over a period of X years:
[ C * NAV(D) / NAV(Y)] ^ [1 / X] - 1 where Y = D-X
Return on date D since the start date S of the unit: [ C * NAV(D) / NAV(S)] ^ [1 / F] - 1 where F = 1 if the unit has existed for less than one year on date D where F = (D-S) / 365.25 if the unit has existed for longer than one year on date D
where C is a factor that is determined for all N dividends between the calculation date D and the reference date. For dividend i on date Di with value Wi:
Ci = [Wi / NAV(Di)] + 1 i = 1 ... N
from which C = C0 * .... * CN. If the interval between the two dates exceeds one year, the ordinary return calculation is
converted into a return on an annual basis by taking the nth square root of 1 plus the total return of the unit.
The return figures shown above do not take account of the fees and charges associated with the issue and redemption of units.
These are the performance figures for capitalisation and distribution shares.
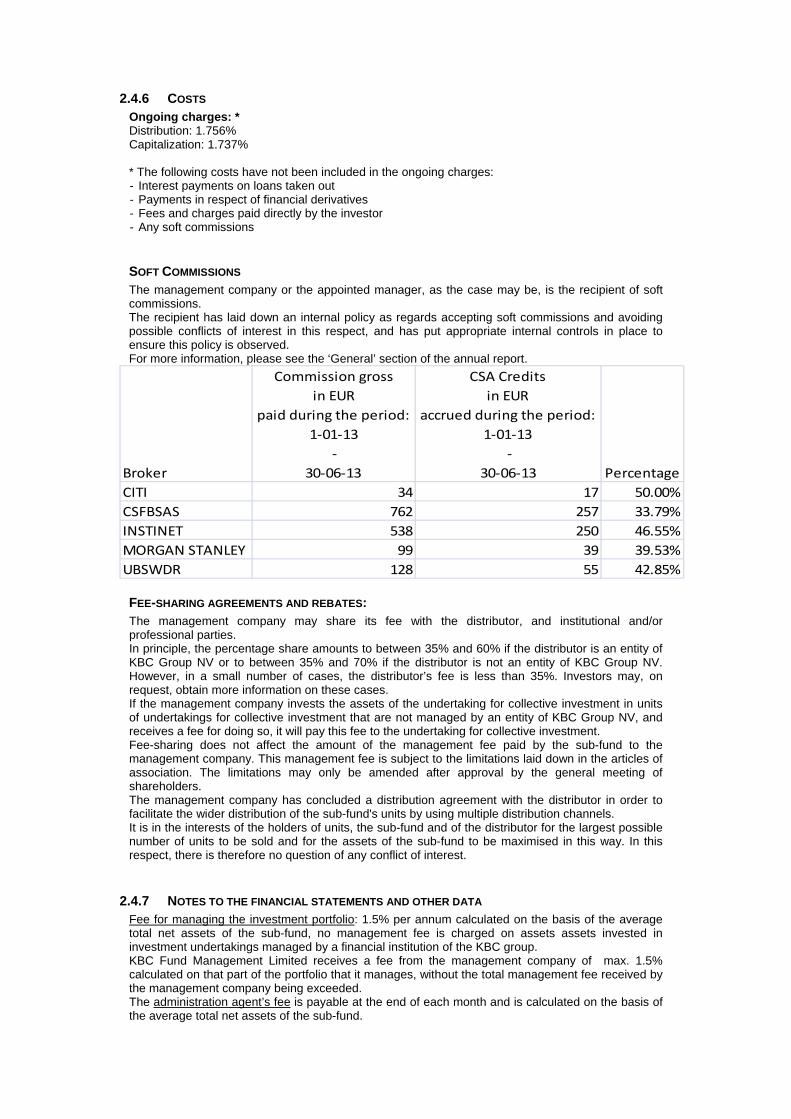
2.4.6 COSTS Ongoing charges: * Distribution: 1.756% Capitalization: 1.737% * The following costs have not been included in the ongoing charges: - Interest payments on loans taken out - Payments in respect of financial derivatives - Fees and charges paid directly by the investor - Any soft commissions
SOFT COMMISSIONS The management company or the appointed manager, as the case may be, is the recipient of soft commissions. The recipient has laid down an internal policy as regards accepting soft commissions and avoiding possible conflicts of interest in this respect, and has put appropriate internal controls in place to ensure this policy is observed. For more information, please see the ‘General’ section of the annual report.
Broker
Commission gross
in EUR
paid during the period:
1‐01‐13
‐
30‐06‐13
CSA Credits
in EUR
accrued during the period:
1‐01‐13
‐
30‐06‐13 Percentage
CITI 34 17 50.00%
CSFBSAS 762 257 33.79%
INSTINET 538 250 46.55%
MORGAN STANLEY 99 39 39.53%
UBSWDR 128 55 42.85%
FEE-SHARING AGREEMENTS AND REBATES: The management company may share its fee with the distributor, and institutional and/or professional parties. In principle, the percentage share amounts to between 35% and 60% if the distributor is an entity of KBC Group NV or to between 35% and 70% if the distributor is not an entity of KBC Group NV. However, in a small number of cases, the distributor’s fee is less than 35%. Investors may, on request, obtain more information on these cases. If the management company invests the assets of the undertaking for collective investment in units of undertakings for collective investment that are not managed by an entity of KBC Group NV, and receives a fee for doing so, it will pay this fee to the undertaking for collective investment. Fee-sharing does not affect the amount of the management fee paid by the sub-fund to the management company. This management fee is subject to the limitations laid down in the articles of association. The limitations may only be amended after approval by the general meeting of shareholders. The management company has concluded a distribution agreement with the distributor in order to facilitate the wider distribution of the sub-fund's units by using multiple distribution channels. It is in the interests of the holders of units, the sub-fund and of the distributor for the largest possible number of units to be sold and for the assets of the sub-fund to be maximised in this way. In this respect, there is therefore no question of any conflict of interest.
2.4.7 NOTES TO THE FINANCIAL STATEMENTS AND OTHER DATA Fee for managing the investment portfolio: 1.5% per annum calculated on the basis of the average total net assets of the sub-fund, no management fee is charged on assets assets invested in investment undertakings managed by a financial institution of the KBC group. KBC Fund Management Limited receives a fee from the management company of max. 1.5% calculated on that part of the portfolio that it manages, without the total management fee received by the management company being exceeded. The administration agent’s fee is payable at the end of each month and is calculated on the basis of the average total net assets of the sub-fund.

Auditor's fee: 1 700 EUR per year. This fee is not including VAT and can be indexed on an annual basis in accordance with the decisions of the general meeting. The custody fee is calculated on the value of the securities held in custody by the custodian on the final banking day of the preceding calendar year, except on those assets invested in investment undertakings managed by a financial institution of the KBC group. The custody fee is paid at the beginning of the calendar year. Social, ethical and environmental aspects: No manufacturers of controversial weapons whose use over the past five decades, according to the international consensus, has led to disproportionate human suffering among the civilian population will be included in the portfolio of investments. This involves the manufacturers of anti-personnel mines, cluster bombs and munitions and weapons containing depleted uranium. In this way, the sub-fund seeks to reflect not only simple financial reality but also the social reality of the sector or region in question. Exercising voting rights. If necessary, relevant and in the interest of the shareholders, the management company will exercise the voting rights attached to the shares in the Bevek’s portfolio. The management company will adhere to the following criteria when determining how it stands relative to the items on the agenda that are put to the vote: - Shareholder value may not be adversely affected. - Corporate governance rules, especially with regard to the rights of minority shareholders, must be
respected. - The minimum standards with regard to sustainable business and corporate social responsibility
must be met. The list of companies for which voting rights are exercised is available at the registered office of the Bevek. Securities lending In accordance with the Royal Decree of 7 March 2006 concerning securities lending, the undertaking for collective investment has taken out securities loans with a principal to whom the full title of the loaned securities was transferred, without recording this transfer of ownership in the accounts. For the period from 1 January 2013 to 30 June 2013, the fee for securities lent comes to 7,450.26 EUR. The undertaking for collective investment receives 50% of the fee received for securities lent. The detailed list of securities lending transactions carried out can be obtained from the registered office of the collective investment undertaking at 2 Havenlaan, 1080 Brussels.
Overview of securities lent as at 30/06/2013
Name Currency Quantity Price Value in currency of the
portfolio
AZ ELECTRONIC MATERIALS SA GBP 22.987 3,072 82.399,14
CHONGQING RURAL COMMERCIAL BANK -H HKD 236.999 3,290 77.337,73
CHRISTIAN HANSEN HOLDING A/S DKK 16.803 196,200 441.994,50
DKSH HOLDING LTD CHF 1.711 77,700 108.093,91
GEOX SPA EUR 12.879 1,914 24.650,41
IBERDROLA SA EUR 23.525 4,056 95.417,40
POWSZECHNY ZAKLAD UBEZPIECZEN SA PLN 499 409,700 47.212,67
TELEFONICA DEUTSCHLAND HOLDING AG EUR 98.024 5,561 545.111,46
TOMTOM NV EUR 4.233 3,785 16.021,90
Total 1.438.239,12
Details of collateral received for securities lent
Name Currency Nominal value Currency fund Value in Currency fund
AUSTRIA 2012 3,4% 22/11/2022 EUR 185.000 EUR 211.098,13
FLEMISH COMMUNITY - 09/14 3.75% 31/03 EUR 550.000 EUR 569.555,80
FRANCE 2008 3.75% 25/10/2019 EUR 1.095.000 EUR 1.270.842,77
Total 2.051.496,70 Voor de waardering van de ontvangen(+) / gegeven(-) collateral op deze detaillijst werden indicatieve koersen gebruikt vanuit de afdeling Collateral Management van KBC Bank.

Semi-Annual report as at 30th June 2013
TABLE OF CONTENTS
2. Information on KBC Equity Fund Telecom
2.1. Management report 2.1.1. Launch date and subscription price 2.1.2. Stock exchange listing 2.1.3. Aim and distinctive features of the investment policy 2.1.4. Financial portfolio management 2.1.5. Distributors 2.1.6. Index and benchmark 2.1.7. Policy conducted during the financial year 2.1.8. Future policy 2.1.9. Synthetic risk and reward indicator (SRRI)
2.2. Balance sheet
2.3. Profit and loss account
2.4. Composition of the assets and key figures
2.4.1. Composition of the assets 2.4.2. Change in the composition of the assets 2.4.3. Value of commitments in respect of financial derivatives positions 2.4.4. Evolution of the number of subscriptions, repayments and the net asset value 2.4.5. Return figures 2.4.6. Expenses 2.4.7. Notes to the financial statements and other data


2 INFORMATION ON KBC EQUITY FUND TELECOM
2.1 MANAGEMENT REPORT
2.1.1 LAUNCH DATE AND SUBSCRIPTION PRICE Classic Shares : Launch date: 30 April 1998 Initial subscription price: 20000 BEF Currency: EUR Institutional B Shares : Launch date: 25 November 2011 Initial subscription price: 235.62 EUR Currency: EUR
2.1.2 STOCK EXCHANGE LISTING Not applicable.
2.1.3 GOAL AND KEY PRINCIPLES OF THE INVESTMENT POLICY
SUB-FUND’S OBJECT: The main objective of this sub-fund is to generate the highest possible return for its shareholders by investing directly or indirectly in transferable securities. This is reflected in its pursuit of capital gains and income. To this end, the assets are invested, either directly or indirectly via correlated financial instruments, primarily in shares.
SUB-FUND’S INVESTMENT POLICY:
PERMITTED ASSET CLASSES: The sub-fund may invest in securities, money market instruments, units in undertakings for collective investment, deposits, financial derivatives, liquid assets and all other instruments insofar as permitted by the applicable laws and regulations and consistent with the sub-fund’s object The sub-fund shall invest no more than 10% of its assets in units of other undertakings for collective investment.
RESTRICTIONS OF THE INVESTMENT POLICY: The investment policy will be implemented within the limits set by law and regulations. The sub-fund may borrow up to 10% of its net assets, insofar as these are short-term borrowings aimed at solving temporary liquidity problems.
PERMITTED DERIVATIVES TRANSACTIONS: Derivates may be used either for hedging purposes or to achieve investment objectives. Changes will be made to the investments at regular intervals to comply with the sub-fund's investment strategy. In addition, listed and unlisted derivates may be used to achieve the objectives: these may be forward contracts, options or swaps on securities, indices, currencies or interest rates or other transactions involving derivatives. Unlisted derivatives transactions will only be concluded with prime financial institutions specialised in such transactions. Such derivatives may also be used to hedge the assets against exchange-rate fluctuations. Subject to the applicable laws and regulations and the articles of association, the sub-fund always seeks to conclude the most effective transactions. All costs associated with the transactions will be charged to the sub-fund and all income generated will be paid to the sub-fund. If the transactions result in a risk in respect of the counterparty, this risk can be hedged by using a margin management system that ensures that the sub-fund is the beneficiary of security (collateral) in the form of cash or investment grade bonds. When calculating the value of the bonds, a margin will be applied that varies depending on the residual term to maturity and the currency in which the bond in question is denominated. The relationship with the counterparty or counterparties is governed by standard international agreements.
STRATEGY SELECTED At least 75% of the assets are invested in shares of companies in the telecommunication sector where conditions are such as to allow accelerated economic growth in the short or medium term.
RISK CONCENTRATION Shares in the telecommunication sector.
LENDING FINANCIAL INSTRUMENTS: The sub-fund may lend financial instruments within the limits set by law and regulations. This lending does not affect the sub-fund’s risk profile since: - it takes place within the framework of a securities lending system managed by a principal. In
addition, the sub-fund has a relationship only with the principal of the securities lending system which acts as counterparty and to which title of the loaned securities is transferred. The choice of principal is subject to strict selection criteria. The return of securities similar to the securities that have been lent is guaranteed by the principal.
- through a margin management system, the sub-fund is always guaranteed financial security, the actual value of which always exceeds the actual value of the securities that have been lent, in case the principal does not return similar securities.
The return of securities similar to the securities that have been lent can be requested at any time, which means that the lending of securities does not affect the management of the sub-fund's assets. By lending securities, the sub-fund can generate an additional return. The principal pays a fee to the management company. After deducting the fee for the margin management and clearing services of KBC Bank, most of this fee is paid to the sub-fund. The relationship with the counterparty or counterparties is governed by standard international agreements. More information is provided on the terms and conditions governing securities lending in the annual or half-yearly report for the sub-fund.
GENERAL STRATEGY FOR HEDGING THE EXCHANGE RATE RISK: In order to protect its assets against exchange rate fluctuations and within the limitations laid down in the articles of association, the sub-fund may perform transactions relating to the sale of forward currency contracts, as well as the sale of call options and the purchase of put options on currencies. The transactions in question may relate solely to contracts traded on a regulated market that operates regularly, is recognised and is open to the public or that are traded with a recognised, prime financial institution specialising in such transactions and dealing in the over-the-counter (OTC) market in options. With the same objective, the sub-fund may also sell currencies forward or exchange them in private transactions with prime financial institutions specialising in such transactions. The hedging objective of the aforementioned transactions suggests that there is a direct link between these transactions and the assets to be hedged, which implies that the transactions carried out in a particular currency may in principle not exceed, in terms of volume, either the valuation value of all the assets in the same currency or the holding period of those assets.
SOCIAL, ETHICAL AND ENVIRONMENTAL ASPECTS:
No manufacturers of controversial weapons whose use over the past five decades, according to the international consensus, has led to disproportionate human suffering among the civilian population will be included in the portfolio of investments. This involves the manufacturers of anti-personnel mines, cluster bombs and munitions and weapons containing depleted uranium. In this way, the sub-fund seeks to reflect not only simple financial reality but also the social reality of the sector or region in question.
THE EUROPEAN SAVINGS DIRECTIVE AND TAX ON DEBT CLAIM RETURNS OBTAINED THROUGH THE
REDEMPTION OF OWN UNITS OR IN THE EVENT OF FULL OR PARTIAL DISTRIBUTION OF EQUITY
CAPITAL. The following information is of a general character and is not intended to cover all aspects of an investment in a UCITS. In certain cases entirely different rules might even apply. Moreover, both tax law and the interpretation of it can change. Investors who wish to have more information about the

tax implications – in both Belgium and abroad – of acquiring, holding and transferring units should seek the advice of their usual financial and tax advisers. This UCITS shall invest a maximum of 15% of its assets directly or indirectly in debt instruments as intended by the European Savings Directive. A. European Savings Directive (Directive 2003/48/EC) The European Savings Directive has been implemented in Belgium. Since this UCITS invests a maximum of 15% of its assets directly or indirectly in debt claims as intended by the European Savings Directive, the income of this UCITS does not fall within the scope of this directive. B. Tax on debt claim returns obtained through the redemption of own units or in the event of full or partial distribution of equity capital (Article 19bis Income Tax Code 1992). The income from this UCITS is not subject to the tax on debt instrument returns as intended by Article 19bis, Income Tax Code 1992.
2.1.4 FINANCIAL PORTFOLIO MANAGEMENT There is no delegation of the portfolio.
2.1.5 DISTRIBUTORS KBC Asset Management S.A., 5, Place de la Gare, L-1616 Luxembourg.
2.1.6 INDEX AND BENCHMARK See ‘Sub-fund’s investment policy’.

2.1.7 POLICY PERSUED DURING THE FINANCIAL YEAR The first half of 2013 was a turbulent period in the telecoms sector. There was a fair amount of news particularly in Europe (33% of the sub-fund). For instance, telecoms heavyweight Telefonica (5% of the sub-fund) had better-than-expected cash flow figures in its home market, which gave investors hope that Spain was over the worst. The European Commission did its bit too, with positive statements by a number of Commissioners fuelling investor dreams of more flexible rules for consolidation within the sector, as well as less price regulation. There was also a raft of takeovers and rumours about takeovers. For example, Vodafone (10% of the sub-fund) acquired Kabel Deutschland, while the share price of Vodafone was boosted by takeover speculation. On the other hand, Telefonica sold its Irish operations. Vivendi has been endeavouring for some time to streamline its business portfolio by spinning off certain activities, though without any firm results to date. The position for the issuer, Vodafone, amounted to more than 10% (10.19%) of the assets. The situation is now being rectified in the interests of the investors.
2.1.8 FUTURE POLICY Regulation of the sector continues to have a major impact on turnover and profit, especially in Europe. In addition, there is also the sluggish state of economic growth, which will continue to weigh on the figures of European telecom operators. However, we ought to see signs of improvement there in the second half of 2013. We expect competition to become keener in the US now that Japan's Softbank (4% of the sub-fund) has entered the market after acquiring Sprint (2% of the sub-fund). Softbank intends to make significant investments in developing Sprint's network and has the reputation of being an aggressive competitor.
2.1.9 SYNTHETIC RISK AND REWARD INDICATOR Classic Shares: 6 on a scale of 1 (lowest risk) to 7 (highest risk). Institutional B Shares: 6 on a scale of 1 (lowest risk) to 7 (highest risk). The value of a share can decrease or increase and the investor may not get back the amount invested. In accordance with Commission Regulation (EU) No. 583/2010, a synthetic risk and reward indicator has been calculated. This indicator provides a quantitative measure of the sub-fund's potential return and the risk involved, calculated in the currency in which the sub-fund is denominated. It is given as a figure between 1 and 7. The higher the figure, the greater the potential return, but also the more difficult it is to predict this return. Losses are possible too. The lowest figure does not mean that the investment is entirely free of risk. However, it does indicate that, compared with the higher figures, this product will generally provide a lower, but more predictable return. The synthetic risk and reward indicator is assessed regularly and can therefore go up or down based on data from the past. Data from the past is not always a reliable indicator of future risk and return.

2.2 BALANCE SHEET
Balance sheet layout 30/06/2013 (in the currency of the sub-fundt)
30/06/2012 (in the currency of the sub-fund )
TOTAL NET ASSETS 39.342.362,90 44.731.867,78
II. Securities, money market instruments, UCIs and derivatives
A. Bonds and other debt instruments a) Bonds a} Collateral received in the form of bonds 3.121.438,10 258.662,59 C. Shares and similar instruments a) Shares 39.836.530,36 44.054.398,61 Of which securities lent 2.933.529,30 241.690,22
IV. Receivables and payables within one year A. Receivables a) Accounts receivable 130.598,16 1.832,91 b) Tax assets 5.620,50 7.053,55 B. Payables a) Accounts payable (-) -163.951,04 -56.664,43 c) Borrowings (-) -782.779,96 -427.612,66 d) Collateral (-) -3.121.438,10 -258.662,59
V. Deposits and cash at bank and in hand A. Demand balances at banks 126.172,99 1.061.564,73
VI. Accruals and deferrals A. Expense to be carried forward 33.190,97 58.831,71 B. Accrued income 247.881,17 83.936,78 C. Accrued expense (-) -90.900,25 -51.470,42
TOTAL SHAREHOLDERS' EQUITY 39.342.362,90 44.731.867,78
A. Capital 36.366.244,74 39.666.537,12
B. Income equalization -86.344,27 279.945,31
D. Result for the period 3.062.462,43 4.785.385,35
Off-balance-sheet headings
I Collateral (+/-)
I.A Collateral (+/-)
I.A.A Securities/market instruments 3.121.438,10 258.662,58
IX Financial instruments lent 2.933.529,30 241.690,22
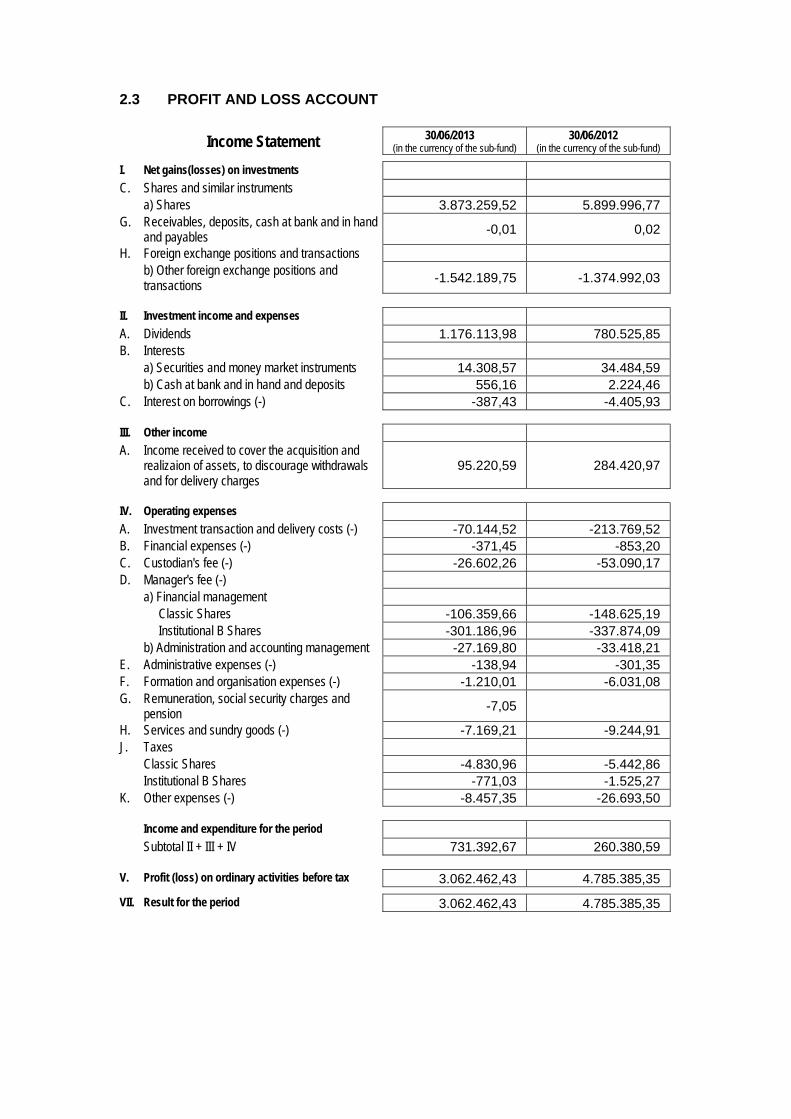
2.3 PROFIT AND LOSS ACCOUNT
Income Statement 30/06/2013 (in the currency of the sub-fund)
30/06/2012 (in the currency of the sub-fund)
I. Net gains(losses) on investments C. Shares and similar instruments a) Shares 3.873.259,52 5.899.996,77 G. Receivables, deposits, cash at bank and in hand
and payables -0,01 0,02
H. Foreign exchange positions and transactions b) Other foreign exchange positions and
transactions -1.542.189,75 -1.374.992,03
II. Investment income and expenses A. Dividends 1.176.113,98 780.525,85 B. Interests a) Securities and money market instruments 14.308,57 34.484,59 b) Cash at bank and in hand and deposits 556,16 2.224,46 C. Interest on borrowings (-) -387,43 -4.405,93
III. Other income A. Income received to cover the acquisition and
realizaion of assets, to discourage withdrawals and for delivery charges
95.220,59 284.420,97
IV. Operating expenses A. Investment transaction and delivery costs (-) -70.144,52 -213.769,52 B. Financial expenses (-) -371,45 -853,20 C. Custodian's fee (-) -26.602,26 -53.090,17 D. Manager's fee (-) a) Financial management Classic Shares -106.359,66 -148.625,19 Institutional B Shares -301.186,96 -337.874,09 b) Administration and accounting management -27.169,80 -33.418,21 E. Administrative expenses (-) -138,94 -301,35 F. Formation and organisation expenses (-) -1.210,01 -6.031,08 G. Remuneration, social security charges and
pension -7,05
H. Services and sundry goods (-) -7.169,21 -9.244,91 J. Taxes Classic Shares -4.830,96 -5.442,86 Institutional B Shares -771,03 -1.525,27 K. Other expenses (-) -8.457,35 -26.693,50
Income and expenditure for the period Subtotal II + III + IV 731.392,67 260.380,59
V. Profit (loss) on ordinary activities before tax 3.062.462,43 4.785.385,35
VII. Result for the period 3.062.462,43 4.785.385,35
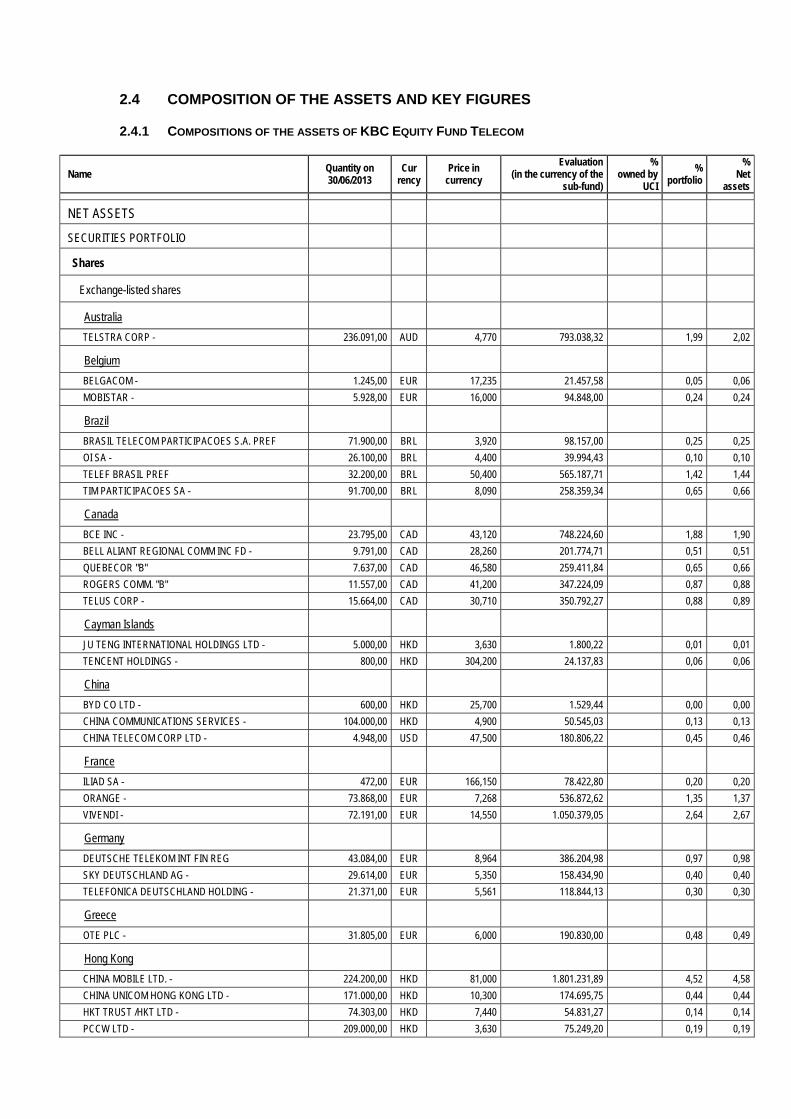
2.4 COMPOSITION OF THE ASSETS AND KEY FIGURES
2.4.1 COMPOSITIONS OF THE ASSETS OF KBC EQUITY FUND TELECOM
Name Quantity on 30/06/2013
Cur rency
Price in currency
Evaluation (in the currency of the
sub-fund)
% owned by
UCI
% portfolio
% Net
assets
NET ASSETS
SECURITIES PORTFOLIO
Shares
Exchange-listed shares
Australia
TELSTRA CORP - 236.091,00 AUD 4,770 793.038,32 1,99 2,02
Belgium
BELGACOM - 1.245,00 EUR 17,235 21.457,58 0,05 0,06
MOBISTAR - 5.928,00 EUR 16,000 94.848,00 0,24 0,24
Brazil
BRASIL TELECOM PARTICIPACOES S.A. PREF 71.900,00 BRL 3,920 98.157,00 0,25 0,25
OI SA - 26.100,00 BRL 4,400 39.994,43 0,10 0,10
TELEF BRASIL PREF 32.200,00 BRL 50,400 565.187,71 1,42 1,44
TIM PARTICIPACOES SA - 91.700,00 BRL 8,090 258.359,34 0,65 0,66
Canada
BCE INC - 23.795,00 CAD 43,120 748.224,60 1,88 1,90
BELL ALIANT REGIONAL COMM INC FD - 9.791,00 CAD 28,260 201.774,71 0,51 0,51
QUEBECOR "B" 7.637,00 CAD 46,580 259.411,84 0,65 0,66
ROGERS COMM. "B" 11.557,00 CAD 41,200 347.224,09 0,87 0,88
TELUS CORP - 15.664,00 CAD 30,710 350.792,27 0,88 0,89
Cayman Islands
JU TENG INTERNATIONAL HOLDINGS LTD - 5.000,00 HKD 3,630 1.800,22 0,01 0,01
TENCENT HOLDINGS - 800,00 HKD 304,200 24.137,83 0,06 0,06
China
BYD CO LTD - 600,00 HKD 25,700 1.529,44 0,00 0,00
CHINA COMMUNICATIONS SERVICES - 104.000,00 HKD 4,900 50.545,03 0,13 0,13
CHINA TELECOM CORP LTD - 4.948,00 USD 47,500 180.806,22 0,45 0,46
France
ILIAD SA - 472,00 EUR 166,150 78.422,80 0,20 0,20
ORANGE - 73.868,00 EUR 7,268 536.872,62 1,35 1,37
VIVENDI - 72.191,00 EUR 14,550 1.050.379,05 2,64 2,67
Germany
DEUTSCHE TELEKOM INT FIN REG 43.084,00 EUR 8,964 386.204,98 0,97 0,98
SKY DEUTSCHLAND AG - 29.614,00 EUR 5,350 158.434,90 0,40 0,40
TELEFONICA DEUTSCHLAND HOLDING - 21.371,00 EUR 5,561 118.844,13 0,30 0,30
Greece
OTE PLC - 31.805,00 EUR 6,000 190.830,00 0,48 0,49
Hong Kong
CHINA MOBILE LTD. - 224.200,00 HKD 81,000 1.801.231,89 4,52 4,58
CHINA UNICOM HONG KONG LTD - 171.000,00 HKD 10,300 174.695,75 0,44 0,44
HKT TRUST /HKT LTD - 74.303,00 HKD 7,440 54.831,27 0,14 0,14
PCCW LTD - 209.000,00 HKD 3,630 75.249,20 0,19 0,19
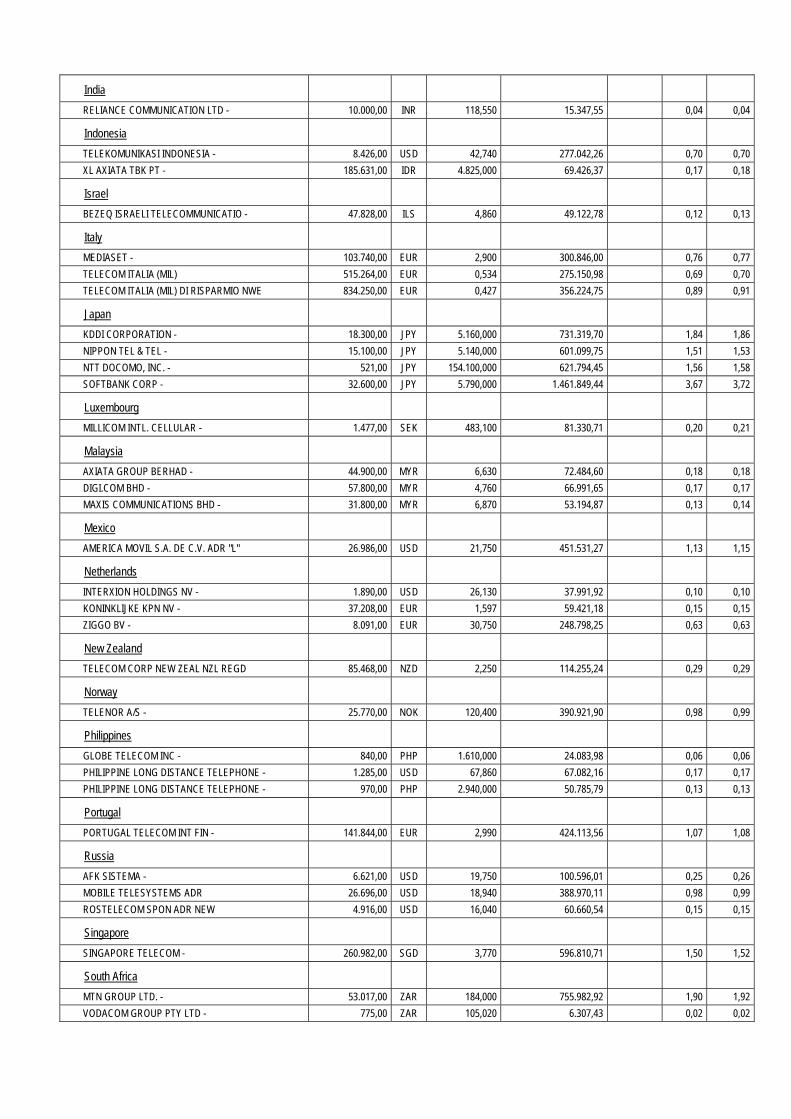
India
RELIANCE COMMUNICATION LTD - 10.000,00 INR 118,550 15.347,55 0,04 0,04
Indonesia
TELEKOMUNIKASI INDONESIA - 8.426,00 USD 42,740 277.042,26 0,70 0,70
XL AXIATA TBK PT - 185.631,00 IDR 4.825,000 69.426,37 0,17 0,18
Israel
BEZEQ ISRAELI TELECOMMUNICATIO - 47.828,00 ILS 4,860 49.122,78 0,12 0,13
Italy
MEDIASET - 103.740,00 EUR 2,900 300.846,00 0,76 0,77
TELECOM ITALIA (MIL) 515.264,00 EUR 0,534 275.150,98 0,69 0,70
TELECOM ITALIA (MIL) DI RISPARMIO NWE 834.250,00 EUR 0,427 356.224,75 0,89 0,91
Japan
KDDI CORPORATION - 18.300,00 JPY 5.160,000 731.319,70 1,84 1,86
NIPPON TEL & TEL - 15.100,00 JPY 5.140,000 601.099,75 1,51 1,53
NTT DOCOMO, INC. - 521,00 JPY 154.100,000 621.794,45 1,56 1,58
SOFTBANK CORP - 32.600,00 JPY 5.790,000 1.461.849,44 3,67 3,72
Luxembourg
MILLICOM INTL. CELLULAR - 1.477,00 SEK 483,100 81.330,71 0,20 0,21
Malaysia
AXIATA GROUP BERHAD - 44.900,00 MYR 6,630 72.484,60 0,18 0,18
DIGI.COM BHD - 57.800,00 MYR 4,760 66.991,65 0,17 0,17
MAXIS COMMUNICATIONS BHD - 31.800,00 MYR 6,870 53.194,87 0,13 0,14
Mexico
AMERICA MOVIL S.A. DE C.V. ADR "L" 26.986,00 USD 21,750 451.531,27 1,13 1,15
Netherlands
INTERXION HOLDINGS NV - 1.890,00 USD 26,130 37.991,92 0,10 0,10
KONINKLIJKE KPN NV - 37.208,00 EUR 1,597 59.421,18 0,15 0,15
ZIGGO BV - 8.091,00 EUR 30,750 248.798,25 0,63 0,63
New Zealand
TELECOM CORP NEW ZEAL NZL REGD 85.468,00 NZD 2,250 114.255,24 0,29 0,29
Norway
TELENOR A/S - 25.770,00 NOK 120,400 390.921,90 0,98 0,99
Philippines
GLOBE TELECOM INC - 840,00 PHP 1.610,000 24.083,98 0,06 0,06
PHILIPPINE LONG DISTANCE TELEPHONE - 1.285,00 USD 67,860 67.082,16 0,17 0,17
PHILIPPINE LONG DISTANCE TELEPHONE - 970,00 PHP 2.940,000 50.785,79 0,13 0,13
Portugal
PORTUGAL TELECOM INT FIN - 141.844,00 EUR 2,990 424.113,56 1,07 1,08
Russia
AFK SISTEMA - 6.621,00 USD 19,750 100.596,01 0,25 0,26
MOBILE TELESYSTEMS ADR 26.696,00 USD 18,940 388.970,11 0,98 0,99
ROSTELECOM SPON ADR NEW 4.916,00 USD 16,040 60.660,54 0,15 0,15
Singapore
SINGAPORE TELECOM - 260.982,00 SGD 3,770 596.810,71 1,50 1,52
South Africa
MTN GROUP LTD. - 53.017,00 ZAR 184,000 755.982,92 1,90 1,92
VODACOM GROUP PTY LTD - 775,00 ZAR 105,020 6.307,43 0,02 0,02
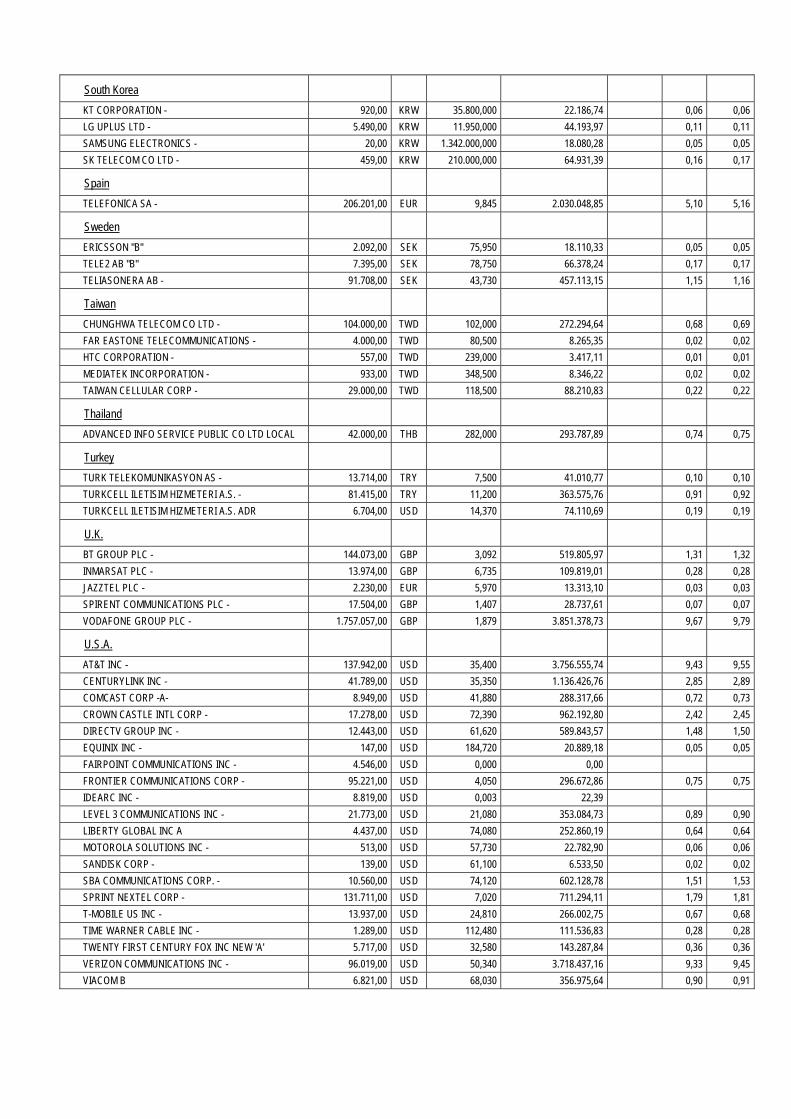
South Korea
KT CORPORATION - 920,00 KRW 35.800,000 22.186,74 0,06 0,06
LG UPLUS LTD - 5.490,00 KRW 11.950,000 44.193,97 0,11 0,11
SAMSUNG ELECTRONICS - 20,00 KRW 1.342.000,000 18.080,28 0,05 0,05
SK TELECOM CO LTD - 459,00 KRW 210.000,000 64.931,39 0,16 0,17
Spain
TELEFONICA SA - 206.201,00 EUR 9,845 2.030.048,85 5,10 5,16
Sweden
ERICSSON "B" 2.092,00 SEK 75,950 18.110,33 0,05 0,05
TELE2 AB "B" 7.395,00 SEK 78,750 66.378,24 0,17 0,17
TELIASONERA AB - 91.708,00 SEK 43,730 457.113,15 1,15 1,16
Taiwan
CHUNGHWA TELECOM CO LTD - 104.000,00 TWD 102,000 272.294,64 0,68 0,69
FAR EASTONE TELECOMMUNICATIONS - 4.000,00 TWD 80,500 8.265,35 0,02 0,02
HTC CORPORATION - 557,00 TWD 239,000 3.417,11 0,01 0,01
MEDIATEK INCORPORATION - 933,00 TWD 348,500 8.346,22 0,02 0,02
TAIWAN CELLULAR CORP - 29.000,00 TWD 118,500 88.210,83 0,22 0,22
Thailand
ADVANCED INFO SERVICE PUBLIC CO LTD LOCAL 42.000,00 THB 282,000 293.787,89 0,74 0,75
Turkey
TURK TELEKOMUNIKASYON AS - 13.714,00 TRY 7,500 41.010,77 0,10 0,10
TURKCELL ILETISIM HIZMETERI A.S. - 81.415,00 TRY 11,200 363.575,76 0,91 0,92
TURKCELL ILETISIM HIZMETERI A.S. ADR 6.704,00 USD 14,370 74.110,69 0,19 0,19
U.K.
BT GROUP PLC - 144.073,00 GBP 3,092 519.805,97 1,31 1,32
INMARSAT PLC - 13.974,00 GBP 6,735 109.819,01 0,28 0,28
JAZZTEL PLC - 2.230,00 EUR 5,970 13.313,10 0,03 0,03
SPIRENT COMMUNICATIONS PLC - 17.504,00 GBP 1,407 28.737,61 0,07 0,07
VODAFONE GROUP PLC - 1.757.057,00 GBP 1,879 3.851.378,73 9,67 9,79
U.S.A.
AT&T INC - 137.942,00 USD 35,400 3.756.555,74 9,43 9,55
CENTURYLINK INC - 41.789,00 USD 35,350 1.136.426,76 2,85 2,89
COMCAST CORP -A- 8.949,00 USD 41,880 288.317,66 0,72 0,73
CROWN CASTLE INTL CORP - 17.278,00 USD 72,390 962.192,80 2,42 2,45
DIRECTV GROUP INC - 12.443,00 USD 61,620 589.843,57 1,48 1,50
EQUINIX INC - 147,00 USD 184,720 20.889,18 0,05 0,05
FAIRPOINT COMMUNICATIONS INC - 4.546,00 USD 0,000 0,00
FRONTIER COMMUNICATIONS CORP - 95.221,00 USD 4,050 296.672,86 0,75 0,75
IDEARC INC - 8.819,00 USD 0,003 22,39
LEVEL 3 COMMUNICATIONS INC - 21.773,00 USD 21,080 353.084,73 0,89 0,90
LIBERTY GLOBAL INC A 4.437,00 USD 74,080 252.860,19 0,64 0,64
MOTOROLA SOLUTIONS INC - 513,00 USD 57,730 22.782,90 0,06 0,06
SANDISK CORP - 139,00 USD 61,100 6.533,50 0,02 0,02
SBA COMMUNICATIONS CORP. - 10.560,00 USD 74,120 602.128,78 1,51 1,53
SPRINT NEXTEL CORP - 131.711,00 USD 7,020 711.294,11 1,79 1,81
T-MOBILE US INC - 13.937,00 USD 24,810 266.002,75 0,67 0,68
TIME WARNER CABLE INC - 1.289,00 USD 112,480 111.536,83 0,28 0,28
TWENTY FIRST CENTURY FOX INC NEW 'A' 5.717,00 USD 32,580 143.287,84 0,36 0,36
VERIZON COMMUNICATIONS INC - 96.019,00 USD 50,340 3.718.437,16 9,33 9,45
VIACOM B 6.821,00 USD 68,030 356.975,64 0,90 0,91
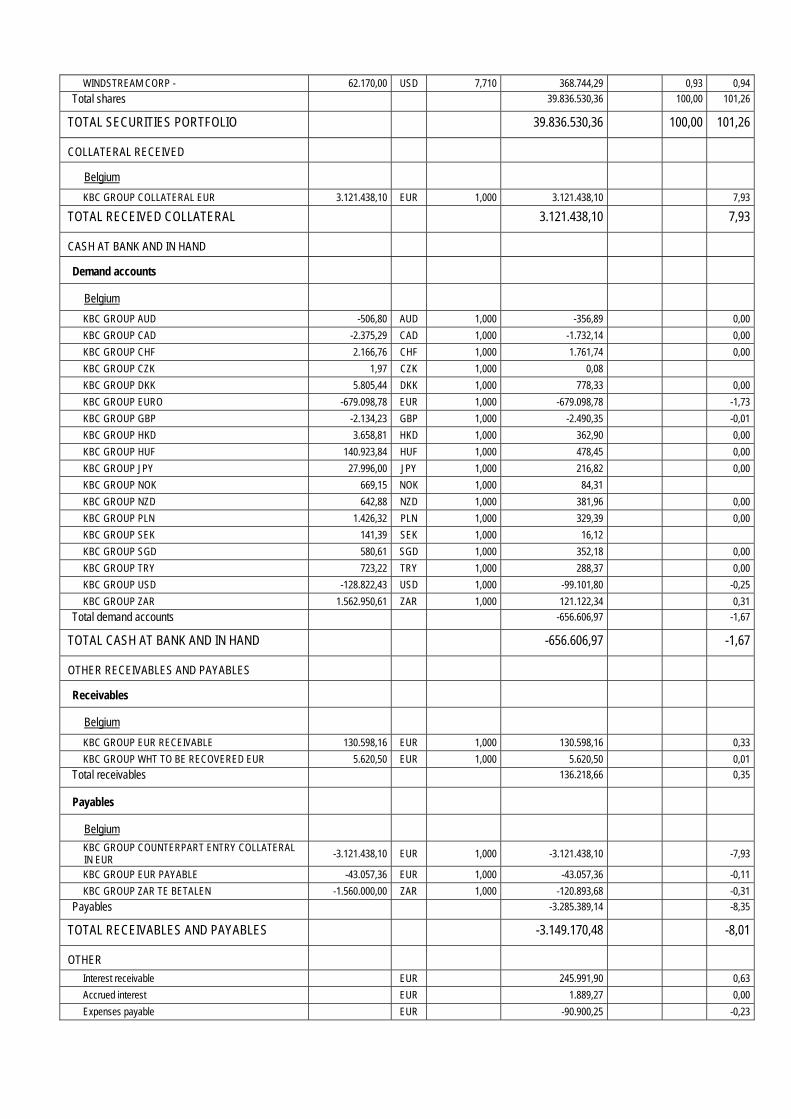
WINDSTREAM CORP - 62.170,00 USD 7,710 368.744,29 0,93 0,94
Total shares 39.836.530,36 100,00 101,26
TOTAL SECURITIES PORTFOLIO 39.836.530,36 100,00 101,26
COLLATERAL RECEIVED
Belgium
KBC GROUP COLLATERAL EUR 3.121.438,10 EUR 1,000 3.121.438,10 7,93
TOTAL RECEIVED COLLATERAL 3.121.438,10 7,93
CASH AT BANK AND IN HAND
Demand accounts
Belgium
KBC GROUP AUD -506,80 AUD 1,000 -356,89 0,00
KBC GROUP CAD -2.375,29 CAD 1,000 -1.732,14 0,00
KBC GROUP CHF 2.166,76 CHF 1,000 1.761,74 0,00
KBC GROUP CZK 1,97 CZK 1,000 0,08
KBC GROUP DKK 5.805,44 DKK 1,000 778,33 0,00
KBC GROUP EURO -679.098,78 EUR 1,000 -679.098,78 -1,73
KBC GROUP GBP -2.134,23 GBP 1,000 -2.490,35 -0,01
KBC GROUP HKD 3.658,81 HKD 1,000 362,90 0,00
KBC GROUP HUF 140.923,84 HUF 1,000 478,45 0,00
KBC GROUP JPY 27.996,00 JPY 1,000 216,82 0,00
KBC GROUP NOK 669,15 NOK 1,000 84,31
KBC GROUP NZD 642,88 NZD 1,000 381,96 0,00
KBC GROUP PLN 1.426,32 PLN 1,000 329,39 0,00
KBC GROUP SEK 141,39 SEK 1,000 16,12
KBC GROUP SGD 580,61 SGD 1,000 352,18 0,00
KBC GROUP TRY 723,22 TRY 1,000 288,37 0,00
KBC GROUP USD -128.822,43 USD 1,000 -99.101,80 -0,25
KBC GROUP ZAR 1.562.950,61 ZAR 1,000 121.122,34 0,31
Total demand accounts -656.606,97 -1,67
TOTAL CASH AT BANK AND IN HAND -656.606,97 -1,67
OTHER RECEIVABLES AND PAYABLES
Receivables
Belgium
KBC GROUP EUR RECEIVABLE 130.598,16 EUR 1,000 130.598,16 0,33
KBC GROUP WHT TO BE RECOVERED EUR 5.620,50 EUR 1,000 5.620,50 0,01
Total receivables 136.218,66 0,35
Payables
Belgium
KBC GROUP COUNTERPART ENTRY COLLATERAL IN EUR -3.121.438,10 EUR 1,000 -3.121.438,10 -7,93
KBC GROUP EUR PAYABLE -43.057,36 EUR 1,000 -43.057,36 -0,11
KBC GROUP ZAR TE BETALEN -1.560.000,00 ZAR 1,000 -120.893,68 -0,31
Payables -3.285.389,14 -8,35
TOTAL RECEIVABLES AND PAYABLES -3.149.170,48 -8,01
OTHER
Interest receivable EUR 245.991,90 0,63
Accrued interest EUR 1.889,27 0,00
Expenses payable EUR -90.900,25 -0,23

Expenses to be carried forward EUR 33.190,97 0,09
TOTAL OTHER 190.171,89 0,48
TOTAL NET ASSETS 39.342.362,90 100,00

Geographic breakdown (as a % of securities portfolio)
31/12/2011 30/06/2012 31/12/2012 30/06/2013 Australia 1,03 1,10 0,78 2,35 Austria 0,25 0,00 0,00 0,00 Belgium 0,00 0,00 0,36 0,29 Brazil 1,04 0,93 0,00 2,41 Canada 3,25 2,19 2,48 4,79 Switzerland 0,00 0,00 0,65 0,00 China 0,72 0,00 0,65 0,58 Cayman Islands 0,00 0,00 0,15 0,07 Germany 2,02 1,23 3,59 1,67 Egypt 0,03 0,22 0,16 0,00 Spain 3,90 2,36 3,51 5,10 Finland 0,78 0,00 0,94 0,00 France 4,19 4,53 4,11 4,18 U.K. 11,37 12,40 9,80 11,35 Greece 0,00 0,00 0,00 0,48 Hong Kong 5,49 6,14 5,54 5,29 India 0,51 0,23 0,15 0,04 Indonesia 0,53 0,78 0,70 0,87 Israel 0,00 0,00 0,00 0,12 Italy 0,96 1,61 0,88 2,34 Japan 6,28 6,61 6,06 8,58 South Korea 0,51 0,96 0,71 0,38 Luxembourg 0,82 0,81 0,00 0,20 Mexico 2,21 3,43 3,02 1,13 Malaysia 0,23 0,60 0,62 0,48 Netherlands 1,16 2,06 1,56 0,87 Norway 0,76 0,93 1,65 0,98 New Zealand 0,24 0,34 0,19 0,29 Philippines 0,06 0,13 0,12 0,36 Portugal 0,00 0,00 0,15 1,06 Russia 0,80 1,23 1,17 1,38 Singapore 1,67 1,72 0,73 1,50 Sweden 2,84 3,07 2,60 1,36 Thailand 0,55 0,75 0,76 0,74 Turkey 0,00 0,00 0,39 1,20 Taiwan 1,76 1,76 1,13 0,96 U.S.A. 41,55 39,77 42,42 34,69 South Africa 2,49 2,11 2,27 1,91 Total 100,00 100,00 100,00 100,00
Sector breakdown (as a % of securities portfolio)
31/12/2011 30/06/2012 31/12/2012 30/06/2013 Consum(cycl) 2,49 2,59 4,05 8,54 Cons.goods 0,00 0,18 0,00 0,00 Technology 23,32 19,03 23,06 1,50 Telecomm. 73,66 77,79 72,02 89,44 Utilities 0,53 0,41 0,26 0,22 Various 0,00 0,00 0,61 0,30 Total 100,00 100,00 100,00 100,00
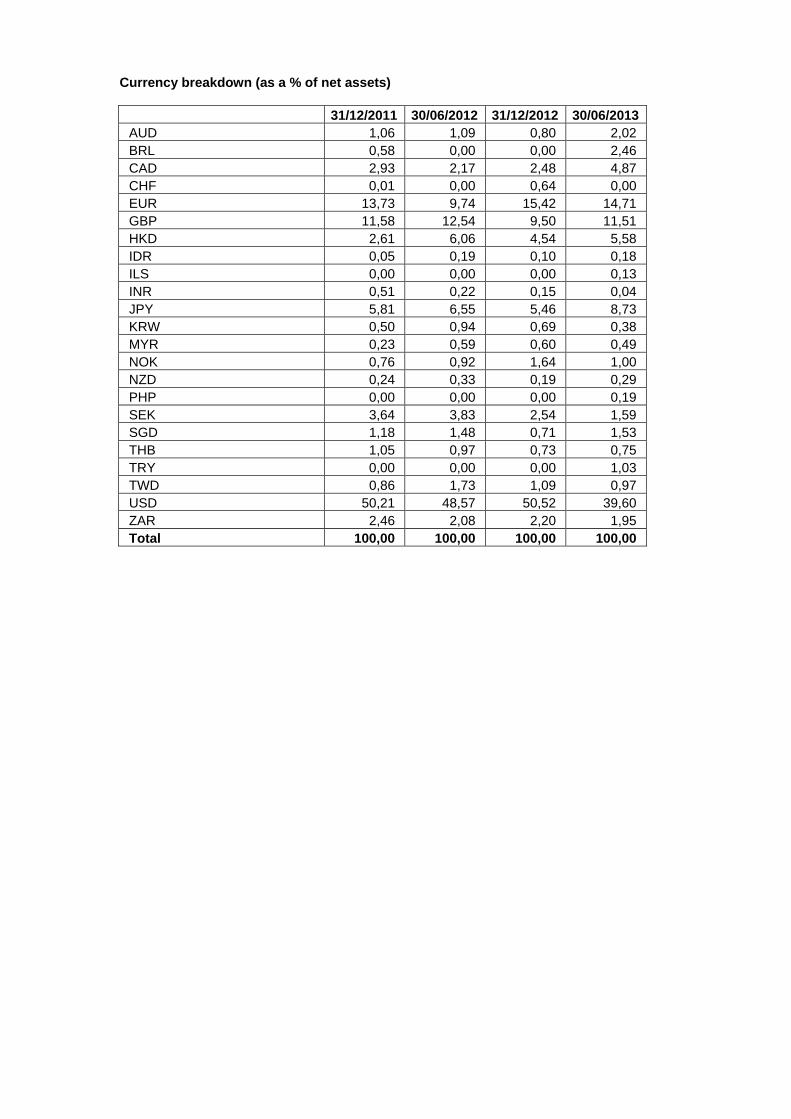
Currency breakdown (as a % of net assets)
31/12/2011 30/06/2012 31/12/2012 30/06/2013 AUD 1,06 1,09 0,80 2,02 BRL 0,58 0,00 0,00 2,46 CAD 2,93 2,17 2,48 4,87 CHF 0,01 0,00 0,64 0,00 EUR 13,73 9,74 15,42 14,71 GBP 11,58 12,54 9,50 11,51 HKD 2,61 6,06 4,54 5,58 IDR 0,05 0,19 0,10 0,18 ILS 0,00 0,00 0,00 0,13 INR 0,51 0,22 0,15 0,04 JPY 5,81 6,55 5,46 8,73 KRW 0,50 0,94 0,69 0,38 MYR 0,23 0,59 0,60 0,49 NOK 0,76 0,92 1,64 1,00 NZD 0,24 0,33 0,19 0,29 PHP 0,00 0,00 0,00 0,19 SEK 3,64 3,83 2,54 1,59 SGD 1,18 1,48 0,71 1,53 THB 1,05 0,97 0,73 0,75 TRY 0,00 0,00 0,00 1,03 TWD 0,86 1,73 1,09 0,97 USD 50,21 48,57 50,52 39,60 ZAR 2,46 2,08 2,20 1,95 Total 100,00 100,00 100,00 100,00

2.4.2 CHANGES IN THE COMPOSITION OF THE ASSETS OF KBC EQUITY FUND TELECOM (IN THE
CURRENCY OF THE SUB-FUND)
1st half of year YearPurchases 17.574.252,71 17.574.252,71 Sales 55.203.852,00 55.203.852,00 Total 1 72.778.104,70 72.778.104,70 Subscriptions 17.499.975,21 17.499.975,21 Redemptions 58.580.477,63 58.580.477,63 Total 2 76.080.452,84 76.080.452,84 Monthly average of total assets
55.332.596,98 55.332.596,98
Turnover rate -5,97 % -5,97 %
1st half of year YearPurchases 17.574.252,71 17.574.252,71 Sales 55.203.852,00 55.203.852,00 Total 1 72.778.104,70 72.778.104,70 Subscriptions 17.499.975,21 17.499.975,21 Redemptions 58.580.477,63 58.580.477,63 Total 2 76.080.452,84 76.080.452,84 Monthly average of total assets
43.423.381,13 43.423.381,13
Corrected turnover rate -7,60 % -7,60 %
The table above shows the capital volume of portfolio transactions. This volume (adjusted to take account of total subscriptions and redemptions) is also compared to the average net assets at the beginning and end of the period. A figure close to 0% implies that the transactions relating to the securities or transactions relating to the assets (excluding deposits and cash) in a given period only involve subscriptions and redemptions. A negative percentage shows that subscriptions and redemptions entailed few, if any, transactions in the portfolio. Active asset management may result in high turnover rates (monthly percentage >50%). The detailed list of transactions is available for consultation free of charge at the registered office of the Bevek or fund at Havenlaan 2, 1080 Brussels.

2.4.3 AMOUNT OF COMMITMENTS IN RESPECT OF FINANCIAL DERIVATIVES POSITIONS
NAME Currency Value in currency
In the currency of the sub-fund
Lot-size
Transactiondate
KBC COLLATERAL EUR
EUR 3.121.438,10 3.121.438,10 N/A 28.06.2013
2.4.4 CHANGES OF THE NUMBER OF SUBSCRIPTIONS AND REDEMPTIONS AND THE NET ASSET
VALUE
Classic Shares
Period Change in number of shares in circulation
Year Subscriptions Redemptions End of period
Cap. Dis. Cap. Dis. Cap. Dis. Total
2011 - 06 721.542,55 77.989,25 335.076,11 19.394,46 546.759,22 67.075,30 613.834,52
2012 - 06 396.473,44 8.634,55 895.642,94 60.368,94 47.589,72 15.340,90 62.930,62
2013 - 06 30.387,40 389,34 41.105,25 5.520,42 36.871,87 10.209,83 47.081,70
Period Amounts received and paid by the UCI
(in the currency of the class)
Year Subscriptions Redemptions
Capitalization Distribution Capitalization Distribution
2011 - 06 149.105.337,30 11.318.638,73 85.090.833,24 4.338.813,08
2012 - 06 95.468.744,97 1.657.473,39 214.506.340,30 12.432.288,96
2013 - 06 8.873.913,31 86.779,51 11.731.887,25 1.231.965,26
Period Net asset value
End of period (in the currency of the class)
Year Of the class Of one share
Capitalization Distribution
2011 - 06 149.134.108,99 248,49 197,80
2012 - 06 16.213.540,41 272,28 212,24
2013 - 06 13.308.789,31 297,66 228,57
Institutional B Shares
Period Change in number of shares in circulation
Year Subscriptions Redemptions End of period
Cap. Dis. Cap. Dis. Cap. Dis. Total 2012 - 06 651.359,00 546.729,00 104.630,00 104.630,00
2013 - 06 262.863,25 280.137,12 87.356,12 87.356,12
Period Amounts received and paid by the UCI
(in the currency of the class)
Year Subscriptions Redemptions
Capitalization Distribution Capitalization Distribution
2012 - 06 162.836.504,00 141.853.836,60
2013 - 06 75.788.351,32 79.204.144,65
Period Net asset value
End of period (in the currency of the class)

Year Of the class Of one share
Capitalization Distribution
2012 - 06 28.518.327,38 272,56
2013 - 06 26.033.573,59 298,02
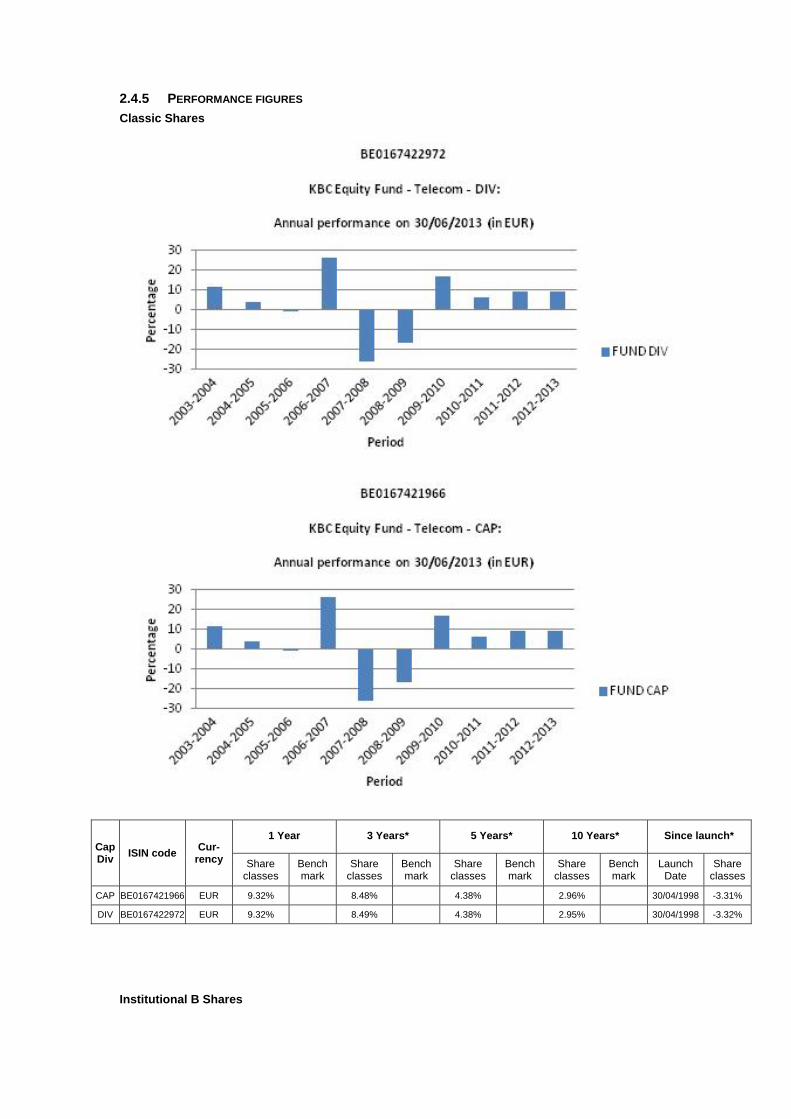
2.4.5 PERFORMANCE FIGURES
Classic Shares
Cap Div
ISIN code Cur-
rency
1 Year 3 Years* 5 Years* 10 Years* Since launch*
Share classes
Bench mark
Share classes
Bench mark
Share classes
Bench mark
Share classes
Bench mark
Launch Date
Share classes
CAP BE0167421966 EUR 9.32% 8.48% 4.38% 2.96% 30/04/1998 -3.31%
DIV BE0167422972 EUR 9.32% 8.49% 4.38% 2.95% 30/04/1998 -3.32%
Institutional B Shares

Cap Div
ISIN code Cur-
rency
1 Year 3 Years* 5 Years* 10 Years* Since launch*
Share classes
Bench mark
Share classes
Bench mark
Share classes
Bench mark
Share classes
Bench mark
Launch Date
Share classes
CAP BE6228908537 EUR 9.34% 25/11/2011 15.86%
Risk warning: Past performance is not a guide to future performance. * Return on annual basis.
Classic Shares The bar chart shows the performance for full financial years. The figures do not take account of any restructuring. Calculated in EUR (ex BEF). The return is calculated as the change in the net asset value between two dates expressed
as a percentage. In the case of units that pay dividends, the dividend is incorporated geometrically in the return.
Calculation method for date D, where NAV stands for net asset value: Capitalisation units (CAP) Return on date D over a period of X years:
[NIW(D) / NIW(Y)] ^ [1 / X] - 1 where Y = D-X
Return on date D since the start date S of the unit: [NIW(D) / NIW(S)] ^ [1 / F] - 1 where F = 1 if the unit has existed for less than one year on date D where F = (D-S) / 365.25 if the unit has existed for longer than one year on date D
Distribution units (DIV) Return on date D over a period of X years:
[ C * NIW(D) / NIW(Y)] ^ [1 / X] - 1 where Y = D-X
Return on date D since the start date S of the unit: [ C * NIW(D) / NIW(S)] ^ [1 / F] - 1 where F = 1 if the unit has existed for less than one year on date D where F = (D-S) / 365.25 if the unit has existed for longer than one year on date D where C is a factor that is determined for all N dividends between the calculation date D and the reference date.
For dividend i on date Di with value Wi: Ci = [Wi / NIW(Di)] + 1 i = 1 ... N

from whichC = C0 * .... * CN. If the interval between the two dates exceeds one year, the ordinary return calculation is
converted into a return on an annual basis by taking the nth square root of 1 plus the total return of the unit.
The return figures shown above do not take account of the fees and charges associated with the issue and redemption of units.
These are the performance figures for capitalisation and distribution shares.
Institutional B Shares The bar chart shows the performance for full financial years. The figures do not take account of any restructuring. Calculated in EUR. The return is calculated as the change in the net asset value between two dates expressed
as a percentage. Calculation method for date D, where NAV stands for net asset value:
Capitalisation units (CAP) Return on date D over a period of X years:
[NIW(D) / NIW(Y)] ^ [1 / X] - 1 where Y = D-X
Return on date D since the start date S of the unit: [NIW(D) / NIW(S)] ^ [1 / F] - 1 where F = 1 if the unit has existed for less than one year on date D where F = (D-S) / 365.25 if the unit has existed for longer than one year on date D
If the interval between the two dates exceeds one year, the ordinary return calculation is converted into a return on an annual basis by taking the nth square root of 1 plus the total return of the unit.
The return figures shown above do not take account of the fees and charges associated with the issue and redemption of units.
These are the performance figures for capitalization shares.

2.4.6 COSTS Ongoing Charges: * Classic Shares Distribution: 1.805% Classic Shares Capitalization: 1.805% Institutional B Shares Capitalization: 1.789% * The following costs have not been included in the ongoing charges: - Interest payments on loans taken out - Payments in respect of financial derivatives - Fees and charges paid directly by the investor - Any soft commissions
SOFT COMMISSIONS The management company or the appointed manager, as the case may be, is the recipient of soft commissions. The recipient has laid down an internal policy as regards accepting soft commissions and avoiding possible conflicts of interest in this respect, and has put appropriate internal controls in place to ensure this policy is observed. For more information, please see the ‘General’ section of the annual report.
Broker
Commission gross
in EUR
paid during the period:
1‐01‐13
‐
30‐06‐13
CSA Credits
in EUR
accrued during the period:
1‐01‐13
‐
30‐06‐13 Percentage
CITI 4,390 2,903 66.15%
CSFBSAS 7,071 3,685 52.12%
EQ MACQUARIE 2,081 1,041 50.00%
INSTINET 5,356 2,131 39.78%
MORGAN STANLEY 20,436 10,266 50.24%
UBSWDR 3,132 1,559 49.79%
FEE-SHARING AGREEMENTS AND REBATES: The management company may share its fee with the distributor, and institutional and/or professional parties. In principle, the percentage share amounts to between 35% and 60% if the distributor is an entity of KBC Group NV or to between 35% and 70% if the distributor is not an entity of KBC Group NV. However, in a small number of cases, the distributor’s fee is less than 35%. Investors may, on request, obtain more information on these cases. If the management company invests the assets of the undertaking for collective investment in units of undertakings for collective investment that are not managed by an entity of KBC Group NV, and receives a fee for doing so, it will pay this fee to the undertaking for collective investment. Fee-sharing does not affect the amount of the management fee paid by the sub-fund to the management company. This management fee is subject to the limitations laid down in the articles of association. The limitations may only be amended after approval by the general meeting of shareholders. The management company has concluded a distribution agreement with the distributor in order to facilitate the wider distribution of the sub-fund's units by using multiple distribution channels. It is in the interests of the holders of units, the sub-fund and of the distributor for the largest possible number of units to be sold and for the assets of the sub-fund to be maximised in this way. In this respect, there is therefore no question of any conflict of interest.
2.4.7 NOTES TO THE FINANCIAL STATEMENTS AND OTHER DATA Fee for managing the investment portfolio: 1.5% per annum calculated on the basis of the average total net assets of the sub-fund, no management fee is charged on assets assets invested in investment undertakings managed by a financial institution of the KBC group. The administration agent’s fee is payable at the end of each month and is calculated on the basis of the average total net assets of the sub-fund.

Auditor's fee: 1 700 EUR per year. This fee is not including VAT and can be indexed on an annual basis in accordance with the decisions of the general meeting. The custody fee is calculated on the value of the securities held in custody by the custodian on the final banking day of the preceding calendar year, except on those assets invested in investment undertakings managed by a financial institution of the KBC group. The custody fee is paid at the beginning of the calendar year. Social, ethical and environmental aspects: No manufacturers of controversial weapons whose use over the past five decades, according to the international consensus, has led to disproportionate human suffering among the civilian population will be included in the portfolio of investments. This involves the manufacturers of anti-personnel mines, cluster bombs and munitions and weapons containing depleted uranium. In this way, the sub-fund seeks to reflect not only simple financial reality but also the social reality of the sector or region in question. Exercising voting rights. If necessary, relevant and in the interest of the shareholders, the management company will exercise the voting rights attached to the shares in the Bevek’s portfolio. The management company will adhere to the following criteria when determining how it stands relative to the items on the agenda that are put to the vote: - Shareholder value may not be adversely affected. - Corporate governance rules, especially with regard to the rights of minority shareholders, must be
respected. - The minimum standards with regard to sustainable business and corporate social responsibility
must be met. The list of companies for which voting rights are exercised is available at the registered office of the Bevek. Securities lending In accordance with the Royal Decree of 7 March 2006 concerning securities lending, the undertaking for collective investment has taken out securities loans with a principal to whom the full title of the loaned securities was transferred, without recording this transfer of ownership in the accounts. For the period from 1 January 2013 to 30 June 2013, the fee for securities lent comes to 15,211.07 EUR. The undertaking for collective investment receives 50% of the fee received for securities lent. The detailed list of securities lending transactions carried out can be obtained from the registered office of the collective investment undertaking at 2 Havenlaan, 1080 Brussels.
Overview of securities lent as at 30/06/2013
Name Currency Quantity Price Value in currency of the
portfolio
BCE INC NEW CAD 23.769 43,120 747.407,04
BELL ALIANT INC CAD 9.790 28,260 201.754,10
BYD CO LTD -H- HKD 599 25,700 1.526,89
CHINA UNICOM HONG KONG LTD HKD 170.999 10,300 174.694,73
KDDI CORPORATION JPY 18.200 5.160,000 727.323,42
ROGERS COMMUNICATIONS INC - CL B CAD 11.501 41,200 345.541,60
SINGAPORE TELECOM LTD SGD 260.981 3,770 596.808,43
TELEFONICA DEUTSCHLAND HOLDING AG EUR 9.735 5,561 54.136,34
TELIASONERA SEK 16.920 43,730 84.336,75
Total 2.933.529,30
Details of collateral received for securities lent
Name Currency Nominal value Currency fund Value in Currency fund
AUSTRIA 2012 3,4% 22/11/2022 EUR 355.000 EUR 405.080,20
FRANCE 2008 3.75% 25/10/2019 EUR 1.803.000 EUR 2.092.538,36
NETHERLANDS 2011 1% 15/01/2014 EUR 58.000 EUR 58.573,04
NETHERLANDS 2011 2.5% 15/01/17 EUR 527.000 EUR 565.246,51
Total 3.121.438,11 For the valuation of the collateral received, indicative prices have been used in this detail list by the Collateral Management Division of KBC Bank.

Semi-Annual report as at 30th June 2013
TABLE OF CONTENTS
2. Information on KBC Equity Fund Oil
2.1. Management report 2.1.1. Launch date and subscription price 2.1.2. Stock exchange listing 2.1.3. Aim and distinctive features of the investment policy 2.1.4. Financial portfolio management 2.1.5. Distributors 2.1.6. Index and benchmark 2.1.7. Policy conducted during the financial year 2.1.8. Future policy 2.1.9. Synthetic risk and reward indicator (SRRI)
2.2. Balance sheet
2.3. Profit and loss account
2.4. Composition of the assets and key figures
2.4.1. Composition of the assets 2.4.2. Change in the composition of the assets 2.4.3. Value of commitments in respect of financial derivatives positions 2.4.4. Evolution of the number of subscriptions, repayments and the net asset value 2.4.5. Return figures 2.4.6. Expenses 2.4.7. Notes to the financial statements and other data


2 INFORMATION ON KBC EQUITY FUND OIL
2.1 MANAGEMENT REPORT
2.1.1 LAUNCH DATE AND SUBSCRIPTION PRICE Classic Shares : Launch date: 29 September 2000 Initial subscription price: 500 EUR Currency: EUR Institutional B Shares : Launch date: 25 November 2011 Initial subscription price: 574.29 EUR Currency: EUR
2.1.2 STOCK EXCHANGE LISTING Not applicable.
2.1.3 GOAL AND KEY PRINCIPLES OF THE INVESTMENT POLICY
SUB-FUND’S OBJECT: The main objective of this sub-fund is to generate the highest possible return for its shareholders by investing directly or indirectly in transferable securities. This is reflected in its pursuit of capital gains and income. To this end, the assets are invested, either directly or indirectly via correlated financial instruments, primarily in shares.
SUB-FUND’S INVESTMENT POLICY:
PERMITTED ASSET CLASSES: The sub-fund may invest in securities, money market instruments, units in undertakings for collective investment, deposits, financial derivatives, liquid assets and all other instruments insofar as permitted by the applicable laws and regulations and consistent with the sub-fund’s object The sub-fund shall invest no more than 10% of its assets in units of other undertakings for collective investment.
RESTRICTIONS OF THE INVESTMENT POLICY: The investment policy will be implemented within the limits set by law and regulations. The sub-fund may borrow up to 10% of its net assets, insofar as these are short-term borrowings aimed at solving temporary liquidity problems.
PERMITTED DERIVATIVES TRANSACTIONS: Derivates may be used either for hedging purposes or to achieve investment objectives. Changes will be made to the investments at regular intervals to comply with the sub-fund's investment strategy. In addition, listed and unlisted derivates may be used to achieve the objectives: these may be forward contracts, options or swaps on securities, indices, currencies or interest rates or other transactions involving derivatives. Unlisted derivatives transactions will only be concluded with prime financial institutions specialised in such transactions. Such derivatives may also be used to hedge the assets against exchange-rate fluctuations. Subject to the applicable laws and regulations and the articles of association, the sub-fund always seeks to conclude the most effective transactions. All costs associated with the transactions will be charged to the sub-fund and all income generated will be paid to the sub-fund. If the transactions result in a risk in respect of the counterparty, this risk can be hedged by using a margin management system that ensures that the sub-fund is the beneficiary of security (collateral) in the form of cash or investment grade bonds. When calculating the value of the bonds, a margin will be applied that varies depending on the residual term to maturity and the currency in which the bond in question is denominated. The relationship with the counterparty or counterparties is governed by standard international agreements.

STRATEGY SELECTED At least 75% of the assets are invested in shares of companies operating in the oil sector, including companies involved in extracting or refining crude oil or natural gas, or companies involved in the distribution of these products or derivatives thereof.
LENDING FINANCIAL INSTRUMENTS: The sub-fund may lend financial instruments within the limits set by law and regulations. This lending does not affect the sub-fund’s risk profile since: - it takes place within the framework of a securities lending system managed by a principal. In
addition, the sub-fund has a relationship only with the principal of the securities lending system which acts as counterparty and to which title of the loaned securities is transferred. The choice of principal is subject to strict selection criteria. The return of securities similar to the securities that have been lent is guaranteed by the principal.
- through a margin management system, the sub-fund is always guaranteed financial security, the actual value of which always exceeds the actual value of the securities that have been lent, in case the principal does not return similar securities.
The return of securities similar to the securities that have been lent can be requested at any time, which means that the lending of securities does not affect the management of the sub-fund's assets. By lending securities, the sub-fund can generate an additional return. The principal pays a fee to the management company. After deducting the fee for the margin management and clearing services of KBC Bank, most of this fee is paid to the sub-fund. The relationship with the counterparty or counterparties is governed by standard international agreements. More information is provided on the terms and conditions governing securities lending in the annual or half-yearly report for the sub-fund.
VOLATILITY OF THE NET ASSET VALUE: The volatility of the net asset value may be high due to the composition of the portfolio.
GENERAL STRATEGY FOR HEDGING THE EXCHANGE RATE RISK: In order to protect its assets against exchange rate fluctuations and within the limitations laid down in the articles of association, the sub-fund may perform transactions relating to the sale of forward currency contracts, as well as the sale of call options and the purchase of put options on currencies. The transactions in question may relate solely to contracts traded on a regulated market that operates regularly, is recognised and is open to the public or that are traded with a recognised, prime financial institution specialising in such transactions and dealing in the over-the-counter (OTC) market in options. With the same objective, the sub-fund may also sell currencies forward or exchange them in private transactions with prime financial institutions specialising in such transactions. The hedging objective of the aforementioned transactions suggests that there is a direct link between these transactions and the assets to be hedged, which implies that the transactions carried out in a particular currency may in principle not exceed, in terms of volume, either the valuation value of all the assets in the same currency or the holding period of those assets.
SOCIAL, ETHICAL AND ENVIRONMENTAL ASPECTS:
No manufacturers of controversial weapons whose use over the past five decades, according to the international consensus, has led to disproportionate human suffering among the civilian population will be included in the portfolio of investments. This involves the manufacturers of anti-personnel mines, cluster bombs and munitions and weapons containing depleted uranium. In this way, the sub-fund seeks to reflect not only simple financial reality but also the social reality of the sector or region in question.
THE EUROPEAN SAVINGS DIRECTIVE AND TAX ON DEBT CLAIM RETURNS OBTAINED THROUGH THE
REDEMPTION OF OWN UNITS OR IN THE EVENT OF FULL OR PARTIAL DISTRIBUTION OF EQUITY
CAPITAL. The following information is of a general character and is not intended to cover all aspects of an investment in a UCITS. In certain cases entirely different rules might even apply. Moreover, both tax law and the interpretation of it can change. Investors who wish to have more information about the

tax implications – in both Belgium and abroad – of acquiring, holding and transferring units should seek the advice of their usual financial and tax advisers. This UCITS shall invest a maximum of 15% of its assets directly or indirectly in debt instruments as intended by the European Savings Directive. A. European Savings Directive (Directive 2003/48/EC) The European Savings Directive has been implemented in Belgium. Since this UCITS invests a maximum of 15% of its assets directly or indirectly in debt claims as intended by the European Savings Directive, the income of this UCITS does not fall within the scope of this directive. B. Tax on debt claim returns obtained through the redemption of own units or in the event of full or partial distribution of equity capital (Article 19bis Income Tax Code 1992). The income from this UCITS is not subject to the tax on debt instrument returns as intended by Article 19bis, Income Tax Code 1992.
2.1.4 FINANCIAL PORTFOLIO MANAGEMENT There is no delegation of the portfolio.
2.1.5 DISTRIBUTORS KBC Asset Management S.A., 5, Place de la Gare, L-1616 Luxembourg.
2.1.6 INDEX AND BENCHMARK See ‘Sub-fund’s investment policy’.

2.1.7 POLICY PERSUED DURING THE FINANCIAL YEAR The oil price was remarkably robust throughout the first three months of this year. The oil market began the new year under some pressure because of major maintenance works on key oilfields in the North Sea and production disruptions in important oil producing countries within and outside OPEC. An example was the ongoing sabotage of vital pipelines in Nigeria in which criminals tap off oil. Additionally, Sudan blocked oil exports from the breakaway South Sudan because of a dispute about prices. Demand was also higher in the first months of the year due to the cold winter. Geopolitical tensions also continued: all eyes remained focused on the civil war in Syria and this, combined with the persistent tensions with Iran regarding its nuclear programme, drove up the risk premium in the early months of the year. The oil price peaked in February at 118 USD per barrel. A combination of a recovery in oil production in the North Sea, strong growth in oil production in the US from the shale fields and lower seasonal demand all helped bring about a correction in the oil price in March. From mid-May onwards, doubts again arose regarding the policy in Japan, the European narrative and the robustness of the US economy. The ISM fell below 50 again in June and concerns began to be expressed about the liquidity of the banking sector in China. These factors obviously had an impact on oil prices, which briefly even went below 100 USD. Gas prices in North America continued the recovery which began in the second half of last year. The Henry Hub gas price peaked in 2008 at over 10 USD, but fluctuated between 2 USD and 4 USD in 2012 as a result of a steady supply of US shale gas. The US gas price recovered strongly this year, rising above 4 USD, driven by increased demand for gas due to the economic recovery (though this is still historically low) in combination with the very cold winter in the US. The years of low prices also meant that it was less commercially interesting for oil companies to exploit sources with high reserves of gas. European gas prices are under constant pressure due to the reopening of negotiations about long-term agreements between Russia and European companies, in which the gas price is linked to the oil price. As American companies and households take full advantage of the cheap gas available there, the US is exporting unused coal to Europe. This is putting additional pressure on demand for gas in Europe. which fell despite the cold winter in Europe. The global LNG market remained very tight, with high prices. Despite the strong oil price this year, the oil sector underperformed the market. Across the regions, the strong performance of the US and Japan stands out, while China, Russia and South America noticeably lagged behind. The fund was overweight in the US names. Broadly speaking, exploration and production companies performed better than the integrated players and oil services companies. Companies with activities in shale gas production, in particular, performed very strongly, profiting from the strong production growth and falling costs due to efficiency improvements. The strong performance of American gas companies also stood out. Within the oil services industry, the European players were the negative outliers. A number of large profit warnings during the final months of the reporting period completely soured the sentiment. The fund was overweight in exploration and oil services companies at the expense of integrated oil companies. In the refinery sector, we preferred American players because of the higher margins.
2.1.8 FUTURE POLICY We believe that 2012 marked an end to the era of year-on-year rises in oil prices, and expect the oil price to come under pressure in the years ahead. Geopolitical events will produce occasional price rallies, but we believe the downward trend will continue. On the one hand, we foresee only a limited rise in demand, driven mainly by the anticipated economic recovery in the US and China ((which is currently faltering). The International Energy Agency has made a major downward adjustment in its demand growth forecasts for this year, to 785,000 barrels. We think demand for oil will also be disappointing in the coming years, dampened by a weaker global economy than in the recent past, combined with reductions in energy use, especially in the developed markets. As an example, US President Barrack Obama has imposed stricter requirements on the automotive sector for fuel consumption in recent years. The low gas prices in the US have recently led to a rise in the number of cars and buses running on natural gas. On the other hand, we also think production will continue to increase going forward, especially in Iraq, the US and some other non-OPEC countries. The situation on the oil market has undergone a complete facelift in recent years. Oil production in the US rose more strongly last year than at any time since 1859, and the increase is threatening to bring about a revolution on the oil market. No one would have dared to suspect that things would take off in the way they have. The impulse has come from the new hydraulic drilling technology. The extraction of shale gas has grown explosively in recent years, especially in the US. This technique involves injecting water into the shale rock under high pressure, as it were forcing the fossil fuels out of the rock. This technology is now also finding its way into the oil market. Following the shale gas boom in the US, we can now expect to see a massive rise in shale oil production. The International Energy Agency (IEA) has calculated that, based on current reserves, the US could
become the biggest oil producer in the world within five years. That will of course not happen, but we nonetheless expect production to rise sharply in the next few years. We expect downward pressure on oil prices as a result of the shale revolution, though it will probably be less dramatic than some market commentators are claiming. After a year of overproduction, global oil stocks rose substantially in 2012, a trend which is continuing in 2013. We expect to see a rise in the OPEC reserve capacity this year compared with 2012. In combination with our expectation of rising production and a slight easing of geopolitical tensions, this should lead to lower risk premiums on the Brent oil price during 2013. We think the recent oil price rise prompted by events in Egypt will be short-lived. Reserve capacity is low by historical standards, making the oil price very vulnerable to geopolitical tensions in the short term. Nonetheless, we expect oil prices to remain around 100 USD this year. Given that Saudi Arabia – the only oil producer that can influence the price – is happy with the current oil price, it is likely that it will cut its production in order to bolster prices in the event of any correction. A price of 100 USD a barrel covers the fiscal budgets of most producers, with the exception of Iran, which is dealing with the consequences of the sanctions. Budgets have risen substantially in recent years – since the start of the Arab Spring – due to investments in social provisions, care and schooling. For consumers, a price of 100 USD is acceptable because it does not stand in the way of economic growth and inflationary pressures are limited. We think the changes in the policy of the Fed – and possibly the Chinese central bank – combined with the anticipated rise in US interest rates and a depreciating dollar will push the oil price below 100 USD. The recovery in the American Henry Hub gas price was stronger than we had anticipated. The harsh winter meant that gas reserves were a good deal lower than in recent years. We think the prospects for the American gas markets are looking a good deal more attractive. The low gas prices made it less commercially interesting for oil and gas companies to exploit sources with high gas reserves last year. We expect European gas prices to remain under pressure, as the weak economic growth and substitution to cheaper gas keeps the lid on demand. The LNG market remains very tight and we expect prices to stay very high. We will maintain our underweight position in integrated oil companies for the rest of the year. The oil giants are faced with rising costs, higher investment expenditure and weak production growth. On top of that, we are seeing profitability falling further. As we expect gas prices in the US to remain stable or rise slightly in the coming years, we are likely to take advantage of the summer price weakness to buy up these shares. We remain overweight in oil services. The oil price determines future investments in new oilfields, and at the current oil price most projects are viable. In the medium term, it will be a major challenge to ensure that supply keeps pace with rising demand. We share the fear that the oil giants will cut their investment budgets in order to maintain operational cash flows. In order to be able to continue paying high dividends, heavy investments are needed in new projects. We firmly favour US oil services companies. Despite the weak performance of the European oil services industry in the last six months, we will remain on the sidelines in the near term. Another key theme that we will continue to play this year is shale oil. Since we expect production of this oil to increase exponentially in the years ahead, companies which have built up strong positions in the various shale fields offer highly attractive growth narratives. We think the market is still underestimating the impact of ever-improving drilling techniques and the resultant falling costs. We are unwinding our overweight position in US refineries. The differential between US and world oil prices has narrowed sharply in recent weeks, and this has given US refineries a significant cost advantage. On top of that, demand for diesel and petrol in the US is weak and American companies are dependent on exports. The sharp depreciation of the South American currencies will also make American: diesel expensive, and that will depress demand in the coming months. The European refinery sector continues to struggle and we remain underweight in this segment. Another structural theme that we will continue to play is liquid natural gas (LNG). There will be very little new capacity on the supply side in the coming years, whereas demand will continue to grow strongly, especially in Asia. However, not everything in the garden is rosy in this segment, and we remain selective. The costs of building LNG export terminals are rising exponentially in Australia, and this is putting pressure on the commercial viability of some projects. Companies that are feeling the negative effects of this are underweight in portfolio. We have a clear preference for gas companies that are well positioned on the global costs curve. Another theme in which we will continue to invest is E&P (exploration and production). Companies in this segment look for oil and gas fields based on seismological data, which their geologists then interpret. Potential new finds create a great deal of shareholder value. Thus far, 2013 has been a disappointing year in terms of exploration, but we think there will be a number of successful test drillings in the second half of the year. We choose to invest in a basket in order to spread the risks, because the risk profile of these companies is substantially higher. Exploration hot spots for 2013 continue to be the Barents Sea, East Africa, Angola, Gabon and the Gulf of Mexico.

2.1.9 SYNTHETIC RISK AND REWARD INDICATOR Classic Shares: 7 on a scale of 1 (lowest risk) to 7 (highest risk). Institutional B Shares: 7 on a scale of 1 (lowest risk) to 7 (highest risk). The value of a share can decrease or increase and the investor may not get back the amount invested. In accordance with Commission Regulation (EU) No. 583/2010, a synthetic risk and reward indicator has been calculated. This indicator provides a quantitative measure of the sub-fund's potential return and the risk involved, calculated in the currency in which the sub-fund is denominated. It is given as a figure between 1 and 7. The higher the figure, the greater the potential return, but also the more difficult it is to predict this return. Losses are possible too. The lowest figure does not mean that the investment is entirely free of risk. However, it does indicate that, compared with the higher figures, this product will generally provide a lower, but more predictable return. The synthetic risk and reward indicator is assessed regularly and can therefore go up or down based on data from the past. Data from the past is not always a reliable indicator of future risk and return.
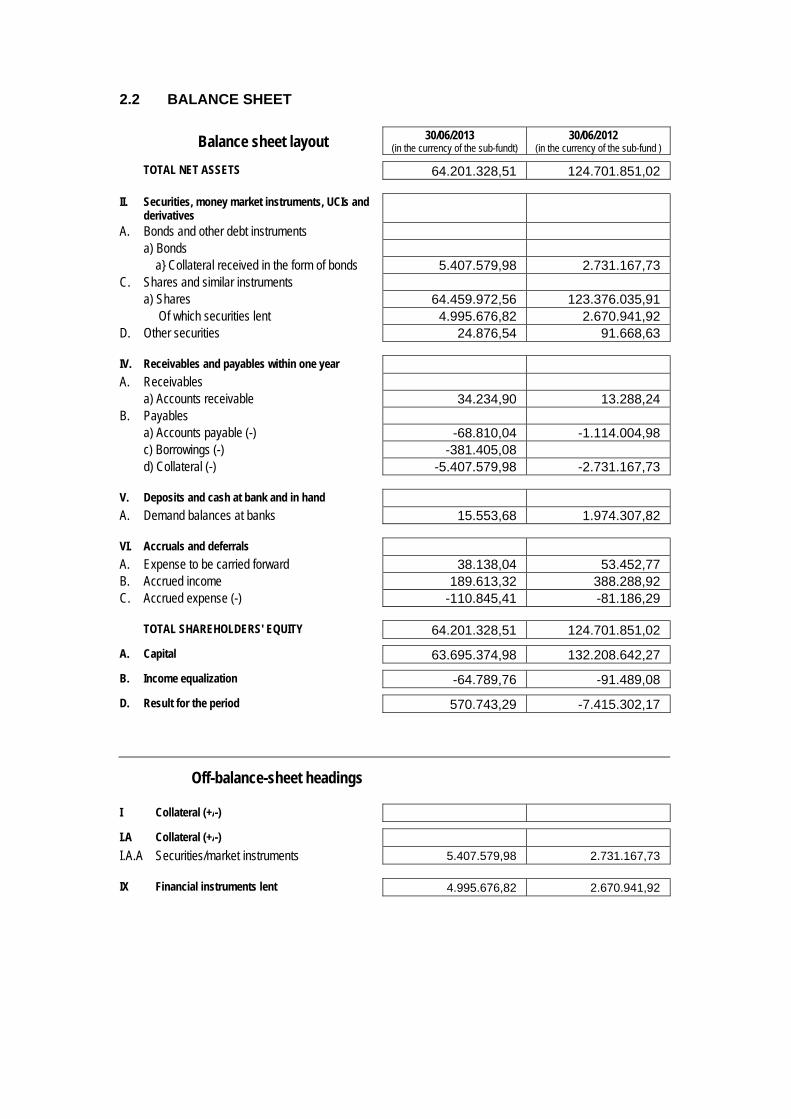
2.2 BALANCE SHEET
Balance sheet layout 30/06/2013 (in the currency of the sub-fundt)
30/06/2012 (in the currency of the sub-fund )
TOTAL NET ASSETS 64.201.328,51 124.701.851,02
II. Securities, money market instruments, UCIs and derivatives
A. Bonds and other debt instruments a) Bonds a} Collateral received in the form of bonds 5.407.579,98 2.731.167,73 C. Shares and similar instruments a) Shares 64.459.972,56 123.376.035,91 Of which securities lent 4.995.676,82 2.670.941,92 D. Other securities 24.876,54 91.668,63
IV. Receivables and payables within one year A. Receivables a) Accounts receivable 34.234,90 13.288,24 B. Payables a) Accounts payable (-) -68.810,04 -1.114.004,98 c) Borrowings (-) -381.405,08 d) Collateral (-) -5.407.579,98 -2.731.167,73
V. Deposits and cash at bank and in hand A. Demand balances at banks 15.553,68 1.974.307,82
VI. Accruals and deferrals A. Expense to be carried forward 38.138,04 53.452,77 B. Accrued income 189.613,32 388.288,92 C. Accrued expense (-) -110.845,41 -81.186,29
TOTAL SHAREHOLDERS' EQUITY 64.201.328,51 124.701.851,02
A. Capital 63.695.374,98 132.208.642,27
B. Income equalization -64.789,76 -91.489,08
D. Result for the period 570.743,29 -7.415.302,17
Off-balance-sheet headings
I Collateral (+/-)
I.A Collateral (+/-)
I.A.A Securities/market instruments 5.407.579,98 2.731.167,73
IX Financial instruments lent 4.995.676,82 2.670.941,92

2.3 PROFIT AND LOSS ACCOUNT
Income Statement 30/06/2013 (in the currency of the sub-fund)
30/06/2012 (in the currency of the sub-fund)
I. Net gains(losses) on investments C. Shares and similar instruments a) Shares 1.440.605,19 -11.229.304,06 D. Other securities 11.298,34 -5.900,64 G. Receivables, deposits, cash at bank and in hand
and payables -0,02
H. Foreign exchange positions and transactions b) Other foreign exchange positions and
transactions -1.268.496,10 2.653.976,56
II. Investment income and expenses A. Dividends 1.072.028,98 2.302.883,30 B. Interests a) Securities and money market instruments 25.120,74 31.350,67 b) Cash at bank and in hand and deposits 3.155,71 9.934,02 c) Collateral (+/-) 0,31 C. Interest on borrowings (-) -373,41 -3.301,27
III. Other income A. Income received to cover the acquisition and
realizaion of assets, to discourage withdrawals and for delivery charges
93.647,29 273.868,28
IV. Operating expenses A. Investment transaction and delivery costs (-) -58.860,37 -181.831,34 B. Financial expenses (-) -961,13 -1.101,06 C. Custodian's fee (-) -30.732,40 -50.584,22 D. Manager's fee (-) a) Financial management Classic Shares -238.892,68 -372.850,70 Institutional B Shares -397.710,41 -687.934,45 b) Administration and accounting management -42.440,22 -76.533,29 E. Administrative expenses (-) -323,25 -325,49 F. Formation and organisation expenses (-) -2.095,86 -7.836,39 G. Remuneration, social security charges and
pension -12,73 -10,60
H. Services and sundry goods (-) -11.824,04 -16.133,20 J. Taxes Classic Shares -9.860,31 -6.602,04 Institutional B Shares -868,96 -1.421,69 K. Other expenses (-) -11.661,09 -45.644,85
Income and expenditure for the period Subtotal II + III + IV 387.335,86 1.165.925,99
V. Profit (loss) on ordinary activities before tax 570.743,29 -7.415.302,17
VII. Result for the period 570.743,29 -7.415.302,17
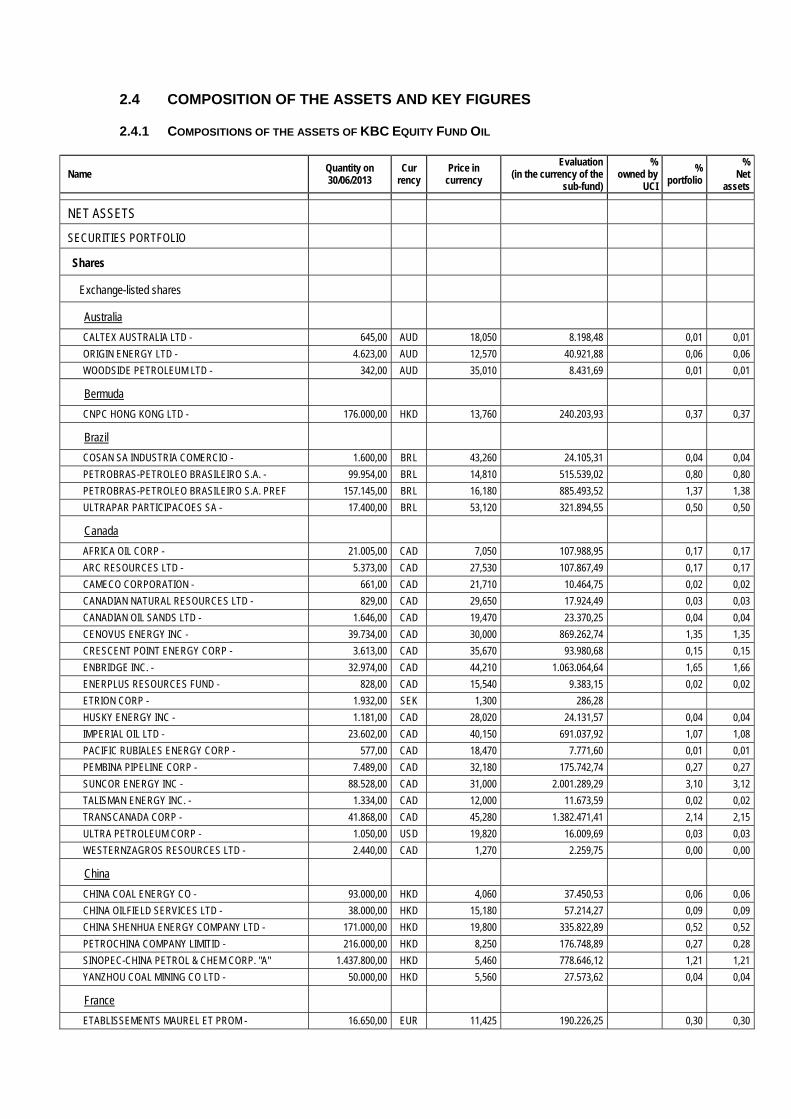
2.4 COMPOSITION OF THE ASSETS AND KEY FIGURES
2.4.1 COMPOSITIONS OF THE ASSETS OF KBC EQUITY FUND OIL
Name Quantity on 30/06/2013
Cur rency
Price in currency
Evaluation (in the currency of the
sub-fund)
% owned by
UCI
% portfolio
% Net
assets
NET ASSETS
SECURITIES PORTFOLIO
Shares
Exchange-listed shares
Australia
CALTEX AUSTRALIA LTD - 645,00 AUD 18,050 8.198,48 0,01 0,01
ORIGIN ENERGY LTD - 4.623,00 AUD 12,570 40.921,88 0,06 0,06
WOODSIDE PETROLEUM LTD - 342,00 AUD 35,010 8.431,69 0,01 0,01
Bermuda
CNPC HONG KONG LTD - 176.000,00 HKD 13,760 240.203,93 0,37 0,37
Brazil
COSAN SA INDUSTRIA COMERCIO - 1.600,00 BRL 43,260 24.105,31 0,04 0,04
PETROBRAS-PETROLEO BRASILEIRO S.A. - 99.954,00 BRL 14,810 515.539,02 0,80 0,80
PETROBRAS-PETROLEO BRASILEIRO S.A. PREF 157.145,00 BRL 16,180 885.493,52 1,37 1,38
ULTRAPAR PARTICIPACOES SA - 17.400,00 BRL 53,120 321.894,55 0,50 0,50
Canada
AFRICA OIL CORP - 21.005,00 CAD 7,050 107.988,95 0,17 0,17
ARC RESOURCES LTD - 5.373,00 CAD 27,530 107.867,49 0,17 0,17
CAMECO CORPORATION - 661,00 CAD 21,710 10.464,75 0,02 0,02
CANADIAN NATURAL RESOURCES LTD - 829,00 CAD 29,650 17.924,49 0,03 0,03
CANADIAN OIL SANDS LTD - 1.646,00 CAD 19,470 23.370,25 0,04 0,04
CENOVUS ENERGY INC - 39.734,00 CAD 30,000 869.262,74 1,35 1,35
CRESCENT POINT ENERGY CORP - 3.613,00 CAD 35,670 93.980,68 0,15 0,15
ENBRIDGE INC. - 32.974,00 CAD 44,210 1.063.064,64 1,65 1,66
ENERPLUS RESOURCES FUND - 828,00 CAD 15,540 9.383,15 0,02 0,02
ETRION CORP - 1.932,00 SEK 1,300 286,28
HUSKY ENERGY INC - 1.181,00 CAD 28,020 24.131,57 0,04 0,04
IMPERIAL OIL LTD - 23.602,00 CAD 40,150 691.037,92 1,07 1,08
PACIFIC RUBIALES ENERGY CORP - 577,00 CAD 18,470 7.771,60 0,01 0,01
PEMBINA PIPELINE CORP - 7.489,00 CAD 32,180 175.742,74 0,27 0,27
SUNCOR ENERGY INC - 88.528,00 CAD 31,000 2.001.289,29 3,10 3,12
TALISMAN ENERGY INC. - 1.334,00 CAD 12,000 11.673,59 0,02 0,02
TRANSCANADA CORP - 41.868,00 CAD 45,280 1.382.471,41 2,14 2,15
ULTRA PETROLEUM CORP - 1.050,00 USD 19,820 16.009,69 0,03 0,03
WESTERNZAGROS RESOURCES LTD - 2.440,00 CAD 1,270 2.259,75 0,00 0,00
China
CHINA COAL ENERGY CO - 93.000,00 HKD 4,060 37.450,53 0,06 0,06
CHINA OILFIELD SERVICES LTD - 38.000,00 HKD 15,180 57.214,27 0,09 0,09
CHINA SHENHUA ENERGY COMPANY LTD - 171.000,00 HKD 19,800 335.822,89 0,52 0,52
PETROCHINA COMPANY LIMITID - 216.000,00 HKD 8,250 176.748,89 0,27 0,28
SINOPEC-CHINA PETROL & CHEM CORP. "A" 1.437.800,00 HKD 5,460 778.646,12 1,21 1,21
YANZHOU COAL MINING CO LTD - 50.000,00 HKD 5,560 27.573,62 0,04 0,04
France
ETABLISSEMENTS MAUREL ET PROM - 16.650,00 EUR 11,425 190.226,25 0,30 0,30
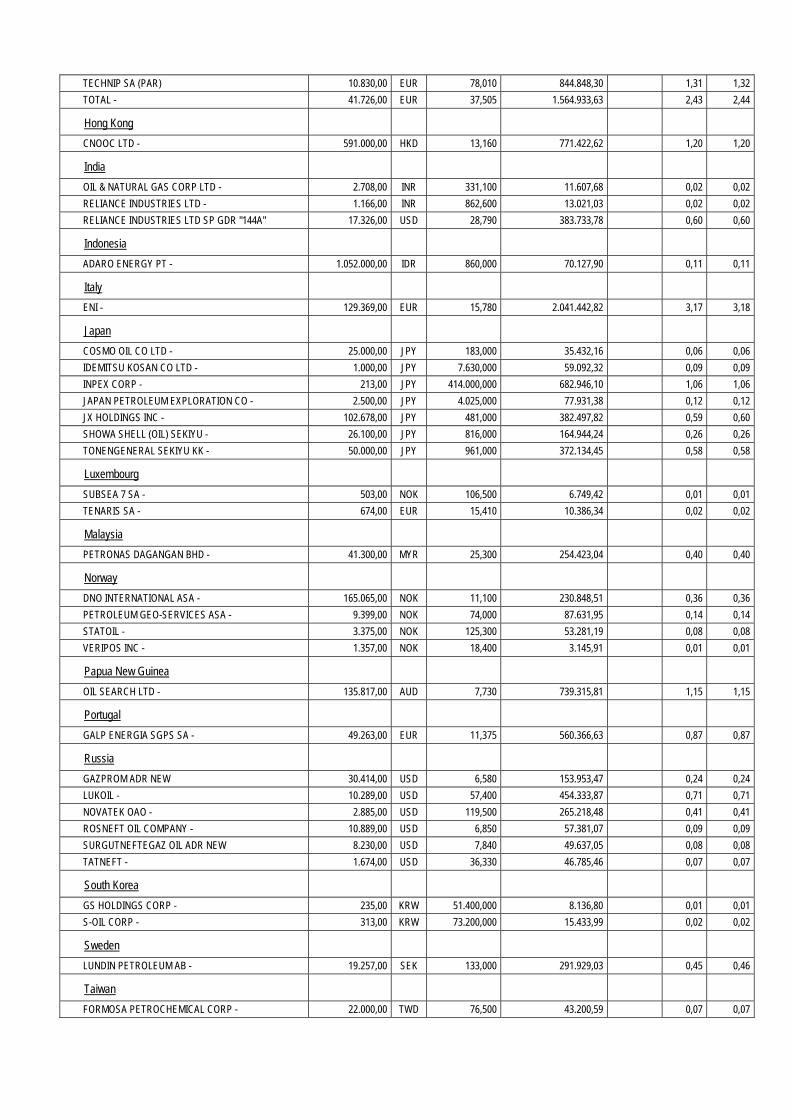
TECHNIP SA (PAR) 10.830,00 EUR 78,010 844.848,30 1,31 1,32
TOTAL - 41.726,00 EUR 37,505 1.564.933,63 2,43 2,44
Hong Kong
CNOOC LTD - 591.000,00 HKD 13,160 771.422,62 1,20 1,20
India
OIL & NATURAL GAS CORP LTD - 2.708,00 INR 331,100 11.607,68 0,02 0,02
RELIANCE INDUSTRIES LTD - 1.166,00 INR 862,600 13.021,03 0,02 0,02
RELIANCE INDUSTRIES LTD SP GDR "144A" 17.326,00 USD 28,790 383.733,78 0,60 0,60
Indonesia
ADARO ENERGY PT - 1.052.000,00 IDR 860,000 70.127,90 0,11 0,11
Italy
ENI - 129.369,00 EUR 15,780 2.041.442,82 3,17 3,18
Japan
COSMO OIL CO LTD - 25.000,00 JPY 183,000 35.432,16 0,06 0,06
IDEMITSU KOSAN CO LTD - 1.000,00 JPY 7.630,000 59.092,32 0,09 0,09
INPEX CORP - 213,00 JPY 414.000,000 682.946,10 1,06 1,06
JAPAN PETROLEUM EXPLORATION CO - 2.500,00 JPY 4.025,000 77.931,38 0,12 0,12
JX HOLDINGS INC - 102.678,00 JPY 481,000 382.497,82 0,59 0,60
SHOWA SHELL (OIL) SEKIYU - 26.100,00 JPY 816,000 164.944,24 0,26 0,26
TONENGENERAL SEKIYU KK - 50.000,00 JPY 961,000 372.134,45 0,58 0,58
Luxembourg
SUBSEA 7 SA - 503,00 NOK 106,500 6.749,42 0,01 0,01
TENARIS SA - 674,00 EUR 15,410 10.386,34 0,02 0,02
Malaysia
PETRONAS DAGANGAN BHD - 41.300,00 MYR 25,300 254.423,04 0,40 0,40
Norway
DNO INTERNATIONAL ASA - 165.065,00 NOK 11,100 230.848,51 0,36 0,36
PETROLEUM GEO-SERVICES ASA - 9.399,00 NOK 74,000 87.631,95 0,14 0,14
STATOIL - 3.375,00 NOK 125,300 53.281,19 0,08 0,08
VERIPOS INC - 1.357,00 NOK 18,400 3.145,91 0,01 0,01
Papua New Guinea
OIL SEARCH LTD - 135.817,00 AUD 7,730 739.315,81 1,15 1,15
Portugal
GALP ENERGIA SGPS SA - 49.263,00 EUR 11,375 560.366,63 0,87 0,87
Russia
GAZPROM ADR NEW 30.414,00 USD 6,580 153.953,47 0,24 0,24
LUKOIL - 10.289,00 USD 57,400 454.333,87 0,71 0,71
NOVATEK OAO - 2.885,00 USD 119,500 265.218,48 0,41 0,41
ROSNEFT OIL COMPANY - 10.889,00 USD 6,850 57.381,07 0,09 0,09
SURGUTNEFTEGAZ OIL ADR NEW 8.230,00 USD 7,840 49.637,05 0,08 0,08
TATNEFT - 1.674,00 USD 36,330 46.785,46 0,07 0,07
South Korea
GS HOLDINGS CORP - 235,00 KRW 51.400,000 8.136,80 0,01 0,01
S-OIL CORP - 313,00 KRW 73.200,000 15.433,99 0,02 0,02
Sweden
LUNDIN PETROLEUM AB - 19.257,00 SEK 133,000 291.929,03 0,45 0,46
Taiwan
FORMOSA PETROCHEMICAL CORP - 22.000,00 TWD 76,500 43.200,59 0,07 0,07
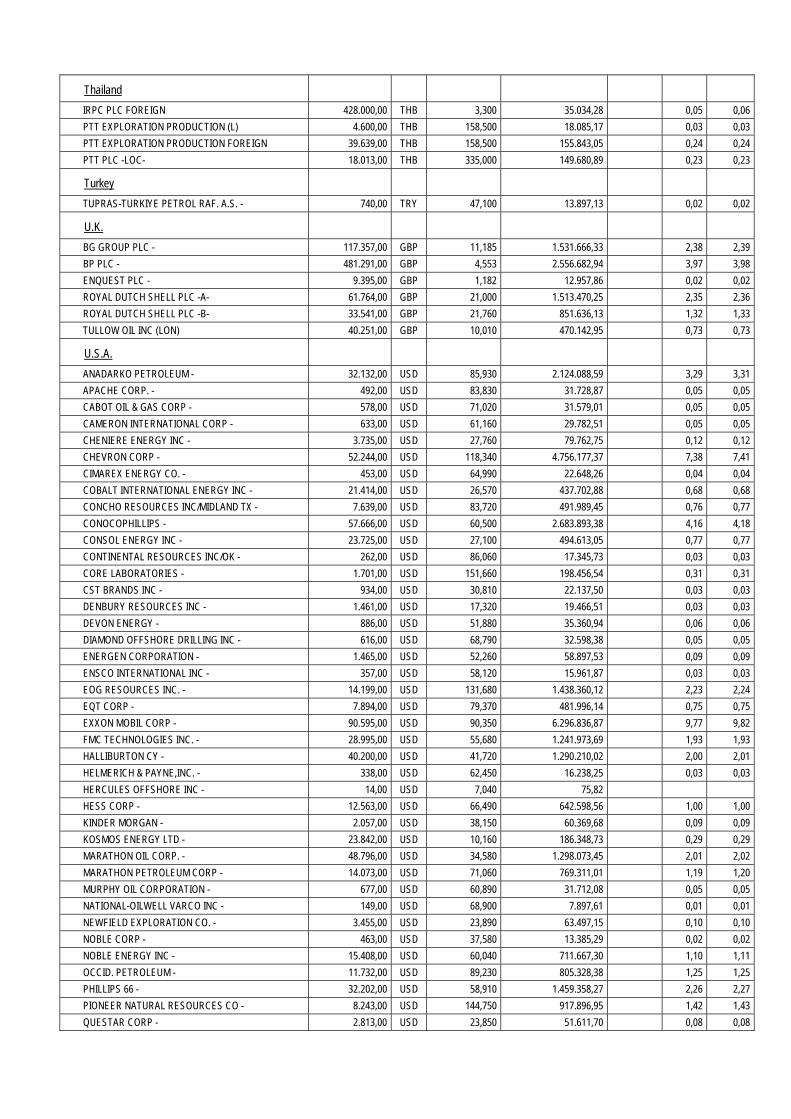
Thailand
IRPC PLC FOREIGN 428.000,00 THB 3,300 35.034,28 0,05 0,06
PTT EXPLORATION PRODUCTION (L) 4.600,00 THB 158,500 18.085,17 0,03 0,03
PTT EXPLORATION PRODUCTION FOREIGN 39.639,00 THB 158,500 155.843,05 0,24 0,24
PTT PLC -LOC- 18.013,00 THB 335,000 149.680,89 0,23 0,23
Turkey
TUPRAS-TURKIYE PETROL RAF. A.S. - 740,00 TRY 47,100 13.897,13 0,02 0,02
U.K.
BG GROUP PLC - 117.357,00 GBP 11,185 1.531.666,33 2,38 2,39
BP PLC - 481.291,00 GBP 4,553 2.556.682,94 3,97 3,98
ENQUEST PLC - 9.395,00 GBP 1,182 12.957,86 0,02 0,02
ROYAL DUTCH SHELL PLC -A- 61.764,00 GBP 21,000 1.513.470,25 2,35 2,36
ROYAL DUTCH SHELL PLC -B- 33.541,00 GBP 21,760 851.636,13 1,32 1,33
TULLOW OIL INC (LON) 40.251,00 GBP 10,010 470.142,95 0,73 0,73
U.S.A.
ANADARKO PETROLEUM - 32.132,00 USD 85,930 2.124.088,59 3,29 3,31
APACHE CORP. - 492,00 USD 83,830 31.728,87 0,05 0,05
CABOT OIL & GAS CORP - 578,00 USD 71,020 31.579,01 0,05 0,05
CAMERON INTERNATIONAL CORP - 633,00 USD 61,160 29.782,51 0,05 0,05
CHENIERE ENERGY INC - 3.735,00 USD 27,760 79.762,75 0,12 0,12
CHEVRON CORP - 52.244,00 USD 118,340 4.756.177,37 7,38 7,41
CIMAREX ENERGY CO. - 453,00 USD 64,990 22.648,26 0,04 0,04
COBALT INTERNATIONAL ENERGY INC - 21.414,00 USD 26,570 437.702,88 0,68 0,68
CONCHO RESOURCES INC/MIDLAND TX - 7.639,00 USD 83,720 491.989,45 0,76 0,77
CONOCOPHILLIPS - 57.666,00 USD 60,500 2.683.893,38 4,16 4,18
CONSOL ENERGY INC - 23.725,00 USD 27,100 494.613,05 0,77 0,77
CONTINENTAL RESOURCES INC/OK - 262,00 USD 86,060 17.345,73 0,03 0,03
CORE LABORATORIES - 1.701,00 USD 151,660 198.456,54 0,31 0,31
CST BRANDS INC - 934,00 USD 30,810 22.137,50 0,03 0,03
DENBURY RESOURCES INC - 1.461,00 USD 17,320 19.466,51 0,03 0,03
DEVON ENERGY - 886,00 USD 51,880 35.360,94 0,06 0,06
DIAMOND OFFSHORE DRILLING INC - 616,00 USD 68,790 32.598,38 0,05 0,05
ENERGEN CORPORATION - 1.465,00 USD 52,260 58.897,53 0,09 0,09
ENSCO INTERNATIONAL INC - 357,00 USD 58,120 15.961,87 0,03 0,03
EOG RESOURCES INC. - 14.199,00 USD 131,680 1.438.360,12 2,23 2,24
EQT CORP - 7.894,00 USD 79,370 481.996,14 0,75 0,75
EXXON MOBIL CORP - 90.595,00 USD 90,350 6.296.836,87 9,77 9,82
FMC TECHNOLOGIES INC. - 28.995,00 USD 55,680 1.241.973,69 1,93 1,93
HALLIBURTON CY - 40.200,00 USD 41,720 1.290.210,02 2,00 2,01
HELMERICH & PAYNE,INC. - 338,00 USD 62,450 16.238,25 0,03 0,03
HERCULES OFFSHORE INC - 14,00 USD 7,040 75,82
HESS CORP - 12.563,00 USD 66,490 642.598,56 1,00 1,00
KINDER MORGAN - 2.057,00 USD 38,150 60.369,68 0,09 0,09
KOSMOS ENERGY LTD - 23.842,00 USD 10,160 186.348,73 0,29 0,29
MARATHON OIL CORP. - 48.796,00 USD 34,580 1.298.073,45 2,01 2,02
MARATHON PETROLEUM CORP - 14.073,00 USD 71,060 769.311,01 1,19 1,20
MURPHY OIL CORPORATION - 677,00 USD 60,890 31.712,08 0,05 0,05
NATIONAL-OILWELL VARCO INC - 149,00 USD 68,900 7.897,61 0,01 0,01
NEWFIELD EXPLORATION CO. - 3.455,00 USD 23,890 63.497,15 0,10 0,10
NOBLE CORP - 463,00 USD 37,580 13.385,29 0,02 0,02
NOBLE ENERGY INC - 15.408,00 USD 60,040 711.667,30 1,10 1,11
OCCID. PETROLEUM - 11.732,00 USD 89,230 805.328,38 1,25 1,25
PHILLIPS 66 - 32.202,00 USD 58,910 1.459.358,27 2,26 2,27
PIONEER NATURAL RESOURCES CO - 8.243,00 USD 144,750 917.896,95 1,42 1,43
QUESTAR CORP - 2.813,00 USD 23,850 51.611,70 0,08 0,08
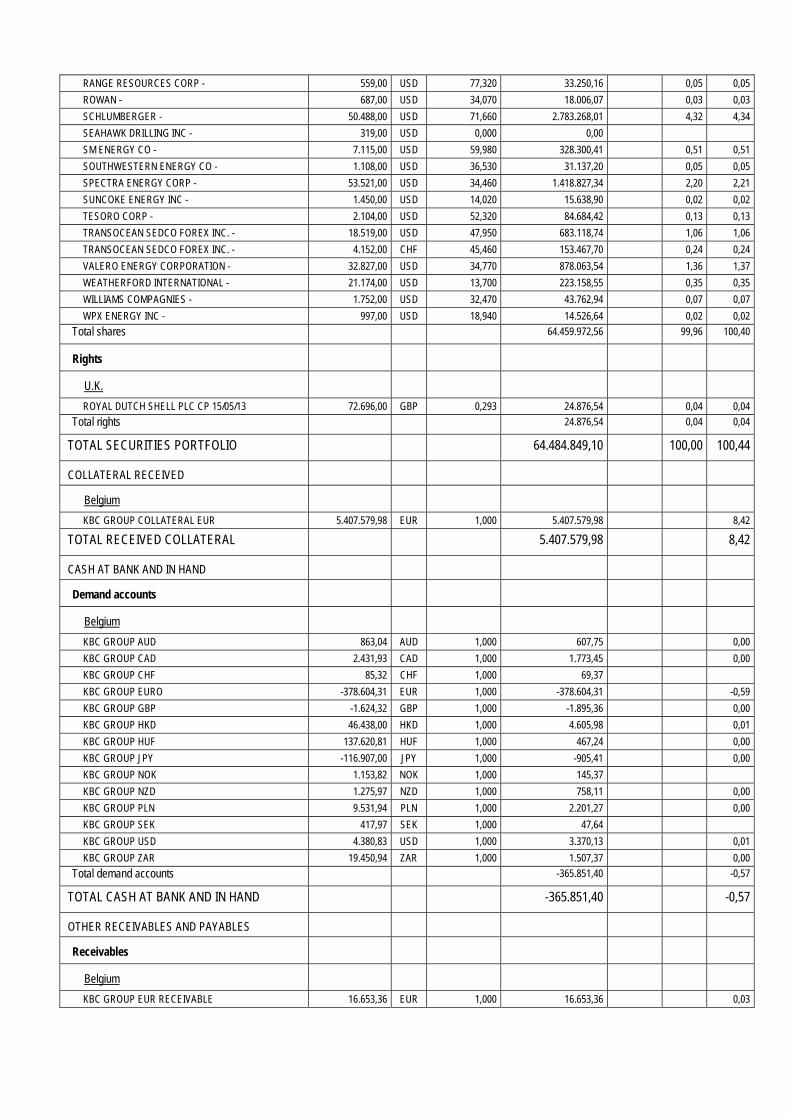
RANGE RESOURCES CORP - 559,00 USD 77,320 33.250,16 0,05 0,05
ROWAN - 687,00 USD 34,070 18.006,07 0,03 0,03
SCHLUMBERGER - 50.488,00 USD 71,660 2.783.268,01 4,32 4,34
SEAHAWK DRILLING INC - 319,00 USD 0,000 0,00
SM ENERGY CO - 7.115,00 USD 59,980 328.300,41 0,51 0,51
SOUTHWESTERN ENERGY CO - 1.108,00 USD 36,530 31.137,20 0,05 0,05
SPECTRA ENERGY CORP - 53.521,00 USD 34,460 1.418.827,34 2,20 2,21
SUNCOKE ENERGY INC - 1.450,00 USD 14,020 15.638,90 0,02 0,02
TESORO CORP - 2.104,00 USD 52,320 84.684,42 0,13 0,13
TRANSOCEAN SEDCO FOREX INC. - 18.519,00 USD 47,950 683.118,74 1,06 1,06
TRANSOCEAN SEDCO FOREX INC. - 4.152,00 CHF 45,460 153.467,70 0,24 0,24
VALERO ENERGY CORPORATION - 32.827,00 USD 34,770 878.063,54 1,36 1,37
WEATHERFORD INTERNATIONAL - 21.174,00 USD 13,700 223.158,55 0,35 0,35
WILLIAMS COMPAGNIES - 1.752,00 USD 32,470 43.762,94 0,07 0,07
WPX ENERGY INC - 997,00 USD 18,940 14.526,64 0,02 0,02
Total shares 64.459.972,56 99,96 100,40
Rights
U.K.
ROYAL DUTCH SHELL PLC CP 15/05/13 72.696,00 GBP 0,293 24.876,54 0,04 0,04
Total rights 24.876,54 0,04 0,04
TOTAL SECURITIES PORTFOLIO 64.484.849,10 100,00 100,44
COLLATERAL RECEIVED
Belgium
KBC GROUP COLLATERAL EUR 5.407.579,98 EUR 1,000 5.407.579,98 8,42
TOTAL RECEIVED COLLATERAL 5.407.579,98 8,42
CASH AT BANK AND IN HAND
Demand accounts
Belgium
KBC GROUP AUD 863,04 AUD 1,000 607,75 0,00
KBC GROUP CAD 2.431,93 CAD 1,000 1.773,45 0,00
KBC GROUP CHF 85,32 CHF 1,000 69,37
KBC GROUP EURO -378.604,31 EUR 1,000 -378.604,31 -0,59
KBC GROUP GBP -1.624,32 GBP 1,000 -1.895,36 0,00
KBC GROUP HKD 46.438,00 HKD 1,000 4.605,98 0,01
KBC GROUP HUF 137.620,81 HUF 1,000 467,24 0,00
KBC GROUP JPY -116.907,00 JPY 1,000 -905,41 0,00
KBC GROUP NOK 1.153,82 NOK 1,000 145,37
KBC GROUP NZD 1.275,97 NZD 1,000 758,11 0,00
KBC GROUP PLN 9.531,94 PLN 1,000 2.201,27 0,00
KBC GROUP SEK 417,97 SEK 1,000 47,64
KBC GROUP USD 4.380,83 USD 1,000 3.370,13 0,01
KBC GROUP ZAR 19.450,94 ZAR 1,000 1.507,37 0,00
Total demand accounts -365.851,40 -0,57
TOTAL CASH AT BANK AND IN HAND -365.851,40 -0,57
OTHER RECEIVABLES AND PAYABLES
Receivables
Belgium
KBC GROUP EUR RECEIVABLE 16.653,36 EUR 1,000 16.653,36 0,03
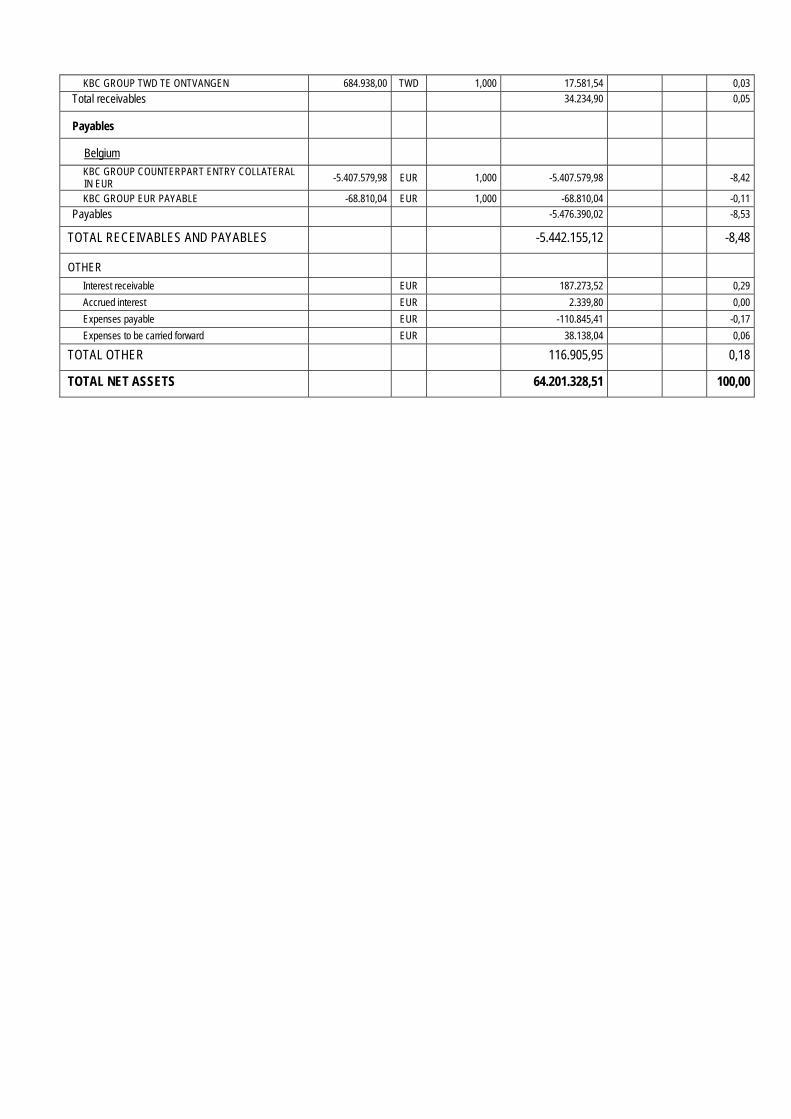
KBC GROUP TWD TE ONTVANGEN 684.938,00 TWD 1,000 17.581,54 0,03
Total receivables 34.234,90 0,05
Payables
Belgium
KBC GROUP COUNTERPART ENTRY COLLATERAL IN EUR -5.407.579,98 EUR 1,000 -5.407.579,98 -8,42
KBC GROUP EUR PAYABLE -68.810,04 EUR 1,000 -68.810,04 -0,11
Payables -5.476.390,02 -8,53
TOTAL RECEIVABLES AND PAYABLES -5.442.155,12 -8,48
OTHER
Interest receivable EUR 187.273,52 0,29
Accrued interest EUR 2.339,80 0,00
Expenses payable EUR -110.845,41 -0,17
Expenses to be carried forward EUR 38.138,04 0,06
TOTAL OTHER 116.905,95 0,18
TOTAL NET ASSETS 64.201.328,51 100,00
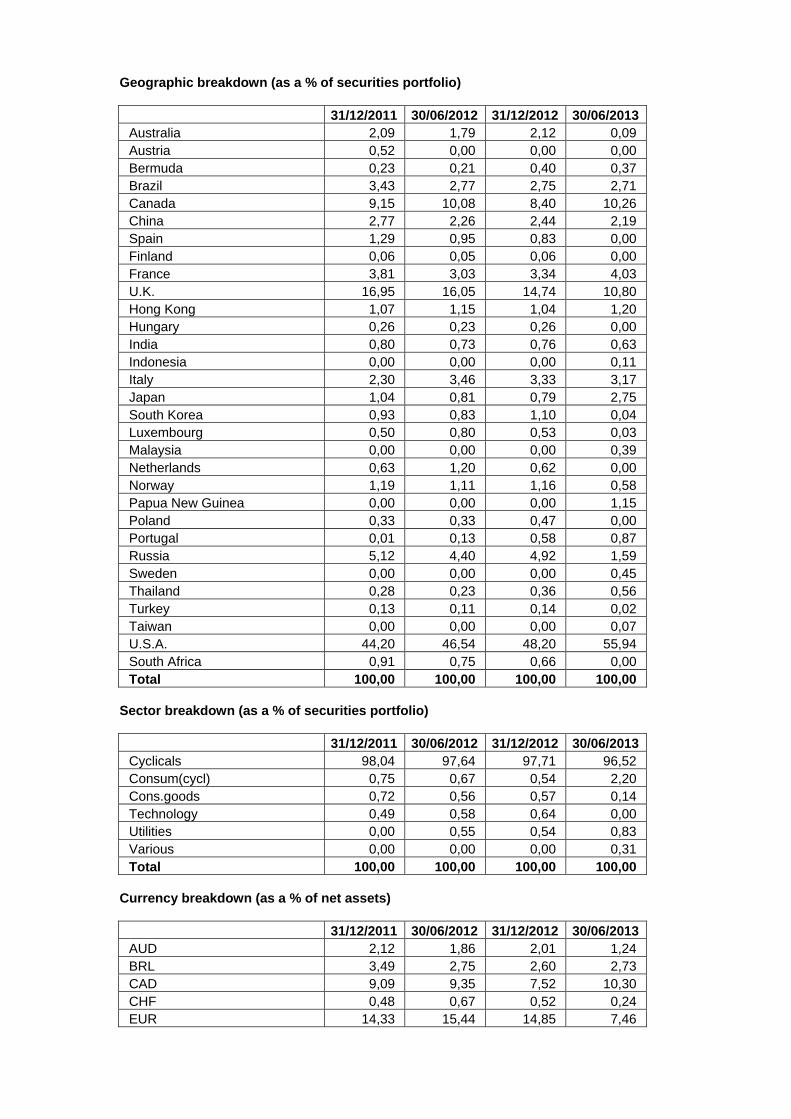
Geographic breakdown (as a % of securities portfolio)
31/12/2011 30/06/2012 31/12/2012 30/06/2013 Australia 2,09 1,79 2,12 0,09 Austria 0,52 0,00 0,00 0,00 Bermuda 0,23 0,21 0,40 0,37 Brazil 3,43 2,77 2,75 2,71 Canada 9,15 10,08 8,40 10,26 China 2,77 2,26 2,44 2,19 Spain 1,29 0,95 0,83 0,00 Finland 0,06 0,05 0,06 0,00 France 3,81 3,03 3,34 4,03 U.K. 16,95 16,05 14,74 10,80 Hong Kong 1,07 1,15 1,04 1,20 Hungary 0,26 0,23 0,26 0,00 India 0,80 0,73 0,76 0,63 Indonesia 0,00 0,00 0,00 0,11 Italy 2,30 3,46 3,33 3,17 Japan 1,04 0,81 0,79 2,75 South Korea 0,93 0,83 1,10 0,04 Luxembourg 0,50 0,80 0,53 0,03 Malaysia 0,00 0,00 0,00 0,39 Netherlands 0,63 1,20 0,62 0,00 Norway 1,19 1,11 1,16 0,58 Papua New Guinea 0,00 0,00 0,00 1,15 Poland 0,33 0,33 0,47 0,00 Portugal 0,01 0,13 0,58 0,87 Russia 5,12 4,40 4,92 1,59 Sweden 0,00 0,00 0,00 0,45 Thailand 0,28 0,23 0,36 0,56 Turkey 0,13 0,11 0,14 0,02 Taiwan 0,00 0,00 0,00 0,07 U.S.A. 44,20 46,54 48,20 55,94 South Africa 0,91 0,75 0,66 0,00 Total 100,00 100,00 100,00 100,00
Sector breakdown (as a % of securities portfolio)
31/12/2011 30/06/2012 31/12/2012 30/06/2013 Cyclicals 98,04 97,64 97,71 96,52 Consum(cycl) 0,75 0,67 0,54 2,20 Cons.goods 0,72 0,56 0,57 0,14 Technology 0,49 0,58 0,64 0,00 Utilities 0,00 0,55 0,54 0,83 Various 0,00 0,00 0,00 0,31 Total 100,00 100,00 100,00 100,00
Currency breakdown (as a % of net assets)
31/12/2011 30/06/2012 31/12/2012 30/06/2013 AUD 2,12 1,86 2,01 1,24 BRL 3,49 2,75 2,60 2,73 CAD 9,09 9,35 7,52 10,30 CHF 0,48 0,67 0,52 0,24 EUR 14,33 15,44 14,85 7,46

GBP 11,48 9,89 10,15 10,86 HKD 3,83 3,42 3,30 3,79 HUF 0,26 0,23 0,24 0,00 IDR 0,00 0,00 0,00 0,11 INR 0,31 0,28 0,40 0,04 JPY 1,05 1,05 0,75 2,77 KRW 0,93 0,82 1,04 0,04 MYR 0,00 0,00 0,00 0,40 NOK 1,59 1,52 2,46 0,60 PLN 0,33 0,42 0,45 0,00 SEK 0,01 0,01 0,02 0,46 THB 0,28 0,23 0,34 0,56 TRY 0,12 0,15 0,13 0,02 TWD 0,00 0,00 0,00 0,09 USD 49,38 51,16 52,31 58,29 ZAR 0,92 0,75 0,91 0,00 Total 100,00 100,00 100,00 100,00

2.4.2 CHANGES IN THE COMPOSITION OF THE ASSETS OF KBC EQUITY FUND OIL (IN THE
CURRENCY OF THE SUB-FUND)
1st half of year YearPurchases 25.918.841,53 25.918.841,53 Sales 47.772.197,37 47.772.197,37 Total 1 73.691.038,90 73.691.038,90 Subscriptions 23.274.657,63 23.274.657,63 Redemptions 50.300.487,73 50.300.487,73 Total 2 73.575.145,36 73.575.145,36 Monthly average of total assets
86.141.042,47 86.141.042,47
Turnover rate 0,13 % 0,13 %
1st half of year YearPurchases 25.918.841,53 25.918.841,53 Sales 47.772.197,37 47.772.197,37 Total 1 73.691.038,90 73.691.038,90 Subscriptions 23.274.657,63 23.274.657,63 Redemptions 50.300.487,73 50.300.487,73 Total 2 73.575.145,36 73.575.145,36 Monthly average of total assets
-47.497.353,69 -47.497.353,69
Corrected turnover rate -0,24 % -0,24 %
The table above shows the capital volume of portfolio transactions. This volume (adjusted to take account of total subscriptions and redemptions) is also compared to the average net assets at the beginning and end of the period. A figure close to 0% implies that the transactions relating to the securities or transactions relating to the assets (excluding deposits and cash) in a given period only involve subscriptions and redemptions. A negative percentage shows that subscriptions and redemptions entailed few, if any, transactions in the portfolio. Active asset management may result in high turnover rates (monthly percentage >50%). The detailed list of transactions is available for consultation free of charge at the registered office of the Bevek or fund at Havenlaan 2, 1080 Brussels.

2.4.3 AMOUNT OF COMMITMENTS IN RESPECT OF FINANCIAL DERIVATIVES POSITIONS
NAME Currency Value in currency
In the currency of the sub-fund
Lot-size
Transactiondate
KBC COLLATERAL EUR
EUR 5.407.579,98 5.407.579,98 N/A 28.06.2013
2.4.4 CHANGES OF THE NUMBER OF SUBSCRIPTIONS AND REDEMPTIONS AND THE NET ASSET
VALUE
Classic Shares
Period Change in number of shares in circulation
Year Subscriptions Redemptions End of period
Cap. Dis. Cap. Dis. Cap. Dis. Total
2011 - 06 319.024,51 11.500,33 274.773,66 26.980,69 237.777,61 44.094,13 281.871,74
2012 - 06 78.585,67 2.717,96 261.843,95 27.712,01 54.519,33 19.100,08 73.619,41
2013 - 06 26.322,38 1.178,44 49.756,66 6.331,50 31.085,04 13.947,02 45.032,06
Period Amounts received and paid by the UCI
(in the currency of the class)
Year Subscriptions Redemptions
Capitalization Distribution Capitalization Distribution
2011 - 06 210.862.323,90 6.242.786,88 175.985.893,80 14.269.332,77
2012 - 06 49.448.669,73 1.495.173,04 156.528.354,10 14.323.092,06
2013 - 06 17.724.421,53 658.230,61 32.916.508,86 3.564.594,16
Period Net asset value
End of period (in the currency of the class)
Year Of the class Of one share
Capitalization Distribution
2011 - 06 177.079.301,09 642,34 552,13
2012 - 06 43.698.014,40 616,81 527,21
2013 - 06 27.433.545,34 639,60 541,45
Institutional B Shares
Period Change in number of shares in circulation
Year Subscriptions Redemptions End of period
Cap. Dis. Cap. Dis. Cap. Dis. Total 2012 - 06 239.800,00 108.587,00 131.213,00 131.213,00
2013 - 06 115.337,44 189.132,97 57.417,47 57.417,47
Period Amounts received and paid by the UCI
(in the currency of the class)
Year Subscriptions Redemptions
Capitalization Distribution Capitalization Distribution
2012 - 06 152.327.285,00 68.390.194,03
2013 - 06 76.199.181,90 122.890.083,70
Period Net asset value
End of period (in the currency of the class)

Year Of the class Of one share
Capitalization Distribution
2012 - 06 81.003.836,62 617,35
2013 - 06 36.767.783,17 640,36
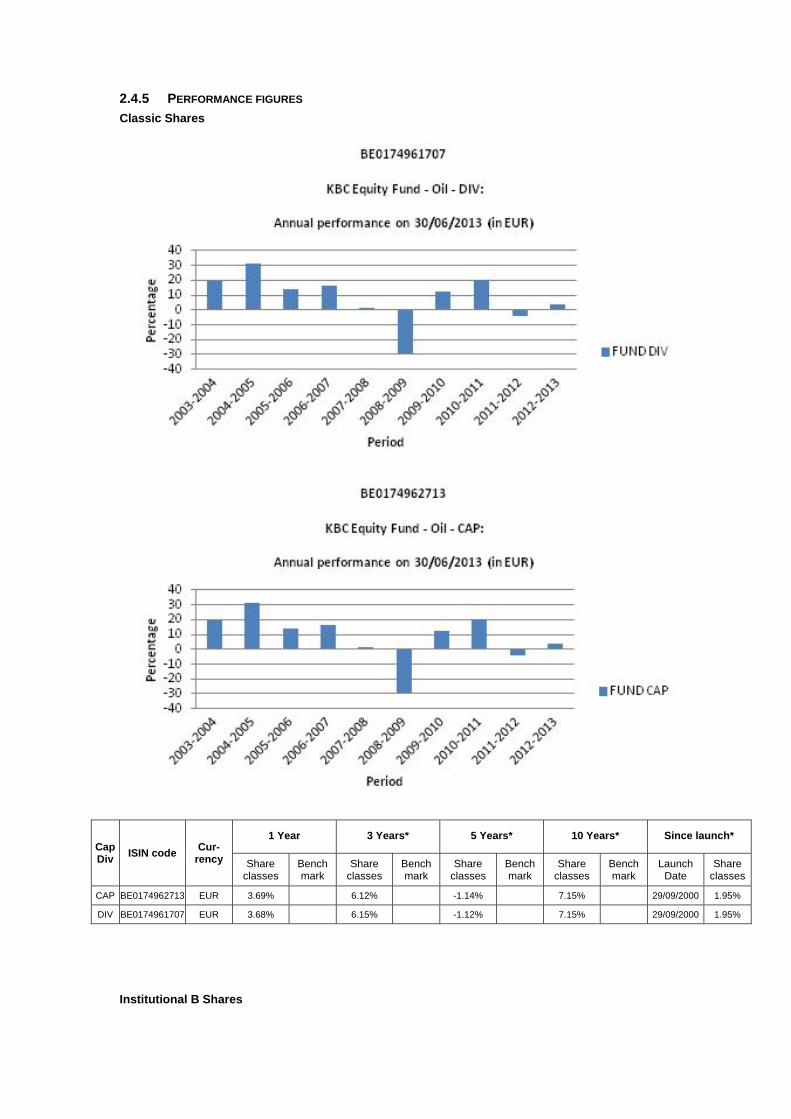
2.4.5 PERFORMANCE FIGURES
Classic Shares
Cap Div
ISIN code Cur-
rency
1 Year 3 Years* 5 Years* 10 Years* Since launch*
Share classes
Bench mark
Share classes
Bench mark
Share classes
Bench mark
Share classes
Bench mark
Launch Date
Share classes
CAP BE0174962713 EUR 3.69% 6.12% -1.14% 7.15% 29/09/2000 1.95%
DIV BE0174961707 EUR 3.68% 6.15% -1.12% 7.15% 29/09/2000 1.95%
Institutional B Shares
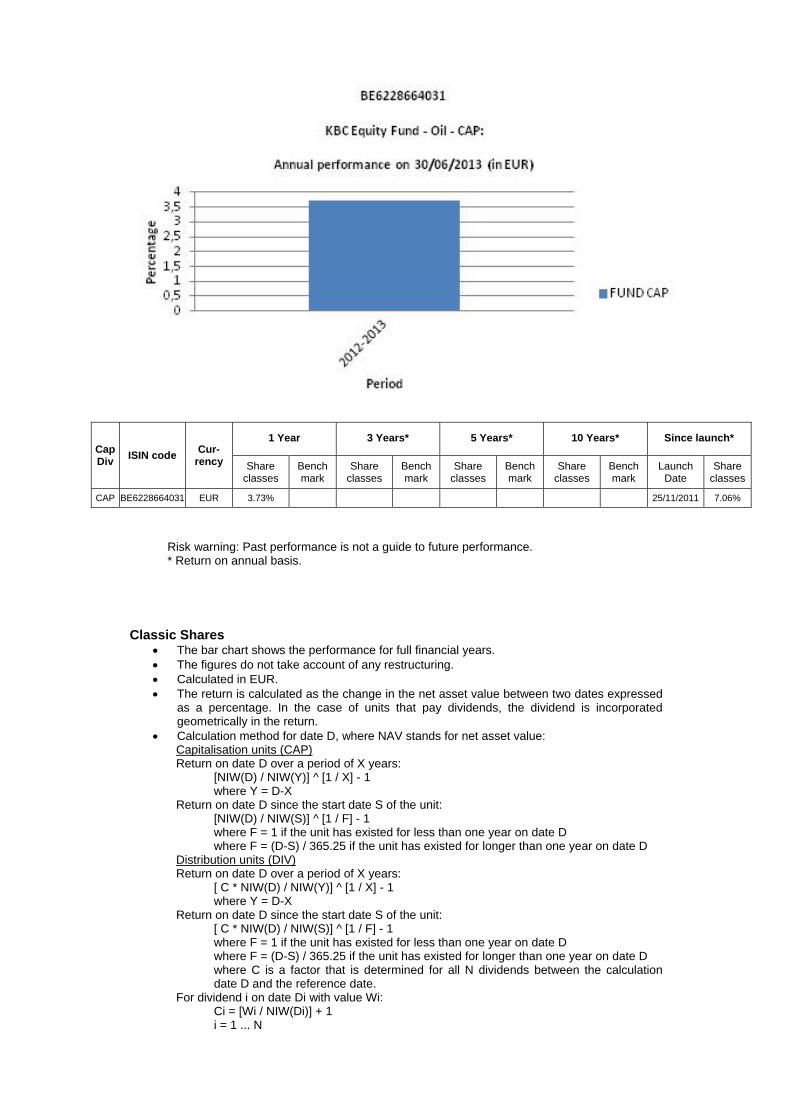
Cap Div
ISIN code Cur-
rency
1 Year 3 Years* 5 Years* 10 Years* Since launch*
Share classes
Bench mark
Share classes
Bench mark
Share classes
Bench mark
Share classes
Bench mark
Launch Date
Share classes
CAP BE6228664031 EUR 3.73% 25/11/2011 7.06%
Risk warning: Past performance is not a guide to future performance. * Return on annual basis.
Classic Shares The bar chart shows the performance for full financial years. The figures do not take account of any restructuring. Calculated in EUR. The return is calculated as the change in the net asset value between two dates expressed
as a percentage. In the case of units that pay dividends, the dividend is incorporated geometrically in the return.
Calculation method for date D, where NAV stands for net asset value: Capitalisation units (CAP) Return on date D over a period of X years:
[NIW(D) / NIW(Y)] ^ [1 / X] - 1 where Y = D-X
Return on date D since the start date S of the unit: [NIW(D) / NIW(S)] ^ [1 / F] - 1 where F = 1 if the unit has existed for less than one year on date D where F = (D-S) / 365.25 if the unit has existed for longer than one year on date D
Distribution units (DIV) Return on date D over a period of X years:
[ C * NIW(D) / NIW(Y)] ^ [1 / X] - 1 where Y = D-X
Return on date D since the start date S of the unit: [ C * NIW(D) / NIW(S)] ^ [1 / F] - 1 where F = 1 if the unit has existed for less than one year on date D where F = (D-S) / 365.25 if the unit has existed for longer than one year on date D where C is a factor that is determined for all N dividends between the calculation date D and the reference date.
For dividend i on date Di with value Wi: Ci = [Wi / NIW(Di)] + 1 i = 1 ... N

from whichC = C0 * .... * CN. If the interval between the two dates exceeds one year, the ordinary return calculation is
converted into a return on an annual basis by taking the nth square root of 1 plus the total return of the unit.
The return figures shown above do not take account of the fees and charges associated with the issue and redemption of units.
These are the performance figures for capitalisation and distribution shares.
Institutional B Shares The bar chart shows the performance for full financial years. The figures do not take account of any restructuring. Calculated in EUR. The return is calculated as the change in the net asset value between two dates expressed
as a percentage. Calculation method for date D, where NAV stands for net asset value:
Capitalisation units (CAP) Return on date D over a period of X years:
[NIW(D) / NIW(Y)] ^ [1 / X] - 1 where Y = D-X
Return on date D since the start date S of the unit: [NIW(D) / NIW(S)] ^ [1 / F] - 1 where F = 1 if the unit has existed for less than one year on date D where F = (D-S) / 365.25 if the unit has existed for longer than one year on date D
If the interval between the two dates exceeds one year, the ordinary return calculation is converted into a return on an annual basis by taking the nth square root of 1 plus the total return of the unit.
The return figures shown above do not take account of the fees and charges associated with the issue and redemption of units.
These are the performance figures for capitalization shares.
2.4.6 COSTS Ongoing Charges: * Classic Shares Distribution: 1.733% Classic Shares Capitalization: 1.71% Institutional B Shares Capitalization: 1.678% * The following costs have not been included in the ongoing charges: - Interest payments on loans taken out - Payments in respect of financial derivatives - Fees and charges paid directly by the investor - Any soft commissions
SOFT COMMISSIONS The management company or the appointed manager, as the case may be, is the recipient of soft commissions. The recipient has laid down an internal policy as regards accepting soft commissions and avoiding possible conflicts of interest in this respect, and has put appropriate internal controls in place to ensure this policy is observed. For more information, please see the ‘General’ section of the annual report.
Broker
Commission gross
in EUR
paid during the period:
1‐01‐13
‐
30‐06‐13
CSA Credits
in EUR
accrued during the period:
1‐01‐13
‐
30‐06‐13 Percentage
CITI 10,138 7,267 71.68%
CSFBSAS 1,594 759 47.61%
EQ MACQUARIE 11,548 6,211 53.79%
HSBC 72 12 16.67%
INSTINET 6,352 2,984 46.98%
MERRILL 5,811 3,048 52.45%
MORGAN STANLEY 3,045 1,505 49.42%
UBSWDR 2,356 1,275 54.11%
FEE-SHARING AGREEMENTS AND REBATES: The management company may share its fee with the distributor, and institutional and/or professional parties. In principle, the percentage share amounts to between 35% and 60% if the distributor is an entity of KBC Group NV or to between 35% and 70% if the distributor is not an entity of KBC Group NV. However, in a small number of cases, the distributor’s fee is less than 35%. Investors may, on request, obtain more information on these cases. If the management company invests the assets of the undertaking for collective investment in units of undertakings for collective investment that are not managed by an entity of KBC Group NV, and receives a fee for doing so, it will pay this fee to the undertaking for collective investment. Fee-sharing does not affect the amount of the management fee paid by the sub-fund to the management company. This management fee is subject to the limitations laid down in the articles of association. The limitations may only be amended after approval by the general meeting of shareholders. The management company has concluded a distribution agreement with the distributor in order to facilitate the wider distribution of the sub-fund's units by using multiple distribution channels. It is in the interests of the holders of units, the sub-fund and of the distributor for the largest possible number of units to be sold and for the assets of the sub-fund to be maximised in this way. In this respect, there is therefore no question of any conflict of interest.
2.4.7 NOTES TO THE FINANCIAL STATEMENTS AND OTHER DATA Fee for managing the investment portfolio: 1.5% per annum calculated on the basis of the average total net assets of the sub-fund, no management fee is charged on assets assets invested in investment undertakings managed by a financial institution of the KBC group.

The administration agent’s fee is payable at the end of each month and is calculated on the basis of the average total net assets of the sub-fund. Auditor's fee: 1 700 EUR per year. This fee is not including VAT and can be indexed on an annual basis in accordance with the decisions of the general meeting. The custody fee is calculated on the value of the securities held in custody by the custodian on the final banking day of the preceding calendar year, except on those assets invested in investment undertakings managed by a financial institution of the KBC group. The custody fee is paid at the beginning of the calendar year. Social, ethical and environmental aspects: No manufacturers of controversial weapons whose use over the past five decades, according to the international consensus, has led to disproportionate human suffering among the civilian population will be included in the portfolio of investments. This involves the manufacturers of anti-personnel mines, cluster bombs and munitions and weapons containing depleted uranium. In this way, the sub-fund seeks to reflect not only simple financial reality but also the social reality of the sector or region in question. Exercising voting rights. If necessary, relevant and in the interest of the shareholders, the management company will exercise the voting rights attached to the shares in the Bevek’s portfolio. The management company will adhere to the following criteria when determining how it stands relative to the items on the agenda that are put to the vote: - Shareholder value may not be adversely affected. - Corporate governance rules, especially with regard to the rights of minority shareholders, must be
respected. - The minimum standards with regard to sustainable business and corporate social responsibility
must be met. The list of companies for which voting rights are exercised is available at the registered office of the Bevek. Securities lending In accordance with the Royal Decree of 7 March 2006 concerning securities lending, the undertaking for collective investment has taken out securities loans with a principal to whom the full title of the loaned securities was transferred, without recording this transfer of ownership in the accounts. For the period from 1 January 2013 to 30 June 2013, the fee for securities lent comes to 30,415.24 EUR. The undertaking for collective investment receives 50% of the fee received for securities lent. The detailed list of securities lending transactions carried out can be obtained from the registered office of the collective investment undertaking at 2 Havenlaan, 1080 Brussels.
Overview of securities lent as at 30/06/2013
Name Currency Quantity Price Value in currency of the
portfolio
ARC ENERGY CORP CAD 5.372 27,530 107.847,41
CAMECO CORP CAD 660 21,710 10.448,92
CANADIAN NATURAL RES CAD 815 29,650 17.621,78
CENOVUS ENERGY INC CAD 39.683 30,000 868.147,01
CRESCENT POINT ENERGY CORP CAD 3.612 35,670 93.954,67
ENBRIDGE INC CAD 32.931 44,210 1.061.678,34
ENERPLUS CORP CAD 739 15,540 8.374,58
JAPAN PETROLEUM EXPLORATION CO LTD JPY 1.000 4.025,000 31.172,55
PACIFIC RUBIALES ENERGY CORP. CAD 560 18,470 7.542,62
PEMBINA PIPELINE CORP CAD 7.488 32,180 175.719,27
SUBSEA 7 SA NOK 502 106,500 6.736,01
TENARIS SA EUR 673 15,410 10.370,93
TRANSCANADA CORP CAD 41.867 45,280 1.382.438,39
TRANSOCEAN LTD USD 22.670 47,950 836.238,56
TULLOW OIL PLC GBP 29.949 10,010 349.812,71
YANZHOU COAL MINING CO -H- HKD 49.999 5,560 27.573,07
Total 4.995.676,82
Details of collateral received for securities lent

Name Currency Nominal value Currency fund Value in Currency fund
AUSTRIA 2012 3,4% 22/11/2022 EUR 406.000 EUR 463.274,83
BUNDESREPUB.DTL. AN 2005 3 1/2% 04/01/16 EUR 2.315.000 EUR 2.543.050,65
FRANCE 2008 3.75% 25/10/2019 EUR 2.069.000 EUR 2.401.254,50
Total 5.407.579,98 For the valuation of the collateral received, indicative prices have been used in this detail list by the Collateral Management Division of KBC Bank.

Semi-Annual report as at 30th June 2013
TABLE OF CONTENTS
2. Information on KBC Equity Fund Trends
2.1. Management report 2.1.1. Launch date and subscription price 2.1.2. Stock exchange listing 2.1.3. Aim and distinctive features of the investment policy 2.1.4. Financial portfolio management 2.1.5. Distributors 2.1.6. Index and benchmark 2.1.7. Policy conducted during the financial year 2.1.8. Future policy 2.1.9. Synthetic risk and reward indicator (SRRI)
2.2. Balance sheet
2.3. Profit and loss account
2.4. Composition of the assets and key figures
2.4.1. Composition of the assets 2.4.2. Change in the composition of the assets 2.4.3. Value of commitments in respect of financial derivatives positions 2.4.4. Evolution of the number of subscriptions, repayments and the net asset value 2.4.5. Return figures 2.4.6. Expenses 2.4.7. Notes to the financial statements and other data


2 INFORMATION ON KBC EQUITY FUND TRENDS
2.1 MANAGEMENT REPORT
2.1.1 LAUNCH DATE AND SUBSCRIPTION PRICE Classic Shares : Launch date: 30 April 1998 Initial subscription price: 5000 BEF Currency: EUR Institutional B Shares : Launch date: 25 November 2011 Initial subscription price: 77.97 EUR Currency: EUR
2.1.2 STOCK EXCHANGE LISTING Not applicable.
2.1.3 GOAL AND KEY PRINCIPLES OF THE INVESTMENT POLICY
SUB-FUND’S OBJECT: The main objective of this sub-fund is to generate the highest possible return for its shareholders by investing directly or indirectly in transferable securities. This is reflected in its pursuit of capital gains and income. To this end, the assets are invested, either directly or indirectly via correlated financial instruments, primarily in shares.
SUB-FUND’S INVESTMENT POLICY:
PERMITTED ASSET CLASSES: The sub-fund may invest in securities, money market instruments, units in undertakings for collective investment, deposits, financial derivatives, liquid assets and all other instruments insofar as permitted by the applicable laws and regulations and consistent with the sub-fund’s object The sub-fund shall invest no more than 10% of its assets in units of other undertakings for collective investment.
RESTRICTIONS OF THE INVESTMENT POLICY: The investment policy will be implemented within the limits set by law and regulations. The sub-fund may borrow up to 10% of its net assets, insofar as these are short-term borrowings aimed at solving temporary liquidity problems.
PERMITTED DERIVATIVES TRANSACTIONS: Derivates may be used either for hedging purposes or to achieve investment objectives. Changes will be made to the investments at regular intervals to comply with the sub-fund's investment strategy. In addition, listed and unlisted derivates may be used to achieve the objectives: these may be forward contracts, options or swaps on securities, indices, currencies or interest rates or other transactions involving derivatives. Unlisted derivatives transactions will only be concluded with prime financial institutions specialised in such transactions. Such derivatives may also be used to hedge the assets against exchange-rate fluctuations. Subject to the applicable laws and regulations and the articles of association, the sub-fund always seeks to conclude the most effective transactions. All costs associated with the transactions will be charged to the sub-fund and all income generated will be paid to the sub-fund. If the transactions result in a risk in respect of the counterparty, this risk can be hedged by using a margin management system that ensures that the sub-fund is the beneficiary of security (collateral) in the form of cash or investment grade bonds. When calculating the value of the bonds, a margin will be applied that varies depending on the residual term to maturity and the currency in which the bond in question is denominated. The relationship with the counterparty or counterparties is governed by standard international agreements.
STRATEGY SELECTED The sub-fund invests primarily in shares of companies operating in areas which, according to the manager, fit with the theme 'challenges and opportunities that will apply during this and subsequent decades'. The manager focuses mainly on shares of emerging market companies, companies involved in urban development, those involved in prospecting and mining of natural resources and companies whose business focuses on long-term trends of demographics, globalisation, healthcare, technology and innovation.
RISK CONCENTRATION New economy shares.
LENDING FINANCIAL INSTRUMENTS: The sub-fund may lend financial instruments within the limits set by law and regulations. This lending does not affect the sub-fund’s risk profile since: - it takes place within the framework of a securities lending system managed by a principal. In
addition, the sub-fund has a relationship only with the principal of the securities lending system which acts as counterparty and to which title of the loaned securities is transferred. The choice of principal is subject to strict selection criteria. The return of securities similar to the securities that have been lent is guaranteed by the principal.
- through a margin management system, the sub-fund is always guaranteed financial security, the actual value of which always exceeds the actual value of the securities that have been lent, in case the principal does not return similar securities.
The return of securities similar to the securities that have been lent can be requested at any time, which means that the lending of securities does not affect the management of the sub-fund's assets. By lending securities, the sub-fund can generate an additional return. The principal pays a fee to the management company. After deducting the fee for the margin management and clearing services of KBC Bank, most of this fee is paid to the sub-fund. The relationship with the counterparty or counterparties is governed by standard international agreements. More information is provided on the terms and conditions governing securities lending in the annual or half-yearly report for the sub-fund.
VOLATILITY OF THE NET ASSET VALUE: The volatility of the net asset value may be high due to the composition of the portfolio.
GENERAL STRATEGY FOR HEDGING THE EXCHANGE RATE RISK: In order to protect its assets against exchange rate fluctuations and within the limitations laid down in the articles of association, the sub-fund may perform transactions relating to the sale of forward currency contracts, as well as the sale of call options and the purchase of put options on currencies. The transactions in question may relate solely to contracts traded on a regulated market that operates regularly, is recognised and is open to the public or that are traded with a recognised, prime financial institution specialising in such transactions and dealing in the over-the-counter (OTC) market in options. With the same objective, the sub-fund may also sell currencies forward or exchange them in private transactions with prime financial institutions specialising in such transactions. The hedging objective of the aforementioned transactions suggests that there is a direct link between these transactions and the assets to be hedged, which implies that the transactions carried out in a particular currency may in principle not exceed, in terms of volume, either the valuation value of all the assets in the same currency or the holding period of those assets.
SOCIAL, ETHICAL AND ENVIRONMENTAL ASPECTS:
No manufacturers of controversial weapons whose use over the past five decades, according to the international consensus, has led to disproportionate human suffering among the civilian population will be included in the portfolio of investments. This involves the manufacturers of anti-personnel mines, cluster bombs and munitions and weapons containing depleted uranium. In this way, the sub-fund seeks to reflect not only simple financial reality but also the social reality of the sector or region in question.

THE EUROPEAN SAVINGS DIRECTIVE AND TAX ON DEBT CLAIM RETURNS OBTAINED THROUGH THE
REDEMPTION OF OWN UNITS OR IN THE EVENT OF FULL OR PARTIAL DISTRIBUTION OF EQUITY
CAPITAL. The following information is of a general character and is not intended to cover all aspects of an investment in a UCITS. In certain cases entirely different rules might even apply. Moreover, both tax law and the interpretation of it can change. Investors who wish to have more information about the tax implications – in both Belgium and abroad – of acquiring, holding and transferring units should seek the advice of their usual financial and tax advisers. This UCITS shall invest a maximum of 15% of its assets directly or indirectly in debt instruments as intended by the European Savings Directive. A. European Savings Directive (Directive 2003/48/EC) The European Savings Directive has been implemented in Belgium. Since this UCITS invests a maximum of 15% of its assets directly or indirectly in debt claims as intended by the European Savings Directive, the income of this UCITS does not fall within the scope of this directive. B. Tax on debt claim returns obtained through the redemption of own units or in the event of full or partial distribution of equity capital (Article 19bis Income Tax Code 1992). The income from this UCITS is not subject to the tax on debt instrument returns as intended by Article 19bis, Income Tax Code 1992.
2.1.4 FINANCIAL PORTFOLIO MANAGEMENT The management company has delegated the intellectual management, to KBC Fund Management Limited, Joshua Dawson House, Dawson Street , Dublin 2, IRELAND..
2.1.5 DISTRIBUTORS KBC Asset Management S.A., 5, Place de la Gare, L-1616 Luxembourg.
2.1.6 INDEX AND BENCHMARK See ‘Sub-fund’s investment policy’.
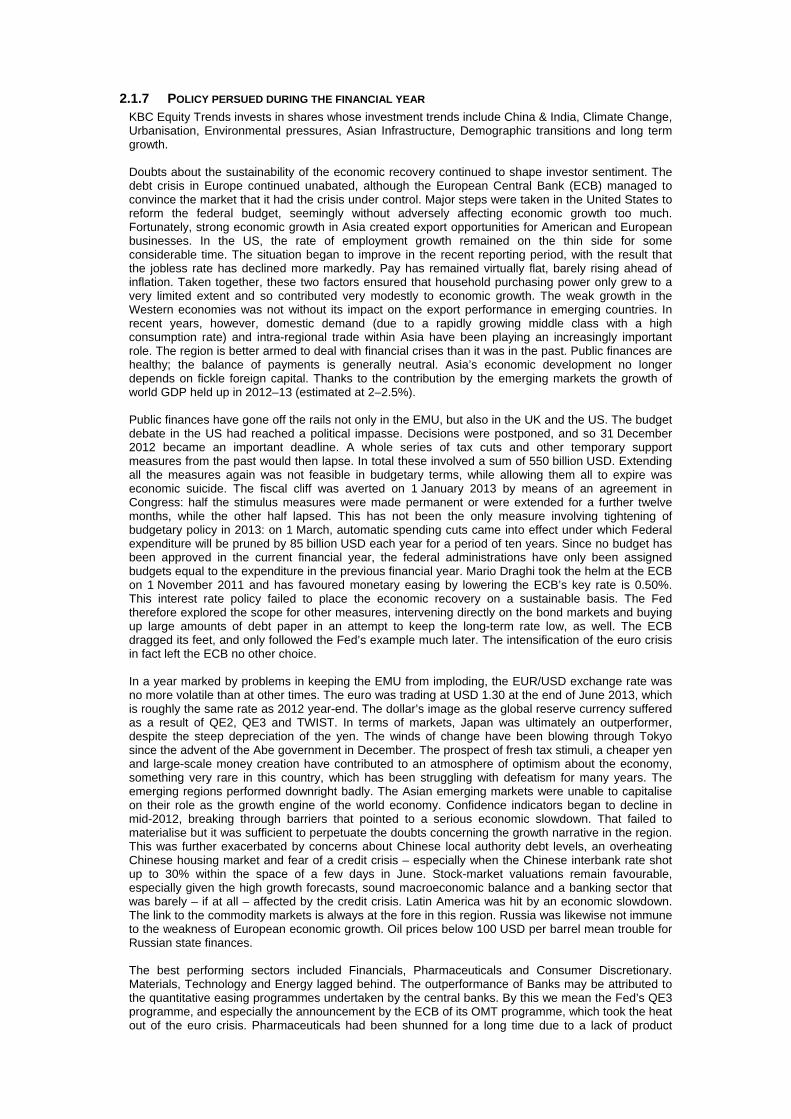
2.1.7 POLICY PERSUED DURING THE FINANCIAL YEAR KBC Equity Trends invests in shares whose investment trends include China & India, Climate Change, Urbanisation, Environmental pressures, Asian Infrastructure, Demographic transitions and long term growth. Doubts about the sustainability of the economic recovery continued to shape investor sentiment. The debt crisis in Europe continued unabated, although the European Central Bank (ECB) managed to convince the market that it had the crisis under control. Major steps were taken in the United States to reform the federal budget, seemingly without adversely affecting economic growth too much. Fortunately, strong economic growth in Asia created export opportunities for American and European businesses. In the US, the rate of employment growth remained on the thin side for some considerable time. The situation began to improve in the recent reporting period, with the result that the jobless rate has declined more markedly. Pay has remained virtually flat, barely rising ahead of inflation. Taken together, these two factors ensured that household purchasing power only grew to a very limited extent and so contributed very modestly to economic growth. The weak growth in the Western economies was not without its impact on the export performance in emerging countries. In recent years, however, domestic demand (due to a rapidly growing middle class with a high consumption rate) and intra-regional trade within Asia have been playing an increasingly important role. The region is better armed to deal with financial crises than it was in the past. Public finances are healthy; the balance of payments is generally neutral. Asia’s economic development no longer depends on fickle foreign capital. Thanks to the contribution by the emerging markets the growth of world GDP held up in 2012–13 (estimated at 2–2.5%). Public finances have gone off the rails not only in the EMU, but also in the UK and the US. The budget debate in the US had reached a political impasse. Decisions were postponed, and so 31 December 2012 became an important deadline. A whole series of tax cuts and other temporary support measures from the past would then lapse. In total these involved a sum of 550 billion USD. Extending all the measures again was not feasible in budgetary terms, while allowing them all to expire was economic suicide. The fiscal cliff was averted on 1 January 2013 by means of an agreement in Congress: half the stimulus measures were made permanent or were extended for a further twelve months, while the other half lapsed. This has not been the only measure involving tightening of budgetary policy in 2013: on 1 March, automatic spending cuts came into effect under which Federal expenditure will be pruned by 85 billion USD each year for a period of ten years. Since no budget has been approved in the current financial year, the federal administrations have only been assigned budgets equal to the expenditure in the previous financial year. Mario Draghi took the helm at the ECB on 1 November 2011 and has favoured monetary easing by lowering the ECB’s key rate is 0.50%. This interest rate policy failed to place the economic recovery on a sustainable basis. The Fed therefore explored the scope for other measures, intervening directly on the bond markets and buying up large amounts of debt paper in an attempt to keep the long-term rate low, as well. The ECB dragged its feet, and only followed the Fed’s example much later. The intensification of the euro crisis in fact left the ECB no other choice. In a year marked by problems in keeping the EMU from imploding, the EUR/USD exchange rate was no more volatile than at other times. The euro was trading at USD 1.30 at the end of June 2013, which is roughly the same rate as 2012 year-end. The dollar’s image as the global reserve currency suffered as a result of QE2, QE3 and TWIST. In terms of markets, Japan was ultimately an outperformer, despite the steep depreciation of the yen. The winds of change have been blowing through Tokyo since the advent of the Abe government in December. The prospect of fresh tax stimuli, a cheaper yen and large-scale money creation have contributed to an atmosphere of optimism about the economy, something very rare in this country, which has been struggling with defeatism for many years. The emerging regions performed downright badly. The Asian emerging markets were unable to capitalise on their role as the growth engine of the world economy. Confidence indicators began to decline in mid-2012, breaking through barriers that pointed to a serious economic slowdown. That failed to materialise but it was sufficient to perpetuate the doubts concerning the growth narrative in the region. This was further exacerbated by concerns about Chinese local authority debt levels, an overheating Chinese housing market and fear of a credit crisis – especially when the Chinese interbank rate shot up to 30% within the space of a few days in June. Stock-market valuations remain favourable, especially given the high growth forecasts, sound macroeconomic balance and a banking sector that was barely – if at all – affected by the credit crisis. Latin America was hit by an economic slowdown. The link to the commodity markets is always at the fore in this region. Russia was likewise not immune to the weakness of European economic growth. Oil prices below 100 USD per barrel mean trouble for Russian state finances. The best performing sectors included Financials, Pharmaceuticals and Consumer Discretionary. Materials, Technology and Energy lagged behind. The outperformance of Banks may be attributed to the quantitative easing programmes undertaken by the central banks. By this we mean the Fed’s QE3 programme, and especially the announcement by the ECB of its OMT programme, which took the heat out of the euro crisis. Pharmaceuticals had been shunned for a long time due to a lack of product
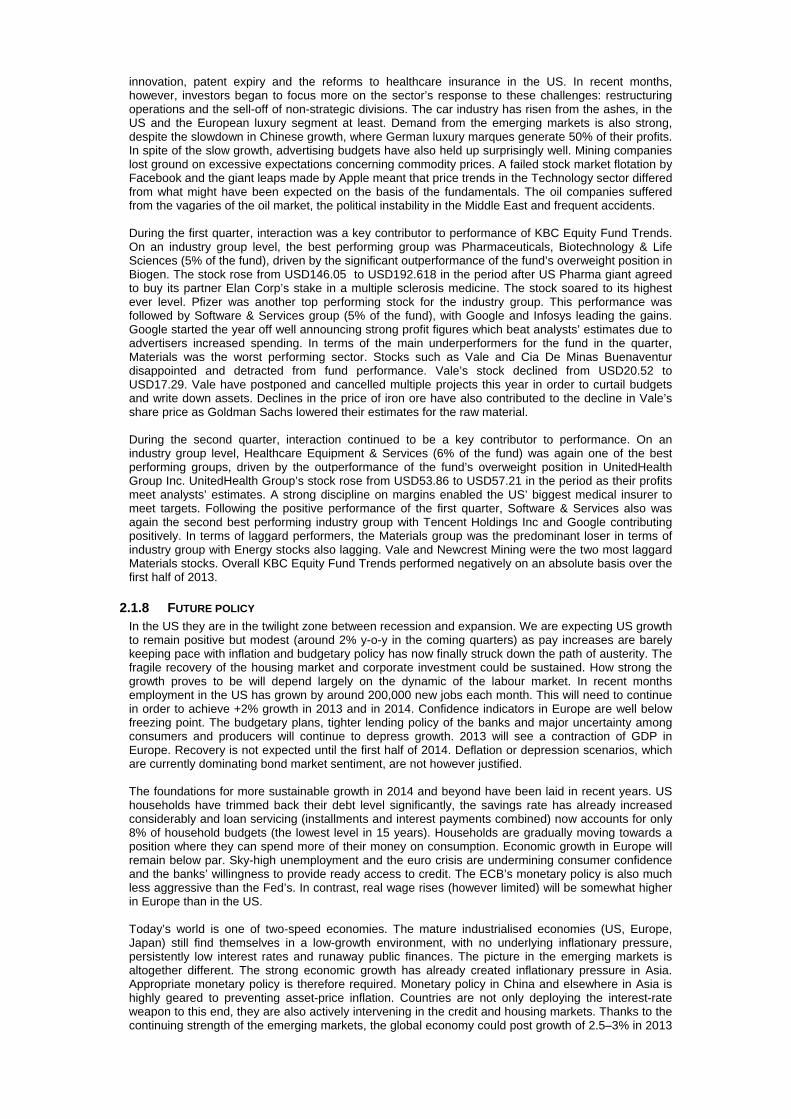
innovation, patent expiry and the reforms to healthcare insurance in the US. In recent months, however, investors began to focus more on the sector’s response to these challenges: restructuring operations and the sell-off of non-strategic divisions. The car industry has risen from the ashes, in the US and the European luxury segment at least. Demand from the emerging markets is also strong, despite the slowdown in Chinese growth, where German luxury marques generate 50% of their profits. In spite of the slow growth, advertising budgets have also held up surprisingly well. Mining companies lost ground on excessive expectations concerning commodity prices. A failed stock market flotation by Facebook and the giant leaps made by Apple meant that price trends in the Technology sector differed from what might have been expected on the basis of the fundamentals. The oil companies suffered from the vagaries of the oil market, the political instability in the Middle East and frequent accidents. During the first quarter, interaction was a key contributor to performance of KBC Equity Fund Trends. On an industry group level, the best performing group was Pharmaceuticals, Biotechnology & Life Sciences (5% of the fund), driven by the significant outperformance of the fund’s overweight position in Biogen. The stock rose from USD146.05 to USD192.618 in the period after US Pharma giant agreed to buy its partner Elan Corp’s stake in a multiple sclerosis medicine. The stock soared to its highest ever level. Pfizer was another top performing stock for the industry group. This performance was followed by Software & Services group (5% of the fund), with Google and Infosys leading the gains. Google started the year off well announcing strong profit figures which beat analysts’ estimates due to advertisers increased spending. In terms of the main underperformers for the fund in the quarter, Materials was the worst performing sector. Stocks such as Vale and Cia De Minas Buenaventur disappointed and detracted from fund performance. Vale’s stock declined from USD20.52 to USD17.29. Vale have postponed and cancelled multiple projects this year in order to curtail budgets and write down assets. Declines in the price of iron ore have also contributed to the decline in Vale’s share price as Goldman Sachs lowered their estimates for the raw material. During the second quarter, interaction continued to be a key contributor to performance. On an industry group level, Healthcare Equipment & Services (6% of the fund) was again one of the best performing groups, driven by the outperformance of the fund’s overweight position in UnitedHealth Group Inc. UnitedHealth Group’s stock rose from USD53.86 to USD57.21 in the period as their profits meet analysts’ estimates. A strong discipline on margins enabled the US’ biggest medical insurer to meet targets. Following the positive performance of the first quarter, Software & Services also was again the second best performing industry group with Tencent Holdings Inc and Google contributing positively. In terms of laggard performers, the Materials group was the predominant loser in terms of industry group with Energy stocks also lagging. Vale and Newcrest Mining were the two most laggard Materials stocks. Overall KBC Equity Fund Trends performed negatively on an absolute basis over the first half of 2013.
2.1.8 FUTURE POLICY In the US they are in the twilight zone between recession and expansion. We are expecting US growth to remain positive but modest (around 2% y-o-y in the coming quarters) as pay increases are barely keeping pace with inflation and budgetary policy has now finally struck down the path of austerity. The fragile recovery of the housing market and corporate investment could be sustained. How strong the growth proves to be will depend largely on the dynamic of the labour market. In recent months employment in the US has grown by around 200,000 new jobs each month. This will need to continue in order to achieve +2% growth in 2013 and in 2014. Confidence indicators in Europe are well below freezing point. The budgetary plans, tighter lending policy of the banks and major uncertainty among consumers and producers will continue to depress growth. 2013 will see a contraction of GDP in Europe. Recovery is not expected until the first half of 2014. Deflation or depression scenarios, which are currently dominating bond market sentiment, are not however justified. The foundations for more sustainable growth in 2014 and beyond have been laid in recent years. US households have trimmed back their debt level significantly, the savings rate has already increased considerably and loan servicing (installments and interest payments combined) now accounts for only 8% of household budgets (the lowest level in 15 years). Households are gradually moving towards a position where they can spend more of their money on consumption. Economic growth in Europe will remain below par. Sky-high unemployment and the euro crisis are undermining consumer confidence and the banks’ willingness to provide ready access to credit. The ECB’s monetary policy is also much less aggressive than the Fed’s. In contrast, real wage rises (however limited) will be somewhat higher in Europe than in the US. Today’s world is one of two-speed economies. The mature industrialised economies (US, Europe, Japan) still find themselves in a low-growth environment, with no underlying inflationary pressure, persistently low interest rates and runaway public finances. The picture in the emerging markets is altogether different. The strong economic growth has already created inflationary pressure in Asia. Appropriate monetary policy is therefore required. Monetary policy in China and elsewhere in Asia is highly geared to preventing asset-price inflation. Countries are not only deploying the interest-rate weapon to this end, they are also actively intervening in the credit and housing markets. Thanks to the continuing strength of the emerging markets, the global economy could post growth of 2.5–3% in 2013
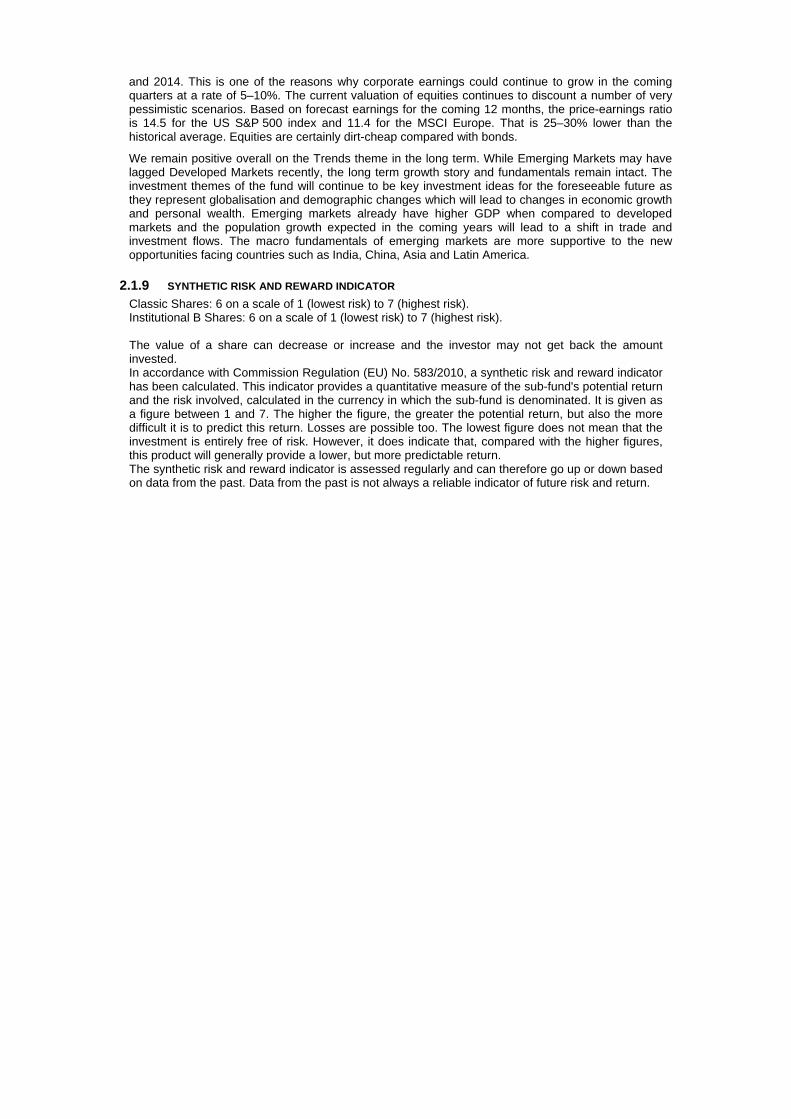
and 2014. This is one of the reasons why corporate earnings could continue to grow in the coming quarters at a rate of 5–10%. The current valuation of equities continues to discount a number of very pessimistic scenarios. Based on forecast earnings for the coming 12 months, the price-earnings ratio is 14.5 for the US S&P 500 index and 11.4 for the MSCI Europe. That is 25–30% lower than the historical average. Equities are certainly dirt-cheap compared with bonds.
We remain positive overall on the Trends theme in the long term. While Emerging Markets may have lagged Developed Markets recently, the long term growth story and fundamentals remain intact. The investment themes of the fund will continue to be key investment ideas for the foreseeable future as they represent globalisation and demographic changes which will lead to changes in economic growth and personal wealth. Emerging markets already have higher GDP when compared to developed markets and the population growth expected in the coming years will lead to a shift in trade and investment flows. The macro fundamentals of emerging markets are more supportive to the new opportunities facing countries such as India, China, Asia and Latin America.
2.1.9 SYNTHETIC RISK AND REWARD INDICATOR Classic Shares: 6 on a scale of 1 (lowest risk) to 7 (highest risk). Institutional B Shares: 6 on a scale of 1 (lowest risk) to 7 (highest risk). The value of a share can decrease or increase and the investor may not get back the amount invested. In accordance with Commission Regulation (EU) No. 583/2010, a synthetic risk and reward indicator has been calculated. This indicator provides a quantitative measure of the sub-fund's potential return and the risk involved, calculated in the currency in which the sub-fund is denominated. It is given as a figure between 1 and 7. The higher the figure, the greater the potential return, but also the more difficult it is to predict this return. Losses are possible too. The lowest figure does not mean that the investment is entirely free of risk. However, it does indicate that, compared with the higher figures, this product will generally provide a lower, but more predictable return. The synthetic risk and reward indicator is assessed regularly and can therefore go up or down based on data from the past. Data from the past is not always a reliable indicator of future risk and return.
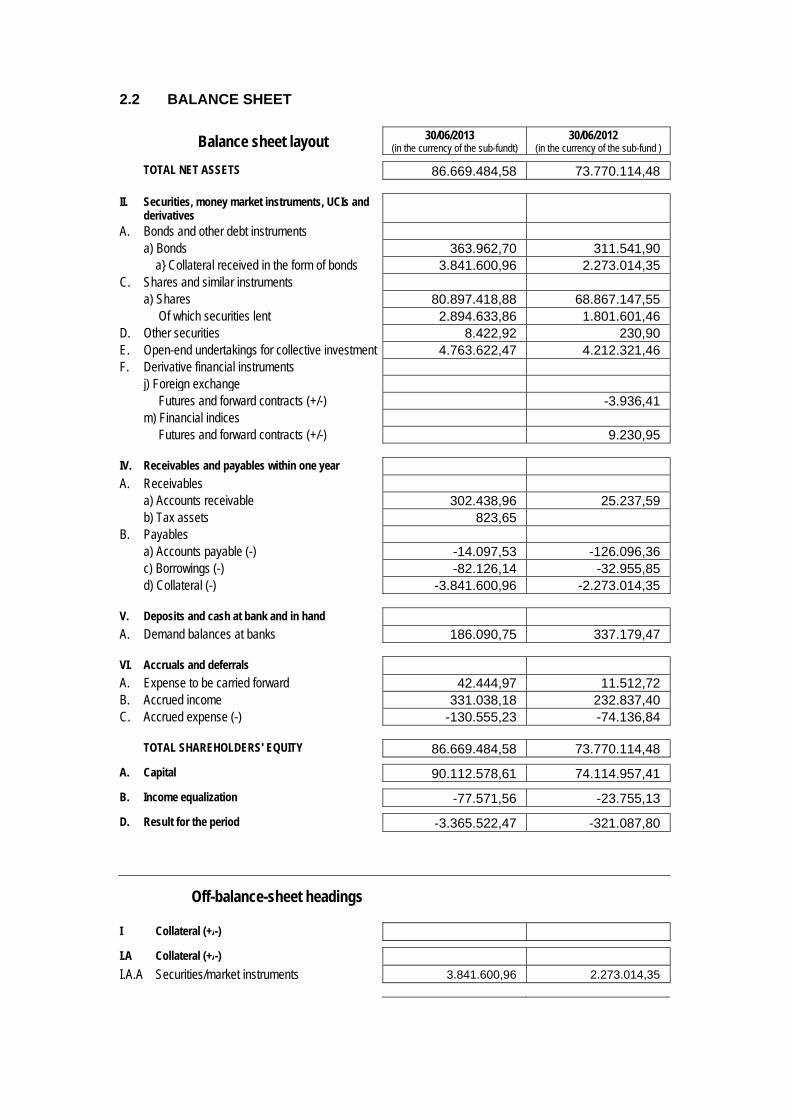
2.2 BALANCE SHEET
Balance sheet layout 30/06/2013 (in the currency of the sub-fundt)
30/06/2012 (in the currency of the sub-fund )
TOTAL NET ASSETS 86.669.484,58 73.770.114,48
II. Securities, money market instruments, UCIs and derivatives
A. Bonds and other debt instruments a) Bonds 363.962,70 311.541,90 a} Collateral received in the form of bonds 3.841.600,96 2.273.014,35 C. Shares and similar instruments a) Shares 80.897.418,88 68.867.147,55 Of which securities lent 2.894.633,86 1.801.601,46 D. Other securities 8.422,92 230,90 E. Open-end undertakings for collective investment 4.763.622,47 4.212.321,46 F. Derivative financial instruments j) Foreign exchange Futures and forward contracts (+/-) -3.936,41 m) Financial indices Futures and forward contracts (+/-) 9.230,95
IV. Receivables and payables within one year A. Receivables a) Accounts receivable 302.438,96 25.237,59 b) Tax assets 823,65 B. Payables a) Accounts payable (-) -14.097,53 -126.096,36 c) Borrowings (-) -82.126,14 -32.955,85 d) Collateral (-) -3.841.600,96 -2.273.014,35
V. Deposits and cash at bank and in hand A. Demand balances at banks 186.090,75 337.179,47
VI. Accruals and deferrals A. Expense to be carried forward 42.444,97 11.512,72 B. Accrued income 331.038,18 232.837,40 C. Accrued expense (-) -130.555,23 -74.136,84
TOTAL SHAREHOLDERS' EQUITY 86.669.484,58 73.770.114,48
A. Capital 90.112.578,61 74.114.957,41
B. Income equalization -77.571,56 -23.755,13
D. Result for the period -3.365.522,47 -321.087,80
Off-balance-sheet headings
I Collateral (+/-)
I.A Collateral (+/-)
I.A.A Securities/market instruments 3.841.600,96 2.273.014,35
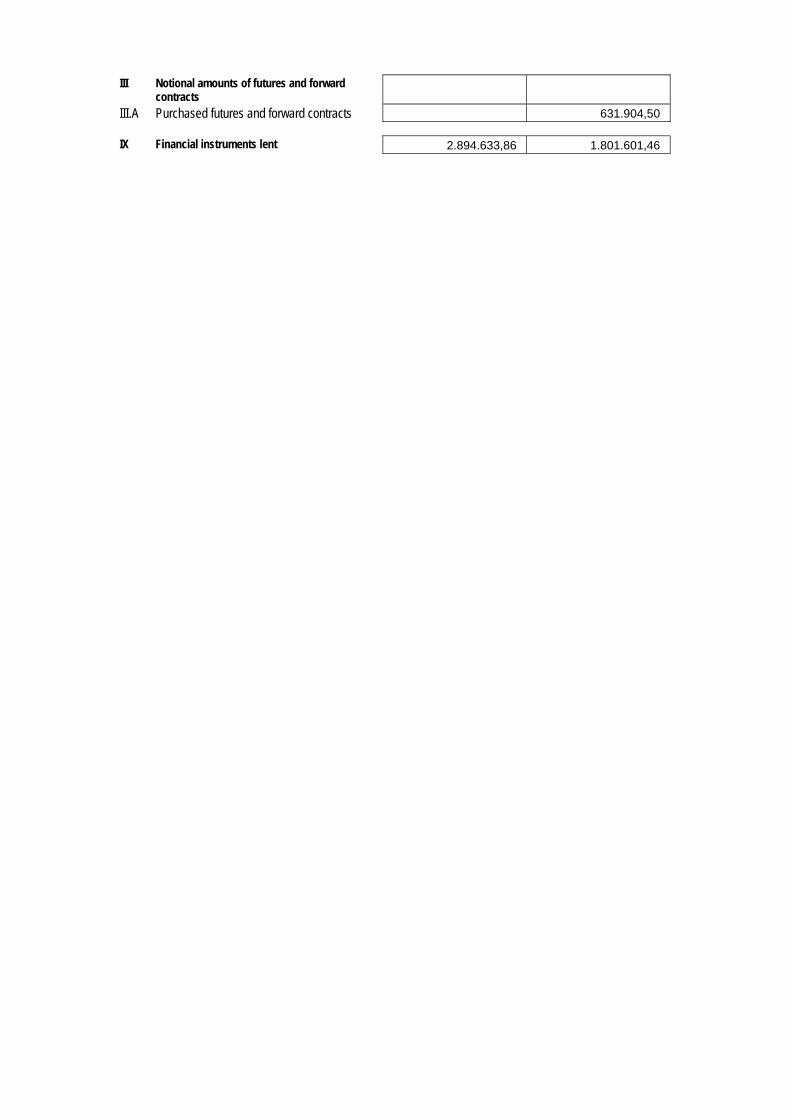
III Notional amounts of futures and forward contracts
III.A Purchased futures and forward contracts 631.904,50
IX Financial instruments lent 2.894.633,86 1.801.601,46
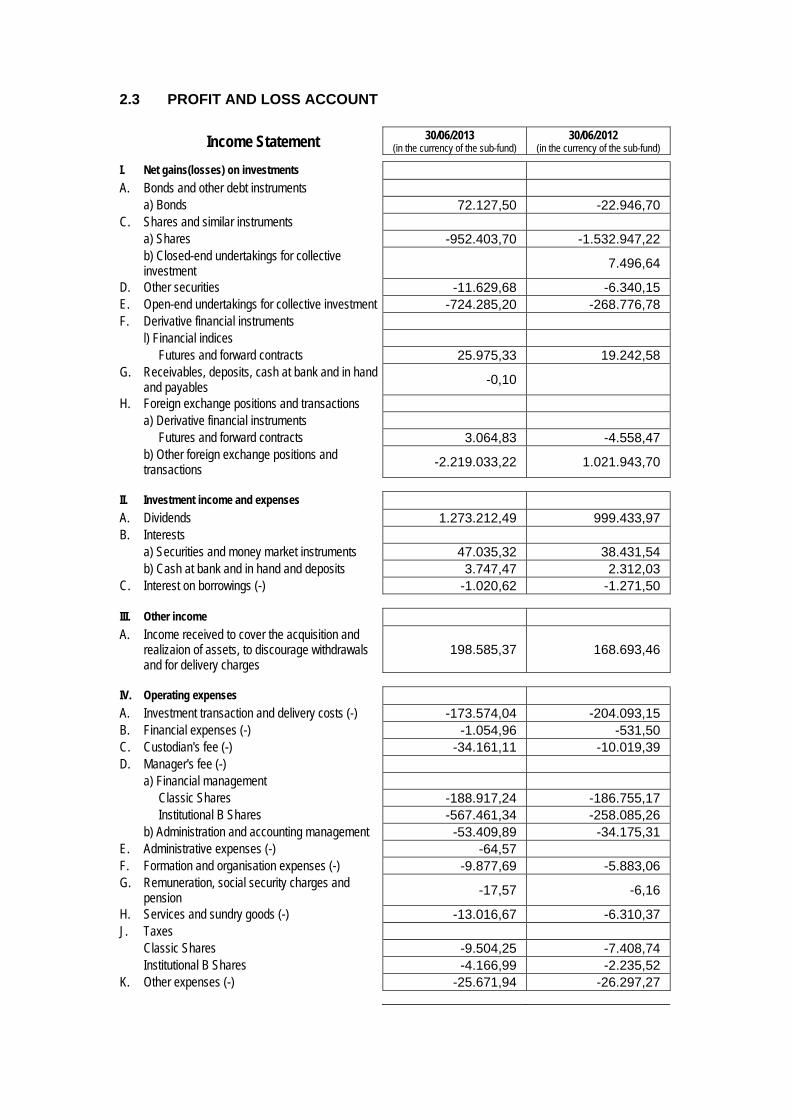
2.3 PROFIT AND LOSS ACCOUNT
Income Statement 30/06/2013 (in the currency of the sub-fund)
30/06/2012 (in the currency of the sub-fund)
I. Net gains(losses) on investments A. Bonds and other debt instruments a) Bonds 72.127,50 -22.946,70 C. Shares and similar instruments a) Shares -952.403,70 -1.532.947,22 b) Closed-end undertakings for collective
investment 7.496,64
D. Other securities -11.629,68 -6.340,15 E. Open-end undertakings for collective investment -724.285,20 -268.776,78 F. Derivative financial instruments l) Financial indices Futures and forward contracts 25.975,33 19.242,58 G. Receivables, deposits, cash at bank and in hand
and payables -0,10
H. Foreign exchange positions and transactions a) Derivative financial instruments Futures and forward contracts 3.064,83 -4.558,47 b) Other foreign exchange positions and
transactions -2.219.033,22 1.021.943,70
II. Investment income and expenses A. Dividends 1.273.212,49 999.433,97 B. Interests a) Securities and money market instruments 47.035,32 38.431,54 b) Cash at bank and in hand and deposits 3.747,47 2.312,03 C. Interest on borrowings (-) -1.020,62 -1.271,50
III. Other income A. Income received to cover the acquisition and
realizaion of assets, to discourage withdrawals and for delivery charges
198.585,37 168.693,46
IV. Operating expenses A. Investment transaction and delivery costs (-) -173.574,04 -204.093,15 B. Financial expenses (-) -1.054,96 -531,50 C. Custodian's fee (-) -34.161,11 -10.019,39 D. Manager's fee (-) a) Financial management Classic Shares -188.917,24 -186.755,17 Institutional B Shares -567.461,34 -258.085,26 b) Administration and accounting management -53.409,89 -34.175,31 E. Administrative expenses (-) -64,57 F. Formation and organisation expenses (-) -9.877,69 -5.883,06 G. Remuneration, social security charges and
pension -17,57 -6,16
H. Services and sundry goods (-) -13.016,67 -6.310,37 J. Taxes Classic Shares -9.504,25 -7.408,74 Institutional B Shares -4.166,99 -2.235,52 K. Other expenses (-) -25.671,94 -26.297,27

Income and expenditure for the period Subtotal II + III + IV 440.661,77 465.798,60
V. Profit (loss) on ordinary activities before tax -3.365.522,47 -321.087,80
VII. Result for the period -3.365.522,47 -321.087,80
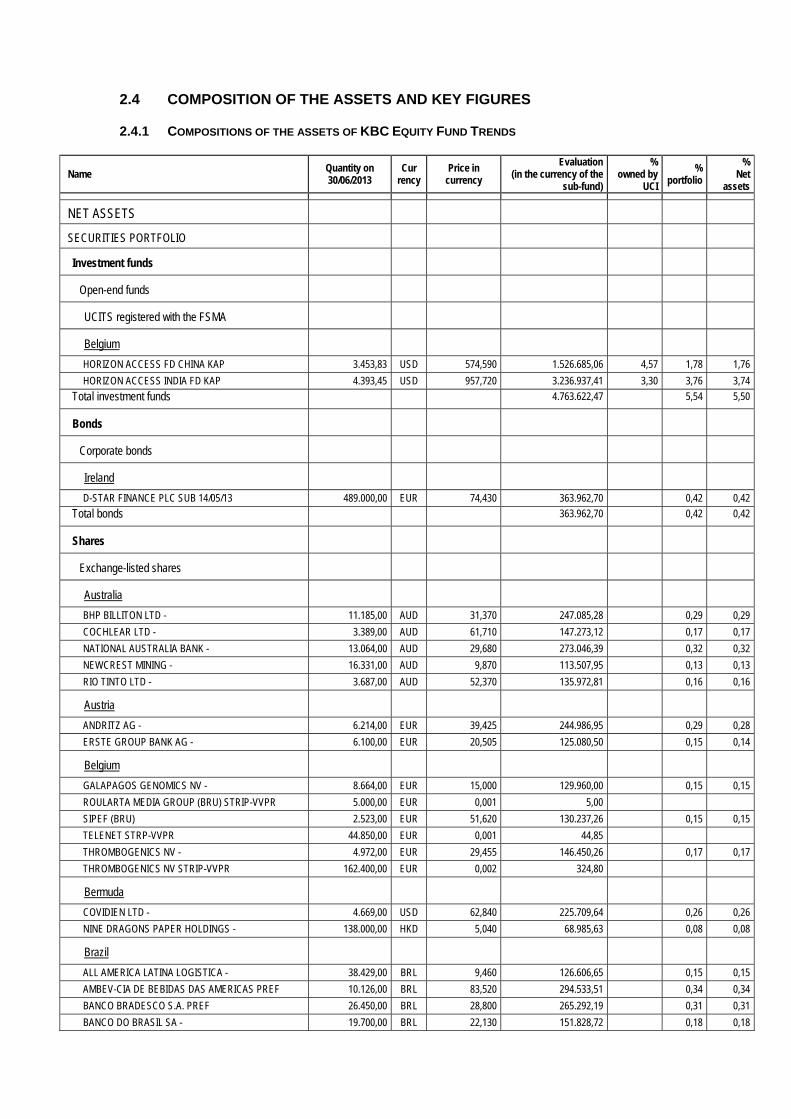
2.4 COMPOSITION OF THE ASSETS AND KEY FIGURES
2.4.1 COMPOSITIONS OF THE ASSETS OF KBC EQUITY FUND TRENDS
Name Quantity on 30/06/2013
Cur rency
Price in currency
Evaluation (in the currency of the
sub-fund)
% owned by
UCI
% portfolio
% Net
assets
NET ASSETS
SECURITIES PORTFOLIO
Investment funds
Open-end funds
UCITS registered with the FSMA
Belgium
HORIZON ACCESS FD CHINA KAP 3.453,83 USD 574,590 1.526.685,06 4,57 1,78 1,76
HORIZON ACCESS INDIA FD KAP 4.393,45 USD 957,720 3.236.937,41 3,30 3,76 3,74
Total investment funds 4.763.622,47 5,54 5,50
Bonds
Corporate bonds
Ireland
D-STAR FINANCE PLC SUB 14/05/13 489.000,00 EUR 74,430 363.962,70 0,42 0,42
Total bonds 363.962,70 0,42 0,42
Shares
Exchange-listed shares
Australia
BHP BILLITON LTD - 11.185,00 AUD 31,370 247.085,28 0,29 0,29
COCHLEAR LTD - 3.389,00 AUD 61,710 147.273,12 0,17 0,17
NATIONAL AUSTRALIA BANK - 13.064,00 AUD 29,680 273.046,39 0,32 0,32
NEWCREST MINING - 16.331,00 AUD 9,870 113.507,95 0,13 0,13
RIO TINTO LTD - 3.687,00 AUD 52,370 135.972,81 0,16 0,16
Austria
ANDRITZ AG - 6.214,00 EUR 39,425 244.986,95 0,29 0,28
ERSTE GROUP BANK AG - 6.100,00 EUR 20,505 125.080,50 0,15 0,14
Belgium
GALAPAGOS GENOMICS NV - 8.664,00 EUR 15,000 129.960,00 0,15 0,15
ROULARTA MEDIA GROUP (BRU) STRIP-VVPR 5.000,00 EUR 0,001 5,00
SIPEF (BRU) 2.523,00 EUR 51,620 130.237,26 0,15 0,15
TELENET STRP-VVPR 44.850,00 EUR 0,001 44,85
THROMBOGENICS NV - 4.972,00 EUR 29,455 146.450,26 0,17 0,17
THROMBOGENICS NV STRIP-VVPR 162.400,00 EUR 0,002 324,80
Bermuda
COVIDIEN LTD - 4.669,00 USD 62,840 225.709,64 0,26 0,26
NINE DRAGONS PAPER HOLDINGS - 138.000,00 HKD 5,040 68.985,63 0,08 0,08
Brazil
ALL AMERICA LATINA LOGISTICA - 38.429,00 BRL 9,460 126.606,65 0,15 0,15
AMBEV-CIA DE BEBIDAS DAS AMERICAS PREF 10.126,00 BRL 83,520 294.533,51 0,34 0,34
BANCO BRADESCO S.A. PREF 26.450,00 BRL 28,800 265.292,19 0,31 0,31
BANCO DO BRASIL SA - 19.700,00 BRL 22,130 151.828,72 0,18 0,18
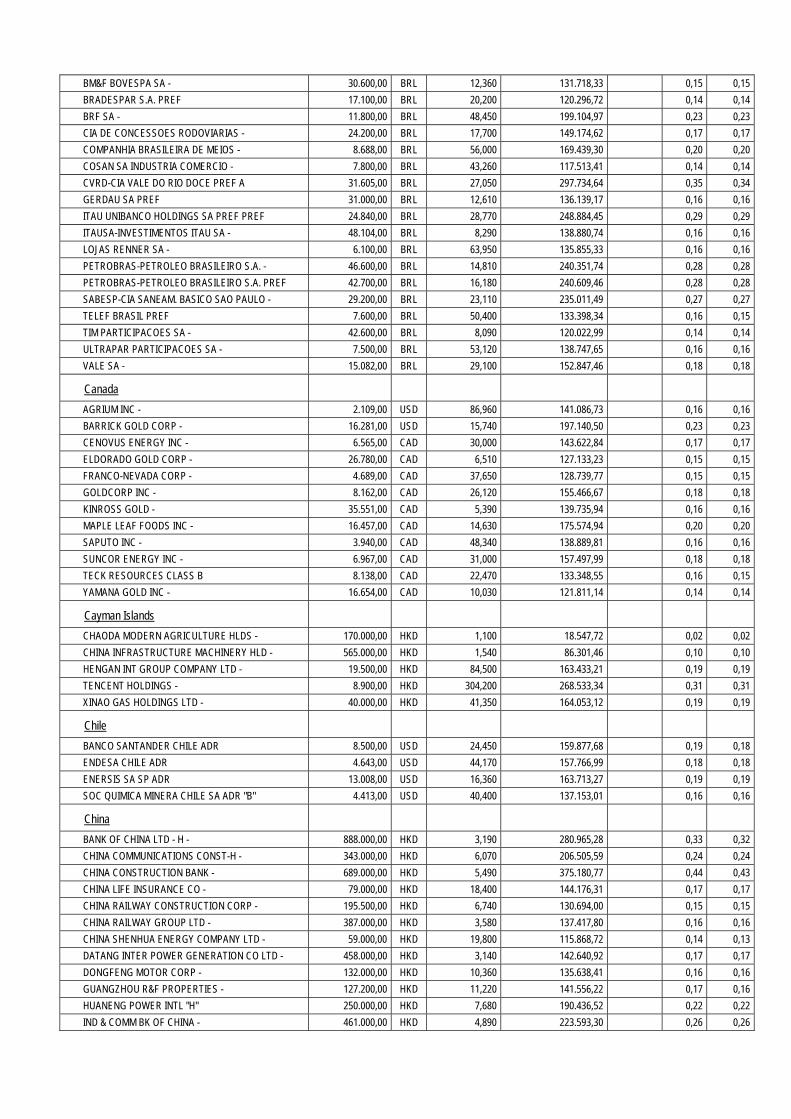
BM&F BOVESPA SA - 30.600,00 BRL 12,360 131.718,33 0,15 0,15
BRADESPAR S.A. PREF 17.100,00 BRL 20,200 120.296,72 0,14 0,14
BRF SA - 11.800,00 BRL 48,450 199.104,97 0,23 0,23
CIA DE CONCESSOES RODOVIARIAS - 24.200,00 BRL 17,700 149.174,62 0,17 0,17
COMPANHIA BRASILEIRA DE MEIOS - 8.688,00 BRL 56,000 169.439,30 0,20 0,20
COSAN SA INDUSTRIA COMERCIO - 7.800,00 BRL 43,260 117.513,41 0,14 0,14
CVRD-CIA VALE DO RIO DOCE PREF A 31.605,00 BRL 27,050 297.734,64 0,35 0,34
GERDAU SA PREF 31.000,00 BRL 12,610 136.139,17 0,16 0,16
ITAU UNIBANCO HOLDINGS SA PREF PREF 24.840,00 BRL 28,770 248.884,45 0,29 0,29
ITAUSA-INVESTIMENTOS ITAU SA - 48.104,00 BRL 8,290 138.880,74 0,16 0,16
LOJAS RENNER SA - 6.100,00 BRL 63,950 135.855,33 0,16 0,16
PETROBRAS-PETROLEO BRASILEIRO S.A. - 46.600,00 BRL 14,810 240.351,74 0,28 0,28
PETROBRAS-PETROLEO BRASILEIRO S.A. PREF 42.700,00 BRL 16,180 240.609,46 0,28 0,28
SABESP-CIA SANEAM. BASICO SAO PAULO - 29.200,00 BRL 23,110 235.011,49 0,27 0,27
TELEF BRASIL PREF 7.600,00 BRL 50,400 133.398,34 0,16 0,15
TIM PARTICIPACOES SA - 42.600,00 BRL 8,090 120.022,99 0,14 0,14
ULTRAPAR PARTICIPACOES SA - 7.500,00 BRL 53,120 138.747,65 0,16 0,16
VALE SA - 15.082,00 BRL 29,100 152.847,46 0,18 0,18
Canada
AGRIUM INC - 2.109,00 USD 86,960 141.086,73 0,16 0,16
BARRICK GOLD CORP - 16.281,00 USD 15,740 197.140,50 0,23 0,23
CENOVUS ENERGY INC - 6.565,00 CAD 30,000 143.622,84 0,17 0,17
ELDORADO GOLD CORP - 26.780,00 CAD 6,510 127.133,23 0,15 0,15
FRANCO-NEVADA CORP - 4.689,00 CAD 37,650 128.739,77 0,15 0,15
GOLDCORP INC - 8.162,00 CAD 26,120 155.466,67 0,18 0,18
KINROSS GOLD - 35.551,00 CAD 5,390 139.735,94 0,16 0,16
MAPLE LEAF FOODS INC - 16.457,00 CAD 14,630 175.574,94 0,20 0,20
SAPUTO INC - 3.940,00 CAD 48,340 138.889,81 0,16 0,16
SUNCOR ENERGY INC - 6.967,00 CAD 31,000 157.497,99 0,18 0,18
TECK RESOURCES CLASS B 8.138,00 CAD 22,470 133.348,55 0,16 0,15
YAMANA GOLD INC - 16.654,00 CAD 10,030 121.811,14 0,14 0,14
Cayman Islands
CHAODA MODERN AGRICULTURE HLDS - 170.000,00 HKD 1,100 18.547,72 0,02 0,02
CHINA INFRASTRUCTURE MACHINERY HLD - 565.000,00 HKD 1,540 86.301,46 0,10 0,10
HENGAN INT GROUP COMPANY LTD - 19.500,00 HKD 84,500 163.433,21 0,19 0,19
TENCENT HOLDINGS - 8.900,00 HKD 304,200 268.533,34 0,31 0,31
XINAO GAS HOLDINGS LTD - 40.000,00 HKD 41,350 164.053,12 0,19 0,19
Chile
BANCO SANTANDER CHILE ADR 8.500,00 USD 24,450 159.877,68 0,19 0,18
ENDESA CHILE ADR 4.643,00 USD 44,170 157.766,99 0,18 0,18
ENERSIS SA SP ADR 13.008,00 USD 16,360 163.713,27 0,19 0,19
SOC QUIMICA MINERA CHILE SA ADR "B" 4.413,00 USD 40,400 137.153,01 0,16 0,16
China
BANK OF CHINA LTD - H - 888.000,00 HKD 3,190 280.965,28 0,33 0,32
CHINA COMMUNICATIONS CONST-H - 343.000,00 HKD 6,070 206.505,59 0,24 0,24
CHINA CONSTRUCTION BANK - 689.000,00 HKD 5,490 375.180,77 0,44 0,43
CHINA LIFE INSURANCE CO - 79.000,00 HKD 18,400 144.176,31 0,17 0,17
CHINA RAILWAY CONSTRUCTION CORP - 195.500,00 HKD 6,740 130.694,00 0,15 0,15
CHINA RAILWAY GROUP LTD - 387.000,00 HKD 3,580 137.417,80 0,16 0,16
CHINA SHENHUA ENERGY COMPANY LTD - 59.000,00 HKD 19,800 115.868,72 0,14 0,13
DATANG INTER POWER GENERATION CO LTD - 458.000,00 HKD 3,140 142.640,92 0,17 0,17
DONGFENG MOTOR CORP - 132.000,00 HKD 10,360 135.638,41 0,16 0,16
GUANGZHOU R&F PROPERTIES - 127.200,00 HKD 11,220 141.556,22 0,17 0,16
HUANENG POWER INTL "H" 250.000,00 HKD 7,680 190.436,52 0,22 0,22
IND & COMM BK OF CHINA - 461.000,00 HKD 4,890 223.593,30 0,26 0,26
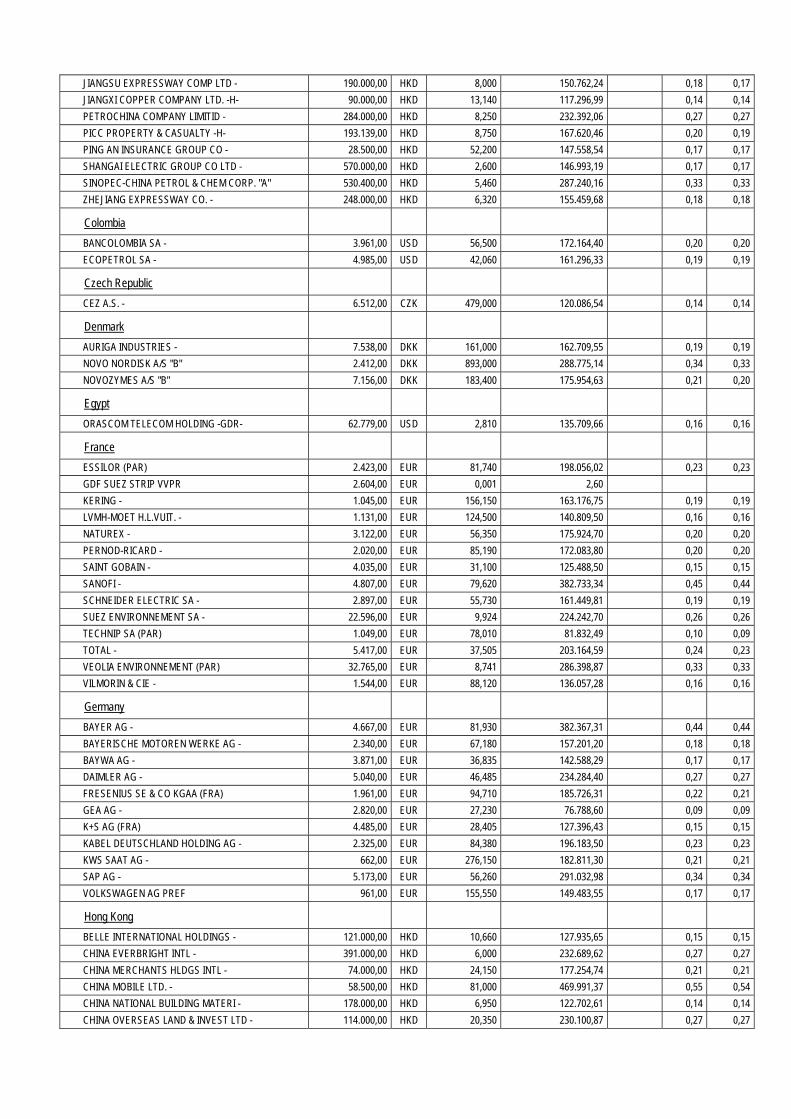
JIANGSU EXPRESSWAY COMP LTD - 190.000,00 HKD 8,000 150.762,24 0,18 0,17
JIANGXI COPPER COMPANY LTD. -H- 90.000,00 HKD 13,140 117.296,99 0,14 0,14
PETROCHINA COMPANY LIMITID - 284.000,00 HKD 8,250 232.392,06 0,27 0,27
PICC PROPERTY & CASUALTY -H- 193.139,00 HKD 8,750 167.620,46 0,20 0,19
PING AN INSURANCE GROUP CO - 28.500,00 HKD 52,200 147.558,54 0,17 0,17
SHANGAI ELECTRIC GROUP CO LTD - 570.000,00 HKD 2,600 146.993,19 0,17 0,17
SINOPEC-CHINA PETROL & CHEM CORP. "A" 530.400,00 HKD 5,460 287.240,16 0,33 0,33
ZHEJIANG EXPRESSWAY CO. - 248.000,00 HKD 6,320 155.459,68 0,18 0,18
Colombia
BANCOLOMBIA SA - 3.961,00 USD 56,500 172.164,40 0,20 0,20
ECOPETROL SA - 4.985,00 USD 42,060 161.296,33 0,19 0,19
Czech Republic
CEZ A.S. - 6.512,00 CZK 479,000 120.086,54 0,14 0,14
Denmark
AURIGA INDUSTRIES - 7.538,00 DKK 161,000 162.709,55 0,19 0,19
NOVO NORDISK A/S "B" 2.412,00 DKK 893,000 288.775,14 0,34 0,33
NOVOZYMES A/S "B" 7.156,00 DKK 183,400 175.954,63 0,21 0,20
Egypt
ORASCOM TELECOM HOLDING -GDR- 62.779,00 USD 2,810 135.709,66 0,16 0,16
France
ESSILOR (PAR) 2.423,00 EUR 81,740 198.056,02 0,23 0,23
GDF SUEZ STRIP VVPR 2.604,00 EUR 0,001 2,60
KERING - 1.045,00 EUR 156,150 163.176,75 0,19 0,19
LVMH-MOET H.L.VUIT. - 1.131,00 EUR 124,500 140.809,50 0,16 0,16
NATUREX - 3.122,00 EUR 56,350 175.924,70 0,20 0,20
PERNOD-RICARD - 2.020,00 EUR 85,190 172.083,80 0,20 0,20
SAINT GOBAIN - 4.035,00 EUR 31,100 125.488,50 0,15 0,15
SANOFI - 4.807,00 EUR 79,620 382.733,34 0,45 0,44
SCHNEIDER ELECTRIC SA - 2.897,00 EUR 55,730 161.449,81 0,19 0,19
SUEZ ENVIRONNEMENT SA - 22.596,00 EUR 9,924 224.242,70 0,26 0,26
TECHNIP SA (PAR) 1.049,00 EUR 78,010 81.832,49 0,10 0,09
TOTAL - 5.417,00 EUR 37,505 203.164,59 0,24 0,23
VEOLIA ENVIRONNEMENT (PAR) 32.765,00 EUR 8,741 286.398,87 0,33 0,33
VILMORIN & CIE - 1.544,00 EUR 88,120 136.057,28 0,16 0,16
Germany
BAYER AG - 4.667,00 EUR 81,930 382.367,31 0,44 0,44
BAYERISCHE MOTOREN WERKE AG - 2.340,00 EUR 67,180 157.201,20 0,18 0,18
BAYWA AG - 3.871,00 EUR 36,835 142.588,29 0,17 0,17
DAIMLER AG - 5.040,00 EUR 46,485 234.284,40 0,27 0,27
FRESENIUS SE & CO KGAA (FRA) 1.961,00 EUR 94,710 185.726,31 0,22 0,21
GEA AG - 2.820,00 EUR 27,230 76.788,60 0,09 0,09
K+S AG (FRA) 4.485,00 EUR 28,405 127.396,43 0,15 0,15
KABEL DEUTSCHLAND HOLDING AG - 2.325,00 EUR 84,380 196.183,50 0,23 0,23
KWS SAAT AG - 662,00 EUR 276,150 182.811,30 0,21 0,21
SAP AG - 5.173,00 EUR 56,260 291.032,98 0,34 0,34
VOLKSWAGEN AG PREF 961,00 EUR 155,550 149.483,55 0,17 0,17
Hong Kong
BELLE INTERNATIONAL HOLDINGS - 121.000,00 HKD 10,660 127.935,65 0,15 0,15
CHINA EVERBRIGHT INTL - 391.000,00 HKD 6,000 232.689,62 0,27 0,27
CHINA MERCHANTS HLDGS INTL - 74.000,00 HKD 24,150 177.254,74 0,21 0,21
CHINA MOBILE LTD. - 58.500,00 HKD 81,000 469.991,37 0,55 0,54
CHINA NATIONAL BUILDING MATERI - 178.000,00 HKD 6,950 122.702,61 0,14 0,14
CHINA OVERSEAS LAND & INVEST LTD - 114.000,00 HKD 20,350 230.100,87 0,27 0,27
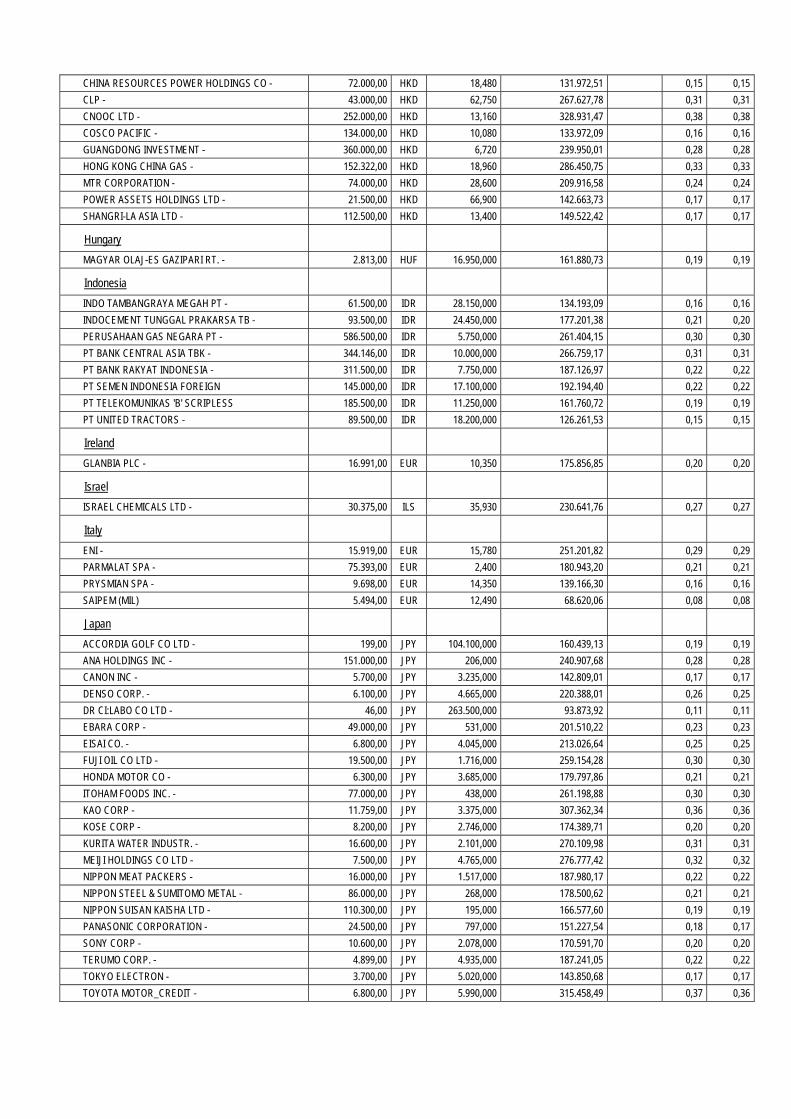
CHINA RESOURCES POWER HOLDINGS CO - 72.000,00 HKD 18,480 131.972,51 0,15 0,15
CLP - 43.000,00 HKD 62,750 267.627,78 0,31 0,31
CNOOC LTD - 252.000,00 HKD 13,160 328.931,47 0,38 0,38
COSCO PACIFIC - 134.000,00 HKD 10,080 133.972,09 0,16 0,16
GUANGDONG INVESTMENT - 360.000,00 HKD 6,720 239.950,01 0,28 0,28
HONG KONG CHINA GAS - 152.322,00 HKD 18,960 286.450,75 0,33 0,33
MTR CORPORATION - 74.000,00 HKD 28,600 209.916,58 0,24 0,24
POWER ASSETS HOLDINGS LTD - 21.500,00 HKD 66,900 142.663,73 0,17 0,17
SHANGRI-LA ASIA LTD - 112.500,00 HKD 13,400 149.522,42 0,17 0,17
Hungary
MAGYAR OLAJ-ES GAZIPARI RT. - 2.813,00 HUF 16.950,000 161.880,73 0,19 0,19
Indonesia
INDO TAMBANGRAYA MEGAH PT - 61.500,00 IDR 28.150,000 134.193,09 0,16 0,16
INDOCEMENT TUNGGAL PRAKARSA TB - 93.500,00 IDR 24.450,000 177.201,38 0,21 0,20
PERUSAHAAN GAS NEGARA PT - 586.500,00 IDR 5.750,000 261.404,15 0,30 0,30
PT BANK CENTRAL ASIA TBK - 344.146,00 IDR 10.000,000 266.759,17 0,31 0,31
PT BANK RAKYAT INDONESIA - 311.500,00 IDR 7.750,000 187.126,97 0,22 0,22
PT SEMEN INDONESIA FOREIGN 145.000,00 IDR 17.100,000 192.194,40 0,22 0,22
PT TELEKOMUNIKAS 'B' SCRIPLESS 185.500,00 IDR 11.250,000 161.760,72 0,19 0,19
PT UNITED TRACTORS - 89.500,00 IDR 18.200,000 126.261,53 0,15 0,15
Ireland
GLANBIA PLC - 16.991,00 EUR 10,350 175.856,85 0,20 0,20
Israel
ISRAEL CHEMICALS LTD - 30.375,00 ILS 35,930 230.641,76 0,27 0,27
Italy
ENI - 15.919,00 EUR 15,780 251.201,82 0,29 0,29
PARMALAT SPA - 75.393,00 EUR 2,400 180.943,20 0,21 0,21
PRYSMIAN SPA - 9.698,00 EUR 14,350 139.166,30 0,16 0,16
SAIPEM (MIL) 5.494,00 EUR 12,490 68.620,06 0,08 0,08
Japan
ACCORDIA GOLF CO LTD - 199,00 JPY 104.100,000 160.439,13 0,19 0,19
ANA HOLDINGS INC - 151.000,00 JPY 206,000 240.907,68 0,28 0,28
CANON INC - 5.700,00 JPY 3.235,000 142.809,01 0,17 0,17
DENSO CORP. - 6.100,00 JPY 4.665,000 220.388,01 0,26 0,25
DR CI:LABO CO LTD - 46,00 JPY 263.500,000 93.873,92 0,11 0,11
EBARA CORP - 49.000,00 JPY 531,000 201.510,22 0,23 0,23
EISAI CO. - 6.800,00 JPY 4.045,000 213.026,64 0,25 0,25
FUJI OIL CO LTD - 19.500,00 JPY 1.716,000 259.154,28 0,30 0,30
HONDA MOTOR CO - 6.300,00 JPY 3.685,000 179.797,86 0,21 0,21
ITOHAM FOODS INC. - 77.000,00 JPY 438,000 261.198,88 0,30 0,30
KAO CORP - 11.759,00 JPY 3.375,000 307.362,34 0,36 0,36
KOSE CORP - 8.200,00 JPY 2.746,000 174.389,71 0,20 0,20
KURITA WATER INDUSTR. - 16.600,00 JPY 2.101,000 270.109,98 0,31 0,31
MEIJI HOLDINGS CO LTD - 7.500,00 JPY 4.765,000 276.777,42 0,32 0,32
NIPPON MEAT PACKERS - 16.000,00 JPY 1.517,000 187.980,17 0,22 0,22
NIPPON STEEL & SUMITOMO METAL - 86.000,00 JPY 268,000 178.500,62 0,21 0,21
NIPPON SUISAN KAISHA LTD - 110.300,00 JPY 195,000 166.577,60 0,19 0,19
PANASONIC CORPORATION - 24.500,00 JPY 797,000 151.227,54 0,18 0,17
SONY CORP - 10.600,00 JPY 2.078,000 170.591,70 0,20 0,20
TERUMO CORP. - 4.899,00 JPY 4.935,000 187.241,05 0,22 0,22
TOKYO ELECTRON - 3.700,00 JPY 5.020,000 143.850,68 0,17 0,17
TOYOTA MOTOR_CREDIT - 6.800,00 JPY 5.990,000 315.458,49 0,37 0,36
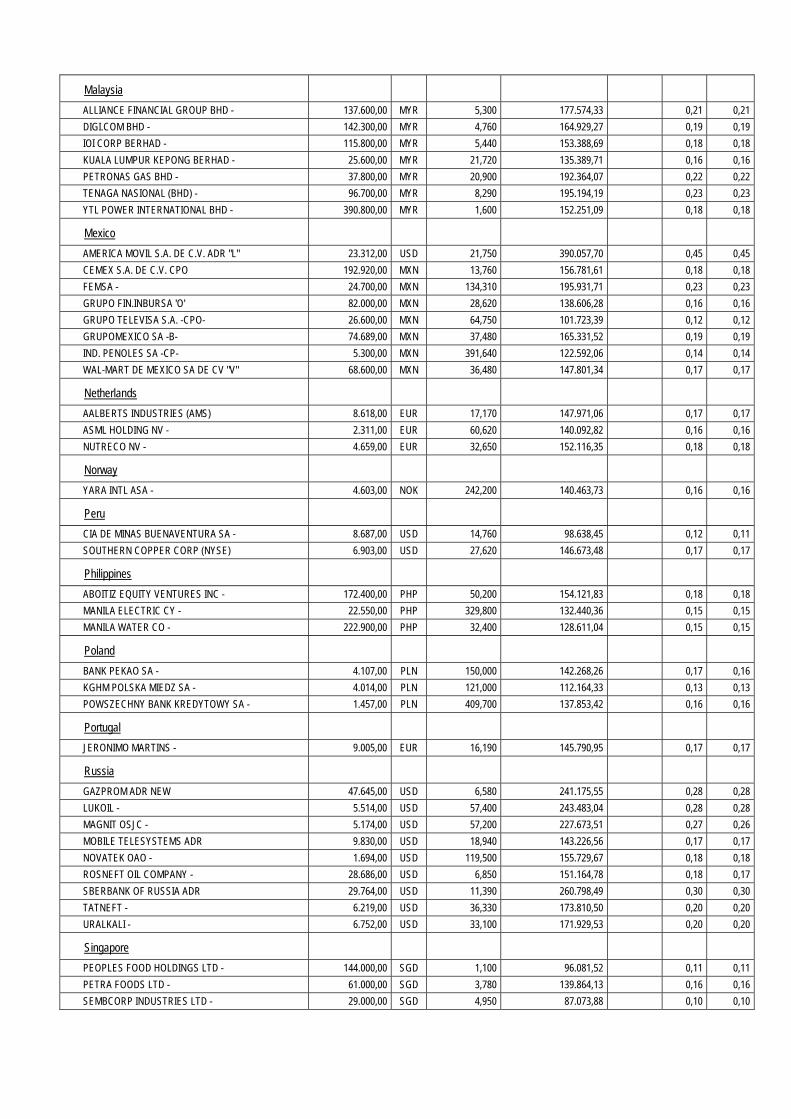
Malaysia
ALLIANCE FINANCIAL GROUP BHD - 137.600,00 MYR 5,300 177.574,33 0,21 0,21
DIGI.COM BHD - 142.300,00 MYR 4,760 164.929,27 0,19 0,19
IOI CORP BERHAD - 115.800,00 MYR 5,440 153.388,69 0,18 0,18
KUALA LUMPUR KEPONG BERHAD - 25.600,00 MYR 21,720 135.389,71 0,16 0,16
PETRONAS GAS BHD - 37.800,00 MYR 20,900 192.364,07 0,22 0,22
TENAGA NASIONAL (BHD) - 96.700,00 MYR 8,290 195.194,19 0,23 0,23
YTL POWER INTERNATIONAL BHD - 390.800,00 MYR 1,600 152.251,09 0,18 0,18
Mexico
AMERICA MOVIL S.A. DE C.V. ADR "L" 23.312,00 USD 21,750 390.057,70 0,45 0,45
CEMEX S.A. DE C.V. CPO 192.920,00 MXN 13,760 156.781,61 0,18 0,18
FEMSA - 24.700,00 MXN 134,310 195.931,71 0,23 0,23
GRUPO FIN.INBURSA 'O' 82.000,00 MXN 28,620 138.606,28 0,16 0,16
GRUPO TELEVISA S.A. -CPO- 26.600,00 MXN 64,750 101.723,39 0,12 0,12
GRUPOMEXICO SA -B- 74.689,00 MXN 37,480 165.331,52 0,19 0,19
IND. PENOLES SA -CP- 5.300,00 MXN 391,640 122.592,06 0,14 0,14
WAL-MART DE MEXICO SA DE CV "V" 68.600,00 MXN 36,480 147.801,34 0,17 0,17
Netherlands
AALBERTS INDUSTRIES (AMS) 8.618,00 EUR 17,170 147.971,06 0,17 0,17
ASML HOLDING NV - 2.311,00 EUR 60,620 140.092,82 0,16 0,16
NUTRECO NV - 4.659,00 EUR 32,650 152.116,35 0,18 0,18
Norway
YARA INTL ASA - 4.603,00 NOK 242,200 140.463,73 0,16 0,16
Peru
CIA DE MINAS BUENAVENTURA SA - 8.687,00 USD 14,760 98.638,45 0,12 0,11
SOUTHERN COPPER CORP (NYSE) 6.903,00 USD 27,620 146.673,48 0,17 0,17
Philippines
ABOITIZ EQUITY VENTURES INC - 172.400,00 PHP 50,200 154.121,83 0,18 0,18
MANILA ELECTRIC CY - 22.550,00 PHP 329,800 132.440,36 0,15 0,15
MANILA WATER CO - 222.900,00 PHP 32,400 128.611,04 0,15 0,15
Poland
BANK PEKAO SA - 4.107,00 PLN 150,000 142.268,26 0,17 0,16
KGHM POLSKA MIEDZ SA - 4.014,00 PLN 121,000 112.164,33 0,13 0,13
POWSZECHNY BANK KREDYTOWY SA - 1.457,00 PLN 409,700 137.853,42 0,16 0,16
Portugal
JERONIMO MARTINS - 9.005,00 EUR 16,190 145.790,95 0,17 0,17
Russia
GAZPROM ADR NEW 47.645,00 USD 6,580 241.175,55 0,28 0,28
LUKOIL - 5.514,00 USD 57,400 243.483,04 0,28 0,28
MAGNIT OSJC - 5.174,00 USD 57,200 227.673,51 0,27 0,26
MOBILE TELESYSTEMS ADR 9.830,00 USD 18,940 143.226,56 0,17 0,17
NOVATEK OAO - 1.694,00 USD 119,500 155.729,67 0,18 0,18
ROSNEFT OIL COMPANY - 28.686,00 USD 6,850 151.164,78 0,18 0,17
SBERBANK OF RUSSIA ADR 29.764,00 USD 11,390 260.798,49 0,30 0,30
TATNEFT - 6.219,00 USD 36,330 173.810,50 0,20 0,20
URALKALI - 6.752,00 USD 33,100 171.929,53 0,20 0,20
Singapore
PEOPLES FOOD HOLDINGS LTD - 144.000,00 SGD 1,100 96.081,52 0,11 0,11
PETRA FOODS LTD - 61.000,00 SGD 3,780 139.864,13 0,16 0,16
SEMBCORP INDUSTRIES LTD - 29.000,00 SGD 4,950 87.073,88 0,10 0,10
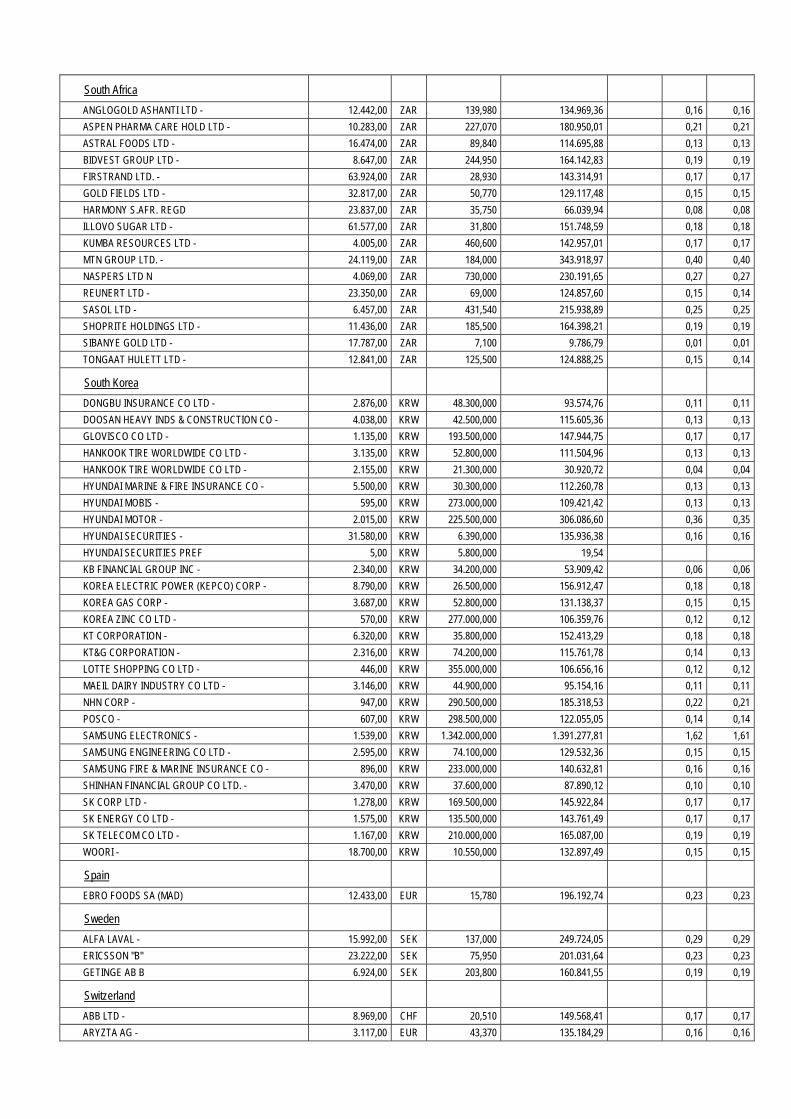
South Africa
ANGLOGOLD ASHANTI LTD - 12.442,00 ZAR 139,980 134.969,36 0,16 0,16
ASPEN PHARMA CARE HOLD LTD - 10.283,00 ZAR 227,070 180.950,01 0,21 0,21
ASTRAL FOODS LTD - 16.474,00 ZAR 89,840 114.695,88 0,13 0,13
BIDVEST GROUP LTD - 8.647,00 ZAR 244,950 164.142,83 0,19 0,19
FIRSTRAND LTD. - 63.924,00 ZAR 28,930 143.314,91 0,17 0,17
GOLD FIELDS LTD - 32.817,00 ZAR 50,770 129.117,48 0,15 0,15
HARMONY S.AFR. REGD 23.837,00 ZAR 35,750 66.039,94 0,08 0,08
ILLOVO SUGAR LTD - 61.577,00 ZAR 31,800 151.748,59 0,18 0,18
KUMBA RESOURCES LTD - 4.005,00 ZAR 460,600 142.957,01 0,17 0,17
MTN GROUP LTD. - 24.119,00 ZAR 184,000 343.918,97 0,40 0,40
NASPERS LTD N 4.069,00 ZAR 730,000 230.191,65 0,27 0,27
REUNERT LTD - 23.350,00 ZAR 69,000 124.857,60 0,15 0,14
SASOL LTD - 6.457,00 ZAR 431,540 215.938,89 0,25 0,25
SHOPRITE HOLDINGS LTD - 11.436,00 ZAR 185,500 164.398,21 0,19 0,19
SIBANYE GOLD LTD - 17.787,00 ZAR 7,100 9.786,79 0,01 0,01
TONGAAT HULETT LTD - 12.841,00 ZAR 125,500 124.888,25 0,15 0,14
South Korea
DONGBU INSURANCE CO LTD - 2.876,00 KRW 48.300,000 93.574,76 0,11 0,11
DOOSAN HEAVY INDS & CONSTRUCTION CO - 4.038,00 KRW 42.500,000 115.605,36 0,13 0,13
GLOVISCO CO LTD - 1.135,00 KRW 193.500,000 147.944,75 0,17 0,17
HANKOOK TIRE WORLDWIDE CO LTD - 3.135,00 KRW 52.800,000 111.504,96 0,13 0,13
HANKOOK TIRE WORLDWIDE CO LTD - 2.155,00 KRW 21.300,000 30.920,72 0,04 0,04
HYUNDAI MARINE & FIRE INSURANCE CO - 5.500,00 KRW 30.300,000 112.260,78 0,13 0,13
HYUNDAI MOBIS - 595,00 KRW 273.000,000 109.421,42 0,13 0,13
HYUNDAI MOTOR - 2.015,00 KRW 225.500,000 306.086,60 0,36 0,35
HYUNDAI SECURITIES - 31.580,00 KRW 6.390,000 135.936,38 0,16 0,16
HYUNDAI SECURITIES PREF 5,00 KRW 5.800,000 19,54
KB FINANCIAL GROUP INC - 2.340,00 KRW 34.200,000 53.909,42 0,06 0,06
KOREA ELECTRIC POWER (KEPCO) CORP - 8.790,00 KRW 26.500,000 156.912,47 0,18 0,18
KOREA GAS CORP - 3.687,00 KRW 52.800,000 131.138,37 0,15 0,15
KOREA ZINC CO LTD - 570,00 KRW 277.000,000 106.359,76 0,12 0,12
KT CORPORATION - 6.320,00 KRW 35.800,000 152.413,29 0,18 0,18
KT&G CORPORATION - 2.316,00 KRW 74.200,000 115.761,78 0,14 0,13
LOTTE SHOPPING CO LTD - 446,00 KRW 355.000,000 106.656,16 0,12 0,12
MAEIL DAIRY INDUSTRY CO LTD - 3.146,00 KRW 44.900,000 95.154,16 0,11 0,11
NHN CORP - 947,00 KRW 290.500,000 185.318,53 0,22 0,21
POSCO - 607,00 KRW 298.500,000 122.055,05 0,14 0,14
SAMSUNG ELECTRONICS - 1.539,00 KRW 1.342.000,000 1.391.277,81 1,62 1,61
SAMSUNG ENGINEERING CO LTD - 2.595,00 KRW 74.100,000 129.532,36 0,15 0,15
SAMSUNG FIRE & MARINE INSURANCE CO - 896,00 KRW 233.000,000 140.632,81 0,16 0,16
SHINHAN FINANCIAL GROUP CO LTD. - 3.470,00 KRW 37.600,000 87.890,12 0,10 0,10
SK CORP LTD - 1.278,00 KRW 169.500,000 145.922,84 0,17 0,17
SK ENERGY CO LTD - 1.575,00 KRW 135.500,000 143.761,49 0,17 0,17
SK TELECOM CO LTD - 1.167,00 KRW 210.000,000 165.087,00 0,19 0,19
WOORI - 18.700,00 KRW 10.550,000 132.897,49 0,15 0,15
Spain
EBRO FOODS SA (MAD) 12.433,00 EUR 15,780 196.192,74 0,23 0,23
Sweden
ALFA LAVAL - 15.992,00 SEK 137,000 249.724,05 0,29 0,29
ERICSSON "B" 23.222,00 SEK 75,950 201.031,64 0,23 0,23
GETINGE AB B 6.924,00 SEK 203,800 160.841,55 0,19 0,19
Switzerland
ABB LTD - 8.969,00 CHF 20,510 149.568,41 0,17 0,17
ARYZTA AG - 3.117,00 EUR 43,370 135.184,29 0,16 0,16

COMPAGNIE FINANCIERE RICHEMONT "A" 2.599,00 CHF 83,550 176.556,18 0,21 0,20
EMMI AG - 910,00 CHF 276,750 204.766,65 0,24 0,24
GEBERIT AG - 2.207,00 CHF 234,300 420.440,77 0,49 0,49
LINDT & SPRUENGLI AG - 5,00 CHF 41.160,000 167.330,68 0,19 0,19
NOVARTIS AG ADR 7.865,00 USD 70,710 427.828,41 0,50 0,49
PENTAIR LTD - REGISTERED - 9.488,00 USD 57,690 421.080,64 0,49 0,49
ROCHE HOLDING GENOTS 2.063,00 CHF 235,000 394.182,45 0,46 0,46
SULZER FRERES (NOM) 975,00 CHF 151,100 119.784,13 0,14 0,14
SYNGENTA (NOM) 469,00 CHF 369,600 140.940,24 0,16 0,16
THE SWATCH GROUP AG REG 2.724,00 CHF 89,000 197.118,46 0,23 0,23
Taiwan
ASUSTEK COMPUTER INC - 18.000,00 TWD 258,000 119.205,91 0,14 0,14
CHICONY ELECTRONICS CO LTD - 73.520,00 TWD 78,000 147.199,28 0,17 0,17
FUBON FINANCIAL HOLDING CO - 208.991,00 TWD 40,850 219.141,80 0,26 0,25
HON HAI PRECISION GDR 47.051,00 USD 4,870 176.273,84 0,21 0,20
MEDIATEK INCORPORATION - 15.828,00 TWD 348,500 141.590,59 0,17 0,16
MEGA FINANCIAL HOLD CO - 994,00 TWD 22,750 580,46 0,00 0,00
MSTAR SEMICONDUCTOR INC - 363,00 TWD 216,000 2.012,64 0,00 0,00
NOVATEK MICROELECTRONICS CORP - 42.000,00 TWD 145,500 156.862,04 0,18 0,18
PEGATRON CORP - 137.000,00 TWD 49,500 174.072,97 0,20 0,20
PHISON ELECTRONICS CORP - 23.000,00 TWD 246,500 145.529,26 0,17 0,17
RICHTEK TECHNOLOGY CORP - 39.000,00 TWD 133,000 133.144,07 0,16 0,15
SHIN KONG FINANCIAL HOLDING CO - 583.768,00 TWD 10,100 151.344,71 0,18 0,18
SIMPLO TECHNOLOGY CO LTD - 36.900,00 TWD 130,000 123.133,24 0,14 0,14
TAISHIN_FINANCIAL HOLD CO - 461.819,00 TWD 13,200 156.477,29 0,18 0,18
TAIWAN SEMICONDUCTOR - 284.000,00 TWD 111,000 809.183,27 0,94 0,93
TECO ELECTRIC AND MACHINERY CO - 121.000,00 TWD 30,000 93.177,75 0,11 0,11
TRIPOD TECHNOLOGY CORP - 96.000,00 TWD 64,700 159.434,05 0,19 0,18
TSRC CORP - 98.800,00 TWD 57,500 145.824,46 0,17 0,17
UNITED MICRO ELECTRONICS - 549.000,00 TWD 14,500 204.336,49 0,24 0,24
Thailand
ADVANCED INFO SERVICE PUBLIC CO LTD LOCAL 28.500,00 THB 282,000 199.356,07 0,23 0,23
BANGKOK BANK PUBLIC LOCAL 50.100,00 THB 204,000 253.514,84 0,30 0,29
BANK OF AYUDHYA PCL - 204.100,00 THB 35,500 179.724,32 0,21 0,21
BANK OF AYUDHYA PCL - 14.200,00 THB 35,500 12.504,09 0,02 0,01
CHAROEN POKHAND FOODS PCL - 227.800,00 THB 25,750 145.501,16 0,17 0,17
KASIKORNBANK PLC LOC 38.500,00 THB 191,000 182.402,00 0,21 0,21
PTT EXPLORATION PRODUCTION FOREIGN 38.279,00 THB 158,500 150.496,13 0,18 0,17
SIAM COMM. BK. PUBL. CO. LOCAL 51.400,00 THB 172,000 219.294,16 0,26 0,25
Turkey
AKBANK T.A.S. - 65.574,00 TRY 7,860 205.507,03 0,24 0,24
EMLAK KONUT GAYRIMENKUL YATIRI - 132.699,00 TRY 2,720 143.915,98 0,17 0,17
HACI OMER SABANCI HOLDING S.A - 32.243,00 TRY 10,150 130.489,02 0,15 0,15
TOFAS TURK OTOMOBIL FABRIKASI AS - 31.400,00 TRY 12,050 150.865,23 0,18 0,17
TUPRAS-TURKIYE PETROL RAF. A.S. - 8.372,00 TRY 47,100 157.225,36 0,18 0,18
TURK HAVA YOLLARI AO - 76.967,00 TRY 7,500 230.164,47 0,27 0,27
TURK TELEKOMUNIKASYON AS - 55.105,00 TRY 7,500 164.787,68 0,19 0,19
U.K.
ANGLO AMERICAN PLC PLC 9.598,00 GBP 12,660 141.786,09 0,17 0,16
ARM HOLDG - 21.841,00 GBP 7,950 202.609,04 0,24 0,23
BG GROUP PLC - 12.696,00 GBP 11,185 165.699,84 0,19 0,19
BILLITON PLC - 5.968,00 GBP 16,820 117.131,58 0,14 0,14
BP PLC - 29.151,00 GBP 4,553 154.854,06 0,18 0,18
CARNIVAL PLC PLC 5.316,00 GBP 22,900 142.049,47 0,17 0,16
DAIRY CREST GROUP PLC - 37.764,00 GBP 4,542 200.144,79 0,23 0,23
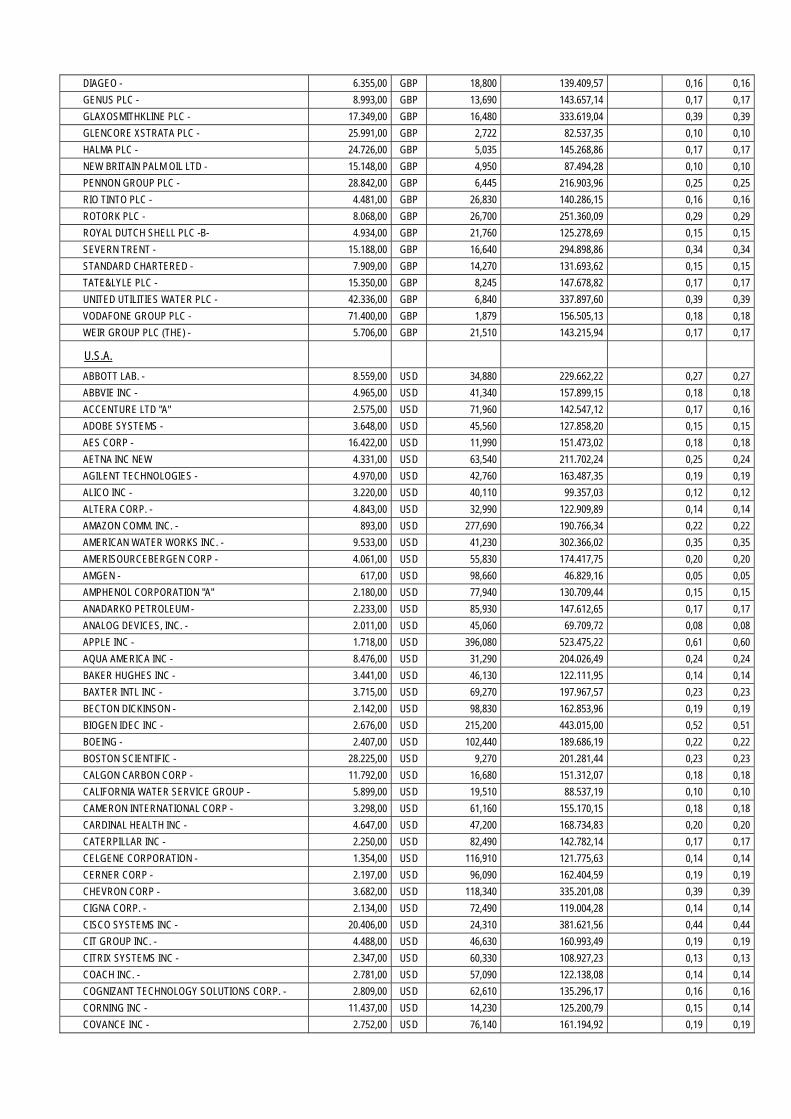
DIAGEO - 6.355,00 GBP 18,800 139.409,57 0,16 0,16
GENUS PLC - 8.993,00 GBP 13,690 143.657,14 0,17 0,17
GLAXOSMITHKLINE PLC - 17.349,00 GBP 16,480 333.619,04 0,39 0,39
GLENCORE XSTRATA PLC - 25.991,00 GBP 2,722 82.537,35 0,10 0,10
HALMA PLC - 24.726,00 GBP 5,035 145.268,86 0,17 0,17
NEW BRITAIN PALM OIL LTD - 15.148,00 GBP 4,950 87.494,28 0,10 0,10
PENNON GROUP PLC - 28.842,00 GBP 6,445 216.903,96 0,25 0,25
RIO TINTO PLC - 4.481,00 GBP 26,830 140.286,15 0,16 0,16
ROTORK PLC - 8.068,00 GBP 26,700 251.360,09 0,29 0,29
ROYAL DUTCH SHELL PLC -B- 4.934,00 GBP 21,760 125.278,69 0,15 0,15
SEVERN TRENT - 15.188,00 GBP 16,640 294.898,86 0,34 0,34
STANDARD CHARTERED - 7.909,00 GBP 14,270 131.693,62 0,15 0,15
TATE&LYLE PLC - 15.350,00 GBP 8,245 147.678,82 0,17 0,17
UNITED UTILITIES WATER PLC - 42.336,00 GBP 6,840 337.897,60 0,39 0,39
VODAFONE GROUP PLC - 71.400,00 GBP 1,879 156.505,13 0,18 0,18
WEIR GROUP PLC (THE) - 5.706,00 GBP 21,510 143.215,94 0,17 0,17
U.S.A.
ABBOTT LAB. - 8.559,00 USD 34,880 229.662,22 0,27 0,27
ABBVIE INC - 4.965,00 USD 41,340 157.899,15 0,18 0,18
ACCENTURE LTD "A" 2.575,00 USD 71,960 142.547,12 0,17 0,16
ADOBE SYSTEMS - 3.648,00 USD 45,560 127.858,20 0,15 0,15
AES CORP - 16.422,00 USD 11,990 151.473,02 0,18 0,18
AETNA INC NEW 4.331,00 USD 63,540 211.702,24 0,25 0,24
AGILENT TECHNOLOGIES - 4.970,00 USD 42,760 163.487,35 0,19 0,19
ALICO INC - 3.220,00 USD 40,110 99.357,03 0,12 0,12
ALTERA CORP. - 4.843,00 USD 32,990 122.909,89 0,14 0,14
AMAZON COMM. INC. - 893,00 USD 277,690 190.766,34 0,22 0,22
AMERICAN WATER WORKS INC. - 9.533,00 USD 41,230 302.366,02 0,35 0,35
AMERISOURCEBERGEN CORP - 4.061,00 USD 55,830 174.417,75 0,20 0,20
AMGEN - 617,00 USD 98,660 46.829,16 0,05 0,05
AMPHENOL CORPORATION "A" 2.180,00 USD 77,940 130.709,44 0,15 0,15
ANADARKO PETROLEUM - 2.233,00 USD 85,930 147.612,65 0,17 0,17
ANALOG DEVICES, INC. - 2.011,00 USD 45,060 69.709,72 0,08 0,08
APPLE INC - 1.718,00 USD 396,080 523.475,22 0,61 0,60
AQUA AMERICA INC - 8.476,00 USD 31,290 204.026,49 0,24 0,24
BAKER HUGHES INC - 3.441,00 USD 46,130 122.111,95 0,14 0,14
BAXTER INTL INC - 3.715,00 USD 69,270 197.967,57 0,23 0,23
BECTON DICKINSON - 2.142,00 USD 98,830 162.853,96 0,19 0,19
BIOGEN IDEC INC - 2.676,00 USD 215,200 443.015,00 0,52 0,51
BOEING - 2.407,00 USD 102,440 189.686,19 0,22 0,22
BOSTON SCIENTIFIC - 28.225,00 USD 9,270 201.281,44 0,23 0,23
CALGON CARBON CORP - 11.792,00 USD 16,680 151.312,07 0,18 0,18
CALIFORNIA WATER SERVICE GROUP - 5.899,00 USD 19,510 88.537,19 0,10 0,10
CAMERON INTERNATIONAL CORP - 3.298,00 USD 61,160 155.170,15 0,18 0,18
CARDINAL HEALTH INC - 4.647,00 USD 47,200 168.734,83 0,20 0,20
CATERPILLAR INC - 2.250,00 USD 82,490 142.782,14 0,17 0,17
CELGENE CORPORATION - 1.354,00 USD 116,910 121.775,63 0,14 0,14
CERNER CORP - 2.197,00 USD 96,090 162.404,59 0,19 0,19
CHEVRON CORP - 3.682,00 USD 118,340 335.201,08 0,39 0,39
CIGNA CORP. - 2.134,00 USD 72,490 119.004,28 0,14 0,14
CISCO SYSTEMS INC - 20.406,00 USD 24,310 381.621,56 0,44 0,44
CIT GROUP INC. - 4.488,00 USD 46,630 160.993,49 0,19 0,19
CITRIX SYSTEMS INC - 2.347,00 USD 60,330 108.927,23 0,13 0,13
COACH INC. - 2.781,00 USD 57,090 122.138,08 0,14 0,14
COGNIZANT TECHNOLOGY SOLUTIONS CORP. - 2.809,00 USD 62,610 135.296,17 0,16 0,16
CORNING INC - 11.437,00 USD 14,230 125.200,79 0,15 0,14
COVANCE INC - 2.752,00 USD 76,140 161.194,92 0,19 0,19
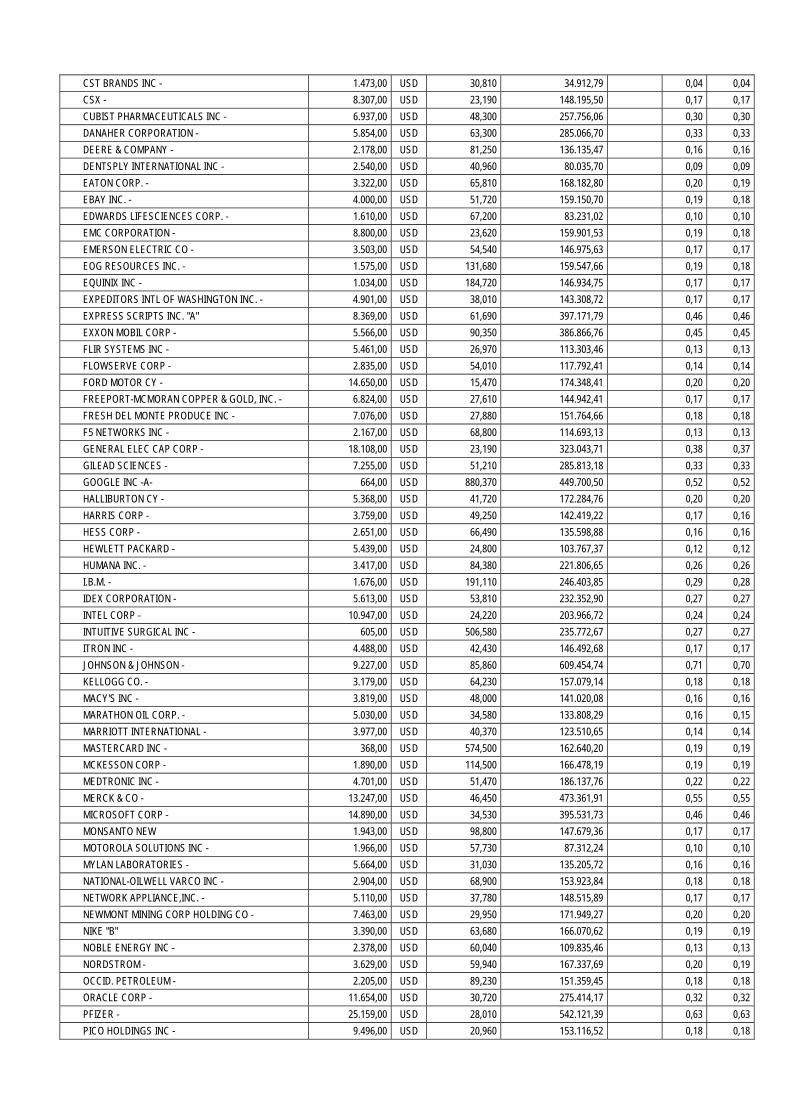
CST BRANDS INC - 1.473,00 USD 30,810 34.912,79 0,04 0,04
CSX - 8.307,00 USD 23,190 148.195,50 0,17 0,17
CUBIST PHARMACEUTICALS INC - 6.937,00 USD 48,300 257.756,06 0,30 0,30
DANAHER CORPORATION - 5.854,00 USD 63,300 285.066,70 0,33 0,33
DEERE & COMPANY - 2.178,00 USD 81,250 136.135,47 0,16 0,16
DENTSPLY INTERNATIONAL INC - 2.540,00 USD 40,960 80.035,70 0,09 0,09
EATON CORP. - 3.322,00 USD 65,810 168.182,80 0,20 0,19
EBAY INC. - 4.000,00 USD 51,720 159.150,70 0,19 0,18
EDWARDS LIFESCIENCES CORP. - 1.610,00 USD 67,200 83.231,02 0,10 0,10
EMC CORPORATION - 8.800,00 USD 23,620 159.901,53 0,19 0,18
EMERSON ELECTRIC CO - 3.503,00 USD 54,540 146.975,63 0,17 0,17
EOG RESOURCES INC. - 1.575,00 USD 131,680 159.547,66 0,19 0,18
EQUINIX INC - 1.034,00 USD 184,720 146.934,75 0,17 0,17
EXPEDITORS INTL OF WASHINGTON INC. - 4.901,00 USD 38,010 143.308,72 0,17 0,17
EXPRESS SCRIPTS INC. "A" 8.369,00 USD 61,690 397.171,79 0,46 0,46
EXXON MOBIL CORP - 5.566,00 USD 90,350 386.866,76 0,45 0,45
FLIR SYSTEMS INC - 5.461,00 USD 26,970 113.303,46 0,13 0,13
FLOWSERVE CORP - 2.835,00 USD 54,010 117.792,41 0,14 0,14
FORD MOTOR CY - 14.650,00 USD 15,470 174.348,41 0,20 0,20
FREEPORT-MCMORAN COPPER & GOLD, INC. - 6.824,00 USD 27,610 144.942,41 0,17 0,17
FRESH DEL MONTE PRODUCE INC - 7.076,00 USD 27,880 151.764,66 0,18 0,18
F5 NETWORKS INC - 2.167,00 USD 68,800 114.693,13 0,13 0,13
GENERAL ELEC CAP CORP - 18.108,00 USD 23,190 323.043,71 0,38 0,37
GILEAD SCIENCES - 7.255,00 USD 51,210 285.813,18 0,33 0,33
GOOGLE INC -A- 664,00 USD 880,370 449.700,50 0,52 0,52
HALLIBURTON CY - 5.368,00 USD 41,720 172.284,76 0,20 0,20
HARRIS CORP - 3.759,00 USD 49,250 142.419,22 0,17 0,16
HESS CORP - 2.651,00 USD 66,490 135.598,88 0,16 0,16
HEWLETT PACKARD - 5.439,00 USD 24,800 103.767,37 0,12 0,12
HUMANA INC. - 3.417,00 USD 84,380 221.806,65 0,26 0,26
I.B.M. - 1.676,00 USD 191,110 246.403,85 0,29 0,28
IDEX CORPORATION - 5.613,00 USD 53,810 232.352,90 0,27 0,27
INTEL CORP - 10.947,00 USD 24,220 203.966,72 0,24 0,24
INTUITIVE SURGICAL INC - 605,00 USD 506,580 235.772,67 0,27 0,27
ITRON INC - 4.488,00 USD 42,430 146.492,68 0,17 0,17
JOHNSON & JOHNSON - 9.227,00 USD 85,860 609.454,74 0,71 0,70
KELLOGG CO. - 3.179,00 USD 64,230 157.079,14 0,18 0,18
MACY'S INC - 3.819,00 USD 48,000 141.020,08 0,16 0,16
MARATHON OIL CORP. - 5.030,00 USD 34,580 133.808,29 0,16 0,15
MARRIOTT INTERNATIONAL - 3.977,00 USD 40,370 123.510,65 0,14 0,14
MASTERCARD INC - 368,00 USD 574,500 162.640,20 0,19 0,19
MCKESSON CORP - 1.890,00 USD 114,500 166.478,19 0,19 0,19
MEDTRONIC INC - 4.701,00 USD 51,470 186.137,76 0,22 0,22
MERCK & CO - 13.247,00 USD 46,450 473.361,91 0,55 0,55
MICROSOFT CORP - 14.890,00 USD 34,530 395.531,73 0,46 0,46
MONSANTO NEW 1.943,00 USD 98,800 147.679,36 0,17 0,17
MOTOROLA SOLUTIONS INC - 1.966,00 USD 57,730 87.312,24 0,10 0,10
MYLAN LABORATORIES - 5.664,00 USD 31,030 135.205,72 0,16 0,16
NATIONAL-OILWELL VARCO INC - 2.904,00 USD 68,900 153.923,84 0,18 0,18
NETWORK APPLIANCE,INC. - 5.110,00 USD 37,780 148.515,89 0,17 0,17
NEWMONT MINING CORP HOLDING CO - 7.463,00 USD 29,950 171.949,27 0,20 0,20
NIKE "B" 3.390,00 USD 63,680 166.070,62 0,19 0,19
NOBLE ENERGY INC - 2.378,00 USD 60,040 109.835,46 0,13 0,13
NORDSTROM - 3.629,00 USD 59,940 167.337,69 0,20 0,19
OCCID. PETROLEUM - 2.205,00 USD 89,230 151.359,45 0,18 0,18
ORACLE CORP - 11.654,00 USD 30,720 275.414,17 0,32 0,32
PFIZER - 25.159,00 USD 28,010 542.121,39 0,63 0,63
PICO HOLDINGS INC - 9.496,00 USD 20,960 153.116,52 0,18 0,18

PIONEER NATURAL RESOURCES CO - 1.448,00 USD 144,750 161.241,63 0,19 0,19
PLUM CREEK TIMBER CO INC - 4.124,00 USD 46,670 148.062,99 0,17 0,17
PRICELINE.COM INC. - 168,00 USD 827,130 106.898,87 0,12 0,12
QUALCOMM CORP - 5.869,00 USD 61,080 275.773,92 0,32 0,32
RAYONIER INC - 2.724,00 USD 55,390 116.072,28 0,14 0,13
RED HAT INC - 4.246,00 USD 47,820 156.199,49 0,18 0,18
REGENRON PHARMACEUTICALS - 1.304,00 USD 224,880 225.589,29 0,26 0,26
SALESFORCE.COM INC. - 3.820,00 USD 38,180 112.199,09 0,13 0,13
SANDISK CORP - 2.145,00 USD 61,100 100.822,76 0,12 0,12
SBA COMMUNICATIONS CORP. - 2.649,00 USD 74,120 151.045,37 0,18 0,17
SCHLUMBERGER - 3.430,00 USD 71,660 189.086,70 0,22 0,22
ST JUDE MEDICAL INC. - 2.985,00 USD 45,630 104.781,56 0,12 0,12
STARWOOD HOTELS & RESORTS - 2.544,00 USD 63,190 123.667,48 0,14 0,14
STRYKER CORPORATION - 2.049,00 USD 64,680 101.953,47 0,12 0,12
SYMANTEC CORPORATION - 8.648,00 USD 22,470 149.488,85 0,17 0,17
TERADATA CORP - 1.973,00 USD 50,230 76.239,55 0,09 0,09
TEXAS INSTRUMENTS - 5.675,00 USD 34,850 152.145,36 0,18 0,18
THE MOSAIC COMPANY - 3.158,00 USD 53,810 130.726,96 0,15 0,15
THERMO ELECTRONIC - 2.357,00 USD 84,630 153.452,50 0,18 0,18
TIFFANY & CO - 2.777,00 USD 72,840 155.609,42 0,18 0,18
TIME WARNER CABLE INC - 1.485,00 USD 112,480 128.496,65 0,15 0,15
TIME WARNER INC - 3.381,00 USD 57,820 150.388,05 0,18 0,17
TWENTY FIRST CENTURY FOX INC NEW 'A' 6.049,00 USD 32,580 151.608,91 0,18 0,18
TYSON FOODS INC -A- 8.211,00 USD 25,680 162.211,31 0,19 0,19
UNITEDHEALTH GROUP INC. - 10.384,00 USD 65,480 523.074,33 0,61 0,60
VALERO ENERGY CORPORATION - 4.639,00 USD 34,770 124.084,95 0,14 0,14
VALMONT INDUSTRIES - 1.400,00 USD 143,090 154.108,78 0,18 0,18
VARIAN MEDICAL SYSTEMS - 2.844,00 USD 67,450 147.571,20 0,17 0,17
VISA INC - 1.671,00 USD 182,750 234.922,11 0,27 0,27
WALT DISNEY - 3.357,00 USD 63,150 163.085,28 0,19 0,19
WATERS CORP - 2.182,00 USD 100,050 167.943,00 0,20 0,19
WELLPOINT INC - 4.160,00 USD 81,840 261.908,15 0,30 0,30
XILINX INC. - 3.401,00 USD 39,610 103.633,83 0,12 0,12
XYLEM INC/NY - 12.929,00 USD 26,940 267.949,27 0,31 0,31
ZIMMER HOLDINGS INC. - 2.306,00 USD 74,940 132.942,26 0,16 0,15
3M CO - 1.926,00 USD 109,350 162.018,69 0,19 0,19
Zaire
GROWTHPOINT PROPERTIES LTD - 80.154,00 ZAR 26,390 163.924,40 0,19 0,19
Total shares 80.897.418,88 94,03 93,34
Rights
Brazil
ITAUSA-INVESTIMENTOS ITAU SA CP 08/05/2013 1.505,00 BRL 2,530 1.326,06 0,00 0,00
China
PICC PROPERTY & CASUALTY CP 28/05/2013 1,00 HKD 3,260 0,32
France
GROUPE FNAC CP 20/06/13 1.045,00 EUR 2,003 2.093,14 0,00 0,00
SAINT GOBAIN CP 12/06/13 4.035,00 EUR 1,240 5.003,40 0,01 0,01
Taiwan
SHIN KONG FINANCIAL HOLDING CO CP 14/06/13 27.608,00 TWD 0,000 0,00
Total rights 8.422,92 0,01 0,01
TOTAL SECURITIES PORTFOLIO 86.033.426,97 100,00 99,27
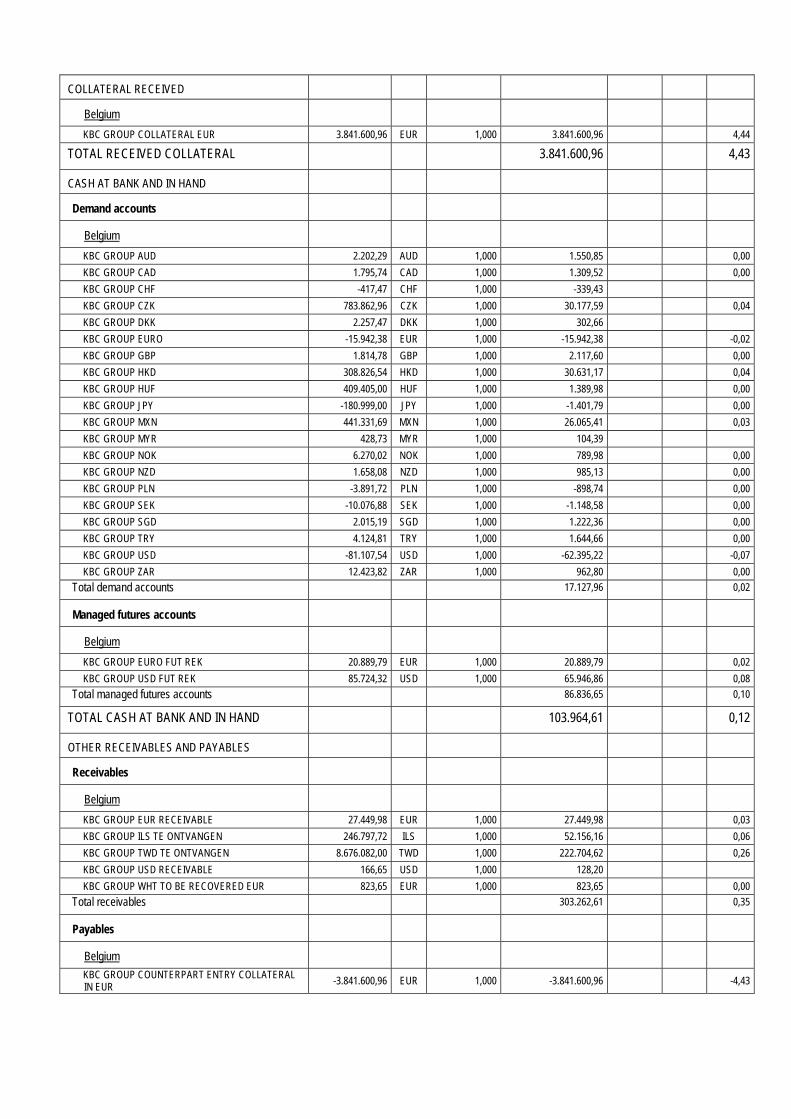
COLLATERAL RECEIVED
Belgium
KBC GROUP COLLATERAL EUR 3.841.600,96 EUR 1,000 3.841.600,96 4,44
TOTAL RECEIVED COLLATERAL 3.841.600,96 4,43
CASH AT BANK AND IN HAND
Demand accounts
Belgium
KBC GROUP AUD 2.202,29 AUD 1,000 1.550,85 0,00
KBC GROUP CAD 1.795,74 CAD 1,000 1.309,52 0,00
KBC GROUP CHF -417,47 CHF 1,000 -339,43
KBC GROUP CZK 783.862,96 CZK 1,000 30.177,59 0,04
KBC GROUP DKK 2.257,47 DKK 1,000 302,66
KBC GROUP EURO -15.942,38 EUR 1,000 -15.942,38 -0,02
KBC GROUP GBP 1.814,78 GBP 1,000 2.117,60 0,00
KBC GROUP HKD 308.826,54 HKD 1,000 30.631,17 0,04
KBC GROUP HUF 409.405,00 HUF 1,000 1.389,98 0,00
KBC GROUP JPY -180.999,00 JPY 1,000 -1.401,79 0,00
KBC GROUP MXN 441.331,69 MXN 1,000 26.065,41 0,03
KBC GROUP MYR 428,73 MYR 1,000 104,39
KBC GROUP NOK 6.270,02 NOK 1,000 789,98 0,00
KBC GROUP NZD 1.658,08 NZD 1,000 985,13 0,00
KBC GROUP PLN -3.891,72 PLN 1,000 -898,74 0,00
KBC GROUP SEK -10.076,88 SEK 1,000 -1.148,58 0,00
KBC GROUP SGD 2.015,19 SGD 1,000 1.222,36 0,00
KBC GROUP TRY 4.124,81 TRY 1,000 1.644,66 0,00
KBC GROUP USD -81.107,54 USD 1,000 -62.395,22 -0,07
KBC GROUP ZAR 12.423,82 ZAR 1,000 962,80 0,00
Total demand accounts 17.127,96 0,02
Managed futures accounts
Belgium
KBC GROUP EURO FUT REK 20.889,79 EUR 1,000 20.889,79 0,02
KBC GROUP USD FUT REK 85.724,32 USD 1,000 65.946,86 0,08
Total managed futures accounts 86.836,65 0,10
TOTAL CASH AT BANK AND IN HAND 103.964,61 0,12
OTHER RECEIVABLES AND PAYABLES
Receivables
Belgium
KBC GROUP EUR RECEIVABLE 27.449,98 EUR 1,000 27.449,98 0,03
KBC GROUP ILS TE ONTVANGEN 246.797,72 ILS 1,000 52.156,16 0,06
KBC GROUP TWD TE ONTVANGEN 8.676.082,00 TWD 1,000 222.704,62 0,26
KBC GROUP USD RECEIVABLE 166,65 USD 1,000 128,20
KBC GROUP WHT TO BE RECOVERED EUR 823,65 EUR 1,000 823,65 0,00
Total receivables 303.262,61 0,35
Payables
Belgium
KBC GROUP COUNTERPART ENTRY COLLATERAL IN EUR
-3.841.600,96 EUR 1,000 -3.841.600,96 -4,43

KBC GROUP EUR PAYABLE -14.097,53 EUR 1,000 -14.097,53 -0,02
Payables -3.855.698,49 -4,45
TOTAL RECEIVABLES AND PAYABLES -3.552.435,88 -4,10
OTHER
Interest receivable EUR 327.846,51 0,38
Accrued interest EUR 3.191,67 0,00
Expenses payable EUR -130.555,23 -0,15
Expenses to be carried forward EUR 42.444,97 0,05
TOTAL OTHER 242.927,92 0,28
TOTAL NET ASSETS 86.669.484,58 100,00
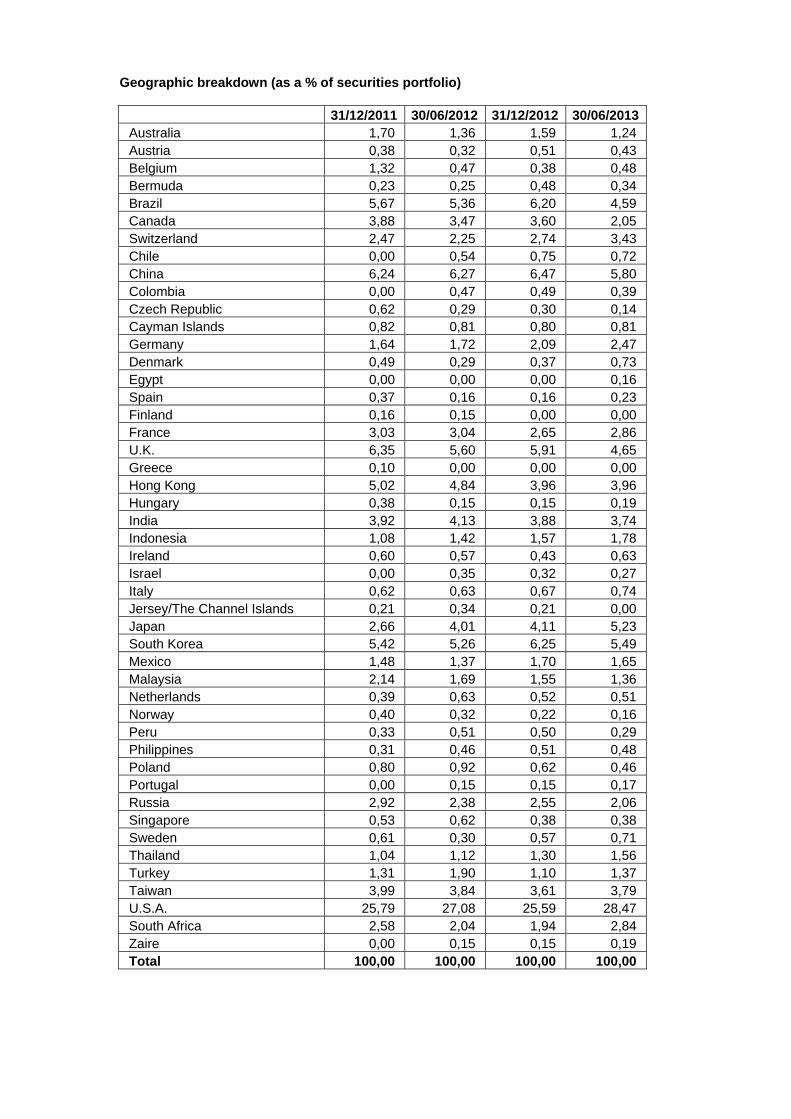
Geographic breakdown (as a % of securities portfolio)
31/12/2011 30/06/2012 31/12/2012 30/06/2013 Australia 1,70 1,36 1,59 1,24 Austria 0,38 0,32 0,51 0,43 Belgium 1,32 0,47 0,38 0,48 Bermuda 0,23 0,25 0,48 0,34 Brazil 5,67 5,36 6,20 4,59 Canada 3,88 3,47 3,60 2,05 Switzerland 2,47 2,25 2,74 3,43 Chile 0,00 0,54 0,75 0,72 China 6,24 6,27 6,47 5,80 Colombia 0,00 0,47 0,49 0,39 Czech Republic 0,62 0,29 0,30 0,14 Cayman Islands 0,82 0,81 0,80 0,81 Germany 1,64 1,72 2,09 2,47 Denmark 0,49 0,29 0,37 0,73 Egypt 0,00 0,00 0,00 0,16 Spain 0,37 0,16 0,16 0,23 Finland 0,16 0,15 0,00 0,00 France 3,03 3,04 2,65 2,86 U.K. 6,35 5,60 5,91 4,65 Greece 0,10 0,00 0,00 0,00 Hong Kong 5,02 4,84 3,96 3,96 Hungary 0,38 0,15 0,15 0,19 India 3,92 4,13 3,88 3,74 Indonesia 1,08 1,42 1,57 1,78 Ireland 0,60 0,57 0,43 0,63 Israel 0,00 0,35 0,32 0,27 Italy 0,62 0,63 0,67 0,74 Jersey/The Channel Islands 0,21 0,34 0,21 0,00 Japan 2,66 4,01 4,11 5,23 South Korea 5,42 5,26 6,25 5,49 Mexico 1,48 1,37 1,70 1,65 Malaysia 2,14 1,69 1,55 1,36 Netherlands 0,39 0,63 0,52 0,51 Norway 0,40 0,32 0,22 0,16 Peru 0,33 0,51 0,50 0,29 Philippines 0,31 0,46 0,51 0,48 Poland 0,80 0,92 0,62 0,46 Portugal 0,00 0,15 0,15 0,17 Russia 2,92 2,38 2,55 2,06 Singapore 0,53 0,62 0,38 0,38 Sweden 0,61 0,30 0,57 0,71 Thailand 1,04 1,12 1,30 1,56 Turkey 1,31 1,90 1,10 1,37 Taiwan 3,99 3,84 3,61 3,79 U.S.A. 25,79 27,08 25,59 28,47 South Africa 2,58 2,04 1,94 2,84 Zaire 0,00 0,15 0,15 0,19 Total 100,00 100,00 100,00 100,00
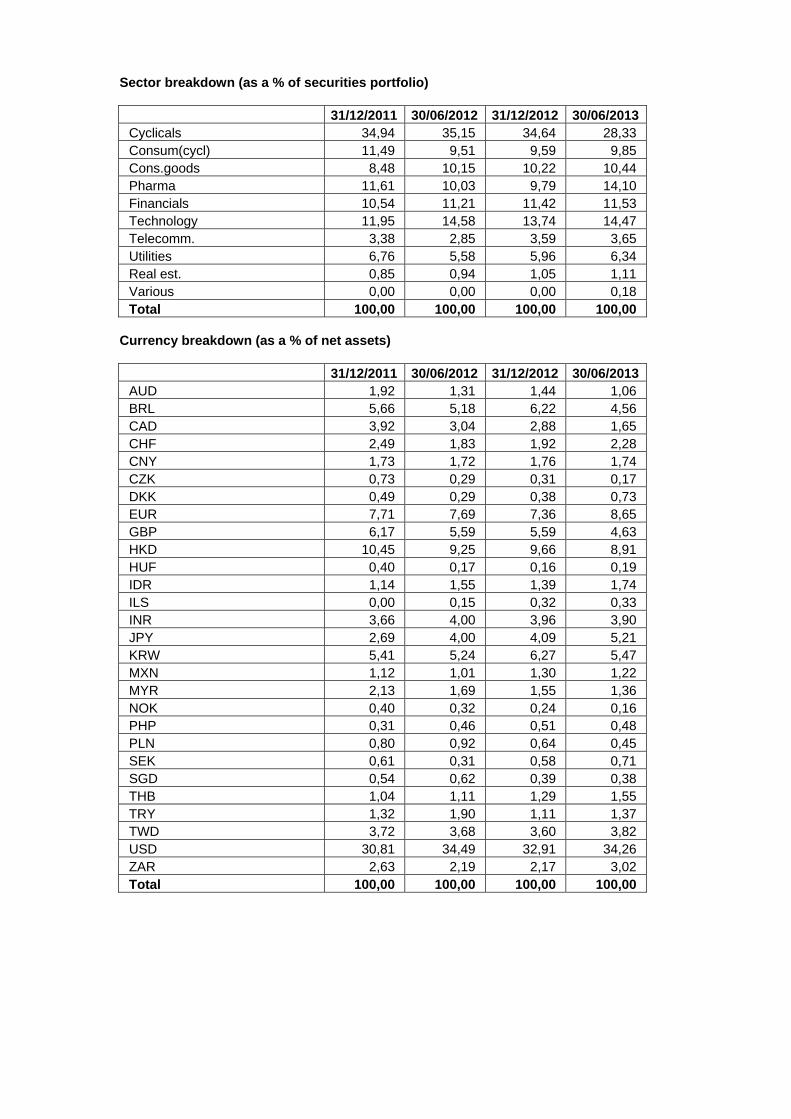
Sector breakdown (as a % of securities portfolio)
31/12/2011 30/06/2012 31/12/2012 30/06/2013 Cyclicals 34,94 35,15 34,64 28,33 Consum(cycl) 11,49 9,51 9,59 9,85 Cons.goods 8,48 10,15 10,22 10,44 Pharma 11,61 10,03 9,79 14,10 Financials 10,54 11,21 11,42 11,53 Technology 11,95 14,58 13,74 14,47 Telecomm. 3,38 2,85 3,59 3,65 Utilities 6,76 5,58 5,96 6,34 Real est. 0,85 0,94 1,05 1,11 Various 0,00 0,00 0,00 0,18 Total 100,00 100,00 100,00 100,00
Currency breakdown (as a % of net assets)
31/12/2011 30/06/2012 31/12/2012 30/06/2013 AUD 1,92 1,31 1,44 1,06 BRL 5,66 5,18 6,22 4,56 CAD 3,92 3,04 2,88 1,65 CHF 2,49 1,83 1,92 2,28 CNY 1,73 1,72 1,76 1,74 CZK 0,73 0,29 0,31 0,17 DKK 0,49 0,29 0,38 0,73 EUR 7,71 7,69 7,36 8,65 GBP 6,17 5,59 5,59 4,63 HKD 10,45 9,25 9,66 8,91 HUF 0,40 0,17 0,16 0,19 IDR 1,14 1,55 1,39 1,74 ILS 0,00 0,15 0,32 0,33 INR 3,66 4,00 3,96 3,90 JPY 2,69 4,00 4,09 5,21 KRW 5,41 5,24 6,27 5,47 MXN 1,12 1,01 1,30 1,22 MYR 2,13 1,69 1,55 1,36 NOK 0,40 0,32 0,24 0,16 PHP 0,31 0,46 0,51 0,48 PLN 0,80 0,92 0,64 0,45 SEK 0,61 0,31 0,58 0,71 SGD 0,54 0,62 0,39 0,38 THB 1,04 1,11 1,29 1,55 TRY 1,32 1,90 1,11 1,37 TWD 3,72 3,68 3,60 3,82 USD 30,81 34,49 32,91 34,26 ZAR 2,63 2,19 2,17 3,02 Total 100,00 100,00 100,00 100,00

2.4.2 CHANGES IN THE COMPOSITION OF THE ASSETS OF KBC EQUITY FUND TRENDS (IN THE
CURRENCY OF THE SUB-FUND)
1st half of year YearPurchases 55.525.915,01 55.525.915,01 Sales 67.374.321,39 67.374.321,39 Total 1 122.900.236,40 122.900.236,40 Subscriptions 56.196.462,02 56.196.462,02 Redemptions 67.992.164,78 67.992.164,78 Total 2 124.188.626,80 124.188.626,80 Monthly average of total assets
108.524.662,74 108.524.662,74
Turnover rate -1,19 % -1,19 %
1st half of year YearPurchases 55.525.915,01 55.525.915,01 Sales 67.374.321,39 67.374.321,39 Total 1 122.900.236,40 122.900.236,40 Subscriptions 56.196.462,02 56.196.462,02 Redemptions 67.992.164,78 67.992.164,78 Total 2 124.188.626,80 124.188.626,80 Monthly average of total assets
363.952.088,98 363.952.088,98
Corrected turnover rate -0,35 % -0,35 %
The table above shows the capital volume of portfolio transactions. This volume (adjusted to take account of total subscriptions and redemptions) is also compared to the average net assets at the beginning and end of the period. A figure close to 0% implies that the transactions relating to the securities or transactions relating to the assets (excluding deposits and cash) in a given period only involve subscriptions and redemptions. A negative percentage shows that subscriptions and redemptions entailed few, if any, transactions in the portfolio. Active asset management may result in high turnover rates (monthly percentage >50%). The detailed list of transactions is available for consultation free of charge at the registered office of the Bevek or fund at Havenlaan 2, 1080 Brussels.
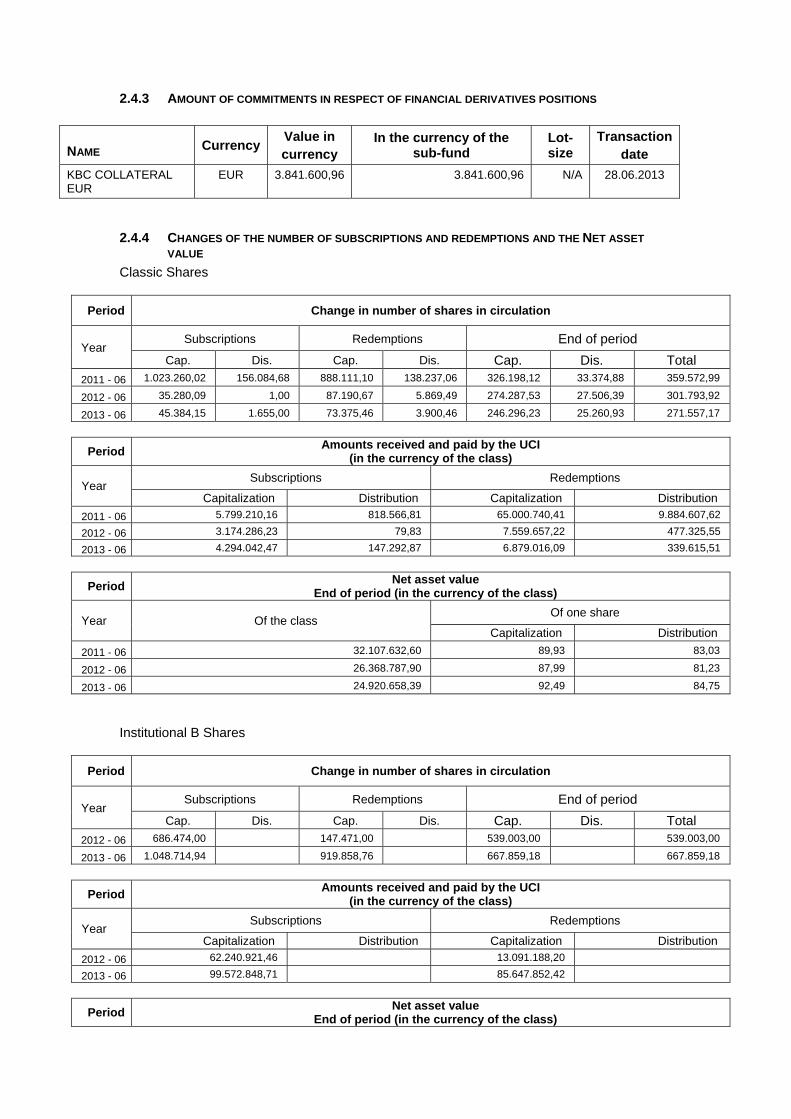
2.4.3 AMOUNT OF COMMITMENTS IN RESPECT OF FINANCIAL DERIVATIVES POSITIONS
NAME Currency Value in currency
In the currency of the sub-fund
Lot-size
Transactiondate
KBC COLLATERAL EUR
EUR 3.841.600,96 3.841.600,96 N/A 28.06.2013
2.4.4 CHANGES OF THE NUMBER OF SUBSCRIPTIONS AND REDEMPTIONS AND THE NET ASSET
VALUE
Classic Shares
Period Change in number of shares in circulation
Year Subscriptions Redemptions End of period
Cap. Dis. Cap. Dis. Cap. Dis. Total
2011 - 06 1.023.260,02 156.084,68 888.111,10 138.237,06 326.198,12 33.374,88 359.572,99
2012 - 06 35.280,09 1,00 87.190,67 5.869,49 274.287,53 27.506,39 301.793,92
2013 - 06 45.384,15 1.655,00 73.375,46 3.900,46 246.296,23 25.260,93 271.557,17
Period Amounts received and paid by the UCI
(in the currency of the class)
Year Subscriptions Redemptions
Capitalization Distribution Capitalization Distribution
2011 - 06 5.799.210,16 818.566,81 65.000.740,41 9.884.607,62
2012 - 06 3.174.286,23 79,83 7.559.657,22 477.325,55
2013 - 06 4.294.042,47 147.292,87 6.879.016,09 339.615,51
Period Net asset value
End of period (in the currency of the class)
Year Of the class Of one share
Capitalization Distribution
2011 - 06 32.107.632,60 89,93 83,03
2012 - 06 26.368.787,90 87,99 81,23
2013 - 06 24.920.658,39 92,49 84,75
Institutional B Shares
Period Change in number of shares in circulation
Year Subscriptions Redemptions End of period
Cap. Dis. Cap. Dis. Cap. Dis. Total 2012 - 06 686.474,00 147.471,00 539.003,00 539.003,00
2013 - 06 1.048.714,94 919.858,76 667.859,18 667.859,18
Period Amounts received and paid by the UCI
(in the currency of the class)
Year Subscriptions Redemptions
Capitalization Distribution Capitalization Distribution
2012 - 06 62.240.921,46 13.091.188,20
2013 - 06 99.572.848,71 85.647.852,42
Period Net asset value
End of period (in the currency of the class)
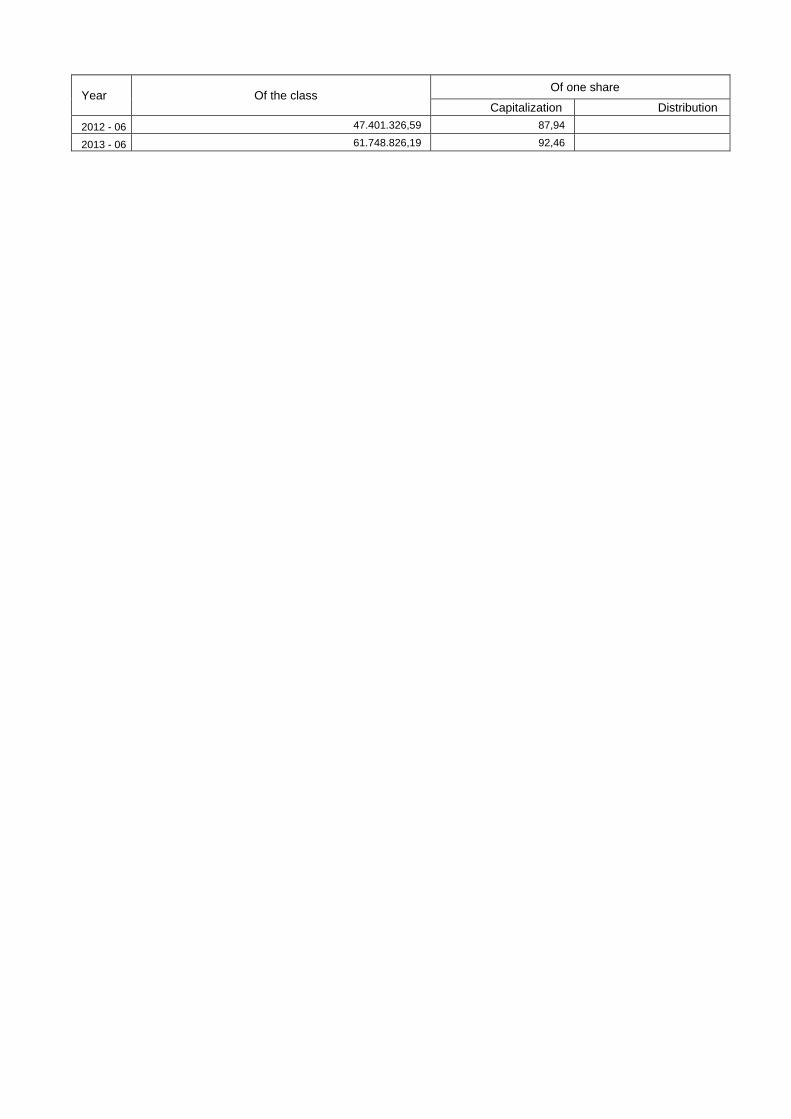
Year Of the class Of one share
Capitalization Distribution
2012 - 06 47.401.326,59 87,94
2013 - 06 61.748.826,19 92,46
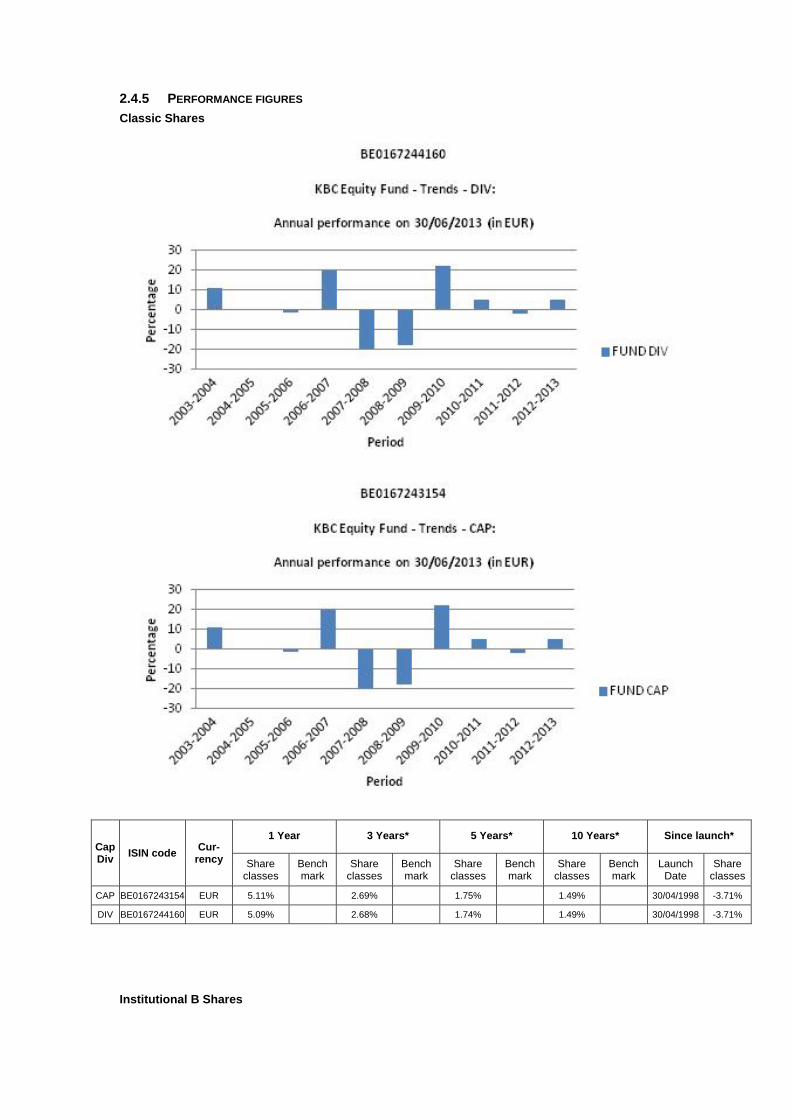
2.4.5 PERFORMANCE FIGURES
Classic Shares
Cap Div
ISIN code Cur-
rency
1 Year 3 Years* 5 Years* 10 Years* Since launch*
Share classes
Bench mark
Share classes
Bench mark
Share classes
Bench mark
Share classes
Bench mark
Launch Date
Share classes
CAP BE0167243154 EUR 5.11% 2.69% 1.75% 1.49% 30/04/1998 -3.71%
DIV BE0167244160 EUR 5.09% 2.68% 1.74% 1.49% 30/04/1998 -3.71%
Institutional B Shares

Cap Div
ISIN code Cur-
rency
1 Year 3 Years* 5 Years* 10 Years* Since launch*
Share classes
Bench mark
Share classes
Bench mark
Share classes
Bench mark
Share classes
Bench mark
Launch Date
Share classes
CAP BE6228927727 EUR 5.14% 20/01/2012 2.12%
Risk warning: Past performance is not a guide to future performance. * Return on annual basis.
Classic Shares The bar chart shows the performance for full financial years. The figures do not take account of any restructuring. Calculated in EUR (ex BEF). The return is calculated as the change in the net asset value between two dates expressed
as a percentage. In the case of units that pay dividends, the dividend is incorporated geometrically in the return.
Calculation method for date D, where NAV stands for net asset value: Capitalisation units (CAP) Return on date D over a period of X years:
[NIW(D) / NIW(Y)] ^ [1 / X] - 1 where Y = D-X
Return on date D since the start date S of the unit: [NIW(D) / NIW(S)] ^ [1 / F] - 1 where F = 1 if the unit has existed for less than one year on date D where F = (D-S) / 365.25 if the unit has existed for longer than one year on date D
Distribution units (DIV) Return on date D over a period of X years:
[ C * NIW(D) / NIW(Y)] ^ [1 / X] - 1 where Y = D-X
Return on date D since the start date S of the unit: [ C * NIW(D) / NIW(S)] ^ [1 / F] - 1 where F = 1 if the unit has existed for less than one year on date D where F = (D-S) / 365.25 if the unit has existed for longer than one year on date D where C is a factor that is determined for all N dividends between the calculation date D and the reference date.
For dividend i on date Di with value Wi: Ci = [Wi / NIW(Di)] + 1 i = 1 ... N

from whichC = C0 * .... * CN. If the interval between the two dates exceeds one year, the ordinary return calculation is
converted into a return on an annual basis by taking the nth square root of 1 plus the total return of the unit.
The return figures shown above do not take account of the fees and charges associated with the issue and redemption of units.
These are the performance figures for capitalisation and distribution shares.
Institutional B Shares The bar chart shows the performance for full financial years. The figures do not take account of any restructuring. Calculated in EUR. The return is calculated as the change in the net asset value between two dates expressed
as a percentage. Calculation method for date D, where NAV stands for net asset value:
Capitalisation units (CAP) Return on date D over a period of X years:
[NIW(D) / NIW(Y)] ^ [1 / X] - 1 where Y = D-X
Return on date D since the start date S of the unit: [NIW(D) / NIW(S)] ^ [1 / F] - 1 where F = 1 if the unit has existed for less than one year on date D where F = (D-S) / 365.25 if the unit has existed for longer than one year on date D
If the interval between the two dates exceeds one year, the ordinary return calculation is converted into a return on an annual basis by taking the nth square root of 1 plus the total return of the unit.
The return figures shown above do not take account of the fees and charges associated with the issue and redemption of units.
These are the performance figures for capitalization shares.
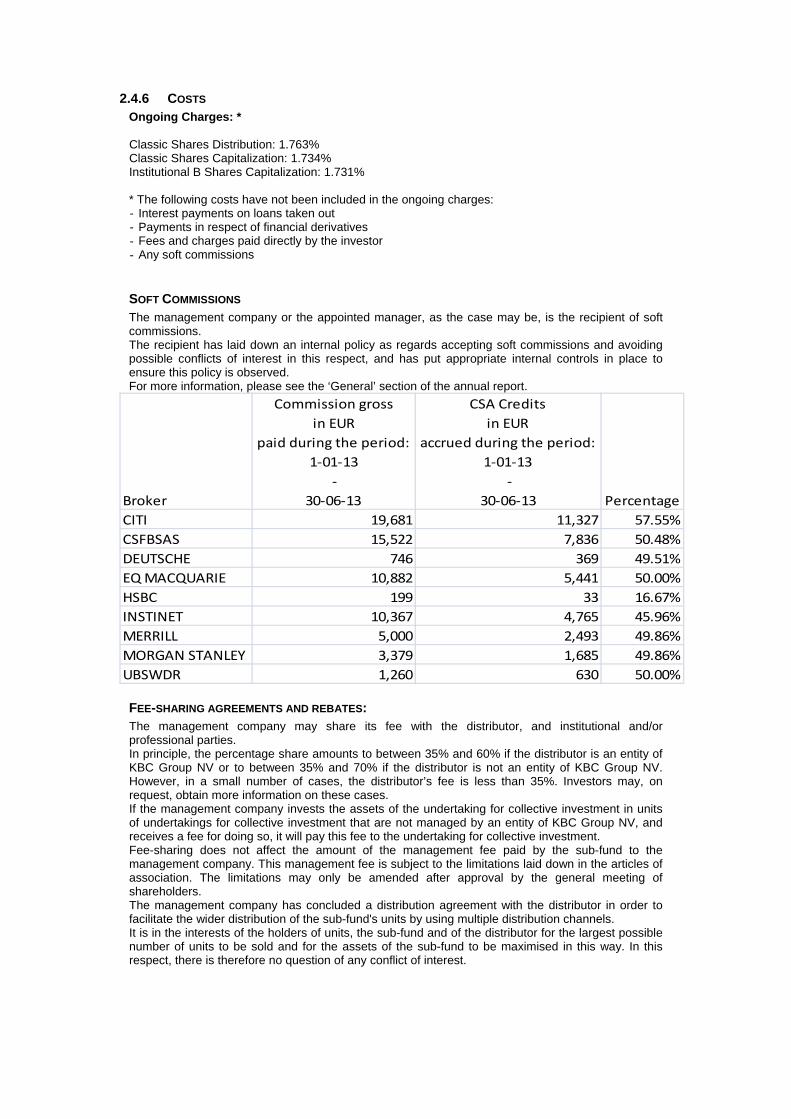
2.4.6 COSTS Ongoing Charges: * Classic Shares Distribution: 1.763% Classic Shares Capitalization: 1.734% Institutional B Shares Capitalization: 1.731% * The following costs have not been included in the ongoing charges: - Interest payments on loans taken out - Payments in respect of financial derivatives - Fees and charges paid directly by the investor - Any soft commissions
SOFT COMMISSIONS The management company or the appointed manager, as the case may be, is the recipient of soft commissions. The recipient has laid down an internal policy as regards accepting soft commissions and avoiding possible conflicts of interest in this respect, and has put appropriate internal controls in place to ensure this policy is observed. For more information, please see the ‘General’ section of the annual report.
Broker
Commission gross
in EUR
paid during the period:
1‐01‐13
‐
30‐06‐13
CSA Credits
in EUR
accrued during the period:
1‐01‐13
‐
30‐06‐13 Percentage
CITI 19,681 11,327 57.55%
CSFBSAS 15,522 7,836 50.48%
DEUTSCHE 746 369 49.51%
EQ MACQUARIE 10,882 5,441 50.00%
HSBC 199 33 16.67%
INSTINET 10,367 4,765 45.96%
MERRILL 5,000 2,493 49.86%
MORGAN STANLEY 3,379 1,685 49.86%
UBSWDR 1,260 630 50.00%
FEE-SHARING AGREEMENTS AND REBATES: The management company may share its fee with the distributor, and institutional and/or professional parties. In principle, the percentage share amounts to between 35% and 60% if the distributor is an entity of KBC Group NV or to between 35% and 70% if the distributor is not an entity of KBC Group NV. However, in a small number of cases, the distributor’s fee is less than 35%. Investors may, on request, obtain more information on these cases. If the management company invests the assets of the undertaking for collective investment in units of undertakings for collective investment that are not managed by an entity of KBC Group NV, and receives a fee for doing so, it will pay this fee to the undertaking for collective investment. Fee-sharing does not affect the amount of the management fee paid by the sub-fund to the management company. This management fee is subject to the limitations laid down in the articles of association. The limitations may only be amended after approval by the general meeting of shareholders. The management company has concluded a distribution agreement with the distributor in order to facilitate the wider distribution of the sub-fund's units by using multiple distribution channels. It is in the interests of the holders of units, the sub-fund and of the distributor for the largest possible number of units to be sold and for the assets of the sub-fund to be maximised in this way. In this respect, there is therefore no question of any conflict of interest.
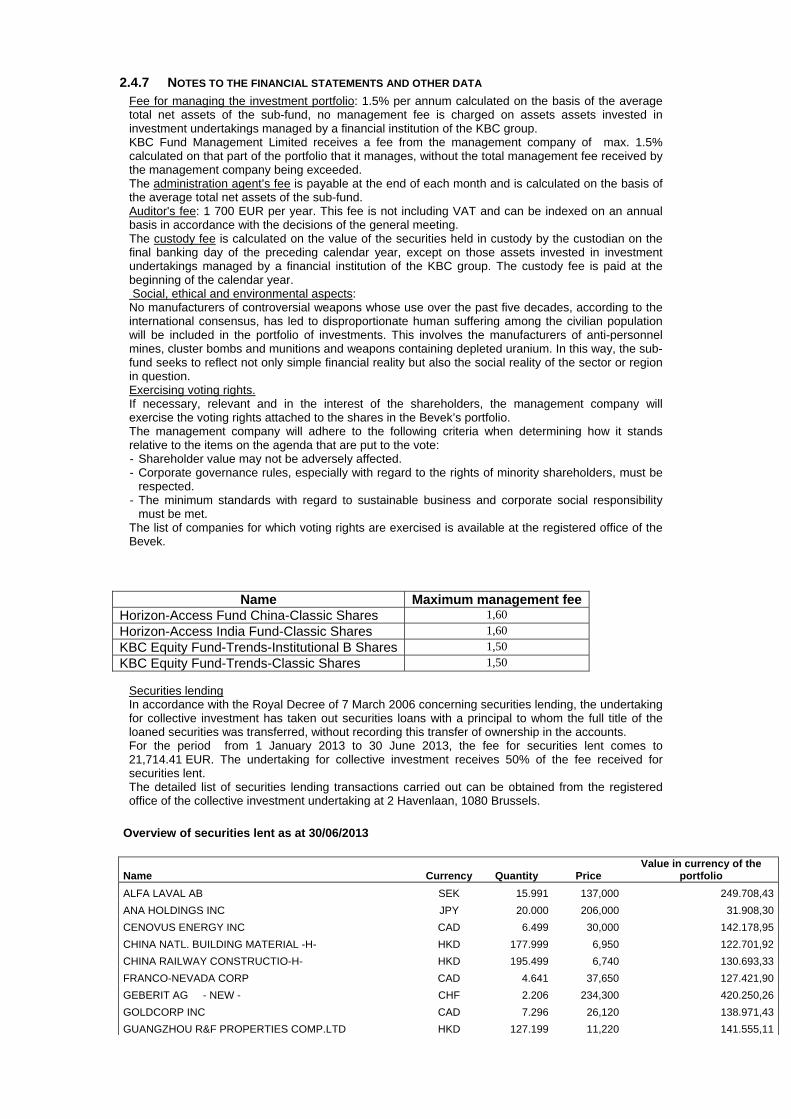
2.4.7 NOTES TO THE FINANCIAL STATEMENTS AND OTHER DATA Fee for managing the investment portfolio: 1.5% per annum calculated on the basis of the average total net assets of the sub-fund, no management fee is charged on assets assets invested in investment undertakings managed by a financial institution of the KBC group. KBC Fund Management Limited receives a fee from the management company of max. 1.5% calculated on that part of the portfolio that it manages, without the total management fee received by the management company being exceeded. The administration agent’s fee is payable at the end of each month and is calculated on the basis of the average total net assets of the sub-fund. Auditor's fee: 1 700 EUR per year. This fee is not including VAT and can be indexed on an annual basis in accordance with the decisions of the general meeting. The custody fee is calculated on the value of the securities held in custody by the custodian on the final banking day of the preceding calendar year, except on those assets invested in investment undertakings managed by a financial institution of the KBC group. The custody fee is paid at the beginning of the calendar year. Social, ethical and environmental aspects: No manufacturers of controversial weapons whose use over the past five decades, according to the international consensus, has led to disproportionate human suffering among the civilian population will be included in the portfolio of investments. This involves the manufacturers of anti-personnel mines, cluster bombs and munitions and weapons containing depleted uranium. In this way, the sub-fund seeks to reflect not only simple financial reality but also the social reality of the sector or region in question. Exercising voting rights. If necessary, relevant and in the interest of the shareholders, the management company will exercise the voting rights attached to the shares in the Bevek’s portfolio. The management company will adhere to the following criteria when determining how it stands relative to the items on the agenda that are put to the vote: - Shareholder value may not be adversely affected. - Corporate governance rules, especially with regard to the rights of minority shareholders, must be
respected. - The minimum standards with regard to sustainable business and corporate social responsibility
must be met. The list of companies for which voting rights are exercised is available at the registered office of the Bevek.
Name Maximum management fee Horizon-Access Fund China-Classic Shares 1,60
Horizon-Access India Fund-Classic Shares 1,60
KBC Equity Fund-Trends-Institutional B Shares 1,50
KBC Equity Fund-Trends-Classic Shares 1,50
Securities lending In accordance with the Royal Decree of 7 March 2006 concerning securities lending, the undertaking for collective investment has taken out securities loans with a principal to whom the full title of the loaned securities was transferred, without recording this transfer of ownership in the accounts. For the period from 1 January 2013 to 30 June 2013, the fee for securities lent comes to 21,714.41 EUR. The undertaking for collective investment receives 50% of the fee received for securities lent. The detailed list of securities lending transactions carried out can be obtained from the registered office of the collective investment undertaking at 2 Havenlaan, 1080 Brussels.
Overview of securities lent as at 30/06/2013
Name Currency Quantity Price Value in currency of the
portfolio
ALFA LAVAL AB SEK 15.991 137,000 249.708,43
ANA HOLDINGS INC JPY 20.000 206,000 31.908,30
CENOVUS ENERGY INC CAD 6.499 30,000 142.178,95
CHINA NATL. BUILDING MATERIAL -H- HKD 177.999 6,950 122.701,92
CHINA RAILWAY CONSTRUCTIO-H- HKD 195.499 6,740 130.693,33
FRANCO-NEVADA CORP CAD 4.641 37,650 127.421,90
GEBERIT AG - NEW - CHF 2.206 234,300 420.250,26
GOLDCORP INC CAD 7.296 26,120 138.971,43
GUANGZHOU R&F PROPERTIES COMP.LTD HKD 127.199 11,220 141.555,11

HALMA INC GBP 24.725 5,035 145.262,98
K+S AG EUR 4.484 28,405 127.368,02
KGHM POLSKA MIEDZ SA PLN 4.013 121,000 112.136,39
PERNOD-RICARD EUR 2.019 85,190 171.998,61
PICC PROPERTY & CASUALTY -H- HKD 19.139 8,750 16.610,25
POWSZECHNY ZAKLAD UBEZPIECZEN SA PLN 1.456 409,700 137.758,81
SEVERN TRENT PLC -NEW- GBP 14.155 16,640 274.841,54
TOTAL EUR 5.416 37,505 203.127,08
TURK HAVA YOLLARI ANONIM ORTAKLIGI TRY 66.927 7,500 200.140,55
Total 2.894.633,86
Details of collateral received for securities lent
Name Currency Nominal value Currency fund Value in Currency fund
AUSTRIA 2012 3,4% 22/11/2022 EUR 1.024.000 EUR 1.168.456,70
FLEMISH COMMUNITY - 09/14 3.75% 31/03 EUR 1.000.000 EUR 1.035.556,00
FRANCE 2008 3.75% 25/10/2019 EUR 1.411.000 EUR 1.637.588,26
Total 3.841.600,96 For the valuation of the collateral received, indicative prices have been used in this detail list by the Collateral Management Division of KBC Bank.

Semi-Annual report as at 30th June 2013
TABLE OF CONTENTS
2. Information on KBC Equity Fund Eurozone
2.1. Management report 2.1.1. Launch date and subscription price 2.1.2. Stock exchange listing 2.1.3. Aim and distinctive features of the investment policy 2.1.4. Financial portfolio management 2.1.5. Distributors 2.1.6. Index and benchmark 2.1.7. Policy conducted during the financial year 2.1.8. Future policy 2.1.9. Synthetic risk and reward indicator (SRRI)
2.2. Balance sheet
2.3. Profit and loss account
2.4. Composition of the assets and key figures
2.4.1. Composition of the assets 2.4.2. Change in the composition of the assets 2.4.3. Value of commitments in respect of financial derivatives positions 2.4.4. Evolution of the number of subscriptions, repayments and the net asset value 2.4.5. Return figures 2.4.6. Expenses 2.4.7. Notes to the financial statements and other data


2 INFORMATION ON KBC EQUITY FUND EUROZONE
2.1 MANAGEMENT REPORT
2.1.1 LAUNCH DATE AND SUBSCRIPTION PRICE Classic Shares : Launch date: 2 February 2001 Initial subscription price: 500 EUR Currency: EUR Institutional B Shares : Launch date: 24 November 2011 Initial subscription price: 264.23 EUR Currency: EUR
2.1.2 STOCK EXCHANGE LISTING Not applicable.
2.1.3 GOAL AND KEY PRINCIPLES OF THE INVESTMENT POLICY
SUB-FUND’S OBJECT: The main objective of this sub-fund is to generate the highest possible return for its shareholders by investing directly or indirectly in transferable securities. This is reflected in its pursuit of capital gains and income. To this end, the assets are invested, either directly or indirectly via correlated financial instruments, primarily in shares.
SUB-FUND’S INVESTMENT POLICY:
PERMITTED ASSET CLASSES: The sub-fund may invest in securities, money market instruments, units in undertakings for collective investment, deposits, financial derivatives, liquid assets and all other instruments insofar as permitted by the applicable laws and regulations and consistent with the sub-fund’s object The sub-fund shall invest no more than 10% of its assets in units of other undertakings for collective investment.
RESTRICTIONS OF THE INVESTMENT POLICY: The investment policy will be implemented within the limits set by law and regulations. The sub-fund may borrow up to 10% of its net assets, insofar as these are short-term borrowings aimed at solving temporary liquidity problems.
PERMITTED DERIVATIVES TRANSACTIONS: Derivates may be used either for hedging purposes or to achieve investment objectives. Changes will be made to the investments at regular intervals to comply with the sub-fund's investment strategy. In addition, listed and unlisted derivates may be used to achieve the objectives: these may be forward contracts, options or swaps on securities, indices, currencies or interest rates or other transactions involving derivatives. Unlisted derivatives transactions will only be concluded with prime financial institutions specialised in such transactions. Such derivatives may also be used to hedge the assets against exchange-rate fluctuations. Subject to the applicable laws and regulations and the articles of association, the sub-fund always seeks to conclude the most effective transactions. All costs associated with the transactions will be charged to the sub-fund and all income generated will be paid to the sub-fund. If the transactions result in a risk in respect of the counterparty, this risk can be hedged by using a margin management system that ensures that the sub-fund is the beneficiary of security (collateral) in the form of cash or investment grade bonds. When calculating the value of the bonds, a margin will be applied that varies depending on the residual term to maturity and the currency in which the bond in question is denominated. The relationship with the counterparty or counterparties is governed by standard international agreements.
STRATEGY SELECTED At least 75% of the assets are invested in shares of euro-area companies.

LENDING FINANCIAL INSTRUMENTS: The sub-fund may lend financial instruments within the limits set by law and regulations. This lending does not affect the sub-fund’s risk profile since: - it takes place within the framework of a securities lending system managed by a principal. In
addition, the sub-fund has a relationship only with the principal of the securities lending system which acts as counterparty and to which title of the loaned securities is transferred. The choice of principal is subject to strict selection criteria. The return of securities similar to the securities that have been lent is guaranteed by the principal.
- through a margin management system, the sub-fund is always guaranteed financial security, the actual value of which always exceeds the actual value of the securities that have been lent, in case the principal does not return similar securities.
The return of securities similar to the securities that have been lent can be requested at any time, which means that the lending of securities does not affect the management of the sub-fund's assets. By lending securities, the sub-fund can generate an additional return. The principal pays a fee to the management company. After deducting the fee for the margin management and clearing services of KBC Bank, most of this fee is paid to the sub-fund. The relationship with the counterparty or counterparties is governed by standard international agreements. More information is provided on the terms and conditions governing securities lending in the annual or half-yearly report for the sub-fund.
VOLATILITY OF THE NET ASSET VALUE: The volatility of the net asset value may be high due to the composition of the portfolio.
GENERAL STRATEGY FOR HEDGING THE EXCHANGE RATE RISK: In order to protect its assets against exchange rate fluctuations and within the limitations laid down in the articles of association, the sub-fund may perform transactions relating to the sale of forward currency contracts, as well as the sale of call options and the purchase of put options on currencies. The transactions in question may relate solely to contracts traded on a regulated market that operates regularly, is recognised and is open to the public or that are traded with a recognised, prime financial institution specialising in such transactions and dealing in the over-the-counter (OTC) market in options. With the same objective, the sub-fund may also sell currencies forward or exchange them in private transactions with prime financial institutions specialising in such transactions. The hedging objective of the aforementioned transactions suggests that there is a direct link between these transactions and the assets to be hedged, which implies that the transactions carried out in a particular currency may in principle not exceed, in terms of volume, either the valuation value of all the assets in the same currency or the holding period of those assets.
SOCIAL, ETHICAL AND ENVIRONMENTAL ASPECTS:
No manufacturers of controversial weapons whose use over the past five decades, according to the international consensus, has led to disproportionate human suffering among the civilian population will be included in the portfolio of investments. This involves the manufacturers of anti-personnel mines, cluster bombs and munitions and weapons containing depleted uranium. In this way, the sub-fund seeks to reflect not only simple financial reality but also the social reality of the sector or region in question.
THE EUROPEAN SAVINGS DIRECTIVE AND TAX ON DEBT CLAIM RETURNS OBTAINED THROUGH THE
REDEMPTION OF OWN UNITS OR IN THE EVENT OF FULL OR PARTIAL DISTRIBUTION OF EQUITY
CAPITAL. The following information is of a general character and is not intended to cover all aspects of an investment in a UCITS. In certain cases entirely different rules might even apply. Moreover, both tax law and the interpretation of it can change. Investors who wish to have more information about the tax implications – in both Belgium and abroad – of acquiring, holding and transferring units should seek the advice of their usual financial and tax advisers. This UCITS shall invest a maximum of 15% of its assets directly or indirectly in debt instruments as intended by the European Savings Directive.
A. European Savings Directive (Directive 2003/48/EC) The European Savings Directive has been implemented in Belgium. Since this UCITS invests a maximum of 15% of its assets directly or indirectly in debt claims as intended by the European Savings Directive, the income of this UCITS does not fall within the scope of this directive. B. Tax on debt claim returns obtained through the redemption of own units or in the event of full or partial distribution of equity capital (Article 19bis Income Tax Code 1992). The income from this UCITS is not subject to the tax on debt instrument returns as intended by Article 19bis, Income Tax Code 1992.
2.1.4 FINANCIAL PORTFOLIO MANAGEMENT There is no delegation of the portfolio.
2.1.5 DISTRIBUTORS KBC Asset Management S.A., 5, Place de la Gare, L-1616 Luxembourg.
2.1.6 INDEX AND BENCHMARK See ‘Sub-fund’s investment policy’.
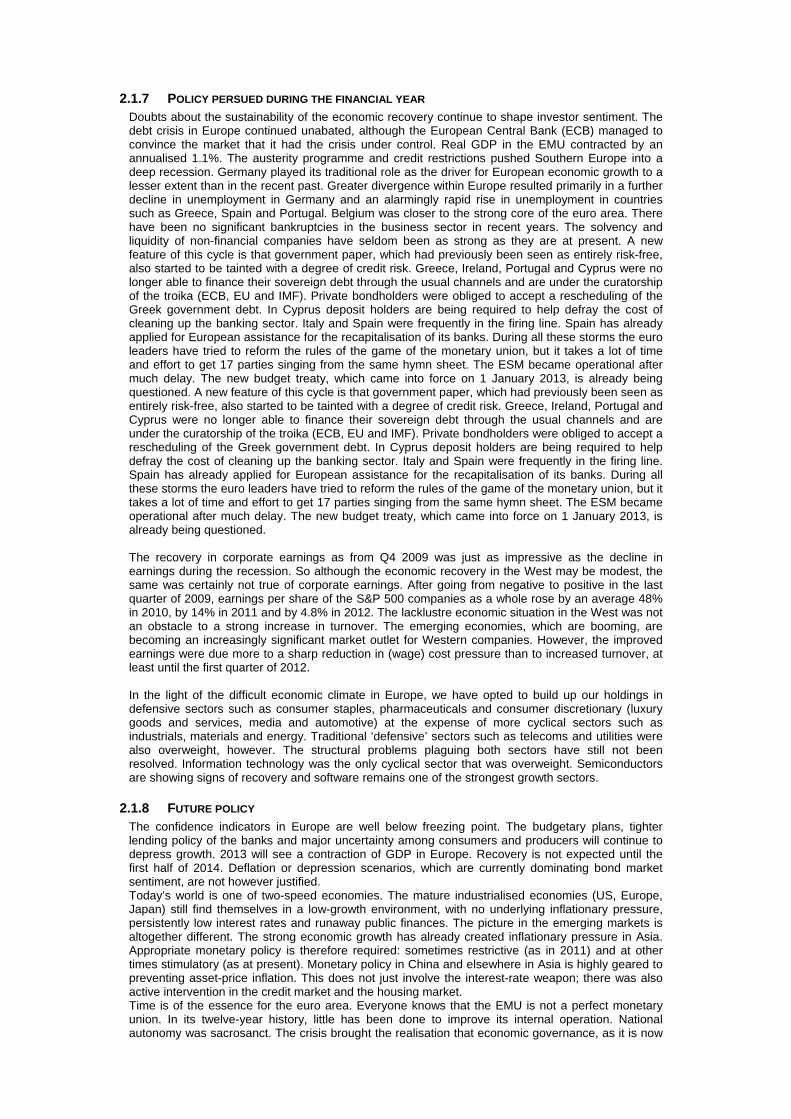
2.1.7 POLICY PERSUED DURING THE FINANCIAL YEAR Doubts about the sustainability of the economic recovery continue to shape investor sentiment. The debt crisis in Europe continued unabated, although the European Central Bank (ECB) managed to convince the market that it had the crisis under control. Real GDP in the EMU contracted by an annualised 1.1%. The austerity programme and credit restrictions pushed Southern Europe into a deep recession. Germany played its traditional role as the driver for European economic growth to a lesser extent than in the recent past. Greater divergence within Europe resulted primarily in a further decline in unemployment in Germany and an alarmingly rapid rise in unemployment in countries such as Greece, Spain and Portugal. Belgium was closer to the strong core of the euro area. There have been no significant bankruptcies in the business sector in recent years. The solvency and liquidity of non-financial companies have seldom been as strong as they are at present. A new feature of this cycle is that government paper, which had previously been seen as entirely risk-free, also started to be tainted with a degree of credit risk. Greece, Ireland, Portugal and Cyprus were no longer able to finance their sovereign debt through the usual channels and are under the curatorship of the troika (ECB, EU and IMF). Private bondholders were obliged to accept a rescheduling of the Greek government debt. In Cyprus deposit holders are being required to help defray the cost of cleaning up the banking sector. Italy and Spain were frequently in the firing line. Spain has already applied for European assistance for the recapitalisation of its banks. During all these storms the euro leaders have tried to reform the rules of the game of the monetary union, but it takes a lot of time and effort to get 17 parties singing from the same hymn sheet. The ESM became operational after much delay. The new budget treaty, which came into force on 1 January 2013, is already being questioned. A new feature of this cycle is that government paper, which had previously been seen as entirely risk-free, also started to be tainted with a degree of credit risk. Greece, Ireland, Portugal and Cyprus were no longer able to finance their sovereign debt through the usual channels and are under the curatorship of the troika (ECB, EU and IMF). Private bondholders were obliged to accept a rescheduling of the Greek government debt. In Cyprus deposit holders are being required to help defray the cost of cleaning up the banking sector. Italy and Spain were frequently in the firing line. Spain has already applied for European assistance for the recapitalisation of its banks. During all these storms the euro leaders have tried to reform the rules of the game of the monetary union, but it takes a lot of time and effort to get 17 parties singing from the same hymn sheet. The ESM became operational after much delay. The new budget treaty, which came into force on 1 January 2013, is already being questioned. The recovery in corporate earnings as from Q4 2009 was just as impressive as the decline in earnings during the recession. So although the economic recovery in the West may be modest, the same was certainly not true of corporate earnings. After going from negative to positive in the last quarter of 2009, earnings per share of the S&P 500 companies as a whole rose by an average 48% in 2010, by 14% in 2011 and by 4.8% in 2012. The lacklustre economic situation in the West was not an obstacle to a strong increase in turnover. The emerging economies, which are booming, are becoming an increasingly significant market outlet for Western companies. However, the improved earnings were due more to a sharp reduction in (wage) cost pressure than to increased turnover, at least until the first quarter of 2012. In the light of the difficult economic climate in Europe, we have opted to build up our holdings in defensive sectors such as consumer staples, pharmaceuticals and consumer discretionary (luxury goods and services, media and automotive) at the expense of more cyclical sectors such as industrials, materials and energy. Traditional ‘defensive’ sectors such as telecoms and utilities were also overweight, however. The structural problems plaguing both sectors have still not been resolved. Information technology was the only cyclical sector that was overweight. Semiconductors are showing signs of recovery and software remains one of the strongest growth sectors.
2.1.8 FUTURE POLICY The confidence indicators in Europe are well below freezing point. The budgetary plans, tighter lending policy of the banks and major uncertainty among consumers and producers will continue to depress growth. 2013 will see a contraction of GDP in Europe. Recovery is not expected until the first half of 2014. Deflation or depression scenarios, which are currently dominating bond market sentiment, are not however justified. Today’s world is one of two-speed economies. The mature industrialised economies (US, Europe, Japan) still find themselves in a low-growth environment, with no underlying inflationary pressure, persistently low interest rates and runaway public finances. The picture in the emerging markets is altogether different. The strong economic growth has already created inflationary pressure in Asia. Appropriate monetary policy is therefore required: sometimes restrictive (as in 2011) and at other times stimulatory (as at present). Monetary policy in China and elsewhere in Asia is highly geared to preventing asset-price inflation. This does not just involve the interest-rate weapon; there was also active intervention in the credit market and the housing market. Time is of the essence for the euro area. Everyone knows that the EMU is not a perfect monetary union. In its twelve-year history, little has been done to improve its internal operation. National autonomy was sacrosanct. The crisis brought the realisation that economic governance, as it is now
called in Eurospeak, needs to be tackled as a matter of urgency. In concrete terms, this involves measures such as supranational supervision of banks (scheduled to be in place by early 2015), strict monitoring and sanctioning of budgetary policy (a huge challenge given the emergence of austerity fatigue), monitoring of pay policy and harmonising European taxation (a big taboo). Our strategy for the second half of the year is to combine structural, qualitative growth narratives with cyclical value stocks, i.e. companies that stand to benefit from a cyclical recovery but whose share price does not yet fully reflect this. Capital goods do not meet this criterion, but a number of cyclical segments are by contrast attractively valued, including aircraft companies, staffing agencies and outsourcing services. The recent correction also creates opportunities for bringing a number of quality stocks (i.e. outperformers in the first half of the year) into the portfolio. Based on this approach, consumer staples and health care will remain overweight. The strong product pipelines of European pharmaceuticals companies do not appear to be priced into the share prices. We are also increasing our position in consumer discretionary stocks with a more cyclical tint. We are overweight in automotive companies and their suppliers, reflecting the apparent bottoming out of the European car market and the continuing strength of the Chinese market. Technology stocks are still attractively valued. Sectors that remain underweight are materials, telecoms, energy and utilities.
2.1.9 SYNTHETIC RISK AND REWARD INDICATOR Classic Shares: 7 on a scale of 1 (lowest risk) to 7 (highest risk). Institutional B Shares: 7 on a scale of 1 (lowest risk) to 7 (highest risk). The value of a share can decrease or increase and the investor may not get back the amount invested. In accordance with Commission Regulation (EU) No. 583/2010, a synthetic risk and reward indicator has been calculated. This indicator provides a quantitative measure of the sub-fund's potential return and the risk involved, calculated in the currency in which the sub-fund is denominated. It is given as a figure between 1 and 7. The higher the figure, the greater the potential return, but also the more difficult it is to predict this return. Losses are possible too. The lowest figure does not mean that the investment is entirely free of risk. However, it does indicate that, compared with the higher figures, this product will generally provide a lower, but more predictable return. The synthetic risk and reward indicator is assessed regularly and can therefore go up or down based on data from the past. Data from the past is not always a reliable indicator of future risk and return.
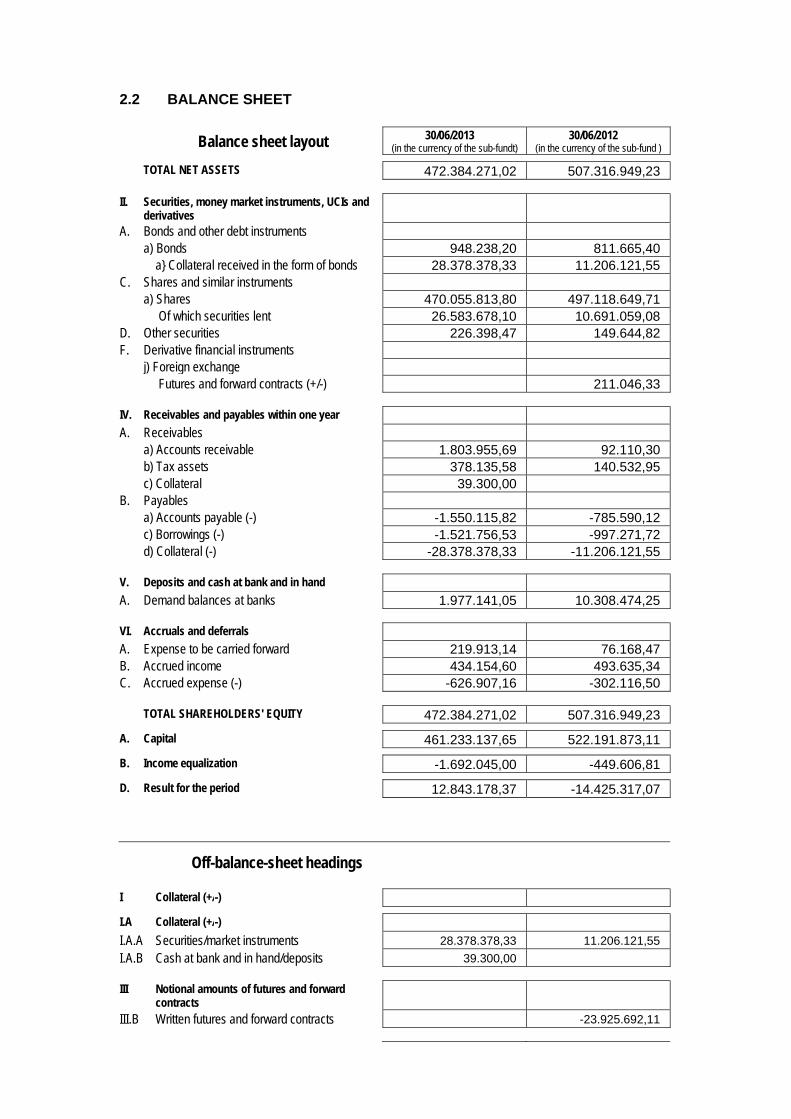
2.2 BALANCE SHEET
Balance sheet layout 30/06/2013 (in the currency of the sub-fundt)
30/06/2012 (in the currency of the sub-fund )
TOTAL NET ASSETS 472.384.271,02 507.316.949,23
II. Securities, money market instruments, UCIs and derivatives
A. Bonds and other debt instruments a) Bonds 948.238,20 811.665,40 a} Collateral received in the form of bonds 28.378.378,33 11.206.121,55 C. Shares and similar instruments a) Shares 470.055.813,80 497.118.649,71 Of which securities lent 26.583.678,10 10.691.059,08 D. Other securities 226.398,47 149.644,82 F. Derivative financial instruments j) Foreign exchange Futures and forward contracts (+/-) 211.046,33
IV. Receivables and payables within one year A. Receivables a) Accounts receivable 1.803.955,69 92.110,30 b) Tax assets 378.135,58 140.532,95 c) Collateral 39.300,00 B. Payables a) Accounts payable (-) -1.550.115,82 -785.590,12 c) Borrowings (-) -1.521.756,53 -997.271,72 d) Collateral (-) -28.378.378,33 -11.206.121,55
V. Deposits and cash at bank and in hand A. Demand balances at banks 1.977.141,05 10.308.474,25
VI. Accruals and deferrals A. Expense to be carried forward 219.913,14 76.168,47 B. Accrued income 434.154,60 493.635,34 C. Accrued expense (-) -626.907,16 -302.116,50
TOTAL SHAREHOLDERS' EQUITY 472.384.271,02 507.316.949,23
A. Capital 461.233.137,65 522.191.873,11
B. Income equalization -1.692.045,00 -449.606,81
D. Result for the period 12.843.178,37 -14.425.317,07
Off-balance-sheet headings
I Collateral (+/-)
I.A Collateral (+/-)
I.A.A Securities/market instruments 28.378.378,33 11.206.121,55
I.A.B Cash at bank and in hand/deposits 39.300,00
III Notional amounts of futures and forward contracts
III.B Written futures and forward contracts -23.925.692,11
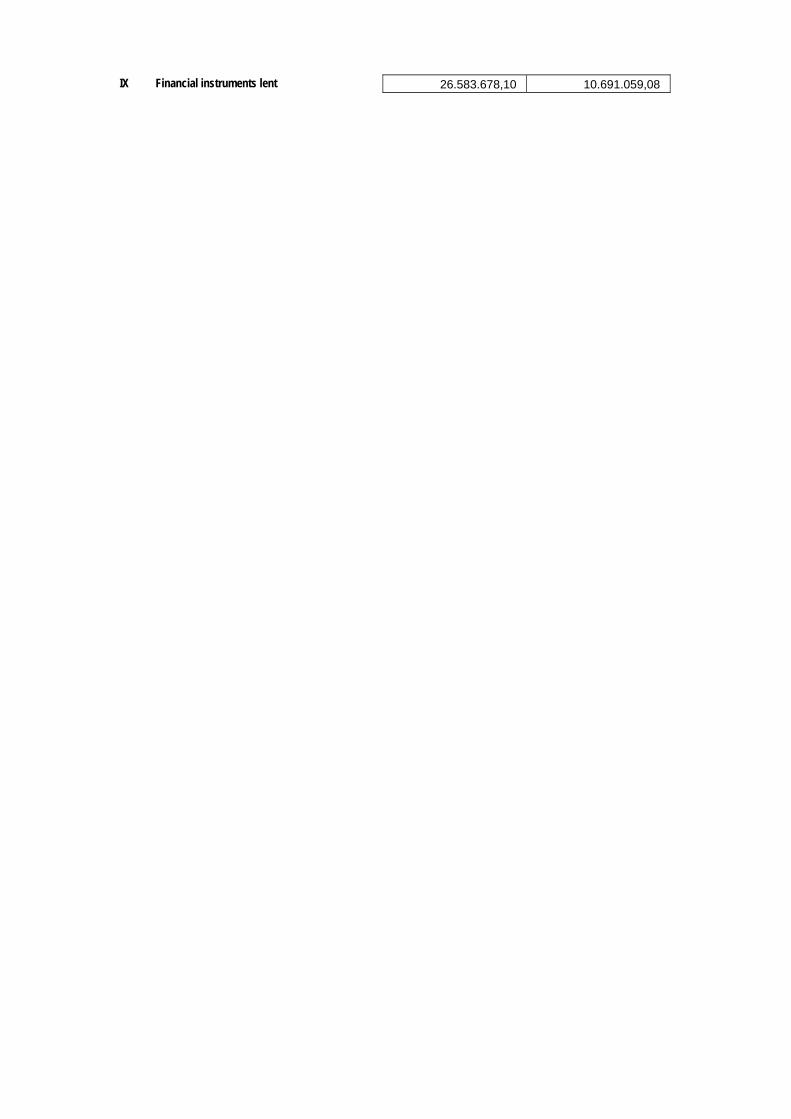
IX Financial instruments lent 26.583.678,10 10.691.059,08
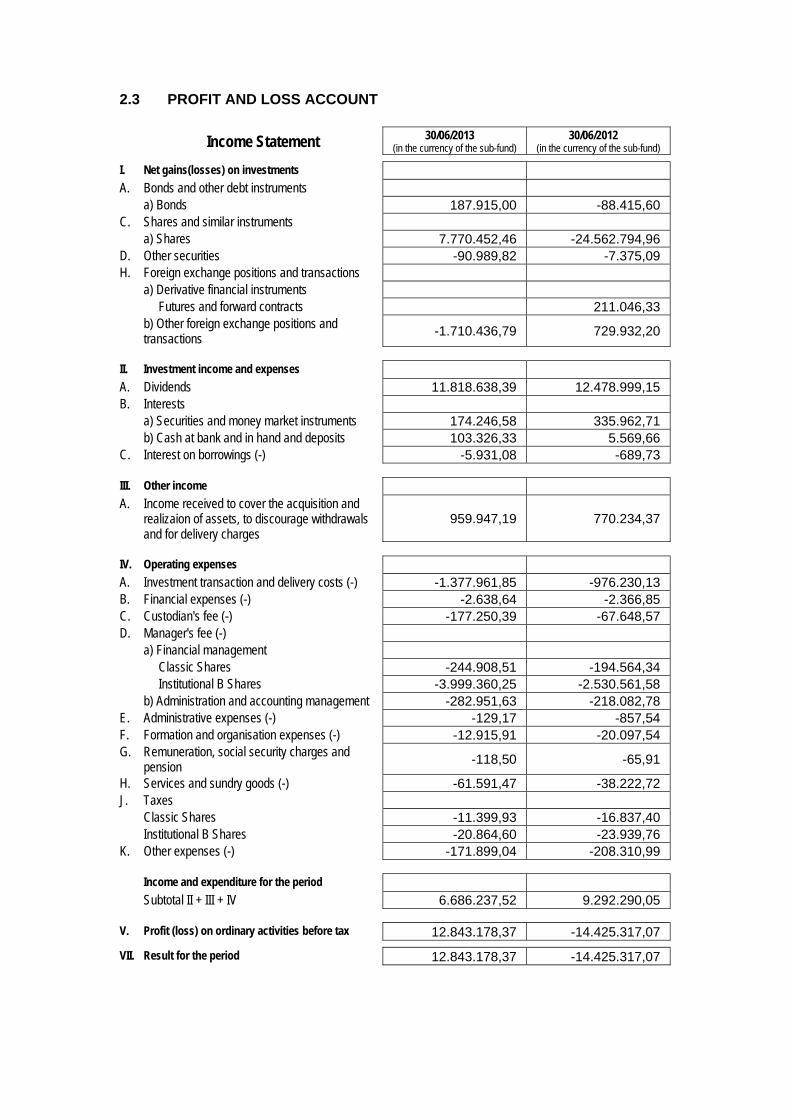
2.3 PROFIT AND LOSS ACCOUNT
Income Statement 30/06/2013 (in the currency of the sub-fund)
30/06/2012 (in the currency of the sub-fund)
I. Net gains(losses) on investments A. Bonds and other debt instruments a) Bonds 187.915,00 -88.415,60 C. Shares and similar instruments a) Shares 7.770.452,46 -24.562.794,96 D. Other securities -90.989,82 -7.375,09 H. Foreign exchange positions and transactions a) Derivative financial instruments Futures and forward contracts 211.046,33 b) Other foreign exchange positions and
transactions -1.710.436,79 729.932,20
II. Investment income and expenses A. Dividends 11.818.638,39 12.478.999,15 B. Interests a) Securities and money market instruments 174.246,58 335.962,71 b) Cash at bank and in hand and deposits 103.326,33 5.569,66 C. Interest on borrowings (-) -5.931,08 -689,73
III. Other income A. Income received to cover the acquisition and
realizaion of assets, to discourage withdrawals and for delivery charges
959.947,19 770.234,37
IV. Operating expenses A. Investment transaction and delivery costs (-) -1.377.961,85 -976.230,13 B. Financial expenses (-) -2.638,64 -2.366,85 C. Custodian's fee (-) -177.250,39 -67.648,57 D. Manager's fee (-) a) Financial management Classic Shares -244.908,51 -194.564,34 Institutional B Shares -3.999.360,25 -2.530.561,58 b) Administration and accounting management -282.951,63 -218.082,78 E. Administrative expenses (-) -129,17 -857,54 F. Formation and organisation expenses (-) -12.915,91 -20.097,54 G. Remuneration, social security charges and
pension -118,50 -65,91
H. Services and sundry goods (-) -61.591,47 -38.222,72 J. Taxes Classic Shares -11.399,93 -16.837,40 Institutional B Shares -20.864,60 -23.939,76 K. Other expenses (-) -171.899,04 -208.310,99
Income and expenditure for the period Subtotal II + III + IV 6.686.237,52 9.292.290,05
V. Profit (loss) on ordinary activities before tax 12.843.178,37 -14.425.317,07
VII. Result for the period 12.843.178,37 -14.425.317,07
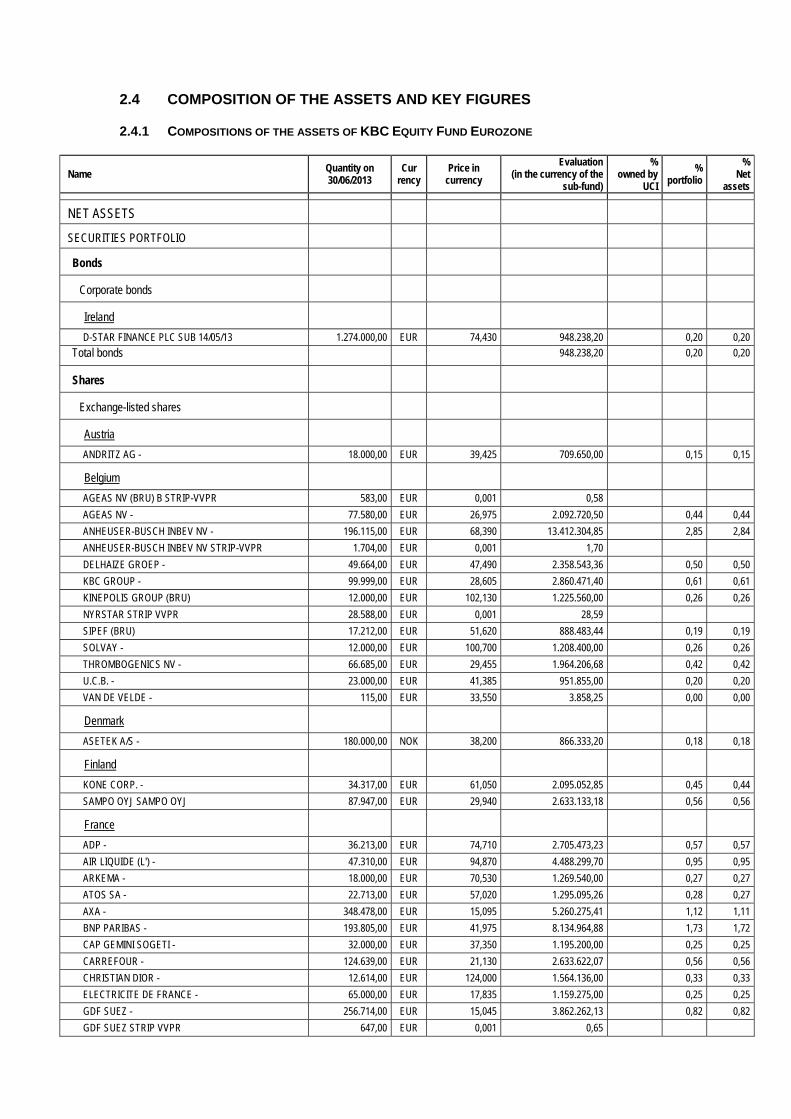
2.4 COMPOSITION OF THE ASSETS AND KEY FIGURES
2.4.1 COMPOSITIONS OF THE ASSETS OF KBC EQUITY FUND EUROZONE
Name Quantity on 30/06/2013
Cur rency
Price in currency
Evaluation (in the currency of the
sub-fund)
% owned by
UCI
% portfolio
% Net
assets
NET ASSETS
SECURITIES PORTFOLIO
Bonds
Corporate bonds
Ireland
D-STAR FINANCE PLC SUB 14/05/13 1.274.000,00 EUR 74,430 948.238,20 0,20 0,20
Total bonds 948.238,20 0,20 0,20
Shares
Exchange-listed shares
Austria
ANDRITZ AG - 18.000,00 EUR 39,425 709.650,00 0,15 0,15
Belgium
AGEAS NV (BRU) B STRIP-VVPR 583,00 EUR 0,001 0,58
AGEAS NV - 77.580,00 EUR 26,975 2.092.720,50 0,44 0,44
ANHEUSER-BUSCH INBEV NV - 196.115,00 EUR 68,390 13.412.304,85 2,85 2,84
ANHEUSER-BUSCH INBEV NV STRIP-VVPR 1.704,00 EUR 0,001 1,70
DELHAIZE GROEP - 49.664,00 EUR 47,490 2.358.543,36 0,50 0,50
KBC GROUP - 99.999,00 EUR 28,605 2.860.471,40 0,61 0,61
KINEPOLIS GROUP (BRU) 12.000,00 EUR 102,130 1.225.560,00 0,26 0,26
NYRSTAR STRIP VVPR 28.588,00 EUR 0,001 28,59
SIPEF (BRU) 17.212,00 EUR 51,620 888.483,44 0,19 0,19
SOLVAY - 12.000,00 EUR 100,700 1.208.400,00 0,26 0,26
THROMBOGENICS NV - 66.685,00 EUR 29,455 1.964.206,68 0,42 0,42
U.C.B. - 23.000,00 EUR 41,385 951.855,00 0,20 0,20
VAN DE VELDE - 115,00 EUR 33,550 3.858,25 0,00 0,00
Denmark
ASETEK A/S - 180.000,00 NOK 38,200 866.333,20 0,18 0,18
Finland
KONE CORP. - 34.317,00 EUR 61,050 2.095.052,85 0,45 0,44
SAMPO OYJ SAMPO OYJ 87.947,00 EUR 29,940 2.633.133,18 0,56 0,56
France
ADP - 36.213,00 EUR 74,710 2.705.473,23 0,57 0,57
AIR LIQUIDE (L') - 47.310,00 EUR 94,870 4.488.299,70 0,95 0,95
ARKEMA - 18.000,00 EUR 70,530 1.269.540,00 0,27 0,27
ATOS SA - 22.713,00 EUR 57,020 1.295.095,26 0,28 0,27
AXA - 348.478,00 EUR 15,095 5.260.275,41 1,12 1,11
BNP PARIBAS - 193.805,00 EUR 41,975 8.134.964,88 1,73 1,72
CAP GEMINI SOGETI - 32.000,00 EUR 37,350 1.195.200,00 0,25 0,25
CARREFOUR - 124.639,00 EUR 21,130 2.633.622,07 0,56 0,56
CHRISTIAN DIOR - 12.614,00 EUR 124,000 1.564.136,00 0,33 0,33
ELECTRICITE DE FRANCE - 65.000,00 EUR 17,835 1.159.275,00 0,25 0,25
GDF SUEZ - 256.714,00 EUR 15,045 3.862.262,13 0,82 0,82
GDF SUEZ STRIP VVPR 647,00 EUR 0,001 0,65
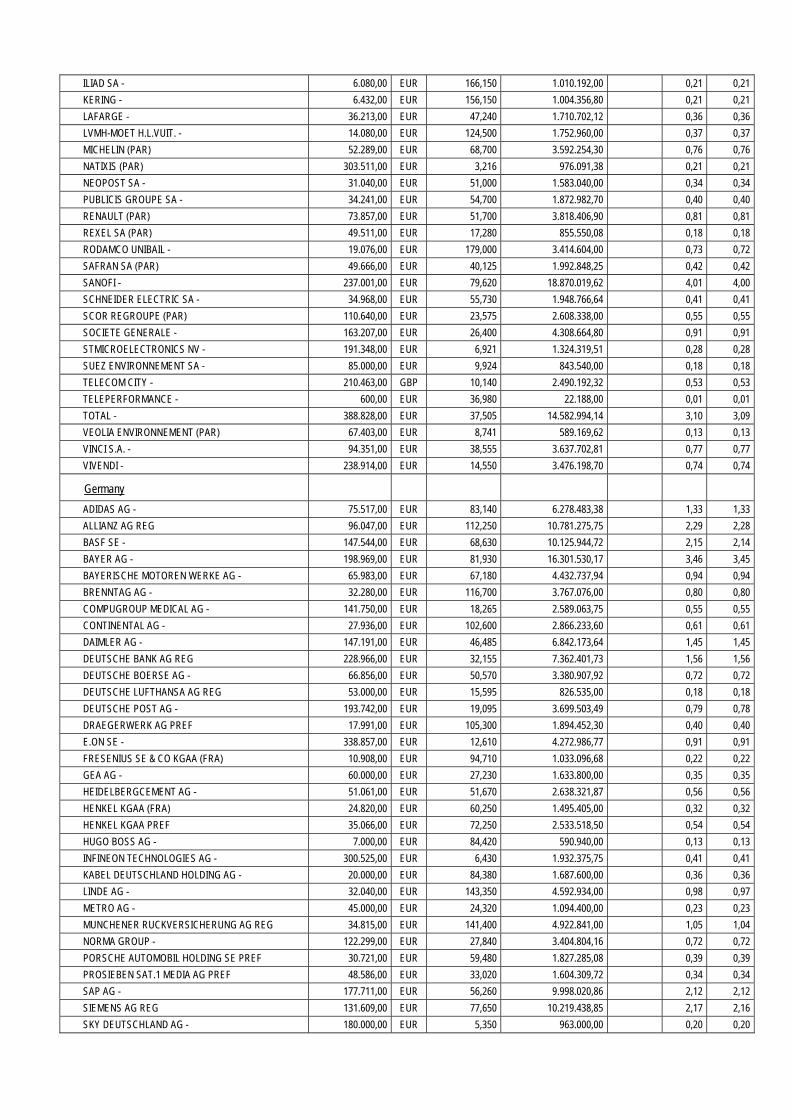
ILIAD SA - 6.080,00 EUR 166,150 1.010.192,00 0,21 0,21
KERING - 6.432,00 EUR 156,150 1.004.356,80 0,21 0,21
LAFARGE - 36.213,00 EUR 47,240 1.710.702,12 0,36 0,36
LVMH-MOET H.L.VUIT. - 14.080,00 EUR 124,500 1.752.960,00 0,37 0,37
MICHELIN (PAR) 52.289,00 EUR 68,700 3.592.254,30 0,76 0,76
NATIXIS (PAR) 303.511,00 EUR 3,216 976.091,38 0,21 0,21
NEOPOST SA - 31.040,00 EUR 51,000 1.583.040,00 0,34 0,34
PUBLICIS GROUPE SA - 34.241,00 EUR 54,700 1.872.982,70 0,40 0,40
RENAULT (PAR) 73.857,00 EUR 51,700 3.818.406,90 0,81 0,81
REXEL SA (PAR) 49.511,00 EUR 17,280 855.550,08 0,18 0,18
RODAMCO UNIBAIL - 19.076,00 EUR 179,000 3.414.604,00 0,73 0,72
SAFRAN SA (PAR) 49.666,00 EUR 40,125 1.992.848,25 0,42 0,42
SANOFI - 237.001,00 EUR 79,620 18.870.019,62 4,01 4,00
SCHNEIDER ELECTRIC SA - 34.968,00 EUR 55,730 1.948.766,64 0,41 0,41
SCOR REGROUPE (PAR) 110.640,00 EUR 23,575 2.608.338,00 0,55 0,55
SOCIETE GENERALE - 163.207,00 EUR 26,400 4.308.664,80 0,91 0,91
STMICROELECTRONICS NV - 191.348,00 EUR 6,921 1.324.319,51 0,28 0,28
SUEZ ENVIRONNEMENT SA - 85.000,00 EUR 9,924 843.540,00 0,18 0,18
TELECOM CITY - 210.463,00 GBP 10,140 2.490.192,32 0,53 0,53
TELEPERFORMANCE - 600,00 EUR 36,980 22.188,00 0,01 0,01
TOTAL - 388.828,00 EUR 37,505 14.582.994,14 3,10 3,09
VEOLIA ENVIRONNEMENT (PAR) 67.403,00 EUR 8,741 589.169,62 0,13 0,13
VINCI S.A. - 94.351,00 EUR 38,555 3.637.702,81 0,77 0,77
VIVENDI - 238.914,00 EUR 14,550 3.476.198,70 0,74 0,74
Germany
ADIDAS AG - 75.517,00 EUR 83,140 6.278.483,38 1,33 1,33
ALLIANZ AG REG 96.047,00 EUR 112,250 10.781.275,75 2,29 2,28
BASF SE - 147.544,00 EUR 68,630 10.125.944,72 2,15 2,14
BAYER AG - 198.969,00 EUR 81,930 16.301.530,17 3,46 3,45
BAYERISCHE MOTOREN WERKE AG - 65.983,00 EUR 67,180 4.432.737,94 0,94 0,94
BRENNTAG AG - 32.280,00 EUR 116,700 3.767.076,00 0,80 0,80
COMPUGROUP MEDICAL AG - 141.750,00 EUR 18,265 2.589.063,75 0,55 0,55
CONTINENTAL AG - 27.936,00 EUR 102,600 2.866.233,60 0,61 0,61
DAIMLER AG - 147.191,00 EUR 46,485 6.842.173,64 1,45 1,45
DEUTSCHE BANK AG REG 228.966,00 EUR 32,155 7.362.401,73 1,56 1,56
DEUTSCHE BOERSE AG - 66.856,00 EUR 50,570 3.380.907,92 0,72 0,72
DEUTSCHE LUFTHANSA AG REG 53.000,00 EUR 15,595 826.535,00 0,18 0,18
DEUTSCHE POST AG - 193.742,00 EUR 19,095 3.699.503,49 0,79 0,78
DRAEGERWERK AG PREF 17.991,00 EUR 105,300 1.894.452,30 0,40 0,40
E.ON SE - 338.857,00 EUR 12,610 4.272.986,77 0,91 0,91
FRESENIUS SE & CO KGAA (FRA) 10.908,00 EUR 94,710 1.033.096,68 0,22 0,22
GEA AG - 60.000,00 EUR 27,230 1.633.800,00 0,35 0,35
HEIDELBERGCEMENT AG - 51.061,00 EUR 51,670 2.638.321,87 0,56 0,56
HENKEL KGAA (FRA) 24.820,00 EUR 60,250 1.495.405,00 0,32 0,32
HENKEL KGAA PREF 35.066,00 EUR 72,250 2.533.518,50 0,54 0,54
HUGO BOSS AG - 7.000,00 EUR 84,420 590.940,00 0,13 0,13
INFINEON TECHNOLOGIES AG - 300.525,00 EUR 6,430 1.932.375,75 0,41 0,41
KABEL DEUTSCHLAND HOLDING AG - 20.000,00 EUR 84,380 1.687.600,00 0,36 0,36
LINDE AG - 32.040,00 EUR 143,350 4.592.934,00 0,98 0,97
METRO AG - 45.000,00 EUR 24,320 1.094.400,00 0,23 0,23
MUNCHENER RUCKVERSICHERUNG AG REG 34.815,00 EUR 141,400 4.922.841,00 1,05 1,04
NORMA GROUP - 122.299,00 EUR 27,840 3.404.804,16 0,72 0,72
PORSCHE AUTOMOBIL HOLDING SE PREF 30.721,00 EUR 59,480 1.827.285,08 0,39 0,39
PROSIEBEN SAT.1 MEDIA AG PREF 48.586,00 EUR 33,020 1.604.309,72 0,34 0,34
SAP AG - 177.711,00 EUR 56,260 9.998.020,86 2,12 2,12
SIEMENS AG REG 131.609,00 EUR 77,650 10.219.438,85 2,17 2,16
SKY DEUTSCHLAND AG - 180.000,00 EUR 5,350 963.000,00 0,20 0,20
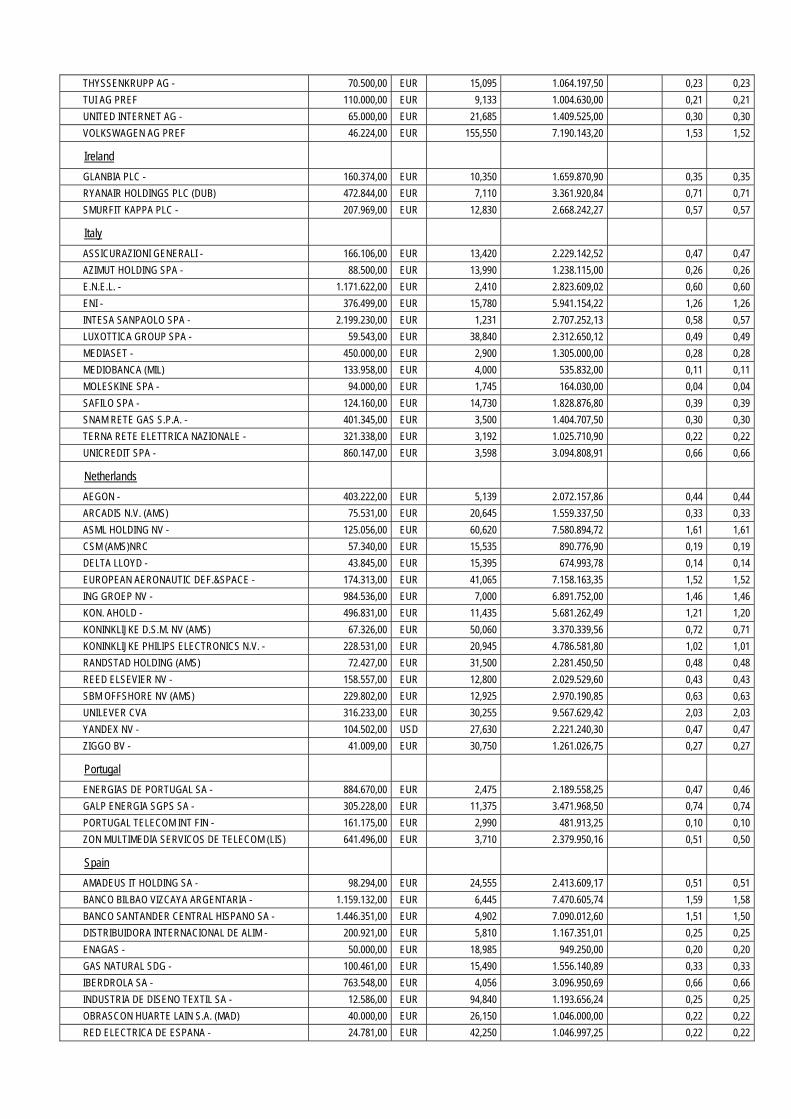
THYSSENKRUPP AG - 70.500,00 EUR 15,095 1.064.197,50 0,23 0,23
TUI AG PREF 110.000,00 EUR 9,133 1.004.630,00 0,21 0,21
UNITED INTERNET AG - 65.000,00 EUR 21,685 1.409.525,00 0,30 0,30
VOLKSWAGEN AG PREF 46.224,00 EUR 155,550 7.190.143,20 1,53 1,52
Ireland
GLANBIA PLC - 160.374,00 EUR 10,350 1.659.870,90 0,35 0,35
RYANAIR HOLDINGS PLC (DUB) 472.844,00 EUR 7,110 3.361.920,84 0,71 0,71
SMURFIT KAPPA PLC - 207.969,00 EUR 12,830 2.668.242,27 0,57 0,57
Italy
ASSICURAZIONI GENERALI - 166.106,00 EUR 13,420 2.229.142,52 0,47 0,47
AZIMUT HOLDING SPA - 88.500,00 EUR 13,990 1.238.115,00 0,26 0,26
E.N.E.L. - 1.171.622,00 EUR 2,410 2.823.609,02 0,60 0,60
ENI - 376.499,00 EUR 15,780 5.941.154,22 1,26 1,26
INTESA SANPAOLO SPA - 2.199.230,00 EUR 1,231 2.707.252,13 0,58 0,57
LUXOTTICA GROUP SPA - 59.543,00 EUR 38,840 2.312.650,12 0,49 0,49
MEDIASET - 450.000,00 EUR 2,900 1.305.000,00 0,28 0,28
MEDIOBANCA (MIL) 133.958,00 EUR 4,000 535.832,00 0,11 0,11
MOLESKINE SPA - 94.000,00 EUR 1,745 164.030,00 0,04 0,04
SAFILO SPA - 124.160,00 EUR 14,730 1.828.876,80 0,39 0,39
SNAM RETE GAS S.P.A. - 401.345,00 EUR 3,500 1.404.707,50 0,30 0,30
TERNA RETE ELETTRICA NAZIONALE - 321.338,00 EUR 3,192 1.025.710,90 0,22 0,22
UNICREDIT SPA - 860.147,00 EUR 3,598 3.094.808,91 0,66 0,66
Netherlands
AEGON - 403.222,00 EUR 5,139 2.072.157,86 0,44 0,44
ARCADIS N.V. (AMS) 75.531,00 EUR 20,645 1.559.337,50 0,33 0,33
ASML HOLDING NV - 125.056,00 EUR 60,620 7.580.894,72 1,61 1,61
CSM (AMS)NRC 57.340,00 EUR 15,535 890.776,90 0,19 0,19
DELTA LLOYD - 43.845,00 EUR 15,395 674.993,78 0,14 0,14
EUROPEAN AERONAUTIC DEF.&SPACE - 174.313,00 EUR 41,065 7.158.163,35 1,52 1,52
ING GROEP NV - 984.536,00 EUR 7,000 6.891.752,00 1,46 1,46
KON. AHOLD - 496.831,00 EUR 11,435 5.681.262,49 1,21 1,20
KONINKLIJKE D.S.M. NV (AMS) 67.326,00 EUR 50,060 3.370.339,56 0,72 0,71
KONINKLIJKE PHILIPS ELECTRONICS N.V. - 228.531,00 EUR 20,945 4.786.581,80 1,02 1,01
RANDSTAD HOLDING (AMS) 72.427,00 EUR 31,500 2.281.450,50 0,48 0,48
REED ELSEVIER NV - 158.557,00 EUR 12,800 2.029.529,60 0,43 0,43
SBM OFFSHORE NV (AMS) 229.802,00 EUR 12,925 2.970.190,85 0,63 0,63
UNILEVER CVA 316.233,00 EUR 30,255 9.567.629,42 2,03 2,03
YANDEX NV - 104.502,00 USD 27,630 2.221.240,30 0,47 0,47
ZIGGO BV - 41.009,00 EUR 30,750 1.261.026,75 0,27 0,27
Portugal
ENERGIAS DE PORTUGAL SA - 884.670,00 EUR 2,475 2.189.558,25 0,47 0,46
GALP ENERGIA SGPS SA - 305.228,00 EUR 11,375 3.471.968,50 0,74 0,74
PORTUGAL TELECOM INT FIN - 161.175,00 EUR 2,990 481.913,25 0,10 0,10
ZON MULTIMEDIA SERVICOS DE TELECOM (LIS) 641.496,00 EUR 3,710 2.379.950,16 0,51 0,50
Spain
AMADEUS IT HOLDING SA - 98.294,00 EUR 24,555 2.413.609,17 0,51 0,51
BANCO BILBAO VIZCAYA ARGENTARIA - 1.159.132,00 EUR 6,445 7.470.605,74 1,59 1,58
BANCO SANTANDER CENTRAL HISPANO SA - 1.446.351,00 EUR 4,902 7.090.012,60 1,51 1,50
DISTRIBUIDORA INTERNACIONAL DE ALIM - 200.921,00 EUR 5,810 1.167.351,01 0,25 0,25
ENAGAS - 50.000,00 EUR 18,985 949.250,00 0,20 0,20
GAS NATURAL SDG - 100.461,00 EUR 15,490 1.556.140,89 0,33 0,33
IBERDROLA SA - 763.548,00 EUR 4,056 3.096.950,69 0,66 0,66
INDUSTRIA DE DISENO TEXTIL SA - 12.586,00 EUR 94,840 1.193.656,24 0,25 0,25
OBRASCON HUARTE LAIN S.A. (MAD) 40.000,00 EUR 26,150 1.046.000,00 0,22 0,22
RED ELECTRICA DE ESPANA - 24.781,00 EUR 42,250 1.046.997,25 0,22 0,22
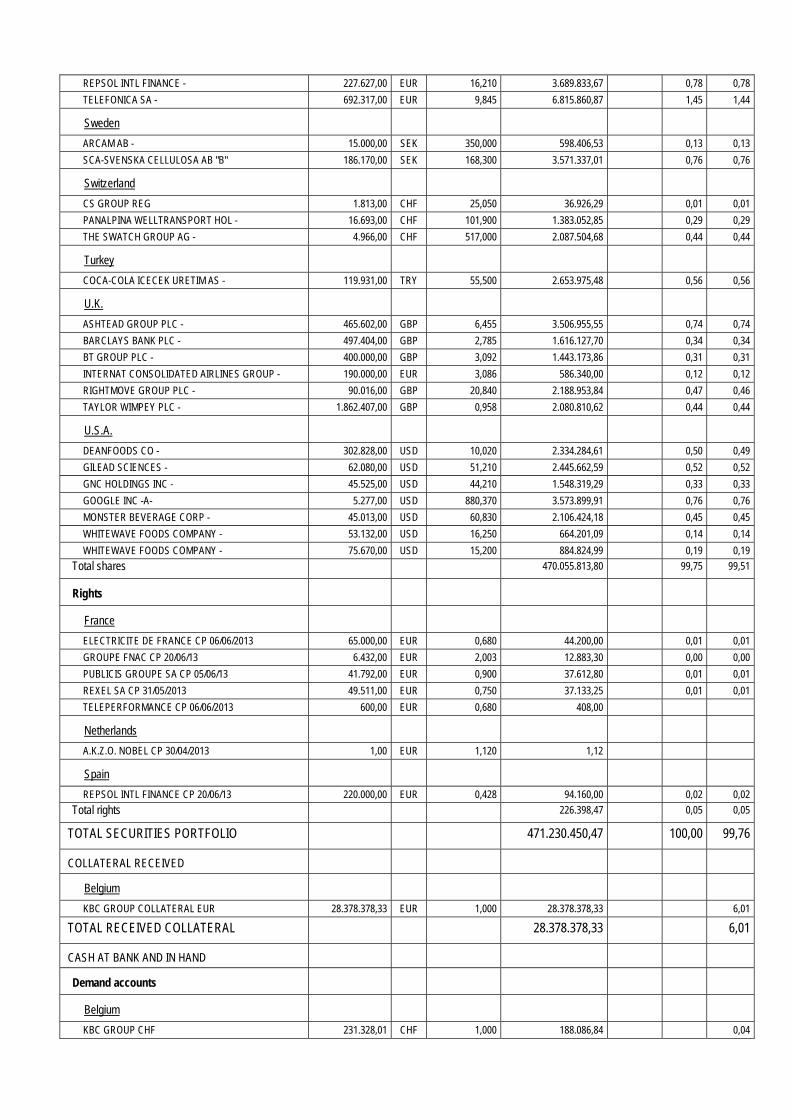
REPSOL INTL FINANCE - 227.627,00 EUR 16,210 3.689.833,67 0,78 0,78
TELEFONICA SA - 692.317,00 EUR 9,845 6.815.860,87 1,45 1,44
Sweden
ARCAM AB - 15.000,00 SEK 350,000 598.406,53 0,13 0,13
SCA-SVENSKA CELLULOSA AB "B" 186.170,00 SEK 168,300 3.571.337,01 0,76 0,76
Switzerland
CS GROUP REG 1.813,00 CHF 25,050 36.926,29 0,01 0,01
PANALPINA WELLTRANSPORT HOL - 16.693,00 CHF 101,900 1.383.052,85 0,29 0,29
THE SWATCH GROUP AG - 4.966,00 CHF 517,000 2.087.504,68 0,44 0,44
Turkey
COCA-COLA ICECEK URETIM AS - 119.931,00 TRY 55,500 2.653.975,48 0,56 0,56
U.K.
ASHTEAD GROUP PLC - 465.602,00 GBP 6,455 3.506.955,55 0,74 0,74
BARCLAYS BANK PLC - 497.404,00 GBP 2,785 1.616.127,70 0,34 0,34
BT GROUP PLC - 400.000,00 GBP 3,092 1.443.173,86 0,31 0,31
INTERNAT CONSOLIDATED AIRLINES GROUP - 190.000,00 EUR 3,086 586.340,00 0,12 0,12
RIGHTMOVE GROUP PLC - 90.016,00 GBP 20,840 2.188.953,84 0,47 0,46
TAYLOR WIMPEY PLC - 1.862.407,00 GBP 0,958 2.080.810,62 0,44 0,44
U.S.A.
DEANFOODS CO - 302.828,00 USD 10,020 2.334.284,61 0,50 0,49
GILEAD SCIENCES - 62.080,00 USD 51,210 2.445.662,59 0,52 0,52
GNC HOLDINGS INC - 45.525,00 USD 44,210 1.548.319,29 0,33 0,33
GOOGLE INC -A- 5.277,00 USD 880,370 3.573.899,91 0,76 0,76
MONSTER BEVERAGE CORP - 45.013,00 USD 60,830 2.106.424,18 0,45 0,45
WHITEWAVE FOODS COMPANY - 53.132,00 USD 16,250 664.201,09 0,14 0,14
WHITEWAVE FOODS COMPANY - 75.670,00 USD 15,200 884.824,99 0,19 0,19
Total shares 470.055.813,80 99,75 99,51
Rights
France
ELECTRICITE DE FRANCE CP 06/06/2013 65.000,00 EUR 0,680 44.200,00 0,01 0,01
GROUPE FNAC CP 20/06/13 6.432,00 EUR 2,003 12.883,30 0,00 0,00
PUBLICIS GROUPE SA CP 05/06/13 41.792,00 EUR 0,900 37.612,80 0,01 0,01
REXEL SA CP 31/05/2013 49.511,00 EUR 0,750 37.133,25 0,01 0,01
TELEPERFORMANCE CP 06/06/2013 600,00 EUR 0,680 408,00
Netherlands
A.K.Z.O. NOBEL CP 30/04/2013 1,00 EUR 1,120 1,12
Spain
REPSOL INTL FINANCE CP 20/06/13 220.000,00 EUR 0,428 94.160,00 0,02 0,02
Total rights 226.398,47 0,05 0,05
TOTAL SECURITIES PORTFOLIO 471.230.450,47 100,00 99,76
COLLATERAL RECEIVED
Belgium
KBC GROUP COLLATERAL EUR 28.378.378,33 EUR 1,000 28.378.378,33 6,01
TOTAL RECEIVED COLLATERAL 28.378.378,33 6,01
CASH AT BANK AND IN HAND
Demand accounts
Belgium
KBC GROUP CHF 231.328,01 CHF 1,000 188.086,84 0,04
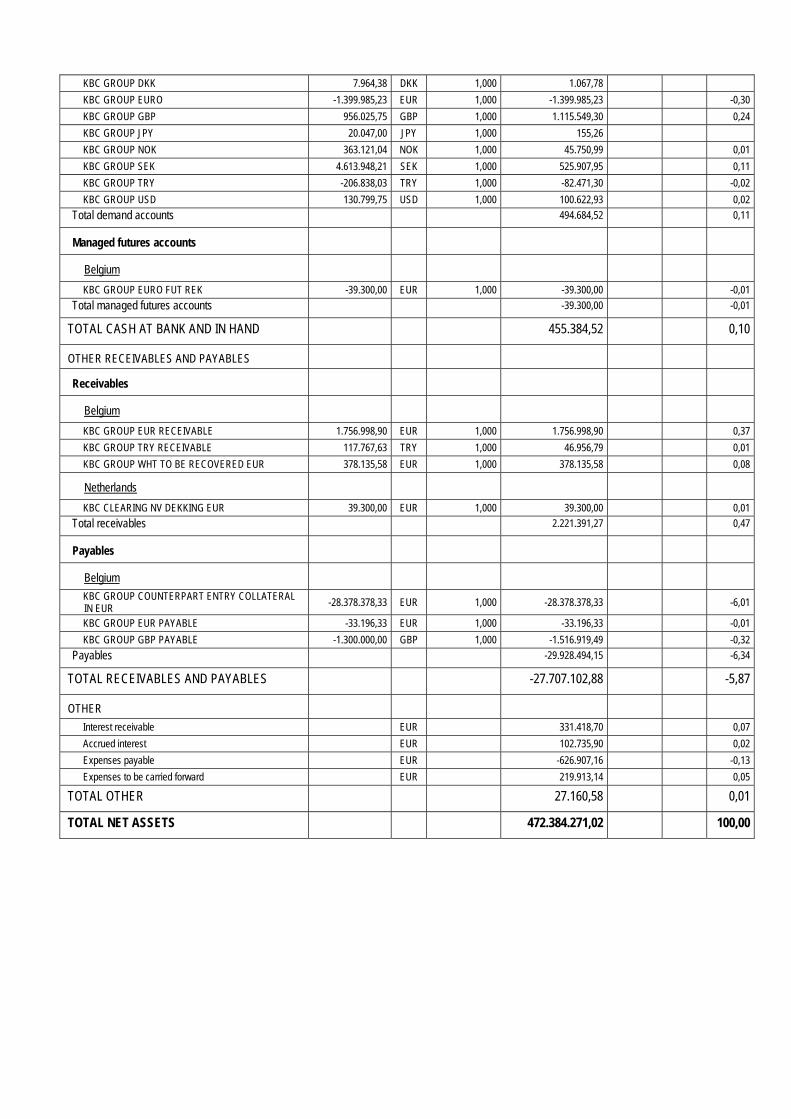
KBC GROUP DKK 7.964,38 DKK 1,000 1.067,78
KBC GROUP EURO -1.399.985,23 EUR 1,000 -1.399.985,23 -0,30
KBC GROUP GBP 956.025,75 GBP 1,000 1.115.549,30 0,24
KBC GROUP JPY 20.047,00 JPY 1,000 155,26
KBC GROUP NOK 363.121,04 NOK 1,000 45.750,99 0,01
KBC GROUP SEK 4.613.948,21 SEK 1,000 525.907,95 0,11
KBC GROUP TRY -206.838,03 TRY 1,000 -82.471,30 -0,02
KBC GROUP USD 130.799,75 USD 1,000 100.622,93 0,02
Total demand accounts 494.684,52 0,11
Managed futures accounts
Belgium
KBC GROUP EURO FUT REK -39.300,00 EUR 1,000 -39.300,00 -0,01
Total managed futures accounts -39.300,00 -0,01
TOTAL CASH AT BANK AND IN HAND 455.384,52 0,10
OTHER RECEIVABLES AND PAYABLES
Receivables
Belgium
KBC GROUP EUR RECEIVABLE 1.756.998,90 EUR 1,000 1.756.998,90 0,37
KBC GROUP TRY RECEIVABLE 117.767,63 TRY 1,000 46.956,79 0,01
KBC GROUP WHT TO BE RECOVERED EUR 378.135,58 EUR 1,000 378.135,58 0,08
Netherlands
KBC CLEARING NV DEKKING EUR 39.300,00 EUR 1,000 39.300,00 0,01
Total receivables 2.221.391,27 0,47
Payables
Belgium
KBC GROUP COUNTERPART ENTRY COLLATERAL IN EUR -28.378.378,33 EUR 1,000 -28.378.378,33 -6,01
KBC GROUP EUR PAYABLE -33.196,33 EUR 1,000 -33.196,33 -0,01
KBC GROUP GBP PAYABLE -1.300.000,00 GBP 1,000 -1.516.919,49 -0,32
Payables -29.928.494,15 -6,34
TOTAL RECEIVABLES AND PAYABLES -27.707.102,88 -5,87
OTHER
Interest receivable EUR 331.418,70 0,07
Accrued interest EUR 102.735,90 0,02
Expenses payable EUR -626.907,16 -0,13
Expenses to be carried forward EUR 219.913,14 0,05
TOTAL OTHER 27.160,58 0,01
TOTAL NET ASSETS 472.384.271,02 100,00

Geographic breakdown (as a % of securities portfolio)
31/12/2011 30/06/2012 31/12/2012 30/06/2013 Austria 0,37 0,00 0,00 0,15 Belgium 4,90 5,47 4,36 5,72 Switzerland 2,10 1,20 0,89 0,74 Cayman Islands 0,09 0,00 0,00 0,00 Germany 25,37 27,41 29,91 31,49 Denmark 0,31 0,52 1,42 0,18 Spain 8,46 7,86 8,91 7,99 Finland 1,39 0,53 0,56 1,00 France 24,59 26,54 27,35 23,76 U.K. 7,57 7,32 4,86 2,42 Ireland 2,26 1,39 0,57 1,83 Italy 6,44 7,33 7,15 5,65 Jersey/The Channel Islands 0,56 0,22 0,49 0,00 Japan 0,38 0,34 0,00 0,00 South Korea 0,20 0,33 0,19 0,00 Luxembourg 2,11 1,77 1,64 0,00 Netherlands 9,53 8,44 6,64 12,94 Norway 0,52 1,04 0,73 0,00 Portugal 0,88 0,00 0,14 1,81 Sweden 1,36 1,00 2,33 0,88 Turkey 0,00 0,00 0,00 0,56 U.S.A. 0,61 1,29 1,86 2,88 Total 100,00 100,00 100,00 100,00
Sector breakdown (as a % of securities portfolio)
31/12/2011 30/06/2012 31/12/2012 30/06/2013 Cyclicals 30,15 33,54 31,11 27,85 Consum(cycl) 13,64 13,38 15,19 17,82 Cons.goods 12,94 11,81 11,85 11,17 Pharma 5,25 6,41 5,75 6,25 Financials 19,60 18,15 20,66 19,51 Technology 5,25 6,11 5,66 8,74 Telecomm. 6,86 5,12 4,21 2,65 Utilities 6,31 5,48 5,57 5,28 Real est. 0,00 0,00 0,00 0,72 Various 0,00 0,00 0,00 0,01 Total 100,00 100,00 100,00 100,00
Currency breakdown (as a % of net assets)
31/12/2011 30/06/2012 31/12/2012 30/06/2013 CHF 2,30 0,02 1,06 0,78 DKK 0,31 0,51 1,42 0,00 EUR 86,92 92,31 87,45 91,39 GBP 7,51 3,44 5,14 2,74 JPY 0,38 0,34 0,00 0,00 KRW 0,20 0,32 0,19 0,00 NOK 0,52 1,02 0,73 0,19 SEK 1,35 0,98 2,32 0,99 TRY 0,00 0,00 0,00 0,55 USD 0,51 1,06 1,69 3,36

Total 100,00 100,00 100,00 100,00

2.4.2 CHANGES IN THE COMPOSITION OF THE ASSETS OF KBC EQUITY FUND EUROZONE (IN THE
CURRENCY OF THE SUB-FUND)
1st half of year YearPurchases 539.773.520,20 539.773.520,20 Sales 571.436.781,38 571.436.781,38 Total 1 1.111.210.301,58 1.111.210.301,58 Subscriptions 385.233.842,38 385.233.842,38 Redemptions 422.235.966,65 422.235.966,65 Total 2 807.469.809,03 807.469.809,03 Monthly average of total assets
572.751.050,76 572.751.050,76
Turnover rate 53,03 % 53,03 %
1st half of year YearPurchases 539.773.520,20 539.773.520,20 Sales 571.436.781,38 571.436.781,38 Total 1 1.111.210.301,58 1.111.210.301,58 Subscriptions 385.233.842,38 385.233.842,38 Redemptions 422.235.966,65 422.235.966,65 Total 2 807.469.809,03 807.469.809,03 Monthly average of total assets
568.121.525,79 568.121.525,79
Corrected turnover rate 53,46 % 53,46 %
The table above shows the capital volume of portfolio transactions. This volume (adjusted to take account of total subscriptions and redemptions) is also compared to the average net assets at the beginning and end of the period. A figure close to 0% implies that the transactions relating to the securities or transactions relating to the assets (excluding deposits and cash) in a given period only involve subscriptions and redemptions. A negative percentage shows that subscriptions and redemptions entailed few, if any, transactions in the portfolio. Active asset management may result in high turnover rates (monthly percentage >50%). The detailed list of transactions is available for consultation free of charge at the registered office of the Bevek or fund at Havenlaan 2, 1080 Brussels.

2.4.3 AMOUNT OF COMMITMENTS IN RESPECT OF FINANCIAL DERIVATIVES POSITIONS
NAME Currency Value in currency
In the currency of the sub-fund
Lot-size
Transactiondate
KBC COLLATERAL EUR
EUR 28.378.378,33 28.378.378,33 N/A 28.06.2013
KBCCLEAR DEKKING EUR
EUR 39.300,00 39.300,00 N/A 28.06.2013
2.4.4 CHANGES OF THE NUMBER OF SUBSCRIPTIONS AND REDEMPTIONS AND THE NET ASSET
VALUE
Classic Shares
Period Change in number of shares in circulation
Year Subscriptions Redemptions End of period
Cap. Dis. Cap. Dis. Cap. Dis. Total
2011 - 06 14.321,68 153.554,00 88.696,38 189.402,00 41.080,29 63.521,00 104.601,29
2012 - 06 95.134,33 61.186,58 50.601,64 58.220,00 85.612,97 66.487,58 152.100,56
2013 - 06 81.669,24 3.342,14 91.943,13 61.510,13 75.339,08 8.319,59 83.658,67
Period Amounts received and paid by the UCI
(in the currency of the class)
Year Subscriptions Redemptions
Capitalization Distribution Capitalization Distribution
2011 - 06 4.975.370,72 43.694.936,30 31.742.518,78 53.900.722,32
2012 - 06 29.607.487,15 16.043.578,43 14.706.423,92 15.205.174,48
2013 - 06 28.441.227,19 888.594,64 31.872.282,49 16.421.641,92
Period Net asset value
End of period (in the currency of the class)
Year Of the class Of one share
Capitalization Distribution
2011 - 06 33.052.229,25 353,33 291,83
2012 - 06 42.484.116,32 304,37 247,05
2013 - 06 29.531.614,68 360,05 289,20
Institutional B Shares
Period Change in number of shares in circulation
Year Subscriptions Redemptions End of period
Cap. Dis. Cap. Dis. Cap. Dis. Total 2012 - 06 1.927.471,00 402.362,00 1.525.109,00 1.525.109,00
2013 - 06 1.831.981,99 2.129.716,43 1.227.374,56 1.227.374,56
Period Amounts received and paid by the UCI
(in the currency of the class)
Year Subscriptions Redemptions
Capitalization Distribution Capitalization Distribution
2012 - 06 599.877.077,30 121.593.032,70
2013 - 06 641.327.337,70 737.209.377,50
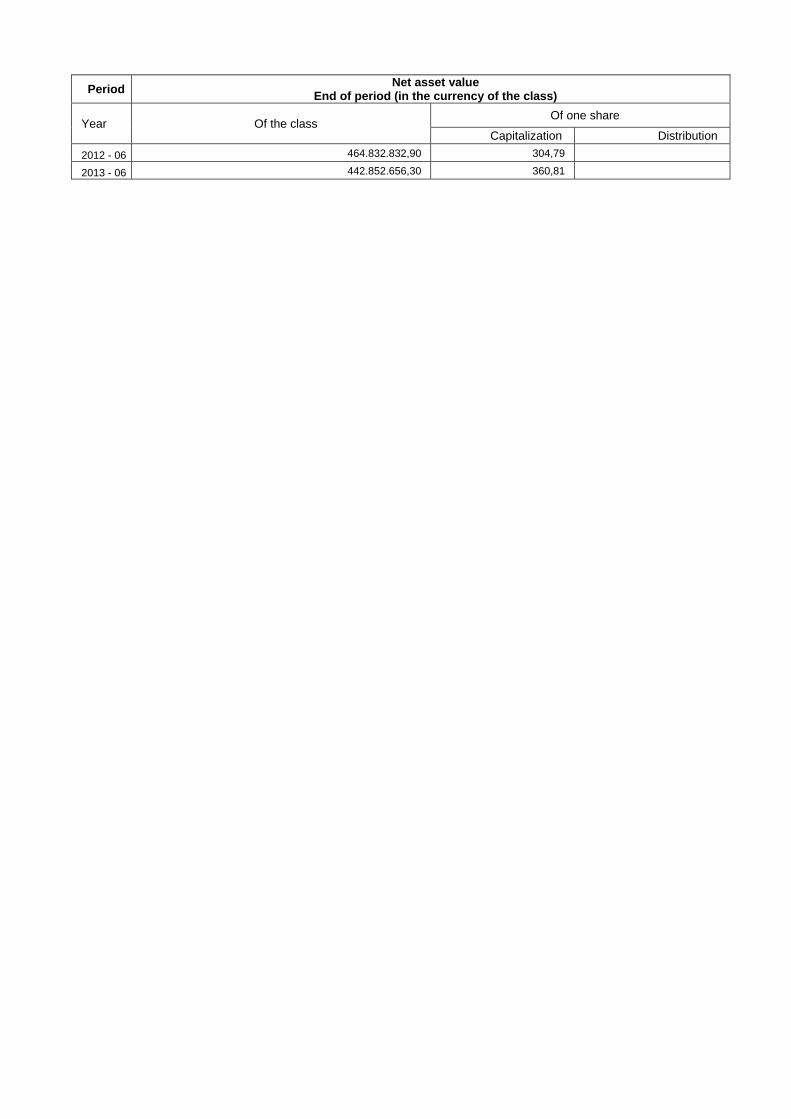
Period Net asset value
End of period (in the currency of the class)
Year Of the class Of one share
Capitalization Distribution
2012 - 06 464.832.832,90 304,79
2013 - 06 442.852.656,30 360,81
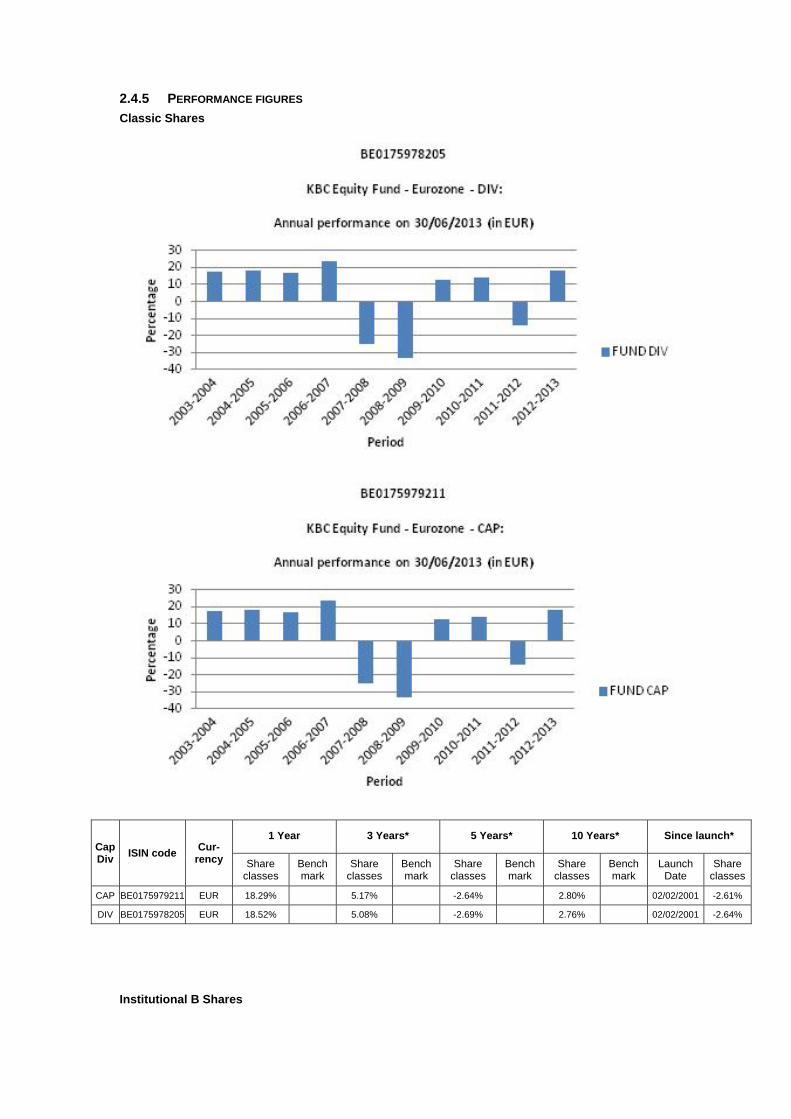
2.4.5 PERFORMANCE FIGURES
Classic Shares
Cap Div
ISIN code Cur-
rency
1 Year 3 Years* 5 Years* 10 Years* Since launch*
Share classes
Bench mark
Share classes
Bench mark
Share classes
Bench mark
Share classes
Bench mark
Launch Date
Share classes
CAP BE0175979211 EUR 18.29% 5.17% -2.64% 2.80% 02/02/2001 -2.61%
DIV BE0175978205 EUR 18.52% 5.08% -2.69% 2.76% 02/02/2001 -2.64%
Institutional B Shares

Cap Div
ISIN code Cur-
rency
1 Year 3 Years* 5 Years* 10 Years* Since launch*
Share classes
Bench mark
Share classes
Bench mark
Share classes
Bench mark
Share classes
Bench mark
Launch Date
Share classes
CAP BE6228543763 EUR 18.38% 24/11/2011 21.51%
Risk warning: Past performance is not a guide to future performance. * Return on annual basis.
Classic Shares The bar chart shows the performance for full financial years. The figures do not take account of any restructuring. Calculated in EUR. The return is calculated as the change in the net asset value between two dates expressed
as a percentage. In the case of units that pay dividends, the dividend is incorporated geometrically in the return.
Calculation method for date D, where NAV stands for net asset value: Capitalisation units (CAP) Return on date D over a period of X years:
[NIW(D) / NIW(Y)] ^ [1 / X] - 1 where Y = D-X
Return on date D since the start date S of the unit: [NIW(D) / NIW(S)] ^ [1 / F] - 1 where F = 1 if the unit has existed for less than one year on date D where F = (D-S) / 365.25 if the unit has existed for longer than one year on date D
Distribution units (DIV) Return on date D over a period of X years:
[ C * NIW(D) / NIW(Y)] ^ [1 / X] - 1 where Y = D-X
Return on date D since the start date S of the unit: [ C * NIW(D) / NIW(S)] ^ [1 / F] - 1 where F = 1 if the unit has existed for less than one year on date D where F = (D-S) / 365.25 if the unit has existed for longer than one year on date D where C is a factor that is determined for all N dividends between the calculation date D and the reference date.
For dividend i on date Di with value Wi: Ci = [Wi / NIW(Di)] + 1 i = 1 ... N

from whichC = C0 * .... * CN. If the interval between the two dates exceeds one year, the ordinary return calculation is
converted into a return on an annual basis by taking the nth square root of 1 plus the total return of the unit.
The return figures shown above do not take account of the fees and charges associated with the issue and redemption of units.
These are the performance figures for capitalisation and distribution shares.
Institutional B Shares The bar chart shows the performance for full financial years. The figures do not take account of any restructuring. Calculated in EUR. The return is calculated as the change in the net asset value between two dates expressed
as a percentage. Calculation method for date D, where NAV stands for net asset value:
Capitalisation units (CAP) Return on date D over a period of X years:
[NIW(D) / NIW(Y)] ^ [1 / X] - 1 where Y = D-X
Return on date D since the start date S of the unit: [NIW(D) / NIW(S)] ^ [1 / F] - 1 where F = 1 if the unit has existed for less than one year on date D where F = (D-S) / 365.25 if the unit has existed for longer than one year on date D
If the interval between the two dates exceeds one year, the ordinary return calculation is converted into a return on an annual basis by taking the nth square root of 1 plus the total return of the unit.
The return figures shown above do not take account of the fees and charges associated with the issue and redemption of units.
These are the performance figures for capitalization shares.

2.4.6 COSTS Ongoing Charges: * Classic Shares Distribution: 1.464% Classic Shares Capitalization: 1.701% Institutional B Shares Capitalization: 1.653% * The following costs have not been included in the ongoing charges: - Interest payments on loans taken out - Payments in respect of financial derivatives - Fees and charges paid directly by the investor - Any soft commissions
SOFT COMMISSIONS The management company or the appointed manager, as the case may be, is the recipient of soft commissions. The recipient has laid down an internal policy as regards accepting soft commissions and avoiding possible conflicts of interest in this respect, and has put appropriate internal controls in place to ensure this policy is observed. For more information, please see the ‘General’ section of the annual report.
Broker
Commission gross
in EUR
paid during the period:
1‐01‐13
‐
30‐06‐13
CSA Credits
in EUR
accrued during the period:
1‐01‐13
‐
30‐06‐13 Percentage
CITI 91,815 45,439 49.49%
CSFBSAS 113,475 50,986 44.93%
DEUTSCHE 108,641 52,979 48.77%
EQ MACQUARIE 760 434 57.14%
HSBC 27,628 9,813 35.52%
INSTINET 140,391 66,532 47.39%
MERRILL 40,802 20,673 50.67%
MORGAN STANLEY 109,766 49,699 45.28%
SOCGEN 8,858 3,512 39.65%
UBSWDR 34,195 13,916 40.69%
FEE-SHARING AGREEMENTS AND REBATES: The management company may share its fee with the distributor, and institutional and/or professional parties. In principle, the percentage share amounts to between 35% and 60% if the distributor is an entity of KBC Group NV or to between 35% and 70% if the distributor is not an entity of KBC Group NV. However, in a small number of cases, the distributor’s fee is less than 35%. Investors may, on request, obtain more information on these cases. If the management company invests the assets of the undertaking for collective investment in units of undertakings for collective investment that are not managed by an entity of KBC Group NV, and receives a fee for doing so, it will pay this fee to the undertaking for collective investment. Fee-sharing does not affect the amount of the management fee paid by the sub-fund to the management company. This management fee is subject to the limitations laid down in the articles of association. The limitations may only be amended after approval by the general meeting of shareholders. The management company has concluded a distribution agreement with the distributor in order to facilitate the wider distribution of the sub-fund's units by using multiple distribution channels. It is in the interests of the holders of units, the sub-fund and of the distributor for the largest possible number of units to be sold and for the assets of the sub-fund to be maximised in this way. In this respect, there is therefore no question of any conflict of interest.

2.4.7 NOTES TO THE FINANCIAL STATEMENTS AND OTHER DATA Fee for managing the investment portfolio: 1.5% per annum calculated on the basis of the average total net assets of the sub-fund, no management fee is charged on assets assets invested in investment undertakings managed by a financial institution of the KBC group. The administration agent’s fee is payable at the end of each month and is calculated on the basis of the average total net assets of the sub-fund. Auditor's fee: 1 700 EUR per year. This fee is not including VAT and can be indexed on an annual basis in accordance with the decisions of the general meeting. The custody fee is calculated on the value of the securities held in custody by the custodian on the final banking day of the preceding calendar year, except on those assets invested in investment undertakings managed by a financial institution of the KBC group. The custody fee is paid at the beginning of the calendar year. Social, ethical and environmental aspects: No manufacturers of controversial weapons whose use over the past five decades, according to the international consensus, has led to disproportionate human suffering among the civilian population will be included in the portfolio of investments. This involves the manufacturers of anti-personnel mines, cluster bombs and munitions and weapons containing depleted uranium. In this way, the sub-fund seeks to reflect not only simple financial reality but also the social reality of the sector or region in question. Exercising voting rights. If necessary, relevant and in the interest of the shareholders, the management company will exercise the voting rights attached to the shares in the Bevek’s portfolio. The management company will adhere to the following criteria when determining how it stands relative to the items on the agenda that are put to the vote: - Shareholder value may not be adversely affected. - Corporate governance rules, especially with regard to the rights of minority shareholders, must be
respected. - The minimum standards with regard to sustainable business and corporate social responsibility
must be met. The list of companies for which voting rights are exercised is available at the registered office of the Bevek. Securities lending In accordance with the Royal Decree of 7 March 2006 concerning securities lending, the undertaking for collective investment has taken out securities loans with a principal to whom the full title of the loaned securities was transferred, without recording this transfer of ownership in the accounts. For the period from 1 January 2013 to 30 June 2013, the fee for securities lent comes to 37,122.47 EUR. The undertaking for collective investment receives 50% of the fee received for securities lent. The detailed list of securities lending transactions carried out can be obtained from the registered office of the collective investment undertaking at 2 Havenlaan, 1080 Brussels.
Overview of securities lent as at 30/06/2013
Name Currency Quantity Price Value in currency of the
portfolio
ADP EUR 34.240 74,710 2.558.070,40
ASML HOLDING EUR 743 60,620 45.040,66
BASF SE REGISTERED EUR 24.943 68,630 1.711.838,09
CARREFOUR SUPERMARCHE EUR 120.462 21,130 2.545.362,06
DELHAIZE GROEP EUR 49.663 47,490 2.358.495,87
IBERDROLA SA EUR 763.547 4,056 3.096.946,63
INFINEON TECHNOLOGIES EUR 164.935 6,430 1.060.532,05
INTL CONSOLIDATED AIRLINES GROUP SA EUR 189.999 3,086 586.336,91
KONE OY -B- NW 2005 EUR 30.999 61,050 1.892.488,95
LINDE AG EUR 29.163 143,350 4.180.516,05
LUXOTTICA GROUP SPA EUR 16.778 38,840 651.657,52
MEDIASET SPA EUR 398.479 2,900 1.155.589,10
NEOPOST SA EUR 25.226 51,000 1.286.526,00
PORTUGAL TELECOM SGPS -REGISTERED- EUR 161.174 2,990 481.910,26
SKY DEUTSCHL.AG (NAMENS-AKTIEN ON) EUR 85.577 5,350 457.836,95
THYSSENKRUPP AG EUR 70.499 15,095 1.064.182,40
VOLKSWAGEN BEV EUR 9.324 155,550 1.450.348,20
Total 26.583.678,10
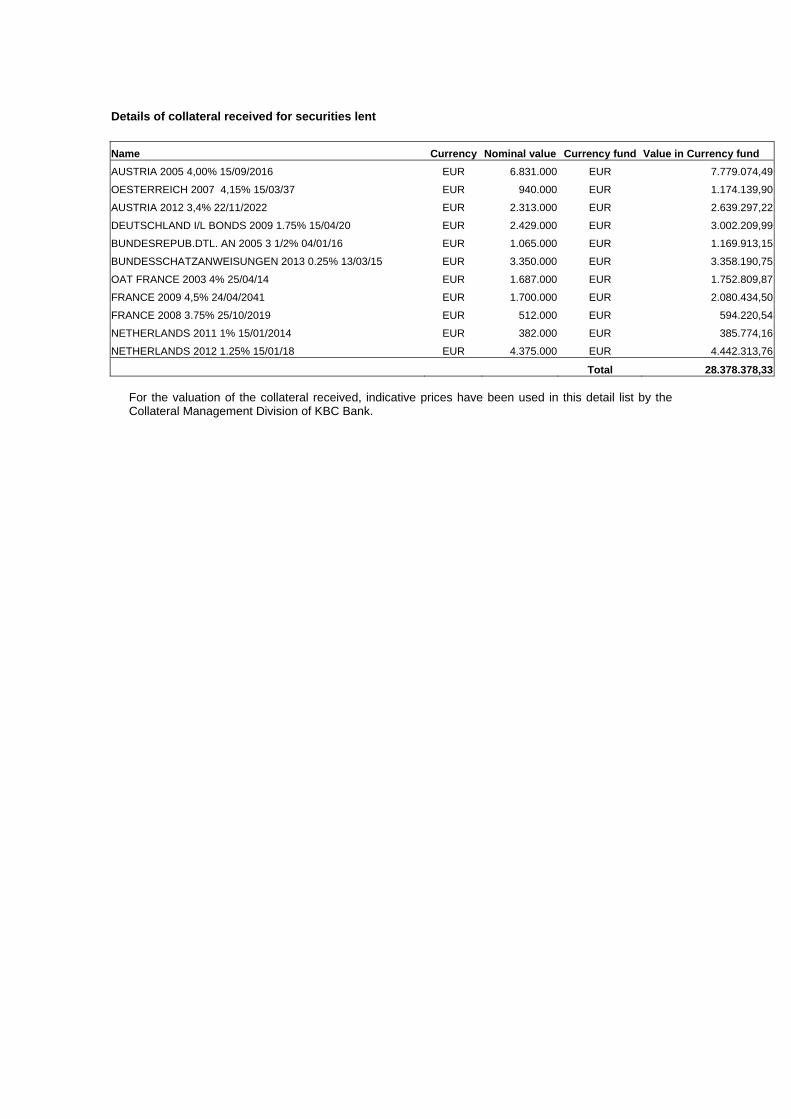
Details of collateral received for securities lent
Name Currency Nominal value Currency fund Value in Currency fund
AUSTRIA 2005 4,00% 15/09/2016 EUR 6.831.000 EUR 7.779.074,49
OESTERREICH 2007 4,15% 15/03/37 EUR 940.000 EUR 1.174.139,90
AUSTRIA 2012 3,4% 22/11/2022 EUR 2.313.000 EUR 2.639.297,22
DEUTSCHLAND I/L BONDS 2009 1.75% 15/04/20 EUR 2.429.000 EUR 3.002.209,99
BUNDESREPUB.DTL. AN 2005 3 1/2% 04/01/16 EUR 1.065.000 EUR 1.169.913,15
BUNDESSCHATZANWEISUNGEN 2013 0.25% 13/03/15 EUR 3.350.000 EUR 3.358.190,75
OAT FRANCE 2003 4% 25/04/14 EUR 1.687.000 EUR 1.752.809,87
FRANCE 2009 4,5% 24/04/2041 EUR 1.700.000 EUR 2.080.434,50
FRANCE 2008 3.75% 25/10/2019 EUR 512.000 EUR 594.220,54
NETHERLANDS 2011 1% 15/01/2014 EUR 382.000 EUR 385.774,16
NETHERLANDS 2012 1.25% 15/01/18 EUR 4.375.000 EUR 4.442.313,76
Total 28.378.378,33 For the valuation of the collateral received, indicative prices have been used in this detail list by the Collateral Management Division of KBC Bank.

Semi-Annual report as at 30th June 2013
TABLE OF CONTENTS
2. Information on KBC Equity Fund Euro Finance
2.1. Management report 2.1.1. Launch date and subscription price 2.1.2. Stock exchange listing 2.1.3. Aim and distinctive features of the investment policy 2.1.4. Financial portfolio management 2.1.5. Distributors 2.1.6. Index and benchmark 2.1.7. Policy conducted during the financial year 2.1.8. Future policy 2.1.9. Synthetic risk and reward indicator (SRRI)
2.2. Balance sheet
2.3. Profit and loss account
2.4. Composition of the assets and key figures
2.4.1. Composition of the assets 2.4.2. Change in the composition of the assets 2.4.3. Value of commitments in respect of financial derivatives positions 2.4.4. Evolution of the number of subscriptions, repayments and the net asset value 2.4.5. Return figures 2.4.6. Expenses 2.4.7. Notes to the financial statements and other data


2 INFORMATION ON KBC EQUITY FUND EURO FINANCE
2.1 MANAGEMENT REPORT
2.1.1 LAUNCH DATE AND SUBSCRIPTION PRICE Classic Shares : Launch date: 31 May 2000 Initial subscription price: 500 EUR Currency: EUR Institutional B Shares : Launch date: 24 November 2011 Initial subscription price: 194.92 EUR Currency: EUR
2.1.2 STOCK EXCHANGE LISTING Not applicable.
2.1.3 GOAL AND KEY PRINCIPLES OF THE INVESTMENT POLICY
SUB-FUND’S OBJECT: The main objective of this sub-fund is to generate the highest possible return for its shareholders by investing directly or indirectly in transferable securities. This is reflected in its pursuit of capital gains and income. To this end, the assets are invested, either directly or indirectly via correlated financial instruments, primarily in shares.
SUB-FUND’S INVESTMENT POLICY:
PERMITTED ASSET CLASSES: The sub-fund may invest in securities, money market instruments, units in undertakings for collective investment, deposits, financial derivatives, liquid assets and all other instruments insofar as permitted by the applicable laws and regulations and consistent with the sub-fund’s object The sub-fund shall invest no more than 10% of its assets in units of other undertakings for collective investment.
RESTRICTIONS OF THE INVESTMENT POLICY: The investment policy will be implemented within the limits set by law and regulations. The sub-fund may borrow up to 10% of its net assets, insofar as these are short-term borrowings aimed at solving temporary liquidity problems.
PERMITTED DERIVATIVES TRANSACTIONS: Derivates may be used either for hedging purposes or to achieve investment objectives. Changes will be made to the investments at regular intervals to comply with the sub-fund's investment strategy. In addition, listed and unlisted derivates may be used to achieve the objectives: these may be forward contracts, options or swaps on securities, indices, currencies or interest rates or other transactions involving derivatives. Unlisted derivatives transactions will only be concluded with prime financial institutions specialised in such transactions. Such derivatives may also be used to hedge the assets against exchange-rate fluctuations. Subject to the applicable laws and regulations and the articles of association, the sub-fund always seeks to conclude the most effective transactions. All costs associated with the transactions will be charged to the sub-fund and all income generated will be paid to the sub-fund. If the transactions result in a risk in respect of the counterparty, this risk can be hedged by using a margin management system that ensures that the sub-fund is the beneficiary of security (collateral) in the form of cash or investment grade bonds. When calculating the value of the bonds, a margin will be applied that varies depending on the residual term to maturity and the currency in which the bond in question is denominated. The relationship with the counterparty or counterparties is governed by standard international agreements.
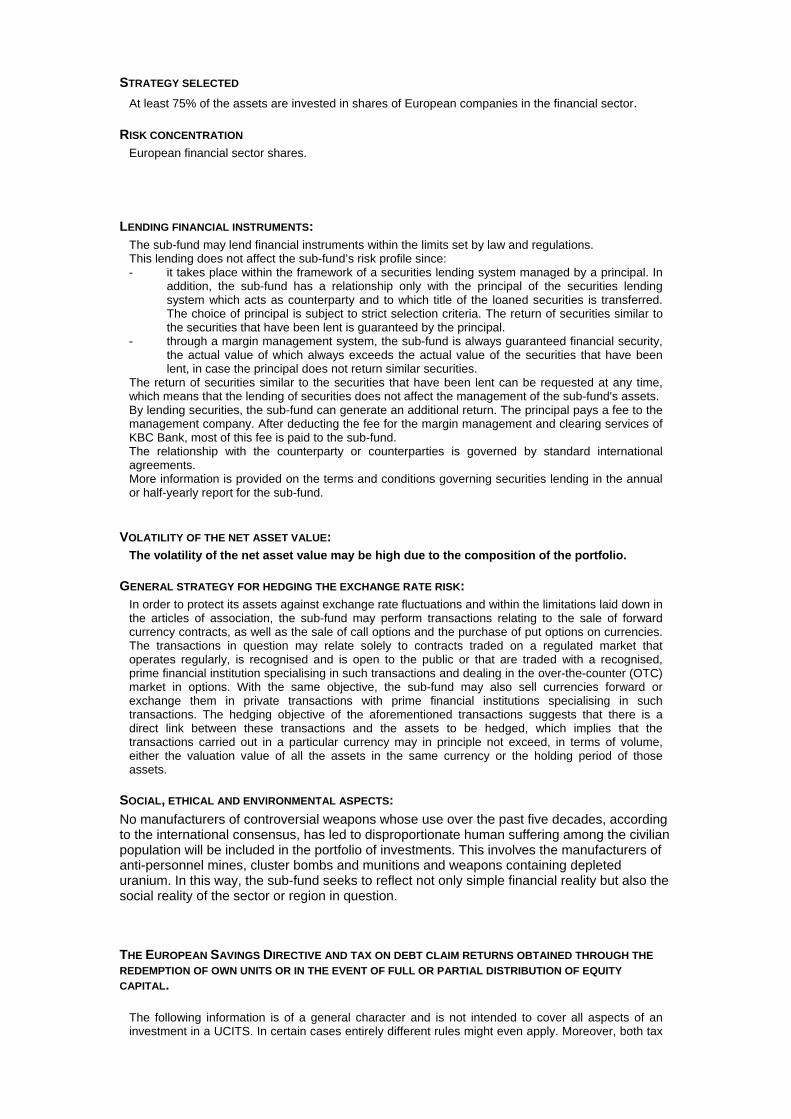
STRATEGY SELECTED
At least 75% of the assets are invested in shares of European companies in the financial sector.
RISK CONCENTRATION European financial sector shares.
LENDING FINANCIAL INSTRUMENTS: The sub-fund may lend financial instruments within the limits set by law and regulations. This lending does not affect the sub-fund’s risk profile since: - it takes place within the framework of a securities lending system managed by a principal. In
addition, the sub-fund has a relationship only with the principal of the securities lending system which acts as counterparty and to which title of the loaned securities is transferred. The choice of principal is subject to strict selection criteria. The return of securities similar to the securities that have been lent is guaranteed by the principal.
- through a margin management system, the sub-fund is always guaranteed financial security, the actual value of which always exceeds the actual value of the securities that have been lent, in case the principal does not return similar securities.
The return of securities similar to the securities that have been lent can be requested at any time, which means that the lending of securities does not affect the management of the sub-fund's assets. By lending securities, the sub-fund can generate an additional return. The principal pays a fee to the management company. After deducting the fee for the margin management and clearing services of KBC Bank, most of this fee is paid to the sub-fund. The relationship with the counterparty or counterparties is governed by standard international agreements. More information is provided on the terms and conditions governing securities lending in the annual or half-yearly report for the sub-fund.
VOLATILITY OF THE NET ASSET VALUE: The volatility of the net asset value may be high due to the composition of the portfolio.
GENERAL STRATEGY FOR HEDGING THE EXCHANGE RATE RISK: In order to protect its assets against exchange rate fluctuations and within the limitations laid down in the articles of association, the sub-fund may perform transactions relating to the sale of forward currency contracts, as well as the sale of call options and the purchase of put options on currencies. The transactions in question may relate solely to contracts traded on a regulated market that operates regularly, is recognised and is open to the public or that are traded with a recognised, prime financial institution specialising in such transactions and dealing in the over-the-counter (OTC) market in options. With the same objective, the sub-fund may also sell currencies forward or exchange them in private transactions with prime financial institutions specialising in such transactions. The hedging objective of the aforementioned transactions suggests that there is a direct link between these transactions and the assets to be hedged, which implies that the transactions carried out in a particular currency may in principle not exceed, in terms of volume, either the valuation value of all the assets in the same currency or the holding period of those assets.
SOCIAL, ETHICAL AND ENVIRONMENTAL ASPECTS:
No manufacturers of controversial weapons whose use over the past five decades, according to the international consensus, has led to disproportionate human suffering among the civilian population will be included in the portfolio of investments. This involves the manufacturers of anti-personnel mines, cluster bombs and munitions and weapons containing depleted uranium. In this way, the sub-fund seeks to reflect not only simple financial reality but also the social reality of the sector or region in question.
THE EUROPEAN SAVINGS DIRECTIVE AND TAX ON DEBT CLAIM RETURNS OBTAINED THROUGH THE
REDEMPTION OF OWN UNITS OR IN THE EVENT OF FULL OR PARTIAL DISTRIBUTION OF EQUITY
CAPITAL. The following information is of a general character and is not intended to cover all aspects of an investment in a UCITS. In certain cases entirely different rules might even apply. Moreover, both tax
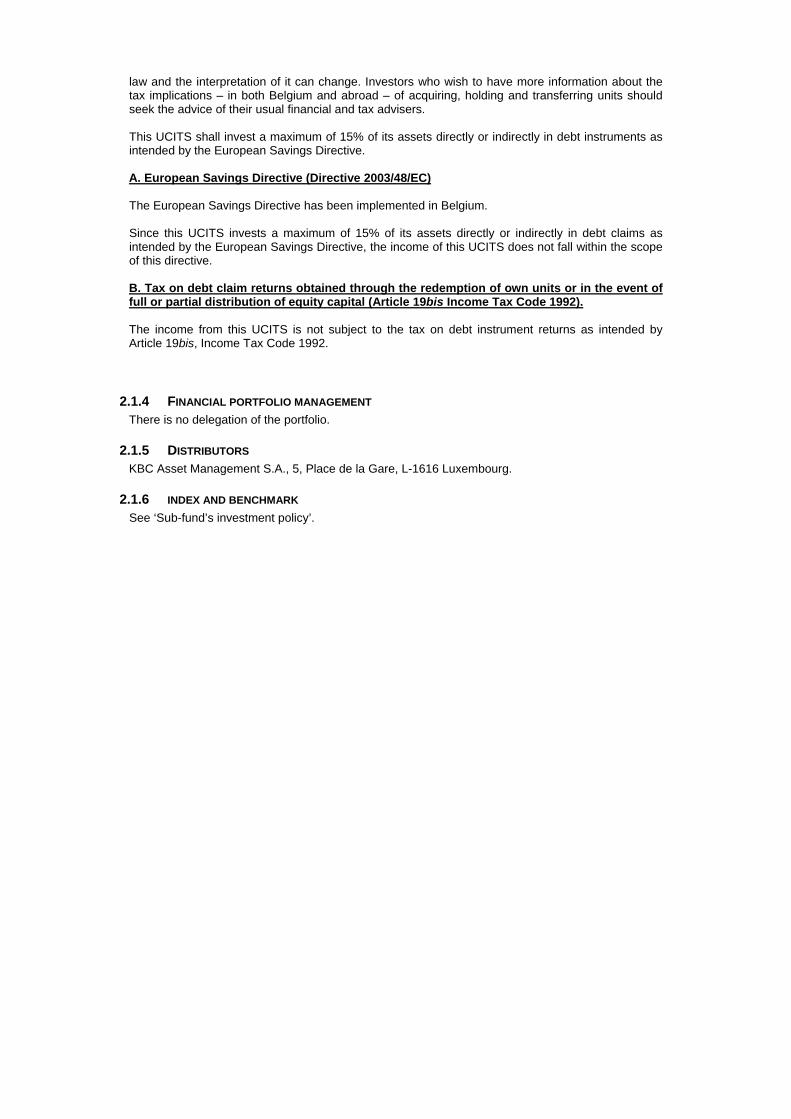
law and the interpretation of it can change. Investors who wish to have more information about the tax implications – in both Belgium and abroad – of acquiring, holding and transferring units should seek the advice of their usual financial and tax advisers. This UCITS shall invest a maximum of 15% of its assets directly or indirectly in debt instruments as intended by the European Savings Directive. A. European Savings Directive (Directive 2003/48/EC) The European Savings Directive has been implemented in Belgium. Since this UCITS invests a maximum of 15% of its assets directly or indirectly in debt claims as intended by the European Savings Directive, the income of this UCITS does not fall within the scope of this directive. B. Tax on debt claim returns obtained through the redemption of own units or in the event of full or partial distribution of equity capital (Article 19bis Income Tax Code 1992). The income from this UCITS is not subject to the tax on debt instrument returns as intended by Article 19bis, Income Tax Code 1992.
2.1.4 FINANCIAL PORTFOLIO MANAGEMENT There is no delegation of the portfolio.
2.1.5 DISTRIBUTORS KBC Asset Management S.A., 5, Place de la Gare, L-1616 Luxembourg.
2.1.6 INDEX AND BENCHMARK See ‘Sub-fund’s investment policy’.
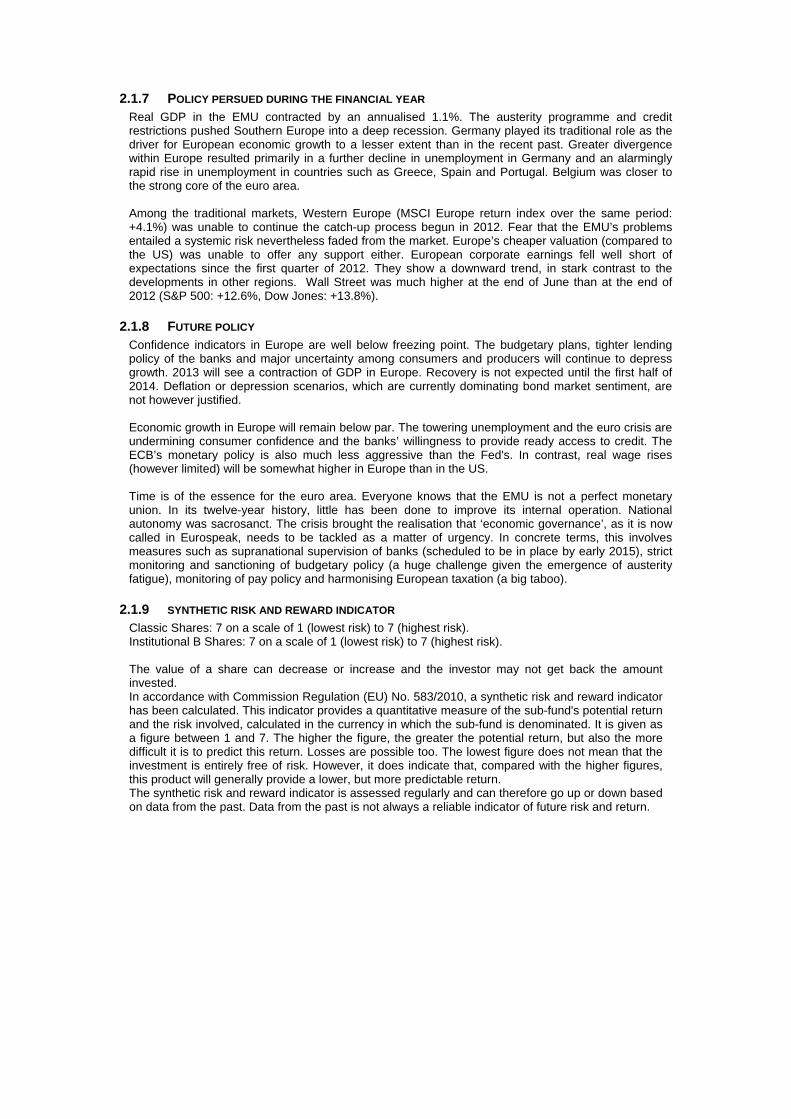
2.1.7 POLICY PERSUED DURING THE FINANCIAL YEAR Real GDP in the EMU contracted by an annualised 1.1%. The austerity programme and credit restrictions pushed Southern Europe into a deep recession. Germany played its traditional role as the driver for European economic growth to a lesser extent than in the recent past. Greater divergence within Europe resulted primarily in a further decline in unemployment in Germany and an alarmingly rapid rise in unemployment in countries such as Greece, Spain and Portugal. Belgium was closer to the strong core of the euro area. Among the traditional markets, Western Europe (MSCI Europe return index over the same period: +4.1%) was unable to continue the catch-up process begun in 2012. Fear that the EMU’s problems entailed a systemic risk nevertheless faded from the market. Europe’s cheaper valuation (compared to the US) was unable to offer any support either. European corporate earnings fell well short of expectations since the first quarter of 2012. They show a downward trend, in stark contrast to the developments in other regions. Wall Street was much higher at the end of June than at the end of 2012 (S&P 500: +12.6%, Dow Jones: +13.8%).
2.1.8 FUTURE POLICY Confidence indicators in Europe are well below freezing point. The budgetary plans, tighter lending policy of the banks and major uncertainty among consumers and producers will continue to depress growth. 2013 will see a contraction of GDP in Europe. Recovery is not expected until the first half of 2014. Deflation or depression scenarios, which are currently dominating bond market sentiment, are not however justified. Economic growth in Europe will remain below par. The towering unemployment and the euro crisis are undermining consumer confidence and the banks’ willingness to provide ready access to credit. The ECB’s monetary policy is also much less aggressive than the Fed's. In contrast, real wage rises (however limited) will be somewhat higher in Europe than in the US. Time is of the essence for the euro area. Everyone knows that the EMU is not a perfect monetary union. In its twelve-year history, little has been done to improve its internal operation. National autonomy was sacrosanct. The crisis brought the realisation that ‘economic governance’, as it is now called in Eurospeak, needs to be tackled as a matter of urgency. In concrete terms, this involves measures such as supranational supervision of banks (scheduled to be in place by early 2015), strict monitoring and sanctioning of budgetary policy (a huge challenge given the emergence of austerity fatigue), monitoring of pay policy and harmonising European taxation (a big taboo).
2.1.9 SYNTHETIC RISK AND REWARD INDICATOR Classic Shares: 7 on a scale of 1 (lowest risk) to 7 (highest risk). Institutional B Shares: 7 on a scale of 1 (lowest risk) to 7 (highest risk). The value of a share can decrease or increase and the investor may not get back the amount invested. In accordance with Commission Regulation (EU) No. 583/2010, a synthetic risk and reward indicator has been calculated. This indicator provides a quantitative measure of the sub-fund's potential return and the risk involved, calculated in the currency in which the sub-fund is denominated. It is given as a figure between 1 and 7. The higher the figure, the greater the potential return, but also the more difficult it is to predict this return. Losses are possible too. The lowest figure does not mean that the investment is entirely free of risk. However, it does indicate that, compared with the higher figures, this product will generally provide a lower, but more predictable return. The synthetic risk and reward indicator is assessed regularly and can therefore go up or down based on data from the past. Data from the past is not always a reliable indicator of future risk and return.
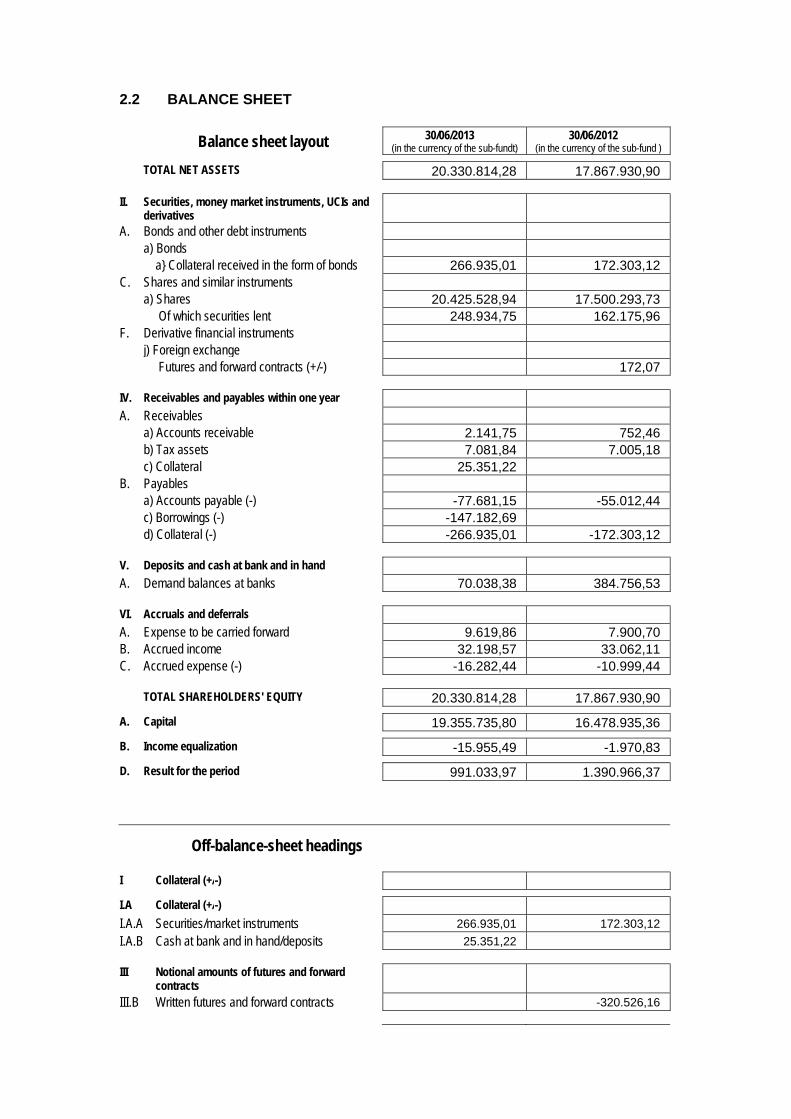
2.2 BALANCE SHEET
Balance sheet layout 30/06/2013 (in the currency of the sub-fundt)
30/06/2012 (in the currency of the sub-fund )
TOTAL NET ASSETS 20.330.814,28 17.867.930,90
II. Securities, money market instruments, UCIs and derivatives
A. Bonds and other debt instruments a) Bonds a} Collateral received in the form of bonds 266.935,01 172.303,12 C. Shares and similar instruments a) Shares 20.425.528,94 17.500.293,73 Of which securities lent 248.934,75 162.175,96 F. Derivative financial instruments j) Foreign exchange Futures and forward contracts (+/-) 172,07
IV. Receivables and payables within one year A. Receivables a) Accounts receivable 2.141,75 752,46 b) Tax assets 7.081,84 7.005,18 c) Collateral 25.351,22 B. Payables a) Accounts payable (-) -77.681,15 -55.012,44 c) Borrowings (-) -147.182,69 d) Collateral (-) -266.935,01 -172.303,12
V. Deposits and cash at bank and in hand A. Demand balances at banks 70.038,38 384.756,53
VI. Accruals and deferrals A. Expense to be carried forward 9.619,86 7.900,70 B. Accrued income 32.198,57 33.062,11 C. Accrued expense (-) -16.282,44 -10.999,44
TOTAL SHAREHOLDERS' EQUITY 20.330.814,28 17.867.930,90
A. Capital 19.355.735,80 16.478.935,36
B. Income equalization -15.955,49 -1.970,83
D. Result for the period 991.033,97 1.390.966,37
Off-balance-sheet headings
I Collateral (+/-)
I.A Collateral (+/-)
I.A.A Securities/market instruments 266.935,01 172.303,12
I.A.B Cash at bank and in hand/deposits 25.351,22
III Notional amounts of futures and forward contracts
III.B Written futures and forward contracts -320.526,16
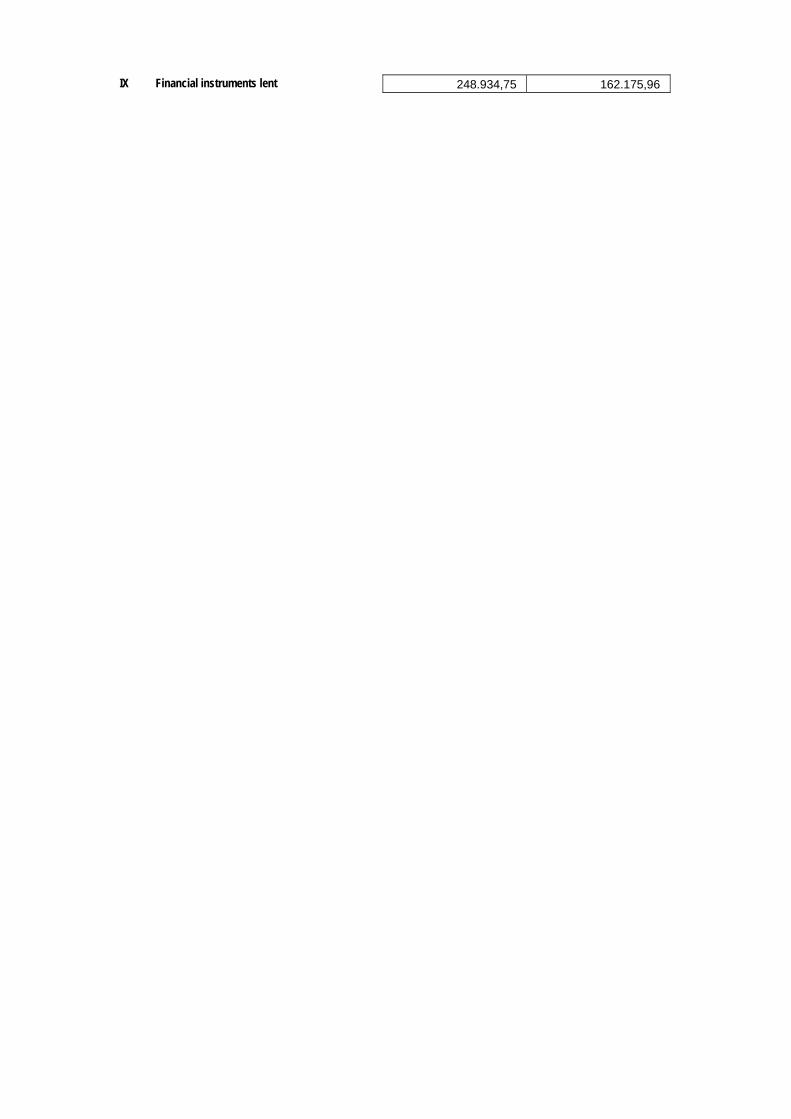
IX Financial instruments lent 248.934,75 162.175,96
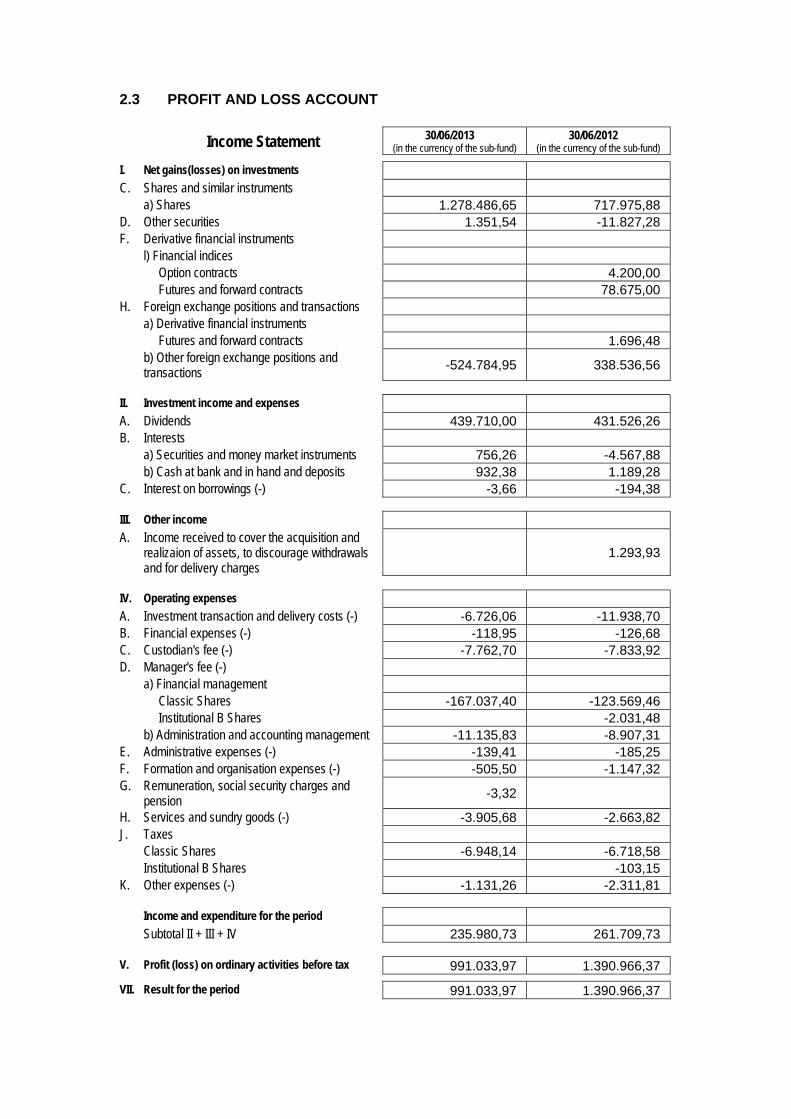
2.3 PROFIT AND LOSS ACCOUNT
Income Statement 30/06/2013 (in the currency of the sub-fund)
30/06/2012 (in the currency of the sub-fund)
I. Net gains(losses) on investments C. Shares and similar instruments a) Shares 1.278.486,65 717.975,88 D. Other securities 1.351,54 -11.827,28 F. Derivative financial instruments l) Financial indices Option contracts 4.200,00 Futures and forward contracts 78.675,00 H. Foreign exchange positions and transactions a) Derivative financial instruments Futures and forward contracts 1.696,48 b) Other foreign exchange positions and
transactions -524.784,95 338.536,56
II. Investment income and expenses A. Dividends 439.710,00 431.526,26 B. Interests a) Securities and money market instruments 756,26 -4.567,88 b) Cash at bank and in hand and deposits 932,38 1.189,28 C. Interest on borrowings (-) -3,66 -194,38
III. Other income A. Income received to cover the acquisition and
realizaion of assets, to discourage withdrawals and for delivery charges
1.293,93
IV. Operating expenses A. Investment transaction and delivery costs (-) -6.726,06 -11.938,70 B. Financial expenses (-) -118,95 -126,68 C. Custodian's fee (-) -7.762,70 -7.833,92 D. Manager's fee (-) a) Financial management Classic Shares -167.037,40 -123.569,46 Institutional B Shares -2.031,48 b) Administration and accounting management -11.135,83 -8.907,31 E. Administrative expenses (-) -139,41 -185,25 F. Formation and organisation expenses (-) -505,50 -1.147,32 G. Remuneration, social security charges and
pension -3,32
H. Services and sundry goods (-) -3.905,68 -2.663,82 J. Taxes Classic Shares -6.948,14 -6.718,58 Institutional B Shares -103,15 K. Other expenses (-) -1.131,26 -2.311,81
Income and expenditure for the period Subtotal II + III + IV 235.980,73 261.709,73
V. Profit (loss) on ordinary activities before tax 991.033,97 1.390.966,37
VII. Result for the period 991.033,97 1.390.966,37

2.4 COMPOSITION OF THE ASSETS AND KEY FIGURES
2.4.1 COMPOSITIONS OF THE ASSETS OF KBC EQUITY FUND EURO FINANCE
Name Quantity on 30/06/2013
Cur rency
Price in currency
Evaluation (in the currency of the
sub-fund)
% owned by
UCI
% portfolio
% Net
assets
NET ASSETS
SECURITIES PORTFOLIO
Shares
Exchange-listed shares
Austria
VIENNA INSURANCE GROUP - 2.000,00 EUR 35,685 71.370,00 0,35 0,35
Belgium
AGEAS NV (BRU) B STRIP-VVPR 2.666,00 EUR 0,001 2,67
AGEAS NV - 11.000,00 EUR 26,975 296.725,00 1,45 1,46
KBC ANCORA - 6.000,00 EUR 15,000 90.000,00 0,44 0,44
KBC GROUP - 7.000,00 EUR 28,605 200.235,00 0,98 0,99
Cyprus
BANK OF CYPRUS PUBLIC CO LTD - 10.000,00 EUR 0,207 2.070,00 0,01 0,01
Denmark
DANSKE BK AS - 8.804,00 DKK 98,000 115.674,37 0,57 0,57
Finland
SAMPO OYJ SAMPO OYJ 8.600,00 EUR 29,940 257.484,00 1,26 1,27
France
AXA - 43.248,00 EUR 15,095 652.828,56 3,20 3,21
BNP PARIBAS - 15.976,00 EUR 41,975 670.592,60 3,28 3,30
CNP ASSURANCE (PAR) 4.302,00 EUR 11,025 47.429,55 0,23 0,23
NATIXIS (PAR) 40.000,00 EUR 3,216 128.640,00 0,63 0,63
RODAMCO UNIBAIL - 1.388,00 EUR 179,000 248.452,00 1,22 1,22
SCOR REGROUPE (PAR) 9.375,00 EUR 23,575 221.015,63 1,08 1,09
SOCIETE GENERALE - 16.115,00 EUR 26,400 425.436,00 2,08 2,09
Germany
ALLIANZ AG REG 7.555,00 EUR 112,250 848.048,75 4,15 4,17
COMMERZBANK AG - 11.700,00 EUR 6,698 78.366,60 0,38 0,39
DEUTSCHE BANK AG REG 16.500,00 EUR 32,155 530.557,50 2,60 2,61
DEUTSCHE BOERSE AG - 5.000,00 EUR 50,570 252.850,00 1,24 1,24
HANNOVER RUECK SE (FRA) NAAM 3.459,00 EUR 55,320 191.351,88 0,94 0,94
MUNCHENER RUCKVERSICHERUNG AG REG 3.544,00 EUR 141,400 501.121,60 2,45 2,47
Ireland
ALLIED IRISH BANKS PLC - 100.000,00 EUR 0,061 6.100,00 0,03 0,03
PERMANENT TSB GROUP HOLDINGS P - 373.367,00 EUR 0,026 9.819,55 0,05 0,05
Italy
ASSICURAZIONI GENERALI - 10.000,00 EUR 13,420 134.200,00 0,66 0,66
AZIMUT HOLDING SPA - 10.515,00 EUR 13,990 147.104,85 0,72 0,72
BANCO POPLARE DI VERONA E NOVARA - 40.000,00 EUR 0,905 36.180,00 0,18 0,18
INTESA SANPAOLO SPA (MIL) RSNC 40.000,00 EUR 1,030 41.200,00 0,20 0,20
INTESA SANPAOLO SPA - 200.000,00 EUR 1,231 246.200,00 1,21 1,21
MEDIOBANCA (MIL) 35.000,00 EUR 4,000 140.000,00 0,69 0,69
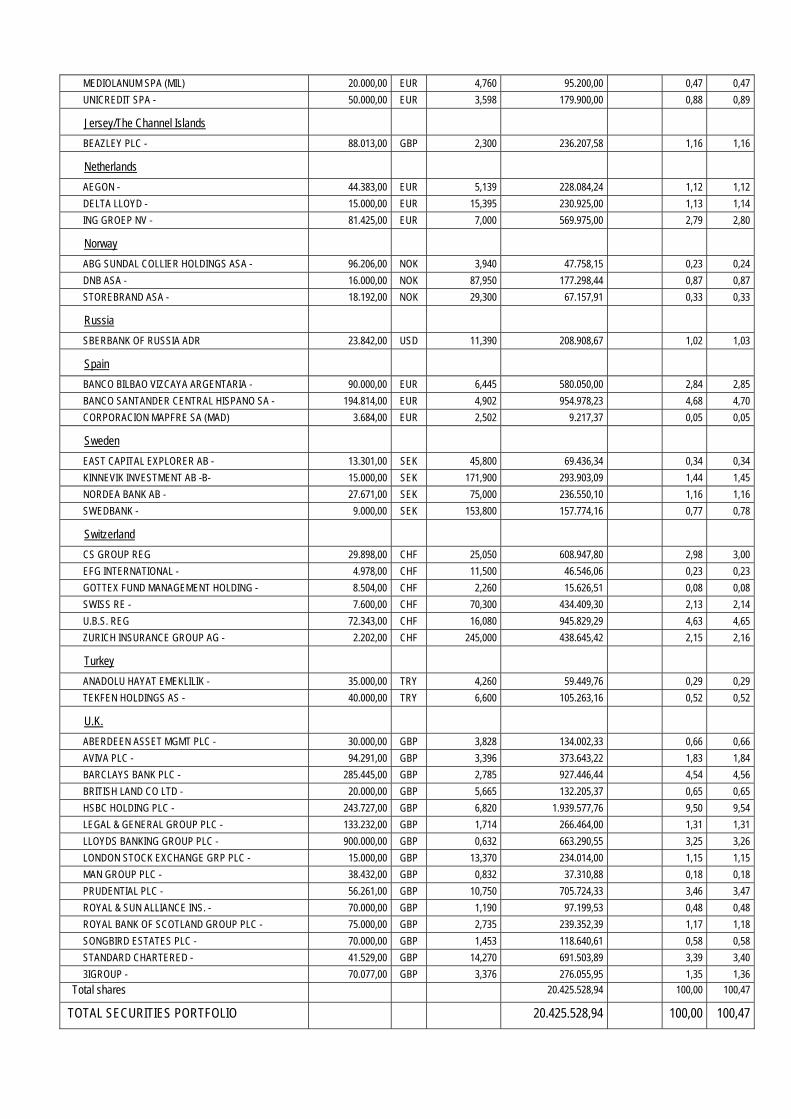
MEDIOLANUM SPA (MIL) 20.000,00 EUR 4,760 95.200,00 0,47 0,47
UNICREDIT SPA - 50.000,00 EUR 3,598 179.900,00 0,88 0,89
Jersey/The Channel Islands
BEAZLEY PLC - 88.013,00 GBP 2,300 236.207,58 1,16 1,16
Netherlands
AEGON - 44.383,00 EUR 5,139 228.084,24 1,12 1,12
DELTA LLOYD - 15.000,00 EUR 15,395 230.925,00 1,13 1,14
ING GROEP NV - 81.425,00 EUR 7,000 569.975,00 2,79 2,80
Norway
ABG SUNDAL COLLIER HOLDINGS ASA - 96.206,00 NOK 3,940 47.758,15 0,23 0,24
DNB ASA - 16.000,00 NOK 87,950 177.298,44 0,87 0,87
STOREBRAND ASA - 18.192,00 NOK 29,300 67.157,91 0,33 0,33
Russia
SBERBANK OF RUSSIA ADR 23.842,00 USD 11,390 208.908,67 1,02 1,03
Spain
BANCO BILBAO VIZCAYA ARGENTARIA - 90.000,00 EUR 6,445 580.050,00 2,84 2,85
BANCO SANTANDER CENTRAL HISPANO SA - 194.814,00 EUR 4,902 954.978,23 4,68 4,70
CORPORACION MAPFRE SA (MAD) 3.684,00 EUR 2,502 9.217,37 0,05 0,05
Sweden
EAST CAPITAL EXPLORER AB - 13.301,00 SEK 45,800 69.436,34 0,34 0,34
KINNEVIK INVESTMENT AB -B- 15.000,00 SEK 171,900 293.903,09 1,44 1,45
NORDEA BANK AB - 27.671,00 SEK 75,000 236.550,10 1,16 1,16
SWEDBANK - 9.000,00 SEK 153,800 157.774,16 0,77 0,78
Switzerland
CS GROUP REG 29.898,00 CHF 25,050 608.947,80 2,98 3,00
EFG INTERNATIONAL - 4.978,00 CHF 11,500 46.546,06 0,23 0,23
GOTTEX FUND MANAGEMENT HOLDING - 8.504,00 CHF 2,260 15.626,51 0,08 0,08
SWISS RE - 7.600,00 CHF 70,300 434.409,30 2,13 2,14
U.B.S. REG 72.343,00 CHF 16,080 945.829,29 4,63 4,65
ZURICH INSURANCE GROUP AG - 2.202,00 CHF 245,000 438.645,42 2,15 2,16
Turkey
ANADOLU HAYAT EMEKLILIK - 35.000,00 TRY 4,260 59.449,76 0,29 0,29
TEKFEN HOLDINGS AS - 40.000,00 TRY 6,600 105.263,16 0,52 0,52
U.K.
ABERDEEN ASSET MGMT PLC - 30.000,00 GBP 3,828 134.002,33 0,66 0,66
AVIVA PLC - 94.291,00 GBP 3,396 373.643,22 1,83 1,84
BARCLAYS BANK PLC - 285.445,00 GBP 2,785 927.446,44 4,54 4,56
BRITISH LAND CO LTD - 20.000,00 GBP 5,665 132.205,37 0,65 0,65
HSBC HOLDING PLC - 243.727,00 GBP 6,820 1.939.577,76 9,50 9,54
LEGAL & GENERAL GROUP PLC - 133.232,00 GBP 1,714 266.464,00 1,31 1,31
LLOYDS BANKING GROUP PLC - 900.000,00 GBP 0,632 663.290,55 3,25 3,26
LONDON STOCK EXCHANGE GRP PLC - 15.000,00 GBP 13,370 234.014,00 1,15 1,15
MAN GROUP PLC - 38.432,00 GBP 0,832 37.310,88 0,18 0,18
PRUDENTIAL PLC - 56.261,00 GBP 10,750 705.724,33 3,46 3,47
ROYAL & SUN ALLIANCE INS. - 70.000,00 GBP 1,190 97.199,53 0,48 0,48
ROYAL BANK OF SCOTLAND GROUP PLC - 75.000,00 GBP 2,735 239.352,39 1,17 1,18
SONGBIRD ESTATES PLC - 70.000,00 GBP 1,453 118.640,61 0,58 0,58
STANDARD CHARTERED - 41.529,00 GBP 14,270 691.503,89 3,39 3,40
3IGROUP - 70.077,00 GBP 3,376 276.055,95 1,35 1,36
Total shares 20.425.528,94 100,00 100,47
TOTAL SECURITIES PORTFOLIO 20.425.528,94 100,00 100,47
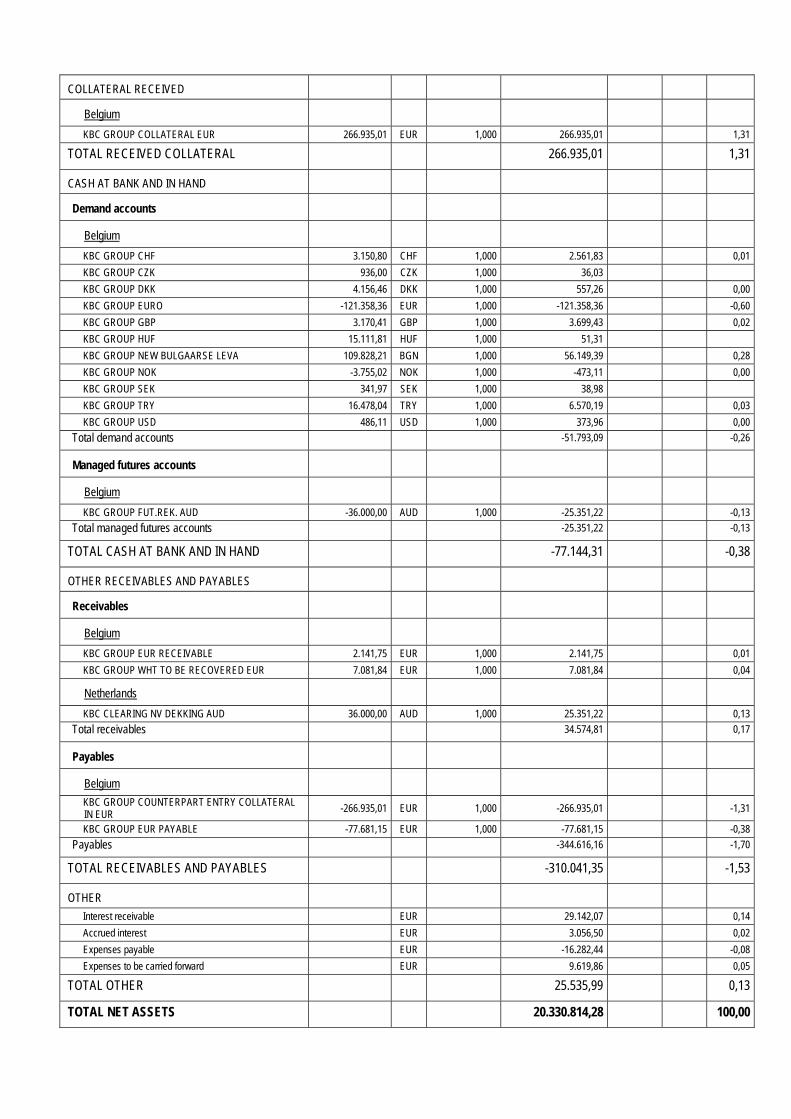
COLLATERAL RECEIVED
Belgium
KBC GROUP COLLATERAL EUR 266.935,01 EUR 1,000 266.935,01 1,31
TOTAL RECEIVED COLLATERAL 266.935,01 1,31
CASH AT BANK AND IN HAND
Demand accounts
Belgium
KBC GROUP CHF 3.150,80 CHF 1,000 2.561,83 0,01
KBC GROUP CZK 936,00 CZK 1,000 36,03
KBC GROUP DKK 4.156,46 DKK 1,000 557,26 0,00
KBC GROUP EURO -121.358,36 EUR 1,000 -121.358,36 -0,60
KBC GROUP GBP 3.170,41 GBP 1,000 3.699,43 0,02
KBC GROUP HUF 15.111,81 HUF 1,000 51,31
KBC GROUP NEW BULGAARSE LEVA 109.828,21 BGN 1,000 56.149,39 0,28
KBC GROUP NOK -3.755,02 NOK 1,000 -473,11 0,00
KBC GROUP SEK 341,97 SEK 1,000 38,98
KBC GROUP TRY 16.478,04 TRY 1,000 6.570,19 0,03
KBC GROUP USD 486,11 USD 1,000 373,96 0,00
Total demand accounts -51.793,09 -0,26
Managed futures accounts
Belgium
KBC GROUP FUT.REK. AUD -36.000,00 AUD 1,000 -25.351,22 -0,13
Total managed futures accounts -25.351,22 -0,13
TOTAL CASH AT BANK AND IN HAND -77.144,31 -0,38
OTHER RECEIVABLES AND PAYABLES
Receivables
Belgium
KBC GROUP EUR RECEIVABLE 2.141,75 EUR 1,000 2.141,75 0,01
KBC GROUP WHT TO BE RECOVERED EUR 7.081,84 EUR 1,000 7.081,84 0,04
Netherlands
KBC CLEARING NV DEKKING AUD 36.000,00 AUD 1,000 25.351,22 0,13
Total receivables 34.574,81 0,17
Payables
Belgium
KBC GROUP COUNTERPART ENTRY COLLATERAL IN EUR
-266.935,01 EUR 1,000 -266.935,01 -1,31
KBC GROUP EUR PAYABLE -77.681,15 EUR 1,000 -77.681,15 -0,38
Payables -344.616,16 -1,70
TOTAL RECEIVABLES AND PAYABLES -310.041,35 -1,53
OTHER
Interest receivable EUR 29.142,07 0,14
Accrued interest EUR 3.056,50 0,02
Expenses payable EUR -16.282,44 -0,08
Expenses to be carried forward EUR 9.619,86 0,05
TOTAL OTHER 25.535,99 0,13
TOTAL NET ASSETS 20.330.814,28 100,00

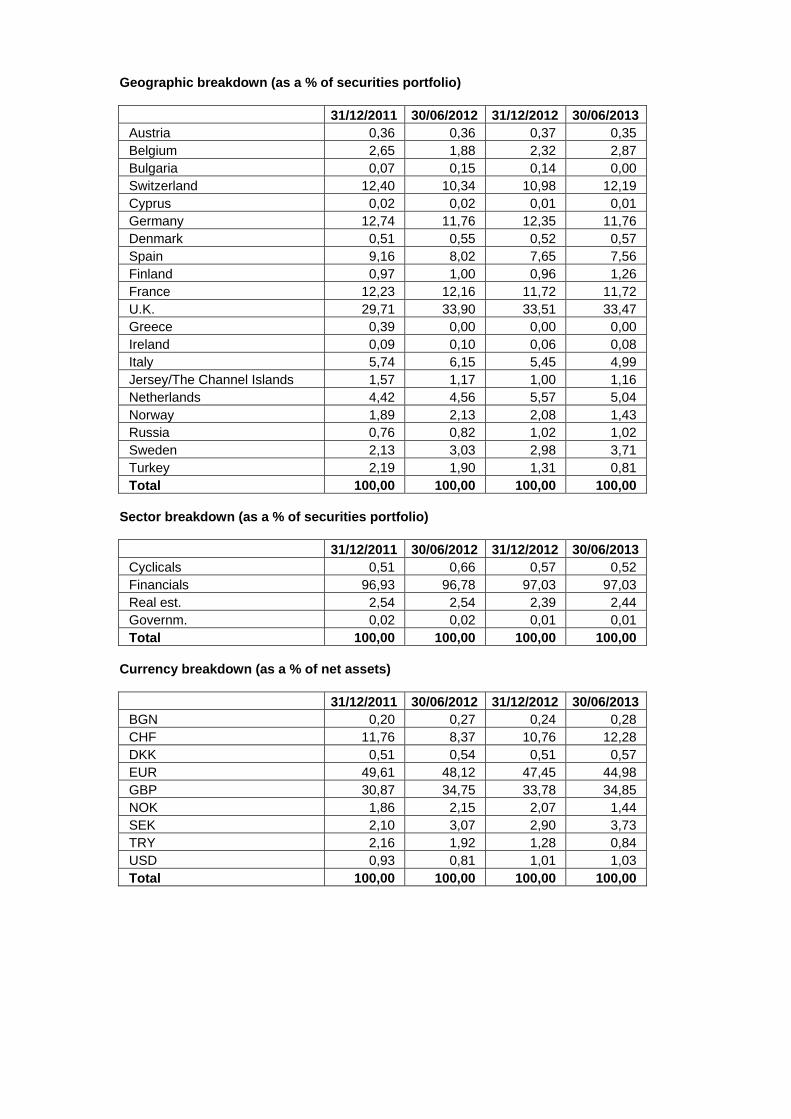
Geographic breakdown (as a % of securities portfolio)
31/12/2011 30/06/2012 31/12/2012 30/06/2013 Austria 0,36 0,36 0,37 0,35 Belgium 2,65 1,88 2,32 2,87 Bulgaria 0,07 0,15 0,14 0,00 Switzerland 12,40 10,34 10,98 12,19 Cyprus 0,02 0,02 0,01 0,01 Germany 12,74 11,76 12,35 11,76 Denmark 0,51 0,55 0,52 0,57 Spain 9,16 8,02 7,65 7,56 Finland 0,97 1,00 0,96 1,26 France 12,23 12,16 11,72 11,72 U.K. 29,71 33,90 33,51 33,47 Greece 0,39 0,00 0,00 0,00 Ireland 0,09 0,10 0,06 0,08 Italy 5,74 6,15 5,45 4,99 Jersey/The Channel Islands 1,57 1,17 1,00 1,16 Netherlands 4,42 4,56 5,57 5,04 Norway 1,89 2,13 2,08 1,43 Russia 0,76 0,82 1,02 1,02 Sweden 2,13 3,03 2,98 3,71 Turkey 2,19 1,90 1,31 0,81 Total 100,00 100,00 100,00 100,00
Sector breakdown (as a % of securities portfolio)
31/12/2011 30/06/2012 31/12/2012 30/06/2013 Cyclicals 0,51 0,66 0,57 0,52 Financials 96,93 96,78 97,03 97,03 Real est. 2,54 2,54 2,39 2,44 Governm. 0,02 0,02 0,01 0,01 Total 100,00 100,00 100,00 100,00
Currency breakdown (as a % of net assets)
31/12/2011 30/06/2012 31/12/2012 30/06/2013 BGN 0,20 0,27 0,24 0,28 CHF 11,76 8,37 10,76 12,28 DKK 0,51 0,54 0,51 0,57 EUR 49,61 48,12 47,45 44,98 GBP 30,87 34,75 33,78 34,85 NOK 1,86 2,15 2,07 1,44 SEK 2,10 3,07 2,90 3,73 TRY 2,16 1,92 1,28 0,84 USD 0,93 0,81 1,01 1,03 Total 100,00 100,00 100,00 100,00

2.4.2 CHANGES IN THE COMPOSITION OF THE ASSETS OF KBC EQUITY FUND EURO FINANCE (IN
THE CURRENCY OF THE SUB-FUND)
1st half of year YearPurchases 457.479,65 457.479,65 Sales 2.523.169,00 2.523.169,00 Total 1 2.980.648,66 2.980.648,66 Subscriptions 962.406,76 962.406,76 Redemptions 3.871.856,34 3.871.856,34 Total 2 4.834.263,10 4.834.263,10 Monthly average of total assets
22.666.199,17 22.666.199,17
Turnover rate -8,18 % -8,18 %
1st half of year YearPurchases 457.479,65 457.479,65 Sales 2.523.169,00 2.523.169,00 Total 1 2.980.648,66 2.980.648,66 Subscriptions 962.406,76 962.406,76 Redemptions 3.871.856,34 3.871.856,34 Total 2 4.834.263,10 4.834.263,10 Monthly average of total assets
22.495.320,93 22.495.320,93
Corrected turnover rate -8,24 % -8,24 %
The table above shows the capital volume of portfolio transactions. This volume (adjusted to take account of total subscriptions and redemptions) is also compared to the average net assets at the beginning and end of the period. A figure close to 0% implies that the transactions relating to the securities or transactions relating to the assets (excluding deposits and cash) in a given period only involve subscriptions and redemptions. A negative percentage shows that subscriptions and redemptions entailed few, if any, transactions in the portfolio. Active asset management may result in high turnover rates (monthly percentage >50%). The detailed list of transactions is available for consultation free of charge at the registered office of the Bevek or fund at Havenlaan 2, 1080 Brussels.
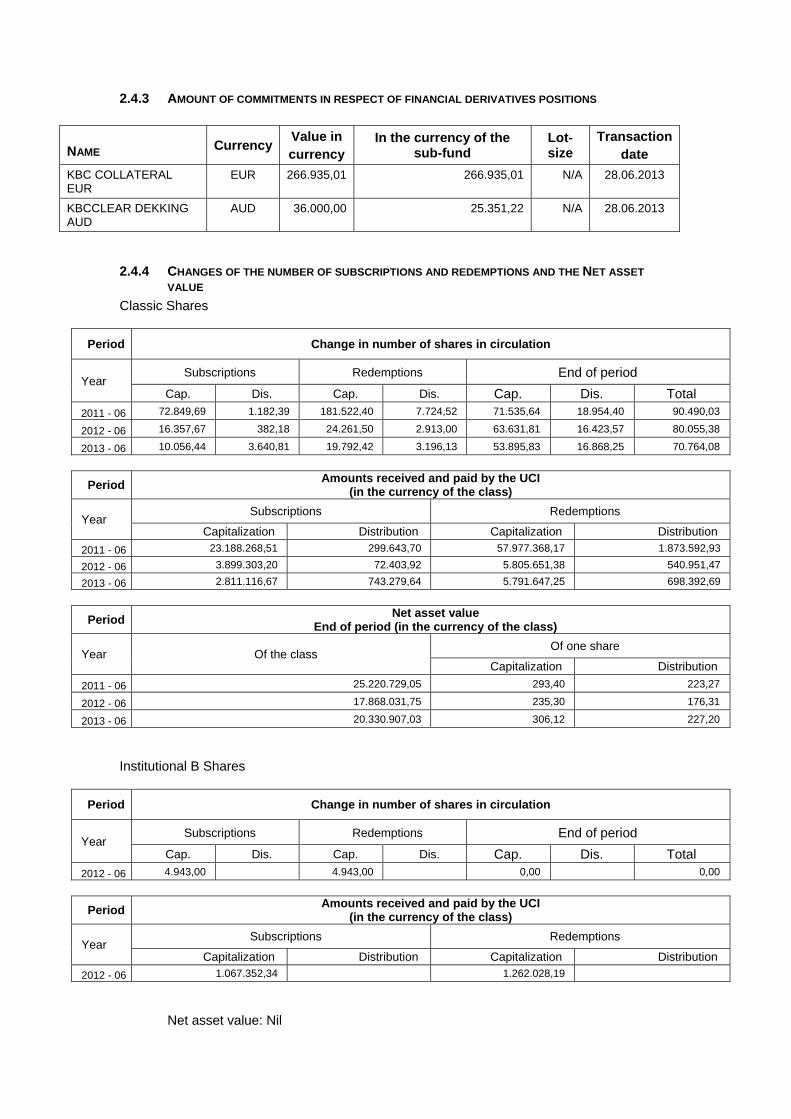
2.4.3 AMOUNT OF COMMITMENTS IN RESPECT OF FINANCIAL DERIVATIVES POSITIONS
NAME Currency Value in currency
In the currency of the sub-fund
Lot-size
Transactiondate
KBC COLLATERAL EUR
EUR 266.935,01 266.935,01 N/A 28.06.2013
KBCCLEAR DEKKING AUD
AUD 36.000,00 25.351,22 N/A 28.06.2013
2.4.4 CHANGES OF THE NUMBER OF SUBSCRIPTIONS AND REDEMPTIONS AND THE NET ASSET
VALUE
Classic Shares
Period Change in number of shares in circulation
Year Subscriptions Redemptions End of period
Cap. Dis. Cap. Dis. Cap. Dis. Total
2011 - 06 72.849,69 1.182,39 181.522,40 7.724,52 71.535,64 18.954,40 90.490,03
2012 - 06 16.357,67 382,18 24.261,50 2.913,00 63.631,81 16.423,57 80.055,38
2013 - 06 10.056,44 3.640,81 19.792,42 3.196,13 53.895,83 16.868,25 70.764,08
Period Amounts received and paid by the UCI
(in the currency of the class)
Year Subscriptions Redemptions
Capitalization Distribution Capitalization Distribution
2011 - 06 23.188.268,51 299.643,70 57.977.368,17 1.873.592,93
2012 - 06 3.899.303,20 72.403,92 5.805.651,38 540.951,47
2013 - 06 2.811.116,67 743.279,64 5.791.647,25 698.392,69
Period Net asset value
End of period (in the currency of the class)
Year Of the class Of one share
Capitalization Distribution
2011 - 06 25.220.729,05 293,40 223,27
2012 - 06 17.868.031,75 235,30 176,31
2013 - 06 20.330.907,03 306,12 227,20
Institutional B Shares
Period Change in number of shares in circulation
Year Subscriptions Redemptions End of period
Cap. Dis. Cap. Dis. Cap. Dis. Total 2012 - 06 4.943,00 4.943,00 0,00 0,00
Period Amounts received and paid by the UCI
(in the currency of the class)
Year Subscriptions Redemptions
Capitalization Distribution Capitalization Distribution
2012 - 06 1.067.352,34 1.262.028,19
Net asset value: Nil


2.4.5 PERFORMANCE FIGURES
Classic Shares
Cap Div
ISIN code Cur-
rency
1 Year 3 Years* 5 Years* 10 Years* Since launch*
Share classes
Bench mark
Share classes
Bench mark
Share classes
Bench mark
Share classes
Bench mark
Launch Date
Share classes
CAP BE0174093758 EUR 30.10% 2.29% -4.12% -0.08% 31/05/2000 -3.68%
DIV BE0174092743 EUR 30.05% 2.24% -4.15% -0.10% 31/05/2000 -3.70%
Risk warning: Past performance is not a guide to future performance. * Return on annual basis.

Classic Shares
The bar chart shows the performance for full financial years. The figures do not take account of any restructuring. Calculated in EUR. The return is calculated as the change in the net asset value between two dates expressed
as a percentage. In the case of units that pay dividends, the dividend is incorporated geometrically in the return.
Calculation method for date D, where NAV stands for net asset value: Capitalisation units (CAP) Return on date D over a period of X years:
[NIW(D) / NIW(Y)] ^ [1 / X] - 1 where Y = D-X
Return on date D since the start date S of the unit: [NIW(D) / NIW(S)] ^ [1 / F] - 1 where F = 1 if the unit has existed for less than one year on date D where F = (D-S) / 365.25 if the unit has existed for longer than one year on date D
Distribution units (DIV) Return on date D over a period of X years:
[ C * NIW(D) / NIW(Y)] ^ [1 / X] - 1 where Y = D-X
Return on date D since the start date S of the unit: [ C * NIW(D) / NIW(S)] ^ [1 / F] - 1 where F = 1 if the unit has existed for less than one year on date D where F = (D-S) / 365.25 if the unit has existed for longer than one year on date D where C is a factor that is determined for all N dividends between the calculation date D and the reference date.
For dividend i on date Di with value Wi: Ci = [Wi / NIW(Di)] + 1 i = 1 ... N from whichC = C0 * .... * CN.
If the interval between the two dates exceeds one year, the ordinary return calculation is converted into a return on an annual basis by taking the nth square root of 1 plus the total return of the unit.
The return figures shown above do not take account of the fees and charges associated with the issue and redemption of units.
These are the performance figures for capitalisation and distribution shares.
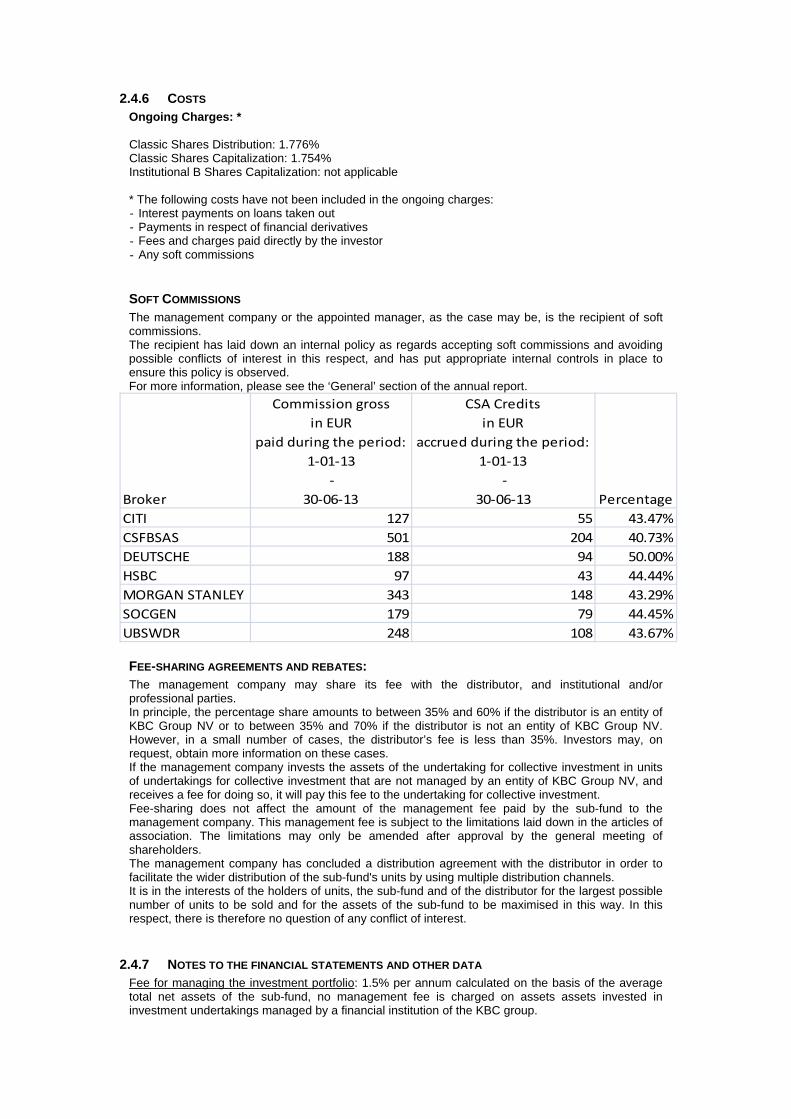
2.4.6 COSTS Ongoing Charges: * Classic Shares Distribution: 1.776% Classic Shares Capitalization: 1.754% Institutional B Shares Capitalization: not applicable * The following costs have not been included in the ongoing charges: - Interest payments on loans taken out - Payments in respect of financial derivatives - Fees and charges paid directly by the investor - Any soft commissions
SOFT COMMISSIONS The management company or the appointed manager, as the case may be, is the recipient of soft commissions. The recipient has laid down an internal policy as regards accepting soft commissions and avoiding possible conflicts of interest in this respect, and has put appropriate internal controls in place to ensure this policy is observed. For more information, please see the ‘General’ section of the annual report.
Broker
Commission gross
in EUR
paid during the period:
1‐01‐13
‐
30‐06‐13
CSA Credits
in EUR
accrued during the period:
1‐01‐13
‐
30‐06‐13 Percentage
CITI 127 55 43.47%
CSFBSAS 501 204 40.73%
DEUTSCHE 188 94 50.00%
HSBC 97 43 44.44%
MORGAN STANLEY 343 148 43.29%
SOCGEN 179 79 44.45%
UBSWDR 248 108 43.67%
FEE-SHARING AGREEMENTS AND REBATES: The management company may share its fee with the distributor, and institutional and/or professional parties. In principle, the percentage share amounts to between 35% and 60% if the distributor is an entity of KBC Group NV or to between 35% and 70% if the distributor is not an entity of KBC Group NV. However, in a small number of cases, the distributor’s fee is less than 35%. Investors may, on request, obtain more information on these cases. If the management company invests the assets of the undertaking for collective investment in units of undertakings for collective investment that are not managed by an entity of KBC Group NV, and receives a fee for doing so, it will pay this fee to the undertaking for collective investment. Fee-sharing does not affect the amount of the management fee paid by the sub-fund to the management company. This management fee is subject to the limitations laid down in the articles of association. The limitations may only be amended after approval by the general meeting of shareholders. The management company has concluded a distribution agreement with the distributor in order to facilitate the wider distribution of the sub-fund's units by using multiple distribution channels. It is in the interests of the holders of units, the sub-fund and of the distributor for the largest possible number of units to be sold and for the assets of the sub-fund to be maximised in this way. In this respect, there is therefore no question of any conflict of interest.
2.4.7 NOTES TO THE FINANCIAL STATEMENTS AND OTHER DATA Fee for managing the investment portfolio: 1.5% per annum calculated on the basis of the average total net assets of the sub-fund, no management fee is charged on assets assets invested in investment undertakings managed by a financial institution of the KBC group.
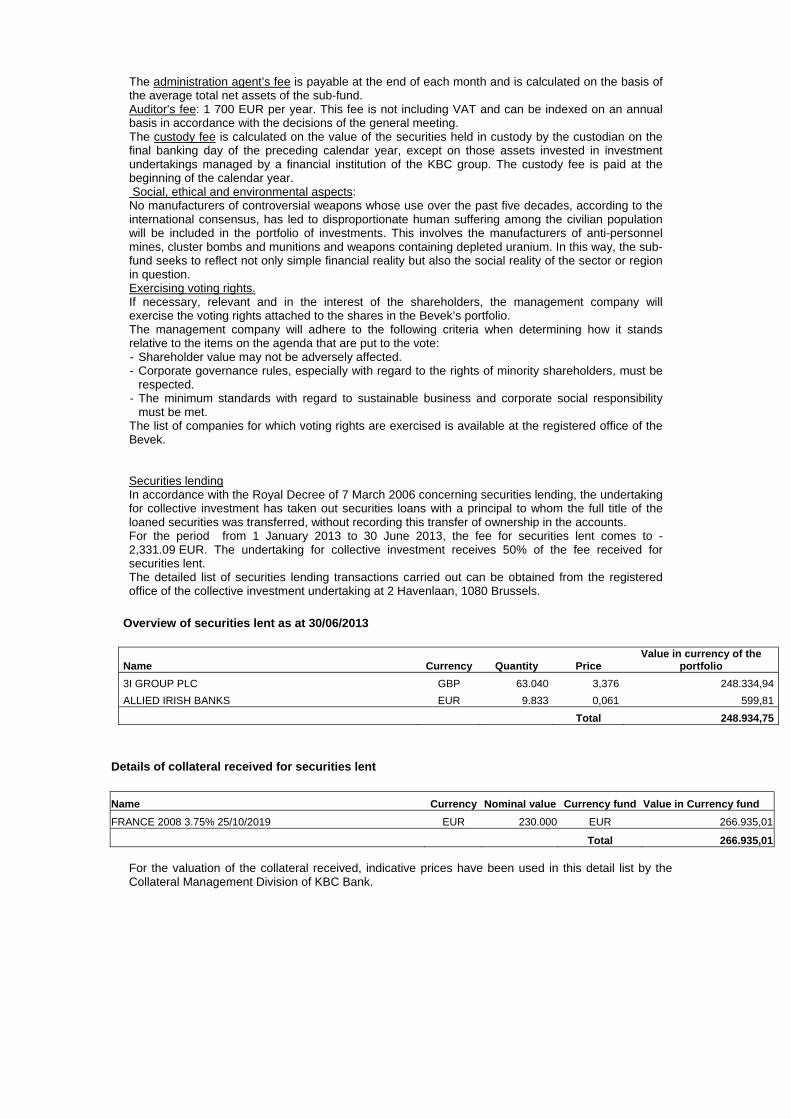
The administration agent’s fee is payable at the end of each month and is calculated on the basis of the average total net assets of the sub-fund. Auditor's fee: 1 700 EUR per year. This fee is not including VAT and can be indexed on an annual basis in accordance with the decisions of the general meeting. The custody fee is calculated on the value of the securities held in custody by the custodian on the final banking day of the preceding calendar year, except on those assets invested in investment undertakings managed by a financial institution of the KBC group. The custody fee is paid at the beginning of the calendar year. Social, ethical and environmental aspects: No manufacturers of controversial weapons whose use over the past five decades, according to the international consensus, has led to disproportionate human suffering among the civilian population will be included in the portfolio of investments. This involves the manufacturers of anti-personnel mines, cluster bombs and munitions and weapons containing depleted uranium. In this way, the sub-fund seeks to reflect not only simple financial reality but also the social reality of the sector or region in question. Exercising voting rights. If necessary, relevant and in the interest of the shareholders, the management company will exercise the voting rights attached to the shares in the Bevek’s portfolio. The management company will adhere to the following criteria when determining how it stands relative to the items on the agenda that are put to the vote: - Shareholder value may not be adversely affected. - Corporate governance rules, especially with regard to the rights of minority shareholders, must be
respected. - The minimum standards with regard to sustainable business and corporate social responsibility
must be met. The list of companies for which voting rights are exercised is available at the registered office of the Bevek. Securities lending In accordance with the Royal Decree of 7 March 2006 concerning securities lending, the undertaking for collective investment has taken out securities loans with a principal to whom the full title of the loaned securities was transferred, without recording this transfer of ownership in the accounts. For the period from 1 January 2013 to 30 June 2013, the fee for securities lent comes to -2,331.09 EUR. The undertaking for collective investment receives 50% of the fee received for securities lent. The detailed list of securities lending transactions carried out can be obtained from the registered office of the collective investment undertaking at 2 Havenlaan, 1080 Brussels.
Overview of securities lent as at 30/06/2013
Name Currency Quantity Price Value in currency of the
portfolio
3I GROUP PLC GBP 63.040 3,376 248.334,94
ALLIED IRISH BANKS EUR 9.833 0,061 599,81
Total 248.934,75
Details of collateral received for securities lent
Name Currency Nominal value Currency fund Value in Currency fund
FRANCE 2008 3.75% 25/10/2019 EUR 230.000 EUR 266.935,01
Total 266.935,01 For the valuation of the collateral received, indicative prices have been used in this detail list by the Collateral Management Division of KBC Bank.

Semi-Annual report as at 30th June 2013
TABLE OF CONTENTS
2. Information on KBC Equity Fund US Small Caps
2.1. Management report 2.1.1. Launch date and subscription price 2.1.2. Stock exchange listing 2.1.3. Aim and distinctive features of the investment policy 2.1.4. Financial portfolio management 2.1.5. Distributors 2.1.6. Index and benchmark 2.1.7. Policy conducted during the financial year 2.1.8. Future policy 2.1.9. Synthetic risk and reward indicator (SRRI)
2.2. Balance sheet
2.3. Profit and loss account
2.4. Composition of the assets and key figures
2.4.1. Composition of the assets 2.4.2. Change in the composition of the assets 2.4.3. Value of commitments in respect of financial derivatives positions 2.4.4. Evolution of the number of subscriptions, repayments and the net asset value 2.4.5. Return figures 2.4.6. Expenses 2.4.7. Notes to the financial statements and other data


2 INFORMATION ON KBC EQUITY FUND US SMALL CAPS
2.1 MANAGEMENT REPORT
2.1.1 LAUNCH DATE AND SUBSCRIPTION PRICE Classic Shares : Launch date: 31 July 1998 Initial subscription price: 500 USD Currency: USD Institutional B Shares : Launch date: 25 November 2011 Initial subscription price: 853.66 USD Currency: USD
2.1.2 STOCK EXCHANGE LISTING Not applicable.
2.1.3 GOAL AND KEY PRINCIPLES OF THE INVESTMENT POLICY
SUB-FUND’S OBJECT: The main objective of this sub-fund is to generate the highest possible return for its shareholders by investing directly or indirectly in transferable securities. This is reflected in its pursuit of capital gains and income. To this end, the assets are invested, either directly or indirectly via correlated financial instruments, primarily in shares.
SUB-FUND’S INVESTMENT POLICY:
PERMITTED ASSET CLASSES: The sub-fund may invest in securities, money market instruments, units in undertakings for collective investment, deposits, financial derivatives, liquid assets and all other instruments insofar as permitted by the applicable laws and regulations and consistent with the sub-fund’s object The sub-fund shall invest no more than 10% of its assets in units of other undertakings for collective investment.
RESTRICTIONS OF THE INVESTMENT POLICY: The investment policy will be implemented within the limits set by law and regulations. The sub-fund may borrow up to 10% of its net assets, insofar as these are short-term borrowings aimed at solving temporary liquidity problems.
PERMITTED DERIVATIVES TRANSACTIONS: Derivates may be used either for hedging purposes or to achieve investment objectives. Changes will be made to the investments at regular intervals to comply with the sub-fund's investment strategy. In addition, listed and unlisted derivates may be used to achieve the objectives: these may be forward contracts, options or swaps on securities, indices, currencies or interest rates or other transactions involving derivatives. Unlisted derivatives transactions will only be concluded with prime financial institutions specialised in such transactions. Such derivatives may also be used to hedge the assets against exchange-rate fluctuations. Subject to the applicable laws and regulations and the articles of association, the sub-fund always seeks to conclude the most effective transactions. All costs associated with the transactions will be charged to the sub-fund and all income generated will be paid to the sub-fund. If the transactions result in a risk in respect of the counterparty, this risk can be hedged by using a margin management system that ensures that the sub-fund is the beneficiary of security (collateral) in the form of cash or investment grade bonds. When calculating the value of the bonds, a margin will be applied that varies depending on the residual term to maturity and the currency in which the bond in question is denominated. The relationship with the counterparty or counterparties is governed by standard international agreements.
STRATEGY SELECTED At least 75% of the assets are invested in shares of American companies that are not included in the S&P 500, since conditions in America are such as to ensure accelerated economic growth in the short or medium term.
RISK CONCENTRATION American shares not included in the S&P 500.
LENDING FINANCIAL INSTRUMENTS: The sub-fund may lend financial instruments within the limits set by law and regulations. This lending does not affect the sub-fund’s risk profile since: - it takes place within the framework of a securities lending system managed by a principal. In
addition, the sub-fund has a relationship only with the principal of the securities lending system which acts as counterparty and to which title of the loaned securities is transferred. The choice of principal is subject to strict selection criteria. The return of securities similar to the securities that have been lent is guaranteed by the principal.
- through a margin management system, the sub-fund is always guaranteed financial security, the actual value of which always exceeds the actual value of the securities that have been lent, in case the principal does not return similar securities.
The return of securities similar to the securities that have been lent can be requested at any time, which means that the lending of securities does not affect the management of the sub-fund's assets. By lending securities, the sub-fund can generate an additional return. The principal pays a fee to the management company. After deducting the fee for the margin management and clearing services of KBC Bank, most of this fee is paid to the sub-fund. The relationship with the counterparty or counterparties is governed by standard international agreements. More information is provided on the terms and conditions governing securities lending in the annual or half-yearly report for the sub-fund.
VOLATILITY OF THE NET ASSET VALUE: The volatility of the net asset value may be high due to the composition of the portfolio.
GENERAL STRATEGY FOR HEDGING THE EXCHANGE RATE RISK: In order to protect its assets against exchange rate fluctuations and within the limitations laid down in the articles of association, the sub-fund may perform transactions relating to the sale of forward currency contracts, as well as the sale of call options and the purchase of put options on currencies. The transactions in question may relate solely to contracts traded on a regulated market that operates regularly, is recognised and is open to the public or that are traded with a recognised, prime financial institution specialising in such transactions and dealing in the over-the-counter (OTC) market in options. With the same objective, the sub-fund may also sell currencies forward or exchange them in private transactions with prime financial institutions specialising in such transactions. The hedging objective of the aforementioned transactions suggests that there is a direct link between these transactions and the assets to be hedged, which implies that the transactions carried out in a particular currency may in principle not exceed, in terms of volume, either the valuation value of all the assets in the same currency or the holding period of those assets.
SOCIAL, ETHICAL AND ENVIRONMENTAL ASPECTS:
No manufacturers of controversial weapons whose use over the past five decades, according to the international consensus, has led to disproportionate human suffering among the civilian population will be included in the portfolio of investments. This involves the manufacturers of anti-personnel mines, cluster bombs and munitions and weapons containing depleted uranium. In this way, the sub-fund seeks to reflect not only simple financial reality but also the social reality of the sector or region in question.
THE EUROPEAN SAVINGS DIRECTIVE AND TAX ON DEBT CLAIM RETURNS OBTAINED THROUGH THE
REDEMPTION OF OWN UNITS OR IN THE EVENT OF FULL OR PARTIAL DISTRIBUTION OF EQUITY
CAPITAL.
The following information is of a general character and is not intended to cover all aspects of an investment in a UCITS. In certain cases entirely different rules might even apply. Moreover, both tax law and the interpretation of it can change. Investors who wish to have more information about the tax implications – in both Belgium and abroad – of acquiring, holding and transferring units should seek the advice of their usual financial and tax advisers. This UCITS shall invest a maximum of 15% of its assets directly or indirectly in debt instruments as intended by the European Savings Directive. A. European Savings Directive (Directive 2003/48/EC) The European Savings Directive has been implemented in Belgium. Since this UCITS invests a maximum of 15% of its assets directly or indirectly in debt claims as intended by the European Savings Directive, the income of this UCITS does not fall within the scope of this directive. B. Tax on debt claim returns obtained through the redemption of own units or in the event of full or partial distribution of equity capital (Article 19bis Income Tax Code 1992). The income from this UCITS is not subject to the tax on debt instrument returns as intended by Article 19bis, Income Tax Code 1992.
2.1.4 FINANCIAL PORTFOLIO MANAGEMENT There is no delegation of the portfolio.
2.1.5 DISTRIBUTORS KBC Asset Management S.A., 5, Place de la Gare, L-1616 Luxembourg.
2.1.6 INDEX AND BENCHMARK See ‘Sub-fund’s investment policy’.

2.1.7 POLICY PERSUED DURING THE FINANCIAL YEAR Although more jobs have been created than lost in the US since 2010, the rate of employment growth remained on the thin side for some considerable time. The situation began to improve in the recent reporting period, with the result that the jobless rate has declined more markedly. Pay has remained virtually flat, barely rising ahead of inflation. Taken together, these two factors ensured that household purchasing power only grew to a very limited extent and so contributed very modestly to economic growth. The latter was therefore limited (+1.6% growth year-on-year in the four quarters to the first three months of 2013). The initial phase of the economic recovery went hand in hand with a strong stockmarket rally, leaving the S&P 500 75% higher at the end of April 2010 than its low point on 9 March 2009. Since then, the equity markets have struggled to find fresh impetus. The euro crisis and fear that the European banking sector would collapse naturally continued to cast a dark cloud over the market. On top of this, the stock markets were affected by vacillating sentiment about the economic situation. This was also true in recent months. In the first three months of 2012 the markets were buoyed up by relative economic optimism. In April/May 2012 the markets ran out of steam but from early June 2012 there was a further fine rally that disregarded the deteriorating economic signals. Jitters were sparked at the end of the reporting period by comments from the Fed Chairman (signalling the imminent end of quantitative easing?) and concerns about China (local authority debt problems). Overall, the MSCI All Countries (the broadest global index) was up 7.9% in euro terms on 30 June 2013 compared to year-end 2012.
2.1.8 FUTURE POLICY We are expecting US growth to remain positive but modest (around 2% y-o-y in the coming quarters) as pay increases are barely keeping pace with inflation and budgetary policy has now finally (and probably for many years) struck down the path of austerity. The fragile recovery of the housing market and corporate investment could be sustained. How strong the growth proves to be will depend largely on the dynamic of the labour market. In recent months employment in the US has grown by around 200 000 new jobs each month. This will need to continue in order to achieve +2% growth in 2013 and in 2014. In the US, Republicans and Democrats may have totally different views about the required budgetary policy, but a common thread throughout the negotiations in recent months has been that the federal finances need to be reformed step by step and that a tighter budgetary policy than in the recent past will need to be implemented in the years ahead. Tighter also than the average budgetary policy in the EMU. This is being counterbalanced by extremely accommodating monetary policy. The Fed is making unprecedented cash injections with its programme for purchasing government bonds and other debt paper. In doing so, the Fed wants to prevent the banks from being preoccupied with their own solvency and hence imposing unduly strict lending conditions, which would undermine economic growth. These cash injections will either find their way into the real economy or generate inflationary expectations. In any case they will keep long rates low and banish any fears of deflation.
2.1.9 SYNTHETIC RISK AND REWARD INDICATOR Classic Shares: 7 on a scale of 1 (lowest risk) to 7 (highest risk). Institutional B Shares: 7 on a scale of 1 (lowest risk) to 7 (highest risk). The value of a share can decrease or increase and the investor may not get back the amount invested. In accordance with Commission Regulation (EU) No. 583/2010, a synthetic risk and reward indicator has been calculated. This indicator provides a quantitative measure of the sub-fund's potential return and the risk involved, calculated in the currency in which the sub-fund is denominated. It is given as a figure between 1 and 7. The higher the figure, the greater the potential return, but also the more difficult it is to predict this return. Losses are possible too. The lowest figure does not mean that the investment is entirely free of risk. However, it does indicate that, compared with the higher figures, this product will generally provide a lower, but more predictable return. The synthetic risk and reward indicator is assessed regularly and can therefore go up or down based on data from the past. Data from the past is not always a reliable indicator of future risk and return.
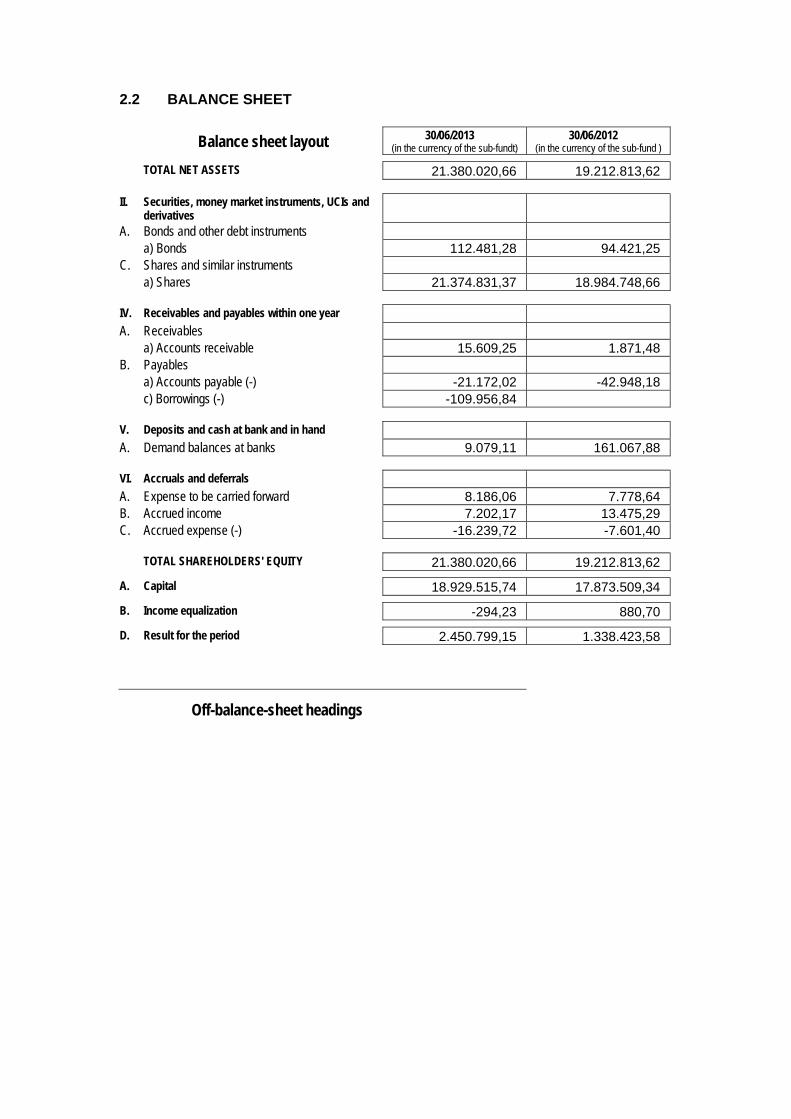
2.2 BALANCE SHEET
Balance sheet layout 30/06/2013 (in the currency of the sub-fundt)
30/06/2012 (in the currency of the sub-fund )
TOTAL NET ASSETS 21.380.020,66 19.212.813,62
II. Securities, money market instruments, UCIs and derivatives
A. Bonds and other debt instruments a) Bonds 112.481,28 94.421,25 C. Shares and similar instruments a) Shares 21.374.831,37 18.984.748,66
IV. Receivables and payables within one year A. Receivables a) Accounts receivable 15.609,25 1.871,48 B. Payables a) Accounts payable (-) -21.172,02 -42.948,18 c) Borrowings (-) -109.956,84
V. Deposits and cash at bank and in hand A. Demand balances at banks 9.079,11 161.067,88
VI. Accruals and deferrals A. Expense to be carried forward 8.186,06 7.778,64 B. Accrued income 7.202,17 13.475,29 C. Accrued expense (-) -16.239,72 -7.601,40
TOTAL SHAREHOLDERS' EQUITY 21.380.020,66 19.212.813,62
A. Capital 18.929.515,74 17.873.509,34
B. Income equalization -294,23 880,70
D. Result for the period 2.450.799,15 1.338.423,58
Off-balance-sheet headings
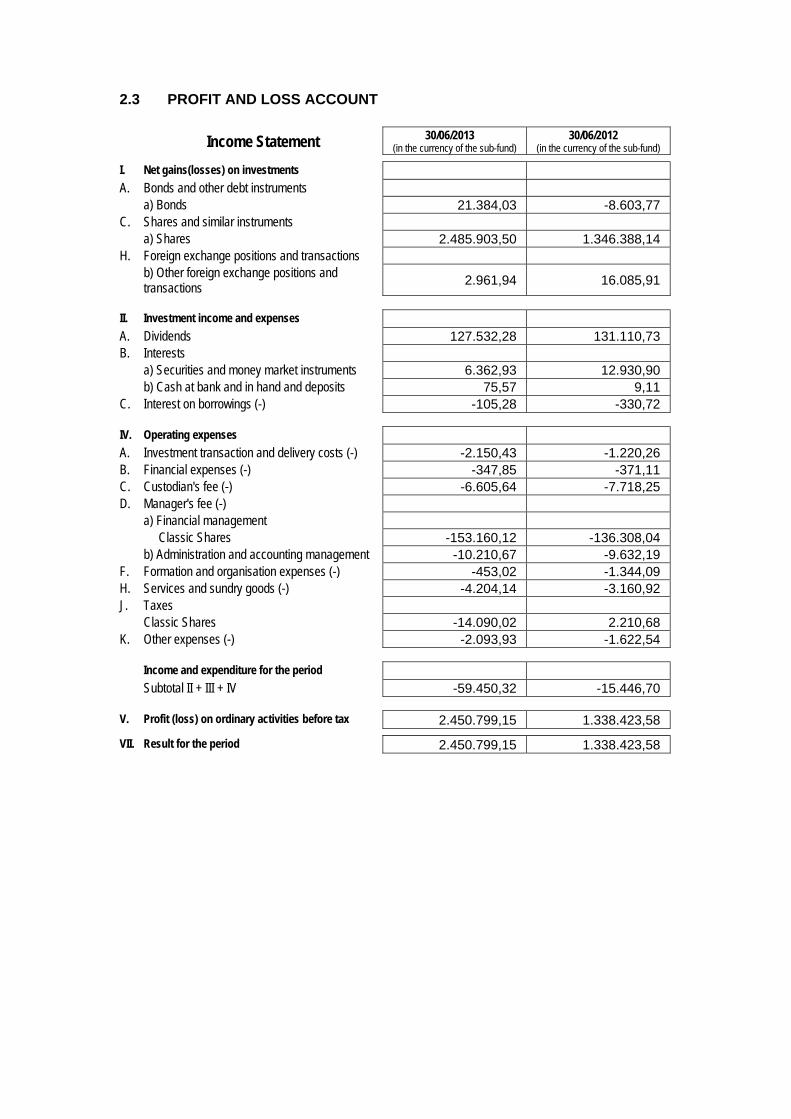
2.3 PROFIT AND LOSS ACCOUNT
Income Statement 30/06/2013 (in the currency of the sub-fund)
30/06/2012 (in the currency of the sub-fund)
I. Net gains(losses) on investments A. Bonds and other debt instruments a) Bonds 21.384,03 -8.603,77 C. Shares and similar instruments a) Shares 2.485.903,50 1.346.388,14 H. Foreign exchange positions and transactions b) Other foreign exchange positions and
transactions 2.961,94 16.085,91
II. Investment income and expenses A. Dividends 127.532,28 131.110,73 B. Interests a) Securities and money market instruments 6.362,93 12.930,90 b) Cash at bank and in hand and deposits 75,57 9,11 C. Interest on borrowings (-) -105,28 -330,72
IV. Operating expenses A. Investment transaction and delivery costs (-) -2.150,43 -1.220,26 B. Financial expenses (-) -347,85 -371,11 C. Custodian's fee (-) -6.605,64 -7.718,25 D. Manager's fee (-) a) Financial management Classic Shares -153.160,12 -136.308,04 b) Administration and accounting management -10.210,67 -9.632,19 F. Formation and organisation expenses (-) -453,02 -1.344,09 H. Services and sundry goods (-) -4.204,14 -3.160,92 J. Taxes Classic Shares -14.090,02 2.210,68 K. Other expenses (-) -2.093,93 -1.622,54
Income and expenditure for the period Subtotal II + III + IV -59.450,32 -15.446,70
V. Profit (loss) on ordinary activities before tax 2.450.799,15 1.338.423,58
VII. Result for the period 2.450.799,15 1.338.423,58
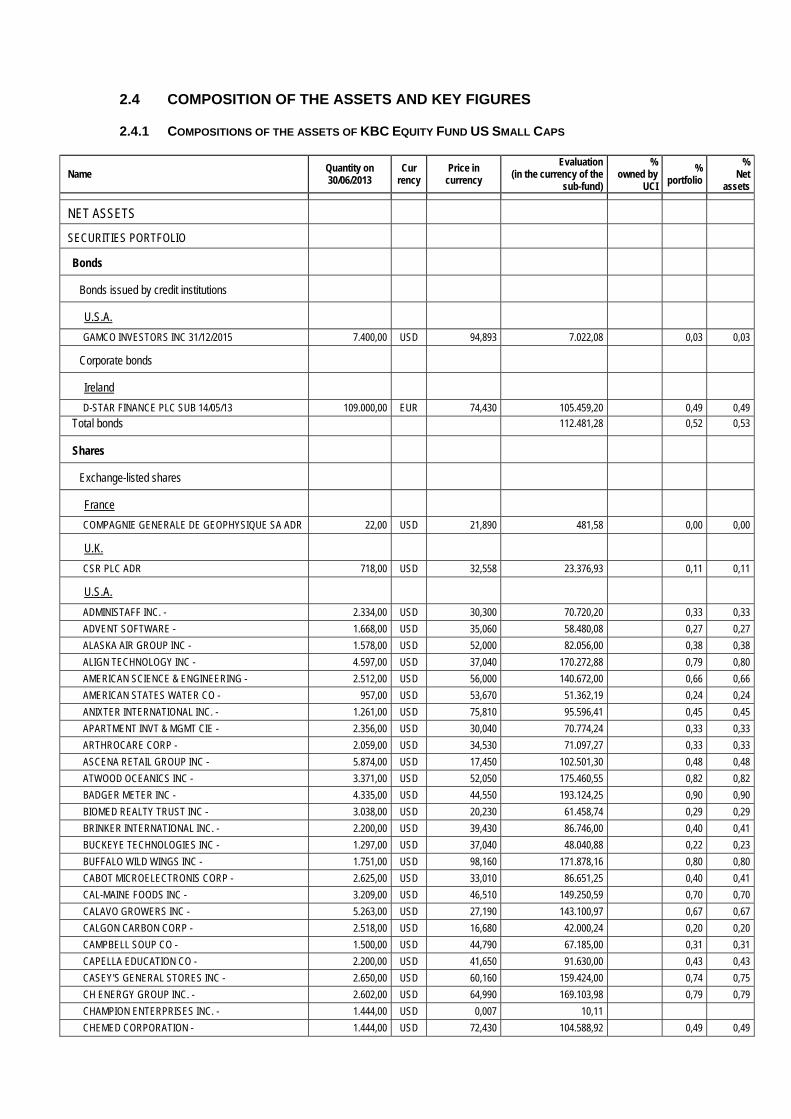
2.4 COMPOSITION OF THE ASSETS AND KEY FIGURES
2.4.1 COMPOSITIONS OF THE ASSETS OF KBC EQUITY FUND US SMALL CAPS
Name Quantity on 30/06/2013
Cur rency
Price in currency
Evaluation (in the currency of the
sub-fund)
% owned by
UCI
% portfolio
% Net
assets
NET ASSETS
SECURITIES PORTFOLIO
Bonds
Bonds issued by credit institutions
U.S.A.
GAMCO INVESTORS INC 31/12/2015 7.400,00 USD 94,893 7.022,08 0,03 0,03
Corporate bonds
Ireland
D-STAR FINANCE PLC SUB 14/05/13 109.000,00 EUR 74,430 105.459,20 0,49 0,49
Total bonds 112.481,28 0,52 0,53
Shares
Exchange-listed shares
France
COMPAGNIE GENERALE DE GEOPHYSIQUE SA ADR 22,00 USD 21,890 481,58 0,00 0,00
U.K.
CSR PLC ADR 718,00 USD 32,558 23.376,93 0,11 0,11
U.S.A.
ADMINISTAFF INC. - 2.334,00 USD 30,300 70.720,20 0,33 0,33
ADVENT SOFTWARE - 1.668,00 USD 35,060 58.480,08 0,27 0,27
ALASKA AIR GROUP INC - 1.578,00 USD 52,000 82.056,00 0,38 0,38
ALIGN TECHNOLOGY INC - 4.597,00 USD 37,040 170.272,88 0,79 0,80
AMERICAN SCIENCE & ENGINEERING - 2.512,00 USD 56,000 140.672,00 0,66 0,66
AMERICAN STATES WATER CO - 957,00 USD 53,670 51.362,19 0,24 0,24
ANIXTER INTERNATIONAL INC. - 1.261,00 USD 75,810 95.596,41 0,45 0,45
APARTMENT INVT & MGMT CIE - 2.356,00 USD 30,040 70.774,24 0,33 0,33
ARTHROCARE CORP - 2.059,00 USD 34,530 71.097,27 0,33 0,33
ASCENA RETAIL GROUP INC - 5.874,00 USD 17,450 102.501,30 0,48 0,48
ATWOOD OCEANICS INC - 3.371,00 USD 52,050 175.460,55 0,82 0,82
BADGER METER INC - 4.335,00 USD 44,550 193.124,25 0,90 0,90
BIOMED REALTY TRUST INC - 3.038,00 USD 20,230 61.458,74 0,29 0,29
BRINKER INTERNATIONAL INC. - 2.200,00 USD 39,430 86.746,00 0,40 0,41
BUCKEYE TECHNOLOGIES INC - 1.297,00 USD 37,040 48.040,88 0,22 0,23
BUFFALO WILD WINGS INC - 1.751,00 USD 98,160 171.878,16 0,80 0,80
CABOT MICROELECTRONIS CORP - 2.625,00 USD 33,010 86.651,25 0,40 0,41
CAL-MAINE FOODS INC - 3.209,00 USD 46,510 149.250,59 0,70 0,70
CALAVO GROWERS INC - 5.263,00 USD 27,190 143.100,97 0,67 0,67
CALGON CARBON CORP - 2.518,00 USD 16,680 42.000,24 0,20 0,20
CAMPBELL SOUP CO - 1.500,00 USD 44,790 67.185,00 0,31 0,31
CAPELLA EDUCATION CO - 2.200,00 USD 41,650 91.630,00 0,43 0,43
CASEY'S GENERAL STORES INC - 2.650,00 USD 60,160 159.424,00 0,74 0,75
CH ENERGY GROUP INC. - 2.602,00 USD 64,990 169.103,98 0,79 0,79
CHAMPION ENTERPRISES INC. - 1.444,00 USD 0,007 10,11
CHEMED CORPORATION - 1.444,00 USD 72,430 104.588,92 0,49 0,49

CHILDREN'S PLACE - 3.788,00 USD 54,800 207.582,40 0,97 0,97
CHURCHILL DOWNS INC - 2.651,00 USD 78,850 209.031,35 0,97 0,98
CLEVELAND-CLIFFS INC - 786,00 USD 16,250 12.772,50 0,06 0,06
COGNEX CORP - 3.824,00 USD 45,220 172.921,28 0,81 0,81
COLONIAL PROPERTIES TRUST - 4.409,00 USD 24,120 106.345,08 0,50 0,50
COOPER COMPANY INC (THE) - 1.472,00 USD 119,050 175.241,60 0,82 0,82
CORRECTIONS CORPORATION OF AMERICA I - 4.938,00 USD 33,870 167.250,06 0,78 0,78
CORVEL CORP - 5.752,00 USD 29,270 168.361,04 0,78 0,79
CROCS IN - 1.075,00 USD 16,500 17.737,50 0,08 0,08
CSG SYSTEMS INTL INC - 2.519,00 USD 21,700 54.662,30 0,25 0,26
CUBIC CORP - 2.182,00 USD 48,100 104.954,20 0,49 0,49
DARLING INTERNATIONAL INC - 3.149,00 USD 18,660 58.760,34 0,27 0,28
DECKERS OUTDOOR CORP - 2.554,00 USD 50,510 129.002,54 0,60 0,60
DEVRY INC - 2.242,00 USD 31,020 69.546,84 0,32 0,33
DIME COMMUNITY BANCSHARES - 4.276,00 USD 15,320 65.508,32 0,31 0,31
DIODES INC - 1.383,00 USD 25,970 35.916,51 0,17 0,17
DSP GROUP INC - 10.956,00 USD 8,310 91.044,36 0,42 0,43
EAST WEST BANCORP - 5.340,00 USD 27,500 146.850,00 0,68 0,69
EL PASO ELECTRIC CO - 4.322,00 USD 35,310 152.609,82 0,71 0,71
EPIQ SYSTEMS ICN - 3.020,00 USD 13,470 40.679,40 0,19 0,19
EPR PROPERTIES - 2.442,00 USD 50,270 122.759,34 0,57 0,57
ERA GROUP INC - 1.964,00 USD 26,150 51.358,60 0,24 0,24
ESTERLINE TECHNOLOGIES CORP - 2.246,00 USD 72,290 162.363,34 0,76 0,76
EXPRESS SCRIPTS INC. "A" 831,00 USD 61,690 51.264,39 0,24 0,24
EXTRA SPACE STORAGE INC - 4.742,00 USD 41,930 198.832,06 0,93 0,93
FAIRCHILD SEMICONDUCTOR INTL - 2.045,00 USD 13,800 28.221,00 0,13 0,13
FIRST CASH FINANCIAL SERVICES - 2.035,00 USD 49,210 100.142,35 0,47 0,47
FIRST FINANCIAL BANKSHARES INC - 2.415,00 USD 55,660 134.418,90 0,63 0,63
FOSSIL GROUP INC - 976,00 USD 103,310 100.830,56 0,47 0,47
F5 NETWORKS INC - 764,00 USD 68,800 52.563,20 0,25 0,25
GAMCO INVESTORS INC "A" 2.338,00 USD 55,410 129.548,58 0,60 0,61
GENERAL CABLE CORP - 3.521,00 USD 30,750 108.270,75 0,50 0,51
GUESS INC - 2.000,00 USD 31,030 62.060,00 0,29 0,29
GULFMARK OFFSHORE INC - 4.408,00 USD 45,090 198.756,72 0,93 0,93
H.B. FULLER - 2.744,00 USD 37,810 103.750,64 0,48 0,49
HANGER INC - 5.295,00 USD 31,630 167.480,85 0,78 0,78
HANMI FINANCIAL CORP - 6.391,00 USD 17,670 112.928,97 0,53 0,53
HAVERTY FURNITURE CO - 2.810,00 USD 23,010 64.658,10 0,30 0,30
HIBBETT SPORTS INC - 3.151,00 USD 55,500 174.880,50 0,81 0,82
HOLLY CORPORATION - 4.002,00 USD 42,780 171.205,56 0,80 0,80
HOME PROPERTIES INC - 2.065,00 USD 65,370 134.989,05 0,63 0,63
HSN INC - 2.755,00 USD 53,720 147.998,60 0,69 0,69
HUB GROUP INC -A- 3.355,00 USD 36,420 122.189,10 0,57 0,57
HURON CONSULTING GROUP INC - 4.081,00 USD 46,240 188.705,44 0,88 0,88
INFINITY PROPERTY & CASUALTY C - 2.261,00 USD 59,760 135.117,36 0,63 0,63
INSITUFORM TECHN. CORP. - 1.516,00 USD 22,510 34.125,16 0,16 0,16
INVESTORS BANCORP INC - 6.486,00 USD 21,080 136.724,88 0,64 0,64
IPC THE HOSPITALIST CO INC - 2.476,00 USD 51,360 127.167,36 0,59 0,60
J&J SNACK FOODS CORP - 2.059,00 USD 77,800 160.190,20 0,75 0,75
JAKKS PACIFIC INC - 1.446,00 USD 11,250 16.267,50 0,08 0,08
JARDEN CORPORATION - 2.700,00 USD 43,750 118.125,00 0,55 0,55
JONES LANG LASALLE INC - 494,00 USD 91,140 45.023,16 0,21 0,21
KILROY REALTY CORP - 3.043,00 USD 53,010 161.309,43 0,75 0,75
KINDRED HEALTHCARE INC - 2.371,00 USD 13,130 31.131,23 0,15 0,15
LAM RESEARCH CORP - 2.869,00 USD 44,340 127.211,46 0,59 0,60
LANCE INC - 3.815,00 USD 28,410 108.384,15 0,50 0,51
LASALLE HOTEL PROPERTIES - 5.084,00 USD 24,700 125.574,80 0,58 0,59
LAYNE CHRISTENSEN COMPANY - 1.910,00 USD 19,510 37.264,10 0,17 0,17
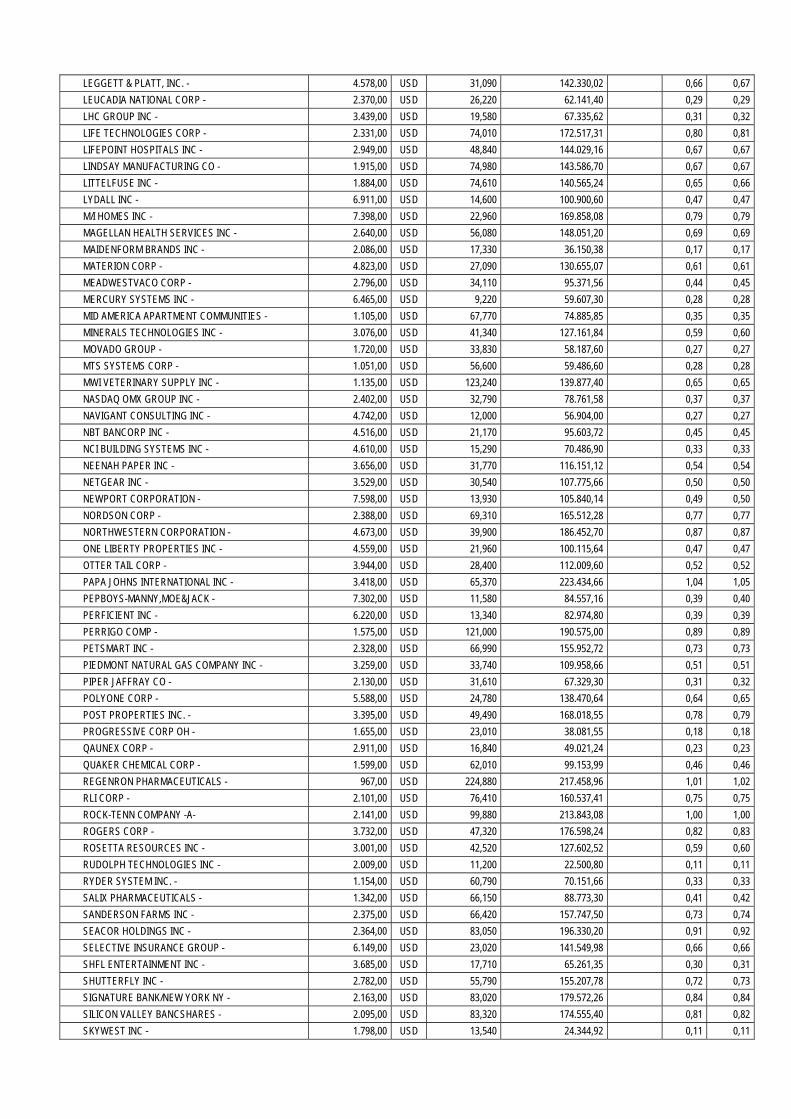
LEGGETT & PLATT, INC. - 4.578,00 USD 31,090 142.330,02 0,66 0,67
LEUCADIA NATIONAL CORP - 2.370,00 USD 26,220 62.141,40 0,29 0,29
LHC GROUP INC - 3.439,00 USD 19,580 67.335,62 0,31 0,32
LIFE TECHNOLOGIES CORP - 2.331,00 USD 74,010 172.517,31 0,80 0,81
LIFEPOINT HOSPITALS INC - 2.949,00 USD 48,840 144.029,16 0,67 0,67
LINDSAY MANUFACTURING CO - 1.915,00 USD 74,980 143.586,70 0,67 0,67
LITTELFUSE INC - 1.884,00 USD 74,610 140.565,24 0,65 0,66
LYDALL INC - 6.911,00 USD 14,600 100.900,60 0,47 0,47
M/I HOMES INC - 7.398,00 USD 22,960 169.858,08 0,79 0,79
MAGELLAN HEALTH SERVICES INC - 2.640,00 USD 56,080 148.051,20 0,69 0,69
MAIDENFORM BRANDS INC - 2.086,00 USD 17,330 36.150,38 0,17 0,17
MATERION CORP - 4.823,00 USD 27,090 130.655,07 0,61 0,61
MEADWESTVACO CORP - 2.796,00 USD 34,110 95.371,56 0,44 0,45
MERCURY SYSTEMS INC - 6.465,00 USD 9,220 59.607,30 0,28 0,28
MID AMERICA APARTMENT COMMUNITIES - 1.105,00 USD 67,770 74.885,85 0,35 0,35
MINERALS TECHNOLOGIES INC - 3.076,00 USD 41,340 127.161,84 0,59 0,60
MOVADO GROUP - 1.720,00 USD 33,830 58.187,60 0,27 0,27
MTS SYSTEMS CORP - 1.051,00 USD 56,600 59.486,60 0,28 0,28
MWI VETERINARY SUPPLY INC - 1.135,00 USD 123,240 139.877,40 0,65 0,65
NASDAQ OMX GROUP INC - 2.402,00 USD 32,790 78.761,58 0,37 0,37
NAVIGANT CONSULTING INC - 4.742,00 USD 12,000 56.904,00 0,27 0,27
NBT BANCORP INC - 4.516,00 USD 21,170 95.603,72 0,45 0,45
NCI BUILDING SYSTEMS INC - 4.610,00 USD 15,290 70.486,90 0,33 0,33
NEENAH PAPER INC - 3.656,00 USD 31,770 116.151,12 0,54 0,54
NETGEAR INC - 3.529,00 USD 30,540 107.775,66 0,50 0,50
NEWPORT CORPORATION - 7.598,00 USD 13,930 105.840,14 0,49 0,50
NORDSON CORP - 2.388,00 USD 69,310 165.512,28 0,77 0,77
NORTHWESTERN CORPORATION - 4.673,00 USD 39,900 186.452,70 0,87 0,87
ONE LIBERTY PROPERTIES INC - 4.559,00 USD 21,960 100.115,64 0,47 0,47
OTTER TAIL CORP - 3.944,00 USD 28,400 112.009,60 0,52 0,52
PAPA JOHNS INTERNATIONAL INC - 3.418,00 USD 65,370 223.434,66 1,04 1,05
PEPBOYS-MANNY,MOE&JACK - 7.302,00 USD 11,580 84.557,16 0,39 0,40
PERFICIENT INC - 6.220,00 USD 13,340 82.974,80 0,39 0,39
PERRIGO COMP - 1.575,00 USD 121,000 190.575,00 0,89 0,89
PETSMART INC - 2.328,00 USD 66,990 155.952,72 0,73 0,73
PIEDMONT NATURAL GAS COMPANY INC - 3.259,00 USD 33,740 109.958,66 0,51 0,51
PIPER JAFFRAY CO - 2.130,00 USD 31,610 67.329,30 0,31 0,32
POLYONE CORP - 5.588,00 USD 24,780 138.470,64 0,64 0,65
POST PROPERTIES INC. - 3.395,00 USD 49,490 168.018,55 0,78 0,79
PROGRESSIVE CORP OH - 1.655,00 USD 23,010 38.081,55 0,18 0,18
QAUNEX CORP - 2.911,00 USD 16,840 49.021,24 0,23 0,23
QUAKER CHEMICAL CORP - 1.599,00 USD 62,010 99.153,99 0,46 0,46
REGENRON PHARMACEUTICALS - 967,00 USD 224,880 217.458,96 1,01 1,02
RLI CORP - 2.101,00 USD 76,410 160.537,41 0,75 0,75
ROCK-TENN COMPANY -A- 2.141,00 USD 99,880 213.843,08 1,00 1,00
ROGERS CORP - 3.732,00 USD 47,320 176.598,24 0,82 0,83
ROSETTA RESOURCES INC - 3.001,00 USD 42,520 127.602,52 0,59 0,60
RUDOLPH TECHNOLOGIES INC - 2.009,00 USD 11,200 22.500,80 0,11 0,11
RYDER SYSTEM INC. - 1.154,00 USD 60,790 70.151,66 0,33 0,33
SALIX PHARMACEUTICALS - 1.342,00 USD 66,150 88.773,30 0,41 0,42
SANDERSON FARMS INC - 2.375,00 USD 66,420 157.747,50 0,73 0,74
SEACOR HOLDINGS INC - 2.364,00 USD 83,050 196.330,20 0,91 0,92
SELECTIVE INSURANCE GROUP - 6.149,00 USD 23,020 141.549,98 0,66 0,66
SHFL ENTERTAINMENT INC - 3.685,00 USD 17,710 65.261,35 0,30 0,31
SHUTTERFLY INC - 2.782,00 USD 55,790 155.207,78 0,72 0,73
SIGNATURE BANK/NEW YORK NY - 2.163,00 USD 83,020 179.572,26 0,84 0,84
SILICON VALLEY BANCSHARES - 2.095,00 USD 83,320 174.555,40 0,81 0,82
SKYWEST INC - 1.798,00 USD 13,540 24.344,92 0,11 0,11

SL GREEN REALTY CORP - 1.176,00 USD 88,190 103.711,44 0,48 0,49
SNAP-ON,INC. - 1.390,00 USD 89,380 124.238,20 0,58 0,58
SOURCEFIRE INC - 2.348,00 USD 55,550 130.431,40 0,61 0,61
SOUTHWEST GAS CORP - 3.459,00 USD 46,790 161.846,61 0,75 0,76
STAGE STORES INC - 6.745,00 USD 23,500 158.507,50 0,74 0,74
STAMPS.COM INC - 4.992,00 USD 39,390 196.634,88 0,92 0,92
STONE ENERGY CORP. - 6.740,00 USD 22,030 148.482,20 0,69 0,69
STURM RUGER & CO INC - 3.759,00 USD 48,040 180.582,36 0,84 0,85
SUNPOWER CORP -A- 173,00 USD 20,700 3.581,10 0,02 0,02
SUNSTONE HOTEL INVESTORS INC - 4.642,00 USD 12,080 56.075,36 0,26 0,26
SYNAPTICS INC - 4.637,00 USD 38,560 178.802,72 0,83 0,84
TAKE-TWO INTERACTIVE SOFTWARE - 4.110,00 USD 14,970 61.526,70 0,29 0,29
TANGER FACTORY OUTLET CENTERS - 3.536,00 USD 33,460 118.314,56 0,55 0,55
TELEDYNE TECHNOLOGIES INC - 2.386,00 USD 77,350 184.557,10 0,86 0,86
TETRA TECH INC. - 5.068,00 USD 23,510 119.148,68 0,56 0,56
TETRA TECHNOLOGIES INC - 3.354,00 USD 10,260 34.412,04 0,16 0,16
THE CHEESECAKE FACTORY INC. - 2.700,00 USD 41,890 113.103,00 0,53 0,53
THE TORO COMPANY - 3.952,00 USD 45,410 179.460,32 0,84 0,84
THORATEC CORP - 4.248,00 USD 31,310 133.004,88 0,62 0,62
TREX CO INC - 3.230,00 USD 47,490 153.392,70 0,71 0,72
TRIUMPH GROUP INC - 1.908,00 USD 79,150 151.018,20 0,70 0,71
TRUEBLUE INC - 5.230,00 USD 21,050 110.091,50 0,51 0,52
TYLER TECHNOLOGIES INC - 3.428,00 USD 68,550 234.989,40 1,10 1,11
ULTRATECH INC - 3.903,00 USD 36,720 143.318,16 0,67 0,67
UNIFIRST CORP - 520,00 USD 91,250 47.450,00 0,22 0,22
UNISOURCE ENERGY CORP - 2.805,00 USD 44,730 125.467,65 0,58 0,59
UNITED STATIONERS INC - 2.082,00 USD 33,550 69.851,10 0,33 0,33
UNIVERSAL TECHNICAL INSTITUTE INC - 6.290,00 USD 10,330 64.975,70 0,30 0,30
URS CORP - 1.632,00 USD 47,220 77.063,04 0,36 0,36
USA MOBILITY INC - 5.002,00 USD 13,570 67.877,14 0,32 0,32
VEECO INSTRUMENTS INC - 1.484,00 USD 35,420 52.563,28 0,25 0,25
VIROPHARMA - 5.500,00 USD 28,650 157.575,00 0,73 0,74
VISHAY INTERTECHNOLOGIE INC. - 4.806,00 USD 13,890 66.755,34 0,31 0,31
VISHAY PRECISION GR INC - 577,00 USD 15,140 8.735,78 0,04 0,04
WATERS CORP - 1.329,00 USD 100,050 132.966,45 0,62 0,62
WATTS WATER TECHNOLOGIES INC "A" 4.858,00 USD 45,340 220.261,72 1,03 1,03
WAUSAU-MOSINEE PAPER CORP. - 6.396,00 USD 11,400 72.914,40 0,34 0,34
WEBSTER FINANCIAL CORP - 7.269,00 USD 25,680 186.667,92 0,87 0,87
WEX INC - 2.265,00 USD 76,700 173.725,50 0,81 0,81
WILLIAMS-SONOMA INC - 1.883,00 USD 55,890 105.240,87 0,49 0,49
WORLD ACCES INC. - 1.796,00 USD 86,940 156.144,24 0,73 0,73
WORLD FUEL SERVICES CORP - 3.702,00 USD 39,980 148.005,96 0,69 0,69
WYNN RESORTS LTD - 1.036,00 USD 128,000 132.608,00 0,62 0,62
YAHOO INC. - 2.782,00 USD 25,110 69.856,02 0,33 0,33
ZEBRA TECHNOLOGIES CORP -A- 1.920,00 USD 43,440 83.404,80 0,39 0,39
Total shares 21.374.831,37 99,48 99,98
TOTAL SECURITIES PORTFOLIO 21.487.312,65 100,00 100,50
CASH AT BANK AND IN HAND
Demand accounts
Belgium
KBC GROUP CAD 1.133,92 CAD 1,000 1.074,88 0,01
KBC GROUP EURO -19.831,22 EUR 1,000 -25.778,60 -0,12
KBC GROUP GBP 310,83 GBP 1,000 471,47 0,00
KBC GROUP USD -83.909,65 USD 1,000 -83.909,65 -0,39
Total demand accounts -108.141,90 -0,51

Managed futures accounts
Belgium
KBC GROUP EURO FUT REK -54,97 EUR 1,000 -71,46
KBC GROUP FUT.REK.CHF -186,51 CHF 1,000 -197,13 0,00
KBC GROUP USD FUT REK 7.532,76 USD 1,000 7.532,76 0,04
Total managed futures accounts 7.264,17 0,03
TOTAL CASH AT BANK AND IN HAND -100.877,73 -0,47
OTHER RECEIVABLES AND PAYABLES
Receivables
Belgium
KBC GROUP USD RECEIVABLE 15.609,25 USD 1,000 15.609,25 0,07
Total receivables 15.609,25 0,07
Payables
Belgium
KBC GROUP EUR PAYABLE -281,08 EUR 1,000 -365,38 0,00
KBC GROUP USD PAYABLE -20.806,64 USD 1,000 -20.806,64 -0,10
Payables -21.172,02 -0,10
TOTAL RECEIVABLES AND PAYABLES -5.562,77 -0,03
OTHER
Interest receivable USD 7.202,17 0,03
Expenses payable USD -16.239,72 -0,08
Expenses to be carried forward USD 8.186,06 0,04
TOTAL OTHER -851,49 0,00
TOTAL NET ASSETS 21.380.020,66 100,00
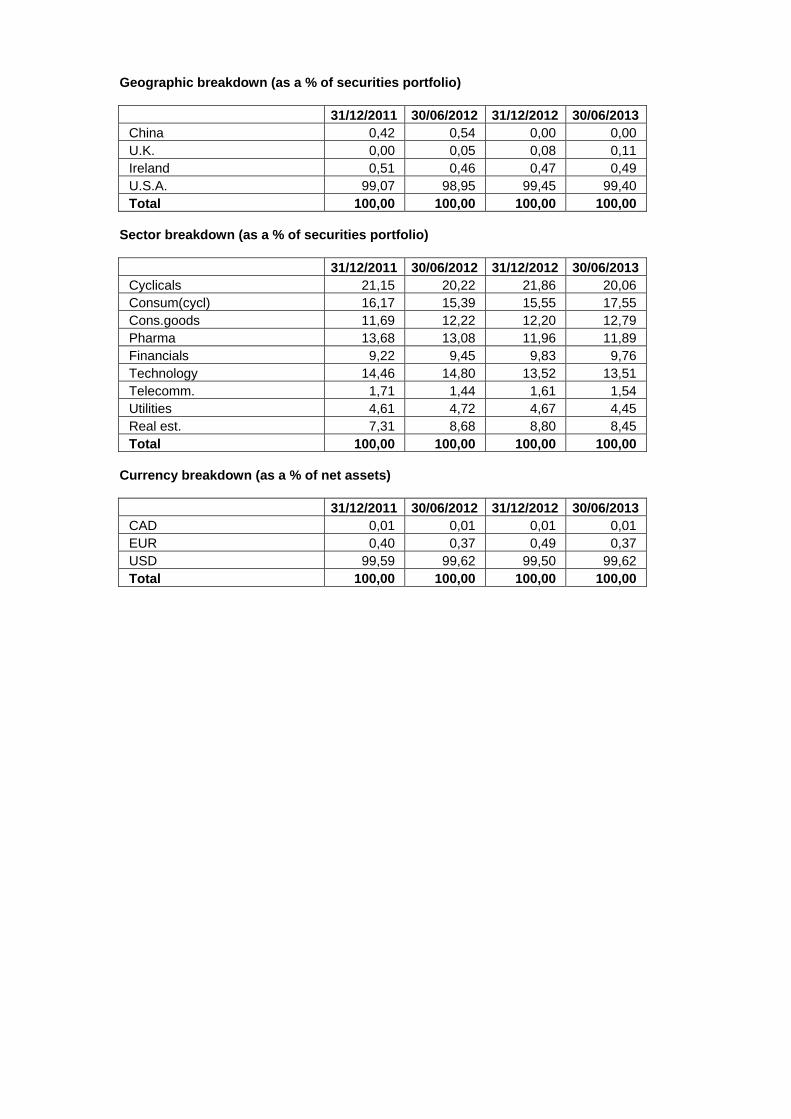
Geographic breakdown (as a % of securities portfolio)
31/12/2011 30/06/2012 31/12/2012 30/06/2013 China 0,42 0,54 0,00 0,00 U.K. 0,00 0,05 0,08 0,11 Ireland 0,51 0,46 0,47 0,49 U.S.A. 99,07 98,95 99,45 99,40 Total 100,00 100,00 100,00 100,00
Sector breakdown (as a % of securities portfolio)
31/12/2011 30/06/2012 31/12/2012 30/06/2013 Cyclicals 21,15 20,22 21,86 20,06 Consum(cycl) 16,17 15,39 15,55 17,55 Cons.goods 11,69 12,22 12,20 12,79 Pharma 13,68 13,08 11,96 11,89 Financials 9,22 9,45 9,83 9,76 Technology 14,46 14,80 13,52 13,51 Telecomm. 1,71 1,44 1,61 1,54 Utilities 4,61 4,72 4,67 4,45 Real est. 7,31 8,68 8,80 8,45 Total 100,00 100,00 100,00 100,00
Currency breakdown (as a % of net assets)
31/12/2011 30/06/2012 31/12/2012 30/06/2013 CAD 0,01 0,01 0,01 0,01 EUR 0,40 0,37 0,49 0,37 USD 99,59 99,62 99,50 99,62 Total 100,00 100,00 100,00 100,00

2.4.2 CHANGES IN THE COMPOSITION OF THE ASSETS OF KBC EQUITY FUND US SMALL CAPS (IN
THE CURRENCY OF THE SUB-FUND)
1st half of year YearPurchases 1.104.876,16 1.104.876,16 Sales 469.283,53 469.283,53 Total 1 1.574.159,69 1.574.159,69 Subscriptions 3.277.158,03 3.277.158,03 Redemptions 2.709.700,96 2.709.700,96 Total 2 5.986.858,99 5.986.858,99 Monthly average of total assets
20.790.145,65 20.790.145,65
Turnover rate -21,22 % -21,22 %
1st half of year YearPurchases 1.104.876,16 1.104.876,16 Sales 469.283,53 469.283,53 Total 1 1.574.159,69 1.574.159,69 Subscriptions 3.277.158,03 3.277.158,03 Redemptions 2.709.700,96 2.709.700,96 Total 2 5.986.858,99 5.986.858,99 Monthly average of total assets
20.753.923,88 20.753.923,88
Corrected turnover rate -21,26 % -21,26 %
The table above shows the capital volume of portfolio transactions. This volume (adjusted to take account of total subscriptions and redemptions) is also compared to the average net assets at the beginning and end of the period. A figure close to 0% implies that the transactions relating to the securities or transactions relating to the assets (excluding deposits and cash) in a given period only involve subscriptions and redemptions. A negative percentage shows that subscriptions and redemptions entailed few, if any, transactions in the portfolio. Active asset management may result in high turnover rates (monthly percentage >50%). The detailed list of transactions is available for consultation free of charge at the registered office of the Bevek or fund at Havenlaan 2, 1080 Brussels.

2.4.3 AMOUNT OF COMMITMENTS IN RESPECT OF FINANCIAL DERIVATIVES POSITIONS Nil
2.4.4 CHANGES OF THE NUMBER OF SUBSCRIPTIONS AND REDEMPTIONS AND THE NET ASSET
VALUE
Classic Shares
Period Change in number of shares in circulation
Year Subscriptions Redemptions End of period
Cap. Dis. Cap. Dis. Cap. Dis. Total
2011 - 06 9.243,78 891,55 51.873,01 14.057,88 19.342,59 4.446,57 23.789,16
2012 - 06 3.247,29 818,00 6.801,04 1.655,00 15.788,84 3.609,57 19.398,41
2013 - 06 1.863,19 1.730,00 3.720,85 1.641,00 13.931,17 3.698,57 17.629,74
Period Amounts received and paid by the UCI
(in the currency of the class)
Year Subscriptions Redemptions
Capitalization Distribution Capitalization Distribution
2011 - 06 8.504.739,29 758.954,82 42.511.687,48 10.404.336,25
2012 - 06 3.106.314,38 767.644,51 6.477.259,33 1.526.876,08
2013 - 06 2.118.223,47 1.915.165,82 4.111.554,63 1.731.380,49
Period Net asset value
End of period (in the currency of the class)
Year Of the class Of one share
Capitalization Distribution
2011 - 06 23.977.937,52 1.018,67 961,26
2012 - 06 19.212.813,62 1.001,04 944,03
2013 - 06 21.380.020,21 1.227,47 1.157,19
Institutional B Shares
Change in number of shares in circulation: Nil
Amounts received and paid by the UCI: Nil
Net asset value: Nil
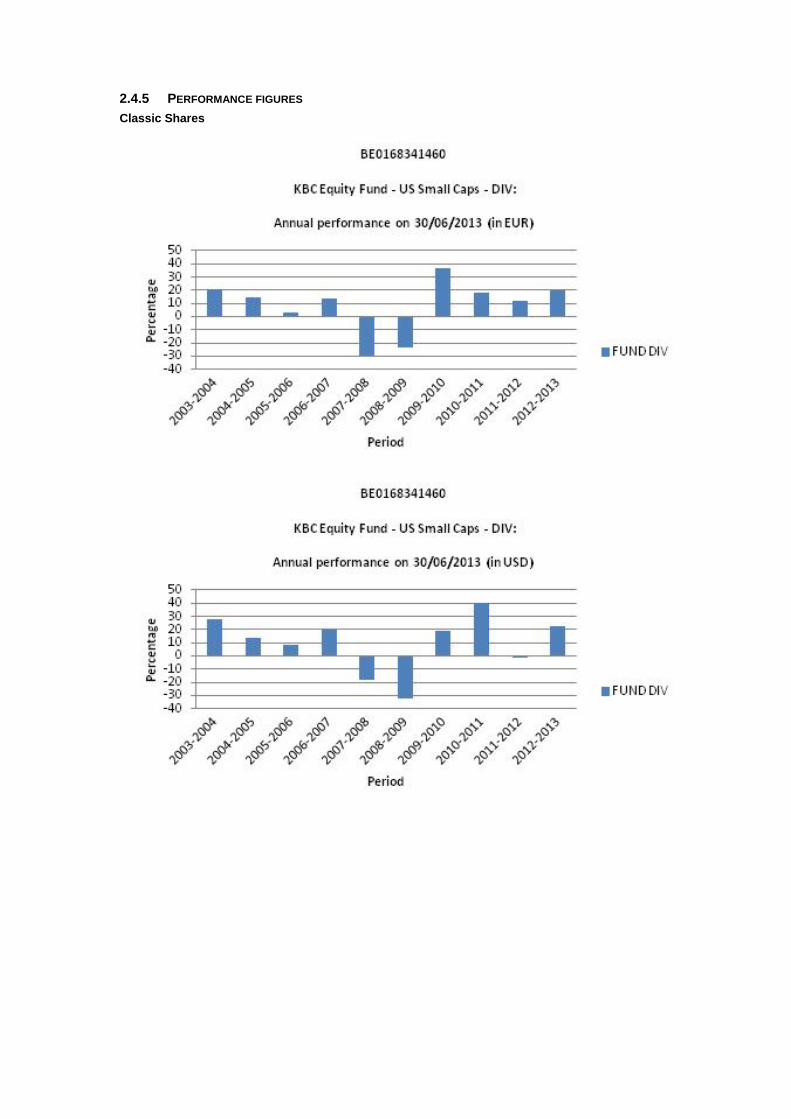
2.4.5 PERFORMANCE FIGURES
Classic Shares

Cap Div
ISIN code Cur-
rency
1 Year 3 Years* 5 Years* 10 Years* Since launch*
Share classes
Bench mark
Share classes
Bench mark
Share classes
Bench mark
Share classes
Bench mark
Launch Date
Share classes
CAP BE0168342476 EUR 19.71% 16.73% 10.67% 6.48% 31/07/1998 5.00%
CAP BE0168342476 USD 22.62% 19.07% 6.49% 7.81% 31/07/1998 6.21%
DIV BE0168341460 EUR 19.68% 16.72% 10.66% 6.48% 31/07/1998 5.00%
DIV BE0168341460 USD 22.58% 19.06% 6.48% 7.81% 31/07/1998 6.20%
Risk warning: Past performance is not a guide to future performance. * Return on annual basis.
Classic Shares
The bar chart shows the performance for full financial years. The figures do not take account of any restructuring. Calculated in USD and in EUR. The return is calculated as the change in the net asset value between two dates expressed
as a percentage. In the case of units that pay dividends, the dividend is incorporated geometrically in the return.
Calculation method for date D, where NAV stands for net asset value: Capitalisation units (CAP) Return on date D over a period of X years:
[NIW(D) / NIW(Y)] ^ [1 / X] - 1 where Y = D-X
Return on date D since the start date S of the unit: [NIW(D) / NIW(S)] ^ [1 / F] - 1 where F = 1 if the unit has existed for less than one year on date D where F = (D-S) / 365.25 if the unit has existed for longer than one year on date D
Distribution units (DIV) Return on date D over a period of X years:
[ C * NIW(D) / NIW(Y)] ^ [1 / X] - 1 where Y = D-X
Return on date D since the start date S of the unit: [ C * NIW(D) / NIW(S)] ^ [1 / F] - 1 where F = 1 if the unit has existed for less than one year on date D where F = (D-S) / 365.25 if the unit has existed for longer than one year on date D where C is a factor that is determined for all N dividends between the calculation date D and the reference date.
For dividend i on date Di with value Wi: Ci = [Wi / NIW(Di)] + 1 i = 1 ... N from whichC = C0 * .... * CN.
If the interval between the two dates exceeds one year, the ordinary return calculation is converted into a return on an annual basis by taking the nth square root of 1 plus the total return of the unit.
The return figures shown above do not take account of the fees and charges associated with the issue and redemption of units.
These are the performance figures for capitalisation and distribution shares.
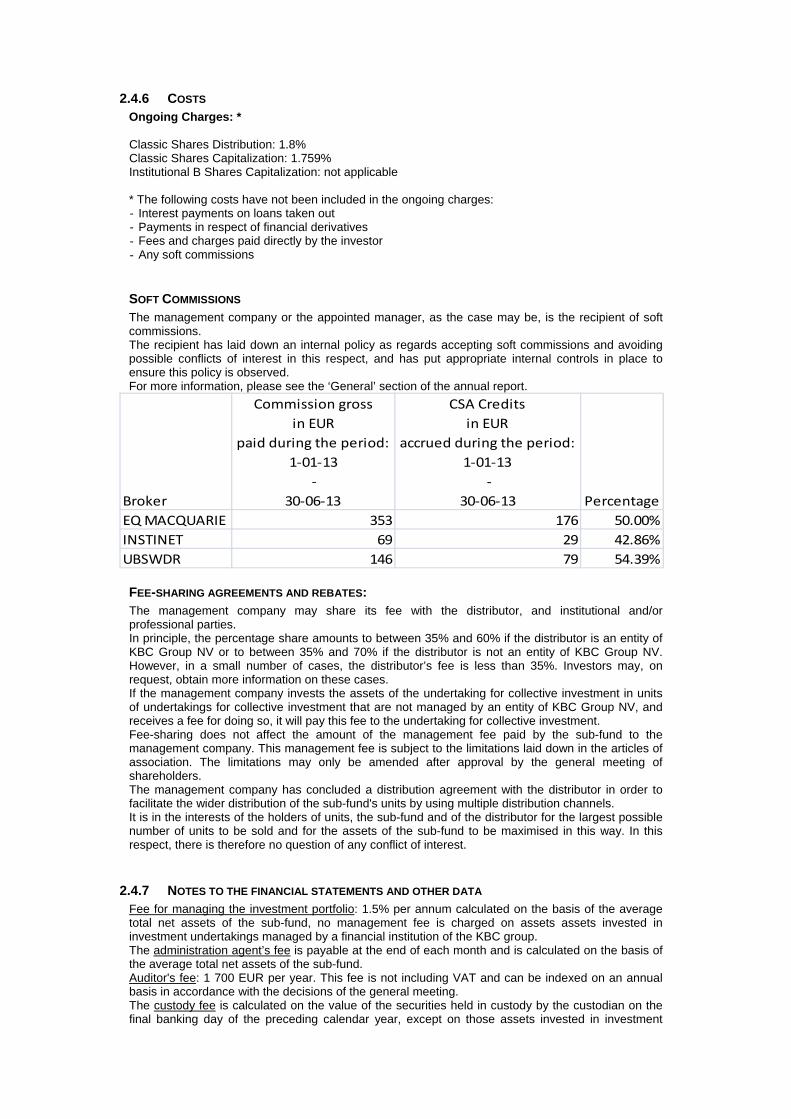
2.4.6 COSTS Ongoing Charges: * Classic Shares Distribution: 1.8% Classic Shares Capitalization: 1.759% Institutional B Shares Capitalization: not applicable * The following costs have not been included in the ongoing charges: - Interest payments on loans taken out - Payments in respect of financial derivatives - Fees and charges paid directly by the investor - Any soft commissions
SOFT COMMISSIONS The management company or the appointed manager, as the case may be, is the recipient of soft commissions. The recipient has laid down an internal policy as regards accepting soft commissions and avoiding possible conflicts of interest in this respect, and has put appropriate internal controls in place to ensure this policy is observed. For more information, please see the ‘General’ section of the annual report.
Broker
Commission gross
in EUR
paid during the period:
1‐01‐13
‐
30‐06‐13
CSA Credits
in EUR
accrued during the period:
1‐01‐13
‐
30‐06‐13 Percentage
EQ MACQUARIE 353 176 50.00%
INSTINET 69 29 42.86%
UBSWDR 146 79 54.39%
FEE-SHARING AGREEMENTS AND REBATES: The management company may share its fee with the distributor, and institutional and/or professional parties. In principle, the percentage share amounts to between 35% and 60% if the distributor is an entity of KBC Group NV or to between 35% and 70% if the distributor is not an entity of KBC Group NV. However, in a small number of cases, the distributor’s fee is less than 35%. Investors may, on request, obtain more information on these cases. If the management company invests the assets of the undertaking for collective investment in units of undertakings for collective investment that are not managed by an entity of KBC Group NV, and receives a fee for doing so, it will pay this fee to the undertaking for collective investment. Fee-sharing does not affect the amount of the management fee paid by the sub-fund to the management company. This management fee is subject to the limitations laid down in the articles of association. The limitations may only be amended after approval by the general meeting of shareholders. The management company has concluded a distribution agreement with the distributor in order to facilitate the wider distribution of the sub-fund's units by using multiple distribution channels. It is in the interests of the holders of units, the sub-fund and of the distributor for the largest possible number of units to be sold and for the assets of the sub-fund to be maximised in this way. In this respect, there is therefore no question of any conflict of interest.
2.4.7 NOTES TO THE FINANCIAL STATEMENTS AND OTHER DATA Fee for managing the investment portfolio: 1.5% per annum calculated on the basis of the average total net assets of the sub-fund, no management fee is charged on assets assets invested in investment undertakings managed by a financial institution of the KBC group. The administration agent’s fee is payable at the end of each month and is calculated on the basis of the average total net assets of the sub-fund. Auditor's fee: 1 700 EUR per year. This fee is not including VAT and can be indexed on an annual basis in accordance with the decisions of the general meeting. The custody fee is calculated on the value of the securities held in custody by the custodian on the final banking day of the preceding calendar year, except on those assets invested in investment
undertakings managed by a financial institution of the KBC group. The custody fee is paid at the beginning of the calendar year. Social, ethical and environmental aspects: No manufacturers of controversial weapons whose use over the past five decades, according to the international consensus, has led to disproportionate human suffering among the civilian population will be included in the portfolio of investments. This involves the manufacturers of anti-personnel mines, cluster bombs and munitions and weapons containing depleted uranium. In this way, the sub-fund seeks to reflect not only simple financial reality but also the social reality of the sector or region in question. Exercising voting rights. If necessary, relevant and in the interest of the shareholders, the management company will exercise the voting rights attached to the shares in the Bevek’s portfolio. The management company will adhere to the following criteria when determining how it stands relative to the items on the agenda that are put to the vote: - Shareholder value may not be adversely affected. - Corporate governance rules, especially with regard to the rights of minority shareholders, must be
respected. - The minimum standards with regard to sustainable business and corporate social responsibility
must be met. The list of companies for which voting rights are exercised is available at the registered office of the Bevek.

Semi-Annual report as at 30th June 2013
TABLE OF CONTENTS
2. Information on KBC Equity Fund Japan
2.1. Management report 2.1.1. Launch date and subscription price 2.1.2. Stock exchange listing 2.1.3. Aim and distinctive features of the investment policy 2.1.4. Financial portfolio management 2.1.5. Distributors 2.1.6. Index and benchmark 2.1.7. Policy conducted during the financial year 2.1.8. Future policy 2.1.9. Synthetic risk and reward indicator (SRRI)
2.2. Balance sheet
2.3. Profit and loss account
2.4. Composition of the assets and key figures
2.4.1. Composition of the assets 2.4.2. Change in the composition of the assets 2.4.3. Value of commitments in respect of financial derivatives positions 2.4.4. Evolution of the number of subscriptions, repayments and the net asset value 2.4.5. Return figures 2.4.6. Expenses 2.4.7. Notes to the financial statements and other data


2 INFORMATION ON KBC EQUITY FUND JAPAN
2.1 MANAGEMENT REPORT
2.1.1 LAUNCH DATE AND SUBSCRIPTION PRICE Classic Shares : Launch date: 17 April 1991 Initial subscription price: 75000 JPY Currency: JPY Institutional B Shares : Launch date: 24 November 2011 Initial subscription price: 26483 JPY Currency: JPY
2.1.2 STOCK EXCHANGE LISTING Not applicable.
2.1.3 GOAL AND KEY PRINCIPLES OF THE INVESTMENT POLICY
SUB-FUND’S OBJECT: The main objective of this sub-fund is to generate the highest possible return for its shareholders by investing directly or indirectly in transferable securities. This is reflected in its pursuit of capital gains and income. To this end, the assets are invested, either directly or indirectly via correlated financial instruments, primarily in shares.
SUB-FUND’S INVESTMENT POLICY:
PERMITTED ASSET CLASSES: The sub-fund may invest in securities, money market instruments, units in undertakings for collective investment, deposits, financial derivatives, liquid assets and all other instruments insofar as permitted by the applicable laws and regulations and consistent with the sub-fund’s object The sub-fund shall invest no more than 10% of its assets in units of other undertakings for collective investment.
RESTRICTIONS OF THE INVESTMENT POLICY: The investment policy will be implemented within the limits set by law and regulations. The sub-fund may borrow up to 10% of its net assets, insofar as these are short-term borrowings aimed at solving temporary liquidity problems.
PERMITTED DERIVATIVES TRANSACTIONS: Derivates may be used either for hedging purposes or to achieve investment objectives. Changes will be made to the investments at regular intervals to comply with the sub-fund's investment strategy. In addition, listed and unlisted derivates may be used to achieve the objectives: these may be forward contracts, options or swaps on securities, indices, currencies or interest rates or other transactions involving derivatives. Unlisted derivatives transactions will only be concluded with prime financial institutions specialised in such transactions. Such derivatives may also be used to hedge the assets against exchange-rate fluctuations. Subject to the applicable laws and regulations and the articles of association, the sub-fund always seeks to conclude the most effective transactions. All costs associated with the transactions will be charged to the sub-fund and all income generated will be paid to the sub-fund. If the transactions result in a risk in respect of the counterparty, this risk can be hedged by using a margin management system that ensures that the sub-fund is the beneficiary of security (collateral) in the form of cash or investment grade bonds. When calculating the value of the bonds, a margin will be applied that varies depending on the residual term to maturity and the currency in which the bond in question is denominated. The relationship with the counterparty or counterparties is governed by standard international agreements.
STRATEGY SELECTED At least 75% of the assets are invested in shares of Japanese companies.
RISK CONCENTRATION Japanese shares.
LENDING FINANCIAL INSTRUMENTS: The sub-fund may lend financial instruments within the limits set by law and regulations. This lending does not affect the sub-fund’s risk profile since: - it takes place within the framework of a securities lending system managed by a principal. In
addition, the sub-fund has a relationship only with the principal of the securities lending system which acts as counterparty and to which title of the loaned securities is transferred. The choice of principal is subject to strict selection criteria. The return of securities similar to the securities that have been lent is guaranteed by the principal.
- through a margin management system, the sub-fund is always guaranteed financial security, the actual value of which always exceeds the actual value of the securities that have been lent, in case the principal does not return similar securities.
The return of securities similar to the securities that have been lent can be requested at any time, which means that the lending of securities does not affect the management of the sub-fund's assets. By lending securities, the sub-fund can generate an additional return. The principal pays a fee to the management company. After deducting the fee for the margin management and clearing services of KBC Bank, most of this fee is paid to the sub-fund. The relationship with the counterparty or counterparties is governed by standard international agreements. More information is provided on the terms and conditions governing securities lending in the annual or half-yearly report for the sub-fund.
VOLATILITY OF THE NET ASSET VALUE: The volatility of the net asset value may be high due to the composition of the portfolio.
GENERAL STRATEGY FOR HEDGING THE EXCHANGE RATE RISK: In order to protect its assets against exchange rate fluctuations and within the limitations laid down in the articles of association, the sub-fund may perform transactions relating to the sale of forward currency contracts, as well as the sale of call options and the purchase of put options on currencies. The transactions in question may relate solely to contracts traded on a regulated market that operates regularly, is recognised and is open to the public or that are traded with a recognised, prime financial institution specialising in such transactions and dealing in the over-the-counter (OTC) market in options. With the same objective, the sub-fund may also sell currencies forward or exchange them in private transactions with prime financial institutions specialising in such transactions. The hedging objective of the aforementioned transactions suggests that there is a direct link between these transactions and the assets to be hedged, which implies that the transactions carried out in a particular currency may in principle not exceed, in terms of volume, either the valuation value of all the assets in the same currency or the holding period of those assets.
SOCIAL, ETHICAL AND ENVIRONMENTAL ASPECTS:
No manufacturers of controversial weapons whose use over the past five decades, according to the international consensus, has led to disproportionate human suffering among the civilian population will be included in the portfolio of investments. This involves the manufacturers of anti-personnel mines, cluster bombs and munitions and weapons containing depleted uranium. In this way, the sub-fund seeks to reflect not only simple financial reality but also the social reality of the sector or region in question.
THE EUROPEAN SAVINGS DIRECTIVE AND TAX ON DEBT CLAIM RETURNS OBTAINED THROUGH THE
REDEMPTION OF OWN UNITS OR IN THE EVENT OF FULL OR PARTIAL DISTRIBUTION OF EQUITY
CAPITAL. The following information is of a general character and is not intended to cover all aspects of an investment in a UCITS. In certain cases entirely different rules might even apply. Moreover, both tax law and the interpretation of it can change. Investors who wish to have more information about the tax implications – in both Belgium and abroad – of acquiring, holding and transferring units should seek the advice of their usual financial and tax advisers.
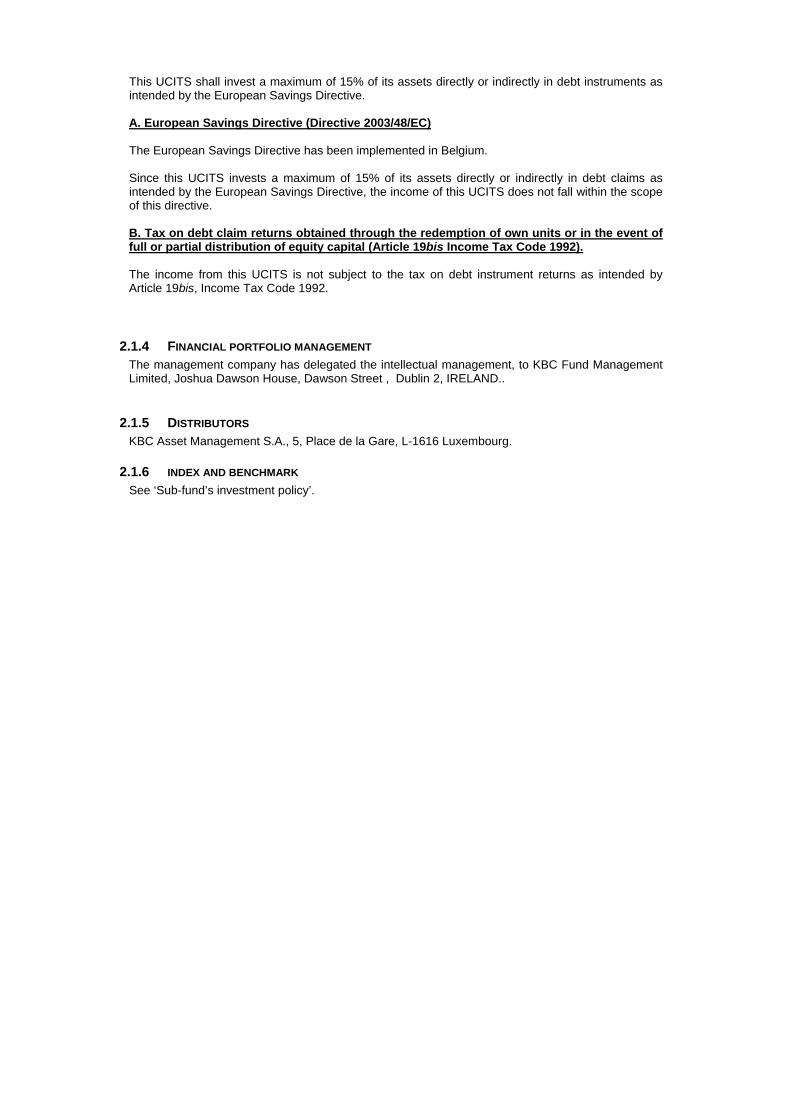
This UCITS shall invest a maximum of 15% of its assets directly or indirectly in debt instruments as intended by the European Savings Directive. A. European Savings Directive (Directive 2003/48/EC) The European Savings Directive has been implemented in Belgium. Since this UCITS invests a maximum of 15% of its assets directly or indirectly in debt claims as intended by the European Savings Directive, the income of this UCITS does not fall within the scope of this directive. B. Tax on debt claim returns obtained through the redemption of own units or in the event of full or partial distribution of equity capital (Article 19bis Income Tax Code 1992). The income from this UCITS is not subject to the tax on debt instrument returns as intended by Article 19bis, Income Tax Code 1992.
2.1.4 FINANCIAL PORTFOLIO MANAGEMENT The management company has delegated the intellectual management, to KBC Fund Management Limited, Joshua Dawson House, Dawson Street , Dublin 2, IRELAND..
2.1.5 DISTRIBUTORS KBC Asset Management S.A., 5, Place de la Gare, L-1616 Luxembourg.
2.1.6 INDEX AND BENCHMARK See ‘Sub-fund’s investment policy’.
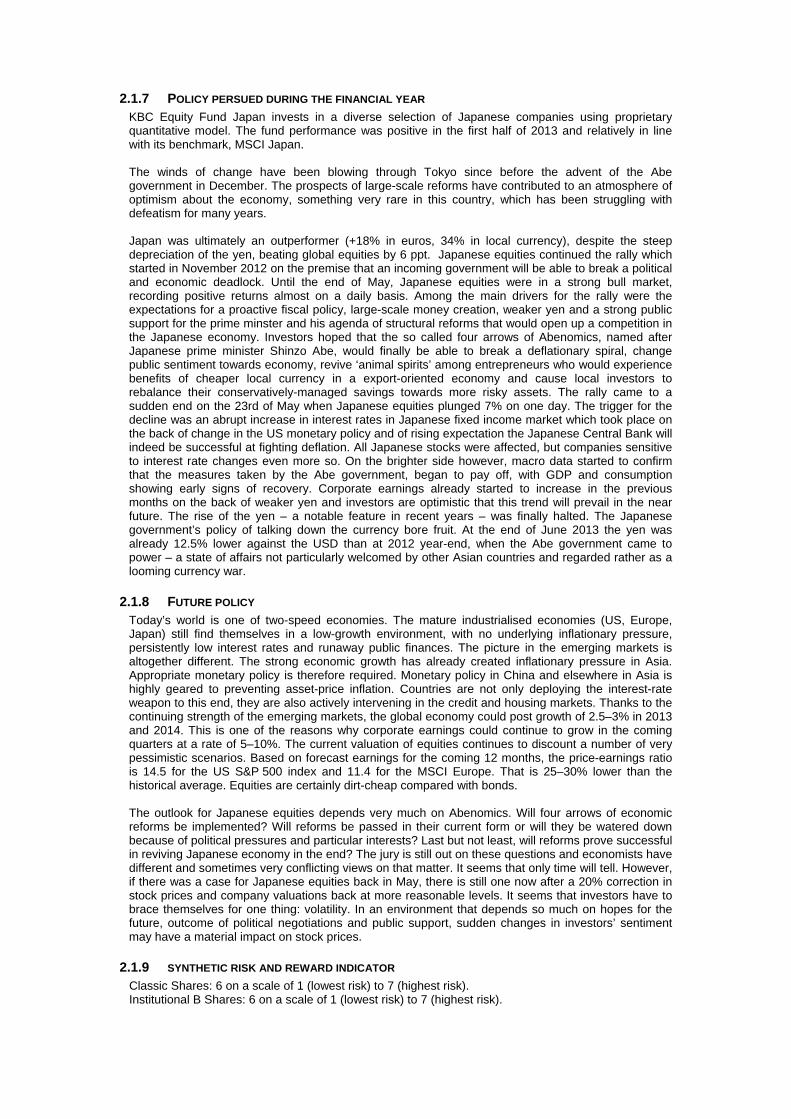
2.1.7 POLICY PERSUED DURING THE FINANCIAL YEAR KBC Equity Fund Japan invests in a diverse selection of Japanese companies using proprietary quantitative model. The fund performance was positive in the first half of 2013 and relatively in line with its benchmark, MSCI Japan. The winds of change have been blowing through Tokyo since before the advent of the Abe government in December. The prospects of large-scale reforms have contributed to an atmosphere of optimism about the economy, something very rare in this country, which has been struggling with defeatism for many years. Japan was ultimately an outperformer (+18% in euros, 34% in local currency), despite the steep depreciation of the yen, beating global equities by 6 ppt. Japanese equities continued the rally which started in November 2012 on the premise that an incoming government will be able to break a political and economic deadlock. Until the end of May, Japanese equities were in a strong bull market, recording positive returns almost on a daily basis. Among the main drivers for the rally were the expectations for a proactive fiscal policy, large-scale money creation, weaker yen and a strong public support for the prime minster and his agenda of structural reforms that would open up a competition in the Japanese economy. Investors hoped that the so called four arrows of Abenomics, named after Japanese prime minister Shinzo Abe, would finally be able to break a deflationary spiral, change public sentiment towards economy, revive ‘animal spirits’ among entrepreneurs who would experience benefits of cheaper local currency in a export-oriented economy and cause local investors to rebalance their conservatively-managed savings towards more risky assets. The rally came to a sudden end on the 23rd of May when Japanese equities plunged 7% on one day. The trigger for the decline was an abrupt increase in interest rates in Japanese fixed income market which took place on the back of change in the US monetary policy and of rising expectation the Japanese Central Bank will indeed be successful at fighting deflation. All Japanese stocks were affected, but companies sensitive to interest rate changes even more so. On the brighter side however, macro data started to confirm that the measures taken by the Abe government, began to pay off, with GDP and consumption showing early signs of recovery. Corporate earnings already started to increase in the previous months on the back of weaker yen and investors are optimistic that this trend will prevail in the near future. The rise of the yen – a notable feature in recent years – was finally halted. The Japanese government’s policy of talking down the currency bore fruit. At the end of June 2013 the yen was already 12.5% lower against the USD than at 2012 year-end, when the Abe government came to power – a state of affairs not particularly welcomed by other Asian countries and regarded rather as a looming currency war.
2.1.8 FUTURE POLICY Today’s world is one of two-speed economies. The mature industrialised economies (US, Europe, Japan) still find themselves in a low-growth environment, with no underlying inflationary pressure, persistently low interest rates and runaway public finances. The picture in the emerging markets is altogether different. The strong economic growth has already created inflationary pressure in Asia. Appropriate monetary policy is therefore required. Monetary policy in China and elsewhere in Asia is highly geared to preventing asset-price inflation. Countries are not only deploying the interest-rate weapon to this end, they are also actively intervening in the credit and housing markets. Thanks to the continuing strength of the emerging markets, the global economy could post growth of 2.5–3% in 2013 and 2014. This is one of the reasons why corporate earnings could continue to grow in the coming quarters at a rate of 5–10%. The current valuation of equities continues to discount a number of very pessimistic scenarios. Based on forecast earnings for the coming 12 months, the price-earnings ratio is 14.5 for the US S&P 500 index and 11.4 for the MSCI Europe. That is 25–30% lower than the historical average. Equities are certainly dirt-cheap compared with bonds. The outlook for Japanese equities depends very much on Abenomics. Will four arrows of economic reforms be implemented? Will reforms be passed in their current form or will they be watered down because of political pressures and particular interests? Last but not least, will reforms prove successful in reviving Japanese economy in the end? The jury is still out on these questions and economists have different and sometimes very conflicting views on that matter. It seems that only time will tell. However, if there was a case for Japanese equities back in May, there is still one now after a 20% correction in stock prices and company valuations back at more reasonable levels. It seems that investors have to brace themselves for one thing: volatility. In an environment that depends so much on hopes for the future, outcome of political negotiations and public support, sudden changes in investors’ sentiment may have a material impact on stock prices.
2.1.9 SYNTHETIC RISK AND REWARD INDICATOR Classic Shares: 6 on a scale of 1 (lowest risk) to 7 (highest risk). Institutional B Shares: 6 on a scale of 1 (lowest risk) to 7 (highest risk).

The value of a share can decrease or increase and the investor may not get back the amount invested. In accordance with Commission Regulation (EU) No. 583/2010, a synthetic risk and reward indicator has been calculated. This indicator provides a quantitative measure of the sub-fund's potential return and the risk involved, calculated in the currency in which the sub-fund is denominated. It is given as a figure between 1 and 7. The higher the figure, the greater the potential return, but also the more difficult it is to predict this return. Losses are possible too. The lowest figure does not mean that the investment is entirely free of risk. However, it does indicate that, compared with the higher figures, this product will generally provide a lower, but more predictable return. The synthetic risk and reward indicator is assessed regularly and can therefore go up or down based on data from the past. Data from the past is not always a reliable indicator of future risk and return.
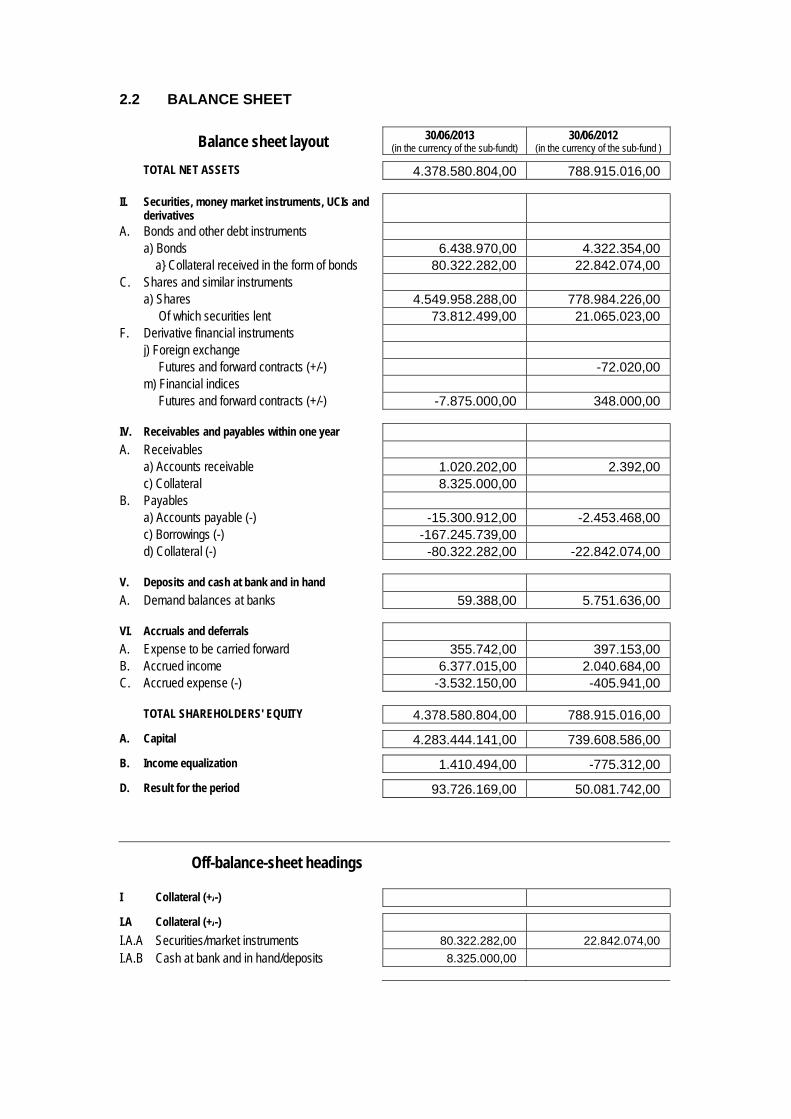
2.2 BALANCE SHEET
Balance sheet layout 30/06/2013 (in the currency of the sub-fundt)
30/06/2012 (in the currency of the sub-fund )
TOTAL NET ASSETS 4.378.580.804,00 788.915.016,00
II. Securities, money market instruments, UCIs and derivatives
A. Bonds and other debt instruments a) Bonds 6.438.970,00 4.322.354,00 a} Collateral received in the form of bonds 80.322.282,00 22.842.074,00 C. Shares and similar instruments a) Shares 4.549.958.288,00 778.984.226,00 Of which securities lent 73.812.499,00 21.065.023,00 F. Derivative financial instruments j) Foreign exchange Futures and forward contracts (+/-) -72.020,00 m) Financial indices Futures and forward contracts (+/-) -7.875.000,00 348.000,00
IV. Receivables and payables within one year A. Receivables a) Accounts receivable 1.020.202,00 2.392,00 c) Collateral 8.325.000,00 B. Payables a) Accounts payable (-) -15.300.912,00 -2.453.468,00 c) Borrowings (-) -167.245.739,00 d) Collateral (-) -80.322.282,00 -22.842.074,00
V. Deposits and cash at bank and in hand A. Demand balances at banks 59.388,00 5.751.636,00
VI. Accruals and deferrals A. Expense to be carried forward 355.742,00 397.153,00 B. Accrued income 6.377.015,00 2.040.684,00 C. Accrued expense (-) -3.532.150,00 -405.941,00
TOTAL SHAREHOLDERS' EQUITY 4.378.580.804,00 788.915.016,00
A. Capital 4.283.444.141,00 739.608.586,00
B. Income equalization 1.410.494,00 -775.312,00
D. Result for the period 93.726.169,00 50.081.742,00
Off-balance-sheet headings
I Collateral (+/-)
I.A Collateral (+/-)
I.A.A Securities/market instruments 80.322.282,00 22.842.074,00
I.A.B Cash at bank and in hand/deposits 8.325.000,00

III Notional amounts of futures and forward contracts
III.A Purchased futures and forward contracts 8.914.000,00
III.B Written futures and forward contracts -169.650.000,00
IX Financial instruments lent 73.812.499,03 21.065.023,00

2.3 PROFIT AND LOSS ACCOUNT
Income Statement 30/06/2013 (in the currency of the sub-fund)
30/06/2012 (in the currency of the sub-fund)
I. Net gains(losses) on investments A. Bonds and other debt instruments a) Bonds 1.165.709,00 -470.766,00 C. Shares and similar instruments a) Shares 94.880.889,00 42.731.389,00 F. Derivative financial instruments l) Financial indices Futures and forward contracts -5.404.500,00 668.000,00 G. Receivables, deposits, cash at bank and in hand
and payables -1,00
H. Foreign exchange positions and transactions a) Derivative financial instruments Futures and forward contracts 266.190,00 -204.474,00 b) Other foreign exchange positions and
transactions 172.241,00 156.973,00
II. Investment income and expenses A. Dividends 12.991.351,00 13.656.367,00 B. Interests a) Securities and money market instruments 453.050,00 1.279.473,00 b) Cash at bank and in hand and deposits 1.023,00 480,00 C. Interest on borrowings (-) -7.630,00 -14.091,00
III. Other income A. Income received to cover the acquisition and
realizaion of assets, to discourage withdrawals and for delivery charges
8.233.104,00
IV. Operating expenses A. Investment transaction and delivery costs (-) -2.631.578,00 -861.430,00 B. Financial expenses (-) -6.305,00 -6.356,00 C. Custodian's fee (-) -286.605,00 -345.345,00 D. Manager's fee (-) a) Financial management Classic Shares -7.279.944,00 -5.459.457,00 Institutional B Shares -4.925.645,00 b) Administration and accounting management -813.711,00 -413.351,00 E. Administrative expenses (-) -5.071,00 -6.331,00 F. Formation and organisation expenses (-) -19.871,00 -66.534,00 H. Services and sundry goods (-) -292.934,00 -195.564,00 J. Taxes Classic Shares -476.874,00 -320.586,00 Institutional B Shares -159.507,00 K. Other expenses (-) -2.127.212,00 -46.655,00
Income and expenditure for the period Subtotal II + III + IV 2.645.641,00 7.200.620,00
V. Profit (loss) on ordinary activities before tax 93.726.169,00 50.081.742,00
VII. Result for the period 93.726.169,00 50.081.742,00
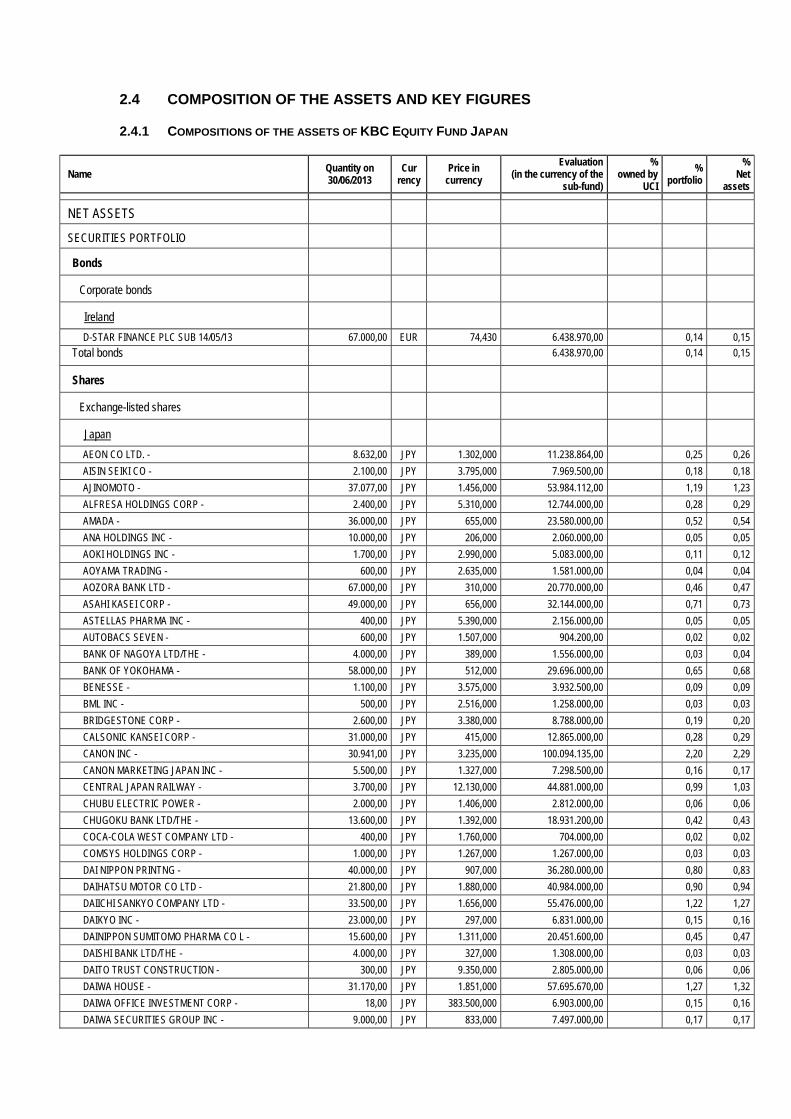
2.4 COMPOSITION OF THE ASSETS AND KEY FIGURES
2.4.1 COMPOSITIONS OF THE ASSETS OF KBC EQUITY FUND JAPAN
Name Quantity on 30/06/2013
Cur rency
Price in currency
Evaluation (in the currency of the
sub-fund)
% owned by
UCI
% portfolio
% Net
assets
NET ASSETS
SECURITIES PORTFOLIO
Bonds
Corporate bonds
Ireland
D-STAR FINANCE PLC SUB 14/05/13 67.000,00 EUR 74,430 6.438.970,00 0,14 0,15
Total bonds 6.438.970,00 0,14 0,15
Shares
Exchange-listed shares
Japan
AEON CO LTD. - 8.632,00 JPY 1.302,000 11.238.864,00 0,25 0,26
AISIN SEIKI CO - 2.100,00 JPY 3.795,000 7.969.500,00 0,18 0,18
AJINOMOTO - 37.077,00 JPY 1.456,000 53.984.112,00 1,19 1,23
ALFRESA HOLDINGS CORP - 2.400,00 JPY 5.310,000 12.744.000,00 0,28 0,29
AMADA - 36.000,00 JPY 655,000 23.580.000,00 0,52 0,54
ANA HOLDINGS INC - 10.000,00 JPY 206,000 2.060.000,00 0,05 0,05
AOKI HOLDINGS INC - 1.700,00 JPY 2.990,000 5.083.000,00 0,11 0,12
AOYAMA TRADING - 600,00 JPY 2.635,000 1.581.000,00 0,04 0,04
AOZORA BANK LTD - 67.000,00 JPY 310,000 20.770.000,00 0,46 0,47
ASAHI KASEI CORP - 49.000,00 JPY 656,000 32.144.000,00 0,71 0,73
ASTELLAS PHARMA INC - 400,00 JPY 5.390,000 2.156.000,00 0,05 0,05
AUTOBACS SEVEN - 600,00 JPY 1.507,000 904.200,00 0,02 0,02
BANK OF NAGOYA LTD/THE - 4.000,00 JPY 389,000 1.556.000,00 0,03 0,04
BANK OF YOKOHAMA - 58.000,00 JPY 512,000 29.696.000,00 0,65 0,68
BENESSE - 1.100,00 JPY 3.575,000 3.932.500,00 0,09 0,09
BML INC - 500,00 JPY 2.516,000 1.258.000,00 0,03 0,03
BRIDGESTONE CORP - 2.600,00 JPY 3.380,000 8.788.000,00 0,19 0,20
CALSONIC KANSEI CORP - 31.000,00 JPY 415,000 12.865.000,00 0,28 0,29
CANON INC - 30.941,00 JPY 3.235,000 100.094.135,00 2,20 2,29
CANON MARKETING JAPAN INC - 5.500,00 JPY 1.327,000 7.298.500,00 0,16 0,17
CENTRAL JAPAN RAILWAY - 3.700,00 JPY 12.130,000 44.881.000,00 0,99 1,03
CHUBU ELECTRIC POWER - 2.000,00 JPY 1.406,000 2.812.000,00 0,06 0,06
CHUGOKU BANK LTD/THE - 13.600,00 JPY 1.392,000 18.931.200,00 0,42 0,43
COCA-COLA WEST COMPANY LTD - 400,00 JPY 1.760,000 704.000,00 0,02 0,02
COMSYS HOLDINGS CORP - 1.000,00 JPY 1.267,000 1.267.000,00 0,03 0,03
DAI NIPPON PRINTNG - 40.000,00 JPY 907,000 36.280.000,00 0,80 0,83
DAIHATSU MOTOR CO LTD - 21.800,00 JPY 1.880,000 40.984.000,00 0,90 0,94
DAIICHI SANKYO COMPANY LTD - 33.500,00 JPY 1.656,000 55.476.000,00 1,22 1,27
DAIKYO INC - 23.000,00 JPY 297,000 6.831.000,00 0,15 0,16
DAINIPPON SUMITOMO PHARMA CO L - 15.600,00 JPY 1.311,000 20.451.600,00 0,45 0,47
DAISHI BANK LTD/THE - 4.000,00 JPY 327,000 1.308.000,00 0,03 0,03
DAITO TRUST CONSTRUCTION - 300,00 JPY 9.350,000 2.805.000,00 0,06 0,06
DAIWA HOUSE - 31.170,00 JPY 1.851,000 57.695.670,00 1,27 1,32
DAIWA OFFICE INVESTMENT CORP - 18,00 JPY 383.500,000 6.903.000,00 0,15 0,16
DAIWA SECURITIES GROUP INC - 9.000,00 JPY 833,000 7.497.000,00 0,17 0,17
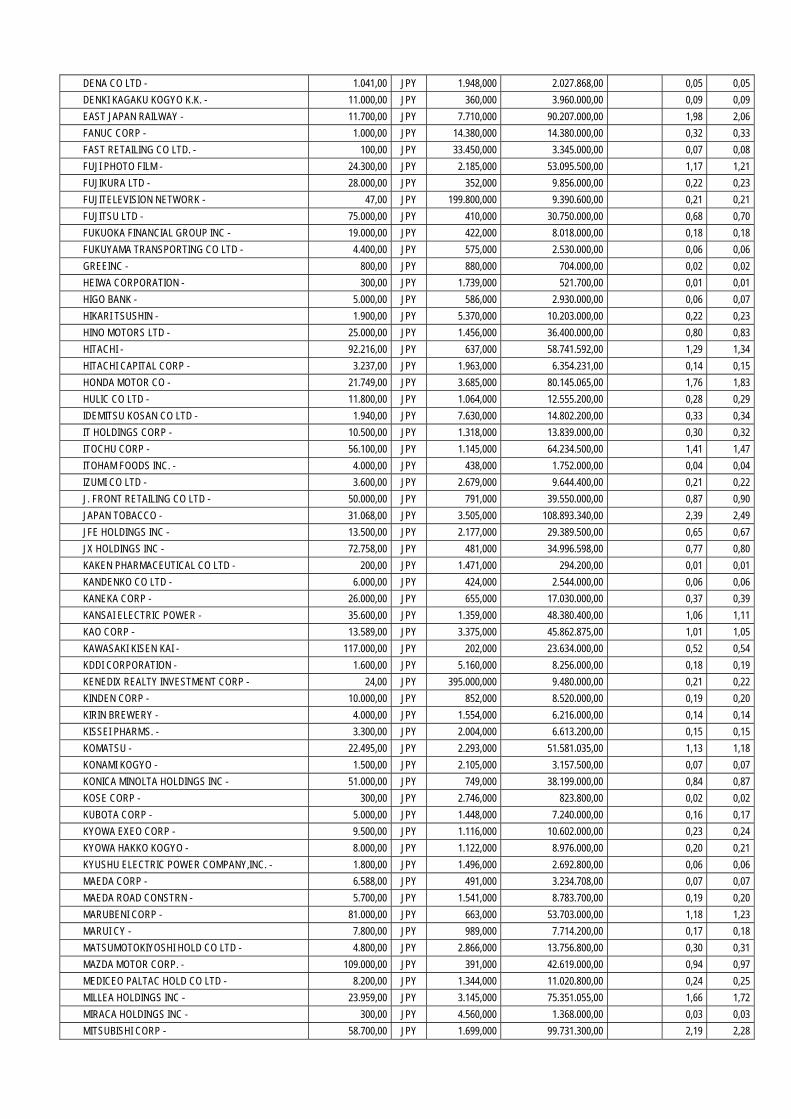
DENA CO LTD - 1.041,00 JPY 1.948,000 2.027.868,00 0,05 0,05
DENKI KAGAKU KOGYO K.K. - 11.000,00 JPY 360,000 3.960.000,00 0,09 0,09
EAST JAPAN RAILWAY - 11.700,00 JPY 7.710,000 90.207.000,00 1,98 2,06
FANUC CORP - 1.000,00 JPY 14.380,000 14.380.000,00 0,32 0,33
FAST RETAILING CO LTD. - 100,00 JPY 33.450,000 3.345.000,00 0,07 0,08
FUJI PHOTO FILM - 24.300,00 JPY 2.185,000 53.095.500,00 1,17 1,21
FUJIKURA LTD - 28.000,00 JPY 352,000 9.856.000,00 0,22 0,23
FUJITELEVISION NETWORK - 47,00 JPY 199.800,000 9.390.600,00 0,21 0,21
FUJITSU LTD - 75.000,00 JPY 410,000 30.750.000,00 0,68 0,70
FUKUOKA FINANCIAL GROUP INC - 19.000,00 JPY 422,000 8.018.000,00 0,18 0,18
FUKUYAMA TRANSPORTING CO LTD - 4.400,00 JPY 575,000 2.530.000,00 0,06 0,06
GREEINC - 800,00 JPY 880,000 704.000,00 0,02 0,02
HEIWA CORPORATION - 300,00 JPY 1.739,000 521.700,00 0,01 0,01
HIGO BANK - 5.000,00 JPY 586,000 2.930.000,00 0,06 0,07
HIKARI TSUSHIN - 1.900,00 JPY 5.370,000 10.203.000,00 0,22 0,23
HINO MOTORS LTD - 25.000,00 JPY 1.456,000 36.400.000,00 0,80 0,83
HITACHI - 92.216,00 JPY 637,000 58.741.592,00 1,29 1,34
HITACHI CAPITAL CORP - 3.237,00 JPY 1.963,000 6.354.231,00 0,14 0,15
HONDA MOTOR CO - 21.749,00 JPY 3.685,000 80.145.065,00 1,76 1,83
HULIC CO LTD - 11.800,00 JPY 1.064,000 12.555.200,00 0,28 0,29
IDEMITSU KOSAN CO LTD - 1.940,00 JPY 7.630,000 14.802.200,00 0,33 0,34
IT HOLDINGS CORP - 10.500,00 JPY 1.318,000 13.839.000,00 0,30 0,32
ITOCHU CORP - 56.100,00 JPY 1.145,000 64.234.500,00 1,41 1,47
ITOHAM FOODS INC. - 4.000,00 JPY 438,000 1.752.000,00 0,04 0,04
IZUMI CO LTD - 3.600,00 JPY 2.679,000 9.644.400,00 0,21 0,22
J. FRONT RETAILING CO LTD - 50.000,00 JPY 791,000 39.550.000,00 0,87 0,90
JAPAN TOBACCO - 31.068,00 JPY 3.505,000 108.893.340,00 2,39 2,49
JFE HOLDINGS INC - 13.500,00 JPY 2.177,000 29.389.500,00 0,65 0,67
JX HOLDINGS INC - 72.758,00 JPY 481,000 34.996.598,00 0,77 0,80
KAKEN PHARMACEUTICAL CO LTD - 200,00 JPY 1.471,000 294.200,00 0,01 0,01
KANDENKO CO LTD - 6.000,00 JPY 424,000 2.544.000,00 0,06 0,06
KANEKA CORP - 26.000,00 JPY 655,000 17.030.000,00 0,37 0,39
KANSAI ELECTRIC POWER - 35.600,00 JPY 1.359,000 48.380.400,00 1,06 1,11
KAO CORP - 13.589,00 JPY 3.375,000 45.862.875,00 1,01 1,05
KAWASAKI KISEN KAI - 117.000,00 JPY 202,000 23.634.000,00 0,52 0,54
KDDI CORPORATION - 1.600,00 JPY 5.160,000 8.256.000,00 0,18 0,19
KENEDIX REALTY INVESTMENT CORP - 24,00 JPY 395.000,000 9.480.000,00 0,21 0,22
KINDEN CORP - 10.000,00 JPY 852,000 8.520.000,00 0,19 0,20
KIRIN BREWERY - 4.000,00 JPY 1.554,000 6.216.000,00 0,14 0,14
KISSEI PHARMS. - 3.300,00 JPY 2.004,000 6.613.200,00 0,15 0,15
KOMATSU - 22.495,00 JPY 2.293,000 51.581.035,00 1,13 1,18
KONAMI KOGYO - 1.500,00 JPY 2.105,000 3.157.500,00 0,07 0,07
KONICA MINOLTA HOLDINGS INC - 51.000,00 JPY 749,000 38.199.000,00 0,84 0,87
KOSE CORP - 300,00 JPY 2.746,000 823.800,00 0,02 0,02
KUBOTA CORP - 5.000,00 JPY 1.448,000 7.240.000,00 0,16 0,17
KYOWA EXEO CORP - 9.500,00 JPY 1.116,000 10.602.000,00 0,23 0,24
KYOWA HAKKO KOGYO - 8.000,00 JPY 1.122,000 8.976.000,00 0,20 0,21
KYUSHU ELECTRIC POWER COMPANY,INC. - 1.800,00 JPY 1.496,000 2.692.800,00 0,06 0,06
MAEDA CORP - 6.588,00 JPY 491,000 3.234.708,00 0,07 0,07
MAEDA ROAD CONSTRN - 5.700,00 JPY 1.541,000 8.783.700,00 0,19 0,20
MARUBENI CORP - 81.000,00 JPY 663,000 53.703.000,00 1,18 1,23
MARUI CY - 7.800,00 JPY 989,000 7.714.200,00 0,17 0,18
MATSUMOTOKIYOSHI HOLD CO LTD - 4.800,00 JPY 2.866,000 13.756.800,00 0,30 0,31
MAZDA MOTOR CORP. - 109.000,00 JPY 391,000 42.619.000,00 0,94 0,97
MEDICEO PALTAC HOLD CO LTD - 8.200,00 JPY 1.344,000 11.020.800,00 0,24 0,25
MILLEA HOLDINGS INC - 23.959,00 JPY 3.145,000 75.351.055,00 1,66 1,72
MIRACA HOLDINGS INC - 300,00 JPY 4.560,000 1.368.000,00 0,03 0,03
MITSUBISHI CORP - 58.700,00 JPY 1.699,000 99.731.300,00 2,19 2,28
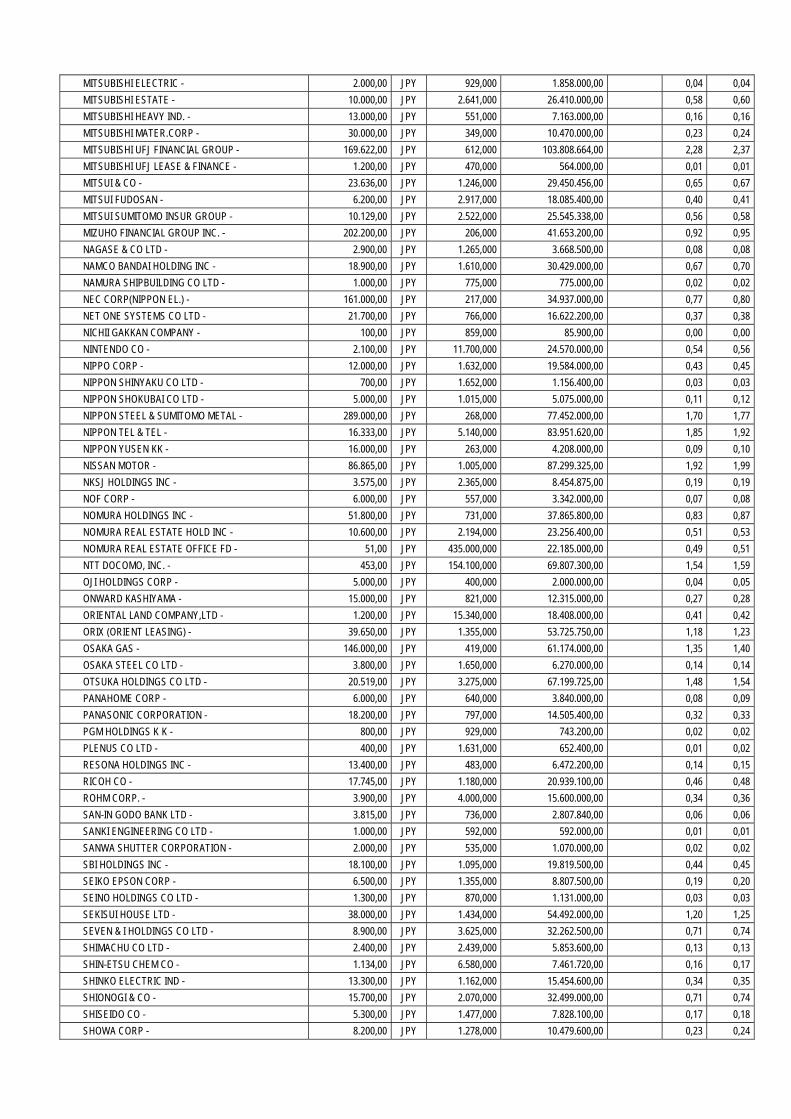
MITSUBISHI ELECTRIC - 2.000,00 JPY 929,000 1.858.000,00 0,04 0,04
MITSUBISHI ESTATE - 10.000,00 JPY 2.641,000 26.410.000,00 0,58 0,60
MITSUBISHI HEAVY IND. - 13.000,00 JPY 551,000 7.163.000,00 0,16 0,16
MITSUBISHI MATER.CORP - 30.000,00 JPY 349,000 10.470.000,00 0,23 0,24
MITSUBISHI UFJ FINANCIAL GROUP - 169.622,00 JPY 612,000 103.808.664,00 2,28 2,37
MITSUBISHI UFJ LEASE & FINANCE - 1.200,00 JPY 470,000 564.000,00 0,01 0,01
MITSUI & CO - 23.636,00 JPY 1.246,000 29.450.456,00 0,65 0,67
MITSUI FUDOSAN - 6.200,00 JPY 2.917,000 18.085.400,00 0,40 0,41
MITSUI SUMITOMO INSUR GROUP - 10.129,00 JPY 2.522,000 25.545.338,00 0,56 0,58
MIZUHO FINANCIAL GROUP INC. - 202.200,00 JPY 206,000 41.653.200,00 0,92 0,95
NAGASE & CO LTD - 2.900,00 JPY 1.265,000 3.668.500,00 0,08 0,08
NAMCO BANDAI HOLDING INC - 18.900,00 JPY 1.610,000 30.429.000,00 0,67 0,70
NAMURA SHIPBUILDING CO LTD - 1.000,00 JPY 775,000 775.000,00 0,02 0,02
NEC CORP(NIPPON EL.) - 161.000,00 JPY 217,000 34.937.000,00 0,77 0,80
NET ONE SYSTEMS CO LTD - 21.700,00 JPY 766,000 16.622.200,00 0,37 0,38
NICHII GAKKAN COMPANY - 100,00 JPY 859,000 85.900,00 0,00 0,00
NINTENDO CO - 2.100,00 JPY 11.700,000 24.570.000,00 0,54 0,56
NIPPO CORP - 12.000,00 JPY 1.632,000 19.584.000,00 0,43 0,45
NIPPON SHINYAKU CO LTD - 700,00 JPY 1.652,000 1.156.400,00 0,03 0,03
NIPPON SHOKUBAI CO LTD - 5.000,00 JPY 1.015,000 5.075.000,00 0,11 0,12
NIPPON STEEL & SUMITOMO METAL - 289.000,00 JPY 268,000 77.452.000,00 1,70 1,77
NIPPON TEL & TEL - 16.333,00 JPY 5.140,000 83.951.620,00 1,85 1,92
NIPPON YUSEN KK - 16.000,00 JPY 263,000 4.208.000,00 0,09 0,10
NISSAN MOTOR - 86.865,00 JPY 1.005,000 87.299.325,00 1,92 1,99
NKSJ HOLDINGS INC - 3.575,00 JPY 2.365,000 8.454.875,00 0,19 0,19
NOF CORP - 6.000,00 JPY 557,000 3.342.000,00 0,07 0,08
NOMURA HOLDINGS INC - 51.800,00 JPY 731,000 37.865.800,00 0,83 0,87
NOMURA REAL ESTATE HOLD INC - 10.600,00 JPY 2.194,000 23.256.400,00 0,51 0,53
NOMURA REAL ESTATE OFFICE FD - 51,00 JPY 435.000,000 22.185.000,00 0,49 0,51
NTT DOCOMO, INC. - 453,00 JPY 154.100,000 69.807.300,00 1,54 1,59
OJI HOLDINGS CORP - 5.000,00 JPY 400,000 2.000.000,00 0,04 0,05
ONWARD KASHIYAMA - 15.000,00 JPY 821,000 12.315.000,00 0,27 0,28
ORIENTAL LAND COMPANY,LTD - 1.200,00 JPY 15.340,000 18.408.000,00 0,41 0,42
ORIX (ORIENT LEASING) - 39.650,00 JPY 1.355,000 53.725.750,00 1,18 1,23
OSAKA GAS - 146.000,00 JPY 419,000 61.174.000,00 1,35 1,40
OSAKA STEEL CO LTD - 3.800,00 JPY 1.650,000 6.270.000,00 0,14 0,14
OTSUKA HOLDINGS CO LTD - 20.519,00 JPY 3.275,000 67.199.725,00 1,48 1,54
PANAHOME CORP - 6.000,00 JPY 640,000 3.840.000,00 0,08 0,09
PANASONIC CORPORATION - 18.200,00 JPY 797,000 14.505.400,00 0,32 0,33
PGM HOLDINGS K K - 800,00 JPY 929,000 743.200,00 0,02 0,02
PLENUS CO LTD - 400,00 JPY 1.631,000 652.400,00 0,01 0,02
RESONA HOLDINGS INC - 13.400,00 JPY 483,000 6.472.200,00 0,14 0,15
RICOH CO - 17.745,00 JPY 1.180,000 20.939.100,00 0,46 0,48
ROHM CORP. - 3.900,00 JPY 4.000,000 15.600.000,00 0,34 0,36
SAN-IN GODO BANK LTD - 3.815,00 JPY 736,000 2.807.840,00 0,06 0,06
SANKI ENGINEERING CO LTD - 1.000,00 JPY 592,000 592.000,00 0,01 0,01
SANWA SHUTTER CORPORATION - 2.000,00 JPY 535,000 1.070.000,00 0,02 0,02
SBI HOLDINGS INC - 18.100,00 JPY 1.095,000 19.819.500,00 0,44 0,45
SEIKO EPSON CORP - 6.500,00 JPY 1.355,000 8.807.500,00 0,19 0,20
SEINO HOLDINGS CO LTD - 1.300,00 JPY 870,000 1.131.000,00 0,03 0,03
SEKISUI HOUSE LTD - 38.000,00 JPY 1.434,000 54.492.000,00 1,20 1,25
SEVEN & I HOLDINGS CO LTD - 8.900,00 JPY 3.625,000 32.262.500,00 0,71 0,74
SHIMACHU CO LTD - 2.400,00 JPY 2.439,000 5.853.600,00 0,13 0,13
SHIN-ETSU CHEM CO - 1.134,00 JPY 6.580,000 7.461.720,00 0,16 0,17
SHINKO ELECTRIC IND - 13.300,00 JPY 1.162,000 15.454.600,00 0,34 0,35
SHIONOGI & CO - 15.700,00 JPY 2.070,000 32.499.000,00 0,71 0,74
SHISEIDO CO - 5.300,00 JPY 1.477,000 7.828.100,00 0,17 0,18
SHOWA CORP - 8.200,00 JPY 1.278,000 10.479.600,00 0,23 0,24
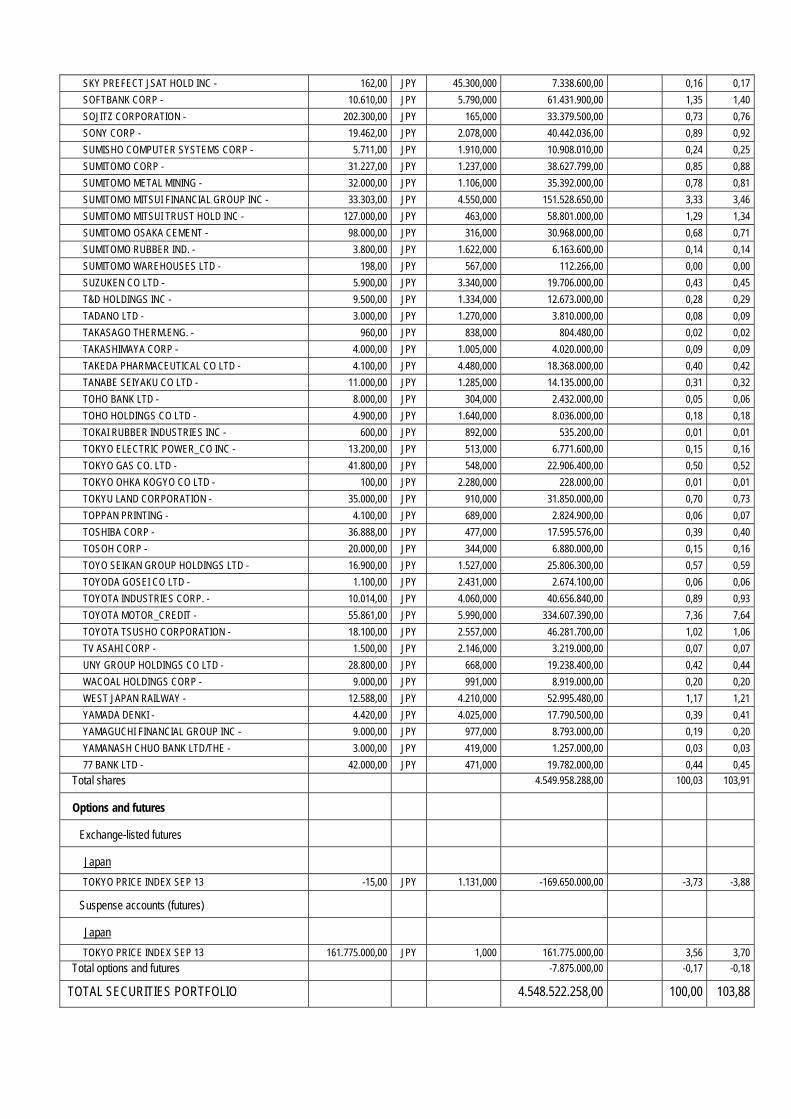
SKY PREFECT JSAT HOLD INC - 162,00 JPY 45.300,000 7.338.600,00 0,16 0,17
SOFTBANK CORP - 10.610,00 JPY 5.790,000 61.431.900,00 1,35 1,40
SOJITZ CORPORATION - 202.300,00 JPY 165,000 33.379.500,00 0,73 0,76
SONY CORP - 19.462,00 JPY 2.078,000 40.442.036,00 0,89 0,92
SUMISHO COMPUTER SYSTEMS CORP - 5.711,00 JPY 1.910,000 10.908.010,00 0,24 0,25
SUMITOMO CORP - 31.227,00 JPY 1.237,000 38.627.799,00 0,85 0,88
SUMITOMO METAL MINING - 32.000,00 JPY 1.106,000 35.392.000,00 0,78 0,81
SUMITOMO MITSUI FINANCIAL GROUP INC - 33.303,00 JPY 4.550,000 151.528.650,00 3,33 3,46
SUMITOMO MITSUI TRUST HOLD INC - 127.000,00 JPY 463,000 58.801.000,00 1,29 1,34
SUMITOMO OSAKA CEMENT - 98.000,00 JPY 316,000 30.968.000,00 0,68 0,71
SUMITOMO RUBBER IND. - 3.800,00 JPY 1.622,000 6.163.600,00 0,14 0,14
SUMITOMO WAREHOUSES LTD - 198,00 JPY 567,000 112.266,00 0,00 0,00
SUZUKEN CO LTD - 5.900,00 JPY 3.340,000 19.706.000,00 0,43 0,45
T&D HOLDINGS INC - 9.500,00 JPY 1.334,000 12.673.000,00 0,28 0,29
TADANO LTD - 3.000,00 JPY 1.270,000 3.810.000,00 0,08 0,09
TAKASAGO THERM.ENG. - 960,00 JPY 838,000 804.480,00 0,02 0,02
TAKASHIMAYA CORP - 4.000,00 JPY 1.005,000 4.020.000,00 0,09 0,09
TAKEDA PHARMACEUTICAL CO LTD - 4.100,00 JPY 4.480,000 18.368.000,00 0,40 0,42
TANABE SEIYAKU CO LTD - 11.000,00 JPY 1.285,000 14.135.000,00 0,31 0,32
TOHO BANK LTD - 8.000,00 JPY 304,000 2.432.000,00 0,05 0,06
TOHO HOLDINGS CO LTD - 4.900,00 JPY 1.640,000 8.036.000,00 0,18 0,18
TOKAI RUBBER INDUSTRIES INC - 600,00 JPY 892,000 535.200,00 0,01 0,01
TOKYO ELECTRIC POWER_CO INC - 13.200,00 JPY 513,000 6.771.600,00 0,15 0,16
TOKYO GAS CO. LTD - 41.800,00 JPY 548,000 22.906.400,00 0,50 0,52
TOKYO OHKA KOGYO CO LTD - 100,00 JPY 2.280,000 228.000,00 0,01 0,01
TOKYU LAND CORPORATION - 35.000,00 JPY 910,000 31.850.000,00 0,70 0,73
TOPPAN PRINTING - 4.100,00 JPY 689,000 2.824.900,00 0,06 0,07
TOSHIBA CORP - 36.888,00 JPY 477,000 17.595.576,00 0,39 0,40
TOSOH CORP - 20.000,00 JPY 344,000 6.880.000,00 0,15 0,16
TOYO SEIKAN GROUP HOLDINGS LTD - 16.900,00 JPY 1.527,000 25.806.300,00 0,57 0,59
TOYODA GOSEI CO LTD - 1.100,00 JPY 2.431,000 2.674.100,00 0,06 0,06
TOYOTA INDUSTRIES CORP. - 10.014,00 JPY 4.060,000 40.656.840,00 0,89 0,93
TOYOTA MOTOR_CREDIT - 55.861,00 JPY 5.990,000 334.607.390,00 7,36 7,64
TOYOTA TSUSHO CORPORATION - 18.100,00 JPY 2.557,000 46.281.700,00 1,02 1,06
TV ASAHI CORP - 1.500,00 JPY 2.146,000 3.219.000,00 0,07 0,07
UNY GROUP HOLDINGS CO LTD - 28.800,00 JPY 668,000 19.238.400,00 0,42 0,44
WACOAL HOLDINGS CORP - 9.000,00 JPY 991,000 8.919.000,00 0,20 0,20
WEST JAPAN RAILWAY - 12.588,00 JPY 4.210,000 52.995.480,00 1,17 1,21
YAMADA DENKI - 4.420,00 JPY 4.025,000 17.790.500,00 0,39 0,41
YAMAGUCHI FINANCIAL GROUP INC - 9.000,00 JPY 977,000 8.793.000,00 0,19 0,20
YAMANASH CHUO BANK LTD/THE - 3.000,00 JPY 419,000 1.257.000,00 0,03 0,03
77 BANK LTD - 42.000,00 JPY 471,000 19.782.000,00 0,44 0,45
Total shares 4.549.958.288,00 100,03 103,91
Options and futures
Exchange-listed futures
Japan
TOKYO PRICE INDEX SEP 13 -15,00 JPY 1.131,000 -169.650.000,00 -3,73 -3,88
Suspense accounts (futures)
Japan
TOKYO PRICE INDEX SEP 13 161.775.000,00 JPY 1,000 161.775.000,00 3,56 3,70
Total options and futures -7.875.000,00 -0,17 -0,18
TOTAL SECURITIES PORTFOLIO 4.548.522.258,00 100,00 103,88
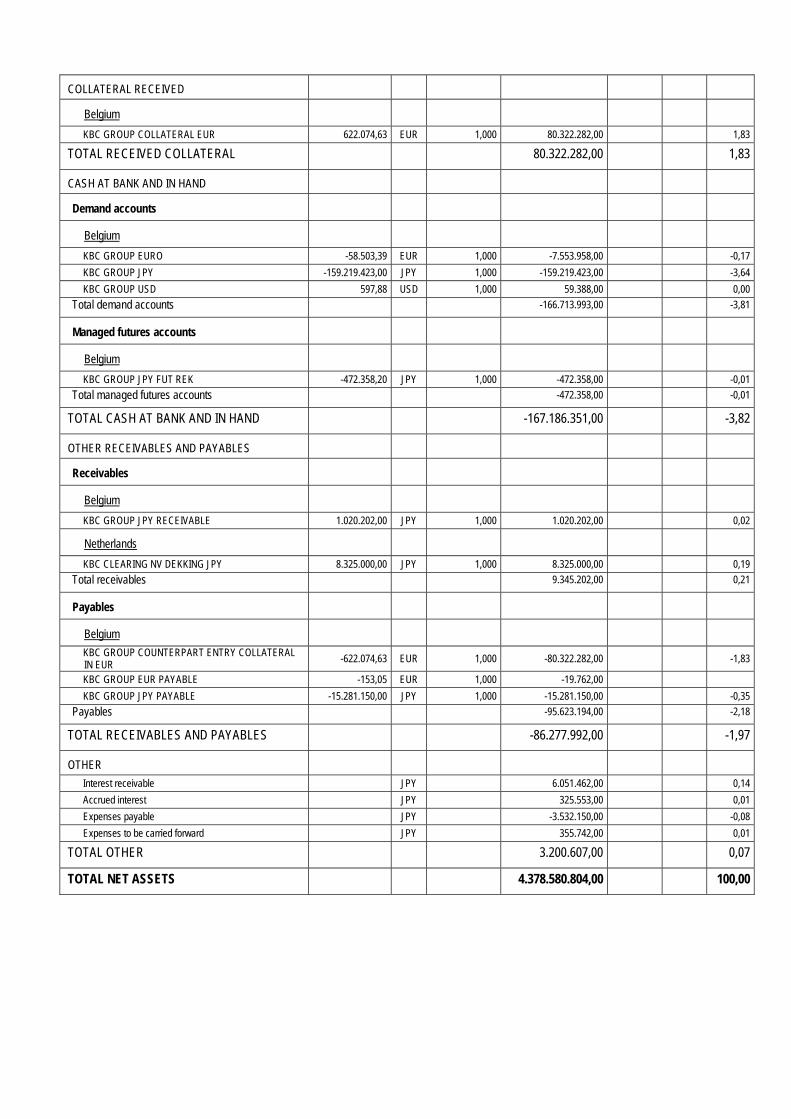
COLLATERAL RECEIVED
Belgium
KBC GROUP COLLATERAL EUR 622.074,63 EUR 1,000 80.322.282,00 1,83
TOTAL RECEIVED COLLATERAL 80.322.282,00 1,83
CASH AT BANK AND IN HAND
Demand accounts
Belgium
KBC GROUP EURO -58.503,39 EUR 1,000 -7.553.958,00 -0,17
KBC GROUP JPY -159.219.423,00 JPY 1,000 -159.219.423,00 -3,64
KBC GROUP USD 597,88 USD 1,000 59.388,00 0,00
Total demand accounts -166.713.993,00 -3,81
Managed futures accounts
Belgium
KBC GROUP JPY FUT REK -472.358,20 JPY 1,000 -472.358,00 -0,01
Total managed futures accounts -472.358,00 -0,01
TOTAL CASH AT BANK AND IN HAND -167.186.351,00 -3,82
OTHER RECEIVABLES AND PAYABLES
Receivables
Belgium
KBC GROUP JPY RECEIVABLE 1.020.202,00 JPY 1,000 1.020.202,00 0,02
Netherlands
KBC CLEARING NV DEKKING JPY 8.325.000,00 JPY 1,000 8.325.000,00 0,19
Total receivables 9.345.202,00 0,21
Payables
Belgium
KBC GROUP COUNTERPART ENTRY COLLATERAL IN EUR
-622.074,63 EUR 1,000 -80.322.282,00 -1,83
KBC GROUP EUR PAYABLE -153,05 EUR 1,000 -19.762,00
KBC GROUP JPY PAYABLE -15.281.150,00 JPY 1,000 -15.281.150,00 -0,35
Payables -95.623.194,00 -2,18
TOTAL RECEIVABLES AND PAYABLES -86.277.992,00 -1,97
OTHER
Interest receivable JPY 6.051.462,00 0,14
Accrued interest JPY 325.553,00 0,01
Expenses payable JPY -3.532.150,00 -0,08
Expenses to be carried forward JPY 355.742,00 0,01
TOTAL OTHER 3.200.607,00 0,07
TOTAL NET ASSETS 4.378.580.804,00 100,00

Geographic breakdown (as a % of securities portfolio)
31/12/2011 30/06/2012 31/12/2012 30/06/2013 Belgium 0,01 -0,01 -0,03 0,00 Ireland 0,54 0,55 0,59 0,14 Japan 99,45 99,46 99,44 99,86 Total 100,00 100,00 100,00 100,00
Sector breakdown (as a % of securities portfolio)
31/12/2011 30/06/2012 31/12/2012 30/06/2013 Cyclicals 26,09 25,32 25,57 21,77 Consum(cycl) 27,66 27,67 28,10 28,84 Cons.goods 7,40 7,76 7,08 7,95 Pharma 6,41 6,65 6,56 6,20 Financials 13,53 14,17 15,60 15,57 Technology 9,52 9,12 8,09 8,24 Telecomm. 4,61 3,97 4,13 4,92 Utilities 3,91 3,44 2,67 3,19 Real est. 0,87 1,90 2,20 3,32 Total 100,00 100,00 100,00 100,00
Currency breakdown (as a % of net assets)
31/12/2011 30/06/2012 31/12/2012 30/06/2013 EUR -0,91 -0,08 0,36 -0,03 JPY 100,90 100,07 99,63 100,03 USD 0,01 0,01 0,01 0,00 Total 100,00 100,00 100,00 100,00

2.4.2 CHANGES IN THE COMPOSITION OF THE ASSETS OF KBC EQUITY FUND JAPAN (IN THE
CURRENCY OF THE SUB-FUND)
1st half of year YearPurchases 5.335.964.193,59 5.335.964.193,59 Sales 1.657.491.634,36 1.657.491.634,36 Total 1 6.993.455.827,95 6.993.455.827,95 Subscriptions 4.912.136.948,21 4.912.136.948,21 Redemptions 1.403.599.412,00 1.403.599.412,00 Total 2 6.315.736.360,21 6.315.736.360,21 Monthly average of total assets
1.779.198.709,52 1.779.198.709,52
Turnover rate 38,09 % 38,09 %
1st half of year YearPurchases 5.335.964.193,59 5.335.964.193,59 Sales 1.657.491.634,36 1.657.491.634,36 Total 1 6.993.455.827,95 6.993.455.827,95 Subscriptions 4.912.136.948,21 4.912.136.948,21 Redemptions 1.403.599.412,00 1.403.599.412,00 Total 2 6.315.736.360,21 6.315.736.360,21 Monthly average of total assets
2.895.618.319,74 2.895.618.319,74
Corrected turnover rate 23,40 % 23,40 %
The table above shows the capital volume of portfolio transactions. This volume (adjusted to take account of total subscriptions and redemptions) is also compared to the average net assets at the beginning and end of the period. A figure close to 0% implies that the transactions relating to the securities or transactions relating to the assets (excluding deposits and cash) in a given period only involve subscriptions and redemptions. A negative percentage shows that subscriptions and redemptions entailed few, if any, transactions in the portfolio. Active asset management may result in high turnover rates (monthly percentage >50%). The detailed list of transactions is available for consultation free of charge at the registered office of the Bevek or fund at Havenlaan 2, 1080 Brussels.
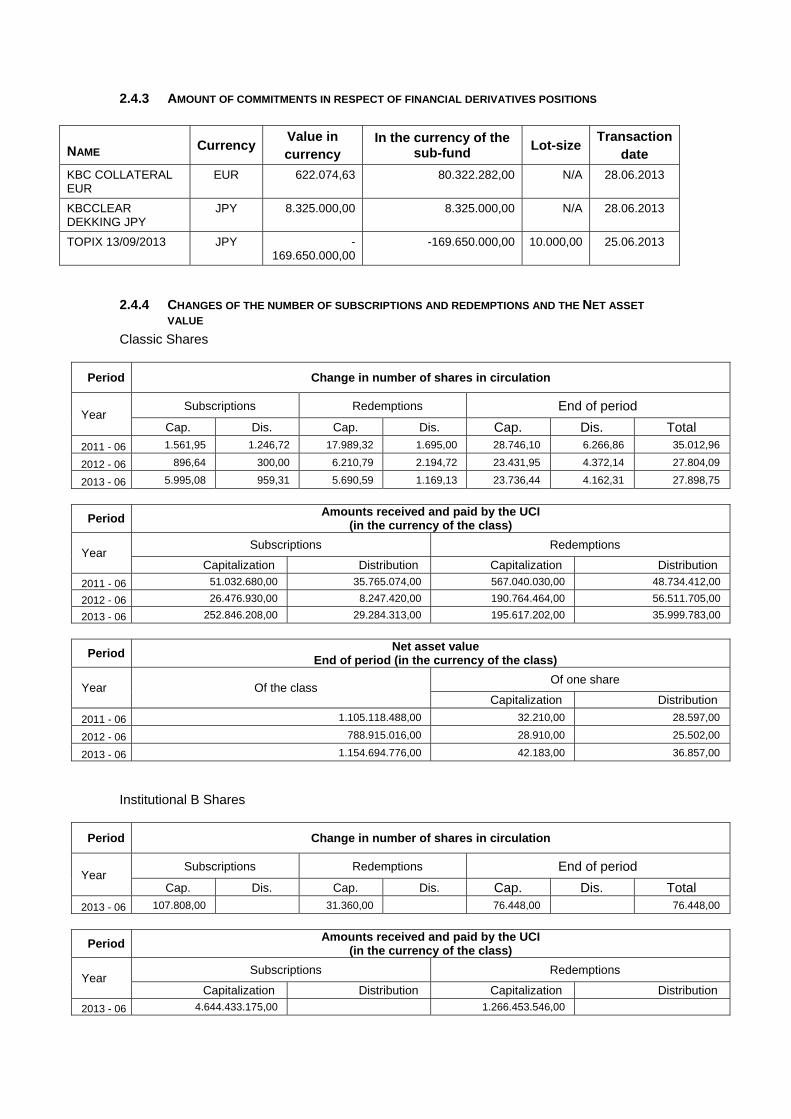
2.4.3 AMOUNT OF COMMITMENTS IN RESPECT OF FINANCIAL DERIVATIVES POSITIONS
NAME Currency Value in currency
In the currency of the sub-fund
Lot-size Transaction
date
KBC COLLATERAL EUR
EUR 622.074,63 80.322.282,00 N/A 28.06.2013
KBCCLEAR DEKKING JPY
JPY 8.325.000,00 8.325.000,00 N/A 28.06.2013
TOPIX 13/09/2013 JPY -169.650.000,00
-169.650.000,00 10.000,00 25.06.2013
2.4.4 CHANGES OF THE NUMBER OF SUBSCRIPTIONS AND REDEMPTIONS AND THE NET ASSET
VALUE
Classic Shares
Period Change in number of shares in circulation
Year Subscriptions Redemptions End of period
Cap. Dis. Cap. Dis. Cap. Dis. Total
2011 - 06 1.561,95 1.246,72 17.989,32 1.695,00 28.746,10 6.266,86 35.012,96
2012 - 06 896,64 300,00 6.210,79 2.194,72 23.431,95 4.372,14 27.804,09
2013 - 06 5.995,08 959,31 5.690,59 1.169,13 23.736,44 4.162,31 27.898,75
Period Amounts received and paid by the UCI
(in the currency of the class)
Year Subscriptions Redemptions
Capitalization Distribution Capitalization Distribution
2011 - 06 51.032.680,00 35.765.074,00 567.040.030,00 48.734.412,00
2012 - 06 26.476.930,00 8.247.420,00 190.764.464,00 56.511.705,00
2013 - 06 252.846.208,00 29.284.313,00 195.617.202,00 35.999.783,00
Period Net asset value
End of period (in the currency of the class)
Year Of the class Of one share
Capitalization Distribution
2011 - 06 1.105.118.488,00 32.210,00 28.597,00
2012 - 06 788.915.016,00 28.910,00 25.502,00
2013 - 06 1.154.694.776,00 42.183,00 36.857,00
Institutional B Shares
Period Change in number of shares in circulation
Year Subscriptions Redemptions End of period
Cap. Dis. Cap. Dis. Cap. Dis. Total 2013 - 06 107.808,00 31.360,00 76.448,00 76.448,00
Period Amounts received and paid by the UCI
(in the currency of the class)
Year Subscriptions Redemptions
Capitalization Distribution Capitalization Distribution
2013 - 06 4.644.433.175,00 1.266.453.546,00

Period Net asset value
End of period (in the currency of the class)
Year Of the class Of one share
Capitalization Distribution
2013 - 06 3.223.886.028,00 42.171,00

2.4.5 PERFORMANCE FIGURES
Classic Shares
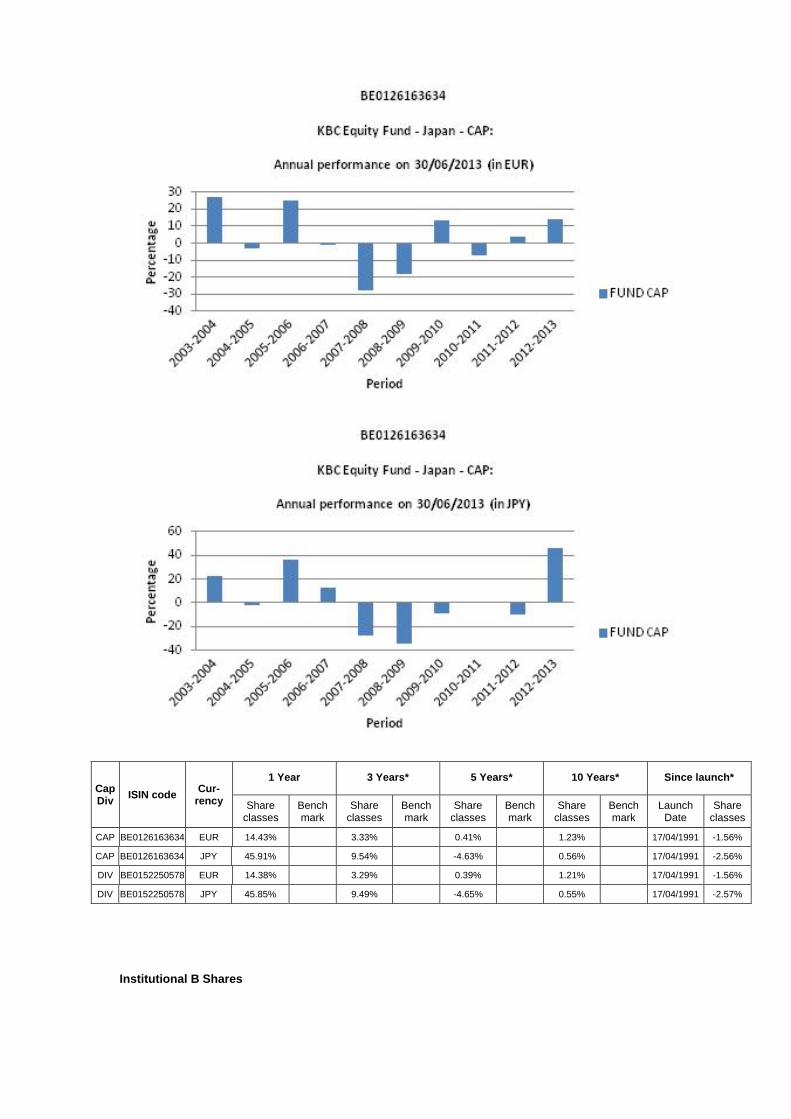
Cap Div
ISIN code Cur-
rency
1 Year 3 Years* 5 Years* 10 Years* Since launch*
Share classes
Bench mark
Share classes
Bench mark
Share classes
Bench mark
Share classes
Bench mark
Launch Date
Share classes
CAP BE0126163634 EUR 14.43% 3.33% 0.41% 1.23% 17/04/1991 -1.56%
CAP BE0126163634 JPY 45.91% 9.54% -4.63% 0.56% 17/04/1991 -2.56%
DIV BE0152250578 EUR 14.38% 3.29% 0.39% 1.21% 17/04/1991 -1.56%
DIV BE0152250578 JPY 45.85% 9.49% -4.65% 0.55% 17/04/1991 -2.57%
Institutional B Shares

Cap Div
ISIN code Cur-
rency
1 Year 3 Years* 5 Years* 10 Years* Since launch*
Share classes
Bench mark
Share classes
Bench mark
Share classes
Bench mark
Share classes
Bench mark
Launch Date
Share classes
CAP BE6228564975 EUR 24/05/2013
CAP BE6228564975 JPY 24/05/2013
Risk warning: Past performance is not a guide to future performance. * Return on annual basis.
Classic Shares The bar chart shows the performance for full financial years. The figures do not take account of any restructuring.

Calculated in JPY and in EUR. The return is calculated as the change in the net asset value between two dates expressed
as a percentage. In the case of units that pay dividends, the dividend is incorporated geometrically in the return.
Calculation method for date D, where NAV stands for net asset value: Capitalisation units (CAP) Return on date D over a period of X years:
[NIW(D) / NIW(Y)] ^ [1 / X] - 1 where Y = D-X
Return on date D since the start date S of the unit: [NIW(D) / NIW(S)] ^ [1 / F] - 1 where F = 1 if the unit has existed for less than one year on date D where F = (D-S) / 365.25 if the unit has existed for longer than one year on date D
Distribution units (DIV) Return on date D over a period of X years:
[ C * NIW(D) / NIW(Y)] ^ [1 / X] - 1 where Y = D-X
Return on date D since the start date S of the unit: [ C * NIW(D) / NIW(S)] ^ [1 / F] - 1 where F = 1 if the unit has existed for less than one year on date D where F = (D-S) / 365.25 if the unit has existed for longer than one year on date D where C is a factor that is determined for all N dividends between the calculation date D and the reference date.
For dividend i on date Di with value Wi: Ci = [Wi / NIW(Di)] + 1 i = 1 ... N from whichC = C0 * .... * CN.
If the interval between the two dates exceeds one year, the ordinary return calculation is converted into a return on an annual basis by taking the nth square root of 1 plus the total return of the unit.
The return figures shown above do not take account of the fees and charges associated with the issue and redemption of units.
These are the performance figures for capitalisation and distribution shares.
Institutional B Shares The bar chart shows the performance for full financial years. The figures do not take account of any restructuring. Calculated in JPY and in EUR. The return is calculated as the change in the net asset value between two dates expressed
as a percentage. Calculation method for date D, where NAV stands for net asset value:
Capitalisation units (CAP) Return on date D over a period of X years:
[NIW(D) / NIW(Y)] ^ [1 / X] - 1 where Y = D-X
Return on date D since the start date S of the unit: [NIW(D) / NIW(S)] ^ [1 / F] - 1 where F = 1 if the unit has existed for less than one year on date D where F = (D-S) / 365.25 if the unit has existed for longer than one year on date D
If the interval between the two dates exceeds one year, the ordinary return calculation is converted into a return on an annual basis by taking the nth square root of 1 plus the total return of the unit.
The return figures shown above do not take account of the fees and charges associated with the issue and redemption of units.
These are the performance figures for capitalization shares.
2.4.6 COSTS Ongoing Charges: * Classic Shares Distribution: 1.8% Classic Shares Capitalization: 1.752% Institutional B Shares Capitalization: 0.2% * The following costs have not been included in the ongoing charges: - Interest payments on loans taken out - Payments in respect of financial derivatives - Fees and charges paid directly by the investor - Any soft commissions
SOFT COMMISSIONS The management company or the appointed manager, as the case may be, is the recipient of soft commissions. The recipient has laid down an internal policy as regards accepting soft commissions and avoiding possible conflicts of interest in this respect, and has put appropriate internal controls in place to ensure this policy is observed. For more information, please see the ‘General’ section of the annual report.
Broker
Commission gross
in EUR
paid during the period:
1‐01‐13
‐
30‐06‐13
CSA Credits
in EUR
accrued during the period:
1‐01‐13
‐
30‐06‐13 Percentage
CSFBSAS 1,515 823 54.32%
INSTINET 136 41 30.00%
MERRILL 5,268 2,634 50.00%
UBSWDR 5,504 2,753 50.01%
FEE-SHARING AGREEMENTS AND REBATES: The management company may share its fee with the distributor, and institutional and/or professional parties. In principle, the percentage share amounts to between 35% and 60% if the distributor is an entity of KBC Group NV or to between 35% and 70% if the distributor is not an entity of KBC Group NV. However, in a small number of cases, the distributor’s fee is less than 35%. Investors may, on request, obtain more information on these cases. If the management company invests the assets of the undertaking for collective investment in units of undertakings for collective investment that are not managed by an entity of KBC Group NV, and receives a fee for doing so, it will pay this fee to the undertaking for collective investment. Fee-sharing does not affect the amount of the management fee paid by the sub-fund to the management company. This management fee is subject to the limitations laid down in the articles of association. The limitations may only be amended after approval by the general meeting of shareholders. The management company has concluded a distribution agreement with the distributor in order to facilitate the wider distribution of the sub-fund's units by using multiple distribution channels. It is in the interests of the holders of units, the sub-fund and of the distributor for the largest possible number of units to be sold and for the assets of the sub-fund to be maximised in this way. In this respect, there is therefore no question of any conflict of interest.
2.4.7 NOTES TO THE FINANCIAL STATEMENTS AND OTHER DATA Fee for managing the investment portfolio: 1.5% per annum calculated on the basis of the average total net assets of the sub-fund, no management fee is charged on assets assets invested in investment undertakings managed by a financial institution of the KBC group. KBC Fund Management Limited receives a fee from the management company of max. 1.5% calculated on that part of the portfolio that it manages, without the total management fee received by the management company being exceeded. The administration agent’s fee is payable at the end of each month and is calculated on the basis of the average total net assets of the sub-fund.
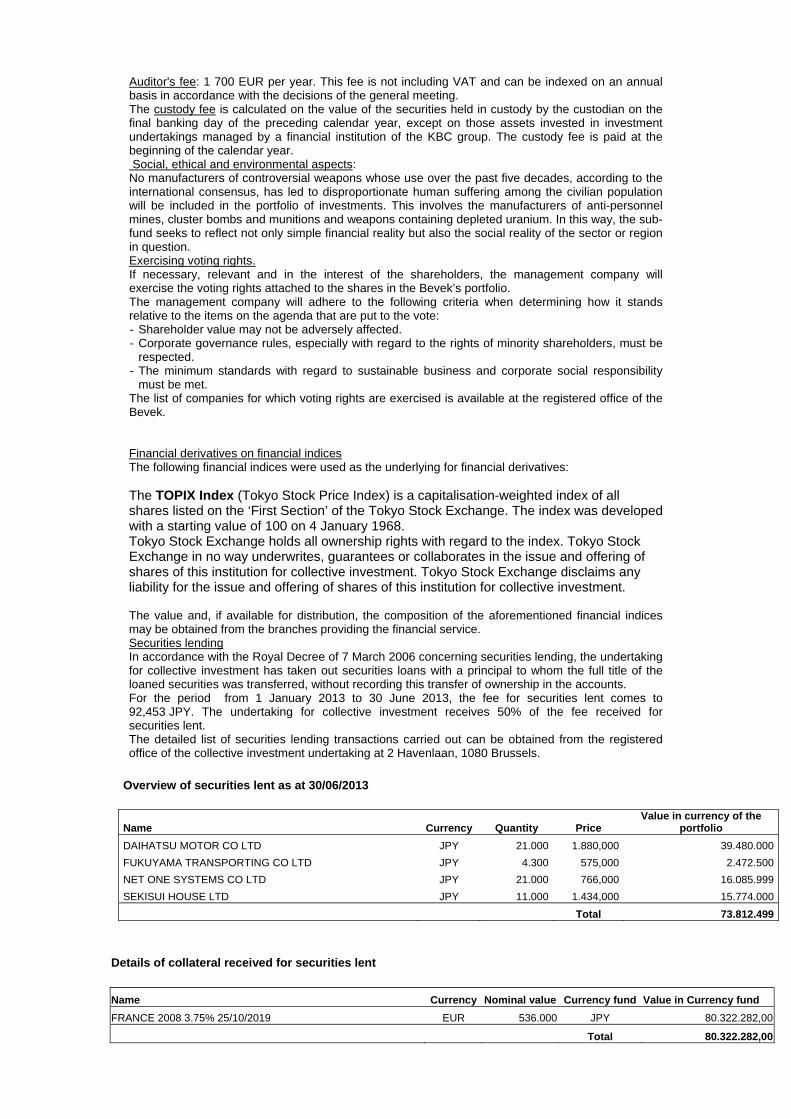
Auditor's fee: 1 700 EUR per year. This fee is not including VAT and can be indexed on an annual basis in accordance with the decisions of the general meeting. The custody fee is calculated on the value of the securities held in custody by the custodian on the final banking day of the preceding calendar year, except on those assets invested in investment undertakings managed by a financial institution of the KBC group. The custody fee is paid at the beginning of the calendar year. Social, ethical and environmental aspects: No manufacturers of controversial weapons whose use over the past five decades, according to the international consensus, has led to disproportionate human suffering among the civilian population will be included in the portfolio of investments. This involves the manufacturers of anti-personnel mines, cluster bombs and munitions and weapons containing depleted uranium. In this way, the sub-fund seeks to reflect not only simple financial reality but also the social reality of the sector or region in question. Exercising voting rights. If necessary, relevant and in the interest of the shareholders, the management company will exercise the voting rights attached to the shares in the Bevek’s portfolio. The management company will adhere to the following criteria when determining how it stands relative to the items on the agenda that are put to the vote: - Shareholder value may not be adversely affected. - Corporate governance rules, especially with regard to the rights of minority shareholders, must be
respected. - The minimum standards with regard to sustainable business and corporate social responsibility
must be met. The list of companies for which voting rights are exercised is available at the registered office of the Bevek. Financial derivatives on financial indices The following financial indices were used as the underlying for financial derivatives: The TOPIX Index (Tokyo Stock Price Index) is a capitalisation-weighted index of all shares listed on the ‘First Section’ of the Tokyo Stock Exchange. The index was developed with a starting value of 100 on 4 January 1968. Tokyo Stock Exchange holds all ownership rights with regard to the index. Tokyo Stock Exchange in no way underwrites, guarantees or collaborates in the issue and offering of shares of this institution for collective investment. Tokyo Stock Exchange disclaims any liability for the issue and offering of shares of this institution for collective investment. The value and, if available for distribution, the composition of the aforementioned financial indices may be obtained from the branches providing the financial service. Securities lending In accordance with the Royal Decree of 7 March 2006 concerning securities lending, the undertaking for collective investment has taken out securities loans with a principal to whom the full title of the loaned securities was transferred, without recording this transfer of ownership in the accounts. For the period from 1 January 2013 to 30 June 2013, the fee for securities lent comes to 92,453 JPY. The undertaking for collective investment receives 50% of the fee received for securities lent. The detailed list of securities lending transactions carried out can be obtained from the registered office of the collective investment undertaking at 2 Havenlaan, 1080 Brussels.
Overview of securities lent as at 30/06/2013
Name Currency Quantity Price Value in currency of the
portfolio
DAIHATSU MOTOR CO LTD JPY 21.000 1.880,000 39.480.000
FUKUYAMA TRANSPORTING CO LTD JPY 4.300 575,000 2.472.500
NET ONE SYSTEMS CO LTD JPY 21.000 766,000 16.085.999
SEKISUI HOUSE LTD JPY 11.000 1.434,000 15.774.000
Total 73.812.499
Details of collateral received for securities lent
Name Currency Nominal value Currency fund Value in Currency fund
FRANCE 2008 3.75% 25/10/2019 EUR 536.000 JPY 80.322.282,00
Total 80.322.282,00

For the valuation of the collateral received, indicative prices have been used in this detail list by the Collateral Management Division of KBC Bank.

Semi-Annual report as at 30th June 2013
TABLE OF CONTENTS
2. Information on KBC Equity Fund Growth by Innovation
2.1. Management report 2.1.1. Launch date and subscription price 2.1.2. Stock exchange listing 2.1.3. Aim and distinctive features of the investment policy 2.1.4. Financial portfolio management 2.1.5. Distributors 2.1.6. Index and benchmark 2.1.7. Policy conducted during the financial year 2.1.8. Future policy 2.1.9. Synthetic risk and reward indicator (SRRI)
2.2. Balance sheet
2.3. Profit and loss account
2.4. Composition of the assets and key figures
2.4.1. Composition of the assets 2.4.2. Change in the composition of the assets 2.4.3. Value of commitments in respect of financial derivatives positions 2.4.4. Evolution of the number of subscriptions, repayments and the net asset value 2.4.5. Return figures 2.4.6. Expenses 2.4.7. Notes to the financial statements and other data


2 INFORMATION ON KBC EQUITY FUND GROWTH BY INNOVATION
2.1 MANAGEMENT REPORT
2.1.1 LAUNCH DATE AND SUBSCRIPTION PRICE Classic Shares : Launch date: 28 May 1998 Initial subscription price: 20000 BEF Currency: EUR Institutional B Shares : Launch date: 25 November 2011 Initial subscription price: 131.05 EUR Currency: EUR
2.1.2 STOCK EXCHANGE LISTING Not applicable.
2.1.3 GOAL AND KEY PRINCIPLES OF THE INVESTMENT POLICY
SUB-FUND’S OBJECT: The main objective of this sub-fund is to generate the highest possible return for its shareholders by investing directly or indirectly in transferable securities. This is reflected in its pursuit of capital gains and income. To this end, the assets are invested, either directly or indirectly via correlated financial instruments, primarily in shares.
SUB-FUND’S INVESTMENT POLICY:
PERMITTED ASSET CLASSES: The sub-fund may invest in securities, money market instruments, units in undertakings for collective investment, deposits, financial derivatives, liquid assets and all other instruments insofar as permitted by the applicable laws and regulations and consistent with the sub-fund’s object The sub-fund shall invest no more than 10% of its assets in units of other undertakings for collective investment.
RESTRICTIONS OF THE INVESTMENT POLICY: The investment policy will be implemented within the limits set by law and regulations. The sub-fund may borrow up to 10% of its net assets, insofar as these are short-term borrowings aimed at solving temporary liquidity problems.
PERMITTED DERIVATIVES TRANSACTIONS: Derivates may be used either for hedging purposes or to achieve investment objectives. Changes will be made to the investments at regular intervals to comply with the sub-fund's investment strategy. In addition, listed and unlisted derivates may be used to achieve the objectives: these may be forward contracts, options or swaps on securities, indices, currencies or interest rates or other transactions involving derivatives. Unlisted derivatives transactions will only be concluded with prime financial institutions specialised in such transactions. Such derivatives may also be used to hedge the assets against exchange-rate fluctuations. Subject to the applicable laws and regulations and the articles of association, the sub-fund always seeks to conclude the most effective transactions. All costs associated with the transactions will be charged to the sub-fund and all income generated will be paid to the sub-fund. If the transactions result in a risk in respect of the counterparty, this risk can be hedged by using a margin management system that ensures that the sub-fund is the beneficiary of security (collateral) in the form of cash or investment grade bonds. When calculating the value of the bonds, a margin will be applied that varies depending on the residual term to maturity and the currency in which the bond in question is denominated. The relationship with the counterparty or counterparties is governed by standard international agreements.
STRATEGY SELECTED At least 75% of the assets are invested in a global selection of shares issued by high-potential growth companies. In particular, this involves companies where the focus on research and development generates extra added value. To overcome any liquidity problems, the sub-fund may, be temporary and ancillary invest in other securities.
RISK CONCENTRATION Growth shares.
LENDING FINANCIAL INSTRUMENTS: The sub-fund may lend financial instruments within the limits set by law and regulations. This lending does not affect the sub-fund’s risk profile since: - it takes place within the framework of a securities lending system managed by a principal. In
addition, the sub-fund has a relationship only with the principal of the securities lending system which acts as counterparty and to which title of the loaned securities is transferred. The choice of principal is subject to strict selection criteria. The return of securities similar to the securities that have been lent is guaranteed by the principal.
- through a margin management system, the sub-fund is always guaranteed financial security, the actual value of which always exceeds the actual value of the securities that have been lent, in case the principal does not return similar securities.
The return of securities similar to the securities that have been lent can be requested at any time, which means that the lending of securities does not affect the management of the sub-fund's assets. By lending securities, the sub-fund can generate an additional return. The principal pays a fee to the management company. After deducting the fee for the margin management and clearing services of KBC Bank, most of this fee is paid to the sub-fund. The relationship with the counterparty or counterparties is governed by standard international agreements. More information is provided on the terms and conditions governing securities lending in the annual or half-yearly report for the sub-fund.
VOLATILITY OF THE NET ASSET VALUE: The volatility of the net asset value may be high due to the composition of the portfolio.
GENERAL STRATEGY FOR HEDGING THE EXCHANGE RATE RISK: In order to protect its assets against exchange rate fluctuations and within the limitations laid down in the articles of association, the sub-fund may perform transactions relating to the sale of forward currency contracts, as well as the sale of call options and the purchase of put options on currencies. The transactions in question may relate solely to contracts traded on a regulated market that operates regularly, is recognised and is open to the public or that are traded with a recognised, prime financial institution specialising in such transactions and dealing in the over-the-counter (OTC) market in options. With the same objective, the sub-fund may also sell currencies forward or exchange them in private transactions with prime financial institutions specialising in such transactions. The hedging objective of the aforementioned transactions suggests that there is a direct link between these transactions and the assets to be hedged, which implies that the transactions carried out in a particular currency may in principle not exceed, in terms of volume, either the valuation value of all the assets in the same currency or the holding period of those assets.
SOCIAL, ETHICAL AND ENVIRONMENTAL ASPECTS:
No manufacturers of controversial weapons whose use over the past five decades, according to the international consensus, has led to disproportionate human suffering among the civilian population will be included in the portfolio of investments. This involves the manufacturers of anti-personnel mines, cluster bombs and munitions and weapons containing depleted uranium. In this way, the sub-fund seeks to reflect not only simple financial reality but also the social reality of the sector or region in question.
THE EUROPEAN SAVINGS DIRECTIVE AND TAX ON DEBT CLAIM RETURNS OBTAINED THROUGH THE
REDEMPTION OF OWN UNITS OR IN THE EVENT OF FULL OR PARTIAL DISTRIBUTION OF EQUITY
CAPITAL. The following information is of a general character and is not intended to cover all aspects of an investment in a UCITS. In certain cases entirely different rules might even apply. Moreover, both tax law and the interpretation of it can change. Investors who wish to have more information about the tax implications – in both Belgium and abroad – of acquiring, holding and transferring units should seek the advice of their usual financial and tax advisers. This UCITS shall invest a maximum of 15% of its assets directly or indirectly in debt instruments as intended by the European Savings Directive. A. European Savings Directive (Directive 2003/48/EC) The European Savings Directive has been implemented in Belgium. Since this UCITS invests a maximum of 15% of its assets directly or indirectly in debt claims as intended by the European Savings Directive, the income of this UCITS does not fall within the scope of this directive. B. Tax on debt claim returns obtained through the redemption of own units or in the event of full or partial distribution of equity capital (Article 19bis Income Tax Code 1992). The income from this UCITS is not subject to the tax on debt instrument returns as intended by Article 19bis, Income Tax Code 1992.
2.1.4 FINANCIAL PORTFOLIO MANAGEMENT The management company has delegated the intellectual management, to KBC Fund Management Limited, Joshua Dawson House, Dawson Street , Dublin 2, IRELAND..
2.1.5 DISTRIBUTORS KBC Asset Management S.A., 5, Place de la Gare, L-1616 Luxembourg.
2.1.6 INDEX AND BENCHMARK See ‘Sub-fund’s investment policy’.
2.1.7 POLICY PERSUED DURING THE FINANCIAL YEAR The fund invests in a global selection of innovative companies, that is, companies whose investment in Research and Development is expected to drive future growth and returns. Doubts about the sustainability of the economic recovery continued to shape investor sentiment. The debt crisis in Europe continued unabated, although the European Central Bank (ECB) managed to convince the market that it had the crisis under control. Major steps were taken in the United States to reform the federal budget, seemingly without adversely affecting economic growth too much. Fortunately, strong economic growth in Asia created export opportunities for American and European businesses. In the US, the rate of employment growth remained on the thin side for some considerable time. The situation began to improve in the recent reporting period, with the result that the jobless rate has declined more markedly. Pay has remained virtually flat, barely rising ahead of inflation. Taken together, these two factors ensured that household purchasing power only grew to a very limited extent and so contributed very modestly to economic growth. The weak growth in the Western economies was not without its impact on the export performance in emerging countries. In recent years, however, domestic demand (due to a rapidly growing middle class with a high consumption rate) and intra-regional trade within Asia have been playing an increasingly important role. The region is better armed to deal with financial crises than it was in the past. Public finances are healthy; the balance of payments is generally neutral. Asia’s economic development no longer depends on fickle foreign capital. Thanks to the contribution by the emerging markets the growth of world GDP held up in 2012–13 (estimated at 2–2.5%). Public finances have gone off the rails not only in the EMU, but also in the UK and the US. The budget debate in the US had reached a political impasse. Decisions were postponed, and so 31 December 2012 became an important deadline. A whole series of tax cuts and other temporary support measures from the past would then lapse. In total these involved a sum of 550 billion USD. Extending all the measures again was not feasible in budgetary terms, while allowing them all to expire was economic suicide. The fiscal cliff was averted on 1 January 2013 by means of an agreement in Congress: half the stimulus measures were made permanent or were extended for a further twelve months, while the other half lapsed. This has not been the only measure involving tightening of budgetary policy in 2013: on 1 March, automatic spending cuts came into effect under which Federal expenditure will be pruned by 85 billion USD each year for a period of ten years. Since no budget has been approved in the current financial year, the federal administrations have only been assigned budgets equal to the expenditure in the previous financial year. Mario Draghi took the helm at the ECB on 1 November 2011 and has favoured monetary easing by lowering the ECB’s key rate is 0.50%. This interest rate policy failed to place the economic recovery on a sustainable basis. The Fed therefore explored the scope for other measures, intervening directly on the bond markets and buying up large amounts of debt paper in an attempt to keep the long-term rate low, as well. The ECB dragged its feet, and only followed the Fed’s example much later. The intensification of the euro crisis in fact left the ECB no other choice. In a year marked by problems in keeping the EMU from imploding, the EUR/USD exchange rate was no more volatile than at other times. The euro was trading at USD 1.30 at the end of June 2013, which is roughly the same rate as 2012 year-end. The dollar’s image as the global reserve currency suffered as a result of QE2, QE3 and TWIST. In terms of markets, Japan was ultimately an outperformer, despite the steep depreciation of the yen. The winds of change have been blowing through Tokyo since the advent of the Abe government in December. The prospect of fresh tax stimuli, a cheaper yen and large-scale money creation have contributed to an atmosphere of optimism about the economy, something very rare in this country, which has been struggling with defeatism for many years. The emerging regions performed downright badly. The Asian emerging markets were unable to capitalise on their role as the growth engine of the world economy. Confidence indicators began to decline in mid-2012, breaking through barriers that pointed to a serious economic slowdown. That failed to materialise but it was sufficient to perpetuate the doubts concerning the growth narrative in the region. This was further exacerbated by concerns about Chinese local authority debt levels, an overheating Chinese housing market and fear of a credit crisis – especially when the Chinese interbank rate shot up to 30% within the space of a few days in June. Stock-market valuations remain favourable, especially given the high growth forecasts, sound macroeconomic balance and a banking sector that was barely – if at all – affected by the credit crisis. Latin America was hit by an economic slowdown. The link to the commodity markets is always at the fore in this region. Russia was likewise not immune to the weakness of European economic growth. Oil prices below 100 USD per barrel mean trouble for Russian state finances. The best performing sectors included Financials, Pharmaceuticals and Consumer Discretionary. Materials, Technology and Energy lagged behind. The outperformance of Banks may be attributed to the quantitative easing programmes undertaken by the central banks. By this we mean the Fed’s QE3 programme, and especially the announcement by the ECB of its OMT programme, which took the heat out of the euro crisis. Pharmaceuticals had been shunned for a long time due to a lack of product innovation, patent expiry and the reforms to healthcare insurance in the US. In recent months,
however, investors began to focus more on the sector’s response to these challenges: restructuring operations and the sell-off of non-strategic divisions. The car industry has risen from the ashes, in the US and the European luxury segment at least. Demand from the emerging markets is also strong, despite the slowdown in Chinese growth, where German luxury marques generate 50% of their profits. In spite of the slow growth, advertising budgets have also held up surprisingly well. Mining companies lost ground on excessive expectations concerning commodity prices. A failed stock market flotation by Facebook and the giant leaps made by Apple meant that price trends in the Technology sector differed from what might have been expected on the basis of the fundamentals. The oil companies suffered from the vagaries of the oil market, the political instability in the Middle East and frequent accidents. In terms of the performance of KBC Equity Fund Growth By Innovation, first quarter performance was positive on an absolute basis. On an allocation level, the best performing industry group was Pharmaceuticals Biotechnology & Life Sciences (19% of the fund), largely due to the fund’s overweight position in names such as Biogen Idec and Alkermes. Biogen Idec rose from USD146.05to USD192.618, boosted by the news that it had won FDA approval for its first drug for multiple sclerosis. This was followed by the materials sector (2.5% of the fund), with the overweight position in Monsanto and Du Pont de Nemours contributing positively to performance. Both seed companies, Monsanto whose share price increased from USD93.08 to USD105.63 and Du Pont de Nemours whose share price increased from USD44.71 to USD49.16 were helped by the news at the end of the first quarter that they had agreed to drop their respective antitrust and patent lawsuits and enter into licensing agreements. The energy group (8% of the fund) and the automobiles and components group (10% of the fund) were among the main underperformers for the fund during the quarter. Within the energy sector, underperformance was driven mainly by the fund’s overweight position in OAO Gazprom ADR, which declined from USD9.425 to USD8.55 on concerns of a lower than expected dividend as demand for its fuel weakened. Within automobiles and components group, one of the main detractors was the fund’s overweight position in Volkswagen, which underperformed the market with its share price declining from USD172.15 to EUR155.75. On a regional basis, the Pacific region (12% of the fund) was the main detractor from performance, while the European region (26% of the fund) contributed positively over the period. The performance of KBC Equity Fund Growth By Innovation was again positive during the second quarter on an absolute basis. The materials sector (2.5% of the fund) was again among the main outperformers for the fund during the quarter. Within the sector, outperformance was again driven by the fund’s overweight position in Du Pont de Nemours, which increased from USD49.16 to USD52.50 over the quarter after the company reported first quarter earnings figures that exceeded expectations as profits from crop seeds and pesticides hit a record. The automobiles and components group (10% of the fund) reversed some of the losses from the first quarter and was also among the top performing industry groups. Disappointing performance came from the technology hardware and equipment group (14% of the fund) during the quarter. The overweight position in F5 network impacted performance negatively, after the share price fell from USD89.08 to USD68.80. During the quarter, the data management equipment maker reported preliminary quarterly profit and revenue figures that missed forecasts due to a slowdown in North American sales. This led to a significant slump in share price on that day. On a regional basis, the Pacific region (12% of the fund) was the main contributor to performance, however all other regions also contributed positively to performance over the quarter. Overall KBC Equity Fund Growth By Innovation performed positively on an absolute basis over the first half of 2013.
2.1.8 FUTURE POLICY
In the US they are in the twilight zone between recession and expansion. We are expecting US growth to remain positive but modest (around 2% y-o-y in the coming quarters) as pay increases are barely keeping pace with inflation and budgetary policy has now finally struck down the path of austerity. The fragile recovery of the housing market and corporate investment could be sustained. How strong the growth proves to be will depend largely on the dynamic of the labour market. In recent months employment in the US has grown by around 200,000 new jobs each month. This will need to continue in order to achieve +2% growth in 2013 and in 2014. Confidence indicators in Europe are well below freezing point. The budgetary plans, tighter lending policy of the banks and major uncertainty among consumers and producers will continue to depress growth. 2013 will see a contraction of GDP in Europe. Recovery is not expected until the first half of 2014. Deflation or depression scenarios, which are currently dominating bond market sentiment, are not however justified.
The foundations for more sustainable growth in 2014 and beyond have been laid in recent years. US households have trimmed back their debt level significantly, the savings rate has already increased considerably and loan servicing (installments and interest payments combined) now accounts for only 8% of household budgets (the lowest level in 15 years). Households are gradually moving towards a position where they can spend more of their money on consumption. Economic growth in Europe will remain below par. Sky-high unemployment and the euro crisis are undermining consumer confidence and the banks’ willingness to provide ready access to credit. The ECB’s monetary policy is also much less aggressive than the Fed’s. In contrast, real wage rises (however limited) will be somewhat higher in Europe than in the US.
Today’s world is one of two-speed economies. The mature industrialised economies (US, Europe, Japan) still find themselves in a low-growth environment, with no underlying inflationary pressure, persistently low interest rates and runaway public finances. The picture in the emerging markets is altogether different. The strong economic growth has already created inflationary pressure in Asia. Appropriate monetary policy is therefore required. Monetary policy in China and elsewhere in Asia is highly geared to preventing asset-price inflation. Countries are not only deploying the interest-rate weapon to this end, they are also actively intervening in the credit and housing markets. Thanks to the continuing strength of the emerging markets, the global economy could post growth of 2.5–3% in 2013 and 2014. This is one of the reasons why corporate earnings could continue to grow in the coming quarters at a rate of 5–10%. The current valuation of equities continues to discount a number of very pessimistic scenarios. Based on forecast earnings for the coming 12 months, the price-earnings ratio is 14.5 for the US S&P 500 index and 11.4 for the MSCI Europe. That is 25–30% lower than the historical average. Equities are certainly dirt-cheap compared with bonds.
In line with the theme, KBC Equity Fund Growth by Innovation will continue to invest in a global selection of innovative companies, that is, companies whose investment in Research and Development is expected to drive future growth and returns.
2.1.9 SYNTHETIC RISK AND REWARD INDICATOR Classic Shares: 6 on a scale of 1 (lowest risk) to 7 (highest risk). Institutional B Shares: 6 on a scale of 1 (lowest risk) to 7 (highest risk). The value of a share can decrease or increase and the investor may not get back the amount invested. In accordance with Commission Regulation (EU) No. 583/2010, a synthetic risk and reward indicator has been calculated. This indicator provides a quantitative measure of the sub-fund's potential return and the risk involved, calculated in the currency in which the sub-fund is denominated. It is given as a figure between 1 and 7. The higher the figure, the greater the potential return, but also the more difficult it is to predict this return. Losses are possible too. The lowest figure does not mean that the investment is entirely free of risk. However, it does indicate that, compared with the higher figures, this product will generally provide a lower, but more predictable return. The synthetic risk and reward indicator is assessed regularly and can therefore go up or down based on data from the past. Data from the past is not always a reliable indicator of future risk and return.

2.2 BALANCE SHEET
Balance sheet layout 30/06/2013 (in the currency of the sub-fundt)
30/06/2012 (in the currency of the sub-fund )
TOTAL NET ASSETS 8.474.476,95 50.576.302,31
II. Securities, money market instruments, UCIs and derivatives
A. Bonds and other debt instruments a) Bonds 155.558,70 133.153,90 a} Collateral received in the form of bonds 251.539,62 355.556,31 C. Shares and similar instruments a) Shares 8.300.403,49 50.179.750,49 Of which securities lent 229.311,20 326.985,24 F. Derivative financial instruments j) Foreign exchange Futures and forward contracts (+/-) -1.272,21 m) Financial indices Futures and forward contracts (+/-) 3.664,52
IV. Receivables and payables within one year A. Receivables a) Accounts receivable 9.051,60 14.142,12 b) Tax assets 813,36 2.496,24 B. Payables a) Accounts payable (-) -3.515,61 -76.268,02 c) Borrowings (-) -16.343,51 d) Collateral (-) -251.539,62 -355.556,31
V. Deposits and cash at bank and in hand A. Demand balances at banks 24.967,91 284.554,04
VI. Accruals and deferrals A. Expense to be carried forward 28.434,27 12.368,87 B. Accrued income 16.946,85 51.183,52 C. Accrued expense (-) -41.840,11 -27.471,16
TOTAL SHAREHOLDERS' EQUITY 8.474.476,95 50.576.302,31
A. Capital 3.619.831,04 48.413.921,39
B. Income equalization -13.825,14 -32.134,50
D. Result for the period 4.868.471,05 2.194.515,42
Off-balance-sheet headings
I Collateral (+/-)
I.A Collateral (+/-)
I.A.A Securities/market instruments 251.539,62 355.556,31
III Notional amounts of futures and forward contracts
III.A Purchased futures and forward contracts 227.931,77

IX Financial instruments lent 229.311,20 326.985,24

2.3 PROFIT AND LOSS ACCOUNT
Income Statement 30/06/2013 (in the currency of the sub-fund)
30/06/2012 (in the currency of the sub-fund)
I. Net gains(losses) on investments A. Bonds and other debt instruments a) Bonds 30.827,50 -14.504,60 C. Shares and similar instruments a) Shares 5.028.778,04 971.242,45 D. Other securities 410,22 F. Derivative financial instruments l) Financial indices Futures and forward contracts 11.443,82 9.101,17 H. Foreign exchange positions and transactions a) Derivative financial instruments Futures and forward contracts 1.260,48 -1.749,42 b) Other foreign exchange positions and
transactions -269.891,75 969.835,62
II. Investment income and expenses A. Dividends 325.859,49 601.747,97 B. Interests a) Securities and money market instruments 27.725,49 22.646,13 b) Cash at bank and in hand and deposits 253,52 597,88 C. Interest on borrowings (-) -1.245,68 -932,64
III. Other income A. Income received to cover the acquisition and
realizaion of assets, to discourage withdrawals and for delivery charges
78.565,57 106.544,62
IV. Operating expenses A. Investment transaction and delivery costs (-) -66.633,19 -69.372,66 B. Financial expenses (-) -1.919,30 -362,58 C. Custodian's fee (-) -22.874,04 -11.905,83 D. Manager's fee (-) a) Financial management Classic Shares -43.470,87 -43.777,53 Institutional B Shares -202.026,20 -291.027,96 b) Administration and accounting management -16.366,43 -24.559,55 E. Administrative expenses (-) -14,51 -9,05 F. Formation and organisation expenses (-) -1.166,92 -2.584,04 G. Remuneration, social security charges and
pension -4,24
H. Services and sundry goods (-) -5.938,76 -5.299,79 J. Taxes Classic Shares -1.961,46 -2.324,00 Institutional B Shares 67,00 -2.240,33 K. Other expenses (-) -2.800,75 -16.956,42
Income and expenditure for the period Subtotal II + III + IV 66.052,96 260.179,98
V. Profit (loss) on ordinary activities before tax 4.868.471,05 2.194.515,42
VII. Result for the period 4.868.471,05 2.194.515,42

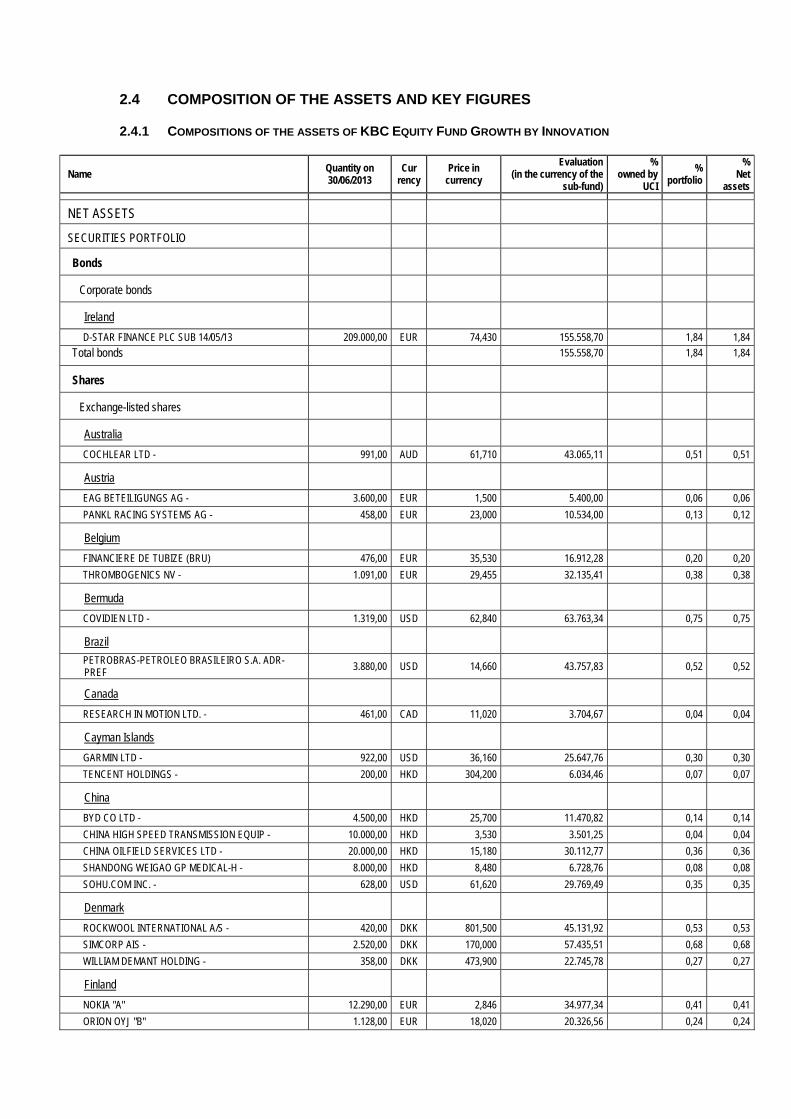
2.4 COMPOSITION OF THE ASSETS AND KEY FIGURES
2.4.1 COMPOSITIONS OF THE ASSETS OF KBC EQUITY FUND GROWTH BY INNOVATION
Name Quantity on 30/06/2013
Cur rency
Price in currency
Evaluation (in the currency of the
sub-fund)
% owned by
UCI
% portfolio
% Net
assets
NET ASSETS
SECURITIES PORTFOLIO
Bonds
Corporate bonds
Ireland
D-STAR FINANCE PLC SUB 14/05/13 209.000,00 EUR 74,430 155.558,70 1,84 1,84
Total bonds 155.558,70 1,84 1,84
Shares
Exchange-listed shares
Australia
COCHLEAR LTD - 991,00 AUD 61,710 43.065,11 0,51 0,51
Austria
EAG BETEILIGUNGS AG - 3.600,00 EUR 1,500 5.400,00 0,06 0,06
PANKL RACING SYSTEMS AG - 458,00 EUR 23,000 10.534,00 0,13 0,12
Belgium
FINANCIERE DE TUBIZE (BRU) 476,00 EUR 35,530 16.912,28 0,20 0,20
THROMBOGENICS NV - 1.091,00 EUR 29,455 32.135,41 0,38 0,38
Bermuda
COVIDIEN LTD - 1.319,00 USD 62,840 63.763,34 0,75 0,75
Brazil
PETROBRAS-PETROLEO BRASILEIRO S.A. ADR-PREF 3.880,00 USD 14,660 43.757,83 0,52 0,52
Canada
RESEARCH IN MOTION LTD. - 461,00 CAD 11,020 3.704,67 0,04 0,04
Cayman Islands
GARMIN LTD - 922,00 USD 36,160 25.647,76 0,30 0,30
TENCENT HOLDINGS - 200,00 HKD 304,200 6.034,46 0,07 0,07
China
BYD CO LTD - 4.500,00 HKD 25,700 11.470,82 0,14 0,14
CHINA HIGH SPEED TRANSMISSION EQUIP - 10.000,00 HKD 3,530 3.501,25 0,04 0,04
CHINA OILFIELD SERVICES LTD - 20.000,00 HKD 15,180 30.112,77 0,36 0,36
SHANDONG WEIGAO GP MEDICAL-H - 8.000,00 HKD 8,480 6.728,76 0,08 0,08
SOHU.COM INC. - 628,00 USD 61,620 29.769,49 0,35 0,35
Denmark
ROCKWOOL INTERNATIONAL A/S - 420,00 DKK 801,500 45.131,92 0,53 0,53
SIMCORP AIS - 2.520,00 DKK 170,000 57.435,51 0,68 0,68
WILLIAM DEMANT HOLDING - 358,00 DKK 473,900 22.745,78 0,27 0,27
Finland
NOKIA "A" 12.290,00 EUR 2,846 34.977,34 0,41 0,41
ORION OYJ "B" 1.128,00 EUR 18,020 20.326,56 0,24 0,24
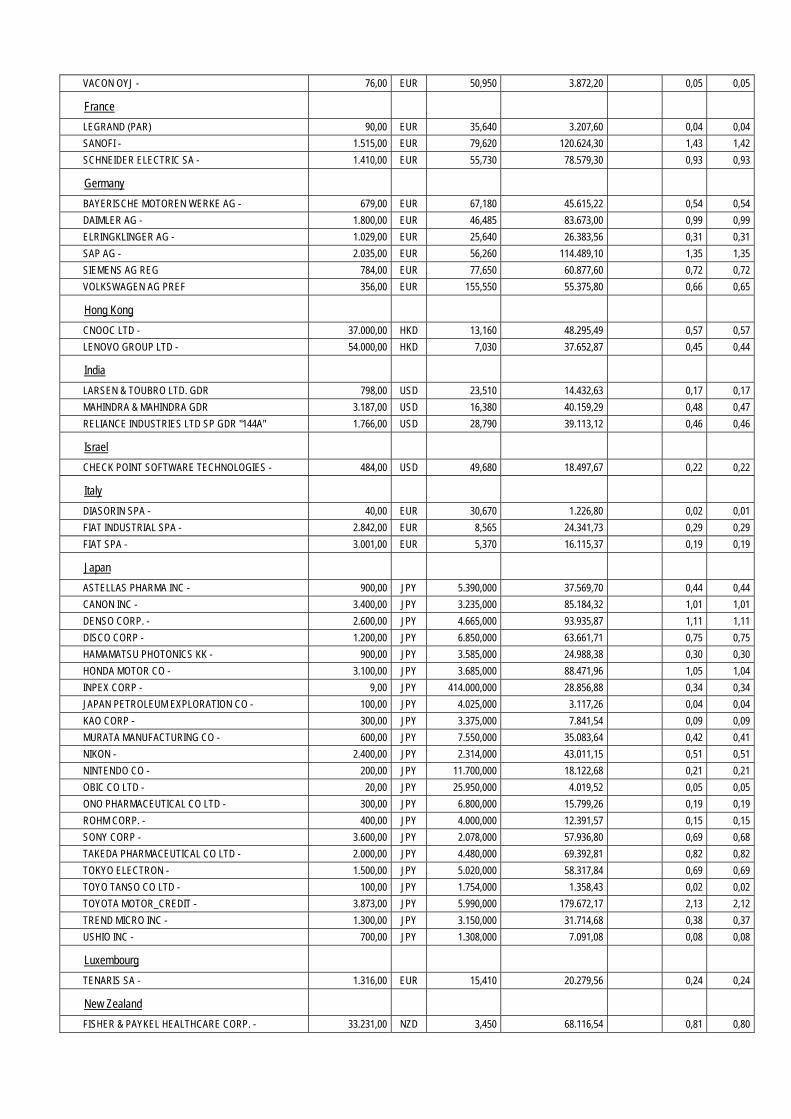
VACON OYJ - 76,00 EUR 50,950 3.872,20 0,05 0,05
France
LEGRAND (PAR) 90,00 EUR 35,640 3.207,60 0,04 0,04
SANOFI - 1.515,00 EUR 79,620 120.624,30 1,43 1,42
SCHNEIDER ELECTRIC SA - 1.410,00 EUR 55,730 78.579,30 0,93 0,93
Germany
BAYERISCHE MOTOREN WERKE AG - 679,00 EUR 67,180 45.615,22 0,54 0,54
DAIMLER AG - 1.800,00 EUR 46,485 83.673,00 0,99 0,99
ELRINGKLINGER AG - 1.029,00 EUR 25,640 26.383,56 0,31 0,31
SAP AG - 2.035,00 EUR 56,260 114.489,10 1,35 1,35
SIEMENS AG REG 784,00 EUR 77,650 60.877,60 0,72 0,72
VOLKSWAGEN AG PREF 356,00 EUR 155,550 55.375,80 0,66 0,65
Hong Kong
CNOOC LTD - 37.000,00 HKD 13,160 48.295,49 0,57 0,57
LENOVO GROUP LTD - 54.000,00 HKD 7,030 37.652,87 0,45 0,44
India
LARSEN & TOUBRO LTD. GDR 798,00 USD 23,510 14.432,63 0,17 0,17
MAHINDRA & MAHINDRA GDR 3.187,00 USD 16,380 40.159,29 0,48 0,47
RELIANCE INDUSTRIES LTD SP GDR "144A" 1.766,00 USD 28,790 39.113,12 0,46 0,46
Israel
CHECK POINT SOFTWARE TECHNOLOGIES - 484,00 USD 49,680 18.497,67 0,22 0,22
Italy
DIASORIN SPA - 40,00 EUR 30,670 1.226,80 0,02 0,01
FIAT INDUSTRIAL SPA - 2.842,00 EUR 8,565 24.341,73 0,29 0,29
FIAT SPA - 3.001,00 EUR 5,370 16.115,37 0,19 0,19
Japan
ASTELLAS PHARMA INC - 900,00 JPY 5.390,000 37.569,70 0,44 0,44
CANON INC - 3.400,00 JPY 3.235,000 85.184,32 1,01 1,01
DENSO CORP. - 2.600,00 JPY 4.665,000 93.935,87 1,11 1,11
DISCO CORP - 1.200,00 JPY 6.850,000 63.661,71 0,75 0,75
HAMAMATSU PHOTONICS KK - 900,00 JPY 3.585,000 24.988,38 0,30 0,30
HONDA MOTOR CO - 3.100,00 JPY 3.685,000 88.471,96 1,05 1,04
INPEX CORP - 9,00 JPY 414.000,000 28.856,88 0,34 0,34
JAPAN PETROLEUM EXPLORATION CO - 100,00 JPY 4.025,000 3.117,26 0,04 0,04
KAO CORP - 300,00 JPY 3.375,000 7.841,54 0,09 0,09
MURATA MANUFACTURING CO - 600,00 JPY 7.550,000 35.083,64 0,42 0,41
NIKON - 2.400,00 JPY 2.314,000 43.011,15 0,51 0,51
NINTENDO CO - 200,00 JPY 11.700,000 18.122,68 0,21 0,21
OBIC CO LTD - 20,00 JPY 25.950,000 4.019,52 0,05 0,05
ONO PHARMACEUTICAL CO LTD - 300,00 JPY 6.800,000 15.799,26 0,19 0,19
ROHM CORP. - 400,00 JPY 4.000,000 12.391,57 0,15 0,15
SONY CORP - 3.600,00 JPY 2.078,000 57.936,80 0,69 0,68
TAKEDA PHARMACEUTICAL CO LTD - 2.000,00 JPY 4.480,000 69.392,81 0,82 0,82
TOKYO ELECTRON - 1.500,00 JPY 5.020,000 58.317,84 0,69 0,69
TOYO TANSO CO LTD - 100,00 JPY 1.754,000 1.358,43 0,02 0,02
TOYOTA MOTOR_CREDIT - 3.873,00 JPY 5.990,000 179.672,17 2,13 2,12
TREND MICRO INC - 1.300,00 JPY 3.150,000 31.714,68 0,38 0,37
USHIO INC - 700,00 JPY 1.308,000 7.091,08 0,08 0,08
Luxembourg
TENARIS SA - 1.316,00 EUR 15,410 20.279,56 0,24 0,24
New Zealand
FISHER & PAYKEL HEALTHCARE CORP. - 33.231,00 NZD 3,450 68.116,54 0,81 0,80
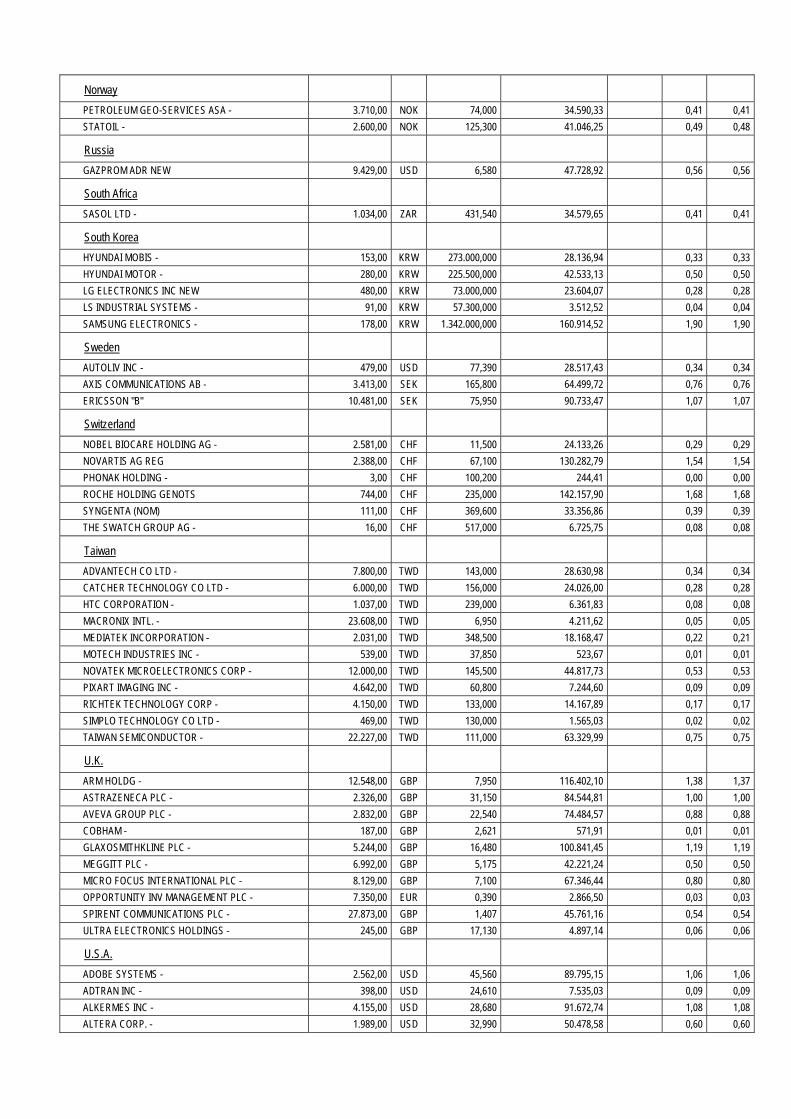
Norway
PETROLEUM GEO-SERVICES ASA - 3.710,00 NOK 74,000 34.590,33 0,41 0,41
STATOIL - 2.600,00 NOK 125,300 41.046,25 0,49 0,48
Russia
GAZPROM ADR NEW 9.429,00 USD 6,580 47.728,92 0,56 0,56
South Africa
SASOL LTD - 1.034,00 ZAR 431,540 34.579,65 0,41 0,41
South Korea
HYUNDAI MOBIS - 153,00 KRW 273.000,000 28.136,94 0,33 0,33
HYUNDAI MOTOR - 280,00 KRW 225.500,000 42.533,13 0,50 0,50
LG ELECTRONICS INC NEW 480,00 KRW 73.000,000 23.604,07 0,28 0,28
LS INDUSTRIAL SYSTEMS - 91,00 KRW 57.300,000 3.512,52 0,04 0,04
SAMSUNG ELECTRONICS - 178,00 KRW 1.342.000,000 160.914,52 1,90 1,90
Sweden
AUTOLIV INC - 479,00 USD 77,390 28.517,43 0,34 0,34
AXIS COMMUNICATIONS AB - 3.413,00 SEK 165,800 64.499,72 0,76 0,76
ERICSSON "B" 10.481,00 SEK 75,950 90.733,47 1,07 1,07
Switzerland
NOBEL BIOCARE HOLDING AG - 2.581,00 CHF 11,500 24.133,26 0,29 0,29
NOVARTIS AG REG 2.388,00 CHF 67,100 130.282,79 1,54 1,54
PHONAK HOLDING - 3,00 CHF 100,200 244,41 0,00 0,00
ROCHE HOLDING GENOTS 744,00 CHF 235,000 142.157,90 1,68 1,68
SYNGENTA (NOM) 111,00 CHF 369,600 33.356,86 0,39 0,39
THE SWATCH GROUP AG - 16,00 CHF 517,000 6.725,75 0,08 0,08
Taiwan
ADVANTECH CO LTD - 7.800,00 TWD 143,000 28.630,98 0,34 0,34
CATCHER TECHNOLOGY CO LTD - 6.000,00 TWD 156,000 24.026,00 0,28 0,28
HTC CORPORATION - 1.037,00 TWD 239,000 6.361,83 0,08 0,08
MACRONIX INTL. - 23.608,00 TWD 6,950 4.211,62 0,05 0,05
MEDIATEK INCORPORATION - 2.031,00 TWD 348,500 18.168,47 0,22 0,21
MOTECH INDUSTRIES INC - 539,00 TWD 37,850 523,67 0,01 0,01
NOVATEK MICROELECTRONICS CORP - 12.000,00 TWD 145,500 44.817,73 0,53 0,53
PIXART IMAGING INC - 4.642,00 TWD 60,800 7.244,60 0,09 0,09
RICHTEK TECHNOLOGY CORP - 4.150,00 TWD 133,000 14.167,89 0,17 0,17
SIMPLO TECHNOLOGY CO LTD - 469,00 TWD 130,000 1.565,03 0,02 0,02
TAIWAN SEMICONDUCTOR - 22.227,00 TWD 111,000 63.329,99 0,75 0,75
U.K.
ARM HOLDG - 12.548,00 GBP 7,950 116.402,10 1,38 1,37
ASTRAZENECA PLC - 2.326,00 GBP 31,150 84.544,81 1,00 1,00
AVEVA GROUP PLC - 2.832,00 GBP 22,540 74.484,57 0,88 0,88
COBHAM - 187,00 GBP 2,621 571,91 0,01 0,01
GLAXOSMITHKLINE PLC - 5.244,00 GBP 16,480 100.841,45 1,19 1,19
MEGGITT PLC - 6.992,00 GBP 5,175 42.221,24 0,50 0,50
MICRO FOCUS INTERNATIONAL PLC - 8.129,00 GBP 7,100 67.346,44 0,80 0,80
OPPORTUNITY INV MANAGEMENT PLC - 7.350,00 EUR 0,390 2.866,50 0,03 0,03
SPIRENT COMMUNICATIONS PLC - 27.873,00 GBP 1,407 45.761,16 0,54 0,54
ULTRA ELECTRONICS HOLDINGS - 245,00 GBP 17,130 4.897,14 0,06 0,06
U.S.A.
ADOBE SYSTEMS - 2.562,00 USD 45,560 89.795,15 1,06 1,06
ADTRAN INC - 398,00 USD 24,610 7.535,03 0,09 0,09
ALKERMES INC - 4.155,00 USD 28,680 91.672,74 1,08 1,08
ALTERA CORP. - 1.989,00 USD 32,990 50.478,58 0,60 0,60
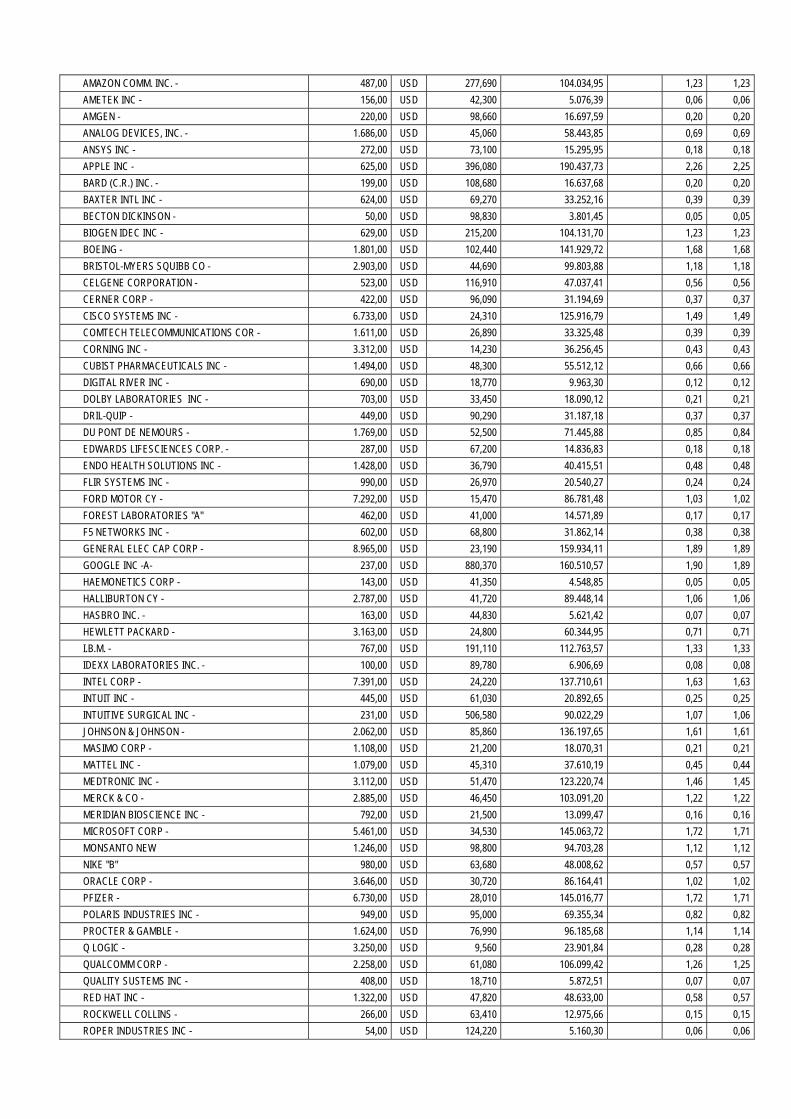
AMAZON COMM. INC. - 487,00 USD 277,690 104.034,95 1,23 1,23
AMETEK INC - 156,00 USD 42,300 5.076,39 0,06 0,06
AMGEN - 220,00 USD 98,660 16.697,59 0,20 0,20
ANALOG DEVICES, INC. - 1.686,00 USD 45,060 58.443,85 0,69 0,69
ANSYS INC - 272,00 USD 73,100 15.295,95 0,18 0,18
APPLE INC - 625,00 USD 396,080 190.437,73 2,26 2,25
BARD (C.R.) INC. - 199,00 USD 108,680 16.637,68 0,20 0,20
BAXTER INTL INC - 624,00 USD 69,270 33.252,16 0,39 0,39
BECTON DICKINSON - 50,00 USD 98,830 3.801,45 0,05 0,05
BIOGEN IDEC INC - 629,00 USD 215,200 104.131,70 1,23 1,23
BOEING - 1.801,00 USD 102,440 141.929,72 1,68 1,68
BRISTOL-MYERS SQUIBB CO - 2.903,00 USD 44,690 99.803,88 1,18 1,18
CELGENE CORPORATION - 523,00 USD 116,910 47.037,41 0,56 0,56
CERNER CORP - 422,00 USD 96,090 31.194,69 0,37 0,37
CISCO SYSTEMS INC - 6.733,00 USD 24,310 125.916,79 1,49 1,49
COMTECH TELECOMMUNICATIONS COR - 1.611,00 USD 26,890 33.325,48 0,39 0,39
CORNING INC - 3.312,00 USD 14,230 36.256,45 0,43 0,43
CUBIST PHARMACEUTICALS INC - 1.494,00 USD 48,300 55.512,12 0,66 0,66
DIGITAL RIVER INC - 690,00 USD 18,770 9.963,30 0,12 0,12
DOLBY LABORATORIES INC - 703,00 USD 33,450 18.090,12 0,21 0,21
DRIL-QUIP - 449,00 USD 90,290 31.187,18 0,37 0,37
DU PONT DE NEMOURS - 1.769,00 USD 52,500 71.445,88 0,85 0,84
EDWARDS LIFESCIENCES CORP. - 287,00 USD 67,200 14.836,83 0,18 0,18
ENDO HEALTH SOLUTIONS INC - 1.428,00 USD 36,790 40.415,51 0,48 0,48
FLIR SYSTEMS INC - 990,00 USD 26,970 20.540,27 0,24 0,24
FORD MOTOR CY - 7.292,00 USD 15,470 86.781,48 1,03 1,02
FOREST LABORATORIES "A" 462,00 USD 41,000 14.571,89 0,17 0,17
F5 NETWORKS INC - 602,00 USD 68,800 31.862,14 0,38 0,38
GENERAL ELEC CAP CORP - 8.965,00 USD 23,190 159.934,11 1,89 1,89
GOOGLE INC -A- 237,00 USD 880,370 160.510,57 1,90 1,89
HAEMONETICS CORP - 143,00 USD 41,350 4.548,85 0,05 0,05
HALLIBURTON CY - 2.787,00 USD 41,720 89.448,14 1,06 1,06
HASBRO INC. - 163,00 USD 44,830 5.621,42 0,07 0,07
HEWLETT PACKARD - 3.163,00 USD 24,800 60.344,95 0,71 0,71
I.B.M. - 767,00 USD 191,110 112.763,57 1,33 1,33
IDEXX LABORATORIES INC. - 100,00 USD 89,780 6.906,69 0,08 0,08
INTEL CORP - 7.391,00 USD 24,220 137.710,61 1,63 1,63
INTUIT INC - 445,00 USD 61,030 20.892,65 0,25 0,25
INTUITIVE SURGICAL INC - 231,00 USD 506,580 90.022,29 1,07 1,06
JOHNSON & JOHNSON - 2.062,00 USD 85,860 136.197,65 1,61 1,61
MASIMO CORP - 1.108,00 USD 21,200 18.070,31 0,21 0,21
MATTEL INC - 1.079,00 USD 45,310 37.610,19 0,45 0,44
MEDTRONIC INC - 3.112,00 USD 51,470 123.220,74 1,46 1,45
MERCK & CO - 2.885,00 USD 46,450 103.091,20 1,22 1,22
MERIDIAN BIOSCIENCE INC - 792,00 USD 21,500 13.099,47 0,16 0,16
MICROSOFT CORP - 5.461,00 USD 34,530 145.063,72 1,72 1,71
MONSANTO NEW 1.246,00 USD 98,800 94.703,28 1,12 1,12
NIKE "B" 980,00 USD 63,680 48.008,62 0,57 0,57
ORACLE CORP - 3.646,00 USD 30,720 86.164,41 1,02 1,02
PFIZER - 6.730,00 USD 28,010 145.016,77 1,72 1,71
POLARIS INDUSTRIES INC - 949,00 USD 95,000 69.355,34 0,82 0,82
PROCTER & GAMBLE - 1.624,00 USD 76,990 96.185,68 1,14 1,14
Q LOGIC - 3.250,00 USD 9,560 23.901,84 0,28 0,28
QUALCOMM CORP - 2.258,00 USD 61,080 106.099,42 1,26 1,25
QUALITY SUSTEMS INC - 408,00 USD 18,710 5.872,51 0,07 0,07
RED HAT INC - 1.322,00 USD 47,820 48.633,00 0,58 0,57
ROCKWELL COLLINS - 266,00 USD 63,410 12.975,66 0,15 0,15
ROPER INDUSTRIES INC - 54,00 USD 124,220 5.160,30 0,06 0,06
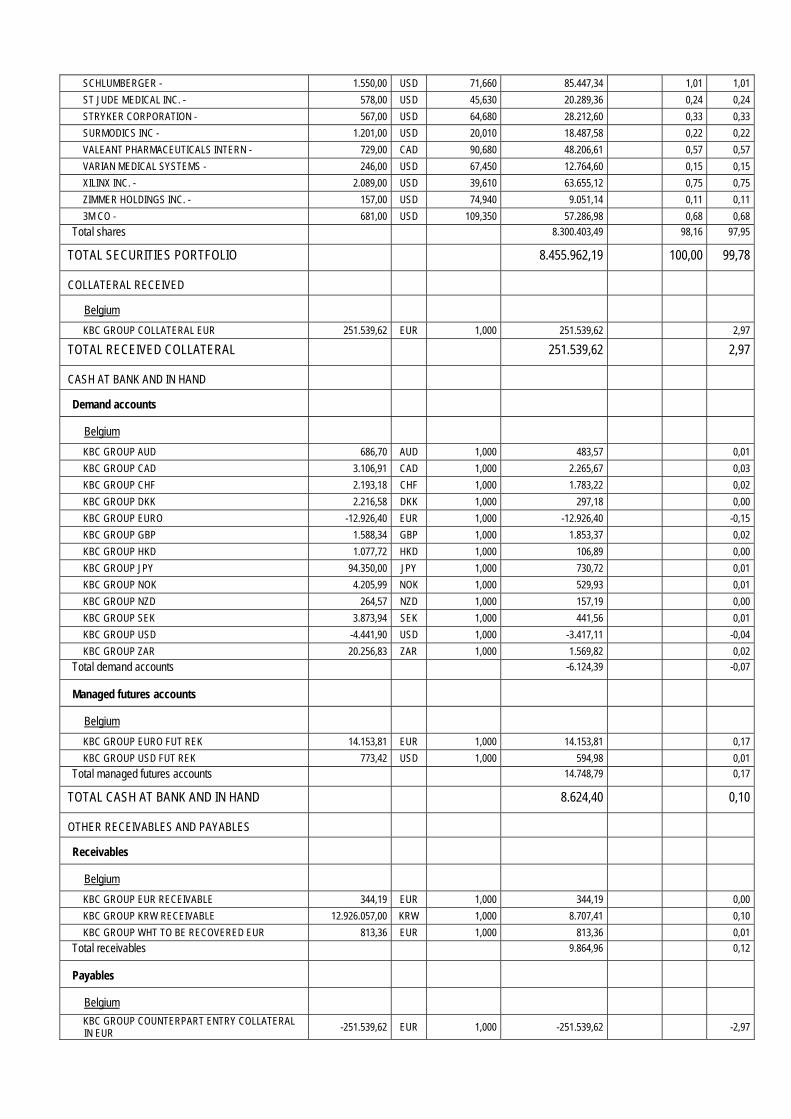
SCHLUMBERGER - 1.550,00 USD 71,660 85.447,34 1,01 1,01
ST JUDE MEDICAL INC. - 578,00 USD 45,630 20.289,36 0,24 0,24
STRYKER CORPORATION - 567,00 USD 64,680 28.212,60 0,33 0,33
SURMODICS INC - 1.201,00 USD 20,010 18.487,58 0,22 0,22
VALEANT PHARMACEUTICALS INTERN - 729,00 CAD 90,680 48.206,61 0,57 0,57
VARIAN MEDICAL SYSTEMS - 246,00 USD 67,450 12.764,60 0,15 0,15
XILINX INC. - 2.089,00 USD 39,610 63.655,12 0,75 0,75
ZIMMER HOLDINGS INC. - 157,00 USD 74,940 9.051,14 0,11 0,11
3M CO - 681,00 USD 109,350 57.286,98 0,68 0,68
Total shares 8.300.403,49 98,16 97,95
TOTAL SECURITIES PORTFOLIO 8.455.962,19 100,00 99,78
COLLATERAL RECEIVED
Belgium
KBC GROUP COLLATERAL EUR 251.539,62 EUR 1,000 251.539,62 2,97
TOTAL RECEIVED COLLATERAL 251.539,62 2,97
CASH AT BANK AND IN HAND
Demand accounts
Belgium
KBC GROUP AUD 686,70 AUD 1,000 483,57 0,01
KBC GROUP CAD 3.106,91 CAD 1,000 2.265,67 0,03
KBC GROUP CHF 2.193,18 CHF 1,000 1.783,22 0,02
KBC GROUP DKK 2.216,58 DKK 1,000 297,18 0,00
KBC GROUP EURO -12.926,40 EUR 1,000 -12.926,40 -0,15
KBC GROUP GBP 1.588,34 GBP 1,000 1.853,37 0,02
KBC GROUP HKD 1.077,72 HKD 1,000 106,89 0,00
KBC GROUP JPY 94.350,00 JPY 1,000 730,72 0,01
KBC GROUP NOK 4.205,99 NOK 1,000 529,93 0,01
KBC GROUP NZD 264,57 NZD 1,000 157,19 0,00
KBC GROUP SEK 3.873,94 SEK 1,000 441,56 0,01
KBC GROUP USD -4.441,90 USD 1,000 -3.417,11 -0,04
KBC GROUP ZAR 20.256,83 ZAR 1,000 1.569,82 0,02
Total demand accounts -6.124,39 -0,07
Managed futures accounts
Belgium
KBC GROUP EURO FUT REK 14.153,81 EUR 1,000 14.153,81 0,17
KBC GROUP USD FUT REK 773,42 USD 1,000 594,98 0,01
Total managed futures accounts 14.748,79 0,17
TOTAL CASH AT BANK AND IN HAND 8.624,40 0,10
OTHER RECEIVABLES AND PAYABLES
Receivables
Belgium
KBC GROUP EUR RECEIVABLE 344,19 EUR 1,000 344,19 0,00
KBC GROUP KRW RECEIVABLE 12.926.057,00 KRW 1,000 8.707,41 0,10
KBC GROUP WHT TO BE RECOVERED EUR 813,36 EUR 1,000 813,36 0,01
Total receivables 9.864,96 0,12
Payables
Belgium
KBC GROUP COUNTERPART ENTRY COLLATERAL IN EUR
-251.539,62 EUR 1,000 -251.539,62 -2,97
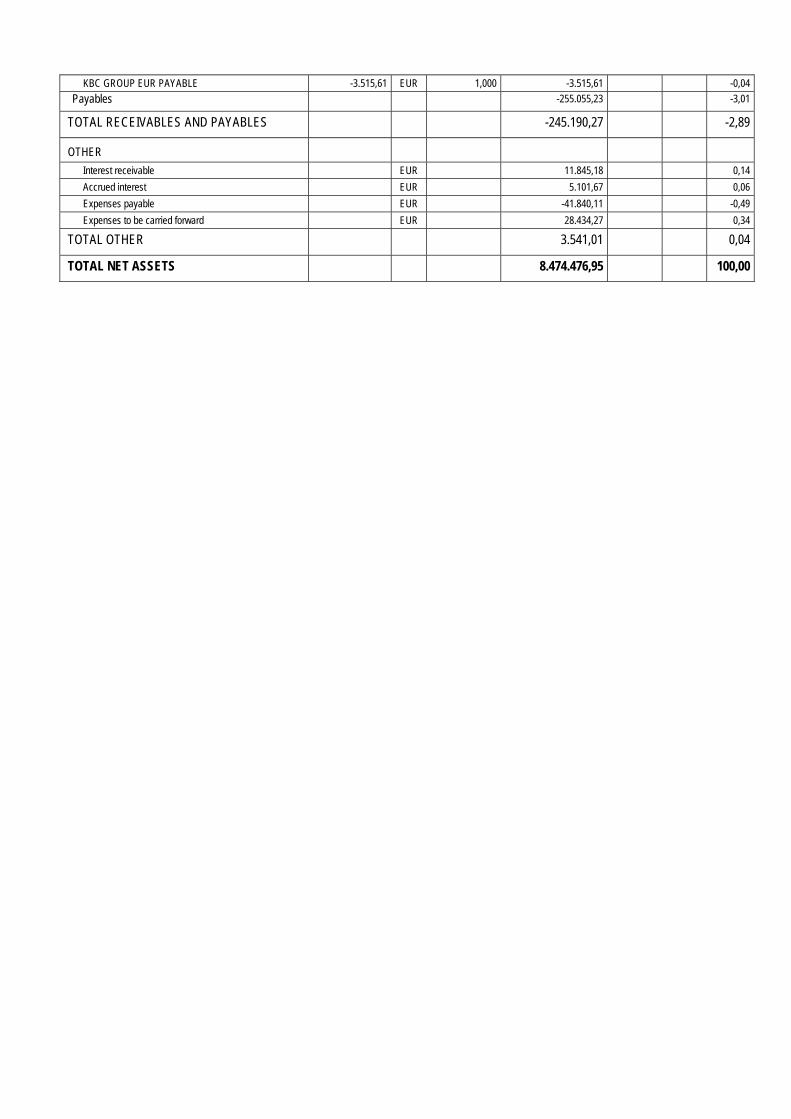
KBC GROUP EUR PAYABLE -3.515,61 EUR 1,000 -3.515,61 -0,04
Payables -255.055,23 -3,01
TOTAL RECEIVABLES AND PAYABLES -245.190,27 -2,89
OTHER
Interest receivable EUR 11.845,18 0,14
Accrued interest EUR 5.101,67 0,06
Expenses payable EUR -41.840,11 -0,49
Expenses to be carried forward EUR 28.434,27 0,34
TOTAL OTHER 3.541,01 0,04
TOTAL NET ASSETS 8.474.476,95 100,00
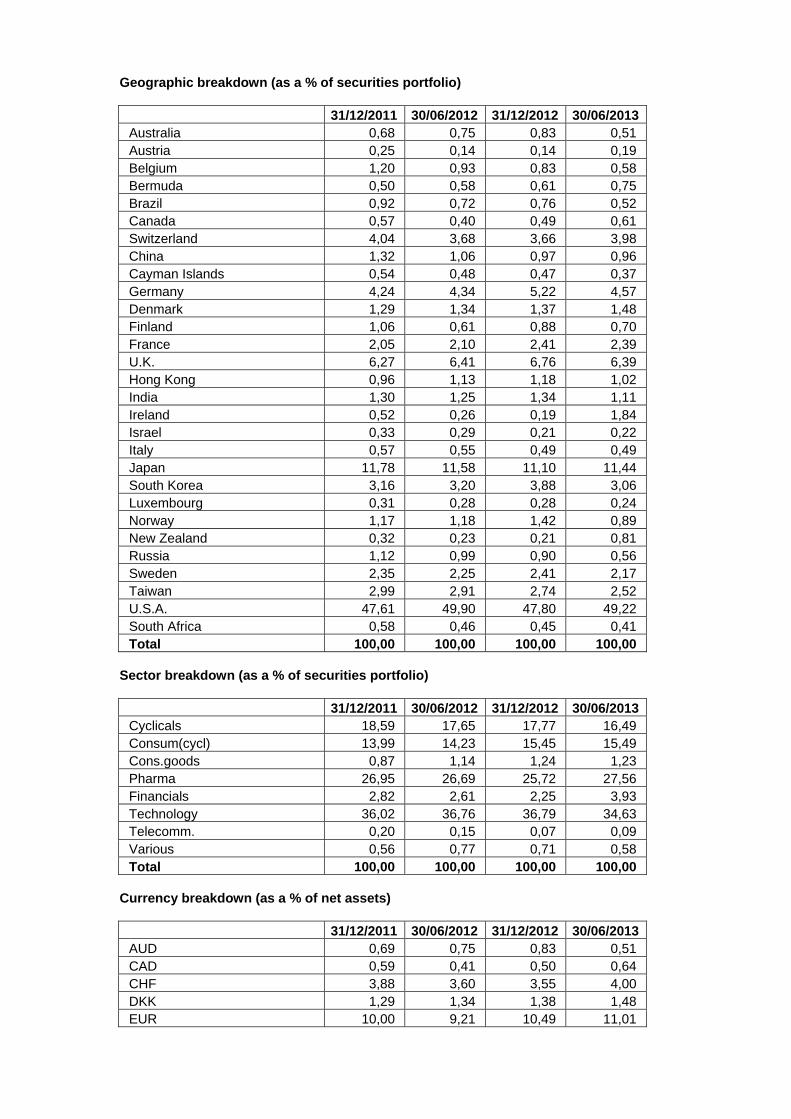
Geographic breakdown (as a % of securities portfolio)
31/12/2011 30/06/2012 31/12/2012 30/06/2013 Australia 0,68 0,75 0,83 0,51 Austria 0,25 0,14 0,14 0,19 Belgium 1,20 0,93 0,83 0,58 Bermuda 0,50 0,58 0,61 0,75 Brazil 0,92 0,72 0,76 0,52 Canada 0,57 0,40 0,49 0,61 Switzerland 4,04 3,68 3,66 3,98 China 1,32 1,06 0,97 0,96 Cayman Islands 0,54 0,48 0,47 0,37 Germany 4,24 4,34 5,22 4,57 Denmark 1,29 1,34 1,37 1,48 Finland 1,06 0,61 0,88 0,70 France 2,05 2,10 2,41 2,39 U.K. 6,27 6,41 6,76 6,39 Hong Kong 0,96 1,13 1,18 1,02 India 1,30 1,25 1,34 1,11 Ireland 0,52 0,26 0,19 1,84 Israel 0,33 0,29 0,21 0,22 Italy 0,57 0,55 0,49 0,49 Japan 11,78 11,58 11,10 11,44 South Korea 3,16 3,20 3,88 3,06 Luxembourg 0,31 0,28 0,28 0,24 Norway 1,17 1,18 1,42 0,89 New Zealand 0,32 0,23 0,21 0,81 Russia 1,12 0,99 0,90 0,56 Sweden 2,35 2,25 2,41 2,17 Taiwan 2,99 2,91 2,74 2,52 U.S.A. 47,61 49,90 47,80 49,22 South Africa 0,58 0,46 0,45 0,41 Total 100,00 100,00 100,00 100,00
Sector breakdown (as a % of securities portfolio)
31/12/2011 30/06/2012 31/12/2012 30/06/2013 Cyclicals 18,59 17,65 17,77 16,49 Consum(cycl) 13,99 14,23 15,45 15,49 Cons.goods 0,87 1,14 1,24 1,23 Pharma 26,95 26,69 25,72 27,56 Financials 2,82 2,61 2,25 3,93 Technology 36,02 36,76 36,79 34,63 Telecomm. 0,20 0,15 0,07 0,09 Various 0,56 0,77 0,71 0,58 Total 100,00 100,00 100,00 100,00
Currency breakdown (as a % of net assets)
31/12/2011 30/06/2012 31/12/2012 30/06/2013 AUD 0,69 0,75 0,83 0,51 CAD 0,59 0,41 0,50 0,64 CHF 3,88 3,60 3,55 4,00 DKK 1,29 1,34 1,38 1,48 EUR 10,00 9,21 10,49 11,01
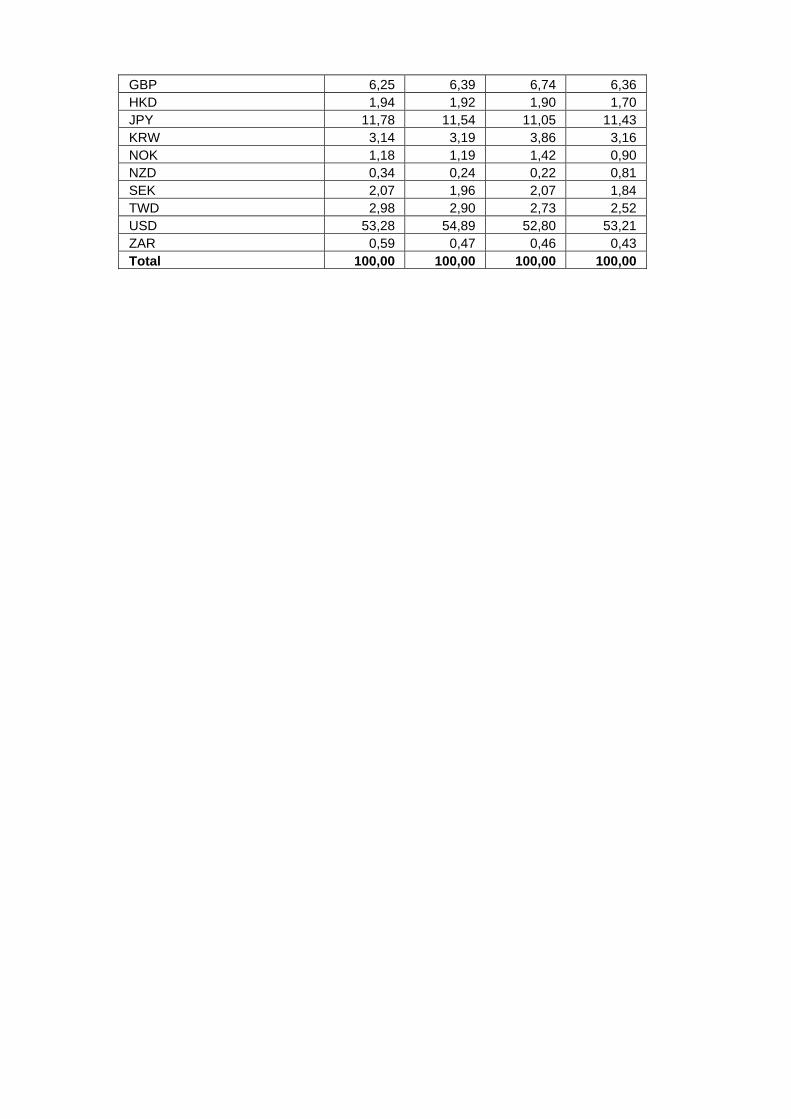
GBP 6,25 6,39 6,74 6,36 HKD 1,94 1,92 1,90 1,70 JPY 11,78 11,54 11,05 11,43 KRW 3,14 3,19 3,86 3,16 NOK 1,18 1,19 1,42 0,90 NZD 0,34 0,24 0,22 0,81 SEK 2,07 1,96 2,07 1,84 TWD 2,98 2,90 2,73 2,52 USD 53,28 54,89 52,80 53,21 ZAR 0,59 0,47 0,46 0,43 Total 100,00 100,00 100,00 100,00

2.4.2 CHANGES IN THE COMPOSITION OF THE ASSETS OF KBC EQUITY FUND GROWTH BY
INNOVATION (IN THE CURRENCY OF THE SUB-FUND)
1st half of year YearPurchases 3.043.894,25 3.043.894,25 Sales 63.714.916,12 63.714.916,12 Total 1 66.758.810,37 66.758.810,37 Subscriptions 6.237.842,59 6.237.842,59 Redemptions 67.221.390,83 67.221.390,83 Total 2 73.459.233,42 73.459.233,42 Monthly average of total assets
34.206.740,01 34.206.740,01
Turnover rate -19,59 % -19,59 %
1st half of year YearPurchases 3.043.894,25 3.043.894,25 Sales 63.714.916,12 63.714.916,12 Total 1 66.758.810,37 66.758.810,37 Subscriptions 6.237.842,59 6.237.842,59 Redemptions 67.221.390,83 67.221.390,83 Total 2 73.459.233,42 73.459.233,42 Monthly average of total assets
34.756.837,07 34.756.837,07
Corrected turnover rate -19,28 % -19,28 %
The table above shows the capital volume of portfolio transactions. This volume (adjusted to take account of total subscriptions and redemptions) is also compared to the average net assets at the beginning and end of the period. A figure close to 0% implies that the transactions relating to the securities or transactions relating to the assets (excluding deposits and cash) in a given period only involve subscriptions and redemptions. A negative percentage shows that subscriptions and redemptions entailed few, if any, transactions in the portfolio. Active asset management may result in high turnover rates (monthly percentage >50%). The detailed list of transactions is available for consultation free of charge at the registered office of the Bevek or fund at Havenlaan 2, 1080 Brussels.
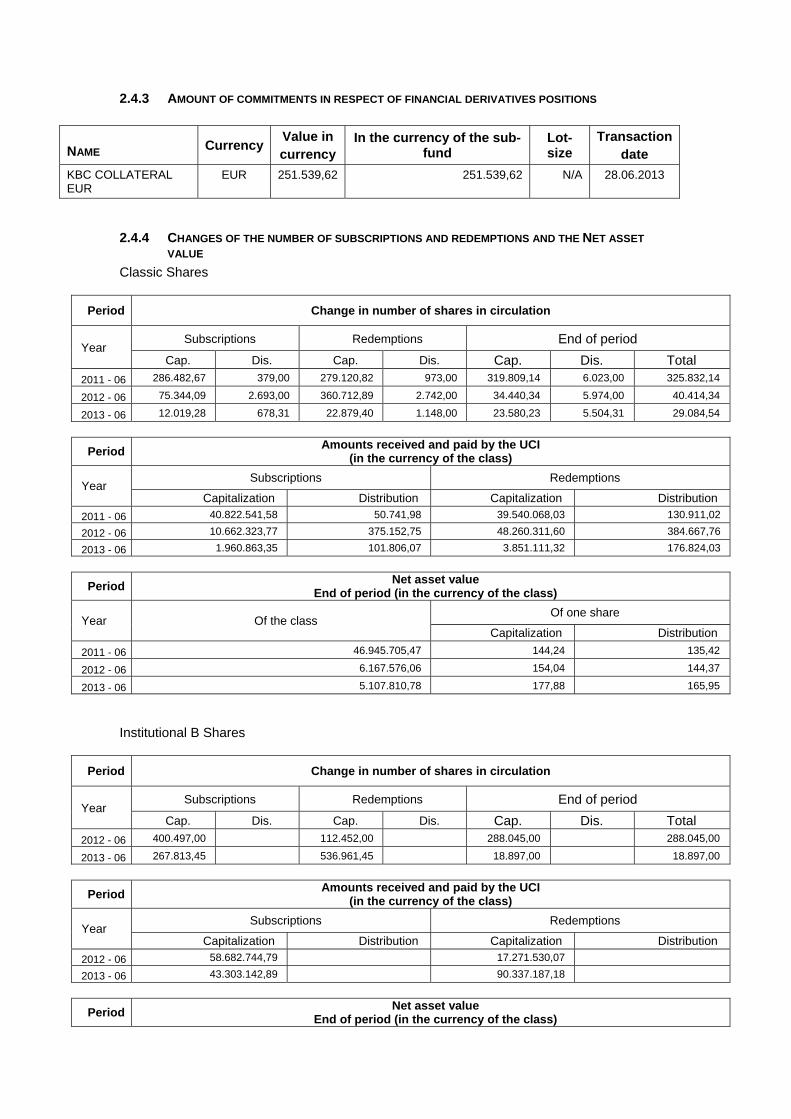
2.4.3 AMOUNT OF COMMITMENTS IN RESPECT OF FINANCIAL DERIVATIVES POSITIONS
NAME Currency Value in currency
In the currency of the sub-fund
Lot-size
Transactiondate
KBC COLLATERAL EUR
EUR 251.539,62 251.539,62 N/A 28.06.2013
2.4.4 CHANGES OF THE NUMBER OF SUBSCRIPTIONS AND REDEMPTIONS AND THE NET ASSET
VALUE
Classic Shares
Period Change in number of shares in circulation
Year Subscriptions Redemptions End of period
Cap. Dis. Cap. Dis. Cap. Dis. Total
2011 - 06 286.482,67 379,00 279.120,82 973,00 319.809,14 6.023,00 325.832,14
2012 - 06 75.344,09 2.693,00 360.712,89 2.742,00 34.440,34 5.974,00 40.414,34
2013 - 06 12.019,28 678,31 22.879,40 1.148,00 23.580,23 5.504,31 29.084,54
Period Amounts received and paid by the UCI
(in the currency of the class)
Year Subscriptions Redemptions
Capitalization Distribution Capitalization Distribution
2011 - 06 40.822.541,58 50.741,98 39.540.068,03 130.911,02
2012 - 06 10.662.323,77 375.152,75 48.260.311,60 384.667,76
2013 - 06 1.960.863,35 101.806,07 3.851.111,32 176.824,03
Period Net asset value
End of period (in the currency of the class)
Year Of the class Of one share
Capitalization Distribution
2011 - 06 46.945.705,47 144,24 135,42
2012 - 06 6.167.576,06 154,04 144,37
2013 - 06 5.107.810,78 177,88 165,95
Institutional B Shares
Period Change in number of shares in circulation
Year Subscriptions Redemptions End of period
Cap. Dis. Cap. Dis. Cap. Dis. Total 2012 - 06 400.497,00 112.452,00 288.045,00 288.045,00
2013 - 06 267.813,45 536.961,45 18.897,00 18.897,00
Period Amounts received and paid by the UCI
(in the currency of the class)
Year Subscriptions Redemptions
Capitalization Distribution Capitalization Distribution
2012 - 06 58.682.744,79 17.271.530,07
2013 - 06 43.303.142,89 90.337.187,18
Period Net asset value
End of period (in the currency of the class)

Year Of the class Of one share
Capitalization Distribution
2012 - 06 44.408.726,24 154,17
2013 - 06 3.366.666,17 178,16
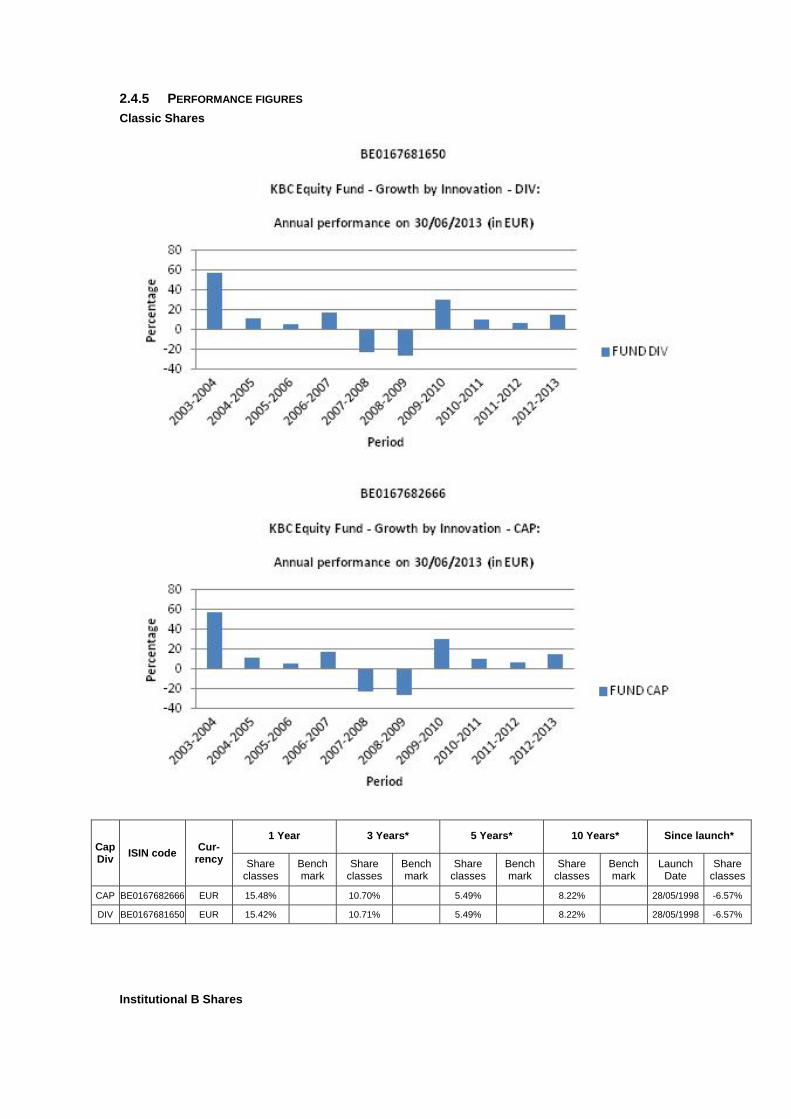
2.4.5 PERFORMANCE FIGURES
Classic Shares
Cap Div
ISIN code Cur-
rency
1 Year 3 Years* 5 Years* 10 Years* Since launch*
Share classes
Bench mark
Share classes
Bench mark
Share classes
Bench mark
Share classes
Bench mark
Launch Date
Share classes
CAP BE0167682666 EUR 15.48% 10.70% 5.49% 8.22% 28/05/1998 -6.57%
DIV BE0167681650 EUR 15.42% 10.71% 5.49% 8.22% 28/05/1998 -6.57%
Institutional B Shares

Cap Div
ISIN code Cur-
rency
1 Year 3 Years* 5 Years* 10 Years* Since launch*
Share classes
Bench mark
Share classes
Bench mark
Share classes
Bench mark
Share classes
Bench mark
Launch Date
Share classes
CAP BE6228547806 EUR 15.56% 25/11/2011 21.22%
Risk warning: Past performance is not a guide to future performance. * Return on annual basis.
Classic Shares The bar chart shows the performance for full financial years. The figures do not take account of any restructuring. Calculated in EUR (ex BEF). The return is calculated as the change in the net asset value between two dates expressed
as a percentage. In the case of units that pay dividends, the dividend is incorporated geometrically in the return.
Calculation method for date D, where NAV stands for net asset value: Capitalisation units (CAP) Return on date D over a period of X years:
[NIW(D) / NIW(Y)] ^ [1 / X] - 1 where Y = D-X
Return on date D since the start date S of the unit: [NIW(D) / NIW(S)] ^ [1 / F] - 1 where F = 1 if the unit has existed for less than one year on date D where F = (D-S) / 365.25 if the unit has existed for longer than one year on date D
Distribution units (DIV) Return on date D over a period of X years:
[ C * NIW(D) / NIW(Y)] ^ [1 / X] - 1 where Y = D-X
Return on date D since the start date S of the unit: [ C * NIW(D) / NIW(S)] ^ [1 / F] - 1 where F = 1 if the unit has existed for less than one year on date D where F = (D-S) / 365.25 if the unit has existed for longer than one year on date D where C is a factor that is determined for all N dividends between the calculation date D and the reference date.
For dividend i on date Di with value Wi: Ci = [Wi / NIW(Di)] + 1 i = 1 ... N

from whichC = C0 * .... * CN. If the interval between the two dates exceeds one year, the ordinary return calculation is
converted into a return on an annual basis by taking the nth square root of 1 plus the total return of the unit.
The return figures shown above do not take account of the fees and charges associated with the issue and redemption of units.
These are the performance figures for capitalisation and distribution shares.
Institutional B Shares The bar chart shows the performance for full financial years. The figures do not take account of any restructuring. Calculated in EUR. The return is calculated as the change in the net asset value between two dates expressed
as a percentage. Calculation method for date D, where NAV stands for net asset value:
Capitalisation units (CAP) Return on date D over a period of X years:
[NIW(D) / NIW(Y)] ^ [1 / X] - 1 where Y = D-X
Return on date D since the start date S of the unit: [NIW(D) / NIW(S)] ^ [1 / F] - 1 where F = 1 if the unit has existed for less than one year on date D where F = (D-S) / 365.25 if the unit has existed for longer than one year on date D
If the interval between the two dates exceeds one year, the ordinary return calculation is converted into a return on an annual basis by taking the nth square root of 1 plus the total return of the unit.
The return figures shown above do not take account of the fees and charges associated with the issue and redemption of units.
These are the performance figures for capitalization shares.

2.4.6 COSTS Ongoing Charges: * Classic Shares Distribution: 1.978% Classic Shares Capitalization: 1.872% Institutional B Shares Capitalization: 1.662% * The following costs have not been included in the ongoing charges: - Interest payments on loans taken out - Payments in respect of financial derivatives - Fees and charges paid directly by the investor - Any soft commissions
SOFT COMMISSIONS The management company or the appointed manager, as the case may be, is the recipient of soft commissions. The recipient has laid down an internal policy as regards accepting soft commissions and avoiding possible conflicts of interest in this respect, and has put appropriate internal controls in place to ensure this policy is observed. For more information, please see the ‘General’ section of the annual report.
Broker
Commission gross
in EUR
paid during the period:
1‐01‐13
‐
30‐06‐13
CSA Credits
in EUR
accrued during the period:
1‐01‐13
‐
30‐06‐13 Percentage
CITI 11,742 6,305 53.70%
CSFBSAS 5,877 2,914 49.58%
EQ MACQUARIE 12,626 6,313 50.00%
INSTINET 10,177 4,913 48.27%
MORGAN STANLEY 911 453 49.65%
FEE-SHARING AGREEMENTS AND REBATES: The management company may share its fee with the distributor, and institutional and/or professional parties. In principle, the percentage share amounts to between 35% and 60% if the distributor is an entity of KBC Group NV or to between 35% and 70% if the distributor is not an entity of KBC Group NV. However, in a small number of cases, the distributor’s fee is less than 35%. Investors may, on request, obtain more information on these cases. If the management company invests the assets of the undertaking for collective investment in units of undertakings for collective investment that are not managed by an entity of KBC Group NV, and receives a fee for doing so, it will pay this fee to the undertaking for collective investment. Fee-sharing does not affect the amount of the management fee paid by the sub-fund to the management company. This management fee is subject to the limitations laid down in the articles of association. The limitations may only be amended after approval by the general meeting of shareholders. The management company has concluded a distribution agreement with the distributor in order to facilitate the wider distribution of the sub-fund's units by using multiple distribution channels. It is in the interests of the holders of units, the sub-fund and of the distributor for the largest possible number of units to be sold and for the assets of the sub-fund to be maximised in this way. In this respect, there is therefore no question of any conflict of interest.
2.4.7 NOTES TO THE FINANCIAL STATEMENTS AND OTHER DATA Fee for managing the investment portfolio: 1.5% per annum calculated on the basis of the average total net assets of the sub-fund, no management fee is charged on assets assets invested in investment undertakings managed by a financial institution of the KBC group. KBC Fund Management Limited receives a fee from the management company of max. 1.5% calculated on that part of the portfolio that it manages, without the total management fee received by the management company being exceeded.
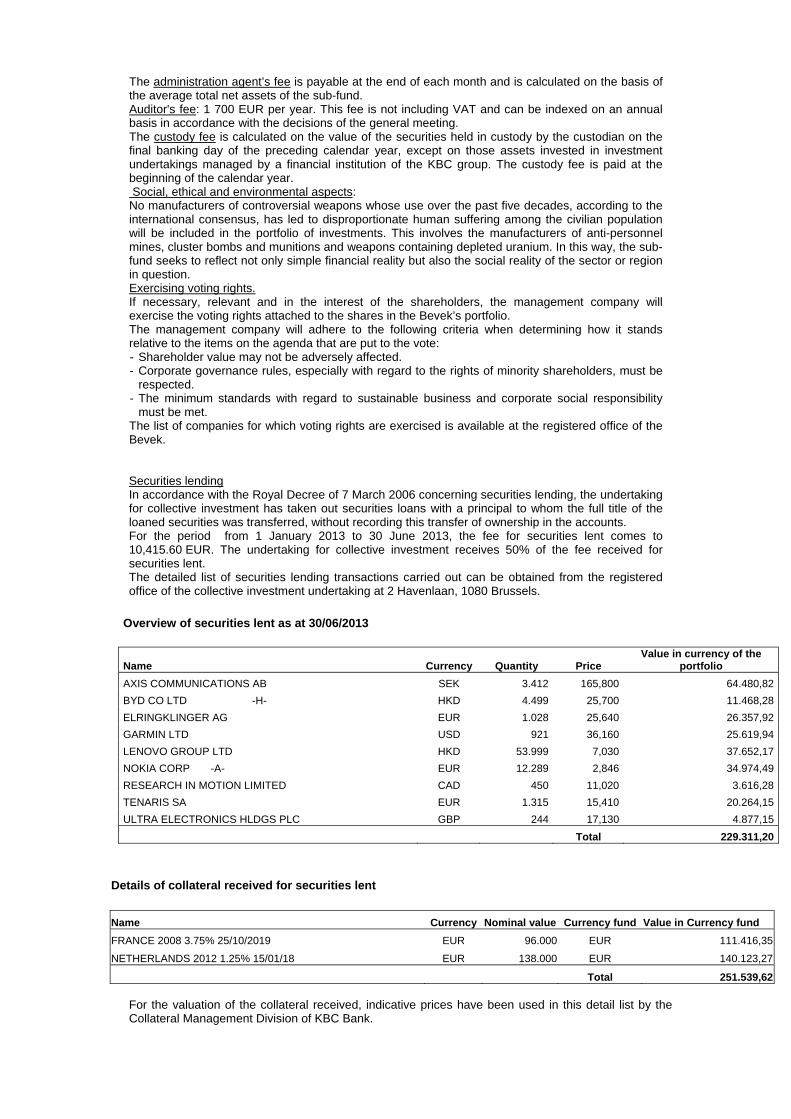
The administration agent’s fee is payable at the end of each month and is calculated on the basis of the average total net assets of the sub-fund. Auditor's fee: 1 700 EUR per year. This fee is not including VAT and can be indexed on an annual basis in accordance with the decisions of the general meeting. The custody fee is calculated on the value of the securities held in custody by the custodian on the final banking day of the preceding calendar year, except on those assets invested in investment undertakings managed by a financial institution of the KBC group. The custody fee is paid at the beginning of the calendar year. Social, ethical and environmental aspects: No manufacturers of controversial weapons whose use over the past five decades, according to the international consensus, has led to disproportionate human suffering among the civilian population will be included in the portfolio of investments. This involves the manufacturers of anti-personnel mines, cluster bombs and munitions and weapons containing depleted uranium. In this way, the sub-fund seeks to reflect not only simple financial reality but also the social reality of the sector or region in question. Exercising voting rights. If necessary, relevant and in the interest of the shareholders, the management company will exercise the voting rights attached to the shares in the Bevek’s portfolio. The management company will adhere to the following criteria when determining how it stands relative to the items on the agenda that are put to the vote: - Shareholder value may not be adversely affected. - Corporate governance rules, especially with regard to the rights of minority shareholders, must be
respected. - The minimum standards with regard to sustainable business and corporate social responsibility
must be met. The list of companies for which voting rights are exercised is available at the registered office of the Bevek. Securities lending In accordance with the Royal Decree of 7 March 2006 concerning securities lending, the undertaking for collective investment has taken out securities loans with a principal to whom the full title of the loaned securities was transferred, without recording this transfer of ownership in the accounts. For the period from 1 January 2013 to 30 June 2013, the fee for securities lent comes to 10,415.60 EUR. The undertaking for collective investment receives 50% of the fee received for securities lent. The detailed list of securities lending transactions carried out can be obtained from the registered office of the collective investment undertaking at 2 Havenlaan, 1080 Brussels.
Overview of securities lent as at 30/06/2013
Name Currency Quantity Price Value in currency of the
portfolio
AXIS COMMUNICATIONS AB SEK 3.412 165,800 64.480,82
BYD CO LTD -H- HKD 4.499 25,700 11.468,28
ELRINGKLINGER AG EUR 1.028 25,640 26.357,92
GARMIN LTD USD 921 36,160 25.619,94
LENOVO GROUP LTD HKD 53.999 7,030 37.652,17
NOKIA CORP -A- EUR 12.289 2,846 34.974,49
RESEARCH IN MOTION LIMITED CAD 450 11,020 3.616,28
TENARIS SA EUR 1.315 15,410 20.264,15
ULTRA ELECTRONICS HLDGS PLC GBP 244 17,130 4.877,15
Total 229.311,20
Details of collateral received for securities lent
Name Currency Nominal value Currency fund Value in Currency fund
FRANCE 2008 3.75% 25/10/2019 EUR 96.000 EUR 111.416,35
NETHERLANDS 2012 1.25% 15/01/18 EUR 138.000 EUR 140.123,27
Total 251.539,62 For the valuation of the collateral received, indicative prices have been used in this detail list by the Collateral Management Division of KBC Bank.

Semi-Annual report as at 30th June 2013
TABLE OF CONTENTS
2. Information on KBC Equity Fund Quant EMU
2.1. Management report 2.1.1. Launch date and subscription price 2.1.2. Stock exchange listing 2.1.3. Aim and distinctive features of the investment policy 2.1.4. Financial portfolio management 2.1.5. Distributors 2.1.6. Index and benchmark 2.1.7. Policy conducted during the financial year 2.1.8. Future policy 2.1.9. Synthetic risk and reward indicator (SRRI)
2.2. Balance sheet
2.3. Profit and loss account
2.4. Composition of the assets and key figures
2.4.1. Composition of the assets 2.4.2. Change in the composition of the assets 2.4.3. Value of commitments in respect of financial derivatives positions 2.4.4. Evolution of the number of subscriptions, repayments and the net asset value 2.4.5. Return figures 2.4.6. Expenses 2.4.7. Notes to the financial statements and other data


2 INFORMATION ON KBC EQUITY FUND QUANT EMU
2.1 MANAGEMENT REPORT
2.1.1 LAUNCH DATE AND SUBSCRIPTION PRICE Classic Shares : Launch date: 1 October 2010 Initial subscription price: 500 EUR Currency: EUR Institutional B Shares : Launch date: 24 November 2011 Initial subscription price: 389.97 EUR Currency: EUR
2.1.2 STOCK EXCHANGE LISTING Not applicable.
2.1.3 GOAL AND KEY PRINCIPLES OF THE INVESTMENT POLICY
SUB-FUND’S OBJECT: The main objective of this sub-fund is to generate the highest possible return for its shareholders by investing directly or indirectly in transferable securities. This is reflected in its pursuit of capital gains and income. To this end, the assets are invested, either directly or indirectly via correlated financial instruments, primarily in shares.
SUB-FUND’S INVESTMENT POLICY:
PERMITTED ASSET CLASSES: The sub-fund may invest in securities, money market instruments, units in undertakings for collective investment, deposits, financial derivatives, liquid assets and all other instruments insofar as permitted by the applicable laws and regulations and consistent with the sub-fund’s object The sub-fund shall invest no more than 10% of its assets in units of other undertakings for collective investment.
RESTRICTIONS OF THE INVESTMENT POLICY: The investment policy will be implemented within the limits set by law and regulations. The sub-fund may borrow up to 10% of its net assets, insofar as these are short-term borrowings aimed at solving temporary liquidity problems.
PERMITTED DERIVATIVES TRANSACTIONS: Derivates may be used either for hedging purposes or to achieve investment objectives. Changes will be made to the investments at regular intervals to comply with the sub-fund's investment strategy. In addition, listed and unlisted derivates may be used to achieve the objectives: these may be forward contracts, options or swaps on securities, indices, currencies or interest rates or other transactions involving derivatives. Unlisted derivatives transactions will only be concluded with prime financial institutions specialised in such transactions. Such derivatives may also be used to hedge the assets against exchange-rate fluctuations. Subject to the applicable laws and regulations and the articles of association, the sub-fund always seeks to conclude the most effective transactions. All costs associated with the transactions will be charged to the sub-fund and all income generated will be paid to the sub-fund. If the transactions result in a risk in respect of the counterparty, this risk can be hedged by using a margin management system that ensures that the sub-fund is the beneficiary of security (collateral) in the form of cash or investment grade bonds. When calculating the value of the bonds, a margin will be applied that varies depending on the residual term to maturity and the currency in which the bond in question is denominated. The relationship with the counterparty or counterparties is governed by standard international agreements.
Derivatives may be used to partially hedge the open exchange risk in relation to the reference currency (euro). Where appropriate, they may therefore limit the foreign exchange risk expressed in euros, and hence the market risk and performance risk too.
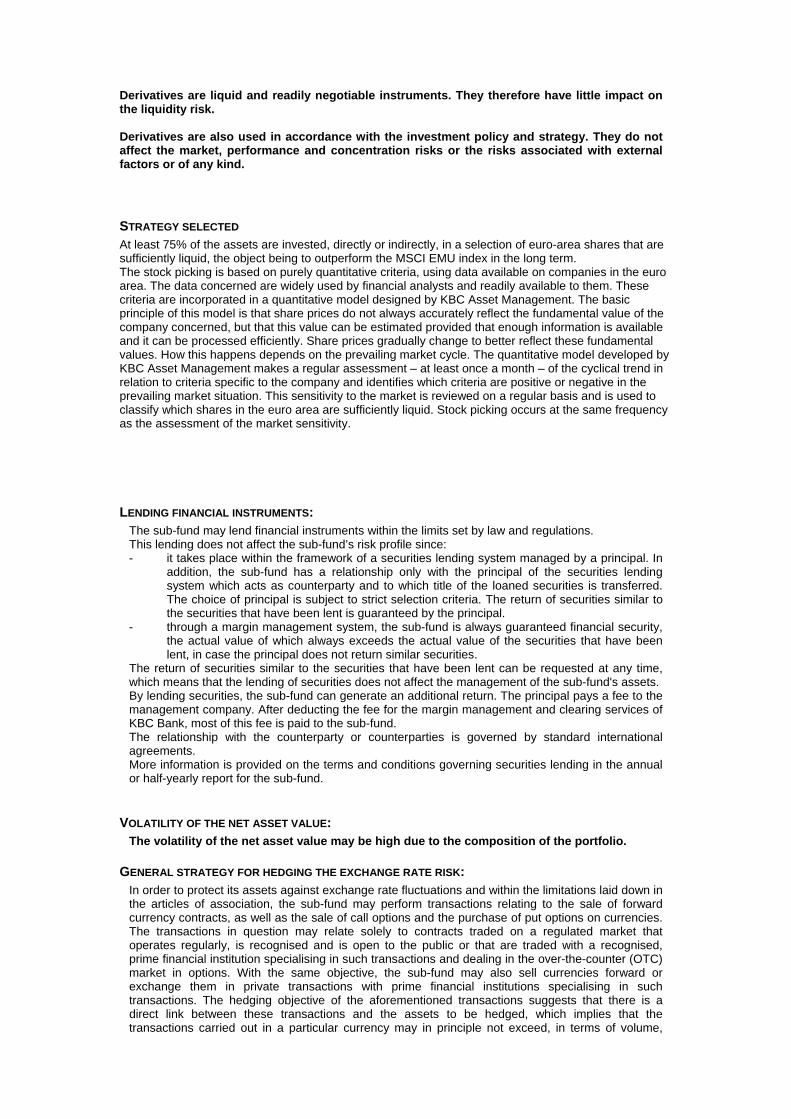
Derivatives are liquid and readily negotiable instruments. They therefore have little impact on the liquidity risk.
Derivatives are also used in accordance with the investment policy and strategy. They do not affect the market, performance and concentration risks or the risks associated with external factors or of any kind.
STRATEGY SELECTED At least 75% of the assets are invested, directly or indirectly, in a selection of euro-area shares that are sufficiently liquid, the object being to outperform the MSCI EMU index in the long term. The stock picking is based on purely quantitative criteria, using data available on companies in the euro area. The data concerned are widely used by financial analysts and readily available to them. These criteria are incorporated in a quantitative model designed by KBC Asset Management. The basic principle of this model is that share prices do not always accurately reflect the fundamental value of the company concerned, but that this value can be estimated provided that enough information is available and it can be processed efficiently. Share prices gradually change to better reflect these fundamental values. How this happens depends on the prevailing market cycle. The quantitative model developed by KBC Asset Management makes a regular assessment – at least once a month – of the cyclical trend in relation to criteria specific to the company and identifies which criteria are positive or negative in the prevailing market situation. This sensitivity to the market is reviewed on a regular basis and is used to classify which shares in the euro area are sufficiently liquid. Stock picking occurs at the same frequency as the assessment of the market sensitivity.
LENDING FINANCIAL INSTRUMENTS: The sub-fund may lend financial instruments within the limits set by law and regulations. This lending does not affect the sub-fund’s risk profile since: - it takes place within the framework of a securities lending system managed by a principal. In
addition, the sub-fund has a relationship only with the principal of the securities lending system which acts as counterparty and to which title of the loaned securities is transferred. The choice of principal is subject to strict selection criteria. The return of securities similar to the securities that have been lent is guaranteed by the principal.
- through a margin management system, the sub-fund is always guaranteed financial security, the actual value of which always exceeds the actual value of the securities that have been lent, in case the principal does not return similar securities.
The return of securities similar to the securities that have been lent can be requested at any time, which means that the lending of securities does not affect the management of the sub-fund's assets. By lending securities, the sub-fund can generate an additional return. The principal pays a fee to the management company. After deducting the fee for the margin management and clearing services of KBC Bank, most of this fee is paid to the sub-fund. The relationship with the counterparty or counterparties is governed by standard international agreements. More information is provided on the terms and conditions governing securities lending in the annual or half-yearly report for the sub-fund.
VOLATILITY OF THE NET ASSET VALUE: The volatility of the net asset value may be high due to the composition of the portfolio.
GENERAL STRATEGY FOR HEDGING THE EXCHANGE RATE RISK: In order to protect its assets against exchange rate fluctuations and within the limitations laid down in the articles of association, the sub-fund may perform transactions relating to the sale of forward currency contracts, as well as the sale of call options and the purchase of put options on currencies. The transactions in question may relate solely to contracts traded on a regulated market that operates regularly, is recognised and is open to the public or that are traded with a recognised, prime financial institution specialising in such transactions and dealing in the over-the-counter (OTC) market in options. With the same objective, the sub-fund may also sell currencies forward or exchange them in private transactions with prime financial institutions specialising in such transactions. The hedging objective of the aforementioned transactions suggests that there is a direct link between these transactions and the assets to be hedged, which implies that the transactions carried out in a particular currency may in principle not exceed, in terms of volume,

either the valuation value of all the assets in the same currency or the holding period of those assets.
SOCIAL, ETHICAL AND ENVIRONMENTAL ASPECTS:
No manufacturers of controversial weapons whose use over the past five decades, according to the international consensus, has led to disproportionate human suffering among the civilian population will be included in the portfolio of investments. This involves the manufacturers of anti-personnel mines, cluster bombs and munitions and weapons containing depleted uranium. In this way, the sub-fund seeks to reflect not only simple financial reality but also the social reality of the sector or region in question.
THE EUROPEAN SAVINGS DIRECTIVE AND TAX ON DEBT CLAIM RETURNS OBTAINED THROUGH THE
REDEMPTION OF OWN UNITS OR IN THE EVENT OF FULL OR PARTIAL DISTRIBUTION OF EQUITY
CAPITAL. The following information is of a general character and is not intended to cover all aspects of an investment in a UCITS. In certain cases entirely different rules might even apply. Moreover, both tax law and the interpretation of it can change. Investors who wish to have more information about the tax implications – in both Belgium and abroad – of acquiring, holding and transferring units should seek the advice of their usual financial and tax advisers. This UCITS shall invest a maximum of 15% of its assets directly or indirectly in debt instruments as intended by the European Savings Directive. A. European Savings Directive (Directive 2003/48/EC) The European Savings Directive has been implemented in Belgium. Since this UCITS invests a maximum of 15% of its assets directly or indirectly in debt claims as intended by the European Savings Directive, the income of this UCITS does not fall within the scope of this directive. B. Tax on debt claim returns obtained through the redemption of own units or in the event of full or partial distribution of equity capital (Article 19bis Income Tax Code 1992). The income from this UCITS is not subject to the tax on debt instrument returns as intended by Article 19bis, Income Tax Code 1992.
2.1.4 FINANCIAL PORTFOLIO MANAGEMENT There is no delegation of the portfolio.
2.1.5 DISTRIBUTORS KBC Asset Management S.A., 5, Place de la Gare, L-1616 Luxembourg.
2.1.6 INDEX AND BENCHMARK See ‘Sub-fund’s investment policy’.
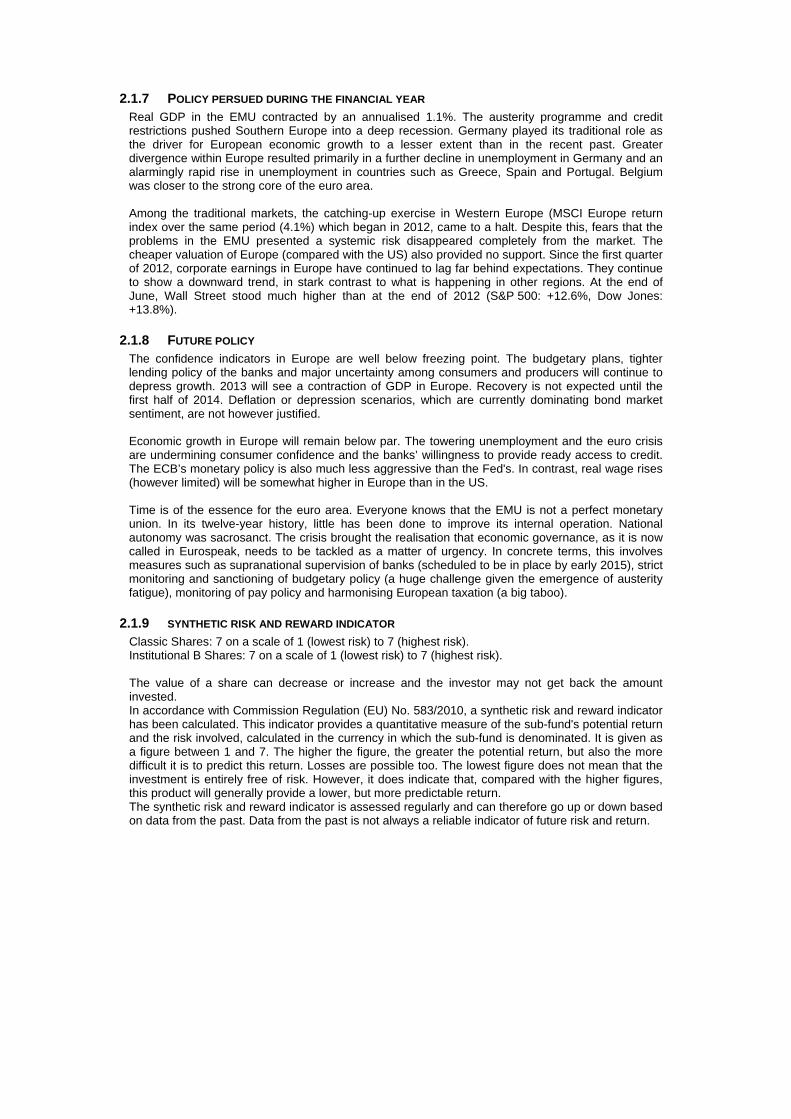
2.1.7 POLICY PERSUED DURING THE FINANCIAL YEAR Real GDP in the EMU contracted by an annualised 1.1%. The austerity programme and credit restrictions pushed Southern Europe into a deep recession. Germany played its traditional role as the driver for European economic growth to a lesser extent than in the recent past. Greater divergence within Europe resulted primarily in a further decline in unemployment in Germany and an alarmingly rapid rise in unemployment in countries such as Greece, Spain and Portugal. Belgium was closer to the strong core of the euro area. Among the traditional markets, the catching-up exercise in Western Europe (MSCI Europe return index over the same period (4.1%) which began in 2012, came to a halt. Despite this, fears that the problems in the EMU presented a systemic risk disappeared completely from the market. The cheaper valuation of Europe (compared with the US) also provided no support. Since the first quarter of 2012, corporate earnings in Europe have continued to lag far behind expectations. They continue to show a downward trend, in stark contrast to what is happening in other regions. At the end of June, Wall Street stood much higher than at the end of 2012 (S&P 500: +12.6%, Dow Jones: +13.8%).
2.1.8 FUTURE POLICY The confidence indicators in Europe are well below freezing point. The budgetary plans, tighter lending policy of the banks and major uncertainty among consumers and producers will continue to depress growth. 2013 will see a contraction of GDP in Europe. Recovery is not expected until the first half of 2014. Deflation or depression scenarios, which are currently dominating bond market sentiment, are not however justified. Economic growth in Europe will remain below par. The towering unemployment and the euro crisis are undermining consumer confidence and the banks’ willingness to provide ready access to credit. The ECB’s monetary policy is also much less aggressive than the Fed's. In contrast, real wage rises (however limited) will be somewhat higher in Europe than in the US. Time is of the essence for the euro area. Everyone knows that the EMU is not a perfect monetary union. In its twelve-year history, little has been done to improve its internal operation. National autonomy was sacrosanct. The crisis brought the realisation that economic governance, as it is now called in Eurospeak, needs to be tackled as a matter of urgency. In concrete terms, this involves measures such as supranational supervision of banks (scheduled to be in place by early 2015), strict monitoring and sanctioning of budgetary policy (a huge challenge given the emergence of austerity fatigue), monitoring of pay policy and harmonising European taxation (a big taboo).
2.1.9 SYNTHETIC RISK AND REWARD INDICATOR Classic Shares: 7 on a scale of 1 (lowest risk) to 7 (highest risk). Institutional B Shares: 7 on a scale of 1 (lowest risk) to 7 (highest risk). The value of a share can decrease or increase and the investor may not get back the amount invested. In accordance with Commission Regulation (EU) No. 583/2010, a synthetic risk and reward indicator has been calculated. This indicator provides a quantitative measure of the sub-fund's potential return and the risk involved, calculated in the currency in which the sub-fund is denominated. It is given as a figure between 1 and 7. The higher the figure, the greater the potential return, but also the more difficult it is to predict this return. Losses are possible too. The lowest figure does not mean that the investment is entirely free of risk. However, it does indicate that, compared with the higher figures, this product will generally provide a lower, but more predictable return. The synthetic risk and reward indicator is assessed regularly and can therefore go up or down based on data from the past. Data from the past is not always a reliable indicator of future risk and return.

2.2 BALANCE SHEET
Balance sheet layout 30/06/2013 (in the currency of the sub-fundt)
30/06/2012 (in the currency of the sub-fund )
TOTAL NET ASSETS 296.387.526,82 371.919.700,23
II. Securities, money market instruments, UCIs and derivatives
A. Bonds and other debt instruments a) Bonds 1.989.696,00 1.702.842,00 a} Collateral received in the form of bonds 36.627.847,36 21.837.122,38 C. Shares and similar instruments a) Shares 295.962.929,44 369.133.950,30 Of which securities lent 34.173.159,36 20.996.350,75 D. Other securities 311.495,46 25.333,44 F. Derivative financial instruments m) Financial indices Futures and forward contracts (+/-) 183.500,55
IV. Receivables and payables within one year A. Receivables a) Accounts receivable 143.206,35 b) Tax assets 298.981,55 103.248,71 B. Payables a) Accounts payable (-) -7.423,31 -454.862,62 c) Borrowings (-) -2.857.066,40 d) Collateral (-) -36.627.847,36 -21.837.122,38
V. Deposits and cash at bank and in hand A. Demand balances at banks 492.406,41 989.446,65
VI. Accruals and deferrals A. Expense to be carried forward 164.311,26 71.140,17 B. Accrued income 292.546,80 374.127,34 C. Accrued expense (-) -403.556,74 -209.026,31
TOTAL SHAREHOLDERS' EQUITY 296.387.526,82 371.919.700,23
A. Capital 280.289.368,86 384.097.385,21
B. Income equalization -1.878.044,38 -603.133,30
D. Result for the period 17.976.202,34 -11.574.551,68
Off-balance-sheet headings
I Collateral (+/-)
I.A Collateral (+/-)
I.A.A Securities/market instruments 36.627.847,36 21.837.122,38
III Notional amounts of futures and forward contracts
III.A Purchased futures and forward contracts 3.089.350,00
IX Financial instruments lent 34.173.159,36 20.996.350,75

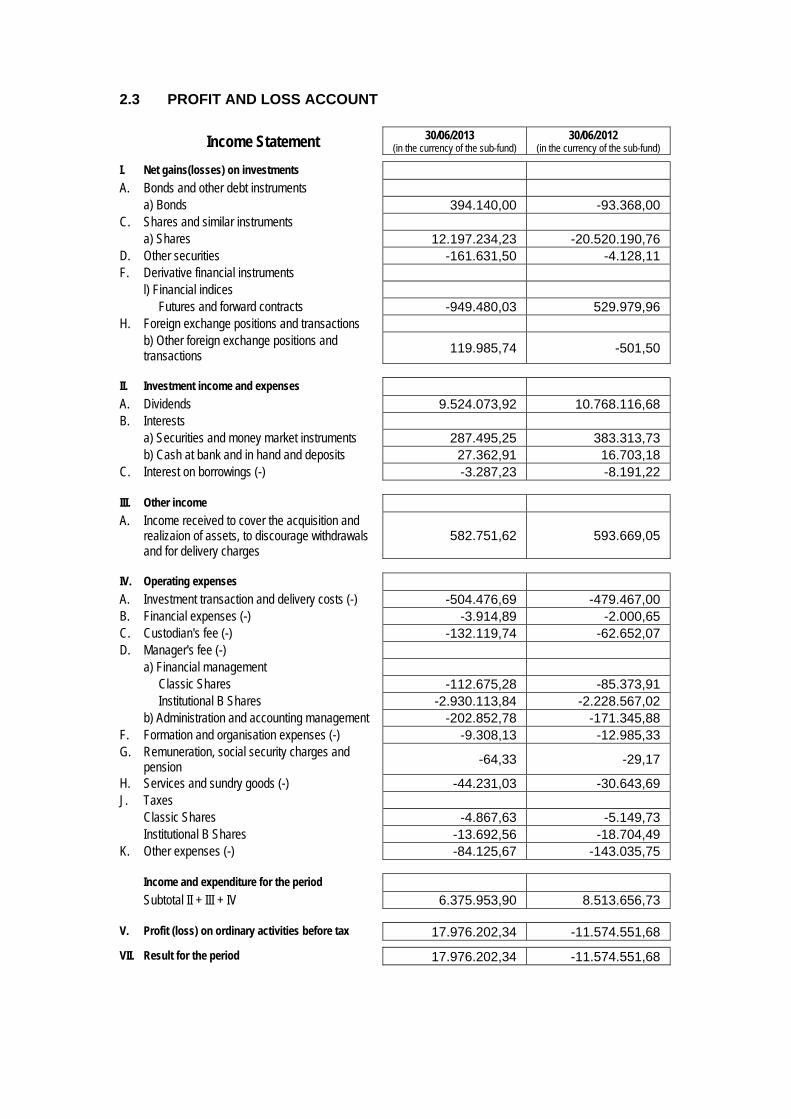
2.3 PROFIT AND LOSS ACCOUNT
Income Statement 30/06/2013 (in the currency of the sub-fund)
30/06/2012 (in the currency of the sub-fund)
I. Net gains(losses) on investments A. Bonds and other debt instruments a) Bonds 394.140,00 -93.368,00 C. Shares and similar instruments a) Shares 12.197.234,23 -20.520.190,76 D. Other securities -161.631,50 -4.128,11 F. Derivative financial instruments l) Financial indices Futures and forward contracts -949.480,03 529.979,96 H. Foreign exchange positions and transactions b) Other foreign exchange positions and
transactions 119.985,74 -501,50
II. Investment income and expenses A. Dividends 9.524.073,92 10.768.116,68 B. Interests a) Securities and money market instruments 287.495,25 383.313,73 b) Cash at bank and in hand and deposits 27.362,91 16.703,18 C. Interest on borrowings (-) -3.287,23 -8.191,22
III. Other income A. Income received to cover the acquisition and
realizaion of assets, to discourage withdrawals and for delivery charges
582.751,62 593.669,05
IV. Operating expenses A. Investment transaction and delivery costs (-) -504.476,69 -479.467,00 B. Financial expenses (-) -3.914,89 -2.000,65 C. Custodian's fee (-) -132.119,74 -62.652,07 D. Manager's fee (-) a) Financial management Classic Shares -112.675,28 -85.373,91 Institutional B Shares -2.930.113,84 -2.228.567,02 b) Administration and accounting management -202.852,78 -171.345,88 F. Formation and organisation expenses (-) -9.308,13 -12.985,33 G. Remuneration, social security charges and
pension -64,33 -29,17
H. Services and sundry goods (-) -44.231,03 -30.643,69 J. Taxes Classic Shares -4.867,63 -5.149,73 Institutional B Shares -13.692,56 -18.704,49 K. Other expenses (-) -84.125,67 -143.035,75
Income and expenditure for the period Subtotal II + III + IV 6.375.953,90 8.513.656,73
V. Profit (loss) on ordinary activities before tax 17.976.202,34 -11.574.551,68
VII. Result for the period 17.976.202,34 -11.574.551,68
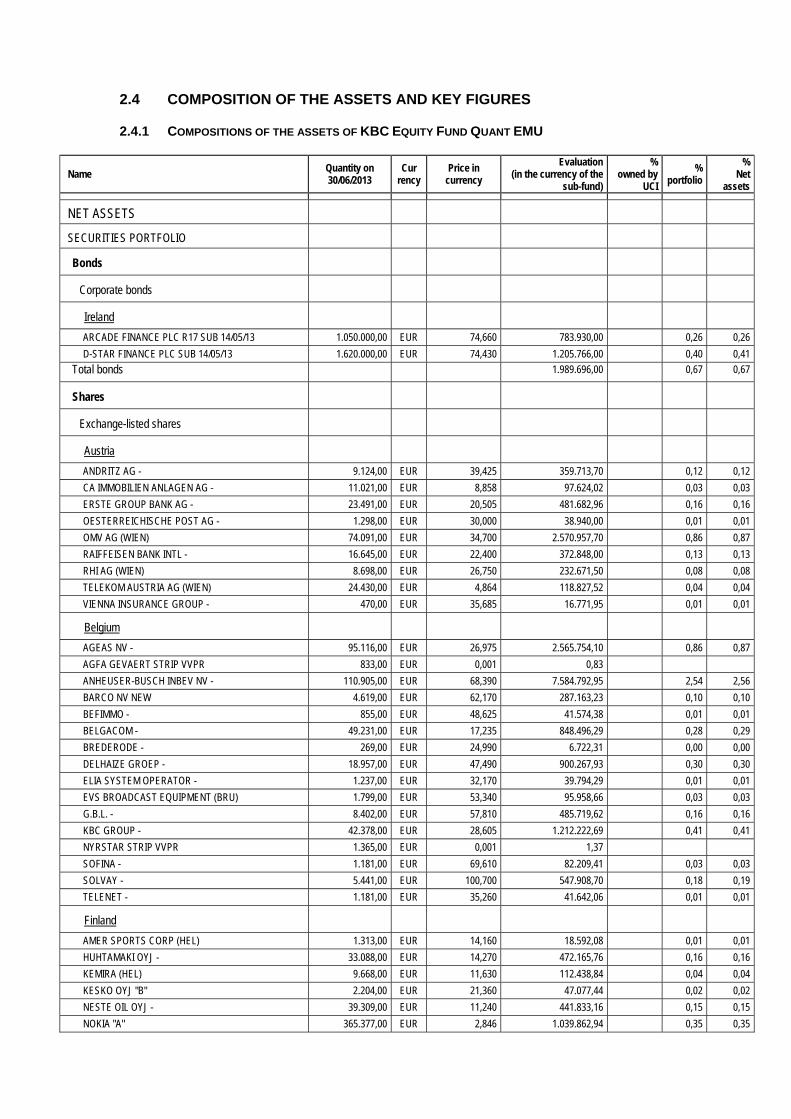
2.4 COMPOSITION OF THE ASSETS AND KEY FIGURES
2.4.1 COMPOSITIONS OF THE ASSETS OF KBC EQUITY FUND QUANT EMU
Name Quantity on 30/06/2013
Cur rency
Price in currency
Evaluation (in the currency of the
sub-fund)
% owned by
UCI
% portfolio
% Net
assets
NET ASSETS
SECURITIES PORTFOLIO
Bonds
Corporate bonds
Ireland
ARCADE FINANCE PLC R17 SUB 14/05/13 1.050.000,00 EUR 74,660 783.930,00 0,26 0,26
D-STAR FINANCE PLC SUB 14/05/13 1.620.000,00 EUR 74,430 1.205.766,00 0,40 0,41
Total bonds 1.989.696,00 0,67 0,67
Shares
Exchange-listed shares
Austria
ANDRITZ AG - 9.124,00 EUR 39,425 359.713,70 0,12 0,12
CA IMMOBILIEN ANLAGEN AG - 11.021,00 EUR 8,858 97.624,02 0,03 0,03
ERSTE GROUP BANK AG - 23.491,00 EUR 20,505 481.682,96 0,16 0,16
OESTERREICHISCHE POST AG - 1.298,00 EUR 30,000 38.940,00 0,01 0,01
OMV AG (WIEN) 74.091,00 EUR 34,700 2.570.957,70 0,86 0,87
RAIFFEISEN BANK INTL - 16.645,00 EUR 22,400 372.848,00 0,13 0,13
RHI AG (WIEN) 8.698,00 EUR 26,750 232.671,50 0,08 0,08
TELEKOM AUSTRIA AG (WIEN) 24.430,00 EUR 4,864 118.827,52 0,04 0,04
VIENNA INSURANCE GROUP - 470,00 EUR 35,685 16.771,95 0,01 0,01
Belgium
AGEAS NV - 95.116,00 EUR 26,975 2.565.754,10 0,86 0,87
AGFA GEVAERT STRIP VVPR 833,00 EUR 0,001 0,83
ANHEUSER-BUSCH INBEV NV - 110.905,00 EUR 68,390 7.584.792,95 2,54 2,56
BARCO NV NEW 4.619,00 EUR 62,170 287.163,23 0,10 0,10
BEFIMMO - 855,00 EUR 48,625 41.574,38 0,01 0,01
BELGACOM - 49.231,00 EUR 17,235 848.496,29 0,28 0,29
BREDERODE - 269,00 EUR 24,990 6.722,31 0,00 0,00
DELHAIZE GROEP - 18.957,00 EUR 47,490 900.267,93 0,30 0,30
ELIA SYSTEM OPERATOR - 1.237,00 EUR 32,170 39.794,29 0,01 0,01
EVS BROADCAST EQUIPMENT (BRU) 1.799,00 EUR 53,340 95.958,66 0,03 0,03
G.B.L. - 8.402,00 EUR 57,810 485.719,62 0,16 0,16
KBC GROUP - 42.378,00 EUR 28,605 1.212.222,69 0,41 0,41
NYRSTAR STRIP VVPR 1.365,00 EUR 0,001 1,37
SOFINA - 1.181,00 EUR 69,610 82.209,41 0,03 0,03
SOLVAY - 5.441,00 EUR 100,700 547.908,70 0,18 0,19
TELENET - 1.181,00 EUR 35,260 41.642,06 0,01 0,01
Finland
AMER SPORTS CORP (HEL) 1.313,00 EUR 14,160 18.592,08 0,01 0,01
HUHTAMAKI OYJ - 33.088,00 EUR 14,270 472.165,76 0,16 0,16
KEMIRA (HEL) 9.668,00 EUR 11,630 112.438,84 0,04 0,04
KESKO OYJ "B" 2.204,00 EUR 21,360 47.077,44 0,02 0,02
NESTE OIL OYJ - 39.309,00 EUR 11,240 441.833,16 0,15 0,15
NOKIA "A" 365.377,00 EUR 2,846 1.039.862,94 0,35 0,35
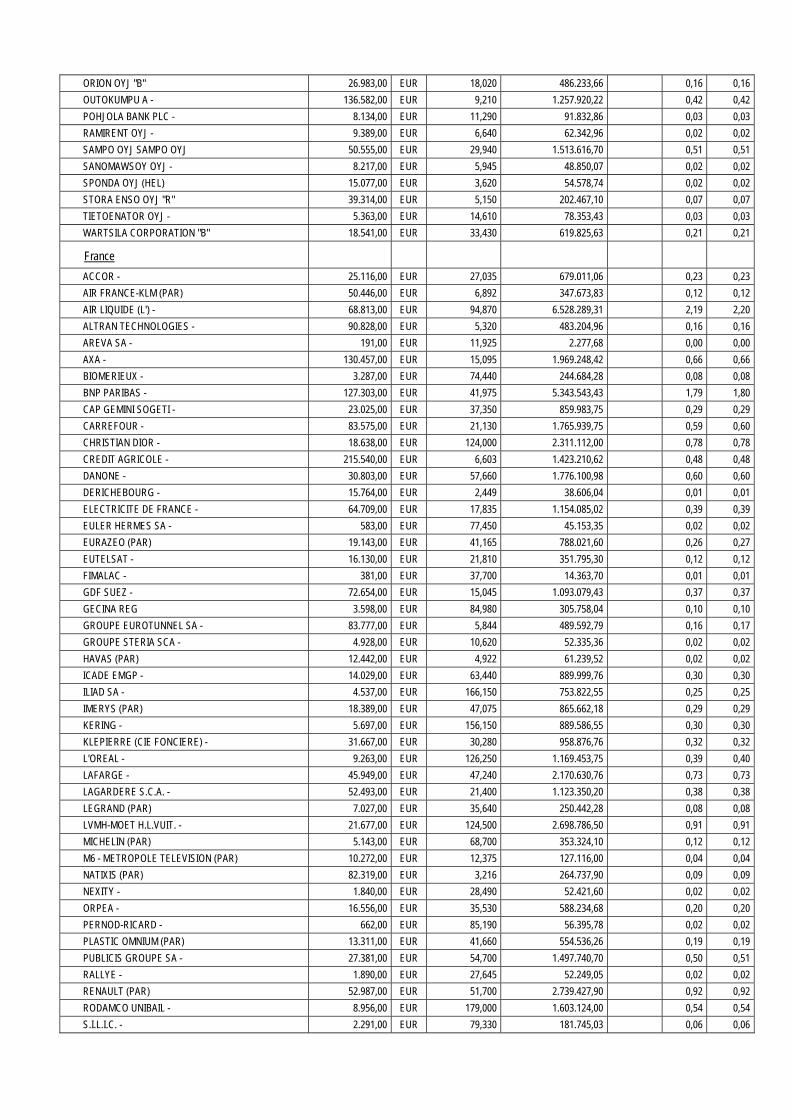
ORION OYJ "B" 26.983,00 EUR 18,020 486.233,66 0,16 0,16
OUTOKUMPU A - 136.582,00 EUR 9,210 1.257.920,22 0,42 0,42
POHJOLA BANK PLC - 8.134,00 EUR 11,290 91.832,86 0,03 0,03
RAMIRENT OYJ - 9.389,00 EUR 6,640 62.342,96 0,02 0,02
SAMPO OYJ SAMPO OYJ 50.555,00 EUR 29,940 1.513.616,70 0,51 0,51
SANOMAWSOY OYJ - 8.217,00 EUR 5,945 48.850,07 0,02 0,02
SPONDA OYJ (HEL) 15.077,00 EUR 3,620 54.578,74 0,02 0,02
STORA ENSO OYJ "R" 39.314,00 EUR 5,150 202.467,10 0,07 0,07
TIETOENATOR OYJ - 5.363,00 EUR 14,610 78.353,43 0,03 0,03
WARTSILA CORPORATION "B" 18.541,00 EUR 33,430 619.825,63 0,21 0,21
France
ACCOR - 25.116,00 EUR 27,035 679.011,06 0,23 0,23
AIR FRANCE-KLM (PAR) 50.446,00 EUR 6,892 347.673,83 0,12 0,12
AIR LIQUIDE (L') - 68.813,00 EUR 94,870 6.528.289,31 2,19 2,20
ALTRAN TECHNOLOGIES - 90.828,00 EUR 5,320 483.204,96 0,16 0,16
AREVA SA - 191,00 EUR 11,925 2.277,68 0,00 0,00
AXA - 130.457,00 EUR 15,095 1.969.248,42 0,66 0,66
BIOMERIEUX - 3.287,00 EUR 74,440 244.684,28 0,08 0,08
BNP PARIBAS - 127.303,00 EUR 41,975 5.343.543,43 1,79 1,80
CAP GEMINI SOGETI - 23.025,00 EUR 37,350 859.983,75 0,29 0,29
CARREFOUR - 83.575,00 EUR 21,130 1.765.939,75 0,59 0,60
CHRISTIAN DIOR - 18.638,00 EUR 124,000 2.311.112,00 0,78 0,78
CREDIT AGRICOLE - 215.540,00 EUR 6,603 1.423.210,62 0,48 0,48
DANONE - 30.803,00 EUR 57,660 1.776.100,98 0,60 0,60
DERICHEBOURG - 15.764,00 EUR 2,449 38.606,04 0,01 0,01
ELECTRICITE DE FRANCE - 64.709,00 EUR 17,835 1.154.085,02 0,39 0,39
EULER HERMES SA - 583,00 EUR 77,450 45.153,35 0,02 0,02
EURAZEO (PAR) 19.143,00 EUR 41,165 788.021,60 0,26 0,27
EUTELSAT - 16.130,00 EUR 21,810 351.795,30 0,12 0,12
FIMALAC - 381,00 EUR 37,700 14.363,70 0,01 0,01
GDF SUEZ - 72.654,00 EUR 15,045 1.093.079,43 0,37 0,37
GECINA REG 3.598,00 EUR 84,980 305.758,04 0,10 0,10
GROUPE EUROTUNNEL SA - 83.777,00 EUR 5,844 489.592,79 0,16 0,17
GROUPE STERIA SCA - 4.928,00 EUR 10,620 52.335,36 0,02 0,02
HAVAS (PAR) 12.442,00 EUR 4,922 61.239,52 0,02 0,02
ICADE EMGP - 14.029,00 EUR 63,440 889.999,76 0,30 0,30
ILIAD SA - 4.537,00 EUR 166,150 753.822,55 0,25 0,25
IMERYS (PAR) 18.389,00 EUR 47,075 865.662,18 0,29 0,29
KERING - 5.697,00 EUR 156,150 889.586,55 0,30 0,30
KLEPIERRE (CIE FONCIERE) - 31.667,00 EUR 30,280 958.876,76 0,32 0,32
L'OREAL - 9.263,00 EUR 126,250 1.169.453,75 0,39 0,40
LAFARGE - 45.949,00 EUR 47,240 2.170.630,76 0,73 0,73
LAGARDERE S.C.A. - 52.493,00 EUR 21,400 1.123.350,20 0,38 0,38
LEGRAND (PAR) 7.027,00 EUR 35,640 250.442,28 0,08 0,08
LVMH-MOET H.L.VUIT. - 21.677,00 EUR 124,500 2.698.786,50 0,91 0,91
MICHELIN (PAR) 5.143,00 EUR 68,700 353.324,10 0,12 0,12
M6 - METROPOLE TELEVISION (PAR) 10.272,00 EUR 12,375 127.116,00 0,04 0,04
NATIXIS (PAR) 82.319,00 EUR 3,216 264.737,90 0,09 0,09
NEXITY - 1.840,00 EUR 28,490 52.421,60 0,02 0,02
ORPEA - 16.556,00 EUR 35,530 588.234,68 0,20 0,20
PERNOD-RICARD - 662,00 EUR 85,190 56.395,78 0,02 0,02
PLASTIC OMNIUM (PAR) 13.311,00 EUR 41,660 554.536,26 0,19 0,19
PUBLICIS GROUPE SA - 27.381,00 EUR 54,700 1.497.740,70 0,50 0,51
RALLYE - 1.890,00 EUR 27,645 52.249,05 0,02 0,02
RENAULT (PAR) 52.987,00 EUR 51,700 2.739.427,90 0,92 0,92
RODAMCO UNIBAIL - 8.956,00 EUR 179,000 1.603.124,00 0,54 0,54
S.I.L.I.C. - 2.291,00 EUR 79,330 181.745,03 0,06 0,06
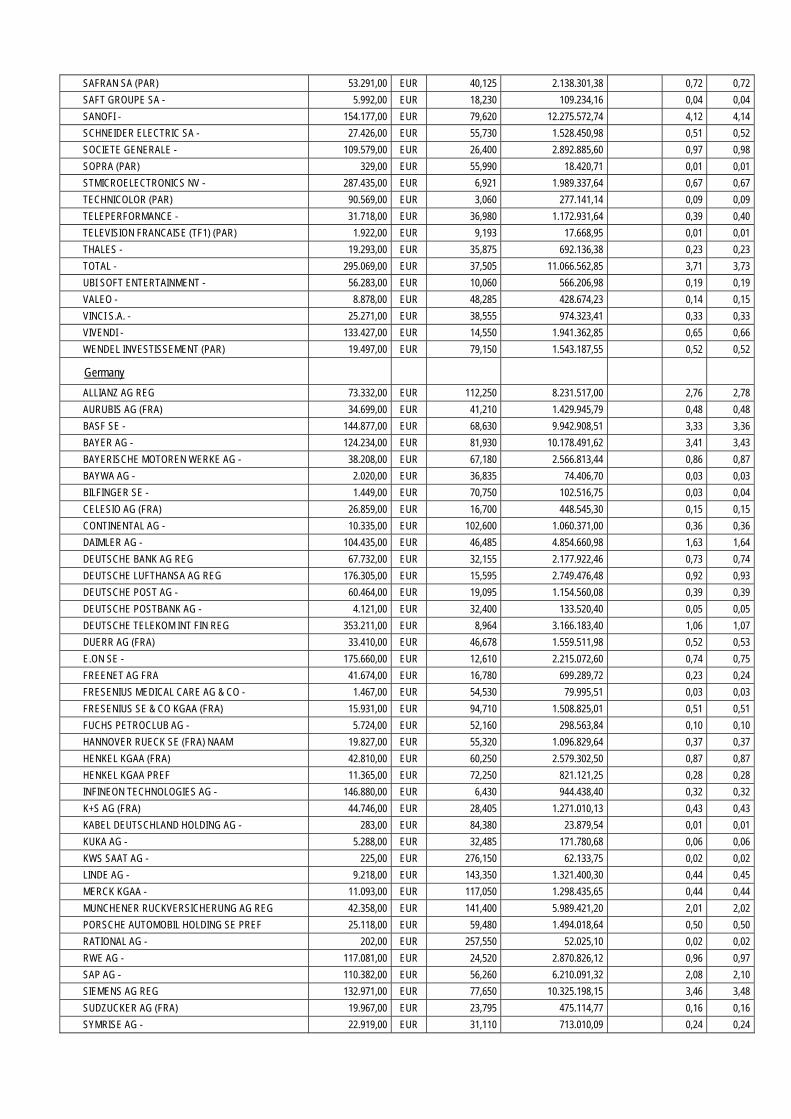
SAFRAN SA (PAR) 53.291,00 EUR 40,125 2.138.301,38 0,72 0,72
SAFT GROUPE SA - 5.992,00 EUR 18,230 109.234,16 0,04 0,04
SANOFI - 154.177,00 EUR 79,620 12.275.572,74 4,12 4,14
SCHNEIDER ELECTRIC SA - 27.426,00 EUR 55,730 1.528.450,98 0,51 0,52
SOCIETE GENERALE - 109.579,00 EUR 26,400 2.892.885,60 0,97 0,98
SOPRA (PAR) 329,00 EUR 55,990 18.420,71 0,01 0,01
STMICROELECTRONICS NV - 287.435,00 EUR 6,921 1.989.337,64 0,67 0,67
TECHNICOLOR (PAR) 90.569,00 EUR 3,060 277.141,14 0,09 0,09
TELEPERFORMANCE - 31.718,00 EUR 36,980 1.172.931,64 0,39 0,40
TELEVISION FRANCAISE (TF1) (PAR) 1.922,00 EUR 9,193 17.668,95 0,01 0,01
THALES - 19.293,00 EUR 35,875 692.136,38 0,23 0,23
TOTAL - 295.069,00 EUR 37,505 11.066.562,85 3,71 3,73
UBI SOFT ENTERTAINMENT - 56.283,00 EUR 10,060 566.206,98 0,19 0,19
VALEO - 8.878,00 EUR 48,285 428.674,23 0,14 0,15
VINCI S.A. - 25.271,00 EUR 38,555 974.323,41 0,33 0,33
VIVENDI - 133.427,00 EUR 14,550 1.941.362,85 0,65 0,66
WENDEL INVESTISSEMENT (PAR) 19.497,00 EUR 79,150 1.543.187,55 0,52 0,52
Germany
ALLIANZ AG REG 73.332,00 EUR 112,250 8.231.517,00 2,76 2,78
AURUBIS AG (FRA) 34.699,00 EUR 41,210 1.429.945,79 0,48 0,48
BASF SE - 144.877,00 EUR 68,630 9.942.908,51 3,33 3,36
BAYER AG - 124.234,00 EUR 81,930 10.178.491,62 3,41 3,43
BAYERISCHE MOTOREN WERKE AG - 38.208,00 EUR 67,180 2.566.813,44 0,86 0,87
BAYWA AG - 2.020,00 EUR 36,835 74.406,70 0,03 0,03
BILFINGER SE - 1.449,00 EUR 70,750 102.516,75 0,03 0,04
CELESIO AG (FRA) 26.859,00 EUR 16,700 448.545,30 0,15 0,15
CONTINENTAL AG - 10.335,00 EUR 102,600 1.060.371,00 0,36 0,36
DAIMLER AG - 104.435,00 EUR 46,485 4.854.660,98 1,63 1,64
DEUTSCHE BANK AG REG 67.732,00 EUR 32,155 2.177.922,46 0,73 0,74
DEUTSCHE LUFTHANSA AG REG 176.305,00 EUR 15,595 2.749.476,48 0,92 0,93
DEUTSCHE POST AG - 60.464,00 EUR 19,095 1.154.560,08 0,39 0,39
DEUTSCHE POSTBANK AG - 4.121,00 EUR 32,400 133.520,40 0,05 0,05
DEUTSCHE TELEKOM INT FIN REG 353.211,00 EUR 8,964 3.166.183,40 1,06 1,07
DUERR AG (FRA) 33.410,00 EUR 46,678 1.559.511,98 0,52 0,53
E.ON SE - 175.660,00 EUR 12,610 2.215.072,60 0,74 0,75
FREENET AG FRA 41.674,00 EUR 16,780 699.289,72 0,23 0,24
FRESENIUS MEDICAL CARE AG & CO - 1.467,00 EUR 54,530 79.995,51 0,03 0,03
FRESENIUS SE & CO KGAA (FRA) 15.931,00 EUR 94,710 1.508.825,01 0,51 0,51
FUCHS PETROCLUB AG - 5.724,00 EUR 52,160 298.563,84 0,10 0,10
HANNOVER RUECK SE (FRA) NAAM 19.827,00 EUR 55,320 1.096.829,64 0,37 0,37
HENKEL KGAA (FRA) 42.810,00 EUR 60,250 2.579.302,50 0,87 0,87
HENKEL KGAA PREF 11.365,00 EUR 72,250 821.121,25 0,28 0,28
INFINEON TECHNOLOGIES AG - 146.880,00 EUR 6,430 944.438,40 0,32 0,32
K+S AG (FRA) 44.746,00 EUR 28,405 1.271.010,13 0,43 0,43
KABEL DEUTSCHLAND HOLDING AG - 283,00 EUR 84,380 23.879,54 0,01 0,01
KUKA AG - 5.288,00 EUR 32,485 171.780,68 0,06 0,06
KWS SAAT AG - 225,00 EUR 276,150 62.133,75 0,02 0,02
LINDE AG - 9.218,00 EUR 143,350 1.321.400,30 0,44 0,45
MERCK KGAA - 11.093,00 EUR 117,050 1.298.435,65 0,44 0,44
MUNCHENER RUCKVERSICHERUNG AG REG 42.358,00 EUR 141,400 5.989.421,20 2,01 2,02
PORSCHE AUTOMOBIL HOLDING SE PREF 25.118,00 EUR 59,480 1.494.018,64 0,50 0,50
RATIONAL AG - 202,00 EUR 257,550 52.025,10 0,02 0,02
RWE AG - 117.081,00 EUR 24,520 2.870.826,12 0,96 0,97
SAP AG - 110.382,00 EUR 56,260 6.210.091,32 2,08 2,10
SIEMENS AG REG 132.971,00 EUR 77,650 10.325.198,15 3,46 3,48
SUDZUCKER AG (FRA) 19.967,00 EUR 23,795 475.114,77 0,16 0,16
SYMRISE AG - 22.919,00 EUR 31,110 713.010,09 0,24 0,24
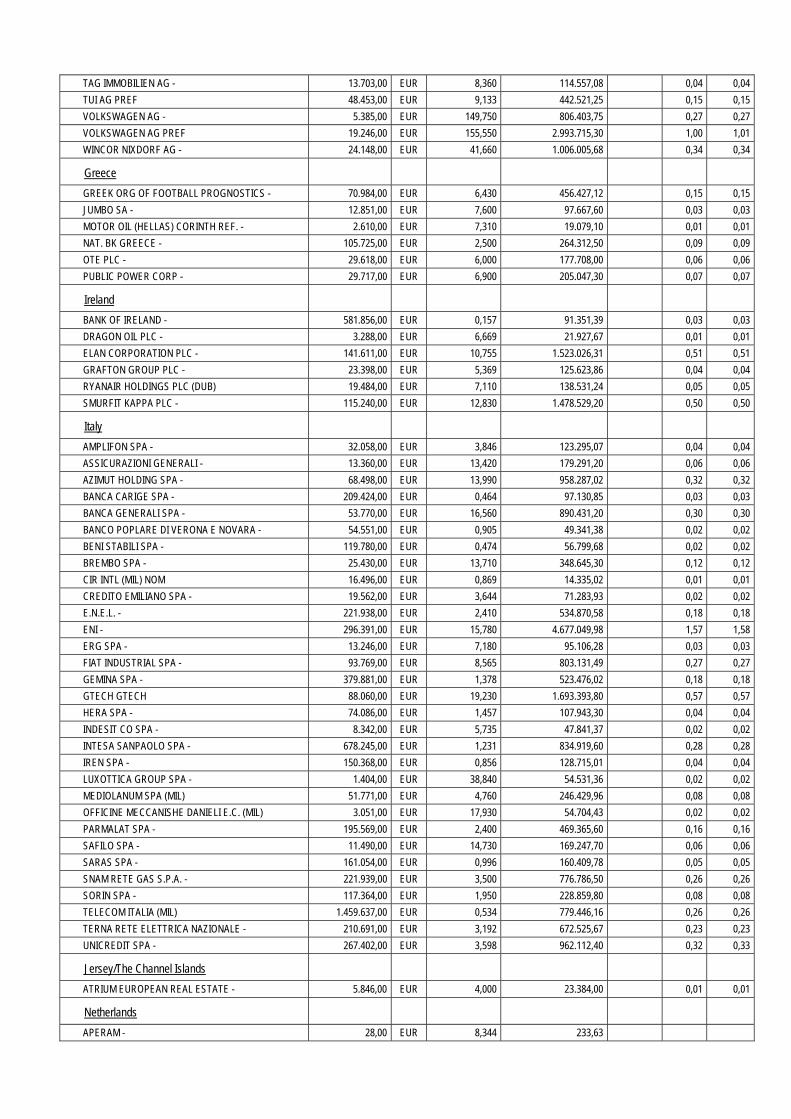
TAG IMMOBILIEN AG - 13.703,00 EUR 8,360 114.557,08 0,04 0,04
TUI AG PREF 48.453,00 EUR 9,133 442.521,25 0,15 0,15
VOLKSWAGEN AG - 5.385,00 EUR 149,750 806.403,75 0,27 0,27
VOLKSWAGEN AG PREF 19.246,00 EUR 155,550 2.993.715,30 1,00 1,01
WINCOR NIXDORF AG - 24.148,00 EUR 41,660 1.006.005,68 0,34 0,34
Greece
GREEK ORG OF FOOTBALL PROGNOSTICS - 70.984,00 EUR 6,430 456.427,12 0,15 0,15
JUMBO SA - 12.851,00 EUR 7,600 97.667,60 0,03 0,03
MOTOR OIL (HELLAS) CORINTH REF. - 2.610,00 EUR 7,310 19.079,10 0,01 0,01
NAT. BK GREECE - 105.725,00 EUR 2,500 264.312,50 0,09 0,09
OTE PLC - 29.618,00 EUR 6,000 177.708,00 0,06 0,06
PUBLIC POWER CORP - 29.717,00 EUR 6,900 205.047,30 0,07 0,07
Ireland
BANK OF IRELAND - 581.856,00 EUR 0,157 91.351,39 0,03 0,03
DRAGON OIL PLC - 3.288,00 EUR 6,669 21.927,67 0,01 0,01
ELAN CORPORATION PLC - 141.611,00 EUR 10,755 1.523.026,31 0,51 0,51
GRAFTON GROUP PLC - 23.398,00 EUR 5,369 125.623,86 0,04 0,04
RYANAIR HOLDINGS PLC (DUB) 19.484,00 EUR 7,110 138.531,24 0,05 0,05
SMURFIT KAPPA PLC - 115.240,00 EUR 12,830 1.478.529,20 0,50 0,50
Italy
AMPLIFON SPA - 32.058,00 EUR 3,846 123.295,07 0,04 0,04
ASSICURAZIONI GENERALI - 13.360,00 EUR 13,420 179.291,20 0,06 0,06
AZIMUT HOLDING SPA - 68.498,00 EUR 13,990 958.287,02 0,32 0,32
BANCA CARIGE SPA - 209.424,00 EUR 0,464 97.130,85 0,03 0,03
BANCA GENERALI SPA - 53.770,00 EUR 16,560 890.431,20 0,30 0,30
BANCO POPLARE DI VERONA E NOVARA - 54.551,00 EUR 0,905 49.341,38 0,02 0,02
BENI STABILI SPA - 119.780,00 EUR 0,474 56.799,68 0,02 0,02
BREMBO SPA - 25.430,00 EUR 13,710 348.645,30 0,12 0,12
CIR INTL (MIL) NOM 16.496,00 EUR 0,869 14.335,02 0,01 0,01
CREDITO EMILIANO SPA - 19.562,00 EUR 3,644 71.283,93 0,02 0,02
E.N.E.L. - 221.938,00 EUR 2,410 534.870,58 0,18 0,18
ENI - 296.391,00 EUR 15,780 4.677.049,98 1,57 1,58
ERG SPA - 13.246,00 EUR 7,180 95.106,28 0,03 0,03
FIAT INDUSTRIAL SPA - 93.769,00 EUR 8,565 803.131,49 0,27 0,27
GEMINA SPA - 379.881,00 EUR 1,378 523.476,02 0,18 0,18
GTECH GTECH 88.060,00 EUR 19,230 1.693.393,80 0,57 0,57
HERA SPA - 74.086,00 EUR 1,457 107.943,30 0,04 0,04
INDESIT CO SPA - 8.342,00 EUR 5,735 47.841,37 0,02 0,02
INTESA SANPAOLO SPA - 678.245,00 EUR 1,231 834.919,60 0,28 0,28
IREN SPA - 150.368,00 EUR 0,856 128.715,01 0,04 0,04
LUXOTTICA GROUP SPA - 1.404,00 EUR 38,840 54.531,36 0,02 0,02
MEDIOLANUM SPA (MIL) 51.771,00 EUR 4,760 246.429,96 0,08 0,08
OFFICINE MECCANISHE DANIELI E.C. (MIL) 3.051,00 EUR 17,930 54.704,43 0,02 0,02
PARMALAT SPA - 195.569,00 EUR 2,400 469.365,60 0,16 0,16
SAFILO SPA - 11.490,00 EUR 14,730 169.247,70 0,06 0,06
SARAS SPA - 161.054,00 EUR 0,996 160.409,78 0,05 0,05
SNAM RETE GAS S.P.A. - 221.939,00 EUR 3,500 776.786,50 0,26 0,26
SORIN SPA - 117.364,00 EUR 1,950 228.859,80 0,08 0,08
TELECOM ITALIA (MIL) 1.459.637,00 EUR 0,534 779.446,16 0,26 0,26
TERNA RETE ELETTRICA NAZIONALE - 210.691,00 EUR 3,192 672.525,67 0,23 0,23
UNICREDIT SPA - 267.402,00 EUR 3,598 962.112,40 0,32 0,33
Jersey/The Channel Islands
ATRIUM EUROPEAN REAL ESTATE - 5.846,00 EUR 4,000 23.384,00 0,01 0,01
Netherlands
APERAM - 28,00 EUR 8,344 233,63
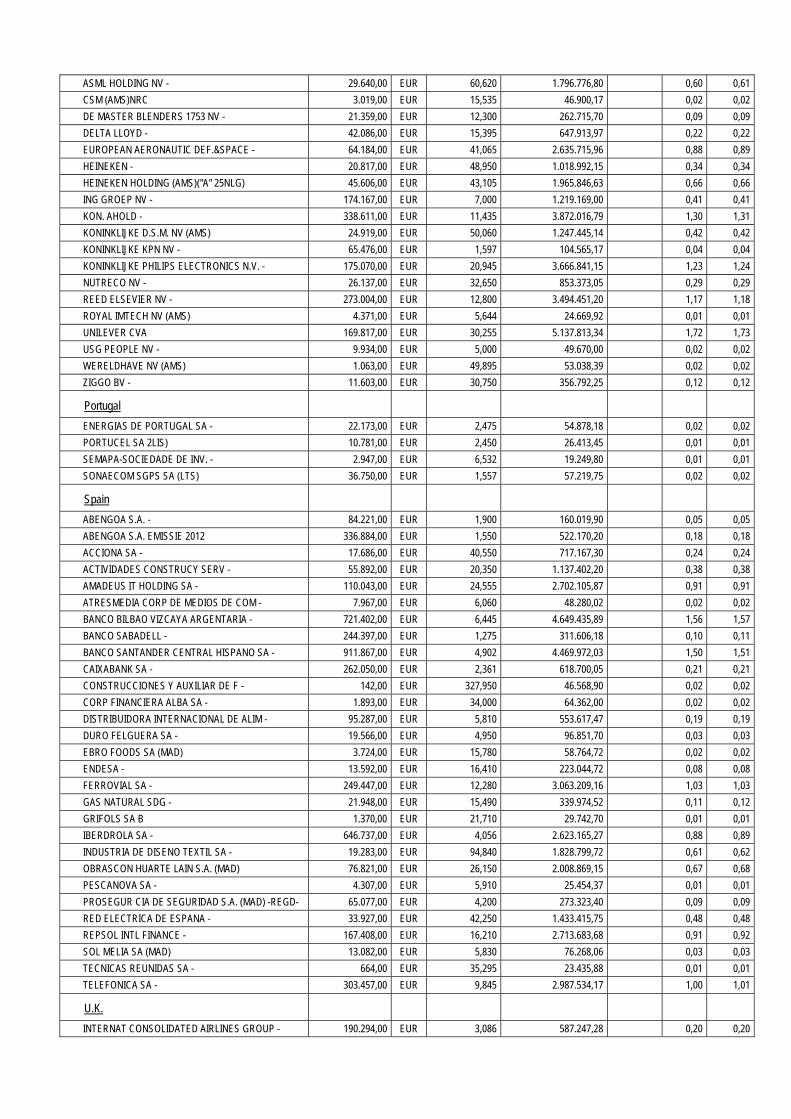
ASML HOLDING NV - 29.640,00 EUR 60,620 1.796.776,80 0,60 0,61
CSM (AMS)NRC 3.019,00 EUR 15,535 46.900,17 0,02 0,02
DE MASTER BLENDERS 1753 NV - 21.359,00 EUR 12,300 262.715,70 0,09 0,09
DELTA LLOYD - 42.086,00 EUR 15,395 647.913,97 0,22 0,22
EUROPEAN AERONAUTIC DEF.&SPACE - 64.184,00 EUR 41,065 2.635.715,96 0,88 0,89
HEINEKEN - 20.817,00 EUR 48,950 1.018.992,15 0,34 0,34
HEINEKEN HOLDING (AMS)("A" 25NLG) 45.606,00 EUR 43,105 1.965.846,63 0,66 0,66
ING GROEP NV - 174.167,00 EUR 7,000 1.219.169,00 0,41 0,41
KON. AHOLD - 338.611,00 EUR 11,435 3.872.016,79 1,30 1,31
KONINKLIJKE D.S.M. NV (AMS) 24.919,00 EUR 50,060 1.247.445,14 0,42 0,42
KONINKLIJKE KPN NV - 65.476,00 EUR 1,597 104.565,17 0,04 0,04
KONINKLIJKE PHILIPS ELECTRONICS N.V. - 175.070,00 EUR 20,945 3.666.841,15 1,23 1,24
NUTRECO NV - 26.137,00 EUR 32,650 853.373,05 0,29 0,29
REED ELSEVIER NV - 273.004,00 EUR 12,800 3.494.451,20 1,17 1,18
ROYAL IMTECH NV (AMS) 4.371,00 EUR 5,644 24.669,92 0,01 0,01
UNILEVER CVA 169.817,00 EUR 30,255 5.137.813,34 1,72 1,73
USG PEOPLE NV - 9.934,00 EUR 5,000 49.670,00 0,02 0,02
WERELDHAVE NV (AMS) 1.063,00 EUR 49,895 53.038,39 0,02 0,02
ZIGGO BV - 11.603,00 EUR 30,750 356.792,25 0,12 0,12
Portugal
ENERGIAS DE PORTUGAL SA - 22.173,00 EUR 2,475 54.878,18 0,02 0,02
PORTUCEL SA 2LIS) 10.781,00 EUR 2,450 26.413,45 0,01 0,01
SEMAPA-SOCIEDADE DE INV. - 2.947,00 EUR 6,532 19.249,80 0,01 0,01
SONAECOM SGPS SA (LTS) 36.750,00 EUR 1,557 57.219,75 0,02 0,02
Spain
ABENGOA S.A. - 84.221,00 EUR 1,900 160.019,90 0,05 0,05
ABENGOA S.A. EMISSIE 2012 336.884,00 EUR 1,550 522.170,20 0,18 0,18
ACCIONA SA - 17.686,00 EUR 40,550 717.167,30 0,24 0,24
ACTIVIDADES CONSTRUCY SERV - 55.892,00 EUR 20,350 1.137.402,20 0,38 0,38
AMADEUS IT HOLDING SA - 110.043,00 EUR 24,555 2.702.105,87 0,91 0,91
ATRESMEDIA CORP DE MEDIOS DE COM - 7.967,00 EUR 6,060 48.280,02 0,02 0,02
BANCO BILBAO VIZCAYA ARGENTARIA - 721.402,00 EUR 6,445 4.649.435,89 1,56 1,57
BANCO SABADELL - 244.397,00 EUR 1,275 311.606,18 0,10 0,11
BANCO SANTANDER CENTRAL HISPANO SA - 911.867,00 EUR 4,902 4.469.972,03 1,50 1,51
CAIXABANK SA - 262.050,00 EUR 2,361 618.700,05 0,21 0,21
CONSTRUCCIONES Y AUXILIAR DE F - 142,00 EUR 327,950 46.568,90 0,02 0,02
CORP FINANCIERA ALBA SA - 1.893,00 EUR 34,000 64.362,00 0,02 0,02
DISTRIBUIDORA INTERNACIONAL DE ALIM - 95.287,00 EUR 5,810 553.617,47 0,19 0,19
DURO FELGUERA SA - 19.566,00 EUR 4,950 96.851,70 0,03 0,03
EBRO FOODS SA (MAD) 3.724,00 EUR 15,780 58.764,72 0,02 0,02
ENDESA - 13.592,00 EUR 16,410 223.044,72 0,08 0,08
FERROVIAL SA - 249.447,00 EUR 12,280 3.063.209,16 1,03 1,03
GAS NATURAL SDG - 21.948,00 EUR 15,490 339.974,52 0,11 0,12
GRIFOLS SA B 1.370,00 EUR 21,710 29.742,70 0,01 0,01
IBERDROLA SA - 646.737,00 EUR 4,056 2.623.165,27 0,88 0,89
INDUSTRIA DE DISENO TEXTIL SA - 19.283,00 EUR 94,840 1.828.799,72 0,61 0,62
OBRASCON HUARTE LAIN S.A. (MAD) 76.821,00 EUR 26,150 2.008.869,15 0,67 0,68
PESCANOVA SA - 4.307,00 EUR 5,910 25.454,37 0,01 0,01
PROSEGUR CIA DE SEGURIDAD S.A. (MAD) -REGD- 65.077,00 EUR 4,200 273.323,40 0,09 0,09
RED ELECTRICA DE ESPANA - 33.927,00 EUR 42,250 1.433.415,75 0,48 0,48
REPSOL INTL FINANCE - 167.408,00 EUR 16,210 2.713.683,68 0,91 0,92
SOL MELIA SA (MAD) 13.082,00 EUR 5,830 76.268,06 0,03 0,03
TECNICAS REUNIDAS SA - 664,00 EUR 35,295 23.435,88 0,01 0,01
TELEFONICA SA - 303.457,00 EUR 9,845 2.987.534,17 1,00 1,01
U.K.
INTERNAT CONSOLIDATED AIRLINES GROUP - 190.294,00 EUR 3,086 587.247,28 0,20 0,20
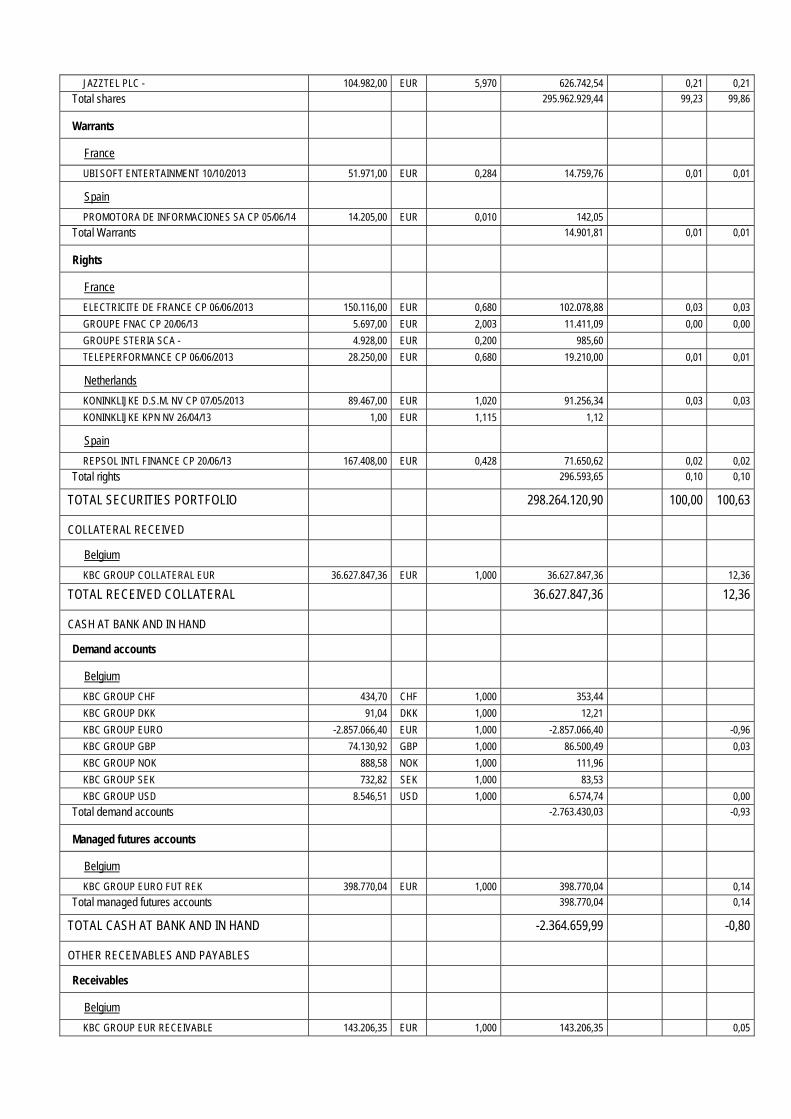
JAZZTEL PLC - 104.982,00 EUR 5,970 626.742,54 0,21 0,21
Total shares 295.962.929,44 99,23 99,86
Warrants
France
UBI SOFT ENTERTAINMENT 10/10/2013 51.971,00 EUR 0,284 14.759,76 0,01 0,01
Spain
PROMOTORA DE INFORMACIONES SA CP 05/06/14 14.205,00 EUR 0,010 142,05
Total Warrants 14.901,81 0,01 0,01
Rights
France
ELECTRICITE DE FRANCE CP 06/06/2013 150.116,00 EUR 0,680 102.078,88 0,03 0,03
GROUPE FNAC CP 20/06/13 5.697,00 EUR 2,003 11.411,09 0,00 0,00
GROUPE STERIA SCA - 4.928,00 EUR 0,200 985,60
TELEPERFORMANCE CP 06/06/2013 28.250,00 EUR 0,680 19.210,00 0,01 0,01
Netherlands
KONINKLIJKE D.S.M. NV CP 07/05/2013 89.467,00 EUR 1,020 91.256,34 0,03 0,03
KONINKLIJKE KPN NV 26/04/13 1,00 EUR 1,115 1,12
Spain
REPSOL INTL FINANCE CP 20/06/13 167.408,00 EUR 0,428 71.650,62 0,02 0,02
Total rights 296.593,65 0,10 0,10
TOTAL SECURITIES PORTFOLIO 298.264.120,90 100,00 100,63
COLLATERAL RECEIVED
Belgium
KBC GROUP COLLATERAL EUR 36.627.847,36 EUR 1,000 36.627.847,36 12,36
TOTAL RECEIVED COLLATERAL 36.627.847,36 12,36
CASH AT BANK AND IN HAND
Demand accounts
Belgium
KBC GROUP CHF 434,70 CHF 1,000 353,44
KBC GROUP DKK 91,04 DKK 1,000 12,21
KBC GROUP EURO -2.857.066,40 EUR 1,000 -2.857.066,40 -0,96
KBC GROUP GBP 74.130,92 GBP 1,000 86.500,49 0,03
KBC GROUP NOK 888,58 NOK 1,000 111,96
KBC GROUP SEK 732,82 SEK 1,000 83,53
KBC GROUP USD 8.546,51 USD 1,000 6.574,74 0,00
Total demand accounts -2.763.430,03 -0,93
Managed futures accounts
Belgium
KBC GROUP EURO FUT REK 398.770,04 EUR 1,000 398.770,04 0,14
Total managed futures accounts 398.770,04 0,14
TOTAL CASH AT BANK AND IN HAND -2.364.659,99 -0,80
OTHER RECEIVABLES AND PAYABLES
Receivables
Belgium
KBC GROUP EUR RECEIVABLE 143.206,35 EUR 1,000 143.206,35 0,05

KBC GROUP WHT TO BE RECOVERED EUR 298.981,55 EUR 1,000 298.981,55 0,10
Total receivables 442.187,90 0,15
Payables
Belgium
KBC GROUP COUNTERPART ENTRY COLLATERAL IN EUR -36.627.847,36 EUR 1,000 -36.627.847,36 -12,36
KBC GROUP EUR PAYABLE -7.423,31 EUR 1,000 -7.423,31 0,00
Payables -36.635.270,67 -12,36
TOTAL RECEIVABLES AND PAYABLES -36.193.082,77 -12,21
OTHER
Interest receivable EUR 186.681,16 0,06
Accrued interest EUR 105.865,64 0,04
Expenses payable EUR -403.556,74 -0,14
Expenses to be carried forward EUR 164.311,26 0,06
TOTAL OTHER 53.301,32 0,02
TOTAL NET ASSETS 296.387.526,82 100,00
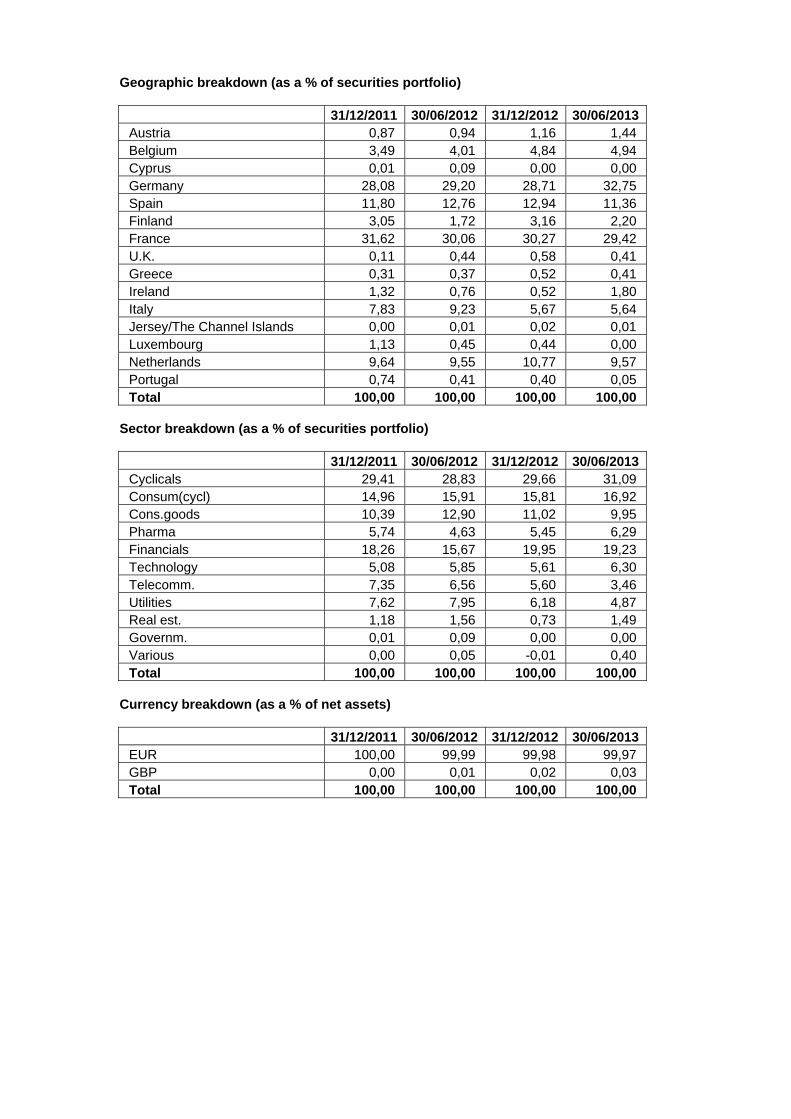
Geographic breakdown (as a % of securities portfolio)
31/12/2011 30/06/2012 31/12/2012 30/06/2013 Austria 0,87 0,94 1,16 1,44 Belgium 3,49 4,01 4,84 4,94 Cyprus 0,01 0,09 0,00 0,00 Germany 28,08 29,20 28,71 32,75 Spain 11,80 12,76 12,94 11,36 Finland 3,05 1,72 3,16 2,20 France 31,62 30,06 30,27 29,42 U.K. 0,11 0,44 0,58 0,41 Greece 0,31 0,37 0,52 0,41 Ireland 1,32 0,76 0,52 1,80 Italy 7,83 9,23 5,67 5,64 Jersey/The Channel Islands 0,00 0,01 0,02 0,01 Luxembourg 1,13 0,45 0,44 0,00 Netherlands 9,64 9,55 10,77 9,57 Portugal 0,74 0,41 0,40 0,05 Total 100,00 100,00 100,00 100,00
Sector breakdown (as a % of securities portfolio)
31/12/2011 30/06/2012 31/12/2012 30/06/2013 Cyclicals 29,41 28,83 29,66 31,09 Consum(cycl) 14,96 15,91 15,81 16,92 Cons.goods 10,39 12,90 11,02 9,95 Pharma 5,74 4,63 5,45 6,29 Financials 18,26 15,67 19,95 19,23 Technology 5,08 5,85 5,61 6,30 Telecomm. 7,35 6,56 5,60 3,46 Utilities 7,62 7,95 6,18 4,87 Real est. 1,18 1,56 0,73 1,49 Governm. 0,01 0,09 0,00 0,00 Various 0,00 0,05 -0,01 0,40 Total 100,00 100,00 100,00 100,00
Currency breakdown (as a % of net assets)
31/12/2011 30/06/2012 31/12/2012 30/06/2013 EUR 100,00 99,99 99,98 99,97 GBP 0,00 0,01 0,02 0,03 Total 100,00 100,00 100,00 100,00

2.4.2 CHANGES IN THE COMPOSITION OF THE ASSETS OF KBC EQUITY FUND QUANT EMU (IN THE
CURRENCY OF THE SUB-FUND)
1st half of year YearPurchases 209.053.712,92 209.053.712,92 Sales 295.260.591,35 295.260.591,35 Total 1 504.314.304,26 504.314.304,26 Subscriptions 182.233.244,49 182.233.244,49 Redemptions 300.541.063,80 300.541.063,80 Total 2 482.774.308,29 482.774.308,29 Monthly average of total assets
411.502.729,34 411.502.729,34
Turnover rate 5,23 % 5,23 %
1st half of year YearPurchases 209.053.712,92 209.053.712,92 Sales 295.260.591,35 295.260.591,35 Total 1 504.314.304,26 504.314.304,26 Subscriptions 182.233.244,49 182.233.244,49 Redemptions 300.541.063,80 300.541.063,80 Total 2 482.774.308,29 482.774.308,29 Monthly average of total assets
487.330.225,61 487.330.225,61
Corrected turnover rate 4,42 % 4,42 %
The table above shows the capital volume of portfolio transactions. This volume (adjusted to take account of total subscriptions and redemptions) is also compared to the average net assets at the beginning and end of the period. A figure close to 0% implies that the transactions relating to the securities or transactions relating to the assets (excluding deposits and cash) in a given period only involve subscriptions and redemptions. A negative percentage shows that subscriptions and redemptions entailed few, if any, transactions in the portfolio. Active asset management may result in high turnover rates (monthly percentage >50%). The detailed list of transactions is available for consultation free of charge at the registered office of the Bevek or fund at Havenlaan 2, 1080 Brussels.
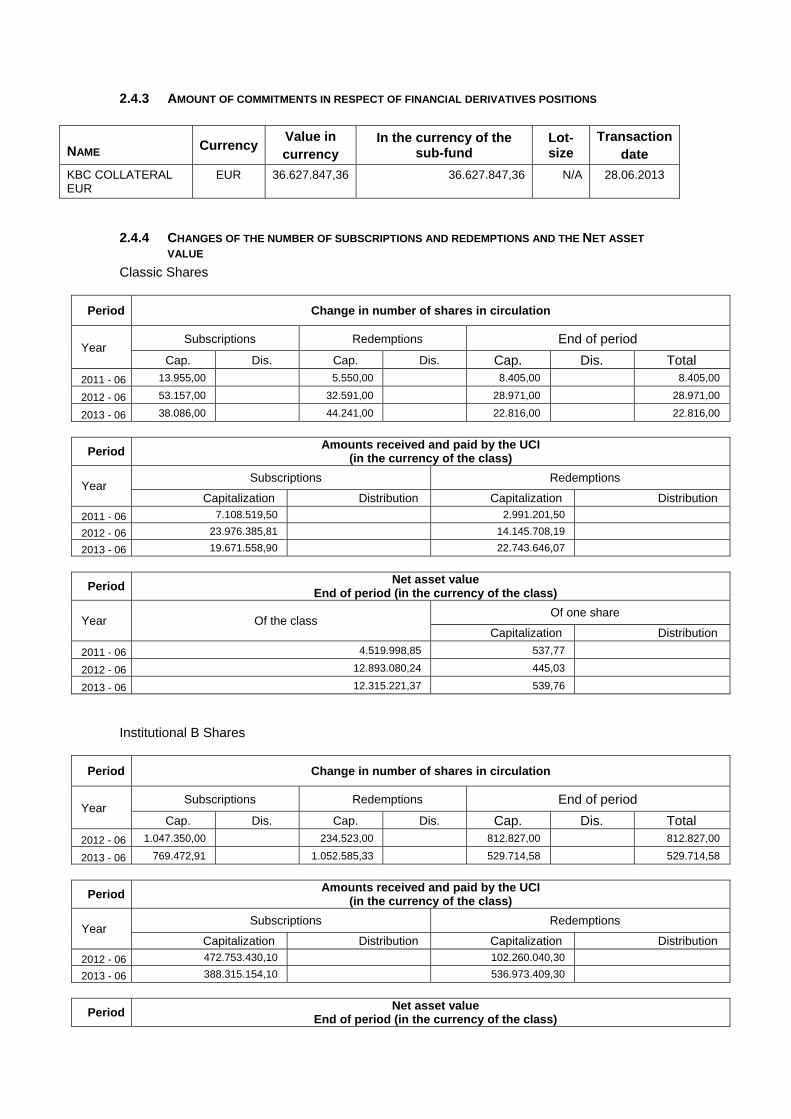
2.4.3 AMOUNT OF COMMITMENTS IN RESPECT OF FINANCIAL DERIVATIVES POSITIONS
NAME Currency Value in currency
In the currency of the sub-fund
Lot-size
Transactiondate
KBC COLLATERAL EUR
EUR 36.627.847,36 36.627.847,36 N/A 28.06.2013
2.4.4 CHANGES OF THE NUMBER OF SUBSCRIPTIONS AND REDEMPTIONS AND THE NET ASSET
VALUE
Classic Shares
Period Change in number of shares in circulation
Year Subscriptions Redemptions End of period
Cap. Dis. Cap. Dis. Cap. Dis. Total
2011 - 06 13.955,00 5.550,00 8.405,00 8.405,00
2012 - 06 53.157,00 32.591,00 28.971,00 28.971,00
2013 - 06 38.086,00 44.241,00 22.816,00 22.816,00
Period Amounts received and paid by the UCI
(in the currency of the class)
Year Subscriptions Redemptions
Capitalization Distribution Capitalization Distribution
2011 - 06 7.108.519,50 2.991.201,50
2012 - 06 23.976.385,81 14.145.708,19
2013 - 06 19.671.558,90 22.743.646,07
Period Net asset value
End of period (in the currency of the class)
Year Of the class Of one share
Capitalization Distribution
2011 - 06 4.519.998,85 537,77
2012 - 06 12.893.080,24 445,03
2013 - 06 12.315.221,37 539,76
Institutional B Shares
Period Change in number of shares in circulation
Year Subscriptions Redemptions End of period
Cap. Dis. Cap. Dis. Cap. Dis. Total 2012 - 06 1.047.350,00 234.523,00 812.827,00 812.827,00
2013 - 06 769.472,91 1.052.585,33 529.714,58 529.714,58
Period Amounts received and paid by the UCI
(in the currency of the class)
Year Subscriptions Redemptions
Capitalization Distribution Capitalization Distribution
2012 - 06 472.753.430,10 102.260.040,30
2013 - 06 388.315.154,10 536.973.409,30
Period Net asset value
End of period (in the currency of the class)

Year Of the class Of one share
Capitalization Distribution
2012 - 06 359.026.620,00 441,70
2013 - 06 284.072.305,50 536,27

2.4.5 PERFORMANCE FIGURES
Classic Shares
Cap Div
ISIN code Cur-
rency
1 Year 3 Years* 5 Years* 10 Years* Since launch*
Share classes
Bench mark
Share classes
Bench mark
Share classes
Bench mark
Share classes
Bench mark
Launch Date
Share classes
CAP BE6208574895 EUR 21.29% 01/10/2010 2.83%
Institutional B Shares
Cap ISIN code Cur- 1 Year 3 Years* 5 Years* 10 Years* Since launch*
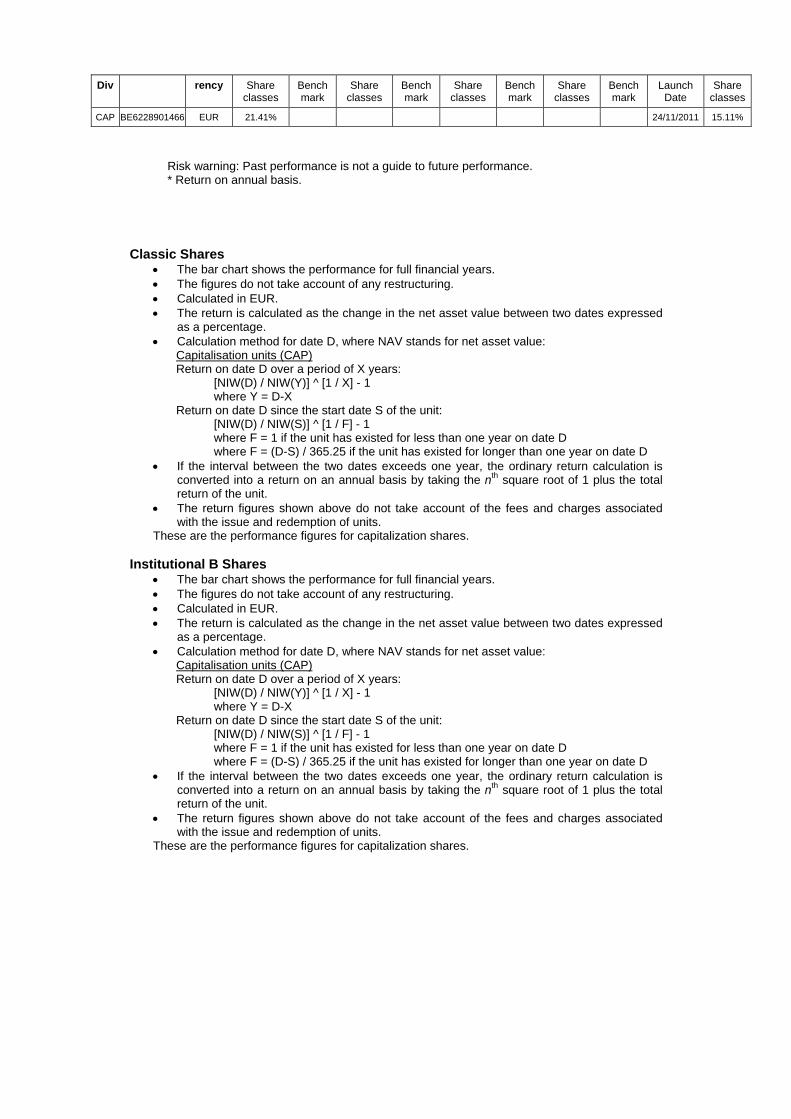
Div rency Share classes
Bench mark
Share classes
Bench mark
Share classes
Bench mark
Share classes
Bench mark
Launch Date
Share classes
CAP BE6228901466 EUR 21.41% 24/11/2011 15.11%
Risk warning: Past performance is not a guide to future performance. * Return on annual basis.
Classic Shares The bar chart shows the performance for full financial years. The figures do not take account of any restructuring. Calculated in EUR. The return is calculated as the change in the net asset value between two dates expressed
as a percentage. Calculation method for date D, where NAV stands for net asset value:
Capitalisation units (CAP) Return on date D over a period of X years:
[NIW(D) / NIW(Y)] ^ [1 / X] - 1 where Y = D-X
Return on date D since the start date S of the unit: [NIW(D) / NIW(S)] ^ [1 / F] - 1 where F = 1 if the unit has existed for less than one year on date D where F = (D-S) / 365.25 if the unit has existed for longer than one year on date D
If the interval between the two dates exceeds one year, the ordinary return calculation is converted into a return on an annual basis by taking the nth square root of 1 plus the total return of the unit.
The return figures shown above do not take account of the fees and charges associated with the issue and redemption of units.
These are the performance figures for capitalization shares.
Institutional B Shares The bar chart shows the performance for full financial years. The figures do not take account of any restructuring. Calculated in EUR. The return is calculated as the change in the net asset value between two dates expressed
as a percentage. Calculation method for date D, where NAV stands for net asset value:
Capitalisation units (CAP) Return on date D over a period of X years:
[NIW(D) / NIW(Y)] ^ [1 / X] - 1 where Y = D-X
Return on date D since the start date S of the unit: [NIW(D) / NIW(S)] ^ [1 / F] - 1 where F = 1 if the unit has existed for less than one year on date D where F = (D-S) / 365.25 if the unit has existed for longer than one year on date D
If the interval between the two dates exceeds one year, the ordinary return calculation is converted into a return on an annual basis by taking the nth square root of 1 plus the total return of the unit.
The return figures shown above do not take account of the fees and charges associated with the issue and redemption of units.
These are the performance figures for capitalization shares.

2.4.6 COSTS Ongoing Charges: * Classic Shares Capitalization: 1.756% Institutional B Shares Capitalization: 1.679% * The following costs have not been included in the ongoing charges: - Interest payments on loans taken out - Payments in respect of financial derivatives - Fees and charges paid directly by the investor - Any soft commissions
SOFT COMMISSIONS The management company or the appointed manager, as the case may be, is the recipient of soft commissions. The recipient has laid down an internal policy as regards accepting soft commissions and avoiding possible conflicts of interest in this respect, and has put appropriate internal controls in place to ensure this policy is observed. For more information, please see the ‘General’ section of the annual report.
Broker
Commission gross
in EUR
paid during the period:
1‐01‐13
‐
30‐06‐13
CSA Credits
in EUR
accrued during the period:
1‐01‐13
‐
30‐06‐13 Percentage
CITI 28,444 24,248 85.25%
CSFBSAS 20,843 11,717 56.22%
DEUTSCHE 101,640 50,820 50.00%
INSTINET 34,319 17,160 50.00%
MERRILL 34,547 17,274 50.00%
MORGAN STANLEY 11,092 6,099 54.99%
UBSWDR 533 123 23.08%
FEE-SHARING AGREEMENTS AND REBATES: The management company may share its fee with the distributor, and institutional and/or professional parties. In principle, the percentage share amounts to between 35% and 60% if the distributor is an entity of KBC Group NV or to between 35% and 70% if the distributor is not an entity of KBC Group NV. However, in a small number of cases, the distributor’s fee is less than 35%. Investors may, on request, obtain more information on these cases. If the management company invests the assets of the undertaking for collective investment in units of undertakings for collective investment that are not managed by an entity of KBC Group NV, and receives a fee for doing so, it will pay this fee to the undertaking for collective investment. Fee-sharing does not affect the amount of the management fee paid by the sub-fund to the management company. This management fee is subject to the limitations laid down in the articles of association. The limitations may only be amended after approval by the general meeting of shareholders. The management company has concluded a distribution agreement with the distributor in order to facilitate the wider distribution of the sub-fund's units by using multiple distribution channels. It is in the interests of the holders of units, the sub-fund and of the distributor for the largest possible number of units to be sold and for the assets of the sub-fund to be maximised in this way. In this respect, there is therefore no question of any conflict of interest.
2.4.7 NOTES TO THE FINANCIAL STATEMENTS AND OTHER DATA Fee for managing the investment portfolio: 1.5% per annum calculated on the basis of the average total net assets of the sub-fund, no management fee is charged on assets assets invested in investment undertakings managed by a financial institution of the KBC group. The administration agent’s fee is payable at the end of each month and is calculated on the basis of the average total net assets of the sub-fund.
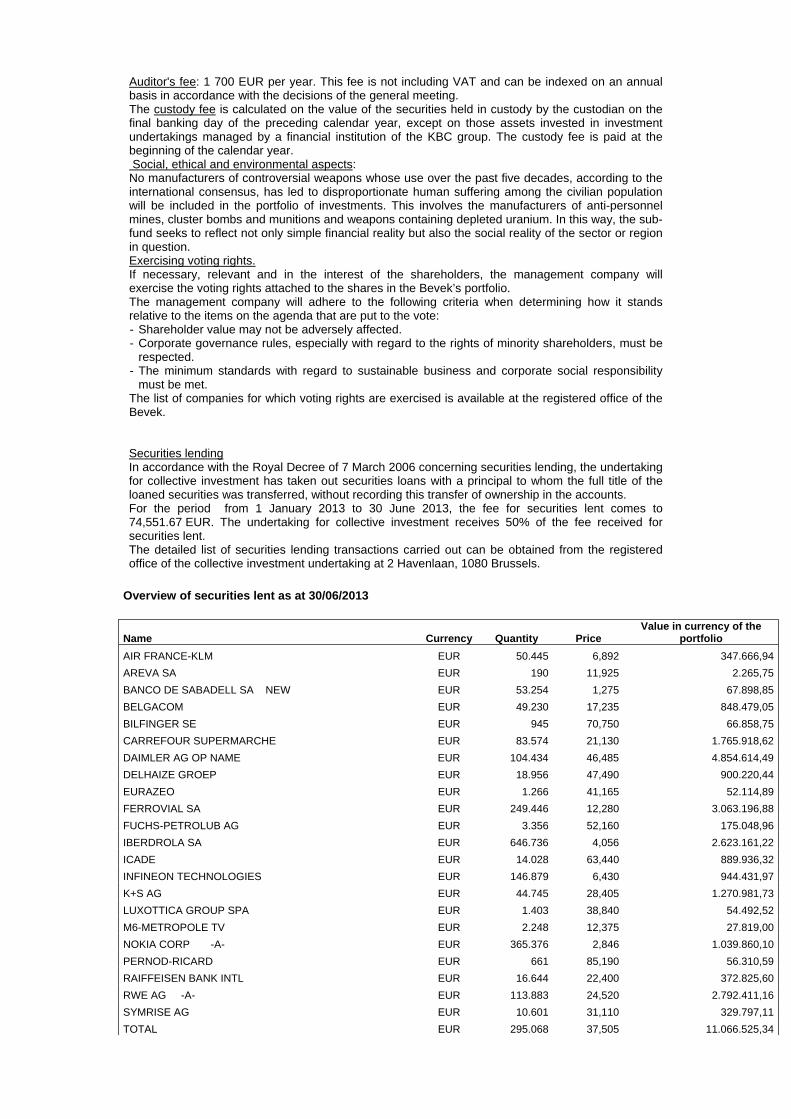
Auditor's fee: 1 700 EUR per year. This fee is not including VAT and can be indexed on an annual basis in accordance with the decisions of the general meeting. The custody fee is calculated on the value of the securities held in custody by the custodian on the final banking day of the preceding calendar year, except on those assets invested in investment undertakings managed by a financial institution of the KBC group. The custody fee is paid at the beginning of the calendar year. Social, ethical and environmental aspects: No manufacturers of controversial weapons whose use over the past five decades, according to the international consensus, has led to disproportionate human suffering among the civilian population will be included in the portfolio of investments. This involves the manufacturers of anti-personnel mines, cluster bombs and munitions and weapons containing depleted uranium. In this way, the sub-fund seeks to reflect not only simple financial reality but also the social reality of the sector or region in question. Exercising voting rights. If necessary, relevant and in the interest of the shareholders, the management company will exercise the voting rights attached to the shares in the Bevek’s portfolio. The management company will adhere to the following criteria when determining how it stands relative to the items on the agenda that are put to the vote: - Shareholder value may not be adversely affected. - Corporate governance rules, especially with regard to the rights of minority shareholders, must be
respected. - The minimum standards with regard to sustainable business and corporate social responsibility
must be met. The list of companies for which voting rights are exercised is available at the registered office of the Bevek. Securities lending In accordance with the Royal Decree of 7 March 2006 concerning securities lending, the undertaking for collective investment has taken out securities loans with a principal to whom the full title of the loaned securities was transferred, without recording this transfer of ownership in the accounts. For the period from 1 January 2013 to 30 June 2013, the fee for securities lent comes to 74,551.67 EUR. The undertaking for collective investment receives 50% of the fee received for securities lent. The detailed list of securities lending transactions carried out can be obtained from the registered office of the collective investment undertaking at 2 Havenlaan, 1080 Brussels.
Overview of securities lent as at 30/06/2013
Name Currency Quantity Price Value in currency of the
portfolio
AIR FRANCE-KLM EUR 50.445 6,892 347.666,94
AREVA SA EUR 190 11,925 2.265,75
BANCO DE SABADELL SA NEW EUR 53.254 1,275 67.898,85
BELGACOM EUR 49.230 17,235 848.479,05
BILFINGER SE EUR 945 70,750 66.858,75
CARREFOUR SUPERMARCHE EUR 83.574 21,130 1.765.918,62
DAIMLER AG OP NAME EUR 104.434 46,485 4.854.614,49
DELHAIZE GROEP EUR 18.956 47,490 900.220,44
EURAZEO EUR 1.266 41,165 52.114,89
FERROVIAL SA EUR 249.446 12,280 3.063.196,88
FUCHS-PETROLUB AG EUR 3.356 52,160 175.048,96
IBERDROLA SA EUR 646.736 4,056 2.623.161,22
ICADE EUR 14.028 63,440 889.936,32
INFINEON TECHNOLOGIES EUR 146.879 6,430 944.431,97
K+S AG EUR 44.745 28,405 1.270.981,73
LUXOTTICA GROUP SPA EUR 1.403 38,840 54.492,52
M6-METROPOLE TV EUR 2.248 12,375 27.819,00
NOKIA CORP -A- EUR 365.376 2,846 1.039.860,10
PERNOD-RICARD EUR 661 85,190 56.310,59
RAIFFEISEN BANK INTL EUR 16.644 22,400 372.825,60
RWE AG -A- EUR 113.883 24,520 2.792.411,16
SYMRISE AG EUR 10.601 31,110 329.797,11
TOTAL EUR 295.068 37,505 11.066.525,34
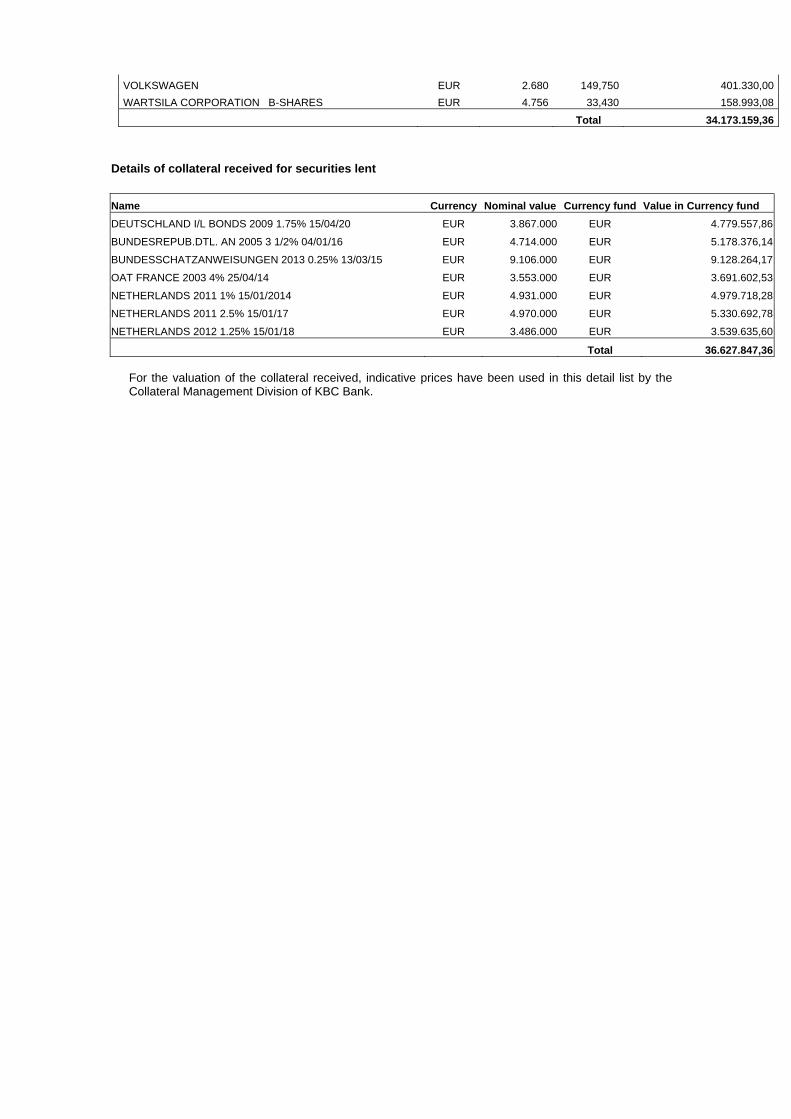
VOLKSWAGEN EUR 2.680 149,750 401.330,00
WARTSILA CORPORATION B-SHARES EUR 4.756 33,430 158.993,08
Total 34.173.159,36
Details of collateral received for securities lent
Name Currency Nominal value Currency fund Value in Currency fund
DEUTSCHLAND I/L BONDS 2009 1.75% 15/04/20 EUR 3.867.000 EUR 4.779.557,86
BUNDESREPUB.DTL. AN 2005 3 1/2% 04/01/16 EUR 4.714.000 EUR 5.178.376,14
BUNDESSCHATZANWEISUNGEN 2013 0.25% 13/03/15 EUR 9.106.000 EUR 9.128.264,17
OAT FRANCE 2003 4% 25/04/14 EUR 3.553.000 EUR 3.691.602,53
NETHERLANDS 2011 1% 15/01/2014 EUR 4.931.000 EUR 4.979.718,28
NETHERLANDS 2011 2.5% 15/01/17 EUR 4.970.000 EUR 5.330.692,78
NETHERLANDS 2012 1.25% 15/01/18 EUR 3.486.000 EUR 3.539.635,60
Total 36.627.847,36 For the valuation of the collateral received, indicative prices have been used in this detail list by the Collateral Management Division of KBC Bank.

Semi-Annual report as at 30th June 2013
TABLE OF CONTENTS
2. Information on KBC Equity Fund Euro Telecom & Technology
2.1. Management report 2.1.1. Launch date and subscription price 2.1.2. Stock exchange listing 2.1.3. Aim and distinctive features of the investment policy 2.1.4. Financial portfolio management 2.1.5. Distributors 2.1.6. Index and benchmark 2.1.7. Policy conducted during the financial year 2.1.8. Future policy 2.1.9. Synthetic risk and reward indicator (SRRI)
2.2. Balance sheet
2.3. Profit and loss account
2.4. Composition of the assets and key figures
2.4.1. Composition of the assets 2.4.2. Change in the composition of the assets 2.4.3. Value of commitments in respect of financial derivatives positions 2.4.4. Evolution of the number of subscriptions, repayments and the net asset value 2.4.5. Return figures 2.4.6. Expenses 2.4.7. Notes to the financial statements and other data


2 INFORMATION ON KBC EQUITY FUND EURO TELECOM & TECHNOLOGY
2.1 MANAGEMENT REPORT
2.1.1 LAUNCH DATE AND SUBSCRIPTION PRICE Classic Shares : Launch date: 28 January 2000 Initial subscription price: 500 EUR Currency: EUR Institutional B Shares : Launch date: 24 November 2011 Initial subscription price: 83.18 EUR Currency: EUR
2.1.2 STOCK EXCHANGE LISTING Not applicable.
2.1.3 GOAL AND KEY PRINCIPLES OF THE INVESTMENT POLICY
SUB-FUND’S OBJECT: The main objective of this sub-fund is to generate the highest possible return for its shareholders by investing directly or indirectly in transferable securities. This is reflected in its pursuit of capital gains and income. To this end, the assets are invested, either directly or indirectly via correlated financial instruments, primarily in shares.
SUB-FUND’S INVESTMENT POLICY:
PERMITTED ASSET CLASSES: The sub-fund may invest in securities, money market instruments, units in undertakings for collective investment, deposits, financial derivatives, liquid assets and all other instruments insofar as permitted by the applicable laws and regulations and consistent with the sub-fund’s object The sub-fund shall invest no more than 10% of its assets in units of other undertakings for collective investment.
RESTRICTIONS OF THE INVESTMENT POLICY: The investment policy will be implemented within the limits set by law and regulations. The sub-fund may borrow up to 10% of its net assets, insofar as these are short-term borrowings aimed at solving temporary liquidity problems.
PERMITTED DERIVATIVES TRANSACTIONS: Derivates may be used either for hedging purposes or to achieve investment objectives. Changes will be made to the investments at regular intervals to comply with the sub-fund's investment strategy. In addition, listed and unlisted derivates may be used to achieve the objectives: these may be forward contracts, options or swaps on securities, indices, currencies or interest rates or other transactions involving derivatives. Unlisted derivatives transactions will only be concluded with prime financial institutions specialised in such transactions. Such derivatives may also be used to hedge the assets against exchange-rate fluctuations. Subject to the applicable laws and regulations and the articles of association, the sub-fund always seeks to conclude the most effective transactions. All costs associated with the transactions will be charged to the sub-fund and all income generated will be paid to the sub-fund. If the transactions result in a risk in respect of the counterparty, this risk can be hedged by using a margin management system that ensures that the sub-fund is the beneficiary of security (collateral) in the form of cash or investment grade bonds. When calculating the value of the bonds, a margin will be applied that varies depending on the residual term to maturity and the currency in which the bond in question is denominated. The relationship with the counterparty or counterparties is governed by standard international agreements.
STRATEGY SELECTED The assets are invested primarily in shares of European companies in the telecommunication, technology and media sectors.
RISK CONCENTRATION Shares of European companies in the telecommunication, technology and media sectors.
LENDING FINANCIAL INSTRUMENTS: The sub-fund may lend financial instruments within the limits set by law and regulations. This lending does not affect the sub-fund’s risk profile since: - it takes place within the framework of a securities lending system managed by a principal. In
addition, the sub-fund has a relationship only with the principal of the securities lending system which acts as counterparty and to which title of the loaned securities is transferred. The choice of principal is subject to strict selection criteria. The return of securities similar to the securities that have been lent is guaranteed by the principal.
- through a margin management system, the sub-fund is always guaranteed financial security, the actual value of which always exceeds the actual value of the securities that have been lent, in case the principal does not return similar securities.
The return of securities similar to the securities that have been lent can be requested at any time, which means that the lending of securities does not affect the management of the sub-fund's assets. By lending securities, the sub-fund can generate an additional return. The principal pays a fee to the management company. After deducting the fee for the margin management and clearing services of KBC Bank, most of this fee is paid to the sub-fund. The relationship with the counterparty or counterparties is governed by standard international agreements. More information is provided on the terms and conditions governing securities lending in the annual or half-yearly report for the sub-fund.
VOLATILITY OF THE NET ASSET VALUE: The volatility of the net asset value may be high due to the composition of the portfolio.
GENERAL STRATEGY FOR HEDGING THE EXCHANGE RATE RISK: In order to protect its assets against exchange rate fluctuations and within the limitations laid down in the articles of association, the sub-fund may perform transactions relating to the sale of forward currency contracts, as well as the sale of call options and the purchase of put options on currencies. The transactions in question may relate solely to contracts traded on a regulated market that operates regularly, is recognised and is open to the public or that are traded with a recognised, prime financial institution specialising in such transactions and dealing in the over-the-counter (OTC) market in options. With the same objective, the sub-fund may also sell currencies forward or exchange them in private transactions with prime financial institutions specialising in such transactions. The hedging objective of the aforementioned transactions suggests that there is a direct link between these transactions and the assets to be hedged, which implies that the transactions carried out in a particular currency may in principle not exceed, in terms of volume, either the valuation value of all the assets in the same currency or the holding period of those assets.
SOCIAL, ETHICAL AND ENVIRONMENTAL ASPECTS:
No manufacturers of controversial weapons whose use over the past five decades, according to the international consensus, has led to disproportionate human suffering among the civilian population will be included in the portfolio of investments. This involves the manufacturers of anti-personnel mines, cluster bombs and munitions and weapons containing depleted uranium. In this way, the sub-fund seeks to reflect not only simple financial reality but also the social reality of the sector or region in question.
THE EUROPEAN SAVINGS DIRECTIVE AND TAX ON DEBT CLAIM RETURNS OBTAINED THROUGH THE
REDEMPTION OF OWN UNITS OR IN THE EVENT OF FULL OR PARTIAL DISTRIBUTION OF EQUITY
CAPITAL.

The following information is of a general character and is not intended to cover all aspects of an investment in a UCITS. In certain cases entirely different rules might even apply. Moreover, both tax law and the interpretation of it can change. Investors who wish to have more information about the tax implications – in both Belgium and abroad – of acquiring, holding and transferring units should seek the advice of their usual financial and tax advisers. This UCITS shall invest a maximum of 15% of its assets directly or indirectly in debt instruments as intended by the European Savings Directive. A. European Savings Directive (Directive 2003/48/EC) The European Savings Directive has been implemented in Belgium. Since this UCITS invests a maximum of 15% of its assets directly or indirectly in debt claims as intended by the European Savings Directive, the income of this UCITS does not fall within the scope of this directive. B. Tax on debt claim returns obtained through the redemption of own units or in the event of full or partial distribution of equity capital (Article 19bis Income Tax Code 1992). The income from this UCITS is not subject to the tax on debt instrument returns as intended by Article 19bis, Income Tax Code 1992.
2.1.4 FINANCIAL PORTFOLIO MANAGEMENT There is no delegation of the portfolio.
2.1.5 DISTRIBUTORS KBC Asset Management S.A., 5, Place de la Gare, L-1616 Luxembourg.
2.1.6 INDEX AND BENCHMARK See ‘Sub-fund’s investment policy’.
2.1.7 POLICY PERSUED DURING THE FINANCIAL YEAR Real GDP in the EMU contracted by an annualised 1.1%. The austerity programme and credit restrictions pushed Southern Europe into a deep recession. Germany played its traditional role as the driver for European economic growth to a lesser extent than in the recent past. Greater divergence within Europe resulted primarily in a further decline in unemployment in Germany and an alarmingly rapid rise in unemployment in countries such as Greece, Spain and Portugal. Belgium was closer to the strong core of the euro area. Among the traditional markets, Western Europe (MSCI Europe return index over the same period: +4.1%) was unable to continue the catch-up process begun in 2012. Fear that the EMU’s problems entailed a systemic risk nevertheless faded from the market. Europe’s cheaper valuation (compared to the US) was unable to offer any support either. European corporate earnings fell well short of expectations since the first quarter of 2012. They show a downward trend, in stark contrast to developments in other regions. Wall Street was much higher at the end of June than at the end of 2012 (S&P 500: +12.6%, Dow Jones: +13.8%).
2.1.8 FUTURE POLICY Confidence indicators in Europe are well below freezing point. The budgetary plans, tighter lending policy of the banks and major uncertainty among consumers and producers will continue to depress growth. 2013 will see a contraction of GDP in Europe. Recovery is not expected until the first half of 2014. Deflation or depression scenarios, which are currently dominating bond market sentiment, are not however justified. Economic growth in Europe will remain below par. The towering unemployment and the euro crisis are undermining consumer confidence and the banks’ willingness to provide ready access to credit. The ECB’s monetary policy is also much less aggressive than the Fed's. In contrast, real wage rises (however limited) will be somewhat higher in Europe than in the US. Time is of the essence for the euro area. Everyone knows that the EMU is not a perfect monetary union. In its twelve-year history, little has been done to improve its internal operation. National autonomy was sacrosanct. The crisis brought the realisation that ‘economic governance’, as it is now called in Eurospeak, needs to be tackled as a matter of urgency. In concrete terms, this involves measures such as supranational supervision of banks (scheduled to be in place by early 2015), strict monitoring and sanctioning of budgetary policy (a huge challenge given the emergence of austerity fatigue), monitoring of pay policy and harmonising European taxation (a big taboo).
2.1.9 SYNTHETIC RISK AND REWARD INDICATOR Classic Shares: 6 on a scale of 1 (lowest risk) to 7 (highest risk). Institutional B Shares: 6 on a scale of 1 (lowest risk) to 7 (highest risk). The value of a share can decrease or increase and the investor may not get back the amount invested. In accordance with Commission Regulation (EU) No. 583/2010, a synthetic risk and reward indicator has been calculated. This indicator provides a quantitative measure of the sub-fund's potential return and the risk involved, calculated in the currency in which the sub-fund is denominated. It is given as a figure between 1 and 7. The higher the figure, the greater the potential return, but also the more difficult it is to predict this return. Losses are possible too. The lowest figure does not mean that the investment is entirely free of risk. However, it does indicate that, compared with the higher figures, this product will generally provide a lower, but more predictable return. The synthetic risk and reward indicator is assessed regularly and can therefore go up or down based on data from the past. Data from the past is not always a reliable indicator of future risk and return.
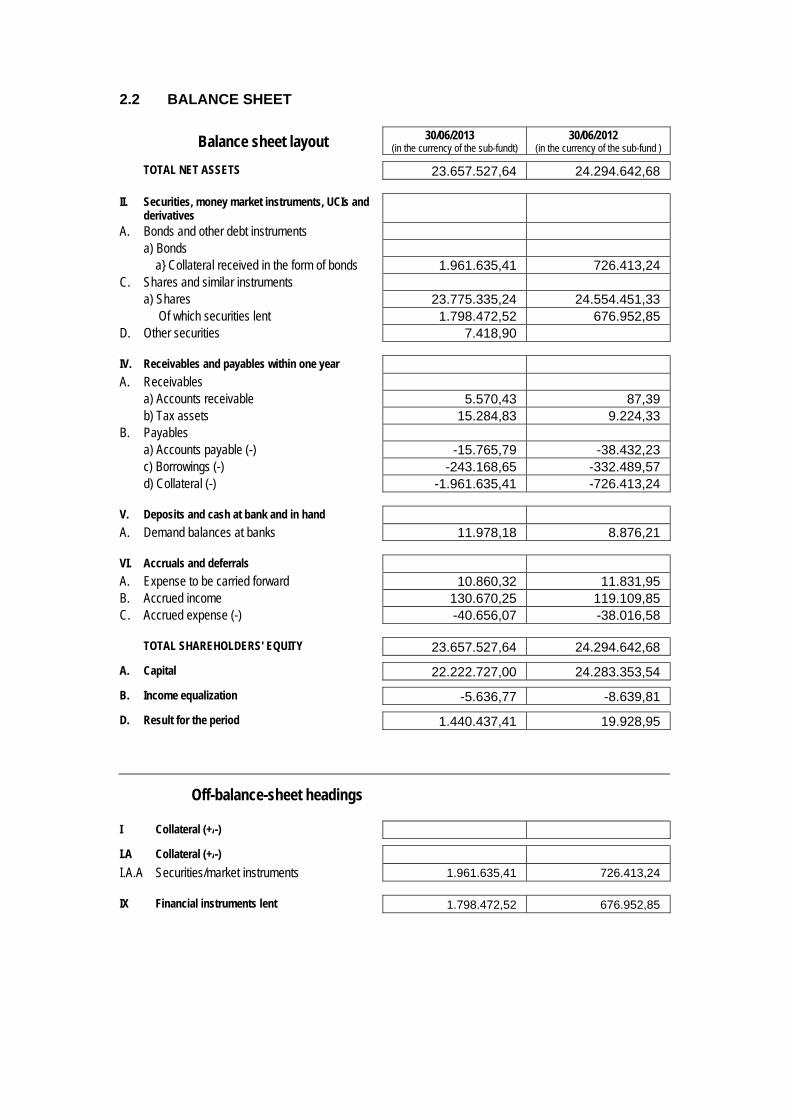
2.2 BALANCE SHEET
Balance sheet layout 30/06/2013 (in the currency of the sub-fundt)
30/06/2012 (in the currency of the sub-fund )
TOTAL NET ASSETS 23.657.527,64 24.294.642,68
II. Securities, money market instruments, UCIs and derivatives
A. Bonds and other debt instruments a) Bonds a} Collateral received in the form of bonds 1.961.635,41 726.413,24 C. Shares and similar instruments a) Shares 23.775.335,24 24.554.451,33 Of which securities lent 1.798.472,52 676.952,85 D. Other securities 7.418,90
IV. Receivables and payables within one year A. Receivables a) Accounts receivable 5.570,43 87,39 b) Tax assets 15.284,83 9.224,33 B. Payables a) Accounts payable (-) -15.765,79 -38.432,23 c) Borrowings (-) -243.168,65 -332.489,57 d) Collateral (-) -1.961.635,41 -726.413,24
V. Deposits and cash at bank and in hand A. Demand balances at banks 11.978,18 8.876,21
VI. Accruals and deferrals A. Expense to be carried forward 10.860,32 11.831,95 B. Accrued income 130.670,25 119.109,85 C. Accrued expense (-) -40.656,07 -38.016,58
TOTAL SHAREHOLDERS' EQUITY 23.657.527,64 24.294.642,68
A. Capital 22.222.727,00 24.283.353,54
B. Income equalization -5.636,77 -8.639,81
D. Result for the period 1.440.437,41 19.928,95
Off-balance-sheet headings
I Collateral (+/-)
I.A Collateral (+/-)
I.A.A Securities/market instruments 1.961.635,41 726.413,24
IX Financial instruments lent 1.798.472,52 676.952,85
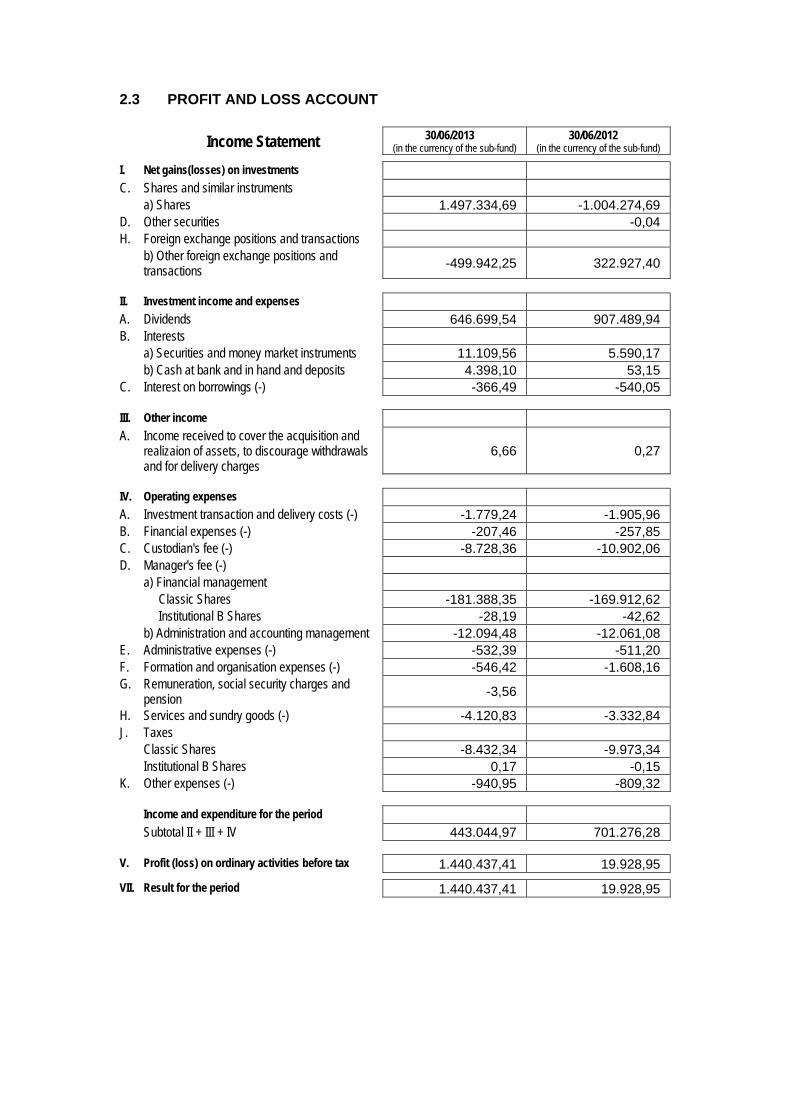
2.3 PROFIT AND LOSS ACCOUNT
Income Statement 30/06/2013 (in the currency of the sub-fund)
30/06/2012 (in the currency of the sub-fund)
I. Net gains(losses) on investments C. Shares and similar instruments a) Shares 1.497.334,69 -1.004.274,69 D. Other securities -0,04 H. Foreign exchange positions and transactions b) Other foreign exchange positions and
transactions -499.942,25 322.927,40
II. Investment income and expenses A. Dividends 646.699,54 907.489,94 B. Interests a) Securities and money market instruments 11.109,56 5.590,17 b) Cash at bank and in hand and deposits 4.398,10 53,15 C. Interest on borrowings (-) -366,49 -540,05
III. Other income A. Income received to cover the acquisition and
realizaion of assets, to discourage withdrawals and for delivery charges
6,66 0,27
IV. Operating expenses A. Investment transaction and delivery costs (-) -1.779,24 -1.905,96 B. Financial expenses (-) -207,46 -257,85 C. Custodian's fee (-) -8.728,36 -10.902,06 D. Manager's fee (-) a) Financial management Classic Shares -181.388,35 -169.912,62 Institutional B Shares -28,19 -42,62 b) Administration and accounting management -12.094,48 -12.061,08 E. Administrative expenses (-) -532,39 -511,20 F. Formation and organisation expenses (-) -546,42 -1.608,16 G. Remuneration, social security charges and
pension -3,56
H. Services and sundry goods (-) -4.120,83 -3.332,84 J. Taxes Classic Shares -8.432,34 -9.973,34 Institutional B Shares 0,17 -0,15 K. Other expenses (-) -940,95 -809,32
Income and expenditure for the period Subtotal II + III + IV 443.044,97 701.276,28
V. Profit (loss) on ordinary activities before tax 1.440.437,41 19.928,95
VII. Result for the period 1.440.437,41 19.928,95
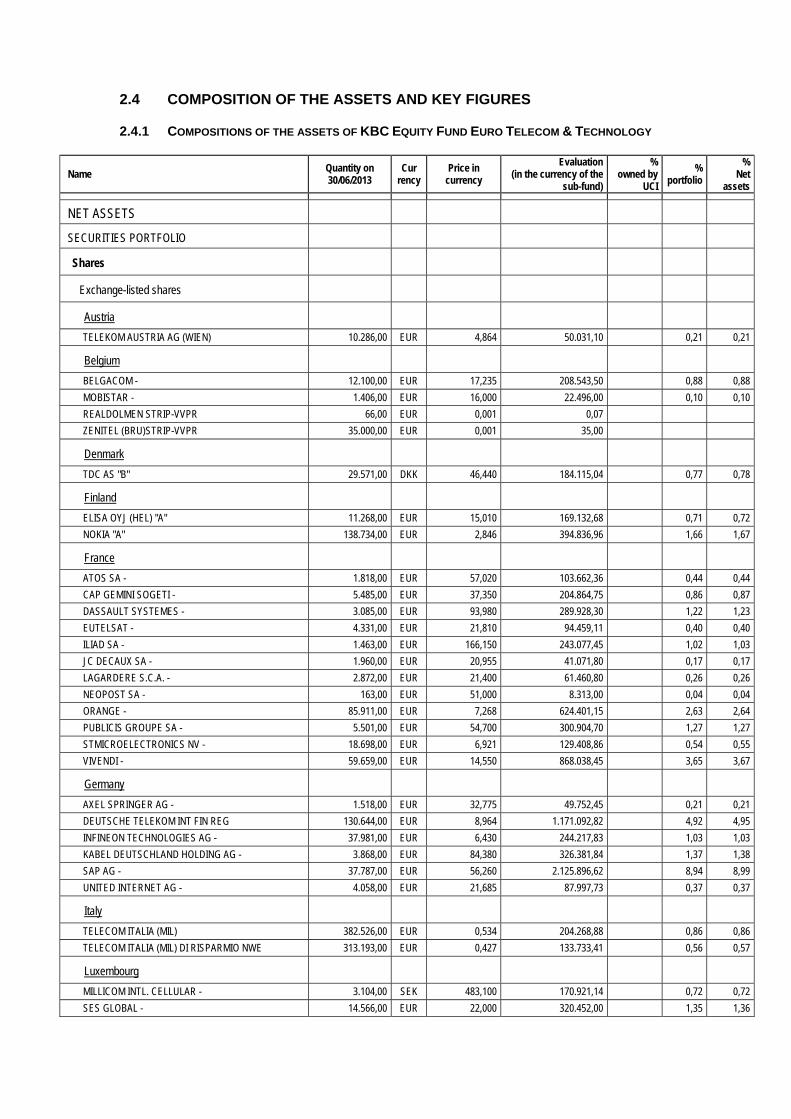
2.4 COMPOSITION OF THE ASSETS AND KEY FIGURES
2.4.1 COMPOSITIONS OF THE ASSETS OF KBC EQUITY FUND EURO TELECOM & TECHNOLOGY
Name Quantity on 30/06/2013
Cur rency
Price in currency
Evaluation (in the currency of the
sub-fund)
% owned by
UCI
% portfolio
% Net
assets
NET ASSETS
SECURITIES PORTFOLIO
Shares
Exchange-listed shares
Austria
TELEKOM AUSTRIA AG (WIEN) 10.286,00 EUR 4,864 50.031,10 0,21 0,21
Belgium
BELGACOM - 12.100,00 EUR 17,235 208.543,50 0,88 0,88
MOBISTAR - 1.406,00 EUR 16,000 22.496,00 0,10 0,10
REALDOLMEN STRIP-VVPR 66,00 EUR 0,001 0,07
ZENITEL (BRU)STRIP-VVPR 35.000,00 EUR 0,001 35,00
Denmark
TDC AS "B" 29.571,00 DKK 46,440 184.115,04 0,77 0,78
Finland
ELISA OYJ (HEL) "A" 11.268,00 EUR 15,010 169.132,68 0,71 0,72
NOKIA "A" 138.734,00 EUR 2,846 394.836,96 1,66 1,67
France
ATOS SA - 1.818,00 EUR 57,020 103.662,36 0,44 0,44
CAP GEMINI SOGETI - 5.485,00 EUR 37,350 204.864,75 0,86 0,87
DASSAULT SYSTEMES - 3.085,00 EUR 93,980 289.928,30 1,22 1,23
EUTELSAT - 4.331,00 EUR 21,810 94.459,11 0,40 0,40
ILIAD SA - 1.463,00 EUR 166,150 243.077,45 1,02 1,03
JC DECAUX SA - 1.960,00 EUR 20,955 41.071,80 0,17 0,17
LAGARDERE S.C.A. - 2.872,00 EUR 21,400 61.460,80 0,26 0,26
NEOPOST SA - 163,00 EUR 51,000 8.313,00 0,04 0,04
ORANGE - 85.911,00 EUR 7,268 624.401,15 2,63 2,64
PUBLICIS GROUPE SA - 5.501,00 EUR 54,700 300.904,70 1,27 1,27
STMICROELECTRONICS NV - 18.698,00 EUR 6,921 129.408,86 0,54 0,55
VIVENDI - 59.659,00 EUR 14,550 868.038,45 3,65 3,67
Germany
AXEL SPRINGER AG - 1.518,00 EUR 32,775 49.752,45 0,21 0,21
DEUTSCHE TELEKOM INT FIN REG 130.644,00 EUR 8,964 1.171.092,82 4,92 4,95
INFINEON TECHNOLOGIES AG - 37.981,00 EUR 6,430 244.217,83 1,03 1,03
KABEL DEUTSCHLAND HOLDING AG - 3.868,00 EUR 84,380 326.381,84 1,37 1,38
SAP AG - 37.787,00 EUR 56,260 2.125.896,62 8,94 8,99
UNITED INTERNET AG - 4.058,00 EUR 21,685 87.997,73 0,37 0,37
Italy
TELECOM ITALIA (MIL) 382.526,00 EUR 0,534 204.268,88 0,86 0,86
TELECOM ITALIA (MIL) DI RISPARMIO NWE 313.193,00 EUR 0,427 133.733,41 0,56 0,57
Luxembourg
MILLICOM INTL. CELLULAR - 3.104,00 SEK 483,100 170.921,14 0,72 0,72
SES GLOBAL - 14.566,00 EUR 22,000 320.452,00 1,35 1,36
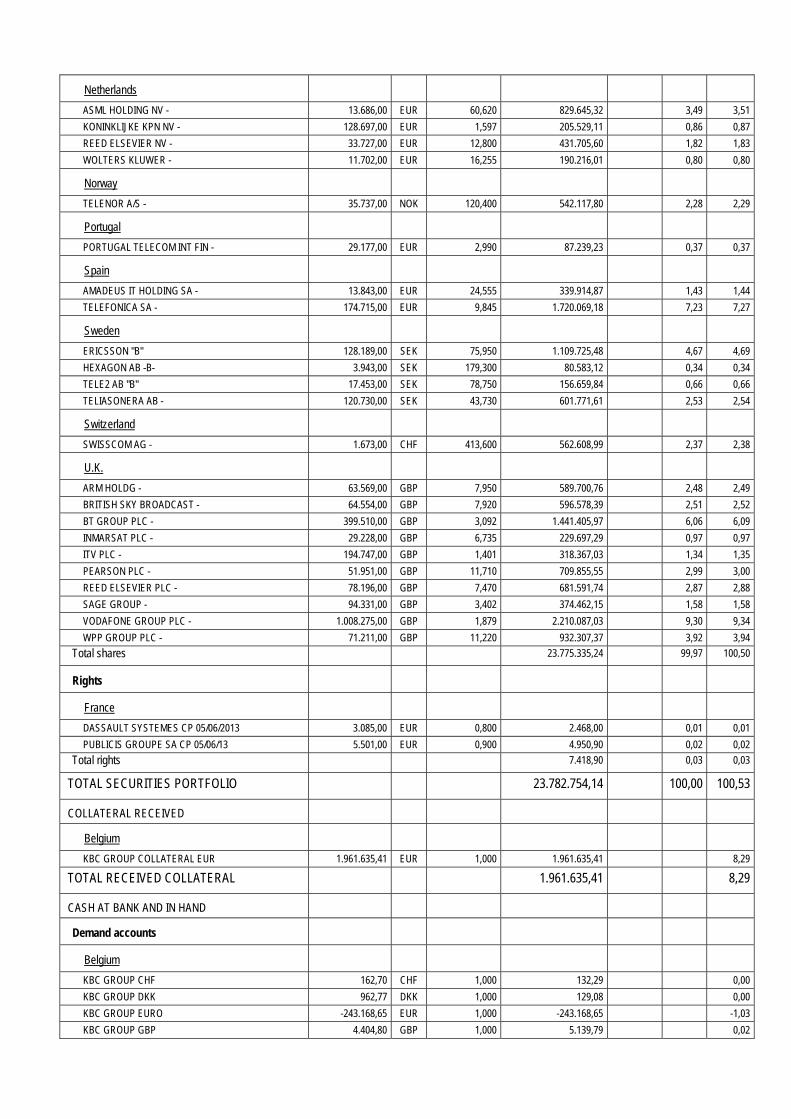
Netherlands
ASML HOLDING NV - 13.686,00 EUR 60,620 829.645,32 3,49 3,51
KONINKLIJKE KPN NV - 128.697,00 EUR 1,597 205.529,11 0,86 0,87
REED ELSEVIER NV - 33.727,00 EUR 12,800 431.705,60 1,82 1,83
WOLTERS KLUWER - 11.702,00 EUR 16,255 190.216,01 0,80 0,80
Norway
TELENOR A/S - 35.737,00 NOK 120,400 542.117,80 2,28 2,29
Portugal
PORTUGAL TELECOM INT FIN - 29.177,00 EUR 2,990 87.239,23 0,37 0,37
Spain
AMADEUS IT HOLDING SA - 13.843,00 EUR 24,555 339.914,87 1,43 1,44
TELEFONICA SA - 174.715,00 EUR 9,845 1.720.069,18 7,23 7,27
Sweden
ERICSSON "B" 128.189,00 SEK 75,950 1.109.725,48 4,67 4,69
HEXAGON AB -B- 3.943,00 SEK 179,300 80.583,12 0,34 0,34
TELE2 AB "B" 17.453,00 SEK 78,750 156.659,84 0,66 0,66
TELIASONERA AB - 120.730,00 SEK 43,730 601.771,61 2,53 2,54
Switzerland
SWISSCOM AG - 1.673,00 CHF 413,600 562.608,99 2,37 2,38
U.K.
ARM HOLDG - 63.569,00 GBP 7,950 589.700,76 2,48 2,49
BRITISH SKY BROADCAST - 64.554,00 GBP 7,920 596.578,39 2,51 2,52
BT GROUP PLC - 399.510,00 GBP 3,092 1.441.405,97 6,06 6,09
INMARSAT PLC - 29.228,00 GBP 6,735 229.697,29 0,97 0,97
ITV PLC - 194.747,00 GBP 1,401 318.367,03 1,34 1,35
PEARSON PLC - 51.951,00 GBP 11,710 709.855,55 2,99 3,00
REED ELSEVIER PLC - 78.196,00 GBP 7,470 681.591,74 2,87 2,88
SAGE GROUP - 94.331,00 GBP 3,402 374.462,15 1,58 1,58
VODAFONE GROUP PLC - 1.008.275,00 GBP 1,879 2.210.087,03 9,30 9,34
WPP GROUP PLC - 71.211,00 GBP 11,220 932.307,37 3,92 3,94
Total shares 23.775.335,24 99,97 100,50
Rights
France
DASSAULT SYSTEMES CP 05/06/2013 3.085,00 EUR 0,800 2.468,00 0,01 0,01
PUBLICIS GROUPE SA CP 05/06/13 5.501,00 EUR 0,900 4.950,90 0,02 0,02
Total rights 7.418,90 0,03 0,03
TOTAL SECURITIES PORTFOLIO 23.782.754,14 100,00 100,53
COLLATERAL RECEIVED
Belgium
KBC GROUP COLLATERAL EUR 1.961.635,41 EUR 1,000 1.961.635,41 8,29
TOTAL RECEIVED COLLATERAL 1.961.635,41 8,29
CASH AT BANK AND IN HAND
Demand accounts
Belgium
KBC GROUP CHF 162,70 CHF 1,000 132,29 0,00
KBC GROUP DKK 962,77 DKK 1,000 129,08 0,00
KBC GROUP EURO -243.168,65 EUR 1,000 -243.168,65 -1,03
KBC GROUP GBP 4.404,80 GBP 1,000 5.139,79 0,02
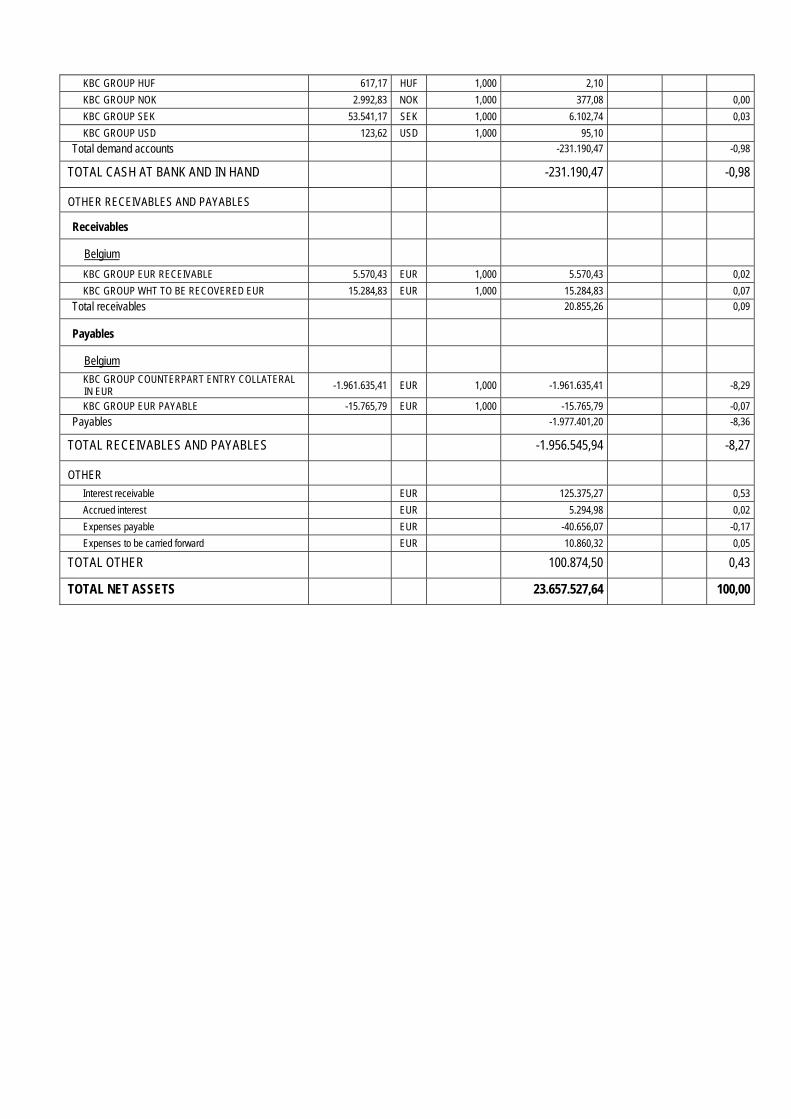
KBC GROUP HUF 617,17 HUF 1,000 2,10
KBC GROUP NOK 2.992,83 NOK 1,000 377,08 0,00
KBC GROUP SEK 53.541,17 SEK 1,000 6.102,74 0,03
KBC GROUP USD 123,62 USD 1,000 95,10
Total demand accounts -231.190,47 -0,98
TOTAL CASH AT BANK AND IN HAND -231.190,47 -0,98
OTHER RECEIVABLES AND PAYABLES
Receivables
Belgium
KBC GROUP EUR RECEIVABLE 5.570,43 EUR 1,000 5.570,43 0,02
KBC GROUP WHT TO BE RECOVERED EUR 15.284,83 EUR 1,000 15.284,83 0,07
Total receivables 20.855,26 0,09
Payables
Belgium
KBC GROUP COUNTERPART ENTRY COLLATERAL IN EUR -1.961.635,41 EUR 1,000 -1.961.635,41 -8,29
KBC GROUP EUR PAYABLE -15.765,79 EUR 1,000 -15.765,79 -0,07
Payables -1.977.401,20 -8,36
TOTAL RECEIVABLES AND PAYABLES -1.956.545,94 -8,27
OTHER
Interest receivable EUR 125.375,27 0,53
Accrued interest EUR 5.294,98 0,02
Expenses payable EUR -40.656,07 -0,17
Expenses to be carried forward EUR 10.860,32 0,05
TOTAL OTHER 100.874,50 0,43
TOTAL NET ASSETS 23.657.527,64 100,00
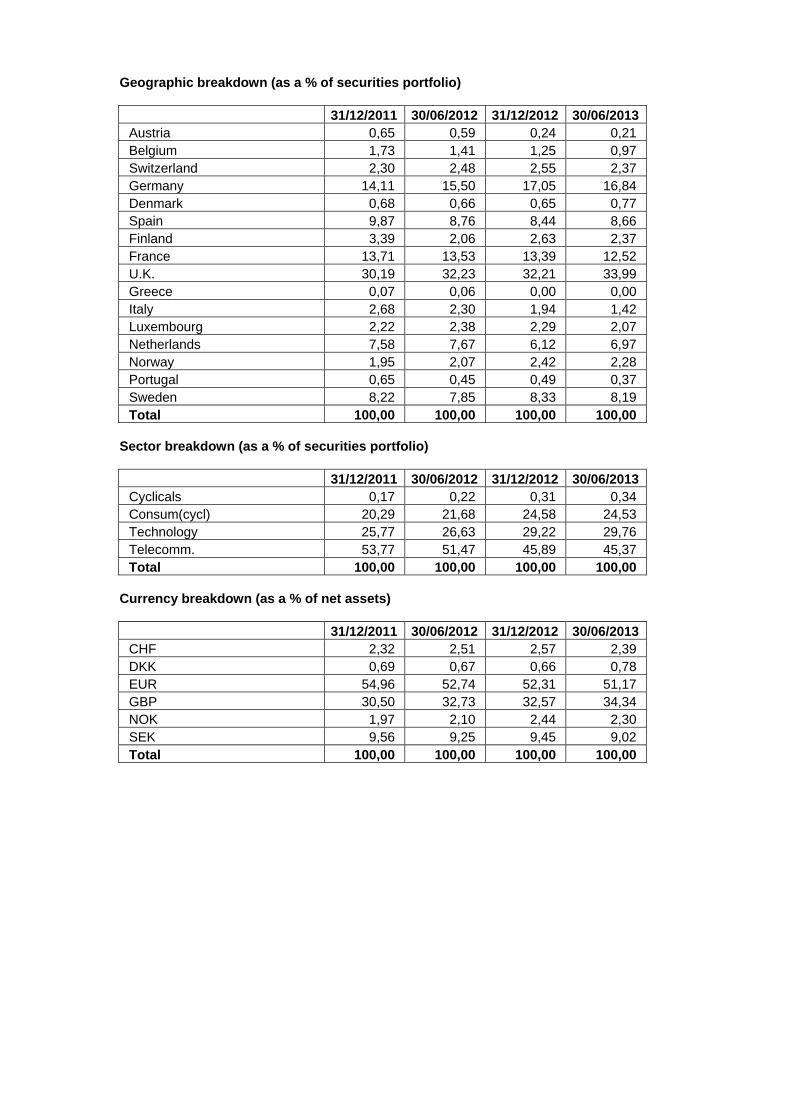
Geographic breakdown (as a % of securities portfolio)
31/12/2011 30/06/2012 31/12/2012 30/06/2013 Austria 0,65 0,59 0,24 0,21 Belgium 1,73 1,41 1,25 0,97 Switzerland 2,30 2,48 2,55 2,37 Germany 14,11 15,50 17,05 16,84 Denmark 0,68 0,66 0,65 0,77 Spain 9,87 8,76 8,44 8,66 Finland 3,39 2,06 2,63 2,37 France 13,71 13,53 13,39 12,52 U.K. 30,19 32,23 32,21 33,99 Greece 0,07 0,06 0,00 0,00 Italy 2,68 2,30 1,94 1,42 Luxembourg 2,22 2,38 2,29 2,07 Netherlands 7,58 7,67 6,12 6,97 Norway 1,95 2,07 2,42 2,28 Portugal 0,65 0,45 0,49 0,37 Sweden 8,22 7,85 8,33 8,19 Total 100,00 100,00 100,00 100,00
Sector breakdown (as a % of securities portfolio)
31/12/2011 30/06/2012 31/12/2012 30/06/2013 Cyclicals 0,17 0,22 0,31 0,34 Consum(cycl) 20,29 21,68 24,58 24,53 Technology 25,77 26,63 29,22 29,76 Telecomm. 53,77 51,47 45,89 45,37 Total 100,00 100,00 100,00 100,00
Currency breakdown (as a % of net assets)
31/12/2011 30/06/2012 31/12/2012 30/06/2013 CHF 2,32 2,51 2,57 2,39 DKK 0,69 0,67 0,66 0,78 EUR 54,96 52,74 52,31 51,17 GBP 30,50 32,73 32,57 34,34 NOK 1,97 2,10 2,44 2,30 SEK 9,56 9,25 9,45 9,02 Total 100,00 100,00 100,00 100,00

2.4.2 CHANGES IN THE COMPOSITION OF THE ASSETS OF KBC EQUITY FUND EURO TELECOM &
TECHNOLOGY (IN THE CURRENCY OF THE SUB-FUND)
1st half of year YearPurchases 345.388,65 345.388,65 Sales 2.105.613,89 2.105.613,89 Total 1 2.451.002,54 2.451.002,54 Subscriptions 173.197,95 173.197,95 Redemptions 2.116.224,63 2.116.224,63 Total 2 2.289.422,58 2.289.422,58 Monthly average of total assets
24.579.186,07 24.579.186,07
Turnover rate 0,66 % 0,66 %
1st half of year YearPurchases 345.388,65 345.388,65 Sales 2.105.613,89 2.105.613,89 Total 1 2.451.002,54 2.451.002,54 Subscriptions 173.197,95 173.197,95 Redemptions 2.116.224,63 2.116.224,63 Total 2 2.289.422,58 2.289.422,58 Monthly average of total assets
26.840.524,75 26.840.524,75
Corrected turnover rate 0,60 % 0,60 %
The table above shows the capital volume of portfolio transactions. This volume (adjusted to take account of total subscriptions and redemptions) is also compared to the average net assets at the beginning and end of the period. A figure close to 0% implies that the transactions relating to the securities or transactions relating to the assets (excluding deposits and cash) in a given period only involve subscriptions and redemptions. A negative percentage shows that subscriptions and redemptions entailed few, if any, transactions in the portfolio. Active asset management may result in high turnover rates (monthly percentage >50%). The detailed list of transactions is available for consultation free of charge at the registered office of the Bevek or fund at Havenlaan 2, 1080 Brussels.
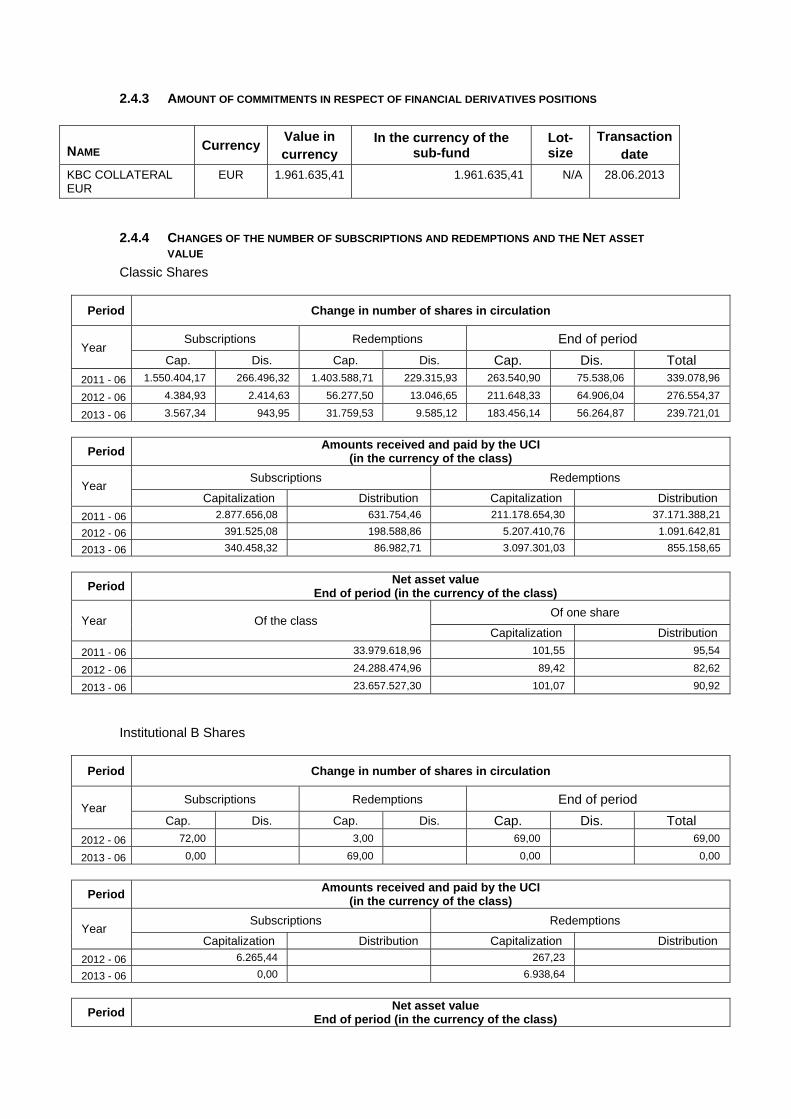
2.4.3 AMOUNT OF COMMITMENTS IN RESPECT OF FINANCIAL DERIVATIVES POSITIONS
NAME Currency Value in currency
In the currency of the sub-fund
Lot-size
Transactiondate
KBC COLLATERAL EUR
EUR 1.961.635,41 1.961.635,41 N/A 28.06.2013
2.4.4 CHANGES OF THE NUMBER OF SUBSCRIPTIONS AND REDEMPTIONS AND THE NET ASSET
VALUE
Classic Shares
Period Change in number of shares in circulation
Year Subscriptions Redemptions End of period
Cap. Dis. Cap. Dis. Cap. Dis. Total
2011 - 06 1.550.404,17 266.496,32 1.403.588,71 229.315,93 263.540,90 75.538,06 339.078,96
2012 - 06 4.384,93 2.414,63 56.277,50 13.046,65 211.648,33 64.906,04 276.554,37
2013 - 06 3.567,34 943,95 31.759,53 9.585,12 183.456,14 56.264,87 239.721,01
Period Amounts received and paid by the UCI
(in the currency of the class)
Year Subscriptions Redemptions
Capitalization Distribution Capitalization Distribution
2011 - 06 2.877.656,08 631.754,46 211.178.654,30 37.171.388,21
2012 - 06 391.525,08 198.588,86 5.207.410,76 1.091.642,81
2013 - 06 340.458,32 86.982,71 3.097.301,03 855.158,65
Period Net asset value
End of period (in the currency of the class)
Year Of the class Of one share
Capitalization Distribution
2011 - 06 33.979.618,96 101,55 95,54
2012 - 06 24.288.474,96 89,42 82,62
2013 - 06 23.657.527,30 101,07 90,92
Institutional B Shares
Period Change in number of shares in circulation
Year Subscriptions Redemptions End of period
Cap. Dis. Cap. Dis. Cap. Dis. Total 2012 - 06 72,00 3,00 69,00 69,00
2013 - 06 0,00 69,00 0,00 0,00
Period Amounts received and paid by the UCI
(in the currency of the class)
Year Subscriptions Redemptions
Capitalization Distribution Capitalization Distribution
2012 - 06 6.265,44 267,23
2013 - 06 0,00 6.938,64
Period Net asset value
End of period (in the currency of the class)
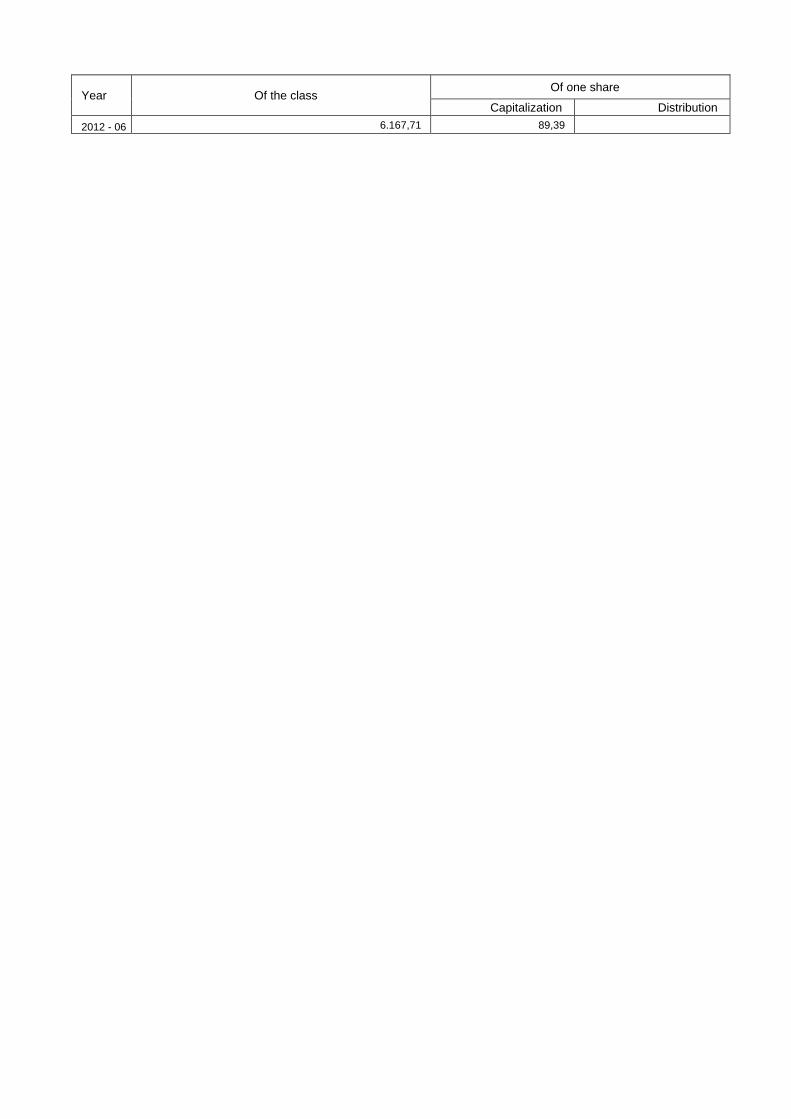
Year Of the class Of one share
Capitalization Distribution
2012 - 06 6.167,71 89,39
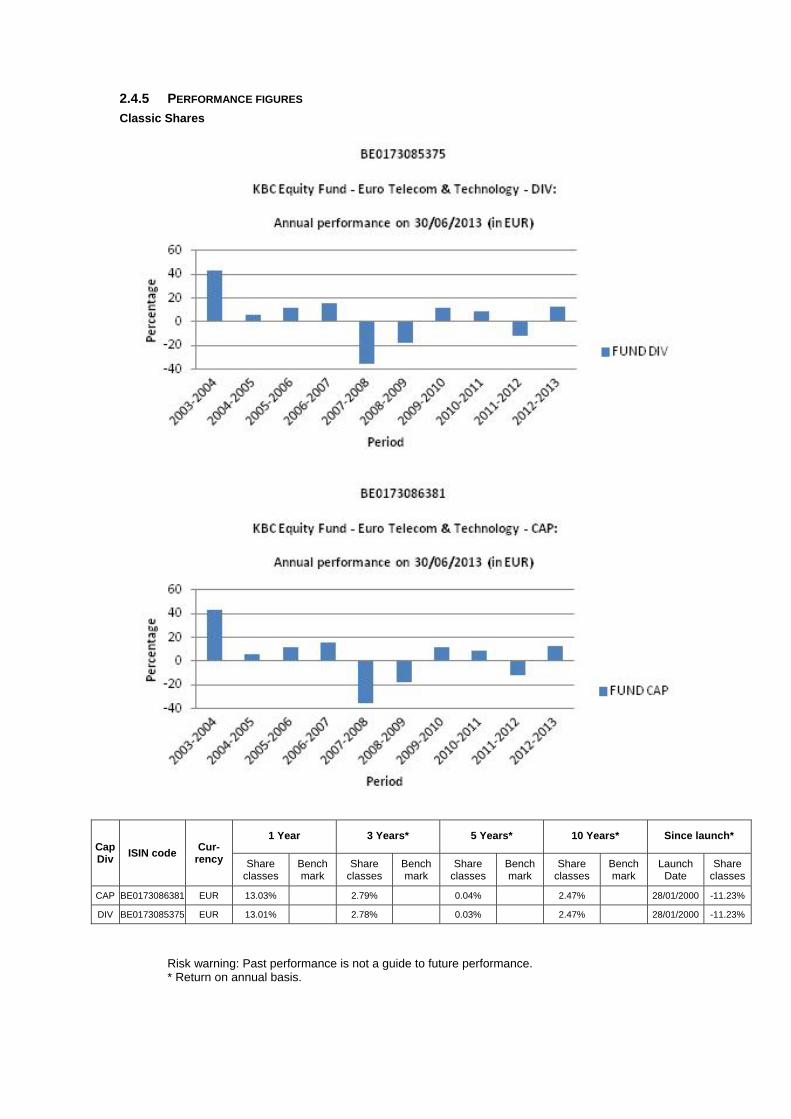
2.4.5 PERFORMANCE FIGURES
Classic Shares
Cap Div
ISIN code Cur-
rency
1 Year 3 Years* 5 Years* 10 Years* Since launch*
Share classes
Bench mark
Share classes
Bench mark
Share classes
Bench mark
Share classes
Bench mark
Launch Date
Share classes
CAP BE0173086381 EUR 13.03% 2.79% 0.04% 2.47% 28/01/2000 -11.23%
DIV BE0173085375 EUR 13.01% 2.78% 0.03% 2.47% 28/01/2000 -11.23%
Risk warning: Past performance is not a guide to future performance. * Return on annual basis.

Classic Shares
The bar chart shows the performance for full financial years. The figures do not take account of any restructuring. Calculated in EUR. The return is calculated as the change in the net asset value between two dates expressed
as a percentage. In the case of units that pay dividends, the dividend is incorporated geometrically in the return.
Calculation method for date D, where NAV stands for net asset value: Capitalisation units (CAP) Return on date D over a period of X years:
[NIW(D) / NIW(Y)] ^ [1 / X] - 1 where Y = D-X
Return on date D since the start date S of the unit: [NIW(D) / NIW(S)] ^ [1 / F] - 1 where F = 1 if the unit has existed for less than one year on date D where F = (D-S) / 365.25 if the unit has existed for longer than one year on date D
Distribution units (DIV) Return on date D over a period of X years:
[ C * NIW(D) / NIW(Y)] ^ [1 / X] - 1 where Y = D-X
Return on date D since the start date S of the unit: [ C * NIW(D) / NIW(S)] ^ [1 / F] - 1 where F = 1 if the unit has existed for less than one year on date D where F = (D-S) / 365.25 if the unit has existed for longer than one year on date D where C is a factor that is determined for all N dividends between the calculation date D and the reference date.
For dividend i on date Di with value Wi: Ci = [Wi / NIW(Di)] + 1 i = 1 ... N from whichC = C0 * .... * CN.
If the interval between the two dates exceeds one year, the ordinary return calculation is converted into a return on an annual basis by taking the nth square root of 1 plus the total return of the unit.
The return figures shown above do not take account of the fees and charges associated with the issue and redemption of units.
These are the performance figures for capitalisation and distribution shares.
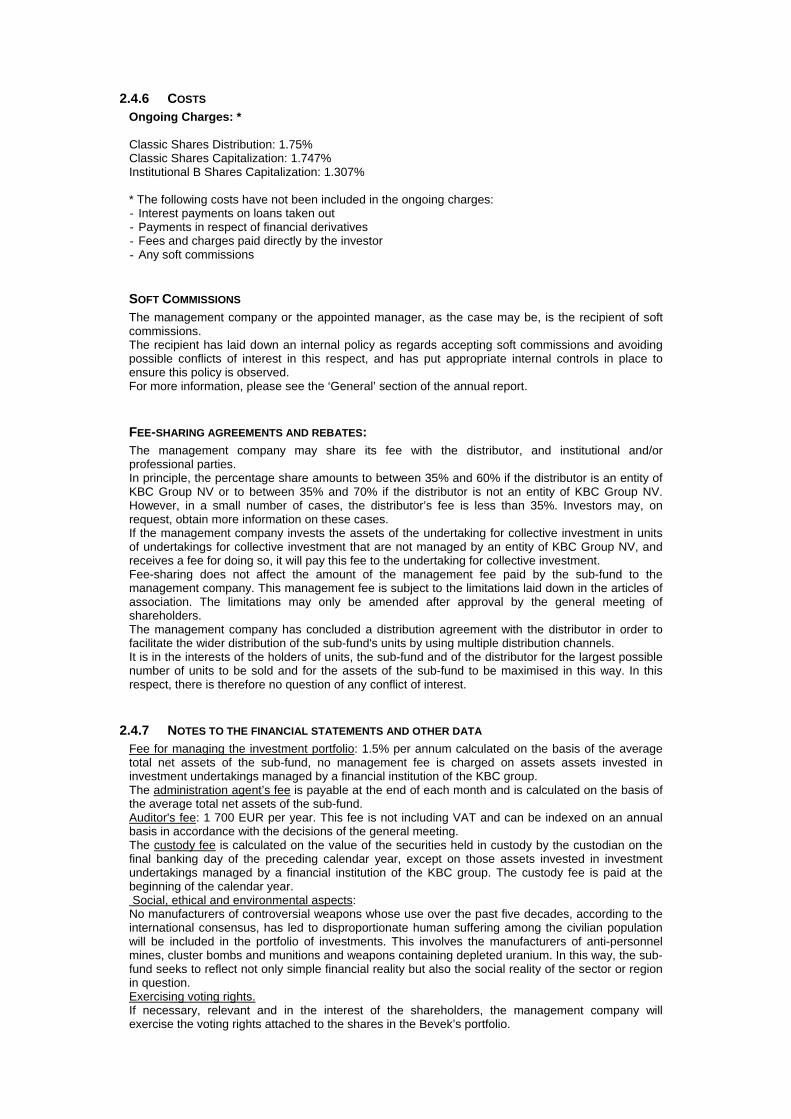
2.4.6 COSTS Ongoing Charges: * Classic Shares Distribution: 1.75% Classic Shares Capitalization: 1.747% Institutional B Shares Capitalization: 1.307% * The following costs have not been included in the ongoing charges: - Interest payments on loans taken out - Payments in respect of financial derivatives - Fees and charges paid directly by the investor - Any soft commissions
SOFT COMMISSIONS The management company or the appointed manager, as the case may be, is the recipient of soft commissions. The recipient has laid down an internal policy as regards accepting soft commissions and avoiding possible conflicts of interest in this respect, and has put appropriate internal controls in place to ensure this policy is observed. For more information, please see the ‘General’ section of the annual report.
FEE-SHARING AGREEMENTS AND REBATES: The management company may share its fee with the distributor, and institutional and/or professional parties. In principle, the percentage share amounts to between 35% and 60% if the distributor is an entity of KBC Group NV or to between 35% and 70% if the distributor is not an entity of KBC Group NV. However, in a small number of cases, the distributor’s fee is less than 35%. Investors may, on request, obtain more information on these cases. If the management company invests the assets of the undertaking for collective investment in units of undertakings for collective investment that are not managed by an entity of KBC Group NV, and receives a fee for doing so, it will pay this fee to the undertaking for collective investment. Fee-sharing does not affect the amount of the management fee paid by the sub-fund to the management company. This management fee is subject to the limitations laid down in the articles of association. The limitations may only be amended after approval by the general meeting of shareholders. The management company has concluded a distribution agreement with the distributor in order to facilitate the wider distribution of the sub-fund's units by using multiple distribution channels. It is in the interests of the holders of units, the sub-fund and of the distributor for the largest possible number of units to be sold and for the assets of the sub-fund to be maximised in this way. In this respect, there is therefore no question of any conflict of interest.
2.4.7 NOTES TO THE FINANCIAL STATEMENTS AND OTHER DATA Fee for managing the investment portfolio: 1.5% per annum calculated on the basis of the average total net assets of the sub-fund, no management fee is charged on assets assets invested in investment undertakings managed by a financial institution of the KBC group. The administration agent’s fee is payable at the end of each month and is calculated on the basis of the average total net assets of the sub-fund. Auditor's fee: 1 700 EUR per year. This fee is not including VAT and can be indexed on an annual basis in accordance with the decisions of the general meeting. The custody fee is calculated on the value of the securities held in custody by the custodian on the final banking day of the preceding calendar year, except on those assets invested in investment undertakings managed by a financial institution of the KBC group. The custody fee is paid at the beginning of the calendar year. Social, ethical and environmental aspects: No manufacturers of controversial weapons whose use over the past five decades, according to the international consensus, has led to disproportionate human suffering among the civilian population will be included in the portfolio of investments. This involves the manufacturers of anti-personnel mines, cluster bombs and munitions and weapons containing depleted uranium. In this way, the sub-fund seeks to reflect not only simple financial reality but also the social reality of the sector or region in question. Exercising voting rights. If necessary, relevant and in the interest of the shareholders, the management company will exercise the voting rights attached to the shares in the Bevek’s portfolio.
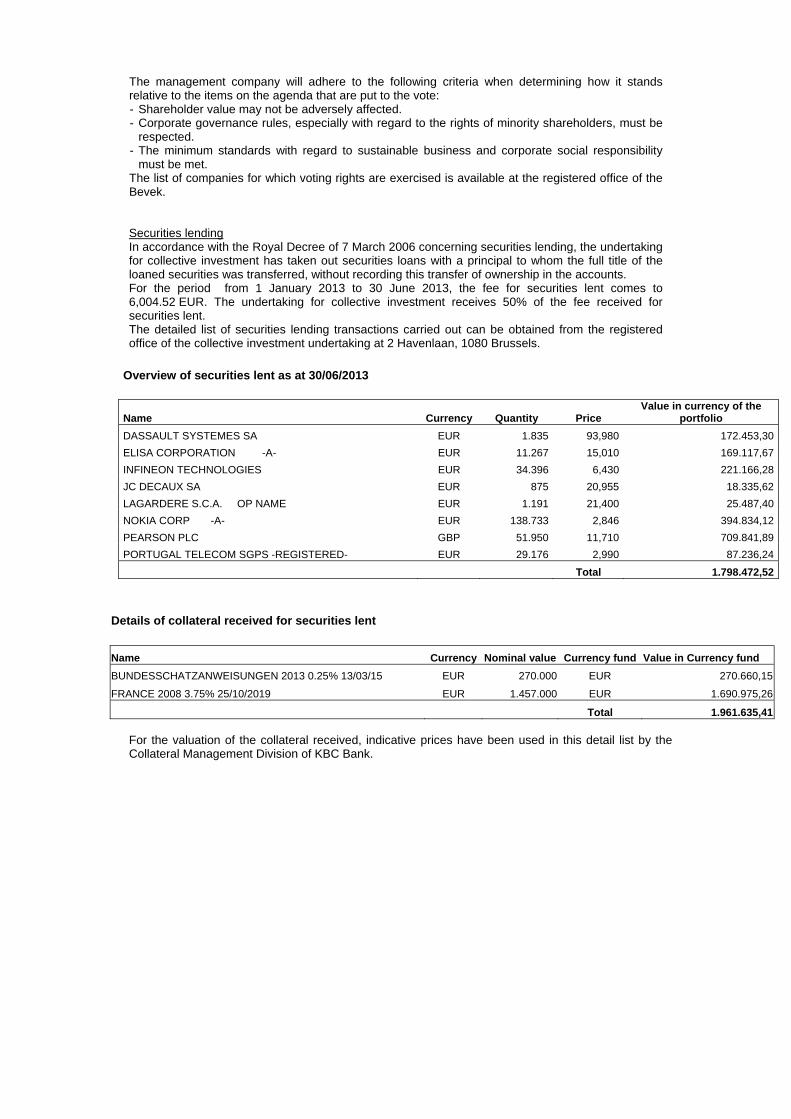
The management company will adhere to the following criteria when determining how it stands relative to the items on the agenda that are put to the vote: - Shareholder value may not be adversely affected. - Corporate governance rules, especially with regard to the rights of minority shareholders, must be
respected. - The minimum standards with regard to sustainable business and corporate social responsibility
must be met. The list of companies for which voting rights are exercised is available at the registered office of the Bevek. Securities lending In accordance with the Royal Decree of 7 March 2006 concerning securities lending, the undertaking for collective investment has taken out securities loans with a principal to whom the full title of the loaned securities was transferred, without recording this transfer of ownership in the accounts. For the period from 1 January 2013 to 30 June 2013, the fee for securities lent comes to 6,004.52 EUR. The undertaking for collective investment receives 50% of the fee received for securities lent. The detailed list of securities lending transactions carried out can be obtained from the registered office of the collective investment undertaking at 2 Havenlaan, 1080 Brussels.
Overview of securities lent as at 30/06/2013
Name Currency Quantity Price Value in currency of the
portfolio
DASSAULT SYSTEMES SA EUR 1.835 93,980 172.453,30
ELISA CORPORATION -A- EUR 11.267 15,010 169.117,67
INFINEON TECHNOLOGIES EUR 34.396 6,430 221.166,28
JC DECAUX SA EUR 875 20,955 18.335,62
LAGARDERE S.C.A. OP NAME EUR 1.191 21,400 25.487,40
NOKIA CORP -A- EUR 138.733 2,846 394.834,12
PEARSON PLC GBP 51.950 11,710 709.841,89
PORTUGAL TELECOM SGPS -REGISTERED- EUR 29.176 2,990 87.236,24
Total 1.798.472,52
Details of collateral received for securities lent
Name Currency Nominal value Currency fund Value in Currency fund
BUNDESSCHATZANWEISUNGEN 2013 0.25% 13/03/15 EUR 270.000 EUR 270.660,15
FRANCE 2008 3.75% 25/10/2019 EUR 1.457.000 EUR 1.690.975,26
Total 1.961.635,41 For the valuation of the collateral received, indicative prices have been used in this detail list by the Collateral Management Division of KBC Bank.

Semi-Annual report as at 30th June 2013
TABLE OF CONTENTS
2. Information on KBC Equity Fund Euro Cyclicals
2.1. Management report 2.1.1. Launch date and subscription price 2.1.2. Stock exchange listing 2.1.3. Aim and distinctive features of the investment policy 2.1.4. Financial portfolio management 2.1.5. Distributors 2.1.6. Index and benchmark 2.1.7. Policy conducted during the financial year 2.1.8. Future policy 2.1.9. Synthetic risk and reward indicator (SRRI)
2.2. Balance sheet
2.3. Profit and loss account
2.4. Composition of the assets and key figures
2.4.1. Composition of the assets 2.4.2. Change in the composition of the assets 2.4.3. Value of commitments in respect of financial derivatives positions 2.4.4. Evolution of the number of subscriptions, repayments and the net asset value 2.4.5. Return figures 2.4.6. Expenses 2.4.7. Notes to the financial statements and other data


2 INFORMATION ON KBC EQUITY FUND EURO CYCLICALS
2.1 MANAGEMENT REPORT
2.1.1 LAUNCH DATE AND SUBSCRIPTION PRICE Classic Shares : Launch date: 30 December 1999 Initial subscription price: 500 EUR Currency: EUR Institutional B Shares : Launch date: 24 November 2011 Initial subscription price: 516.88 EUR Currency: EUR
2.1.2 STOCK EXCHANGE LISTING Not applicable.
2.1.3 GOAL AND KEY PRINCIPLES OF THE INVESTMENT POLICY
SUB-FUND’S OBJECT: The main objective of this sub-fund is to generate the highest possible return for its shareholders by investing directly or indirectly in transferable securities. This is reflected in its pursuit of capital gains and income. To this end, the assets are invested, either directly or indirectly via correlated financial instruments, primarily in shares.
SUB-FUND’S INVESTMENT POLICY:
PERMITTED ASSET CLASSES: The sub-fund may invest in securities, money market instruments, units in undertakings for collective investment, deposits, financial derivatives, liquid assets and all other instruments insofar as permitted by the applicable laws and regulations and consistent with the sub-fund’s object The sub-fund shall invest no more than 10% of its assets in units of other undertakings for collective investment.
RESTRICTIONS OF THE INVESTMENT POLICY: The investment policy will be implemented within the limits set by law and regulations. The sub-fund may borrow up to 10% of its net assets, insofar as these are short-term borrowings aimed at solving temporary liquidity problems.
PERMITTED DERIVATIVES TRANSACTIONS: Derivates may be used either for hedging purposes or to achieve investment objectives. Changes will be made to the investments at regular intervals to comply with the sub-fund's investment strategy. In addition, listed and unlisted derivates may be used to achieve the objectives: these may be forward contracts, options or swaps on securities, indices, currencies or interest rates or other transactions involving derivatives. Unlisted derivatives transactions will only be concluded with prime financial institutions specialised in such transactions. Such derivatives may also be used to hedge the assets against exchange-rate fluctuations. Subject to the applicable laws and regulations and the articles of association, the sub-fund always seeks to conclude the most effective transactions. All costs associated with the transactions will be charged to the sub-fund and all income generated will be paid to the sub-fund. If the transactions result in a risk in respect of the counterparty, this risk can be hedged by using a margin management system that ensures that the sub-fund is the beneficiary of security (collateral) in the form of cash or investment grade bonds. When calculating the value of the bonds, a margin will be applied that varies depending on the residual term to maturity and the currency in which the bond in question is denominated. The relationship with the counterparty or counterparties is governed by standard international agreements.
STRATEGY SELECTED At least 75% of the assets are invested in shares of European companies in cyclical sectors.
LENDING FINANCIAL INSTRUMENTS: The sub-fund may lend financial instruments within the limits set by law and regulations. This lending does not affect the sub-fund’s risk profile since: - it takes place within the framework of a securities lending system managed by a principal. In
addition, the sub-fund has a relationship only with the principal of the securities lending system which acts as counterparty and to which title of the loaned securities is transferred. The choice of principal is subject to strict selection criteria. The return of securities similar to the securities that have been lent is guaranteed by the principal.
- through a margin management system, the sub-fund is always guaranteed financial security, the actual value of which always exceeds the actual value of the securities that have been lent, in case the principal does not return similar securities.
The return of securities similar to the securities that have been lent can be requested at any time, which means that the lending of securities does not affect the management of the sub-fund's assets. By lending securities, the sub-fund can generate an additional return. The principal pays a fee to the management company. After deducting the fee for the margin management and clearing services of KBC Bank, most of this fee is paid to the sub-fund. The relationship with the counterparty or counterparties is governed by standard international agreements. More information is provided on the terms and conditions governing securities lending in the annual or half-yearly report for the sub-fund.
VOLATILITY OF THE NET ASSET VALUE: The volatility of the net asset value may be high due to the composition of the portfolio.
GENERAL STRATEGY FOR HEDGING THE EXCHANGE RATE RISK: In order to protect its assets against exchange rate fluctuations and within the limitations laid down in the articles of association, the sub-fund may perform transactions relating to the sale of forward currency contracts, as well as the sale of call options and the purchase of put options on currencies. The transactions in question may relate solely to contracts traded on a regulated market that operates regularly, is recognised and is open to the public or that are traded with a recognised, prime financial institution specialising in such transactions and dealing in the over-the-counter (OTC) market in options. With the same objective, the sub-fund may also sell currencies forward or exchange them in private transactions with prime financial institutions specialising in such transactions. The hedging objective of the aforementioned transactions suggests that there is a direct link between these transactions and the assets to be hedged, which implies that the transactions carried out in a particular currency may in principle not exceed, in terms of volume, either the valuation value of all the assets in the same currency or the holding period of those assets.
SOCIAL, ETHICAL AND ENVIRONMENTAL ASPECTS:
No manufacturers of controversial weapons whose use over the past five decades, according to the international consensus, has led to disproportionate human suffering among the civilian population will be included in the portfolio of investments. This involves the manufacturers of anti-personnel mines, cluster bombs and munitions and weapons containing depleted uranium. In this way, the sub-fund seeks to reflect not only simple financial reality but also the social reality of the sector or region in question.
THE EUROPEAN SAVINGS DIRECTIVE AND TAX ON DEBT CLAIM RETURNS OBTAINED THROUGH THE
REDEMPTION OF OWN UNITS OR IN THE EVENT OF FULL OR PARTIAL DISTRIBUTION OF EQUITY
CAPITAL. The following information is of a general character and is not intended to cover all aspects of an investment in a UCITS. In certain cases entirely different rules might even apply. Moreover, both tax law and the interpretation of it can change. Investors who wish to have more information about the tax implications – in both Belgium and abroad – of acquiring, holding and transferring units should seek the advice of their usual financial and tax advisers. This UCITS shall invest a maximum of 15% of its assets directly or indirectly in debt instruments as intended by the European Savings Directive.

A. European Savings Directive (Directive 2003/48/EC) The European Savings Directive has been implemented in Belgium. Since this UCITS invests a maximum of 15% of its assets directly or indirectly in debt claims as intended by the European Savings Directive, the income of this UCITS does not fall within the scope of this directive. B. Tax on debt claim returns obtained through the redemption of own units or in the event of full or partial distribution of equity capital (Article 19bis Income Tax Code 1992). The income from this UCITS is not subject to the tax on debt instrument returns as intended by Article 19bis, Income Tax Code 1992.
2.1.4 FINANCIAL PORTFOLIO MANAGEMENT There is no delegation of the portfolio.
2.1.5 DISTRIBUTORS KBC Asset Management S.A., 5, Place de la Gare, L-1616 Luxembourg.
2.1.6 INDEX AND BENCHMARK See ‘Sub-fund’s investment policy’.
2.1.7 POLICY PERSUED DURING THE FINANCIAL YEAR Real GDP in the EMU contracted by an annualised 1.1%. The austerity programme and credit restrictions pushed Southern Europe into a deep recession. Germany played its traditional role as the driver for European economic growth to a lesser extent than in the recent past. Greater divergence within Europe resulted primarily in a further decline in unemployment in Germany and an alarmingly rapid rise in unemployment in countries such as Greece, Spain and Portugal. Belgium was closer to the strong core of the euro area. Among the traditional markets, Western Europe (MSCI Europe return index over the same period: +4.1%) was unable to continue the catch-up process begun in 2012. Fear that the EMU’s problems entailed a systemic risk nevertheless faded from the market. Europe’s cheaper valuation (compared to the US) was unable to offer any support either. European corporate earnings fell well short of expectations since the first quarter of 2012. They show a downward trend, in stark contrast to developments in other regions. Wall Street was much higher at the end of June than at the end of 2012 (S&P 500: +12.6%, Dow Jones: +13.8%).
2.1.8 FUTURE POLICY Confidence indicators in Europe are well below freezing point. The budgetary plans, tighter lending policy of the banks and major uncertainty among consumers and producers will continue to depress growth. 2013 will see a contraction of GDP in Europe. Recovery is not expected until the first half of 2014. Deflation or depression scenarios, which are currently dominating bond market sentiment, are not however justified. Economic growth in Europe will remain below par. The towering unemployment and the euro crisis are undermining consumer confidence and the banks’ willingness to provide ready access to credit. The ECB’s monetary policy is also much less aggressive than the Fed's. In contrast, real wage rises (however limited) will be somewhat higher in Europe than in the US. Time is of the essence for the euro area. Everyone knows that the EMU is not a perfect monetary union. In its twelve-year history, little has been done to improve its internal operation. National autonomy was sacrosanct. The crisis brought the realisation that ‘economic governance’, as it is now called in Eurospeak, needs to be tackled as a matter of urgency. In concrete terms, this involves measures such as supranational supervision of banks (scheduled to be in place by early 2015), strict monitoring and sanctioning of budgetary policy (a huge challenge given the emergence of austerity fatigue), monitoring of pay policy and harmonising European taxation (a big taboo).
2.1.9 SYNTHETIC RISK AND REWARD INDICATOR Classic Shares: 7 on a scale of 1 (lowest risk) to 7 (highest risk). Institutional B Shares: 7 on a scale of 1 (lowest risk) to 7 (highest risk). The value of a share can decrease or increase and the investor may not get back the amount invested. In accordance with Commission Regulation (EU) No. 583/2010, a synthetic risk and reward indicator has been calculated. This indicator provides a quantitative measure of the sub-fund's potential return and the risk involved, calculated in the currency in which the sub-fund is denominated. It is given as a figure between 1 and 7. The higher the figure, the greater the potential return, but also the more difficult it is to predict this return. Losses are possible too. The lowest figure does not mean that the investment is entirely free of risk. However, it does indicate that, compared with the higher figures, this product will generally provide a lower, but more predictable return. The synthetic risk and reward indicator is assessed regularly and can therefore go up or down based on data from the past. Data from the past is not always a reliable indicator of future risk and return.
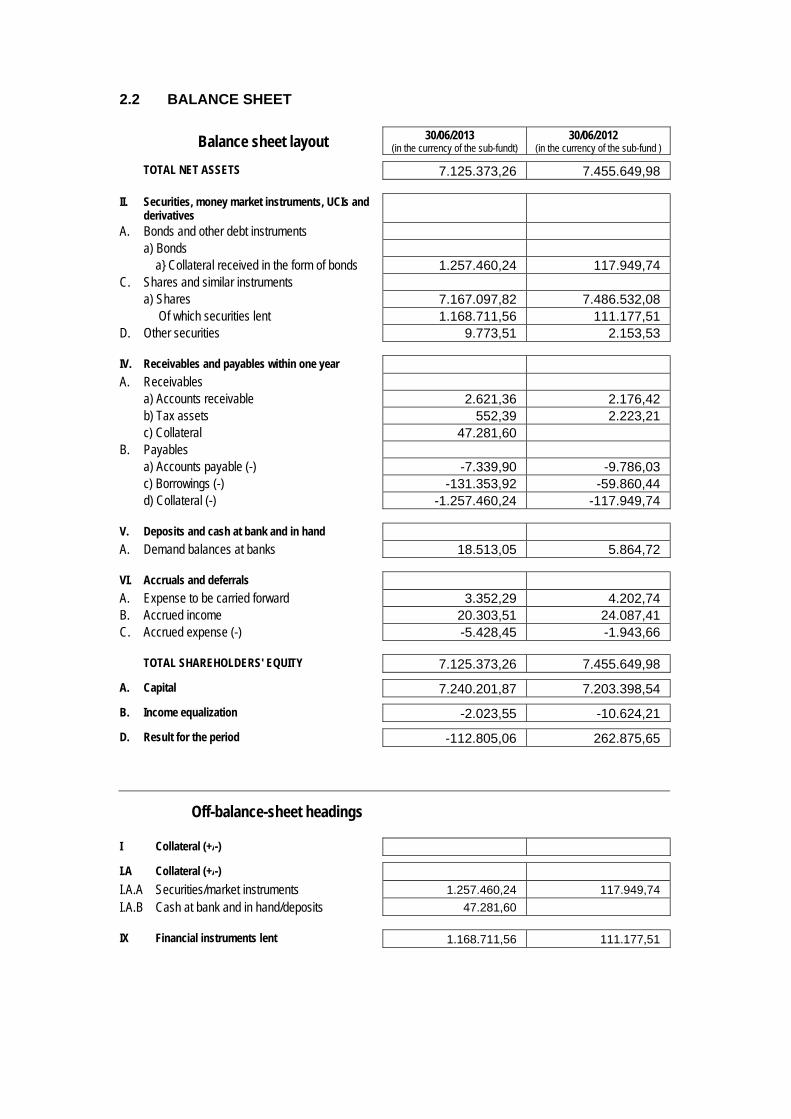
2.2 BALANCE SHEET
Balance sheet layout 30/06/2013 (in the currency of the sub-fundt)
30/06/2012 (in the currency of the sub-fund )
TOTAL NET ASSETS 7.125.373,26 7.455.649,98
II. Securities, money market instruments, UCIs and derivatives
A. Bonds and other debt instruments a) Bonds a} Collateral received in the form of bonds 1.257.460,24 117.949,74 C. Shares and similar instruments a) Shares 7.167.097,82 7.486.532,08 Of which securities lent 1.168.711,56 111.177,51 D. Other securities 9.773,51 2.153,53
IV. Receivables and payables within one year A. Receivables a) Accounts receivable 2.621,36 2.176,42 b) Tax assets 552,39 2.223,21 c) Collateral 47.281,60 B. Payables a) Accounts payable (-) -7.339,90 -9.786,03 c) Borrowings (-) -131.353,92 -59.860,44 d) Collateral (-) -1.257.460,24 -117.949,74
V. Deposits and cash at bank and in hand A. Demand balances at banks 18.513,05 5.864,72
VI. Accruals and deferrals A. Expense to be carried forward 3.352,29 4.202,74 B. Accrued income 20.303,51 24.087,41 C. Accrued expense (-) -5.428,45 -1.943,66
TOTAL SHAREHOLDERS' EQUITY 7.125.373,26 7.455.649,98
A. Capital 7.240.201,87 7.203.398,54
B. Income equalization -2.023,55 -10.624,21
D. Result for the period -112.805,06 262.875,65
Off-balance-sheet headings
I Collateral (+/-)
I.A Collateral (+/-)
I.A.A Securities/market instruments 1.257.460,24 117.949,74
I.A.B Cash at bank and in hand/deposits 47.281,60
IX Financial instruments lent 1.168.711,56 111.177,51

2.3 PROFIT AND LOSS ACCOUNT
Income Statement 30/06/2013 (in the currency of the sub-fund)
30/06/2012 (in the currency of the sub-fund)
I. Net gains(losses) on investments C. Shares and similar instruments a) Shares -11.517,73 2.388,72 D. Other securities -2.865,52 -262,33 F. Derivative financial instruments l) Financial indices Futures and forward contracts 12.091,59 H. Foreign exchange positions and transactions b) Other foreign exchange positions and
transactions -175.507,15 145.499,05
II. Investment income and expenses A. Dividends 152.571,01 181.735,76 B. Interests a) Securities and money market instruments 1.249,97 -4.080,88 b) Cash at bank and in hand and deposits 21,04 46,25 C. Interest on borrowings (-) -101,22 -298,57
IV. Operating expenses A. Investment transaction and delivery costs (-) -3.058,04 -7.831,48 B. Financial expenses (-) -115,34 -60,94 C. Custodian's fee (-) -2.704,92 -4.445,13 D. Manager's fee (-) a) Financial management Classic Shares -56.358,21 -58.477,16 b) Administration and accounting management -3.757,11 -5.118,52 E. Administrative expenses (-) -60,65 -72,49 F. Formation and organisation expenses (-) -159,73 -660,26 H. Services and sundry goods (-) -2.321,88 -1.799,09 J. Taxes Classic Shares -7.526,65 4.808,99 K. Other expenses (-) -592,93 -587,86
Income and expenditure for the period Subtotal II + III + IV 77.085,34 103.158,62
V. Profit (loss) on ordinary activities before tax -112.805,06 262.875,65
VII. Result for the period -112.805,06 262.875,65
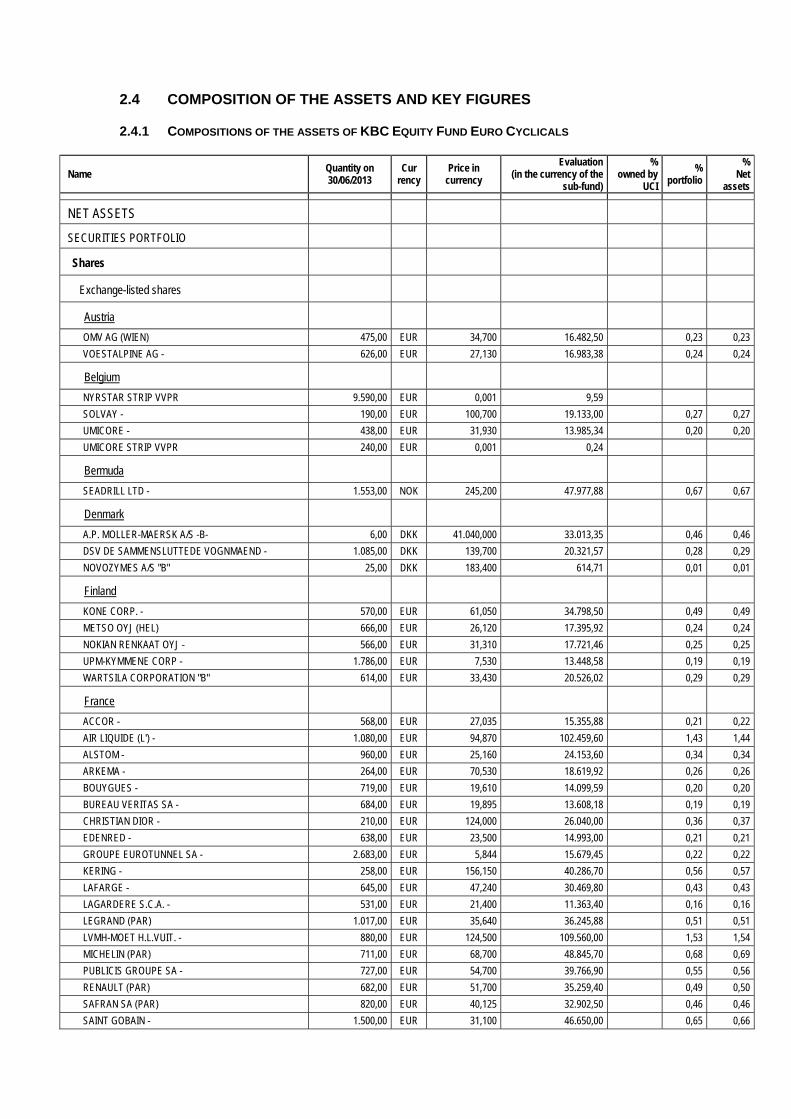
2.4 COMPOSITION OF THE ASSETS AND KEY FIGURES
2.4.1 COMPOSITIONS OF THE ASSETS OF KBC EQUITY FUND EURO CYCLICALS
Name Quantity on 30/06/2013
Cur rency
Price in currency
Evaluation (in the currency of the
sub-fund)
% owned by
UCI
% portfolio
% Net
assets
NET ASSETS
SECURITIES PORTFOLIO
Shares
Exchange-listed shares
Austria
OMV AG (WIEN) 475,00 EUR 34,700 16.482,50 0,23 0,23
VOESTALPINE AG - 626,00 EUR 27,130 16.983,38 0,24 0,24
Belgium
NYRSTAR STRIP VVPR 9.590,00 EUR 0,001 9,59
SOLVAY - 190,00 EUR 100,700 19.133,00 0,27 0,27
UMICORE - 438,00 EUR 31,930 13.985,34 0,20 0,20
UMICORE STRIP VVPR 240,00 EUR 0,001 0,24
Bermuda
SEADRILL LTD - 1.553,00 NOK 245,200 47.977,88 0,67 0,67
Denmark
A.P. MOLLER-MAERSK A/S -B- 6,00 DKK 41.040,000 33.013,35 0,46 0,46
DSV DE SAMMENSLUTTEDE VOGNMAEND - 1.085,00 DKK 139,700 20.321,57 0,28 0,29
NOVOZYMES A/S "B" 25,00 DKK 183,400 614,71 0,01 0,01
Finland
KONE CORP. - 570,00 EUR 61,050 34.798,50 0,49 0,49
METSO OYJ (HEL) 666,00 EUR 26,120 17.395,92 0,24 0,24
NOKIAN RENKAAT OYJ - 566,00 EUR 31,310 17.721,46 0,25 0,25
UPM-KYMMENE CORP - 1.786,00 EUR 7,530 13.448,58 0,19 0,19
WARTSILA CORPORATION "B" 614,00 EUR 33,430 20.526,02 0,29 0,29
France
ACCOR - 568,00 EUR 27,035 15.355,88 0,21 0,22
AIR LIQUIDE (L') - 1.080,00 EUR 94,870 102.459,60 1,43 1,44
ALSTOM - 960,00 EUR 25,160 24.153,60 0,34 0,34
ARKEMA - 264,00 EUR 70,530 18.619,92 0,26 0,26
BOUYGUES - 719,00 EUR 19,610 14.099,59 0,20 0,20
BUREAU VERITAS SA - 684,00 EUR 19,895 13.608,18 0,19 0,19
CHRISTIAN DIOR - 210,00 EUR 124,000 26.040,00 0,36 0,37
EDENRED - 638,00 EUR 23,500 14.993,00 0,21 0,21
GROUPE EUROTUNNEL SA - 2.683,00 EUR 5,844 15.679,45 0,22 0,22
KERING - 258,00 EUR 156,150 40.286,70 0,56 0,57
LAFARGE - 645,00 EUR 47,240 30.469,80 0,43 0,43
LAGARDERE S.C.A. - 531,00 EUR 21,400 11.363,40 0,16 0,16
LEGRAND (PAR) 1.017,00 EUR 35,640 36.245,88 0,51 0,51
LVMH-MOET H.L.VUIT. - 880,00 EUR 124,500 109.560,00 1,53 1,54
MICHELIN (PAR) 711,00 EUR 68,700 48.845,70 0,68 0,69
PUBLICIS GROUPE SA - 727,00 EUR 54,700 39.766,90 0,55 0,56
RENAULT (PAR) 682,00 EUR 51,700 35.259,40 0,49 0,50
SAFRAN SA (PAR) 820,00 EUR 40,125 32.902,50 0,46 0,46
SAINT GOBAIN - 1.500,00 EUR 31,100 46.650,00 0,65 0,66
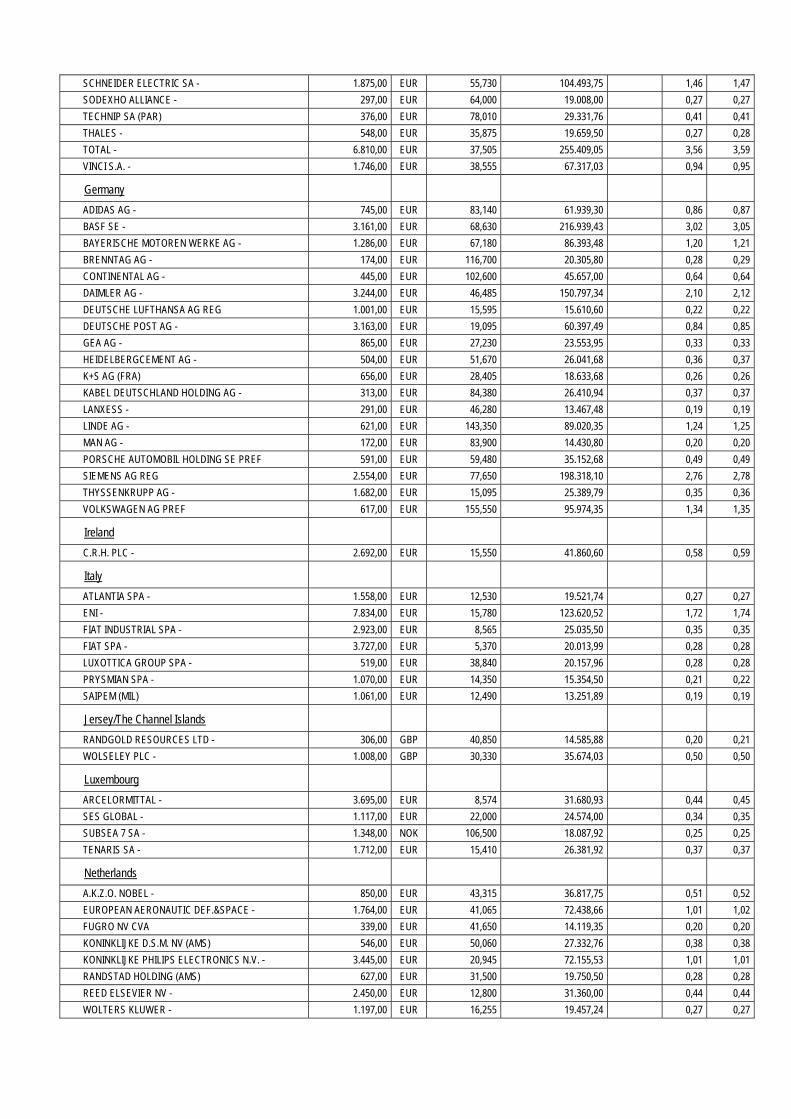
SCHNEIDER ELECTRIC SA - 1.875,00 EUR 55,730 104.493,75 1,46 1,47
SODEXHO ALLIANCE - 297,00 EUR 64,000 19.008,00 0,27 0,27
TECHNIP SA (PAR) 376,00 EUR 78,010 29.331,76 0,41 0,41
THALES - 548,00 EUR 35,875 19.659,50 0,27 0,28
TOTAL - 6.810,00 EUR 37,505 255.409,05 3,56 3,59
VINCI S.A. - 1.746,00 EUR 38,555 67.317,03 0,94 0,95
Germany
ADIDAS AG - 745,00 EUR 83,140 61.939,30 0,86 0,87
BASF SE - 3.161,00 EUR 68,630 216.939,43 3,02 3,05
BAYERISCHE MOTOREN WERKE AG - 1.286,00 EUR 67,180 86.393,48 1,20 1,21
BRENNTAG AG - 174,00 EUR 116,700 20.305,80 0,28 0,29
CONTINENTAL AG - 445,00 EUR 102,600 45.657,00 0,64 0,64
DAIMLER AG - 3.244,00 EUR 46,485 150.797,34 2,10 2,12
DEUTSCHE LUFTHANSA AG REG 1.001,00 EUR 15,595 15.610,60 0,22 0,22
DEUTSCHE POST AG - 3.163,00 EUR 19,095 60.397,49 0,84 0,85
GEA AG - 865,00 EUR 27,230 23.553,95 0,33 0,33
HEIDELBERGCEMENT AG - 504,00 EUR 51,670 26.041,68 0,36 0,37
K+S AG (FRA) 656,00 EUR 28,405 18.633,68 0,26 0,26
KABEL DEUTSCHLAND HOLDING AG - 313,00 EUR 84,380 26.410,94 0,37 0,37
LANXESS - 291,00 EUR 46,280 13.467,48 0,19 0,19
LINDE AG - 621,00 EUR 143,350 89.020,35 1,24 1,25
MAN AG - 172,00 EUR 83,900 14.430,80 0,20 0,20
PORSCHE AUTOMOBIL HOLDING SE PREF 591,00 EUR 59,480 35.152,68 0,49 0,49
SIEMENS AG REG 2.554,00 EUR 77,650 198.318,10 2,76 2,78
THYSSENKRUPP AG - 1.682,00 EUR 15,095 25.389,79 0,35 0,36
VOLKSWAGEN AG PREF 617,00 EUR 155,550 95.974,35 1,34 1,35
Ireland
C.R.H. PLC - 2.692,00 EUR 15,550 41.860,60 0,58 0,59
Italy
ATLANTIA SPA - 1.558,00 EUR 12,530 19.521,74 0,27 0,27
ENI - 7.834,00 EUR 15,780 123.620,52 1,72 1,74
FIAT INDUSTRIAL SPA - 2.923,00 EUR 8,565 25.035,50 0,35 0,35
FIAT SPA - 3.727,00 EUR 5,370 20.013,99 0,28 0,28
LUXOTTICA GROUP SPA - 519,00 EUR 38,840 20.157,96 0,28 0,28
PRYSMIAN SPA - 1.070,00 EUR 14,350 15.354,50 0,21 0,22
SAIPEM (MIL) 1.061,00 EUR 12,490 13.251,89 0,19 0,19
Jersey/The Channel Islands
RANDGOLD RESOURCES LTD - 306,00 GBP 40,850 14.585,88 0,20 0,21
WOLSELEY PLC - 1.008,00 GBP 30,330 35.674,03 0,50 0,50
Luxembourg
ARCELORMITTAL - 3.695,00 EUR 8,574 31.680,93 0,44 0,45
SES GLOBAL - 1.117,00 EUR 22,000 24.574,00 0,34 0,35
SUBSEA 7 SA - 1.348,00 NOK 106,500 18.087,92 0,25 0,25
TENARIS SA - 1.712,00 EUR 15,410 26.381,92 0,37 0,37
Netherlands
A.K.Z.O. NOBEL - 850,00 EUR 43,315 36.817,75 0,51 0,52
EUROPEAN AERONAUTIC DEF.&SPACE - 1.764,00 EUR 41,065 72.438,66 1,01 1,02
FUGRO NV CVA 339,00 EUR 41,650 14.119,35 0,20 0,20
KONINKLIJKE D.S.M. NV (AMS) 546,00 EUR 50,060 27.332,76 0,38 0,38
KONINKLIJKE PHILIPS ELECTRONICS N.V. - 3.445,00 EUR 20,945 72.155,53 1,01 1,01
RANDSTAD HOLDING (AMS) 627,00 EUR 31,500 19.750,50 0,28 0,28
REED ELSEVIER NV - 2.450,00 EUR 12,800 31.360,00 0,44 0,44
WOLTERS KLUWER - 1.197,00 EUR 16,255 19.457,24 0,27 0,27
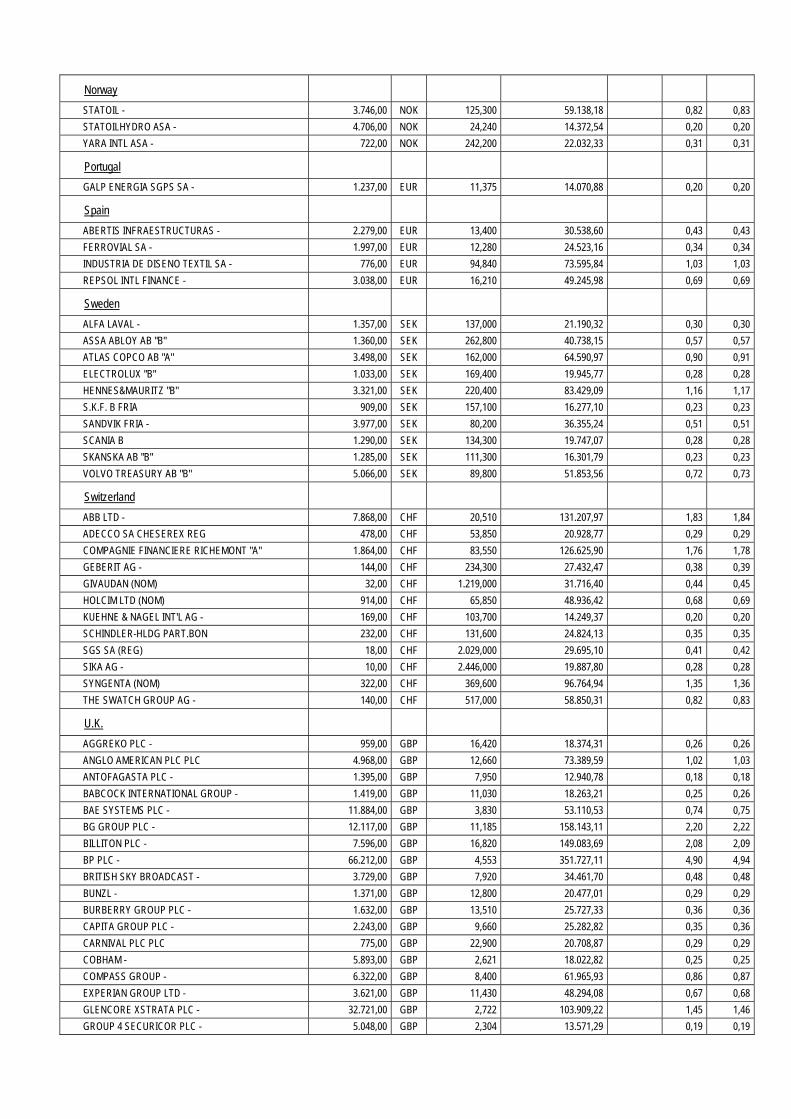
Norway
STATOIL - 3.746,00 NOK 125,300 59.138,18 0,82 0,83
STATOILHYDRO ASA - 4.706,00 NOK 24,240 14.372,54 0,20 0,20
YARA INTL ASA - 722,00 NOK 242,200 22.032,33 0,31 0,31
Portugal
GALP ENERGIA SGPS SA - 1.237,00 EUR 11,375 14.070,88 0,20 0,20
Spain
ABERTIS INFRAESTRUCTURAS - 2.279,00 EUR 13,400 30.538,60 0,43 0,43
FERROVIAL SA - 1.997,00 EUR 12,280 24.523,16 0,34 0,34
INDUSTRIA DE DISENO TEXTIL SA - 776,00 EUR 94,840 73.595,84 1,03 1,03
REPSOL INTL FINANCE - 3.038,00 EUR 16,210 49.245,98 0,69 0,69
Sweden
ALFA LAVAL - 1.357,00 SEK 137,000 21.190,32 0,30 0,30
ASSA ABLOY AB "B" 1.360,00 SEK 262,800 40.738,15 0,57 0,57
ATLAS COPCO AB "A" 3.498,00 SEK 162,000 64.590,97 0,90 0,91
ELECTROLUX "B" 1.033,00 SEK 169,400 19.945,77 0,28 0,28
HENNES&MAURITZ "B" 3.321,00 SEK 220,400 83.429,09 1,16 1,17
S.K.F. B FRIA 909,00 SEK 157,100 16.277,10 0,23 0,23
SANDVIK FRIA - 3.977,00 SEK 80,200 36.355,24 0,51 0,51
SCANIA B 1.290,00 SEK 134,300 19.747,07 0,28 0,28
SKANSKA AB "B" 1.285,00 SEK 111,300 16.301,79 0,23 0,23
VOLVO TREASURY AB "B" 5.066,00 SEK 89,800 51.853,56 0,72 0,73
Switzerland
ABB LTD - 7.868,00 CHF 20,510 131.207,97 1,83 1,84
ADECCO SA CHESEREX REG 478,00 CHF 53,850 20.928,77 0,29 0,29
COMPAGNIE FINANCIERE RICHEMONT "A" 1.864,00 CHF 83,550 126.625,90 1,76 1,78
GEBERIT AG - 144,00 CHF 234,300 27.432,47 0,38 0,39
GIVAUDAN (NOM) 32,00 CHF 1.219,000 31.716,40 0,44 0,45
HOLCIM LTD (NOM) 914,00 CHF 65,850 48.936,42 0,68 0,69
KUEHNE & NAGEL INT'L AG - 169,00 CHF 103,700 14.249,37 0,20 0,20
SCHINDLER-HLDG PART.BON 232,00 CHF 131,600 24.824,13 0,35 0,35
SGS SA (REG) 18,00 CHF 2.029,000 29.695,10 0,41 0,42
SIKA AG - 10,00 CHF 2.446,000 19.887,80 0,28 0,28
SYNGENTA (NOM) 322,00 CHF 369,600 96.764,94 1,35 1,36
THE SWATCH GROUP AG - 140,00 CHF 517,000 58.850,31 0,82 0,83
U.K.
AGGREKO PLC - 959,00 GBP 16,420 18.374,31 0,26 0,26
ANGLO AMERICAN PLC PLC 4.968,00 GBP 12,660 73.389,59 1,02 1,03
ANTOFAGASTA PLC - 1.395,00 GBP 7,950 12.940,78 0,18 0,18
BABCOCK INTERNATIONAL GROUP - 1.419,00 GBP 11,030 18.263,21 0,25 0,26
BAE SYSTEMS PLC - 11.884,00 GBP 3,830 53.110,53 0,74 0,75
BG GROUP PLC - 12.117,00 GBP 11,185 158.143,11 2,20 2,22
BILLITON PLC - 7.596,00 GBP 16,820 149.083,69 2,08 2,09
BP PLC - 66.212,00 GBP 4,553 351.727,11 4,90 4,94
BRITISH SKY BROADCAST - 3.729,00 GBP 7,920 34.461,70 0,48 0,48
BUNZL - 1.371,00 GBP 12,800 20.477,01 0,29 0,29
BURBERRY GROUP PLC - 1.632,00 GBP 13,510 25.727,33 0,36 0,36
CAPITA GROUP PLC - 2.243,00 GBP 9,660 25.282,82 0,35 0,36
CARNIVAL PLC PLC 775,00 GBP 22,900 20.708,87 0,29 0,29
COBHAM - 5.893,00 GBP 2,621 18.022,82 0,25 0,25
COMPASS GROUP - 6.322,00 GBP 8,400 61.965,93 0,86 0,87
EXPERIAN GROUP LTD - 3.621,00 GBP 11,430 48.294,08 0,67 0,68
GLENCORE XSTRATA PLC - 32.721,00 GBP 2,722 103.909,22 1,45 1,46
GROUP 4 SECURICOR PLC - 5.048,00 GBP 2,304 13.571,29 0,19 0,19
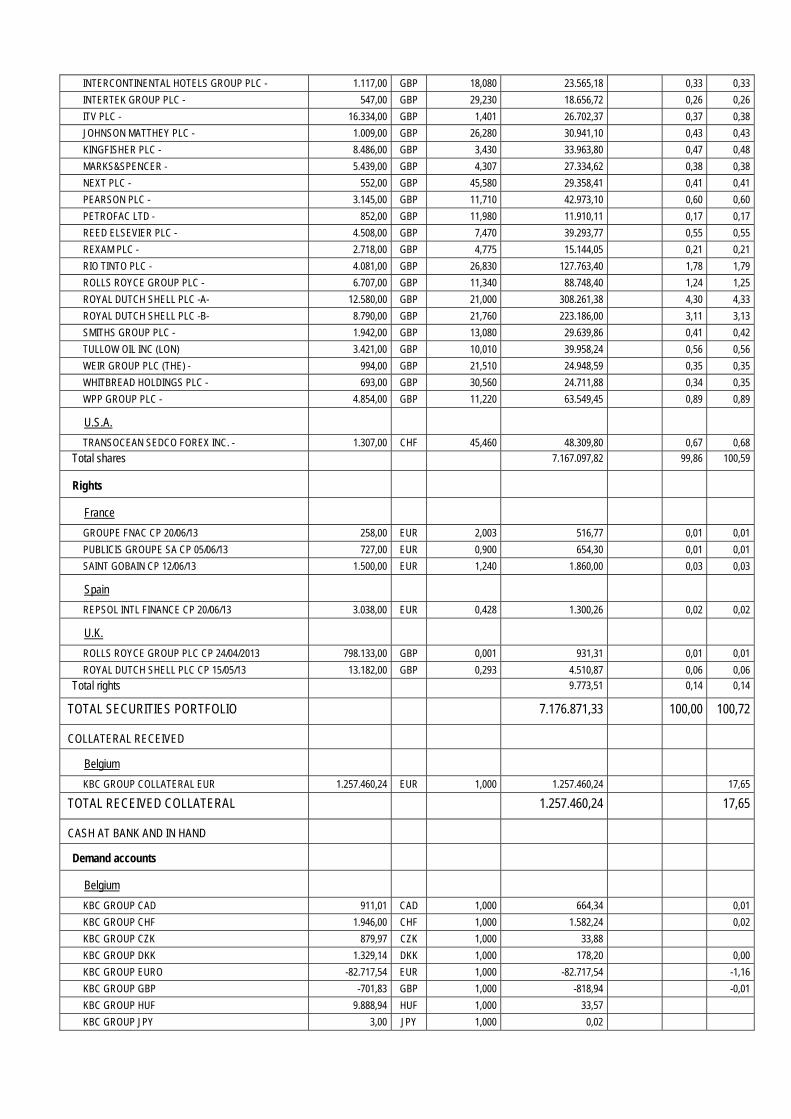
INTERCONTINENTAL HOTELS GROUP PLC - 1.117,00 GBP 18,080 23.565,18 0,33 0,33
INTERTEK GROUP PLC - 547,00 GBP 29,230 18.656,72 0,26 0,26
ITV PLC - 16.334,00 GBP 1,401 26.702,37 0,37 0,38
JOHNSON MATTHEY PLC - 1.009,00 GBP 26,280 30.941,10 0,43 0,43
KINGFISHER PLC - 8.486,00 GBP 3,430 33.963,80 0,47 0,48
MARKS&SPENCER - 5.439,00 GBP 4,307 27.334,62 0,38 0,38
NEXT PLC - 552,00 GBP 45,580 29.358,41 0,41 0,41
PEARSON PLC - 3.145,00 GBP 11,710 42.973,10 0,60 0,60
PETROFAC LTD - 852,00 GBP 11,980 11.910,11 0,17 0,17
REED ELSEVIER PLC - 4.508,00 GBP 7,470 39.293,77 0,55 0,55
REXAM PLC - 2.718,00 GBP 4,775 15.144,05 0,21 0,21
RIO TINTO PLC - 4.081,00 GBP 26,830 127.763,40 1,78 1,79
ROLLS ROYCE GROUP PLC - 6.707,00 GBP 11,340 88.748,40 1,24 1,25
ROYAL DUTCH SHELL PLC -A- 12.580,00 GBP 21,000 308.261,38 4,30 4,33
ROYAL DUTCH SHELL PLC -B- 8.790,00 GBP 21,760 223.186,00 3,11 3,13
SMITHS GROUP PLC - 1.942,00 GBP 13,080 29.639,86 0,41 0,42
TULLOW OIL INC (LON) 3.421,00 GBP 10,010 39.958,24 0,56 0,56
WEIR GROUP PLC (THE) - 994,00 GBP 21,510 24.948,59 0,35 0,35
WHITBREAD HOLDINGS PLC - 693,00 GBP 30,560 24.711,88 0,34 0,35
WPP GROUP PLC - 4.854,00 GBP 11,220 63.549,45 0,89 0,89
U.S.A.
TRANSOCEAN SEDCO FOREX INC. - 1.307,00 CHF 45,460 48.309,80 0,67 0,68
Total shares 7.167.097,82 99,86 100,59
Rights
France
GROUPE FNAC CP 20/06/13 258,00 EUR 2,003 516,77 0,01 0,01
PUBLICIS GROUPE SA CP 05/06/13 727,00 EUR 0,900 654,30 0,01 0,01
SAINT GOBAIN CP 12/06/13 1.500,00 EUR 1,240 1.860,00 0,03 0,03
Spain
REPSOL INTL FINANCE CP 20/06/13 3.038,00 EUR 0,428 1.300,26 0,02 0,02
U.K.
ROLLS ROYCE GROUP PLC CP 24/04/2013 798.133,00 GBP 0,001 931,31 0,01 0,01
ROYAL DUTCH SHELL PLC CP 15/05/13 13.182,00 GBP 0,293 4.510,87 0,06 0,06
Total rights 9.773,51 0,14 0,14
TOTAL SECURITIES PORTFOLIO 7.176.871,33 100,00 100,72
COLLATERAL RECEIVED
Belgium
KBC GROUP COLLATERAL EUR 1.257.460,24 EUR 1,000 1.257.460,24 17,65
TOTAL RECEIVED COLLATERAL 1.257.460,24 17,65
CASH AT BANK AND IN HAND
Demand accounts
Belgium
KBC GROUP CAD 911,01 CAD 1,000 664,34 0,01
KBC GROUP CHF 1.946,00 CHF 1,000 1.582,24 0,02
KBC GROUP CZK 879,97 CZK 1,000 33,88
KBC GROUP DKK 1.329,14 DKK 1,000 178,20 0,00
KBC GROUP EURO -82.717,54 EUR 1,000 -82.717,54 -1,16
KBC GROUP GBP -701,83 GBP 1,000 -818,94 -0,01
KBC GROUP HUF 9.888,94 HUF 1,000 33,57
KBC GROUP JPY 3,00 JPY 1,000 0,02

KBC GROUP NOK 8.201,61 NOK 1,000 1.033,35 0,02
KBC GROUP SEK -4.701,08 SEK 1,000 -535,84 -0,01
KBC GROUP USD 5.002,96 USD 1,000 3.848,73 0,05
KBC GROUP ZAR 343,31 ZAR 1,000 26,61
Total demand accounts -76.671,38 -1,08
Managed futures accounts
Belgium
KBC GROUP EURO FUT REK 11.112,11 EUR 1,000 11.112,11 0,16
KBC GROUP JPY FUT REK -6.105.000,00 JPY 1,000 -47.281,60 -0,66
Total managed futures accounts -36.169,49 -0,51
TOTAL CASH AT BANK AND IN HAND -112.840,87 -1,58
OTHER RECEIVABLES AND PAYABLES
Receivables
Belgium
KBC GROUP EUR RECEIVABLE 2.621,36 EUR 1,000 2.621,36 0,04
KBC GROUP WHT TO BE RECOVERED EUR 552,39 EUR 1,000 552,39 0,01
Netherlands
KBC CLEARING NV DEKKING JPY 6.105.000,00 JPY 1,000 47.281,60 0,66
Total receivables 50.455,35 0,71
Payables
Belgium
KBC GROUP COUNTERPART ENTRY COLLATERAL IN EUR
-1.257.460,24 EUR 1,000 -1.257.460,24 -17,65
KBC GROUP EUR PAYABLE -7.339,90 EUR 1,000 -7.339,90 -0,10
Payables -1.264.800,14 -17,75
TOTAL RECEIVABLES AND PAYABLES -1.214.344,79 -17,04
OTHER
Interest receivable EUR 18.875,78 0,27
Accrued interest EUR 1.427,73 0,02
Expenses payable EUR -5.428,45 -0,08
Expenses to be carried forward EUR 3.352,29 0,05
TOTAL OTHER 18.227,35 0,26
TOTAL NET ASSETS 7.125.373,26 100,00

Geographic breakdown (as a % of securities portfolio)
31/12/2011 30/06/2012 31/12/2012 30/06/2013 Austria 0,40 0,46 0,40 0,47 Belgium 0,51 0,64 0,51 0,46 Bermuda 0,46 0,39 0,38 0,67 Switzerland 7,84 7,18 7,69 8,79 Germany 15,45 14,52 16,26 17,06 Denmark 1,16 0,96 0,95 0,75 Spain 1,91 2,27 2,45 2,50 Finland 1,47 1,46 1,51 1,45 France 15,39 15,45 15,94 16,37 U.K. 37,88 38,20 35,81 34,05 Ireland 0,65 0,54 0,54 0,58 Italy 3,80 3,77 3,61 3,30 Jersey/The Channel Islands 0,83 0,70 0,77 0,70 Luxembourg 1,36 1,44 1,59 1,40 Netherlands 3,27 3,40 3,48 4,09 Norway 2,16 1,99 1,87 1,33 Portugal 0,17 0,17 0,19 0,20 Sweden 4,74 5,85 5,47 5,16 U.S.A. 0,55 0,61 0,58 0,67 Total 100,00 100,00 100,00 100,00
Sector breakdown (as a % of securities portfolio)
31/12/2011 30/06/2012 31/12/2012 30/06/2013 Cyclicals 80,41 70,39 69,55 66,55 Consum(cycl) 18,73 24,80 25,64 28,74 Cons.goods 0,00 3,93 3,98 4,01 Pharma 0,17 0,24 0,26 0,28 Financials 0,12 0,00 0,00 0,00 Technology 0,27 0,36 0,36 0,21 Telecomm. 0,29 0,28 0,21 0,20 Various 0,01 0,00 0,00 0,01 Total 100,00 100,00 100,00 100,00
Currency breakdown (as a % of net assets)
31/12/2011 30/06/2012 31/12/2012 30/06/2013 CAD 0,01 0,01 0,01 0,01 CHF 8,33 7,85 8,32 9,58 DKK 1,22 0,97 0,96 0,76 EUR 43,85 43,28 45,77 47,03 GBP 39,04 39,26 36,79 35,08 NOK 2,83 2,69 2,58 2,29 SEK 4,70 5,90 5,49 5,20 USD 0,02 0,04 0,08 0,05 Total 100,00 100,00 100,00 100,00

2.4.2 CHANGES IN THE COMPOSITION OF THE ASSETS OF KBC EQUITY FUND EURO CYCLICALS
(IN THE CURRENCY OF THE SUB-FUND)
1st half of year YearPurchases 538.180,27 538.180,27 Sales 764.649,42 764.649,42 Total 1 1.302.829,68 1.302.829,68 Subscriptions 837.660,35 837.660,35 Redemptions 1.136.511,63 1.136.511,63 Total 2 1.974.171,98 1.974.171,98 Monthly average of total assets
7.656.507,35 7.656.507,35
Turnover rate -8,77 % -8,77 %
1st half of year YearPurchases 538.180,27 538.180,27 Sales 764.649,42 764.649,42 Total 1 1.302.829,68 1.302.829,68 Subscriptions 837.660,35 837.660,35 Redemptions 1.136.511,63 1.136.511,63 Total 2 1.974.171,98 1.974.171,98 Monthly average of total assets
7.549.109,39 7.549.109,39
Corrected turnover rate -8,89 % -8,89 %
The table above shows the capital volume of portfolio transactions. This volume (adjusted to take account of total subscriptions and redemptions) is also compared to the average net assets at the beginning and end of the period. A figure close to 0% implies that the transactions relating to the securities or transactions relating to the assets (excluding deposits and cash) in a given period only involve subscriptions and redemptions. A negative percentage shows that subscriptions and redemptions entailed few, if any, transactions in the portfolio. Active asset management may result in high turnover rates (monthly percentage >50%). The detailed list of transactions is available for consultation free of charge at the registered office of the Bevek or fund at Havenlaan 2, 1080 Brussels.
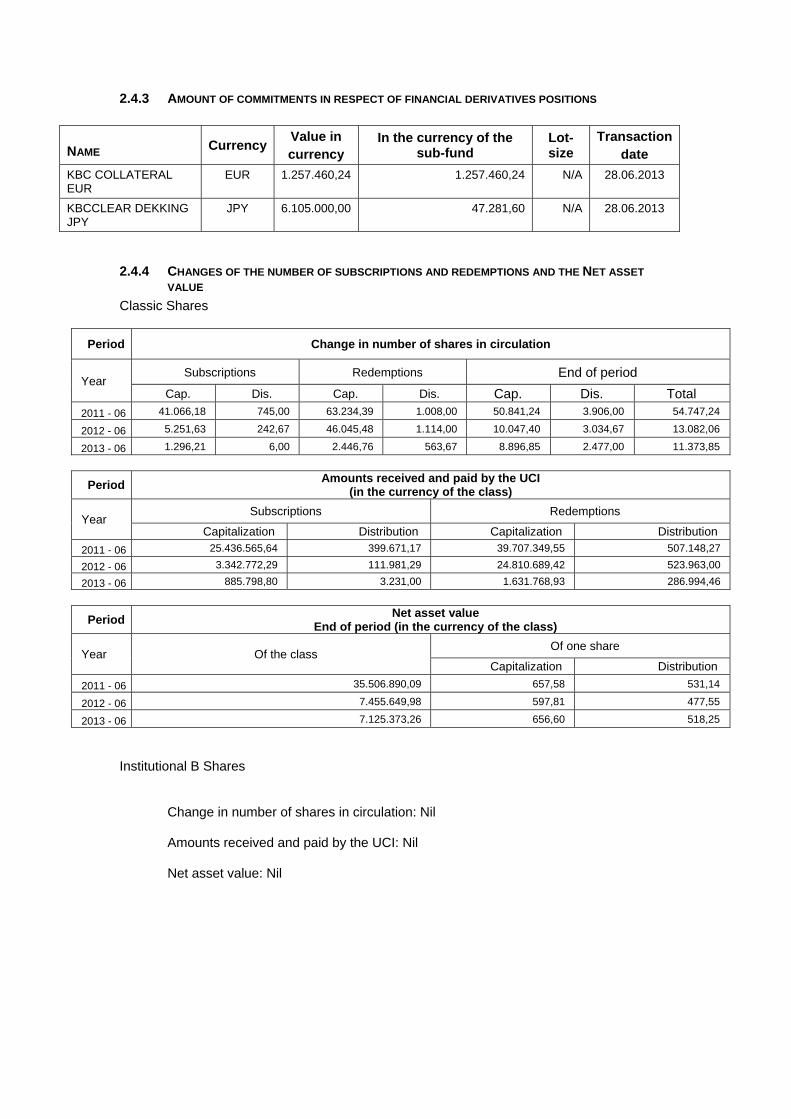
2.4.3 AMOUNT OF COMMITMENTS IN RESPECT OF FINANCIAL DERIVATIVES POSITIONS
NAME Currency Value in currency
In the currency of the sub-fund
Lot-size
Transactiondate
KBC COLLATERAL EUR
EUR 1.257.460,24 1.257.460,24 N/A 28.06.2013
KBCCLEAR DEKKING JPY
JPY 6.105.000,00 47.281,60 N/A 28.06.2013
2.4.4 CHANGES OF THE NUMBER OF SUBSCRIPTIONS AND REDEMPTIONS AND THE NET ASSET
VALUE
Classic Shares
Period Change in number of shares in circulation
Year Subscriptions Redemptions End of period
Cap. Dis. Cap. Dis. Cap. Dis. Total
2011 - 06 41.066,18 745,00 63.234,39 1.008,00 50.841,24 3.906,00 54.747,24
2012 - 06 5.251,63 242,67 46.045,48 1.114,00 10.047,40 3.034,67 13.082,06
2013 - 06 1.296,21 6,00 2.446,76 563,67 8.896,85 2.477,00 11.373,85
Period Amounts received and paid by the UCI
(in the currency of the class)
Year Subscriptions Redemptions
Capitalization Distribution Capitalization Distribution
2011 - 06 25.436.565,64 399.671,17 39.707.349,55 507.148,27
2012 - 06 3.342.772,29 111.981,29 24.810.689,42 523.963,00
2013 - 06 885.798,80 3.231,00 1.631.768,93 286.994,46
Period Net asset value
End of period (in the currency of the class)
Year Of the class Of one share
Capitalization Distribution
2011 - 06 35.506.890,09 657,58 531,14
2012 - 06 7.455.649,98 597,81 477,55
2013 - 06 7.125.373,26 656,60 518,25
Institutional B Shares
Change in number of shares in circulation: Nil
Amounts received and paid by the UCI: Nil
Net asset value: Nil
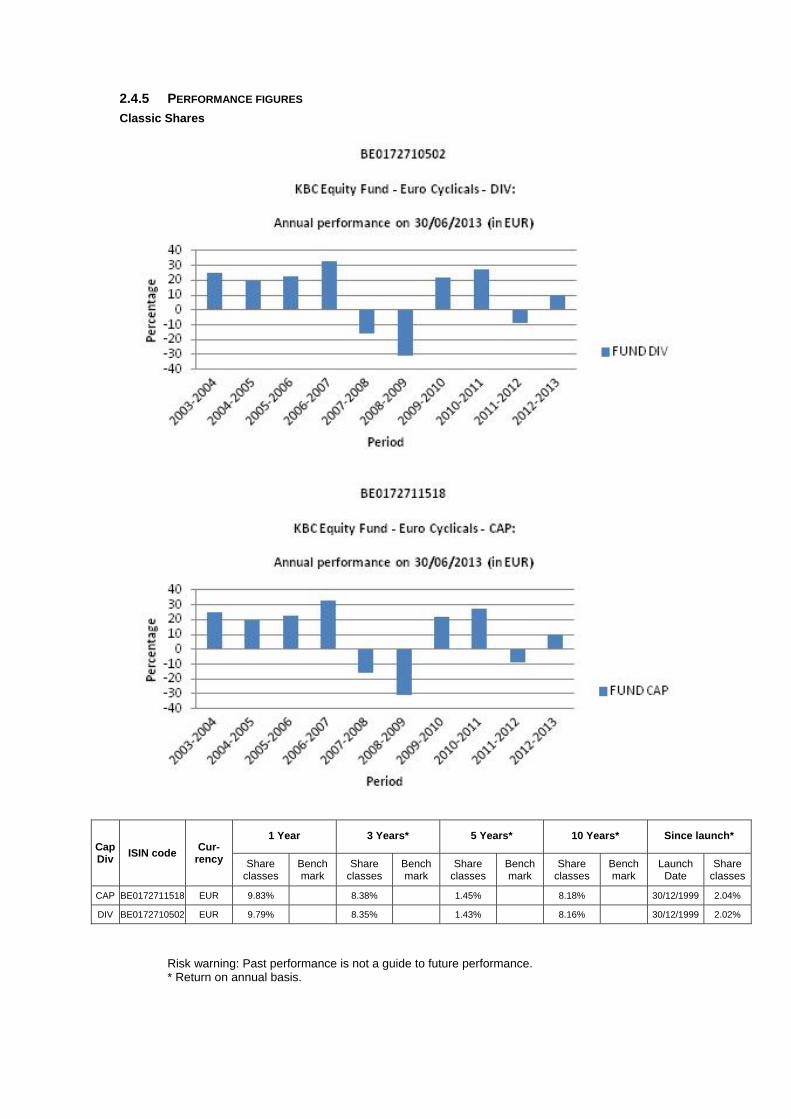
2.4.5 PERFORMANCE FIGURES
Classic Shares
Cap Div
ISIN code Cur-
rency
1 Year 3 Years* 5 Years* 10 Years* Since launch*
Share classes
Bench mark
Share classes
Bench mark
Share classes
Bench mark
Share classes
Bench mark
Launch Date
Share classes
CAP BE0172711518 EUR 9.83% 8.38% 1.45% 8.18% 30/12/1999 2.04%
DIV BE0172710502 EUR 9.79% 8.35% 1.43% 8.16% 30/12/1999 2.02%
Risk warning: Past performance is not a guide to future performance. * Return on annual basis.

Classic Shares
The bar chart shows the performance for full financial years. The figures do not take account of any restructuring. Calculated in EUR. The return is calculated as the change in the net asset value between two dates expressed
as a percentage. In the case of units that pay dividends, the dividend is incorporated geometrically in the return.
Calculation method for date D, where NAV stands for net asset value: Capitalisation units (CAP) Return on date D over a period of X years:
[NIW(D) / NIW(Y)] ^ [1 / X] - 1 where Y = D-X
Return on date D since the start date S of the unit: [NIW(D) / NIW(S)] ^ [1 / F] - 1 where F = 1 if the unit has existed for less than one year on date D where F = (D-S) / 365.25 if the unit has existed for longer than one year on date D
Distribution units (DIV) Return on date D over a period of X years:
[ C * NIW(D) / NIW(Y)] ^ [1 / X] - 1 where Y = D-X
Return on date D since the start date S of the unit: [ C * NIW(D) / NIW(S)] ^ [1 / F] - 1 where F = 1 if the unit has existed for less than one year on date D where F = (D-S) / 365.25 if the unit has existed for longer than one year on date D where C is a factor that is determined for all N dividends between the calculation date D and the reference date.
For dividend i on date Di with value Wi: Ci = [Wi / NIW(Di)] + 1 i = 1 ... N from whichC = C0 * .... * CN.
If the interval between the two dates exceeds one year, the ordinary return calculation is converted into a return on an annual basis by taking the nth square root of 1 plus the total return of the unit.
The return figures shown above do not take account of the fees and charges associated with the issue and redemption of units.
These are the performance figures for capitalisation and distribution shares.
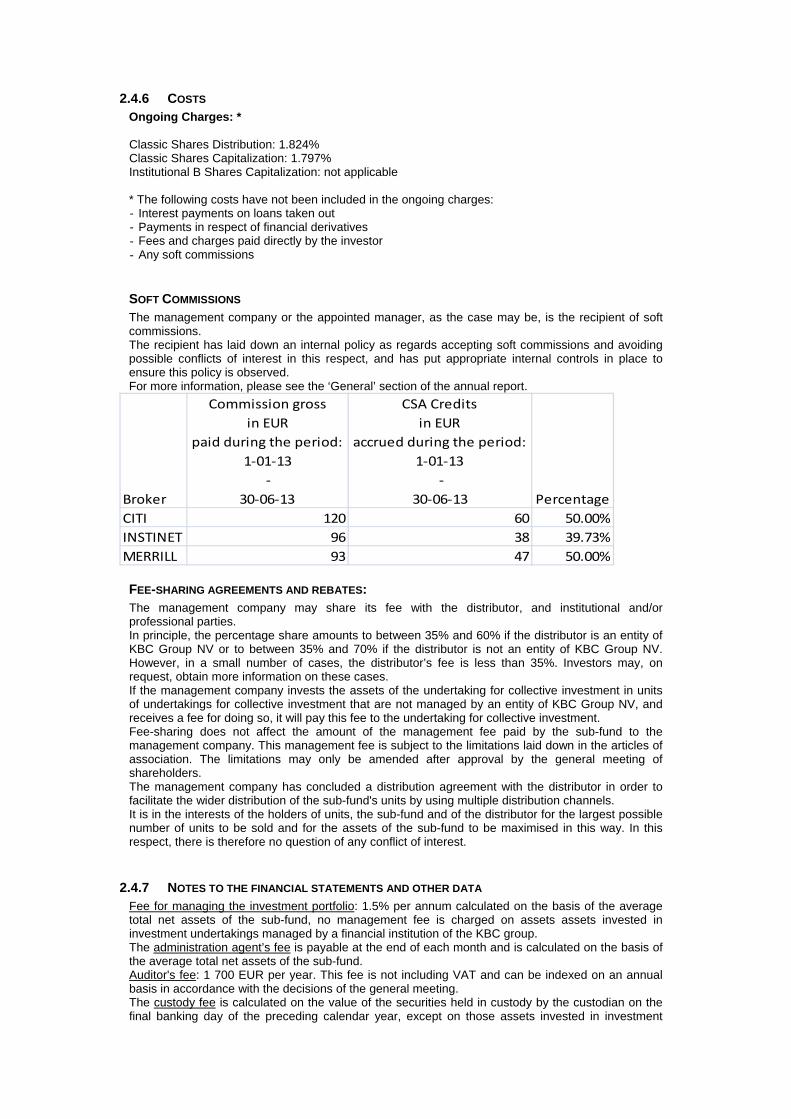
2.4.6 COSTS Ongoing Charges: * Classic Shares Distribution: 1.824% Classic Shares Capitalization: 1.797% Institutional B Shares Capitalization: not applicable * The following costs have not been included in the ongoing charges: - Interest payments on loans taken out - Payments in respect of financial derivatives - Fees and charges paid directly by the investor - Any soft commissions
SOFT COMMISSIONS The management company or the appointed manager, as the case may be, is the recipient of soft commissions. The recipient has laid down an internal policy as regards accepting soft commissions and avoiding possible conflicts of interest in this respect, and has put appropriate internal controls in place to ensure this policy is observed. For more information, please see the ‘General’ section of the annual report.
Broker
Commission gross
in EUR
paid during the period:
1‐01‐13
‐
30‐06‐13
CSA Credits
in EUR
accrued during the period:
1‐01‐13
‐
30‐06‐13 Percentage
CITI 120 60 50.00%
INSTINET 96 38 39.73%
MERRILL 93 47 50.00%
FEE-SHARING AGREEMENTS AND REBATES: The management company may share its fee with the distributor, and institutional and/or professional parties. In principle, the percentage share amounts to between 35% and 60% if the distributor is an entity of KBC Group NV or to between 35% and 70% if the distributor is not an entity of KBC Group NV. However, in a small number of cases, the distributor’s fee is less than 35%. Investors may, on request, obtain more information on these cases. If the management company invests the assets of the undertaking for collective investment in units of undertakings for collective investment that are not managed by an entity of KBC Group NV, and receives a fee for doing so, it will pay this fee to the undertaking for collective investment. Fee-sharing does not affect the amount of the management fee paid by the sub-fund to the management company. This management fee is subject to the limitations laid down in the articles of association. The limitations may only be amended after approval by the general meeting of shareholders. The management company has concluded a distribution agreement with the distributor in order to facilitate the wider distribution of the sub-fund's units by using multiple distribution channels. It is in the interests of the holders of units, the sub-fund and of the distributor for the largest possible number of units to be sold and for the assets of the sub-fund to be maximised in this way. In this respect, there is therefore no question of any conflict of interest.
2.4.7 NOTES TO THE FINANCIAL STATEMENTS AND OTHER DATA Fee for managing the investment portfolio: 1.5% per annum calculated on the basis of the average total net assets of the sub-fund, no management fee is charged on assets assets invested in investment undertakings managed by a financial institution of the KBC group. The administration agent’s fee is payable at the end of each month and is calculated on the basis of the average total net assets of the sub-fund. Auditor's fee: 1 700 EUR per year. This fee is not including VAT and can be indexed on an annual basis in accordance with the decisions of the general meeting. The custody fee is calculated on the value of the securities held in custody by the custodian on the final banking day of the preceding calendar year, except on those assets invested in investment
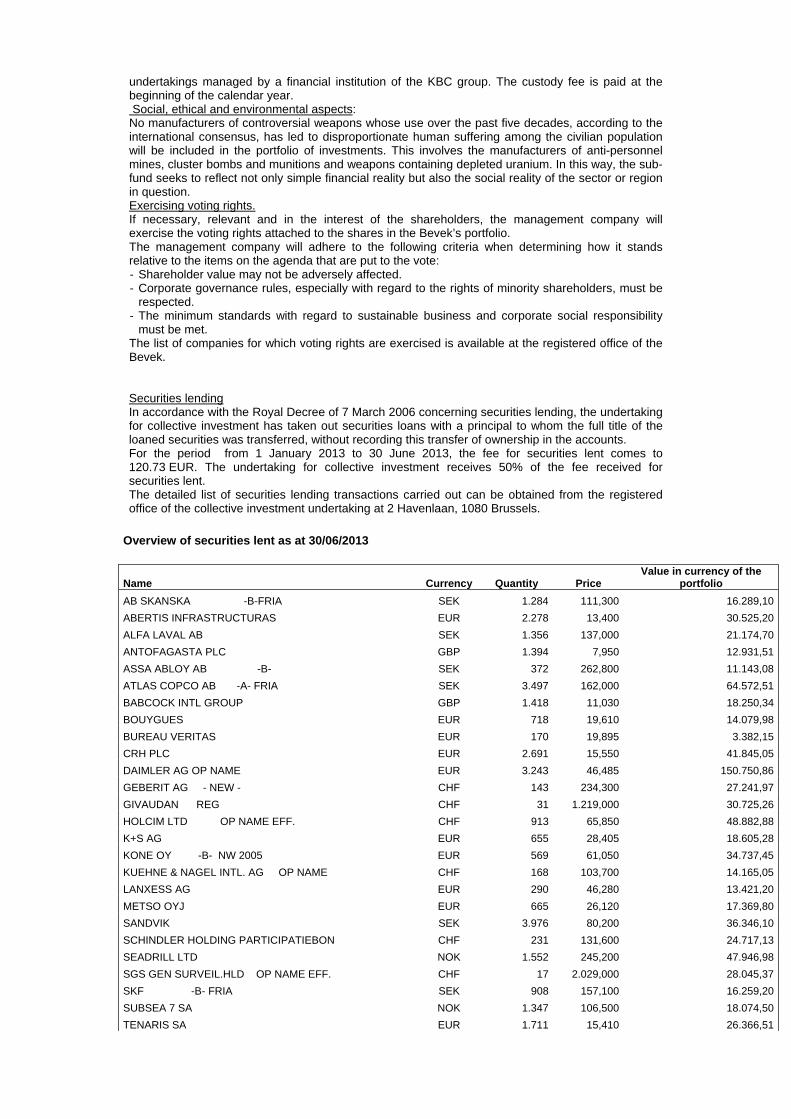
undertakings managed by a financial institution of the KBC group. The custody fee is paid at the beginning of the calendar year. Social, ethical and environmental aspects: No manufacturers of controversial weapons whose use over the past five decades, according to the international consensus, has led to disproportionate human suffering among the civilian population will be included in the portfolio of investments. This involves the manufacturers of anti-personnel mines, cluster bombs and munitions and weapons containing depleted uranium. In this way, the sub-fund seeks to reflect not only simple financial reality but also the social reality of the sector or region in question. Exercising voting rights. If necessary, relevant and in the interest of the shareholders, the management company will exercise the voting rights attached to the shares in the Bevek’s portfolio. The management company will adhere to the following criteria when determining how it stands relative to the items on the agenda that are put to the vote: - Shareholder value may not be adversely affected. - Corporate governance rules, especially with regard to the rights of minority shareholders, must be
respected. - The minimum standards with regard to sustainable business and corporate social responsibility
must be met. The list of companies for which voting rights are exercised is available at the registered office of the Bevek. Securities lending In accordance with the Royal Decree of 7 March 2006 concerning securities lending, the undertaking for collective investment has taken out securities loans with a principal to whom the full title of the loaned securities was transferred, without recording this transfer of ownership in the accounts. For the period from 1 January 2013 to 30 June 2013, the fee for securities lent comes to 120.73 EUR. The undertaking for collective investment receives 50% of the fee received for securities lent. The detailed list of securities lending transactions carried out can be obtained from the registered office of the collective investment undertaking at 2 Havenlaan, 1080 Brussels.
Overview of securities lent as at 30/06/2013
Name Currency Quantity Price Value in currency of the
portfolio
AB SKANSKA -B-FRIA SEK 1.284 111,300 16.289,10
ABERTIS INFRASTRUCTURAS EUR 2.278 13,400 30.525,20
ALFA LAVAL AB SEK 1.356 137,000 21.174,70
ANTOFAGASTA PLC GBP 1.394 7,950 12.931,51
ASSA ABLOY AB -B- SEK 372 262,800 11.143,08
ATLAS COPCO AB -A- FRIA SEK 3.497 162,000 64.572,51
BABCOCK INTL GROUP GBP 1.418 11,030 18.250,34
BOUYGUES EUR 718 19,610 14.079,98
BUREAU VERITAS EUR 170 19,895 3.382,15
CRH PLC EUR 2.691 15,550 41.845,05
DAIMLER AG OP NAME EUR 3.243 46,485 150.750,86
GEBERIT AG - NEW - CHF 143 234,300 27.241,97
GIVAUDAN REG CHF 31 1.219,000 30.725,26
HOLCIM LTD OP NAME EFF. CHF 913 65,850 48.882,88
K+S AG EUR 655 28,405 18.605,28
KONE OY -B- NW 2005 EUR 569 61,050 34.737,45
KUEHNE & NAGEL INTL. AG OP NAME CHF 168 103,700 14.165,05
LANXESS AG EUR 290 46,280 13.421,20
METSO OYJ EUR 665 26,120 17.369,80
SANDVIK SEK 3.976 80,200 36.346,10
SCHINDLER HOLDING PARTICIPATIEBON CHF 231 131,600 24.717,13
SEADRILL LTD NOK 1.552 245,200 47.946,98
SGS GEN SURVEIL.HLD OP NAME EFF. CHF 17 2.029,000 28.045,37
SKF -B- FRIA SEK 908 157,100 16.259,20
SUBSEA 7 SA NOK 1.347 106,500 18.074,50
TENARIS SA EUR 1.711 15,410 26.366,51
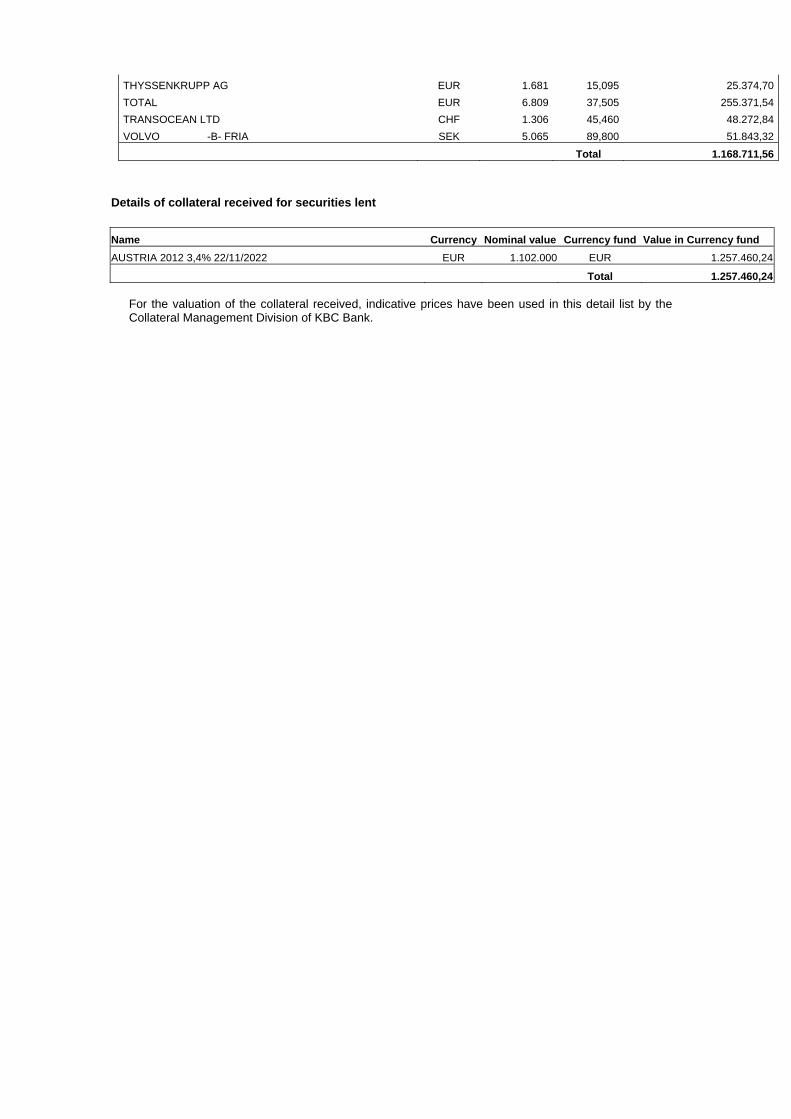
THYSSENKRUPP AG EUR 1.681 15,095 25.374,70
TOTAL EUR 6.809 37,505 255.371,54
TRANSOCEAN LTD CHF 1.306 45,460 48.272,84
VOLVO -B- FRIA SEK 5.065 89,800 51.843,32
Total 1.168.711,56
Details of collateral received for securities lent
Name Currency Nominal value Currency fund Value in Currency fund
AUSTRIA 2012 3,4% 22/11/2022 EUR 1.102.000 EUR 1.257.460,24
Total 1.257.460,24 For the valuation of the collateral received, indicative prices have been used in this detail list by the Collateral Management Division of KBC Bank.

Semi-Annual report as at 30th June 2013
TABLE OF CONTENTS
2. Information on KBC Equity Fund Pharma Growth
2.1. Management report 2.1.1. Launch date and subscription price 2.1.2. Stock exchange listing 2.1.3. Aim and distinctive features of the investment policy 2.1.4. Financial portfolio management 2.1.5. Distributors 2.1.6. Index and benchmark 2.1.7. Policy conducted during the financial year 2.1.8. Future policy 2.1.9. Synthetic risk and reward indicator (SRRI)
2.2. Balance sheet
2.3. Profit and loss account
2.4. Composition of the assets and key figures
2.4.1. Composition of the assets 2.4.2. Change in the composition of the assets 2.4.3. Value of commitments in respect of financial derivatives positions 2.4.4. Evolution of the number of subscriptions, repayments and the net asset value 2.4.5. Return figures 2.4.6. Expenses 2.4.7. Notes to the financial statements and other data


2 INFORMATION ON KBC EQUITY FUND PHARMA GROWTH
2.1 MANAGEMENT REPORT
2.1.1 LAUNCH DATE AND SUBSCRIPTION PRICE Classic Shares : Launch date: 28 September 2001 Initial subscription price: 500 EUR Currency: EUR Institutional B Shares : Launch date: 25 November 2011 Initial subscription price: 504.14 EUR Currency: EUR
2.1.2 STOCK EXCHANGE LISTING Not applicable.
2.1.3 GOAL AND KEY PRINCIPLES OF THE INVESTMENT POLICY
SUB-FUND’S OBJECT: The main objective of this sub-fund is to generate the highest possible return for its shareholders by investing directly or indirectly in transferable securities. This is reflected in its pursuit of capital gains and income. To this end, the assets are invested, either directly or indirectly via correlated financial instruments, primarily in shares.
SUB-FUND’S INVESTMENT POLICY:
PERMITTED ASSET CLASSES: The sub-fund may invest in securities, money market instruments, units in undertakings for collective investment, deposits, financial derivatives, liquid assets and all other instruments insofar as permitted by the applicable laws and regulations and consistent with the sub-fund’s object The sub-fund shall invest no more than 10% of its assets in units of other undertakings for collective investment.
RESTRICTIONS OF THE INVESTMENT POLICY: The investment policy will be implemented within the limits set by law and regulations. The sub-fund may borrow up to 10% of its net assets, insofar as these are short-term borrowings aimed at solving temporary liquidity problems.
PERMITTED DERIVATIVES TRANSACTIONS: Derivates may be used either for hedging purposes or to achieve investment objectives. Changes will be made to the investments at regular intervals to comply with the sub-fund's investment strategy. In addition, listed and unlisted derivates may be used to achieve the objectives: these may be forward contracts, options or swaps on securities, indices, currencies or interest rates or other transactions involving derivatives. Unlisted derivatives transactions will only be concluded with prime financial institutions specialised in such transactions. Such derivatives may also be used to hedge the assets against exchange-rate fluctuations. Subject to the applicable laws and regulations and the articles of association, the sub-fund always seeks to conclude the most effective transactions. All costs associated with the transactions will be charged to the sub-fund and all income generated will be paid to the sub-fund. If the transactions result in a risk in respect of the counterparty, this risk can be hedged by using a margin management system that ensures that the sub-fund is the beneficiary of security (collateral) in the form of cash or investment grade bonds. When calculating the value of the bonds, a margin will be applied that varies depending on the residual term to maturity and the currency in which the bond in question is denominated. The relationship with the counterparty or counterparties is governed by standard international agreements.
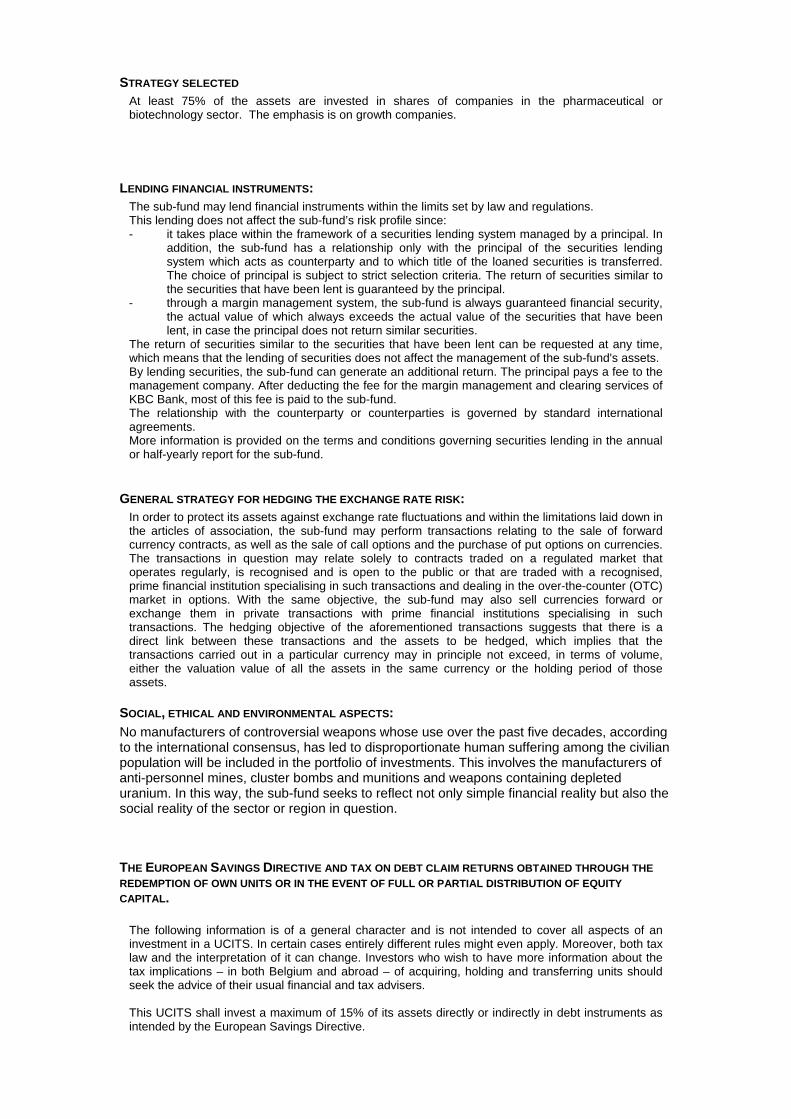
STRATEGY SELECTED At least 75% of the assets are invested in shares of companies in the pharmaceutical or biotechnology sector. The emphasis is on growth companies.
LENDING FINANCIAL INSTRUMENTS: The sub-fund may lend financial instruments within the limits set by law and regulations. This lending does not affect the sub-fund’s risk profile since: - it takes place within the framework of a securities lending system managed by a principal. In
addition, the sub-fund has a relationship only with the principal of the securities lending system which acts as counterparty and to which title of the loaned securities is transferred. The choice of principal is subject to strict selection criteria. The return of securities similar to the securities that have been lent is guaranteed by the principal.
- through a margin management system, the sub-fund is always guaranteed financial security, the actual value of which always exceeds the actual value of the securities that have been lent, in case the principal does not return similar securities.
The return of securities similar to the securities that have been lent can be requested at any time, which means that the lending of securities does not affect the management of the sub-fund's assets. By lending securities, the sub-fund can generate an additional return. The principal pays a fee to the management company. After deducting the fee for the margin management and clearing services of KBC Bank, most of this fee is paid to the sub-fund. The relationship with the counterparty or counterparties is governed by standard international agreements. More information is provided on the terms and conditions governing securities lending in the annual or half-yearly report for the sub-fund.
GENERAL STRATEGY FOR HEDGING THE EXCHANGE RATE RISK: In order to protect its assets against exchange rate fluctuations and within the limitations laid down in the articles of association, the sub-fund may perform transactions relating to the sale of forward currency contracts, as well as the sale of call options and the purchase of put options on currencies. The transactions in question may relate solely to contracts traded on a regulated market that operates regularly, is recognised and is open to the public or that are traded with a recognised, prime financial institution specialising in such transactions and dealing in the over-the-counter (OTC) market in options. With the same objective, the sub-fund may also sell currencies forward or exchange them in private transactions with prime financial institutions specialising in such transactions. The hedging objective of the aforementioned transactions suggests that there is a direct link between these transactions and the assets to be hedged, which implies that the transactions carried out in a particular currency may in principle not exceed, in terms of volume, either the valuation value of all the assets in the same currency or the holding period of those assets.
SOCIAL, ETHICAL AND ENVIRONMENTAL ASPECTS:
No manufacturers of controversial weapons whose use over the past five decades, according to the international consensus, has led to disproportionate human suffering among the civilian population will be included in the portfolio of investments. This involves the manufacturers of anti-personnel mines, cluster bombs and munitions and weapons containing depleted uranium. In this way, the sub-fund seeks to reflect not only simple financial reality but also the social reality of the sector or region in question.
THE EUROPEAN SAVINGS DIRECTIVE AND TAX ON DEBT CLAIM RETURNS OBTAINED THROUGH THE
REDEMPTION OF OWN UNITS OR IN THE EVENT OF FULL OR PARTIAL DISTRIBUTION OF EQUITY
CAPITAL. The following information is of a general character and is not intended to cover all aspects of an investment in a UCITS. In certain cases entirely different rules might even apply. Moreover, both tax law and the interpretation of it can change. Investors who wish to have more information about the tax implications – in both Belgium and abroad – of acquiring, holding and transferring units should seek the advice of their usual financial and tax advisers. This UCITS shall invest a maximum of 15% of its assets directly or indirectly in debt instruments as intended by the European Savings Directive.

A. European Savings Directive (Directive 2003/48/EC) The European Savings Directive has been implemented in Belgium. Since this UCITS invests a maximum of 15% of its assets directly or indirectly in debt claims as intended by the European Savings Directive, the income of this UCITS does not fall within the scope of this directive. B. Tax on debt claim returns obtained through the redemption of own units or in the event of full or partial distribution of equity capital (Article 19bis Income Tax Code 1992). The income from this UCITS is not subject to the tax on debt instrument returns as intended by Article 19bis, Income Tax Code 1992.
2.1.4 FINANCIAL PORTFOLIO MANAGEMENT There is no delegation of the portfolio.
2.1.5 DISTRIBUTORS KBC Asset Management S.A., 5, Place de la Gare, L-1616 Luxembourg.
2.1.6 INDEX AND BENCHMARK See ‘Sub-fund’s investment policy’.

2.1.7 POLICY PERSUED DURING THE FINANCIAL YEAR The global economy remained exceptionally vulnerable over the past six months. Doubts about the sustainability of the economic recovery continued to shape investor sentiment. The debt crisis in Europe continued unabated, although the European Central Bank managed to convince the market that it had the crisis under control. Major steps were taken in the United States to reform the federal budget, This sector was badly affected by the problems surrounding this budget at the end of last year. Against this backdrop, the broad health care sector performed well. The less economically sensitive pharmaceuticals manufacturers posted a slightly stronger performance than providers of medical services and technologies. Although the latter rallied briefly at the start of the year following the weak performance at the end of last year, they lost ground again fairly quickly. Among pharmaceuticals producers, those involved in the biotech segment in particular, readily steamed ahead. Although the annual results posted by these companies were on the weak side overall, a steady stream of predominantly positive research data on pipeline drugs more than compensated for this.
2.1.8 FUTURE POLICY We remain positive on the American biotech sector. We expect to see further good news coming out of the research programmes of these companies, from which they will benefit going forward.. The big names in this segment, in particular, have a solid financial basis, and several players are buying back their own shares. Now that much of the wave of patent expiries has passed, we are also more optimistic regarding the large pharmaceuticals companies. We expect mergers and acquisitions to play a less prominent role here moving forward. We tend to favour companies that focus on the European market: although pricing pressure for drugs was heavy in this region, we think this will reduce going forward, and this will have an incrementally positive impact. We also do not think that the rise of ' biosimilars’ will have a significant impact. Further, we see a substantial presence in the emerging markets as a positive development; although the growth in these markets is flattening somewhat, it is still very attractive. Finally, the dividend yields in this segment are very attractive in the present low interest-rate climate. We take a mixed view going forward on this segment of providers of services and technologies. Our preference is for companies which bring innovative products to market. We avoid companies that are highly dependent on government finance or which are vulnerable to stricter regulation, such as US health insurers.
2.1.9 SYNTHETIC RISK AND REWARD INDICATOR Classic Shares: 6 on a scale of 1 (lowest risk) to 7 (highest risk). Institutional B Shares: 6 on a scale of 1 (lowest risk) to 7 (highest risk). The value of a share can decrease or increase and the investor may not get back the amount invested. In accordance with Commission Regulation (EU) No. 583/2010, a synthetic risk and reward indicator has been calculated. This indicator provides a quantitative measure of the sub-fund's potential return and the risk involved, calculated in the currency in which the sub-fund is denominated. It is given as a figure between 1 and 7. The higher the figure, the greater the potential return, but also the more difficult it is to predict this return. Losses are possible too. The lowest figure does not mean that the investment is entirely free of risk. However, it does indicate that, compared with the higher figures, this product will generally provide a lower, but more predictable return. The synthetic risk and reward indicator is assessed regularly and can therefore go up or down based on data from the past. Data from the past is not always a reliable indicator of future risk and return.
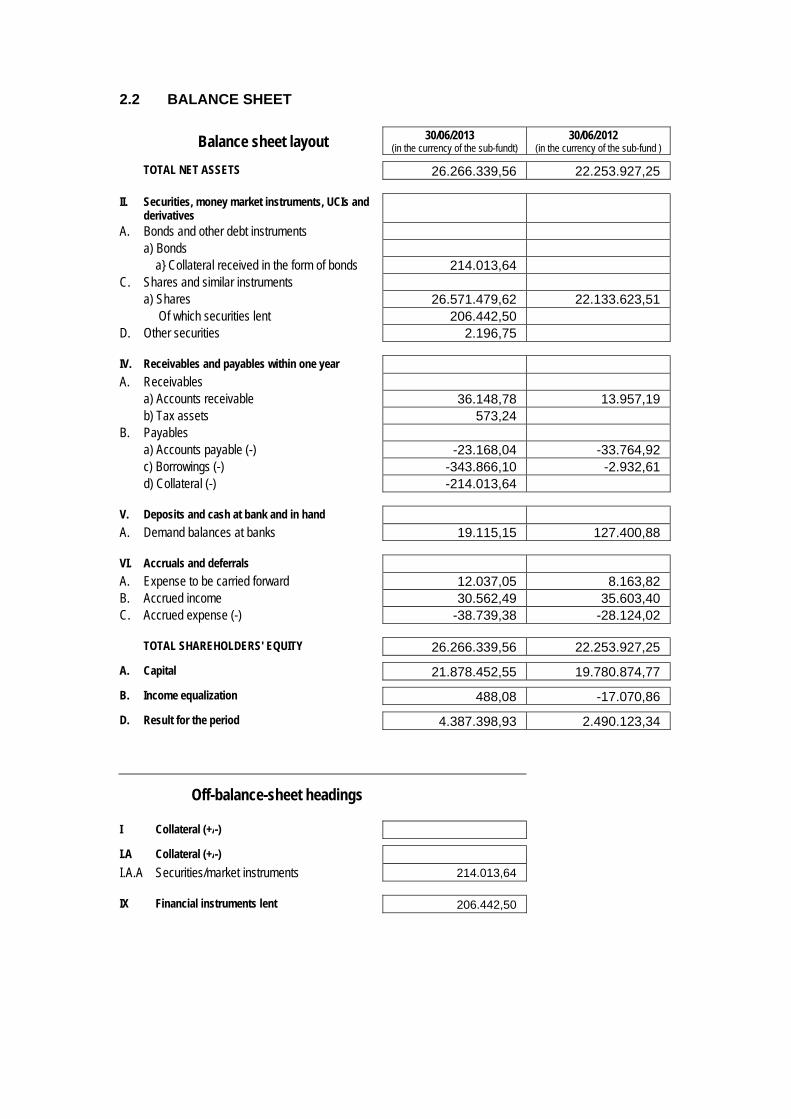
2.2 BALANCE SHEET
Balance sheet layout 30/06/2013 (in the currency of the sub-fundt)
30/06/2012 (in the currency of the sub-fund )
TOTAL NET ASSETS 26.266.339,56 22.253.927,25
II. Securities, money market instruments, UCIs and derivatives
A. Bonds and other debt instruments a) Bonds a} Collateral received in the form of bonds 214.013,64 C. Shares and similar instruments a) Shares 26.571.479,62 22.133.623,51 Of which securities lent 206.442,50 D. Other securities 2.196,75
IV. Receivables and payables within one year A. Receivables a) Accounts receivable 36.148,78 13.957,19 b) Tax assets 573,24 B. Payables a) Accounts payable (-) -23.168,04 -33.764,92 c) Borrowings (-) -343.866,10 -2.932,61 d) Collateral (-) -214.013,64
V. Deposits and cash at bank and in hand A. Demand balances at banks 19.115,15 127.400,88
VI. Accruals and deferrals A. Expense to be carried forward 12.037,05 8.163,82 B. Accrued income 30.562,49 35.603,40 C. Accrued expense (-) -38.739,38 -28.124,02
TOTAL SHAREHOLDERS' EQUITY 26.266.339,56 22.253.927,25
A. Capital 21.878.452,55 19.780.874,77
B. Income equalization 488,08 -17.070,86
D. Result for the period 4.387.398,93 2.490.123,34
Off-balance-sheet headings
I Collateral (+/-)
I.A Collateral (+/-)
I.A.A Securities/market instruments 214.013,64
IX Financial instruments lent 206.442,50

2.3 PROFIT AND LOSS ACCOUNT
Income Statement 30/06/2013 (in the currency of the sub-fund)
30/06/2012 (in the currency of the sub-fund)
I. Net gains(losses) on investments C. Shares and similar instruments a) Shares 4.446.325,65 2.028.051,16 b) Closed-end undertakings for collective
investment 19.302,30
D. Other securities 306,94 237,97 H. Foreign exchange positions and transactions b) Other foreign exchange positions and
transactions -103.886,34 346.472,62
II. Investment income and expenses A. Dividends 268.936,02 343.613,56 B. Interests a) Securities and money market instruments 2.728,69 2.365,84 b) Cash at bank and in hand and deposits 212,59 317,57 C. Interest on borrowings (-) -237,25 -953,67
III. Other income A. Income received to cover the acquisition and
realizaion of assets, to discourage withdrawals and for delivery charges
8.356,11 20.299,39
IV. Operating expenses A. Investment transaction and delivery costs (-) -4.992,91 -82.255,44 B. Financial expenses (-) -254,01 -314,90 C. Custodian's fee (-) -9.751,91 -7.718,01 D. Manager's fee (-) a) Financial management Classic Shares -154.894,47 -122.072,44 Institutional B Shares -37.611,77 -33.315,41 b) Administration and accounting management -12.833,81 -11.107,38 E. Administrative expenses (-) -70,54 F. Formation and organisation expenses (-) -593,19 -2.190,28 G. Remuneration, social security charges and
pension -3,90
H. Services and sundry goods (-) -4.335,70 -3.039,73 J. Taxes Classic Shares -7.714,26 -4.421,37 Institutional B Shares -102,06 -79,49 K. Other expenses (-) -2.184,95 -3.068,95
Income and expenditure for the period Subtotal II + III + IV 44.652,68 96.059,29
V. Profit (loss) on ordinary activities before tax 4.387.398,93 2.490.123,34
VII. Result for the period 4.387.398,93 2.490.123,34
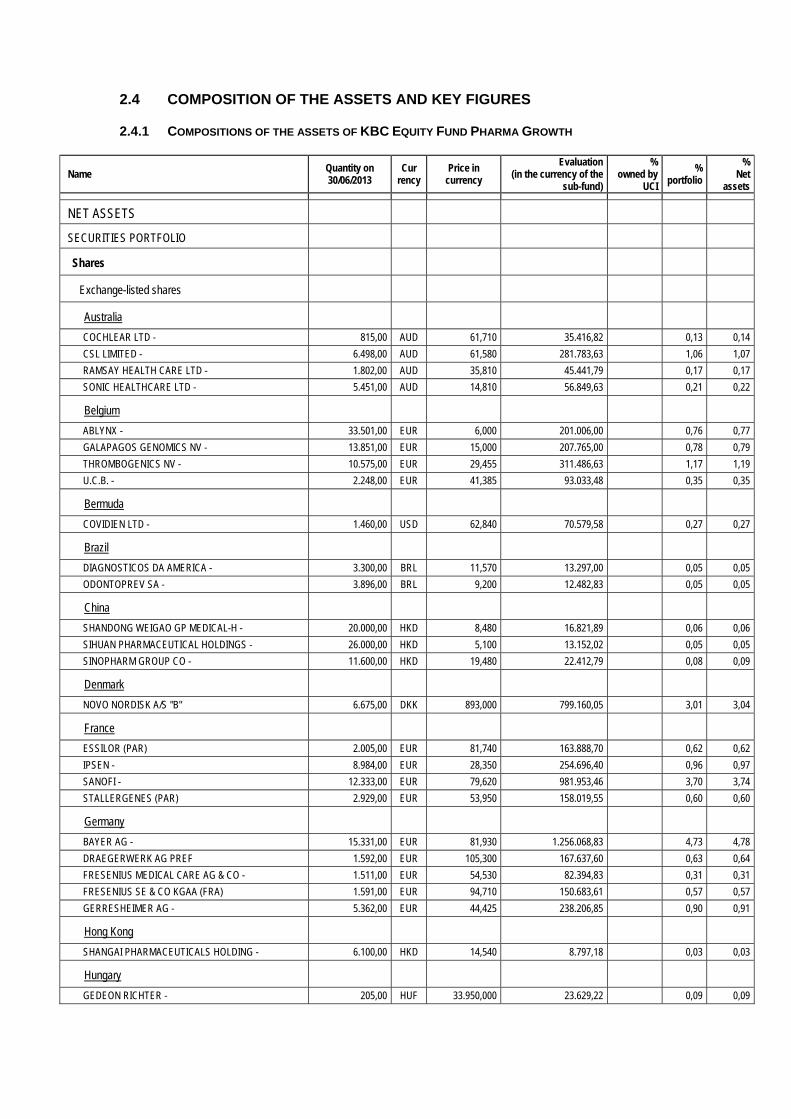
2.4 COMPOSITION OF THE ASSETS AND KEY FIGURES
2.4.1 COMPOSITIONS OF THE ASSETS OF KBC EQUITY FUND PHARMA GROWTH
Name Quantity on 30/06/2013
Cur rency
Price in currency
Evaluation (in the currency of the
sub-fund)
% owned by
UCI
% portfolio
% Net
assets
NET ASSETS
SECURITIES PORTFOLIO
Shares
Exchange-listed shares
Australia
COCHLEAR LTD - 815,00 AUD 61,710 35.416,82 0,13 0,14
CSL LIMITED - 6.498,00 AUD 61,580 281.783,63 1,06 1,07
RAMSAY HEALTH CARE LTD - 1.802,00 AUD 35,810 45.441,79 0,17 0,17
SONIC HEALTHCARE LTD - 5.451,00 AUD 14,810 56.849,63 0,21 0,22
Belgium
ABLYNX - 33.501,00 EUR 6,000 201.006,00 0,76 0,77
GALAPAGOS GENOMICS NV - 13.851,00 EUR 15,000 207.765,00 0,78 0,79
THROMBOGENICS NV - 10.575,00 EUR 29,455 311.486,63 1,17 1,19
U.C.B. - 2.248,00 EUR 41,385 93.033,48 0,35 0,35
Bermuda
COVIDIEN LTD - 1.460,00 USD 62,840 70.579,58 0,27 0,27
Brazil
DIAGNOSTICOS DA AMERICA - 3.300,00 BRL 11,570 13.297,00 0,05 0,05
ODONTOPREV SA - 3.896,00 BRL 9,200 12.482,83 0,05 0,05
China
SHANDONG WEIGAO GP MEDICAL-H - 20.000,00 HKD 8,480 16.821,89 0,06 0,06
SIHUAN PHARMACEUTICAL HOLDINGS - 26.000,00 HKD 5,100 13.152,02 0,05 0,05
SINOPHARM GROUP CO - 11.600,00 HKD 19,480 22.412,79 0,08 0,09
Denmark
NOVO NORDISK A/S "B" 6.675,00 DKK 893,000 799.160,05 3,01 3,04
France
ESSILOR (PAR) 2.005,00 EUR 81,740 163.888,70 0,62 0,62
IPSEN - 8.984,00 EUR 28,350 254.696,40 0,96 0,97
SANOFI - 12.333,00 EUR 79,620 981.953,46 3,70 3,74
STALLERGENES (PAR) 2.929,00 EUR 53,950 158.019,55 0,60 0,60
Germany
BAYER AG - 15.331,00 EUR 81,930 1.256.068,83 4,73 4,78
DRAEGERWERK AG PREF 1.592,00 EUR 105,300 167.637,60 0,63 0,64
FRESENIUS MEDICAL CARE AG & CO - 1.511,00 EUR 54,530 82.394,83 0,31 0,31
FRESENIUS SE & CO KGAA (FRA) 1.591,00 EUR 94,710 150.683,61 0,57 0,57
GERRESHEIMER AG - 5.362,00 EUR 44,425 238.206,85 0,90 0,91
Hong Kong
SHANGAI PHARMACEUTICALS HOLDING - 6.100,00 HKD 14,540 8.797,18 0,03 0,03
Hungary
GEDEON RICHTER - 205,00 HUF 33.950,000 23.629,22 0,09 0,09
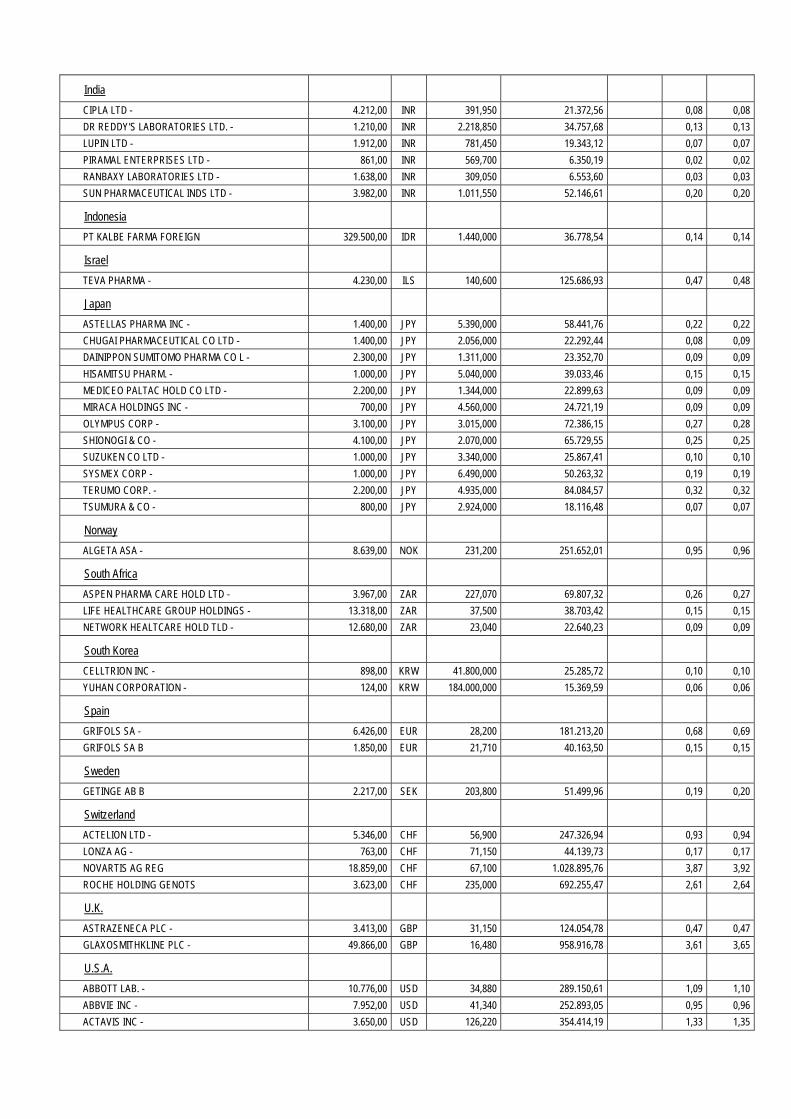
India
CIPLA LTD - 4.212,00 INR 391,950 21.372,56 0,08 0,08
DR REDDY'S LABORATORIES LTD. - 1.210,00 INR 2.218,850 34.757,68 0,13 0,13
LUPIN LTD - 1.912,00 INR 781,450 19.343,12 0,07 0,07
PIRAMAL ENTERPRISES LTD - 861,00 INR 569,700 6.350,19 0,02 0,02
RANBAXY LABORATORIES LTD - 1.638,00 INR 309,050 6.553,60 0,03 0,03
SUN PHARMACEUTICAL INDS LTD - 3.982,00 INR 1.011,550 52.146,61 0,20 0,20
Indonesia
PT KALBE FARMA FOREIGN 329.500,00 IDR 1.440,000 36.778,54 0,14 0,14
Israel
TEVA PHARMA - 4.230,00 ILS 140,600 125.686,93 0,47 0,48
Japan
ASTELLAS PHARMA INC - 1.400,00 JPY 5.390,000 58.441,76 0,22 0,22
CHUGAI PHARMACEUTICAL CO LTD - 1.400,00 JPY 2.056,000 22.292,44 0,08 0,09
DAINIPPON SUMITOMO PHARMA CO L - 2.300,00 JPY 1.311,000 23.352,70 0,09 0,09
HISAMITSU PHARM. - 1.000,00 JPY 5.040,000 39.033,46 0,15 0,15
MEDICEO PALTAC HOLD CO LTD - 2.200,00 JPY 1.344,000 22.899,63 0,09 0,09
MIRACA HOLDINGS INC - 700,00 JPY 4.560,000 24.721,19 0,09 0,09
OLYMPUS CORP - 3.100,00 JPY 3.015,000 72.386,15 0,27 0,28
SHIONOGI & CO - 4.100,00 JPY 2.070,000 65.729,55 0,25 0,25
SUZUKEN CO LTD - 1.000,00 JPY 3.340,000 25.867,41 0,10 0,10
SYSMEX CORP - 1.000,00 JPY 6.490,000 50.263,32 0,19 0,19
TERUMO CORP. - 2.200,00 JPY 4.935,000 84.084,57 0,32 0,32
TSUMURA & CO - 800,00 JPY 2.924,000 18.116,48 0,07 0,07
Norway
ALGETA ASA - 8.639,00 NOK 231,200 251.652,01 0,95 0,96
South Africa
ASPEN PHARMA CARE HOLD LTD - 3.967,00 ZAR 227,070 69.807,32 0,26 0,27
LIFE HEALTHCARE GROUP HOLDINGS - 13.318,00 ZAR 37,500 38.703,42 0,15 0,15
NETWORK HEALTCARE HOLD TLD - 12.680,00 ZAR 23,040 22.640,23 0,09 0,09
South Korea
CELLTRION INC - 898,00 KRW 41.800,000 25.285,72 0,10 0,10
YUHAN CORPORATION - 124,00 KRW 184.000,000 15.369,59 0,06 0,06
Spain
GRIFOLS SA - 6.426,00 EUR 28,200 181.213,20 0,68 0,69
GRIFOLS SA B 1.850,00 EUR 21,710 40.163,50 0,15 0,15
Sweden
GETINGE AB B 2.217,00 SEK 203,800 51.499,96 0,19 0,20
Switzerland
ACTELION LTD - 5.346,00 CHF 56,900 247.326,94 0,93 0,94
LONZA AG - 763,00 CHF 71,150 44.139,73 0,17 0,17
NOVARTIS AG REG 18.859,00 CHF 67,100 1.028.895,76 3,87 3,92
ROCHE HOLDING GENOTS 3.623,00 CHF 235,000 692.255,47 2,61 2,64
U.K.
ASTRAZENECA PLC - 3.413,00 GBP 31,150 124.054,78 0,47 0,47
GLAXOSMITHKLINE PLC - 49.866,00 GBP 16,480 958.916,78 3,61 3,65
U.S.A.
ABBOTT LAB. - 10.776,00 USD 34,880 289.150,61 1,09 1,10
ABBVIE INC - 7.952,00 USD 41,340 252.893,05 0,95 0,96
ACTAVIS INC - 3.650,00 USD 126,220 354.414,19 1,33 1,35

AETNA INC NEW 210,00 USD 63,540 10.264,94 0,04 0,04
AGILENT TECHNOLOGIES - 4.962,00 USD 42,760 163.224,19 0,61 0,62
ALLERGAN INC. - 1.854,00 USD 84,240 120.148,44 0,45 0,46
BIOGEN IDEC INC - 8.454,00 USD 215,200 1.399.569,81 5,27 5,33
BIOMARIN PHARMACEUTICAL INC - 2.130,00 USD 55,790 91.416,80 0,34 0,35
BOSTON SCIENTIFIC - 51.288,00 USD 9,270 365.751,03 1,38 1,39
BRISTOL-MYERS SQUIBB CO - 1.519,00 USD 44,690 52.222,56 0,20 0,20
CARDINAL HEALTH INC - 8.518,00 USD 47,200 309.292,71 1,16 1,18
CELGENE CORPORATION - 699,00 USD 116,910 62.866,44 0,24 0,24
CERNER CORP - 1.778,00 USD 96,090 131.431,66 0,50 0,50
COVANCE INC - 6.714,00 USD 76,140 393.264,07 1,48 1,50
CUBIST PHARMACEUTICALS INC - 16.357,00 USD 48,300 607.772,21 2,29 2,31
EXPRESS SCRIPTS INC. "A" 13.986,00 USD 61,690 663.740,55 2,50 2,53
FOREST LABORATORIES "A" 3.271,00 USD 41,000 103.170,24 0,39 0,39
GILEAD SCIENCES - 23.068,00 USD 51,210 908.771,66 3,42 3,46
HOSPIRA INC. - 2.644,00 USD 38,310 77.922,64 0,29 0,30
HUMANA INC. - 6.431,00 USD 84,380 417.453,48 1,57 1,59
ILLUMINA INC - 3.835,00 USD 74,840 220.794,98 0,83 0,84
INTUITIVE SURGICAL INC - 72,00 USD 506,580 28.058,90 0,11 0,11
JOHNSON & JOHNSON - 35.765,00 USD 85,860 2.362.322,41 8,89 9,00
MCKESSON CORP - 5.746,00 USD 114,500 506.128,93 1,91 1,93
MERCK & CO - 44.646,00 USD 46,450 1.595.358,64 6,00 6,07
NPS PHARMACEUTICALS INC - 18.268,00 USD 15,100 212.206,17 0,80 0,81
PFIZER - 97.781,00 USD 28,010 2.106.966,54 7,93 8,02
REGENRON PHARMACEUTICALS - 4.372,00 USD 224,880 756.346,92 2,85 2,88
SALIX PHARMACEUTICALS - 4.888,00 USD 66,150 248.743,13 0,94 0,95
STRYKER CORPORATION - 3.219,00 USD 64,680 160.169,95 0,60 0,61
UNITED THERAPEUTICS CORP. - 46,00 USD 65,820 2.329,19 0,01 0,01
UNITEDHEALTH GROUP INC. - 18.890,00 USD 65,480 951.547,97 3,58 3,62
WELLPOINT INC - 5.988,00 USD 81,840 376.996,63 1,42 1,44
Unlisted shares
U.S.A.
ALTEA THERAPEUTICS - 172.413,00 USD 0,000 0,13
METABOLEX PREF B1 238.903,00 USD 0,000 0,18
Total shares 26.571.479,62 99,99 101,16
Rights
France
STALLERGENES CP 05/06/2013 2.929,00 EUR 0,750 2.196,75 0,01 0,01
Total rights 2.196,75 0,01 0,01
TOTAL SECURITIES PORTFOLIO 26.573.676,37 100,00 101,17
COLLATERAL RECEIVED
Belgium
KBC GROUP COLLATERAL EUR 214.013,64 EUR 1,000 214.013,64 0,82
TOTAL RECEIVED COLLATERAL 214.013,64 0,82
CASH AT BANK AND IN HAND
Demand accounts
Belgium
KBC GROUP AUD 6.313,13 AUD 1,000 4.445,71 0,02
KBC GROUP CAD -1,97 CAD 1,000 -1,44
KBC GROUP CHF 4.430,10 CHF 1,000 3.602,00 0,01
KBC GROUP CZK 29,32 CZK 1,000 1,13
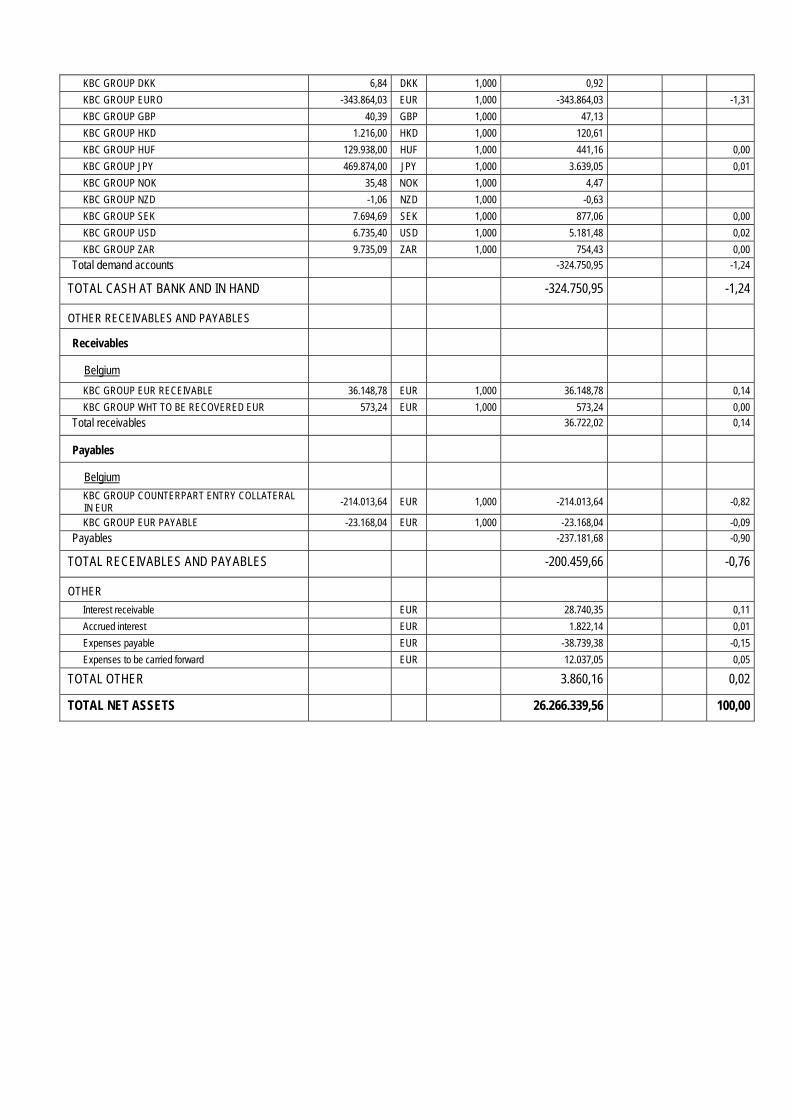
KBC GROUP DKK 6,84 DKK 1,000 0,92
KBC GROUP EURO -343.864,03 EUR 1,000 -343.864,03 -1,31
KBC GROUP GBP 40,39 GBP 1,000 47,13
KBC GROUP HKD 1.216,00 HKD 1,000 120,61
KBC GROUP HUF 129.938,00 HUF 1,000 441,16 0,00
KBC GROUP JPY 469.874,00 JPY 1,000 3.639,05 0,01
KBC GROUP NOK 35,48 NOK 1,000 4,47
KBC GROUP NZD -1,06 NZD 1,000 -0,63
KBC GROUP SEK 7.694,69 SEK 1,000 877,06 0,00
KBC GROUP USD 6.735,40 USD 1,000 5.181,48 0,02
KBC GROUP ZAR 9.735,09 ZAR 1,000 754,43 0,00
Total demand accounts -324.750,95 -1,24
TOTAL CASH AT BANK AND IN HAND -324.750,95 -1,24
OTHER RECEIVABLES AND PAYABLES
Receivables
Belgium
KBC GROUP EUR RECEIVABLE 36.148,78 EUR 1,000 36.148,78 0,14
KBC GROUP WHT TO BE RECOVERED EUR 573,24 EUR 1,000 573,24 0,00
Total receivables 36.722,02 0,14
Payables
Belgium
KBC GROUP COUNTERPART ENTRY COLLATERAL IN EUR
-214.013,64 EUR 1,000 -214.013,64 -0,82
KBC GROUP EUR PAYABLE -23.168,04 EUR 1,000 -23.168,04 -0,09
Payables -237.181,68 -0,90
TOTAL RECEIVABLES AND PAYABLES -200.459,66 -0,76
OTHER
Interest receivable EUR 28.740,35 0,11
Accrued interest EUR 1.822,14 0,01
Expenses payable EUR -38.739,38 -0,15
Expenses to be carried forward EUR 12.037,05 0,05
TOTAL OTHER 3.860,16 0,02
TOTAL NET ASSETS 26.266.339,56 100,00
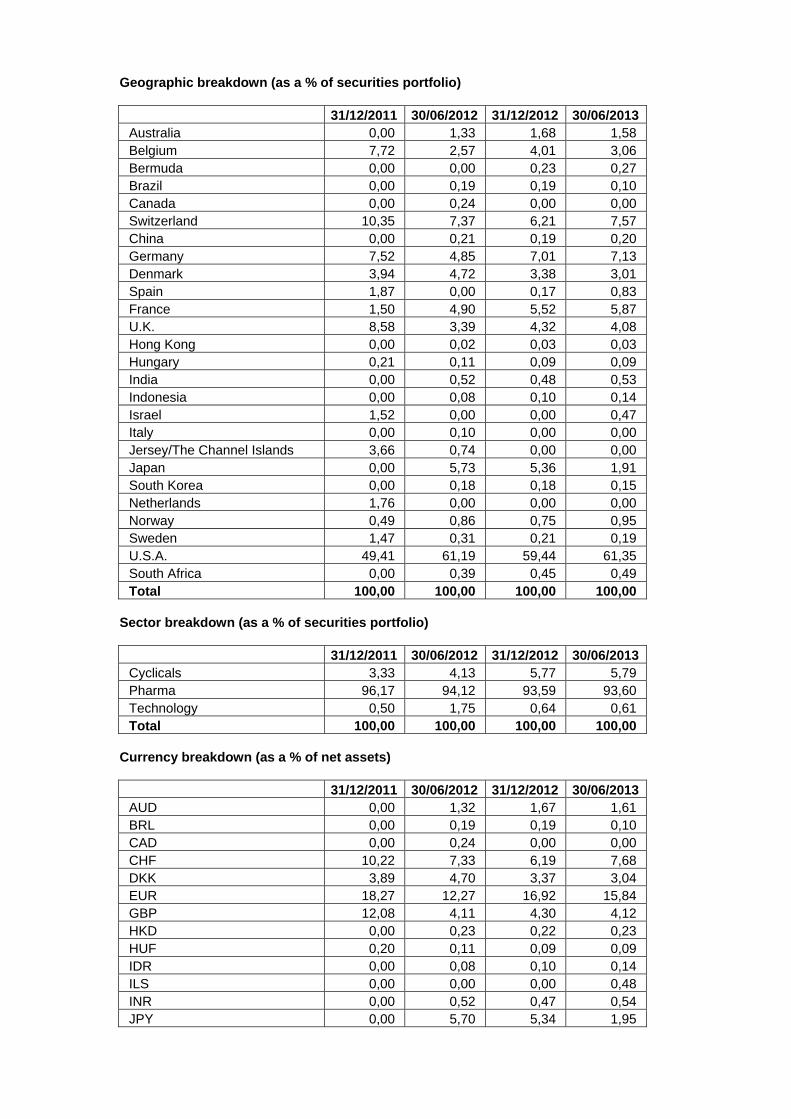
Geographic breakdown (as a % of securities portfolio)
31/12/2011 30/06/2012 31/12/2012 30/06/2013 Australia 0,00 1,33 1,68 1,58 Belgium 7,72 2,57 4,01 3,06 Bermuda 0,00 0,00 0,23 0,27 Brazil 0,00 0,19 0,19 0,10 Canada 0,00 0,24 0,00 0,00 Switzerland 10,35 7,37 6,21 7,57 China 0,00 0,21 0,19 0,20 Germany 7,52 4,85 7,01 7,13 Denmark 3,94 4,72 3,38 3,01 Spain 1,87 0,00 0,17 0,83 France 1,50 4,90 5,52 5,87 U.K. 8,58 3,39 4,32 4,08 Hong Kong 0,00 0,02 0,03 0,03 Hungary 0,21 0,11 0,09 0,09 India 0,00 0,52 0,48 0,53 Indonesia 0,00 0,08 0,10 0,14 Israel 1,52 0,00 0,00 0,47 Italy 0,00 0,10 0,00 0,00 Jersey/The Channel Islands 3,66 0,74 0,00 0,00 Japan 0,00 5,73 5,36 1,91 South Korea 0,00 0,18 0,18 0,15 Netherlands 1,76 0,00 0,00 0,00 Norway 0,49 0,86 0,75 0,95 Sweden 1,47 0,31 0,21 0,19 U.S.A. 49,41 61,19 59,44 61,35 South Africa 0,00 0,39 0,45 0,49 Total 100,00 100,00 100,00 100,00
Sector breakdown (as a % of securities portfolio)
31/12/2011 30/06/2012 31/12/2012 30/06/2013 Cyclicals 3,33 4,13 5,77 5,79 Pharma 96,17 94,12 93,59 93,60 Technology 0,50 1,75 0,64 0,61 Total 100,00 100,00 100,00 100,00
Currency breakdown (as a % of net assets)
31/12/2011 30/06/2012 31/12/2012 30/06/2013 AUD 0,00 1,32 1,67 1,61 BRL 0,00 0,19 0,19 0,10 CAD 0,00 0,24 0,00 0,00 CHF 10,22 7,33 6,19 7,68 DKK 3,89 4,70 3,37 3,04 EUR 18,27 12,27 16,92 15,84 GBP 12,08 4,11 4,30 4,12 HKD 0,00 0,23 0,22 0,23 HUF 0,20 0,11 0,09 0,09 IDR 0,00 0,08 0,10 0,14 ILS 0,00 0,00 0,00 0,48 INR 0,00 0,52 0,47 0,54 JPY 0,00 5,70 5,34 1,95

KRW 0,00 0,17 0,18 0,15 NOK 0,48 0,85 0,75 0,96 SEK 1,45 0,31 0,21 0,20 USD 53,41 61,48 59,55 62,37 ZAR 0,00 0,39 0,45 0,50 Total 100,00 100,00 100,00 100,00

2.4.2 CHANGES IN THE COMPOSITION OF THE ASSETS OF KBC EQUITY FUND PHARMA GROWTH
(IN THE CURRENCY OF THE SUB-FUND)
1st half of year YearPurchases 1.080.712,87 1.080.712,87 Sales 6.072.664,36 6.072.664,36 Total 1 7.153.377,23 7.153.377,23 Subscriptions 3.038.539,38 3.038.539,38 Redemptions 8.412.571,39 8.412.571,39 Total 2 11.451.110,77 11.451.110,77 Monthly average of total assets
26.079.331,95 26.079.331,95
Turnover rate -16,48 % -16,48 %
1st half of year YearPurchases 1.080.712,87 1.080.712,87 Sales 6.072.664,36 6.072.664,36 Total 1 7.153.377,23 7.153.377,23 Subscriptions 3.038.539,38 3.038.539,38 Redemptions 8.412.571,39 8.412.571,39 Total 2 11.451.110,77 11.451.110,77 Monthly average of total assets
25.584.793,05 25.584.793,05
Corrected turnover rate -16,80 % -16,80 %
The table above shows the capital volume of portfolio transactions. This volume (adjusted to take account of total subscriptions and redemptions) is also compared to the average net assets at the beginning and end of the period. A figure close to 0% implies that the transactions relating to the securities or transactions relating to the assets (excluding deposits and cash) in a given period only involve subscriptions and redemptions. A negative percentage shows that subscriptions and redemptions entailed few, if any, transactions in the portfolio. Active asset management may result in high turnover rates (monthly percentage >50%). The detailed list of transactions is available for consultation free of charge at the registered office of the Bevek or fund at Havenlaan 2, 1080 Brussels.
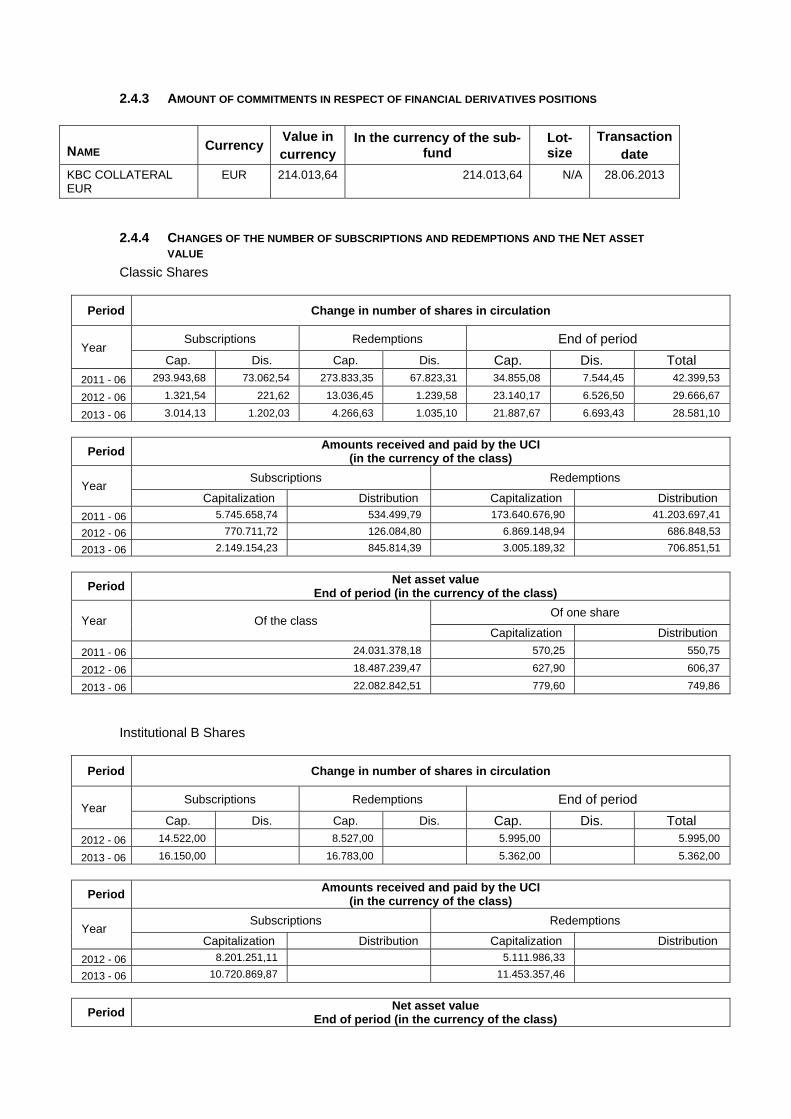
2.4.3 AMOUNT OF COMMITMENTS IN RESPECT OF FINANCIAL DERIVATIVES POSITIONS
NAME Currency Value in currency
In the currency of the sub-fund
Lot-size
Transactiondate
KBC COLLATERAL EUR
EUR 214.013,64 214.013,64 N/A 28.06.2013
2.4.4 CHANGES OF THE NUMBER OF SUBSCRIPTIONS AND REDEMPTIONS AND THE NET ASSET
VALUE
Classic Shares
Period Change in number of shares in circulation
Year Subscriptions Redemptions End of period
Cap. Dis. Cap. Dis. Cap. Dis. Total
2011 - 06 293.943,68 73.062,54 273.833,35 67.823,31 34.855,08 7.544,45 42.399,53
2012 - 06 1.321,54 221,62 13.036,45 1.239,58 23.140,17 6.526,50 29.666,67
2013 - 06 3.014,13 1.202,03 4.266,63 1.035,10 21.887,67 6.693,43 28.581,10
Period Amounts received and paid by the UCI
(in the currency of the class)
Year Subscriptions Redemptions
Capitalization Distribution Capitalization Distribution
2011 - 06 5.745.658,74 534.499,79 173.640.676,90 41.203.697,41
2012 - 06 770.711,72 126.084,80 6.869.148,94 686.848,53
2013 - 06 2.149.154,23 845.814,39 3.005.189,32 706.851,51
Period Net asset value
End of period (in the currency of the class)
Year Of the class Of one share
Capitalization Distribution
2011 - 06 24.031.378,18 570,25 550,75
2012 - 06 18.487.239,47 627,90 606,37
2013 - 06 22.082.842,51 779,60 749,86
Institutional B Shares
Period Change in number of shares in circulation
Year Subscriptions Redemptions End of period
Cap. Dis. Cap. Dis. Cap. Dis. Total 2012 - 06 14.522,00 8.527,00 5.995,00 5.995,00
2013 - 06 16.150,00 16.783,00 5.362,00 5.362,00
Period Amounts received and paid by the UCI
(in the currency of the class)
Year Subscriptions Redemptions
Capitalization Distribution Capitalization Distribution
2012 - 06 8.201.251,11 5.111.986,33
2013 - 06 10.720.869,87 11.453.357,46
Period Net asset value
End of period (in the currency of the class)

Year Of the class Of one share
Capitalization Distribution
2012 - 06 3.766.687,77 628,30
2013 - 06 4.183.497,05 780,21
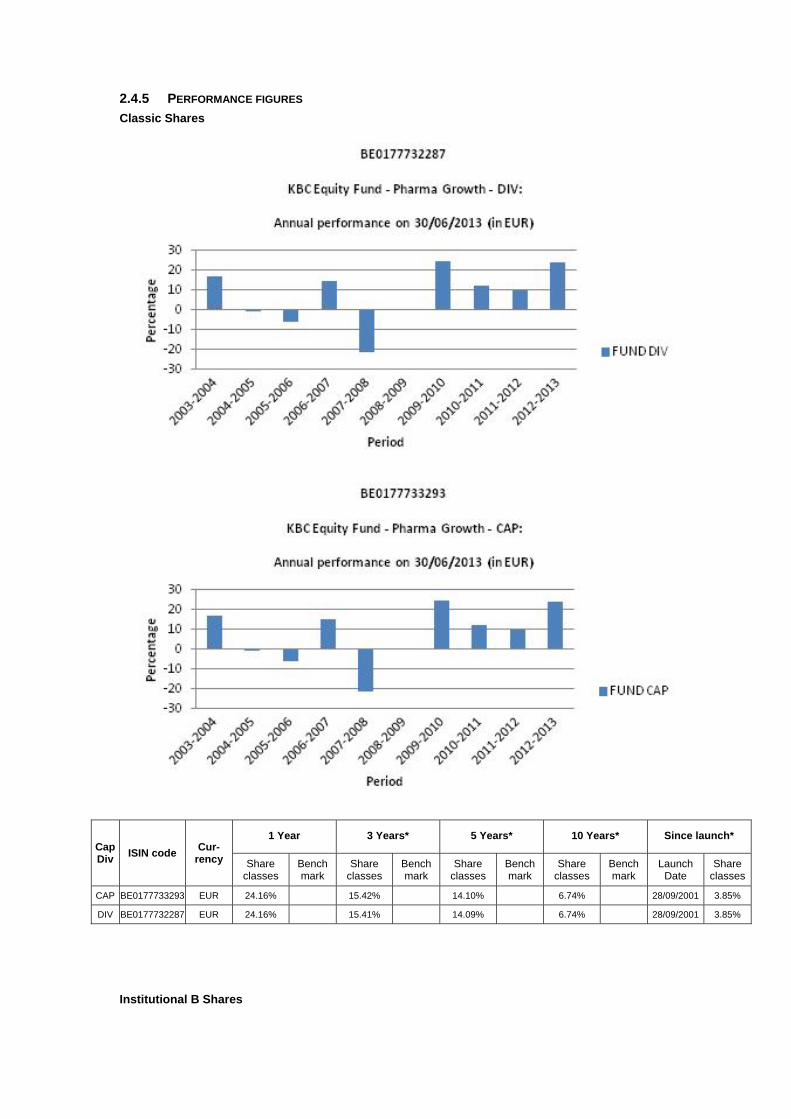
2.4.5 PERFORMANCE FIGURES
Classic Shares
Cap Div
ISIN code Cur-
rency
1 Year 3 Years* 5 Years* 10 Years* Since launch*
Share classes
Bench mark
Share classes
Bench mark
Share classes
Bench mark
Share classes
Bench mark
Launch Date
Share classes
CAP BE0177733293 EUR 24.16% 15.42% 14.10% 6.74% 28/09/2001 3.85%
DIV BE0177732287 EUR 24.16% 15.41% 14.09% 6.74% 28/09/2001 3.85%
Institutional B Shares

Cap Div
ISIN code Cur-
rency
1 Year 3 Years* 5 Years* 10 Years* Since launch*
Share classes
Bench mark
Share classes
Bench mark
Share classes
Bench mark
Share classes
Bench mark
Launch Date
Share classes
CAP BE6228904494 EUR 24.18% 25/11/2011 31.47%
Risk warning: Past performance is not a guide to future performance. * Return on annual basis.
Classic Shares The bar chart shows the performance for full financial years. The figures do not take account of any restructuring. Calculated in EUR. The return is calculated as the change in the net asset value between two dates expressed
as a percentage. In the case of units that pay dividends, the dividend is incorporated geometrically in the return.
Calculation method for date D, where NAV stands for net asset value: Capitalisation units (CAP) Return on date D over a period of X years:
[NIW(D) / NIW(Y)] ^ [1 / X] - 1 where Y = D-X
Return on date D since the start date S of the unit: [NIW(D) / NIW(S)] ^ [1 / F] - 1 where F = 1 if the unit has existed for less than one year on date D where F = (D-S) / 365.25 if the unit has existed for longer than one year on date D
Distribution units (DIV) Return on date D over a period of X years:
[ C * NIW(D) / NIW(Y)] ^ [1 / X] - 1 where Y = D-X
Return on date D since the start date S of the unit: [ C * NIW(D) / NIW(S)] ^ [1 / F] - 1 where F = 1 if the unit has existed for less than one year on date D where F = (D-S) / 365.25 if the unit has existed for longer than one year on date D where C is a factor that is determined for all N dividends between the calculation date D and the reference date.
For dividend i on date Di with value Wi: Ci = [Wi / NIW(Di)] + 1 i = 1 ... N

from whichC = C0 * .... * CN. If the interval between the two dates exceeds one year, the ordinary return calculation is
converted into a return on an annual basis by taking the nth square root of 1 plus the total return of the unit.
The return figures shown above do not take account of the fees and charges associated with the issue and redemption of units.
These are the performance figures for capitalisation and distribution shares.
Institutional B Shares The bar chart shows the performance for full financial years. The figures do not take account of any restructuring. Calculated in EUR. The return is calculated as the change in the net asset value between two dates expressed
as a percentage. Calculation method for date D, where NAV stands for net asset value:
Capitalisation units (CAP) Return on date D over a period of X years:
[NIW(D) / NIW(Y)] ^ [1 / X] - 1 where Y = D-X
Return on date D since the start date S of the unit: [NIW(D) / NIW(S)] ^ [1 / F] - 1 where F = 1 if the unit has existed for less than one year on date D where F = (D-S) / 365.25 if the unit has existed for longer than one year on date D
If the interval between the two dates exceeds one year, the ordinary return calculation is converted into a return on an annual basis by taking the nth square root of 1 plus the total return of the unit.
The return figures shown above do not take account of the fees and charges associated with the issue and redemption of units.
These are the performance figures for capitalization shares.
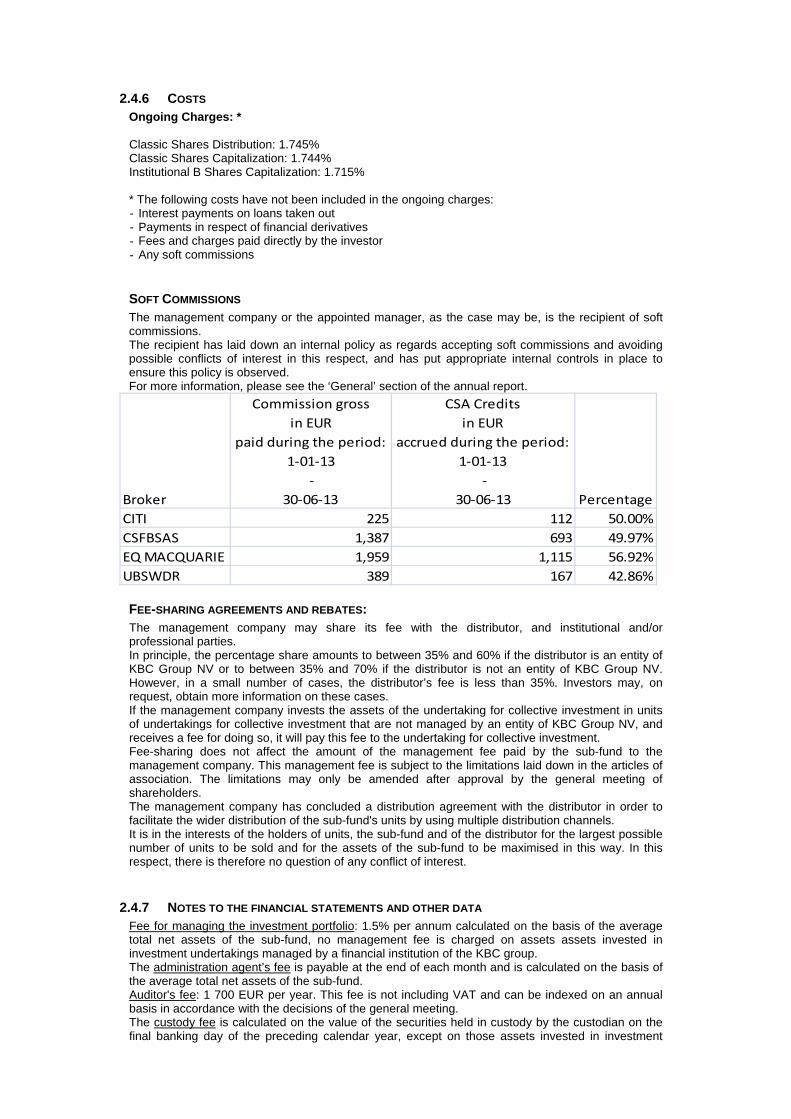
2.4.6 COSTS Ongoing Charges: * Classic Shares Distribution: 1.745% Classic Shares Capitalization: 1.744% Institutional B Shares Capitalization: 1.715% * The following costs have not been included in the ongoing charges: - Interest payments on loans taken out - Payments in respect of financial derivatives - Fees and charges paid directly by the investor - Any soft commissions
SOFT COMMISSIONS The management company or the appointed manager, as the case may be, is the recipient of soft commissions. The recipient has laid down an internal policy as regards accepting soft commissions and avoiding possible conflicts of interest in this respect, and has put appropriate internal controls in place to ensure this policy is observed. For more information, please see the ‘General’ section of the annual report.
Broker
Commission gross
in EUR
paid during the period:
1‐01‐13
‐
30‐06‐13
CSA Credits
in EUR
accrued during the period:
1‐01‐13
‐
30‐06‐13 Percentage
CITI 225 112 50.00%
CSFBSAS 1,387 693 49.97%
EQ MACQUARIE 1,959 1,115 56.92%
UBSWDR 389 167 42.86%
FEE-SHARING AGREEMENTS AND REBATES: The management company may share its fee with the distributor, and institutional and/or professional parties. In principle, the percentage share amounts to between 35% and 60% if the distributor is an entity of KBC Group NV or to between 35% and 70% if the distributor is not an entity of KBC Group NV. However, in a small number of cases, the distributor’s fee is less than 35%. Investors may, on request, obtain more information on these cases. If the management company invests the assets of the undertaking for collective investment in units of undertakings for collective investment that are not managed by an entity of KBC Group NV, and receives a fee for doing so, it will pay this fee to the undertaking for collective investment. Fee-sharing does not affect the amount of the management fee paid by the sub-fund to the management company. This management fee is subject to the limitations laid down in the articles of association. The limitations may only be amended after approval by the general meeting of shareholders. The management company has concluded a distribution agreement with the distributor in order to facilitate the wider distribution of the sub-fund's units by using multiple distribution channels. It is in the interests of the holders of units, the sub-fund and of the distributor for the largest possible number of units to be sold and for the assets of the sub-fund to be maximised in this way. In this respect, there is therefore no question of any conflict of interest.
2.4.7 NOTES TO THE FINANCIAL STATEMENTS AND OTHER DATA Fee for managing the investment portfolio: 1.5% per annum calculated on the basis of the average total net assets of the sub-fund, no management fee is charged on assets assets invested in investment undertakings managed by a financial institution of the KBC group. The administration agent’s fee is payable at the end of each month and is calculated on the basis of the average total net assets of the sub-fund. Auditor's fee: 1 700 EUR per year. This fee is not including VAT and can be indexed on an annual basis in accordance with the decisions of the general meeting. The custody fee is calculated on the value of the securities held in custody by the custodian on the final banking day of the preceding calendar year, except on those assets invested in investment
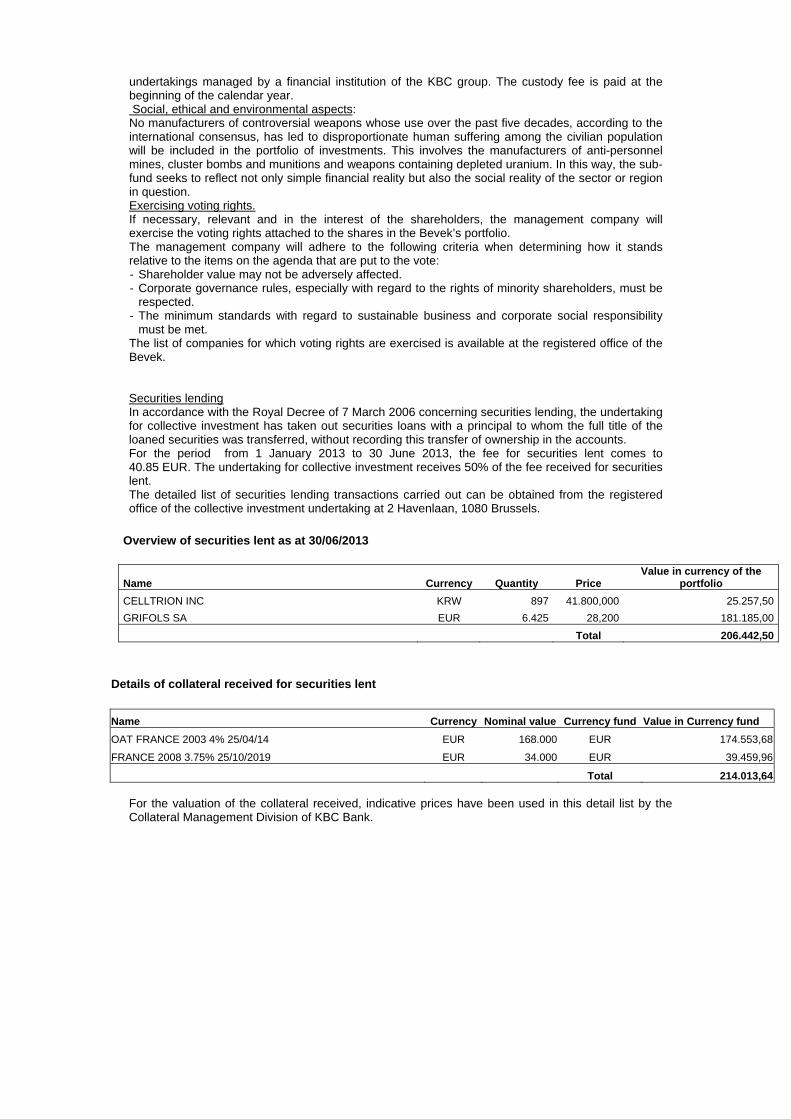
undertakings managed by a financial institution of the KBC group. The custody fee is paid at the beginning of the calendar year. Social, ethical and environmental aspects: No manufacturers of controversial weapons whose use over the past five decades, according to the international consensus, has led to disproportionate human suffering among the civilian population will be included in the portfolio of investments. This involves the manufacturers of anti-personnel mines, cluster bombs and munitions and weapons containing depleted uranium. In this way, the sub-fund seeks to reflect not only simple financial reality but also the social reality of the sector or region in question. Exercising voting rights. If necessary, relevant and in the interest of the shareholders, the management company will exercise the voting rights attached to the shares in the Bevek’s portfolio. The management company will adhere to the following criteria when determining how it stands relative to the items on the agenda that are put to the vote: - Shareholder value may not be adversely affected. - Corporate governance rules, especially with regard to the rights of minority shareholders, must be
respected. - The minimum standards with regard to sustainable business and corporate social responsibility
must be met. The list of companies for which voting rights are exercised is available at the registered office of the Bevek. Securities lending In accordance with the Royal Decree of 7 March 2006 concerning securities lending, the undertaking for collective investment has taken out securities loans with a principal to whom the full title of the loaned securities was transferred, without recording this transfer of ownership in the accounts. For the period from 1 January 2013 to 30 June 2013, the fee for securities lent comes to 40.85 EUR. The undertaking for collective investment receives 50% of the fee received for securities lent. The detailed list of securities lending transactions carried out can be obtained from the registered office of the collective investment undertaking at 2 Havenlaan, 1080 Brussels.
Overview of securities lent as at 30/06/2013
Name Currency Quantity Price Value in currency of the
portfolio
CELLTRION INC KRW 897 41.800,000 25.257,50
GRIFOLS SA EUR 6.425 28,200 181.185,00
Total 206.442,50
Details of collateral received for securities lent
Name Currency Nominal value Currency fund Value in Currency fund
OAT FRANCE 2003 4% 25/04/14 EUR 168.000 EUR 174.553,68
FRANCE 2008 3.75% 25/10/2019 EUR 34.000 EUR 39.459,96
Total 214.013,64 For the valuation of the collateral received, indicative prices have been used in this detail list by the Collateral Management Division of KBC Bank.

Semi-Annual report as at 30th June 2013
TABLE OF CONTENTS
2. Information on KBC Equity Fund Technology
2.1. Management report 2.1.1. Launch date and subscription price 2.1.2. Stock exchange listing 2.1.3. Aim and distinctive features of the investment policy 2.1.4. Financial portfolio management 2.1.5. Distributors 2.1.6. Index and benchmark 2.1.7. Policy conducted during the financial year 2.1.8. Future policy 2.1.9. Synthetic risk and reward indicator (SRRI)
2.2. Balance sheet
2.3. Profit and loss account
2.4. Composition of the assets and key figures
2.4.1. Composition of the assets 2.4.2. Change in the composition of the assets 2.4.3. Value of commitments in respect of financial derivatives positions 2.4.4. Evolution of the number of subscriptions, repayments and the net asset value 2.4.5. Return figures 2.4.6. Expenses 2.4.7. Notes to the financial statements and other data


2 INFORMATION ON KBC EQUITY FUND TECHNOLOGY
2.1 MANAGEMENT REPORT
2.1.1 LAUNCH DATE AND SUBSCRIPTION PRICE Classic Shares : Launch date: 27 June 1997 Initial subscription price: 1000 USD Currency: USD Institutional B Shares : Launch date: 25 November 2011 Initial subscription price: 126.55 USD Currency: USD
2.1.2 STOCK EXCHANGE LISTING Not applicable.
2.1.3 GOAL AND KEY PRINCIPLES OF THE INVESTMENT POLICY
SUB-FUND’S OBJECT: The main objective of this sub-fund is to generate the highest possible return for its shareholders by investing directly or indirectly in transferable securities. This is reflected in its pursuit of capital gains and income. To this end, the assets are invested, either directly or indirectly via correlated financial instruments, primarily in shares.
SUB-FUND’S INVESTMENT POLICY:
PERMITTED ASSET CLASSES: The sub-fund may invest in securities, money market instruments, units in undertakings for collective investment, deposits, financial derivatives, liquid assets and all other instruments insofar as permitted by the applicable laws and regulations and consistent with the sub-fund’s object The sub-fund shall invest no more than 10% of its assets in units of other undertakings for collective investment.
RESTRICTIONS OF THE INVESTMENT POLICY: The investment policy will be implemented within the limits set by law and regulations. The sub-fund may borrow up to 10% of its net assets, insofar as these are short-term borrowings aimed at solving temporary liquidity problems.
PERMITTED DERIVATIVES TRANSACTIONS: Derivates may be used either for hedging purposes or to achieve investment objectives. Changes will be made to the investments at regular intervals to comply with the sub-fund's investment strategy. In addition, listed and unlisted derivates may be used to achieve the objectives: these may be forward contracts, options or swaps on securities, indices, currencies or interest rates or other transactions involving derivatives. Unlisted derivatives transactions will only be concluded with prime financial institutions specialised in such transactions. Such derivatives may also be used to hedge the assets against exchange-rate fluctuations. Subject to the applicable laws and regulations and the articles of association, the sub-fund always seeks to conclude the most effective transactions. All costs associated with the transactions will be charged to the sub-fund and all income generated will be paid to the sub-fund. If the transactions result in a risk in respect of the counterparty, this risk can be hedged by using a margin management system that ensures that the sub-fund is the beneficiary of security (collateral) in the form of cash or investment grade bonds. When calculating the value of the bonds, a margin will be applied that varies depending on the residual term to maturity and the currency in which the bond in question is denominated. The relationship with the counterparty or counterparties is governed by standard international agreements.

STRATEGY SELECTED At least 75% of the assets are invested in shares of companies in the technology sector where conditions are such as to ensure accelerated economic growth in the short or medium term.
RISK CONCENTRATION Shares in the technology sector.
LENDING FINANCIAL INSTRUMENTS: The sub-fund may lend financial instruments within the limits set by law and regulations. This lending does not affect the sub-fund’s risk profile since: - it takes place within the framework of a securities lending system managed by a principal. In
addition, the sub-fund has a relationship only with the principal of the securities lending system which acts as counterparty and to which title of the loaned securities is transferred. The choice of principal is subject to strict selection criteria. The return of securities similar to the securities that have been lent is guaranteed by the principal.
- through a margin management system, the sub-fund is always guaranteed financial security, the actual value of which always exceeds the actual value of the securities that have been lent, in case the principal does not return similar securities.
The return of securities similar to the securities that have been lent can be requested at any time, which means that the lending of securities does not affect the management of the sub-fund's assets. By lending securities, the sub-fund can generate an additional return. The principal pays a fee to the management company. After deducting the fee for the margin management and clearing services of KBC Bank, most of this fee is paid to the sub-fund. The relationship with the counterparty or counterparties is governed by standard international agreements. More information is provided on the terms and conditions governing securities lending in the annual or half-yearly report for the sub-fund.
VOLATILITY OF THE NET ASSET VALUE: The volatility of the net asset value may be high due to the composition of the portfolio.
GENERAL STRATEGY FOR HEDGING THE EXCHANGE RATE RISK: In order to protect its assets against exchange rate fluctuations and within the limitations laid down in the articles of association, the sub-fund may perform transactions relating to the sale of forward currency contracts, as well as the sale of call options and the purchase of put options on currencies. The transactions in question may relate solely to contracts traded on a regulated market that operates regularly, is recognised and is open to the public or that are traded with a recognised, prime financial institution specialising in such transactions and dealing in the over-the-counter (OTC) market in options. With the same objective, the sub-fund may also sell currencies forward or exchange them in private transactions with prime financial institutions specialising in such transactions. The hedging objective of the aforementioned transactions suggests that there is a direct link between these transactions and the assets to be hedged, which implies that the transactions carried out in a particular currency may in principle not exceed, in terms of volume, either the valuation value of all the assets in the same currency or the holding period of those assets.
SOCIAL, ETHICAL AND ENVIRONMENTAL ASPECTS:
No manufacturers of controversial weapons whose use over the past five decades, according to the international consensus, has led to disproportionate human suffering among the civilian population will be included in the portfolio of investments. This involves the manufacturers of anti-personnel mines, cluster bombs and munitions and weapons containing depleted uranium. In this way, the sub-fund seeks to reflect not only simple financial reality but also the social reality of the sector or region in question.
THE EUROPEAN SAVINGS DIRECTIVE AND TAX ON DEBT CLAIM RETURNS OBTAINED THROUGH THE
REDEMPTION OF OWN UNITS OR IN THE EVENT OF FULL OR PARTIAL DISTRIBUTION OF EQUITY
CAPITAL.

The following information is of a general character and is not intended to cover all aspects of an investment in a UCITS. In certain cases entirely different rules might even apply. Moreover, both tax law and the interpretation of it can change. Investors who wish to have more information about the tax implications – in both Belgium and abroad – of acquiring, holding and transferring units should seek the advice of their usual financial and tax advisers. This UCITS shall invest a maximum of 15% of its assets directly or indirectly in debt instruments as intended by the European Savings Directive. A. European Savings Directive (Directive 2003/48/EC) The European Savings Directive has been implemented in Belgium. Since this UCITS invests a maximum of 15% of its assets directly or indirectly in debt claims as intended by the European Savings Directive, the income of this UCITS does not fall within the scope of this directive. B. Tax on debt claim returns obtained through the redemption of own units or in the event of full or partial distribution of equity capital (Article 19bis Income Tax Code 1992). The income from this UCITS is not subject to the tax on debt instrument returns as intended by Article 19bis, Income Tax Code 1992.
2.1.4 FINANCIAL PORTFOLIO MANAGEMENT There is no delegation of the portfolio.
2.1.5 DISTRIBUTORS KBC Asset Management S.A., 5, Place de la Gare, L-1616 Luxembourg.
2.1.6 INDEX AND BENCHMARK See ‘Sub-fund’s investment policy’.
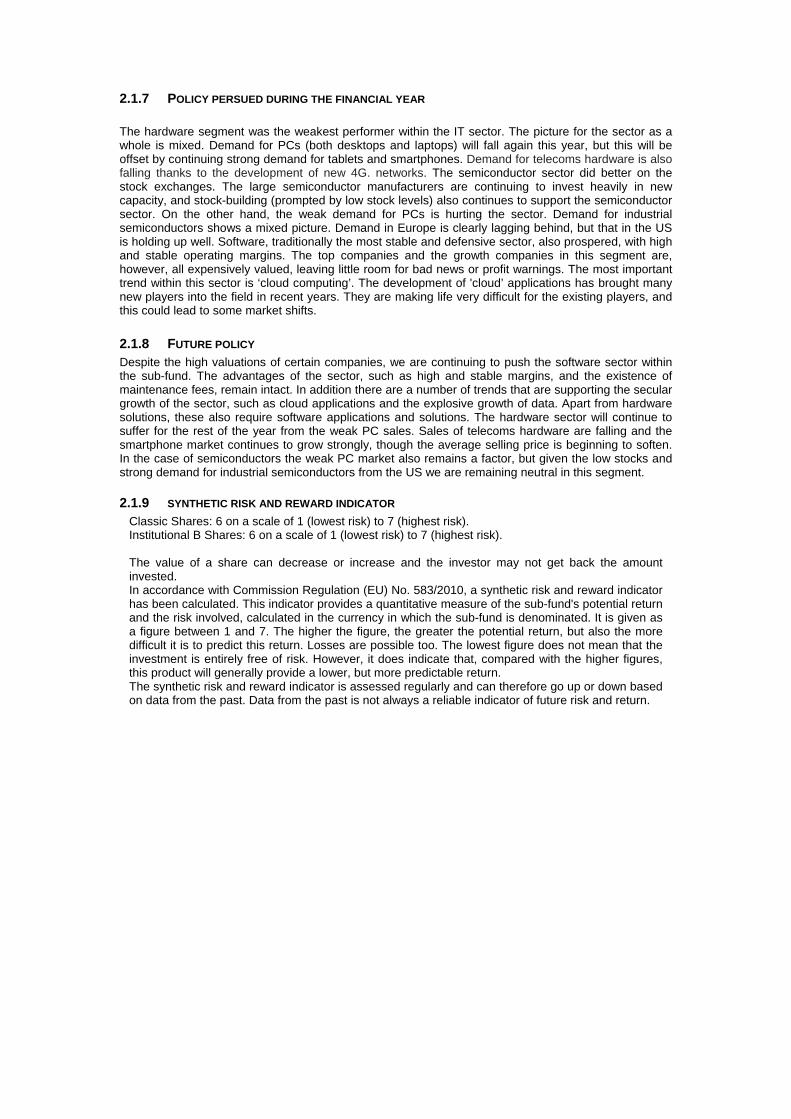
2.1.7 POLICY PERSUED DURING THE FINANCIAL YEAR
The hardware segment was the weakest performer within the IT sector. The picture for the sector as a whole is mixed. Demand for PCs (both desktops and laptops) will fall again this year, but this will be offset by continuing strong demand for tablets and smartphones. Demand for telecoms hardware is also falling thanks to the development of new 4G. networks. The semiconductor sector did better on the stock exchanges. The large semiconductor manufacturers are continuing to invest heavily in new capacity, and stock-building (prompted by low stock levels) also continues to support the semiconductor sector. On the other hand, the weak demand for PCs is hurting the sector. Demand for industrial semiconductors shows a mixed picture. Demand in Europe is clearly lagging behind, but that in the US is holding up well. Software, traditionally the most stable and defensive sector, also prospered, with high and stable operating margins. The top companies and the growth companies in this segment are, however, all expensively valued, leaving little room for bad news or profit warnings. The most important trend within this sector is ‘cloud computing’. The development of 'cloud’ applications has brought many new players into the field in recent years. They are making life very difficult for the existing players, and this could lead to some market shifts.
2.1.8 FUTURE POLICY Despite the high valuations of certain companies, we are continuing to push the software sector within the sub-fund. The advantages of the sector, such as high and stable margins, and the existence of maintenance fees, remain intact. In addition there are a number of trends that are supporting the secular growth of the sector, such as cloud applications and the explosive growth of data. Apart from hardware solutions, these also require software applications and solutions. The hardware sector will continue to suffer for the rest of the year from the weak PC sales. Sales of telecoms hardware are falling and the smartphone market continues to grow strongly, though the average selling price is beginning to soften. In the case of semiconductors the weak PC market also remains a factor, but given the low stocks and strong demand for industrial semiconductors from the US we are remaining neutral in this segment.
2.1.9 SYNTHETIC RISK AND REWARD INDICATOR Classic Shares: 6 on a scale of 1 (lowest risk) to 7 (highest risk). Institutional B Shares: 6 on a scale of 1 (lowest risk) to 7 (highest risk). The value of a share can decrease or increase and the investor may not get back the amount invested. In accordance with Commission Regulation (EU) No. 583/2010, a synthetic risk and reward indicator has been calculated. This indicator provides a quantitative measure of the sub-fund's potential return and the risk involved, calculated in the currency in which the sub-fund is denominated. It is given as a figure between 1 and 7. The higher the figure, the greater the potential return, but also the more difficult it is to predict this return. Losses are possible too. The lowest figure does not mean that the investment is entirely free of risk. However, it does indicate that, compared with the higher figures, this product will generally provide a lower, but more predictable return. The synthetic risk and reward indicator is assessed regularly and can therefore go up or down based on data from the past. Data from the past is not always a reliable indicator of future risk and return.
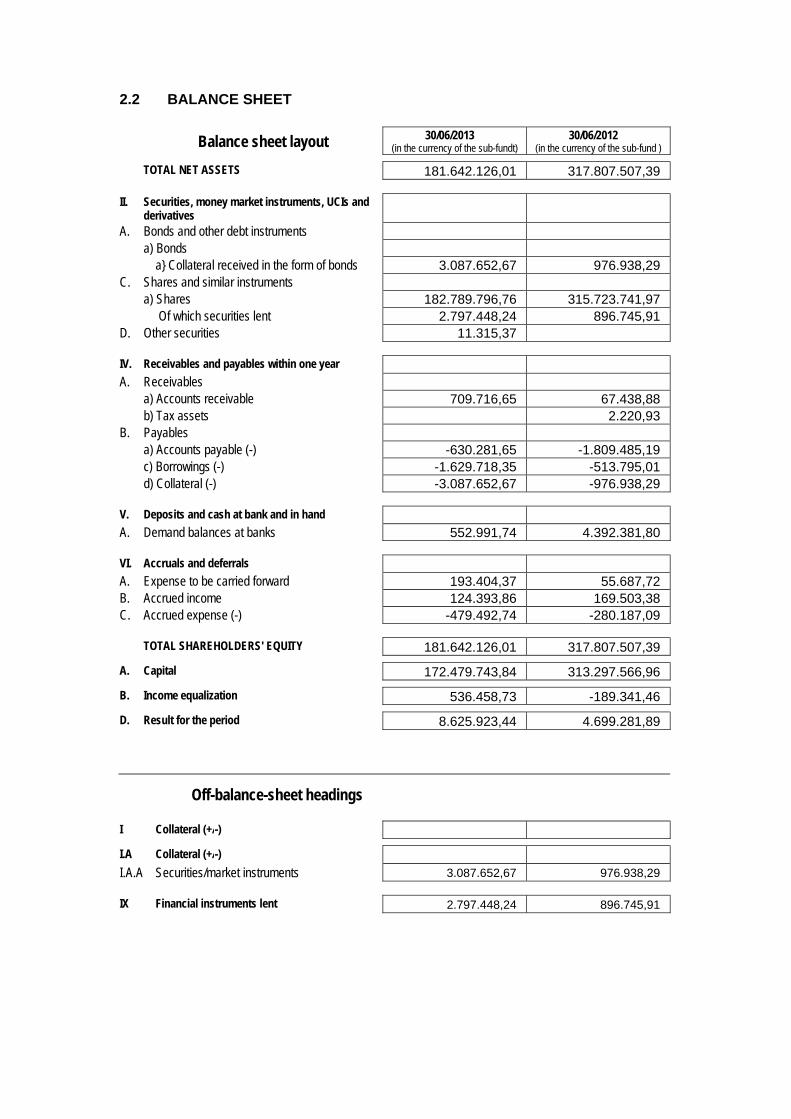
2.2 BALANCE SHEET
Balance sheet layout 30/06/2013 (in the currency of the sub-fundt)
30/06/2012 (in the currency of the sub-fund )
TOTAL NET ASSETS 181.642.126,01 317.807.507,39
II. Securities, money market instruments, UCIs and derivatives
A. Bonds and other debt instruments a) Bonds a} Collateral received in the form of bonds 3.087.652,67 976.938,29 C. Shares and similar instruments a) Shares 182.789.796,76 315.723.741,97 Of which securities lent 2.797.448,24 896.745,91 D. Other securities 11.315,37
IV. Receivables and payables within one year A. Receivables a) Accounts receivable 709.716,65 67.438,88 b) Tax assets 2.220,93 B. Payables a) Accounts payable (-) -630.281,65 -1.809.485,19 c) Borrowings (-) -1.629.718,35 -513.795,01 d) Collateral (-) -3.087.652,67 -976.938,29
V. Deposits and cash at bank and in hand A. Demand balances at banks 552.991,74 4.392.381,80
VI. Accruals and deferrals A. Expense to be carried forward 193.404,37 55.687,72 B. Accrued income 124.393,86 169.503,38 C. Accrued expense (-) -479.492,74 -280.187,09
TOTAL SHAREHOLDERS' EQUITY 181.642.126,01 317.807.507,39
A. Capital 172.479.743,84 313.297.566,96
B. Income equalization 536.458,73 -189.341,46
D. Result for the period 8.625.923,44 4.699.281,89
Off-balance-sheet headings
I Collateral (+/-)
I.A Collateral (+/-)
I.A.A Securities/market instruments 3.087.652,67 976.938,29
IX Financial instruments lent 2.797.448,24 896.745,91
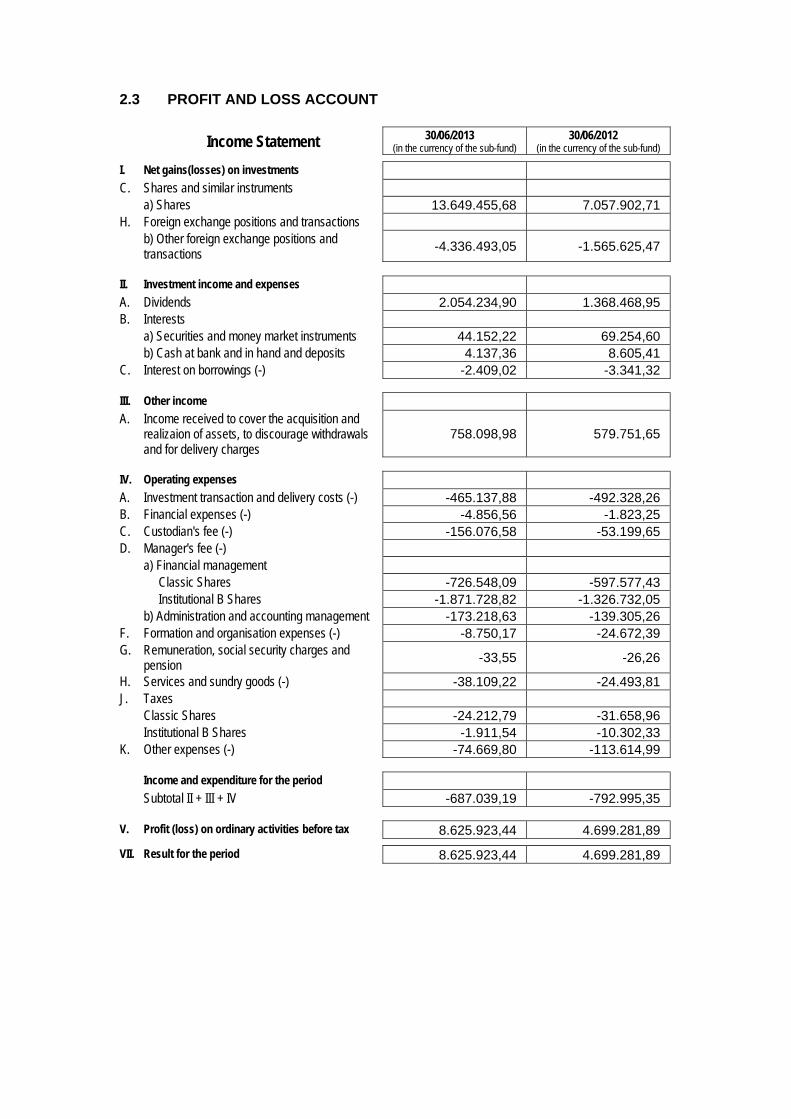
2.3 PROFIT AND LOSS ACCOUNT
Income Statement 30/06/2013 (in the currency of the sub-fund)
30/06/2012 (in the currency of the sub-fund)
I. Net gains(losses) on investments C. Shares and similar instruments a) Shares 13.649.455,68 7.057.902,71 H. Foreign exchange positions and transactions b) Other foreign exchange positions and
transactions -4.336.493,05 -1.565.625,47
II. Investment income and expenses A. Dividends 2.054.234,90 1.368.468,95 B. Interests a) Securities and money market instruments 44.152,22 69.254,60 b) Cash at bank and in hand and deposits 4.137,36 8.605,41 C. Interest on borrowings (-) -2.409,02 -3.341,32
III. Other income A. Income received to cover the acquisition and
realizaion of assets, to discourage withdrawals and for delivery charges
758.098,98 579.751,65
IV. Operating expenses A. Investment transaction and delivery costs (-) -465.137,88 -492.328,26 B. Financial expenses (-) -4.856,56 -1.823,25 C. Custodian's fee (-) -156.076,58 -53.199,65 D. Manager's fee (-) a) Financial management Classic Shares -726.548,09 -597.577,43 Institutional B Shares -1.871.728,82 -1.326.732,05 b) Administration and accounting management -173.218,63 -139.305,26 F. Formation and organisation expenses (-) -8.750,17 -24.672,39 G. Remuneration, social security charges and
pension -33,55 -26,26
H. Services and sundry goods (-) -38.109,22 -24.493,81 J. Taxes Classic Shares -24.212,79 -31.658,96 Institutional B Shares -1.911,54 -10.302,33 K. Other expenses (-) -74.669,80 -113.614,99
Income and expenditure for the period Subtotal II + III + IV -687.039,19 -792.995,35
V. Profit (loss) on ordinary activities before tax 8.625.923,44 4.699.281,89
VII. Result for the period 8.625.923,44 4.699.281,89
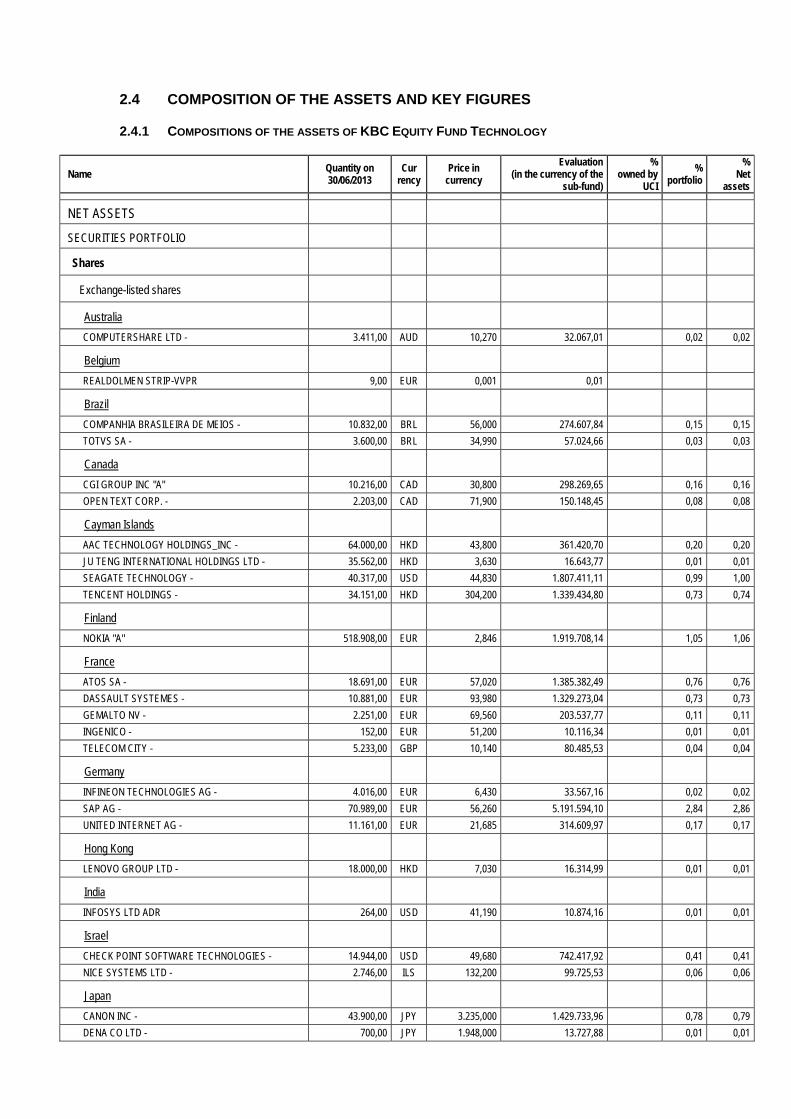
2.4 COMPOSITION OF THE ASSETS AND KEY FIGURES
2.4.1 COMPOSITIONS OF THE ASSETS OF KBC EQUITY FUND TECHNOLOGY
Name Quantity on 30/06/2013
Cur rency
Price in currency
Evaluation (in the currency of the
sub-fund)
% owned by
UCI
% portfolio
% Net
assets
NET ASSETS
SECURITIES PORTFOLIO
Shares
Exchange-listed shares
Australia
COMPUTERSHARE LTD - 3.411,00 AUD 10,270 32.067,01 0,02 0,02
Belgium
REALDOLMEN STRIP-VVPR 9,00 EUR 0,001 0,01
Brazil
COMPANHIA BRASILEIRA DE MEIOS - 10.832,00 BRL 56,000 274.607,84 0,15 0,15
TOTVS SA - 3.600,00 BRL 34,990 57.024,66 0,03 0,03
Canada
CGI GROUP INC "A" 10.216,00 CAD 30,800 298.269,65 0,16 0,16
OPEN TEXT CORP. - 2.203,00 CAD 71,900 150.148,45 0,08 0,08
Cayman Islands
AAC TECHNOLOGY HOLDINGS_INC - 64.000,00 HKD 43,800 361.420,70 0,20 0,20
JU TENG INTERNATIONAL HOLDINGS LTD - 35.562,00 HKD 3,630 16.643,77 0,01 0,01
SEAGATE TECHNOLOGY - 40.317,00 USD 44,830 1.807.411,11 0,99 1,00
TENCENT HOLDINGS - 34.151,00 HKD 304,200 1.339.434,80 0,73 0,74
Finland
NOKIA "A" 518.908,00 EUR 2,846 1.919.708,14 1,05 1,06
France
ATOS SA - 18.691,00 EUR 57,020 1.385.382,49 0,76 0,76
DASSAULT SYSTEMES - 10.881,00 EUR 93,980 1.329.273,04 0,73 0,73
GEMALTO NV - 2.251,00 EUR 69,560 203.537,77 0,11 0,11
INGENICO - 152,00 EUR 51,200 10.116,34 0,01 0,01
TELECOM CITY - 5.233,00 GBP 10,140 80.485,53 0,04 0,04
Germany
INFINEON TECHNOLOGIES AG - 4.016,00 EUR 6,430 33.567,16 0,02 0,02
SAP AG - 70.989,00 EUR 56,260 5.191.594,10 2,84 2,86
UNITED INTERNET AG - 11.161,00 EUR 21,685 314.609,97 0,17 0,17
Hong Kong
LENOVO GROUP LTD - 18.000,00 HKD 7,030 16.314,99 0,01 0,01
India
INFOSYS LTD ADR 264,00 USD 41,190 10.874,16 0,01 0,01
Israel
CHECK POINT SOFTWARE TECHNOLOGIES - 14.944,00 USD 49,680 742.417,92 0,41 0,41
NICE SYSTEMS LTD - 2.746,00 ILS 132,200 99.725,53 0,06 0,06
Japan
CANON INC - 43.900,00 JPY 3.235,000 1.429.733,96 0,78 0,79
DENA CO LTD - 700,00 JPY 1.948,000 13.727,88 0,01 0,01
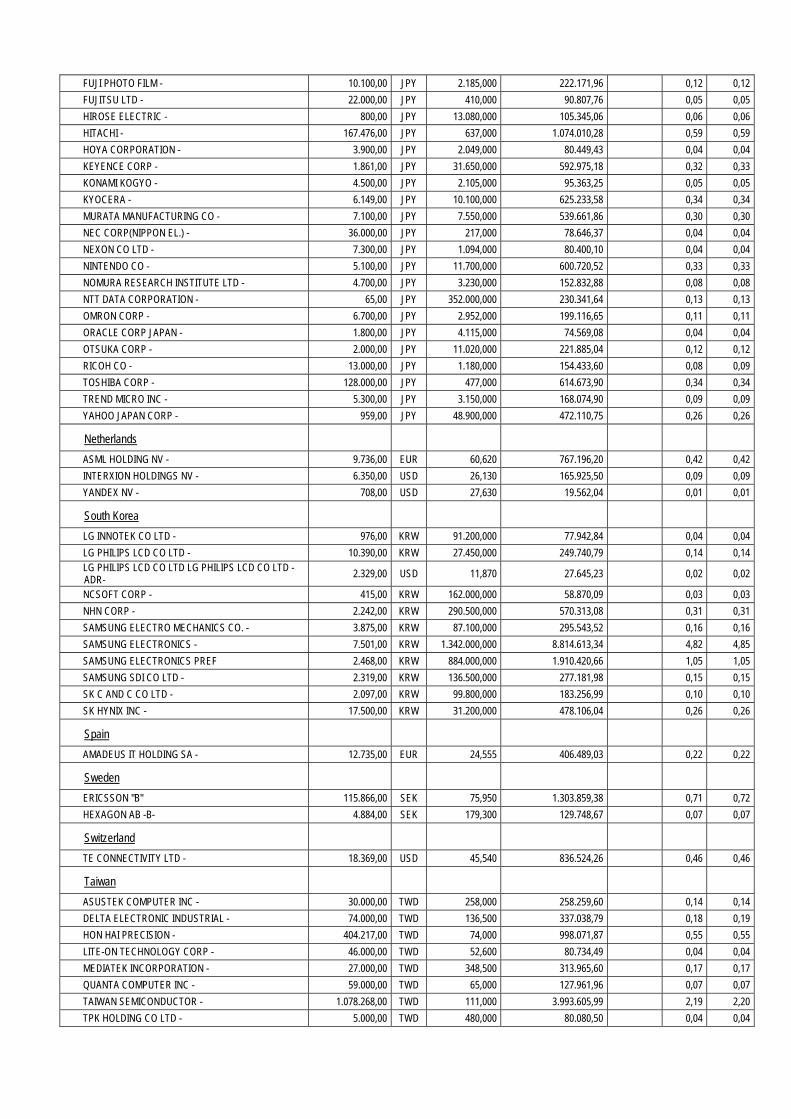
FUJI PHOTO FILM - 10.100,00 JPY 2.185,000 222.171,96 0,12 0,12
FUJITSU LTD - 22.000,00 JPY 410,000 90.807,76 0,05 0,05
HIROSE ELECTRIC - 800,00 JPY 13.080,000 105.345,06 0,06 0,06
HITACHI - 167.476,00 JPY 637,000 1.074.010,28 0,59 0,59
HOYA CORPORATION - 3.900,00 JPY 2.049,000 80.449,43 0,04 0,04
KEYENCE CORP - 1.861,00 JPY 31.650,000 592.975,18 0,32 0,33
KONAMI KOGYO - 4.500,00 JPY 2.105,000 95.363,25 0,05 0,05
KYOCERA - 6.149,00 JPY 10.100,000 625.233,58 0,34 0,34
MURATA MANUFACTURING CO - 7.100,00 JPY 7.550,000 539.661,86 0,30 0,30
NEC CORP(NIPPON EL.) - 36.000,00 JPY 217,000 78.646,37 0,04 0,04
NEXON CO LTD - 7.300,00 JPY 1.094,000 80.400,10 0,04 0,04
NINTENDO CO - 5.100,00 JPY 11.700,000 600.720,52 0,33 0,33
NOMURA RESEARCH INSTITUTE LTD - 4.700,00 JPY 3.230,000 152.832,88 0,08 0,08
NTT DATA CORPORATION - 65,00 JPY 352.000,000 230.341,64 0,13 0,13
OMRON CORP - 6.700,00 JPY 2.952,000 199.116,65 0,11 0,11
ORACLE CORP JAPAN - 1.800,00 JPY 4.115,000 74.569,08 0,04 0,04
OTSUKA CORP - 2.000,00 JPY 11.020,000 221.885,04 0,12 0,12
RICOH CO - 13.000,00 JPY 1.180,000 154.433,60 0,08 0,09
TOSHIBA CORP - 128.000,00 JPY 477,000 614.673,90 0,34 0,34
TREND MICRO INC - 5.300,00 JPY 3.150,000 168.074,90 0,09 0,09
YAHOO JAPAN CORP - 959,00 JPY 48.900,000 472.110,75 0,26 0,26
Netherlands
ASML HOLDING NV - 9.736,00 EUR 60,620 767.196,20 0,42 0,42
INTERXION HOLDINGS NV - 6.350,00 USD 26,130 165.925,50 0,09 0,09
YANDEX NV - 708,00 USD 27,630 19.562,04 0,01 0,01
South Korea
LG INNOTEK CO LTD - 976,00 KRW 91.200,000 77.942,84 0,04 0,04
LG PHILIPS LCD CO LTD - 10.390,00 KRW 27.450,000 249.740,79 0,14 0,14 LG PHILIPS LCD CO LTD LG PHILIPS LCD CO LTD -ADR-
2.329,00 USD 11,870 27.645,23 0,02 0,02
NCSOFT CORP - 415,00 KRW 162.000,000 58.870,09 0,03 0,03
NHN CORP - 2.242,00 KRW 290.500,000 570.313,08 0,31 0,31
SAMSUNG ELECTRO MECHANICS CO. - 3.875,00 KRW 87.100,000 295.543,52 0,16 0,16
SAMSUNG ELECTRONICS - 7.501,00 KRW 1.342.000,000 8.814.613,34 4,82 4,85
SAMSUNG ELECTRONICS PREF 2.468,00 KRW 884.000,000 1.910.420,66 1,05 1,05
SAMSUNG SDI CO LTD - 2.319,00 KRW 136.500,000 277.181,98 0,15 0,15
SK C AND C CO LTD - 2.097,00 KRW 99.800,000 183.256,99 0,10 0,10
SK HYNIX INC - 17.500,00 KRW 31.200,000 478.106,04 0,26 0,26
Spain
AMADEUS IT HOLDING SA - 12.735,00 EUR 24,555 406.489,03 0,22 0,22
Sweden
ERICSSON "B" 115.866,00 SEK 75,950 1.303.859,38 0,71 0,72
HEXAGON AB -B- 4.884,00 SEK 179,300 129.748,67 0,07 0,07
Switzerland
TE CONNECTIVITY LTD - 18.369,00 USD 45,540 836.524,26 0,46 0,46
Taiwan
ASUSTEK COMPUTER INC - 30.000,00 TWD 258,000 258.259,60 0,14 0,14
DELTA ELECTRONIC INDUSTRIAL - 74.000,00 TWD 136,500 337.038,79 0,18 0,19
HON HAI PRECISION - 404.217,00 TWD 74,000 998.071,87 0,55 0,55
LITE-ON TECHNOLOGY CORP - 46.000,00 TWD 52,600 80.734,49 0,04 0,04
MEDIATEK INCORPORATION - 27.000,00 TWD 348,500 313.965,60 0,17 0,17
QUANTA COMPUTER INC - 59.000,00 TWD 65,000 127.961,96 0,07 0,07
TAIWAN SEMICONDUCTOR - 1.078.268,00 TWD 111,000 3.993.605,99 2,19 2,20
TPK HOLDING CO LTD - 5.000,00 TWD 480,000 80.080,50 0,04 0,04
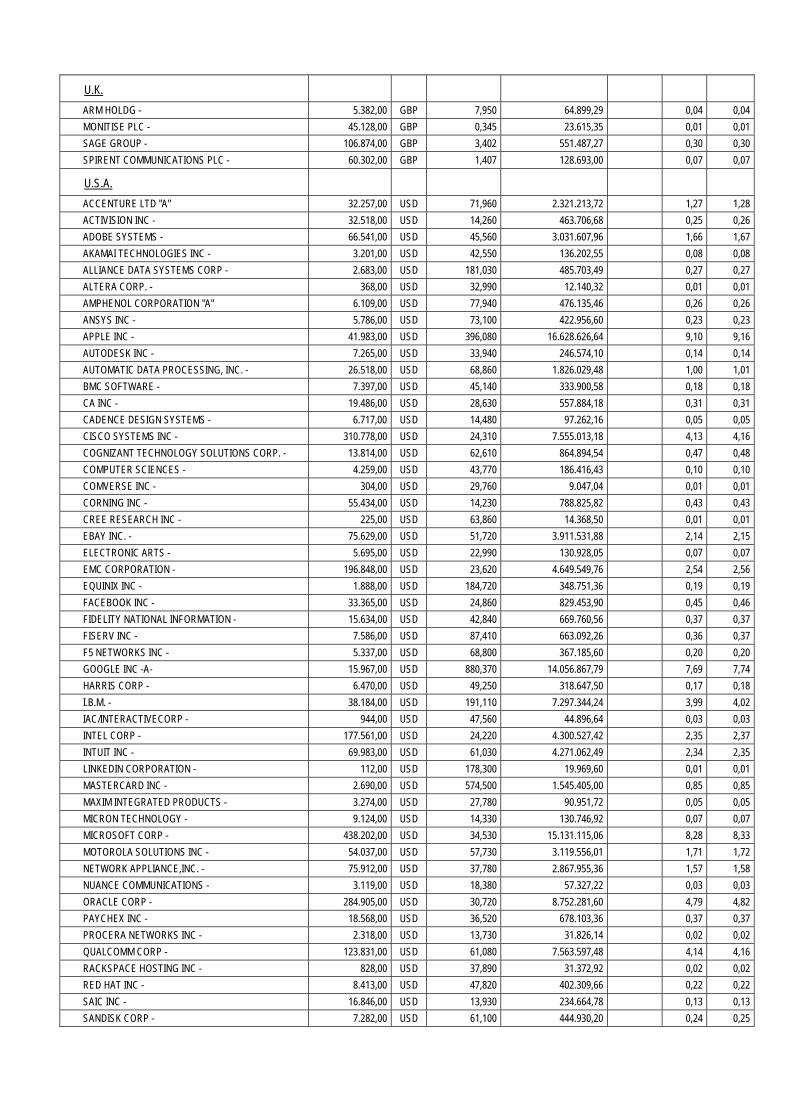
U.K.
ARM HOLDG - 5.382,00 GBP 7,950 64.899,29 0,04 0,04
MONITISE PLC - 45.128,00 GBP 0,345 23.615,35 0,01 0,01
SAGE GROUP - 106.874,00 GBP 3,402 551.487,27 0,30 0,30
SPIRENT COMMUNICATIONS PLC - 60.302,00 GBP 1,407 128.693,00 0,07 0,07
U.S.A.
ACCENTURE LTD "A" 32.257,00 USD 71,960 2.321.213,72 1,27 1,28
ACTIVISION INC - 32.518,00 USD 14,260 463.706,68 0,25 0,26
ADOBE SYSTEMS - 66.541,00 USD 45,560 3.031.607,96 1,66 1,67
AKAMAI TECHNOLOGIES INC - 3.201,00 USD 42,550 136.202,55 0,08 0,08
ALLIANCE DATA SYSTEMS CORP - 2.683,00 USD 181,030 485.703,49 0,27 0,27
ALTERA CORP. - 368,00 USD 32,990 12.140,32 0,01 0,01
AMPHENOL CORPORATION "A" 6.109,00 USD 77,940 476.135,46 0,26 0,26
ANSYS INC - 5.786,00 USD 73,100 422.956,60 0,23 0,23
APPLE INC - 41.983,00 USD 396,080 16.628.626,64 9,10 9,16
AUTODESK INC - 7.265,00 USD 33,940 246.574,10 0,14 0,14
AUTOMATIC DATA PROCESSING, INC. - 26.518,00 USD 68,860 1.826.029,48 1,00 1,01
BMC SOFTWARE - 7.397,00 USD 45,140 333.900,58 0,18 0,18
CA INC - 19.486,00 USD 28,630 557.884,18 0,31 0,31
CADENCE DESIGN SYSTEMS - 6.717,00 USD 14,480 97.262,16 0,05 0,05
CISCO SYSTEMS INC - 310.778,00 USD 24,310 7.555.013,18 4,13 4,16
COGNIZANT TECHNOLOGY SOLUTIONS CORP. - 13.814,00 USD 62,610 864.894,54 0,47 0,48
COMPUTER SCIENCES - 4.259,00 USD 43,770 186.416,43 0,10 0,10
COMVERSE INC - 304,00 USD 29,760 9.047,04 0,01 0,01
CORNING INC - 55.434,00 USD 14,230 788.825,82 0,43 0,43
CREE RESEARCH INC - 225,00 USD 63,860 14.368,50 0,01 0,01
EBAY INC. - 75.629,00 USD 51,720 3.911.531,88 2,14 2,15
ELECTRONIC ARTS - 5.695,00 USD 22,990 130.928,05 0,07 0,07
EMC CORPORATION - 196.848,00 USD 23,620 4.649.549,76 2,54 2,56
EQUINIX INC - 1.888,00 USD 184,720 348.751,36 0,19 0,19
FACEBOOK INC - 33.365,00 USD 24,860 829.453,90 0,45 0,46
FIDELITY NATIONAL INFORMATION - 15.634,00 USD 42,840 669.760,56 0,37 0,37
FISERV INC - 7.586,00 USD 87,410 663.092,26 0,36 0,37
F5 NETWORKS INC - 5.337,00 USD 68,800 367.185,60 0,20 0,20
GOOGLE INC -A- 15.967,00 USD 880,370 14.056.867,79 7,69 7,74
HARRIS CORP - 6.470,00 USD 49,250 318.647,50 0,17 0,18
I.B.M. - 38.184,00 USD 191,110 7.297.344,24 3,99 4,02
IAC/INTERACTIVECORP - 944,00 USD 47,560 44.896,64 0,03 0,03
INTEL CORP - 177.561,00 USD 24,220 4.300.527,42 2,35 2,37
INTUIT INC - 69.983,00 USD 61,030 4.271.062,49 2,34 2,35
LINKEDIN CORPORATION - 112,00 USD 178,300 19.969,60 0,01 0,01
MASTERCARD INC - 2.690,00 USD 574,500 1.545.405,00 0,85 0,85
MAXIM INTEGRATED PRODUCTS - 3.274,00 USD 27,780 90.951,72 0,05 0,05
MICRON TECHNOLOGY - 9.124,00 USD 14,330 130.746,92 0,07 0,07
MICROSOFT CORP - 438.202,00 USD 34,530 15.131.115,06 8,28 8,33
MOTOROLA SOLUTIONS INC - 54.037,00 USD 57,730 3.119.556,01 1,71 1,72
NETWORK APPLIANCE,INC. - 75.912,00 USD 37,780 2.867.955,36 1,57 1,58
NUANCE COMMUNICATIONS - 3.119,00 USD 18,380 57.327,22 0,03 0,03
ORACLE CORP - 284.905,00 USD 30,720 8.752.281,60 4,79 4,82
PAYCHEX INC - 18.568,00 USD 36,520 678.103,36 0,37 0,37
PROCERA NETWORKS INC - 2.318,00 USD 13,730 31.826,14 0,02 0,02
QUALCOMM CORP - 123.831,00 USD 61,080 7.563.597,48 4,14 4,16
RACKSPACE HOSTING INC - 828,00 USD 37,890 31.372,92 0,02 0,02
RED HAT INC - 8.413,00 USD 47,820 402.309,66 0,22 0,22
SAIC INC - 16.846,00 USD 13,930 234.664,78 0,13 0,13
SANDISK CORP - 7.282,00 USD 61,100 444.930,20 0,24 0,25
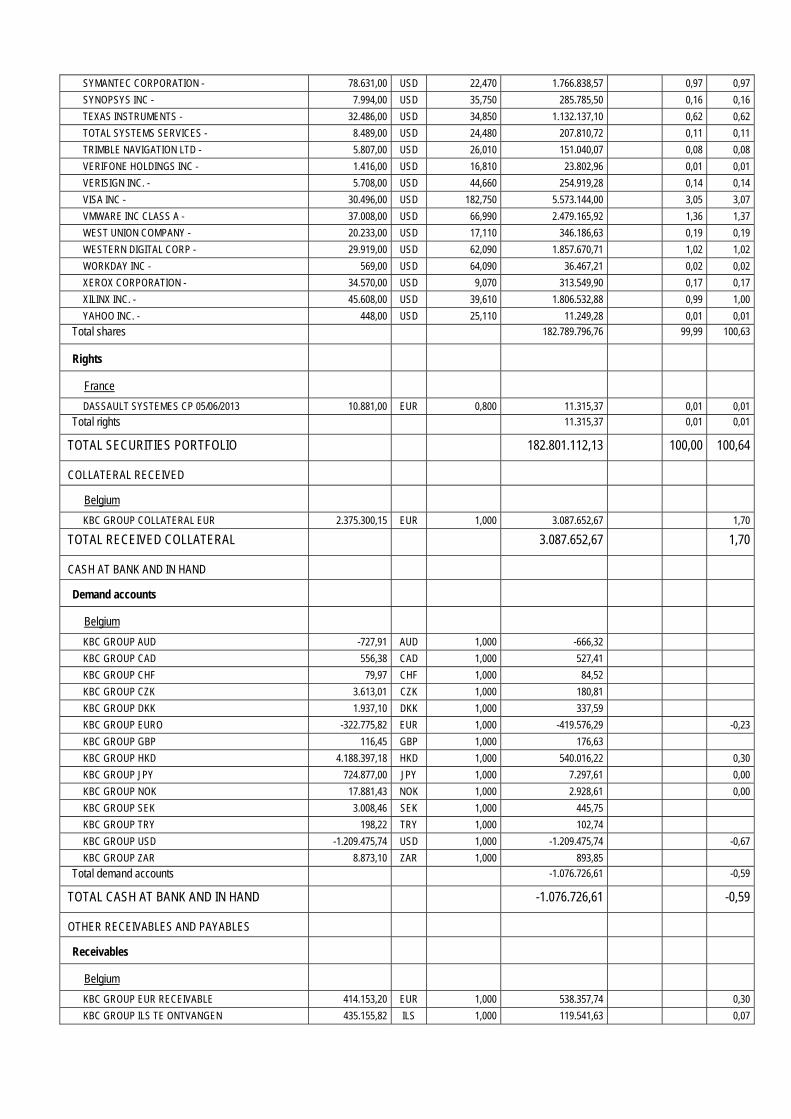
SYMANTEC CORPORATION - 78.631,00 USD 22,470 1.766.838,57 0,97 0,97
SYNOPSYS INC - 7.994,00 USD 35,750 285.785,50 0,16 0,16
TEXAS INSTRUMENTS - 32.486,00 USD 34,850 1.132.137,10 0,62 0,62
TOTAL SYSTEMS SERVICES - 8.489,00 USD 24,480 207.810,72 0,11 0,11
TRIMBLE NAVIGATION LTD - 5.807,00 USD 26,010 151.040,07 0,08 0,08
VERIFONE HOLDINGS INC - 1.416,00 USD 16,810 23.802,96 0,01 0,01
VERISIGN INC. - 5.708,00 USD 44,660 254.919,28 0,14 0,14
VISA INC - 30.496,00 USD 182,750 5.573.144,00 3,05 3,07
VMWARE INC CLASS A - 37.008,00 USD 66,990 2.479.165,92 1,36 1,37
WEST UNION COMPANY - 20.233,00 USD 17,110 346.186,63 0,19 0,19
WESTERN DIGITAL CORP - 29.919,00 USD 62,090 1.857.670,71 1,02 1,02
WORKDAY INC - 569,00 USD 64,090 36.467,21 0,02 0,02
XEROX CORPORATION - 34.570,00 USD 9,070 313.549,90 0,17 0,17
XILINX INC. - 45.608,00 USD 39,610 1.806.532,88 0,99 1,00
YAHOO INC. - 448,00 USD 25,110 11.249,28 0,01 0,01
Total shares 182.789.796,76 99,99 100,63
Rights
France
DASSAULT SYSTEMES CP 05/06/2013 10.881,00 EUR 0,800 11.315,37 0,01 0,01
Total rights 11.315,37 0,01 0,01
TOTAL SECURITIES PORTFOLIO 182.801.112,13 100,00 100,64
COLLATERAL RECEIVED
Belgium
KBC GROUP COLLATERAL EUR 2.375.300,15 EUR 1,000 3.087.652,67 1,70
TOTAL RECEIVED COLLATERAL 3.087.652,67 1,70
CASH AT BANK AND IN HAND
Demand accounts
Belgium
KBC GROUP AUD -727,91 AUD 1,000 -666,32
KBC GROUP CAD 556,38 CAD 1,000 527,41
KBC GROUP CHF 79,97 CHF 1,000 84,52
KBC GROUP CZK 3.613,01 CZK 1,000 180,81
KBC GROUP DKK 1.937,10 DKK 1,000 337,59
KBC GROUP EURO -322.775,82 EUR 1,000 -419.576,29 -0,23
KBC GROUP GBP 116,45 GBP 1,000 176,63
KBC GROUP HKD 4.188.397,18 HKD 1,000 540.016,22 0,30
KBC GROUP JPY 724.877,00 JPY 1,000 7.297,61 0,00
KBC GROUP NOK 17.881,43 NOK 1,000 2.928,61 0,00
KBC GROUP SEK 3.008,46 SEK 1,000 445,75
KBC GROUP TRY 198,22 TRY 1,000 102,74
KBC GROUP USD -1.209.475,74 USD 1,000 -1.209.475,74 -0,67
KBC GROUP ZAR 8.873,10 ZAR 1,000 893,85
Total demand accounts -1.076.726,61 -0,59
TOTAL CASH AT BANK AND IN HAND -1.076.726,61 -0,59
OTHER RECEIVABLES AND PAYABLES
Receivables
Belgium
KBC GROUP EUR RECEIVABLE 414.153,20 EUR 1,000 538.357,74 0,30
KBC GROUP ILS TE ONTVANGEN 435.155,82 ILS 1,000 119.541,63 0,07
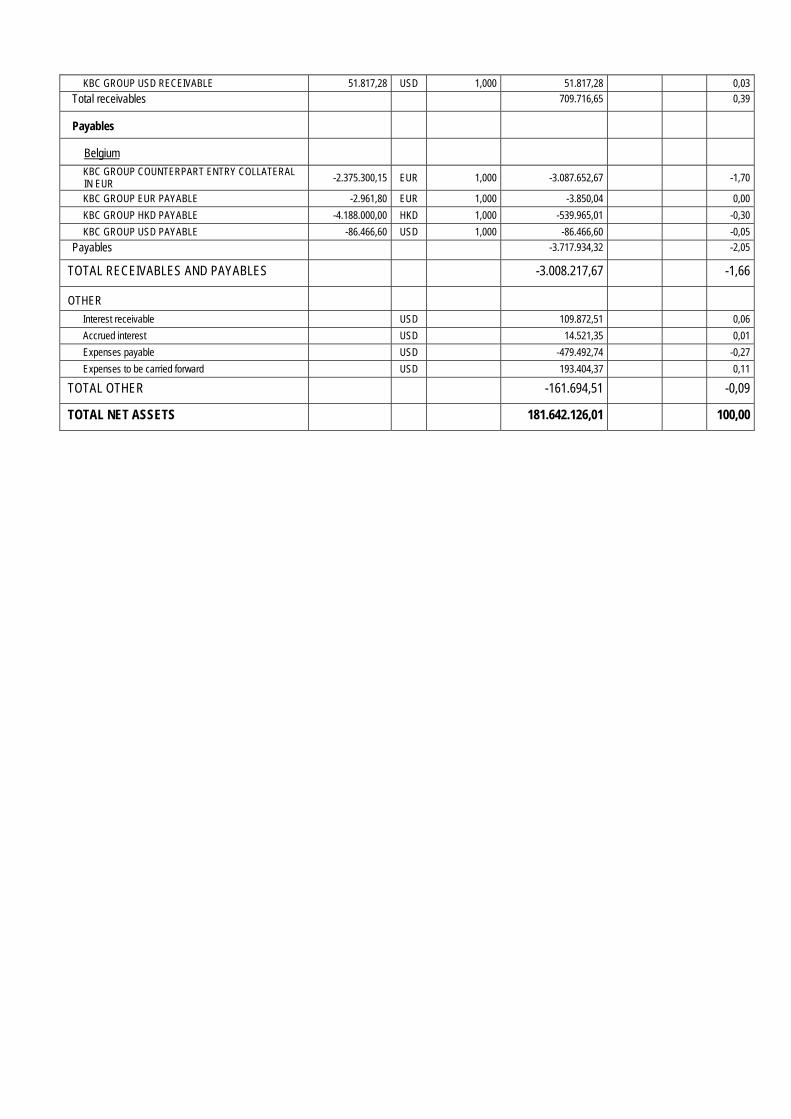
KBC GROUP USD RECEIVABLE 51.817,28 USD 1,000 51.817,28 0,03
Total receivables 709.716,65 0,39
Payables
Belgium
KBC GROUP COUNTERPART ENTRY COLLATERAL IN EUR -2.375.300,15 EUR 1,000 -3.087.652,67 -1,70
KBC GROUP EUR PAYABLE -2.961,80 EUR 1,000 -3.850,04 0,00
KBC GROUP HKD PAYABLE -4.188.000,00 HKD 1,000 -539.965,01 -0,30
KBC GROUP USD PAYABLE -86.466,60 USD 1,000 -86.466,60 -0,05
Payables -3.717.934,32 -2,05
TOTAL RECEIVABLES AND PAYABLES -3.008.217,67 -1,66
OTHER
Interest receivable USD 109.872,51 0,06
Accrued interest USD 14.521,35 0,01
Expenses payable USD -479.492,74 -0,27
Expenses to be carried forward USD 193.404,37 0,11
TOTAL OTHER -161.694,51 -0,09
TOTAL NET ASSETS 181.642.126,01 100,00
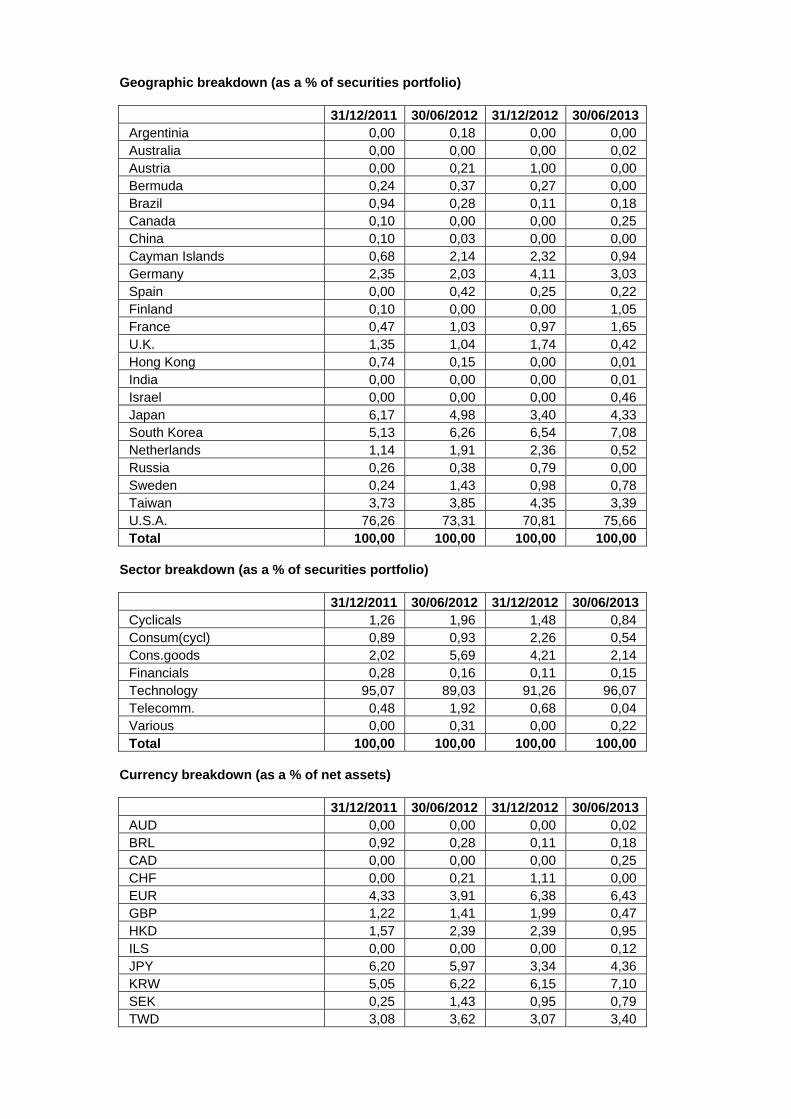
Geographic breakdown (as a % of securities portfolio)
31/12/2011 30/06/2012 31/12/2012 30/06/2013 Argentinia 0,00 0,18 0,00 0,00 Australia 0,00 0,00 0,00 0,02 Austria 0,00 0,21 1,00 0,00 Bermuda 0,24 0,37 0,27 0,00 Brazil 0,94 0,28 0,11 0,18 Canada 0,10 0,00 0,00 0,25 China 0,10 0,03 0,00 0,00 Cayman Islands 0,68 2,14 2,32 0,94 Germany 2,35 2,03 4,11 3,03 Spain 0,00 0,42 0,25 0,22 Finland 0,10 0,00 0,00 1,05 France 0,47 1,03 0,97 1,65 U.K. 1,35 1,04 1,74 0,42 Hong Kong 0,74 0,15 0,00 0,01 India 0,00 0,00 0,00 0,01 Israel 0,00 0,00 0,00 0,46 Japan 6,17 4,98 3,40 4,33 South Korea 5,13 6,26 6,54 7,08 Netherlands 1,14 1,91 2,36 0,52 Russia 0,26 0,38 0,79 0,00 Sweden 0,24 1,43 0,98 0,78 Taiwan 3,73 3,85 4,35 3,39 U.S.A. 76,26 73,31 70,81 75,66 Total 100,00 100,00 100,00 100,00
Sector breakdown (as a % of securities portfolio)
31/12/2011 30/06/2012 31/12/2012 30/06/2013 Cyclicals 1,26 1,96 1,48 0,84 Consum(cycl) 0,89 0,93 2,26 0,54 Cons.goods 2,02 5,69 4,21 2,14 Financials 0,28 0,16 0,11 0,15 Technology 95,07 89,03 91,26 96,07 Telecomm. 0,48 1,92 0,68 0,04 Various 0,00 0,31 0,00 0,22 Total 100,00 100,00 100,00 100,00
Currency breakdown (as a % of net assets)
31/12/2011 30/06/2012 31/12/2012 30/06/2013 AUD 0,00 0,00 0,00 0,02 BRL 0,92 0,28 0,11 0,18 CAD 0,00 0,00 0,00 0,25 CHF 0,00 0,21 1,11 0,00 EUR 4,33 3,91 6,38 6,43 GBP 1,22 1,41 1,99 0,47 HKD 1,57 2,39 2,39 0,95 ILS 0,00 0,00 0,00 0,12 JPY 6,20 5,97 3,34 4,36 KRW 5,05 6,22 6,15 7,10 SEK 0,25 1,43 0,95 0,79 TWD 3,08 3,62 3,07 3,40
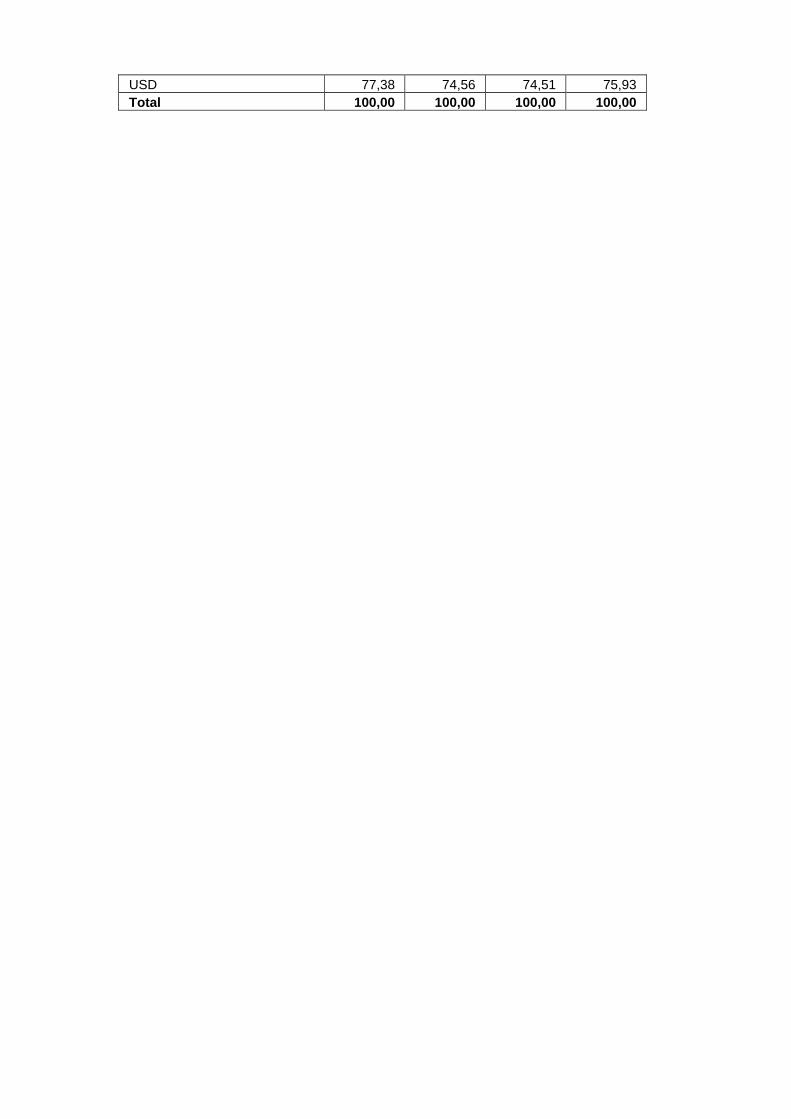
USD 77,38 74,56 74,51 75,93 Total 100,00 100,00 100,00 100,00

2.4.2 CHANGES IN THE COMPOSITION OF THE ASSETS OF KBC EQUITY FUND TECHNOLOGY (IN
THE CURRENCY OF THE SUB-FUND)
1st half of year YearPurchases 161.599.153,87 161.599.153,87 Sales 421.939.122,11 421.939.122,11 Total 1 583.538.275,98 583.538.275,98 Subscriptions 170.278.817,47 170.278.817,47 Redemptions 444.999.388,05 444.999.388,05 Total 2 615.278.205,52 615.278.205,52 Monthly average of total assets
353.734.304,56 353.734.304,56
Turnover rate -8,97 % -8,97 %
1st half of year YearPurchases 161.599.153,87 161.599.153,87 Sales 421.939.122,11 421.939.122,11 Total 1 583.538.275,98 583.538.275,98 Subscriptions 170.278.817,47 170.278.817,47 Redemptions 444.999.388,05 444.999.388,05 Total 2 615.278.205,52 615.278.205,52 Monthly average of total assets
316.576.197,26 316.576.197,26
Corrected turnover rate -10,03 % -10,03 %
The table above shows the capital volume of portfolio transactions. This volume (adjusted to take account of total subscriptions and redemptions) is also compared to the average net assets at the beginning and end of the period. A figure close to 0% implies that the transactions relating to the securities or transactions relating to the assets (excluding deposits and cash) in a given period only involve subscriptions and redemptions. A negative percentage shows that subscriptions and redemptions entailed few, if any, transactions in the portfolio. Active asset management may result in high turnover rates (monthly percentage >50%). The detailed list of transactions is available for consultation free of charge at the registered office of the Bevek or fund at Havenlaan 2, 1080 Brussels.
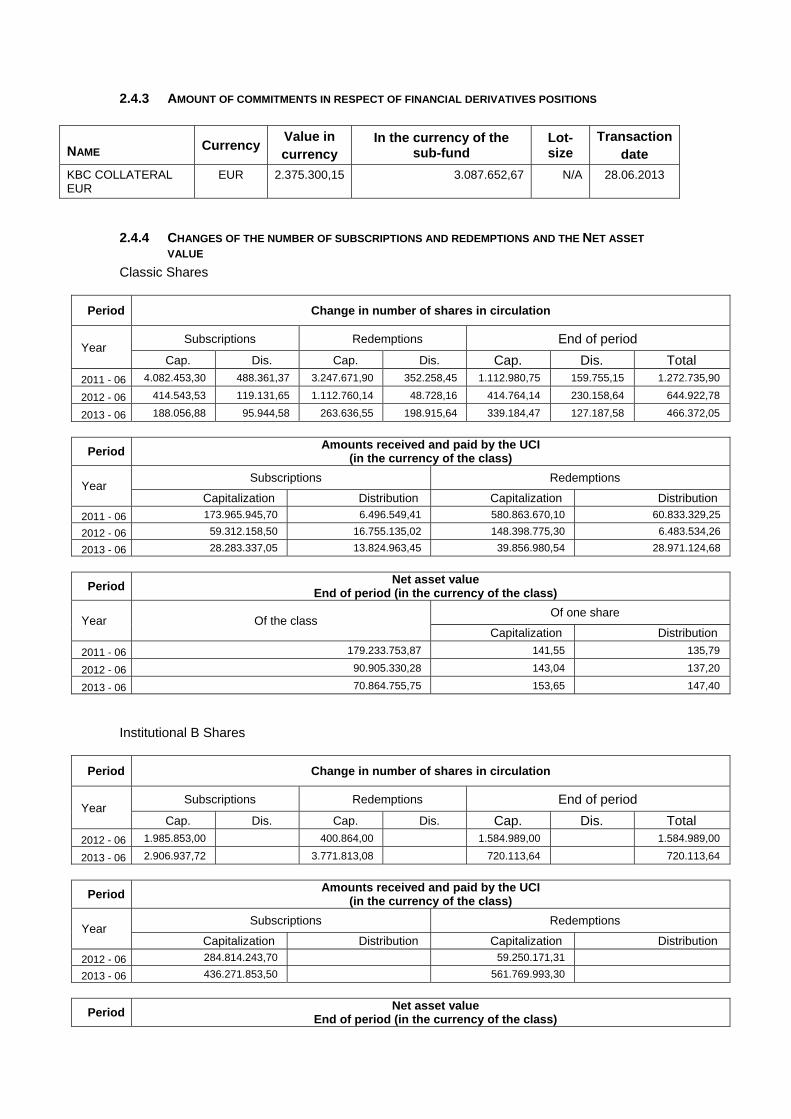
2.4.3 AMOUNT OF COMMITMENTS IN RESPECT OF FINANCIAL DERIVATIVES POSITIONS
NAME Currency Value in currency
In the currency of the sub-fund
Lot-size
Transactiondate
KBC COLLATERAL EUR
EUR 2.375.300,15 3.087.652,67 N/A 28.06.2013
2.4.4 CHANGES OF THE NUMBER OF SUBSCRIPTIONS AND REDEMPTIONS AND THE NET ASSET
VALUE
Classic Shares
Period Change in number of shares in circulation
Year Subscriptions Redemptions End of period
Cap. Dis. Cap. Dis. Cap. Dis. Total
2011 - 06 4.082.453,30 488.361,37 3.247.671,90 352.258,45 1.112.980,75 159.755,15 1.272.735,90
2012 - 06 414.543,53 119.131,65 1.112.760,14 48.728,16 414.764,14 230.158,64 644.922,78
2013 - 06 188.056,88 95.944,58 263.636,55 198.915,64 339.184,47 127.187,58 466.372,05
Period Amounts received and paid by the UCI
(in the currency of the class)
Year Subscriptions Redemptions
Capitalization Distribution Capitalization Distribution
2011 - 06 173.965.945,70 6.496.549,41 580.863.670,10 60.833.329,25
2012 - 06 59.312.158,50 16.755.135,02 148.398.775,30 6.483.534,26
2013 - 06 28.283.337,05 13.824.963,45 39.856.980,54 28.971.124,68
Period Net asset value
End of period (in the currency of the class)
Year Of the class Of one share
Capitalization Distribution
2011 - 06 179.233.753,87 141,55 135,79
2012 - 06 90.905.330,28 143,04 137,20
2013 - 06 70.864.755,75 153,65 147,40
Institutional B Shares
Period Change in number of shares in circulation
Year Subscriptions Redemptions End of period
Cap. Dis. Cap. Dis. Cap. Dis. Total 2012 - 06 1.985.853,00 400.864,00 1.584.989,00 1.584.989,00
2013 - 06 2.906.937,72 3.771.813,08 720.113,64 720.113,64
Period Amounts received and paid by the UCI
(in the currency of the class)
Year Subscriptions Redemptions
Capitalization Distribution Capitalization Distribution
2012 - 06 284.814.243,70 59.250.171,31
2013 - 06 436.271.853,50 561.769.993,30
Period Net asset value
End of period (in the currency of the class)

Year Of the class Of one share
Capitalization Distribution
2012 - 06 226.902.177,10 143,16
2013 - 06 110.777.370,30 153,83
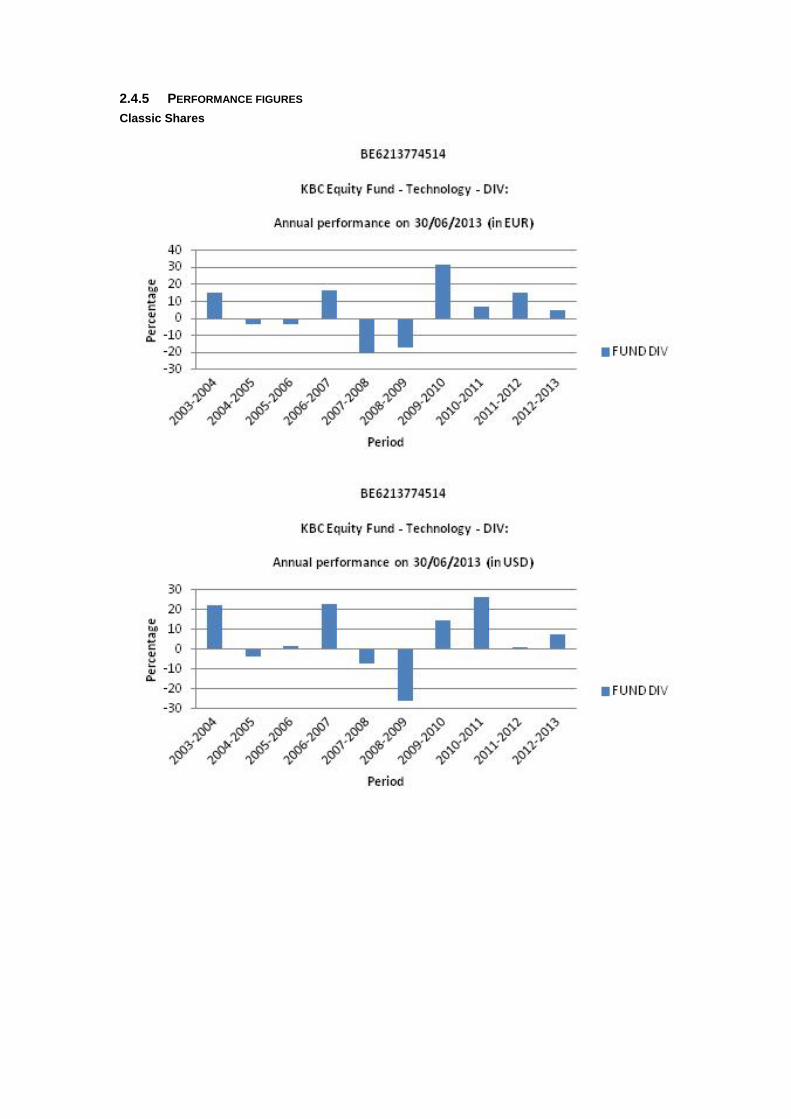
2.4.5 PERFORMANCE FIGURES
Classic Shares
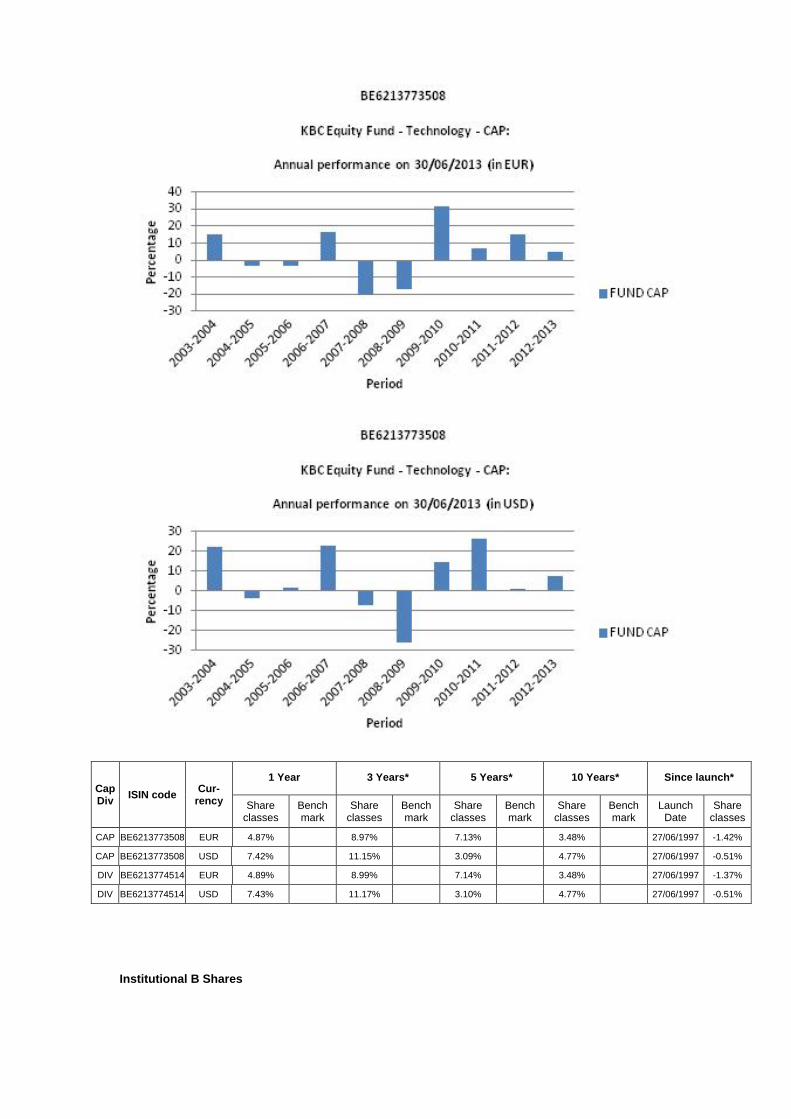
Cap Div
ISIN code Cur-
rency
1 Year 3 Years* 5 Years* 10 Years* Since launch*
Share classes
Bench mark
Share classes
Bench mark
Share classes
Bench mark
Share classes
Bench mark
Launch Date
Share classes
CAP BE6213773508 EUR 4.87% 8.97% 7.13% 3.48% 27/06/1997 -1.42%
CAP BE6213773508 USD 7.42% 11.15% 3.09% 4.77% 27/06/1997 -0.51%
DIV BE6213774514 EUR 4.89% 8.99% 7.14% 3.48% 27/06/1997 -1.37%
DIV BE6213774514 USD 7.43% 11.17% 3.10% 4.77% 27/06/1997 -0.51%
Institutional B Shares

Cap Div
ISIN code Cur-
rency
1 Year 3 Years* 5 Years* 10 Years* Since launch*
Share classes
Bench mark
Share classes
Bench mark
Share classes
Bench mark
Share classes
Bench mark
Launch Date
Share classes
CAP BE6228907521 EUR 4.91% 25/11/2011 14.48%
CAP BE6228907521 USD 7.45% 25/11/2011 12.76%
Risk warning: Past performance is not a guide to future performance. * Return on annual basis.
Classic Shares The bar chart shows the performance for full financial years. The figures do not take account of any restructuring.

Calculated in USD and in EUR. The return is calculated as the change in the net asset value between two dates expressed
as a percentage. In the case of units that pay dividends, the dividend is incorporated geometrically in the return.
Calculation method for date D, where NAV stands for net asset value: Capitalisation units (CAP) Return on date D over a period of X years:
[NIW(D) / NIW(Y)] ^ [1 / X] - 1 where Y = D-X
Return on date D since the start date S of the unit: [NIW(D) / NIW(S)] ^ [1 / F] - 1 where F = 1 if the unit has existed for less than one year on date D where F = (D-S) / 365.25 if the unit has existed for longer than one year on date D
Distribution units (DIV) Return on date D over a period of X years:
[ C * NIW(D) / NIW(Y)] ^ [1 / X] - 1 where Y = D-X
Return on date D since the start date S of the unit: [ C * NIW(D) / NIW(S)] ^ [1 / F] - 1 where F = 1 if the unit has existed for less than one year on date D where F = (D-S) / 365.25 if the unit has existed for longer than one year on date D where C is a factor that is determined for all N dividends between the calculation date D and the reference date.
For dividend i on date Di with value Wi: Ci = [Wi / NIW(Di)] + 1 i = 1 ... N from whichC = C0 * .... * CN.
If the interval between the two dates exceeds one year, the ordinary return calculation is converted into a return on an annual basis by taking the nth square root of 1 plus the total return of the unit.
The return figures shown above do not take account of the fees and charges associated with the issue and redemption of units.
These are the performance figures for capitalisation and distribution shares.
Institutional B Shares The bar chart shows the performance for full financial years. The figures do not take account of any restructuring. Calculated in USD and in EUR. The return is calculated as the change in the net asset value between two dates expressed
as a percentage. Calculation method for date D, where NAV stands for net asset value:
Capitalisation units (CAP) Return on date D over a period of X years:
[NIW(D) / NIW(Y)] ^ [1 / X] - 1 where Y = D-X
Return on date D since the start date S of the unit: [NIW(D) / NIW(S)] ^ [1 / F] - 1 where F = 1 if the unit has existed for less than one year on date D where F = (D-S) / 365.25 if the unit has existed for longer than one year on date D
If the interval between the two dates exceeds one year, the ordinary return calculation is converted into a return on an annual basis by taking the nth square root of 1 plus the total return of the unit.
The return figures shown above do not take account of the fees and charges associated with the issue and redemption of units.
These are the performance figures for capitalization shares.
2.4.6 COSTS Ongoing Charges: * Classic Shares Distribution: 1.725% Classic Shares Capitalization: 1.74% Institutional B Shares Capitalization: 1.697% * The following costs have not been included in the ongoing charges: - Interest payments on loans taken out - Payments in respect of financial derivatives - Fees and charges paid directly by the investor - Any soft commissions
SOFT COMMISSIONS The management company or the appointed manager, as the case may be, is the recipient of soft commissions. The recipient has laid down an internal policy as regards accepting soft commissions and avoiding possible conflicts of interest in this respect, and has put appropriate internal controls in place to ensure this policy is observed. For more information, please see the ‘General’ section of the annual report.
Broker
Commission gross
in EUR
paid during the period:
1‐01‐13
‐
30‐06‐13
CSA Credits
in EUR
accrued during the period:
1‐01‐13
‐
30‐06‐13 Percentage
CITI 63,291 39,876 63.00%
CSFBSAS 24,156 11,886 49.21%
DEUTSCHE 6,312 3,536 56.02%
EQ MACQUARIE 3,851 1,926 50.00%
HSBC 533 200 37.50%
INSTINET 77,388 53,205 68.75%
MERRILL 22,625 11,313 50.00%
MORGAN STANLEY 20,181 10,637 52.71%
UBSWDR 9,719 4,860 50.00%
FEE-SHARING AGREEMENTS AND REBATES: The management company may share its fee with the distributor, and institutional and/or professional parties. In principle, the percentage share amounts to between 35% and 60% if the distributor is an entity of KBC Group NV or to between 35% and 70% if the distributor is not an entity of KBC Group NV. However, in a small number of cases, the distributor’s fee is less than 35%. Investors may, on request, obtain more information on these cases. If the management company invests the assets of the undertaking for collective investment in units of undertakings for collective investment that are not managed by an entity of KBC Group NV, and receives a fee for doing so, it will pay this fee to the undertaking for collective investment. Fee-sharing does not affect the amount of the management fee paid by the sub-fund to the management company. This management fee is subject to the limitations laid down in the articles of association. The limitations may only be amended after approval by the general meeting of shareholders. The management company has concluded a distribution agreement with the distributor in order to facilitate the wider distribution of the sub-fund's units by using multiple distribution channels. It is in the interests of the holders of units, the sub-fund and of the distributor for the largest possible number of units to be sold and for the assets of the sub-fund to be maximised in this way. In this respect, there is therefore no question of any conflict of interest.
2.4.7 NOTES TO THE FINANCIAL STATEMENTS AND OTHER DATA Fee for managing the investment portfolio: 1.5% per annum calculated on the basis of the average total net assets of the sub-fund, no management fee is charged on assets assets invested in investment undertakings managed by a financial institution of the KBC group. The administration agent’s fee is payable at the end of each month and is calculated on the basis of the average total net assets of the sub-fund. Auditor's fee: 1 700 EUR per year. This fee is not including VAT and can be indexed on an annual basis in accordance with the decisions of the general meeting. The custody fee is calculated on the value of the securities held in custody by the custodian on the final banking day of the preceding calendar year, except on those assets invested in investment undertakings managed by a financial institution of the KBC group. The custody fee is paid at the beginning of the calendar year. Social, ethical and environmental aspects: No manufacturers of controversial weapons whose use over the past five decades, according to the international consensus, has led to disproportionate human suffering among the civilian population will be included in the portfolio of investments. This involves the manufacturers of anti-personnel mines, cluster bombs and munitions and weapons containing depleted uranium. In this way, the sub-fund seeks to reflect not only simple financial reality but also the social reality of the sector or region in question. Exercising voting rights. If necessary, relevant and in the interest of the shareholders, the management company will exercise the voting rights attached to the shares in the Bevek’s portfolio. The management company will adhere to the following criteria when determining how it stands relative to the items on the agenda that are put to the vote: - Shareholder value may not be adversely affected. - Corporate governance rules, especially with regard to the rights of minority shareholders, must be
respected. - The minimum standards with regard to sustainable business and corporate social responsibility
must be met. The list of companies for which voting rights are exercised is available at the registered office of the Bevek. Securities lending In accordance with the Royal Decree of 7 March 2006 concerning securities lending, the undertaking for collective investment has taken out securities loans with a principal to whom the full title of the loaned securities was transferred, without recording this transfer of ownership in the accounts. For the period from 1 January 2013 to 30 June 2013, the fee for securities lent comes to 33,647.79 USD. The undertaking for collective investment receives 50% of the fee received for securities lent. The detailed list of securities lending transactions carried out can be obtained from the registered office of the collective investment undertaking at 2 Havenlaan, 1080 Brussels.
Overview of securities lent as at 30/06/2013
Name Currency Quantity Price Value in currency of the
portfolio
DASSAULT SYSTEMES SA EUR 127 93,980 15.514,90
GEMALTO EUR 2.250 69,560 203.447,35
INGENICO EUR 149 51,200 9.916,68
LENOVO GROUP LTD HKD 17.999 7,030 16.314,08
NOKIA CORP -A- EUR 518.907 2,846 1.919.704,44
OPEN TEXT CORP CAD 2.194 71,900 149.535,05
ORACLE CORP JAPAN JPY 1.000 4.115,000 41.427,27
YAHOO JAPAN CORP JPY 897 48.900,000 441.588,47
Total 2.797.448,24
Details of collateral received for securities lent
Name Currency Nominal value Currency fund Value in Currency fund
AUSTRIA 2012 3,4% 22/11/2022 EUR 200.000 USD 296.655,64
FRANCE 2008 3.75% 25/10/2019 EUR 1.850.000 USD 2.790.997,03
Total 3.087.652,67

For the valuation of the collateral received, indicative prices have been used in this detail list by the Collateral Management Division of KBC Bank.

Semi-Annual report as at 30th June 2013
TABLE OF CONTENTS
2. Information on KBC Equity Fund Consumer Durables
2.1. Management report 2.1.1. Launch date and subscription price 2.1.2. Stock exchange listing 2.1.3. Aim and distinctive features of the investment policy 2.1.4. Financial portfolio management 2.1.5. Distributors 2.1.6. Index and benchmark 2.1.7. Policy conducted during the financial year 2.1.8. Future policy 2.1.9. Synthetic risk and reward indicator (SRRI)
2.2. Balance sheet
2.3. Profit and loss account
2.4. Composition of the assets and key figures
2.4.1. Composition of the assets 2.4.2. Change in the composition of the assets 2.4.3. Value of commitments in respect of financial derivatives positions 2.4.4. Evolution of the number of subscriptions, repayments and the net asset value 2.4.5. Return figures 2.4.6. Expenses 2.4.7. Notes to the financial statements and other data


2 INFORMATION ON KBC EQUITY FUND CONSUMER DURABLES
2.1 MANAGEMENT REPORT
2.1.1 LAUNCH DATE AND SUBSCRIPTION PRICE Classic Shares : Launch date: 1 October 1999 Initial subscription price: 500 EUR Currency: EUR Institutional B Shares : Launch date: 25 November 2011 Initial subscription price: 268.07 EUR Currency: EUR
2.1.2 STOCK EXCHANGE LISTING Not applicable.
2.1.3 GOAL AND KEY PRINCIPLES OF THE INVESTMENT POLICY
SUB-FUND’S OBJECT: The main objective of this sub-fund is to generate the highest possible return for its shareholders by investing directly or indirectly in transferable securities. This is reflected in its pursuit of capital gains and income. To this end, the assets are invested, either directly or indirectly via correlated financial instruments, primarily in shares.
SUB-FUND’S INVESTMENT POLICY:
PERMITTED ASSET CLASSES: The sub-fund may invest in securities, money market instruments, units in undertakings for collective investment, deposits, financial derivatives, liquid assets and all other instruments insofar as permitted by the applicable laws and regulations and consistent with the sub-fund’s object The sub-fund shall invest no more than 10% of its assets in units of other undertakings for collective investment.
RESTRICTIONS OF THE INVESTMENT POLICY: The investment policy will be implemented within the limits set by law and regulations. The sub-fund may borrow up to 10% of its net assets, insofar as these are short-term borrowings aimed at solving temporary liquidity problems.
PERMITTED DERIVATIVES TRANSACTIONS: Derivates may be used either for hedging purposes or to achieve investment objectives. Changes will be made to the investments at regular intervals to comply with the sub-fund's investment strategy. In addition, listed and unlisted derivates may be used to achieve the objectives: these may be forward contracts, options or swaps on securities, indices, currencies or interest rates or other transactions involving derivatives. Unlisted derivatives transactions will only be concluded with prime financial institutions specialised in such transactions. Such derivatives may also be used to hedge the assets against exchange-rate fluctuations. Subject to the applicable laws and regulations and the articles of association, the sub-fund always seeks to conclude the most effective transactions. All costs associated with the transactions will be charged to the sub-fund and all income generated will be paid to the sub-fund. If the transactions result in a risk in respect of the counterparty, this risk can be hedged by using a margin management system that ensures that the sub-fund is the beneficiary of security (collateral) in the form of cash or investment grade bonds. When calculating the value of the bonds, a margin will be applied that varies depending on the residual term to maturity and the currency in which the bond in question is denominated. The relationship with the counterparty or counterparties is governed by standard international agreements.
STRATEGY SELECTED The sub-fund will invest at least 75% of its assets in shares from sectors associated with consumption, including wholesale and retail trade and manufacturers of consumer goods. The manager is responsible for the stock picking. The selection is not restricted to shares from a particular stock-market index. The sub-fund invests worldwide.
RISK CONCENTRATION Shares in consumption-sensitive sectors.
LENDING FINANCIAL INSTRUMENTS: The sub-fund may lend financial instruments within the limits set by law and regulations. This lending does not affect the sub-fund’s risk profile since: - it takes place within the framework of a securities lending system managed by a principal. In
addition, the sub-fund has a relationship only with the principal of the securities lending system which acts as counterparty and to which title of the loaned securities is transferred. The choice of principal is subject to strict selection criteria. The return of securities similar to the securities that have been lent is guaranteed by the principal.
- through a margin management system, the sub-fund is always guaranteed financial security, the actual value of which always exceeds the actual value of the securities that have been lent, in case the principal does not return similar securities.
The return of securities similar to the securities that have been lent can be requested at any time, which means that the lending of securities does not affect the management of the sub-fund's assets. By lending securities, the sub-fund can generate an additional return. The principal pays a fee to the management company. After deducting the fee for the margin management and clearing services of KBC Bank, most of this fee is paid to the sub-fund. The relationship with the counterparty or counterparties is governed by standard international agreements. More information is provided on the terms and conditions governing securities lending in the annual or half-yearly report for the sub-fund.
VOLATILITY OF THE NET ASSET VALUE: The volatility of the net asset value may be high due to the composition of the portfolio.
GENERAL STRATEGY FOR HEDGING THE EXCHANGE RATE RISK: In order to protect its assets against exchange rate fluctuations and within the limitations laid down in the articles of association, the sub-fund may perform transactions relating to the sale of forward currency contracts, as well as the sale of call options and the purchase of put options on currencies. The transactions in question may relate solely to contracts traded on a regulated market that operates regularly, is recognised and is open to the public or that are traded with a recognised, prime financial institution specialising in such transactions and dealing in the over-the-counter (OTC) market in options. With the same objective, the sub-fund may also sell currencies forward or exchange them in private transactions with prime financial institutions specialising in such transactions. The hedging objective of the aforementioned transactions suggests that there is a direct link between these transactions and the assets to be hedged, which implies that the transactions carried out in a particular currency may in principle not exceed, in terms of volume, either the valuation value of all the assets in the same currency or the holding period of those assets.
SOCIAL, ETHICAL AND ENVIRONMENTAL ASPECTS:
No manufacturers of controversial weapons whose use over the past five decades, according to the international consensus, has led to disproportionate human suffering among the civilian population will be included in the portfolio of investments. This involves the manufacturers of anti-personnel mines, cluster bombs and munitions and weapons containing depleted uranium. In this way, the sub-fund seeks to reflect not only simple financial reality but also the social reality of the sector or region in question.

THE EUROPEAN SAVINGS DIRECTIVE AND TAX ON DEBT CLAIM RETURNS OBTAINED THROUGH THE
REDEMPTION OF OWN UNITS OR IN THE EVENT OF FULL OR PARTIAL DISTRIBUTION OF EQUITY
CAPITAL. The following information is of a general character and is not intended to cover all aspects of an investment in a UCITS. In certain cases entirely different rules might even apply. Moreover, both tax law and the interpretation of it can change. Investors who wish to have more information about the tax implications – in both Belgium and abroad – of acquiring, holding and transferring units should seek the advice of their usual financial and tax advisers. This UCITS shall invest a maximum of 15% of its assets directly or indirectly in debt instruments as intended by the European Savings Directive. A. European Savings Directive (Directive 2003/48/EC) The European Savings Directive has been implemented in Belgium. Since this UCITS invests a maximum of 15% of its assets directly or indirectly in debt claims as intended by the European Savings Directive, the income of this UCITS does not fall within the scope of this directive. B. Tax on debt claim returns obtained through the redemption of own units or in the event of full or partial distribution of equity capital (Article 19bis Income Tax Code 1992). The income from this UCITS is not subject to the tax on debt instrument returns as intended by Article 19bis, Income Tax Code 1992.
2.1.4 FINANCIAL PORTFOLIO MANAGEMENT There is no delegation of the portfolio.
2.1.5 DISTRIBUTORS KBC Asset Management S.A., 5, Place de la Gare, L-1616 Luxembourg.
2.1.6 INDEX AND BENCHMARK See ‘Sub-fund’s investment policy’.
2.1.7 POLICY PERSUED DURING THE FINANCIAL YEAR KBC Equity Fund Consumer Durables posted a further increase over the last six months on the back of a global stock market rally. American shares (56% of the portfolio performed particularly well thanks to very positive macroeconomic data. Positive news on US consumer confidence and a recovery in the housing market boosted share prices, including those of general distributors (23% of the sub-fund). The most economically sensitive segment, automotive (26% of the portfolio) performed well despite the downward adjustment of forecasts when the annual results were published because of weak demand in Europe. On the other hand, demand in Europe does now also appear to be bottoming out. Within the Consumer Durables & Apparel segment (15% of the portfolio), companies in the luxury segment did particularly well thanks to persistently strong sales of luxury products, especially to Chinese consumers.
2.1.8 FUTURE POLICY Given the growing consumer confidence in the US and the fact that consumer confidence in Europe is bottoming out, we are fairly positive regarding the future for the various segments. US consumer spending could come under some pressure in the near term as a result of the automatic tax hikes which came into operation earlier in the year. The growth outlook for companies which mainly target European consumers is significantly less promising than for companies with an international focus. Asian consumers, and especially those in China, are continuing to prosper. We are overweight in Media and Automotive and in the Consumer Durables & Apparel segment. We remain moderately optimistic regarding the automotive sector. Car makers on both sides of the Atlantic Ocean should benefit from strong car sales in the US and the anticipated gradual bottoming out of sales in Europe. Japanese car makers also stand to benefit from the depreciation of the yen and new fiscal stimulus measures in Japan. We are also optimistic regarding the Media segment, as advertising budgets have held up surprisingly well in spite of the slow growth. The Consumer Durables & Apparel segment mainly comprises companies in the luxury segment and manufacturers of sports goods. We foresee strong growth in sales and earnings in this segment going forward, and therefore take a positive stance. The luxury segment is also growing very strongly, principally driven by the continuing growth of the Chinese economy and the resultant rapidly growing Chinese middle class. Manufacturers of sports goods are also going through a buoyant period, benefiting not only from the growing prosperity in emerging economies but also seeing substantial growth in mature markets, especially the US, thanks to product innovations. We remain underweight in the travel-related segment in the light of current valuations. Restaurants, in particular, are somewhat expensive. Valuations in the hotel segment have also risen sharply, and we think an underweight position is appropriate at this point in the profit cycle. One area in the travel-related segment that we are continuing to play is the cruise industry, which is currently cheap and is enjoying structural growth in consumer demand. Given current valuations, we are rather cautious regarding general distribution companies, which are accordingly underweight in the portfolio. As an early cyclical sector, these companies have performed very strongly in anticipation of improving consumer spending in the coming quarters. Consumer spending has held up well in the US thus far, and is showing the first signs of bottoming out in the UK, but in the rest of Europe the outlook for the short term appears very weak. Given the great diversity of companies within the General Distribution segment, we are adopting a selective approach here.
2.1.9 SYNTHETIC RISK AND REWARD INDICATOR Classic Shares: 6 on a scale of 1 (lowest risk) to 7 (highest risk). Institutional B Shares: 6 on a scale of 1 (lowest risk) to 7 (highest risk). The value of a share can decrease or increase and the investor may not get back the amount invested. In accordance with Commission Regulation (EU) No. 583/2010, a synthetic risk and reward indicator has been calculated. This indicator provides a quantitative measure of the sub-fund's potential return and the risk involved, calculated in the currency in which the sub-fund is denominated. It is given as a figure between 1 and 7. The higher the figure, the greater the potential return, but also the more difficult it is to predict this return. Losses are possible too. The lowest figure does not mean that the investment is entirely free of risk. However, it does indicate that, compared with the higher figures, this product will generally provide a lower, but more predictable return. The synthetic risk and reward indicator is assessed regularly and can therefore go up or down based on data from the past. Data from the past is not always a reliable indicator of future risk and return.

2.2 BALANCE SHEET
Balance sheet layout 30/06/2013 (in the currency of the sub-fundt)
30/06/2012 (in the currency of the sub-fund )
TOTAL NET ASSETS 65.587.032,87 45.826.354,39
II. Securities, money market instruments, UCIs and derivatives
A. Bonds and other debt instruments a) Bonds a} Collateral received in the form of bonds 1.540.680,74 1.373.367,79 C. Shares and similar instruments a) Shares 65.966.831,01 46.217.522,93 Of which securities lent 1.438.948,07 1.270.533,83 D. Other securities 23.202,22 3.449,28
IV. Receivables and payables within one year A. Receivables a) Accounts receivable 118.613,36 B. Payables a) Accounts payable (-) -113.571,58 -91.711,05 c) Borrowings (-) -544.407,14 -371.566,80 d) Collateral (-) -1.540.680,74 -1.373.367,79
V. Deposits and cash at bank and in hand A. Demand balances at banks 169.470,26 42.231,15
VI. Accruals and deferrals A. Expense to be carried forward 15.555,56 7.223,98 B. Accrued income 93.606,58 89.449,75 C. Accrued expense (-) -142.267,40 -70.244,85
TOTAL SHAREHOLDERS' EQUITY 65.587.032,87 45.826.354,39
A. Capital 49.378.222,54 45.949.285,76
B. Income equalization -95.128,58 -157.266,47
D. Result for the period 16.303.938,91 34.335,10
Off-balance-sheet headings
I Collateral (+/-)
I.A Collateral (+/-)
I.A.A Securities/market instruments 1.540.680,74 1.373.367,79
IX Financial instruments lent 1.438.948,07 1.270.533,83

2.3 PROFIT AND LOSS ACCOUNT
Income Statement 30/06/2013 (in the currency of the sub-fund)
30/06/2012 (in the currency of the sub-fund)
I. Net gains(losses) on investments C. Shares and similar instruments a) Shares 16.402.588,68 -3.059.853,93 D. Other securities -31.611,89 349,26 G. Receivables, deposits, cash at bank and in hand
and payables 0,12
H. Foreign exchange positions and transactions b) Other foreign exchange positions and
transactions -486.399,29 2.727.059,70
II. Investment income and expenses A. Dividends 1.112.103,69 676.608,05 B. Interests a) Securities and money market instruments 22.342,18 1.810,59 b) Cash at bank and in hand and deposits 487,66 297,18 C. Interest on borrowings (-) -872,92 -650,80
III. Other income A. Income received to cover the acquisition and
realizaion of assets, to discourage withdrawals and for delivery charges
392.212,19 226.748,80
IV. Operating expenses A. Investment transaction and delivery costs (-) -191.952,07 -141.190,89 B. Financial expenses (-) -594,98 -266,11 C. Custodian's fee (-) -12.526,75 -8.016,22 D. Manager's fee (-) a) Financial management Classic Shares -63.381,43 -57.709,69 Institutional B Shares -716.924,81 -274.086,10 b) Administration and accounting management -52.020,36 -24.752,64 E. Administrative expenses (-) -13,08 F. Formation and organisation expenses (-) -2.403,68 -3.723,62 G. Remuneration, social security charges and
pension -12,11 -6,19
H. Services and sundry goods (-) -10.455,53 -4.640,21 J. Taxes Classic Shares -2.893,53 -2.222,99 Institutional B Shares -2.854,24 -1.935,01 K. Other expenses (-) -50.878,94 -19.484,08
Income and expenditure for the period Subtotal II + III + IV 419.361,29 366.780,07
V. Profit (loss) on ordinary activities before tax 16.303.938,91 34.335,10
VII. Result for the period 16.303.938,91 34.335,10
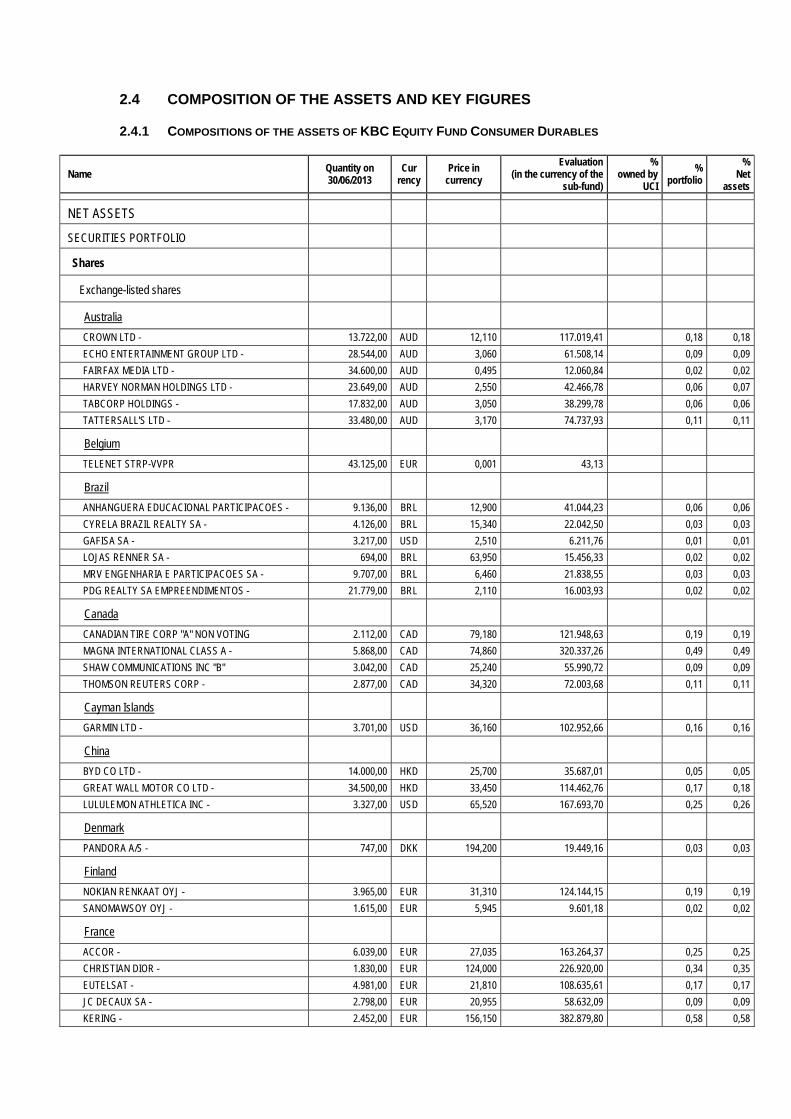
2.4 COMPOSITION OF THE ASSETS AND KEY FIGURES
2.4.1 COMPOSITIONS OF THE ASSETS OF KBC EQUITY FUND CONSUMER DURABLES
Name Quantity on 30/06/2013
Cur rency
Price in currency
Evaluation (in the currency of the
sub-fund)
% owned by
UCI
% portfolio
% Net
assets
NET ASSETS
SECURITIES PORTFOLIO
Shares
Exchange-listed shares
Australia
CROWN LTD - 13.722,00 AUD 12,110 117.019,41 0,18 0,18
ECHO ENTERTAINMENT GROUP LTD - 28.544,00 AUD 3,060 61.508,14 0,09 0,09
FAIRFAX MEDIA LTD - 34.600,00 AUD 0,495 12.060,84 0,02 0,02
HARVEY NORMAN HOLDINGS LTD - 23.649,00 AUD 2,550 42.466,78 0,06 0,07
TABCORP HOLDINGS - 17.832,00 AUD 3,050 38.299,78 0,06 0,06
TATTERSALL'S LTD - 33.480,00 AUD 3,170 74.737,93 0,11 0,11
Belgium
TELENET STRP-VVPR 43.125,00 EUR 0,001 43,13
Brazil
ANHANGUERA EDUCACIONAL PARTICIPACOES - 9.136,00 BRL 12,900 41.044,23 0,06 0,06
CYRELA BRAZIL REALTY SA - 4.126,00 BRL 15,340 22.042,50 0,03 0,03
GAFISA SA - 3.217,00 USD 2,510 6.211,76 0,01 0,01
LOJAS RENNER SA - 694,00 BRL 63,950 15.456,33 0,02 0,02
MRV ENGENHARIA E PARTICIPACOES SA - 9.707,00 BRL 6,460 21.838,55 0,03 0,03
PDG REALTY SA EMPREENDIMENTOS - 21.779,00 BRL 2,110 16.003,93 0,02 0,02
Canada
CANADIAN TIRE CORP "A" NON VOTING 2.112,00 CAD 79,180 121.948,63 0,19 0,19
MAGNA INTERNATIONAL CLASS A - 5.868,00 CAD 74,860 320.337,26 0,49 0,49
SHAW COMMUNICATIONS INC "B" 3.042,00 CAD 25,240 55.990,72 0,09 0,09
THOMSON REUTERS CORP - 2.877,00 CAD 34,320 72.003,68 0,11 0,11
Cayman Islands
GARMIN LTD - 3.701,00 USD 36,160 102.952,66 0,16 0,16
China
BYD CO LTD - 14.000,00 HKD 25,700 35.687,01 0,05 0,05
GREAT WALL MOTOR CO LTD - 34.500,00 HKD 33,450 114.462,76 0,17 0,18
LULULEMON ATHLETICA INC - 3.327,00 USD 65,520 167.693,70 0,25 0,26
Denmark
PANDORA A/S - 747,00 DKK 194,200 19.449,16 0,03 0,03
Finland
NOKIAN RENKAAT OYJ - 3.965,00 EUR 31,310 124.144,15 0,19 0,19
SANOMAWSOY OYJ - 1.615,00 EUR 5,945 9.601,18 0,02 0,02
France
ACCOR - 6.039,00 EUR 27,035 163.264,37 0,25 0,25
CHRISTIAN DIOR - 1.830,00 EUR 124,000 226.920,00 0,34 0,35
EUTELSAT - 4.981,00 EUR 21,810 108.635,61 0,17 0,17
JC DECAUX SA - 2.798,00 EUR 20,955 58.632,09 0,09 0,09
KERING - 2.452,00 EUR 156,150 382.879,80 0,58 0,58
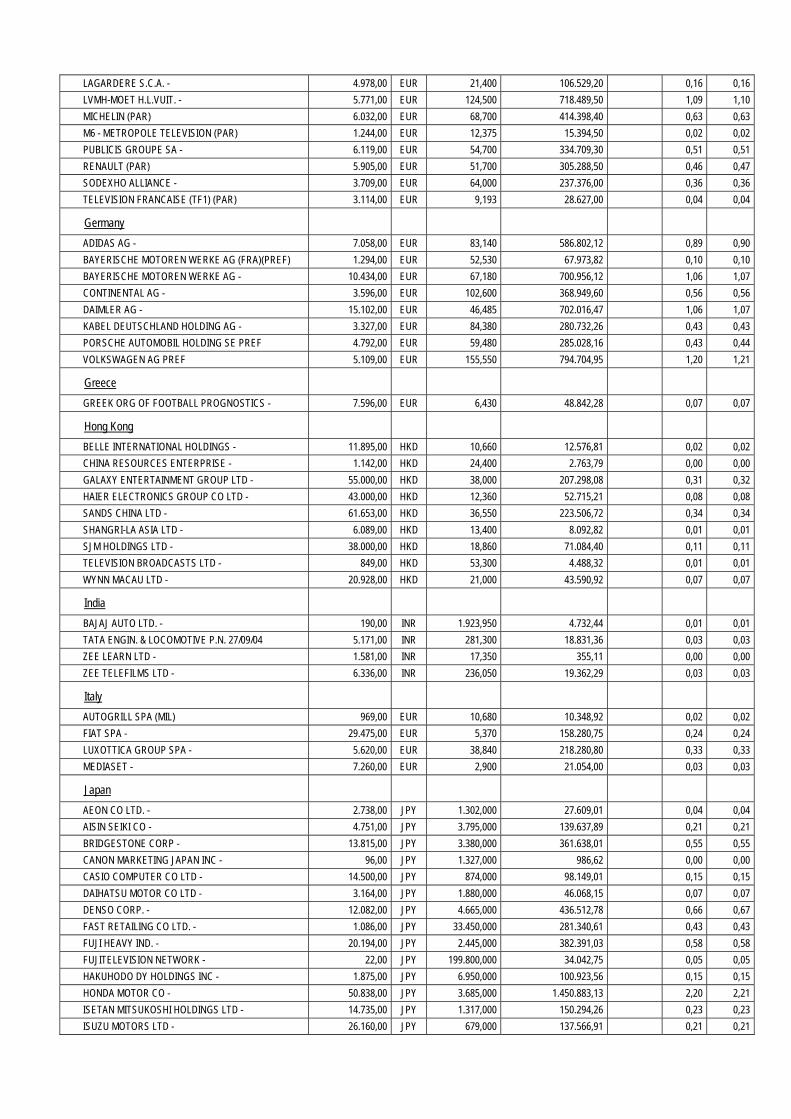
LAGARDERE S.C.A. - 4.978,00 EUR 21,400 106.529,20 0,16 0,16
LVMH-MOET H.L.VUIT. - 5.771,00 EUR 124,500 718.489,50 1,09 1,10
MICHELIN (PAR) 6.032,00 EUR 68,700 414.398,40 0,63 0,63
M6 - METROPOLE TELEVISION (PAR) 1.244,00 EUR 12,375 15.394,50 0,02 0,02
PUBLICIS GROUPE SA - 6.119,00 EUR 54,700 334.709,30 0,51 0,51
RENAULT (PAR) 5.905,00 EUR 51,700 305.288,50 0,46 0,47
SODEXHO ALLIANCE - 3.709,00 EUR 64,000 237.376,00 0,36 0,36
TELEVISION FRANCAISE (TF1) (PAR) 3.114,00 EUR 9,193 28.627,00 0,04 0,04
Germany
ADIDAS AG - 7.058,00 EUR 83,140 586.802,12 0,89 0,90
BAYERISCHE MOTOREN WERKE AG (FRA)(PREF) 1.294,00 EUR 52,530 67.973,82 0,10 0,10
BAYERISCHE MOTOREN WERKE AG - 10.434,00 EUR 67,180 700.956,12 1,06 1,07
CONTINENTAL AG - 3.596,00 EUR 102,600 368.949,60 0,56 0,56
DAIMLER AG - 15.102,00 EUR 46,485 702.016,47 1,06 1,07
KABEL DEUTSCHLAND HOLDING AG - 3.327,00 EUR 84,380 280.732,26 0,43 0,43
PORSCHE AUTOMOBIL HOLDING SE PREF 4.792,00 EUR 59,480 285.028,16 0,43 0,44
VOLKSWAGEN AG PREF 5.109,00 EUR 155,550 794.704,95 1,20 1,21
Greece
GREEK ORG OF FOOTBALL PROGNOSTICS - 7.596,00 EUR 6,430 48.842,28 0,07 0,07
Hong Kong
BELLE INTERNATIONAL HOLDINGS - 11.895,00 HKD 10,660 12.576,81 0,02 0,02
CHINA RESOURCES ENTERPRISE - 1.142,00 HKD 24,400 2.763,79 0,00 0,00
GALAXY ENTERTAINMENT GROUP LTD - 55.000,00 HKD 38,000 207.298,08 0,31 0,32
HAIER ELECTRONICS GROUP CO LTD - 43.000,00 HKD 12,360 52.715,21 0,08 0,08
SANDS CHINA LTD - 61.653,00 HKD 36,550 223.506,72 0,34 0,34
SHANGRI-LA ASIA LTD - 6.089,00 HKD 13,400 8.092,82 0,01 0,01
SJM HOLDINGS LTD - 38.000,00 HKD 18,860 71.084,40 0,11 0,11
TELEVISION BROADCASTS LTD - 849,00 HKD 53,300 4.488,32 0,01 0,01
WYNN MACAU LTD - 20.928,00 HKD 21,000 43.590,92 0,07 0,07
India
BAJAJ AUTO LTD. - 190,00 INR 1.923,950 4.732,44 0,01 0,01
TATA ENGIN. & LOCOMOTIVE P.N. 27/09/04 5.171,00 INR 281,300 18.831,36 0,03 0,03
ZEE LEARN LTD - 1.581,00 INR 17,350 355,11 0,00 0,00
ZEE TELEFILMS LTD - 6.336,00 INR 236,050 19.362,29 0,03 0,03
Italy
AUTOGRILL SPA (MIL) 969,00 EUR 10,680 10.348,92 0,02 0,02
FIAT SPA - 29.475,00 EUR 5,370 158.280,75 0,24 0,24
LUXOTTICA GROUP SPA - 5.620,00 EUR 38,840 218.280,80 0,33 0,33
MEDIASET - 7.260,00 EUR 2,900 21.054,00 0,03 0,03
Japan
AEON CO LTD. - 2.738,00 JPY 1.302,000 27.609,01 0,04 0,04
AISIN SEIKI CO - 4.751,00 JPY 3.795,000 139.637,89 0,21 0,21
BRIDGESTONE CORP - 13.815,00 JPY 3.380,000 361.638,01 0,55 0,55
CANON MARKETING JAPAN INC - 96,00 JPY 1.327,000 986,62 0,00 0,00
CASIO COMPUTER CO LTD - 14.500,00 JPY 874,000 98.149,01 0,15 0,15
DAIHATSU MOTOR CO LTD - 3.164,00 JPY 1.880,000 46.068,15 0,07 0,07
DENSO CORP. - 12.082,00 JPY 4.665,000 436.512,78 0,66 0,67
FAST RETAILING CO LTD. - 1.086,00 JPY 33.450,000 281.340,61 0,43 0,43
FUJI HEAVY IND. - 20.194,00 JPY 2.445,000 382.391,03 0,58 0,58
FUJITELEVISION NETWORK - 22,00 JPY 199.800,000 34.042,75 0,05 0,05
HAKUHODO DY HOLDINGS INC - 1.875,00 JPY 6.950,000 100.923,56 0,15 0,15
HONDA MOTOR CO - 50.838,00 JPY 3.685,000 1.450.883,13 2,20 2,21
ISETAN MITSUKOSHI HOLDINGS LTD - 14.735,00 JPY 1.317,000 150.294,26 0,23 0,23
ISUZU MOTORS LTD - 26.160,00 JPY 679,000 137.566,91 0,21 0,21
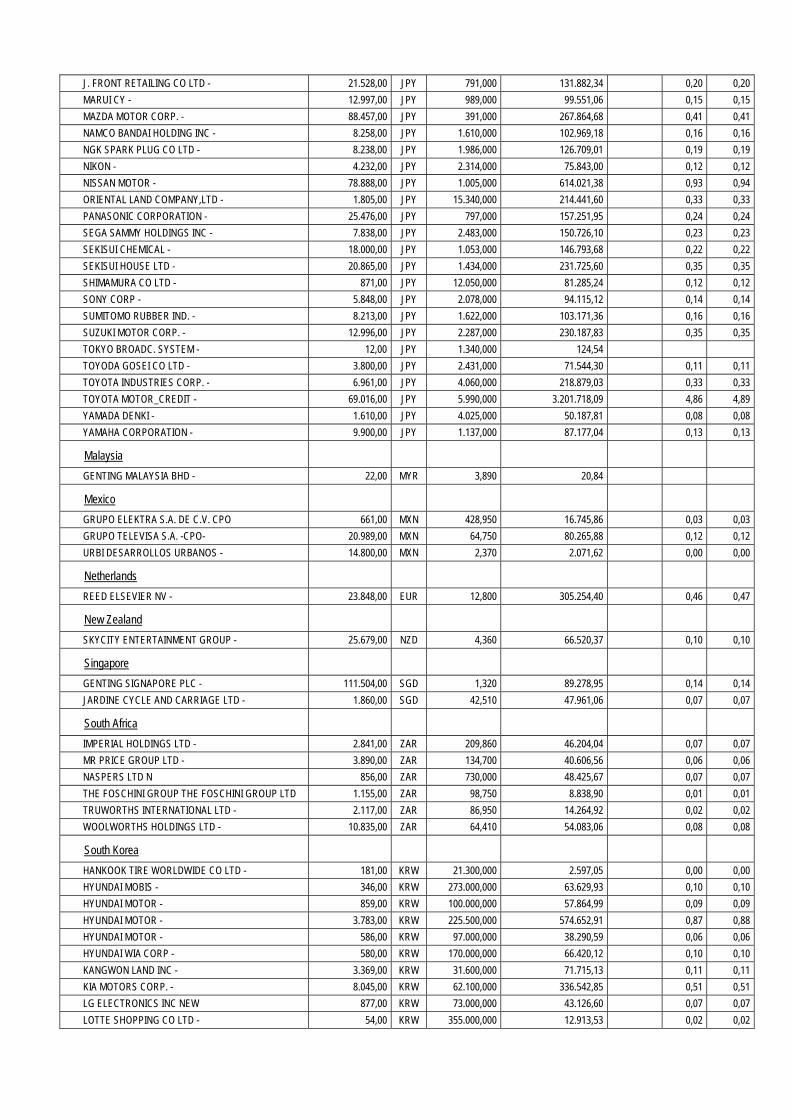
J. FRONT RETAILING CO LTD - 21.528,00 JPY 791,000 131.882,34 0,20 0,20
MARUI CY - 12.997,00 JPY 989,000 99.551,06 0,15 0,15
MAZDA MOTOR CORP. - 88.457,00 JPY 391,000 267.864,68 0,41 0,41
NAMCO BANDAI HOLDING INC - 8.258,00 JPY 1.610,000 102.969,18 0,16 0,16
NGK SPARK PLUG CO LTD - 8.238,00 JPY 1.986,000 126.709,01 0,19 0,19
NIKON - 4.232,00 JPY 2.314,000 75.843,00 0,12 0,12
NISSAN MOTOR - 78.888,00 JPY 1.005,000 614.021,38 0,93 0,94
ORIENTAL LAND COMPANY,LTD - 1.805,00 JPY 15.340,000 214.441,60 0,33 0,33
PANASONIC CORPORATION - 25.476,00 JPY 797,000 157.251,95 0,24 0,24
SEGA SAMMY HOLDINGS INC - 7.838,00 JPY 2.483,000 150.726,10 0,23 0,23
SEKISUI CHEMICAL - 18.000,00 JPY 1.053,000 146.793,68 0,22 0,22
SEKISUI HOUSE LTD - 20.865,00 JPY 1.434,000 231.725,60 0,35 0,35
SHIMAMURA CO LTD - 871,00 JPY 12.050,000 81.285,24 0,12 0,12
SONY CORP - 5.848,00 JPY 2.078,000 94.115,12 0,14 0,14
SUMITOMO RUBBER IND. - 8.213,00 JPY 1.622,000 103.171,36 0,16 0,16
SUZUKI MOTOR CORP. - 12.996,00 JPY 2.287,000 230.187,83 0,35 0,35
TOKYO BROADC. SYSTEM - 12,00 JPY 1.340,000 124,54
TOYODA GOSEI CO LTD - 3.800,00 JPY 2.431,000 71.544,30 0,11 0,11
TOYOTA INDUSTRIES CORP. - 6.961,00 JPY 4.060,000 218.879,03 0,33 0,33
TOYOTA MOTOR_CREDIT - 69.016,00 JPY 5.990,000 3.201.718,09 4,86 4,89
YAMADA DENKI - 1.610,00 JPY 4.025,000 50.187,81 0,08 0,08
YAMAHA CORPORATION - 9.900,00 JPY 1.137,000 87.177,04 0,13 0,13
Malaysia
GENTING MALAYSIA BHD - 22,00 MYR 3,890 20,84
Mexico
GRUPO ELEKTRA S.A. DE C.V. CPO 661,00 MXN 428,950 16.745,86 0,03 0,03
GRUPO TELEVISA S.A. -CPO- 20.989,00 MXN 64,750 80.265,88 0,12 0,12
URBI DESARROLLOS URBANOS - 14.800,00 MXN 2,370 2.071,62 0,00 0,00
Netherlands
REED ELSEVIER NV - 23.848,00 EUR 12,800 305.254,40 0,46 0,47
New Zealand
SKYCITY ENTERTAINMENT GROUP - 25.679,00 NZD 4,360 66.520,37 0,10 0,10
Singapore
GENTING SIGNAPORE PLC - 111.504,00 SGD 1,320 89.278,95 0,14 0,14
JARDINE CYCLE AND CARRIAGE LTD - 1.860,00 SGD 42,510 47.961,06 0,07 0,07
South Africa
IMPERIAL HOLDINGS LTD - 2.841,00 ZAR 209,860 46.204,04 0,07 0,07
MR PRICE GROUP LTD - 3.890,00 ZAR 134,700 40.606,56 0,06 0,06
NASPERS LTD N 856,00 ZAR 730,000 48.425,67 0,07 0,07
THE FOSCHINI GROUP THE FOSCHINI GROUP LTD 1.155,00 ZAR 98,750 8.838,90 0,01 0,01
TRUWORTHS INTERNATIONAL LTD - 2.117,00 ZAR 86,950 14.264,92 0,02 0,02
WOOLWORTHS HOLDINGS LTD - 10.835,00 ZAR 64,410 54.083,06 0,08 0,08
South Korea
HANKOOK TIRE WORLDWIDE CO LTD - 181,00 KRW 21.300,000 2.597,05 0,00 0,00
HYUNDAI MOBIS - 346,00 KRW 273.000,000 63.629,93 0,10 0,10
HYUNDAI MOTOR - 859,00 KRW 100.000,000 57.864,99 0,09 0,09
HYUNDAI MOTOR - 3.783,00 KRW 225.500,000 574.652,91 0,87 0,88
HYUNDAI MOTOR - 586,00 KRW 97.000,000 38.290,59 0,06 0,06
HYUNDAI WIA CORP - 580,00 KRW 170.000,000 66.420,12 0,10 0,10
KANGWON LAND INC - 3.369,00 KRW 31.600,000 71.715,13 0,11 0,11
KIA MOTORS CORP. - 8.045,00 KRW 62.100,000 336.542,85 0,51 0,51
LG ELECTRONICS INC NEW 877,00 KRW 73.000,000 43.126,60 0,07 0,07
LOTTE SHOPPING CO LTD - 54,00 KRW 355.000,000 12.913,53 0,02 0,02
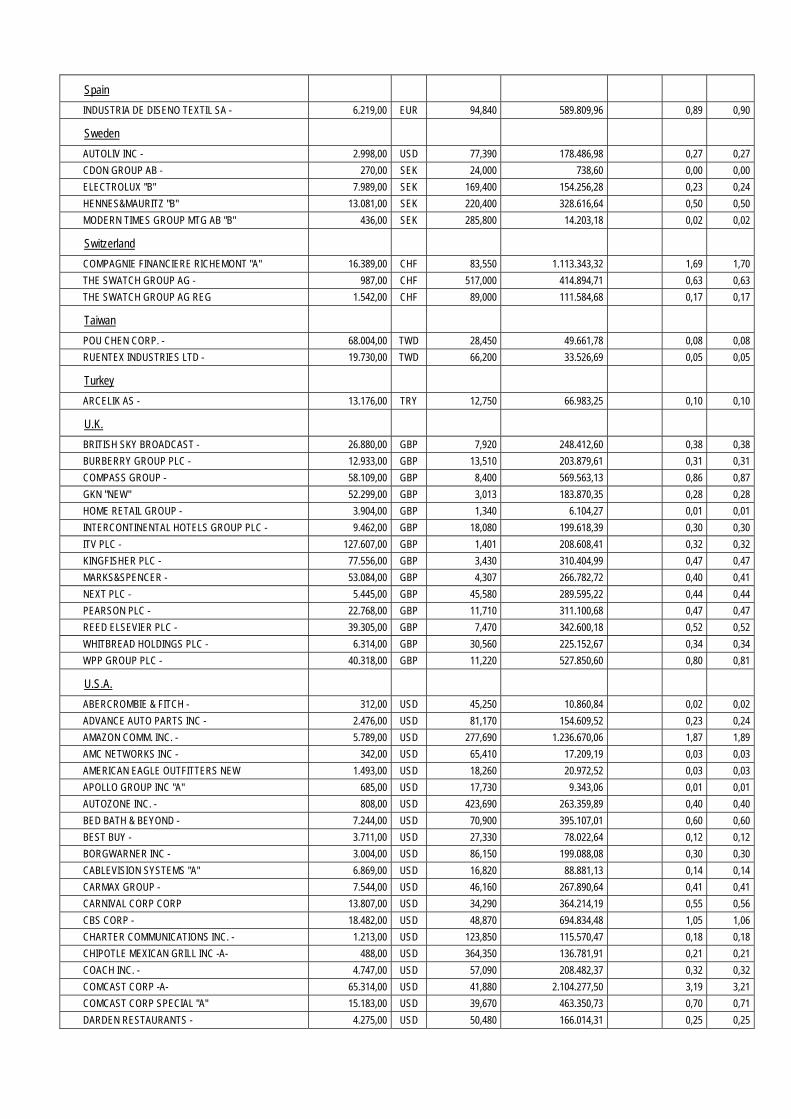
Spain
INDUSTRIA DE DISENO TEXTIL SA - 6.219,00 EUR 94,840 589.809,96 0,89 0,90
Sweden
AUTOLIV INC - 2.998,00 USD 77,390 178.486,98 0,27 0,27
CDON GROUP AB - 270,00 SEK 24,000 738,60 0,00 0,00
ELECTROLUX "B" 7.989,00 SEK 169,400 154.256,28 0,23 0,24
HENNES&MAURITZ "B" 13.081,00 SEK 220,400 328.616,64 0,50 0,50
MODERN TIMES GROUP MTG AB "B" 436,00 SEK 285,800 14.203,18 0,02 0,02
Switzerland
COMPAGNIE FINANCIERE RICHEMONT "A" 16.389,00 CHF 83,550 1.113.343,32 1,69 1,70
THE SWATCH GROUP AG - 987,00 CHF 517,000 414.894,71 0,63 0,63
THE SWATCH GROUP AG REG 1.542,00 CHF 89,000 111.584,68 0,17 0,17
Taiwan
POU CHEN CORP. - 68.004,00 TWD 28,450 49.661,78 0,08 0,08
RUENTEX INDUSTRIES LTD - 19.730,00 TWD 66,200 33.526,69 0,05 0,05
Turkey
ARCELIK AS - 13.176,00 TRY 12,750 66.983,25 0,10 0,10
U.K.
BRITISH SKY BROADCAST - 26.880,00 GBP 7,920 248.412,60 0,38 0,38
BURBERRY GROUP PLC - 12.933,00 GBP 13,510 203.879,61 0,31 0,31
COMPASS GROUP - 58.109,00 GBP 8,400 569.563,13 0,86 0,87
GKN "NEW" 52.299,00 GBP 3,013 183.870,35 0,28 0,28
HOME RETAIL GROUP - 3.904,00 GBP 1,340 6.104,27 0,01 0,01
INTERCONTINENTAL HOTELS GROUP PLC - 9.462,00 GBP 18,080 199.618,39 0,30 0,30
ITV PLC - 127.607,00 GBP 1,401 208.608,41 0,32 0,32
KINGFISHER PLC - 77.556,00 GBP 3,430 310.404,99 0,47 0,47
MARKS&SPENCER - 53.084,00 GBP 4,307 266.782,72 0,40 0,41
NEXT PLC - 5.445,00 GBP 45,580 289.595,22 0,44 0,44
PEARSON PLC - 22.768,00 GBP 11,710 311.100,68 0,47 0,47
REED ELSEVIER PLC - 39.305,00 GBP 7,470 342.600,18 0,52 0,52
WHITBREAD HOLDINGS PLC - 6.314,00 GBP 30,560 225.152,67 0,34 0,34
WPP GROUP PLC - 40.318,00 GBP 11,220 527.850,60 0,80 0,81
U.S.A.
ABERCROMBIE & FITCH - 312,00 USD 45,250 10.860,84 0,02 0,02
ADVANCE AUTO PARTS INC - 2.476,00 USD 81,170 154.609,52 0,23 0,24
AMAZON COMM. INC. - 5.789,00 USD 277,690 1.236.670,06 1,87 1,89
AMC NETWORKS INC - 342,00 USD 65,410 17.209,19 0,03 0,03
AMERICAN EAGLE OUTFITTERS NEW 1.493,00 USD 18,260 20.972,52 0,03 0,03
APOLLO GROUP INC "A" 685,00 USD 17,730 9.343,06 0,01 0,01
AUTOZONE INC. - 808,00 USD 423,690 263.359,89 0,40 0,40
BED BATH & BEYOND - 7.244,00 USD 70,900 395.107,01 0,60 0,60
BEST BUY - 3.711,00 USD 27,330 78.022,64 0,12 0,12
BORGWARNER INC - 3.004,00 USD 86,150 199.088,08 0,30 0,30
CABLEVISION SYSTEMS "A" 6.869,00 USD 16,820 88.881,13 0,14 0,14
CARMAX GROUP - 7.544,00 USD 46,160 267.890,64 0,41 0,41
CARNIVAL CORP CORP 13.807,00 USD 34,290 364.214,19 0,55 0,56
CBS CORP - 18.482,00 USD 48,870 694.834,48 1,05 1,06
CHARTER COMMUNICATIONS INC. - 1.213,00 USD 123,850 115.570,47 0,18 0,18
CHIPOTLE MEXICAN GRILL INC -A- 488,00 USD 364,350 136.781,91 0,21 0,21
COACH INC. - 4.747,00 USD 57,090 208.482,37 0,32 0,32
COMCAST CORP -A- 65.314,00 USD 41,880 2.104.277,50 3,19 3,21
COMCAST CORP SPECIAL "A" 15.183,00 USD 39,670 463.350,73 0,70 0,71
DARDEN RESTAURANTS - 4.275,00 USD 50,480 166.014,31 0,25 0,25

DELPHI AUTOMOTIVE PLC - 9.291,00 USD 50,690 362.305,40 0,55 0,55
DEVRY INC - 633,00 USD 31,020 15.105,52 0,02 0,02
DIRECTV GROUP INC - 17.605,00 USD 61,620 834.541,20 1,27 1,27
DISCOVERY COMMUNICATIONS INC - 3.708,00 USD 69,660 198.707,04 0,30 0,30
DISCOVERY COMMUNICATIONS INC -A- 3.889,00 USD 77,210 230.994,45 0,35 0,35
DISH NETWORK CORP - 4.128,00 USD 42,520 135.027,74 0,21 0,21
DOLLAR GENERAL CORPORATION - 9.430,00 USD 50,430 365.839,60 0,55 0,56
DOLLAR TREE STORES INC. - 7.468,00 USD 50,840 292.078,71 0,44 0,45
DR HORTON INC - 9.873,00 USD 21,280 161.625,85 0,25 0,25
EXPEDIA INC. - 3.614,00 USD 60,150 167.229,86 0,25 0,26
FAMILY DOLLAR STORES - 3.351,00 USD 62,310 160.628,36 0,24 0,25
FORD MOTOR CY - 89.000,00 USD 15,470 1.059.181,48 1,61 1,62
FOSSIL GROUP INC - 1.673,00 USD 103,310 132.962,25 0,20 0,20
GAMESTOP CORPORATION - 4.335,00 USD 42,030 140.164,67 0,21 0,21
GAP INC - 10.072,00 USD 41,730 323.336,07 0,49 0,49
GEN.MOTORS - 23.364,00 USD 33,310 598.703,62 0,91 0,91
GENUINE PARTS - 5.361,00 USD 78,070 321.973,44 0,49 0,49
HARLEY DAVIDSON - 5.994,00 USD 54,820 252.781,81 0,38 0,39
HASBRO INC. - 4.390,00 USD 44,830 151.399,11 0,23 0,23
HOME DEPOT - 28.896,00 USD 77,470 1.722.111,79 2,61 2,63
INTERPUBLIC GROUP - 14.536,00 USD 14,550 162.703,90 0,25 0,25
JOHNSON CONTROLS - 15.886,00 USD 35,790 437.387,45 0,66 0,67
KOHL'S CORPORATION - 2.266,00 USD 50,510 88.049,59 0,13 0,13
L BRANDS INC - 7.988,00 USD 49,250 302.645,59 0,46 0,46
LAS VEGAS SANDS CORP - 12.726,00 USD 52,930 518.183,84 0,79 0,79
LEGGETT & PLATT, INC. - 5.483,00 USD 31,090 131.138,14 0,20 0,20
LIBERTY GLOBAL INC -C- 4.098,00 USD 67,890 214.026,63 0,32 0,33
LIBERTY GLOBAL INC A 7.433,00 USD 74,080 423.599,23 0,64 0,65
LIBERTY INTERACTIVE CORP - 17.266,00 USD 23,010 305.631,71 0,46 0,47
LIBERTY SPINCO INC - 3.116,00 USD 126,760 303.857,34 0,46 0,46
LIBERTY VENTURES - 383,00 USD 85,010 25.047,18 0,04 0,04
LOWE'S CIE - 16.398,00 USD 40,900 515.946,00 0,78 0,79
MACY'S INC - 12.523,00 USD 48,000 462.423,26 0,70 0,71
MARRIOTT INTERNATIONAL - 8.397,00 USD 40,370 260.779,21 0,40 0,40
MATTEL INC - 11.194,00 USD 45,310 390.183,97 0,59 0,60
MC DONALD'S CORP - 18.038,00 USD 99,000 1.373.768,75 2,08 2,10
MGM RESORTS INTERNATIONAL - 12.474,00 USD 14,780 141.830,69 0,22 0,22
MOHAWK INDUSTRIES INC - 2.031,00 USD 112,490 175.757,51 0,27 0,27
NETFLIX INC - 564,00 USD 211,090 91.587,63 0,14 0,14
NEWELL RUBBERMAID,INC. - 9.811,00 USD 26,250 198.121,97 0,30 0,30
NIKE "B" 22.191,00 USD 63,680 1.087.101,22 1,65 1,66
NORDSTROM - 5.510,00 USD 59,940 254.072,93 0,39 0,39
O'REILLY AUTOMOTIVE INC. - 3.092,00 USD 112,620 267.882,94 0,41 0,41
OMNICOM GROUP - 7.114,00 USD 62,870 344.070,45 0,52 0,53
PENNEY - 3.233,00 USD 17,080 42.479,91 0,06 0,07
PETSMART INC - 3.490,00 USD 66,990 179.856,22 0,27 0,27
PHILLIPS VAN HEUSEN - 2.628,00 USD 125,050 252.812,83 0,38 0,39
POLO RALPH LAUREN CORP - 1.973,00 USD 173,740 263.704,15 0,40 0,40
PRICELINE.COM INC. - 1.547,00 USD 827,130 984.360,42 1,49 1,50
PULTE GROUP INC - 12.120,00 USD 18,970 176.872,37 0,27 0,27
ROSS STORES - 6.456,00 USD 64,810 321.881,19 0,49 0,49
ROYAL CARIBBEAN CRUISES LTD - 4.718,00 USD 33,340 121.007,86 0,18 0,18
SCRIPPS NETWORKS INTER-CL A - 3.069,00 USD 66,760 157.617,08 0,24 0,24
SIRIUS XM RADIO INC - 72.011,00 USD 3,350 185.581,08 0,28 0,28
STAPLES INC - 15.848,00 USD 15,860 193.360,47 0,29 0,30
STARBUCKS CORP - 4.787,00 USD 65,490 241.172,88 0,37 0,37
STARWOOD HOTELS & RESORTS - 6.374,00 USD 63,190 309.849,27 0,47 0,47
TARGET CORP - 19.111,00 USD 68,860 1.012.372,84 1,53 1,54
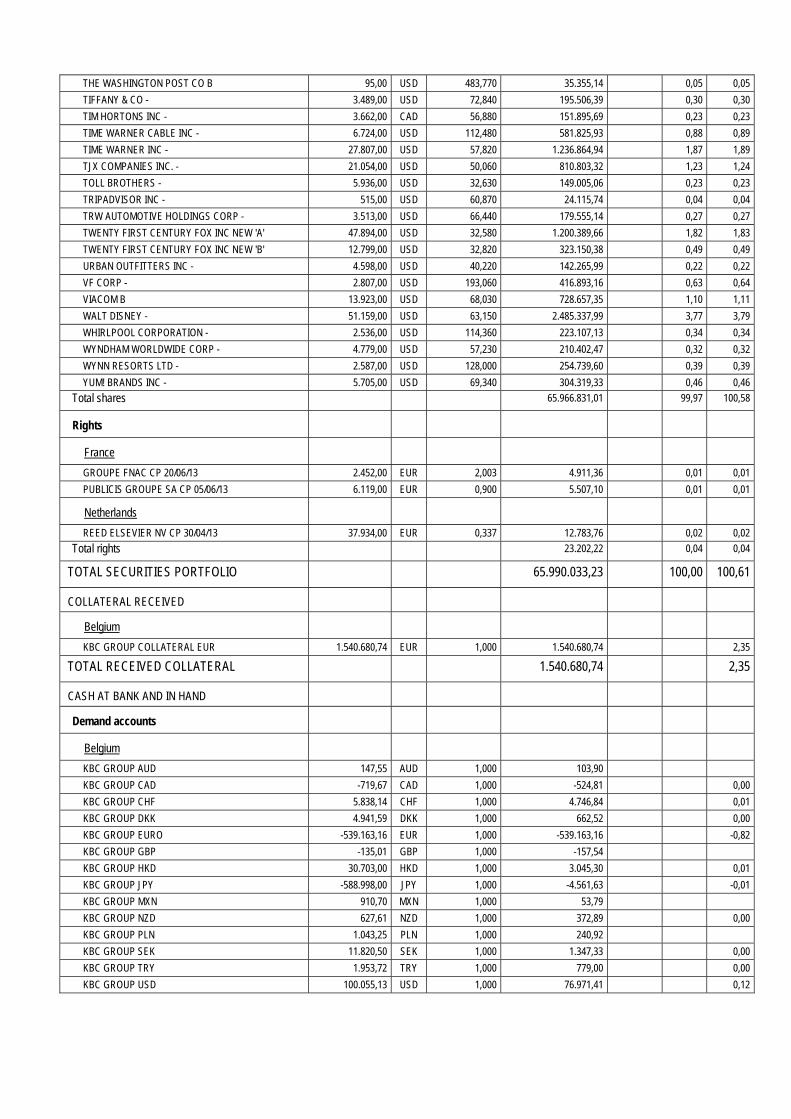
THE WASHINGTON POST CO B 95,00 USD 483,770 35.355,14 0,05 0,05
TIFFANY & CO - 3.489,00 USD 72,840 195.506,39 0,30 0,30
TIM HORTONS INC - 3.662,00 CAD 56,880 151.895,69 0,23 0,23
TIME WARNER CABLE INC - 6.724,00 USD 112,480 581.825,93 0,88 0,89
TIME WARNER INC - 27.807,00 USD 57,820 1.236.864,94 1,87 1,89
TJX COMPANIES INC. - 21.054,00 USD 50,060 810.803,32 1,23 1,24
TOLL BROTHERS - 5.936,00 USD 32,630 149.005,06 0,23 0,23
TRIPADVISOR INC - 515,00 USD 60,870 24.115,74 0,04 0,04
TRW AUTOMOTIVE HOLDINGS CORP - 3.513,00 USD 66,440 179.555,14 0,27 0,27
TWENTY FIRST CENTURY FOX INC NEW 'A' 47.894,00 USD 32,580 1.200.389,66 1,82 1,83
TWENTY FIRST CENTURY FOX INC NEW 'B' 12.799,00 USD 32,820 323.150,38 0,49 0,49
URBAN OUTFITTERS INC - 4.598,00 USD 40,220 142.265,99 0,22 0,22
VF CORP - 2.807,00 USD 193,060 416.893,16 0,63 0,64
VIACOM B 13.923,00 USD 68,030 728.657,35 1,10 1,11
WALT DISNEY - 51.159,00 USD 63,150 2.485.337,99 3,77 3,79
WHIRLPOOL CORPORATION - 2.536,00 USD 114,360 223.107,13 0,34 0,34
WYNDHAM WORLDWIDE CORP - 4.779,00 USD 57,230 210.402,47 0,32 0,32
WYNN RESORTS LTD - 2.587,00 USD 128,000 254.739,60 0,39 0,39
YUM! BRANDS INC - 5.705,00 USD 69,340 304.319,33 0,46 0,46
Total shares 65.966.831,01 99,97 100,58
Rights
France
GROUPE FNAC CP 20/06/13 2.452,00 EUR 2,003 4.911,36 0,01 0,01
PUBLICIS GROUPE SA CP 05/06/13 6.119,00 EUR 0,900 5.507,10 0,01 0,01
Netherlands
REED ELSEVIER NV CP 30/04/13 37.934,00 EUR 0,337 12.783,76 0,02 0,02
Total rights 23.202,22 0,04 0,04
TOTAL SECURITIES PORTFOLIO 65.990.033,23 100,00 100,61
COLLATERAL RECEIVED
Belgium
KBC GROUP COLLATERAL EUR 1.540.680,74 EUR 1,000 1.540.680,74 2,35
TOTAL RECEIVED COLLATERAL 1.540.680,74 2,35
CASH AT BANK AND IN HAND
Demand accounts
Belgium
KBC GROUP AUD 147,55 AUD 1,000 103,90
KBC GROUP CAD -719,67 CAD 1,000 -524,81 0,00
KBC GROUP CHF 5.838,14 CHF 1,000 4.746,84 0,01
KBC GROUP DKK 4.941,59 DKK 1,000 662,52 0,00
KBC GROUP EURO -539.163,16 EUR 1,000 -539.163,16 -0,82
KBC GROUP GBP -135,01 GBP 1,000 -157,54
KBC GROUP HKD 30.703,00 HKD 1,000 3.045,30 0,01
KBC GROUP JPY -588.998,00 JPY 1,000 -4.561,63 -0,01
KBC GROUP MXN 910,70 MXN 1,000 53,79
KBC GROUP NZD 627,61 NZD 1,000 372,89 0,00
KBC GROUP PLN 1.043,25 PLN 1,000 240,92
KBC GROUP SEK 11.820,50 SEK 1,000 1.347,33 0,00
KBC GROUP TRY 1.953,72 TRY 1,000 779,00 0,00
KBC GROUP USD 100.055,13 USD 1,000 76.971,41 0,12
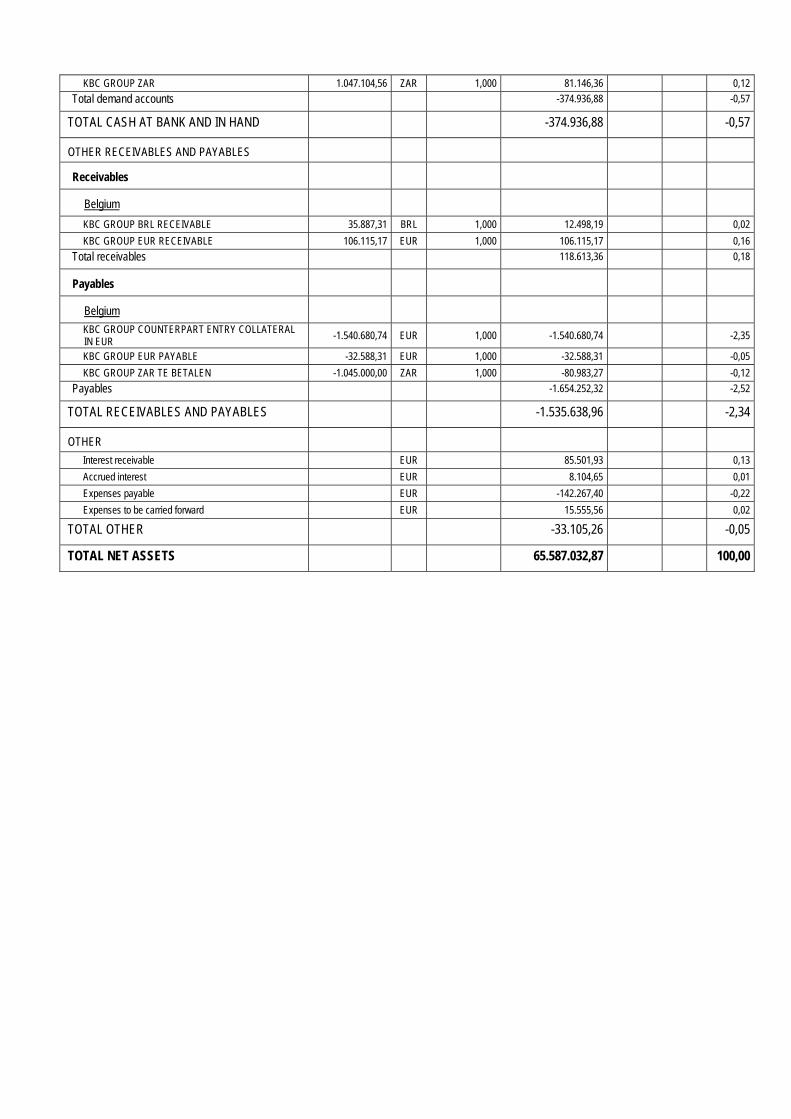
KBC GROUP ZAR 1.047.104,56 ZAR 1,000 81.146,36 0,12
Total demand accounts -374.936,88 -0,57
TOTAL CASH AT BANK AND IN HAND -374.936,88 -0,57
OTHER RECEIVABLES AND PAYABLES
Receivables
Belgium
KBC GROUP BRL RECEIVABLE 35.887,31 BRL 1,000 12.498,19 0,02
KBC GROUP EUR RECEIVABLE 106.115,17 EUR 1,000 106.115,17 0,16
Total receivables 118.613,36 0,18
Payables
Belgium
KBC GROUP COUNTERPART ENTRY COLLATERAL IN EUR -1.540.680,74 EUR 1,000 -1.540.680,74 -2,35
KBC GROUP EUR PAYABLE -32.588,31 EUR 1,000 -32.588,31 -0,05
KBC GROUP ZAR TE BETALEN -1.045.000,00 ZAR 1,000 -80.983,27 -0,12
Payables -1.654.252,32 -2,52
TOTAL RECEIVABLES AND PAYABLES -1.535.638,96 -2,34
OTHER
Interest receivable EUR 85.501,93 0,13
Accrued interest EUR 8.104,65 0,01
Expenses payable EUR -142.267,40 -0,22
Expenses to be carried forward EUR 15.555,56 0,02
TOTAL OTHER -33.105,26 -0,05
TOTAL NET ASSETS 65.587.032,87 100,00
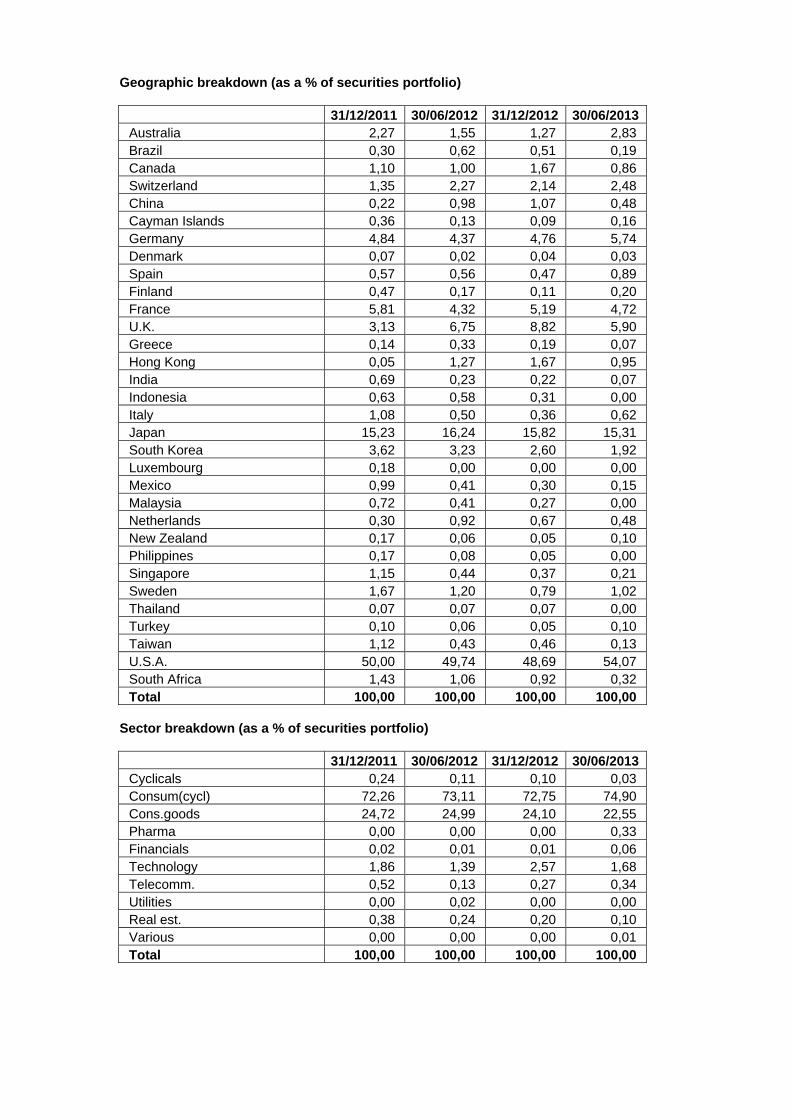
Geographic breakdown (as a % of securities portfolio)
31/12/2011 30/06/2012 31/12/2012 30/06/2013 Australia 2,27 1,55 1,27 2,83 Brazil 0,30 0,62 0,51 0,19 Canada 1,10 1,00 1,67 0,86 Switzerland 1,35 2,27 2,14 2,48 China 0,22 0,98 1,07 0,48 Cayman Islands 0,36 0,13 0,09 0,16 Germany 4,84 4,37 4,76 5,74 Denmark 0,07 0,02 0,04 0,03 Spain 0,57 0,56 0,47 0,89 Finland 0,47 0,17 0,11 0,20 France 5,81 4,32 5,19 4,72 U.K. 3,13 6,75 8,82 5,90 Greece 0,14 0,33 0,19 0,07 Hong Kong 0,05 1,27 1,67 0,95 India 0,69 0,23 0,22 0,07 Indonesia 0,63 0,58 0,31 0,00 Italy 1,08 0,50 0,36 0,62 Japan 15,23 16,24 15,82 15,31 South Korea 3,62 3,23 2,60 1,92 Luxembourg 0,18 0,00 0,00 0,00 Mexico 0,99 0,41 0,30 0,15 Malaysia 0,72 0,41 0,27 0,00 Netherlands 0,30 0,92 0,67 0,48 New Zealand 0,17 0,06 0,05 0,10 Philippines 0,17 0,08 0,05 0,00 Singapore 1,15 0,44 0,37 0,21 Sweden 1,67 1,20 0,79 1,02 Thailand 0,07 0,07 0,07 0,00 Turkey 0,10 0,06 0,05 0,10 Taiwan 1,12 0,43 0,46 0,13 U.S.A. 50,00 49,74 48,69 54,07 South Africa 1,43 1,06 0,92 0,32 Total 100,00 100,00 100,00 100,00
Sector breakdown (as a % of securities portfolio)
31/12/2011 30/06/2012 31/12/2012 30/06/2013 Cyclicals 0,24 0,11 0,10 0,03 Consum(cycl) 72,26 73,11 72,75 74,90 Cons.goods 24,72 24,99 24,10 22,55 Pharma 0,00 0,00 0,00 0,33 Financials 0,02 0,01 0,01 0,06 Technology 1,86 1,39 2,57 1,68 Telecomm. 0,52 0,13 0,27 0,34 Utilities 0,00 0,02 0,00 0,00 Real est. 0,38 0,24 0,20 0,10 Various 0,00 0,00 0,00 0,01 Total 100,00 100,00 100,00 100,00
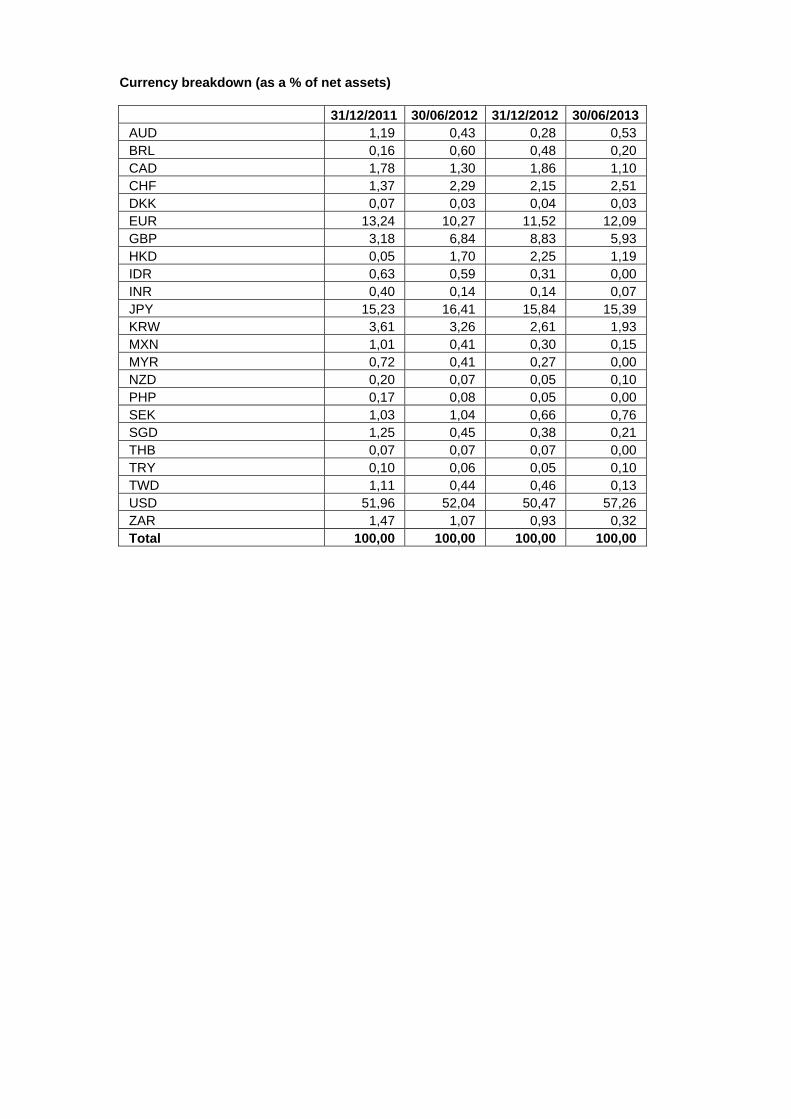
Currency breakdown (as a % of net assets)
31/12/2011 30/06/2012 31/12/2012 30/06/2013 AUD 1,19 0,43 0,28 0,53 BRL 0,16 0,60 0,48 0,20 CAD 1,78 1,30 1,86 1,10 CHF 1,37 2,29 2,15 2,51 DKK 0,07 0,03 0,04 0,03 EUR 13,24 10,27 11,52 12,09 GBP 3,18 6,84 8,83 5,93 HKD 0,05 1,70 2,25 1,19 IDR 0,63 0,59 0,31 0,00 INR 0,40 0,14 0,14 0,07 JPY 15,23 16,41 15,84 15,39 KRW 3,61 3,26 2,61 1,93 MXN 1,01 0,41 0,30 0,15 MYR 0,72 0,41 0,27 0,00 NZD 0,20 0,07 0,05 0,10 PHP 0,17 0,08 0,05 0,00 SEK 1,03 1,04 0,66 0,76 SGD 1,25 0,45 0,38 0,21 THB 0,07 0,07 0,07 0,00 TRY 0,10 0,06 0,05 0,10 TWD 1,11 0,44 0,46 0,13 USD 51,96 52,04 50,47 57,26 ZAR 1,47 1,07 0,93 0,32 Total 100,00 100,00 100,00 100,00

2.4.2 CHANGES IN THE COMPOSITION OF THE ASSETS OF KBC EQUITY FUND CONSUMER
DURABLES (IN THE CURRENCY OF THE SUB-FUND)
1st half of year YearPurchases 104.478.422,13 104.478.422,13 Sales 89.778.129,24 89.778.129,24 Total 1 194.256.551,37 194.256.551,37 Subscriptions 121.280.745,25 121.280.745,25 Redemptions 106.723.080,09 106.723.080,09 Total 2 228.003.825,34 228.003.825,34 Monthly average of total assets
104.755.242,18 104.755.242,18
Turnover rate -32,22 % -32,22 %
1st half of year YearPurchases 104.478.422,13 104.478.422,13 Sales 89.778.129,24 89.778.129,24 Total 1 194.256.551,37 194.256.551,37 Subscriptions 121.280.745,25 121.280.745,25 Redemptions 106.723.080,09 106.723.080,09 Total 2 228.003.825,34 228.003.825,34 Monthly average of total assets
101.130.578,27 101.130.578,27
Corrected turnover rate -33,37 % -33,37 %
The table above shows the capital volume of portfolio transactions. This volume (adjusted to take account of total subscriptions and redemptions) is also compared to the average net assets at the beginning and end of the period. A figure close to 0% implies that the transactions relating to the securities or transactions relating to the assets (excluding deposits and cash) in a given period only involve subscriptions and redemptions. A negative percentage shows that subscriptions and redemptions entailed few, if any, transactions in the portfolio. Active asset management may result in high turnover rates (monthly percentage >50%). The detailed list of transactions is available for consultation free of charge at the registered office of the Bevek or fund at Havenlaan 2, 1080 Brussels.

2.4.3 AMOUNT OF COMMITMENTS IN RESPECT OF FINANCIAL DERIVATIVES POSITIONS
NAME Currency Value in currency
In the currency of the sub-fund
Lot-size
Transactiondate
KBC COLLATERAL EUR
EUR 1.540.680,74 1.540.680,74 N/A 28.06.2013
2.4.4 CHANGES OF THE NUMBER OF SUBSCRIPTIONS AND REDEMPTIONS AND THE NET ASSET
VALUE
Classic Shares
Period Change in number of shares in circulation
Year Subscriptions Redemptions End of period
Cap. Dis. Cap. Dis. Cap. Dis. Total
2011 - 06 1.758.739,47 25.512,44 1.783.954,54 23.823,88 100.780,14 2.962,97 103.743,11
2012 - 06 40.142,63 55,97 124.332,97 635,02 16.589,80 2.383,92 18.973,72
2013 - 06 16.886,82 491,20 17.112,01 540,22 16.364,62 2.334,90 18.699,52
Period Amounts received and paid by the UCI
(in the currency of the class)
Year Subscriptions Redemptions
Capitalization Distribution Capitalization Distribution
2011 - 06 76.160.587,75 152.984,37 541.643.371,30 7.323.920,27
2012 - 06 12.547.853,12 14.276,48 34.997.423,68 179.137,52
2013 - 06 6.172.916,55 170.231,05 6.493.775,72 178.045,97
Period Net asset value
End of period (in the currency of the class)
Year Of the class Of one share
Capitalization Distribution
2011 - 06 30.845.635,71 298,16 268,86
2012 - 06 6.033.391,12 321,96 290,37
2013 - 06 7.503.813,01 406,47 364,94
Institutional B Shares
Period Change in number of shares in circulation
Year Subscriptions Redemptions End of period
Cap. Dis. Cap. Dis. Cap. Dis. Total 2012 - 06 260.356,10 136.919,27 123.436,83 123.436,83
2013 - 06 405.579,83 386.360,14 142.656,52 142.656,52
Period Amounts received and paid by the UCI
(in the currency of the class)
Year Subscriptions Redemptions
Capitalization Distribution Capitalization Distribution
2012 - 06 83.823.737,45 44.071.409,84
2013 - 06 147.193.568,70 147.629.462,20
Period Net asset value
End of period (in the currency of the class)

Year Of the class Of one share
Capitalization Distribution
2012 - 06 39.792.963,27 322,38
2013 - 06 58.083.219,86 407,15
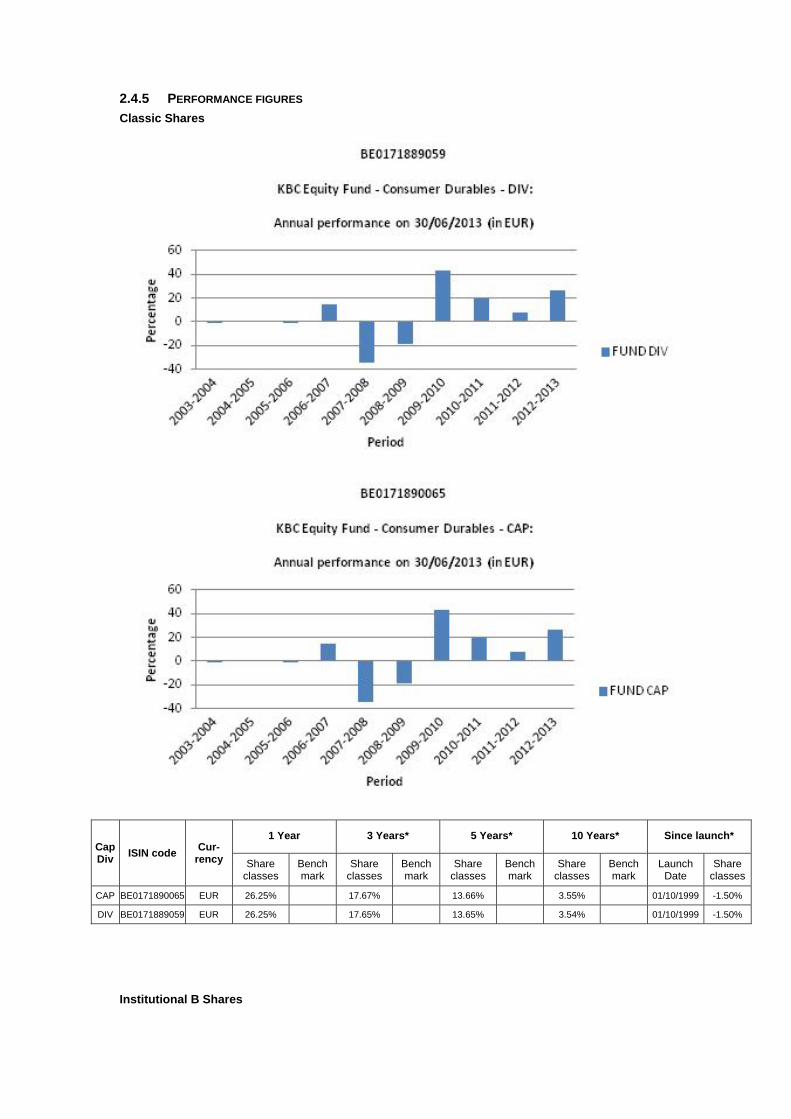
2.4.5 PERFORMANCE FIGURES
Classic Shares
Cap Div
ISIN code Cur-
rency
1 Year 3 Years* 5 Years* 10 Years* Since launch*
Share classes
Bench mark
Share classes
Bench mark
Share classes
Bench mark
Share classes
Bench mark
Launch Date
Share classes
CAP BE0171890065 EUR 26.25% 17.67% 13.66% 3.55% 01/10/1999 -1.50%
DIV BE0171889059 EUR 26.25% 17.65% 13.65% 3.54% 01/10/1999 -1.50%
Institutional B Shares

Cap Div
ISIN code Cur-
rency
1 Year 3 Years* 5 Years* 10 Years* Since launch*
Share classes
Bench mark
Share classes
Bench mark
Share classes
Bench mark
Share classes
Bench mark
Launch Date
Share classes
CAP BE6228539720 EUR 26.30% 25/11/2011 29.93%
Risk warning: Past performance is not a guide to future performance. * Return on annual basis.
Classic Shares The bar chart shows the performance for full financial years. The figures do not take account of any restructuring. Calculated in EUR. The return is calculated as the change in the net asset value between two dates expressed
as a percentage. In the case of units that pay dividends, the dividend is incorporated geometrically in the return.
Calculation method for date D, where NAV stands for net asset value: Capitalisation units (CAP) Return on date D over a period of X years:
[NIW(D) / NIW(Y)] ^ [1 / X] - 1 where Y = D-X
Return on date D since the start date S of the unit: [NIW(D) / NIW(S)] ^ [1 / F] - 1 where F = 1 if the unit has existed for less than one year on date D where F = (D-S) / 365.25 if the unit has existed for longer than one year on date D
Distribution units (DIV) Return on date D over a period of X years:
[ C * NIW(D) / NIW(Y)] ^ [1 / X] - 1 where Y = D-X
Return on date D since the start date S of the unit: [ C * NIW(D) / NIW(S)] ^ [1 / F] - 1 where F = 1 if the unit has existed for less than one year on date D where F = (D-S) / 365.25 if the unit has existed for longer than one year on date D where C is a factor that is determined for all N dividends between the calculation date D and the reference date.
For dividend i on date Di with value Wi: Ci = [Wi / NIW(Di)] + 1 i = 1 ... N

from whichC = C0 * .... * CN. If the interval between the two dates exceeds one year, the ordinary return calculation is
converted into a return on an annual basis by taking the nth square root of 1 plus the total return of the unit.
The return figures shown above do not take account of the fees and charges associated with the issue and redemption of units.
These are the performance figures for capitalisation and distribution shares.
Institutional B Shares The bar chart shows the performance for full financial years. The figures do not take account of any restructuring. Calculated in EUR. The return is calculated as the change in the net asset value between two dates expressed
as a percentage. Calculation method for date D, where NAV stands for net asset value:
Capitalisation units (CAP) Return on date D over a period of X years:
[NIW(D) / NIW(Y)] ^ [1 / X] - 1 where Y = D-X
Return on date D since the start date S of the unit: [NIW(D) / NIW(S)] ^ [1 / F] - 1 where F = 1 if the unit has existed for less than one year on date D where F = (D-S) / 365.25 if the unit has existed for longer than one year on date D
If the interval between the two dates exceeds one year, the ordinary return calculation is converted into a return on an annual basis by taking the nth square root of 1 plus the total return of the unit.
The return figures shown above do not take account of the fees and charges associated with the issue and redemption of units.
These are the performance figures for capitalization shares.
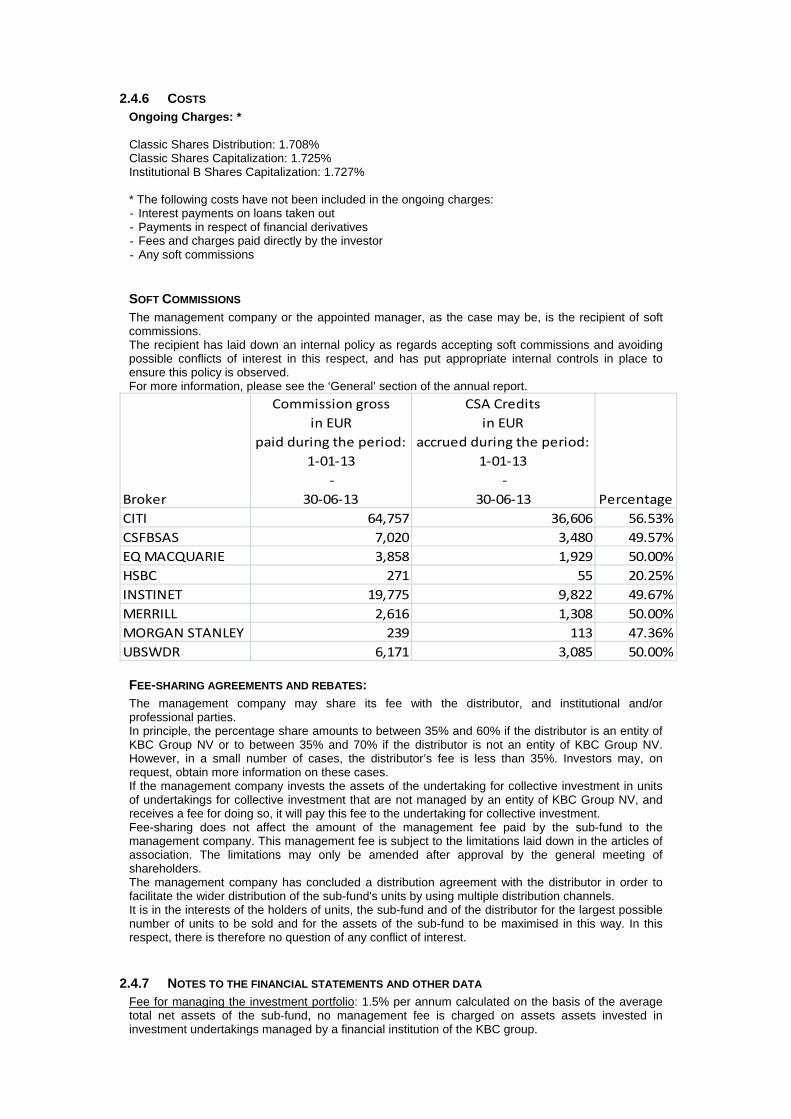
2.4.6 COSTS Ongoing Charges: * Classic Shares Distribution: 1.708% Classic Shares Capitalization: 1.725% Institutional B Shares Capitalization: 1.727% * The following costs have not been included in the ongoing charges: - Interest payments on loans taken out - Payments in respect of financial derivatives - Fees and charges paid directly by the investor - Any soft commissions
SOFT COMMISSIONS The management company or the appointed manager, as the case may be, is the recipient of soft commissions. The recipient has laid down an internal policy as regards accepting soft commissions and avoiding possible conflicts of interest in this respect, and has put appropriate internal controls in place to ensure this policy is observed. For more information, please see the ‘General’ section of the annual report.
Broker
Commission gross
in EUR
paid during the period:
1‐01‐13
‐
30‐06‐13
CSA Credits
in EUR
accrued during the period:
1‐01‐13
‐
30‐06‐13 Percentage
CITI 64,757 36,606 56.53%
CSFBSAS 7,020 3,480 49.57%
EQ MACQUARIE 3,858 1,929 50.00%
HSBC 271 55 20.25%
INSTINET 19,775 9,822 49.67%
MERRILL 2,616 1,308 50.00%
MORGAN STANLEY 239 113 47.36%
UBSWDR 6,171 3,085 50.00%
FEE-SHARING AGREEMENTS AND REBATES: The management company may share its fee with the distributor, and institutional and/or professional parties. In principle, the percentage share amounts to between 35% and 60% if the distributor is an entity of KBC Group NV or to between 35% and 70% if the distributor is not an entity of KBC Group NV. However, in a small number of cases, the distributor’s fee is less than 35%. Investors may, on request, obtain more information on these cases. If the management company invests the assets of the undertaking for collective investment in units of undertakings for collective investment that are not managed by an entity of KBC Group NV, and receives a fee for doing so, it will pay this fee to the undertaking for collective investment. Fee-sharing does not affect the amount of the management fee paid by the sub-fund to the management company. This management fee is subject to the limitations laid down in the articles of association. The limitations may only be amended after approval by the general meeting of shareholders. The management company has concluded a distribution agreement with the distributor in order to facilitate the wider distribution of the sub-fund's units by using multiple distribution channels. It is in the interests of the holders of units, the sub-fund and of the distributor for the largest possible number of units to be sold and for the assets of the sub-fund to be maximised in this way. In this respect, there is therefore no question of any conflict of interest.
2.4.7 NOTES TO THE FINANCIAL STATEMENTS AND OTHER DATA Fee for managing the investment portfolio: 1.5% per annum calculated on the basis of the average total net assets of the sub-fund, no management fee is charged on assets assets invested in investment undertakings managed by a financial institution of the KBC group.
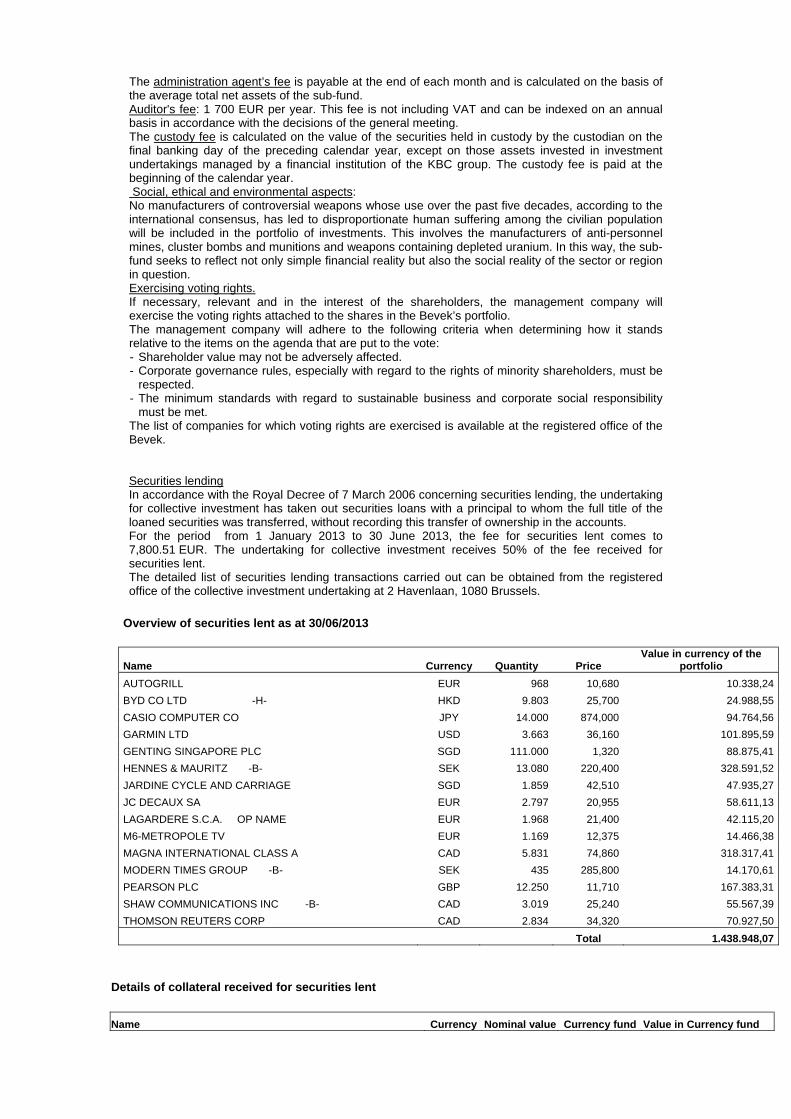
The administration agent’s fee is payable at the end of each month and is calculated on the basis of the average total net assets of the sub-fund. Auditor's fee: 1 700 EUR per year. This fee is not including VAT and can be indexed on an annual basis in accordance with the decisions of the general meeting. The custody fee is calculated on the value of the securities held in custody by the custodian on the final banking day of the preceding calendar year, except on those assets invested in investment undertakings managed by a financial institution of the KBC group. The custody fee is paid at the beginning of the calendar year. Social, ethical and environmental aspects: No manufacturers of controversial weapons whose use over the past five decades, according to the international consensus, has led to disproportionate human suffering among the civilian population will be included in the portfolio of investments. This involves the manufacturers of anti-personnel mines, cluster bombs and munitions and weapons containing depleted uranium. In this way, the sub-fund seeks to reflect not only simple financial reality but also the social reality of the sector or region in question. Exercising voting rights. If necessary, relevant and in the interest of the shareholders, the management company will exercise the voting rights attached to the shares in the Bevek’s portfolio. The management company will adhere to the following criteria when determining how it stands relative to the items on the agenda that are put to the vote: - Shareholder value may not be adversely affected. - Corporate governance rules, especially with regard to the rights of minority shareholders, must be
respected. - The minimum standards with regard to sustainable business and corporate social responsibility
must be met. The list of companies for which voting rights are exercised is available at the registered office of the Bevek. Securities lending In accordance with the Royal Decree of 7 March 2006 concerning securities lending, the undertaking for collective investment has taken out securities loans with a principal to whom the full title of the loaned securities was transferred, without recording this transfer of ownership in the accounts. For the period from 1 January 2013 to 30 June 2013, the fee for securities lent comes to 7,800.51 EUR. The undertaking for collective investment receives 50% of the fee received for securities lent. The detailed list of securities lending transactions carried out can be obtained from the registered office of the collective investment undertaking at 2 Havenlaan, 1080 Brussels.
Overview of securities lent as at 30/06/2013
Name Currency Quantity Price Value in currency of the
portfolio
AUTOGRILL EUR 968 10,680 10.338,24
BYD CO LTD -H- HKD 9.803 25,700 24.988,55
CASIO COMPUTER CO JPY 14.000 874,000 94.764,56
GARMIN LTD USD 3.663 36,160 101.895,59
GENTING SINGAPORE PLC SGD 111.000 1,320 88.875,41
HENNES & MAURITZ -B- SEK 13.080 220,400 328.591,52
JARDINE CYCLE AND CARRIAGE SGD 1.859 42,510 47.935,27
JC DECAUX SA EUR 2.797 20,955 58.611,13
LAGARDERE S.C.A. OP NAME EUR 1.968 21,400 42.115,20
M6-METROPOLE TV EUR 1.169 12,375 14.466,38
MAGNA INTERNATIONAL CLASS A CAD 5.831 74,860 318.317,41
MODERN TIMES GROUP -B- SEK 435 285,800 14.170,61
PEARSON PLC GBP 12.250 11,710 167.383,31
SHAW COMMUNICATIONS INC -B- CAD 3.019 25,240 55.567,39
THOMSON REUTERS CORP CAD 2.834 34,320 70.927,50
Total 1.438.948,07
Details of collateral received for securities lent
Name Currency Nominal value Currency fund Value in Currency fund

AUSTRIA 2012 3,4% 22/11/2022 EUR 327.000 EUR 373.130,22
FRANCE 2008 3.75% 25/10/2019 EUR 1.006.000 EUR 1.167.550,52
Total 1.540.680,74 For the valuation of the collateral received, indicative prices have been used in this detail list by the Collateral Management Division of KBC Bank.

Semi-Annual report as at 30th June 2013
TABLE OF CONTENTS
2. Information on KBC Equity Fund Utilities
2.1. Management report 2.1.1. Launch date and subscription price 2.1.2. Stock exchange listing 2.1.3. Aim and distinctive features of the investment policy 2.1.4. Financial portfolio management 2.1.5. Distributors 2.1.6. Index and benchmark 2.1.7. Policy conducted during the financial year 2.1.8. Future policy 2.1.9. Synthetic risk and reward indicator (SRRI)
2.2. Balance sheet
2.3. Profit and loss account
2.4. Composition of the assets and key figures
2.4.1. Composition of the assets 2.4.2. Change in the composition of the assets 2.4.3. Value of commitments in respect of financial derivatives positions 2.4.4. Evolution of the number of subscriptions, repayments and the net asset value 2.4.5. Return figures 2.4.6. Expenses 2.4.7. Notes to the financial statements and other data


2 INFORMATION ON KBC EQUITY FUND UTILITIES
2.1 MANAGEMENT REPORT
2.1.1 LAUNCH DATE AND SUBSCRIPTION PRICE Launch date: 31 December 1998 Initial subscription price: 20000 BEF Currency: EUR
2.1.2 STOCK EXCHANGE LISTING Not applicable.
2.1.3 GOAL AND KEY PRINCIPLES OF THE INVESTMENT POLICY
SUB-FUND’S OBJECT: The main objective of this sub-fund is to generate the highest possible return for its shareholders by investing directly or indirectly in transferable securities. This is reflected in its pursuit of capital gains and income. To this end, the assets are invested, either directly or indirectly via correlated financial instruments, primarily in shares.
SUB-FUND’S INVESTMENT POLICY:
PERMITTED ASSET CLASSES: The sub-fund may invest in securities, money market instruments, units in undertakings for collective investment, deposits, financial derivatives, liquid assets and all other instruments insofar as permitted by the applicable laws and regulations and consistent with the sub-fund’s object The sub-fund shall invest no more than 10% of its assets in units of other undertakings for collective investment.
RESTRICTIONS OF THE INVESTMENT POLICY: The investment policy will be implemented within the limits set by law and regulations. The sub-fund may borrow up to 10% of its net assets, insofar as these are short-term borrowings aimed at solving temporary liquidity problems.
PERMITTED DERIVATIVES TRANSACTIONS: Derivates may be used either for hedging purposes or to achieve investment objectives. Changes will be made to the investments at regular intervals to comply with the sub-fund's investment strategy. In addition, listed and unlisted derivates may be used to achieve the objectives: these may be forward contracts, options or swaps on securities, indices, currencies or interest rates or other transactions involving derivatives. Unlisted derivatives transactions will only be concluded with prime financial institutions specialised in such transactions. Such derivatives may also be used to hedge the assets against exchange-rate fluctuations. Subject to the applicable laws and regulations and the articles of association, the sub-fund always seeks to conclude the most effective transactions. All costs associated with the transactions will be charged to the sub-fund and all income generated will be paid to the sub-fund. If the transactions result in a risk in respect of the counterparty, this risk can be hedged by using a margin management system that ensures that the sub-fund is the beneficiary of security (collateral) in the form of cash or investment grade bonds. When calculating the value of the bonds, a margin will be applied that varies depending on the residual term to maturity and the currency in which the bond in question is denominated. The relationship with the counterparty or counterparties is governed by standard international agreements.
STRATEGY SELECTED At least 75% of the assets are invested in shares of public utility companies in countries where conditions are such as to ensure accelerated economic growth in the short or medium term.
LENDING FINANCIAL INSTRUMENTS: The sub-fund may lend financial instruments within the limits set by law and regulations. This lending does not affect the sub-fund’s risk profile since:
- it takes place within the framework of a securities lending system managed by a principal. In addition, the sub-fund has a relationship only with the principal of the securities lending system which acts as counterparty and to which title of the loaned securities is transferred. The choice of principal is subject to strict selection criteria. The return of securities similar to the securities that have been lent is guaranteed by the principal.
- through a margin management system, the sub-fund is always guaranteed financial security, the actual value of which always exceeds the actual value of the securities that have been lent, in case the principal does not return similar securities.
The return of securities similar to the securities that have been lent can be requested at any time, which means that the lending of securities does not affect the management of the sub-fund's assets. By lending securities, the sub-fund can generate an additional return. The principal pays a fee to the management company. After deducting the fee for the margin management and clearing services of KBC Bank, most of this fee is paid to the sub-fund. The relationship with the counterparty or counterparties is governed by standard international agreements. More information is provided on the terms and conditions governing securities lending in the annual or half-yearly report for the sub-fund.
VOLATILITY OF THE NET ASSET VALUE: The volatility of the net asset value may be high due to the composition of the portfolio.
GENERAL STRATEGY FOR HEDGING THE EXCHANGE RATE RISK: In order to protect its assets against exchange rate fluctuations and within the limitations laid down in the articles of association, the sub-fund may perform transactions relating to the sale of forward currency contracts, as well as the sale of call options and the purchase of put options on currencies. The transactions in question may relate solely to contracts traded on a regulated market that operates regularly, is recognised and is open to the public or that are traded with a recognised, prime financial institution specialising in such transactions and dealing in the over-the-counter (OTC) market in options. With the same objective, the sub-fund may also sell currencies forward or exchange them in private transactions with prime financial institutions specialising in such transactions. The hedging objective of the aforementioned transactions suggests that there is a direct link between these transactions and the assets to be hedged, which implies that the transactions carried out in a particular currency may in principle not exceed, in terms of volume, either the valuation value of all the assets in the same currency or the holding period of those assets.
SOCIAL, ETHICAL AND ENVIRONMENTAL ASPECTS:
No manufacturers of controversial weapons whose use over the past five decades, according to the international consensus, has led to disproportionate human suffering among the civilian population will be included in the portfolio of investments. This involves the manufacturers of anti-personnel mines, cluster bombs and munitions and weapons containing depleted uranium. In this way, the sub-fund seeks to reflect not only simple financial reality but also the social reality of the sector or region in question.
THE EUROPEAN SAVINGS DIRECTIVE AND TAX ON DEBT CLAIM RETURNS OBTAINED THROUGH THE
REDEMPTION OF OWN UNITS OR IN THE EVENT OF FULL OR PARTIAL DISTRIBUTION OF EQUITY
CAPITAL. The following information is of a general character and is not intended to cover all aspects of an investment in a UCITS. In certain cases entirely different rules might even apply. Moreover, both tax law and the interpretation of it can change. Investors who wish to have more information about the tax implications – in both Belgium and abroad – of acquiring, holding and transferring units should seek the advice of their usual financial and tax advisers. This UCITS shall invest a maximum of 15% of its assets directly or indirectly in debt instruments as intended by the European Savings Directive. A. European Savings Directive (Directive 2003/48/EC) The European Savings Directive has been implemented in Belgium. Since this UCITS invests a maximum of 15% of its assets directly or indirectly in debt claims as intended by the European Savings Directive, the income of this UCITS does not fall within the scope of this directive.

B. Tax on debt claim returns obtained through the redemption of own units or in the event of full or partial distribution of equity capital (Article 19bis Income Tax Code 1992). The income from this UCITS is not subject to the tax on debt instrument returns as intended by Article 19bis, Income Tax Code 1992.
2.1.4 FINANCIAL PORTFOLIO MANAGEMENT There is no delegation of the portfolio.
2.1.5 DISTRIBUTORS KBC Asset Management S.A., 5, Place de la Gare, L-1616 Luxembourg.
2.1.6 INDEX AND BENCHMARK See ‘Sub-fund’s investment policy’.
2.1.7 POLICY PERSUED DURING THE FINANCIAL YEAR The utilities sector performed strongly relative to the broad market in the early months of this year, with interest in the sector being driven mainly by a quest for returns. In March and April, in particular, investors sought out underperforming sectors with high dividend returns. From the end of May onwards, however, the long-standing downward trend in the utilities sector resumed and all the gains made relative to the broader market were lost again. The fact that the American central bank is thinking about starting to scale back its extremely expansive monetary policy caused a surge in yields on government bonds. Share prices of companies with highly regulated activities which benefit from stable and predictable earnings were particularly hard hit as they became relatively less attractive compared to government bonds, especially in the US and Europe. Integrated utility companies with greater exposure to electricity generation continue to face difficulties in the US and (Continental) Europe, with earnings under unrelenting pressure due to persistently lower electricity prices driven by a structural decline in demand and excessive generating capacity. However, the political and regulatory risk remains high. There are striking regional differences in the performance of utility company shares. Japanese utilities (6% of the portfolio) performed strongly in the first half-year, bolstered by the monetary easing by the Japanese central bank and hopes that a number of nuclear reactors would be brought back on stream quickly. A slowing Chinese economy weighed on the performance of Asiatic utilities. North American utilities (45% of the portfolio) were popular in the first quarter of 2013 as many investors see them as an interesting alternative to low-yielding US government paper. In May, however, it became apparent that the high valuations could not compete with the rapid rise in interest rates. The underweighting of Continental European utilities (18% of the portfolio) proved to be a good choice given the weaker performance of European utilities in general. European integrated utility companies, in particular, are still in the throes of restructuring, with a focus on reducing debt by selling off activities, curbing investments and implementing strict cost-saving programmes. Water companies were the subject of takeover speculation.
2.1.8 FUTURE POLICY The performance of the utilities sector over the next six months will be determined by what happens to interest rates. Fundamentally, the outlook in most regions remains challenging, especially for utility companies with high exposure to the electricity and gas markets in the US and Europe. Reducing debt levels will remain a top priority for these companies and growth in general will be limited. Some growth can by contrast the expected in the largely regulated activities in the transmission and distribution of electricity, gas and water because of the pressing need for investments in transmission and distribution networks. In the emerging markets, there is still a need to expand the infrastructure, while in the developed countries the existing networks need to be adapted to accommodate renewable energy technologies. Electricity producers in the US are confronted with stricter environmental regulations, while in Europe more news is anticipated on a political intervention into the market for CO2 emission trading rights. Regulated activities remain heavily dependent on political decisions and any changes in the regulatory framework.
2.1.9 SYNTHETIC RISK AND REWARD INDICATOR 6 on a scale of 1 (lowest risk) to 7 (highest risk). The value of a share can decrease or increase and the investor may not get back the amount invested. In accordance with Commission Regulation (EU) No. 583/2010, a synthetic risk and reward indicator has been calculated. This indicator provides a quantitative measure of the sub-fund's potential return and the risk involved, calculated in the currency in which the sub-fund is denominated. It is given as a figure between 1 and 7. The higher the figure, the greater the potential return, but also the more difficult it is to predict this return. Losses are possible too. The lowest figure does not mean that the investment is entirely free of risk. However, it does indicate that, compared with the higher figures, this product will generally provide a lower, but more predictable return. The synthetic risk and reward indicator is assessed regularly and can therefore go up or down based on data from the past. Data from the past is not always a reliable indicator of future risk and return.

2.2 BALANCE SHEET
Balance sheet layout 30/06/2013 (in the currency of the sub-fundt)
30/06/2012 (in the currency of the sub-fund )
TOTAL NET ASSETS 18.158.800,82 23.938.178,83
II. Securities, money market instruments, UCIs and derivatives
A. Bonds and other debt instruments a) Bonds a} Collateral received in the form of bonds 1.176.799,51 632.691,69 C. Shares and similar instruments a) Shares 18.140.268,10 23.470.303,94 Of which securities lent 592.898,65 206.028,91 D. Other securities 22,44 4.439,63 F. Derivative financial instruments j) Foreign exchange Futures and forward contracts (+/-) 10.706,57 n) Derivative financial instruments Swap contracts (+/-) 202.300,00
IV. Receivables and payables within one year A. Receivables a) Accounts receivable 446,65 133,55 b) Tax assets 3.997,00 4.987,00 B. Payables a) Accounts payable (-) -26.561,93 -73.050,17 c) Borrowings (-) -111.177,27 -125.227,76 d) Collateral (-) -1.176.799,51 -632.691,69
V. Deposits and cash at bank and in hand A. Demand balances at banks 22.665,39 239.891,80
VI. Accruals and deferrals A. Expense to be carried forward 9.124,41 10.065,67 B. Accrued income 133.449,81 206.468,51 C. Accrued expense (-) -13.433,78 -12.839,91
TOTAL SHAREHOLDERS' EQUITY 18.158.800,82 23.938.178,83
A. Capital 17.257.556,27 23.202.247,63
B. Income equalization -13.757,39 -9.183,13
D. Result for the period 915.001,94 745.114,33
Off-balance-sheet headings
I Collateral (+/-)
I.A Collateral (+/-)
I.A.A Securities/market instruments 1.176.799,51 632.691,69
III Notional amounts of futures and forward contracts
III.B Written futures and forward contracts -444.400,55
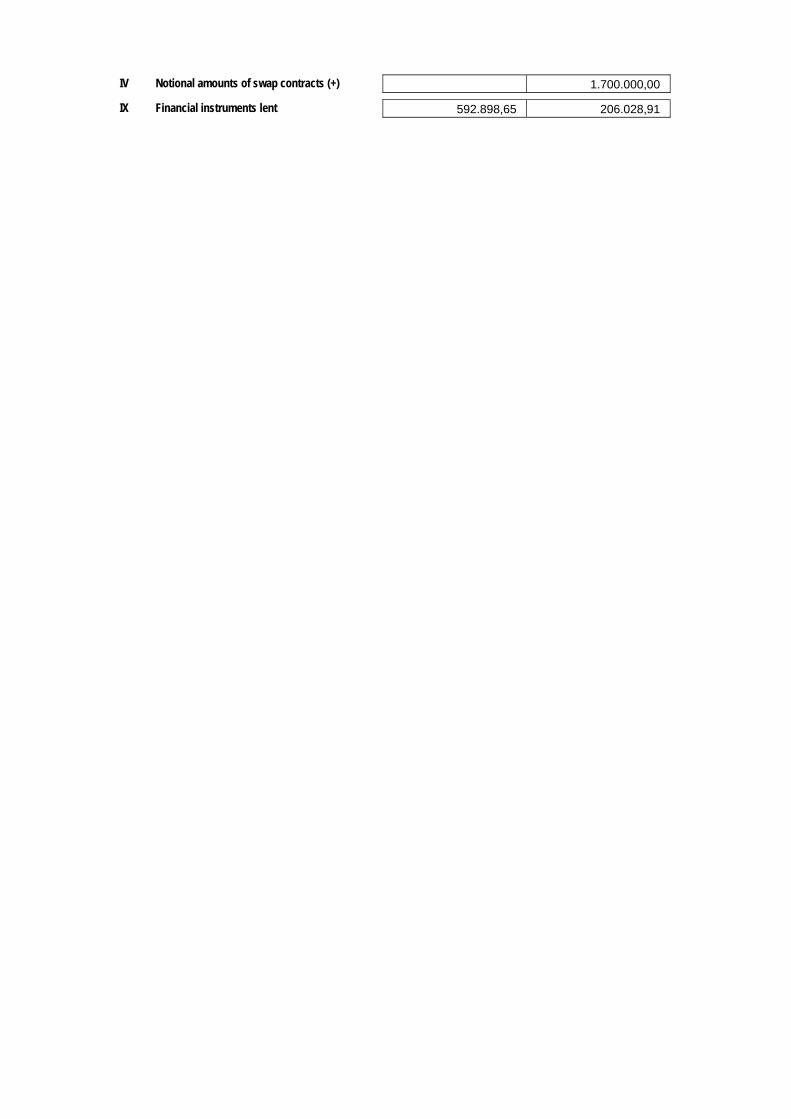
IV Notional amounts of swap contracts (+) 1.700.000,00
IX Financial instruments lent 592.898,65 206.028,91
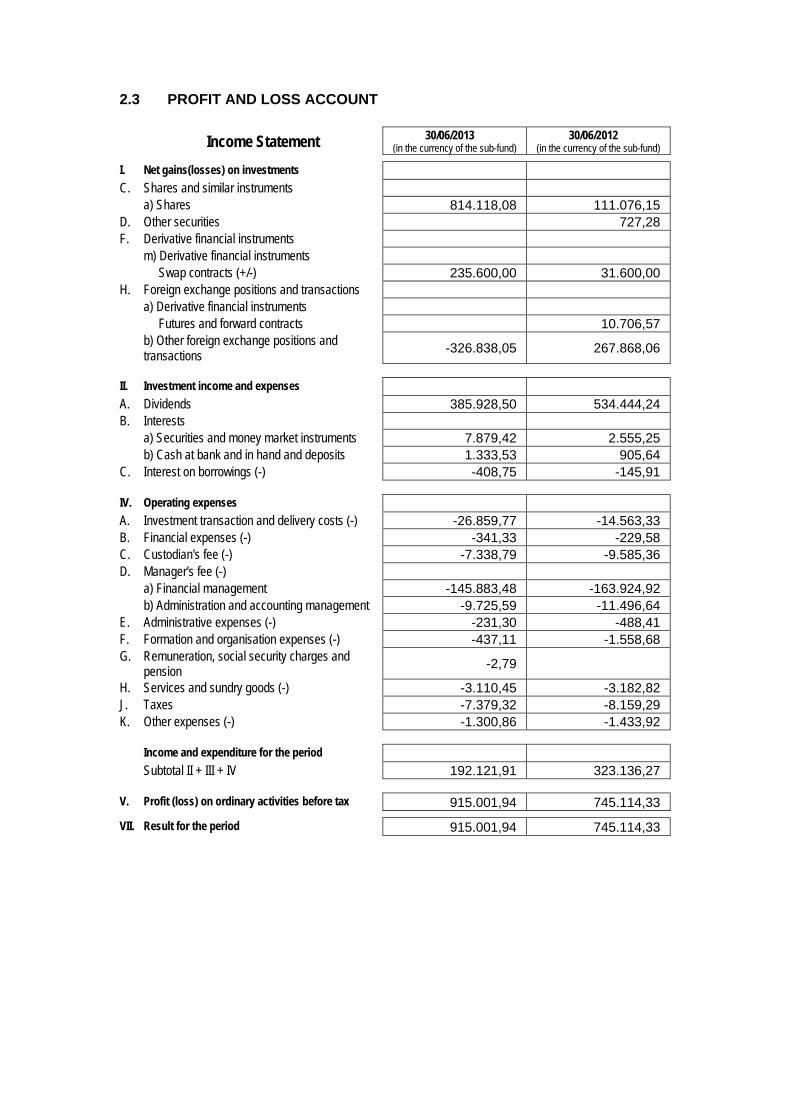
2.3 PROFIT AND LOSS ACCOUNT
Income Statement 30/06/2013 (in the currency of the sub-fund)
30/06/2012 (in the currency of the sub-fund)
I. Net gains(losses) on investments C. Shares and similar instruments a) Shares 814.118,08 111.076,15 D. Other securities 727,28 F. Derivative financial instruments m) Derivative financial instruments Swap contracts (+/-) 235.600,00 31.600,00 H. Foreign exchange positions and transactions a) Derivative financial instruments Futures and forward contracts 10.706,57 b) Other foreign exchange positions and
transactions -326.838,05 267.868,06
II. Investment income and expenses A. Dividends 385.928,50 534.444,24 B. Interests a) Securities and money market instruments 7.879,42 2.555,25 b) Cash at bank and in hand and deposits 1.333,53 905,64 C. Interest on borrowings (-) -408,75 -145,91
IV. Operating expenses A. Investment transaction and delivery costs (-) -26.859,77 -14.563,33 B. Financial expenses (-) -341,33 -229,58 C. Custodian's fee (-) -7.338,79 -9.585,36 D. Manager's fee (-) a) Financial management -145.883,48 -163.924,92 b) Administration and accounting management -9.725,59 -11.496,64 E. Administrative expenses (-) -231,30 -488,41 F. Formation and organisation expenses (-) -437,11 -1.558,68 G. Remuneration, social security charges and
pension -2,79
H. Services and sundry goods (-) -3.110,45 -3.182,82 J. Taxes -7.379,32 -8.159,29 K. Other expenses (-) -1.300,86 -1.433,92
Income and expenditure for the period Subtotal II + III + IV 192.121,91 323.136,27
V. Profit (loss) on ordinary activities before tax 915.001,94 745.114,33
VII. Result for the period 915.001,94 745.114,33
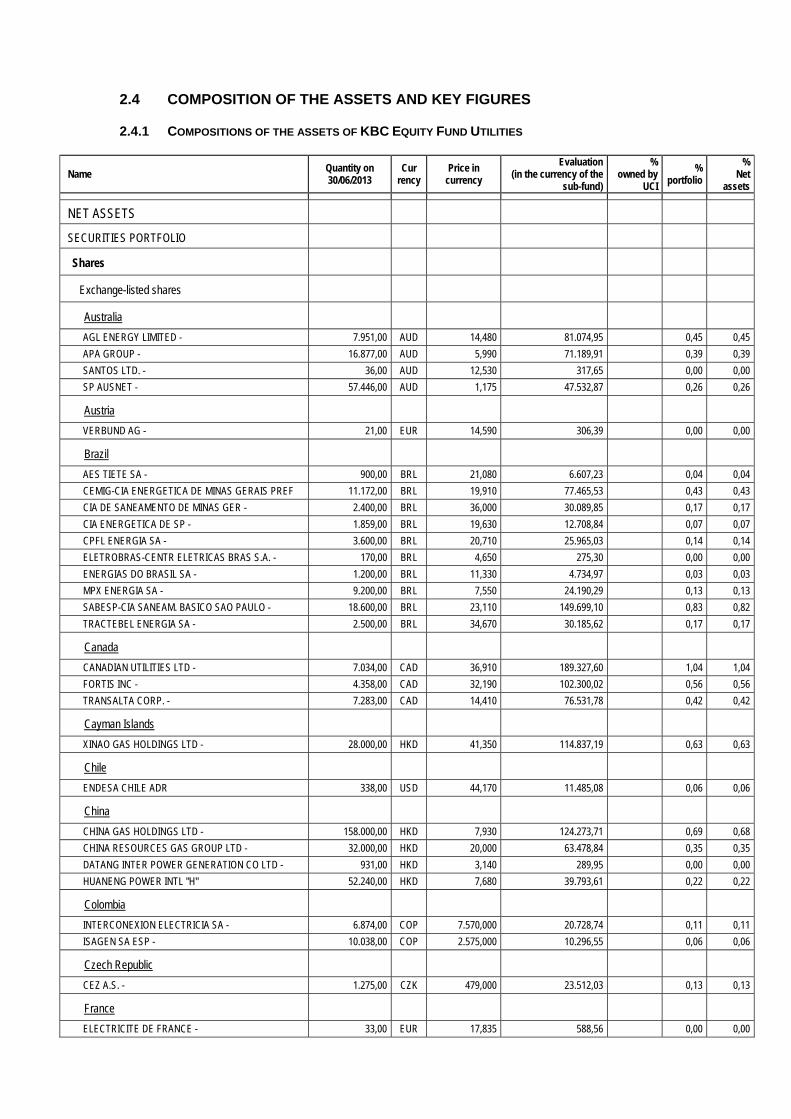
2.4 COMPOSITION OF THE ASSETS AND KEY FIGURES
2.4.1 COMPOSITIONS OF THE ASSETS OF KBC EQUITY FUND UTILITIES
Name Quantity on 30/06/2013
Cur rency
Price in currency
Evaluation (in the currency of the
sub-fund)
% owned by
UCI
% portfolio
% Net
assets
NET ASSETS
SECURITIES PORTFOLIO
Shares
Exchange-listed shares
Australia
AGL ENERGY LIMITED - 7.951,00 AUD 14,480 81.074,95 0,45 0,45
APA GROUP - 16.877,00 AUD 5,990 71.189,91 0,39 0,39
SANTOS LTD. - 36,00 AUD 12,530 317,65 0,00 0,00
SP AUSNET - 57.446,00 AUD 1,175 47.532,87 0,26 0,26
Austria
VERBUND AG - 21,00 EUR 14,590 306,39 0,00 0,00
Brazil
AES TIETE SA - 900,00 BRL 21,080 6.607,23 0,04 0,04
CEMIG-CIA ENERGETICA DE MINAS GERAIS PREF 11.172,00 BRL 19,910 77.465,53 0,43 0,43
CIA DE SANEAMENTO DE MINAS GER - 2.400,00 BRL 36,000 30.089,85 0,17 0,17
CIA ENERGETICA DE SP - 1.859,00 BRL 19,630 12.708,84 0,07 0,07
CPFL ENERGIA SA - 3.600,00 BRL 20,710 25.965,03 0,14 0,14
ELETROBRAS-CENTR ELETRICAS BRAS S.A. - 170,00 BRL 4,650 275,30 0,00 0,00
ENERGIAS DO BRASIL SA - 1.200,00 BRL 11,330 4.734,97 0,03 0,03
MPX ENERGIA SA - 9.200,00 BRL 7,550 24.190,29 0,13 0,13
SABESP-CIA SANEAM. BASICO SAO PAULO - 18.600,00 BRL 23,110 149.699,10 0,83 0,82
TRACTEBEL ENERGIA SA - 2.500,00 BRL 34,670 30.185,62 0,17 0,17
Canada
CANADIAN UTILITIES LTD - 7.034,00 CAD 36,910 189.327,60 1,04 1,04
FORTIS INC - 4.358,00 CAD 32,190 102.300,02 0,56 0,56
TRANSALTA CORP. - 7.283,00 CAD 14,410 76.531,78 0,42 0,42
Cayman Islands
XINAO GAS HOLDINGS LTD - 28.000,00 HKD 41,350 114.837,19 0,63 0,63
Chile
ENDESA CHILE ADR 338,00 USD 44,170 11.485,08 0,06 0,06
China
CHINA GAS HOLDINGS LTD - 158.000,00 HKD 7,930 124.273,71 0,69 0,68
CHINA RESOURCES GAS GROUP LTD - 32.000,00 HKD 20,000 63.478,84 0,35 0,35
DATANG INTER POWER GENERATION CO LTD - 931,00 HKD 3,140 289,95 0,00 0,00
HUANENG POWER INTL "H" 52.240,00 HKD 7,680 39.793,61 0,22 0,22
Colombia
INTERCONEXION ELECTRICIA SA - 6.874,00 COP 7.570,000 20.728,74 0,11 0,11
ISAGEN SA ESP - 10.038,00 COP 2.575,000 10.296,55 0,06 0,06
Czech Republic
CEZ A.S. - 1.275,00 CZK 479,000 23.512,03 0,13 0,13
France
ELECTRICITE DE FRANCE - 33,00 EUR 17,835 588,56 0,00 0,00
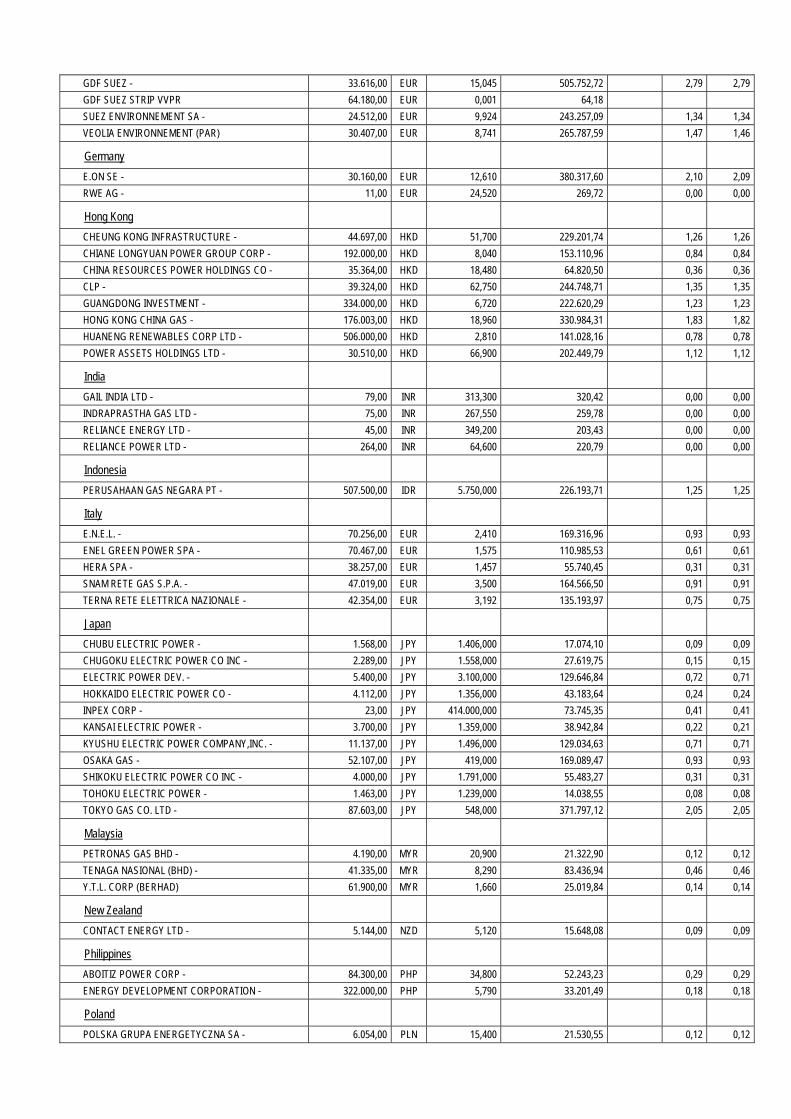
GDF SUEZ - 33.616,00 EUR 15,045 505.752,72 2,79 2,79
GDF SUEZ STRIP VVPR 64.180,00 EUR 0,001 64,18
SUEZ ENVIRONNEMENT SA - 24.512,00 EUR 9,924 243.257,09 1,34 1,34
VEOLIA ENVIRONNEMENT (PAR) 30.407,00 EUR 8,741 265.787,59 1,47 1,46
Germany
E.ON SE - 30.160,00 EUR 12,610 380.317,60 2,10 2,09
RWE AG - 11,00 EUR 24,520 269,72 0,00 0,00
Hong Kong
CHEUNG KONG INFRASTRUCTURE - 44.697,00 HKD 51,700 229.201,74 1,26 1,26
CHIANE LONGYUAN POWER GROUP CORP - 192.000,00 HKD 8,040 153.110,96 0,84 0,84
CHINA RESOURCES POWER HOLDINGS CO - 35.364,00 HKD 18,480 64.820,50 0,36 0,36
CLP - 39.324,00 HKD 62,750 244.748,71 1,35 1,35
GUANGDONG INVESTMENT - 334.000,00 HKD 6,720 222.620,29 1,23 1,23
HONG KONG CHINA GAS - 176.003,00 HKD 18,960 330.984,31 1,83 1,82
HUANENG RENEWABLES CORP LTD - 506.000,00 HKD 2,810 141.028,16 0,78 0,78
POWER ASSETS HOLDINGS LTD - 30.510,00 HKD 66,900 202.449,79 1,12 1,12
India
GAIL INDIA LTD - 79,00 INR 313,300 320,42 0,00 0,00
INDRAPRASTHA GAS LTD - 75,00 INR 267,550 259,78 0,00 0,00
RELIANCE ENERGY LTD - 45,00 INR 349,200 203,43 0,00 0,00
RELIANCE POWER LTD - 264,00 INR 64,600 220,79 0,00 0,00
Indonesia
PERUSAHAAN GAS NEGARA PT - 507.500,00 IDR 5.750,000 226.193,71 1,25 1,25
Italy
E.N.E.L. - 70.256,00 EUR 2,410 169.316,96 0,93 0,93
ENEL GREEN POWER SPA - 70.467,00 EUR 1,575 110.985,53 0,61 0,61
HERA SPA - 38.257,00 EUR 1,457 55.740,45 0,31 0,31
SNAM RETE GAS S.P.A. - 47.019,00 EUR 3,500 164.566,50 0,91 0,91
TERNA RETE ELETTRICA NAZIONALE - 42.354,00 EUR 3,192 135.193,97 0,75 0,75
Japan
CHUBU ELECTRIC POWER - 1.568,00 JPY 1.406,000 17.074,10 0,09 0,09
CHUGOKU ELECTRIC POWER CO INC - 2.289,00 JPY 1.558,000 27.619,75 0,15 0,15
ELECTRIC POWER DEV. - 5.400,00 JPY 3.100,000 129.646,84 0,72 0,71
HOKKAIDO ELECTRIC POWER CO - 4.112,00 JPY 1.356,000 43.183,64 0,24 0,24
INPEX CORP - 23,00 JPY 414.000,000 73.745,35 0,41 0,41
KANSAI ELECTRIC POWER - 3.700,00 JPY 1.359,000 38.942,84 0,22 0,21
KYUSHU ELECTRIC POWER COMPANY,INC. - 11.137,00 JPY 1.496,000 129.034,63 0,71 0,71
OSAKA GAS - 52.107,00 JPY 419,000 169.089,47 0,93 0,93
SHIKOKU ELECTRIC POWER CO INC - 4.000,00 JPY 1.791,000 55.483,27 0,31 0,31
TOHOKU ELECTRIC POWER - 1.463,00 JPY 1.239,000 14.038,55 0,08 0,08
TOKYO GAS CO. LTD - 87.603,00 JPY 548,000 371.797,12 2,05 2,05
Malaysia
PETRONAS GAS BHD - 4.190,00 MYR 20,900 21.322,90 0,12 0,12
TENAGA NASIONAL (BHD) - 41.335,00 MYR 8,290 83.436,94 0,46 0,46
Y.T.L. CORP (BERHAD) 61.900,00 MYR 1,660 25.019,84 0,14 0,14
New Zealand
CONTACT ENERGY LTD - 5.144,00 NZD 5,120 15.648,08 0,09 0,09
Philippines
ABOITIZ POWER CORP - 84.300,00 PHP 34,800 52.243,23 0,29 0,29
ENERGY DEVELOPMENT CORPORATION - 322.000,00 PHP 5,790 33.201,49 0,18 0,18
Poland
POLSKA GRUPA ENERGETYCZNA SA - 6.054,00 PLN 15,400 21.530,55 0,12 0,12
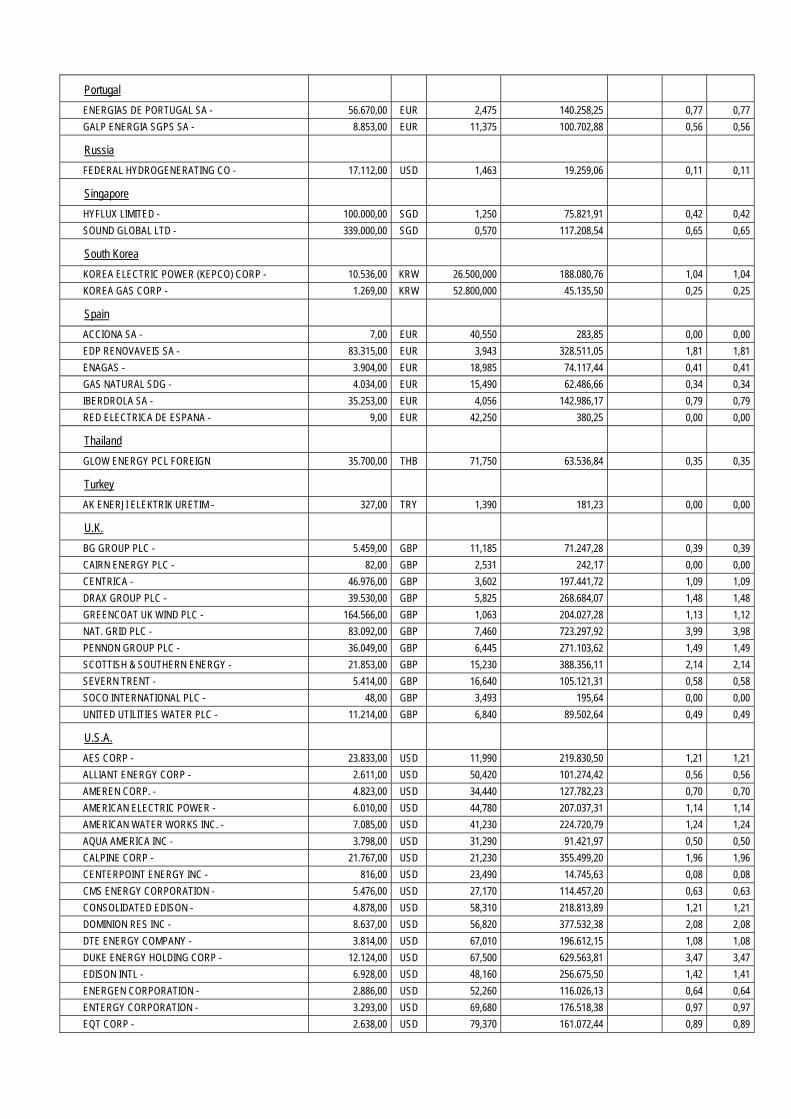
Portugal
ENERGIAS DE PORTUGAL SA - 56.670,00 EUR 2,475 140.258,25 0,77 0,77
GALP ENERGIA SGPS SA - 8.853,00 EUR 11,375 100.702,88 0,56 0,56
Russia
FEDERAL HYDROGENERATING CO - 17.112,00 USD 1,463 19.259,06 0,11 0,11
Singapore
HYFLUX LIMITED - 100.000,00 SGD 1,250 75.821,91 0,42 0,42
SOUND GLOBAL LTD - 339.000,00 SGD 0,570 117.208,54 0,65 0,65
South Korea
KOREA ELECTRIC POWER (KEPCO) CORP - 10.536,00 KRW 26.500,000 188.080,76 1,04 1,04
KOREA GAS CORP - 1.269,00 KRW 52.800,000 45.135,50 0,25 0,25
Spain
ACCIONA SA - 7,00 EUR 40,550 283,85 0,00 0,00
EDP RENOVAVEIS SA - 83.315,00 EUR 3,943 328.511,05 1,81 1,81
ENAGAS - 3.904,00 EUR 18,985 74.117,44 0,41 0,41
GAS NATURAL SDG - 4.034,00 EUR 15,490 62.486,66 0,34 0,34
IBERDROLA SA - 35.253,00 EUR 4,056 142.986,17 0,79 0,79
RED ELECTRICA DE ESPANA - 9,00 EUR 42,250 380,25 0,00 0,00
Thailand
GLOW ENERGY PCL FOREIGN 35.700,00 THB 71,750 63.536,84 0,35 0,35
Turkey
AK ENERJI ELEKTRIK URETIM - 327,00 TRY 1,390 181,23 0,00 0,00
U.K.
BG GROUP PLC - 5.459,00 GBP 11,185 71.247,28 0,39 0,39
CAIRN ENERGY PLC - 82,00 GBP 2,531 242,17 0,00 0,00
CENTRICA - 46.976,00 GBP 3,602 197.441,72 1,09 1,09
DRAX GROUP PLC - 39.530,00 GBP 5,825 268.684,07 1,48 1,48
GREENCOAT UK WIND PLC - 164.566,00 GBP 1,063 204.027,28 1,13 1,12
NAT. GRID PLC - 83.092,00 GBP 7,460 723.297,92 3,99 3,98
PENNON GROUP PLC - 36.049,00 GBP 6,445 271.103,62 1,49 1,49
SCOTTISH & SOUTHERN ENERGY - 21.853,00 GBP 15,230 388.356,11 2,14 2,14
SEVERN TRENT - 5.414,00 GBP 16,640 105.121,31 0,58 0,58
SOCO INTERNATIONAL PLC - 48,00 GBP 3,493 195,64 0,00 0,00
UNITED UTILITIES WATER PLC - 11.214,00 GBP 6,840 89.502,64 0,49 0,49
U.S.A.
AES CORP - 23.833,00 USD 11,990 219.830,50 1,21 1,21
ALLIANT ENERGY CORP - 2.611,00 USD 50,420 101.274,42 0,56 0,56
AMEREN CORP. - 4.823,00 USD 34,440 127.782,23 0,70 0,70
AMERICAN ELECTRIC POWER - 6.010,00 USD 44,780 207.037,31 1,14 1,14
AMERICAN WATER WORKS INC. - 7.085,00 USD 41,230 224.720,79 1,24 1,24
AQUA AMERICA INC - 3.798,00 USD 31,290 91.421,97 0,50 0,50
CALPINE CORP - 21.767,00 USD 21,230 355.499,20 1,96 1,96
CENTERPOINT ENERGY INC - 816,00 USD 23,490 14.745,63 0,08 0,08
CMS ENERGY CORPORATION - 5.476,00 USD 27,170 114.457,20 0,63 0,63
CONSOLIDATED EDISON - 4.878,00 USD 58,310 218.813,89 1,21 1,21
DOMINION RES INC - 8.637,00 USD 56,820 377.532,38 2,08 2,08
DTE ENERGY COMPANY - 3.814,00 USD 67,010 196.612,15 1,08 1,08
DUKE ENERGY HOLDING CORP - 12.124,00 USD 67,500 629.563,81 3,47 3,47
EDISON INTL - 6.928,00 USD 48,160 256.675,50 1,42 1,41
ENERGEN CORPORATION - 2.886,00 USD 52,260 116.026,13 0,64 0,64
ENTERGY CORPORATION - 3.293,00 USD 69,680 176.518,38 0,97 0,97
EQT CORP - 2.638,00 USD 79,370 161.072,44 0,89 0,89
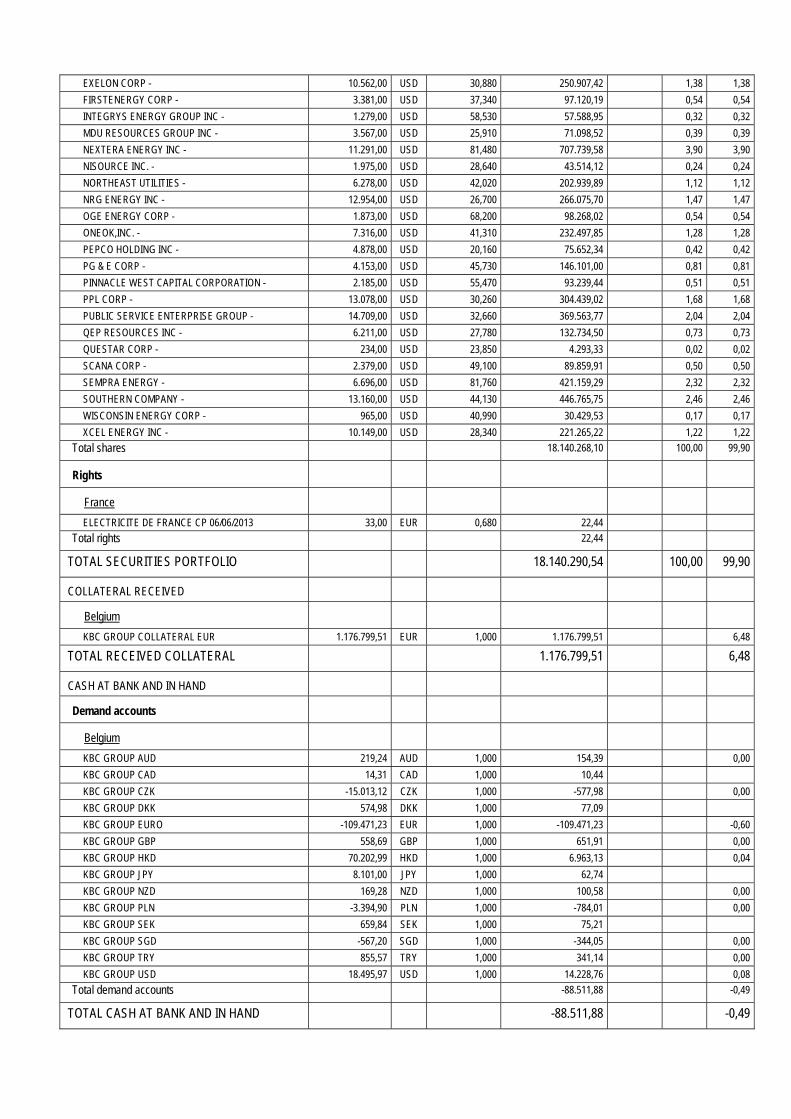
EXELON CORP - 10.562,00 USD 30,880 250.907,42 1,38 1,38
FIRSTENERGY CORP - 3.381,00 USD 37,340 97.120,19 0,54 0,54
INTEGRYS ENERGY GROUP INC - 1.279,00 USD 58,530 57.588,95 0,32 0,32
MDU RESOURCES GROUP INC - 3.567,00 USD 25,910 71.098,52 0,39 0,39
NEXTERA ENERGY INC - 11.291,00 USD 81,480 707.739,58 3,90 3,90
NISOURCE INC. - 1.975,00 USD 28,640 43.514,12 0,24 0,24
NORTHEAST UTILITIES - 6.278,00 USD 42,020 202.939,89 1,12 1,12
NRG ENERGY INC - 12.954,00 USD 26,700 266.075,70 1,47 1,47
OGE ENERGY CORP - 1.873,00 USD 68,200 98.268,02 0,54 0,54
ONEOK,INC. - 7.316,00 USD 41,310 232.497,85 1,28 1,28
PEPCO HOLDING INC - 4.878,00 USD 20,160 75.652,34 0,42 0,42
PG & E CORP - 4.153,00 USD 45,730 146.101,00 0,81 0,81
PINNACLE WEST CAPITAL CORPORATION - 2.185,00 USD 55,470 93.239,44 0,51 0,51
PPL CORP - 13.078,00 USD 30,260 304.439,02 1,68 1,68
PUBLIC SERVICE ENTERPRISE GROUP - 14.709,00 USD 32,660 369.563,77 2,04 2,04
QEP RESOURCES INC - 6.211,00 USD 27,780 132.734,50 0,73 0,73
QUESTAR CORP - 234,00 USD 23,850 4.293,33 0,02 0,02
SCANA CORP - 2.379,00 USD 49,100 89.859,91 0,50 0,50
SEMPRA ENERGY - 6.696,00 USD 81,760 421.159,29 2,32 2,32
SOUTHERN COMPANY - 13.160,00 USD 44,130 446.765,75 2,46 2,46
WISCONSIN ENERGY CORP - 965,00 USD 40,990 30.429,53 0,17 0,17
XCEL ENERGY INC - 10.149,00 USD 28,340 221.265,22 1,22 1,22
Total shares 18.140.268,10 100,00 99,90
Rights
France
ELECTRICITE DE FRANCE CP 06/06/2013 33,00 EUR 0,680 22,44
Total rights 22,44
TOTAL SECURITIES PORTFOLIO 18.140.290,54 100,00 99,90
COLLATERAL RECEIVED
Belgium
KBC GROUP COLLATERAL EUR 1.176.799,51 EUR 1,000 1.176.799,51 6,48
TOTAL RECEIVED COLLATERAL 1.176.799,51 6,48
CASH AT BANK AND IN HAND
Demand accounts
Belgium
KBC GROUP AUD 219,24 AUD 1,000 154,39 0,00
KBC GROUP CAD 14,31 CAD 1,000 10,44
KBC GROUP CZK -15.013,12 CZK 1,000 -577,98 0,00
KBC GROUP DKK 574,98 DKK 1,000 77,09
KBC GROUP EURO -109.471,23 EUR 1,000 -109.471,23 -0,60
KBC GROUP GBP 558,69 GBP 1,000 651,91 0,00
KBC GROUP HKD 70.202,99 HKD 1,000 6.963,13 0,04
KBC GROUP JPY 8.101,00 JPY 1,000 62,74
KBC GROUP NZD 169,28 NZD 1,000 100,58 0,00
KBC GROUP PLN -3.394,90 PLN 1,000 -784,01 0,00
KBC GROUP SEK 659,84 SEK 1,000 75,21
KBC GROUP SGD -567,20 SGD 1,000 -344,05 0,00
KBC GROUP TRY 855,57 TRY 1,000 341,14 0,00
KBC GROUP USD 18.495,97 USD 1,000 14.228,76 0,08
Total demand accounts -88.511,88 -0,49
TOTAL CASH AT BANK AND IN HAND -88.511,88 -0,49
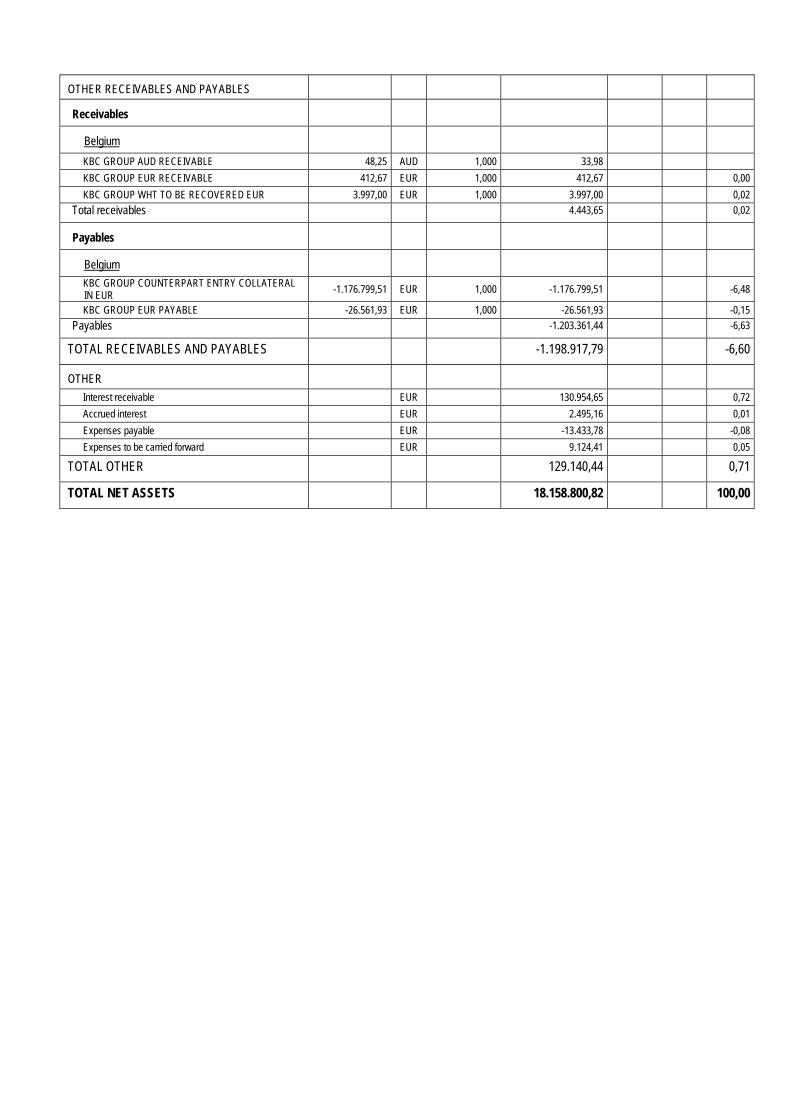
OTHER RECEIVABLES AND PAYABLES
Receivables
Belgium
KBC GROUP AUD RECEIVABLE 48,25 AUD 1,000 33,98
KBC GROUP EUR RECEIVABLE 412,67 EUR 1,000 412,67 0,00
KBC GROUP WHT TO BE RECOVERED EUR 3.997,00 EUR 1,000 3.997,00 0,02
Total receivables 4.443,65 0,02
Payables
Belgium
KBC GROUP COUNTERPART ENTRY COLLATERAL IN EUR -1.176.799,51 EUR 1,000 -1.176.799,51 -6,48
KBC GROUP EUR PAYABLE -26.561,93 EUR 1,000 -26.561,93 -0,15
Payables -1.203.361,44 -6,63
TOTAL RECEIVABLES AND PAYABLES -1.198.917,79 -6,60
OTHER
Interest receivable EUR 130.954,65 0,72
Accrued interest EUR 2.495,16 0,01
Expenses payable EUR -13.433,78 -0,08
Expenses to be carried forward EUR 9.124,41 0,05
TOTAL OTHER 129.140,44 0,71
TOTAL NET ASSETS 18.158.800,82 100,00
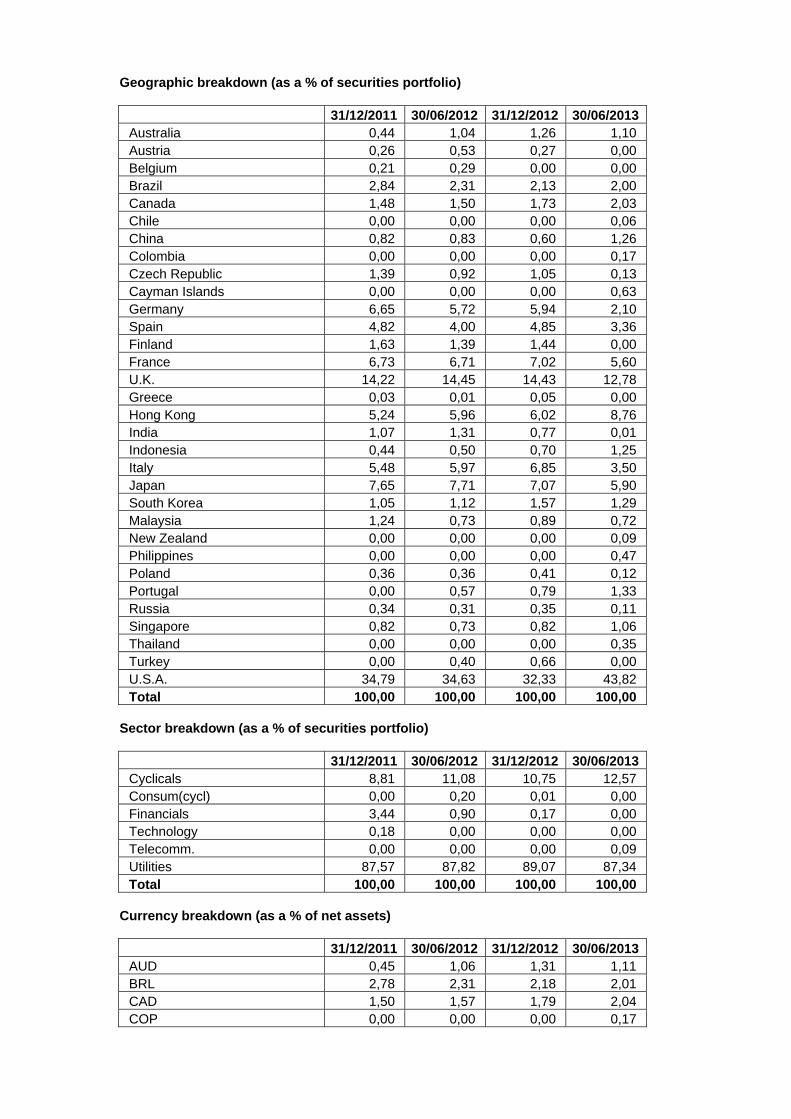
Geographic breakdown (as a % of securities portfolio)
31/12/2011 30/06/2012 31/12/2012 30/06/2013 Australia 0,44 1,04 1,26 1,10 Austria 0,26 0,53 0,27 0,00 Belgium 0,21 0,29 0,00 0,00 Brazil 2,84 2,31 2,13 2,00 Canada 1,48 1,50 1,73 2,03 Chile 0,00 0,00 0,00 0,06 China 0,82 0,83 0,60 1,26 Colombia 0,00 0,00 0,00 0,17 Czech Republic 1,39 0,92 1,05 0,13 Cayman Islands 0,00 0,00 0,00 0,63 Germany 6,65 5,72 5,94 2,10 Spain 4,82 4,00 4,85 3,36 Finland 1,63 1,39 1,44 0,00 France 6,73 6,71 7,02 5,60 U.K. 14,22 14,45 14,43 12,78 Greece 0,03 0,01 0,05 0,00 Hong Kong 5,24 5,96 6,02 8,76 India 1,07 1,31 0,77 0,01 Indonesia 0,44 0,50 0,70 1,25 Italy 5,48 5,97 6,85 3,50 Japan 7,65 7,71 7,07 5,90 South Korea 1,05 1,12 1,57 1,29 Malaysia 1,24 0,73 0,89 0,72 New Zealand 0,00 0,00 0,00 0,09 Philippines 0,00 0,00 0,00 0,47 Poland 0,36 0,36 0,41 0,12 Portugal 0,00 0,57 0,79 1,33 Russia 0,34 0,31 0,35 0,11 Singapore 0,82 0,73 0,82 1,06 Thailand 0,00 0,00 0,00 0,35 Turkey 0,00 0,40 0,66 0,00 U.S.A. 34,79 34,63 32,33 43,82 Total 100,00 100,00 100,00 100,00
Sector breakdown (as a % of securities portfolio)
31/12/2011 30/06/2012 31/12/2012 30/06/2013 Cyclicals 8,81 11,08 10,75 12,57 Consum(cycl) 0,00 0,20 0,01 0,00 Financials 3,44 0,90 0,17 0,00 Technology 0,18 0,00 0,00 0,00 Telecomm. 0,00 0,00 0,00 0,09 Utilities 87,57 87,82 89,07 87,34 Total 100,00 100,00 100,00 100,00
Currency breakdown (as a % of net assets)
31/12/2011 30/06/2012 31/12/2012 30/06/2013 AUD 0,45 1,06 1,31 1,11 BRL 2,78 2,31 2,18 2,01 CAD 1,50 1,57 1,79 2,04 COP 0,00 0,00 0,00 0,17
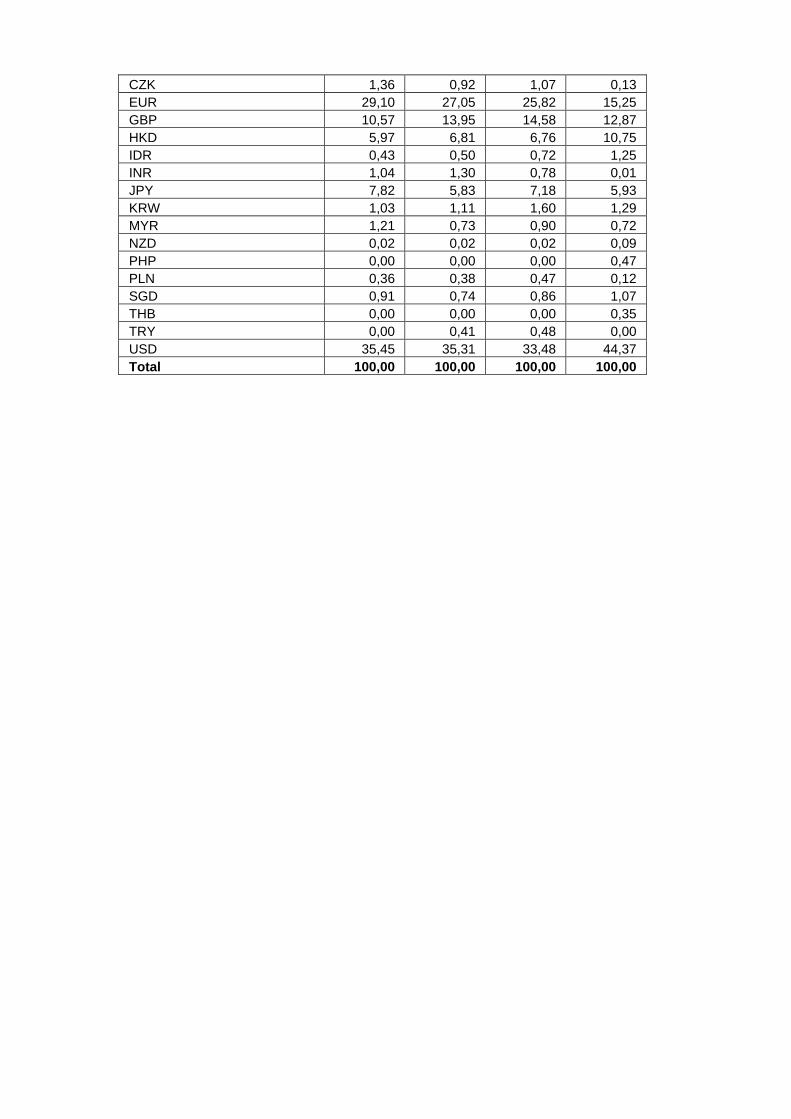
CZK 1,36 0,92 1,07 0,13 EUR 29,10 27,05 25,82 15,25 GBP 10,57 13,95 14,58 12,87 HKD 5,97 6,81 6,76 10,75 IDR 0,43 0,50 0,72 1,25 INR 1,04 1,30 0,78 0,01 JPY 7,82 5,83 7,18 5,93 KRW 1,03 1,11 1,60 1,29 MYR 1,21 0,73 0,90 0,72 NZD 0,02 0,02 0,02 0,09 PHP 0,00 0,00 0,00 0,47 PLN 0,36 0,38 0,47 0,12 SGD 0,91 0,74 0,86 1,07 THB 0,00 0,00 0,00 0,35 TRY 0,00 0,41 0,48 0,00 USD 35,45 35,31 33,48 44,37 Total 100,00 100,00 100,00 100,00

2.4.2 CHANGES IN THE COMPOSITION OF THE ASSETS OF KBC EQUITY FUND UTILITIES (IN THE
CURRENCY OF THE SUB-FUND)
1st half of year YearPurchases 8.480.445,85 8.480.445,85 Sales 11.642.511,89 11.642.511,89 Total 1 20.122.957,74 20.122.957,74 Subscriptions 1.587.760,55 1.587.760,55 Redemptions 4.540.379,22 4.540.379,22 Total 2 6.128.139,77 6.128.139,77 Monthly average of total assets
19.765.413,11 19.765.413,11
Turnover rate 70,80 % 70,80 %
1st half of year YearPurchases 8.480.445,85 8.480.445,85 Sales 11.642.511,89 11.642.511,89 Total 1 20.122.957,74 20.122.957,74 Subscriptions 1.587.760,55 1.587.760,55 Redemptions 4.540.379,22 4.540.379,22 Total 2 6.128.139,77 6.128.139,77 Monthly average of total assets
19.740.482,94 19.740.482,94
Corrected turnover rate 70,89 % 70,89 %
The table above shows the capital volume of portfolio transactions. This volume (adjusted to take account of total subscriptions and redemptions) is also compared to the average net assets at the beginning and end of the period. A figure close to 0% implies that the transactions relating to the securities or transactions relating to the assets (excluding deposits and cash) in a given period only involve subscriptions and redemptions. A negative percentage shows that subscriptions and redemptions entailed few, if any, transactions in the portfolio. Active asset management may result in high turnover rates (monthly percentage >50%). The detailed list of transactions is available for consultation free of charge at the registered office of the Bevek or fund at Havenlaan 2, 1080 Brussels.
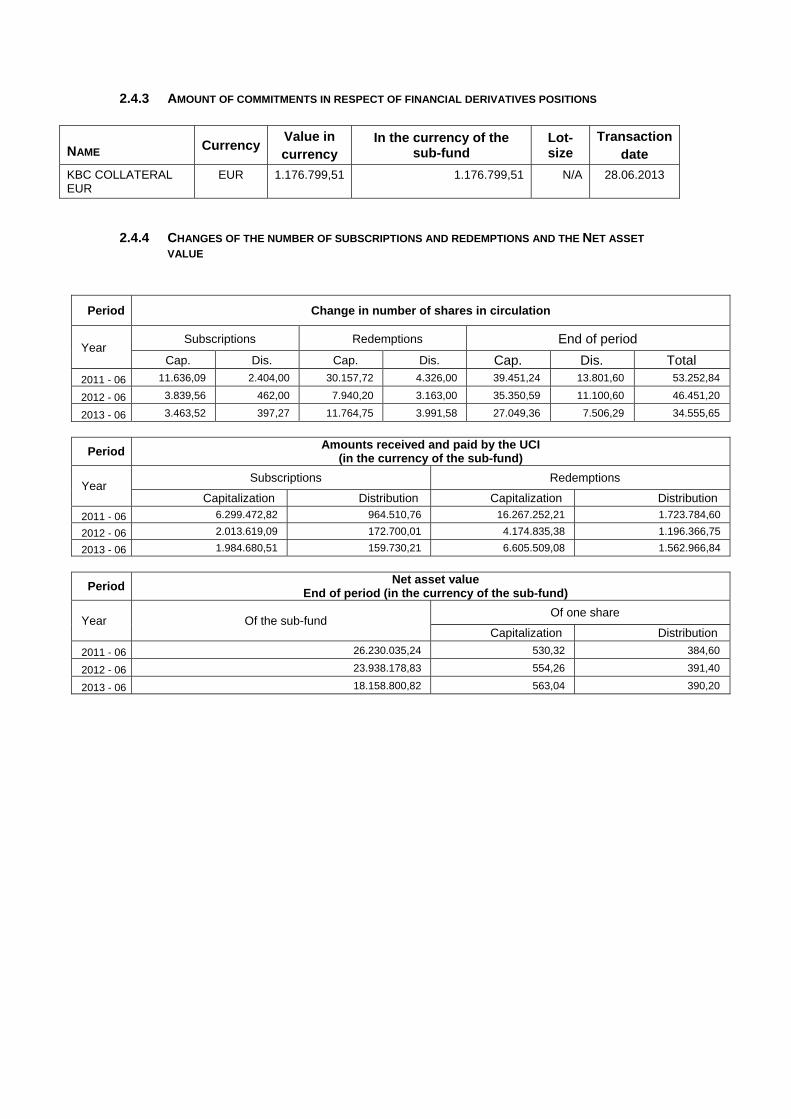
2.4.3 AMOUNT OF COMMITMENTS IN RESPECT OF FINANCIAL DERIVATIVES POSITIONS
NAME Currency Value in currency
In the currency of the sub-fund
Lot-size
Transactiondate
KBC COLLATERAL EUR
EUR 1.176.799,51 1.176.799,51 N/A 28.06.2013
2.4.4 CHANGES OF THE NUMBER OF SUBSCRIPTIONS AND REDEMPTIONS AND THE NET ASSET
VALUE
Period Change in number of shares in circulation
Year Subscriptions Redemptions End of period
Cap. Dis. Cap. Dis. Cap. Dis. Total
2011 - 06 11.636,09 2.404,00 30.157,72 4.326,00 39.451,24 13.801,60 53.252,84
2012 - 06 3.839,56 462,00 7.940,20 3.163,00 35.350,59 11.100,60 46.451,20
2013 - 06 3.463,52 397,27 11.764,75 3.991,58 27.049,36 7.506,29 34.555,65
Period Amounts received and paid by the UCI
(in the currency of the sub-fund)
Year Subscriptions Redemptions
Capitalization Distribution Capitalization Distribution
2011 - 06 6.299.472,82 964.510,76 16.267.252,21 1.723.784,60
2012 - 06 2.013.619,09 172.700,01 4.174.835,38 1.196.366,75
2013 - 06 1.984.680,51 159.730,21 6.605.509,08 1.562.966,84
Period Net asset value
End of period (in the currency of the sub-fund)
Year Of the sub-fund Of one share
Capitalization Distribution
2011 - 06 26.230.035,24 530,32 384,60
2012 - 06 23.938.178,83 554,26 391,40
2013 - 06 18.158.800,82 563,04 390,20
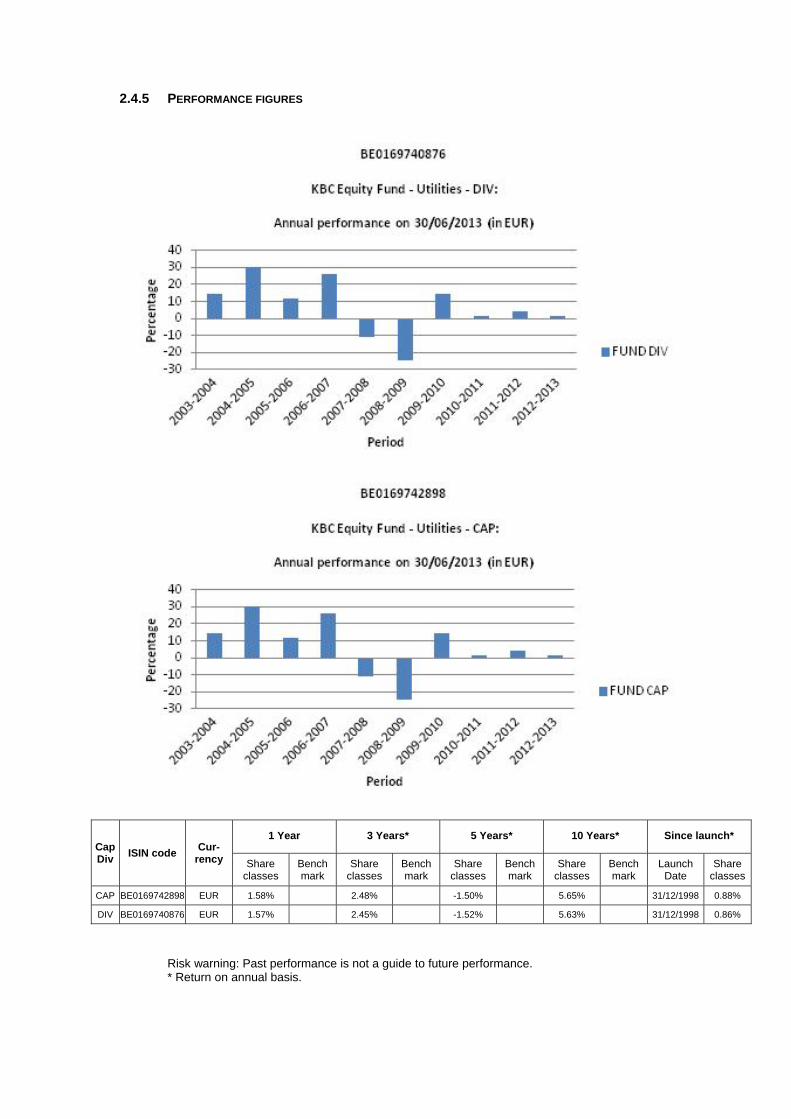
2.4.5 PERFORMANCE FIGURES
Cap Div
ISIN code Cur-
rency
1 Year 3 Years* 5 Years* 10 Years* Since launch*
Share classes
Bench mark
Share classes
Bench mark
Share classes
Bench mark
Share classes
Bench mark
Launch Date
Share classes
CAP BE0169742898 EUR 1.58% 2.48% -1.50% 5.65% 31/12/1998 0.88%
DIV BE0169740876 EUR 1.57% 2.45% -1.52% 5.63% 31/12/1998 0.86%
Risk warning: Past performance is not a guide to future performance. * Return on annual basis.

The bar chart shows the performance for full financial years. The figures do not take account of any restructuring. Calculated in EUR (ex BEF). the return is calculated as the change in the net asset value between two dates expressed
as a percentage. In the case of units that pay dividends, the dividend is incorporated geometrically in the return.
Calculation method for date D, where NAV stands for net asset value: Capitalisation units (CAP) Return on date D over a period of X years:
[NAV(D) / NAV(Y)] ^ [1 / X] - 1 where Y = D-X
Return on date D since the start date S of the unit: [NAV(D) / NAV(S)] ^ [1 / F] - 1 where F = 1 if the unit has existed for less than one year on date D where F = (D-S) / 365.25 if the unit has existed for longer than one year on date D
Distribution units (DIV) Return on date D over a period of X years:
[ C * NAV(D) / NAV(Y)] ^ [1 / X] - 1 where Y = D-X
Return on date D since the start date S of the unit: [ C * NAV(D) / NAV(S)] ^ [1 / F] - 1 where F = 1 if the unit has existed for less than one year on date D where F = (D-S) / 365.25 if the unit has existed for longer than one year on date D
where C is a factor that is determined for all N dividends between the calculation date D and the reference date. For dividend i on date Di with value Wi:
Ci = [Wi / NAV(Di)] + 1 i = 1 ... N
from which C = C0 * .... * CN. If the interval between the two dates exceeds one year, the ordinary return calculation is
converted into a return on an annual basis by taking the nth square root of 1 plus the total return of the unit.
The return figures shown above do not take account of the fees and charges associated with the issue and redemption of units.
These are the performance figures for capitalisation and distribution shares.
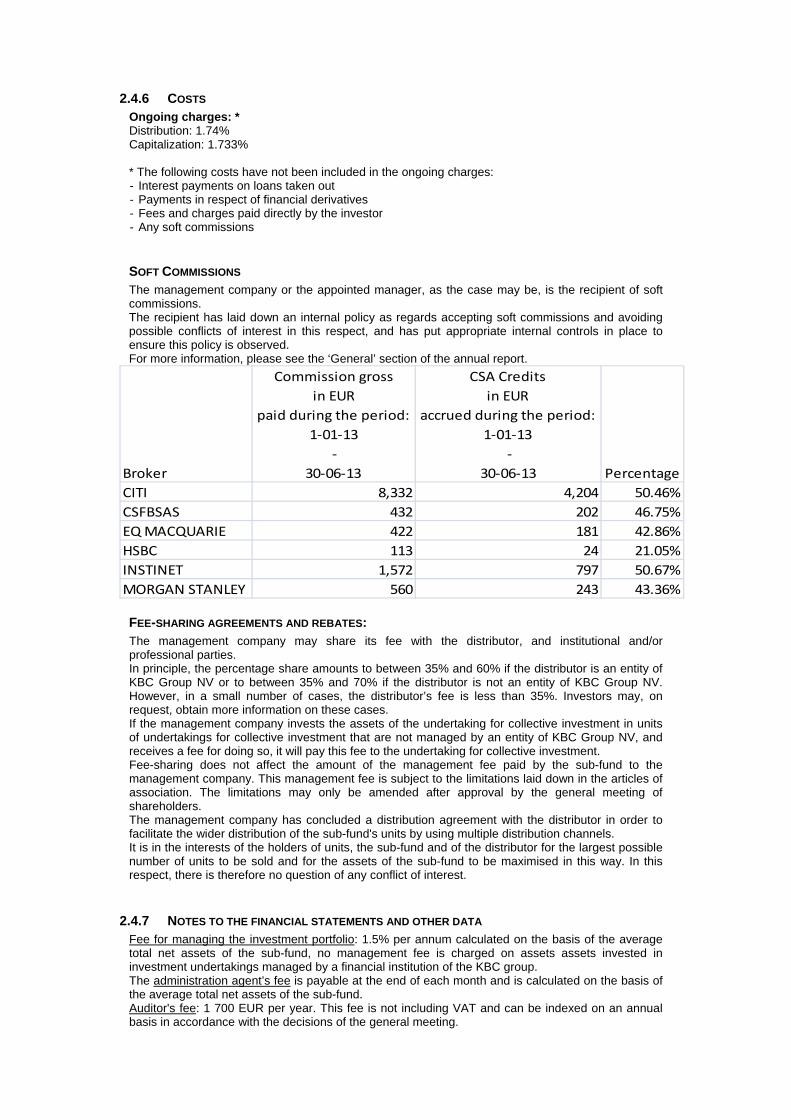
2.4.6 COSTS Ongoing charges: * Distribution: 1.74% Capitalization: 1.733% * The following costs have not been included in the ongoing charges: - Interest payments on loans taken out - Payments in respect of financial derivatives - Fees and charges paid directly by the investor - Any soft commissions
SOFT COMMISSIONS The management company or the appointed manager, as the case may be, is the recipient of soft commissions. The recipient has laid down an internal policy as regards accepting soft commissions and avoiding possible conflicts of interest in this respect, and has put appropriate internal controls in place to ensure this policy is observed. For more information, please see the ‘General’ section of the annual report.
Broker
Commission gross
in EUR
paid during the period:
1‐01‐13
‐
30‐06‐13
CSA Credits
in EUR
accrued during the period:
1‐01‐13
‐
30‐06‐13 Percentage
CITI 8,332 4,204 50.46%
CSFBSAS 432 202 46.75%
EQ MACQUARIE 422 181 42.86%
HSBC 113 24 21.05%
INSTINET 1,572 797 50.67%
MORGAN STANLEY 560 243 43.36%
FEE-SHARING AGREEMENTS AND REBATES: The management company may share its fee with the distributor, and institutional and/or professional parties. In principle, the percentage share amounts to between 35% and 60% if the distributor is an entity of KBC Group NV or to between 35% and 70% if the distributor is not an entity of KBC Group NV. However, in a small number of cases, the distributor’s fee is less than 35%. Investors may, on request, obtain more information on these cases. If the management company invests the assets of the undertaking for collective investment in units of undertakings for collective investment that are not managed by an entity of KBC Group NV, and receives a fee for doing so, it will pay this fee to the undertaking for collective investment. Fee-sharing does not affect the amount of the management fee paid by the sub-fund to the management company. This management fee is subject to the limitations laid down in the articles of association. The limitations may only be amended after approval by the general meeting of shareholders. The management company has concluded a distribution agreement with the distributor in order to facilitate the wider distribution of the sub-fund's units by using multiple distribution channels. It is in the interests of the holders of units, the sub-fund and of the distributor for the largest possible number of units to be sold and for the assets of the sub-fund to be maximised in this way. In this respect, there is therefore no question of any conflict of interest.
2.4.7 NOTES TO THE FINANCIAL STATEMENTS AND OTHER DATA Fee for managing the investment portfolio: 1.5% per annum calculated on the basis of the average total net assets of the sub-fund, no management fee is charged on assets assets invested in investment undertakings managed by a financial institution of the KBC group. The administration agent’s fee is payable at the end of each month and is calculated on the basis of the average total net assets of the sub-fund. Auditor's fee: 1 700 EUR per year. This fee is not including VAT and can be indexed on an annual basis in accordance with the decisions of the general meeting.

The custody fee is calculated on the value of the securities held in custody by the custodian on the final banking day of the preceding calendar year, except on those assets invested in investment undertakings managed by a financial institution of the KBC group. The custody fee is paid at the beginning of the calendar year. Social, ethical and environmental aspects: No manufacturers of controversial weapons whose use over the past five decades, according to the international consensus, has led to disproportionate human suffering among the civilian population will be included in the portfolio of investments. This involves the manufacturers of anti-personnel mines, cluster bombs and munitions and weapons containing depleted uranium. In this way, the sub-fund seeks to reflect not only simple financial reality but also the social reality of the sector or region in question. Exercising voting rights. If necessary, relevant and in the interest of the shareholders, the management company will exercise the voting rights attached to the shares in the Bevek’s portfolio. The management company will adhere to the following criteria when determining how it stands relative to the items on the agenda that are put to the vote: - Shareholder value may not be adversely affected. - Corporate governance rules, especially with regard to the rights of minority shareholders, must be
respected. - The minimum standards with regard to sustainable business and corporate social responsibility
must be met. The list of companies for which voting rights are exercised is available at the registered office of the Bevek. Securities lending In accordance with the Royal Decree of 7 March 2006 concerning securities lending, the undertaking for collective investment has taken out securities loans with a principal to whom the full title of the loaned securities was transferred, without recording this transfer of ownership in the accounts. For the period from 1 January 2013 to 30 June 2013, the fee for securities lent comes to 4,775.48 EUR. The undertaking for collective investment receives 50% of the fee received for securities lent. The detailed list of securities lending transactions carried out can be obtained from the registered office of the collective investment undertaking at 2 Havenlaan, 1080 Brussels.
Overview of securities lent as at 30/06/2013
Name Currency Quantity Price Value in currency of the
portfolio
FORTIS INC CAD 4.357 32,190 102.276,55
IBERDROLA SA EUR 35.252 4,056 142.982,11
PENNON GROUP PLC GBP 19.213 6,445 144.489,83
POLSKA GRUPA ENERGETYCZNA SA PLN 6.053 15,400 21.527,00
SEVERN TRENT PLC -NEW- GBP 5.413 16,640 105.101,89
TRANSALTA CORP. CAD 7.282 14,410 76.521,27
Total 592.898,65
Details of collateral received for securities lent
Name Currency Nominal value Currency fund Value in Currency fund
FLEMISH COMMUNITY - 09/14 3.75% 31/03 EUR 550.000 EUR 569.555,80
BUNDESSCHATZANWEISUNGEN 2013 0.25% 13/03/15 EUR 389.000 EUR 389.951,10
NETHERLANDS 2012 1.25% 15/01/18 EUR 214.000 EUR 217.292,61
Total 1.176.799,51 Voor de waardering van de ontvangen(+) / gegeven(-) collateral op deze detaillijst werden indicatieve koersen gebruikt vanuit de afdeling Collateral Management van KBC Bank.

Semi-Annual report as at 30th June 2013
TABLE OF CONTENTS
2. Information on KBC Equity Fund Satellites
2.1. Management report 2.1.1. Launch date and subscription price 2.1.2. Stock exchange listing 2.1.3. Aim and distinctive features of the investment policy 2.1.4. Financial portfolio management 2.1.5. Distributors 2.1.6. Index and benchmark 2.1.7. Policy conducted during the financial year 2.1.8. Future policy 2.1.9. Synthetic risk and reward indicator (SRRI)
2.2. Balance sheet
2.3. Profit and loss account
2.4. Composition of the assets and key figures
2.4.1. Composition of the assets 2.4.2. Change in the composition of the assets 2.4.3. Value of commitments in respect of financial derivatives positions 2.4.4. Evolution of the number of subscriptions, repayments and the net asset value 2.4.5. Return figures 2.4.6. Expenses 2.4.7. Notes to the financial statements and other data


2 INFORMATION ON KBC EQUITY FUND SATELLITES
2.1 MANAGEMENT REPORT
2.1.1 LAUNCH DATE AND SUBSCRIPTION PRICE Classic Shares : Launch date: 30 January 2009 Initial subscription price: 500 EUR Currency: EUR Institutional B Shares : Launch date: 24 November 2011 Initial subscription price: 676.29 EUR Currency: EUR
2.1.2 STOCK EXCHANGE LISTING Not applicable.
2.1.3 GOAL AND KEY PRINCIPLES OF THE INVESTMENT POLICY
SUB-FUND’S OBJECT: The main objective of this sub-fund is to generate the highest possible return for its shareholders by investing directly or indirectly in transferable securities. This is reflected in its pursuit of capital gains and income. To this end, the assets are invested, either directly or indirectly via correlated financial instruments, primarily in shares.
SUB-FUND’S INVESTMENT POLICY:
PERMITTED ASSET CLASSES: The sub-fund may invest in securities, money market instruments, units in undertakings for collective investment, deposits, financial derivatives, liquid assets and all other instruments insofar as permitted by the applicable laws and regulations and consistent with the sub-fund’s object The sub-fund shall invest no more than 10% of its assets in units of other undertakings for collective investment.
RESTRICTIONS OF THE INVESTMENT POLICY: The investment policy will be implemented within the limits set by law and regulations. The sub-fund may borrow up to 10% of its net assets, insofar as these are short-term borrowings aimed at solving temporary liquidity problems.
PERMITTED DERIVATIVES TRANSACTIONS: Derivates may be used either for hedging purposes or to achieve investment objectives. Changes will be made to the investments at regular intervals to comply with the sub-fund's investment strategy. In addition, listed and unlisted derivates may be used to achieve the objectives: these may be forward contracts, options or swaps on securities, indices, currencies or interest rates or other transactions involving derivatives. Unlisted derivatives transactions will only be concluded with prime financial institutions specialised in such transactions. Such derivatives may also be used to hedge the assets against exchange-rate fluctuations. Subject to the applicable laws and regulations and the articles of association, the sub-fund always seeks to conclude the most effective transactions. All costs associated with the transactions will be charged to the sub-fund and all income generated will be paid to the sub-fund. If the transactions result in a risk in respect of the counterparty, this risk can be hedged by using a margin management system that ensures that the sub-fund is the beneficiary of security (collateral) in the form of cash or investment grade bonds. When calculating the value of the bonds, a margin will be applied that varies depending on the residual term to maturity and the currency in which the bond in question is denominated. The relationship with the counterparty or counterparties is governed by standard international agreements. Derivatives may be used to partially hedge the open exchange risk in relation to the reference currency (euro). Where appropriate, they may therefore limit the foreign exchange risk expressed in euros, and hence the market risk and performance risk too.

Derivatives are liquid and readily negotiable instruments. They do not, therefore, affect the liquidity risk. Derivatives are also used in accordance with the investment policy and strategy. They do not affect the market, performance and concentration risks or the risks associated with external factors or of any kind.
STRATEGY SELECTED At least 75% of the assets are invested, directly or indirectly, in a selection of shares in global companies. The manager has autonomy in the stock picking, which is theme-based. As a result, the sub-fund's investments may at any time be focused to a greater or lesser extent on one or more very specific themes. Some examples of these themes (this list is not exhaustive) are family companies, holding companies with a greater average undervaluation in relation to their intrinsic value, and global companies that generate a significant percentage of their turnover in emerging countries.
LENDING FINANCIAL INSTRUMENTS: The sub-fund may lend financial instruments within the limits set by law and regulations. This lending does not affect the sub-fund’s risk profile since: - it takes place within the framework of a securities lending system managed by a principal. In
addition, the sub-fund has a relationship only with the principal of the securities lending system which acts as counterparty and to which title of the loaned securities is transferred. The choice of principal is subject to strict selection criteria. The return of securities similar to the securities that have been lent is guaranteed by the principal.
- through a margin management system, the sub-fund is always guaranteed financial security, the actual value of which always exceeds the actual value of the securities that have been lent, in case the principal does not return similar securities.
The return of securities similar to the securities that have been lent can be requested at any time, which means that the lending of securities does not affect the management of the sub-fund's assets. By lending securities, the sub-fund can generate an additional return. The principal pays a fee to the management company. After deducting the fee for the margin management and clearing services of KBC Bank, most of this fee is paid to the sub-fund. The relationship with the counterparty or counterparties is governed by standard international agreements. More information is provided on the terms and conditions governing securities lending in the annual or half-yearly report for the sub-fund.
VOLATILITY OF THE NET ASSET VALUE: The volatility of the net asset value may be high due to the composition of the portfolio.
GENERAL STRATEGY FOR HEDGING THE EXCHANGE RATE RISK: In order to protect its assets against exchange rate fluctuations and within the limitations laid down in the articles of association, the sub-fund may perform transactions relating to the sale of forward currency contracts, as well as the sale of call options and the purchase of put options on currencies. The transactions in question may relate solely to contracts traded on a regulated market that operates regularly, is recognised and is open to the public or that are traded with a recognised, prime financial institution specialising in such transactions and dealing in the over-the-counter (OTC) market in options. With the same objective, the sub-fund may also sell currencies forward or exchange them in private transactions with prime financial institutions specialising in such transactions. The hedging objective of the aforementioned transactions suggests that there is a direct link between these transactions and the assets to be hedged, which implies that the transactions carried out in a particular currency may in principle not exceed, in terms of volume, either the valuation value of all the assets in the same currency or the holding period of those assets.
SOCIAL, ETHICAL AND ENVIRONMENTAL ASPECTS:
No manufacturers of controversial weapons whose use over the past five decades, according to the international consensus, has led to disproportionate human suffering among the civilian population will be included in the portfolio of investments. This involves the manufacturers of
anti-personnel mines, cluster bombs and munitions and weapons containing depleted uranium. In this way, the sub-fund seeks to reflect not only simple financial reality but also the social reality of the sector or region in question.
THE EUROPEAN SAVINGS DIRECTIVE AND TAX ON DEBT CLAIM RETURNS OBTAINED THROUGH THE
REDEMPTION OF OWN UNITS OR IN THE EVENT OF FULL OR PARTIAL DISTRIBUTION OF EQUITY
CAPITAL. The following information is of a general character and is not intended to cover all aspects of an investment in a UCITS. In certain cases entirely different rules might even apply. Moreover, both tax law and the interpretation of it can change. Investors who wish to have more information about the tax implications – in both Belgium and abroad – of acquiring, holding and transferring units should seek the advice of their usual financial and tax advisers. This UCITS shall invest a maximum of 15% of its assets directly or indirectly in debt instruments as intended by the European Savings Directive. A. European Savings Directive (Directive 2003/48/EC) The European Savings Directive has been implemented in Belgium. Since this UCITS invests a maximum of 15% of its assets directly or indirectly in debt claims as intended by the European Savings Directive, the income of this UCITS does not fall within the scope of this directive. B. Tax on debt claim returns obtained through the redemption of own units or in the event of full or partial distribution of equity capital (Article 19bis Income Tax Code 1992). The income from this UCITS is not subject to the tax on debt instrument returns as intended by Article 19bis, Income Tax Code 1992.
2.1.4 FINANCIAL PORTFOLIO MANAGEMENT There is no delegation of the portfolio.
2.1.5 DISTRIBUTORS KBC Asset Management S.A., 5, Place de la Gare, L-1616 Luxembourg.
2.1.6 INDEX AND BENCHMARK See ‘Sub-fund’s investment policy’.
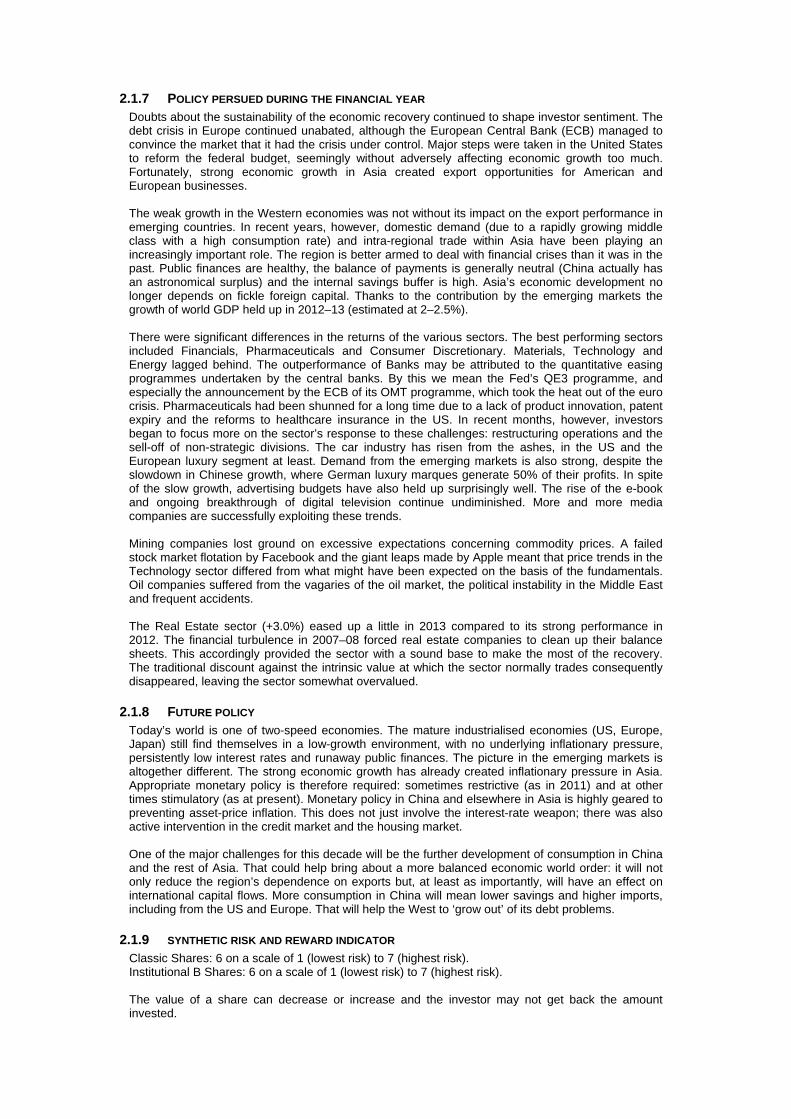
2.1.7 POLICY PERSUED DURING THE FINANCIAL YEAR Doubts about the sustainability of the economic recovery continued to shape investor sentiment. The debt crisis in Europe continued unabated, although the European Central Bank (ECB) managed to convince the market that it had the crisis under control. Major steps were taken in the United States to reform the federal budget, seemingly without adversely affecting economic growth too much. Fortunately, strong economic growth in Asia created export opportunities for American and European businesses. The weak growth in the Western economies was not without its impact on the export performance in emerging countries. In recent years, however, domestic demand (due to a rapidly growing middle class with a high consumption rate) and intra-regional trade within Asia have been playing an increasingly important role. The region is better armed to deal with financial crises than it was in the past. Public finances are healthy, the balance of payments is generally neutral (China actually has an astronomical surplus) and the internal savings buffer is high. Asia’s economic development no longer depends on fickle foreign capital. Thanks to the contribution by the emerging markets the growth of world GDP held up in 2012–13 (estimated at 2–2.5%). There were significant differences in the returns of the various sectors. The best performing sectors included Financials, Pharmaceuticals and Consumer Discretionary. Materials, Technology and Energy lagged behind. The outperformance of Banks may be attributed to the quantitative easing programmes undertaken by the central banks. By this we mean the Fed’s QE3 programme, and especially the announcement by the ECB of its OMT programme, which took the heat out of the euro crisis. Pharmaceuticals had been shunned for a long time due to a lack of product innovation, patent expiry and the reforms to healthcare insurance in the US. In recent months, however, investors began to focus more on the sector’s response to these challenges: restructuring operations and the sell-off of non-strategic divisions. The car industry has risen from the ashes, in the US and the European luxury segment at least. Demand from the emerging markets is also strong, despite the slowdown in Chinese growth, where German luxury marques generate 50% of their profits. In spite of the slow growth, advertising budgets have also held up surprisingly well. The rise of the e-book and ongoing breakthrough of digital television continue undiminished. More and more media companies are successfully exploiting these trends. Mining companies lost ground on excessive expectations concerning commodity prices. A failed stock market flotation by Facebook and the giant leaps made by Apple meant that price trends in the Technology sector differed from what might have been expected on the basis of the fundamentals. Oil companies suffered from the vagaries of the oil market, the political instability in the Middle East and frequent accidents. The Real Estate sector (+3.0%) eased up a little in 2013 compared to its strong performance in 2012. The financial turbulence in 2007–08 forced real estate companies to clean up their balance sheets. This accordingly provided the sector with a sound base to make the most of the recovery. The traditional discount against the intrinsic value at which the sector normally trades consequently disappeared, leaving the sector somewhat overvalued.
2.1.8 FUTURE POLICY Today’s world is one of two-speed economies. The mature industrialised economies (US, Europe, Japan) still find themselves in a low-growth environment, with no underlying inflationary pressure, persistently low interest rates and runaway public finances. The picture in the emerging markets is altogether different. The strong economic growth has already created inflationary pressure in Asia. Appropriate monetary policy is therefore required: sometimes restrictive (as in 2011) and at other times stimulatory (as at present). Monetary policy in China and elsewhere in Asia is highly geared to preventing asset-price inflation. This does not just involve the interest-rate weapon; there was also active intervention in the credit market and the housing market. One of the major challenges for this decade will be the further development of consumption in China and the rest of Asia. That could help bring about a more balanced economic world order: it will not only reduce the region’s dependence on exports but, at least as importantly, will have an effect on international capital flows. More consumption in China will mean lower savings and higher imports, including from the US and Europe. That will help the West to ‘grow out’ of its debt problems.
2.1.9 SYNTHETIC RISK AND REWARD INDICATOR Classic Shares: 6 on a scale of 1 (lowest risk) to 7 (highest risk). Institutional B Shares: 6 on a scale of 1 (lowest risk) to 7 (highest risk). The value of a share can decrease or increase and the investor may not get back the amount invested.

In accordance with Commission Regulation (EU) No. 583/2010, a synthetic risk and reward indicator has been calculated. This indicator provides a quantitative measure of the sub-fund's potential return and the risk involved, calculated in the currency in which the sub-fund is denominated. It is given as a figure between 1 and 7. The higher the figure, the greater the potential return, but also the more difficult it is to predict this return. Losses are possible too. The lowest figure does not mean that the investment is entirely free of risk. However, it does indicate that, compared with the higher figures, this product will generally provide a lower, but more predictable return. The synthetic risk and reward indicator is assessed regularly and can therefore go up or down based on data from the past. Data from the past is not always a reliable indicator of future risk and return.

2.2 BALANCE SHEET
Balance sheet layout 30/06/2013 (in the currency of the sub-fundt)
30/06/2012 (in the currency of the sub-fund )
TOTAL NET ASSETS 222.299.638,87 38.024.679,46
II. Securities, money market instruments, UCIs and derivatives
A. Bonds and other debt instruments a) Bonds 107.923,50 92.379,50 a} Collateral received in the form of bonds 11.797.716,35 1.896.089,60 C. Shares and similar instruments a) Shares 222.910.355,81 37.569.991,48 Of which securities lent 10.892.181,19 1.824.775,38 D. Other securities 736,20 3,40 F. Derivative financial instruments j) Foreign exchange Futures and forward contracts (+/-) 174.437,63
IV. Receivables and payables within one year A. Receivables a) Accounts receivable 321.862,48 b) Tax assets 104.784,25 64.500,31 B. Payables a) Accounts payable (-) -4.990,90 -47.111,02 c) Borrowings (-) -5.558.062,00 d) Collateral (-) -11.797.716,35 -1.896.089,60
V. Deposits and cash at bank and in hand A. Demand balances at banks 4.253.389,07 334.762,59
VI. Accruals and deferrals A. Expense to be carried forward 22.230,35 5.234,07 B. Accrued income 182.309,56 30.546,05 C. Accrued expense (-) -215.337,08 -25.626,92
TOTAL SHAREHOLDERS' EQUITY 222.299.638,87 38.024.679,46
A. Capital 208.339.753,00 35.765.574,67
B. Income equalization -47.759,52 -39.341,17
D. Result for the period 14.007.645,39 2.298.445,96
Off-balance-sheet headings
I Collateral (+/-)
I.A Collateral (+/-)
I.A.A Securities/market instruments 11.797.716,35 1.896.089,60
III Notional amounts of futures and forward contracts
III.B Written futures and forward contracts -62.854.318,01
IX Financial instruments lent 10.892.181,19 1.824.775,38

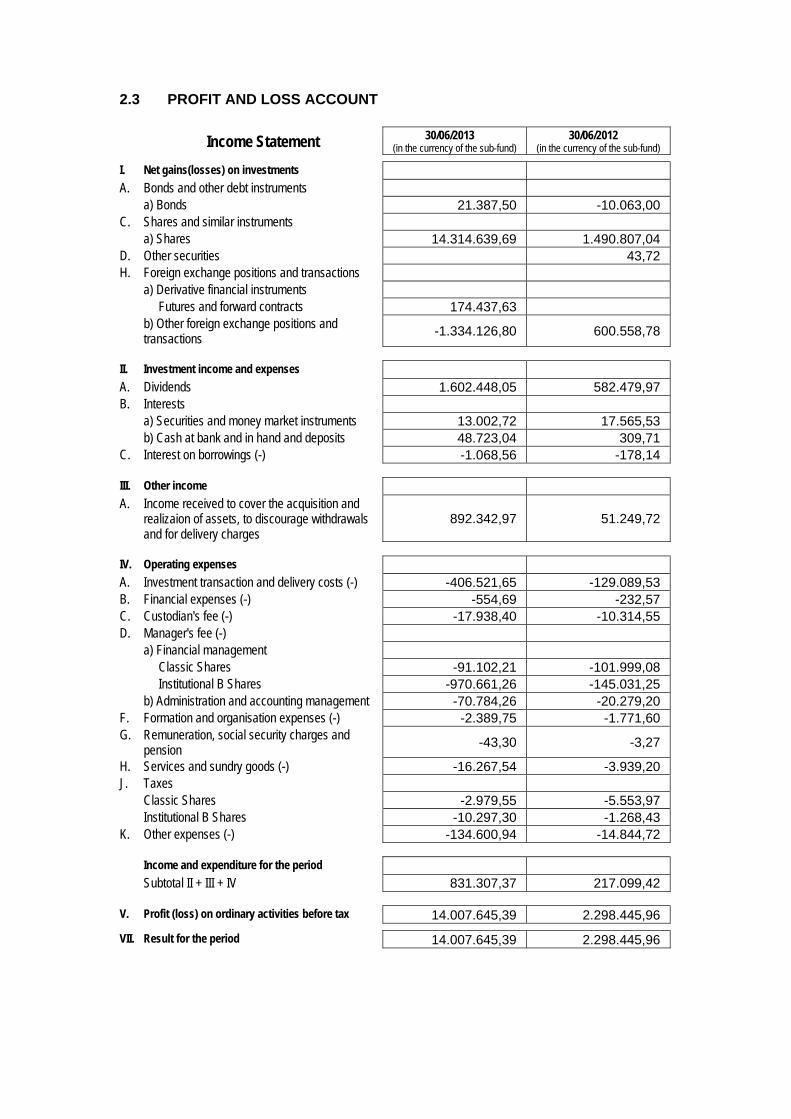
2.3 PROFIT AND LOSS ACCOUNT
Income Statement 30/06/2013 (in the currency of the sub-fund)
30/06/2012 (in the currency of the sub-fund)
I. Net gains(losses) on investments A. Bonds and other debt instruments a) Bonds 21.387,50 -10.063,00 C. Shares and similar instruments a) Shares 14.314.639,69 1.490.807,04 D. Other securities 43,72 H. Foreign exchange positions and transactions a) Derivative financial instruments Futures and forward contracts 174.437,63 b) Other foreign exchange positions and
transactions -1.334.126,80 600.558,78
II. Investment income and expenses A. Dividends 1.602.448,05 582.479,97 B. Interests a) Securities and money market instruments 13.002,72 17.565,53 b) Cash at bank and in hand and deposits 48.723,04 309,71 C. Interest on borrowings (-) -1.068,56 -178,14
III. Other income A. Income received to cover the acquisition and
realizaion of assets, to discourage withdrawals and for delivery charges
892.342,97 51.249,72
IV. Operating expenses A. Investment transaction and delivery costs (-) -406.521,65 -129.089,53 B. Financial expenses (-) -554,69 -232,57 C. Custodian's fee (-) -17.938,40 -10.314,55 D. Manager's fee (-) a) Financial management Classic Shares -91.102,21 -101.999,08 Institutional B Shares -970.661,26 -145.031,25 b) Administration and accounting management -70.784,26 -20.279,20 F. Formation and organisation expenses (-) -2.389,75 -1.771,60 G. Remuneration, social security charges and
pension -43,30 -3,27
H. Services and sundry goods (-) -16.267,54 -3.939,20 J. Taxes Classic Shares -2.979,55 -5.553,97 Institutional B Shares -10.297,30 -1.268,43 K. Other expenses (-) -134.600,94 -14.844,72
Income and expenditure for the period Subtotal II + III + IV 831.307,37 217.099,42
V. Profit (loss) on ordinary activities before tax 14.007.645,39 2.298.445,96
VII. Result for the period 14.007.645,39 2.298.445,96
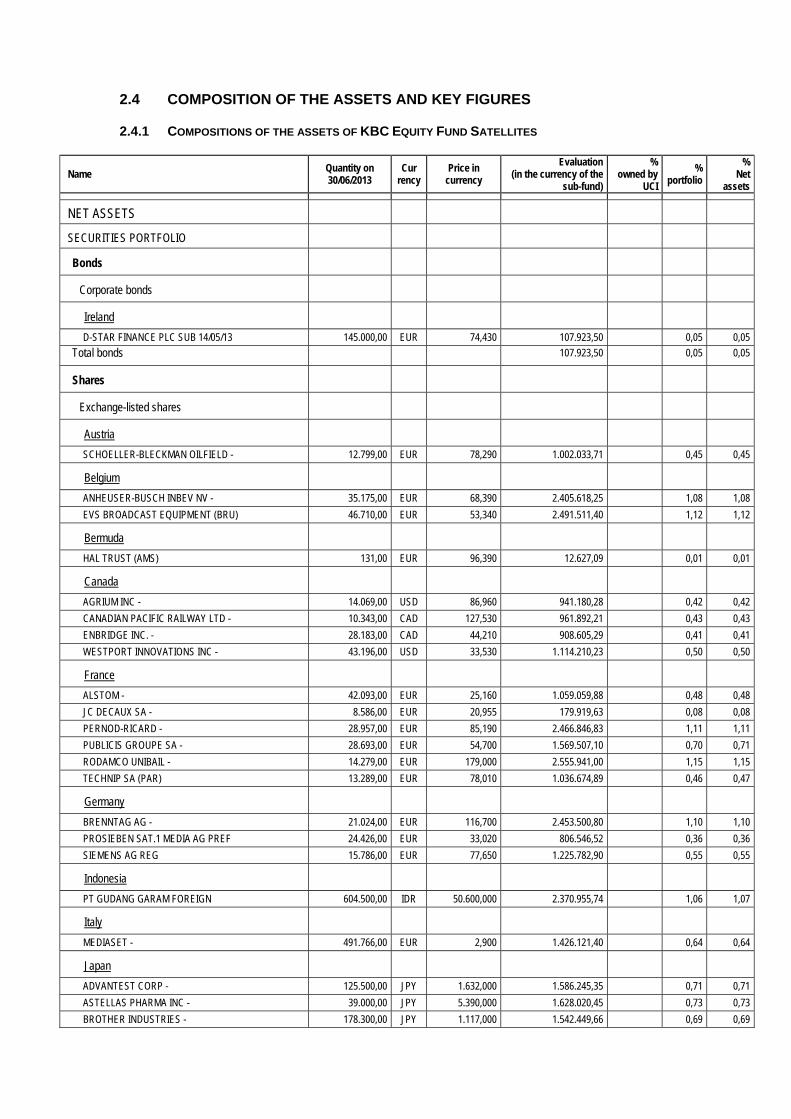
2.4 COMPOSITION OF THE ASSETS AND KEY FIGURES
2.4.1 COMPOSITIONS OF THE ASSETS OF KBC EQUITY FUND SATELLITES
Name Quantity on 30/06/2013
Cur rency
Price in currency
Evaluation (in the currency of the
sub-fund)
% owned by
UCI
% portfolio
% Net
assets
NET ASSETS
SECURITIES PORTFOLIO
Bonds
Corporate bonds
Ireland
D-STAR FINANCE PLC SUB 14/05/13 145.000,00 EUR 74,430 107.923,50 0,05 0,05
Total bonds 107.923,50 0,05 0,05
Shares
Exchange-listed shares
Austria
SCHOELLER-BLECKMAN OILFIELD - 12.799,00 EUR 78,290 1.002.033,71 0,45 0,45
Belgium
ANHEUSER-BUSCH INBEV NV - 35.175,00 EUR 68,390 2.405.618,25 1,08 1,08
EVS BROADCAST EQUIPMENT (BRU) 46.710,00 EUR 53,340 2.491.511,40 1,12 1,12
Bermuda
HAL TRUST (AMS) 131,00 EUR 96,390 12.627,09 0,01 0,01
Canada
AGRIUM INC - 14.069,00 USD 86,960 941.180,28 0,42 0,42
CANADIAN PACIFIC RAILWAY LTD - 10.343,00 CAD 127,530 961.892,21 0,43 0,43
ENBRIDGE INC. - 28.183,00 CAD 44,210 908.605,29 0,41 0,41
WESTPORT INNOVATIONS INC - 43.196,00 USD 33,530 1.114.210,23 0,50 0,50
France
ALSTOM - 42.093,00 EUR 25,160 1.059.059,88 0,48 0,48
JC DECAUX SA - 8.586,00 EUR 20,955 179.919,63 0,08 0,08
PERNOD-RICARD - 28.957,00 EUR 85,190 2.466.846,83 1,11 1,11
PUBLICIS GROUPE SA - 28.693,00 EUR 54,700 1.569.507,10 0,70 0,71
RODAMCO UNIBAIL - 14.279,00 EUR 179,000 2.555.941,00 1,15 1,15
TECHNIP SA (PAR) 13.289,00 EUR 78,010 1.036.674,89 0,46 0,47
Germany
BRENNTAG AG - 21.024,00 EUR 116,700 2.453.500,80 1,10 1,10
PROSIEBEN SAT.1 MEDIA AG PREF 24.426,00 EUR 33,020 806.546,52 0,36 0,36
SIEMENS AG REG 15.786,00 EUR 77,650 1.225.782,90 0,55 0,55
Indonesia
PT GUDANG GARAM FOREIGN 604.500,00 IDR 50.600,000 2.370.955,74 1,06 1,07
Italy
MEDIASET - 491.766,00 EUR 2,900 1.426.121,40 0,64 0,64
Japan
ADVANTEST CORP - 125.500,00 JPY 1.632,000 1.586.245,35 0,71 0,71
ASTELLAS PHARMA INC - 39.000,00 JPY 5.390,000 1.628.020,45 0,73 0,73
BROTHER INDUSTRIES - 178.300,00 JPY 1.117,000 1.542.449,66 0,69 0,69
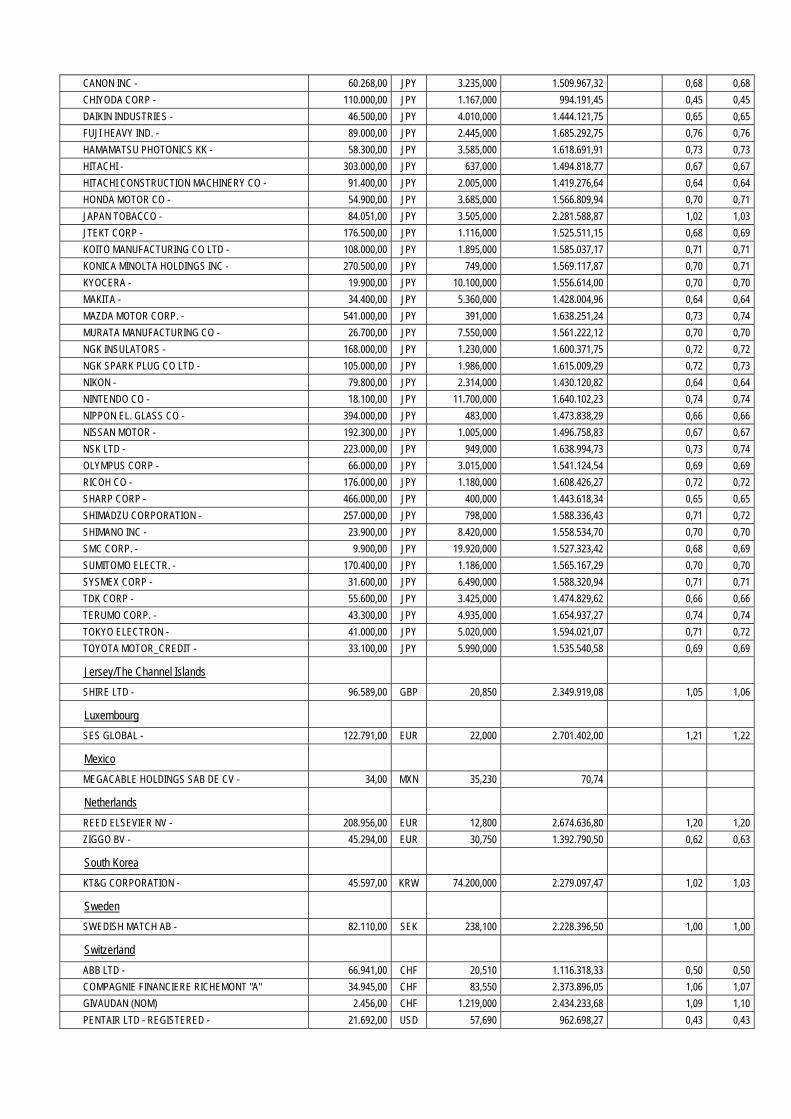
CANON INC - 60.268,00 JPY 3.235,000 1.509.967,32 0,68 0,68
CHIYODA CORP - 110.000,00 JPY 1.167,000 994.191,45 0,45 0,45
DAIKIN INDUSTRIES - 46.500,00 JPY 4.010,000 1.444.121,75 0,65 0,65
FUJI HEAVY IND. - 89.000,00 JPY 2.445,000 1.685.292,75 0,76 0,76
HAMAMATSU PHOTONICS KK - 58.300,00 JPY 3.585,000 1.618.691,91 0,73 0,73
HITACHI - 303.000,00 JPY 637,000 1.494.818,77 0,67 0,67
HITACHI CONSTRUCTION MACHINERY CO - 91.400,00 JPY 2.005,000 1.419.276,64 0,64 0,64
HONDA MOTOR CO - 54.900,00 JPY 3.685,000 1.566.809,94 0,70 0,71
JAPAN TOBACCO - 84.051,00 JPY 3.505,000 2.281.588,87 1,02 1,03
JTEKT CORP - 176.500,00 JPY 1.116,000 1.525.511,15 0,68 0,69
KOITO MANUFACTURING CO LTD - 108.000,00 JPY 1.895,000 1.585.037,17 0,71 0,71
KONICA MINOLTA HOLDINGS INC - 270.500,00 JPY 749,000 1.569.117,87 0,70 0,71
KYOCERA - 19.900,00 JPY 10.100,000 1.556.614,00 0,70 0,70
MAKITA - 34.400,00 JPY 5.360,000 1.428.004,96 0,64 0,64
MAZDA MOTOR CORP. - 541.000,00 JPY 391,000 1.638.251,24 0,73 0,74
MURATA MANUFACTURING CO - 26.700,00 JPY 7.550,000 1.561.222,12 0,70 0,70
NGK INSULATORS - 168.000,00 JPY 1.230,000 1.600.371,75 0,72 0,72
NGK SPARK PLUG CO LTD - 105.000,00 JPY 1.986,000 1.615.009,29 0,72 0,73
NIKON - 79.800,00 JPY 2.314,000 1.430.120,82 0,64 0,64
NINTENDO CO - 18.100,00 JPY 11.700,000 1.640.102,23 0,74 0,74
NIPPON EL. GLASS CO - 394.000,00 JPY 483,000 1.473.838,29 0,66 0,66
NISSAN MOTOR - 192.300,00 JPY 1.005,000 1.496.758,83 0,67 0,67
NSK LTD - 223.000,00 JPY 949,000 1.638.994,73 0,73 0,74
OLYMPUS CORP - 66.000,00 JPY 3.015,000 1.541.124,54 0,69 0,69
RICOH CO - 176.000,00 JPY 1.180,000 1.608.426,27 0,72 0,72
SHARP CORP - 466.000,00 JPY 400,000 1.443.618,34 0,65 0,65
SHIMADZU CORPORATION - 257.000,00 JPY 798,000 1.588.336,43 0,71 0,72
SHIMANO INC - 23.900,00 JPY 8.420,000 1.558.534,70 0,70 0,70
SMC CORP. - 9.900,00 JPY 19.920,000 1.527.323,42 0,68 0,69
SUMITOMO ELECTR. - 170.400,00 JPY 1.186,000 1.565.167,29 0,70 0,70
SYSMEX CORP - 31.600,00 JPY 6.490,000 1.588.320,94 0,71 0,71
TDK CORP - 55.600,00 JPY 3.425,000 1.474.829,62 0,66 0,66
TERUMO CORP. - 43.300,00 JPY 4.935,000 1.654.937,27 0,74 0,74
TOKYO ELECTRON - 41.000,00 JPY 5.020,000 1.594.021,07 0,71 0,72
TOYOTA MOTOR_CREDIT - 33.100,00 JPY 5.990,000 1.535.540,58 0,69 0,69
Jersey/The Channel Islands
SHIRE LTD - 96.589,00 GBP 20,850 2.349.919,08 1,05 1,06
Luxembourg
SES GLOBAL - 122.791,00 EUR 22,000 2.701.402,00 1,21 1,22
Mexico
MEGACABLE HOLDINGS SAB DE CV - 34,00 MXN 35,230 70,74
Netherlands
REED ELSEVIER NV - 208.956,00 EUR 12,800 2.674.636,80 1,20 1,20
ZIGGO BV - 45.294,00 EUR 30,750 1.392.790,50 0,62 0,63
South Korea
KT&G CORPORATION - 45.597,00 KRW 74.200,000 2.279.097,47 1,02 1,03
Sweden
SWEDISH MATCH AB - 82.110,00 SEK 238,100 2.228.396,50 1,00 1,00
Switzerland
ABB LTD - 66.941,00 CHF 20,510 1.116.318,33 0,50 0,50
COMPAGNIE FINANCIERE RICHEMONT "A" 34.945,00 CHF 83,550 2.373.896,05 1,06 1,07
GIVAUDAN (NOM) 2.456,00 CHF 1.219,000 2.434.233,68 1,09 1,10
PENTAIR LTD - REGISTERED - 21.692,00 USD 57,690 962.698,27 0,43 0,43
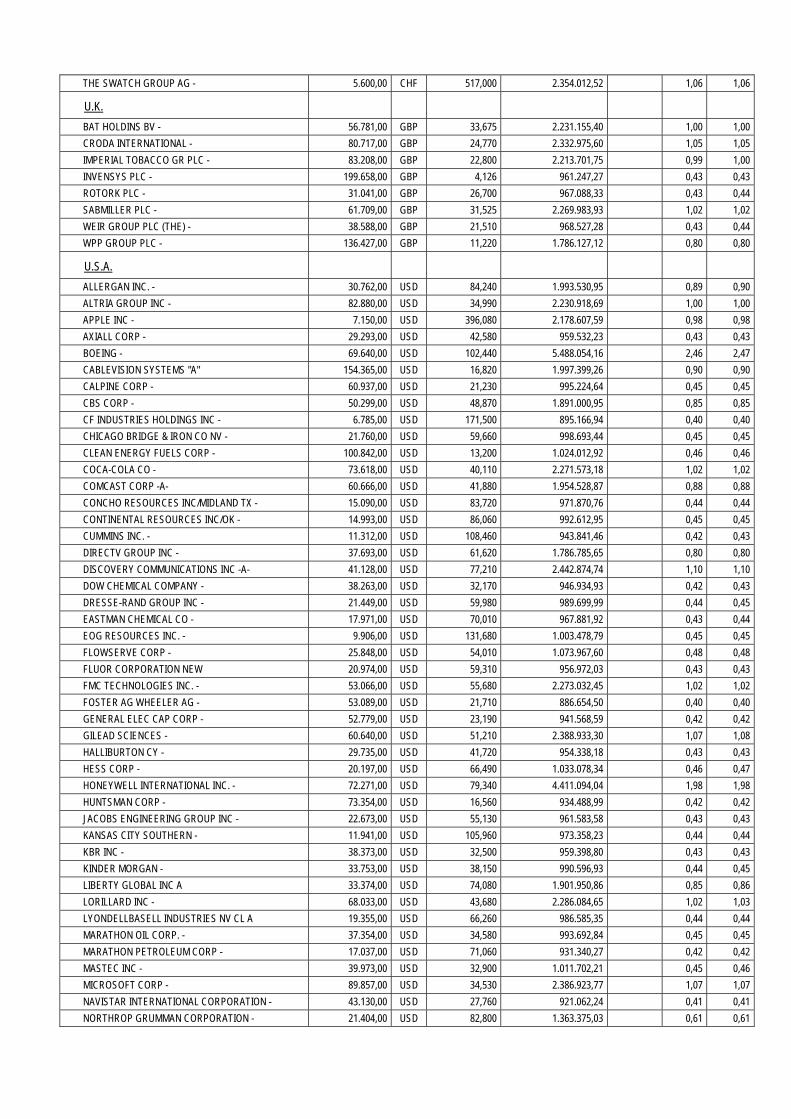
THE SWATCH GROUP AG - 5.600,00 CHF 517,000 2.354.012,52 1,06 1,06
U.K.
BAT HOLDINS BV - 56.781,00 GBP 33,675 2.231.155,40 1,00 1,00
CRODA INTERNATIONAL - 80.717,00 GBP 24,770 2.332.975,60 1,05 1,05
IMPERIAL TOBACCO GR PLC - 83.208,00 GBP 22,800 2.213.701,75 0,99 1,00
INVENSYS PLC - 199.658,00 GBP 4,126 961.247,27 0,43 0,43
ROTORK PLC - 31.041,00 GBP 26,700 967.088,33 0,43 0,44
SABMILLER PLC - 61.709,00 GBP 31,525 2.269.983,93 1,02 1,02
WEIR GROUP PLC (THE) - 38.588,00 GBP 21,510 968.527,28 0,43 0,44
WPP GROUP PLC - 136.427,00 GBP 11,220 1.786.127,12 0,80 0,80
U.S.A.
ALLERGAN INC. - 30.762,00 USD 84,240 1.993.530,95 0,89 0,90
ALTRIA GROUP INC - 82.880,00 USD 34,990 2.230.918,69 1,00 1,00
APPLE INC - 7.150,00 USD 396,080 2.178.607,59 0,98 0,98
AXIALL CORP - 29.293,00 USD 42,580 959.532,23 0,43 0,43
BOEING - 69.640,00 USD 102,440 5.488.054,16 2,46 2,47
CABLEVISION SYSTEMS "A" 154.365,00 USD 16,820 1.997.399,26 0,90 0,90
CALPINE CORP - 60.937,00 USD 21,230 995.224,64 0,45 0,45
CBS CORP - 50.299,00 USD 48,870 1.891.000,95 0,85 0,85
CF INDUSTRIES HOLDINGS INC - 6.785,00 USD 171,500 895.166,94 0,40 0,40
CHICAGO BRIDGE & IRON CO NV - 21.760,00 USD 59,660 998.693,44 0,45 0,45
CLEAN ENERGY FUELS CORP - 100.842,00 USD 13,200 1.024.012,92 0,46 0,46
COCA-COLA CO - 73.618,00 USD 40,110 2.271.573,18 1,02 1,02
COMCAST CORP -A- 60.666,00 USD 41,880 1.954.528,87 0,88 0,88
CONCHO RESOURCES INC/MIDLAND TX - 15.090,00 USD 83,720 971.870,76 0,44 0,44
CONTINENTAL RESOURCES INC/OK - 14.993,00 USD 86,060 992.612,95 0,45 0,45
CUMMINS INC. - 11.312,00 USD 108,460 943.841,46 0,42 0,43
DIRECTV GROUP INC - 37.693,00 USD 61,620 1.786.785,65 0,80 0,80
DISCOVERY COMMUNICATIONS INC -A- 41.128,00 USD 77,210 2.442.874,74 1,10 1,10
DOW CHEMICAL COMPANY - 38.263,00 USD 32,170 946.934,93 0,42 0,43
DRESSE-RAND GROUP INC - 21.449,00 USD 59,980 989.699,99 0,44 0,45
EASTMAN CHEMICAL CO - 17.971,00 USD 70,010 967.881,92 0,43 0,44
EOG RESOURCES INC. - 9.906,00 USD 131,680 1.003.478,79 0,45 0,45
FLOWSERVE CORP - 25.848,00 USD 54,010 1.073.967,60 0,48 0,48
FLUOR CORPORATION NEW 20.974,00 USD 59,310 956.972,03 0,43 0,43
FMC TECHNOLOGIES INC. - 53.066,00 USD 55,680 2.273.032,45 1,02 1,02
FOSTER AG WHEELER AG - 53.089,00 USD 21,710 886.654,50 0,40 0,40
GENERAL ELEC CAP CORP - 52.779,00 USD 23,190 941.568,59 0,42 0,42
GILEAD SCIENCES - 60.640,00 USD 51,210 2.388.933,30 1,07 1,08
HALLIBURTON CY - 29.735,00 USD 41,720 954.338,18 0,43 0,43
HESS CORP - 20.197,00 USD 66,490 1.033.078,34 0,46 0,47
HONEYWELL INTERNATIONAL INC. - 72.271,00 USD 79,340 4.411.094,04 1,98 1,98
HUNTSMAN CORP - 73.354,00 USD 16,560 934.488,99 0,42 0,42
JACOBS ENGINEERING GROUP INC - 22.673,00 USD 55,130 961.583,58 0,43 0,43
KANSAS CITY SOUTHERN - 11.941,00 USD 105,960 973.358,23 0,44 0,44
KBR INC - 38.373,00 USD 32,500 959.398,80 0,43 0,43
KINDER MORGAN - 33.753,00 USD 38,150 990.596,93 0,44 0,45
LIBERTY GLOBAL INC A 33.374,00 USD 74,080 1.901.950,86 0,85 0,86
LORILLARD INC - 68.033,00 USD 43,680 2.286.084,65 1,02 1,03
LYONDELLBASELL INDUSTRIES NV CL A 19.355,00 USD 66,260 986.585,35 0,44 0,44
MARATHON OIL CORP. - 37.354,00 USD 34,580 993.692,84 0,45 0,45
MARATHON PETROLEUM CORP - 17.037,00 USD 71,060 931.340,27 0,42 0,42
MASTEC INC - 39.973,00 USD 32,900 1.011.702,21 0,45 0,46
MICROSOFT CORP - 89.857,00 USD 34,530 2.386.923,77 1,07 1,07
NAVISTAR INTERNATIONAL CORPORATION - 43.130,00 USD 27,760 921.062,24 0,41 0,41
NORTHROP GRUMMAN CORPORATION - 21.404,00 USD 82,800 1.363.375,03 0,61 0,61
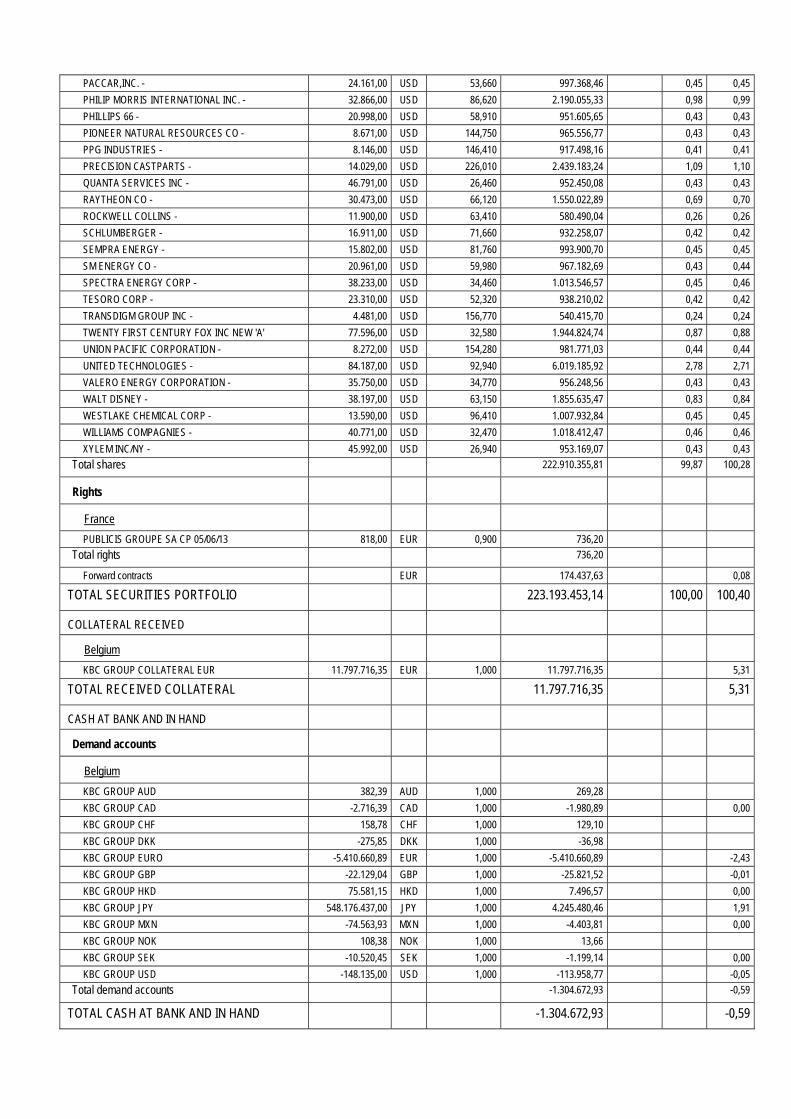
PACCAR,INC. - 24.161,00 USD 53,660 997.368,46 0,45 0,45
PHILIP MORRIS INTERNATIONAL INC. - 32.866,00 USD 86,620 2.190.055,33 0,98 0,99
PHILLIPS 66 - 20.998,00 USD 58,910 951.605,65 0,43 0,43
PIONEER NATURAL RESOURCES CO - 8.671,00 USD 144,750 965.556,77 0,43 0,43
PPG INDUSTRIES - 8.146,00 USD 146,410 917.498,16 0,41 0,41
PRECISION CASTPARTS - 14.029,00 USD 226,010 2.439.183,24 1,09 1,10
QUANTA SERVICES INC - 46.791,00 USD 26,460 952.450,08 0,43 0,43
RAYTHEON CO - 30.473,00 USD 66,120 1.550.022,89 0,69 0,70
ROCKWELL COLLINS - 11.900,00 USD 63,410 580.490,04 0,26 0,26
SCHLUMBERGER - 16.911,00 USD 71,660 932.258,07 0,42 0,42
SEMPRA ENERGY - 15.802,00 USD 81,760 993.900,70 0,45 0,45
SM ENERGY CO - 20.961,00 USD 59,980 967.182,69 0,43 0,44
SPECTRA ENERGY CORP - 38.233,00 USD 34,460 1.013.546,57 0,45 0,46
TESORO CORP - 23.310,00 USD 52,320 938.210,02 0,42 0,42
TRANSDIGM GROUP INC - 4.481,00 USD 156,770 540.415,70 0,24 0,24
TWENTY FIRST CENTURY FOX INC NEW 'A' 77.596,00 USD 32,580 1.944.824,74 0,87 0,88
UNION PACIFIC CORPORATION - 8.272,00 USD 154,280 981.771,03 0,44 0,44
UNITED TECHNOLOGIES - 84.187,00 USD 92,940 6.019.185,92 2,78 2,71
VALERO ENERGY CORPORATION - 35.750,00 USD 34,770 956.248,56 0,43 0,43
WALT DISNEY - 38.197,00 USD 63,150 1.855.635,47 0,83 0,84
WESTLAKE CHEMICAL CORP - 13.590,00 USD 96,410 1.007.932,84 0,45 0,45
WILLIAMS COMPAGNIES - 40.771,00 USD 32,470 1.018.412,47 0,46 0,46
XYLEM INC/NY - 45.992,00 USD 26,940 953.169,07 0,43 0,43
Total shares 222.910.355,81 99,87 100,28
Rights
France
PUBLICIS GROUPE SA CP 05/06/13 818,00 EUR 0,900 736,20
Total rights 736,20
Forward contracts EUR 174.437,63 0,08
TOTAL SECURITIES PORTFOLIO 223.193.453,14 100,00 100,40
COLLATERAL RECEIVED
Belgium
KBC GROUP COLLATERAL EUR 11.797.716,35 EUR 1,000 11.797.716,35 5,31
TOTAL RECEIVED COLLATERAL 11.797.716,35 5,31
CASH AT BANK AND IN HAND
Demand accounts
Belgium
KBC GROUP AUD 382,39 AUD 1,000 269,28
KBC GROUP CAD -2.716,39 CAD 1,000 -1.980,89 0,00
KBC GROUP CHF 158,78 CHF 1,000 129,10
KBC GROUP DKK -275,85 DKK 1,000 -36,98
KBC GROUP EURO -5.410.660,89 EUR 1,000 -5.410.660,89 -2,43
KBC GROUP GBP -22.129,04 GBP 1,000 -25.821,52 -0,01
KBC GROUP HKD 75.581,15 HKD 1,000 7.496,57 0,00
KBC GROUP JPY 548.176.437,00 JPY 1,000 4.245.480,46 1,91
KBC GROUP MXN -74.563,93 MXN 1,000 -4.403,81 0,00
KBC GROUP NOK 108,38 NOK 1,000 13,66
KBC GROUP SEK -10.520,45 SEK 1,000 -1.199,14 0,00
KBC GROUP USD -148.135,00 USD 1,000 -113.958,77 -0,05
Total demand accounts -1.304.672,93 -0,59
TOTAL CASH AT BANK AND IN HAND -1.304.672,93 -0,59
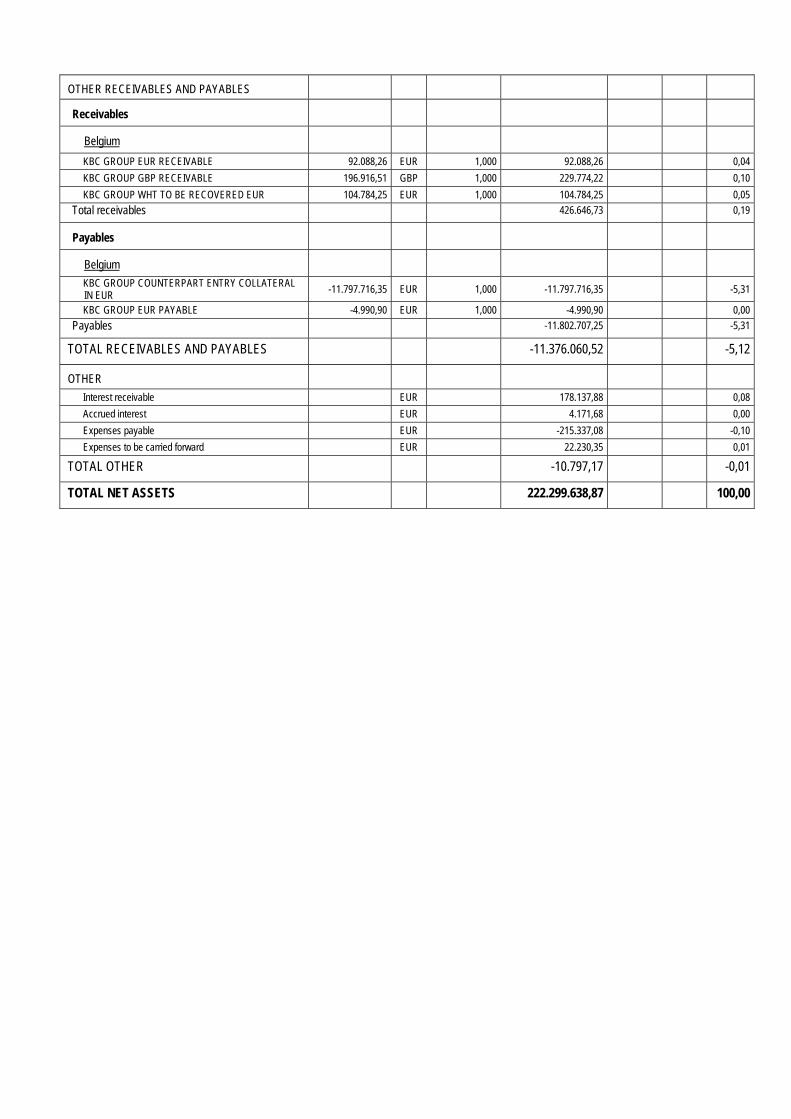
OTHER RECEIVABLES AND PAYABLES
Receivables
Belgium
KBC GROUP EUR RECEIVABLE 92.088,26 EUR 1,000 92.088,26 0,04
KBC GROUP GBP RECEIVABLE 196.916,51 GBP 1,000 229.774,22 0,10
KBC GROUP WHT TO BE RECOVERED EUR 104.784,25 EUR 1,000 104.784,25 0,05
Total receivables 426.646,73 0,19
Payables
Belgium
KBC GROUP COUNTERPART ENTRY COLLATERAL IN EUR -11.797.716,35 EUR 1,000 -11.797.716,35 -5,31
KBC GROUP EUR PAYABLE -4.990,90 EUR 1,000 -4.990,90 0,00
Payables -11.802.707,25 -5,31
TOTAL RECEIVABLES AND PAYABLES -11.376.060,52 -5,12
OTHER
Interest receivable EUR 178.137,88 0,08
Accrued interest EUR 4.171,68 0,00
Expenses payable EUR -215.337,08 -0,10
Expenses to be carried forward EUR 22.230,35 0,01
TOTAL OTHER -10.797,17 -0,01
TOTAL NET ASSETS 222.299.638,87 100,00

Geographic breakdown (as a % of securities portfolio)
31/12/2011 30/06/2012 31/12/2012 30/06/2013 Australia 0,00 0,00 0,00 0,87 Austria 0,00 3,98 1,16 0,45 Belgium 16,78 12,74 9,29 2,27 Bermuda 1,27 0,69 0,60 0,01 Brazil 1,65 0,00 0,00 0,00 Canada 0,00 0,00 0,00 1,76 Switzerland 6,57 5,92 6,85 4,14 Germany 2,48 7,60 7,14 2,01 Denmark 5,74 7,42 7,71 0,00 Finland 2,96 0,00 0,00 0,00 France 0,76 7,56 8,60 3,97 U.K. 22,49 20,27 17,55 6,15 Greece 0,15 0,00 0,00 0,00 Hong Kong 1,47 0,77 0,57 0,00 Indonesia 0,00 0,00 0,00 1,06 Ireland 3,85 0,25 0,17 0,05 Italy 0,00 2,26 6,13 0,64 Jersey/The Channel Islands 0,00 0,00 0,00 1,05 Japan 0,00 0,00 0,00 26,53 South Korea 0,00 0,00 0,00 1,02 Luxembourg 0,00 0,00 0,00 1,21 Netherlands 14,69 9,56 9,96 1,82 Norway 2,90 3,50 0,00 0,00 Sweden 3,65 6,68 7,74 1,00 U.S.A. 12,59 10,80 16,53 43,99 Total 100,00 100,00 100,00 100,00
Sector breakdown (as a % of securities portfolio)
31/12/2011 30/06/2012 31/12/2012 30/06/2013 Cyclicals 35,19 43,87 32,57 40,26 Consum(cycl) 16,92 10,27 9,87 26,01 Cons.goods 33,29 20,27 32,08 13,77 Pharma 4,80 13,43 13,05 5,89 Financials 5,19 4,45 5,66 0,55 Technology 2,96 3,84 6,77 10,86 Telecomm. 0,00 3,87 0,00 0,62 Utilities 1,65 0,00 0,00 0,89 Real est. 0,00 0,00 0,00 1,15 Total 100,00 100,00 100,00 100,00
Currency breakdown (as a % of net assets)
31/12/2011 30/06/2012 31/12/2012 30/06/2013 BRL 1,65 0,00 0,00 0,00 CAD 0,00 0,00 0,00 0,84 CHF 6,58 5,86 6,83 3,53 DKK 5,75 7,36 7,69 0,00 EUR 45,73 48,60 43,19 38,41 GBP 22,54 20,10 17,52 7,20 HKD 1,47 0,76 0,56 0,00 IDR 0,00 0,00 0,00 1,07
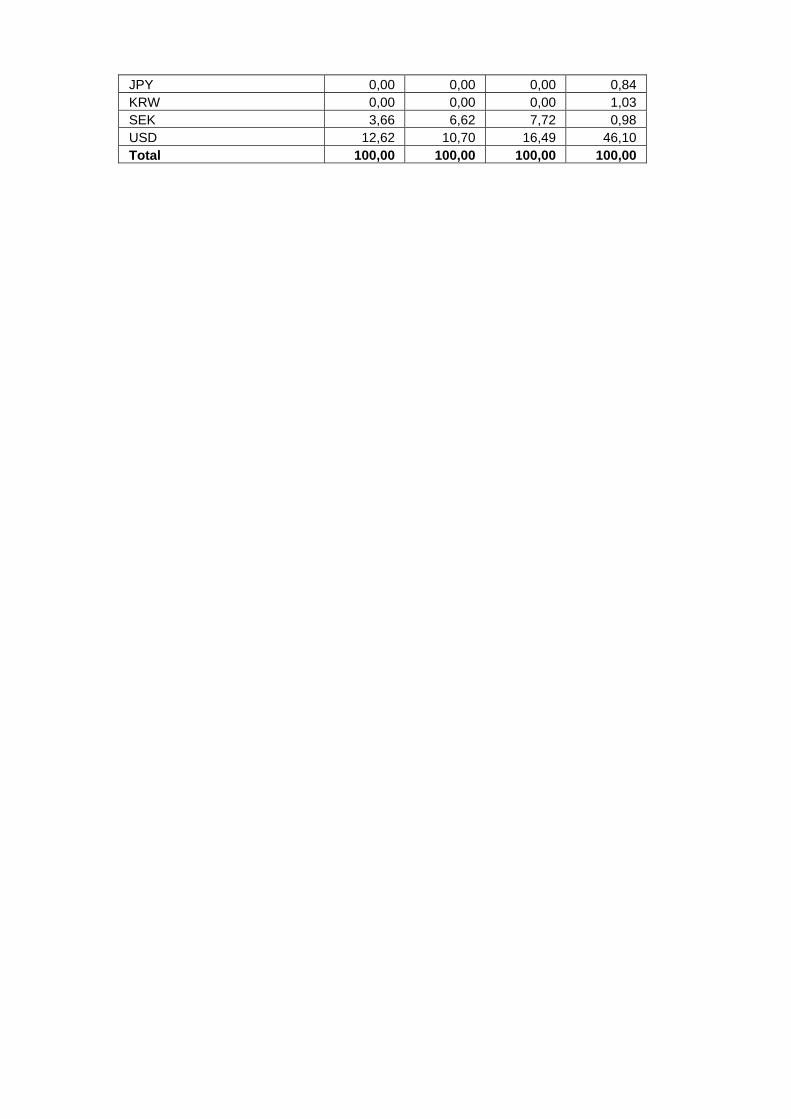
JPY 0,00 0,00 0,00 0,84 KRW 0,00 0,00 0,00 1,03 SEK 3,66 6,62 7,72 0,98 USD 12,62 10,70 16,49 46,10 Total 100,00 100,00 100,00 100,00

2.4.2 CHANGES IN THE COMPOSITION OF THE ASSETS OF KBC EQUITY FUND SATELLITES (IN THE
CURRENCY OF THE SUB-FUND)
1st half of year YearPurchases 357.609.676,93 357.609.676,93 Sales 196.231.150,18 196.231.150,18 Total 1 553.840.827,12 553.840.827,12 Subscriptions 315.990.552,38 315.990.552,38 Redemptions 157.794.660,38 157.794.660,38 Total 2 473.785.212,76 473.785.212,76 Monthly average of total assets
136.186.642,35 136.186.642,35
Turnover rate 58,78 % 58,78 %
1st half of year YearPurchases 357.609.676,93 357.609.676,93 Sales 196.231.150,18 196.231.150,18 Total 1 553.840.827,12 553.840.827,12 Subscriptions 315.990.552,38 315.990.552,38 Redemptions 157.794.660,38 157.794.660,38 Total 2 473.785.212,76 473.785.212,76 Monthly average of total assets
140.087.168,80 140.087.168,80
Corrected turnover rate 57,15 % 57,15 %
The table above shows the capital volume of portfolio transactions. This volume (adjusted to take account of total subscriptions and redemptions) is also compared to the average net assets at the beginning and end of the period. A figure close to 0% implies that the transactions relating to the securities or transactions relating to the assets (excluding deposits and cash) in a given period only involve subscriptions and redemptions. A negative percentage shows that subscriptions and redemptions entailed few, if any, transactions in the portfolio. Active asset management may result in high turnover rates (monthly percentage >50%). The detailed list of transactions is available for consultation free of charge at the registered office of the Bevek or fund at Havenlaan 2, 1080 Brussels.
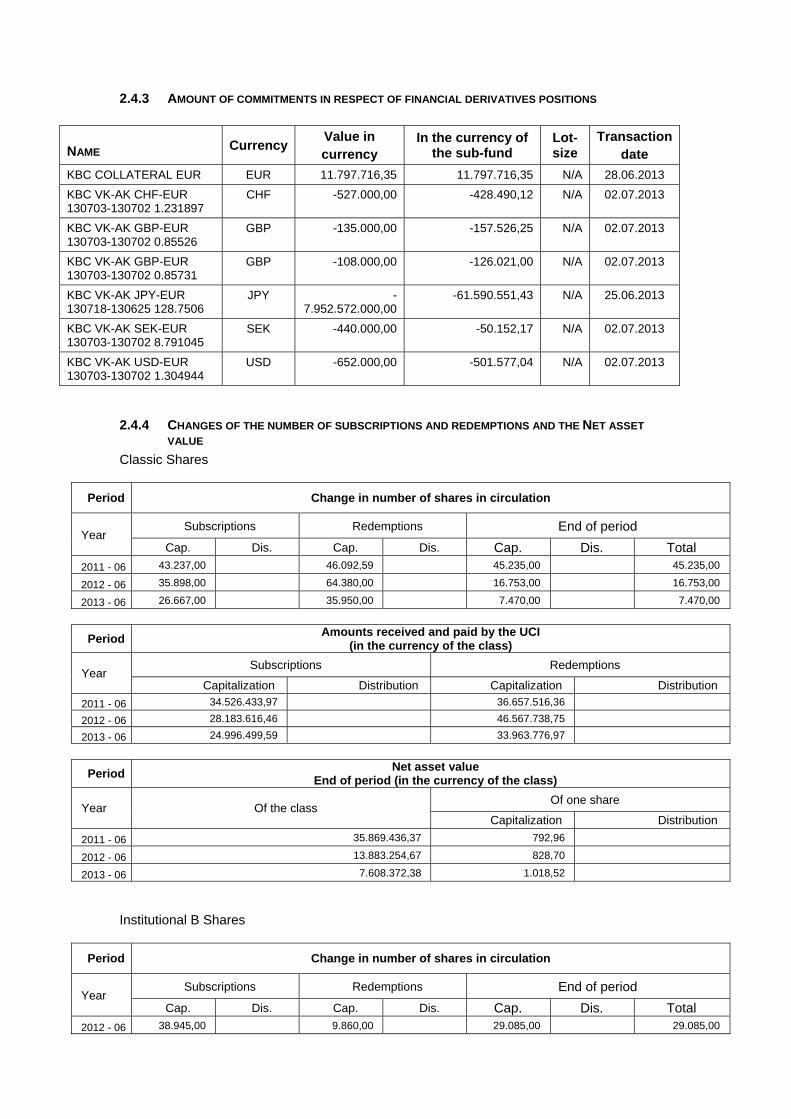
2.4.3 AMOUNT OF COMMITMENTS IN RESPECT OF FINANCIAL DERIVATIVES POSITIONS
NAME Currency Value in currency
In the currency of the sub-fund
Lot-size
Transactiondate
KBC COLLATERAL EUR EUR 11.797.716,35 11.797.716,35 N/A 28.06.2013
KBC VK-AK CHF-EUR 130703-130702 1.231897
CHF -527.000,00 -428.490,12 N/A 02.07.2013
KBC VK-AK GBP-EUR 130703-130702 0.85526
GBP -135.000,00 -157.526,25 N/A 02.07.2013
KBC VK-AK GBP-EUR 130703-130702 0.85731
GBP -108.000,00 -126.021,00 N/A 02.07.2013
KBC VK-AK JPY-EUR 130718-130625 128.7506
JPY -7.952.572.000,00
-61.590.551,43 N/A 25.06.2013
KBC VK-AK SEK-EUR 130703-130702 8.791045
SEK -440.000,00 -50.152,17 N/A 02.07.2013
KBC VK-AK USD-EUR 130703-130702 1.304944
USD -652.000,00 -501.577,04 N/A 02.07.2013
2.4.4 CHANGES OF THE NUMBER OF SUBSCRIPTIONS AND REDEMPTIONS AND THE NET ASSET
VALUE
Classic Shares
Period Change in number of shares in circulation
Year Subscriptions Redemptions End of period
Cap. Dis. Cap. Dis. Cap. Dis. Total 2011 - 06 43.237,00 46.092,59 45.235,00 45.235,00
2012 - 06 35.898,00 64.380,00 16.753,00 16.753,00
2013 - 06 26.667,00 35.950,00 7.470,00 7.470,00
Period Amounts received and paid by the UCI
(in the currency of the class)
Year Subscriptions Redemptions
Capitalization Distribution Capitalization Distribution
2011 - 06 34.526.433,97 36.657.516,36
2012 - 06 28.183.616,46 46.567.738,75
2013 - 06 24.996.499,59 33.963.776,97
Period Net asset value
End of period (in the currency of the class)
Year Of the class Of one share
Capitalization Distribution
2011 - 06 35.869.436,37 792,96
2012 - 06 13.883.254,67 828,70
2013 - 06 7.608.372,38 1.018,52
Institutional B Shares
Period Change in number of shares in circulation
Year Subscriptions Redemptions End of period
Cap. Dis. Cap. Dis. Cap. Dis. Total
2012 - 06 38.945,00 9.860,00 29.085,00 29.085,00
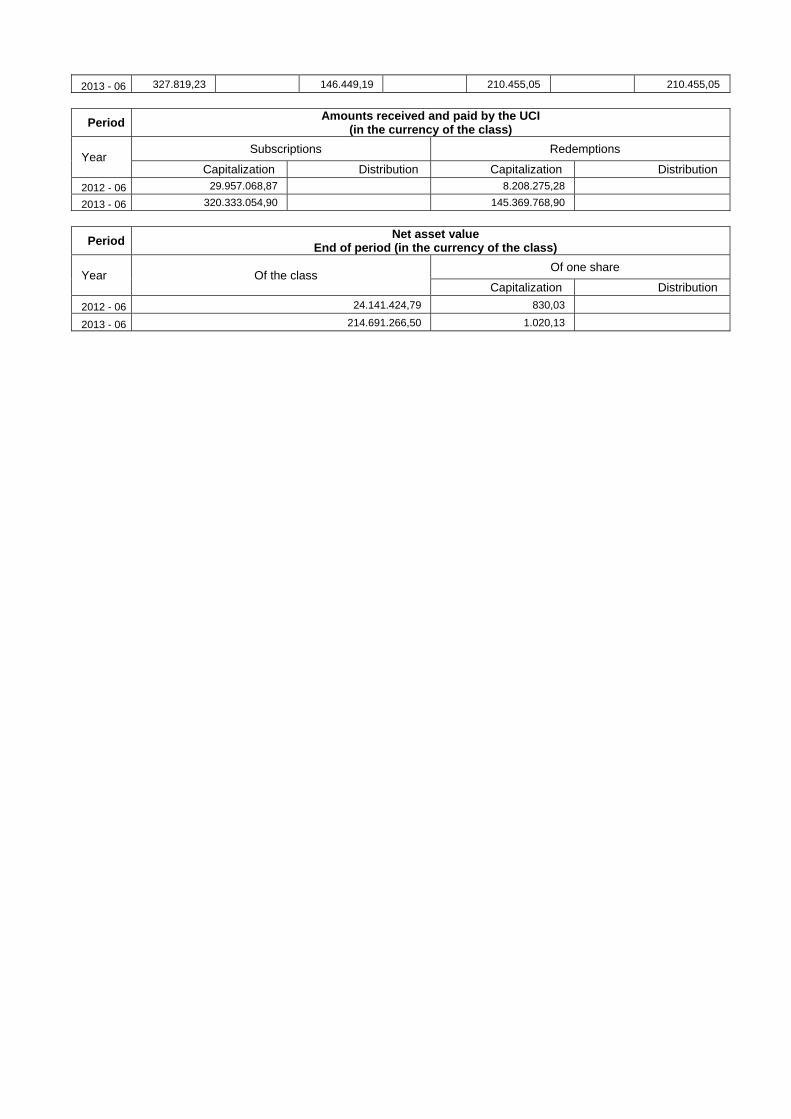
2013 - 06 327.819,23 146.449,19 210.455,05 210.455,05
Period Amounts received and paid by the UCI
(in the currency of the class)
Year Subscriptions Redemptions
Capitalization Distribution Capitalization Distribution
2012 - 06 29.957.068,87 8.208.275,28
2013 - 06 320.333.054,90 145.369.768,90
Period Net asset value
End of period (in the currency of the class)
Year Of the class Of one share
Capitalization Distribution
2012 - 06 24.141.424,79 830,03
2013 - 06 214.691.266,50 1.020,13
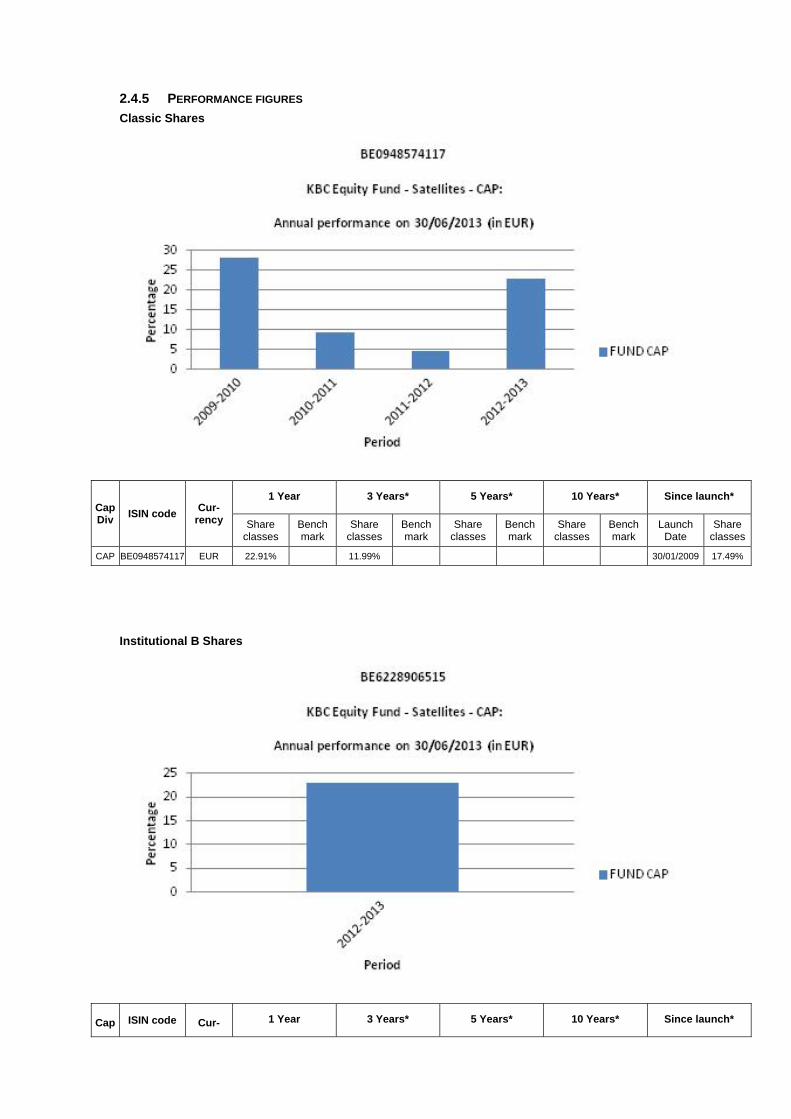
2.4.5 PERFORMANCE FIGURES
Classic Shares
Cap Div
ISIN code Cur-
rency
1 Year 3 Years* 5 Years* 10 Years* Since launch*
Share classes
Bench mark
Share classes
Bench mark
Share classes
Bench mark
Share classes
Bench mark
Launch Date
Share classes
CAP BE0948574117 EUR 22.91% 11.99% 30/01/2009 17.49%
Institutional B Shares
Cap ISIN code Cur- 1 Year 3 Years* 5 Years* 10 Years* Since launch*

Div rency Share classes
Bench mark
Share classes
Bench mark
Share classes
Bench mark
Share classes
Bench mark
Launch Date
Share classes
CAP BE6228906515 EUR 22.90% 24/11/2011 29.32%
Risk warning: Past performance is not a guide to future performance. * Return on annual basis.
Classic Shares The bar chart shows the performance for full financial years. The figures do not take account of any restructuring. Calculated in EUR. The return is calculated as the change in the net asset value between two dates expressed
as a percentage. Calculation method for date D, where NAV stands for net asset value:
Capitalisation units (CAP) Return on date D over a period of X years:
[NIW(D) / NIW(Y)] ^ [1 / X] - 1 where Y = D-X
Return on date D since the start date S of the unit: [NIW(D) / NIW(S)] ^ [1 / F] - 1 where F = 1 if the unit has existed for less than one year on date D where F = (D-S) / 365.25 if the unit has existed for longer than one year on date D
If the interval between the two dates exceeds one year, the ordinary return calculation is converted into a return on an annual basis by taking the nth square root of 1 plus the total return of the unit.
The return figures shown above do not take account of the fees and charges associated with the issue and redemption of units.
These are the performance figures for capitalization shares.
Institutional B Shares The bar chart shows the performance for full financial years. The figures do not take account of any restructuring. Calculated in EUR. The return is calculated as the change in the net asset value between two dates expressed
as a percentage. Calculation method for date D, where NAV stands for net asset value:
Capitalisation units (CAP) Return on date D over a period of X years:
[NIW(D) / NIW(Y)] ^ [1 / X] - 1 where Y = D-X
Return on date D since the start date S of the unit: [NIW(D) / NIW(S)] ^ [1 / F] - 1 where F = 1 if the unit has existed for less than one year on date D where F = (D-S) / 365.25 if the unit has existed for longer than one year on date D
If the interval between the two dates exceeds one year, the ordinary return calculation is converted into a return on an annual basis by taking the nth square root of 1 plus the total return of the unit.
The return figures shown above do not take account of the fees and charges associated with the issue and redemption of units.
These are the performance figures for capitalization shares.
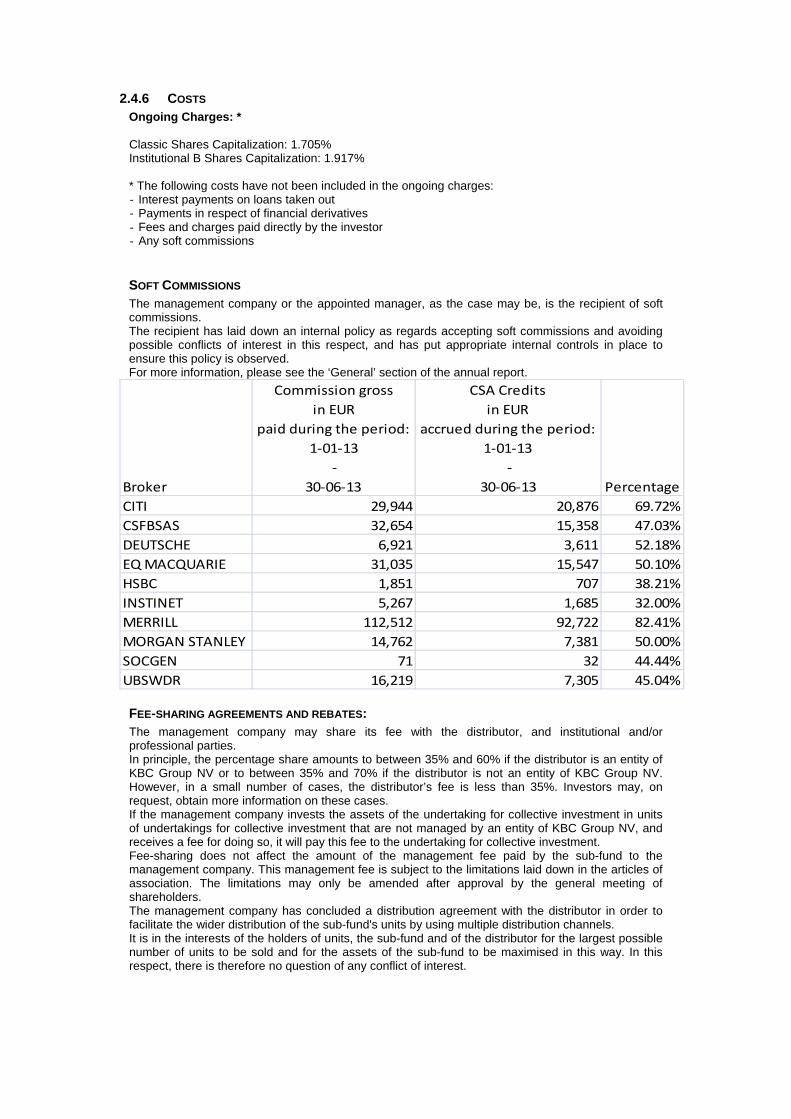
2.4.6 COSTS Ongoing Charges: * Classic Shares Capitalization: 1.705% Institutional B Shares Capitalization: 1.917% * The following costs have not been included in the ongoing charges: - Interest payments on loans taken out - Payments in respect of financial derivatives - Fees and charges paid directly by the investor - Any soft commissions
SOFT COMMISSIONS The management company or the appointed manager, as the case may be, is the recipient of soft commissions. The recipient has laid down an internal policy as regards accepting soft commissions and avoiding possible conflicts of interest in this respect, and has put appropriate internal controls in place to ensure this policy is observed. For more information, please see the ‘General’ section of the annual report.
Broker
Commission gross
in EUR
paid during the period:
1‐01‐13
‐
30‐06‐13
CSA Credits
in EUR
accrued during the period:
1‐01‐13
‐
30‐06‐13 Percentage
CITI 29,944 20,876 69.72%
CSFBSAS 32,654 15,358 47.03%
DEUTSCHE 6,921 3,611 52.18%
EQ MACQUARIE 31,035 15,547 50.10%
HSBC 1,851 707 38.21%
INSTINET 5,267 1,685 32.00%
MERRILL 112,512 92,722 82.41%
MORGAN STANLEY 14,762 7,381 50.00%
SOCGEN 71 32 44.44%
UBSWDR 16,219 7,305 45.04%
FEE-SHARING AGREEMENTS AND REBATES: The management company may share its fee with the distributor, and institutional and/or professional parties. In principle, the percentage share amounts to between 35% and 60% if the distributor is an entity of KBC Group NV or to between 35% and 70% if the distributor is not an entity of KBC Group NV. However, in a small number of cases, the distributor’s fee is less than 35%. Investors may, on request, obtain more information on these cases. If the management company invests the assets of the undertaking for collective investment in units of undertakings for collective investment that are not managed by an entity of KBC Group NV, and receives a fee for doing so, it will pay this fee to the undertaking for collective investment. Fee-sharing does not affect the amount of the management fee paid by the sub-fund to the management company. This management fee is subject to the limitations laid down in the articles of association. The limitations may only be amended after approval by the general meeting of shareholders. The management company has concluded a distribution agreement with the distributor in order to facilitate the wider distribution of the sub-fund's units by using multiple distribution channels. It is in the interests of the holders of units, the sub-fund and of the distributor for the largest possible number of units to be sold and for the assets of the sub-fund to be maximised in this way. In this respect, there is therefore no question of any conflict of interest.

2.4.7 NOTES TO THE FINANCIAL STATEMENTS AND OTHER DATA Fee for managing the investment portfolio: 1.5% per annum calculated on the basis of the average total net assets of the sub-fund, no management fee is charged on assets assets invested in investment undertakings managed by a financial institution of the KBC group. The administration agent’s fee is payable at the end of each month and is calculated on the basis of the average total net assets of the sub-fund. Auditor's fee: 1 700 EUR per year. This fee is not including VAT and can be indexed on an annual basis in accordance with the decisions of the general meeting. The custody fee is calculated on the value of the securities held in custody by the custodian on the final banking day of the preceding calendar year, except on those assets invested in investment undertakings managed by a financial institution of the KBC group. The custody fee is paid at the beginning of the calendar year. Social, ethical and environmental aspects: No manufacturers of controversial weapons whose use over the past five decades, according to the international consensus, has led to disproportionate human suffering among the civilian population will be included in the portfolio of investments. This involves the manufacturers of anti-personnel mines, cluster bombs and munitions and weapons containing depleted uranium. In this way, the sub-fund seeks to reflect not only simple financial reality but also the social reality of the sector or region in question. Exercising voting rights. If necessary, relevant and in the interest of the shareholders, the management company will exercise the voting rights attached to the shares in the Bevek’s portfolio. The management company will adhere to the following criteria when determining how it stands relative to the items on the agenda that are put to the vote: - Shareholder value may not be adversely affected. - Corporate governance rules, especially with regard to the rights of minority shareholders, must be
respected. - The minimum standards with regard to sustainable business and corporate social responsibility
must be met. The list of companies for which voting rights are exercised is available at the registered office of the Bevek. Securities lending In accordance with the Royal Decree of 7 March 2006 concerning securities lending, the undertaking for collective investment has taken out securities loans with a principal to whom the full title of the loaned securities was transferred, without recording this transfer of ownership in the accounts. For the period from 1 January 2013 to 30 June 2013, the fee for securities lent comes to 2,224.33 EUR. The undertaking for collective investment receives 50% of the fee received for securities lent. The detailed list of securities lending transactions carried out can be obtained from the registered office of the collective investment undertaking at 2 Havenlaan, 1080 Brussels.
Overview of securities lent as at 30/06/2013
Name Currency Quantity Price Value in currency of the
portfolio
ABB LTD CHF 49.461 20,510 824.819,18
ADVANTEST CORP JPY 118.500 1.632,000 1.497.769,52
ALSTOM EUR 42.092 25,160 1.059.034,72
CANADIAN PACIFIC RAILWAY LTD CAD 8.675 127,530 806.769,31
ENBRIDGE INC CAD 26.118 44,210 842.030,76
GIVAUDAN REG CHF 274 1.219,000 271.571,67
PERNOD-RICARD EUR 26.134 85,190 2.226.355,46
SHARP CORP JPY 375.000 400,000 1.161.710,04
SHIRE PLC GBP 89.829 20,850 2.185.454,67
WEIR GROUP PLC GBP 664 21,510 16.665,86
Total 10.892.181,19
Details of collateral received for securities lent
Name Currency Nominal value Currency fund Value in Currency fund
AUSTRIA 2012 3,4% 22/11/2022 EUR 937.000 EUR 1.069.183,53
BUNDESSCHATZANWEISUNGEN 2013 0.25% 13/03/15 EUR 2.599.000 EUR 2.605.354,56
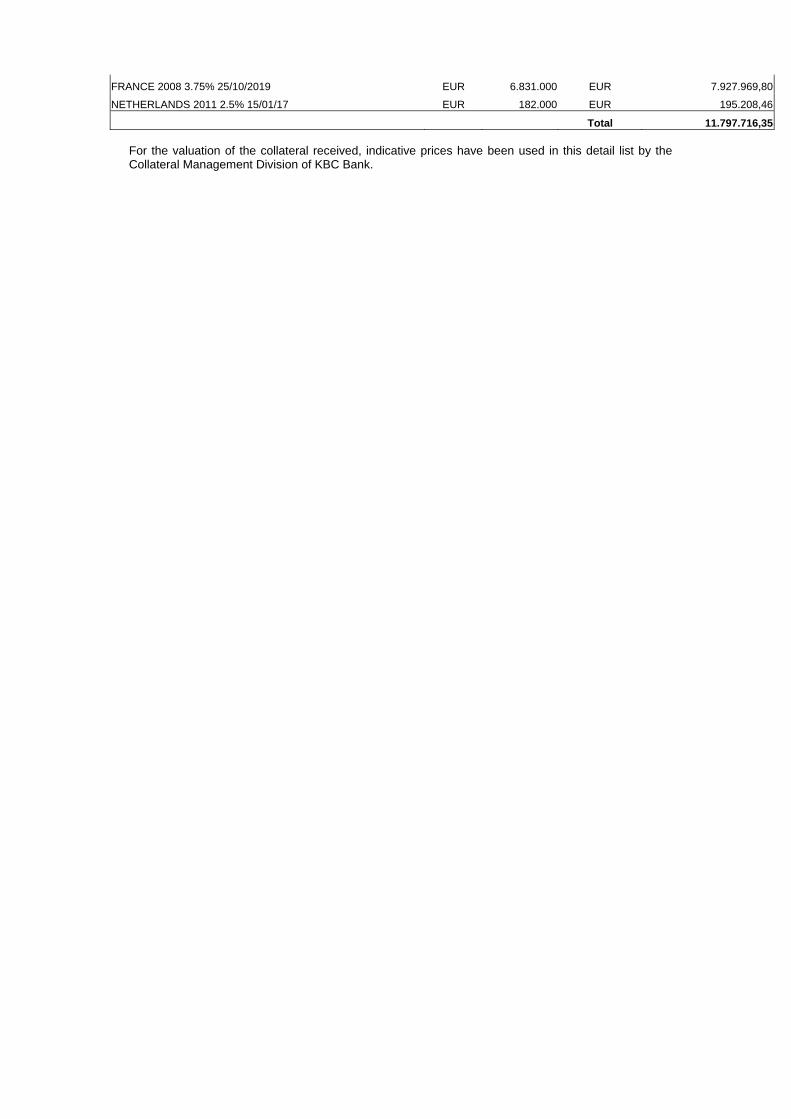
FRANCE 2008 3.75% 25/10/2019 EUR 6.831.000 EUR 7.927.969,80
NETHERLANDS 2011 2.5% 15/01/17 EUR 182.000 EUR 195.208,46
Total 11.797.716,35 For the valuation of the collateral received, indicative prices have been used in this detail list by the Collateral Management Division of KBC Bank.

Semi-Annual report as at 30th June 2013
TABLE OF CONTENTS
2. Information on KBC Equity Fund CSOB BRIC
2.1. Management report 2.1.1. Launch date and subscription price 2.1.2. Stock exchange listing 2.1.3. Aim and distinctive features of the investment policy 2.1.4. Financial portfolio management 2.1.5. Distributors 2.1.6. Index and benchmark 2.1.7. Policy conducted during the financial year 2.1.8. Future policy 2.1.9. Synthetic risk and reward indicator (SRRI)
2.2. Balance sheet
2.3. Profit and loss account
2.4. Composition of the assets and key figures
2.4.1. Composition of the assets 2.4.2. Change in the composition of the assets 2.4.3. Value of commitments in respect of financial derivatives positions 2.4.4. Evolution of the number of subscriptions, repayments and the net asset value 2.4.5. Return figures 2.4.6. Expenses 2.4.7. Notes to the financial statements and other data

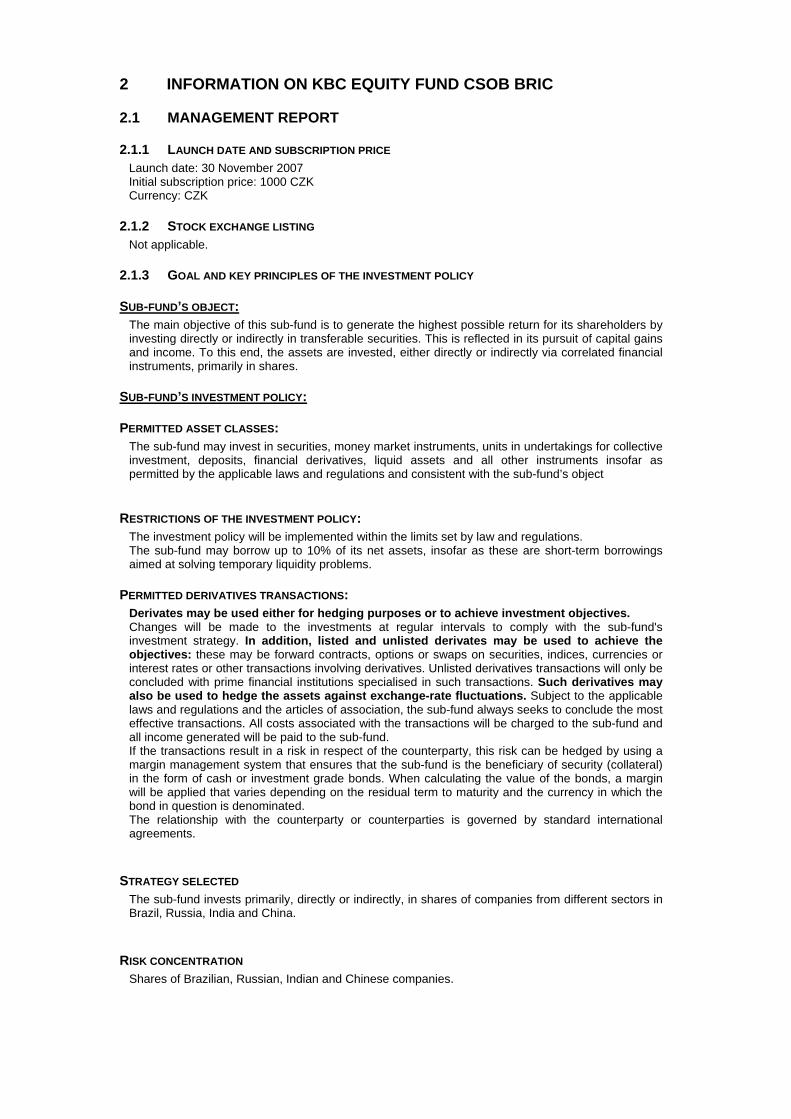
2 INFORMATION ON KBC EQUITY FUND CSOB BRIC
2.1 MANAGEMENT REPORT
2.1.1 LAUNCH DATE AND SUBSCRIPTION PRICE Launch date: 30 November 2007 Initial subscription price: 1000 CZK Currency: CZK
2.1.2 STOCK EXCHANGE LISTING Not applicable.
2.1.3 GOAL AND KEY PRINCIPLES OF THE INVESTMENT POLICY
SUB-FUND’S OBJECT: The main objective of this sub-fund is to generate the highest possible return for its shareholders by investing directly or indirectly in transferable securities. This is reflected in its pursuit of capital gains and income. To this end, the assets are invested, either directly or indirectly via correlated financial instruments, primarily in shares.
SUB-FUND’S INVESTMENT POLICY:
PERMITTED ASSET CLASSES: The sub-fund may invest in securities, money market instruments, units in undertakings for collective investment, deposits, financial derivatives, liquid assets and all other instruments insofar as permitted by the applicable laws and regulations and consistent with the sub-fund’s object
RESTRICTIONS OF THE INVESTMENT POLICY: The investment policy will be implemented within the limits set by law and regulations. The sub-fund may borrow up to 10% of its net assets, insofar as these are short-term borrowings aimed at solving temporary liquidity problems.
PERMITTED DERIVATIVES TRANSACTIONS: Derivates may be used either for hedging purposes or to achieve investment objectives. Changes will be made to the investments at regular intervals to comply with the sub-fund's investment strategy. In addition, listed and unlisted derivates may be used to achieve the objectives: these may be forward contracts, options or swaps on securities, indices, currencies or interest rates or other transactions involving derivatives. Unlisted derivatives transactions will only be concluded with prime financial institutions specialised in such transactions. Such derivatives may also be used to hedge the assets against exchange-rate fluctuations. Subject to the applicable laws and regulations and the articles of association, the sub-fund always seeks to conclude the most effective transactions. All costs associated with the transactions will be charged to the sub-fund and all income generated will be paid to the sub-fund. If the transactions result in a risk in respect of the counterparty, this risk can be hedged by using a margin management system that ensures that the sub-fund is the beneficiary of security (collateral) in the form of cash or investment grade bonds. When calculating the value of the bonds, a margin will be applied that varies depending on the residual term to maturity and the currency in which the bond in question is denominated. The relationship with the counterparty or counterparties is governed by standard international agreements.
STRATEGY SELECTED The sub-fund invests primarily, directly or indirectly, in shares of companies from different sectors in Brazil, Russia, India and China.
RISK CONCENTRATION Shares of Brazilian, Russian, Indian and Chinese companies.

INVESTMENTS IN ASSETS OTHER THAN SECURITIES OR MONEY MARKET INSTRUMENTS Under the investment policy referred to above, the sub-fund may invest primarily in permitted assets other than securities or money market instruments, including units in UCIs.
LENDING FINANCIAL INSTRUMENTS: The sub-fund may lend financial instruments within the limits set by law and regulations. This lending does not affect the sub-fund’s risk profile since: - it takes place within the framework of a securities lending system managed by a principal. In
addition, the sub-fund has a relationship only with the principal of the securities lending system which acts as counterparty and to which title of the loaned securities is transferred. The choice of principal is subject to strict selection criteria. The return of securities similar to the securities that have been lent is guaranteed by the principal.
- through a margin management system, the sub-fund is always guaranteed financial security, the actual value of which always exceeds the actual value of the securities that have been lent, in case the principal does not return similar securities.
The return of securities similar to the securities that have been lent can be requested at any time, which means that the lending of securities does not affect the management of the sub-fund's assets. By lending securities, the sub-fund can generate an additional return. The principal pays a fee to the management company. After deducting the fee for the margin management and clearing services of KBC Bank, most of this fee is paid to the sub-fund. The relationship with the counterparty or counterparties is governed by standard international agreements. More information is provided on the terms and conditions governing securities lending in the annual or half-yearly report for the sub-fund.
VOLATILITY OF THE NET ASSET VALUE: The volatility of the net asset value may be high due to the composition of the portfolio.
GENERAL STRATEGY FOR HEDGING THE EXCHANGE RATE RISK: In order to protect its assets against exchange rate fluctuations and within the limitations laid down in the articles of association, the sub-fund may perform transactions relating to the sale of forward currency contracts, as well as the sale of call options and the purchase of put options on currencies. The transactions in question may relate solely to contracts traded on a regulated market that operates regularly, is recognised and is open to the public or that are traded with a recognised, prime financial institution specialising in such transactions and dealing in the over-the-counter (OTC) market in options. With the same objective, the sub-fund may also sell currencies forward or exchange them in private transactions with prime financial institutions specialising in such transactions. The hedging objective of the aforementioned transactions suggests that there is a direct link between these transactions and the assets to be hedged, which implies that the transactions carried out in a particular currency may in principle not exceed, in terms of volume, either the valuation value of all the assets in the same currency or the holding period of those assets.
SOCIAL, ETHICAL AND ENVIRONMENTAL ASPECTS:
No manufacturers of controversial weapons whose use over the past five decades, according to the international consensus, has led to disproportionate human suffering among the civilian population will be included in the portfolio of investments. This involves the manufacturers of anti-personnel mines, cluster bombs and munitions and weapons containing depleted uranium. In this way, the sub-fund seeks to reflect not only simple financial reality but also the social reality of the sector or region in question.
THE EUROPEAN SAVINGS DIRECTIVE AND TAX ON DEBT CLAIM RETURNS OBTAINED THROUGH THE
REDEMPTION OF OWN UNITS OR IN THE EVENT OF FULL OR PARTIAL DISTRIBUTION OF EQUITY
CAPITAL. The following information is of a general character and is not intended to cover all aspects of an investment in a UCITS. In certain cases entirely different rules might even apply. Moreover, both tax law and the interpretation of it can change. Investors who wish to have more information about the

tax implications – in both Belgium and abroad – of acquiring, holding and transferring units should seek the advice of their usual financial and tax advisers. This UCITS shall invest a maximum of 15% of its assets directly or indirectly in debt instruments as intended by the European Savings Directive. A. European Savings Directive (Directive 2003/48/EC) The European Savings Directive has been implemented in Belgium. Since this UCITS invests a maximum of 15% of its assets directly or indirectly in debt claims as intended by the European Savings Directive, the income of this UCITS does not fall within the scope of this directive. B. Tax on debt claim returns obtained through the redemption of own units or in the event of full or partial distribution of equity capital (Article 19bis Income Tax Code 1992). The income from this UCITS is not subject to the tax on debt instrument returns as intended by Article 19bis, Income Tax Code 1992.
2.1.4 FINANCIAL PORTFOLIO MANAGEMENT The management company has delegated the intellectual management, to KBC Fund Management Limited, Joshua Dawson House, Dawson Street , Dublin 2, IRELAND..
2.1.5 DISTRIBUTORS KBC Asset Management S.A., 5, Place de la Gare, L-1616 Luxembourg.
2.1.6 INDEX AND BENCHMARK See ‘Sub-fund’s investment policy’.
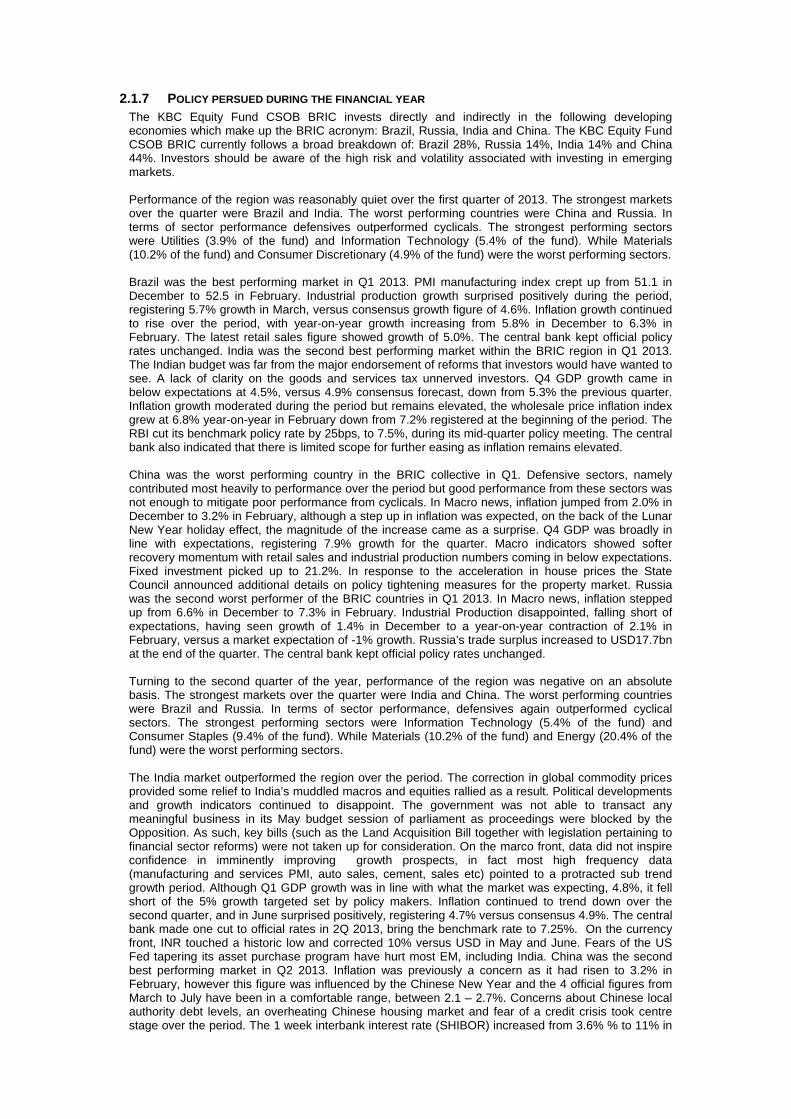
2.1.7 POLICY PERSUED DURING THE FINANCIAL YEAR The KBC Equity Fund CSOB BRIC invests directly and indirectly in the following developing economies which make up the BRIC acronym: Brazil, Russia, India and China. The KBC Equity Fund CSOB BRIC currently follows a broad breakdown of: Brazil 28%, Russia 14%, India 14% and China 44%. Investors should be aware of the high risk and volatility associated with investing in emerging markets. Performance of the region was reasonably quiet over the first quarter of 2013. The strongest markets over the quarter were Brazil and India. The worst performing countries were China and Russia. In terms of sector performance defensives outperformed cyclicals. The strongest performing sectors were Utilities (3.9% of the fund) and Information Technology (5.4% of the fund). While Materials (10.2% of the fund) and Consumer Discretionary (4.9% of the fund) were the worst performing sectors. Brazil was the best performing market in Q1 2013. PMI manufacturing index crept up from 51.1 in December to 52.5 in February. Industrial production growth surprised positively during the period, registering 5.7% growth in March, versus consensus growth figure of 4.6%. Inflation growth continued to rise over the period, with year-on-year growth increasing from 5.8% in December to 6.3% in February. The latest retail sales figure showed growth of 5.0%. The central bank kept official policy rates unchanged. India was the second best performing market within the BRIC region in Q1 2013. The Indian budget was far from the major endorsement of reforms that investors would have wanted to see. A lack of clarity on the goods and services tax unnerved investors. Q4 GDP growth came in below expectations at 4.5%, versus 4.9% consensus forecast, down from 5.3% the previous quarter. Inflation growth moderated during the period but remains elevated, the wholesale price inflation index grew at 6.8% year-on-year in February down from 7.2% registered at the beginning of the period. The RBI cut its benchmark policy rate by 25bps, to 7.5%, during its mid-quarter policy meeting. The central bank also indicated that there is limited scope for further easing as inflation remains elevated. China was the worst performing country in the BRIC collective in Q1. Defensive sectors, namely contributed most heavily to performance over the period but good performance from these sectors was not enough to mitigate poor performance from cyclicals. In Macro news, inflation jumped from 2.0% in December to 3.2% in February, although a step up in inflation was expected, on the back of the Lunar New Year holiday effect, the magnitude of the increase came as a surprise. Q4 GDP was broadly in line with expectations, registering 7.9% growth for the quarter. Macro indicators showed softer recovery momentum with retail sales and industrial production numbers coming in below expectations. Fixed investment picked up to 21.2%. In response to the acceleration in house prices the State Council announced additional details on policy tightening measures for the property market. Russia was the second worst performer of the BRIC countries in Q1 2013. In Macro news, inflation stepped up from 6.6% in December to 7.3% in February. Industrial Production disappointed, falling short of expectations, having seen growth of 1.4% in December to a year-on-year contraction of 2.1% in February, versus a market expectation of -1% growth. Russia’s trade surplus increased to USD17.7bn at the end of the quarter. The central bank kept official policy rates unchanged. Turning to the second quarter of the year, performance of the region was negative on an absolute basis. The strongest markets over the quarter were India and China. The worst performing countries were Brazil and Russia. In terms of sector performance, defensives again outperformed cyclical sectors. The strongest performing sectors were Information Technology (5.4% of the fund) and Consumer Staples (9.4% of the fund). While Materials (10.2% of the fund) and Energy (20.4% of the fund) were the worst performing sectors. The India market outperformed the region over the period. The correction in global commodity prices provided some relief to India’s muddled macros and equities rallied as a result. Political developments and growth indicators continued to disappoint. The government was not able to transact any meaningful business in its May budget session of parliament as proceedings were blocked by the Opposition. As such, key bills (such as the Land Acquisition Bill together with legislation pertaining to financial sector reforms) were not taken up for consideration. On the marco front, data did not inspire confidence in imminently improving growth prospects, in fact most high frequency data (manufacturing and services PMI, auto sales, cement, sales etc) pointed to a protracted sub trend growth period. Although Q1 GDP growth was in line with what the market was expecting, 4.8%, it fell short of the 5% growth targeted set by policy makers. Inflation continued to trend down over the second quarter, and in June surprised positively, registering 4.7% versus consensus 4.9%. The central bank made one cut to official rates in 2Q 2013, bring the benchmark rate to 7.25%. On the currency front, INR touched a historic low and corrected 10% versus USD in May and June. Fears of the US Fed tapering its asset purchase program have hurt most EM, including India. China was the second best performing market in Q2 2013. Inflation was previously a concern as it had risen to 3.2% in February, however this figure was influenced by the Chinese New Year and the 4 official figures from March to July have been in a comfortable range, between 2.1 – 2.7%. Concerns about Chinese local authority debt levels, an overheating Chinese housing market and fear of a credit crisis took centre stage over the period. The 1 week interbank interest rate (SHIBOR) increased from 3.6% % to 11% in

the first 3 weeks of June and declining to below 4% in the last week of June. The main motivation behind this was to encourage more caution in lending practices and improve the capital allocation process but it did have a negative impact on financial markets, particularly the Chinese financial sector (16% of fund). Brazil was the worst performing market in Q2. Both local and global factors were behind poor performance. Brazil’s largest companies are very reliant on the global macroeconomic situation as their fortunes are dependent on commodity-oriented exports. Commodity prices, driven down by a slowdown in global and Chinese economy. Brazil-China commodity link, one of the main engines of local economy growth in the first decade of 21st century, went into reverse. Local economic data was not supportive either. On the economic front, GDP growth continued to disappoint, coming in below expectations. Q1 2013 GDP growth registered 1.9% versus consensus 2.3%. Russia was the second worst performing market in Q2. Sentiment was weak, and not just because of lower commodity prices. Foreign investors were abandoning the Russian story as corporate governance in some state-controlled companies deteriorated. Additionally, Russian equities reacted negatively to the ongoing recession in Europe as well as the Cypriot banking crisis. In the first quarter of 2013, the economy grew more than expected. GDP increased by 1.6% YoY, well above the Economics Ministry’s estimate of 1.1%. Nevertheless, it was the slowest quarterly growth since 2009. Industrial production in May declined by -1.4% YoY reflecting a slump in foreign demand and weak domestic spending. Investment and construction activity was also contracting. The Ruble suffered significant losses, particularly in June, due the aforementioned sell-off of emerging market currencies after the Fed stated it is contemplating to end its quantitative easing. The Ruble depreciated against the Dollar and the Euro by 7.6% and 6.2%, respectively.
2.1.8 FUTURE POLICY During its mid-quarter policy meeting the Indian Central Bank again indicated that the scope for further easing was limited. The government announced various policy measures to check the INR slide. In particular, confidence in Indian assets was boosted on the back of the government’s agreement to further raise natural gas prices, which should serve to boost foreign investment in the energy sector and reduce local explorers’ dependency on imports. In China, the new government administration intends to move towards a more market based economy, and facilitate an economic rebalance from export and investment led growth towards consumption driven growth. Although these policies are likely to be beneficial in the long run, the short term impact is increased uncertainty and market volatility. Unless the Russian government implements some significant reforms of its deteriorating economic model, the potential economic growth will, at best, linger around 2% - 3% annually. Russia is likely suffering from the so called middle-income trap that strikes countries with GDP per capita of around 16 000 USD. It is the first BRIC country to reach this phase. Nonetheless, The Russian stock market has one appealing benefit – its dividend yield. Since the state-controlled companies are ordered to pay out at least 25 % of net income, the market dividend yield is above 4 %. Other than that, the oil price is to be watched. Turning to Brazil, the unemployment rate continues to be very low at 5.5%. Moreover, cheaper local currency should help domestic exporters. Its largest companies are dependent on the global macroeconomic situation and on commodity prices. We do continue to believe, however, that the global economic picture is getting stronger. Moreover, a substantial part of the slowdown in the Brazilian economy appears to be priced in at current valuations and expectations are already moderate on a relative basis. Overall, equity markets were quite volatile in the second quarter of 2013 and the volatility is likely to continue. Historically, emerging market equities are more volatile than their counterparts in developed markets as their prices are more sensitive to changes in global macroeconomic data and investors’ sentiment towards risk assets. This was true over last few months and is likely to continue to prove true going forward. We do continue to believe, however, that the global economic picture is getting stronger. Overall, a reasonable level of good quality growth continues to be seen in emerging markets. Relative to developed markets, the region is not experiencing the same deleveraging that is being experienced elsewhere, particularly in Europe. While growth has clearly slowed in recent years, we do not expect a major deterioration from current levels going forward.
2.1.9 SYNTHETIC RISK AND REWARD INDICATOR 7 on a scale of 1 (lowest risk) to 7 (highest risk). The value of a share can decrease or increase and the investor may not get back the amount invested. In accordance with Commission Regulation (EU) No. 583/2010, a synthetic risk and reward indicator has been calculated. This indicator provides a quantitative measure of the sub-fund's potential return and the risk involved, calculated in the currency in which the sub-fund is denominated. It is given as a figure between 1 and 7. The higher the figure, the greater the potential return, but also the more difficult it is to predict this return. Losses are possible too. The lowest figure does not mean that the

investment is entirely free of risk. However, it does indicate that, compared with the higher figures, this product will generally provide a lower, but more predictable return. The synthetic risk and reward indicator is assessed regularly and can therefore go up or down based on data from the past. Data from the past is not always a reliable indicator of future risk and return.
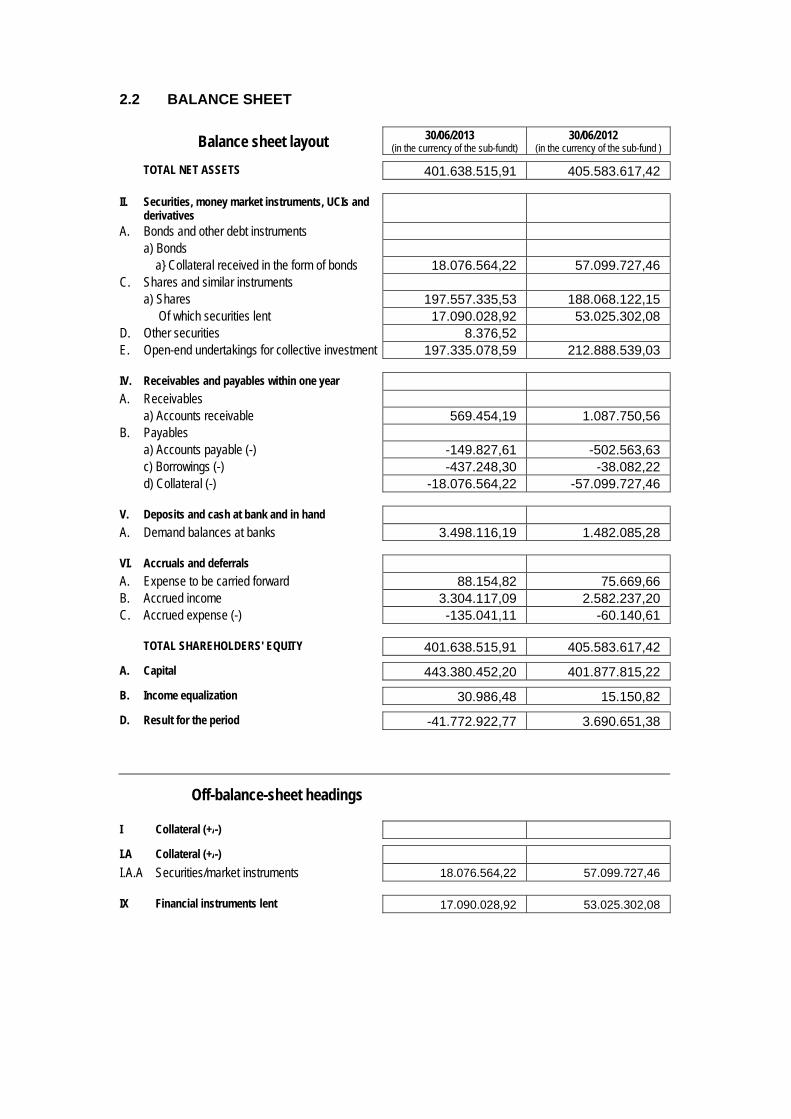
2.2 BALANCE SHEET
Balance sheet layout 30/06/2013 (in the currency of the sub-fundt)
30/06/2012 (in the currency of the sub-fund )
TOTAL NET ASSETS 401.638.515,91 405.583.617,42
II. Securities, money market instruments, UCIs and derivatives
A. Bonds and other debt instruments a) Bonds a} Collateral received in the form of bonds 18.076.564,22 57.099.727,46 C. Shares and similar instruments a) Shares 197.557.335,53 188.068.122,15 Of which securities lent 17.090.028,92 53.025.302,08 D. Other securities 8.376,52 E. Open-end undertakings for collective investment 197.335.078,59 212.888.539,03
IV. Receivables and payables within one year A. Receivables a) Accounts receivable 569.454,19 1.087.750,56 B. Payables a) Accounts payable (-) -149.827,61 -502.563,63 c) Borrowings (-) -437.248,30 -38.082,22 d) Collateral (-) -18.076.564,22 -57.099.727,46
V. Deposits and cash at bank and in hand A. Demand balances at banks 3.498.116,19 1.482.085,28
VI. Accruals and deferrals A. Expense to be carried forward 88.154,82 75.669,66 B. Accrued income 3.304.117,09 2.582.237,20 C. Accrued expense (-) -135.041,11 -60.140,61
TOTAL SHAREHOLDERS' EQUITY 401.638.515,91 405.583.617,42
A. Capital 443.380.452,20 401.877.815,22
B. Income equalization 30.986,48 15.150,82
D. Result for the period -41.772.922,77 3.690.651,38
Off-balance-sheet headings
I Collateral (+/-)
I.A Collateral (+/-)
I.A.A Securities/market instruments 18.076.564,22 57.099.727,46
IX Financial instruments lent 17.090.028,92 53.025.302,08
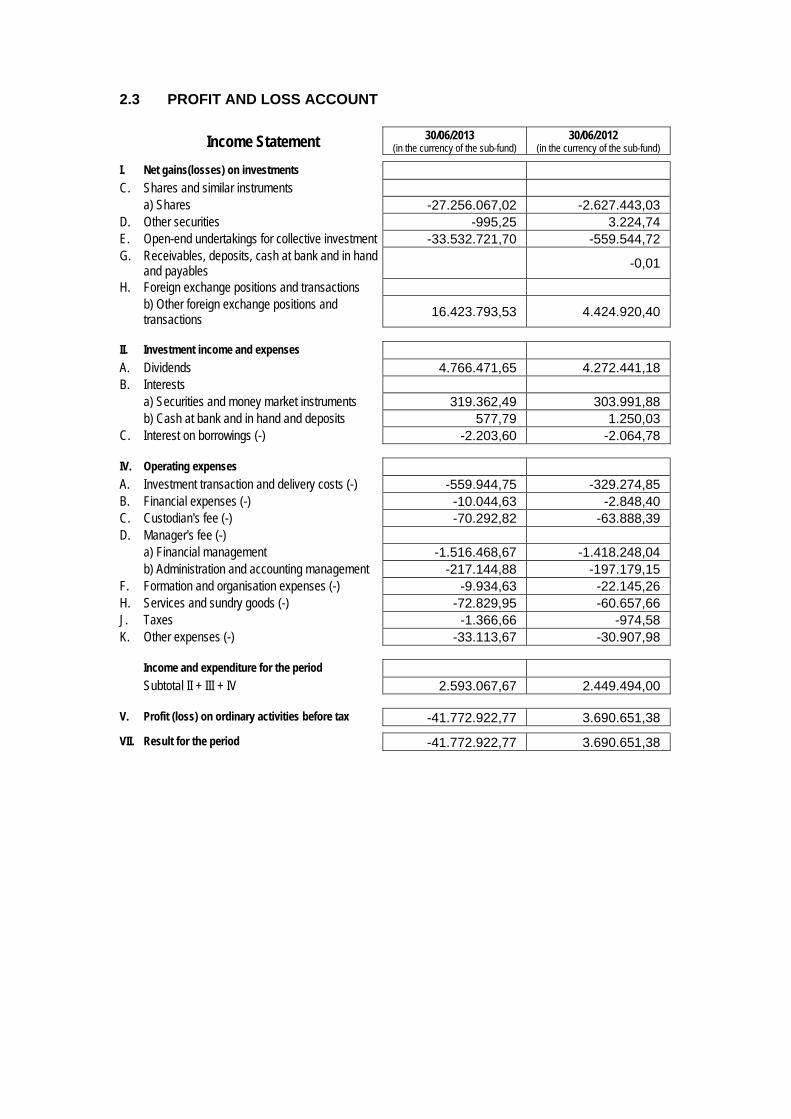
2.3 PROFIT AND LOSS ACCOUNT
Income Statement 30/06/2013 (in the currency of the sub-fund)
30/06/2012 (in the currency of the sub-fund)
I. Net gains(losses) on investments C. Shares and similar instruments a) Shares -27.256.067,02 -2.627.443,03 D. Other securities -995,25 3.224,74 E. Open-end undertakings for collective investment -33.532.721,70 -559.544,72 G. Receivables, deposits, cash at bank and in hand
and payables -0,01
H. Foreign exchange positions and transactions b) Other foreign exchange positions and
transactions 16.423.793,53 4.424.920,40
II. Investment income and expenses A. Dividends 4.766.471,65 4.272.441,18 B. Interests a) Securities and money market instruments 319.362,49 303.991,88 b) Cash at bank and in hand and deposits 577,79 1.250,03 C. Interest on borrowings (-) -2.203,60 -2.064,78
IV. Operating expenses A. Investment transaction and delivery costs (-) -559.944,75 -329.274,85 B. Financial expenses (-) -10.044,63 -2.848,40 C. Custodian's fee (-) -70.292,82 -63.888,39 D. Manager's fee (-) a) Financial management -1.516.468,67 -1.418.248,04 b) Administration and accounting management -217.144,88 -197.179,15 F. Formation and organisation expenses (-) -9.934,63 -22.145,26 H. Services and sundry goods (-) -72.829,95 -60.657,66 J. Taxes -1.366,66 -974,58 K. Other expenses (-) -33.113,67 -30.907,98
Income and expenditure for the period Subtotal II + III + IV 2.593.067,67 2.449.494,00
V. Profit (loss) on ordinary activities before tax -41.772.922,77 3.690.651,38
VII. Result for the period -41.772.922,77 3.690.651,38
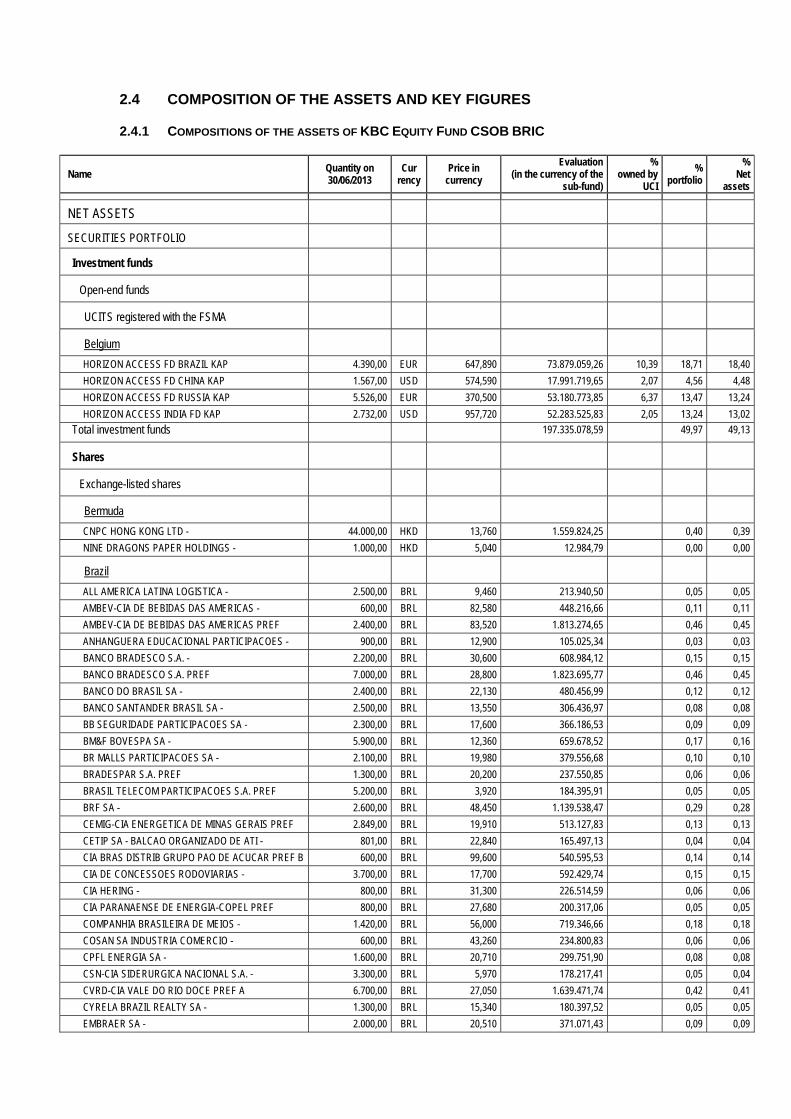
2.4 COMPOSITION OF THE ASSETS AND KEY FIGURES
2.4.1 COMPOSITIONS OF THE ASSETS OF KBC EQUITY FUND CSOB BRIC
Name Quantity on 30/06/2013
Cur rency
Price in currency
Evaluation (in the currency of the
sub-fund)
% owned by
UCI
% portfolio
% Net
assets
NET ASSETS
SECURITIES PORTFOLIO
Investment funds
Open-end funds
UCITS registered with the FSMA
Belgium
HORIZON ACCESS FD BRAZIL KAP 4.390,00 EUR 647,890 73.879.059,26 10,39 18,71 18,40
HORIZON ACCESS FD CHINA KAP 1.567,00 USD 574,590 17.991.719,65 2,07 4,56 4,48
HORIZON ACCESS FD RUSSIA KAP 5.526,00 EUR 370,500 53.180.773,85 6,37 13,47 13,24
HORIZON ACCESS INDIA FD KAP 2.732,00 USD 957,720 52.283.525,83 2,05 13,24 13,02
Total investment funds 197.335.078,59 49,97 49,13
Shares
Exchange-listed shares
Bermuda
CNPC HONG KONG LTD - 44.000,00 HKD 13,760 1.559.824,25 0,40 0,39
NINE DRAGONS PAPER HOLDINGS - 1.000,00 HKD 5,040 12.984,79 0,00 0,00
Brazil
ALL AMERICA LATINA LOGISTICA - 2.500,00 BRL 9,460 213.940,50 0,05 0,05
AMBEV-CIA DE BEBIDAS DAS AMERICAS - 600,00 BRL 82,580 448.216,66 0,11 0,11
AMBEV-CIA DE BEBIDAS DAS AMERICAS PREF 2.400,00 BRL 83,520 1.813.274,65 0,46 0,45
ANHANGUERA EDUCACIONAL PARTICIPACOES - 900,00 BRL 12,900 105.025,34 0,03 0,03
BANCO BRADESCO S.A. - 2.200,00 BRL 30,600 608.984,12 0,15 0,15
BANCO BRADESCO S.A. PREF 7.000,00 BRL 28,800 1.823.695,77 0,46 0,45
BANCO DO BRASIL SA - 2.400,00 BRL 22,130 480.456,99 0,12 0,12
BANCO SANTANDER BRASIL SA - 2.500,00 BRL 13,550 306.436,97 0,08 0,08
BB SEGURIDADE PARTICIPACOES SA - 2.300,00 BRL 17,600 366.186,53 0,09 0,09
BM&F BOVESPA SA - 5.900,00 BRL 12,360 659.678,52 0,17 0,16
BR MALLS PARTICIPACOES SA - 2.100,00 BRL 19,980 379.556,68 0,10 0,10
BRADESPAR S.A. PREF 1.300,00 BRL 20,200 237.550,85 0,06 0,06
BRASIL TELECOM PARTICIPACOES S.A. PREF 5.200,00 BRL 3,920 184.395,91 0,05 0,05
BRF SA - 2.600,00 BRL 48,450 1.139.538,47 0,29 0,28
CEMIG-CIA ENERGETICA DE MINAS GERAIS PREF 2.849,00 BRL 19,910 513.127,83 0,13 0,13
CETIP SA - BALCAO ORGANIZADO DE ATI - 801,00 BRL 22,840 165.497,13 0,04 0,04
CIA BRAS DISTRIB GRUPO PAO DE ACUCAR PREF B 600,00 BRL 99,600 540.595,53 0,14 0,14
CIA DE CONCESSOES RODOVIARIAS - 3.700,00 BRL 17,700 592.429,74 0,15 0,15
CIA HERING - 800,00 BRL 31,300 226.514,59 0,06 0,06
CIA PARANAENSE DE ENERGIA-COPEL PREF 800,00 BRL 27,680 200.317,06 0,05 0,05
COMPANHIA BRASILEIRA DE MEIOS - 1.420,00 BRL 56,000 719.346,66 0,18 0,18
COSAN SA INDUSTRIA COMERCIO - 600,00 BRL 43,260 234.800,83 0,06 0,06
CPFL ENERGIA SA - 1.600,00 BRL 20,710 299.751,90 0,08 0,08
CSN-CIA SIDERURGICA NACIONAL S.A. - 3.300,00 BRL 5,970 178.217,41 0,05 0,04
CVRD-CIA VALE DO RIO DOCE PREF A 6.700,00 BRL 27,050 1.639.471,74 0,42 0,41
CYRELA BRAZIL REALTY SA - 1.300,00 BRL 15,340 180.397,52 0,05 0,05
EMBRAER SA - 2.000,00 BRL 20,510 371.071,43 0,09 0,09
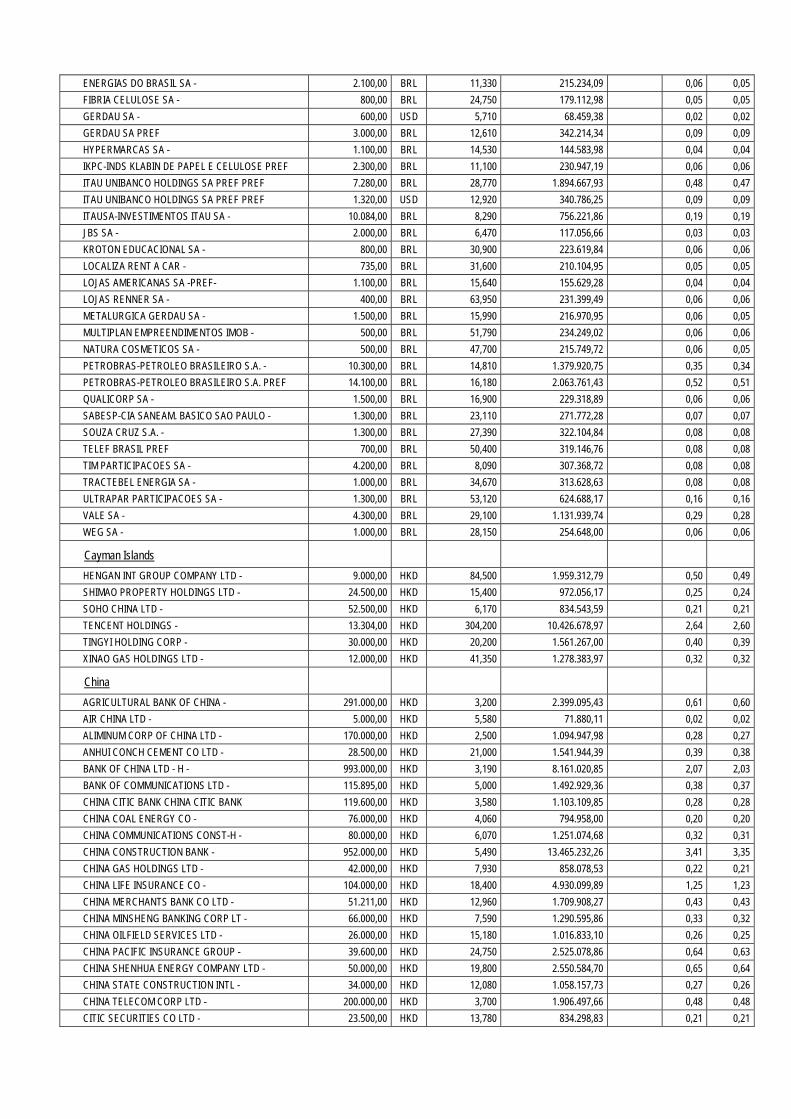
ENERGIAS DO BRASIL SA - 2.100,00 BRL 11,330 215.234,09 0,06 0,05
FIBRIA CELULOSE SA - 800,00 BRL 24,750 179.112,98 0,05 0,05
GERDAU SA - 600,00 USD 5,710 68.459,38 0,02 0,02
GERDAU SA PREF 3.000,00 BRL 12,610 342.214,34 0,09 0,09
HYPERMARCAS SA - 1.100,00 BRL 14,530 144.583,98 0,04 0,04
IKPC-INDS KLABIN DE PAPEL E CELULOSE PREF 2.300,00 BRL 11,100 230.947,19 0,06 0,06
ITAU UNIBANCO HOLDINGS SA PREF PREF 7.280,00 BRL 28,770 1.894.667,93 0,48 0,47
ITAU UNIBANCO HOLDINGS SA PREF PREF 1.320,00 USD 12,920 340.786,25 0,09 0,09
ITAUSA-INVESTIMENTOS ITAU SA - 10.084,00 BRL 8,290 756.221,86 0,19 0,19
JBS SA - 2.000,00 BRL 6,470 117.056,66 0,03 0,03
KROTON EDUCACIONAL SA - 800,00 BRL 30,900 223.619,84 0,06 0,06
LOCALIZA RENT A CAR - 735,00 BRL 31,600 210.104,95 0,05 0,05
LOJAS AMERICANAS SA -PREF- 1.100,00 BRL 15,640 155.629,28 0,04 0,04
LOJAS RENNER SA - 400,00 BRL 63,950 231.399,49 0,06 0,06
METALURGICA GERDAU SA - 1.500,00 BRL 15,990 216.970,95 0,06 0,05
MULTIPLAN EMPREENDIMENTOS IMOB - 500,00 BRL 51,790 234.249,02 0,06 0,06
NATURA COSMETICOS SA - 500,00 BRL 47,700 215.749,72 0,06 0,05
PETROBRAS-PETROLEO BRASILEIRO S.A. - 10.300,00 BRL 14,810 1.379.920,75 0,35 0,34
PETROBRAS-PETROLEO BRASILEIRO S.A. PREF 14.100,00 BRL 16,180 2.063.761,43 0,52 0,51
QUALICORP SA - 1.500,00 BRL 16,900 229.318,89 0,06 0,06
SABESP-CIA SANEAM. BASICO SAO PAULO - 1.300,00 BRL 23,110 271.772,28 0,07 0,07
SOUZA CRUZ S.A. - 1.300,00 BRL 27,390 322.104,84 0,08 0,08
TELEF BRASIL PREF 700,00 BRL 50,400 319.146,76 0,08 0,08
TIM PARTICIPACOES SA - 4.200,00 BRL 8,090 307.368,72 0,08 0,08
TRACTEBEL ENERGIA SA - 1.000,00 BRL 34,670 313.628,63 0,08 0,08
ULTRAPAR PARTICIPACOES SA - 1.300,00 BRL 53,120 624.688,17 0,16 0,16
VALE SA - 4.300,00 BRL 29,100 1.131.939,74 0,29 0,28
WEG SA - 1.000,00 BRL 28,150 254.648,00 0,06 0,06
Cayman Islands
HENGAN INT GROUP COMPANY LTD - 9.000,00 HKD 84,500 1.959.312,79 0,50 0,49
SHIMAO PROPERTY HOLDINGS LTD - 24.500,00 HKD 15,400 972.056,17 0,25 0,24
SOHO CHINA LTD - 52.500,00 HKD 6,170 834.543,59 0,21 0,21
TENCENT HOLDINGS - 13.304,00 HKD 304,200 10.426.678,97 2,64 2,60
TINGYI HOLDING CORP - 30.000,00 HKD 20,200 1.561.267,00 0,40 0,39
XINAO GAS HOLDINGS LTD - 12.000,00 HKD 41,350 1.278.383,97 0,32 0,32
China
AGRICULTURAL BANK OF CHINA - 291.000,00 HKD 3,200 2.399.095,43 0,61 0,60
AIR CHINA LTD - 5.000,00 HKD 5,580 71.880,11 0,02 0,02
ALIMINUM CORP OF CHINA LTD - 170.000,00 HKD 2,500 1.094.947,98 0,28 0,27
ANHUI CONCH CEMENT CO LTD - 28.500,00 HKD 21,000 1.541.944,39 0,39 0,38
BANK OF CHINA LTD - H - 993.000,00 HKD 3,190 8.161.020,85 2,07 2,03
BANK OF COMMUNICATIONS LTD - 115.895,00 HKD 5,000 1.492.929,36 0,38 0,37
CHINA CITIC BANK CHINA CITIC BANK 119.600,00 HKD 3,580 1.103.109,85 0,28 0,28
CHINA COAL ENERGY CO - 76.000,00 HKD 4,060 794.958,00 0,20 0,20
CHINA COMMUNICATIONS CONST-H - 80.000,00 HKD 6,070 1.251.074,68 0,32 0,31
CHINA CONSTRUCTION BANK - 952.000,00 HKD 5,490 13.465.232,26 3,41 3,35
CHINA GAS HOLDINGS LTD - 42.000,00 HKD 7,930 858.078,53 0,22 0,21
CHINA LIFE INSURANCE CO - 104.000,00 HKD 18,400 4.930.099,89 1,25 1,23
CHINA MERCHANTS BANK CO LTD - 51.211,00 HKD 12,960 1.709.908,27 0,43 0,43
CHINA MINSHENG BANKING CORP LT - 66.000,00 HKD 7,590 1.290.595,86 0,33 0,32
CHINA OILFIELD SERVICES LTD - 26.000,00 HKD 15,180 1.016.833,10 0,26 0,25
CHINA PACIFIC INSURANCE GROUP - 39.600,00 HKD 24,750 2.525.078,86 0,64 0,63
CHINA SHENHUA ENERGY COMPANY LTD - 50.000,00 HKD 19,800 2.550.584,70 0,65 0,64
CHINA STATE CONSTRUCTION INTL - 34.000,00 HKD 12,080 1.058.157,73 0,27 0,26
CHINA TELECOM CORP LTD - 200.000,00 HKD 3,700 1.906.497,66 0,48 0,48
CITIC SECURITIES CO LTD - 23.500,00 HKD 13,780 834.298,83 0,21 0,21
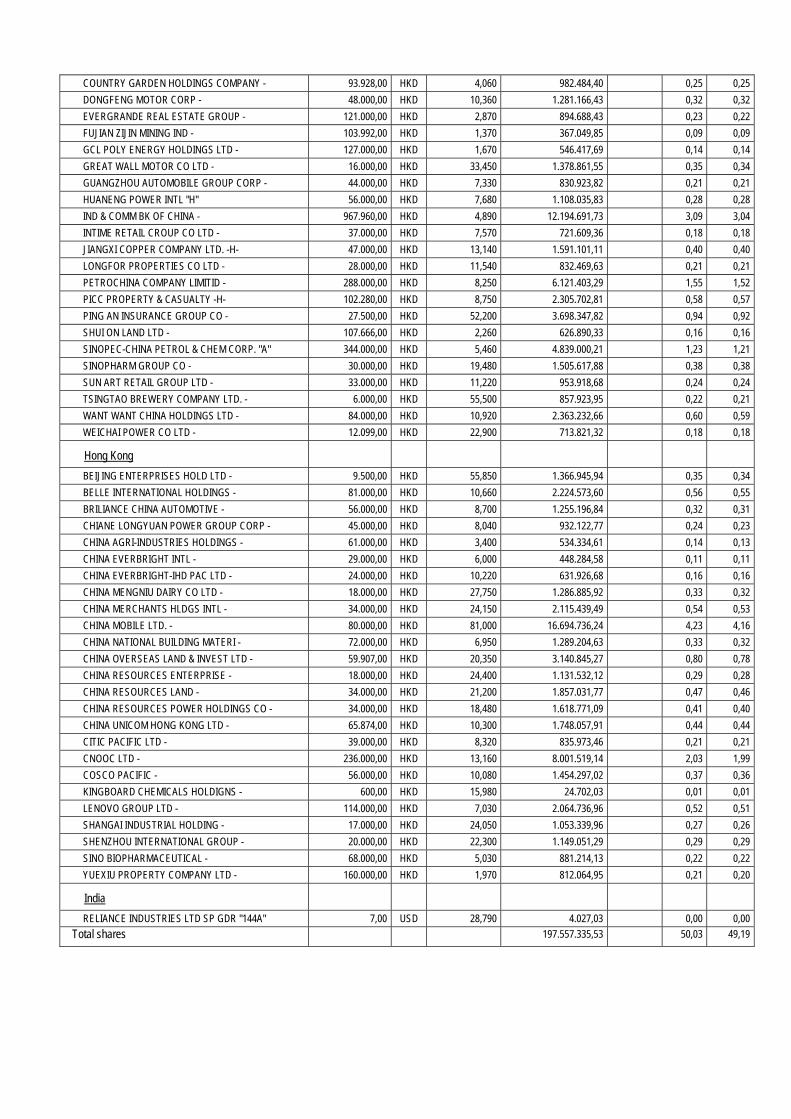
COUNTRY GARDEN HOLDINGS COMPANY - 93.928,00 HKD 4,060 982.484,40 0,25 0,25
DONGFENG MOTOR CORP - 48.000,00 HKD 10,360 1.281.166,43 0,32 0,32
EVERGRANDE REAL ESTATE GROUP - 121.000,00 HKD 2,870 894.688,43 0,23 0,22
FUJIAN ZIJIN MINING IND - 103.992,00 HKD 1,370 367.049,85 0,09 0,09
GCL POLY ENERGY HOLDINGS LTD - 127.000,00 HKD 1,670 546.417,69 0,14 0,14
GREAT WALL MOTOR CO LTD - 16.000,00 HKD 33,450 1.378.861,55 0,35 0,34
GUANGZHOU AUTOMOBILE GROUP CORP - 44.000,00 HKD 7,330 830.923,82 0,21 0,21
HUANENG POWER INTL "H" 56.000,00 HKD 7,680 1.108.035,83 0,28 0,28
IND & COMM BK OF CHINA - 967.960,00 HKD 4,890 12.194.691,73 3,09 3,04
INTIME RETAIL CROUP CO LTD - 37.000,00 HKD 7,570 721.609,36 0,18 0,18
JIANGXI COPPER COMPANY LTD. -H- 47.000,00 HKD 13,140 1.591.101,11 0,40 0,40
LONGFOR PROPERTIES CO LTD - 28.000,00 HKD 11,540 832.469,63 0,21 0,21
PETROCHINA COMPANY LIMITID - 288.000,00 HKD 8,250 6.121.403,29 1,55 1,52
PICC PROPERTY & CASUALTY -H- 102.280,00 HKD 8,750 2.305.702,81 0,58 0,57
PING AN INSURANCE GROUP CO - 27.500,00 HKD 52,200 3.698.347,82 0,94 0,92
SHUI ON LAND LTD - 107.666,00 HKD 2,260 626.890,33 0,16 0,16
SINOPEC-CHINA PETROL & CHEM CORP. "A" 344.000,00 HKD 5,460 4.839.000,21 1,23 1,21
SINOPHARM GROUP CO - 30.000,00 HKD 19,480 1.505.617,88 0,38 0,38
SUN ART RETAIL GROUP LTD - 33.000,00 HKD 11,220 953.918,68 0,24 0,24
TSINGTAO BREWERY COMPANY LTD. - 6.000,00 HKD 55,500 857.923,95 0,22 0,21
WANT WANT CHINA HOLDINGS LTD - 84.000,00 HKD 10,920 2.363.232,66 0,60 0,59
WEICHAI POWER CO LTD - 12.099,00 HKD 22,900 713.821,32 0,18 0,18
Hong Kong
BEIJING ENTERPRISES HOLD LTD - 9.500,00 HKD 55,850 1.366.945,94 0,35 0,34
BELLE INTERNATIONAL HOLDINGS - 81.000,00 HKD 10,660 2.224.573,60 0,56 0,55
BRILIANCE CHINA AUTOMOTIVE - 56.000,00 HKD 8,700 1.255.196,84 0,32 0,31
CHIANE LONGYUAN POWER GROUP CORP - 45.000,00 HKD 8,040 932.122,77 0,24 0,23
CHINA AGRI-INDUSTRIES HOLDINGS - 61.000,00 HKD 3,400 534.334,61 0,14 0,13
CHINA EVERBRIGHT INTL - 29.000,00 HKD 6,000 448.284,58 0,11 0,11
CHINA EVERBRIGHT-IHD PAC LTD - 24.000,00 HKD 10,220 631.926,68 0,16 0,16
CHINA MENGNIU DAIRY CO LTD - 18.000,00 HKD 27,750 1.286.885,92 0,33 0,32
CHINA MERCHANTS HLDGS INTL - 34.000,00 HKD 24,150 2.115.439,49 0,54 0,53
CHINA MOBILE LTD. - 80.000,00 HKD 81,000 16.694.736,24 4,23 4,16
CHINA NATIONAL BUILDING MATERI - 72.000,00 HKD 6,950 1.289.204,63 0,33 0,32
CHINA OVERSEAS LAND & INVEST LTD - 59.907,00 HKD 20,350 3.140.845,27 0,80 0,78
CHINA RESOURCES ENTERPRISE - 18.000,00 HKD 24,400 1.131.532,12 0,29 0,28
CHINA RESOURCES LAND - 34.000,00 HKD 21,200 1.857.031,77 0,47 0,46
CHINA RESOURCES POWER HOLDINGS CO - 34.000,00 HKD 18,480 1.618.771,09 0,41 0,40
CHINA UNICOM HONG KONG LTD - 65.874,00 HKD 10,300 1.748.057,91 0,44 0,44
CITIC PACIFIC LTD - 39.000,00 HKD 8,320 835.973,46 0,21 0,21
CNOOC LTD - 236.000,00 HKD 13,160 8.001.519,14 2,03 1,99
COSCO PACIFIC - 56.000,00 HKD 10,080 1.454.297,02 0,37 0,36
KINGBOARD CHEMICALS HOLDIGNS - 600,00 HKD 15,980 24.702,03 0,01 0,01
LENOVO GROUP LTD - 114.000,00 HKD 7,030 2.064.736,96 0,52 0,51
SHANGAI INDUSTRIAL HOLDING - 17.000,00 HKD 24,050 1.053.339,96 0,27 0,26
SHENZHOU INTERNATIONAL GROUP - 20.000,00 HKD 22,300 1.149.051,29 0,29 0,29
SINO BIOPHARMACEUTICAL - 68.000,00 HKD 5,030 881.214,13 0,22 0,22
YUEXIU PROPERTY COMPANY LTD - 160.000,00 HKD 1,970 812.064,95 0,21 0,20
India
RELIANCE INDUSTRIES LTD SP GDR "144A" 7,00 USD 28,790 4.027,03 0,00 0,00
Total shares 197.557.335,53 50,03 49,19
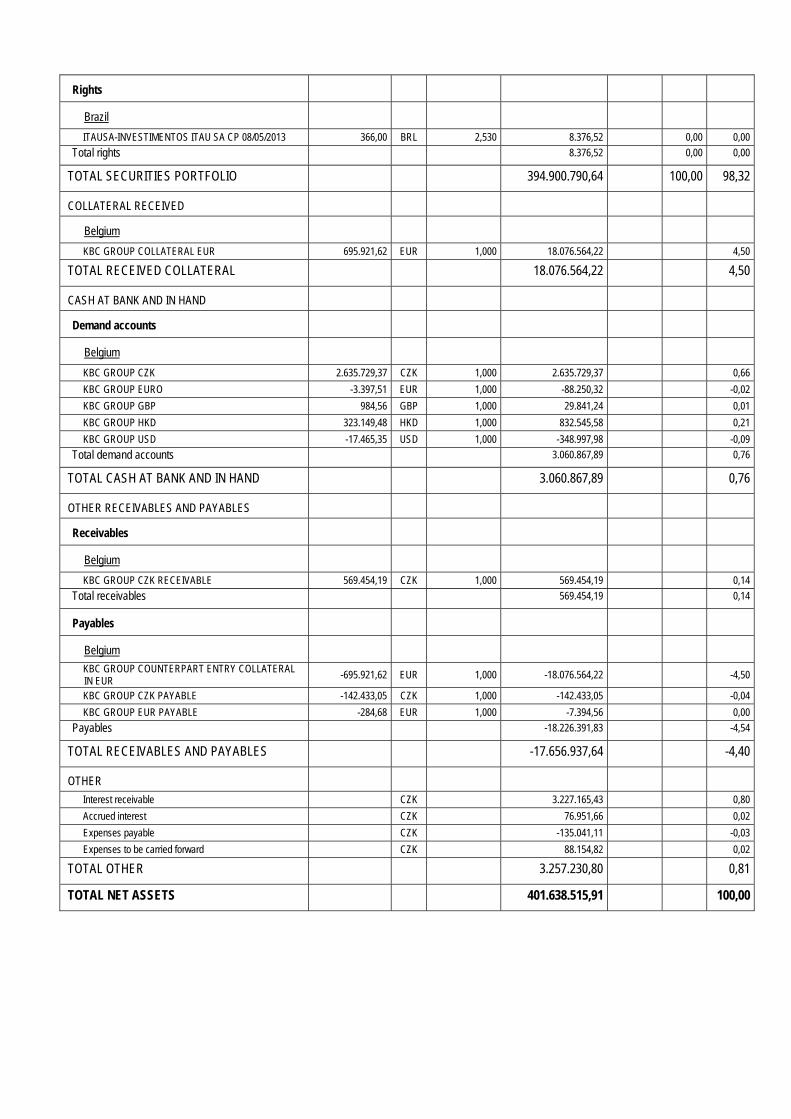
Rights
Brazil
ITAUSA-INVESTIMENTOS ITAU SA CP 08/05/2013 366,00 BRL 2,530 8.376,52 0,00 0,00
Total rights 8.376,52 0,00 0,00
TOTAL SECURITIES PORTFOLIO 394.900.790,64 100,00 98,32
COLLATERAL RECEIVED
Belgium
KBC GROUP COLLATERAL EUR 695.921,62 EUR 1,000 18.076.564,22 4,50
TOTAL RECEIVED COLLATERAL 18.076.564,22 4,50
CASH AT BANK AND IN HAND
Demand accounts
Belgium
KBC GROUP CZK 2.635.729,37 CZK 1,000 2.635.729,37 0,66
KBC GROUP EURO -3.397,51 EUR 1,000 -88.250,32 -0,02
KBC GROUP GBP 984,56 GBP 1,000 29.841,24 0,01
KBC GROUP HKD 323.149,48 HKD 1,000 832.545,58 0,21
KBC GROUP USD -17.465,35 USD 1,000 -348.997,98 -0,09
Total demand accounts 3.060.867,89 0,76
TOTAL CASH AT BANK AND IN HAND 3.060.867,89 0,76
OTHER RECEIVABLES AND PAYABLES
Receivables
Belgium
KBC GROUP CZK RECEIVABLE 569.454,19 CZK 1,000 569.454,19 0,14
Total receivables 569.454,19 0,14
Payables
Belgium
KBC GROUP COUNTERPART ENTRY COLLATERAL IN EUR
-695.921,62 EUR 1,000 -18.076.564,22 -4,50
KBC GROUP CZK PAYABLE -142.433,05 CZK 1,000 -142.433,05 -0,04
KBC GROUP EUR PAYABLE -284,68 EUR 1,000 -7.394,56 0,00
Payables -18.226.391,83 -4,54
TOTAL RECEIVABLES AND PAYABLES -17.656.937,64 -4,40
OTHER
Interest receivable CZK 3.227.165,43 0,80
Accrued interest CZK 76.951,66 0,02
Expenses payable CZK -135.041,11 -0,03
Expenses to be carried forward CZK 88.154,82 0,02
TOTAL OTHER 3.257.230,80 0,81
TOTAL NET ASSETS 401.638.515,91 100,00
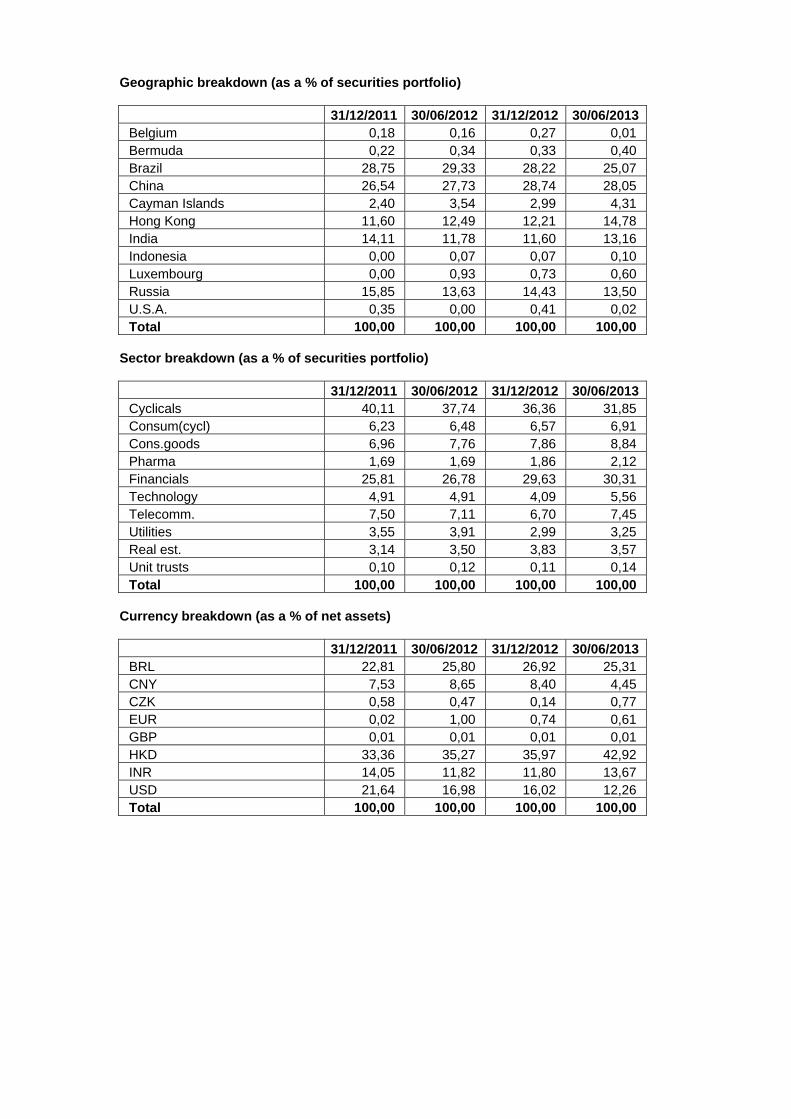
Geographic breakdown (as a % of securities portfolio)
31/12/2011 30/06/2012 31/12/2012 30/06/2013 Belgium 0,18 0,16 0,27 0,01 Bermuda 0,22 0,34 0,33 0,40 Brazil 28,75 29,33 28,22 25,07 China 26,54 27,73 28,74 28,05 Cayman Islands 2,40 3,54 2,99 4,31 Hong Kong 11,60 12,49 12,21 14,78 India 14,11 11,78 11,60 13,16 Indonesia 0,00 0,07 0,07 0,10 Luxembourg 0,00 0,93 0,73 0,60 Russia 15,85 13,63 14,43 13,50 U.S.A. 0,35 0,00 0,41 0,02 Total 100,00 100,00 100,00 100,00
Sector breakdown (as a % of securities portfolio)
31/12/2011 30/06/2012 31/12/2012 30/06/2013 Cyclicals 40,11 37,74 36,36 31,85 Consum(cycl) 6,23 6,48 6,57 6,91 Cons.goods 6,96 7,76 7,86 8,84 Pharma 1,69 1,69 1,86 2,12 Financials 25,81 26,78 29,63 30,31 Technology 4,91 4,91 4,09 5,56 Telecomm. 7,50 7,11 6,70 7,45 Utilities 3,55 3,91 2,99 3,25 Real est. 3,14 3,50 3,83 3,57 Unit trusts 0,10 0,12 0,11 0,14 Total 100,00 100,00 100,00 100,00
Currency breakdown (as a % of net assets)
31/12/2011 30/06/2012 31/12/2012 30/06/2013 BRL 22,81 25,80 26,92 25,31 CNY 7,53 8,65 8,40 4,45 CZK 0,58 0,47 0,14 0,77 EUR 0,02 1,00 0,74 0,61 GBP 0,01 0,01 0,01 0,01 HKD 33,36 35,27 35,97 42,92 INR 14,05 11,82 11,80 13,67 USD 21,64 16,98 16,02 12,26 Total 100,00 100,00 100,00 100,00

2.4.2 CHANGES IN THE COMPOSITION OF THE ASSETS OF KBC EQUITY FUND CSOB BRIC (IN
THE CURRENCY OF THE SUB-FUND)
1st half of year YearPurchases 158.981.317,82 158.981.317,82 Sales 152.715.050,99 152.715.050,99 Total 1 311.696.368,82 311.696.368,82 Subscriptions 45.718.673,71 45.718.673,71 Redemptions 37.940.071,79 37.940.071,79 Total 2 83.658.745,50 83.658.745,50 Monthly average of total assets
442.061.716,29 442.061.716,29
Turnover rate 51,58 % 51,58 %
1st half of year YearPurchases 158.981.317,82 158.981.317,82 Sales 152.715.050,99 152.715.050,99 Total 1 311.696.368,82 311.696.368,82 Subscriptions 45.718.673,71 45.718.673,71 Redemptions 37.940.071,79 37.940.071,79 Total 2 83.658.745,50 83.658.745,50 Monthly average of total assets
432.020.353,36 432.020.353,36
Corrected turnover rate 52,78 % 52,78 %
The table above shows the capital volume of portfolio transactions. This volume (adjusted to take account of total subscriptions and redemptions) is also compared to the average net assets at the beginning and end of the period. A figure close to 0% implies that the transactions relating to the securities or transactions relating to the assets (excluding deposits and cash) in a given period only involve subscriptions and redemptions. A negative percentage shows that subscriptions and redemptions entailed few, if any, transactions in the portfolio. Active asset management may result in high turnover rates (monthly percentage >50%). The detailed list of transactions is available for consultation free of charge at the registered office of the Bevek or fund at Havenlaan 2, 1080 Brussels.

2.4.3 AMOUNT OF COMMITMENTS IN RESPECT OF FINANCIAL DERIVATIVES POSITIONS
NAME Currency Value in currency
In the currency of the sub-fund
Lot-size
Transactiondate
KBC COLLATERAL EUR
EUR 695.921,62 18.076.564,22 N/A 28.06.2013
2.4.4 CHANGES OF THE NUMBER OF SUBSCRIPTIONS AND REDEMPTIONS AND THE NET ASSET
VALUE
Period Change in number of shares in circulation
Year Subscriptions Redemptions End of period
Cap. Dis. Cap. Dis. Cap. Dis. Total
2011 - 06 180.735,71 0,00 76.202,70 0,00 555.629,36 0,00 555.629,36
2012 - 06 127.783,05 0,00 95.709,11 0,00 587.703,30 0,00 587.703,30
2013 - 06 114.047,66 0,00 95.788,96 0,00 605.962,01 0,00 605.962,01
Period Amounts received and paid by the UCI
(in the currency of the sub-fund)
Year Subscriptions Redemptions
Capitalization Distribution Capitalization Distribution
2011 - 06 144.530.757,90 0,00 61.464.957,04 0,00
2012 - 06 89.791.952,28 0,00 65.872.718,62 0,00
2013 - 06 81.900.639,66 0,00 68.994.827,70 0,00
Period Net asset value
End of period (in the currency of the sub-fund)
Year Of the sub-fund Of one share
Capitalization Distribution
2011 - 06 420.298.997,20 756,44 N/A
2012 - 06 405.583.617,40 690,12 N/A
2013 - 06 401.638.347,40 662,81 N/A
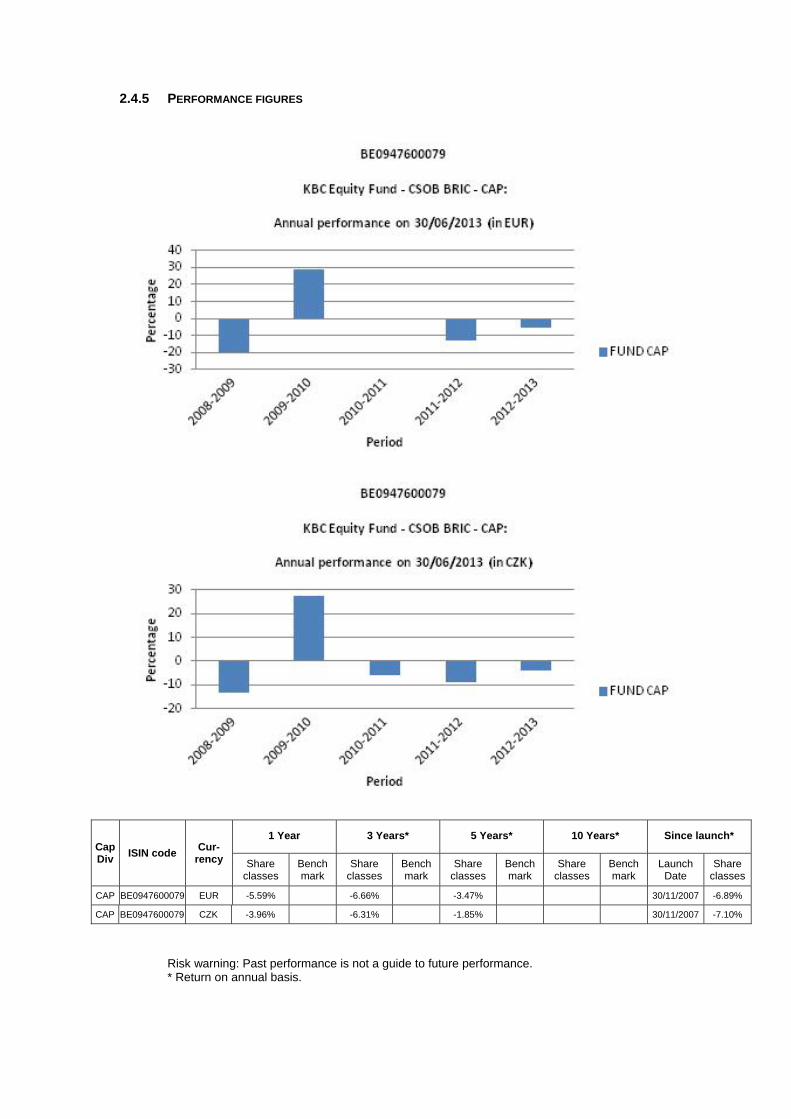
2.4.5 PERFORMANCE FIGURES
Cap Div
ISIN code Cur-
rency
1 Year 3 Years* 5 Years* 10 Years* Since launch*
Share classes
Bench mark
Share classes
Bench mark
Share classes
Bench mark
Share classes
Bench mark
Launch Date
Share classes
CAP BE0947600079 EUR -5.59% -6.66% -3.47% 30/11/2007 -6.89%
CAP BE0947600079 CZK -3.96% -6.31% -1.85% 30/11/2007 -7.10%
Risk warning: Past performance is not a guide to future performance. * Return on annual basis.

The bar chart shows the performance for full financial years. The figures do not take account of any restructuring. Calculated in CZK and in EUR. the return is calculated as the change in the net asset value between two dates expressed
as a percentage. In the case of units that pay dividends, the dividend is incorporated geometrically in the return.
Calculation method for date D, where NAV stands for net asset value: Capitalisation units (CAP) Return on date D over a period of X years:
[NAV(D) / NAV(Y)] ^ [1 / X] - 1 where Y = D-X
Return on date D since the start date S of the unit: [NAV(D) / NAV(S)] ^ [1 / F] - 1 where F = 1 if the unit has existed for less than one year on date D where F = (D-S) / 365.25 if the unit has existed for longer than one year on date D
Distribution units (DIV) Return on date D over a period of X years:
[ C * NAV(D) / NAV(Y)] ^ [1 / X] - 1 where Y = D-X
Return on date D since the start date S of the unit: [ C * NAV(D) / NAV(S)] ^ [1 / F] - 1 where F = 1 if the unit has existed for less than one year on date D where F = (D-S) / 365.25 if the unit has existed for longer than one year on date D
where C is a factor that is determined for all N dividends between the calculation date D and the reference date. For dividend i on date Di with value Wi:
Ci = [Wi / NAV(Di)] + 1 i = 1 ... N
from which C = C0 * .... * CN. If the interval between the two dates exceeds one year, the ordinary return calculation is
converted into a return on an annual basis by taking the nth square root of 1 plus the total return of the unit.
The return figures shown above do not take account of the fees and charges associated with the issue and redemption of units.
These are the performance figures for capitalisation and distribution shares.

2.4.6 COSTS Ongoing charges: * Distribution: not applicable Capitalization: 1.789% * The following costs have not been included in the ongoing charges: - Interest payments on loans taken out - Payments in respect of financial derivatives - Fees and charges paid directly by the investor - Any soft commissions
SOFT COMMISSIONS The management company or the appointed manager, as the case may be, is the recipient of soft commissions. The recipient has laid down an internal policy as regards accepting soft commissions and avoiding possible conflicts of interest in this respect, and has put appropriate internal controls in place to ensure this policy is observed. For more information, please see the ‘General’ section of the annual report.
Broker
Commission gross
in EUR
paid during the period:
1‐01‐13
‐
30‐06‐13
CSA Credits
in EUR
accrued during the period:
1‐01‐13
‐
30‐06‐13 Percentage
CITI 1,967 1,027 52.22%
CSFBSAS 112 41 37.02%
EQ MACQUARIE 1,073 537 50.00%
INSTINET 1,174 587 50.00%
FEE-SHARING AGREEMENTS AND REBATES: The management company may share its fee with the distributor, and institutional and/or professional parties. In principle, the percentage share amounts to between 35% and 60% if the distributor is an entity of KBC Group NV or to between 35% and 70% if the distributor is not an entity of KBC Group NV. However, in a small number of cases, the distributor’s fee is less than 35%. Investors may, on request, obtain more information on these cases. If the management company invests the assets of the undertaking for collective investment in units of undertakings for collective investment that are not managed by an entity of KBC Group NV, and receives a fee for doing so, it will pay this fee to the undertaking for collective investment. Fee-sharing does not affect the amount of the management fee paid by the sub-fund to the management company. This management fee is subject to the limitations laid down in the articles of association. The limitations may only be amended after approval by the general meeting of shareholders. The management company has concluded a distribution agreement with the distributor in order to facilitate the wider distribution of the sub-fund's units by using multiple distribution channels. It is in the interests of the holders of units, the sub-fund and of the distributor for the largest possible number of units to be sold and for the assets of the sub-fund to be maximised in this way. In this respect, there is therefore no question of any conflict of interest.
2.4.7 NOTES TO THE FINANCIAL STATEMENTS AND OTHER DATA Fee for managing the investment portfolio: 1.5% per annum calculated on the basis of the average total net assets of the sub-fund, no management fee is charged on assets assets invested in investment undertakings managed by a financial institution of the KBC group. KBC Fund Management Limited receives a fee from the management company of max. 1.5% calculated on that part of the portfolio that it manages, without the total management fee received by the management company being exceeded. The administration agent’s fee is payable at the end of each month and is calculated on the basis of the average total net assets of the sub-fund. Auditor's fee: 1 700 EUR per year. This fee is not including VAT and can be indexed on an annual basis in accordance with the decisions of the general meeting.

The custody fee is calculated on the value of the securities held in custody by the custodian on the final banking day of the preceding calendar year, except on those assets invested in investment undertakings managed by a financial institution of the KBC group. The custody fee is paid at the beginning of the calendar year. Social, ethical and environmental aspects: No manufacturers of controversial weapons whose use over the past five decades, according to the international consensus, has led to disproportionate human suffering among the civilian population will be included in the portfolio of investments. This involves the manufacturers of anti-personnel mines, cluster bombs and munitions and weapons containing depleted uranium. In this way, the sub-fund seeks to reflect not only simple financial reality but also the social reality of the sector or region in question. Exercising voting rights. If necessary, relevant and in the interest of the shareholders, the management company will exercise the voting rights attached to the shares in the Bevek’s portfolio. The management company will adhere to the following criteria when determining how it stands relative to the items on the agenda that are put to the vote: - Shareholder value may not be adversely affected. - Corporate governance rules, especially with regard to the rights of minority shareholders, must be
respected. - The minimum standards with regard to sustainable business and corporate social responsibility
must be met. The list of companies for which voting rights are exercised is available at the registered office of the Bevek.
Name Maximum management fee Horizon-Access Fund Brazil 1,60
Horizon-Access Fund China-Classic Shares 1,60
Horizon-Access Fund Russia 1,60
Horizon-Access India Fund-Classic Shares 1,60
KBC Equity Fund-CSOB BRIC 1,50
Securities lending In accordance with the Royal Decree of 7 March 2006 concerning securities lending, the undertaking for collective investment has taken out securities loans with a principal to whom the full title of the loaned securities was transferred, without recording this transfer of ownership in the accounts. For the period from 1 January 2013 to 30 June 2013, the fee for securities lent comes to 290,113.51 CZK. The undertaking for collective investment receives 50% of the fee received for securities lent. The detailed list of securities lending transactions carried out can be obtained from the registered office of the collective investment undertaking at 2 Havenlaan, 1080 Brussels.
Overview of securities lent as at 30/06/2013
Name Currency Quantity Price Value in currency of the
portfolio
AIR CHINA LTD H CNY1 HKD 4.999 5,580 71.865,81
ALUMINUM CORP OF CHINA LTD -H- HKD 120.000 2,500 772.904,57
ANHUI CONCH CEMENT CO LTD -H- HKD 22.999 21,000 1.244.321,99
BRILLIANCE CHINA HKD 55.999 8,700 1.255.174,34
CHINA MERCHANTS BANK CO LTD -H- HKD 51.210 12,960 1.709.874,77
CHINA NATL. BUILDING MATERIAL -H- HKD 55.999 6,950 1.002.696,82
CHINA RESOURCES ENTERPRISE HKD 3.000 24,400 188.588,63
CHINA RESOURCES LAND HKD 32.999 21,200 1.802.358,50
CHINA UNICOM HONG KONG LTD HKD 65.873 10,300 1.748.031,26
CITIC PACIFIC LTD HKD 38.999 8,320 835.952,13
EVERGRANDE REAL ESTATE GROUP LTD HKD 116.999 2,870 865.104,65
GCL POLY ENERGY HOLDINGS LTD HKD 126.999 1,670 546.413,48
LENOVO GROUP LTD HKD 81.999 7,030 1.485.143,48
SHIMAO PROPERTY HOLDINGS LTD HKD 24.499 15,400 972.016,45
WANT WANT CHINA HOLDINGS LTD HKD 78.999 10,920 2.222.535,81
ZIJIN MINING GROUP CO -H- HKD 103.991 1,370 367.046,23
Total 17.090.028,92
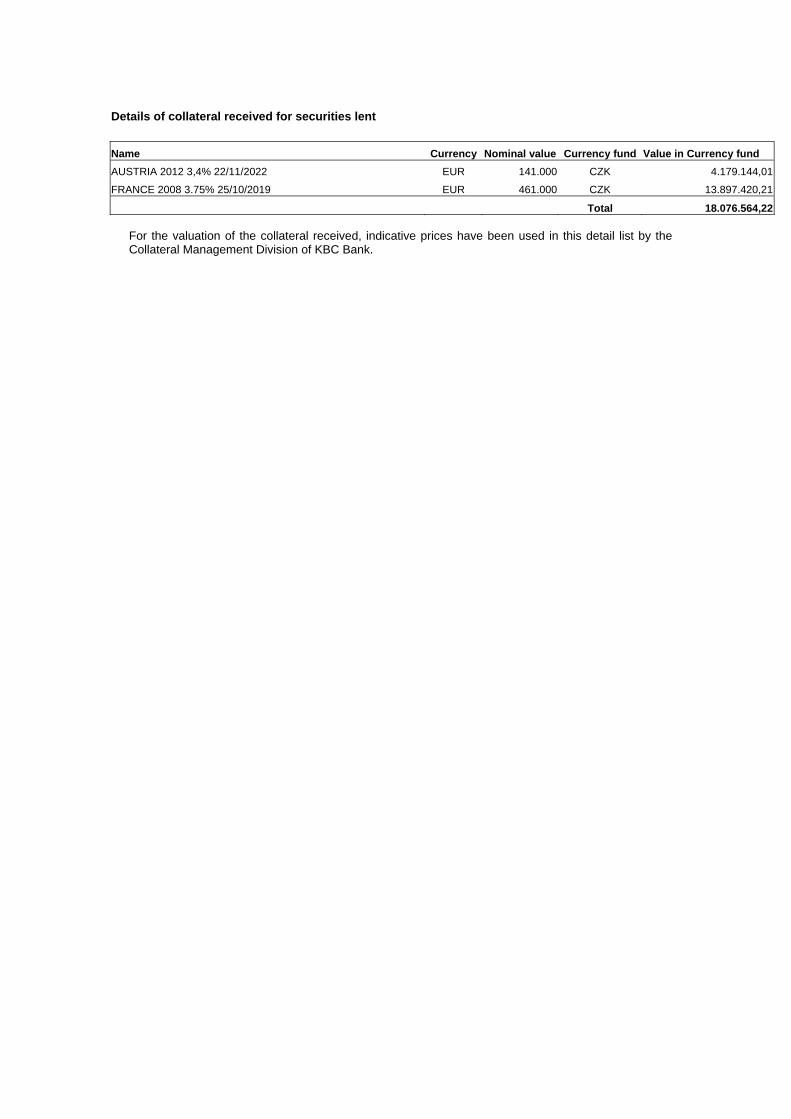
Details of collateral received for securities lent
Name Currency Nominal value Currency fund Value in Currency fund
AUSTRIA 2012 3,4% 22/11/2022 EUR 141.000 CZK 4.179.144,01
FRANCE 2008 3.75% 25/10/2019 EUR 461.000 CZK 13.897.420,21
Total 18.076.564,22 For the valuation of the collateral received, indicative prices have been used in this detail list by the Collateral Management Division of KBC Bank.

Semi-Annual report as at 30th June 2013
TABLE OF CONTENTS
2. Information on KBC Equity Fund High Dividend
2.1. Management report 2.1.1. Launch date and subscription price 2.1.2. Stock exchange listing 2.1.3. Aim and distinctive features of the investment policy 2.1.4. Financial portfolio management 2.1.5. Distributors 2.1.6. Index and benchmark 2.1.7. Policy conducted during the financial year 2.1.8. Future policy 2.1.9. Synthetic risk and reward indicator (SRRI)
2.2. Balance sheet
2.3. Profit and loss account
2.4. Composition of the assets and key figures
2.4.1. Composition of the assets 2.4.2. Change in the composition of the assets 2.4.3. Value of commitments in respect of financial derivatives positions 2.4.4. Evolution of the number of subscriptions, repayments and the net asset value 2.4.5. Return figures 2.4.6. Expenses 2.4.7. Notes to the financial statements and other data


2 INFORMATION ON KBC EQUITY FUND HIGH DIVIDEND
2.1 MANAGEMENT REPORT
2.1.1 LAUNCH DATE AND SUBSCRIPTION PRICE Classic Shares : Launch date: 2 May 2003 Initial subscription price: 500 EUR Currency: EUR Institutional B Shares : Launch date: 25 November 2011 Initial subscription price: 686.86 EUR Currency: EUR
2.1.2 STOCK EXCHANGE LISTING Not applicable.
2.1.3 GOAL AND KEY PRINCIPLES OF THE INVESTMENT POLICY
SUB-FUND’S OBJECT: The main objective of this sub-fund is to generate the highest possible return for its shareholders by investing directly or indirectly in transferable securities. This is reflected in its pursuit of capital gains and income. To this end, the assets are invested, either directly or indirectly via correlated financial instruments, primarily in shares.
SUB-FUND’S INVESTMENT POLICY:
PERMITTED ASSET CLASSES: The sub-fund may invest in securities, money market instruments, units in undertakings for collective investment, deposits, financial derivatives, liquid assets and all other instruments insofar as permitted by the applicable laws and regulations and consistent with the sub-fund’s object The sub-fund shall invest no more than 10% of its assets in units of other undertakings for collective investment.
RESTRICTIONS OF THE INVESTMENT POLICY: The investment policy will be implemented within the limits set by law and regulations. The sub-fund may borrow up to 10% of its net assets, insofar as these are short-term borrowings aimed at solving temporary liquidity problems.
PERMITTED DERIVATIVES TRANSACTIONS: Derivates may be used either for hedging purposes or to achieve investment objectives. Changes will be made to the investments at regular intervals to comply with the sub-fund's investment strategy. In addition, listed and unlisted derivates may be used to achieve the objectives: these may be forward contracts, options or swaps on securities, indices, currencies or interest rates or other transactions involving derivatives. Unlisted derivatives transactions will only be concluded with prime financial institutions specialised in such transactions. Such derivatives may also be used to hedge the assets against exchange-rate fluctuations. Subject to the applicable laws and regulations and the articles of association, the sub-fund always seeks to conclude the most effective transactions. All costs associated with the transactions will be charged to the sub-fund and all income generated will be paid to the sub-fund. If the transactions result in a risk in respect of the counterparty, this risk can be hedged by using a margin management system that ensures that the sub-fund is the beneficiary of security (collateral) in the form of cash or investment grade bonds. When calculating the value of the bonds, a margin will be applied that varies depending on the residual term to maturity and the currency in which the bond in question is denominated. The relationship with the counterparty or counterparties is governed by standard international agreements.
STRATEGY SELECTED
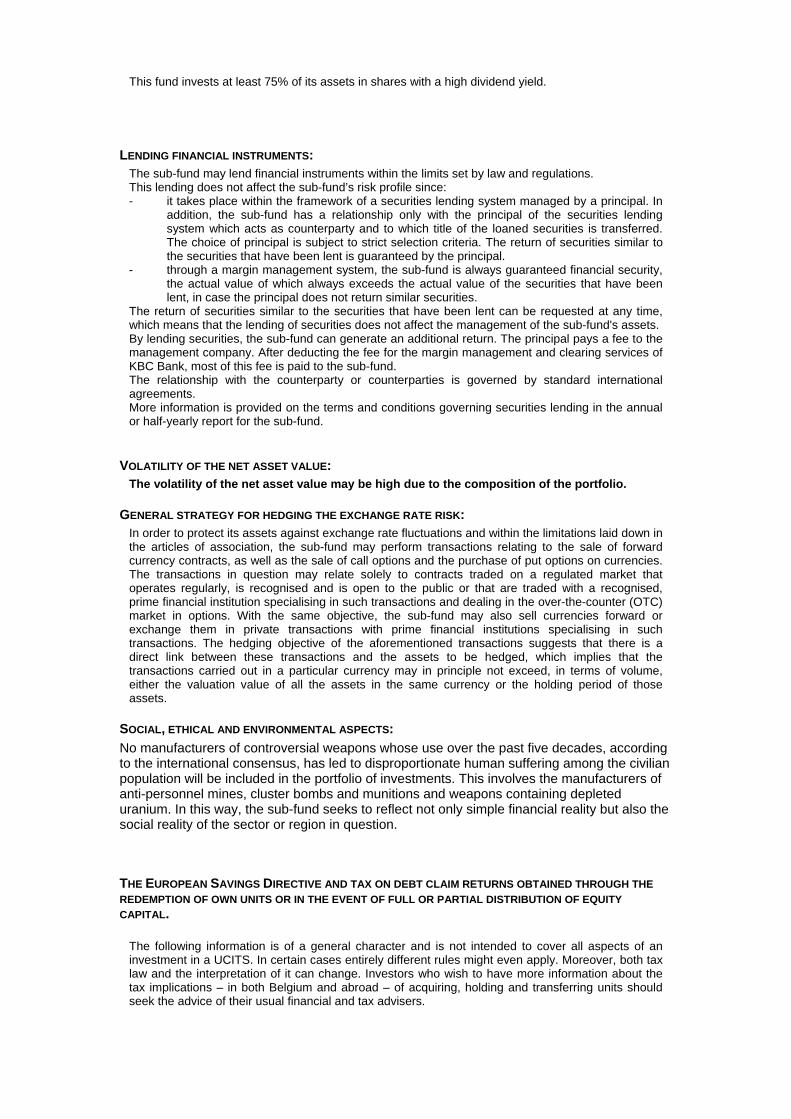
This fund invests at least 75% of its assets in shares with a high dividend yield.
LENDING FINANCIAL INSTRUMENTS: The sub-fund may lend financial instruments within the limits set by law and regulations. This lending does not affect the sub-fund’s risk profile since: - it takes place within the framework of a securities lending system managed by a principal. In
addition, the sub-fund has a relationship only with the principal of the securities lending system which acts as counterparty and to which title of the loaned securities is transferred. The choice of principal is subject to strict selection criteria. The return of securities similar to the securities that have been lent is guaranteed by the principal.
- through a margin management system, the sub-fund is always guaranteed financial security, the actual value of which always exceeds the actual value of the securities that have been lent, in case the principal does not return similar securities.
The return of securities similar to the securities that have been lent can be requested at any time, which means that the lending of securities does not affect the management of the sub-fund's assets. By lending securities, the sub-fund can generate an additional return. The principal pays a fee to the management company. After deducting the fee for the margin management and clearing services of KBC Bank, most of this fee is paid to the sub-fund. The relationship with the counterparty or counterparties is governed by standard international agreements. More information is provided on the terms and conditions governing securities lending in the annual or half-yearly report for the sub-fund.
VOLATILITY OF THE NET ASSET VALUE: The volatility of the net asset value may be high due to the composition of the portfolio.
GENERAL STRATEGY FOR HEDGING THE EXCHANGE RATE RISK: In order to protect its assets against exchange rate fluctuations and within the limitations laid down in the articles of association, the sub-fund may perform transactions relating to the sale of forward currency contracts, as well as the sale of call options and the purchase of put options on currencies. The transactions in question may relate solely to contracts traded on a regulated market that operates regularly, is recognised and is open to the public or that are traded with a recognised, prime financial institution specialising in such transactions and dealing in the over-the-counter (OTC) market in options. With the same objective, the sub-fund may also sell currencies forward or exchange them in private transactions with prime financial institutions specialising in such transactions. The hedging objective of the aforementioned transactions suggests that there is a direct link between these transactions and the assets to be hedged, which implies that the transactions carried out in a particular currency may in principle not exceed, in terms of volume, either the valuation value of all the assets in the same currency or the holding period of those assets.
SOCIAL, ETHICAL AND ENVIRONMENTAL ASPECTS:
No manufacturers of controversial weapons whose use over the past five decades, according to the international consensus, has led to disproportionate human suffering among the civilian population will be included in the portfolio of investments. This involves the manufacturers of anti-personnel mines, cluster bombs and munitions and weapons containing depleted uranium. In this way, the sub-fund seeks to reflect not only simple financial reality but also the social reality of the sector or region in question.
THE EUROPEAN SAVINGS DIRECTIVE AND TAX ON DEBT CLAIM RETURNS OBTAINED THROUGH THE
REDEMPTION OF OWN UNITS OR IN THE EVENT OF FULL OR PARTIAL DISTRIBUTION OF EQUITY
CAPITAL. The following information is of a general character and is not intended to cover all aspects of an investment in a UCITS. In certain cases entirely different rules might even apply. Moreover, both tax law and the interpretation of it can change. Investors who wish to have more information about the tax implications – in both Belgium and abroad – of acquiring, holding and transferring units should seek the advice of their usual financial and tax advisers.
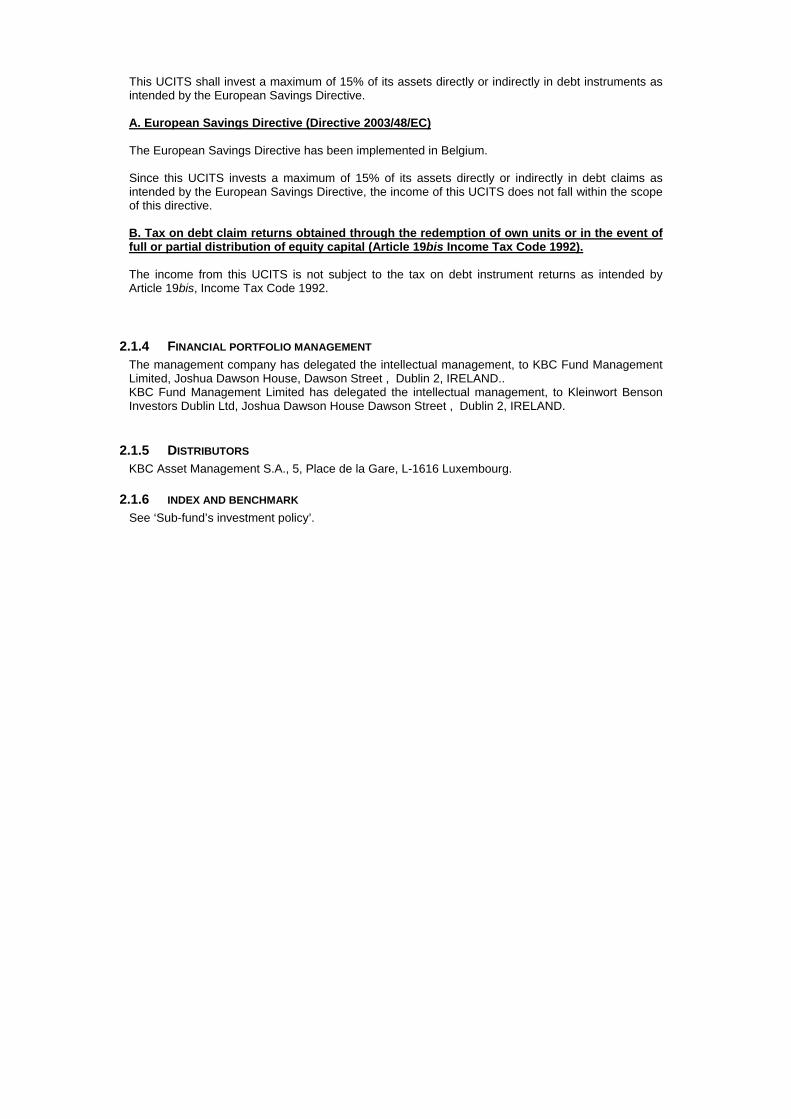
This UCITS shall invest a maximum of 15% of its assets directly or indirectly in debt instruments as intended by the European Savings Directive. A. European Savings Directive (Directive 2003/48/EC) The European Savings Directive has been implemented in Belgium. Since this UCITS invests a maximum of 15% of its assets directly or indirectly in debt claims as intended by the European Savings Directive, the income of this UCITS does not fall within the scope of this directive. B. Tax on debt claim returns obtained through the redemption of own units or in the event of full or partial distribution of equity capital (Article 19bis Income Tax Code 1992). The income from this UCITS is not subject to the tax on debt instrument returns as intended by Article 19bis, Income Tax Code 1992.
2.1.4 FINANCIAL PORTFOLIO MANAGEMENT The management company has delegated the intellectual management, to KBC Fund Management Limited, Joshua Dawson House, Dawson Street , Dublin 2, IRELAND.. KBC Fund Management Limited has delegated the intellectual management, to Kleinwort Benson Investors Dublin Ltd, Joshua Dawson House Dawson Street , Dublin 2, IRELAND.
2.1.5 DISTRIBUTORS KBC Asset Management S.A., 5, Place de la Gare, L-1616 Luxembourg.
2.1.6 INDEX AND BENCHMARK See ‘Sub-fund’s investment policy’.
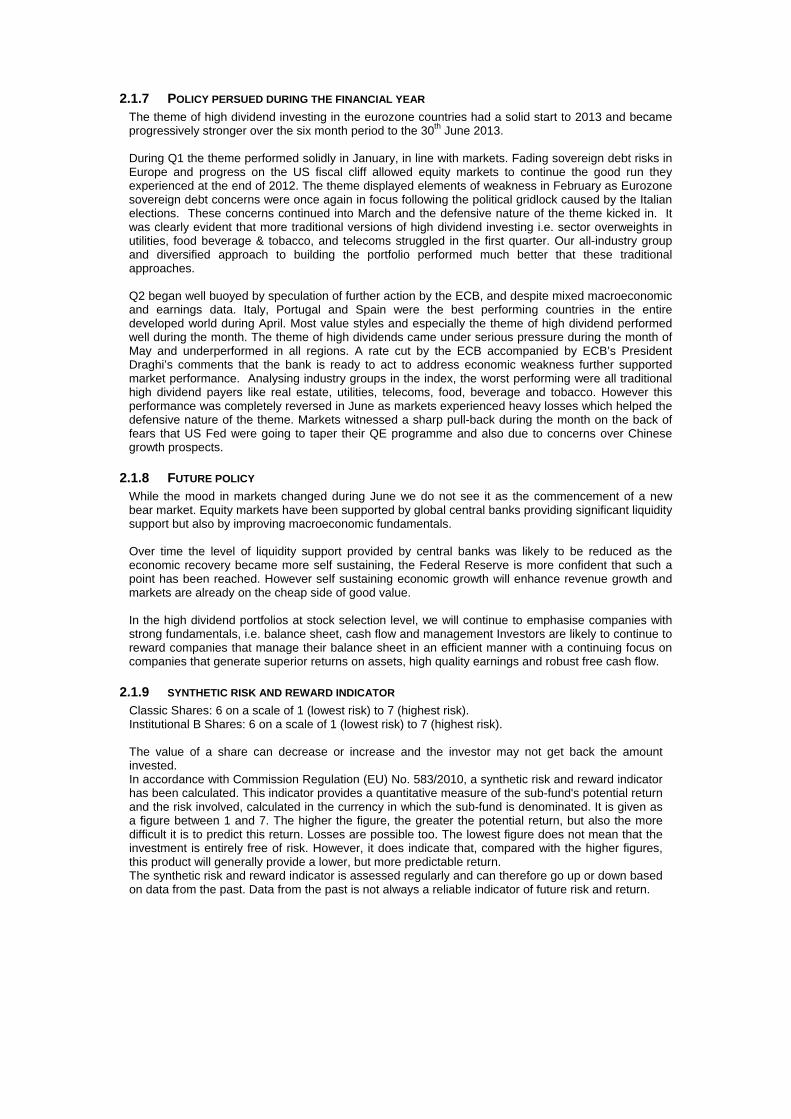
2.1.7 POLICY PERSUED DURING THE FINANCIAL YEAR The theme of high dividend investing in the eurozone countries had a solid start to 2013 and became progressively stronger over the six month period to the 30th June 2013. During Q1 the theme performed solidly in January, in line with markets. Fading sovereign debt risks in Europe and progress on the US fiscal cliff allowed equity markets to continue the good run they experienced at the end of 2012. The theme displayed elements of weakness in February as Eurozone sovereign debt concerns were once again in focus following the political gridlock caused by the Italian elections. These concerns continued into March and the defensive nature of the theme kicked in. It was clearly evident that more traditional versions of high dividend investing i.e. sector overweights in utilities, food beverage & tobacco, and telecoms struggled in the first quarter. Our all-industry group and diversified approach to building the portfolio performed much better that these traditional approaches. Q2 began well buoyed by speculation of further action by the ECB, and despite mixed macroeconomic and earnings data. Italy, Portugal and Spain were the best performing countries in the entire developed world during April. Most value styles and especially the theme of high dividend performed well during the month. The theme of high dividends came under serious pressure during the month of May and underperformed in all regions. A rate cut by the ECB accompanied by ECB’s President Draghi’s comments that the bank is ready to act to address economic weakness further supported market performance. Analysing industry groups in the index, the worst performing were all traditional high dividend payers like real estate, utilities, telecoms, food, beverage and tobacco. However this performance was completely reversed in June as markets experienced heavy losses which helped the defensive nature of the theme. Markets witnessed a sharp pull-back during the month on the back of fears that US Fed were going to taper their QE programme and also due to concerns over Chinese growth prospects.
2.1.8 FUTURE POLICY While the mood in markets changed during June we do not see it as the commencement of a new bear market. Equity markets have been supported by global central banks providing significant liquidity support but also by improving macroeconomic fundamentals. Over time the level of liquidity support provided by central banks was likely to be reduced as the economic recovery became more self sustaining, the Federal Reserve is more confident that such a point has been reached. However self sustaining economic growth will enhance revenue growth and markets are already on the cheap side of good value. In the high dividend portfolios at stock selection level, we will continue to emphasise companies with strong fundamentals, i.e. balance sheet, cash flow and management Investors are likely to continue to reward companies that manage their balance sheet in an efficient manner with a continuing focus on companies that generate superior returns on assets, high quality earnings and robust free cash flow.
2.1.9 SYNTHETIC RISK AND REWARD INDICATOR Classic Shares: 6 on a scale of 1 (lowest risk) to 7 (highest risk). Institutional B Shares: 6 on a scale of 1 (lowest risk) to 7 (highest risk). The value of a share can decrease or increase and the investor may not get back the amount invested. In accordance with Commission Regulation (EU) No. 583/2010, a synthetic risk and reward indicator has been calculated. This indicator provides a quantitative measure of the sub-fund's potential return and the risk involved, calculated in the currency in which the sub-fund is denominated. It is given as a figure between 1 and 7. The higher the figure, the greater the potential return, but also the more difficult it is to predict this return. Losses are possible too. The lowest figure does not mean that the investment is entirely free of risk. However, it does indicate that, compared with the higher figures, this product will generally provide a lower, but more predictable return. The synthetic risk and reward indicator is assessed regularly and can therefore go up or down based on data from the past. Data from the past is not always a reliable indicator of future risk and return.
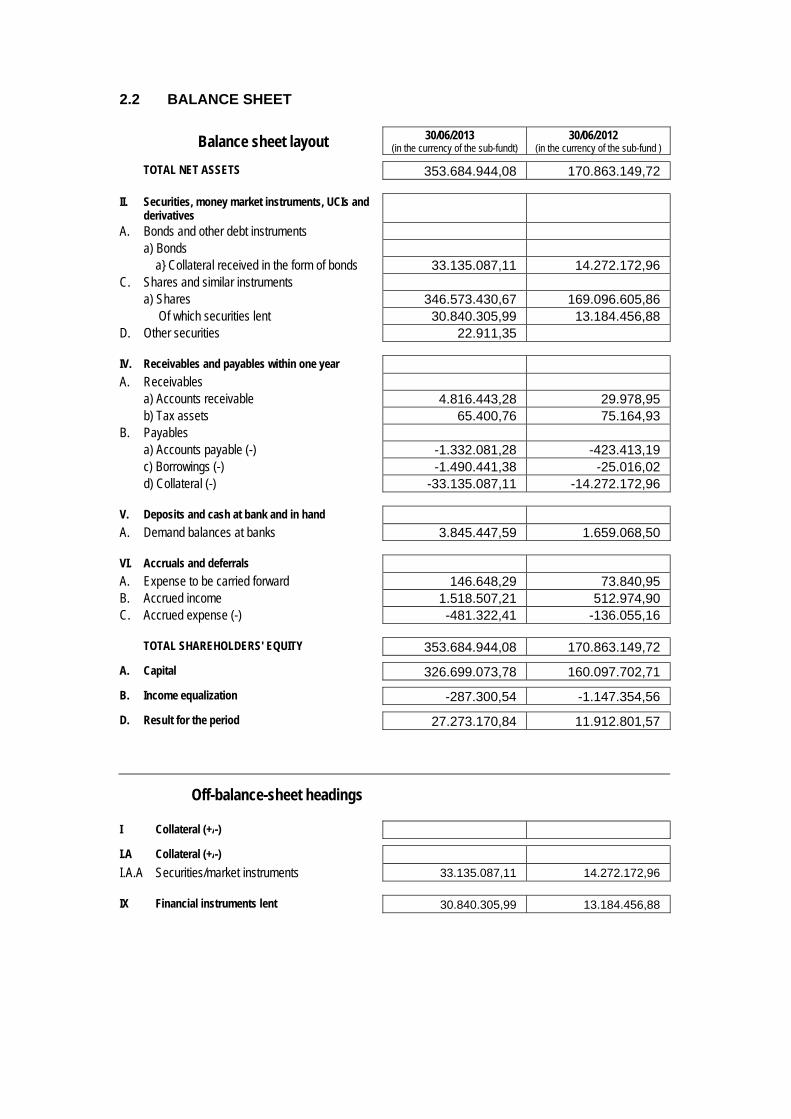
2.2 BALANCE SHEET
Balance sheet layout 30/06/2013 (in the currency of the sub-fundt)
30/06/2012 (in the currency of the sub-fund )
TOTAL NET ASSETS 353.684.944,08 170.863.149,72
II. Securities, money market instruments, UCIs and derivatives
A. Bonds and other debt instruments a) Bonds a} Collateral received in the form of bonds 33.135.087,11 14.272.172,96 C. Shares and similar instruments a) Shares 346.573.430,67 169.096.605,86 Of which securities lent 30.840.305,99 13.184.456,88 D. Other securities 22.911,35
IV. Receivables and payables within one year A. Receivables a) Accounts receivable 4.816.443,28 29.978,95 b) Tax assets 65.400,76 75.164,93 B. Payables a) Accounts payable (-) -1.332.081,28 -423.413,19 c) Borrowings (-) -1.490.441,38 -25.016,02 d) Collateral (-) -33.135.087,11 -14.272.172,96
V. Deposits and cash at bank and in hand A. Demand balances at banks 3.845.447,59 1.659.068,50
VI. Accruals and deferrals A. Expense to be carried forward 146.648,29 73.840,95 B. Accrued income 1.518.507,21 512.974,90 C. Accrued expense (-) -481.322,41 -136.055,16
TOTAL SHAREHOLDERS' EQUITY 353.684.944,08 170.863.149,72
A. Capital 326.699.073,78 160.097.702,71
B. Income equalization -287.300,54 -1.147.354,56
D. Result for the period 27.273.170,84 11.912.801,57
Off-balance-sheet headings
I Collateral (+/-)
I.A Collateral (+/-)
I.A.A Securities/market instruments 33.135.087,11 14.272.172,96
IX Financial instruments lent 30.840.305,99 13.184.456,88
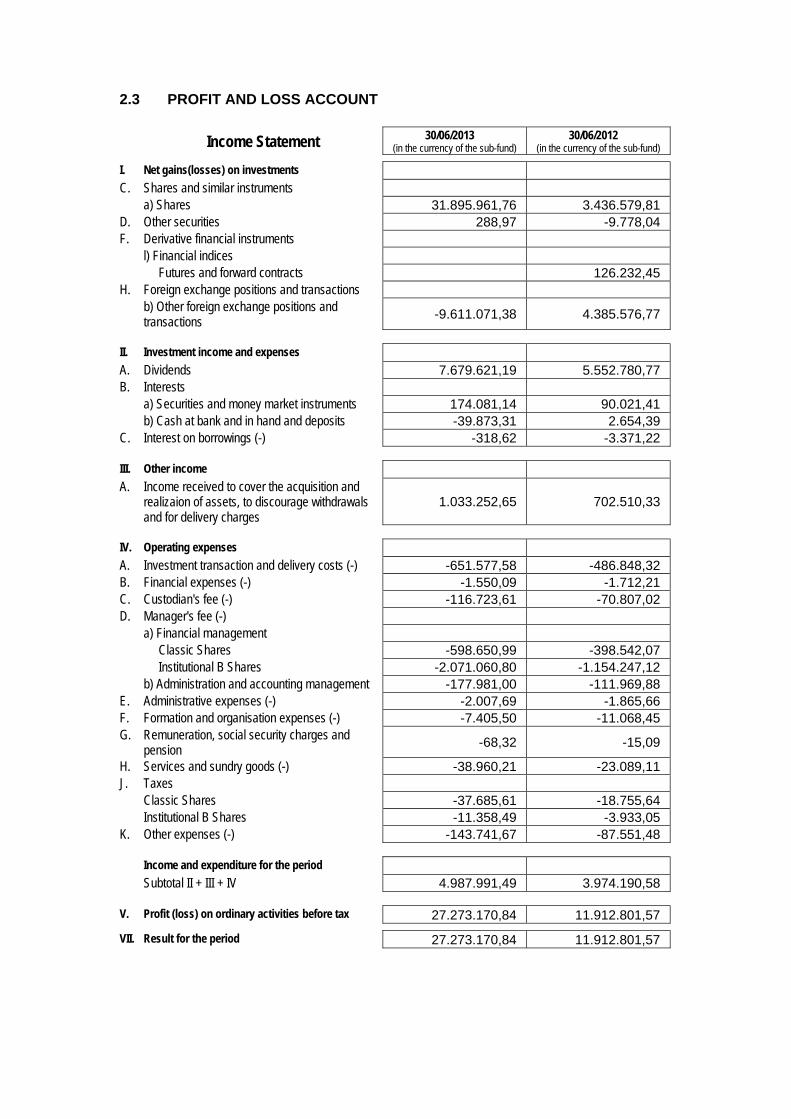
2.3 PROFIT AND LOSS ACCOUNT
Income Statement 30/06/2013 (in the currency of the sub-fund)
30/06/2012 (in the currency of the sub-fund)
I. Net gains(losses) on investments C. Shares and similar instruments a) Shares 31.895.961,76 3.436.579,81 D. Other securities 288,97 -9.778,04 F. Derivative financial instruments l) Financial indices Futures and forward contracts 126.232,45 H. Foreign exchange positions and transactions b) Other foreign exchange positions and
transactions -9.611.071,38 4.385.576,77
II. Investment income and expenses A. Dividends 7.679.621,19 5.552.780,77 B. Interests a) Securities and money market instruments 174.081,14 90.021,41 b) Cash at bank and in hand and deposits -39.873,31 2.654,39 C. Interest on borrowings (-) -318,62 -3.371,22
III. Other income A. Income received to cover the acquisition and
realizaion of assets, to discourage withdrawals and for delivery charges
1.033.252,65 702.510,33
IV. Operating expenses A. Investment transaction and delivery costs (-) -651.577,58 -486.848,32 B. Financial expenses (-) -1.550,09 -1.712,21 C. Custodian's fee (-) -116.723,61 -70.807,02 D. Manager's fee (-) a) Financial management Classic Shares -598.650,99 -398.542,07 Institutional B Shares -2.071.060,80 -1.154.247,12 b) Administration and accounting management -177.981,00 -111.969,88 E. Administrative expenses (-) -2.007,69 -1.865,66 F. Formation and organisation expenses (-) -7.405,50 -11.068,45 G. Remuneration, social security charges and
pension -68,32 -15,09
H. Services and sundry goods (-) -38.960,21 -23.089,11 J. Taxes Classic Shares -37.685,61 -18.755,64 Institutional B Shares -11.358,49 -3.933,05 K. Other expenses (-) -143.741,67 -87.551,48
Income and expenditure for the period Subtotal II + III + IV 4.987.991,49 3.974.190,58
V. Profit (loss) on ordinary activities before tax 27.273.170,84 11.912.801,57
VII. Result for the period 27.273.170,84 11.912.801,57
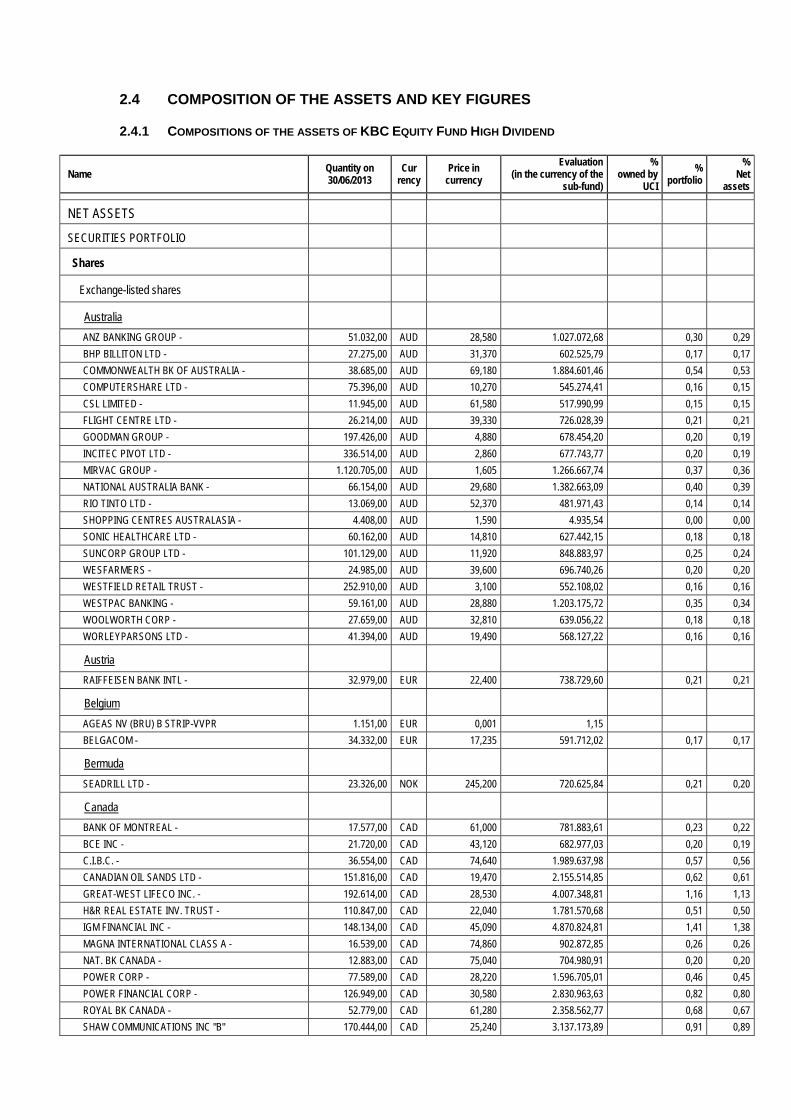
2.4 COMPOSITION OF THE ASSETS AND KEY FIGURES
2.4.1 COMPOSITIONS OF THE ASSETS OF KBC EQUITY FUND HIGH DIVIDEND
Name Quantity on 30/06/2013
Cur rency
Price in currency
Evaluation (in the currency of the
sub-fund)
% owned by
UCI
% portfolio
% Net
assets
NET ASSETS
SECURITIES PORTFOLIO
Shares
Exchange-listed shares
Australia
ANZ BANKING GROUP - 51.032,00 AUD 28,580 1.027.072,68 0,30 0,29
BHP BILLITON LTD - 27.275,00 AUD 31,370 602.525,79 0,17 0,17
COMMONWEALTH BK OF AUSTRALIA - 38.685,00 AUD 69,180 1.884.601,46 0,54 0,53
COMPUTERSHARE LTD - 75.396,00 AUD 10,270 545.274,41 0,16 0,15
CSL LIMITED - 11.945,00 AUD 61,580 517.990,99 0,15 0,15
FLIGHT CENTRE LTD - 26.214,00 AUD 39,330 726.028,39 0,21 0,21
GOODMAN GROUP - 197.426,00 AUD 4,880 678.454,20 0,20 0,19
INCITEC PIVOT LTD - 336.514,00 AUD 2,860 677.743,77 0,20 0,19
MIRVAC GROUP - 1.120.705,00 AUD 1,605 1.266.667,74 0,37 0,36
NATIONAL AUSTRALIA BANK - 66.154,00 AUD 29,680 1.382.663,09 0,40 0,39
RIO TINTO LTD - 13.069,00 AUD 52,370 481.971,43 0,14 0,14
SHOPPING CENTRES AUSTRALASIA - 4.408,00 AUD 1,590 4.935,54 0,00 0,00
SONIC HEALTHCARE LTD - 60.162,00 AUD 14,810 627.442,15 0,18 0,18
SUNCORP GROUP LTD - 101.129,00 AUD 11,920 848.883,97 0,25 0,24
WESFARMERS - 24.985,00 AUD 39,600 696.740,26 0,20 0,20
WESTFIELD RETAIL TRUST - 252.910,00 AUD 3,100 552.108,02 0,16 0,16
WESTPAC BANKING - 59.161,00 AUD 28,880 1.203.175,72 0,35 0,34
WOOLWORTH CORP - 27.659,00 AUD 32,810 639.056,22 0,18 0,18
WORLEYPARSONS LTD - 41.394,00 AUD 19,490 568.127,22 0,16 0,16
Austria
RAIFFEISEN BANK INTL - 32.979,00 EUR 22,400 738.729,60 0,21 0,21
Belgium
AGEAS NV (BRU) B STRIP-VVPR 1.151,00 EUR 0,001 1,15
BELGACOM - 34.332,00 EUR 17,235 591.712,02 0,17 0,17
Bermuda
SEADRILL LTD - 23.326,00 NOK 245,200 720.625,84 0,21 0,20
Canada
BANK OF MONTREAL - 17.577,00 CAD 61,000 781.883,61 0,23 0,22
BCE INC - 21.720,00 CAD 43,120 682.977,03 0,20 0,19
C.I.B.C. - 36.554,00 CAD 74,640 1.989.637,98 0,57 0,56
CANADIAN OIL SANDS LTD - 151.816,00 CAD 19,470 2.155.514,85 0,62 0,61
GREAT-WEST LIFECO INC. - 192.614,00 CAD 28,530 4.007.348,81 1,16 1,13
H&R REAL ESTATE INV. TRUST - 110.847,00 CAD 22,040 1.781.570,68 0,51 0,50
IGM FINANCIAL INC - 148.134,00 CAD 45,090 4.870.824,81 1,41 1,38
MAGNA INTERNATIONAL CLASS A - 16.539,00 CAD 74,860 902.872,85 0,26 0,26
NAT. BK CANADA - 12.883,00 CAD 75,040 704.980,91 0,20 0,20
POWER CORP - 77.589,00 CAD 28,220 1.596.705,01 0,46 0,45
POWER FINANCIAL CORP - 126.949,00 CAD 30,580 2.830.963,63 0,82 0,80
ROYAL BK CANADA - 52.779,00 CAD 61,280 2.358.562,77 0,68 0,67
SHAW COMMUNICATIONS INC "B" 170.444,00 CAD 25,240 3.137.173,89 0,91 0,89
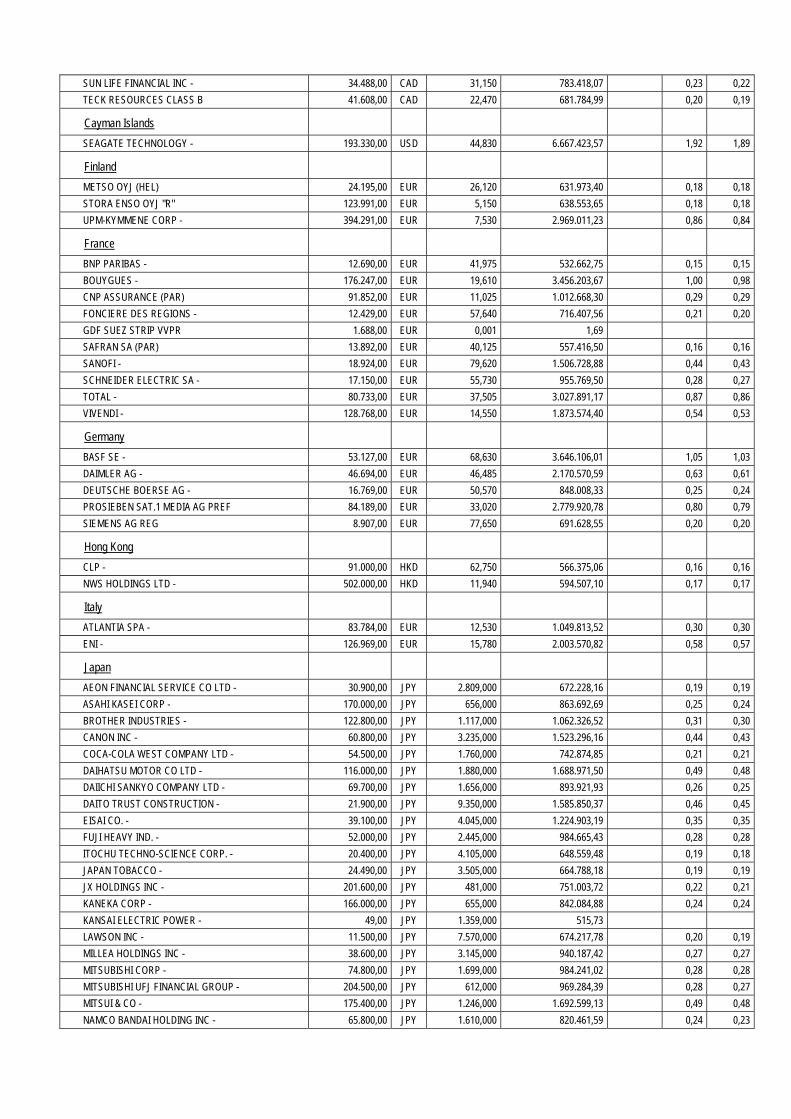
SUN LIFE FINANCIAL INC - 34.488,00 CAD 31,150 783.418,07 0,23 0,22
TECK RESOURCES CLASS B 41.608,00 CAD 22,470 681.784,99 0,20 0,19
Cayman Islands
SEAGATE TECHNOLOGY - 193.330,00 USD 44,830 6.667.423,57 1,92 1,89
Finland
METSO OYJ (HEL) 24.195,00 EUR 26,120 631.973,40 0,18 0,18
STORA ENSO OYJ "R" 123.991,00 EUR 5,150 638.553,65 0,18 0,18
UPM-KYMMENE CORP - 394.291,00 EUR 7,530 2.969.011,23 0,86 0,84
France
BNP PARIBAS - 12.690,00 EUR 41,975 532.662,75 0,15 0,15
BOUYGUES - 176.247,00 EUR 19,610 3.456.203,67 1,00 0,98
CNP ASSURANCE (PAR) 91.852,00 EUR 11,025 1.012.668,30 0,29 0,29
FONCIERE DES REGIONS - 12.429,00 EUR 57,640 716.407,56 0,21 0,20
GDF SUEZ STRIP VVPR 1.688,00 EUR 0,001 1,69
SAFRAN SA (PAR) 13.892,00 EUR 40,125 557.416,50 0,16 0,16
SANOFI - 18.924,00 EUR 79,620 1.506.728,88 0,44 0,43
SCHNEIDER ELECTRIC SA - 17.150,00 EUR 55,730 955.769,50 0,28 0,27
TOTAL - 80.733,00 EUR 37,505 3.027.891,17 0,87 0,86
VIVENDI - 128.768,00 EUR 14,550 1.873.574,40 0,54 0,53
Germany
BASF SE - 53.127,00 EUR 68,630 3.646.106,01 1,05 1,03
DAIMLER AG - 46.694,00 EUR 46,485 2.170.570,59 0,63 0,61
DEUTSCHE BOERSE AG - 16.769,00 EUR 50,570 848.008,33 0,25 0,24
PROSIEBEN SAT.1 MEDIA AG PREF 84.189,00 EUR 33,020 2.779.920,78 0,80 0,79
SIEMENS AG REG 8.907,00 EUR 77,650 691.628,55 0,20 0,20
Hong Kong
CLP - 91.000,00 HKD 62,750 566.375,06 0,16 0,16
NWS HOLDINGS LTD - 502.000,00 HKD 11,940 594.507,10 0,17 0,17
Italy
ATLANTIA SPA - 83.784,00 EUR 12,530 1.049.813,52 0,30 0,30
ENI - 126.969,00 EUR 15,780 2.003.570,82 0,58 0,57
Japan
AEON FINANCIAL SERVICE CO LTD - 30.900,00 JPY 2.809,000 672.228,16 0,19 0,19
ASAHI KASEI CORP - 170.000,00 JPY 656,000 863.692,69 0,25 0,24
BROTHER INDUSTRIES - 122.800,00 JPY 1.117,000 1.062.326,52 0,31 0,30
CANON INC - 60.800,00 JPY 3.235,000 1.523.296,16 0,44 0,43
COCA-COLA WEST COMPANY LTD - 54.500,00 JPY 1.760,000 742.874,85 0,21 0,21
DAIHATSU MOTOR CO LTD - 116.000,00 JPY 1.880,000 1.688.971,50 0,49 0,48
DAIICHI SANKYO COMPANY LTD - 69.700,00 JPY 1.656,000 893.921,93 0,26 0,25
DAITO TRUST CONSTRUCTION - 21.900,00 JPY 9.350,000 1.585.850,37 0,46 0,45
EISAI CO. - 39.100,00 JPY 4.045,000 1.224.903,19 0,35 0,35
FUJI HEAVY IND. - 52.000,00 JPY 2.445,000 984.665,43 0,28 0,28
ITOCHU TECHNO-SCIENCE CORP. - 20.400,00 JPY 4.105,000 648.559,48 0,19 0,18
JAPAN TOBACCO - 24.490,00 JPY 3.505,000 664.788,18 0,19 0,19
JX HOLDINGS INC - 201.600,00 JPY 481,000 751.003,72 0,22 0,21
KANEKA CORP - 166.000,00 JPY 655,000 842.084,88 0,24 0,24
KANSAI ELECTRIC POWER - 49,00 JPY 1.359,000 515,73
LAWSON INC - 11.500,00 JPY 7.570,000 674.217,78 0,20 0,19
MILLEA HOLDINGS INC - 38.600,00 JPY 3.145,000 940.187,42 0,27 0,27
MITSUBISHI CORP - 74.800,00 JPY 1.699,000 984.241,02 0,28 0,28
MITSUBISHI UFJ FINANCIAL GROUP - 204.500,00 JPY 612,000 969.284,39 0,28 0,27
MITSUI & CO - 175.400,00 JPY 1.246,000 1.692.599,13 0,49 0,48
NAMCO BANDAI HOLDING INC - 65.800,00 JPY 1.610,000 820.461,59 0,24 0,23
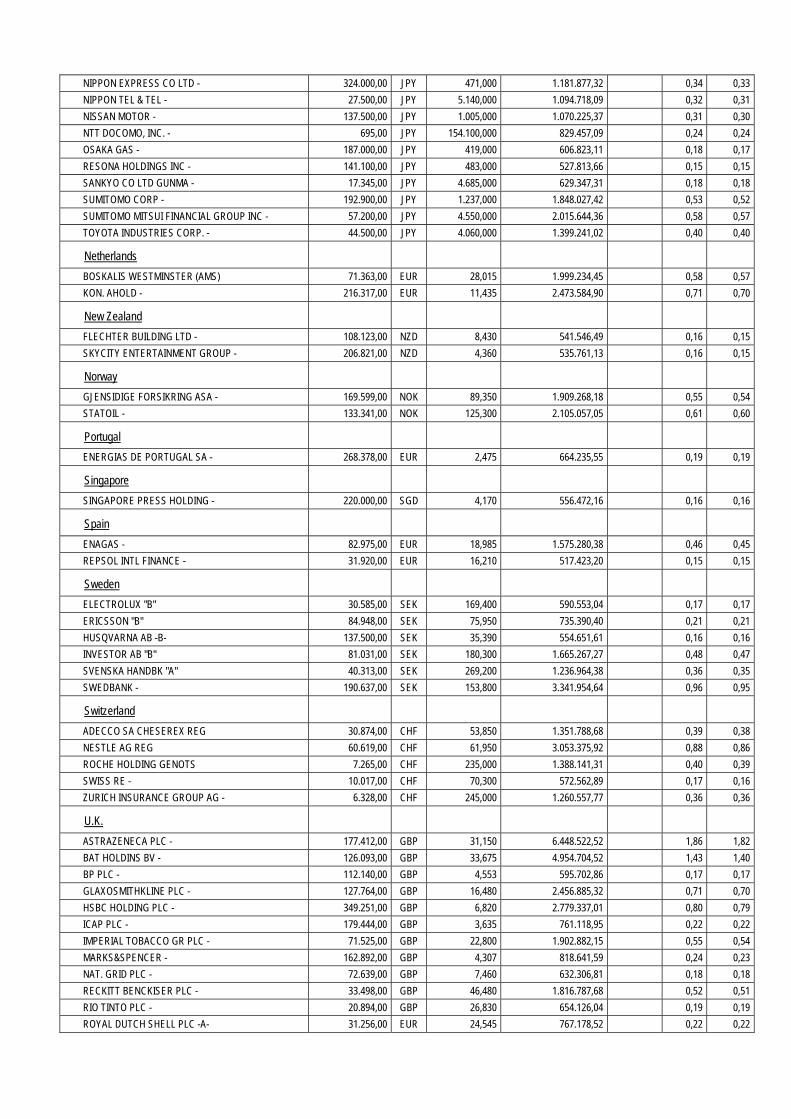
NIPPON EXPRESS CO LTD - 324.000,00 JPY 471,000 1.181.877,32 0,34 0,33
NIPPON TEL & TEL - 27.500,00 JPY 5.140,000 1.094.718,09 0,32 0,31
NISSAN MOTOR - 137.500,00 JPY 1.005,000 1.070.225,37 0,31 0,30
NTT DOCOMO, INC. - 695,00 JPY 154.100,000 829.457,09 0,24 0,24
OSAKA GAS - 187.000,00 JPY 419,000 606.823,11 0,18 0,17
RESONA HOLDINGS INC - 141.100,00 JPY 483,000 527.813,66 0,15 0,15
SANKYO CO LTD GUNMA - 17.345,00 JPY 4.685,000 629.347,31 0,18 0,18
SUMITOMO CORP - 192.900,00 JPY 1.237,000 1.848.027,42 0,53 0,52
SUMITOMO MITSUI FINANCIAL GROUP INC - 57.200,00 JPY 4.550,000 2.015.644,36 0,58 0,57
TOYOTA INDUSTRIES CORP. - 44.500,00 JPY 4.060,000 1.399.241,02 0,40 0,40
Netherlands
BOSKALIS WESTMINSTER (AMS) 71.363,00 EUR 28,015 1.999.234,45 0,58 0,57
KON. AHOLD - 216.317,00 EUR 11,435 2.473.584,90 0,71 0,70
New Zealand
FLECHTER BUILDING LTD - 108.123,00 NZD 8,430 541.546,49 0,16 0,15
SKYCITY ENTERTAINMENT GROUP - 206.821,00 NZD 4,360 535.761,13 0,16 0,15
Norway
GJENSIDIGE FORSIKRING ASA - 169.599,00 NOK 89,350 1.909.268,18 0,55 0,54
STATOIL - 133.341,00 NOK 125,300 2.105.057,05 0,61 0,60
Portugal
ENERGIAS DE PORTUGAL SA - 268.378,00 EUR 2,475 664.235,55 0,19 0,19
Singapore
SINGAPORE PRESS HOLDING - 220.000,00 SGD 4,170 556.472,16 0,16 0,16
Spain
ENAGAS - 82.975,00 EUR 18,985 1.575.280,38 0,46 0,45
REPSOL INTL FINANCE - 31.920,00 EUR 16,210 517.423,20 0,15 0,15
Sweden
ELECTROLUX "B" 30.585,00 SEK 169,400 590.553,04 0,17 0,17
ERICSSON "B" 84.948,00 SEK 75,950 735.390,40 0,21 0,21
HUSQVARNA AB -B- 137.500,00 SEK 35,390 554.651,61 0,16 0,16
INVESTOR AB "B" 81.031,00 SEK 180,300 1.665.267,27 0,48 0,47
SVENSKA HANDBK "A" 40.313,00 SEK 269,200 1.236.964,38 0,36 0,35
SWEDBANK - 190.637,00 SEK 153,800 3.341.954,64 0,96 0,95
Switzerland
ADECCO SA CHESEREX REG 30.874,00 CHF 53,850 1.351.788,68 0,39 0,38
NESTLE AG REG 60.619,00 CHF 61,950 3.053.375,92 0,88 0,86
ROCHE HOLDING GENOTS 7.265,00 CHF 235,000 1.388.141,31 0,40 0,39
SWISS RE - 10.017,00 CHF 70,300 572.562,89 0,17 0,16
ZURICH INSURANCE GROUP AG - 6.328,00 CHF 245,000 1.260.557,77 0,36 0,36
U.K.
ASTRAZENECA PLC - 177.412,00 GBP 31,150 6.448.522,52 1,86 1,82
BAT HOLDINS BV - 126.093,00 GBP 33,675 4.954.704,52 1,43 1,40
BP PLC - 112.140,00 GBP 4,553 595.702,86 0,17 0,17
GLAXOSMITHKLINE PLC - 127.764,00 GBP 16,480 2.456.885,32 0,71 0,70
HSBC HOLDING PLC - 349.251,00 GBP 6,820 2.779.337,01 0,80 0,79
ICAP PLC - 179.444,00 GBP 3,635 761.118,95 0,22 0,22
IMPERIAL TOBACCO GR PLC - 71.525,00 GBP 22,800 1.902.882,15 0,55 0,54
MARKS&SPENCER - 162.892,00 GBP 4,307 818.641,59 0,24 0,23
NAT. GRID PLC - 72.639,00 GBP 7,460 632.306,81 0,18 0,18
RECKITT BENCKISER PLC - 33.498,00 GBP 46,480 1.816.787,68 0,52 0,51
RIO TINTO PLC - 20.894,00 GBP 26,830 654.126,04 0,19 0,19
ROYAL DUTCH SHELL PLC -A- 31.256,00 EUR 24,545 767.178,52 0,22 0,22

SAGE GROUP - 210.537,00 GBP 3,402 835.760,65 0,24 0,24
SMITH&NEPHEW PLC - 68.043,00 GBP 7,350 583.565,99 0,17 0,17
STANDARD CHARTERED - 31.436,00 GBP 14,270 523.444,25 0,15 0,15
STANDARD LIFE PLC - 316.761,00 GBP 3,457 1.277.762,87 0,37 0,36
VODAFONE GROUP PLC - 1.540.726,00 GBP 1,879 3.377.192,29 0,97 0,96
U.S.A.
ACCENTURE LTD "A" 34.183,00 USD 71,960 1.892.306,09 0,55 0,54
AETNA INC NEW 17.192,00 USD 63,540 840.356,70 0,24 0,24
ALLIANT ENERGY CORP - 24.584,00 USD 50,420 953.554,33 0,28 0,27
ALTRIA GROUP INC - 36.977,00 USD 34,990 995.326,74 0,29 0,28
ANNALY CAPITAL MANAGEMENT INC - 311.306,00 USD 12,570 3.010.321,12 0,87 0,85
AT&T INC - 80.078,00 USD 35,400 2.180.753,29 0,63 0,62
AUTOMATIC DATA PROCESSING, INC. - 18.771,00 USD 68,860 994.361,92 0,29 0,28
AVERY DENNISON CORPORATION - 63.514,00 USD 42,760 2.089.282,74 0,60 0,59
BAXTER INTL INC - 49.345,00 USD 69,270 2.629.531,62 0,76 0,74
BEST BUY - 152.073,00 USD 27,330 3.197.288,32 0,92 0,90
BLACKROCK INC. - 16.590,00 USD 256,850 3.278.053,31 0,95 0,93
BRISTOL-MYERS SQUIBB CO - 60.149,00 USD 44,690 2.067.896,62 0,60 0,59
CA INC - 164.890,00 USD 28,630 3.631.664,51 1,05 1,03
CARDINAL HEALTH INC - 42.159,00 USD 47,200 1.530.813,75 0,44 0,43
CHEVRON CORP - 81.535,00 USD 118,340 7.422.764,75 2,14 2,10
CONOCOPHILLIPS - 148.123,00 USD 60,500 6.893.946,84 1,99 1,95
DEERE & COMPANY - 37.303,00 USD 81,250 2.331.616,86 0,67 0,66
DOVER CORPORATION - 18.136,00 USD 77,660 1.083.500,08 0,31 0,31
DR.PEPPER SNAPPLE GROUP INC - 20.868,00 USD 45,930 737.339,21 0,21 0,21
DTE ENERGY COMPANY - 15.010,00 USD 67,010 773.767,29 0,22 0,22
DU PONT DE NEMOURS - 65.028,00 USD 52,500 2.626.332,79 0,76 0,74
EATON VANCE CORP - 39.184,00 USD 37,590 1.133.107,59 0,33 0,32
EMERSON ELECTRIC CO - 56.201,00 USD 54,540 2.358.029,49 0,68 0,67
ENTERGY CORPORATION - 62.444,00 USD 69,680 3.347.255,88 0,97 0,95
EXELON CORP - 40.323,00 USD 30,880 957.900,02 0,28 0,27
EXXON MOBIL CORP - 111.675,00 USD 90,350 7.762.009,58 2,24 2,20
GAP INC - 28.468,00 USD 41,730 913.893,10 0,26 0,26
GENERAL ELEC CAP CORP - 183.074,00 USD 23,190 3.266.009,74 0,94 0,92
GENUINE PARTS - 15.564,00 USD 78,070 934.749,97 0,27 0,26
H&R BLOCK, INC. - 145.263,00 USD 27,750 3.101.044,89 0,90 0,88
HARRIS CORP - 99.965,00 USD 49,250 3.787.426,92 1,09 1,07
HASBRO INC. - 63.802,00 USD 44,830 2.200.356,69 0,64 0,62
ILLINOIS TOOL WORKS INC - 16.526,00 USD 69,170 879.377,97 0,25 0,25
INTEL CORP - 153.387,00 USD 24,220 2.857.937,64 0,83 0,81
INTL PAPER COMP. - 23.878,00 USD 44,310 813.935,06 0,24 0,23
JPMORGAN CHASE & CO - 18.269,00 USD 52,790 741.919,00 0,21 0,21
KIMBERLEY-CLARK CORP - 54.505,00 USD 97,140 4.073.094,62 1,18 1,15
LIBERTY PROPERTY TRUST - 23.697,00 USD 36,960 673.775,77 0,19 0,19
LILLY (ELI) & CO - 240.684,00 USD 49,120 9.094.851,97 2,63 2,57
LORILLARD INC - 242.441,00 USD 43,680 8.146.644,26 2,35 2,30
M&T BANK CORP - 35.313,00 USD 111,750 3.035.793,33 0,88 0,86
MATTEL INC - 72.292,00 USD 45,310 2.519.848,08 0,73 0,71
MAXIM INTEGRATED PRODUCTS - 55.164,00 USD 27,780 1.178.902,93 0,34 0,33
MCGRAW HILL FINANCIAL INC - 27.475,00 USD 53,190 1.124.236,67 0,32 0,32
MEADWESTVACO CORP - 86.839,00 USD 34,110 2.278.697,05 0,66 0,64
MEDTRONIC INC - 23.283,00 USD 51,470 921.898,62 0,27 0,26
MICROSOFT CORP - 289.905,00 USD 34,530 7.700.915,19 2,22 2,18
NORFOLK STHN CP - 16.141,00 USD 72,650 902.102,97 0,26 0,26
PARKER-HANNIFIN CORPORATION - 11.444,00 USD 95,400 839.878,14 0,24 0,24
PAYCHEX INC - 27.237,00 USD 36,520 765.209,05 0,22 0,22
PFIZER - 157.385,00 USD 28,010 3.391.302,29 0,98 0,96
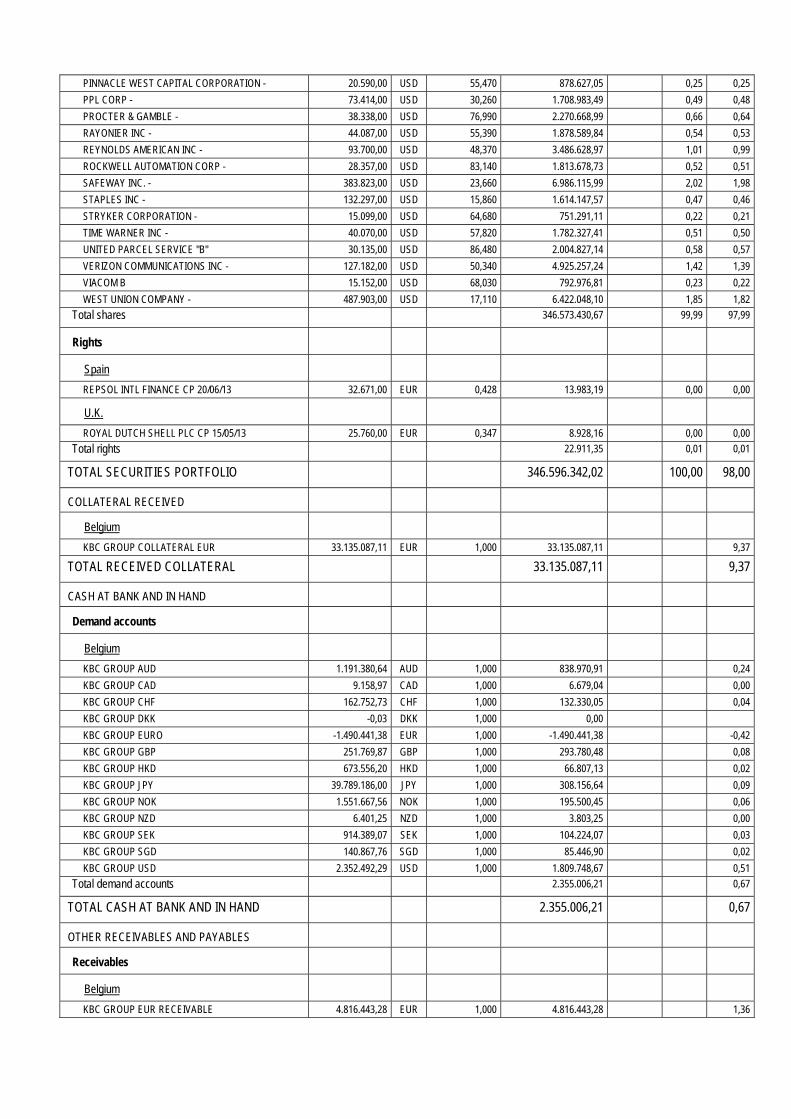
PINNACLE WEST CAPITAL CORPORATION - 20.590,00 USD 55,470 878.627,05 0,25 0,25
PPL CORP - 73.414,00 USD 30,260 1.708.983,49 0,49 0,48
PROCTER & GAMBLE - 38.338,00 USD 76,990 2.270.668,99 0,66 0,64
RAYONIER INC - 44.087,00 USD 55,390 1.878.589,84 0,54 0,53
REYNOLDS AMERICAN INC - 93.700,00 USD 48,370 3.486.628,97 1,01 0,99
ROCKWELL AUTOMATION CORP - 28.357,00 USD 83,140 1.813.678,73 0,52 0,51
SAFEWAY INC. - 383.823,00 USD 23,660 6.986.115,99 2,02 1,98
STAPLES INC - 132.297,00 USD 15,860 1.614.147,57 0,47 0,46
STRYKER CORPORATION - 15.099,00 USD 64,680 751.291,11 0,22 0,21
TIME WARNER INC - 40.070,00 USD 57,820 1.782.327,41 0,51 0,50
UNITED PARCEL SERVICE "B" 30.135,00 USD 86,480 2.004.827,14 0,58 0,57
VERIZON COMMUNICATIONS INC - 127.182,00 USD 50,340 4.925.257,24 1,42 1,39
VIACOM B 15.152,00 USD 68,030 792.976,81 0,23 0,22
WEST UNION COMPANY - 487.903,00 USD 17,110 6.422.048,10 1,85 1,82
Total shares 346.573.430,67 99,99 97,99
Rights
Spain
REPSOL INTL FINANCE CP 20/06/13 32.671,00 EUR 0,428 13.983,19 0,00 0,00
U.K.
ROYAL DUTCH SHELL PLC CP 15/05/13 25.760,00 EUR 0,347 8.928,16 0,00 0,00
Total rights 22.911,35 0,01 0,01
TOTAL SECURITIES PORTFOLIO 346.596.342,02 100,00 98,00
COLLATERAL RECEIVED
Belgium
KBC GROUP COLLATERAL EUR 33.135.087,11 EUR 1,000 33.135.087,11 9,37
TOTAL RECEIVED COLLATERAL 33.135.087,11 9,37
CASH AT BANK AND IN HAND
Demand accounts
Belgium
KBC GROUP AUD 1.191.380,64 AUD 1,000 838.970,91 0,24
KBC GROUP CAD 9.158,97 CAD 1,000 6.679,04 0,00
KBC GROUP CHF 162.752,73 CHF 1,000 132.330,05 0,04
KBC GROUP DKK -0,03 DKK 1,000 0,00
KBC GROUP EURO -1.490.441,38 EUR 1,000 -1.490.441,38 -0,42
KBC GROUP GBP 251.769,87 GBP 1,000 293.780,48 0,08
KBC GROUP HKD 673.556,20 HKD 1,000 66.807,13 0,02
KBC GROUP JPY 39.789.186,00 JPY 1,000 308.156,64 0,09
KBC GROUP NOK 1.551.667,56 NOK 1,000 195.500,45 0,06
KBC GROUP NZD 6.401,25 NZD 1,000 3.803,25 0,00
KBC GROUP SEK 914.389,07 SEK 1,000 104.224,07 0,03
KBC GROUP SGD 140.867,76 SGD 1,000 85.446,90 0,02
KBC GROUP USD 2.352.492,29 USD 1,000 1.809.748,67 0,51
Total demand accounts 2.355.006,21 0,67
TOTAL CASH AT BANK AND IN HAND 2.355.006,21 0,67
OTHER RECEIVABLES AND PAYABLES
Receivables
Belgium
KBC GROUP EUR RECEIVABLE 4.816.443,28 EUR 1,000 4.816.443,28 1,36
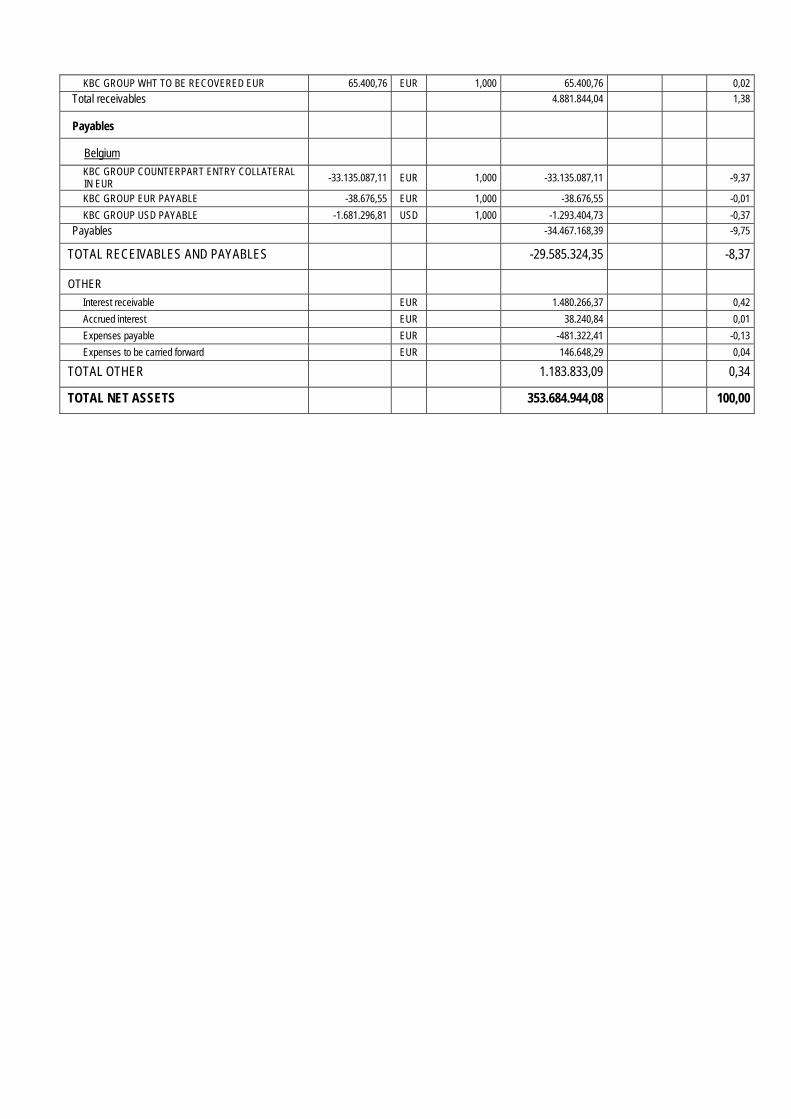
KBC GROUP WHT TO BE RECOVERED EUR 65.400,76 EUR 1,000 65.400,76 0,02
Total receivables 4.881.844,04 1,38
Payables
Belgium
KBC GROUP COUNTERPART ENTRY COLLATERAL IN EUR -33.135.087,11 EUR 1,000 -33.135.087,11 -9,37
KBC GROUP EUR PAYABLE -38.676,55 EUR 1,000 -38.676,55 -0,01
KBC GROUP USD PAYABLE -1.681.296,81 USD 1,000 -1.293.404,73 -0,37
Payables -34.467.168,39 -9,75
TOTAL RECEIVABLES AND PAYABLES -29.585.324,35 -8,37
OTHER
Interest receivable EUR 1.480.266,37 0,42
Accrued interest EUR 38.240,84 0,01
Expenses payable EUR -481.322,41 -0,13
Expenses to be carried forward EUR 146.648,29 0,04
TOTAL OTHER 1.183.833,09 0,34
TOTAL NET ASSETS 353.684.944,08 100,00
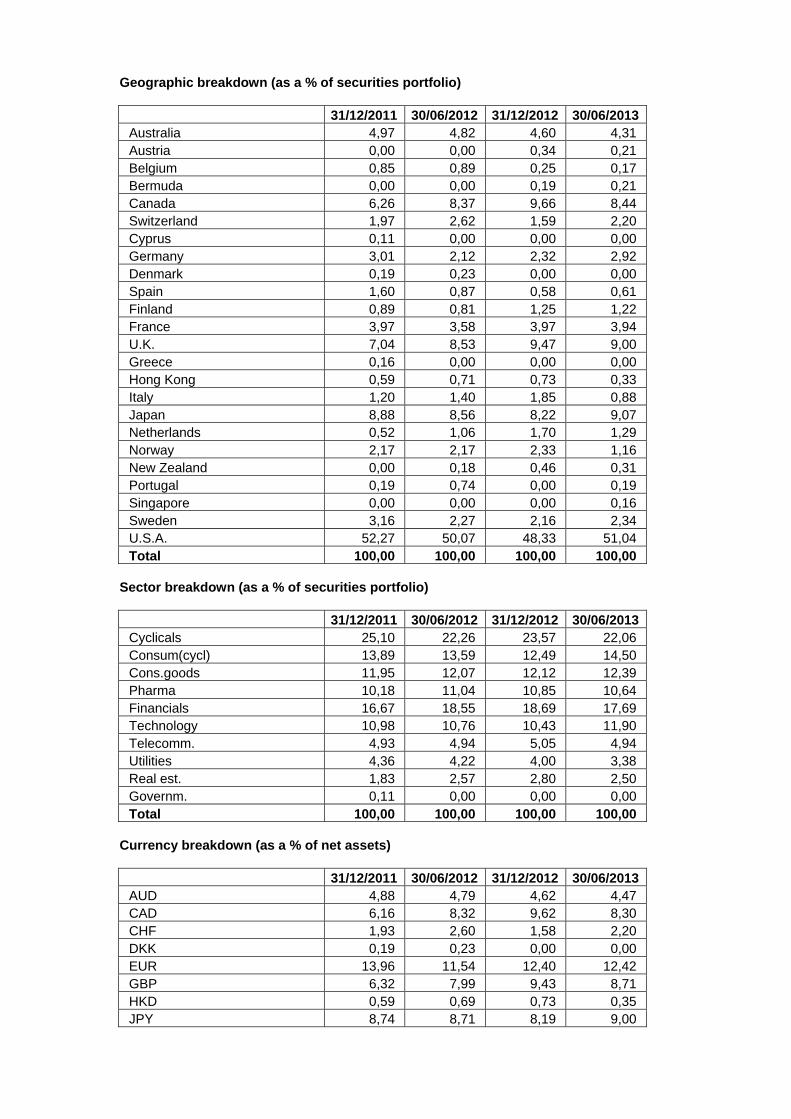
Geographic breakdown (as a % of securities portfolio)
31/12/2011 30/06/2012 31/12/2012 30/06/2013 Australia 4,97 4,82 4,60 4,31 Austria 0,00 0,00 0,34 0,21 Belgium 0,85 0,89 0,25 0,17 Bermuda 0,00 0,00 0,19 0,21 Canada 6,26 8,37 9,66 8,44 Switzerland 1,97 2,62 1,59 2,20 Cyprus 0,11 0,00 0,00 0,00 Germany 3,01 2,12 2,32 2,92 Denmark 0,19 0,23 0,00 0,00 Spain 1,60 0,87 0,58 0,61 Finland 0,89 0,81 1,25 1,22 France 3,97 3,58 3,97 3,94 U.K. 7,04 8,53 9,47 9,00 Greece 0,16 0,00 0,00 0,00 Hong Kong 0,59 0,71 0,73 0,33 Italy 1,20 1,40 1,85 0,88 Japan 8,88 8,56 8,22 9,07 Netherlands 0,52 1,06 1,70 1,29 Norway 2,17 2,17 2,33 1,16 New Zealand 0,00 0,18 0,46 0,31 Portugal 0,19 0,74 0,00 0,19 Singapore 0,00 0,00 0,00 0,16 Sweden 3,16 2,27 2,16 2,34 U.S.A. 52,27 50,07 48,33 51,04 Total 100,00 100,00 100,00 100,00
Sector breakdown (as a % of securities portfolio)
31/12/2011 30/06/2012 31/12/2012 30/06/2013 Cyclicals 25,10 22,26 23,57 22,06 Consum(cycl) 13,89 13,59 12,49 14,50 Cons.goods 11,95 12,07 12,12 12,39 Pharma 10,18 11,04 10,85 10,64 Financials 16,67 18,55 18,69 17,69 Technology 10,98 10,76 10,43 11,90 Telecomm. 4,93 4,94 5,05 4,94 Utilities 4,36 4,22 4,00 3,38 Real est. 1,83 2,57 2,80 2,50 Governm. 0,11 0,00 0,00 0,00 Total 100,00 100,00 100,00 100,00
Currency breakdown (as a % of net assets)
31/12/2011 30/06/2012 31/12/2012 30/06/2013 AUD 4,88 4,79 4,62 4,47 CAD 6,16 8,32 9,62 8,30 CHF 1,93 2,60 1,58 2,20 DKK 0,19 0,23 0,00 0,00 EUR 13,96 11,54 12,40 12,42 GBP 6,32 7,99 9,43 8,71 HKD 0,59 0,69 0,73 0,35 JPY 8,74 8,71 8,19 9,00

NOK 2,13 2,16 2,52 1,40 NZD 0,00 0,21 0,46 0,31 SEK 3,11 2,26 2,15 2,33 SGD 0,00 0,00 0,00 0,18 USD 51,99 50,50 48,30 50,33 Total 100,00 100,00 100,00 100,00

2.4.2 CHANGES IN THE COMPOSITION OF THE ASSETS OF KBC EQUITY FUND HIGH DIVIDEND (IN
THE CURRENCY OF THE SUB-FUND)
1st half of year YearPurchases 338.297.914,55 338.297.914,55 Sales 344.296.620,34 344.296.620,34 Total 1 682.594.534,89 682.594.534,89 Subscriptions 325.042.149,86 325.042.149,86 Redemptions 328.204.712,50 328.204.712,50 Total 2 653.246.862,36 653.246.862,36 Monthly average of total assets
359.499.154,46 359.499.154,46
Turnover rate 8,16 % 8,16 %
1st half of year YearPurchases 338.297.914,55 338.297.914,55 Sales 344.296.620,34 344.296.620,34 Total 1 682.594.534,89 682.594.534,89 Subscriptions 325.042.149,86 325.042.149,86 Redemptions 328.204.712,50 328.204.712,50 Total 2 653.246.862,36 653.246.862,36 Monthly average of total assets
244.055.488,83 244.055.488,83
Corrected turnover rate 12,02 % 12,02 %
The table above shows the capital volume of portfolio transactions. This volume (adjusted to take account of total subscriptions and redemptions) is also compared to the average net assets at the beginning and end of the period. A figure close to 0% implies that the transactions relating to the securities or transactions relating to the assets (excluding deposits and cash) in a given period only involve subscriptions and redemptions. A negative percentage shows that subscriptions and redemptions entailed few, if any, transactions in the portfolio. Active asset management may result in high turnover rates (monthly percentage >50%). The detailed list of transactions is available for consultation free of charge at the registered office of the Bevek or fund at Havenlaan 2, 1080 Brussels.

2.4.3 AMOUNT OF COMMITMENTS IN RESPECT OF FINANCIAL DERIVATIVES POSITIONS
NAME Currency Value in currency
In the currency of the sub-fund
Lot-size
Transactiondate
KBC COLLATERAL EUR
EUR 33.135.087,11 33.135.087,11 N/A 28.06.2013
2.4.4 CHANGES OF THE NUMBER OF SUBSCRIPTIONS AND REDEMPTIONS AND THE NET ASSET
VALUE
Classic Shares
Period Change in number of shares in circulation
Year Subscriptions Redemptions End of period
Cap. Dis. Cap. Dis. Cap. Dis. Total
2011 - 06 401.989,80 21.053,65 397.539,58 22.953,63 253.617,15 46.910,38 300.527,53
2012 - 06 143.331,70 2.803,05 357.706,17 8.151,55 39.242,67 41.561,88 80.804,55
2013 - 06 49.302,20 27.410,03 17.824,92 27.262,73 70.719,95 41.709,18 112.429,13
Period Amounts received and paid by the UCI
(in the currency of the class)
Year Subscriptions Redemptions
Capitalization Distribution Capitalization Distribution
2011 - 06 291.976.077,30 12.251.146,65 291.321.179,90 14.017.011,69
2012 - 06 102.020.920,30 1.736.888,94 249.288.906,00 4.933.941,28
2013 - 06 45.102.859,60 19.425.081,37 16.151.926,00 18.336.374,98
Period Net asset value
End of period (in the currency of the class)
Year Of the class Of one share
Capitalization Distribution
2011 - 06 217.486.752,95 746,83 598,56
2012 - 06 58.846.663,98 818,05 643,48
2013 - 06 98.228.403,86 954,75 736,25
Institutional B Shares
Period Change in number of shares in circulation
Year Subscriptions Redemptions End of period
Cap. Dis. Cap. Dis. Cap. Dis. Total 2012 - 06 399.802,00 262.893,00 136.909,00 136.909,00
2013 - 06 623.189,13 492.676,27 267.421,87 267.421,87
Period Amounts received and paid by the UCI
(in the currency of the class)
Year Subscriptions Redemptions
Capitalization Distribution Capitalization Distribution
2012 - 06 308.504.959,10 210.059.199,00
2013 - 06 563.211.820,60 444.083.668,20
Period Net asset value
End of period (in the currency of the class)

Year Of the class Of one share
Capitalization Distribution
2012 - 06 112.016.485,70 818,18
2013 - 06 255.456.540,20 955,26
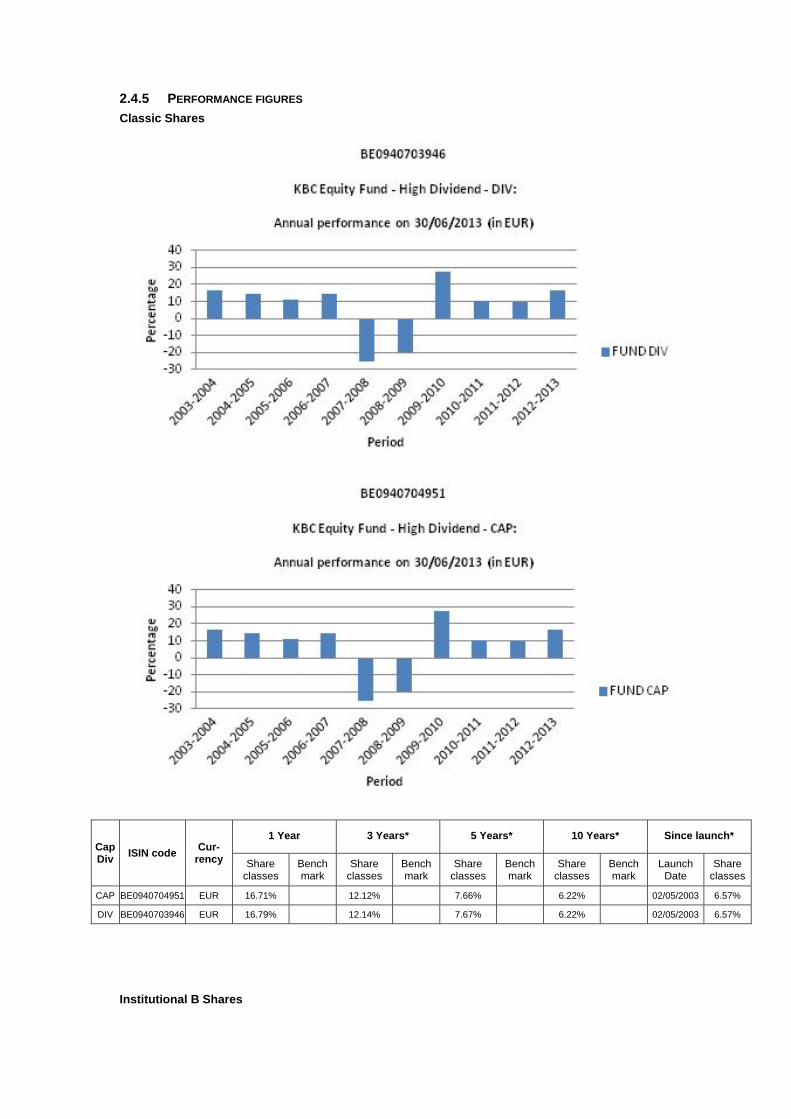
2.4.5 PERFORMANCE FIGURES
Classic Shares
Cap Div
ISIN code Cur-
rency
1 Year 3 Years* 5 Years* 10 Years* Since launch*
Share classes
Bench mark
Share classes
Bench mark
Share classes
Bench mark
Share classes
Bench mark
Launch Date
Share classes
CAP BE0940704951 EUR 16.71% 12.12% 7.66% 6.22% 02/05/2003 6.57%
DIV BE0940703946 EUR 16.79% 12.14% 7.67% 6.22% 02/05/2003 6.57%
Institutional B Shares

Cap Div
ISIN code Cur-
rency
1 Year 3 Years* 5 Years* 10 Years* Since launch*
Share classes
Bench mark
Share classes
Bench mark
Share classes
Bench mark
Share classes
Bench mark
Launch Date
Share classes
CAP BE6228914592 EUR 16.75% 25/11/2011 22.96%
Risk warning: Past performance is not a guide to future performance. * Return on annual basis.
Classic Shares The bar chart shows the performance for full financial years. The figures do not take account of any restructuring. Calculated in EUR. The return is calculated as the change in the net asset value between two dates expressed
as a percentage. In the case of units that pay dividends, the dividend is incorporated geometrically in the return.
Calculation method for date D, where NAV stands for net asset value: Capitalisation units (CAP) Return on date D over a period of X years:
[NIW(D) / NIW(Y)] ^ [1 / X] - 1 where Y = D-X
Return on date D since the start date S of the unit: [NIW(D) / NIW(S)] ^ [1 / F] - 1 where F = 1 if the unit has existed for less than one year on date D where F = (D-S) / 365.25 if the unit has existed for longer than one year on date D
Distribution units (DIV) Return on date D over a period of X years:
[ C * NIW(D) / NIW(Y)] ^ [1 / X] - 1 where Y = D-X
Return on date D since the start date S of the unit: [ C * NIW(D) / NIW(S)] ^ [1 / F] - 1 where F = 1 if the unit has existed for less than one year on date D where F = (D-S) / 365.25 if the unit has existed for longer than one year on date D where C is a factor that is determined for all N dividends between the calculation date D and the reference date.
For dividend i on date Di with value Wi: Ci = [Wi / NIW(Di)] + 1 i = 1 ... N

from whichC = C0 * .... * CN. If the interval between the two dates exceeds one year, the ordinary return calculation is
converted into a return on an annual basis by taking the nth square root of 1 plus the total return of the unit.
The return figures shown above do not take account of the fees and charges associated with the issue and redemption of units.
These are the performance figures for capitalisation and distribution shares.
Institutional B Shares The bar chart shows the performance for full financial years. The figures do not take account of any restructuring. Calculated in EUR. The return is calculated as the change in the net asset value between two dates expressed
as a percentage. Calculation method for date D, where NAV stands for net asset value:
Capitalisation units (CAP) Return on date D over a period of X years:
[NIW(D) / NIW(Y)] ^ [1 / X] - 1 where Y = D-X
Return on date D since the start date S of the unit: [NIW(D) / NIW(S)] ^ [1 / F] - 1 where F = 1 if the unit has existed for less than one year on date D where F = (D-S) / 365.25 if the unit has existed for longer than one year on date D
If the interval between the two dates exceeds one year, the ordinary return calculation is converted into a return on an annual basis by taking the nth square root of 1 plus the total return of the unit.
The return figures shown above do not take account of the fees and charges associated with the issue and redemption of units.
These are the performance figures for capitalization shares.
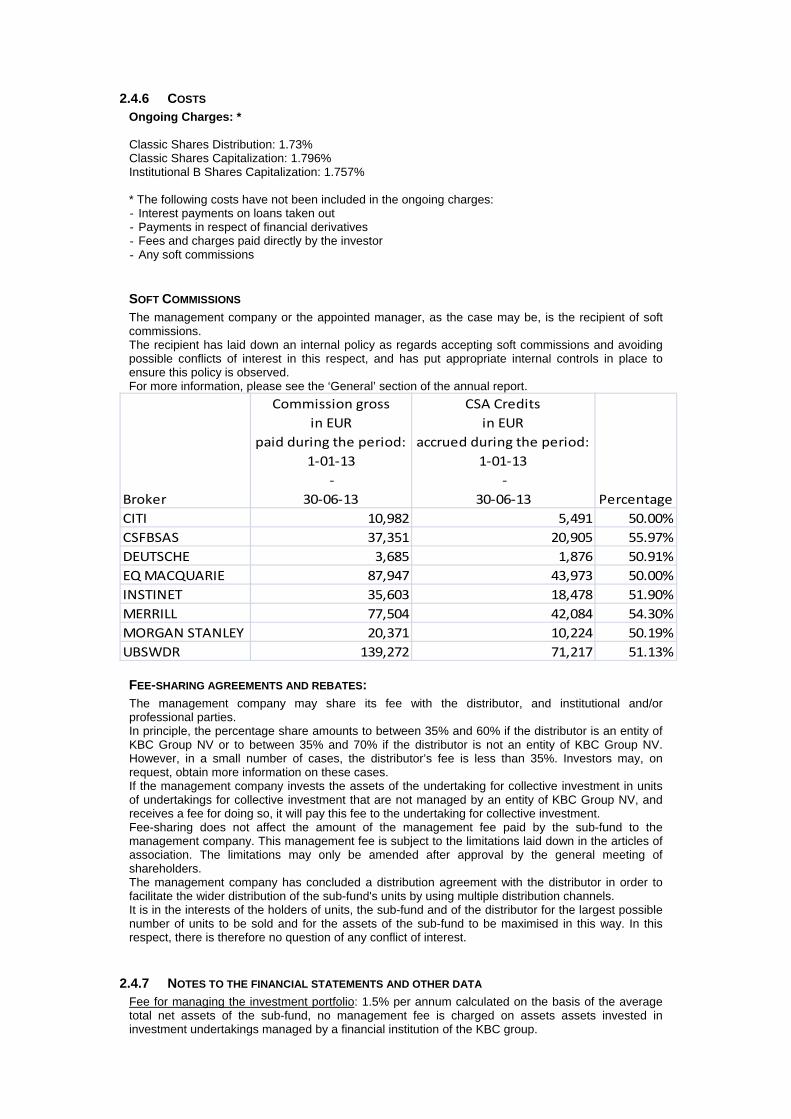
2.4.6 COSTS Ongoing Charges: * Classic Shares Distribution: 1.73% Classic Shares Capitalization: 1.796% Institutional B Shares Capitalization: 1.757% * The following costs have not been included in the ongoing charges: - Interest payments on loans taken out - Payments in respect of financial derivatives - Fees and charges paid directly by the investor - Any soft commissions
SOFT COMMISSIONS The management company or the appointed manager, as the case may be, is the recipient of soft commissions. The recipient has laid down an internal policy as regards accepting soft commissions and avoiding possible conflicts of interest in this respect, and has put appropriate internal controls in place to ensure this policy is observed. For more information, please see the ‘General’ section of the annual report.
Broker
Commission gross
in EUR
paid during the period:
1‐01‐13
‐
30‐06‐13
CSA Credits
in EUR
accrued during the period:
1‐01‐13
‐
30‐06‐13 Percentage
CITI 10,982 5,491 50.00%
CSFBSAS 37,351 20,905 55.97%
DEUTSCHE 3,685 1,876 50.91%
EQ MACQUARIE 87,947 43,973 50.00%
INSTINET 35,603 18,478 51.90%
MERRILL 77,504 42,084 54.30%
MORGAN STANLEY 20,371 10,224 50.19%
UBSWDR 139,272 71,217 51.13%
FEE-SHARING AGREEMENTS AND REBATES: The management company may share its fee with the distributor, and institutional and/or professional parties. In principle, the percentage share amounts to between 35% and 60% if the distributor is an entity of KBC Group NV or to between 35% and 70% if the distributor is not an entity of KBC Group NV. However, in a small number of cases, the distributor’s fee is less than 35%. Investors may, on request, obtain more information on these cases. If the management company invests the assets of the undertaking for collective investment in units of undertakings for collective investment that are not managed by an entity of KBC Group NV, and receives a fee for doing so, it will pay this fee to the undertaking for collective investment. Fee-sharing does not affect the amount of the management fee paid by the sub-fund to the management company. This management fee is subject to the limitations laid down in the articles of association. The limitations may only be amended after approval by the general meeting of shareholders. The management company has concluded a distribution agreement with the distributor in order to facilitate the wider distribution of the sub-fund's units by using multiple distribution channels. It is in the interests of the holders of units, the sub-fund and of the distributor for the largest possible number of units to be sold and for the assets of the sub-fund to be maximised in this way. In this respect, there is therefore no question of any conflict of interest.
2.4.7 NOTES TO THE FINANCIAL STATEMENTS AND OTHER DATA Fee for managing the investment portfolio: 1.5% per annum calculated on the basis of the average total net assets of the sub-fund, no management fee is charged on assets assets invested in investment undertakings managed by a financial institution of the KBC group.
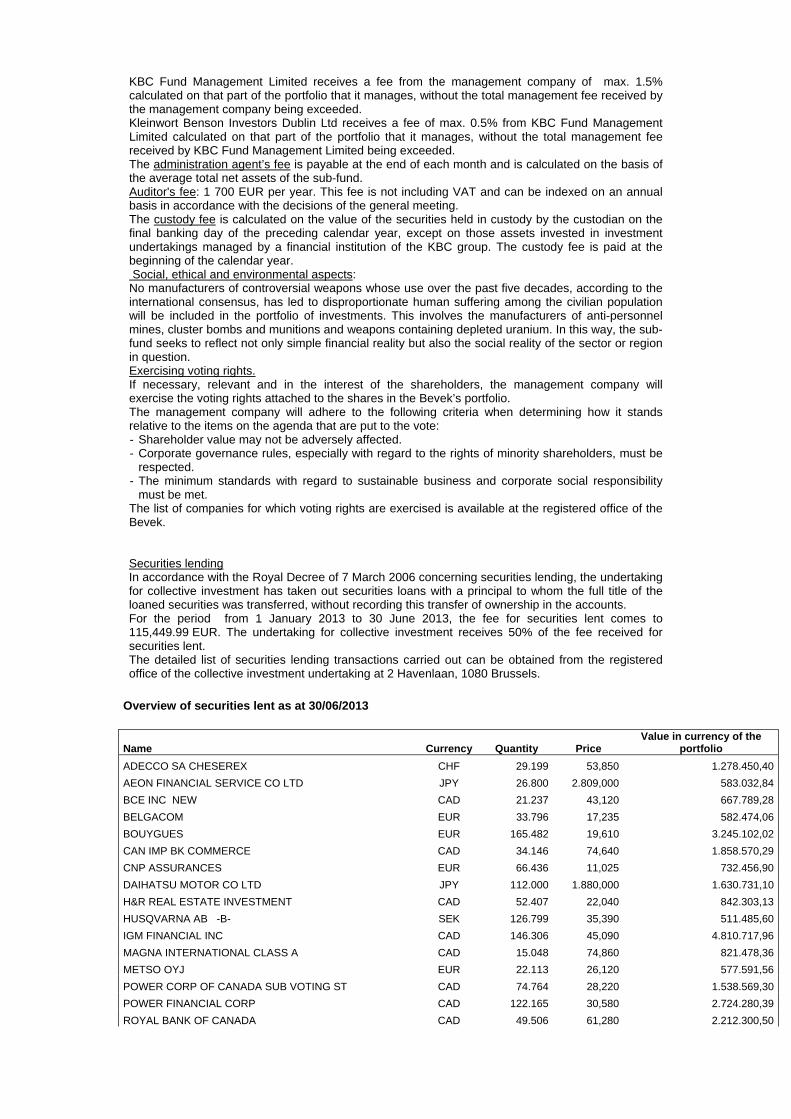
KBC Fund Management Limited receives a fee from the management company of max. 1.5% calculated on that part of the portfolio that it manages, without the total management fee received by the management company being exceeded. Kleinwort Benson Investors Dublin Ltd receives a fee of max. 0.5% from KBC Fund Management Limited calculated on that part of the portfolio that it manages, without the total management fee received by KBC Fund Management Limited being exceeded. The administration agent’s fee is payable at the end of each month and is calculated on the basis of the average total net assets of the sub-fund. Auditor's fee: 1 700 EUR per year. This fee is not including VAT and can be indexed on an annual basis in accordance with the decisions of the general meeting. The custody fee is calculated on the value of the securities held in custody by the custodian on the final banking day of the preceding calendar year, except on those assets invested in investment undertakings managed by a financial institution of the KBC group. The custody fee is paid at the beginning of the calendar year. Social, ethical and environmental aspects: No manufacturers of controversial weapons whose use over the past five decades, according to the international consensus, has led to disproportionate human suffering among the civilian population will be included in the portfolio of investments. This involves the manufacturers of anti-personnel mines, cluster bombs and munitions and weapons containing depleted uranium. In this way, the sub-fund seeks to reflect not only simple financial reality but also the social reality of the sector or region in question. Exercising voting rights. If necessary, relevant and in the interest of the shareholders, the management company will exercise the voting rights attached to the shares in the Bevek’s portfolio. The management company will adhere to the following criteria when determining how it stands relative to the items on the agenda that are put to the vote: - Shareholder value may not be adversely affected. - Corporate governance rules, especially with regard to the rights of minority shareholders, must be
respected. - The minimum standards with regard to sustainable business and corporate social responsibility
must be met. The list of companies for which voting rights are exercised is available at the registered office of the Bevek. Securities lending In accordance with the Royal Decree of 7 March 2006 concerning securities lending, the undertaking for collective investment has taken out securities loans with a principal to whom the full title of the loaned securities was transferred, without recording this transfer of ownership in the accounts. For the period from 1 January 2013 to 30 June 2013, the fee for securities lent comes to 115,449.99 EUR. The undertaking for collective investment receives 50% of the fee received for securities lent. The detailed list of securities lending transactions carried out can be obtained from the registered office of the collective investment undertaking at 2 Havenlaan, 1080 Brussels.
Overview of securities lent as at 30/06/2013
Name Currency Quantity Price Value in currency of the
portfolio
ADECCO SA CHESEREX CHF 29.199 53,850 1.278.450,40
AEON FINANCIAL SERVICE CO LTD JPY 26.800 2.809,000 583.032,84
BCE INC NEW CAD 21.237 43,120 667.789,28
BELGACOM EUR 33.796 17,235 582.474,06
BOUYGUES EUR 165.482 19,610 3.245.102,02
CAN IMP BK COMMERCE CAD 34.146 74,640 1.858.570,29
CNP ASSURANCES EUR 66.436 11,025 732.456,90
DAIHATSU MOTOR CO LTD JPY 112.000 1.880,000 1.630.731,10
H&R REAL ESTATE INVESTMENT CAD 52.407 22,040 842.303,13
HUSQVARNA AB -B- SEK 126.799 35,390 511.485,60
IGM FINANCIAL INC CAD 146.306 45,090 4.810.717,96
MAGNA INTERNATIONAL CLASS A CAD 15.048 74,860 821.478,36
METSO OYJ EUR 22.113 26,120 577.591,56
POWER CORP OF CANADA SUB VOTING ST CAD 74.764 28,220 1.538.569,30
POWER FINANCIAL CORP CAD 122.165 30,580 2.724.280,39
ROYAL BANK OF CANADA CAD 49.506 61,280 2.212.300,50
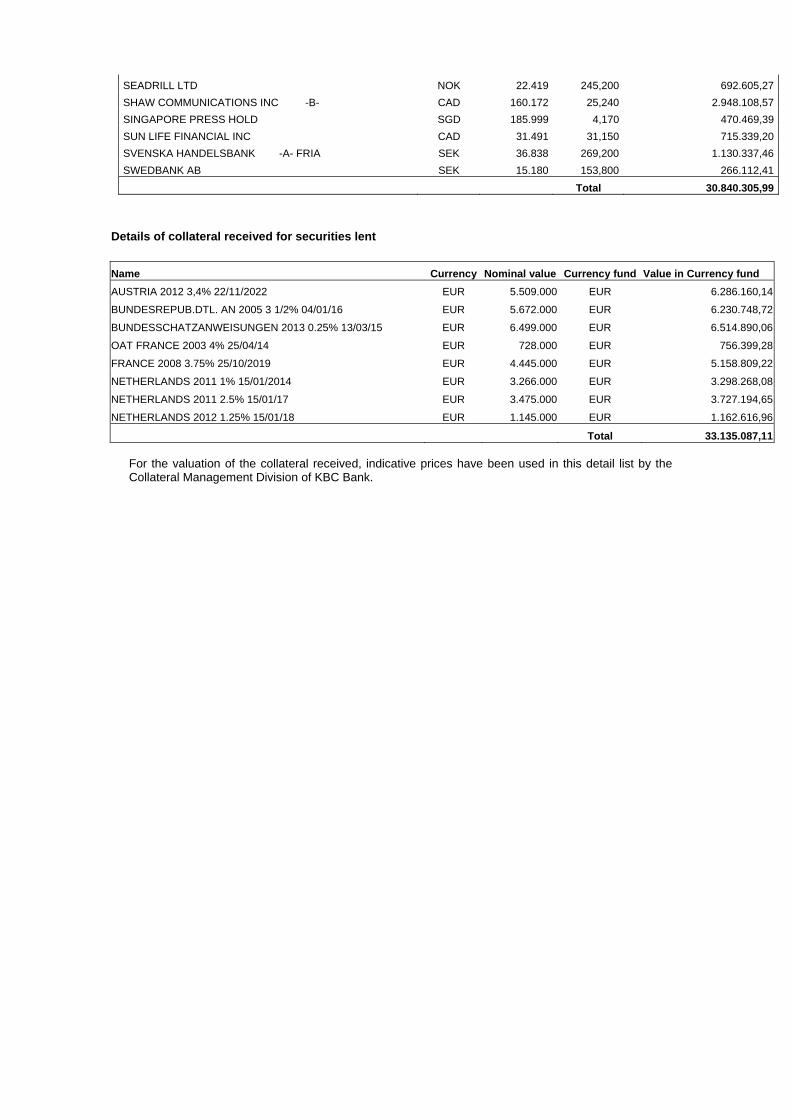
SEADRILL LTD NOK 22.419 245,200 692.605,27
SHAW COMMUNICATIONS INC -B- CAD 160.172 25,240 2.948.108,57
SINGAPORE PRESS HOLD SGD 185.999 4,170 470.469,39
SUN LIFE FINANCIAL INC CAD 31.491 31,150 715.339,20
SVENSKA HANDELSBANK -A- FRIA SEK 36.838 269,200 1.130.337,46
SWEDBANK AB SEK 15.180 153,800 266.112,41
Total 30.840.305,99
Details of collateral received for securities lent
Name Currency Nominal value Currency fund Value in Currency fund
AUSTRIA 2012 3,4% 22/11/2022 EUR 5.509.000 EUR 6.286.160,14
BUNDESREPUB.DTL. AN 2005 3 1/2% 04/01/16 EUR 5.672.000 EUR 6.230.748,72
BUNDESSCHATZANWEISUNGEN 2013 0.25% 13/03/15 EUR 6.499.000 EUR 6.514.890,06
OAT FRANCE 2003 4% 25/04/14 EUR 728.000 EUR 756.399,28
FRANCE 2008 3.75% 25/10/2019 EUR 4.445.000 EUR 5.158.809,22
NETHERLANDS 2011 1% 15/01/2014 EUR 3.266.000 EUR 3.298.268,08
NETHERLANDS 2011 2.5% 15/01/17 EUR 3.475.000 EUR 3.727.194,65
NETHERLANDS 2012 1.25% 15/01/18 EUR 1.145.000 EUR 1.162.616,96
Total 33.135.087,11 For the valuation of the collateral received, indicative prices have been used in this detail list by the Collateral Management Division of KBC Bank.

Semi-Annual report as at 30th June 2013
TABLE OF CONTENTS
2. Information on KBC Equity Fund Pacific
2.1. Management report 2.1.1. Launch date and subscription price 2.1.2. Stock exchange listing 2.1.3. Aim and distinctive features of the investment policy 2.1.4. Financial portfolio management 2.1.5. Distributors 2.1.6. Index and benchmark 2.1.7. Policy conducted during the financial year 2.1.8. Future policy 2.1.9. Synthetic risk and reward indicator (SRRI)
2.2. Balance sheet
2.3. Profit and loss account
2.4. Composition of the assets and key figures
2.4.1. Composition of the assets 2.4.2. Change in the composition of the assets 2.4.3. Value of commitments in respect of financial derivatives positions 2.4.4. Evolution of the number of subscriptions, repayments and the net asset value 2.4.5. Return figures 2.4.6. Expenses 2.4.7. Notes to the financial statements and other data


2 INFORMATION ON KBC EQUITY FUND PACIFIC
2.1 MANAGEMENT REPORT
2.1.1 LAUNCH DATE AND SUBSCRIPTION PRICE Classic Shares : Launch date: 3 March 2006 Initial subscription price: 500 EUR Currency: EUR Institutional B Shares : Launch date: 24 November 2011 Initial subscription price: 309.11 EUR Currency: EUR
2.1.2 STOCK EXCHANGE LISTING Not applicable.
2.1.3 GOAL AND KEY PRINCIPLES OF THE INVESTMENT POLICY
SUB-FUND’S OBJECT: The main objective of this sub-fund is to generate the highest possible return for its shareholders by investing directly or indirectly in transferable securities. This is reflected in its pursuit of capital gains and income. To this end, the assets are invested, either directly or indirectly via correlated financial instruments, primarily in shares.
SUB-FUND’S INVESTMENT POLICY:
PERMITTED ASSET CLASSES: The sub-fund may invest in securities, money market instruments, units in undertakings for collective investment, deposits, financial derivatives, liquid assets and all other instruments insofar as permitted by the applicable laws and regulations and consistent with the sub-fund’s object The sub-fund shall invest no more than 10% of its assets in units of other undertakings for collective investment.
RESTRICTIONS OF THE INVESTMENT POLICY: The investment policy will be implemented within the limits set by law and regulations. The sub-fund may borrow up to 10% of its net assets, insofar as these are short-term borrowings aimed at solving temporary liquidity problems.
PERMITTED DERIVATIVES TRANSACTIONS: Derivates may be used either for hedging purposes or to achieve investment objectives. Changes will be made to the investments at regular intervals to comply with the sub-fund's investment strategy. In addition, listed and unlisted derivates may be used to achieve the objectives: these may be forward contracts, options or swaps on securities, indices, currencies or interest rates or other transactions involving derivatives. Unlisted derivatives transactions will only be concluded with prime financial institutions specialised in such transactions. Such derivatives may also be used to hedge the assets against exchange-rate fluctuations. Subject to the applicable laws and regulations and the articles of association, the sub-fund always seeks to conclude the most effective transactions. All costs associated with the transactions will be charged to the sub-fund and all income generated will be paid to the sub-fund. If the transactions result in a risk in respect of the counterparty, this risk can be hedged by using a margin management system that ensures that the sub-fund is the beneficiary of security (collateral) in the form of cash or investment grade bonds. When calculating the value of the bonds, a margin will be applied that varies depending on the residual term to maturity and the currency in which the bond in question is denominated. The relationship with the counterparty or counterparties is governed by standard international agreements.
STRATEGY SELECTED At least 75% of the assets are invested in shares of companies in the Pacific region.
RISK CONCENTRATION Shares from the Pacific region.
LENDING FINANCIAL INSTRUMENTS: The sub-fund may lend financial instruments within the limits set by law and regulations. This lending does not affect the sub-fund’s risk profile since: - it takes place within the framework of a securities lending system managed by a principal. In
addition, the sub-fund has a relationship only with the principal of the securities lending system which acts as counterparty and to which title of the loaned securities is transferred. The choice of principal is subject to strict selection criteria. The return of securities similar to the securities that have been lent is guaranteed by the principal.
- through a margin management system, the sub-fund is always guaranteed financial security, the actual value of which always exceeds the actual value of the securities that have been lent, in case the principal does not return similar securities.
The return of securities similar to the securities that have been lent can be requested at any time, which means that the lending of securities does not affect the management of the sub-fund's assets. By lending securities, the sub-fund can generate an additional return. The principal pays a fee to the management company. After deducting the fee for the margin management and clearing services of KBC Bank, most of this fee is paid to the sub-fund. The relationship with the counterparty or counterparties is governed by standard international agreements. More information is provided on the terms and conditions governing securities lending in the annual or half-yearly report for the sub-fund.
VOLATILITY OF THE NET ASSET VALUE: The volatility of the net asset value may be high due to the composition of the portfolio.
GENERAL STRATEGY FOR HEDGING THE EXCHANGE RATE RISK: In order to protect its assets against exchange rate fluctuations and within the limitations laid down in the articles of association, the sub-fund may perform transactions relating to the sale of forward currency contracts, as well as the sale of call options and the purchase of put options on currencies. The transactions in question may relate solely to contracts traded on a regulated market that operates regularly, is recognised and is open to the public or that are traded with a recognised, prime financial institution specialising in such transactions and dealing in the over-the-counter (OTC) market in options. With the same objective, the sub-fund may also sell currencies forward or exchange them in private transactions with prime financial institutions specialising in such transactions. The hedging objective of the aforementioned transactions suggests that there is a direct link between these transactions and the assets to be hedged, which implies that the transactions carried out in a particular currency may in principle not exceed, in terms of volume, either the valuation value of all the assets in the same currency or the holding period of those assets.
SOCIAL, ETHICAL AND ENVIRONMENTAL ASPECTS:
No manufacturers of controversial weapons whose use over the past five decades, according to the international consensus, has led to disproportionate human suffering among the civilian population will be included in the portfolio of investments. This involves the manufacturers of anti-personnel mines, cluster bombs and munitions and weapons containing depleted uranium. In this way, the sub-fund seeks to reflect not only simple financial reality but also the social reality of the sector or region in question.
THE EUROPEAN SAVINGS DIRECTIVE AND TAX ON DEBT CLAIM RETURNS OBTAINED THROUGH THE
REDEMPTION OF OWN UNITS OR IN THE EVENT OF FULL OR PARTIAL DISTRIBUTION OF EQUITY
CAPITAL. The following information is of a general character and is not intended to cover all aspects of an investment in a UCITS. In certain cases entirely different rules might even apply. Moreover, both tax
law and the interpretation of it can change. Investors who wish to have more information about the tax implications – in both Belgium and abroad – of acquiring, holding and transferring units should seek the advice of their usual financial and tax advisers. This UCITS shall invest a maximum of 15% of its assets directly or indirectly in debt instruments as intended by the European Savings Directive. A. European Savings Directive (Directive 2003/48/EC) The European Savings Directive has been implemented in Belgium. Since this UCITS invests a maximum of 15% of its assets directly or indirectly in debt claims as intended by the European Savings Directive, the income of this UCITS does not fall within the scope of this directive. B. Tax on debt claim returns obtained through the redemption of own units or in the event of full or partial distribution of equity capital (Article 19bis Income Tax Code 1992). The income from this UCITS is not subject to the tax on debt instrument returns as intended by Article 19bis, Income Tax Code 1992.
2.1.4 FINANCIAL PORTFOLIO MANAGEMENT The management company has delegated the intellectual management, to KBC Fund Management Limited, Joshua Dawson House, Dawson Street , Dublin 2, IRELAND..
2.1.5 DISTRIBUTORS KBC Asset Management S.A., 5, Place de la Gare, L-1616 Luxembourg.
2.1.6 INDEX AND BENCHMARK See ‘Sub-fund’s investment policy’.

2.1.7 POLICY PERSUED DURING THE FINANCIAL YEAR KBC Equity Fund Pacific invests in a diverse selection of Pacific companies. The Pacific region comprises of Japan (60%), Australia (26%), Hong Kong (9%), Singapore (5%) and New Zealand. Diverse selection of Japanese companies is constructed using proprietary quantitative model while Pacific-ex-Japan part of the portfolio is managed passively. The fund increased in value in 2013 and outperformed its MSCI Pacific benchmark in the euro terms. The winds of change have been blowing through Tokyo since before the advent of the Abe government in December. The prospects of large-scale reforms have contributed to an atmosphere of optimism about the economy, something very rare in this country, which has been struggling with defeatism for many years. Japan was ultimately an outperformer (+18% in euros, 34% in local currency), despite the steep depreciation of the yen, beating global equities by 6 ppt. Japanese equities continued the rally which started in November 2012 on the premise that an incoming government will be able to break a political and economic deadlock. Until the end of May, Japanese equities were in a strong bull market, recording positive returns almost on a daily basis. Among the main drivers for the rally were the expectations for a proactive fiscal policy, large-scale money creation, weaker yen and a strong public support for the prime minster and his agenda of structural reforms that would open up a competition in the Japanese economy. Investors hoped that the so called four arrows of Abenomics, named after Japanese prime minister Shinzo Abe, would finally be able to break a deflationary spiral, change public sentiment towards economy, revive ‘animal spirits’ among entrepreneurs who would experience benefits of cheaper local currency in a export-oriented economy and cause local investors to rebalance their conservatively-managed savings towards more risky assets. The rally came to a sudden end on the 23rd of May when Japanese equities plunged 7% on one day. The trigger for the decline was an abrupt increase in interest rates in Japanese fixed income market which took place on the back of change in the US monetary policy and of rising expectation the Japanese Central Bank will indeed be successful at fighting deflation. All Japanese stocks were affected, but companies sensitive to interest rate changes even more so. On the brighter side however, macro data started to confirm that the measures taken by the Abe government, began to pay off, with GDP and consumption showing early signs of recovery. Corporate earnings already started to increase in the previous months on the back of weaker yen and investors are optimistic that this trend will prevail in the near future. The rise of the yen – a notable feature in recent years – was finally halted. The Japanese government’s policy of talking down the currency bore fruit. At the end of June 2013 the yen was already 12.5% lower against the USD than at 2012 year-end, when the Abe government came to power – a state of affairs not particularly welcomed by other Asian countries and regarded rather as a looming currency war. Australian stock prices moved in line with global equities, as measured by MSCI World index in the euro terms, in the first four months of 2013. The last two month were much less benign down-under and Aussie stocks participated in a broad market sell-off that followed Ben Bernanke’s comments on a gradual end to the Quantitative Easing program. Weakness in the local currency, and the growing perception that Aussie dollar has further to fall, seemingly have been a catalyst for foreign selling out of the local equity market. Commodity prices, driven down by a slowdown in global economy, disappointed in the first half of the 2013. On the equity side, the worst performing sectors globally included Materials, Technology and Energy. The Resources/Mining sector, a big player on Austrailia’s corporate scene, could not be left unaffected and was a clear laggard. Slowdown in Chinese economy did not help either. Australia is often seen as a second derivative of China growth due to the commodity link, so any negative news coming out of China is likely to have a big impact on local economy. The debit balance on current accounts held at KBC Bank came to more than -10% (-27.30%) of the assets. The situation has been rectified in the interests of the investors.
2.1.8 FUTURE POLICY Today’s world is one of two-speed economies. The mature industrialised economies (US, Europe, Japan) still find themselves in a low-growth environment, with no underlying inflationary pressure, persistently low interest rates and runaway public finances. The picture in the emerging markets is altogether different. The strong economic growth has already created inflationary pressure in Asia. Appropriate monetary policy is therefore required. Monetary policy in China and elsewhere in Asia is highly geared to preventing asset-price inflation. Countries are not only deploying the interest-rate weapon to this end, they are also actively intervening in the credit and housing markets. Thanks to the continuing strength of the emerging markets, the global economy could post growth of 2.5–3% in 2013 and 2014. This is one of the reasons why corporate earnings could continue to grow in the coming quarters at a rate of 5–10%. The current valuation of equities continues to discount a number of very pessimistic scenarios. Based on forecast earnings for the coming 12 months, the price-earnings ratio is 14.5 for the US S&P 500 index and 11.4 for the MSCI Europe. That is 25–30% lower than the historical average. Equities are certainly dirt-cheap compared with bonds.
The performance of Pacific region is to a large extend reliant on Japanese equities which depend heavily on Abenomics. Will four arrows of economic reforms be implemented? Will reforms be passed in their current form or will they be watered down because of political pressures and particular interests? Last but not least, will reforms prove successful in reviving Japanese economy in the end? The jury is still out on these questions and economists have different and sometimes very conflicting views on that matter. It seems that only time will tell. However, if there was a case for Japanese equities back in May, there is still one now after a 20% correction in stock prices and company valuations back at more reasonable levels. It seems that investors have to brace themselves for one thing: volatility. In an environment that depends so much on hopes for the future, outcome of political negotiations and public support, sudden changes in investors’ sentiment may have a material impact on stock prices.
2.1.9 SYNTHETIC RISK AND REWARD INDICATOR Classic Shares: 6 on a scale of 1 (lowest risk) to 7 (highest risk). Institutional B Shares: 6 on a scale of 1 (lowest risk) to 7 (highest risk). The value of a share can decrease or increase and the investor may not get back the amount invested. In accordance with Commission Regulation (EU) No. 583/2010, a synthetic risk and reward indicator has been calculated. This indicator provides a quantitative measure of the sub-fund's potential return and the risk involved, calculated in the currency in which the sub-fund is denominated. It is given as a figure between 1 and 7. The higher the figure, the greater the potential return, but also the more difficult it is to predict this return. Losses are possible too. The lowest figure does not mean that the investment is entirely free of risk. However, it does indicate that, compared with the higher figures, this product will generally provide a lower, but more predictable return. The synthetic risk and reward indicator is assessed regularly and can therefore go up or down based on data from the past. Data from the past is not always a reliable indicator of future risk and return.
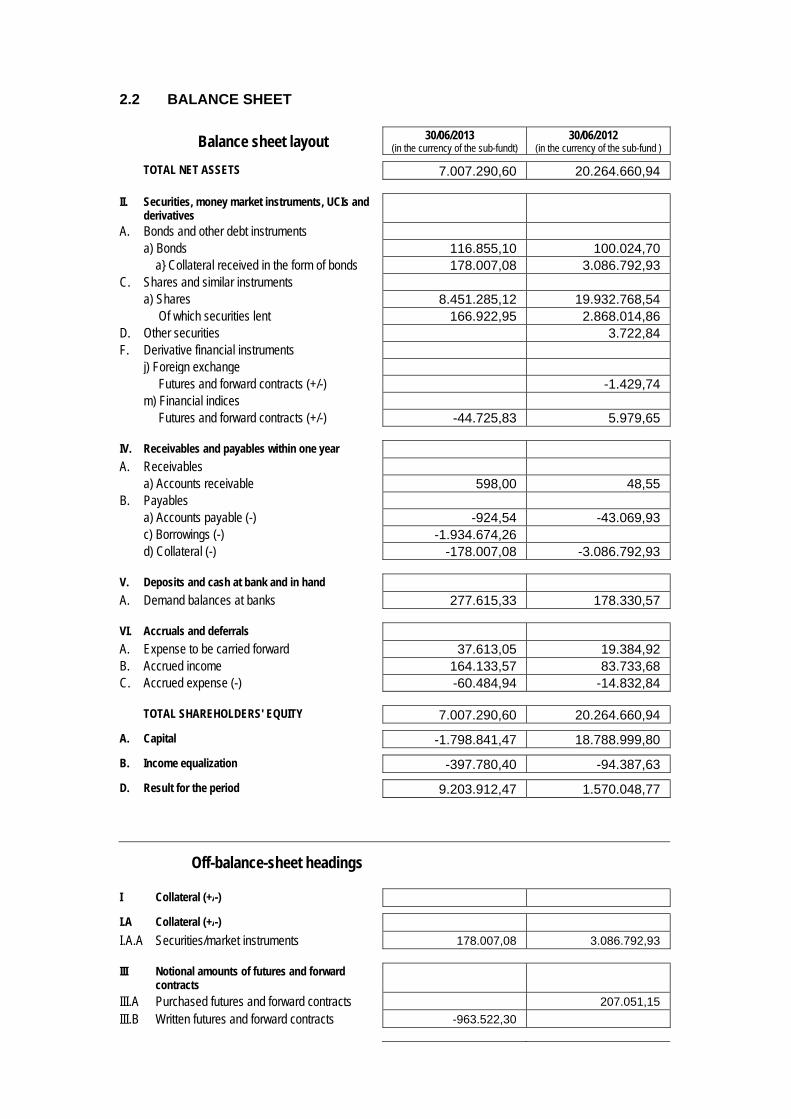
2.2 BALANCE SHEET
Balance sheet layout 30/06/2013 (in the currency of the sub-fundt)
30/06/2012 (in the currency of the sub-fund )
TOTAL NET ASSETS 7.007.290,60 20.264.660,94
II. Securities, money market instruments, UCIs and derivatives
A. Bonds and other debt instruments a) Bonds 116.855,10 100.024,70 a} Collateral received in the form of bonds 178.007,08 3.086.792,93 C. Shares and similar instruments a) Shares 8.451.285,12 19.932.768,54 Of which securities lent 166.922,95 2.868.014,86 D. Other securities 3.722,84 F. Derivative financial instruments j) Foreign exchange Futures and forward contracts (+/-) -1.429,74 m) Financial indices Futures and forward contracts (+/-) -44.725,83 5.979,65
IV. Receivables and payables within one year A. Receivables a) Accounts receivable 598,00 48,55 B. Payables a) Accounts payable (-) -924,54 -43.069,93 c) Borrowings (-) -1.934.674,26 d) Collateral (-) -178.007,08 -3.086.792,93
V. Deposits and cash at bank and in hand A. Demand balances at banks 277.615,33 178.330,57
VI. Accruals and deferrals A. Expense to be carried forward 37.613,05 19.384,92 B. Accrued income 164.133,57 83.733,68 C. Accrued expense (-) -60.484,94 -14.832,84
TOTAL SHAREHOLDERS' EQUITY 7.007.290,60 20.264.660,94
A. Capital -1.798.841,47 18.788.999,80
B. Income equalization -397.780,40 -94.387,63
D. Result for the period 9.203.912,47 1.570.048,77
Off-balance-sheet headings
I Collateral (+/-)
I.A Collateral (+/-)
I.A.A Securities/market instruments 178.007,08 3.086.792,93
III Notional amounts of futures and forward contracts
III.A Purchased futures and forward contracts 207.051,15
III.B Written futures and forward contracts -963.522,30

IX Financial instruments lent 166.922,95 2.868.014,86
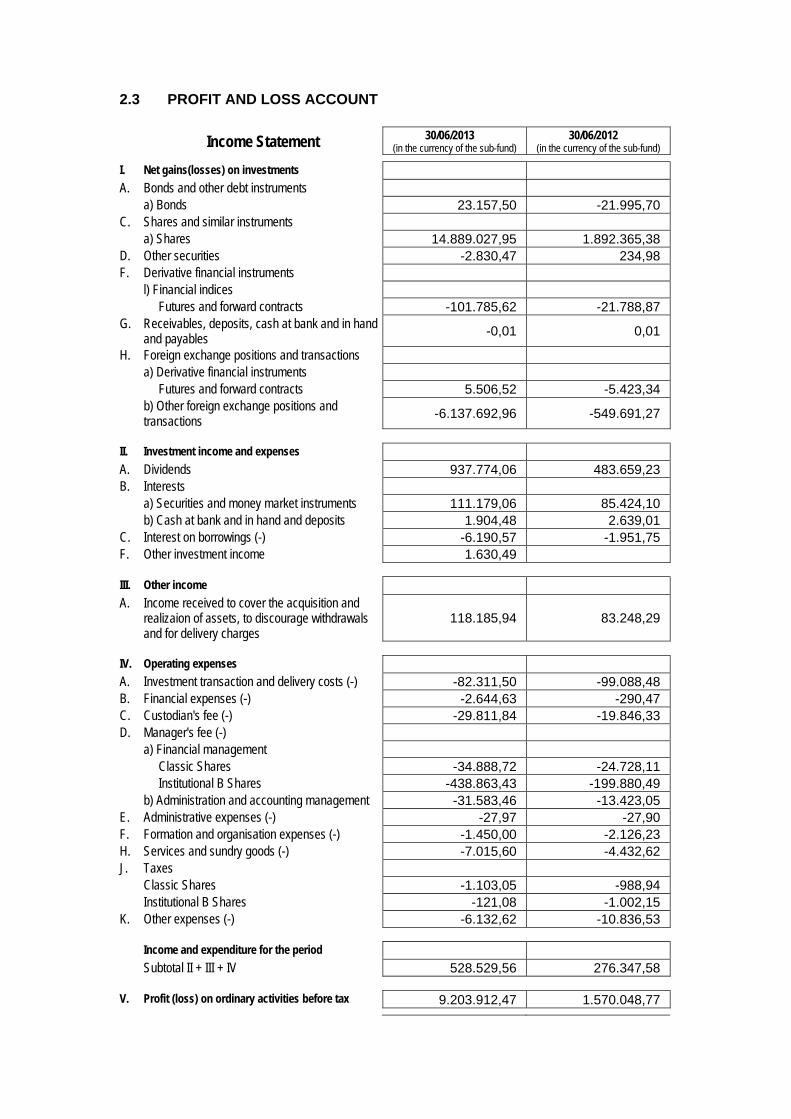
2.3 PROFIT AND LOSS ACCOUNT
Income Statement 30/06/2013 (in the currency of the sub-fund)
30/06/2012 (in the currency of the sub-fund)
I. Net gains(losses) on investments A. Bonds and other debt instruments a) Bonds 23.157,50 -21.995,70 C. Shares and similar instruments a) Shares 14.889.027,95 1.892.365,38 D. Other securities -2.830,47 234,98 F. Derivative financial instruments l) Financial indices Futures and forward contracts -101.785,62 -21.788,87 G. Receivables, deposits, cash at bank and in hand
and payables -0,01 0,01
H. Foreign exchange positions and transactions a) Derivative financial instruments Futures and forward contracts 5.506,52 -5.423,34 b) Other foreign exchange positions and
transactions -6.137.692,96 -549.691,27
II. Investment income and expenses A. Dividends 937.774,06 483.659,23 B. Interests a) Securities and money market instruments 111.179,06 85.424,10 b) Cash at bank and in hand and deposits 1.904,48 2.639,01 C. Interest on borrowings (-) -6.190,57 -1.951,75 F. Other investment income 1.630,49
III. Other income A. Income received to cover the acquisition and
realizaion of assets, to discourage withdrawals and for delivery charges
118.185,94 83.248,29
IV. Operating expenses A. Investment transaction and delivery costs (-) -82.311,50 -99.088,48 B. Financial expenses (-) -2.644,63 -290,47 C. Custodian's fee (-) -29.811,84 -19.846,33 D. Manager's fee (-) a) Financial management Classic Shares -34.888,72 -24.728,11 Institutional B Shares -438.863,43 -199.880,49 b) Administration and accounting management -31.583,46 -13.423,05 E. Administrative expenses (-) -27,97 -27,90 F. Formation and organisation expenses (-) -1.450,00 -2.126,23 H. Services and sundry goods (-) -7.015,60 -4.432,62 J. Taxes Classic Shares -1.103,05 -988,94 Institutional B Shares -121,08 -1.002,15 K. Other expenses (-) -6.132,62 -10.836,53
Income and expenditure for the period Subtotal II + III + IV 528.529,56 276.347,58
V. Profit (loss) on ordinary activities before tax 9.203.912,47 1.570.048,77

VII. Result for the period 9.203.912,47 1.570.048,77
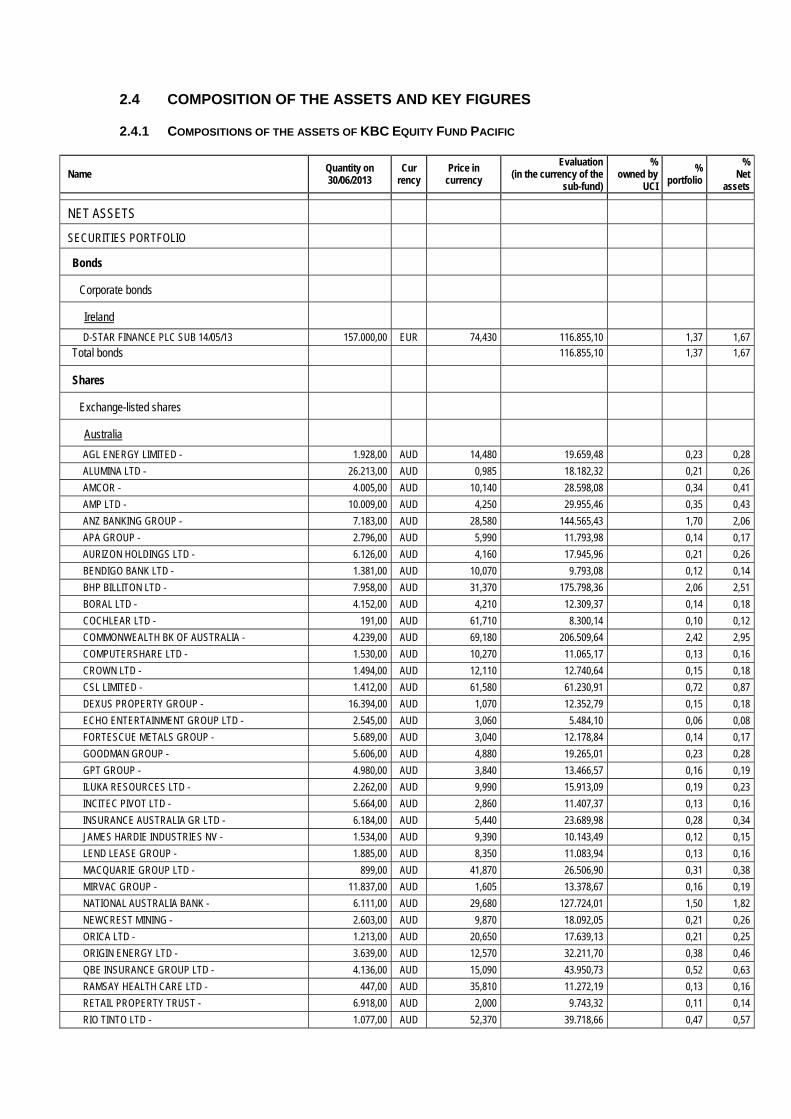
2.4 COMPOSITION OF THE ASSETS AND KEY FIGURES
2.4.1 COMPOSITIONS OF THE ASSETS OF KBC EQUITY FUND PACIFIC
Name Quantity on 30/06/2013
Cur rency
Price in currency
Evaluation (in the currency of the
sub-fund)
% owned by
UCI
% portfolio
% Net
assets
NET ASSETS
SECURITIES PORTFOLIO
Bonds
Corporate bonds
Ireland
D-STAR FINANCE PLC SUB 14/05/13 157.000,00 EUR 74,430 116.855,10 1,37 1,67
Total bonds 116.855,10 1,37 1,67
Shares
Exchange-listed shares
Australia
AGL ENERGY LIMITED - 1.928,00 AUD 14,480 19.659,48 0,23 0,28
ALUMINA LTD - 26.213,00 AUD 0,985 18.182,32 0,21 0,26
AMCOR - 4.005,00 AUD 10,140 28.598,08 0,34 0,41
AMP LTD - 10.009,00 AUD 4,250 29.955,46 0,35 0,43
ANZ BANKING GROUP - 7.183,00 AUD 28,580 144.565,43 1,70 2,06
APA GROUP - 2.796,00 AUD 5,990 11.793,98 0,14 0,17
AURIZON HOLDINGS LTD - 6.126,00 AUD 4,160 17.945,96 0,21 0,26
BENDIGO BANK LTD - 1.381,00 AUD 10,070 9.793,08 0,12 0,14
BHP BILLITON LTD - 7.958,00 AUD 31,370 175.798,36 2,06 2,51
BORAL LTD - 4.152,00 AUD 4,210 12.309,37 0,14 0,18
COCHLEAR LTD - 191,00 AUD 61,710 8.300,14 0,10 0,12
COMMONWEALTH BK OF AUSTRALIA - 4.239,00 AUD 69,180 206.509,64 2,42 2,95
COMPUTERSHARE LTD - 1.530,00 AUD 10,270 11.065,17 0,13 0,16
CROWN LTD - 1.494,00 AUD 12,110 12.740,64 0,15 0,18
CSL LIMITED - 1.412,00 AUD 61,580 61.230,91 0,72 0,87
DEXUS PROPERTY GROUP - 16.394,00 AUD 1,070 12.352,79 0,15 0,18
ECHO ENTERTAINMENT GROUP LTD - 2.545,00 AUD 3,060 5.484,10 0,06 0,08
FORTESCUE METALS GROUP - 5.689,00 AUD 3,040 12.178,84 0,14 0,17
GOODMAN GROUP - 5.606,00 AUD 4,880 19.265,01 0,23 0,28
GPT GROUP - 4.980,00 AUD 3,840 13.466,57 0,16 0,19
ILUKA RESOURCES LTD - 2.262,00 AUD 9,990 15.913,09 0,19 0,23
INCITEC PIVOT LTD - 5.664,00 AUD 2,860 11.407,37 0,13 0,16
INSURANCE AUSTRALIA GR LTD - 6.184,00 AUD 5,440 23.689,98 0,28 0,34
JAMES HARDIE INDUSTRIES NV - 1.534,00 AUD 9,390 10.143,49 0,12 0,15
LEND LEASE GROUP - 1.885,00 AUD 8,350 11.083,94 0,13 0,16
MACQUARIE GROUP LTD - 899,00 AUD 41,870 26.506,90 0,31 0,38
MIRVAC GROUP - 11.837,00 AUD 1,605 13.378,67 0,16 0,19
NATIONAL AUSTRALIA BANK - 6.111,00 AUD 29,680 127.724,01 1,50 1,82
NEWCREST MINING - 2.603,00 AUD 9,870 18.092,05 0,21 0,26
ORICA LTD - 1.213,00 AUD 20,650 17.639,13 0,21 0,25
ORIGIN ENERGY LTD - 3.639,00 AUD 12,570 32.211,70 0,38 0,46
QBE INSURANCE GROUP LTD - 4.136,00 AUD 15,090 43.950,73 0,52 0,63
RAMSAY HEALTH CARE LTD - 447,00 AUD 35,810 11.272,19 0,13 0,16
RETAIL PROPERTY TRUST - 6.918,00 AUD 2,000 9.743,32 0,11 0,14
RIO TINTO LTD - 1.077,00 AUD 52,370 39.718,66 0,47 0,57
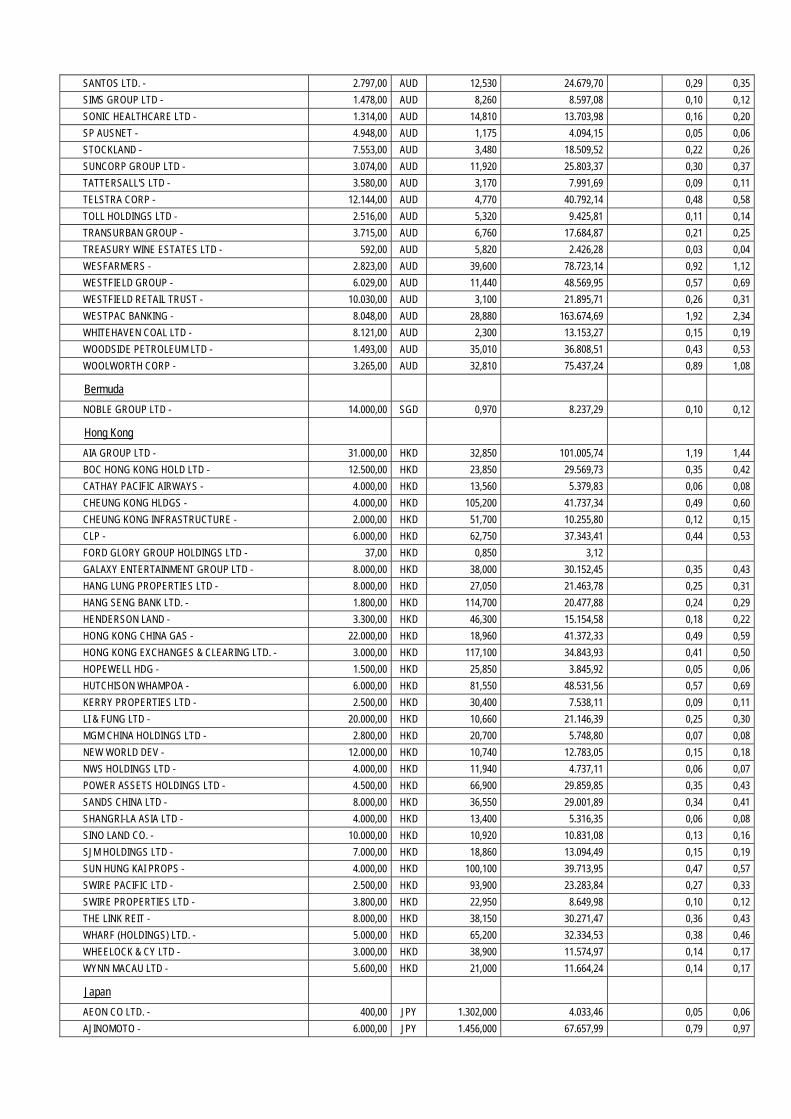
SANTOS LTD. - 2.797,00 AUD 12,530 24.679,70 0,29 0,35
SIMS GROUP LTD - 1.478,00 AUD 8,260 8.597,08 0,10 0,12
SONIC HEALTHCARE LTD - 1.314,00 AUD 14,810 13.703,98 0,16 0,20
SP AUSNET - 4.948,00 AUD 1,175 4.094,15 0,05 0,06
STOCKLAND - 7.553,00 AUD 3,480 18.509,52 0,22 0,26
SUNCORP GROUP LTD - 3.074,00 AUD 11,920 25.803,37 0,30 0,37
TATTERSALL'S LTD - 3.580,00 AUD 3,170 7.991,69 0,09 0,11
TELSTRA CORP - 12.144,00 AUD 4,770 40.792,14 0,48 0,58
TOLL HOLDINGS LTD - 2.516,00 AUD 5,320 9.425,81 0,11 0,14
TRANSURBAN GROUP - 3.715,00 AUD 6,760 17.684,87 0,21 0,25
TREASURY WINE ESTATES LTD - 592,00 AUD 5,820 2.426,28 0,03 0,04
WESFARMERS - 2.823,00 AUD 39,600 78.723,14 0,92 1,12
WESTFIELD GROUP - 6.029,00 AUD 11,440 48.569,95 0,57 0,69
WESTFIELD RETAIL TRUST - 10.030,00 AUD 3,100 21.895,71 0,26 0,31
WESTPAC BANKING - 8.048,00 AUD 28,880 163.674,69 1,92 2,34
WHITEHAVEN COAL LTD - 8.121,00 AUD 2,300 13.153,27 0,15 0,19
WOODSIDE PETROLEUM LTD - 1.493,00 AUD 35,010 36.808,51 0,43 0,53
WOOLWORTH CORP - 3.265,00 AUD 32,810 75.437,24 0,89 1,08
Bermuda
NOBLE GROUP LTD - 14.000,00 SGD 0,970 8.237,29 0,10 0,12
Hong Kong
AIA GROUP LTD - 31.000,00 HKD 32,850 101.005,74 1,19 1,44
BOC HONG KONG HOLD LTD - 12.500,00 HKD 23,850 29.569,73 0,35 0,42
CATHAY PACIFIC AIRWAYS - 4.000,00 HKD 13,560 5.379,83 0,06 0,08
CHEUNG KONG HLDGS - 4.000,00 HKD 105,200 41.737,34 0,49 0,60
CHEUNG KONG INFRASTRUCTURE - 2.000,00 HKD 51,700 10.255,80 0,12 0,15
CLP - 6.000,00 HKD 62,750 37.343,41 0,44 0,53
FORD GLORY GROUP HOLDINGS LTD - 37,00 HKD 0,850 3,12
GALAXY ENTERTAINMENT GROUP LTD - 8.000,00 HKD 38,000 30.152,45 0,35 0,43
HANG LUNG PROPERTIES LTD - 8.000,00 HKD 27,050 21.463,78 0,25 0,31
HANG SENG BANK LTD. - 1.800,00 HKD 114,700 20.477,88 0,24 0,29
HENDERSON LAND - 3.300,00 HKD 46,300 15.154,58 0,18 0,22
HONG KONG CHINA GAS - 22.000,00 HKD 18,960 41.372,33 0,49 0,59
HONG KONG EXCHANGES & CLEARING LTD. - 3.000,00 HKD 117,100 34.843,93 0,41 0,50
HOPEWELL HDG - 1.500,00 HKD 25,850 3.845,92 0,05 0,06
HUTCHISON WHAMPOA - 6.000,00 HKD 81,550 48.531,56 0,57 0,69
KERRY PROPERTIES LTD - 2.500,00 HKD 30,400 7.538,11 0,09 0,11
LI & FUNG LTD - 20.000,00 HKD 10,660 21.146,39 0,25 0,30
MGM CHINA HOLDINGS LTD - 2.800,00 HKD 20,700 5.748,80 0,07 0,08
NEW WORLD DEV - 12.000,00 HKD 10,740 12.783,05 0,15 0,18
NWS HOLDINGS LTD - 4.000,00 HKD 11,940 4.737,11 0,06 0,07
POWER ASSETS HOLDINGS LTD - 4.500,00 HKD 66,900 29.859,85 0,35 0,43
SANDS CHINA LTD - 8.000,00 HKD 36,550 29.001,89 0,34 0,41
SHANGRI-LA ASIA LTD - 4.000,00 HKD 13,400 5.316,35 0,06 0,08
SINO LAND CO. - 10.000,00 HKD 10,920 10.831,08 0,13 0,16
SJM HOLDINGS LTD - 7.000,00 HKD 18,860 13.094,49 0,15 0,19
SUN HUNG KAI PROPS - 4.000,00 HKD 100,100 39.713,95 0,47 0,57
SWIRE PACIFIC LTD - 2.500,00 HKD 93,900 23.283,84 0,27 0,33
SWIRE PROPERTIES LTD - 3.800,00 HKD 22,950 8.649,98 0,10 0,12
THE LINK REIT - 8.000,00 HKD 38,150 30.271,47 0,36 0,43
WHARF (HOLDINGS) LTD. - 5.000,00 HKD 65,200 32.334,53 0,38 0,46
WHEELOCK & CY LTD - 3.000,00 HKD 38,900 11.574,97 0,14 0,17
WYNN MACAU LTD - 5.600,00 HKD 21,000 11.664,24 0,14 0,17
Japan
AEON CO LTD. - 400,00 JPY 1.302,000 4.033,46 0,05 0,06
AJINOMOTO - 6.000,00 JPY 1.456,000 67.657,99 0,79 0,97
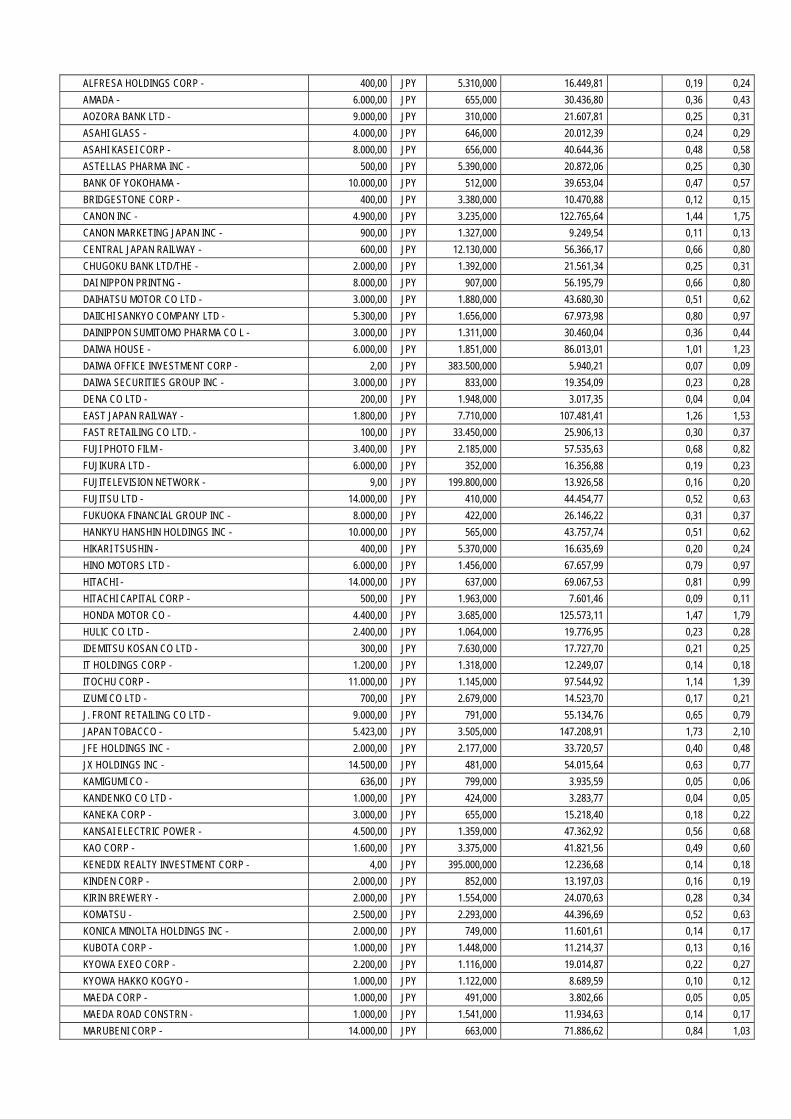
ALFRESA HOLDINGS CORP - 400,00 JPY 5.310,000 16.449,81 0,19 0,24
AMADA - 6.000,00 JPY 655,000 30.436,80 0,36 0,43
AOZORA BANK LTD - 9.000,00 JPY 310,000 21.607,81 0,25 0,31
ASAHI GLASS - 4.000,00 JPY 646,000 20.012,39 0,24 0,29
ASAHI KASEI CORP - 8.000,00 JPY 656,000 40.644,36 0,48 0,58
ASTELLAS PHARMA INC - 500,00 JPY 5.390,000 20.872,06 0,25 0,30
BANK OF YOKOHAMA - 10.000,00 JPY 512,000 39.653,04 0,47 0,57
BRIDGESTONE CORP - 400,00 JPY 3.380,000 10.470,88 0,12 0,15
CANON INC - 4.900,00 JPY 3.235,000 122.765,64 1,44 1,75
CANON MARKETING JAPAN INC - 900,00 JPY 1.327,000 9.249,54 0,11 0,13
CENTRAL JAPAN RAILWAY - 600,00 JPY 12.130,000 56.366,17 0,66 0,80
CHUGOKU BANK LTD/THE - 2.000,00 JPY 1.392,000 21.561,34 0,25 0,31
DAI NIPPON PRINTNG - 8.000,00 JPY 907,000 56.195,79 0,66 0,80
DAIHATSU MOTOR CO LTD - 3.000,00 JPY 1.880,000 43.680,30 0,51 0,62
DAIICHI SANKYO COMPANY LTD - 5.300,00 JPY 1.656,000 67.973,98 0,80 0,97
DAINIPPON SUMITOMO PHARMA CO L - 3.000,00 JPY 1.311,000 30.460,04 0,36 0,44
DAIWA HOUSE - 6.000,00 JPY 1.851,000 86.013,01 1,01 1,23
DAIWA OFFICE INVESTMENT CORP - 2,00 JPY 383.500,000 5.940,21 0,07 0,09
DAIWA SECURITIES GROUP INC - 3.000,00 JPY 833,000 19.354,09 0,23 0,28
DENA CO LTD - 200,00 JPY 1.948,000 3.017,35 0,04 0,04
EAST JAPAN RAILWAY - 1.800,00 JPY 7.710,000 107.481,41 1,26 1,53
FAST RETAILING CO LTD. - 100,00 JPY 33.450,000 25.906,13 0,30 0,37
FUJI PHOTO FILM - 3.400,00 JPY 2.185,000 57.535,63 0,68 0,82
FUJIKURA LTD - 6.000,00 JPY 352,000 16.356,88 0,19 0,23
FUJITELEVISION NETWORK - 9,00 JPY 199.800,000 13.926,58 0,16 0,20
FUJITSU LTD - 14.000,00 JPY 410,000 44.454,77 0,52 0,63
FUKUOKA FINANCIAL GROUP INC - 8.000,00 JPY 422,000 26.146,22 0,31 0,37
HANKYU HANSHIN HOLDINGS INC - 10.000,00 JPY 565,000 43.757,74 0,51 0,62
HIKARI TSUSHIN - 400,00 JPY 5.370,000 16.635,69 0,20 0,24
HINO MOTORS LTD - 6.000,00 JPY 1.456,000 67.657,99 0,79 0,97
HITACHI - 14.000,00 JPY 637,000 69.067,53 0,81 0,99
HITACHI CAPITAL CORP - 500,00 JPY 1.963,000 7.601,46 0,09 0,11
HONDA MOTOR CO - 4.400,00 JPY 3.685,000 125.573,11 1,47 1,79
HULIC CO LTD - 2.400,00 JPY 1.064,000 19.776,95 0,23 0,28
IDEMITSU KOSAN CO LTD - 300,00 JPY 7.630,000 17.727,70 0,21 0,25
IT HOLDINGS CORP - 1.200,00 JPY 1.318,000 12.249,07 0,14 0,18
ITOCHU CORP - 11.000,00 JPY 1.145,000 97.544,92 1,14 1,39
IZUMI CO LTD - 700,00 JPY 2.679,000 14.523,70 0,17 0,21
J. FRONT RETAILING CO LTD - 9.000,00 JPY 791,000 55.134,76 0,65 0,79
JAPAN TOBACCO - 5.423,00 JPY 3.505,000 147.208,91 1,73 2,10
JFE HOLDINGS INC - 2.000,00 JPY 2.177,000 33.720,57 0,40 0,48
JX HOLDINGS INC - 14.500,00 JPY 481,000 54.015,64 0,63 0,77
KAMIGUMI CO - 636,00 JPY 799,000 3.935,59 0,05 0,06
KANDENKO CO LTD - 1.000,00 JPY 424,000 3.283,77 0,04 0,05
KANEKA CORP - 3.000,00 JPY 655,000 15.218,40 0,18 0,22
KANSAI ELECTRIC POWER - 4.500,00 JPY 1.359,000 47.362,92 0,56 0,68
KAO CORP - 1.600,00 JPY 3.375,000 41.821,56 0,49 0,60
KENEDIX REALTY INVESTMENT CORP - 4,00 JPY 395.000,000 12.236,68 0,14 0,18
KINDEN CORP - 2.000,00 JPY 852,000 13.197,03 0,16 0,19
KIRIN BREWERY - 2.000,00 JPY 1.554,000 24.070,63 0,28 0,34
KOMATSU - 2.500,00 JPY 2.293,000 44.396,69 0,52 0,63
KONICA MINOLTA HOLDINGS INC - 2.000,00 JPY 749,000 11.601,61 0,14 0,17
KUBOTA CORP - 1.000,00 JPY 1.448,000 11.214,37 0,13 0,16
KYOWA EXEO CORP - 2.200,00 JPY 1.116,000 19.014,87 0,22 0,27
KYOWA HAKKO KOGYO - 1.000,00 JPY 1.122,000 8.689,59 0,10 0,12
MAEDA CORP - 1.000,00 JPY 491,000 3.802,66 0,05 0,05
MAEDA ROAD CONSTRN - 1.000,00 JPY 1.541,000 11.934,63 0,14 0,17
MARUBENI CORP - 14.000,00 JPY 663,000 71.886,62 0,84 1,03
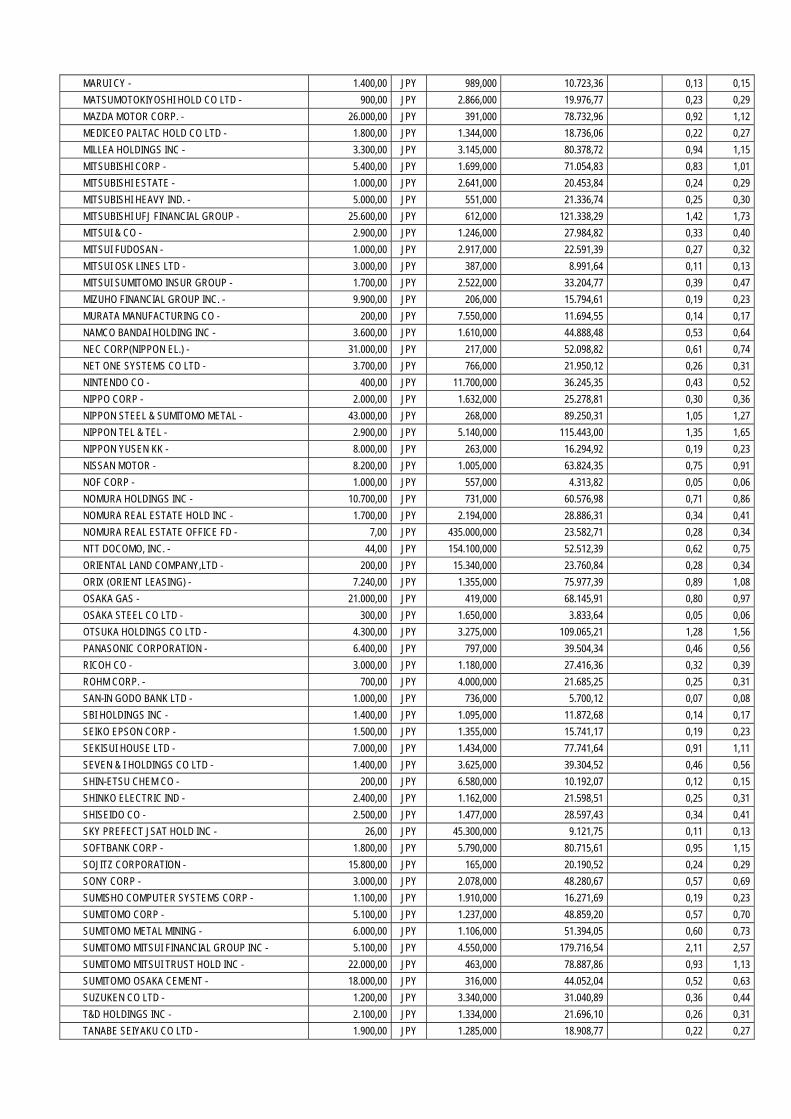
MARUI CY - 1.400,00 JPY 989,000 10.723,36 0,13 0,15
MATSUMOTOKIYOSHI HOLD CO LTD - 900,00 JPY 2.866,000 19.976,77 0,23 0,29
MAZDA MOTOR CORP. - 26.000,00 JPY 391,000 78.732,96 0,92 1,12
MEDICEO PALTAC HOLD CO LTD - 1.800,00 JPY 1.344,000 18.736,06 0,22 0,27
MILLEA HOLDINGS INC - 3.300,00 JPY 3.145,000 80.378,72 0,94 1,15
MITSUBISHI CORP - 5.400,00 JPY 1.699,000 71.054,83 0,83 1,01
MITSUBISHI ESTATE - 1.000,00 JPY 2.641,000 20.453,84 0,24 0,29
MITSUBISHI HEAVY IND. - 5.000,00 JPY 551,000 21.336,74 0,25 0,30
MITSUBISHI UFJ FINANCIAL GROUP - 25.600,00 JPY 612,000 121.338,29 1,42 1,73
MITSUI & CO - 2.900,00 JPY 1.246,000 27.984,82 0,33 0,40
MITSUI FUDOSAN - 1.000,00 JPY 2.917,000 22.591,39 0,27 0,32
MITSUI OSK LINES LTD - 3.000,00 JPY 387,000 8.991,64 0,11 0,13
MITSUI SUMITOMO INSUR GROUP - 1.700,00 JPY 2.522,000 33.204,77 0,39 0,47
MIZUHO FINANCIAL GROUP INC. - 9.900,00 JPY 206,000 15.794,61 0,19 0,23
MURATA MANUFACTURING CO - 200,00 JPY 7.550,000 11.694,55 0,14 0,17
NAMCO BANDAI HOLDING INC - 3.600,00 JPY 1.610,000 44.888,48 0,53 0,64
NEC CORP(NIPPON EL.) - 31.000,00 JPY 217,000 52.098,82 0,61 0,74
NET ONE SYSTEMS CO LTD - 3.700,00 JPY 766,000 21.950,12 0,26 0,31
NINTENDO CO - 400,00 JPY 11.700,000 36.245,35 0,43 0,52
NIPPO CORP - 2.000,00 JPY 1.632,000 25.278,81 0,30 0,36
NIPPON STEEL & SUMITOMO METAL - 43.000,00 JPY 268,000 89.250,31 1,05 1,27
NIPPON TEL & TEL - 2.900,00 JPY 5.140,000 115.443,00 1,35 1,65
NIPPON YUSEN KK - 8.000,00 JPY 263,000 16.294,92 0,19 0,23
NISSAN MOTOR - 8.200,00 JPY 1.005,000 63.824,35 0,75 0,91
NOF CORP - 1.000,00 JPY 557,000 4.313,82 0,05 0,06
NOMURA HOLDINGS INC - 10.700,00 JPY 731,000 60.576,98 0,71 0,86
NOMURA REAL ESTATE HOLD INC - 1.700,00 JPY 2.194,000 28.886,31 0,34 0,41
NOMURA REAL ESTATE OFFICE FD - 7,00 JPY 435.000,000 23.582,71 0,28 0,34
NTT DOCOMO, INC. - 44,00 JPY 154.100,000 52.512,39 0,62 0,75
ORIENTAL LAND COMPANY,LTD - 200,00 JPY 15.340,000 23.760,84 0,28 0,34
ORIX (ORIENT LEASING) - 7.240,00 JPY 1.355,000 75.977,39 0,89 1,08
OSAKA GAS - 21.000,00 JPY 419,000 68.145,91 0,80 0,97
OSAKA STEEL CO LTD - 300,00 JPY 1.650,000 3.833,64 0,05 0,06
OTSUKA HOLDINGS CO LTD - 4.300,00 JPY 3.275,000 109.065,21 1,28 1,56
PANASONIC CORPORATION - 6.400,00 JPY 797,000 39.504,34 0,46 0,56
RICOH CO - 3.000,00 JPY 1.180,000 27.416,36 0,32 0,39
ROHM CORP. - 700,00 JPY 4.000,000 21.685,25 0,25 0,31
SAN-IN GODO BANK LTD - 1.000,00 JPY 736,000 5.700,12 0,07 0,08
SBI HOLDINGS INC - 1.400,00 JPY 1.095,000 11.872,68 0,14 0,17
SEIKO EPSON CORP - 1.500,00 JPY 1.355,000 15.741,17 0,19 0,23
SEKISUI HOUSE LTD - 7.000,00 JPY 1.434,000 77.741,64 0,91 1,11
SEVEN & I HOLDINGS CO LTD - 1.400,00 JPY 3.625,000 39.304,52 0,46 0,56
SHIN-ETSU CHEM CO - 200,00 JPY 6.580,000 10.192,07 0,12 0,15
SHINKO ELECTRIC IND - 2.400,00 JPY 1.162,000 21.598,51 0,25 0,31
SHISEIDO CO - 2.500,00 JPY 1.477,000 28.597,43 0,34 0,41
SKY PREFECT JSAT HOLD INC - 26,00 JPY 45.300,000 9.121,75 0,11 0,13
SOFTBANK CORP - 1.800,00 JPY 5.790,000 80.715,61 0,95 1,15
SOJITZ CORPORATION - 15.800,00 JPY 165,000 20.190,52 0,24 0,29
SONY CORP - 3.000,00 JPY 2.078,000 48.280,67 0,57 0,69
SUMISHO COMPUTER SYSTEMS CORP - 1.100,00 JPY 1.910,000 16.271,69 0,19 0,23
SUMITOMO CORP - 5.100,00 JPY 1.237,000 48.859,20 0,57 0,70
SUMITOMO METAL MINING - 6.000,00 JPY 1.106,000 51.394,05 0,60 0,73
SUMITOMO MITSUI FINANCIAL GROUP INC - 5.100,00 JPY 4.550,000 179.716,54 2,11 2,57
SUMITOMO MITSUI TRUST HOLD INC - 22.000,00 JPY 463,000 78.887,86 0,93 1,13
SUMITOMO OSAKA CEMENT - 18.000,00 JPY 316,000 44.052,04 0,52 0,63
SUZUKEN CO LTD - 1.200,00 JPY 3.340,000 31.040,89 0,36 0,44
T&D HOLDINGS INC - 2.100,00 JPY 1.334,000 21.696,10 0,26 0,31
TANABE SEIYAKU CO LTD - 1.900,00 JPY 1.285,000 18.908,77 0,22 0,27
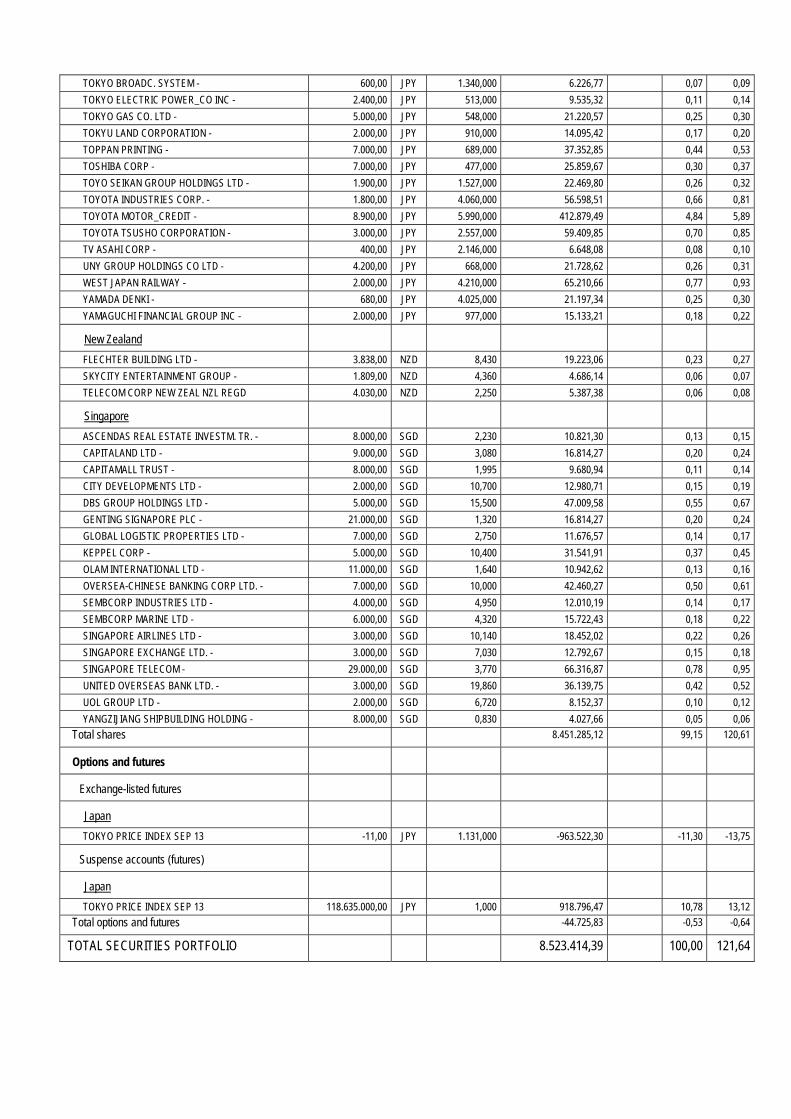
TOKYO BROADC. SYSTEM - 600,00 JPY 1.340,000 6.226,77 0,07 0,09
TOKYO ELECTRIC POWER_CO INC - 2.400,00 JPY 513,000 9.535,32 0,11 0,14
TOKYO GAS CO. LTD - 5.000,00 JPY 548,000 21.220,57 0,25 0,30
TOKYU LAND CORPORATION - 2.000,00 JPY 910,000 14.095,42 0,17 0,20
TOPPAN PRINTING - 7.000,00 JPY 689,000 37.352,85 0,44 0,53
TOSHIBA CORP - 7.000,00 JPY 477,000 25.859,67 0,30 0,37
TOYO SEIKAN GROUP HOLDINGS LTD - 1.900,00 JPY 1.527,000 22.469,80 0,26 0,32
TOYOTA INDUSTRIES CORP. - 1.800,00 JPY 4.060,000 56.598,51 0,66 0,81
TOYOTA MOTOR_CREDIT - 8.900,00 JPY 5.990,000 412.879,49 4,84 5,89
TOYOTA TSUSHO CORPORATION - 3.000,00 JPY 2.557,000 59.409,85 0,70 0,85
TV ASAHI CORP - 400,00 JPY 2.146,000 6.648,08 0,08 0,10
UNY GROUP HOLDINGS CO LTD - 4.200,00 JPY 668,000 21.728,62 0,26 0,31
WEST JAPAN RAILWAY - 2.000,00 JPY 4.210,000 65.210,66 0,77 0,93
YAMADA DENKI - 680,00 JPY 4.025,000 21.197,34 0,25 0,30
YAMAGUCHI FINANCIAL GROUP INC - 2.000,00 JPY 977,000 15.133,21 0,18 0,22
New Zealand
FLECHTER BUILDING LTD - 3.838,00 NZD 8,430 19.223,06 0,23 0,27
SKYCITY ENTERTAINMENT GROUP - 1.809,00 NZD 4,360 4.686,14 0,06 0,07
TELECOM CORP NEW ZEAL NZL REGD 4.030,00 NZD 2,250 5.387,38 0,06 0,08
Singapore
ASCENDAS REAL ESTATE INVESTM. TR. - 8.000,00 SGD 2,230 10.821,30 0,13 0,15
CAPITALAND LTD - 9.000,00 SGD 3,080 16.814,27 0,20 0,24
CAPITAMALL TRUST - 8.000,00 SGD 1,995 9.680,94 0,11 0,14
CITY DEVELOPMENTS LTD - 2.000,00 SGD 10,700 12.980,71 0,15 0,19
DBS GROUP HOLDINGS LTD - 5.000,00 SGD 15,500 47.009,58 0,55 0,67
GENTING SIGNAPORE PLC - 21.000,00 SGD 1,320 16.814,27 0,20 0,24
GLOBAL LOGISTIC PROPERTIES LTD - 7.000,00 SGD 2,750 11.676,57 0,14 0,17
KEPPEL CORP - 5.000,00 SGD 10,400 31.541,91 0,37 0,45
OLAM INTERNATIONAL LTD - 11.000,00 SGD 1,640 10.942,62 0,13 0,16
OVERSEA-CHINESE BANKING CORP LTD. - 7.000,00 SGD 10,000 42.460,27 0,50 0,61
SEMBCORP INDUSTRIES LTD - 4.000,00 SGD 4,950 12.010,19 0,14 0,17
SEMBCORP MARINE LTD - 6.000,00 SGD 4,320 15.722,43 0,18 0,22
SINGAPORE AIRLINES LTD - 3.000,00 SGD 10,140 18.452,02 0,22 0,26
SINGAPORE EXCHANGE LTD. - 3.000,00 SGD 7,030 12.792,67 0,15 0,18
SINGAPORE TELECOM - 29.000,00 SGD 3,770 66.316,87 0,78 0,95
UNITED OVERSEAS BANK LTD. - 3.000,00 SGD 19,860 36.139,75 0,42 0,52
UOL GROUP LTD - 2.000,00 SGD 6,720 8.152,37 0,10 0,12
YANGZIJIANG SHIPBUILDING HOLDING - 8.000,00 SGD 0,830 4.027,66 0,05 0,06
Total shares 8.451.285,12 99,15 120,61
Options and futures
Exchange-listed futures
Japan
TOKYO PRICE INDEX SEP 13 -11,00 JPY 1.131,000 -963.522,30 -11,30 -13,75
Suspense accounts (futures)
Japan
TOKYO PRICE INDEX SEP 13 118.635.000,00 JPY 1,000 918.796,47 10,78 13,12
Total options and futures -44.725,83 -0,53 -0,64
TOTAL SECURITIES PORTFOLIO 8.523.414,39 100,00 121,64
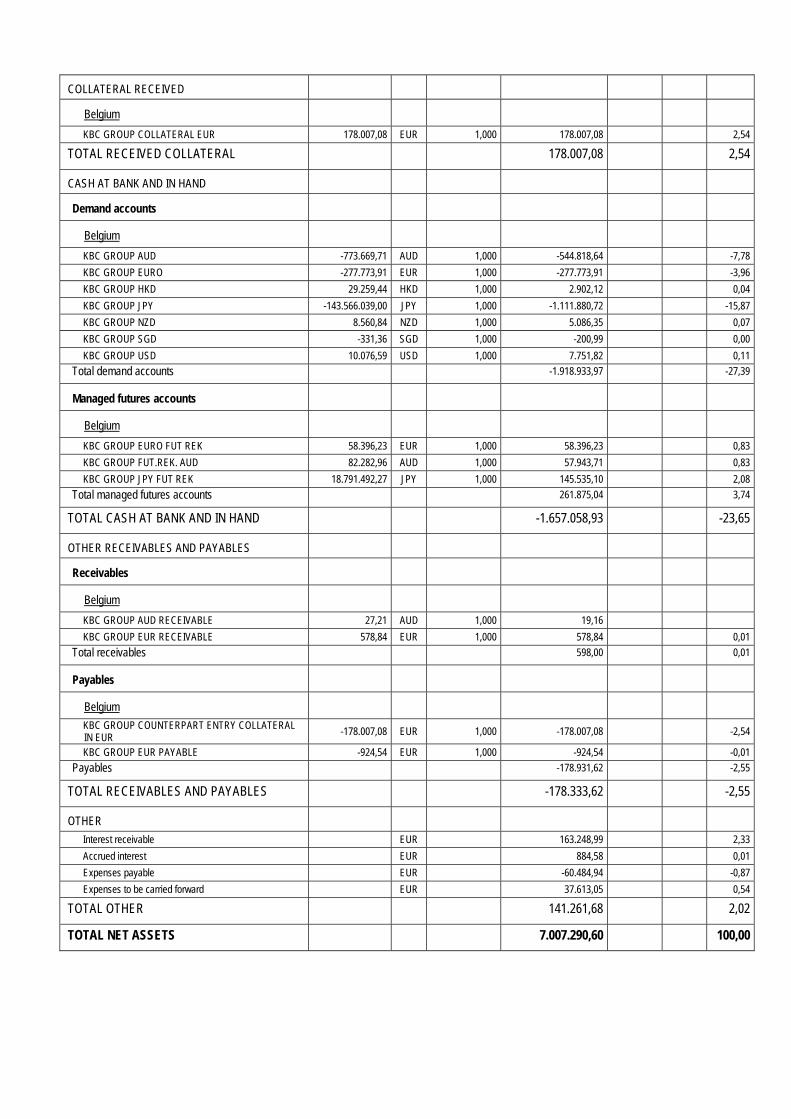
COLLATERAL RECEIVED
Belgium
KBC GROUP COLLATERAL EUR 178.007,08 EUR 1,000 178.007,08 2,54
TOTAL RECEIVED COLLATERAL 178.007,08 2,54
CASH AT BANK AND IN HAND
Demand accounts
Belgium
KBC GROUP AUD -773.669,71 AUD 1,000 -544.818,64 -7,78
KBC GROUP EURO -277.773,91 EUR 1,000 -277.773,91 -3,96
KBC GROUP HKD 29.259,44 HKD 1,000 2.902,12 0,04
KBC GROUP JPY -143.566.039,00 JPY 1,000 -1.111.880,72 -15,87
KBC GROUP NZD 8.560,84 NZD 1,000 5.086,35 0,07
KBC GROUP SGD -331,36 SGD 1,000 -200,99 0,00
KBC GROUP USD 10.076,59 USD 1,000 7.751,82 0,11
Total demand accounts -1.918.933,97 -27,39
Managed futures accounts
Belgium
KBC GROUP EURO FUT REK 58.396,23 EUR 1,000 58.396,23 0,83
KBC GROUP FUT.REK. AUD 82.282,96 AUD 1,000 57.943,71 0,83
KBC GROUP JPY FUT REK 18.791.492,27 JPY 1,000 145.535,10 2,08
Total managed futures accounts 261.875,04 3,74
TOTAL CASH AT BANK AND IN HAND -1.657.058,93 -23,65
OTHER RECEIVABLES AND PAYABLES
Receivables
Belgium
KBC GROUP AUD RECEIVABLE 27,21 AUD 1,000 19,16
KBC GROUP EUR RECEIVABLE 578,84 EUR 1,000 578,84 0,01
Total receivables 598,00 0,01
Payables
Belgium
KBC GROUP COUNTERPART ENTRY COLLATERAL IN EUR
-178.007,08 EUR 1,000 -178.007,08 -2,54
KBC GROUP EUR PAYABLE -924,54 EUR 1,000 -924,54 -0,01
Payables -178.931,62 -2,55
TOTAL RECEIVABLES AND PAYABLES -178.333,62 -2,55
OTHER
Interest receivable EUR 163.248,99 2,33
Accrued interest EUR 884,58 0,01
Expenses payable EUR -60.484,94 -0,87
Expenses to be carried forward EUR 37.613,05 0,54
TOTAL OTHER 141.261,68 2,02
TOTAL NET ASSETS 7.007.290,60 100,00
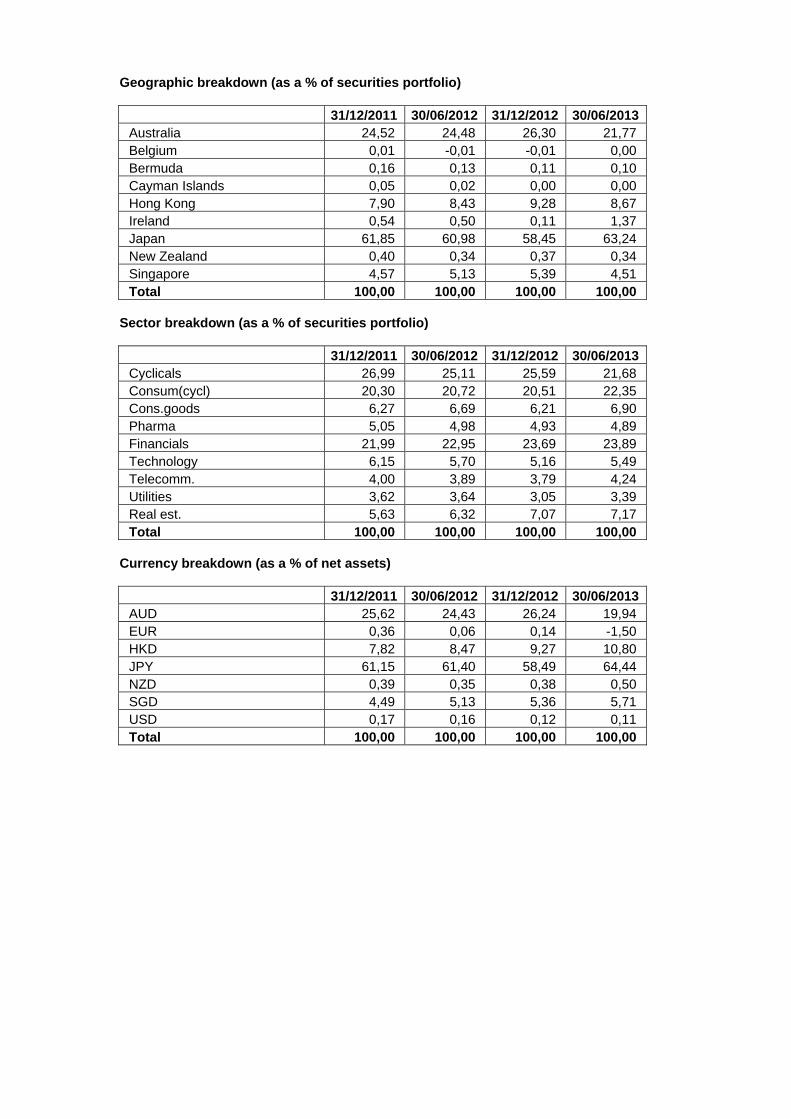
Geographic breakdown (as a % of securities portfolio)
31/12/2011 30/06/2012 31/12/2012 30/06/2013 Australia 24,52 24,48 26,30 21,77 Belgium 0,01 -0,01 -0,01 0,00 Bermuda 0,16 0,13 0,11 0,10 Cayman Islands 0,05 0,02 0,00 0,00 Hong Kong 7,90 8,43 9,28 8,67 Ireland 0,54 0,50 0,11 1,37 Japan 61,85 60,98 58,45 63,24 New Zealand 0,40 0,34 0,37 0,34 Singapore 4,57 5,13 5,39 4,51 Total 100,00 100,00 100,00 100,00
Sector breakdown (as a % of securities portfolio)
31/12/2011 30/06/2012 31/12/2012 30/06/2013 Cyclicals 26,99 25,11 25,59 21,68 Consum(cycl) 20,30 20,72 20,51 22,35 Cons.goods 6,27 6,69 6,21 6,90 Pharma 5,05 4,98 4,93 4,89 Financials 21,99 22,95 23,69 23,89 Technology 6,15 5,70 5,16 5,49 Telecomm. 4,00 3,89 3,79 4,24 Utilities 3,62 3,64 3,05 3,39 Real est. 5,63 6,32 7,07 7,17 Total 100,00 100,00 100,00 100,00
Currency breakdown (as a % of net assets)
31/12/2011 30/06/2012 31/12/2012 30/06/2013 AUD 25,62 24,43 26,24 19,94 EUR 0,36 0,06 0,14 -1,50 HKD 7,82 8,47 9,27 10,80 JPY 61,15 61,40 58,49 64,44 NZD 0,39 0,35 0,38 0,50 SGD 4,49 5,13 5,36 5,71 USD 0,17 0,16 0,12 0,11 Total 100,00 100,00 100,00 100,00
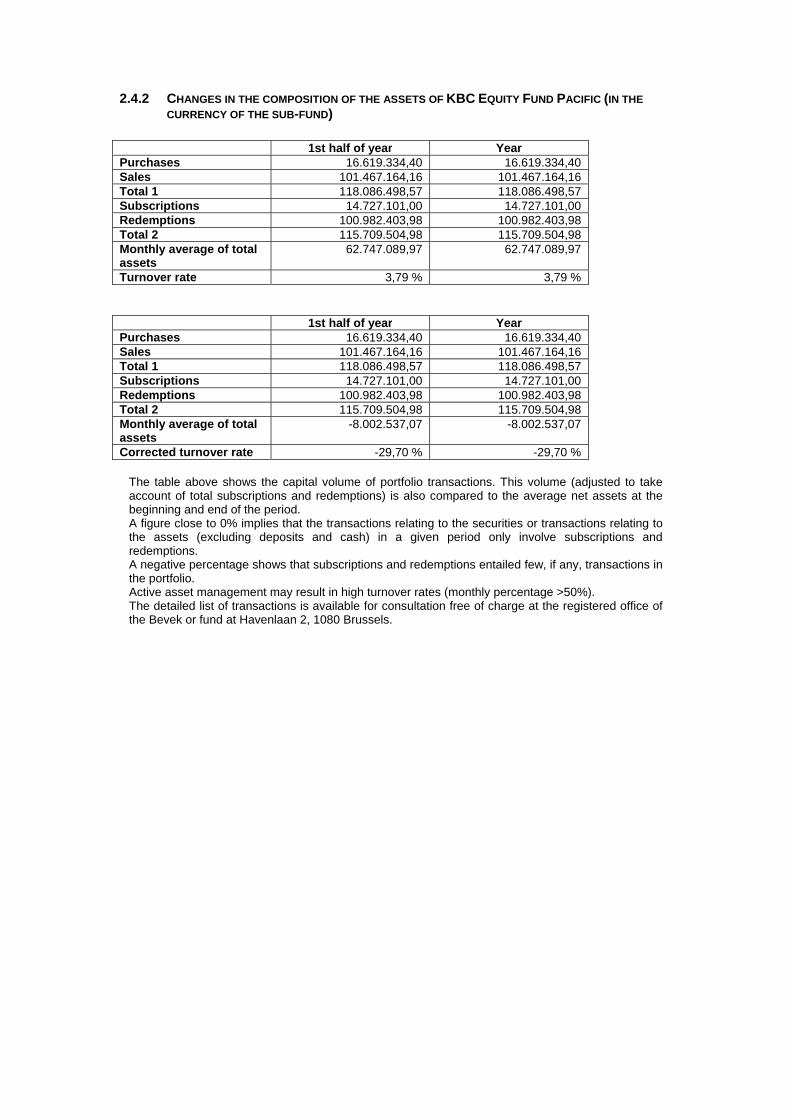
2.4.2 CHANGES IN THE COMPOSITION OF THE ASSETS OF KBC EQUITY FUND PACIFIC (IN THE
CURRENCY OF THE SUB-FUND)
1st half of year YearPurchases 16.619.334,40 16.619.334,40 Sales 101.467.164,16 101.467.164,16 Total 1 118.086.498,57 118.086.498,57 Subscriptions 14.727.101,00 14.727.101,00 Redemptions 100.982.403,98 100.982.403,98 Total 2 115.709.504,98 115.709.504,98 Monthly average of total assets
62.747.089,97 62.747.089,97
Turnover rate 3,79 % 3,79 %
1st half of year YearPurchases 16.619.334,40 16.619.334,40 Sales 101.467.164,16 101.467.164,16 Total 1 118.086.498,57 118.086.498,57 Subscriptions 14.727.101,00 14.727.101,00 Redemptions 100.982.403,98 100.982.403,98 Total 2 115.709.504,98 115.709.504,98 Monthly average of total assets
-8.002.537,07 -8.002.537,07
Corrected turnover rate -29,70 % -29,70 %
The table above shows the capital volume of portfolio transactions. This volume (adjusted to take account of total subscriptions and redemptions) is also compared to the average net assets at the beginning and end of the period. A figure close to 0% implies that the transactions relating to the securities or transactions relating to the assets (excluding deposits and cash) in a given period only involve subscriptions and redemptions. A negative percentage shows that subscriptions and redemptions entailed few, if any, transactions in the portfolio. Active asset management may result in high turnover rates (monthly percentage >50%). The detailed list of transactions is available for consultation free of charge at the registered office of the Bevek or fund at Havenlaan 2, 1080 Brussels.

2.4.3 AMOUNT OF COMMITMENTS IN RESPECT OF FINANCIAL DERIVATIVES POSITIONS
NAME Currency Value in currency
In the currency of the sub-fund
Lot-size Transaction
date
KBC COLLATERAL EUR
EUR 178.007,08 178.007,08 N/A 28.06.2013
TOPIX 13/09/2013 JPY -124.409.999,00
-963.522,30 10.000,00 25.06.2013
2.4.4 CHANGES OF THE NUMBER OF SUBSCRIPTIONS AND REDEMPTIONS AND THE NET ASSET
VALUE
Classic Shares
Period Change in number of shares in circulation
Year Subscriptions Redemptions End of period
Cap. Dis. Cap. Dis. Cap. Dis. Total
2011 - 06 509.309,51 169,00 549.645,27 337,00 457.670,86 1.450,00 459.120,86
2012 - 06 175.586,18 348,00 625.710,07 568,00 7.546,97 1.230,00 8.776,97
2013 - 06 10.951,87 424,73 12.346,24 396,00 6.152,60 1.258,73 7.411,33
Period Amounts received and paid by the UCI
(in the currency of the class)
Year Subscriptions Redemptions
Capitalization Distribution Capitalization Distribution
2011 - 06 181.065.737,40 57.044,30 192.779.808,10 113.852,69
2012 - 06 57.007.240,99 112.397,76 197.679.948,70 186.349,75
2013 - 06 4.025.247,19 151.283,13 4.781.360,53 136.337,48
Period Net asset value
End of period (in the currency of the class)
Year Of the class Of one share
Capitalization Distribution
2011 - 06 156.924.168,55 341,83 329,52
2012 - 06 3.020.192,11 346,70 328,17
2013 - 06 2.902.784,75 396,31 369,00
Institutional B Shares
Period Change in number of shares in circulation
Year Subscriptions Redemptions End of period
Cap. Dis. Cap. Dis. Cap. Dis. Total 2012 - 06 379.769,00 329.886,00 49.883,00 49.883,00
2013 - 06 278.193,58 317.699,24 10.377,34 10.377,34
Period Amounts received and paid by the UCI
(in the currency of the class)
Year Subscriptions Redemptions
Capitalization Distribution Capitalization Distribution
2012 - 06 120.325.010,40 110.702.222,40
2013 - 06 100.302.223,20 122.572.079,00

Period Net asset value
End of period (in the currency of the class)
Year Of the class Of one share
Capitalization Distribution
2012 - 06 17.244.468,84 345,70
2013 - 06 4.104.505,85 395,53
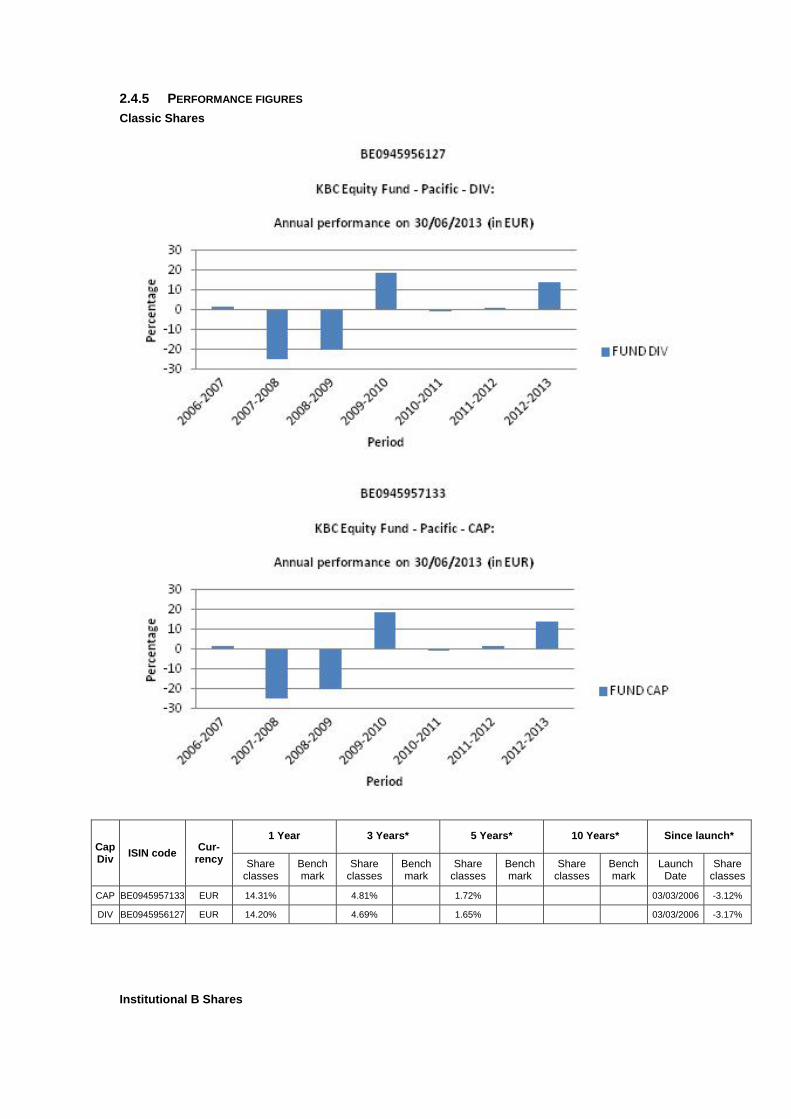
2.4.5 PERFORMANCE FIGURES
Classic Shares
Cap Div
ISIN code Cur-
rency
1 Year 3 Years* 5 Years* 10 Years* Since launch*
Share classes
Bench mark
Share classes
Bench mark
Share classes
Bench mark
Share classes
Bench mark
Launch Date
Share classes
CAP BE0945957133 EUR 14.31% 4.81% 1.72% 03/03/2006 -3.12%
DIV BE0945956127 EUR 14.20% 4.69% 1.65% 03/03/2006 -3.17%
Institutional B Shares

Cap Div
ISIN code Cur-
rency
1 Year 3 Years* 5 Years* 10 Years* Since launch*
Share classes
Bench mark
Share classes
Bench mark
Share classes
Bench mark
Share classes
Bench mark
Launch Date
Share classes
CAP BE6228902472 EUR 14.41% 24/11/2011 16.67%
Risk warning: Past performance is not a guide to future performance. * Return on annual basis.
Classic Shares The bar chart shows the performance for full financial years. The figures do not take account of any restructuring. Calculated in EUR. The return is calculated as the change in the net asset value between two dates expressed
as a percentage. In the case of units that pay dividends, the dividend is incorporated geometrically in the return.
Calculation method for date D, where NAV stands for net asset value: Capitalisation units (CAP) Return on date D over a period of X years:
[NIW(D) / NIW(Y)] ^ [1 / X] - 1 where Y = D-X
Return on date D since the start date S of the unit: [NIW(D) / NIW(S)] ^ [1 / F] - 1 where F = 1 if the unit has existed for less than one year on date D where F = (D-S) / 365.25 if the unit has existed for longer than one year on date D
Distribution units (DIV) Return on date D over a period of X years:
[ C * NIW(D) / NIW(Y)] ^ [1 / X] - 1 where Y = D-X
Return on date D since the start date S of the unit: [ C * NIW(D) / NIW(S)] ^ [1 / F] - 1 where F = 1 if the unit has existed for less than one year on date D where F = (D-S) / 365.25 if the unit has existed for longer than one year on date D where C is a factor that is determined for all N dividends between the calculation date D and the reference date.
For dividend i on date Di with value Wi: Ci = [Wi / NIW(Di)] + 1 i = 1 ... N
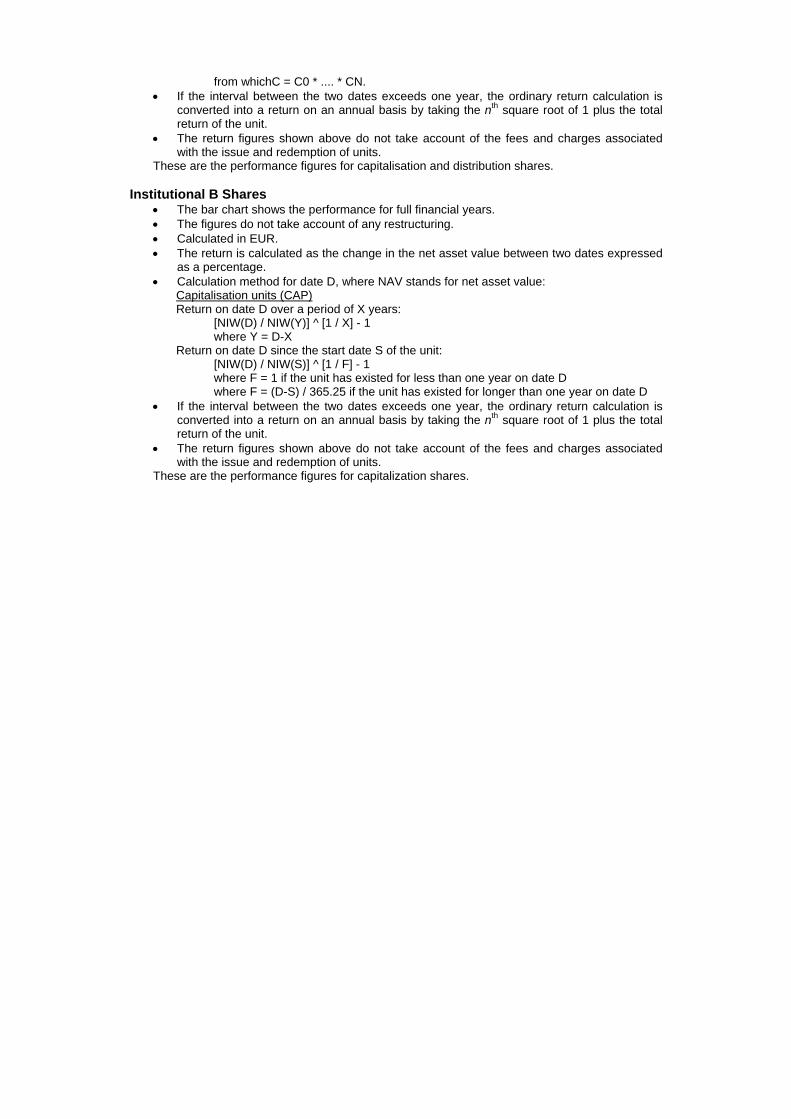
from whichC = C0 * .... * CN. If the interval between the two dates exceeds one year, the ordinary return calculation is
converted into a return on an annual basis by taking the nth square root of 1 plus the total return of the unit.
The return figures shown above do not take account of the fees and charges associated with the issue and redemption of units.
These are the performance figures for capitalisation and distribution shares.
Institutional B Shares The bar chart shows the performance for full financial years. The figures do not take account of any restructuring. Calculated in EUR. The return is calculated as the change in the net asset value between two dates expressed
as a percentage. Calculation method for date D, where NAV stands for net asset value:
Capitalisation units (CAP) Return on date D over a period of X years:
[NIW(D) / NIW(Y)] ^ [1 / X] - 1 where Y = D-X
Return on date D since the start date S of the unit: [NIW(D) / NIW(S)] ^ [1 / F] - 1 where F = 1 if the unit has existed for less than one year on date D where F = (D-S) / 365.25 if the unit has existed for longer than one year on date D
If the interval between the two dates exceeds one year, the ordinary return calculation is converted into a return on an annual basis by taking the nth square root of 1 plus the total return of the unit.
The return figures shown above do not take account of the fees and charges associated with the issue and redemption of units.
These are the performance figures for capitalization shares.

2.4.6 COSTS Ongoing Charges: * Classic Shares Distribution: 1.995% Classic Shares Capitalization: 1.882% Institutional B Shares Capitalization: 1.789% * The following costs have not been included in the ongoing charges: - Interest payments on loans taken out - Payments in respect of financial derivatives - Fees and charges paid directly by the investor - Any soft commissions
SOFT COMMISSIONS The management company or the appointed manager, as the case may be, is the recipient of soft commissions. The recipient has laid down an internal policy as regards accepting soft commissions and avoiding possible conflicts of interest in this respect, and has put appropriate internal controls in place to ensure this policy is observed. For more information, please see the ‘General’ section of the annual report.
Broker
Commission gross
in EUR
paid during the period:
1‐01‐13
‐
30‐06‐13
CSA Credits
in EUR
accrued during the period:
1‐01‐13
‐
30‐06‐13 Percentage
EQ MACQUARIE 22,125 11,063 50.00%
INSTINET 5,819 2,910 50.00%
MERRILL 521 260 50.00%
UBSWDR 21,899 10,950 50.00%
FEE-SHARING AGREEMENTS AND REBATES: The management company may share its fee with the distributor, and institutional and/or professional parties. In principle, the percentage share amounts to between 35% and 60% if the distributor is an entity of KBC Group NV or to between 35% and 70% if the distributor is not an entity of KBC Group NV. However, in a small number of cases, the distributor’s fee is less than 35%. Investors may, on request, obtain more information on these cases. If the management company invests the assets of the undertaking for collective investment in units of undertakings for collective investment that are not managed by an entity of KBC Group NV, and receives a fee for doing so, it will pay this fee to the undertaking for collective investment. Fee-sharing does not affect the amount of the management fee paid by the sub-fund to the management company. This management fee is subject to the limitations laid down in the articles of association. The limitations may only be amended after approval by the general meeting of shareholders. The management company has concluded a distribution agreement with the distributor in order to facilitate the wider distribution of the sub-fund's units by using multiple distribution channels. It is in the interests of the holders of units, the sub-fund and of the distributor for the largest possible number of units to be sold and for the assets of the sub-fund to be maximised in this way. In this respect, there is therefore no question of any conflict of interest.
2.4.7 NOTES TO THE FINANCIAL STATEMENTS AND OTHER DATA Fee for managing the investment portfolio: 1.5% per annum calculated on the basis of the average total net assets of the sub-fund, no management fee is charged on assets assets invested in investment undertakings managed by a financial institution of the KBC group. KBC Fund Management Limited receives a fee from the management company of max. 1.5% calculated on that part of the portfolio that it manages, without the total management fee received by the management company being exceeded. The administration agent’s fee is payable at the end of each month and is calculated on the basis of the average total net assets of the sub-fund.
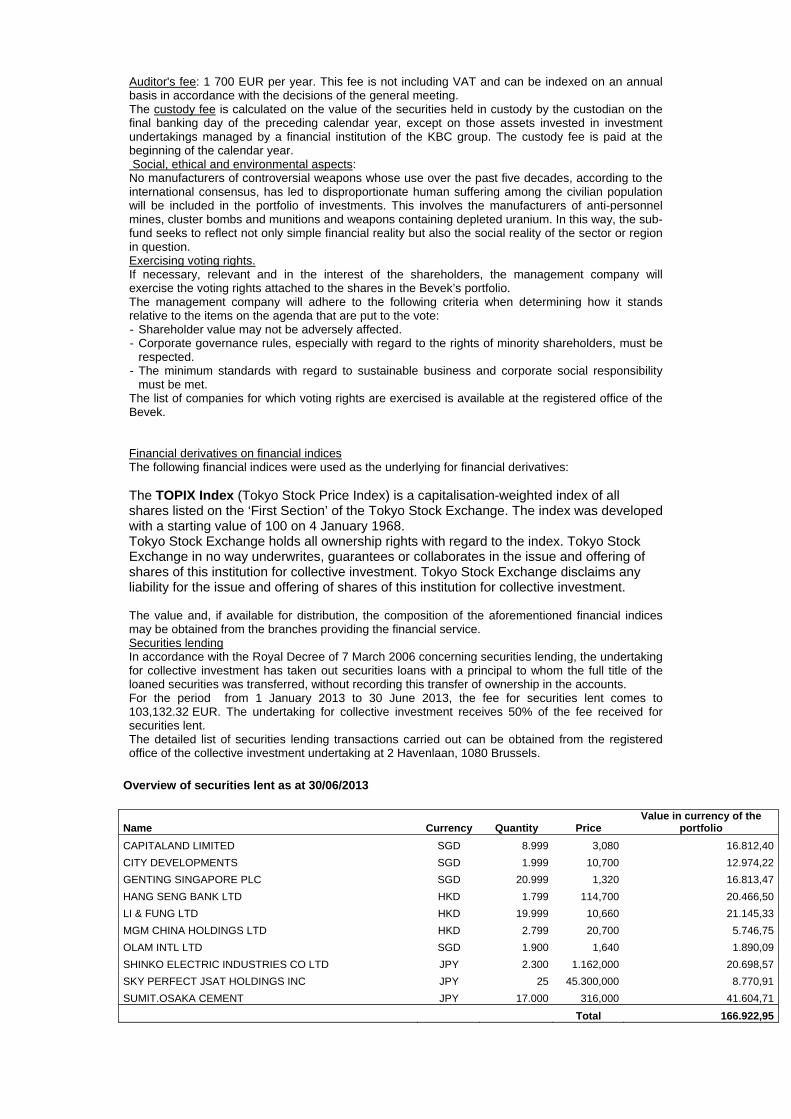
Auditor's fee: 1 700 EUR per year. This fee is not including VAT and can be indexed on an annual basis in accordance with the decisions of the general meeting. The custody fee is calculated on the value of the securities held in custody by the custodian on the final banking day of the preceding calendar year, except on those assets invested in investment undertakings managed by a financial institution of the KBC group. The custody fee is paid at the beginning of the calendar year. Social, ethical and environmental aspects: No manufacturers of controversial weapons whose use over the past five decades, according to the international consensus, has led to disproportionate human suffering among the civilian population will be included in the portfolio of investments. This involves the manufacturers of anti-personnel mines, cluster bombs and munitions and weapons containing depleted uranium. In this way, the sub-fund seeks to reflect not only simple financial reality but also the social reality of the sector or region in question. Exercising voting rights. If necessary, relevant and in the interest of the shareholders, the management company will exercise the voting rights attached to the shares in the Bevek’s portfolio. The management company will adhere to the following criteria when determining how it stands relative to the items on the agenda that are put to the vote: - Shareholder value may not be adversely affected. - Corporate governance rules, especially with regard to the rights of minority shareholders, must be
respected. - The minimum standards with regard to sustainable business and corporate social responsibility
must be met. The list of companies for which voting rights are exercised is available at the registered office of the Bevek. Financial derivatives on financial indices The following financial indices were used as the underlying for financial derivatives: The TOPIX Index (Tokyo Stock Price Index) is a capitalisation-weighted index of all shares listed on the ‘First Section’ of the Tokyo Stock Exchange. The index was developed with a starting value of 100 on 4 January 1968. Tokyo Stock Exchange holds all ownership rights with regard to the index. Tokyo Stock Exchange in no way underwrites, guarantees or collaborates in the issue and offering of shares of this institution for collective investment. Tokyo Stock Exchange disclaims any liability for the issue and offering of shares of this institution for collective investment. The value and, if available for distribution, the composition of the aforementioned financial indices may be obtained from the branches providing the financial service. Securities lending In accordance with the Royal Decree of 7 March 2006 concerning securities lending, the undertaking for collective investment has taken out securities loans with a principal to whom the full title of the loaned securities was transferred, without recording this transfer of ownership in the accounts. For the period from 1 January 2013 to 30 June 2013, the fee for securities lent comes to 103,132.32 EUR. The undertaking for collective investment receives 50% of the fee received for securities lent. The detailed list of securities lending transactions carried out can be obtained from the registered office of the collective investment undertaking at 2 Havenlaan, 1080 Brussels.
Overview of securities lent as at 30/06/2013
Name Currency Quantity Price Value in currency of the
portfolio
CAPITALAND LIMITED SGD 8.999 3,080 16.812,40
CITY DEVELOPMENTS SGD 1.999 10,700 12.974,22
GENTING SINGAPORE PLC SGD 20.999 1,320 16.813,47
HANG SENG BANK LTD HKD 1.799 114,700 20.466,50
LI & FUNG LTD HKD 19.999 10,660 21.145,33
MGM CHINA HOLDINGS LTD HKD 2.799 20,700 5.746,75
OLAM INTL LTD SGD 1.900 1,640 1.890,09
SHINKO ELECTRIC INDUSTRIES CO LTD JPY 2.300 1.162,000 20.698,57
SKY PERFECT JSAT HOLDINGS INC JPY 25 45.300,000 8.770,91
SUMIT.OSAKA CEMENT JPY 17.000 316,000 41.604,71
Total 166.922,95

Details of collateral received for securities lent
Name Currency Nominal value Currency fund Value in Currency fund
AUSTRIA 2012 3,4% 22/11/2022 EUR 156.000 EUR 178.007,08
Total 178.007,08 For the valuation of the collateral received, indicative prices have been used in this detail list by the Collateral Management Division of KBC Bank.

Semi-Annual report as at 30th June 2013
TABLE OF CONTENTS
2. Information on KBC Equity Fund Luxury & Tourism
2.1. Management report 2.1.1. Launch date and subscription price 2.1.2. Stock exchange listing 2.1.3. Aim and distinctive features of the investment policy 2.1.4. Financial portfolio management 2.1.5. Distributors 2.1.6. Index and benchmark 2.1.7. Policy conducted during the financial year 2.1.8. Future policy 2.1.9. Synthetic risk and reward indicator (SRRI)
2.2. Balance sheet
2.3. Profit and loss account
2.4. Composition of the assets and key figures
2.4.1. Composition of the assets 2.4.2. Change in the composition of the assets 2.4.3. Value of commitments in respect of financial derivatives positions 2.4.4. Evolution of the number of subscriptions, repayments and the net asset value 2.4.5. Return figures 2.4.6. Expenses 2.4.7. Notes to the financial statements and other data


2 INFORMATION ON KBC EQUITY FUND LUXURY & TOURISM
2.1 MANAGEMENT REPORT
2.1.1 LAUNCH DATE AND SUBSCRIPTION PRICE Classic Shares : Launch date: 25 June 1998 Initial subscription price: 100 EUR Currency: EUR Institutional B Shares : Launch date: 25 November 2011 Initial subscription price: 90.08 EUR Currency: EUR
2.1.2 STOCK EXCHANGE LISTING Not applicable.
2.1.3 GOAL AND KEY PRINCIPLES OF THE INVESTMENT POLICY
SUB-FUND’S OBJECT: The main objective of this sub-fund is to generate the highest possible return for its shareholders by investing directly or indirectly in transferable securities. This is reflected in its pursuit of capital gains and income. To this end, the assets are invested, either directly or indirectly via correlated financial instruments, primarily in shares.
SUB-FUND’S INVESTMENT POLICY:
PERMITTED ASSET CLASSES: The sub-fund may invest in securities, money market instruments, units in undertakings for collective investment, deposits, financial derivatives, liquid assets and all other instruments insofar as permitted by the applicable laws and regulations and consistent with the sub-fund’s object The sub-fund shall invest no more than 10% of its assets in units of other undertakings for collective investment.
RESTRICTIONS OF THE INVESTMENT POLICY: The investment policy will be implemented within the limits set by law and regulations. The sub-fund may borrow up to 10% of its net assets, insofar as these are short-term borrowings aimed at solving temporary liquidity problems.
PERMITTED DERIVATIVES TRANSACTIONS: Derivates may be used either for hedging purposes or to achieve investment objectives. Changes will be made to the investments at regular intervals to comply with the sub-fund's investment strategy. In addition, listed and unlisted derivates may be used to achieve the objectives: these may be forward contracts, options or swaps on securities, indices, currencies or interest rates or other transactions involving derivatives. Unlisted derivatives transactions will only be concluded with prime financial institutions specialised in such transactions. Such derivatives may also be used to hedge the assets against exchange-rate fluctuations. Subject to the applicable laws and regulations and the articles of association, the sub-fund always seeks to conclude the most effective transactions. All costs associated with the transactions will be charged to the sub-fund and all income generated will be paid to the sub-fund. If the transactions result in a risk in respect of the counterparty, this risk can be hedged by using a margin management system that ensures that the sub-fund is the beneficiary of security (collateral) in the form of cash or investment grade bonds. When calculating the value of the bonds, a margin will be applied that varies depending on the residual term to maturity and the currency in which the bond in question is denominated. The relationship with the counterparty or counterparties is governed by standard international agreements.

STRATEGY SELECTED At least 75% of the assets are invested in share of companies associated with themes such as tourism and leisure and companies in the luxury goods sector.
LENDING FINANCIAL INSTRUMENTS: The sub-fund may lend financial instruments within the limits set by law and regulations. This lending does not affect the sub-fund’s risk profile since: - it takes place within the framework of a securities lending system managed by a principal. In
addition, the sub-fund has a relationship only with the principal of the securities lending system which acts as counterparty and to which title of the loaned securities is transferred. The choice of principal is subject to strict selection criteria. The return of securities similar to the securities that have been lent is guaranteed by the principal.
- through a margin management system, the sub-fund is always guaranteed financial security, the actual value of which always exceeds the actual value of the securities that have been lent, in case the principal does not return similar securities.
The return of securities similar to the securities that have been lent can be requested at any time, which means that the lending of securities does not affect the management of the sub-fund's assets. By lending securities, the sub-fund can generate an additional return. The principal pays a fee to the management company. After deducting the fee for the margin management and clearing services of KBC Bank, most of this fee is paid to the sub-fund. The relationship with the counterparty or counterparties is governed by standard international agreements. More information is provided on the terms and conditions governing securities lending in the annual or half-yearly report for the sub-fund.
VOLATILITY OF THE NET ASSET VALUE: The volatility of the net asset value may be high due to the composition of the portfolio.
GENERAL STRATEGY FOR HEDGING THE EXCHANGE RATE RISK: In order to protect its assets against exchange rate fluctuations and within the limitations laid down in the articles of association, the sub-fund may perform transactions relating to the sale of forward currency contracts, as well as the sale of call options and the purchase of put options on currencies. The transactions in question may relate solely to contracts traded on a regulated market that operates regularly, is recognised and is open to the public or that are traded with a recognised, prime financial institution specialising in such transactions and dealing in the over-the-counter (OTC) market in options. With the same objective, the sub-fund may also sell currencies forward or exchange them in private transactions with prime financial institutions specialising in such transactions. The hedging objective of the aforementioned transactions suggests that there is a direct link between these transactions and the assets to be hedged, which implies that the transactions carried out in a particular currency may in principle not exceed, in terms of volume, either the valuation value of all the assets in the same currency or the holding period of those assets.
SOCIAL, ETHICAL AND ENVIRONMENTAL ASPECTS:
No manufacturers of controversial weapons whose use over the past five decades, according to the international consensus, has led to disproportionate human suffering among the civilian population will be included in the portfolio of investments. This involves the manufacturers of anti-personnel mines, cluster bombs and munitions and weapons containing depleted uranium. In this way, the sub-fund seeks to reflect not only simple financial reality but also the social reality of the sector or region in question.
THE EUROPEAN SAVINGS DIRECTIVE AND TAX ON DEBT CLAIM RETURNS OBTAINED THROUGH THE
REDEMPTION OF OWN UNITS OR IN THE EVENT OF FULL OR PARTIAL DISTRIBUTION OF EQUITY
CAPITAL. The following information is of a general character and is not intended to cover all aspects of an investment in a UCITS. In certain cases entirely different rules might even apply. Moreover, both tax law and the interpretation of it can change. Investors who wish to have more information about the tax implications – in both Belgium and abroad – of acquiring, holding and transferring units should seek the advice of their usual financial and tax advisers.

This UCITS shall invest a maximum of 15% of its assets directly or indirectly in debt instruments as intended by the European Savings Directive. A. European Savings Directive (Directive 2003/48/EC) The European Savings Directive has been implemented in Belgium. Since this UCITS invests a maximum of 15% of its assets directly or indirectly in debt claims as intended by the European Savings Directive, the income of this UCITS does not fall within the scope of this directive. B. Tax on debt claim returns obtained through the redemption of own units or in the event of full or partial distribution of equity capital (Article 19bis Income Tax Code 1992). The income from this UCITS is not subject to the tax on debt instrument returns as intended by Article 19bis, Income Tax Code 1992.
2.1.4 FINANCIAL PORTFOLIO MANAGEMENT The management company has delegated the intellectual management, to KBC Fund Management Limited, Joshua Dawson House, Dawson Street , Dublin 2, IRELAND..
2.1.5 DISTRIBUTORS KBC Asset Management S.A., 5, Place de la Gare, L-1616 Luxembourg.
2.1.6 INDEX AND BENCHMARK See ‘Sub-fund’s investment policy’.

2.1.7 POLICY PERSUED DURING THE FINANCIAL YEAR KBC Equity Luxury & Tourism invests in shares of companies related to the luxury and tourism industries such as Automobiles, Consumer Durables, Luxury Retail, Personal Products, Recreation, Travel & Accommodation. Doubts about the sustainability of the economic recovery continued to shape investor sentiment. The debt crisis in Europe continued unabated, although the European Central Bank (ECB) managed to convince the market that it had the crisis under control. Major steps were taken in the United States to reform the federal budget, seemingly without adversely affecting economic growth too much. Fortunately, strong economic growth in Asia created export opportunities for American and European businesses. In the US, the rate of employment growth remained on the thin side for some considerable time. The situation began to improve in the recent reporting period, with the result that the jobless rate has declined more markedly. Pay has remained virtually flat, barely rising ahead of inflation. Taken together, these two factors ensured that household purchasing power only grew to a very limited extent and so contributed very modestly to economic growth. The weak growth in the Western economies was not without its impact on the export performance in emerging countries. In recent years, however, domestic demand (due to a rapidly growing middle class with a high consumption rate) and intra-regional trade within Asia have been playing an increasingly important role. The region is better armed to deal with financial crises than it was in the past. Public finances are healthy; the balance of payments is generally neutral. Asia’s economic development no longer depends on fickle foreign capital. Thanks to the contribution by the emerging markets the growth of world GDP held up in 2012–13 (estimated at 2–2.5%). Public finances have gone off the rails not only in the EMU, but also in the UK and the US. The budget debate in the US had reached a political impasse. Decisions were postponed, and so 31 December 2012 became an important deadline. A whole series of tax cuts and other temporary support measures from the past would then lapse. In total these involved a sum of 550 billion USD. Extending all the measures again was not feasible in budgetary terms, while allowing them all to expire was economic suicide. The fiscal cliff was averted on 1 January 2013 by means of an agreement in Congress: half the stimulus measures were made permanent or were extended for a further twelve months, while the other half lapsed. This has not been the only measure involving tightening of budgetary policy in 2013: on 1 March, automatic spending cuts came into effect under which Federal expenditure will be pruned by 85 billion USD each year for a period of ten years. Since no budget has been approved in the current financial year, the federal administrations have only been assigned budgets equal to the expenditure in the previous financial year. Mario Draghi took the helm at the ECB on 1 November 2011 and has favoured monetary easing by lowering the ECB’s key rate is 0.50%. This interest rate policy failed to place the economic recovery on a sustainable basis. The Fed therefore explored the scope for other measures, intervening directly on the bond markets and buying up large amounts of debt paper in an attempt to keep the long-term rate low, as well. The ECB dragged its feet, and only followed the Fed’s example much later. The intensification of the euro crisis in fact left the ECB no other choice. In a year marked by problems in keeping the EMU from imploding, the EUR/USD exchange rate was no more volatile than at other times. The euro was trading at USD 1.30 at the end of June 2013, which is roughly the same rate as 2012 year-end. The dollar’s image as the global reserve currency suffered as a result of QE2, QE3 and TWIST. In terms of markets, Japan was ultimately an outperformer, despite the steep depreciation of the yen. The winds of change have been blowing through Tokyo since the advent of the Abe government in December. The prospect of fresh tax stimuli, a cheaper yen and large-scale money creation have contributed to an atmosphere of optimism about the economy, something very rare in this country, which has been struggling with defeatism for many years. The emerging regions performed downright badly. The Asian emerging markets were unable to capitalise on their role as the growth engine of the world economy. Confidence indicators began to decline in mid-2012, breaking through barriers that pointed to a serious economic slowdown. That failed to materialise but it was sufficient to perpetuate the doubts concerning the growth narrative in the region. This was further exacerbated by concerns about Chinese local authority debt levels, an overheating Chinese housing market and fear of a credit crisis – especially when the Chinese interbank rate shot up to 30% within the space of a few days in June. Stock-market valuations remain favourable, especially given the high growth forecasts, sound macroeconomic balance and a banking sector that was barely – if at all – affected by the credit crisis. Latin America was hit by an economic slowdown. The link to the commodity markets is always at the fore in this region. Russia was likewise not immune to the weakness of European economic growth. Oil prices below 100 USD per barrel mean trouble for Russian state finances. The best performing sectors included Financials, Pharmaceuticals and Consumer Discretionary. Materials, Technology and Energy lagged behind. The outperformance of Banks may be attributed to the quantitative easing programmes undertaken by the central banks. By this we mean the Fed’s QE3 programme, and especially the announcement by the ECB of its OMT programme, which took the heat out of the euro crisis. Pharmaceuticals had been shunned for a long time due to a lack of product

innovation, patent expiry and the reforms to healthcare insurance in the US. In recent months, however, investors began to focus more on the sector’s response to these challenges: restructuring operations and the sell-off of non-strategic divisions. The car industry has risen from the ashes, in the US and the European luxury segment at least. Demand from the emerging markets is also strong, despite the slowdown in Chinese growth, where German luxury marques generate 50% of their profits. In spite of the slow growth, advertising budgets have also held up surprisingly well. Mining companies lost ground on excessive expectations concerning commodity prices. A failed stock market flotation by Facebook and the giant leaps made by Apple meant that price trends in the Technology sector differed from what might have been expected on the basis of the fundamentals. The oil companies suffered from the vagaries of the oil market, the political instability in the Middle East and frequent accidents. During the first quarter, asset allocation was a key contributor to positive performance of KBC Equity Fund Luxury & Tourism. On an industry group level, the best performing group was Consumer Durables (33% of the fund), driven by the significant outperformance of the fund’s overweight position in Safilo Group. The stock rose from EUR6.665 to EUR10.58 in the period after the luxury sunglasses and eyewear maker reported better than expected fourth-quarter results. Revenues increased for Safilo while their net debt decreased. Their improving outlook led to many analysts upgrading the stock. This was followed by Household & Personal Products group (11% of the fund), with Japanese stocks Kao and Kose leading. Kao was the top performing stock in the Industry group increasing from JPY2249 to JPY3040. Both Kao and Kose are luxury cosmetic manufacturers and retailers. In terms of the main underperformers for the fund in the quarter, there were no distinctive laggard themes within the fund. However stocks such as Bang & Olufsen and Mulberry disappointed and detracted from fund performance. British handbag maker Mulberry had a tumultuous first quarter with strong gains in the first two months of the year followed by a sharp and steep decline in March. This was due to the company announcement that sales in the first ten weeks of the year did not meet market expectations. During the second quarter, asset allocation continued to be a key contributor to positive performance. On an industry group level, Consumer Durables (33% of the fund) was again one of the best performing groups, driven by the outperformance of the fund’s overweight position in Pandora, Safilo and Sharp. Pandora’s stock rose from DKK160 to DKK194.20 in the period as the recent decline in gold and silver prices will lower costs for the Danish jewellery maker. Sales for the first quarter were also impressive for Pandora indicating a turnaround in their growth story. Following the positive performance of the first quarter, Household & Personal Products was again the second best performing industry group with Kao and Kose repeating their strong gains. In terms of laggard performers, the Food & Beverage industry group did not impress. Luxury food and beverage producers such as Pernod Ricard, Remy Cointreau and Diageo were all in negative territory. Overall KBC Equity Fund Luxury & Tourism performed positively on an absolute basis over the first half of 2013.
2.1.8 FUTURE POLICY
In the US they are in the twilight zone between recession and expansion. We are expecting US growth to remain positive but modest (around 2% y-o-y in the coming quarters) as pay increases are barely keeping pace with inflation and budgetary policy has now finally struck down the path of austerity. The fragile recovery of the housing market and corporate investment could be sustained. How strong the growth proves to be will depend largely on the dynamic of the labour market. In recent months employment in the US has grown by around 200,000 new jobs each month. This will need to continue in order to achieve +2% growth in 2013 and in 2014. Confidence indicators in Europe are well below freezing point. The budgetary plans, tighter lending policy of the banks and major uncertainty among consumers and producers will continue to depress growth. 2013 will see a contraction of GDP in Europe. Recovery is not expected until the first half of 2014. Deflation or depression scenarios, which are currently dominating bond market sentiment, are not however justified.
The foundations for more sustainable growth in 2014 and beyond have been laid in recent years. US households have trimmed back their debt level significantly, the savings rate has already increased considerably and loan servicing (installments and interest payments combined) now accounts for only 8% of household budgets (the lowest level in 15 years). Households are gradually moving towards a position where they can spend more of their money on consumption. Economic growth in Europe will remain below par. Sky-high unemployment and the euro crisis are undermining consumer confidence and the banks’ willingness to provide ready access to credit. The ECB’s monetary policy is also much less aggressive than the Fed’s. In contrast, real wage rises (however limited) will be somewhat higher in Europe than in the US.
Today’s world is one of two-speed economies. The mature industrialised economies (US, Europe, Japan) still find themselves in a low-growth environment, with no underlying inflationary pressure, persistently low interest rates and runaway public finances. The picture in the emerging markets is altogether different. The strong economic growth has already created inflationary pressure in Asia. Appropriate monetary policy is therefore required. Monetary policy in China and elsewhere in Asia is highly geared to preventing asset-price inflation. Countries are not only deploying the interest-rate weapon to this end, they are also actively intervening in the credit and housing markets. Thanks to the continuing strength of the emerging markets, the global economy could post growth of 2.5–3% in 2013
and 2014. This is one of the reasons why corporate earnings could continue to grow in the coming quarters at a rate of 5–10%. The current valuation of equities continues to discount a number of very pessimistic scenarios. Based on forecast earnings for the coming 12 months, the price-earnings ratio is 14.5 for the US S&P 500 index and 11.4 for the MSCI Europe. That is 25–30% lower than the historical average. Equities are certainly dirt-cheap compared with bonds..
We remain positive overall on the Luxury & Tourism theme in both the short term and long term. While comparisons to previous years make reporting periods difficult relatively, on an absolute basis the sector is performing well with most companies performing in line with market expectations. The deceleration of growth in China is an obvious concern for the fund, seeing as this is a major growth region for the luxury sector. The pick-up in activity and consumer sentiment in the US is supportive for both luxury and tourism themes. European luxury demand remains weak as fiscal austerity continues, however inbound tourism flows continue to strengthen sales as tourists exploit the price differentials. The increasing trend in brands shifting towards retail from wholesale is a clear indicator that they are seeking to retain control on all levels of the business and is reassuring to investors.
2.1.9 SYNTHETIC RISK AND REWARD INDICATOR Classic Shares: 7 on a scale of 1 (lowest risk) to 7 (highest risk). Institutional B Shares: 7 on a scale of 1 (lowest risk) to 7 (highest risk). The value of a share can decrease or increase and the investor may not get back the amount invested. In accordance with Commission Regulation (EU) No. 583/2010, a synthetic risk and reward indicator has been calculated. This indicator provides a quantitative measure of the sub-fund's potential return and the risk involved, calculated in the currency in which the sub-fund is denominated. It is given as a figure between 1 and 7. The higher the figure, the greater the potential return, but also the more difficult it is to predict this return. Losses are possible too. The lowest figure does not mean that the investment is entirely free of risk. However, it does indicate that, compared with the higher figures, this product will generally provide a lower, but more predictable return. The synthetic risk and reward indicator is assessed regularly and can therefore go up or down based on data from the past. Data from the past is not always a reliable indicator of future risk and return.
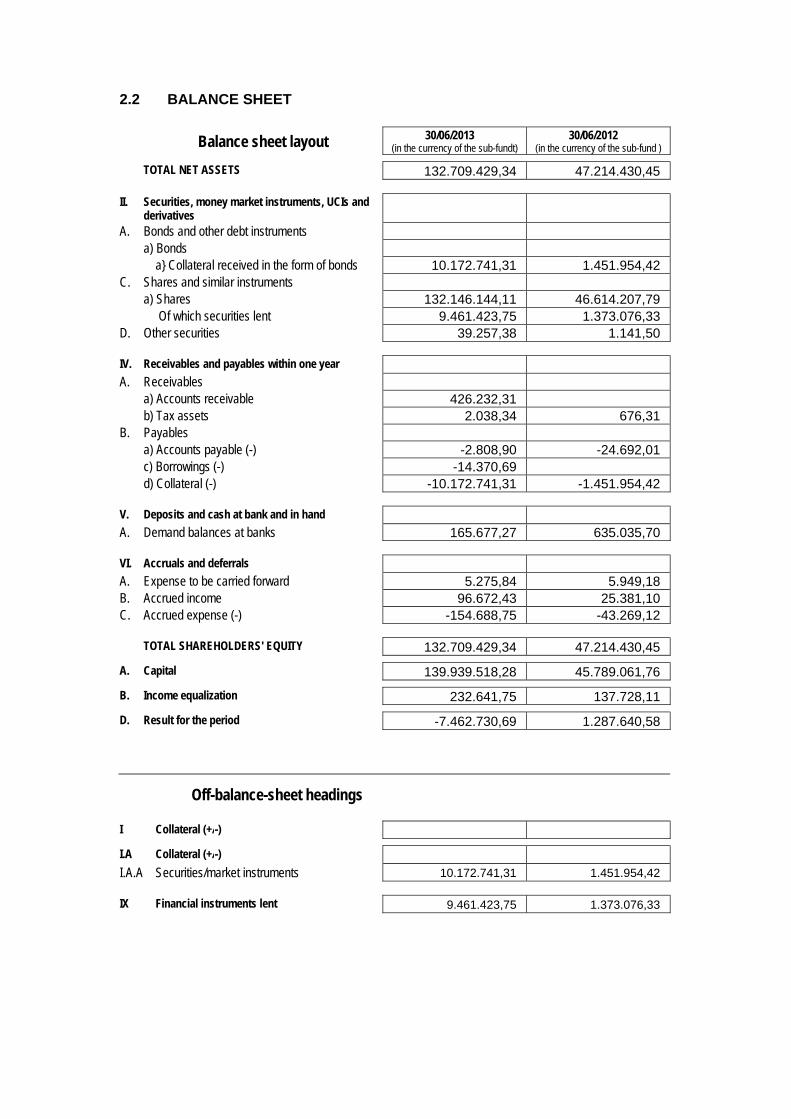
2.2 BALANCE SHEET
Balance sheet layout 30/06/2013 (in the currency of the sub-fundt)
30/06/2012 (in the currency of the sub-fund )
TOTAL NET ASSETS 132.709.429,34 47.214.430,45
II. Securities, money market instruments, UCIs and derivatives
A. Bonds and other debt instruments a) Bonds a} Collateral received in the form of bonds 10.172.741,31 1.451.954,42 C. Shares and similar instruments a) Shares 132.146.144,11 46.614.207,79 Of which securities lent 9.461.423,75 1.373.076,33 D. Other securities 39.257,38 1.141,50
IV. Receivables and payables within one year A. Receivables a) Accounts receivable 426.232,31 b) Tax assets 2.038,34 676,31 B. Payables a) Accounts payable (-) -2.808,90 -24.692,01 c) Borrowings (-) -14.370,69 d) Collateral (-) -10.172.741,31 -1.451.954,42
V. Deposits and cash at bank and in hand A. Demand balances at banks 165.677,27 635.035,70
VI. Accruals and deferrals A. Expense to be carried forward 5.275,84 5.949,18 B. Accrued income 96.672,43 25.381,10 C. Accrued expense (-) -154.688,75 -43.269,12
TOTAL SHAREHOLDERS' EQUITY 132.709.429,34 47.214.430,45
A. Capital 139.939.518,28 45.789.061,76
B. Income equalization 232.641,75 137.728,11
D. Result for the period -7.462.730,69 1.287.640,58
Off-balance-sheet headings
I Collateral (+/-)
I.A Collateral (+/-)
I.A.A Securities/market instruments 10.172.741,31 1.451.954,42
IX Financial instruments lent 9.461.423,75 1.373.076,33
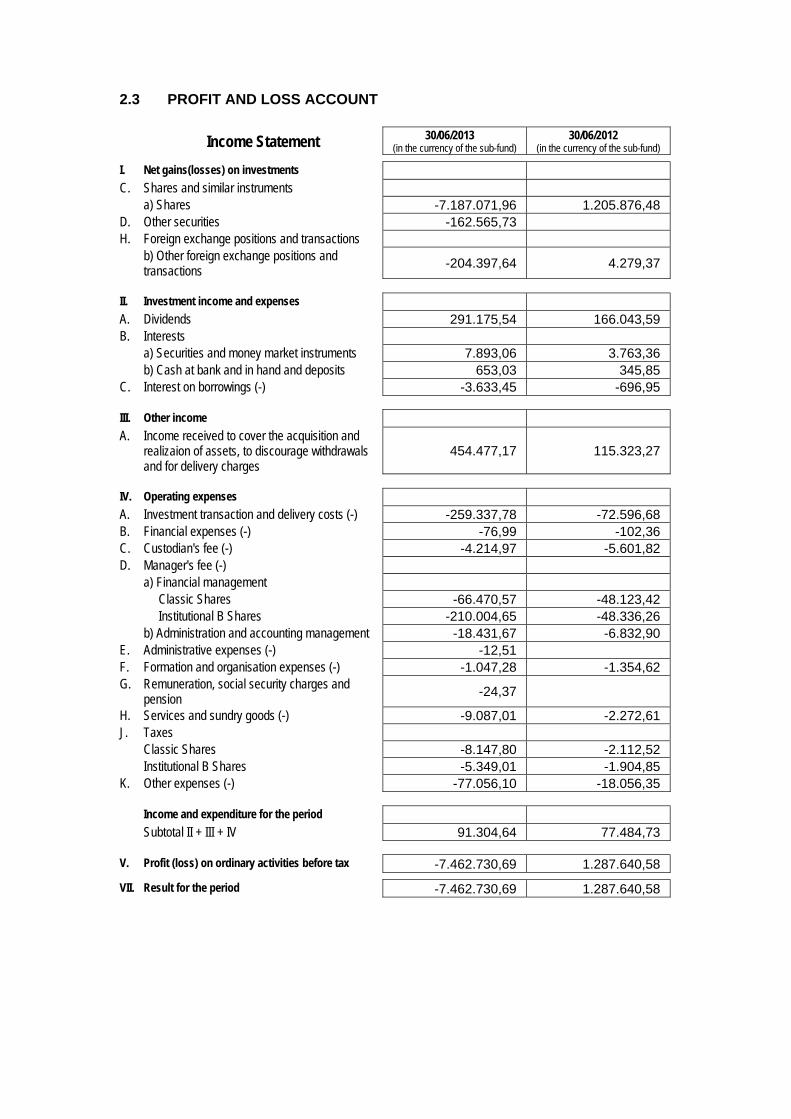
2.3 PROFIT AND LOSS ACCOUNT
Income Statement 30/06/2013 (in the currency of the sub-fund)
30/06/2012 (in the currency of the sub-fund)
I. Net gains(losses) on investments C. Shares and similar instruments a) Shares -7.187.071,96 1.205.876,48 D. Other securities -162.565,73 H. Foreign exchange positions and transactions b) Other foreign exchange positions and
transactions -204.397,64 4.279,37
II. Investment income and expenses A. Dividends 291.175,54 166.043,59 B. Interests a) Securities and money market instruments 7.893,06 3.763,36 b) Cash at bank and in hand and deposits 653,03 345,85 C. Interest on borrowings (-) -3.633,45 -696,95
III. Other income A. Income received to cover the acquisition and
realizaion of assets, to discourage withdrawals and for delivery charges
454.477,17 115.323,27
IV. Operating expenses A. Investment transaction and delivery costs (-) -259.337,78 -72.596,68 B. Financial expenses (-) -76,99 -102,36 C. Custodian's fee (-) -4.214,97 -5.601,82 D. Manager's fee (-) a) Financial management Classic Shares -66.470,57 -48.123,42 Institutional B Shares -210.004,65 -48.336,26 b) Administration and accounting management -18.431,67 -6.832,90 E. Administrative expenses (-) -12,51 F. Formation and organisation expenses (-) -1.047,28 -1.354,62 G. Remuneration, social security charges and
pension -24,37
H. Services and sundry goods (-) -9.087,01 -2.272,61 J. Taxes Classic Shares -8.147,80 -2.112,52 Institutional B Shares -5.349,01 -1.904,85 K. Other expenses (-) -77.056,10 -18.056,35
Income and expenditure for the period Subtotal II + III + IV 91.304,64 77.484,73
V. Profit (loss) on ordinary activities before tax -7.462.730,69 1.287.640,58
VII. Result for the period -7.462.730,69 1.287.640,58
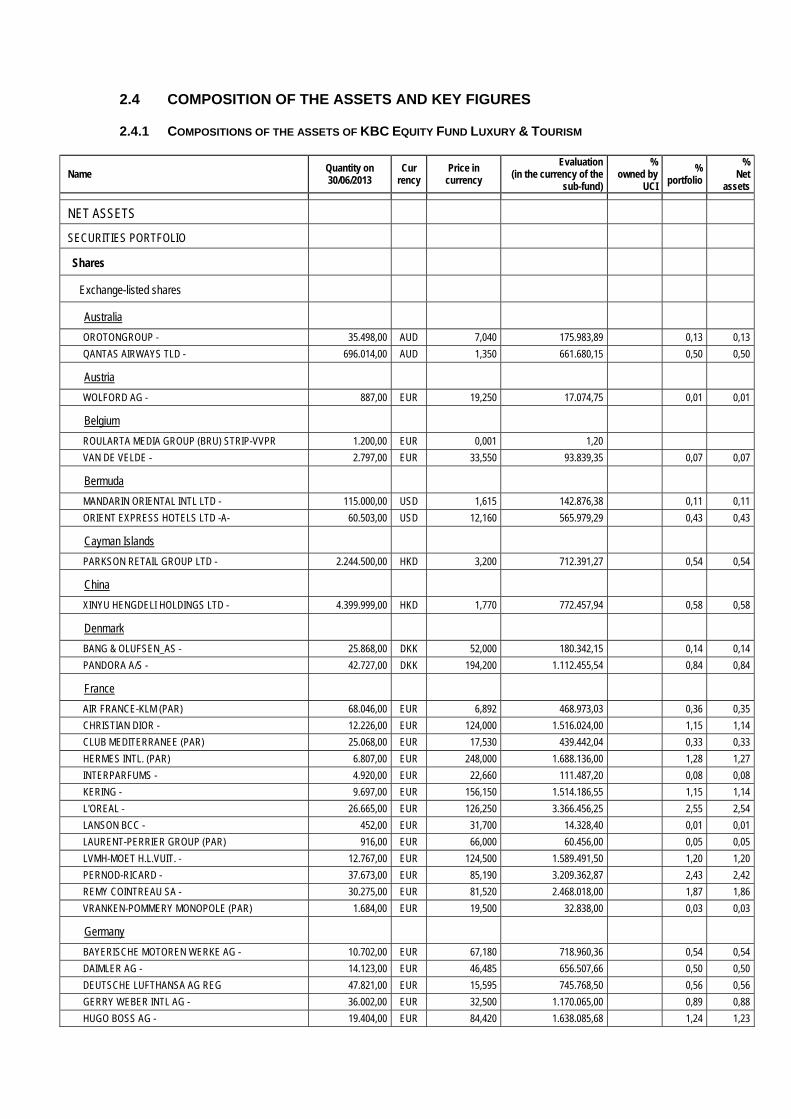
2.4 COMPOSITION OF THE ASSETS AND KEY FIGURES
2.4.1 COMPOSITIONS OF THE ASSETS OF KBC EQUITY FUND LUXURY & TOURISM
Name Quantity on 30/06/2013
Cur rency
Price in currency
Evaluation (in the currency of the
sub-fund)
% owned by
UCI
% portfolio
% Net
assets
NET ASSETS
SECURITIES PORTFOLIO
Shares
Exchange-listed shares
Australia
OROTONGROUP - 35.498,00 AUD 7,040 175.983,89 0,13 0,13
QANTAS AIRWAYS TLD - 696.014,00 AUD 1,350 661.680,15 0,50 0,50
Austria
WOLFORD AG - 887,00 EUR 19,250 17.074,75 0,01 0,01
Belgium
ROULARTA MEDIA GROUP (BRU) STRIP-VVPR 1.200,00 EUR 0,001 1,20
VAN DE VELDE - 2.797,00 EUR 33,550 93.839,35 0,07 0,07
Bermuda
MANDARIN ORIENTAL INTL LTD - 115.000,00 USD 1,615 142.876,38 0,11 0,11
ORIENT EXPRESS HOTELS LTD -A- 60.503,00 USD 12,160 565.979,29 0,43 0,43
Cayman Islands
PARKSON RETAIL GROUP LTD - 2.244.500,00 HKD 3,200 712.391,27 0,54 0,54
China
XINYU HENGDELI HOLDINGS LTD - 4.399.999,00 HKD 1,770 772.457,94 0,58 0,58
Denmark
BANG & OLUFSEN_AS - 25.868,00 DKK 52,000 180.342,15 0,14 0,14
PANDORA A/S - 42.727,00 DKK 194,200 1.112.455,54 0,84 0,84
France
AIR FRANCE-KLM (PAR) 68.046,00 EUR 6,892 468.973,03 0,36 0,35
CHRISTIAN DIOR - 12.226,00 EUR 124,000 1.516.024,00 1,15 1,14
CLUB MEDITERRANEE (PAR) 25.068,00 EUR 17,530 439.442,04 0,33 0,33
HERMES INTL. (PAR) 6.807,00 EUR 248,000 1.688.136,00 1,28 1,27
INTERPARFUMS - 4.920,00 EUR 22,660 111.487,20 0,08 0,08
KERING - 9.697,00 EUR 156,150 1.514.186,55 1,15 1,14
L'OREAL - 26.665,00 EUR 126,250 3.366.456,25 2,55 2,54
LANSON BCC - 452,00 EUR 31,700 14.328,40 0,01 0,01
LAURENT-PERRIER GROUP (PAR) 916,00 EUR 66,000 60.456,00 0,05 0,05
LVMH-MOET H.L.VUIT. - 12.767,00 EUR 124,500 1.589.491,50 1,20 1,20
PERNOD-RICARD - 37.673,00 EUR 85,190 3.209.362,87 2,43 2,42
REMY COINTREAU SA - 30.275,00 EUR 81,520 2.468.018,00 1,87 1,86
VRANKEN-POMMERY MONOPOLE (PAR) 1.684,00 EUR 19,500 32.838,00 0,03 0,03
Germany
BAYERISCHE MOTOREN WERKE AG - 10.702,00 EUR 67,180 718.960,36 0,54 0,54
DAIMLER AG - 14.123,00 EUR 46,485 656.507,66 0,50 0,50
DEUTSCHE LUFTHANSA AG REG 47.821,00 EUR 15,595 745.768,50 0,56 0,56
GERRY WEBER INTL AG - 36.002,00 EUR 32,500 1.170.065,00 0,89 0,88
HUGO BOSS AG - 19.404,00 EUR 84,420 1.638.085,68 1,24 1,23
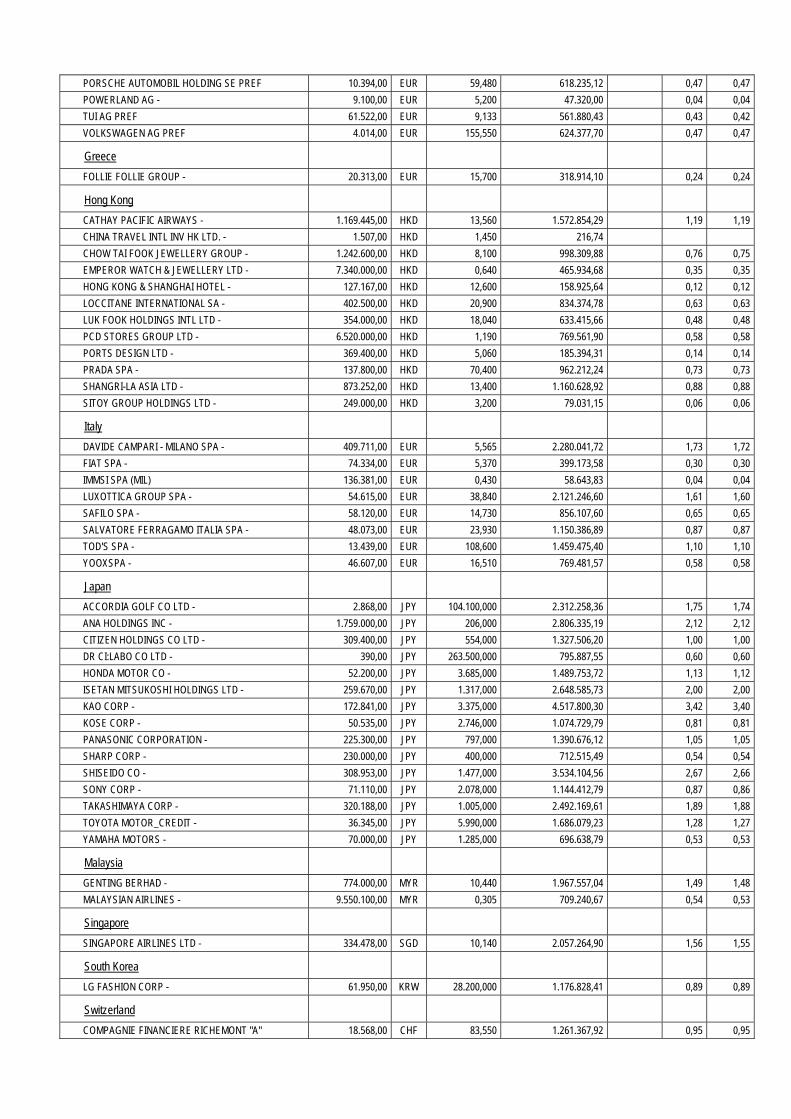
PORSCHE AUTOMOBIL HOLDING SE PREF 10.394,00 EUR 59,480 618.235,12 0,47 0,47
POWERLAND AG - 9.100,00 EUR 5,200 47.320,00 0,04 0,04
TUI AG PREF 61.522,00 EUR 9,133 561.880,43 0,43 0,42
VOLKSWAGEN AG PREF 4.014,00 EUR 155,550 624.377,70 0,47 0,47
Greece
FOLLIE FOLLIE GROUP - 20.313,00 EUR 15,700 318.914,10 0,24 0,24
Hong Kong
CATHAY PACIFIC AIRWAYS - 1.169.445,00 HKD 13,560 1.572.854,29 1,19 1,19
CHINA TRAVEL INTL INV HK LTD. - 1.507,00 HKD 1,450 216,74
CHOW TAI FOOK JEWELLERY GROUP - 1.242.600,00 HKD 8,100 998.309,88 0,76 0,75
EMPEROR WATCH & JEWELLERY LTD - 7.340.000,00 HKD 0,640 465.934,68 0,35 0,35
HONG KONG & SHANGHAI HOTEL - 127.167,00 HKD 12,600 158.925,64 0,12 0,12
LOCCITANE INTERNATIONAL SA - 402.500,00 HKD 20,900 834.374,78 0,63 0,63
LUK FOOK HOLDINGS INTL LTD - 354.000,00 HKD 18,040 633.415,66 0,48 0,48
PCD STORES GROUP LTD - 6.520.000,00 HKD 1,190 769.561,90 0,58 0,58
PORTS DESIGN LTD - 369.400,00 HKD 5,060 185.394,31 0,14 0,14
PRADA SPA - 137.800,00 HKD 70,400 962.212,24 0,73 0,73
SHANGRI-LA ASIA LTD - 873.252,00 HKD 13,400 1.160.628,92 0,88 0,88
SITOY GROUP HOLDINGS LTD - 249.000,00 HKD 3,200 79.031,15 0,06 0,06
Italy
DAVIDE CAMPARI - MILANO SPA - 409.711,00 EUR 5,565 2.280.041,72 1,73 1,72
FIAT SPA - 74.334,00 EUR 5,370 399.173,58 0,30 0,30
IMMSI SPA (MIL) 136.381,00 EUR 0,430 58.643,83 0,04 0,04
LUXOTTICA GROUP SPA - 54.615,00 EUR 38,840 2.121.246,60 1,61 1,60
SAFILO SPA - 58.120,00 EUR 14,730 856.107,60 0,65 0,65
SALVATORE FERRAGAMO ITALIA SPA - 48.073,00 EUR 23,930 1.150.386,89 0,87 0,87
TOD'S SPA - 13.439,00 EUR 108,600 1.459.475,40 1,10 1,10
YOOXSPA - 46.607,00 EUR 16,510 769.481,57 0,58 0,58
Japan
ACCORDIA GOLF CO LTD - 2.868,00 JPY 104.100,000 2.312.258,36 1,75 1,74
ANA HOLDINGS INC - 1.759.000,00 JPY 206,000 2.806.335,19 2,12 2,12
CITIZEN HOLDINGS CO LTD - 309.400,00 JPY 554,000 1.327.506,20 1,00 1,00
DR CI:LABO CO LTD - 390,00 JPY 263.500,000 795.887,55 0,60 0,60
HONDA MOTOR CO - 52.200,00 JPY 3.685,000 1.489.753,72 1,13 1,12
ISETAN MITSUKOSHI HOLDINGS LTD - 259.670,00 JPY 1.317,000 2.648.585,73 2,00 2,00
KAO CORP - 172.841,00 JPY 3.375,000 4.517.800,30 3,42 3,40
KOSE CORP - 50.535,00 JPY 2.746,000 1.074.729,79 0,81 0,81
PANASONIC CORPORATION - 225.300,00 JPY 797,000 1.390.676,12 1,05 1,05
SHARP CORP - 230.000,00 JPY 400,000 712.515,49 0,54 0,54
SHISEIDO CO - 308.953,00 JPY 1.477,000 3.534.104,56 2,67 2,66
SONY CORP - 71.110,00 JPY 2.078,000 1.144.412,79 0,87 0,86
TAKASHIMAYA CORP - 320.188,00 JPY 1.005,000 2.492.169,61 1,89 1,88
TOYOTA MOTOR_CREDIT - 36.345,00 JPY 5.990,000 1.686.079,23 1,28 1,27
YAMAHA MOTORS - 70.000,00 JPY 1.285,000 696.638,79 0,53 0,53
Malaysia
GENTING BERHAD - 774.000,00 MYR 10,440 1.967.557,04 1,49 1,48
MALAYSIAN AIRLINES - 9.550.100,00 MYR 0,305 709.240,67 0,54 0,53
Singapore
SINGAPORE AIRLINES LTD - 334.478,00 SGD 10,140 2.057.264,90 1,56 1,55
South Korea
LG FASHION CORP - 61.950,00 KRW 28.200,000 1.176.828,41 0,89 0,89
Switzerland
COMPAGNIE FINANCIERE RICHEMONT "A" 18.568,00 CHF 83,550 1.261.367,92 0,95 0,95
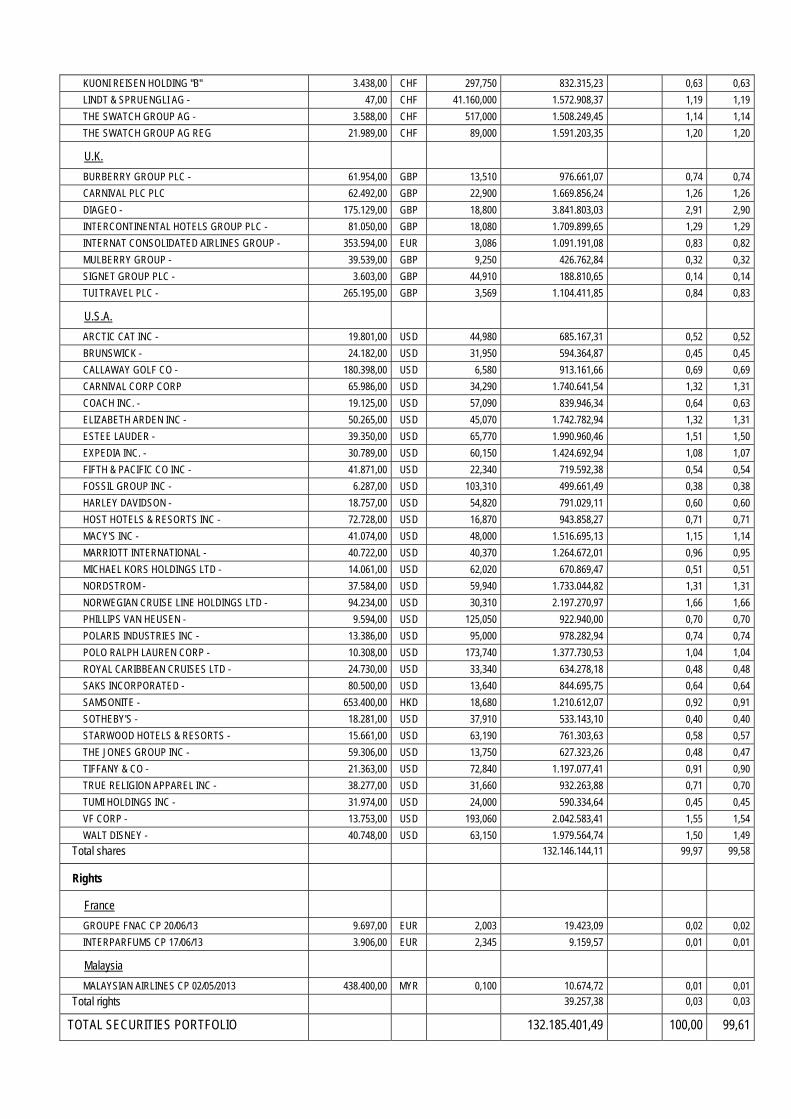
KUONI REISEN HOLDING "B" 3.438,00 CHF 297,750 832.315,23 0,63 0,63
LINDT & SPRUENGLI AG - 47,00 CHF 41.160,000 1.572.908,37 1,19 1,19
THE SWATCH GROUP AG - 3.588,00 CHF 517,000 1.508.249,45 1,14 1,14
THE SWATCH GROUP AG REG 21.989,00 CHF 89,000 1.591.203,35 1,20 1,20
U.K.
BURBERRY GROUP PLC - 61.954,00 GBP 13,510 976.661,07 0,74 0,74
CARNIVAL PLC PLC 62.492,00 GBP 22,900 1.669.856,24 1,26 1,26
DIAGEO - 175.129,00 GBP 18,800 3.841.803,03 2,91 2,90
INTERCONTINENTAL HOTELS GROUP PLC - 81.050,00 GBP 18,080 1.709.899,65 1,29 1,29
INTERNAT CONSOLIDATED AIRLINES GROUP - 353.594,00 EUR 3,086 1.091.191,08 0,83 0,82
MULBERRY GROUP - 39.539,00 GBP 9,250 426.762,84 0,32 0,32
SIGNET GROUP PLC - 3.603,00 GBP 44,910 188.810,65 0,14 0,14
TUI TRAVEL PLC - 265.195,00 GBP 3,569 1.104.411,85 0,84 0,83
U.S.A.
ARCTIC CAT INC - 19.801,00 USD 44,980 685.167,31 0,52 0,52
BRUNSWICK - 24.182,00 USD 31,950 594.364,87 0,45 0,45
CALLAWAY GOLF CO - 180.398,00 USD 6,580 913.161,66 0,69 0,69
CARNIVAL CORP CORP 65.986,00 USD 34,290 1.740.641,54 1,32 1,31
COACH INC. - 19.125,00 USD 57,090 839.946,34 0,64 0,63
ELIZABETH ARDEN INC - 50.265,00 USD 45,070 1.742.782,94 1,32 1,31
ESTEE LAUDER - 39.350,00 USD 65,770 1.990.960,46 1,51 1,50
EXPEDIA INC. - 30.789,00 USD 60,150 1.424.692,94 1,08 1,07
FIFTH & PACIFIC CO INC - 41.871,00 USD 22,340 719.592,38 0,54 0,54
FOSSIL GROUP INC - 6.287,00 USD 103,310 499.661,49 0,38 0,38
HARLEY DAVIDSON - 18.757,00 USD 54,820 791.029,11 0,60 0,60
HOST HOTELS & RESORTS INC - 72.728,00 USD 16,870 943.858,27 0,71 0,71
MACY'S INC - 41.074,00 USD 48,000 1.516.695,13 1,15 1,14
MARRIOTT INTERNATIONAL - 40.722,00 USD 40,370 1.264.672,01 0,96 0,95
MICHAEL KORS HOLDINGS LTD - 14.061,00 USD 62,020 670.869,47 0,51 0,51
NORDSTROM - 37.584,00 USD 59,940 1.733.044,82 1,31 1,31
NORWEGIAN CRUISE LINE HOLDINGS LTD - 94.234,00 USD 30,310 2.197.270,97 1,66 1,66
PHILLIPS VAN HEUSEN - 9.594,00 USD 125,050 922.940,00 0,70 0,70
POLARIS INDUSTRIES INC - 13.386,00 USD 95,000 978.282,94 0,74 0,74
POLO RALPH LAUREN CORP - 10.308,00 USD 173,740 1.377.730,53 1,04 1,04
ROYAL CARIBBEAN CRUISES LTD - 24.730,00 USD 33,340 634.278,18 0,48 0,48
SAKS INCORPORATED - 80.500,00 USD 13,640 844.695,75 0,64 0,64
SAMSONITE - 653.400,00 HKD 18,680 1.210.612,07 0,92 0,91
SOTHEBY'S - 18.281,00 USD 37,910 533.143,10 0,40 0,40
STARWOOD HOTELS & RESORTS - 15.661,00 USD 63,190 761.303,63 0,58 0,57
THE JONES GROUP INC - 59.306,00 USD 13,750 627.323,26 0,48 0,47
TIFFANY & CO - 21.363,00 USD 72,840 1.197.077,41 0,91 0,90
TRUE RELIGION APPAREL INC - 38.277,00 USD 31,660 932.263,88 0,71 0,70
TUMI HOLDINGS INC - 31.974,00 USD 24,000 590.334,64 0,45 0,45
VF CORP - 13.753,00 USD 193,060 2.042.583,41 1,55 1,54
WALT DISNEY - 40.748,00 USD 63,150 1.979.564,74 1,50 1,49
Total shares 132.146.144,11 99,97 99,58
Rights
France
GROUPE FNAC CP 20/06/13 9.697,00 EUR 2,003 19.423,09 0,02 0,02
INTERPARFUMS CP 17/06/13 3.906,00 EUR 2,345 9.159,57 0,01 0,01
Malaysia
MALAYSIAN AIRLINES CP 02/05/2013 438.400,00 MYR 0,100 10.674,72 0,01 0,01
Total rights 39.257,38 0,03 0,03
TOTAL SECURITIES PORTFOLIO 132.185.401,49 100,00 99,61
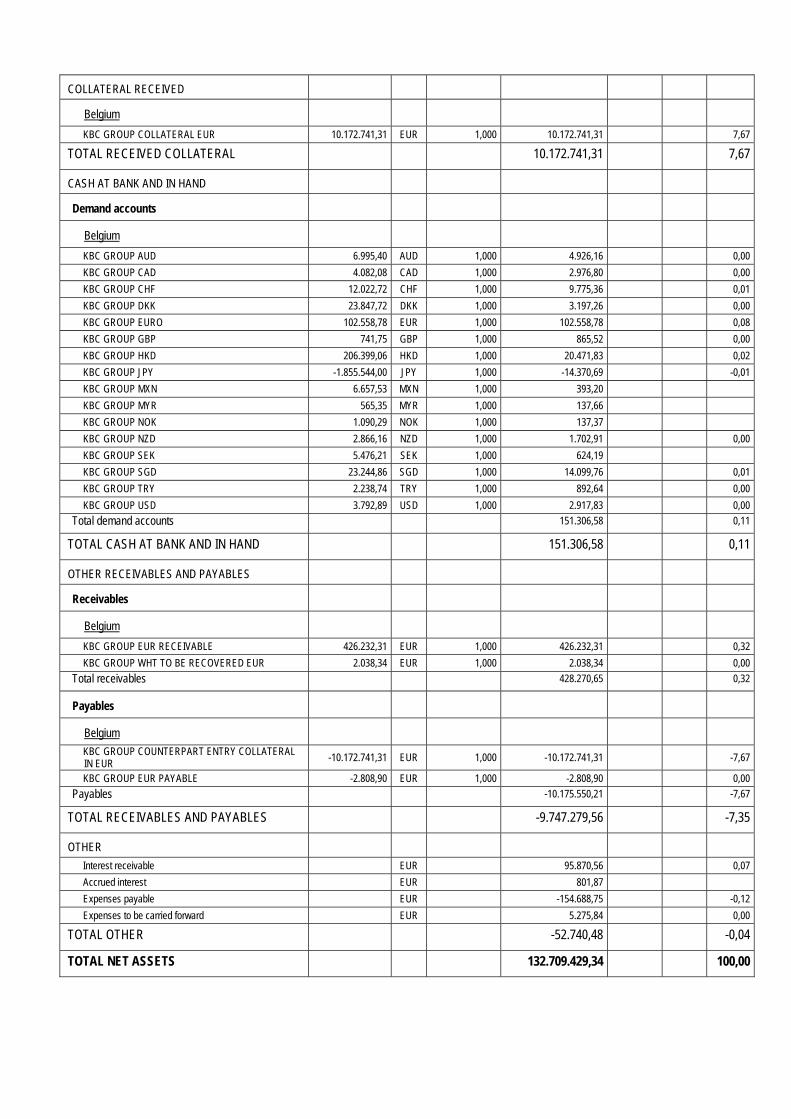
COLLATERAL RECEIVED
Belgium
KBC GROUP COLLATERAL EUR 10.172.741,31 EUR 1,000 10.172.741,31 7,67
TOTAL RECEIVED COLLATERAL 10.172.741,31 7,67
CASH AT BANK AND IN HAND
Demand accounts
Belgium
KBC GROUP AUD 6.995,40 AUD 1,000 4.926,16 0,00
KBC GROUP CAD 4.082,08 CAD 1,000 2.976,80 0,00
KBC GROUP CHF 12.022,72 CHF 1,000 9.775,36 0,01
KBC GROUP DKK 23.847,72 DKK 1,000 3.197,26 0,00
KBC GROUP EURO 102.558,78 EUR 1,000 102.558,78 0,08
KBC GROUP GBP 741,75 GBP 1,000 865,52 0,00
KBC GROUP HKD 206.399,06 HKD 1,000 20.471,83 0,02
KBC GROUP JPY -1.855.544,00 JPY 1,000 -14.370,69 -0,01
KBC GROUP MXN 6.657,53 MXN 1,000 393,20
KBC GROUP MYR 565,35 MYR 1,000 137,66
KBC GROUP NOK 1.090,29 NOK 1,000 137,37
KBC GROUP NZD 2.866,16 NZD 1,000 1.702,91 0,00
KBC GROUP SEK 5.476,21 SEK 1,000 624,19
KBC GROUP SGD 23.244,86 SGD 1,000 14.099,76 0,01
KBC GROUP TRY 2.238,74 TRY 1,000 892,64 0,00
KBC GROUP USD 3.792,89 USD 1,000 2.917,83 0,00
Total demand accounts 151.306,58 0,11
TOTAL CASH AT BANK AND IN HAND 151.306,58 0,11
OTHER RECEIVABLES AND PAYABLES
Receivables
Belgium
KBC GROUP EUR RECEIVABLE 426.232,31 EUR 1,000 426.232,31 0,32
KBC GROUP WHT TO BE RECOVERED EUR 2.038,34 EUR 1,000 2.038,34 0,00
Total receivables 428.270,65 0,32
Payables
Belgium
KBC GROUP COUNTERPART ENTRY COLLATERAL IN EUR
-10.172.741,31 EUR 1,000 -10.172.741,31 -7,67
KBC GROUP EUR PAYABLE -2.808,90 EUR 1,000 -2.808,90 0,00
Payables -10.175.550,21 -7,67
TOTAL RECEIVABLES AND PAYABLES -9.747.279,56 -7,35
OTHER
Interest receivable EUR 95.870,56 0,07
Accrued interest EUR 801,87
Expenses payable EUR -154.688,75 -0,12
Expenses to be carried forward EUR 5.275,84 0,00
TOTAL OTHER -52.740,48 -0,04
TOTAL NET ASSETS 132.709.429,34 100,00
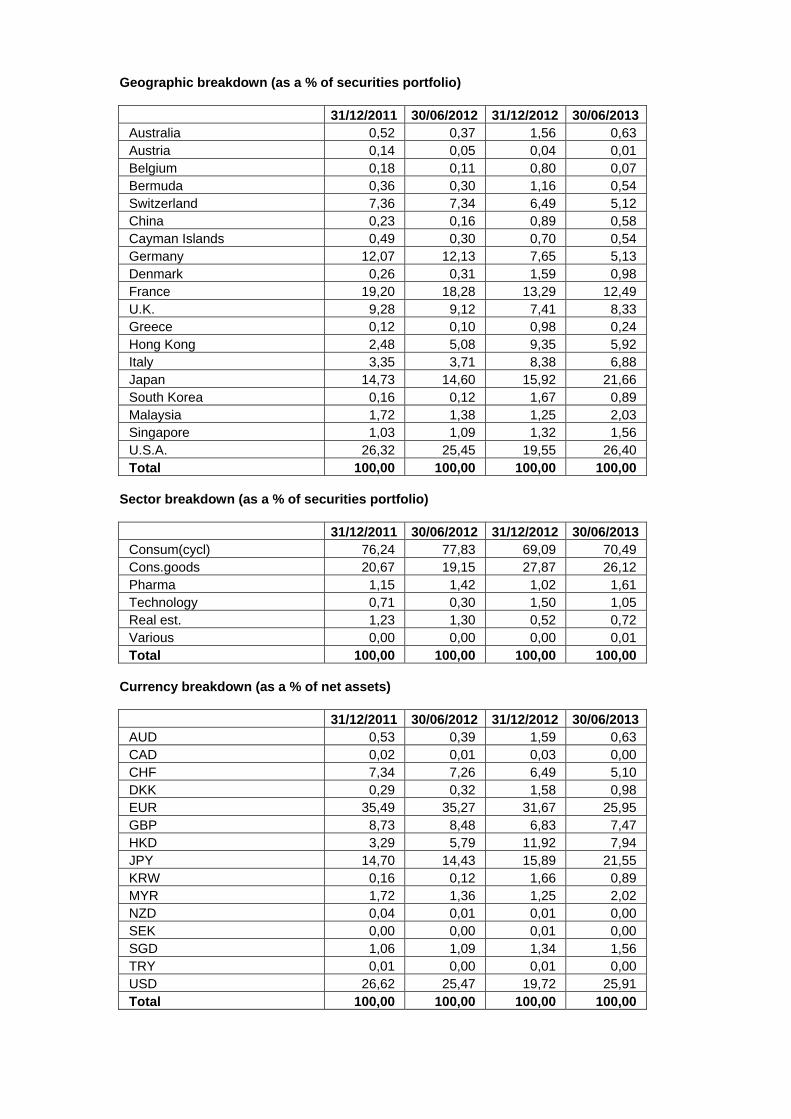
Geographic breakdown (as a % of securities portfolio)
31/12/2011 30/06/2012 31/12/2012 30/06/2013 Australia 0,52 0,37 1,56 0,63 Austria 0,14 0,05 0,04 0,01 Belgium 0,18 0,11 0,80 0,07 Bermuda 0,36 0,30 1,16 0,54 Switzerland 7,36 7,34 6,49 5,12 China 0,23 0,16 0,89 0,58 Cayman Islands 0,49 0,30 0,70 0,54 Germany 12,07 12,13 7,65 5,13 Denmark 0,26 0,31 1,59 0,98 France 19,20 18,28 13,29 12,49 U.K. 9,28 9,12 7,41 8,33 Greece 0,12 0,10 0,98 0,24 Hong Kong 2,48 5,08 9,35 5,92 Italy 3,35 3,71 8,38 6,88 Japan 14,73 14,60 15,92 21,66 South Korea 0,16 0,12 1,67 0,89 Malaysia 1,72 1,38 1,25 2,03 Singapore 1,03 1,09 1,32 1,56 U.S.A. 26,32 25,45 19,55 26,40 Total 100,00 100,00 100,00 100,00
Sector breakdown (as a % of securities portfolio)
31/12/2011 30/06/2012 31/12/2012 30/06/2013 Consum(cycl) 76,24 77,83 69,09 70,49 Cons.goods 20,67 19,15 27,87 26,12 Pharma 1,15 1,42 1,02 1,61 Technology 0,71 0,30 1,50 1,05 Real est. 1,23 1,30 0,52 0,72 Various 0,00 0,00 0,00 0,01 Total 100,00 100,00 100,00 100,00
Currency breakdown (as a % of net assets)
31/12/2011 30/06/2012 31/12/2012 30/06/2013 AUD 0,53 0,39 1,59 0,63 CAD 0,02 0,01 0,03 0,00 CHF 7,34 7,26 6,49 5,10 DKK 0,29 0,32 1,58 0,98 EUR 35,49 35,27 31,67 25,95 GBP 8,73 8,48 6,83 7,47 HKD 3,29 5,79 11,92 7,94 JPY 14,70 14,43 15,89 21,55 KRW 0,16 0,12 1,66 0,89 MYR 1,72 1,36 1,25 2,02 NZD 0,04 0,01 0,01 0,00 SEK 0,00 0,00 0,01 0,00 SGD 1,06 1,09 1,34 1,56 TRY 0,01 0,00 0,01 0,00 USD 26,62 25,47 19,72 25,91 Total 100,00 100,00 100,00 100,00

2.4.2 CHANGES IN THE COMPOSITION OF THE ASSETS OF KBC EQUITY FUND LUXURY & TOURISM
(IN THE CURRENCY OF THE SUB-FUND)
1st half of year YearPurchases 173.537.495,78 173.537.495,78 Sales 45.813.492,56 45.813.492,56 Total 1 219.350.988,34 219.350.988,34 Subscriptions 180.143.350,65 180.143.350,65 Redemptions 51.963.942,99 51.963.942,99 Total 2 232.107.293,64 232.107.293,64 Monthly average of total assets
39.054.780,75 39.054.780,75
Turnover rate -32,66 % -32,66 %
1st half of year YearPurchases 173.537.495,78 173.537.495,78 Sales 45.813.492,56 45.813.492,56 Total 1 219.350.988,34 219.350.988,34 Subscriptions 180.143.350,65 180.143.350,65 Redemptions 51.963.942,99 51.963.942,99 Total 2 232.107.293,64 232.107.293,64 Monthly average of total assets
41.907.767,35 41.907.767,35
Corrected turnover rate -30,44 % -30,44 %
The table above shows the capital volume of portfolio transactions. This volume (adjusted to take account of total subscriptions and redemptions) is also compared to the average net assets at the beginning and end of the period. A figure close to 0% implies that the transactions relating to the securities or transactions relating to the assets (excluding deposits and cash) in a given period only involve subscriptions and redemptions. A negative percentage shows that subscriptions and redemptions entailed few, if any, transactions in the portfolio. Active asset management may result in high turnover rates (monthly percentage >50%). The detailed list of transactions is available for consultation free of charge at the registered office of the Bevek or fund at Havenlaan 2, 1080 Brussels.
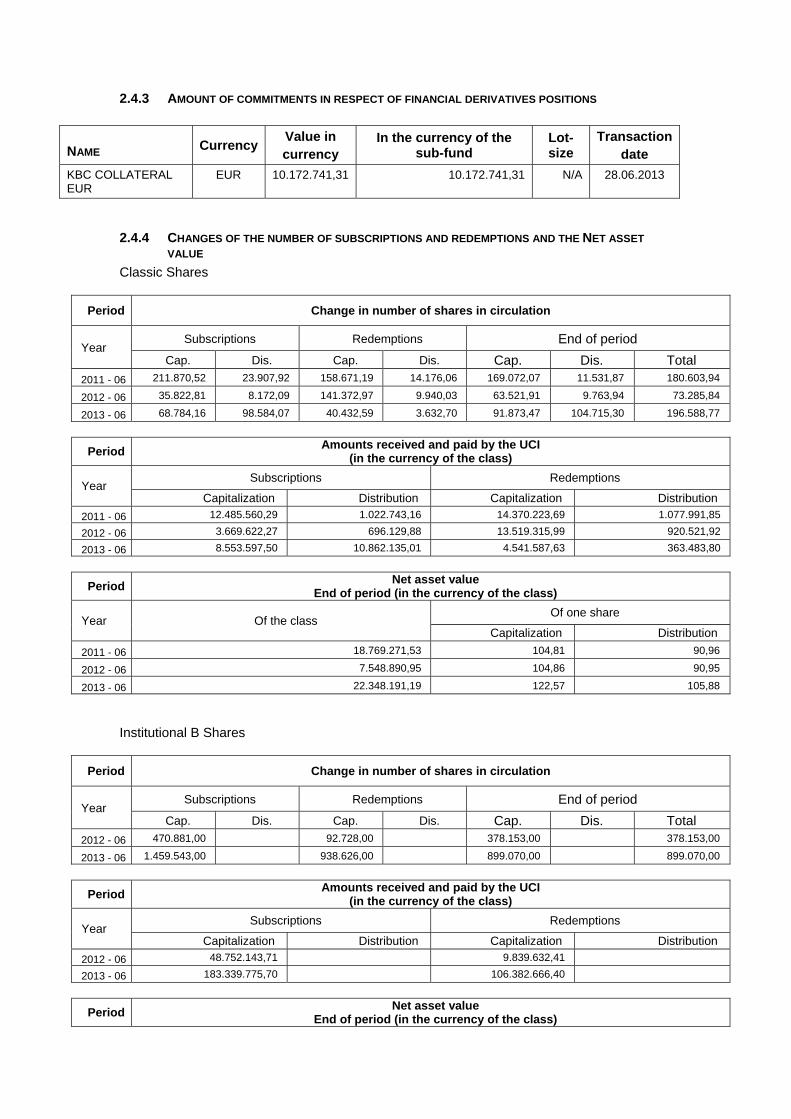
2.4.3 AMOUNT OF COMMITMENTS IN RESPECT OF FINANCIAL DERIVATIVES POSITIONS
NAME Currency Value in currency
In the currency of the sub-fund
Lot-size
Transactiondate
KBC COLLATERAL EUR
EUR 10.172.741,31 10.172.741,31 N/A 28.06.2013
2.4.4 CHANGES OF THE NUMBER OF SUBSCRIPTIONS AND REDEMPTIONS AND THE NET ASSET
VALUE
Classic Shares
Period Change in number of shares in circulation
Year Subscriptions Redemptions End of period
Cap. Dis. Cap. Dis. Cap. Dis. Total
2011 - 06 211.870,52 23.907,92 158.671,19 14.176,06 169.072,07 11.531,87 180.603,94
2012 - 06 35.822,81 8.172,09 141.372,97 9.940,03 63.521,91 9.763,94 73.285,84
2013 - 06 68.784,16 98.584,07 40.432,59 3.632,70 91.873,47 104.715,30 196.588,77
Period Amounts received and paid by the UCI
(in the currency of the class)
Year Subscriptions Redemptions
Capitalization Distribution Capitalization Distribution
2011 - 06 12.485.560,29 1.022.743,16 14.370.223,69 1.077.991,85
2012 - 06 3.669.622,27 696.129,88 13.519.315,99 920.521,92
2013 - 06 8.553.597,50 10.862.135,01 4.541.587,63 363.483,80
Period Net asset value
End of period (in the currency of the class)
Year Of the class Of one share
Capitalization Distribution
2011 - 06 18.769.271,53 104,81 90,96
2012 - 06 7.548.890,95 104,86 90,95
2013 - 06 22.348.191,19 122,57 105,88
Institutional B Shares
Period Change in number of shares in circulation
Year Subscriptions Redemptions End of period
Cap. Dis. Cap. Dis. Cap. Dis. Total 2012 - 06 470.881,00 92.728,00 378.153,00 378.153,00
2013 - 06 1.459.543,00 938.626,00 899.070,00 899.070,00
Period Amounts received and paid by the UCI
(in the currency of the class)
Year Subscriptions Redemptions
Capitalization Distribution Capitalization Distribution
2012 - 06 48.752.143,71 9.839.632,41
2013 - 06 183.339.775,70 106.382.666,40
Period Net asset value
End of period (in the currency of the class)

Year Of the class Of one share
Capitalization Distribution
2012 - 06 39.665.539,48 104,89
2013 - 06 110.361.238,10 122,75
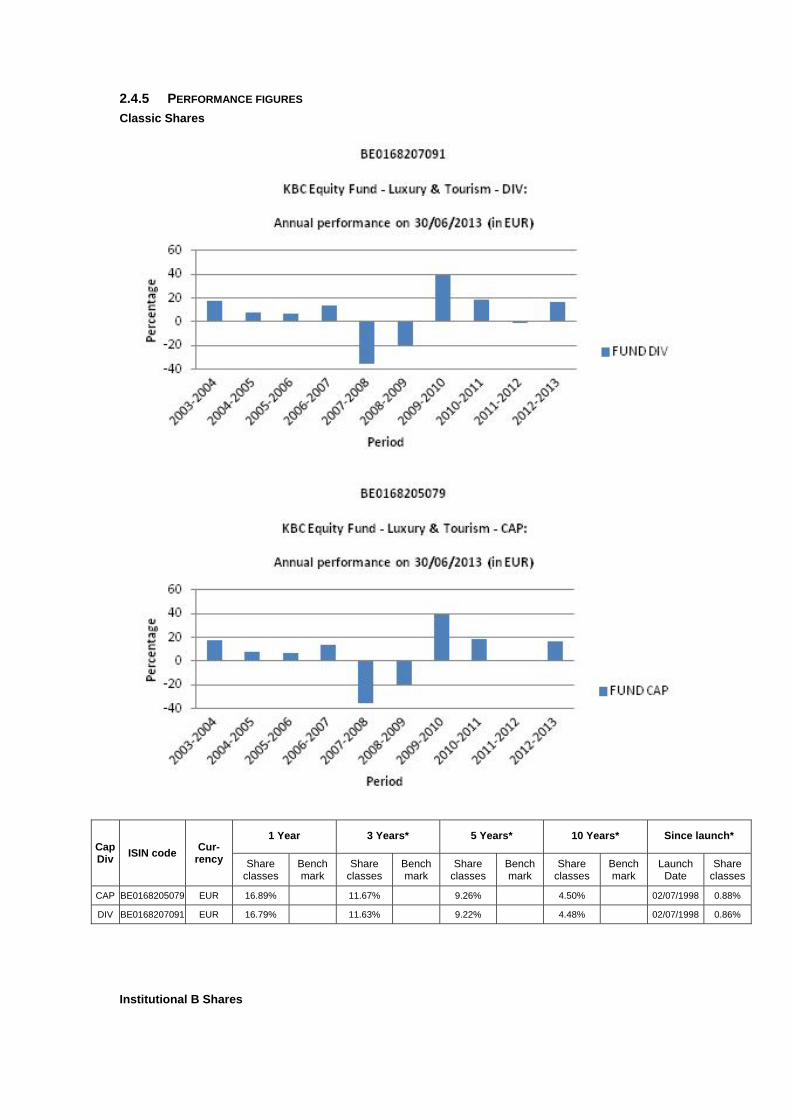
2.4.5 PERFORMANCE FIGURES
Classic Shares
Cap Div
ISIN code Cur-
rency
1 Year 3 Years* 5 Years* 10 Years* Since launch*
Share classes
Bench mark
Share classes
Bench mark
Share classes
Bench mark
Share classes
Bench mark
Launch Date
Share classes
CAP BE0168205079 EUR 16.89% 11.67% 9.26% 4.50% 02/07/1998 0.88%
DIV BE0168207091 EUR 16.79% 11.63% 9.22% 4.48% 02/07/1998 0.86%
Institutional B Shares

Cap Div
ISIN code Cur-
rency
1 Year 3 Years* 5 Years* 10 Years* Since launch*
Share classes
Bench mark
Share classes
Bench mark
Share classes
Bench mark
Share classes
Bench mark
Launch Date
Share classes
CAP BE6228550834 EUR 17.03% 25/11/2011 21.39%
Risk warning: Past performance is not a guide to future performance. * Return on annual basis.
Classic Shares The bar chart shows the performance for full financial years. The figures do not take account of any restructuring. Calculated in EUR. The return is calculated as the change in the net asset value between two dates expressed
as a percentage. In the case of units that pay dividends, the dividend is incorporated geometrically in the return.
Calculation method for date D, where NAV stands for net asset value: Capitalisation units (CAP) Return on date D over a period of X years:
[NIW(D) / NIW(Y)] ^ [1 / X] - 1 where Y = D-X
Return on date D since the start date S of the unit: [NIW(D) / NIW(S)] ^ [1 / F] - 1 where F = 1 if the unit has existed for less than one year on date D where F = (D-S) / 365.25 if the unit has existed for longer than one year on date D
Distribution units (DIV) Return on date D over a period of X years:
[ C * NIW(D) / NIW(Y)] ^ [1 / X] - 1 where Y = D-X
Return on date D since the start date S of the unit: [ C * NIW(D) / NIW(S)] ^ [1 / F] - 1 where F = 1 if the unit has existed for less than one year on date D where F = (D-S) / 365.25 if the unit has existed for longer than one year on date D where C is a factor that is determined for all N dividends between the calculation date D and the reference date.
For dividend i on date Di with value Wi: Ci = [Wi / NIW(Di)] + 1 i = 1 ... N

from whichC = C0 * .... * CN. If the interval between the two dates exceeds one year, the ordinary return calculation is
converted into a return on an annual basis by taking the nth square root of 1 plus the total return of the unit.
The return figures shown above do not take account of the fees and charges associated with the issue and redemption of units.
These are the performance figures for capitalisation and distribution shares.
Institutional B Shares The bar chart shows the performance for full financial years. The figures do not take account of any restructuring. Calculated in EUR. The return is calculated as the change in the net asset value between two dates expressed
as a percentage. Calculation method for date D, where NAV stands for net asset value:
Capitalisation units (CAP) Return on date D over a period of X years:
[NIW(D) / NIW(Y)] ^ [1 / X] - 1 where Y = D-X
Return on date D since the start date S of the unit: [NIW(D) / NIW(S)] ^ [1 / F] - 1 where F = 1 if the unit has existed for less than one year on date D where F = (D-S) / 365.25 if the unit has existed for longer than one year on date D
If the interval between the two dates exceeds one year, the ordinary return calculation is converted into a return on an annual basis by taking the nth square root of 1 plus the total return of the unit.
The return figures shown above do not take account of the fees and charges associated with the issue and redemption of units.
These are the performance figures for capitalization shares.
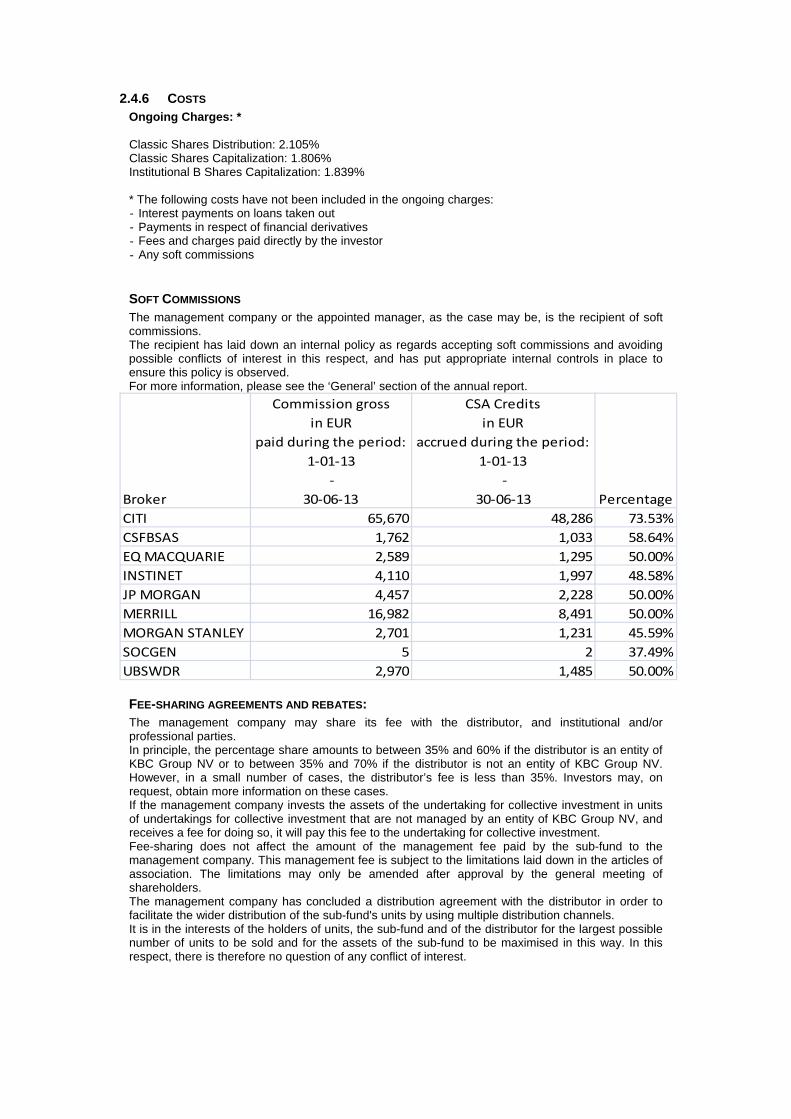
2.4.6 COSTS Ongoing Charges: * Classic Shares Distribution: 2.105% Classic Shares Capitalization: 1.806% Institutional B Shares Capitalization: 1.839% * The following costs have not been included in the ongoing charges: - Interest payments on loans taken out - Payments in respect of financial derivatives - Fees and charges paid directly by the investor - Any soft commissions
SOFT COMMISSIONS The management company or the appointed manager, as the case may be, is the recipient of soft commissions. The recipient has laid down an internal policy as regards accepting soft commissions and avoiding possible conflicts of interest in this respect, and has put appropriate internal controls in place to ensure this policy is observed. For more information, please see the ‘General’ section of the annual report.
Broker
Commission gross
in EUR
paid during the period:
1‐01‐13
‐
30‐06‐13
CSA Credits
in EUR
accrued during the period:
1‐01‐13
‐
30‐06‐13 Percentage
CITI 65,670 48,286 73.53%
CSFBSAS 1,762 1,033 58.64%
EQ MACQUARIE 2,589 1,295 50.00%
INSTINET 4,110 1,997 48.58%
JP MORGAN 4,457 2,228 50.00%
MERRILL 16,982 8,491 50.00%
MORGAN STANLEY 2,701 1,231 45.59%
SOCGEN 5 2 37.49%
UBSWDR 2,970 1,485 50.00%
FEE-SHARING AGREEMENTS AND REBATES: The management company may share its fee with the distributor, and institutional and/or professional parties. In principle, the percentage share amounts to between 35% and 60% if the distributor is an entity of KBC Group NV or to between 35% and 70% if the distributor is not an entity of KBC Group NV. However, in a small number of cases, the distributor’s fee is less than 35%. Investors may, on request, obtain more information on these cases. If the management company invests the assets of the undertaking for collective investment in units of undertakings for collective investment that are not managed by an entity of KBC Group NV, and receives a fee for doing so, it will pay this fee to the undertaking for collective investment. Fee-sharing does not affect the amount of the management fee paid by the sub-fund to the management company. This management fee is subject to the limitations laid down in the articles of association. The limitations may only be amended after approval by the general meeting of shareholders. The management company has concluded a distribution agreement with the distributor in order to facilitate the wider distribution of the sub-fund's units by using multiple distribution channels. It is in the interests of the holders of units, the sub-fund and of the distributor for the largest possible number of units to be sold and for the assets of the sub-fund to be maximised in this way. In this respect, there is therefore no question of any conflict of interest.
2.4.7 NOTES TO THE FINANCIAL STATEMENTS AND OTHER DATA Fee for managing the investment portfolio: 1.5% per annum calculated on the basis of the average total net assets of the sub-fund, no management fee is charged on assets assets invested in investment undertakings managed by a financial institution of the KBC group. KBC Fund Management Limited receives a fee from the management company of max. 1.5% calculated on that part of the portfolio that it manages, without the total management fee received by the management company being exceeded. The administration agent’s fee is payable at the end of each month and is calculated on the basis of the average total net assets of the sub-fund. Auditor's fee: 1 700 EUR per year. This fee is not including VAT and can be indexed on an annual basis in accordance with the decisions of the general meeting. The custody fee is calculated on the value of the securities held in custody by the custodian on the final banking day of the preceding calendar year, except on those assets invested in investment undertakings managed by a financial institution of the KBC group. The custody fee is paid at the beginning of the calendar year. Social, ethical and environmental aspects: No manufacturers of controversial weapons whose use over the past five decades, according to the international consensus, has led to disproportionate human suffering among the civilian population will be included in the portfolio of investments. This involves the manufacturers of anti-personnel mines, cluster bombs and munitions and weapons containing depleted uranium. In this way, the sub-fund seeks to reflect not only simple financial reality but also the social reality of the sector or region in question. Exercising voting rights. If necessary, relevant and in the interest of the shareholders, the management company will exercise the voting rights attached to the shares in the Bevek’s portfolio. The management company will adhere to the following criteria when determining how it stands relative to the items on the agenda that are put to the vote: - Shareholder value may not be adversely affected. - Corporate governance rules, especially with regard to the rights of minority shareholders, must be
respected. - The minimum standards with regard to sustainable business and corporate social responsibility
must be met. The list of companies for which voting rights are exercised is available at the registered office of the Bevek. Securities lending In accordance with the Royal Decree of 7 March 2006 concerning securities lending, the undertaking for collective investment has taken out securities loans with a principal to whom the full title of the loaned securities was transferred, without recording this transfer of ownership in the accounts. For the period from 1 January 2013 to 30 June 2013, the fee for securities lent comes to 8,222.72 EUR. The undertaking for collective investment receives 50% of the fee received for securities lent. The detailed list of securities lending transactions carried out can be obtained from the registered office of the collective investment undertaking at 2 Havenlaan, 1080 Brussels.
Overview of securities lent as at 30/06/2013
Name Currency Quantity Price Value in currency of the
portfolio
AIR FRANCE-KLM EUR 47.588 6,892 327.976,50
DAIMLER AG OP NAME EUR 12.629 46,485 587.059,06
HERMES INTERNATIONAL SA EUR 253 248,000 62.744,00
HUGO BOSS - NAMEN-AKT. EUR 321 84,420 27.098,82
KAO CORP JPY 1.000 3.375,000 26.138,48
LINDT & SPRUENGLI AG REGISTERED CHF 1 41.160,000 33.466,14
PERNOD-RICARD EUR 37.672 85,190 3.209.277,68
PRADA SPA HKD 110.199 70,400 769.483,50
SHISEIDO CO JPY 258.000 1.477,000 2.951.254,65
SWATCH GROUP OP NAME CHF 211 89,000 15.268,72
TOD'S SPA EUR 13.367 108,600 1.451.656,20
Total 9.461.423,75
Details of collateral received for securities lent
Name Currency Nominal value Currency fund Value in Currency fund
AUSTRIA 2012 3,4% 22/11/2022 EUR 2.760.000 EUR 3.149.355,96
FRANCE 2008 3.75% 25/10/2019 EUR 5.573.000 EUR 6.467.951,35
NETHERLANDS 2011 1% 15/01/2014 EUR 550.000 EUR 555.434,00
Total 10.172.741,31 For the valuation of the collateral received, indicative prices have been used in this detail list by the Collateral Management Division of KBC Bank.

Semi-Annual report as at 30th June 2013
TABLE OF CONTENTS
2. Information on KBC Equity Fund Quant Europe
2.1. Management report 2.1.1. Launch date and subscription price 2.1.2. Stock exchange listing 2.1.3. Aim and distinctive features of the investment policy 2.1.4. Financial portfolio management 2.1.5. Distributors 2.1.6. Index and benchmark 2.1.7. Policy conducted during the financial year 2.1.8. Future policy 2.1.9. Synthetic risk and reward indicator (SRRI)
2.2. Balance sheet
2.3. Profit and loss account
2.4. Composition of the assets and key figures
2.4.1. Composition of the assets 2.4.2. Change in the composition of the assets 2.4.3. Value of commitments in respect of financial derivatives positions 2.4.4. Evolution of the number of subscriptions, repayments and the net asset value 2.4.5. Return figures 2.4.6. Expenses 2.4.7. Notes to the financial statements and other data

2 INFORMATION ON KBC EQUITY FUND QUANT EUROPE
2.1 MANAGEMENT REPORT
2.1.1 LAUNCH DATE AND SUBSCRIPTION PRICE Classic Shares : Launch date: 28 September 2007 Initial subscription price: 500 EUR Currency: EUR Institutional B Shares : Launch date: 24 November 2011 Initial subscription price: 268.08 EUR Currency: EUR
2.1.2 STOCK EXCHANGE LISTING Not applicable.
2.1.3 GOAL AND KEY PRINCIPLES OF THE INVESTMENT POLICY
SUB-FUND’S OBJECT: The main objective of this sub-fund is to generate the highest possible return for its shareholders by investing directly or indirectly in transferable securities. This is reflected in its pursuit of capital gains and income. To this end, the assets are invested, either directly or indirectly via correlated financial instruments, primarily in shares.
SUB-FUND’S INVESTMENT POLICY:
PERMITTED ASSET CLASSES: The sub-fund may invest in securities, money market instruments, units in undertakings for collective investment, deposits, financial derivatives, liquid assets and all other instruments insofar as permitted by the applicable laws and regulations and consistent with the sub-fund’s object The sub-fund shall invest no more than 10% of its assets in units of other undertakings for collective investment.
RESTRICTIONS OF THE INVESTMENT POLICY: The investment policy will be implemented within the limits set by law and regulations. The sub-fund may borrow up to 10% of its net assets, insofar as these are short-term borrowings aimed at solving temporary liquidity problems.
PERMITTED DERIVATIVES TRANSACTIONS: Derivates may be used either for hedging purposes or to achieve investment objectives. Changes will be made to the investments at regular intervals to comply with the sub-fund's investment strategy. In addition, listed and unlisted derivates may be used to achieve the objectives: these may be forward contracts, options or swaps on securities, indices, currencies or interest rates or other transactions involving derivatives. Unlisted derivatives transactions will only be concluded with prime financial institutions specialised in such transactions. Such derivatives may also be used to hedge the assets against exchange-rate fluctuations. Subject to the applicable laws and regulations and the articles of association, the sub-fund always seeks to conclude the most effective transactions. All costs associated with the transactions will be charged to the sub-fund and all income generated will be paid to the sub-fund. If the transactions result in a risk in respect of the counterparty, this risk can be hedged by using a margin management system that ensures that the sub-fund is the beneficiary of security (collateral) in the form of cash or investment grade bonds. When calculating the value of the bonds, a margin will be applied that varies depending on the residual term to maturity and the currency in which the bond in question is denominated. The relationship with the counterparty or counterparties is governed by standard international agreements. Derivatives may be used to partially hedge the open exchange risk in relation to the reference currency (euro). Where appropriate, they may therefore limit the foreign exchange risk expressed in euros, and hence the market risk and performance risk too.
Derivatives are liquid and readily negotiable instruments. They do not, therefore, affect the liquidity risk. Derivatives are also used in accordance with the investment policy and strategy. They do not affect the market, performance and concentration risks or the risks associated with external factors or of any kind.
Strategy selected The assets are invested primarily in European shares. The stock picking is based on a series of quantitative models. Developed by KBC Asset Management, these models evaluate shares by sector on the basis of quantitative criteria, mainly fundamental data on the company, such as the price/earnings ratio, and price data, such as the historical return. The basic principle behind these models is that share prices do not always accurately reflect the fundamental value of the company concerned, but that this value can be estimated provided that enough information is available and that it can be processed efficiently.
LENDING FINANCIAL INSTRUMENTS: The sub-fund may lend financial instruments within the limits set by law and regulations. This lending does not affect the sub-fund’s risk profile since: - it takes place within the framework of a securities lending system managed by a principal. In
addition, the sub-fund has a relationship only with the principal of the securities lending system which acts as counterparty and to which title of the loaned securities is transferred. The choice of principal is subject to strict selection criteria. The return of securities similar to the securities that have been lent is guaranteed by the principal.
- through a margin management system, the sub-fund is always guaranteed financial security, the actual value of which always exceeds the actual value of the securities that have been lent, in case the principal does not return similar securities.
The return of securities similar to the securities that have been lent can be requested at any time, which means that the lending of securities does not affect the management of the sub-fund's assets. By lending securities, the sub-fund can generate an additional return. The principal pays a fee to the management company. After deducting the fee for the margin management and clearing services of KBC Bank, most of this fee is paid to the sub-fund. The relationship with the counterparty or counterparties is governed by standard international agreements. More information is provided on the terms and conditions governing securities lending in the annual or half-yearly report for the sub-fund.
GENERAL STRATEGY FOR HEDGING THE EXCHANGE RATE RISK: In order to protect its assets against exchange rate fluctuations and within the limitations laid down in the articles of association, the sub-fund may perform transactions relating to the sale of forward currency contracts, as well as the sale of call options and the purchase of put options on currencies. The transactions in question may relate solely to contracts traded on a regulated market that operates regularly, is recognised and is open to the public or that are traded with a recognised, prime financial institution specialising in such transactions and dealing in the over-the-counter (OTC) market in options. With the same objective, the sub-fund may also sell currencies forward or exchange them in private transactions with prime financial institutions specialising in such transactions. The hedging objective of the aforementioned transactions suggests that there is a direct link between these transactions and the assets to be hedged, which implies that the transactions carried out in a particular currency may in principle not exceed, in terms of volume, either the valuation value of all the assets in the same currency or the holding period of those assets.
SOCIAL, ETHICAL AND ENVIRONMENTAL ASPECTS:
No manufacturers of controversial weapons whose use over the past five decades, according to the international consensus, has led to disproportionate human suffering among the civilian population will be included in the portfolio of investments. This involves the manufacturers of anti-personnel mines, cluster bombs and munitions and weapons containing depleted uranium. In this way, the sub-fund seeks to reflect not only simple financial reality but also the social reality of the sector or region in question.
THE EUROPEAN SAVINGS DIRECTIVE AND TAX ON DEBT CLAIM RETURNS OBTAINED THROUGH THE
REDEMPTION OF OWN UNITS OR IN THE EVENT OF FULL OR PARTIAL DISTRIBUTION OF EQUITY
CAPITAL. The following information is of a general character and is not intended to cover all aspects of an investment in a UCITS. In certain cases entirely different rules might even apply. Moreover, both tax law and the interpretation of it can change. Investors who wish to have more information about the tax implications – in both Belgium and abroad – of acquiring, holding and transferring units should seek the advice of their usual financial and tax advisers. This UCITS shall invest a maximum of 15% of its assets directly or indirectly in debt instruments as intended by the European Savings Directive. A. European Savings Directive (Directive 2003/48/EC) The European Savings Directive has been implemented in Belgium. Since this UCITS invests a maximum of 15% of its assets directly or indirectly in debt claims as intended by the European Savings Directive, the income of this UCITS does not fall within the scope of this directive. B. Tax on debt claim returns obtained through the redemption of own units or in the event of full or partial distribution of equity capital (Article 19bis Income Tax Code 1992). The income from this UCITS is not subject to the tax on debt instrument returns as intended by Article 19bis, Income Tax Code 1992.
2.1.4 FINANCIAL PORTFOLIO MANAGEMENT There is no delegation of the portfolio.
2.1.5 DISTRIBUTORS KBC Asset Management S.A., 5, Place de la Gare, L-1616 Luxembourg.
2.1.6 INDEX AND BENCHMARK See ‘Sub-fund’s investment policy’.

2.1.7 POLICY PERSUED DURING THE FINANCIAL YEAR Real GDP in the EMU contracted by an annualised 1.1%. The austerity programme and credit restrictions pushed Southern Europe into a deep recession. Germany played its traditional role as the driver for European economic growth to a lesser extent than in the recent past. Greater divergence within Europe resulted primarily in a further decline in unemployment in Germany and an alarmingly rapid rise in unemployment in countries such as Greece, Spain and Portugal. Belgium was closer to the strong core of the euro area. Among the traditional markets, Western Europe (MSCI Europe return index over the same period: +4.1%) was unable to continue the catch-up process begun in 2012. Fear that the EMU’s problems entailed a systemic risk nevertheless faded from the market. Europe’s cheaper valuation (compared to the US) was unable to offer any support either. European corporate earnings fell well short of expectations since the first quarter of 2012. They show a downward trend, in stark contrast to developments in other regions. Wall Street was much higher at the end of June than at the end of 2012 (S&P 500: +12.6%, Dow Jones: +13.8%).
2.1.8 FUTURE POLICY Confidence indicators in Europe are well below freezing point. The budgetary plans, tighter lending policy of the banks and major uncertainty among consumers and producers will continue to depress growth. 2013 will see a contraction of GDP in Europe. Recovery is not expected until the first half of 2014. Deflation or depression scenarios, which are currently dominating bond market sentiment, are not however justified. Economic growth in Europe will remain below par. The towering unemployment and the euro crisis are undermining consumer confidence and the banks’ willingness to provide ready access to credit. The ECB’s monetary policy is also much less aggressive than the Fed's. In contrast, real wage rises (however limited) will be somewhat higher in Europe than in the US. Time is of the essence for the euro area. Everyone knows that the EMU is not a perfect monetary union. In its twelve-year history, little has been done to improve its internal operation. National autonomy was sacrosanct. The crisis brought the realisation that ‘economic governance’, as it is now called in Eurospeak, needs to be tackled as a matter of urgency. In concrete terms, this involves measures such as supranational supervision of banks (scheduled to be in place by early 2015), strict monitoring and sanctioning of budgetary policy (a huge challenge given the emergence of austerity fatigue), monitoring of pay policy and harmonising European taxation (a big taboo).
2.1.9 SYNTHETIC RISK AND REWARD INDICATOR Classic Shares: 6 on a scale of 1 (lowest risk) to 7 (highest risk). Institutional B Shares: 6 on a scale of 1 (lowest risk) to 7 (highest risk). The value of a share can decrease or increase and the investor may not get back the amount invested. In accordance with Commission Regulation (EU) No. 583/2010, a synthetic risk and reward indicator has been calculated. This indicator provides a quantitative measure of the sub-fund's potential return and the risk involved, calculated in the currency in which the sub-fund is denominated. It is given as a figure between 1 and 7. The higher the figure, the greater the potential return, but also the more difficult it is to predict this return. Losses are possible too. The lowest figure does not mean that the investment is entirely free of risk. However, it does indicate that, compared with the higher figures, this product will generally provide a lower, but more predictable return. The synthetic risk and reward indicator is assessed regularly and can therefore go up or down based on data from the past. Data from the past is not always a reliable indicator of future risk and return.

2.2 BALANCE SHEET
Balance sheet layout 30/06/2013 (in the currency of the sub-fundt)
30/06/2012 (in the currency of the sub-fund )
TOTAL NET ASSETS 41.962.108,08 38.610.766,28
II. Securities, money market instruments, UCIs and derivatives
A. Bonds and other debt instruments a) Bonds 134.718,30 115.315,10 a} Collateral received in the form of bonds 2.867.810,48 669.877,96 C. Shares and similar instruments a) Shares 43.092.651,64 38.342.956,53 Of which securities lent 2.669.605,73 636.079,45 D. Other securities 33.321,88 573,68 F. Derivative financial instruments m) Financial indices Futures and forward contracts (+/-) -32.616,57 10.599,40
IV. Receivables and payables within one year A. Receivables a) Accounts receivable 18.908,76 b) Tax assets 15.399,30 7.836,36 c) Collateral 67.888,10 B. Payables a) Accounts payable (-) -983,91 -48.346,48 c) Borrowings (-) -1.558.608,56 d) Collateral (-) -2.867.810,48 -669.877,96
V. Deposits and cash at bank and in hand A. Demand balances at banks 86.749,42 94.518,13
VI. Accruals and deferrals A. Expense to be carried forward 19.671,76 -1.656,27 B. Accrued income 116.713,52 108.724,92 C. Accrued expense (-) -31.705,56 -19.755,09
TOTAL SHAREHOLDERS' EQUITY 41.962.108,08 38.610.766,28
A. Capital 39.780.336,48 37.651.037,89
B. Income equalization -152.220,22 -22.851,06
D. Result for the period 2.333.991,82 982.579,45
Off-balance-sheet headings
I Collateral (+/-)
I.A Collateral (+/-)
I.A.A Securities/market instruments 2.867.810,48 669.877,96
I.A.B Cash at bank and in hand/deposits 67.888,10

III Notional amounts of futures and forward contracts
III.A Purchased futures and forward contracts 249.272,06
III.B Written futures and forward contracts -1.022.873,05
IX Financial instruments lent 2.669.605,73 636.079,45
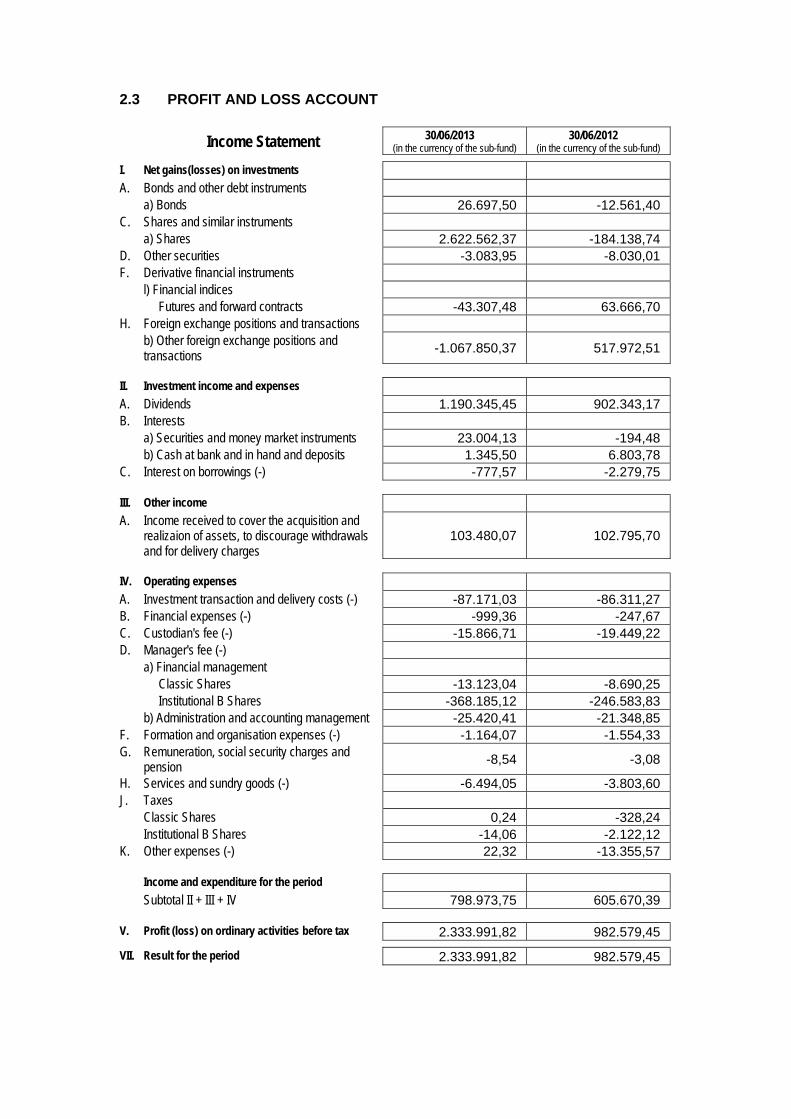
2.3 PROFIT AND LOSS ACCOUNT
Income Statement 30/06/2013 (in the currency of the sub-fund)
30/06/2012 (in the currency of the sub-fund)
I. Net gains(losses) on investments A. Bonds and other debt instruments a) Bonds 26.697,50 -12.561,40 C. Shares and similar instruments a) Shares 2.622.562,37 -184.138,74 D. Other securities -3.083,95 -8.030,01 F. Derivative financial instruments l) Financial indices Futures and forward contracts -43.307,48 63.666,70 H. Foreign exchange positions and transactions b) Other foreign exchange positions and
transactions -1.067.850,37 517.972,51
II. Investment income and expenses A. Dividends 1.190.345,45 902.343,17 B. Interests a) Securities and money market instruments 23.004,13 -194,48 b) Cash at bank and in hand and deposits 1.345,50 6.803,78 C. Interest on borrowings (-) -777,57 -2.279,75
III. Other income A. Income received to cover the acquisition and
realizaion of assets, to discourage withdrawals and for delivery charges
103.480,07 102.795,70
IV. Operating expenses A. Investment transaction and delivery costs (-) -87.171,03 -86.311,27 B. Financial expenses (-) -999,36 -247,67 C. Custodian's fee (-) -15.866,71 -19.449,22 D. Manager's fee (-) a) Financial management Classic Shares -13.123,04 -8.690,25 Institutional B Shares -368.185,12 -246.583,83 b) Administration and accounting management -25.420,41 -21.348,85 F. Formation and organisation expenses (-) -1.164,07 -1.554,33 G. Remuneration, social security charges and
pension -8,54 -3,08
H. Services and sundry goods (-) -6.494,05 -3.803,60 J. Taxes Classic Shares 0,24 -328,24 Institutional B Shares -14,06 -2.122,12 K. Other expenses (-) 22,32 -13.355,57
Income and expenditure for the period Subtotal II + III + IV 798.973,75 605.670,39
V. Profit (loss) on ordinary activities before tax 2.333.991,82 982.579,45
VII. Result for the period 2.333.991,82 982.579,45
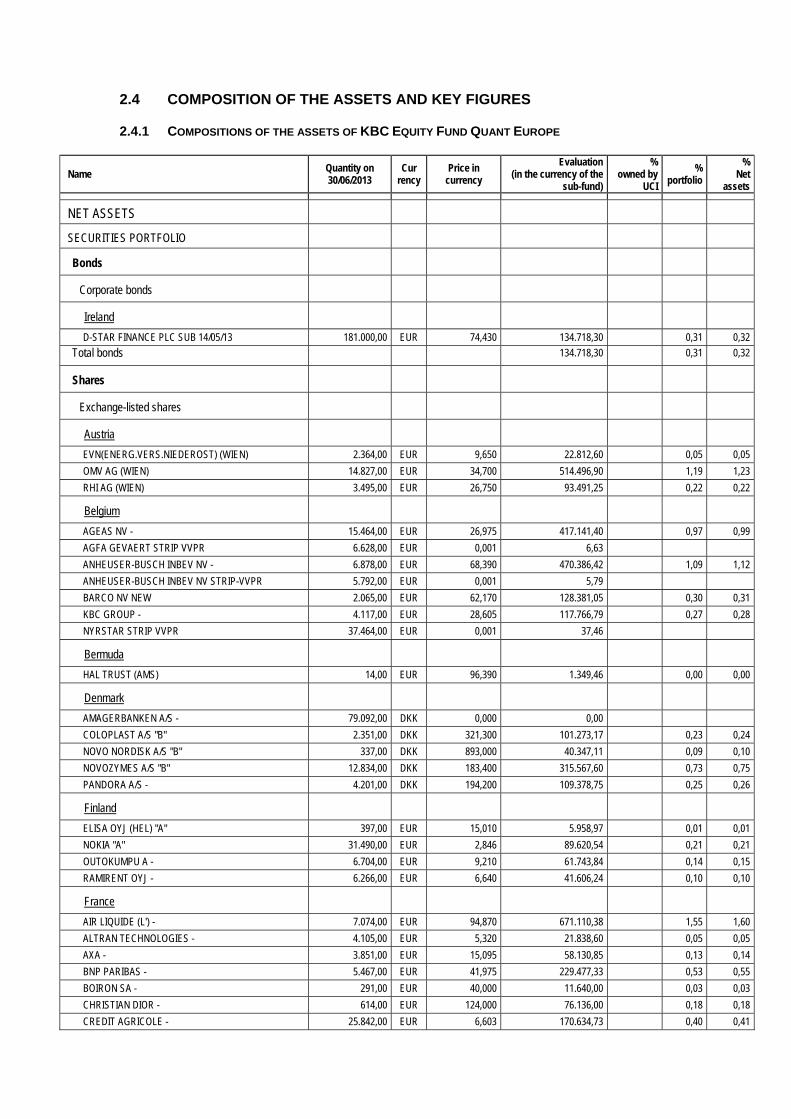
2.4 COMPOSITION OF THE ASSETS AND KEY FIGURES
2.4.1 COMPOSITIONS OF THE ASSETS OF KBC EQUITY FUND QUANT EUROPE
Name Quantity on 30/06/2013
Cur rency
Price in currency
Evaluation (in the currency of the
sub-fund)
% owned by
UCI
% portfolio
% Net
assets
NET ASSETS
SECURITIES PORTFOLIO
Bonds
Corporate bonds
Ireland
D-STAR FINANCE PLC SUB 14/05/13 181.000,00 EUR 74,430 134.718,30 0,31 0,32
Total bonds 134.718,30 0,31 0,32
Shares
Exchange-listed shares
Austria
EVN(ENERG.VERS.NIEDEROST) (WIEN) 2.364,00 EUR 9,650 22.812,60 0,05 0,05
OMV AG (WIEN) 14.827,00 EUR 34,700 514.496,90 1,19 1,23
RHI AG (WIEN) 3.495,00 EUR 26,750 93.491,25 0,22 0,22
Belgium
AGEAS NV - 15.464,00 EUR 26,975 417.141,40 0,97 0,99
AGFA GEVAERT STRIP VVPR 6.628,00 EUR 0,001 6,63
ANHEUSER-BUSCH INBEV NV - 6.878,00 EUR 68,390 470.386,42 1,09 1,12
ANHEUSER-BUSCH INBEV NV STRIP-VVPR 5.792,00 EUR 0,001 5,79
BARCO NV NEW 2.065,00 EUR 62,170 128.381,05 0,30 0,31
KBC GROUP - 4.117,00 EUR 28,605 117.766,79 0,27 0,28
NYRSTAR STRIP VVPR 37.464,00 EUR 0,001 37,46
Bermuda
HAL TRUST (AMS) 14,00 EUR 96,390 1.349,46 0,00 0,00
Denmark
AMAGERBANKEN A/S - 79.092,00 DKK 0,000 0,00
COLOPLAST A/S "B" 2.351,00 DKK 321,300 101.273,17 0,23 0,24
NOVO NORDISK A/S "B" 337,00 DKK 893,000 40.347,11 0,09 0,10
NOVOZYMES A/S "B" 12.834,00 DKK 183,400 315.567,60 0,73 0,75
PANDORA A/S - 4.201,00 DKK 194,200 109.378,75 0,25 0,26
Finland
ELISA OYJ (HEL) "A" 397,00 EUR 15,010 5.958,97 0,01 0,01
NOKIA "A" 31.490,00 EUR 2,846 89.620,54 0,21 0,21
OUTOKUMPU A - 6.704,00 EUR 9,210 61.743,84 0,14 0,15
RAMIRENT OYJ - 6.266,00 EUR 6,640 41.606,24 0,10 0,10
France
AIR LIQUIDE (L') - 7.074,00 EUR 94,870 671.110,38 1,55 1,60
ALTRAN TECHNOLOGIES - 4.105,00 EUR 5,320 21.838,60 0,05 0,05
AXA - 3.851,00 EUR 15,095 58.130,85 0,13 0,14
BNP PARIBAS - 5.467,00 EUR 41,975 229.477,33 0,53 0,55
BOIRON SA - 291,00 EUR 40,000 11.640,00 0,03 0,03
CHRISTIAN DIOR - 614,00 EUR 124,000 76.136,00 0,18 0,18
CREDIT AGRICOLE - 25.842,00 EUR 6,603 170.634,73 0,40 0,41
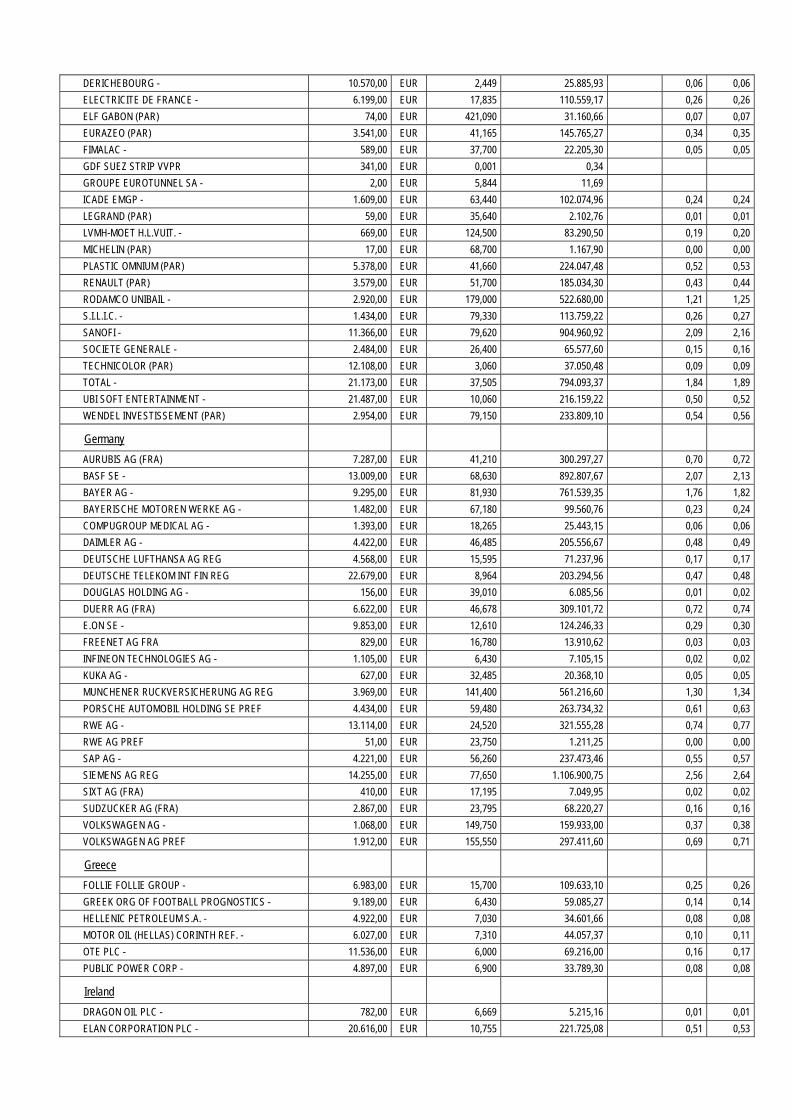
DERICHEBOURG - 10.570,00 EUR 2,449 25.885,93 0,06 0,06
ELECTRICITE DE FRANCE - 6.199,00 EUR 17,835 110.559,17 0,26 0,26
ELF GABON (PAR) 74,00 EUR 421,090 31.160,66 0,07 0,07
EURAZEO (PAR) 3.541,00 EUR 41,165 145.765,27 0,34 0,35
FIMALAC - 589,00 EUR 37,700 22.205,30 0,05 0,05
GDF SUEZ STRIP VVPR 341,00 EUR 0,001 0,34
GROUPE EUROTUNNEL SA - 2,00 EUR 5,844 11,69
ICADE EMGP - 1.609,00 EUR 63,440 102.074,96 0,24 0,24
LEGRAND (PAR) 59,00 EUR 35,640 2.102,76 0,01 0,01
LVMH-MOET H.L.VUIT. - 669,00 EUR 124,500 83.290,50 0,19 0,20
MICHELIN (PAR) 17,00 EUR 68,700 1.167,90 0,00 0,00
PLASTIC OMNIUM (PAR) 5.378,00 EUR 41,660 224.047,48 0,52 0,53
RENAULT (PAR) 3.579,00 EUR 51,700 185.034,30 0,43 0,44
RODAMCO UNIBAIL - 2.920,00 EUR 179,000 522.680,00 1,21 1,25
S.I.L.I.C. - 1.434,00 EUR 79,330 113.759,22 0,26 0,27
SANOFI - 11.366,00 EUR 79,620 904.960,92 2,09 2,16
SOCIETE GENERALE - 2.484,00 EUR 26,400 65.577,60 0,15 0,16
TECHNICOLOR (PAR) 12.108,00 EUR 3,060 37.050,48 0,09 0,09
TOTAL - 21.173,00 EUR 37,505 794.093,37 1,84 1,89
UBI SOFT ENTERTAINMENT - 21.487,00 EUR 10,060 216.159,22 0,50 0,52
WENDEL INVESTISSEMENT (PAR) 2.954,00 EUR 79,150 233.809,10 0,54 0,56
Germany
AURUBIS AG (FRA) 7.287,00 EUR 41,210 300.297,27 0,70 0,72
BASF SE - 13.009,00 EUR 68,630 892.807,67 2,07 2,13
BAYER AG - 9.295,00 EUR 81,930 761.539,35 1,76 1,82
BAYERISCHE MOTOREN WERKE AG - 1.482,00 EUR 67,180 99.560,76 0,23 0,24
COMPUGROUP MEDICAL AG - 1.393,00 EUR 18,265 25.443,15 0,06 0,06
DAIMLER AG - 4.422,00 EUR 46,485 205.556,67 0,48 0,49
DEUTSCHE LUFTHANSA AG REG 4.568,00 EUR 15,595 71.237,96 0,17 0,17
DEUTSCHE TELEKOM INT FIN REG 22.679,00 EUR 8,964 203.294,56 0,47 0,48
DOUGLAS HOLDING AG - 156,00 EUR 39,010 6.085,56 0,01 0,02
DUERR AG (FRA) 6.622,00 EUR 46,678 309.101,72 0,72 0,74
E.ON SE - 9.853,00 EUR 12,610 124.246,33 0,29 0,30
FREENET AG FRA 829,00 EUR 16,780 13.910,62 0,03 0,03
INFINEON TECHNOLOGIES AG - 1.105,00 EUR 6,430 7.105,15 0,02 0,02
KUKA AG - 627,00 EUR 32,485 20.368,10 0,05 0,05
MUNCHENER RUCKVERSICHERUNG AG REG 3.969,00 EUR 141,400 561.216,60 1,30 1,34
PORSCHE AUTOMOBIL HOLDING SE PREF 4.434,00 EUR 59,480 263.734,32 0,61 0,63
RWE AG - 13.114,00 EUR 24,520 321.555,28 0,74 0,77
RWE AG PREF 51,00 EUR 23,750 1.211,25 0,00 0,00
SAP AG - 4.221,00 EUR 56,260 237.473,46 0,55 0,57
SIEMENS AG REG 14.255,00 EUR 77,650 1.106.900,75 2,56 2,64
SIXT AG (FRA) 410,00 EUR 17,195 7.049,95 0,02 0,02
SUDZUCKER AG (FRA) 2.867,00 EUR 23,795 68.220,27 0,16 0,16
VOLKSWAGEN AG - 1.068,00 EUR 149,750 159.933,00 0,37 0,38
VOLKSWAGEN AG PREF 1.912,00 EUR 155,550 297.411,60 0,69 0,71
Greece
FOLLIE FOLLIE GROUP - 6.983,00 EUR 15,700 109.633,10 0,25 0,26
GREEK ORG OF FOOTBALL PROGNOSTICS - 9.189,00 EUR 6,430 59.085,27 0,14 0,14
HELLENIC PETROLEUM S.A. - 4.922,00 EUR 7,030 34.601,66 0,08 0,08
MOTOR OIL (HELLAS) CORINTH REF. - 6.027,00 EUR 7,310 44.057,37 0,10 0,11
OTE PLC - 11.536,00 EUR 6,000 69.216,00 0,16 0,17
PUBLIC POWER CORP - 4.897,00 EUR 6,900 33.789,30 0,08 0,08
Ireland
DRAGON OIL PLC - 782,00 EUR 6,669 5.215,16 0,01 0,01
ELAN CORPORATION PLC - 20.616,00 EUR 10,755 221.725,08 0,51 0,53
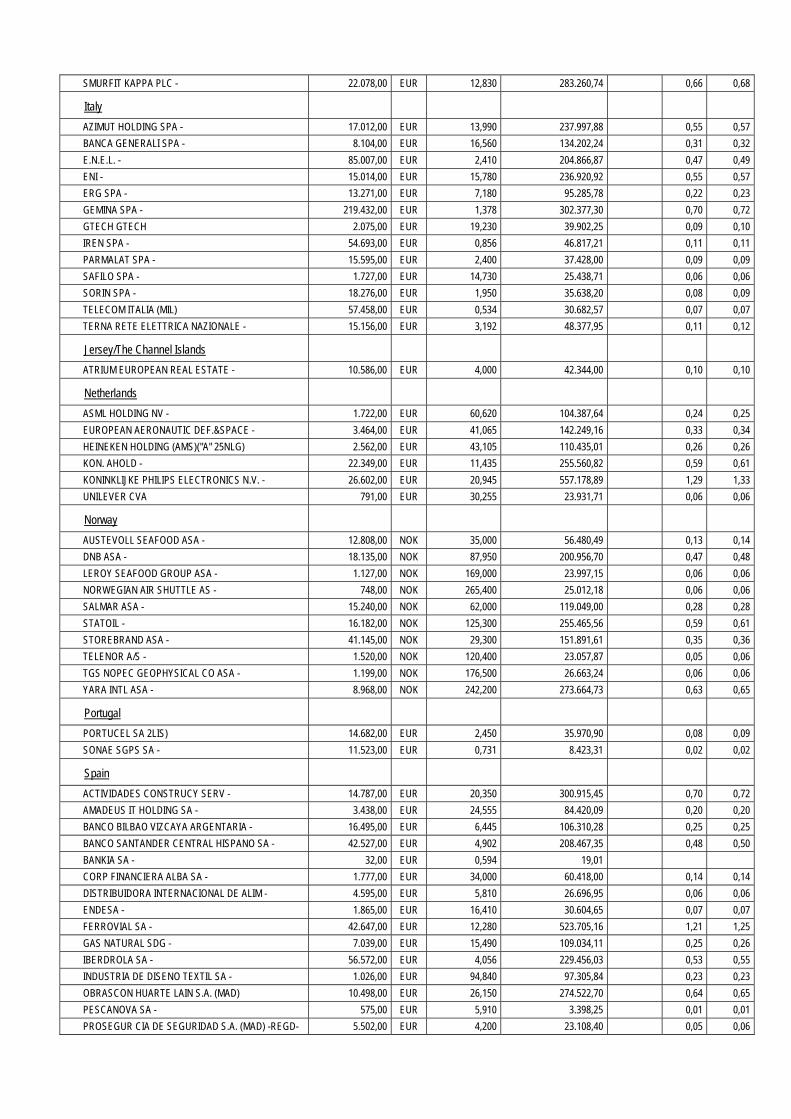
SMURFIT KAPPA PLC - 22.078,00 EUR 12,830 283.260,74 0,66 0,68
Italy
AZIMUT HOLDING SPA - 17.012,00 EUR 13,990 237.997,88 0,55 0,57
BANCA GENERALI SPA - 8.104,00 EUR 16,560 134.202,24 0,31 0,32
E.N.E.L. - 85.007,00 EUR 2,410 204.866,87 0,47 0,49
ENI - 15.014,00 EUR 15,780 236.920,92 0,55 0,57
ERG SPA - 13.271,00 EUR 7,180 95.285,78 0,22 0,23
GEMINA SPA - 219.432,00 EUR 1,378 302.377,30 0,70 0,72
GTECH GTECH 2.075,00 EUR 19,230 39.902,25 0,09 0,10
IREN SPA - 54.693,00 EUR 0,856 46.817,21 0,11 0,11
PARMALAT SPA - 15.595,00 EUR 2,400 37.428,00 0,09 0,09
SAFILO SPA - 1.727,00 EUR 14,730 25.438,71 0,06 0,06
SORIN SPA - 18.276,00 EUR 1,950 35.638,20 0,08 0,09
TELECOM ITALIA (MIL) 57.458,00 EUR 0,534 30.682,57 0,07 0,07
TERNA RETE ELETTRICA NAZIONALE - 15.156,00 EUR 3,192 48.377,95 0,11 0,12
Jersey/The Channel Islands
ATRIUM EUROPEAN REAL ESTATE - 10.586,00 EUR 4,000 42.344,00 0,10 0,10
Netherlands
ASML HOLDING NV - 1.722,00 EUR 60,620 104.387,64 0,24 0,25
EUROPEAN AERONAUTIC DEF.&SPACE - 3.464,00 EUR 41,065 142.249,16 0,33 0,34
HEINEKEN HOLDING (AMS)("A" 25NLG) 2.562,00 EUR 43,105 110.435,01 0,26 0,26
KON. AHOLD - 22.349,00 EUR 11,435 255.560,82 0,59 0,61
KONINKLIJKE PHILIPS ELECTRONICS N.V. - 26.602,00 EUR 20,945 557.178,89 1,29 1,33
UNILEVER CVA 791,00 EUR 30,255 23.931,71 0,06 0,06
Norway
AUSTEVOLL SEAFOOD ASA - 12.808,00 NOK 35,000 56.480,49 0,13 0,14
DNB ASA - 18.135,00 NOK 87,950 200.956,70 0,47 0,48
LEROY SEAFOOD GROUP ASA - 1.127,00 NOK 169,000 23.997,15 0,06 0,06
NORWEGIAN AIR SHUTTLE AS - 748,00 NOK 265,400 25.012,18 0,06 0,06
SALMAR ASA - 15.240,00 NOK 62,000 119.049,00 0,28 0,28
STATOIL - 16.182,00 NOK 125,300 255.465,56 0,59 0,61
STOREBRAND ASA - 41.145,00 NOK 29,300 151.891,61 0,35 0,36
TELENOR A/S - 1.520,00 NOK 120,400 23.057,87 0,05 0,06
TGS NOPEC GEOPHYSICAL CO ASA - 1.199,00 NOK 176,500 26.663,24 0,06 0,06
YARA INTL ASA - 8.968,00 NOK 242,200 273.664,73 0,63 0,65
Portugal
PORTUCEL SA 2LIS) 14.682,00 EUR 2,450 35.970,90 0,08 0,09
SONAE SGPS SA - 11.523,00 EUR 0,731 8.423,31 0,02 0,02
Spain
ACTIVIDADES CONSTRUCY SERV - 14.787,00 EUR 20,350 300.915,45 0,70 0,72
AMADEUS IT HOLDING SA - 3.438,00 EUR 24,555 84.420,09 0,20 0,20
BANCO BILBAO VIZCAYA ARGENTARIA - 16.495,00 EUR 6,445 106.310,28 0,25 0,25
BANCO SANTANDER CENTRAL HISPANO SA - 42.527,00 EUR 4,902 208.467,35 0,48 0,50
BANKIA SA - 32,00 EUR 0,594 19,01
CORP FINANCIERA ALBA SA - 1.777,00 EUR 34,000 60.418,00 0,14 0,14
DISTRIBUIDORA INTERNACIONAL DE ALIM - 4.595,00 EUR 5,810 26.696,95 0,06 0,06
ENDESA - 1.865,00 EUR 16,410 30.604,65 0,07 0,07
FERROVIAL SA - 42.647,00 EUR 12,280 523.705,16 1,21 1,25
GAS NATURAL SDG - 7.039,00 EUR 15,490 109.034,11 0,25 0,26
IBERDROLA SA - 56.572,00 EUR 4,056 229.456,03 0,53 0,55
INDUSTRIA DE DISENO TEXTIL SA - 1.026,00 EUR 94,840 97.305,84 0,23 0,23
OBRASCON HUARTE LAIN S.A. (MAD) 10.498,00 EUR 26,150 274.522,70 0,64 0,65
PESCANOVA SA - 575,00 EUR 5,910 3.398,25 0,01 0,01
PROSEGUR CIA DE SEGURIDAD S.A. (MAD) -REGD- 5.502,00 EUR 4,200 23.108,40 0,05 0,06
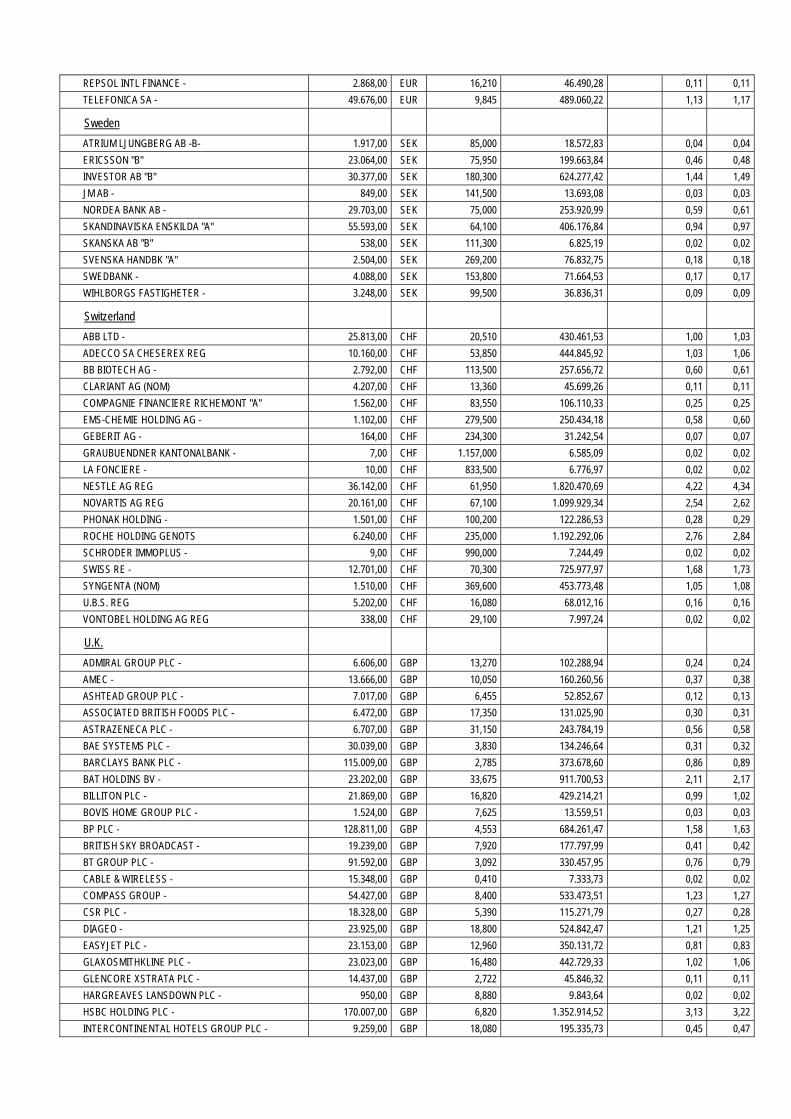
REPSOL INTL FINANCE - 2.868,00 EUR 16,210 46.490,28 0,11 0,11
TELEFONICA SA - 49.676,00 EUR 9,845 489.060,22 1,13 1,17
Sweden
ATRIUM LJUNGBERG AB -B- 1.917,00 SEK 85,000 18.572,83 0,04 0,04
ERICSSON "B" 23.064,00 SEK 75,950 199.663,84 0,46 0,48
INVESTOR AB "B" 30.377,00 SEK 180,300 624.277,42 1,44 1,49
JM AB - 849,00 SEK 141,500 13.693,08 0,03 0,03
NORDEA BANK AB - 29.703,00 SEK 75,000 253.920,99 0,59 0,61
SKANDINAVISKA ENSKILDA "A" 55.593,00 SEK 64,100 406.176,84 0,94 0,97
SKANSKA AB "B" 538,00 SEK 111,300 6.825,19 0,02 0,02
SVENSKA HANDBK "A" 2.504,00 SEK 269,200 76.832,75 0,18 0,18
SWEDBANK - 4.088,00 SEK 153,800 71.664,53 0,17 0,17
WIHLBORGS FASTIGHETER - 3.248,00 SEK 99,500 36.836,31 0,09 0,09
Switzerland
ABB LTD - 25.813,00 CHF 20,510 430.461,53 1,00 1,03
ADECCO SA CHESEREX REG 10.160,00 CHF 53,850 444.845,92 1,03 1,06
BB BIOTECH AG - 2.792,00 CHF 113,500 257.656,72 0,60 0,61
CLARIANT AG (NOM) 4.207,00 CHF 13,360 45.699,26 0,11 0,11
COMPAGNIE FINANCIERE RICHEMONT "A" 1.562,00 CHF 83,550 106.110,33 0,25 0,25
EMS-CHEMIE HOLDING AG - 1.102,00 CHF 279,500 250.434,18 0,58 0,60
GEBERIT AG - 164,00 CHF 234,300 31.242,54 0,07 0,07
GRAUBUENDNER KANTONALBANK - 7,00 CHF 1.157,000 6.585,09 0,02 0,02
LA FONCIERE - 10,00 CHF 833,500 6.776,97 0,02 0,02
NESTLE AG REG 36.142,00 CHF 61,950 1.820.470,69 4,22 4,34
NOVARTIS AG REG 20.161,00 CHF 67,100 1.099.929,34 2,54 2,62
PHONAK HOLDING - 1.501,00 CHF 100,200 122.286,53 0,28 0,29
ROCHE HOLDING GENOTS 6.240,00 CHF 235,000 1.192.292,06 2,76 2,84
SCHRODER IMMOPLUS - 9,00 CHF 990,000 7.244,49 0,02 0,02
SWISS RE - 12.701,00 CHF 70,300 725.977,97 1,68 1,73
SYNGENTA (NOM) 1.510,00 CHF 369,600 453.773,48 1,05 1,08
U.B.S. REG 5.202,00 CHF 16,080 68.012,16 0,16 0,16
VONTOBEL HOLDING AG REG 338,00 CHF 29,100 7.997,24 0,02 0,02
U.K.
ADMIRAL GROUP PLC - 6.606,00 GBP 13,270 102.288,94 0,24 0,24
AMEC - 13.666,00 GBP 10,050 160.260,56 0,37 0,38
ASHTEAD GROUP PLC - 7.017,00 GBP 6,455 52.852,67 0,12 0,13
ASSOCIATED BRITISH FOODS PLC - 6.472,00 GBP 17,350 131.025,90 0,30 0,31
ASTRAZENECA PLC - 6.707,00 GBP 31,150 243.784,19 0,56 0,58
BAE SYSTEMS PLC - 30.039,00 GBP 3,830 134.246,64 0,31 0,32
BARCLAYS BANK PLC - 115.009,00 GBP 2,785 373.678,60 0,86 0,89
BAT HOLDINS BV - 23.202,00 GBP 33,675 911.700,53 2,11 2,17
BILLITON PLC - 21.869,00 GBP 16,820 429.214,21 0,99 1,02
BOVIS HOME GROUP PLC - 1.524,00 GBP 7,625 13.559,51 0,03 0,03
BP PLC - 128.811,00 GBP 4,553 684.261,47 1,58 1,63
BRITISH SKY BROADCAST - 19.239,00 GBP 7,920 177.797,99 0,41 0,42
BT GROUP PLC - 91.592,00 GBP 3,092 330.457,95 0,76 0,79
CABLE & WIRELESS - 15.348,00 GBP 0,410 7.333,73 0,02 0,02
COMPASS GROUP - 54.427,00 GBP 8,400 533.473,51 1,23 1,27
CSR PLC - 18.328,00 GBP 5,390 115.271,79 0,27 0,28
DIAGEO - 23.925,00 GBP 18,800 524.842,47 1,21 1,25
EASYJET PLC - 23.153,00 GBP 12,960 350.131,72 0,81 0,83
GLAXOSMITHKLINE PLC - 23.023,00 GBP 16,480 442.729,33 1,02 1,06
GLENCORE XSTRATA PLC - 14.437,00 GBP 2,722 45.846,32 0,11 0,11
HARGREAVES LANSDOWN PLC - 950,00 GBP 8,880 9.843,64 0,02 0,02
HSBC HOLDING PLC - 170.007,00 GBP 6,820 1.352.914,52 3,13 3,22
INTERCONTINENTAL HOTELS GROUP PLC - 9.259,00 GBP 18,080 195.335,73 0,45 0,47

ITV PLC - 113.777,00 GBP 1,401 185.999,51 0,43 0,44
JOHNSON MATTHEY PLC - 5.916,00 GBP 26,280 181.414,80 0,42 0,43
LLOYDS BANKING GROUP PLC - 479.487,00 GBP 0,632 353.376,88 0,82 0,84
MONDI PLC - 14.343,00 GBP 8,180 136.902,85 0,32 0,33
MONEYSUPERMARKET.COM - 34.251,00 GBP 1,916 76.575,16 0,18 0,18
PACE MICRO TECHNOLOGY PLC - 11.098,00 GBP 2,419 31.325,63 0,07 0,08
PETROFAC LTD - 367,00 GBP 11,980 5.130,29 0,01 0,01
PREMIER OIL PLC - 1.246,00 GBP 3,331 4.842,97 0,01 0,01
PRUDENTIAL PLC - 5.181,00 GBP 10,750 64.989,21 0,15 0,16
RECKITT BENCKISER PLC - 16.983,00 GBP 46,480 921.084,99 2,13 2,20
RIO TINTO PLC - 10.255,00 GBP 26,830 321.052,10 0,74 0,77
ROLLS ROYCE GROUP PLC - 20.177,00 GBP 11,340 266.986,21 0,62 0,64
ROYAL DUTCH SHELL PLC -A- 11.535,00 GBP 21,000 282.654,61 0,65 0,67
ROYAL DUTCH SHELL PLC -B- 22.637,00 GBP 21,760 574.773,77 1,33 1,37
SAVILLS - 22.251,00 GBP 5,710 148.253,45 0,34 0,35
SCHRODERS PLC - 3.080,00 GBP 21,830 78.455,54 0,18 0,19
SIGNET GROUP PLC - 162,00 GBP 44,910 8.489,40 0,02 0,02
STANDARD CHARTERED - 33.192,00 GBP 14,270 552.683,59 1,28 1,32
STANDARD LIFE PLC - 86.039,00 GBP 3,457 347.067,47 0,80 0,83
TESCO - 26.288,00 GBP 3,314 101.655,11 0,24 0,24
UNILEVER PLC - 2.806,00 GBP 26,620 87.159,53 0,20 0,21
VODAFONE GROUP PLC - 340.593,00 GBP 1,879 746.562,37 1,73 1,78
WH SMITH PLC - 12.016,00 GBP 7,180 100.670,81 0,23 0,24
3IGROUP - 91.707,00 GBP 3,376 361.263,51 0,84 0,86
Total shares 43.092.651,64 99,69 102,69
Options and futures
Exchange-listed futures
Belgium
EURO - STOXX 50 SEP 13 -20,00 EUR 2.598,000 -519.600,00 -1,20 -1,24
U.K.
FTSE 100 ID X FUT SEP 13 -7,00 GBP 6.161,500 -503.273,05 -1,16 -1,20
Suspense accounts (futures)
Belgium
EURO - STOXX 50 SEP 13 501.400,00 EUR 1,000 501.400,00 1,16 1,20
U.K.
FTSE 100 ID X FUT SEP 13 418.950,00 GBP 1,000 488.856,48 1,13 1,17
Total options and futures -32.616,57 -0,08 -0,08
Warrants
France
UBI SOFT ENTERTAINMENT 10/10/2013 2.399,00 EUR 0,284 681,32 0,00 0,00
Spain
PROMOTORA DE INFORMACIONES SA CP 05/06/14 51.131,00 EUR 0,010 511,31 0,00 0,00
Total Warrants 1.192,63 0,00 0,00
Rights
France
ELECTRICITE DE FRANCE CP 06/06/2013 20.316,00 EUR 0,680 13.814,88 0,03 0,03
Spain
REPSOL INTL FINANCE CP 20/06/13 2.868,00 EUR 0,428 1.227,50 0,00 0,00
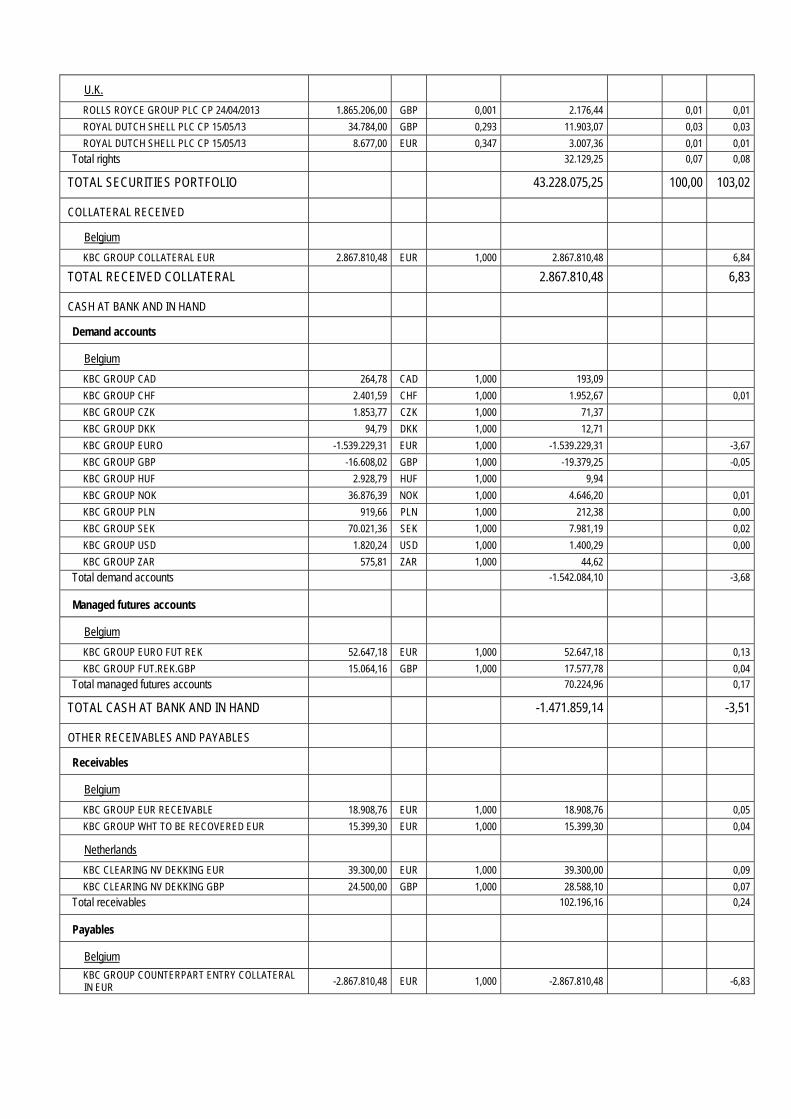
U.K.
ROLLS ROYCE GROUP PLC CP 24/04/2013 1.865.206,00 GBP 0,001 2.176,44 0,01 0,01
ROYAL DUTCH SHELL PLC CP 15/05/13 34.784,00 GBP 0,293 11.903,07 0,03 0,03
ROYAL DUTCH SHELL PLC CP 15/05/13 8.677,00 EUR 0,347 3.007,36 0,01 0,01
Total rights 32.129,25 0,07 0,08
TOTAL SECURITIES PORTFOLIO 43.228.075,25 100,00 103,02
COLLATERAL RECEIVED
Belgium
KBC GROUP COLLATERAL EUR 2.867.810,48 EUR 1,000 2.867.810,48 6,84
TOTAL RECEIVED COLLATERAL 2.867.810,48 6,83
CASH AT BANK AND IN HAND
Demand accounts
Belgium
KBC GROUP CAD 264,78 CAD 1,000 193,09
KBC GROUP CHF 2.401,59 CHF 1,000 1.952,67 0,01
KBC GROUP CZK 1.853,77 CZK 1,000 71,37
KBC GROUP DKK 94,79 DKK 1,000 12,71
KBC GROUP EURO -1.539.229,31 EUR 1,000 -1.539.229,31 -3,67
KBC GROUP GBP -16.608,02 GBP 1,000 -19.379,25 -0,05
KBC GROUP HUF 2.928,79 HUF 1,000 9,94
KBC GROUP NOK 36.876,39 NOK 1,000 4.646,20 0,01
KBC GROUP PLN 919,66 PLN 1,000 212,38 0,00
KBC GROUP SEK 70.021,36 SEK 1,000 7.981,19 0,02
KBC GROUP USD 1.820,24 USD 1,000 1.400,29 0,00
KBC GROUP ZAR 575,81 ZAR 1,000 44,62
Total demand accounts -1.542.084,10 -3,68
Managed futures accounts
Belgium
KBC GROUP EURO FUT REK 52.647,18 EUR 1,000 52.647,18 0,13
KBC GROUP FUT.REK.GBP 15.064,16 GBP 1,000 17.577,78 0,04
Total managed futures accounts 70.224,96 0,17
TOTAL CASH AT BANK AND IN HAND -1.471.859,14 -3,51
OTHER RECEIVABLES AND PAYABLES
Receivables
Belgium
KBC GROUP EUR RECEIVABLE 18.908,76 EUR 1,000 18.908,76 0,05
KBC GROUP WHT TO BE RECOVERED EUR 15.399,30 EUR 1,000 15.399,30 0,04
Netherlands
KBC CLEARING NV DEKKING EUR 39.300,00 EUR 1,000 39.300,00 0,09
KBC CLEARING NV DEKKING GBP 24.500,00 GBP 1,000 28.588,10 0,07
Total receivables 102.196,16 0,24
Payables
Belgium
KBC GROUP COUNTERPART ENTRY COLLATERAL IN EUR -2.867.810,48 EUR 1,000 -2.867.810,48 -6,83

KBC GROUP EUR PAYABLE -983,91 EUR 1,000 -983,91 0,00
Payables -2.868.794,39 -6,84
TOTAL RECEIVABLES AND PAYABLES -2.766.598,23 -6,59
OTHER
Interest receivable EUR 105.738,24 0,25
Accrued interest EUR 10.975,28 0,03
Expenses payable EUR -31.705,56 -0,08
Expenses to be carried forward EUR 19.671,76 0,05
TOTAL OTHER 104.679,72 0,25
TOTAL NET ASSETS 41.962.108,08 100,00
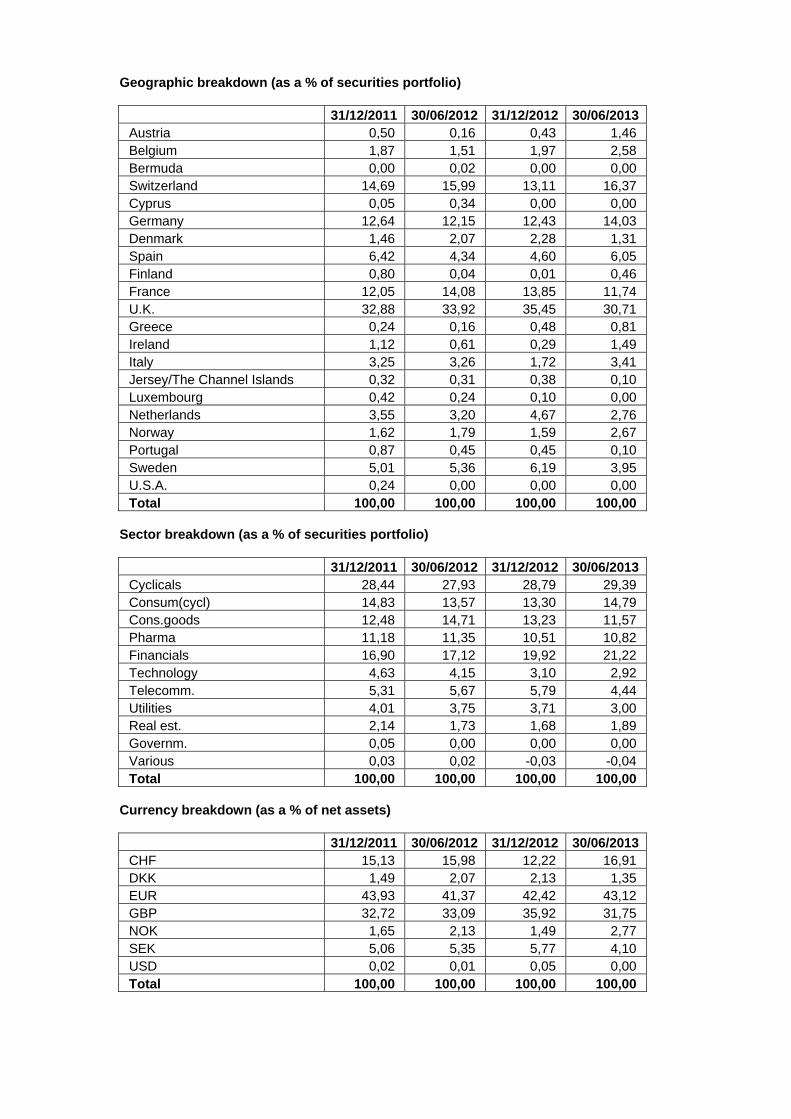
Geographic breakdown (as a % of securities portfolio)
31/12/2011 30/06/2012 31/12/2012 30/06/2013 Austria 0,50 0,16 0,43 1,46 Belgium 1,87 1,51 1,97 2,58 Bermuda 0,00 0,02 0,00 0,00 Switzerland 14,69 15,99 13,11 16,37 Cyprus 0,05 0,34 0,00 0,00 Germany 12,64 12,15 12,43 14,03 Denmark 1,46 2,07 2,28 1,31 Spain 6,42 4,34 4,60 6,05 Finland 0,80 0,04 0,01 0,46 France 12,05 14,08 13,85 11,74 U.K. 32,88 33,92 35,45 30,71 Greece 0,24 0,16 0,48 0,81 Ireland 1,12 0,61 0,29 1,49 Italy 3,25 3,26 1,72 3,41 Jersey/The Channel Islands 0,32 0,31 0,38 0,10 Luxembourg 0,42 0,24 0,10 0,00 Netherlands 3,55 3,20 4,67 2,76 Norway 1,62 1,79 1,59 2,67 Portugal 0,87 0,45 0,45 0,10 Sweden 5,01 5,36 6,19 3,95 U.S.A. 0,24 0,00 0,00 0,00 Total 100,00 100,00 100,00 100,00
Sector breakdown (as a % of securities portfolio)
31/12/2011 30/06/2012 31/12/2012 30/06/2013 Cyclicals 28,44 27,93 28,79 29,39 Consum(cycl) 14,83 13,57 13,30 14,79 Cons.goods 12,48 14,71 13,23 11,57 Pharma 11,18 11,35 10,51 10,82 Financials 16,90 17,12 19,92 21,22 Technology 4,63 4,15 3,10 2,92 Telecomm. 5,31 5,67 5,79 4,44 Utilities 4,01 3,75 3,71 3,00 Real est. 2,14 1,73 1,68 1,89 Governm. 0,05 0,00 0,00 0,00 Various 0,03 0,02 -0,03 -0,04 Total 100,00 100,00 100,00 100,00
Currency breakdown (as a % of net assets)
31/12/2011 30/06/2012 31/12/2012 30/06/2013 CHF 15,13 15,98 12,22 16,91 DKK 1,49 2,07 2,13 1,35 EUR 43,93 41,37 42,42 43,12 GBP 32,72 33,09 35,92 31,75 NOK 1,65 2,13 1,49 2,77 SEK 5,06 5,35 5,77 4,10 USD 0,02 0,01 0,05 0,00 Total 100,00 100,00 100,00 100,00

2.4.2 CHANGES IN THE COMPOSITION OF THE ASSETS OF KBC EQUITY FUND QUANT EUROPE (IN
THE CURRENCY OF THE SUB-FUND)
1st half of year YearPurchases 26.451.744,16 26.451.744,16 Sales 29.527.128,70 29.527.128,70 Total 1 55.978.872,86 55.978.872,86 Subscriptions 25.158.498,81 25.158.498,81 Redemptions 33.058.325,38 33.058.325,38 Total 2 58.216.824,19 58.216.824,19 Monthly average of total assets
51.493.753,29 51.493.753,29
Turnover rate -4,35 % -4,35 %
1st half of year YearPurchases 26.451.744,16 26.451.744,16 Sales 29.527.128,70 29.527.128,70 Total 1 55.978.872,86 55.978.872,86 Subscriptions 25.158.498,81 25.158.498,81 Redemptions 33.058.325,38 33.058.325,38 Total 2 58.216.824,19 58.216.824,19 Monthly average of total assets
29.618.201,88 29.618.201,88
Corrected turnover rate -7,56 % -7,56 %
The table above shows the capital volume of portfolio transactions. This volume (adjusted to take account of total subscriptions and redemptions) is also compared to the average net assets at the beginning and end of the period. A figure close to 0% implies that the transactions relating to the securities or transactions relating to the assets (excluding deposits and cash) in a given period only involve subscriptions and redemptions. A negative percentage shows that subscriptions and redemptions entailed few, if any, transactions in the portfolio. Active asset management may result in high turnover rates (monthly percentage >50%). The detailed list of transactions is available for consultation free of charge at the registered office of the Bevek or fund at Havenlaan 2, 1080 Brussels.
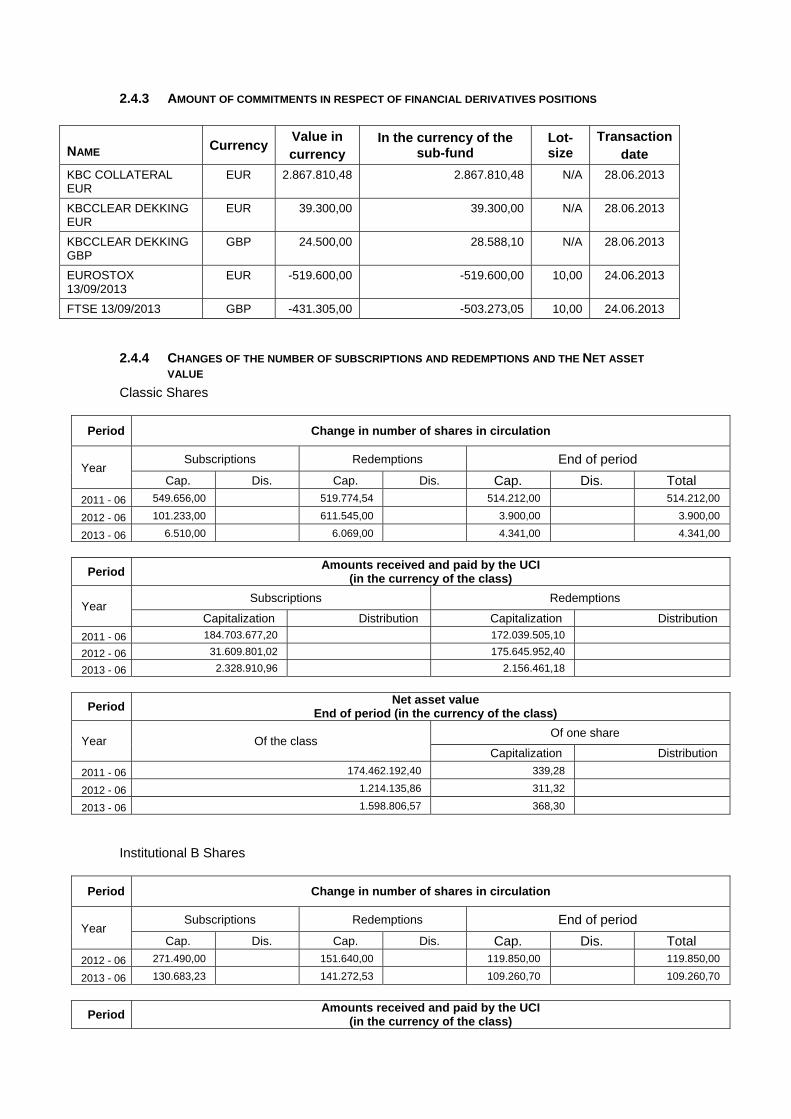
2.4.3 AMOUNT OF COMMITMENTS IN RESPECT OF FINANCIAL DERIVATIVES POSITIONS
NAME Currency Value in currency
In the currency of the sub-fund
Lot-size
Transactiondate
KBC COLLATERAL EUR
EUR 2.867.810,48 2.867.810,48 N/A 28.06.2013
KBCCLEAR DEKKING EUR
EUR 39.300,00 39.300,00 N/A 28.06.2013
KBCCLEAR DEKKING GBP
GBP 24.500,00 28.588,10 N/A 28.06.2013
EUROSTOX 13/09/2013
EUR -519.600,00 -519.600,00 10,00 24.06.2013
FTSE 13/09/2013 GBP -431.305,00 -503.273,05 10,00 24.06.2013
2.4.4 CHANGES OF THE NUMBER OF SUBSCRIPTIONS AND REDEMPTIONS AND THE NET ASSET
VALUE
Classic Shares
Period Change in number of shares in circulation
Year Subscriptions Redemptions End of period
Cap. Dis. Cap. Dis. Cap. Dis. Total 2011 - 06 549.656,00 519.774,54 514.212,00 514.212,00
2012 - 06 101.233,00 611.545,00 3.900,00 3.900,00
2013 - 06 6.510,00 6.069,00 4.341,00 4.341,00
Period Amounts received and paid by the UCI
(in the currency of the class)
Year Subscriptions Redemptions
Capitalization Distribution Capitalization Distribution
2011 - 06 184.703.677,20 172.039.505,10
2012 - 06 31.609.801,02 175.645.952,40
2013 - 06 2.328.910,96 2.156.461,18
Period Net asset value
End of period (in the currency of the class)
Year Of the class Of one share
Capitalization Distribution
2011 - 06 174.462.192,40 339,28
2012 - 06 1.214.135,86 311,32
2013 - 06 1.598.806,57 368,30
Institutional B Shares
Period Change in number of shares in circulation
Year Subscriptions Redemptions End of period
Cap. Dis. Cap. Dis. Cap. Dis. Total 2012 - 06 271.490,00 151.640,00 119.850,00 119.850,00
2013 - 06 130.683,23 141.272,53 109.260,70 109.260,70
Period Amounts received and paid by the UCI
(in the currency of the class)
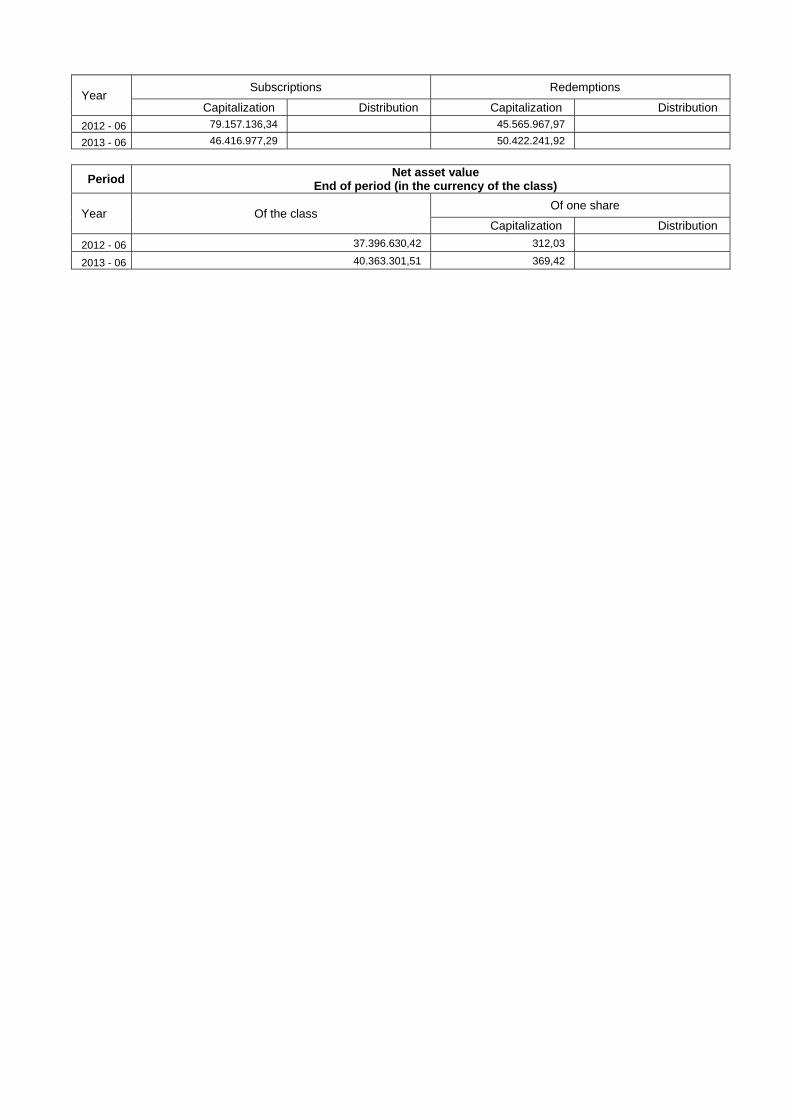
Year Subscriptions Redemptions
Capitalization Distribution Capitalization Distribution
2012 - 06 79.157.136,34 45.565.967,97
2013 - 06 46.416.977,29 50.422.241,92
Period Net asset value
End of period (in the currency of the class)
Year Of the class Of one share
Capitalization Distribution
2012 - 06 37.396.630,42 312,03
2013 - 06 40.363.301,51 369,42
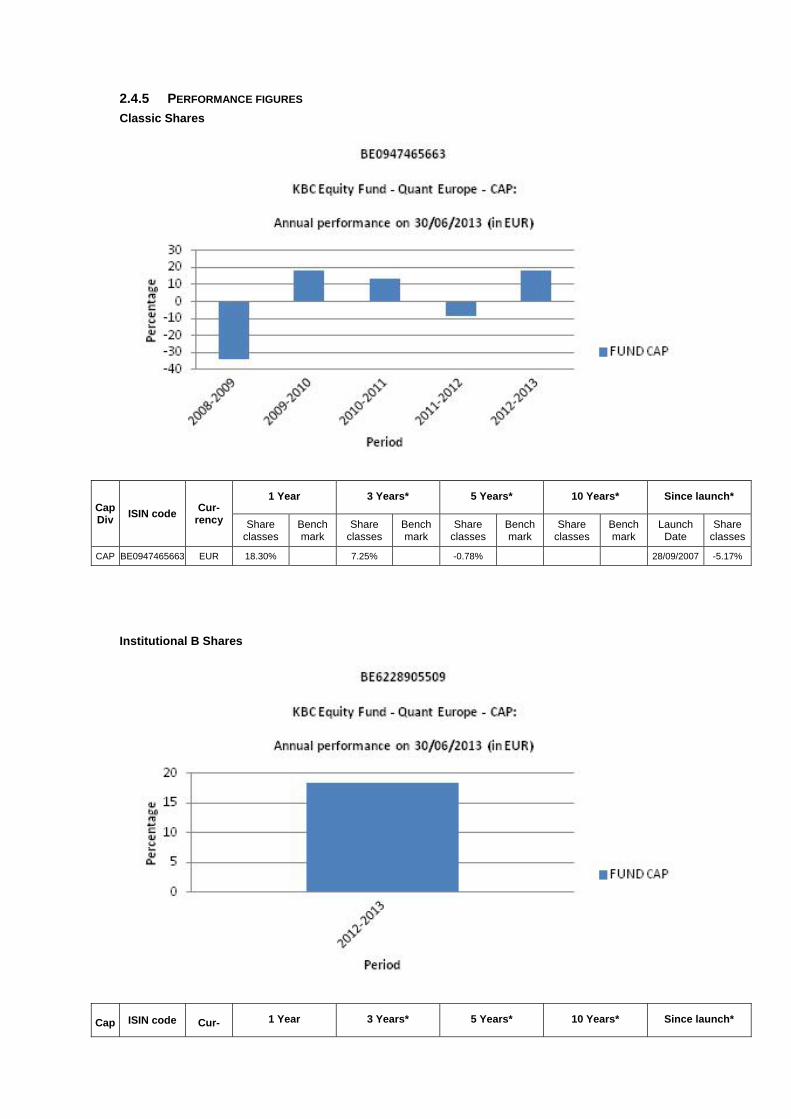
2.4.5 PERFORMANCE FIGURES
Classic Shares
Cap Div
ISIN code Cur-
rency
1 Year 3 Years* 5 Years* 10 Years* Since launch*
Share classes
Bench mark
Share classes
Bench mark
Share classes
Bench mark
Share classes
Bench mark
Launch Date
Share classes
CAP BE0947465663 EUR 18.30% 7.25% -0.78% 28/09/2007 -5.17%
Institutional B Shares
Cap ISIN code Cur- 1 Year 3 Years* 5 Years* 10 Years* Since launch*

Div rency Share classes
Bench mark
Share classes
Bench mark
Share classes
Bench mark
Share classes
Bench mark
Launch Date
Share classes
CAP BE6228905509 EUR 18.39% 24/11/2011 22.21%
Risk warning: Past performance is not a guide to future performance. * Return on annual basis.
Classic Shares The bar chart shows the performance for full financial years. The figures do not take account of any restructuring. Calculated in EUR. The return is calculated as the change in the net asset value between two dates expressed
as a percentage. Calculation method for date D, where NAV stands for net asset value:
Capitalisation units (CAP) Return on date D over a period of X years:
[NIW(D) / NIW(Y)] ^ [1 / X] - 1 where Y = D-X
Return on date D since the start date S of the unit: [NIW(D) / NIW(S)] ^ [1 / F] - 1 where F = 1 if the unit has existed for less than one year on date D where F = (D-S) / 365.25 if the unit has existed for longer than one year on date D
If the interval between the two dates exceeds one year, the ordinary return calculation is converted into a return on an annual basis by taking the nth square root of 1 plus the total return of the unit.
The return figures shown above do not take account of the fees and charges associated with the issue and redemption of units.
These are the performance figures for capitalization shares.
Institutional B Shares The bar chart shows the performance for full financial years. The figures do not take account of any restructuring. Calculated in EUR. The return is calculated as the change in the net asset value between two dates expressed
as a percentage. Calculation method for date D, where NAV stands for net asset value:
Capitalisation units (CAP) Return on date D over a period of X years:
[NIW(D) / NIW(Y)] ^ [1 / X] - 1 where Y = D-X
Return on date D since the start date S of the unit: [NIW(D) / NIW(S)] ^ [1 / F] - 1 where F = 1 if the unit has existed for less than one year on date D where F = (D-S) / 365.25 if the unit has existed for longer than one year on date D
If the interval between the two dates exceeds one year, the ordinary return calculation is converted into a return on an annual basis by taking the nth square root of 1 plus the total return of the unit.
The return figures shown above do not take account of the fees and charges associated with the issue and redemption of units.
These are the performance figures for capitalization shares.

2.4.6 COSTS Ongoing Charges: * Classic Shares Capitalization: 1.711% Institutional B Shares Capitalization: 1.644% * The following costs have not been included in the ongoing charges: - Interest payments on loans taken out - Payments in respect of financial derivatives - Fees and charges paid directly by the investor - Any soft commissions
SOFT COMMISSIONS The management company or the appointed manager, as the case may be, is the recipient of soft commissions. The recipient has laid down an internal policy as regards accepting soft commissions and avoiding possible conflicts of interest in this respect, and has put appropriate internal controls in place to ensure this policy is observed. For more information, please see the ‘General’ section of the annual report.
Broker
Commission gross
in EUR
paid during the period:
1‐01‐13
‐
30‐06‐13
CSA Credits
in EUR
accrued during the period:
1‐01‐13
‐
30‐06‐13 Percentage
CITI 26 13 50.01%
CSFBSAS 1,783 704 39.47%
DEUTSCHE 5,234 2,617 50.00%
EQ MACQUARIE 5,299 2,815 53.11%
INSTINET 2,770 1,385 50.00%
MERRILL 11,987 5,994 50.00%
MORGAN STANLEY 7,589 4,336 57.14%
FEE-SHARING AGREEMENTS AND REBATES: The management company may share its fee with the distributor, and institutional and/or professional parties. In principle, the percentage share amounts to between 35% and 60% if the distributor is an entity of KBC Group NV or to between 35% and 70% if the distributor is not an entity of KBC Group NV. However, in a small number of cases, the distributor’s fee is less than 35%. Investors may, on request, obtain more information on these cases. If the management company invests the assets of the undertaking for collective investment in units of undertakings for collective investment that are not managed by an entity of KBC Group NV, and receives a fee for doing so, it will pay this fee to the undertaking for collective investment. Fee-sharing does not affect the amount of the management fee paid by the sub-fund to the management company. This management fee is subject to the limitations laid down in the articles of association. The limitations may only be amended after approval by the general meeting of shareholders. The management company has concluded a distribution agreement with the distributor in order to facilitate the wider distribution of the sub-fund's units by using multiple distribution channels. It is in the interests of the holders of units, the sub-fund and of the distributor for the largest possible number of units to be sold and for the assets of the sub-fund to be maximised in this way. In this respect, there is therefore no question of any conflict of interest.
2.4.7 NOTES TO THE FINANCIAL STATEMENTS AND OTHER DATA Fee for managing the investment portfolio: 1.5% per annum calculated on the basis of the average total net assets of the sub-fund, no management fee is charged on assets assets invested in investment undertakings managed by a financial institution of the KBC group. The administration agent’s fee is payable at the end of each month and is calculated on the basis of the average total net assets of the sub-fund.
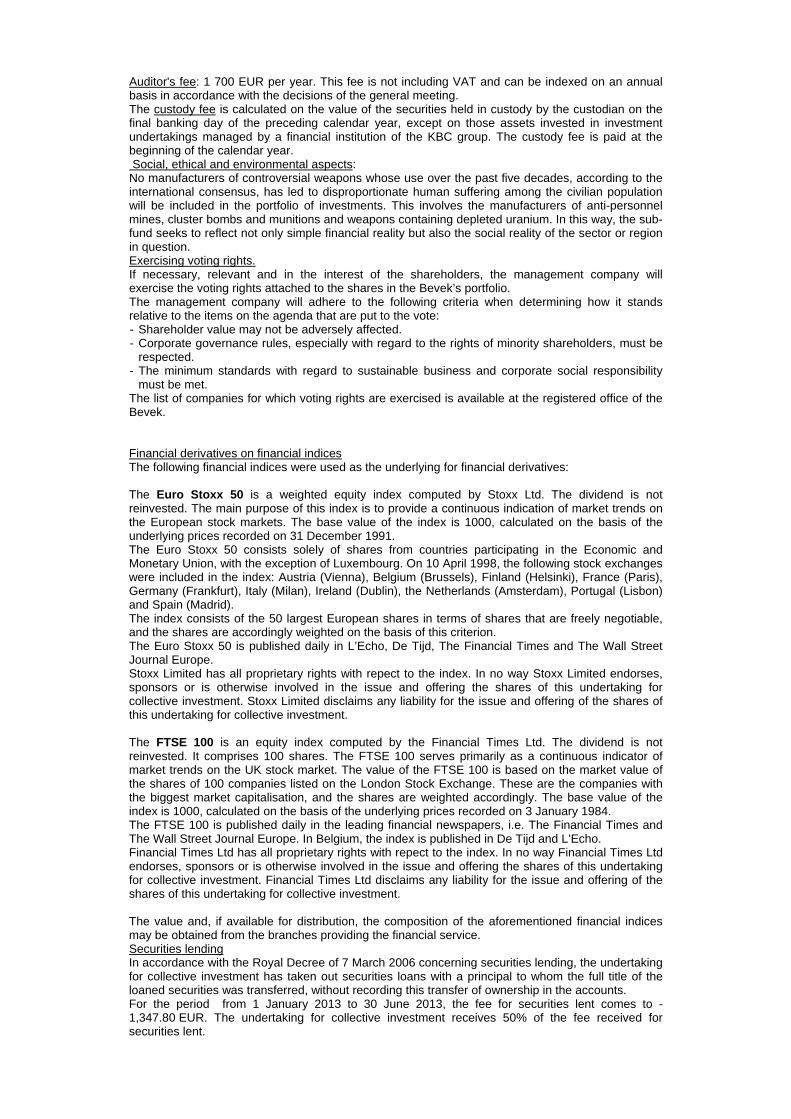
Auditor's fee: 1 700 EUR per year. This fee is not including VAT and can be indexed on an annual basis in accordance with the decisions of the general meeting. The custody fee is calculated on the value of the securities held in custody by the custodian on the final banking day of the preceding calendar year, except on those assets invested in investment undertakings managed by a financial institution of the KBC group. The custody fee is paid at the beginning of the calendar year. Social, ethical and environmental aspects: No manufacturers of controversial weapons whose use over the past five decades, according to the international consensus, has led to disproportionate human suffering among the civilian population will be included in the portfolio of investments. This involves the manufacturers of anti-personnel mines, cluster bombs and munitions and weapons containing depleted uranium. In this way, the sub-fund seeks to reflect not only simple financial reality but also the social reality of the sector or region in question. Exercising voting rights. If necessary, relevant and in the interest of the shareholders, the management company will exercise the voting rights attached to the shares in the Bevek’s portfolio. The management company will adhere to the following criteria when determining how it stands relative to the items on the agenda that are put to the vote: - Shareholder value may not be adversely affected. - Corporate governance rules, especially with regard to the rights of minority shareholders, must be
respected. - The minimum standards with regard to sustainable business and corporate social responsibility
must be met. The list of companies for which voting rights are exercised is available at the registered office of the Bevek. Financial derivatives on financial indices The following financial indices were used as the underlying for financial derivatives: The Euro Stoxx 50 is a weighted equity index computed by Stoxx Ltd. The dividend is not reinvested. The main purpose of this index is to provide a continuous indication of market trends on the European stock markets. The base value of the index is 1000, calculated on the basis of the underlying prices recorded on 31 December 1991. The Euro Stoxx 50 consists solely of shares from countries participating in the Economic and Monetary Union, with the exception of Luxembourg. On 10 April 1998, the following stock exchanges were included in the index: Austria (Vienna), Belgium (Brussels), Finland (Helsinki), France (Paris), Germany (Frankfurt), Italy (Milan), Ireland (Dublin), the Netherlands (Amsterdam), Portugal (Lisbon) and Spain (Madrid). The index consists of the 50 largest European shares in terms of shares that are freely negotiable, and the shares are accordingly weighted on the basis of this criterion. The Euro Stoxx 50 is published daily in L’Echo, De Tijd, The Financial Times and The Wall Street Journal Europe. Stoxx Limited has all proprietary rights with repect to the index. In no way Stoxx Limited endorses, sponsors or is otherwise involved in the issue and offering the shares of this undertaking for collective investment. Stoxx Limited disclaims any liability for the issue and offering of the shares of this undertaking for collective investment. The FTSE 100 is an equity index computed by the Financial Times Ltd. The dividend is not reinvested. It comprises 100 shares. The FTSE 100 serves primarily as a continuous indicator of market trends on the UK stock market. The value of the FTSE 100 is based on the market value of the shares of 100 companies listed on the London Stock Exchange. These are the companies with the biggest market capitalisation, and the shares are weighted accordingly. The base value of the index is 1000, calculated on the basis of the underlying prices recorded on 3 January 1984. The FTSE 100 is published daily in the leading financial newspapers, i.e. The Financial Times and The Wall Street Journal Europe. In Belgium, the index is published in De Tijd and L’Echo. Financial Times Ltd has all proprietary rights with repect to the index. In no way Financial Times Ltd endorses, sponsors or is otherwise involved in the issue and offering the shares of this undertaking for collective investment. Financial Times Ltd disclaims any liability for the issue and offering of the shares of this undertaking for collective investment. The value and, if available for distribution, the composition of the aforementioned financial indices may be obtained from the branches providing the financial service. Securities lending In accordance with the Royal Decree of 7 March 2006 concerning securities lending, the undertaking for collective investment has taken out securities loans with a principal to whom the full title of the loaned securities was transferred, without recording this transfer of ownership in the accounts. For the period from 1 January 2013 to 30 June 2013, the fee for securities lent comes to -1,347.80 EUR. The undertaking for collective investment receives 50% of the fee received for securities lent.
The detailed list of securities lending transactions carried out can be obtained from the registered office of the collective investment undertaking at 2 Havenlaan, 1080 Brussels.
Overview of securities lent as at 30/06/2013
Name Currency Quantity Price Value in currency of the
portfolio
3I GROUP PLC GBP 4.741 3,376 18.676,33
AB SKANSKA -B-FRIA SEK 537 111,300 6.812,50
ADMIRAL GROUP PLC GBP 6.504 13,270 100.709,54
CLARIANT AG REGISTERED CHF 4.206 13,360 45.688,40
DAIMLER AG OP NAME EUR 4.421 46,485 205.510,18
EASYJET PLC GBP 23.152 12,960 350.116,59
EMS CHEMIE HOLDING AG REGD CHF 152 279,500 34.542,65
ERICSSON (LM) -B- SEK 23.063 75,950 199.655,19
FERROVIAL SA EUR 10.675 12,280 131.089,00
GEBERIT AG - NEW - CHF 163 234,300 31.052,04
IBERDROLA SA EUR 56.571 4,056 229.451,98
ICADE EUR 325 63,440 20.618,00
JM AB SEK 848 141,500 13.676,95
NOKIA CORP -A- EUR 31.489 2,846 89.617,69
RWE AG -A- EUR 13.113 24,520 321.530,76
SVENSKA HANDELSBANK -A- FRIA SEK 2.503 269,200 76.802,07
TOTAL EUR 21.172 37,505 794.055,86
Total 2.669.605,73
Details of collateral received for securities lent
Name Currency Nominal value Currency fund Value in Currency fund
FRANCE 2008 3.75% 25/10/2019 EUR 2.471.000 EUR 2.867.810,48
Total 2.867.810,48 For the valuation of the collateral received, indicative prices have been used in this detail list by the Collateral Management Division of KBC Bank.

Semi-Annual report as at 30th June 2013
TABLE OF CONTENTS
2. Information on KBC Equity Fund Flanders
2.1. Management report 2.1.1. Launch date and subscription price 2.1.2. Stock exchange listing 2.1.3. Aim and distinctive features of the investment policy 2.1.4. Financial portfolio management 2.1.5. Distributors 2.1.6. Index and benchmark 2.1.7. Policy conducted during the financial year 2.1.8. Future policy 2.1.9. Synthetic risk and reward indicator (SRRI)
2.2. Balance sheet
2.3. Profit and loss account
2.4. Composition of the assets and key figures
2.4.1. Composition of the assets 2.4.2. Change in the composition of the assets 2.4.3. Value of commitments in respect of financial derivatives positions 2.4.4. Evolution of the number of subscriptions, repayments and the net asset value 2.4.5. Return figures 2.4.6. Expenses 2.4.7. Notes to the financial statements and other data

2 INFORMATION ON KBC EQUITY FUND FLANDERS
2.1 MANAGEMENT REPORT
2.1.1 LAUNCH DATE AND SUBSCRIPTION PRICE Launch date: 27 June 1997 Initial subscription price: 20000 BEF Currency: EUR
2.1.2 STOCK EXCHANGE LISTING Not applicable.
2.1.3 GOAL AND KEY PRINCIPLES OF THE INVESTMENT POLICY
SUB-FUND’S OBJECT: The main objective of this sub-fund is to generate the highest possible return for its shareholders by investing directly or indirectly in transferable securities. This is reflected in its pursuit of capital gains and income. To this end, the assets are invested, either directly or indirectly via correlated financial instruments, primarily in shares.
SUB-FUND’S INVESTMENT POLICY:
PERMITTED ASSET CLASSES: The sub-fund may invest in securities, money market instruments, units in undertakings for collective investment, deposits, financial derivatives, liquid assets and all other instruments insofar as permitted by the applicable laws and regulations and consistent with the sub-fund’s object The sub-fund shall invest no more than 10% of its assets in units of other undertakings for collective investment.
RESTRICTIONS OF THE INVESTMENT POLICY: The investment policy will be implemented within the limits set by law and regulations. The sub-fund may borrow up to 10% of its net assets, insofar as these are short-term borrowings aimed at solving temporary liquidity problems.
PERMITTED DERIVATIVES TRANSACTIONS: Derivates may be used either for hedging purposes or to achieve investment objectives. Changes will be made to the investments at regular intervals to comply with the sub-fund's investment strategy. In addition, listed and unlisted derivates may be used to achieve the objectives: these may be forward contracts, options or swaps on securities, indices, currencies or interest rates or other transactions involving derivatives. Unlisted derivatives transactions will only be concluded with prime financial institutions specialised in such transactions. Such derivatives may also be used to hedge the assets against exchange-rate fluctuations. Subject to the applicable laws and regulations and the articles of association, the sub-fund always seeks to conclude the most effective transactions. All costs associated with the transactions will be charged to the sub-fund and all income generated will be paid to the sub-fund. If the transactions result in a risk in respect of the counterparty, this risk can be hedged by using a margin management system that ensures that the sub-fund is the beneficiary of security (collateral) in the form of cash or investment grade bonds. When calculating the value of the bonds, a margin will be applied that varies depending on the residual term to maturity and the currency in which the bond in question is denominated. The relationship with the counterparty or counterparties is governed by standard international agreements.
STRATEGY SELECTED The assets are invested primarily in shares with a Flemish character where conditions are such as to allow accelerated economic growth in the short or medium term.
RISK CONCENTRATION Shares with a Flemish character.
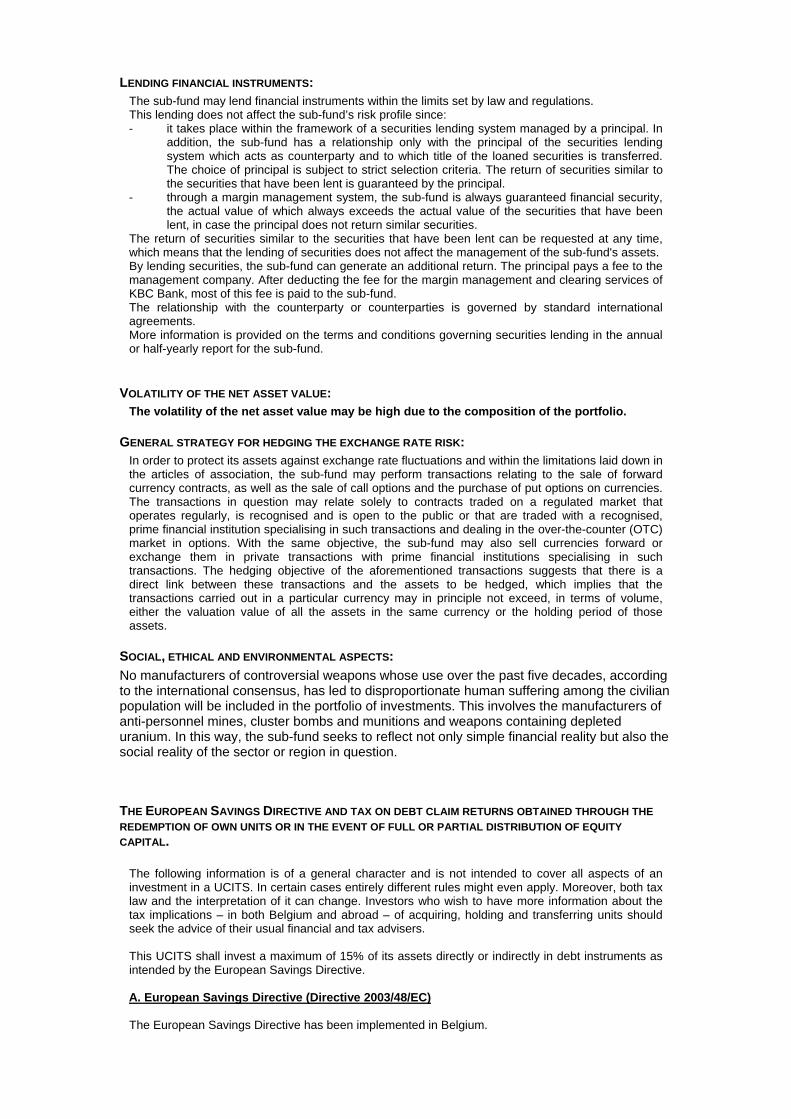
LENDING FINANCIAL INSTRUMENTS: The sub-fund may lend financial instruments within the limits set by law and regulations. This lending does not affect the sub-fund’s risk profile since: - it takes place within the framework of a securities lending system managed by a principal. In
addition, the sub-fund has a relationship only with the principal of the securities lending system which acts as counterparty and to which title of the loaned securities is transferred. The choice of principal is subject to strict selection criteria. The return of securities similar to the securities that have been lent is guaranteed by the principal.
- through a margin management system, the sub-fund is always guaranteed financial security, the actual value of which always exceeds the actual value of the securities that have been lent, in case the principal does not return similar securities.
The return of securities similar to the securities that have been lent can be requested at any time, which means that the lending of securities does not affect the management of the sub-fund's assets. By lending securities, the sub-fund can generate an additional return. The principal pays a fee to the management company. After deducting the fee for the margin management and clearing services of KBC Bank, most of this fee is paid to the sub-fund. The relationship with the counterparty or counterparties is governed by standard international agreements. More information is provided on the terms and conditions governing securities lending in the annual or half-yearly report for the sub-fund.
VOLATILITY OF THE NET ASSET VALUE: The volatility of the net asset value may be high due to the composition of the portfolio.
GENERAL STRATEGY FOR HEDGING THE EXCHANGE RATE RISK: In order to protect its assets against exchange rate fluctuations and within the limitations laid down in the articles of association, the sub-fund may perform transactions relating to the sale of forward currency contracts, as well as the sale of call options and the purchase of put options on currencies. The transactions in question may relate solely to contracts traded on a regulated market that operates regularly, is recognised and is open to the public or that are traded with a recognised, prime financial institution specialising in such transactions and dealing in the over-the-counter (OTC) market in options. With the same objective, the sub-fund may also sell currencies forward or exchange them in private transactions with prime financial institutions specialising in such transactions. The hedging objective of the aforementioned transactions suggests that there is a direct link between these transactions and the assets to be hedged, which implies that the transactions carried out in a particular currency may in principle not exceed, in terms of volume, either the valuation value of all the assets in the same currency or the holding period of those assets.
SOCIAL, ETHICAL AND ENVIRONMENTAL ASPECTS:
No manufacturers of controversial weapons whose use over the past five decades, according to the international consensus, has led to disproportionate human suffering among the civilian population will be included in the portfolio of investments. This involves the manufacturers of anti-personnel mines, cluster bombs and munitions and weapons containing depleted uranium. In this way, the sub-fund seeks to reflect not only simple financial reality but also the social reality of the sector or region in question.
THE EUROPEAN SAVINGS DIRECTIVE AND TAX ON DEBT CLAIM RETURNS OBTAINED THROUGH THE
REDEMPTION OF OWN UNITS OR IN THE EVENT OF FULL OR PARTIAL DISTRIBUTION OF EQUITY
CAPITAL. The following information is of a general character and is not intended to cover all aspects of an investment in a UCITS. In certain cases entirely different rules might even apply. Moreover, both tax law and the interpretation of it can change. Investors who wish to have more information about the tax implications – in both Belgium and abroad – of acquiring, holding and transferring units should seek the advice of their usual financial and tax advisers. This UCITS shall invest a maximum of 15% of its assets directly or indirectly in debt instruments as intended by the European Savings Directive. A. European Savings Directive (Directive 2003/48/EC) The European Savings Directive has been implemented in Belgium.

Since this UCITS invests a maximum of 15% of its assets directly or indirectly in debt claims as intended by the European Savings Directive, the income of this UCITS does not fall within the scope of this directive. B. Tax on debt claim returns obtained through the redemption of own units or in the event of full or partial distribution of equity capital (Article 19bis Income Tax Code 1992). The income from this UCITS is not subject to the tax on debt instrument returns as intended by Article 19bis, Income Tax Code 1992.
2.1.4 FINANCIAL PORTFOLIO MANAGEMENT There is no delegation of the portfolio.
2.1.5 DISTRIBUTORS KBC Asset Management S.A., 5, Place de la Gare, L-1616 Luxembourg.
2.1.6 INDEX AND BENCHMARK See ‘Sub-fund’s investment policy’.
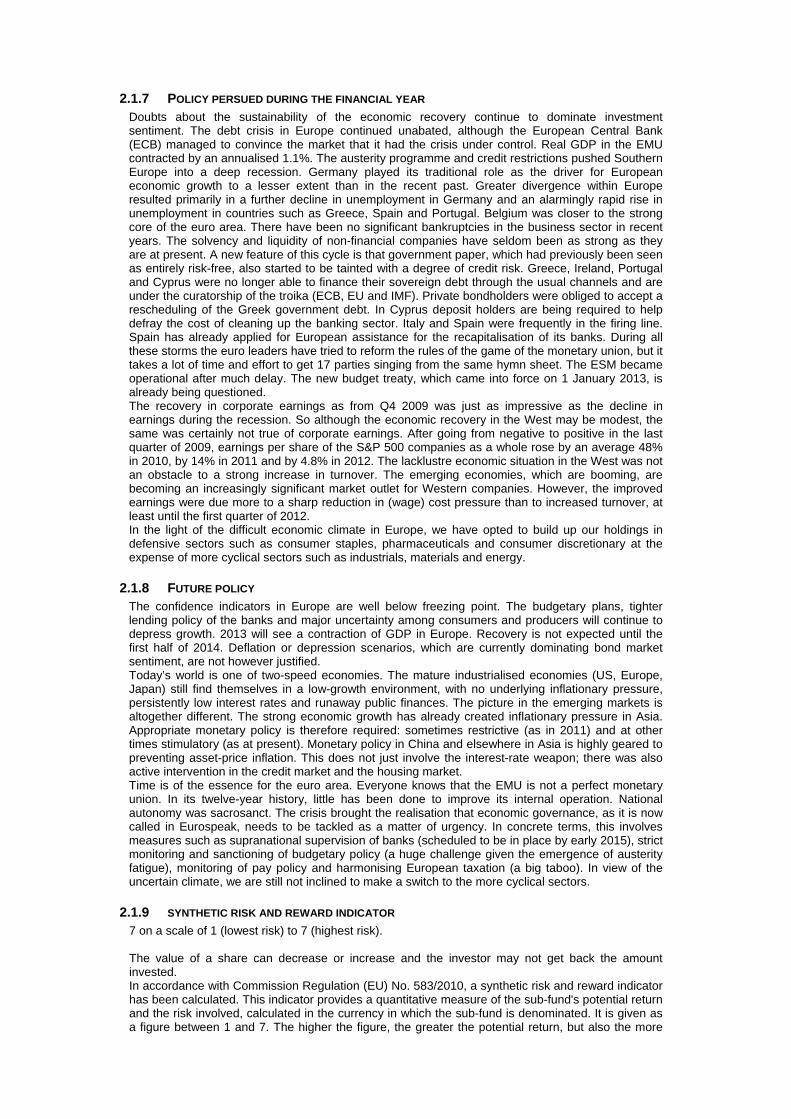
2.1.7 POLICY PERSUED DURING THE FINANCIAL YEAR Doubts about the sustainability of the economic recovery continue to dominate investment sentiment. The debt crisis in Europe continued unabated, although the European Central Bank (ECB) managed to convince the market that it had the crisis under control. Real GDP in the EMU contracted by an annualised 1.1%. The austerity programme and credit restrictions pushed Southern Europe into a deep recession. Germany played its traditional role as the driver for European economic growth to a lesser extent than in the recent past. Greater divergence within Europe resulted primarily in a further decline in unemployment in Germany and an alarmingly rapid rise in unemployment in countries such as Greece, Spain and Portugal. Belgium was closer to the strong core of the euro area. There have been no significant bankruptcies in the business sector in recent years. The solvency and liquidity of non-financial companies have seldom been as strong as they are at present. A new feature of this cycle is that government paper, which had previously been seen as entirely risk-free, also started to be tainted with a degree of credit risk. Greece, Ireland, Portugal and Cyprus were no longer able to finance their sovereign debt through the usual channels and are under the curatorship of the troika (ECB, EU and IMF). Private bondholders were obliged to accept a rescheduling of the Greek government debt. In Cyprus deposit holders are being required to help defray the cost of cleaning up the banking sector. Italy and Spain were frequently in the firing line. Spain has already applied for European assistance for the recapitalisation of its banks. During all these storms the euro leaders have tried to reform the rules of the game of the monetary union, but it takes a lot of time and effort to get 17 parties singing from the same hymn sheet. The ESM became operational after much delay. The new budget treaty, which came into force on 1 January 2013, is already being questioned. The recovery in corporate earnings as from Q4 2009 was just as impressive as the decline in earnings during the recession. So although the economic recovery in the West may be modest, the same was certainly not true of corporate earnings. After going from negative to positive in the last quarter of 2009, earnings per share of the S&P 500 companies as a whole rose by an average 48% in 2010, by 14% in 2011 and by 4.8% in 2012. The lacklustre economic situation in the West was not an obstacle to a strong increase in turnover. The emerging economies, which are booming, are becoming an increasingly significant market outlet for Western companies. However, the improved earnings were due more to a sharp reduction in (wage) cost pressure than to increased turnover, at least until the first quarter of 2012. In the light of the difficult economic climate in Europe, we have opted to build up our holdings in defensive sectors such as consumer staples, pharmaceuticals and consumer discretionary at the expense of more cyclical sectors such as industrials, materials and energy.
2.1.8 FUTURE POLICY The confidence indicators in Europe are well below freezing point. The budgetary plans, tighter lending policy of the banks and major uncertainty among consumers and producers will continue to depress growth. 2013 will see a contraction of GDP in Europe. Recovery is not expected until the first half of 2014. Deflation or depression scenarios, which are currently dominating bond market sentiment, are not however justified. Today’s world is one of two-speed economies. The mature industrialised economies (US, Europe, Japan) still find themselves in a low-growth environment, with no underlying inflationary pressure, persistently low interest rates and runaway public finances. The picture in the emerging markets is altogether different. The strong economic growth has already created inflationary pressure in Asia. Appropriate monetary policy is therefore required: sometimes restrictive (as in 2011) and at other times stimulatory (as at present). Monetary policy in China and elsewhere in Asia is highly geared to preventing asset-price inflation. This does not just involve the interest-rate weapon; there was also active intervention in the credit market and the housing market. Time is of the essence for the euro area. Everyone knows that the EMU is not a perfect monetary union. In its twelve-year history, little has been done to improve its internal operation. National autonomy was sacrosanct. The crisis brought the realisation that economic governance, as it is now called in Eurospeak, needs to be tackled as a matter of urgency. In concrete terms, this involves measures such as supranational supervision of banks (scheduled to be in place by early 2015), strict monitoring and sanctioning of budgetary policy (a huge challenge given the emergence of austerity fatigue), monitoring of pay policy and harmonising European taxation (a big taboo). In view of the uncertain climate, we are still not inclined to make a switch to the more cyclical sectors.
2.1.9 SYNTHETIC RISK AND REWARD INDICATOR 7 on a scale of 1 (lowest risk) to 7 (highest risk). The value of a share can decrease or increase and the investor may not get back the amount invested. In accordance with Commission Regulation (EU) No. 583/2010, a synthetic risk and reward indicator has been calculated. This indicator provides a quantitative measure of the sub-fund's potential return and the risk involved, calculated in the currency in which the sub-fund is denominated. It is given as a figure between 1 and 7. The higher the figure, the greater the potential return, but also the more

difficult it is to predict this return. Losses are possible too. The lowest figure does not mean that the investment is entirely free of risk. However, it does indicate that, compared with the higher figures, this product will generally provide a lower, but more predictable return. The synthetic risk and reward indicator is assessed regularly and can therefore go up or down based on data from the past. Data from the past is not always a reliable indicator of future risk and return.

2.2 BALANCE SHEET
Balance sheet layout 30/06/2013 (in the currency of the sub-fundt)
30/06/2012 (in the currency of the sub-fund )
TOTAL NET ASSETS 19.210.091,11 19.384.034,04
II. Securities, money market instruments, UCIs and derivatives
A. Bonds and other debt instruments a) Bonds a} Collateral received in the form of bonds 116.852,41 C. Shares and similar instruments a) Shares 19.147.771,47 19.101.188,26 Of which securities lent 120.084,05 b) Closed-end undertakings for collective
investment 11.072,88
D. Other securities 44.870,66 41.607,50
IV. Receivables and payables within one year A. Receivables a) Accounts receivable 344.671,20 133.190,23 b) Tax assets 249.944,97 225.409,69 B. Payables a) Accounts payable (-) -36.268,15 -308.175,85 c) Borrowings (-) -547.983,65 d) Collateral (-) -116.852,41
V. Deposits and cash at bank and in hand A. Demand balances at banks 273,30 168.318,61
VI. Accruals and deferrals A. Expense to be carried forward 9.067,99 6.984,02 B. Accrued income 13.509,50 15.941,68 C. Accrued expense (-) -15.766,18 -11.502,98
TOTAL SHAREHOLDERS' EQUITY 19.210.091,11 19.384.034,04
A. Capital 18.531.984,97 17.513.382,92
B. Income equalization -14.978,35 -4.914,85
D. Result for the period 693.084,49 1.875.565,97
Off-balance-sheet headings
I Collateral (+/-)
I.A Collateral (+/-)
I.A.A Securities/market instruments 116.852,41
IX Financial instruments lent 120.084,05
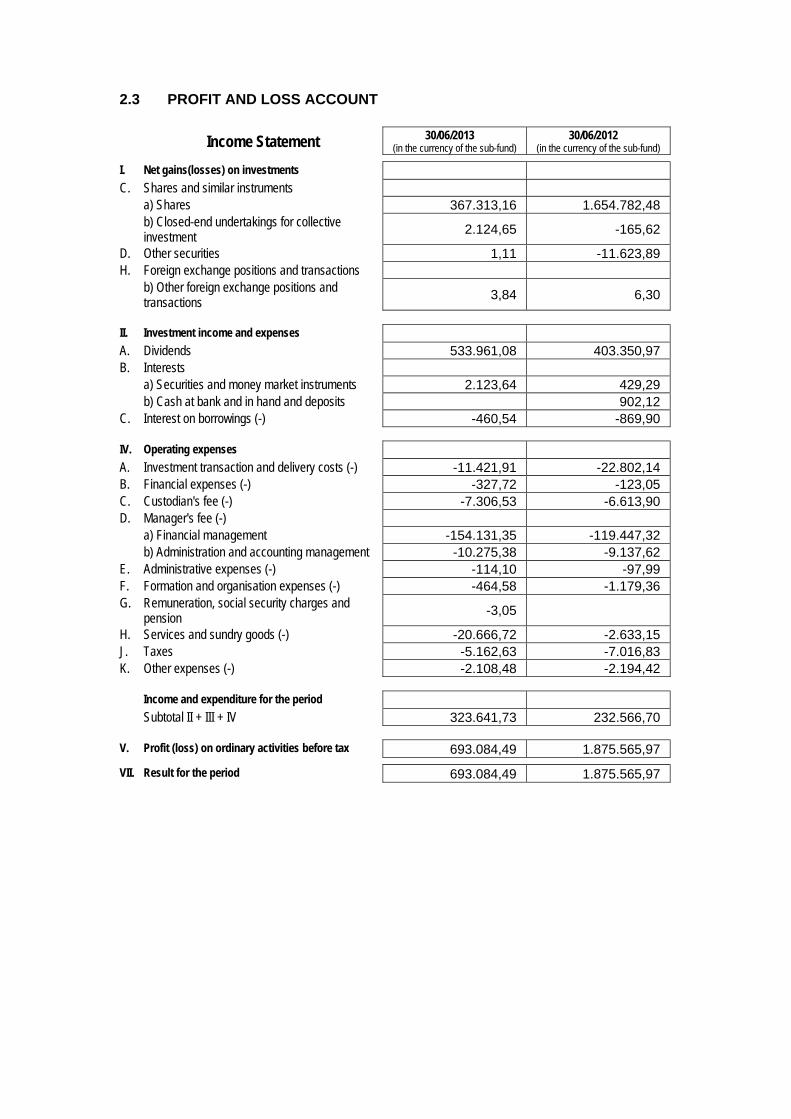
2.3 PROFIT AND LOSS ACCOUNT
Income Statement 30/06/2013 (in the currency of the sub-fund)
30/06/2012 (in the currency of the sub-fund)
I. Net gains(losses) on investments C. Shares and similar instruments a) Shares 367.313,16 1.654.782,48 b) Closed-end undertakings for collective
investment 2.124,65 -165,62
D. Other securities 1,11 -11.623,89 H. Foreign exchange positions and transactions b) Other foreign exchange positions and
transactions 3,84 6,30
II. Investment income and expenses A. Dividends 533.961,08 403.350,97 B. Interests a) Securities and money market instruments 2.123,64 429,29 b) Cash at bank and in hand and deposits 902,12 C. Interest on borrowings (-) -460,54 -869,90
IV. Operating expenses A. Investment transaction and delivery costs (-) -11.421,91 -22.802,14 B. Financial expenses (-) -327,72 -123,05 C. Custodian's fee (-) -7.306,53 -6.613,90 D. Manager's fee (-) a) Financial management -154.131,35 -119.447,32 b) Administration and accounting management -10.275,38 -9.137,62 E. Administrative expenses (-) -114,10 -97,99 F. Formation and organisation expenses (-) -464,58 -1.179,36 G. Remuneration, social security charges and
pension -3,05
H. Services and sundry goods (-) -20.666,72 -2.633,15 J. Taxes -5.162,63 -7.016,83 K. Other expenses (-) -2.108,48 -2.194,42
Income and expenditure for the period Subtotal II + III + IV 323.641,73 232.566,70
V. Profit (loss) on ordinary activities before tax 693.084,49 1.875.565,97
VII. Result for the period 693.084,49 1.875.565,97
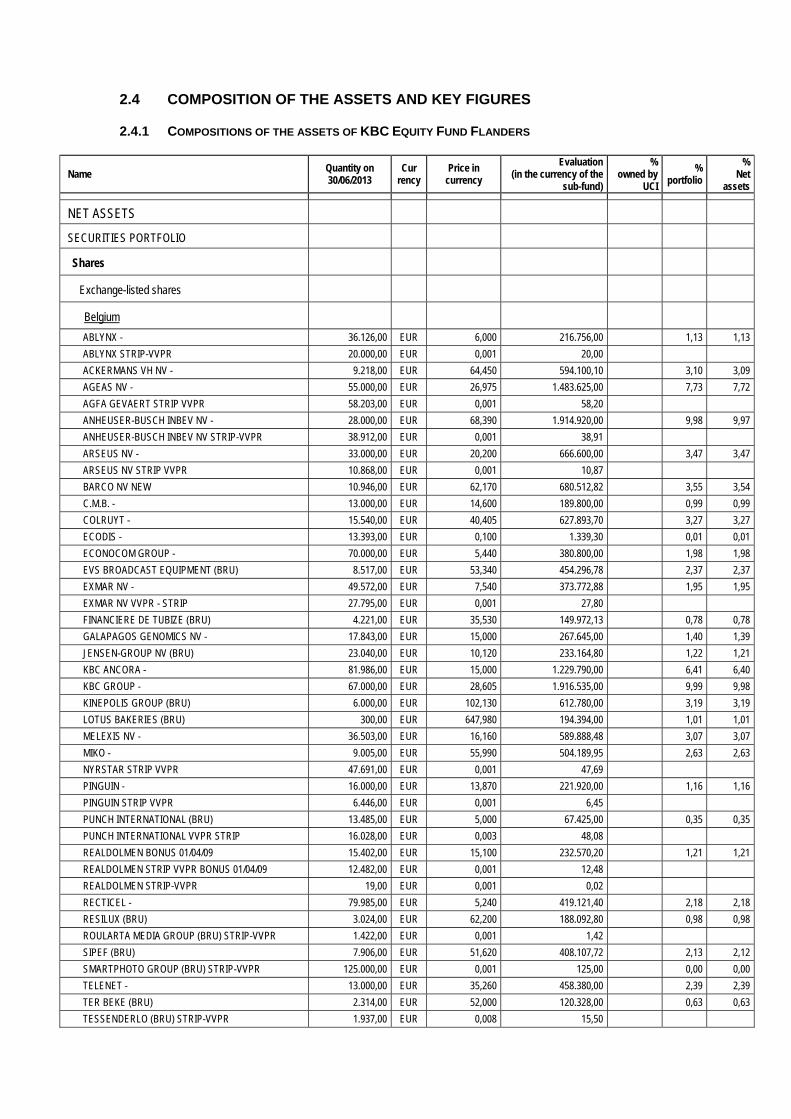
2.4 COMPOSITION OF THE ASSETS AND KEY FIGURES
2.4.1 COMPOSITIONS OF THE ASSETS OF KBC EQUITY FUND FLANDERS
Name Quantity on 30/06/2013
Cur rency
Price in currency
Evaluation (in the currency of the
sub-fund)
% owned by
UCI
% portfolio
% Net
assets
NET ASSETS
SECURITIES PORTFOLIO
Shares
Exchange-listed shares
Belgium
ABLYNX - 36.126,00 EUR 6,000 216.756,00 1,13 1,13
ABLYNX STRIP-VVPR 20.000,00 EUR 0,001 20,00
ACKERMANS VH NV - 9.218,00 EUR 64,450 594.100,10 3,10 3,09
AGEAS NV - 55.000,00 EUR 26,975 1.483.625,00 7,73 7,72
AGFA GEVAERT STRIP VVPR 58.203,00 EUR 0,001 58,20
ANHEUSER-BUSCH INBEV NV - 28.000,00 EUR 68,390 1.914.920,00 9,98 9,97
ANHEUSER-BUSCH INBEV NV STRIP-VVPR 38.912,00 EUR 0,001 38,91
ARSEUS NV - 33.000,00 EUR 20,200 666.600,00 3,47 3,47
ARSEUS NV STRIP VVPR 10.868,00 EUR 0,001 10,87
BARCO NV NEW 10.946,00 EUR 62,170 680.512,82 3,55 3,54
C.M.B. - 13.000,00 EUR 14,600 189.800,00 0,99 0,99
COLRUYT - 15.540,00 EUR 40,405 627.893,70 3,27 3,27
ECODIS - 13.393,00 EUR 0,100 1.339,30 0,01 0,01
ECONOCOM GROUP - 70.000,00 EUR 5,440 380.800,00 1,98 1,98
EVS BROADCAST EQUIPMENT (BRU) 8.517,00 EUR 53,340 454.296,78 2,37 2,37
EXMAR NV - 49.572,00 EUR 7,540 373.772,88 1,95 1,95
EXMAR NV VVPR - STRIP 27.795,00 EUR 0,001 27,80
FINANCIERE DE TUBIZE (BRU) 4.221,00 EUR 35,530 149.972,13 0,78 0,78
GALAPAGOS GENOMICS NV - 17.843,00 EUR 15,000 267.645,00 1,40 1,39
JENSEN-GROUP NV (BRU) 23.040,00 EUR 10,120 233.164,80 1,22 1,21
KBC ANCORA - 81.986,00 EUR 15,000 1.229.790,00 6,41 6,40
KBC GROUP - 67.000,00 EUR 28,605 1.916.535,00 9,99 9,98
KINEPOLIS GROUP (BRU) 6.000,00 EUR 102,130 612.780,00 3,19 3,19
LOTUS BAKERIES (BRU) 300,00 EUR 647,980 194.394,00 1,01 1,01
MELEXIS NV - 36.503,00 EUR 16,160 589.888,48 3,07 3,07
MIKO - 9.005,00 EUR 55,990 504.189,95 2,63 2,63
NYRSTAR STRIP VVPR 47.691,00 EUR 0,001 47,69
PINGUIN - 16.000,00 EUR 13,870 221.920,00 1,16 1,16
PINGUIN STRIP VVPR 6.446,00 EUR 0,001 6,45
PUNCH INTERNATIONAL (BRU) 13.485,00 EUR 5,000 67.425,00 0,35 0,35
PUNCH INTERNATIONAL VVPR STRIP 16.028,00 EUR 0,003 48,08
REALDOLMEN BONUS 01/04/09 15.402,00 EUR 15,100 232.570,20 1,21 1,21
REALDOLMEN STRIP VVPR BONUS 01/04/09 12.482,00 EUR 0,001 12,48
REALDOLMEN STRIP-VVPR 19,00 EUR 0,001 0,02
RECTICEL - 79.985,00 EUR 5,240 419.121,40 2,18 2,18
RESILUX (BRU) 3.024,00 EUR 62,200 188.092,80 0,98 0,98
ROULARTA MEDIA GROUP (BRU) STRIP-VVPR 1.422,00 EUR 0,001 1,42
SIPEF (BRU) 7.906,00 EUR 51,620 408.107,72 2,13 2,12
SMARTPHOTO GROUP (BRU) STRIP-VVPR 125.000,00 EUR 0,001 125,00 0,00 0,00
TELENET - 13.000,00 EUR 35,260 458.380,00 2,39 2,39
TER BEKE (BRU) 2.314,00 EUR 52,000 120.328,00 0,63 0,63
TESSENDERLO (BRU) STRIP-VVPR 1.937,00 EUR 0,008 15,50
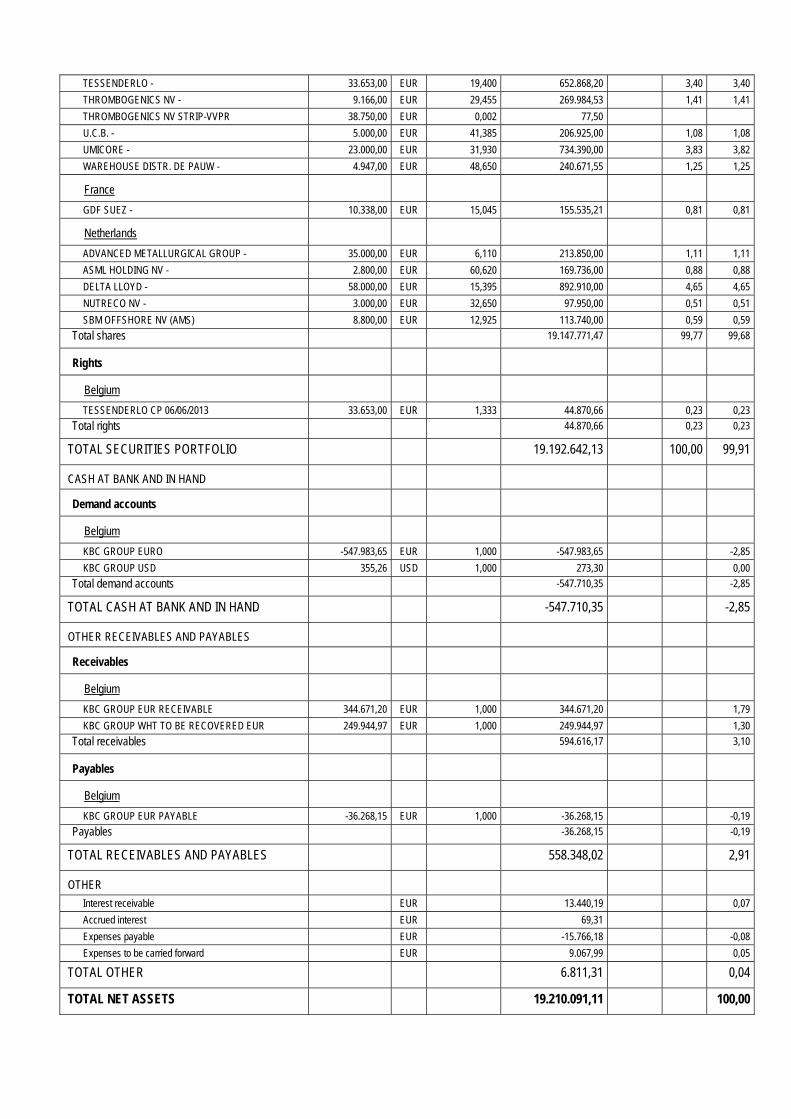
TESSENDERLO - 33.653,00 EUR 19,400 652.868,20 3,40 3,40
THROMBOGENICS NV - 9.166,00 EUR 29,455 269.984,53 1,41 1,41
THROMBOGENICS NV STRIP-VVPR 38.750,00 EUR 0,002 77,50
U.C.B. - 5.000,00 EUR 41,385 206.925,00 1,08 1,08
UMICORE - 23.000,00 EUR 31,930 734.390,00 3,83 3,82
WAREHOUSE DISTR. DE PAUW - 4.947,00 EUR 48,650 240.671,55 1,25 1,25
France
GDF SUEZ - 10.338,00 EUR 15,045 155.535,21 0,81 0,81
Netherlands
ADVANCED METALLURGICAL GROUP - 35.000,00 EUR 6,110 213.850,00 1,11 1,11
ASML HOLDING NV - 2.800,00 EUR 60,620 169.736,00 0,88 0,88
DELTA LLOYD - 58.000,00 EUR 15,395 892.910,00 4,65 4,65
NUTRECO NV - 3.000,00 EUR 32,650 97.950,00 0,51 0,51
SBM OFFSHORE NV (AMS) 8.800,00 EUR 12,925 113.740,00 0,59 0,59
Total shares 19.147.771,47 99,77 99,68
Rights
Belgium
TESSENDERLO CP 06/06/2013 33.653,00 EUR 1,333 44.870,66 0,23 0,23
Total rights 44.870,66 0,23 0,23
TOTAL SECURITIES PORTFOLIO 19.192.642,13 100,00 99,91
CASH AT BANK AND IN HAND
Demand accounts
Belgium
KBC GROUP EURO -547.983,65 EUR 1,000 -547.983,65 -2,85
KBC GROUP USD 355,26 USD 1,000 273,30 0,00
Total demand accounts -547.710,35 -2,85
TOTAL CASH AT BANK AND IN HAND -547.710,35 -2,85
OTHER RECEIVABLES AND PAYABLES
Receivables
Belgium
KBC GROUP EUR RECEIVABLE 344.671,20 EUR 1,000 344.671,20 1,79
KBC GROUP WHT TO BE RECOVERED EUR 249.944,97 EUR 1,000 249.944,97 1,30
Total receivables 594.616,17 3,10
Payables
Belgium
KBC GROUP EUR PAYABLE -36.268,15 EUR 1,000 -36.268,15 -0,19
Payables -36.268,15 -0,19
TOTAL RECEIVABLES AND PAYABLES 558.348,02 2,91
OTHER
Interest receivable EUR 13.440,19 0,07
Accrued interest EUR 69,31
Expenses payable EUR -15.766,18 -0,08
Expenses to be carried forward EUR 9.067,99 0,05
TOTAL OTHER 6.811,31 0,04
TOTAL NET ASSETS 19.210.091,11 100,00
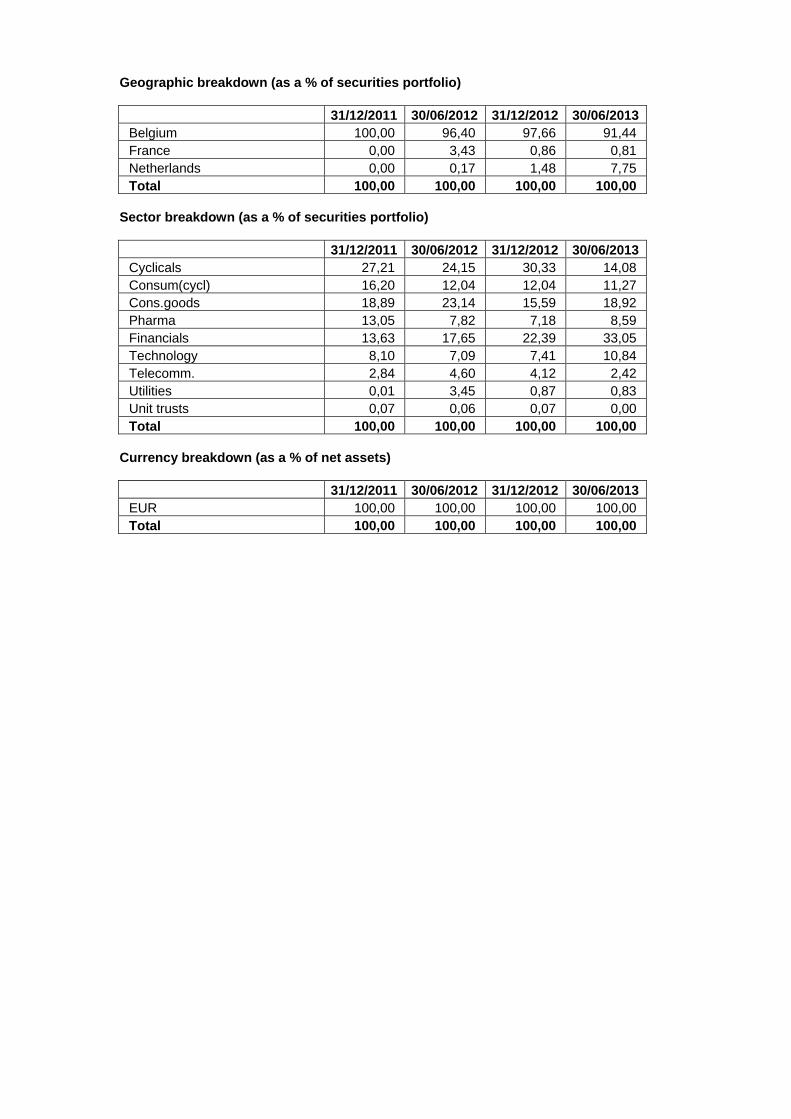
Geographic breakdown (as a % of securities portfolio)
31/12/2011 30/06/2012 31/12/2012 30/06/2013 Belgium 100,00 96,40 97,66 91,44 France 0,00 3,43 0,86 0,81 Netherlands 0,00 0,17 1,48 7,75 Total 100,00 100,00 100,00 100,00
Sector breakdown (as a % of securities portfolio)
31/12/2011 30/06/2012 31/12/2012 30/06/2013 Cyclicals 27,21 24,15 30,33 14,08 Consum(cycl) 16,20 12,04 12,04 11,27 Cons.goods 18,89 23,14 15,59 18,92 Pharma 13,05 7,82 7,18 8,59 Financials 13,63 17,65 22,39 33,05 Technology 8,10 7,09 7,41 10,84 Telecomm. 2,84 4,60 4,12 2,42 Utilities 0,01 3,45 0,87 0,83 Unit trusts 0,07 0,06 0,07 0,00 Total 100,00 100,00 100,00 100,00
Currency breakdown (as a % of net assets)
31/12/2011 30/06/2012 31/12/2012 30/06/2013 EUR 100,00 100,00 100,00 100,00 Total 100,00 100,00 100,00 100,00

2.4.2 CHANGES IN THE COMPOSITION OF THE ASSETS OF KBC EQUITY FUND FLANDERS (IN THE
CURRENCY OF THE SUB-FUND)
1st half of year YearPurchases 6.802.755,15 6.802.755,15 Sales 8.447.703,77 8.447.703,77 Total 1 15.250.458,92 15.250.458,92 Subscriptions 3.514.563,16 3.514.563,16 Redemptions 6.157.171,95 6.157.171,95 Total 2 9.671.735,11 9.671.735,11 Monthly average of total assets
20.898.501,83 20.898.501,83
Turnover rate 26,69 % 26,69 %
1st half of year YearPurchases 6.802.755,15 6.802.755,15 Sales 8.447.703,77 8.447.703,77 Total 1 15.250.458,92 15.250.458,92 Subscriptions 3.514.563,16 3.514.563,16 Redemptions 6.157.171,95 6.157.171,95 Total 2 9.671.735,11 9.671.735,11 Monthly average of total assets
20.847.248,91 20.847.248,91
Corrected turnover rate 26,76 % 26,76 %
The table above shows the capital volume of portfolio transactions. This volume (adjusted to take account of total subscriptions and redemptions) is also compared to the average net assets at the beginning and end of the period. A figure close to 0% implies that the transactions relating to the securities or transactions relating to the assets (excluding deposits and cash) in a given period only involve subscriptions and redemptions. A negative percentage shows that subscriptions and redemptions entailed few, if any, transactions in the portfolio. Active asset management may result in high turnover rates (monthly percentage >50%). The detailed list of transactions is available for consultation free of charge at the registered office of the Bevek or fund at Havenlaan 2, 1080 Brussels.
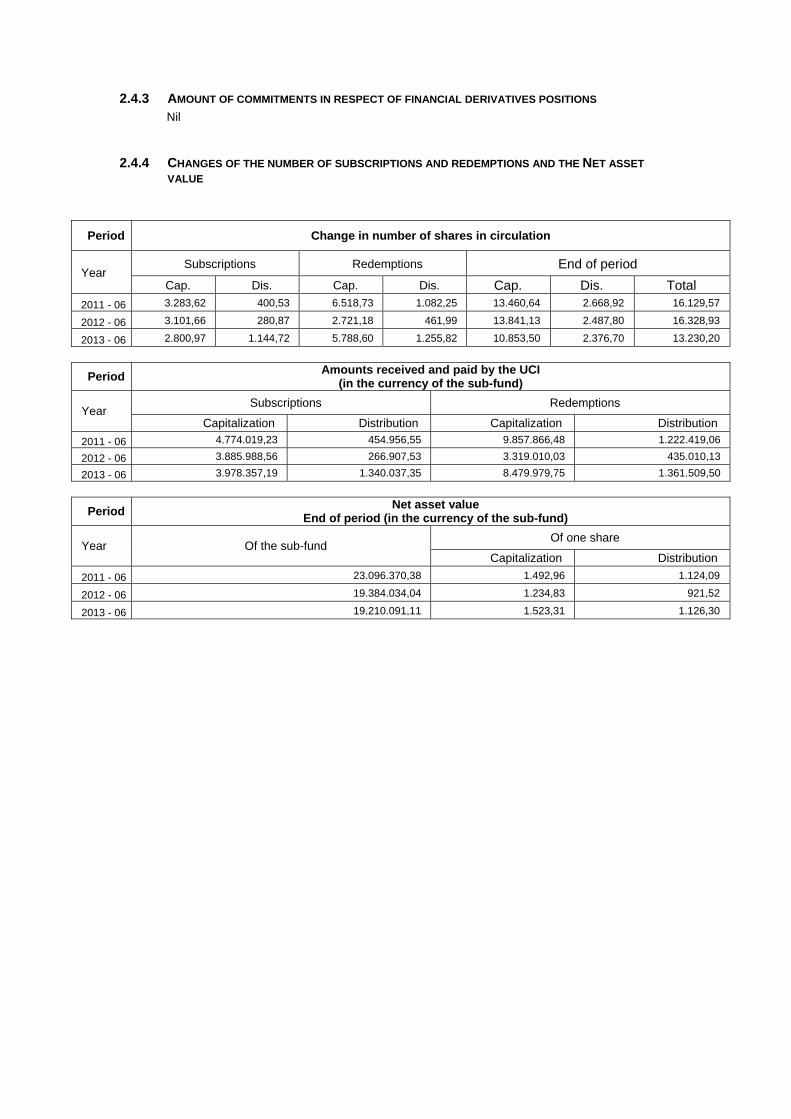
2.4.3 AMOUNT OF COMMITMENTS IN RESPECT OF FINANCIAL DERIVATIVES POSITIONS Nil
2.4.4 CHANGES OF THE NUMBER OF SUBSCRIPTIONS AND REDEMPTIONS AND THE NET ASSET
VALUE
Period Change in number of shares in circulation
Year Subscriptions Redemptions End of period
Cap. Dis. Cap. Dis. Cap. Dis. Total
2011 - 06 3.283,62 400,53 6.518,73 1.082,25 13.460,64 2.668,92 16.129,57
2012 - 06 3.101,66 280,87 2.721,18 461,99 13.841,13 2.487,80 16.328,93
2013 - 06 2.800,97 1.144,72 5.788,60 1.255,82 10.853,50 2.376,70 13.230,20
Period Amounts received and paid by the UCI
(in the currency of the sub-fund)
Year Subscriptions Redemptions
Capitalization Distribution Capitalization Distribution
2011 - 06 4.774.019,23 454.956,55 9.857.866,48 1.222.419,06
2012 - 06 3.885.988,56 266.907,53 3.319.010,03 435.010,13
2013 - 06 3.978.357,19 1.340.037,35 8.479.979,75 1.361.509,50
Period Net asset value
End of period (in the currency of the sub-fund)
Year Of the sub-fund Of one share
Capitalization Distribution
2011 - 06 23.096.370,38 1.492,96 1.124,09
2012 - 06 19.384.034,04 1.234,83 921,52
2013 - 06 19.210.091,11 1.523,31 1.126,30

2.4.5 PERFORMANCE FIGURES
Cap Div
ISIN code Cur-
rency
1 Year 3 Years* 5 Years* 10 Years* Since launch*
Share classes
Bench mark
Share classes
Bench mark
Share classes
Bench mark
Share classes
Bench mark
Launch Date
Share classes
CAP BE0164243223 EUR 23.36% 4.58% 3.32% 10.90% 27/06/1997 7.26%
DIV BE0164244239 EUR 23.32% 4.56% 3.30% 10.89% 27/06/1997 7.25%
Risk warning: Past performance is not a guide to future performance. * Return on annual basis.
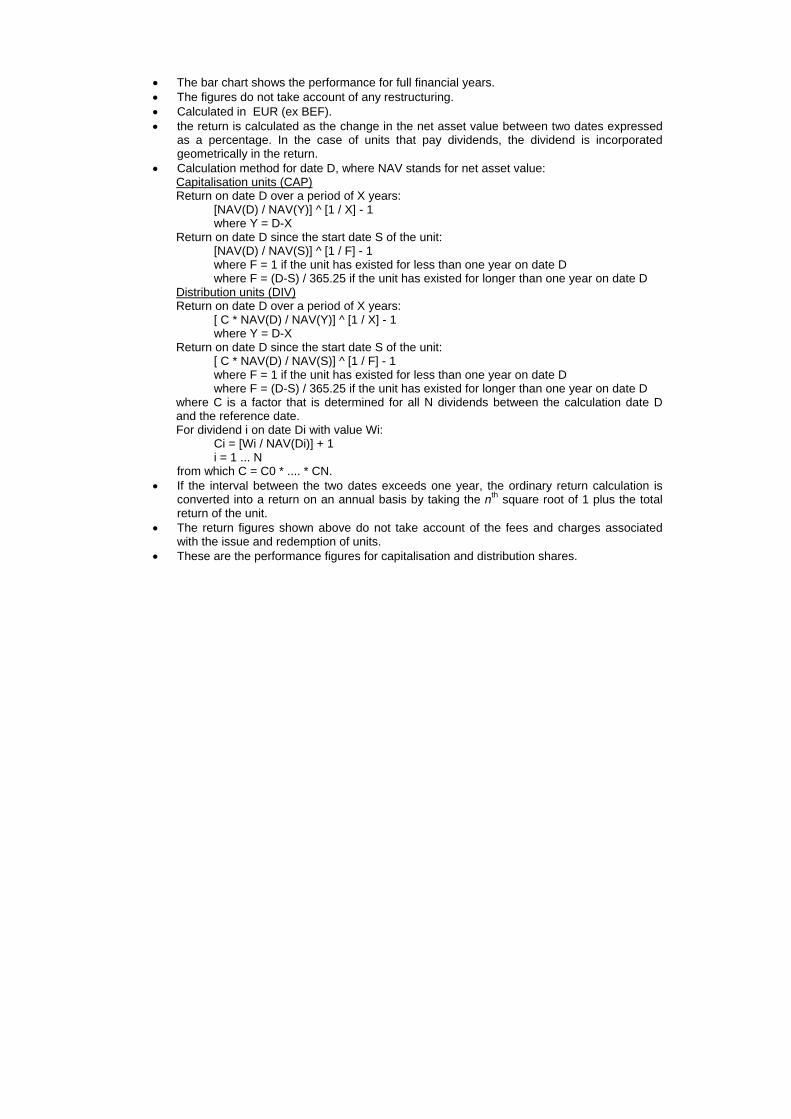
The bar chart shows the performance for full financial years. The figures do not take account of any restructuring. Calculated in EUR (ex BEF). the return is calculated as the change in the net asset value between two dates expressed
as a percentage. In the case of units that pay dividends, the dividend is incorporated geometrically in the return.
Calculation method for date D, where NAV stands for net asset value: Capitalisation units (CAP) Return on date D over a period of X years:
[NAV(D) / NAV(Y)] ^ [1 / X] - 1 where Y = D-X
Return on date D since the start date S of the unit: [NAV(D) / NAV(S)] ^ [1 / F] - 1 where F = 1 if the unit has existed for less than one year on date D where F = (D-S) / 365.25 if the unit has existed for longer than one year on date D
Distribution units (DIV) Return on date D over a period of X years:
[ C * NAV(D) / NAV(Y)] ^ [1 / X] - 1 where Y = D-X
Return on date D since the start date S of the unit: [ C * NAV(D) / NAV(S)] ^ [1 / F] - 1 where F = 1 if the unit has existed for less than one year on date D where F = (D-S) / 365.25 if the unit has existed for longer than one year on date D
where C is a factor that is determined for all N dividends between the calculation date D and the reference date. For dividend i on date Di with value Wi:
Ci = [Wi / NAV(Di)] + 1 i = 1 ... N
from which C = C0 * .... * CN. If the interval between the two dates exceeds one year, the ordinary return calculation is
converted into a return on an annual basis by taking the nth square root of 1 plus the total return of the unit.
The return figures shown above do not take account of the fees and charges associated with the issue and redemption of units.
These are the performance figures for capitalisation and distribution shares.
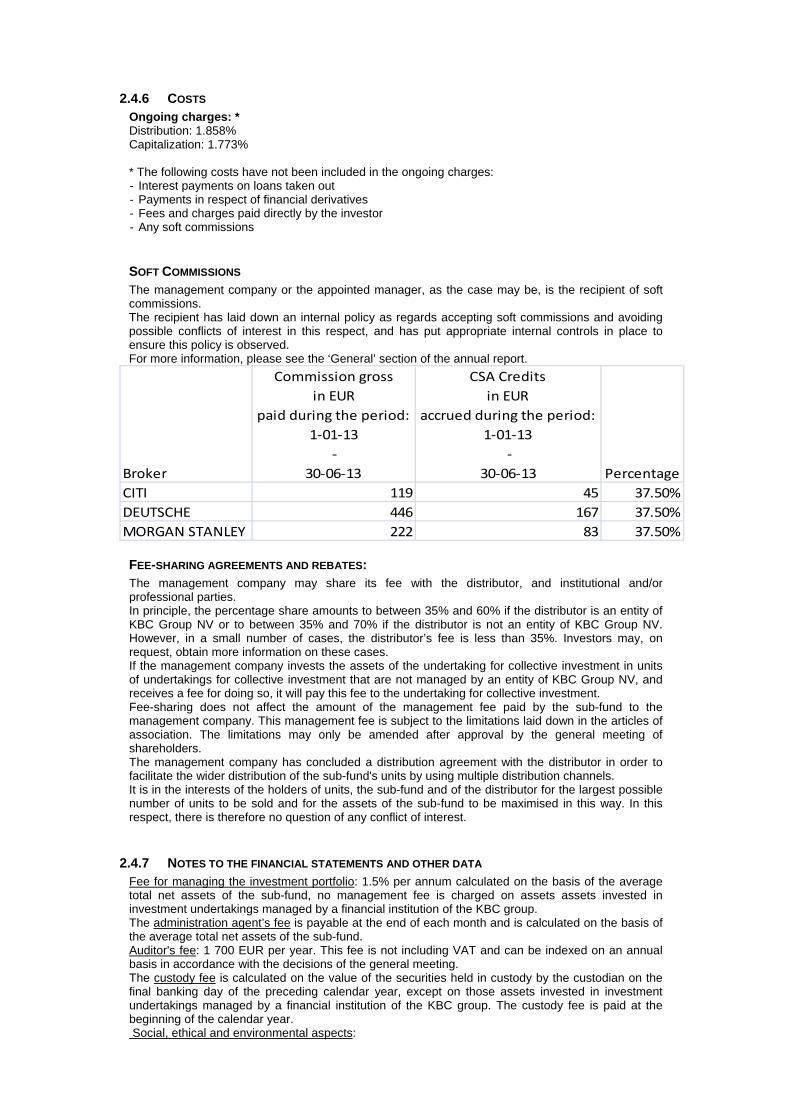
2.4.6 COSTS Ongoing charges: * Distribution: 1.858% Capitalization: 1.773% * The following costs have not been included in the ongoing charges: - Interest payments on loans taken out - Payments in respect of financial derivatives - Fees and charges paid directly by the investor - Any soft commissions
SOFT COMMISSIONS The management company or the appointed manager, as the case may be, is the recipient of soft commissions. The recipient has laid down an internal policy as regards accepting soft commissions and avoiding possible conflicts of interest in this respect, and has put appropriate internal controls in place to ensure this policy is observed. For more information, please see the ‘General’ section of the annual report.
Broker
Commission gross
in EUR
paid during the period:
1‐01‐13
‐
30‐06‐13
CSA Credits
in EUR
accrued during the period:
1‐01‐13
‐
30‐06‐13 Percentage
CITI 119 45 37.50%
DEUTSCHE 446 167 37.50%
MORGAN STANLEY 222 83 37.50%
FEE-SHARING AGREEMENTS AND REBATES: The management company may share its fee with the distributor, and institutional and/or professional parties. In principle, the percentage share amounts to between 35% and 60% if the distributor is an entity of KBC Group NV or to between 35% and 70% if the distributor is not an entity of KBC Group NV. However, in a small number of cases, the distributor’s fee is less than 35%. Investors may, on request, obtain more information on these cases. If the management company invests the assets of the undertaking for collective investment in units of undertakings for collective investment that are not managed by an entity of KBC Group NV, and receives a fee for doing so, it will pay this fee to the undertaking for collective investment. Fee-sharing does not affect the amount of the management fee paid by the sub-fund to the management company. This management fee is subject to the limitations laid down in the articles of association. The limitations may only be amended after approval by the general meeting of shareholders. The management company has concluded a distribution agreement with the distributor in order to facilitate the wider distribution of the sub-fund's units by using multiple distribution channels. It is in the interests of the holders of units, the sub-fund and of the distributor for the largest possible number of units to be sold and for the assets of the sub-fund to be maximised in this way. In this respect, there is therefore no question of any conflict of interest.
2.4.7 NOTES TO THE FINANCIAL STATEMENTS AND OTHER DATA Fee for managing the investment portfolio: 1.5% per annum calculated on the basis of the average total net assets of the sub-fund, no management fee is charged on assets assets invested in investment undertakings managed by a financial institution of the KBC group. The administration agent’s fee is payable at the end of each month and is calculated on the basis of the average total net assets of the sub-fund. Auditor's fee: 1 700 EUR per year. This fee is not including VAT and can be indexed on an annual basis in accordance with the decisions of the general meeting. The custody fee is calculated on the value of the securities held in custody by the custodian on the final banking day of the preceding calendar year, except on those assets invested in investment undertakings managed by a financial institution of the KBC group. The custody fee is paid at the beginning of the calendar year. Social, ethical and environmental aspects:
No manufacturers of controversial weapons whose use over the past five decades, according to the international consensus, has led to disproportionate human suffering among the civilian population will be included in the portfolio of investments. This involves the manufacturers of anti-personnel mines, cluster bombs and munitions and weapons containing depleted uranium. In this way, the sub-fund seeks to reflect not only simple financial reality but also the social reality of the sector or region in question. Exercising voting rights. If necessary, relevant and in the interest of the shareholders, the management company will exercise the voting rights attached to the shares in the Bevek’s portfolio. The management company will adhere to the following criteria when determining how it stands relative to the items on the agenda that are put to the vote: - Shareholder value may not be adversely affected. - Corporate governance rules, especially with regard to the rights of minority shareholders, must be
respected. - The minimum standards with regard to sustainable business and corporate social responsibility
must be met. The list of companies for which voting rights are exercised is available at the registered office of the Bevek. Securities lending In accordance with the Royal Decree of 7 March 2006 concerning securities lending, the undertaking for collective investment has taken out securities loans with a principal to whom the full title of the loaned securities was transferred, without recording this transfer of ownership in the accounts. For the period from 1 January 2013 to 30 June 2013, the fee for securities lent comes to 2,050.65 EUR. The undertaking for collective investment receives 50% of the fee received for securities lent. The detailed list of securities lending transactions carried out can be obtained from the registered office of the collective investment undertaking at 2 Havenlaan, 1080 Brussels.

Semi-Annual report as at 30th June 2013
TABLE OF CONTENTS
2. Information on KBC Equity Fund High Dividend Eurozone
2.1. Management report 2.1.1. Launch date and subscription price 2.1.2. Stock exchange listing 2.1.3. Aim and distinctive features of the investment policy 2.1.4. Financial portfolio management 2.1.5. Distributors 2.1.6. Index and benchmark 2.1.7. Policy conducted during the financial year 2.1.8. Future policy 2.1.9. Synthetic risk and reward indicator (SRRI)
2.2. Balance sheet
2.3. Profit and loss account
2.4. Composition of the assets and key figures
2.4.1. Composition of the assets 2.4.2. Change in the composition of the assets 2.4.3. Value of commitments in respect of financial derivatives positions 2.4.4. Evolution of the number of subscriptions, repayments and the net asset value 2.4.5. Return figures 2.4.6. Expenses 2.4.7. Notes to the financial statements and other data


2 INFORMATION ON KBC EQUITY FUND HIGH DIVIDEND EUROZONE
2.1 MANAGEMENT REPORT
2.1.1 LAUNCH DATE AND SUBSCRIPTION PRICE Classic Shares : Launch date: 27 July 2007 Initial subscription price: 500 EUR Currency: EUR Institutional B Shares : Launch date: 24 November 2011 Initial subscription price: 266.02 EUR Currency: EUR
2.1.2 STOCK EXCHANGE LISTING Not applicable.
2.1.3 GOAL AND KEY PRINCIPLES OF THE INVESTMENT POLICY
SUB-FUND’S OBJECT: The main objective of this sub-fund is to generate the highest possible return for its shareholders by investing directly or indirectly in transferable securities. This is reflected in its pursuit of capital gains and income. To this end, the assets are invested, either directly or indirectly via correlated financial instruments, primarily in shares.
SUB-FUND’S INVESTMENT POLICY:
PERMITTED ASSET CLASSES: The sub-fund may invest in securities, money market instruments, units in undertakings for collective investment, deposits, financial derivatives, liquid assets and all other instruments insofar as permitted by the applicable laws and regulations and consistent with the sub-fund’s object The sub-fund shall invest no more than 10% of its assets in units of other undertakings for collective investment.
RESTRICTIONS OF THE INVESTMENT POLICY: The investment policy will be implemented within the limits set by law and regulations. The sub-fund may borrow up to 10% of its net assets, insofar as these are short-term borrowings aimed at solving temporary liquidity problems.
PERMITTED DERIVATIVES TRANSACTIONS: Derivates may be used either for hedging purposes or to achieve investment objectives. Changes will be made to the investments at regular intervals to comply with the sub-fund's investment strategy. In addition, listed and unlisted derivates may be used to achieve the objectives: these may be forward contracts, options or swaps on securities, indices, currencies or interest rates or other transactions involving derivatives. Unlisted derivatives transactions will only be concluded with prime financial institutions specialised in such transactions. Such derivatives may also be used to hedge the assets against exchange-rate fluctuations. Subject to the applicable laws and regulations and the articles of association, the sub-fund always seeks to conclude the most effective transactions. All costs associated with the transactions will be charged to the sub-fund and all income generated will be paid to the sub-fund. If the transactions result in a risk in respect of the counterparty, this risk can be hedged by using a margin management system that ensures that the sub-fund is the beneficiary of security (collateral) in the form of cash or investment grade bonds. When calculating the value of the bonds, a margin will be applied that varies depending on the residual term to maturity and the currency in which the bond in question is denominated. The relationship with the counterparty or counterparties is governed by standard international agreements. To the extent that derivatives are used, it concerns liquid and readily negotiable instruments. They do not, therefore, affect the liquidity risk.

To the extent that derivatives are used, they are used to carry out the investment policy and within the limits of the investment strategy. They do not affect the market, performance and concentration risks or the risks associated with external factors or any kind.
Strategy selected This fund invests at least 75% of its assets in euro-area shares with a high dividend yield.
LENDING FINANCIAL INSTRUMENTS: The sub-fund may lend financial instruments within the limits set by law and regulations. This lending does not affect the sub-fund’s risk profile since: - it takes place within the framework of a securities lending system managed by a principal. In
addition, the sub-fund has a relationship only with the principal of the securities lending system which acts as counterparty and to which title of the loaned securities is transferred. The choice of principal is subject to strict selection criteria. The return of securities similar to the securities that have been lent is guaranteed by the principal.
- through a margin management system, the sub-fund is always guaranteed financial security, the actual value of which always exceeds the actual value of the securities that have been lent, in case the principal does not return similar securities.
The return of securities similar to the securities that have been lent can be requested at any time, which means that the lending of securities does not affect the management of the sub-fund's assets. By lending securities, the sub-fund can generate an additional return. The principal pays a fee to the management company. After deducting the fee for the margin management and clearing services of KBC Bank, most of this fee is paid to the sub-fund. The relationship with the counterparty or counterparties is governed by standard international agreements. More information is provided on the terms and conditions governing securities lending in the annual or half-yearly report for the sub-fund.
VOLATILITY OF THE NET ASSET VALUE: The volatility of the net asset value may be high due to the composition of the portfolio.
GENERAL STRATEGY FOR HEDGING THE EXCHANGE RATE RISK: In order to protect its assets against exchange rate fluctuations and within the limitations laid down in the articles of association, the sub-fund may perform transactions relating to the sale of forward currency contracts, as well as the sale of call options and the purchase of put options on currencies. The transactions in question may relate solely to contracts traded on a regulated market that operates regularly, is recognised and is open to the public or that are traded with a recognised, prime financial institution specialising in such transactions and dealing in the over-the-counter (OTC) market in options. With the same objective, the sub-fund may also sell currencies forward or exchange them in private transactions with prime financial institutions specialising in such transactions. The hedging objective of the aforementioned transactions suggests that there is a direct link between these transactions and the assets to be hedged, which implies that the transactions carried out in a particular currency may in principle not exceed, in terms of volume, either the valuation value of all the assets in the same currency or the holding period of those assets.
SOCIAL, ETHICAL AND ENVIRONMENTAL ASPECTS:
No manufacturers of controversial weapons whose use over the past five decades, according to the international consensus, has led to disproportionate human suffering among the civilian population will be included in the portfolio of investments. This involves the manufacturers of anti-personnel mines, cluster bombs and munitions and weapons containing depleted uranium. In this way, the sub-fund seeks to reflect not only simple financial reality but also the social reality of the sector or region in question.
THE EUROPEAN SAVINGS DIRECTIVE AND TAX ON DEBT CLAIM RETURNS OBTAINED THROUGH THE
REDEMPTION OF OWN UNITS OR IN THE EVENT OF FULL OR PARTIAL DISTRIBUTION OF EQUITY
CAPITAL. The following information is of a general character and is not intended to cover all aspects of an investment in a UCITS. In certain cases entirely different rules might even apply. Moreover, both tax law and the interpretation of it can change. Investors who wish to have more information about the tax implications – in both Belgium and abroad – of acquiring, holding and transferring units should seek the advice of their usual financial and tax advisers. This UCITS shall invest a maximum of 15% of its assets directly or indirectly in debt instruments as intended by the European Savings Directive. A. European Savings Directive (Directive 2003/48/EC) The European Savings Directive has been implemented in Belgium. Since this UCITS invests a maximum of 15% of its assets directly or indirectly in debt claims as intended by the European Savings Directive, the income of this UCITS does not fall within the scope of this directive. B. Tax on debt claim returns obtained through the redemption of own units or in the event of full or partial distribution of equity capital (Article 19bis Income Tax Code 1992). The income from this UCITS is not subject to the tax on debt instrument returns as intended by Article 19bis, Income Tax Code 1992.
2.1.4 FINANCIAL PORTFOLIO MANAGEMENT The management company has delegated the intellectual management, to KBC Fund Management Limited, Joshua Dawson House, Dawson Street , Dublin 2, IRELAND.. KBC Fund Management Limited has delegated the intellectual management, to Kleinwort Benson Investors Dublin Ltd, Joshua Dawson House Dawson Street , Dublin 2, IRELAND.
2.1.5 DISTRIBUTORS KBC Asset Management S.A., 5, Place de la Gare, L-1616 Luxembourg.
2.1.6 INDEX AND BENCHMARK See ‘Sub-fund’s investment policy’.
2.1.7 POLICY PERSUED DURING THE FINANCIAL YEAR The theme of high dividend investing fluctuated in performance during January but ended the month slightly ahead of the broad market. Fading sovereign debt risks in Europe and progress on the US fiscal cliff enabled equity markets to continue the good run they’ve enjoyed since mid 2012. All regions contributed similarly to the overall return with every market in the developed world having positive returns (in local currency). In February the theme performed in line with global markets. Most of the positive market returns were generated in the North American and Pacific Basin regions. European markets were much more muted with the political gridlock in Italy taking market participants by surprise and contributed to an overall “risk-off” mood amongst European investors. The theme of high dividend performed well during the month of March and in most regions other than the Pacific Basin. The financial uncertainty surrounding Cyprus contributed to weaker returns for most European countries and the defensive nature of the theme contributed solidly. Most value styles and especially the theme of high dividend performed well during the month of April. The developed market indices generally rallied in April on increased intervention by the Bank of Japan and speculation of further action by the ECB. In May the global equity index continued with positive gains on stronger than expected macroeconomic data. Rate cuts in Europe, Australia, Korea and Israel also supported market performance. The positively performing equity markets experienced since the start of the year were derailed during the month of June as global markets sank on the back of the hawkish FOMC meeting which increased fears that tapering was on the near horizon. With the slowdown in market returns, the theme of high dividends was generally positive during the month of June and outperformed in all regions except for the Pacific Region where it was a strong detractor from performance.
2.1.8 FUTURE POLICY While the mood in markets changed during June we do not see it as the commencement of a new bear market. Equity markets have been supported by global central banks providing significant liquidity support but also by improving macroeconomic fundamentals. Over time the level of liquidity support provided by central banks was likely to be reduced as the economic recovery became more self sustaining, the Federal Reserve is more confident that such a point has been reached. However self sustaining economic growth will enhance revenue growth and markets are already on the cheap side of good value. In the high dividend portfolios at stock selection level, we will continue to emphasise companies with strong fundamentals, i.e. balance sheet, cash flow and management Investors are likely to continue to reward companies that manage their balance sheet in an efficient manner with a continuing focus on companies that generate superior returns on assets, high quality earnings and robust free cash flow.
2.1.9 SYNTHETIC RISK AND REWARD INDICATOR Classic Shares: 7 on a scale of 1 (lowest risk) to 7 (highest risk). Institutional B Shares: 7 on a scale of 1 (lowest risk) to 7 (highest risk). The value of a share can decrease or increase and the investor may not get back the amount invested. In accordance with Commission Regulation (EU) No. 583/2010, a synthetic risk and reward indicator has been calculated. This indicator provides a quantitative measure of the sub-fund's potential return and the risk involved, calculated in the currency in which the sub-fund is denominated. It is given as a figure between 1 and 7. The higher the figure, the greater the potential return, but also the more difficult it is to predict this return. Losses are possible too. The lowest figure does not mean that the investment is entirely free of risk. However, it does indicate that, compared with the higher figures, this product will generally provide a lower, but more predictable return. The synthetic risk and reward indicator is assessed regularly and can therefore go up or down based on data from the past. Data from the past is not always a reliable indicator of future risk and return.
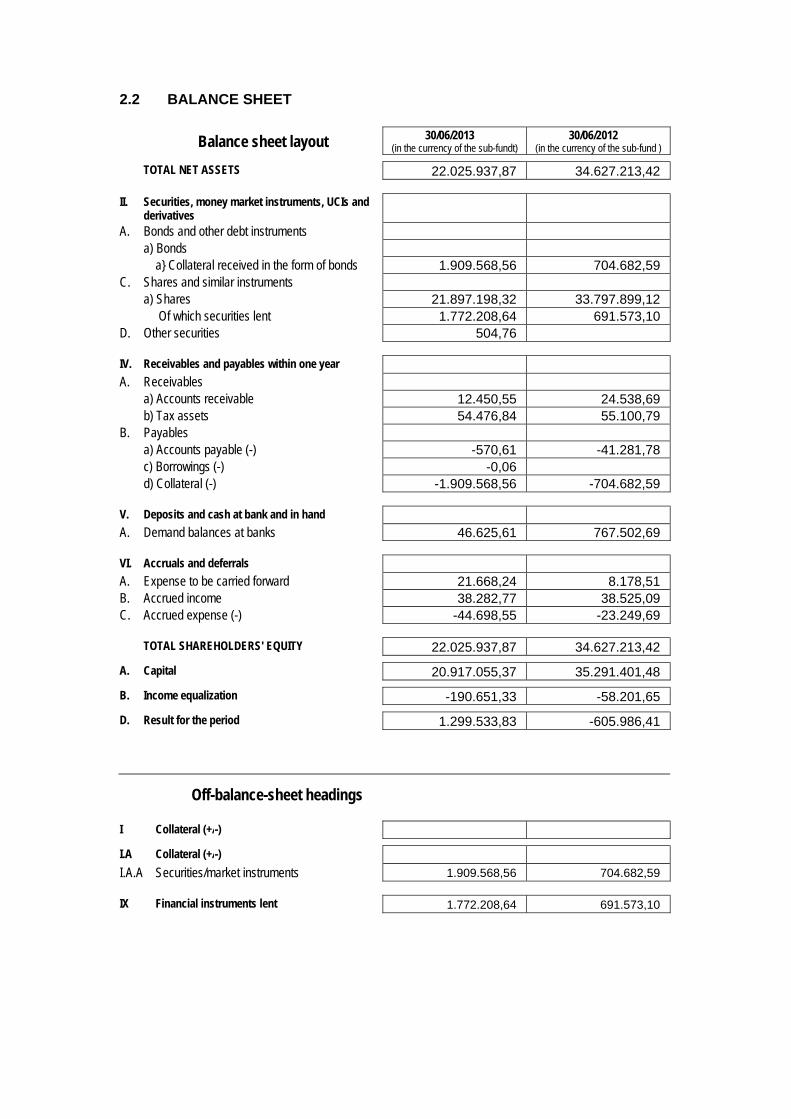
2.2 BALANCE SHEET
Balance sheet layout 30/06/2013 (in the currency of the sub-fundt)
30/06/2012 (in the currency of the sub-fund )
TOTAL NET ASSETS 22.025.937,87 34.627.213,42
II. Securities, money market instruments, UCIs and derivatives
A. Bonds and other debt instruments a) Bonds a} Collateral received in the form of bonds 1.909.568,56 704.682,59 C. Shares and similar instruments a) Shares 21.897.198,32 33.797.899,12 Of which securities lent 1.772.208,64 691.573,10 D. Other securities 504,76
IV. Receivables and payables within one year A. Receivables a) Accounts receivable 12.450,55 24.538,69 b) Tax assets 54.476,84 55.100,79 B. Payables a) Accounts payable (-) -570,61 -41.281,78 c) Borrowings (-) -0,06 d) Collateral (-) -1.909.568,56 -704.682,59
V. Deposits and cash at bank and in hand A. Demand balances at banks 46.625,61 767.502,69
VI. Accruals and deferrals A. Expense to be carried forward 21.668,24 8.178,51 B. Accrued income 38.282,77 38.525,09 C. Accrued expense (-) -44.698,55 -23.249,69
TOTAL SHAREHOLDERS' EQUITY 22.025.937,87 34.627.213,42
A. Capital 20.917.055,37 35.291.401,48
B. Income equalization -190.651,33 -58.201,65
D. Result for the period 1.299.533,83 -605.986,41
Off-balance-sheet headings
I Collateral (+/-)
I.A Collateral (+/-)
I.A.A Securities/market instruments 1.909.568,56 704.682,59
IX Financial instruments lent 1.772.208,64 691.573,10
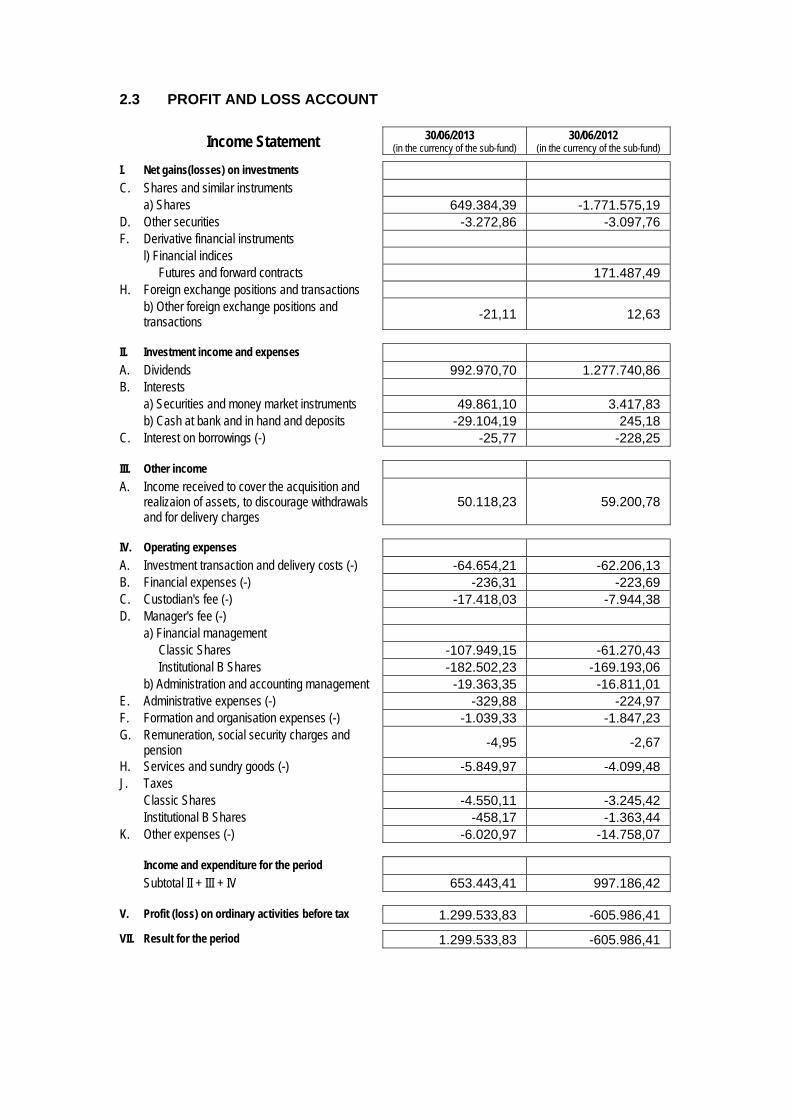
2.3 PROFIT AND LOSS ACCOUNT
Income Statement 30/06/2013 (in the currency of the sub-fund)
30/06/2012 (in the currency of the sub-fund)
I. Net gains(losses) on investments C. Shares and similar instruments a) Shares 649.384,39 -1.771.575,19 D. Other securities -3.272,86 -3.097,76 F. Derivative financial instruments l) Financial indices Futures and forward contracts 171.487,49 H. Foreign exchange positions and transactions b) Other foreign exchange positions and
transactions -21,11 12,63
II. Investment income and expenses A. Dividends 992.970,70 1.277.740,86 B. Interests a) Securities and money market instruments 49.861,10 3.417,83 b) Cash at bank and in hand and deposits -29.104,19 245,18 C. Interest on borrowings (-) -25,77 -228,25
III. Other income A. Income received to cover the acquisition and
realizaion of assets, to discourage withdrawals and for delivery charges
50.118,23 59.200,78
IV. Operating expenses A. Investment transaction and delivery costs (-) -64.654,21 -62.206,13 B. Financial expenses (-) -236,31 -223,69 C. Custodian's fee (-) -17.418,03 -7.944,38 D. Manager's fee (-) a) Financial management Classic Shares -107.949,15 -61.270,43 Institutional B Shares -182.502,23 -169.193,06 b) Administration and accounting management -19.363,35 -16.811,01 E. Administrative expenses (-) -329,88 -224,97 F. Formation and organisation expenses (-) -1.039,33 -1.847,23 G. Remuneration, social security charges and
pension -4,95 -2,67
H. Services and sundry goods (-) -5.849,97 -4.099,48 J. Taxes Classic Shares -4.550,11 -3.245,42 Institutional B Shares -458,17 -1.363,44 K. Other expenses (-) -6.020,97 -14.758,07
Income and expenditure for the period Subtotal II + III + IV 653.443,41 997.186,42
V. Profit (loss) on ordinary activities before tax 1.299.533,83 -605.986,41
VII. Result for the period 1.299.533,83 -605.986,41
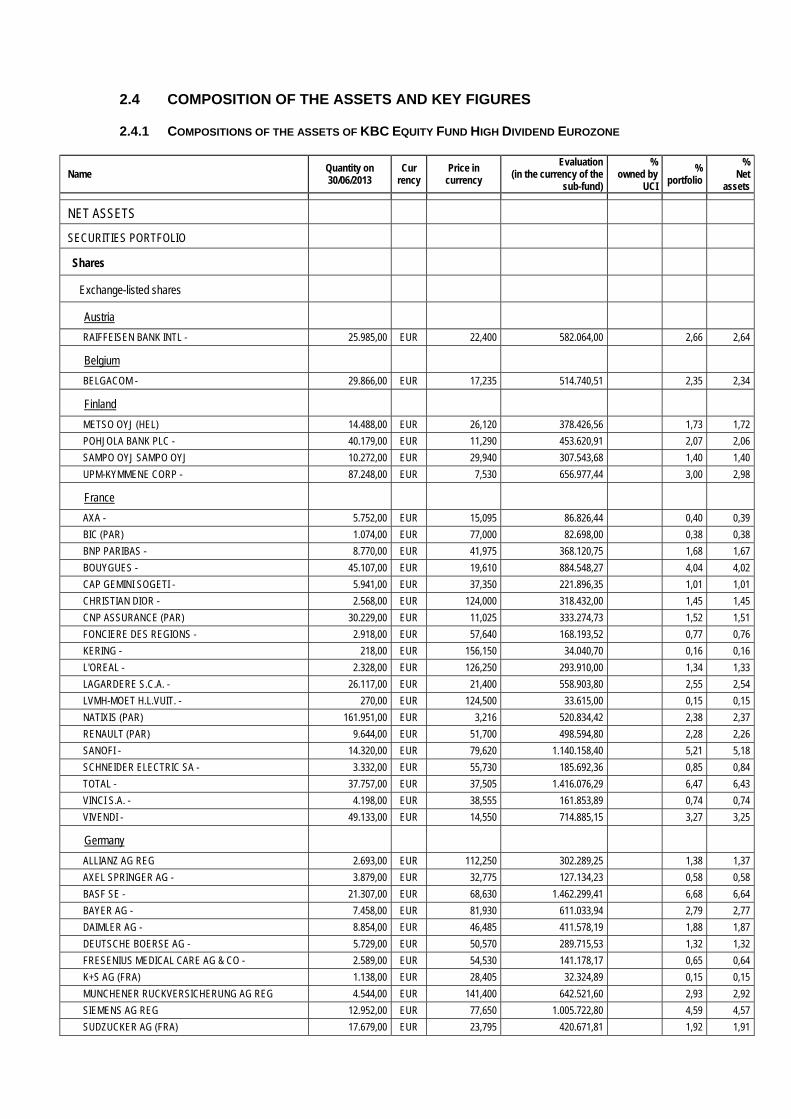
2.4 COMPOSITION OF THE ASSETS AND KEY FIGURES
2.4.1 COMPOSITIONS OF THE ASSETS OF KBC EQUITY FUND HIGH DIVIDEND EUROZONE
Name Quantity on 30/06/2013
Cur rency
Price in currency
Evaluation (in the currency of the
sub-fund)
% owned by
UCI
% portfolio
% Net
assets
NET ASSETS
SECURITIES PORTFOLIO
Shares
Exchange-listed shares
Austria
RAIFFEISEN BANK INTL - 25.985,00 EUR 22,400 582.064,00 2,66 2,64
Belgium
BELGACOM - 29.866,00 EUR 17,235 514.740,51 2,35 2,34
Finland
METSO OYJ (HEL) 14.488,00 EUR 26,120 378.426,56 1,73 1,72
POHJOLA BANK PLC - 40.179,00 EUR 11,290 453.620,91 2,07 2,06
SAMPO OYJ SAMPO OYJ 10.272,00 EUR 29,940 307.543,68 1,40 1,40
UPM-KYMMENE CORP - 87.248,00 EUR 7,530 656.977,44 3,00 2,98
France
AXA - 5.752,00 EUR 15,095 86.826,44 0,40 0,39
BIC (PAR) 1.074,00 EUR 77,000 82.698,00 0,38 0,38
BNP PARIBAS - 8.770,00 EUR 41,975 368.120,75 1,68 1,67
BOUYGUES - 45.107,00 EUR 19,610 884.548,27 4,04 4,02
CAP GEMINI SOGETI - 5.941,00 EUR 37,350 221.896,35 1,01 1,01
CHRISTIAN DIOR - 2.568,00 EUR 124,000 318.432,00 1,45 1,45
CNP ASSURANCE (PAR) 30.229,00 EUR 11,025 333.274,73 1,52 1,51
FONCIERE DES REGIONS - 2.918,00 EUR 57,640 168.193,52 0,77 0,76
KERING - 218,00 EUR 156,150 34.040,70 0,16 0,16
L'OREAL - 2.328,00 EUR 126,250 293.910,00 1,34 1,33
LAGARDERE S.C.A. - 26.117,00 EUR 21,400 558.903,80 2,55 2,54
LVMH-MOET H.L.VUIT. - 270,00 EUR 124,500 33.615,00 0,15 0,15
NATIXIS (PAR) 161.951,00 EUR 3,216 520.834,42 2,38 2,37
RENAULT (PAR) 9.644,00 EUR 51,700 498.594,80 2,28 2,26
SANOFI - 14.320,00 EUR 79,620 1.140.158,40 5,21 5,18
SCHNEIDER ELECTRIC SA - 3.332,00 EUR 55,730 185.692,36 0,85 0,84
TOTAL - 37.757,00 EUR 37,505 1.416.076,29 6,47 6,43
VINCI S.A. - 4.198,00 EUR 38,555 161.853,89 0,74 0,74
VIVENDI - 49.133,00 EUR 14,550 714.885,15 3,27 3,25
Germany
ALLIANZ AG REG 2.693,00 EUR 112,250 302.289,25 1,38 1,37
AXEL SPRINGER AG - 3.879,00 EUR 32,775 127.134,23 0,58 0,58
BASF SE - 21.307,00 EUR 68,630 1.462.299,41 6,68 6,64
BAYER AG - 7.458,00 EUR 81,930 611.033,94 2,79 2,77
DAIMLER AG - 8.854,00 EUR 46,485 411.578,19 1,88 1,87
DEUTSCHE BOERSE AG - 5.729,00 EUR 50,570 289.715,53 1,32 1,32
FRESENIUS MEDICAL CARE AG & CO - 2.589,00 EUR 54,530 141.178,17 0,65 0,64
K+S AG (FRA) 1.138,00 EUR 28,405 32.324,89 0,15 0,15
MUNCHENER RUCKVERSICHERUNG AG REG 4.544,00 EUR 141,400 642.521,60 2,93 2,92
SIEMENS AG REG 12.952,00 EUR 77,650 1.005.722,80 4,59 4,57
SUDZUCKER AG (FRA) 17.679,00 EUR 23,795 420.671,81 1,92 1,91

VOLKSWAGEN AG PREF 3.729,00 EUR 155,550 580.045,95 2,65 2,63
Italy
ATLANTIA SPA - 49.670,00 EUR 12,530 622.365,10 2,84 2,83
ENI - 22.656,00 EUR 15,780 357.511,68 1,63 1,62
Netherlands
HEINEKEN HOLDING (AMS)("A" 25NLG) 806,00 EUR 43,105 34.742,63 0,16 0,16
KON. AHOLD - 57.431,00 EUR 11,435 656.723,49 3,00 2,98
RANDSTAD HOLDING (AMS) 7.330,00 EUR 31,500 230.895,00 1,05 1,05
UNILEVER CVA 33.444,00 EUR 30,255 1.011.848,22 4,62 4,59
Portugal
ENERGIAS DE PORTUGAL SA - 125.631,00 EUR 2,475 310.936,73 1,42 1,41
Spain
AMADEUS IT HOLDING SA - 13.255,00 EUR 24,555 325.476,53 1,49 1,48
BANCO BILBAO VIZCAYA ARGENTARIA - 63.174,00 EUR 6,445 407.156,43 1,86 1,85
ENAGAS - 45.376,00 EUR 18,985 861.463,36 3,93 3,91
INDUSTRIA DE DISENO TEXTIL SA - 749,00 EUR 94,840 71.035,16 0,32 0,32
RED ELECTRICA DE ESPANA - 1.529,00 EUR 42,250 64.600,25 0,30 0,29
Total shares 21.897.198,32 100,00 99,42
Rights
France
GROUPE FNAC CP 20/06/13 252,00 EUR 2,003 504,76 0,00 0,00
Total rights 504,76 0,00 0,00
TOTAL SECURITIES PORTFOLIO 21.897.703,08 100,00 99,42
COLLATERAL RECEIVED
Belgium
KBC GROUP COLLATERAL EUR 1.909.568,56 EUR 1,000 1.909.568,56 8,67
TOTAL RECEIVED COLLATERAL 1.909.568,56 8,67
CASH AT BANK AND IN HAND
Demand accounts
Belgium
KBC GROUP EURO 46.251,18 EUR 1,000 46.251,18 0,21
KBC GROUP GBP 320,89 GBP 1,000 374,43 0,00
KBC GROUP USD -0,08 USD 1,000 -0,06
Total demand accounts 46.625,55 0,21
TOTAL CASH AT BANK AND IN HAND 46.625,55 0,21
OTHER RECEIVABLES AND PAYABLES
Receivables
Belgium
KBC GROUP EUR RECEIVABLE 12.450,55 EUR 1,000 12.450,55 0,06
KBC GROUP WHT TO BE RECOVERED EUR 54.476,84 EUR 1,000 54.476,84 0,25
Total receivables 66.927,39 0,30
Payables
Belgium
KBC GROUP COUNTERPART ENTRY COLLATERAL IN EUR -1.909.568,56 EUR 1,000 -1.909.568,56 -8,67
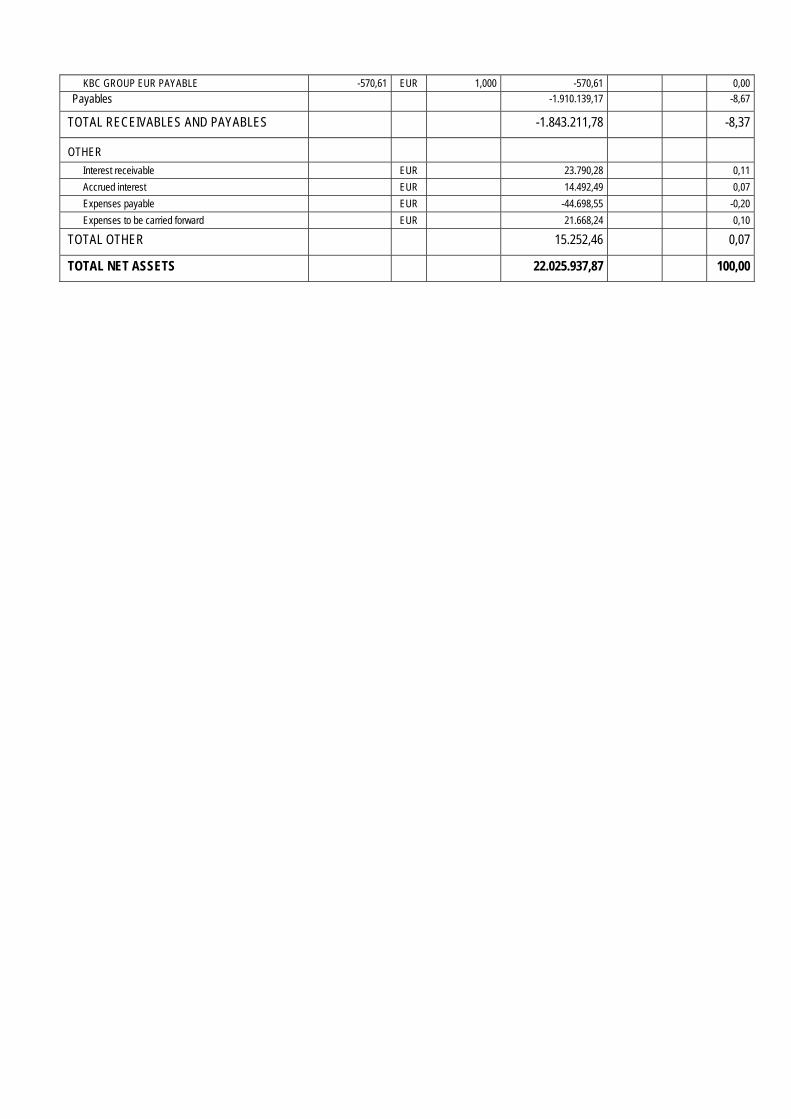
KBC GROUP EUR PAYABLE -570,61 EUR 1,000 -570,61 0,00
Payables -1.910.139,17 -8,67
TOTAL RECEIVABLES AND PAYABLES -1.843.211,78 -8,37
OTHER
Interest receivable EUR 23.790,28 0,11
Accrued interest EUR 14.492,49 0,07
Expenses payable EUR -44.698,55 -0,20
Expenses to be carried forward EUR 21.668,24 0,10
TOTAL OTHER 15.252,46 0,07
TOTAL NET ASSETS 22.025.937,87 100,00
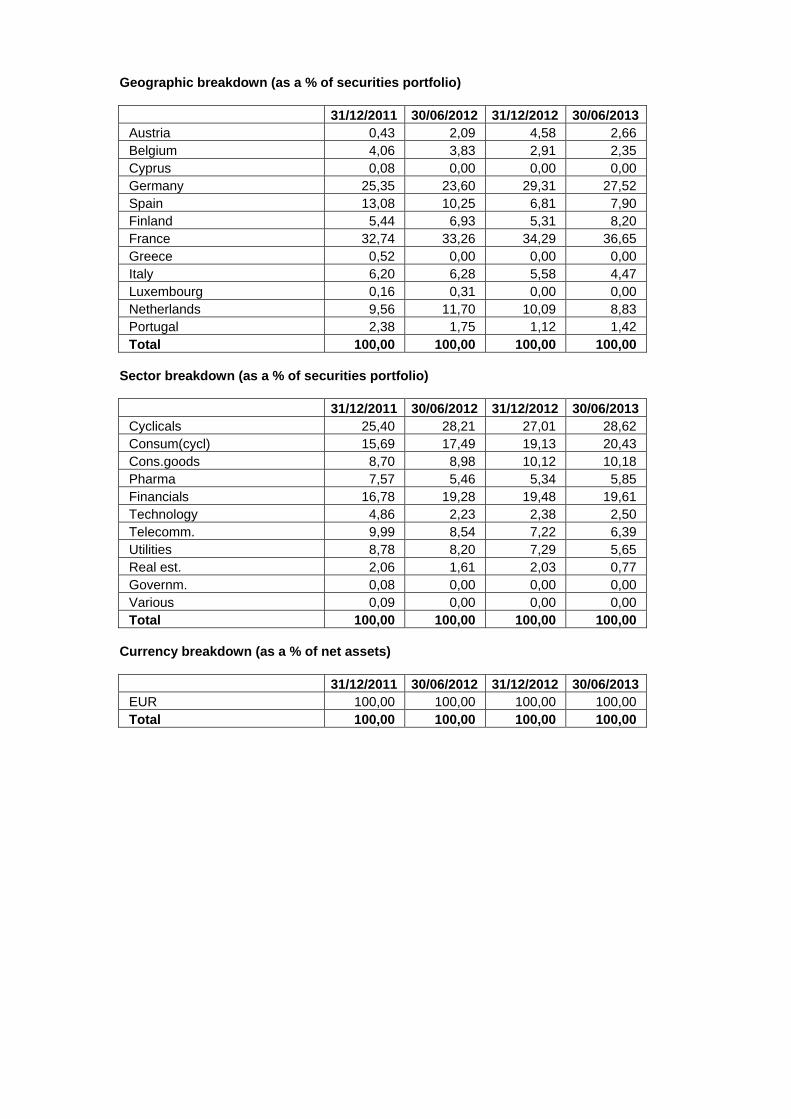
Geographic breakdown (as a % of securities portfolio)
31/12/2011 30/06/2012 31/12/2012 30/06/2013 Austria 0,43 2,09 4,58 2,66 Belgium 4,06 3,83 2,91 2,35 Cyprus 0,08 0,00 0,00 0,00 Germany 25,35 23,60 29,31 27,52 Spain 13,08 10,25 6,81 7,90 Finland 5,44 6,93 5,31 8,20 France 32,74 33,26 34,29 36,65 Greece 0,52 0,00 0,00 0,00 Italy 6,20 6,28 5,58 4,47 Luxembourg 0,16 0,31 0,00 0,00 Netherlands 9,56 11,70 10,09 8,83 Portugal 2,38 1,75 1,12 1,42 Total 100,00 100,00 100,00 100,00
Sector breakdown (as a % of securities portfolio)
31/12/2011 30/06/2012 31/12/2012 30/06/2013 Cyclicals 25,40 28,21 27,01 28,62 Consum(cycl) 15,69 17,49 19,13 20,43 Cons.goods 8,70 8,98 10,12 10,18 Pharma 7,57 5,46 5,34 5,85 Financials 16,78 19,28 19,48 19,61 Technology 4,86 2,23 2,38 2,50 Telecomm. 9,99 8,54 7,22 6,39 Utilities 8,78 8,20 7,29 5,65 Real est. 2,06 1,61 2,03 0,77 Governm. 0,08 0,00 0,00 0,00 Various 0,09 0,00 0,00 0,00 Total 100,00 100,00 100,00 100,00
Currency breakdown (as a % of net assets)
31/12/2011 30/06/2012 31/12/2012 30/06/2013 EUR 100,00 100,00 100,00 100,00 Total 100,00 100,00 100,00 100,00

2.4.2 CHANGES IN THE COMPOSITION OF THE ASSETS OF KBC EQUITY FUND HIGH DIVIDEND
EUROZONE (IN THE CURRENCY OF THE SUB-FUND)
1st half of year YearPurchases 21.465.389,44 21.465.389,44 Sales 49.089.534,64 49.089.534,64 Total 1 70.554.924,08 70.554.924,08 Subscriptions 13.029.571,49 13.029.571,49 Redemptions 41.056.453,62 41.056.453,62 Total 2 54.086.025,11 54.086.025,11 Monthly average of total assets
39.607.810,59 39.607.810,59
Turnover rate 41,58 % 41,58 %
1st half of year YearPurchases 21.465.389,44 21.465.389,44 Sales 49.089.534,64 49.089.534,64 Total 1 70.554.924,08 70.554.924,08 Subscriptions 13.029.571,49 13.029.571,49 Redemptions 41.056.453,62 41.056.453,62 Total 2 54.086.025,11 54.086.025,11 Monthly average of total assets
38.746.703,77 38.746.703,77
Corrected turnover rate 42,50 % 42,50 %
The table above shows the capital volume of portfolio transactions. This volume (adjusted to take account of total subscriptions and redemptions) is also compared to the average net assets at the beginning and end of the period. A figure close to 0% implies that the transactions relating to the securities or transactions relating to the assets (excluding deposits and cash) in a given period only involve subscriptions and redemptions. A negative percentage shows that subscriptions and redemptions entailed few, if any, transactions in the portfolio. Active asset management may result in high turnover rates (monthly percentage >50%). The detailed list of transactions is available for consultation free of charge at the registered office of the Bevek or fund at Havenlaan 2, 1080 Brussels.

2.4.3 AMOUNT OF COMMITMENTS IN RESPECT OF FINANCIAL DERIVATIVES POSITIONS
NAME Currency Value in currency
In the currency of the sub-fund
Lot-size
Transactiondate
KBC COLLATERAL EUR
EUR 1.909.568,56 1.909.568,56 N/A 28.06.2013
2.4.4 CHANGES OF THE NUMBER OF SUBSCRIPTIONS AND REDEMPTIONS AND THE NET ASSET
VALUE
Classic Shares
Period Change in number of shares in circulation
Year Subscriptions Redemptions End of period
Cap. Dis. Cap. Dis. Cap. Dis. Total
2011 - 06 223.094,89 2.042,00 185.129,05 1.939,00 120.237,18 6.656,00 126.893,18
2012 - 06 45.583,54 4.230,95 146.965,65 803,00 18.855,07 10.083,95 28.939,02
2013 - 06 19.488,37 3.547,96 15.832,33 1.658,00 22.511,11 11.973,91 34.485,02
Period Amounts received and paid by the UCI
(in the currency of the class)
Year Subscriptions Redemptions
Capitalization Distribution Capitalization Distribution
2011 - 06 75.529.408,34 659.246,85 62.812.667,76 640.652,43
2012 - 06 13.939.369,17 1.124.034,41 41.616.609,32 218.623,10
2013 - 06 6.663.337,57 1.092.803,68 5.768.505,87 521.795,63
Period Net asset value
End of period (in the currency of the class)
Year Of the class Of one share
Capitalization Distribution
2011 - 06 44.587.415,50 352,88 324,26
2012 - 06 8.363.172,61 300,25 267,95
2013 - 06 11.817.993,20 358,50 312,99
Institutional B Shares
Period Change in number of shares in circulation
Year Subscriptions Redemptions End of period
Cap. Dis. Cap. Dis. Cap. Dis. Total 2012 - 06 133.142,00 45.579,00 87.563,00 87.563,00
2013 - 06 109.711,00 168.803,00 28.471,00 28.471,00
Period Amounts received and paid by the UCI
(in the currency of the class)
Year Subscriptions Redemptions
Capitalization Distribution Capitalization Distribution
2012 - 06 40.581.580,32 13.846.580,54
2013 - 06 37.119.040,36 58.085.022,13
Period Net asset value
End of period (in the currency of the class)

Year Of the class Of one share
Capitalization Distribution
2012 - 06 26.264.040,81 299,94
2013 - 06 10.207.944,67 358,54
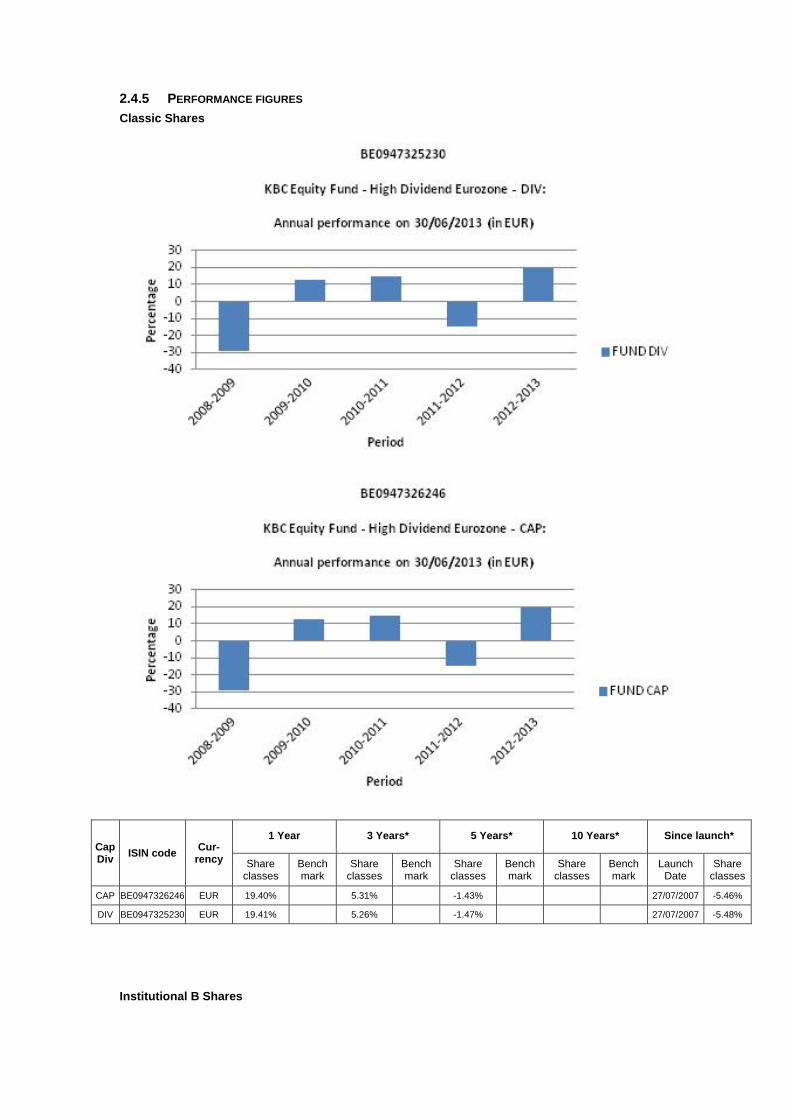
2.4.5 PERFORMANCE FIGURES
Classic Shares
Cap Div
ISIN code Cur-
rency
1 Year 3 Years* 5 Years* 10 Years* Since launch*
Share classes
Bench mark
Share classes
Bench mark
Share classes
Bench mark
Share classes
Bench mark
Launch Date
Share classes
CAP BE0947326246 EUR 19.40% 5.31% -1.43% 27/07/2007 -5.46%
DIV BE0947325230 EUR 19.41% 5.26% -1.47% 27/07/2007 -5.48%
Institutional B Shares

Cap Div
ISIN code Cur-
rency
1 Year 3 Years* 5 Years* 10 Years* Since launch*
Share classes
Bench mark
Share classes
Bench mark
Share classes
Bench mark
Share classes
Bench mark
Launch Date
Share classes
CAP BE6228916613 EUR 19.54% 25/11/2011 13.09%
Risk warning: Past performance is not a guide to future performance. * Return on annual basis.
Classic Shares The bar chart shows the performance for full financial years. The figures do not take account of any restructuring. Calculated in EUR. The return is calculated as the change in the net asset value between two dates expressed
as a percentage. In the case of units that pay dividends, the dividend is incorporated geometrically in the return.
Calculation method for date D, where NAV stands for net asset value: Capitalisation units (CAP) Return on date D over a period of X years:
[NIW(D) / NIW(Y)] ^ [1 / X] - 1 where Y = D-X
Return on date D since the start date S of the unit: [NIW(D) / NIW(S)] ^ [1 / F] - 1 where F = 1 if the unit has existed for less than one year on date D where F = (D-S) / 365.25 if the unit has existed for longer than one year on date D
Distribution units (DIV) Return on date D over a period of X years:
[ C * NIW(D) / NIW(Y)] ^ [1 / X] - 1 where Y = D-X
Return on date D since the start date S of the unit: [ C * NIW(D) / NIW(S)] ^ [1 / F] - 1 where F = 1 if the unit has existed for less than one year on date D where F = (D-S) / 365.25 if the unit has existed for longer than one year on date D where C is a factor that is determined for all N dividends between the calculation date D and the reference date.
For dividend i on date Di with value Wi: Ci = [Wi / NIW(Di)] + 1 i = 1 ... N from whichC = C0 * .... * CN.
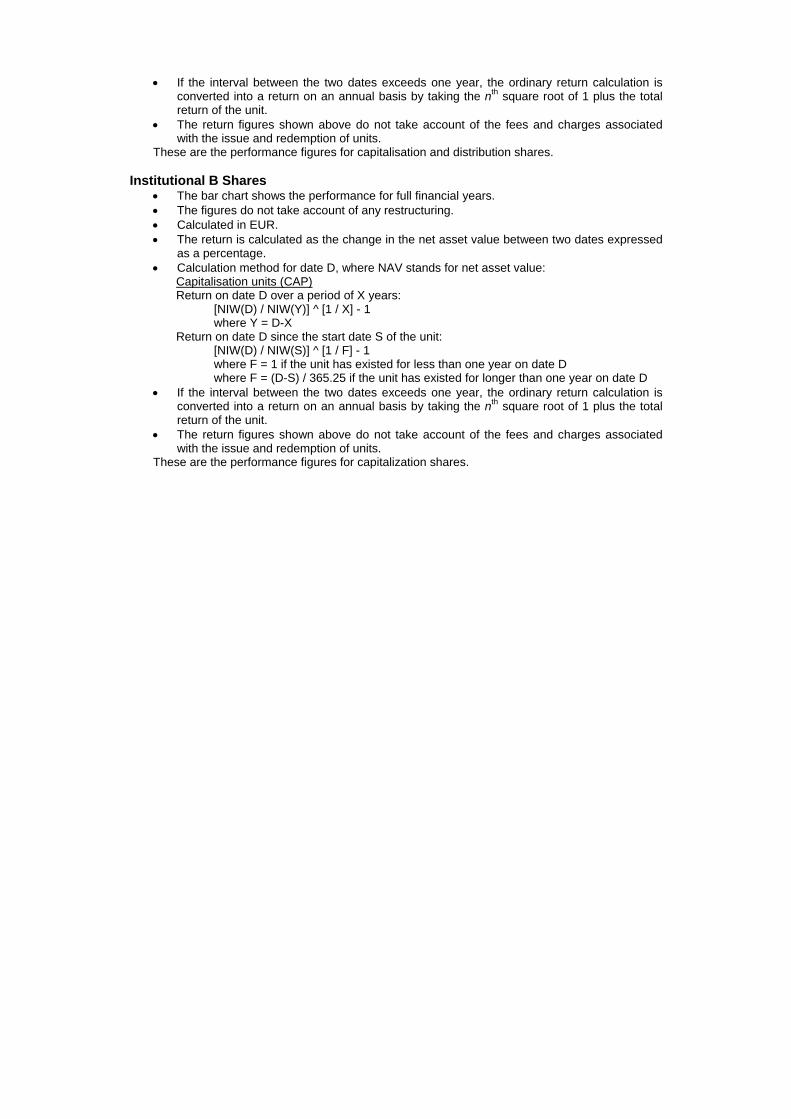
If the interval between the two dates exceeds one year, the ordinary return calculation is converted into a return on an annual basis by taking the nth square root of 1 plus the total return of the unit.
The return figures shown above do not take account of the fees and charges associated with the issue and redemption of units.
These are the performance figures for capitalisation and distribution shares.
Institutional B Shares The bar chart shows the performance for full financial years. The figures do not take account of any restructuring. Calculated in EUR. The return is calculated as the change in the net asset value between two dates expressed
as a percentage. Calculation method for date D, where NAV stands for net asset value:
Capitalisation units (CAP) Return on date D over a period of X years:
[NIW(D) / NIW(Y)] ^ [1 / X] - 1 where Y = D-X
Return on date D since the start date S of the unit: [NIW(D) / NIW(S)] ^ [1 / F] - 1 where F = 1 if the unit has existed for less than one year on date D where F = (D-S) / 365.25 if the unit has existed for longer than one year on date D
If the interval between the two dates exceeds one year, the ordinary return calculation is converted into a return on an annual basis by taking the nth square root of 1 plus the total return of the unit.
The return figures shown above do not take account of the fees and charges associated with the issue and redemption of units.
These are the performance figures for capitalization shares.

2.4.6 COSTS Ongoing Charges: * Classic Shares Distribution: 1.794% Classic Shares Capitalization: 1.813% Institutional B Shares Capitalization: 1.691% * The following costs have not been included in the ongoing charges: - Interest payments on loans taken out - Payments in respect of financial derivatives - Fees and charges paid directly by the investor - Any soft commissions
SOFT COMMISSIONS The management company or the appointed manager, as the case may be, is the recipient of soft commissions. The recipient has laid down an internal policy as regards accepting soft commissions and avoiding possible conflicts of interest in this respect, and has put appropriate internal controls in place to ensure this policy is observed. For more information, please see the ‘General’ section of the annual report.
Broker
Commission gross
in EUR
paid during the period:
1‐01‐13
‐
30‐06‐13
CSA Credits
in EUR
accrued during the period:
1‐01‐13
‐
30‐06‐13 Percentage
CITI 2,417 1,381 57.14%
DEUTSCHE 714 357 50.00%
EQ MACQUARIE 5,173 2,587 50.00%
INSTINET 2,428 1,819 74.94%
MERRILL 12,588 6,294 50.00%
MORGAN STANLEY 2,122 1,061 50.00%
UBSWDR 12,008 6,113 50.91%
FEE-SHARING AGREEMENTS AND REBATES: The management company may share its fee with the distributor, and institutional and/or professional parties. In principle, the percentage share amounts to between 35% and 60% if the distributor is an entity of KBC Group NV or to between 35% and 70% if the distributor is not an entity of KBC Group NV. However, in a small number of cases, the distributor’s fee is less than 35%. Investors may, on request, obtain more information on these cases. If the management company invests the assets of the undertaking for collective investment in units of undertakings for collective investment that are not managed by an entity of KBC Group NV, and receives a fee for doing so, it will pay this fee to the undertaking for collective investment. Fee-sharing does not affect the amount of the management fee paid by the sub-fund to the management company. This management fee is subject to the limitations laid down in the articles of association. The limitations may only be amended after approval by the general meeting of shareholders. The management company has concluded a distribution agreement with the distributor in order to facilitate the wider distribution of the sub-fund's units by using multiple distribution channels. It is in the interests of the holders of units, the sub-fund and of the distributor for the largest possible number of units to be sold and for the assets of the sub-fund to be maximised in this way. In this respect, there is therefore no question of any conflict of interest.
2.4.7 NOTES TO THE FINANCIAL STATEMENTS AND OTHER DATA Fee for managing the investment portfolio: 1.5% per annum calculated on the basis of the average total net assets of the sub-fund, no management fee is charged on assets assets invested in investment undertakings managed by a financial institution of the KBC group.
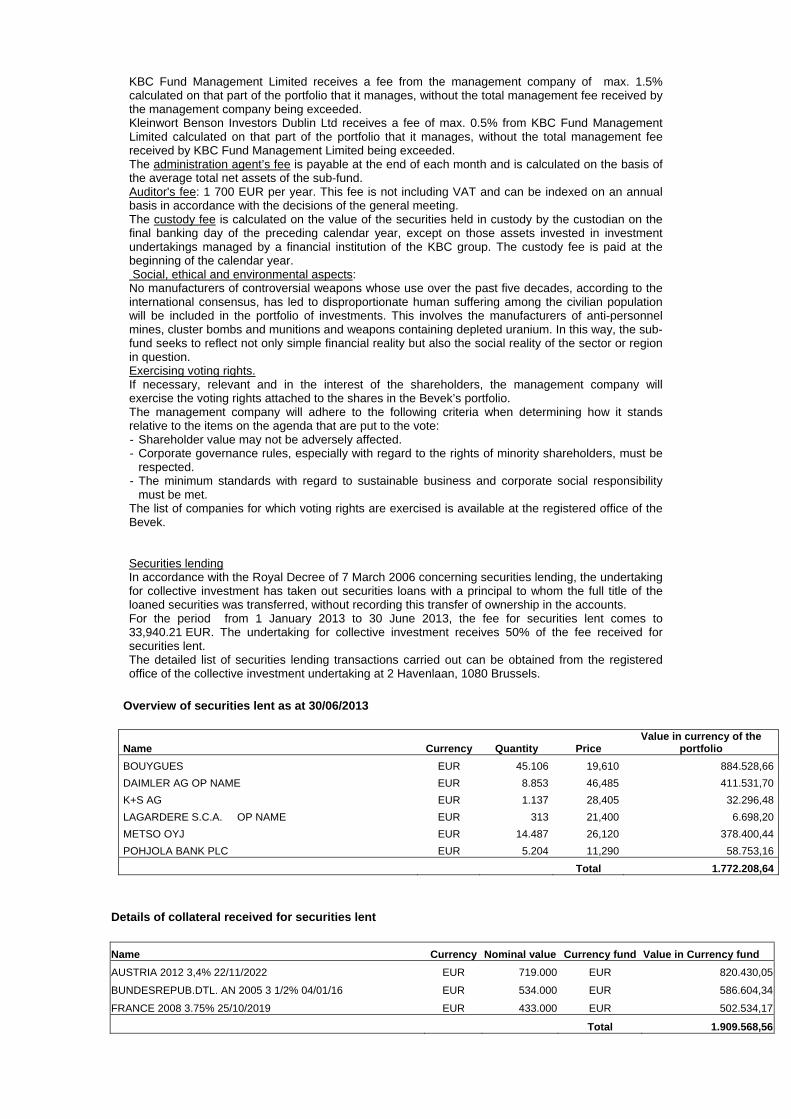
KBC Fund Management Limited receives a fee from the management company of max. 1.5% calculated on that part of the portfolio that it manages, without the total management fee received by the management company being exceeded. Kleinwort Benson Investors Dublin Ltd receives a fee of max. 0.5% from KBC Fund Management Limited calculated on that part of the portfolio that it manages, without the total management fee received by KBC Fund Management Limited being exceeded. The administration agent’s fee is payable at the end of each month and is calculated on the basis of the average total net assets of the sub-fund. Auditor's fee: 1 700 EUR per year. This fee is not including VAT and can be indexed on an annual basis in accordance with the decisions of the general meeting. The custody fee is calculated on the value of the securities held in custody by the custodian on the final banking day of the preceding calendar year, except on those assets invested in investment undertakings managed by a financial institution of the KBC group. The custody fee is paid at the beginning of the calendar year. Social, ethical and environmental aspects: No manufacturers of controversial weapons whose use over the past five decades, according to the international consensus, has led to disproportionate human suffering among the civilian population will be included in the portfolio of investments. This involves the manufacturers of anti-personnel mines, cluster bombs and munitions and weapons containing depleted uranium. In this way, the sub-fund seeks to reflect not only simple financial reality but also the social reality of the sector or region in question. Exercising voting rights. If necessary, relevant and in the interest of the shareholders, the management company will exercise the voting rights attached to the shares in the Bevek’s portfolio. The management company will adhere to the following criteria when determining how it stands relative to the items on the agenda that are put to the vote: - Shareholder value may not be adversely affected. - Corporate governance rules, especially with regard to the rights of minority shareholders, must be
respected. - The minimum standards with regard to sustainable business and corporate social responsibility
must be met. The list of companies for which voting rights are exercised is available at the registered office of the Bevek. Securities lending In accordance with the Royal Decree of 7 March 2006 concerning securities lending, the undertaking for collective investment has taken out securities loans with a principal to whom the full title of the loaned securities was transferred, without recording this transfer of ownership in the accounts. For the period from 1 January 2013 to 30 June 2013, the fee for securities lent comes to 33,940.21 EUR. The undertaking for collective investment receives 50% of the fee received for securities lent. The detailed list of securities lending transactions carried out can be obtained from the registered office of the collective investment undertaking at 2 Havenlaan, 1080 Brussels.
Overview of securities lent as at 30/06/2013
Name Currency Quantity Price Value in currency of the
portfolio
BOUYGUES EUR 45.106 19,610 884.528,66
DAIMLER AG OP NAME EUR 8.853 46,485 411.531,70
K+S AG EUR 1.137 28,405 32.296,48
LAGARDERE S.C.A. OP NAME EUR 313 21,400 6.698,20
METSO OYJ EUR 14.487 26,120 378.400,44
POHJOLA BANK PLC EUR 5.204 11,290 58.753,16
Total 1.772.208,64
Details of collateral received for securities lent
Name Currency Nominal value Currency fund Value in Currency fund
AUSTRIA 2012 3,4% 22/11/2022 EUR 719.000 EUR 820.430,05
BUNDESREPUB.DTL. AN 2005 3 1/2% 04/01/16 EUR 534.000 EUR 586.604,34
FRANCE 2008 3.75% 25/10/2019 EUR 433.000 EUR 502.534,17
Total 1.909.568,56

For the valuation of the collateral received, indicative prices have been used in this detail list by the Collateral Management Division of KBC Bank.

Semi-Annual report as at 30th June 2013
TABLE OF CONTENTS
2. Information on KBC Equity Fund BRIC
2.1. Management report 2.1.1. Launch date and subscription price 2.1.2. Stock exchange listing 2.1.3. Aim and distinctive features of the investment policy 2.1.4. Financial portfolio management 2.1.5. Distributors 2.1.6. Index and benchmark 2.1.7. Policy conducted during the financial year 2.1.8. Future policy 2.1.9. Synthetic risk and reward indicator (SRRI)
2.2. Balance sheet
2.3. Profit and loss account
2.4. Composition of the assets and key figures
2.4.1. Composition of the assets 2.4.2. Change in the composition of the assets 2.4.3. Value of commitments in respect of financial derivatives positions 2.4.4. Evolution of the number of subscriptions, repayments and the net asset value 2.4.5. Return figures 2.4.6. Expenses 2.4.7. Notes to the financial statements and other data

2 INFORMATION ON KBC EQUITY FUND BRIC
2.1 MANAGEMENT REPORT
2.1.1 LAUNCH DATE AND SUBSCRIPTION PRICE Launch date: 24 May 2006 Initial subscription price: 1000 EUR Currency: EUR
2.1.2 STOCK EXCHANGE LISTING Not applicable.
2.1.3 GOAL AND KEY PRINCIPLES OF THE INVESTMENT POLICY
SUB-FUND’S OBJECT: The main objective of this sub-fund is to generate the highest possible return for its shareholders by investing directly or indirectly in transferable securities. This is reflected in its pursuit of capital gains and income. To this end, the assets are invested, either directly or indirectly via correlated financial instruments, primarily in shares.
SUB-FUND’S INVESTMENT POLICY:
PERMITTED ASSET CLASSES: The sub-fund may invest in securities, money market instruments, units in undertakings for collective investment, deposits, financial derivatives, liquid assets and all other instruments insofar as permitted by the applicable laws and regulations and consistent with the sub-fund’s object
RESTRICTIONS OF THE INVESTMENT POLICY: The investment policy will be implemented within the limits set by law and regulations. The sub-fund may borrow up to 10% of its net assets, insofar as these are short-term borrowings aimed at solving temporary liquidity problems.
PERMITTED DERIVATIVES TRANSACTIONS: Derivates may be used either for hedging purposes or to achieve investment objectives. Changes will be made to the investments at regular intervals to comply with the sub-fund's investment strategy. In addition, listed and unlisted derivates may be used to achieve the objectives: these may be forward contracts, options or swaps on securities, indices, currencies or interest rates or other transactions involving derivatives. Unlisted derivatives transactions will only be concluded with prime financial institutions specialised in such transactions. Such derivatives may also be used to hedge the assets against exchange-rate fluctuations. Subject to the applicable laws and regulations and the articles of association, the sub-fund always seeks to conclude the most effective transactions. All costs associated with the transactions will be charged to the sub-fund and all income generated will be paid to the sub-fund. If the transactions result in a risk in respect of the counterparty, this risk can be hedged by using a margin management system that ensures that the sub-fund is the beneficiary of security (collateral) in the form of cash or investment grade bonds. When calculating the value of the bonds, a margin will be applied that varies depending on the residual term to maturity and the currency in which the bond in question is denominated. The relationship with the counterparty or counterparties is governed by standard international agreements.
STRATEGY SELECTED The sub-fund invests primarily, directly or indirectly, in shares of companies from different sectors in Brazil, Russia, India and China.
RISK CONCENTRATION Shares of Brazilian, Russian, Indian and Chinese companies.

PRIMARILY INVESTMENTS IN ASSETS OTHER THAN SECURITIES OR MONEY MARKET INSTRUMENTS Under the investment policy referred to above, the sub-fund may invest primarily in permitted assets other than securities or money market instruments, more specific units in UCIs.
LENDING FINANCIAL INSTRUMENTS: The sub-fund may lend financial instruments within the limits set by law and regulations. This lending does not affect the sub-fund’s risk profile since: - it takes place within the framework of a securities lending system managed by a principal. In
addition, the sub-fund has a relationship only with the principal of the securities lending system which acts as counterparty and to which title of the loaned securities is transferred. The choice of principal is subject to strict selection criteria. The return of securities similar to the securities that have been lent is guaranteed by the principal.
- through a margin management system, the sub-fund is always guaranteed financial security, the actual value of which always exceeds the actual value of the securities that have been lent, in case the principal does not return similar securities.
The return of securities similar to the securities that have been lent can be requested at any time, which means that the lending of securities does not affect the management of the sub-fund's assets. By lending securities, the sub-fund can generate an additional return. The principal pays a fee to the management company. After deducting the fee for the margin management and clearing services of KBC Bank, most of this fee is paid to the sub-fund. The relationship with the counterparty or counterparties is governed by standard international agreements. More information is provided on the terms and conditions governing securities lending in the annual or half-yearly report for the sub-fund.
VOLATILITY OF THE NET ASSET VALUE: The volatility of the net asset value may be high due to the composition of the portfolio.
GENERAL STRATEGY FOR HEDGING THE EXCHANGE RATE RISK: In order to protect its assets against exchange rate fluctuations and within the limitations laid down in the articles of association, the sub-fund may perform transactions relating to the sale of forward currency contracts, as well as the sale of call options and the purchase of put options on currencies. The transactions in question may relate solely to contracts traded on a regulated market that operates regularly, is recognised and is open to the public or that are traded with a recognised, prime financial institution specialising in such transactions and dealing in the over-the-counter (OTC) market in options. With the same objective, the sub-fund may also sell currencies forward or exchange them in private transactions with prime financial institutions specialising in such transactions. The hedging objective of the aforementioned transactions suggests that there is a direct link between these transactions and the assets to be hedged, which implies that the transactions carried out in a particular currency may in principle not exceed, in terms of volume, either the valuation value of all the assets in the same currency or the holding period of those assets.
SOCIAL, ETHICAL AND ENVIRONMENTAL ASPECTS:
No manufacturers of controversial weapons whose use over the past five decades, according to the international consensus, has led to disproportionate human suffering among the civilian population will be included in the portfolio of investments. This involves the manufacturers of anti-personnel mines, cluster bombs and munitions and weapons containing depleted uranium. In this way, the sub-fund seeks to reflect not only simple financial reality but also the social reality of the sector or region in question.
THE EUROPEAN SAVINGS DIRECTIVE AND TAX ON DEBT CLAIM RETURNS OBTAINED THROUGH THE
REDEMPTION OF OWN UNITS OR IN THE EVENT OF FULL OR PARTIAL DISTRIBUTION OF EQUITY
CAPITAL. The following information is of a general character and is not intended to cover all aspects of an investment in a UCITS. In certain cases entirely different rules might even apply. Moreover, both tax law and the interpretation of it can change. Investors who wish to have more information about the tax implications – in both Belgium and abroad – of acquiring, holding and transferring units should seek the advice of their usual financial and tax advisers.
This UCITS shall invest a maximum of 15% of its assets directly or indirectly in debt instruments as intended by the European Savings Directive. A. European Savings Directive (Directive 2003/48/EC) The European Savings Directive has been implemented in Belgium. Since this UCITS invests a maximum of 15% of its assets directly or indirectly in debt claims as intended by the European Savings Directive, the income of this UCITS does not fall within the scope of this directive. B. Tax on debt claim returns obtained through the redemption of own units or in the event of full or partial distribution of equity capital (Article 19bis Income Tax Code 1992). The income from this UCITS is not subject to the tax on debt instrument returns as intended by Article 19bis, Income Tax Code 1992.
2.1.4 FINANCIAL PORTFOLIO MANAGEMENT The management company has delegated the intellectual management, to KBC Fund Management Limited, Joshua Dawson House, Dawson Street , Dublin 2, IRELAND..
2.1.5 DISTRIBUTORS KBC Asset Management S.A., 5, Place de la Gare, L-1616 Luxembourg.
2.1.6 INDEX AND BENCHMARK See ‘Sub-fund’s investment policy’.

2.1.7 POLICY PERSUED DURING THE FINANCIAL YEAR The KBC Equity Fund BRIC invests directly and indirectly in the following developing economies which make up the BRIC acronym: Brazil, Russia, India and China. The KBC Equity Fund BRIC currently follows a broad breakdown of: Brazil 28%, Russia 14%, India 14% and China 44%. This fund was launched at the start of June 2006. Investors should be aware of the high risk and volatility associated with investing in emerging markets. Performance of the region was reasonably quiet over the first quarter of 2013. The strongest markets over the quarter were Brazil and India. The worst performing countries were China and Russia. In terms of sector performance defensives outperformed cyclicals. The strongest performing sectors were Utilities (3.9% of the fund) and Information Technology (5.4% of the fund). While Materials (10.2% of the fund) and Consumer Discretionary (4.9% of the fund) were the worst performing sectors. Brazil was the best performing market in Q1 2013. PMI manufacturing index crept up from 51.1 in December to 52.5 in February. Industrial production growth surprised positively during the period, registering 5.7% growth in March, versus consensus growth figure of 4.6%. Inflation growth continued to rise over the period, with year-on-year growth increasing from 5.8% in December to 6.3% in February. The latest retail sales figure showed growth of 5.0%. The central bank kept official policy rates unchanged. India was the second best performing market within the BRIC region in Q1 2013. The Indian budget was far from the major endorsement of reforms that investors would have wanted to see. A lack of clarity on the goods and services tax unnerved investors. Q4 GDP growth came in below expectations at 4.5%, versus 4.9% consensus forecast, down from 5.3% the previous quarter. Inflation growth moderated during the period but remains elevated, the wholesale price inflation index grew at 6.8% year-on-year in February down from 7.2% registered at the beginning of the period. The RBI cut its benchmark policy rate by 25bps, to 7.5%, during its mid-quarter policy meeting. The central bank also indicated that there is limited scope for further easing as inflation remains elevated. China was the worst performing country in the BRIC collective in Q1. Defensive sectors, namely contributed most heavily to performance over the period but good performance from these sectors was not enough to mitigate poor performance from cyclicals. In Macro news, inflation jumped from 2.0% in December to 3.2% in February, although a step up in inflation was expected, on the back of the Lunar New Year holiday effect, the magnitude of the increase came as a surprise. Q4 GDP was broadly in line with expectations, registering 7.9% growth for the quarter. Macro indicators showed softer recovery momentum with retail sales and industrial production numbers coming in below expectations. Fixed investment picked up to 21.2%. In response to the acceleration in house prices the State Council announced additional details on policy tightening measures for the property market. Russia was the second worst performer of the BRIC countries in Q1 2013. In Macro news, inflation stepped up from 6.6% in December to 7.3% in February. Industrial Production disappointed, falling short of expectations, having seen growth of 1.4% in December to a year-on-year contraction of 2.1% in February, versus a market expectation of -1% growth. Russia’s trade surplus increased to USD17.7bn at the end of the quarter. The central bank kept official policy rates unchanged. Turning to the second quarter of the year, performance of the region was negative on an absolute basis. The strongest markets over the quarter were India and China. The worst performing countries were Brazil and Russia. In terms of sector performance, defensives again outperformed cyclical sectors. The strongest performing sectors were Information Technology (5.4% of the fund) and Consumer Staples (9.4% of the fund). While Materials (10.2% of the fund) and Energy (20.4% of the fund) were the worst performing sectors. The India market outperformed the region over the period. The correction in global commodity prices provided some relief to India’s muddled macros and equities rallied as a result. Political developments and growth indicators continued to disappoint. The government was not able to transact any meaningful business in its May budget session of parliament as proceedings were blocked by the Opposition. As such, key bills (such as the Land Acquisition Bill together with legislation pertaining to financial sector reforms) were not taken up for consideration. On the marco front, data did not inspire confidence in imminently improving growth prospects, in fact most high frequency data (manufacturing and services PMI, auto sales, cement, sales etc) pointed to a protracted sub trend growth period. Although Q1 GDP growth was in line with what the market was expecting, 4.8%, it fell short of the 5% growth targeted set by policy makers. Inflation continued to trend down over the second quarter, and in June surprised positively, registering 4.7% versus consensus 4.9%. The central bank made one cut to official rates in 2Q 2013, bring the benchmark rate to 7.25%. On the currency front, INR touched a historic low and corrected 10% versus USD in May and June. Fears of the US Fed tapering its asset purchase program have hurt most EM, including India. China was the second best performing market in Q2 2013. Inflation was previously a concern as it had risen to 3.2% in February, however this figure was influenced by the Chinese New Year and the 4 official figures from March to July have been in a comfortable range, between 2.1 – 2.7%. Concerns about Chinese local authority debt levels, an overheating Chinese housing market and fear of a credit crisis took centre stage over the period. The 1 week interbank interest rate (SHIBOR) increased from 3.6% % to 11% in
the first 3 weeks of June and declining to below 4% in the last week of June. The main motivation behind this was to encourage more caution in lending practices and improve the capital allocation process but it did have a negative impact on financial markets, particularly the Chinese financial sector (16% of fund). Brazil was the worst performing market in Q2. Both local and global factors were behind poor performance. Brazil’s largest companies are very reliant on the global macroeconomic situation as their fortunes are dependent on commodity-oriented exports. Commodity prices, driven down by a slowdown in global and Chinese economy. Brazil-China commodity link, one of the main engines of local economy growth in the first decade of 21st century, went into reverse. Local economic data was not supportive either. On the economic front, GDP growth continued to disappoint, coming in below expectations. Q1 2013 GDP growth registered 1.9% versus consensus 2.3%. Russia was the second worst performing market in Q2. Sentiment was weak, and not just because of lower commodity prices. Foreign investors were abandoning the Russian story as corporate governance in some state-controlled companies deteriorated. Additionally, Russian equities reacted negatively to the ongoing recession in Europe as well as the Cypriot banking crisis. In the first quarter of 2013, the economy grew more than expected. GDP increased by 1.6% YoY, well above the Economics Ministry’s estimate of 1.1%. Nevertheless, it was the slowest quarterly growth since 2009. Industrial production in May declined by -1.4% YoY reflecting a slump in foreign demand and weak domestic spending. Investment and construction activity was also contracting. The Ruble suffered significant losses, particularly in June, due the aforementioned sell-off of emerging market currencies after the Fed stated it is contemplating to end its quantitative easing. The Ruble depreciated against the Dollar and the Euro by 7.6% and 6.2%, respectively.
2.1.8 FUTURE POLICY During its mid-quarter policy meeting the Indian Central Bank again indicated that the scope for further easing was limited. The government announced various policy measures to check the INR slide. In particular, confidence in Indian assets was boosted on the back of the government’s agreement to further raise natural gas prices, which should serve to boost foreign investment in the energy sector and reduce local explorers’ dependency on imports. In China, the new government administration intends to move towards a more market based economy, and facilitate an economic rebalance from export and investment led growth towards consumption driven growth. Although these policies are likely to be beneficial in the long run, the short term impact is increased uncertainty and market volatility. Unless the Russian government implements some significant reforms of its deteriorating economic model, the potential economic growth will, at best, linger around 2% - 3% annually. Russia is likely suffering from the so called middle-income trap that strikes countries with GDP per capita of around 16 000 USD. It is the first BRIC country to reach this phase. Nonetheless, The Russian stock market has one appealing benefit – its dividend yield. Since the state-controlled companies are ordered to pay out at least 25 % of net income, the market dividend yield is above 4 %. Other than that, the oil price is to be watched. Turning to Brazil, the unemployment rate continues to be very low at 5.5%. Moreover, cheaper local currency should help domestic exporters. Its largest companies are dependent on the global macroeconomic situation and on commodity prices. We do continue to believe, however, that the global economic picture is getting stronger. Moreover, a substantial part of the slowdown in the Brazilian economy appears to be priced in at current valuations and expectations are already moderate on a relative basis. Overall, equity markets were quite volatile in the second quarter of 2013 and the volatility is likely to continue. Historically, emerging market equities are more volatile than their counterparts in developed markets as their prices are more sensitive to changes in global macroeconomic data and investors’ sentiment towards risk assets. This was true over last few months and is likely to continue to prove true going forward. We do continue to believe, however, that the global economic picture is getting stronger. Overall, a reasonable level of good quality growth continues to be seen in emerging markets. Relative to developed markets, the region is not experiencing the same deleveraging that is being experienced elsewhere, particularly in Europe. While growth has clearly slowed in recent years, we do not expect a major deterioration from current levels going forward.
2.1.9 SYNTHETIC RISK AND REWARD INDICATOR 7 on a scale of 1 (lowest risk) to 7 (highest risk). The value of a share can decrease or increase and the investor may not get back the amount invested. In accordance with Commission Regulation (EU) No. 583/2010, a synthetic risk and reward indicator has been calculated. This indicator provides a quantitative measure of the sub-fund's potential return and the risk involved, calculated in the currency in which the sub-fund is denominated. It is given as a figure between 1 and 7. The higher the figure, the greater the potential return, but also the more difficult it is to predict this return. Losses are possible too. The lowest figure does not mean that the

investment is entirely free of risk. However, it does indicate that, compared with the higher figures, this product will generally provide a lower, but more predictable return. The synthetic risk and reward indicator is assessed regularly and can therefore go up or down based on data from the past. Data from the past is not always a reliable indicator of future risk and return.

2.2 BALANCE SHEET
Balance sheet layout 30/06/2013 (in the currency of the sub-fundt)
30/06/2012 (in the currency of the sub-fund )
TOTAL NET ASSETS 52.909.009,82 60.935.721,78
II. Securities, money market instruments, UCIs and derivatives
A. Bonds and other debt instruments a) Bonds 349.076,70 298.799,90 a} Collateral received in the form of bonds 2.572.227,23 2.289.744,51 C. Shares and similar instruments a) Shares 26.013.188,84 28.019.654,01 Of which securities lent 2.429.487,56 2.120.107,38 D. Other securities 911,95 E. Open-end undertakings for collective investment 26.050.877,20 32.144.051,45 F. Derivative financial instruments j) Foreign exchange Futures and forward contracts (+/-) -3.257,34 m) Financial indices Futures and forward contracts (+/-) 6.156,16
IV. Receivables and payables within one year A. Receivables a) Accounts receivable 45.019,97 25.259,04 B. Payables a) Accounts payable (-) -114.300,21 -86.308,73 c) Borrowings (-) -39.793,64 d) Collateral (-) -2.572.227,23 -2.289.744,51
V. Deposits and cash at bank and in hand A. Demand balances at banks 165.959,56 128.482,40
VI. Accruals and deferrals A. Expense to be carried forward 12.559,58 11.967,52 B. Accrued income 450.289,38 408.610,01 C. Accrued expense (-) -24.779,51 -17.692,64
TOTAL SHAREHOLDERS' EQUITY 52.909.009,82 60.935.721,78
A. Capital 60.495.050,13 60.234.180,62
B. Income equalization -672,44 -2.635,83
D. Result for the period -7.585.367,87 704.176,99
Off-balance-sheet headings
I Collateral (+/-)
I.A Collateral (+/-)
I.A.A Securities/market instruments 2.572.227,23 2.289.744,51
III Notional amounts of futures and forward contracts
III.A Purchased futures and forward contracts 585.251,63
IX Financial instruments lent 2.429.487,56 2.120.107,38
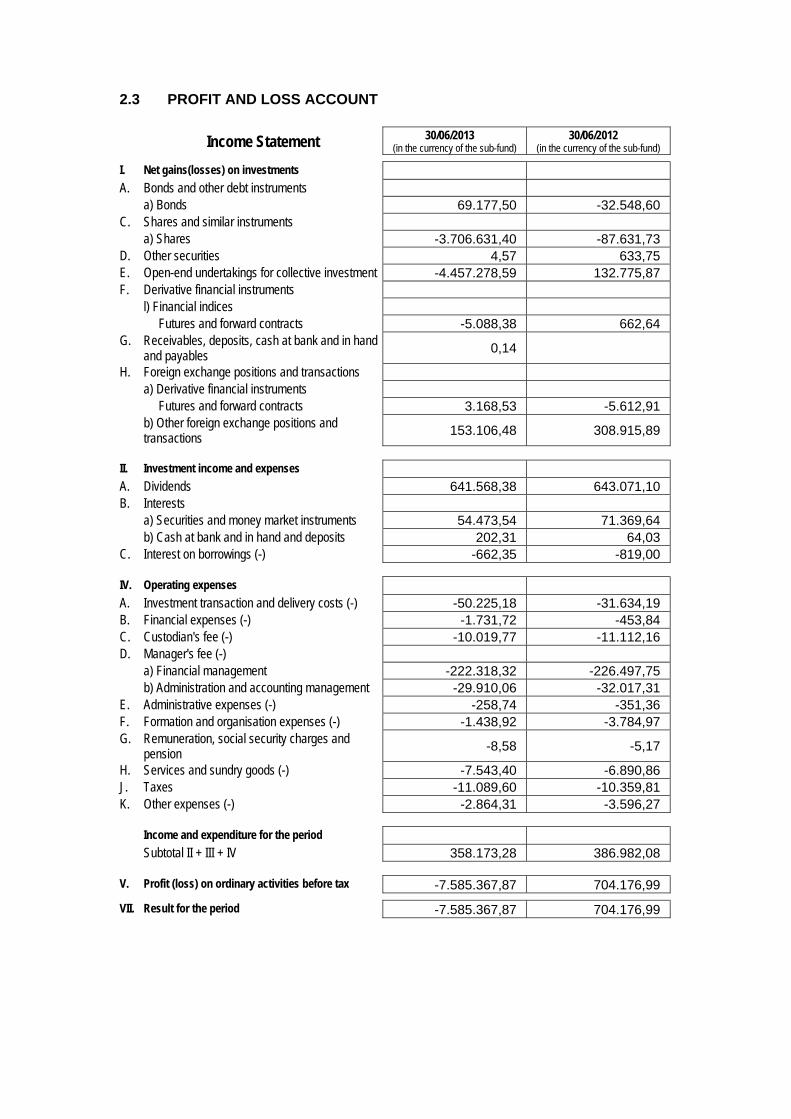
2.3 PROFIT AND LOSS ACCOUNT
Income Statement 30/06/2013 (in the currency of the sub-fund)
30/06/2012 (in the currency of the sub-fund)
I. Net gains(losses) on investments A. Bonds and other debt instruments a) Bonds 69.177,50 -32.548,60 C. Shares and similar instruments a) Shares -3.706.631,40 -87.631,73 D. Other securities 4,57 633,75 E. Open-end undertakings for collective investment -4.457.278,59 132.775,87 F. Derivative financial instruments l) Financial indices Futures and forward contracts -5.088,38 662,64 G. Receivables, deposits, cash at bank and in hand
and payables 0,14
H. Foreign exchange positions and transactions a) Derivative financial instruments Futures and forward contracts 3.168,53 -5.612,91 b) Other foreign exchange positions and
transactions 153.106,48 308.915,89
II. Investment income and expenses A. Dividends 641.568,38 643.071,10 B. Interests a) Securities and money market instruments 54.473,54 71.369,64 b) Cash at bank and in hand and deposits 202,31 64,03 C. Interest on borrowings (-) -662,35 -819,00
IV. Operating expenses A. Investment transaction and delivery costs (-) -50.225,18 -31.634,19 B. Financial expenses (-) -1.731,72 -453,84 C. Custodian's fee (-) -10.019,77 -11.112,16 D. Manager's fee (-) a) Financial management -222.318,32 -226.497,75 b) Administration and accounting management -29.910,06 -32.017,31 E. Administrative expenses (-) -258,74 -351,36 F. Formation and organisation expenses (-) -1.438,92 -3.784,97 G. Remuneration, social security charges and
pension -8,58 -5,17
H. Services and sundry goods (-) -7.543,40 -6.890,86 J. Taxes -11.089,60 -10.359,81 K. Other expenses (-) -2.864,31 -3.596,27
Income and expenditure for the period Subtotal II + III + IV 358.173,28 386.982,08
V. Profit (loss) on ordinary activities before tax -7.585.367,87 704.176,99
VII. Result for the period -7.585.367,87 704.176,99
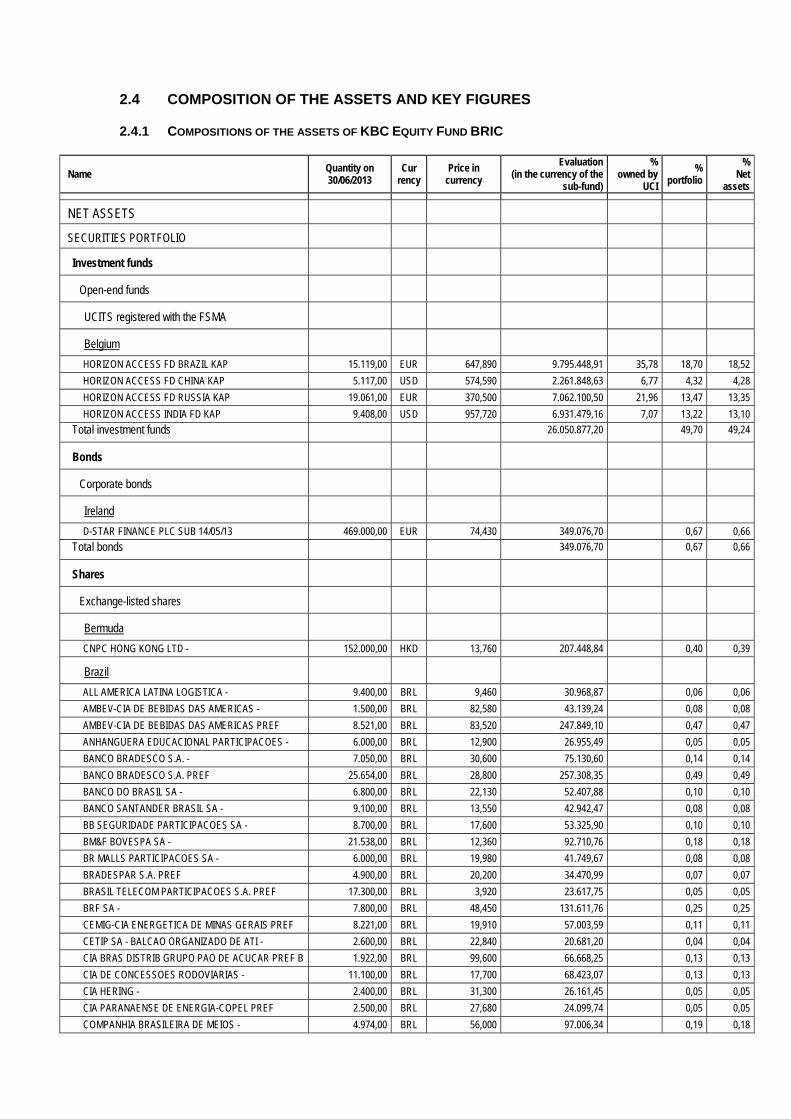
2.4 COMPOSITION OF THE ASSETS AND KEY FIGURES
2.4.1 COMPOSITIONS OF THE ASSETS OF KBC EQUITY FUND BRIC
Name Quantity on 30/06/2013
Cur rency
Price in currency
Evaluation (in the currency of the
sub-fund)
% owned by
UCI
% portfolio
% Net
assets
NET ASSETS
SECURITIES PORTFOLIO
Investment funds
Open-end funds
UCITS registered with the FSMA
Belgium
HORIZON ACCESS FD BRAZIL KAP 15.119,00 EUR 647,890 9.795.448,91 35,78 18,70 18,52
HORIZON ACCESS FD CHINA KAP 5.117,00 USD 574,590 2.261.848,63 6,77 4,32 4,28
HORIZON ACCESS FD RUSSIA KAP 19.061,00 EUR 370,500 7.062.100,50 21,96 13,47 13,35
HORIZON ACCESS INDIA FD KAP 9.408,00 USD 957,720 6.931.479,16 7,07 13,22 13,10
Total investment funds 26.050.877,20 49,70 49,24
Bonds
Corporate bonds
Ireland
D-STAR FINANCE PLC SUB 14/05/13 469.000,00 EUR 74,430 349.076,70 0,67 0,66
Total bonds 349.076,70 0,67 0,66
Shares
Exchange-listed shares
Bermuda
CNPC HONG KONG LTD - 152.000,00 HKD 13,760 207.448,84 0,40 0,39
Brazil
ALL AMERICA LATINA LOGISTICA - 9.400,00 BRL 9,460 30.968,87 0,06 0,06
AMBEV-CIA DE BEBIDAS DAS AMERICAS - 1.500,00 BRL 82,580 43.139,24 0,08 0,08
AMBEV-CIA DE BEBIDAS DAS AMERICAS PREF 8.521,00 BRL 83,520 247.849,10 0,47 0,47
ANHANGUERA EDUCACIONAL PARTICIPACOES - 6.000,00 BRL 12,900 26.955,49 0,05 0,05
BANCO BRADESCO S.A. - 7.050,00 BRL 30,600 75.130,60 0,14 0,14
BANCO BRADESCO S.A. PREF 25.654,00 BRL 28,800 257.308,35 0,49 0,49
BANCO DO BRASIL SA - 6.800,00 BRL 22,130 52.407,88 0,10 0,10
BANCO SANTANDER BRASIL SA - 9.100,00 BRL 13,550 42.942,47 0,08 0,08
BB SEGURIDADE PARTICIPACOES SA - 8.700,00 BRL 17,600 53.325,90 0,10 0,10
BM&F BOVESPA SA - 21.538,00 BRL 12,360 92.710,76 0,18 0,18
BR MALLS PARTICIPACOES SA - 6.000,00 BRL 19,980 41.749,67 0,08 0,08
BRADESPAR S.A. PREF 4.900,00 BRL 20,200 34.470,99 0,07 0,07
BRASIL TELECOM PARTICIPACOES S.A. PREF 17.300,00 BRL 3,920 23.617,75 0,05 0,05
BRF SA - 7.800,00 BRL 48,450 131.611,76 0,25 0,25
CEMIG-CIA ENERGETICA DE MINAS GERAIS PREF 8.221,00 BRL 19,910 57.003,59 0,11 0,11
CETIP SA - BALCAO ORGANIZADO DE ATI - 2.600,00 BRL 22,840 20.681,20 0,04 0,04
CIA BRAS DISTRIB GRUPO PAO DE ACUCAR PREF B 1.922,00 BRL 99,600 66.668,25 0,13 0,13
CIA DE CONCESSOES RODOVIARIAS - 11.100,00 BRL 17,700 68.423,07 0,13 0,13
CIA HERING - 2.400,00 BRL 31,300 26.161,45 0,05 0,05
CIA PARANAENSE DE ENERGIA-COPEL PREF 2.500,00 BRL 27,680 24.099,74 0,05 0,05
COMPANHIA BRASILEIRA DE MEIOS - 4.974,00 BRL 56,000 97.006,34 0,19 0,18
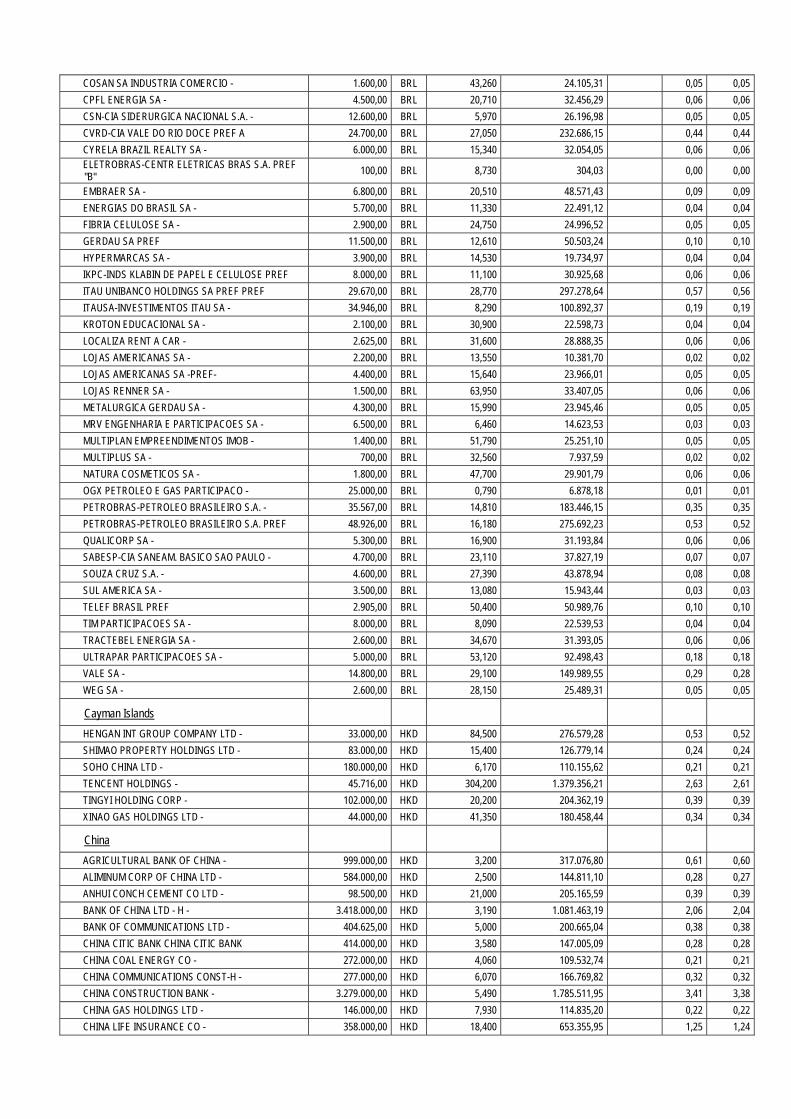
COSAN SA INDUSTRIA COMERCIO - 1.600,00 BRL 43,260 24.105,31 0,05 0,05
CPFL ENERGIA SA - 4.500,00 BRL 20,710 32.456,29 0,06 0,06
CSN-CIA SIDERURGICA NACIONAL S.A. - 12.600,00 BRL 5,970 26.196,98 0,05 0,05
CVRD-CIA VALE DO RIO DOCE PREF A 24.700,00 BRL 27,050 232.686,15 0,44 0,44
CYRELA BRAZIL REALTY SA - 6.000,00 BRL 15,340 32.054,05 0,06 0,06 ELETROBRAS-CENTR ELETRICAS BRAS S.A. PREF "B"
100,00 BRL 8,730 304,03 0,00 0,00
EMBRAER SA - 6.800,00 BRL 20,510 48.571,43 0,09 0,09
ENERGIAS DO BRASIL SA - 5.700,00 BRL 11,330 22.491,12 0,04 0,04
FIBRIA CELULOSE SA - 2.900,00 BRL 24,750 24.996,52 0,05 0,05
GERDAU SA PREF 11.500,00 BRL 12,610 50.503,24 0,10 0,10
HYPERMARCAS SA - 3.900,00 BRL 14,530 19.734,97 0,04 0,04
IKPC-INDS KLABIN DE PAPEL E CELULOSE PREF 8.000,00 BRL 11,100 30.925,68 0,06 0,06
ITAU UNIBANCO HOLDINGS SA PREF PREF 29.670,00 BRL 28,770 297.278,64 0,57 0,56
ITAUSA-INVESTIMENTOS ITAU SA - 34.946,00 BRL 8,290 100.892,37 0,19 0,19
KROTON EDUCACIONAL SA - 2.100,00 BRL 30,900 22.598,73 0,04 0,04
LOCALIZA RENT A CAR - 2.625,00 BRL 31,600 28.888,35 0,06 0,06
LOJAS AMERICANAS SA - 2.200,00 BRL 13,550 10.381,70 0,02 0,02
LOJAS AMERICANAS SA -PREF- 4.400,00 BRL 15,640 23.966,01 0,05 0,05
LOJAS RENNER SA - 1.500,00 BRL 63,950 33.407,05 0,06 0,06
METALURGICA GERDAU SA - 4.300,00 BRL 15,990 23.945,46 0,05 0,05
MRV ENGENHARIA E PARTICIPACOES SA - 6.500,00 BRL 6,460 14.623,53 0,03 0,03
MULTIPLAN EMPREENDIMENTOS IMOB - 1.400,00 BRL 51,790 25.251,10 0,05 0,05
MULTIPLUS SA - 700,00 BRL 32,560 7.937,59 0,02 0,02
NATURA COSMETICOS SA - 1.800,00 BRL 47,700 29.901,79 0,06 0,06
OGX PETROLEO E GAS PARTICIPACO - 25.000,00 BRL 0,790 6.878,18 0,01 0,01
PETROBRAS-PETROLEO BRASILEIRO S.A. - 35.567,00 BRL 14,810 183.446,15 0,35 0,35
PETROBRAS-PETROLEO BRASILEIRO S.A. PREF 48.926,00 BRL 16,180 275.692,23 0,53 0,52
QUALICORP SA - 5.300,00 BRL 16,900 31.193,84 0,06 0,06
SABESP-CIA SANEAM. BASICO SAO PAULO - 4.700,00 BRL 23,110 37.827,19 0,07 0,07
SOUZA CRUZ S.A. - 4.600,00 BRL 27,390 43.878,94 0,08 0,08
SUL AMERICA SA - 3.500,00 BRL 13,080 15.943,44 0,03 0,03
TELEF BRASIL PREF 2.905,00 BRL 50,400 50.989,76 0,10 0,10
TIM PARTICIPACOES SA - 8.000,00 BRL 8,090 22.539,53 0,04 0,04
TRACTEBEL ENERGIA SA - 2.600,00 BRL 34,670 31.393,05 0,06 0,06
ULTRAPAR PARTICIPACOES SA - 5.000,00 BRL 53,120 92.498,43 0,18 0,18
VALE SA - 14.800,00 BRL 29,100 149.989,55 0,29 0,28
WEG SA - 2.600,00 BRL 28,150 25.489,31 0,05 0,05
Cayman Islands
HENGAN INT GROUP COMPANY LTD - 33.000,00 HKD 84,500 276.579,28 0,53 0,52
SHIMAO PROPERTY HOLDINGS LTD - 83.000,00 HKD 15,400 126.779,14 0,24 0,24
SOHO CHINA LTD - 180.000,00 HKD 6,170 110.155,62 0,21 0,21
TENCENT HOLDINGS - 45.716,00 HKD 304,200 1.379.356,21 2,63 2,61
TINGYI HOLDING CORP - 102.000,00 HKD 20,200 204.362,19 0,39 0,39
XINAO GAS HOLDINGS LTD - 44.000,00 HKD 41,350 180.458,44 0,34 0,34
China
AGRICULTURAL BANK OF CHINA - 999.000,00 HKD 3,200 317.076,80 0,61 0,60
ALIMINUM CORP OF CHINA LTD - 584.000,00 HKD 2,500 144.811,10 0,28 0,27
ANHUI CONCH CEMENT CO LTD - 98.500,00 HKD 21,000 205.165,59 0,39 0,39
BANK OF CHINA LTD - H - 3.418.000,00 HKD 3,190 1.081.463,19 2,06 2,04
BANK OF COMMUNICATIONS LTD - 404.625,00 HKD 5,000 200.665,04 0,38 0,38
CHINA CITIC BANK CHINA CITIC BANK 414.000,00 HKD 3,580 147.005,09 0,28 0,28
CHINA COAL ENERGY CO - 272.000,00 HKD 4,060 109.532,74 0,21 0,21
CHINA COMMUNICATIONS CONST-H - 277.000,00 HKD 6,070 166.769,82 0,32 0,32
CHINA CONSTRUCTION BANK - 3.279.000,00 HKD 5,490 1.785.511,95 3,41 3,38
CHINA GAS HOLDINGS LTD - 146.000,00 HKD 7,930 114.835,20 0,22 0,22
CHINA LIFE INSURANCE CO - 358.000,00 HKD 18,400 653.355,95 1,25 1,24
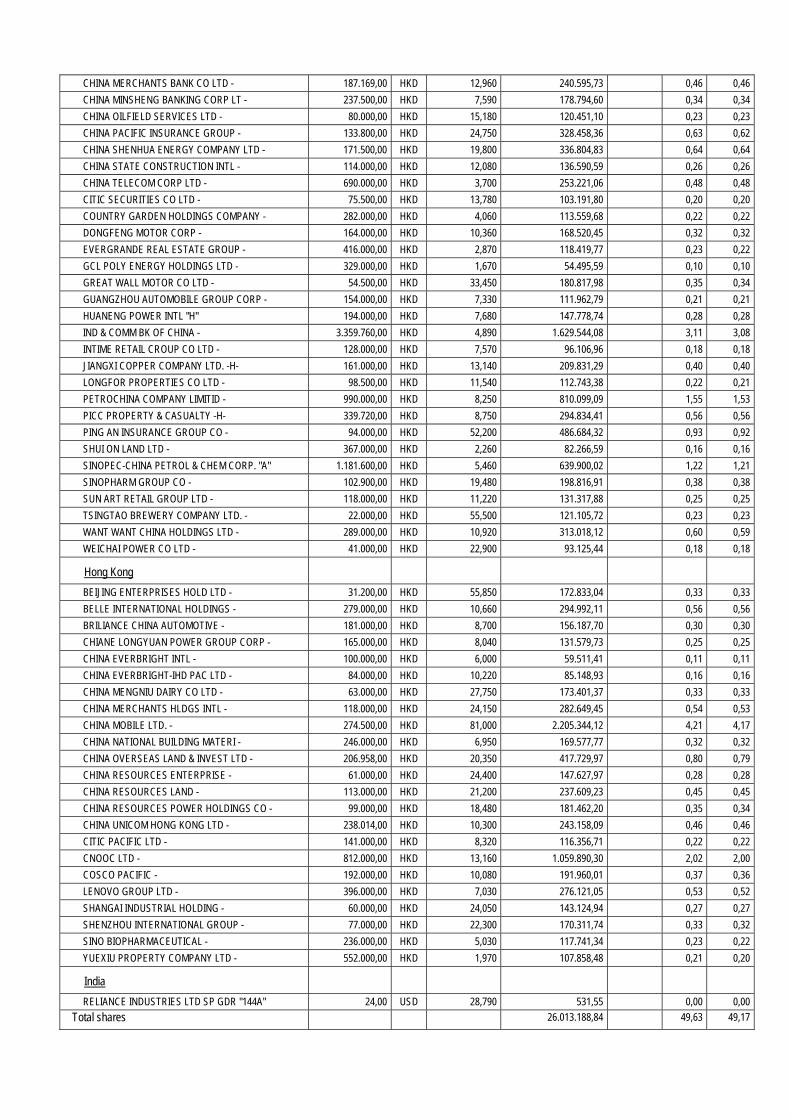
CHINA MERCHANTS BANK CO LTD - 187.169,00 HKD 12,960 240.595,73 0,46 0,46
CHINA MINSHENG BANKING CORP LT - 237.500,00 HKD 7,590 178.794,60 0,34 0,34
CHINA OILFIELD SERVICES LTD - 80.000,00 HKD 15,180 120.451,10 0,23 0,23
CHINA PACIFIC INSURANCE GROUP - 133.800,00 HKD 24,750 328.458,36 0,63 0,62
CHINA SHENHUA ENERGY COMPANY LTD - 171.500,00 HKD 19,800 336.804,83 0,64 0,64
CHINA STATE CONSTRUCTION INTL - 114.000,00 HKD 12,080 136.590,59 0,26 0,26
CHINA TELECOM CORP LTD - 690.000,00 HKD 3,700 253.221,06 0,48 0,48
CITIC SECURITIES CO LTD - 75.500,00 HKD 13,780 103.191,80 0,20 0,20
COUNTRY GARDEN HOLDINGS COMPANY - 282.000,00 HKD 4,060 113.559,68 0,22 0,22
DONGFENG MOTOR CORP - 164.000,00 HKD 10,360 168.520,45 0,32 0,32
EVERGRANDE REAL ESTATE GROUP - 416.000,00 HKD 2,870 118.419,77 0,23 0,22
GCL POLY ENERGY HOLDINGS LTD - 329.000,00 HKD 1,670 54.495,59 0,10 0,10
GREAT WALL MOTOR CO LTD - 54.500,00 HKD 33,450 180.817,98 0,35 0,34
GUANGZHOU AUTOMOBILE GROUP CORP - 154.000,00 HKD 7,330 111.962,79 0,21 0,21
HUANENG POWER INTL "H" 194.000,00 HKD 7,680 147.778,74 0,28 0,28
IND & COMM BK OF CHINA - 3.359.760,00 HKD 4,890 1.629.544,08 3,11 3,08
INTIME RETAIL CROUP CO LTD - 128.000,00 HKD 7,570 96.106,96 0,18 0,18
JIANGXI COPPER COMPANY LTD. -H- 161.000,00 HKD 13,140 209.831,29 0,40 0,40
LONGFOR PROPERTIES CO LTD - 98.500,00 HKD 11,540 112.743,38 0,22 0,21
PETROCHINA COMPANY LIMITID - 990.000,00 HKD 8,250 810.099,09 1,55 1,53
PICC PROPERTY & CASUALTY -H- 339.720,00 HKD 8,750 294.834,41 0,56 0,56
PING AN INSURANCE GROUP CO - 94.000,00 HKD 52,200 486.684,32 0,93 0,92
SHUI ON LAND LTD - 367.000,00 HKD 2,260 82.266,59 0,16 0,16
SINOPEC-CHINA PETROL & CHEM CORP. "A" 1.181.600,00 HKD 5,460 639.900,02 1,22 1,21
SINOPHARM GROUP CO - 102.900,00 HKD 19,480 198.816,91 0,38 0,38
SUN ART RETAIL GROUP LTD - 118.000,00 HKD 11,220 131.317,88 0,25 0,25
TSINGTAO BREWERY COMPANY LTD. - 22.000,00 HKD 55,500 121.105,72 0,23 0,23
WANT WANT CHINA HOLDINGS LTD - 289.000,00 HKD 10,920 313.018,12 0,60 0,59
WEICHAI POWER CO LTD - 41.000,00 HKD 22,900 93.125,44 0,18 0,18
Hong Kong
BEIJING ENTERPRISES HOLD LTD - 31.200,00 HKD 55,850 172.833,04 0,33 0,33
BELLE INTERNATIONAL HOLDINGS - 279.000,00 HKD 10,660 294.992,11 0,56 0,56
BRILIANCE CHINA AUTOMOTIVE - 181.000,00 HKD 8,700 156.187,70 0,30 0,30
CHIANE LONGYUAN POWER GROUP CORP - 165.000,00 HKD 8,040 131.579,73 0,25 0,25
CHINA EVERBRIGHT INTL - 100.000,00 HKD 6,000 59.511,41 0,11 0,11
CHINA EVERBRIGHT-IHD PAC LTD - 84.000,00 HKD 10,220 85.148,93 0,16 0,16
CHINA MENGNIU DAIRY CO LTD - 63.000,00 HKD 27,750 173.401,37 0,33 0,33
CHINA MERCHANTS HLDGS INTL - 118.000,00 HKD 24,150 282.649,45 0,54 0,53
CHINA MOBILE LTD. - 274.500,00 HKD 81,000 2.205.344,12 4,21 4,17
CHINA NATIONAL BUILDING MATERI - 246.000,00 HKD 6,950 169.577,77 0,32 0,32
CHINA OVERSEAS LAND & INVEST LTD - 206.958,00 HKD 20,350 417.729,97 0,80 0,79
CHINA RESOURCES ENTERPRISE - 61.000,00 HKD 24,400 147.627,97 0,28 0,28
CHINA RESOURCES LAND - 113.000,00 HKD 21,200 237.609,23 0,45 0,45
CHINA RESOURCES POWER HOLDINGS CO - 99.000,00 HKD 18,480 181.462,20 0,35 0,34
CHINA UNICOM HONG KONG LTD - 238.014,00 HKD 10,300 243.158,09 0,46 0,46
CITIC PACIFIC LTD - 141.000,00 HKD 8,320 116.356,71 0,22 0,22
CNOOC LTD - 812.000,00 HKD 13,160 1.059.890,30 2,02 2,00
COSCO PACIFIC - 192.000,00 HKD 10,080 191.960,01 0,37 0,36
LENOVO GROUP LTD - 396.000,00 HKD 7,030 276.121,05 0,53 0,52
SHANGAI INDUSTRIAL HOLDING - 60.000,00 HKD 24,050 143.124,94 0,27 0,27
SHENZHOU INTERNATIONAL GROUP - 77.000,00 HKD 22,300 170.311,74 0,33 0,32
SINO BIOPHARMACEUTICAL - 236.000,00 HKD 5,030 117.741,34 0,23 0,22
YUEXIU PROPERTY COMPANY LTD - 552.000,00 HKD 1,970 107.858,48 0,21 0,20
India
RELIANCE INDUSTRIES LTD SP GDR "144A" 24,00 USD 28,790 531,55 0,00 0,00
Total shares 26.013.188,84 49,63 49,17

Rights
Brazil
CETIP SA - BALCAO ORGANIZADO DE ATI CP 14/05/13
1,00 BRL 0,030 0,01
ITAUSA-INVESTIMENTOS ITAU SA CP 08/05/2013 1.035,00 BRL 2,530 911,94 0,00 0,00
Total rights 911,95 0,00 0,00
TOTAL SECURITIES PORTFOLIO 52.414.054,69 100,00 99,07
COLLATERAL RECEIVED
Belgium
KBC GROUP COLLATERAL EUR 2.572.227,23 EUR 1,000 2.572.227,23 4,86
TOTAL RECEIVED COLLATERAL 2.572.227,23 4,86
CASH AT BANK AND IN HAND
Demand accounts
Belgium
KBC GROUP EURO 70.758,57 EUR 1,000 70.758,57 0,13
KBC GROUP HKD 959.629,84 HKD 1,000 95.181,54 0,18
KBC GROUP USD -51.727,75 USD 1,000 -39.793,64 -0,08
Total demand accounts 126.146,47 0,24
Managed futures accounts
Belgium
KBC GROUP EURO FUT REK 2,78 EUR 1,000 2,78
KBC GROUP FUT. REK. HKD 168,04 HKD 1,000 16,67
Total managed futures accounts 19,45
TOTAL CASH AT BANK AND IN HAND 126.165,92 0,24
OTHER RECEIVABLES AND PAYABLES
Receivables
Belgium
KBC GROUP EUR RECEIVABLE 45.019,97 EUR 1,000 45.019,97 0,09
Total receivables 45.019,97 0,09
Payables
Belgium
KBC GROUP COUNTERPART ENTRY COLLATERAL IN EUR -2.572.227,23 EUR 1,000 -2.572.227,23 -4,86
KBC GROUP EUR PAYABLE -114.300,21 EUR 1,000 -114.300,21 -0,22
Payables -2.686.527,44 -5,08
TOTAL RECEIVABLES AND PAYABLES -2.641.507,47 -4,99
OTHER
Interest receivable EUR 447.547,13 0,85
Accrued interest EUR 2.742,25 0,01
Expenses payable EUR -24.779,51 -0,05
Expenses to be carried forward EUR 12.559,58 0,02
TOTAL OTHER 438.069,45 0,83
TOTAL NET ASSETS 52.909.009,82 100,00

Geographic breakdown (as a % of securities portfolio)
31/12/2011 30/06/2012 31/12/2012 30/06/2013 Belgium 0,19 0,15 0,27 0,01 Bermuda 0,13 0,33 0,50 0,40 Brazil 28,75 29,32 28,24 25,01 China 25,80 27,83 28,14 27,61 Cayman Islands 2,44 3,15 3,09 4,35 Hong Kong 11,87 12,39 11,87 14,58 India 14,10 11,74 11,63 13,14 Indonesia 0,00 0,07 0,07 0,10 Ireland 0,53 0,49 0,44 0,67 Luxembourg 0,00 0,94 0,73 0,60 Russia 15,84 13,59 14,62 13,51 U.S.A. 0,35 0,00 0,40 0,02 Total 100,00 100,00 100,00 100,00
Sector breakdown (as a % of securities portfolio)
31/12/2011 30/06/2012 31/12/2012 30/06/2013 Cyclicals 40,49 37,33 36,09 31,59 Consum(cycl) 6,39 6,40 6,64 6,91 Cons.goods 6,91 7,48 8,08 8,63 Pharma 1,71 1,76 1,75 2,11 Financials 25,97 27,41 29,77 30,96 Technology 4,90 4,90 4,13 5,53 Telecomm. 7,27 7,23 6,64 7,43 Utilities 3,26 3,91 3,07 3,17 Real est. 3,01 3,45 3,70 3,53 Unit trusts 0,10 0,12 0,12 0,14 Various -0,01 0,01 0,01 0,00 Total 100,00 100,00 100,00 100,00
Currency breakdown (as a % of net assets)
31/12/2011 30/06/2012 31/12/2012 30/06/2013 BRL 27,68 28,97 28,09 25,55 CNY 7,57 8,67 8,33 4,25 EUR 0,26 1,04 1,06 1,31 HKD 33,50 35,58 35,90 42,86 INR 14,09 11,83 11,85 13,76 USD 16,90 13,91 14,77 12,27 Total 100,00 100,00 100,00 100,00

2.4.2 CHANGES IN THE COMPOSITION OF THE ASSETS OF KBC EQUITY FUND BRIC (IN THE
CURRENCY OF THE SUB-FUND)
1st half of year YearPurchases 18.825.551,70 18.825.551,70 Sales 21.422.455,57 21.422.455,57 Total 1 40.248.007,26 40.248.007,26 Subscriptions 2.314.434,55 2.314.434,55 Redemptions 4.939.671,22 4.939.671,22 Total 2 7.254.105,77 7.254.105,77 Monthly average of total assets
60.872.065,09 60.872.065,09
Turnover rate 54,20 % 54,20 %
1st half of year YearPurchases 18.825.551,70 18.825.551,70 Sales 21.422.455,57 21.422.455,57 Total 1 40.248.007,26 40.248.007,26 Subscriptions 2.314.434,55 2.314.434,55 Redemptions 4.939.671,22 4.939.671,22 Total 2 7.254.105,77 7.254.105,77 Monthly average of total assets
60.183.688,10 60.183.688,10
Corrected turnover rate 54,82 % 54,82 %
The table above shows the capital volume of portfolio transactions. This volume (adjusted to take account of total subscriptions and redemptions) is also compared to the average net assets at the beginning and end of the period. A figure close to 0% implies that the transactions relating to the securities or transactions relating to the assets (excluding deposits and cash) in a given period only involve subscriptions and redemptions. A negative percentage shows that subscriptions and redemptions entailed few, if any, transactions in the portfolio. Active asset management may result in high turnover rates (monthly percentage >50%). The detailed list of transactions is available for consultation free of charge at the registered office of the Bevek or fund at Havenlaan 2, 1080 Brussels.

2.4.3 AMOUNT OF COMMITMENTS IN RESPECT OF FINANCIAL DERIVATIVES POSITIONS
NAME Currency Value in currency
In the currency of the sub-fund
Lot-size
Transactiondate
KBC COLLATERAL EUR
EUR 2.572.227,23 2.572.227,23 N/A 28.06.2013
2.4.4 CHANGES OF THE NUMBER OF SUBSCRIPTIONS AND REDEMPTIONS AND THE NET ASSET
VALUE
Period Change in number of shares in circulation
Year Subscriptions Redemptions End of period
Cap. Dis. Cap. Dis. Cap. Dis. Total
2011 - 06 7.402,80 2.070,73 14.150,86 2.105,31 42.292,38 10.955,85 53.248,22
2012 - 06 5.259,70 470,53 6.998,30 2.348,00 40.553,78 9.078,38 49.632,16
2013 - 06 3.149,50 464,06 5.745,69 1.697,69 37.957,60 7.844,75 45.802,35
Period Amounts received and paid by the UCI
(in the currency of the sub-fund)
Year Subscriptions Redemptions
Capitalization Distribution Capitalization Distribution
2011 - 06 11.047.111,96 3.052.659,50 21.067.912,35 3.048.440,34
2012 - 06 6.734.391,24 602.302,65 9.090.016,80 3.016.306,99
2013 - 06 4.074.679,96 593.737,40 7.433.325,94 2.109.070,61
Period Net asset value
End of period (in the currency of the sub-fund)
Year Of the sub-fund Of one share
Capitalization Distribution
2011 - 06 75.306.104,17 1.421,62 1.385,79
2012 - 06 60.935.721,78 1.235,00 1.195,34
2013 - 06 52.909.009,82 1.162,82 1.118,12
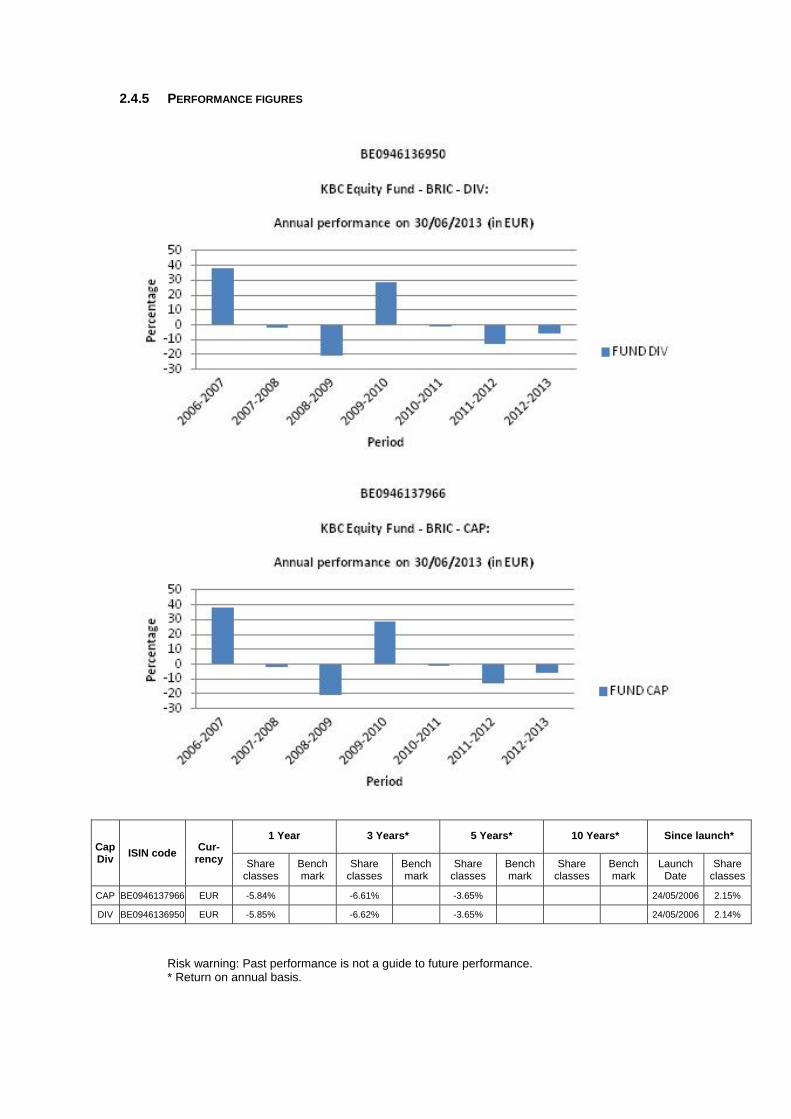
2.4.5 PERFORMANCE FIGURES
Cap Div
ISIN code Cur-
rency
1 Year 3 Years* 5 Years* 10 Years* Since launch*
Share classes
Bench mark
Share classes
Bench mark
Share classes
Bench mark
Share classes
Bench mark
Launch Date
Share classes
CAP BE0946137966 EUR -5.84% -6.61% -3.65% 24/05/2006 2.15%
DIV BE0946136950 EUR -5.85% -6.62% -3.65% 24/05/2006 2.14%
Risk warning: Past performance is not a guide to future performance. * Return on annual basis.

The bar chart shows the performance for full financial years. The figures do not take account of any restructuring. Calculated in EUR. the return is calculated as the change in the net asset value between two dates expressed
as a percentage. In the case of units that pay dividends, the dividend is incorporated geometrically in the return.
Calculation method for date D, where NAV stands for net asset value: Capitalisation units (CAP) Return on date D over a period of X years:
[NAV(D) / NAV(Y)] ^ [1 / X] - 1 where Y = D-X
Return on date D since the start date S of the unit: [NAV(D) / NAV(S)] ^ [1 / F] - 1 where F = 1 if the unit has existed for less than one year on date D where F = (D-S) / 365.25 if the unit has existed for longer than one year on date D
Distribution units (DIV) Return on date D over a period of X years:
[ C * NAV(D) / NAV(Y)] ^ [1 / X] - 1 where Y = D-X
Return on date D since the start date S of the unit: [ C * NAV(D) / NAV(S)] ^ [1 / F] - 1 where F = 1 if the unit has existed for less than one year on date D where F = (D-S) / 365.25 if the unit has existed for longer than one year on date D
where C is a factor that is determined for all N dividends between the calculation date D and the reference date. For dividend i on date Di with value Wi:
Ci = [Wi / NAV(Di)] + 1 i = 1 ... N
from which C = C0 * .... * CN. If the interval between the two dates exceeds one year, the ordinary return calculation is
converted into a return on an annual basis by taking the nth square root of 1 plus the total return of the unit.
The return figures shown above do not take account of the fees and charges associated with the issue and redemption of units.
These are the performance figures for capitalisation and distribution shares.
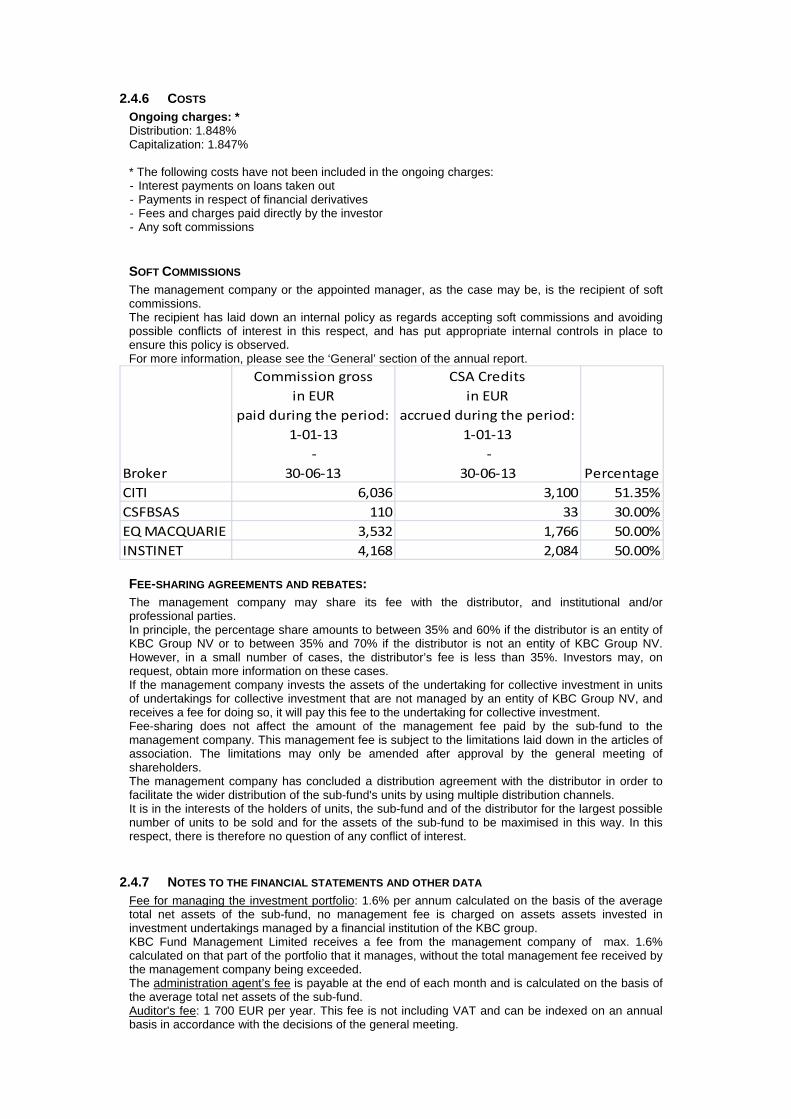
2.4.6 COSTS Ongoing charges: * Distribution: 1.848% Capitalization: 1.847% * The following costs have not been included in the ongoing charges: - Interest payments on loans taken out - Payments in respect of financial derivatives - Fees and charges paid directly by the investor - Any soft commissions
SOFT COMMISSIONS The management company or the appointed manager, as the case may be, is the recipient of soft commissions. The recipient has laid down an internal policy as regards accepting soft commissions and avoiding possible conflicts of interest in this respect, and has put appropriate internal controls in place to ensure this policy is observed. For more information, please see the ‘General’ section of the annual report.
Broker
Commission gross
in EUR
paid during the period:
1‐01‐13
‐
30‐06‐13
CSA Credits
in EUR
accrued during the period:
1‐01‐13
‐
30‐06‐13 Percentage
CITI 6,036 3,100 51.35%
CSFBSAS 110 33 30.00%
EQ MACQUARIE 3,532 1,766 50.00%
INSTINET 4,168 2,084 50.00%
FEE-SHARING AGREEMENTS AND REBATES: The management company may share its fee with the distributor, and institutional and/or professional parties. In principle, the percentage share amounts to between 35% and 60% if the distributor is an entity of KBC Group NV or to between 35% and 70% if the distributor is not an entity of KBC Group NV. However, in a small number of cases, the distributor’s fee is less than 35%. Investors may, on request, obtain more information on these cases. If the management company invests the assets of the undertaking for collective investment in units of undertakings for collective investment that are not managed by an entity of KBC Group NV, and receives a fee for doing so, it will pay this fee to the undertaking for collective investment. Fee-sharing does not affect the amount of the management fee paid by the sub-fund to the management company. This management fee is subject to the limitations laid down in the articles of association. The limitations may only be amended after approval by the general meeting of shareholders. The management company has concluded a distribution agreement with the distributor in order to facilitate the wider distribution of the sub-fund's units by using multiple distribution channels. It is in the interests of the holders of units, the sub-fund and of the distributor for the largest possible number of units to be sold and for the assets of the sub-fund to be maximised in this way. In this respect, there is therefore no question of any conflict of interest.
2.4.7 NOTES TO THE FINANCIAL STATEMENTS AND OTHER DATA Fee for managing the investment portfolio: 1.6% per annum calculated on the basis of the average total net assets of the sub-fund, no management fee is charged on assets assets invested in investment undertakings managed by a financial institution of the KBC group. KBC Fund Management Limited receives a fee from the management company of max. 1.6% calculated on that part of the portfolio that it manages, without the total management fee received by the management company being exceeded. The administration agent’s fee is payable at the end of each month and is calculated on the basis of the average total net assets of the sub-fund. Auditor's fee: 1 700 EUR per year. This fee is not including VAT and can be indexed on an annual basis in accordance with the decisions of the general meeting.
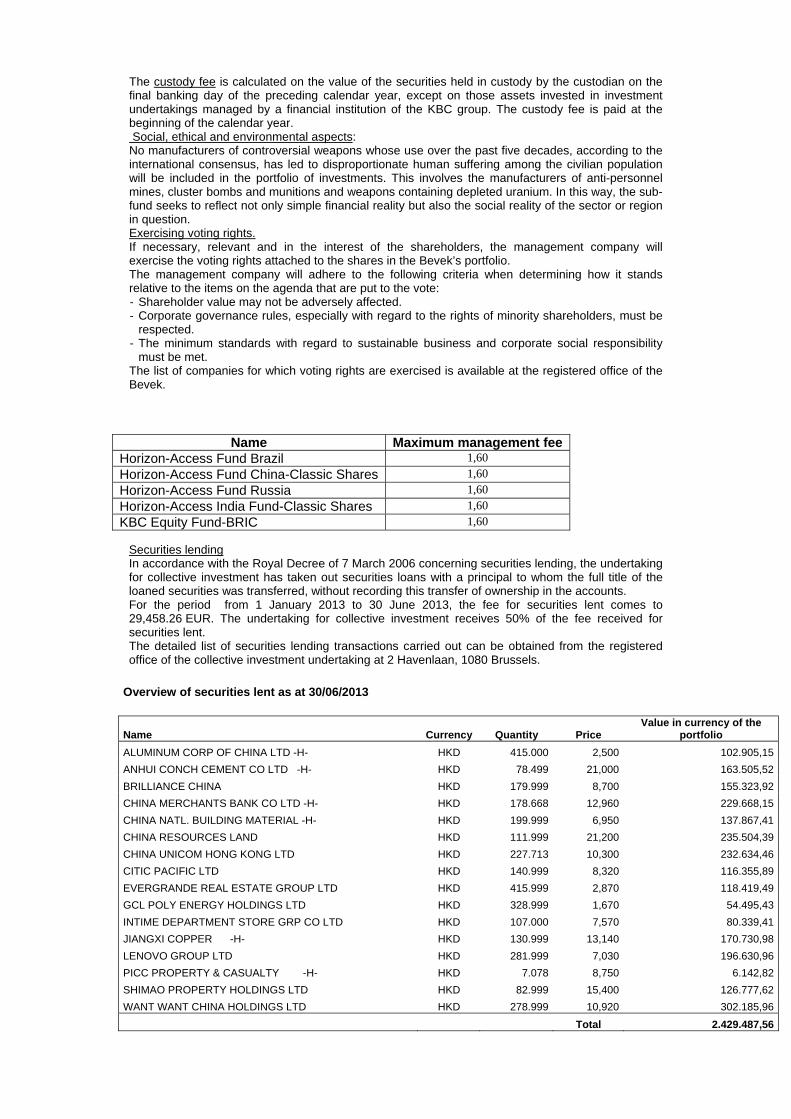
The custody fee is calculated on the value of the securities held in custody by the custodian on the final banking day of the preceding calendar year, except on those assets invested in investment undertakings managed by a financial institution of the KBC group. The custody fee is paid at the beginning of the calendar year. Social, ethical and environmental aspects: No manufacturers of controversial weapons whose use over the past five decades, according to the international consensus, has led to disproportionate human suffering among the civilian population will be included in the portfolio of investments. This involves the manufacturers of anti-personnel mines, cluster bombs and munitions and weapons containing depleted uranium. In this way, the sub-fund seeks to reflect not only simple financial reality but also the social reality of the sector or region in question. Exercising voting rights. If necessary, relevant and in the interest of the shareholders, the management company will exercise the voting rights attached to the shares in the Bevek’s portfolio. The management company will adhere to the following criteria when determining how it stands relative to the items on the agenda that are put to the vote: - Shareholder value may not be adversely affected. - Corporate governance rules, especially with regard to the rights of minority shareholders, must be
respected. - The minimum standards with regard to sustainable business and corporate social responsibility
must be met. The list of companies for which voting rights are exercised is available at the registered office of the Bevek.
Name Maximum management fee Horizon-Access Fund Brazil 1,60
Horizon-Access Fund China-Classic Shares 1,60
Horizon-Access Fund Russia 1,60
Horizon-Access India Fund-Classic Shares 1,60
KBC Equity Fund-BRIC 1,60
Securities lending In accordance with the Royal Decree of 7 March 2006 concerning securities lending, the undertaking for collective investment has taken out securities loans with a principal to whom the full title of the loaned securities was transferred, without recording this transfer of ownership in the accounts. For the period from 1 January 2013 to 30 June 2013, the fee for securities lent comes to 29,458.26 EUR. The undertaking for collective investment receives 50% of the fee received for securities lent. The detailed list of securities lending transactions carried out can be obtained from the registered office of the collective investment undertaking at 2 Havenlaan, 1080 Brussels.
Overview of securities lent as at 30/06/2013
Name Currency Quantity Price Value in currency of the
portfolio
ALUMINUM CORP OF CHINA LTD -H- HKD 415.000 2,500 102.905,15
ANHUI CONCH CEMENT CO LTD -H- HKD 78.499 21,000 163.505,52
BRILLIANCE CHINA HKD 179.999 8,700 155.323,92
CHINA MERCHANTS BANK CO LTD -H- HKD 178.668 12,960 229.668,15
CHINA NATL. BUILDING MATERIAL -H- HKD 199.999 6,950 137.867,41
CHINA RESOURCES LAND HKD 111.999 21,200 235.504,39
CHINA UNICOM HONG KONG LTD HKD 227.713 10,300 232.634,46
CITIC PACIFIC LTD HKD 140.999 8,320 116.355,89
EVERGRANDE REAL ESTATE GROUP LTD HKD 415.999 2,870 118.419,49
GCL POLY ENERGY HOLDINGS LTD HKD 328.999 1,670 54.495,43
INTIME DEPARTMENT STORE GRP CO LTD HKD 107.000 7,570 80.339,41
JIANGXI COPPER -H- HKD 130.999 13,140 170.730,98
LENOVO GROUP LTD HKD 281.999 7,030 196.630,96
PICC PROPERTY & CASUALTY -H- HKD 7.078 8,750 6.142,82
SHIMAO PROPERTY HOLDINGS LTD HKD 82.999 15,400 126.777,62
WANT WANT CHINA HOLDINGS LTD HKD 278.999 10,920 302.185,96
Total 2.429.487,56

Details of collateral received for securities lent
Name Currency Nominal value Currency fund Value in Currency fund
AUSTRIA 2012 3,4% 22/11/2022 EUR 557.000 EUR 635.576,55
FRANCE 2008 3.75% 25/10/2019 EUR 1.128.000 EUR 1.309.142,14
NETHERLANDS 2012 1.25% 15/01/18 EUR 618.000 EUR 627.508,54
Total 2.572.227,23 For the valuation of the collateral received, indicative prices have been used in this detail list by the Collateral Management Division of KBC Bank.

Semi-Annual report as at 30th June 2013
TABLE OF CONTENTS
2. Information on KBC Equity Fund High Dividend North America
2.1. Management report 2.1.1. Launch date and subscription price 2.1.2. Stock exchange listing 2.1.3. Aim and distinctive features of the investment policy 2.1.4. Financial portfolio management 2.1.5. Distributors 2.1.6. Index and benchmark 2.1.7. Policy conducted during the financial year 2.1.8. Future policy 2.1.9. Synthetic risk and reward indicator (SRRI)
2.2. Balance sheet
2.3. Profit and loss account
2.4. Composition of the assets and key figures
2.4.1. Composition of the assets 2.4.2. Change in the composition of the assets 2.4.3. Value of commitments in respect of financial derivatives positions 2.4.4. Evolution of the number of subscriptions, repayments and the net asset value 2.4.5. Return figures 2.4.6. Expenses 2.4.7. Notes to the financial statements and other data


2 INFORMATION ON KBC EQUITY FUND HIGH DIVIDEND NORTH AMERICA
2.1 MANAGEMENT REPORT
2.1.1 LAUNCH DATE AND SUBSCRIPTION PRICE Classic Shares : Launch date: 30 April 2001 Initial subscription price: 500 USD Currency: USD Institutional B Shares : Launch date: 25 November 2011 Initial subscription price: 470.49 USD Currency: USD
2.1.2 STOCK EXCHANGE LISTING Not applicable.
2.1.3 GOAL AND KEY PRINCIPLES OF THE INVESTMENT POLICY
SUB-FUND’S OBJECT: The main objective of this sub-fund is to generate the highest possible return for its shareholders by investing directly or indirectly in transferable securities. This is reflected in its pursuit of capital gains and income. To this end, the assets are invested, either directly or indirectly via correlated financial instruments, primarily in shares.
SUB-FUND’S INVESTMENT POLICY:
PERMITTED ASSET CLASSES: The sub-fund may invest in securities, money market instruments, units in undertakings for collective investment, deposits, financial derivatives, liquid assets and all other instruments insofar as permitted by the applicable laws and regulations and consistent with the sub-fund’s object The sub-fund shall invest no more than 10% of its assets in units of other undertakings for collective investment.
RESTRICTIONS OF THE INVESTMENT POLICY: The investment policy will be implemented within the limits set by law and regulations. The sub-fund may borrow up to 10% of its net assets, insofar as these are short-term borrowings aimed at solving temporary liquidity problems.
PERMITTED DERIVATIVES TRANSACTIONS: Derivates may be used either for hedging purposes or to achieve investment objectives. Changes will be made to the investments at regular intervals to comply with the sub-fund's investment strategy. In addition, listed and unlisted derivates may be used to achieve the objectives: these may be forward contracts, options or swaps on securities, indices, currencies or interest rates or other transactions involving derivatives. Unlisted derivatives transactions will only be concluded with prime financial institutions specialised in such transactions. Such derivatives may also be used to hedge the assets against exchange-rate fluctuations. Subject to the applicable laws and regulations and the articles of association, the sub-fund always seeks to conclude the most effective transactions. All costs associated with the transactions will be charged to the sub-fund and all income generated will be paid to the sub-fund. If the transactions result in a risk in respect of the counterparty, this risk can be hedged by using a margin management system that ensures that the sub-fund is the beneficiary of security (collateral) in the form of cash or investment grade bonds. When calculating the value of the bonds, a margin will be applied that varies depending on the residual term to maturity and the currency in which the bond in question is denominated. The relationship with the counterparty or counterparties is governed by standard international agreements.
STRATEGY SELECTED The assets are invested primarily in shares with a high dividend yield of companies in North American countries.
LENDING FINANCIAL INSTRUMENTS: The sub-fund may lend financial instruments within the limits set by law and regulations. This lending does not affect the sub-fund’s risk profile since: - it takes place within the framework of a securities lending system managed by a principal. In
addition, the sub-fund has a relationship only with the principal of the securities lending system which acts as counterparty and to which title of the loaned securities is transferred. The choice of principal is subject to strict selection criteria. The return of securities similar to the securities that have been lent is guaranteed by the principal.
- through a margin management system, the sub-fund is always guaranteed financial security, the actual value of which always exceeds the actual value of the securities that have been lent, in case the principal does not return similar securities.
The return of securities similar to the securities that have been lent can be requested at any time, which means that the lending of securities does not affect the management of the sub-fund's assets. By lending securities, the sub-fund can generate an additional return. The principal pays a fee to the management company. After deducting the fee for the margin management and clearing services of KBC Bank, most of this fee is paid to the sub-fund. The relationship with the counterparty or counterparties is governed by standard international agreements. More information is provided on the terms and conditions governing securities lending in the annual or half-yearly report for the sub-fund.
VOLATILITY OF THE NET ASSET VALUE: The volatility of the net asset value may be high due to the composition of the portfolio.
GENERAL STRATEGY FOR HEDGING THE EXCHANGE RATE RISK: In order to protect its assets against exchange rate fluctuations and within the limitations laid down in the articles of association, the sub-fund may perform transactions relating to the sale of forward currency contracts, as well as the sale of call options and the purchase of put options on currencies. The transactions in question may relate solely to contracts traded on a regulated market that operates regularly, is recognised and is open to the public or that are traded with a recognised, prime financial institution specialising in such transactions and dealing in the over-the-counter (OTC) market in options. With the same objective, the sub-fund may also sell currencies forward or exchange them in private transactions with prime financial institutions specialising in such transactions. The hedging objective of the aforementioned transactions suggests that there is a direct link between these transactions and the assets to be hedged, which implies that the transactions carried out in a particular currency may in principle not exceed, in terms of volume, either the valuation value of all the assets in the same currency or the holding period of those assets.
SOCIAL, ETHICAL AND ENVIRONMENTAL ASPECTS:
No manufacturers of controversial weapons whose use over the past five decades, according to the international consensus, has led to disproportionate human suffering among the civilian population will be included in the portfolio of investments. This involves the manufacturers of anti-personnel mines, cluster bombs and munitions and weapons containing depleted uranium. In this way, the sub-fund seeks to reflect not only simple financial reality but also the social reality of the sector or region in question.
THE EUROPEAN SAVINGS DIRECTIVE AND TAX ON DEBT CLAIM RETURNS OBTAINED THROUGH THE
REDEMPTION OF OWN UNITS OR IN THE EVENT OF FULL OR PARTIAL DISTRIBUTION OF EQUITY
CAPITAL. The following information is of a general character and is not intended to cover all aspects of an investment in a UCITS. In certain cases entirely different rules might even apply. Moreover, both tax law and the interpretation of it can change. Investors who wish to have more information about the tax implications – in both Belgium and abroad – of acquiring, holding and transferring units should seek the advice of their usual financial and tax advisers.
This UCITS shall invest a maximum of 15% of its assets directly or indirectly in debt instruments as intended by the European Savings Directive. A. European Savings Directive (Directive 2003/48/EC) The European Savings Directive has been implemented in Belgium. Since this UCITS invests a maximum of 15% of its assets directly or indirectly in debt claims as intended by the European Savings Directive, the income of this UCITS does not fall within the scope of this directive. B. Tax on debt claim returns obtained through the redemption of own units or in the event of full or partial distribution of equity capital (Article 19bis Income Tax Code 1992). The income from this UCITS is not subject to the tax on debt instrument returns as intended by Article 19bis, Income Tax Code 1992.
2.1.4 FINANCIAL PORTFOLIO MANAGEMENT There is no delegation of the portfolio.
2.1.5 DISTRIBUTORS KBC Asset Management S.A., 5, Place de la Gare, L-1616 Luxembourg.
2.1.6 INDEX AND BENCHMARK See ‘Sub-fund’s investment policy’.

2.1.7 POLICY PERSUED DURING THE FINANCIAL YEAR Although more jobs have been created than lost in the US since 2010, the rate of employment growth remained on the thin side for some considerable time. The situation began to improve in the recent reporting period, with the result that the jobless rate has declined more markedly. Pay has remained virtually flat, barely rising ahead of inflation. Taken together, these two factors ensured that household purchasing power only grew to a very limited extent and so contributed very modestly to economic growth. The latter was therefore limited (+1.6% growth year-on-year in the four quarters to the first three months of 2013). The initial phase of the economic recovery went hand in hand with a strong stockmarket rally, leaving the S&P 500 75% higher at the end of April 2010 than its low point on 9 March 2009. Since then, the equity markets have struggled to find fresh impetus. The euro crisis and fear that the European banking sector would collapse naturally continued to cast a dark cloud over the market. On top of this, the stock markets were affected by vacillating sentiment about the economic situation. This was also true in recent months. In the first three months of 2012 the markets were buoyed up by relative economic optimism. In April/May 2012 the markets ran out of steam but from early June 2012 there was a further fine rally that disregarded the deteriorating economic signals. Jitters were sparked at the end of the reporting period by comments from the Fed Chairman (signalling the imminent end of quantitative easing?) and concerns about China (local authority debt problems). Overall, the MSCI All Countries (the broadest global index) was up 7.9% in euro terms on 30 June 2013 compared to year-end 2012.
2.1.8 FUTURE POLICY We are expecting US growth to remain positive but modest (around 2% y-o-y in the coming quarters) as pay increases are barely keeping pace with inflation and budgetary policy has now finally (and probably for many years) struck down the path of austerity. The fragile recovery of the housing market and corporate investment could be sustained. How strong the growth proves to be will depend largely on the dynamic of the labour market. In recent months employment in the US has grown by around 200 000 new jobs each month. This will need to continue in order to achieve +2% growth in 2013 and in 2014. In the US, Republicans and Democrats may have totally different views about the required budgetary policy, but a common thread throughout the negotiations in recent months has been that the federal finances need to be reformed step by step and that a tighter budgetary policy than in the recent past will need to be implemented in the years ahead. Tighter also than the average budgetary policy in the EMU. This is being counterbalanced by extremely accommodating monetary policy. The Fed is making unprecedented cash injections with its programme for purchasing government bonds and other debt paper. In doing so, the Fed wants to prevent the banks from being preoccupied with their own solvency and hence imposing unduly strict lending conditions, which would undermine economic growth. These cash injections will either find their way into the real economy or generate inflationary expectations. In any case they will keep long rates low and banish any fears of deflation.
2.1.9 SYNTHETIC RISK AND REWARD INDICATOR Classic Shares: 6 on a scale of 1 (lowest risk) to 7 (highest risk). Institutional B Shares: 6 on a scale of 1 (lowest risk) to 7 (highest risk). The value of a share can decrease or increase and the investor may not get back the amount invested. In accordance with Commission Regulation (EU) No. 583/2010, a synthetic risk and reward indicator has been calculated. This indicator provides a quantitative measure of the sub-fund's potential return and the risk involved, calculated in the currency in which the sub-fund is denominated. It is given as a figure between 1 and 7. The higher the figure, the greater the potential return, but also the more difficult it is to predict this return. Losses are possible too. The lowest figure does not mean that the investment is entirely free of risk. However, it does indicate that, compared with the higher figures, this product will generally provide a lower, but more predictable return. The synthetic risk and reward indicator is assessed regularly and can therefore go up or down based on data from the past. Data from the past is not always a reliable indicator of future risk and return.
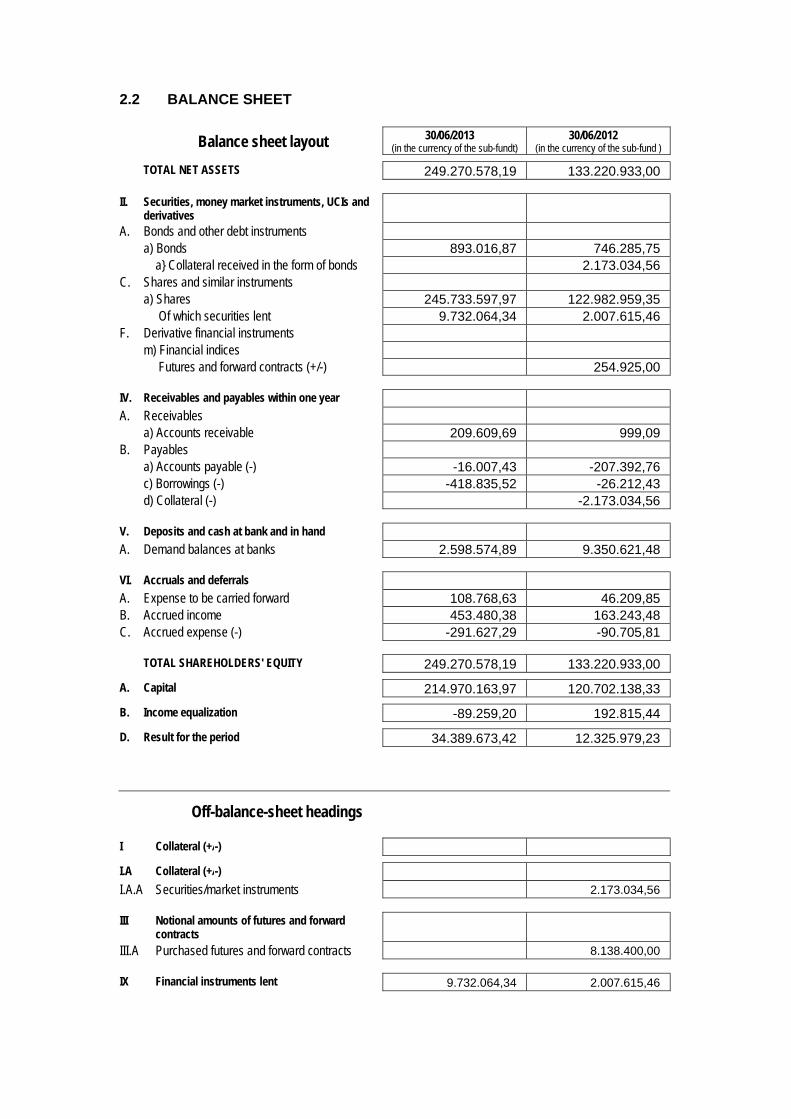
2.2 BALANCE SHEET
Balance sheet layout 30/06/2013 (in the currency of the sub-fundt)
30/06/2012 (in the currency of the sub-fund )
TOTAL NET ASSETS 249.270.578,19 133.220.933,00
II. Securities, money market instruments, UCIs and derivatives
A. Bonds and other debt instruments a) Bonds 893.016,87 746.285,75 a} Collateral received in the form of bonds 2.173.034,56 C. Shares and similar instruments a) Shares 245.733.597,97 122.982.959,35 Of which securities lent 9.732.064,34 2.007.615,46 F. Derivative financial instruments m) Financial indices Futures and forward contracts (+/-) 254.925,00
IV. Receivables and payables within one year A. Receivables a) Accounts receivable 209.609,69 999,09 B. Payables a) Accounts payable (-) -16.007,43 -207.392,76 c) Borrowings (-) -418.835,52 -26.212,43 d) Collateral (-) -2.173.034,56
V. Deposits and cash at bank and in hand A. Demand balances at banks 2.598.574,89 9.350.621,48
VI. Accruals and deferrals A. Expense to be carried forward 108.768,63 46.209,85 B. Accrued income 453.480,38 163.243,48 C. Accrued expense (-) -291.627,29 -90.705,81
TOTAL SHAREHOLDERS' EQUITY 249.270.578,19 133.220.933,00
A. Capital 214.970.163,97 120.702.138,33
B. Income equalization -89.259,20 192.815,44
D. Result for the period 34.389.673,42 12.325.979,23
Off-balance-sheet headings
I Collateral (+/-)
I.A Collateral (+/-)
I.A.A Securities/market instruments 2.173.034,56
III Notional amounts of futures and forward contracts
III.A Purchased futures and forward contracts 8.138.400,00
IX Financial instruments lent 9.732.064,34 2.007.615,46


2.3 PROFIT AND LOSS ACCOUNT
Income Statement 30/06/2013 (in the currency of the sub-fund)
30/06/2012 (in the currency of the sub-fund)
I. Net gains(losses) on investments A. Bonds and other debt instruments a) Bonds 178.841,70 -81.727,03 C. Shares and similar instruments a) Shares 33.757.334,18 9.606.111,08 F. Derivative financial instruments l) Financial indices Futures and forward contracts 108.975,00 2.035.050,00 H. Foreign exchange positions and transactions b) Other foreign exchange positions and
transactions -790.552,19 120.712,59
II. Investment income and expenses A. Dividends 3.146.417,51 1.233.934,45 B. Interests a) Securities and money market instruments 132.023,09 152.581,23 b) Cash at bank and in hand and deposits 6.993,70 9.074,63 C. Interest on borrowings (-) -3.741,71 -6.698,44
III. Other income A. Income received to cover the acquisition and
realizaion of assets, to discourage withdrawals and for delivery charges
420.300,26 326.280,44
IV. Operating expenses A. Investment transaction and delivery costs (-) -166.351,94 -162.495,61 B. Financial expenses (-) -2.991,56 -789,76 C. Custodian's fee (-) -87.222,86 -40.682,22 D. Manager's fee (-) a) Financial management Classic Shares -216.340,60 -139.574,36 Institutional B Shares -1.821.987,38 -583.648,09 b) Administration and accounting management -135.888,70 -49.737,61 E. Administrative expenses (-) -165,53 -49,38 F. Formation and organisation expenses (-) -6.305,10 -5.708,12 G. Remuneration, social security charges and
pension -49,23 -5,76
H. Services and sundry goods (-) -32.001,91 -10.387,93 J. Taxes Classic Shares -11.338,28 -7.934,31 Institutional B Shares -9.429,86 -5.832,76 K. Other expenses (-) -76.845,17 -62.493,81
Income and expenditure for the period Subtotal II + III + IV 1.135.074,73 645.832,59
V. Profit (loss) on ordinary activities before tax 34.389.673,42 12.325.979,23
VII. Result for the period 34.389.673,42 12.325.979,23
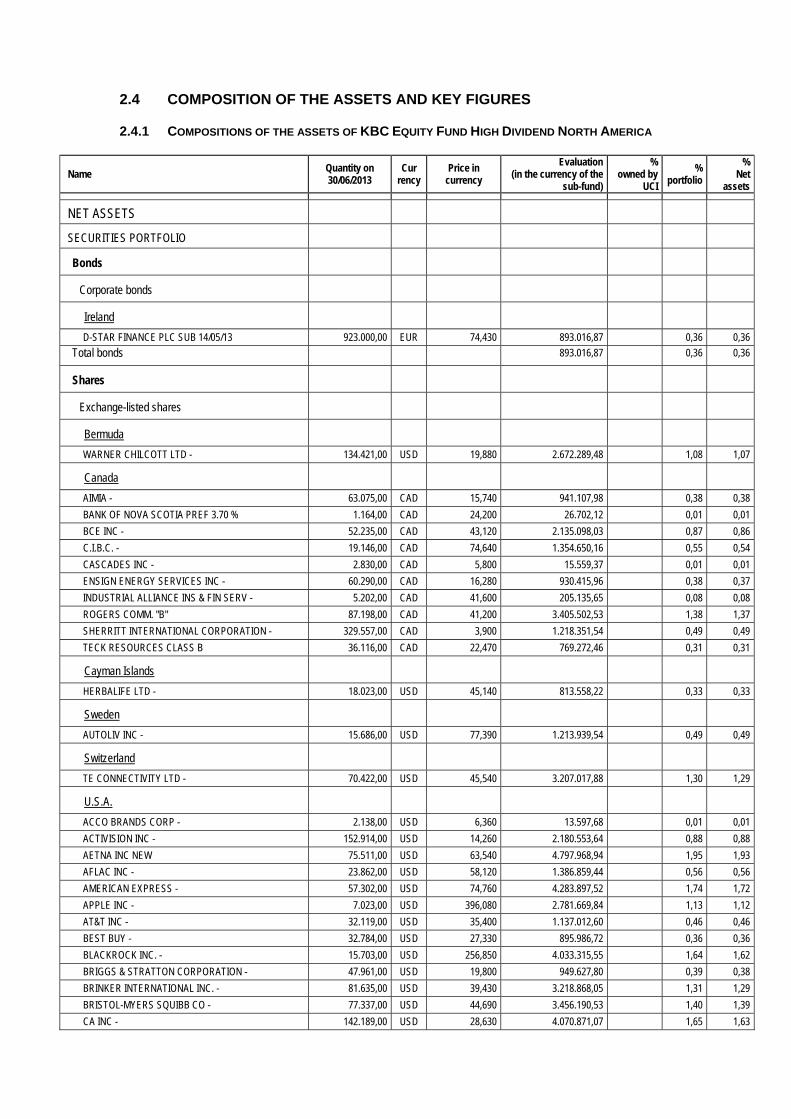
2.4 COMPOSITION OF THE ASSETS AND KEY FIGURES
2.4.1 COMPOSITIONS OF THE ASSETS OF KBC EQUITY FUND HIGH DIVIDEND NORTH AMERICA
Name Quantity on 30/06/2013
Cur rency
Price in currency
Evaluation (in the currency of the
sub-fund)
% owned by
UCI
% portfolio
% Net
assets
NET ASSETS
SECURITIES PORTFOLIO
Bonds
Corporate bonds
Ireland
D-STAR FINANCE PLC SUB 14/05/13 923.000,00 EUR 74,430 893.016,87 0,36 0,36
Total bonds 893.016,87 0,36 0,36
Shares
Exchange-listed shares
Bermuda
WARNER CHILCOTT LTD - 134.421,00 USD 19,880 2.672.289,48 1,08 1,07
Canada
AIMIA - 63.075,00 CAD 15,740 941.107,98 0,38 0,38
BANK OF NOVA SCOTIA PREF 3.70 % 1.164,00 CAD 24,200 26.702,12 0,01 0,01
BCE INC - 52.235,00 CAD 43,120 2.135.098,03 0,87 0,86
C.I.B.C. - 19.146,00 CAD 74,640 1.354.650,16 0,55 0,54
CASCADES INC - 2.830,00 CAD 5,800 15.559,37 0,01 0,01
ENSIGN ENERGY SERVICES INC - 60.290,00 CAD 16,280 930.415,96 0,38 0,37
INDUSTRIAL ALLIANCE INS & FIN SERV - 5.202,00 CAD 41,600 205.135,65 0,08 0,08
ROGERS COMM. "B" 87.198,00 CAD 41,200 3.405.502,53 1,38 1,37
SHERRITT INTERNATIONAL CORPORATION - 329.557,00 CAD 3,900 1.218.351,54 0,49 0,49
TECK RESOURCES CLASS B 36.116,00 CAD 22,470 769.272,46 0,31 0,31
Cayman Islands
HERBALIFE LTD - 18.023,00 USD 45,140 813.558,22 0,33 0,33
Sweden
AUTOLIV INC - 15.686,00 USD 77,390 1.213.939,54 0,49 0,49
Switzerland
TE CONNECTIVITY LTD - 70.422,00 USD 45,540 3.207.017,88 1,30 1,29
U.S.A.
ACCO BRANDS CORP - 2.138,00 USD 6,360 13.597,68 0,01 0,01
ACTIVISION INC - 152.914,00 USD 14,260 2.180.553,64 0,88 0,88
AETNA INC NEW 75.511,00 USD 63,540 4.797.968,94 1,95 1,93
AFLAC INC - 23.862,00 USD 58,120 1.386.859,44 0,56 0,56
AMERICAN EXPRESS - 57.302,00 USD 74,760 4.283.897,52 1,74 1,72
APPLE INC - 7.023,00 USD 396,080 2.781.669,84 1,13 1,12
AT&T INC - 32.119,00 USD 35,400 1.137.012,60 0,46 0,46
BEST BUY - 32.784,00 USD 27,330 895.986,72 0,36 0,36
BLACKROCK INC. - 15.703,00 USD 256,850 4.033.315,55 1,64 1,62
BRIGGS & STRATTON CORPORATION - 47.961,00 USD 19,800 949.627,80 0,39 0,38
BRINKER INTERNATIONAL INC. - 81.635,00 USD 39,430 3.218.868,05 1,31 1,29
BRISTOL-MYERS SQUIBB CO - 77.337,00 USD 44,690 3.456.190,53 1,40 1,39
CA INC - 142.189,00 USD 28,630 4.070.871,07 1,65 1,63
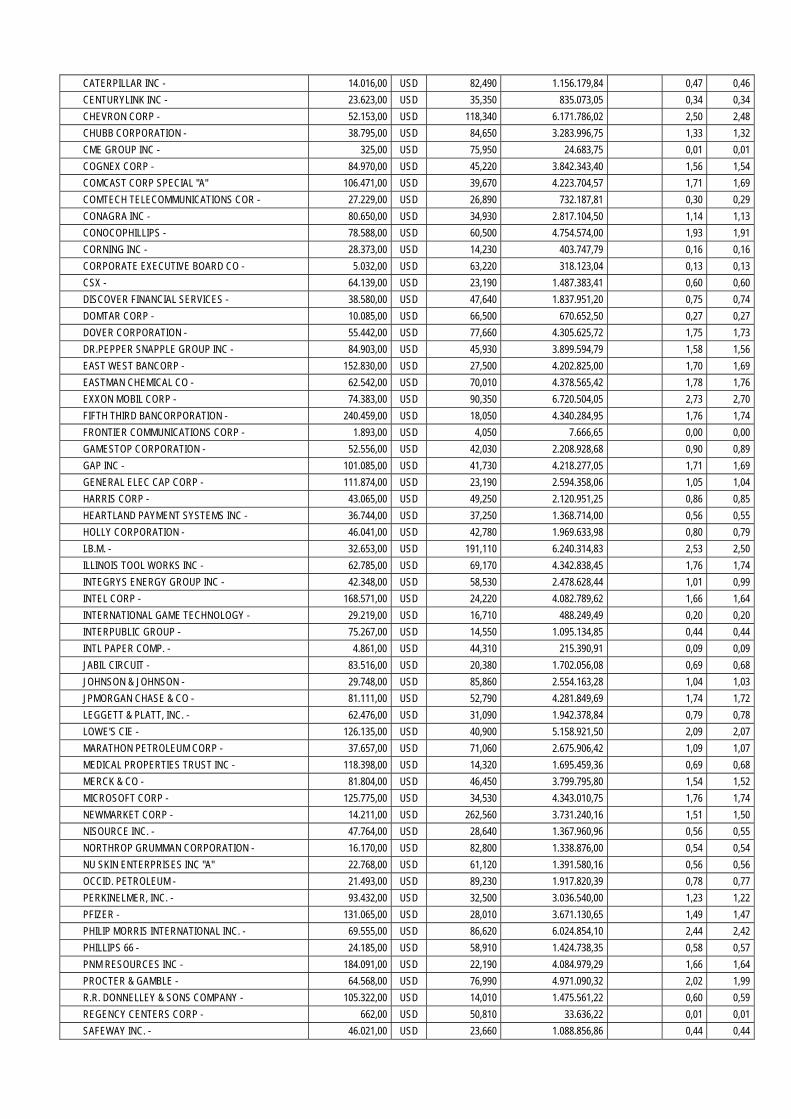
CATERPILLAR INC - 14.016,00 USD 82,490 1.156.179,84 0,47 0,46
CENTURYLINK INC - 23.623,00 USD 35,350 835.073,05 0,34 0,34
CHEVRON CORP - 52.153,00 USD 118,340 6.171.786,02 2,50 2,48
CHUBB CORPORATION - 38.795,00 USD 84,650 3.283.996,75 1,33 1,32
CME GROUP INC - 325,00 USD 75,950 24.683,75 0,01 0,01
COGNEX CORP - 84.970,00 USD 45,220 3.842.343,40 1,56 1,54
COMCAST CORP SPECIAL "A" 106.471,00 USD 39,670 4.223.704,57 1,71 1,69
COMTECH TELECOMMUNICATIONS COR - 27.229,00 USD 26,890 732.187,81 0,30 0,29
CONAGRA INC - 80.650,00 USD 34,930 2.817.104,50 1,14 1,13
CONOCOPHILLIPS - 78.588,00 USD 60,500 4.754.574,00 1,93 1,91
CORNING INC - 28.373,00 USD 14,230 403.747,79 0,16 0,16
CORPORATE EXECUTIVE BOARD CO - 5.032,00 USD 63,220 318.123,04 0,13 0,13
CSX - 64.139,00 USD 23,190 1.487.383,41 0,60 0,60
DISCOVER FINANCIAL SERVICES - 38.580,00 USD 47,640 1.837.951,20 0,75 0,74
DOMTAR CORP - 10.085,00 USD 66,500 670.652,50 0,27 0,27
DOVER CORPORATION - 55.442,00 USD 77,660 4.305.625,72 1,75 1,73
DR.PEPPER SNAPPLE GROUP INC - 84.903,00 USD 45,930 3.899.594,79 1,58 1,56
EAST WEST BANCORP - 152.830,00 USD 27,500 4.202.825,00 1,70 1,69
EASTMAN CHEMICAL CO - 62.542,00 USD 70,010 4.378.565,42 1,78 1,76
EXXON MOBIL CORP - 74.383,00 USD 90,350 6.720.504,05 2,73 2,70
FIFTH THIRD BANCORPORATION - 240.459,00 USD 18,050 4.340.284,95 1,76 1,74
FRONTIER COMMUNICATIONS CORP - 1.893,00 USD 4,050 7.666,65 0,00 0,00
GAMESTOP CORPORATION - 52.556,00 USD 42,030 2.208.928,68 0,90 0,89
GAP INC - 101.085,00 USD 41,730 4.218.277,05 1,71 1,69
GENERAL ELEC CAP CORP - 111.874,00 USD 23,190 2.594.358,06 1,05 1,04
HARRIS CORP - 43.065,00 USD 49,250 2.120.951,25 0,86 0,85
HEARTLAND PAYMENT SYSTEMS INC - 36.744,00 USD 37,250 1.368.714,00 0,56 0,55
HOLLY CORPORATION - 46.041,00 USD 42,780 1.969.633,98 0,80 0,79
I.B.M. - 32.653,00 USD 191,110 6.240.314,83 2,53 2,50
ILLINOIS TOOL WORKS INC - 62.785,00 USD 69,170 4.342.838,45 1,76 1,74
INTEGRYS ENERGY GROUP INC - 42.348,00 USD 58,530 2.478.628,44 1,01 0,99
INTEL CORP - 168.571,00 USD 24,220 4.082.789,62 1,66 1,64
INTERNATIONAL GAME TECHNOLOGY - 29.219,00 USD 16,710 488.249,49 0,20 0,20
INTERPUBLIC GROUP - 75.267,00 USD 14,550 1.095.134,85 0,44 0,44
INTL PAPER COMP. - 4.861,00 USD 44,310 215.390,91 0,09 0,09
JABIL CIRCUIT - 83.516,00 USD 20,380 1.702.056,08 0,69 0,68
JOHNSON & JOHNSON - 29.748,00 USD 85,860 2.554.163,28 1,04 1,03
JPMORGAN CHASE & CO - 81.111,00 USD 52,790 4.281.849,69 1,74 1,72
LEGGETT & PLATT, INC. - 62.476,00 USD 31,090 1.942.378,84 0,79 0,78
LOWE'S CIE - 126.135,00 USD 40,900 5.158.921,50 2,09 2,07
MARATHON PETROLEUM CORP - 37.657,00 USD 71,060 2.675.906,42 1,09 1,07
MEDICAL PROPERTIES TRUST INC - 118.398,00 USD 14,320 1.695.459,36 0,69 0,68
MERCK & CO - 81.804,00 USD 46,450 3.799.795,80 1,54 1,52
MICROSOFT CORP - 125.775,00 USD 34,530 4.343.010,75 1,76 1,74
NEWMARKET CORP - 14.211,00 USD 262,560 3.731.240,16 1,51 1,50
NISOURCE INC. - 47.764,00 USD 28,640 1.367.960,96 0,56 0,55
NORTHROP GRUMMAN CORPORATION - 16.170,00 USD 82,800 1.338.876,00 0,54 0,54
NU SKIN ENTERPRISES INC "A" 22.768,00 USD 61,120 1.391.580,16 0,56 0,56
OCCID. PETROLEUM - 21.493,00 USD 89,230 1.917.820,39 0,78 0,77
PERKINELMER, INC. - 93.432,00 USD 32,500 3.036.540,00 1,23 1,22
PFIZER - 131.065,00 USD 28,010 3.671.130,65 1,49 1,47
PHILIP MORRIS INTERNATIONAL INC. - 69.555,00 USD 86,620 6.024.854,10 2,44 2,42
PHILLIPS 66 - 24.185,00 USD 58,910 1.424.738,35 0,58 0,57
PNM RESOURCES INC - 184.091,00 USD 22,190 4.084.979,29 1,66 1,64
PROCTER & GAMBLE - 64.568,00 USD 76,990 4.971.090,32 2,02 1,99
R.R. DONNELLEY & SONS COMPANY - 105.322,00 USD 14,010 1.475.561,22 0,60 0,59
REGENCY CENTERS CORP - 662,00 USD 50,810 33.636,22 0,01 0,01
SAFEWAY INC. - 46.021,00 USD 23,660 1.088.856,86 0,44 0,44
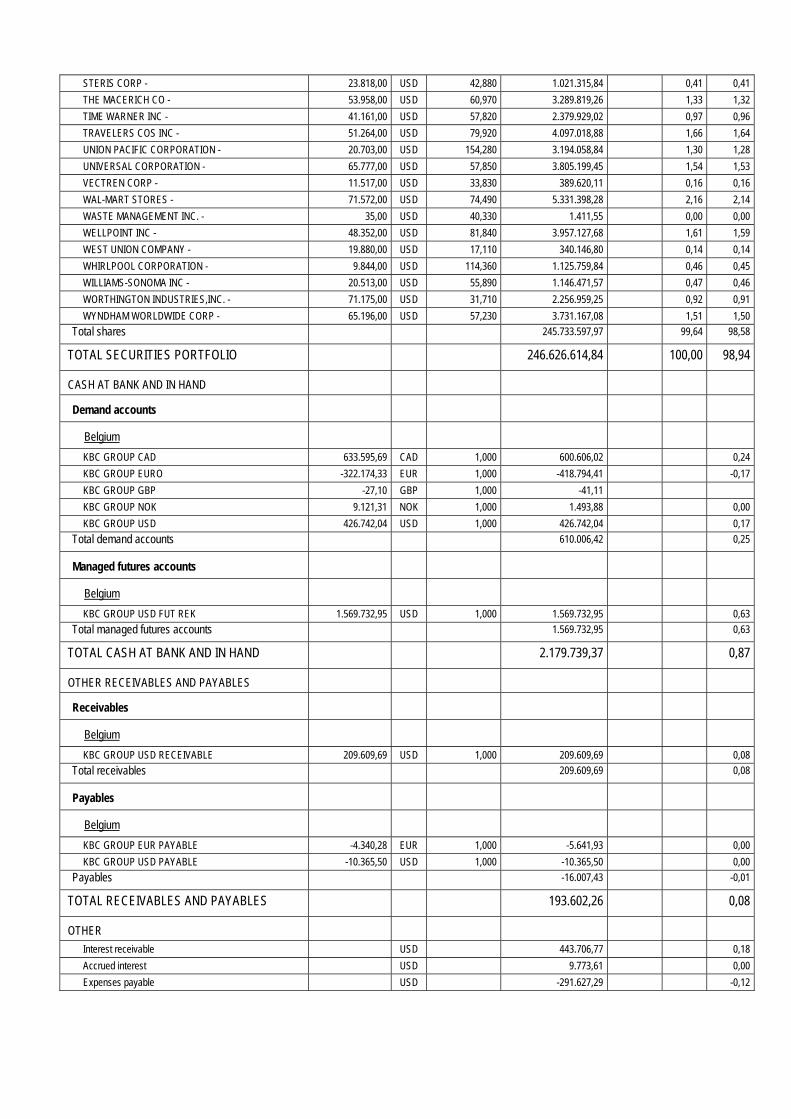
STERIS CORP - 23.818,00 USD 42,880 1.021.315,84 0,41 0,41
THE MACERICH CO - 53.958,00 USD 60,970 3.289.819,26 1,33 1,32
TIME WARNER INC - 41.161,00 USD 57,820 2.379.929,02 0,97 0,96
TRAVELERS COS INC - 51.264,00 USD 79,920 4.097.018,88 1,66 1,64
UNION PACIFIC CORPORATION - 20.703,00 USD 154,280 3.194.058,84 1,30 1,28
UNIVERSAL CORPORATION - 65.777,00 USD 57,850 3.805.199,45 1,54 1,53
VECTREN CORP - 11.517,00 USD 33,830 389.620,11 0,16 0,16
WAL-MART STORES - 71.572,00 USD 74,490 5.331.398,28 2,16 2,14
WASTE MANAGEMENT INC. - 35,00 USD 40,330 1.411,55 0,00 0,00
WELLPOINT INC - 48.352,00 USD 81,840 3.957.127,68 1,61 1,59
WEST UNION COMPANY - 19.880,00 USD 17,110 340.146,80 0,14 0,14
WHIRLPOOL CORPORATION - 9.844,00 USD 114,360 1.125.759,84 0,46 0,45
WILLIAMS-SONOMA INC - 20.513,00 USD 55,890 1.146.471,57 0,47 0,46
WORTHINGTON INDUSTRIES,INC. - 71.175,00 USD 31,710 2.256.959,25 0,92 0,91
WYNDHAM WORLDWIDE CORP - 65.196,00 USD 57,230 3.731.167,08 1,51 1,50
Total shares 245.733.597,97 99,64 98,58
TOTAL SECURITIES PORTFOLIO 246.626.614,84 100,00 98,94
CASH AT BANK AND IN HAND
Demand accounts
Belgium
KBC GROUP CAD 633.595,69 CAD 1,000 600.606,02 0,24
KBC GROUP EURO -322.174,33 EUR 1,000 -418.794,41 -0,17
KBC GROUP GBP -27,10 GBP 1,000 -41,11
KBC GROUP NOK 9.121,31 NOK 1,000 1.493,88 0,00
KBC GROUP USD 426.742,04 USD 1,000 426.742,04 0,17
Total demand accounts 610.006,42 0,25
Managed futures accounts
Belgium
KBC GROUP USD FUT REK 1.569.732,95 USD 1,000 1.569.732,95 0,63
Total managed futures accounts 1.569.732,95 0,63
TOTAL CASH AT BANK AND IN HAND 2.179.739,37 0,87
OTHER RECEIVABLES AND PAYABLES
Receivables
Belgium
KBC GROUP USD RECEIVABLE 209.609,69 USD 1,000 209.609,69 0,08
Total receivables 209.609,69 0,08
Payables
Belgium
KBC GROUP EUR PAYABLE -4.340,28 EUR 1,000 -5.641,93 0,00
KBC GROUP USD PAYABLE -10.365,50 USD 1,000 -10.365,50 0,00
Payables -16.007,43 -0,01
TOTAL RECEIVABLES AND PAYABLES 193.602,26 0,08
OTHER
Interest receivable USD 443.706,77 0,18
Accrued interest USD 9.773,61 0,00
Expenses payable USD -291.627,29 -0,12
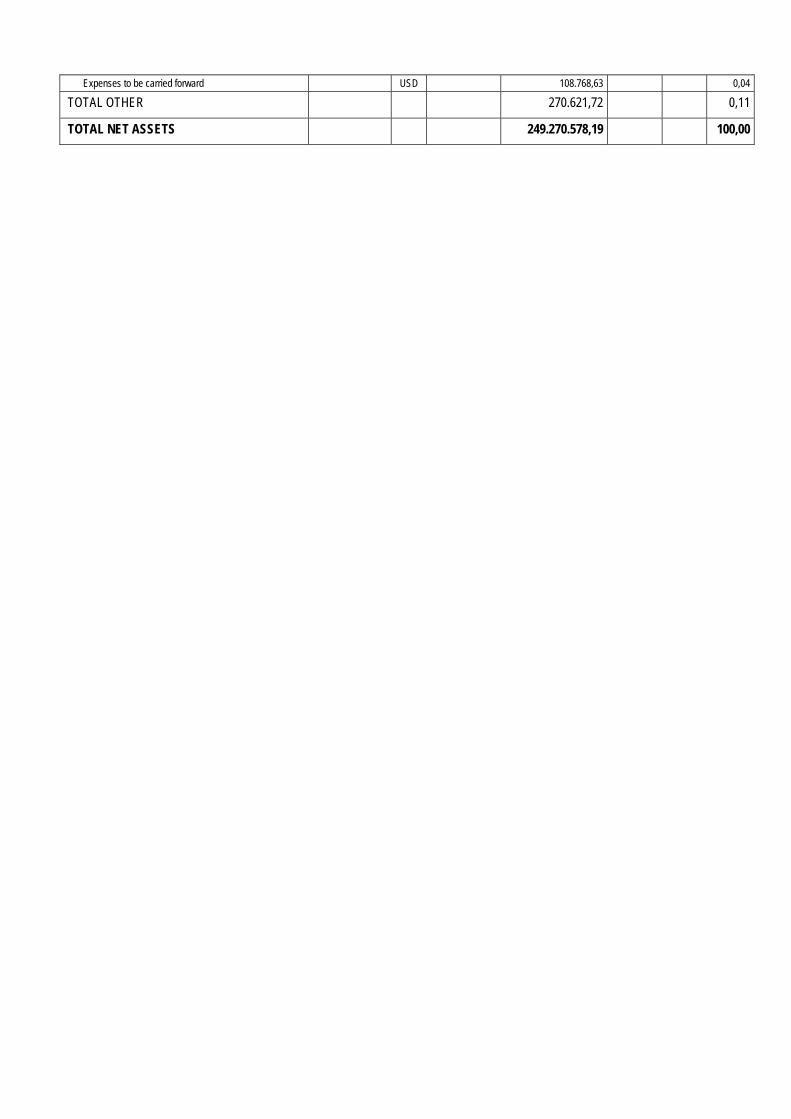
Expenses to be carried forward USD 108.768,63 0,04
TOTAL OTHER 270.621,72 0,11
TOTAL NET ASSETS 249.270.578,19 100,00

Geographic breakdown (as a % of securities portfolio)
31/12/2011 30/06/2012 31/12/2012 30/06/2013 Bermuda 0,85 0,00 0,00 1,08 Canada 10,66 7,85 8,59 4,46 Cayman Islands 0,00 0,00 0,00 0,33 U.K. 0,20 0,08 0,35 0,00 Ireland 0,52 0,60 0,30 0,36 Sweden 0,34 0,73 0,81 0,49 U.S.A. 87,43 90,74 89,95 93,28 Total 100,00 100,00 100,00 100,00
Sector breakdown (as a % of securities portfolio)
31/12/2011 30/06/2012 31/12/2012 30/06/2013 Cyclicals 23,80 21,54 22,24 22,12 Consum(cycl) 12,35 13,17 13,57 13,84 Cons.goods 13,12 14,70 15,76 14,56 Pharma 11,11 10,34 9,88 10,55 Financials 16,30 14,43 14,18 15,55 Technology 16,03 17,48 16,04 15,90 Telecomm. 3,65 3,13 3,51 3,06 Utilities 2,53 2,61 2,43 2,38 Real est. 1,11 2,60 2,39 2,04 Total 100,00 100,00 100,00 100,00
Currency breakdown (as a % of net assets)
31/12/2011 30/06/2012 31/12/2012 30/06/2013 CAD 10,99 7,40 8,55 4,66 EUR 0,45 0,51 0,26 0,19 USD 88,56 92,09 91,19 95,15 Total 100,00 100,00 100,00 100,00

2.4.2 CHANGES IN THE COMPOSITION OF THE ASSETS OF KBC EQUITY FUND HIGH DIVIDEND
NORTH AMERICA (IN THE CURRENCY OF THE SUB-FUND)
1st half of year YearPurchases 140.102.634,32 140.102.634,32 Sales 169.719.216,40 169.719.216,40 Total 1 309.821.850,72 309.821.850,72 Subscriptions 168.976.071,77 168.976.071,77 Redemptions 198.557.359,18 198.557.359,18 Total 2 367.533.430,95 367.533.430,95 Monthly average of total assets
275.760.529,98 275.760.529,98
Turnover rate -20,93 % -20,93 %
1st half of year YearPurchases 140.102.634,32 140.102.634,32 Sales 169.719.216,40 169.719.216,40 Total 1 309.821.850,72 309.821.850,72 Subscriptions 168.976.071,77 168.976.071,77 Redemptions 198.557.359,18 198.557.359,18 Total 2 367.533.430,95 367.533.430,95 Monthly average of total assets
292.551.225,37 292.551.225,37
Corrected turnover rate -19,73 % -19,73 %
The table above shows the capital volume of portfolio transactions. This volume (adjusted to take account of total subscriptions and redemptions) is also compared to the average net assets at the beginning and end of the period. A figure close to 0% implies that the transactions relating to the securities or transactions relating to the assets (excluding deposits and cash) in a given period only involve subscriptions and redemptions. A negative percentage shows that subscriptions and redemptions entailed few, if any, transactions in the portfolio. Active asset management may result in high turnover rates (monthly percentage >50%). The detailed list of transactions is available for consultation free of charge at the registered office of the Bevek or fund at Havenlaan 2, 1080 Brussels.
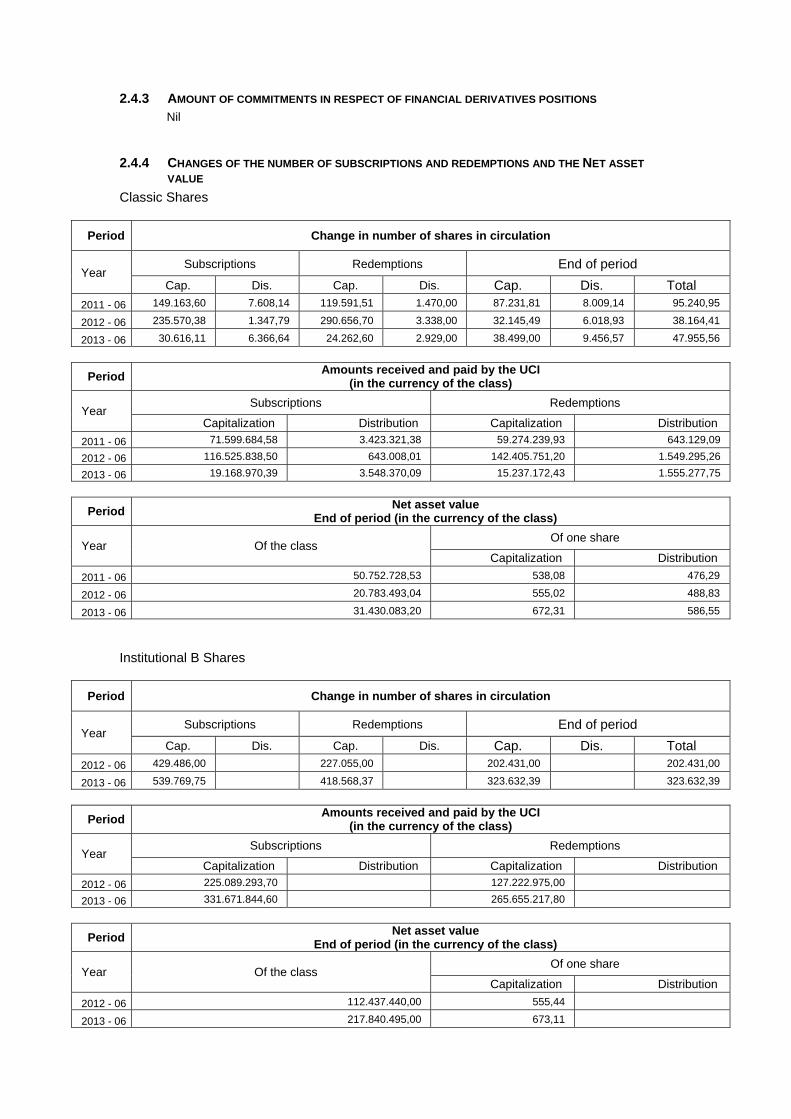
2.4.3 AMOUNT OF COMMITMENTS IN RESPECT OF FINANCIAL DERIVATIVES POSITIONS Nil
2.4.4 CHANGES OF THE NUMBER OF SUBSCRIPTIONS AND REDEMPTIONS AND THE NET ASSET
VALUE
Classic Shares
Period Change in number of shares in circulation
Year Subscriptions Redemptions End of period
Cap. Dis. Cap. Dis. Cap. Dis. Total
2011 - 06 149.163,60 7.608,14 119.591,51 1.470,00 87.231,81 8.009,14 95.240,95
2012 - 06 235.570,38 1.347,79 290.656,70 3.338,00 32.145,49 6.018,93 38.164,41
2013 - 06 30.616,11 6.366,64 24.262,60 2.929,00 38.499,00 9.456,57 47.955,56
Period Amounts received and paid by the UCI
(in the currency of the class)
Year Subscriptions Redemptions
Capitalization Distribution Capitalization Distribution
2011 - 06 71.599.684,58 3.423.321,38 59.274.239,93 643.129,09
2012 - 06 116.525.838,50 643.008,01 142.405.751,20 1.549.295,26
2013 - 06 19.168.970,39 3.548.370,09 15.237.172,43 1.555.277,75
Period Net asset value
End of period (in the currency of the class)
Year Of the class Of one share
Capitalization Distribution
2011 - 06 50.752.728,53 538,08 476,29
2012 - 06 20.783.493,04 555,02 488,83
2013 - 06 31.430.083,20 672,31 586,55
Institutional B Shares
Period Change in number of shares in circulation
Year Subscriptions Redemptions End of period
Cap. Dis. Cap. Dis. Cap. Dis. Total 2012 - 06 429.486,00 227.055,00 202.431,00 202.431,00
2013 - 06 539.769,75 418.568,37 323.632,39 323.632,39
Period Amounts received and paid by the UCI
(in the currency of the class)
Year Subscriptions Redemptions
Capitalization Distribution Capitalization Distribution
2012 - 06 225.089.293,70 127.222.975,00
2013 - 06 331.671.844,60 265.655.217,80
Period Net asset value
End of period (in the currency of the class)
Year Of the class Of one share
Capitalization Distribution
2012 - 06 112.437.440,00 555,44
2013 - 06 217.840.495,00 673,11

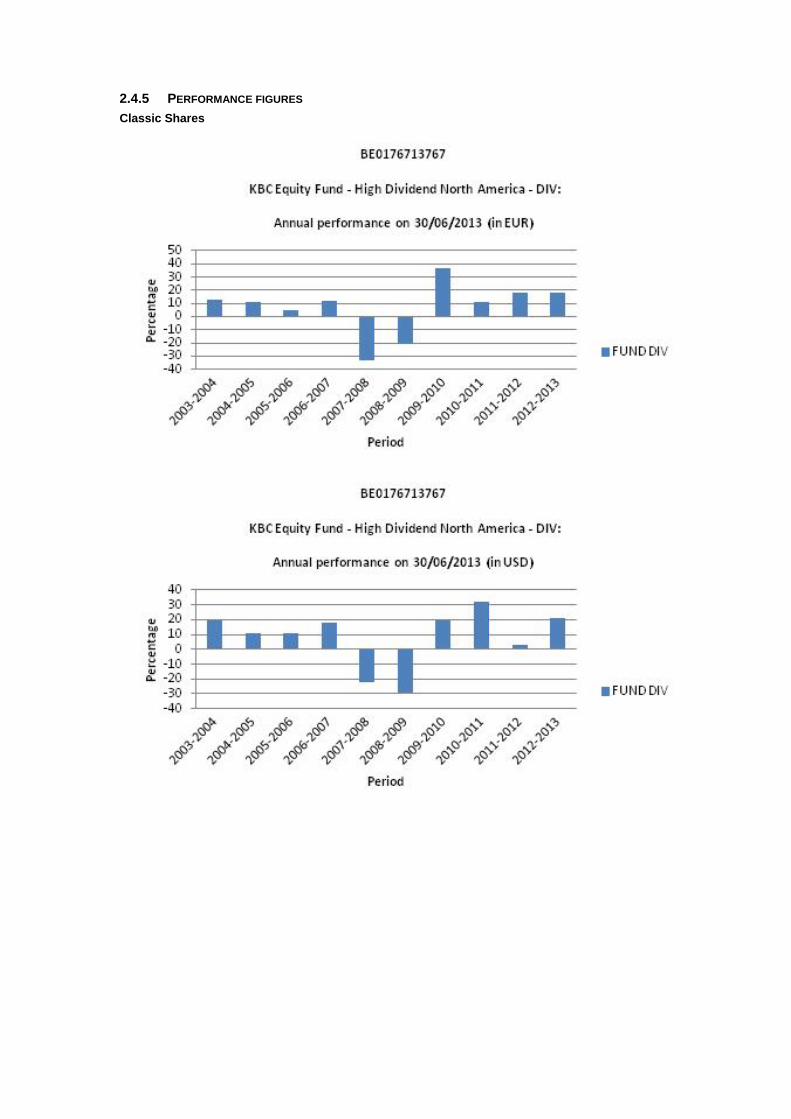
2.4.5 PERFORMANCE FIGURES
Classic Shares
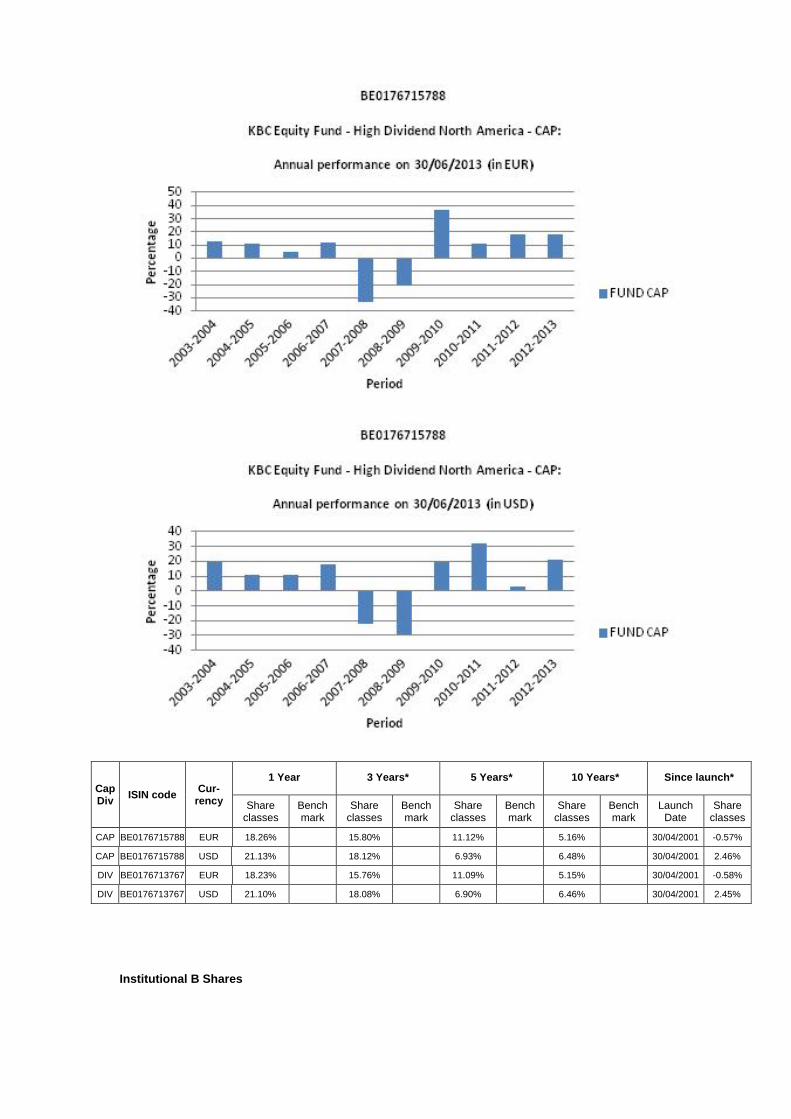
Cap Div
ISIN code Cur-
rency
1 Year 3 Years* 5 Years* 10 Years* Since launch*
Share classes
Bench mark
Share classes
Bench mark
Share classes
Bench mark
Share classes
Bench mark
Launch Date
Share classes
CAP BE0176715788 EUR 18.26% 15.80% 11.12% 5.16% 30/04/2001 -0.57%
CAP BE0176715788 USD 21.13% 18.12% 6.93% 6.48% 30/04/2001 2.46%
DIV BE0176713767 EUR 18.23% 15.76% 11.09% 5.15% 30/04/2001 -0.58%
DIV BE0176713767 USD 21.10% 18.08% 6.90% 6.46% 30/04/2001 2.45%
Institutional B Shares

Cap Div
ISIN code Cur-
rency
1 Year 3 Years* 5 Years* 10 Years* Since launch*
Share classes
Bench mark
Share classes
Bench mark
Share classes
Bench mark
Share classes
Bench mark
Launch Date
Share classes
CAP BE6228548812 EUR 18.31% 25/11/2011 26.78%
CAP BE6228548812 USD 21.19% 25/11/2011 25.24%
Risk warning: Past performance is not a guide to future performance. * Return on annual basis.
Classic Shares The bar chart shows the performance for full financial years. The figures do not take account of any restructuring.

Calculated in USD and in EUR. The return is calculated as the change in the net asset value between two dates expressed
as a percentage. In the case of units that pay dividends, the dividend is incorporated geometrically in the return.
Calculation method for date D, where NAV stands for net asset value: Capitalisation units (CAP) Return on date D over a period of X years:
[NIW(D) / NIW(Y)] ^ [1 / X] - 1 where Y = D-X
Return on date D since the start date S of the unit: [NIW(D) / NIW(S)] ^ [1 / F] - 1 where F = 1 if the unit has existed for less than one year on date D where F = (D-S) / 365.25 if the unit has existed for longer than one year on date D
Distribution units (DIV) Return on date D over a period of X years:
[ C * NIW(D) / NIW(Y)] ^ [1 / X] - 1 where Y = D-X
Return on date D since the start date S of the unit: [ C * NIW(D) / NIW(S)] ^ [1 / F] - 1 where F = 1 if the unit has existed for less than one year on date D where F = (D-S) / 365.25 if the unit has existed for longer than one year on date D where C is a factor that is determined for all N dividends between the calculation date D and the reference date.
For dividend i on date Di with value Wi: Ci = [Wi / NIW(Di)] + 1 i = 1 ... N from whichC = C0 * .... * CN.
If the interval between the two dates exceeds one year, the ordinary return calculation is converted into a return on an annual basis by taking the nth square root of 1 plus the total return of the unit.
The return figures shown above do not take account of the fees and charges associated with the issue and redemption of units.
These are the performance figures for capitalisation and distribution shares.
Institutional B Shares The bar chart shows the performance for full financial years. The figures do not take account of any restructuring. Calculated in USD and in EUR. The return is calculated as the change in the net asset value between two dates expressed
as a percentage. Calculation method for date D, where NAV stands for net asset value:
Capitalisation units (CAP) Return on date D over a period of X years:
[NIW(D) / NIW(Y)] ^ [1 / X] - 1 where Y = D-X
Return on date D since the start date S of the unit: [NIW(D) / NIW(S)] ^ [1 / F] - 1 where F = 1 if the unit has existed for less than one year on date D where F = (D-S) / 365.25 if the unit has existed for longer than one year on date D
If the interval between the two dates exceeds one year, the ordinary return calculation is converted into a return on an annual basis by taking the nth square root of 1 plus the total return of the unit.
The return figures shown above do not take account of the fees and charges associated with the issue and redemption of units.
These are the performance figures for capitalization shares.

2.4.6 COSTS Ongoing Charges: * Classic Shares Distribution: 1.804% Classic Shares Capitalization: 1.764% Institutional B Shares Capitalization: 1.725% * The following costs have not been included in the ongoing charges: - Interest payments on loans taken out - Payments in respect of financial derivatives - Fees and charges paid directly by the investor - Any soft commissions
SOFT COMMISSIONS The management company or the appointed manager, as the case may be, is the recipient of soft commissions. The recipient has laid down an internal policy as regards accepting soft commissions and avoiding possible conflicts of interest in this respect, and has put appropriate internal controls in place to ensure this policy is observed. For more information, please see the ‘General’ section of the annual report.
Broker
Commission gross
in EUR
paid during the period:
1‐01‐13
‐
30‐06‐13
CSA Credits
in EUR
accrued during the period:
1‐01‐13
‐
30‐06‐13 Percentage
CITI 17,601 13,201 75.00%
CSFBSAS 223 111 50.00%
EQ MACQUARIE 56,157 33,689 59.99%
INSTINET 154 66 42.86%
MERRILL 14,982 7,491 50.00%
MORGAN STANLEY 163 70 42.86%
UBSWDR 26,875 14,090 52.43%
FEE-SHARING AGREEMENTS AND REBATES: The management company may share its fee with the distributor, and institutional and/or professional parties. In principle, the percentage share amounts to between 35% and 60% if the distributor is an entity of KBC Group NV or to between 35% and 70% if the distributor is not an entity of KBC Group NV. However, in a small number of cases, the distributor’s fee is less than 35%. Investors may, on request, obtain more information on these cases. If the management company invests the assets of the undertaking for collective investment in units of undertakings for collective investment that are not managed by an entity of KBC Group NV, and receives a fee for doing so, it will pay this fee to the undertaking for collective investment. Fee-sharing does not affect the amount of the management fee paid by the sub-fund to the management company. This management fee is subject to the limitations laid down in the articles of association. The limitations may only be amended after approval by the general meeting of shareholders. The management company has concluded a distribution agreement with the distributor in order to facilitate the wider distribution of the sub-fund's units by using multiple distribution channels. It is in the interests of the holders of units, the sub-fund and of the distributor for the largest possible number of units to be sold and for the assets of the sub-fund to be maximised in this way. In this respect, there is therefore no question of any conflict of interest.
2.4.7 NOTES TO THE FINANCIAL STATEMENTS AND OTHER DATA Fee for managing the investment portfolio: 1.5% per annum calculated on the basis of the average total net assets of the sub-fund, no management fee is charged on assets assets invested in investment undertakings managed by a financial institution of the KBC group.
The administration agent’s fee is payable at the end of each month and is calculated on the basis of the average total net assets of the sub-fund. Auditor's fee: 1 700 EUR per year. This fee is not including VAT and can be indexed on an annual basis in accordance with the decisions of the general meeting. The custody fee is calculated on the value of the securities held in custody by the custodian on the final banking day of the preceding calendar year, except on those assets invested in investment undertakings managed by a financial institution of the KBC group. The custody fee is paid at the beginning of the calendar year. Social, ethical and environmental aspects: No manufacturers of controversial weapons whose use over the past five decades, according to the international consensus, has led to disproportionate human suffering among the civilian population will be included in the portfolio of investments. This involves the manufacturers of anti-personnel mines, cluster bombs and munitions and weapons containing depleted uranium. In this way, the sub-fund seeks to reflect not only simple financial reality but also the social reality of the sector or region in question. Exercising voting rights. If necessary, relevant and in the interest of the shareholders, the management company will exercise the voting rights attached to the shares in the Bevek’s portfolio. The management company will adhere to the following criteria when determining how it stands relative to the items on the agenda that are put to the vote: - Shareholder value may not be adversely affected. - Corporate governance rules, especially with regard to the rights of minority shareholders, must be
respected. - The minimum standards with regard to sustainable business and corporate social responsibility
must be met. The list of companies for which voting rights are exercised is available at the registered office of the Bevek. Securities lending In accordance with the Royal Decree of 7 March 2006 concerning securities lending, the undertaking for collective investment has taken out securities loans with a principal to whom the full title of the loaned securities was transferred, without recording this transfer of ownership in the accounts. For the period from 1 January 2013 to 30 June 2013, the fee for securities lent comes to 64,294.02 USD. The undertaking for collective investment receives 50% of the fee received for securities lent. The detailed list of securities lending transactions carried out can be obtained from the registered office of the collective investment undertaking at 2 Havenlaan, 1080 Brussels.
Overview of securities lent as at 30/06/2013
Name Currency Quantity Price Value in currency of the
portfolio
AIMIA INC CAD 62.976 15,740 939.630,86
BCE INC NEW CAD 52.229 43,120 2.134.852,78
CAN IMP BK COMMERCE CAD 19.145 74,640 1.354.579,41
ENSIGN ENERGY SERVICES INC CAD 60.289 16,280 930.400,53
HERBALIFE LTD USD 12.327 45,140 556.440,78
ROGERS COMMUNICATIONS INC - CL B CAD 87.128 41,200 3.402.768,69
TECK RESOURCES LTD CLASS B CAD 19.408 22,470 413.391,29
Total 9.732.064,34

Semi-Annual report as at 30th June 2013
TABLE OF CONTENTS
2. Information on KBC Equity Fund Finance
2.1. Management report 2.1.1. Launch date and subscription price 2.1.2. Stock exchange listing 2.1.3. Aim and distinctive features of the investment policy 2.1.4. Financial portfolio management 2.1.5. Distributors 2.1.6. Index and benchmark 2.1.7. Policy conducted during the financial year 2.1.8. Future policy 2.1.9. Synthetic risk and reward indicator (SRRI)
2.2. Balance sheet
2.3. Profit and loss account
2.4. Composition of the assets and key figures
2.4.1. Composition of the assets 2.4.2. Change in the composition of the assets 2.4.3. Value of commitments in respect of financial derivatives positions 2.4.4. Evolution of the number of subscriptions, repayments and the net asset value 2.4.5. Return figures 2.4.6. Expenses 2.4.7. Notes to the financial statements and other data


2 INFORMATION ON KBC EQUITY FUND FINANCE
2.1 MANAGEMENT REPORT
2.1.1 LAUNCH DATE AND SUBSCRIPTION PRICE Classic Shares : Launch date: 27 March 1998 Initial subscription price: 20000 BEF Currency: EUR Institutional B Shares : Launch date: 25 November 2011 Initial subscription price: 268.5 EUR Currency: EUR
2.1.2 STOCK EXCHANGE LISTING Not applicable.
2.1.3 GOAL AND KEY PRINCIPLES OF THE INVESTMENT POLICY
SUB-FUND’S OBJECT: The main objective of this sub-fund is to generate the highest possible return for its shareholders by investing directly or indirectly in transferable securities. This is reflected in its pursuit of capital gains and income. To this end, the assets are invested, either directly or indirectly via correlated financial instruments, primarily in shares.
SUB-FUND’S INVESTMENT POLICY:
PERMITTED ASSET CLASSES: The sub-fund may invest in securities, money market instruments, units in undertakings for collective investment, deposits, financial derivatives, liquid assets and all other instruments insofar as permitted by the applicable laws and regulations and consistent with the sub-fund’s object The sub-fund shall invest no more than 10% of its assets in units of other undertakings for collective investment.
RESTRICTIONS OF THE INVESTMENT POLICY: The investment policy will be implemented within the limits set by law and regulations. The sub-fund may borrow up to 10% of its net assets, insofar as these are short-term borrowings aimed at solving temporary liquidity problems.
PERMITTED DERIVATIVES TRANSACTIONS: Derivates may be used either for hedging purposes or to achieve investment objectives. Changes will be made to the investments at regular intervals to comply with the sub-fund's investment strategy. In addition, listed and unlisted derivates may be used to achieve the objectives: these may be forward contracts, options or swaps on securities, indices, currencies or interest rates or other transactions involving derivatives. Unlisted derivatives transactions will only be concluded with prime financial institutions specialised in such transactions. Such derivatives may also be used to hedge the assets against exchange-rate fluctuations. Subject to the applicable laws and regulations and the articles of association, the sub-fund always seeks to conclude the most effective transactions. All costs associated with the transactions will be charged to the sub-fund and all income generated will be paid to the sub-fund. If the transactions result in a risk in respect of the counterparty, this risk can be hedged by using a margin management system that ensures that the sub-fund is the beneficiary of security (collateral) in the form of cash or investment grade bonds. When calculating the value of the bonds, a margin will be applied that varies depending on the residual term to maturity and the currency in which the bond in question is denominated. The relationship with the counterparty or counterparties is governed by standard international agreements.
STRATEGY SELECTED At least 75% of the assets are invested in shares of companies in the financial sector where conditions are such as to allow accelerated economic growth in the short or medium term.
LENDING FINANCIAL INSTRUMENTS: The sub-fund may lend financial instruments within the limits set by law and regulations. This lending does not affect the sub-fund’s risk profile since: - it takes place within the framework of a securities lending system managed by a principal. In
addition, the sub-fund has a relationship only with the principal of the securities lending system which acts as counterparty and to which title of the loaned securities is transferred. The choice of principal is subject to strict selection criteria. The return of securities similar to the securities that have been lent is guaranteed by the principal.
- through a margin management system, the sub-fund is always guaranteed financial security, the actual value of which always exceeds the actual value of the securities that have been lent, in case the principal does not return similar securities.
The return of securities similar to the securities that have been lent can be requested at any time, which means that the lending of securities does not affect the management of the sub-fund's assets. By lending securities, the sub-fund can generate an additional return. The principal pays a fee to the management company. After deducting the fee for the margin management and clearing services of KBC Bank, most of this fee is paid to the sub-fund. The relationship with the counterparty or counterparties is governed by standard international agreements. More information is provided on the terms and conditions governing securities lending in the annual or half-yearly report for the sub-fund.
VOLATILITY OF THE NET ASSET VALUE: The volatility of the net asset value may be high due to the composition of the portfolio.
GENERAL STRATEGY FOR HEDGING THE EXCHANGE RATE RISK: In order to protect its assets against exchange rate fluctuations and within the limitations laid down in the articles of association, the sub-fund may perform transactions relating to the sale of forward currency contracts, as well as the sale of call options and the purchase of put options on currencies. The transactions in question may relate solely to contracts traded on a regulated market that operates regularly, is recognised and is open to the public or that are traded with a recognised, prime financial institution specialising in such transactions and dealing in the over-the-counter (OTC) market in options. With the same objective, the sub-fund may also sell currencies forward or exchange them in private transactions with prime financial institutions specialising in such transactions. The hedging objective of the aforementioned transactions suggests that there is a direct link between these transactions and the assets to be hedged, which implies that the transactions carried out in a particular currency may in principle not exceed, in terms of volume, either the valuation value of all the assets in the same currency or the holding period of those assets.
SOCIAL, ETHICAL AND ENVIRONMENTAL ASPECTS:
No manufacturers of controversial weapons whose use over the past five decades, according to the international consensus, has led to disproportionate human suffering among the civilian population will be included in the portfolio of investments. This involves the manufacturers of anti-personnel mines, cluster bombs and munitions and weapons containing depleted uranium. In this way, the sub-fund seeks to reflect not only simple financial reality but also the social reality of the sector or region in question.
THE EUROPEAN SAVINGS DIRECTIVE AND TAX ON DEBT CLAIM RETURNS OBTAINED THROUGH THE
REDEMPTION OF OWN UNITS OR IN THE EVENT OF FULL OR PARTIAL DISTRIBUTION OF EQUITY
CAPITAL. The following information is of a general character and is not intended to cover all aspects of an investment in a UCITS. In certain cases entirely different rules might even apply. Moreover, both tax law and the interpretation of it can change. Investors who wish to have more information about the tax implications – in both Belgium and abroad – of acquiring, holding and transferring units should seek the advice of their usual financial and tax advisers.

This UCITS shall invest a maximum of 15% of its assets directly or indirectly in debt instruments as intended by the European Savings Directive. A. European Savings Directive (Directive 2003/48/EC) The European Savings Directive has been implemented in Belgium. Since this UCITS invests a maximum of 15% of its assets directly or indirectly in debt claims as intended by the European Savings Directive, the income of this UCITS does not fall within the scope of this directive. B. Tax on debt claim returns obtained through the redemption of own units or in the event of full or partial distribution of equity capital (Article 19bis Income Tax Code 1992). The income from this UCITS is not subject to the tax on debt instrument returns as intended by Article 19bis, Income Tax Code 1992.
2.1.4 FINANCIAL PORTFOLIO MANAGEMENT There is no delegation of the portfolio.
2.1.5 DISTRIBUTORS KBC Asset Management S.A., 5, Place de la Gare, L-1616 Luxembourg.
2.1.6 INDEX AND BENCHMARK See ‘Sub-fund’s investment policy’.

2.1.7 POLICY PERSUED DURING THE FINANCIAL YEAR Doubts about the sustainability of the economic recovery continued to shape investor sentiment. The debt crisis in Europe continued unabated, although the European Central Bank (ECB) managed to convince the market that it had the crisis under control. Major steps were taken in the United States to reform the federal budget, seemingly without adversely affecting economic growth too much. Fortunately, strong economic growth in Asia created export opportunities for American and European businesses. The weak growth in the Western economies was not without its impact on the export performance in emerging countries. In recent years, however, domestic demand (due to a rapidly growing middle class with a high consumption rate) and intra-regional trade within Asia have been playing an increasingly important role. The region is better armed to deal with financial crises than it was in the past. Public finances are healthy, the balance of payments is generally neutral (China actually has an astronomical surplus) and the internal savings buffer is high. Asia’s economic development no longer depends on fickle foreign capital. Thanks to the contribution by the emerging markets the growth of world GDP held up in 2012–13 (estimated at 2–2.5%). There were significant differences in the returns of the various sectors. The best performing sectors included Financials, Pharmaceuticals and Consumer Discretionary. Materials, Technology and Energy lagged behind. The outperformance of Banks may be attributed to the quantitative easing programmes undertaken by the central banks. By this we mean the Fed’s QE3 programme, and especially the announcement by the ECB of its OMT programme, which took the heat out of the euro crisis. Pharmaceuticals had been shunned for a long time due to a lack of product innovation, patent expiry and the reforms to healthcare insurance in the US. In recent months, however, investors began to focus more on the sector’s response to these challenges: restructuring operations and the sell-off of non-strategic divisions. The car industry has risen from the ashes, in the US and the European luxury segment at least. Demand from the emerging markets is also strong, despite the slowdown in Chinese growth, where German luxury marques generate 50% of their profits. In spite of the slow growth, advertising budgets have also held up surprisingly well. The rise of the e-book and ongoing breakthrough of digital television continue undiminished. More and more media companies are successfully exploiting these trends. Mining companies lost ground on excessive expectations concerning commodity prices. A failed stock market flotation by Facebook and the giant leaps made by Apple meant that price trends in the Technology sector differed from what might have been expected on the basis of the fundamentals. Oil companies suffered from the vagaries of the oil market, the political instability in the Middle East and frequent accidents. The Real Estate sector (+3.0%) eased up a little in 2013 compared to its strong performance in 2012. The financial turbulence in 2007–08 forced real estate companies to clean up their balance sheets. This accordingly provided the sector with a sound base to make the most of the recovery. The traditional discount to the net asset value at which the sector normally trades consequently disappeared, leaving the sector somewhat overvalued.
2.1.8 FUTURE POLICY Today’s world is one of two-speed economies. The mature industrialised economies (US, Europe, Japan) still find themselves in a low-growth environment, with no underlying inflationary pressure, persistently low interest rates and runaway public finances. The picture in the emerging markets is altogether different. The strong economic growth has already created inflationary pressure in Asia. Appropriate monetary policy is therefore required: sometimes restrictive (as in 2011) and at other times stimulatory (as at present). Monetary policy in China and elsewhere in Asia is highly geared to preventing asset-price inflation. This does not just involve the interest-rate weapon; there was also active intervention in the credit market and the housing market. One of the major challenges for this decade will be the further development of consumption in China and the rest of Asia. That could help bring about a more balanced economic world order: it will not only reduce the region’s dependence on exports but, at least as importantly, will have an effect on international capital flows. More consumption in China will mean lower savings and higher imports, including from the US and Europe. That will help the West to ‘grow out’ of its debt problems.
2.1.9 SYNTHETIC RISK AND REWARD INDICATOR Classic Shares: 7 on a scale of 1 (lowest risk) to 7 (highest risk). Institutional B Shares: 7 on a scale of 1 (lowest risk) to 7 (highest risk). The value of a share can decrease or increase and the investor may not get back the amount invested.

In accordance with Commission Regulation (EU) No. 583/2010, a synthetic risk and reward indicator has been calculated. This indicator provides a quantitative measure of the sub-fund's potential return and the risk involved, calculated in the currency in which the sub-fund is denominated. It is given as a figure between 1 and 7. The higher the figure, the greater the potential return, but also the more difficult it is to predict this return. Losses are possible too. The lowest figure does not mean that the investment is entirely free of risk. However, it does indicate that, compared with the higher figures, this product will generally provide a lower, but more predictable return. The synthetic risk and reward indicator is assessed regularly and can therefore go up or down based on data from the past. Data from the past is not always a reliable indicator of future risk and return.
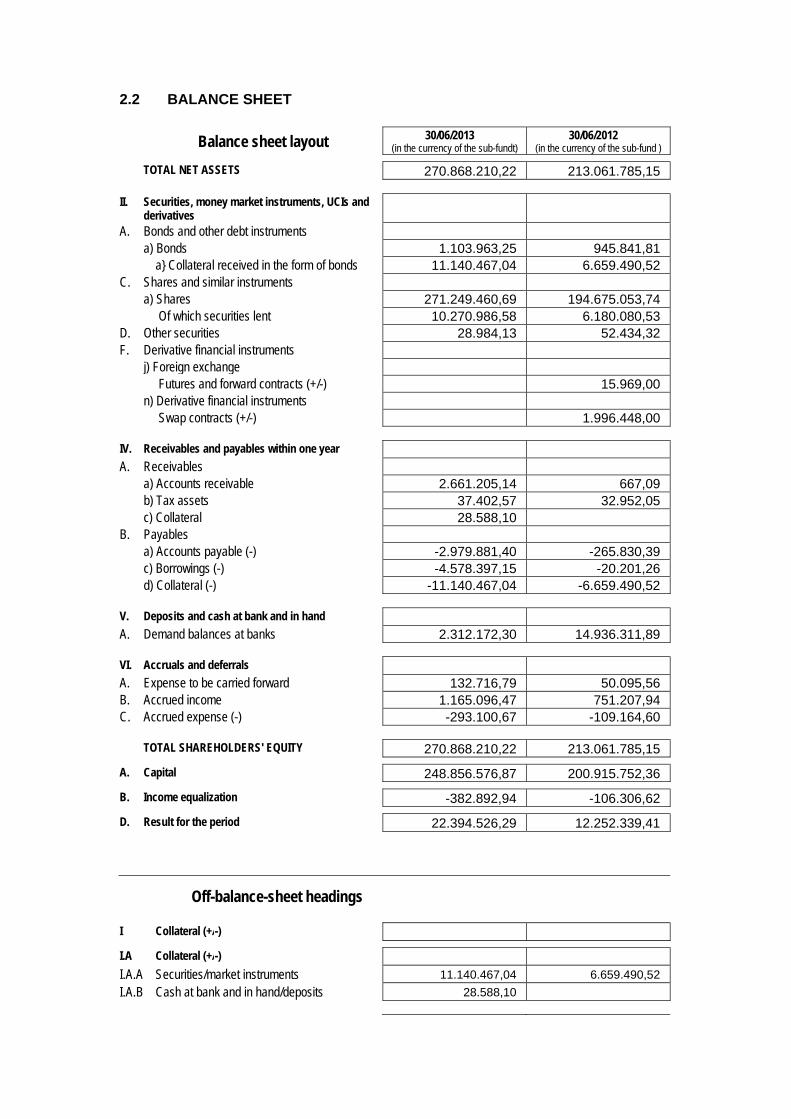
2.2 BALANCE SHEET
Balance sheet layout 30/06/2013 (in the currency of the sub-fundt)
30/06/2012 (in the currency of the sub-fund )
TOTAL NET ASSETS 270.868.210,22 213.061.785,15
II. Securities, money market instruments, UCIs and derivatives
A. Bonds and other debt instruments a) Bonds 1.103.963,25 945.841,81 a} Collateral received in the form of bonds 11.140.467,04 6.659.490,52 C. Shares and similar instruments a) Shares 271.249.460,69 194.675.053,74 Of which securities lent 10.270.986,58 6.180.080,53 D. Other securities 28.984,13 52.434,32 F. Derivative financial instruments j) Foreign exchange Futures and forward contracts (+/-) 15.969,00 n) Derivative financial instruments Swap contracts (+/-) 1.996.448,00
IV. Receivables and payables within one year A. Receivables a) Accounts receivable 2.661.205,14 667,09 b) Tax assets 37.402,57 32.952,05 c) Collateral 28.588,10 B. Payables a) Accounts payable (-) -2.979.881,40 -265.830,39 c) Borrowings (-) -4.578.397,15 -20.201,26 d) Collateral (-) -11.140.467,04 -6.659.490,52
V. Deposits and cash at bank and in hand A. Demand balances at banks 2.312.172,30 14.936.311,89
VI. Accruals and deferrals A. Expense to be carried forward 132.716,79 50.095,56 B. Accrued income 1.165.096,47 751.207,94 C. Accrued expense (-) -293.100,67 -109.164,60
TOTAL SHAREHOLDERS' EQUITY 270.868.210,22 213.061.785,15
A. Capital 248.856.576,87 200.915.752,36
B. Income equalization -382.892,94 -106.306,62
D. Result for the period 22.394.526,29 12.252.339,41
Off-balance-sheet headings
I Collateral (+/-)
I.A Collateral (+/-)
I.A.A Securities/market instruments 11.140.467,04 6.659.490,52
I.A.B Cash at bank and in hand/deposits 28.588,10
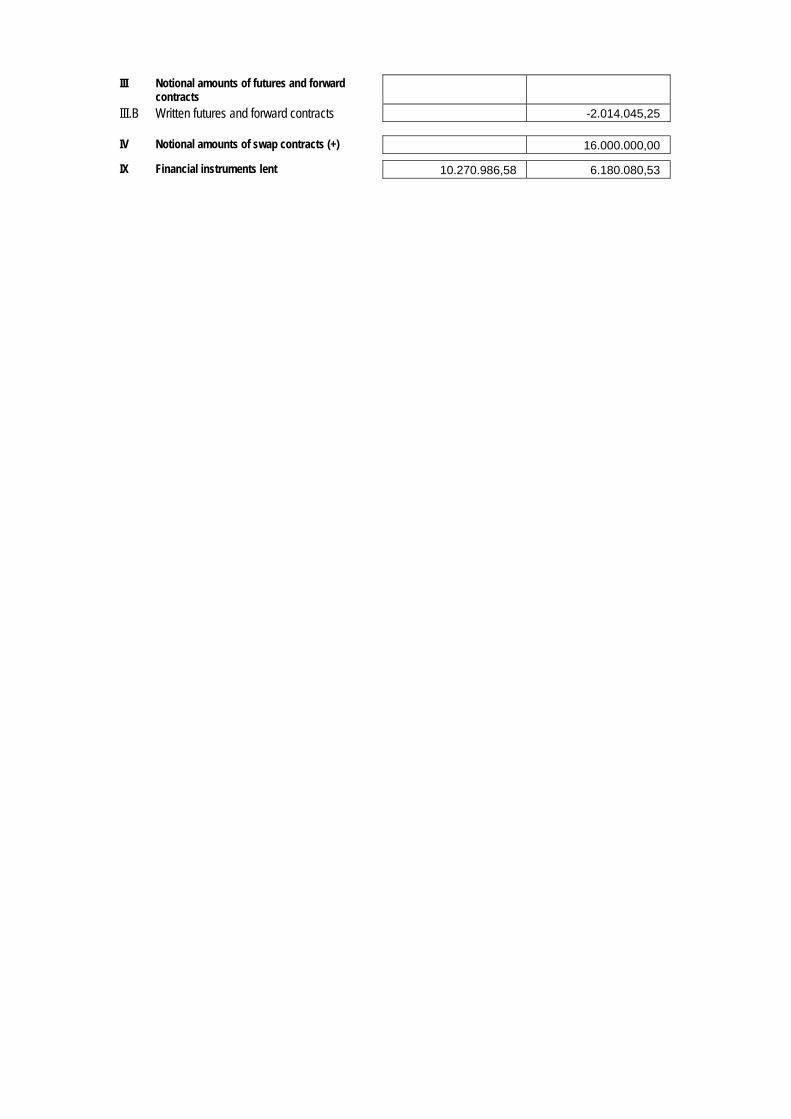
III Notional amounts of futures and forward contracts
III.B Written futures and forward contracts -2.014.045,25
IV Notional amounts of swap contracts (+) 16.000.000,00
IX Financial instruments lent 10.270.986,58 6.180.080,53
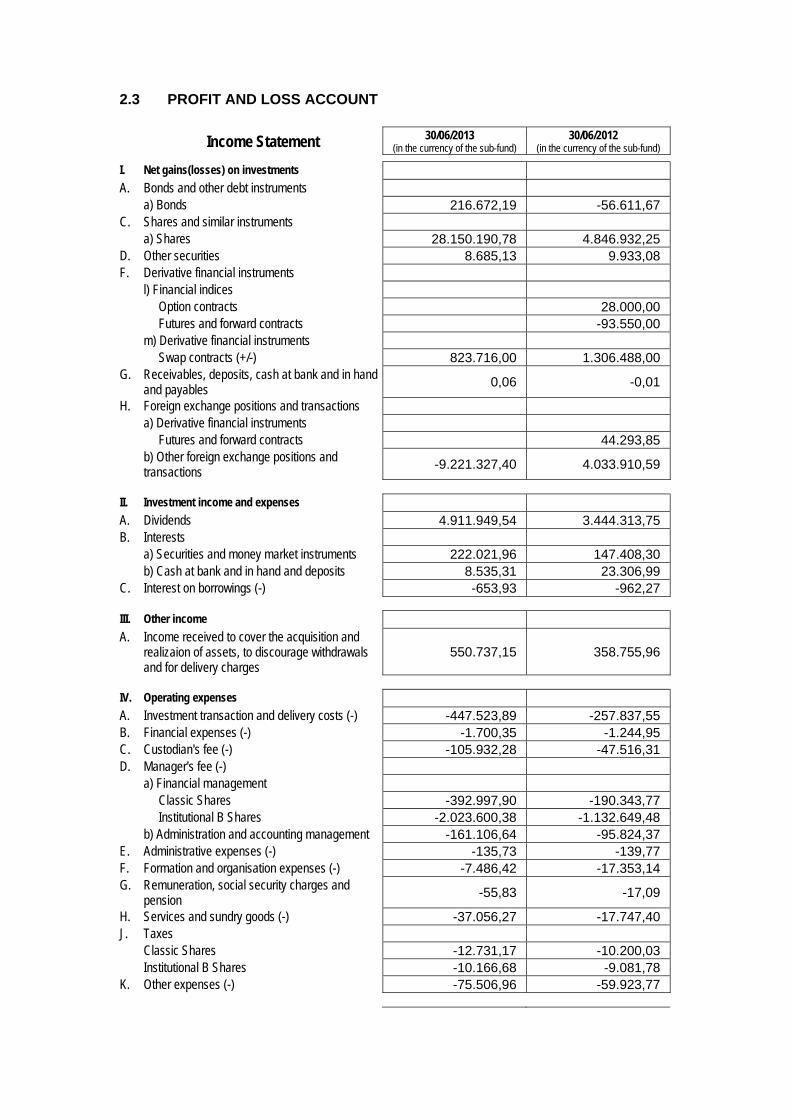
2.3 PROFIT AND LOSS ACCOUNT
Income Statement 30/06/2013 (in the currency of the sub-fund)
30/06/2012 (in the currency of the sub-fund)
I. Net gains(losses) on investments A. Bonds and other debt instruments a) Bonds 216.672,19 -56.611,67 C. Shares and similar instruments a) Shares 28.150.190,78 4.846.932,25 D. Other securities 8.685,13 9.933,08 F. Derivative financial instruments l) Financial indices Option contracts 28.000,00 Futures and forward contracts -93.550,00 m) Derivative financial instruments Swap contracts (+/-) 823.716,00 1.306.488,00 G. Receivables, deposits, cash at bank and in hand
and payables 0,06 -0,01
H. Foreign exchange positions and transactions a) Derivative financial instruments Futures and forward contracts 44.293,85 b) Other foreign exchange positions and
transactions -9.221.327,40 4.033.910,59
II. Investment income and expenses A. Dividends 4.911.949,54 3.444.313,75 B. Interests a) Securities and money market instruments 222.021,96 147.408,30 b) Cash at bank and in hand and deposits 8.535,31 23.306,99 C. Interest on borrowings (-) -653,93 -962,27
III. Other income A. Income received to cover the acquisition and
realizaion of assets, to discourage withdrawals and for delivery charges
550.737,15 358.755,96
IV. Operating expenses A. Investment transaction and delivery costs (-) -447.523,89 -257.837,55 B. Financial expenses (-) -1.700,35 -1.244,95 C. Custodian's fee (-) -105.932,28 -47.516,31 D. Manager's fee (-) a) Financial management Classic Shares -392.997,90 -190.343,77 Institutional B Shares -2.023.600,38 -1.132.649,48 b) Administration and accounting management -161.106,64 -95.824,37 E. Administrative expenses (-) -135,73 -139,77 F. Formation and organisation expenses (-) -7.486,42 -17.353,14 G. Remuneration, social security charges and
pension -55,83 -17,09
H. Services and sundry goods (-) -37.056,27 -17.747,40 J. Taxes Classic Shares -12.731,17 -10.200,03 Institutional B Shares -10.166,68 -9.081,78 K. Other expenses (-) -75.506,96 -59.923,77
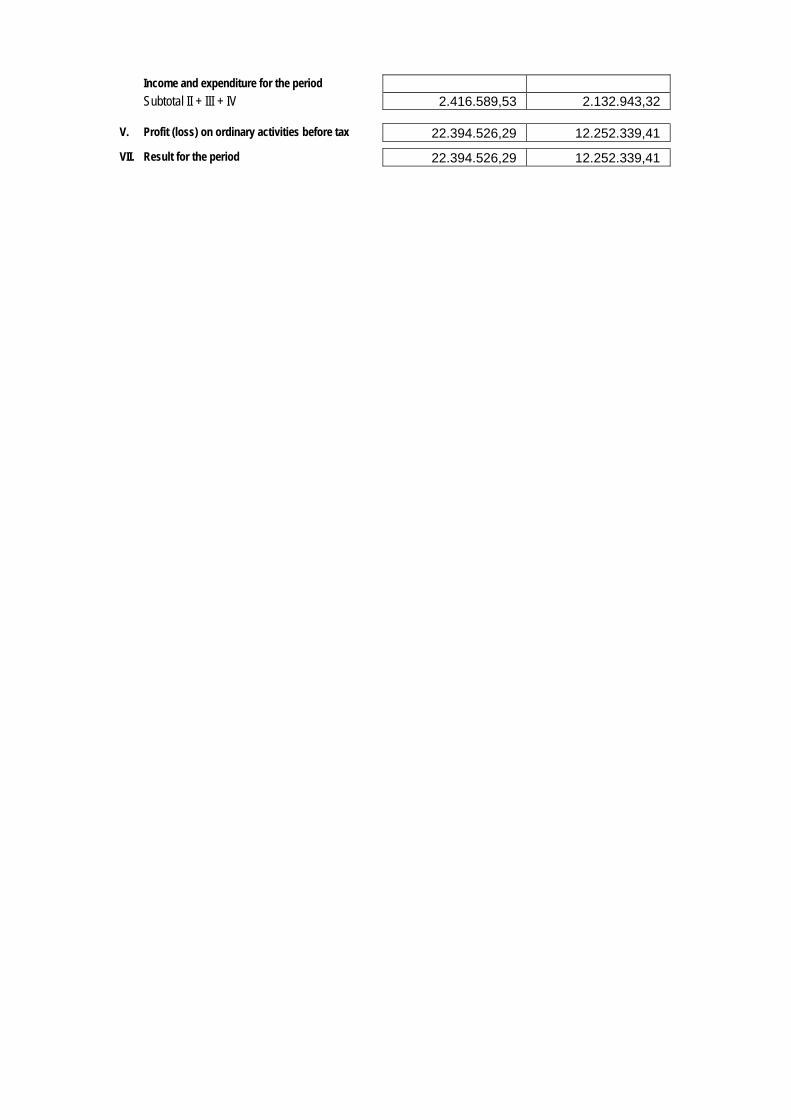
Income and expenditure for the period Subtotal II + III + IV 2.416.589,53 2.132.943,32
V. Profit (loss) on ordinary activities before tax 22.394.526,29 12.252.339,41
VII. Result for the period 22.394.526,29 12.252.339,41
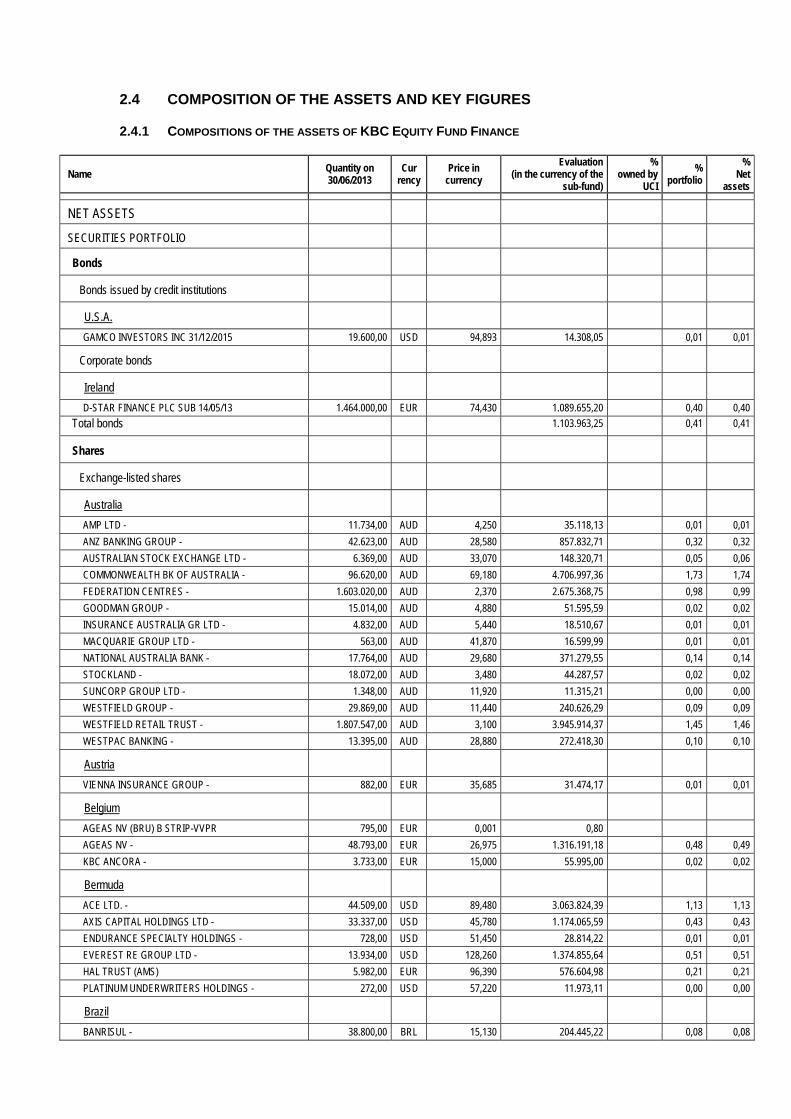
2.4 COMPOSITION OF THE ASSETS AND KEY FIGURES
2.4.1 COMPOSITIONS OF THE ASSETS OF KBC EQUITY FUND FINANCE
Name Quantity on 30/06/2013
Cur rency
Price in currency
Evaluation (in the currency of the
sub-fund)
% owned by
UCI
% portfolio
% Net
assets
NET ASSETS
SECURITIES PORTFOLIO
Bonds
Bonds issued by credit institutions
U.S.A.
GAMCO INVESTORS INC 31/12/2015 19.600,00 USD 94,893 14.308,05 0,01 0,01
Corporate bonds
Ireland
D-STAR FINANCE PLC SUB 14/05/13 1.464.000,00 EUR 74,430 1.089.655,20 0,40 0,40
Total bonds 1.103.963,25 0,41 0,41
Shares
Exchange-listed shares
Australia
AMP LTD - 11.734,00 AUD 4,250 35.118,13 0,01 0,01
ANZ BANKING GROUP - 42.623,00 AUD 28,580 857.832,71 0,32 0,32
AUSTRALIAN STOCK EXCHANGE LTD - 6.369,00 AUD 33,070 148.320,71 0,05 0,06
COMMONWEALTH BK OF AUSTRALIA - 96.620,00 AUD 69,180 4.706.997,36 1,73 1,74
FEDERATION CENTRES - 1.603.020,00 AUD 2,370 2.675.368,75 0,98 0,99
GOODMAN GROUP - 15.014,00 AUD 4,880 51.595,59 0,02 0,02
INSURANCE AUSTRALIA GR LTD - 4.832,00 AUD 5,440 18.510,67 0,01 0,01
MACQUARIE GROUP LTD - 563,00 AUD 41,870 16.599,99 0,01 0,01
NATIONAL AUSTRALIA BANK - 17.764,00 AUD 29,680 371.279,55 0,14 0,14
STOCKLAND - 18.072,00 AUD 3,480 44.287,57 0,02 0,02
SUNCORP GROUP LTD - 1.348,00 AUD 11,920 11.315,21 0,00 0,00
WESTFIELD GROUP - 29.869,00 AUD 11,440 240.626,29 0,09 0,09
WESTFIELD RETAIL TRUST - 1.807.547,00 AUD 3,100 3.945.914,37 1,45 1,46
WESTPAC BANKING - 13.395,00 AUD 28,880 272.418,30 0,10 0,10
Austria
VIENNA INSURANCE GROUP - 882,00 EUR 35,685 31.474,17 0,01 0,01
Belgium
AGEAS NV (BRU) B STRIP-VVPR 795,00 EUR 0,001 0,80
AGEAS NV - 48.793,00 EUR 26,975 1.316.191,18 0,48 0,49
KBC ANCORA - 3.733,00 EUR 15,000 55.995,00 0,02 0,02
Bermuda
ACE LTD. - 44.509,00 USD 89,480 3.063.824,39 1,13 1,13
AXIS CAPITAL HOLDINGS LTD - 33.337,00 USD 45,780 1.174.065,59 0,43 0,43
ENDURANCE SPECIALTY HOLDINGS - 728,00 USD 51,450 28.814,22 0,01 0,01
EVEREST RE GROUP LTD - 13.934,00 USD 128,260 1.374.855,64 0,51 0,51
HAL TRUST (AMS) 5.982,00 EUR 96,390 576.604,98 0,21 0,21
PLATINUM UNDERWRITERS HOLDINGS - 272,00 USD 57,220 11.973,11 0,00 0,00
Brazil
BANRISUL - 38.800,00 BRL 15,130 204.445,22 0,08 0,08

BM&F BOVESPA SA - 320.000,00 BRL 12,360 1.377.446,54 0,51 0,51
CETIP SA - BALCAO ORGANIZADO DE ATI - 123.500,00 BRL 22,840 982.357,04 0,36 0,36
ITAU UNIBANCO HOLDINGS SA PREF PREF 330.590,00 BRL 28,770 3.312.347,39 1,22 1,22
SUL AMERICA SA - 30.139,00 BRL 13,080 137.291,26 0,05 0,05
Canada
BANK OF NOVA SCOTIA - 95.837,00 CAD 56,220 3.929.086,37 1,44 1,45
C.I.B.C. - 8.135,00 CAD 74,640 442.788,89 0,16 0,16
INTACT FINANCIAL CORP - 29.114,00 CAD 59,250 1.257.933,71 0,46 0,46
MANULIFE FINANCIAL CORP - 2.086,00 CAD 16,830 25.601,53 0,01 0,01
ROYAL BK CANADA - 82.227,00 CAD 61,280 3.674.520,94 1,35 1,36
SUN LIFE FINANCIAL INC - 622,00 CAD 31,150 14.129,15 0,01 0,01
TORONTO DOMINION BK - 9.981,00 CAD 84,470 614.814,46 0,23 0,23
China
AGRICULTURAL BANK OF CHINA - 4.437.000,00 HKD 3,200 1.408.278,04 0,52 0,52
BANK OF CHINA LTD - H - 7.166.000,00 HKD 3,190 2.267.339,15 0,83 0,84
BANK OF COMMUNICATIONS LTD - 400.000,00 HKD 5,000 198.371,37 0,07 0,07
CHINA CONSTRUCTION BANK - 4.449.830,00 HKD 5,490 2.423.063,32 0,89 0,90
CHINA LIFE INSURANCE CO - 361.120,00 HKD 18,400 659.050,00 0,24 0,24
CHONGQING RURAL COMMERCIAL BANK - 689.000,00 HKD 3,290 224.835,10 0,08 0,08
CITIC SECURITIES CO LTD - 177.000,00 HKD 13,780 241.919,84 0,09 0,09
HAITONG SECURITIES CO LTD - 425.200,00 HKD 9,400 396.433,28 0,15 0,15
IND & COMM BK OF CHINA - 9.903.707,00 HKD 4,890 4.803.476,18 1,76 1,77
PING AN INSURANCE GROUP CO - 43.185,00 HKD 52,200 223.590,03 0,08 0,08
Colombia
GRUPO DE INVERSIONES SURAMERIC - 19.269,00 COP 37.940,000 291.221,85 0,11 0,11
Finland
SPONDA OYJ (HEL) 48.311,00 EUR 3,620 174.885,82 0,06 0,07
France
AXA - 193.522,00 EUR 15,095 2.921.214,59 1,07 1,08
BNP PARIBAS - 88.245,00 EUR 41,975 3.704.083,88 1,36 1,37
CNP ASSURANCE (PAR) 9.714,00 EUR 11,025 107.096,85 0,04 0,04
ICADE EMGP - 5.362,00 EUR 63,440 340.165,28 0,13 0,13
KLEPIERRE (CIE FONCIERE) - 5.013,00 EUR 30,280 151.793,64 0,06 0,06
NATIXIS (PAR) 6.773,00 EUR 3,216 21.781,97 0,01 0,01
RODAMCO UNIBAIL - 1.663,00 EUR 179,000 297.677,00 0,11 0,11
SCOR REGROUPE (PAR) 69.810,00 EUR 23,575 1.645.770,75 0,60 0,61
SOCIETE GENERALE - 51.092,00 EUR 26,400 1.348.828,80 0,50 0,50
Germany
ALLIANZ AG REG 69.392,00 EUR 112,250 7.789.252,00 2,86 2,88
DEUTSCHE BANK AG REG 80.442,00 EUR 32,155 2.586.612,51 0,95 0,96
DEUTSCHE BOERSE AG - 9.802,00 EUR 50,570 495.687,14 0,18 0,18
DEUTSCHE WOHNEN AG - 40.159,00 EUR 13,045 523.874,16 0,19 0,19
GSW IMMOBILIEN AG - 24.340,00 EUR 29,725 723.506,50 0,27 0,27
HANNOVER RUECK SE (FRA) NAAM 3.622,00 EUR 55,320 200.369,04 0,07 0,07
MUNCHENER RUCKVERSICHERUNG AG REG 3.693,00 EUR 141,400 522.190,20 0,19 0,19
Hong Kong
AIA GROUP LTD - 977.600,00 HKD 32,850 3.185.264,97 1,17 1,18
BOC HONG KONG HOLD LTD - 2.439.578,00 HKD 23,850 5.771.013,51 2,12 2,13
CHEUNG KONG HLDGS - 41.775,00 HKD 105,200 435.894,31 0,16 0,16
CHINA OVERSEAS LAND & INVEST LTD - 64.000,00 HKD 20,350 129.179,44 0,05 0,05
HANG LUNG PROPERTIES LTD - 68.147,00 HKD 27,050 182.836,55 0,07 0,07
HANG SENG BANK LTD. - 44.166,00 HKD 114,700 502.458,83 0,18 0,19
HENDERSON LAND - 49.783,00 HKD 46,300 228.618,33 0,08 0,08
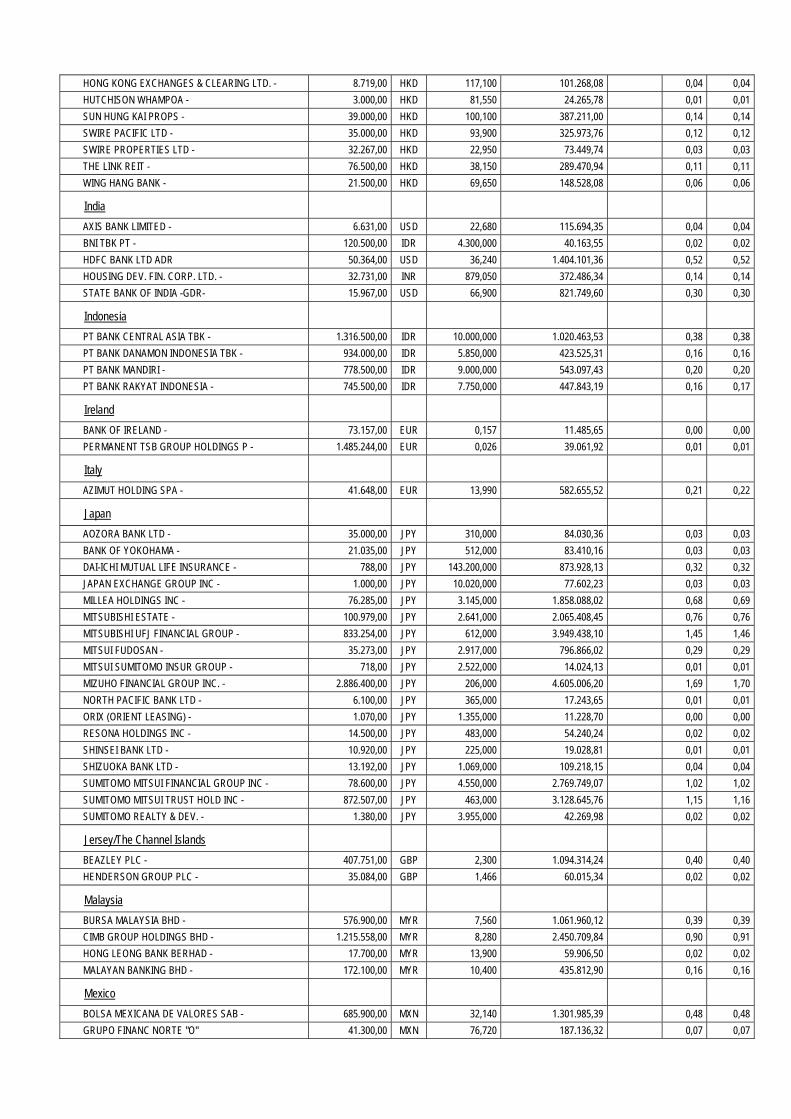
HONG KONG EXCHANGES & CLEARING LTD. - 8.719,00 HKD 117,100 101.268,08 0,04 0,04
HUTCHISON WHAMPOA - 3.000,00 HKD 81,550 24.265,78 0,01 0,01
SUN HUNG KAI PROPS - 39.000,00 HKD 100,100 387.211,00 0,14 0,14
SWIRE PACIFIC LTD - 35.000,00 HKD 93,900 325.973,76 0,12 0,12
SWIRE PROPERTIES LTD - 32.267,00 HKD 22,950 73.449,74 0,03 0,03
THE LINK REIT - 76.500,00 HKD 38,150 289.470,94 0,11 0,11
WING HANG BANK - 21.500,00 HKD 69,650 148.528,08 0,06 0,06
India
AXIS BANK LIMITED - 6.631,00 USD 22,680 115.694,35 0,04 0,04
BNI TBK PT - 120.500,00 IDR 4.300,000 40.163,55 0,02 0,02
HDFC BANK LTD ADR 50.364,00 USD 36,240 1.404.101,36 0,52 0,52
HOUSING DEV. FIN. CORP. LTD. - 32.731,00 INR 879,050 372.486,34 0,14 0,14
STATE BANK OF INDIA -GDR- 15.967,00 USD 66,900 821.749,60 0,30 0,30
Indonesia
PT BANK CENTRAL ASIA TBK - 1.316.500,00 IDR 10.000,000 1.020.463,53 0,38 0,38
PT BANK DANAMON INDONESIA TBK - 934.000,00 IDR 5.850,000 423.525,31 0,16 0,16
PT BANK MANDIRI - 778.500,00 IDR 9.000,000 543.097,43 0,20 0,20
PT BANK RAKYAT INDONESIA - 745.500,00 IDR 7.750,000 447.843,19 0,16 0,17
Ireland
BANK OF IRELAND - 73.157,00 EUR 0,157 11.485,65 0,00 0,00
PERMANENT TSB GROUP HOLDINGS P - 1.485.244,00 EUR 0,026 39.061,92 0,01 0,01
Italy
AZIMUT HOLDING SPA - 41.648,00 EUR 13,990 582.655,52 0,21 0,22
Japan
AOZORA BANK LTD - 35.000,00 JPY 310,000 84.030,36 0,03 0,03
BANK OF YOKOHAMA - 21.035,00 JPY 512,000 83.410,16 0,03 0,03
DAI-ICHI MUTUAL LIFE INSURANCE - 788,00 JPY 143.200,000 873.928,13 0,32 0,32
JAPAN EXCHANGE GROUP INC - 1.000,00 JPY 10.020,000 77.602,23 0,03 0,03
MILLEA HOLDINGS INC - 76.285,00 JPY 3.145,000 1.858.088,02 0,68 0,69
MITSUBISHI ESTATE - 100.979,00 JPY 2.641,000 2.065.408,45 0,76 0,76
MITSUBISHI UFJ FINANCIAL GROUP - 833.254,00 JPY 612,000 3.949.438,10 1,45 1,46
MITSUI FUDOSAN - 35.273,00 JPY 2.917,000 796.866,02 0,29 0,29
MITSUI SUMITOMO INSUR GROUP - 718,00 JPY 2.522,000 14.024,13 0,01 0,01
MIZUHO FINANCIAL GROUP INC. - 2.886.400,00 JPY 206,000 4.605.006,20 1,69 1,70
NORTH PACIFIC BANK LTD - 6.100,00 JPY 365,000 17.243,65 0,01 0,01
ORIX (ORIENT LEASING) - 1.070,00 JPY 1.355,000 11.228,70 0,00 0,00
RESONA HOLDINGS INC - 14.500,00 JPY 483,000 54.240,24 0,02 0,02
SHINSEI BANK LTD - 10.920,00 JPY 225,000 19.028,81 0,01 0,01
SHIZUOKA BANK LTD - 13.192,00 JPY 1.069,000 109.218,15 0,04 0,04
SUMITOMO MITSUI FINANCIAL GROUP INC - 78.600,00 JPY 4.550,000 2.769.749,07 1,02 1,02
SUMITOMO MITSUI TRUST HOLD INC - 872.507,00 JPY 463,000 3.128.645,76 1,15 1,16
SUMITOMO REALTY & DEV. - 1.380,00 JPY 3.955,000 42.269,98 0,02 0,02
Jersey/The Channel Islands
BEAZLEY PLC - 407.751,00 GBP 2,300 1.094.314,24 0,40 0,40
HENDERSON GROUP PLC - 35.084,00 GBP 1,466 60.015,34 0,02 0,02
Malaysia
BURSA MALAYSIA BHD - 576.900,00 MYR 7,560 1.061.960,12 0,39 0,39
CIMB GROUP HOLDINGS BHD - 1.215.558,00 MYR 8,280 2.450.709,84 0,90 0,91
HONG LEONG BANK BERHAD - 17.700,00 MYR 13,900 59.906,50 0,02 0,02
MALAYAN BANKING BHD - 172.100,00 MYR 10,400 435.812,90 0,16 0,16
Mexico
BOLSA MEXICANA DE VALORES SAB - 685.900,00 MXN 32,140 1.301.985,39 0,48 0,48
GRUPO FINANC NORTE "O" 41.300,00 MXN 76,720 187.136,32 0,07 0,07
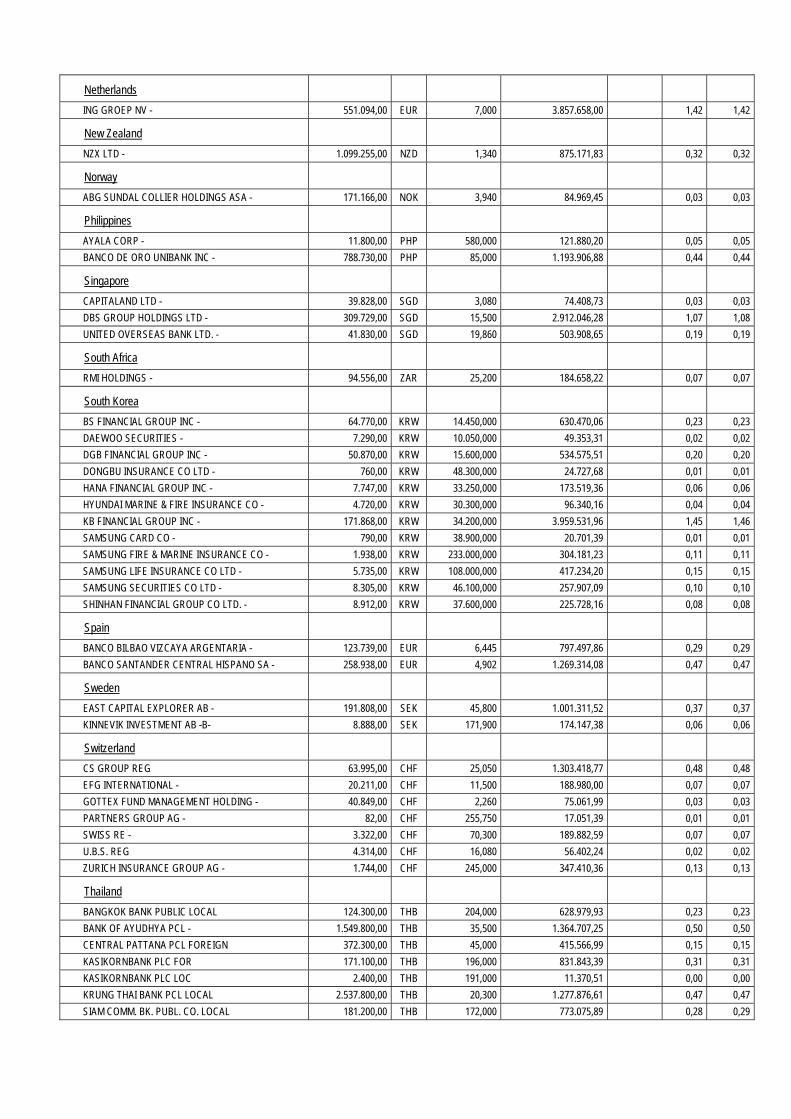
Netherlands
ING GROEP NV - 551.094,00 EUR 7,000 3.857.658,00 1,42 1,42
New Zealand
NZX LTD - 1.099.255,00 NZD 1,340 875.171,83 0,32 0,32
Norway
ABG SUNDAL COLLIER HOLDINGS ASA - 171.166,00 NOK 3,940 84.969,45 0,03 0,03
Philippines
AYALA CORP - 11.800,00 PHP 580,000 121.880,20 0,05 0,05
BANCO DE ORO UNIBANK INC - 788.730,00 PHP 85,000 1.193.906,88 0,44 0,44
Singapore
CAPITALAND LTD - 39.828,00 SGD 3,080 74.408,73 0,03 0,03
DBS GROUP HOLDINGS LTD - 309.729,00 SGD 15,500 2.912.046,28 1,07 1,08
UNITED OVERSEAS BANK LTD. - 41.830,00 SGD 19,860 503.908,65 0,19 0,19
South Africa
RMI HOLDINGS - 94.556,00 ZAR 25,200 184.658,22 0,07 0,07
South Korea
BS FINANCIAL GROUP INC - 64.770,00 KRW 14.450,000 630.470,06 0,23 0,23
DAEWOO SECURITIES - 7.290,00 KRW 10.050,000 49.353,31 0,02 0,02
DGB FINANCIAL GROUP INC - 50.870,00 KRW 15.600,000 534.575,51 0,20 0,20
DONGBU INSURANCE CO LTD - 760,00 KRW 48.300,000 24.727,68 0,01 0,01
HANA FINANCIAL GROUP INC - 7.747,00 KRW 33.250,000 173.519,36 0,06 0,06
HYUNDAI MARINE & FIRE INSURANCE CO - 4.720,00 KRW 30.300,000 96.340,16 0,04 0,04
KB FINANCIAL GROUP INC - 171.868,00 KRW 34.200,000 3.959.531,96 1,45 1,46
SAMSUNG CARD CO - 790,00 KRW 38.900,000 20.701,39 0,01 0,01
SAMSUNG FIRE & MARINE INSURANCE CO - 1.938,00 KRW 233.000,000 304.181,23 0,11 0,11
SAMSUNG LIFE INSURANCE CO LTD - 5.735,00 KRW 108.000,000 417.234,20 0,15 0,15
SAMSUNG SECURITIES CO LTD - 8.305,00 KRW 46.100,000 257.907,09 0,10 0,10
SHINHAN FINANCIAL GROUP CO LTD. - 8.912,00 KRW 37.600,000 225.728,16 0,08 0,08
Spain
BANCO BILBAO VIZCAYA ARGENTARIA - 123.739,00 EUR 6,445 797.497,86 0,29 0,29
BANCO SANTANDER CENTRAL HISPANO SA - 258.938,00 EUR 4,902 1.269.314,08 0,47 0,47
Sweden
EAST CAPITAL EXPLORER AB - 191.808,00 SEK 45,800 1.001.311,52 0,37 0,37
KINNEVIK INVESTMENT AB -B- 8.888,00 SEK 171,900 174.147,38 0,06 0,06
Switzerland
CS GROUP REG 63.995,00 CHF 25,050 1.303.418,77 0,48 0,48
EFG INTERNATIONAL - 20.211,00 CHF 11,500 188.980,00 0,07 0,07
GOTTEX FUND MANAGEMENT HOLDING - 40.849,00 CHF 2,260 75.061,99 0,03 0,03
PARTNERS GROUP AG - 82,00 CHF 255,750 17.051,39 0,01 0,01
SWISS RE - 3.322,00 CHF 70,300 189.882,59 0,07 0,07
U.B.S. REG 4.314,00 CHF 16,080 56.402,24 0,02 0,02
ZURICH INSURANCE GROUP AG - 1.744,00 CHF 245,000 347.410,36 0,13 0,13
Thailand
BANGKOK BANK PUBLIC LOCAL 124.300,00 THB 204,000 628.979,93 0,23 0,23
BANK OF AYUDHYA PCL - 1.549.800,00 THB 35,500 1.364.707,25 0,50 0,50
CENTRAL PATTANA PCL FOREIGN 372.300,00 THB 45,000 415.566,99 0,15 0,15
KASIKORNBANK PLC FOR 171.100,00 THB 196,000 831.843,39 0,31 0,31
KASIKORNBANK PLC LOC 2.400,00 THB 191,000 11.370,51 0,00 0,00
KRUNG THAI BANK PCL LOCAL 2.537.800,00 THB 20,300 1.277.876,61 0,47 0,47
SIAM COMM. BK. PUBL. CO. LOCAL 181.200,00 THB 172,000 773.075,89 0,28 0,29
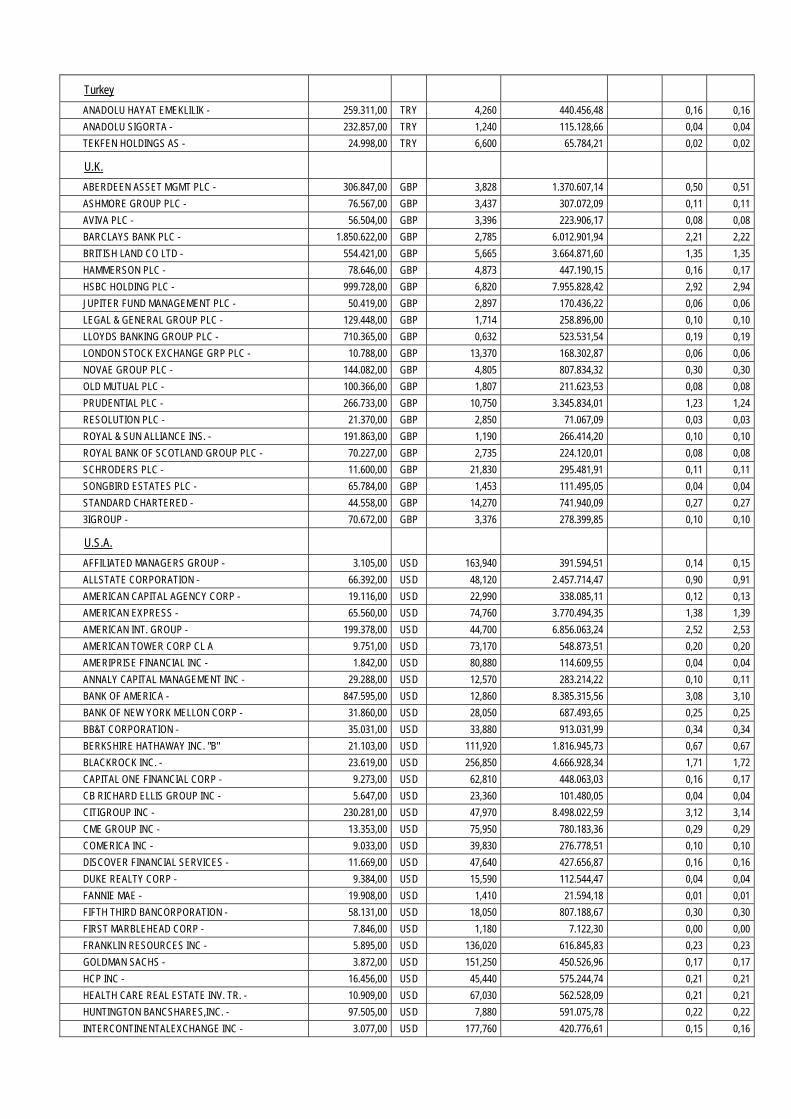
Turkey
ANADOLU HAYAT EMEKLILIK - 259.311,00 TRY 4,260 440.456,48 0,16 0,16
ANADOLU SIGORTA - 232.857,00 TRY 1,240 115.128,66 0,04 0,04
TEKFEN HOLDINGS AS - 24.998,00 TRY 6,600 65.784,21 0,02 0,02
U.K.
ABERDEEN ASSET MGMT PLC - 306.847,00 GBP 3,828 1.370.607,14 0,50 0,51
ASHMORE GROUP PLC - 76.567,00 GBP 3,437 307.072,09 0,11 0,11
AVIVA PLC - 56.504,00 GBP 3,396 223.906,17 0,08 0,08
BARCLAYS BANK PLC - 1.850.622,00 GBP 2,785 6.012.901,94 2,21 2,22
BRITISH LAND CO LTD - 554.421,00 GBP 5,665 3.664.871,60 1,35 1,35
HAMMERSON PLC - 78.646,00 GBP 4,873 447.190,15 0,16 0,17
HSBC HOLDING PLC - 999.728,00 GBP 6,820 7.955.828,42 2,92 2,94
JUPITER FUND MANAGEMENT PLC - 50.419,00 GBP 2,897 170.436,22 0,06 0,06
LEGAL & GENERAL GROUP PLC - 129.448,00 GBP 1,714 258.896,00 0,10 0,10
LLOYDS BANKING GROUP PLC - 710.365,00 GBP 0,632 523.531,54 0,19 0,19
LONDON STOCK EXCHANGE GRP PLC - 10.788,00 GBP 13,370 168.302,87 0,06 0,06
NOVAE GROUP PLC - 144.082,00 GBP 4,805 807.834,32 0,30 0,30
OLD MUTUAL PLC - 100.366,00 GBP 1,807 211.623,53 0,08 0,08
PRUDENTIAL PLC - 266.733,00 GBP 10,750 3.345.834,01 1,23 1,24
RESOLUTION PLC - 21.370,00 GBP 2,850 71.067,09 0,03 0,03
ROYAL & SUN ALLIANCE INS. - 191.863,00 GBP 1,190 266.414,20 0,10 0,10
ROYAL BANK OF SCOTLAND GROUP PLC - 70.227,00 GBP 2,735 224.120,01 0,08 0,08
SCHRODERS PLC - 11.600,00 GBP 21,830 295.481,91 0,11 0,11
SONGBIRD ESTATES PLC - 65.784,00 GBP 1,453 111.495,05 0,04 0,04
STANDARD CHARTERED - 44.558,00 GBP 14,270 741.940,09 0,27 0,27
3IGROUP - 70.672,00 GBP 3,376 278.399,85 0,10 0,10
U.S.A.
AFFILIATED MANAGERS GROUP - 3.105,00 USD 163,940 391.594,51 0,14 0,15
ALLSTATE CORPORATION - 66.392,00 USD 48,120 2.457.714,47 0,90 0,91
AMERICAN CAPITAL AGENCY CORP - 19.116,00 USD 22,990 338.085,11 0,12 0,13
AMERICAN EXPRESS - 65.560,00 USD 74,760 3.770.494,35 1,38 1,39
AMERICAN INT. GROUP - 199.378,00 USD 44,700 6.856.063,24 2,52 2,53
AMERICAN TOWER CORP CL A 9.751,00 USD 73,170 548.873,51 0,20 0,20
AMERIPRISE FINANCIAL INC - 1.842,00 USD 80,880 114.609,55 0,04 0,04
ANNALY CAPITAL MANAGEMENT INC - 29.288,00 USD 12,570 283.214,22 0,10 0,11
BANK OF AMERICA - 847.595,00 USD 12,860 8.385.315,56 3,08 3,10
BANK OF NEW YORK MELLON CORP - 31.860,00 USD 28,050 687.493,65 0,25 0,25
BB&T CORPORATION - 35.031,00 USD 33,880 913.031,99 0,34 0,34
BERKSHIRE HATHAWAY INC. "B" 21.103,00 USD 111,920 1.816.945,73 0,67 0,67
BLACKROCK INC. - 23.619,00 USD 256,850 4.666.928,34 1,71 1,72
CAPITAL ONE FINANCIAL CORP - 9.273,00 USD 62,810 448.063,03 0,16 0,17
CB RICHARD ELLIS GROUP INC - 5.647,00 USD 23,360 101.480,05 0,04 0,04
CITIGROUP INC - 230.281,00 USD 47,970 8.498.022,59 3,12 3,14
CME GROUP INC - 13.353,00 USD 75,950 780.183,36 0,29 0,29
COMERICA INC - 9.033,00 USD 39,830 276.778,51 0,10 0,10
DISCOVER FINANCIAL SERVICES - 11.669,00 USD 47,640 427.656,87 0,16 0,16
DUKE REALTY CORP - 9.384,00 USD 15,590 112.544,47 0,04 0,04
FANNIE MAE - 19.908,00 USD 1,410 21.594,18 0,01 0,01
FIFTH THIRD BANCORPORATION - 58.131,00 USD 18,050 807.188,67 0,30 0,30
FIRST MARBLEHEAD CORP - 7.846,00 USD 1,180 7.122,30 0,00 0,00
FRANKLIN RESOURCES INC - 5.895,00 USD 136,020 616.845,83 0,23 0,23
GOLDMAN SACHS - 3.872,00 USD 151,250 450.526,96 0,17 0,17
HCP INC - 16.456,00 USD 45,440 575.244,74 0,21 0,21
HEALTH CARE REAL ESTATE INV. TR. - 10.909,00 USD 67,030 562.528,09 0,21 0,21
HUNTINGTON BANCSHARES,INC. - 97.505,00 USD 7,880 591.075,78 0,22 0,22
INTERCONTINENTALEXCHANGE INC - 3.077,00 USD 177,760 420.776,61 0,15 0,16

INVESCO LTD - 10.509,00 USD 31,800 257.086,08 0,09 0,10
ISTAR FINANCIAL INC - 2.534,00 USD 11,290 22.008,51 0,01 0,01
JANUS CAPITAL GROUP INC - 3.247,00 USD 8,510 21.257,00 0,01 0,01
JPMORGAN CHASE & CO - 305.409,00 USD 52,790 12.402.908,77 4,56 4,58
KEYCORP - 89.646,00 USD 11,040 761.359,98 0,28 0,28
LINCOLN NATIONAL CORPORATION - 3.458,00 USD 36,470 97.017,66 0,04 0,04
MCGRAW HILL FINANCIAL INC - 15.542,00 USD 53,190 635.955,83 0,23 0,24
METLIFE INC. - 42.170,00 USD 45,760 1.484.498,19 0,55 0,55
MOODY'S CORP - 4.284,00 USD 60,930 200.803,23 0,07 0,07
MORGAN STANLEY - 11.420,00 USD 24,430 214.624,66 0,08 0,08
NASDAQ OMX GROUP INC - 10.262,00 USD 32,790 258.859,13 0,10 0,10
PARTNERRE LTD - 2.965,00 USD 90,560 206.562,35 0,08 0,08
PEOPLES UNITED FINANCIAL INC - 71.146,00 USD 14,900 815.505,35 0,30 0,30
PNC FINANCIAL SERVICES GROUP - 68.217,00 USD 72,920 3.826.743,32 1,41 1,41
POPULAR INC - 9.366,00 USD 30,330 218.532,79 0,08 0,08
PRINCIPAL FINANCIAL GROUP INC - 12.271,00 USD 37,450 353.526,39 0,13 0,13
PROLOGIS TRUST - 2.057,00 USD 37,720 59.689,24 0,02 0,02
PRUDENTIAL FINANCIAL INC - 55.845,00 USD 73,030 3.137.441,61 1,15 1,16
PUBLIC STORAGE INC - 25.801,00 USD 153,330 3.043.362,82 1,12 1,12
RADIAN GROUP INC - 5.209,00 USD 11,620 46.564,03 0,02 0,02
REGIONS FINANCIAL CORPORATION - 56.073,00 USD 9,530 411.089,85 0,15 0,15
REINSURANCE GROUP OF AMERICA INC - 2.336,00 USD 69,110 124.194,91 0,05 0,05
SCHWAB (CHARLES) CORP. - 8.404,00 USD 21,230 137.254,34 0,05 0,05
SIMON PROPERTY GROUP INC - 37.447,00 USD 157,920 4.549.296,28 1,67 1,68
STATE STREET CORPORATION - 21.662,00 USD 65,210 1.086.682,84 0,40 0,40
SUNTRUST BANKS - 19.514,00 USD 31,570 473.926,44 0,17 0,18
SYNOVIS FINANCIAL CORPORATION - 50.744,00 USD 2,920 113.987,60 0,04 0,04
TD AMERITRADE HOLDING CORP - 6.456,00 USD 24,290 120.637,16 0,04 0,05
TORCHMARK - 2.908,00 USD 65,140 145.724,38 0,05 0,05
TRAVELERS COS INC - 56.372,00 USD 79,920 3.465.843,71 1,27 1,28
US BANCORP - 109.523,00 USD 36,150 3.045.816,18 1,12 1,12
VALIDUS HOLDINGS LTD - 5.607,00 USD 36,120 155.800,32 0,06 0,06
VENTAS INC - 21.479,00 USD 69,460 1.147.727,78 0,42 0,42
VIRTUS INVESTMENT PARTNERS INC - 222,00 USD 176,270 30.103,81 0,01 0,01
WELLS FARGO COMPANY - 222.209,00 USD 41,270 7.054.823,78 2,59 2,61
WINTRUST FINANCIAL CORP - 14.389,00 USD 38,280 423.733,30 0,16 0,16
XL GROUP PLC "A" 16.407,00 USD 30,320 382.691,16 0,14 0,14
ZIONS BANCORPORATION - 25.556,00 USD 28,880 567.780,04 0,21 0,21
Total shares 271.249.460,69 99,58 100,14
Warrants
U.S.A.
AIG-FP MATCHED FUNDING 19/01/2021 1.961,00 USD 18,240 27.516,46 0,01 0,01
Total Warrants 27.516,46 0,01 0,01
Rights
Australia
AUSTRALIAN STOCK EXCHANGE LTD CP 11/06/2013 670,00 AUD 3,110 1.467,34 0,00 0,00
Brazil
CETIP SA - BALCAO ORGANIZADO DE ATI CP 14/05/13 32,00 BRL 0,030 0,33
Total rights 1.467,67 0,00 0,00
TOTAL SECURITIES PORTFOLIO 272.382.408,07 100,00 100,56
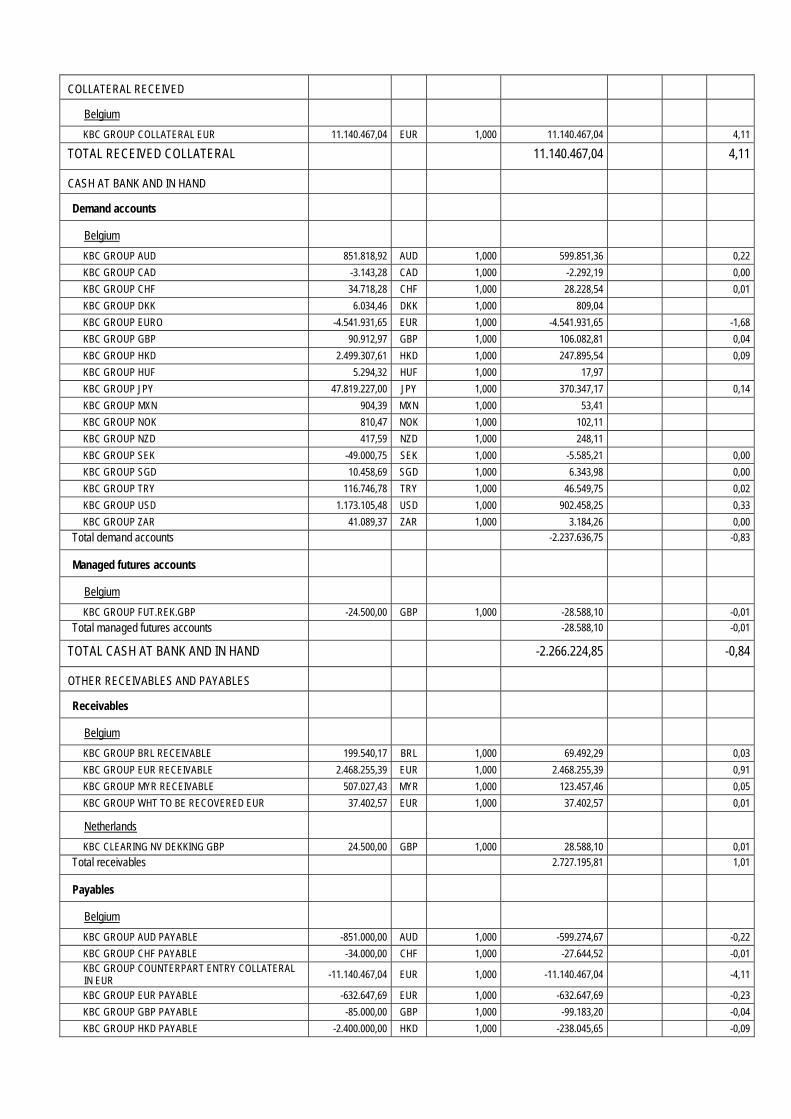
COLLATERAL RECEIVED
Belgium
KBC GROUP COLLATERAL EUR 11.140.467,04 EUR 1,000 11.140.467,04 4,11
TOTAL RECEIVED COLLATERAL 11.140.467,04 4,11
CASH AT BANK AND IN HAND
Demand accounts
Belgium
KBC GROUP AUD 851.818,92 AUD 1,000 599.851,36 0,22
KBC GROUP CAD -3.143,28 CAD 1,000 -2.292,19 0,00
KBC GROUP CHF 34.718,28 CHF 1,000 28.228,54 0,01
KBC GROUP DKK 6.034,46 DKK 1,000 809,04
KBC GROUP EURO -4.541.931,65 EUR 1,000 -4.541.931,65 -1,68
KBC GROUP GBP 90.912,97 GBP 1,000 106.082,81 0,04
KBC GROUP HKD 2.499.307,61 HKD 1,000 247.895,54 0,09
KBC GROUP HUF 5.294,32 HUF 1,000 17,97
KBC GROUP JPY 47.819.227,00 JPY 1,000 370.347,17 0,14
KBC GROUP MXN 904,39 MXN 1,000 53,41
KBC GROUP NOK 810,47 NOK 1,000 102,11
KBC GROUP NZD 417,59 NZD 1,000 248,11
KBC GROUP SEK -49.000,75 SEK 1,000 -5.585,21 0,00
KBC GROUP SGD 10.458,69 SGD 1,000 6.343,98 0,00
KBC GROUP TRY 116.746,78 TRY 1,000 46.549,75 0,02
KBC GROUP USD 1.173.105,48 USD 1,000 902.458,25 0,33
KBC GROUP ZAR 41.089,37 ZAR 1,000 3.184,26 0,00
Total demand accounts -2.237.636,75 -0,83
Managed futures accounts
Belgium
KBC GROUP FUT.REK.GBP -24.500,00 GBP 1,000 -28.588,10 -0,01
Total managed futures accounts -28.588,10 -0,01
TOTAL CASH AT BANK AND IN HAND -2.266.224,85 -0,84
OTHER RECEIVABLES AND PAYABLES
Receivables
Belgium
KBC GROUP BRL RECEIVABLE 199.540,17 BRL 1,000 69.492,29 0,03
KBC GROUP EUR RECEIVABLE 2.468.255,39 EUR 1,000 2.468.255,39 0,91
KBC GROUP MYR RECEIVABLE 507.027,43 MYR 1,000 123.457,46 0,05
KBC GROUP WHT TO BE RECOVERED EUR 37.402,57 EUR 1,000 37.402,57 0,01
Netherlands
KBC CLEARING NV DEKKING GBP 24.500,00 GBP 1,000 28.588,10 0,01
Total receivables 2.727.195,81 1,01
Payables
Belgium
KBC GROUP AUD PAYABLE -851.000,00 AUD 1,000 -599.274,67 -0,22
KBC GROUP CHF PAYABLE -34.000,00 CHF 1,000 -27.644,52 -0,01 KBC GROUP COUNTERPART ENTRY COLLATERAL IN EUR
-11.140.467,04 EUR 1,000 -11.140.467,04 -4,11
KBC GROUP EUR PAYABLE -632.647,69 EUR 1,000 -632.647,69 -0,23
KBC GROUP GBP PAYABLE -85.000,00 GBP 1,000 -99.183,20 -0,04
KBC GROUP HKD PAYABLE -2.400.000,00 HKD 1,000 -238.045,65 -0,09
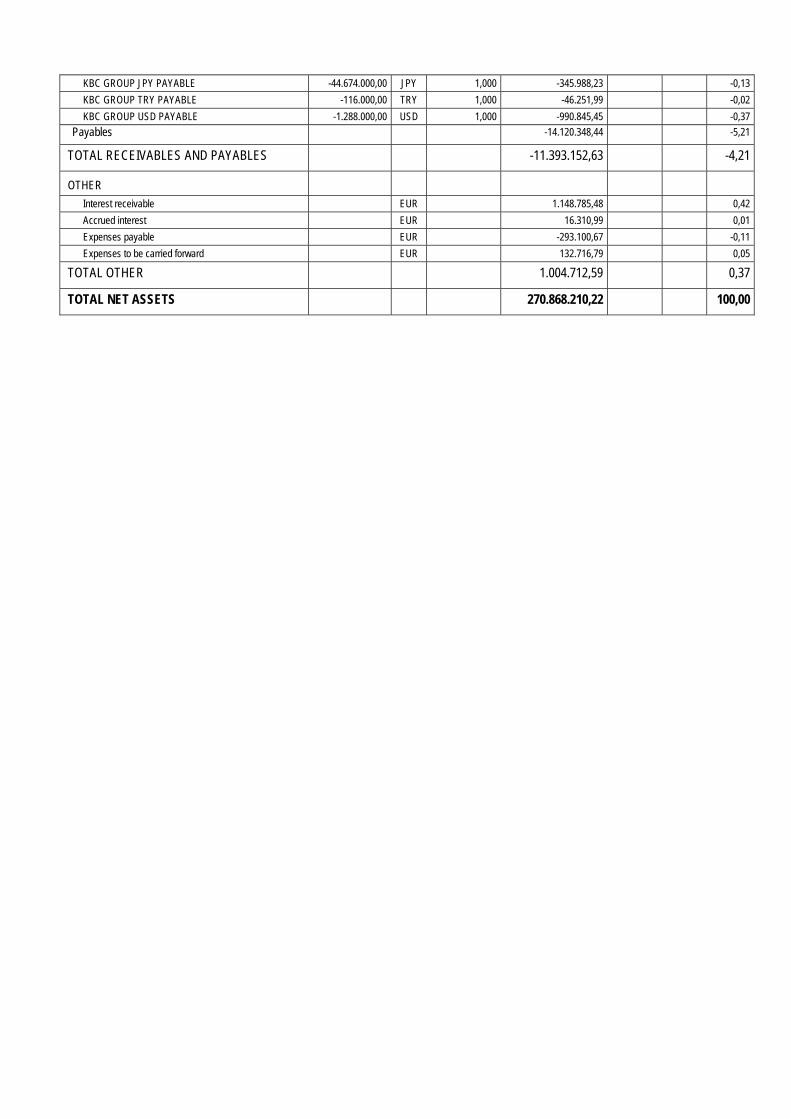
KBC GROUP JPY PAYABLE -44.674.000,00 JPY 1,000 -345.988,23 -0,13
KBC GROUP TRY PAYABLE -116.000,00 TRY 1,000 -46.251,99 -0,02
KBC GROUP USD PAYABLE -1.288.000,00 USD 1,000 -990.845,45 -0,37
Payables -14.120.348,44 -5,21
TOTAL RECEIVABLES AND PAYABLES -11.393.152,63 -4,21
OTHER
Interest receivable EUR 1.148.785,48 0,42
Accrued interest EUR 16.310,99 0,01
Expenses payable EUR -293.100,67 -0,11
Expenses to be carried forward EUR 132.716,79 0,05
TOTAL OTHER 1.004.712,59 0,37
TOTAL NET ASSETS 270.868.210,22 100,00
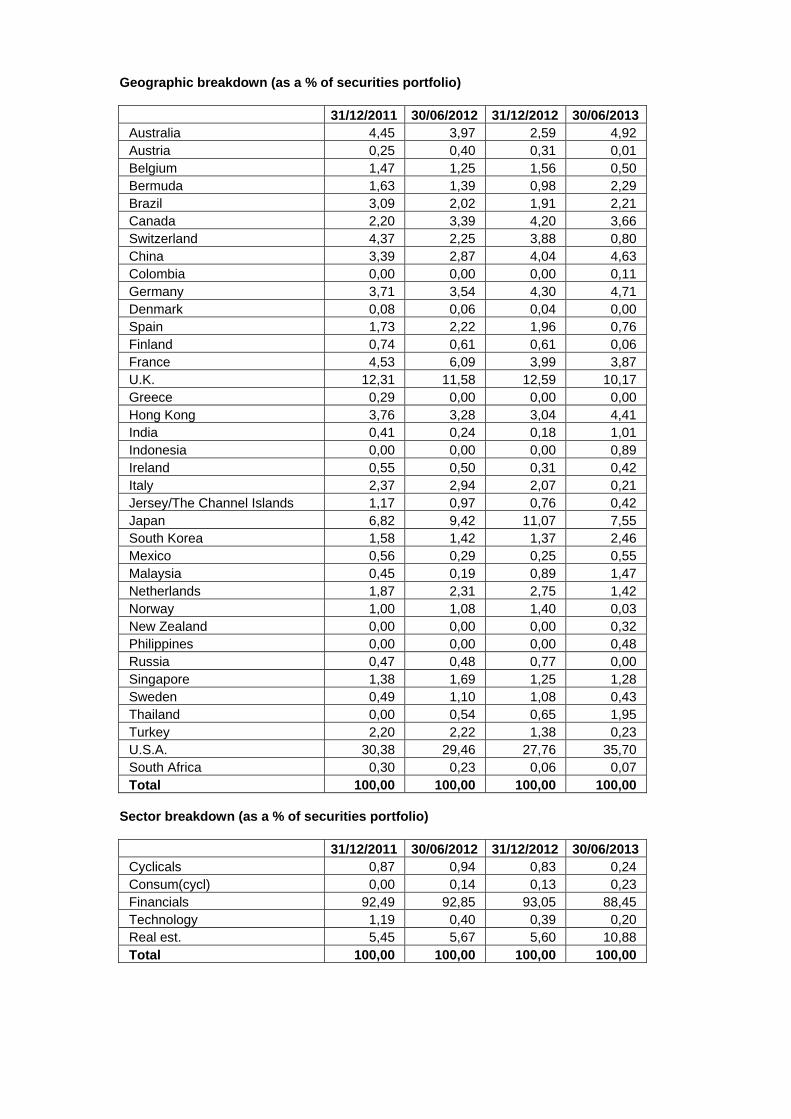
Geographic breakdown (as a % of securities portfolio)
31/12/2011 30/06/2012 31/12/2012 30/06/2013 Australia 4,45 3,97 2,59 4,92 Austria 0,25 0,40 0,31 0,01 Belgium 1,47 1,25 1,56 0,50 Bermuda 1,63 1,39 0,98 2,29 Brazil 3,09 2,02 1,91 2,21 Canada 2,20 3,39 4,20 3,66 Switzerland 4,37 2,25 3,88 0,80 China 3,39 2,87 4,04 4,63 Colombia 0,00 0,00 0,00 0,11 Germany 3,71 3,54 4,30 4,71 Denmark 0,08 0,06 0,04 0,00 Spain 1,73 2,22 1,96 0,76 Finland 0,74 0,61 0,61 0,06 France 4,53 6,09 3,99 3,87 U.K. 12,31 11,58 12,59 10,17 Greece 0,29 0,00 0,00 0,00 Hong Kong 3,76 3,28 3,04 4,41 India 0,41 0,24 0,18 1,01 Indonesia 0,00 0,00 0,00 0,89 Ireland 0,55 0,50 0,31 0,42 Italy 2,37 2,94 2,07 0,21 Jersey/The Channel Islands 1,17 0,97 0,76 0,42 Japan 6,82 9,42 11,07 7,55 South Korea 1,58 1,42 1,37 2,46 Mexico 0,56 0,29 0,25 0,55 Malaysia 0,45 0,19 0,89 1,47 Netherlands 1,87 2,31 2,75 1,42 Norway 1,00 1,08 1,40 0,03 New Zealand 0,00 0,00 0,00 0,32 Philippines 0,00 0,00 0,00 0,48 Russia 0,47 0,48 0,77 0,00 Singapore 1,38 1,69 1,25 1,28 Sweden 0,49 1,10 1,08 0,43 Thailand 0,00 0,54 0,65 1,95 Turkey 2,20 2,22 1,38 0,23 U.S.A. 30,38 29,46 27,76 35,70 South Africa 0,30 0,23 0,06 0,07 Total 100,00 100,00 100,00 100,00
Sector breakdown (as a % of securities portfolio)
31/12/2011 30/06/2012 31/12/2012 30/06/2013 Cyclicals 0,87 0,94 0,83 0,24 Consum(cycl) 0,00 0,14 0,13 0,23 Financials 92,49 92,85 93,05 88,45 Technology 1,19 0,40 0,39 0,20 Real est. 5,45 5,67 5,60 10,88 Total 100,00 100,00 100,00 100,00
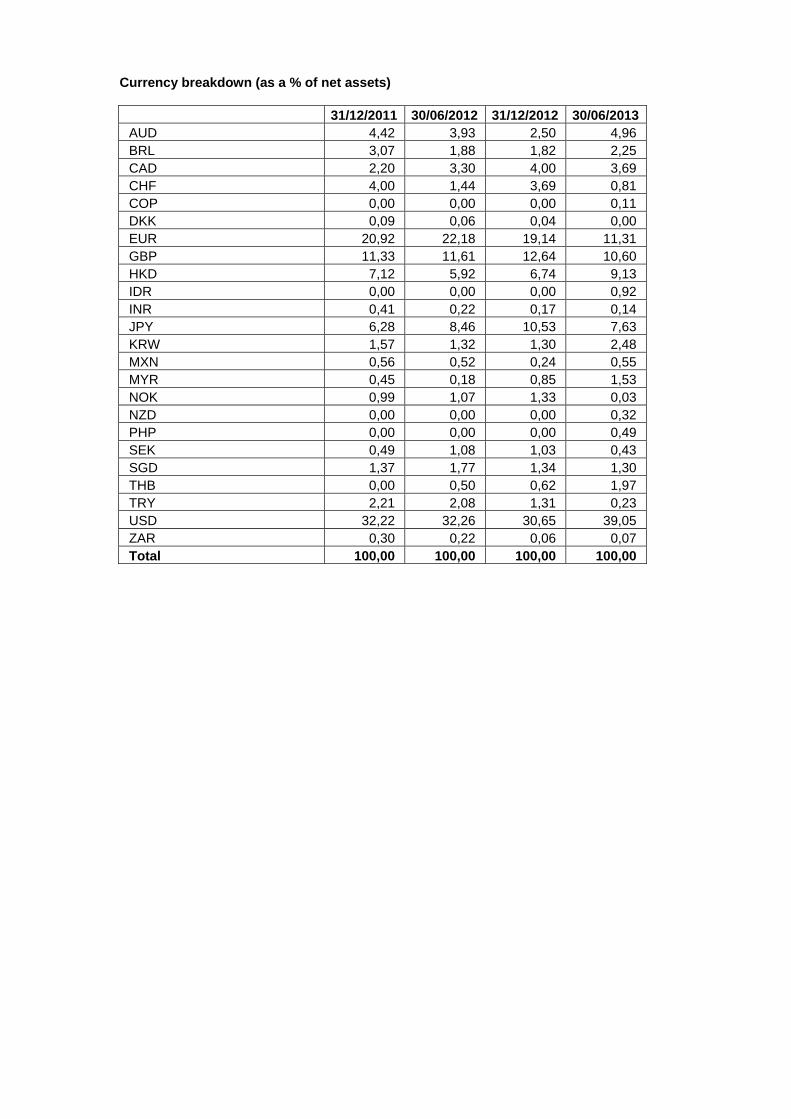
Currency breakdown (as a % of net assets)
31/12/2011 30/06/2012 31/12/2012 30/06/2013 AUD 4,42 3,93 2,50 4,96 BRL 3,07 1,88 1,82 2,25 CAD 2,20 3,30 4,00 3,69 CHF 4,00 1,44 3,69 0,81 COP 0,00 0,00 0,00 0,11 DKK 0,09 0,06 0,04 0,00 EUR 20,92 22,18 19,14 11,31 GBP 11,33 11,61 12,64 10,60 HKD 7,12 5,92 6,74 9,13 IDR 0,00 0,00 0,00 0,92 INR 0,41 0,22 0,17 0,14 JPY 6,28 8,46 10,53 7,63 KRW 1,57 1,32 1,30 2,48 MXN 0,56 0,52 0,24 0,55 MYR 0,45 0,18 0,85 1,53 NOK 0,99 1,07 1,33 0,03 NZD 0,00 0,00 0,00 0,32 PHP 0,00 0,00 0,00 0,49 SEK 0,49 1,08 1,03 0,43 SGD 1,37 1,77 1,34 1,30 THB 0,00 0,50 0,62 1,97 TRY 2,21 2,08 1,31 0,23 USD 32,22 32,26 30,65 39,05 ZAR 0,30 0,22 0,06 0,07 Total 100,00 100,00 100,00 100,00

2.4.2 CHANGES IN THE COMPOSITION OF THE ASSETS OF KBC EQUITY FUND FINANCE (IN THE
CURRENCY OF THE SUB-FUND)
1st half of year YearPurchases 207.200.321,31 207.200.321,31 Sales 253.139.292,34 253.139.292,34 Total 1 460.339.613,65 460.339.613,65 Subscriptions 163.540.657,09 163.540.657,09 Redemptions 227.849.920,67 227.849.920,67 Total 2 391.390.577,76 391.390.577,76 Monthly average of total assets
326.839.751,22 326.839.751,22
Turnover rate 21,10 % 21,10 %
1st half of year YearPurchases 207.200.321,31 207.200.321,31 Sales 253.139.292,34 253.139.292,34 Total 1 460.339.613,65 460.339.613,65 Subscriptions 163.540.657,09 163.540.657,09 Redemptions 227.849.920,67 227.849.920,67 Total 2 391.390.577,76 391.390.577,76 Monthly average of total assets
339.583.510,10 339.583.510,10
Corrected turnover rate 20,30 % 20,30 %
The table above shows the capital volume of portfolio transactions. This volume (adjusted to take account of total subscriptions and redemptions) is also compared to the average net assets at the beginning and end of the period. A figure close to 0% implies that the transactions relating to the securities or transactions relating to the assets (excluding deposits and cash) in a given period only involve subscriptions and redemptions. A negative percentage shows that subscriptions and redemptions entailed few, if any, transactions in the portfolio. Active asset management may result in high turnover rates (monthly percentage >50%). The detailed list of transactions is available for consultation free of charge at the registered office of the Bevek or fund at Havenlaan 2, 1080 Brussels.
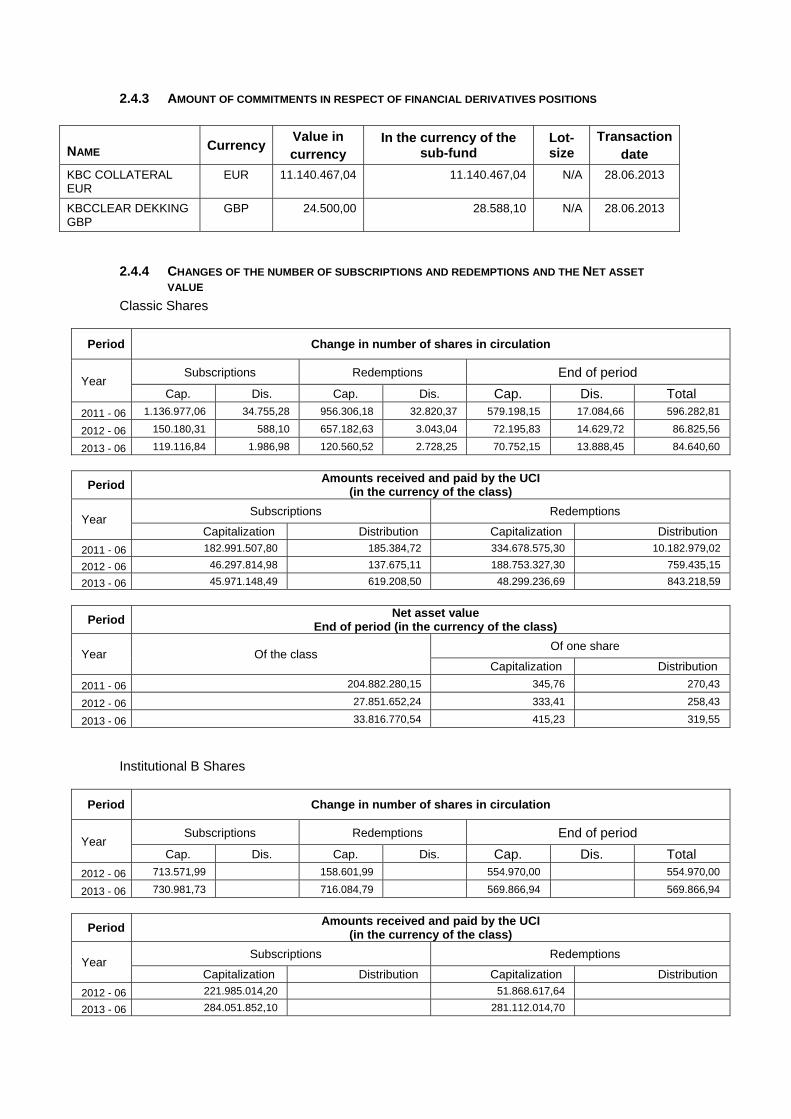
2.4.3 AMOUNT OF COMMITMENTS IN RESPECT OF FINANCIAL DERIVATIVES POSITIONS
NAME Currency Value in currency
In the currency of the sub-fund
Lot-size
Transactiondate
KBC COLLATERAL EUR
EUR 11.140.467,04 11.140.467,04 N/A 28.06.2013
KBCCLEAR DEKKING GBP
GBP 24.500,00 28.588,10 N/A 28.06.2013
2.4.4 CHANGES OF THE NUMBER OF SUBSCRIPTIONS AND REDEMPTIONS AND THE NET ASSET
VALUE
Classic Shares
Period Change in number of shares in circulation
Year Subscriptions Redemptions End of period
Cap. Dis. Cap. Dis. Cap. Dis. Total
2011 - 06 1.136.977,06 34.755,28 956.306,18 32.820,37 579.198,15 17.084,66 596.282,81
2012 - 06 150.180,31 588,10 657.182,63 3.043,04 72.195,83 14.629,72 86.825,56
2013 - 06 119.116,84 1.986,98 120.560,52 2.728,25 70.752,15 13.888,45 84.640,60
Period Amounts received and paid by the UCI
(in the currency of the class)
Year Subscriptions Redemptions
Capitalization Distribution Capitalization Distribution
2011 - 06 182.991.507,80 185.384,72 334.678.575,30 10.182.979,02
2012 - 06 46.297.814,98 137.675,11 188.753.327,30 759.435,15
2013 - 06 45.971.148,49 619.208,50 48.299.236,69 843.218,59
Period Net asset value
End of period (in the currency of the class)
Year Of the class Of one share
Capitalization Distribution
2011 - 06 204.882.280,15 345,76 270,43
2012 - 06 27.851.652,24 333,41 258,43
2013 - 06 33.816.770,54 415,23 319,55
Institutional B Shares
Period Change in number of shares in circulation
Year Subscriptions Redemptions End of period
Cap. Dis. Cap. Dis. Cap. Dis. Total 2012 - 06 713.571,99 158.601,99 554.970,00 554.970,00
2013 - 06 730.981,73 716.084,79 569.866,94 569.866,94
Period Amounts received and paid by the UCI
(in the currency of the class)
Year Subscriptions Redemptions
Capitalization Distribution Capitalization Distribution
2012 - 06 221.985.014,20 51.868.617,64
2013 - 06 284.051.852,10 281.112.014,70

Period Net asset value
End of period (in the currency of the class)
Year Of the class Of one share
Capitalization Distribution
2012 - 06 185.210.132,90 333,73
2013 - 06 237.051.439,70 415,98
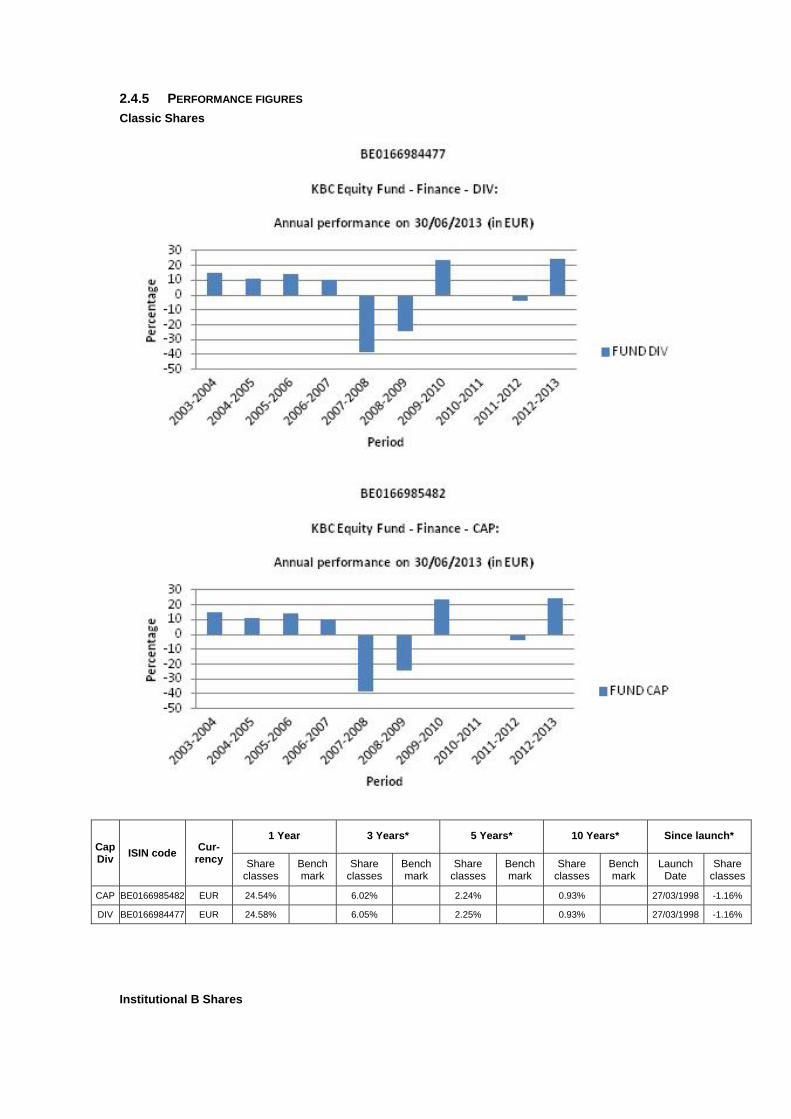
2.4.5 PERFORMANCE FIGURES
Classic Shares
Cap Div
ISIN code Cur-
rency
1 Year 3 Years* 5 Years* 10 Years* Since launch*
Share classes
Bench mark
Share classes
Bench mark
Share classes
Bench mark
Share classes
Bench mark
Launch Date
Share classes
CAP BE0166985482 EUR 24.54% 6.02% 2.24% 0.93% 27/03/1998 -1.16%
DIV BE0166984477 EUR 24.58% 6.05% 2.25% 0.93% 27/03/1998 -1.16%
Institutional B Shares

Cap Div
ISIN code Cur-
rency
1 Year 3 Years* 5 Years* 10 Years* Since launch*
Share classes
Bench mark
Share classes
Bench mark
Share classes
Bench mark
Share classes
Bench mark
Launch Date
Share classes
CAP BE6228544779 EUR 24.65% 25/11/2011 31.56%
Risk warning: Past performance is not a guide to future performance. * Return on annual basis.
Classic Shares The bar chart shows the performance for full financial years. The figures do not take account of any restructuring. Calculated in EUR (ex BEF). The return is calculated as the change in the net asset value between two dates expressed
as a percentage. In the case of units that pay dividends, the dividend is incorporated geometrically in the return.
Calculation method for date D, where NAV stands for net asset value: Capitalisation units (CAP) Return on date D over a period of X years:
[NIW(D) / NIW(Y)] ^ [1 / X] - 1 where Y = D-X
Return on date D since the start date S of the unit: [NIW(D) / NIW(S)] ^ [1 / F] - 1 where F = 1 if the unit has existed for less than one year on date D where F = (D-S) / 365.25 if the unit has existed for longer than one year on date D
Distribution units (DIV) Return on date D over a period of X years:
[ C * NIW(D) / NIW(Y)] ^ [1 / X] - 1 where Y = D-X
Return on date D since the start date S of the unit: [ C * NIW(D) / NIW(S)] ^ [1 / F] - 1 where F = 1 if the unit has existed for less than one year on date D where F = (D-S) / 365.25 if the unit has existed for longer than one year on date D where C is a factor that is determined for all N dividends between the calculation date D and the reference date.
For dividend i on date Di with value Wi: Ci = [Wi / NIW(Di)] + 1 i = 1 ... N

from whichC = C0 * .... * CN. If the interval between the two dates exceeds one year, the ordinary return calculation is
converted into a return on an annual basis by taking the nth square root of 1 plus the total return of the unit.
The return figures shown above do not take account of the fees and charges associated with the issue and redemption of units.
These are the performance figures for capitalisation and distribution shares.
Institutional B Shares The bar chart shows the performance for full financial years. The figures do not take account of any restructuring. Calculated in EUR. The return is calculated as the change in the net asset value between two dates expressed
as a percentage. Calculation method for date D, where NAV stands for net asset value:
Capitalisation units (CAP) Return on date D over a period of X years:
[NIW(D) / NIW(Y)] ^ [1 / X] - 1 where Y = D-X
Return on date D since the start date S of the unit: [NIW(D) / NIW(S)] ^ [1 / F] - 1 where F = 1 if the unit has existed for less than one year on date D where F = (D-S) / 365.25 if the unit has existed for longer than one year on date D
If the interval between the two dates exceeds one year, the ordinary return calculation is converted into a return on an annual basis by taking the nth square root of 1 plus the total return of the unit.
The return figures shown above do not take account of the fees and charges associated with the issue and redemption of units.
These are the performance figures for capitalization shares.
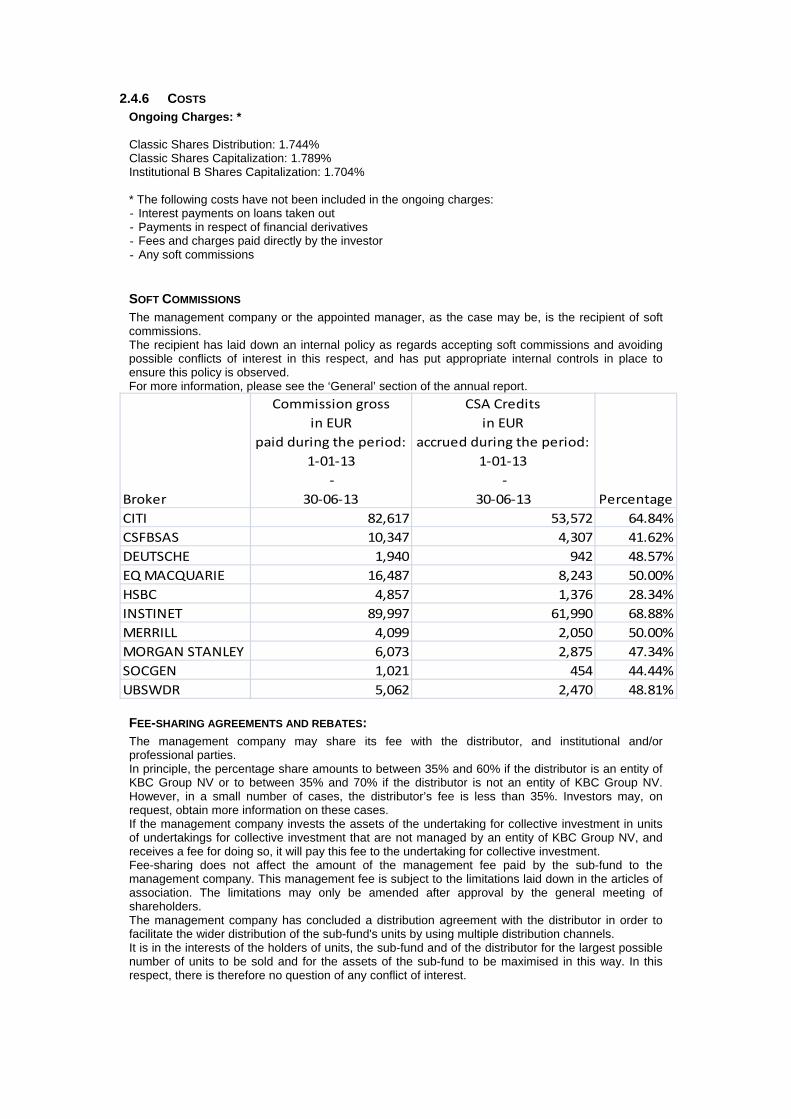
2.4.6 COSTS Ongoing Charges: * Classic Shares Distribution: 1.744% Classic Shares Capitalization: 1.789% Institutional B Shares Capitalization: 1.704% * The following costs have not been included in the ongoing charges: - Interest payments on loans taken out - Payments in respect of financial derivatives - Fees and charges paid directly by the investor - Any soft commissions
SOFT COMMISSIONS The management company or the appointed manager, as the case may be, is the recipient of soft commissions. The recipient has laid down an internal policy as regards accepting soft commissions and avoiding possible conflicts of interest in this respect, and has put appropriate internal controls in place to ensure this policy is observed. For more information, please see the ‘General’ section of the annual report.
Broker
Commission gross
in EUR
paid during the period:
1‐01‐13
‐
30‐06‐13
CSA Credits
in EUR
accrued during the period:
1‐01‐13
‐
30‐06‐13 Percentage
CITI 82,617 53,572 64.84%
CSFBSAS 10,347 4,307 41.62%
DEUTSCHE 1,940 942 48.57%
EQ MACQUARIE 16,487 8,243 50.00%
HSBC 4,857 1,376 28.34%
INSTINET 89,997 61,990 68.88%
MERRILL 4,099 2,050 50.00%
MORGAN STANLEY 6,073 2,875 47.34%
SOCGEN 1,021 454 44.44%
UBSWDR 5,062 2,470 48.81%
FEE-SHARING AGREEMENTS AND REBATES: The management company may share its fee with the distributor, and institutional and/or professional parties. In principle, the percentage share amounts to between 35% and 60% if the distributor is an entity of KBC Group NV or to between 35% and 70% if the distributor is not an entity of KBC Group NV. However, in a small number of cases, the distributor’s fee is less than 35%. Investors may, on request, obtain more information on these cases. If the management company invests the assets of the undertaking for collective investment in units of undertakings for collective investment that are not managed by an entity of KBC Group NV, and receives a fee for doing so, it will pay this fee to the undertaking for collective investment. Fee-sharing does not affect the amount of the management fee paid by the sub-fund to the management company. This management fee is subject to the limitations laid down in the articles of association. The limitations may only be amended after approval by the general meeting of shareholders. The management company has concluded a distribution agreement with the distributor in order to facilitate the wider distribution of the sub-fund's units by using multiple distribution channels. It is in the interests of the holders of units, the sub-fund and of the distributor for the largest possible number of units to be sold and for the assets of the sub-fund to be maximised in this way. In this respect, there is therefore no question of any conflict of interest.

2.4.7 NOTES TO THE FINANCIAL STATEMENTS AND OTHER DATA Fee for managing the investment portfolio: 1.5% per annum calculated on the basis of the average total net assets of the sub-fund, no management fee is charged on assets assets invested in investment undertakings managed by a financial institution of the KBC group. The administration agent’s fee is payable at the end of each month and is calculated on the basis of the average total net assets of the sub-fund. Auditor's fee: 1 700 EUR per year. This fee is not including VAT and can be indexed on an annual basis in accordance with the decisions of the general meeting. The custody fee is calculated on the value of the securities held in custody by the custodian on the final banking day of the preceding calendar year, except on those assets invested in investment undertakings managed by a financial institution of the KBC group. The custody fee is paid at the beginning of the calendar year. Social, ethical and environmental aspects: No manufacturers of controversial weapons whose use over the past five decades, according to the international consensus, has led to disproportionate human suffering among the civilian population will be included in the portfolio of investments. This involves the manufacturers of anti-personnel mines, cluster bombs and munitions and weapons containing depleted uranium. In this way, the sub-fund seeks to reflect not only simple financial reality but also the social reality of the sector or region in question. Exercising voting rights. If necessary, relevant and in the interest of the shareholders, the management company will exercise the voting rights attached to the shares in the Bevek’s portfolio. The management company will adhere to the following criteria when determining how it stands relative to the items on the agenda that are put to the vote: - Shareholder value may not be adversely affected. - Corporate governance rules, especially with regard to the rights of minority shareholders, must be
respected. - The minimum standards with regard to sustainable business and corporate social responsibility
must be met. The list of companies for which voting rights are exercised is available at the registered office of the Bevek. Securities lending In accordance with the Royal Decree of 7 March 2006 concerning securities lending, the undertaking for collective investment has taken out securities loans with a principal to whom the full title of the loaned securities was transferred, without recording this transfer of ownership in the accounts. For the period from 1 January 2013 to 30 June 2013, the fee for securities lent comes to 133,867.76 EUR. The undertaking for collective investment receives 50% of the fee received for securities lent. The detailed list of securities lending transactions carried out can be obtained from the registered office of the collective investment undertaking at 2 Havenlaan, 1080 Brussels.
Overview of securities lent as at 30/06/2013
Name Currency Quantity Price Value in currency of the
portfolio
ASHMORE GROUP PLC GBP 76.566 3,437 307.068,08
BANK OF IRELAND EUR 73.156 0,157 11.485,49
BANK OF NOVA SCOTIA CAD 95.836 56,220 3.929.045,37
CAN IMP BK COMMERCE CAD 8.134 74,640 442.734,46
CAPITALAND LIMITED SGD 39.000 3,080 72.861,82
CHONGQING RURAL COMMERCIAL BANK -H HKD 688.999 3,290 224.834,78
CITIC SECURITIES CO-H SHARES HKD 100.000 13,780 136.677,87
HAL TRUST UNIT 10 VOTING RIGHTS EUR 2.300 96,390 221.697,00
HANG SENG BANK LTD HKD 44.165 114,700 502.447,46
ICADE EUR 5.361 63,440 340.101,84
ROYAL BANK OF CANADA CAD 77.407 61,280 3.459.127,08
SUN LIFE FINANCIAL INC CAD 546 31,150 12.402,76
TORONTO DOMINION BK CAD 9.911 84,470 610.502,57
Total 10.270.986,58
Details of collateral received for securities lent
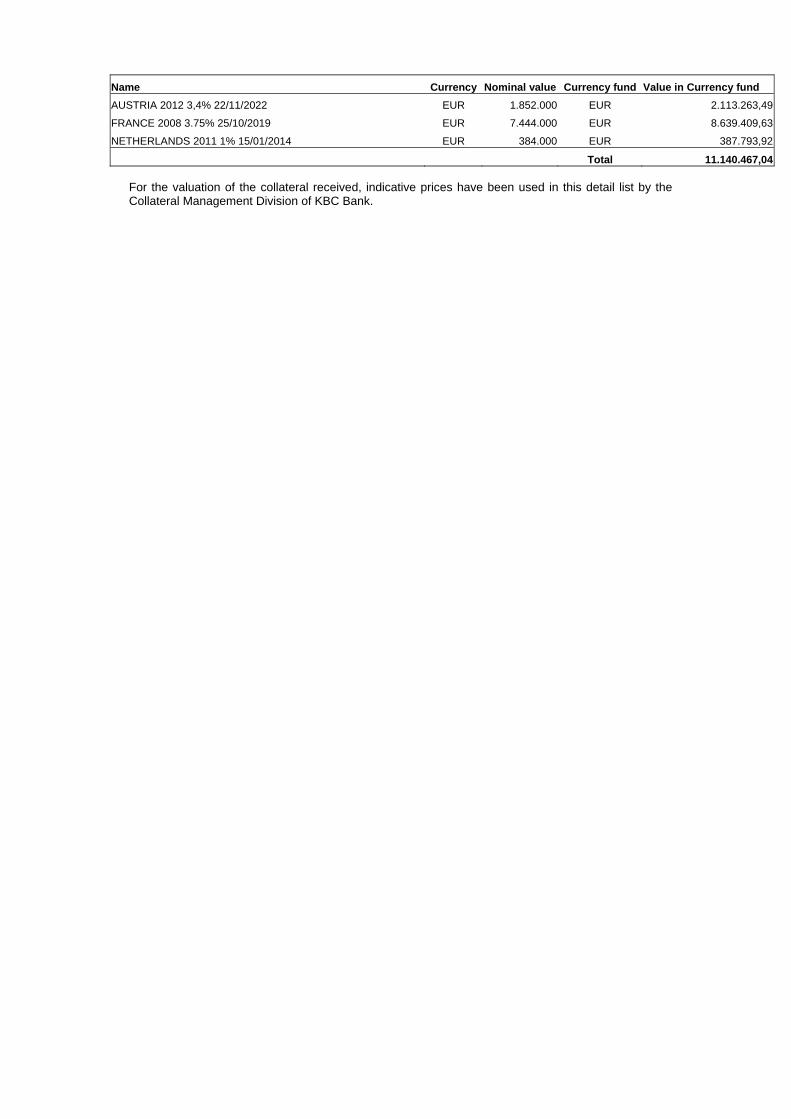
Name Currency Nominal value Currency fund Value in Currency fund
AUSTRIA 2012 3,4% 22/11/2022 EUR 1.852.000 EUR 2.113.263,49
FRANCE 2008 3.75% 25/10/2019 EUR 7.444.000 EUR 8.639.409,63
NETHERLANDS 2011 1% 15/01/2014 EUR 384.000 EUR 387.793,92
Total 11.140.467,04 For the valuation of the collateral received, indicative prices have been used in this detail list by the Collateral Management Division of KBC Bank.

Semi-Annual report as at 30th June 2013
TABLE OF CONTENTS
2. Information on KBC Equity Fund Global Leaders
2.1. Management report 2.1.1. Launch date and subscription price 2.1.2. Stock exchange listing 2.1.3. Aim and distinctive features of the investment policy 2.1.4. Financial portfolio management 2.1.5. Distributors 2.1.6. Index and benchmark 2.1.7. Policy conducted during the financial year 2.1.8. Future policy 2.1.9. Synthetic risk and reward indicator (SRRI)
2.2. Balance sheet
2.3. Profit and loss account
2.4. Composition of the assets and key figures
2.4.1. Composition of the assets 2.4.2. Change in the composition of the assets 2.4.3. Value of commitments in respect of financial derivatives positions 2.4.4. Evolution of the number of subscriptions, repayments and the net asset value 2.4.5. Return figures 2.4.6. Expenses 2.4.7. Notes to the financial statements and other data


2 INFORMATION ON KBC EQUITY FUND GLOBAL LEADERS
2.1 MANAGEMENT REPORT
2.1.1 LAUNCH DATE AND SUBSCRIPTION PRICE Classic Shares : Launch date: 1 September 2000 Initial subscription price: 500 EUR Currency: EUR Institutional B Shares : Launch date: 25 November 2011 Initial subscription price: 223.71 EUR Currency: EUR
2.1.2 STOCK EXCHANGE LISTING Not applicable.
2.1.3 GOAL AND KEY PRINCIPLES OF THE INVESTMENT POLICY
SUB-FUND’S OBJECT: The main objective of this sub-fund is to generate the highest possible return for its shareholders by investing directly or indirectly in transferable securities. This is reflected in its pursuit of capital gains and income. To this end, the assets are invested, either directly or indirectly via correlated financial instruments, primarily in shares.
SUB-FUND’S INVESTMENT POLICY:
PERMITTED ASSET CLASSES: The sub-fund may invest in securities, money market instruments, units in undertakings for collective investment, deposits, financial derivatives, liquid assets and all other instruments insofar as permitted by the applicable laws and regulations and consistent with the sub-fund’s object The sub-fund shall invest no more than 10% of its assets in units of other undertakings for collective investment.
RESTRICTIONS OF THE INVESTMENT POLICY: The investment policy will be implemented within the limits set by law and regulations. The sub-fund may borrow up to 10% of its net assets, insofar as these are short-term borrowings aimed at solving temporary liquidity problems.
PERMITTED DERIVATIVES TRANSACTIONS: Derivates may be used either for hedging purposes or to achieve investment objectives. Changes will be made to the investments at regular intervals to comply with the sub-fund's investment strategy. In addition, listed and unlisted derivates may be used to achieve the objectives: these may be forward contracts, options or swaps on securities, indices, currencies or interest rates or other transactions involving derivatives. Unlisted derivatives transactions will only be concluded with prime financial institutions specialised in such transactions. Such derivatives may also be used to hedge the assets against exchange-rate fluctuations. Subject to the applicable laws and regulations and the articles of association, the sub-fund always seeks to conclude the most effective transactions. All costs associated with the transactions will be charged to the sub-fund and all income generated will be paid to the sub-fund. If the transactions result in a risk in respect of the counterparty, this risk can be hedged by using a margin management system that ensures that the sub-fund is the beneficiary of security (collateral) in the form of cash or investment grade bonds. When calculating the value of the bonds, a margin will be applied that varies depending on the residual term to maturity and the currency in which the bond in question is denominated. The relationship with the counterparty or counterparties is governed by standard international agreements.

STRATEGY SELECTED At least 75% of the assets are invested in a global selection of shares issued by large cap multinationals. The emphasis is on: multinational character, consolidation, market leader and extensive global presence.
LENDING FINANCIAL INSTRUMENTS: The sub-fund may lend financial instruments within the limits set by law and regulations. This lending does not affect the sub-fund’s risk profile since: - it takes place within the framework of a securities lending system managed by a principal. In
addition, the sub-fund has a relationship only with the principal of the securities lending system which acts as counterparty and to which title of the loaned securities is transferred. The choice of principal is subject to strict selection criteria. The return of securities similar to the securities that have been lent is guaranteed by the principal.
- through a margin management system, the sub-fund is always guaranteed financial security, the actual value of which always exceeds the actual value of the securities that have been lent, in case the principal does not return similar securities.
The return of securities similar to the securities that have been lent can be requested at any time, which means that the lending of securities does not affect the management of the sub-fund's assets. By lending securities, the sub-fund can generate an additional return. The principal pays a fee to the management company. After deducting the fee for the margin management and clearing services of KBC Bank, most of this fee is paid to the sub-fund. The relationship with the counterparty or counterparties is governed by standard international agreements. More information is provided on the terms and conditions governing securities lending in the annual or half-yearly report for the sub-fund.
VOLATILITY OF THE NET ASSET VALUE: The volatility of the net asset value may be high due to the composition of the portfolio.
GENERAL STRATEGY FOR HEDGING THE EXCHANGE RATE RISK: In order to protect its assets against exchange rate fluctuations and within the limitations laid down in the articles of association, the sub-fund may perform transactions relating to the sale of forward currency contracts, as well as the sale of call options and the purchase of put options on currencies. The transactions in question may relate solely to contracts traded on a regulated market that operates regularly, is recognised and is open to the public or that are traded with a recognised, prime financial institution specialising in such transactions and dealing in the over-the-counter (OTC) market in options. With the same objective, the sub-fund may also sell currencies forward or exchange them in private transactions with prime financial institutions specialising in such transactions. The hedging objective of the aforementioned transactions suggests that there is a direct link between these transactions and the assets to be hedged, which implies that the transactions carried out in a particular currency may in principle not exceed, in terms of volume, either the valuation value of all the assets in the same currency or the holding period of those assets.
SOCIAL, ETHICAL AND ENVIRONMENTAL ASPECTS:
No manufacturers of controversial weapons whose use over the past five decades, according to the international consensus, has led to disproportionate human suffering among the civilian population will be included in the portfolio of investments. This involves the manufacturers of anti-personnel mines, cluster bombs and munitions and weapons containing depleted uranium. In this way, the sub-fund seeks to reflect not only simple financial reality but also the social reality of the sector or region in question.
THE EUROPEAN SAVINGS DIRECTIVE AND TAX ON DEBT CLAIM RETURNS OBTAINED THROUGH THE
REDEMPTION OF OWN UNITS OR IN THE EVENT OF FULL OR PARTIAL DISTRIBUTION OF EQUITY
CAPITAL.

The following information is of a general character and is not intended to cover all aspects of an investment in a UCITS. In certain cases entirely different rules might even apply. Moreover, both tax law and the interpretation of it can change. Investors who wish to have more information about the tax implications – in both Belgium and abroad – of acquiring, holding and transferring units should seek the advice of their usual financial and tax advisers. This UCITS shall invest a maximum of 15% of its assets directly or indirectly in debt instruments as intended by the European Savings Directive. A. European Savings Directive (Directive 2003/48/EC) The European Savings Directive has been implemented in Belgium. Since this UCITS invests a maximum of 15% of its assets directly or indirectly in debt claims as intended by the European Savings Directive, the income of this UCITS does not fall within the scope of this directive. B. Tax on debt claim returns obtained through the redemption of own units or in the event of full or partial distribution of equity capital (Article 19bis Income Tax Code 1992). The income from this UCITS is not subject to the tax on debt instrument returns as intended by Article 19bis, Income Tax Code 1992.
2.1.4 FINANCIAL PORTFOLIO MANAGEMENT The management company has delegated the intellectual management, to KBC Fund Management Limited, Joshua Dawson House, Dawson Street , Dublin 2, IRELAND..
2.1.5 DISTRIBUTORS KBC Asset Management S.A., 5, Place de la Gare, L-1616 Luxembourg.
2.1.6 INDEX AND BENCHMARK See ‘Sub-fund’s investment policy’.
2.1.7 POLICY PERSUED DURING THE FINANCIAL YEAR KBC Equity Fund Global Leaders invests at least 75% of its assets in a global portfolio of shares of multinational companies. Doubts about the sustainability of the economic recovery continued to shape investor sentiment. The debt crisis in Europe continued unabated, although the European Central Bank (ECB) managed to convince the market that it had the crisis under control. Major steps were taken in the United States to reform the federal budget, seemingly without adversely affecting economic growth too much. Fortunately, strong economic growth in Asia created export opportunities for American and European businesses. In the US, the rate of employment growth remained on the thin side for some considerable time. The situation began to improve in the recent reporting period, with the result that the jobless rate has declined more markedly. Pay has remained virtually flat, barely rising ahead of inflation. Taken together, these two factors ensured that household purchasing power only grew to a very limited extent and so contributed very modestly to economic growth. The weak growth in the Western economies was not without its impact on the export performance in emerging countries. In recent years, however, domestic demand (due to a rapidly growing middle class with a high consumption rate) and intra-regional trade within Asia have been playing an increasingly important role. The region is better armed to deal with financial crises than it was in the past. Public finances are healthy; the balance of payments is generally neutral. Asia’s economic development no longer depends on fickle foreign capital. Thanks to the contribution by the emerging markets the growth of world GDP held up in 2012–13 (estimated at 2–2.5%). Public finances have gone off the rails not only in the EMU, but also in the UK and the US. The budget debate in the US had reached a political impasse. Decisions were postponed, and so 31 December 2012 became an important deadline. A whole series of tax cuts and other temporary support measures from the past would then lapse. In total these involved a sum of 550 billion USD. Extending all the measures again was not feasible in budgetary terms, while allowing them all to expire was economic suicide. The fiscal cliff was averted on 1 January 2013 by means of an agreement in Congress: half the stimulus measures were made permanent or were extended for a further twelve months, while the other half lapsed. This has not been the only measure involving tightening of budgetary policy in 2013: on 1 March, automatic spending cuts came into effect under which Federal expenditure will be pruned by 85 billion USD each year for a period of ten years. Since no budget has been approved in the current financial year, the federal administrations have only been assigned budgets equal to the expenditure in the previous financial year. Mario Draghi took the helm at the ECB on 1 November 2011 and has favoured monetary easing by lowering the ECB’s key rate is 0.50%. This interest rate policy failed to place the economic recovery on a sustainable basis. The Fed therefore explored the scope for other measures, intervening directly on the bond markets and buying up large amounts of debt paper in an attempt to keep the long-term rate low, as well. The ECB dragged its feet, and only followed the Fed’s example much later. The intensification of the euro crisis in fact left the ECB no other choice. In a year marked by problems in keeping the EMU from imploding, the EUR/USD exchange rate was no more volatile than at other times. The euro was trading at USD 1.30 at the end of June 2013, which is roughly the same rate as 2012 year-end. The dollar’s image as the global reserve currency suffered as a result of QE2, QE3 and TWIST. In terms of markets, Japan was ultimately an outperformer, despite the steep depreciation of the yen. The winds of change have been blowing through Tokyo since the advent of the Abe government in December. The prospect of fresh tax stimuli, a cheaper yen and large-scale money creation have contributed to an atmosphere of optimism about the economy, something very rare in this country, which has been struggling with defeatism for many years. The emerging regions performed downright badly. The Asian emerging markets were unable to capitalise on their role as the growth engine of the world economy. Confidence indicators began to decline in mid-2012, breaking through barriers that pointed to a serious economic slowdown. That failed to materialise but it was sufficient to perpetuate the doubts concerning the growth narrative in the region. This was further exacerbated by concerns about Chinese local authority debt levels, an overheating Chinese housing market and fear of a credit crisis – especially when the Chinese interbank rate shot up to 30% within the space of a few days in June. Stock-market valuations remain favourable, especially given the high growth forecasts, sound macroeconomic balance and a banking sector that was barely – if at all – affected by the credit crisis. Latin America was hit by an economic slowdown. The link to the commodity markets is always at the fore in this region. Russia was likewise not immune to the weakness of European economic growth. Oil prices below 100 USD per barrel mean trouble for Russian state finances. The best performing sectors included Financials, Pharmaceuticals and Consumer Discretionary. Materials, Technology and Energy lagged behind. The outperformance of Banks may be attributed to the quantitative easing programmes undertaken by the central banks. By this we mean the Fed’s QE3 programme, and especially the announcement by the ECB of its OMT programme, which took the heat out of the euro crisis. Pharmaceuticals had been shunned for a long time due to a lack of product innovation, patent expiry and the reforms to healthcare insurance in the US. In recent months,
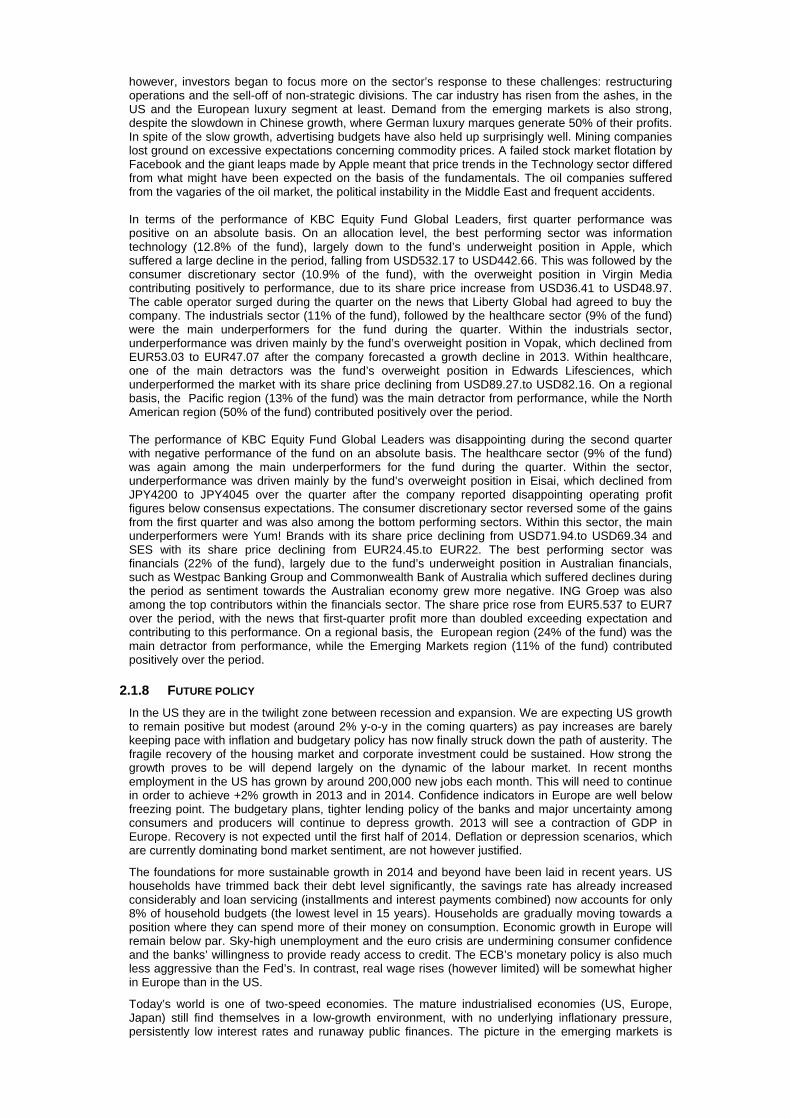
however, investors began to focus more on the sector’s response to these challenges: restructuring operations and the sell-off of non-strategic divisions. The car industry has risen from the ashes, in the US and the European luxury segment at least. Demand from the emerging markets is also strong, despite the slowdown in Chinese growth, where German luxury marques generate 50% of their profits. In spite of the slow growth, advertising budgets have also held up surprisingly well. Mining companies lost ground on excessive expectations concerning commodity prices. A failed stock market flotation by Facebook and the giant leaps made by Apple meant that price trends in the Technology sector differed from what might have been expected on the basis of the fundamentals. The oil companies suffered from the vagaries of the oil market, the political instability in the Middle East and frequent accidents. In terms of the performance of KBC Equity Fund Global Leaders, first quarter performance was positive on an absolute basis. On an allocation level, the best performing sector was information technology (12.8% of the fund), largely down to the fund’s underweight position in Apple, which suffered a large decline in the period, falling from USD532.17 to USD442.66. This was followed by the consumer discretionary sector (10.9% of the fund), with the overweight position in Virgin Media contributing positively to performance, due to its share price increase from USD36.41 to USD48.97. The cable operator surged during the quarter on the news that Liberty Global had agreed to buy the company. The industrials sector (11% of the fund), followed by the healthcare sector (9% of the fund) were the main underperformers for the fund during the quarter. Within the industrials sector, underperformance was driven mainly by the fund’s overweight position in Vopak, which declined from EUR53.03 to EUR47.07 after the company forecasted a growth decline in 2013. Within healthcare, one of the main detractors was the fund’s overweight position in Edwards Lifesciences, which underperformed the market with its share price declining from USD89.27.to USD82.16. On a regional basis, the Pacific region (13% of the fund) was the main detractor from performance, while the North American region (50% of the fund) contributed positively over the period. The performance of KBC Equity Fund Global Leaders was disappointing during the second quarter with negative performance of the fund on an absolute basis. The healthcare sector (9% of the fund) was again among the main underperformers for the fund during the quarter. Within the sector, underperformance was driven mainly by the fund’s overweight position in Eisai, which declined from JPY4200 to JPY4045 over the quarter after the company reported disappointing operating profit figures below consensus expectations. The consumer discretionary sector reversed some of the gains from the first quarter and was also among the bottom performing sectors. Within this sector, the main underperformers were Yum! Brands with its share price declining from USD71.94.to USD69.34 and SES with its share price declining from EUR24.45.to EUR22. The best performing sector was financials (22% of the fund), largely due to the fund’s underweight position in Australian financials, such as Westpac Banking Group and Commonwealth Bank of Australia which suffered declines during the period as sentiment towards the Australian economy grew more negative. ING Groep was also among the top contributors within the financials sector. The share price rose from EUR5.537 to EUR7 over the period, with the news that first-quarter profit more than doubled exceeding expectation and contributing to this performance. On a regional basis, the European region (24% of the fund) was the main detractor from performance, while the Emerging Markets region (11% of the fund) contributed positively over the period.
2.1.8 FUTURE POLICY
In the US they are in the twilight zone between recession and expansion. We are expecting US growth to remain positive but modest (around 2% y-o-y in the coming quarters) as pay increases are barely keeping pace with inflation and budgetary policy has now finally struck down the path of austerity. The fragile recovery of the housing market and corporate investment could be sustained. How strong the growth proves to be will depend largely on the dynamic of the labour market. In recent months employment in the US has grown by around 200,000 new jobs each month. This will need to continue in order to achieve +2% growth in 2013 and in 2014. Confidence indicators in Europe are well below freezing point. The budgetary plans, tighter lending policy of the banks and major uncertainty among consumers and producers will continue to depress growth. 2013 will see a contraction of GDP in Europe. Recovery is not expected until the first half of 2014. Deflation or depression scenarios, which are currently dominating bond market sentiment, are not however justified.
The foundations for more sustainable growth in 2014 and beyond have been laid in recent years. US households have trimmed back their debt level significantly, the savings rate has already increased considerably and loan servicing (installments and interest payments combined) now accounts for only 8% of household budgets (the lowest level in 15 years). Households are gradually moving towards a position where they can spend more of their money on consumption. Economic growth in Europe will remain below par. Sky-high unemployment and the euro crisis are undermining consumer confidence and the banks’ willingness to provide ready access to credit. The ECB’s monetary policy is also much less aggressive than the Fed’s. In contrast, real wage rises (however limited) will be somewhat higher in Europe than in the US.
Today’s world is one of two-speed economies. The mature industrialised economies (US, Europe, Japan) still find themselves in a low-growth environment, with no underlying inflationary pressure, persistently low interest rates and runaway public finances. The picture in the emerging markets is
altogether different. The strong economic growth has already created inflationary pressure in Asia. Appropriate monetary policy is therefore required. Monetary policy in China and elsewhere in Asia is highly geared to preventing asset-price inflation. Countries are not only deploying the interest-rate weapon to this end, they are also actively intervening in the credit and housing markets. Thanks to the continuing strength of the emerging markets, the global economy could post growth of 2.5–3% in 2013 and 2014. This is one of the reasons why corporate earnings could continue to grow in the coming quarters at a rate of 5–10%. The current valuation of equities continues to discount a number of very pessimistic scenarios. Based on forecast earnings for the coming 12 months, the price-earnings ratio is 14.5 for the US S&P 500 index and 11.4 for the MSCI Europe. That is 25–30% lower than the historical average. Equities are certainly dirt-cheap compared with bonds.
In line with the theme, KBC Equity Fund Global Leaders will continue to invest in a global portfolio of multinational companies that are characterised by their market leadership and global presence.
2.1.9 SYNTHETIC RISK AND REWARD INDICATOR Classic Shares: 6 on a scale of 1 (lowest risk) to 7 (highest risk). Institutional B Shares: 6 on a scale of 1 (lowest risk) to 7 (highest risk). The value of a share can decrease or increase and the investor may not get back the amount invested. In accordance with Commission Regulation (EU) No. 583/2010, a synthetic risk and reward indicator has been calculated. This indicator provides a quantitative measure of the sub-fund's potential return and the risk involved, calculated in the currency in which the sub-fund is denominated. It is given as a figure between 1 and 7. The higher the figure, the greater the potential return, but also the more difficult it is to predict this return. Losses are possible too. The lowest figure does not mean that the investment is entirely free of risk. However, it does indicate that, compared with the higher figures, this product will generally provide a lower, but more predictable return. The synthetic risk and reward indicator is assessed regularly and can therefore go up or down based on data from the past. Data from the past is not always a reliable indicator of future risk and return.

2.2 BALANCE SHEET
Balance sheet layout 30/06/2013 (in the currency of the sub-fundt)
30/06/2012 (in the currency of the sub-fund )
TOTAL NET ASSETS 42.635.584,64 85.725.615,90
II. Securities, money market instruments, UCIs and derivatives
A. Bonds and other debt instruments a) Bonds a} Collateral received in the form of bonds 1.450.923,04 2.357.316,00 C. Shares and similar instruments a) Shares 42.346.617,95 85.520.303,82 Of which securities lent 1.336.747,25 2.168.784,99 D. Other securities 5.650,88 5.368,69
IV. Receivables and payables within one year A. Receivables a) Accounts receivable 135.172,68 2.138,44 b) Tax assets 2.957,35 6.214,22 c) Collateral 40.387,72 B. Payables a) Accounts payable (-) -37.551,29 -172.434,75 c) Borrowings (-) -83.999,06 d) Collateral (-) -1.450.923,04 -2.357.316,00
V. Deposits and cash at bank and in hand A. Demand balances at banks 172.899,34 122.009,43
VI. Accruals and deferrals A. Expense to be carried forward 21.182,70 39.647,28 B. Accrued income 95.735,71 259.462,93 C. Accrued expense (-) -63.469,34 -57.094,16
TOTAL SHAREHOLDERS' EQUITY 42.635.584,64 85.725.615,90
A. Capital 40.381.907,72 80.530.031,37
B. Income equalization -107,87 -211.100,96
D. Result for the period 2.253.784,79 5.406.685,49
Off-balance-sheet headings
I Collateral (+/-)
I.A Collateral (+/-)
I.A.A Securities/market instruments 1.450.923,04 2.357.316,00
I.A.B Cash at bank and in hand/deposits 40.387,72
IX Financial instruments lent 1.336.747,25 2.168.784,99
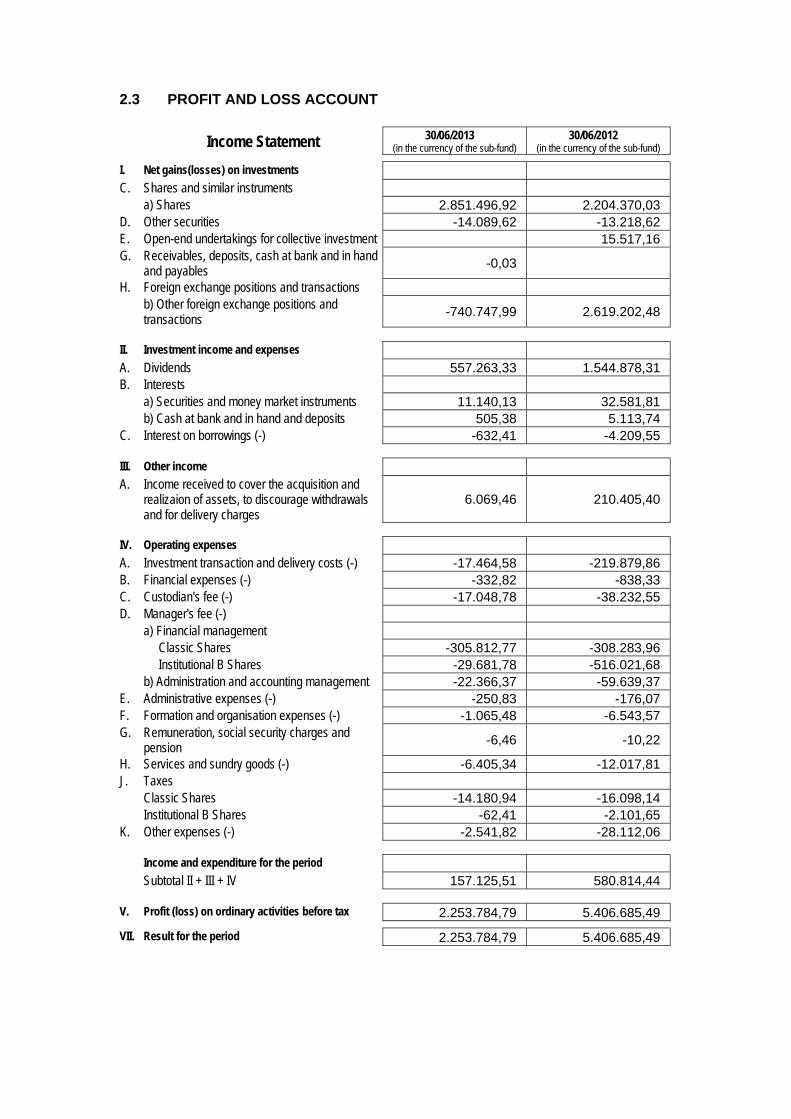
2.3 PROFIT AND LOSS ACCOUNT
Income Statement 30/06/2013 (in the currency of the sub-fund)
30/06/2012 (in the currency of the sub-fund)
I. Net gains(losses) on investments C. Shares and similar instruments a) Shares 2.851.496,92 2.204.370,03 D. Other securities -14.089,62 -13.218,62 E. Open-end undertakings for collective investment 15.517,16 G. Receivables, deposits, cash at bank and in hand
and payables -0,03
H. Foreign exchange positions and transactions b) Other foreign exchange positions and
transactions -740.747,99 2.619.202,48
II. Investment income and expenses A. Dividends 557.263,33 1.544.878,31 B. Interests a) Securities and money market instruments 11.140,13 32.581,81 b) Cash at bank and in hand and deposits 505,38 5.113,74 C. Interest on borrowings (-) -632,41 -4.209,55
III. Other income A. Income received to cover the acquisition and
realizaion of assets, to discourage withdrawals and for delivery charges
6.069,46 210.405,40
IV. Operating expenses A. Investment transaction and delivery costs (-) -17.464,58 -219.879,86 B. Financial expenses (-) -332,82 -838,33 C. Custodian's fee (-) -17.048,78 -38.232,55 D. Manager's fee (-) a) Financial management Classic Shares -305.812,77 -308.283,96 Institutional B Shares -29.681,78 -516.021,68 b) Administration and accounting management -22.366,37 -59.639,37 E. Administrative expenses (-) -250,83 -176,07 F. Formation and organisation expenses (-) -1.065,48 -6.543,57 G. Remuneration, social security charges and
pension -6,46 -10,22
H. Services and sundry goods (-) -6.405,34 -12.017,81 J. Taxes Classic Shares -14.180,94 -16.098,14 Institutional B Shares -62,41 -2.101,65 K. Other expenses (-) -2.541,82 -28.112,06
Income and expenditure for the period Subtotal II + III + IV 157.125,51 580.814,44
V. Profit (loss) on ordinary activities before tax 2.253.784,79 5.406.685,49
VII. Result for the period 2.253.784,79 5.406.685,49
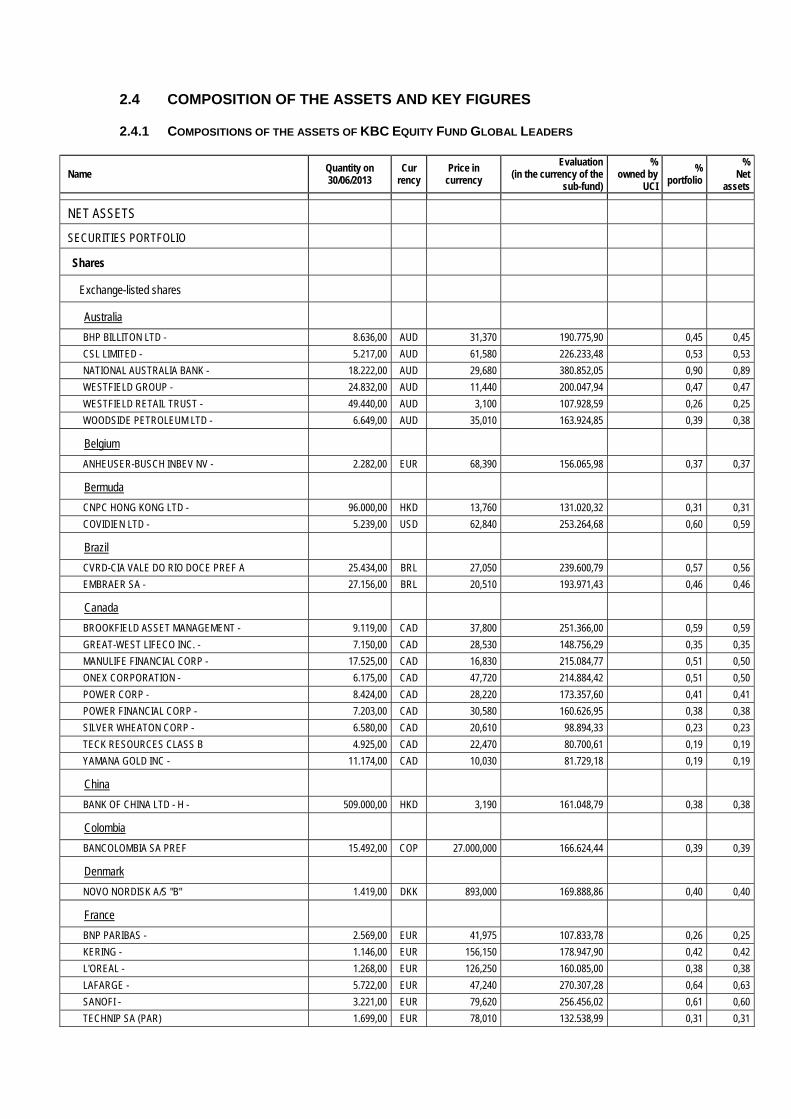
2.4 COMPOSITION OF THE ASSETS AND KEY FIGURES
2.4.1 COMPOSITIONS OF THE ASSETS OF KBC EQUITY FUND GLOBAL LEADERS
Name Quantity on 30/06/2013
Cur rency
Price in currency
Evaluation (in the currency of the
sub-fund)
% owned by
UCI
% portfolio
% Net
assets
NET ASSETS
SECURITIES PORTFOLIO
Shares
Exchange-listed shares
Australia
BHP BILLITON LTD - 8.636,00 AUD 31,370 190.775,90 0,45 0,45
CSL LIMITED - 5.217,00 AUD 61,580 226.233,48 0,53 0,53
NATIONAL AUSTRALIA BANK - 18.222,00 AUD 29,680 380.852,05 0,90 0,89
WESTFIELD GROUP - 24.832,00 AUD 11,440 200.047,94 0,47 0,47
WESTFIELD RETAIL TRUST - 49.440,00 AUD 3,100 107.928,59 0,26 0,25
WOODSIDE PETROLEUM LTD - 6.649,00 AUD 35,010 163.924,85 0,39 0,38
Belgium
ANHEUSER-BUSCH INBEV NV - 2.282,00 EUR 68,390 156.065,98 0,37 0,37
Bermuda
CNPC HONG KONG LTD - 96.000,00 HKD 13,760 131.020,32 0,31 0,31
COVIDIEN LTD - 5.239,00 USD 62,840 253.264,68 0,60 0,59
Brazil
CVRD-CIA VALE DO RIO DOCE PREF A 25.434,00 BRL 27,050 239.600,79 0,57 0,56
EMBRAER SA - 27.156,00 BRL 20,510 193.971,43 0,46 0,46
Canada
BROOKFIELD ASSET MANAGEMENT - 9.119,00 CAD 37,800 251.366,00 0,59 0,59
GREAT-WEST LIFECO INC. - 7.150,00 CAD 28,530 148.756,29 0,35 0,35
MANULIFE FINANCIAL CORP - 17.525,00 CAD 16,830 215.084,77 0,51 0,50
ONEX CORPORATION - 6.175,00 CAD 47,720 214.884,42 0,51 0,50
POWER CORP - 8.424,00 CAD 28,220 173.357,60 0,41 0,41
POWER FINANCIAL CORP - 7.203,00 CAD 30,580 160.626,95 0,38 0,38
SILVER WHEATON CORP - 6.580,00 CAD 20,610 98.894,33 0,23 0,23
TECK RESOURCES CLASS B 4.925,00 CAD 22,470 80.700,61 0,19 0,19
YAMANA GOLD INC - 11.174,00 CAD 10,030 81.729,18 0,19 0,19
China
BANK OF CHINA LTD - H - 509.000,00 HKD 3,190 161.048,79 0,38 0,38
Colombia
BANCOLOMBIA SA PREF 15.492,00 COP 27.000,000 166.624,44 0,39 0,39
Denmark
NOVO NORDISK A/S "B" 1.419,00 DKK 893,000 169.888,86 0,40 0,40
France
BNP PARIBAS - 2.569,00 EUR 41,975 107.833,78 0,26 0,25
KERING - 1.146,00 EUR 156,150 178.947,90 0,42 0,42
L'OREAL - 1.268,00 EUR 126,250 160.085,00 0,38 0,38
LAFARGE - 5.722,00 EUR 47,240 270.307,28 0,64 0,63
SANOFI - 3.221,00 EUR 79,620 256.456,02 0,61 0,60
TECHNIP SA (PAR) 1.699,00 EUR 78,010 132.538,99 0,31 0,31
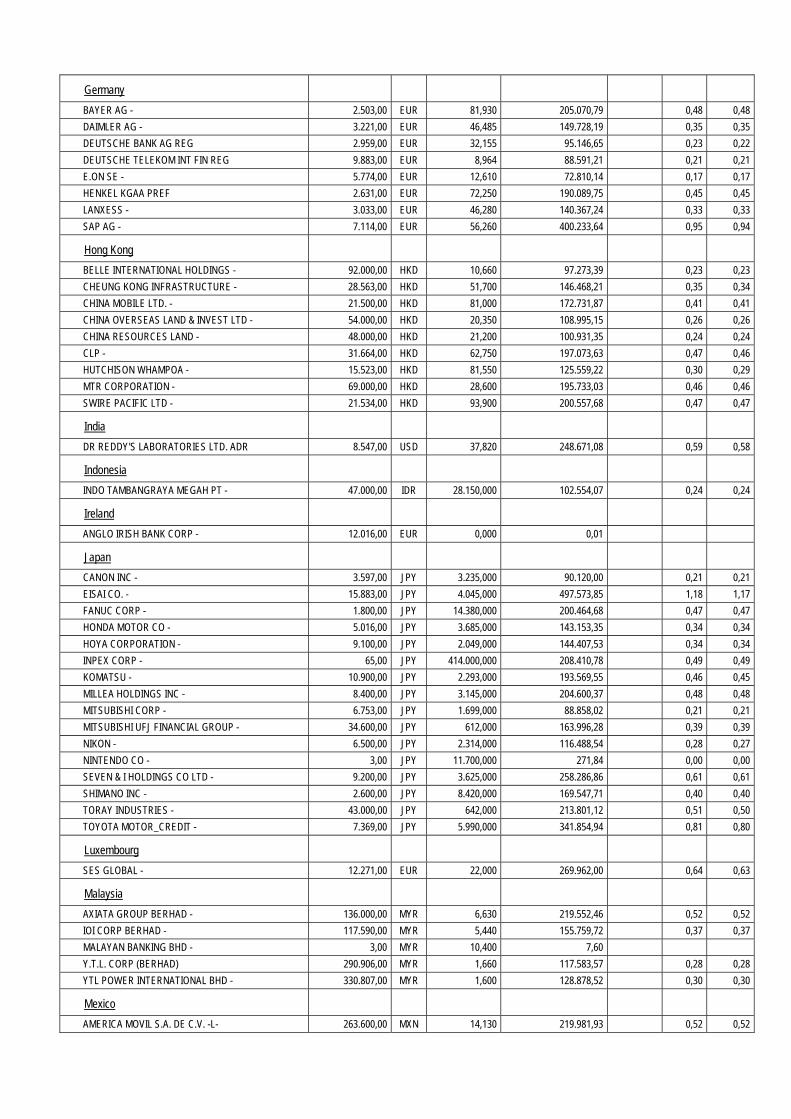
Germany
BAYER AG - 2.503,00 EUR 81,930 205.070,79 0,48 0,48
DAIMLER AG - 3.221,00 EUR 46,485 149.728,19 0,35 0,35
DEUTSCHE BANK AG REG 2.959,00 EUR 32,155 95.146,65 0,23 0,22
DEUTSCHE TELEKOM INT FIN REG 9.883,00 EUR 8,964 88.591,21 0,21 0,21
E.ON SE - 5.774,00 EUR 12,610 72.810,14 0,17 0,17
HENKEL KGAA PREF 2.631,00 EUR 72,250 190.089,75 0,45 0,45
LANXESS - 3.033,00 EUR 46,280 140.367,24 0,33 0,33
SAP AG - 7.114,00 EUR 56,260 400.233,64 0,95 0,94
Hong Kong
BELLE INTERNATIONAL HOLDINGS - 92.000,00 HKD 10,660 97.273,39 0,23 0,23
CHEUNG KONG INFRASTRUCTURE - 28.563,00 HKD 51,700 146.468,21 0,35 0,34
CHINA MOBILE LTD. - 21.500,00 HKD 81,000 172.731,87 0,41 0,41
CHINA OVERSEAS LAND & INVEST LTD - 54.000,00 HKD 20,350 108.995,15 0,26 0,26
CHINA RESOURCES LAND - 48.000,00 HKD 21,200 100.931,35 0,24 0,24
CLP - 31.664,00 HKD 62,750 197.073,63 0,47 0,46
HUTCHISON WHAMPOA - 15.523,00 HKD 81,550 125.559,22 0,30 0,29
MTR CORPORATION - 69.000,00 HKD 28,600 195.733,03 0,46 0,46
SWIRE PACIFIC LTD - 21.534,00 HKD 93,900 200.557,68 0,47 0,47
India
DR REDDY'S LABORATORIES LTD. ADR 8.547,00 USD 37,820 248.671,08 0,59 0,58
Indonesia
INDO TAMBANGRAYA MEGAH PT - 47.000,00 IDR 28.150,000 102.554,07 0,24 0,24
Ireland
ANGLO IRISH BANK CORP - 12.016,00 EUR 0,000 0,01
Japan
CANON INC - 3.597,00 JPY 3.235,000 90.120,00 0,21 0,21
EISAI CO. - 15.883,00 JPY 4.045,000 497.573,85 1,18 1,17
FANUC CORP - 1.800,00 JPY 14.380,000 200.464,68 0,47 0,47
HONDA MOTOR CO - 5.016,00 JPY 3.685,000 143.153,35 0,34 0,34
HOYA CORPORATION - 9.100,00 JPY 2.049,000 144.407,53 0,34 0,34
INPEX CORP - 65,00 JPY 414.000,000 208.410,78 0,49 0,49
KOMATSU - 10.900,00 JPY 2.293,000 193.569,55 0,46 0,45
MILLEA HOLDINGS INC - 8.400,00 JPY 3.145,000 204.600,37 0,48 0,48
MITSUBISHI CORP - 6.753,00 JPY 1.699,000 88.858,02 0,21 0,21
MITSUBISHI UFJ FINANCIAL GROUP - 34.600,00 JPY 612,000 163.996,28 0,39 0,39
NIKON - 6.500,00 JPY 2.314,000 116.488,54 0,28 0,27
NINTENDO CO - 3,00 JPY 11.700,000 271,84 0,00 0,00
SEVEN & I HOLDINGS CO LTD - 9.200,00 JPY 3.625,000 258.286,86 0,61 0,61
SHIMANO INC - 2.600,00 JPY 8.420,000 169.547,71 0,40 0,40
TORAY INDUSTRIES - 43.000,00 JPY 642,000 213.801,12 0,51 0,50
TOYOTA MOTOR_CREDIT - 7.369,00 JPY 5.990,000 341.854,94 0,81 0,80
Luxembourg
SES GLOBAL - 12.271,00 EUR 22,000 269.962,00 0,64 0,63
Malaysia
AXIATA GROUP BERHAD - 136.000,00 MYR 6,630 219.552,46 0,52 0,52
IOI CORP BERHAD - 117.590,00 MYR 5,440 155.759,72 0,37 0,37
MALAYAN BANKING BHD - 3,00 MYR 10,400 7,60
Y.T.L. CORP (BERHAD) 290.906,00 MYR 1,660 117.583,57 0,28 0,28
YTL POWER INTERNATIONAL BHD - 330.807,00 MYR 1,600 128.878,52 0,30 0,30
Mexico
AMERICA MOVIL S.A. DE C.V. -L- 263.600,00 MXN 14,130 219.981,93 0,52 0,52
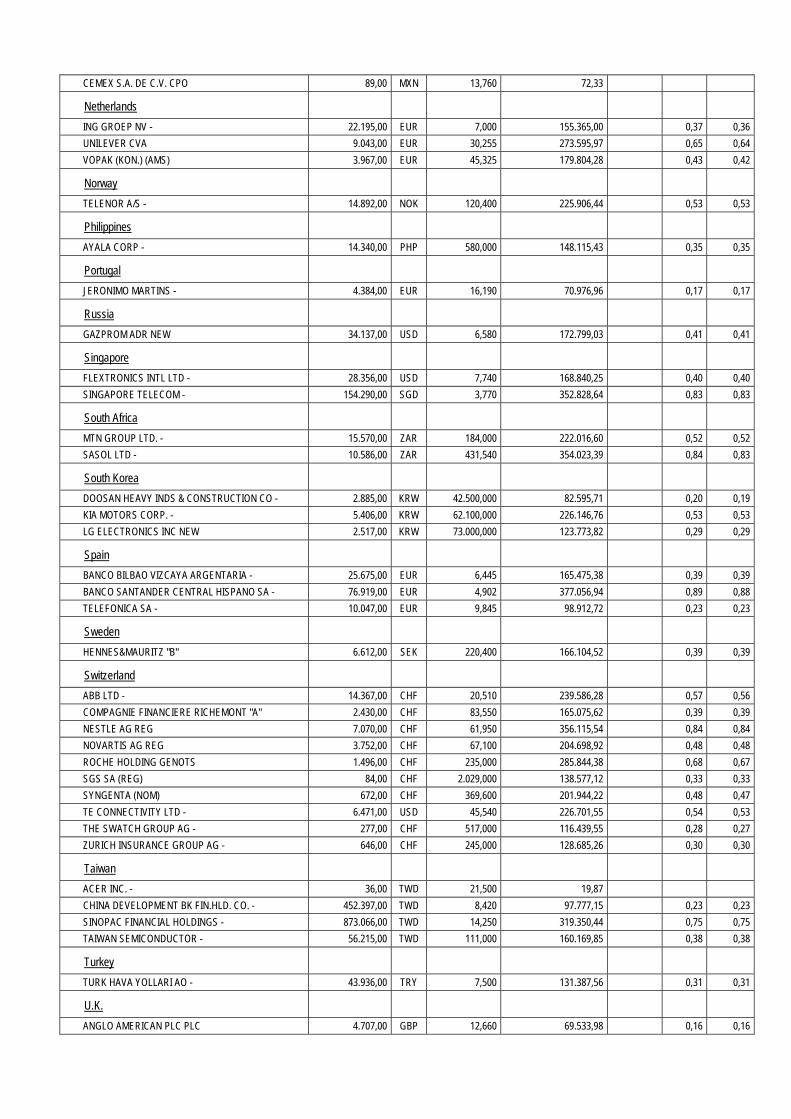
CEMEX S.A. DE C.V. CPO 89,00 MXN 13,760 72,33
Netherlands
ING GROEP NV - 22.195,00 EUR 7,000 155.365,00 0,37 0,36
UNILEVER CVA 9.043,00 EUR 30,255 273.595,97 0,65 0,64
VOPAK (KON.) (AMS) 3.967,00 EUR 45,325 179.804,28 0,43 0,42
Norway
TELENOR A/S - 14.892,00 NOK 120,400 225.906,44 0,53 0,53
Philippines
AYALA CORP - 14.340,00 PHP 580,000 148.115,43 0,35 0,35
Portugal
JERONIMO MARTINS - 4.384,00 EUR 16,190 70.976,96 0,17 0,17
Russia
GAZPROM ADR NEW 34.137,00 USD 6,580 172.799,03 0,41 0,41
Singapore
FLEXTRONICS INTL LTD - 28.356,00 USD 7,740 168.840,25 0,40 0,40
SINGAPORE TELECOM - 154.290,00 SGD 3,770 352.828,64 0,83 0,83
South Africa
MTN GROUP LTD. - 15.570,00 ZAR 184,000 222.016,60 0,52 0,52
SASOL LTD - 10.586,00 ZAR 431,540 354.023,39 0,84 0,83
South Korea
DOOSAN HEAVY INDS & CONSTRUCTION CO - 2.885,00 KRW 42.500,000 82.595,71 0,20 0,19
KIA MOTORS CORP. - 5.406,00 KRW 62.100,000 226.146,76 0,53 0,53
LG ELECTRONICS INC NEW 2.517,00 KRW 73.000,000 123.773,82 0,29 0,29
Spain
BANCO BILBAO VIZCAYA ARGENTARIA - 25.675,00 EUR 6,445 165.475,38 0,39 0,39
BANCO SANTANDER CENTRAL HISPANO SA - 76.919,00 EUR 4,902 377.056,94 0,89 0,88
TELEFONICA SA - 10.047,00 EUR 9,845 98.912,72 0,23 0,23
Sweden
HENNES&MAURITZ "B" 6.612,00 SEK 220,400 166.104,52 0,39 0,39
Switzerland
ABB LTD - 14.367,00 CHF 20,510 239.586,28 0,57 0,56
COMPAGNIE FINANCIERE RICHEMONT "A" 2.430,00 CHF 83,550 165.075,62 0,39 0,39
NESTLE AG REG 7.070,00 CHF 61,950 356.115,54 0,84 0,84
NOVARTIS AG REG 3.752,00 CHF 67,100 204.698,92 0,48 0,48
ROCHE HOLDING GENOTS 1.496,00 CHF 235,000 285.844,38 0,68 0,67
SGS SA (REG) 84,00 CHF 2.029,000 138.577,12 0,33 0,33
SYNGENTA (NOM) 672,00 CHF 369,600 201.944,22 0,48 0,47
TE CONNECTIVITY LTD - 6.471,00 USD 45,540 226.701,55 0,54 0,53
THE SWATCH GROUP AG - 277,00 CHF 517,000 116.439,55 0,28 0,27
ZURICH INSURANCE GROUP AG - 646,00 CHF 245,000 128.685,26 0,30 0,30
Taiwan
ACER INC. - 36,00 TWD 21,500 19,87
CHINA DEVELOPMENT BK FIN.HLD. CO. - 452.397,00 TWD 8,420 97.777,15 0,23 0,23
SINOPAC FINANCIAL HOLDINGS - 873.066,00 TWD 14,250 319.350,44 0,75 0,75
TAIWAN SEMICONDUCTOR - 56.215,00 TWD 111,000 160.169,85 0,38 0,38
Turkey
TURK HAVA YOLLARI AO - 43.936,00 TRY 7,500 131.387,56 0,31 0,31
U.K.
ANGLO AMERICAN PLC PLC 4.707,00 GBP 12,660 69.533,98 0,16 0,16
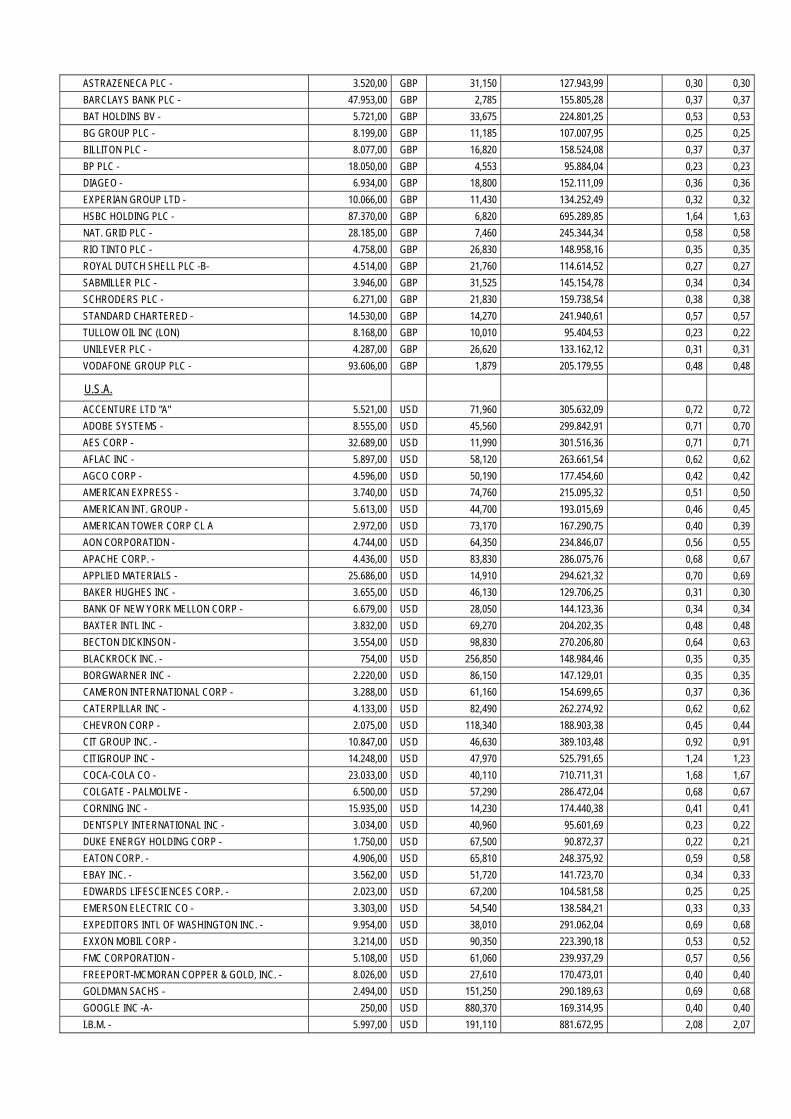
ASTRAZENECA PLC - 3.520,00 GBP 31,150 127.943,99 0,30 0,30
BARCLAYS BANK PLC - 47.953,00 GBP 2,785 155.805,28 0,37 0,37
BAT HOLDINS BV - 5.721,00 GBP 33,675 224.801,25 0,53 0,53
BG GROUP PLC - 8.199,00 GBP 11,185 107.007,95 0,25 0,25
BILLITON PLC - 8.077,00 GBP 16,820 158.524,08 0,37 0,37
BP PLC - 18.050,00 GBP 4,553 95.884,04 0,23 0,23
DIAGEO - 6.934,00 GBP 18,800 152.111,09 0,36 0,36
EXPERIAN GROUP LTD - 10.066,00 GBP 11,430 134.252,49 0,32 0,32
HSBC HOLDING PLC - 87.370,00 GBP 6,820 695.289,85 1,64 1,63
NAT. GRID PLC - 28.185,00 GBP 7,460 245.344,34 0,58 0,58
RIO TINTO PLC - 4.758,00 GBP 26,830 148.958,16 0,35 0,35
ROYAL DUTCH SHELL PLC -B- 4.514,00 GBP 21,760 114.614,52 0,27 0,27
SABMILLER PLC - 3.946,00 GBP 31,525 145.154,78 0,34 0,34
SCHRODERS PLC - 6.271,00 GBP 21,830 159.738,54 0,38 0,38
STANDARD CHARTERED - 14.530,00 GBP 14,270 241.940,61 0,57 0,57
TULLOW OIL INC (LON) 8.168,00 GBP 10,010 95.404,53 0,23 0,22
UNILEVER PLC - 4.287,00 GBP 26,620 133.162,12 0,31 0,31
VODAFONE GROUP PLC - 93.606,00 GBP 1,879 205.179,55 0,48 0,48
U.S.A.
ACCENTURE LTD "A" 5.521,00 USD 71,960 305.632,09 0,72 0,72
ADOBE SYSTEMS - 8.555,00 USD 45,560 299.842,91 0,71 0,70
AES CORP - 32.689,00 USD 11,990 301.516,36 0,71 0,71
AFLAC INC - 5.897,00 USD 58,120 263.661,54 0,62 0,62
AGCO CORP - 4.596,00 USD 50,190 177.454,60 0,42 0,42
AMERICAN EXPRESS - 3.740,00 USD 74,760 215.095,32 0,51 0,50
AMERICAN INT. GROUP - 5.613,00 USD 44,700 193.015,69 0,46 0,45
AMERICAN TOWER CORP CL A 2.972,00 USD 73,170 167.290,75 0,40 0,39
AON CORPORATION - 4.744,00 USD 64,350 234.846,07 0,56 0,55
APACHE CORP. - 4.436,00 USD 83,830 286.075,76 0,68 0,67
APPLIED MATERIALS - 25.686,00 USD 14,910 294.621,32 0,70 0,69
BAKER HUGHES INC - 3.655,00 USD 46,130 129.706,25 0,31 0,30
BANK OF NEW YORK MELLON CORP - 6.679,00 USD 28,050 144.123,36 0,34 0,34
BAXTER INTL INC - 3.832,00 USD 69,270 204.202,35 0,48 0,48
BECTON DICKINSON - 3.554,00 USD 98,830 270.206,80 0,64 0,63
BLACKROCK INC. - 754,00 USD 256,850 148.984,46 0,35 0,35
BORGWARNER INC - 2.220,00 USD 86,150 147.129,01 0,35 0,35
CAMERON INTERNATIONAL CORP - 3.288,00 USD 61,160 154.699,65 0,37 0,36
CATERPILLAR INC - 4.133,00 USD 82,490 262.274,92 0,62 0,62
CHEVRON CORP - 2.075,00 USD 118,340 188.903,38 0,45 0,44
CIT GROUP INC. - 10.847,00 USD 46,630 389.103,48 0,92 0,91
CITIGROUP INC - 14.248,00 USD 47,970 525.791,65 1,24 1,23
COCA-COLA CO - 23.033,00 USD 40,110 710.711,31 1,68 1,67
COLGATE - PALMOLIVE - 6.500,00 USD 57,290 286.472,04 0,68 0,67
CORNING INC - 15.935,00 USD 14,230 174.440,38 0,41 0,41
DENTSPLY INTERNATIONAL INC - 3.034,00 USD 40,960 95.601,69 0,23 0,22
DUKE ENERGY HOLDING CORP - 1.750,00 USD 67,500 90.872,37 0,22 0,21
EATON CORP. - 4.906,00 USD 65,810 248.375,92 0,59 0,58
EBAY INC. - 3.562,00 USD 51,720 141.723,70 0,34 0,33
EDWARDS LIFESCIENCES CORP. - 2.023,00 USD 67,200 104.581,58 0,25 0,25
EMERSON ELECTRIC CO - 3.303,00 USD 54,540 138.584,21 0,33 0,33
EXPEDITORS INTL OF WASHINGTON INC. - 9.954,00 USD 38,010 291.062,04 0,69 0,68
EXXON MOBIL CORP - 3.214,00 USD 90,350 223.390,18 0,53 0,52
FMC CORPORATION - 5.108,00 USD 61,060 239.937,29 0,57 0,56
FREEPORT-MCMORAN COPPER & GOLD, INC. - 8.026,00 USD 27,610 170.473,01 0,40 0,40
GOLDMAN SACHS - 2.494,00 USD 151,250 290.189,63 0,69 0,68
GOOGLE INC -A- 250,00 USD 880,370 169.314,95 0,40 0,40
I.B.M. - 5.997,00 USD 191,110 881.672,95 2,08 2,07
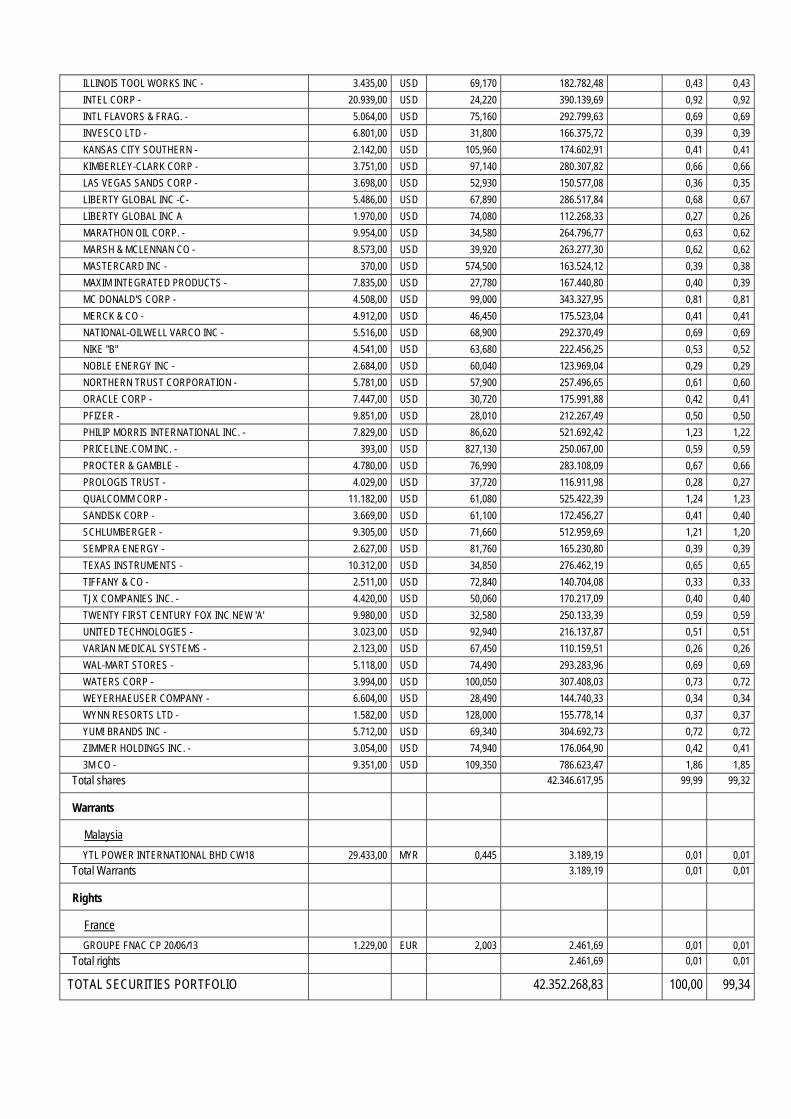
ILLINOIS TOOL WORKS INC - 3.435,00 USD 69,170 182.782,48 0,43 0,43
INTEL CORP - 20.939,00 USD 24,220 390.139,69 0,92 0,92
INTL FLAVORS & FRAG. - 5.064,00 USD 75,160 292.799,63 0,69 0,69
INVESCO LTD - 6.801,00 USD 31,800 166.375,72 0,39 0,39
KANSAS CITY SOUTHERN - 2.142,00 USD 105,960 174.602,91 0,41 0,41
KIMBERLEY-CLARK CORP - 3.751,00 USD 97,140 280.307,82 0,66 0,66
LAS VEGAS SANDS CORP - 3.698,00 USD 52,930 150.577,08 0,36 0,35
LIBERTY GLOBAL INC -C- 5.486,00 USD 67,890 286.517,84 0,68 0,67
LIBERTY GLOBAL INC A 1.970,00 USD 74,080 112.268,33 0,27 0,26
MARATHON OIL CORP. - 9.954,00 USD 34,580 264.796,77 0,63 0,62
MARSH & MCLENNAN CO - 8.573,00 USD 39,920 263.277,30 0,62 0,62
MASTERCARD INC - 370,00 USD 574,500 163.524,12 0,39 0,38
MAXIM INTEGRATED PRODUCTS - 7.835,00 USD 27,780 167.440,80 0,40 0,39
MC DONALD'S CORP - 4.508,00 USD 99,000 343.327,95 0,81 0,81
MERCK & CO - 4.912,00 USD 46,450 175.523,04 0,41 0,41
NATIONAL-OILWELL VARCO INC - 5.516,00 USD 68,900 292.370,49 0,69 0,69
NIKE "B" 4.541,00 USD 63,680 222.456,25 0,53 0,52
NOBLE ENERGY INC - 2.684,00 USD 60,040 123.969,04 0,29 0,29
NORTHERN TRUST CORPORATION - 5.781,00 USD 57,900 257.496,65 0,61 0,60
ORACLE CORP - 7.447,00 USD 30,720 175.991,88 0,42 0,41
PFIZER - 9.851,00 USD 28,010 212.267,49 0,50 0,50
PHILIP MORRIS INTERNATIONAL INC. - 7.829,00 USD 86,620 521.692,42 1,23 1,22
PRICELINE.COM INC. - 393,00 USD 827,130 250.067,00 0,59 0,59
PROCTER & GAMBLE - 4.780,00 USD 76,990 283.108,09 0,67 0,66
PROLOGIS TRUST - 4.029,00 USD 37,720 116.911,98 0,28 0,27
QUALCOMM CORP - 11.182,00 USD 61,080 525.422,39 1,24 1,23
SANDISK CORP - 3.669,00 USD 61,100 172.456,27 0,41 0,40
SCHLUMBERGER - 9.305,00 USD 71,660 512.959,69 1,21 1,20
SEMPRA ENERGY - 2.627,00 USD 81,760 165.230,80 0,39 0,39
TEXAS INSTRUMENTS - 10.312,00 USD 34,850 276.462,19 0,65 0,65
TIFFANY & CO - 2.511,00 USD 72,840 140.704,08 0,33 0,33
TJX COMPANIES INC. - 4.420,00 USD 50,060 170.217,09 0,40 0,40
TWENTY FIRST CENTURY FOX INC NEW 'A' 9.980,00 USD 32,580 250.133,39 0,59 0,59
UNITED TECHNOLOGIES - 3.023,00 USD 92,940 216.137,87 0,51 0,51
VARIAN MEDICAL SYSTEMS - 2.123,00 USD 67,450 110.159,51 0,26 0,26
WAL-MART STORES - 5.118,00 USD 74,490 293.283,96 0,69 0,69
WATERS CORP - 3.994,00 USD 100,050 307.408,03 0,73 0,72
WEYERHAEUSER COMPANY - 6.604,00 USD 28,490 144.740,33 0,34 0,34
WYNN RESORTS LTD - 1.582,00 USD 128,000 155.778,14 0,37 0,37
YUM! BRANDS INC - 5.712,00 USD 69,340 304.692,73 0,72 0,72
ZIMMER HOLDINGS INC. - 3.054,00 USD 74,940 176.064,90 0,42 0,41
3M CO - 9.351,00 USD 109,350 786.623,47 1,86 1,85
Total shares 42.346.617,95 99,99 99,32
Warrants
Malaysia
YTL POWER INTERNATIONAL BHD CW18 29.433,00 MYR 0,445 3.189,19 0,01 0,01
Total Warrants 3.189,19 0,01 0,01
Rights
France
GROUPE FNAC CP 20/06/13 1.229,00 EUR 2,003 2.461,69 0,01 0,01
Total rights 2.461,69 0,01 0,01
TOTAL SECURITIES PORTFOLIO 42.352.268,83 100,00 99,34

COLLATERAL RECEIVED
Belgium
KBC GROUP COLLATERAL EUR 1.450.923,04 EUR 1,000 1.450.923,04 3,41
TOTAL RECEIVED COLLATERAL 1.450.923,04 3,40
CASH AT BANK AND IN HAND
Demand accounts
Belgium
KBC GROUP AUD 1.510,12 AUD 1,000 1.063,43 0,00
KBC GROUP CAD 3.156,31 CAD 1,000 2.301,69 0,01
KBC GROUP CHF 4.400,77 CHF 1,000 3.578,15 0,01
KBC GROUP CZK 20.848,89 CZK 1,000 802,65 0,00
KBC GROUP DKK 26.708,98 DKK 1,000 3.580,87 0,01
KBC GROUP EURO 128.667,38 EUR 1,000 128.667,38 0,30
KBC GROUP GBP 3.594,76 GBP 1,000 4.194,59 0,01
KBC GROUP HKD 58.756,86 HKD 1,000 5.827,84 0,01
KBC GROUP HUF 2.117.288,18 HUF 1,000 7.188,46 0,02
KBC GROUP JPY 146.342,00 JPY 1,000 1.133,38 0,00
KBC GROUP MXN 482,68 MXN 1,000 28,51
KBC GROUP NOK 10.258,91 NOK 1,000 1.292,56 0,00
KBC GROUP NZD 8.784,98 NZD 1,000 5.219,52 0,01
KBC GROUP PLN 11.961,51 PLN 1,000 2.762,35 0,01
KBC GROUP SEK 7.026,99 SEK 1,000 800,95 0,00
KBC GROUP SGD 5.509,50 SGD 1,000 3.341,93 0,01
KBC GROUP TRY 678,47 TRY 1,000 270,52 0,00
KBC GROUP USD -56.690,38 USD 1,000 -43.611,34 -0,10
KBC GROUP ZAR 10.898,13 ZAR 1,000 844,56 0,00
Total demand accounts 129.288,00 0,30
Managed futures accounts
Belgium
KBC GROUP USD FUT REK -52.500,00 USD 1,000 -40.387,72 -0,10
Total managed futures accounts -40.387,72 -0,10
TOTAL CASH AT BANK AND IN HAND 88.900,28 0,21
OTHER RECEIVABLES AND PAYABLES
Receivables
Belgium
KBC GROUP BRL RECEIVABLE 35.626,93 BRL 1,000 12.407,51 0,03
KBC GROUP COP TE ONTVANGEN 30.864.891,93 COP 1,000 12.295,10 0,03
KBC GROUP EUR RECEIVABLE 60.029,46 EUR 1,000 60.029,46 0,14
KBC GROUP KRW RECEIVABLE 19.430.696,00 KRW 1,000 13.089,14 0,03
KBC GROUP MYR RECEIVABLE 103.216,80 MYR 1,000 25.132,53 0,06
KBC GROUP TWD TE ONTVANGEN 476.023,00 TWD 1,000 12.218,94 0,03
KBC GROUP WHT TO BE RECOVERED EUR 2.957,35 EUR 1,000 2.957,35 0,01
Netherlands
KBC CLEARING NV DEKKING USD 52.500,00 USD 1,000 40.387,72 0,10
Total receivables 178.517,75 0,42
Payables
Belgium
KBC GROUP COUNTERPART ENTRY COLLATERAL IN EUR
-1.450.923,04 EUR 1,000 -1.450.923,04 -3,40

KBC GROUP EUR PAYABLE -37.551,29 EUR 1,000 -37.551,29 -0,09
Payables -1.488.474,33 -3,49
TOTAL RECEIVABLES AND PAYABLES -1.309.956,58 -3,07
OTHER
Interest receivable EUR 93.188,94 0,22
Accrued interest EUR 2.546,77 0,01
Expenses payable EUR -63.469,34 -0,15
Expenses to be carried forward EUR 21.182,70 0,05
TOTAL OTHER 53.449,07 0,13
TOTAL NET ASSETS 42.635.584,64 100,00
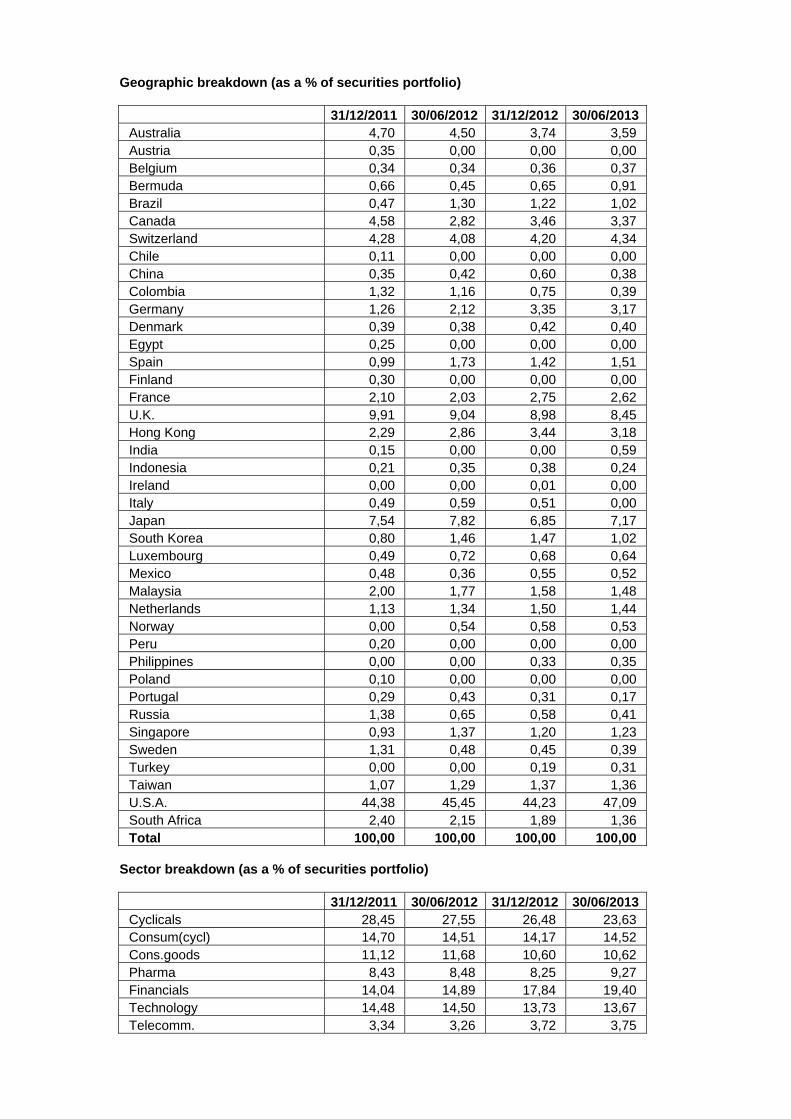
Geographic breakdown (as a % of securities portfolio)
31/12/2011 30/06/2012 31/12/2012 30/06/2013 Australia 4,70 4,50 3,74 3,59 Austria 0,35 0,00 0,00 0,00 Belgium 0,34 0,34 0,36 0,37 Bermuda 0,66 0,45 0,65 0,91 Brazil 0,47 1,30 1,22 1,02 Canada 4,58 2,82 3,46 3,37 Switzerland 4,28 4,08 4,20 4,34 Chile 0,11 0,00 0,00 0,00 China 0,35 0,42 0,60 0,38 Colombia 1,32 1,16 0,75 0,39 Germany 1,26 2,12 3,35 3,17 Denmark 0,39 0,38 0,42 0,40 Egypt 0,25 0,00 0,00 0,00 Spain 0,99 1,73 1,42 1,51 Finland 0,30 0,00 0,00 0,00 France 2,10 2,03 2,75 2,62 U.K. 9,91 9,04 8,98 8,45 Hong Kong 2,29 2,86 3,44 3,18 India 0,15 0,00 0,00 0,59 Indonesia 0,21 0,35 0,38 0,24 Ireland 0,00 0,00 0,01 0,00 Italy 0,49 0,59 0,51 0,00 Japan 7,54 7,82 6,85 7,17 South Korea 0,80 1,46 1,47 1,02 Luxembourg 0,49 0,72 0,68 0,64 Mexico 0,48 0,36 0,55 0,52 Malaysia 2,00 1,77 1,58 1,48 Netherlands 1,13 1,34 1,50 1,44 Norway 0,00 0,54 0,58 0,53 Peru 0,20 0,00 0,00 0,00 Philippines 0,00 0,00 0,33 0,35 Poland 0,10 0,00 0,00 0,00 Portugal 0,29 0,43 0,31 0,17 Russia 1,38 0,65 0,58 0,41 Singapore 0,93 1,37 1,20 1,23 Sweden 1,31 0,48 0,45 0,39 Turkey 0,00 0,00 0,19 0,31 Taiwan 1,07 1,29 1,37 1,36 U.S.A. 44,38 45,45 44,23 47,09 South Africa 2,40 2,15 1,89 1,36 Total 100,00 100,00 100,00 100,00
Sector breakdown (as a % of securities portfolio)
31/12/2011 30/06/2012 31/12/2012 30/06/2013 Cyclicals 28,45 27,55 26,48 23,63 Consum(cycl) 14,70 14,51 14,17 14,52 Cons.goods 11,12 11,68 10,60 10,62 Pharma 8,43 8,48 8,25 9,27 Financials 14,04 14,89 17,84 19,40 Technology 14,48 14,50 13,73 13,67 Telecomm. 3,34 3,26 3,72 3,75
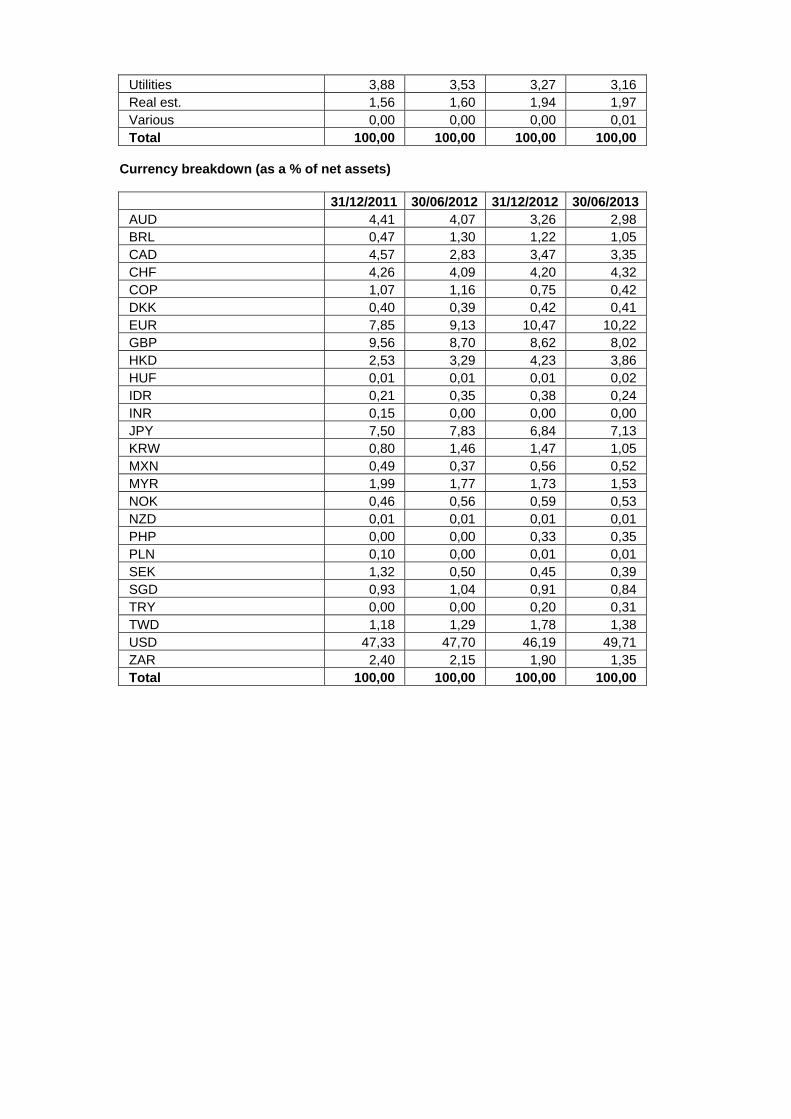
Utilities 3,88 3,53 3,27 3,16 Real est. 1,56 1,60 1,94 1,97 Various 0,00 0,00 0,00 0,01 Total 100,00 100,00 100,00 100,00
Currency breakdown (as a % of net assets)
31/12/2011 30/06/2012 31/12/2012 30/06/2013 AUD 4,41 4,07 3,26 2,98 BRL 0,47 1,30 1,22 1,05 CAD 4,57 2,83 3,47 3,35 CHF 4,26 4,09 4,20 4,32 COP 1,07 1,16 0,75 0,42 DKK 0,40 0,39 0,42 0,41 EUR 7,85 9,13 10,47 10,22 GBP 9,56 8,70 8,62 8,02 HKD 2,53 3,29 4,23 3,86 HUF 0,01 0,01 0,01 0,02 IDR 0,21 0,35 0,38 0,24 INR 0,15 0,00 0,00 0,00 JPY 7,50 7,83 6,84 7,13 KRW 0,80 1,46 1,47 1,05 MXN 0,49 0,37 0,56 0,52 MYR 1,99 1,77 1,73 1,53 NOK 0,46 0,56 0,59 0,53 NZD 0,01 0,01 0,01 0,01 PHP 0,00 0,00 0,33 0,35 PLN 0,10 0,00 0,01 0,01 SEK 1,32 0,50 0,45 0,39 SGD 0,93 1,04 0,91 0,84 TRY 0,00 0,00 0,20 0,31 TWD 1,18 1,29 1,78 1,38 USD 47,33 47,70 46,19 49,71 ZAR 2,40 2,15 1,90 1,35 Total 100,00 100,00 100,00 100,00

2.4.2 CHANGES IN THE COMPOSITION OF THE ASSETS OF KBC EQUITY FUND GLOBAL LEADERS
(IN THE CURRENCY OF THE SUB-FUND)
1st half of year YearPurchases 2.262.254,87 2.262.254,87 Sales 9.749.635,60 9.749.635,60 Total 1 12.011.890,47 12.011.890,47 Subscriptions 2.452.711,01 2.452.711,01 Redemptions 9.806.897,04 9.806.897,04 Total 2 12.259.608,05 12.259.608,05 Monthly average of total assets
45.482.167,77 45.482.167,77
Turnover rate -0,54 % -0,54 %
1st half of year YearPurchases 2.262.254,87 2.262.254,87 Sales 9.749.635,60 9.749.635,60 Total 1 12.011.890,47 12.011.890,47 Subscriptions 2.452.711,01 2.452.711,01 Redemptions 9.806.897,04 9.806.897,04 Total 2 12.259.608,05 12.259.608,05 Monthly average of total assets
67.132.136,59 67.132.136,59
Corrected turnover rate -0,37 % -0,37 %
The table above shows the capital volume of portfolio transactions. This volume (adjusted to take account of total subscriptions and redemptions) is also compared to the average net assets at the beginning and end of the period. A figure close to 0% implies that the transactions relating to the securities or transactions relating to the assets (excluding deposits and cash) in a given period only involve subscriptions and redemptions. A negative percentage shows that subscriptions and redemptions entailed few, if any, transactions in the portfolio. Active asset management may result in high turnover rates (monthly percentage >50%). The detailed list of transactions is available for consultation free of charge at the registered office of the Bevek or fund at Havenlaan 2, 1080 Brussels.

2.4.3 AMOUNT OF COMMITMENTS IN RESPECT OF FINANCIAL DERIVATIVES POSITIONS
NAME Currency Value in currency
In the currency of the sub-fund
Lot-size
Transactiondate
KBC COLLATERAL EUR
EUR 1.450.923,04 1.450.923,04 N/A 28.06.2013
KBCCLEAR DEKKING USD
USD 52.500,00 40.387,72 N/A 28.06.2013
2.4.4 CHANGES OF THE NUMBER OF SUBSCRIPTIONS AND REDEMPTIONS AND THE NET ASSET
VALUE
Classic Shares
Period Change in number of shares in circulation
Year Subscriptions Redemptions End of period
Cap. Dis. Cap. Dis. Cap. Dis. Total
2011 - 06 463.846,82 39.279,51 427.053,52 90.770,55 483.590,35 48.229,51 531.819,86
2012 - 06 108.032,78 5.014,68 460.543,88 12.406,00 131.079,25 40.838,19 171.917,44
2013 - 06 12.007,52 2.490,76 32.119,13 8.118,71 110.967,64 35.210,25 146.177,89
Period Amounts received and paid by the UCI
(in the currency of the class)
Year Subscriptions Redemptions
Capitalization Distribution Capitalization Distribution
2011 - 06 120.127.184,80 8.508.448,78 109.549.986,80 20.319.985,61
2012 - 06 26.525.021,18 1.069.240,99 107.233.134,10 2.603.576,09
2013 - 06 3.342.848,33 590.643,21 8.885.470,72 1.901.988,00
Period Net asset value
End of period (in the currency of the class)
Year Of the class Of one share
Capitalization Distribution
2011 - 06 135.382.371,44 258,05 219,66
2012 - 06 43.051.742,40 259,96 219,81
2013 - 06 39.843.381,64 283,55 237,95
Institutional B Shares
Period Change in number of shares in circulation
Year Subscriptions Redemptions End of period
Cap. Dis. Cap. Dis. Cap. Dis. Total 2012 - 06 427.720,00 263.720,00 164.000,00 164.000,00
2013 - 06 86.451,00 240.622,00 9.829,00 9.829,00
Period Amounts received and paid by the UCI
(in the currency of the class)
Year Subscriptions Redemptions
Capitalization Distribution Capitalization Distribution
2012 - 06 105.932.170,70 68.025.439,57
2013 - 06 23.488.425,49 65.580.474,40

Period Net asset value
End of period (in the currency of the class)
Year Of the class Of one share
Capitalization Distribution
2012 - 06 42.673.873,50 260,21
2013 - 06 2.792.203,00 284,08
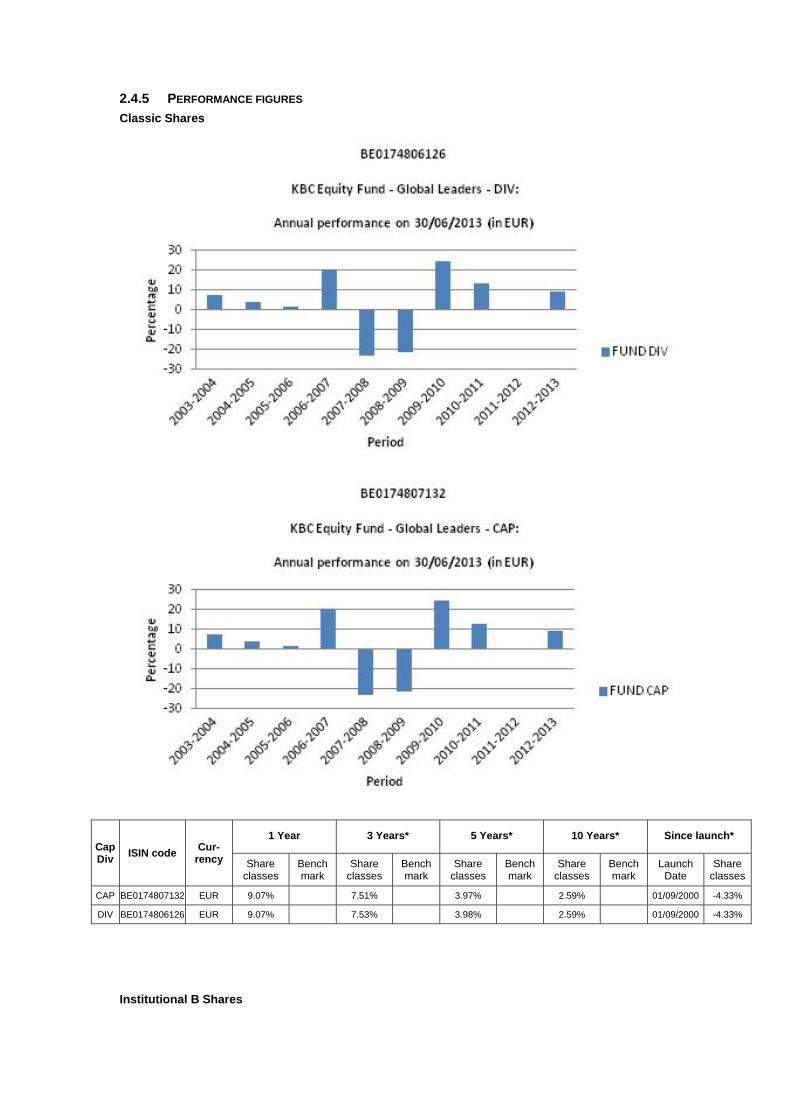
2.4.5 PERFORMANCE FIGURES
Classic Shares
Cap Div
ISIN code Cur-
rency
1 Year 3 Years* 5 Years* 10 Years* Since launch*
Share classes
Bench mark
Share classes
Bench mark
Share classes
Bench mark
Share classes
Bench mark
Launch Date
Share classes
CAP BE0174807132 EUR 9.07% 7.51% 3.97% 2.59% 01/09/2000 -4.33%
DIV BE0174806126 EUR 9.07% 7.53% 3.98% 2.59% 01/09/2000 -4.33%
Institutional B Shares
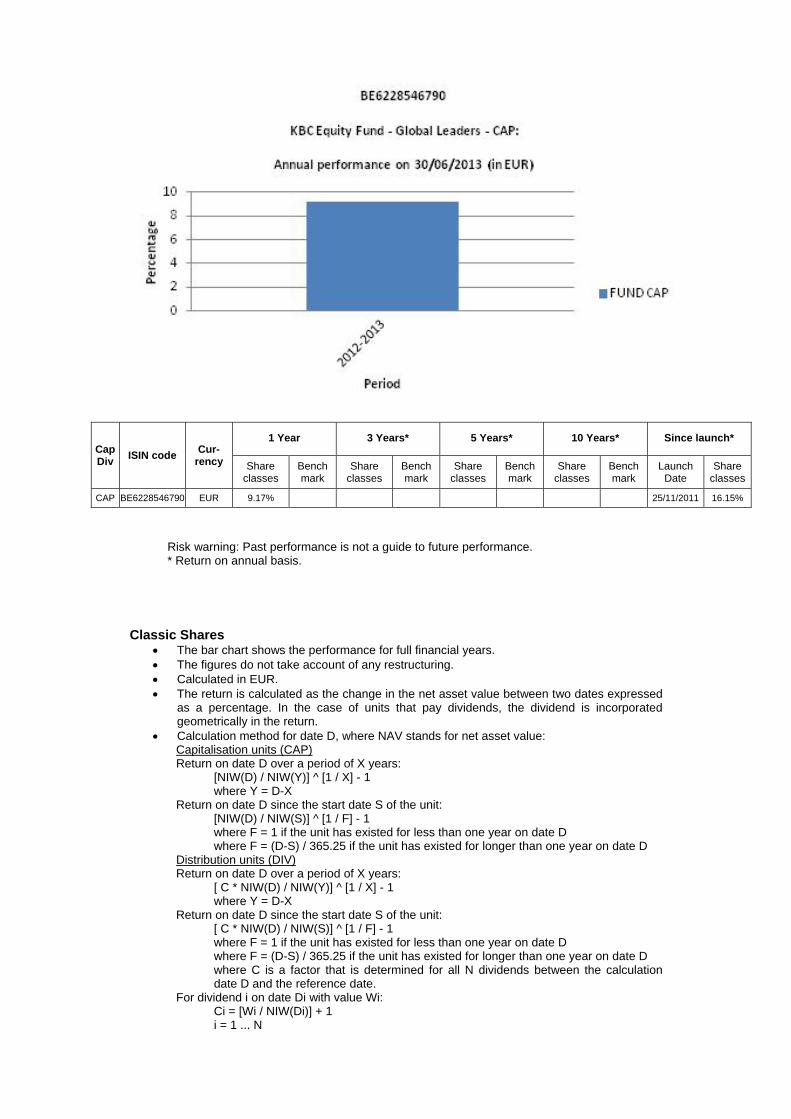
Cap Div
ISIN code Cur-
rency
1 Year 3 Years* 5 Years* 10 Years* Since launch*
Share classes
Bench mark
Share classes
Bench mark
Share classes
Bench mark
Share classes
Bench mark
Launch Date
Share classes
CAP BE6228546790 EUR 9.17% 25/11/2011 16.15%
Risk warning: Past performance is not a guide to future performance. * Return on annual basis.
Classic Shares The bar chart shows the performance for full financial years. The figures do not take account of any restructuring. Calculated in EUR. The return is calculated as the change in the net asset value between two dates expressed
as a percentage. In the case of units that pay dividends, the dividend is incorporated geometrically in the return.
Calculation method for date D, where NAV stands for net asset value: Capitalisation units (CAP) Return on date D over a period of X years:
[NIW(D) / NIW(Y)] ^ [1 / X] - 1 where Y = D-X
Return on date D since the start date S of the unit: [NIW(D) / NIW(S)] ^ [1 / F] - 1 where F = 1 if the unit has existed for less than one year on date D where F = (D-S) / 365.25 if the unit has existed for longer than one year on date D
Distribution units (DIV) Return on date D over a period of X years:
[ C * NIW(D) / NIW(Y)] ^ [1 / X] - 1 where Y = D-X
Return on date D since the start date S of the unit: [ C * NIW(D) / NIW(S)] ^ [1 / F] - 1 where F = 1 if the unit has existed for less than one year on date D where F = (D-S) / 365.25 if the unit has existed for longer than one year on date D where C is a factor that is determined for all N dividends between the calculation date D and the reference date.
For dividend i on date Di with value Wi: Ci = [Wi / NIW(Di)] + 1 i = 1 ... N

from whichC = C0 * .... * CN. If the interval between the two dates exceeds one year, the ordinary return calculation is
converted into a return on an annual basis by taking the nth square root of 1 plus the total return of the unit.
The return figures shown above do not take account of the fees and charges associated with the issue and redemption of units.
These are the performance figures for capitalisation and distribution shares.
Institutional B Shares The bar chart shows the performance for full financial years. The figures do not take account of any restructuring. Calculated in EUR. The return is calculated as the change in the net asset value between two dates expressed
as a percentage. Calculation method for date D, where NAV stands for net asset value:
Capitalisation units (CAP) Return on date D over a period of X years:
[NIW(D) / NIW(Y)] ^ [1 / X] - 1 where Y = D-X
Return on date D since the start date S of the unit: [NIW(D) / NIW(S)] ^ [1 / F] - 1 where F = 1 if the unit has existed for less than one year on date D where F = (D-S) / 365.25 if the unit has existed for longer than one year on date D
If the interval between the two dates exceeds one year, the ordinary return calculation is converted into a return on an annual basis by taking the nth square root of 1 plus the total return of the unit.
The return figures shown above do not take account of the fees and charges associated with the issue and redemption of units.
These are the performance figures for capitalization shares.

2.4.6 COSTS Ongoing Charges: * Classic Shares Distribution: 1.766% Classic Shares Capitalization: 1.761% Institutional B Shares Capitalization: 1.676% * The following costs have not been included in the ongoing charges: - Interest payments on loans taken out - Payments in respect of financial derivatives - Fees and charges paid directly by the investor - Any soft commissions
SOFT COMMISSIONS The management company or the appointed manager, as the case may be, is the recipient of soft commissions. The recipient has laid down an internal policy as regards accepting soft commissions and avoiding possible conflicts of interest in this respect, and has put appropriate internal controls in place to ensure this policy is observed. For more information, please see the ‘General’ section of the annual report.
Broker
Commission gross
in EUR
paid during the period:
1‐01‐13
‐
30‐06‐13
CSA Credits
in EUR
accrued during the period:
1‐01‐13
‐
30‐06‐13 Percentage
CITI 2,130 1,084 50.88%
CSFBSAS 595 223 37.49%
INSTINET 4,781 2,388 49.94%
MORGAN STANLEY 38 14 37.50%
UBSWDR 7 3 42.83%
FEE-SHARING AGREEMENTS AND REBATES: The management company may share its fee with the distributor, and institutional and/or professional parties. In principle, the percentage share amounts to between 35% and 60% if the distributor is an entity of KBC Group NV or to between 35% and 70% if the distributor is not an entity of KBC Group NV. However, in a small number of cases, the distributor’s fee is less than 35%. Investors may, on request, obtain more information on these cases. If the management company invests the assets of the undertaking for collective investment in units of undertakings for collective investment that are not managed by an entity of KBC Group NV, and receives a fee for doing so, it will pay this fee to the undertaking for collective investment. Fee-sharing does not affect the amount of the management fee paid by the sub-fund to the management company. This management fee is subject to the limitations laid down in the articles of association. The limitations may only be amended after approval by the general meeting of shareholders. The management company has concluded a distribution agreement with the distributor in order to facilitate the wider distribution of the sub-fund's units by using multiple distribution channels. It is in the interests of the holders of units, the sub-fund and of the distributor for the largest possible number of units to be sold and for the assets of the sub-fund to be maximised in this way. In this respect, there is therefore no question of any conflict of interest.
2.4.7 NOTES TO THE FINANCIAL STATEMENTS AND OTHER DATA Fee for managing the investment portfolio: 1.5% per annum calculated on the basis of the average total net assets of the sub-fund, no management fee is charged on assets assets invested in investment undertakings managed by a financial institution of the KBC group. KBC Fund Management Limited receives a fee from the management company of max. 1.5% calculated on that part of the portfolio that it manages, without the total management fee received by the management company being exceeded.
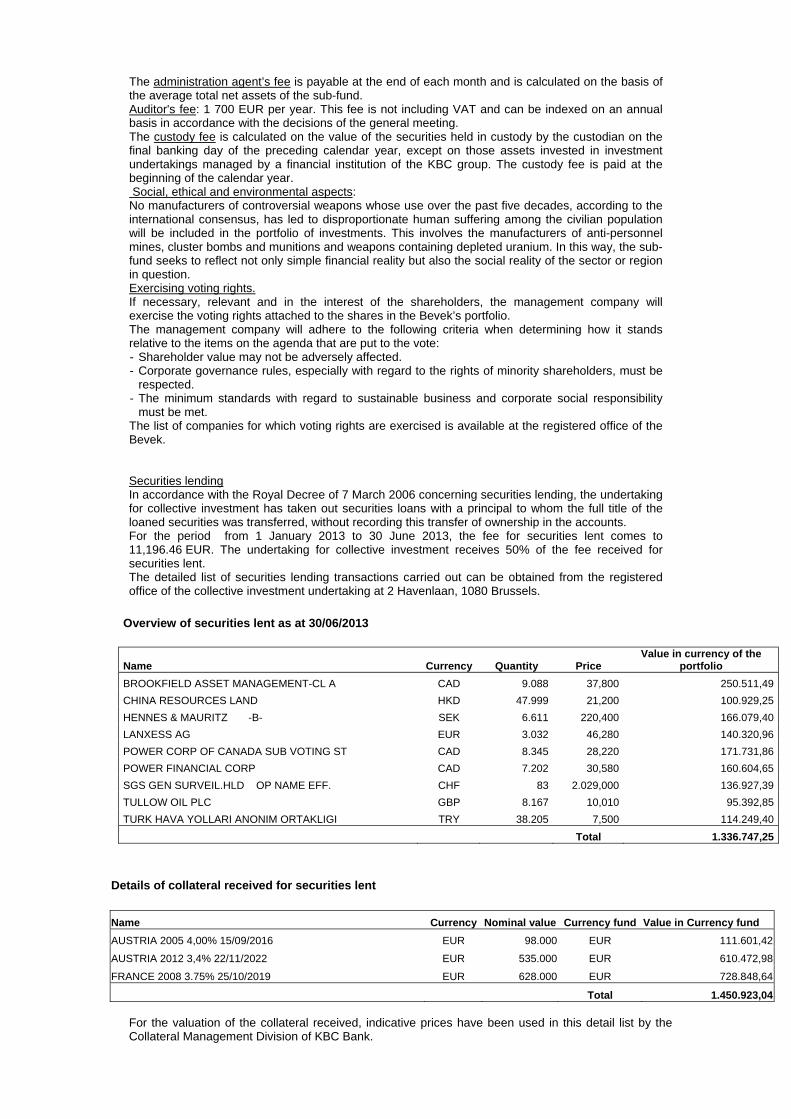
The administration agent’s fee is payable at the end of each month and is calculated on the basis of the average total net assets of the sub-fund. Auditor's fee: 1 700 EUR per year. This fee is not including VAT and can be indexed on an annual basis in accordance with the decisions of the general meeting. The custody fee is calculated on the value of the securities held in custody by the custodian on the final banking day of the preceding calendar year, except on those assets invested in investment undertakings managed by a financial institution of the KBC group. The custody fee is paid at the beginning of the calendar year. Social, ethical and environmental aspects: No manufacturers of controversial weapons whose use over the past five decades, according to the international consensus, has led to disproportionate human suffering among the civilian population will be included in the portfolio of investments. This involves the manufacturers of anti-personnel mines, cluster bombs and munitions and weapons containing depleted uranium. In this way, the sub-fund seeks to reflect not only simple financial reality but also the social reality of the sector or region in question. Exercising voting rights. If necessary, relevant and in the interest of the shareholders, the management company will exercise the voting rights attached to the shares in the Bevek’s portfolio. The management company will adhere to the following criteria when determining how it stands relative to the items on the agenda that are put to the vote: - Shareholder value may not be adversely affected. - Corporate governance rules, especially with regard to the rights of minority shareholders, must be
respected. - The minimum standards with regard to sustainable business and corporate social responsibility
must be met. The list of companies for which voting rights are exercised is available at the registered office of the Bevek. Securities lending In accordance with the Royal Decree of 7 March 2006 concerning securities lending, the undertaking for collective investment has taken out securities loans with a principal to whom the full title of the loaned securities was transferred, without recording this transfer of ownership in the accounts. For the period from 1 January 2013 to 30 June 2013, the fee for securities lent comes to 11,196.46 EUR. The undertaking for collective investment receives 50% of the fee received for securities lent. The detailed list of securities lending transactions carried out can be obtained from the registered office of the collective investment undertaking at 2 Havenlaan, 1080 Brussels.
Overview of securities lent as at 30/06/2013
Name Currency Quantity Price Value in currency of the
portfolio
BROOKFIELD ASSET MANAGEMENT-CL A CAD 9.088 37,800 250.511,49
CHINA RESOURCES LAND HKD 47.999 21,200 100.929,25
HENNES & MAURITZ -B- SEK 6.611 220,400 166.079,40
LANXESS AG EUR 3.032 46,280 140.320,96
POWER CORP OF CANADA SUB VOTING ST CAD 8.345 28,220 171.731,86
POWER FINANCIAL CORP CAD 7.202 30,580 160.604,65
SGS GEN SURVEIL.HLD OP NAME EFF. CHF 83 2.029,000 136.927,39
TULLOW OIL PLC GBP 8.167 10,010 95.392,85
TURK HAVA YOLLARI ANONIM ORTAKLIGI TRY 38.205 7,500 114.249,40
Total 1.336.747,25
Details of collateral received for securities lent
Name Currency Nominal value Currency fund Value in Currency fund
AUSTRIA 2005 4,00% 15/09/2016 EUR 98.000 EUR 111.601,42
AUSTRIA 2012 3,4% 22/11/2022 EUR 535.000 EUR 610.472,98
FRANCE 2008 3.75% 25/10/2019 EUR 628.000 EUR 728.848,64
Total 1.450.923,04 For the valuation of the collateral received, indicative prices have been used in this detail list by the Collateral Management Division of KBC Bank.


Semi-Annual report as at 30th June 2013
TABLE OF CONTENTS
2. Information on KBC Equity Fund New Asia
2.1. Management report 2.1.1. Launch date and subscription price 2.1.2. Stock exchange listing 2.1.3. Aim and distinctive features of the investment policy 2.1.4. Financial portfolio management 2.1.5. Distributors 2.1.6. Index and benchmark 2.1.7. Policy conducted during the financial year 2.1.8. Future policy 2.1.9. Synthetic risk and reward indicator (SRRI)
2.2. Balance sheet
2.3. Profit and loss account
2.4. Composition of the assets and key figures
2.4.1. Composition of the assets 2.4.2. Change in the composition of the assets 2.4.3. Value of commitments in respect of financial derivatives positions 2.4.4. Evolution of the number of subscriptions, repayments and the net asset value 2.4.5. Return figures 2.4.6. Expenses 2.4.7. Notes to the financial statements and other data


2 INFORMATION ON KBC EQUITY FUND NEW ASIA
2.1 MANAGEMENT REPORT
2.1.1 LAUNCH DATE AND SUBSCRIPTION PRICE Classic Shares : Launch date: 28 January 1994 Initial subscription price: 20000 BEF Currency: EUR Institutional B Shares : Launch date: 24 November 2011 Initial subscription price: 444.36 EUR Currency: EUR
2.1.2 STOCK EXCHANGE LISTING Not applicable.
2.1.3 GOAL AND KEY PRINCIPLES OF THE INVESTMENT POLICY
SUB-FUND’S OBJECT: The main objective of this sub-fund is to generate the highest possible return for its shareholders by investing directly or indirectly in transferable securities. This is reflected in its pursuit of capital gains and income. To this end, the assets are invested, either directly or indirectly via correlated financial instruments, primarily in shares.
SUB-FUND’S INVESTMENT POLICY:
PERMITTED ASSET CLASSES: The sub-fund may invest in securities, money market instruments, units in undertakings for collective investment, deposits, financial derivatives, liquid assets and all other instruments insofar as permitted by the applicable laws and regulations and consistent with the sub-fund’s object The sub-fund shall invest no more than 10% of its assets in units of other undertakings for collective investment.
RESTRICTIONS OF THE INVESTMENT POLICY: The investment policy will be implemented within the limits set by law and regulations. The sub-fund may borrow up to 10% of its net assets, insofar as these are short-term borrowings aimed at solving temporary liquidity problems.
PERMITTED DERIVATIVES TRANSACTIONS: Derivates may be used either for hedging purposes or to achieve investment objectives. Changes will be made to the investments at regular intervals to comply with the sub-fund's investment strategy. In addition, listed and unlisted derivates may be used to achieve the objectives: these may be forward contracts, options or swaps on securities, indices, currencies or interest rates or other transactions involving derivatives. Unlisted derivatives transactions will only be concluded with prime financial institutions specialised in such transactions. Such derivatives may also be used to hedge the assets against exchange-rate fluctuations. Subject to the applicable laws and regulations and the articles of association, the sub-fund always seeks to conclude the most effective transactions. All costs associated with the transactions will be charged to the sub-fund and all income generated will be paid to the sub-fund. If the transactions result in a risk in respect of the counterparty, this risk can be hedged by using a margin management system that ensures that the sub-fund is the beneficiary of security (collateral) in the form of cash or investment grade bonds. When calculating the value of the bonds, a margin will be applied that varies depending on the residual term to maturity and the currency in which the bond in question is denominated. The relationship with the counterparty or counterparties is governed by standard international agreements.
STRATEGY SELECTED At least 75% of the assets are invested in shares of companies in Asian countries where conditions are such as to allow on accelerated economic growth in the short or medium term.
RISK CONCENTRATION Asian shares.
LENDING FINANCIAL INSTRUMENTS: The sub-fund may lend financial instruments within the limits set by law and regulations. This lending does not affect the sub-fund’s risk profile since: - it takes place within the framework of a securities lending system managed by a principal. In
addition, the sub-fund has a relationship only with the principal of the securities lending system which acts as counterparty and to which title of the loaned securities is transferred. The choice of principal is subject to strict selection criteria. The return of securities similar to the securities that have been lent is guaranteed by the principal.
- through a margin management system, the sub-fund is always guaranteed financial security, the actual value of which always exceeds the actual value of the securities that have been lent, in case the principal does not return similar securities.
The return of securities similar to the securities that have been lent can be requested at any time, which means that the lending of securities does not affect the management of the sub-fund's assets. By lending securities, the sub-fund can generate an additional return. The principal pays a fee to the management company. After deducting the fee for the margin management and clearing services of KBC Bank, most of this fee is paid to the sub-fund. The relationship with the counterparty or counterparties is governed by standard international agreements. More information is provided on the terms and conditions governing securities lending in the annual or half-yearly report for the sub-fund.
VOLATILITY OF THE NET ASSET VALUE: The volatility of the net asset value may be high due to the composition of the portfolio.
GENERAL STRATEGY FOR HEDGING THE EXCHANGE RATE RISK: In order to protect its assets against exchange rate fluctuations and within the limitations laid down in the articles of association, the sub-fund may perform transactions relating to the sale of forward currency contracts, as well as the sale of call options and the purchase of put options on currencies. The transactions in question may relate solely to contracts traded on a regulated market that operates regularly, is recognised and is open to the public or that are traded with a recognised, prime financial institution specialising in such transactions and dealing in the over-the-counter (OTC) market in options. With the same objective, the sub-fund may also sell currencies forward or exchange them in private transactions with prime financial institutions specialising in such transactions. The hedging objective of the aforementioned transactions suggests that there is a direct link between these transactions and the assets to be hedged, which implies that the transactions carried out in a particular currency may in principle not exceed, in terms of volume, either the valuation value of all the assets in the same currency or the holding period of those assets.
SOCIAL, ETHICAL AND ENVIRONMENTAL ASPECTS:
No manufacturers of controversial weapons whose use over the past five decades, according to the international consensus, has led to disproportionate human suffering among the civilian population will be included in the portfolio of investments. This involves the manufacturers of anti-personnel mines, cluster bombs and munitions and weapons containing depleted uranium. In this way, the sub-fund seeks to reflect not only simple financial reality but also the social reality of the sector or region in question.
THE EUROPEAN SAVINGS DIRECTIVE AND TAX ON DEBT CLAIM RETURNS OBTAINED THROUGH THE
REDEMPTION OF OWN UNITS OR IN THE EVENT OF FULL OR PARTIAL DISTRIBUTION OF EQUITY
CAPITAL.

The following information is of a general character and is not intended to cover all aspects of an investment in a UCITS. In certain cases entirely different rules might even apply. Moreover, both tax law and the interpretation of it can change. Investors who wish to have more information about the tax implications – in both Belgium and abroad – of acquiring, holding and transferring units should seek the advice of their usual financial and tax advisers. This UCITS shall invest a maximum of 15% of its assets directly or indirectly in debt instruments as intended by the European Savings Directive. A. European Savings Directive (Directive 2003/48/EC) The European Savings Directive has been implemented in Belgium. Since this UCITS invests a maximum of 15% of its assets directly or indirectly in debt claims as intended by the European Savings Directive, the income of this UCITS does not fall within the scope of this directive. B. Tax on debt claim returns obtained through the redemption of own units or in the event of full or partial distribution of equity capital (Article 19bis Income Tax Code 1992). The income from this UCITS is not subject to the tax on debt instrument returns as intended by Article 19bis, Income Tax Code 1992.
2.1.4 FINANCIAL PORTFOLIO MANAGEMENT The management company has delegated the intellectual management, to KBC Fund Management Limited, Joshua Dawson House, Dawson Street , Dublin 2, IRELAND..
2.1.5 DISTRIBUTORS KBC Asset Management S.A., 5, Place de la Gare, L-1616 Luxembourg.
2.1.6 INDEX AND BENCHMARK See ‘Sub-fund’s investment policy’.
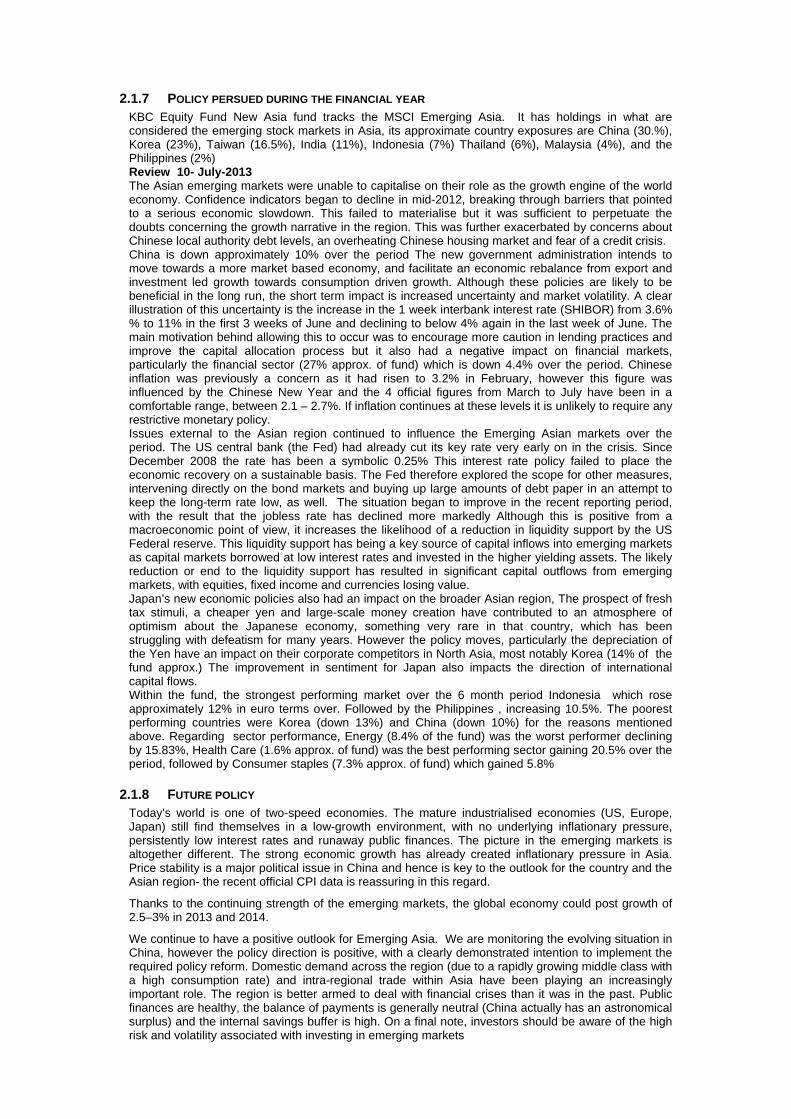
2.1.7 POLICY PERSUED DURING THE FINANCIAL YEAR KBC Equity Fund New Asia fund tracks the MSCI Emerging Asia. It has holdings in what are considered the emerging stock markets in Asia, its approximate country exposures are China (30.%), Korea (23%), Taiwan (16.5%), India (11%), Indonesia (7%) Thailand (6%), Malaysia (4%), and the Philippines (2%) Review 10- July-2013 The Asian emerging markets were unable to capitalise on their role as the growth engine of the world economy. Confidence indicators began to decline in mid-2012, breaking through barriers that pointed to a serious economic slowdown. This failed to materialise but it was sufficient to perpetuate the doubts concerning the growth narrative in the region. This was further exacerbated by concerns about Chinese local authority debt levels, an overheating Chinese housing market and fear of a credit crisis. China is down approximately 10% over the period The new government administration intends to move towards a more market based economy, and facilitate an economic rebalance from export and investment led growth towards consumption driven growth. Although these policies are likely to be beneficial in the long run, the short term impact is increased uncertainty and market volatility. A clear illustration of this uncertainty is the increase in the 1 week interbank interest rate (SHIBOR) from 3.6% % to 11% in the first 3 weeks of June and declining to below 4% again in the last week of June. The main motivation behind allowing this to occur was to encourage more caution in lending practices and improve the capital allocation process but it also had a negative impact on financial markets, particularly the financial sector (27% approx. of fund) which is down 4.4% over the period. Chinese inflation was previously a concern as it had risen to 3.2% in February, however this figure was influenced by the Chinese New Year and the 4 official figures from March to July have been in a comfortable range, between 2.1 – 2.7%. If inflation continues at these levels it is unlikely to require any restrictive monetary policy. Issues external to the Asian region continued to influence the Emerging Asian markets over the period. The US central bank (the Fed) had already cut its key rate very early on in the crisis. Since December 2008 the rate has been a symbolic 0.25% This interest rate policy failed to place the economic recovery on a sustainable basis. The Fed therefore explored the scope for other measures, intervening directly on the bond markets and buying up large amounts of debt paper in an attempt to keep the long-term rate low, as well. The situation began to improve in the recent reporting period, with the result that the jobless rate has declined more markedly Although this is positive from a macroeconomic point of view, it increases the likelihood of a reduction in liquidity support by the US Federal reserve. This liquidity support has being a key source of capital inflows into emerging markets as capital markets borrowed at low interest rates and invested in the higher yielding assets. The likely reduction or end to the liquidity support has resulted in significant capital outflows from emerging markets, with equities, fixed income and currencies losing value. Japan’s new economic policies also had an impact on the broader Asian region, The prospect of fresh tax stimuli, a cheaper yen and large-scale money creation have contributed to an atmosphere of optimism about the Japanese economy, something very rare in that country, which has been struggling with defeatism for many years. However the policy moves, particularly the depreciation of the Yen have an impact on their corporate competitors in North Asia, most notably Korea (14% of the fund approx.) The improvement in sentiment for Japan also impacts the direction of international capital flows. Within the fund, the strongest performing market over the 6 month period Indonesia which rose approximately 12% in euro terms over. Followed by the Philippines , increasing 10.5%. The poorest performing countries were Korea (down 13%) and China (down 10%) for the reasons mentioned above. Regarding sector performance, Energy (8.4% of the fund) was the worst performer declining by 15.83%, Health Care (1.6% approx. of fund) was the best performing sector gaining 20.5% over the period, followed by Consumer staples (7.3% approx. of fund) which gained 5.8%
2.1.8 FUTURE POLICY Today’s world is one of two-speed economies. The mature industrialised economies (US, Europe, Japan) still find themselves in a low-growth environment, with no underlying inflationary pressure, persistently low interest rates and runaway public finances. The picture in the emerging markets is altogether different. The strong economic growth has already created inflationary pressure in Asia. Price stability is a major political issue in China and hence is key to the outlook for the country and the Asian region- the recent official CPI data is reassuring in this regard.
Thanks to the continuing strength of the emerging markets, the global economy could post growth of 2.5–3% in 2013 and 2014.
We continue to have a positive outlook for Emerging Asia. We are monitoring the evolving situation in China, however the policy direction is positive, with a clearly demonstrated intention to implement the required policy reform. Domestic demand across the region (due to a rapidly growing middle class with a high consumption rate) and intra-regional trade within Asia have been playing an increasingly important role. The region is better armed to deal with financial crises than it was in the past. Public finances are healthy, the balance of payments is generally neutral (China actually has an astronomical surplus) and the internal savings buffer is high. On a final note, investors should be aware of the high risk and volatility associated with investing in emerging markets

2.1.9 SYNTHETIC RISK AND REWARD INDICATOR Classic Shares: 6 on a scale of 1 (lowest risk) to 7 (highest risk). Institutional B Shares: 6 on a scale of 1 (lowest risk) to 7 (highest risk). The value of a share can decrease or increase and the investor may not get back the amount invested. In accordance with Commission Regulation (EU) No. 583/2010, a synthetic risk and reward indicator has been calculated. This indicator provides a quantitative measure of the sub-fund's potential return and the risk involved, calculated in the currency in which the sub-fund is denominated. It is given as a figure between 1 and 7. The higher the figure, the greater the potential return, but also the more difficult it is to predict this return. Losses are possible too. The lowest figure does not mean that the investment is entirely free of risk. However, it does indicate that, compared with the higher figures, this product will generally provide a lower, but more predictable return. The synthetic risk and reward indicator is assessed regularly and can therefore go up or down based on data from the past. Data from the past is not always a reliable indicator of future risk and return.

2.2 BALANCE SHEET
Balance sheet layout 30/06/2013 (in the currency of the sub-fundt)
30/06/2012 (in the currency of the sub-fund )
TOTAL NET ASSETS 214.124.462,71 275.469.979,36
II. Securities, money market instruments, UCIs and derivatives
A. Bonds and other debt instruments a) Bonds 985.453,20 843.520,40 a} Collateral received in the form of bonds 12.405.149,52 25.047.945,13 C. Shares and similar instruments a) Shares 195.240.446,81 248.542.220,78 Of which securities lent 11.699.768,92 23.290.977,47 D. Other securities 2.595,27 30,19 E. Open-end undertakings for collective investment 16.513.716,42 22.699.432,68 F. Derivative financial instruments j) Foreign exchange Futures and forward contracts (+/-) -10.109,00 m) Financial indices Futures and forward contracts (+/-) 17.442,45
IV. Receivables and payables within one year A. Receivables a) Accounts receivable 11.134.534,71 476.705,93 B. Payables a) Accounts payable (-) -9.204.120,11 -498.835,44 c) Borrowings (-) -2.567.181,57 -185.288,02 d) Collateral (-) -12.405.149,52 -25.047.945,13
V. Deposits and cash at bank and in hand A. Demand balances at banks 597.801,49 1.868.286,61
VI. Accruals and deferrals A. Expense to be carried forward 95.611,04 72.560,28 B. Accrued income 1.567.127,35 1.808.285,44 C. Accrued expense (-) -241.521,90 -164.272,94
TOTAL SHAREHOLDERS' EQUITY 214.124.462,71 275.469.979,36
A. Capital 229.164.374,70 266.328.054,19
B. Income equalization -158.097,25 -139.915,27
D. Result for the period -14.881.814,74 9.281.840,44
Off-balance-sheet headings
I Collateral (+/-)
I.A Collateral (+/-)
I.A.A Securities/market instruments 12.405.149,52 25.047.945,13
III Notional amounts of futures and forward contracts
III.A Purchased futures and forward contracts 1.737.789,27

IX Financial instruments lent 11.699.768,92 23.290.977,47
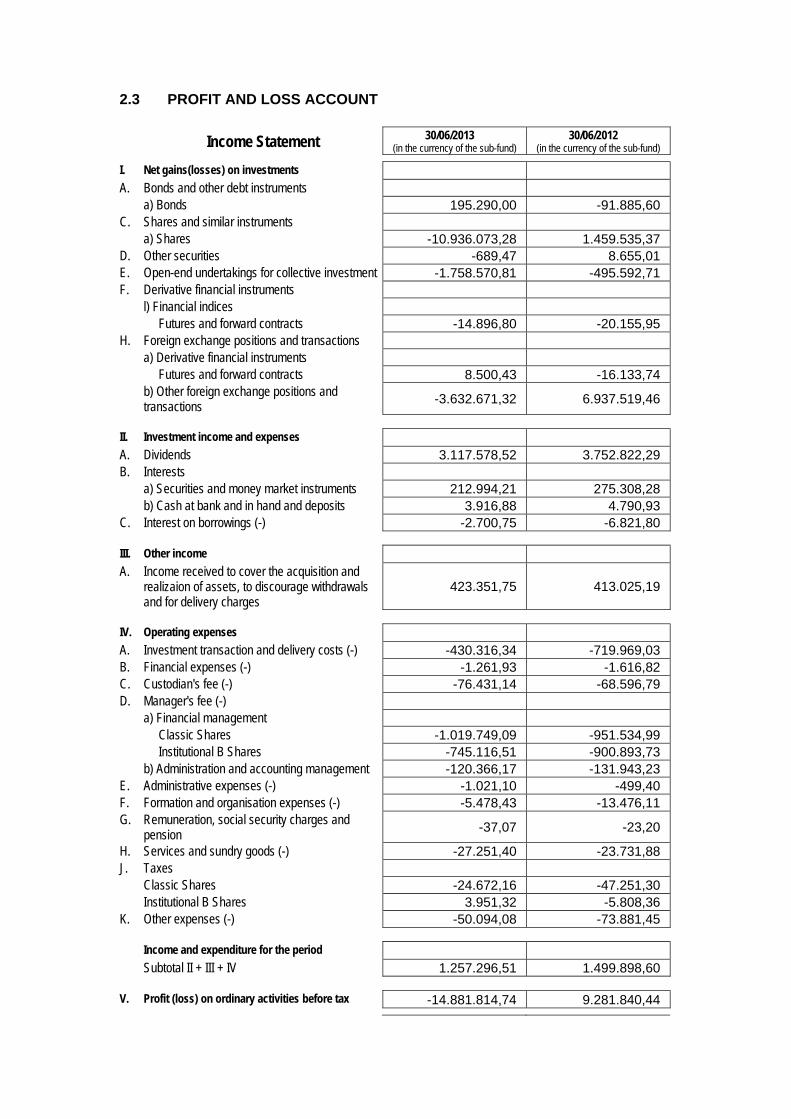
2.3 PROFIT AND LOSS ACCOUNT
Income Statement 30/06/2013 (in the currency of the sub-fund)
30/06/2012 (in the currency of the sub-fund)
I. Net gains(losses) on investments A. Bonds and other debt instruments a) Bonds 195.290,00 -91.885,60 C. Shares and similar instruments a) Shares -10.936.073,28 1.459.535,37 D. Other securities -689,47 8.655,01 E. Open-end undertakings for collective investment -1.758.570,81 -495.592,71 F. Derivative financial instruments l) Financial indices Futures and forward contracts -14.896,80 -20.155,95 H. Foreign exchange positions and transactions a) Derivative financial instruments Futures and forward contracts 8.500,43 -16.133,74 b) Other foreign exchange positions and
transactions -3.632.671,32 6.937.519,46
II. Investment income and expenses A. Dividends 3.117.578,52 3.752.822,29 B. Interests a) Securities and money market instruments 212.994,21 275.308,28 b) Cash at bank and in hand and deposits 3.916,88 4.790,93 C. Interest on borrowings (-) -2.700,75 -6.821,80
III. Other income A. Income received to cover the acquisition and
realizaion of assets, to discourage withdrawals and for delivery charges
423.351,75 413.025,19
IV. Operating expenses A. Investment transaction and delivery costs (-) -430.316,34 -719.969,03 B. Financial expenses (-) -1.261,93 -1.616,82 C. Custodian's fee (-) -76.431,14 -68.596,79 D. Manager's fee (-) a) Financial management Classic Shares -1.019.749,09 -951.534,99 Institutional B Shares -745.116,51 -900.893,73 b) Administration and accounting management -120.366,17 -131.943,23 E. Administrative expenses (-) -1.021,10 -499,40 F. Formation and organisation expenses (-) -5.478,43 -13.476,11 G. Remuneration, social security charges and
pension -37,07 -23,20
H. Services and sundry goods (-) -27.251,40 -23.731,88 J. Taxes Classic Shares -24.672,16 -47.251,30 Institutional B Shares 3.951,32 -5.808,36 K. Other expenses (-) -50.094,08 -73.881,45
Income and expenditure for the period Subtotal II + III + IV 1.257.296,51 1.499.898,60
V. Profit (loss) on ordinary activities before tax -14.881.814,74 9.281.840,44
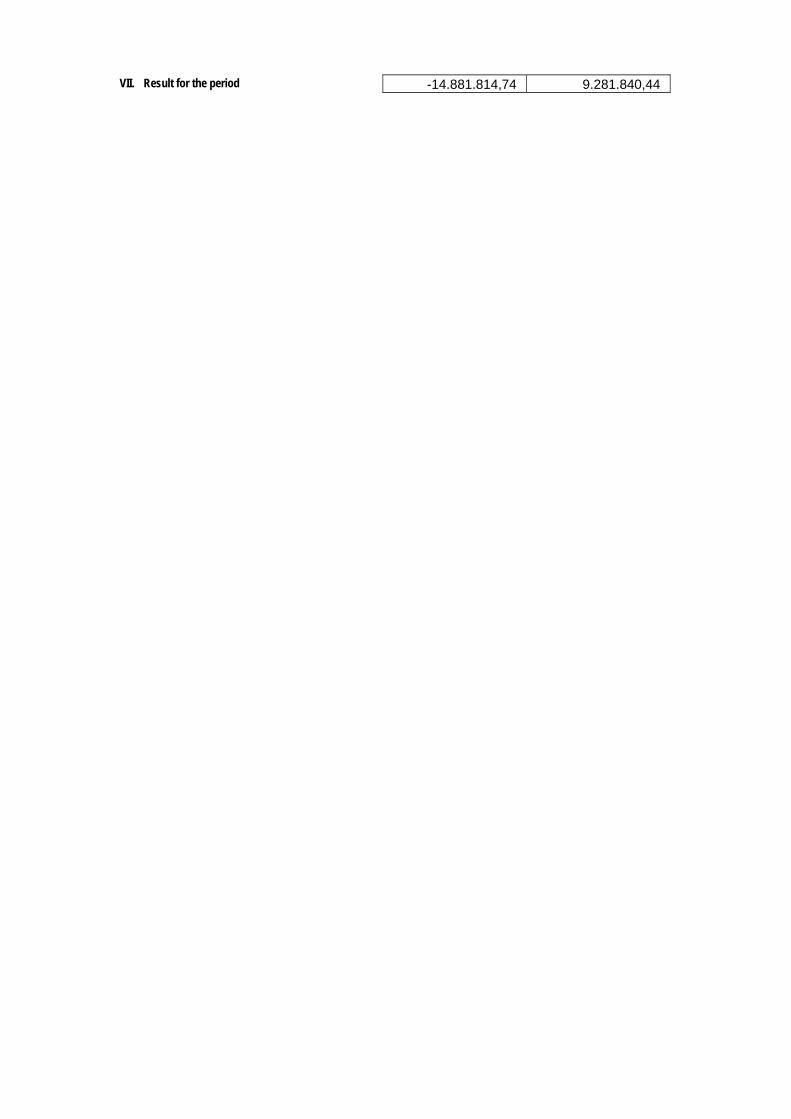
VII. Result for the period -14.881.814,74 9.281.840,44
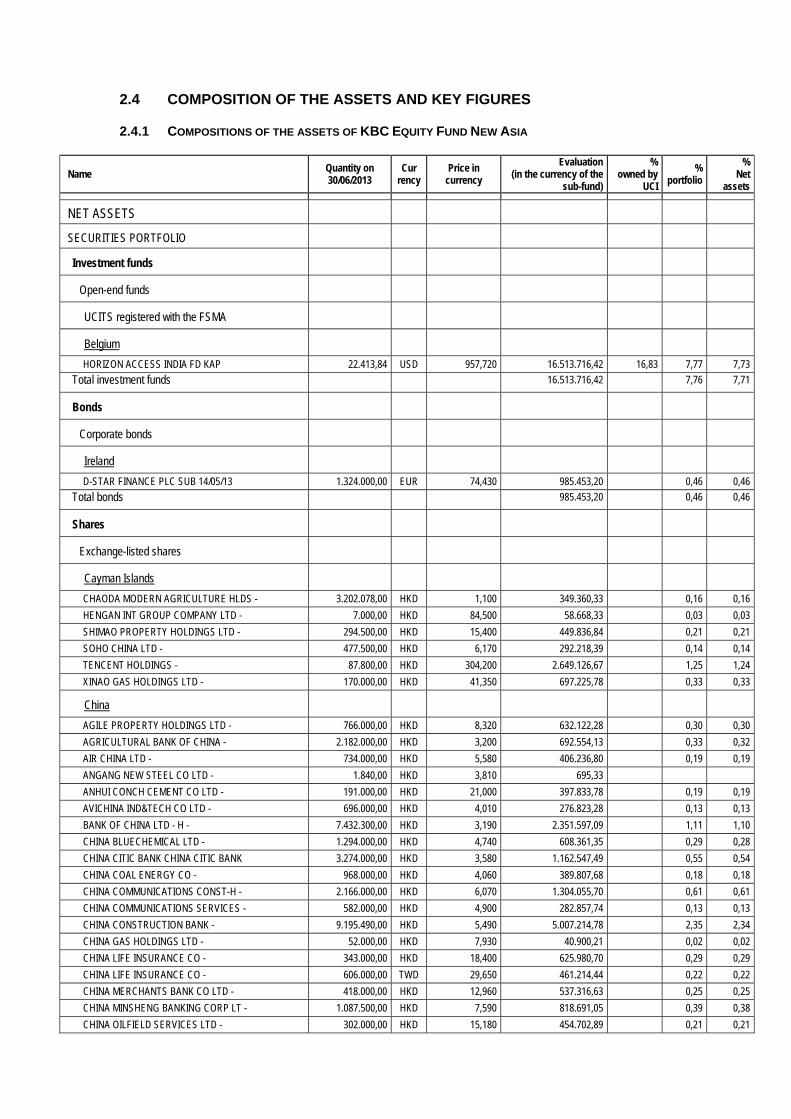
2.4 COMPOSITION OF THE ASSETS AND KEY FIGURES
2.4.1 COMPOSITIONS OF THE ASSETS OF KBC EQUITY FUND NEW ASIA
Name Quantity on 30/06/2013
Cur rency
Price in currency
Evaluation (in the currency of the
sub-fund)
% owned by
UCI
% portfolio
% Net
assets
NET ASSETS
SECURITIES PORTFOLIO
Investment funds
Open-end funds
UCITS registered with the FSMA
Belgium
HORIZON ACCESS INDIA FD KAP 22.413,84 USD 957,720 16.513.716,42 16,83 7,77 7,73
Total investment funds 16.513.716,42 7,76 7,71
Bonds
Corporate bonds
Ireland
D-STAR FINANCE PLC SUB 14/05/13 1.324.000,00 EUR 74,430 985.453,20 0,46 0,46
Total bonds 985.453,20 0,46 0,46
Shares
Exchange-listed shares
Cayman Islands
CHAODA MODERN AGRICULTURE HLDS - 3.202.078,00 HKD 1,100 349.360,33 0,16 0,16
HENGAN INT GROUP COMPANY LTD - 7.000,00 HKD 84,500 58.668,33 0,03 0,03
SHIMAO PROPERTY HOLDINGS LTD - 294.500,00 HKD 15,400 449.836,84 0,21 0,21
SOHO CHINA LTD - 477.500,00 HKD 6,170 292.218,39 0,14 0,14
TENCENT HOLDINGS - 87.800,00 HKD 304,200 2.649.126,67 1,25 1,24
XINAO GAS HOLDINGS LTD - 170.000,00 HKD 41,350 697.225,78 0,33 0,33
China
AGILE PROPERTY HOLDINGS LTD - 766.000,00 HKD 8,320 632.122,28 0,30 0,30
AGRICULTURAL BANK OF CHINA - 2.182.000,00 HKD 3,200 692.554,13 0,33 0,32
AIR CHINA LTD - 734.000,00 HKD 5,580 406.236,80 0,19 0,19
ANGANG NEW STEEL CO LTD - 1.840,00 HKD 3,810 695,33
ANHUI CONCH CEMENT CO LTD - 191.000,00 HKD 21,000 397.833,78 0,19 0,19
AVICHINA IND&TECH CO LTD - 696.000,00 HKD 4,010 276.823,28 0,13 0,13
BANK OF CHINA LTD - H - 7.432.300,00 HKD 3,190 2.351.597,09 1,11 1,10
CHINA BLUECHEMICAL LTD - 1.294.000,00 HKD 4,740 608.361,35 0,29 0,28
CHINA CITIC BANK CHINA CITIC BANK 3.274.000,00 HKD 3,580 1.162.547,49 0,55 0,54
CHINA COAL ENERGY CO - 968.000,00 HKD 4,060 389.807,68 0,18 0,18
CHINA COMMUNICATIONS CONST-H - 2.166.000,00 HKD 6,070 1.304.055,70 0,61 0,61
CHINA COMMUNICATIONS SERVICES - 582.000,00 HKD 4,900 282.857,74 0,13 0,13
CHINA CONSTRUCTION BANK - 9.195.490,00 HKD 5,490 5.007.214,78 2,35 2,34
CHINA GAS HOLDINGS LTD - 52.000,00 HKD 7,930 40.900,21 0,02 0,02
CHINA LIFE INSURANCE CO - 343.000,00 HKD 18,400 625.980,70 0,29 0,29
CHINA LIFE INSURANCE CO - 606.000,00 TWD 29,650 461.214,44 0,22 0,22
CHINA MERCHANTS BANK CO LTD - 418.000,00 HKD 12,960 537.316,63 0,25 0,25
CHINA MINSHENG BANKING CORP LT - 1.087.500,00 HKD 7,590 818.691,05 0,39 0,38
CHINA OILFIELD SERVICES LTD - 302.000,00 HKD 15,180 454.702,89 0,21 0,21
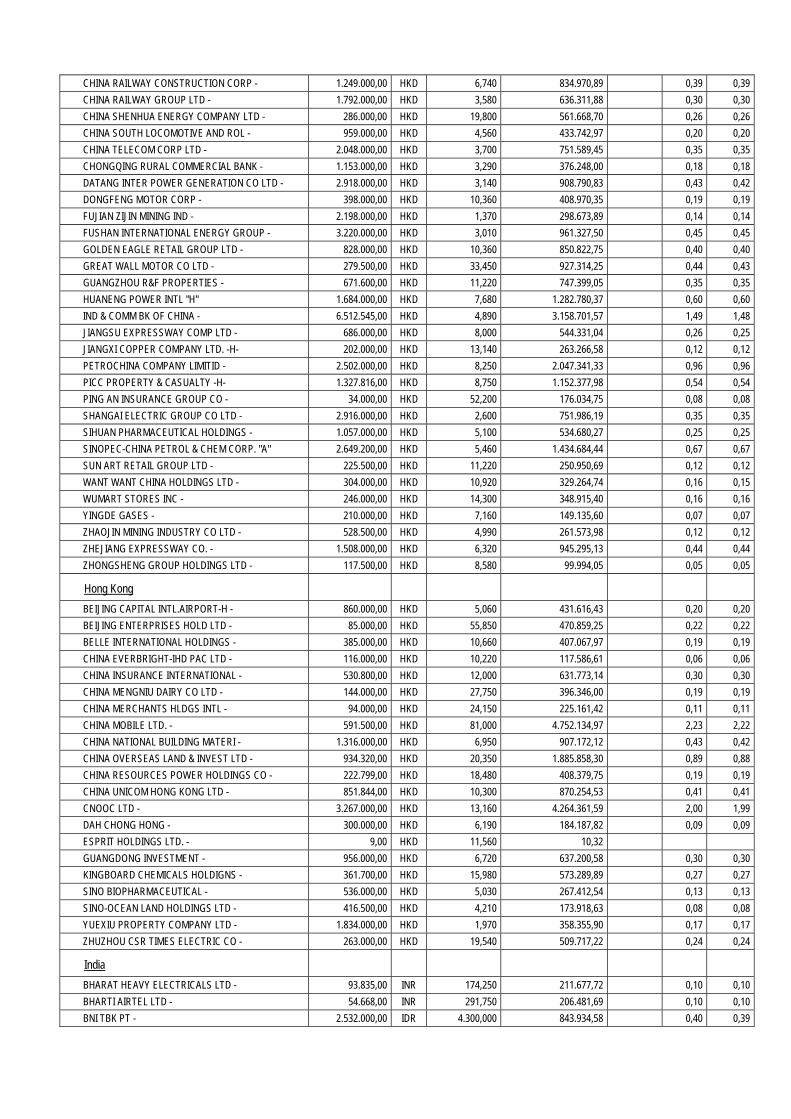
CHINA RAILWAY CONSTRUCTION CORP - 1.249.000,00 HKD 6,740 834.970,89 0,39 0,39
CHINA RAILWAY GROUP LTD - 1.792.000,00 HKD 3,580 636.311,88 0,30 0,30
CHINA SHENHUA ENERGY COMPANY LTD - 286.000,00 HKD 19,800 561.668,70 0,26 0,26
CHINA SOUTH LOCOMOTIVE AND ROL - 959.000,00 HKD 4,560 433.742,97 0,20 0,20
CHINA TELECOM CORP LTD - 2.048.000,00 HKD 3,700 751.589,45 0,35 0,35
CHONGQING RURAL COMMERCIAL BANK - 1.153.000,00 HKD 3,290 376.248,00 0,18 0,18
DATANG INTER POWER GENERATION CO LTD - 2.918.000,00 HKD 3,140 908.790,83 0,43 0,42
DONGFENG MOTOR CORP - 398.000,00 HKD 10,360 408.970,35 0,19 0,19
FUJIAN ZIJIN MINING IND - 2.198.000,00 HKD 1,370 298.673,89 0,14 0,14
FUSHAN INTERNATIONAL ENERGY GROUP - 3.220.000,00 HKD 3,010 961.327,50 0,45 0,45
GOLDEN EAGLE RETAIL GROUP LTD - 828.000,00 HKD 10,360 850.822,75 0,40 0,40
GREAT WALL MOTOR CO LTD - 279.500,00 HKD 33,450 927.314,25 0,44 0,43
GUANGZHOU R&F PROPERTIES - 671.600,00 HKD 11,220 747.399,05 0,35 0,35
HUANENG POWER INTL "H" 1.684.000,00 HKD 7,680 1.282.780,37 0,60 0,60
IND & COMM BK OF CHINA - 6.512.545,00 HKD 4,890 3.158.701,57 1,49 1,48
JIANGSU EXPRESSWAY COMP LTD - 686.000,00 HKD 8,000 544.331,04 0,26 0,25
JIANGXI COPPER COMPANY LTD. -H- 202.000,00 HKD 13,140 263.266,58 0,12 0,12
PETROCHINA COMPANY LIMITID - 2.502.000,00 HKD 8,250 2.047.341,33 0,96 0,96
PICC PROPERTY & CASUALTY -H- 1.327.816,00 HKD 8,750 1.152.377,98 0,54 0,54
PING AN INSURANCE GROUP CO - 34.000,00 HKD 52,200 176.034,75 0,08 0,08
SHANGAI ELECTRIC GROUP CO LTD - 2.916.000,00 HKD 2,600 751.986,19 0,35 0,35
SIHUAN PHARMACEUTICAL HOLDINGS - 1.057.000,00 HKD 5,100 534.680,27 0,25 0,25
SINOPEC-CHINA PETROL & CHEM CORP. "A" 2.649.200,00 HKD 5,460 1.434.684,44 0,67 0,67
SUN ART RETAIL GROUP LTD - 225.500,00 HKD 11,220 250.950,69 0,12 0,12
WANT WANT CHINA HOLDINGS LTD - 304.000,00 HKD 10,920 329.264,74 0,16 0,15
WUMART STORES INC - 246.000,00 HKD 14,300 348.915,40 0,16 0,16
YINGDE GASES - 210.000,00 HKD 7,160 149.135,60 0,07 0,07
ZHAOJIN MINING INDUSTRY CO LTD - 528.500,00 HKD 4,990 261.573,98 0,12 0,12
ZHEJIANG EXPRESSWAY CO. - 1.508.000,00 HKD 6,320 945.295,13 0,44 0,44
ZHONGSHENG GROUP HOLDINGS LTD - 117.500,00 HKD 8,580 99.994,05 0,05 0,05
Hong Kong
BEIJING CAPITAL INTL.AIRPORT-H - 860.000,00 HKD 5,060 431.616,43 0,20 0,20
BEIJING ENTERPRISES HOLD LTD - 85.000,00 HKD 55,850 470.859,25 0,22 0,22
BELLE INTERNATIONAL HOLDINGS - 385.000,00 HKD 10,660 407.067,97 0,19 0,19
CHINA EVERBRIGHT-IHD PAC LTD - 116.000,00 HKD 10,220 117.586,61 0,06 0,06
CHINA INSURANCE INTERNATIONAL - 530.800,00 HKD 12,000 631.773,14 0,30 0,30
CHINA MENGNIU DAIRY CO LTD - 144.000,00 HKD 27,750 396.346,00 0,19 0,19
CHINA MERCHANTS HLDGS INTL - 94.000,00 HKD 24,150 225.161,42 0,11 0,11
CHINA MOBILE LTD. - 591.500,00 HKD 81,000 4.752.134,97 2,23 2,22
CHINA NATIONAL BUILDING MATERI - 1.316.000,00 HKD 6,950 907.172,12 0,43 0,42
CHINA OVERSEAS LAND & INVEST LTD - 934.320,00 HKD 20,350 1.885.858,30 0,89 0,88
CHINA RESOURCES POWER HOLDINGS CO - 222.799,00 HKD 18,480 408.379,75 0,19 0,19
CHINA UNICOM HONG KONG LTD - 851.844,00 HKD 10,300 870.254,53 0,41 0,41
CNOOC LTD - 3.267.000,00 HKD 13,160 4.264.361,59 2,00 1,99
DAH CHONG HONG - 300.000,00 HKD 6,190 184.187,82 0,09 0,09
ESPRIT HOLDINGS LTD. - 9,00 HKD 11,560 10,32
GUANGDONG INVESTMENT - 956.000,00 HKD 6,720 637.200,58 0,30 0,30
KINGBOARD CHEMICALS HOLDIGNS - 361.700,00 HKD 15,980 573.289,89 0,27 0,27
SINO BIOPHARMACEUTICAL - 536.000,00 HKD 5,030 267.412,54 0,13 0,13
SINO-OCEAN LAND HOLDINGS LTD - 416.500,00 HKD 4,210 173.918,63 0,08 0,08
YUEXIU PROPERTY COMPANY LTD - 1.834.000,00 HKD 1,970 358.355,90 0,17 0,17
ZHUZHOU CSR TIMES ELECTRIC CO - 263.000,00 HKD 19,540 509.717,22 0,24 0,24
India
BHARAT HEAVY ELECTRICALS LTD - 93.835,00 INR 174,250 211.677,72 0,10 0,10
BHARTI AIRTEL LTD - 54.668,00 INR 291,750 206.481,69 0,10 0,10
BNI TBK PT - 2.532.000,00 IDR 4.300,000 843.934,58 0,40 0,39
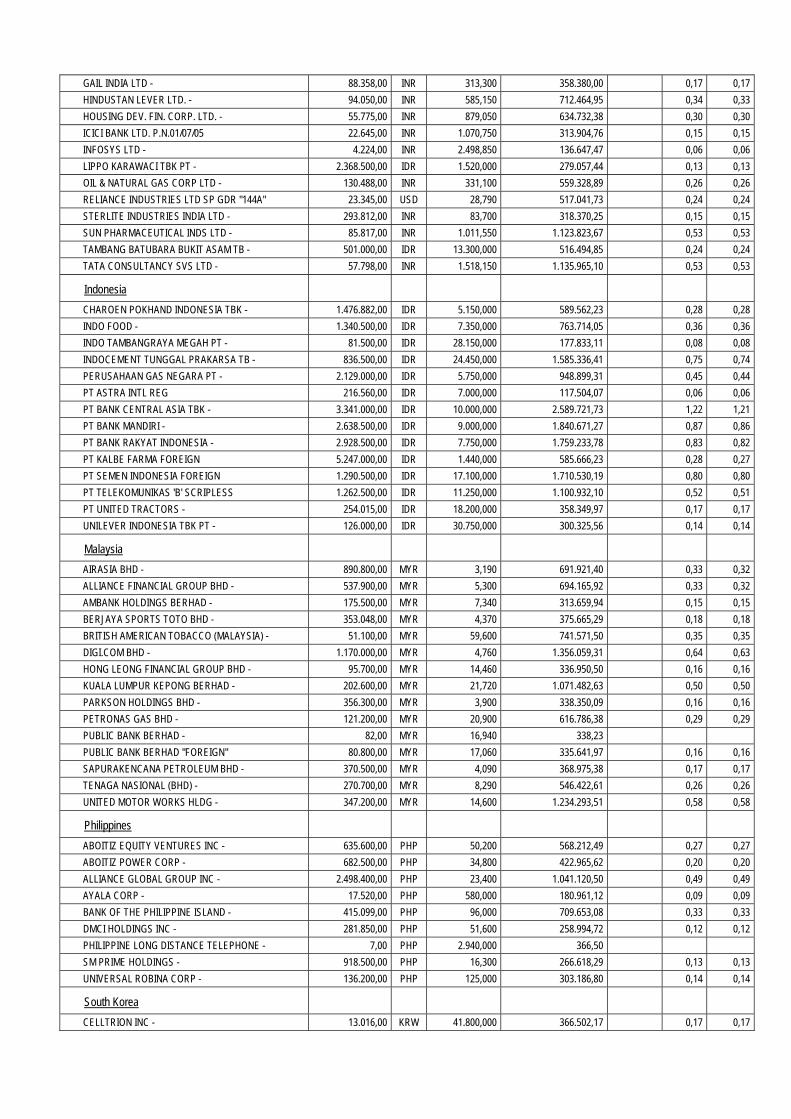
GAIL INDIA LTD - 88.358,00 INR 313,300 358.380,00 0,17 0,17
HINDUSTAN LEVER LTD. - 94.050,00 INR 585,150 712.464,95 0,34 0,33
HOUSING DEV. FIN. CORP. LTD. - 55.775,00 INR 879,050 634.732,38 0,30 0,30
ICICI BANK LTD. P.N.01/07/05 22.645,00 INR 1.070,750 313.904,76 0,15 0,15
INFOSYS LTD - 4.224,00 INR 2.498,850 136.647,47 0,06 0,06
LIPPO KARAWACI TBK PT - 2.368.500,00 IDR 1.520,000 279.057,44 0,13 0,13
OIL & NATURAL GAS CORP LTD - 130.488,00 INR 331,100 559.328,89 0,26 0,26
RELIANCE INDUSTRIES LTD SP GDR "144A" 23.345,00 USD 28,790 517.041,73 0,24 0,24
STERLITE INDUSTRIES INDIA LTD - 293.812,00 INR 83,700 318.370,25 0,15 0,15
SUN PHARMACEUTICAL INDS LTD - 85.817,00 INR 1.011,550 1.123.823,67 0,53 0,53
TAMBANG BATUBARA BUKIT ASAM TB - 501.000,00 IDR 13.300,000 516.494,85 0,24 0,24
TATA CONSULTANCY SVS LTD - 57.798,00 INR 1.518,150 1.135.965,10 0,53 0,53
Indonesia
CHAROEN POKHAND INDONESIA TBK - 1.476.882,00 IDR 5.150,000 589.562,23 0,28 0,28
INDO FOOD - 1.340.500,00 IDR 7.350,000 763.714,05 0,36 0,36
INDO TAMBANGRAYA MEGAH PT - 81.500,00 IDR 28.150,000 177.833,11 0,08 0,08
INDOCEMENT TUNGGAL PRAKARSA TB - 836.500,00 IDR 24.450,000 1.585.336,41 0,75 0,74
PERUSAHAAN GAS NEGARA PT - 2.129.000,00 IDR 5.750,000 948.899,31 0,45 0,44
PT ASTRA INTL REG 216.560,00 IDR 7.000,000 117.504,07 0,06 0,06
PT BANK CENTRAL ASIA TBK - 3.341.000,00 IDR 10.000,000 2.589.721,73 1,22 1,21
PT BANK MANDIRI - 2.638.500,00 IDR 9.000,000 1.840.671,27 0,87 0,86
PT BANK RAKYAT INDONESIA - 2.928.500,00 IDR 7.750,000 1.759.233,78 0,83 0,82
PT KALBE FARMA FOREIGN 5.247.000,00 IDR 1.440,000 585.666,23 0,28 0,27
PT SEMEN INDONESIA FOREIGN 1.290.500,00 IDR 17.100,000 1.710.530,19 0,80 0,80
PT TELEKOMUNIKAS 'B' SCRIPLESS 1.262.500,00 IDR 11.250,000 1.100.932,10 0,52 0,51
PT UNITED TRACTORS - 254.015,00 IDR 18.200,000 358.349,97 0,17 0,17
UNILEVER INDONESIA TBK PT - 126.000,00 IDR 30.750,000 300.325,56 0,14 0,14
Malaysia
AIRASIA BHD - 890.800,00 MYR 3,190 691.921,40 0,33 0,32
ALLIANCE FINANCIAL GROUP BHD - 537.900,00 MYR 5,300 694.165,92 0,33 0,32
AMBANK HOLDINGS BERHAD - 175.500,00 MYR 7,340 313.659,94 0,15 0,15
BERJAYA SPORTS TOTO BHD - 353.048,00 MYR 4,370 375.665,29 0,18 0,18
BRITISH AMERICAN TOBACCO (MALAYSIA) - 51.100,00 MYR 59,600 741.571,50 0,35 0,35
DIGI.COM BHD - 1.170.000,00 MYR 4,760 1.356.059,31 0,64 0,63
HONG LEONG FINANCIAL GROUP BHD - 95.700,00 MYR 14,460 336.950,50 0,16 0,16
KUALA LUMPUR KEPONG BERHAD - 202.600,00 MYR 21,720 1.071.482,63 0,50 0,50
PARKSON HOLDINGS BHD - 356.300,00 MYR 3,900 338.350,09 0,16 0,16
PETRONAS GAS BHD - 121.200,00 MYR 20,900 616.786,38 0,29 0,29
PUBLIC BANK BERHAD - 82,00 MYR 16,940 338,23
PUBLIC BANK BERHAD "FOREIGN" 80.800,00 MYR 17,060 335.641,97 0,16 0,16
SAPURAKENCANA PETROLEUM BHD - 370.500,00 MYR 4,090 368.975,38 0,17 0,17
TENAGA NASIONAL (BHD) - 270.700,00 MYR 8,290 546.422,61 0,26 0,26
UNITED MOTOR WORKS HLDG - 347.200,00 MYR 14,600 1.234.293,51 0,58 0,58
Philippines
ABOITIZ EQUITY VENTURES INC - 635.600,00 PHP 50,200 568.212,49 0,27 0,27
ABOITIZ POWER CORP - 682.500,00 PHP 34,800 422.965,62 0,20 0,20
ALLIANCE GLOBAL GROUP INC - 2.498.400,00 PHP 23,400 1.041.120,50 0,49 0,49
AYALA CORP - 17.520,00 PHP 580,000 180.961,12 0,09 0,09
BANK OF THE PHILIPPINE ISLAND - 415.099,00 PHP 96,000 709.653,08 0,33 0,33
DMCI HOLDINGS INC - 281.850,00 PHP 51,600 258.994,72 0,12 0,12
PHILIPPINE LONG DISTANCE TELEPHONE - 7,00 PHP 2.940,000 366,50
SM PRIME HOLDINGS - 918.500,00 PHP 16,300 266.618,29 0,13 0,13
UNIVERSAL ROBINA CORP - 136.200,00 PHP 125,000 303.186,80 0,14 0,14
South Korea
CELLTRION INC - 13.016,00 KRW 41.800,000 366.502,17 0,17 0,17
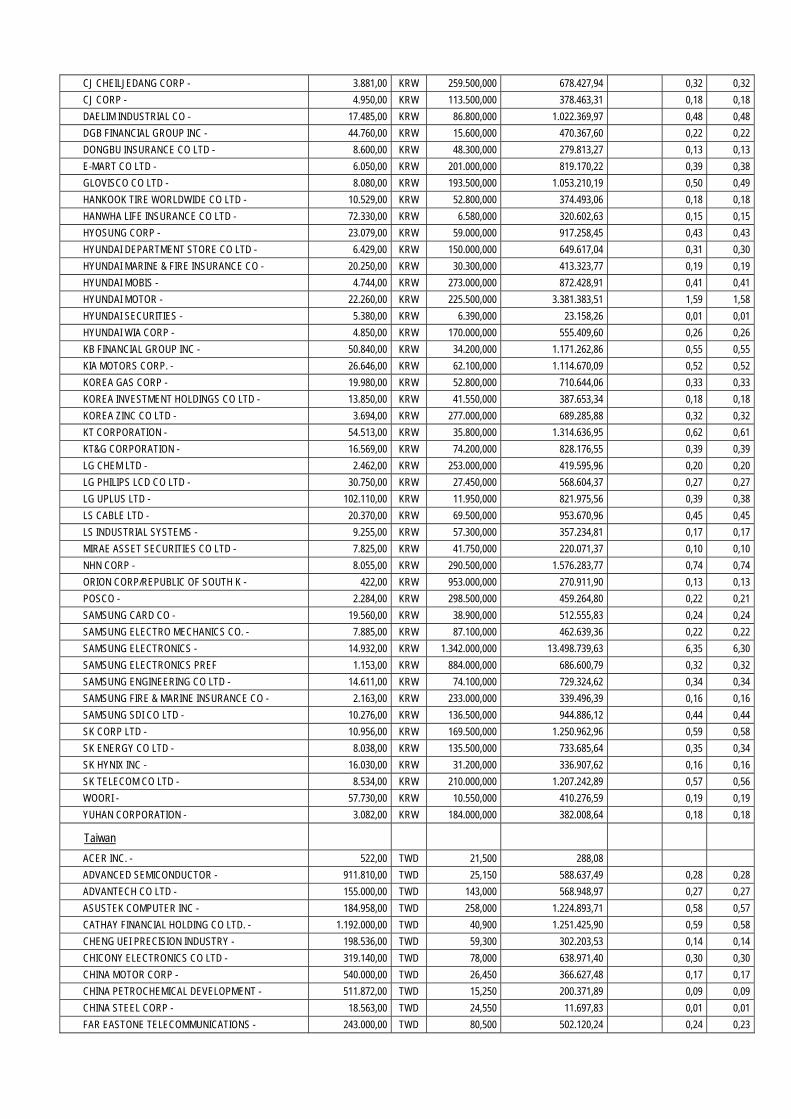
CJ CHEILJEDANG CORP - 3.881,00 KRW 259.500,000 678.427,94 0,32 0,32
CJ CORP - 4.950,00 KRW 113.500,000 378.463,31 0,18 0,18
DAELIM INDUSTRIAL CO - 17.485,00 KRW 86.800,000 1.022.369,97 0,48 0,48
DGB FINANCIAL GROUP INC - 44.760,00 KRW 15.600,000 470.367,60 0,22 0,22
DONGBU INSURANCE CO LTD - 8.600,00 KRW 48.300,000 279.813,27 0,13 0,13
E-MART CO LTD - 6.050,00 KRW 201.000,000 819.170,22 0,39 0,38
GLOVISCO CO LTD - 8.080,00 KRW 193.500,000 1.053.210,19 0,50 0,49
HANKOOK TIRE WORLDWIDE CO LTD - 10.529,00 KRW 52.800,000 374.493,06 0,18 0,18
HANWHA LIFE INSURANCE CO LTD - 72.330,00 KRW 6.580,000 320.602,63 0,15 0,15
HYOSUNG CORP - 23.079,00 KRW 59.000,000 917.258,45 0,43 0,43
HYUNDAI DEPARTMENT STORE CO LTD - 6.429,00 KRW 150.000,000 649.617,04 0,31 0,30
HYUNDAI MARINE & FIRE INSURANCE CO - 20.250,00 KRW 30.300,000 413.323,77 0,19 0,19
HYUNDAI MOBIS - 4.744,00 KRW 273.000,000 872.428,91 0,41 0,41
HYUNDAI MOTOR - 22.260,00 KRW 225.500,000 3.381.383,51 1,59 1,58
HYUNDAI SECURITIES - 5.380,00 KRW 6.390,000 23.158,26 0,01 0,01
HYUNDAI WIA CORP - 4.850,00 KRW 170.000,000 555.409,60 0,26 0,26
KB FINANCIAL GROUP INC - 50.840,00 KRW 34.200,000 1.171.262,86 0,55 0,55
KIA MOTORS CORP. - 26.646,00 KRW 62.100,000 1.114.670,09 0,52 0,52
KOREA GAS CORP - 19.980,00 KRW 52.800,000 710.644,06 0,33 0,33
KOREA INVESTMENT HOLDINGS CO LTD - 13.850,00 KRW 41.550,000 387.653,34 0,18 0,18
KOREA ZINC CO LTD - 3.694,00 KRW 277.000,000 689.285,88 0,32 0,32
KT CORPORATION - 54.513,00 KRW 35.800,000 1.314.636,95 0,62 0,61
KT&G CORPORATION - 16.569,00 KRW 74.200,000 828.176,55 0,39 0,39
LG CHEM LTD - 2.462,00 KRW 253.000,000 419.595,96 0,20 0,20
LG PHILIPS LCD CO LTD - 30.750,00 KRW 27.450,000 568.604,37 0,27 0,27
LG UPLUS LTD - 102.110,00 KRW 11.950,000 821.975,56 0,39 0,38
LS CABLE LTD - 20.370,00 KRW 69.500,000 953.670,96 0,45 0,45
LS INDUSTRIAL SYSTEMS - 9.255,00 KRW 57.300,000 357.234,81 0,17 0,17
MIRAE ASSET SECURITIES CO LTD - 7.825,00 KRW 41.750,000 220.071,37 0,10 0,10
NHN CORP - 8.055,00 KRW 290.500,000 1.576.283,77 0,74 0,74
ORION CORP/REPUBLIC OF SOUTH K - 422,00 KRW 953.000,000 270.911,90 0,13 0,13
POSCO - 2.284,00 KRW 298.500,000 459.264,80 0,22 0,21
SAMSUNG CARD CO - 19.560,00 KRW 38.900,000 512.555,83 0,24 0,24
SAMSUNG ELECTRO MECHANICS CO. - 7.885,00 KRW 87.100,000 462.639,36 0,22 0,22
SAMSUNG ELECTRONICS - 14.932,00 KRW 1.342.000,000 13.498.739,63 6,35 6,30
SAMSUNG ELECTRONICS PREF 1.153,00 KRW 884.000,000 686.600,79 0,32 0,32
SAMSUNG ENGINEERING CO LTD - 14.611,00 KRW 74.100,000 729.324,62 0,34 0,34
SAMSUNG FIRE & MARINE INSURANCE CO - 2.163,00 KRW 233.000,000 339.496,39 0,16 0,16
SAMSUNG SDI CO LTD - 10.276,00 KRW 136.500,000 944.886,12 0,44 0,44
SK CORP LTD - 10.956,00 KRW 169.500,000 1.250.962,96 0,59 0,58
SK ENERGY CO LTD - 8.038,00 KRW 135.500,000 733.685,64 0,35 0,34
SK HYNIX INC - 16.030,00 KRW 31.200,000 336.907,62 0,16 0,16
SK TELECOM CO LTD - 8.534,00 KRW 210.000,000 1.207.242,89 0,57 0,56
WOORI - 57.730,00 KRW 10.550,000 410.276,59 0,19 0,19
YUHAN CORPORATION - 3.082,00 KRW 184.000,000 382.008,64 0,18 0,18
Taiwan
ACER INC. - 522,00 TWD 21,500 288,08
ADVANCED SEMICONDUCTOR - 911.810,00 TWD 25,150 588.637,49 0,28 0,28
ADVANTECH CO LTD - 155.000,00 TWD 143,000 568.948,97 0,27 0,27
ASUSTEK COMPUTER INC - 184.958,00 TWD 258,000 1.224.893,71 0,58 0,57
CATHAY FINANCIAL HOLDING CO LTD. - 1.192.000,00 TWD 40,900 1.251.425,90 0,59 0,58
CHENG UEI PRECISION INDUSTRY - 198.536,00 TWD 59,300 302.203,53 0,14 0,14
CHICONY ELECTRONICS CO LTD - 319.140,00 TWD 78,000 638.971,40 0,30 0,30
CHINA MOTOR CORP - 540.000,00 TWD 26,450 366.627,48 0,17 0,17
CHINA PETROCHEMICAL DEVELOPMENT - 511.872,00 TWD 15,250 200.371,89 0,09 0,09
CHINA STEEL CORP - 18.563,00 TWD 24,550 11.697,83 0,01 0,01
FAR EASTONE TELECOMMUNICATIONS - 243.000,00 TWD 80,500 502.120,24 0,24 0,23
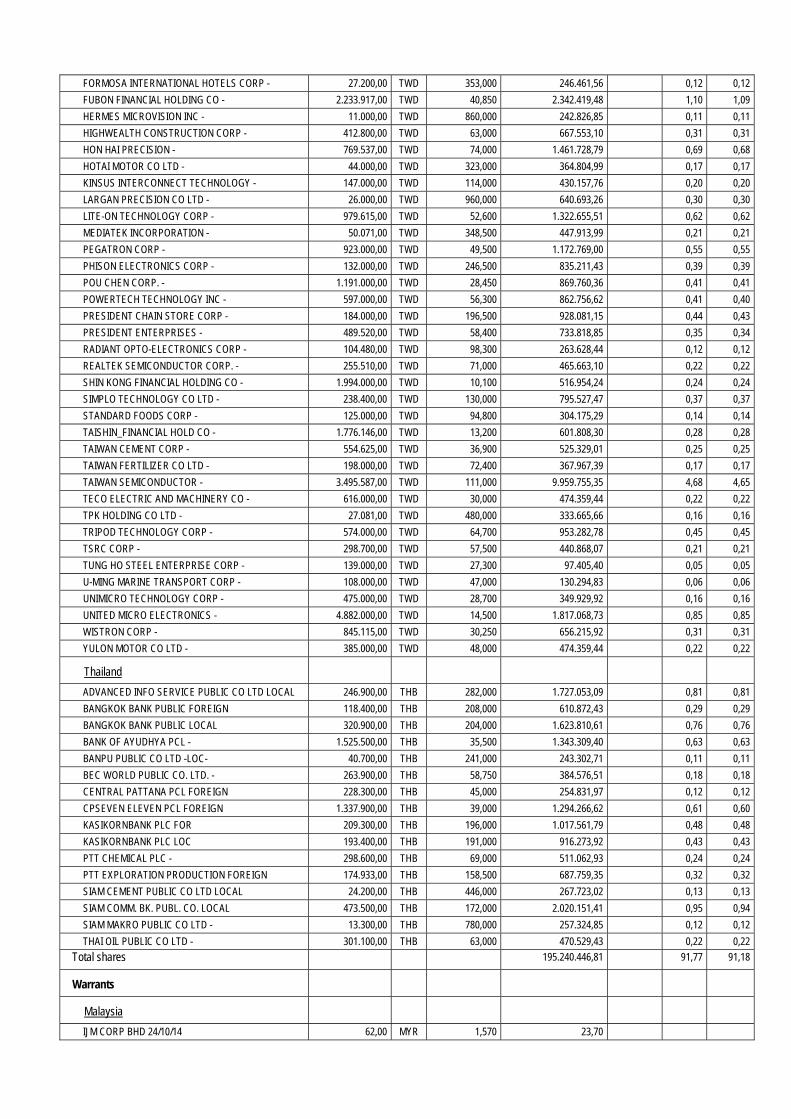
FORMOSA INTERNATIONAL HOTELS CORP - 27.200,00 TWD 353,000 246.461,56 0,12 0,12
FUBON FINANCIAL HOLDING CO - 2.233.917,00 TWD 40,850 2.342.419,48 1,10 1,09
HERMES MICROVISION INC - 11.000,00 TWD 860,000 242.826,85 0,11 0,11
HIGHWEALTH CONSTRUCTION CORP - 412.800,00 TWD 63,000 667.553,10 0,31 0,31
HON HAI PRECISION - 769.537,00 TWD 74,000 1.461.728,79 0,69 0,68
HOTAI MOTOR CO LTD - 44.000,00 TWD 323,000 364.804,99 0,17 0,17
KINSUS INTERCONNECT TECHNOLOGY - 147.000,00 TWD 114,000 430.157,76 0,20 0,20
LARGAN PRECISION CO LTD - 26.000,00 TWD 960,000 640.693,26 0,30 0,30
LITE-ON TECHNOLOGY CORP - 979.615,00 TWD 52,600 1.322.655,51 0,62 0,62
MEDIATEK INCORPORATION - 50.071,00 TWD 348,500 447.913,99 0,21 0,21
PEGATRON CORP - 923.000,00 TWD 49,500 1.172.769,00 0,55 0,55
PHISON ELECTRONICS CORP - 132.000,00 TWD 246,500 835.211,43 0,39 0,39
POU CHEN CORP. - 1.191.000,00 TWD 28,450 869.760,36 0,41 0,41
POWERTECH TECHNOLOGY INC - 597.000,00 TWD 56,300 862.756,62 0,41 0,40
PRESIDENT CHAIN STORE CORP - 184.000,00 TWD 196,500 928.081,15 0,44 0,43
PRESIDENT ENTERPRISES - 489.520,00 TWD 58,400 733.818,85 0,35 0,34
RADIANT OPTO-ELECTRONICS CORP - 104.480,00 TWD 98,300 263.628,44 0,12 0,12
REALTEK SEMICONDUCTOR CORP. - 255.510,00 TWD 71,000 465.663,10 0,22 0,22
SHIN KONG FINANCIAL HOLDING CO - 1.994.000,00 TWD 10,100 516.954,24 0,24 0,24
SIMPLO TECHNOLOGY CO LTD - 238.400,00 TWD 130,000 795.527,47 0,37 0,37
STANDARD FOODS CORP - 125.000,00 TWD 94,800 304.175,29 0,14 0,14
TAISHIN_FINANCIAL HOLD CO - 1.776.146,00 TWD 13,200 601.808,30 0,28 0,28
TAIWAN CEMENT CORP - 554.625,00 TWD 36,900 525.329,01 0,25 0,25
TAIWAN FERTILIZER CO LTD - 198.000,00 TWD 72,400 367.967,39 0,17 0,17
TAIWAN SEMICONDUCTOR - 3.495.587,00 TWD 111,000 9.959.755,35 4,68 4,65
TECO ELECTRIC AND MACHINERY CO - 616.000,00 TWD 30,000 474.359,44 0,22 0,22
TPK HOLDING CO LTD - 27.081,00 TWD 480,000 333.665,66 0,16 0,16
TRIPOD TECHNOLOGY CORP - 574.000,00 TWD 64,700 953.282,78 0,45 0,45
TSRC CORP - 298.700,00 TWD 57,500 440.868,07 0,21 0,21
TUNG HO STEEL ENTERPRISE CORP - 139.000,00 TWD 27,300 97.405,40 0,05 0,05
U-MING MARINE TRANSPORT CORP - 108.000,00 TWD 47,000 130.294,83 0,06 0,06
UNIMICRO TECHNOLOGY CORP - 475.000,00 TWD 28,700 349.929,92 0,16 0,16
UNITED MICRO ELECTRONICS - 4.882.000,00 TWD 14,500 1.817.068,73 0,85 0,85
WISTRON CORP - 845.115,00 TWD 30,250 656.215,92 0,31 0,31
YULON MOTOR CO LTD - 385.000,00 TWD 48,000 474.359,44 0,22 0,22
Thailand
ADVANCED INFO SERVICE PUBLIC CO LTD LOCAL 246.900,00 THB 282,000 1.727.053,09 0,81 0,81
BANGKOK BANK PUBLIC FOREIGN 118.400,00 THB 208,000 610.872,43 0,29 0,29
BANGKOK BANK PUBLIC LOCAL 320.900,00 THB 204,000 1.623.810,61 0,76 0,76
BANK OF AYUDHYA PCL - 1.525.500,00 THB 35,500 1.343.309,40 0,63 0,63
BANPU PUBLIC CO LTD -LOC- 40.700,00 THB 241,000 243.302,71 0,11 0,11
BEC WORLD PUBLIC CO. LTD. - 263.900,00 THB 58,750 384.576,51 0,18 0,18
CENTRAL PATTANA PCL FOREIGN 228.300,00 THB 45,000 254.831,97 0,12 0,12
CPSEVEN ELEVEN PCL FOREIGN 1.337.900,00 THB 39,000 1.294.266,62 0,61 0,60
KASIKORNBANK PLC FOR 209.300,00 THB 196,000 1.017.561,79 0,48 0,48
KASIKORNBANK PLC LOC 193.400,00 THB 191,000 916.273,92 0,43 0,43
PTT CHEMICAL PLC - 298.600,00 THB 69,000 511.062,93 0,24 0,24
PTT EXPLORATION PRODUCTION FOREIGN 174.933,00 THB 158,500 687.759,35 0,32 0,32
SIAM CEMENT PUBLIC CO LTD LOCAL 24.200,00 THB 446,000 267.723,02 0,13 0,13
SIAM COMM. BK. PUBL. CO. LOCAL 473.500,00 THB 172,000 2.020.151,41 0,95 0,94
SIAM MAKRO PUBLIC CO LTD - 13.300,00 THB 780,000 257.324,85 0,12 0,12
THAI OIL PUBLIC CO LTD - 301.100,00 THB 63,000 470.529,43 0,22 0,22
Total shares 195.240.446,81 91,77 91,18
Warrants
Malaysia
IJM CORP BHD 24/10/14 62,00 MYR 1,570 23,70
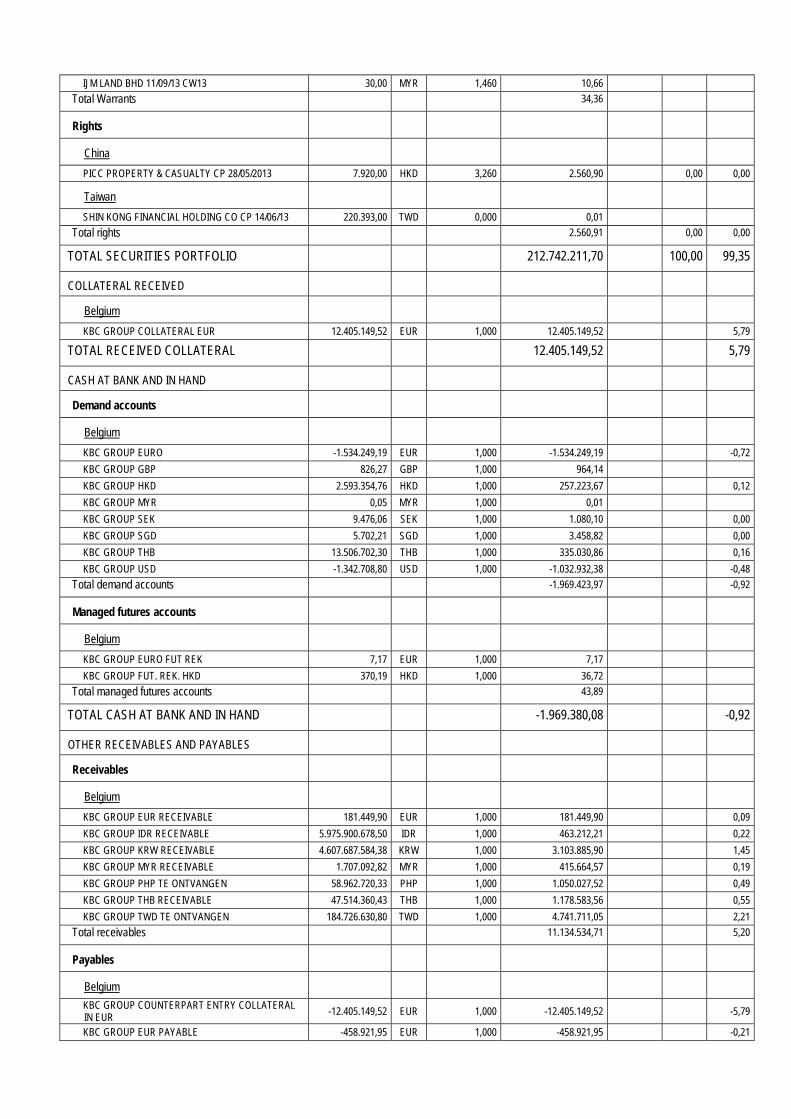
IJM LAND BHD 11/09/13 CW13 30,00 MYR 1,460 10,66
Total Warrants 34,36
Rights
China
PICC PROPERTY & CASUALTY CP 28/05/2013 7.920,00 HKD 3,260 2.560,90 0,00 0,00
Taiwan
SHIN KONG FINANCIAL HOLDING CO CP 14/06/13 220.393,00 TWD 0,000 0,01
Total rights 2.560,91 0,00 0,00
TOTAL SECURITIES PORTFOLIO 212.742.211,70 100,00 99,35
COLLATERAL RECEIVED
Belgium
KBC GROUP COLLATERAL EUR 12.405.149,52 EUR 1,000 12.405.149,52 5,79
TOTAL RECEIVED COLLATERAL 12.405.149,52 5,79
CASH AT BANK AND IN HAND
Demand accounts
Belgium
KBC GROUP EURO -1.534.249,19 EUR 1,000 -1.534.249,19 -0,72
KBC GROUP GBP 826,27 GBP 1,000 964,14
KBC GROUP HKD 2.593.354,76 HKD 1,000 257.223,67 0,12
KBC GROUP MYR 0,05 MYR 1,000 0,01
KBC GROUP SEK 9.476,06 SEK 1,000 1.080,10 0,00
KBC GROUP SGD 5.702,21 SGD 1,000 3.458,82 0,00
KBC GROUP THB 13.506.702,30 THB 1,000 335.030,86 0,16
KBC GROUP USD -1.342.708,80 USD 1,000 -1.032.932,38 -0,48
Total demand accounts -1.969.423,97 -0,92
Managed futures accounts
Belgium
KBC GROUP EURO FUT REK 7,17 EUR 1,000 7,17
KBC GROUP FUT. REK. HKD 370,19 HKD 1,000 36,72
Total managed futures accounts 43,89
TOTAL CASH AT BANK AND IN HAND -1.969.380,08 -0,92
OTHER RECEIVABLES AND PAYABLES
Receivables
Belgium
KBC GROUP EUR RECEIVABLE 181.449,90 EUR 1,000 181.449,90 0,09
KBC GROUP IDR RECEIVABLE 5.975.900.678,50 IDR 1,000 463.212,21 0,22
KBC GROUP KRW RECEIVABLE 4.607.687.584,38 KRW 1,000 3.103.885,90 1,45
KBC GROUP MYR RECEIVABLE 1.707.092,82 MYR 1,000 415.664,57 0,19
KBC GROUP PHP TE ONTVANGEN 58.962.720,33 PHP 1,000 1.050.027,52 0,49
KBC GROUP THB RECEIVABLE 47.514.360,43 THB 1,000 1.178.583,56 0,55
KBC GROUP TWD TE ONTVANGEN 184.726.630,80 TWD 1,000 4.741.711,05 2,21
Total receivables 11.134.534,71 5,20
Payables
Belgium
KBC GROUP COUNTERPART ENTRY COLLATERAL IN EUR -12.405.149,52 EUR 1,000 -12.405.149,52 -5,79
KBC GROUP EUR PAYABLE -458.921,95 EUR 1,000 -458.921,95 -0,21
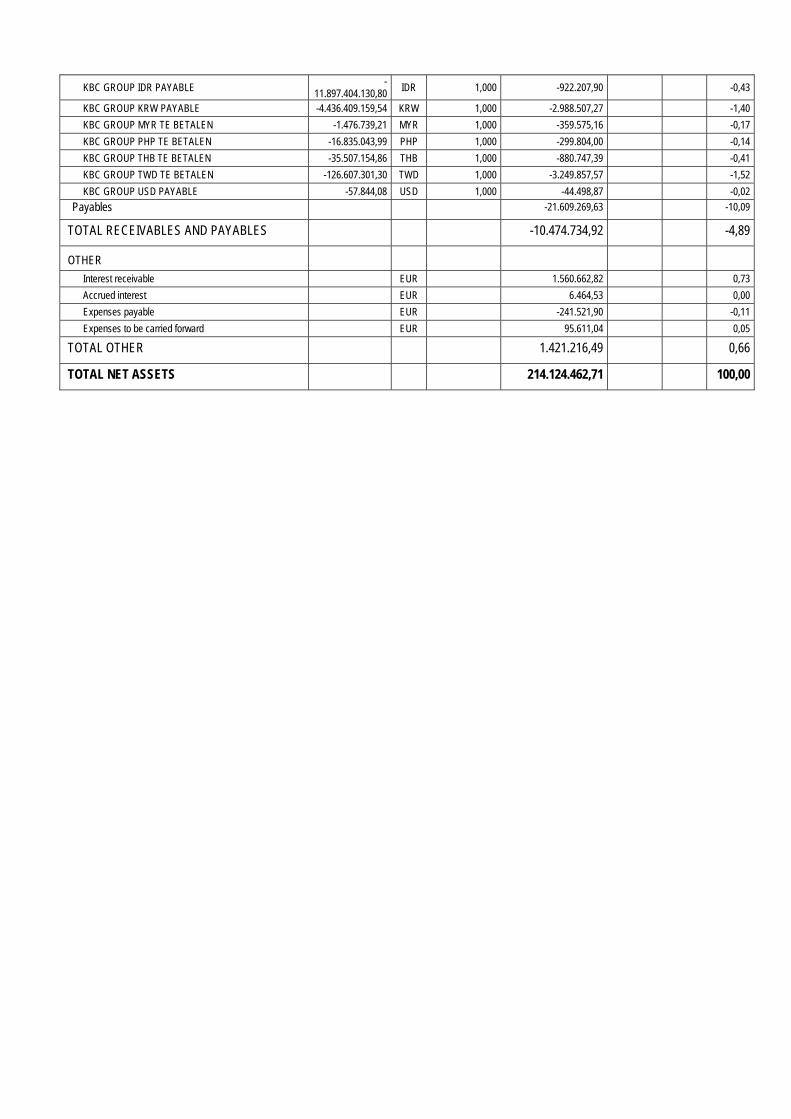
KBC GROUP IDR PAYABLE -
11.897.404.130,80 IDR 1,000 -922.207,90 -0,43
KBC GROUP KRW PAYABLE -4.436.409.159,54 KRW 1,000 -2.988.507,27 -1,40
KBC GROUP MYR TE BETALEN -1.476.739,21 MYR 1,000 -359.575,16 -0,17
KBC GROUP PHP TE BETALEN -16.835.043,99 PHP 1,000 -299.804,00 -0,14
KBC GROUP THB TE BETALEN -35.507.154,86 THB 1,000 -880.747,39 -0,41
KBC GROUP TWD TE BETALEN -126.607.301,30 TWD 1,000 -3.249.857,57 -1,52
KBC GROUP USD PAYABLE -57.844,08 USD 1,000 -44.498,87 -0,02
Payables -21.609.269,63 -10,09
TOTAL RECEIVABLES AND PAYABLES -10.474.734,92 -4,89
OTHER
Interest receivable EUR 1.560.662,82 0,73
Accrued interest EUR 6.464,53 0,00
Expenses payable EUR -241.521,90 -0,11
Expenses to be carried forward EUR 95.611,04 0,05
TOTAL OTHER 1.421.216,49 0,66
TOTAL NET ASSETS 214.124.462,71 100,00
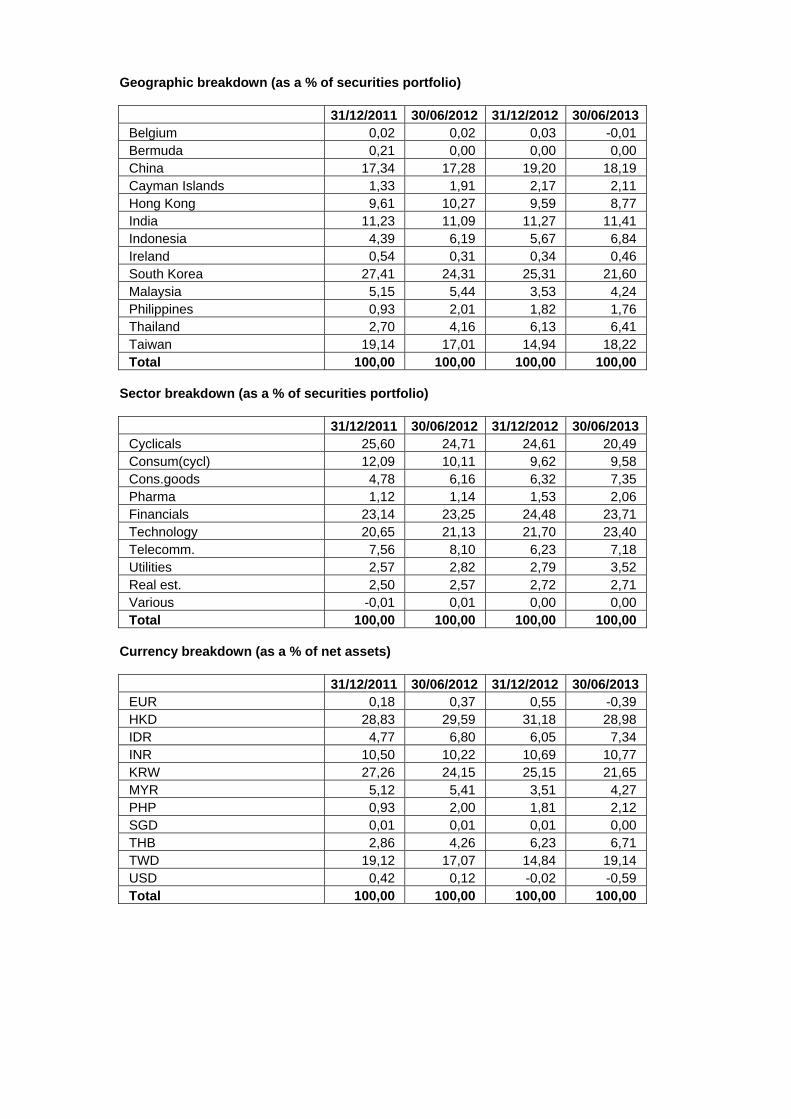
Geographic breakdown (as a % of securities portfolio)
31/12/2011 30/06/2012 31/12/2012 30/06/2013 Belgium 0,02 0,02 0,03 -0,01 Bermuda 0,21 0,00 0,00 0,00 China 17,34 17,28 19,20 18,19 Cayman Islands 1,33 1,91 2,17 2,11 Hong Kong 9,61 10,27 9,59 8,77 India 11,23 11,09 11,27 11,41 Indonesia 4,39 6,19 5,67 6,84 Ireland 0,54 0,31 0,34 0,46 South Korea 27,41 24,31 25,31 21,60 Malaysia 5,15 5,44 3,53 4,24 Philippines 0,93 2,01 1,82 1,76 Thailand 2,70 4,16 6,13 6,41 Taiwan 19,14 17,01 14,94 18,22 Total 100,00 100,00 100,00 100,00
Sector breakdown (as a % of securities portfolio)
31/12/2011 30/06/2012 31/12/2012 30/06/2013 Cyclicals 25,60 24,71 24,61 20,49 Consum(cycl) 12,09 10,11 9,62 9,58 Cons.goods 4,78 6,16 6,32 7,35 Pharma 1,12 1,14 1,53 2,06 Financials 23,14 23,25 24,48 23,71 Technology 20,65 21,13 21,70 23,40 Telecomm. 7,56 8,10 6,23 7,18 Utilities 2,57 2,82 2,79 3,52 Real est. 2,50 2,57 2,72 2,71 Various -0,01 0,01 0,00 0,00 Total 100,00 100,00 100,00 100,00
Currency breakdown (as a % of net assets)
31/12/2011 30/06/2012 31/12/2012 30/06/2013 EUR 0,18 0,37 0,55 -0,39 HKD 28,83 29,59 31,18 28,98 IDR 4,77 6,80 6,05 7,34 INR 10,50 10,22 10,69 10,77 KRW 27,26 24,15 25,15 21,65 MYR 5,12 5,41 3,51 4,27 PHP 0,93 2,00 1,81 2,12 SGD 0,01 0,01 0,01 0,00 THB 2,86 4,26 6,23 6,71 TWD 19,12 17,07 14,84 19,14 USD 0,42 0,12 -0,02 -0,59 Total 100,00 100,00 100,00 100,00

2.4.2 CHANGES IN THE COMPOSITION OF THE ASSETS OF KBC EQUITY FUND NEW ASIA (IN THE
CURRENCY OF THE SUB-FUND)
1st half of year YearPurchases 107.743.654,88 107.743.654,88 Sales 112.803.315,87 112.803.315,87 Total 1 220.546.970,75 220.546.970,75 Subscriptions 105.631.727,32 105.631.727,32 Redemptions 110.942.814,00 110.942.814,00 Total 2 216.574.541,32 216.574.541,32 Monthly average of total assets
244.235.760,38 244.235.760,38
Turnover rate 1,63 % 1,63 %
1st half of year YearPurchases 107.743.654,88 107.743.654,88 Sales 112.803.315,87 112.803.315,87 Total 1 220.546.970,75 220.546.970,75 Subscriptions 105.631.727,32 105.631.727,32 Redemptions 110.942.814,00 110.942.814,00 Total 2 216.574.541,32 216.574.541,32 Monthly average of total assets
179.747.938,05 179.747.938,05
Corrected turnover rate 2,21 % 2,21 %
The table above shows the capital volume of portfolio transactions. This volume (adjusted to take account of total subscriptions and redemptions) is also compared to the average net assets at the beginning and end of the period. A figure close to 0% implies that the transactions relating to the securities or transactions relating to the assets (excluding deposits and cash) in a given period only involve subscriptions and redemptions. A negative percentage shows that subscriptions and redemptions entailed few, if any, transactions in the portfolio. Active asset management may result in high turnover rates (monthly percentage >50%). The detailed list of transactions is available for consultation free of charge at the registered office of the Bevek or fund at Havenlaan 2, 1080 Brussels.

2.4.3 AMOUNT OF COMMITMENTS IN RESPECT OF FINANCIAL DERIVATIVES POSITIONS
NAME Currency Value in currency
In the currency of the sub-fund
Lot-size
Transactiondate
KBC COLLATERAL EUR
EUR 12.405.149,52 12.405.149,52 N/A 28.06.2013
2.4.4 CHANGES OF THE NUMBER OF SUBSCRIPTIONS AND REDEMPTIONS AND THE NET ASSET
VALUE
Classic Shares
Period Change in number of shares in circulation
Year Subscriptions Redemptions End of period
Cap. Dis. Cap. Dis. Cap. Dis. Total
2011 - 06 537.849,55 25.971,72 605.791,88 20.615,78 422.168,71 47.064,27 469.232,98
2012 - 06 97.724,32 47.229,68 302.301,87 7.872,50 217.591,15 86.421,45 304.012,61
2013 - 06 27.170,71 23.572,44 60.763,52 51.595,41 183.998,34 58.398,48 242.396,82
Period Amounts received and paid by the UCI
(in the currency of the class)
Year Subscriptions Redemptions
Capitalization Distribution Capitalization Distribution
2011 - 06 288.036.260,90 10.699.570,27 321.325.030,00 8.434.374,79
2012 - 06 48.090.377,30 18.654.962,48 139.702.628,90 2.942.240,69
2013 - 06 14.673.195,06 9.885.579,77 32.955.449,68 22.053.158,32
Period Net asset value
End of period (in the currency of the class)
Year Of the class Of one share
Capitalization Distribution
2011 - 06 239.478.016,53 522,60 400,56
2012 - 06 141.717.298,88 499,95 381,08
2013 - 06 119.839.704,41 525,15 397,49
Institutional B Shares
Period Change in number of shares in circulation
Year Subscriptions Redemptions End of period
Cap. Dis. Cap. Dis. Cap. Dis. Total 2012 - 06 393.606,00 126.199,00 267.407,00 267.407,00
2013 - 06 312.522,05 400.485,80 179.443,25 179.443,25
Period Amounts received and paid by the UCI
(in the currency of the class)
Year Subscriptions Redemptions
Capitalization Distribution Capitalization Distribution
2012 - 06 191.860.417,60 63.033.490,23
2013 - 06 169.663.682,00 211.560.487,60
Period Net asset value
End of period (in the currency of the class)

Year Of the class Of one share
Capitalization Distribution
2012 - 06 133.752.680,50 500,18
2013 - 06 94.284.758,30 525,43
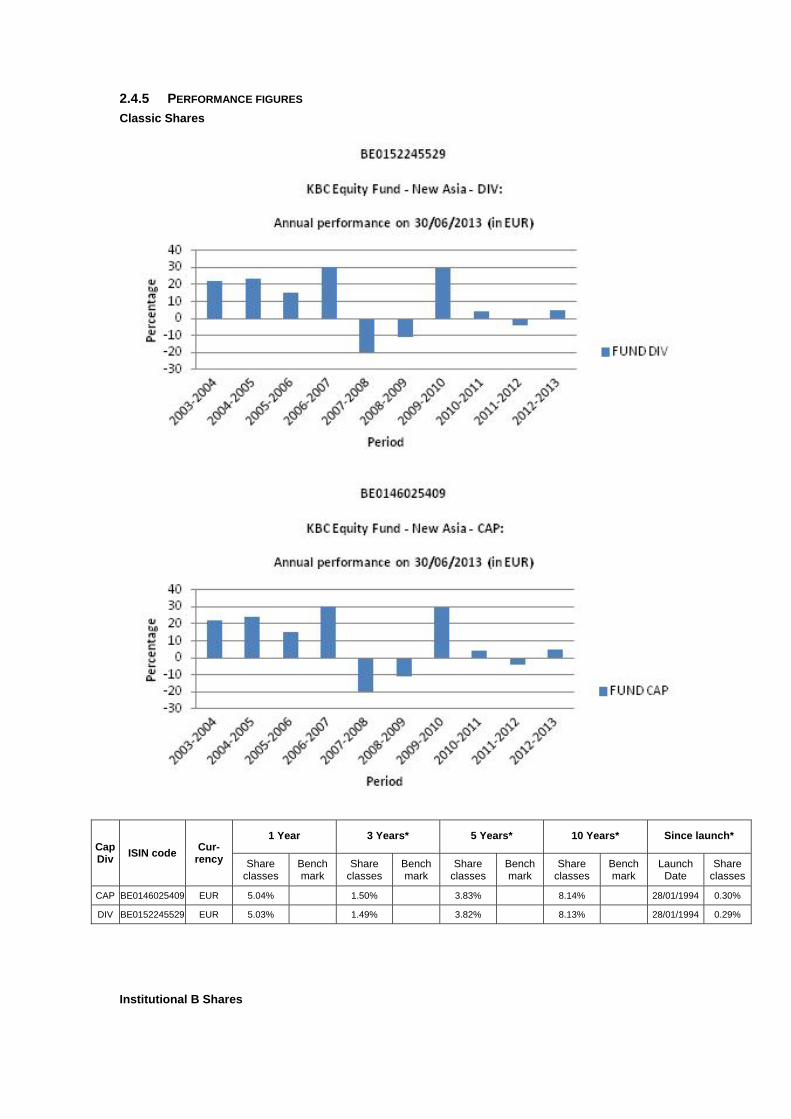
2.4.5 PERFORMANCE FIGURES
Classic Shares
Cap Div
ISIN code Cur-
rency
1 Year 3 Years* 5 Years* 10 Years* Since launch*
Share classes
Bench mark
Share classes
Bench mark
Share classes
Bench mark
Share classes
Bench mark
Launch Date
Share classes
CAP BE0146025409 EUR 5.04% 1.50% 3.83% 8.14% 28/01/1994 0.30%
DIV BE0152245529 EUR 5.03% 1.49% 3.82% 8.13% 28/01/1994 0.29%
Institutional B Shares

Cap Div
ISIN code Cur-
rency
1 Year 3 Years* 5 Years* 10 Years* Since launch*
Share classes
Bench mark
Share classes
Bench mark
Share classes
Bench mark
Share classes
Bench mark
Launch Date
Share classes
CAP BE6228552855 EUR 5.05% 24/11/2011 11.05%
Risk warning: Past performance is not a guide to future performance. * Return on annual basis.
Classic Shares The bar chart shows the performance for full financial years. The figures do not take account of any restructuring. Calculated in EUR (ex BEF). The return is calculated as the change in the net asset value between two dates expressed
as a percentage. In the case of units that pay dividends, the dividend is incorporated geometrically in the return.
Calculation method for date D, where NAV stands for net asset value: Capitalisation units (CAP) Return on date D over a period of X years:
[NIW(D) / NIW(Y)] ^ [1 / X] - 1 where Y = D-X
Return on date D since the start date S of the unit: [NIW(D) / NIW(S)] ^ [1 / F] - 1 where F = 1 if the unit has existed for less than one year on date D where F = (D-S) / 365.25 if the unit has existed for longer than one year on date D
Distribution units (DIV) Return on date D over a period of X years:
[ C * NIW(D) / NIW(Y)] ^ [1 / X] - 1 where Y = D-X
Return on date D since the start date S of the unit: [ C * NIW(D) / NIW(S)] ^ [1 / F] - 1 where F = 1 if the unit has existed for less than one year on date D where F = (D-S) / 365.25 if the unit has existed for longer than one year on date D where C is a factor that is determined for all N dividends between the calculation date D and the reference date.
For dividend i on date Di with value Wi: Ci = [Wi / NIW(Di)] + 1 i = 1 ... N

from whichC = C0 * .... * CN. If the interval between the two dates exceeds one year, the ordinary return calculation is
converted into a return on an annual basis by taking the nth square root of 1 plus the total return of the unit.
The return figures shown above do not take account of the fees and charges associated with the issue and redemption of units.
These are the performance figures for capitalisation and distribution shares.
Institutional B Shares The bar chart shows the performance for full financial years. The figures do not take account of any restructuring. Calculated in EUR. The return is calculated as the change in the net asset value between two dates expressed
as a percentage. Calculation method for date D, where NAV stands for net asset value:
Capitalisation units (CAP) Return on date D over a period of X years:
[NIW(D) / NIW(Y)] ^ [1 / X] - 1 where Y = D-X
Return on date D since the start date S of the unit: [NIW(D) / NIW(S)] ^ [1 / F] - 1 where F = 1 if the unit has existed for less than one year on date D where F = (D-S) / 365.25 if the unit has existed for longer than one year on date D
If the interval between the two dates exceeds one year, the ordinary return calculation is converted into a return on an annual basis by taking the nth square root of 1 plus the total return of the unit.
The return figures shown above do not take account of the fees and charges associated with the issue and redemption of units.
These are the performance figures for capitalization shares.

2.4.6 COSTS Ongoing Charges: * Classic Shares Distribution: 1.846% Classic Shares Capitalization: 1.828% Institutional B Shares Capitalization: 1.835% * The following costs have not been included in the ongoing charges: - Interest payments on loans taken out - Payments in respect of financial derivatives - Fees and charges paid directly by the investor - Any soft commissions
SOFT COMMISSIONS The management company or the appointed manager, as the case may be, is the recipient of soft commissions. The recipient has laid down an internal policy as regards accepting soft commissions and avoiding possible conflicts of interest in this respect, and has put appropriate internal controls in place to ensure this policy is observed. For more information, please see the ‘General’ section of the annual report.
Broker
Commission gross
in EUR
paid during the period:
1‐01‐13
‐
30‐06‐13
CSA Credits
in EUR
accrued during the period:
1‐01‐13
‐
30‐06‐13 Percentage
CITI 74,100 37,050 50.00%
CSFBSAS 6,609 3,304 50.00%
EQ MACQUARIE 833 417 50.00%
INSTINET 40,482 20,241 50.00%
FEE-SHARING AGREEMENTS AND REBATES: The management company may share its fee with the distributor, and institutional and/or professional parties. In principle, the percentage share amounts to between 35% and 60% if the distributor is an entity of KBC Group NV or to between 35% and 70% if the distributor is not an entity of KBC Group NV. However, in a small number of cases, the distributor’s fee is less than 35%. Investors may, on request, obtain more information on these cases. If the management company invests the assets of the undertaking for collective investment in units of undertakings for collective investment that are not managed by an entity of KBC Group NV, and receives a fee for doing so, it will pay this fee to the undertaking for collective investment. Fee-sharing does not affect the amount of the management fee paid by the sub-fund to the management company. This management fee is subject to the limitations laid down in the articles of association. The limitations may only be amended after approval by the general meeting of shareholders. The management company has concluded a distribution agreement with the distributor in order to facilitate the wider distribution of the sub-fund's units by using multiple distribution channels. It is in the interests of the holders of units, the sub-fund and of the distributor for the largest possible number of units to be sold and for the assets of the sub-fund to be maximised in this way. In this respect, there is therefore no question of any conflict of interest.
2.4.7 NOTES TO THE FINANCIAL STATEMENTS AND OTHER DATA Fee for managing the investment portfolio: 1.6% per annum calculated on the basis of the average total net assets of the sub-fund, no management fee is charged on assets assets invested in investment undertakings managed by a financial institution of the KBC group. KBC Fund Management Limited receives a fee from the management company of max. 1.6% calculated on that part of the portfolio that it manages, without the total management fee received by the management company being exceeded. The administration agent’s fee is payable at the end of each month and is calculated on the basis of the average total net assets of the sub-fund.
Auditor's fee: 1 700 EUR per year. This fee is not including VAT and can be indexed on an annual basis in accordance with the decisions of the general meeting. The custody fee is calculated on the value of the securities held in custody by the custodian on the final banking day of the preceding calendar year, except on those assets invested in investment undertakings managed by a financial institution of the KBC group. The custody fee is paid at the beginning of the calendar year. Social, ethical and environmental aspects: No manufacturers of controversial weapons whose use over the past five decades, according to the international consensus, has led to disproportionate human suffering among the civilian population will be included in the portfolio of investments. This involves the manufacturers of anti-personnel mines, cluster bombs and munitions and weapons containing depleted uranium. In this way, the sub-fund seeks to reflect not only simple financial reality but also the social reality of the sector or region in question. Exercising voting rights. If necessary, relevant and in the interest of the shareholders, the management company will exercise the voting rights attached to the shares in the Bevek’s portfolio. The management company will adhere to the following criteria when determining how it stands relative to the items on the agenda that are put to the vote: - Shareholder value may not be adversely affected. - Corporate governance rules, especially with regard to the rights of minority shareholders, must be
respected. - The minimum standards with regard to sustainable business and corporate social responsibility
must be met. The list of companies for which voting rights are exercised is available at the registered office of the Bevek.
Name Maximum management fee Horizon-Access India Fund-Classic Shares 1,60
KBC Equity Fund-New Asia-Classic Shares 1,60
KBC Equity Fund-New Asia-Institutional B Shares 1,60
Securities lending In accordance with the Royal Decree of 7 March 2006 concerning securities lending, the undertaking for collective investment has taken out securities loans with a principal to whom the full title of the loaned securities was transferred, without recording this transfer of ownership in the accounts. For the period from 1 January 2013 to 30 June 2013, the fee for securities lent comes to 146,005.61 EUR. The undertaking for collective investment receives 50% of the fee received for securities lent. The detailed list of securities lending transactions carried out can be obtained from the registered office of the collective investment undertaking at 2 Havenlaan, 1080 Brussels.
Overview of securities lent as at 30/06/2013
Name Currency Quantity Price Value in currency of the
portfolio
AIR CHINA LTD H CNY1 HKD 733.999 5,580 406.236,24
ANGANG STEEL COMPANY LTD 'H' HKD 1.839 3,810 694,95
ANHUI CONCH CEMENT CO LTD -H- HKD 190.999 21,000 397.831,70
CELLTRION INC KRW 681 41.800,000 19.175,43
CHINA CONSTRUCTION BANK -H- HKD 7.800.000 5,490 4.247.329,43
CHINA MERCHANTS BANK CO LTD -H- HKD 392.999 12,960 505.179,18
CHINA NATL. BUILDING MATERIAL -H- HKD 1.239.999 6,950 854.781,55
CHINA RAILWAY CONSTRUCTIO-H- HKD 1.175.999 6,740 786.168,88
CHINA UNICOM HONG KONG LTD HKD 801.843 10,300 819.172,88
CHONGQING RURAL COMMERCIAL BANK -H HKD 687.999 3,290 224.508,46
CSR CORP LTD -H- HKD 958.999 4,560 433.742,52
DONGFENG MOTOR CORPORATION HKD 322.000 10,360 330.875,51
GUANGZHOU R&F PROPERTIES COMP.LTD HKD 631.599 11,220 702.883,41
HENGAN INTL GROUP CO LTD HKD 6.876 84,500 57.629,07
JIANGXI COPPER -H- HKD 201.999 13,140 263.265,28
PICC PROPERTY & CASUALTY -H- HKD 149.815 8,750 130.020,66
SHIMAO PROPERTY HOLDINGS LTD HKD 294.499 15,400 449.835,31
WANT WANT CHINA HOLDINGS LTD HKD 303.999 10,920 329.263,65

WUMART STORES INC -H- HKD 10.000 14,300 14.183,55
ZHUZHOU CSR TIMES ELECTRIC - H HKD 221.000 19,540 428.317,51
ZIJIN MINING GROUP CO -H- HKD 2.197.999 1,370 298.673,75
Total 11.699.768,92
Details of collateral received for securities lent
Name Currency Nominal value Currency fund Value in Currency fund
AUSTRIA 2012 3,4% 22/11/2022 EUR 7.868.000 EUR 8.977.946,63
BUNDESREPUB.DTL. AN 2005 3 1/2% 04/01/16 EUR 169.000 EUR 185.648,19
BUNDESSCHATZANWEISUNGEN 2013 0.25% 13/03/15 EUR 1.174.000 EUR 1.176.870,43
FRANCE 2008 3.75% 25/10/2019 EUR 1.779.000 EUR 2.064.684,27
Total 12.405.149,52 For the valuation of the collateral received, indicative prices have been used in this detail list by the Collateral Management Division of KBC Bank.

Semi-Annual report as at 30th June 2013
TABLE OF CONTENTS
2. Information on KBC Equity Fund Latin America
2.1. Management report 2.1.1. Launch date and subscription price 2.1.2. Stock exchange listing 2.1.3. Aim and distinctive features of the investment policy 2.1.4. Financial portfolio management 2.1.5. Distributors 2.1.6. Index and benchmark 2.1.7. Policy conducted during the financial year 2.1.8. Future policy 2.1.9. Synthetic risk and reward indicator (SRRI)
2.2. Balance sheet
2.3. Profit and loss account
2.4. Composition of the assets and key figures
2.4.1. Composition of the assets 2.4.2. Change in the composition of the assets 2.4.3. Value of commitments in respect of financial derivatives positions 2.4.4. Evolution of the number of subscriptions, repayments and the net asset value 2.4.5. Return figures 2.4.6. Expenses 2.4.7. Notes to the financial statements and other data

2 INFORMATION ON KBC EQUITY FUND LATIN AMERICA
2.1 MANAGEMENT REPORT
2.1.1 LAUNCH DATE AND SUBSCRIPTION PRICE Launch date: 28 January 1994 Initial subscription price: 20000 BEF Currency: EUR
2.1.2 STOCK EXCHANGE LISTING Not applicable.
2.1.3 GOAL AND KEY PRINCIPLES OF THE INVESTMENT POLICY
SUB-FUND’S OBJECT: The main objective of this sub-fund is to generate the highest possible return for its shareholders by investing directly or indirectly in transferable securities. This is reflected in its pursuit of capital gains and income. To this end, the assets are invested, either directly or indirectly via correlated financial instruments, primarily in shares.
SUB-FUND’S INVESTMENT POLICY:
PERMITTED ASSET CLASSES: The sub-fund may invest in securities, money market instruments, units in undertakings for collective investment, deposits, financial derivatives, liquid assets and all other instruments insofar as permitted by the applicable laws and regulations and consistent with the sub-fund’s object The sub-fund shall invest no more than 10% of its assets in units of other undertakings for collective investment.
RESTRICTIONS OF THE INVESTMENT POLICY: The investment policy will be implemented within the limits set by law and regulations. The sub-fund may borrow up to 10% of its net assets, insofar as these are short-term borrowings aimed at solving temporary liquidity problems.
PERMITTED DERIVATIVES TRANSACTIONS: Derivates may be used either for hedging purposes or to achieve investment objectives. Changes will be made to the investments at regular intervals to comply with the sub-fund's investment strategy. In addition, listed and unlisted derivates may be used to achieve the objectives: these may be forward contracts, options or swaps on securities, indices, currencies or interest rates or other transactions involving derivatives. Unlisted derivatives transactions will only be concluded with prime financial institutions specialised in such transactions. Such derivatives may also be used to hedge the assets against exchange-rate fluctuations. Subject to the applicable laws and regulations and the articles of association, the sub-fund always seeks to conclude the most effective transactions. All costs associated with the transactions will be charged to the sub-fund and all income generated will be paid to the sub-fund. If the transactions result in a risk in respect of the counterparty, this risk can be hedged by using a margin management system that ensures that the sub-fund is the beneficiary of security (collateral) in the form of cash or investment grade bonds. When calculating the value of the bonds, a margin will be applied that varies depending on the residual term to maturity and the currency in which the bond in question is denominated. The relationship with the counterparty or counterparties is governed by standard international agreements.
STRATEGY SELECTED At least 75% of the assets are invested in shares of companies in Latin American countries where conditions are such as to ensure accelerated economic growth in the short or medium term. This may involve the use of Depository Receipts, including ADRs and GDRs. Investors should note that the sub-fund may invest up to 100% of its assets in Depository Receipts.
RISK CONCENTRATION Latin American shares.
INDEX-TRACKING: The objective of the sub-fund is to track the composition of an index in accordance with and within the limits of Article 63 of the Royal Decree of 12 November 2012 on certain public undertakings for collective investment. Index/indices in question: MSCI Latin America, which covers around 85% of the free-float market capitalisation of the Latin America countries included in the index. Additional information on this index and its composition is available at www.msci.com. Index tracking method: physical replication using optimised sampling: the index is tracked using a selection of shares in the index in order to best replicate the index. In addition, an optimisation algorithm is used that balances the risk and the return of each of the portfolio positions, so optimising the selection. The sub-fund may also make limited use of synthetic replication by way of futures, primarily in order to cushion the effects of buying and selling and to avoid the attendant transaction charges. The index is rebalanced every quarter. The more often an index is rebalanced, the greater the potential impact on the transaction charges within the sub-fund. Given normal market conditions, the expected tracking error is between 0% and 2%. Possible causes of this tracking error could be the method used to track the index, transaction charges, dividend reinvestment, the general costs charged to the sub-fund, any income from lending financial instruments, the use of depository receipts (as explained under the ‘Strategy selected’ heading above). If the composition of the index is no longer sufficiently diversified or if the index is no longer sufficiently representative of the market it relates to or if the value and composition of the index is no longer published in a suitable manner, the management company will inform the Board of Directors without delay. The Board of Directors will consider what action to take in the interest of investors and may convene a general meeting of shareholders in order to amend the investment policy. This fund is not sponsored, endorsed, sold or promoted by MSCI INC. ('MSCI'), any of its affiliates, any of its information providers or any other third party involved in, or related to, compiling, computing or creating any MSCI index (collectively, the 'MSCI parties'). The MSCI indexes are the exclusive property of MSCI. MSCI and the MSCI index names are service mark(s) of MSCI or its affiliates and have been licensed for use for certain purposes by KBC Asset Management. None of the MSCI parties makes any representation or warranty, express or implied, to the issuer or owners of this fund or any other person or entity regarding the advisability of investing in funds generally or in this fund particularly or the ability of any MSCI index to track corresponding stock market performance. MSCI or its affiliates are the licensors of certain trademarks, service marks and trade names and of the MSCI indexes which are determined, composed and calculated by MSCI without regard to this fund or the issuer or owners of this fund or any other person or entity. None of the MSCI parties has any obligation to take the needs of the issuer or owners of this fund or any other person or entity into consideration in determining, composing or calculating the MSCI indexes. None of the MSCI parties is responsible for or has participated in the determination of the timing of, prices at, or quantities of this fund to be issued or in the determination or calculation of the equation by or the consideration into which this fund is redeemable. Further, none of the MSCI parties has any obligation or liability to the issuer or owners of this fund or any other person or entity in connection with the administration, marketing or offering of this fund. Although MSCI shall obtain information for inclusion in or for use in the calculation of the MSCI indexes from sources that MSCI considers reliable, none of the MSCI parties warrants or guarantees the originality, accuracy and/or the completeness of any MSCI index or any data included therein. None of the MSCI parties makes any warranty, express or implied, as to results to be obtained by the issuer of the fund, owners of the fund, or any other person or entity, from the use of any MSCI index or any data included therein. None of the MSCI parties shall have any liability for any errors, omissions or interruptions of or in connection with any MSCI index or any data included therein. Further, none of the MSCI parties makes any express or implied warranties of any kind, and the MSCI parites hereby expressly disclaim all warranties of merchantability and fitness for a particular purpose, with respect to each MSCI index and any data included therein. Without limiting any of the foregoing, in no event shall any of the MSCI parties have any liability for any direct, indirect, special, punitive, consequential or any other damages (including lost profits) even if notified of the possibility of such damages. No purchaser, seller or holder of this fund, or any other person or entity, should use or refer to any MSCI trade name, trademark or service mark to sponsor, endorse, market or promote this fund without first contacting MSCI to determine whether MSCI’s permission is required. Under no circumstances may any person or entity claim any affiliation with MSCI without the prior written permission of MSCI.
LENDING FINANCIAL INSTRUMENTS: The sub-fund may lend financial instruments within the limits set by law and regulations.
This lending does not affect the sub-fund’s risk profile since: - it takes place within the framework of a securities lending system managed by a principal. In
addition, the sub-fund has a relationship only with the principal of the securities lending system which acts as counterparty and to which title of the loaned securities is transferred. The choice of principal is subject to strict selection criteria. The return of securities similar to the securities that have been lent is guaranteed by the principal.
- through a margin management system, the sub-fund is always guaranteed financial security, the actual value of which always exceeds the actual value of the securities that have been lent, in case the principal does not return similar securities.
The return of securities similar to the securities that have been lent can be requested at any time, which means that the lending of securities does not affect the management of the sub-fund's assets. By lending securities, the sub-fund can generate an additional return. The principal pays a fee to the management company. After deducting the fee for the margin management and clearing services of KBC Bank, most of this fee is paid to the sub-fund. The relationship with the counterparty or counterparties is governed by standard international agreements. More information is provided on the terms and conditions governing securities lending in the annual or half-yearly report for the sub-fund.
VOLATILITY OF THE NET ASSET VALUE: The volatility of the net asset value may be high due to the composition of the portfolio.
GENERAL STRATEGY FOR HEDGING THE EXCHANGE RATE RISK: In order to protect its assets against exchange rate fluctuations and within the limitations laid down in the articles of association, the sub-fund may perform transactions relating to the sale of forward currency contracts, as well as the sale of call options and the purchase of put options on currencies. The transactions in question may relate solely to contracts traded on a regulated market that operates regularly, is recognised and is open to the public or that are traded with a recognised, prime financial institution specialising in such transactions and dealing in the over-the-counter (OTC) market in options. With the same objective, the sub-fund may also sell currencies forward or exchange them in private transactions with prime financial institutions specialising in such transactions. The hedging objective of the aforementioned transactions suggests that there is a direct link between these transactions and the assets to be hedged, which implies that the transactions carried out in a particular currency may in principle not exceed, in terms of volume, either the valuation value of all the assets in the same currency or the holding period of those assets.
SOCIAL, ETHICAL AND ENVIRONMENTAL ASPECTS:
No manufacturers of controversial weapons whose use over the past five decades, according to the international consensus, has led to disproportionate human suffering among the civilian population will be included in the portfolio of investments. This involves the manufacturers of anti-personnel mines, cluster bombs and munitions and weapons containing depleted uranium. In this way, the sub-fund seeks to reflect not only simple financial reality but also the social reality of the sector or region in question.
THE EUROPEAN SAVINGS DIRECTIVE AND TAX ON DEBT CLAIM RETURNS OBTAINED THROUGH THE
REDEMPTION OF OWN UNITS OR IN THE EVENT OF FULL OR PARTIAL DISTRIBUTION OF EQUITY
CAPITAL. The following information is of a general character and is not intended to cover all aspects of an investment in a UCITS. In certain cases entirely different rules might even apply. Moreover, both tax law and the interpretation of it can change. Investors who wish to have more information about the tax implications – in both Belgium and abroad – of acquiring, holding and transferring units should seek the advice of their usual financial and tax advisers. This UCITS shall invest a maximum of 15% of its assets directly or indirectly in debt instruments as intended by the European Savings Directive. A. European Savings Directive (Directive 2003/48/EC) The European Savings Directive has been implemented in Belgium.
Since this UCITS invests a maximum of 15% of its assets directly or indirectly in debt claims as intended by the European Savings Directive, the income of this UCITS does not fall within the scope of this directive. B. Tax on debt claim returns obtained through the redemption of own units or in the event of full or partial distribution of equity capital (Article 19bis Income Tax Code 1992). The income from this UCITS is not subject to the tax on debt instrument returns as intended by Article 19bis, Income Tax Code 1992.
2.1.4 FINANCIAL PORTFOLIO MANAGEMENT The management company has delegated the intellectual management, to KBC Fund Management Limited, Joshua Dawson House, Dawson Street , Dublin 2, IRELAND..
2.1.5 DISTRIBUTORS KBC Asset Management S.A., 5, Place de la Gare, L-1616 Luxembourg.
2.1.6 INDEX AND BENCHMARK See ‘Sub-fund’s investment policy’.
2.1.7 POLICY PERSUED DURING THE FINANCIAL YEAR The KBC Equity Fund Latin America invests directly in local Latin American markets as well as ADRs and GDRs where necessary. The fund invests in the following markets with approximately the accompanying proportions: Brazil (59%), Mexico (25%), Chile (8%), Colombia (5%), Peru (2%) and Argentina (1%). The largest holdings are Petrobras, Vale and America Movil. Investors should be aware that emerging markets, such as in Latin America, are more volatile than mature markets. The performance of Latin American stocks in general, and Brazilian stocks in particular, has been disappointing in first half of the 2013 both in absolute as well as in relative terms against global equities. Majority of the underperformance can be attributed to region’s largest economy and fund’s largest country allocation, Brazil, primarily due to depreciation of its local currency, the real, by more than 15% versus the US dollar since its mid-year peak in the early March. On the equity side, the worst performing sectors globally included Materials, Technology and Energy. Not only Brazilian (Value, Petrobras) but also Peruvian and Chilean stock prices could not be left unaffected, given the fact that commodity companies constitute a large portion of local equity market. During the first quarter, the performance was positive in absolute terms driven by good performance of Mexican equities. However, when measured against global equities, Latin American equities underperformed by about 8ppt on a relative basis. At that time, Latin America’s performance did not stand out compared to other Emerging Markets which recorded even lower performance and finished the first quarter relatively flat. During the second quarter, Latin American equities continued to perform poorly not only relatively to equities in developed markets but also compared to other emerging markets. The performance was disappointing in absolute terms as well with the region’s equities down about 16%, underperforming other emerging markets. Global equities, which are dominated by equities in developed markets, particularly in the US, finished second quarter relatively flat in euro terms. Over the last 3 months, both local and global factors were behind poor performance. Brazil’s largest companies are very reliant on the global macroeconomic situation as their fortunes are quite dependent on commodity-oriented exports. Commodity prices, driven down by a slowdown in global and Chinese economy, disappointed in the first half of the 2013. The prices of iron ore, one of the main commodity exports in Brazil, were down more than a quarter since February 2013. Brazil-China commodity link, one of the main engines of local economy growth in the first decade of 21st century, went into reverse. Developments in the US monetary policy did not contribute positively either. The Fed’s chairman, Ben Bernanke, signalled the gradual end to the Quantitative Easing program. This sparked a sell-off in risk assets, particularly affecting emerging market equities. Local economic data in Brazil was not supportive either. On the economic front, GDP growth continued to disappoint. At the start of the year, economists were quite upbeat about prospects for the region’s largest economy and expected GDP to record a 3.5% growth for the full year. However, as in 2012, over last 6 months economic data again continued to come in below expectations. The long-awaited recovery failed to materialise and GDP forecasts had to be revised down accordingly. The most recent forecast for 2013 GDP growth is 2.5%. Brazilian investors, already came to terms with the notion that the GDP growth above 4% annually that was experienced in first decade of 21st century will not be repeated. On a monetary policy front, the interest rate, the Selic, started 2013 at 7.25%, an all-time historic low. Such an accommodative monetary policy (benchmark interest rate decreased by 500 bps since summer 2011) helped stoke price increases without any material and lasting impact on real economy and subsequently the Central Bank had to raise interest rates to 8% to counteract inflation which is already running at the rate close to its upper target. On a positive note, unemployment rate continues to be very low at 5.5%. Moreover, cheaper local currency should help domestic exporters. Contrary to expectations, Headline news did not help Brazil. The Confederations Cup, considered a warm-up tournament ahead of the next year’s World Cup attracted a wrong kind of attention. The government’s effort to use a major sports tournament as a way to promote Brazil on the world’s pitch spectacularly misfired when thousands of Brazilians decided to take to the streets not to cheer up a local soccer team but to protest against government’s misspending of public money on expensive and unnecessary stadiums instead of much needed healthcare, education and infrastructure. It helped a bit in the end that the home team won the title but the reputational damage was already done. Although Mexican equities outperformed other Latin American and emerging market equities, it has been a difficult period for Mexico. Corporate earnings in the first quarter disappointed, the US, its main economic partner, experienced a slowdown and local economic data pointed toward a deceleration in growth rate. The Mexican Central Bank had to mitigate the negative effects by cutting its interest rate by 50bps. Local equities are already quite expensive on the premise that ambitious structural reforms will be implemented which will unlock long-term GDP growth. However, uncertainties surrounding the outlook for reforms arose, which additionally had a negative impact on stock prices.
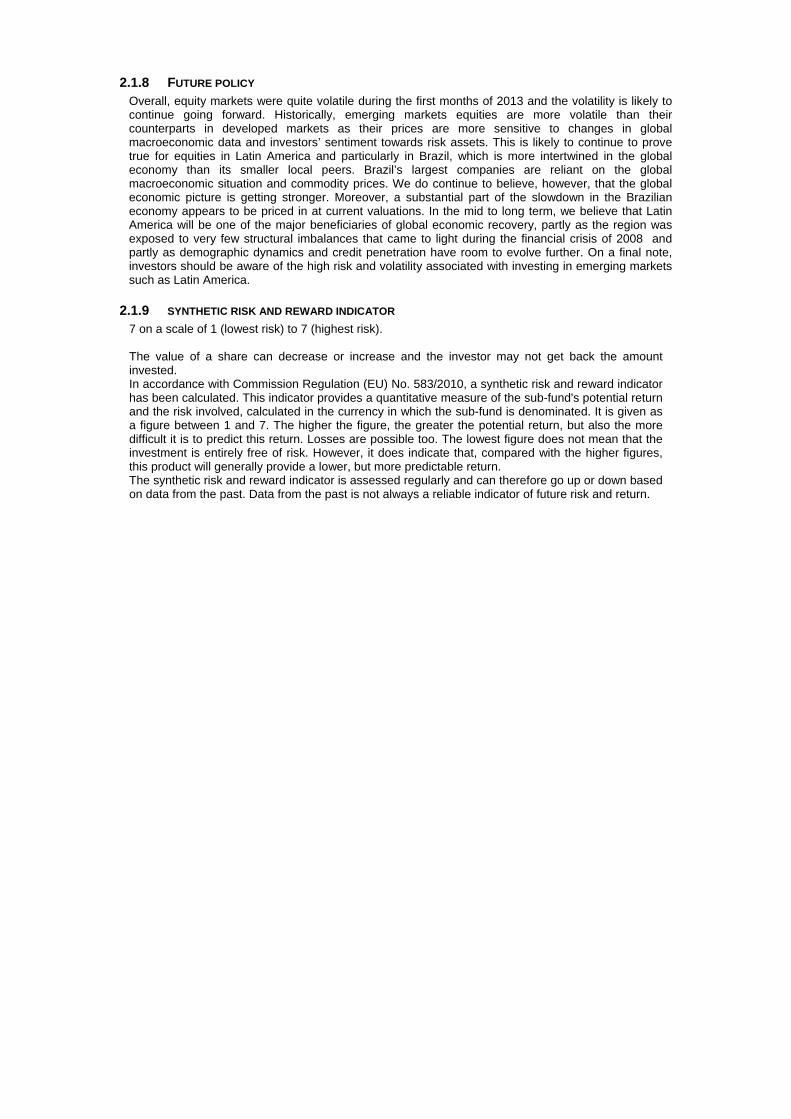
2.1.8 FUTURE POLICY Overall, equity markets were quite volatile during the first months of 2013 and the volatility is likely to continue going forward. Historically, emerging markets equities are more volatile than their counterparts in developed markets as their prices are more sensitive to changes in global macroeconomic data and investors’ sentiment towards risk assets. This is likely to continue to prove true for equities in Latin America and particularly in Brazil, which is more intertwined in the global economy than its smaller local peers. Brazil’s largest companies are reliant on the global macroeconomic situation and commodity prices. We do continue to believe, however, that the global economic picture is getting stronger. Moreover, a substantial part of the slowdown in the Brazilian economy appears to be priced in at current valuations. In the mid to long term, we believe that Latin America will be one of the major beneficiaries of global economic recovery, partly as the region was exposed to very few structural imbalances that came to light during the financial crisis of 2008 and partly as demographic dynamics and credit penetration have room to evolve further. On a final note, investors should be aware of the high risk and volatility associated with investing in emerging markets such as Latin America.
2.1.9 SYNTHETIC RISK AND REWARD INDICATOR 7 on a scale of 1 (lowest risk) to 7 (highest risk). The value of a share can decrease or increase and the investor may not get back the amount invested. In accordance with Commission Regulation (EU) No. 583/2010, a synthetic risk and reward indicator has been calculated. This indicator provides a quantitative measure of the sub-fund's potential return and the risk involved, calculated in the currency in which the sub-fund is denominated. It is given as a figure between 1 and 7. The higher the figure, the greater the potential return, but also the more difficult it is to predict this return. Losses are possible too. The lowest figure does not mean that the investment is entirely free of risk. However, it does indicate that, compared with the higher figures, this product will generally provide a lower, but more predictable return. The synthetic risk and reward indicator is assessed regularly and can therefore go up or down based on data from the past. Data from the past is not always a reliable indicator of future risk and return.

2.2 BALANCE SHEET
Balance sheet layout 30/06/2013 (in the currency of the sub-fundt)
30/06/2012 (in the currency of the sub-fund )
TOTAL NET ASSETS 30.726.949,03 39.158.687,29
II. Securities, money market instruments, UCIs and derivatives
C. Shares and similar instruments a) Shares 30.541.556,11 39.077.025,54 D. Other securities 3.666,35 363,47
IV. Receivables and payables within one year A. Receivables a) Accounts receivable 308.834,85 24.489,74 B. Payables a) Accounts payable (-) -46.344,23 -107.603,11 c) Borrowings (-) -262.099,41 -52.238,88
V. Deposits and cash at bank and in hand A. Demand balances at banks 60.077,02 35.436,32
VI. Accruals and deferrals A. Expense to be carried forward 18.478,67 19.884,59 B. Accrued income 129.565,45 173.812,84 C. Accrued expense (-) -26.785,78 -12.483,22
TOTAL SHAREHOLDERS' EQUITY 30.726.949,03 39.158.687,29
A. Capital 36.317.939,25 39.080.944,16
B. Income equalization 3.517,81 -55.982,98
D. Result for the period -5.594.508,03 133.726,11
Off-balance-sheet headings
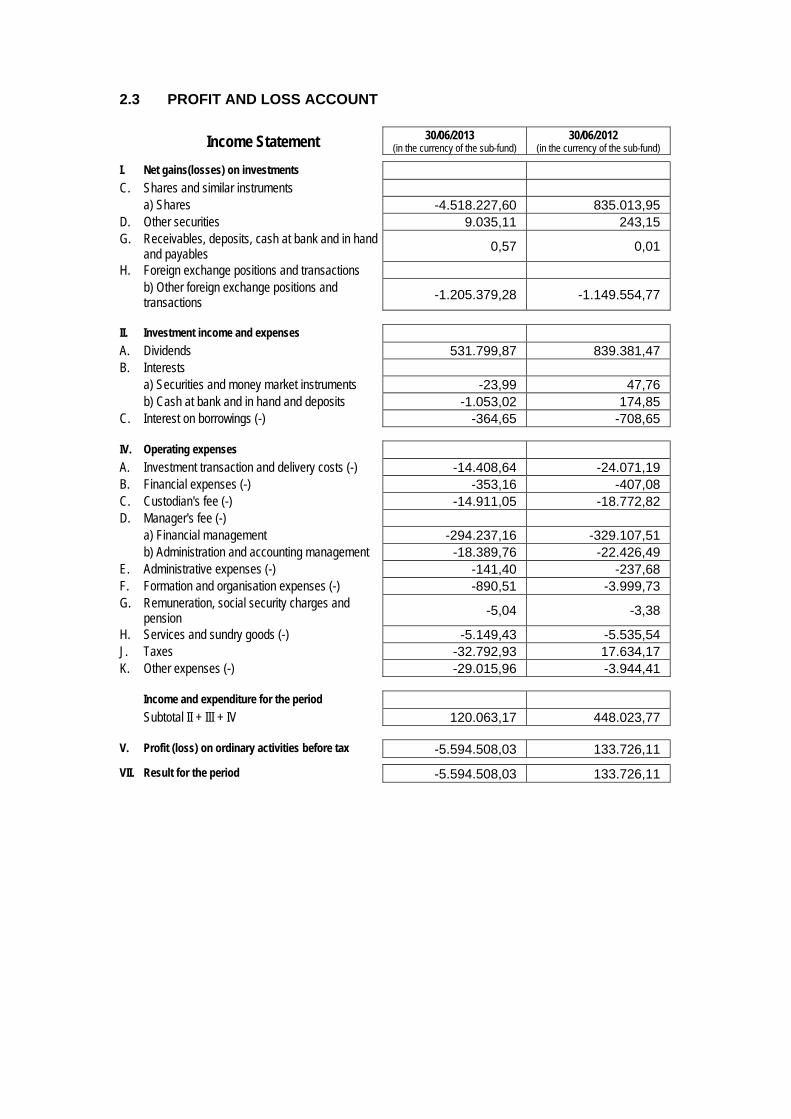
2.3 PROFIT AND LOSS ACCOUNT
Income Statement 30/06/2013 (in the currency of the sub-fund)
30/06/2012 (in the currency of the sub-fund)
I. Net gains(losses) on investments C. Shares and similar instruments a) Shares -4.518.227,60 835.013,95 D. Other securities 9.035,11 243,15 G. Receivables, deposits, cash at bank and in hand
and payables 0,57 0,01
H. Foreign exchange positions and transactions b) Other foreign exchange positions and
transactions -1.205.379,28 -1.149.554,77
II. Investment income and expenses A. Dividends 531.799,87 839.381,47 B. Interests a) Securities and money market instruments -23,99 47,76 b) Cash at bank and in hand and deposits -1.053,02 174,85 C. Interest on borrowings (-) -364,65 -708,65
IV. Operating expenses A. Investment transaction and delivery costs (-) -14.408,64 -24.071,19 B. Financial expenses (-) -353,16 -407,08 C. Custodian's fee (-) -14.911,05 -18.772,82 D. Manager's fee (-) a) Financial management -294.237,16 -329.107,51 b) Administration and accounting management -18.389,76 -22.426,49 E. Administrative expenses (-) -141,40 -237,68 F. Formation and organisation expenses (-) -890,51 -3.999,73 G. Remuneration, social security charges and
pension -5,04 -3,38
H. Services and sundry goods (-) -5.149,43 -5.535,54 J. Taxes -32.792,93 17.634,17 K. Other expenses (-) -29.015,96 -3.944,41
Income and expenditure for the period Subtotal II + III + IV 120.063,17 448.023,77
V. Profit (loss) on ordinary activities before tax -5.594.508,03 133.726,11
VII. Result for the period -5.594.508,03 133.726,11
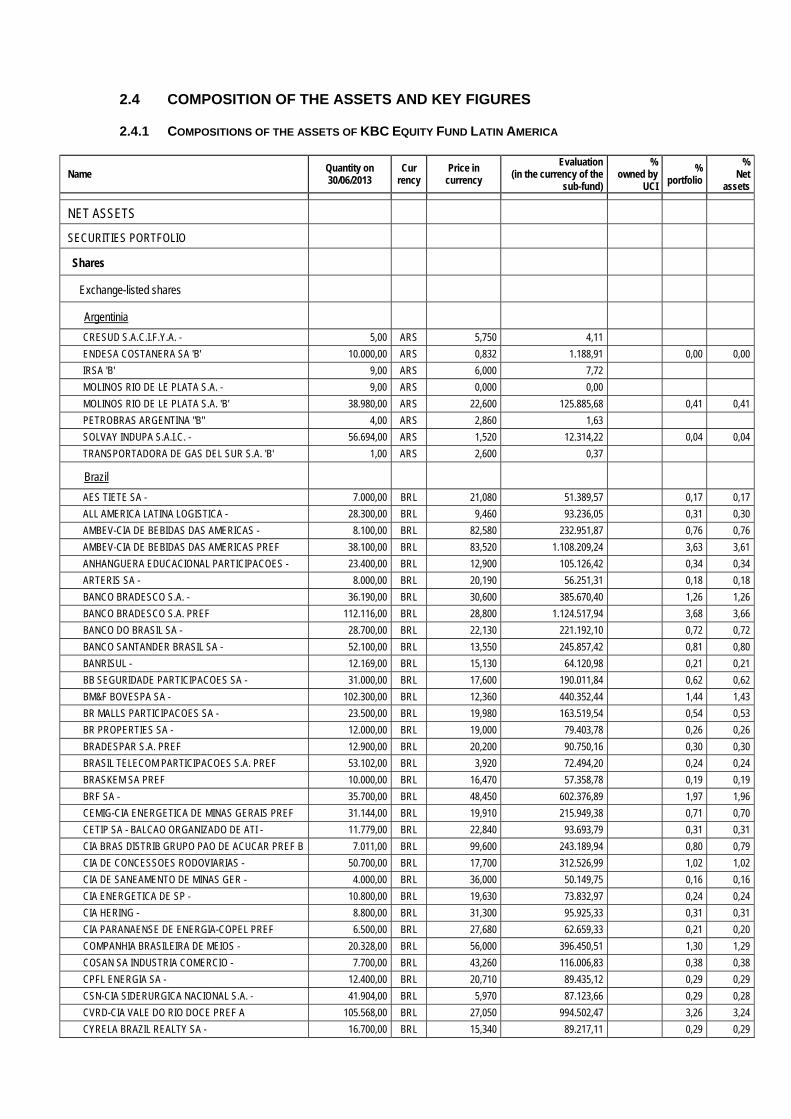
2.4 COMPOSITION OF THE ASSETS AND KEY FIGURES
2.4.1 COMPOSITIONS OF THE ASSETS OF KBC EQUITY FUND LATIN AMERICA
Name Quantity on 30/06/2013
Cur rency
Price in currency
Evaluation (in the currency of the
sub-fund)
% owned by
UCI
% portfolio
% Net
assets
NET ASSETS
SECURITIES PORTFOLIO
Shares
Exchange-listed shares
Argentinia
CRESUD S.A.C.I.F.Y.A. - 5,00 ARS 5,750 4,11
ENDESA COSTANERA SA 'B' 10.000,00 ARS 0,832 1.188,91 0,00 0,00
IRSA 'B' 9,00 ARS 6,000 7,72
MOLINOS RIO DE LE PLATA S.A. - 9,00 ARS 0,000 0,00
MOLINOS RIO DE LE PLATA S.A. 'B' 38.980,00 ARS 22,600 125.885,68 0,41 0,41
PETROBRAS ARGENTINA "B" 4,00 ARS 2,860 1,63
SOLVAY INDUPA S.A.I.C. - 56.694,00 ARS 1,520 12.314,22 0,04 0,04
TRANSPORTADORA DE GAS DEL SUR S.A. 'B' 1,00 ARS 2,600 0,37
Brazil
AES TIETE SA - 7.000,00 BRL 21,080 51.389,57 0,17 0,17
ALL AMERICA LATINA LOGISTICA - 28.300,00 BRL 9,460 93.236,05 0,31 0,30
AMBEV-CIA DE BEBIDAS DAS AMERICAS - 8.100,00 BRL 82,580 232.951,87 0,76 0,76
AMBEV-CIA DE BEBIDAS DAS AMERICAS PREF 38.100,00 BRL 83,520 1.108.209,24 3,63 3,61
ANHANGUERA EDUCACIONAL PARTICIPACOES - 23.400,00 BRL 12,900 105.126,42 0,34 0,34
ARTERIS SA - 8.000,00 BRL 20,190 56.251,31 0,18 0,18
BANCO BRADESCO S.A. - 36.190,00 BRL 30,600 385.670,40 1,26 1,26
BANCO BRADESCO S.A. PREF 112.116,00 BRL 28,800 1.124.517,94 3,68 3,66
BANCO DO BRASIL SA - 28.700,00 BRL 22,130 221.192,10 0,72 0,72
BANCO SANTANDER BRASIL SA - 52.100,00 BRL 13,550 245.857,42 0,81 0,80
BANRISUL - 12.169,00 BRL 15,130 64.120,98 0,21 0,21
BB SEGURIDADE PARTICIPACOES SA - 31.000,00 BRL 17,600 190.011,84 0,62 0,62
BM&F BOVESPA SA - 102.300,00 BRL 12,360 440.352,44 1,44 1,43
BR MALLS PARTICIPACOES SA - 23.500,00 BRL 19,980 163.519,54 0,54 0,53
BR PROPERTIES SA - 12.000,00 BRL 19,000 79.403,78 0,26 0,26
BRADESPAR S.A. PREF 12.900,00 BRL 20,200 90.750,16 0,30 0,30
BRASIL TELECOM PARTICIPACOES S.A. PREF 53.102,00 BRL 3,920 72.494,20 0,24 0,24
BRASKEM SA PREF 10.000,00 BRL 16,470 57.358,78 0,19 0,19
BRF SA - 35.700,00 BRL 48,450 602.376,89 1,97 1,96
CEMIG-CIA ENERGETICA DE MINAS GERAIS PREF 31.144,00 BRL 19,910 215.949,38 0,71 0,70
CETIP SA - BALCAO ORGANIZADO DE ATI - 11.779,00 BRL 22,840 93.693,79 0,31 0,31
CIA BRAS DISTRIB GRUPO PAO DE ACUCAR PREF B 7.011,00 BRL 99,600 243.189,94 0,80 0,79
CIA DE CONCESSOES RODOVIARIAS - 50.700,00 BRL 17,700 312.526,99 1,02 1,02
CIA DE SANEAMENTO DE MINAS GER - 4.000,00 BRL 36,000 50.149,75 0,16 0,16
CIA ENERGETICA DE SP - 10.800,00 BRL 19,630 73.832,97 0,24 0,24
CIA HERING - 8.800,00 BRL 31,300 95.925,33 0,31 0,31
CIA PARANAENSE DE ENERGIA-COPEL PREF 6.500,00 BRL 27,680 62.659,33 0,21 0,20
COMPANHIA BRASILEIRA DE MEIOS - 20.328,00 BRL 56,000 396.450,51 1,30 1,29
COSAN SA INDUSTRIA COMERCIO - 7.700,00 BRL 43,260 116.006,83 0,38 0,38
CPFL ENERGIA SA - 12.400,00 BRL 20,710 89.435,12 0,29 0,29
CSN-CIA SIDERURGICA NACIONAL S.A. - 41.904,00 BRL 5,970 87.123,66 0,29 0,28
CVRD-CIA VALE DO RIO DOCE PREF A 105.568,00 BRL 27,050 994.502,47 3,26 3,24
CYRELA BRAZIL REALTY SA - 16.700,00 BRL 15,340 89.217,11 0,29 0,29
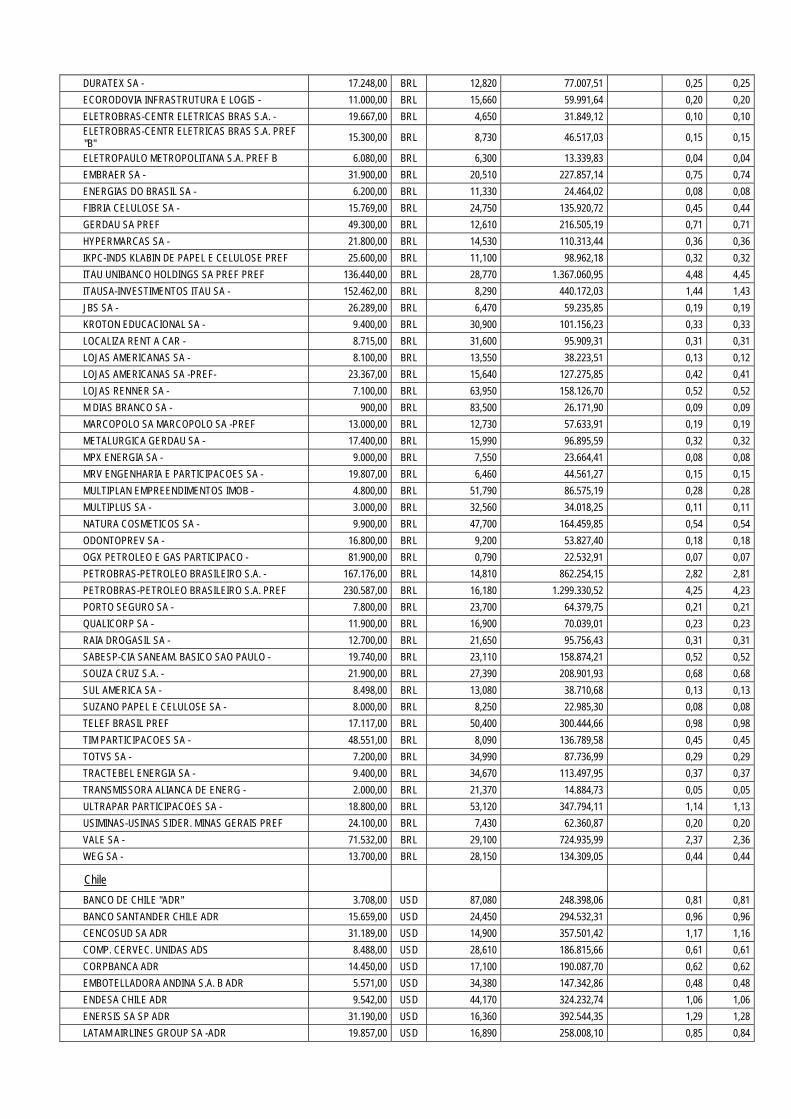
DURATEX SA - 17.248,00 BRL 12,820 77.007,51 0,25 0,25
ECORODOVIA INFRASTRUTURA E LOGIS - 11.000,00 BRL 15,660 59.991,64 0,20 0,20
ELETROBRAS-CENTR ELETRICAS BRAS S.A. - 19.667,00 BRL 4,650 31.849,12 0,10 0,10 ELETROBRAS-CENTR ELETRICAS BRAS S.A. PREF "B" 15.300,00 BRL 8,730 46.517,03 0,15 0,15
ELETROPAULO METROPOLITANA S.A. PREF B 6.080,00 BRL 6,300 13.339,83 0,04 0,04
EMBRAER SA - 31.900,00 BRL 20,510 227.857,14 0,75 0,74
ENERGIAS DO BRASIL SA - 6.200,00 BRL 11,330 24.464,02 0,08 0,08
FIBRIA CELULOSE SA - 15.769,00 BRL 24,750 135.920,72 0,45 0,44
GERDAU SA PREF 49.300,00 BRL 12,610 216.505,19 0,71 0,71
HYPERMARCAS SA - 21.800,00 BRL 14,530 110.313,44 0,36 0,36
IKPC-INDS KLABIN DE PAPEL E CELULOSE PREF 25.600,00 BRL 11,100 98.962,18 0,32 0,32
ITAU UNIBANCO HOLDINGS SA PREF PREF 136.440,00 BRL 28,770 1.367.060,95 4,48 4,45
ITAUSA-INVESTIMENTOS ITAU SA - 152.462,00 BRL 8,290 440.172,03 1,44 1,43
JBS SA - 26.289,00 BRL 6,470 59.235,85 0,19 0,19
KROTON EDUCACIONAL SA - 9.400,00 BRL 30,900 101.156,23 0,33 0,33
LOCALIZA RENT A CAR - 8.715,00 BRL 31,600 95.909,31 0,31 0,31
LOJAS AMERICANAS SA - 8.100,00 BRL 13,550 38.223,51 0,13 0,12
LOJAS AMERICANAS SA -PREF- 23.367,00 BRL 15,640 127.275,85 0,42 0,41
LOJAS RENNER SA - 7.100,00 BRL 63,950 158.126,70 0,52 0,52
M DIAS BRANCO SA - 900,00 BRL 83,500 26.171,90 0,09 0,09
MARCOPOLO SA MARCOPOLO SA -PREF 13.000,00 BRL 12,730 57.633,91 0,19 0,19
METALURGICA GERDAU SA - 17.400,00 BRL 15,990 96.895,59 0,32 0,32
MPX ENERGIA SA - 9.000,00 BRL 7,550 23.664,41 0,08 0,08
MRV ENGENHARIA E PARTICIPACOES SA - 19.807,00 BRL 6,460 44.561,27 0,15 0,15
MULTIPLAN EMPREENDIMENTOS IMOB - 4.800,00 BRL 51,790 86.575,19 0,28 0,28
MULTIPLUS SA - 3.000,00 BRL 32,560 34.018,25 0,11 0,11
NATURA COSMETICOS SA - 9.900,00 BRL 47,700 164.459,85 0,54 0,54
ODONTOPREV SA - 16.800,00 BRL 9,200 53.827,40 0,18 0,18
OGX PETROLEO E GAS PARTICIPACO - 81.900,00 BRL 0,790 22.532,91 0,07 0,07
PETROBRAS-PETROLEO BRASILEIRO S.A. - 167.176,00 BRL 14,810 862.254,15 2,82 2,81
PETROBRAS-PETROLEO BRASILEIRO S.A. PREF 230.587,00 BRL 16,180 1.299.330,52 4,25 4,23
PORTO SEGURO SA - 7.800,00 BRL 23,700 64.379,75 0,21 0,21
QUALICORP SA - 11.900,00 BRL 16,900 70.039,01 0,23 0,23
RAIA DROGASIL SA - 12.700,00 BRL 21,650 95.756,43 0,31 0,31
SABESP-CIA SANEAM. BASICO SAO PAULO - 19.740,00 BRL 23,110 158.874,21 0,52 0,52
SOUZA CRUZ S.A. - 21.900,00 BRL 27,390 208.901,93 0,68 0,68
SUL AMERICA SA - 8.498,00 BRL 13,080 38.710,68 0,13 0,13
SUZANO PAPEL E CELULOSE SA - 8.000,00 BRL 8,250 22.985,30 0,08 0,08
TELEF BRASIL PREF 17.117,00 BRL 50,400 300.444,66 0,98 0,98
TIM PARTICIPACOES SA - 48.551,00 BRL 8,090 136.789,58 0,45 0,45
TOTVS SA - 7.200,00 BRL 34,990 87.736,99 0,29 0,29
TRACTEBEL ENERGIA SA - 9.400,00 BRL 34,670 113.497,95 0,37 0,37
TRANSMISSORA ALIANCA DE ENERG - 2.000,00 BRL 21,370 14.884,73 0,05 0,05
ULTRAPAR PARTICIPACOES SA - 18.800,00 BRL 53,120 347.794,11 1,14 1,13
USIMINAS-USINAS SIDER. MINAS GERAIS PREF 24.100,00 BRL 7,430 62.360,87 0,20 0,20
VALE SA - 71.532,00 BRL 29,100 724.935,99 2,37 2,36
WEG SA - 13.700,00 BRL 28,150 134.309,05 0,44 0,44
Chile
BANCO DE CHILE "ADR" 3.708,00 USD 87,080 248.398,06 0,81 0,81
BANCO SANTANDER CHILE ADR 15.659,00 USD 24,450 294.532,31 0,96 0,96
CENCOSUD SA ADR 31.189,00 USD 14,900 357.501,42 1,17 1,16
COMP. CERVEC. UNIDAS ADS 8.488,00 USD 28,610 186.815,66 0,61 0,61
CORPBANCA ADR 14.450,00 USD 17,100 190.087,70 0,62 0,62
EMBOTELLADORA ANDINA S.A. B ADR 5.571,00 USD 34,380 147.342,86 0,48 0,48
ENDESA CHILE ADR 9.542,00 USD 44,170 324.232,74 1,06 1,06
ENERSIS SA SP ADR 31.190,00 USD 16,360 392.544,35 1,29 1,28
LATAM AIRLINES GROUP SA -ADR 19.857,00 USD 16,890 258.008,10 0,85 0,84
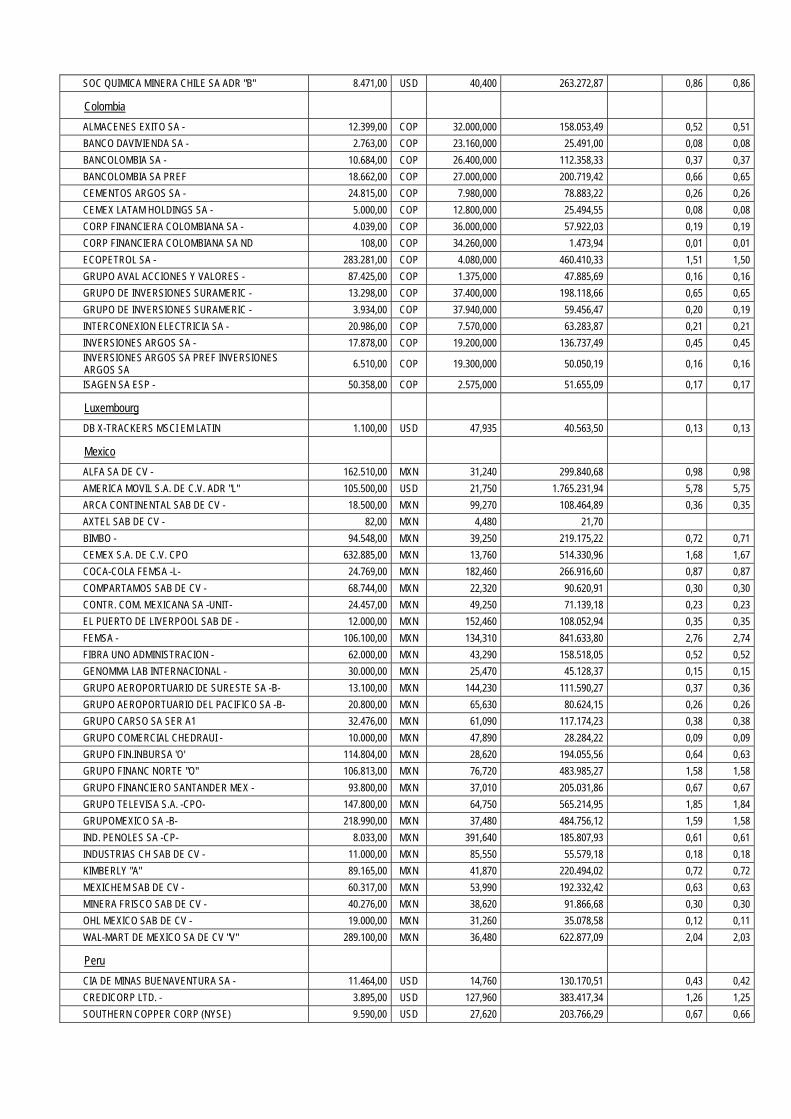
SOC QUIMICA MINERA CHILE SA ADR "B" 8.471,00 USD 40,400 263.272,87 0,86 0,86
Colombia
ALMACENES EXITO SA - 12.399,00 COP 32.000,000 158.053,49 0,52 0,51
BANCO DAVIVIENDA SA - 2.763,00 COP 23.160,000 25.491,00 0,08 0,08
BANCOLOMBIA SA - 10.684,00 COP 26.400,000 112.358,33 0,37 0,37
BANCOLOMBIA SA PREF 18.662,00 COP 27.000,000 200.719,42 0,66 0,65
CEMENTOS ARGOS SA - 24.815,00 COP 7.980,000 78.883,22 0,26 0,26
CEMEX LATAM HOLDINGS SA - 5.000,00 COP 12.800,000 25.494,55 0,08 0,08
CORP FINANCIERA COLOMBIANA SA - 4.039,00 COP 36.000,000 57.922,03 0,19 0,19
CORP FINANCIERA COLOMBIANA SA ND 108,00 COP 34.260,000 1.473,94 0,01 0,01
ECOPETROL SA - 283.281,00 COP 4.080,000 460.410,33 1,51 1,50
GRUPO AVAL ACCIONES Y VALORES - 87.425,00 COP 1.375,000 47.885,69 0,16 0,16
GRUPO DE INVERSIONES SURAMERIC - 13.298,00 COP 37.400,000 198.118,66 0,65 0,65
GRUPO DE INVERSIONES SURAMERIC - 3.934,00 COP 37.940,000 59.456,47 0,20 0,19
INTERCONEXION ELECTRICIA SA - 20.986,00 COP 7.570,000 63.283,87 0,21 0,21
INVERSIONES ARGOS SA - 17.878,00 COP 19.200,000 136.737,49 0,45 0,45 INVERSIONES ARGOS SA PREF INVERSIONES ARGOS SA 6.510,00 COP 19.300,000 50.050,19 0,16 0,16
ISAGEN SA ESP - 50.358,00 COP 2.575,000 51.655,09 0,17 0,17
Luxembourg
DB X-TRACKERS MSCI EM LATIN 1.100,00 USD 47,935 40.563,50 0,13 0,13
Mexico
ALFA SA DE CV - 162.510,00 MXN 31,240 299.840,68 0,98 0,98
AMERICA MOVIL S.A. DE C.V. ADR "L" 105.500,00 USD 21,750 1.765.231,94 5,78 5,75
ARCA CONTINENTAL SAB DE CV - 18.500,00 MXN 99,270 108.464,89 0,36 0,35
AXTEL SAB DE CV - 82,00 MXN 4,480 21,70
BIMBO - 94.548,00 MXN 39,250 219.175,22 0,72 0,71
CEMEX S.A. DE C.V. CPO 632.885,00 MXN 13,760 514.330,96 1,68 1,67
COCA-COLA FEMSA -L- 24.769,00 MXN 182,460 266.916,60 0,87 0,87
COMPARTAMOS SAB DE CV - 68.744,00 MXN 22,320 90.620,91 0,30 0,30
CONTR. COM. MEXICANA SA -UNIT- 24.457,00 MXN 49,250 71.139,18 0,23 0,23
EL PUERTO DE LIVERPOOL SAB DE - 12.000,00 MXN 152,460 108.052,94 0,35 0,35
FEMSA - 106.100,00 MXN 134,310 841.633,80 2,76 2,74
FIBRA UNO ADMINISTRACION - 62.000,00 MXN 43,290 158.518,05 0,52 0,52
GENOMMA LAB INTERNACIONAL - 30.000,00 MXN 25,470 45.128,37 0,15 0,15
GRUPO AEROPORTUARIO DE SURESTE SA -B- 13.100,00 MXN 144,230 111.590,27 0,37 0,36
GRUPO AEROPORTUARIO DEL PACIFICO SA -B- 20.800,00 MXN 65,630 80.624,15 0,26 0,26
GRUPO CARSO SA SER A1 32.476,00 MXN 61,090 117.174,23 0,38 0,38
GRUPO COMERCIAL CHEDRAUI - 10.000,00 MXN 47,890 28.284,22 0,09 0,09
GRUPO FIN.INBURSA 'O' 114.804,00 MXN 28,620 194.055,56 0,64 0,63
GRUPO FINANC NORTE "O" 106.813,00 MXN 76,720 483.985,27 1,58 1,58
GRUPO FINANCIERO SANTANDER MEX - 93.800,00 MXN 37,010 205.031,86 0,67 0,67
GRUPO TELEVISA S.A. -CPO- 147.800,00 MXN 64,750 565.214,95 1,85 1,84
GRUPOMEXICO SA -B- 218.990,00 MXN 37,480 484.756,12 1,59 1,58
IND. PENOLES SA -CP- 8.033,00 MXN 391,640 185.807,93 0,61 0,61
INDUSTRIAS CH SAB DE CV - 11.000,00 MXN 85,550 55.579,18 0,18 0,18
KIMBERLY "A" 89.165,00 MXN 41,870 220.494,02 0,72 0,72
MEXICHEM SAB DE CV - 60.317,00 MXN 53,990 192.332,42 0,63 0,63
MINERA FRISCO SAB DE CV - 40.276,00 MXN 38,620 91.866,68 0,30 0,30
OHL MEXICO SAB DE CV - 19.000,00 MXN 31,260 35.078,58 0,12 0,11
WAL-MART DE MEXICO SA DE CV "V" 289.100,00 MXN 36,480 622.877,09 2,04 2,03
Peru
CIA DE MINAS BUENAVENTURA SA - 11.464,00 USD 14,760 130.170,51 0,43 0,42
CREDICORP LTD. - 3.895,00 USD 127,960 383.417,34 1,26 1,25
SOUTHERN COPPER CORP (NYSE) 9.590,00 USD 27,620 203.766,29 0,67 0,66
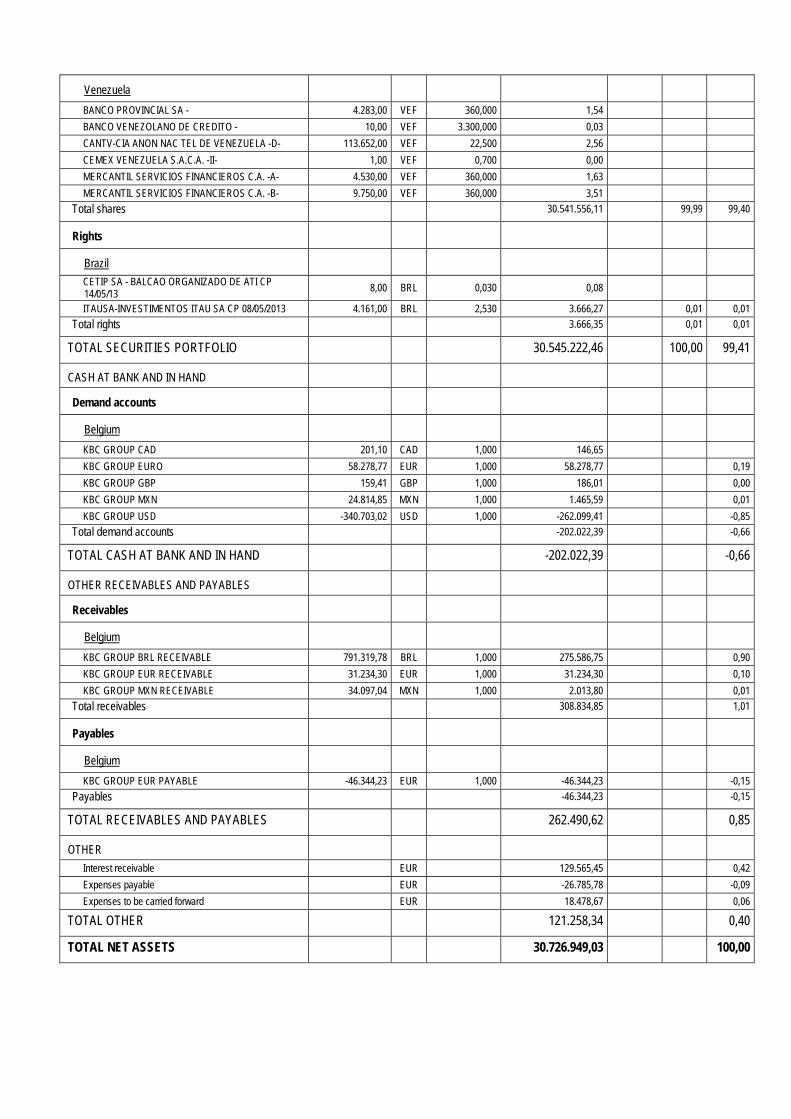
Venezuela
BANCO PROVINCIAL SA - 4.283,00 VEF 360,000 1,54
BANCO VENEZOLANO DE CREDITO - 10,00 VEF 3.300,000 0,03
CANTV-CIA ANON NAC TEL DE VENEZUELA -D- 113.652,00 VEF 22,500 2,56
CEMEX VENEZUELA S.A.C.A. -II- 1,00 VEF 0,700 0,00
MERCANTIL SERVICIOS FINANCIEROS C.A. -A- 4.530,00 VEF 360,000 1,63
MERCANTIL SERVICIOS FINANCIEROS C.A. -B- 9.750,00 VEF 360,000 3,51
Total shares 30.541.556,11 99,99 99,40
Rights
Brazil
CETIP SA - BALCAO ORGANIZADO DE ATI CP 14/05/13
8,00 BRL 0,030 0,08
ITAUSA-INVESTIMENTOS ITAU SA CP 08/05/2013 4.161,00 BRL 2,530 3.666,27 0,01 0,01
Total rights 3.666,35 0,01 0,01
TOTAL SECURITIES PORTFOLIO 30.545.222,46 100,00 99,41
CASH AT BANK AND IN HAND
Demand accounts
Belgium
KBC GROUP CAD 201,10 CAD 1,000 146,65
KBC GROUP EURO 58.278,77 EUR 1,000 58.278,77 0,19
KBC GROUP GBP 159,41 GBP 1,000 186,01 0,00
KBC GROUP MXN 24.814,85 MXN 1,000 1.465,59 0,01
KBC GROUP USD -340.703,02 USD 1,000 -262.099,41 -0,85
Total demand accounts -202.022,39 -0,66
TOTAL CASH AT BANK AND IN HAND -202.022,39 -0,66
OTHER RECEIVABLES AND PAYABLES
Receivables
Belgium
KBC GROUP BRL RECEIVABLE 791.319,78 BRL 1,000 275.586,75 0,90
KBC GROUP EUR RECEIVABLE 31.234,30 EUR 1,000 31.234,30 0,10
KBC GROUP MXN RECEIVABLE 34.097,04 MXN 1,000 2.013,80 0,01
Total receivables 308.834,85 1,01
Payables
Belgium
KBC GROUP EUR PAYABLE -46.344,23 EUR 1,000 -46.344,23 -0,15
Payables -46.344,23 -0,15
TOTAL RECEIVABLES AND PAYABLES 262.490,62 0,85
OTHER
Interest receivable EUR 129.565,45 0,42
Expenses payable EUR -26.785,78 -0,09
Expenses to be carried forward EUR 18.478,67 0,06
TOTAL OTHER 121.258,34 0,40
TOTAL NET ASSETS 30.726.949,03 100,00
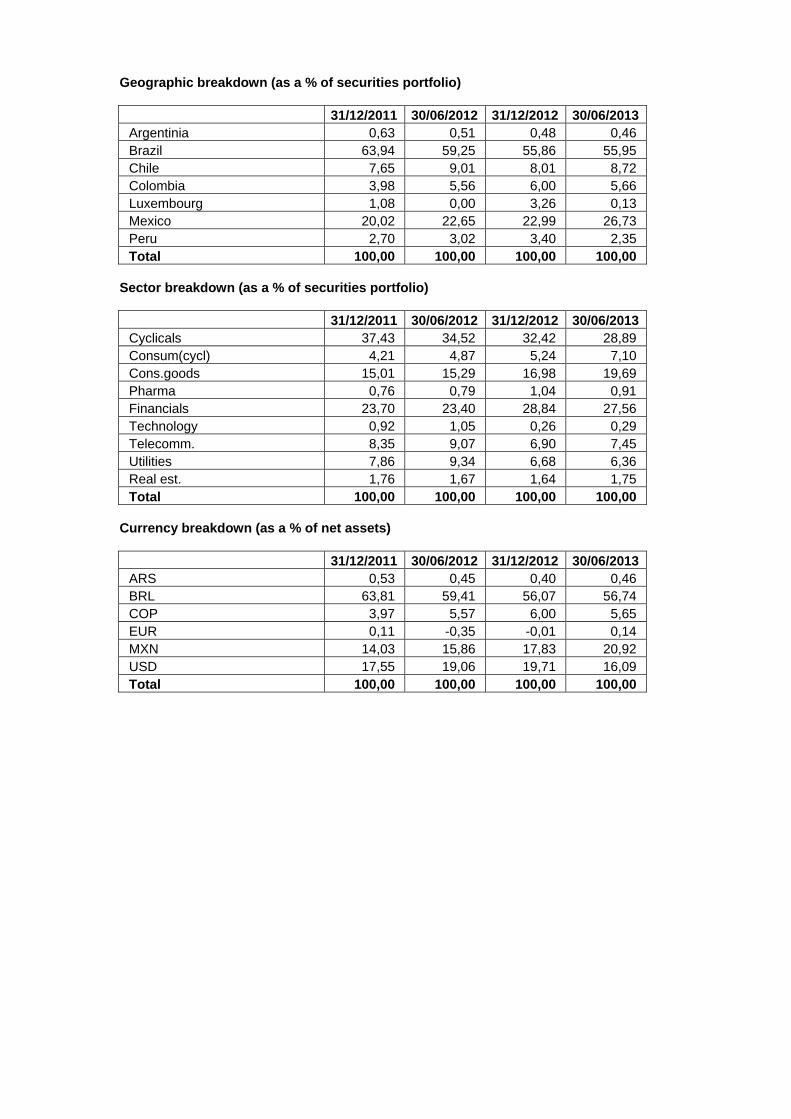
Geographic breakdown (as a % of securities portfolio)
31/12/2011 30/06/2012 31/12/2012 30/06/2013 Argentinia 0,63 0,51 0,48 0,46 Brazil 63,94 59,25 55,86 55,95 Chile 7,65 9,01 8,01 8,72 Colombia 3,98 5,56 6,00 5,66 Luxembourg 1,08 0,00 3,26 0,13 Mexico 20,02 22,65 22,99 26,73 Peru 2,70 3,02 3,40 2,35 Total 100,00 100,00 100,00 100,00
Sector breakdown (as a % of securities portfolio)
31/12/2011 30/06/2012 31/12/2012 30/06/2013 Cyclicals 37,43 34,52 32,42 28,89 Consum(cycl) 4,21 4,87 5,24 7,10 Cons.goods 15,01 15,29 16,98 19,69 Pharma 0,76 0,79 1,04 0,91 Financials 23,70 23,40 28,84 27,56 Technology 0,92 1,05 0,26 0,29 Telecomm. 8,35 9,07 6,90 7,45 Utilities 7,86 9,34 6,68 6,36 Real est. 1,76 1,67 1,64 1,75 Total 100,00 100,00 100,00 100,00
Currency breakdown (as a % of net assets)
31/12/2011 30/06/2012 31/12/2012 30/06/2013 ARS 0,53 0,45 0,40 0,46 BRL 63,81 59,41 56,07 56,74 COP 3,97 5,57 6,00 5,65 EUR 0,11 -0,35 -0,01 0,14 MXN 14,03 15,86 17,83 20,92 USD 17,55 19,06 19,71 16,09 Total 100,00 100,00 100,00 100,00

2.4.2 CHANGES IN THE COMPOSITION OF THE ASSETS OF KBC EQUITY FUND LATIN AMERICA (IN
THE CURRENCY OF THE SUB-FUND)
1st half of year YearPurchases 2.842.242,39 2.842.242,39 Sales 8.534.564,59 8.534.564,59 Total 1 11.376.806,98 11.376.806,98 Subscriptions 1.516.641,26 1.516.641,26 Redemptions 7.279.027,48 7.279.027,48 Total 2 8.795.668,74 8.795.668,74 Monthly average of total assets
37.438.248,03 37.438.248,03
Turnover rate 6,89 % 6,89 %
1st half of year YearPurchases 2.842.242,39 2.842.242,39 Sales 8.534.564,59 8.534.564,59 Total 1 11.376.806,98 11.376.806,98 Subscriptions 1.516.641,26 1.516.641,26 Redemptions 7.279.027,48 7.279.027,48 Total 2 8.795.668,74 8.795.668,74 Monthly average of total assets
36.482.519,31 36.482.519,31
Corrected turnover rate 7,08 % 7,08 %
The table above shows the capital volume of portfolio transactions. This volume (adjusted to take account of total subscriptions and redemptions) is also compared to the average net assets at the beginning and end of the period. A figure close to 0% implies that the transactions relating to the securities or transactions relating to the assets (excluding deposits and cash) in a given period only involve subscriptions and redemptions. A negative percentage shows that subscriptions and redemptions entailed few, if any, transactions in the portfolio. Active asset management may result in high turnover rates (monthly percentage >50%). The detailed list of transactions is available for consultation free of charge at the registered office of the Bevek or fund at Havenlaan 2, 1080 Brussels.
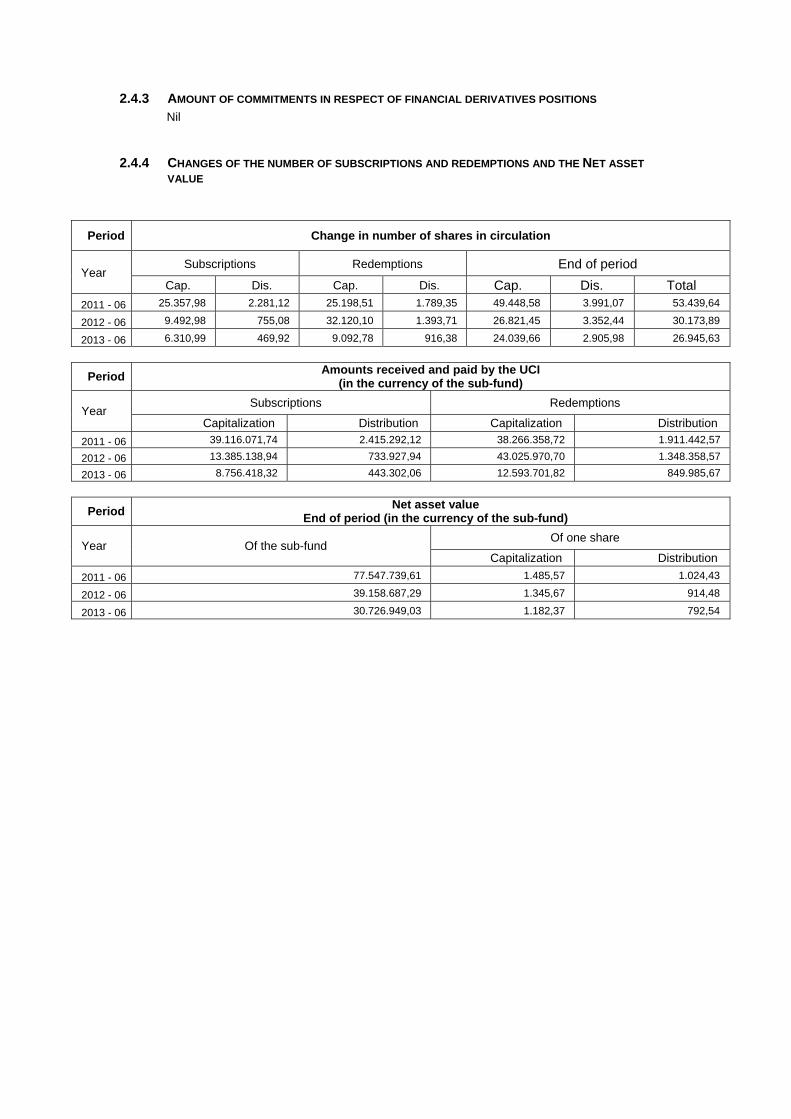
2.4.3 AMOUNT OF COMMITMENTS IN RESPECT OF FINANCIAL DERIVATIVES POSITIONS Nil
2.4.4 CHANGES OF THE NUMBER OF SUBSCRIPTIONS AND REDEMPTIONS AND THE NET ASSET
VALUE
Period Change in number of shares in circulation
Year Subscriptions Redemptions End of period
Cap. Dis. Cap. Dis. Cap. Dis. Total
2011 - 06 25.357,98 2.281,12 25.198,51 1.789,35 49.448,58 3.991,07 53.439,64
2012 - 06 9.492,98 755,08 32.120,10 1.393,71 26.821,45 3.352,44 30.173,89
2013 - 06 6.310,99 469,92 9.092,78 916,38 24.039,66 2.905,98 26.945,63
Period Amounts received and paid by the UCI
(in the currency of the sub-fund)
Year Subscriptions Redemptions
Capitalization Distribution Capitalization Distribution
2011 - 06 39.116.071,74 2.415.292,12 38.266.358,72 1.911.442,57
2012 - 06 13.385.138,94 733.927,94 43.025.970,70 1.348.358,57
2013 - 06 8.756.418,32 443.302,06 12.593.701,82 849.985,67
Period Net asset value
End of period (in the currency of the sub-fund)
Year Of the sub-fund Of one share
Capitalization Distribution
2011 - 06 77.547.739,61 1.485,57 1.024,43
2012 - 06 39.158.687,29 1.345,67 914,48
2013 - 06 30.726.949,03 1.182,37 792,54
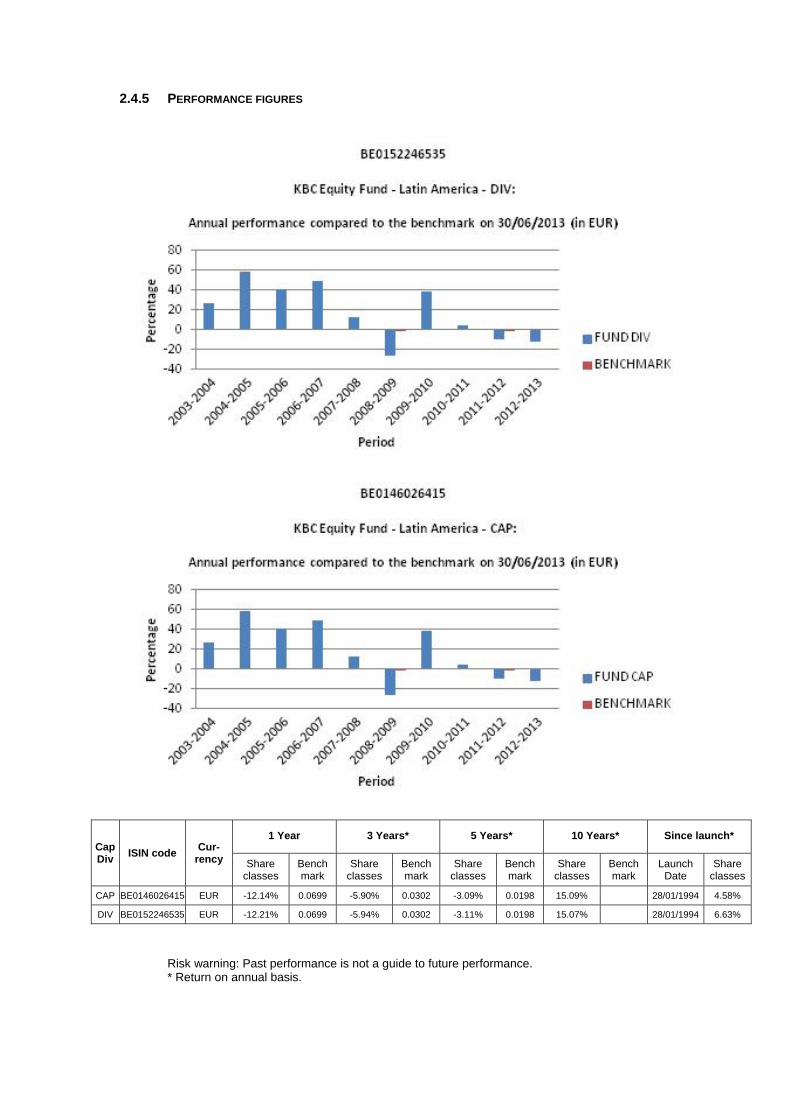
2.4.5 PERFORMANCE FIGURES
Cap Div
ISIN code Cur-
rency
1 Year 3 Years* 5 Years* 10 Years* Since launch*
Share classes
Bench mark
Share classes
Bench mark
Share classes
Bench mark
Share classes
Bench mark
Launch Date
Share classes
CAP BE0146026415 EUR -12.14% 0.0699 -5.90% 0.0302 -3.09% 0.0198 15.09% 28/01/1994 4.58%
DIV BE0152246535 EUR -12.21% 0.0699 -5.94% 0.0302 -3.11% 0.0198 15.07% 28/01/1994 6.63%
Risk warning: Past performance is not a guide to future performance. * Return on annual basis.

The bar chart shows the performance for full financial years. The figures do not take account of any restructuring. Calculated in EUR (ex BEF). the return is calculated as the change in the net asset value between two dates expressed
as a percentage. In the case of units that pay dividends, the dividend is incorporated geometrically in the return.
Calculation method for date D, where NAV stands for net asset value: Capitalisation units (CAP) Return on date D over a period of X years:
[NAV(D) / NAV(Y)] ^ [1 / X] - 1 where Y = D-X
Return on date D since the start date S of the unit: [NAV(D) / NAV(S)] ^ [1 / F] - 1 where F = 1 if the unit has existed for less than one year on date D where F = (D-S) / 365.25 if the unit has existed for longer than one year on date D
Distribution units (DIV) Return on date D over a period of X years:
[ C * NAV(D) / NAV(Y)] ^ [1 / X] - 1 where Y = D-X
Return on date D since the start date S of the unit: [ C * NAV(D) / NAV(S)] ^ [1 / F] - 1 where F = 1 if the unit has existed for less than one year on date D where F = (D-S) / 365.25 if the unit has existed for longer than one year on date D
where C is a factor that is determined for all N dividends between the calculation date D and the reference date. For dividend i on date Di with value Wi:
Ci = [Wi / NAV(Di)] + 1 i = 1 ... N
from which C = C0 * .... * CN. If the interval between the two dates exceeds one year, the ordinary return calculation is
converted into a return on an annual basis by taking the nth square root of 1 plus the total return of the unit.
The return figures shown above do not take account of the fees and charges associated with the issue and redemption of units.
These are the performance figures for capitalisation and distribution shares.
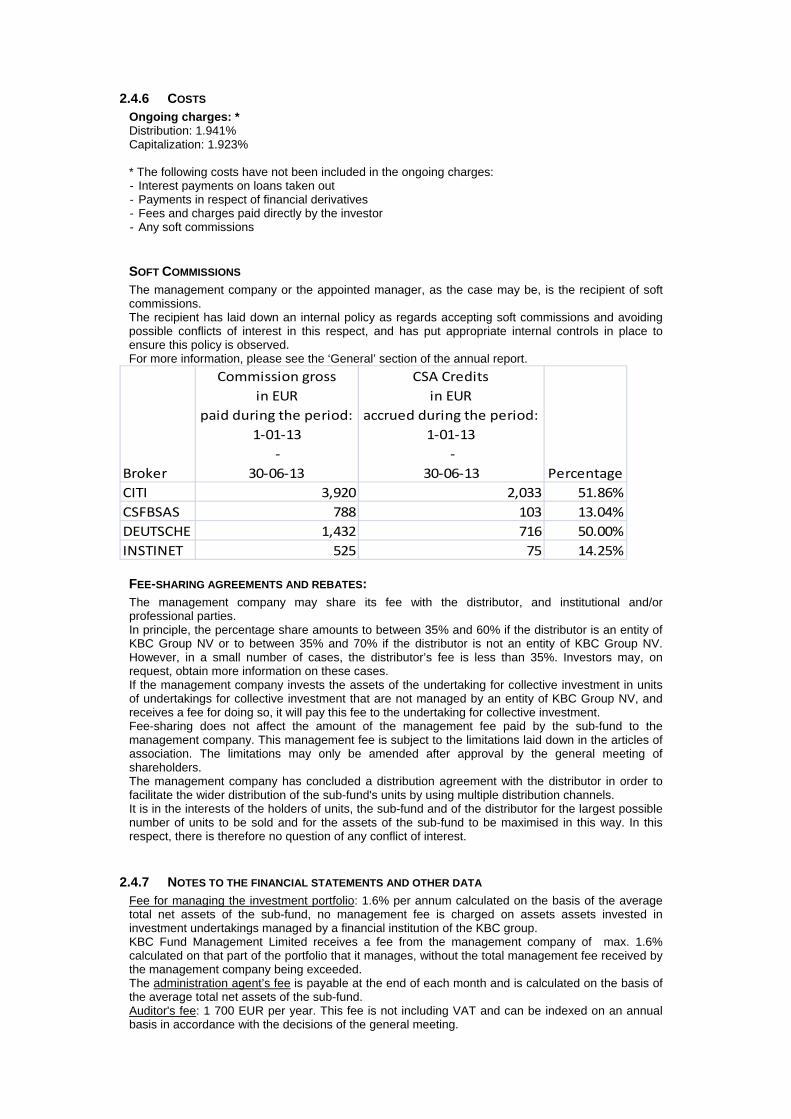
2.4.6 COSTS Ongoing charges: * Distribution: 1.941% Capitalization: 1.923% * The following costs have not been included in the ongoing charges: - Interest payments on loans taken out - Payments in respect of financial derivatives - Fees and charges paid directly by the investor - Any soft commissions
SOFT COMMISSIONS The management company or the appointed manager, as the case may be, is the recipient of soft commissions. The recipient has laid down an internal policy as regards accepting soft commissions and avoiding possible conflicts of interest in this respect, and has put appropriate internal controls in place to ensure this policy is observed. For more information, please see the ‘General’ section of the annual report.
Broker
Commission gross
in EUR
paid during the period:
1‐01‐13
‐
30‐06‐13
CSA Credits
in EUR
accrued during the period:
1‐01‐13
‐
30‐06‐13 Percentage
CITI 3,920 2,033 51.86%
CSFBSAS 788 103 13.04%
DEUTSCHE 1,432 716 50.00%
INSTINET 525 75 14.25%
FEE-SHARING AGREEMENTS AND REBATES: The management company may share its fee with the distributor, and institutional and/or professional parties. In principle, the percentage share amounts to between 35% and 60% if the distributor is an entity of KBC Group NV or to between 35% and 70% if the distributor is not an entity of KBC Group NV. However, in a small number of cases, the distributor’s fee is less than 35%. Investors may, on request, obtain more information on these cases. If the management company invests the assets of the undertaking for collective investment in units of undertakings for collective investment that are not managed by an entity of KBC Group NV, and receives a fee for doing so, it will pay this fee to the undertaking for collective investment. Fee-sharing does not affect the amount of the management fee paid by the sub-fund to the management company. This management fee is subject to the limitations laid down in the articles of association. The limitations may only be amended after approval by the general meeting of shareholders. The management company has concluded a distribution agreement with the distributor in order to facilitate the wider distribution of the sub-fund's units by using multiple distribution channels. It is in the interests of the holders of units, the sub-fund and of the distributor for the largest possible number of units to be sold and for the assets of the sub-fund to be maximised in this way. In this respect, there is therefore no question of any conflict of interest.
2.4.7 NOTES TO THE FINANCIAL STATEMENTS AND OTHER DATA Fee for managing the investment portfolio: 1.6% per annum calculated on the basis of the average total net assets of the sub-fund, no management fee is charged on assets assets invested in investment undertakings managed by a financial institution of the KBC group. KBC Fund Management Limited receives a fee from the management company of max. 1.6% calculated on that part of the portfolio that it manages, without the total management fee received by the management company being exceeded. The administration agent’s fee is payable at the end of each month and is calculated on the basis of the average total net assets of the sub-fund. Auditor's fee: 1 700 EUR per year. This fee is not including VAT and can be indexed on an annual basis in accordance with the decisions of the general meeting.

The custody fee is calculated on the value of the securities held in custody by the custodian on the final banking day of the preceding calendar year, except on those assets invested in investment undertakings managed by a financial institution of the KBC group. The custody fee is paid at the beginning of the calendar year. Social, ethical and environmental aspects: No manufacturers of controversial weapons whose use over the past five decades, according to the international consensus, has led to disproportionate human suffering among the civilian population will be included in the portfolio of investments. This involves the manufacturers of anti-personnel mines, cluster bombs and munitions and weapons containing depleted uranium. In this way, the sub-fund seeks to reflect not only simple financial reality but also the social reality of the sector or region in question. Exercising voting rights. If necessary, relevant and in the interest of the shareholders, the management company will exercise the voting rights attached to the shares in the Bevek’s portfolio. The management company will adhere to the following criteria when determining how it stands relative to the items on the agenda that are put to the vote: - Shareholder value may not be adversely affected. - Corporate governance rules, especially with regard to the rights of minority shareholders, must be
respected. - The minimum standards with regard to sustainable business and corporate social responsibility
must be met. The list of companies for which voting rights are exercised is available at the registered office of the Bevek.
Semi-Annual report as at 30th June 2013
TABLE OF CONTENTS
2. Information on KBC Equity Fund Fallen Angels
2.1. Management report 2.1.1. Launch date and subscription price 2.1.2. Stock exchange listing 2.1.3. Aim and distinctive features of the investment policy 2.1.4. Financial portfolio management 2.1.5. Distributors 2.1.6. Index and benchmark 2.1.7. Policy conducted during the financial year 2.1.8. Future policy 2.1.9. Synthetic risk and reward indicator (SRRI)
2.2. Balance sheet
2.3. Profit and loss account
2.4. Composition of the assets and key figures
2.4.1. Composition of the assets 2.4.2. Change in the composition of the assets 2.4.3. Value of commitments in respect of financial derivatives positions 2.4.4. Evolution of the number of subscriptions, repayments and the net asset value 2.4.5. Return figures 2.4.6. Expenses 2.4.7. Notes to the financial statements and other data

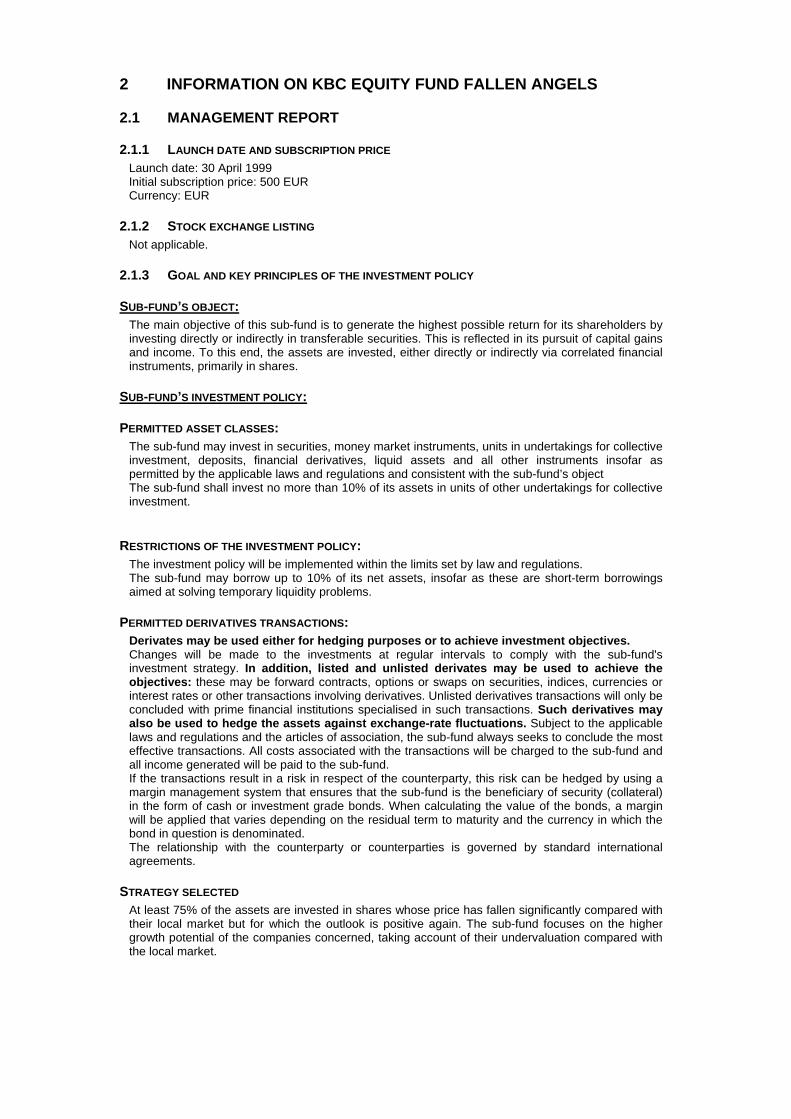
2 INFORMATION ON KBC EQUITY FUND FALLEN ANGELS
2.1 MANAGEMENT REPORT
2.1.1 LAUNCH DATE AND SUBSCRIPTION PRICE Launch date: 30 April 1999 Initial subscription price: 500 EUR Currency: EUR
2.1.2 STOCK EXCHANGE LISTING Not applicable.
2.1.3 GOAL AND KEY PRINCIPLES OF THE INVESTMENT POLICY
SUB-FUND’S OBJECT: The main objective of this sub-fund is to generate the highest possible return for its shareholders by investing directly or indirectly in transferable securities. This is reflected in its pursuit of capital gains and income. To this end, the assets are invested, either directly or indirectly via correlated financial instruments, primarily in shares.
SUB-FUND’S INVESTMENT POLICY:
PERMITTED ASSET CLASSES: The sub-fund may invest in securities, money market instruments, units in undertakings for collective investment, deposits, financial derivatives, liquid assets and all other instruments insofar as permitted by the applicable laws and regulations and consistent with the sub-fund’s object The sub-fund shall invest no more than 10% of its assets in units of other undertakings for collective investment.
RESTRICTIONS OF THE INVESTMENT POLICY: The investment policy will be implemented within the limits set by law and regulations. The sub-fund may borrow up to 10% of its net assets, insofar as these are short-term borrowings aimed at solving temporary liquidity problems.
PERMITTED DERIVATIVES TRANSACTIONS: Derivates may be used either for hedging purposes or to achieve investment objectives. Changes will be made to the investments at regular intervals to comply with the sub-fund's investment strategy. In addition, listed and unlisted derivates may be used to achieve the objectives: these may be forward contracts, options or swaps on securities, indices, currencies or interest rates or other transactions involving derivatives. Unlisted derivatives transactions will only be concluded with prime financial institutions specialised in such transactions. Such derivatives may also be used to hedge the assets against exchange-rate fluctuations. Subject to the applicable laws and regulations and the articles of association, the sub-fund always seeks to conclude the most effective transactions. All costs associated with the transactions will be charged to the sub-fund and all income generated will be paid to the sub-fund. If the transactions result in a risk in respect of the counterparty, this risk can be hedged by using a margin management system that ensures that the sub-fund is the beneficiary of security (collateral) in the form of cash or investment grade bonds. When calculating the value of the bonds, a margin will be applied that varies depending on the residual term to maturity and the currency in which the bond in question is denominated. The relationship with the counterparty or counterparties is governed by standard international agreements.
STRATEGY SELECTED At least 75% of the assets are invested in shares whose price has fallen significantly compared with their local market but for which the outlook is positive again. The sub-fund focuses on the higher growth potential of the companies concerned, taking account of their undervaluation compared with the local market.

LENDING FINANCIAL INSTRUMENTS: The sub-fund may lend financial instruments within the limits set by law and regulations. This lending does not affect the sub-fund’s risk profile since: - it takes place within the framework of a securities lending system managed by a principal. In
addition, the sub-fund has a relationship only with the principal of the securities lending system which acts as counterparty and to which title of the loaned securities is transferred. The choice of principal is subject to strict selection criteria. The return of securities similar to the securities that have been lent is guaranteed by the principal.
- through a margin management system, the sub-fund is always guaranteed financial security, the actual value of which always exceeds the actual value of the securities that have been lent, in case the principal does not return similar securities.
The return of securities similar to the securities that have been lent can be requested at any time, which means that the lending of securities does not affect the management of the sub-fund's assets. By lending securities, the sub-fund can generate an additional return. The principal pays a fee to the management company. After deducting the fee for the margin management and clearing services of KBC Bank, most of this fee is paid to the sub-fund. The relationship with the counterparty or counterparties is governed by standard international agreements. More information is provided on the terms and conditions governing securities lending in the annual or half-yearly report for the sub-fund.
VOLATILITY OF THE NET ASSET VALUE: The volatility of the net asset value may be high due to the composition of the portfolio.
GENERAL STRATEGY FOR HEDGING THE EXCHANGE RATE RISK: In order to protect its assets against exchange rate fluctuations and within the limitations laid down in the articles of association, the sub-fund may perform transactions relating to the sale of forward currency contracts, as well as the sale of call options and the purchase of put options on currencies. The transactions in question may relate solely to contracts traded on a regulated market that operates regularly, is recognised and is open to the public or that are traded with a recognised, prime financial institution specialising in such transactions and dealing in the over-the-counter (OTC) market in options. With the same objective, the sub-fund may also sell currencies forward or exchange them in private transactions with prime financial institutions specialising in such transactions. The hedging objective of the aforementioned transactions suggests that there is a direct link between these transactions and the assets to be hedged, which implies that the transactions carried out in a particular currency may in principle not exceed, in terms of volume, either the valuation value of all the assets in the same currency or the holding period of those assets.
SOCIAL, ETHICAL AND ENVIRONMENTAL ASPECTS:
No manufacturers of controversial weapons whose use over the past five decades, according to the international consensus, has led to disproportionate human suffering among the civilian population will be included in the portfolio of investments. This involves the manufacturers of anti-personnel mines, cluster bombs and munitions and weapons containing depleted uranium. In this way, the sub-fund seeks to reflect not only simple financial reality but also the social reality of the sector or region in question.
THE EUROPEAN SAVINGS DIRECTIVE AND TAX ON DEBT CLAIM RETURNS OBTAINED THROUGH THE
REDEMPTION OF OWN UNITS OR IN THE EVENT OF FULL OR PARTIAL DISTRIBUTION OF EQUITY
CAPITAL. The following information is of a general character and is not intended to cover all aspects of an investment in a UCITS. In certain cases entirely different rules might even apply. Moreover, both tax law and the interpretation of it can change. Investors who wish to have more information about the tax implications – in both Belgium and abroad – of acquiring, holding and transferring units should seek the advice of their usual financial and tax advisers. This UCITS shall invest a maximum of 15% of its assets directly or indirectly in debt instruments as intended by the European Savings Directive. A. European Savings Directive (Directive 2003/48/EC) The European Savings Directive has been implemented in Belgium.
Since this UCITS invests a maximum of 15% of its assets directly or indirectly in debt claims as intended by the European Savings Directive, the income of this UCITS does not fall within the scope of this directive. B. Tax on debt claim returns obtained through the redemption of own units or in the event of full or partial distribution of equity capital (Article 19bis Income Tax Code 1992). The income from this UCITS is not subject to the tax on debt instrument returns as intended by Article 19bis, Income Tax Code 1992.
2.1.4 FINANCIAL PORTFOLIO MANAGEMENT The management company has delegated the intellectual management, to KBC Fund Management Limited, Joshua Dawson House, Dawson Street , Dublin 2, IRELAND..
2.1.5 DISTRIBUTORS KBC Asset Management S.A., 5, Place de la Gare, L-1616 Luxembourg.
2.1.6 INDEX AND BENCHMARK See ‘Sub-fund’s investment policy’.
2.1.7 POLICY PERSUED DURING THE FINANCIAL YEAR KBC Equity Fallen Angels invests in stocks that have for various reasons underperformed their sector or local market index during a relatively long period. Academic research shows that stocks that underperform over a relatively long period become cheap as a result and tend to outperform in the subsequent period of time. History shows that market participants tend to extrapolate the problems of the past on to the future, thereby ignoring the strengths of underperforming and cheap stocks. A hint of good news is sometimes sufficient to again bring these positive elements under the spotlight and can inspire a recovery in the stock price. Moreover, investors tend to lose interest in underperforming stocks and focus rather on the top names of the moment. As a result of this lack of interest, the pricing of these stocks is no longer efficient and this subsequently creates opportunities for bargain hunters. The period of outperformance tends to be surprisingly long which implies that KBC Equity Fund Fallen Angels is characterised as a long-term investor, as opposed to a trading fund. Doubts about the sustainability of the economic recovery continued to shape investor sentiment. The debt crisis in Europe continued unabated, although the European Central Bank (ECB) managed to convince the market that it had the crisis under control. Major steps were taken in the United States to reform the federal budget, seemingly without adversely affecting economic growth too much. Fortunately, strong economic growth in Asia created export opportunities for American and European businesses. In the US, the rate of employment growth remained on the thin side for some considerable time. The situation began to improve in the recent reporting period, with the result that the jobless rate has declined more markedly. Pay has remained virtually flat, barely rising ahead of inflation. Taken together, these two factors ensured that household purchasing power only grew to a very limited extent and so contributed very modestly to economic growth. The weak growth in the Western economies was not without its impact on the export performance in emerging countries. In recent years, however, domestic demand (due to a rapidly growing middle class with a high consumption rate) and intra-regional trade within Asia have been playing an increasingly important role. The region is better armed to deal with financial crises than it was in the past. Public finances are healthy; the balance of payments is generally neutral. Asia’s economic development no longer depends on fickle foreign capital. Thanks to the contribution by the emerging markets the growth of world GDP held up in 2012–13 (estimated at 2–2.5%). Public finances have gone off the rails not only in the EMU, but also in the UK and the US. The budget debate in the US had reached a political impasse. Decisions were postponed, and so 31 December 2012 became an important deadline. A whole series of tax cuts and other temporary support measures from the past would then lapse. In total these involved a sum of 550 billion USD. Extending all the measures again was not feasible in budgetary terms, while allowing them all to expire was economic suicide. The fiscal cliff was averted on 1 January 2013 by means of an agreement in Congress: half the stimulus measures were made permanent or were extended for a further twelve months, while the other half lapsed. This has not been the only measure involving tightening of budgetary policy in 2013: on 1 March, automatic spending cuts came into effect under which Federal expenditure will be pruned by 85 billion USD each year for a period of ten years. Since no budget has been approved in the current financial year, the federal administrations have only been assigned budgets equal to the expenditure in the previous financial year. Mario Draghi took the helm at the ECB on 1 November 2011 and has favoured monetary easing by lowering the ECB’s key rate is 0.50%. This interest rate policy failed to place the economic recovery on a sustainable basis. The Fed therefore explored the scope for other measures, intervening directly on the bond markets and buying up large amounts of debt paper in an attempt to keep the long-term rate low, as well. The ECB dragged its feet, and only followed the Fed’s example much later. The intensification of the euro crisis in fact left the ECB no other choice. In a year marked by problems in keeping the EMU from imploding, the EUR/USD exchange rate was no more volatile than at other times. The euro was trading at USD 1.30 at the end of June 2013, which is roughly the same rate as 2012 year-end. The dollar’s image as the global reserve currency suffered as a result of QE2, QE3 and TWIST. In terms of markets, Japan was ultimately an outperformer, despite the steep depreciation of the yen. The winds of change have been blowing through Tokyo since the advent of the Abe government in December. The prospect of fresh tax stimuli, a cheaper yen and large-scale money creation have contributed to an atmosphere of optimism about the economy, something very rare in this country, which has been struggling with defeatism for many years. The emerging regions performed downright badly. The Asian emerging markets were unable to capitalise on their role as the growth engine of the world economy. Confidence indicators began to decline in mid-2012, breaking through barriers that pointed to a serious economic slowdown. That failed to materialise but it was sufficient to perpetuate the doubts concerning the growth narrative in the region. This was further exacerbated by concerns about Chinese local authority debt levels, an overheating Chinese housing market and fear of a credit crisis – especially when the Chinese interbank rate shot up to 30% within the space of a few days in June. Stock-market valuations remain favourable, especially given the high growth forecasts, sound macroeconomic balance and a banking sector that was barely – if at all – affected by the credit crisis. Latin America was hit by an economic slowdown. The link to the commodity markets is always at the fore in this region. Russia was likewise not immune
to the weakness of European economic growth. Oil prices below 100 USD per barrel mean trouble for Russian state finances. The best performing sectors included Financials, Pharmaceuticals and Consumer Discretionary. Materials, Technology and Energy lagged behind. The outperformance of Banks may be attributed to the quantitative easing programmes undertaken by the central banks. By this we mean the Fed’s QE3 programme, and especially the announcement by the ECB of its OMT programme, which took the heat out of the euro crisis. Pharmaceuticals had been shunned for a long time due to a lack of product innovation, patent expiry and the reforms to healthcare insurance in the US. In recent months, however, investors began to focus more on the sector’s response to these challenges: restructuring operations and the sell-off of non-strategic divisions. The car industry has risen from the ashes, in the US and the European luxury segment at least. Demand from the emerging markets is also strong, despite the slowdown in Chinese growth, where German luxury marques generate 50% of their profits. In spite of the slow growth, advertising budgets have also held up surprisingly well. Mining companies lost ground on excessive expectations concerning commodity prices. A failed stock market flotation by Facebook and the giant leaps made by Apple meant that price trends in the Technology sector differed from what might have been expected on the basis of the fundamentals. The oil companies suffered from the vagaries of the oil market, the political instability in the Middle East and frequent accidents. During the first quarter, stock selection was a key contributor to positive performance of KBC Equity Fund Fallen Angels. On an industry group level, the best performing group was Food Beverage and Tobacco (7% of the fund), driven by the significant outperformance of the fund’s overweight position in American confectionary maker Hershey Co. The stock rose from USD71.44 to USD87.53 in the period after the company announced impressive net sales figures for full-year 2012. The outlook for net sales was increased and earnings per share were also increased. Swiss confectionary Lindt followed in a similar trend with strong results for 2012 and healthy sales growth during the first quarter. The strong performance by Food and Beverage was followed by Pharmaceuticals, Biotechnology & Life Sciences group (7% of the fund), with US Pharma giant Pfizer leading the gains for this group. Pfizer was the top performing stock in the Industry group increasing from USD24.89 to USD28.86. Pfizer beat analysts’ expectations of revenue with its biggest surprise of the last year and a half. Pfizer were also part of the biggest IPO since Facebook Inc when they initiated proceedings to sell Zoetis which specialises in animal health. In terms of the main underperformers for the fund in the quarter, there were no negative performing industry group within the fund. However stocks such as Cie Generale De Geophysique, ING and Aviva disappointed and detracted from fund performance. Dutch financial services company ING saw their share price decline from the start of February after their fourth quarter profit missed estimates and its core capital ratio fell. The stock declined from EUR6.99 to EUR5.537. During the second quarter, stock selection continued to be a key contributor to positive performance. On an industry group level, Semiconductors (2% of the fund) was one of the best performing groups, driven by the outperformance of the fund’s overweight position in Intel Corp. Intel’s stock rose from USD21.83 to USD24.23 in the period as the company forecasted second quarter sales that may exceed analysts’ expectations due to strong demand for their server chips. Retailing and Banking were the second best performing industry group with stocks such as Kingfisher PLC and Lloyds Banking Group leading. In terms of laggard performers, the Energy and Real Estate industry group did not impress and detracted from fund performance. Japanese Oil and Gas exploration company Inpex declined the most as their stocks dropped from JPY504000 to JPY414000. Inpex Corp saw their share price decline after their full year profit missed analysts’ estimates. Overall KBC Equity Fund Fallen Angels performed positively on an absolute basis over the first half of 2013.
2.1.8 FUTURE POLICY
We remain positive overall on the Fallen Angels theme in the short term. The stock selection criteria have been a positive attributor to fund performance and have created value from non-performing stocks which may have been previously neglected.
In the US they are in the twilight zone between recession and expansion. We are expecting US growth to remain positive but modest (around 2% y-o-y in the coming quarters) as pay increases are barely keeping pace with inflation and budgetary policy has now finally struck down the path of austerity. The fragile recovery of the housing market and corporate investment could be sustained. How strong the growth proves to be will depend largely on the dynamic of the labour market. In recent months employment in the US has grown by around 200,000 new jobs each month. This will need to continue in order to achieve +2% growth in 2013 and in 2014. Confidence indicators in Europe are well below freezing point. The budgetary plans, tighter lending policy of the banks and major uncertainty among consumers and producers will continue to depress growth. 2013 will see a contraction of GDP in Europe. Recovery is not expected until the first half of 2014. Deflation or depression scenarios, which are currently dominating bond market sentiment, are not however justified.
The foundations for more sustainable growth in 2014 and beyond have been laid in recent years. US households have trimmed back their debt level significantly, the savings rate has already increased considerably and loan servicing (installments and interest payments combined) now accounts for only
8% of household budgets (the lowest level in 15 years). Households are gradually moving towards a position where they can spend more of their money on consumption. Economic growth in Europe will remain below par. Sky-high unemployment and the euro crisis are undermining consumer confidence and the banks’ willingness to provide ready access to credit. The ECB’s monetary policy is also much less aggressive than the Fed’s. In contrast, real wage rises (however limited) will be somewhat higher in Europe than in the US.
Today’s world is one of two-speed economies. The mature industrialised economies (US, Europe, Japan) still find themselves in a low-growth environment, with no underlying inflationary pressure, persistently low interest rates and runaway public finances. The picture in the emerging markets is altogether different. The strong economic growth has already created inflationary pressure in Asia. Appropriate monetary policy is therefore required. Monetary policy in China and elsewhere in Asia is highly geared to preventing asset-price inflation. Countries are not only deploying the interest-rate weapon to this end, they are also actively intervening in the credit and housing markets. Thanks to the continuing strength of the emerging markets, the global economy could post growth of 2.5–3% in 2013 and 2014. This is one of the reasons why corporate earnings could continue to grow in the coming quarters at a rate of 5–10%. The current valuation of equities continues to discount a number of very pessimistic scenarios. Based on forecast earnings for the coming 12 months, the price-earnings ratio is 14.5 for the US S&P 500 index and 11.4 for the MSCI Europe. That is 25–30% lower than the historical average. Equities are certainly dirt-cheap compared with bonds.
2.1.9 SYNTHETIC RISK AND REWARD INDICATOR 6 on a scale of 1 (lowest risk) to 7 (highest risk). The value of a share can decrease or increase and the investor may not get back the amount invested. In accordance with Commission Regulation (EU) No. 583/2010, a synthetic risk and reward indicator has been calculated. This indicator provides a quantitative measure of the sub-fund's potential return and the risk involved, calculated in the currency in which the sub-fund is denominated. It is given as a figure between 1 and 7. The higher the figure, the greater the potential return, but also the more difficult it is to predict this return. Losses are possible too. The lowest figure does not mean that the investment is entirely free of risk. However, it does indicate that, compared with the higher figures, this product will generally provide a lower, but more predictable return. The synthetic risk and reward indicator is assessed regularly and can therefore go up or down based on data from the past. Data from the past is not always a reliable indicator of future risk and return.

2.2 BALANCE SHEET
Balance sheet layout 30/06/2013 (in the currency of the sub-fundt)
30/06/2012 (in the currency of the sub-fund )
TOTAL NET ASSETS 11.917.239,33 12.403.914,04
II. Securities, money market instruments, UCIs and derivatives
A. Bonds and other debt instruments a) Bonds a} Collateral received in the form of bonds 1.183.416,66 672.000,64 C. Shares and similar instruments a) Shares 11.858.742,92 12.356.755,56 Of which securities lent 683.020,61 241.609,36 D. Other securities 1.385,01 6.978,97
IV. Receivables and payables within one year A. Receivables a) Accounts receivable 24.964,33 20.348,00 b) Tax assets 525,30 B. Payables a) Accounts payable (-) -85.194,37 -17.863,14 c) Borrowings (-) -25.184,23 d) Collateral (-) -1.183.416,66 -672.000,64
V. Deposits and cash at bank and in hand A. Demand balances at banks 65.676,04 41.022,32
VI. Accruals and deferrals A. Expense to be carried forward 5.403,69 5.255,95 B. Accrued income 54.495,14 22.845,93 C. Accrued expense (-) -8.233,43 -6.770,62
TOTAL SHAREHOLDERS' EQUITY 11.917.239,33 12.403.914,04
A. Capital 10.675.790,36 11.597.801,66
B. Income equalization -3.522,65 -1.228,81
D. Result for the period 1.244.971,62 807.341,19
Off-balance-sheet headings
I Collateral (+/-)
I.A Collateral (+/-)
I.A.A Securities/market instruments 1.183.416,66 672.000,64
IX Financial instruments lent 683.020,61 241.609,36

2.3 PROFIT AND LOSS ACCOUNT
Income Statement 30/06/2013 (in the currency of the sub-fund)
30/06/2012 (in the currency of the sub-fund)
I. Net gains(losses) on investments C. Shares and similar instruments a) Shares 1.392.294,49 480.518,38 D. Other securities -19,41 1.664,58 H. Foreign exchange positions and transactions b) Other foreign exchange positions and
transactions -224.684,75 186.585,63
II. Investment income and expenses A. Dividends 193.700,03 243.004,82 B. Interests a) Securities and money market instruments 4.053,79 1.574,22 b) Cash at bank and in hand and deposits 1.001,08 628,77 C. Interest on borrowings (-) -366,02 -496,27
IV. Operating expenses A. Investment transaction and delivery costs (-) -10.091,33 -1.544,15 B. Financial expenses (-) -69,44 -88,40 C. Custodian's fee (-) -4.372,36 -4.918,75 D. Manager's fee (-) a) Financial management -92.405,04 -85.216,38 b) Administration and accounting management -6.160,27 -6.000,67 E. Administrative expenses (-) -64,24 -35,20 F. Formation and organisation expenses (-) -267,99 -883,97 H. Services and sundry goods (-) -2.333,55 -2.134,35 J. Taxes -4.715,16 -4.731,84 K. Other expenses (-) -528,21 -585,23
Income and expenditure for the period Subtotal II + III + IV 77.381,29 138.572,60
V. Profit (loss) on ordinary activities before tax 1.244.971,62 807.341,19
VII. Result for the period 1.244.971,62 807.341,19
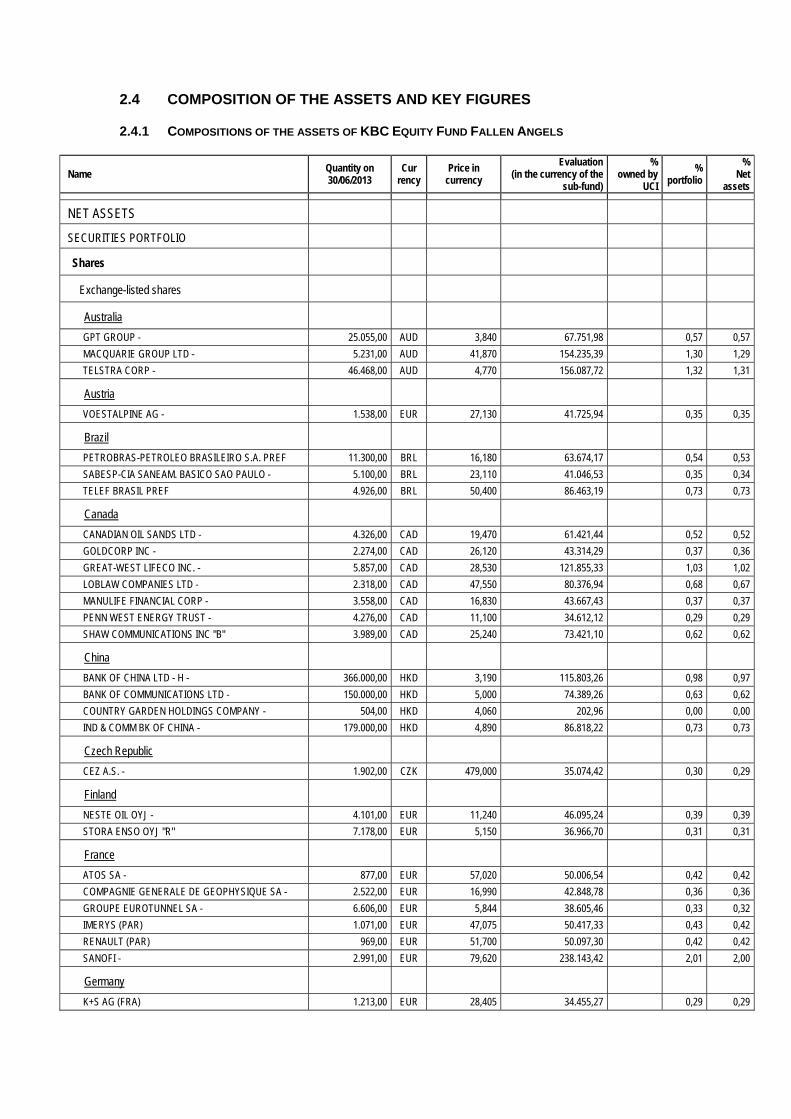
2.4 COMPOSITION OF THE ASSETS AND KEY FIGURES
2.4.1 COMPOSITIONS OF THE ASSETS OF KBC EQUITY FUND FALLEN ANGELS
Name Quantity on 30/06/2013
Cur rency
Price in currency
Evaluation (in the currency of the
sub-fund)
% owned by
UCI
% portfolio
% Net
assets
NET ASSETS
SECURITIES PORTFOLIO
Shares
Exchange-listed shares
Australia
GPT GROUP - 25.055,00 AUD 3,840 67.751,98 0,57 0,57
MACQUARIE GROUP LTD - 5.231,00 AUD 41,870 154.235,39 1,30 1,29
TELSTRA CORP - 46.468,00 AUD 4,770 156.087,72 1,32 1,31
Austria
VOESTALPINE AG - 1.538,00 EUR 27,130 41.725,94 0,35 0,35
Brazil
PETROBRAS-PETROLEO BRASILEIRO S.A. PREF 11.300,00 BRL 16,180 63.674,17 0,54 0,53
SABESP-CIA SANEAM. BASICO SAO PAULO - 5.100,00 BRL 23,110 41.046,53 0,35 0,34
TELEF BRASIL PREF 4.926,00 BRL 50,400 86.463,19 0,73 0,73
Canada
CANADIAN OIL SANDS LTD - 4.326,00 CAD 19,470 61.421,44 0,52 0,52
GOLDCORP INC - 2.274,00 CAD 26,120 43.314,29 0,37 0,36
GREAT-WEST LIFECO INC. - 5.857,00 CAD 28,530 121.855,33 1,03 1,02
LOBLAW COMPANIES LTD - 2.318,00 CAD 47,550 80.376,94 0,68 0,67
MANULIFE FINANCIAL CORP - 3.558,00 CAD 16,830 43.667,43 0,37 0,37
PENN WEST ENERGY TRUST - 4.276,00 CAD 11,100 34.612,12 0,29 0,29
SHAW COMMUNICATIONS INC "B" 3.989,00 CAD 25,240 73.421,10 0,62 0,62
China
BANK OF CHINA LTD - H - 366.000,00 HKD 3,190 115.803,26 0,98 0,97
BANK OF COMMUNICATIONS LTD - 150.000,00 HKD 5,000 74.389,26 0,63 0,62
COUNTRY GARDEN HOLDINGS COMPANY - 504,00 HKD 4,060 202,96 0,00 0,00
IND & COMM BK OF CHINA - 179.000,00 HKD 4,890 86.818,22 0,73 0,73
Czech Republic
CEZ A.S. - 1.902,00 CZK 479,000 35.074,42 0,30 0,29
Finland
NESTE OIL OYJ - 4.101,00 EUR 11,240 46.095,24 0,39 0,39
STORA ENSO OYJ "R" 7.178,00 EUR 5,150 36.966,70 0,31 0,31
France
ATOS SA - 877,00 EUR 57,020 50.006,54 0,42 0,42
COMPAGNIE GENERALE DE GEOPHYSIQUE SA - 2.522,00 EUR 16,990 42.848,78 0,36 0,36
GROUPE EUROTUNNEL SA - 6.606,00 EUR 5,844 38.605,46 0,33 0,32
IMERYS (PAR) 1.071,00 EUR 47,075 50.417,33 0,43 0,42
RENAULT (PAR) 969,00 EUR 51,700 50.097,30 0,42 0,42
SANOFI - 2.991,00 EUR 79,620 238.143,42 2,01 2,00
Germany
K+S AG (FRA) 1.213,00 EUR 28,405 34.455,27 0,29 0,29
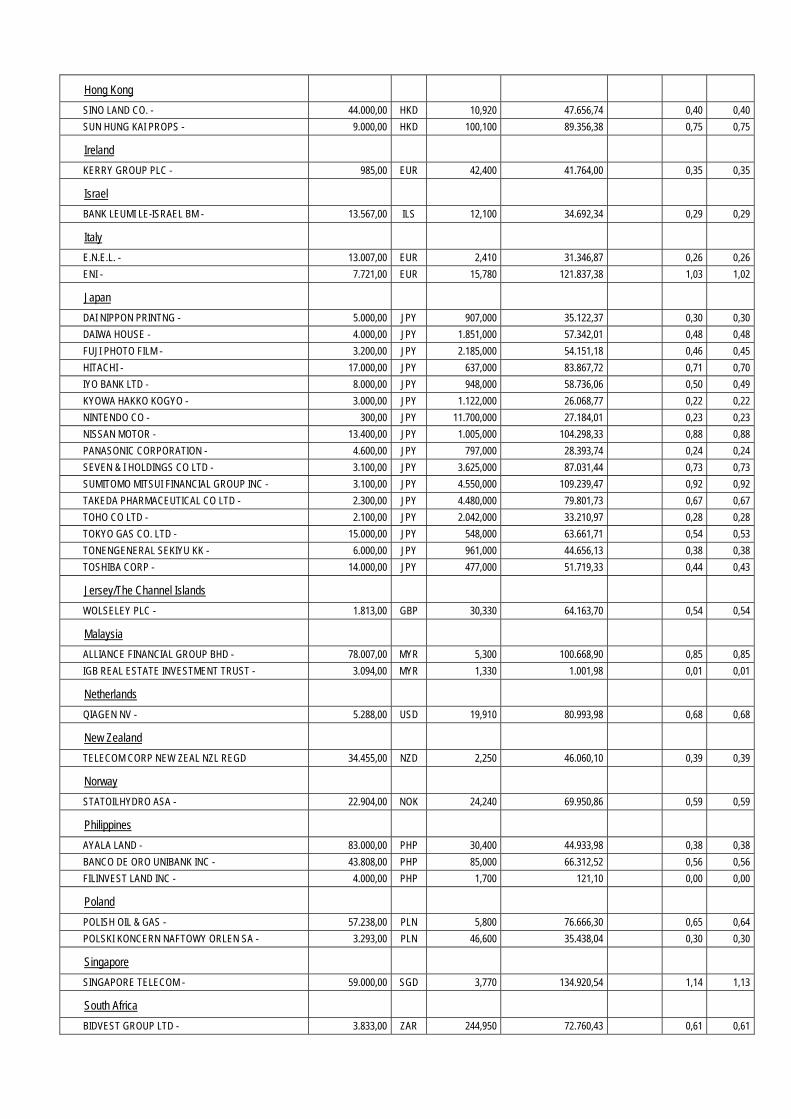
Hong Kong
SINO LAND CO. - 44.000,00 HKD 10,920 47.656,74 0,40 0,40
SUN HUNG KAI PROPS - 9.000,00 HKD 100,100 89.356,38 0,75 0,75
Ireland
KERRY GROUP PLC - 985,00 EUR 42,400 41.764,00 0,35 0,35
Israel
BANK LEUMI LE-ISRAEL BM - 13.567,00 ILS 12,100 34.692,34 0,29 0,29
Italy
E.N.E.L. - 13.007,00 EUR 2,410 31.346,87 0,26 0,26
ENI - 7.721,00 EUR 15,780 121.837,38 1,03 1,02
Japan
DAI NIPPON PRINTNG - 5.000,00 JPY 907,000 35.122,37 0,30 0,30
DAIWA HOUSE - 4.000,00 JPY 1.851,000 57.342,01 0,48 0,48
FUJI PHOTO FILM - 3.200,00 JPY 2.185,000 54.151,18 0,46 0,45
HITACHI - 17.000,00 JPY 637,000 83.867,72 0,71 0,70
IYO BANK LTD - 8.000,00 JPY 948,000 58.736,06 0,50 0,49
KYOWA HAKKO KOGYO - 3.000,00 JPY 1.122,000 26.068,77 0,22 0,22
NINTENDO CO - 300,00 JPY 11.700,000 27.184,01 0,23 0,23
NISSAN MOTOR - 13.400,00 JPY 1.005,000 104.298,33 0,88 0,88
PANASONIC CORPORATION - 4.600,00 JPY 797,000 28.393,74 0,24 0,24
SEVEN & I HOLDINGS CO LTD - 3.100,00 JPY 3.625,000 87.031,44 0,73 0,73
SUMITOMO MITSUI FINANCIAL GROUP INC - 3.100,00 JPY 4.550,000 109.239,47 0,92 0,92
TAKEDA PHARMACEUTICAL CO LTD - 2.300,00 JPY 4.480,000 79.801,73 0,67 0,67
TOHO CO LTD - 2.100,00 JPY 2.042,000 33.210,97 0,28 0,28
TOKYO GAS CO. LTD - 15.000,00 JPY 548,000 63.661,71 0,54 0,53
TONENGENERAL SEKIYU KK - 6.000,00 JPY 961,000 44.656,13 0,38 0,38
TOSHIBA CORP - 14.000,00 JPY 477,000 51.719,33 0,44 0,43
Jersey/The Channel Islands
WOLSELEY PLC - 1.813,00 GBP 30,330 64.163,70 0,54 0,54
Malaysia
ALLIANCE FINANCIAL GROUP BHD - 78.007,00 MYR 5,300 100.668,90 0,85 0,85
IGB REAL ESTATE INVESTMENT TRUST - 3.094,00 MYR 1,330 1.001,98 0,01 0,01
Netherlands
QIAGEN NV - 5.288,00 USD 19,910 80.993,98 0,68 0,68
New Zealand
TELECOM CORP NEW ZEAL NZL REGD 34.455,00 NZD 2,250 46.060,10 0,39 0,39
Norway
STATOILHYDRO ASA - 22.904,00 NOK 24,240 69.950,86 0,59 0,59
Philippines
AYALA LAND - 83.000,00 PHP 30,400 44.933,98 0,38 0,38
BANCO DE ORO UNIBANK INC - 43.808,00 PHP 85,000 66.312,52 0,56 0,56
FILINVEST LAND INC - 4.000,00 PHP 1,700 121,10 0,00 0,00
Poland
POLISH OIL & GAS - 57.238,00 PLN 5,800 76.666,30 0,65 0,64
POLSKI KONCERN NAFTOWY ORLEN SA - 3.293,00 PLN 46,600 35.438,04 0,30 0,30
Singapore
SINGAPORE TELECOM - 59.000,00 SGD 3,770 134.920,54 1,14 1,13
South Africa
BIDVEST GROUP LTD - 3.833,00 ZAR 244,950 72.760,43 0,61 0,61
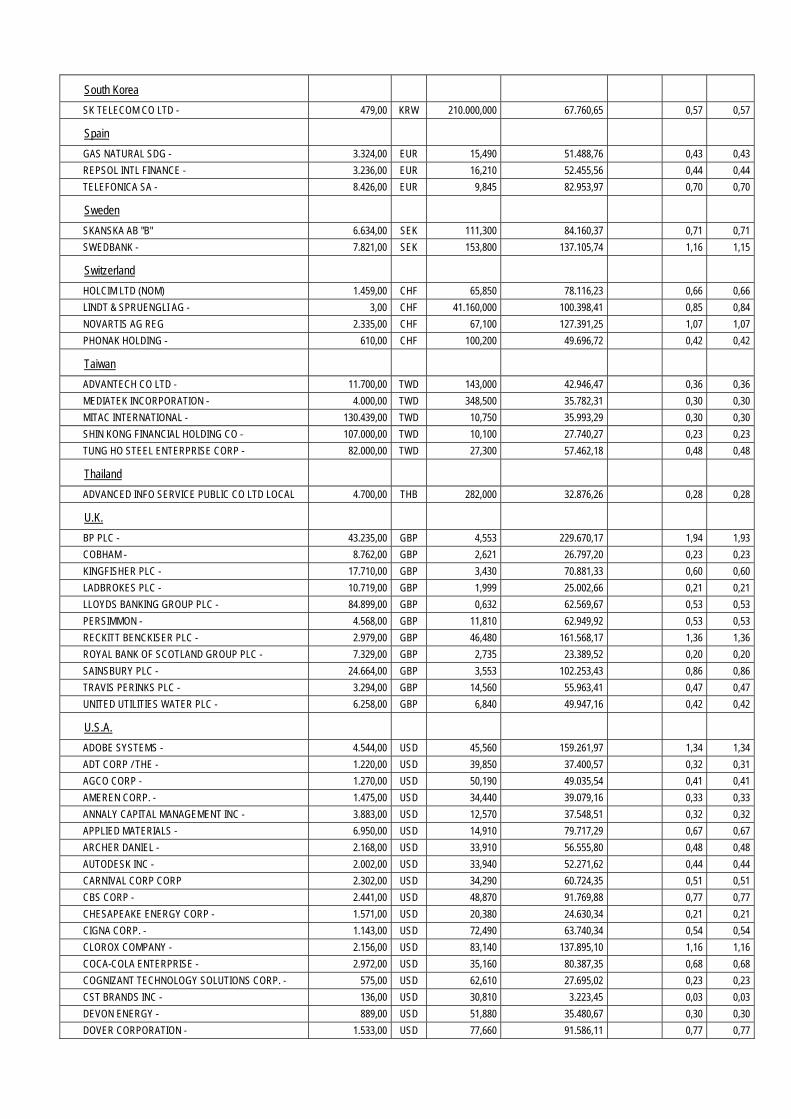
South Korea
SK TELECOM CO LTD - 479,00 KRW 210.000,000 67.760,65 0,57 0,57
Spain
GAS NATURAL SDG - 3.324,00 EUR 15,490 51.488,76 0,43 0,43
REPSOL INTL FINANCE - 3.236,00 EUR 16,210 52.455,56 0,44 0,44
TELEFONICA SA - 8.426,00 EUR 9,845 82.953,97 0,70 0,70
Sweden
SKANSKA AB "B" 6.634,00 SEK 111,300 84.160,37 0,71 0,71
SWEDBANK - 7.821,00 SEK 153,800 137.105,74 1,16 1,15
Switzerland
HOLCIM LTD (NOM) 1.459,00 CHF 65,850 78.116,23 0,66 0,66
LINDT & SPRUENGLI AG - 3,00 CHF 41.160,000 100.398,41 0,85 0,84
NOVARTIS AG REG 2.335,00 CHF 67,100 127.391,25 1,07 1,07
PHONAK HOLDING - 610,00 CHF 100,200 49.696,72 0,42 0,42
Taiwan
ADVANTECH CO LTD - 11.700,00 TWD 143,000 42.946,47 0,36 0,36
MEDIATEK INCORPORATION - 4.000,00 TWD 348,500 35.782,31 0,30 0,30
MITAC INTERNATIONAL - 130.439,00 TWD 10,750 35.993,29 0,30 0,30
SHIN KONG FINANCIAL HOLDING CO - 107.000,00 TWD 10,100 27.740,27 0,23 0,23
TUNG HO STEEL ENTERPRISE CORP - 82.000,00 TWD 27,300 57.462,18 0,48 0,48
Thailand
ADVANCED INFO SERVICE PUBLIC CO LTD LOCAL 4.700,00 THB 282,000 32.876,26 0,28 0,28
U.K.
BP PLC - 43.235,00 GBP 4,553 229.670,17 1,94 1,93
COBHAM - 8.762,00 GBP 2,621 26.797,20 0,23 0,23
KINGFISHER PLC - 17.710,00 GBP 3,430 70.881,33 0,60 0,60
LADBROKES PLC - 10.719,00 GBP 1,999 25.002,66 0,21 0,21
LLOYDS BANKING GROUP PLC - 84.899,00 GBP 0,632 62.569,67 0,53 0,53
PERSIMMON - 4.568,00 GBP 11,810 62.949,92 0,53 0,53
RECKITT BENCKISER PLC - 2.979,00 GBP 46,480 161.568,17 1,36 1,36
ROYAL BANK OF SCOTLAND GROUP PLC - 7.329,00 GBP 2,735 23.389,52 0,20 0,20
SAINSBURY PLC - 24.664,00 GBP 3,553 102.253,43 0,86 0,86
TRAVIS PERINKS PLC - 3.294,00 GBP 14,560 55.963,41 0,47 0,47
UNITED UTILITIES WATER PLC - 6.258,00 GBP 6,840 49.947,16 0,42 0,42
U.S.A.
ADOBE SYSTEMS - 4.544,00 USD 45,560 159.261,97 1,34 1,34
ADT CORP / THE - 1.220,00 USD 39,850 37.400,57 0,32 0,31
AGCO CORP - 1.270,00 USD 50,190 49.035,54 0,41 0,41
AMEREN CORP. - 1.475,00 USD 34,440 39.079,16 0,33 0,33
ANNALY CAPITAL MANAGEMENT INC - 3.883,00 USD 12,570 37.548,51 0,32 0,32
APPLIED MATERIALS - 6.950,00 USD 14,910 79.717,29 0,67 0,67
ARCHER DANIEL - 2.168,00 USD 33,910 56.555,80 0,48 0,48
AUTODESK INC - 2.002,00 USD 33,940 52.271,62 0,44 0,44
CARNIVAL CORP CORP 2.302,00 USD 34,290 60.724,35 0,51 0,51
CBS CORP - 2.441,00 USD 48,870 91.769,88 0,77 0,77
CHESAPEAKE ENERGY CORP - 1.571,00 USD 20,380 24.630,34 0,21 0,21
CIGNA CORP. - 1.143,00 USD 72,490 63.740,34 0,54 0,54
CLOROX COMPANY - 2.156,00 USD 83,140 137.895,10 1,16 1,16
COCA-COLA ENTERPRISE - 2.972,00 USD 35,160 80.387,35 0,68 0,68
COGNIZANT TECHNOLOGY SOLUTIONS CORP. - 575,00 USD 62,610 27.695,02 0,23 0,23
CST BRANDS INC - 136,00 USD 30,810 3.223,45 0,03 0,03
DEVON ENERGY - 889,00 USD 51,880 35.480,67 0,30 0,30
DOVER CORPORATION - 1.533,00 USD 77,660 91.586,11 0,77 0,77
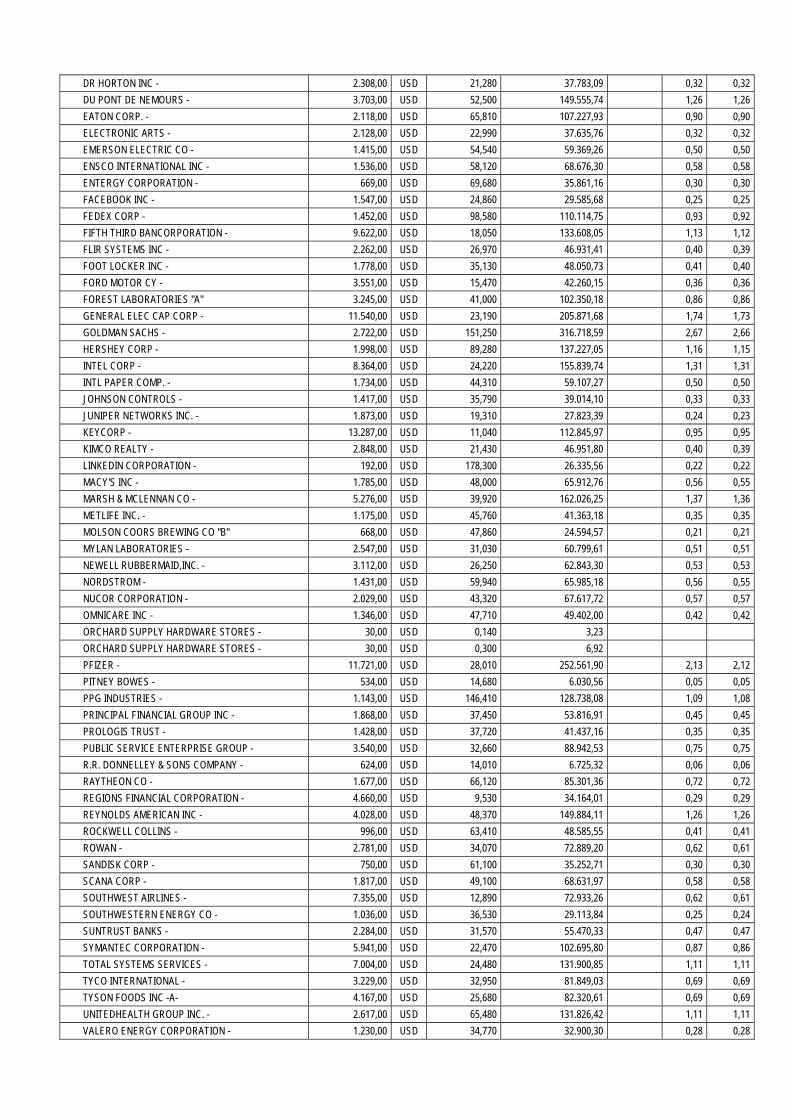
DR HORTON INC - 2.308,00 USD 21,280 37.783,09 0,32 0,32
DU PONT DE NEMOURS - 3.703,00 USD 52,500 149.555,74 1,26 1,26
EATON CORP. - 2.118,00 USD 65,810 107.227,93 0,90 0,90
ELECTRONIC ARTS - 2.128,00 USD 22,990 37.635,76 0,32 0,32
EMERSON ELECTRIC CO - 1.415,00 USD 54,540 59.369,26 0,50 0,50
ENSCO INTERNATIONAL INC - 1.536,00 USD 58,120 68.676,30 0,58 0,58
ENTERGY CORPORATION - 669,00 USD 69,680 35.861,16 0,30 0,30
FACEBOOK INC - 1.547,00 USD 24,860 29.585,68 0,25 0,25
FEDEX CORP - 1.452,00 USD 98,580 110.114,75 0,93 0,92
FIFTH THIRD BANCORPORATION - 9.622,00 USD 18,050 133.608,05 1,13 1,12
FLIR SYSTEMS INC - 2.262,00 USD 26,970 46.931,41 0,40 0,39
FOOT LOCKER INC - 1.778,00 USD 35,130 48.050,73 0,41 0,40
FORD MOTOR CY - 3.551,00 USD 15,470 42.260,15 0,36 0,36
FOREST LABORATORIES "A" 3.245,00 USD 41,000 102.350,18 0,86 0,86
GENERAL ELEC CAP CORP - 11.540,00 USD 23,190 205.871,68 1,74 1,73
GOLDMAN SACHS - 2.722,00 USD 151,250 316.718,59 2,67 2,66
HERSHEY CORP - 1.998,00 USD 89,280 137.227,05 1,16 1,15
INTEL CORP - 8.364,00 USD 24,220 155.839,74 1,31 1,31
INTL PAPER COMP. - 1.734,00 USD 44,310 59.107,27 0,50 0,50
JOHNSON CONTROLS - 1.417,00 USD 35,790 39.014,10 0,33 0,33
JUNIPER NETWORKS INC. - 1.873,00 USD 19,310 27.823,39 0,24 0,23
KEYCORP - 13.287,00 USD 11,040 112.845,97 0,95 0,95
KIMCO REALTY - 2.848,00 USD 21,430 46.951,80 0,40 0,39
LINKEDIN CORPORATION - 192,00 USD 178,300 26.335,56 0,22 0,22
MACY'S INC - 1.785,00 USD 48,000 65.912,76 0,56 0,55
MARSH & MCLENNAN CO - 5.276,00 USD 39,920 162.026,25 1,37 1,36
METLIFE INC. - 1.175,00 USD 45,760 41.363,18 0,35 0,35
MOLSON COORS BREWING CO "B" 668,00 USD 47,860 24.594,57 0,21 0,21
MYLAN LABORATORIES - 2.547,00 USD 31,030 60.799,61 0,51 0,51
NEWELL RUBBERMAID,INC. - 3.112,00 USD 26,250 62.843,30 0,53 0,53
NORDSTROM - 1.431,00 USD 59,940 65.985,18 0,56 0,55
NUCOR CORPORATION - 2.029,00 USD 43,320 67.617,72 0,57 0,57
OMNICARE INC - 1.346,00 USD 47,710 49.402,00 0,42 0,42
ORCHARD SUPPLY HARDWARE STORES - 30,00 USD 0,140 3,23
ORCHARD SUPPLY HARDWARE STORES - 30,00 USD 0,300 6,92
PFIZER - 11.721,00 USD 28,010 252.561,90 2,13 2,12
PITNEY BOWES - 534,00 USD 14,680 6.030,56 0,05 0,05
PPG INDUSTRIES - 1.143,00 USD 146,410 128.738,08 1,09 1,08
PRINCIPAL FINANCIAL GROUP INC - 1.868,00 USD 37,450 53.816,91 0,45 0,45
PROLOGIS TRUST - 1.428,00 USD 37,720 41.437,16 0,35 0,35
PUBLIC SERVICE ENTERPRISE GROUP - 3.540,00 USD 32,660 88.942,53 0,75 0,75
R.R. DONNELLEY & SONS COMPANY - 624,00 USD 14,010 6.725,32 0,06 0,06
RAYTHEON CO - 1.677,00 USD 66,120 85.301,36 0,72 0,72
REGIONS FINANCIAL CORPORATION - 4.660,00 USD 9,530 34.164,01 0,29 0,29
REYNOLDS AMERICAN INC - 4.028,00 USD 48,370 149.884,11 1,26 1,26
ROCKWELL COLLINS - 996,00 USD 63,410 48.585,55 0,41 0,41
ROWAN - 2.781,00 USD 34,070 72.889,20 0,62 0,61
SANDISK CORP - 750,00 USD 61,100 35.252,71 0,30 0,30
SCANA CORP - 1.817,00 USD 49,100 68.631,97 0,58 0,58
SOUTHWEST AIRLINES - 7.355,00 USD 12,890 72.933,26 0,62 0,61
SOUTHWESTERN ENERGY CO - 1.036,00 USD 36,530 29.113,84 0,25 0,24
SUNTRUST BANKS - 2.284,00 USD 31,570 55.470,33 0,47 0,47
SYMANTEC CORPORATION - 5.941,00 USD 22,470 102.695,80 0,87 0,86
TOTAL SYSTEMS SERVICES - 7.004,00 USD 24,480 131.900,85 1,11 1,11
TYCO INTERNATIONAL - 3.229,00 USD 32,950 81.849,03 0,69 0,69
TYSON FOODS INC -A- 4.167,00 USD 25,680 82.320,61 0,69 0,69
UNITEDHEALTH GROUP INC. - 2.617,00 USD 65,480 131.826,42 1,11 1,11
VALERO ENERGY CORPORATION - 1.230,00 USD 34,770 32.900,30 0,28 0,28
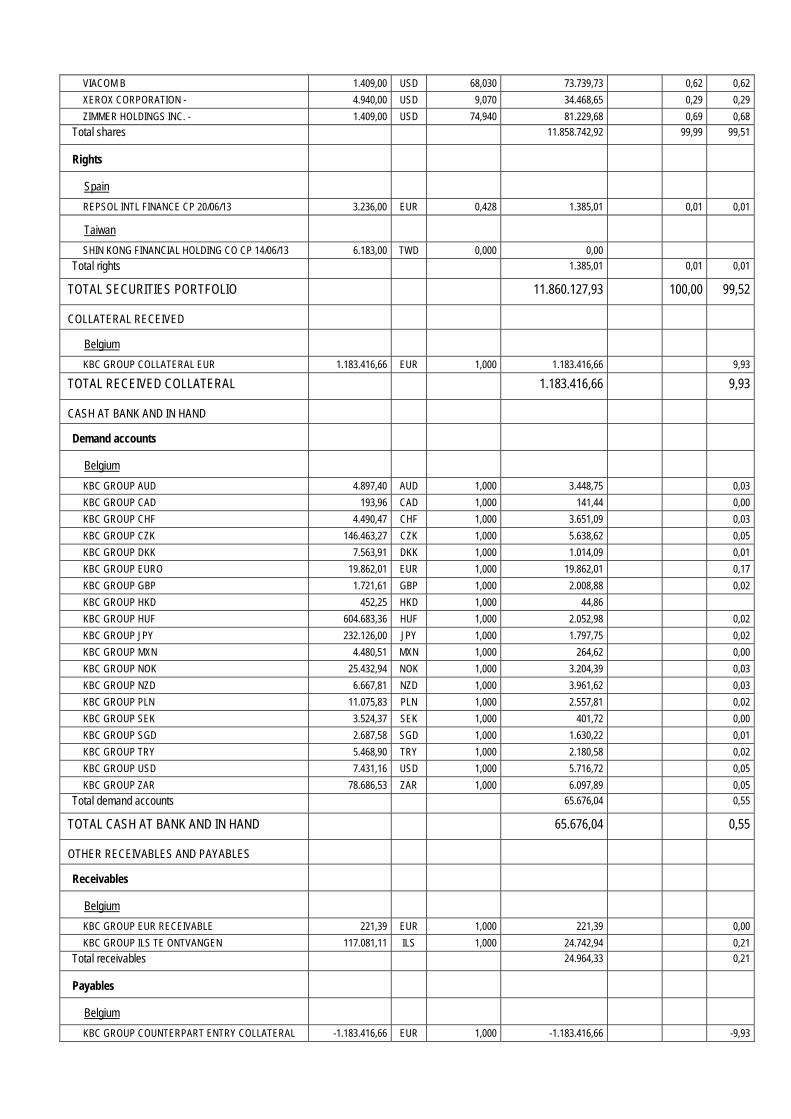
VIACOM B 1.409,00 USD 68,030 73.739,73 0,62 0,62
XEROX CORPORATION - 4.940,00 USD 9,070 34.468,65 0,29 0,29
ZIMMER HOLDINGS INC. - 1.409,00 USD 74,940 81.229,68 0,69 0,68
Total shares 11.858.742,92 99,99 99,51
Rights
Spain
REPSOL INTL FINANCE CP 20/06/13 3.236,00 EUR 0,428 1.385,01 0,01 0,01
Taiwan
SHIN KONG FINANCIAL HOLDING CO CP 14/06/13 6.183,00 TWD 0,000 0,00
Total rights 1.385,01 0,01 0,01
TOTAL SECURITIES PORTFOLIO 11.860.127,93 100,00 99,52
COLLATERAL RECEIVED
Belgium
KBC GROUP COLLATERAL EUR 1.183.416,66 EUR 1,000 1.183.416,66 9,93
TOTAL RECEIVED COLLATERAL 1.183.416,66 9,93
CASH AT BANK AND IN HAND
Demand accounts
Belgium
KBC GROUP AUD 4.897,40 AUD 1,000 3.448,75 0,03
KBC GROUP CAD 193,96 CAD 1,000 141,44 0,00
KBC GROUP CHF 4.490,47 CHF 1,000 3.651,09 0,03
KBC GROUP CZK 146.463,27 CZK 1,000 5.638,62 0,05
KBC GROUP DKK 7.563,91 DKK 1,000 1.014,09 0,01
KBC GROUP EURO 19.862,01 EUR 1,000 19.862,01 0,17
KBC GROUP GBP 1.721,61 GBP 1,000 2.008,88 0,02
KBC GROUP HKD 452,25 HKD 1,000 44,86
KBC GROUP HUF 604.683,36 HUF 1,000 2.052,98 0,02
KBC GROUP JPY 232.126,00 JPY 1,000 1.797,75 0,02
KBC GROUP MXN 4.480,51 MXN 1,000 264,62 0,00
KBC GROUP NOK 25.432,94 NOK 1,000 3.204,39 0,03
KBC GROUP NZD 6.667,81 NZD 1,000 3.961,62 0,03
KBC GROUP PLN 11.075,83 PLN 1,000 2.557,81 0,02
KBC GROUP SEK 3.524,37 SEK 1,000 401,72 0,00
KBC GROUP SGD 2.687,58 SGD 1,000 1.630,22 0,01
KBC GROUP TRY 5.468,90 TRY 1,000 2.180,58 0,02
KBC GROUP USD 7.431,16 USD 1,000 5.716,72 0,05
KBC GROUP ZAR 78.686,53 ZAR 1,000 6.097,89 0,05
Total demand accounts 65.676,04 0,55
TOTAL CASH AT BANK AND IN HAND 65.676,04 0,55
OTHER RECEIVABLES AND PAYABLES
Receivables
Belgium
KBC GROUP EUR RECEIVABLE 221,39 EUR 1,000 221,39 0,00
KBC GROUP ILS TE ONTVANGEN 117.081,11 ILS 1,000 24.742,94 0,21
Total receivables 24.964,33 0,21
Payables
Belgium
KBC GROUP COUNTERPART ENTRY COLLATERAL -1.183.416,66 EUR 1,000 -1.183.416,66 -9,93
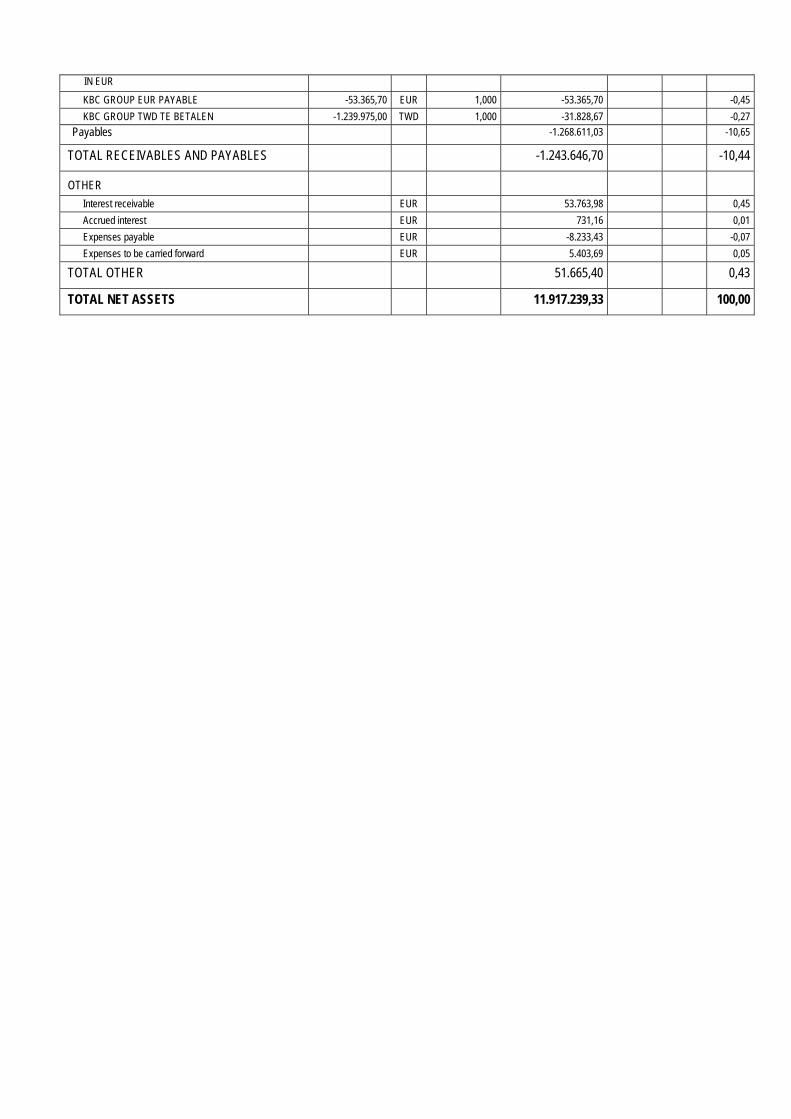
IN EUR
KBC GROUP EUR PAYABLE -53.365,70 EUR 1,000 -53.365,70 -0,45
KBC GROUP TWD TE BETALEN -1.239.975,00 TWD 1,000 -31.828,67 -0,27
Payables -1.268.611,03 -10,65
TOTAL RECEIVABLES AND PAYABLES -1.243.646,70 -10,44
OTHER
Interest receivable EUR 53.763,98 0,45
Accrued interest EUR 731,16 0,01
Expenses payable EUR -8.233,43 -0,07
Expenses to be carried forward EUR 5.403,69 0,05
TOTAL OTHER 51.665,40 0,43
TOTAL NET ASSETS 11.917.239,33 100,00
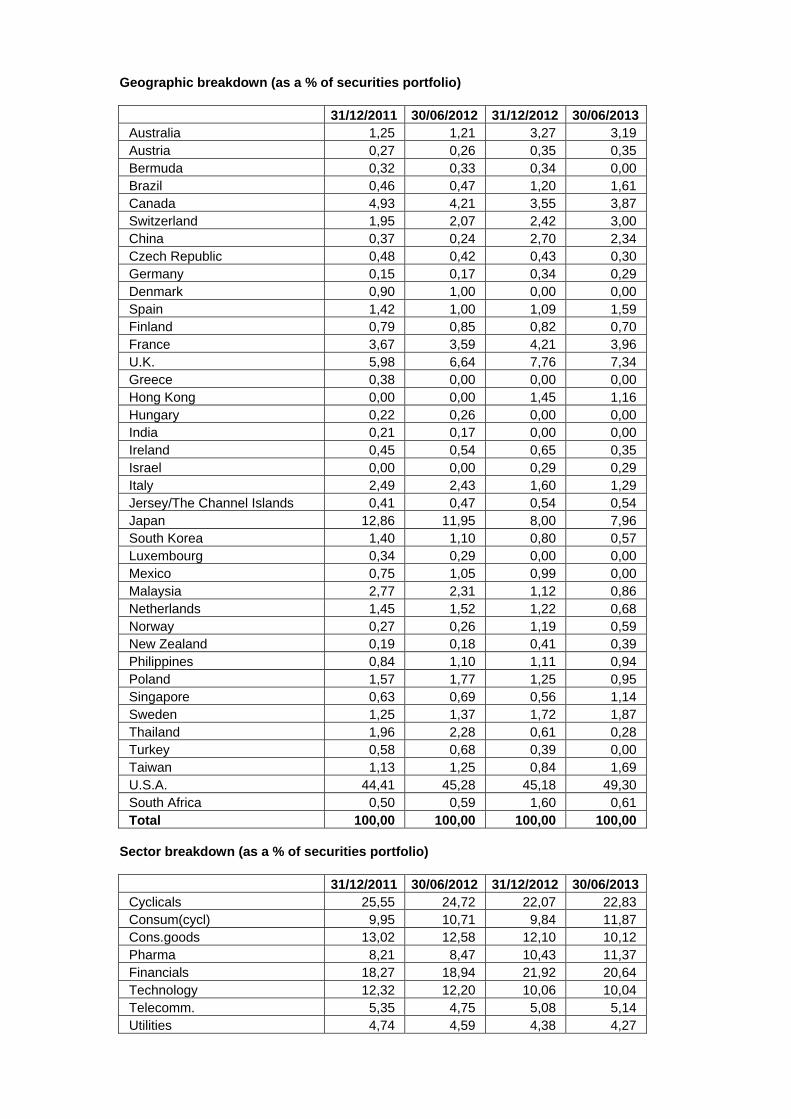
Geographic breakdown (as a % of securities portfolio)
31/12/2011 30/06/2012 31/12/2012 30/06/2013 Australia 1,25 1,21 3,27 3,19 Austria 0,27 0,26 0,35 0,35 Bermuda 0,32 0,33 0,34 0,00 Brazil 0,46 0,47 1,20 1,61 Canada 4,93 4,21 3,55 3,87 Switzerland 1,95 2,07 2,42 3,00 China 0,37 0,24 2,70 2,34 Czech Republic 0,48 0,42 0,43 0,30 Germany 0,15 0,17 0,34 0,29 Denmark 0,90 1,00 0,00 0,00 Spain 1,42 1,00 1,09 1,59 Finland 0,79 0,85 0,82 0,70 France 3,67 3,59 4,21 3,96 U.K. 5,98 6,64 7,76 7,34 Greece 0,38 0,00 0,00 0,00 Hong Kong 0,00 0,00 1,45 1,16 Hungary 0,22 0,26 0,00 0,00 India 0,21 0,17 0,00 0,00 Ireland 0,45 0,54 0,65 0,35 Israel 0,00 0,00 0,29 0,29 Italy 2,49 2,43 1,60 1,29 Jersey/The Channel Islands 0,41 0,47 0,54 0,54 Japan 12,86 11,95 8,00 7,96 South Korea 1,40 1,10 0,80 0,57 Luxembourg 0,34 0,29 0,00 0,00 Mexico 0,75 1,05 0,99 0,00 Malaysia 2,77 2,31 1,12 0,86 Netherlands 1,45 1,52 1,22 0,68 Norway 0,27 0,26 1,19 0,59 New Zealand 0,19 0,18 0,41 0,39 Philippines 0,84 1,10 1,11 0,94 Poland 1,57 1,77 1,25 0,95 Singapore 0,63 0,69 0,56 1,14 Sweden 1,25 1,37 1,72 1,87 Thailand 1,96 2,28 0,61 0,28 Turkey 0,58 0,68 0,39 0,00 Taiwan 1,13 1,25 0,84 1,69 U.S.A. 44,41 45,28 45,18 49,30 South Africa 0,50 0,59 1,60 0,61 Total 100,00 100,00 100,00 100,00
Sector breakdown (as a % of securities portfolio)
31/12/2011 30/06/2012 31/12/2012 30/06/2013 Cyclicals 25,55 24,72 22,07 22,83 Consum(cycl) 9,95 10,71 9,84 11,87 Cons.goods 13,02 12,58 12,10 10,12 Pharma 8,21 8,47 10,43 11,37 Financials 18,27 18,94 21,92 20,64 Technology 12,32 12,20 10,06 10,04 Telecomm. 5,35 4,75 5,08 5,14 Utilities 4,74 4,59 4,38 4,27
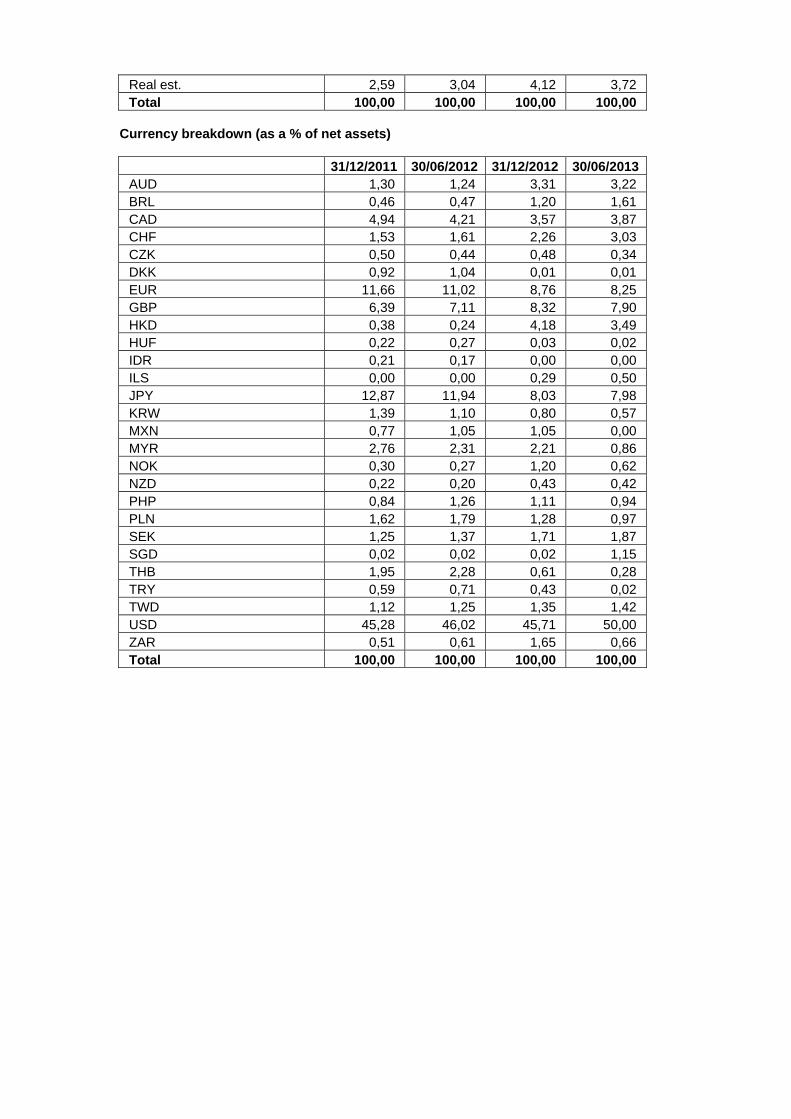
Real est. 2,59 3,04 4,12 3,72 Total 100,00 100,00 100,00 100,00
Currency breakdown (as a % of net assets)
31/12/2011 30/06/2012 31/12/2012 30/06/2013 AUD 1,30 1,24 3,31 3,22 BRL 0,46 0,47 1,20 1,61 CAD 4,94 4,21 3,57 3,87 CHF 1,53 1,61 2,26 3,03 CZK 0,50 0,44 0,48 0,34 DKK 0,92 1,04 0,01 0,01 EUR 11,66 11,02 8,76 8,25 GBP 6,39 7,11 8,32 7,90 HKD 0,38 0,24 4,18 3,49 HUF 0,22 0,27 0,03 0,02 IDR 0,21 0,17 0,00 0,00 ILS 0,00 0,00 0,29 0,50 JPY 12,87 11,94 8,03 7,98 KRW 1,39 1,10 0,80 0,57 MXN 0,77 1,05 1,05 0,00 MYR 2,76 2,31 2,21 0,86 NOK 0,30 0,27 1,20 0,62 NZD 0,22 0,20 0,43 0,42 PHP 0,84 1,26 1,11 0,94 PLN 1,62 1,79 1,28 0,97 SEK 1,25 1,37 1,71 1,87 SGD 0,02 0,02 0,02 1,15 THB 1,95 2,28 0,61 0,28 TRY 0,59 0,71 0,43 0,02 TWD 1,12 1,25 1,35 1,42 USD 45,28 46,02 45,71 50,00 ZAR 0,51 0,61 1,65 0,66 Total 100,00 100,00 100,00 100,00
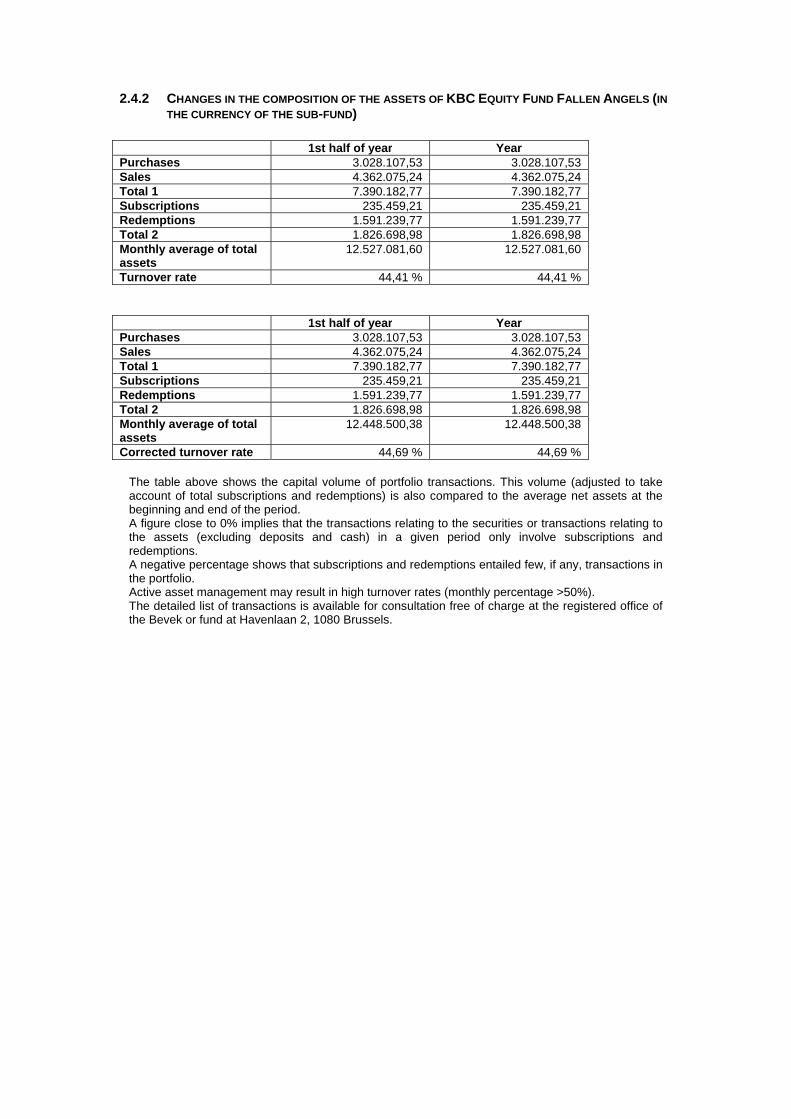
2.4.2 CHANGES IN THE COMPOSITION OF THE ASSETS OF KBC EQUITY FUND FALLEN ANGELS (IN
THE CURRENCY OF THE SUB-FUND)
1st half of year YearPurchases 3.028.107,53 3.028.107,53 Sales 4.362.075,24 4.362.075,24 Total 1 7.390.182,77 7.390.182,77 Subscriptions 235.459,21 235.459,21 Redemptions 1.591.239,77 1.591.239,77 Total 2 1.826.698,98 1.826.698,98 Monthly average of total assets
12.527.081,60 12.527.081,60
Turnover rate 44,41 % 44,41 %
1st half of year YearPurchases 3.028.107,53 3.028.107,53 Sales 4.362.075,24 4.362.075,24 Total 1 7.390.182,77 7.390.182,77 Subscriptions 235.459,21 235.459,21 Redemptions 1.591.239,77 1.591.239,77 Total 2 1.826.698,98 1.826.698,98 Monthly average of total assets
12.448.500,38 12.448.500,38
Corrected turnover rate 44,69 % 44,69 %
The table above shows the capital volume of portfolio transactions. This volume (adjusted to take account of total subscriptions and redemptions) is also compared to the average net assets at the beginning and end of the period. A figure close to 0% implies that the transactions relating to the securities or transactions relating to the assets (excluding deposits and cash) in a given period only involve subscriptions and redemptions. A negative percentage shows that subscriptions and redemptions entailed few, if any, transactions in the portfolio. Active asset management may result in high turnover rates (monthly percentage >50%). The detailed list of transactions is available for consultation free of charge at the registered office of the Bevek or fund at Havenlaan 2, 1080 Brussels.
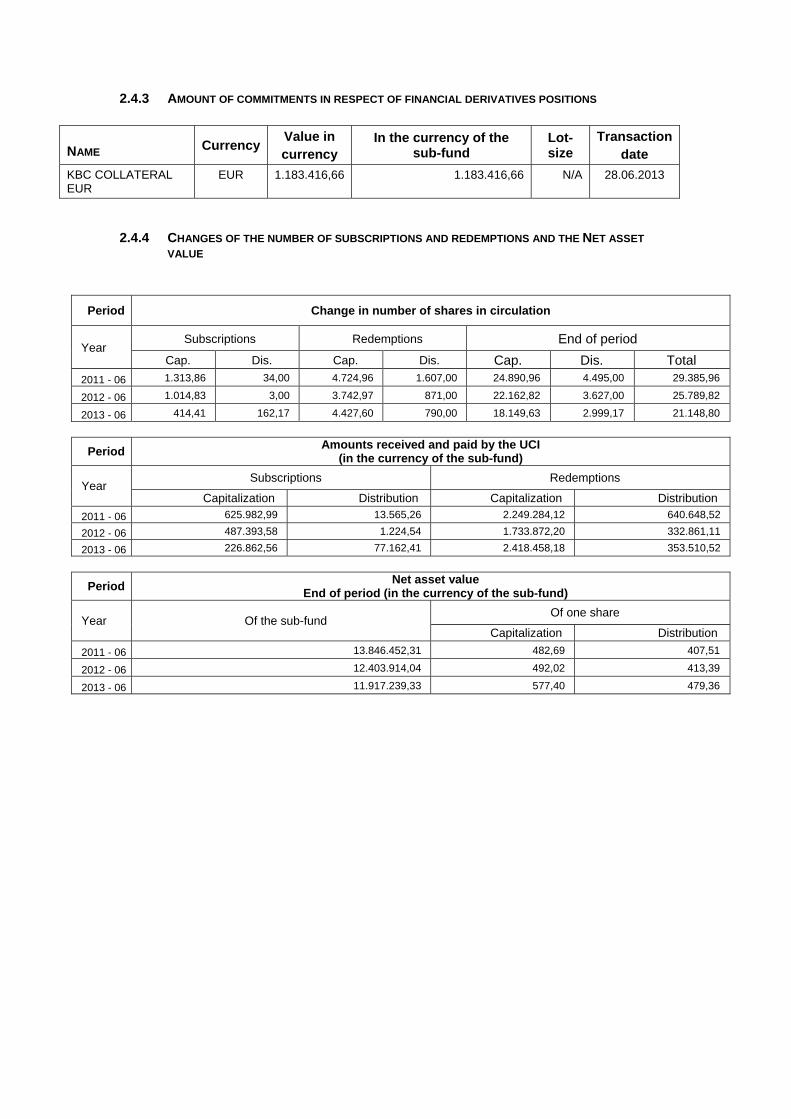
2.4.3 AMOUNT OF COMMITMENTS IN RESPECT OF FINANCIAL DERIVATIVES POSITIONS
NAME Currency Value in currency
In the currency of the sub-fund
Lot-size
Transactiondate
KBC COLLATERAL EUR
EUR 1.183.416,66 1.183.416,66 N/A 28.06.2013
2.4.4 CHANGES OF THE NUMBER OF SUBSCRIPTIONS AND REDEMPTIONS AND THE NET ASSET
VALUE
Period Change in number of shares in circulation
Year Subscriptions Redemptions End of period
Cap. Dis. Cap. Dis. Cap. Dis. Total
2011 - 06 1.313,86 34,00 4.724,96 1.607,00 24.890,96 4.495,00 29.385,96
2012 - 06 1.014,83 3,00 3.742,97 871,00 22.162,82 3.627,00 25.789,82
2013 - 06 414,41 162,17 4.427,60 790,00 18.149,63 2.999,17 21.148,80
Period Amounts received and paid by the UCI
(in the currency of the sub-fund)
Year Subscriptions Redemptions
Capitalization Distribution Capitalization Distribution
2011 - 06 625.982,99 13.565,26 2.249.284,12 640.648,52
2012 - 06 487.393,58 1.224,54 1.733.872,20 332.861,11
2013 - 06 226.862,56 77.162,41 2.418.458,18 353.510,52
Period Net asset value
End of period (in the currency of the sub-fund)
Year Of the sub-fund Of one share
Capitalization Distribution
2011 - 06 13.846.452,31 482,69 407,51
2012 - 06 12.403.914,04 492,02 413,39
2013 - 06 11.917.239,33 577,40 479,36
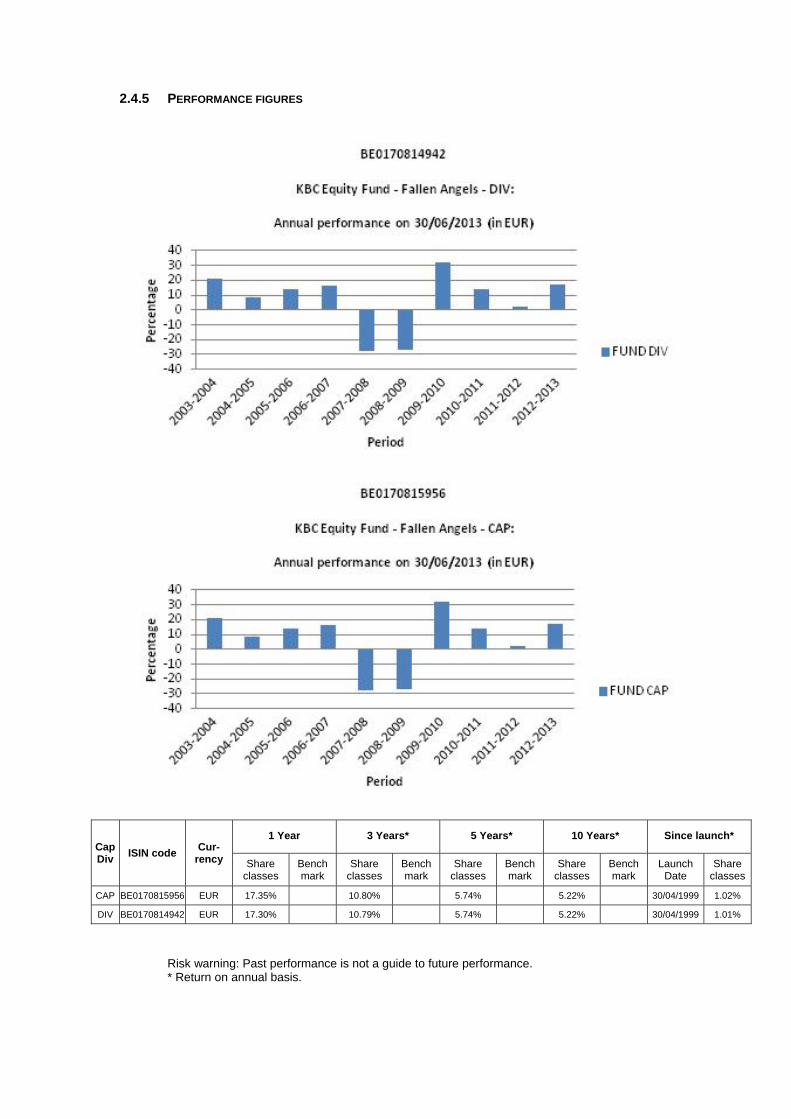
2.4.5 PERFORMANCE FIGURES
Cap Div
ISIN code Cur-
rency
1 Year 3 Years* 5 Years* 10 Years* Since launch*
Share classes
Bench mark
Share classes
Bench mark
Share classes
Bench mark
Share classes
Bench mark
Launch Date
Share classes
CAP BE0170815956 EUR 17.35% 10.80% 5.74% 5.22% 30/04/1999 1.02%
DIV BE0170814942 EUR 17.30% 10.79% 5.74% 5.22% 30/04/1999 1.01%
Risk warning: Past performance is not a guide to future performance. * Return on annual basis.

The bar chart shows the performance for full financial years. The figures do not take account of any restructuring. Calculated in EUR. the return is calculated as the change in the net asset value between two dates expressed
as a percentage. In the case of units that pay dividends, the dividend is incorporated geometrically in the return.
Calculation method for date D, where NAV stands for net asset value: Capitalisation units (CAP) Return on date D over a period of X years:
[NAV(D) / NAV(Y)] ^ [1 / X] - 1 where Y = D-X
Return on date D since the start date S of the unit: [NAV(D) / NAV(S)] ^ [1 / F] - 1 where F = 1 if the unit has existed for less than one year on date D where F = (D-S) / 365.25 if the unit has existed for longer than one year on date D
Distribution units (DIV) Return on date D over a period of X years:
[ C * NAV(D) / NAV(Y)] ^ [1 / X] - 1 where Y = D-X
Return on date D since the start date S of the unit: [ C * NAV(D) / NAV(S)] ^ [1 / F] - 1 where F = 1 if the unit has existed for less than one year on date D where F = (D-S) / 365.25 if the unit has existed for longer than one year on date D
where C is a factor that is determined for all N dividends between the calculation date D and the reference date. For dividend i on date Di with value Wi:
Ci = [Wi / NAV(Di)] + 1 i = 1 ... N
from which C = C0 * .... * CN. If the interval between the two dates exceeds one year, the ordinary return calculation is
converted into a return on an annual basis by taking the nth square root of 1 plus the total return of the unit.
The return figures shown above do not take account of the fees and charges associated with the issue and redemption of units.
These are the performance figures for capitalisation and distribution shares.

2.4.6 COSTS Ongoing charges: * Distribution: 1.782% Capitalization: 1.738% * The following costs have not been included in the ongoing charges: - Interest payments on loans taken out - Payments in respect of financial derivatives - Fees and charges paid directly by the investor - Any soft commissions
SOFT COMMISSIONS The management company or the appointed manager, as the case may be, is the recipient of soft commissions. The recipient has laid down an internal policy as regards accepting soft commissions and avoiding possible conflicts of interest in this respect, and has put appropriate internal controls in place to ensure this policy is observed. For more information, please see the ‘General’ section of the annual report.
Broker
Commission gross
in EUR
paid during the period:
1‐01‐13
‐
30‐06‐13
CSA Credits
in EUR
accrued during the period:
1‐01‐13
‐
30‐06‐13 Percentage
CITI 2,413 1,168 48.41%
CSFBSAS 215 64 30.00%
INSTINET 326 91 27.77%
MORGAN STANLEY 1,563 786 50.26%
UBSWDR 32 14 42.86%
FEE-SHARING AGREEMENTS AND REBATES: The management company may share its fee with the distributor, and institutional and/or professional parties. In principle, the percentage share amounts to between 35% and 60% if the distributor is an entity of KBC Group NV or to between 35% and 70% if the distributor is not an entity of KBC Group NV. However, in a small number of cases, the distributor’s fee is less than 35%. Investors may, on request, obtain more information on these cases. If the management company invests the assets of the undertaking for collective investment in units of undertakings for collective investment that are not managed by an entity of KBC Group NV, and receives a fee for doing so, it will pay this fee to the undertaking for collective investment. Fee-sharing does not affect the amount of the management fee paid by the sub-fund to the management company. This management fee is subject to the limitations laid down in the articles of association. The limitations may only be amended after approval by the general meeting of shareholders. The management company has concluded a distribution agreement with the distributor in order to facilitate the wider distribution of the sub-fund's units by using multiple distribution channels. It is in the interests of the holders of units, the sub-fund and of the distributor for the largest possible number of units to be sold and for the assets of the sub-fund to be maximised in this way. In this respect, there is therefore no question of any conflict of interest.
2.4.7 NOTES TO THE FINANCIAL STATEMENTS AND OTHER DATA Fee for managing the investment portfolio: 1.5% per annum calculated on the basis of the average total net assets of the sub-fund, no management fee is charged on assets assets invested in investment undertakings managed by a financial institution of the KBC group. KBC Fund Management Limited receives a fee from the management company of max. 1.5% calculated on that part of the portfolio that it manages, without the total management fee received by the management company being exceeded. The administration agent’s fee is payable at the end of each month and is calculated on the basis of the average total net assets of the sub-fund.
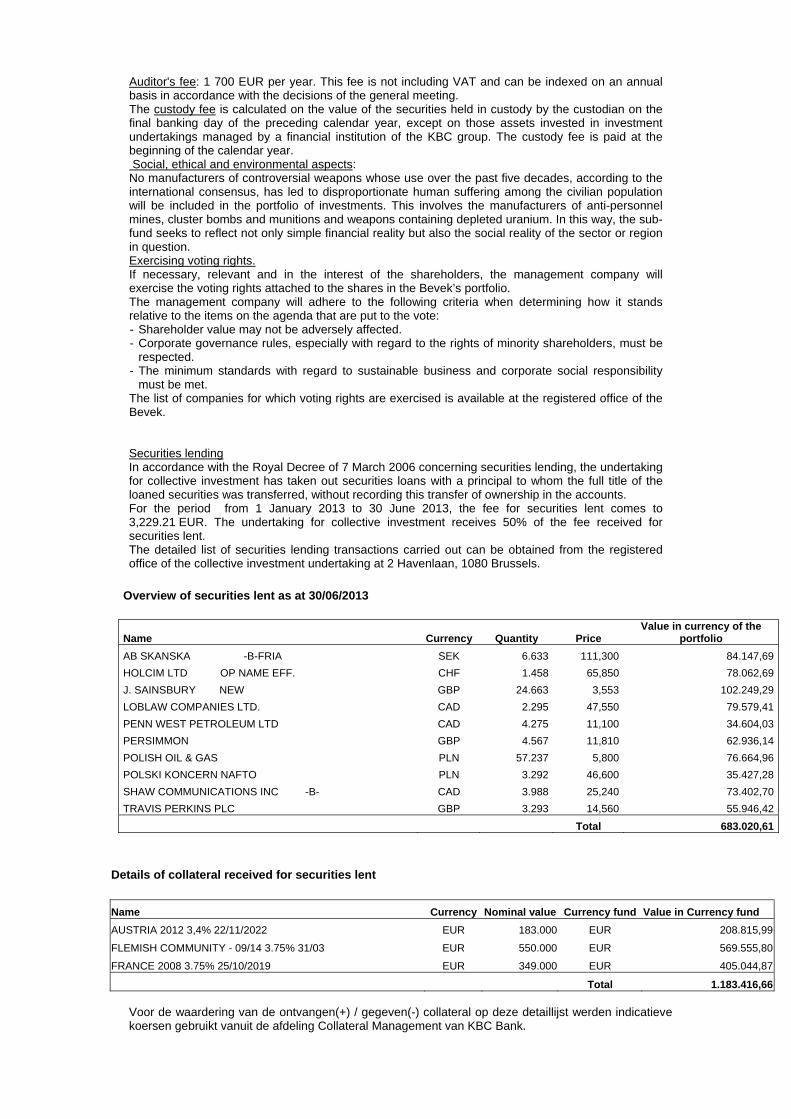
Auditor's fee: 1 700 EUR per year. This fee is not including VAT and can be indexed on an annual basis in accordance with the decisions of the general meeting. The custody fee is calculated on the value of the securities held in custody by the custodian on the final banking day of the preceding calendar year, except on those assets invested in investment undertakings managed by a financial institution of the KBC group. The custody fee is paid at the beginning of the calendar year. Social, ethical and environmental aspects: No manufacturers of controversial weapons whose use over the past five decades, according to the international consensus, has led to disproportionate human suffering among the civilian population will be included in the portfolio of investments. This involves the manufacturers of anti-personnel mines, cluster bombs and munitions and weapons containing depleted uranium. In this way, the sub-fund seeks to reflect not only simple financial reality but also the social reality of the sector or region in question. Exercising voting rights. If necessary, relevant and in the interest of the shareholders, the management company will exercise the voting rights attached to the shares in the Bevek’s portfolio. The management company will adhere to the following criteria when determining how it stands relative to the items on the agenda that are put to the vote: - Shareholder value may not be adversely affected. - Corporate governance rules, especially with regard to the rights of minority shareholders, must be
respected. - The minimum standards with regard to sustainable business and corporate social responsibility
must be met. The list of companies for which voting rights are exercised is available at the registered office of the Bevek. Securities lending In accordance with the Royal Decree of 7 March 2006 concerning securities lending, the undertaking for collective investment has taken out securities loans with a principal to whom the full title of the loaned securities was transferred, without recording this transfer of ownership in the accounts. For the period from 1 January 2013 to 30 June 2013, the fee for securities lent comes to 3,229.21 EUR. The undertaking for collective investment receives 50% of the fee received for securities lent. The detailed list of securities lending transactions carried out can be obtained from the registered office of the collective investment undertaking at 2 Havenlaan, 1080 Brussels.
Overview of securities lent as at 30/06/2013
Name Currency Quantity Price Value in currency of the
portfolio
AB SKANSKA -B-FRIA SEK 6.633 111,300 84.147,69
HOLCIM LTD OP NAME EFF. CHF 1.458 65,850 78.062,69
J. SAINSBURY NEW GBP 24.663 3,553 102.249,29
LOBLAW COMPANIES LTD. CAD 2.295 47,550 79.579,41
PENN WEST PETROLEUM LTD CAD 4.275 11,100 34.604,03
PERSIMMON GBP 4.567 11,810 62.936,14
POLISH OIL & GAS PLN 57.237 5,800 76.664,96
POLSKI KONCERN NAFTO PLN 3.292 46,600 35.427,28
SHAW COMMUNICATIONS INC -B- CAD 3.988 25,240 73.402,70
TRAVIS PERKINS PLC GBP 3.293 14,560 55.946,42
Total 683.020,61
Details of collateral received for securities lent
Name Currency Nominal value Currency fund Value in Currency fund
AUSTRIA 2012 3,4% 22/11/2022 EUR 183.000 EUR 208.815,99
FLEMISH COMMUNITY - 09/14 3.75% 31/03 EUR 550.000 EUR 569.555,80
FRANCE 2008 3.75% 25/10/2019 EUR 349.000 EUR 405.044,87
Total 1.183.416,66 Voor de waardering van de ontvangen(+) / gegeven(-) collateral op deze detaillijst werden indicatieve koersen gebruikt vanuit de afdeling Collateral Management van KBC Bank.


Semi-Annual report as at 30th June 2013
TABLE OF CONTENTS
2. Information on KBC Equity Fund Belgium
2.1. Management report 2.1.1. Launch date and subscription price 2.1.2. Stock exchange listing 2.1.3. Aim and distinctive features of the investment policy 2.1.4. Financial portfolio management 2.1.5. Distributors 2.1.6. Index and benchmark 2.1.7. Policy conducted during the financial year 2.1.8. Future policy 2.1.9. Synthetic risk and reward indicator (SRRI)
2.2. Balance sheet
2.3. Profit and loss account
2.4. Composition of the assets and key figures
2.4.1. Composition of the assets 2.4.2. Change in the composition of the assets 2.4.3. Value of commitments in respect of financial derivatives positions 2.4.4. Evolution of the number of subscriptions, repayments and the net asset value 2.4.5. Return figures 2.4.6. Expenses 2.4.7. Notes to the financial statements and other data

2 INFORMATION ON KBC EQUITY FUND BELGIUM
2.1 MANAGEMENT REPORT
2.1.1 LAUNCH DATE AND SUBSCRIPTION PRICE Launch date: 1 October 1991 Initial subscription price: 5000 BEF Currency: EUR
2.1.2 STOCK EXCHANGE LISTING Not applicable.
2.1.3 GOAL AND KEY PRINCIPLES OF THE INVESTMENT POLICY
SUB-FUND’S OBJECT: The main objective of this sub-fund is to generate the highest possible return for its shareholders by investing directly or indirectly in transferable securities. This is reflected in its pursuit of capital gains and income. To this end, the assets are invested, either directly or indirectly via correlated financial instruments, primarily in shares.
SUB-FUND’S INVESTMENT POLICY:
PERMITTED ASSET CLASSES: The sub-fund may invest in securities, money market instruments, units in undertakings for collective investment, deposits, financial derivatives, liquid assets and all other instruments insofar as permitted by the applicable laws and regulations and consistent with the sub-fund’s object The sub-fund shall invest no more than 10% of its assets in units of other undertakings for collective investment.
RESTRICTIONS OF THE INVESTMENT POLICY: The investment policy will be implemented within the limits set by law and regulations. The sub-fund may borrow up to 10% of its net assets, insofar as these are short-term borrowings aimed at solving temporary liquidity problems.
PERMITTED DERIVATIVES TRANSACTIONS: Derivates may be used either for hedging purposes or to achieve investment objectives. Changes will be made to the investments at regular intervals to comply with the sub-fund's investment strategy. In addition, listed and unlisted derivates may be used to achieve the objectives: these may be forward contracts, options or swaps on securities, indices, currencies or interest rates or other transactions involving derivatives. Unlisted derivatives transactions will only be concluded with prime financial institutions specialised in such transactions. Such derivatives may also be used to hedge the assets against exchange-rate fluctuations. Subject to the applicable laws and regulations and the articles of association, the sub-fund always seeks to conclude the most effective transactions. All costs associated with the transactions will be charged to the sub-fund and all income generated will be paid to the sub-fund. If the transactions result in a risk in respect of the counterparty, this risk can be hedged by using a margin management system that ensures that the sub-fund is the beneficiary of security (collateral) in the form of cash or investment grade bonds. When calculating the value of the bonds, a margin will be applied that varies depending on the residual term to maturity and the currency in which the bond in question is denominated. The relationship with the counterparty or counterparties is governed by standard international agreements.
STRATEGY SELECTED At least 75% of the assets are invested in shares of Belgian companies.
RISK CONCENTRATION Belgian shares.

LENDING FINANCIAL INSTRUMENTS: The sub-fund may lend financial instruments within the limits set by law and regulations. This lending does not affect the sub-fund’s risk profile since: - it takes place within the framework of a securities lending system managed by a principal. In
addition, the sub-fund has a relationship only with the principal of the securities lending system which acts as counterparty and to which title of the loaned securities is transferred. The choice of principal is subject to strict selection criteria. The return of securities similar to the securities that have been lent is guaranteed by the principal.
- through a margin management system, the sub-fund is always guaranteed financial security, the actual value of which always exceeds the actual value of the securities that have been lent, in case the principal does not return similar securities.
The return of securities similar to the securities that have been lent can be requested at any time, which means that the lending of securities does not affect the management of the sub-fund's assets. By lending securities, the sub-fund can generate an additional return. The principal pays a fee to the management company. After deducting the fee for the margin management and clearing services of KBC Bank, most of this fee is paid to the sub-fund. The relationship with the counterparty or counterparties is governed by standard international agreements. More information is provided on the terms and conditions governing securities lending in the annual or half-yearly report for the sub-fund.
VOLATILITY OF THE NET ASSET VALUE: The volatility of the net asset value may be high due to the composition of the portfolio.
GENERAL STRATEGY FOR HEDGING THE EXCHANGE RATE RISK: In order to protect its assets against exchange rate fluctuations and within the limitations laid down in the articles of association, the sub-fund may perform transactions relating to the sale of forward currency contracts, as well as the sale of call options and the purchase of put options on currencies. The transactions in question may relate solely to contracts traded on a regulated market that operates regularly, is recognised and is open to the public or that are traded with a recognised, prime financial institution specialising in such transactions and dealing in the over-the-counter (OTC) market in options. With the same objective, the sub-fund may also sell currencies forward or exchange them in private transactions with prime financial institutions specialising in such transactions. The hedging objective of the aforementioned transactions suggests that there is a direct link between these transactions and the assets to be hedged, which implies that the transactions carried out in a particular currency may in principle not exceed, in terms of volume, either the valuation value of all the assets in the same currency or the holding period of those assets.
SOCIAL, ETHICAL AND ENVIRONMENTAL ASPECTS:
No manufacturers of controversial weapons whose use over the past five decades, according to the international consensus, has led to disproportionate human suffering among the civilian population will be included in the portfolio of investments. This involves the manufacturers of anti-personnel mines, cluster bombs and munitions and weapons containing depleted uranium. In this way, the sub-fund seeks to reflect not only simple financial reality but also the social reality of the sector or region in question.
THE EUROPEAN SAVINGS DIRECTIVE AND TAX ON DEBT CLAIM RETURNS OBTAINED THROUGH THE
REDEMPTION OF OWN UNITS OR IN THE EVENT OF FULL OR PARTIAL DISTRIBUTION OF EQUITY
CAPITAL. The following information is of a general character and is not intended to cover all aspects of an investment in a UCITS. In certain cases entirely different rules might even apply. Moreover, both tax law and the interpretation of it can change. Investors who wish to have more information about the tax implications – in both Belgium and abroad – of acquiring, holding and transferring units should seek the advice of their usual financial and tax advisers. This UCITS shall invest a maximum of 15% of its assets directly or indirectly in debt instruments as intended by the European Savings Directive. A. European Savings Directive (Directive 2003/48/EC) The European Savings Directive has been implemented in Belgium.

Since this UCITS invests a maximum of 15% of its assets directly or indirectly in debt claims as intended by the European Savings Directive, the income of this UCITS does not fall within the scope of this directive. B. Tax on debt claim returns obtained through the redemption of own units or in the event of full or partial distribution of equity capital (Article 19bis Income Tax Code 1992). The income from this UCITS is not subject to the tax on debt instrument returns as intended by Article 19bis, Income Tax Code 1992.
2.1.4 FINANCIAL PORTFOLIO MANAGEMENT There is no delegation of the portfolio.
2.1.5 DISTRIBUTORS KBC Asset Management S.A., 5, Place de la Gare, L-1616 Luxembourg.
2.1.6 INDEX AND BENCHMARK See ‘Sub-fund’s investment policy’.

2.1.7 POLICY PERSUED DURING THE FINANCIAL YEAR Doubts about the sustainability of the economic recovery continue to dominate investment sentiment. The debt crisis in Europe continued unabated, although the European Central Bank (ECB) managed to convince the market that it had the crisis under control. Real GDP in the EMU contracted by an annualised 1.1%. The austerity programme and credit restrictions pushed Southern Europe into a deep recession. Germany played its traditional role as the driver for European economic growth to a lesser extent than in the recent past. Greater divergence within Europe resulted primarily in a further decline in unemployment in Germany and an alarmingly rapid rise in unemployment in countries such as Greece, Spain and Portugal. Belgium was closer to the strong core of the euro area. There have been no significant bankruptcies in the business sector in recent years. The solvency and liquidity of non-financial companies have seldom been as strong as they are at present. A new feature of this cycle is that government paper, which had previously been seen as entirely risk-free, also started to be tainted with a degree of credit risk. Greece, Ireland, Portugal and Cyprus were no longer able to finance their sovereign debt through the usual channels and are under the curatorship of the troika (ECB, EU and IMF). Private bondholders were obliged to accept a rescheduling of the Greek government debt. In Cyprus deposit holders are being required to help defray the cost of cleaning up the banking sector. Italy and Spain were frequently in the firing line. Spain has already applied for European assistance for the recapitalisation of its banks. During all these storms the euro leaders have tried to reform the rules of the game of the monetary union, but it takes a lot of time and effort to get 17 parties singing from the same hymn sheet. The ESM became operational after much delay. The new budget treaty, which came into force on 1 January 2013, is already being questioned The recovery in corporate earnings as from Q4 2009 was just as impressive as the decline in earnings during the recession. So although the economic recovery in the West may be modest, the same was certainly not true of corporate earnings. After going from negative to positive in the last quarter of 2009, earnings per share of the S&P 500 companies as a whole rose by an average 48% in 2010, by 14% in 2011 and by 4.8% in 2012. The lacklustre economic situation in the West was not an obstacle to a strong increase in turnover. The emerging economies, which are booming, are becoming an increasingly significant market outlet for Western companies. However, the improved earnings were due more to a sharp reduction in (wage) cost pressure than to increased turnover, at least until the first quarter of 2012. In the light of the difficult economic climate in Europe, we have opted to build up our holdings in defensive sectors such as consumer staples, pharmaceuticals and consumer discretionary at the expense of more cyclical sectors such as industrials, materials and energy.
2.1.8 FUTURE POLICY The confidence indicators in Europe are well below freezing point. The budgetary plans, tighter lending policy of the banks and major uncertainty among consumers and producers will continue to depress growth. 2013 will see a contraction of GDP in Europe. Recovery is not expected until the first half of 2014. Deflation or depression scenarios, which are currently dominating bond market sentiment, are not however justified. Today’s world is one of two-speed economies. The mature industrialised economies (US, Europe, Japan) still find themselves in a low-growth environment, with no underlying inflationary pressure, persistently low interest rates and runaway public finances. The picture in the emerging markets is altogether different. The strong economic growth has already created inflationary pressure in Asia. Appropriate monetary policy is therefore required: sometimes restrictive (as in 2011) and at other times stimulatory (as at present). Monetary policy in China and elsewhere in Asia is highly geared to preventing asset-price inflation. This does not just involve the interest-rate weapon; there was also active intervention in the credit market and the housing market. Time is of the essence for the euro area. Everyone knows that the EMU is not a perfect monetary union. In its twelve-year history, little has been done to improve its internal operation. National autonomy was sacrosanct. The crisis brought the realisation that economic governance, as it is now called in Eurospeak, needs to be tackled as a matter of urgency. In concrete terms, this involves measures such as supranational supervision of banks (scheduled to be in place by early 2015), strict monitoring and sanctioning of budgetary policy (a huge challenge given the emergence of austerity fatigue), monitoring of pay policy and harmonising European taxation (a big taboo). In view of the uncertain climate, we are still not inclined to make a switch to the more cyclical sectors.
2.1.9 SYNTHETIC RISK AND REWARD INDICATOR 7 on a scale of 1 (lowest risk) to 7 (highest risk). The value of a share can decrease or increase and the investor may not get back the amount invested. In accordance with Commission Regulation (EU) No. 583/2010, a synthetic risk and reward indicator has been calculated. This indicator provides a quantitative measure of the sub-fund's potential return and the risk involved, calculated in the currency in which the sub-fund is denominated. It is given as a figure between 1 and 7. The higher the figure, the greater the potential return, but also the more

difficult it is to predict this return. Losses are possible too. The lowest figure does not mean that the investment is entirely free of risk. However, it does indicate that, compared with the higher figures, this product will generally provide a lower, but more predictable return. The synthetic risk and reward indicator is assessed regularly and can therefore go up or down based on data from the past. Data from the past is not always a reliable indicator of future risk and return.
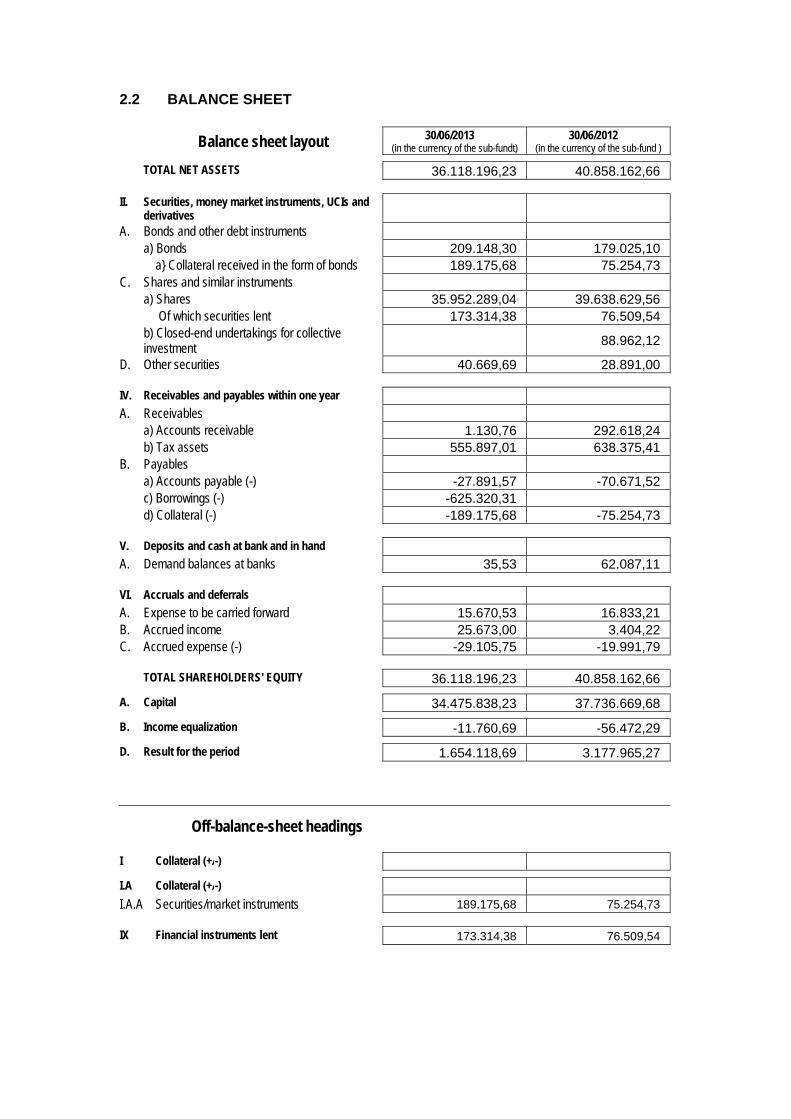
2.2 BALANCE SHEET
Balance sheet layout 30/06/2013 (in the currency of the sub-fundt)
30/06/2012 (in the currency of the sub-fund )
TOTAL NET ASSETS 36.118.196,23 40.858.162,66
II. Securities, money market instruments, UCIs and derivatives
A. Bonds and other debt instruments a) Bonds 209.148,30 179.025,10 a} Collateral received in the form of bonds 189.175,68 75.254,73 C. Shares and similar instruments a) Shares 35.952.289,04 39.638.629,56 Of which securities lent 173.314,38 76.509,54 b) Closed-end undertakings for collective
investment 88.962,12
D. Other securities 40.669,69 28.891,00
IV. Receivables and payables within one year A. Receivables a) Accounts receivable 1.130,76 292.618,24 b) Tax assets 555.897,01 638.375,41 B. Payables a) Accounts payable (-) -27.891,57 -70.671,52 c) Borrowings (-) -625.320,31 d) Collateral (-) -189.175,68 -75.254,73
V. Deposits and cash at bank and in hand A. Demand balances at banks 35,53 62.087,11
VI. Accruals and deferrals A. Expense to be carried forward 15.670,53 16.833,21 B. Accrued income 25.673,00 3.404,22 C. Accrued expense (-) -29.105,75 -19.991,79
TOTAL SHAREHOLDERS' EQUITY 36.118.196,23 40.858.162,66
A. Capital 34.475.838,23 37.736.669,68
B. Income equalization -11.760,69 -56.472,29
D. Result for the period 1.654.118,69 3.177.965,27
Off-balance-sheet headings
I Collateral (+/-)
I.A Collateral (+/-)
I.A.A Securities/market instruments 189.175,68 75.254,73
IX Financial instruments lent 173.314,38 76.509,54

2.3 PROFIT AND LOSS ACCOUNT
Income Statement 30/06/2013 (in the currency of the sub-fund)
30/06/2012 (in the currency of the sub-fund)
I. Net gains(losses) on investments A. Bonds and other debt instruments a) Bonds 41.447,50 -19.501,40 C. Shares and similar instruments a) Shares 868.122,40 2.263.220,20 b) Closed-end undertakings for collective
investment 14.635,03 -1.621,77
D. Other securities 85,70 -9.630,91 H. Foreign exchange positions and transactions b) Other foreign exchange positions and
transactions 0,32 0,85
II. Investment income and expenses A. Dividends 1.442.777,74 1.270.998,89 B. Interests a) Securities and money market instruments 13.270,53 26.206,41 b) Cash at bank and in hand and deposits -351.811,10 161,36 C. Interest on borrowings (-) -1.336,74 -672,10
IV. Operating expenses A. Investment transaction and delivery costs (-) -32.131,90 -37.565,95 B. Financial expenses (-) -1.204,81 -284,44 C. Custodian's fee (-) -12.638,29 -15.669,27 D. Manager's fee (-) a) Financial management -279.778,95 -260.805,74 b) Administration and accounting management -18.651,85 -19.734,85 E. Administrative expenses (-) -467,76 -437,98 F. Formation and organisation expenses (-) -885,45 -2.421,95 G. Remuneration, social security charges and
pension -5,50 -3,28
H. Services and sundry goods (-) -5.017,70 -4.688,34 J. Taxes -19.216,80 -6.161,10 K. Other expenses (-) -3.073,68 -3.423,36
Income and expenditure for the period Subtotal II + III + IV 729.827,74 945.498,30
V. Profit (loss) on ordinary activities before tax 1.654.118,69 3.177.965,27
VII. Result for the period 1.654.118,69 3.177.965,27
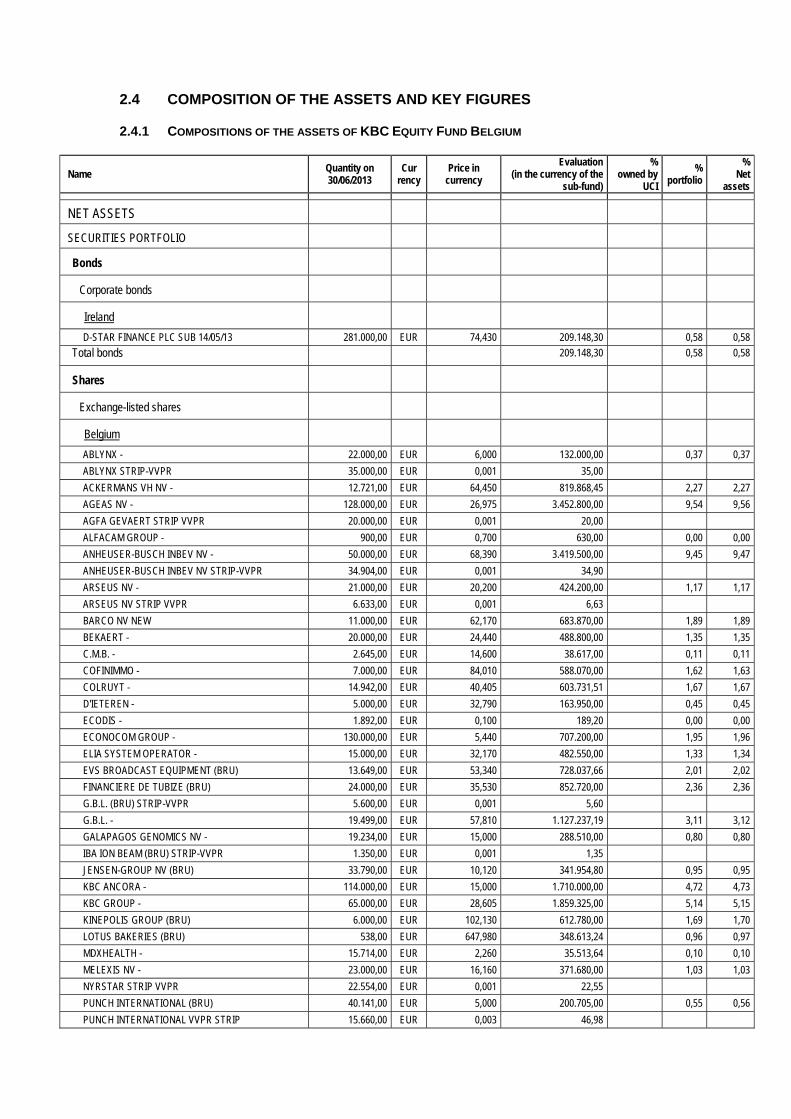
2.4 COMPOSITION OF THE ASSETS AND KEY FIGURES
2.4.1 COMPOSITIONS OF THE ASSETS OF KBC EQUITY FUND BELGIUM
Name Quantity on 30/06/2013
Cur rency
Price in currency
Evaluation (in the currency of the
sub-fund)
% owned by
UCI
% portfolio
% Net
assets
NET ASSETS
SECURITIES PORTFOLIO
Bonds
Corporate bonds
Ireland
D-STAR FINANCE PLC SUB 14/05/13 281.000,00 EUR 74,430 209.148,30 0,58 0,58
Total bonds 209.148,30 0,58 0,58
Shares
Exchange-listed shares
Belgium
ABLYNX - 22.000,00 EUR 6,000 132.000,00 0,37 0,37
ABLYNX STRIP-VVPR 35.000,00 EUR 0,001 35,00
ACKERMANS VH NV - 12.721,00 EUR 64,450 819.868,45 2,27 2,27
AGEAS NV - 128.000,00 EUR 26,975 3.452.800,00 9,54 9,56
AGFA GEVAERT STRIP VVPR 20.000,00 EUR 0,001 20,00
ALFACAM GROUP - 900,00 EUR 0,700 630,00 0,00 0,00
ANHEUSER-BUSCH INBEV NV - 50.000,00 EUR 68,390 3.419.500,00 9,45 9,47
ANHEUSER-BUSCH INBEV NV STRIP-VVPR 34.904,00 EUR 0,001 34,90
ARSEUS NV - 21.000,00 EUR 20,200 424.200,00 1,17 1,17
ARSEUS NV STRIP VVPR 6.633,00 EUR 0,001 6,63
BARCO NV NEW 11.000,00 EUR 62,170 683.870,00 1,89 1,89
BEKAERT - 20.000,00 EUR 24,440 488.800,00 1,35 1,35
C.M.B. - 2.645,00 EUR 14,600 38.617,00 0,11 0,11
COFINIMMO - 7.000,00 EUR 84,010 588.070,00 1,62 1,63
COLRUYT - 14.942,00 EUR 40,405 603.731,51 1,67 1,67
D'IETEREN - 5.000,00 EUR 32,790 163.950,00 0,45 0,45
ECODIS - 1.892,00 EUR 0,100 189,20 0,00 0,00
ECONOCOM GROUP - 130.000,00 EUR 5,440 707.200,00 1,95 1,96
ELIA SYSTEM OPERATOR - 15.000,00 EUR 32,170 482.550,00 1,33 1,34
EVS BROADCAST EQUIPMENT (BRU) 13.649,00 EUR 53,340 728.037,66 2,01 2,02
FINANCIERE DE TUBIZE (BRU) 24.000,00 EUR 35,530 852.720,00 2,36 2,36
G.B.L. (BRU) STRIP-VVPR 5.600,00 EUR 0,001 5,60
G.B.L. - 19.499,00 EUR 57,810 1.127.237,19 3,11 3,12
GALAPAGOS GENOMICS NV - 19.234,00 EUR 15,000 288.510,00 0,80 0,80
IBA ION BEAM (BRU) STRIP-VVPR 1.350,00 EUR 0,001 1,35
JENSEN-GROUP NV (BRU) 33.790,00 EUR 10,120 341.954,80 0,95 0,95
KBC ANCORA - 114.000,00 EUR 15,000 1.710.000,00 4,72 4,73
KBC GROUP - 65.000,00 EUR 28,605 1.859.325,00 5,14 5,15
KINEPOLIS GROUP (BRU) 6.000,00 EUR 102,130 612.780,00 1,69 1,70
LOTUS BAKERIES (BRU) 538,00 EUR 647,980 348.613,24 0,96 0,97
MDXHEALTH - 15.714,00 EUR 2,260 35.513,64 0,10 0,10
MELEXIS NV - 23.000,00 EUR 16,160 371.680,00 1,03 1,03
NYRSTAR STRIP VVPR 22.554,00 EUR 0,001 22,55
PUNCH INTERNATIONAL (BRU) 40.141,00 EUR 5,000 200.705,00 0,55 0,56
PUNCH INTERNATIONAL VVPR STRIP 15.660,00 EUR 0,003 46,98
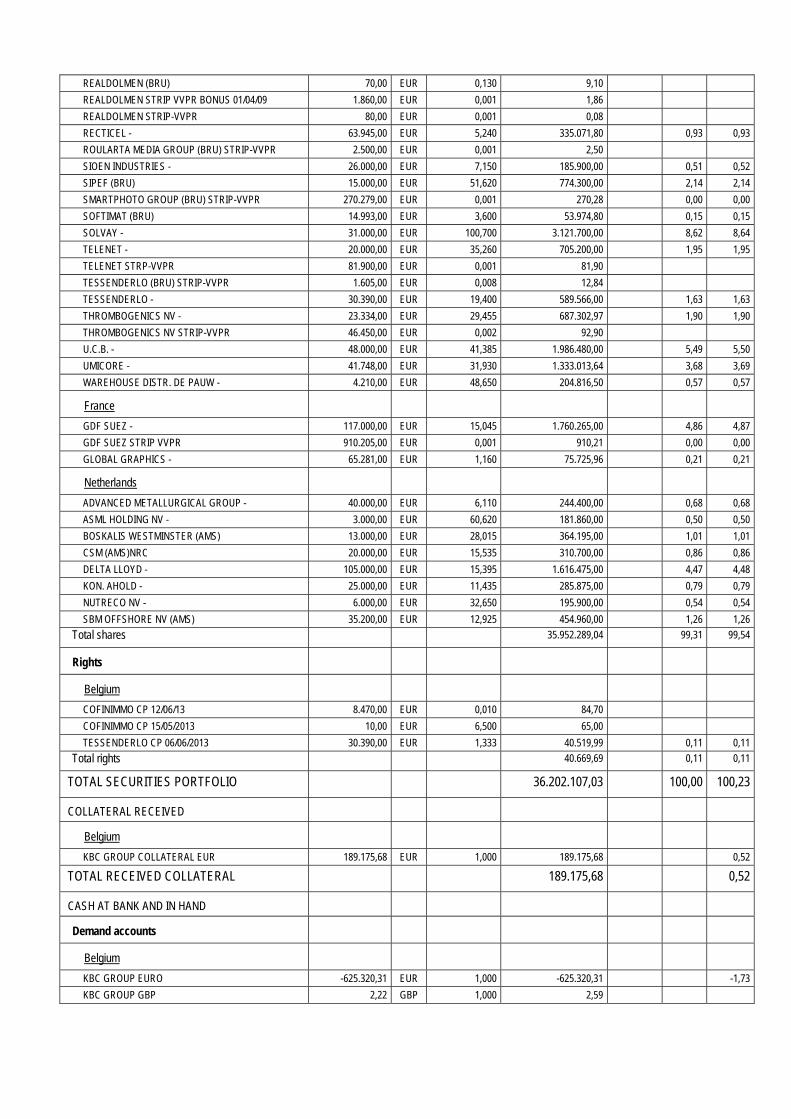
REALDOLMEN (BRU) 70,00 EUR 0,130 9,10
REALDOLMEN STRIP VVPR BONUS 01/04/09 1.860,00 EUR 0,001 1,86
REALDOLMEN STRIP-VVPR 80,00 EUR 0,001 0,08
RECTICEL - 63.945,00 EUR 5,240 335.071,80 0,93 0,93
ROULARTA MEDIA GROUP (BRU) STRIP-VVPR 2.500,00 EUR 0,001 2,50
SIOEN INDUSTRIES - 26.000,00 EUR 7,150 185.900,00 0,51 0,52
SIPEF (BRU) 15.000,00 EUR 51,620 774.300,00 2,14 2,14
SMARTPHOTO GROUP (BRU) STRIP-VVPR 270.279,00 EUR 0,001 270,28 0,00 0,00
SOFTIMAT (BRU) 14.993,00 EUR 3,600 53.974,80 0,15 0,15
SOLVAY - 31.000,00 EUR 100,700 3.121.700,00 8,62 8,64
TELENET - 20.000,00 EUR 35,260 705.200,00 1,95 1,95
TELENET STRP-VVPR 81.900,00 EUR 0,001 81,90
TESSENDERLO (BRU) STRIP-VVPR 1.605,00 EUR 0,008 12,84
TESSENDERLO - 30.390,00 EUR 19,400 589.566,00 1,63 1,63
THROMBOGENICS NV - 23.334,00 EUR 29,455 687.302,97 1,90 1,90
THROMBOGENICS NV STRIP-VVPR 46.450,00 EUR 0,002 92,90
U.C.B. - 48.000,00 EUR 41,385 1.986.480,00 5,49 5,50
UMICORE - 41.748,00 EUR 31,930 1.333.013,64 3,68 3,69
WAREHOUSE DISTR. DE PAUW - 4.210,00 EUR 48,650 204.816,50 0,57 0,57
France
GDF SUEZ - 117.000,00 EUR 15,045 1.760.265,00 4,86 4,87
GDF SUEZ STRIP VVPR 910.205,00 EUR 0,001 910,21 0,00 0,00
GLOBAL GRAPHICS - 65.281,00 EUR 1,160 75.725,96 0,21 0,21
Netherlands
ADVANCED METALLURGICAL GROUP - 40.000,00 EUR 6,110 244.400,00 0,68 0,68
ASML HOLDING NV - 3.000,00 EUR 60,620 181.860,00 0,50 0,50
BOSKALIS WESTMINSTER (AMS) 13.000,00 EUR 28,015 364.195,00 1,01 1,01
CSM (AMS)NRC 20.000,00 EUR 15,535 310.700,00 0,86 0,86
DELTA LLOYD - 105.000,00 EUR 15,395 1.616.475,00 4,47 4,48
KON. AHOLD - 25.000,00 EUR 11,435 285.875,00 0,79 0,79
NUTRECO NV - 6.000,00 EUR 32,650 195.900,00 0,54 0,54
SBM OFFSHORE NV (AMS) 35.200,00 EUR 12,925 454.960,00 1,26 1,26
Total shares 35.952.289,04 99,31 99,54
Rights
Belgium
COFINIMMO CP 12/06/13 8.470,00 EUR 0,010 84,70
COFINIMMO CP 15/05/2013 10,00 EUR 6,500 65,00
TESSENDERLO CP 06/06/2013 30.390,00 EUR 1,333 40.519,99 0,11 0,11
Total rights 40.669,69 0,11 0,11
TOTAL SECURITIES PORTFOLIO 36.202.107,03 100,00 100,23
COLLATERAL RECEIVED
Belgium
KBC GROUP COLLATERAL EUR 189.175,68 EUR 1,000 189.175,68 0,52
TOTAL RECEIVED COLLATERAL 189.175,68 0,52
CASH AT BANK AND IN HAND
Demand accounts
Belgium
KBC GROUP EURO -625.320,31 EUR 1,000 -625.320,31 -1,73
KBC GROUP GBP 2,22 GBP 1,000 2,59
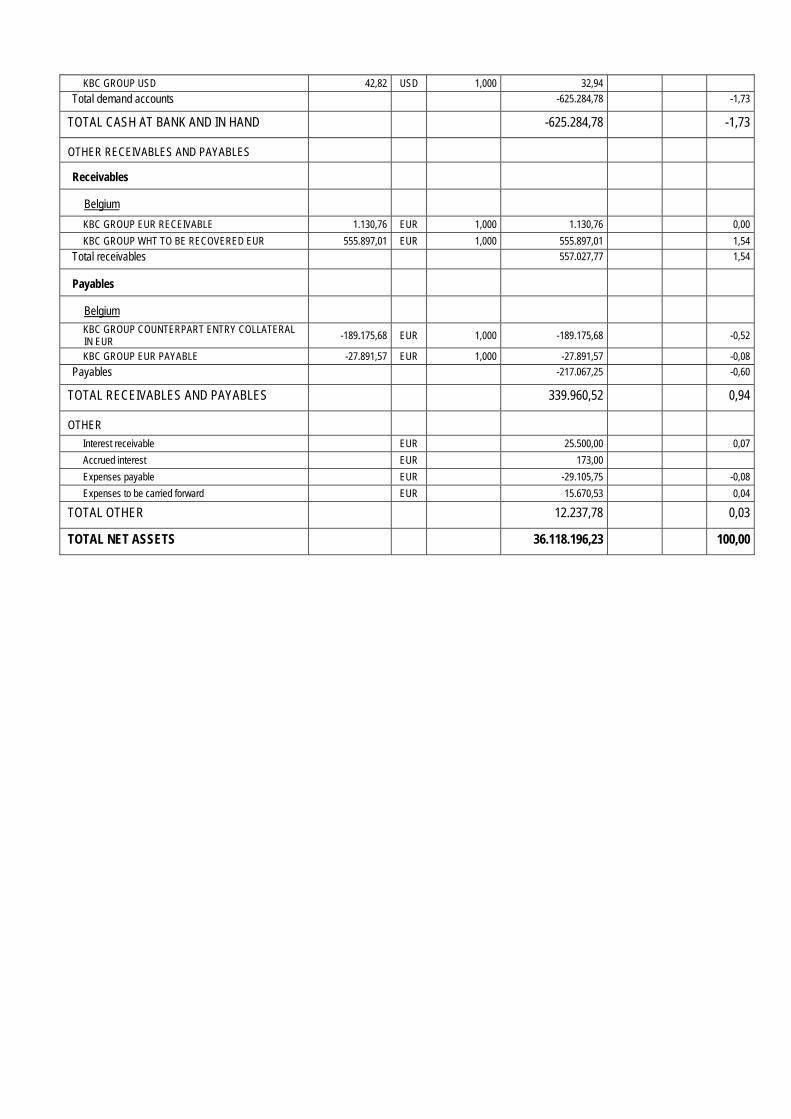
KBC GROUP USD 42,82 USD 1,000 32,94
Total demand accounts -625.284,78 -1,73
TOTAL CASH AT BANK AND IN HAND -625.284,78 -1,73
OTHER RECEIVABLES AND PAYABLES
Receivables
Belgium
KBC GROUP EUR RECEIVABLE 1.130,76 EUR 1,000 1.130,76 0,00
KBC GROUP WHT TO BE RECOVERED EUR 555.897,01 EUR 1,000 555.897,01 1,54
Total receivables 557.027,77 1,54
Payables
Belgium
KBC GROUP COUNTERPART ENTRY COLLATERAL IN EUR -189.175,68 EUR 1,000 -189.175,68 -0,52
KBC GROUP EUR PAYABLE -27.891,57 EUR 1,000 -27.891,57 -0,08
Payables -217.067,25 -0,60
TOTAL RECEIVABLES AND PAYABLES 339.960,52 0,94
OTHER
Interest receivable EUR 25.500,00 0,07
Accrued interest EUR 173,00
Expenses payable EUR -29.105,75 -0,08
Expenses to be carried forward EUR 15.670,53 0,04
TOTAL OTHER 12.237,78 0,03
TOTAL NET ASSETS 36.118.196,23 100,00
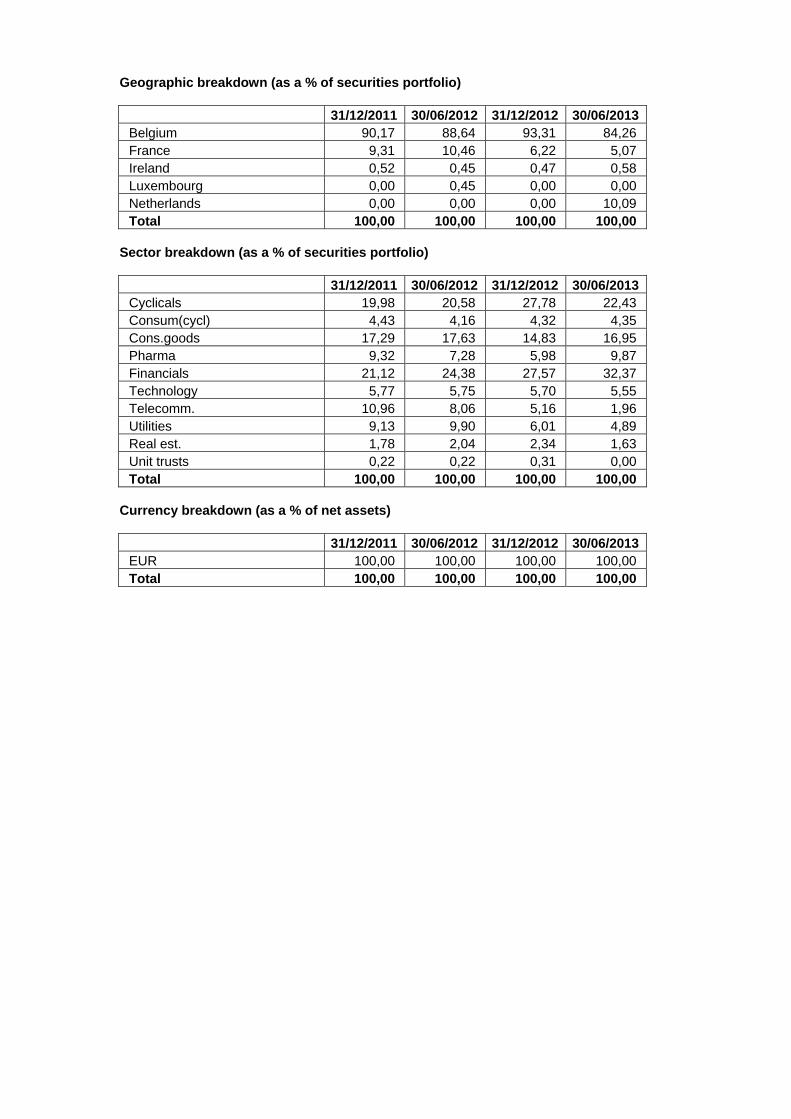
Geographic breakdown (as a % of securities portfolio)
31/12/2011 30/06/2012 31/12/2012 30/06/2013 Belgium 90,17 88,64 93,31 84,26 France 9,31 10,46 6,22 5,07 Ireland 0,52 0,45 0,47 0,58 Luxembourg 0,00 0,45 0,00 0,00 Netherlands 0,00 0,00 0,00 10,09 Total 100,00 100,00 100,00 100,00
Sector breakdown (as a % of securities portfolio)
31/12/2011 30/06/2012 31/12/2012 30/06/2013 Cyclicals 19,98 20,58 27,78 22,43 Consum(cycl) 4,43 4,16 4,32 4,35 Cons.goods 17,29 17,63 14,83 16,95 Pharma 9,32 7,28 5,98 9,87 Financials 21,12 24,38 27,57 32,37 Technology 5,77 5,75 5,70 5,55 Telecomm. 10,96 8,06 5,16 1,96 Utilities 9,13 9,90 6,01 4,89 Real est. 1,78 2,04 2,34 1,63 Unit trusts 0,22 0,22 0,31 0,00 Total 100,00 100,00 100,00 100,00
Currency breakdown (as a % of net assets)
31/12/2011 30/06/2012 31/12/2012 30/06/2013 EUR 100,00 100,00 100,00 100,00 Total 100,00 100,00 100,00 100,00

2.4.2 CHANGES IN THE COMPOSITION OF THE ASSETS OF KBC EQUITY FUND BELGIUM (IN THE
CURRENCY OF THE SUB-FUND)
1st half of year YearPurchases 19.435.811,75 19.435.811,75 Sales 19.544.135,02 19.544.135,02 Total 1 38.979.946,77 38.979.946,77 Subscriptions 4.354.280,95 4.354.280,95 Redemptions 5.891.499,86 5.891.499,86 Total 2 10.245.780,81 10.245.780,81 Monthly average of total assets
37.969.666,59 37.969.666,59
Turnover rate 75,68 % 75,68 %
1st half of year YearPurchases 19.435.811,75 19.435.811,75 Sales 19.544.135,02 19.544.135,02 Total 1 38.979.946,77 38.979.946,77 Subscriptions 4.354.280,95 4.354.280,95 Redemptions 5.891.499,86 5.891.499,86 Total 2 10.245.780,81 10.245.780,81 Monthly average of total assets
38.089.776,99 38.089.776,99
Corrected turnover rate 75,44 % 75,44 %
The table above shows the capital volume of portfolio transactions. This volume (adjusted to take account of total subscriptions and redemptions) is also compared to the average net assets at the beginning and end of the period. A figure close to 0% implies that the transactions relating to the securities or transactions relating to the assets (excluding deposits and cash) in a given period only involve subscriptions and redemptions. A negative percentage shows that subscriptions and redemptions entailed few, if any, transactions in the portfolio. Active asset management may result in high turnover rates (monthly percentage >50%). The detailed list of transactions is available for consultation free of charge at the registered office of the Bevek or fund at Havenlaan 2, 1080 Brussels.
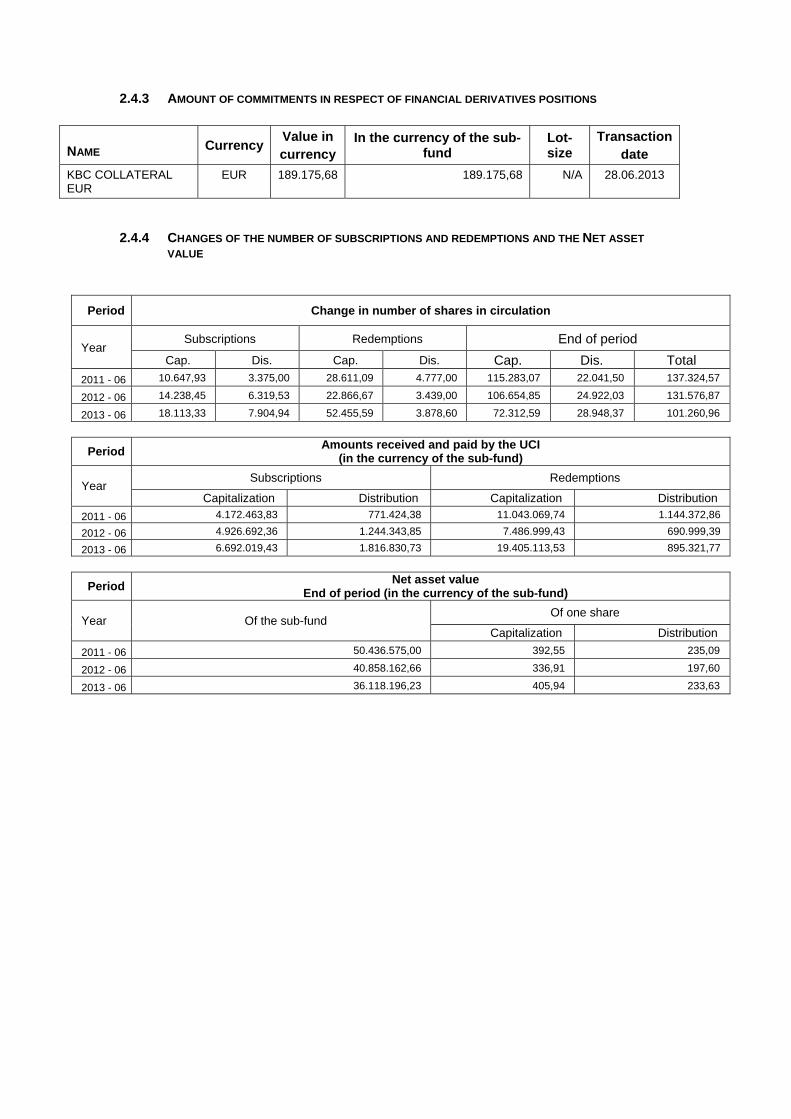
2.4.3 AMOUNT OF COMMITMENTS IN RESPECT OF FINANCIAL DERIVATIVES POSITIONS
NAME Currency Value in currency
In the currency of the sub-fund
Lot-size
Transactiondate
KBC COLLATERAL EUR
EUR 189.175,68 189.175,68 N/A 28.06.2013
2.4.4 CHANGES OF THE NUMBER OF SUBSCRIPTIONS AND REDEMPTIONS AND THE NET ASSET
VALUE
Period Change in number of shares in circulation
Year Subscriptions Redemptions End of period
Cap. Dis. Cap. Dis. Cap. Dis. Total
2011 - 06 10.647,93 3.375,00 28.611,09 4.777,00 115.283,07 22.041,50 137.324,57
2012 - 06 14.238,45 6.319,53 22.866,67 3.439,00 106.654,85 24.922,03 131.576,87
2013 - 06 18.113,33 7.904,94 52.455,59 3.878,60 72.312,59 28.948,37 101.260,96
Period Amounts received and paid by the UCI
(in the currency of the sub-fund)
Year Subscriptions Redemptions
Capitalization Distribution Capitalization Distribution
2011 - 06 4.172.463,83 771.424,38 11.043.069,74 1.144.372,86
2012 - 06 4.926.692,36 1.244.343,85 7.486.999,43 690.999,39
2013 - 06 6.692.019,43 1.816.830,73 19.405.113,53 895.321,77
Period Net asset value
End of period (in the currency of the sub-fund)
Year Of the sub-fund Of one share
Capitalization Distribution
2011 - 06 50.436.575,00 392,55 235,09
2012 - 06 40.858.162,66 336,91 197,60
2013 - 06 36.118.196,23 405,94 233,63
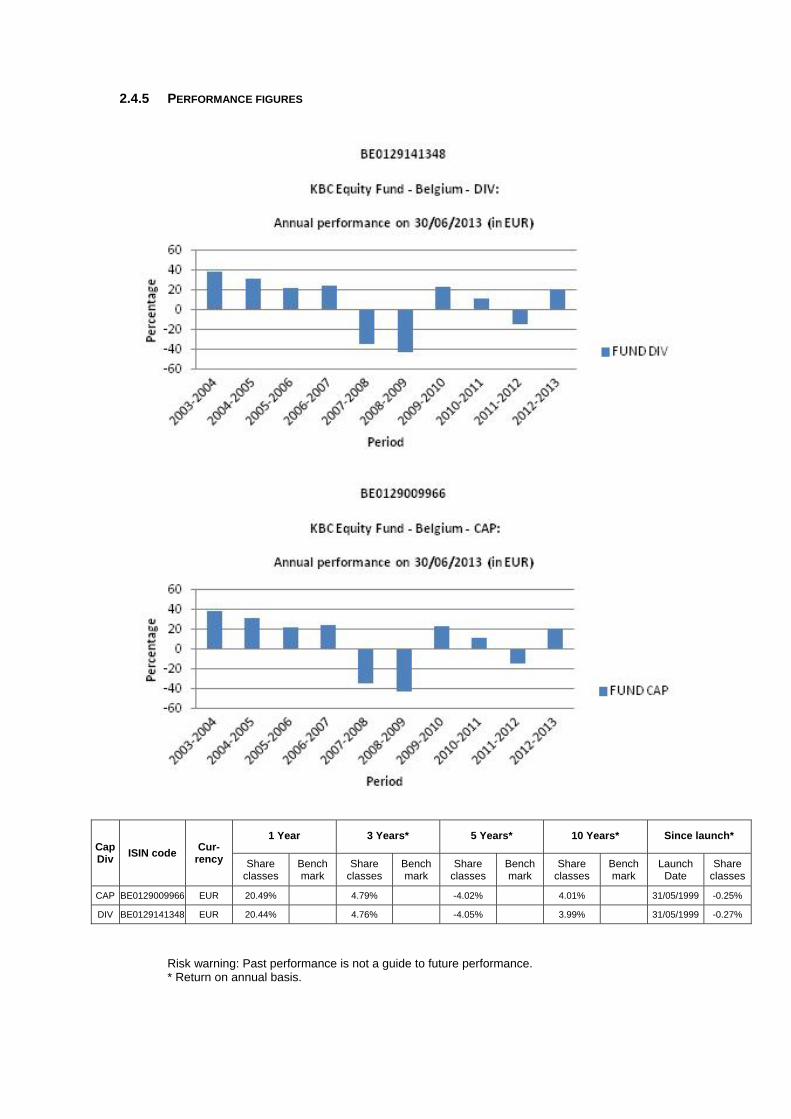
2.4.5 PERFORMANCE FIGURES
Cap Div
ISIN code Cur-
rency
1 Year 3 Years* 5 Years* 10 Years* Since launch*
Share classes
Bench mark
Share classes
Bench mark
Share classes
Bench mark
Share classes
Bench mark
Launch Date
Share classes
CAP BE0129009966 EUR 20.49% 4.79% -4.02% 4.01% 31/05/1999 -0.25%
DIV BE0129141348 EUR 20.44% 4.76% -4.05% 3.99% 31/05/1999 -0.27%
Risk warning: Past performance is not a guide to future performance. * Return on annual basis.
The bar chart shows the performance for full financial years. The figures do not take account of any restructuring. Calculated in EUR (ex BEF). the return is calculated as the change in the net asset value between two dates expressed
as a percentage. In the case of units that pay dividends, the dividend is incorporated geometrically in the return.
Calculation method for date D, where NAV stands for net asset value: Capitalisation units (CAP) Return on date D over a period of X years:
[NAV(D) / NAV(Y)] ^ [1 / X] - 1 where Y = D-X
Return on date D since the start date S of the unit: [NAV(D) / NAV(S)] ^ [1 / F] - 1 where F = 1 if the unit has existed for less than one year on date D where F = (D-S) / 365.25 if the unit has existed for longer than one year on date D
Distribution units (DIV) Return on date D over a period of X years:
[ C * NAV(D) / NAV(Y)] ^ [1 / X] - 1 where Y = D-X
Return on date D since the start date S of the unit: [ C * NAV(D) / NAV(S)] ^ [1 / F] - 1 where F = 1 if the unit has existed for less than one year on date D where F = (D-S) / 365.25 if the unit has existed for longer than one year on date D
where C is a factor that is determined for all N dividends between the calculation date D and the reference date. For dividend i on date Di with value Wi:
Ci = [Wi / NAV(Di)] + 1 i = 1 ... N
from which C = C0 * .... * CN. If the interval between the two dates exceeds one year, the ordinary return calculation is
converted into a return on an annual basis by taking the nth square root of 1 plus the total return of the unit.
The return figures shown above do not take account of the fees and charges associated with the issue and redemption of units.
These are the performance figures for capitalisation and distribution shares.
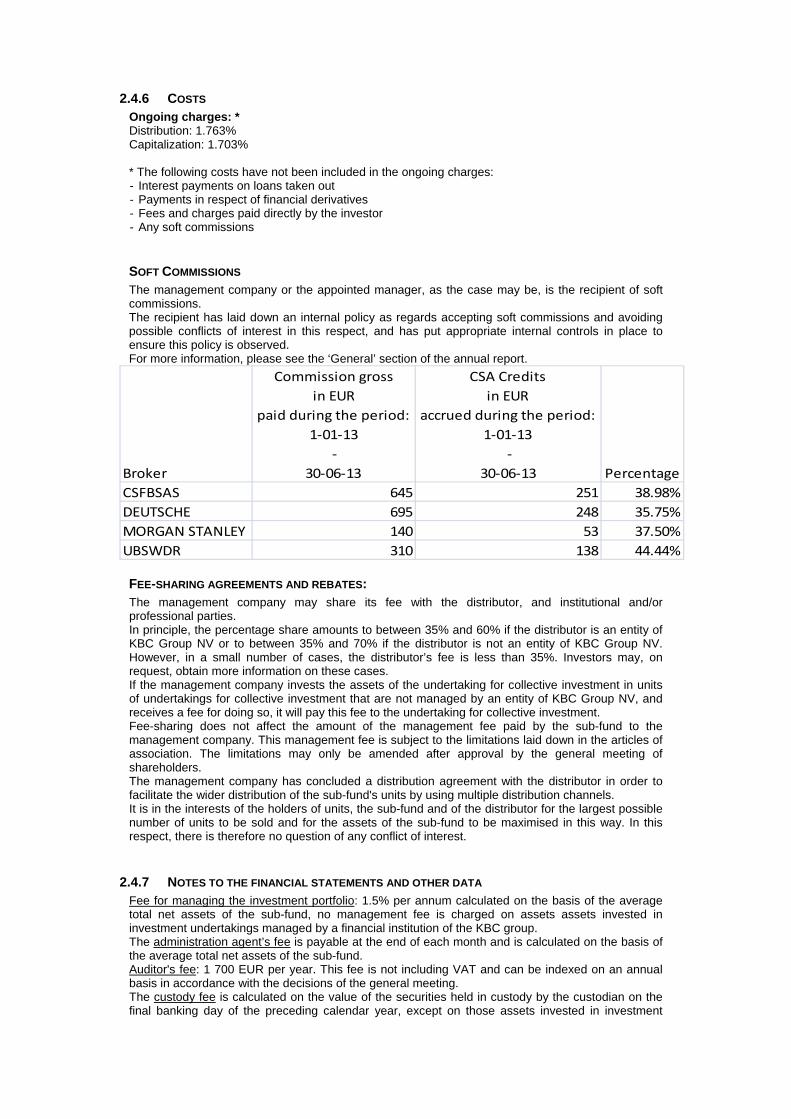
2.4.6 COSTS Ongoing charges: * Distribution: 1.763% Capitalization: 1.703% * The following costs have not been included in the ongoing charges: - Interest payments on loans taken out - Payments in respect of financial derivatives - Fees and charges paid directly by the investor - Any soft commissions
SOFT COMMISSIONS The management company or the appointed manager, as the case may be, is the recipient of soft commissions. The recipient has laid down an internal policy as regards accepting soft commissions and avoiding possible conflicts of interest in this respect, and has put appropriate internal controls in place to ensure this policy is observed. For more information, please see the ‘General’ section of the annual report.
Broker
Commission gross
in EUR
paid during the period:
1‐01‐13
‐
30‐06‐13
CSA Credits
in EUR
accrued during the period:
1‐01‐13
‐
30‐06‐13 Percentage
CSFBSAS 645 251 38.98%
DEUTSCHE 695 248 35.75%
MORGAN STANLEY 140 53 37.50%
UBSWDR 310 138 44.44%
FEE-SHARING AGREEMENTS AND REBATES: The management company may share its fee with the distributor, and institutional and/or professional parties. In principle, the percentage share amounts to between 35% and 60% if the distributor is an entity of KBC Group NV or to between 35% and 70% if the distributor is not an entity of KBC Group NV. However, in a small number of cases, the distributor’s fee is less than 35%. Investors may, on request, obtain more information on these cases. If the management company invests the assets of the undertaking for collective investment in units of undertakings for collective investment that are not managed by an entity of KBC Group NV, and receives a fee for doing so, it will pay this fee to the undertaking for collective investment. Fee-sharing does not affect the amount of the management fee paid by the sub-fund to the management company. This management fee is subject to the limitations laid down in the articles of association. The limitations may only be amended after approval by the general meeting of shareholders. The management company has concluded a distribution agreement with the distributor in order to facilitate the wider distribution of the sub-fund's units by using multiple distribution channels. It is in the interests of the holders of units, the sub-fund and of the distributor for the largest possible number of units to be sold and for the assets of the sub-fund to be maximised in this way. In this respect, there is therefore no question of any conflict of interest.
2.4.7 NOTES TO THE FINANCIAL STATEMENTS AND OTHER DATA Fee for managing the investment portfolio: 1.5% per annum calculated on the basis of the average total net assets of the sub-fund, no management fee is charged on assets assets invested in investment undertakings managed by a financial institution of the KBC group. The administration agent’s fee is payable at the end of each month and is calculated on the basis of the average total net assets of the sub-fund. Auditor's fee: 1 700 EUR per year. This fee is not including VAT and can be indexed on an annual basis in accordance with the decisions of the general meeting. The custody fee is calculated on the value of the securities held in custody by the custodian on the final banking day of the preceding calendar year, except on those assets invested in investment
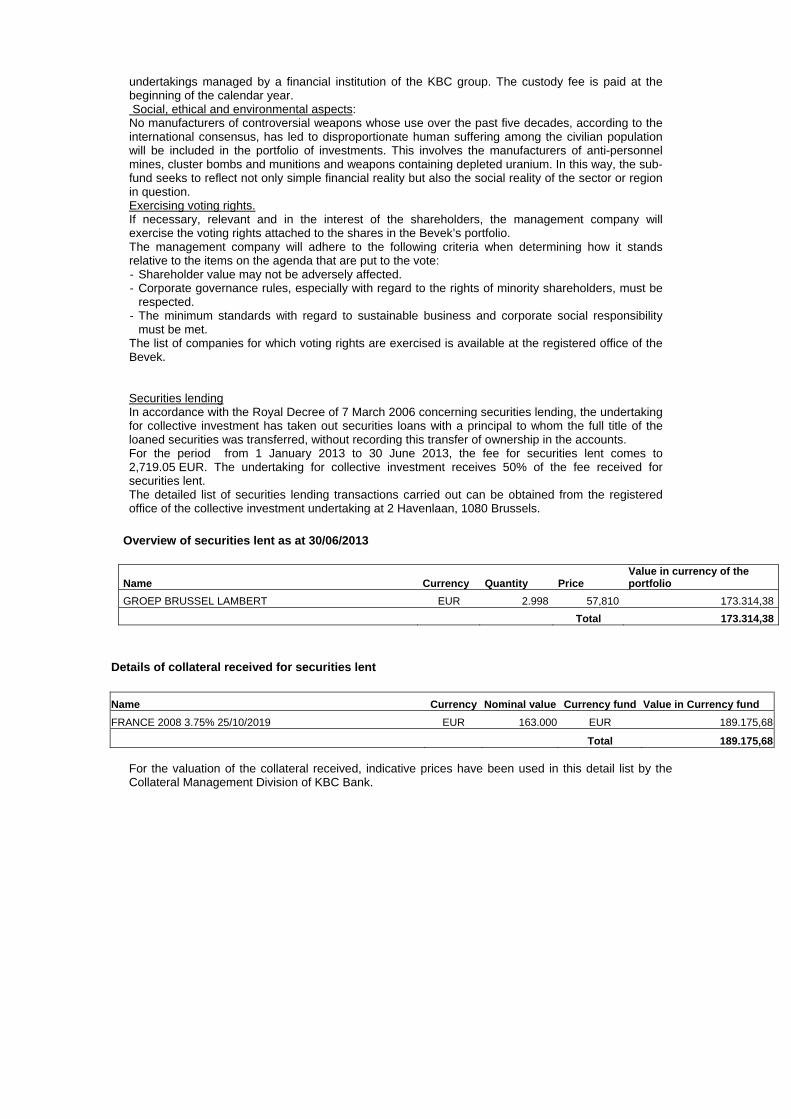
undertakings managed by a financial institution of the KBC group. The custody fee is paid at the beginning of the calendar year. Social, ethical and environmental aspects: No manufacturers of controversial weapons whose use over the past five decades, according to the international consensus, has led to disproportionate human suffering among the civilian population will be included in the portfolio of investments. This involves the manufacturers of anti-personnel mines, cluster bombs and munitions and weapons containing depleted uranium. In this way, the sub-fund seeks to reflect not only simple financial reality but also the social reality of the sector or region in question. Exercising voting rights. If necessary, relevant and in the interest of the shareholders, the management company will exercise the voting rights attached to the shares in the Bevek’s portfolio. The management company will adhere to the following criteria when determining how it stands relative to the items on the agenda that are put to the vote: - Shareholder value may not be adversely affected. - Corporate governance rules, especially with regard to the rights of minority shareholders, must be
respected. - The minimum standards with regard to sustainable business and corporate social responsibility
must be met. The list of companies for which voting rights are exercised is available at the registered office of the Bevek. Securities lending In accordance with the Royal Decree of 7 March 2006 concerning securities lending, the undertaking for collective investment has taken out securities loans with a principal to whom the full title of the loaned securities was transferred, without recording this transfer of ownership in the accounts. For the period from 1 January 2013 to 30 June 2013, the fee for securities lent comes to 2,719.05 EUR. The undertaking for collective investment receives 50% of the fee received for securities lent. The detailed list of securities lending transactions carried out can be obtained from the registered office of the collective investment undertaking at 2 Havenlaan, 1080 Brussels.
Overview of securities lent as at 30/06/2013
Name Currency Quantity Price Value in currency of the portfolio
GROEP BRUSSEL LAMBERT EUR 2.998 57,810 173.314,38
Total 173.314,38
Details of collateral received for securities lent
Name Currency Nominal value Currency fund Value in Currency fund
FRANCE 2008 3.75% 25/10/2019 EUR 163.000 EUR 189.175,68
Total 189.175,68 For the valuation of the collateral received, indicative prices have been used in this detail list by the Collateral Management Division of KBC Bank.

Semi-Annual report as at 30th June 2013
TABLE OF CONTENTS
2. Information on KBC Equity Fund New Markets
2.1. Management report 2.1.1. Launch date and subscription price 2.1.2. Stock exchange listing 2.1.3. Aim and distinctive features of the investment policy 2.1.4. Financial portfolio management 2.1.5. Distributors 2.1.6. Index and benchmark 2.1.7. Policy conducted during the financial year 2.1.8. Future policy 2.1.9. Synthetic risk and reward indicator (SRRI)
2.2. Balance sheet
2.3. Profit and loss account
2.4. Composition of the assets and key figures
2.4.1. Composition of the assets 2.4.2. Change in the composition of the assets 2.4.3. Value of commitments in respect of financial derivatives positions 2.4.4. Evolution of the number of subscriptions, repayments and the net asset value 2.4.5. Return figures 2.4.6. Expenses 2.4.7. Notes to the financial statements and other data


2 INFORMATION ON KBC EQUITY FUND NEW MARKETS
2.1 MANAGEMENT REPORT
2.1.1 LAUNCH DATE AND SUBSCRIPTION PRICE Classic Shares : Launch date: 17 April 1991 Initial subscription price: 20000 BEF Currency: EUR Institutional B Shares : Launch date: 24 November 2011 Initial subscription price: 1254.36 EUR Currency: EUR
2.1.2 STOCK EXCHANGE LISTING Not applicable.
2.1.3 GOAL AND KEY PRINCIPLES OF THE INVESTMENT POLICY
SUB-FUND’S OBJECT: The main objective of this sub-fund is to generate the highest possible return for its shareholders by investing directly or indirectly in transferable securities. This is reflected in its pursuit of capital gains and income. To this end, the assets are invested, either directly or indirectly via correlated financial instruments, primarily in shares.
SUB-FUND’S INVESTMENT POLICY:
PERMITTED ASSET CLASSES: The sub-fund may invest in securities, money market instruments, units in undertakings for collective investment, deposits, financial derivatives, liquid assets and all other instruments insofar as permitted by the applicable laws and regulations and consistent with the sub-fund’s object The sub-fund shall invest no more than 10% of its assets in units of other undertakings for collective investment.
RESTRICTIONS OF THE INVESTMENT POLICY: The investment policy will be implemented within the limits set by law and regulations. The sub-fund may borrow up to 10% of its net assets, insofar as these are short-term borrowings aimed at solving temporary liquidity problems.
PERMITTED DERIVATIVES TRANSACTIONS: Derivates may be used either for hedging purposes or to achieve investment objectives. Changes will be made to the investments at regular intervals to comply with the sub-fund's investment strategy. In addition, listed and unlisted derivates may be used to achieve the objectives: these may be forward contracts, options or swaps on securities, indices, currencies or interest rates or other transactions involving derivatives. Unlisted derivatives transactions will only be concluded with prime financial institutions specialised in such transactions. Such derivatives may also be used to hedge the assets against exchange-rate fluctuations. Subject to the applicable laws and regulations and the articles of association, the sub-fund always seeks to conclude the most effective transactions. All costs associated with the transactions will be charged to the sub-fund and all income generated will be paid to the sub-fund. If the transactions result in a risk in respect of the counterparty, this risk can be hedged by using a margin management system that ensures that the sub-fund is the beneficiary of security (collateral) in the form of cash or investment grade bonds. When calculating the value of the bonds, a margin will be applied that varies depending on the residual term to maturity and the currency in which the bond in question is denominated. The relationship with the counterparty or counterparties is governed by standard international agreements.
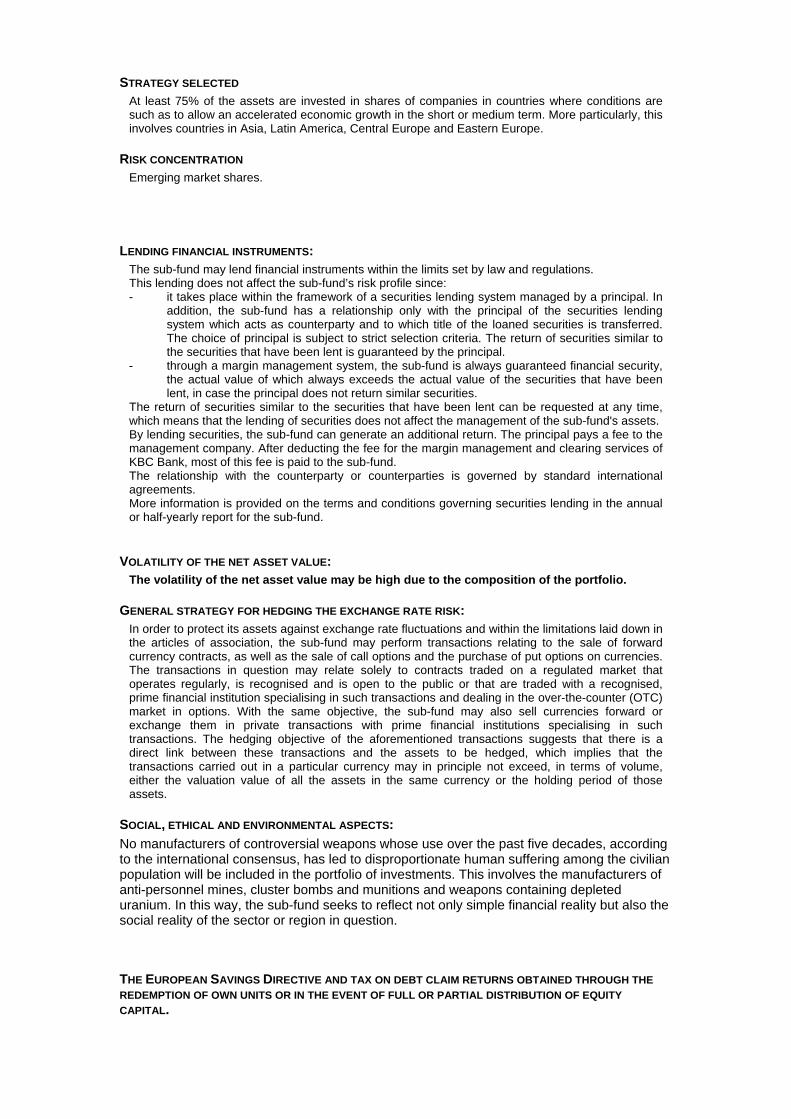
STRATEGY SELECTED At least 75% of the assets are invested in shares of companies in countries where conditions are such as to allow an accelerated economic growth in the short or medium term. More particularly, this involves countries in Asia, Latin America, Central Europe and Eastern Europe.
RISK CONCENTRATION Emerging market shares.
LENDING FINANCIAL INSTRUMENTS: The sub-fund may lend financial instruments within the limits set by law and regulations. This lending does not affect the sub-fund’s risk profile since: - it takes place within the framework of a securities lending system managed by a principal. In
addition, the sub-fund has a relationship only with the principal of the securities lending system which acts as counterparty and to which title of the loaned securities is transferred. The choice of principal is subject to strict selection criteria. The return of securities similar to the securities that have been lent is guaranteed by the principal.
- through a margin management system, the sub-fund is always guaranteed financial security, the actual value of which always exceeds the actual value of the securities that have been lent, in case the principal does not return similar securities.
The return of securities similar to the securities that have been lent can be requested at any time, which means that the lending of securities does not affect the management of the sub-fund's assets. By lending securities, the sub-fund can generate an additional return. The principal pays a fee to the management company. After deducting the fee for the margin management and clearing services of KBC Bank, most of this fee is paid to the sub-fund. The relationship with the counterparty or counterparties is governed by standard international agreements. More information is provided on the terms and conditions governing securities lending in the annual or half-yearly report for the sub-fund.
VOLATILITY OF THE NET ASSET VALUE: The volatility of the net asset value may be high due to the composition of the portfolio.
GENERAL STRATEGY FOR HEDGING THE EXCHANGE RATE RISK: In order to protect its assets against exchange rate fluctuations and within the limitations laid down in the articles of association, the sub-fund may perform transactions relating to the sale of forward currency contracts, as well as the sale of call options and the purchase of put options on currencies. The transactions in question may relate solely to contracts traded on a regulated market that operates regularly, is recognised and is open to the public or that are traded with a recognised, prime financial institution specialising in such transactions and dealing in the over-the-counter (OTC) market in options. With the same objective, the sub-fund may also sell currencies forward or exchange them in private transactions with prime financial institutions specialising in such transactions. The hedging objective of the aforementioned transactions suggests that there is a direct link between these transactions and the assets to be hedged, which implies that the transactions carried out in a particular currency may in principle not exceed, in terms of volume, either the valuation value of all the assets in the same currency or the holding period of those assets.
SOCIAL, ETHICAL AND ENVIRONMENTAL ASPECTS:
No manufacturers of controversial weapons whose use over the past five decades, according to the international consensus, has led to disproportionate human suffering among the civilian population will be included in the portfolio of investments. This involves the manufacturers of anti-personnel mines, cluster bombs and munitions and weapons containing depleted uranium. In this way, the sub-fund seeks to reflect not only simple financial reality but also the social reality of the sector or region in question.
THE EUROPEAN SAVINGS DIRECTIVE AND TAX ON DEBT CLAIM RETURNS OBTAINED THROUGH THE
REDEMPTION OF OWN UNITS OR IN THE EVENT OF FULL OR PARTIAL DISTRIBUTION OF EQUITY
CAPITAL.
The following information is of a general character and is not intended to cover all aspects of an investment in a UCITS. In certain cases entirely different rules might even apply. Moreover, both tax law and the interpretation of it can change. Investors who wish to have more information about the tax implications – in both Belgium and abroad – of acquiring, holding and transferring units should seek the advice of their usual financial and tax advisers. This UCITS shall invest a maximum of 15% of its assets directly or indirectly in debt instruments as intended by the European Savings Directive. A. European Savings Directive (Directive 2003/48/EC) The European Savings Directive has been implemented in Belgium. Since this UCITS invests a maximum of 15% of its assets directly or indirectly in debt claims as intended by the European Savings Directive, the income of this UCITS does not fall within the scope of this directive. B. Tax on debt claim returns obtained through the redemption of own units or in the event of full or partial distribution of equity capital (Article 19bis Income Tax Code 1992). The income from this UCITS is not subject to the tax on debt instrument returns as intended by Article 19bis, Income Tax Code 1992.
2.1.4 FINANCIAL PORTFOLIO MANAGEMENT The management company has delegated the intellectual management, to KBC Fund Management Limited, Joshua Dawson House, Dawson Street , Dublin 2, IRELAND..
2.1.5 DISTRIBUTORS KBC Asset Management S.A., 5, Place de la Gare, L-1616 Luxembourg.
2.1.6 INDEX AND BENCHMARK See ‘Sub-fund’s investment policy’.
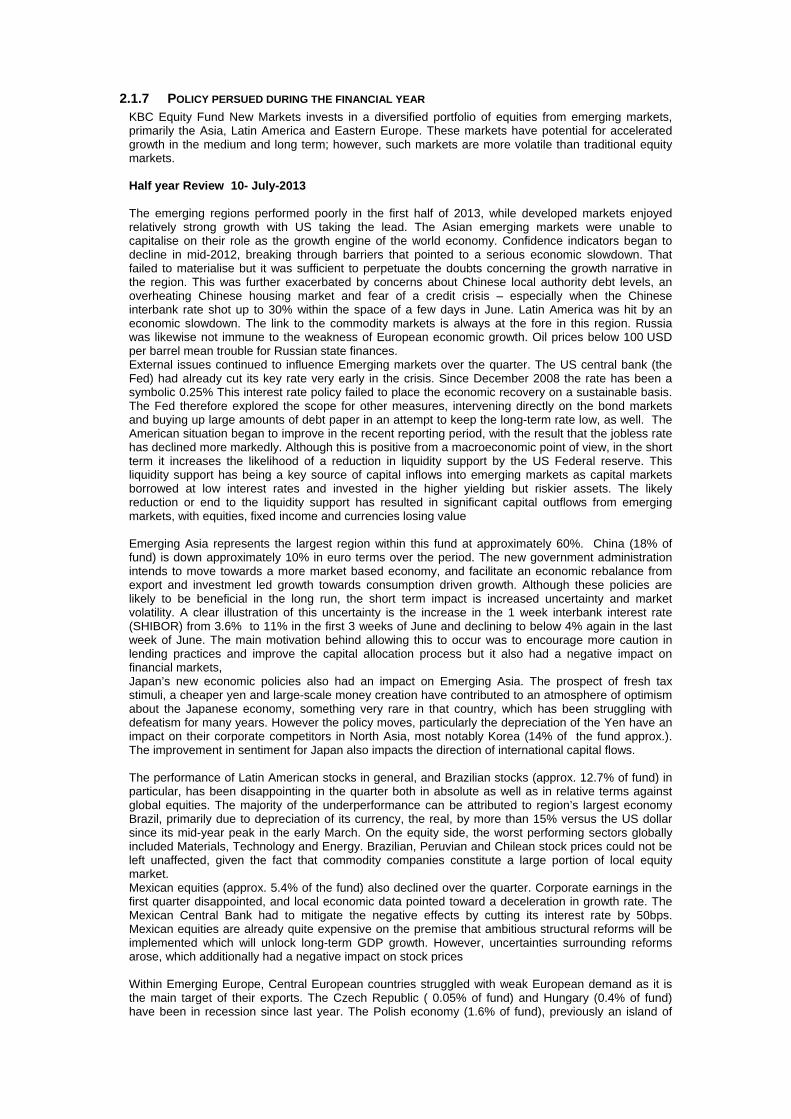
2.1.7 POLICY PERSUED DURING THE FINANCIAL YEAR KBC Equity Fund New Markets invests in a diversified portfolio of equities from emerging markets, primarily the Asia, Latin America and Eastern Europe. These markets have potential for accelerated growth in the medium and long term; however, such markets are more volatile than traditional equity markets. Half year Review 10- July-2013 The emerging regions performed poorly in the first half of 2013, while developed markets enjoyed relatively strong growth with US taking the lead. The Asian emerging markets were unable to capitalise on their role as the growth engine of the world economy. Confidence indicators began to decline in mid-2012, breaking through barriers that pointed to a serious economic slowdown. That failed to materialise but it was sufficient to perpetuate the doubts concerning the growth narrative in the region. This was further exacerbated by concerns about Chinese local authority debt levels, an overheating Chinese housing market and fear of a credit crisis – especially when the Chinese interbank rate shot up to 30% within the space of a few days in June. Latin America was hit by an economic slowdown. The link to the commodity markets is always at the fore in this region. Russia was likewise not immune to the weakness of European economic growth. Oil prices below 100 USD per barrel mean trouble for Russian state finances. External issues continued to influence Emerging markets over the quarter. The US central bank (the Fed) had already cut its key rate very early in the crisis. Since December 2008 the rate has been a symbolic 0.25% This interest rate policy failed to place the economic recovery on a sustainable basis. The Fed therefore explored the scope for other measures, intervening directly on the bond markets and buying up large amounts of debt paper in an attempt to keep the long-term rate low, as well. The American situation began to improve in the recent reporting period, with the result that the jobless rate has declined more markedly. Although this is positive from a macroeconomic point of view, in the short term it increases the likelihood of a reduction in liquidity support by the US Federal reserve. This liquidity support has being a key source of capital inflows into emerging markets as capital markets borrowed at low interest rates and invested in the higher yielding but riskier assets. The likely reduction or end to the liquidity support has resulted in significant capital outflows from emerging markets, with equities, fixed income and currencies losing value Emerging Asia represents the largest region within this fund at approximately 60%. China (18% of fund) is down approximately 10% in euro terms over the period. The new government administration intends to move towards a more market based economy, and facilitate an economic rebalance from export and investment led growth towards consumption driven growth. Although these policies are likely to be beneficial in the long run, the short term impact is increased uncertainty and market volatility. A clear illustration of this uncertainty is the increase in the 1 week interbank interest rate (SHIBOR) from 3.6% to 11% in the first 3 weeks of June and declining to below 4% again in the last week of June. The main motivation behind allowing this to occur was to encourage more caution in lending practices and improve the capital allocation process but it also had a negative impact on financial markets, Japan’s new economic policies also had an impact on Emerging Asia. The prospect of fresh tax stimuli, a cheaper yen and large-scale money creation have contributed to an atmosphere of optimism about the Japanese economy, something very rare in that country, which has been struggling with defeatism for many years. However the policy moves, particularly the depreciation of the Yen have an impact on their corporate competitors in North Asia, most notably Korea (14% of the fund approx.). The improvement in sentiment for Japan also impacts the direction of international capital flows. The performance of Latin American stocks in general, and Brazilian stocks (approx. 12.7% of fund) in particular, has been disappointing in the quarter both in absolute as well as in relative terms against global equities. The majority of the underperformance can be attributed to region’s largest economy Brazil, primarily due to depreciation of its currency, the real, by more than 15% versus the US dollar since its mid-year peak in the early March. On the equity side, the worst performing sectors globally included Materials, Technology and Energy. Brazilian, Peruvian and Chilean stock prices could not be left unaffected, given the fact that commodity companies constitute a large portion of local equity market. Mexican equities (approx. 5.4% of the fund) also declined over the quarter. Corporate earnings in the first quarter disappointed, and local economic data pointed toward a deceleration in growth rate. The Mexican Central Bank had to mitigate the negative effects by cutting its interest rate by 50bps. Mexican equities are already quite expensive on the premise that ambitious structural reforms will be implemented which will unlock long-term GDP growth. However, uncertainties surrounding reforms arose, which additionally had a negative impact on stock prices Within Emerging Europe, Central European countries struggled with weak European demand as it is the main target of their exports. The Czech Republic ( 0.05% of fund) and Hungary (0.4% of fund) have been in recession since last year. The Polish economy (1.6% of fund), previously an island of
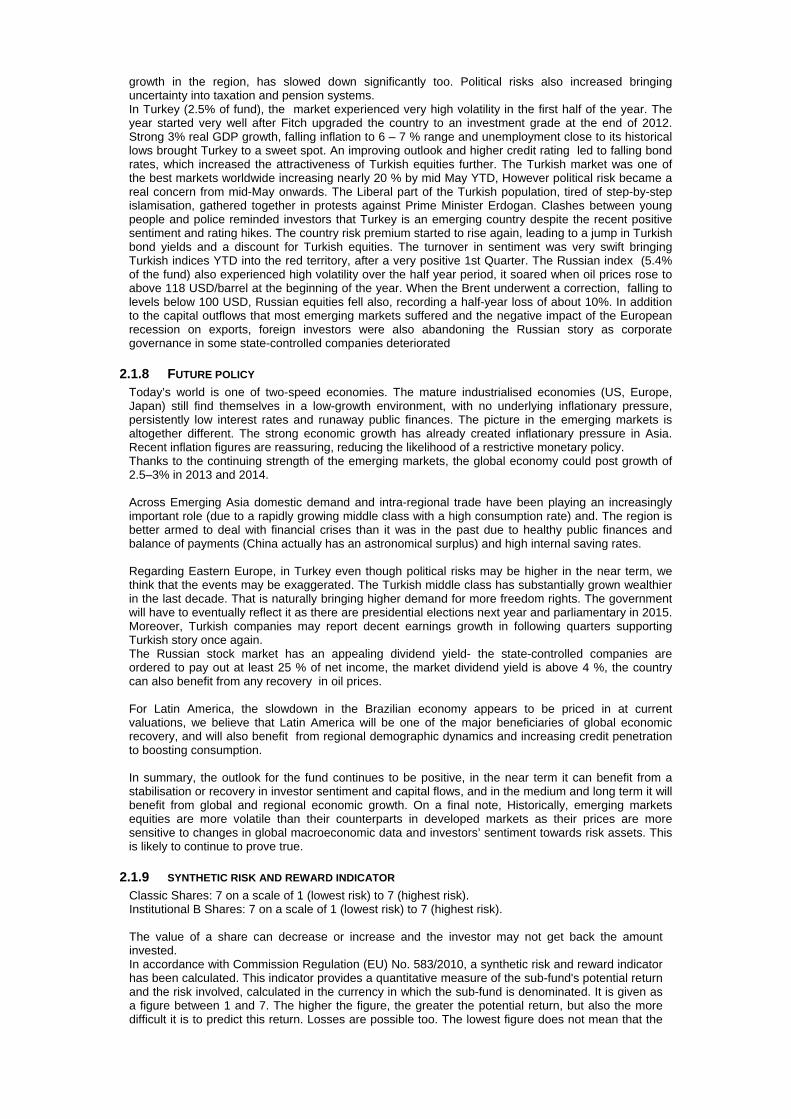
growth in the region, has slowed down significantly too. Political risks also increased bringing uncertainty into taxation and pension systems. In Turkey (2.5% of fund), the market experienced very high volatility in the first half of the year. The year started very well after Fitch upgraded the country to an investment grade at the end of 2012. Strong 3% real GDP growth, falling inflation to 6 – 7 % range and unemployment close to its historical lows brought Turkey to a sweet spot. An improving outlook and higher credit rating led to falling bond rates, which increased the attractiveness of Turkish equities further. The Turkish market was one of the best markets worldwide increasing nearly 20 % by mid May YTD, However political risk became a real concern from mid-May onwards. The Liberal part of the Turkish population, tired of step-by-step islamisation, gathered together in protests against Prime Minister Erdogan. Clashes between young people and police reminded investors that Turkey is an emerging country despite the recent positive sentiment and rating hikes. The country risk premium started to rise again, leading to a jump in Turkish bond yields and a discount for Turkish equities. The turnover in sentiment was very swift bringing Turkish indices YTD into the red territory, after a very positive 1st Quarter. The Russian index (5.4% of the fund) also experienced high volatility over the half year period, it soared when oil prices rose to above 118 USD/barrel at the beginning of the year. When the Brent underwent a correction, falling to levels below 100 USD, Russian equities fell also, recording a half-year loss of about 10%. In addition to the capital outflows that most emerging markets suffered and the negative impact of the European recession on exports, foreign investors were also abandoning the Russian story as corporate governance in some state-controlled companies deteriorated
2.1.8 FUTURE POLICY Today’s world is one of two-speed economies. The mature industrialised economies (US, Europe, Japan) still find themselves in a low-growth environment, with no underlying inflationary pressure, persistently low interest rates and runaway public finances. The picture in the emerging markets is altogether different. The strong economic growth has already created inflationary pressure in Asia. Recent inflation figures are reassuring, reducing the likelihood of a restrictive monetary policy. Thanks to the continuing strength of the emerging markets, the global economy could post growth of 2.5–3% in 2013 and 2014. Across Emerging Asia domestic demand and intra-regional trade have been playing an increasingly important role (due to a rapidly growing middle class with a high consumption rate) and. The region is better armed to deal with financial crises than it was in the past due to healthy public finances and balance of payments (China actually has an astronomical surplus) and high internal saving rates. Regarding Eastern Europe, in Turkey even though political risks may be higher in the near term, we think that the events may be exaggerated. The Turkish middle class has substantially grown wealthier in the last decade. That is naturally bringing higher demand for more freedom rights. The government will have to eventually reflect it as there are presidential elections next year and parliamentary in 2015. Moreover, Turkish companies may report decent earnings growth in following quarters supporting Turkish story once again. The Russian stock market has an appealing dividend yield- the state-controlled companies are ordered to pay out at least 25 % of net income, the market dividend yield is above 4 %, the country can also benefit from any recovery in oil prices. For Latin America, the slowdown in the Brazilian economy appears to be priced in at current valuations, we believe that Latin America will be one of the major beneficiaries of global economic recovery, and will also benefit from regional demographic dynamics and increasing credit penetration to boosting consumption. In summary, the outlook for the fund continues to be positive, in the near term it can benefit from a stabilisation or recovery in investor sentiment and capital flows, and in the medium and long term it will benefit from global and regional economic growth. On a final note, Historically, emerging markets equities are more volatile than their counterparts in developed markets as their prices are more sensitive to changes in global macroeconomic data and investors’ sentiment towards risk assets. This is likely to continue to prove true.
2.1.9 SYNTHETIC RISK AND REWARD INDICATOR Classic Shares: 7 on a scale of 1 (lowest risk) to 7 (highest risk). Institutional B Shares: 7 on a scale of 1 (lowest risk) to 7 (highest risk). The value of a share can decrease or increase and the investor may not get back the amount invested. In accordance with Commission Regulation (EU) No. 583/2010, a synthetic risk and reward indicator has been calculated. This indicator provides a quantitative measure of the sub-fund's potential return and the risk involved, calculated in the currency in which the sub-fund is denominated. It is given as a figure between 1 and 7. The higher the figure, the greater the potential return, but also the more difficult it is to predict this return. Losses are possible too. The lowest figure does not mean that the

investment is entirely free of risk. However, it does indicate that, compared with the higher figures, this product will generally provide a lower, but more predictable return. The synthetic risk and reward indicator is assessed regularly and can therefore go up or down based on data from the past. Data from the past is not always a reliable indicator of future risk and return.

2.2 BALANCE SHEET
Balance sheet layout 30/06/2013 (in the currency of the sub-fundt)
30/06/2012 (in the currency of the sub-fund )
TOTAL NET ASSETS 119.869.319,44 69.110.010,64
II. Securities, money market instruments, UCIs and derivatives
A. Bonds and other debt instruments a) Bonds 371.405,70 317.912,90 a} Collateral received in the form of bonds 5.733.307,45 2.608.111,22 C. Shares and similar instruments a) Shares 110.307.787,77 63.747.701,59 Of which securities lent 4.544.412,05 2.418.848,43 D. Other securities 2.939,52 2.568,05 E. Open-end undertakings for collective investment 8.029.239,65 4.423.053,00 F. Derivative financial instruments j) Foreign exchange Futures and forward contracts (+/-) -4.416,92 m) Financial indices Futures and forward contracts (+/-) 7.182,18
IV. Receivables and payables within one year A. Receivables a) Accounts receivable 7.516.241,10 24.485,50 B. Payables a) Accounts payable (-) -5.203.832,14 -183.790,44 c) Borrowings (-) -2.524.429,29 d) Collateral (-) -5.733.307,45 -2.608.111,22
V. Deposits and cash at bank and in hand A. Demand balances at banks 774.102,86 387.208,37
VI. Accruals and deferrals A. Expense to be carried forward 34.061,13 25.970,05 B. Accrued income 676.587,20 381.802,91 C. Accrued expense (-) -114.784,06 -19.666,55
TOTAL SHAREHOLDERS' EQUITY 119.869.319,44 69.110.010,64
A. Capital 133.643.121,90 65.459.379,67
B. Income equalization -145.357,83 -39.475,32
D. Result for the period -13.628.444,63 3.690.106,29
Off-balance-sheet headings
I Collateral (+/-)
I.A Collateral (+/-)
I.A.A Securities/market instruments 5.733.307,45 2.608.111,22
III Notional amounts of futures and forward contracts
III.A Purchased futures and forward contracts 694.645,36

IX Financial instruments lent 4.544.412,05 2.418.848,43
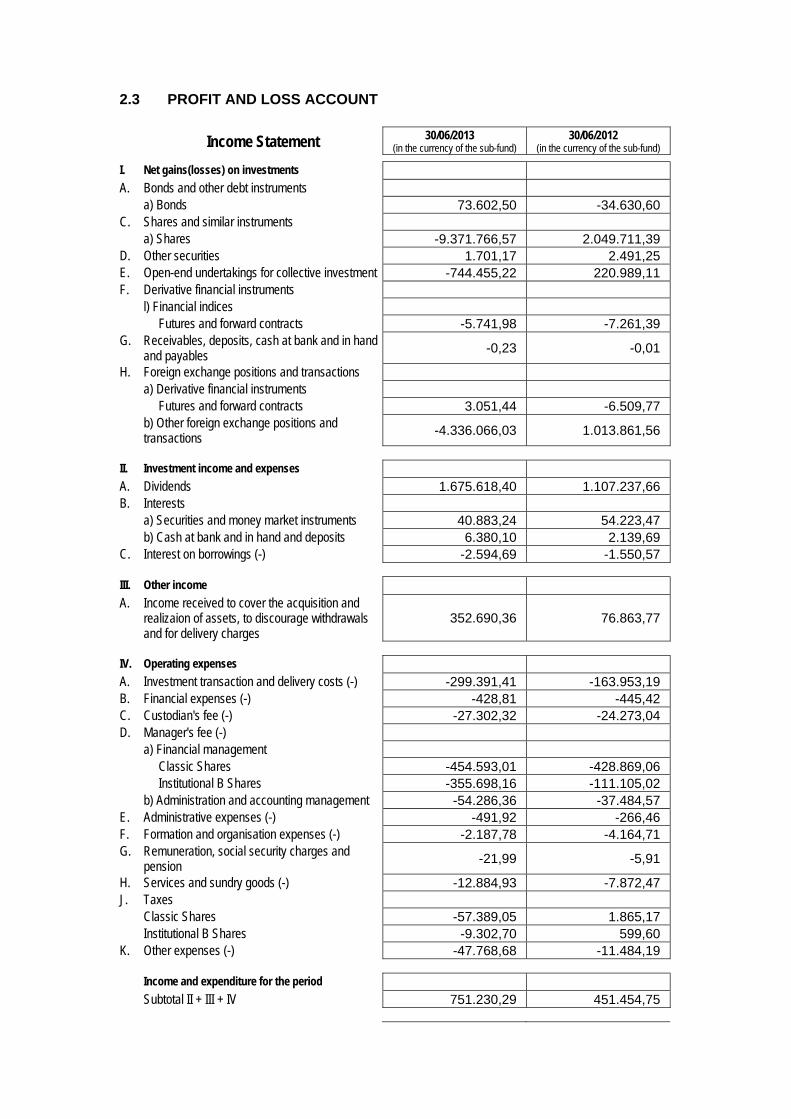
2.3 PROFIT AND LOSS ACCOUNT
Income Statement 30/06/2013 (in the currency of the sub-fund)
30/06/2012 (in the currency of the sub-fund)
I. Net gains(losses) on investments A. Bonds and other debt instruments a) Bonds 73.602,50 -34.630,60 C. Shares and similar instruments a) Shares -9.371.766,57 2.049.711,39 D. Other securities 1.701,17 2.491,25 E. Open-end undertakings for collective investment -744.455,22 220.989,11 F. Derivative financial instruments l) Financial indices Futures and forward contracts -5.741,98 -7.261,39 G. Receivables, deposits, cash at bank and in hand
and payables -0,23 -0,01
H. Foreign exchange positions and transactions a) Derivative financial instruments Futures and forward contracts 3.051,44 -6.509,77 b) Other foreign exchange positions and
transactions -4.336.066,03 1.013.861,56
II. Investment income and expenses A. Dividends 1.675.618,40 1.107.237,66 B. Interests a) Securities and money market instruments 40.883,24 54.223,47 b) Cash at bank and in hand and deposits 6.380,10 2.139,69 C. Interest on borrowings (-) -2.594,69 -1.550,57
III. Other income A. Income received to cover the acquisition and
realizaion of assets, to discourage withdrawals and for delivery charges
352.690,36 76.863,77
IV. Operating expenses A. Investment transaction and delivery costs (-) -299.391,41 -163.953,19 B. Financial expenses (-) -428,81 -445,42 C. Custodian's fee (-) -27.302,32 -24.273,04 D. Manager's fee (-) a) Financial management Classic Shares -454.593,01 -428.869,06 Institutional B Shares -355.698,16 -111.105,02 b) Administration and accounting management -54.286,36 -37.484,57 E. Administrative expenses (-) -491,92 -266,46 F. Formation and organisation expenses (-) -2.187,78 -4.164,71 G. Remuneration, social security charges and
pension -21,99 -5,91
H. Services and sundry goods (-) -12.884,93 -7.872,47 J. Taxes Classic Shares -57.389,05 1.865,17 Institutional B Shares -9.302,70 599,60 K. Other expenses (-) -47.768,68 -11.484,19
Income and expenditure for the period Subtotal II + III + IV 751.230,29 451.454,75
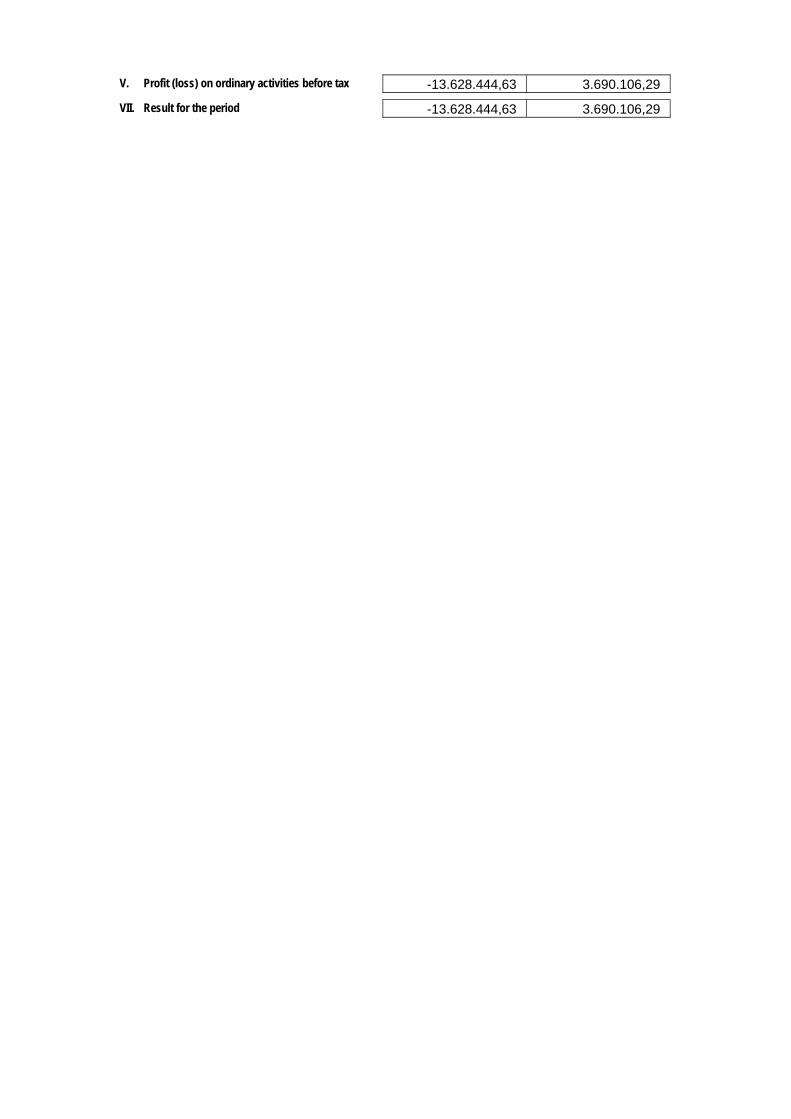
V. Profit (loss) on ordinary activities before tax -13.628.444,63 3.690.106,29
VII. Result for the period -13.628.444,63 3.690.106,29
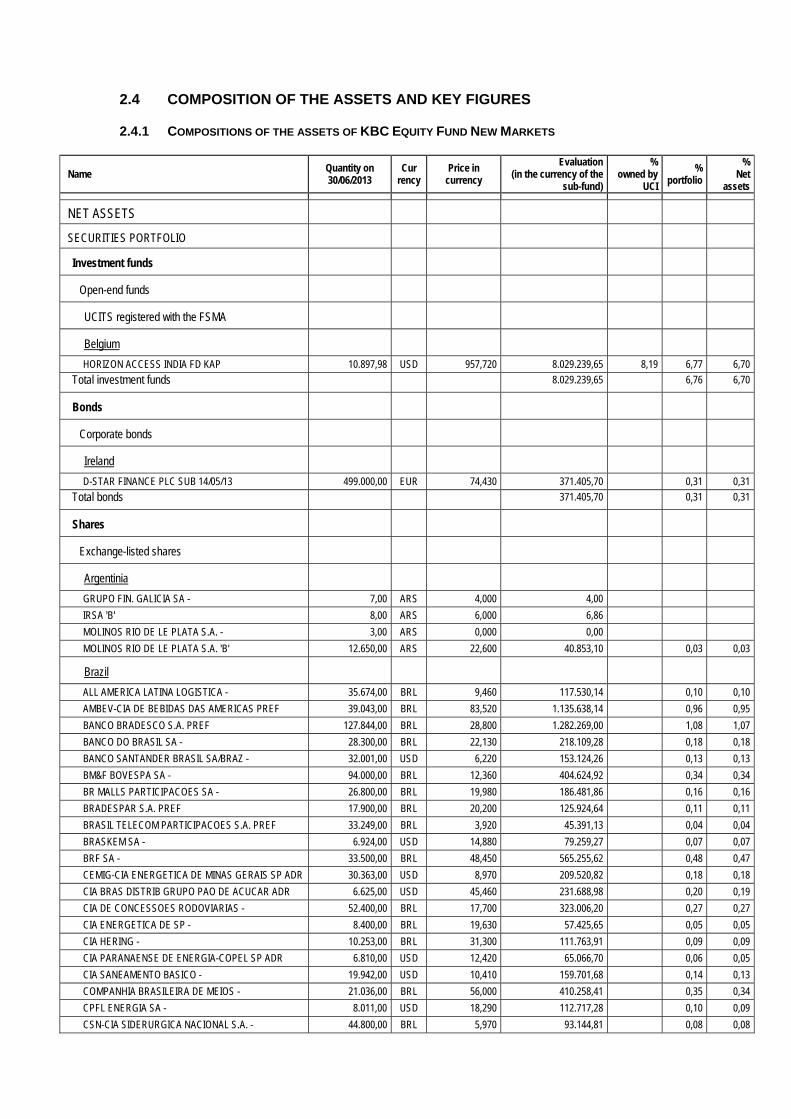
2.4 COMPOSITION OF THE ASSETS AND KEY FIGURES
2.4.1 COMPOSITIONS OF THE ASSETS OF KBC EQUITY FUND NEW MARKETS
Name Quantity on 30/06/2013
Cur rency
Price in currency
Evaluation (in the currency of the
sub-fund)
% owned by
UCI
% portfolio
% Net
assets
NET ASSETS
SECURITIES PORTFOLIO
Investment funds
Open-end funds
UCITS registered with the FSMA
Belgium
HORIZON ACCESS INDIA FD KAP 10.897,98 USD 957,720 8.029.239,65 8,19 6,77 6,70
Total investment funds 8.029.239,65 6,76 6,70
Bonds
Corporate bonds
Ireland
D-STAR FINANCE PLC SUB 14/05/13 499.000,00 EUR 74,430 371.405,70 0,31 0,31
Total bonds 371.405,70 0,31 0,31
Shares
Exchange-listed shares
Argentinia
GRUPO FIN. GALICIA SA - 7,00 ARS 4,000 4,00
IRSA 'B' 8,00 ARS 6,000 6,86
MOLINOS RIO DE LE PLATA S.A. - 3,00 ARS 0,000 0,00
MOLINOS RIO DE LE PLATA S.A. 'B' 12.650,00 ARS 22,600 40.853,10 0,03 0,03
Brazil
ALL AMERICA LATINA LOGISTICA - 35.674,00 BRL 9,460 117.530,14 0,10 0,10
AMBEV-CIA DE BEBIDAS DAS AMERICAS PREF 39.043,00 BRL 83,520 1.135.638,14 0,96 0,95
BANCO BRADESCO S.A. PREF 127.844,00 BRL 28,800 1.282.269,00 1,08 1,07
BANCO DO BRASIL SA - 28.300,00 BRL 22,130 218.109,28 0,18 0,18
BANCO SANTANDER BRASIL SA/BRAZ - 32.001,00 USD 6,220 153.124,26 0,13 0,13
BM&F BOVESPA SA - 94.000,00 BRL 12,360 404.624,92 0,34 0,34
BR MALLS PARTICIPACOES SA - 26.800,00 BRL 19,980 186.481,86 0,16 0,16
BRADESPAR S.A. PREF 17.900,00 BRL 20,200 125.924,64 0,11 0,11
BRASIL TELECOM PARTICIPACOES S.A. PREF 33.249,00 BRL 3,920 45.391,13 0,04 0,04
BRASKEM SA - 6.924,00 USD 14,880 79.259,27 0,07 0,07
BRF SA - 33.500,00 BRL 48,450 565.255,62 0,48 0,47
CEMIG-CIA ENERGETICA DE MINAS GERAIS SP ADR 30.363,00 USD 8,970 209.520,82 0,18 0,18
CIA BRAS DISTRIB GRUPO PAO DE ACUCAR ADR 6.625,00 USD 45,460 231.688,98 0,20 0,19
CIA DE CONCESSOES RODOVIARIAS - 52.400,00 BRL 17,700 323.006,20 0,27 0,27
CIA ENERGETICA DE SP - 8.400,00 BRL 19,630 57.425,65 0,05 0,05
CIA HERING - 10.253,00 BRL 31,300 111.763,91 0,09 0,09
CIA PARANAENSE DE ENERGIA-COPEL SP ADR 6.810,00 USD 12,420 65.066,70 0,06 0,05
CIA SANEAMENTO BASICO - 19.942,00 USD 10,410 159.701,68 0,14 0,13
COMPANHIA BRASILEIRA DE MEIOS - 21.036,00 BRL 56,000 410.258,41 0,35 0,34
CPFL ENERGIA SA - 8.011,00 USD 18,290 112.717,28 0,10 0,09
CSN-CIA SIDERURGICA NACIONAL S.A. - 44.800,00 BRL 5,970 93.144,81 0,08 0,08

CVRD-CIA VALE DO RIO DOCE PREF A 76.968,00 BRL 27,050 725.076,41 0,61 0,61
CYRELA BRAZIL REALTY SA - 28.200,00 BRL 15,340 150.654,04 0,13 0,13
ELETROBRAS-CENTR ELETRICAS BRAS S.A. - 30.901,00 BRL 4,650 50.041,67 0,04 0,04
EMBRAER SA - 36.638,00 BRL 20,510 261.700,00 0,22 0,22
GERDAU SA PREF 40.650,00 BRL 12,610 178.517,97 0,15 0,15
GOL LINHAS AEREAS ADR 9.102,00 USD 3,350 23.456,96 0,02 0,02
HRT PARTICIPACOES EM PETROLEO - 10.000,00 BRL 2,620 9.124,47 0,01 0,01
HYPERMARCAS SA - 23.300,00 BRL 14,530 117.903,81 0,10 0,10
IKPC-INDS KLABIN DE PAPEL E CELULOSE PREF 42.300,00 BRL 11,100 163.519,54 0,14 0,14
ITAU UNIBANCO HOLDINGS SA PREF PREF 114.580,00 BRL 28,770 1.148.034,62 0,97 0,96
ITAUSA-INVESTIMENTOS ITAU SA - 135.902,00 BRL 8,290 392.361,77 0,33 0,33
JBS SA - 34.200,00 BRL 6,470 77.061,36 0,07 0,06
LOJAS AMERICANAS SA -PREF- 36.740,00 BRL 15,640 200.116,18 0,17 0,17
LOJAS RENNER SA - 8.800,00 BRL 63,950 195.988,02 0,17 0,16
METALURGICA GERDAU SA - 18.100,00 BRL 15,990 100.793,69 0,09 0,08
MRV ENGENHARIA E PARTICIPACOES SA - 23.900,00 BRL 6,460 53.769,59 0,05 0,05
MULTIPLAN EMPREENDIMENTOS IMOB - 9.100,00 BRL 51,790 164.132,13 0,14 0,14
NATURA COSMETICOS SA - 12.000,00 BRL 47,700 199.345,27 0,17 0,17
OGX PETROLEO E GAS PARTICIPACO - 64.400,00 BRL 0,790 17.718,19 0,02 0,02
PETROBRAS-PETROLEO BRASILEIRO S.A. - 133.829,00 BRL 14,810 690.258,23 0,58 0,58
PETROBRAS-PETROLEO BRASILEIRO S.A. PREF 190.685,00 BRL 16,180 1.074.487,46 0,91 0,90
SOUZA CRUZ S.A. - 26.600,00 BRL 27,390 253.734,76 0,21 0,21
TELEF BRASIL PREF 15.990,00 BRL 50,400 280.663,09 0,24 0,23
TIM PARTICIPACOES SA - 9.702,00 USD 18,600 138.823,91 0,12 0,12
TRACTEBEL ENERGIA SA - 13.400,00 BRL 34,670 161.794,94 0,14 0,14
ULTRAPAR PARTICIPACOES SA - 17.600,00 BRL 53,120 325.594,48 0,27 0,27
USIMINAS-USINAS SIDER. MINAS GERAIS PREF 32.000,00 BRL 7,430 82.802,81 0,07 0,07
VALE SA - 67.000,00 BRL 29,100 679.006,76 0,57 0,57
Cayman Islands
CHAODA MODERN AGRICULTURE HLDS - 636,00 HKD 1,100 69,39
HENGAN INT GROUP COMPANY LTD - 2.500,00 HKD 84,500 20.952,98 0,02 0,02
SHIMAO PROPERTY HOLDINGS LTD - 102.052,00 HKD 15,400 155.880,30 0,13 0,13
SOHO CHINA LTD - 165.500,00 HKD 6,170 101.281,97 0,09 0,08
TENCENT HOLDINGS - 30.380,00 HKD 304,200 916.634,03 0,77 0,77
XINAO GAS HOLDINGS LTD - 58.000,00 HKD 41,350 237.877,03 0,20 0,20
Chile
BANCO SANTANDER CHILE ADR 19.317,00 USD 24,450 363.336,14 0,31 0,30
COMP. CERVEC. UNIDAS ADS 13.668,00 USD 28,610 300.824,28 0,25 0,25
ENDESA CHILE ADR 13.543,00 USD 44,170 460.184,87 0,39 0,38
ENERSIS SA SP ADR 33.236,00 USD 16,360 418.294,45 0,35 0,35
LATAM AIRLINES GROUP SA -ADR 23.848,00 USD 16,890 309.864,39 0,26 0,26
SOC QUIMICA MINERA CHILE SA ADR "B" 9.869,00 USD 40,400 306.721,75 0,26 0,26
China
AGILE PROPERTY HOLDINGS LTD - 270.000,00 HKD 8,320 222.810,72 0,19 0,19
AGRICULTURAL BANK OF CHINA - 755.000,00 HKD 3,200 239.632,62 0,20 0,20
AIR CHINA LTD - 242.000,00 HKD 5,580 133.936,38 0,11 0,11
ANHUI CONCH CEMENT CO LTD - 68.000,00 HKD 21,000 141.637,16 0,12 0,12
AVICHINA IND&TECH CO LTD - 240.000,00 HKD 4,010 95.456,30 0,08 0,08
BANK OF CHINA LTD - H - 2.568.000,00 HKD 3,190 812.521,20 0,68 0,68
CHINA BLUECHEMICAL LTD - 446.000,00 HKD 4,740 209.682,51 0,18 0,18
CHINA CITIC BANK CHINA CITIC BANK 1.178.800,00 HKD 3,580 418.573,91 0,35 0,35
CHINA COAL ENERGY CO - 329.400,00 HKD 4,060 132.647,37 0,11 0,11
CHINA COMMUNICATIONS CONST-H - 784.253,00 HKD 6,070 472.165,10 0,40 0,39
CHINA COMMUNICATIONS SERVICES - 200.000,00 HKD 4,900 97.201,97 0,08 0,08
CHINA CONSTRUCTION BANK - 3.175.042,00 HKD 5,490 1.728.903,76 1,46 1,44
CHINA GAS HOLDINGS LTD - 16.000,00 HKD 7,930 12.584,68 0,01 0,01
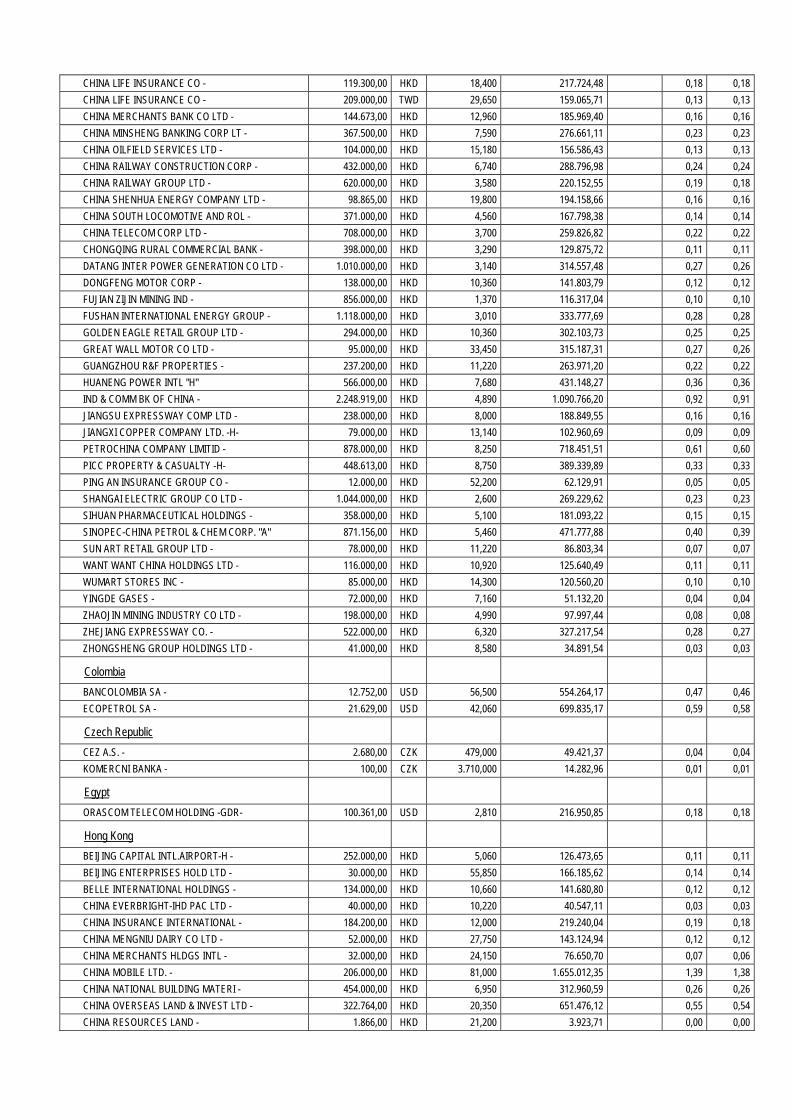
CHINA LIFE INSURANCE CO - 119.300,00 HKD 18,400 217.724,48 0,18 0,18
CHINA LIFE INSURANCE CO - 209.000,00 TWD 29,650 159.065,71 0,13 0,13
CHINA MERCHANTS BANK CO LTD - 144.673,00 HKD 12,960 185.969,40 0,16 0,16
CHINA MINSHENG BANKING CORP LT - 367.500,00 HKD 7,590 276.661,11 0,23 0,23
CHINA OILFIELD SERVICES LTD - 104.000,00 HKD 15,180 156.586,43 0,13 0,13
CHINA RAILWAY CONSTRUCTION CORP - 432.000,00 HKD 6,740 288.796,98 0,24 0,24
CHINA RAILWAY GROUP LTD - 620.000,00 HKD 3,580 220.152,55 0,19 0,18
CHINA SHENHUA ENERGY COMPANY LTD - 98.865,00 HKD 19,800 194.158,66 0,16 0,16
CHINA SOUTH LOCOMOTIVE AND ROL - 371.000,00 HKD 4,560 167.798,38 0,14 0,14
CHINA TELECOM CORP LTD - 708.000,00 HKD 3,700 259.826,82 0,22 0,22
CHONGQING RURAL COMMERCIAL BANK - 398.000,00 HKD 3,290 129.875,72 0,11 0,11
DATANG INTER POWER GENERATION CO LTD - 1.010.000,00 HKD 3,140 314.557,48 0,27 0,26
DONGFENG MOTOR CORP - 138.000,00 HKD 10,360 141.803,79 0,12 0,12
FUJIAN ZIJIN MINING IND - 856.000,00 HKD 1,370 116.317,04 0,10 0,10
FUSHAN INTERNATIONAL ENERGY GROUP - 1.118.000,00 HKD 3,010 333.777,69 0,28 0,28
GOLDEN EAGLE RETAIL GROUP LTD - 294.000,00 HKD 10,360 302.103,73 0,25 0,25
GREAT WALL MOTOR CO LTD - 95.000,00 HKD 33,450 315.187,31 0,27 0,26
GUANGZHOU R&F PROPERTIES - 237.200,00 HKD 11,220 263.971,20 0,22 0,22
HUANENG POWER INTL "H" 566.000,00 HKD 7,680 431.148,27 0,36 0,36
IND & COMM BK OF CHINA - 2.248.919,00 HKD 4,890 1.090.766,20 0,92 0,91
JIANGSU EXPRESSWAY COMP LTD - 238.000,00 HKD 8,000 188.849,55 0,16 0,16
JIANGXI COPPER COMPANY LTD. -H- 79.000,00 HKD 13,140 102.960,69 0,09 0,09
PETROCHINA COMPANY LIMITID - 878.000,00 HKD 8,250 718.451,51 0,61 0,60
PICC PROPERTY & CASUALTY -H- 448.613,00 HKD 8,750 389.339,89 0,33 0,33
PING AN INSURANCE GROUP CO - 12.000,00 HKD 52,200 62.129,91 0,05 0,05
SHANGAI ELECTRIC GROUP CO LTD - 1.044.000,00 HKD 2,600 269.229,62 0,23 0,23
SIHUAN PHARMACEUTICAL HOLDINGS - 358.000,00 HKD 5,100 181.093,22 0,15 0,15
SINOPEC-CHINA PETROL & CHEM CORP. "A" 871.156,00 HKD 5,460 471.777,88 0,40 0,39
SUN ART RETAIL GROUP LTD - 78.000,00 HKD 11,220 86.803,34 0,07 0,07
WANT WANT CHINA HOLDINGS LTD - 116.000,00 HKD 10,920 125.640,49 0,11 0,11
WUMART STORES INC - 85.000,00 HKD 14,300 120.560,20 0,10 0,10
YINGDE GASES - 72.000,00 HKD 7,160 51.132,20 0,04 0,04
ZHAOJIN MINING INDUSTRY CO LTD - 198.000,00 HKD 4,990 97.997,44 0,08 0,08
ZHEJIANG EXPRESSWAY CO. - 522.000,00 HKD 6,320 327.217,54 0,28 0,27
ZHONGSHENG GROUP HOLDINGS LTD - 41.000,00 HKD 8,580 34.891,54 0,03 0,03
Colombia
BANCOLOMBIA SA - 12.752,00 USD 56,500 554.264,17 0,47 0,46
ECOPETROL SA - 21.629,00 USD 42,060 699.835,17 0,59 0,58
Czech Republic
CEZ A.S. - 2.680,00 CZK 479,000 49.421,37 0,04 0,04
KOMERCNI BANKA - 100,00 CZK 3.710,000 14.282,96 0,01 0,01
Egypt
ORASCOM TELECOM HOLDING -GDR- 100.361,00 USD 2,810 216.950,85 0,18 0,18
Hong Kong
BEIJING CAPITAL INTL.AIRPORT-H - 252.000,00 HKD 5,060 126.473,65 0,11 0,11
BEIJING ENTERPRISES HOLD LTD - 30.000,00 HKD 55,850 166.185,62 0,14 0,14
BELLE INTERNATIONAL HOLDINGS - 134.000,00 HKD 10,660 141.680,80 0,12 0,12
CHINA EVERBRIGHT-IHD PAC LTD - 40.000,00 HKD 10,220 40.547,11 0,03 0,03
CHINA INSURANCE INTERNATIONAL - 184.200,00 HKD 12,000 219.240,04 0,19 0,18
CHINA MENGNIU DAIRY CO LTD - 52.000,00 HKD 27,750 143.124,94 0,12 0,12
CHINA MERCHANTS HLDGS INTL - 32.000,00 HKD 24,150 76.650,70 0,07 0,06
CHINA MOBILE LTD. - 206.000,00 HKD 81,000 1.655.012,35 1,39 1,38
CHINA NATIONAL BUILDING MATERI - 454.000,00 HKD 6,950 312.960,59 0,26 0,26
CHINA OVERSEAS LAND & INVEST LTD - 322.764,00 HKD 20,350 651.476,12 0,55 0,54
CHINA RESOURCES LAND - 1.866,00 HKD 21,200 3.923,71 0,00 0,00
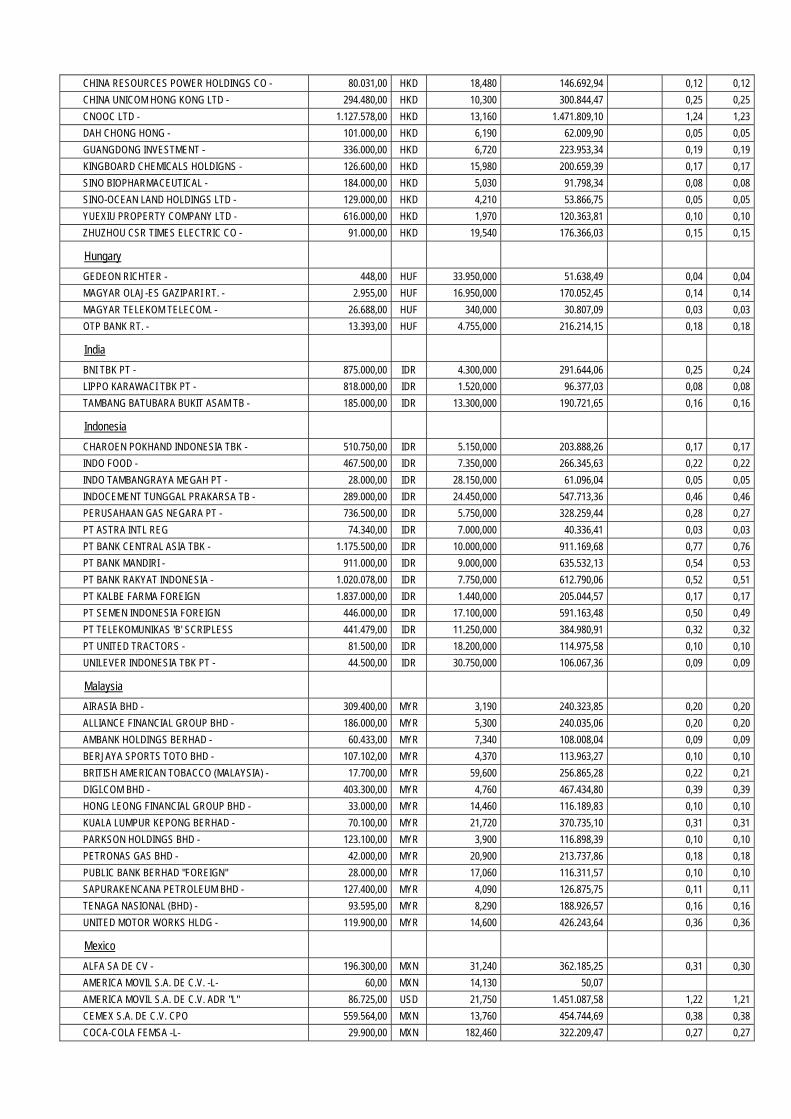
CHINA RESOURCES POWER HOLDINGS CO - 80.031,00 HKD 18,480 146.692,94 0,12 0,12
CHINA UNICOM HONG KONG LTD - 294.480,00 HKD 10,300 300.844,47 0,25 0,25
CNOOC LTD - 1.127.578,00 HKD 13,160 1.471.809,10 1,24 1,23
DAH CHONG HONG - 101.000,00 HKD 6,190 62.009,90 0,05 0,05
GUANGDONG INVESTMENT - 336.000,00 HKD 6,720 223.953,34 0,19 0,19
KINGBOARD CHEMICALS HOLDIGNS - 126.600,00 HKD 15,980 200.659,39 0,17 0,17
SINO BIOPHARMACEUTICAL - 184.000,00 HKD 5,030 91.798,34 0,08 0,08
SINO-OCEAN LAND HOLDINGS LTD - 129.000,00 HKD 4,210 53.866,75 0,05 0,05
YUEXIU PROPERTY COMPANY LTD - 616.000,00 HKD 1,970 120.363,81 0,10 0,10
ZHUZHOU CSR TIMES ELECTRIC CO - 91.000,00 HKD 19,540 176.366,03 0,15 0,15
Hungary
GEDEON RICHTER - 448,00 HUF 33.950,000 51.638,49 0,04 0,04
MAGYAR OLAJ-ES GAZIPARI RT. - 2.955,00 HUF 16.950,000 170.052,45 0,14 0,14
MAGYAR TELEKOM TELECOM. - 26.688,00 HUF 340,000 30.807,09 0,03 0,03
OTP BANK RT. - 13.393,00 HUF 4.755,000 216.214,15 0,18 0,18
India
BNI TBK PT - 875.000,00 IDR 4.300,000 291.644,06 0,25 0,24
LIPPO KARAWACI TBK PT - 818.000,00 IDR 1.520,000 96.377,03 0,08 0,08
TAMBANG BATUBARA BUKIT ASAM TB - 185.000,00 IDR 13.300,000 190.721,65 0,16 0,16
Indonesia
CHAROEN POKHAND INDONESIA TBK - 510.750,00 IDR 5.150,000 203.888,26 0,17 0,17
INDO FOOD - 467.500,00 IDR 7.350,000 266.345,63 0,22 0,22
INDO TAMBANGRAYA MEGAH PT - 28.000,00 IDR 28.150,000 61.096,04 0,05 0,05
INDOCEMENT TUNGGAL PRAKARSA TB - 289.000,00 IDR 24.450,000 547.713,36 0,46 0,46
PERUSAHAAN GAS NEGARA PT - 736.500,00 IDR 5.750,000 328.259,44 0,28 0,27
PT ASTRA INTL REG 74.340,00 IDR 7.000,000 40.336,41 0,03 0,03
PT BANK CENTRAL ASIA TBK - 1.175.500,00 IDR 10.000,000 911.169,68 0,77 0,76
PT BANK MANDIRI - 911.000,00 IDR 9.000,000 635.532,13 0,54 0,53
PT BANK RAKYAT INDONESIA - 1.020.078,00 IDR 7.750,000 612.790,06 0,52 0,51
PT KALBE FARMA FOREIGN 1.837.000,00 IDR 1.440,000 205.044,57 0,17 0,17
PT SEMEN INDONESIA FOREIGN 446.000,00 IDR 17.100,000 591.163,48 0,50 0,49
PT TELEKOMUNIKAS 'B' SCRIPLESS 441.479,00 IDR 11.250,000 384.980,91 0,32 0,32
PT UNITED TRACTORS - 81.500,00 IDR 18.200,000 114.975,58 0,10 0,10
UNILEVER INDONESIA TBK PT - 44.500,00 IDR 30.750,000 106.067,36 0,09 0,09
Malaysia
AIRASIA BHD - 309.400,00 MYR 3,190 240.323,85 0,20 0,20
ALLIANCE FINANCIAL GROUP BHD - 186.000,00 MYR 5,300 240.035,06 0,20 0,20
AMBANK HOLDINGS BERHAD - 60.433,00 MYR 7,340 108.008,04 0,09 0,09
BERJAYA SPORTS TOTO BHD - 107.102,00 MYR 4,370 113.963,27 0,10 0,10
BRITISH AMERICAN TOBACCO (MALAYSIA) - 17.700,00 MYR 59,600 256.865,28 0,22 0,21
DIGI.COM BHD - 403.300,00 MYR 4,760 467.434,80 0,39 0,39
HONG LEONG FINANCIAL GROUP BHD - 33.000,00 MYR 14,460 116.189,83 0,10 0,10
KUALA LUMPUR KEPONG BERHAD - 70.100,00 MYR 21,720 370.735,10 0,31 0,31
PARKSON HOLDINGS BHD - 123.100,00 MYR 3,900 116.898,39 0,10 0,10
PETRONAS GAS BHD - 42.000,00 MYR 20,900 213.737,86 0,18 0,18
PUBLIC BANK BERHAD "FOREIGN" 28.000,00 MYR 17,060 116.311,57 0,10 0,10
SAPURAKENCANA PETROLEUM BHD - 127.400,00 MYR 4,090 126.875,75 0,11 0,11
TENAGA NASIONAL (BHD) - 93.595,00 MYR 8,290 188.926,57 0,16 0,16
UNITED MOTOR WORKS HLDG - 119.900,00 MYR 14,600 426.243,64 0,36 0,36
Mexico
ALFA SA DE CV - 196.300,00 MXN 31,240 362.185,25 0,31 0,30
AMERICA MOVIL S.A. DE C.V. -L- 60,00 MXN 14,130 50,07
AMERICA MOVIL S.A. DE C.V. ADR "L" 86.725,00 USD 21,750 1.451.087,58 1,22 1,21
CEMEX S.A. DE C.V. CPO 559.564,00 MXN 13,760 454.744,69 0,38 0,38
COCA-COLA FEMSA -L- 29.900,00 MXN 182,460 322.209,47 0,27 0,27
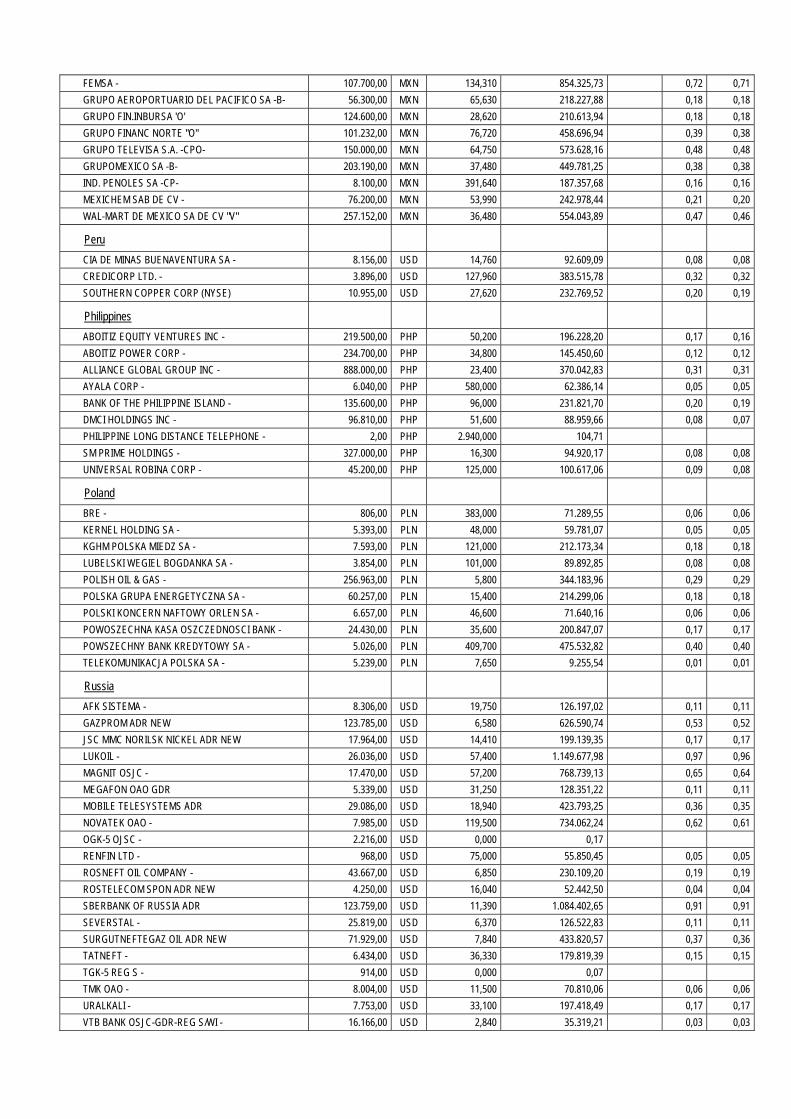
FEMSA - 107.700,00 MXN 134,310 854.325,73 0,72 0,71
GRUPO AEROPORTUARIO DEL PACIFICO SA -B- 56.300,00 MXN 65,630 218.227,88 0,18 0,18
GRUPO FIN.INBURSA 'O' 124.600,00 MXN 28,620 210.613,94 0,18 0,18
GRUPO FINANC NORTE "O" 101.232,00 MXN 76,720 458.696,94 0,39 0,38
GRUPO TELEVISA S.A. -CPO- 150.000,00 MXN 64,750 573.628,16 0,48 0,48
GRUPOMEXICO SA -B- 203.190,00 MXN 37,480 449.781,25 0,38 0,38
IND. PENOLES SA -CP- 8.100,00 MXN 391,640 187.357,68 0,16 0,16
MEXICHEM SAB DE CV - 76.200,00 MXN 53,990 242.978,44 0,21 0,20
WAL-MART DE MEXICO SA DE CV "V" 257.152,00 MXN 36,480 554.043,89 0,47 0,46
Peru
CIA DE MINAS BUENAVENTURA SA - 8.156,00 USD 14,760 92.609,09 0,08 0,08
CREDICORP LTD. - 3.896,00 USD 127,960 383.515,78 0,32 0,32
SOUTHERN COPPER CORP (NYSE) 10.955,00 USD 27,620 232.769,52 0,20 0,19
Philippines
ABOITIZ EQUITY VENTURES INC - 219.500,00 PHP 50,200 196.228,20 0,17 0,16
ABOITIZ POWER CORP - 234.700,00 PHP 34,800 145.450,60 0,12 0,12
ALLIANCE GLOBAL GROUP INC - 888.000,00 PHP 23,400 370.042,83 0,31 0,31
AYALA CORP - 6.040,00 PHP 580,000 62.386,14 0,05 0,05
BANK OF THE PHILIPPINE ISLAND - 135.600,00 PHP 96,000 231.821,70 0,20 0,19
DMCI HOLDINGS INC - 96.810,00 PHP 51,600 88.959,66 0,08 0,07
PHILIPPINE LONG DISTANCE TELEPHONE - 2,00 PHP 2.940,000 104,71
SM PRIME HOLDINGS - 327.000,00 PHP 16,300 94.920,17 0,08 0,08
UNIVERSAL ROBINA CORP - 45.200,00 PHP 125,000 100.617,06 0,09 0,08
Poland
BRE - 806,00 PLN 383,000 71.289,55 0,06 0,06
KERNEL HOLDING SA - 5.393,00 PLN 48,000 59.781,07 0,05 0,05
KGHM POLSKA MIEDZ SA - 7.593,00 PLN 121,000 212.173,34 0,18 0,18
LUBELSKI WEGIEL BOGDANKA SA - 3.854,00 PLN 101,000 89.892,85 0,08 0,08
POLISH OIL & GAS - 256.963,00 PLN 5,800 344.183,96 0,29 0,29
POLSKA GRUPA ENERGETYCZNA SA - 60.257,00 PLN 15,400 214.299,06 0,18 0,18
POLSKI KONCERN NAFTOWY ORLEN SA - 6.657,00 PLN 46,600 71.640,16 0,06 0,06
POWOSZECHNA KASA OSZCZEDNOSCI BANK - 24.430,00 PLN 35,600 200.847,07 0,17 0,17
POWSZECHNY BANK KREDYTOWY SA - 5.026,00 PLN 409,700 475.532,82 0,40 0,40
TELEKOMUNIKACJA POLSKA SA - 5.239,00 PLN 7,650 9.255,54 0,01 0,01
Russia
AFK SISTEMA - 8.306,00 USD 19,750 126.197,02 0,11 0,11
GAZPROM ADR NEW 123.785,00 USD 6,580 626.590,74 0,53 0,52
JSC MMC NORILSK NICKEL ADR NEW 17.964,00 USD 14,410 199.139,35 0,17 0,17
LUKOIL - 26.036,00 USD 57,400 1.149.677,98 0,97 0,96
MAGNIT OSJC - 17.470,00 USD 57,200 768.739,13 0,65 0,64
MEGAFON OAO GDR 5.339,00 USD 31,250 128.351,22 0,11 0,11
MOBILE TELESYSTEMS ADR 29.086,00 USD 18,940 423.793,25 0,36 0,35
NOVATEK OAO - 7.985,00 USD 119,500 734.062,24 0,62 0,61
OGK-5 OJSC - 2.216,00 USD 0,000 0,17
RENFIN LTD - 968,00 USD 75,000 55.850,45 0,05 0,05
ROSNEFT OIL COMPANY - 43.667,00 USD 6,850 230.109,20 0,19 0,19
ROSTELECOM SPON ADR NEW 4.250,00 USD 16,040 52.442,50 0,04 0,04
SBERBANK OF RUSSIA ADR 123.759,00 USD 11,390 1.084.402,65 0,91 0,91
SEVERSTAL - 25.819,00 USD 6,370 126.522,83 0,11 0,11
SURGUTNEFTEGAZ OIL ADR NEW 71.929,00 USD 7,840 433.820,57 0,37 0,36
TATNEFT - 6.434,00 USD 36,330 179.819,39 0,15 0,15
TGK-5 REG S - 914,00 USD 0,000 0,07
TMK OAO - 8.004,00 USD 11,500 70.810,06 0,06 0,06
URALKALI - 7.753,00 USD 33,100 197.418,49 0,17 0,17
VTB BANK OSJC-GDR-REG S/WI - 16.166,00 USD 2,840 35.319,21 0,03 0,03
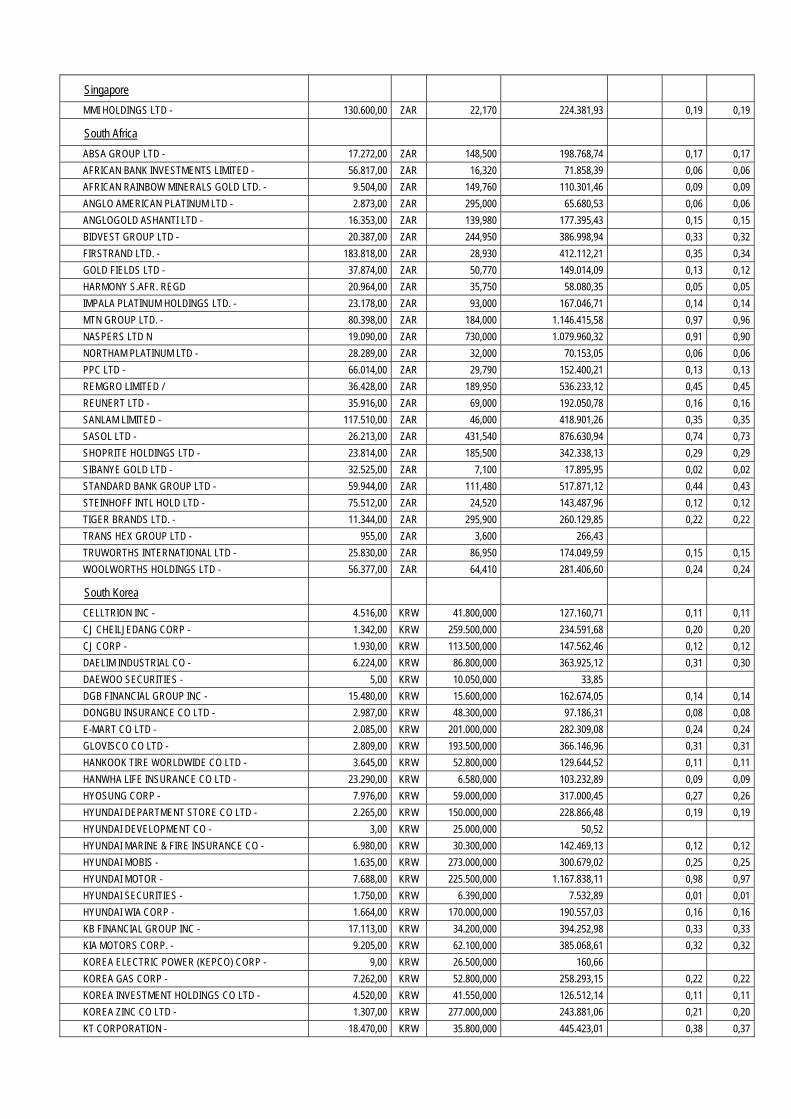
Singapore
MMI HOLDINGS LTD - 130.600,00 ZAR 22,170 224.381,93 0,19 0,19
South Africa
ABSA GROUP LTD - 17.272,00 ZAR 148,500 198.768,74 0,17 0,17
AFRICAN BANK INVESTMENTS LIMITED - 56.817,00 ZAR 16,320 71.858,39 0,06 0,06
AFRICAN RAINBOW MINERALS GOLD LTD. - 9.504,00 ZAR 149,760 110.301,46 0,09 0,09
ANGLO AMERICAN PLATINUM LTD - 2.873,00 ZAR 295,000 65.680,53 0,06 0,06
ANGLOGOLD ASHANTI LTD - 16.353,00 ZAR 139,980 177.395,43 0,15 0,15
BIDVEST GROUP LTD - 20.387,00 ZAR 244,950 386.998,94 0,33 0,32
FIRSTRAND LTD. - 183.818,00 ZAR 28,930 412.112,21 0,35 0,34
GOLD FIELDS LTD - 37.874,00 ZAR 50,770 149.014,09 0,13 0,12
HARMONY S.AFR. REGD 20.964,00 ZAR 35,750 58.080,35 0,05 0,05
IMPALA PLATINUM HOLDINGS LTD. - 23.178,00 ZAR 93,000 167.046,71 0,14 0,14
MTN GROUP LTD. - 80.398,00 ZAR 184,000 1.146.415,58 0,97 0,96
NASPERS LTD N 19.090,00 ZAR 730,000 1.079.960,32 0,91 0,90
NORTHAM PLATINUM LTD - 28.289,00 ZAR 32,000 70.153,05 0,06 0,06
PPC LTD - 66.014,00 ZAR 29,790 152.400,21 0,13 0,13
REMGRO LIMITED / 36.428,00 ZAR 189,950 536.233,12 0,45 0,45
REUNERT LTD - 35.916,00 ZAR 69,000 192.050,78 0,16 0,16
SANLAM LIMITED - 117.510,00 ZAR 46,000 418.901,26 0,35 0,35
SASOL LTD - 26.213,00 ZAR 431,540 876.630,94 0,74 0,73
SHOPRITE HOLDINGS LTD - 23.814,00 ZAR 185,500 342.338,13 0,29 0,29
SIBANYE GOLD LTD - 32.525,00 ZAR 7,100 17.895,95 0,02 0,02
STANDARD BANK GROUP LTD - 59.944,00 ZAR 111,480 517.871,12 0,44 0,43
STEINHOFF INTL HOLD LTD - 75.512,00 ZAR 24,520 143.487,96 0,12 0,12
TIGER BRANDS LTD. - 11.344,00 ZAR 295,900 260.129,85 0,22 0,22
TRANS HEX GROUP LTD - 955,00 ZAR 3,600 266,43
TRUWORTHS INTERNATIONAL LTD - 25.830,00 ZAR 86,950 174.049,59 0,15 0,15
WOOLWORTHS HOLDINGS LTD - 56.377,00 ZAR 64,410 281.406,60 0,24 0,24
South Korea
CELLTRION INC - 4.516,00 KRW 41.800,000 127.160,71 0,11 0,11
CJ CHEILJEDANG CORP - 1.342,00 KRW 259.500,000 234.591,68 0,20 0,20
CJ CORP - 1.930,00 KRW 113.500,000 147.562,46 0,12 0,12
DAELIM INDUSTRIAL CO - 6.224,00 KRW 86.800,000 363.925,12 0,31 0,30
DAEWOO SECURITIES - 5,00 KRW 10.050,000 33,85
DGB FINANCIAL GROUP INC - 15.480,00 KRW 15.600,000 162.674,05 0,14 0,14
DONGBU INSURANCE CO LTD - 2.987,00 KRW 48.300,000 97.186,31 0,08 0,08
E-MART CO LTD - 2.085,00 KRW 201.000,000 282.309,08 0,24 0,24
GLOVISCO CO LTD - 2.809,00 KRW 193.500,000 366.146,96 0,31 0,31
HANKOOK TIRE WORLDWIDE CO LTD - 3.645,00 KRW 52.800,000 129.644,52 0,11 0,11
HANWHA LIFE INSURANCE CO LTD - 23.290,00 KRW 6.580,000 103.232,89 0,09 0,09
HYOSUNG CORP - 7.976,00 KRW 59.000,000 317.000,45 0,27 0,26
HYUNDAI DEPARTMENT STORE CO LTD - 2.265,00 KRW 150.000,000 228.866,48 0,19 0,19
HYUNDAI DEVELOPMENT CO - 3,00 KRW 25.000,000 50,52
HYUNDAI MARINE & FIRE INSURANCE CO - 6.980,00 KRW 30.300,000 142.469,13 0,12 0,12
HYUNDAI MOBIS - 1.635,00 KRW 273.000,000 300.679,02 0,25 0,25
HYUNDAI MOTOR - 7.688,00 KRW 225.500,000 1.167.838,11 0,98 0,97
HYUNDAI SECURITIES - 1.750,00 KRW 6.390,000 7.532,89 0,01 0,01
HYUNDAI WIA CORP - 1.664,00 KRW 170.000,000 190.557,03 0,16 0,16
KB FINANCIAL GROUP INC - 17.113,00 KRW 34.200,000 394.252,98 0,33 0,33
KIA MOTORS CORP. - 9.205,00 KRW 62.100,000 385.068,61 0,32 0,32
KOREA ELECTRIC POWER (KEPCO) CORP - 9,00 KRW 26.500,000 160,66
KOREA GAS CORP - 7.262,00 KRW 52.800,000 258.293,15 0,22 0,22
KOREA INVESTMENT HOLDINGS CO LTD - 4.520,00 KRW 41.550,000 126.512,14 0,11 0,11
KOREA ZINC CO LTD - 1.307,00 KRW 277.000,000 243.881,06 0,21 0,20
KT CORPORATION - 18.470,00 KRW 35.800,000 445.423,01 0,38 0,37
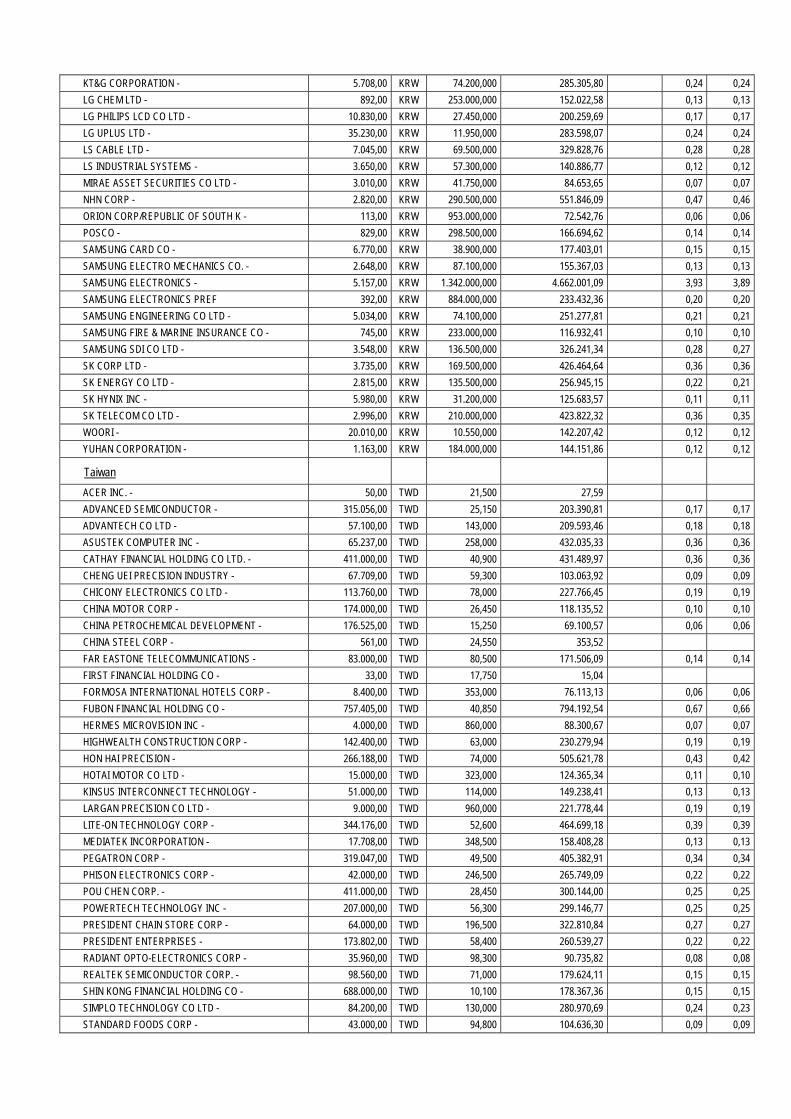
KT&G CORPORATION - 5.708,00 KRW 74.200,000 285.305,80 0,24 0,24
LG CHEM LTD - 892,00 KRW 253.000,000 152.022,58 0,13 0,13
LG PHILIPS LCD CO LTD - 10.830,00 KRW 27.450,000 200.259,69 0,17 0,17
LG UPLUS LTD - 35.230,00 KRW 11.950,000 283.598,07 0,24 0,24
LS CABLE LTD - 7.045,00 KRW 69.500,000 329.828,76 0,28 0,28
LS INDUSTRIAL SYSTEMS - 3.650,00 KRW 57.300,000 140.886,77 0,12 0,12
MIRAE ASSET SECURITIES CO LTD - 3.010,00 KRW 41.750,000 84.653,65 0,07 0,07
NHN CORP - 2.820,00 KRW 290.500,000 551.846,09 0,47 0,46
ORION CORP/REPUBLIC OF SOUTH K - 113,00 KRW 953.000,000 72.542,76 0,06 0,06
POSCO - 829,00 KRW 298.500,000 166.694,62 0,14 0,14
SAMSUNG CARD CO - 6.770,00 KRW 38.900,000 177.403,01 0,15 0,15
SAMSUNG ELECTRO MECHANICS CO. - 2.648,00 KRW 87.100,000 155.367,03 0,13 0,13
SAMSUNG ELECTRONICS - 5.157,00 KRW 1.342.000,000 4.662.001,09 3,93 3,89
SAMSUNG ELECTRONICS PREF 392,00 KRW 884.000,000 233.432,36 0,20 0,20
SAMSUNG ENGINEERING CO LTD - 5.034,00 KRW 74.100,000 251.277,81 0,21 0,21
SAMSUNG FIRE & MARINE INSURANCE CO - 745,00 KRW 233.000,000 116.932,41 0,10 0,10
SAMSUNG SDI CO LTD - 3.548,00 KRW 136.500,000 326.241,34 0,28 0,27
SK CORP LTD - 3.735,00 KRW 169.500,000 426.464,64 0,36 0,36
SK ENERGY CO LTD - 2.815,00 KRW 135.500,000 256.945,15 0,22 0,21
SK HYNIX INC - 5.980,00 KRW 31.200,000 125.683,57 0,11 0,11
SK TELECOM CO LTD - 2.996,00 KRW 210.000,000 423.822,32 0,36 0,35
WOORI - 20.010,00 KRW 10.550,000 142.207,42 0,12 0,12
YUHAN CORPORATION - 1.163,00 KRW 184.000,000 144.151,86 0,12 0,12
Taiwan
ACER INC. - 50,00 TWD 21,500 27,59
ADVANCED SEMICONDUCTOR - 315.056,00 TWD 25,150 203.390,81 0,17 0,17
ADVANTECH CO LTD - 57.100,00 TWD 143,000 209.593,46 0,18 0,18
ASUSTEK COMPUTER INC - 65.237,00 TWD 258,000 432.035,33 0,36 0,36
CATHAY FINANCIAL HOLDING CO LTD. - 411.000,00 TWD 40,900 431.489,97 0,36 0,36
CHENG UEI PRECISION INDUSTRY - 67.709,00 TWD 59,300 103.063,92 0,09 0,09
CHICONY ELECTRONICS CO LTD - 113.760,00 TWD 78,000 227.766,45 0,19 0,19
CHINA MOTOR CORP - 174.000,00 TWD 26,450 118.135,52 0,10 0,10
CHINA PETROCHEMICAL DEVELOPMENT - 176.525,00 TWD 15,250 69.100,57 0,06 0,06
CHINA STEEL CORP - 561,00 TWD 24,550 353,52
FAR EASTONE TELECOMMUNICATIONS - 83.000,00 TWD 80,500 171.506,09 0,14 0,14
FIRST FINANCIAL HOLDING CO - 33,00 TWD 17,750 15,04
FORMOSA INTERNATIONAL HOTELS CORP - 8.400,00 TWD 353,000 76.113,13 0,06 0,06
FUBON FINANCIAL HOLDING CO - 757.405,00 TWD 40,850 794.192,54 0,67 0,66
HERMES MICROVISION INC - 4.000,00 TWD 860,000 88.300,67 0,07 0,07
HIGHWEALTH CONSTRUCTION CORP - 142.400,00 TWD 63,000 230.279,94 0,19 0,19
HON HAI PRECISION - 266.188,00 TWD 74,000 505.621,78 0,43 0,42
HOTAI MOTOR CO LTD - 15.000,00 TWD 323,000 124.365,34 0,11 0,10
KINSUS INTERCONNECT TECHNOLOGY - 51.000,00 TWD 114,000 149.238,41 0,13 0,13
LARGAN PRECISION CO LTD - 9.000,00 TWD 960,000 221.778,44 0,19 0,19
LITE-ON TECHNOLOGY CORP - 344.176,00 TWD 52,600 464.699,18 0,39 0,39
MEDIATEK INCORPORATION - 17.708,00 TWD 348,500 158.408,28 0,13 0,13
PEGATRON CORP - 319.047,00 TWD 49,500 405.382,91 0,34 0,34
PHISON ELECTRONICS CORP - 42.000,00 TWD 246,500 265.749,09 0,22 0,22
POU CHEN CORP. - 411.000,00 TWD 28,450 300.144,00 0,25 0,25
POWERTECH TECHNOLOGY INC - 207.000,00 TWD 56,300 299.146,77 0,25 0,25
PRESIDENT CHAIN STORE CORP - 64.000,00 TWD 196,500 322.810,84 0,27 0,27
PRESIDENT ENTERPRISES - 173.802,00 TWD 58,400 260.539,27 0,22 0,22
RADIANT OPTO-ELECTRONICS CORP - 35.960,00 TWD 98,300 90.735,82 0,08 0,08
REALTEK SEMICONDUCTOR CORP. - 98.560,00 TWD 71,000 179.624,11 0,15 0,15
SHIN KONG FINANCIAL HOLDING CO - 688.000,00 TWD 10,100 178.367,36 0,15 0,15
SIMPLO TECHNOLOGY CO LTD - 84.200,00 TWD 130,000 280.970,69 0,24 0,23
STANDARD FOODS CORP - 43.000,00 TWD 94,800 104.636,30 0,09 0,09
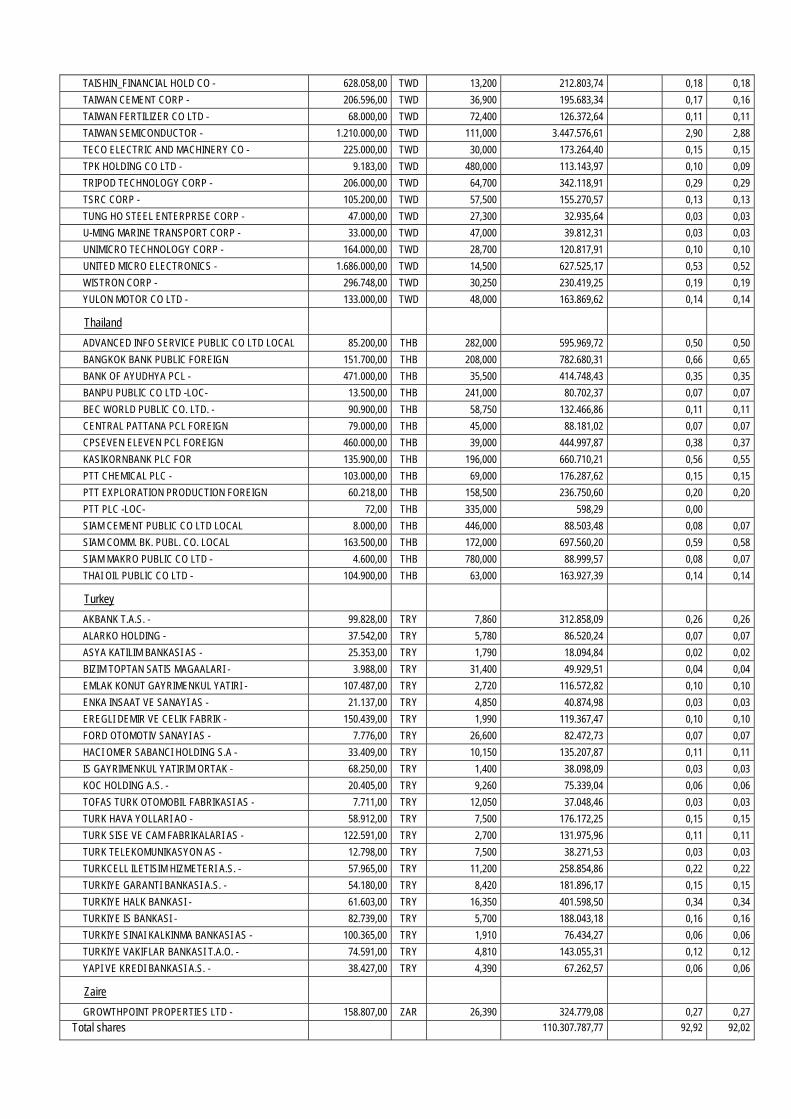
TAISHIN_FINANCIAL HOLD CO - 628.058,00 TWD 13,200 212.803,74 0,18 0,18
TAIWAN CEMENT CORP - 206.596,00 TWD 36,900 195.683,34 0,17 0,16
TAIWAN FERTILIZER CO LTD - 68.000,00 TWD 72,400 126.372,64 0,11 0,11
TAIWAN SEMICONDUCTOR - 1.210.000,00 TWD 111,000 3.447.576,61 2,90 2,88
TECO ELECTRIC AND MACHINERY CO - 225.000,00 TWD 30,000 173.264,40 0,15 0,15
TPK HOLDING CO LTD - 9.183,00 TWD 480,000 113.143,97 0,10 0,09
TRIPOD TECHNOLOGY CORP - 206.000,00 TWD 64,700 342.118,91 0,29 0,29
TSRC CORP - 105.200,00 TWD 57,500 155.270,57 0,13 0,13
TUNG HO STEEL ENTERPRISE CORP - 47.000,00 TWD 27,300 32.935,64 0,03 0,03
U-MING MARINE TRANSPORT CORP - 33.000,00 TWD 47,000 39.812,31 0,03 0,03
UNIMICRO TECHNOLOGY CORP - 164.000,00 TWD 28,700 120.817,91 0,10 0,10
UNITED MICRO ELECTRONICS - 1.686.000,00 TWD 14,500 627.525,17 0,53 0,52
WISTRON CORP - 296.748,00 TWD 30,250 230.419,25 0,19 0,19
YULON MOTOR CO LTD - 133.000,00 TWD 48,000 163.869,62 0,14 0,14
Thailand
ADVANCED INFO SERVICE PUBLIC CO LTD LOCAL 85.200,00 THB 282,000 595.969,72 0,50 0,50
BANGKOK BANK PUBLIC FOREIGN 151.700,00 THB 208,000 782.680,31 0,66 0,65
BANK OF AYUDHYA PCL - 471.000,00 THB 35,500 414.748,43 0,35 0,35
BANPU PUBLIC CO LTD -LOC- 13.500,00 THB 241,000 80.702,37 0,07 0,07
BEC WORLD PUBLIC CO. LTD. - 90.900,00 THB 58,750 132.466,86 0,11 0,11
CENTRAL PATTANA PCL FOREIGN 79.000,00 THB 45,000 88.181,02 0,07 0,07
CPSEVEN ELEVEN PCL FOREIGN 460.000,00 THB 39,000 444.997,87 0,38 0,37
KASIKORNBANK PLC FOR 135.900,00 THB 196,000 660.710,21 0,56 0,55
PTT CHEMICAL PLC - 103.000,00 THB 69,000 176.287,62 0,15 0,15
PTT EXPLORATION PRODUCTION FOREIGN 60.218,00 THB 158,500 236.750,60 0,20 0,20
PTT PLC -LOC- 72,00 THB 335,000 598,29 0,00
SIAM CEMENT PUBLIC CO LTD LOCAL 8.000,00 THB 446,000 88.503,48 0,08 0,07
SIAM COMM. BK. PUBL. CO. LOCAL 163.500,00 THB 172,000 697.560,20 0,59 0,58
SIAM MAKRO PUBLIC CO LTD - 4.600,00 THB 780,000 88.999,57 0,08 0,07
THAI OIL PUBLIC CO LTD - 104.900,00 THB 63,000 163.927,39 0,14 0,14
Turkey
AKBANK T.A.S. - 99.828,00 TRY 7,860 312.858,09 0,26 0,26
ALARKO HOLDING - 37.542,00 TRY 5,780 86.520,24 0,07 0,07
ASYA KATILIM BANKASI AS - 25.353,00 TRY 1,790 18.094,84 0,02 0,02
BIZIM TOPTAN SATIS MAGAALARI - 3.988,00 TRY 31,400 49.929,51 0,04 0,04
EMLAK KONUT GAYRIMENKUL YATIRI - 107.487,00 TRY 2,720 116.572,82 0,10 0,10
ENKA INSAAT VE SANAYI AS - 21.137,00 TRY 4,850 40.874,98 0,03 0,03
EREGLI DEMIR VE CELIK FABRIK - 150.439,00 TRY 1,990 119.367,47 0,10 0,10
FORD OTOMOTIV SANAYI AS - 7.776,00 TRY 26,600 82.472,73 0,07 0,07
HACI OMER SABANCI HOLDING S.A - 33.409,00 TRY 10,150 135.207,87 0,11 0,11
IS GAYRIMENKUL YATIRIM ORTAK - 68.250,00 TRY 1,400 38.098,09 0,03 0,03
KOC HOLDING A.S. - 20.405,00 TRY 9,260 75.339,04 0,06 0,06
TOFAS TURK OTOMOBIL FABRIKASI AS - 7.711,00 TRY 12,050 37.048,46 0,03 0,03
TURK HAVA YOLLARI AO - 58.912,00 TRY 7,500 176.172,25 0,15 0,15
TURK SISE VE CAM FABRIKALARI AS - 122.591,00 TRY 2,700 131.975,96 0,11 0,11
TURK TELEKOMUNIKASYON AS - 12.798,00 TRY 7,500 38.271,53 0,03 0,03
TURKCELL ILETISIM HIZMETERI A.S. - 57.965,00 TRY 11,200 258.854,86 0,22 0,22
TURKIYE GARANTI BANKASI A.S. - 54.180,00 TRY 8,420 181.896,17 0,15 0,15
TURKIYE HALK BANKASI - 61.603,00 TRY 16,350 401.598,50 0,34 0,34
TURKIYE IS BANKASI - 82.739,00 TRY 5,700 188.043,18 0,16 0,16
TURKIYE SINAI KALKINMA BANKASI AS - 100.365,00 TRY 1,910 76.434,27 0,06 0,06
TURKIYE VAKIFLAR BANKASI T.A.O. - 74.591,00 TRY 4,810 143.055,31 0,12 0,12
YAPI VE KREDI BANKASI A.S. - 38.427,00 TRY 4,390 67.262,57 0,06 0,06
Zaire
GROWTHPOINT PROPERTIES LTD - 158.807,00 ZAR 26,390 324.779,08 0,27 0,27
Total shares 110.307.787,77 92,92 92,02
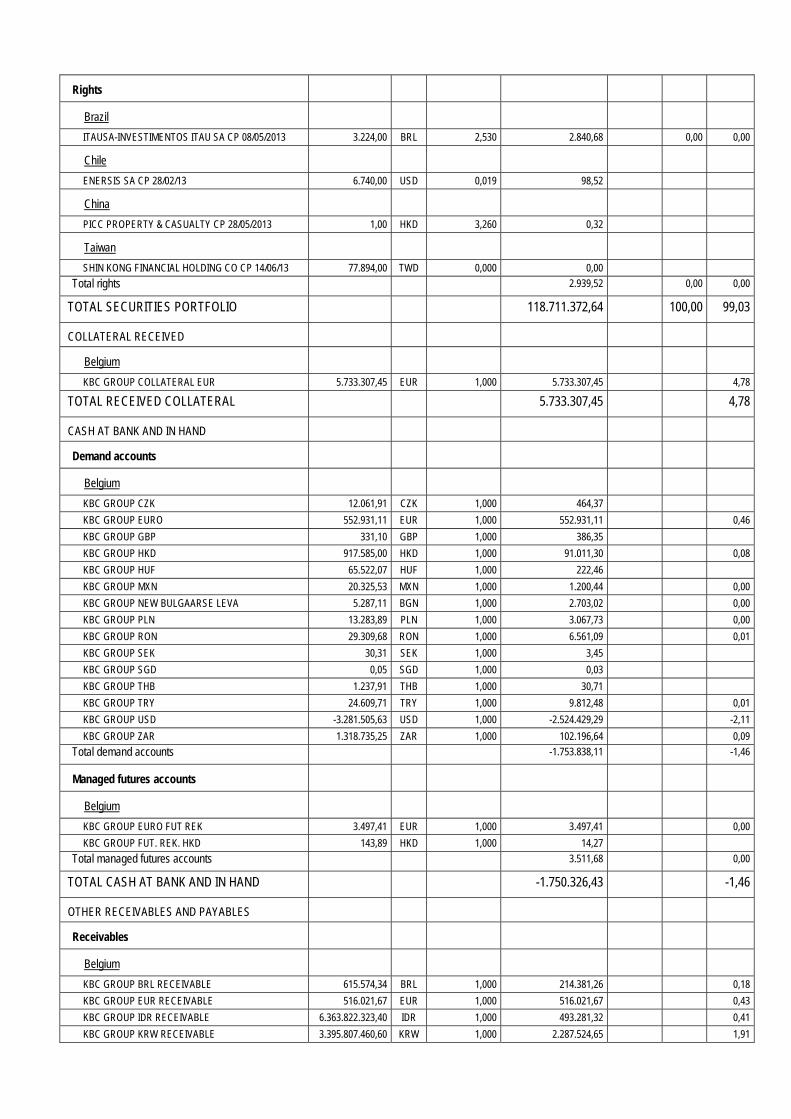
Rights
Brazil
ITAUSA-INVESTIMENTOS ITAU SA CP 08/05/2013 3.224,00 BRL 2,530 2.840,68 0,00 0,00
Chile
ENERSIS SA CP 28/02/13 6.740,00 USD 0,019 98,52
China
PICC PROPERTY & CASUALTY CP 28/05/2013 1,00 HKD 3,260 0,32
Taiwan
SHIN KONG FINANCIAL HOLDING CO CP 14/06/13 77.894,00 TWD 0,000 0,00
Total rights 2.939,52 0,00 0,00
TOTAL SECURITIES PORTFOLIO 118.711.372,64 100,00 99,03
COLLATERAL RECEIVED
Belgium
KBC GROUP COLLATERAL EUR 5.733.307,45 EUR 1,000 5.733.307,45 4,78
TOTAL RECEIVED COLLATERAL 5.733.307,45 4,78
CASH AT BANK AND IN HAND
Demand accounts
Belgium
KBC GROUP CZK 12.061,91 CZK 1,000 464,37
KBC GROUP EURO 552.931,11 EUR 1,000 552.931,11 0,46
KBC GROUP GBP 331,10 GBP 1,000 386,35
KBC GROUP HKD 917.585,00 HKD 1,000 91.011,30 0,08
KBC GROUP HUF 65.522,07 HUF 1,000 222,46
KBC GROUP MXN 20.325,53 MXN 1,000 1.200,44 0,00
KBC GROUP NEW BULGAARSE LEVA 5.287,11 BGN 1,000 2.703,02 0,00
KBC GROUP PLN 13.283,89 PLN 1,000 3.067,73 0,00
KBC GROUP RON 29.309,68 RON 1,000 6.561,09 0,01
KBC GROUP SEK 30,31 SEK 1,000 3,45
KBC GROUP SGD 0,05 SGD 1,000 0,03
KBC GROUP THB 1.237,91 THB 1,000 30,71
KBC GROUP TRY 24.609,71 TRY 1,000 9.812,48 0,01
KBC GROUP USD -3.281.505,63 USD 1,000 -2.524.429,29 -2,11
KBC GROUP ZAR 1.318.735,25 ZAR 1,000 102.196,64 0,09
Total demand accounts -1.753.838,11 -1,46
Managed futures accounts
Belgium
KBC GROUP EURO FUT REK 3.497,41 EUR 1,000 3.497,41 0,00
KBC GROUP FUT. REK. HKD 143,89 HKD 1,000 14,27
Total managed futures accounts 3.511,68 0,00
TOTAL CASH AT BANK AND IN HAND -1.750.326,43 -1,46
OTHER RECEIVABLES AND PAYABLES
Receivables
Belgium
KBC GROUP BRL RECEIVABLE 615.574,34 BRL 1,000 214.381,26 0,18
KBC GROUP EUR RECEIVABLE 516.021,67 EUR 1,000 516.021,67 0,43
KBC GROUP IDR RECEIVABLE 6.363.822.323,40 IDR 1,000 493.281,32 0,41
KBC GROUP KRW RECEIVABLE 3.395.807.460,60 KRW 1,000 2.287.524,65 1,91
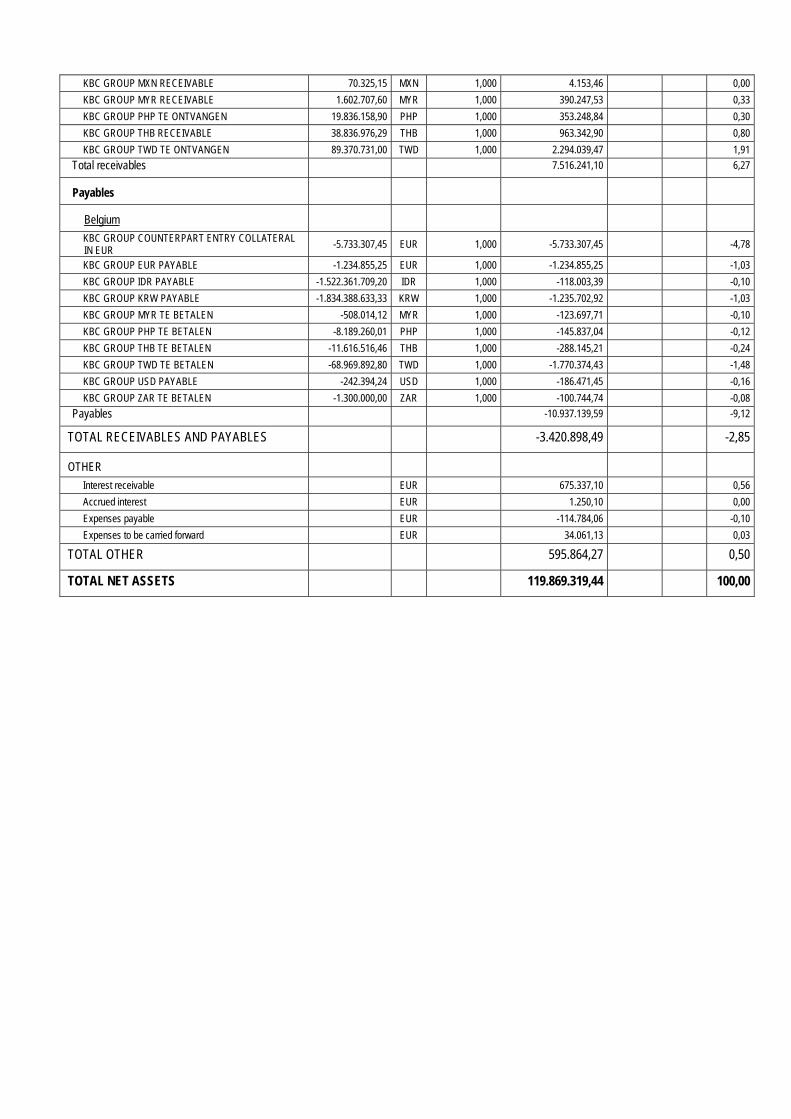
KBC GROUP MXN RECEIVABLE 70.325,15 MXN 1,000 4.153,46 0,00
KBC GROUP MYR RECEIVABLE 1.602.707,60 MYR 1,000 390.247,53 0,33
KBC GROUP PHP TE ONTVANGEN 19.836.158,90 PHP 1,000 353.248,84 0,30
KBC GROUP THB RECEIVABLE 38.836.976,29 THB 1,000 963.342,90 0,80
KBC GROUP TWD TE ONTVANGEN 89.370.731,00 TWD 1,000 2.294.039,47 1,91
Total receivables 7.516.241,10 6,27
Payables
Belgium
KBC GROUP COUNTERPART ENTRY COLLATERAL IN EUR
-5.733.307,45 EUR 1,000 -5.733.307,45 -4,78
KBC GROUP EUR PAYABLE -1.234.855,25 EUR 1,000 -1.234.855,25 -1,03
KBC GROUP IDR PAYABLE -1.522.361.709,20 IDR 1,000 -118.003,39 -0,10
KBC GROUP KRW PAYABLE -1.834.388.633,33 KRW 1,000 -1.235.702,92 -1,03
KBC GROUP MYR TE BETALEN -508.014,12 MYR 1,000 -123.697,71 -0,10
KBC GROUP PHP TE BETALEN -8.189.260,01 PHP 1,000 -145.837,04 -0,12
KBC GROUP THB TE BETALEN -11.616.516,46 THB 1,000 -288.145,21 -0,24
KBC GROUP TWD TE BETALEN -68.969.892,80 TWD 1,000 -1.770.374,43 -1,48
KBC GROUP USD PAYABLE -242.394,24 USD 1,000 -186.471,45 -0,16
KBC GROUP ZAR TE BETALEN -1.300.000,00 ZAR 1,000 -100.744,74 -0,08
Payables -10.937.139,59 -9,12
TOTAL RECEIVABLES AND PAYABLES -3.420.898,49 -2,85
OTHER
Interest receivable EUR 675.337,10 0,56
Accrued interest EUR 1.250,10 0,00
Expenses payable EUR -114.784,06 -0,10
Expenses to be carried forward EUR 34.061,13 0,03
TOTAL OTHER 595.864,27 0,50
TOTAL NET ASSETS 119.869.319,44 100,00
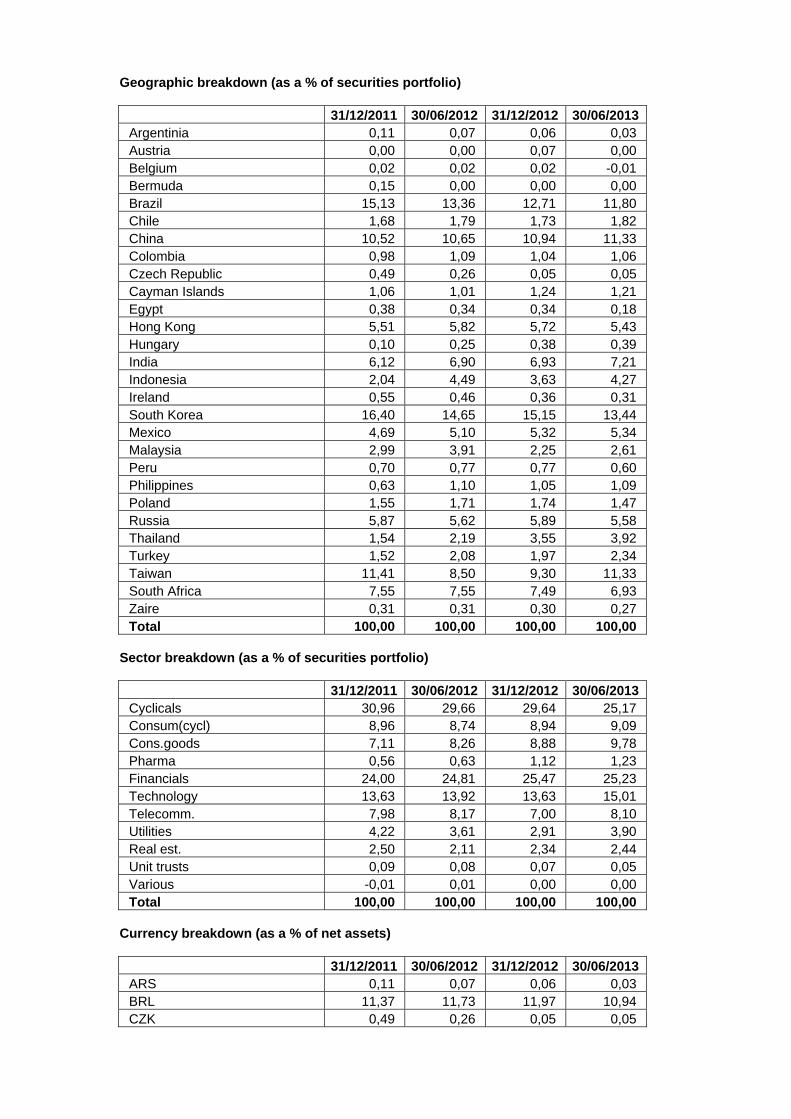
Geographic breakdown (as a % of securities portfolio)
31/12/2011 30/06/2012 31/12/2012 30/06/2013 Argentinia 0,11 0,07 0,06 0,03 Austria 0,00 0,00 0,07 0,00 Belgium 0,02 0,02 0,02 -0,01 Bermuda 0,15 0,00 0,00 0,00 Brazil 15,13 13,36 12,71 11,80 Chile 1,68 1,79 1,73 1,82 China 10,52 10,65 10,94 11,33 Colombia 0,98 1,09 1,04 1,06 Czech Republic 0,49 0,26 0,05 0,05 Cayman Islands 1,06 1,01 1,24 1,21 Egypt 0,38 0,34 0,34 0,18 Hong Kong 5,51 5,82 5,72 5,43 Hungary 0,10 0,25 0,38 0,39 India 6,12 6,90 6,93 7,21 Indonesia 2,04 4,49 3,63 4,27 Ireland 0,55 0,46 0,36 0,31 South Korea 16,40 14,65 15,15 13,44 Mexico 4,69 5,10 5,32 5,34 Malaysia 2,99 3,91 2,25 2,61 Peru 0,70 0,77 0,77 0,60 Philippines 0,63 1,10 1,05 1,09 Poland 1,55 1,71 1,74 1,47 Russia 5,87 5,62 5,89 5,58 Thailand 1,54 2,19 3,55 3,92 Turkey 1,52 2,08 1,97 2,34 Taiwan 11,41 8,50 9,30 11,33 South Africa 7,55 7,55 7,49 6,93 Zaire 0,31 0,31 0,30 0,27 Total 100,00 100,00 100,00 100,00
Sector breakdown (as a % of securities portfolio)
31/12/2011 30/06/2012 31/12/2012 30/06/2013 Cyclicals 30,96 29,66 29,64 25,17 Consum(cycl) 8,96 8,74 8,94 9,09 Cons.goods 7,11 8,26 8,88 9,78 Pharma 0,56 0,63 1,12 1,23 Financials 24,00 24,81 25,47 25,23 Technology 13,63 13,92 13,63 15,01 Telecomm. 7,98 8,17 7,00 8,10 Utilities 4,22 3,61 2,91 3,90 Real est. 2,50 2,11 2,34 2,44 Unit trusts 0,09 0,08 0,07 0,05 Various -0,01 0,01 0,00 0,00 Total 100,00 100,00 100,00 100,00
Currency breakdown (as a % of net assets)
31/12/2011 30/06/2012 31/12/2012 30/06/2013 ARS 0,11 0,07 0,06 0,03 BRL 11,37 11,73 11,97 10,94 CZK 0,49 0,26 0,05 0,05
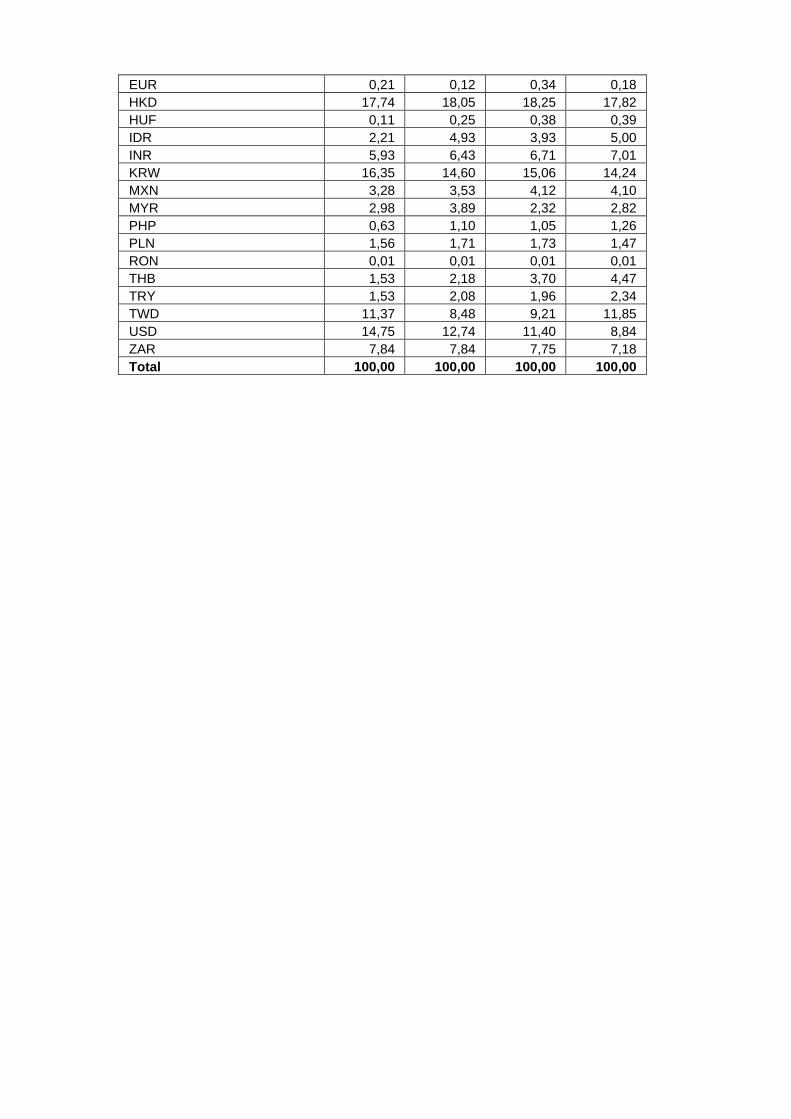
EUR 0,21 0,12 0,34 0,18 HKD 17,74 18,05 18,25 17,82 HUF 0,11 0,25 0,38 0,39 IDR 2,21 4,93 3,93 5,00 INR 5,93 6,43 6,71 7,01 KRW 16,35 14,60 15,06 14,24 MXN 3,28 3,53 4,12 4,10 MYR 2,98 3,89 2,32 2,82 PHP 0,63 1,10 1,05 1,26 PLN 1,56 1,71 1,73 1,47 RON 0,01 0,01 0,01 0,01 THB 1,53 2,18 3,70 4,47 TRY 1,53 2,08 1,96 2,34 TWD 11,37 8,48 9,21 11,85 USD 14,75 12,74 11,40 8,84 ZAR 7,84 7,84 7,75 7,18 Total 100,00 100,00 100,00 100,00

2.4.2 CHANGES IN THE COMPOSITION OF THE ASSETS OF KBC EQUITY FUND NEW MARKETS (IN
THE CURRENCY OF THE SUB-FUND)
1st half of year YearPurchases 117.986.042,46 117.986.042,46 Sales 60.896.309,40 60.896.309,40 Total 1 178.882.351,86 178.882.351,86 Subscriptions 108.408.038,85 108.408.038,85 Redemptions 56.796.521,89 56.796.521,89 Total 2 165.204.560,74 165.204.560,74 Monthly average of total assets
108.957.796,10 108.957.796,10
Turnover rate 12,55 % 12,55 %
1st half of year YearPurchases 117.986.042,46 117.986.042,46 Sales 60.896.309,40 60.896.309,40 Total 1 178.882.351,86 178.882.351,86 Subscriptions 108.408.038,85 108.408.038,85 Redemptions 56.796.521,89 56.796.521,89 Total 2 165.204.560,74 165.204.560,74 Monthly average of total assets
96.649.174,09 96.649.174,09
Corrected turnover rate 14,15 % 14,15 %
The table above shows the capital volume of portfolio transactions. This volume (adjusted to take account of total subscriptions and redemptions) is also compared to the average net assets at the beginning and end of the period. A figure close to 0% implies that the transactions relating to the securities or transactions relating to the assets (excluding deposits and cash) in a given period only involve subscriptions and redemptions. A negative percentage shows that subscriptions and redemptions entailed few, if any, transactions in the portfolio. Active asset management may result in high turnover rates (monthly percentage >50%). The detailed list of transactions is available for consultation free of charge at the registered office of the Bevek or fund at Havenlaan 2, 1080 Brussels.

2.4.3 AMOUNT OF COMMITMENTS IN RESPECT OF FINANCIAL DERIVATIVES POSITIONS
NAME Currency Value in currency
In the currency of the sub-fund
Lot-size
Transactiondate
KBC COLLATERAL EUR
EUR 5.733.307,45 5.733.307,45 N/A 28.06.2013
2.4.4 CHANGES OF THE NUMBER OF SUBSCRIPTIONS AND REDEMPTIONS AND THE NET ASSET
VALUE
Classic Shares
Period Change in number of shares in circulation
Year Subscriptions Redemptions End of period
Cap. Dis. Cap. Dis. Cap. Dis. Total
2011 - 06 19.271,75 7.074,45 21.037,40 3.243,00 46.044,06 18.575,84 64.619,90
2012 - 06 4.024,83 1.331,86 18.075,81 8.647,83 31.993,09 11.259,87 43.252,95
2013 - 06 6.227,88 1.966,38 5.664,16 2.413,34 32.556,81 10.812,91 43.369,72
Period Amounts received and paid by the UCI
(in the currency of the class)
Year Subscriptions Redemptions
Capitalization Distribution Capitalization Distribution
2011 - 06 28.900.244,02 8.063.987,44 30.849.981,53 3.623.041,63
2012 - 06 5.752.524,00 1.460.377,83 24.286.789,41 8.888.616,25
2013 - 06 9.407.290,35 2.277.075,35 8.400.238,94 2.669.684,54
Period Net asset value
End of period (in the currency of the class)
Year Of the class Of one share
Capitalization Distribution
2011 - 06 88.409.941,65 1.473,11 1.108,01
2012 - 06 57.135.160,20 1.413,48 1.058,07
2013 - 06 56.735.223,51 1.398,47 1.036,32
Institutional B Shares
Period Change in number of shares in circulation
Year Subscriptions Redemptions End of period
Cap. Dis. Cap. Dis. Cap. Dis. Total 2012 - 06 18.052,00 9.581,00 8.471,00 8.471,00
2013 - 06 79.880,00 43.204,00 45.147,00 45.147,00
Period Amounts received and paid by the UCI
(in the currency of the class)
Year Subscriptions Redemptions
Capitalization Distribution Capitalization Distribution
2012 - 06 25.178.994,07 13.721.445,15
2013 - 06 120.416.940,80 63.393.792,87
Period Net asset value
End of period (in the currency of the class)

Year Of the class Of one share
Capitalization Distribution
2012 - 06 11.974.850,44 1.413,63
2013 - 06 63.134.095,94 1.398,41

2.4.5 PERFORMANCE FIGURES
Classic Shares
Cap Div
ISIN code Cur-
rency
1 Year 3 Years* 5 Years* 10 Years* Since launch*
Share classes
Bench mark
Share classes
Bench mark
Share classes
Bench mark
Share classes
Bench mark
Launch Date
Share classes
CAP BE0126164640 EUR -1.06% 0.06% 1.41% 9.99% 17/04/1991 4.78%
DIV BE0152251584 EUR -1.07% 0.05% 1.40% 9.98% 17/04/1991 4.77%
Institutional B Shares
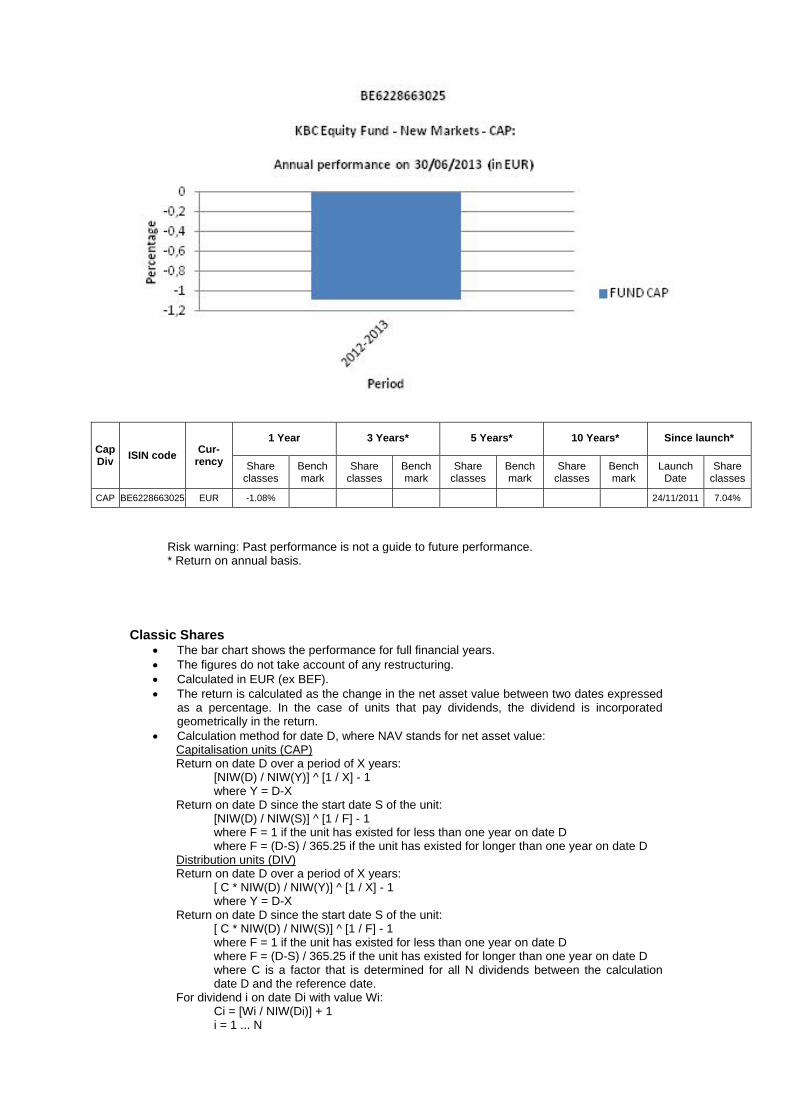
Cap Div
ISIN code Cur-
rency
1 Year 3 Years* 5 Years* 10 Years* Since launch*
Share classes
Bench mark
Share classes
Bench mark
Share classes
Bench mark
Share classes
Bench mark
Launch Date
Share classes
CAP BE6228663025 EUR -1.08% 24/11/2011 7.04%
Risk warning: Past performance is not a guide to future performance. * Return on annual basis.
Classic Shares The bar chart shows the performance for full financial years. The figures do not take account of any restructuring. Calculated in EUR (ex BEF). The return is calculated as the change in the net asset value between two dates expressed
as a percentage. In the case of units that pay dividends, the dividend is incorporated geometrically in the return.
Calculation method for date D, where NAV stands for net asset value: Capitalisation units (CAP) Return on date D over a period of X years:
[NIW(D) / NIW(Y)] ^ [1 / X] - 1 where Y = D-X
Return on date D since the start date S of the unit: [NIW(D) / NIW(S)] ^ [1 / F] - 1 where F = 1 if the unit has existed for less than one year on date D where F = (D-S) / 365.25 if the unit has existed for longer than one year on date D
Distribution units (DIV) Return on date D over a period of X years:
[ C * NIW(D) / NIW(Y)] ^ [1 / X] - 1 where Y = D-X
Return on date D since the start date S of the unit: [ C * NIW(D) / NIW(S)] ^ [1 / F] - 1 where F = 1 if the unit has existed for less than one year on date D where F = (D-S) / 365.25 if the unit has existed for longer than one year on date D where C is a factor that is determined for all N dividends between the calculation date D and the reference date.
For dividend i on date Di with value Wi: Ci = [Wi / NIW(Di)] + 1 i = 1 ... N

from whichC = C0 * .... * CN. If the interval between the two dates exceeds one year, the ordinary return calculation is
converted into a return on an annual basis by taking the nth square root of 1 plus the total return of the unit.
The return figures shown above do not take account of the fees and charges associated with the issue and redemption of units.
These are the performance figures for capitalisation and distribution shares.
Institutional B Shares The bar chart shows the performance for full financial years. The figures do not take account of any restructuring. Calculated in EUR. The return is calculated as the change in the net asset value between two dates expressed
as a percentage. Calculation method for date D, where NAV stands for net asset value:
Capitalisation units (CAP) Return on date D over a period of X years:
[NIW(D) / NIW(Y)] ^ [1 / X] - 1 where Y = D-X
Return on date D since the start date S of the unit: [NIW(D) / NIW(S)] ^ [1 / F] - 1 where F = 1 if the unit has existed for less than one year on date D where F = (D-S) / 365.25 if the unit has existed for longer than one year on date D
If the interval between the two dates exceeds one year, the ordinary return calculation is converted into a return on an annual basis by taking the nth square root of 1 plus the total return of the unit.
The return figures shown above do not take account of the fees and charges associated with the issue and redemption of units.
These are the performance figures for capitalization shares.

2.4.6 COSTS Ongoing Charges: * Classic Shares Distribution: 1.894% Classic Shares Capitalization: 1.882% Institutional B Shares Capitalization: 2.01% * The following costs have not been included in the ongoing charges: - Interest payments on loans taken out - Payments in respect of financial derivatives - Fees and charges paid directly by the investor - Any soft commissions
SOFT COMMISSIONS The management company or the appointed manager, as the case may be, is the recipient of soft commissions. The recipient has laid down an internal policy as regards accepting soft commissions and avoiding possible conflicts of interest in this respect, and has put appropriate internal controls in place to ensure this policy is observed. For more information, please see the ‘General’ section of the annual report.
Broker
Commission gross
in EUR
paid during the period:
1‐01‐13
‐
30‐06‐13
CSA Credits
in EUR
accrued during the period:
1‐01‐13
‐
30‐06‐13 Percentage
CITI 31,981 16,187 50.61%
CSFBSAS 9,044 2,934 32.44%
EQ MACQUARIE 815 106 13.04%
HSBC 4,217 703 16.67%
INSTINET 50,974 25,394 49.82%
MERRILL 19,701 1,850 9.39%
MORGAN STANLEY 1,245 582 46.78%
WOOD 608 101 16.67%
FEE-SHARING AGREEMENTS AND REBATES: The management company may share its fee with the distributor, and institutional and/or professional parties. In principle, the percentage share amounts to between 35% and 60% if the distributor is an entity of KBC Group NV or to between 35% and 70% if the distributor is not an entity of KBC Group NV. However, in a small number of cases, the distributor’s fee is less than 35%. Investors may, on request, obtain more information on these cases. If the management company invests the assets of the undertaking for collective investment in units of undertakings for collective investment that are not managed by an entity of KBC Group NV, and receives a fee for doing so, it will pay this fee to the undertaking for collective investment. Fee-sharing does not affect the amount of the management fee paid by the sub-fund to the management company. This management fee is subject to the limitations laid down in the articles of association. The limitations may only be amended after approval by the general meeting of shareholders. The management company has concluded a distribution agreement with the distributor in order to facilitate the wider distribution of the sub-fund's units by using multiple distribution channels. It is in the interests of the holders of units, the sub-fund and of the distributor for the largest possible number of units to be sold and for the assets of the sub-fund to be maximised in this way. In this respect, there is therefore no question of any conflict of interest.
2.4.7 NOTES TO THE FINANCIAL STATEMENTS AND OTHER DATA Fee for managing the investment portfolio: 1.6% per annum calculated on the basis of the average total net assets of the sub-fund, no management fee is charged on assets assets invested in investment undertakings managed by a financial institution of the KBC group.
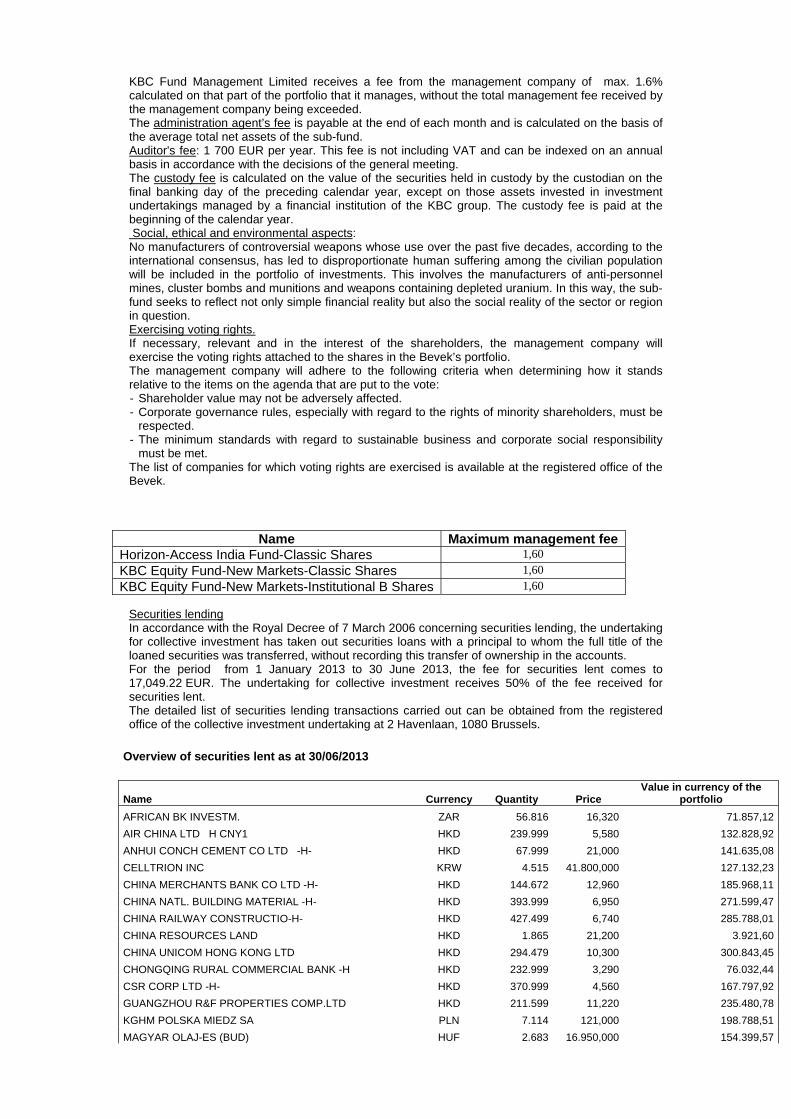
KBC Fund Management Limited receives a fee from the management company of max. 1.6% calculated on that part of the portfolio that it manages, without the total management fee received by the management company being exceeded. The administration agent’s fee is payable at the end of each month and is calculated on the basis of the average total net assets of the sub-fund. Auditor's fee: 1 700 EUR per year. This fee is not including VAT and can be indexed on an annual basis in accordance with the decisions of the general meeting. The custody fee is calculated on the value of the securities held in custody by the custodian on the final banking day of the preceding calendar year, except on those assets invested in investment undertakings managed by a financial institution of the KBC group. The custody fee is paid at the beginning of the calendar year. Social, ethical and environmental aspects: No manufacturers of controversial weapons whose use over the past five decades, according to the international consensus, has led to disproportionate human suffering among the civilian population will be included in the portfolio of investments. This involves the manufacturers of anti-personnel mines, cluster bombs and munitions and weapons containing depleted uranium. In this way, the sub-fund seeks to reflect not only simple financial reality but also the social reality of the sector or region in question. Exercising voting rights. If necessary, relevant and in the interest of the shareholders, the management company will exercise the voting rights attached to the shares in the Bevek’s portfolio. The management company will adhere to the following criteria when determining how it stands relative to the items on the agenda that are put to the vote: - Shareholder value may not be adversely affected. - Corporate governance rules, especially with regard to the rights of minority shareholders, must be
respected. - The minimum standards with regard to sustainable business and corporate social responsibility
must be met. The list of companies for which voting rights are exercised is available at the registered office of the Bevek.
Name Maximum management fee Horizon-Access India Fund-Classic Shares 1,60
KBC Equity Fund-New Markets-Classic Shares 1,60
KBC Equity Fund-New Markets-Institutional B Shares 1,60
Securities lending In accordance with the Royal Decree of 7 March 2006 concerning securities lending, the undertaking for collective investment has taken out securities loans with a principal to whom the full title of the loaned securities was transferred, without recording this transfer of ownership in the accounts. For the period from 1 January 2013 to 30 June 2013, the fee for securities lent comes to 17,049.22 EUR. The undertaking for collective investment receives 50% of the fee received for securities lent. The detailed list of securities lending transactions carried out can be obtained from the registered office of the collective investment undertaking at 2 Havenlaan, 1080 Brussels.
Overview of securities lent as at 30/06/2013
Name Currency Quantity Price Value in currency of the
portfolio
AFRICAN BK INVESTM. ZAR 56.816 16,320 71.857,12
AIR CHINA LTD H CNY1 HKD 239.999 5,580 132.828,92
ANHUI CONCH CEMENT CO LTD -H- HKD 67.999 21,000 141.635,08
CELLTRION INC KRW 4.515 41.800,000 127.132,23
CHINA MERCHANTS BANK CO LTD -H- HKD 144.672 12,960 185.968,11
CHINA NATL. BUILDING MATERIAL -H- HKD 393.999 6,950 271.599,47
CHINA RAILWAY CONSTRUCTIO-H- HKD 427.499 6,740 285.788,01
CHINA RESOURCES LAND HKD 1.865 21,200 3.921,60
CHINA UNICOM HONG KONG LTD HKD 294.479 10,300 300.843,45
CHONGQING RURAL COMMERCIAL BANK -H HKD 232.999 3,290 76.032,44
CSR CORP LTD -H- HKD 370.999 4,560 167.797,92
GUANGZHOU R&F PROPERTIES COMP.LTD HKD 211.599 11,220 235.480,78
KGHM POLSKA MIEDZ SA PLN 7.114 121,000 198.788,51
MAGYAR OLAJ-ES (BUD) HUF 2.683 16.950,000 154.399,57
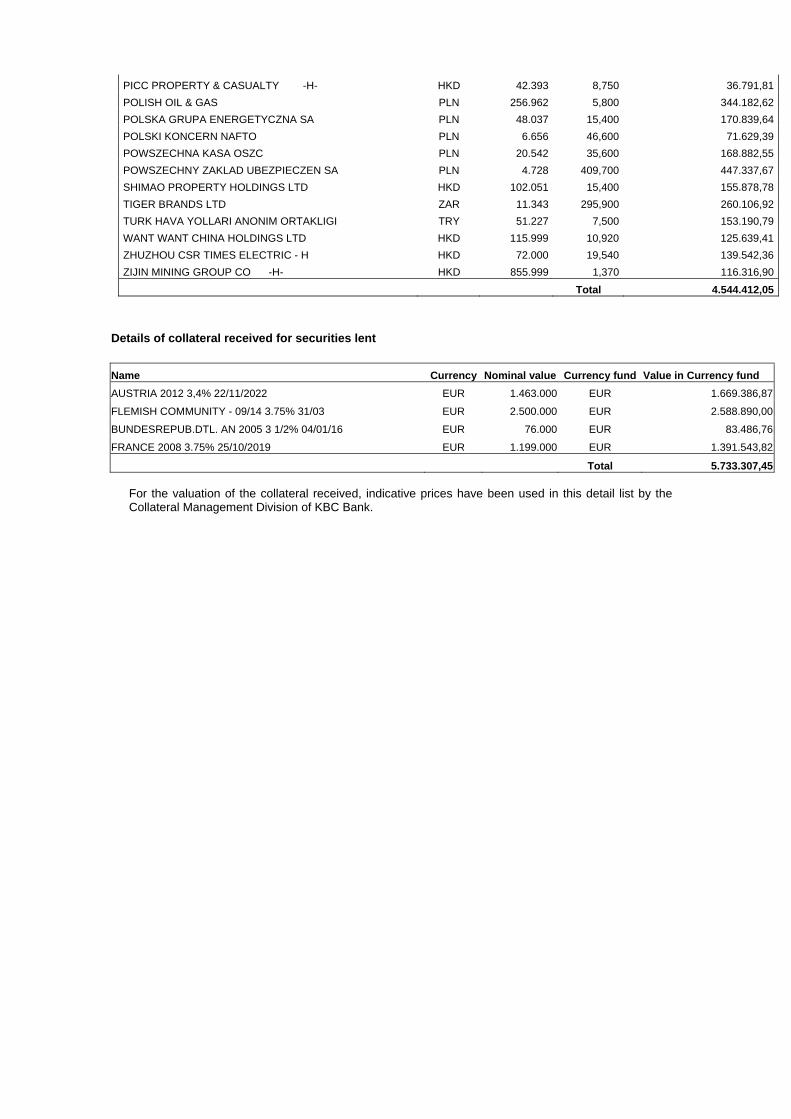
PICC PROPERTY & CASUALTY -H- HKD 42.393 8,750 36.791,81
POLISH OIL & GAS PLN 256.962 5,800 344.182,62
POLSKA GRUPA ENERGETYCZNA SA PLN 48.037 15,400 170.839,64
POLSKI KONCERN NAFTO PLN 6.656 46,600 71.629,39
POWSZECHNA KASA OSZC PLN 20.542 35,600 168.882,55
POWSZECHNY ZAKLAD UBEZPIECZEN SA PLN 4.728 409,700 447.337,67
SHIMAO PROPERTY HOLDINGS LTD HKD 102.051 15,400 155.878,78
TIGER BRANDS LTD ZAR 11.343 295,900 260.106,92
TURK HAVA YOLLARI ANONIM ORTAKLIGI TRY 51.227 7,500 153.190,79
WANT WANT CHINA HOLDINGS LTD HKD 115.999 10,920 125.639,41
ZHUZHOU CSR TIMES ELECTRIC - H HKD 72.000 19,540 139.542,36
ZIJIN MINING GROUP CO -H- HKD 855.999 1,370 116.316,90
Total 4.544.412,05
Details of collateral received for securities lent
Name Currency Nominal value Currency fund Value in Currency fund
AUSTRIA 2012 3,4% 22/11/2022 EUR 1.463.000 EUR 1.669.386,87
FLEMISH COMMUNITY - 09/14 3.75% 31/03 EUR 2.500.000 EUR 2.588.890,00
BUNDESREPUB.DTL. AN 2005 3 1/2% 04/01/16 EUR 76.000 EUR 83.486,76
FRANCE 2008 3.75% 25/10/2019 EUR 1.199.000 EUR 1.391.543,82
Total 5.733.307,45 For the valuation of the collateral received, indicative prices have been used in this detail list by the Collateral Management Division of KBC Bank.

Semi-Annual report as at 30th June 2013
TABLE OF CONTENTS
2. Information on KBC Equity Fund Central Europe
2.1. Management report 2.1.1. Launch date and subscription price 2.1.2. Stock exchange listing 2.1.3. Aim and distinctive features of the investment policy 2.1.4. Financial portfolio management 2.1.5. Distributors 2.1.6. Index and benchmark 2.1.7. Policy conducted during the financial year 2.1.8. Future policy 2.1.9. Synthetic risk and reward indicator (SRRI)
2.2. Balance sheet
2.3. Profit and loss account
2.4. Composition of the assets and key figures
2.4.1. Composition of the assets 2.4.2. Change in the composition of the assets 2.4.3. Value of commitments in respect of financial derivatives positions 2.4.4. Evolution of the number of subscriptions, repayments and the net asset value 2.4.5. Return figures 2.4.6. Expenses 2.4.7. Notes to the financial statements and other data


2 INFORMATION ON KBC EQUITY FUND CENTRAL EUROPE
2.1 MANAGEMENT REPORT
2.1.1 LAUNCH DATE AND SUBSCRIPTION PRICE Classic Shares : Launch date: 30 March 2001 Initial subscription price: 500 EUR Currency: EUR Institutional B Shares : Launch date: 24 November 2011 Initial subscription price: 791.28 EUR Currency: EUR
2.1.2 STOCK EXCHANGE LISTING Not applicable.
2.1.3 GOAL AND KEY PRINCIPLES OF THE INVESTMENT POLICY
SUB-FUND’S OBJECT: The main objective of this sub-fund is to generate the highest possible return for its shareholders by investing directly or indirectly in transferable securities. This is reflected in its pursuit of capital gains and income. To this end, the assets are invested, either directly or indirectly via correlated financial instruments, primarily in shares.
SUB-FUND’S INVESTMENT POLICY:
PERMITTED ASSET CLASSES: The sub-fund may invest in securities, money market instruments, units in undertakings for collective investment, deposits, financial derivatives, liquid assets and all other instruments insofar as permitted by the applicable laws and regulations and consistent with the sub-fund’s object The sub-fund shall invest no more than 10% of its assets in units of other undertakings for collective investment.
RESTRICTIONS OF THE INVESTMENT POLICY: The investment policy will be implemented within the limits set by law and regulations. The sub-fund may borrow up to 10% of its net assets, insofar as these are short-term borrowings aimed at solving temporary liquidity problems.
PERMITTED DERIVATIVES TRANSACTIONS: Derivates may be used either for hedging purposes or to achieve investment objectives. Changes will be made to the investments at regular intervals to comply with the sub-fund's investment strategy. In addition, listed and unlisted derivates may be used to achieve the objectives: these may be forward contracts, options or swaps on securities, indices, currencies or interest rates or other transactions involving derivatives. Unlisted derivatives transactions will only be concluded with prime financial institutions specialised in such transactions. Such derivatives may also be used to hedge the assets against exchange-rate fluctuations. Subject to the applicable laws and regulations and the articles of association, the sub-fund always seeks to conclude the most effective transactions. All costs associated with the transactions will be charged to the sub-fund and all income generated will be paid to the sub-fund. If the transactions result in a risk in respect of the counterparty, this risk can be hedged by using a margin management system that ensures that the sub-fund is the beneficiary of security (collateral) in the form of cash or investment grade bonds. When calculating the value of the bonds, a margin will be applied that varies depending on the residual term to maturity and the currency in which the bond in question is denominated. The relationship with the counterparty or counterparties is governed by standard international agreements.
STRATEGY SELECTED At least 75% of the assets are invested in shares of Central European companies.
RISK CONCENTRATION Central European shares.
LENDING FINANCIAL INSTRUMENTS: The sub-fund may lend financial instruments within the limits set by law and regulations. This lending does not affect the sub-fund’s risk profile since: - it takes place within the framework of a securities lending system managed by a principal. In
addition, the sub-fund has a relationship only with the principal of the securities lending system which acts as counterparty and to which title of the loaned securities is transferred. The choice of principal is subject to strict selection criteria. The return of securities similar to the securities that have been lent is guaranteed by the principal.
- through a margin management system, the sub-fund is always guaranteed financial security, the actual value of which always exceeds the actual value of the securities that have been lent, in case the principal does not return similar securities.
The return of securities similar to the securities that have been lent can be requested at any time, which means that the lending of securities does not affect the management of the sub-fund's assets. By lending securities, the sub-fund can generate an additional return. The principal pays a fee to the management company. After deducting the fee for the margin management and clearing services of KBC Bank, most of this fee is paid to the sub-fund. The relationship with the counterparty or counterparties is governed by standard international agreements. More information is provided on the terms and conditions governing securities lending in the annual or half-yearly report for the sub-fund.
VOLATILITY OF THE NET ASSET VALUE: The volatility of the net asset value may be high due to the composition of the portfolio.
GENERAL STRATEGY FOR HEDGING THE EXCHANGE RATE RISK: In order to protect its assets against exchange rate fluctuations and within the limitations laid down in the articles of association, the sub-fund may perform transactions relating to the sale of forward currency contracts, as well as the sale of call options and the purchase of put options on currencies. The transactions in question may relate solely to contracts traded on a regulated market that operates regularly, is recognised and is open to the public or that are traded with a recognised, prime financial institution specialising in such transactions and dealing in the over-the-counter (OTC) market in options. With the same objective, the sub-fund may also sell currencies forward or exchange them in private transactions with prime financial institutions specialising in such transactions. The hedging objective of the aforementioned transactions suggests that there is a direct link between these transactions and the assets to be hedged, which implies that the transactions carried out in a particular currency may in principle not exceed, in terms of volume, either the valuation value of all the assets in the same currency or the holding period of those assets.
SOCIAL, ETHICAL AND ENVIRONMENTAL ASPECTS:
No manufacturers of controversial weapons whose use over the past five decades, according to the international consensus, has led to disproportionate human suffering among the civilian population will be included in the portfolio of investments. This involves the manufacturers of anti-personnel mines, cluster bombs and munitions and weapons containing depleted uranium. In this way, the sub-fund seeks to reflect not only simple financial reality but also the social reality of the sector or region in question.
THE EUROPEAN SAVINGS DIRECTIVE AND TAX ON DEBT CLAIM RETURNS OBTAINED THROUGH THE
REDEMPTION OF OWN UNITS OR IN THE EVENT OF FULL OR PARTIAL DISTRIBUTION OF EQUITY
CAPITAL. The following information is of a general character and is not intended to cover all aspects of an investment in a UCITS. In certain cases entirely different rules might even apply. Moreover, both tax law and the interpretation of it can change. Investors who wish to have more information about the tax implications – in both Belgium and abroad – of acquiring, holding and transferring units should seek the advice of their usual financial and tax advisers.
This UCITS shall invest a maximum of 15% of its assets directly or indirectly in debt instruments as intended by the European Savings Directive. A. European Savings Directive (Directive 2003/48/EC) The European Savings Directive has been implemented in Belgium. Since this UCITS invests a maximum of 15% of its assets directly or indirectly in debt claims as intended by the European Savings Directive, the income of this UCITS does not fall within the scope of this directive. B. Tax on debt claim returns obtained through the redemption of own units or in the event of full or partial distribution of equity capital (Article 19bis Income Tax Code 1992). The income from this UCITS is not subject to the tax on debt instrument returns as intended by Article 19bis, Income Tax Code 1992.
2.1.4 FINANCIAL PORTFOLIO MANAGEMENT The management company has delegated the intellectual management, to CSOB Asset Management a.s., Radlicka 333/150 , 150 57 Praha 5, CZECH REPUBLIC..
2.1.5 DISTRIBUTORS KBC Asset Management S.A., 5, Place de la Gare, L-1616 Luxembourg.
2.1.6 INDEX AND BENCHMARK See ‘Sub-fund’s investment policy’.
2.1.7 POLICY PERSUED DURING THE FINANCIAL YEAR Central Europe, similar to other emerging markets, unfortunately decoupled from developed equities. Central European markets tumbled in the first half of 2013, while developed markets enjoyed relatively strong growth with US taking the lead. Local economies struggle with weak European demand as it is the main target of their exports. Domestic demand has been also weak in those countries with just little signs of improvement. Czech Republic and Hungary has been already in recession since last year. Polish economy, an island of growth in the region, has slowed down significantly too. Political risks also increased in the region bringing uncertainty into taxation and pension systems. On top of that, rising expectations of QE (quantitative easing) exit have brought outflow to emerging markets. In June, US FED announced that it can limit its bond purchases in the second half of the year and completely stop the QE program in the first half of 2014 should the US economy improve. Fears of end of cheap money period sent lower commodities and riskier emerging markets, Central Europe being no exemption. Romanian and Hungarian markets were the only one with positive performance. All other markets in the region ended the first half in red, Czech and Polish market being hit the most. The fund strategy was based on gradual improvement in global economy and unimpressive progress in Euro zone. Such scenario combined with domestic issues led us to lower our weight in Poland and Czech Republic, keep Hungarian equities neutral and increase exposure to Romanian equities.
2.1.8 FUTURE POLICY Central European markets will depend on Euro zone development. Improvement in European economies may revive also Central European markets. Investors will also await more details from FED and its plans regarding QE. Abundant liquidity has worked in favour of emerging markets so far. At the domestic level, changes in Polish pension system will be crucial as it may drain the liquidity out of the equity market in some scenarios. For the short term, we are not changing our policy much. At the country level, we don’t see clear winner among main CE3 markets. Among others, we like Romanian equities as we think the market is going through a turn-around story and the equities are still trading with discounts to their peers.
2.1.9 SYNTHETIC RISK AND REWARD INDICATOR Classic Shares: 7 on a scale of 1 (lowest risk) to 7 (highest risk). Institutional B Shares: 7 on a scale of 1 (lowest risk) to 7 (highest risk). The value of a share can decrease or increase and the investor may not get back the amount invested. In accordance with Commission Regulation (EU) No. 583/2010, a synthetic risk and reward indicator has been calculated. This indicator provides a quantitative measure of the sub-fund's potential return and the risk involved, calculated in the currency in which the sub-fund is denominated. It is given as a figure between 1 and 7. The higher the figure, the greater the potential return, but also the more difficult it is to predict this return. Losses are possible too. The lowest figure does not mean that the investment is entirely free of risk. However, it does indicate that, compared with the higher figures, this product will generally provide a lower, but more predictable return. The synthetic risk and reward indicator is assessed regularly and can therefore go up or down based on data from the past. Data from the past is not always a reliable indicator of future risk and return.
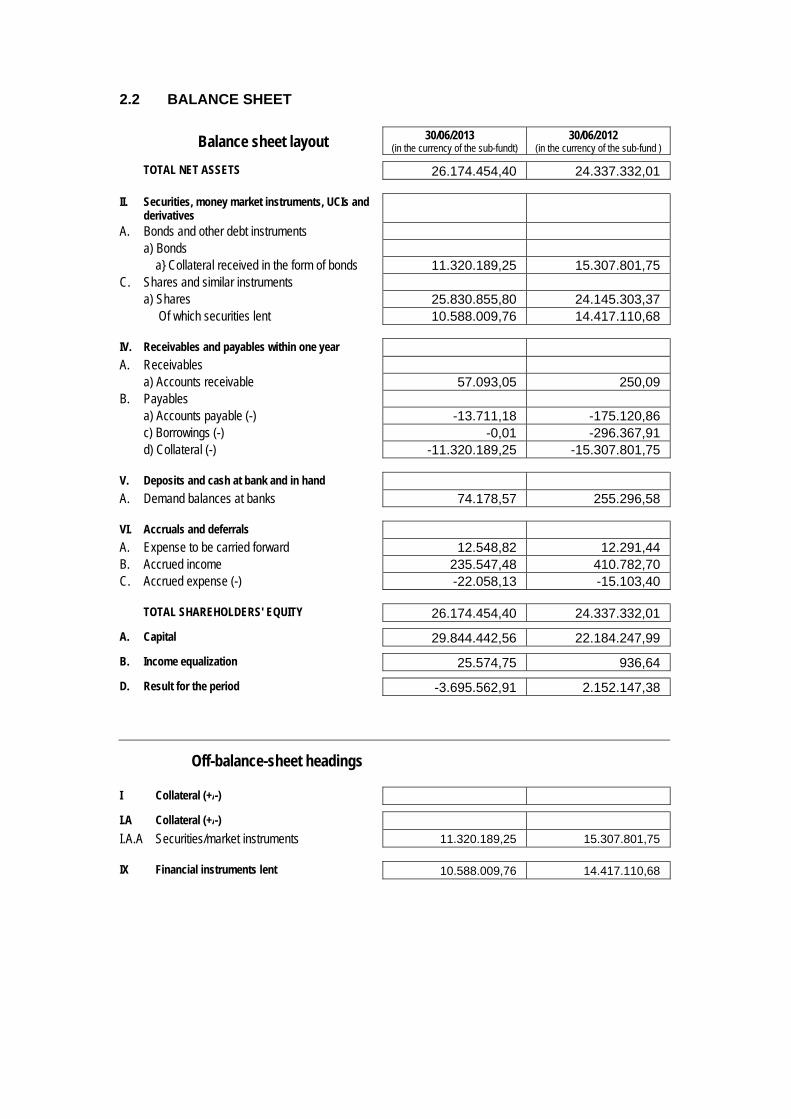
2.2 BALANCE SHEET
Balance sheet layout 30/06/2013 (in the currency of the sub-fundt)
30/06/2012 (in the currency of the sub-fund )
TOTAL NET ASSETS 26.174.454,40 24.337.332,01
II. Securities, money market instruments, UCIs and derivatives
A. Bonds and other debt instruments a) Bonds a} Collateral received in the form of bonds 11.320.189,25 15.307.801,75 C. Shares and similar instruments a) Shares 25.830.855,80 24.145.303,37 Of which securities lent 10.588.009,76 14.417.110,68
IV. Receivables and payables within one year A. Receivables a) Accounts receivable 57.093,05 250,09 B. Payables a) Accounts payable (-) -13.711,18 -175.120,86 c) Borrowings (-) -0,01 -296.367,91 d) Collateral (-) -11.320.189,25 -15.307.801,75
V. Deposits and cash at bank and in hand A. Demand balances at banks 74.178,57 255.296,58
VI. Accruals and deferrals A. Expense to be carried forward 12.548,82 12.291,44 B. Accrued income 235.547,48 410.782,70 C. Accrued expense (-) -22.058,13 -15.103,40
TOTAL SHAREHOLDERS' EQUITY 26.174.454,40 24.337.332,01
A. Capital 29.844.442,56 22.184.247,99
B. Income equalization 25.574,75 936,64
D. Result for the period -3.695.562,91 2.152.147,38
Off-balance-sheet headings
I Collateral (+/-)
I.A Collateral (+/-)
I.A.A Securities/market instruments 11.320.189,25 15.307.801,75
IX Financial instruments lent 10.588.009,76 14.417.110,68
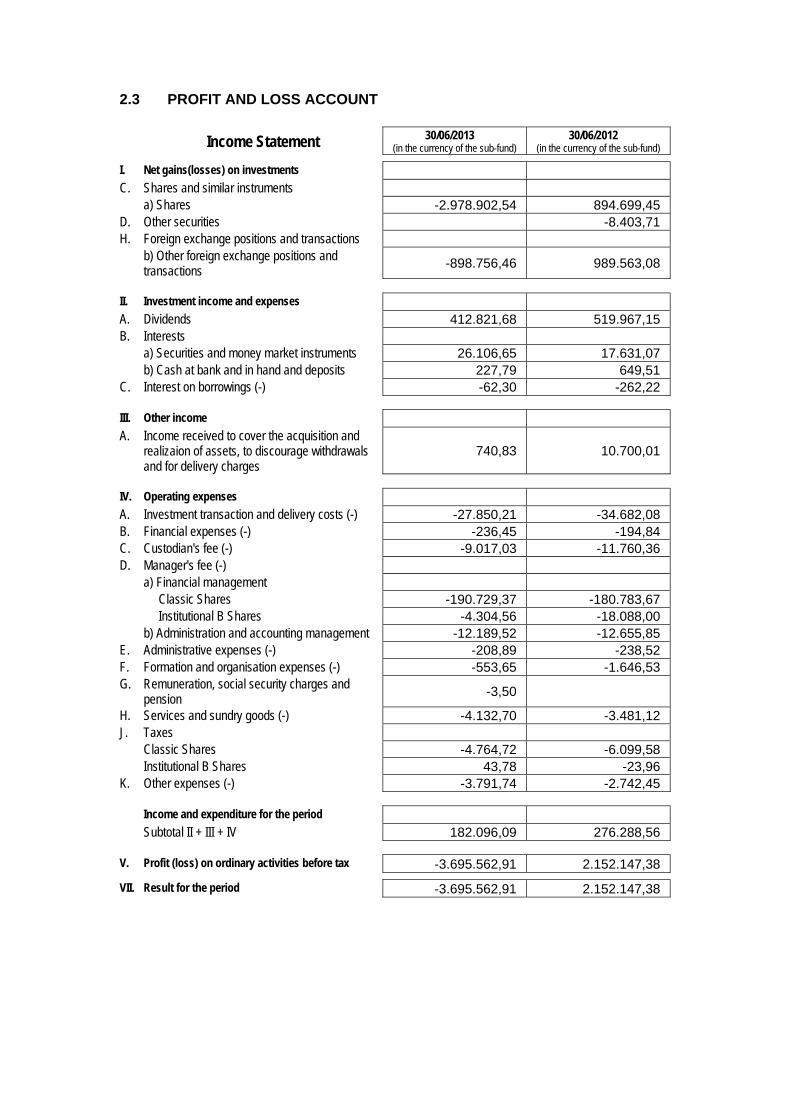
2.3 PROFIT AND LOSS ACCOUNT
Income Statement 30/06/2013 (in the currency of the sub-fund)
30/06/2012 (in the currency of the sub-fund)
I. Net gains(losses) on investments C. Shares and similar instruments a) Shares -2.978.902,54 894.699,45 D. Other securities -8.403,71 H. Foreign exchange positions and transactions b) Other foreign exchange positions and
transactions -898.756,46 989.563,08
II. Investment income and expenses A. Dividends 412.821,68 519.967,15 B. Interests a) Securities and money market instruments 26.106,65 17.631,07 b) Cash at bank and in hand and deposits 227,79 649,51 C. Interest on borrowings (-) -62,30 -262,22
III. Other income A. Income received to cover the acquisition and
realizaion of assets, to discourage withdrawals and for delivery charges
740,83 10.700,01
IV. Operating expenses A. Investment transaction and delivery costs (-) -27.850,21 -34.682,08 B. Financial expenses (-) -236,45 -194,84 C. Custodian's fee (-) -9.017,03 -11.760,36 D. Manager's fee (-) a) Financial management Classic Shares -190.729,37 -180.783,67 Institutional B Shares -4.304,56 -18.088,00 b) Administration and accounting management -12.189,52 -12.655,85 E. Administrative expenses (-) -208,89 -238,52 F. Formation and organisation expenses (-) -553,65 -1.646,53 G. Remuneration, social security charges and
pension -3,50
H. Services and sundry goods (-) -4.132,70 -3.481,12 J. Taxes Classic Shares -4.764,72 -6.099,58 Institutional B Shares 43,78 -23,96 K. Other expenses (-) -3.791,74 -2.742,45
Income and expenditure for the period Subtotal II + III + IV 182.096,09 276.288,56
V. Profit (loss) on ordinary activities before tax -3.695.562,91 2.152.147,38
VII. Result for the period -3.695.562,91 2.152.147,38
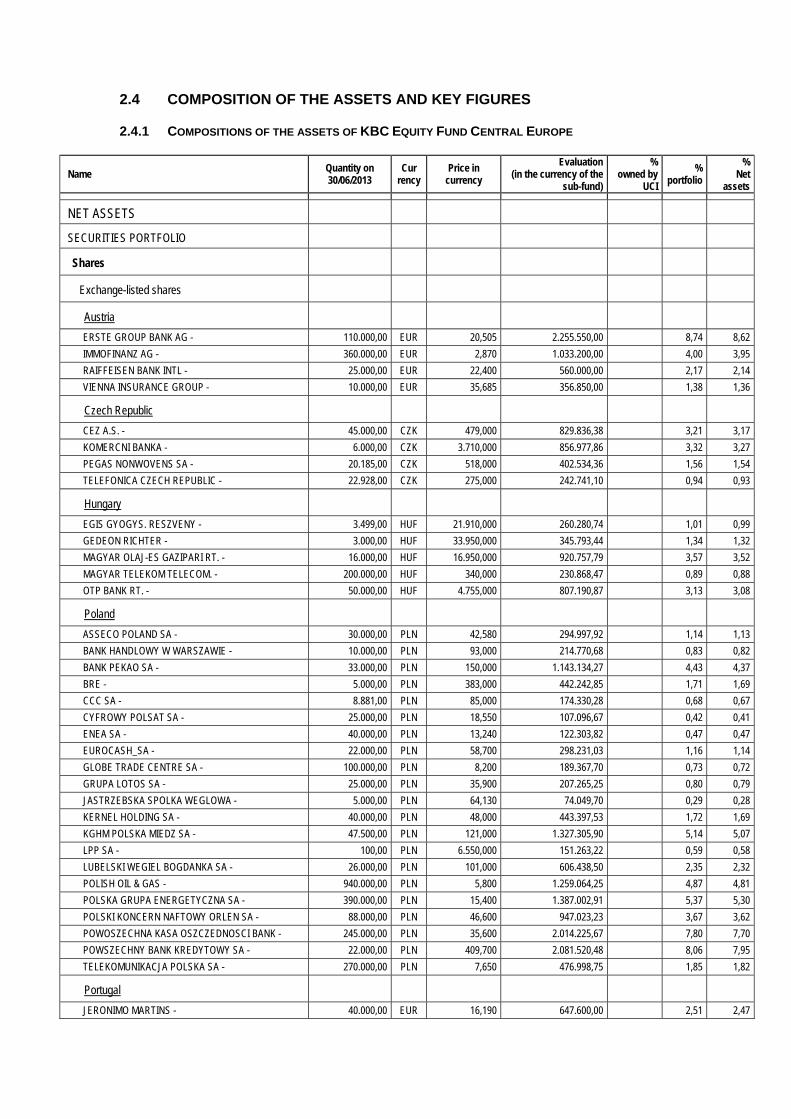
2.4 COMPOSITION OF THE ASSETS AND KEY FIGURES
2.4.1 COMPOSITIONS OF THE ASSETS OF KBC EQUITY FUND CENTRAL EUROPE
Name Quantity on 30/06/2013
Cur rency
Price in currency
Evaluation (in the currency of the
sub-fund)
% owned by
UCI
% portfolio
% Net
assets
NET ASSETS
SECURITIES PORTFOLIO
Shares
Exchange-listed shares
Austria
ERSTE GROUP BANK AG - 110.000,00 EUR 20,505 2.255.550,00 8,74 8,62
IMMOFINANZ AG - 360.000,00 EUR 2,870 1.033.200,00 4,00 3,95
RAIFFEISEN BANK INTL - 25.000,00 EUR 22,400 560.000,00 2,17 2,14
VIENNA INSURANCE GROUP - 10.000,00 EUR 35,685 356.850,00 1,38 1,36
Czech Republic
CEZ A.S. - 45.000,00 CZK 479,000 829.836,38 3,21 3,17
KOMERCNI BANKA - 6.000,00 CZK 3.710,000 856.977,86 3,32 3,27
PEGAS NONWOVENS SA - 20.185,00 CZK 518,000 402.534,36 1,56 1,54
TELEFONICA CZECH REPUBLIC - 22.928,00 CZK 275,000 242.741,10 0,94 0,93
Hungary
EGIS GYOGYS. RESZVENY - 3.499,00 HUF 21.910,000 260.280,74 1,01 0,99
GEDEON RICHTER - 3.000,00 HUF 33.950,000 345.793,44 1,34 1,32
MAGYAR OLAJ-ES GAZIPARI RT. - 16.000,00 HUF 16.950,000 920.757,79 3,57 3,52
MAGYAR TELEKOM TELECOM. - 200.000,00 HUF 340,000 230.868,47 0,89 0,88
OTP BANK RT. - 50.000,00 HUF 4.755,000 807.190,87 3,13 3,08
Poland
ASSECO POLAND SA - 30.000,00 PLN 42,580 294.997,92 1,14 1,13
BANK HANDLOWY W WARSZAWIE - 10.000,00 PLN 93,000 214.770,68 0,83 0,82
BANK PEKAO SA - 33.000,00 PLN 150,000 1.143.134,27 4,43 4,37
BRE - 5.000,00 PLN 383,000 442.242,85 1,71 1,69
CCC SA - 8.881,00 PLN 85,000 174.330,28 0,68 0,67
CYFROWY POLSAT SA - 25.000,00 PLN 18,550 107.096,67 0,42 0,41
ENEA SA - 40.000,00 PLN 13,240 122.303,82 0,47 0,47
EUROCASH_SA - 22.000,00 PLN 58,700 298.231,03 1,16 1,14
GLOBE TRADE CENTRE SA - 100.000,00 PLN 8,200 189.367,70 0,73 0,72
GRUPA LOTOS SA - 25.000,00 PLN 35,900 207.265,25 0,80 0,79
JASTRZEBSKA SPOLKA WEGLOWA - 5.000,00 PLN 64,130 74.049,70 0,29 0,28
KERNEL HOLDING SA - 40.000,00 PLN 48,000 443.397,53 1,72 1,69
KGHM POLSKA MIEDZ SA - 47.500,00 PLN 121,000 1.327.305,90 5,14 5,07
LPP SA - 100,00 PLN 6.550,000 151.263,22 0,59 0,58
LUBELSKI WEGIEL BOGDANKA SA - 26.000,00 PLN 101,000 606.438,50 2,35 2,32
POLISH OIL & GAS - 940.000,00 PLN 5,800 1.259.064,25 4,87 4,81
POLSKA GRUPA ENERGETYCZNA SA - 390.000,00 PLN 15,400 1.387.002,91 5,37 5,30
POLSKI KONCERN NAFTOWY ORLEN SA - 88.000,00 PLN 46,600 947.023,23 3,67 3,62
POWOSZECHNA KASA OSZCZEDNOSCI BANK - 245.000,00 PLN 35,600 2.014.225,67 7,80 7,70
POWSZECHNY BANK KREDYTOWY SA - 22.000,00 PLN 409,700 2.081.520,48 8,06 7,95
TELEKOMUNIKACJA POLSKA SA - 270.000,00 PLN 7,650 476.998,75 1,85 1,82
Portugal
JERONIMO MARTINS - 40.000,00 EUR 16,190 647.600,00 2,51 2,47

Romania
BANCA TRANSILVANIA - 1.939.967,00 RON 1,231 534.585,28 2,07 2,04
OMV PETROM SA - 3.500.000,00 RON 0,421 330.005,37 1,28 1,26
SC FONDUL PROPRIETATEA SA - 6.500.000,00 RON 0,620 901.403,56 3,49 3,44 SOC DE INVEST FINAN ROMANIA 5 OLTENIA CRAIOVA 300.000,00 RON 1,432 96.167,62 0,37 0,37
SSIF BROKER SA - 53.103,00 RON 0,125 1.482,35 0,01 0,01
Slovenia
KRKA DD - 5.000,00 EUR 51,000 255.000,00 0,99 0,97
Total shares 25.830.855,80 100,00 98,69
TOTAL SECURITIES PORTFOLIO 25.830.855,80 100,00 98,69
COLLATERAL RECEIVED
Belgium
KBC GROUP COLLATERAL EUR 11.320.189,25 EUR 1,000 11.320.189,25 43,25
TOTAL RECEIVED COLLATERAL 11.320.189,25 43,25
CASH AT BANK AND IN HAND
Demand accounts
Belgium
KBC GROUP CZK 69.355,67 CZK 1,000 2.670,09 0,01
KBC GROUP EURO 66.618,06 EUR 1,000 66.618,06 0,26
KBC GROUP GBP 0,14 GBP 1,000 0,16
KBC GROUP HUF 6.053,41 HUF 1,000 20,55
KBC GROUP NEW BULGAARSE LEVA -0,01 BGN 1,000 -0,01
KBC GROUP PLN 5.535,23 PLN 1,000 1.278,29 0,01
KBC GROUP RON 987,60 RON 1,000 221,08 0,00
KBC GROUP TRY 3,86 TRY 1,000 1,54
KBC GROUP USD 4.379,10 USD 1,000 3.368,80 0,01
Total demand accounts 74.178,56 0,28
TOTAL CASH AT BANK AND IN HAND 74.178,56 0,28
OTHER RECEIVABLES AND PAYABLES
Receivables
Belgium
KBC GROUP EUR RECEIVABLE 57.093,05 EUR 1,000 57.093,05 0,22
Total receivables 57.093,05 0,22
Payables
Belgium
KBC GROUP COUNTERPART ENTRY COLLATERAL IN EUR
-11.320.189,25 EUR 1,000 -11.320.189,25 -43,25
KBC GROUP EUR PAYABLE -13.711,18 EUR 1,000 -13.711,18 -0,05
Payables -11.333.900,43 -43,30
TOTAL RECEIVABLES AND PAYABLES -11.276.807,38 -43,08
OTHER
Interest receivable EUR 234.157,08 0,90
Accrued interest EUR 1.390,40 0,01
Expenses payable EUR -22.058,13 -0,08

Expenses to be carried forward EUR 12.548,82 0,05
TOTAL OTHER 226.038,17 0,86
TOTAL NET ASSETS 26.174.454,40 100,00
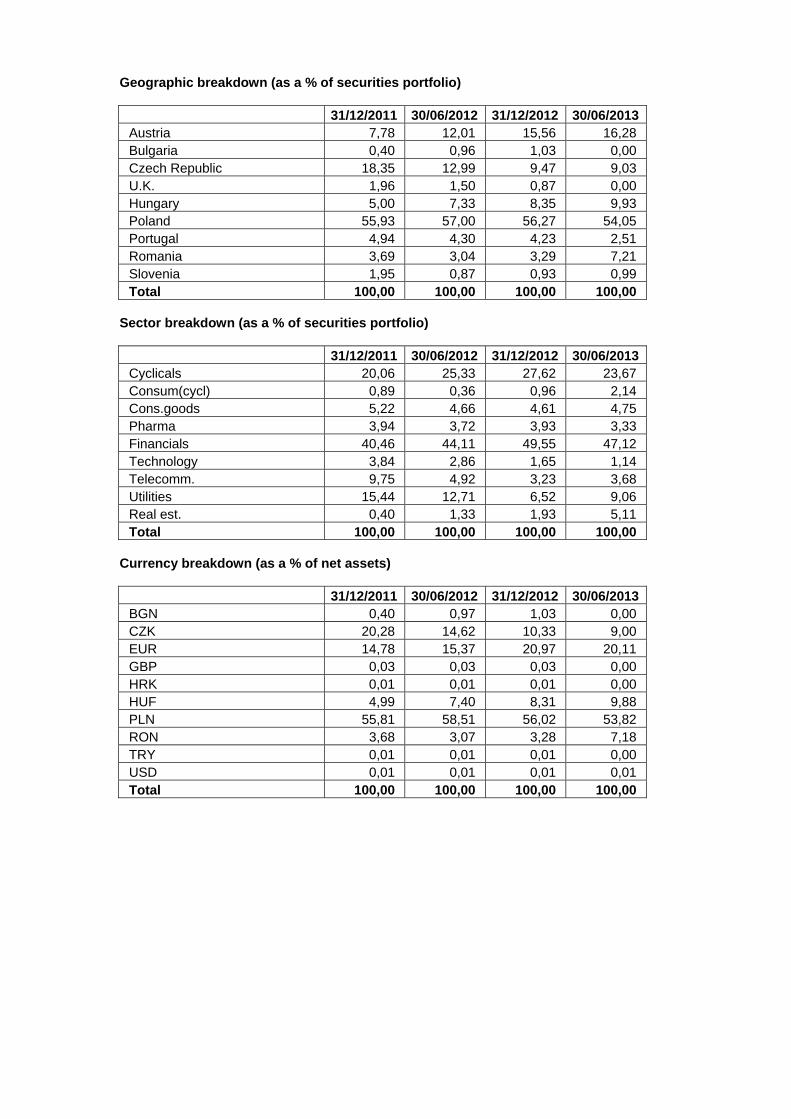
Geographic breakdown (as a % of securities portfolio)
31/12/2011 30/06/2012 31/12/2012 30/06/2013 Austria 7,78 12,01 15,56 16,28 Bulgaria 0,40 0,96 1,03 0,00 Czech Republic 18,35 12,99 9,47 9,03 U.K. 1,96 1,50 0,87 0,00 Hungary 5,00 7,33 8,35 9,93 Poland 55,93 57,00 56,27 54,05 Portugal 4,94 4,30 4,23 2,51 Romania 3,69 3,04 3,29 7,21 Slovenia 1,95 0,87 0,93 0,99 Total 100,00 100,00 100,00 100,00
Sector breakdown (as a % of securities portfolio)
31/12/2011 30/06/2012 31/12/2012 30/06/2013 Cyclicals 20,06 25,33 27,62 23,67 Consum(cycl) 0,89 0,36 0,96 2,14 Cons.goods 5,22 4,66 4,61 4,75 Pharma 3,94 3,72 3,93 3,33 Financials 40,46 44,11 49,55 47,12 Technology 3,84 2,86 1,65 1,14 Telecomm. 9,75 4,92 3,23 3,68 Utilities 15,44 12,71 6,52 9,06 Real est. 0,40 1,33 1,93 5,11 Total 100,00 100,00 100,00 100,00
Currency breakdown (as a % of net assets)
31/12/2011 30/06/2012 31/12/2012 30/06/2013 BGN 0,40 0,97 1,03 0,00 CZK 20,28 14,62 10,33 9,00 EUR 14,78 15,37 20,97 20,11 GBP 0,03 0,03 0,03 0,00 HRK 0,01 0,01 0,01 0,00 HUF 4,99 7,40 8,31 9,88 PLN 55,81 58,51 56,02 53,82 RON 3,68 3,07 3,28 7,18 TRY 0,01 0,01 0,01 0,00 USD 0,01 0,01 0,01 0,01 Total 100,00 100,00 100,00 100,00

2.4.2 CHANGES IN THE COMPOSITION OF THE ASSETS OF KBC EQUITY FUND CENTRAL EUROPE
(IN THE CURRENCY OF THE SUB-FUND)
1st half of year YearPurchases 9.237.326,65 9.237.326,65 Sales 6.294.563,64 6.294.563,64 Total 1 15.531.890,29 15.531.890,29 Subscriptions 7.056.960,84 7.056.960,84 Redemptions 4.173.114,49 4.173.114,49 Total 2 11.230.075,33 11.230.075,33 Monthly average of total assets
24.928.335,87 24.928.335,87
Turnover rate 17,26 % 17,26 %
1st half of year YearPurchases 9.237.326,65 9.237.326,65 Sales 6.294.563,64 6.294.563,64 Total 1 15.531.890,29 15.531.890,29 Subscriptions 7.056.960,84 7.056.960,84 Redemptions 4.173.114,49 4.173.114,49 Total 2 11.230.075,33 11.230.075,33 Monthly average of total assets
23.790.592,62 23.790.592,62
Corrected turnover rate 18,08 % 18,08 %
The table above shows the capital volume of portfolio transactions. This volume (adjusted to take account of total subscriptions and redemptions) is also compared to the average net assets at the beginning and end of the period. A figure close to 0% implies that the transactions relating to the securities or transactions relating to the assets (excluding deposits and cash) in a given period only involve subscriptions and redemptions. A negative percentage shows that subscriptions and redemptions entailed few, if any, transactions in the portfolio. Active asset management may result in high turnover rates (monthly percentage >50%). The detailed list of transactions is available for consultation free of charge at the registered office of the Bevek or fund at Havenlaan 2, 1080 Brussels.
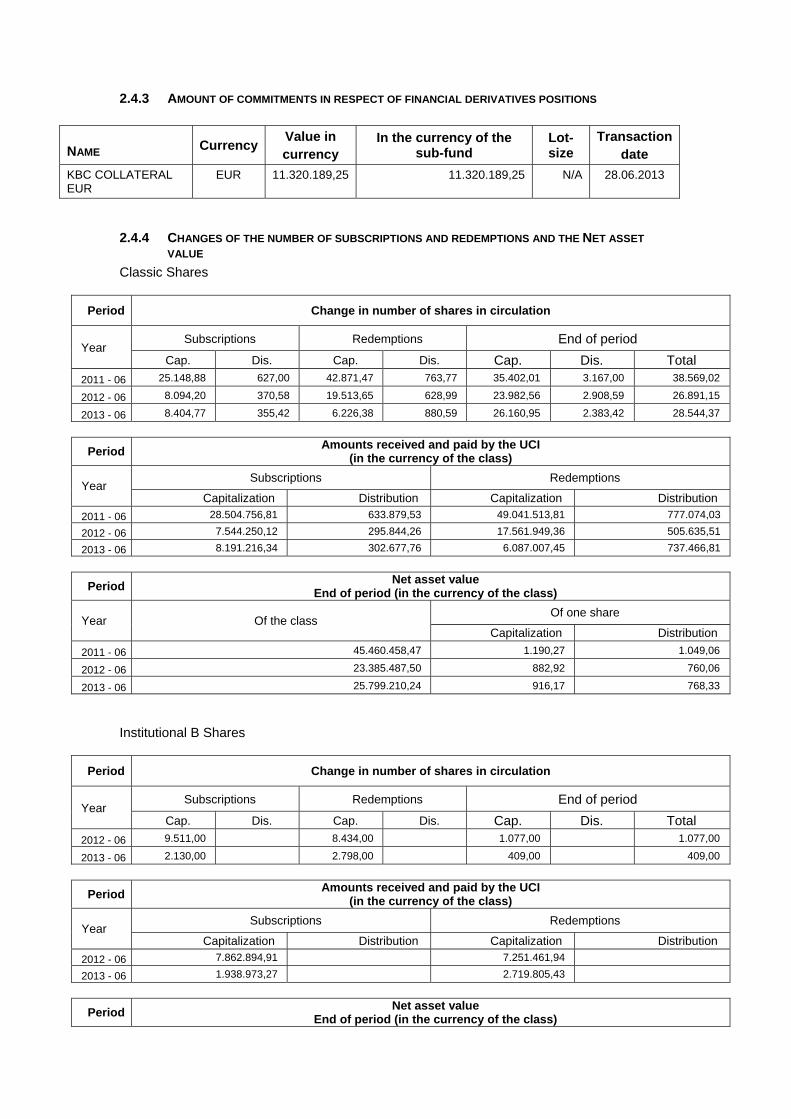
2.4.3 AMOUNT OF COMMITMENTS IN RESPECT OF FINANCIAL DERIVATIVES POSITIONS
NAME Currency Value in currency
In the currency of the sub-fund
Lot-size
Transactiondate
KBC COLLATERAL EUR
EUR 11.320.189,25 11.320.189,25 N/A 28.06.2013
2.4.4 CHANGES OF THE NUMBER OF SUBSCRIPTIONS AND REDEMPTIONS AND THE NET ASSET
VALUE
Classic Shares
Period Change in number of shares in circulation
Year Subscriptions Redemptions End of period
Cap. Dis. Cap. Dis. Cap. Dis. Total
2011 - 06 25.148,88 627,00 42.871,47 763,77 35.402,01 3.167,00 38.569,02
2012 - 06 8.094,20 370,58 19.513,65 628,99 23.982,56 2.908,59 26.891,15
2013 - 06 8.404,77 355,42 6.226,38 880,59 26.160,95 2.383,42 28.544,37
Period Amounts received and paid by the UCI
(in the currency of the class)
Year Subscriptions Redemptions
Capitalization Distribution Capitalization Distribution
2011 - 06 28.504.756,81 633.879,53 49.041.513,81 777.074,03
2012 - 06 7.544.250,12 295.844,26 17.561.949,36 505.635,51
2013 - 06 8.191.216,34 302.677,76 6.087.007,45 737.466,81
Period Net asset value
End of period (in the currency of the class)
Year Of the class Of one share
Capitalization Distribution
2011 - 06 45.460.458,47 1.190,27 1.049,06
2012 - 06 23.385.487,50 882,92 760,06
2013 - 06 25.799.210,24 916,17 768,33
Institutional B Shares
Period Change in number of shares in circulation
Year Subscriptions Redemptions End of period
Cap. Dis. Cap. Dis. Cap. Dis. Total 2012 - 06 9.511,00 8.434,00 1.077,00 1.077,00
2013 - 06 2.130,00 2.798,00 409,00 409,00
Period Amounts received and paid by the UCI
(in the currency of the class)
Year Subscriptions Redemptions
Capitalization Distribution Capitalization Distribution
2012 - 06 7.862.894,91 7.251.461,94
2013 - 06 1.938.973,27 2.719.805,43
Period Net asset value
End of period (in the currency of the class)

Year Of the class Of one share
Capitalization Distribution
2012 - 06 951.844,49 883,79
2013 - 06 375.244,13 917,47
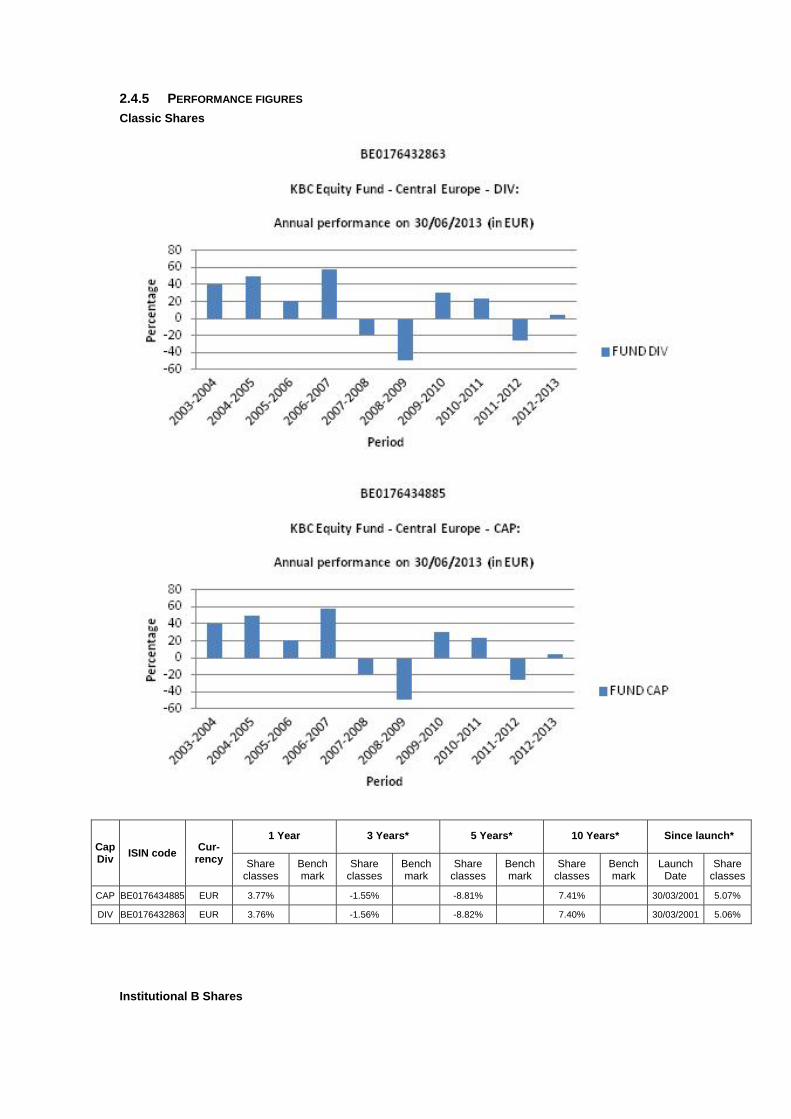
2.4.5 PERFORMANCE FIGURES
Classic Shares
Cap Div
ISIN code Cur-
rency
1 Year 3 Years* 5 Years* 10 Years* Since launch*
Share classes
Bench mark
Share classes
Bench mark
Share classes
Bench mark
Share classes
Bench mark
Launch Date
Share classes
CAP BE0176434885 EUR 3.77% -1.55% -8.81% 7.41% 30/03/2001 5.07%
DIV BE0176432863 EUR 3.76% -1.56% -8.82% 7.40% 30/03/2001 5.06%
Institutional B Shares

Cap Div
ISIN code Cur-
rency
1 Year 3 Years* 5 Years* 10 Years* Since launch*
Share classes
Bench mark
Share classes
Bench mark
Share classes
Bench mark
Share classes
Bench mark
Launch Date
Share classes
CAP BE6228538714 EUR 3.81% 24/11/2011 9.70%
Risk warning: Past performance is not a guide to future performance. * Return on annual basis.
Classic Shares The bar chart shows the performance for full financial years. The figures do not take account of any restructuring. Calculated in EUR. The return is calculated as the change in the net asset value between two dates expressed
as a percentage. In the case of units that pay dividends, the dividend is incorporated geometrically in the return.
Calculation method for date D, where NAV stands for net asset value: Capitalisation units (CAP) Return on date D over a period of X years:
[NIW(D) / NIW(Y)] ^ [1 / X] - 1 where Y = D-X
Return on date D since the start date S of the unit: [NIW(D) / NIW(S)] ^ [1 / F] - 1 where F = 1 if the unit has existed for less than one year on date D where F = (D-S) / 365.25 if the unit has existed for longer than one year on date D
Distribution units (DIV) Return on date D over a period of X years:
[ C * NIW(D) / NIW(Y)] ^ [1 / X] - 1 where Y = D-X
Return on date D since the start date S of the unit: [ C * NIW(D) / NIW(S)] ^ [1 / F] - 1 where F = 1 if the unit has existed for less than one year on date D where F = (D-S) / 365.25 if the unit has existed for longer than one year on date D where C is a factor that is determined for all N dividends between the calculation date D and the reference date.
For dividend i on date Di with value Wi: Ci = [Wi / NIW(Di)] + 1 i = 1 ... N from whichC = C0 * .... * CN.

If the interval between the two dates exceeds one year, the ordinary return calculation is converted into a return on an annual basis by taking the nth square root of 1 plus the total return of the unit.
The return figures shown above do not take account of the fees and charges associated with the issue and redemption of units.
These are the performance figures for capitalisation and distribution shares.
Institutional B Shares The bar chart shows the performance for full financial years. The figures do not take account of any restructuring. Calculated in EUR. The return is calculated as the change in the net asset value between two dates expressed
as a percentage. Calculation method for date D, where NAV stands for net asset value:
Capitalisation units (CAP) Return on date D over a period of X years:
[NIW(D) / NIW(Y)] ^ [1 / X] - 1 where Y = D-X
Return on date D since the start date S of the unit: [NIW(D) / NIW(S)] ^ [1 / F] - 1 where F = 1 if the unit has existed for less than one year on date D where F = (D-S) / 365.25 if the unit has existed for longer than one year on date D
If the interval between the two dates exceeds one year, the ordinary return calculation is converted into a return on an annual basis by taking the nth square root of 1 plus the total return of the unit.
The return figures shown above do not take account of the fees and charges associated with the issue and redemption of units.
These are the performance figures for capitalization shares.
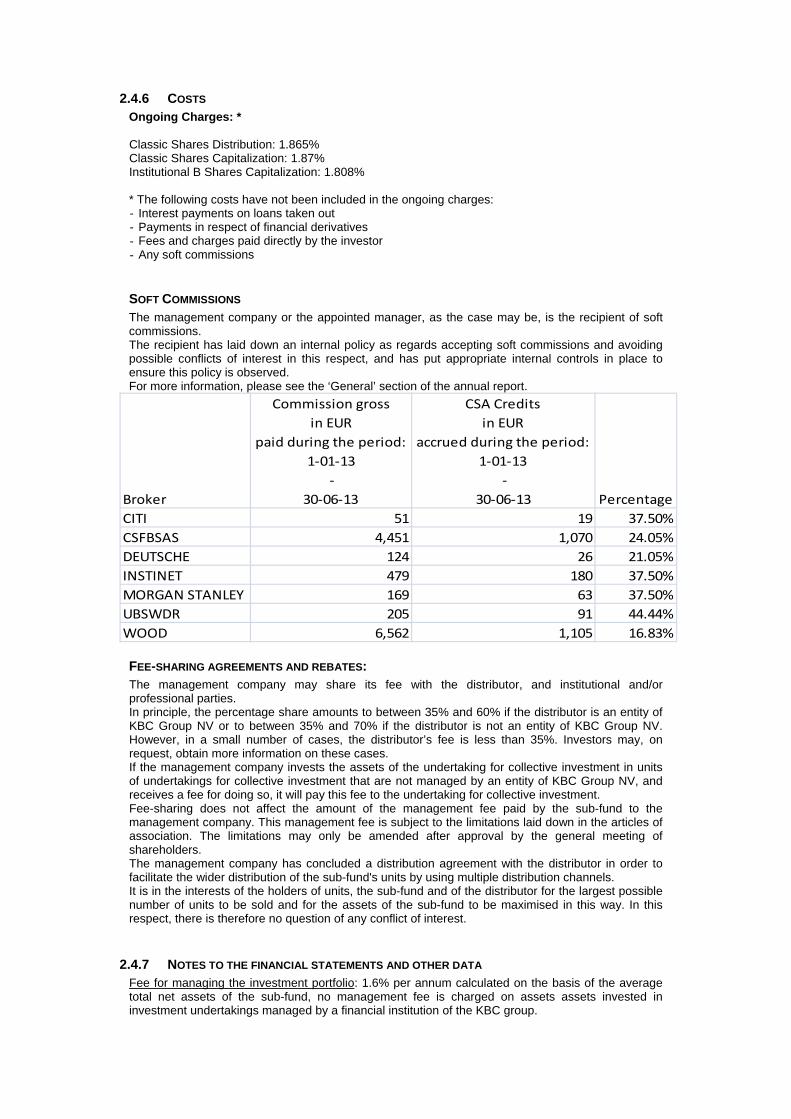
2.4.6 COSTS Ongoing Charges: * Classic Shares Distribution: 1.865% Classic Shares Capitalization: 1.87% Institutional B Shares Capitalization: 1.808% * The following costs have not been included in the ongoing charges: - Interest payments on loans taken out - Payments in respect of financial derivatives - Fees and charges paid directly by the investor - Any soft commissions
SOFT COMMISSIONS The management company or the appointed manager, as the case may be, is the recipient of soft commissions. The recipient has laid down an internal policy as regards accepting soft commissions and avoiding possible conflicts of interest in this respect, and has put appropriate internal controls in place to ensure this policy is observed. For more information, please see the ‘General’ section of the annual report.
Broker
Commission gross
in EUR
paid during the period:
1‐01‐13
‐
30‐06‐13
CSA Credits
in EUR
accrued during the period:
1‐01‐13
‐
30‐06‐13 Percentage
CITI 51 19 37.50%
CSFBSAS 4,451 1,070 24.05%
DEUTSCHE 124 26 21.05%
INSTINET 479 180 37.50%
MORGAN STANLEY 169 63 37.50%
UBSWDR 205 91 44.44%
WOOD 6,562 1,105 16.83%
FEE-SHARING AGREEMENTS AND REBATES: The management company may share its fee with the distributor, and institutional and/or professional parties. In principle, the percentage share amounts to between 35% and 60% if the distributor is an entity of KBC Group NV or to between 35% and 70% if the distributor is not an entity of KBC Group NV. However, in a small number of cases, the distributor’s fee is less than 35%. Investors may, on request, obtain more information on these cases. If the management company invests the assets of the undertaking for collective investment in units of undertakings for collective investment that are not managed by an entity of KBC Group NV, and receives a fee for doing so, it will pay this fee to the undertaking for collective investment. Fee-sharing does not affect the amount of the management fee paid by the sub-fund to the management company. This management fee is subject to the limitations laid down in the articles of association. The limitations may only be amended after approval by the general meeting of shareholders. The management company has concluded a distribution agreement with the distributor in order to facilitate the wider distribution of the sub-fund's units by using multiple distribution channels. It is in the interests of the holders of units, the sub-fund and of the distributor for the largest possible number of units to be sold and for the assets of the sub-fund to be maximised in this way. In this respect, there is therefore no question of any conflict of interest.
2.4.7 NOTES TO THE FINANCIAL STATEMENTS AND OTHER DATA Fee for managing the investment portfolio: 1.6% per annum calculated on the basis of the average total net assets of the sub-fund, no management fee is charged on assets assets invested in investment undertakings managed by a financial institution of the KBC group.
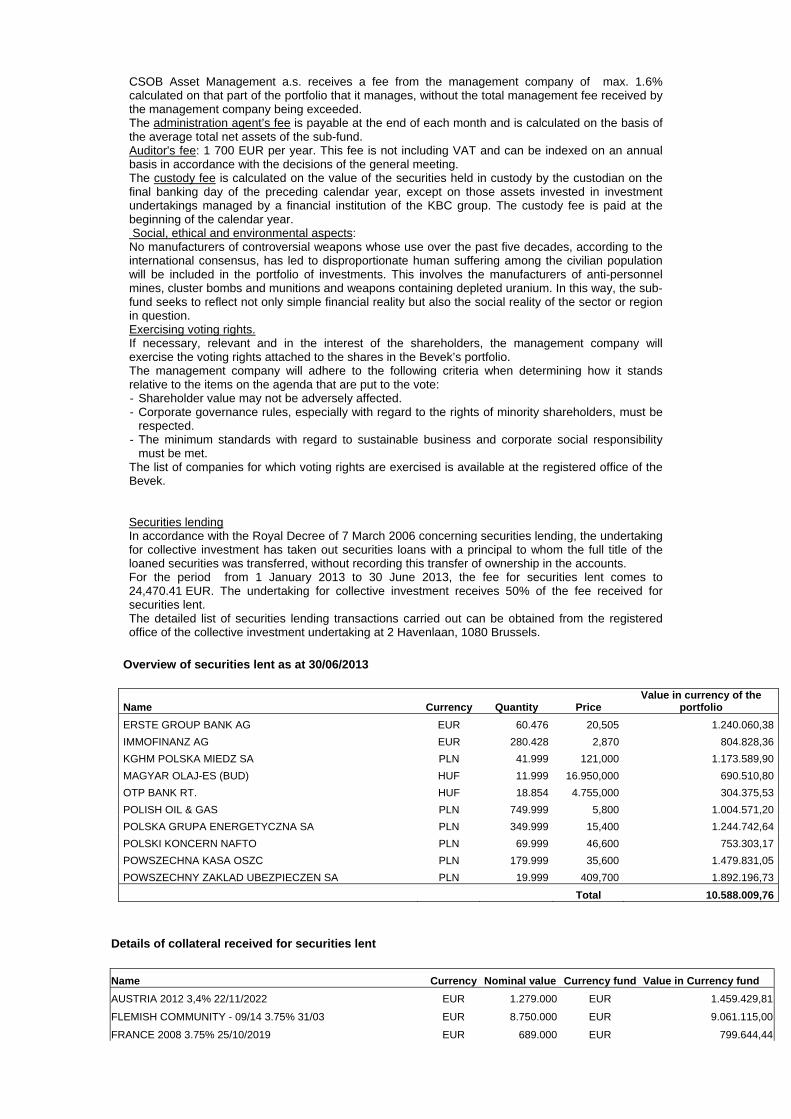
CSOB Asset Management a.s. receives a fee from the management company of max. 1.6% calculated on that part of the portfolio that it manages, without the total management fee received by the management company being exceeded. The administration agent’s fee is payable at the end of each month and is calculated on the basis of the average total net assets of the sub-fund. Auditor's fee: 1 700 EUR per year. This fee is not including VAT and can be indexed on an annual basis in accordance with the decisions of the general meeting. The custody fee is calculated on the value of the securities held in custody by the custodian on the final banking day of the preceding calendar year, except on those assets invested in investment undertakings managed by a financial institution of the KBC group. The custody fee is paid at the beginning of the calendar year. Social, ethical and environmental aspects: No manufacturers of controversial weapons whose use over the past five decades, according to the international consensus, has led to disproportionate human suffering among the civilian population will be included in the portfolio of investments. This involves the manufacturers of anti-personnel mines, cluster bombs and munitions and weapons containing depleted uranium. In this way, the sub-fund seeks to reflect not only simple financial reality but also the social reality of the sector or region in question. Exercising voting rights. If necessary, relevant and in the interest of the shareholders, the management company will exercise the voting rights attached to the shares in the Bevek’s portfolio. The management company will adhere to the following criteria when determining how it stands relative to the items on the agenda that are put to the vote: - Shareholder value may not be adversely affected. - Corporate governance rules, especially with regard to the rights of minority shareholders, must be
respected. - The minimum standards with regard to sustainable business and corporate social responsibility
must be met. The list of companies for which voting rights are exercised is available at the registered office of the Bevek. Securities lending In accordance with the Royal Decree of 7 March 2006 concerning securities lending, the undertaking for collective investment has taken out securities loans with a principal to whom the full title of the loaned securities was transferred, without recording this transfer of ownership in the accounts. For the period from 1 January 2013 to 30 June 2013, the fee for securities lent comes to 24,470.41 EUR. The undertaking for collective investment receives 50% of the fee received for securities lent. The detailed list of securities lending transactions carried out can be obtained from the registered office of the collective investment undertaking at 2 Havenlaan, 1080 Brussels.
Overview of securities lent as at 30/06/2013
Name Currency Quantity Price Value in currency of the
portfolio
ERSTE GROUP BANK AG EUR 60.476 20,505 1.240.060,38
IMMOFINANZ AG EUR 280.428 2,870 804.828,36
KGHM POLSKA MIEDZ SA PLN 41.999 121,000 1.173.589,90
MAGYAR OLAJ-ES (BUD) HUF 11.999 16.950,000 690.510,80
OTP BANK RT. HUF 18.854 4.755,000 304.375,53
POLISH OIL & GAS PLN 749.999 5,800 1.004.571,20
POLSKA GRUPA ENERGETYCZNA SA PLN 349.999 15,400 1.244.742,64
POLSKI KONCERN NAFTO PLN 69.999 46,600 753.303,17
POWSZECHNA KASA OSZC PLN 179.999 35,600 1.479.831,05
POWSZECHNY ZAKLAD UBEZPIECZEN SA PLN 19.999 409,700 1.892.196,73
Total 10.588.009,76
Details of collateral received for securities lent
Name Currency Nominal value Currency fund Value in Currency fund
AUSTRIA 2012 3,4% 22/11/2022 EUR 1.279.000 EUR 1.459.429,81
FLEMISH COMMUNITY - 09/14 3.75% 31/03 EUR 8.750.000 EUR 9.061.115,00
FRANCE 2008 3.75% 25/10/2019 EUR 689.000 EUR 799.644,44
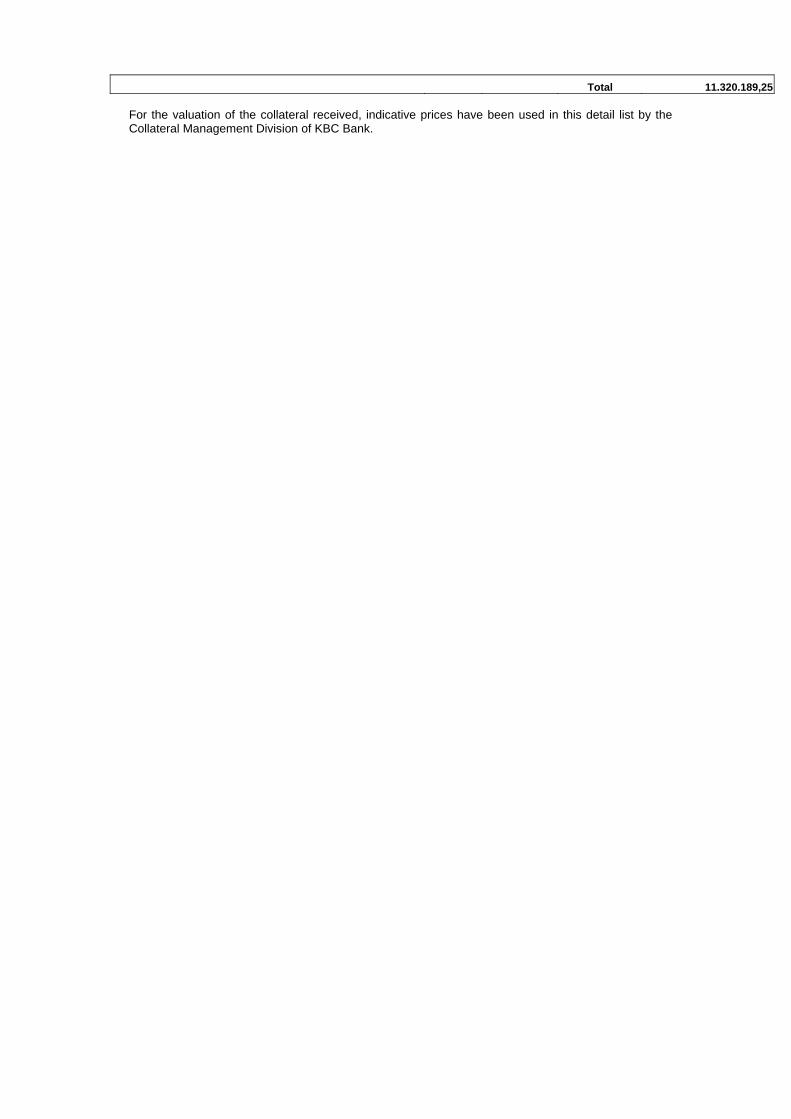
Total 11.320.189,25 For the valuation of the collateral received, indicative prices have been used in this detail list by the Collateral Management Division of KBC Bank.

Semi-Annual report as at 30th June 2013
TABLE OF CONTENTS
2. Information on KBC Equity Fund Quant Global 1
2.1. Management report 2.1.1. Launch date and subscription price 2.1.2. Stock exchange listing 2.1.3. Aim and distinctive features of the investment policy 2.1.4. Financial portfolio management 2.1.5. Distributors 2.1.6. Index and benchmark 2.1.7. Policy conducted during the financial year 2.1.8. Future policy 2.1.9. Synthetic risk and reward indicator (SRRI)
2.2. Balance sheet
2.3. Profit and loss account
2.4. Composition of the assets and key figures
2.4.1. Composition of the assets 2.4.2. Change in the composition of the assets 2.4.3. Value of commitments in respect of financial derivatives positions 2.4.4. Evolution of the number of subscriptions, repayments and the net asset value 2.4.5. Return figures 2.4.6. Expenses 2.4.7. Notes to the financial statements and other data


2 INFORMATION ON KBC EQUITY FUND QUANT GLOBAL 1
2.1 MANAGEMENT REPORT
2.1.1 LAUNCH DATE AND SUBSCRIPTION PRICE Classic Shares : Launch date: 31 October 2002 Initial subscription price: 2500 EUR Currency: EUR Institutional B Shares : Launch date: 25 November 2011 Initial subscription price: 2738.66 EUR Currency: EUR
2.1.2 STOCK EXCHANGE LISTING Not applicable.
2.1.3 GOAL AND KEY PRINCIPLES OF THE INVESTMENT POLICY
SUB-FUND’S OBJECT: The main objective of this sub-fund is to generate the highest possible return for its shareholders by investing directly or indirectly in transferable securities. This is reflected in its pursuit of capital gains and income. To this end, the assets are invested, either directly or indirectly via correlated financial instruments, primarily in shares.
SUB-FUND’S INVESTMENT POLICY:
PERMITTED ASSET CLASSES: The sub-fund may invest in securities, money market instruments, units in undertakings for collective investment, deposits, financial derivatives, liquid assets and all other instruments insofar as permitted by the applicable laws and regulations and consistent with the sub-fund’s object The sub-fund shall invest no more than 10% of its assets in units of other undertakings for collective investment.
RESTRICTIONS OF THE INVESTMENT POLICY: The investment policy will be implemented within the limits set by law and regulations. The sub-fund may borrow up to 10% of its net assets, insofar as these are short-term borrowings aimed at solving temporary liquidity problems.
PERMITTED DERIVATIVES TRANSACTIONS: Derivates may be used either for hedging purposes or to achieve investment objectives. Changes will be made to the investments at regular intervals to comply with the sub-fund's investment strategy. In addition, listed and unlisted derivates may be used to achieve the objectives: these may be forward contracts, options or swaps on securities, indices, currencies or interest rates or other transactions involving derivatives. Unlisted derivatives transactions will only be concluded with prime financial institutions specialised in such transactions. Such derivatives may also be used to hedge the assets against exchange-rate fluctuations. Subject to the applicable laws and regulations and the articles of association, the sub-fund always seeks to conclude the most effective transactions. All costs associated with the transactions will be charged to the sub-fund and all income generated will be paid to the sub-fund. If the transactions result in a risk in respect of the counterparty, this risk can be hedged by using a margin management system that ensures that the sub-fund is the beneficiary of security (collateral) in the form of cash or investment grade bonds. When calculating the value of the bonds, a margin will be applied that varies depending on the residual term to maturity and the currency in which the bond in question is denominated. The relationship with the counterparty or counterparties is governed by standard international agreements.
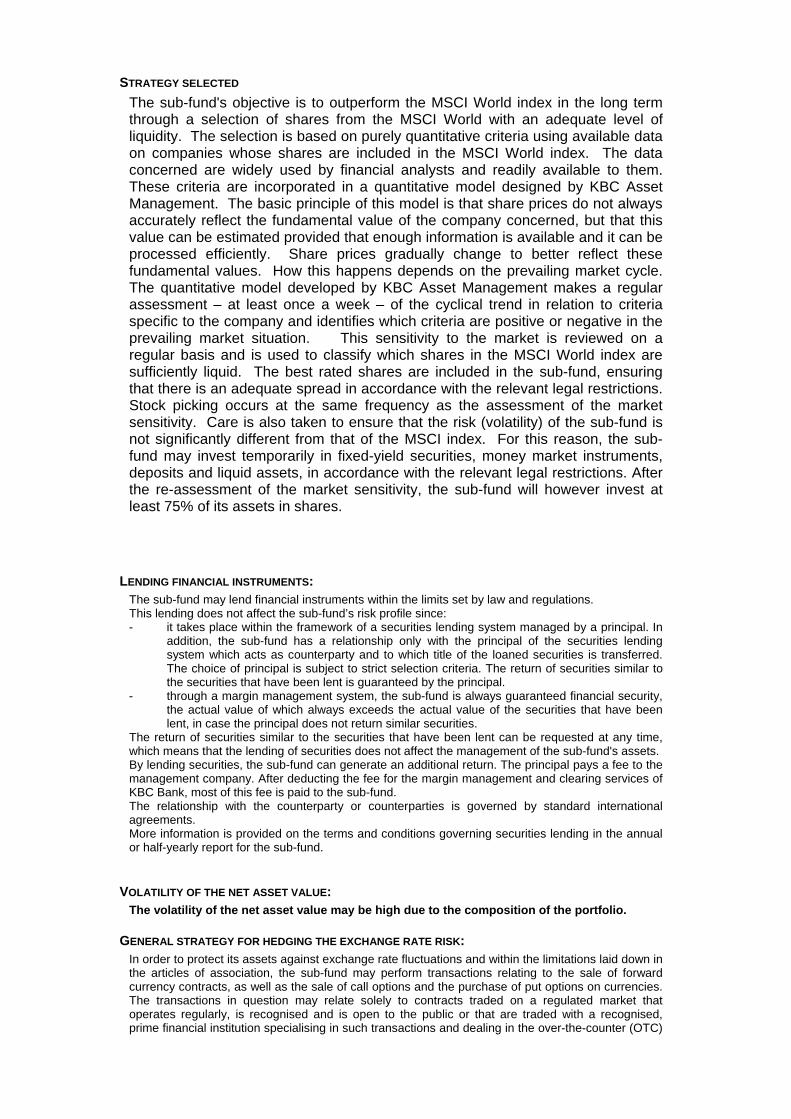
STRATEGY SELECTED
The sub-fund's objective is to outperform the MSCI World index in the long term through a selection of shares from the MSCI World with an adequate level of liquidity. The selection is based on purely quantitative criteria using available data on companies whose shares are included in the MSCI World index. The data concerned are widely used by financial analysts and readily available to them. These criteria are incorporated in a quantitative model designed by KBC Asset Management. The basic principle of this model is that share prices do not always accurately reflect the fundamental value of the company concerned, but that this value can be estimated provided that enough information is available and it can be processed efficiently. Share prices gradually change to better reflect these fundamental values. How this happens depends on the prevailing market cycle. The quantitative model developed by KBC Asset Management makes a regular assessment – at least once a week – of the cyclical trend in relation to criteria specific to the company and identifies which criteria are positive or negative in the prevailing market situation. This sensitivity to the market is reviewed on a regular basis and is used to classify which shares in the MSCI World index are sufficiently liquid. The best rated shares are included in the sub-fund, ensuring that there is an adequate spread in accordance with the relevant legal restrictions. Stock picking occurs at the same frequency as the assessment of the market sensitivity. Care is also taken to ensure that the risk (volatility) of the sub-fund is not significantly different from that of the MSCI index. For this reason, the sub-fund may invest temporarily in fixed-yield securities, money market instruments, deposits and liquid assets, in accordance with the relevant legal restrictions. After the re-assessment of the market sensitivity, the sub-fund will however invest at least 75% of its assets in shares.
LENDING FINANCIAL INSTRUMENTS: The sub-fund may lend financial instruments within the limits set by law and regulations. This lending does not affect the sub-fund’s risk profile since: - it takes place within the framework of a securities lending system managed by a principal. In
addition, the sub-fund has a relationship only with the principal of the securities lending system which acts as counterparty and to which title of the loaned securities is transferred. The choice of principal is subject to strict selection criteria. The return of securities similar to the securities that have been lent is guaranteed by the principal.
- through a margin management system, the sub-fund is always guaranteed financial security, the actual value of which always exceeds the actual value of the securities that have been lent, in case the principal does not return similar securities.
The return of securities similar to the securities that have been lent can be requested at any time, which means that the lending of securities does not affect the management of the sub-fund's assets. By lending securities, the sub-fund can generate an additional return. The principal pays a fee to the management company. After deducting the fee for the margin management and clearing services of KBC Bank, most of this fee is paid to the sub-fund. The relationship with the counterparty or counterparties is governed by standard international agreements. More information is provided on the terms and conditions governing securities lending in the annual or half-yearly report for the sub-fund.
VOLATILITY OF THE NET ASSET VALUE: The volatility of the net asset value may be high due to the composition of the portfolio.
GENERAL STRATEGY FOR HEDGING THE EXCHANGE RATE RISK: In order to protect its assets against exchange rate fluctuations and within the limitations laid down in the articles of association, the sub-fund may perform transactions relating to the sale of forward currency contracts, as well as the sale of call options and the purchase of put options on currencies. The transactions in question may relate solely to contracts traded on a regulated market that operates regularly, is recognised and is open to the public or that are traded with a recognised, prime financial institution specialising in such transactions and dealing in the over-the-counter (OTC)
market in options. With the same objective, the sub-fund may also sell currencies forward or exchange them in private transactions with prime financial institutions specialising in such transactions. The hedging objective of the aforementioned transactions suggests that there is a direct link between these transactions and the assets to be hedged, which implies that the transactions carried out in a particular currency may in principle not exceed, in terms of volume, either the valuation value of all the assets in the same currency or the holding period of those assets.
SOCIAL, ETHICAL AND ENVIRONMENTAL ASPECTS:
No manufacturers of controversial weapons whose use over the past five decades, according to the international consensus, has led to disproportionate human suffering among the civilian population will be included in the portfolio of investments. This involves the manufacturers of anti-personnel mines, cluster bombs and munitions and weapons containing depleted uranium. In this way, the sub-fund seeks to reflect not only simple financial reality but also the social reality of the sector or region in question.
THE EUROPEAN SAVINGS DIRECTIVE AND TAX ON DEBT CLAIM RETURNS OBTAINED THROUGH THE
REDEMPTION OF OWN UNITS OR IN THE EVENT OF FULL OR PARTIAL DISTRIBUTION OF EQUITY
CAPITAL. The following information is of a general character and is not intended to cover all aspects of an investment in a UCITS. In certain cases entirely different rules might even apply. Moreover, both tax law and the interpretation of it can change. Investors who wish to have more information about the tax implications – in both Belgium and abroad – of acquiring, holding and transferring units should seek the advice of their usual financial and tax advisers. This UCITS can invest some or all of its assets directly or indirectly in debt instruments as intended by the European Savings Directive. The debt instrument percentage is determined based on a periodic asset test: every six months the composition of the portfolio is examined, the debt instrument percentage calculated and the average taken of the debt instrument percentages calculated in this way. The average percentage obtained in this way continues to apply for 12 months calculated from the first day of the fifth month following the closure of the financial year. For the results of this periodic asset test, see: www.kbcam.be/assettest. A. European Savings Directive (Directive 2003/48/EC) The European Savings Directive has been implemented in Belgium. Dividends If the UCITS has invested more than 15% of its assets directly or indirectly in debt instruments, a paying agency based in Belgium that pays dividends (coupons) of this UCITS to a natural person (beneficial owner) who is resident in another EU member state (or one of the dependent or associated territories) is obliged to communicate details of this payment to the Belgian government, which will then pass on the information to the tax authorities in the beneficial owner’s state of residence. Income realised on the sale, redemption or repayment of shares If the UCITS has invested more than 25% of its assets directly or indirectly in debt instruments, the interest income realised on the sale, redemption or repayment of the shares falls within the area of application of the European Savings Directive. If that is the case, a paying agency based in Belgium that pays this interest income to a natural person (beneficial owner) who is resident in another EU member state (or one of the dependent or associated territories) is obliged to communicate details of this payment to the Belgian government, which will then pass on the information to the tax authorities in the beneficial owner’s state of residence. B. Tax on debt claim returns obtained through the redemption of own units or in the event of full or partial distribution of equity capital (Article 19bis Income Tax Code 1992). If the UCITS has invested more than 25% of its assets directly or indirectly in debt instruments, both the capitalisation and dividend-entitled shares of the UCITS will fall on redemption or full or partial distribution of the equity capital within the area of application of Article 19bis of the 1992 Income Tax Code. The tax levied under Article 19bis of the 1992 Income Tax Code only applies to shareholders subject to Belgian personal income tax. On the basis of that article, tax will be levied on the debt instrument
returns included in the redemption price, this according to the period in which the shareholder held the shares. The rate is 25%. The debt instrument return comprises the totality of the income arising directly or indirectly, in the form of interest, capital gains or losses, from the income on the assets that were invested in debt instruments.
2.1.4 FINANCIAL PORTFOLIO MANAGEMENT The management company has delegated the intellectual management, to KBC Fund Management Limited, Joshua Dawson House, Dawson Street , Dublin 2, IRELAND..
2.1.5 DISTRIBUTORS KBC Asset Management S.A., 5, Place de la Gare, L-1616 Luxembourg.
2.1.6 INDEX AND BENCHMARK See ‘Sub-fund’s investment policy’.
2.1.7 POLICY PERSUED DURING THE FINANCIAL YEAR KBC Equity Fund Quant Global 1 invests in a diverse selection of companies using proprietary quantitative model. The fund invests in global developed markets. Over the first half of 2013 the fund produced a positive return, outperforming its benchmark the MSCI World benchmark. 1 January – 30 June 2013 Doubts about the sustainability of the economic recovery continued to shape investor sentiment. The debt crisis in Europe continued unabated, although the European Central Bank (ECB) managed to convince the market that it had the crisis under control. Major steps were taken in the United States to reform the federal budget, seemingly without adversely affecting economic growth too much. Fortunately, strong economic growth in Asia created export opportunities for American and European businesses. In the US, the rate of employment growth remained on the thin side for some considerable time. The situation began to improve in the recent reporting period, with the result that the jobless rate has declined more markedly. Pay has remained virtually flat, barely rising ahead of inflation. Taken together, these two factors ensured that household purchasing power only grew to a very limited extent and so contributed very modestly to economic growth. The weak growth in the Western economies was not without its impact on the export performance in emerging countries. In recent years, however, domestic demand (due to a rapidly growing middle class with a high consumption rate) and intra-regional trade within Asia have been playing an increasingly important role. The region is better armed to deal with financial crises than it was in the past. Public finances are healthy, the balance of payments is generally neutral. Asia’s economic development no longer depends on fickle foreign capital. Thanks to the contribution by the emerging markets the growth of world GDP held up in 2012–13 (estimated at 2–2.5%). Public finances have gone off the rails not only in the EMU, but also in the UK and the US. The budget debate in the US had reached a political impasse. Decisions were postponed, and so 31 December 2012 became an important deadline. A whole series of tax cuts and other temporary support measures from the past would then lapse. In total these involved a sum of 550 billion USD. Extending all the measures again was not feasible in budgetary terms, while allowing them all to expire was economic suicide. The fiscal cliff was averted on 1 January 2013 by means of an agreement in Congress: half the stimulus measures were made permanent or were extended for a further twelve months, while the other half lapsed. This has not been the only measure involving tightening of budgetary policy in 2013: on 1 March, automatic spending cuts came into effect under which Federal expenditure will be pruned by 85 billion USD each year for a period of ten years. Since no budget has been approved in the current financial year, the federal administrations have only been assigned budgets equal to the expenditure in the previous financial year. Mario Draghi took the helm at the ECB on 1 November 2011 and has favoured monetary easing by lowering the ECB’s key rate is 0.50%. This interest rate policy failed to place the economic recovery on a sustainable basis. The Fed therefore explored the scope for other measures, intervening directly on the bond markets and buying up large amounts of debt paper in an attempt to keep the long-term rate low, as well. The ECB dragged its feet, and only followed the Fed’s example much later. The intensification of the euro crisis in fact left the ECB no other choice. In a year marked by problems in keeping the EMU from imploding, the EUR/USD exchange rate was no more volatile than at other times. The euro was trading at USD 1.30 at the end of June 2013, which is roughly the same rate as 2012 year-end. The dollar’s image as the global reserve currency suffered as a result of QE2, QE3 and TWIST. In terms of markets, Japan was ultimately an outperformer, despite the steep depreciation of the yen. The winds of change have been blowing through Tokyo since the advent of the Abe government in December. The prospect of fresh tax stimuli, a cheaper yen and large-scale money creation have contributed to an atmosphere of optimism about the economy, something very rare in this country, which has been struggling with defeatism for many years. The emerging regions performed downright badly. The Asian emerging markets were unable to capitalise on their role as the growth engine of the world economy. Confidence indicators began to decline in mid-2012, breaking through barriers that pointed to a serious economic slowdown. That failed to materialise but it was sufficient to perpetuate the doubts concerning the growth narrative in the region. This was further exacerbated by concerns about Chinese local authority debt levels, an overheating Chinese housing market and fear of a credit crisis – especially when the Chinese interbank rate shot up to 30% within the space of a few days in June. Stock-market valuations remain favourable, especially given the high growth forecasts, sound macroeconomic balance and a banking sector that was barely – if at all – affected by the credit crisis. Latin America was hit by an economic slowdown. The link to the commodity markets is always at the fore in this region. Russia was likewise not immune to the weakness of European economic growth. Oil prices below 100 USD per barrel mean trouble for Russian state finances. The best performing sectors included Financials, Pharmaceuticals and Consumer Discretionary. Materials, Technology and Energy lagged behind. The outperformance of Banks may be attributed to the quantitative easing programmes undertaken by the central banks. By this we mean the Fed’s
QE3 programme, and especially the announcement by the ECB of its OMT programme, which took the heat out of the euro crisis. Pharmaceuticals had been shunned for a long time due to a lack of product innovation, patent expiry and the reforms to healthcare insurance in the US. In recent months, however, investors began to focus more on the sector’s response to these challenges: restructuring operations and the sell-off of non-strategic divisions. The car industry has risen from the ashes, in the US and the European luxury segment at least. Demand from the emerging markets is also strong, despite the slowdown in Chinese growth, where German luxury marques generate 50% of their profits. In spite of the slow growth, advertising budgets have also held up surprisingly well. Mining companies lost ground on excessive expectations concerning commodity prices. A failed stock market flotation by Facebook and the giant leaps made by Apple meant that price trends in the Technology sector differed from what might have been expected on the basis of the fundamentals. The oil companies suffered from the vagaries of the oil market, the political instability in the Middle East and frequent accidents.
2.1.8 FUTURE POLICY In the US they are in the twilight zone between recession and expansion. We are expecting US growth to remain positive but modest (around 2% y-o-y in the coming quarters) as pay increases are barely keeping pace with inflation and budgetary policy has now finally struck down the path of austerity. The fragile recovery of the housing market and corporate investment could be sustained. How strong the growth proves to be will depend largely on the dynamic of the labour market. In recent months employment in the US has grown by around 200,000 new jobs each month. This will need to continue in order to achieve +2% growth in 2013 and in 2014. Confidence indicators in Europe are well below freezing point. The budgetary plans, tighter lending policy of the banks and major uncertainty among consumers and producers will continue to depress growth. 2013 will see a contraction of GDP in Europe. Recovery is not expected until the first half of 2014. Deflation or depression scenarios, which are currently dominating bond market sentiment, are not however justified. The foundations for more sustainable growth in 2014 and beyond have been laid in recent years. US households have trimmed back their debt level significantly, the savings rate has already increased considerably and loan servicing (instalments and interest payments combined) now accounts for only 8% of household budgets (the lowest level in 15 years). Households are gradually moving towards a position where they can spend more of their money on consumption. Economic growth in Europe will remain below par. Sky-high unemployment and the euro crisis are undermining consumer confidence and the banks’ willingness to provide ready access to credit. The ECB’s monetary policy is also much less aggressive than the Fed’s. In contrast, real wage rises (however limited) will be somewhat higher in Europe than in the US. Today’s world is one of two-speed economies. The mature industrialised economies (US, Europe, Japan) still find themselves in a low-growth environment, with no underlying inflationary pressure, persistently low interest rates and runaway public finances. The picture in the emerging markets is altogether different. The strong economic growth has already created inflationary pressure in Asia. Appropriate monetary policy is therefore required. Monetary policy in China and elsewhere in Asia is highly geared to preventing asset-price inflation. Countries are not only deploying the interest-rate weapon to this end, they are also actively intervening in the credit and housing markets. Thanks to the continuing strength of the emerging markets, the global economy could post growth of 2.5–3% in 2013 and 2014. This is one of the reasons why corporate earnings could continue to grow in the coming quarters at a rate of 5–10%. The current valuation of equities continues to discount a number of very pessimistic scenarios. Based on forecast earnings for the coming 12 months, the price-earnings ratio is 14.5 for the US S&P 500 index and 11.4 for the MSCI Europe. That is 25–30% lower than the historical average. Equities are certainly dirt-cheap compared with bonds.
2.1.9 SYNTHETIC RISK AND REWARD INDICATOR Classic Shares: 6 on a scale of 1 (lowest risk) to 7 (highest risk). Institutional B Shares: 6 on a scale of 1 (lowest risk) to 7 (highest risk). The value of a share can decrease or increase and the investor may not get back the amount invested. In accordance with Commission Regulation (EU) No. 583/2010, a synthetic risk and reward indicator has been calculated. This indicator provides a quantitative measure of the sub-fund's potential return and the risk involved, calculated in the currency in which the sub-fund is denominated. It is given as a figure between 1 and 7. The higher the figure, the greater the potential return, but also the more difficult it is to predict this return. Losses are possible too. The lowest figure does not mean that the investment is entirely free of risk. However, it does indicate that, compared with the higher figures, this product will generally provide a lower, but more predictable return. The synthetic risk and reward indicator is assessed regularly and can therefore go up or down based on data from the past. Data from the past is not always a reliable indicator of future risk and return.
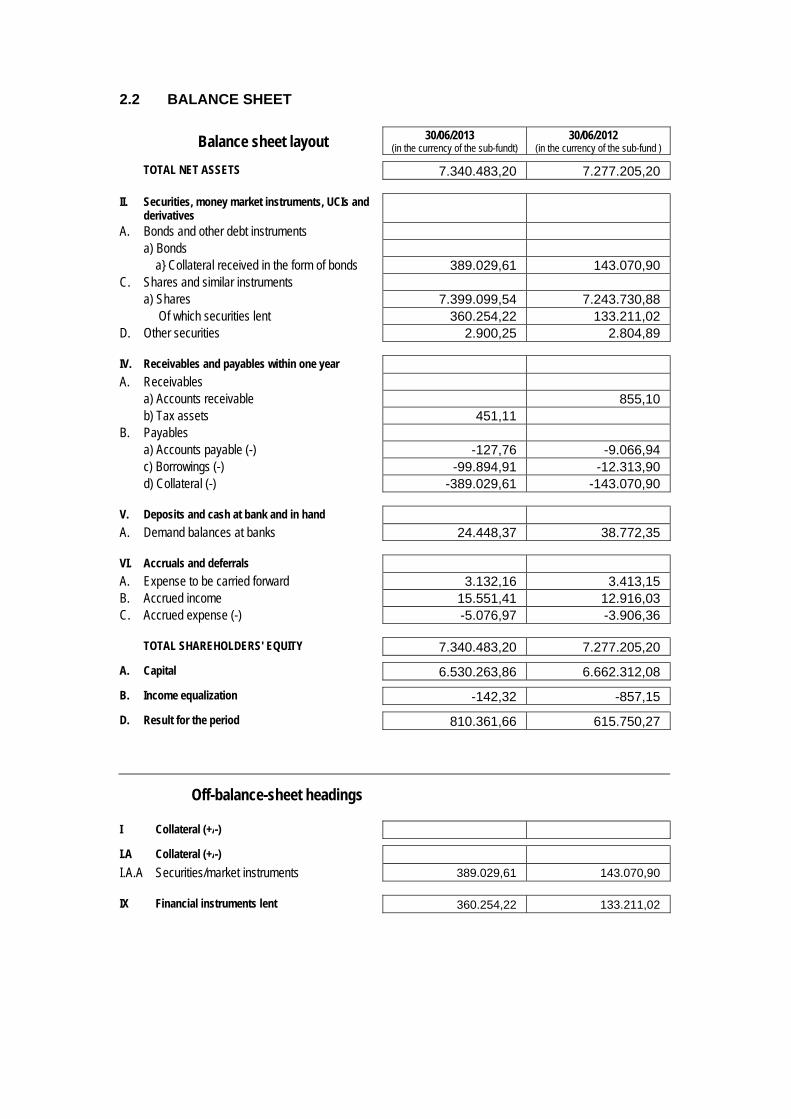
2.2 BALANCE SHEET
Balance sheet layout 30/06/2013 (in the currency of the sub-fundt)
30/06/2012 (in the currency of the sub-fund )
TOTAL NET ASSETS 7.340.483,20 7.277.205,20
II. Securities, money market instruments, UCIs and derivatives
A. Bonds and other debt instruments a) Bonds a} Collateral received in the form of bonds 389.029,61 143.070,90 C. Shares and similar instruments a) Shares 7.399.099,54 7.243.730,88 Of which securities lent 360.254,22 133.211,02 D. Other securities 2.900,25 2.804,89
IV. Receivables and payables within one year A. Receivables a) Accounts receivable 855,10 b) Tax assets 451,11 B. Payables a) Accounts payable (-) -127,76 -9.066,94 c) Borrowings (-) -99.894,91 -12.313,90 d) Collateral (-) -389.029,61 -143.070,90
V. Deposits and cash at bank and in hand A. Demand balances at banks 24.448,37 38.772,35
VI. Accruals and deferrals A. Expense to be carried forward 3.132,16 3.413,15 B. Accrued income 15.551,41 12.916,03 C. Accrued expense (-) -5.076,97 -3.906,36
TOTAL SHAREHOLDERS' EQUITY 7.340.483,20 7.277.205,20
A. Capital 6.530.263,86 6.662.312,08
B. Income equalization -142,32 -857,15
D. Result for the period 810.361,66 615.750,27
Off-balance-sheet headings
I Collateral (+/-)
I.A Collateral (+/-)
I.A.A Securities/market instruments 389.029,61 143.070,90
IX Financial instruments lent 360.254,22 133.211,02
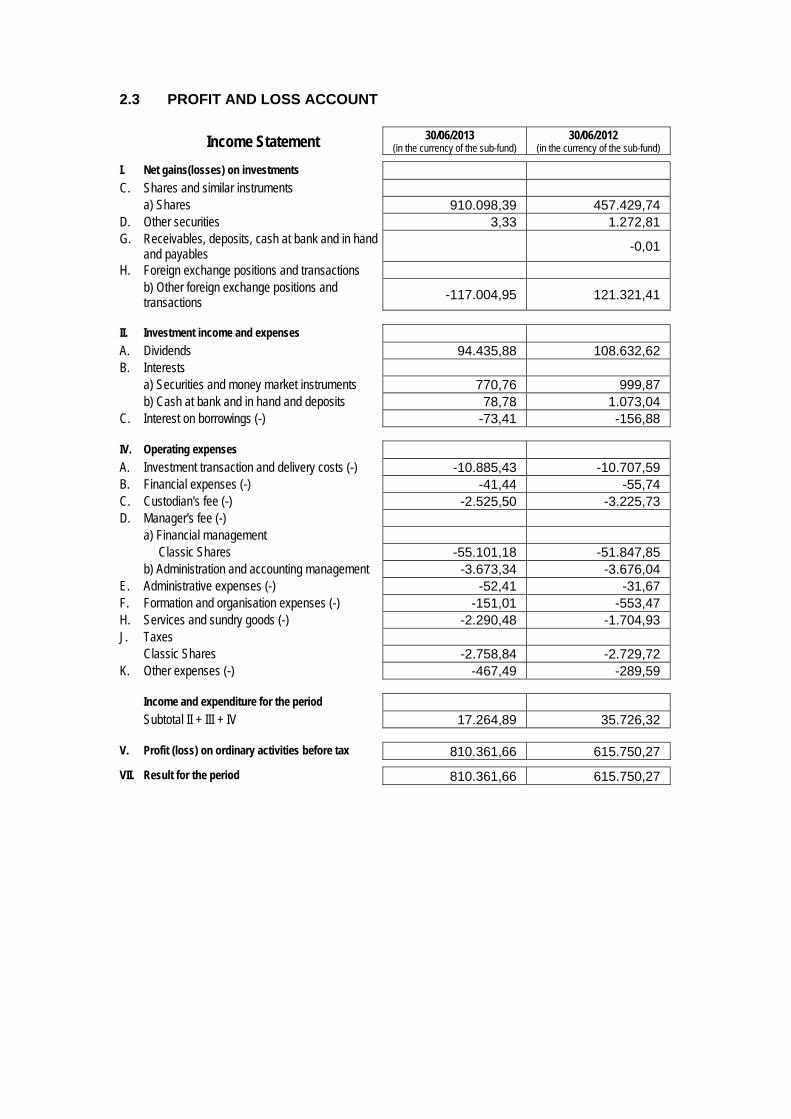
2.3 PROFIT AND LOSS ACCOUNT
Income Statement 30/06/2013 (in the currency of the sub-fund)
30/06/2012 (in the currency of the sub-fund)
I. Net gains(losses) on investments C. Shares and similar instruments a) Shares 910.098,39 457.429,74 D. Other securities 3,33 1.272,81 G. Receivables, deposits, cash at bank and in hand
and payables -0,01
H. Foreign exchange positions and transactions b) Other foreign exchange positions and
transactions -117.004,95 121.321,41
II. Investment income and expenses A. Dividends 94.435,88 108.632,62 B. Interests a) Securities and money market instruments 770,76 999,87 b) Cash at bank and in hand and deposits 78,78 1.073,04 C. Interest on borrowings (-) -73,41 -156,88
IV. Operating expenses A. Investment transaction and delivery costs (-) -10.885,43 -10.707,59 B. Financial expenses (-) -41,44 -55,74 C. Custodian's fee (-) -2.525,50 -3.225,73 D. Manager's fee (-) a) Financial management Classic Shares -55.101,18 -51.847,85 b) Administration and accounting management -3.673,34 -3.676,04 E. Administrative expenses (-) -52,41 -31,67 F. Formation and organisation expenses (-) -151,01 -553,47 H. Services and sundry goods (-) -2.290,48 -1.704,93 J. Taxes Classic Shares -2.758,84 -2.729,72 K. Other expenses (-) -467,49 -289,59
Income and expenditure for the period Subtotal II + III + IV 17.264,89 35.726,32
V. Profit (loss) on ordinary activities before tax 810.361,66 615.750,27
VII. Result for the period 810.361,66 615.750,27
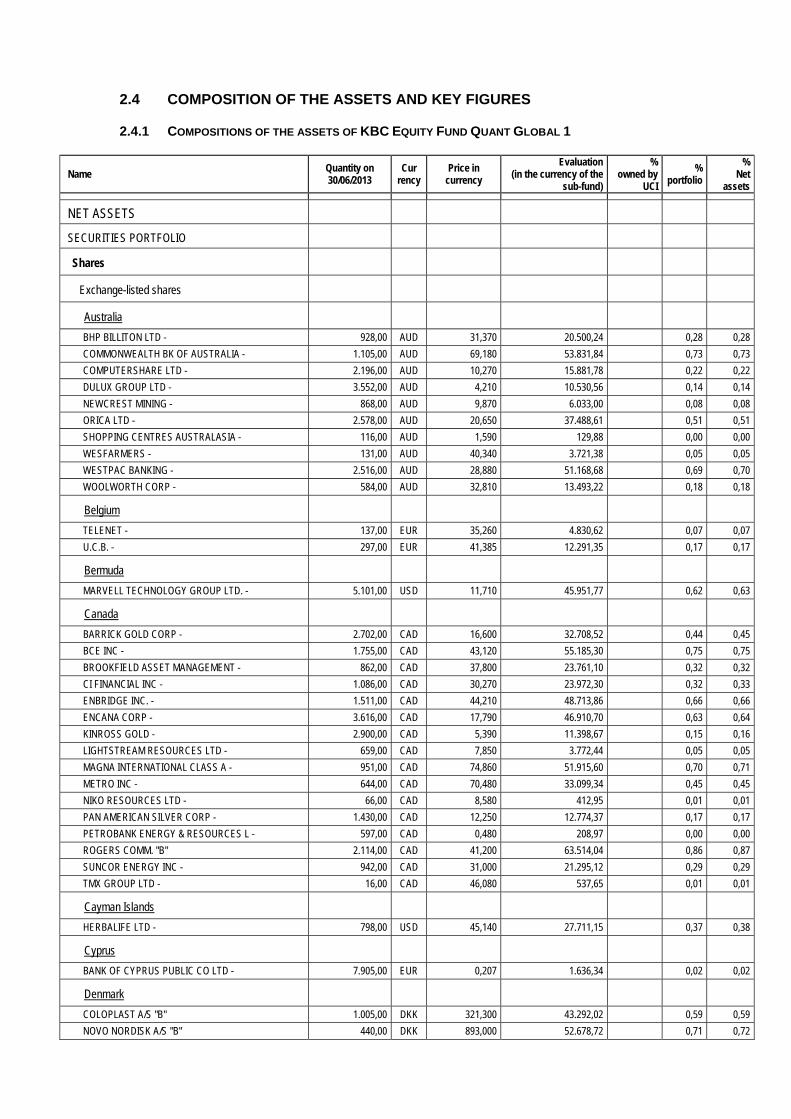
2.4 COMPOSITION OF THE ASSETS AND KEY FIGURES
2.4.1 COMPOSITIONS OF THE ASSETS OF KBC EQUITY FUND QUANT GLOBAL 1
Name Quantity on 30/06/2013
Cur rency
Price in currency
Evaluation (in the currency of the
sub-fund)
% owned by
UCI
% portfolio
% Net
assets
NET ASSETS
SECURITIES PORTFOLIO
Shares
Exchange-listed shares
Australia
BHP BILLITON LTD - 928,00 AUD 31,370 20.500,24 0,28 0,28
COMMONWEALTH BK OF AUSTRALIA - 1.105,00 AUD 69,180 53.831,84 0,73 0,73
COMPUTERSHARE LTD - 2.196,00 AUD 10,270 15.881,78 0,22 0,22
DULUX GROUP LTD - 3.552,00 AUD 4,210 10.530,56 0,14 0,14
NEWCREST MINING - 868,00 AUD 9,870 6.033,00 0,08 0,08
ORICA LTD - 2.578,00 AUD 20,650 37.488,61 0,51 0,51
SHOPPING CENTRES AUSTRALASIA - 116,00 AUD 1,590 129,88 0,00 0,00
WESFARMERS - 131,00 AUD 40,340 3.721,38 0,05 0,05
WESTPAC BANKING - 2.516,00 AUD 28,880 51.168,68 0,69 0,70
WOOLWORTH CORP - 584,00 AUD 32,810 13.493,22 0,18 0,18
Belgium
TELENET - 137,00 EUR 35,260 4.830,62 0,07 0,07
U.C.B. - 297,00 EUR 41,385 12.291,35 0,17 0,17
Bermuda
MARVELL TECHNOLOGY GROUP LTD. - 5.101,00 USD 11,710 45.951,77 0,62 0,63
Canada
BARRICK GOLD CORP - 2.702,00 CAD 16,600 32.708,52 0,44 0,45
BCE INC - 1.755,00 CAD 43,120 55.185,30 0,75 0,75
BROOKFIELD ASSET MANAGEMENT - 862,00 CAD 37,800 23.761,10 0,32 0,32
CI FINANCIAL INC - 1.086,00 CAD 30,270 23.972,30 0,32 0,33
ENBRIDGE INC. - 1.511,00 CAD 44,210 48.713,86 0,66 0,66
ENCANA CORP - 3.616,00 CAD 17,790 46.910,70 0,63 0,64
KINROSS GOLD - 2.900,00 CAD 5,390 11.398,67 0,15 0,16
LIGHTSTREAM RESOURCES LTD - 659,00 CAD 7,850 3.772,44 0,05 0,05
MAGNA INTERNATIONAL CLASS A - 951,00 CAD 74,860 51.915,60 0,70 0,71
METRO INC - 644,00 CAD 70,480 33.099,34 0,45 0,45
NIKO RESOURCES LTD - 66,00 CAD 8,580 412,95 0,01 0,01
PAN AMERICAN SILVER CORP - 1.430,00 CAD 12,250 12.774,37 0,17 0,17
PETROBANK ENERGY & RESOURCES L - 597,00 CAD 0,480 208,97 0,00 0,00
ROGERS COMM. "B" 2.114,00 CAD 41,200 63.514,04 0,86 0,87
SUNCOR ENERGY INC - 942,00 CAD 31,000 21.295,12 0,29 0,29
TMX GROUP LTD - 16,00 CAD 46,080 537,65 0,01 0,01
Cayman Islands
HERBALIFE LTD - 798,00 USD 45,140 27.711,15 0,37 0,38
Cyprus
BANK OF CYPRUS PUBLIC CO LTD - 7.905,00 EUR 0,207 1.636,34 0,02 0,02
Denmark
COLOPLAST A/S "B" 1.005,00 DKK 321,300 43.292,02 0,59 0,59
NOVO NORDISK A/S "B" 440,00 DKK 893,000 52.678,72 0,71 0,72
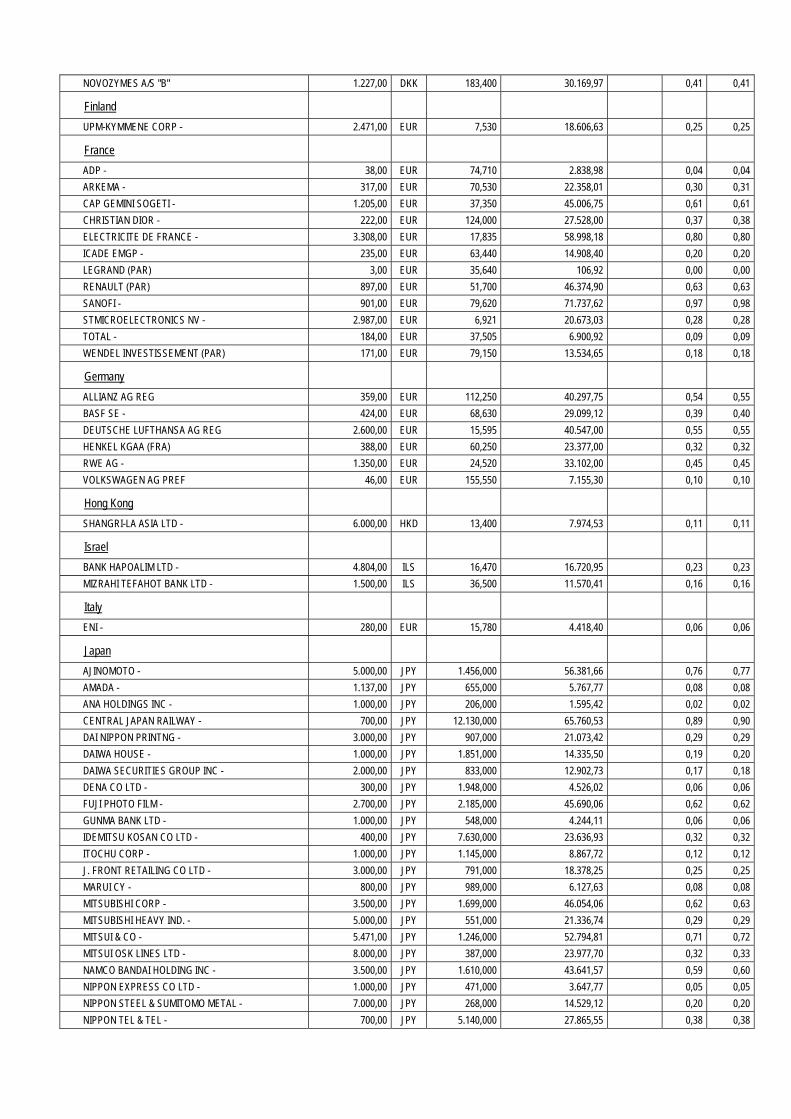
NOVOZYMES A/S "B" 1.227,00 DKK 183,400 30.169,97 0,41 0,41
Finland
UPM-KYMMENE CORP - 2.471,00 EUR 7,530 18.606,63 0,25 0,25
France
ADP - 38,00 EUR 74,710 2.838,98 0,04 0,04
ARKEMA - 317,00 EUR 70,530 22.358,01 0,30 0,31
CAP GEMINI SOGETI - 1.205,00 EUR 37,350 45.006,75 0,61 0,61
CHRISTIAN DIOR - 222,00 EUR 124,000 27.528,00 0,37 0,38
ELECTRICITE DE FRANCE - 3.308,00 EUR 17,835 58.998,18 0,80 0,80
ICADE EMGP - 235,00 EUR 63,440 14.908,40 0,20 0,20
LEGRAND (PAR) 3,00 EUR 35,640 106,92 0,00 0,00
RENAULT (PAR) 897,00 EUR 51,700 46.374,90 0,63 0,63
SANOFI - 901,00 EUR 79,620 71.737,62 0,97 0,98
STMICROELECTRONICS NV - 2.987,00 EUR 6,921 20.673,03 0,28 0,28
TOTAL - 184,00 EUR 37,505 6.900,92 0,09 0,09
WENDEL INVESTISSEMENT (PAR) 171,00 EUR 79,150 13.534,65 0,18 0,18
Germany
ALLIANZ AG REG 359,00 EUR 112,250 40.297,75 0,54 0,55
BASF SE - 424,00 EUR 68,630 29.099,12 0,39 0,40
DEUTSCHE LUFTHANSA AG REG 2.600,00 EUR 15,595 40.547,00 0,55 0,55
HENKEL KGAA (FRA) 388,00 EUR 60,250 23.377,00 0,32 0,32
RWE AG - 1.350,00 EUR 24,520 33.102,00 0,45 0,45
VOLKSWAGEN AG PREF 46,00 EUR 155,550 7.155,30 0,10 0,10
Hong Kong
SHANGRI-LA ASIA LTD - 6.000,00 HKD 13,400 7.974,53 0,11 0,11
Israel
BANK HAPOALIM LTD - 4.804,00 ILS 16,470 16.720,95 0,23 0,23
MIZRAHI TEFAHOT BANK LTD - 1.500,00 ILS 36,500 11.570,41 0,16 0,16
Italy
ENI - 280,00 EUR 15,780 4.418,40 0,06 0,06
Japan
AJINOMOTO - 5.000,00 JPY 1.456,000 56.381,66 0,76 0,77
AMADA - 1.137,00 JPY 655,000 5.767,77 0,08 0,08
ANA HOLDINGS INC - 1.000,00 JPY 206,000 1.595,42 0,02 0,02
CENTRAL JAPAN RAILWAY - 700,00 JPY 12.130,000 65.760,53 0,89 0,90
DAI NIPPON PRINTNG - 3.000,00 JPY 907,000 21.073,42 0,29 0,29
DAIWA HOUSE - 1.000,00 JPY 1.851,000 14.335,50 0,19 0,20
DAIWA SECURITIES GROUP INC - 2.000,00 JPY 833,000 12.902,73 0,17 0,18
DENA CO LTD - 300,00 JPY 1.948,000 4.526,02 0,06 0,06
FUJI PHOTO FILM - 2.700,00 JPY 2.185,000 45.690,06 0,62 0,62
GUNMA BANK LTD - 1.000,00 JPY 548,000 4.244,11 0,06 0,06
IDEMITSU KOSAN CO LTD - 400,00 JPY 7.630,000 23.636,93 0,32 0,32
ITOCHU CORP - 1.000,00 JPY 1.145,000 8.867,72 0,12 0,12
J. FRONT RETAILING CO LTD - 3.000,00 JPY 791,000 18.378,25 0,25 0,25
MARUI CY - 800,00 JPY 989,000 6.127,63 0,08 0,08
MITSUBISHI CORP - 3.500,00 JPY 1.699,000 46.054,06 0,62 0,63
MITSUBISHI HEAVY IND. - 5.000,00 JPY 551,000 21.336,74 0,29 0,29
MITSUI & CO - 5.471,00 JPY 1.246,000 52.794,81 0,71 0,72
MITSUI OSK LINES LTD - 8.000,00 JPY 387,000 23.977,70 0,32 0,33
NAMCO BANDAI HOLDING INC - 3.500,00 JPY 1.610,000 43.641,57 0,59 0,60
NIPPON EXPRESS CO LTD - 1.000,00 JPY 471,000 3.647,77 0,05 0,05
NIPPON STEEL & SUMITOMO METAL - 7.000,00 JPY 268,000 14.529,12 0,20 0,20
NIPPON TEL & TEL - 700,00 JPY 5.140,000 27.865,55 0,38 0,38
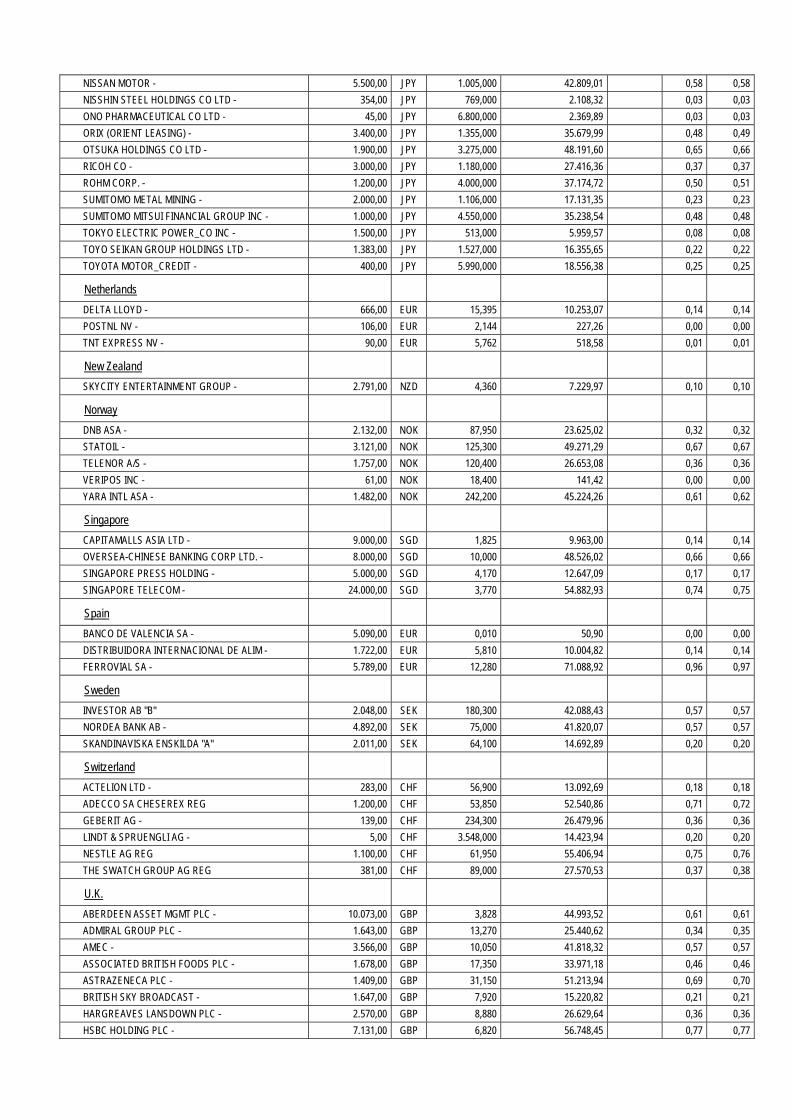
NISSAN MOTOR - 5.500,00 JPY 1.005,000 42.809,01 0,58 0,58
NISSHIN STEEL HOLDINGS CO LTD - 354,00 JPY 769,000 2.108,32 0,03 0,03
ONO PHARMACEUTICAL CO LTD - 45,00 JPY 6.800,000 2.369,89 0,03 0,03
ORIX (ORIENT LEASING) - 3.400,00 JPY 1.355,000 35.679,99 0,48 0,49
OTSUKA HOLDINGS CO LTD - 1.900,00 JPY 3.275,000 48.191,60 0,65 0,66
RICOH CO - 3.000,00 JPY 1.180,000 27.416,36 0,37 0,37
ROHM CORP. - 1.200,00 JPY 4.000,000 37.174,72 0,50 0,51
SUMITOMO METAL MINING - 2.000,00 JPY 1.106,000 17.131,35 0,23 0,23
SUMITOMO MITSUI FINANCIAL GROUP INC - 1.000,00 JPY 4.550,000 35.238,54 0,48 0,48
TOKYO ELECTRIC POWER_CO INC - 1.500,00 JPY 513,000 5.959,57 0,08 0,08
TOYO SEIKAN GROUP HOLDINGS LTD - 1.383,00 JPY 1.527,000 16.355,65 0,22 0,22
TOYOTA MOTOR_CREDIT - 400,00 JPY 5.990,000 18.556,38 0,25 0,25
Netherlands
DELTA LLOYD - 666,00 EUR 15,395 10.253,07 0,14 0,14
POSTNL NV - 106,00 EUR 2,144 227,26 0,00 0,00
TNT EXPRESS NV - 90,00 EUR 5,762 518,58 0,01 0,01
New Zealand
SKYCITY ENTERTAINMENT GROUP - 2.791,00 NZD 4,360 7.229,97 0,10 0,10
Norway
DNB ASA - 2.132,00 NOK 87,950 23.625,02 0,32 0,32
STATOIL - 3.121,00 NOK 125,300 49.271,29 0,67 0,67
TELENOR A/S - 1.757,00 NOK 120,400 26.653,08 0,36 0,36
VERIPOS INC - 61,00 NOK 18,400 141,42 0,00 0,00
YARA INTL ASA - 1.482,00 NOK 242,200 45.224,26 0,61 0,62
Singapore
CAPITAMALLS ASIA LTD - 9.000,00 SGD 1,825 9.963,00 0,14 0,14
OVERSEA-CHINESE BANKING CORP LTD. - 8.000,00 SGD 10,000 48.526,02 0,66 0,66
SINGAPORE PRESS HOLDING - 5.000,00 SGD 4,170 12.647,09 0,17 0,17
SINGAPORE TELECOM - 24.000,00 SGD 3,770 54.882,93 0,74 0,75
Spain
BANCO DE VALENCIA SA - 5.090,00 EUR 0,010 50,90 0,00 0,00
DISTRIBUIDORA INTERNACIONAL DE ALIM - 1.722,00 EUR 5,810 10.004,82 0,14 0,14
FERROVIAL SA - 5.789,00 EUR 12,280 71.088,92 0,96 0,97
Sweden
INVESTOR AB "B" 2.048,00 SEK 180,300 42.088,43 0,57 0,57
NORDEA BANK AB - 4.892,00 SEK 75,000 41.820,07 0,57 0,57
SKANDINAVISKA ENSKILDA "A" 2.011,00 SEK 64,100 14.692,89 0,20 0,20
Switzerland
ACTELION LTD - 283,00 CHF 56,900 13.092,69 0,18 0,18
ADECCO SA CHESEREX REG 1.200,00 CHF 53,850 52.540,86 0,71 0,72
GEBERIT AG - 139,00 CHF 234,300 26.479,96 0,36 0,36
LINDT & SPRUENGLI AG - 5,00 CHF 3.548,000 14.423,94 0,20 0,20
NESTLE AG REG 1.100,00 CHF 61,950 55.406,94 0,75 0,76
THE SWATCH GROUP AG REG 381,00 CHF 89,000 27.570,53 0,37 0,38
U.K.
ABERDEEN ASSET MGMT PLC - 10.073,00 GBP 3,828 44.993,52 0,61 0,61
ADMIRAL GROUP PLC - 1.643,00 GBP 13,270 25.440,62 0,34 0,35
AMEC - 3.566,00 GBP 10,050 41.818,32 0,57 0,57
ASSOCIATED BRITISH FOODS PLC - 1.678,00 GBP 17,350 33.971,18 0,46 0,46
ASTRAZENECA PLC - 1.409,00 GBP 31,150 51.213,94 0,69 0,70
BRITISH SKY BROADCAST - 1.647,00 GBP 7,920 15.220,82 0,21 0,21
HARGREAVES LANSDOWN PLC - 2.570,00 GBP 8,880 26.629,64 0,36 0,36
HSBC HOLDING PLC - 7.131,00 GBP 6,820 56.748,45 0,77 0,77
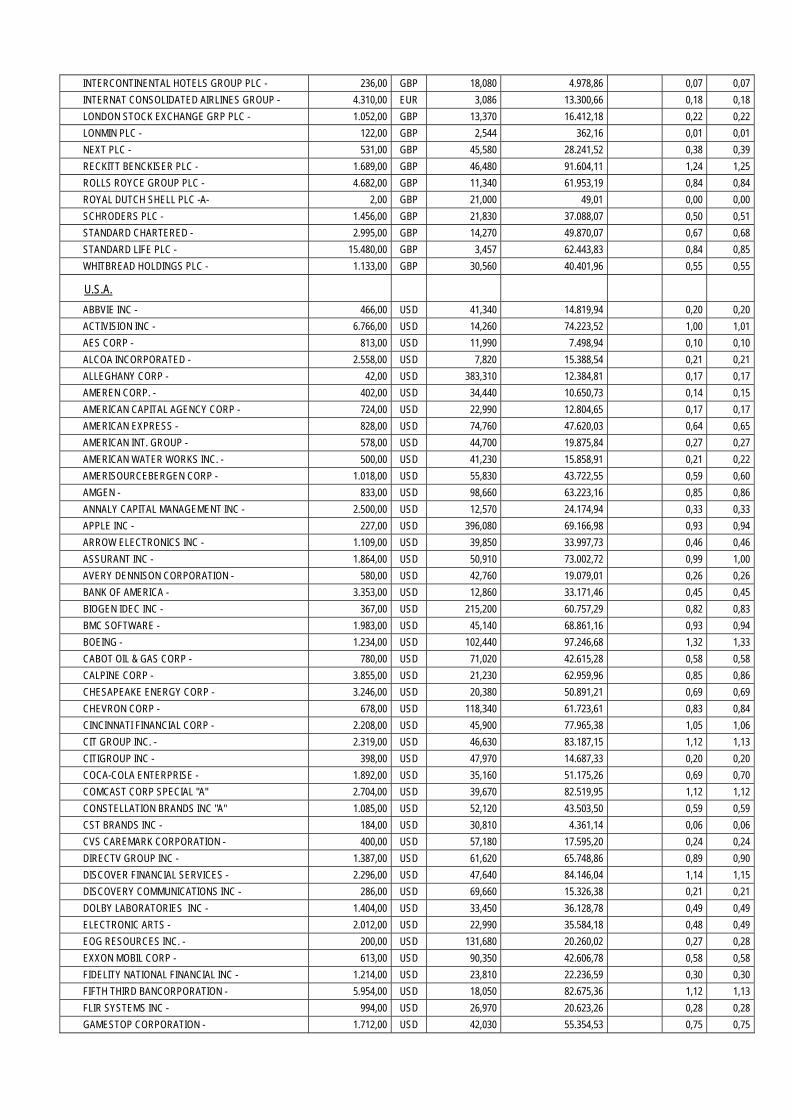
INTERCONTINENTAL HOTELS GROUP PLC - 236,00 GBP 18,080 4.978,86 0,07 0,07
INTERNAT CONSOLIDATED AIRLINES GROUP - 4.310,00 EUR 3,086 13.300,66 0,18 0,18
LONDON STOCK EXCHANGE GRP PLC - 1.052,00 GBP 13,370 16.412,18 0,22 0,22
LONMIN PLC - 122,00 GBP 2,544 362,16 0,01 0,01
NEXT PLC - 531,00 GBP 45,580 28.241,52 0,38 0,39
RECKITT BENCKISER PLC - 1.689,00 GBP 46,480 91.604,11 1,24 1,25
ROLLS ROYCE GROUP PLC - 4.682,00 GBP 11,340 61.953,19 0,84 0,84
ROYAL DUTCH SHELL PLC -A- 2,00 GBP 21,000 49,01 0,00 0,00
SCHRODERS PLC - 1.456,00 GBP 21,830 37.088,07 0,50 0,51
STANDARD CHARTERED - 2.995,00 GBP 14,270 49.870,07 0,67 0,68
STANDARD LIFE PLC - 15.480,00 GBP 3,457 62.443,83 0,84 0,85
WHITBREAD HOLDINGS PLC - 1.133,00 GBP 30,560 40.401,96 0,55 0,55
U.S.A.
ABBVIE INC - 466,00 USD 41,340 14.819,94 0,20 0,20
ACTIVISION INC - 6.766,00 USD 14,260 74.223,52 1,00 1,01
AES CORP - 813,00 USD 11,990 7.498,94 0,10 0,10
ALCOA INCORPORATED - 2.558,00 USD 7,820 15.388,54 0,21 0,21
ALLEGHANY CORP - 42,00 USD 383,310 12.384,81 0,17 0,17
AMEREN CORP. - 402,00 USD 34,440 10.650,73 0,14 0,15
AMERICAN CAPITAL AGENCY CORP - 724,00 USD 22,990 12.804,65 0,17 0,17
AMERICAN EXPRESS - 828,00 USD 74,760 47.620,03 0,64 0,65
AMERICAN INT. GROUP - 578,00 USD 44,700 19.875,84 0,27 0,27
AMERICAN WATER WORKS INC. - 500,00 USD 41,230 15.858,91 0,21 0,22
AMERISOURCEBERGEN CORP - 1.018,00 USD 55,830 43.722,55 0,59 0,60
AMGEN - 833,00 USD 98,660 63.223,16 0,85 0,86
ANNALY CAPITAL MANAGEMENT INC - 2.500,00 USD 12,570 24.174,94 0,33 0,33
APPLE INC - 227,00 USD 396,080 69.166,98 0,93 0,94
ARROW ELECTRONICS INC - 1.109,00 USD 39,850 33.997,73 0,46 0,46
ASSURANT INC - 1.864,00 USD 50,910 73.002,72 0,99 1,00
AVERY DENNISON CORPORATION - 580,00 USD 42,760 19.079,01 0,26 0,26
BANK OF AMERICA - 3.353,00 USD 12,860 33.171,46 0,45 0,45
BIOGEN IDEC INC - 367,00 USD 215,200 60.757,29 0,82 0,83
BMC SOFTWARE - 1.983,00 USD 45,140 68.861,16 0,93 0,94
BOEING - 1.234,00 USD 102,440 97.246,68 1,32 1,33
CABOT OIL & GAS CORP - 780,00 USD 71,020 42.615,28 0,58 0,58
CALPINE CORP - 3.855,00 USD 21,230 62.959,96 0,85 0,86
CHESAPEAKE ENERGY CORP - 3.246,00 USD 20,380 50.891,21 0,69 0,69
CHEVRON CORP - 678,00 USD 118,340 61.723,61 0,83 0,84
CINCINNATI FINANCIAL CORP - 2.208,00 USD 45,900 77.965,38 1,05 1,06
CIT GROUP INC. - 2.319,00 USD 46,630 83.187,15 1,12 1,13
CITIGROUP INC - 398,00 USD 47,970 14.687,33 0,20 0,20
COCA-COLA ENTERPRISE - 1.892,00 USD 35,160 51.175,26 0,69 0,70
COMCAST CORP SPECIAL "A" 2.704,00 USD 39,670 82.519,95 1,12 1,12
CONSTELLATION BRANDS INC "A" 1.085,00 USD 52,120 43.503,50 0,59 0,59
CST BRANDS INC - 184,00 USD 30,810 4.361,14 0,06 0,06
CVS CAREMARK CORPORATION - 400,00 USD 57,180 17.595,20 0,24 0,24
DIRECTV GROUP INC - 1.387,00 USD 61,620 65.748,86 0,89 0,90
DISCOVER FINANCIAL SERVICES - 2.296,00 USD 47,640 84.146,04 1,14 1,15
DISCOVERY COMMUNICATIONS INC - 286,00 USD 69,660 15.326,38 0,21 0,21
DOLBY LABORATORIES INC - 1.404,00 USD 33,450 36.128,78 0,49 0,49
ELECTRONIC ARTS - 2.012,00 USD 22,990 35.584,18 0,48 0,49
EOG RESOURCES INC. - 200,00 USD 131,680 20.260,02 0,27 0,28
EXXON MOBIL CORP - 613,00 USD 90,350 42.606,78 0,58 0,58
FIDELITY NATIONAL FINANCIAL INC - 1.214,00 USD 23,810 22.236,59 0,30 0,30
FIFTH THIRD BANCORPORATION - 5.954,00 USD 18,050 82.675,36 1,12 1,13
FLIR SYSTEMS INC - 994,00 USD 26,970 20.623,26 0,28 0,28
GAMESTOP CORPORATION - 1.712,00 USD 42,030 55.354,53 0,75 0,75
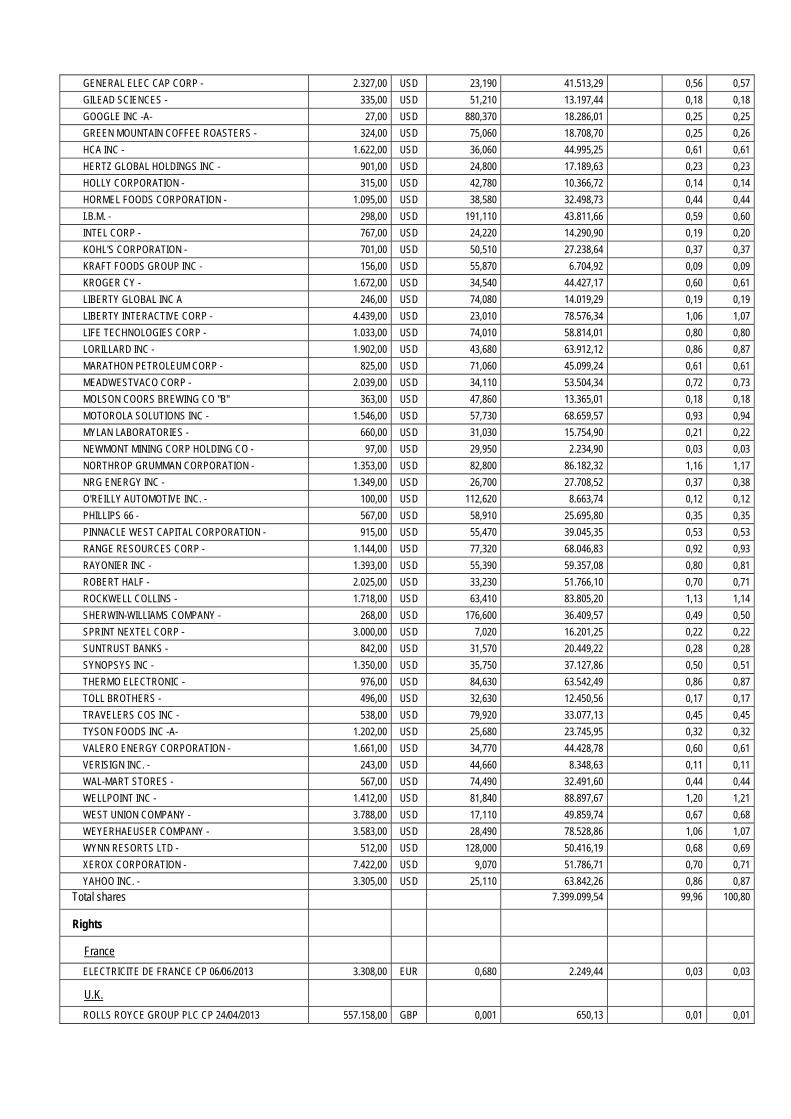
GENERAL ELEC CAP CORP - 2.327,00 USD 23,190 41.513,29 0,56 0,57
GILEAD SCIENCES - 335,00 USD 51,210 13.197,44 0,18 0,18
GOOGLE INC -A- 27,00 USD 880,370 18.286,01 0,25 0,25
GREEN MOUNTAIN COFFEE ROASTERS - 324,00 USD 75,060 18.708,70 0,25 0,26
HCA INC - 1.622,00 USD 36,060 44.995,25 0,61 0,61
HERTZ GLOBAL HOLDINGS INC - 901,00 USD 24,800 17.189,63 0,23 0,23
HOLLY CORPORATION - 315,00 USD 42,780 10.366,72 0,14 0,14
HORMEL FOODS CORPORATION - 1.095,00 USD 38,580 32.498,73 0,44 0,44
I.B.M. - 298,00 USD 191,110 43.811,66 0,59 0,60
INTEL CORP - 767,00 USD 24,220 14.290,90 0,19 0,20
KOHL'S CORPORATION - 701,00 USD 50,510 27.238,64 0,37 0,37
KRAFT FOODS GROUP INC - 156,00 USD 55,870 6.704,92 0,09 0,09
KROGER CY - 1.672,00 USD 34,540 44.427,17 0,60 0,61
LIBERTY GLOBAL INC A 246,00 USD 74,080 14.019,29 0,19 0,19
LIBERTY INTERACTIVE CORP - 4.439,00 USD 23,010 78.576,34 1,06 1,07
LIFE TECHNOLOGIES CORP - 1.033,00 USD 74,010 58.814,01 0,80 0,80
LORILLARD INC - 1.902,00 USD 43,680 63.912,12 0,86 0,87
MARATHON PETROLEUM CORP - 825,00 USD 71,060 45.099,24 0,61 0,61
MEADWESTVACO CORP - 2.039,00 USD 34,110 53.504,34 0,72 0,73
MOLSON COORS BREWING CO "B" 363,00 USD 47,860 13.365,01 0,18 0,18
MOTOROLA SOLUTIONS INC - 1.546,00 USD 57,730 68.659,57 0,93 0,94
MYLAN LABORATORIES - 660,00 USD 31,030 15.754,90 0,21 0,22
NEWMONT MINING CORP HOLDING CO - 97,00 USD 29,950 2.234,90 0,03 0,03
NORTHROP GRUMMAN CORPORATION - 1.353,00 USD 82,800 86.182,32 1,16 1,17
NRG ENERGY INC - 1.349,00 USD 26,700 27.708,52 0,37 0,38
O'REILLY AUTOMOTIVE INC. - 100,00 USD 112,620 8.663,74 0,12 0,12
PHILLIPS 66 - 567,00 USD 58,910 25.695,80 0,35 0,35
PINNACLE WEST CAPITAL CORPORATION - 915,00 USD 55,470 39.045,35 0,53 0,53
RANGE RESOURCES CORP - 1.144,00 USD 77,320 68.046,83 0,92 0,93
RAYONIER INC - 1.393,00 USD 55,390 59.357,08 0,80 0,81
ROBERT HALF - 2.025,00 USD 33,230 51.766,10 0,70 0,71
ROCKWELL COLLINS - 1.718,00 USD 63,410 83.805,20 1,13 1,14
SHERWIN-WILLIAMS COMPANY - 268,00 USD 176,600 36.409,57 0,49 0,50
SPRINT NEXTEL CORP - 3.000,00 USD 7,020 16.201,25 0,22 0,22
SUNTRUST BANKS - 842,00 USD 31,570 20.449,22 0,28 0,28
SYNOPSYS INC - 1.350,00 USD 35,750 37.127,86 0,50 0,51
THERMO ELECTRONIC - 976,00 USD 84,630 63.542,49 0,86 0,87
TOLL BROTHERS - 496,00 USD 32,630 12.450,56 0,17 0,17
TRAVELERS COS INC - 538,00 USD 79,920 33.077,13 0,45 0,45
TYSON FOODS INC -A- 1.202,00 USD 25,680 23.745,95 0,32 0,32
VALERO ENERGY CORPORATION - 1.661,00 USD 34,770 44.428,78 0,60 0,61
VERISIGN INC. - 243,00 USD 44,660 8.348,63 0,11 0,11
WAL-MART STORES - 567,00 USD 74,490 32.491,60 0,44 0,44
WELLPOINT INC - 1.412,00 USD 81,840 88.897,67 1,20 1,21
WEST UNION COMPANY - 3.788,00 USD 17,110 49.859,74 0,67 0,68
WEYERHAEUSER COMPANY - 3.583,00 USD 28,490 78.528,86 1,06 1,07
WYNN RESORTS LTD - 512,00 USD 128,000 50.416,19 0,68 0,69
XEROX CORPORATION - 7.422,00 USD 9,070 51.786,71 0,70 0,71
YAHOO INC. - 3.305,00 USD 25,110 63.842,26 0,86 0,87
Total shares 7.399.099,54 99,96 100,80
Rights
France
ELECTRICITE DE FRANCE CP 06/06/2013 3.308,00 EUR 0,680 2.249,44 0,03 0,03
U.K.
ROLLS ROYCE GROUP PLC CP 24/04/2013 557.158,00 GBP 0,001 650,13 0,01 0,01
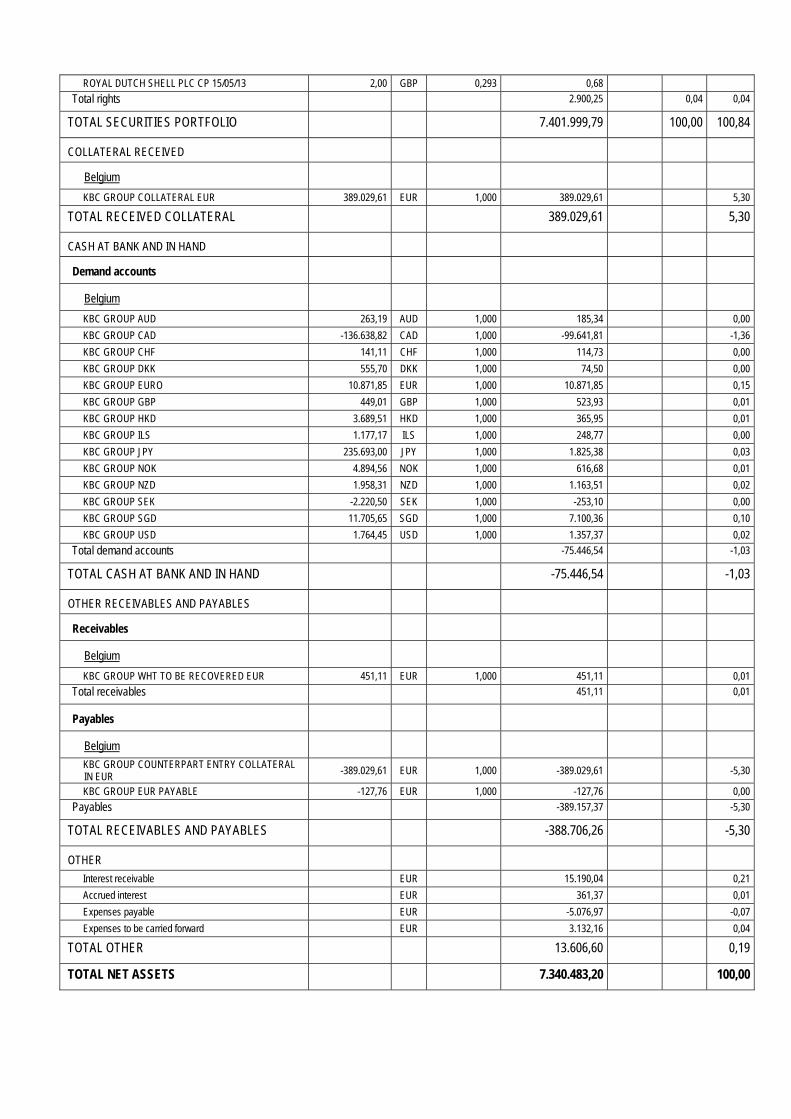
ROYAL DUTCH SHELL PLC CP 15/05/13 2,00 GBP 0,293 0,68
Total rights 2.900,25 0,04 0,04
TOTAL SECURITIES PORTFOLIO 7.401.999,79 100,00 100,84
COLLATERAL RECEIVED
Belgium
KBC GROUP COLLATERAL EUR 389.029,61 EUR 1,000 389.029,61 5,30
TOTAL RECEIVED COLLATERAL 389.029,61 5,30
CASH AT BANK AND IN HAND
Demand accounts
Belgium
KBC GROUP AUD 263,19 AUD 1,000 185,34 0,00
KBC GROUP CAD -136.638,82 CAD 1,000 -99.641,81 -1,36
KBC GROUP CHF 141,11 CHF 1,000 114,73 0,00
KBC GROUP DKK 555,70 DKK 1,000 74,50 0,00
KBC GROUP EURO 10.871,85 EUR 1,000 10.871,85 0,15
KBC GROUP GBP 449,01 GBP 1,000 523,93 0,01
KBC GROUP HKD 3.689,51 HKD 1,000 365,95 0,01
KBC GROUP ILS 1.177,17 ILS 1,000 248,77 0,00
KBC GROUP JPY 235.693,00 JPY 1,000 1.825,38 0,03
KBC GROUP NOK 4.894,56 NOK 1,000 616,68 0,01
KBC GROUP NZD 1.958,31 NZD 1,000 1.163,51 0,02
KBC GROUP SEK -2.220,50 SEK 1,000 -253,10 0,00
KBC GROUP SGD 11.705,65 SGD 1,000 7.100,36 0,10
KBC GROUP USD 1.764,45 USD 1,000 1.357,37 0,02
Total demand accounts -75.446,54 -1,03
TOTAL CASH AT BANK AND IN HAND -75.446,54 -1,03
OTHER RECEIVABLES AND PAYABLES
Receivables
Belgium
KBC GROUP WHT TO BE RECOVERED EUR 451,11 EUR 1,000 451,11 0,01
Total receivables 451,11 0,01
Payables
Belgium
KBC GROUP COUNTERPART ENTRY COLLATERAL IN EUR -389.029,61 EUR 1,000 -389.029,61 -5,30
KBC GROUP EUR PAYABLE -127,76 EUR 1,000 -127,76 0,00
Payables -389.157,37 -5,30
TOTAL RECEIVABLES AND PAYABLES -388.706,26 -5,30
OTHER
Interest receivable EUR 15.190,04 0,21
Accrued interest EUR 361,37 0,01
Expenses payable EUR -5.076,97 -0,07
Expenses to be carried forward EUR 3.132,16 0,04
TOTAL OTHER 13.606,60 0,19
TOTAL NET ASSETS 7.340.483,20 100,00

Geographic breakdown (as a % of securities portfolio)
31/12/2011 30/06/2012 31/12/2012 30/06/2013 Australia 3,38 3,37 3,67 2,87 Austria 0,22 0,00 0,00 0,00 Belgium 0,19 0,00 1,23 0,23 Bermuda 1,42 0,89 0,08 0,62 Canada 6,87 7,09 6,69 5,81 Switzerland 3,30 2,20 2,18 2,56 Cayman Islands 0,00 0,21 0,49 0,37 Cyprus 0,04 0,03 0,03 0,02 Germany 2,18 1,83 2,07 2,35 Denmark 0,46 0,63 0,53 1,70 Spain 0,20 1,02 1,20 1,10 Finland 0,70 0,38 0,40 0,25 France 4,13 3,93 5,46 4,50 U.K. 8,69 7,69 11,32 9,50 Greece 0,32 0,19 0,00 0,00 Hong Kong 0,00 0,00 0,00 0,11 Ireland 0,06 0,24 0,10 0,00 Israel 0,46 0,46 0,48 0,38 Italy 1,12 1,32 0,07 0,06 Jersey/The Channel Islands 0,00 0,36 0,37 0,00 Japan 9,40 9,07 8,31 10,97 Luxembourg 0,00 0,13 0,16 0,00 Malaysia 0,21 0,00 0,00 0,00 Netherlands 0,97 0,29 0,02 0,15 Norway 2,36 2,04 2,02 1,96 New Zealand 0,48 0,35 0,36 0,10 Portugal 0,81 0,70 0,05 0,00 Singapore 1,11 1,93 1,76 1,70 Sweden 2,27 2,74 1,46 1,33 U.S.A. 48,65 50,91 49,49 51,36 Total 100,00 100,00 100,00 100,00
Sector breakdown (as a % of securities portfolio)
31/12/2011 30/06/2012 31/12/2012 30/06/2013 Cyclicals 29,30 25,70 26,47 24,01 Consum(cycl) 12,98 13,54 14,87 16,09 Cons.goods 10,71 11,80 10,45 9,42 Pharma 10,41 10,35 10,41 10,34 Financials 15,93 16,07 17,18 19,94 Technology 12,28 12,54 11,74 12,38 Telecomm. 4,59 4,61 4,44 3,38 Utilities 2,81 3,75 3,52 3,58 Real est. 0,95 1,61 0,89 0,84 Governm. 0,04 0,03 0,03 0,02 Total 100,00 100,00 100,00 100,00
Currency breakdown (as a % of net assets)
31/12/2011 30/06/2012 31/12/2012 30/06/2013 AUD 3,43 3,42 3,69 2,91 CAD 6,87 7,09 6,68 4,51

CHF 3,30 2,27 2,19 2,59 DKK 0,49 0,67 0,55 1,72 EUR 11,22 9,86 10,93 9,08 GBP 8,05 7,83 11,42 9,43 HKD 0,00 0,00 0,00 0,11 ILS 0,46 0,46 0,48 0,39 JPY 9,38 9,10 8,31 11,11 MYR 0,21 0,00 0,00 0,00 NOK 2,35 2,26 2,18 1,99 NZD 0,51 0,38 0,36 0,11 SEK 2,33 2,79 1,46 1,34 SGD 1,11 1,95 1,77 1,82 USD 50,29 51,92 49,98 52,89 Total 100,00 100,00 100,00 100,00

2.4.2 CHANGES IN THE COMPOSITION OF THE ASSETS OF KBC EQUITY FUND QUANT GLOBAL 1
(IN THE CURRENCY OF THE SUB-FUND)
1st half of year YearPurchases 3.670.546,52 3.670.546,52 Sales 4.142.139,77 4.142.139,77 Total 1 7.812.686,29 7.812.686,29 Subscriptions 500.324,11 500.324,11 Redemptions 1.064.992,59 1.064.992,59 Total 2 1.565.316,70 1.565.316,70 Monthly average of total assets
7.465.508,29 7.465.508,29
Turnover rate 83,68 % 83,68 %
1st half of year YearPurchases 3.670.546,52 3.670.546,52 Sales 4.142.139,77 4.142.139,77 Total 1 7.812.686,29 7.812.686,29 Subscriptions 500.324,11 500.324,11 Redemptions 1.064.992,59 1.064.992,59 Total 2 1.565.316,70 1.565.316,70 Monthly average of total assets
7.544.403,42 7.544.403,42
Corrected turnover rate 82,81 % 82,81 %
The table above shows the capital volume of portfolio transactions. This volume (adjusted to take account of total subscriptions and redemptions) is also compared to the average net assets at the beginning and end of the period. A figure close to 0% implies that the transactions relating to the securities or transactions relating to the assets (excluding deposits and cash) in a given period only involve subscriptions and redemptions. A negative percentage shows that subscriptions and redemptions entailed few, if any, transactions in the portfolio. Active asset management may result in high turnover rates (monthly percentage >50%). The detailed list of transactions is available for consultation free of charge at the registered office of the Bevek or fund at Havenlaan 2, 1080 Brussels.
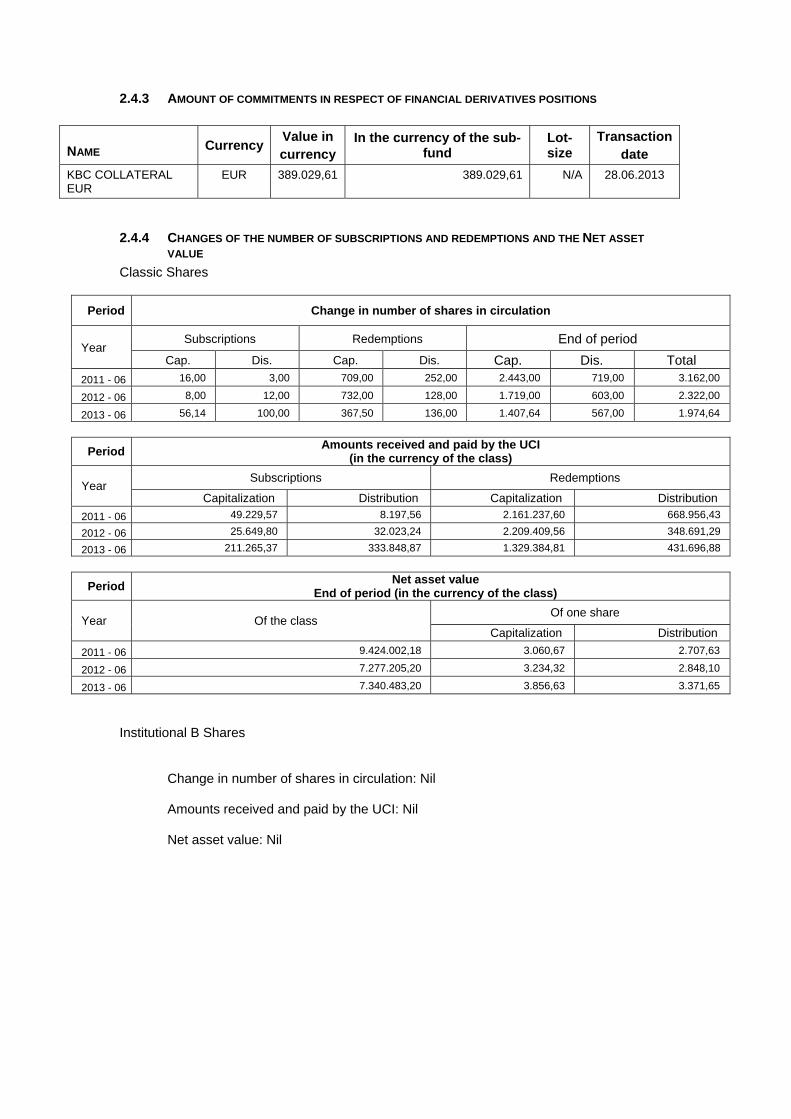
2.4.3 AMOUNT OF COMMITMENTS IN RESPECT OF FINANCIAL DERIVATIVES POSITIONS
NAME Currency Value in currency
In the currency of the sub-fund
Lot-size
Transactiondate
KBC COLLATERAL EUR
EUR 389.029,61 389.029,61 N/A 28.06.2013
2.4.4 CHANGES OF THE NUMBER OF SUBSCRIPTIONS AND REDEMPTIONS AND THE NET ASSET
VALUE
Classic Shares
Period Change in number of shares in circulation
Year Subscriptions Redemptions End of period
Cap. Dis. Cap. Dis. Cap. Dis. Total
2011 - 06 16,00 3,00 709,00 252,00 2.443,00 719,00 3.162,00
2012 - 06 8,00 12,00 732,00 128,00 1.719,00 603,00 2.322,00
2013 - 06 56,14 100,00 367,50 136,00 1.407,64 567,00 1.974,64
Period Amounts received and paid by the UCI
(in the currency of the class)
Year Subscriptions Redemptions
Capitalization Distribution Capitalization Distribution
2011 - 06 49.229,57 8.197,56 2.161.237,60 668.956,43
2012 - 06 25.649,80 32.023,24 2.209.409,56 348.691,29
2013 - 06 211.265,37 333.848,87 1.329.384,81 431.696,88
Period Net asset value
End of period (in the currency of the class)
Year Of the class Of one share
Capitalization Distribution
2011 - 06 9.424.002,18 3.060,67 2.707,63
2012 - 06 7.277.205,20 3.234,32 2.848,10
2013 - 06 7.340.483,20 3.856,63 3.371,65
Institutional B Shares
Change in number of shares in circulation: Nil
Amounts received and paid by the UCI: Nil
Net asset value: Nil
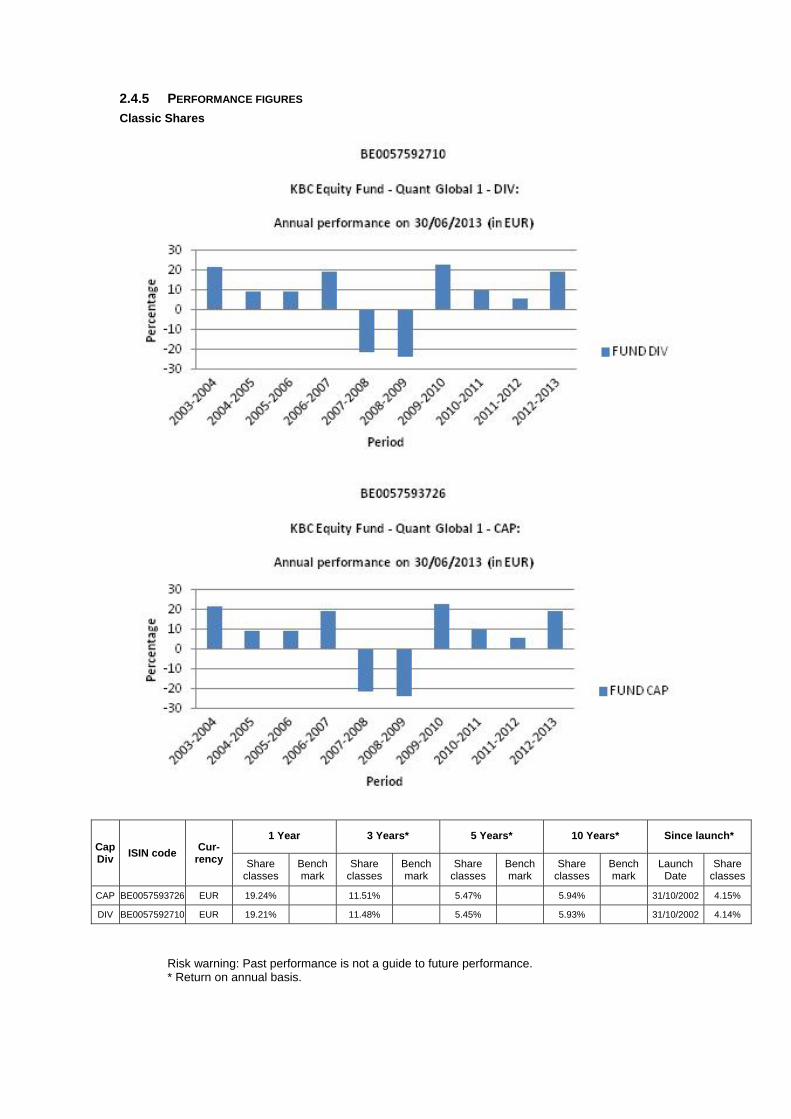
2.4.5 PERFORMANCE FIGURES
Classic Shares
Cap Div
ISIN code Cur-
rency
1 Year 3 Years* 5 Years* 10 Years* Since launch*
Share classes
Bench mark
Share classes
Bench mark
Share classes
Bench mark
Share classes
Bench mark
Launch Date
Share classes
CAP BE0057593726 EUR 19.24% 11.51% 5.47% 5.94% 31/10/2002 4.15%
DIV BE0057592710 EUR 19.21% 11.48% 5.45% 5.93% 31/10/2002 4.14%
Risk warning: Past performance is not a guide to future performance. * Return on annual basis.

Classic Shares
The bar chart shows the performance for full financial years. The figures do not take account of any restructuring. Calculated in EUR. The return is calculated as the change in the net asset value between two dates expressed
as a percentage. In the case of units that pay dividends, the dividend is incorporated geometrically in the return.
Calculation method for date D, where NAV stands for net asset value: Capitalisation units (CAP) Return on date D over a period of X years:
[NIW(D) / NIW(Y)] ^ [1 / X] - 1 where Y = D-X
Return on date D since the start date S of the unit: [NIW(D) / NIW(S)] ^ [1 / F] - 1 where F = 1 if the unit has existed for less than one year on date D where F = (D-S) / 365.25 if the unit has existed for longer than one year on date D
Distribution units (DIV) Return on date D over a period of X years:
[ C * NIW(D) / NIW(Y)] ^ [1 / X] - 1 where Y = D-X
Return on date D since the start date S of the unit: [ C * NIW(D) / NIW(S)] ^ [1 / F] - 1 where F = 1 if the unit has existed for less than one year on date D where F = (D-S) / 365.25 if the unit has existed for longer than one year on date D where C is a factor that is determined for all N dividends between the calculation date D and the reference date.
For dividend i on date Di with value Wi: Ci = [Wi / NIW(Di)] + 1 i = 1 ... N from whichC = C0 * .... * CN.
If the interval between the two dates exceeds one year, the ordinary return calculation is converted into a return on an annual basis by taking the nth square root of 1 plus the total return of the unit.
The return figures shown above do not take account of the fees and charges associated with the issue and redemption of units.
These are the performance figures for capitalisation and distribution shares.
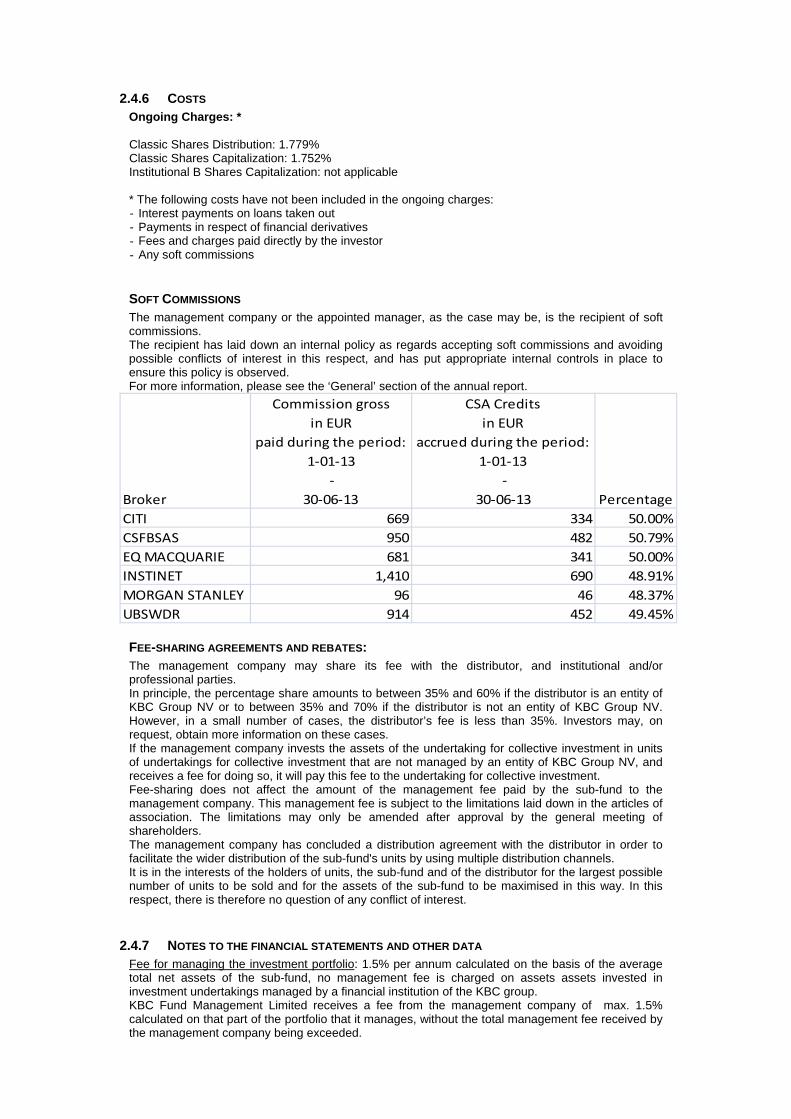
2.4.6 COSTS Ongoing Charges: * Classic Shares Distribution: 1.779% Classic Shares Capitalization: 1.752% Institutional B Shares Capitalization: not applicable * The following costs have not been included in the ongoing charges: - Interest payments on loans taken out - Payments in respect of financial derivatives - Fees and charges paid directly by the investor - Any soft commissions
SOFT COMMISSIONS The management company or the appointed manager, as the case may be, is the recipient of soft commissions. The recipient has laid down an internal policy as regards accepting soft commissions and avoiding possible conflicts of interest in this respect, and has put appropriate internal controls in place to ensure this policy is observed. For more information, please see the ‘General’ section of the annual report.
Broker
Commission gross
in EUR
paid during the period:
1‐01‐13
‐
30‐06‐13
CSA Credits
in EUR
accrued during the period:
1‐01‐13
‐
30‐06‐13 Percentage
CITI 669 334 50.00%
CSFBSAS 950 482 50.79%
EQ MACQUARIE 681 341 50.00%
INSTINET 1,410 690 48.91%
MORGAN STANLEY 96 46 48.37%
UBSWDR 914 452 49.45%
FEE-SHARING AGREEMENTS AND REBATES: The management company may share its fee with the distributor, and institutional and/or professional parties. In principle, the percentage share amounts to between 35% and 60% if the distributor is an entity of KBC Group NV or to between 35% and 70% if the distributor is not an entity of KBC Group NV. However, in a small number of cases, the distributor’s fee is less than 35%. Investors may, on request, obtain more information on these cases. If the management company invests the assets of the undertaking for collective investment in units of undertakings for collective investment that are not managed by an entity of KBC Group NV, and receives a fee for doing so, it will pay this fee to the undertaking for collective investment. Fee-sharing does not affect the amount of the management fee paid by the sub-fund to the management company. This management fee is subject to the limitations laid down in the articles of association. The limitations may only be amended after approval by the general meeting of shareholders. The management company has concluded a distribution agreement with the distributor in order to facilitate the wider distribution of the sub-fund's units by using multiple distribution channels. It is in the interests of the holders of units, the sub-fund and of the distributor for the largest possible number of units to be sold and for the assets of the sub-fund to be maximised in this way. In this respect, there is therefore no question of any conflict of interest.
2.4.7 NOTES TO THE FINANCIAL STATEMENTS AND OTHER DATA Fee for managing the investment portfolio: 1.5% per annum calculated on the basis of the average total net assets of the sub-fund, no management fee is charged on assets assets invested in investment undertakings managed by a financial institution of the KBC group. KBC Fund Management Limited receives a fee from the management company of max. 1.5% calculated on that part of the portfolio that it manages, without the total management fee received by the management company being exceeded.
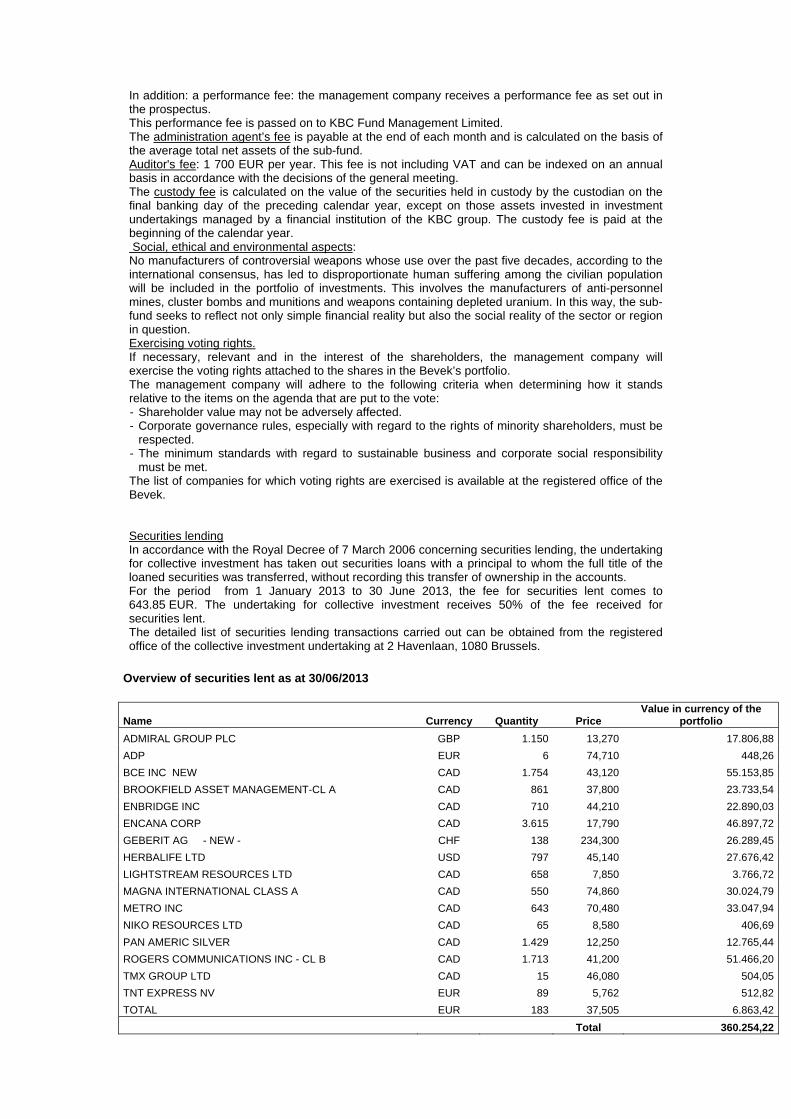
In addition: a performance fee: the management company receives a performance fee as set out in the prospectus. This performance fee is passed on to KBC Fund Management Limited. The administration agent’s fee is payable at the end of each month and is calculated on the basis of the average total net assets of the sub-fund. Auditor's fee: 1 700 EUR per year. This fee is not including VAT and can be indexed on an annual basis in accordance with the decisions of the general meeting. The custody fee is calculated on the value of the securities held in custody by the custodian on the final banking day of the preceding calendar year, except on those assets invested in investment undertakings managed by a financial institution of the KBC group. The custody fee is paid at the beginning of the calendar year. Social, ethical and environmental aspects: No manufacturers of controversial weapons whose use over the past five decades, according to the international consensus, has led to disproportionate human suffering among the civilian population will be included in the portfolio of investments. This involves the manufacturers of anti-personnel mines, cluster bombs and munitions and weapons containing depleted uranium. In this way, the sub-fund seeks to reflect not only simple financial reality but also the social reality of the sector or region in question. Exercising voting rights. If necessary, relevant and in the interest of the shareholders, the management company will exercise the voting rights attached to the shares in the Bevek’s portfolio. The management company will adhere to the following criteria when determining how it stands relative to the items on the agenda that are put to the vote: - Shareholder value may not be adversely affected. - Corporate governance rules, especially with regard to the rights of minority shareholders, must be
respected. - The minimum standards with regard to sustainable business and corporate social responsibility
must be met. The list of companies for which voting rights are exercised is available at the registered office of the Bevek. Securities lending In accordance with the Royal Decree of 7 March 2006 concerning securities lending, the undertaking for collective investment has taken out securities loans with a principal to whom the full title of the loaned securities was transferred, without recording this transfer of ownership in the accounts. For the period from 1 January 2013 to 30 June 2013, the fee for securities lent comes to 643.85 EUR. The undertaking for collective investment receives 50% of the fee received for securities lent. The detailed list of securities lending transactions carried out can be obtained from the registered office of the collective investment undertaking at 2 Havenlaan, 1080 Brussels.
Overview of securities lent as at 30/06/2013
Name Currency Quantity Price Value in currency of the
portfolio
ADMIRAL GROUP PLC GBP 1.150 13,270 17.806,88
ADP EUR 6 74,710 448,26
BCE INC NEW CAD 1.754 43,120 55.153,85
BROOKFIELD ASSET MANAGEMENT-CL A CAD 861 37,800 23.733,54
ENBRIDGE INC CAD 710 44,210 22.890,03
ENCANA CORP CAD 3.615 17,790 46.897,72
GEBERIT AG - NEW - CHF 138 234,300 26.289,45
HERBALIFE LTD USD 797 45,140 27.676,42
LIGHTSTREAM RESOURCES LTD CAD 658 7,850 3.766,72
MAGNA INTERNATIONAL CLASS A CAD 550 74,860 30.024,79
METRO INC CAD 643 70,480 33.047,94
NIKO RESOURCES LTD CAD 65 8,580 406,69
PAN AMERIC SILVER CAD 1.429 12,250 12.765,44
ROGERS COMMUNICATIONS INC - CL B CAD 1.713 41,200 51.466,20
TMX GROUP LTD CAD 15 46,080 504,05
TNT EXPRESS NV EUR 89 5,762 512,82
TOTAL EUR 183 37,505 6.863,42
Total 360.254,22
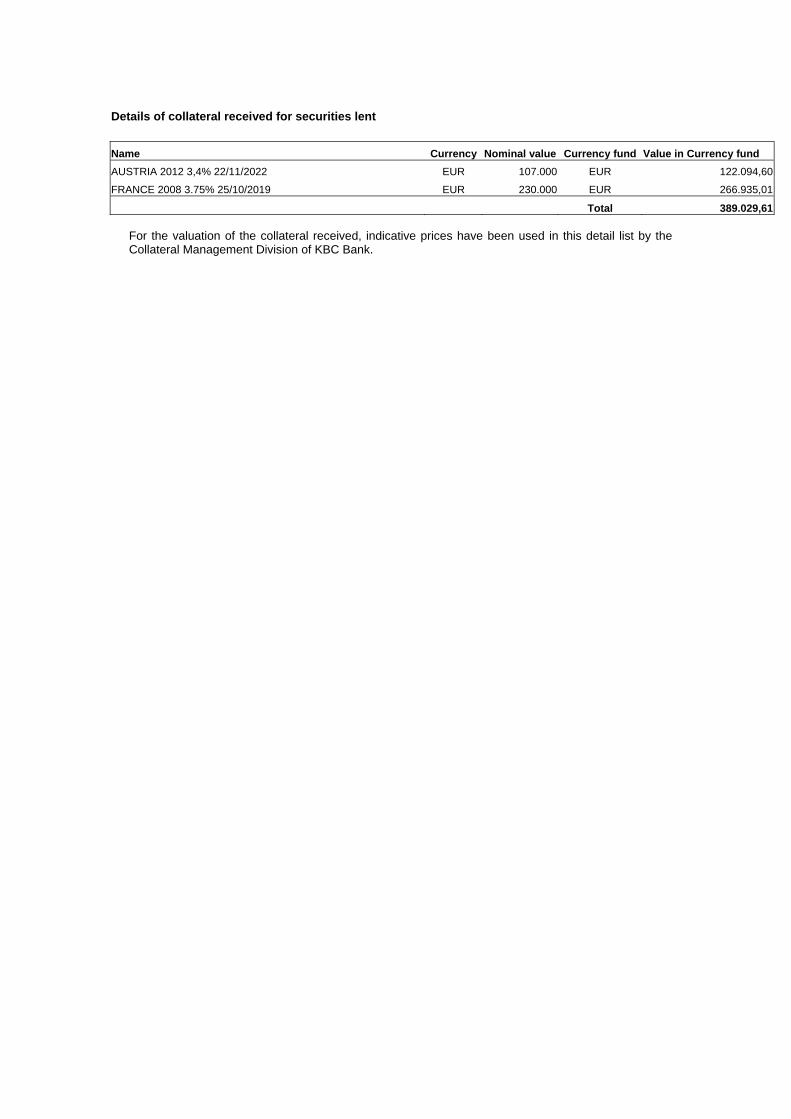
Details of collateral received for securities lent
Name Currency Nominal value Currency fund Value in Currency fund
AUSTRIA 2012 3,4% 22/11/2022 EUR 107.000 EUR 122.094,60
FRANCE 2008 3.75% 25/10/2019 EUR 230.000 EUR 266.935,01
Total 389.029,61 For the valuation of the collateral received, indicative prices have been used in this detail list by the Collateral Management Division of KBC Bank.
Semi-Annual report as at 30th June 2013
TABLE OF CONTENTS
2. Information on KBC Equity Fund Buyback America
2.1. Management report 2.1.1. Launch date and subscription price 2.1.2. Stock exchange listing 2.1.3. Aim and distinctive features of the investment policy 2.1.4. Financial portfolio management 2.1.5. Distributors 2.1.6. Index and benchmark 2.1.7. Policy conducted during the financial year 2.1.8. Future policy 2.1.9. Synthetic risk and reward indicator (SRRI)
2.2. Balance sheet
2.3. Profit and loss account
2.4. Composition of the assets and key figures
2.4.1. Composition of the assets 2.4.2. Change in the composition of the assets 2.4.3. Value of commitments in respect of financial derivatives positions 2.4.4. Evolution of the number of subscriptions, repayments and the net asset value 2.4.5. Return figures 2.4.6. Expenses 2.4.7. Notes to the financial statements and other data


2 INFORMATION ON KBC EQUITY FUND BUYBACK AMERICA
2.1 MANAGEMENT REPORT
2.1.1 LAUNCH DATE AND SUBSCRIPTION PRICE Classic Shares : Launch date: 26 June 1998 Initial subscription price: 500 USD Currency: USD Institutional B Shares : Launch date: 25 November 2011 Initial subscription price: 827.56 USD Currency: USD
2.1.2 STOCK EXCHANGE LISTING Not applicable.
2.1.3 GOAL AND KEY PRINCIPLES OF THE INVESTMENT POLICY
SUB-FUND’S OBJECT: The main objective of this sub-fund is to generate the highest possible return for its shareholders by investing directly or indirectly in transferable securities. This is reflected in its pursuit of capital gains and income. To this end, the assets are invested, either directly or indirectly via correlated financial instruments, primarily in shares.
SUB-FUND’S INVESTMENT POLICY:
PERMITTED ASSET CLASSES: The sub-fund may invest in securities, money market instruments, units in undertakings for collective investment, deposits, financial derivatives, liquid assets and all other instruments insofar as permitted by the applicable laws and regulations and consistent with the sub-fund’s object The sub-fund shall invest no more than 10% of its assets in units of other undertakings for collective investment.
RESTRICTIONS OF THE INVESTMENT POLICY: The investment policy will be implemented within the limits set by law and regulations. The sub-fund may borrow up to 10% of its net assets, insofar as these are short-term borrowings aimed at solving temporary liquidity problems.
PERMITTED DERIVATIVES TRANSACTIONS: Derivates may be used either for hedging purposes or to achieve investment objectives. Changes will be made to the investments at regular intervals to comply with the sub-fund's investment strategy. In addition, listed and unlisted derivates may be used to achieve the objectives: these may be forward contracts, options or swaps on securities, indices, currencies or interest rates or other transactions involving derivatives. Unlisted derivatives transactions will only be concluded with prime financial institutions specialised in such transactions. Such derivatives may also be used to hedge the assets against exchange-rate fluctuations. Subject to the applicable laws and regulations and the articles of association, the sub-fund always seeks to conclude the most effective transactions. All costs associated with the transactions will be charged to the sub-fund and all income generated will be paid to the sub-fund. If the transactions result in a risk in respect of the counterparty, this risk can be hedged by using a margin management system that ensures that the sub-fund is the beneficiary of security (collateral) in the form of cash or investment grade bonds. When calculating the value of the bonds, a margin will be applied that varies depending on the residual term to maturity and the currency in which the bond in question is denominated. The relationship with the counterparty or counterparties is governed by standard international agreements.
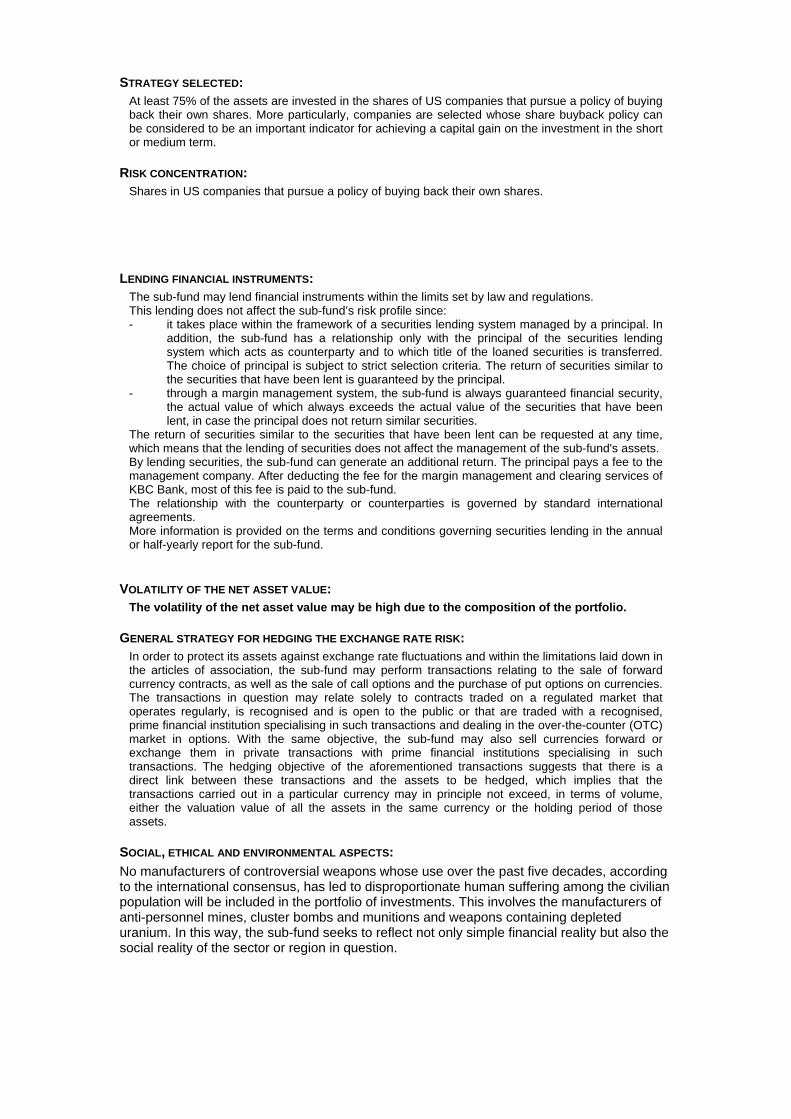
STRATEGY SELECTED: At least 75% of the assets are invested in the shares of US companies that pursue a policy of buying back their own shares. More particularly, companies are selected whose share buyback policy can be considered to be an important indicator for achieving a capital gain on the investment in the short or medium term.
RISK CONCENTRATION: Shares in US companies that pursue a policy of buying back their own shares.
LENDING FINANCIAL INSTRUMENTS: The sub-fund may lend financial instruments within the limits set by law and regulations. This lending does not affect the sub-fund’s risk profile since: - it takes place within the framework of a securities lending system managed by a principal. In
addition, the sub-fund has a relationship only with the principal of the securities lending system which acts as counterparty and to which title of the loaned securities is transferred. The choice of principal is subject to strict selection criteria. The return of securities similar to the securities that have been lent is guaranteed by the principal.
- through a margin management system, the sub-fund is always guaranteed financial security, the actual value of which always exceeds the actual value of the securities that have been lent, in case the principal does not return similar securities.
The return of securities similar to the securities that have been lent can be requested at any time, which means that the lending of securities does not affect the management of the sub-fund's assets. By lending securities, the sub-fund can generate an additional return. The principal pays a fee to the management company. After deducting the fee for the margin management and clearing services of KBC Bank, most of this fee is paid to the sub-fund. The relationship with the counterparty or counterparties is governed by standard international agreements. More information is provided on the terms and conditions governing securities lending in the annual or half-yearly report for the sub-fund.
VOLATILITY OF THE NET ASSET VALUE: The volatility of the net asset value may be high due to the composition of the portfolio.
GENERAL STRATEGY FOR HEDGING THE EXCHANGE RATE RISK: In order to protect its assets against exchange rate fluctuations and within the limitations laid down in the articles of association, the sub-fund may perform transactions relating to the sale of forward currency contracts, as well as the sale of call options and the purchase of put options on currencies. The transactions in question may relate solely to contracts traded on a regulated market that operates regularly, is recognised and is open to the public or that are traded with a recognised, prime financial institution specialising in such transactions and dealing in the over-the-counter (OTC) market in options. With the same objective, the sub-fund may also sell currencies forward or exchange them in private transactions with prime financial institutions specialising in such transactions. The hedging objective of the aforementioned transactions suggests that there is a direct link between these transactions and the assets to be hedged, which implies that the transactions carried out in a particular currency may in principle not exceed, in terms of volume, either the valuation value of all the assets in the same currency or the holding period of those assets.
SOCIAL, ETHICAL AND ENVIRONMENTAL ASPECTS:
No manufacturers of controversial weapons whose use over the past five decades, according to the international consensus, has led to disproportionate human suffering among the civilian population will be included in the portfolio of investments. This involves the manufacturers of anti-personnel mines, cluster bombs and munitions and weapons containing depleted uranium. In this way, the sub-fund seeks to reflect not only simple financial reality but also the social reality of the sector or region in question.

THE EUROPEAN SAVINGS DIRECTIVE AND TAX ON DEBT CLAIM RETURNS OBTAINED THROUGH THE
REDEMPTION OF OWN UNITS OR IN THE EVENT OF FULL OR PARTIAL DISTRIBUTION OF EQUITY
CAPITAL. The following information is of a general character and is not intended to cover all aspects of an investment in a UCITS. In certain cases entirely different rules might even apply. Moreover, both tax law and the interpretation of it can change. Investors who wish to have more information about the tax implications – in both Belgium and abroad – of acquiring, holding and transferring units should seek the advice of their usual financial and tax advisers. This UCITS shall invest a maximum of 15% of its assets directly or indirectly in debt instruments as intended by the European Savings Directive. A. European Savings Directive (Directive 2003/48/EC) The European Savings Directive has been implemented in Belgium. Since this UCITS invests a maximum of 15% of its assets directly or indirectly in debt claims as intended by the European Savings Directive, the income of this UCITS does not fall within the scope of this directive. B. Tax on debt claim returns obtained through the redemption of own units or in the event of full or partial distribution of equity capital (Article 19bis Income Tax Code 1992). The income from this UCITS is not subject to the tax on debt instrument returns as intended by Article 19bis, Income Tax Code 1992.
2.1.4 FINANCIAL PORTFOLIO MANAGEMENT The management company has delegated the intellectual management, to KBC Fund Management Limited, Joshua Dawson House, Dawson Street , Dublin 2, IRELAND..
2.1.5 DISTRIBUTORS KBC Asset Management S.A., 5, Place de la Gare, L-1616 Luxembourg.
2.1.6 INDEX AND BENCHMARK See ‘Sub-fund’s investment policy’.
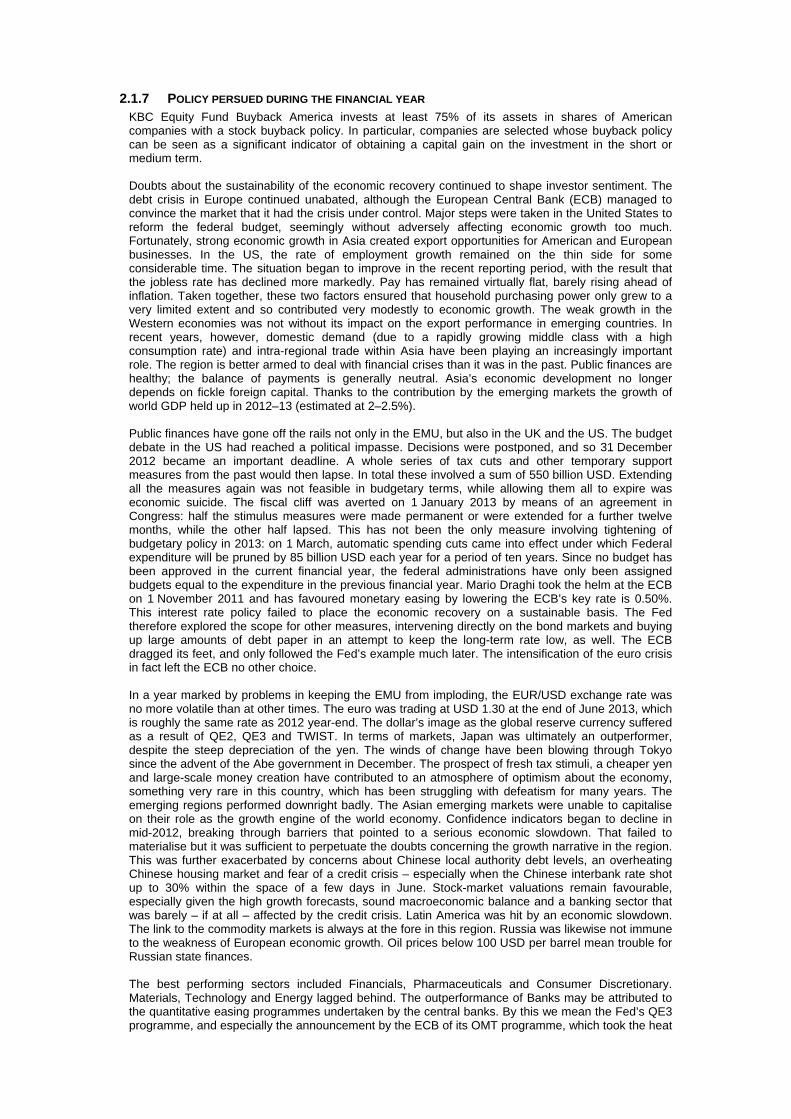
2.1.7 POLICY PERSUED DURING THE FINANCIAL YEAR KBC Equity Fund Buyback America invests at least 75% of its assets in shares of American companies with a stock buyback policy. In particular, companies are selected whose buyback policy can be seen as a significant indicator of obtaining a capital gain on the investment in the short or medium term. Doubts about the sustainability of the economic recovery continued to shape investor sentiment. The debt crisis in Europe continued unabated, although the European Central Bank (ECB) managed to convince the market that it had the crisis under control. Major steps were taken in the United States to reform the federal budget, seemingly without adversely affecting economic growth too much. Fortunately, strong economic growth in Asia created export opportunities for American and European businesses. In the US, the rate of employment growth remained on the thin side for some considerable time. The situation began to improve in the recent reporting period, with the result that the jobless rate has declined more markedly. Pay has remained virtually flat, barely rising ahead of inflation. Taken together, these two factors ensured that household purchasing power only grew to a very limited extent and so contributed very modestly to economic growth. The weak growth in the Western economies was not without its impact on the export performance in emerging countries. In recent years, however, domestic demand (due to a rapidly growing middle class with a high consumption rate) and intra-regional trade within Asia have been playing an increasingly important role. The region is better armed to deal with financial crises than it was in the past. Public finances are healthy; the balance of payments is generally neutral. Asia’s economic development no longer depends on fickle foreign capital. Thanks to the contribution by the emerging markets the growth of world GDP held up in 2012–13 (estimated at 2–2.5%). Public finances have gone off the rails not only in the EMU, but also in the UK and the US. The budget debate in the US had reached a political impasse. Decisions were postponed, and so 31 December 2012 became an important deadline. A whole series of tax cuts and other temporary support measures from the past would then lapse. In total these involved a sum of 550 billion USD. Extending all the measures again was not feasible in budgetary terms, while allowing them all to expire was economic suicide. The fiscal cliff was averted on 1 January 2013 by means of an agreement in Congress: half the stimulus measures were made permanent or were extended for a further twelve months, while the other half lapsed. This has not been the only measure involving tightening of budgetary policy in 2013: on 1 March, automatic spending cuts came into effect under which Federal expenditure will be pruned by 85 billion USD each year for a period of ten years. Since no budget has been approved in the current financial year, the federal administrations have only been assigned budgets equal to the expenditure in the previous financial year. Mario Draghi took the helm at the ECB on 1 November 2011 and has favoured monetary easing by lowering the ECB’s key rate is 0.50%. This interest rate policy failed to place the economic recovery on a sustainable basis. The Fed therefore explored the scope for other measures, intervening directly on the bond markets and buying up large amounts of debt paper in an attempt to keep the long-term rate low, as well. The ECB dragged its feet, and only followed the Fed’s example much later. The intensification of the euro crisis in fact left the ECB no other choice. In a year marked by problems in keeping the EMU from imploding, the EUR/USD exchange rate was no more volatile than at other times. The euro was trading at USD 1.30 at the end of June 2013, which is roughly the same rate as 2012 year-end. The dollar’s image as the global reserve currency suffered as a result of QE2, QE3 and TWIST. In terms of markets, Japan was ultimately an outperformer, despite the steep depreciation of the yen. The winds of change have been blowing through Tokyo since the advent of the Abe government in December. The prospect of fresh tax stimuli, a cheaper yen and large-scale money creation have contributed to an atmosphere of optimism about the economy, something very rare in this country, which has been struggling with defeatism for many years. The emerging regions performed downright badly. The Asian emerging markets were unable to capitalise on their role as the growth engine of the world economy. Confidence indicators began to decline in mid-2012, breaking through barriers that pointed to a serious economic slowdown. That failed to materialise but it was sufficient to perpetuate the doubts concerning the growth narrative in the region. This was further exacerbated by concerns about Chinese local authority debt levels, an overheating Chinese housing market and fear of a credit crisis – especially when the Chinese interbank rate shot up to 30% within the space of a few days in June. Stock-market valuations remain favourable, especially given the high growth forecasts, sound macroeconomic balance and a banking sector that was barely – if at all – affected by the credit crisis. Latin America was hit by an economic slowdown. The link to the commodity markets is always at the fore in this region. Russia was likewise not immune to the weakness of European economic growth. Oil prices below 100 USD per barrel mean trouble for Russian state finances. The best performing sectors included Financials, Pharmaceuticals and Consumer Discretionary. Materials, Technology and Energy lagged behind. The outperformance of Banks may be attributed to the quantitative easing programmes undertaken by the central banks. By this we mean the Fed’s QE3 programme, and especially the announcement by the ECB of its OMT programme, which took the heat
out of the euro crisis. Pharmaceuticals had been shunned for a long time due to a lack of product innovation, patent expiry and the reforms to healthcare insurance in the US. In recent months, however, investors began to focus more on the sector’s response to these challenges: restructuring operations and the sell-off of non-strategic divisions. The car industry has risen from the ashes, in the US and the European luxury segment at least. Demand from the emerging markets is also strong, despite the slowdown in Chinese growth, where German luxury marques generate 50% of their profits. In spite of the slow growth, advertising budgets have also held up surprisingly well. Mining companies lost ground on excessive expectations concerning commodity prices. A failed stock market flotation by Facebook and the giant leaps made by Apple meant that price trends in the Technology sector differed from what might have been expected on the basis of the fundamentals. The oil companies suffered from the vagaries of the oil market, the political instability in the Middle East and frequent accidents. During the first quarter, stock selection was a key contributor to positive performance of KBC Equity Fund Buyback America. On an industry group level, the best performing group was Software and Services (9% of the fund), driven by the significant outperformance of the fund’s overweight position in Activision Blizzard. The stock rose from USD10.62 to USD14.57 in the period after the US video-game maker reported fourth-quarter net income exceeded expectations. This was followed by Technology Hardware & Equipment group (5% of the fund), with the fund’s underweight position in Apple, which suffered a large decline in the period falling from USD532.17 to USD442.66 contributing positively to performance. In terms of the main underperformers for the fund in the quarter, the Utilities sector (2% of the fund), was the biggest detractor after Entergy declined from USD63.75 a share to USD63.24. This was followed by the Energy sector (11% of the fund) after the overweight position in Exxon Mobil underperformed other energy names within the sector. During the second quarter, stock selection continued to be a key contributor to positive performance. On an industry group level, Technology Hardware & Equipment (5% of the fund) was again one of the best performing groups, driven by the outperformance of the fund’s overweight position in Cisco Systems. The stock rose from USD20.895 to USD24.335 in the period after the biggest maker of networking equipment reported fiscal third quarter profit that exceeded expectations. The Utilities sector (2% of the fund) was also among the top performing groups, with Entergy reversing losses from the previous quarter. The integrated energy company rose from USD63.24 to USD69.68. Performance of the stock was boosted by the announcement that a proposed restructuring of New York’s electricity market may help power sales. In terms of the main underperformers for the fund in the quarter, the Real Estate group (2% of the fund), was the biggest detractor after Annaly Capital Management declined from USD15.89 to USD12.57. During the quarter, the share price was negatively impacted by news of a quarterly dividend cut. This was followed by the Insurance group (4% of the fund) with the overweight position in Travelers contributing negatively to performance after share price of the insurance company fell from USD84.19 to USD79.92 over the quarter. Overall KBC Equity Fund Buyback America performed positively on an absolute basis over the first half of 2013.
2.1.8 FUTURE POLICY The current environment continues to be supportive of buybacks. Ultra low interest rates available on fixed income assets is fueling demand for stocks that are returning cash to the investor. High EPS yields and low bond yields present an opportunity for companies to shift their capital structure as debt capital is significantly cheaper. In addition, low interest rates are incentivising corporates to borrow money in the credit markets to buy back their own shares rather that finance large-scale capex or M&A. In line with the theme, KBC Equity Fund Buyback America will continue to invest in a portfolio of US shares that are buying back their own shares with the intention to create shareholder value.
2.1.9 SYNTHETIC RISK AND REWARD INDICATOR Classic Shares: 6 on a scale of 1 (lowest risk) to 7 (highest risk). Institutional B Shares: 6 on a scale of 1 (lowest risk) to 7 (highest risk). The value of a share can decrease or increase and the investor may not get back the amount invested. In accordance with Commission Regulation (EU) No. 583/2010, a synthetic risk and reward indicator has been calculated. This indicator provides a quantitative measure of the sub-fund's potential return and the risk involved, calculated in the currency in which the sub-fund is denominated. It is given as a figure between 1 and 7. The higher the figure, the greater the potential return, but also the more difficult it is to predict this return. Losses are possible too. The lowest figure does not mean that the investment is entirely free of risk. However, it does indicate that, compared with the higher figures, this product will generally provide a lower, but more predictable return. The synthetic risk and reward indicator is assessed regularly and can therefore go up or down based on data from the past. Data from the past is not always a reliable indicator of future risk and return.
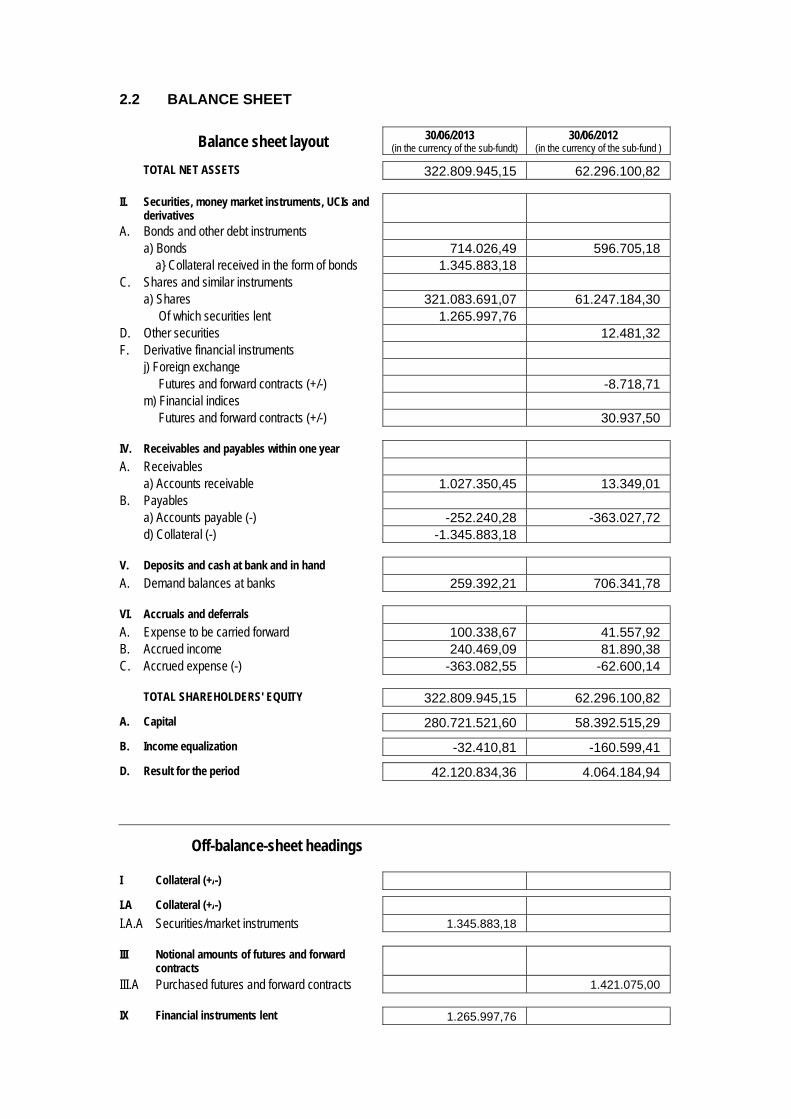
2.2 BALANCE SHEET
Balance sheet layout 30/06/2013 (in the currency of the sub-fundt)
30/06/2012 (in the currency of the sub-fund )
TOTAL NET ASSETS 322.809.945,15 62.296.100,82
II. Securities, money market instruments, UCIs and derivatives
A. Bonds and other debt instruments a) Bonds 714.026,49 596.705,18 a} Collateral received in the form of bonds 1.345.883,18 C. Shares and similar instruments a) Shares 321.083.691,07 61.247.184,30 Of which securities lent 1.265.997,76 D. Other securities 12.481,32 F. Derivative financial instruments j) Foreign exchange Futures and forward contracts (+/-) -8.718,71 m) Financial indices Futures and forward contracts (+/-) 30.937,50
IV. Receivables and payables within one year A. Receivables a) Accounts receivable 1.027.350,45 13.349,01 B. Payables a) Accounts payable (-) -252.240,28 -363.027,72 d) Collateral (-) -1.345.883,18
V. Deposits and cash at bank and in hand A. Demand balances at banks 259.392,21 706.341,78
VI. Accruals and deferrals A. Expense to be carried forward 100.338,67 41.557,92 B. Accrued income 240.469,09 81.890,38 C. Accrued expense (-) -363.082,55 -62.600,14
TOTAL SHAREHOLDERS' EQUITY 322.809.945,15 62.296.100,82
A. Capital 280.721.521,60 58.392.515,29
B. Income equalization -32.410,81 -160.599,41
D. Result for the period 42.120.834,36 4.064.184,94
Off-balance-sheet headings
I Collateral (+/-)
I.A Collateral (+/-)
I.A.A Securities/market instruments 1.345.883,18
III Notional amounts of futures and forward contracts
III.A Purchased futures and forward contracts 1.421.075,00
IX Financial instruments lent 1.265.997,76

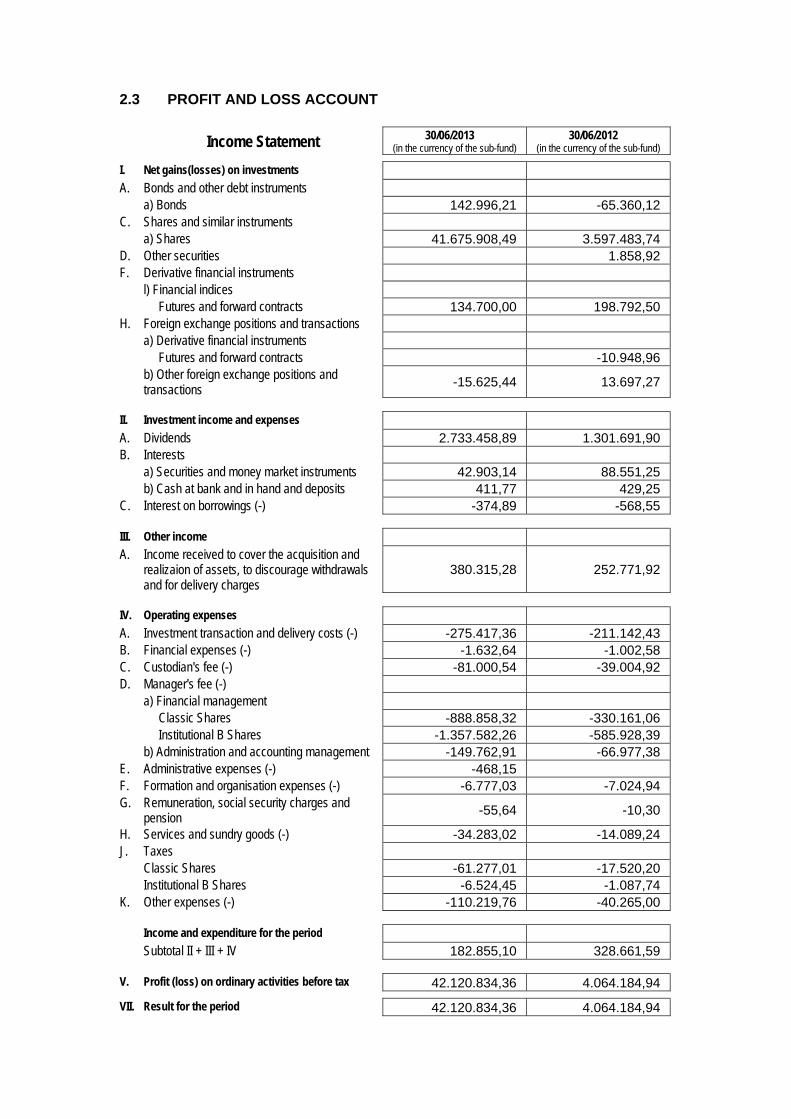
2.3 PROFIT AND LOSS ACCOUNT
Income Statement 30/06/2013 (in the currency of the sub-fund)
30/06/2012 (in the currency of the sub-fund)
I. Net gains(losses) on investments A. Bonds and other debt instruments a) Bonds 142.996,21 -65.360,12 C. Shares and similar instruments a) Shares 41.675.908,49 3.597.483,74 D. Other securities 1.858,92 F. Derivative financial instruments l) Financial indices Futures and forward contracts 134.700,00 198.792,50 H. Foreign exchange positions and transactions a) Derivative financial instruments Futures and forward contracts -10.948,96 b) Other foreign exchange positions and
transactions -15.625,44 13.697,27
II. Investment income and expenses A. Dividends 2.733.458,89 1.301.691,90 B. Interests a) Securities and money market instruments 42.903,14 88.551,25 b) Cash at bank and in hand and deposits 411,77 429,25 C. Interest on borrowings (-) -374,89 -568,55
III. Other income A. Income received to cover the acquisition and
realizaion of assets, to discourage withdrawals and for delivery charges
380.315,28 252.771,92
IV. Operating expenses A. Investment transaction and delivery costs (-) -275.417,36 -211.142,43 B. Financial expenses (-) -1.632,64 -1.002,58 C. Custodian's fee (-) -81.000,54 -39.004,92 D. Manager's fee (-) a) Financial management Classic Shares -888.858,32 -330.161,06 Institutional B Shares -1.357.582,26 -585.928,39 b) Administration and accounting management -149.762,91 -66.977,38 E. Administrative expenses (-) -468,15 F. Formation and organisation expenses (-) -6.777,03 -7.024,94 G. Remuneration, social security charges and
pension -55,64 -10,30
H. Services and sundry goods (-) -34.283,02 -14.089,24 J. Taxes Classic Shares -61.277,01 -17.520,20 Institutional B Shares -6.524,45 -1.087,74 K. Other expenses (-) -110.219,76 -40.265,00
Income and expenditure for the period Subtotal II + III + IV 182.855,10 328.661,59
V. Profit (loss) on ordinary activities before tax 42.120.834,36 4.064.184,94
VII. Result for the period 42.120.834,36 4.064.184,94


2.4 COMPOSITION OF THE ASSETS AND KEY FIGURES
2.4.1 COMPOSITIONS OF THE ASSETS OF KBC EQUITY FUND BUYBACK AMERICA
Name Quantity on 30/06/2013
Cur rency
Price in currency
Evaluation (in the currency of the
sub-fund)
% owned by
UCI
% portfolio
% Net
assets
NET ASSETS
SECURITIES PORTFOLIO
Bonds
Corporate bonds
Ireland
D-STAR FINANCE PLC SUB 14/05/13 738.000,00 EUR 74,430 714.026,49 0,22 0,22
Total bonds 714.026,49 0,22 0,22
Shares
Exchange-listed shares
Bahamas
STEINER LEISURE LTD - 3.427,00 USD 52,860 181.151,22 0,06 0,06
Bermuda
ASPEN INSURANCE HOLDINGS LTD - 4.122,00 USD 37,090 152.884,98 0,05 0,05
AXIS CAPITAL HOLDINGS LTD - 7.732,00 USD 45,780 353.970,96 0,11 0,11
WARNER CHILCOTT LTD - 11.875,00 USD 19,880 236.075,00 0,07 0,07
Cayman Islands
GARMIN LTD - 35.012,00 USD 36,160 1.266.033,92 0,39 0,39
China
SOHU.COM INC. - 6.410,00 USD 61,620 394.984,20 0,12 0,12
Ireland
INGERSOLL RAND PLC - 42.951,00 USD 55,520 2.384.639,52 0,74 0,74
Switzerland
ALLIED WORLD ASSURANCE CO HOLDING - 1.824,00 USD 91,510 166.914,24 0,05 0,05
U.K.
AMDOCS - 78.240,00 USD 37,090 2.901.921,60 0,90 0,90
U.S.A.
A SCHULMAN INC - 20.141,00 USD 26,820 540.181,62 0,17 0,17
ACTIVISION INC - 133.951,00 USD 14,260 1.910.141,26 0,59 0,59
ADOBE SYSTEMS - 86.948,00 USD 45,560 3.961.350,88 1,23 1,23
AECOM TECHNOLOGY CORP - 25.090,00 USD 31,790 797.611,10 0,25 0,25
AERCAP HOLDINGS NV - 10.488,00 USD 17,460 183.120,48 0,06 0,06
AGILENT TECHNOLOGIES - 38.245,00 USD 42,760 1.635.356,20 0,51 0,51
AIRCASTLE LTD - 11.909,00 USD 15,990 190.424,91 0,06 0,06
ALCO STORES INC - 7.163,00 USD 11,030 79.007,89 0,03 0,02
ALLSTATE CORPORATION - 70.475,00 USD 48,120 3.391.257,00 1,05 1,05
AMERICAN CAPITAL LTD - 35.875,00 USD 12,670 454.536,25 0,14 0,14
AMERICAN FINANCIAL GROUP INC - 3.380,00 USD 48,910 165.315,80 0,05 0,05
AMERICAN ORIENTAL BIOENGINEERI - 94.038,00 USD 0,620 58.303,56 0,02 0,02
AMERIPRISE FINANCIAL INC - 26.142,00 USD 80,880 2.114.364,96 0,66 0,66
AMERISOURCEBERGEN CORP - 53.524,00 USD 55,830 2.988.244,92 0,93 0,93
AMGEN - 42.267,00 USD 98,660 4.170.062,22 1,30 1,29
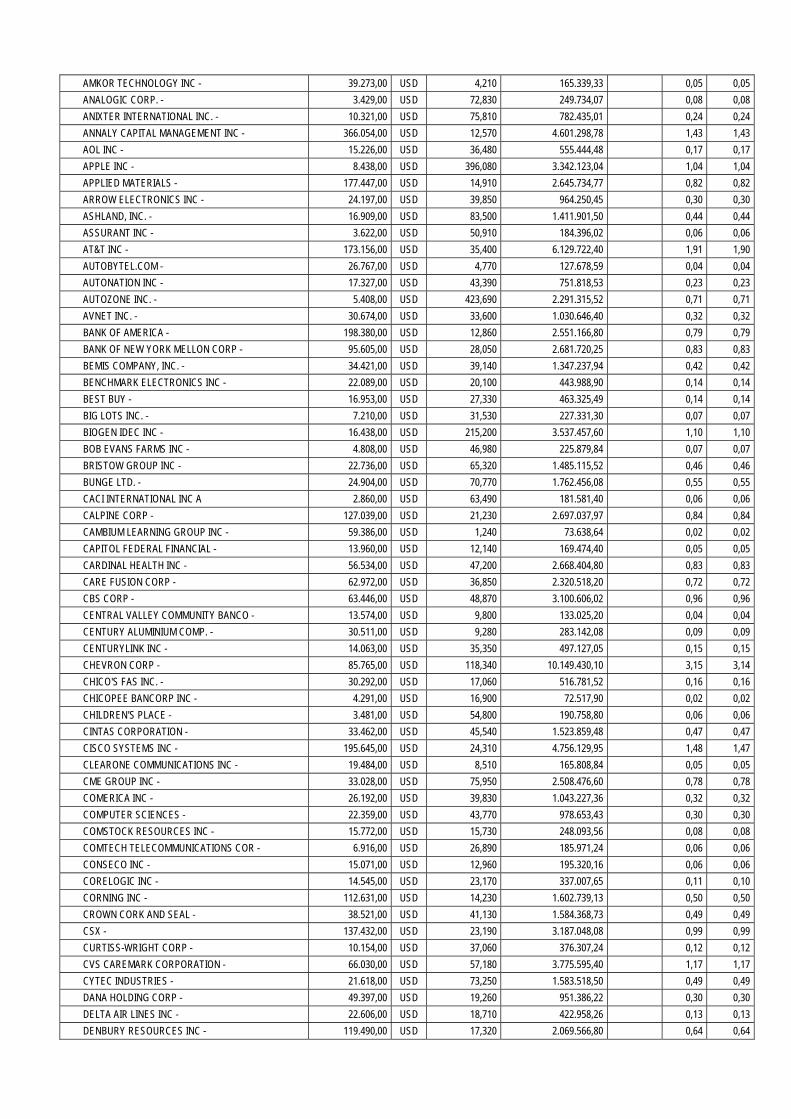
AMKOR TECHNOLOGY INC - 39.273,00 USD 4,210 165.339,33 0,05 0,05
ANALOGIC CORP. - 3.429,00 USD 72,830 249.734,07 0,08 0,08
ANIXTER INTERNATIONAL INC. - 10.321,00 USD 75,810 782.435,01 0,24 0,24
ANNALY CAPITAL MANAGEMENT INC - 366.054,00 USD 12,570 4.601.298,78 1,43 1,43
AOL INC - 15.226,00 USD 36,480 555.444,48 0,17 0,17
APPLE INC - 8.438,00 USD 396,080 3.342.123,04 1,04 1,04
APPLIED MATERIALS - 177.447,00 USD 14,910 2.645.734,77 0,82 0,82
ARROW ELECTRONICS INC - 24.197,00 USD 39,850 964.250,45 0,30 0,30
ASHLAND, INC. - 16.909,00 USD 83,500 1.411.901,50 0,44 0,44
ASSURANT INC - 3.622,00 USD 50,910 184.396,02 0,06 0,06
AT&T INC - 173.156,00 USD 35,400 6.129.722,40 1,91 1,90
AUTOBYTEL.COM - 26.767,00 USD 4,770 127.678,59 0,04 0,04
AUTONATION INC - 17.327,00 USD 43,390 751.818,53 0,23 0,23
AUTOZONE INC. - 5.408,00 USD 423,690 2.291.315,52 0,71 0,71
AVNET INC. - 30.674,00 USD 33,600 1.030.646,40 0,32 0,32
BANK OF AMERICA - 198.380,00 USD 12,860 2.551.166,80 0,79 0,79
BANK OF NEW YORK MELLON CORP - 95.605,00 USD 28,050 2.681.720,25 0,83 0,83
BEMIS COMPANY, INC. - 34.421,00 USD 39,140 1.347.237,94 0,42 0,42
BENCHMARK ELECTRONICS INC - 22.089,00 USD 20,100 443.988,90 0,14 0,14
BEST BUY - 16.953,00 USD 27,330 463.325,49 0,14 0,14
BIG LOTS INC. - 7.210,00 USD 31,530 227.331,30 0,07 0,07
BIOGEN IDEC INC - 16.438,00 USD 215,200 3.537.457,60 1,10 1,10
BOB EVANS FARMS INC - 4.808,00 USD 46,980 225.879,84 0,07 0,07
BRISTOW GROUP INC - 22.736,00 USD 65,320 1.485.115,52 0,46 0,46
BUNGE LTD. - 24.904,00 USD 70,770 1.762.456,08 0,55 0,55
CACI INTERNATIONAL INC A 2.860,00 USD 63,490 181.581,40 0,06 0,06
CALPINE CORP - 127.039,00 USD 21,230 2.697.037,97 0,84 0,84
CAMBIUM LEARNING GROUP INC - 59.386,00 USD 1,240 73.638,64 0,02 0,02
CAPITOL FEDERAL FINANCIAL - 13.960,00 USD 12,140 169.474,40 0,05 0,05
CARDINAL HEALTH INC - 56.534,00 USD 47,200 2.668.404,80 0,83 0,83
CARE FUSION CORP - 62.972,00 USD 36,850 2.320.518,20 0,72 0,72
CBS CORP - 63.446,00 USD 48,870 3.100.606,02 0,96 0,96
CENTRAL VALLEY COMMUNITY BANCO - 13.574,00 USD 9,800 133.025,20 0,04 0,04
CENTURY ALUMINIUM COMP. - 30.511,00 USD 9,280 283.142,08 0,09 0,09
CENTURYLINK INC - 14.063,00 USD 35,350 497.127,05 0,15 0,15
CHEVRON CORP - 85.765,00 USD 118,340 10.149.430,10 3,15 3,14
CHICO'S FAS INC. - 30.292,00 USD 17,060 516.781,52 0,16 0,16
CHICOPEE BANCORP INC - 4.291,00 USD 16,900 72.517,90 0,02 0,02
CHILDREN'S PLACE - 3.481,00 USD 54,800 190.758,80 0,06 0,06
CINTAS CORPORATION - 33.462,00 USD 45,540 1.523.859,48 0,47 0,47
CISCO SYSTEMS INC - 195.645,00 USD 24,310 4.756.129,95 1,48 1,47
CLEARONE COMMUNICATIONS INC - 19.484,00 USD 8,510 165.808,84 0,05 0,05
CME GROUP INC - 33.028,00 USD 75,950 2.508.476,60 0,78 0,78
COMERICA INC - 26.192,00 USD 39,830 1.043.227,36 0,32 0,32
COMPUTER SCIENCES - 22.359,00 USD 43,770 978.653,43 0,30 0,30
COMSTOCK RESOURCES INC - 15.772,00 USD 15,730 248.093,56 0,08 0,08
COMTECH TELECOMMUNICATIONS COR - 6.916,00 USD 26,890 185.971,24 0,06 0,06
CONSECO INC - 15.071,00 USD 12,960 195.320,16 0,06 0,06
CORELOGIC INC - 14.545,00 USD 23,170 337.007,65 0,11 0,10
CORNING INC - 112.631,00 USD 14,230 1.602.739,13 0,50 0,50
CROWN CORK AND SEAL - 38.521,00 USD 41,130 1.584.368,73 0,49 0,49
CSX - 137.432,00 USD 23,190 3.187.048,08 0,99 0,99
CURTISS-WRIGHT CORP - 10.154,00 USD 37,060 376.307,24 0,12 0,12
CVS CAREMARK CORPORATION - 66.030,00 USD 57,180 3.775.595,40 1,17 1,17
CYTEC INDUSTRIES - 21.618,00 USD 73,250 1.583.518,50 0,49 0,49
DANA HOLDING CORP - 49.397,00 USD 19,260 951.386,22 0,30 0,30
DELTA AIR LINES INC - 22.606,00 USD 18,710 422.958,26 0,13 0,13
DENBURY RESOURCES INC - 119.490,00 USD 17,320 2.069.566,80 0,64 0,64
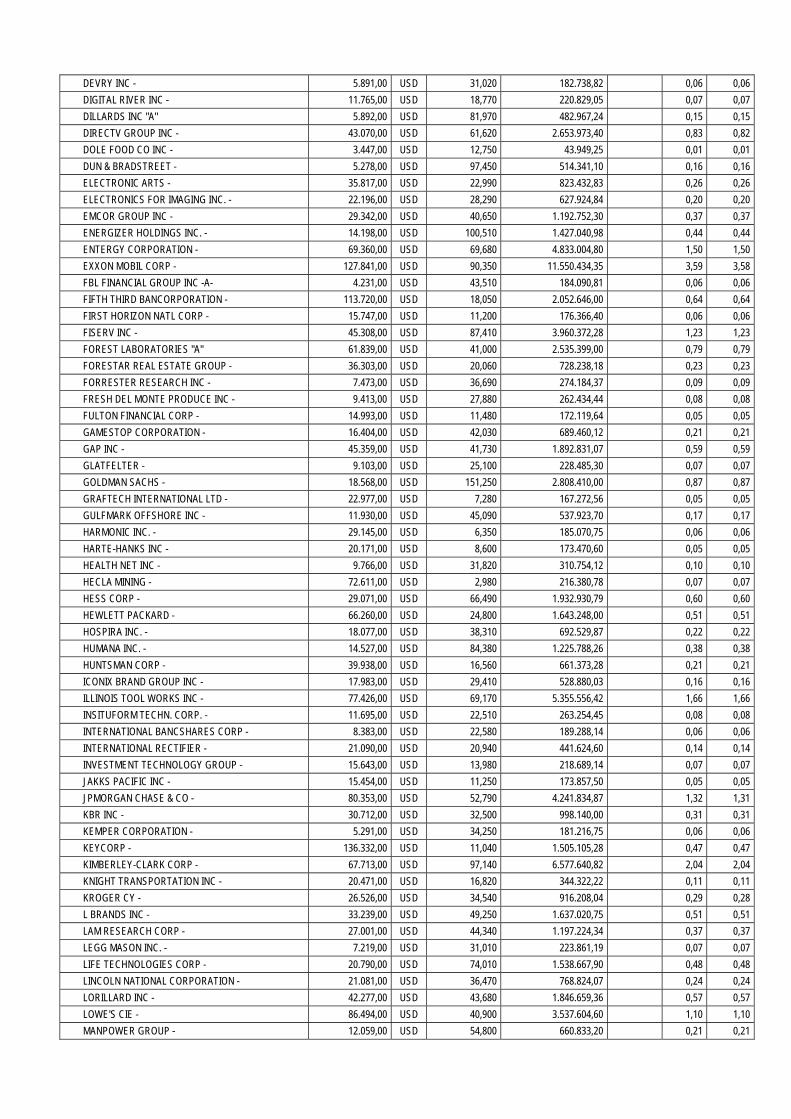
DEVRY INC - 5.891,00 USD 31,020 182.738,82 0,06 0,06
DIGITAL RIVER INC - 11.765,00 USD 18,770 220.829,05 0,07 0,07
DILLARDS INC "A" 5.892,00 USD 81,970 482.967,24 0,15 0,15
DIRECTV GROUP INC - 43.070,00 USD 61,620 2.653.973,40 0,83 0,82
DOLE FOOD CO INC - 3.447,00 USD 12,750 43.949,25 0,01 0,01
DUN & BRADSTREET - 5.278,00 USD 97,450 514.341,10 0,16 0,16
ELECTRONIC ARTS - 35.817,00 USD 22,990 823.432,83 0,26 0,26
ELECTRONICS FOR IMAGING INC. - 22.196,00 USD 28,290 627.924,84 0,20 0,20
EMCOR GROUP INC - 29.342,00 USD 40,650 1.192.752,30 0,37 0,37
ENERGIZER HOLDINGS INC. - 14.198,00 USD 100,510 1.427.040,98 0,44 0,44
ENTERGY CORPORATION - 69.360,00 USD 69,680 4.833.004,80 1,50 1,50
EXXON MOBIL CORP - 127.841,00 USD 90,350 11.550.434,35 3,59 3,58
FBL FINANCIAL GROUP INC -A- 4.231,00 USD 43,510 184.090,81 0,06 0,06
FIFTH THIRD BANCORPORATION - 113.720,00 USD 18,050 2.052.646,00 0,64 0,64
FIRST HORIZON NATL CORP - 15.747,00 USD 11,200 176.366,40 0,06 0,06
FISERV INC - 45.308,00 USD 87,410 3.960.372,28 1,23 1,23
FOREST LABORATORIES "A" 61.839,00 USD 41,000 2.535.399,00 0,79 0,79
FORESTAR REAL ESTATE GROUP - 36.303,00 USD 20,060 728.238,18 0,23 0,23
FORRESTER RESEARCH INC - 7.473,00 USD 36,690 274.184,37 0,09 0,09
FRESH DEL MONTE PRODUCE INC - 9.413,00 USD 27,880 262.434,44 0,08 0,08
FULTON FINANCIAL CORP - 14.993,00 USD 11,480 172.119,64 0,05 0,05
GAMESTOP CORPORATION - 16.404,00 USD 42,030 689.460,12 0,21 0,21
GAP INC - 45.359,00 USD 41,730 1.892.831,07 0,59 0,59
GLATFELTER - 9.103,00 USD 25,100 228.485,30 0,07 0,07
GOLDMAN SACHS - 18.568,00 USD 151,250 2.808.410,00 0,87 0,87
GRAFTECH INTERNATIONAL LTD - 22.977,00 USD 7,280 167.272,56 0,05 0,05
GULFMARK OFFSHORE INC - 11.930,00 USD 45,090 537.923,70 0,17 0,17
HARMONIC INC. - 29.145,00 USD 6,350 185.070,75 0,06 0,06
HARTE-HANKS INC - 20.171,00 USD 8,600 173.470,60 0,05 0,05
HEALTH NET INC - 9.766,00 USD 31,820 310.754,12 0,10 0,10
HECLA MINING - 72.611,00 USD 2,980 216.380,78 0,07 0,07
HESS CORP - 29.071,00 USD 66,490 1.932.930,79 0,60 0,60
HEWLETT PACKARD - 66.260,00 USD 24,800 1.643.248,00 0,51 0,51
HOSPIRA INC. - 18.077,00 USD 38,310 692.529,87 0,22 0,22
HUMANA INC. - 14.527,00 USD 84,380 1.225.788,26 0,38 0,38
HUNTSMAN CORP - 39.938,00 USD 16,560 661.373,28 0,21 0,21
ICONIX BRAND GROUP INC - 17.983,00 USD 29,410 528.880,03 0,16 0,16
ILLINOIS TOOL WORKS INC - 77.426,00 USD 69,170 5.355.556,42 1,66 1,66
INSITUFORM TECHN. CORP. - 11.695,00 USD 22,510 263.254,45 0,08 0,08
INTERNATIONAL BANCSHARES CORP - 8.383,00 USD 22,580 189.288,14 0,06 0,06
INTERNATIONAL RECTIFIER - 21.090,00 USD 20,940 441.624,60 0,14 0,14
INVESTMENT TECHNOLOGY GROUP - 15.643,00 USD 13,980 218.689,14 0,07 0,07
JAKKS PACIFIC INC - 15.454,00 USD 11,250 173.857,50 0,05 0,05
JPMORGAN CHASE & CO - 80.353,00 USD 52,790 4.241.834,87 1,32 1,31
KBR INC - 30.712,00 USD 32,500 998.140,00 0,31 0,31
KEMPER CORPORATION - 5.291,00 USD 34,250 181.216,75 0,06 0,06
KEYCORP - 136.332,00 USD 11,040 1.505.105,28 0,47 0,47
KIMBERLEY-CLARK CORP - 67.713,00 USD 97,140 6.577.640,82 2,04 2,04
KNIGHT TRANSPORTATION INC - 20.471,00 USD 16,820 344.322,22 0,11 0,11
KROGER CY - 26.526,00 USD 34,540 916.208,04 0,29 0,28
L BRANDS INC - 33.239,00 USD 49,250 1.637.020,75 0,51 0,51
LAM RESEARCH CORP - 27.001,00 USD 44,340 1.197.224,34 0,37 0,37
LEGG MASON INC. - 7.219,00 USD 31,010 223.861,19 0,07 0,07
LIFE TECHNOLOGIES CORP - 20.790,00 USD 74,010 1.538.667,90 0,48 0,48
LINCOLN NATIONAL CORPORATION - 21.081,00 USD 36,470 768.824,07 0,24 0,24
LORILLARD INC - 42.277,00 USD 43,680 1.846.659,36 0,57 0,57
LOWE'S CIE - 86.494,00 USD 40,900 3.537.604,60 1,10 1,10
MANPOWER GROUP - 12.059,00 USD 54,800 660.833,20 0,21 0,21
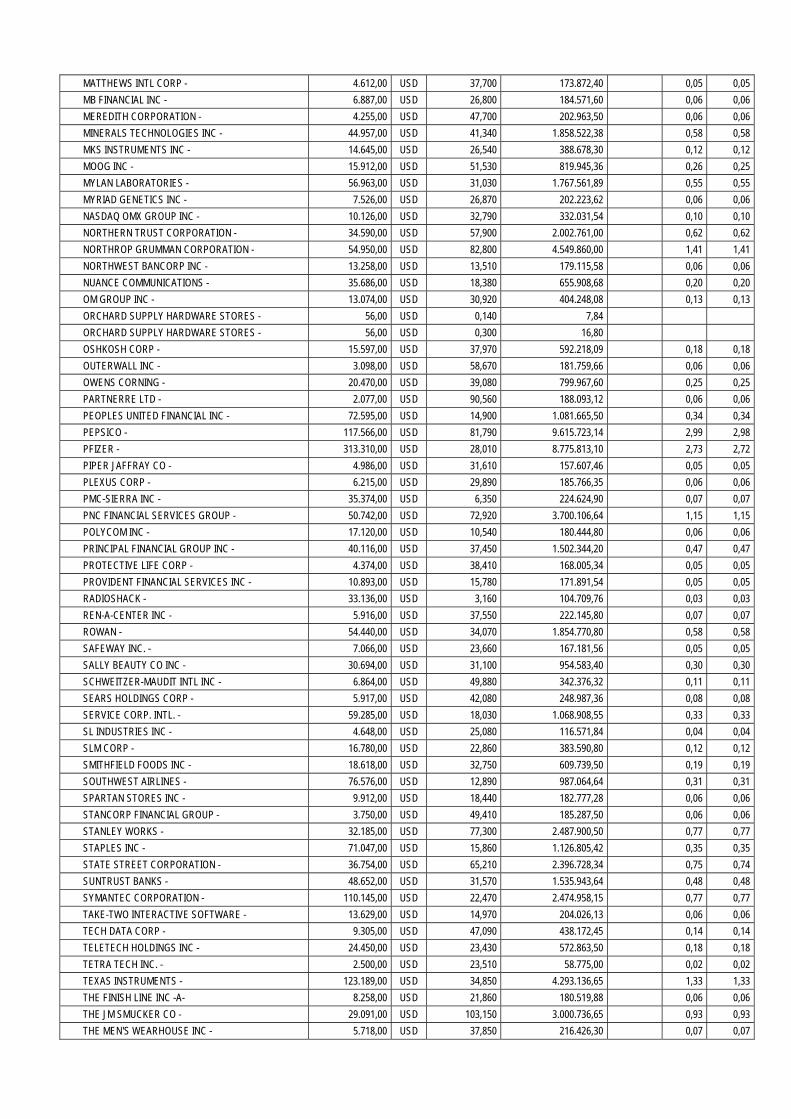
MATTHEWS INTL CORP - 4.612,00 USD 37,700 173.872,40 0,05 0,05
MB FINANCIAL INC - 6.887,00 USD 26,800 184.571,60 0,06 0,06
MEREDITH CORPORATION - 4.255,00 USD 47,700 202.963,50 0,06 0,06
MINERALS TECHNOLOGIES INC - 44.957,00 USD 41,340 1.858.522,38 0,58 0,58
MKS INSTRUMENTS INC - 14.645,00 USD 26,540 388.678,30 0,12 0,12
MOOG INC - 15.912,00 USD 51,530 819.945,36 0,26 0,25
MYLAN LABORATORIES - 56.963,00 USD 31,030 1.767.561,89 0,55 0,55
MYRIAD GENETICS INC - 7.526,00 USD 26,870 202.223,62 0,06 0,06
NASDAQ OMX GROUP INC - 10.126,00 USD 32,790 332.031,54 0,10 0,10
NORTHERN TRUST CORPORATION - 34.590,00 USD 57,900 2.002.761,00 0,62 0,62
NORTHROP GRUMMAN CORPORATION - 54.950,00 USD 82,800 4.549.860,00 1,41 1,41
NORTHWEST BANCORP INC - 13.258,00 USD 13,510 179.115,58 0,06 0,06
NUANCE COMMUNICATIONS - 35.686,00 USD 18,380 655.908,68 0,20 0,20
OM GROUP INC - 13.074,00 USD 30,920 404.248,08 0,13 0,13
ORCHARD SUPPLY HARDWARE STORES - 56,00 USD 0,140 7,84
ORCHARD SUPPLY HARDWARE STORES - 56,00 USD 0,300 16,80
OSHKOSH CORP - 15.597,00 USD 37,970 592.218,09 0,18 0,18
OUTERWALL INC - 3.098,00 USD 58,670 181.759,66 0,06 0,06
OWENS CORNING - 20.470,00 USD 39,080 799.967,60 0,25 0,25
PARTNERRE LTD - 2.077,00 USD 90,560 188.093,12 0,06 0,06
PEOPLES UNITED FINANCIAL INC - 72.595,00 USD 14,900 1.081.665,50 0,34 0,34
PEPSICO - 117.566,00 USD 81,790 9.615.723,14 2,99 2,98
PFIZER - 313.310,00 USD 28,010 8.775.813,10 2,73 2,72
PIPER JAFFRAY CO - 4.986,00 USD 31,610 157.607,46 0,05 0,05
PLEXUS CORP - 6.215,00 USD 29,890 185.766,35 0,06 0,06
PMC-SIERRA INC - 35.374,00 USD 6,350 224.624,90 0,07 0,07
PNC FINANCIAL SERVICES GROUP - 50.742,00 USD 72,920 3.700.106,64 1,15 1,15
POLYCOM INC - 17.120,00 USD 10,540 180.444,80 0,06 0,06
PRINCIPAL FINANCIAL GROUP INC - 40.116,00 USD 37,450 1.502.344,20 0,47 0,47
PROTECTIVE LIFE CORP - 4.374,00 USD 38,410 168.005,34 0,05 0,05
PROVIDENT FINANCIAL SERVICES INC - 10.893,00 USD 15,780 171.891,54 0,05 0,05
RADIOSHACK - 33.136,00 USD 3,160 104.709,76 0,03 0,03
REN-A-CENTER INC - 5.916,00 USD 37,550 222.145,80 0,07 0,07
ROWAN - 54.440,00 USD 34,070 1.854.770,80 0,58 0,58
SAFEWAY INC. - 7.066,00 USD 23,660 167.181,56 0,05 0,05
SALLY BEAUTY CO INC - 30.694,00 USD 31,100 954.583,40 0,30 0,30
SCHWEITZER-MAUDIT INTL INC - 6.864,00 USD 49,880 342.376,32 0,11 0,11
SEARS HOLDINGS CORP - 5.917,00 USD 42,080 248.987,36 0,08 0,08
SERVICE CORP. INTL. - 59.285,00 USD 18,030 1.068.908,55 0,33 0,33
SL INDUSTRIES INC - 4.648,00 USD 25,080 116.571,84 0,04 0,04
SLM CORP - 16.780,00 USD 22,860 383.590,80 0,12 0,12
SMITHFIELD FOODS INC - 18.618,00 USD 32,750 609.739,50 0,19 0,19
SOUTHWEST AIRLINES - 76.576,00 USD 12,890 987.064,64 0,31 0,31
SPARTAN STORES INC - 9.912,00 USD 18,440 182.777,28 0,06 0,06
STANCORP FINANCIAL GROUP - 3.750,00 USD 49,410 185.287,50 0,06 0,06
STANLEY WORKS - 32.185,00 USD 77,300 2.487.900,50 0,77 0,77
STAPLES INC - 71.047,00 USD 15,860 1.126.805,42 0,35 0,35
STATE STREET CORPORATION - 36.754,00 USD 65,210 2.396.728,34 0,75 0,74
SUNTRUST BANKS - 48.652,00 USD 31,570 1.535.943,64 0,48 0,48
SYMANTEC CORPORATION - 110.145,00 USD 22,470 2.474.958,15 0,77 0,77
TAKE-TWO INTERACTIVE SOFTWARE - 13.629,00 USD 14,970 204.026,13 0,06 0,06
TECH DATA CORP - 9.305,00 USD 47,090 438.172,45 0,14 0,14
TELETECH HOLDINGS INC - 24.450,00 USD 23,430 572.863,50 0,18 0,18
TETRA TECH INC. - 2.500,00 USD 23,510 58.775,00 0,02 0,02
TEXAS INSTRUMENTS - 123.189,00 USD 34,850 4.293.136,65 1,33 1,33
THE FINISH LINE INC -A- 8.258,00 USD 21,860 180.519,88 0,06 0,06
THE JM SMUCKER CO - 29.091,00 USD 103,150 3.000.736,65 0,93 0,93
THE MEN'S WEARHOUSE INC - 5.718,00 USD 37,850 216.426,30 0,07 0,07
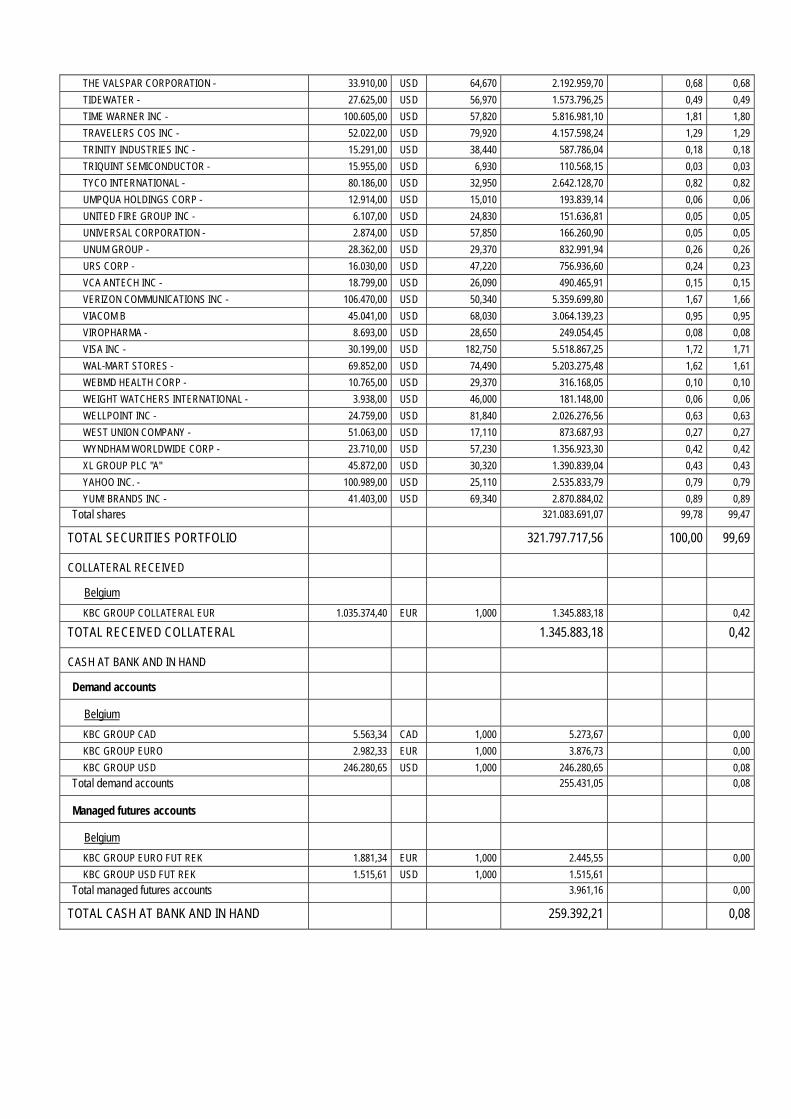
THE VALSPAR CORPORATION - 33.910,00 USD 64,670 2.192.959,70 0,68 0,68
TIDEWATER - 27.625,00 USD 56,970 1.573.796,25 0,49 0,49
TIME WARNER INC - 100.605,00 USD 57,820 5.816.981,10 1,81 1,80
TRAVELERS COS INC - 52.022,00 USD 79,920 4.157.598,24 1,29 1,29
TRINITY INDUSTRIES INC - 15.291,00 USD 38,440 587.786,04 0,18 0,18
TRIQUINT SEMICONDUCTOR - 15.955,00 USD 6,930 110.568,15 0,03 0,03
TYCO INTERNATIONAL - 80.186,00 USD 32,950 2.642.128,70 0,82 0,82
UMPQUA HOLDINGS CORP - 12.914,00 USD 15,010 193.839,14 0,06 0,06
UNITED FIRE GROUP INC - 6.107,00 USD 24,830 151.636,81 0,05 0,05
UNIVERSAL CORPORATION - 2.874,00 USD 57,850 166.260,90 0,05 0,05
UNUM GROUP - 28.362,00 USD 29,370 832.991,94 0,26 0,26
URS CORP - 16.030,00 USD 47,220 756.936,60 0,24 0,23
VCA ANTECH INC - 18.799,00 USD 26,090 490.465,91 0,15 0,15
VERIZON COMMUNICATIONS INC - 106.470,00 USD 50,340 5.359.699,80 1,67 1,66
VIACOM B 45.041,00 USD 68,030 3.064.139,23 0,95 0,95
VIROPHARMA - 8.693,00 USD 28,650 249.054,45 0,08 0,08
VISA INC - 30.199,00 USD 182,750 5.518.867,25 1,72 1,71
WAL-MART STORES - 69.852,00 USD 74,490 5.203.275,48 1,62 1,61
WEBMD HEALTH CORP - 10.765,00 USD 29,370 316.168,05 0,10 0,10
WEIGHT WATCHERS INTERNATIONAL - 3.938,00 USD 46,000 181.148,00 0,06 0,06
WELLPOINT INC - 24.759,00 USD 81,840 2.026.276,56 0,63 0,63
WEST UNION COMPANY - 51.063,00 USD 17,110 873.687,93 0,27 0,27
WYNDHAM WORLDWIDE CORP - 23.710,00 USD 57,230 1.356.923,30 0,42 0,42
XL GROUP PLC "A" 45.872,00 USD 30,320 1.390.839,04 0,43 0,43
YAHOO INC. - 100.989,00 USD 25,110 2.535.833,79 0,79 0,79
YUM! BRANDS INC - 41.403,00 USD 69,340 2.870.884,02 0,89 0,89
Total shares 321.083.691,07 99,78 99,47
TOTAL SECURITIES PORTFOLIO 321.797.717,56 100,00 99,69
COLLATERAL RECEIVED
Belgium
KBC GROUP COLLATERAL EUR 1.035.374,40 EUR 1,000 1.345.883,18 0,42
TOTAL RECEIVED COLLATERAL 1.345.883,18 0,42
CASH AT BANK AND IN HAND
Demand accounts
Belgium
KBC GROUP CAD 5.563,34 CAD 1,000 5.273,67 0,00
KBC GROUP EURO 2.982,33 EUR 1,000 3.876,73 0,00
KBC GROUP USD 246.280,65 USD 1,000 246.280,65 0,08
Total demand accounts 255.431,05 0,08
Managed futures accounts
Belgium
KBC GROUP EURO FUT REK 1.881,34 EUR 1,000 2.445,55 0,00
KBC GROUP USD FUT REK 1.515,61 USD 1,000 1.515,61
Total managed futures accounts 3.961,16 0,00
TOTAL CASH AT BANK AND IN HAND 259.392,21 0,08
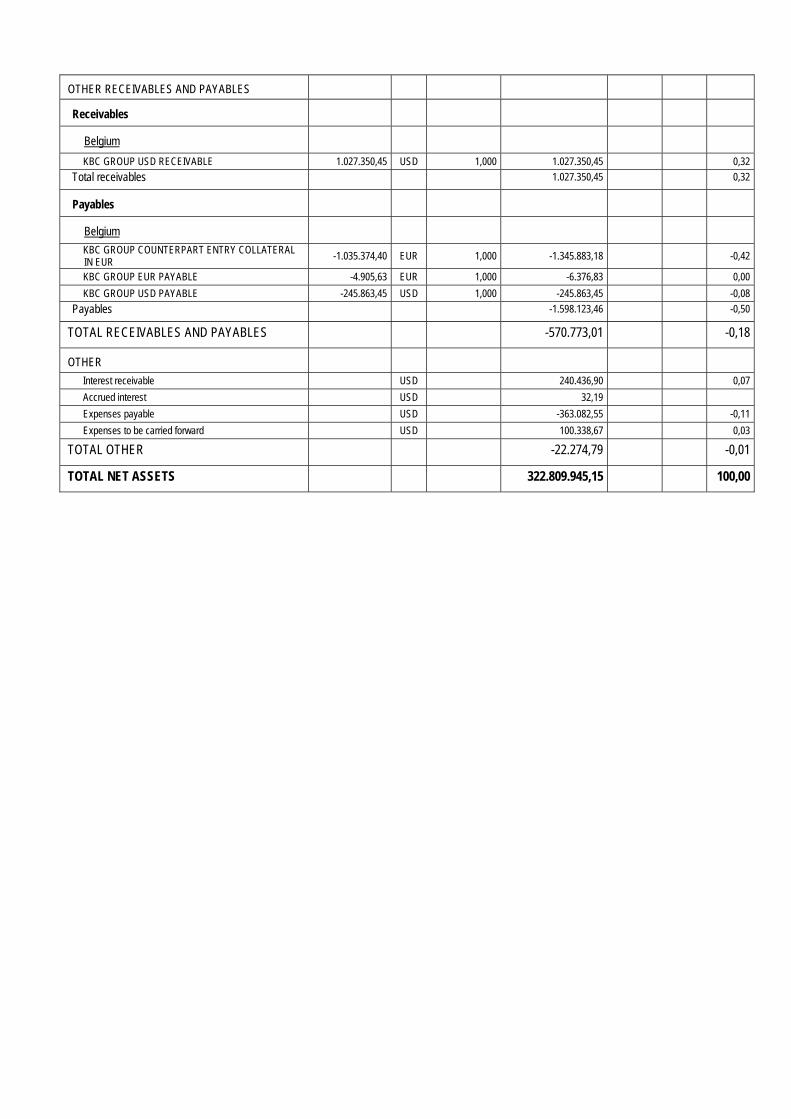
OTHER RECEIVABLES AND PAYABLES
Receivables
Belgium
KBC GROUP USD RECEIVABLE 1.027.350,45 USD 1,000 1.027.350,45 0,32
Total receivables 1.027.350,45 0,32
Payables
Belgium
KBC GROUP COUNTERPART ENTRY COLLATERAL IN EUR
-1.035.374,40 EUR 1,000 -1.345.883,18 -0,42
KBC GROUP EUR PAYABLE -4.905,63 EUR 1,000 -6.376,83 0,00
KBC GROUP USD PAYABLE -245.863,45 USD 1,000 -245.863,45 -0,08
Payables -1.598.123,46 -0,50
TOTAL RECEIVABLES AND PAYABLES -570.773,01 -0,18
OTHER
Interest receivable USD 240.436,90 0,07
Accrued interest USD 32,19
Expenses payable USD -363.082,55 -0,11
Expenses to be carried forward USD 100.338,67 0,03
TOTAL OTHER -22.274,79 -0,01
TOTAL NET ASSETS 322.809.945,15 100,00

Geographic breakdown (as a % of securities portfolio)
31/12/2011 30/06/2012 31/12/2012 30/06/2013 Belgium 0,00 -0,01 0,00 0,00 Bahamas 0,00 0,00 0,00 0,06 Bermuda 0,34 0,19 0,15 0,23 Switzerland 0,09 0,28 0,46 0,05 China 0,08 0,10 0,09 0,12 Cayman Islands 0,00 0,00 0,00 0,39 France 0,01 0,02 0,00 0,00 U.K. 0,36 0,27 0,52 0,90 Ireland 0,60 1,49 0,94 0,96 U.S.A. 98,41 97,56 97,79 97,29 South Africa 0,11 0,10 0,05 0,00 Total 100,00 100,00 100,00 100,00
Sector breakdown (as a % of securities portfolio)
31/12/2011 30/06/2012 31/12/2012 30/06/2013 Cyclicals 23,13 21,78 22,28 19,94 Consum(cycl) 13,56 12,58 12,87 13,82 Cons.goods 15,63 14,62 13,26 13,56 Pharma 10,49 10,89 11,35 11,46 Financials 11,12 12,96 14,33 15,85 Technology 17,50 18,89 17,74 17,65 Telecomm. 4,46 4,21 4,16 3,72 Utilities 2,86 2,55 2,36 2,34 Real est. 1,25 1,52 1,65 1,66 Total 100,00 100,00 100,00 100,00
Currency breakdown (as a % of net assets)
31/12/2011 30/06/2012 31/12/2012 30/06/2013 CAD 0,02 0,00 0,00 0,00 EUR 0,20 -0,35 0,27 0,22 USD 99,78 100,35 99,73 99,78 Total 100,00 100,00 100,00 100,00

2.4.2 CHANGES IN THE COMPOSITION OF THE ASSETS OF KBC EQUITY FUND BUYBACK AMERICA
(IN THE CURRENCY OF THE SUB-FUND)
1st half of year YearPurchases 238.855.093,54 238.855.093,54 Sales 183.908.227,35 183.908.227,35 Total 1 422.763.320,90 422.763.320,90 Subscriptions 245.714.483,06 245.714.483,06 Redemptions 191.763.797,91 191.763.797,91 Total 2 437.478.280,97 437.478.280,97 Monthly average of total assets
303.431.546,95 303.431.546,95
Turnover rate -4,85 % -4,85 %
1st half of year YearPurchases 238.855.093,54 238.855.093,54 Sales 183.908.227,35 183.908.227,35 Total 1 422.763.320,90 422.763.320,90 Subscriptions 245.714.483,06 245.714.483,06 Redemptions 191.763.797,91 191.763.797,91 Total 2 437.478.280,97 437.478.280,97 Monthly average of total assets
333.596.918,50 333.596.918,50
Corrected turnover rate -4,41 % -4,41 %
The table above shows the capital volume of portfolio transactions. This volume (adjusted to take account of total subscriptions and redemptions) is also compared to the average net assets at the beginning and end of the period. A figure close to 0% implies that the transactions relating to the securities or transactions relating to the assets (excluding deposits and cash) in a given period only involve subscriptions and redemptions. A negative percentage shows that subscriptions and redemptions entailed few, if any, transactions in the portfolio. Active asset management may result in high turnover rates (monthly percentage >50%). The detailed list of transactions is available for consultation free of charge at the registered office of the Bevek or fund at Havenlaan 2, 1080 Brussels.

2.4.3 AMOUNT OF COMMITMENTS IN RESPECT OF FINANCIAL DERIVATIVES POSITIONS
NAME Currency Value in currency
In the currency of the sub-fund
Lot-size
Transactiondate
KBC COLLATERAL EUR
EUR 1.035.374,40 1.345.883,18 N/A 28.06.2013
2.4.4 CHANGES OF THE NUMBER OF SUBSCRIPTIONS AND REDEMPTIONS AND THE NET ASSET
VALUE
Classic Shares
Period Change in number of shares in circulation
Year Subscriptions Redemptions End of period
Cap. Dis. Cap. Dis. Cap. Dis. Total
2011 - 06 251.231,04 4.485,75 149.855,91 2.017,00 155.210,51 11.369,04 166.579,55
2012 - 06 43.236,28 1.723,00 161.840,77 2.997,00 36.606,02 10.095,04 46.701,06
2013 - 06 60.146,42 67.401,06 13.815,88 15.289,39 82.936,56 62.206,70 145.143,26
Period Amounts received and paid by the UCI
(in the currency of the class)
Year Subscriptions Redemptions
Capitalization Distribution Capitalization Distribution
2011 - 06 219.670.076,30 3.797.699,54 136.044.648,90 1.589.965,67
2012 - 06 38.936.759,63 1.410.939,06 138.313.514,30 2.472.454,87
2013 - 06 67.949.316,45 66.244.547,66 15.134.684,10 15.536.476,94
Period Net asset value
End of period (in the currency of the class)
Year Of the class Of one share
Capitalization Distribution
2011 - 06 159.308.702,07 962,93 866,52
2012 - 06 43.876.893,71 960,36 863,98
2013 - 06 165.558.562,50 1.193,57 1.070,11
Institutional B Shares
Period Change in number of shares in circulation
Year Subscriptions Redemptions End of period
Cap. Dis. Cap. Dis. Cap. Dis. Total 2012 - 06 148.564,00 129.399,00 19.165,00 19.165,00
2013 - 06 277.328,38 164.849,55 131.643,83 131.643,83
Period Amounts received and paid by the UCI
(in the currency of the class)
Year Subscriptions Redemptions
Capitalization Distribution Capitalization Distribution
2012 - 06 137.066.330,00 121.829.124,50
2013 - 06 296.824.250,30 188.702.076,70
Period Net asset value
End of period (in the currency of the class)

Year Of the class Of one share
Capitalization Distribution
2012 - 06 18.419.207,11 961,09
2013 - 06 157.251.382,70 1.194,52
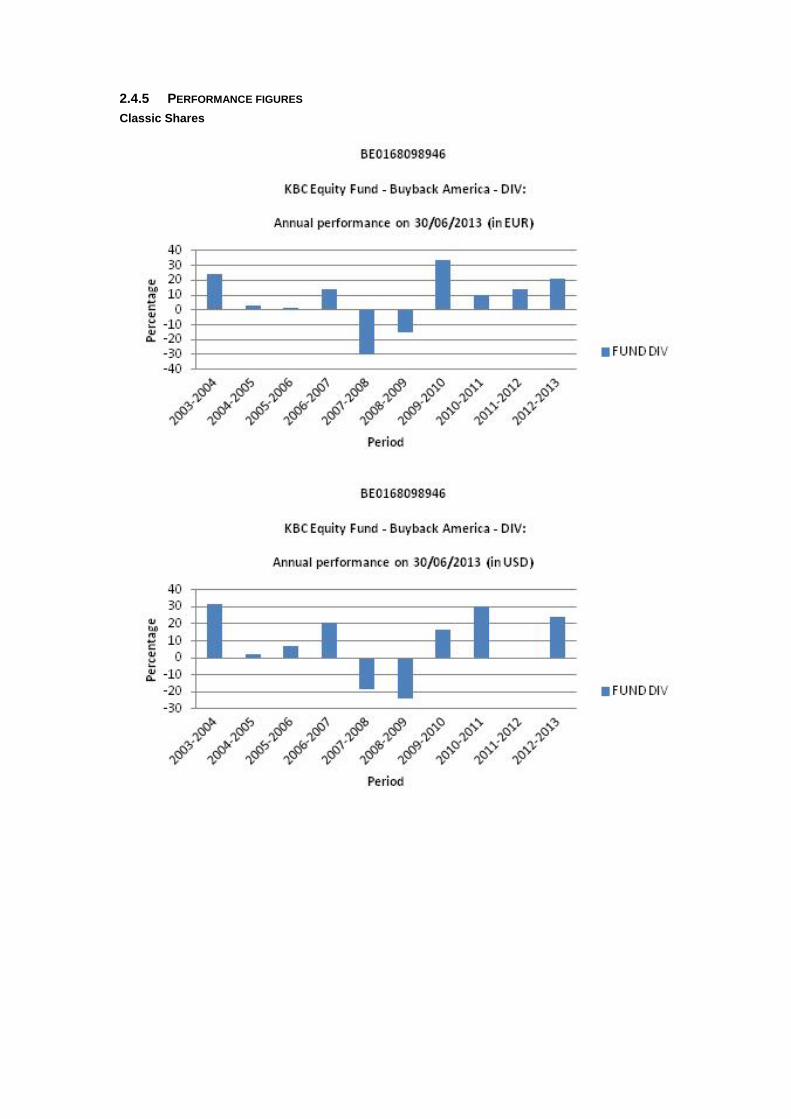
2.4.5 PERFORMANCE FIGURES
Classic Shares
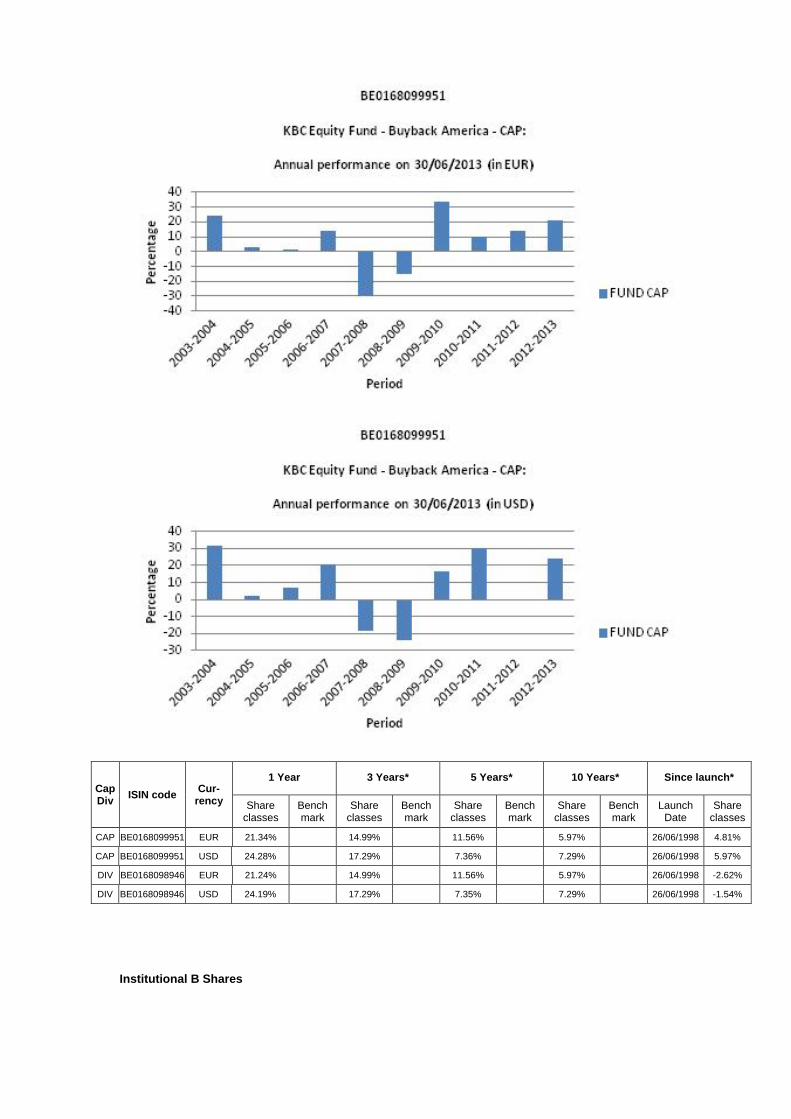
Cap Div
ISIN code Cur-
rency
1 Year 3 Years* 5 Years* 10 Years* Since launch*
Share classes
Bench mark
Share classes
Bench mark
Share classes
Bench mark
Share classes
Bench mark
Launch Date
Share classes
CAP BE0168099951 EUR 21.34% 14.99% 11.56% 5.97% 26/06/1998 4.81%
CAP BE0168099951 USD 24.28% 17.29% 7.36% 7.29% 26/06/1998 5.97%
DIV BE0168098946 EUR 21.24% 14.99% 11.56% 5.97% 26/06/1998 -2.62%
DIV BE0168098946 USD 24.19% 17.29% 7.35% 7.29% 26/06/1998 -1.54%
Institutional B Shares
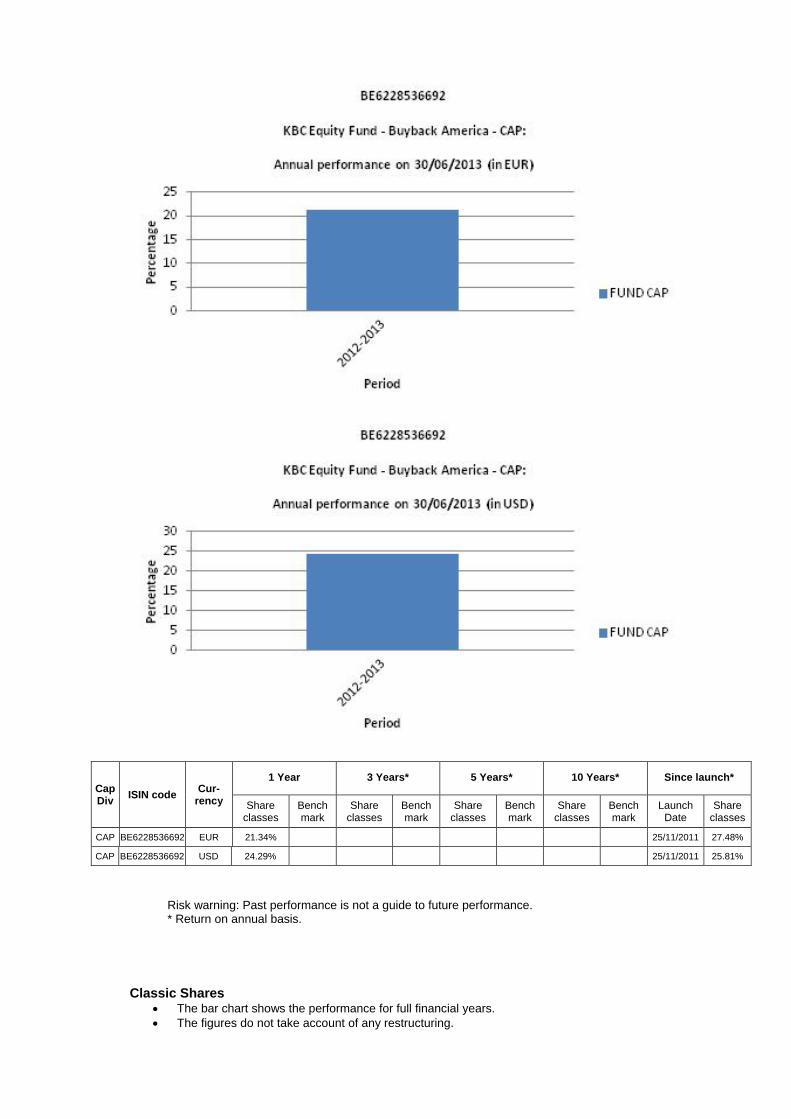
Cap Div
ISIN code Cur-
rency
1 Year 3 Years* 5 Years* 10 Years* Since launch*
Share classes
Bench mark
Share classes
Bench mark
Share classes
Bench mark
Share classes
Bench mark
Launch Date
Share classes
CAP BE6228536692 EUR 21.34% 25/11/2011 27.48%
CAP BE6228536692 USD 24.29% 25/11/2011 25.81%
Risk warning: Past performance is not a guide to future performance. * Return on annual basis.
Classic Shares The bar chart shows the performance for full financial years. The figures do not take account of any restructuring.

Calculated in USD and in EUR. The return is calculated as the change in the net asset value between two dates expressed
as a percentage. In the case of units that pay dividends, the dividend is incorporated geometrically in the return.
Calculation method for date D, where NAV stands for net asset value: Capitalisation units (CAP) Return on date D over a period of X years:
[NIW(D) / NIW(Y)] ^ [1 / X] - 1 where Y = D-X
Return on date D since the start date S of the unit: [NIW(D) / NIW(S)] ^ [1 / F] - 1 where F = 1 if the unit has existed for less than one year on date D where F = (D-S) / 365.25 if the unit has existed for longer than one year on date D
Distribution units (DIV) Return on date D over a period of X years:
[ C * NIW(D) / NIW(Y)] ^ [1 / X] - 1 where Y = D-X
Return on date D since the start date S of the unit: [ C * NIW(D) / NIW(S)] ^ [1 / F] - 1 where F = 1 if the unit has existed for less than one year on date D where F = (D-S) / 365.25 if the unit has existed for longer than one year on date D where C is a factor that is determined for all N dividends between the calculation date D and the reference date.
For dividend i on date Di with value Wi: Ci = [Wi / NIW(Di)] + 1 i = 1 ... N from whichC = C0 * .... * CN.
If the interval between the two dates exceeds one year, the ordinary return calculation is converted into a return on an annual basis by taking the nth square root of 1 plus the total return of the unit.
The return figures shown above do not take account of the fees and charges associated with the issue and redemption of units.
These are the performance figures for capitalisation and distribution shares.
Institutional B Shares The bar chart shows the performance for full financial years. The figures do not take account of any restructuring. Calculated in USD and in EUR. The return is calculated as the change in the net asset value between two dates expressed
as a percentage. Calculation method for date D, where NAV stands for net asset value:
Capitalisation units (CAP) Return on date D over a period of X years:
[NIW(D) / NIW(Y)] ^ [1 / X] - 1 where Y = D-X
Return on date D since the start date S of the unit: [NIW(D) / NIW(S)] ^ [1 / F] - 1 where F = 1 if the unit has existed for less than one year on date D where F = (D-S) / 365.25 if the unit has existed for longer than one year on date D
If the interval between the two dates exceeds one year, the ordinary return calculation is converted into a return on an annual basis by taking the nth square root of 1 plus the total return of the unit.
The return figures shown above do not take account of the fees and charges associated with the issue and redemption of units.
These are the performance figures for capitalization shares.

2.4.6 COSTS Ongoing Charges: * Classic Shares Distribution: 1.926% Classic Shares Capitalization: 1.831% Institutional B Shares Capitalization: 1.82% * The following costs have not been included in the ongoing charges: - Interest payments on loans taken out - Payments in respect of financial derivatives - Fees and charges paid directly by the investor - Any soft commissions
SOFT COMMISSIONS The management company or the appointed manager, as the case may be, is the recipient of soft commissions. The recipient has laid down an internal policy as regards accepting soft commissions and avoiding possible conflicts of interest in this respect, and has put appropriate internal controls in place to ensure this policy is observed. For more information, please see the ‘General’ section of the annual report.
Broker
Commission gross
in EUR
paid during the period:
1‐01‐13
‐
30‐06‐13
CSA Credits
in EUR
accrued during the period:
1‐01‐13
‐
30‐06‐13 Percentage
CSFBSAS 30,338 17,859 58.87%
EQ MACQUARIE 52,304 26,450 50.57%
INSTINET 24,759 12,505 50.51%
MERRILL 37,320 18,660 50.00%
MORGAN STANLEY 36,689 19,764 53.87%
UBSWDR 10,272 5,136 50.00%
FEE-SHARING AGREEMENTS AND REBATES: The management company may share its fee with the distributor, and institutional and/or professional parties. In principle, the percentage share amounts to between 35% and 60% if the distributor is an entity of KBC Group NV or to between 35% and 70% if the distributor is not an entity of KBC Group NV. However, in a small number of cases, the distributor’s fee is less than 35%. Investors may, on request, obtain more information on these cases. If the management company invests the assets of the undertaking for collective investment in units of undertakings for collective investment that are not managed by an entity of KBC Group NV, and receives a fee for doing so, it will pay this fee to the undertaking for collective investment. Fee-sharing does not affect the amount of the management fee paid by the sub-fund to the management company. This management fee is subject to the limitations laid down in the articles of association. The limitations may only be amended after approval by the general meeting of shareholders. The management company has concluded a distribution agreement with the distributor in order to facilitate the wider distribution of the sub-fund's units by using multiple distribution channels. It is in the interests of the holders of units, the sub-fund and of the distributor for the largest possible number of units to be sold and for the assets of the sub-fund to be maximised in this way. In this respect, there is therefore no question of any conflict of interest.
2.4.7 NOTES TO THE FINANCIAL STATEMENTS AND OTHER DATA Fee for managing the investment portfolio: 1.5% per annum calculated on the basis of the average total net assets of the sub-fund, no management fee is charged on assets assets invested in investment undertakings managed by a financial institution of the KBC group. KBC Fund Management Limited receives a fee from the management company of max. 1.5% calculated on that part of the portfolio that it manages, without the total management fee received by the management company being exceeded.
The administration agent’s fee is payable at the end of each month and is calculated on the basis of the average total net assets of the sub-fund. Auditor's fee: 1 700 EUR per year. This fee is not including VAT and can be indexed on an annual basis in accordance with the decisions of the general meeting. The custody fee is calculated on the value of the securities held in custody by the custodian on the final banking day of the preceding calendar year, except on those assets invested in investment undertakings managed by a financial institution of the KBC group. The custody fee is paid at the beginning of the calendar year. Social, ethical and environmental aspects: No manufacturers of controversial weapons whose use over the past five decades, according to the international consensus, has led to disproportionate human suffering among the civilian population will be included in the portfolio of investments. This involves the manufacturers of anti-personnel mines, cluster bombs and munitions and weapons containing depleted uranium. In this way, the sub-fund seeks to reflect not only simple financial reality but also the social reality of the sector or region in question. Exercising voting rights. If necessary, relevant and in the interest of the shareholders, the management company will exercise the voting rights attached to the shares in the Bevek’s portfolio. The management company will adhere to the following criteria when determining how it stands relative to the items on the agenda that are put to the vote: - Shareholder value may not be adversely affected. - Corporate governance rules, especially with regard to the rights of minority shareholders, must be
respected. - The minimum standards with regard to sustainable business and corporate social responsibility
must be met. The list of companies for which voting rights are exercised is available at the registered office of the Bevek. Securities lending In accordance with the Royal Decree of 7 March 2006 concerning securities lending, the undertaking for collective investment has taken out securities loans with a principal to whom the full title of the loaned securities was transferred, without recording this transfer of ownership in the accounts. For the period from 1 January 2013 to 30 June 2013, the fee for securities lent comes to -32.19 USD. The undertaking for collective investment receives 50% of the fee received for securities lent. The detailed list of securities lending transactions carried out can be obtained from the registered office of the collective investment undertaking at 2 Havenlaan, 1080 Brussels.
Overview of securities lent as at 30/06/2013
Name Currency Quantity Price Value in currency of the portfolio
GARMIN LTD USD 35.011 36,160 1.265.997,76
Total 1.265.997,76
Details of collateral received for securities lent
Name Currency Nominal value Currency fund Value in Currency fund
BUNDESSCHATZANWEISUNGEN 2013 0.25% 13/03/15 EUR 980.000 USD 1.277.016,69
OAT FRANCE 2003 4% 25/04/14 EUR 32.000 USD 43.219,49
FRANCE 2008 3.75% 25/10/2019 EUR 17.000 USD 25.647,00
Total 1.345.883,18 For the valuation of the collateral received, indicative prices have been used in this detail list by the Collateral Management Division of KBC Bank.