DSP India Equity Fund - August 2021 - PPT.pdf
64
The image part with relationship ID rId5 was not found in the file. [Title to come] [Sub-Title to come] Strictly for Intended Recipients Only Date * DSP India Fund is the Company incorporated in Mauritius, under which ILSF is the corresponding share class The image part with relationship ID rId5 was not found in the file. Firm & Strategy Overview August 2021 | People | Processes | Performance | This document is a marketing communication.
-
Upload
khangminh22 -
Category
Documents
-
view
0 -
download
0
Transcript of DSP India Equity Fund - August 2021 - PPT.pdf

The image part with relationship ID rId5 was not found in the file.
[Title to come][Sub-Title to come]
Strictly for Intended Recipients OnlyDate* DSP India Fund is the Company incorporated in Mauritius, under which ILSF is the corresponding share class
The image part with relationship ID rId5 was not found in the file.
Firm & Strategy Overview
August 2021
| People | Processes | Performance |
This document is a marketing communication.

2
The DSP Group – Long History
Strictly For Use By Intended Recipients Only
Why DSP?
Founders of BSEThe family behind DSP Group included a founding member of the Bombay Stock Exchange
Market PioneersKey figure in the professionalization of capital markets in India
150+ Years of existence (DSP Group)Among the oldest financial firms in India
25 yearsIn the Indian asset management industry
Successful time-tested legacy in the Indian financial markets
1. Core Business : Only Investment Management
2. Ownership that allows long term thinking : Family-owned and professionally-managed
3. Decades of good investment practices : from JVs with Merrill Lynch and BlackRock
4. Strong corporate access : DSP Group brought many of the top 300 companies in India to capital markets for the first time
5. Experienced Talent : 24 member Equity Investment team, having witnessed many market, economic & business cycles
Source: Internal, 31 July 2021; USDINR rate assumed 74.3871
Equity AUM(US$ 11.4 billion)
Offshore Assets(US$ 2.2 billion)
Domestic Assets(US$ 9.2 billion)
4 Sovereign / Institutional mandates
Firm AUMUS $ 16.7 Bn
3
Our Principles
Source: Internal, Jul 2021
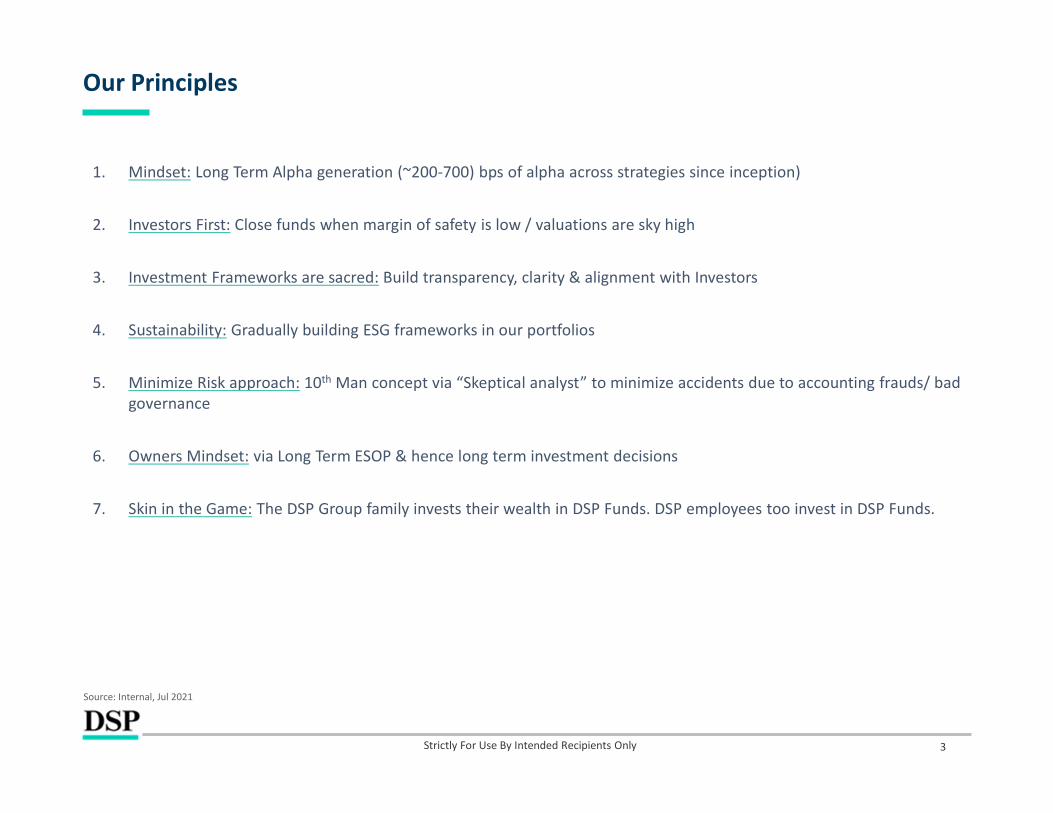
1. Mindset: Long Term Alpha generation (~200-700) bps of alpha across strategies since inception)
2. Investors First: Close funds when margin of safety is low / valuations are sky high
3. Investment Frameworks are sacred: Build transparency, clarity & alignment with Investors
4. Sustainability: Gradually building ESG frameworks in our portfolios
5. Minimize Risk approach: 10th Man concept via “Skeptical analyst” to minimize accidents due to accounting frauds/ bad governance
6. Owners Mindset: via Long Term ESOP & hence long term investment decisions
7. Skin in the Game: The DSP Group family invests their wealth in DSP Funds. DSP employees too invest in DSP Funds.
Strictly For Use By Intended Recipients Only
4
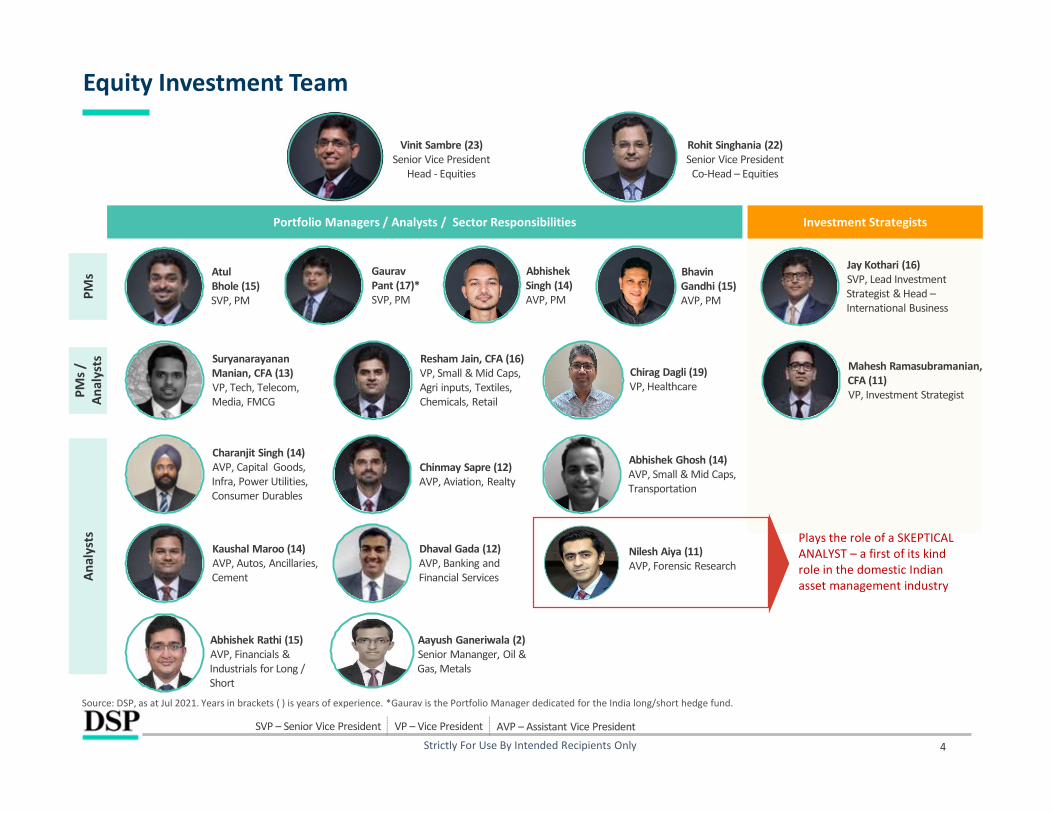
Equity Investment Team
Strictly For Use By Intended Recipients Only
Resham Jain, CFA (16)VP, Small & Mid Caps, Agri inputs, Textiles, Chemicals, Retail
Chinmay Sapre (12)AVP, Aviation, Realty
Abhishek Ghosh (14)AVP, Small & Mid Caps, Transportation
Kaushal Maroo (14)AVP, Autos, Ancillaries, Cement
Charanjit Singh (14)AVP, Capital Goods, Infra, Power Utilities, Consumer Durables
Dhaval Gada (12) AVP, Banking and Financial Services
AtulBhole (15)SVP, PM
GauravPant (17)*SVP, PM
Suryanarayanan Manian, CFA (13)VP, Tech, Telecom, Media, FMCG
Investment Strategists
Mahesh Ramasubramanian, CFA (11)VP, Investment Strategist
Jay Kothari (16)SVP, Lead Investment Strategist & Head –International Business
Portfolio Managers / Analysts / Sector Responsibilities
Rohit Singhania (22)Senior Vice President
Co-Head – Equities
Vinit Sambre (23)Senior Vice President
Head - Equities
Source: DSP, as at Jul 2021. Years in brackets ( ) is years of experience. *Gaurav is the Portfolio Manager dedicated for the India long/short hedge fund.
PMs
PMs /
An
alys
tsAn
alys
ts
Abhishek Rathi (15)AVP, Financials & Industrials for Long / Short
Aayush Ganeriwala (2)Senior Mananger, Oil & Gas, Metals
SVP – Senior Vice President VP – Vice President AVP – Assistant Vice President
Nilesh Aiya (11)AVP, Forensic Research
Plays the role of a SKEPTICAL ANALYST – a first of its kind role in the domestic Indian asset management industry
Chirag Dagli (19)VP, Healthcare
Abhishek Singh (14) AVP, PM
BhavinGandhi (15) AVP, PM

The Opportunity
6
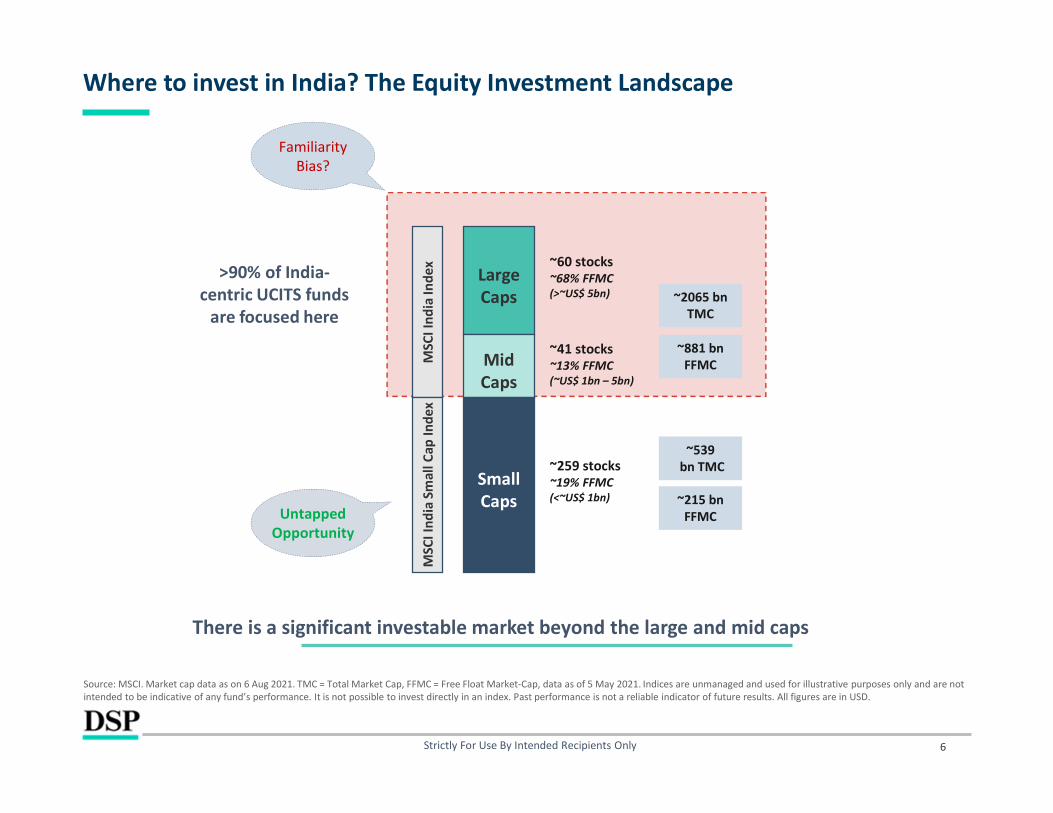
Where to invest in India? The Equity Investment Landscape
Strictly For Use By Intended Recipients Only
Source: MSCI. Market cap data as on 6 Aug 2021. TMC = Total Market Cap, FFMC = Free Float Market-Cap, data as of 5 May 2021. Indices are unmanaged and used for illustrative purposes only and are not intended to be indicative of any fund’s performance. It is not possible to invest directly in an index. Past performance is not a reliable indicator of future results. All figures are in USD.
Large Caps
Mid Caps
~60 stocks~68% FFMC(>~US$ 5bn)
~41 stocks~13% FFMC(~US$ 1bn – 5bn)
MSC
I Ind
ia In
dex
SmallCaps
MSC
I Ind
ia S
mal
l Cap
Inde
x
~259 stocks~19% FFMC(<~US$ 1bn) ~215 bn
FFMC
>90% of India-centric UCITS funds
are focused here
~881 bnFFMC
~2065 bnTMC
~539bn TMC
There is a significant investable market beyond the large and mid caps
Familiarity Bias?
Untapped Opportunity

7
How Small caps performed? Active management generated superior return/risk
Strictly For Use By Intended Recipients Only
Source: Bloomberg, Ambit Capital Research, Returns data are net of fees, data from Nov 2006 to 31 Jul 2021. Indices are unmanaged and used for illustrative purposes only and are not intended to be indicative of any fund’s performance. It is not possible to invest directly in an index. Past performance is not a reliable indicator of future results. All figures are in USD. The DSP Strategy has been implemented since 14 Nov 2006 through certain products managed by DSP Investment Managers Pvt. Ltd., which are not available for investment in any jurisdiction except for India. The ‘average India focused UCITS returns’ refers to the average returns of all India focused UCITS equity funds as listed on Bloomberg.
Our actively managed small and midcap oriented strategy has generated superior return/risk
MSCI India Index, 5.0%
MSCI India Index, 4.5%
MSCI India Index, 4.9%
MSCI India Index, 4.5%
MSCI India Small Cap Index, 5.7%
MSCI India Small Cap Index, 5.7%
MSCI India Small Cap Index, 6.7%
MSCI India Small Cap Index, 5.4%
Average India focused UCITS returns, 5.6%
Average India focused UCITS returns, 6.7%
Average India focused UCITS returns, 7.0%
Average India focused UCITS returns, 5.5%
DSP Strategy, 11.9%
DSP Strategy, 11.7%
DSP Strategy, 12.7%
DSP Strategy, 11.4%
3Y
5Y
7Y
10Y
Rolling Returns
0.8
0.8
1.5
1.6
0.5
0.7
1.4
1.5
1.6
2.0
2.2
2.0
1.0
1.7
3.0
3.5
3Y
5Y
7Y
10Y
Return / Risk (rolling basis)

8
Alpha elements? low ownership, sparse research and high diversification
Strictly For Use By Intended Recipients Only
Diversification MSCI India Index MSCI India Small Cap Index
GICS Industry 41 51
No. of stocks 101 260
Top 10 concentration 46.7% 13.2%
Small-Cap stocks tend to be under-owned and under-researched
Correlation Matrix MSCI AC World Index MSCI EM Index
MSCI India Index 50% 67%
MSCI India Small Cap Index 43% 59%
DSP Strategy 34% 43%
MSCI India Small Cap is more diversified, offering variety in stock picks Lower correlation of MSCI India Small Cap vs MSCI India
2
3 4
1
4.3%alpha
CAGR since inception
of the DSP Strategy over the MSCI Small Cap Index
Large & Mid Cap Alpha waning; Small Cap presents alpha opportunities
Source: Bloomberg, ACE Equity, Internal. Note: Large cap is represented by MSCI India Index and Small Cap is represented by MSCI Small Cap Index. Data as on 31 Jul 2021. For Panel 2 - Institutional holding is as per latest available qtly data (Mar'21/Jun'21) and Analyst coverage is as of 11th July'21; For Panel 3 - holdings data is as of 11th July'21. Correlation data since inception of the fund. Indices are unmanaged and used for illustrative purposes only and are not intended to be indicative of any fund’s performance. It is not possible to invest directly in an index. Past performance is not a reliable indicator of future results. The DSP Strategy has been implemented since 14 Nov 2006 through certain products managed by DSP Investment Managers Pvt. Ltd., which are not available for investment in any jurisdiction except for India.
36
27
20
25
30
35
40
Large Cap Small Cap
Aver
age
inst
itutio
nal o
wne
rshi
p (%
)
32
13
-
5
10
15
20
25
30
35
Large Cap Small Cap
Aver
age
no. o
f ana
lyst
s pe
r sto
ck
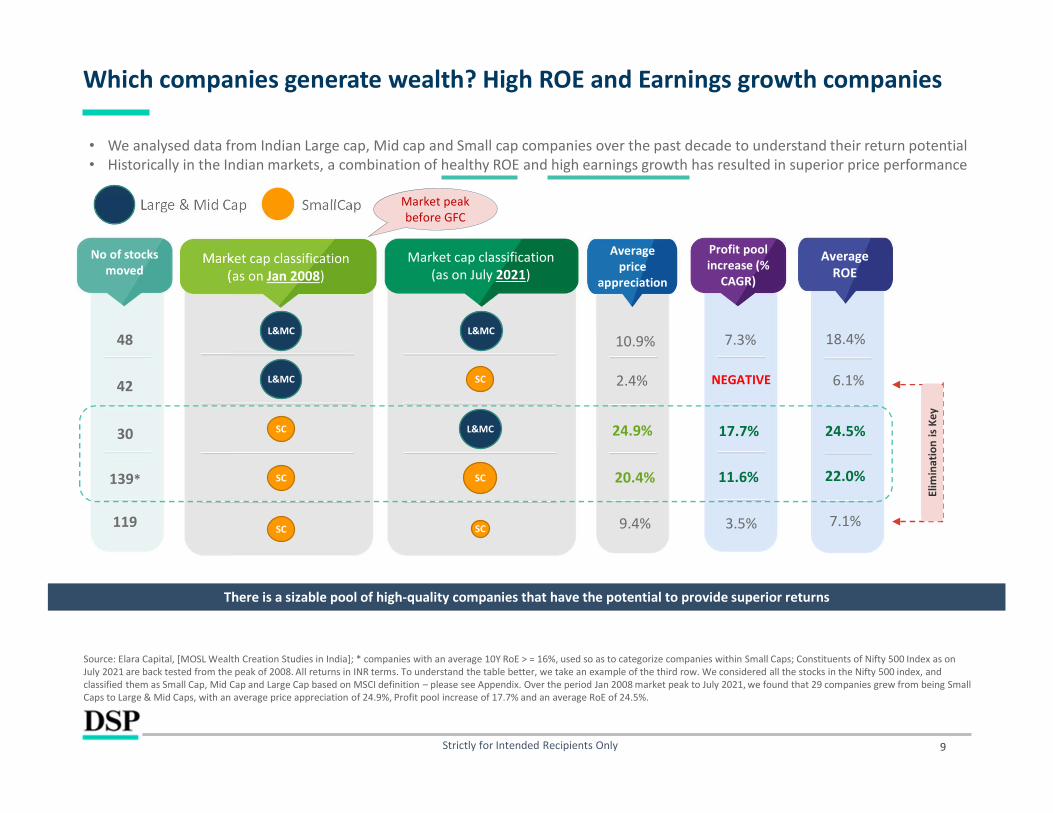
• We analysed data from Indian Large cap, Mid cap and Small cap companies over the past decade to understand their return potential• Historically in the Indian markets, a combination of healthy ROE and high earnings growth has resulted in superior price performance
9
Which companies generate wealth? High ROE and Earnings growth companies
Strictly for Intended Recipients Only
Source: Elara Capital, [MOSL Wealth Creation Studies in India]; * companies with an average 10Y RoE > = 16%, used so as to categorize companies within Small Caps; Constituents of Nifty 500 Index as onJuly 2021 are back tested from the peak of 2008. All returns in INR terms. To understand the table better, we take an example of the third row. We considered all the stocks in the Nifty 500 index, and classified them as Small Cap, Mid Cap and Large Cap based on MSCI definition – please see Appendix. Over the period Jan 2008 market peak to July 2021, we found that 29 companies grew from being Small Caps to Large & Mid Caps, with an average price appreciation of 24.9%, Profit pool increase of 17.7% and an average RoE of 24.5%.
Large & Mid Cap SmallCap
No of stocks moved
Profit pool increase (%
CAGR)
7.3%
17.7%
11.6%
Average ROE
18.4%
24.5%
22.0%
7.1%
6.1%
Market cap classification(as on July 2021)
L&MC
L&MC
SC
SC
SC
Market cap classification(as on Jan 2008)
L&MC
L&MC
SC
SC
SC
No of stocks moved
48
30
139*
119
42 NEGATIVE
3.5%
There is a sizable pool of high-quality companies that have the potential to provide superior returns
Elim
inat
ion
is K
ey
10.9%
24.9%
20.4%
9.4%
2.4%
Average price
appreciation
Market peak before GFC

Investment Philosophy

11
Portfolio Manager: Vinit Sambre
Strictly For Use By Intended Recipients Only
23 years of investment experience across 4 major market cycles
In-depth knowledge of Indian equities, specifically in the small and mid-cap space
Successfully delivered on a variety of mandates including concentrated thematic portfolios
“Patience, embracing volatility and owning capital efficient businesses run by capable managers for long periods of time is my source of wealth creation”
Experience
Recipient of several awards during his tenureRecognition
Buy & Hold
Low Turnover
Demonstrated capability to identify and back high quality managements / promoters through cycles
Style
Vinit Sambre heads the equity team at DSP and has been with the firm since 2005.
Source: Internal, as of Jul 2021
12
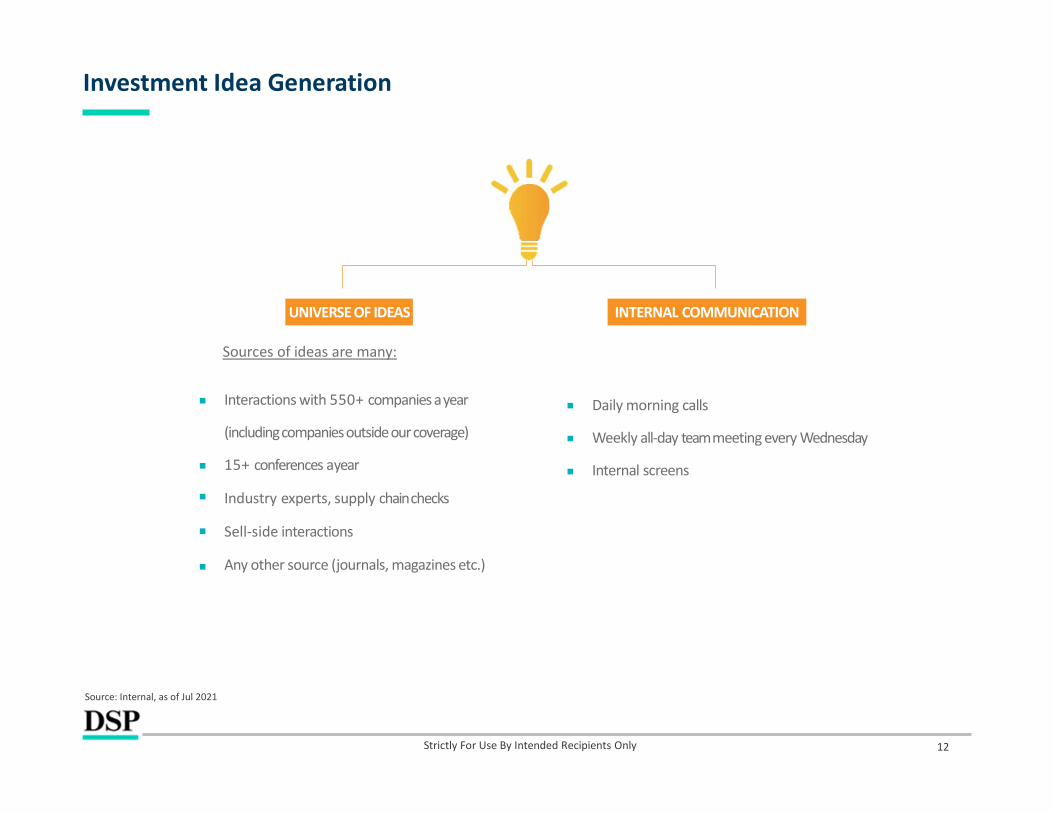
Investment Idea Generation
Strictly For Use By Intended Recipients Only
Source: Internal, as of Jul 2021
INTERNAL COMMUNICATION
Daily morning calls
Weekly all-day team meeting every Wednesday
Internal screens
UNIVERSE OF IDEAS
Sources of ideas are many:
Interactions with 550+ companies a year
(including companies outside our coverage)
15+ conferences ayear
Industry experts, supply chainchecks
Sell-side interactions
Any other source (journals, magazines etc.)

13
Investment Philosophy – Focus is sustainable long term wealth creation
Strictly For Use By Intended Recipients Only
Source: Internal, as of Jul 2021
• Fundamental bottom-up analysis, preferring companies exhibiting:
a) Scalability of their businesses
b) Sustainable high Return on Equity and earnings growth over time
c) Incremental capital allocation in equivalent or better ROE businesses
d) Stakeholder awareness and responsible governance
What we are wary of
• Capital misallocation
• Disruptive competition
• High sensitivity to changing regulations
Our edge: Temperament, Research capability and eliminating behavioral biases
• Long-term investment horizon, turnover ratio ~25% (weight management through cycles).
• Sell Discipline - Profitable positions where valuations rise to unsupportable levels, or Loss-making positions where investment thesis not unfolding as envisioned
Coverage
Covered ~318 stocks~US$ 2.50 trn mkt cap
Active coverage
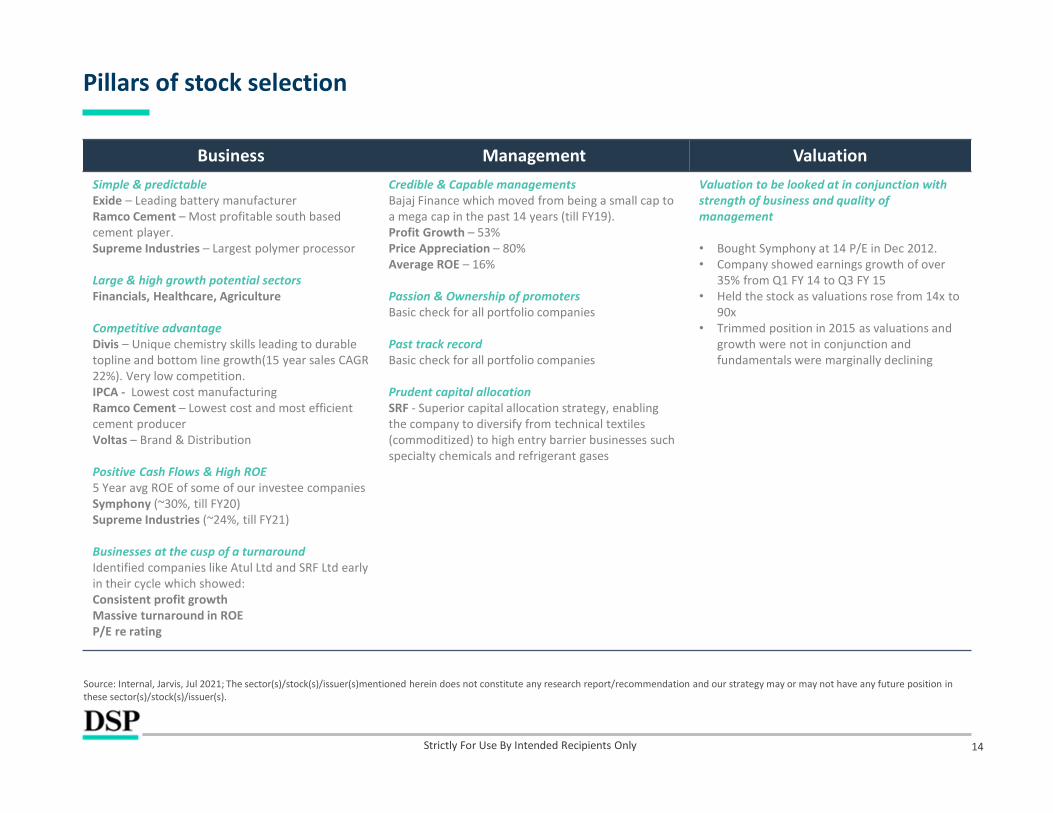
Pillars of stock selection
14
Business Management ValuationSimple & predictable Exide – Leading battery manufacturer Ramco Cement – Most profitable south based cement player.Supreme Industries – Largest polymer processor
Large & high growth potential sectorsFinancials, Healthcare, Agriculture
Competitive advantage Divis – Unique chemistry skills leading to durable topline and bottom line growth(15 year sales CAGR 22%). Very low competition.IPCA - Lowest cost manufacturingRamco Cement – Lowest cost and most efficient cement producerVoltas – Brand & Distribution
Positive Cash Flows & High ROE 5 Year avg ROE of some of our investee companiesSymphony (~30%, till FY20)Supreme Industries (~24%, till FY21)
Businesses at the cusp of a turnaround Identified companies like Atul Ltd and SRF Ltd early in their cycle which showed: Consistent profit growthMassive turnaround in ROE P/E re rating
Credible & Capable managementsBajaj Finance which moved from being a small cap to a mega cap in the past 14 years (till FY19). Profit Growth – 53%Price Appreciation – 80%Average ROE – 16%
Passion & Ownership of promotersBasic check for all portfolio companies
Past track recordBasic check for all portfolio companies
Prudent capital allocation SRF - Superior capital allocation strategy, enablingthe company to diversify from technical textiles (commoditized) to high entry barrier businesses such specialty chemicals and refrigerant gases
Valuation to be looked at in conjunction with strength of business and quality of management
• Bought Symphony at 14 P/E in Dec 2012.• Company showed earnings growth of over
35% from Q1 FY 14 to Q3 FY 15• Held the stock as valuations rose from 14x to
90x• Trimmed position in 2015 as valuations and
growth were not in conjunction and fundamentals were marginally declining
Strictly For Use By Intended Recipients Only
Source: Internal, Jarvis, Jul 2021; The sector(s)/stock(s)/issuer(s)mentioned herein does not constitute any research report/recommendation and our strategy may or may not have any future position in these sector(s)/stock(s)/issuer(s).
15
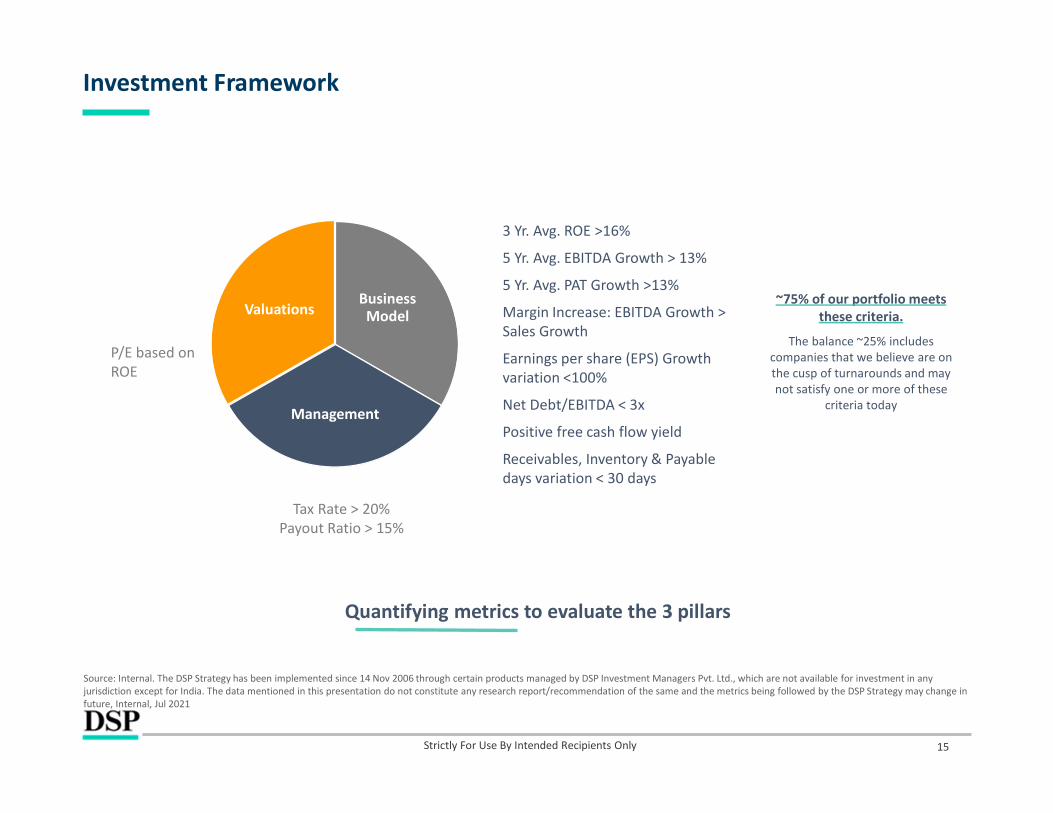
Investment Framework
Quantifying metrics to evaluate the 3 pillars
Business Model
Management
Valuations
3 Yr. Avg. ROE >16%
5 Yr. Avg. EBITDA Growth > 13%
5 Yr. Avg. PAT Growth >13%
Margin Increase: EBITDA Growth > Sales Growth
Earnings per share (EPS) Growth variation <100%
Net Debt/EBITDA < 3x
Positive free cash flow yield
Receivables, Inventory & Payable days variation < 30 days
Tax Rate > 20%Payout Ratio > 15%
P/E based on ROE
Strictly For Use By Intended Recipients Only
~75% of our portfolio meets these criteria.
The balance ~25% includes companies that we believe are on the cusp of turnarounds and may not satisfy one or more of these
criteria today
Source: Internal. The DSP Strategy has been implemented since 14 Nov 2006 through certain products managed by DSP Investment Managers Pvt. Ltd., which are not available for investment in any jurisdiction except for India. The data mentioned in this presentation do not constitute any research report/recommendation of the same and the metrics being followed by the DSP Strategy may change in future, Internal, Jul 2021
16
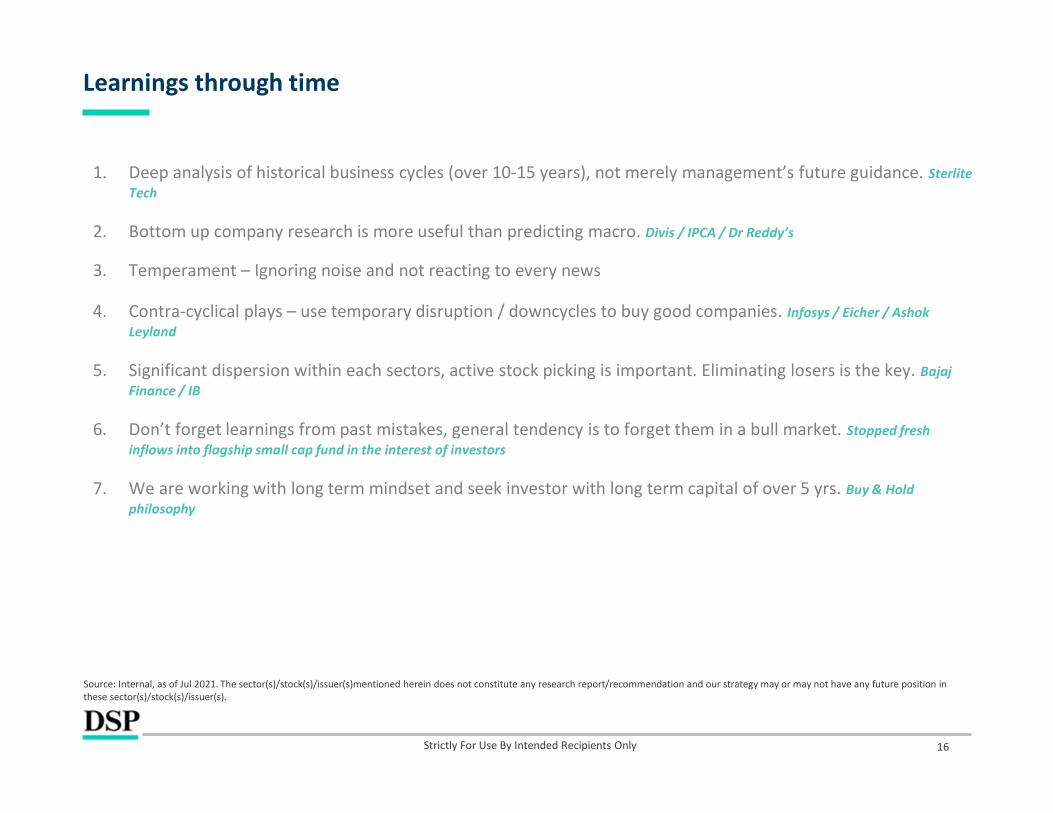
Learnings through time
Strictly For Use By Intended Recipients Only
1. Deep analysis of historical business cycles (over 10-15 years), not merely management’s future guidance. SterliteTech
2. Bottom up company research is more useful than predicting macro. Divis / IPCA / Dr Reddy’s
3. Temperament – Ignoring noise and not reacting to every news
4. Contra-cyclical plays – use temporary disruption / downcycles to buy good companies. Infosys / Eicher / Ashok Leyland
5. Significant dispersion within each sectors, active stock picking is important. Eliminating losers is the key. Bajaj Finance / IB
6. Don’t forget learnings from past mistakes, general tendency is to forget them in a bull market. Stopped fresh inflows into flagship small cap fund in the interest of investors
7. We are working with long term mindset and seek investor with long term capital of over 5 yrs. Buy & Hold philosophy
Source: Internal, as of Jul 2021. The sector(s)/stock(s)/issuer(s)mentioned herein does not constitute any research report/recommendation and our strategy may or may not have any future position in these sector(s)/stock(s)/issuer(s).

17
Buy & Hold philosophy
Strictly For Use By Intended Recipients Only
• Align holding periods of investee companies with their entire business cycles• Portfolio sizing depends upon our assessment of how the company ranks on our philosophy.
TOP 5 GAINERS * RETURNMULTIPLIER HOLDING PERIOD (YEARS) PERIOD HELD
SRF Limited 71.01x 12.0 Years Jul'09 to Jun'21
Eicher Motors Limited 41.58x 5.1 Years Mar'09 to Mar'14
Bajaj Finance Limited 16.89x 5.6 Years Sep'08 to Mar'14
Bayer Cropscience Limited 10.68x 11.5 Years Sep'08 to Feb'20
GRUH Finance Limited 8.40x 4.8 Years Mar'08 to Dec'12
* Representative Indian mid cap equities portfolio data. Source: FactSet. The sector(s)/stock(s)/issuer(s) mentioned in this document do not constitute any recommendation of the same. The representative portfolio may or may not have any future position in these sector(s)/stock(s)/issuer(s).
High Conviction holding
Higher concentration in the portfolio
Add to holding during market corrections
Strong business + quality management = ignore noise, hold, add opportunistically
Source: Internal, as of 30 Jun 2021. The sector(s)/stock(s)/issuer(s)mentioned herein does not constitute any research report/recommendation and our strategy may or may not have any future position in these sector(s)/stock(s)/issuer(s).

18
Sell Discipline
Profitable positions where valuations rise to unsupportable levels
Loss-making positions where investment thesis not unfolding as envisioned
Symphony – In 2015, when the valuation scaled to unprecedented levels and concerns around growth arose due to early monsoons, we trimmed our position marginally to reflect the growth concerns
Ashapura Intimates – Investment thesis based on management’s passion and business potential. Unable to judge financial dressing. Exited position
Trim / book profits
Cut losses / Sell
Mistakes - a source of learning.
Significant deterioration in fundamentalsCorporate governance issues
Fraud or misrepresentation of facts
TOP 5 LOSERS * PRICE DECLINE HOLDING PERIOD (YEARS) PERIOD HELD
AVG WGT DURING
HOLDING PERIOD
Learnings
Pennar Engineered Building Systems
-79% 3.2 Sep’15 to Dec’18 0.7% Capex heavy businesses require clear visibility of growth
Titagarh Wagons Ltd -77% 2.3 Mar’11 to Jul’13 1.2% Capex heavy businesses require clear visibility of growth
Ashapura Intimates Fashion Ltd -95% 1.3 Jul’17 to Dec’18 0.9%
Fortified our core beliefs of not purely relying on management guidance, which we did due to lack of historical cycle data
Navkar Corp Ltd -72% 2.6 Mar’16 to Dec’18 0.7%Be watchful about adverse regulatory changes and capital misallocation
Indo Count Industries -66% 2.2 Oct’16 to Dec’18 0.8%Fortified our core beliefs of not purely relying on management guidance
* Representative Indian mid cap equities portfolio data Source: FactSet. The sector(s)/stock(s)/issuer(s) mentioned in this document do not constitute any recommendation of the same. The representative portfolio may or may not have any future position in these sector(s)/stock(s)/issuer(s).
Strictly For Use By Intended Recipients Only
Source: Internal, as of Dec 2019. The sector(s)/stock(s)/issuer(s)mentioned herein does not constitute any research report/recommendation and our strategy may or may not have any future position in these sector(s)/stock(s)/issuer(s).
Strategy Characteristics, Performance and Risks

20
Differentiated from the typical Indian benchmark (MSCI India)
Strictly For Use By Intended Recipients Only
Source: MSCI, Elara Resarch. Total Market-Cap, data as of 31 Jul 2021. Indices are unmanaged and used for illustrative purposes only and are not intended to be indicative of any fund’s performance. It is not possible to invest directly in an index. Past performance is not a reliable indicator of future results. The DSP Strategy has been implemented since 14 Nov 2006 through certain products managed by DSP Investment Managers Pvt. Ltd., which are not available for investment in any jurisdiction except for India. * Trailing ROE and EPS have been provided. For MSCI India Index, includes ROE for Hindustan Unilever ROE of 95.8% which is an outlier value. Also, top 10 weights have been rebalanced to 100 for the purposes of the portfolio ROE and EPS calculations.
Not our portfolio! This is our portfolio!
Stocks Total Market Cap in USD bn
Weight inMSCI India Index
Reliance Industries 179.3 9.09%
Infosys 92.3 8.59%
HDFC 59.3 6.55%
ICICI Bank 63.6 5.47%
TCS 157.6 4.59%
HUL 73.7 3.00%
Bajaj Finance Ltd 50.6 2.64%
Axis Bank 29.2 2.52%
Bharti Airtel 41.5 2.16%
Asian Paints 38.2 1.78%
Stocks Total Market Cap in USD bn
Weight inDSP Strategy
Portfolio
Manappuram Finance 2.4 4.19%
Balkrishna Industries 6.2 3.92%
Max Financial Services 5.2 3.82%
Atul Limited 3.6 3.37%
Supreme Industries 3.6 3.26%
IPCA Laboratories 3.6 3.18%
Coromandel International 3.6 2.95%
The Ramco Cements 3.5 2.85%
Jubilant Foodworks 6.7 2.84%
Bata India 2.8 2.74%
MSCI India Index (top 10) 10Y Avg ROE 10Y EPS CAGR21.6% 11.2% DSP Strategy (top 10) 10Y Avg ROE 10Y EPS CAGR
17.9% 11.5%

21
DSP Strategy Characteristics
Strictly For Use By Intended Recipients Only
Source: Internal, all returns are net of fees, as of 31 Jul 2021; Portfolio metrics table and sector-wise split as of 7 Aug 2021. Indices are unmanaged and used for illustrative purposes only and are not intended to be indicative of any fund’s performance. It is not possible to invest directly in an index. Past performance is not a reliable indicator of future results. The DSP Strategy has been implemented since 14 Nov 2006 through certain products managed by DSP Investment Managers Pvt. Ltd., which are not available for investment in any jurisdiction except for India. Market-cap split based on MSCI classifications. *The portfolio metrics displayed are estimates of the anticipated development of the portfolio holdings when measured against certain metrics. Some computations may also have extreme values removed from the calculations. These estimates are not intended to be an estimate or representation of future performance of the fund.
Portfolio Metrics* FY21E FY22E FY23EEPS Growth (%) 11.3% 24.5% 24.2%P/E 41.2 36.9 29.7P/BV 7.4 6.5 5.6ROE 17% 18% 18%
Number of Stocks 49
Cap-wise split Small Cap – 66.5%, Mid Cap – 22.5%, Large Cap – 7.1%, Cash – 3.9%
Portfolio Turnover (last 12m) 20%
Strategy AUM ~US$ 1,810 mn
Metrics (US$) 5 Years Since InceptionReturn(CAGR)Fund 13.25% 11.86%Benchmark (MSCI India SmallCap) 13.52% 7.61%
Volatility %Fund 22.63% 30.45% Benchmark (MSCI India SmallCap) 27.59% 35.55%
Risk Free Rate (3m US Libor) 1.40% 1.28%
Sharpe RatioFund 0.52 0.35Benchmark (MSCI India SmallCap) 0.44 0.18
Beta 0.78 0.83Tracking Error 8.18% 8.81%
20.70%
11.40%
11.30%
9.30%
7.00%
6.50%
6.50%
5.50%
5.40%
4.70%
3.10%
2.40%
Financial ServicesConsumer Durables
FMCG/RetailAuto
Building MaterialsPharma/Healthcare
IT/Telecom/TechAgri
ChemicalsCapital Goods
Oil & GasLogistics

22
Possible risks of investing in small cap companies
Strictly For Use By Intended Recipients Only
Investing into small cap and mid cap companies could come with a variety of risks such as, but not limited to
Additional country risks for international investors may also apply such as political risk, currency risk, macro risk, regulatory risk, sovereign risk, economic risk to name a few.
Business model might not scale Liquidity risk
Corporate governance concerns Key-man (promoter) risk
Volatility in returns
Insufficient data on businesses
Unproven business models
Source: Internal

23
Maximum drawdowns
Strictly For Use By Intended Recipients Only
Source: Bloomberg, Data from Dec 2000 to Jul 2021. *Data from DSP Strategy from Nov 2006. All figures in USD
A drawdowns analysis suggests that an actively managed India small cap funds is not different from the large & mid cap index…
Maximum Drawdown MSCI AC World Index MSCI Emerging Market Index MSCI India MSCI India Small Cap DSP Strategy*
Since 2000 60% 66% 73% 81% 74%
-0.9
-0.8
-0.7
-0.6
-0.5
-0.4
-0.3
-0.2
-0.1
0
Jan-
01
Jul-0
1
Jan-
02
Jul-0
2
Jan-
03
Jul-0
3
Jan-
04
Jul-0
4
Jan-
05
Jul-0
5
Jan-
06
Jul-0
6
Jan-
07
Jul-0
7
Jan-
08
Jul-0
8
Jan-
09
Jul-0
9
Jan-
10
Jul-1
0
Jan-
11
Jul-1
1
Jan-
12
Jul-1
2
Jan-
13
Jul-1
3
Jan-
14
Jul-1
4
Jan-
15
Jul-1
5
Jan-
16
Jul-1
6
Jan-
17
Jul-1
7
Jan-
18
Jul-1
8
Jan-
19
Jul-1
9
Jan-
20
Jul-2
0
Jan-
21
Jul-2
1
MSCI AC World Index MSCI Emerging Market Index MSCI India Index MSCI India Small Cap Index DSP Strategy
24
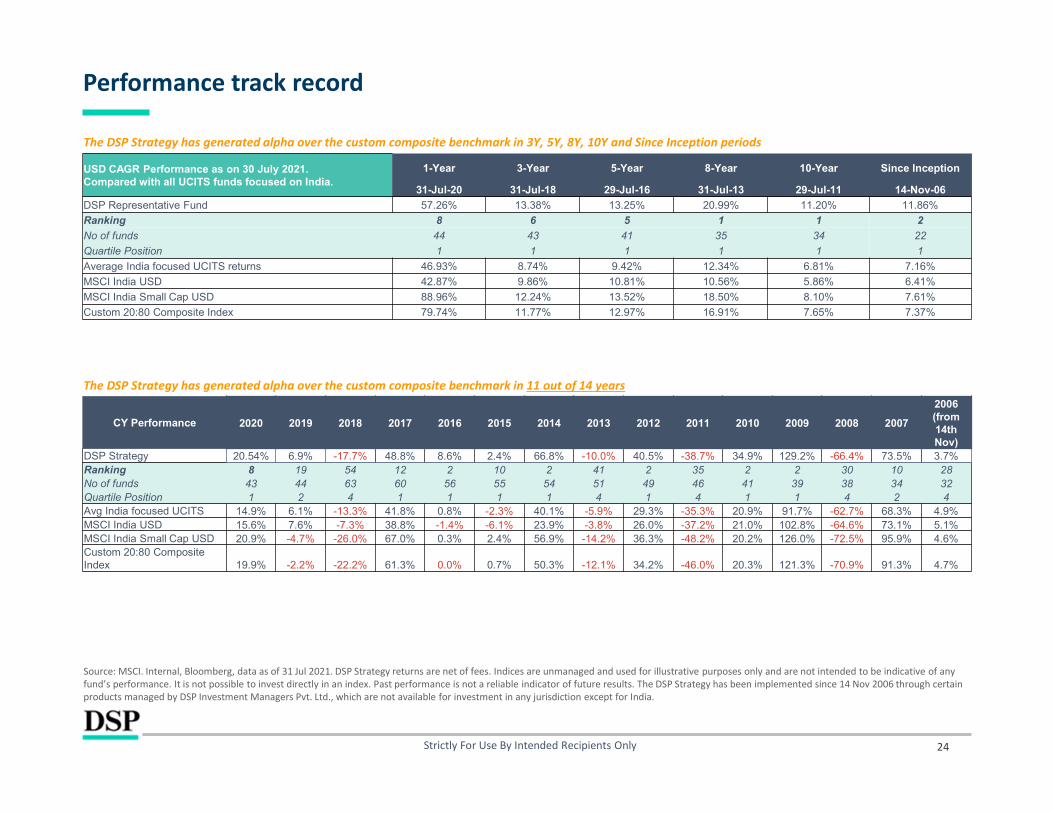
Performance track record
Strictly For Use By Intended Recipients Only
CY Performance 2020 2019 2018 2017 2016 2015 2014 2013 2012 2011 2010 2009 2008 2007
2006 (from 14th Nov)
DSP Strategy 20.54% 6.9% -17.7% 48.8% 8.6% 2.4% 66.8% -10.0% 40.5% -38.7% 34.9% 129.2% -66.4% 73.5% 3.7%Ranking 8 19 54 12 2 10 2 41 2 35 2 2 30 10 28No of funds 43 44 63 60 56 55 54 51 49 46 41 39 38 34 32Quartile Position 1 2 4 1 1 1 1 4 1 4 1 1 4 2 4Avg India focused UCITS 14.9% 6.1% -13.3% 41.8% 0.8% -2.3% 40.1% -5.9% 29.3% -35.3% 20.9% 91.7% -62.7% 68.3% 4.9%MSCI India USD 15.6% 7.6% -7.3% 38.8% -1.4% -6.1% 23.9% -3.8% 26.0% -37.2% 21.0% 102.8% -64.6% 73.1% 5.1%MSCI India Small Cap USD 20.9% -4.7% -26.0% 67.0% 0.3% 2.4% 56.9% -14.2% 36.3% -48.2% 20.2% 126.0% -72.5% 95.9% 4.6%Custom 20:80 Composite Index 19.9% -2.2% -22.2% 61.3% 0.0% 0.7% 50.3% -12.1% 34.2% -46.0% 20.3% 121.3% -70.9% 91.3% 4.7%
Source: MSCI. Internal, Bloomberg, data as of 31 Jul 2021. DSP Strategy returns are net of fees. Indices are unmanaged and used for illustrative purposes only and are not intended to be indicative of any fund’s performance. It is not possible to invest directly in an index. Past performance is not a reliable indicator of future results. The DSP Strategy has been implemented since 14 Nov 2006 through certain products managed by DSP Investment Managers Pvt. Ltd., which are not available for investment in any jurisdiction except for India.
The DSP Strategy has generated alpha over the custom composite benchmark in 11 out of 14 years
The DSP Strategy has generated alpha over the custom composite benchmark in 3Y, 5Y, 8Y, 10Y and Since Inception periods
USD CAGR Performance as on 30 July 2021.Compared with all UCITS funds focused on India.
1-Year 3-Year 5-Year 8-Year 10-Year Since Inception
31-Jul-20 31-Jul-18 29-Jul-16 31-Jul-13 29-Jul-11 14-Nov-06
DSP Representative Fund 57.26% 13.38% 13.25% 20.99% 11.20% 11.86%
Ranking 8 6 5 1 1 2
No of funds 44 43 41 35 34 22
Quartile Position 1 1 1 1 1 1
Average India focused UCITS returns 46.93% 8.74% 9.42% 12.34% 6.81% 7.16%
MSCI India USD 42.87% 9.86% 10.81% 10.56% 5.86% 6.41%
MSCI India Small Cap USD 88.96% 12.24% 13.52% 18.50% 8.10% 7.61%
Custom 20:80 Composite Index 79.74% 11.77% 12.97% 16.91% 7.65% 7.37%

ESG / RISK Framework
26
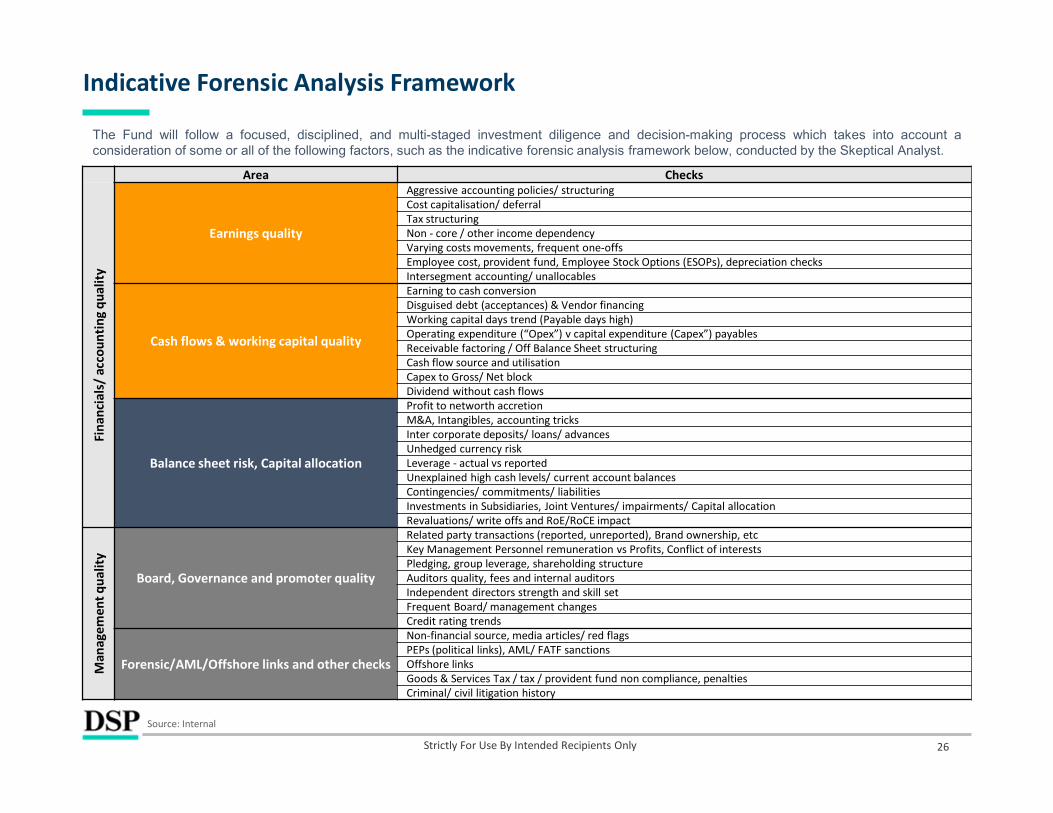
Indicative Forensic Analysis Framework
Strictly For Use By Intended Recipients Only
Area Checks
Fina
ncia
ls/
acco
untin
g qu
ality
Earnings quality
Aggressive accounting policies/ structuringCost capitalisation/ deferralTax structuringNon - core / other income dependencyVarying costs movements, frequent one-offsEmployee cost, provident fund, Employee Stock Options (ESOPs), depreciation checksIntersegment accounting/ unallocables
Cash flows & working capital quality
Earning to cash conversionDisguised debt (acceptances) & Vendor financingWorking capital days trend (Payable days high)Operating expenditure (“Opex”) v capital expenditure (Capex”) payablesReceivable factoring / Off Balance Sheet structuringCash flow source and utilisationCapex to Gross/ Net blockDividend without cash flows
Balance sheet risk, Capital allocation
Profit to networth accretion M&A, Intangibles, accounting tricksInter corporate deposits/ loans/ advancesUnhedged currency riskLeverage - actual vs reportedUnexplained high cash levels/ current account balancesContingencies/ commitments/ liabilitiesInvestments in Subsidiaries, Joint Ventures/ impairments/ Capital allocationRevaluations/ write offs and RoE/RoCE impact
Man
agem
ent q
ualit
y
Board, Governance and promoter quality
Related party transactions (reported, unreported), Brand ownership, etcKey Management Personnel remuneration vs Profits, Conflict of interestsPledging, group leverage, shareholding structure Auditors quality, fees and internal auditorsIndependent directors strength and skill setFrequent Board/ management changesCredit rating trends
Forensic/AML/Offshore links and other checks
Non-financial source, media articles/ red flagsPEPs (political links), AML/ FATF sanctionsOffshore linksGoods & Services Tax / tax / provident fund non compliance, penaltiesCriminal/ civil litigation history
The Fund will follow a focused, disciplined, and multi-staged investment diligence and decision-making process which takes into account aconsideration of some or all of the following factors, such as the indicative forensic analysis framework below, conducted by the Skeptical Analyst.
Source: Internal

27
ESG integration
Strictly For Use By Intended Recipients Only
Two pronged approach
1. INVESTMENT: Integration of ESG factors into investment analysis
Source: Internal, as of Jul 2021. | The above information is only for illustration purpose and should not be construed as recommendation of the stocks.
Analyst Recommendation• Where a company is
exposed to a particular risk, it is flagged.
• Analysts dig deeper as required and incorporate their findings while making a stock recommendation.
4
Score Integration• ESG scores and reports are
compiled along with other fundamental parameters and stock recommendations
• Internal coverage snapshot presented below for reference…
3
Data Provider• Data providers interpret and
aggregate data for each company to come up withheadline ESG metrics
• DSP uses MSCI ESG Manager, currently covering ~200 Indian stocks (target ~350 by year end)
Company Data• Companies report on hundreds
of ESG metrics ranging from CO2 emissions or board independence to maternity leave
21
2. STEWARDSHIP: Engagement with companies - CXOs, board members and investors relations teams, including proxy voting
A sample snapshot from our Internal tracking sheet with MSCI ESG scores (purely representative)…

28
Investment Risk Management at DSP
Strictly For Use By Intended Recipients Only
Source: Internal; Note: Investment process is subject to change. Charts / Tables depicted are purely illustrative in nature. The above information is only for illustration purpose and should not be construed as recommendation of the stocks. To explain the worst-3-day-drawdown table, the first row represents the biggest redemption ever seen by the fund, in a consecutive-3-day period, which in this case was about 4.16% of AUM and occurred on 7th Jan 2013.
Portfolio Risk Monitoring
Independent Risk & Quantitative Analysis team (RQA) Regular Risk meetings to “Hold a Mirror” to portfolio risk
- Macro stress testing- Sector & style exposure & returns monitoring, market trends- Tolerance limits for stop losses and drawdown
Position Level Monitoring
Constant review of performance: large winners / losers Constant monitoring of investment thesis with research team
Key Inputs
Stock level contribution to risk Predicted vs delivered volatility & beta Factor risk breakdown of portfolio, including NAV at risk analytics Tactical indicators for monitoring reversal risks
Indicative: It takes ~10 days to liquidate 66% of the strategy portfolio
Current portfolio +/-25% refers to the assets (AUM) in the strategy increased or decreased by 25%, as two alternative scenarios, to depict how liquidity of the portfolio could change under these new AUMs
Since 31st Dec 2007

Fund Terms and Structure

30
Fund Terms
Source: Internal; *There is no guarantee that the fund will achieve its objective.
Strictly For Use By Intended Recipients Only
Fund Structure DSP India Equity Fund is a compartment of DSP Global Funds ICAV, an umbrella UCITS V compliant ICAVShare class Seed ClassISIN code IE00BK0WZ337Investment manager DSP Investment Managers India Pvt. Ltd.Domicile IrelandInception Date 15 March 2021Reference Currency USDDealing and Valuation DailyAdministrator HSBC Securities Services (Ireland) DACDepository Services Depositary – HSBC France, Dublin Branch Management Company KBA Consulting Management Limited
Seed Share Class – Total Fee and Operating Expenses
(i) 0.70% of the Net Asset Value of the Seed Class when the Net Asset Value of the Fund is up to $150million; or(ii) 0.60% of the Net Asset Value of the Seed Class when the Net Asset Value of the Fund is greater than$150 million and up to $300 million; or(iii) 0.40% of the Net Asset Value of the Seed Class when the Net Asset Value of the Fund is greater than$300 million
Other fees As set out in the Prospectus
Objective*: The DSP India Equity Fund (the “Fund”) aims to achieve long term capital appreciation from a portfolio that is substantially constituted of equity and equity related securities of mid cap and small cap companies.
Investment philosophy : Bottom-up approach to stock picking.
Universe: It is anticipated that the Fund will invest across the entire range of capitalizations (across large cap, mid cap and small cap), however there will be a focus on mid cap and small cap companies. The classification of capitalizations will be based on the classifications of securities comprised in the MSCI INDIA INDEX and the MSCI INDIA SMALL CAP INDEX, which are the indices used by the Fund for performance comparison purposes only.
Diversified: Typically portfolio of ~50 stocks across market capitalization
Risk management: Governed by a robust risk framework; No leverage;
Note: The Fund’s Net Asset Value may have an elevated volatility due to its investment policy.

31
DSP Global Funds ICAV: Structure
Strictly For Use By Intended Recipients Only
Management Agreement
Investment Management Agreement
Subscription of Units of the ICAV
Investors
India
Ireland
Offshore Jurisdictions
DSP Global Funds ICAV
Sub-FundsKBA Consulting Management Ltd.
(Includes – Europe (incl. Ireland), Asia (ex-India), GCC and Latam countries among others)
UK & Mauritius
Thornbridge Investment Management LLPDSP Mauritius Global Services Ltd.
Global Distribution
Redemption of Units of the ICAV
Equity, debt and short term securities, of both corporate and governmental issuers
Fund Inflow/Outflow
DSP Investment Managers Pvt. Ltd.
Local Distributors
Sub-Distributor: Global / Regional / Local
Local Counsels
Local Paying Agents
Local Tax Reporting
DSP GLOBAL FUNDS ICAV - An umbrella type Irish collective asset-management vehicle with segregated liability between Funds
Source: Internal; *There is no guarantee that the fund will achieve its objective.
Note: The Fund’s Net Asset Value may have an elevated volatility due to its investment policy.

Seed share class - Pricing
US$ 0 to US$ 150 mn
FUND AUM THRESHOLD
Step down
US$ 150 to US$ 300 mn
> US$ 300 mn
+ 70 bps25 bps45 bps =
Management Fee Operating expenses* Total Expense Ratio
* Operating expenses are capped at 25 bps, irrespective of AUM.# Operating expenses can reduce over time with economies of scale.Other fees: As set out in the Prospectus, if any
+ 60 bps25 bps35 bps =
+ 40 bps25# bps15 bps =
Step down
Passive India ETFs ~70 bps
Strictly For Use By Intended Recipients Only 32

Appendix

34
Market-cap Classification: SEBI versus MSCI
Source: MSCI, SEBI, as of Jan 2020. SEBI is Securities and Exchange Board of India, the Indian securities market regulator. TMC = Total Market Cap, FFMC = Free Float Market-Cap. Indices are unmanaged and used for illustrative purposes only and are not intended to be indicative of any fund’s performance. It is not possible to invest directly in an index.
Strictly For Use By Intended Recipients Only
SEBI classification
# 1 rank by TMC
Large Caps
Mid Caps
Small Caps
# 100 rank by TMC
# 101 rank by TMC
# 250 rank by TMC
# 251 rank by TMC
MSCI classification
MSCI Large Caps
MSCI Mid Caps
MSCI Small Caps
# 1 rank by FFMC
# 51 rank by FFMC
# 52 rank by FFMC
# 286 rank by FFMC
# 78 rank by FFMC
# 79 rank by FFMC
SEBI-MSCIPotential Overlap
35
Evolution of DSP
Strictly For Use By Intended Recipients Only
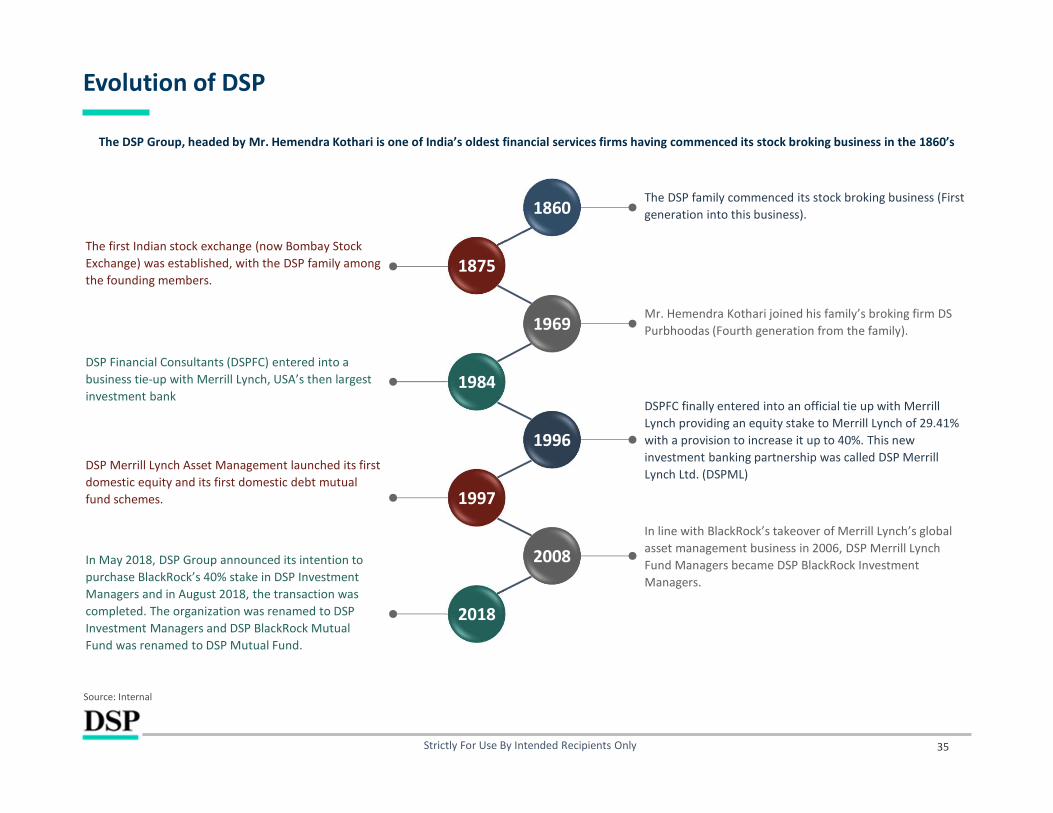
The DSP Group, headed by Mr. Hemendra Kothari is one of India’s oldest financial services firms having commenced its stock broking business in the 1860’s
Source: Internal
1860
1875
1984
1969
1996
2008
1997
The DSP family commenced its stock broking business (First generation into this business).
The first Indian stock exchange (now Bombay Stock Exchange) was established, with the DSP family among the founding members.
Mr. Hemendra Kothari joined his family’s broking firm DS Purbhoodas (Fourth generation from the family).
DSP Financial Consultants (DSPFC) entered into a business tie-up with Merrill Lynch, USA’s then largest investment bank
DSPFC finally entered into an official tie up with Merrill Lynch providing an equity stake to Merrill Lynch of 29.41% with a provision to increase it up to 40%. This new investment banking partnership was called DSP Merrill Lynch Ltd. (DSPML)
DSP Merrill Lynch Asset Management launched its first domestic equity and its first domestic debt mutual fund schemes.
In line with BlackRock’s takeover of Merrill Lynch’s global asset management business in 2006, DSP Merrill Lynch Fund Managers became DSP BlackRock Investment Managers.
In May 2018, DSP Group announced its intention to purchase BlackRock’s 40% stake in DSP Investment Managers and in August 2018, the transaction was completed. The organization was renamed to DSP Investment Managers and DSP BlackRock Mutual Fund was renamed to DSP Mutual Fund.
2018
36
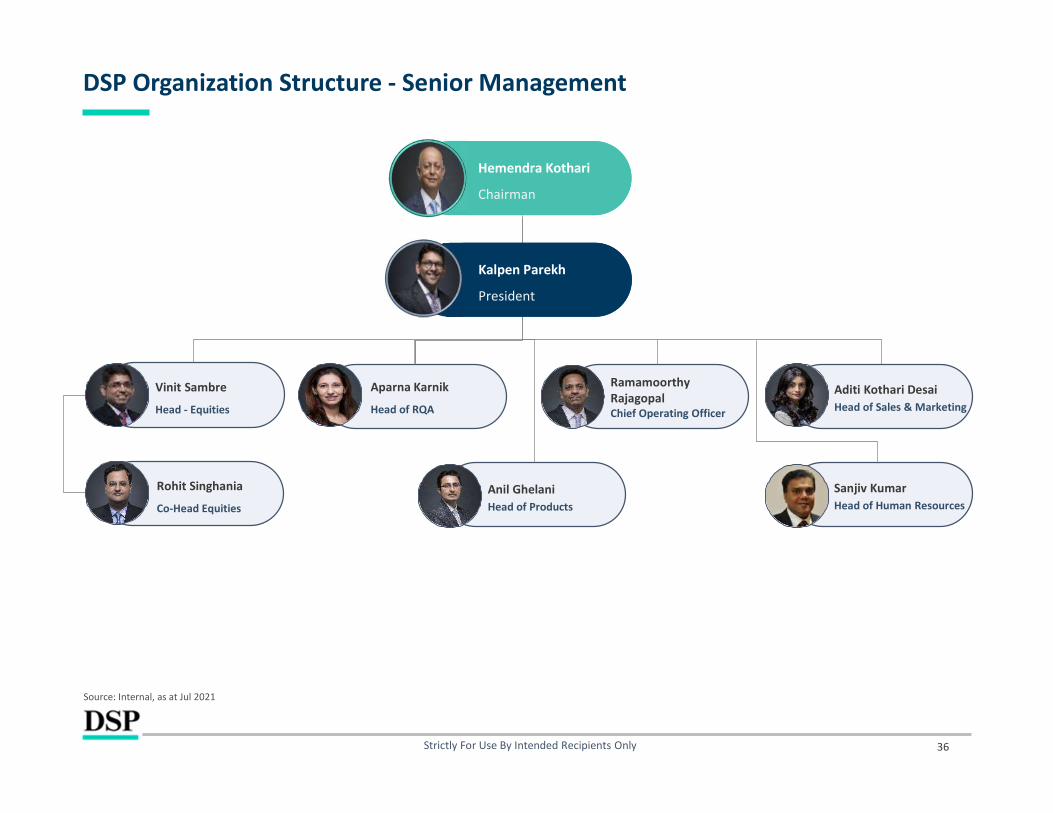
DSP Organization Structure - Senior Management
Strictly For Use By Intended Recipients Only
Source: Internal, as at Jul 2021
Hemendra Kothari
Chairman
Hemendra Kothari
Chairman
Vinit Sambre
Head - Equities
Aditi Kothari DesaiHead of Sales & Marketing
Ramamoorthy RajagopalChief Operating Officer
Anil GhelaniHead of Products
Aparna Karnik
Head of RQA
Sanjiv KumarHead of Human Resources
Rohit Singhania
Co-Head Equities
Kalpen Parekh
President
Kalpen Parekh
President
37
Incentives aligned to investment objectives
Strictly For Use By Intended Recipients Only
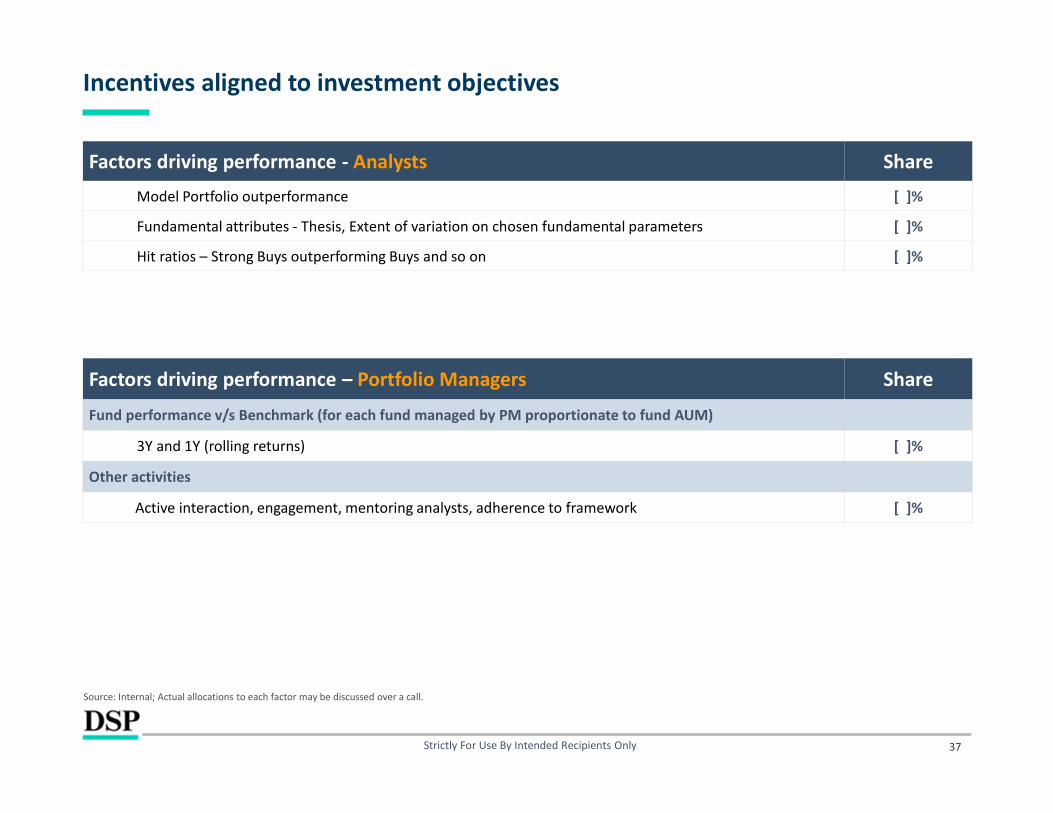
Factors driving performance - Analysts Share
Model Portfolio outperformance [ ]%
Fundamental attributes - Thesis, Extent of variation on chosen fundamental parameters [ ]%
Hit ratios – Strong Buys outperforming Buys and so on [ ]%
Source: Internal; Actual allocations to each factor may be discussed over a call.
Factors driving performance – Portfolio Managers Share
Fund performance v/s Benchmark (for each fund managed by PM proportionate to fund AUM)
3Y and 1Y (rolling returns) [ ]%
Other activities
Active interaction, engagement, mentoring analysts, adherence to framework [ ]%

38
EMs under-represented in Global Equities compared to Global GDP
Strictly For Use By Intended Recipients Only
Source: IMF, World Economic Outlook Database, Morgan Stanley Research, October 2020; * EM refers to emerging markets and developing economies as per IMF
EMs, 40.5%
DMs, 59.5%
Global GDP Weights
EM11%
DM89%
Global Equity Weights

39
Asia’s Share in World GDP is steadily rising
Strictly For Use By Intended Recipients Only
Source: ADB, Morgan Stanley Research, as of May 2021
60% 58%
38%
23%
17% 16%19%
22%
27%
33%
40%
48%52%
1700 1870 1950 1980 2010 2030 2050
% o
f g
lob
al G
DP
Year
40
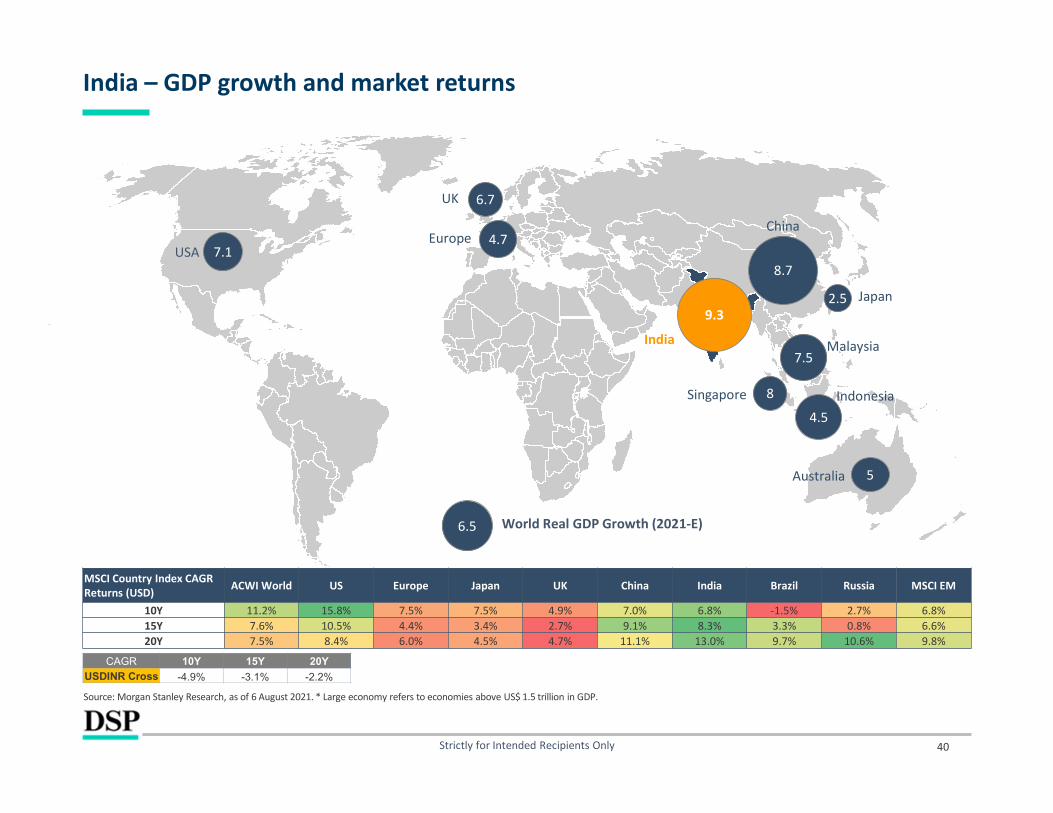
India – GDP growth and market returns
Strictly for Intended Recipients Only
7.18.7
6.7
4.7
2.59.3
6.5
USA
India
China
UK
Europe
Japan
World Real GDP Growth (2021-E)
5Australia
8Singapore
Malaysia7.5
Indonesia4.5
CAGR 10Y 15Y 20Y
USDINR Cross -4.9% -3.1% -2.2%
Source: Morgan Stanley Research, as of 6 August 2021. * Large economy refers to economies above US$ 1.5 trillion in GDP.
MSCI Country Index CAGR Returns (USD) ACWI World US Europe Japan UK China India Brazil Russia MSCI EM
10Y 11.2% 15.8% 7.5% 7.5% 4.9% 7.0% 6.8% -1.5% 2.7% 6.8%15Y 7.6% 10.5% 4.4% 3.4% 2.7% 9.1% 8.3% 3.3% 0.8% 6.6%20Y 7.5% 8.4% 6.0% 4.5% 4.7% 11.1% 13.0% 9.7% 10.6% 9.8%

41
Is sustained 9 - 10% nominal GDP growth for a large economy even possible?
Strictly For Use By Intended Recipients Only
Source: Goldman Sachs Global investment Research, December 2019.
• China/South Korea grew per capita GDP at 9.1% / 8.8%, respectively, for 10 yearsfrom levels similar to India’s US$7,762 PPP adjusted 2018 per capita GDP.
• To convert to nominal GDP growth, we factor 1.5% population growth (assumed).
• So 9 to 10% nominal GDP growth is certainly possible, over a 10 year period orlonger.
Penetration of Financial Services1
Consumption story fast forwarded by Digitization2
Infrastructure boom3
Export Opportunities 4
4 key themes which we believe will play out for India going
forward
Per-capita GDP (PPP)
$7762 $7615 $8273
China - 2018, $18,236
S. Korea - 2000, $18,082
$0
$2,000
$4,000
$6,000
$8,000
$10,000
$12,000
$14,000
$16,000
$18,000
India - 2017 China - 2008 S. Korea - 1990
If India achieves China's 10-yr CAGR of 9.1% If India achieves
S.Korea's 10-yr CAGR of 8.8%
2018

42
India: Structural, not tactical
Strictly For Use By Intended Recipients Only
Tremendous runway for infrastructure growth
Source – Spark Capital Research, Jan 2021
Export opportunities in Textiles and Chemicals
Banking, Insurance, Loans, mortgages, mutual funds all underpenetrated
52
62 77
86
98 12
4
134 147
157 19
2
Indi
aBr
azil
Ger
man
yIta
lyFr
ance
Mal
aysi
aU
KTh
aila
ndCh
ina
US
Loan to GDP
Population 1,350 mn MF Accounts 90.4 mnBank Accounts 1,571 mn Demat Accounts 47.6 mn
1 2
3 4
Falling data costs boosting consumption
Textile/Apparel Exports (CY19) Chemical Exports (CY19)
‘LEVER’: Perfectly fits the ‘Make in India’ theme (Labour rates,
Exchange rates, Value Chain, Energy Cost, Raw-material)
Environmental norms, Good chemistry knowledge, Cost of
operations (labor), De-risking by global customers
1. HIGHWAYS – only 2% of network, 40% of traffic
2. PORTS - ~217 ports versus China’s ~2400 as of FY20
3. AIRPORTS - ~125 airports versus China’s ~235 as of FY20
4. RAILWAYS - freight:22 kmph; passengers: 50 kmph
5. POWER – 25% T&D losses
6. HOUSING – affordable housing schemes targeting 29mn households by 2022, across rural and urban areas
267
37
China India
USD bn
137
45
China India
USD bn
10% 18
%
20% 31
%
34%
38%
40%
45% 52
%
56% 67
% 88%
Indi
a
Chin
a
Thai
land
Kore
a
Mal
aysi
a
Taiw
an
Ger
man
y
Hon
g Ko
ng
Sing
apor
e
USA U
K
Denm
ark
Mortgages as % OF Nominal GDP10.71
5.364.44
3.66 3.15
0.29 0.23 0.18 0.15 0.15 0.11 0.11 0.10 0.12 0.15 0.14 0.150
2
4
6
8
10
12
Aug-
11
Oct
-11
Jun-
14
Jun-
15
Dec-
15
Dec-
17
Mar
-18
Jun-
18
Sep-
18
Dec-
18
Mar
-19
Jun-
19
Sep-
19
Dec-
19
Mar
-20
Jun-
20
Sep-
20
(US$/GB) Pre - Jio Post - Jio

43
India Well Positioned on 3Ds: Debt, Demographics and Deflation
Source: Morgan Stanley (Panels 1,2 and 3), DSP BlackRock (Panel 4).. There is no guarantee that any forecast make will come to pass. For Panel 1, *Data as of 3Q20. For Panel 3, *Latest as of July 19 for Malaysia and Sep Philippines, March 21 for others.
Demographics: Working age population improving in IndiaDebt: 6 out of 10 AXJ Countries Have Debt Above 200% of GDP
90%116%
142%216%221%
261%263%
294%338%
366%
0% 50% 100% 150% 200% 250% 300% 350% 400%
IndonesiaPhilsIndia
MalaysiaThailand
TaiwanKoreaChina
Hong KongSingapore
1 2
Overall Debt to GDP (%, Latest*) 1.2x
1.5x
1.8x
2.1x
2.4x
1980
1985
1990
1995
2000
2005
2010
2015
2020
E
2025
E
2030
E
2035
E
2040
E
2045
E
2050
E
India US World ex IndiaAge Dependency Ratio (%)
Demographics Improving
For example, a value of 2x indicates 2 able labour forceparticipants for every 1 person outside the workforce. ‘x’ isa ratio implying no. of times of numerator over denominator.
Demonetization: A surprise 4th ‘D’!Deflation: India well placed combo of PPI & prior deflation
24
65
42
3
6471
50
55 77
77
0
20
40
60
80
100
-4.0%-2.0%0.0%2.0%4.0%6.0%8.0%
10.0%12.0%14.0%
Indi
a
Phili
ppin
es
Hon
g Ko
ng
Indo
nesi
a
Kore
a
Chin
a
Thai
land
Mal
aysi
a
Taiw
an
Sing
apor
e
PPI YoY% (Latest), LS Months of Deflation, RS
3 4
For crackdown on black money, money laundering, counterfeiting.
Short-term tremors, but positive in the long-term.
Prime Minister Modi – seen as a visionary leader, fully committed to the development of India.
Corporate clean-up, Balance-Sheet firm-up.
GST (Goods and Services Tax)
− Prevent tax evasion
− Widen tax base
− Increase tax/GDP ratio
Strictly for Intended Recipients Only

44
Current Government’s key reforms
Strictly For Use By Intended Recipients Only
Source: UBS Research, Aug 2020
Key structural reform of GST implemented on 1st July 2017
Corporate tax rate bought down from 30% to 22%
Work has begun on Direct Tax Code which aims to simplify/rationalisepersonal tax laws
Single law governing insolvency and liquidation proceedings
Once fully implemented, will help in improving ease of doing business in India, deepen bond markets and also solve NPL issues of the banking sector
Financial inclusion plan (JAM trinity)
Direct transfer of social benefits/subsidies
~320 mn+. bank accounts opened since Sep-14 vs. 625 mn accounts in the last 65 years
Consolidation within large number of PSU banks
Online environment and forest clearance process, credit availability, electricity availability etc.
Key objective to improve India’s ranking from 130 to within 50 over 2 years
Work on simplifying labour complex labour laws to merge into 4 labour codes.
Facilitating the APMC reforms in agriculture
45
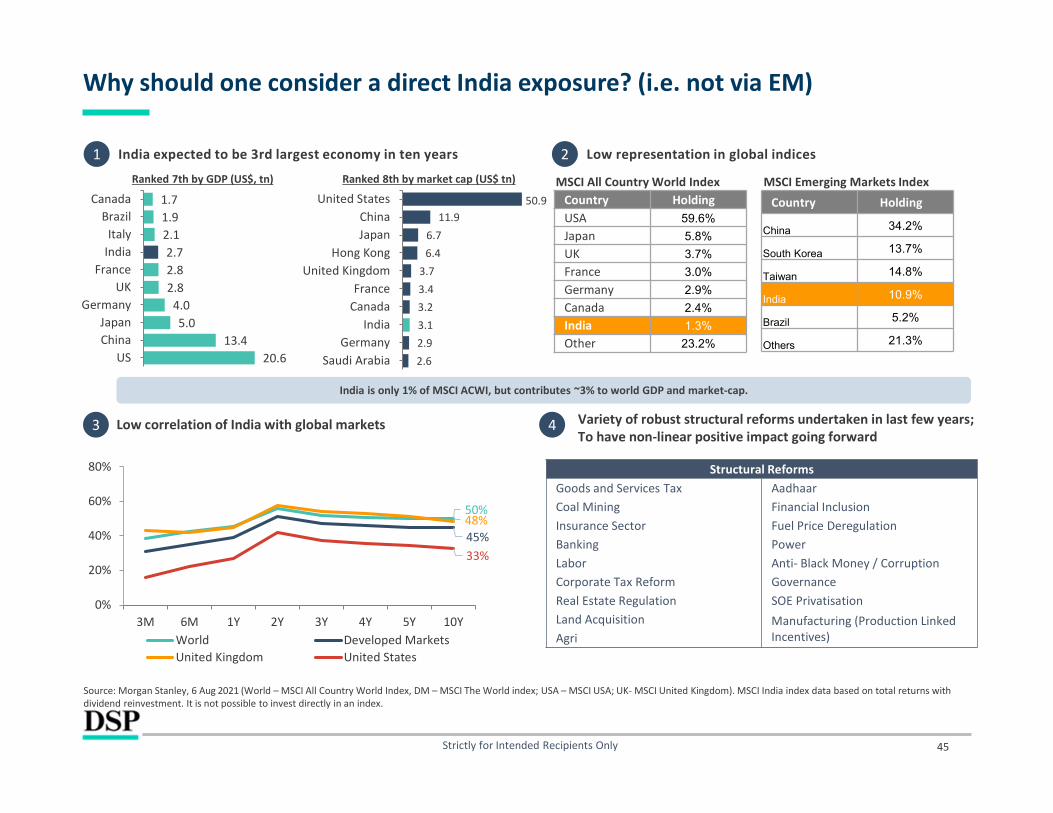
Why should one consider a direct India exposure? (i.e. not via EM)
Strictly for Intended Recipients Only
Source: Morgan Stanley, 6 Aug 2021 (World – MSCI All Country World Index, DM – MSCI The World index; USA – MSCI USA; UK- MSCI United Kingdom). MSCI India index data based on total returns with dividend reinvestment. It is not possible to invest directly in an index.
Low representation in global indices2
3
Country Holding
China 34.2%
South Korea 13.7%
Taiwan 14.8%
India 10.9%
Brazil 5.2%
Others 21.3%
Country HoldingUSA 59.6%
Japan 5.8%
UK 3.7%
France 3.0%
Germany 2.9%
Canada 2.4%
India 1.3%
Other 23.2%
MSCI All Country World Index MSCI Emerging Markets Index
India is only 1% of MSCI ACWI, but contributes ~3% to world GDP and market-cap.
India expected to be 3rd largest economy in ten years1
20.613.4
5.04.0
2.82.82.7
2.11.91.7
USChinaJapan
GermanyUK
FranceIndiaItaly
BrazilCanada
Ranked 8th by market cap (US$ tn)Ranked 7th by GDP (US$, tn)
Low correlation of India with global markets
2.62.93.13.23.43.7
6.46.7
11.950.9
Saudi ArabiaGermany
IndiaCanadaFrance
United KingdomHong Kong
JapanChina
United States
50%
45%48%
33%
3M 6M 1Y 2Y 3Y 4Y 5Y 10Y0%
20%
40%
60%
80%
World Developed MarketsUnited Kingdom United States
4 Variety of robust structural reforms undertaken in last few years; To have non-linear positive impact going forward
Structural ReformsGoods and Services Tax AadhaarCoal Mining Financial InclusionInsurance Sector Fuel Price DeregulationBanking PowerLabor Anti- Black Money / CorruptionCorporate Tax Reform GovernanceReal Estate Regulation SOE PrivatisationLand Acquisition Manufacturing (Production Linked
Incentives)Agri
46
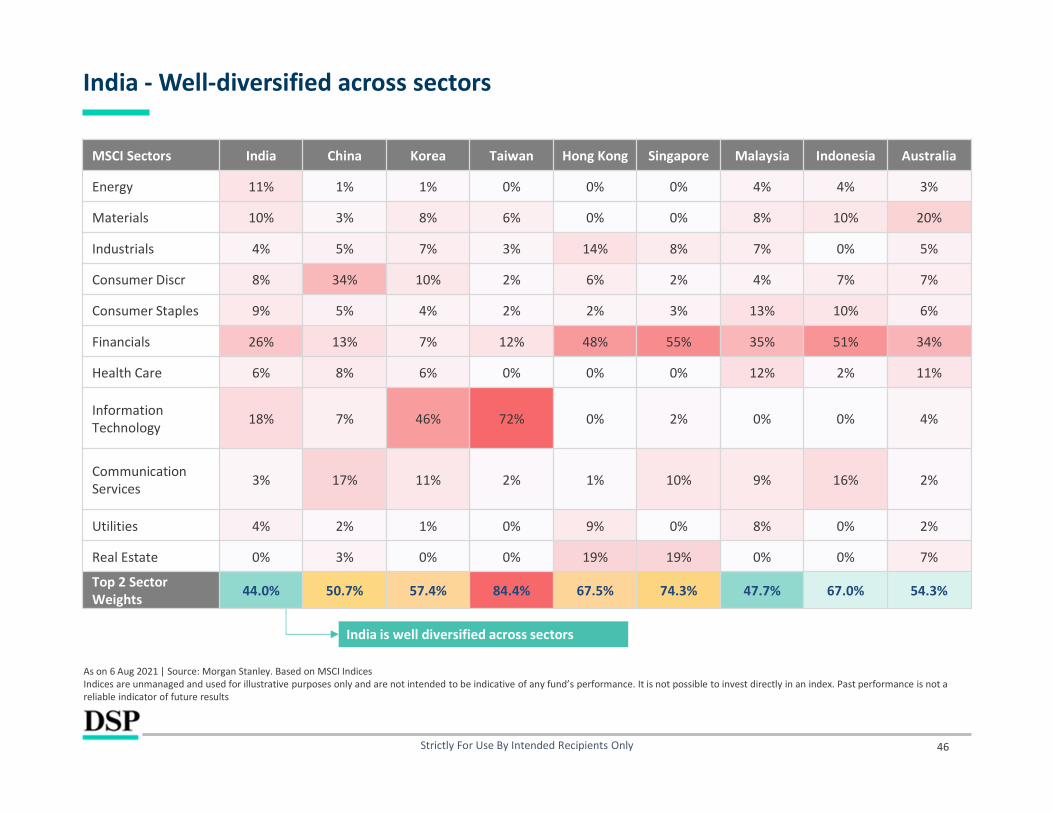
India - Well-diversified across sectors
As on 6 Aug 2021 | Source: Morgan Stanley. Based on MSCI IndicesIndices are unmanaged and used for illustrative purposes only and are not intended to be indicative of any fund’s performance. It is not possible to invest directly in an index. Past performance is not a reliable indicator of future results
Strictly For Use By Intended Recipients Only
India is well diversified across sectors
MSCI Sectors India China Korea Taiwan Hong Kong Singapore Malaysia Indonesia Australia
Energy 11% 1% 1% 0% 0% 0% 4% 4% 3%
Materials 10% 3% 8% 6% 0% 0% 8% 10% 20%
Industrials 4% 5% 7% 3% 14% 8% 7% 0% 5%
Consumer Discr 8% 34% 10% 2% 6% 2% 4% 7% 7%
Consumer Staples 9% 5% 4% 2% 2% 3% 13% 10% 6%
Financials 26% 13% 7% 12% 48% 55% 35% 51% 34%
Health Care 6% 8% 6% 0% 0% 0% 12% 2% 11%
Information Technology 18% 7% 46% 72% 0% 2% 0% 0% 4%
Communication Services 3% 17% 11% 2% 1% 10% 9% 16% 2%
Utilities 4% 2% 1% 0% 9% 0% 8% 0% 2%
Real Estate 0% 3% 0% 0% 19% 19% 0% 0% 7%
Top 2 Sector Weights 44.0% 50.7% 57.4% 84.4% 67.5% 74.3% 47.7% 67.0% 54.3%

91 81 129
181
250
266
291
278
280
216
236
272
361
446
540 72
0 833
820
834 10
24
1107
1178 13
28
1360
1342
1359
1354 14
88
1513 17
02
2285
FY92
FY93
FY94
FY95
FY96
FY97
FY98
FY99
FY00
FY01
FY02
FY03
FY04
FY05
FY06
FY07
FY08
FY09
FY10
FY11
FY12
FY13
FY14
FY15
FY16
FY17
FY18
FY19
FY20
FY21
FY22
E
FY92-96 CAGR: EPS: 29%
Index: -6%
FY96-03 CAGR:EPS: 1%
Index: -1%
FY03-08 CAGR: EPS: 25%
Index: 39%
FY08-18 CAGR:EPS: 5%
Index: 8%
FY20-22E: 23% CAGR
FY93-FY20: 10.5% CAGR
1,896
52,587
0
15000
30000
45000
60000
0
500
1,000
1,500
2,000M
ar-9
2
Jul-9
3
Nov
-94
Mar
-96
Jul-9
7
Nov
-98
Mar
-00
Jul-0
1
Nov
-02
Mar
-04
Jul-0
5
Nov
-06
Mar
-08
Jul-0
9
Nov
-10
Mar
-12
Jul-1
3
Nov
-14
Mar
-16
Jul-1
7
Nov
-18
Mar
-20
Jul-2
1
Sensex EPS (INR) Sensex Index (RHS)
47
Earnings: It’s what really matters the most
Strictly for Intended Recipients Only
Source: MOFSL. Data as of 31 July 2021. CAGR – Compounded annualized growth rate. FY Note: There is no guarantee of returns/income generation in the Scheme. Further, there is no assurance of any capital protection/capital guarantee to the investors in the Scheme. Forecasts may not come to pass.
Earnings growth likely to average around 23% for FY20-FY22E
BSE
Sens
ex In
dex
v/s
EPS
Sensex CAGR (%) EPS CAGR (%)~29 Yrs FY92 – Mar’21 8.8 10.6

48
Relative performance
Strictly For Use By Intended Recipients Only
Note: Sharpe ratio has been calculated as the average of rolling 3/5/10/15 year returns divided by the standard deviation of all 3/5/10/15 year returns respectively. Mutual funds with less than 3 year AUMhistory have been excluded from this analysis. All returns are calculated in USD terms. Latest data as of 31 July 2021. Forecasts may not come to pass.
9.9% 10
.6%
8.9%
9.8%
6.5% 6.
9%
5.8% 6.
3%
5.1% 5.
5%
5.1% 5.3%
3.8%
4.3%
3.6% 4.
1%
3.8% 4.
2%
3.6% 4.
1%
1.9%
2.4%
1.4%
2.1%
0%
2%
4%
6%
8%
10%
12%
3Y CAGR 5Y CAGR 10Y CAGR 15Y CAGR
Ave
rag
e ro
lling
retu
rns
MSCI India MSCI EM MSCI USA MSCI ACWI MSCI Developed MSCI Europe
0.6 0.
8
1.6
4.4
0.5 0.
7 1.2
3.6
0.5 0.
8 1.1
2.4
0.4 0.
8 1.3
2.4
0.4 0.
7 1.1
2.4
0.2 0.4 0.
6
1.6
0.00.51.01.52.02.53.03.54.04.55.0
3Y CAGR 5Y CAGR 10Y CAGR 15Y CAGR
Sha
rpe
ratio

49
Small and Mid Cap Valuation Differential to Large Cap
Source: Bloomberg , Ambit research, 31 Jul 2021.
Strictly For Use By Intended Recipients Only
Kindly note that the following ‘mid’ and ‘small’ cap nomenclature is from an Indian regulator (SEBI) perspective. Accordingly, the strategy has > 65% invested in the ‘mid’ cap bucket at all points (i.e. chart on the left is more relevant)
0.40
0.50
0.60
0.70
0.80
0.90
1.00
1.10
1.20
Jul-0
5
Jul-0
6
Jul-0
7
Jul-0
8
Jul-0
9
Jul-1
0
Jul-1
1
Jul-1
2
Jul-1
3
Jul-1
4
Jul-1
5
Jul-1
6
Jul-1
7
Jul-1
8
Jul-1
9
Jul-2
0
Jul-2
1
NSE Mid Cap Index P/B to Nifty P/B
Max 1.00
Min 0.53
Current 0.85
Average 0.73
0.20
0.30
0.40
0.50
0.60
0.70
0.80
0.90
Jul-0
5
Jul-0
6
Jul-0
7
Jul-0
8
Jul-0
9
Jul-1
0
Jul-1
1
Jul-1
2
Jul-1
3
Jul-1
4
Jul-1
5
Jul-1
6
Jul-1
7
Jul-1
8
Jul-1
9
Jul-2
0
Jul-2
1
BSE Small Cap Index P/B to Nifty P/B
Max 0.80
Min 0.33
Current 0.80
Average 0.52

Stock Elimination
50Strictly For Use By Intended Recipients Only
Source: Internal, Jun 2021
1. Avoid highly cyclical commodity companies as it is not our strength to predict these cycles (such as in metals and commodities companies)
2. Generally avoid companies doing frequent dilution / capital raises because principally it may be a sign of capital inefficiency and are prone to misuse of cash, except banking companies.
3. Generally avoid companies with complex holding / capital structure, multiple subsidiaries created without strong justification and promoters with multiple business interests.
4. Avoid companies with known capital governance issues (these become tempting investments during strong bull markets)
51
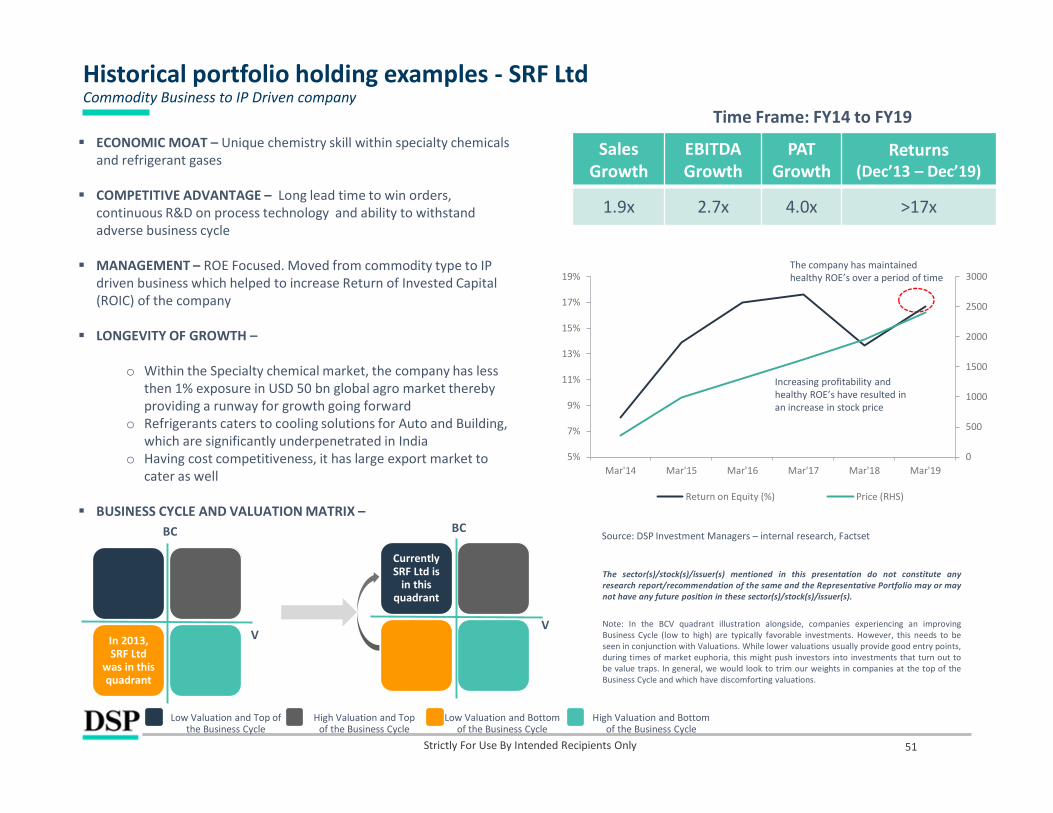
Historical portfolio holding examples - SRF LtdCommodity Business to IP Driven company
ECONOMIC MOAT – Unique chemistry skill within specialty chemicals and refrigerant gases
COMPETITIVE ADVANTAGE – Long lead time to win orders, continuous R&D on process technology and ability to withstand adverse business cycle
MANAGEMENT – ROE Focused. Moved from commodity type to IP driven business which helped to increase Return of Invested Capital (ROIC) of the company
LONGEVITY OF GROWTH –
o Within the Specialty chemical market, the company has less then 1% exposure in USD 50 bn global agro market thereby providing a runway for growth going forward
o Refrigerants caters to cooling solutions for Auto and Building, which are significantly underpenetrated in India
o Having cost competitiveness, it has large export market to cater as well
BUSINESS CYCLE AND VALUATION MATRIX –
In 2013, SRF Ltd
was in this quadrant
Currently SRF Ltd is
in this quadrant
Time Frame: FY14 to FY19
The company has maintained healthy ROE’s over a period of time
BC
V
BC
V
Sales Growth
EBITDA Growth
PATGrowth
Returns (Dec’13 – Dec’19)
1.9x 2.7x 4.0x >17x
The sector(s)/stock(s)/issuer(s) mentioned in this presentation do not constitute anyresearch report/recommendation of the same and the Representative Portfolio may or maynot have any future position in these sector(s)/stock(s)/issuer(s).
Source: DSP Investment Managers – internal research, Factset
0
500
1000
1500
2000
2500
3000
5%
7%
9%
11%
13%
15%
17%
19%
Mar'14 Mar'15 Mar'16 Mar'17 Mar'18 Mar'19
Return on Equity (%) Price (RHS)
Increasing profitability and healthy ROE’s have resulted in an increase in stock price
Low Valuation and Top of the Business Cycle
High Valuation and Top of the Business Cycle
Low Valuation and Bottom of the Business Cycle
High Valuation and Bottom of the Business Cycle
Strictly For Use By Intended Recipients Only
Note: In the BCV quadrant illustration alongside, companies experiencing an improvingBusiness Cycle (low to high) are typically favorable investments. However, this needs to beseen in conjunction with Valuations. While lower valuations usually provide good entry points,during times of market euphoria, this might push investors into investments that turn out tobe value traps. In general, we would look to trim our weights in companies at the top of theBusiness Cycle and which have discomforting valuations.

Driven by ROCE obsession
• The company has been in existence for ~78 years
• Very high standard of corporate governance
• Largest producer of plastics and allied products in India with diversified product portfolio across industrial, B2C and patented products
• Prudent capital allocation reflected in healthy return ratios of the company consistently
• Enjoys healthy market share in each of its product portfolio
• Strong distribution network with more than 3400 channel partners which acts as entry barrier
• Increasing capacity by 40% of over next 24 months funded by internal accruals which will aid growth for next 3-5 years
52
Historical portfolio holding examples – Supreme Industries
Strictly For Use By Intended Recipients Only
Source: Internal, Bloomberg, Jan 2020. The sector(s)/stock(s)/issuer(s) mentioned in this presentation do not constitute any research report/recommendation of the same and the Representative Portfolio may or may not have any future position in these sector(s)/stock(s)/issuer(s).
0
5
10
15
20
25
30
35
40
45
50
FY07 FY08 FY09 FY10 FY11 FY12 FY13 FY14 FY15 FY16 FY17 FY18 FY19
SUPREME INDUSTRIES - ROE

53
ECONOMIC MOAT – Product Innovation. Consistently adding product portfolio every year to improve customer experience. The business model ticks all boxes of what we say as “HedgeHog Effect”*
COMPETITIVE ADVANTAGE – Largest Air Cooler player with 50% market share in Organized market in India. Asset Light model with strong focus on distribution (network with access to 1000+ distributors and 30000+ dealers)
MANAGEMENT – Generates superior ROE and ROCE on a consistent basis.
LONGEVITY OF GROWTH –
o 50% market share in organized player. Unorganized market players have substantial market share in air cooler market. With the introduction of GST, Shift of Unorganized to Organized, would enable to the company to grow sustainably.
o Scaling into Industrial cooling would add to further growth in revenues and diversification to overseas market will help in moderating the impact of seasonality.
BUSINESS CYCLE AND VALUATION MATRIX –
In 2012, Symphony was in this quadrant
In 2018, Symphony was in this quadrant
*HedgeHog Effect: Coined from the book “Good to Great – Why some companies make the leap and other don’t” written by Jim Collins
Time Frame: FY13 to FY18
Investment Period
10%
15%
20%
25%
30%
35%
40%
45%
50
250
450
650
850
1050
1250
1450
1650
1850
2050
Jun-12
Mar-13
Jan-14
Nov-14
Sep-15
Jul-16
Apr-17
Feb-18
Price ROE (RHS)
BC
V
BC
V
Sales Growth
PAT Growth
Average ROE
Returns (Dec’12 –
Jan’18)
2.1x 3.2x 35% >11x
The sector(s)/stock(s)/issuer(s) mentioned in this presentation do not constitute any researchreport/recommendation of the same and the Representative Portfolio may or may not have anyfuture position in these sector(s)/stock(s)/issuer(s).
Source: DSP Investment Managers – internal research, Factset
Historical portfolio holding examples - SymphonyFocused approach
Low Valuation and Top of the Business Cycle
High Valuation and Top of the Business Cycle
Low Valuation and Bottom of the Business Cycle
High Valuation and Bottom of the Business Cycle
Strictly For Use By Intended Recipients Only
Note: In the BCV quadrant illustration alongside, companies experiencing an improvingBusiness Cycle (low to high) are typically favorable investments. However, this needs to beseen in conjunction with Valuations. While lower valuations usually provide good entry points,during times of market euphoria, this might push investors into investments that turn out tobe value traps. In general, we would look to trim our weights in companies at the top of theBusiness Cycle and which have discomforting valuations.
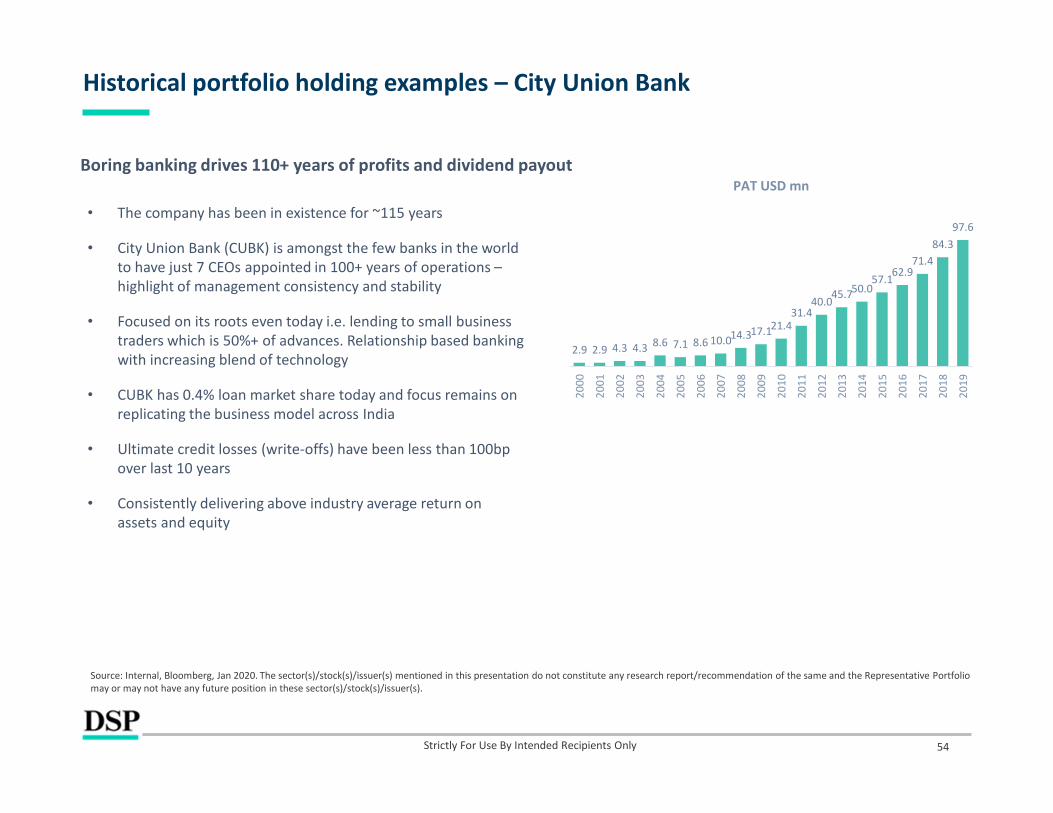
Boring banking drives 110+ years of profits and dividend payout
• The company has been in existence for ~115 years
• City Union Bank (CUBK) is amongst the few banks in the world to have just 7 CEOs appointed in 100+ years of operations –highlight of management consistency and stability
• Focused on its roots even today i.e. lending to small business traders which is 50%+ of advances. Relationship based banking with increasing blend of technology
• CUBK has 0.4% loan market share today and focus remains on replicating the business model across India
• Ultimate credit losses (write-offs) have been less than 100bp over last 10 years
• Consistently delivering above industry average return on assets and equity
54
Historical portfolio holding examples – City Union Bank
Strictly For Use By Intended Recipients Only
97.684.3
71.462.9
57.150.045.7
40.031.4
21.417.114.310.08.67.18.64.34.32.92.9
2019
2018
2017
2016
2015
2014
2013
2012
2011
2010
2009
2008
2007
2006
2005
2004
2003
2002
2001
2000
PAT USD mn
Source: Internal, Bloomberg, Jan 2020. The sector(s)/stock(s)/issuer(s) mentioned in this presentation do not constitute any research report/recommendation of the same and the Representative Portfolio may or may not have any future position in these sector(s)/stock(s)/issuer(s).
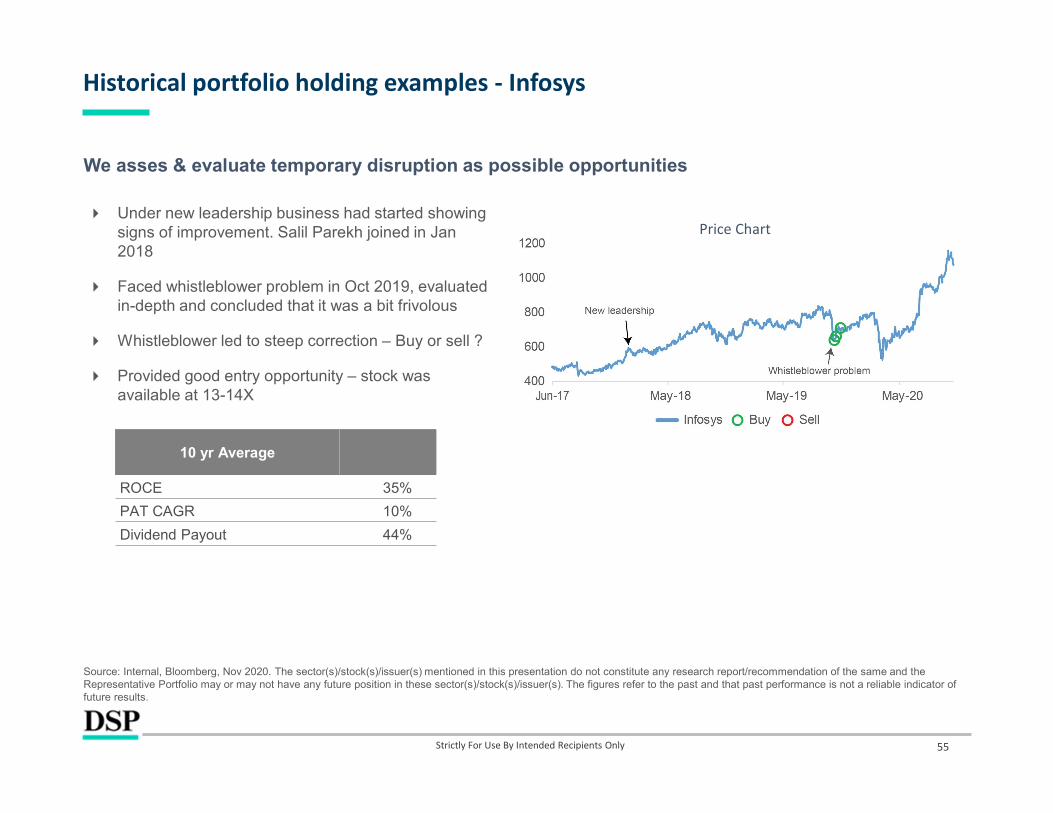
We asses & evaluate temporary disruption as possible opportunities
Under new leadership business had started showing signs of improvement. Salil Parekh joined in Jan 2018
Faced whistleblower problem in Oct 2019, evaluated in-depth and concluded that it was a bit frivolous
Whistleblower led to steep correction – Buy or sell ?
Provided good entry opportunity – stock was available at 13-14X
55
Historical portfolio holding examples - Infosys
Strictly For Use By Intended Recipients Only
Source: Internal, Bloomberg, Nov 2020. The sector(s)/stock(s)/issuer(s) mentioned in this presentation do not constitute any research report/recommendation of the same and the Representative Portfolio may or may not have any future position in these sector(s)/stock(s)/issuer(s). The figures refer to the past and that past performance is not a reliable indicator of future results.
10 yr Average
ROCE 35%
PAT CAGR 10%
Dividend Payout 44%
Price Chart

Strong management, superior ROCE and cost efficient pharma play
Vertically integrated into API – gives huge cost advantage
One of the most capital efficient companies within the sector –average ROCE FY10-15 = 25%
Faced USFDA challenge in 2014 – Buy or Sell ?
ROCE cracked from 28% in FY14 to 5% in FY16; now back to 20%
56
IPCA Laboratories Ltd
Strictly For Use By Intended Recipients Only
Source: Internal, Bloomberg, Oct 2020. The sector(s)/stock(s)/issuer(s) mentioned in this presentation do not constitute any research report/recommendation of the same and the Representative Portfolio may or may not have any future position in these sector(s)/stock(s)/issuer(s). The figures refer to the past and that past performance is not a reliable indicator of future results.
0%10%20%30%40%50%60%70%80%
D:E ROCE OPM %
Price Chart
57
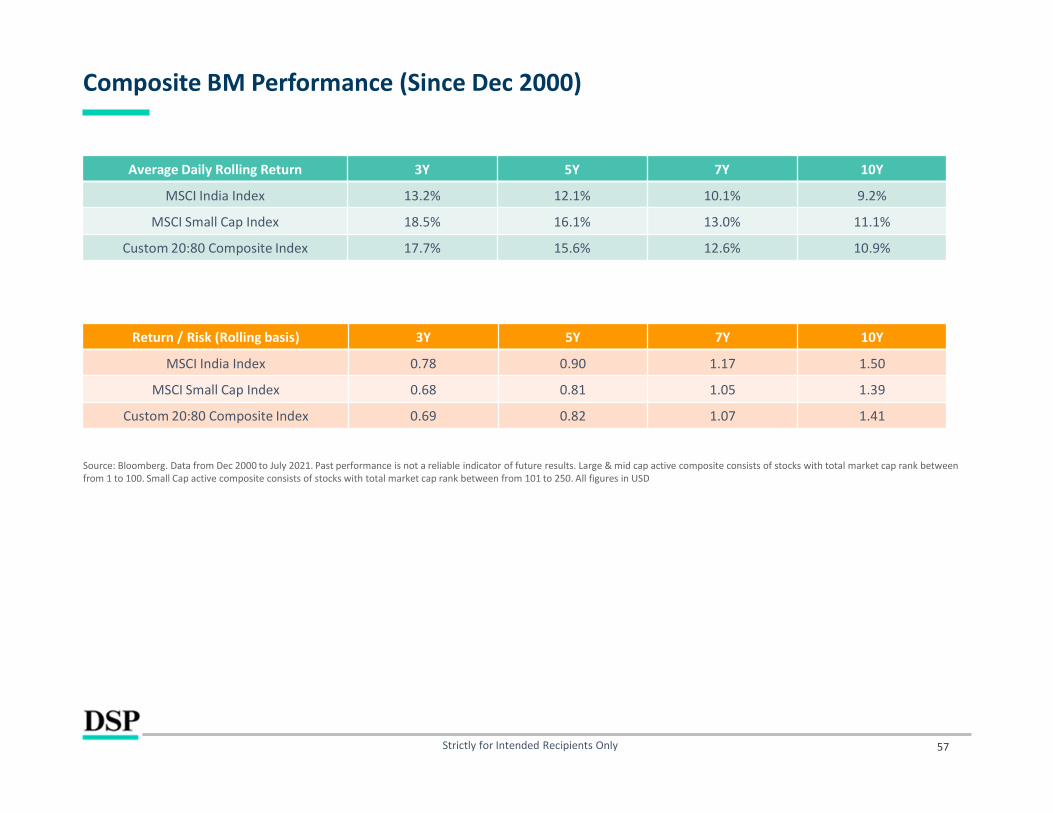
Composite BM Performance (Since Dec 2000)
Strictly for Intended Recipients Only
Source: Bloomberg. Data from Dec 2000 to July 2021. Past performance is not a reliable indicator of future results. Large & mid cap active composite consists of stocks with total market cap rank between from 1 to 100. Small Cap active composite consists of stocks with total market cap rank between from 101 to 250. All figures in USD
Average Daily Rolling Return 3Y 5Y 7Y 10Y
MSCI India Index 13.2% 12.1% 10.1% 9.2%
MSCI Small Cap Index 18.5% 16.1% 13.0% 11.1%
Custom 20:80 Composite Index 17.7% 15.6% 12.6% 10.9%
Return / Risk (Rolling basis) 3Y 5Y 7Y 10Y
MSCI India Index 0.78 0.90 1.17 1.50
MSCI Small Cap Index 0.68 0.81 1.05 1.39
Custom 20:80 Composite Index 0.69 0.82 1.07 1.41
58
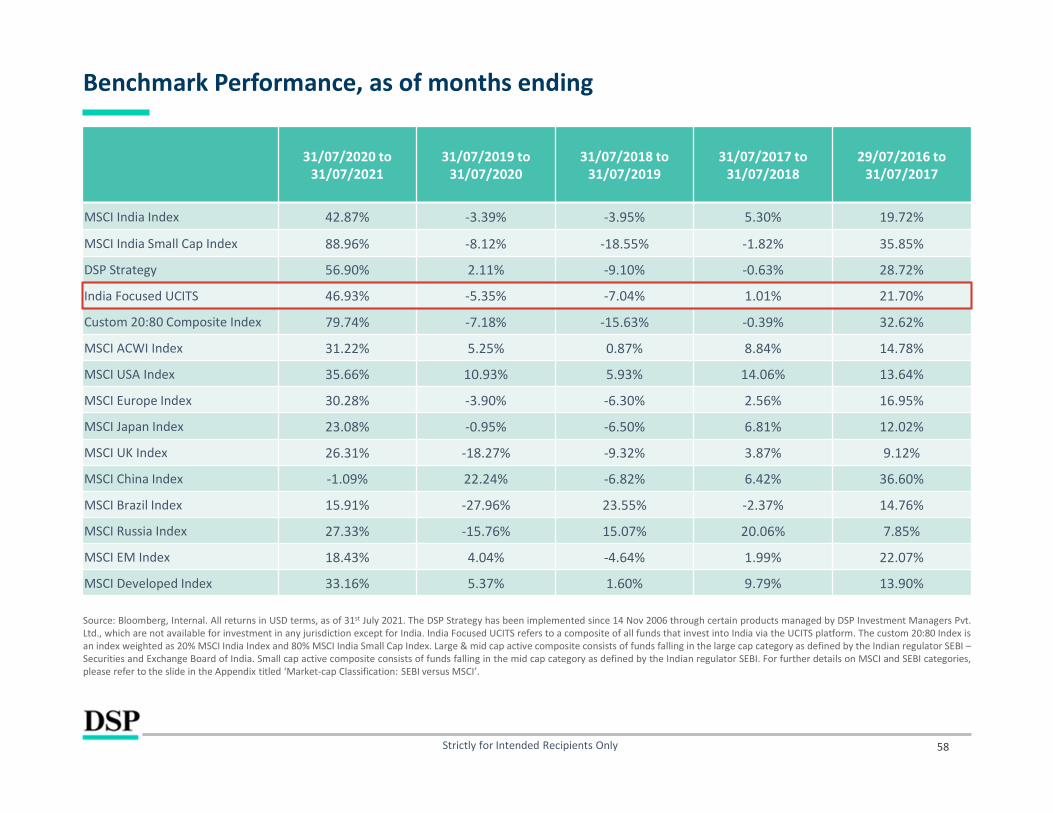
Benchmark Performance, as of months ending
Strictly for Intended Recipients Only
Source: Bloomberg, Internal. All returns in USD terms, as of 31st July 2021. The DSP Strategy has been implemented since 14 Nov 2006 through certain products managed by DSP Investment Managers Pvt.Ltd., which are not available for investment in any jurisdiction except for India. India Focused UCITS refers to a composite of all funds that invest into India via the UCITS platform. The custom 20:80 Index isan index weighted as 20% MSCI India Index and 80% MSCI India Small Cap Index. Large & mid cap active composite consists of funds falling in the large cap category as defined by the Indian regulator SEBI –Securities and Exchange Board of India. Small cap active composite consists of funds falling in the mid cap category as defined by the Indian regulator SEBI. For further details on MSCI and SEBI categories,please refer to the slide in the Appendix titled ‘Market-cap Classification: SEBI versus MSCI’.
31/07/2020 to 31/07/2021
31/07/2019 to 31/07/2020
31/07/2018 to 31/07/2019
31/07/2017 to 31/07/2018
29/07/2016 to 31/07/2017
MSCI India Index 42.87% -3.39% -3.95% 5.30% 19.72%
MSCI India Small Cap Index 88.96% -8.12% -18.55% -1.82% 35.85%
DSP Strategy 56.90% 2.11% -9.10% -0.63% 28.72%
India Focused UCITS 46.93% -5.35% -7.04% 1.01% 21.70%
Custom 20:80 Composite Index 79.74% -7.18% -15.63% -0.39% 32.62%
MSCI ACWI Index 31.22% 5.25% 0.87% 8.84% 14.78%
MSCI USA Index 35.66% 10.93% 5.93% 14.06% 13.64%
MSCI Europe Index 30.28% -3.90% -6.30% 2.56% 16.95%
MSCI Japan Index 23.08% -0.95% -6.50% 6.81% 12.02%
MSCI UK Index 26.31% -18.27% -9.32% 3.87% 9.12%
MSCI China Index -1.09% 22.24% -6.82% 6.42% 36.60%
MSCI Brazil Index 15.91% -27.96% 23.55% -2.37% 14.76%
MSCI Russia Index 27.33% -15.76% 15.07% 20.06% 7.85%
MSCI EM Index 18.43% 4.04% -4.64% 1.99% 22.07%
MSCI Developed Index 33.16% 5.37% 1.60% 9.79% 13.90%

59
Stock Performance, as of months ending
Strictly for Intended Recipients Only
Source: Bloomberg, Internal. All returns in INR terms, as of 31st July 2021. The figures refer to the past and that past performance is not a reliable indicator of future results.
31/07/2020 to 31/07/2021
31/07/2019 to 31/07/2020
31/07/2018 to 31/07/2019
31/07/2017 to 31/07/2018
29/07/2016 to 31/07/2017
SRF 128.27% 40.39% 56.06% 13.99% 3.61%
Infosys 66.72% 21.72% 16.28% 35.00% -5.83%
Symphony 11.39% -31.60% 14.38% -25.39% 20.58%
Ipca Laboratories 12.26% 96.13% 25.82% 58.72% -7.20%

60
Disclaimer
In this material DSP Global Funds ICAV (the “Fund”) has used information that is publicly available, including information developed in-house. Information gatheredand used in this material is believed to be from reliable sources. The Fund however does not warrant the accuracy, reasonableness and or completeness of anyinformation. The data/statistics are given to explain general market trends in the securities market, it should not be construed as any research report/researchrecommendation. We have included statements opinions recommendations in this document, which contain words, or phrases such as “will”, “expect”,“ should”,“believe” and similar expressions or variations of such expressions that are “forward looking statements”. Actual results may differ materially from those suggestedby the forward looking statements due to risk or uncertainties associated with our expectations with respect to, but not limited to, exposure to market risks, generaleconomic and political conditions in India and other countries globally, which have an impact on the Fund and its investments, the monetary and interest policies ofIndia, inflation, deflation, unanticipated turbulence in interest rates, foreign exchange rates, equity prices or other rates or prices etc. The sector(s)/stock(s)/issuer(s)mentioned in this presentation do not constitute any research report/recommendation of the same and the Fund may or may not have any future position in thesesector(s)/stock(s)/issuer(s). All figures and other data given in this document are as on 31 Jul, 2021 (unless otherwise specified) and the same may or may not berelevant in future and the same should not be considered as solicitation/ recommendation/guarantee of future investments by the Fund or its affiliates.
The prospectus and KIIDs for the Fund are available at DSP Global Funds ICAV, 5, George’s Dock, IFSC, Dublin 1, Ireland. The prospectus is available in English and theKIIDs are available in English and Swedish. Swiss representative: Carnegie Fund Services S.A., 11, rue du Général-Dufour, 1204 Geneva, Switzerland. Swiss payingagent: Banque Cantonale de Genève, 17, quai de l’Ile, 1204 Geneva, Switzerland. The Fund is domiciled in Ireland. The prospectus, KIIDs, instrument ofincorporation and annual and semi-annual report can be obtained from the Swiss representative.
The distribution of this material in certain jurisdictions may be restricted or subject to registration requirements and, accordingly, persons who come into possessionof this material in such jurisdictions are required to inform themselves about, and to observe, any such restrictions. The S&P BSE 100, S&P BSE 200, S&P BSE SmallCap, S&P BSE Teck S&P, BSE Metals, S&P BSE Oil and Gas, S&P BSE Healthcare S&P BSE SENSEX are product of Asia Index Private Limited, which is a joint venture ofS&P Dow Jones Indices LLC or its affiliates (“SPDJI”) and BSE, and has been licensed for use by DSP Investment Managers Pvt Ltd. Standard Poor’s® and S&P® areregistered trademarks of Standard Poor’s Financial Services LLC (“S&P”); BSE® is a registered trademark of BSE Limited (“BSE”); and Dow Jones® is a registeredtrademark of Dow Jones Trademark Holdings LLC (“Dow Jones”) © Asia Index Private Limited 2014. All rights reserved.
Each CRISIL Index (including, for the avoidance of doubt, its values and constituents) is the sole property of CRISIL Limited (CRISIL). No CRISIL Index may be copied,retransmitted or redistributed in any manner. While CRISIL uses reasonable care in computing the CRISIL Indices and bases its calculation on data that it considersreliable, CRISIL does not warrant that any CRISIL Index is error free, complete, adequate or without faults. Anyone accessing and/or using any part of the CRISILIndices does so subject to the condition that : (a) CRISIL is not responsible for any errors, omissions or faults with respect to any CRISIL Index or for the resultsobtained from the use of any CRISIL Index; (b) CRISIL does not accept any liability (and expressly excludes all liability) arising from or relating to their use of any partof CRISIL Indices
Large-caps are defined as top 100 stocks on market capitalization, mid-caps as 101-250 small caps as 251 and above as per the Indian regulator.
Within the European Economic Area (“EEA”), including the United Kingdom, this document is intended for professional clients only, as that term is defined inDirective 2014/65/EU (“MiFID II”) on markets in financial instruments. Within Switzerland, it is intended only for qualified investors, as that term is defined in theCollective Investment Schemes Act of 23 June 2006.
Strictly For Use By Intended Recipients Only

61
Disclaimer for UAE (not applicable to the Dubai International Financial Centre and the Abu Dhabi Global Markets)
The offering of the international shares has not been approved or licensed by the UAE Central Bank, the UAE Securities and Commodities Authority (SCA) or anyother relevant licensing authorities in the UAE, and accordingly does not constitute a public offer of securities in the UAE in accordance with the CommercialCompanies Law, Federal Law No. 2 of 2015 (as amended), SCA Resolution No. 3 R.M. of 2017 Concerning the Organization of Promotion and Introduction orotherwise. Accordingly, the international shares may not be offered to the public in the UAE.This presentation is strictly private and confidential and is being issued to a limited number of investors:(a) who fall within with the exceptions set out in SCA Resolutions No. 3 R.M. of 2017 (Qualified Investors, excluding natural persons) and have confirmed the same;(b) upon their request and confirmation that they understand that the international shares have not been approved or licensed by or registered with the SCA, or anyother relevant licensing authorities or governmental agencies in the UAE; and(c) must not be provided to any person other than the original recipient, and may not be reproduced or used for any other purpose.
Strictly For Use By Intended Recipients Only

62
Disclaimer for Chile
This private offering of securities is addressed only to ´Qualified Investors´ (as defined in CMF General Rule No. 216).
Neither the DSP Global Funds ICAV [Issuer) nor the DSP India Equity Fund [Security] will be registered in the Registro de Valores Extranjeros (Foreign SecuritiesRegistry) kept by the Chilean Commission for the Financial Market (Comisión para el Mercado Financiero or “CMF”) and will not be subject to the supervision of theCMF. If such securities are offered within Chile, they will be offered and sold only pursuant to General Rule 336 of the CMF, an exemption to the registrationrequirements, or in circumstances which do not constitute a public offer of securities in Chile within the meaning of article 4 of the Chilean Law No. 18,045 onSecurities Market. The commencement date of this offering is the one contained in the cover pages of this [offering memorandum/prospectus]. The issuer has noobligation to deliver public information in Chile. These Security shall not be subject to public offering in Chile unless registered in the Foreign Securities Registry.
La presente oferta de valores está dirigida a Inversionistas Calificados (según se define en la Norma de Carácter General N° 216 de la CMF).
El DSP Global Funds ICAV [EMISOR] y los DSP India Equity Fund [VALORES] no serán registrados en el Registro de Valores Extranjeros de la Comisión para el MercadoFinanciero o “CMF” y no están sujetos a la fiscalización de la CMF. Si dichos valores son ofrecidos dentro de Chile, serán ofrecidos y colocados sólo de acuerdo a loestablecido en la Norma de Carácter General 336 de la CMF (una excepción a la obligación de inscripción en el Registro de Valores Extranjeros), o en circunstanciasque no constituyan una oferta pública de valores en Chile según lo definido por el Artículo 4 de la Ley 18.045 de Mercado de Valores de Chile. La fecha de inicio de lapresente oferta es la indicada en la portada de este [offering memorandum/prospectus]. El [EMISOR] no está obligado a entregar información pública en Chile,incluyendo en relación a los [VALORES]. Los VALORES no podrán ser objeto de oferta pública mientras no sean inscritos en el Registro de Valores Extranjeros de laCMF.
Strictly For Use By Intended Recipients Only
63
Disclaimer for Hong Kong
FOR RESIDENTS OF HONG KONG
WARNING: The contents of this document have not been reviewed by any regulatory authority in Hong Kong. You are advised to exercise caution in relation tothe offer. If you are in any doubt about any of the contents of this document, you should obtain independent professional advice.
This document does not constitute an offer or invitation to the public in Hong Kong to acquire Shares. Accordingly, no person may issue or have in its possession forthe purposes of issue, this document, the ICAV’s Prospectus or any advertisement, invitation or document relating to the Shares, which is directed at, or thecontents of which are likely to be accessed or read by, the public in Hong Kong except where: (i) the Shares are only intended to be offered to “professionalinvestors” (as such term is defined in the Securities and Futures Ordinance of Hong Kong (Cap. 571 of the Laws of Hong Kong), as amended (the “SFO”) and thesubsidiary legislation made thereunder); (ii) in circumstances which do not result in this document or the ICAV’s Prospectus being a “prospectus” as defined in theCompanies (Winding Up and Miscellaneous Provisions) Ordinance of Hong Kong (Cap. 32 of the Laws of Hong Kong), as amended (the “CO”); or (iii) in circumstanceswhich do not constitute an offer or an invitation to the public for the purposes of the SFO or the CO. The offer of the Shares is personal to the person to whom thisdocument has been delivered and a subscription for Shares will only be accepted from such person. No person to whom a copy of this document is issued may copy,issue or distribute this document in Hong Kong, or make or give a copy of this document to any other person.
Strictly For Use By Intended Recipients Only

INVESTMENT MANAGERS