What is UTI Focused Equity Fund? - ICICI Direct
26
1 1
-
Upload
khangminh22 -
Category
Documents
-
view
5 -
download
0
Transcript of What is UTI Focused Equity Fund? - ICICI Direct

11

2
What is UTI Focused Equity Fund?
Concentrated Portfolio
Exposure to hand-pickedhigh-conviction ideas
Uniquely Positioned
Distinct portfolio relative to broader market indices with potential for alpha creation
Leverage of
Research Expertise
Experienced fund management team tracking large-set of companies
Optimal Portfolio
Diversification
Maximum of 30 stocks across sectors and market capitalisation

3
Stock picking + Position size = Focused Fund Alpha
UTI team’s experience & research framework aid in alpha generation
NBFC Sector Manufacturing Industry
-
500
1,000
1,500
2,000
2,500
3,000
3,500
4,000
4,500
Re
ba
sed
to
100
NBFC1 NBFC2
-
2,000
4,000
6,000
8,000
10,000
12,000
14,000
16,000
18,000
Re
ba
sed
to
100
Ind. Manufacturer1 Ind. Manufacturer2
Above is for illustration purposes only. Sector/stock reference herein may or may not form part of actual portfolio of UTI Focused Equity FundSource: Bloomberg. Data period Jan-2000 to Jun-2021
Return divergence within select sectors – 10 years period
42x
4x
175x
8x
4
Vetri SubramaniamHead Equity & Fund Manager
Sanjay DongreFund Manager
Swati Kulkarni, CFAFund Manager
Ajay Tyagi, CFAFund Manager
Sachin TrivediHead of Research &Fund Manager
Amit PremchandaniFund ManagerBanks, NBFCs
Kamal GadaFund ManagerOverseas InvestmentPharma, Fertilizer,Chemicals, Media
Vishal Chopda, CFAFund ManagerFMCG, QSR, Retail, Telecom
Parag ChavanResearch AnalystMetals & Mining, Building Materials, Healthcare,Consumer Durables
Preethi R SResearch AnalystAuto Ancillaries,Insurance, HFC & NBFCs
Sharwan Goyal, CFA Fund Manager
Deepesh AgarwalResearch AnalystCapital Goods, TextilesInfra – Construction, Utilities
V SrivatsaFund Manager
Akash ShahInvestment Associate
Ayush HarbhajankaInvestment Associate
Nitin Jain, CFAResearch AnalystIT, Internet Sector,Oil & Gas
Ankit AgarwalFund Manager
Ayush JainInvestment Associate
Pradnya S. GanarResearch AnalystCement, Sugar, Hotels
Sudhanshu AsthanaFund Manager
Data as of June 30, 2021, based total work experience in Mutual Fund Industry. Collective overall experience of the team is over 310 years.MF – Mutual Fund; FMCG – Fast-Moving Consumer Goods; QSR – Quick Service Restaurants; IT – Information Technology; HFC – Housing Finance Company; NBFC – Non-banking Finance Company
Collective MF
work experience
of the team
Over 240 Years
Average work
experience of
fund managers
Over 17 Years
Average work
experience of
research analysts
Over 5 Years
About UTI Investment Team

5 5
Research Framework – Rating System
Every company gets an OCF & RoCE rating
based on its previous 5 years data
OCF – Operating Cash Flow; RoCE – Return on Capital Employed. OCF Tiers (C)- 3 Tiers based on the number of years in which they have generated positive operating cash flows inthe previous 5 years (for manufacturing companies). RoCE/ Implied RoE Tiers (R) - 3 Tiers based on the previous 5 year average return on capital (for manufacturing companies & non-lending non banking finance companies (NBFCs)) & based on the previous 5 year average return on asset for banks & NBFCs (including housing finance companies).All data are as of June 30, 2021
RATING PROCESS
C1 C2 C3
R1 R2 R3
OCF Rating
RoCE Rating
LOW HIGH CONSISTENCY
3 TIER RATING SYSTEM
FUND MANDATE &
INVESTMENT STYLE
INVESTMENT UNIVERSE346
120
126
100
Small Cap
Mid Cap
Large Cap
Coverage based on Market cap
79
136
315
Nifty Smallcap 250
Nifty Midcap 150
Nifty 500
Coverage based on Indices

‡ Opens for redemption after 3 years from the date of allotmentThis product is suitable for investors who are seeking*:
• Long term capital growth
• Investment in equity and equity related securities across market capitalisation in maximum 30 stocks
*Investors should consult their financial advisers if in doubt about whether the product is suitable for them
Product labelling assigned during the NFO is based on internal assessment of the scheme characteristics
or model portfolio and the same may vary post NFO when the actual investments are made.
UTI Focused Equity Fund(An open ended equity scheme investing in maximum 30 stocks across market capitalisation)
MUTUAL FUND INVESTMENTS ARE
SUBJECT TO MARKET RISKS, READ
ALL SCHEME RELATED
DOCUMENTS CAREFULLY.

7
Experience
Over 2 decades of industry experience in the India
capital markets and over 15 years of experience of
managing the funds across the market cycle
Investment Philosophy
Focuses on high quality businesses determined by
their high RoCEs with long-term sustainable growth.
Also focuses on companies where there is a visibility
of business transformation and businesses that
might undergo cyclical headwinds
Investment Style
Pursue bottom-up approach in identifying stocks;
follows blend strategy of investing in both growth
and value stocks with a tilt towards growth
Sudhanshu Asthana is an Executive Vice President and
Fund Manager at UTI AMC and joined in April 2021. His
most recent role prior to joining UTI, was as CEO and CIO
of Tamohara Investment Managers, where he spent five
years. For the first 6 years of his career, he worked as a sell
side analyst and has been in the asset management
industry for the last 15 years. He has worked in firms like
Quantum Mutual Fund, SBI Mutual Fund and Axis Mutual
Fund, where he had fund management responsibilities.
He holds a Master’s degree in Economics from Mumbai
University and a Diploma in Investment Management
from NMIMS.
Fund Manager – Sudhanshu Asthana
8
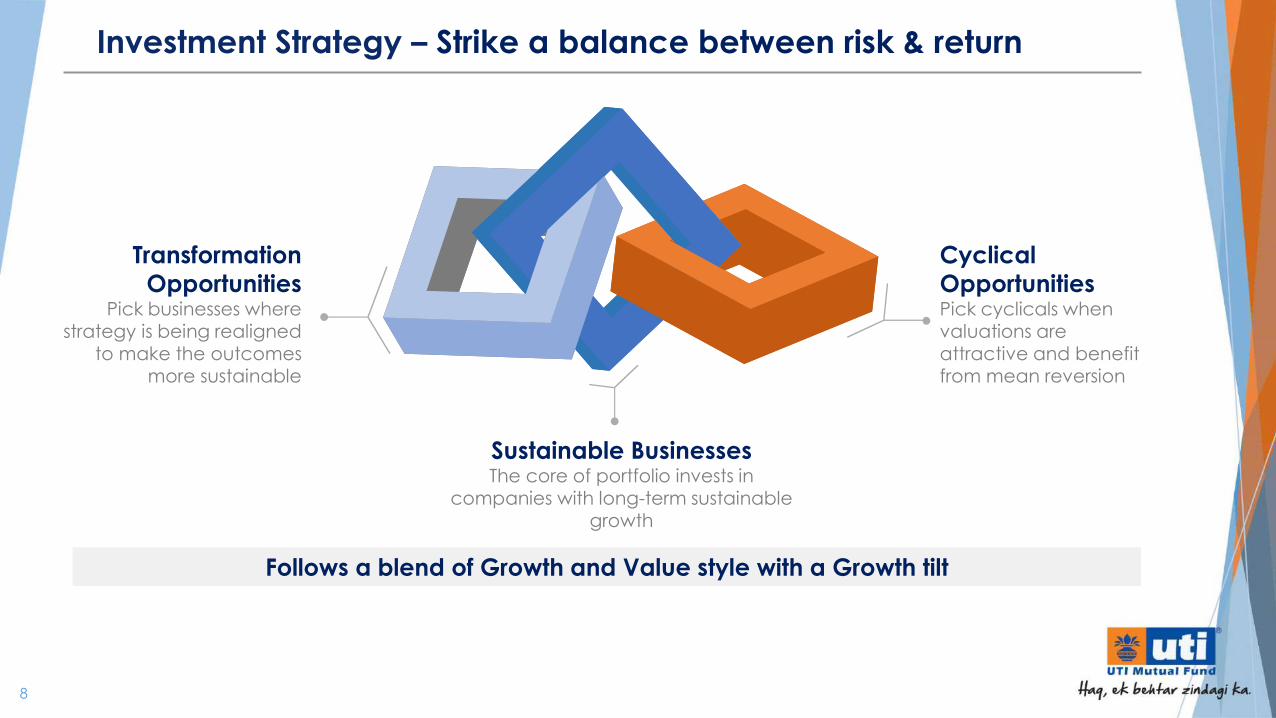
Investment Strategy – Strike a balance between risk & return
Sustainable BusinessesThe core of portfolio invests in
companies with long-term sustainable growth
Transformation
OpportunitiesPick businesses where
strategy is being realigned to make the outcomes
more sustainable
Cyclical
OpportunitiesPick cyclicals when valuations are attractive and benefit from mean reversion
Follows a blend of Growth and Value style with a Growth tilt

9
Exclusion Filter – What to avoid in the portfolio
PORTFOLIOEXCLUSIONS
Inferior RoCEBusinesses which through a cycle generate RoCE lower than cost of capital
Inconsistent
Cash flowsPoor OCF generation
Sustainability
ChallengesPoor visibility of earnings sustainability or growth
run way
High LeverageCompanies with
high debt
Management
IssuesCorporate Governance
& Minority shareholder issues
RoCE – Return on Capital Employed, OCF – Operating Cash Flow

10
Exploit return divergence through stock picking
Analysis is of the 500 companies in the Nifty 500 as of June 30, 2011. Performance data as of June 30, 2021CAGR – Compound Annual Growth Rate. Source: Bloomberg.
Return range of companies in Nifty 500 Index* – 10 years period
CAGR (%)
Nifty 500 TRI – 12.81% CAGR
100 127 90 75 32
<0% 0% to 12.8% 12.8% to 20.0% 20.0% to 30.0% >30.0%
20%
25%
18%
15%
6%
Nu
mb
er
an
d %
of
Sto
cks
*76 stocks / 15% of stocks exited due to delisting, liquidation, shutdown, mergers etc

11
100 127 90 75 32
<0% 0% to 12.8% 12.8% to 20.0% 20.0% to 30.0% >30.0%
20%
25%
18%
15%
6%
Return range of companies in Nifty 500 Index* – 10 years period
Our endeavour is to
pick more stocks
with such outcomes
Exploit return divergence through stock picking
Nu
mb
er
an
d %
of
Sto
cks
CAGR (%)
Nifty 500 TRI – 12.81% CAGR
*76 stocks / 15% of stocks exited due to delisting, liquidation, shutdown, mergers etcAnalysis is of the 500 companies in the Nifty 500 as of June 30, 2011. Performance data as of June 30, 2021CAGR – Compound Annual Growth Rate. Source: Bloomberg.

12
Focus + Concentration = Greater Return Potential
Position sizing to accentuate the portfolio outcome
Return range of companies in Nifty 500 Index*
(10 years period)N
um
be
r a
nd
% o
f Sto
cks
100 127 90 75 32
<0% 0% to 12.8% 12.8% to 20.0% 20.0% to 30.0% >30.0%
20%
25%
18%
15%
6%
CAGR (%)
EXCLUSIONS FOCUS
Consistent OCF, FCF,
high RoCE companies +
transformation and
mean reversion
opportunities
Management Issues,
High Leverage,
Sustainability Challenges,
Inconsistent Cash flows
and Inferior RoCEs
*76 stocks / 15% of stocks exited due to delisting, liquidation, shutdown, mergers etcAnalysis is of the 500 companies in the Nifty 500 as of June 30, 2011. Performance data as of June 30, 2021CAGR – Compound Annual Growth Rate. Source: Bloomberg.

13
STOCK
IDEASDESCRIPTION INVESTMENT
ARGUMENTOUTCOME
2017 2021
Sustainable Growth
▪ Leadership in CVS (3rd
rank), CNS (4th) &
Vitamin (5th)
▪ Largest Indian player in
Brazilian market and
plans to scale up
further
▪ Scaling up of
Brands and Field
Force productivity
to expand
operating margins
▪ High RoCE
business with
stable growth from
branded generic
market
Steady/ Improving RoCESteady Growth,
Superior Margins v/s Industry
Transformation Opportunity
▪ Diversified loan book
with ~50% share of retail
▪ Improving and strong
deposit franchise (over
last 10 years CASA share
moved from 26% to
50%)
▪ Adequately capitalized,
14% Tier 1 capital, last
capital raising in FY 2008
▪ Overall stress have
peaked
▪ Core RoEs
deteriorated
sharply, likely to
rebound
Overall stress has declined
sharply
Core RoEs have rebounded
sharply over last 2 years
The chart above is for illustrative purposes only and should not be construed as advise. The above is to illustrate the concept of identifying stocks in the market and not an endorsement by theMutual Fund and AMC of their soundness or a recommendation to buy or sell these stocks at any point of time. There is also a possibility of the expected event not happening or some otherunforeseen event that may affect performance of the company. The performance of stocks would ultimately depend on various factors such as prevailing market conditions, global politicalscenario, exchange rate etc. Investors are requested to note that there are various factors (both local and international) that can have impact on the future performance and expectations ofany company. There is no assurance or guarantee of any company being able to sustain its performance in future and above information should not be construed as research report or arecommendation to buy or sell any security.
CASA – Current Account Saving Account, RoE – Return on Equity, RoCE – Return on Capital Employed, CVS - Cardiovascular System, CNS - Central nervous system
Research Outcome – Case study

14
Things can go wrong, but quality of stock picking can still help minimize damage
STOCK
IDEASDESCRIPTION INVESTMENT
ARGUMENTOUTCOME
2017 2021
Cyclical + TransformationOpportunity
▪ Established itself as the
largest men’s wear
portfolio by growing 5x
from FY 07 to FY 17
▪ Increased presence in
women’s wear by
acquiring largest value
fashion retailer
▪ Play on fast fashion
with a popular fast
fashion brand in
the portfolio
▪ Focus on working
capital resulting in
healthy operating
RoIC
Scaled up new businesses of
innerwear and fast fashion
In spite of the Pandemic
leverage improved due to
superior working capital
management & fund raising
The chart above is for illustrative purposes only and should not be construed as advise. The above is to illustrate the concept of identifying stocks in the market and not an endorsement by theMutual Fund and AMC of their soundness or a recommendation to buy or sell these stocks at any point of time. There is also a possibility of the expected event not happening or some otherunforeseen event that may affect performance of the company. The performance of stocks would ultimately depend on various factors such as prevailing market conditions, global politicalscenario, exchange rate etc. Investors are requested to note that there are various factors (both local and international) that can have impact on the future performance and expectations ofany company. There is no assurance or guarantee of any company being able to sustain its performance in future and above information should not be construed as research report or arecommendation to buy or sell any security.
RoIC – Return on Invested Capital
Research Outcome – Case study (contd.)

15
Market Cap
Internal Limits
Portfolio Turnover
Agnostic to Market capitalisationPreferred Allocation:
Large Cap: 60-70%, Mid and Small Cap: 30-40%
Single stock limit 9.50%No limits applicable at sector level
05
Investment Style01 Blend with Growth tilt(Biased to High RoCEs & Consistent OCFs)
Stock Selection02
03
04
Bottom-up ApproachPreference for quality companies with long run-way for
growth + transformation & mean reversion opportunities
Driven by StrategyNo target but could be higher due to the conviction and
concentration approach
Investment Framework – Concentrated yet Diversified
RoCE – Return on Capital Employed, OCF – Operating Cash Flow
16
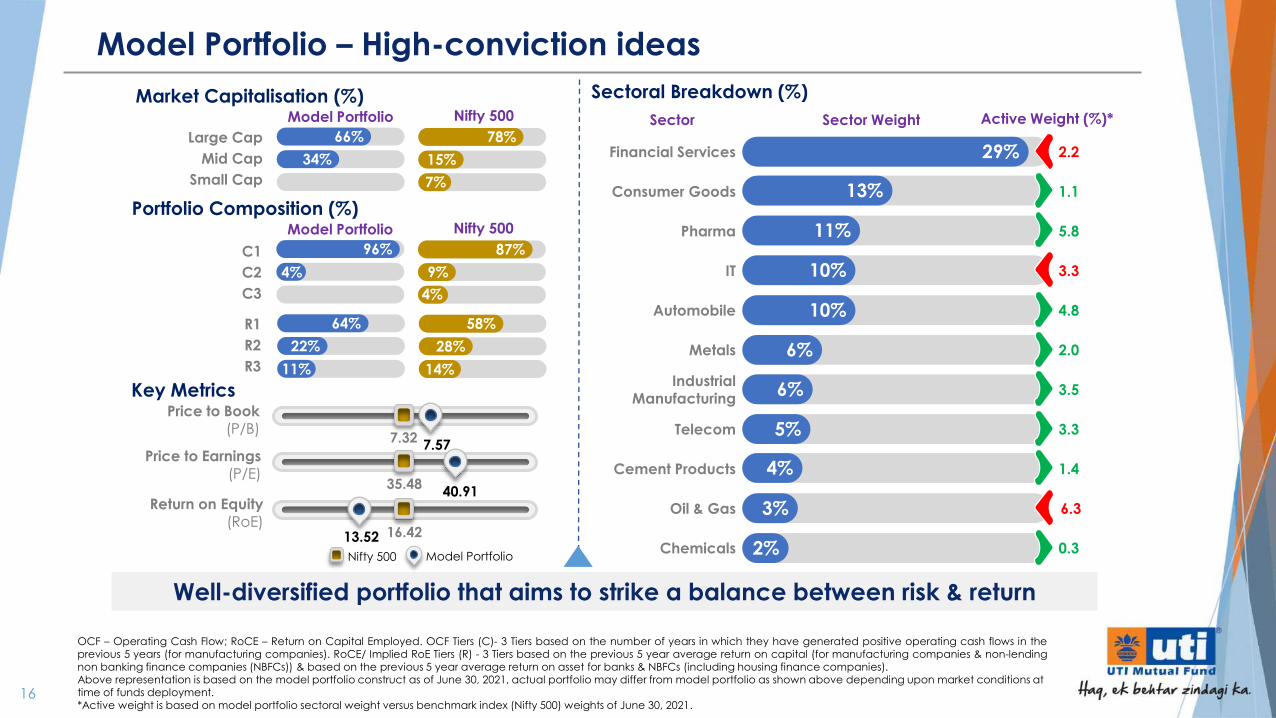
Well-diversified portfolio that aims to strike a balance between risk & return
Sector WeightSector Active Weight (%)*
Sectoral Breakdown (%)
Financial Services 2.2
Consumer Goods 1.1
Pharma 5.8
IT 3.3
Automobile 4.8
Metals 2.0
Industrial Manufacturing
3.5
Telecom 3.3
Cement Products 1.4
Oil & Gas 6.3
Chemicals 0.3
13%
29%
11%
10%
10%
6%
6%
5%
4%
3%
2%
Return on Equity(RoE)
Price to Earnings(P/E)
Price to Book(P/B)
Nifty 500 Model Portfolio
7.327.57
35.4840.91
16.4213.52
Market Capitalisation (%)
Portfolio Composition (%)
Key Metrics
Large Cap
Mid Cap
Small Cap
R1
R2
R3
C1
C2
C3
Model Portfolio Nifty 500
66%
34%
78%
15%
Model Portfolio Nifty 500
96% 87%
9%
64%
22%
58%
28%
11%
4%
4%
7%
14%
Model Portfolio – High-conviction ideas
OCF – Operating Cash Flow; RoCE – Return on Capital Employed. OCF Tiers (C)- 3 Tiers based on the number of years in which they have generated positive operating cash flows in theprevious 5 years (for manufacturing companies). RoCE/ Implied RoE Tiers (R) - 3 Tiers based on the previous 5 year average return on capital (for manufacturing companies & non-lendingnon banking finance companies (NBFCs)) & based on the previous 5 year average return on asset for banks & NBFCs (including housing finance companies).Above representation is based on the model portfolio construct as of June 30, 2021, actual portfolio may differ from model portfolio as shown above depending upon market conditions at time of funds deployment.*Active weight is based on model portfolio sectoral weight versus benchmark index (Nifty 500) weights of June 30, 2021.

17
UTI Focus Equity Fund – Aims for higher active share
SCHEME OCF / ROCE ACTIVE SHARE INVESTMENT STYLE
UTI FLEXI CAP FUNDFlexi-cap Fund
Quality, Growth & Cash flow
FOCUSED FUND(Model Portfolio)
Blend –Growth Tilt
UTI MASTERSHARE UNIT SCHEMELarge-cap Fund
Competitive Franchise &
GARP
UTI MID CAP FUNDMid-cap Fund
Blend –Growth Tilt
UTI VALUE OPPORTUNITIES FUNDValue Fund
Barbell Approach
UTI CORE EQUITY FUNDLarge & Mid-cap Fund
RelativeValue
GROWTH
VALUE
93%
95%
R1
C1
RoCE
OCF
64%
96%
R1
C1
RoCE
OCF
63%
94%
R1
C1
RoCE
OCF
59%
85%
R1
C1
RoCE
OCF
52%
89%
R1
C1
RoCE
OCF
51%
82%
R1
C1
RoCE
OCF
68%
73%
39%
65%
66%
65%
OCF – Operating Cash Flow; RoCE – Return on Capital Employed. OCF Tiers (C)- 3 Tiers based on the number of years in which they have generated positive operating cash flows in theprevious 5 years (for manufacturing companies). RoCE/ Implied RoE Tiers (R) - 3 Tiers based on the previous 5 year average return on capital (for manufacturing companies & non-lendingnon banking finance companies (NBFCs)) & based on the previous 5 year average return on asset for banks & NBFCs (including housing finance companies).Data as on June 30, 2021. GARP – Growth at Reasonable Price

18
A few illustrative stock ideas

19
▪ Small housing finance companies (Average ticket size ` 0.5 - 1.5 mn) are well placed to capture high secular growth in
affordable housing segment in India. Strong domain knowledge of customer segments (particularly self-employed) &
geography is key to success in the space
▪ The company has delivered a high AUM and PAT with CAGR of 42% and 55% respectively in last 5 year with strong RoA of 3.3%
▪ Focus on technology & data analytics differentiates management quality in running traditional business like housing finance
▪ Demonstrated strong asset liability management & ability to access liquidity during crisis times. Cost of funds for this company
is quite competitive & has diversified sources of borrowings
▪ Asset quality has remained best in class despite high-growth & higher exposure to self-employed segment
The chart above is for illustrative purposes only and should not be construed as advise. The above is to illustrate the concept of identifying stocks in the market and not an endorsement by theMutual Fund and AMC of their soundness or a recommendation to buy or sell these stocks at any point of time. There is also a possibility of the expected event not happening or some otherunforeseen event that may affect performance of the company. The performance of stocks would ultimately depend on various factors such as prevailing market conditions, global politicalscenario, exchange rate etc. Investors are requested to note that there are various factors (both local and international) that can have impact on the future performance and expectations ofany company. There is no assurance or guarantee of any company being able to sustain its performance in future and above information should not be construed as research report or arecommendation to buy or sell any security.
AUM – Assets Under Management, PAT – Profit After Tax, NRAI Report - NRAI India Food Services Report 2019; RoCE – Return on Capital Employed; CAGR – Compound Annual Growth RateA
UM
re
ba
sed
to
10
0
Source: Rating Agencies, companies, Kotak Institutional Equities estimates Source: Company published data, UTI AMC research
-
100
200
300
400
500
600
700
800
900
1,000AUM
Affordable Housing Segment Growth%
39 36 36 36 35 35 40
61 64 64 64 65 65 60
FY15 FY16 FY17 FY18 FY19 FY20 FY21
Salaried Self-employed
Niche play in affordable housing segment

20
▪ The company is a proxy to play the imminent up-cycle in two-wheeler (2W) segment within the automobile industry and has
consistently outperformed underlying industry
▪ As of FY19, domestic 2W industry grew at 11% CAGR v/s 14% growth delivered by the company over 10 years period. In last 2
years, industry has witnessed a de-growth of 16% while the company de-grew by only 6%
▪ In addition to underlying segment growth, growth is hinged on order wins with newer but established OEMs. Also, structural
increase in content per bike driven by new regulations and premiumization
▪ The company has strong presence in key components for 2W industry capturing 12-15% of the market share
▪ Company has demonstrated strong Free Cash Flow generation over last 13 years & consistent high RoCE, reflecting its focus on
lean operations and strict capital allocation.
The chart above is for illustrative purposes only and should not be construed as advise. The above is to illustrate the concept of identifying stocks in the market and not an endorsement by theMutual Fund and AMC of their soundness or a recommendation to buy or sell these stocks at any point of time. There is also a possibility of the expected event not happening or some otherunforeseen event that may affect performance of the company. The performance of stocks would ultimately depend on various factors such as prevailing market conditions, global politicalscenario, exchange rate etc. Investors are requested to note that there are various factors (both local and international) that can have impact on the future performance and expectations ofany company. There is no assurance or guarantee of any company being able to sustain its performance in future and above information should not be construed as research report or arecommendation to buy or sell any security.
CAGR – Compound Annual Growth Rate, OEM – Original Equipment Manufacturer, RoCE – Return on Capital EmployedR
eve
nu
e r
eb
ase
d t
o 1
00
Source: Emkay, UTI AMC Research Source: Company published data, UTI AMC research
-
50.00
100.00
150.00
200.00
250.00
300.00
350.00
400.00
FY09 FY10 FY11 FY12 FY13 FY14 FY15 FY16 FY17 FY18 FY19 FY20 FY21
Company's India Sales YoY
4
6
8
10
12
14
16
18
20
22
FY09 FY10 FY11 FY12 FY13 FY14 FY15 FY16 FY17 FY18 FY19 FY20 FY21
2 Wheeler volume (in Million)
Leading player in auto component space

21
▪ Indian apparel industry is expected to grow at a CAGR of 10% in the medium term1
▪ Branded apparel penetration in apparel industry is expected to increase from 48% in FY20 to 56% in FY25 as per Wazir Advisors1
▪ One of the leading apparel retailer in India with over 300 stores across 100+ cities as of Mar-2021
▪ Steady same store growth (SSG) in last 5 years despite increasing ecommerce penetration and scaled up new formats leading
to 18.5% revenue CAGR over FY15-20 (FY21 impacted due to Covid-19 disruptions)
-
50
100
150
200
250
300
350
400
450
500
FY11 FY12 FY13 FY14 FY15 FY16 FY17 FY18 FY19 FY20
Standalone Revenue
0
50
100
150
200
250
300
350
FY11 FY12 FY13 FY14 FY15 FY16 FY17 FY18 FY19 FY20 FY21
Total Fashion stores
Source: Company published data Source: Company published data
Leading apparel retailer
The chart above is for illustrative purposes only and should not be construed as advise. The above is to illustrate the concept of identifying stocks in the market and not an endorsement by theMutual Fund and AMC of their soundness or a recommendation to buy or sell these stocks at any point of time. There is also a possibility of the expected event not happening or some otherunforeseen event that may affect performance of the company. The performance of stocks would ultimately depend on various factors such as prevailing market conditions, global politicalscenario, exchange rate etc. Investors are requested to note that there are various factors (both local and international) that can have impact on the future performance and expectations ofany company. There is no assurance or guarantee of any company being able to sustain its performance in future and above information should not be construed as research report or arecommendation to buy or sell any security.
1Source: ABFRL FY20 Annual Report, CAGR – Compound Annual Growth Rate
22
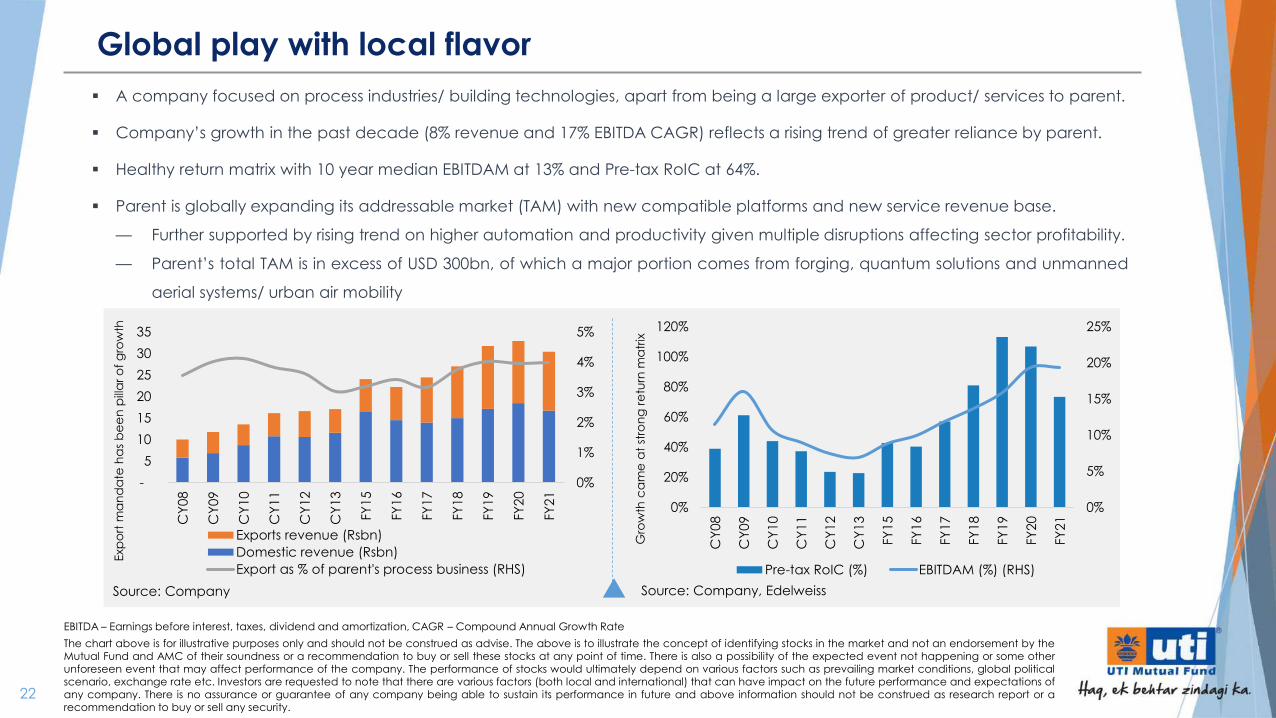
Source: Company Source: Company, Edelweiss
Exp
ort
ma
nd
ate
ha
s b
ee
n p
illa
r o
f g
row
th
Gro
wth
ca
me
at
stro
ng
re
turn
ma
trix
0%
1%
2%
3%
4%
5%
-
5
10
15
20
25
30
35
CY
08
CY
09
CY
10
CY
11
CY
12
CY
13
FY
15
FY
16
FY
17
FY
18
FY
19
FY
20
FY
21
Exports revenue (Rsbn)
Domestic revenue (Rsbn)
Export as % of parent's process business (RHS)
0%
5%
10%
15%
20%
25%
0%
20%
40%
60%
80%
100%
120%
CY
08
CY
09
CY
10
CY
11
CY
12
CY
13
FY
15
FY
16
FY
17
FY
18
FY
19
FY
20
FY
21
Pre-tax RoIC (%) EBITDAM (%) (RHS)
Global play with local flavor
The chart above is for illustrative purposes only and should not be construed as advise. The above is to illustrate the concept of identifying stocks in the market and not an endorsement by theMutual Fund and AMC of their soundness or a recommendation to buy or sell these stocks at any point of time. There is also a possibility of the expected event not happening or some otherunforeseen event that may affect performance of the company. The performance of stocks would ultimately depend on various factors such as prevailing market conditions, global politicalscenario, exchange rate etc. Investors are requested to note that there are various factors (both local and international) that can have impact on the future performance and expectations ofany company. There is no assurance or guarantee of any company being able to sustain its performance in future and above information should not be construed as research report or arecommendation to buy or sell any security.
▪ A company focused on process industries/ building technologies, apart from being a large exporter of product/ services to parent.
▪ Company’s growth in the past decade (8% revenue and 17% EBITDA CAGR) reflects a rising trend of greater reliance by parent.
▪ Healthy return matrix with 10 year median EBITDAM at 13% and Pre-tax RoIC at 64%.
▪ Parent is globally expanding its addressable market (TAM) with new compatible platforms and new service revenue base.
— Further supported by rising trend on higher automation and productivity given multiple disruptions affecting sector profitability.
— Parent’s total TAM is in excess of USD 300bn, of which a major portion comes from forging, quantum solutions and unmanned
aerial systems/ urban air mobility
EBITDA – Earnings before interest, taxes, dividend and amortization, CAGR – Compound Annual Growth Rate

23
Type of Scheme
An open ended equity scheme investing in maximum 30 stocks across market caps
Scheme Objective
The objective of the scheme is to generate long term capital appreciation by investing in equity and equity related instruments of maximum 30 stocks across
the market caps.
However, there can be no assurance or guarantee that the investment objective
of the scheme would be achieved.
Benchmark
Nifty 500 TRI
Minimum Application Amount` 5,000/- and in multiples of ` 1/-
thereafter with no upper limit
Plans Available
The Scheme offers following plans:Regular Plan and Direct Plan
Both the plans offer following Options:Growth and IDCW (Payout)
Load Structure
Entry Load: NilExit Load: Less than one year – 1%;
Greater than or equal to one year - Nil
Fund Snapshot – UTI Focused Equity Fund
0102
03
0405
06UTI FEF
24
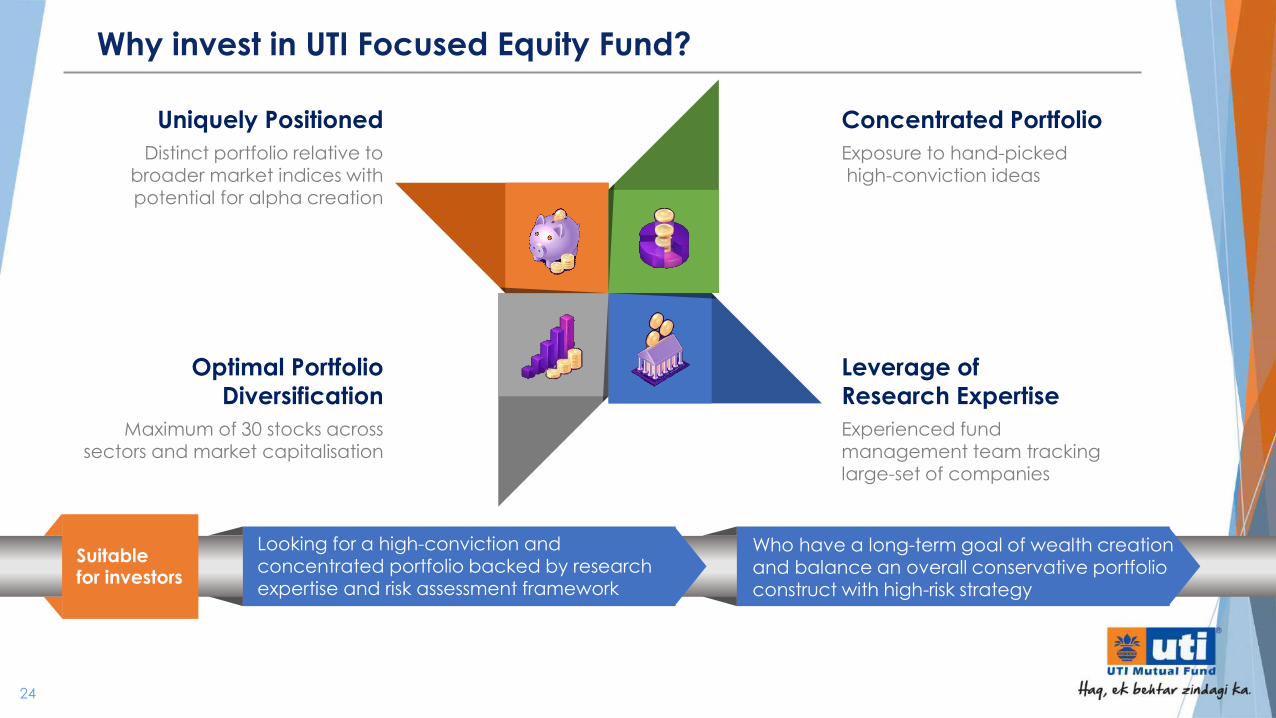
Why invest in UTI Focused Equity Fund?
Who have a long-term goal of wealth creation and balance an overall conservative portfolio construct with high-risk strategy
Looking for a high-conviction and concentrated portfolio backed by research expertise and risk assessment framework
Suitablefor investors
Concentrated Portfolio
Exposure to hand-pickedhigh-conviction ideas
Uniquely Positioned
Distinct portfolio relative to broader market indices with potential for alpha creation
Leverage of
Research Expertise
Experienced fund management team tracking large-set of companies
Optimal Portfolio
Diversification
Maximum of 30 stocks across sectors and market capitalisation

25
Name of the Scheme This product is suitable for investors who are seeking* Riskometer#
UTI Mastershare Unit Scheme(Large Cap Fund- An open ended equity scheme predominantly investing in large cap stocks)
• Long term capital appreciation• Investment predominantly in equity instruments of large cap
companies
UTI Core Equity Fund(Large & Mid Cap Fund- An open ended equity scheme investing in both large cap and mid cap stocks)
• Long term capital appreciation• Investment predominantly in equity instruments of both large
cap and mid cap companies
UTI Mid Cap Fund(Mid Cap Fund- An open ended equity scheme predominantly investing in mid cap stocks)
• Long term capital appreciation• Investment predominantly in mid cap companies
UTI Value Opportunities Fund(An open ended equity scheme following a value investment strategy)
• Long term capital appreciation• Investment in equity instruments following a value investment
strategy across the market capitalization spectrum
UTI Flexi Cap Fund(Flexi Cap Fund- An open ended dynamic equity scheme investing across large cap, mid cap, small cap stocks)
• Long term capital appreciation• Investment in equity instruments of companies with good
growth prospects across the market capitalization spectrum
UTI Focused Equity Fund$
(Focused Fund- An open ended equity scheme investing in maximum 30 stocks across market caps)
• Long term capital growth• Investment in equity and equity related securities across
market capitalisation in maximum 30 stocks
* Investors should consult their financial advisers if in doubt about whether the product is suitable for them.
# Risk-o-meter for the fund is based on the portfolio ending June 30, 2021. The Risk-o-meter of the fund/s is/are evaluated on monthly basis and any changes to Risk-o-meter
are disclosed vide addendum on monthly basis, to view the latest addendum on Risk-o-meter, please visit addenda section on https://utimf.com/forms-and-downloads/
$ Product labelling assigned during the NFO is based on internal assessment of the scheme characteristics or model portfolio and the same may vary post NFO when the
actual investments are made.
Product Label

26
The information contained in this document is for general purposes only and is not an offer to sell or a solicitation to buy/ sell any mutual fund units /
securities. The information / data here in alone are not sufficient and should not be used for the development or implementation of an investment
strategy. The same should not be construed as investment advice to any party.
The information on this document is provided for information purposes only. It does not constitute any offer, recommendation or solicitation to any
person to enter into any transaction or adopt any hedging, trading or investment strategy, nor does it constitute any prediction of likely future
movements in rates or prices or any representation that any such future movements will not exceed those shown in any illustration. Users of this
document should seek advice regarding the appropriateness of investing in any securities, financial instruments or investment strategies referred to on
this document and should understand that statements regarding future prospects may not be realized. The recipient of this material is solely responsible
for any action taken based on this material. Opinions, projections and estimates are subject to change without notice.
UTI AMC Ltd is not an investment adviser, and is not purporting to provide you with investment, legal or tax advice. UTI AMC Ltd or UTI Mutual Fund
(acting through UTI Trustee Company Pvt. Ltd) accepts no liability and will not be liable for any loss or damage arising directly or indirectly (including
special, incidental or consequential loss or damage) from your use of this document, howsoever arising, and including any loss, damage or expense
arising from, but not limited to, any defect, error, imperfection, fault, mistake or inaccuracy with this document, its contents or associated services, or due
to any unavailability of the document or any part thereof or any contents or associated services.
Images, graphics credit: PresentationGO.com, and other public sources.
REGISTERED OFFICE: UTI Tower, ‘Gn’ Block, Bandra Kurla Complex, Bandra (E), Mumbai - 400051. Phone: 022 – 66786666. UTI Asset Management Company
Ltd (Investment Manager for UTI Mutual Fund) Email: [email protected] (CIN-U65991MH2002PLC137867). For more information, please contact the nearest
UTI Financial Centre or your AMFI/ NISM certified Mutual Fund Distributor (MFD) for a copy of the Statement of Additional Information, Scheme
Information Document and Key Information Memorandum cum Application Form.
Please note, Mutual Funds related services are not Exchange traded products and I-Sec is just acting as distributor to solicit Mutual Funds. All disputes with respect to thedistribution activity, would not have access to Exchange investor redressal forum or Arbitration mechanism.
Mutual Fund Investments are subject to market risks, read all scheme related documents carefully.
THANK YOU
For Private Circulation Only