International Equity Fund - SEI Daily Income Trust (SDIT)
57
1 SEI Institutional International Trust / Quarterly Report / December 31, 2021 SCHEDULE OF INVESTMENTS (Unaudited) December 31, 2021 International Equity Fund Description Shares Market Value ($ Thousands) COMMON STOCK — 96.0% Argentina — 0.0% Ternium SA ADR 16,990 $ 739 Australia — 2.4% Altium Ltd 45,948 1,505 BlueScope Steel Ltd 896,249 13,641 Champion Iron Ltd * 513,582 2,036 Commonwealth Bank of Australia 51,912 3,811 CSL Ltd 49,712 10,512 CSR Ltd 807,866 3,455 Fortescue Metals Group Ltd 941,648 13,178 GrainCorp Ltd, Cl A 68,547 412 IGO Ltd 390,578 3,272 Imdex Ltd 98,088 211 Incitec Pivot Ltd 1,218,187 2,883 James Hardie Industries PLC ADR (A) 17,924 729 Lynas Rare Earths Ltd * 681,340 5,034 Orora Ltd 1,391,605 3,544 OZ Minerals Ltd 340,539 7,007 South32 Ltd 8,526,015 24,987 Westpac Banking Corp 167,833 2,603 Whitehaven Coal Ltd * 4,178,286 7,984 WiseTech Global Ltd 178,932 7,592 114,396 Austria — 0.5% ANDRITZ AG 72,724 3,749 OMV AG 222,092 12,616 Raiffeisen Bank International AG 39,393 1,170 Verbund AG, Cl A 9,540 1,073 voestalpine AG 61,009 2,226 20,834 Belgium — 0.0% Solvay SA 6,281 730 Brazil — 0.2% JBS SA 1,321,900 9,007 Canada — 2.9% Advantage Energy Ltd * 224,783 1,319 Air Canada, Cl A * 787,200 13,168 Alimentation Couche-Tard Inc 462,400 19,402 Birchcliff Energy Ltd 269,560 1,379 BRP Inc 24,100 2,114 Canadian National Railway Co 52,900 6,507 Canadian Pacific Railway Ltd 159,857 11,500 Canfor Corp * 120,381 3,055 Capstone Mining Corp * 245,700 1,085 Cascades Inc 96,884 1,071 CI Financial Corp 160,400 3,358 Empire Co Ltd, Cl A 210,700 6,429 First Quantum Minerals Ltd 432,042 10,353 George Weston Ltd 41,600 4,830 Gildan Activewear Inc 39,400 1,673 Intertape Polymer Group Inc 73,100 1,523 Magna International Inc, Cl A 166,434 13,486 Description Shares Market Value ($ Thousands) COMMON STOCK (continued) Martinrea International Inc 49,300 $ 449 MEG Energy Corp * 275,600 2,553 Onex Corp 241,309 18,966 Peyto Exploration & Development Corp 191,700 1,434 Russel Metals Inc 31,084 828 Stelco Holdings Inc 44,300 1,446 Tourmaline Oil Corp 136,600 4,417 Trican Well Service Ltd * 159,959 351 Uni-Select Inc * 47,613 970 Vermilion Energy Inc * 134,200 1,689 Viemed Healthcare Inc * 43,126 225 Whitecap Resources Inc 77,100 457 136,037 Chile — 0.0% Cia Cervecerias Unidas SA ADR 13,494 221 China — 0.3% Beijing Capital International Airport Co Ltd, Cl H * 7,930,000 4,852 Shenzhou International Group Holdings Ltd 291,400 5,603 STMicroelectronics NV 88,029 4,341 14,796 Denmark — 3.5% AP Moller - Maersk A/S, Cl A 324 1,078 AP Moller - Maersk A/S, Cl B 8,202 29,388 Carlsberg AS, Cl B 48,400 8,355 Demant A/S * 95,770 4,896 DSV A/S 79,599 18,576 Genmab A/S * 7,943 3,170 Novo Nordisk A/S, Cl B 701,004 78,829 Orsted AS 67,697 8,682 Pandora A/S * 100,629 12,514 165,488 Finland — 0.8% Fortum Oyj 86,941 2,662 Kesko Oyj, Cl B 496,836 16,557 Neste Oyj 188,282 9,288 Orion Oyj, Cl B 196,453 8,157 36,664 France — 12.1% Air Liquide SA 136,420 23,786 Airbus SE * 177,452 22,674 Alstom SA 448,360 15,918 Amundi SA 33,662 2,777 Arkema SA 16,808 2,367 AXA SA 1,411,656 42,036 BNP Paribas SA 36,165 2,499 Bollore SA 3,159,022 17,675 Bouygues SA 28,501 1,021 Bureau Veritas SA 160,307 5,320 Carrefour SA 1,806,736 33,090 Cie de Saint-Gobain * 21,324 1,500
-
Upload
khangminh22 -
Category
Documents
-
view
5 -
download
0
Transcript of International Equity Fund - SEI Daily Income Trust (SDIT)

1SEI Institutional International Trust / Quarterly Report / December 31, 2021
SCHEDULE OF INVESTMENTS (Unaudited)December 31, 2021
International Equity Fund
Description SharesMarket Value
($ Thousands)
COMMON STOCK — 96.0%Argentina — 0.0%
Ternium SA ADR 16,990 $ 739Australia — 2.4%
Altium Ltd 45,948 1,505BlueScope Steel Ltd 896,249 13,641Champion Iron Ltd * 513,582 2,036Commonwealth Bank of Australia 51,912 3,811CSL Ltd 49,712 10,512CSR Ltd 807,866 3,455Fortescue Metals Group Ltd 941,648 13,178GrainCorp Ltd, Cl A 68,547 412IGO Ltd 390,578 3,272Imdex Ltd 98,088 211Incitec Pivot Ltd 1,218,187 2,883James Hardie Industries PLC ADR (A) 17,924 729Lynas Rare Earths Ltd * 681,340 5,034Orora Ltd 1,391,605 3,544OZ Minerals Ltd 340,539 7,007South32 Ltd 8,526,015 24,987Westpac Banking Corp 167,833 2,603Whitehaven Coal Ltd * 4,178,286 7,984WiseTech Global Ltd 178,932 7,592
114,396Austria — 0.5%
ANDRITZ AG 72,724 3,749OMV AG 222,092 12,616Raiffeisen Bank International AG 39,393 1,170Verbund AG, Cl A 9,540 1,073voestalpine AG 61,009 2,226
20,834Belgium — 0.0%
Solvay SA 6,281 730Brazil — 0.2%
JBS SA 1,321,900 9,007Canada — 2.9%
Advantage Energy Ltd * 224,783 1,319Air Canada, Cl A * 787,200 13,168Alimentation Couche-Tard Inc 462,400 19,402Birchcliff Energy Ltd 269,560 1,379BRP Inc 24,100 2,114Canadian National Railway Co 52,900 6,507Canadian Pacific Railway Ltd 159,857 11,500Canfor Corp * 120,381 3,055Capstone Mining Corp * 245,700 1,085Cascades Inc 96,884 1,071CI Financial Corp 160,400 3,358Empire Co Ltd, Cl A 210,700 6,429First Quantum Minerals Ltd 432,042 10,353George Weston Ltd 41,600 4,830Gildan Activewear Inc 39,400 1,673Intertape Polymer Group Inc 73,100 1,523Magna International Inc, Cl A 166,434 13,486
Description SharesMarket Value
($ Thousands)
COMMON STOCK (continued)Martinrea International Inc 49,300 $ 449MEG Energy Corp * 275,600 2,553Onex Corp 241,309 18,966Peyto Exploration & Development Corp 191,700 1,434Russel Metals Inc 31,084 828Stelco Holdings Inc 44,300 1,446Tourmaline Oil Corp 136,600 4,417Trican Well Service Ltd * 159,959 351Uni-Select Inc * 47,613 970Vermilion Energy Inc * 134,200 1,689Viemed Healthcare Inc * 43,126 225Whitecap Resources Inc 77,100 457
136,037Chile — 0.0%
Cia Cervecerias Unidas SA ADR 13,494 221China — 0.3%
Beijing Capital International Airport Co Ltd, Cl H * 7,930,000 4,852
Shenzhou International Group Holdings Ltd 291,400 5,603STMicroelectronics NV 88,029 4,341
14,796Denmark — 3.5%
AP Moller - Maersk A/S, Cl A 324 1,078AP Moller - Maersk A/S, Cl B 8,202 29,388Carlsberg AS, Cl B 48,400 8,355Demant A/S * 95,770 4,896DSV A/S 79,599 18,576Genmab A/S * 7,943 3,170Novo Nordisk A/S, Cl B 701,004 78,829Orsted AS 67,697 8,682Pandora A/S * 100,629 12,514
165,488Finland — 0.8%
Fortum Oyj 86,941 2,662Kesko Oyj, Cl B 496,836 16,557Neste Oyj 188,282 9,288Orion Oyj, Cl B 196,453 8,157
36,664France — 12.1%
Air Liquide SA 136,420 23,786Airbus SE * 177,452 22,674Alstom SA 448,360 15,918Amundi SA 33,662 2,777Arkema SA 16,808 2,367AXA SA 1,411,656 42,036BNP Paribas SA 36,165 2,499Bollore SA 3,159,022 17,675Bouygues SA 28,501 1,021Bureau Veritas SA 160,307 5,320Carrefour SA 1,806,736 33,090Cie de Saint-Gobain * 21,324 1,500

SEI Institutional International Trust / Quarterly Report / December 31, 20212
SCHEDULE OF INVESTMENTS (Unaudited)December 31, 2021
International Equity Fund (Continued)
Description SharesMarket Value
($ Thousands)
COMMON STOCK (continued)Cie Generale des Etablissements Michelin
SCA, Cl B 13,356 $ 2,189Criteo SA ADR * 60,571 2,354Danone SA 585,039 36,319Edenred 125,156 5,774Eurofins Scientific SE 141,437 17,500Ipsen SA 62,682 5,738IPSOS 18,645 875L'Oreal SA 20,274 9,613LVMH Moet Hennessy Louis Vuitton SE 13,414 11,090Orange SA 1,073,500 11,491Pernod Ricard SA 69,445 16,703Publicis Groupe SA 330,811 22,271Rexel SA * 312,272 6,332Sanofi 612,204 61,670Sartorius Stedim Biotech 32,323 17,732Schneider Electric SE 50,794 9,962Societe Generale SA 486,175 16,700Sodexo SA 225,530 19,764Stellantis NV * 1,036,746 19,663Thales SA 247,999 21,095TotalEnergies SE (A) 577,822 29,326Trigano SA 2,374 462Valeo 274,279 8,291Veolia Environnement SA 838,417 30,758Vinci SA 104,076 10,996Vivendi SE 338,984 4,584Wendel SE 19,332 2,317
572,232Germany — 7.5%
adidas AG 87,032 25,060BASF SE 337,069 23,681Bayer AG 153,318 8,195Bayerische Motoren Werke AG 20,509 2,064BioNTech SE ADR * 41,355 10,661Carl Zeiss Meditec AG 49,009 10,302Continental AG * 61,690 6,532Daimler AG 122,047 9,381Daimler Truck Holding AG * 434,765 15,965Deutsche Boerse AG 56,709 9,486Deutsche Post AG 74,848 4,812E.ON SE 467,492 6,482Fresenius Medical Care AG & Co KGaA 326,130 21,192GEA Group AG 52,394 2,865Hannover Rueck SE 6,286 1,195Infineon Technologies AG 271,319 12,576KION Group AG 175,698 19,277Knorr-Bremse AG 68,500 6,769Linde PLC 33,762 11,749Merck KGaA 132,641 34,241Nemetschek SE 8,105 1,040Rheinmetall AG 22,530 2,128
Description SharesMarket Value
($ Thousands)
COMMON STOCK (continued)RTL Group SA 21,020 $ 1,114RWE AG 458,179 18,612SAP SE 331,362 47,066Siemens AG 234,682 40,747Wacker Chemie AG 19,236 2,879
356,071Hong Kong — 1.5%
AIA Group Ltd 863,800 8,709ASM Pacific Technology Ltd 32,300 349Chaoda Modern Agriculture Holdings Ltd * 2,440,000 12Chow Tai Fook Jewellery Group Ltd 991,400 1,783Hong Kong Exchanges & Clearing Ltd 265,694 15,520Li Ning Co Ltd 568,500 6,224Orient Overseas International Ltd 68,500 1,681Sands China Ltd * 5,432,000 12,653SJM Holdings Ltd * 24,807,340 16,705Wuxi Biologics Cayman Inc * 518,598 6,156
69,792Indonesia — 0.1%
Bank Mandiri Persero Tbk PT 12,245,700 6,055Ireland — 1.8%
Accenture PLC, Cl A 58,235 24,141CRH PLC 18,660 987Experian PLC 242,829 11,946ICON PLC * 102,193 31,649Ryanair Holdings PLC ADR * 142,726 14,605
83,328Israel — 1.7%
Bank Hapoalim BM 2,579,491 26,530Bank Leumi Le-Israel BM 3,141,588 33,763FIBI Holdings Ltd 17,608 805First International Bank Of Israel Ltd/The 24,301 1,009ICL Group Ltd 175,057 1,678Israel Discount Bank Ltd, Cl A 1,188,452 7,996Mizrahi Tefahot Bank Ltd 198,719 7,662
79,443Italy — 4.0%
Assicurazioni Generali SpA 270,023 5,710Azimut Holding SpA 141,983 3,976CNH Industrial NV 1,328,981 25,798DiaSorin SpA 6,306 1,199Enel SpA 2,839,525 22,711Eni SpA 1,587,619 22,020EXOR NV 181,423 16,320Ferrari NV 39,811 10,315FinecoBank Banca Fineco SpA 570,224 9,953MFE-MediaForEurope NV, Cl A * 360,579 367MFE-MediaForEurope NV, Cl B * 360,579 511Recordati Industria Chimica e Farmaceutica
SpA 59,963 3,846Stellantis NV * 147,502 2,775
3SEI Institutional International Trust / Quarterly Report / December 31, 2021
SCHEDULE OF INVESTMENTS (Unaudited)December 31, 2021
International Equity Fund (Continued)
Description SharesMarket Value
($ Thousands)
COMMON STOCK (continued)UniCredit SpA 4,199,104 $ 64,150
189,651Japan — 15.0%
77 Bank Ltd/The 86,064 998ABC-Mart Inc 9,500 407Advantest Corp 115,200 10,847AEON Financial Service Co Ltd 236,600 2,546AGC Inc 371,265 17,754Asahi Group Holdings Ltd (A) 205,800 7,997Asahi Kasei Corp 115,600 1,086ASKUL Corp 101,000 1,344Bandai Namco Holdings Inc 250,802 19,549BayCurrent Consulting Inc 4,000 1,543Bridgestone Corp 451,702 19,419Brother Industries Ltd 79,900 1,537Canon Inc (A) 377,000 9,163Canon Marketing Japan Inc (A) 94,900 1,888Capcom Co Ltd 352,100 8,237Casio Computer Co Ltd 28,900 371Credit Saison Co Ltd 56,100 589CyberAgent Inc * 474,500 7,872Dai-ichi Life Holdings Inc 174,900 3,531Daiichi Sankyo Co Ltd 93,600 2,380Daito Trust Construction Co Ltd 68,000 7,786DeNA Co Ltd * 48,200 742Disco Corp 21,100 6,417Earth Corp 3,600 192FANUC Corp 149,900 31,733FUJIFILM Holdings Corp 11,300 836Fujitsu Ltd 224,005 38,239Glory Ltd 93,100 1,771GungHo Online Entertainment Inc *(A) 60,200 1,351H.U. Group Holdings Inc 21,100 536Hakuhodo DY Holdings Inc 48,100 801Hino Motors Ltd 87,100 716Hitachi Ltd 218,000 11,793Ibiden Co Ltd 14,000 826Iida Group Holdings Co Ltd 64,400 1,498Isuzu Motors Ltd 105,300 1,306ITOCHU Corp 282,200 8,627Japan Exchange Group Inc 412,542 9,020Japan Post Insurance Co Ltd 179,600 2,882JSR Corp 51,400 1,955Kao Corp (A) 260,000 13,580KDDI Corp 428,700 12,500Keyence Corp 32,868 20,612Kirin Holdings Co Ltd (A) 240,000 3,851Koei Tecmo Holdings Co Ltd 21,300 833Kokuyo Co Ltd 224,500 3,341Konica Minolta Inc 601,400 2,736Kyowa Kirin Co Ltd 145,200 3,953Lasertec Corp 41,500 12,642
Description SharesMarket Value
($ Thousands)
COMMON STOCK (continued)Lawson Inc 200,600 $ 9,521Lixil Corp 41,700 1,110Mandom Corp 20,000 246Mazda Motor Corp 730,100 5,599Mitsubishi Corp 36,100 1,147Mitsubishi Electric Corp 1,376,600 17,474Mitsubishi Motors Corp * 163,300 455Mixi Inc 109,000 1,908Mizuno Corp 44,000 857Murata Manufacturing Co Ltd 267,700 21,250Nexon Co Ltd 697,100 13,453Nihon Unisys Ltd 171,500 4,803Nikon Corp 658,000 7,075Nippon Suisan Kaisha Ltd 63,500 300Nippon Telegraph & Telephone Corp 221,300 6,056Nippon Yusen KK 23,600 1,795Nissan Motor Co Ltd * 207,800 1,001Nisshinbo Holdings Inc 93,000 708Nitto Denko Corp 46,500 3,584Nomura Holdings Inc 1,123,500 4,887Okuwa Co Ltd 75,300 622Olympus Corp 47,100 1,085Open House Group Co Ltd 16,000 837ORIX Corp 596,066 12,121Panasonic Corp 1,057,400 11,633Persol Holdings Co Ltd 186,100 5,395Recruit Holdings Co Ltd 527,493 32,006Renesas Electronics Corp * 78,200 965Rohm Co Ltd 6,900 626Sankyo Co Ltd 147,600 3,822Sanwa Holdings Corp 214,700 2,289SBI Holdings Inc/Japan 390,931 10,630SCREEN Holdings Co Ltd 21,800 2,337Secom Co Ltd 19,000 1,319Seiko Epson Corp 141,400 2,542Sekisui House Ltd 14,100 302Seven & i Holdings Co Ltd 392,300 17,223Shimamura Co Ltd 67,900 5,701Sompo Holdings Inc 51,100 2,152Sony Group Corp 92,300 11,609Sony Group Corp ADR 241,869 30,572Sumitomo Mitsui Financial Group Inc 1,174,100 40,137Sumitomo Rubber Industries Ltd (A) 287,700 2,928Sundrug Co Ltd 18,400 480Suntory Beverage & Food Ltd 12,200 441Suzuki Motor Corp 20,000 769T&D Holdings Inc 460,600 5,869Takeda Pharmaceutical Co Ltd 713,000 19,435TIS Inc 144,900 4,302Tokio Marine Holdings Inc 14,700 816Tokyo Electron Ltd 37,800 21,666Tokyo Seimitsu Co Ltd 17,800 785

SEI Institutional International Trust / Quarterly Report / December 31, 20214
SCHEDULE OF INVESTMENTS (Unaudited)December 31, 2021
International Equity Fund (Continued)
Description SharesMarket Value
($ Thousands)
COMMON STOCK (continued)Tomy Co Ltd 128,900 $ 1,232Toshiba Corp 248,200 10,189Universal Entertainment * 396,253 8,400Yamaha Motor Co Ltd (A) 133,300 3,199Z Holdings Corp 1,744,000 10,073ZOZO Inc 8,000 249
712,120Luxembourg — 0.0%
APERAM SA 6,874 372Malta — 0.0%
BGP Holdings *(B) 198,683 –Mexico — 0.9%
Arca Continental SAB de CV 2,314,150 14,703Coca-Cola Femsa SAB de CV ADR 12,791 701Fomento Economico Mexicano SAB de
CV ADR 278,191 21,618Grupo Bimbo SAB de CV, Ser A 105,877 326Grupo Financiero Banorte SAB de CV, Cl O 530,583 3,453
40,801Netherlands — 6.0%
Adyen NV * 6,510 17,112Akzo Nobel NV 353,087 38,748ArcelorMittal SA 253,122 8,102ASM International NV 5,195 2,296ASML Holding NV 70,069 56,312ASML Holding NV, Cl G 16,391 13,049ASR Nederland NV 86,643 3,990BE Semiconductor Industries NV 27,810 2,373ING Groep NV 538,992 7,504James Hardie Industries PLC 65,586 2,636Koninklijke Ahold Delhaize NV 1,010,042 34,614Koninklijke DSM NV 55,518 12,501NXP Semiconductors NV 42,954 9,784PostNL NV 56,148 244Prosus NV 103,722 8,673Randstad NV 186,610 12,741RELX PLC 77,731 2,521Royal Dutch Shell PLC, Cl A 787,914 17,302Universal Music Group NV 298,288 8,406Wolters Kluwer NV 228,324 26,900
285,808New Zealand — 0.0%
Fletcher Building Ltd 99,572 492Ryman Healthcare Ltd 101,037 847
1,339Norway — 0.3%
Aker BP ASA 348,776 10,723Equinor ASA 28,509 755Gjensidige Forsikring ASA 40,110 973Norsk Hydro ASA 240,351 1,895
14,346
Description SharesMarket Value
($ Thousands)
COMMON STOCK (continued)Peru — 0.1%
Credicorp Ltd 40,282 $ 4,917Portugal — 0.1%
EDP - Energias de Portugal SA 335,080 1,841Jeronimo Martins SGPS SA 183,971 4,205
6,046Saudi Arabia — 0.7%
Arabian Cement Co/Saudi Arabia 65,011 654Middle East Paper Co * 28,442 330National Industrialization Co * 799,724 4,249Rabigh Refining & Petrochemical Co * 297,868 1,644Sahara International Petrochemical Co 300,411 3,367Saudi Basic Industries Corp 587,741 18,156Saudi Industrial Investment Group 338,613 2,813Saudi Kayan Petrochemical Co * 708,459 3,213
34,426Singapore — 0.2%
DBS Group Holdings Ltd 422,500 10,235Golden Agri-Resources 2,198,400 400Jardine Cycle & Carriage Ltd 19,000 290
10,925South Africa — 0.1%
DataTec Ltd 100,188 242Investec PLC 634,672 3,447
3,689South Korea — 2.4%
BNK Financial Group Inc 691,155 4,878Hana Financial Group Inc 90,133 3,181Kangwon Land Inc * 761,631 15,366KT Corp ADR 100,388 1,262LG Electronics Inc 88,861 10,315Samsung Electronics Co Ltd 498,666 32,780SK Hynix Inc 228,502 25,111SK Square Co Ltd * 165,222 9,165SK Telecom Co Ltd 255,578 12,398
114,456Spain — 2.6%
Aena SME SA * 91,663 14,439Amadeus IT Group SA, Cl A * 871,841 58,951Banco Bilbao Vizcaya Argentaria SA 1,590,267 9,432Banco Santander SA 5,745,947 19,133CaixaBank SA 5,860,860 16,047Laboratorios Farmaceuticos Rovi SA 10,054 844Repsol SA 150,475 1,786
120,632Sweden — 2.8%
Atlas Copco AB, Cl A 131,951 9,101Byggmax Group AB 122,242 1,208Essity AB, Cl B 706,428 23,019Evolution AB 95,931 13,572Getinge AB, Cl B 217,298 9,471H & M Hennes & Mauritz AB, Cl B (A) 520,777 10,188

5SEI Institutional International Trust / Quarterly Report / December 31, 2021
SCHEDULE OF INVESTMENTS (Unaudited)December 31, 2021
International Equity Fund (Continued)
Description SharesMarket Value
($ Thousands)
COMMON STOCK (continued)Husqvarna AB, Cl B 607,941 $ 9,696Kinnevik AB, Cl B * 237,795 8,445Lundin Energy AB 150,899 5,386Nibe Industrier AB, Cl B 53,677 809Securitas AB, Cl B 1,411,130 19,379Svenska Cellulosa AB SCA, Cl B 46,376 822Swedbank AB, Cl A 407,266 8,177Swedish Match AB 741,333 5,890Tele2 AB, Cl B 95,258 1,357Telefonaktiebolaget LM Ericsson, Cl B 92,975 1,018Volvo AB, Cl B 181,152 4,184
131,722Switzerland — 8.9%
ABB Ltd 172,556 6,590Alcon Inc 110,835 9,776Cie Financiere Richemont SA, Cl A 102,977 15,423Coca-Cola HBC AG 431,212 14,923Credit Suisse Group AG 1,168,397 11,313dormakaba Holding AG 3,105 2,053EMS-Chemie Holding AG 796 891Geberit AG 8,350 6,818Kuehne + Nagel International AG 83,770 27,033Lonza Group AG 31,848 26,567Nestle SA 309,890 43,373Novartis AG 323,381 28,405Roche Holding AG 225,995 93,930SFS Group AG 2,834 391Sika AG 29,824 12,436Sonova Holding AG 19,930 7,796STMicroelectronics NV 213,266 10,525Straumann Holding AG 13,472 28,639Swatch Group AG/The 133,484 40,779Swiss Life Holding AG 9,630 5,890Swiss Prime Site AG 46,159 4,536Tecan Group AG 10,605 6,460Zurich Insurance Group AG 41,452 18,177
422,724Taiwan — 1.2%
Asustek Computer Inc 880,000 11,995Compal Electronics Inc 2,781,000 2,430Evergreen Marine Corp Taiwan Ltd 252,000 1,304Global Mixed Mode Technology Inc 91,000 877Hon Hai Precision Industry Co Ltd 2,300,000 8,637Lite-On Technology Corp 1,577,000 3,637MediaTek Inc 267,987 11,504Novatek Microelectronics Corp 153,000 2,972Sitronix Technology Corp 173,000 2,005Taiwan Semiconductor Manufacturing Co
Ltd ADR 108,541 13,058 58,419
United Kingdom — 13.5%3i Group PLC 981,413 19,261
Description SharesMarket Value
($ Thousands)
COMMON STOCK (continued)Anglo American PLC 682,358 $ 27,874Aon PLC, Cl A 22,895 6,881Aptiv PLC * 67,044 11,059Ashtead Group PLC 131,365 10,572AstraZeneca PLC 223,912 26,318Atlassian Corp PLC, Cl A * 71,978 27,444B&M European Value Retail SA 1,255,693 10,783Balfour Beatty PLC 991,355 3,518Barclays PLC 19,464,684 49,300BP PLC 13,647,374 61,092BP PLC ADR 762,406 20,303British American Tobacco PLC 421,108 15,591Compass Group PLC 1,103,572 24,678Computacenter PLC 62,379 2,459Diageo PLC 580,480 31,732Endava PLC ADR * 20,551 3,451Entain PLC * 327,535 7,466Evraz PLC 1,997,451 16,276Ferguson PLC 87,972 15,615Ferrexpo PLC 524,939 2,129GlaxoSmithKline PLC 320,222 6,968Glencore PLC 4,226,905 21,466Hays PLC 1,294,004 2,562Howden Joinery Group PLC 258,447 3,155IG Group Holdings PLC 186,542 2,054Indivior PLC * 204,652 712Intertek Group PLC 84,420 6,437Investec PLC 732,515 3,993J Sainsbury PLC 189,677 709Kingfisher PLC 1,415,713 6,487London Stock Exchange Group PLC 642 60Man Group PLC/Jersey 746,872 2,300Next PLC * 57,599 6,358Ninety One PLC 375,849 1,380Pagegroup PLC 97,734 839Plus500 Ltd 130,443 2,404Prudential PLC 2,430,668 41,959QinetiQ Group PLC 193,398 697Reckitt Benckiser Group PLC 42,734 3,671RELX PLC 230,860 7,511Rolls-Royce Holdings PLC * 22,496,354 37,442Royal Mail PLC 885,075 6,066Sage Group PLC/The 131,122 1,514Schroders PLC 46,684 2,251Segro PLC ‡ 231,417 4,503Smith & Nephew PLC 1,358,440 23,799St James's Place PLC 49,094 1,119Travis Perkins PLC 85,765 1,806Unilever PLC 406,693 21,734WH Smith PLC * 1,133,288 22,718Wise PLC, Cl A * 271,727 2,785
641,261

SEI Institutional International Trust / Quarterly Report / December 31, 20216
SCHEDULE OF INVESTMENTS (Unaudited)December 31, 2021
International Equity Fund (Continued)
Description SharesMarket Value
($ Thousands)
COMMON STOCK (continued)United States — 1.9%
EPAM Systems Inc * 14,226 $ 9,509IHS Markit Ltd 87,290 11,602Inmode Ltd * 24,094 1,701Lululemon Athletica Inc * 23,952 9,376Mettler-Toledo International Inc * 6,059 10,283Nomad Foods Ltd * 339,725 8,626ResMed Inc 45,572 11,871Shopify Inc, Cl A * 7,623 10,500STERIS PLC 33,581 8,174ZIM Integrated Shipping Services Ltd 112,619 6,629
88,271
Total Common Stock (Cost $3,855,329) ($ Thousands) 4,547,758
PREFERRED STOCK — 0.5%Brazil — 0.0%
Braskem SA(C) 65,200 674Germany — 0.5%
Jungheinrich AG (C) 4,123 211Porsche Automobil Holding SE (C) 87,691 8,321Schaeffler AG (C) 106,067 879Volkswagen AG(C) 70,406 14,210
23,621
Total Preferred Stock (Cost $25,598) ($ Thousands) 24,295
EXCHANGE TRADED FUND — 0.1%United States — 0.1%
iShares Trust iShares ESG Aware MSCI EAFE ETF 65,580 5,211
Total Exchange Traded Fund (Cost $4,970) ($ Thousands) 5,211
AFFILIATED PARTNERSHIP — 1.4%SEI Liquidity Fund, L.P.
0.020% **†(D) 67,123,424 67,148
Total Affiliated Partnership(Cost $67,135) ($ Thousands) 67,148
Description SharesMarket Value
($ Thousands)CASH EQUIVALENT — 1.9%
SEI Daily Income Trust, Government Fund, Cl F
0.010%**† 90,105,249 $ 90,105
Total Cash Equivalent(Cost $90,105) ($ Thousands) 90,105
Total Investments in Securities — 99.9%(Cost $4,043,137) ($ Thousands) $ 4,734,517

7SEI Institutional International Trust / Quarterly Report / December 31, 2021
SCHEDULE OF INVESTMENTS (Unaudited)December 31, 2021
International Equity Fund (Concluded)
A list of the open futures contracts held by the Fund at December 31, 2021, is as follows:
Type of ContractNumber of Contracts
Expiration Date
Notional Amount (Thousands) Value (Thousands)
Unrealized Appreciation/ (Depreciation) (Thousands)
Long ContractsEuro STOXX 50 785 Mar-2022 $ 36,721 $ 38,275 $ 1,232FTSE 100 Index 171 Mar-2022 16,352 16,963 260Hang Seng Index 21 Jan-2022 3,120 3,158 37SPI 200 Index 74 Mar-2022 9,559 9,882 169TOPIX Index 167 Mar-2022 29,124 28,903 148
$ 94,876 $ 97,181 $ 1,846
Percentages are based on Net Assets of $4,737,252 ($ Thousands).* Non-income producing security.** The rate reported is the 7-day effective yield as of December 31, 2021.† Investment in Affiliated Security.‡ Real Estate Investment Trust.(A) Certain securities or partial positions of certain securities are on loan at December 31, 2021. The
total market value of securities on loan at December 31, 2021 was $63,311 ($ Thousands).(B) Level 3 security in accordance with fair value hierarchy.(C) No interest rate available.(D) This security was purchased with cash collateral held from securities on loan. The total market
value of such securities as of December 31, 2021 was $67,148 ($ Thousands).
ADR — American Depositary ReceiptCl — ClassEAFE — Europe, Australasia and Far EastESG — Environmental, Social and GovernanceETF — Exchange-Traded FundFTSE— Financial Times Stock ExchangeL.P. — Limited PartnershipLtd. — LimitedMSCI — Morgan Stanley Capital InternationalPLC — Public Limited CompanySer — SeriesSPI — Share Price IndexTOPIX- Tokyo Price Index
The following is a list of the level of inputs used as of December 31, 2021, in valuing the Fund’s investments and other financial instruments carried at value ($ Thousands):
Investments in SecuritiesLevel 1
($)Level 2
($)Level 3
($)Total
($)Common Stock 4,546,925 833 –^ 4,547,758Preferred Stock 24,295 – – 24,295Exchange Traded Fund 5,211 – – 5,211Affiliated Partnership – 67,148 – 67,148Cash Equivalent 90,105 – – 90,105
Total Investments in Securities 4,666,536 67,981 – 4,734,517
Other Financial InstrumentsLevel 1
($)Level 2
($)Level 3
($)Total
($)Futures Contracts*
Unrealized Appreciation 1,846 – – 1,846
Total Other Financial Instruments 1,846 – – 1,846
^One security with a market value of $0.
*Futures contracts are valued at the unrealized appreciation on the instrument.
For the period ended December 31, 2021, there were transfers in or out of Level 3.
For information on the Fund’s policy regarding valuation of investments and other significant accounting policies, please refer to the Fund’s most recent semi-annual and annual financial statements.
The following is a summary of the transactions with affiliates for the period ended December 31, 2021 ($ Thousands):
Security Description Value 9/30/2021 Purchases at Cost Proceeds from
Sales Realized Loss
Change in Unrealized
Appreciation/(Depreciation)
Value 12/31/2021 Shares Income Capital Gains
SEI Liquidity Fund, L.P. $ 161,647 $ 198,758 $ (293,257) $ — $ — $ 67,148 67,123,424 $ 671 $ — SEI Daily Income Trust, Government Fund, Cl F 48,039 126,301 (84,235) — — 90,105 90,105,249 1 — Totals $ 209,686 $ 325,059 $ (377,492) $ — $ — $ 157,253 $ 672 $ —
Amounts designated as “—“ are $0 or have been rounded to $0.

SEI Institutional International Trust / Quarterly Report / December 31, 20218
SCHEDULE OF INVESSCHEDULE OF INVESTMENTTMENTS (Unaudited)S (Unaudited)December 31, 2021December 31, 2021
Emerging MarkEmerging Markets Equity Fundets Equity Fund
Description SharesMarket Value
($ Thousands)
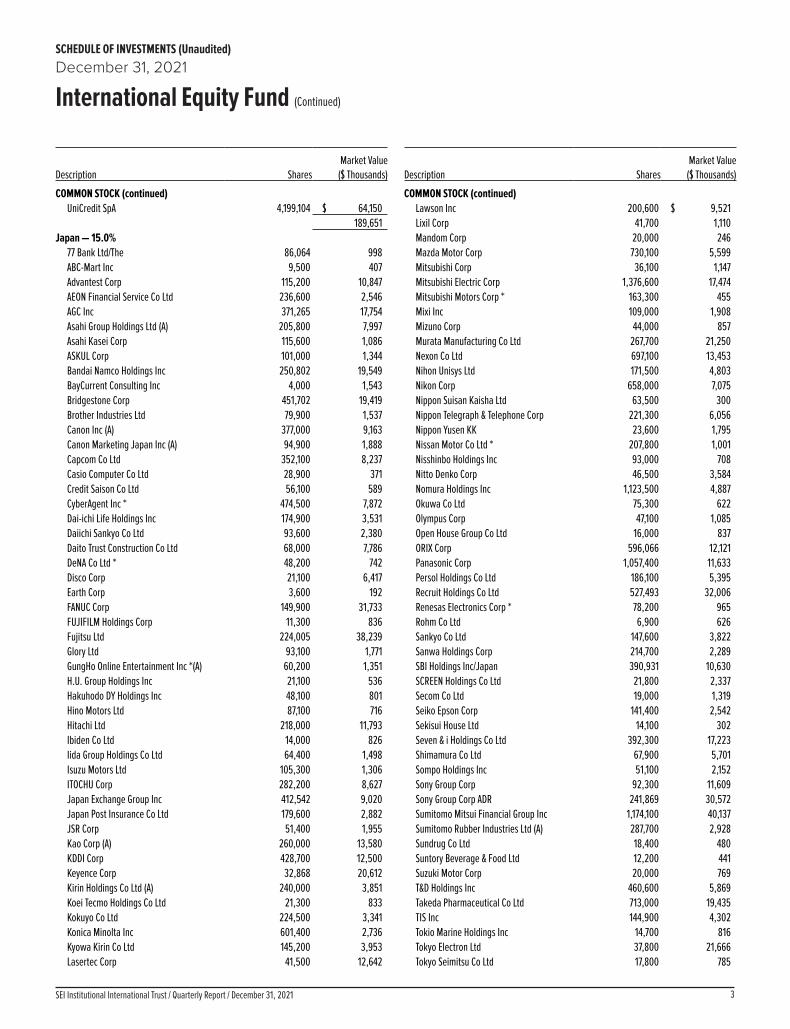
COMMON STOCK — 94.5%Argentina — 0.0%
Ternium SA ADR 23,178 $ 1,009Austria — 0.2%
Erste Group Bank AG 83,356 3,916Brazil — 3.0%
Ambev SA 413,500 1,145Ambev SA ADR 329,514 923Arezzo Industria e Comercio SA 148,800 2,051B3 SA - Brasil Bolsa Balcao 1,870,717 3,741Banco Bradesco SA ADR 907,758 3,104Banco do Brasil SA 835,700 4,329Banco Santander Brasil SA 365,400 1,967Banco Santander Brasil SA ADR 108,700 584Cia Energetica de Minas Gerais ADR (A) 412,639 1,003Cosan SA 1,462,900 5,697CPFL Energia SA 487,000 2,346CSN Mineracao SA 2,644,800 3,200Diagnosticos da America SA * 118,800 720Gerdau SA ADR 258,812 1,273Hapvida Participacoes e Investimentos SA 1,259,400 2,347Iochpe Maxion SA * 224,211 618JBS SA 307,077 2,092Multiplan Empreendimentos Imobiliarios
SA * 226,100 760Natura & Co Holding SA * 267,244 1,220Notre Dame Intermedica Participacoes SA 99,400 1,077Petroleo Brasileiro SA 21,549 237Petroleo Brasileiro SA ADR 318,522 3,497Porto Seguro SA 215,514 809SLC Agricola SA 72,121 583Telefonica Brasil SA 102,725 889TIM SA/Brazil * 807,100 1,905TIM SA/Brazil ADR * 46,719 544Vale SA 18,966 265Vale SA ADR, Cl B 177,295 2,486Vibra Energia SA 1,083,269 4,162WEG SA 205,436 1,216
56,790Canada — 1.3%
Autohome Inc ADR 59,572 1,756Endeavour Mining PLC 57,098 1,254First Quantum Minerals Ltd 489,103 11,721Ivanhoe Mines Ltd, Cl A * 493,877 4,035Pan American Silver Corp 61,801 1,543Parex Resources Inc 272,058 4,654
24,963Chile — 0.6%
Banco Santander Chile ADR 65,723 1,071CAP SA 23,156 225Sociedad Quimica y Minera de Chile SA ADR 189,467 9,555
10,851
Description SharesMarket Value
($ Thousands)
COMMON STOCK (continued)China — 20.8%
360 DigiTech Inc ADR 28,193 $ 646AECC Aviation Power Co Ltd, Cl A 113,200 1,127Agricultural Bank of China Ltd, Cl H 15,571,000 5,352Alibaba Group Holding Ltd * 1,178,188 17,968Alibaba Group Holding Ltd ADR * 110,612 13,140Anhui Conch Cement Co Ltd, Cl H 1,037,500 5,183Baidu Inc ADR * 39,279 5,844Bank of China Ltd, Cl H 13,394,106 4,828Bank of Communications Co Ltd, Cl H 5,076,000 3,066Bank of Nanjing Co Ltd, Cl A 602,834 848BeiGene Ltd ADR * 2,230 604Bilibili Inc ADR *(A) 43,222 2,006Bosideng International Holdings Ltd 1,521,597 958BYD Co Ltd, Cl H 66,870 2,287China BlueChemical Ltd 415,857 116China CITIC Bank Corp Ltd, Cl H 2,543,000 1,103China Communications Services Corp Ltd,
Cl H 1,578,075 769China Construction Bank Corp, Cl H 14,694,050 10,178China Jushi Co Ltd, Cl A 932,077 2,662China Lesso Group Holdings Ltd 2,391,000 3,435China Longyuan Power Group Corp Ltd, Cl H 1,810,238 4,226China Merchants Bank Co Ltd, Cl H 974,562 7,569China National Building Material Co Ltd,
Cl H 1,084,733 1,330China Pacific Insurance Group Co Ltd, Cl H 422,400 1,146China Petroleum & Chemical Corp ADR 35,768 1,664China Petroleum & Chemical Corp, Cl A 2,594,666 1,722China Petroleum & Chemical Corp, Cl H 5,402,000 2,515China Resources Sanjiu Medical &
Pharmaceutical Co Ltd, Cl A 203,500 1,093China Shenhua Energy Co Ltd, Cl H 673,500 1,579Chongqing Zhifei Biological Products Co
Ltd, Cl A 89,600 1,752Contemporary Amperex Technology Co
Ltd, Cl A 8,084 746Daqo New Energy Corp ADR * 13,276 535Dongfeng Motor Group Co Ltd, Cl H * 4,090,940 3,400Fangda Carbon New Material Co Ltd, Cl A 1,225,881 2,081Fujian Green Pine Co Ltd, Cl A 232,480 412Fujian Sunner Development Co Ltd, Cl A 1,347,800 5,111Ginlong Technologies Co Ltd, Cl A 58,820 2,137Great Wall Motor Co Ltd, Cl H 340,000 1,169Guangzhou Kingmed Diagnostics Group
Co Ltd, Cl A 110,900 1,938Guangzhou Tinci Materials Technology Co
Ltd, Cl A 32,000 576Haier Smart Home Co Ltd, Cl A 1,116,561 5,237Haier Smart Home Co Ltd, Cl H 1,784,756 7,543Hangzhou Robam Appliances Co Ltd, Cl A 230,266 1,302Hengli Petrochemical Co Ltd, Cl A 774,400 2,791

9SEI Institutional International Trust / Quarterly Report / December 31, 2021
SCHEDULE OF INVESTMENTS (Unaudited)December 31, 2021
Emerging Markets Equity Fund (Continued)
Description SharesMarket Value
($ Thousands)
COMMON STOCK (continued)Huayu Automotive Systems Co Ltd, Cl A 363,900 $ 1,616Huazhu Group Ltd ADR * 100,216 3,742Imeik Technology Development Co Ltd, Cl A 7,300 614Industrial & Commercial Bank of China
Ltd, Cl H 17,416,140 9,829Inspur Electronic Information Industry Co
Ltd, Cl A 139,915 787JD.com Inc ADR * 58,816 4,121Jiangsu Changshu Rural Commercial Bank
Co Ltd, Cl A 3,800,274 3,942JOYY Inc ADR 14,470 657Kingsoft Corp Ltd 176,049 773Kweichow Moutai Co Ltd, Cl A 15,600 5,017Li Auto Inc ADR * 27,626 887Longfor Group Holdings Ltd 1,061,500 4,997LONGi Green Energy Technology Co Ltd,
Cl A * 534,900 7,235Lufax Holding Ltd ADR * 498,818 2,808Luxshare Precision Industry Co Ltd, Cl A 996,300 7,691Montage Technology Co Ltd, Cl A 341,749 4,497NARI Technology Co Ltd, Cl A 492,300 3,092NetEase Inc ADR 143,270 14,582Ningbo Tuopu Group Co Ltd, Cl A 210,500 1,751NIO Inc ADR * 76,080 2,410Northeast Securities Co Ltd, Cl A 218,200 301Orient Securities Co Ltd/China, Cl A 284,800 659PetroChina Co Ltd, Cl H 3,856,000 1,716PICC Property & Casualty Co Ltd, Cl H 6,794,000 5,551Pinduoduo Inc ADR * 16,055 936Ping An Insurance Group Co of China Ltd,
Cl A 838,700 6,634Ping An Insurance Group Co of China Ltd,
Cl H 2,201,482 15,855QuakeSafe Technologies Co Ltd, Cl A 195,400 3,199Seazen Holdings Co Ltd, Cl A 115,800 529Shenzhen Mindray Bio-Medical Electronics
Co Ltd, Cl A 14,841 887Shenzhen Overseas Chinese Town Co Ltd,
Cl A 2,284,000 2,523Shenzhen SC New Energy Technology
Corp, Cl A 157,000 2,816Shenzhou International Group Holdings Ltd 30,100 579Sichuan Kelun Pharmaceutical Co Ltd, Cl A 747,398 2,220Sinopec Engineering Group Co Ltd, Cl H 844,323 417Sinotrans Ltd, Cl H 2,322,309 745Tencent Holdings Ltd 1,089,190 63,818Tingyi Cayman Islands Holding Corp 450,754 926Trip.com Group Ltd ADR * 73,451 1,808Tsingtao Brewery Co Ltd, Cl H 379,000 3,549Uni-President China Holdings Ltd 884,000 857Unisplendour Corp Ltd, Cl A 154,139 553Vipshop Holdings Ltd ADR * 330,957 2,780
Description SharesMarket Value
($ Thousands)
COMMON STOCK (continued)Want Want China Holdings Ltd 1,170,000 $ 1,074Weichai Power Co Ltd, Cl H 3,336,000 6,530Wingtech Technology Co Ltd, Cl A 507,600 10,298Wuhu Sanqi Interactive Entertainment
Network Technology Group Co Ltd, Cl A 1,058,800 4,488Wuxi Lead Intelligent Equipment Co Ltd,
Cl A 153,380 1,790Xianhe Co Ltd, Cl A 486,779 3,117XPeng Inc ADR, Cl A *(A) 49,232 2,478Xtep International Holdings Ltd 405,500 676Yantai Jereh Oilfield Services Group Co
Ltd, Cl A 232,697 1,460Yifeng Pharmacy Chain Co Ltd, Cl A 452,600 3,913Yuan Longping High-tech Agriculture Co
Ltd, Cl A * 1,165,700 4,254Yum China Holdings Inc 22,528 1,123Zhejiang Expressway Co Ltd, Cl H 1,800,000 1,605Zhejiang HangKe Technology Inc Co, Cl A 146,056 2,465Zhejiang Juhua Co Ltd, Cl A 1,286,713 2,606Zhejiang Weixing New Building Materials
Co Ltd, Cl A 87,617 334Zhongsheng Group Holdings Ltd 797,500 6,219ZTE Corp, Cl H 298,000 816
397,846Colombia — 0.1%
Grupo de Inversiones Suramericana SA 188,689 1,391Czech Republic — 0.1%
CEZ AS 64,644 2,451Moneta Money Bank AS 117,111 502
2,953Germany — 0.2%
Delivery Hero SE * 34,521 3,847Greece — 0.4%
Alpha Services and Holdings SA * 3,264,673 3,999Eurobank Ergasias Services and Holdings
SA * 3,104,746 3,147Hellenic Telecommunications Organization
SA 36,071 667OPAP SA 48,110 682
8,495Hong Kong — 8.9%
A-Living Smart City Services Co Ltd, Cl H 948,250 1,618ASM Pacific Technology Ltd 232,000 2,507Beijing Enterprises Holdings Ltd 1,046,500 3,611Beijing Enterprises Water Group Ltd 2,470,000 960Bilibili Inc, Cl Z * 43,200 1,987Chaoda Modern Agriculture Holdings Ltd * 2,056,181 11China Conch Venture Holdings Ltd 581,000 2,839China Feihe Ltd 1,010,000 1,355China High Precision Automation Group
Ltd *(F) 1,385,624 –China Hongqiao Group Ltd 841,000 888

SEI Institutional International Trust / Quarterly Report / December 31, 202110
SCHEDULE OF INVESTMENTS (Unaudited)December 31, 2021
Emerging Markets Equity Fund (Continued)
Description SharesMarket Value
($ Thousands)
COMMON STOCK (continued)China International Marine Containers
Group Co Ltd, Cl H 556,079 $ 1,000China Medical System Holdings Ltd 4,131,870 6,900China Meidong Auto Holdings Ltd 530,000 2,733China Mengniu Dairy Co Ltd 311,000 1,763China Merchants Port Holdings Co Ltd 2,065,607 3,762China Resources Gas Group Ltd 176,341 997China Resources Land Ltd 4,278,000 17,998China Southern Airlines Co Ltd, Cl H * 4,494,000 2,692China Yongda Automobiles Services
Holdings Ltd 512,000 686Country Garden Services Holdings Co Ltd 724,130 4,338CSPC Pharmaceutical Group Ltd 1,026,247 1,115Geely Automobile Holdings Ltd 2,270,542 6,203Greentown Management Holdings Co
Ltd (A) 1,930,113 1,322Guangzhou Automobile Group Co Ltd, Cl H 5,216,000 5,145Hong Kong Exchanges & Clearing Ltd 103,500 6,046Hopson Development Holdings Ltd 11,901 25Huazhu Group Ltd * 124,300 465Innovent Biologics Inc * 64,656 400JD.com Inc, Cl A * 365,788 12,856Kingboard Holdings Ltd 205,294 999Kingboard Laminates Holdings Ltd 1,989,500 3,384Kunlun Energy Co Ltd 7,178,020 6,730Lenovo Group Ltd 4,524,659 5,200Li Ning Co Ltd 471,988 5,167Meituan, Cl B * 712,500 20,599New China Life Insurance Co Ltd, Cl H 325,700 871Nine Dragons Paper Holdings Ltd 1,712,000 1,838People's Insurance Co Group of China Ltd/
The, Cl H 3,080,407 932Postal Savings Bank of China Co Ltd, Cl H 5,407,000 3,794Q Technology Group Co Ltd 584,767 756Shanghai Pharmaceuticals Holding Co
Ltd, Cl H 387,200 734Shenzhen International Holdings Ltd 15,751 16Sunac China Holdings Ltd 1,880,000 2,841Sunac Services Holdings Ltd 282,000 288Sunny Optical Technology Group Co Ltd 116,802 3,695Topsports International Holdings Ltd 418,216 423Vinda International Holdings Ltd (A) 612,000 1,491WH Group Ltd 4,195,250 2,631Wuxi Biologics Cayman Inc * 154,955 1,839Xiaomi Corp, Cl B * 489,405 1,186Xinyi Solar Holdings Ltd 4,550,458 7,716Yadea Group Holdings Ltd 2,186,000 4,262Yuexiu Property Co Ltd 712,025 627
170,241Hungary — 1.1%
MOL Hungarian Oil & Gas PLC 100,460 780OTP Bank Nyrt * 196,094 10,036
Description SharesMarket Value
($ Thousands)
COMMON STOCK (continued)Richter Gedeon Nyrt 360,805 $ 9,713
20,529India — 11.1%
Apollo Hospitals Enterprise Ltd 45,369 3,060Aptus Value Housing Finance India Ltd * 602,181 2,753AU Small Finance Bank Ltd * 131,378 1,832Avenue Supermarts Ltd * 10,954 688Axis Bank Ltd * 71,394 652Bajaj Finance Ltd 6,660 625Bharat Electronics Ltd 542,788 1,533Bharat Petroleum Corp Ltd 119,040 617Bharti Airtel Ltd * 356,698 3,281Cartrade Tech Ltd * 87,750 1,001Cipla Ltd/India 115,846 1,471Container Corp Of India Ltd 242,483 2,005Divi's Laboratories Ltd 9,463 596DLF Ltd 197,718 1,039EPL Ltd 820,573 2,288Escorts Ltd 44,487 1,142GAIL India Ltd 2,100,516 3,651GMM Pfaudler Ltd 24,158 1,580Godrej Properties Ltd * 75,533 1,902Grasim Industries Ltd 53,990 1,178HCL Technologies Ltd 574,785 10,200HDFC Bank Ltd 295,421 5,879Hero MotoCorp Ltd 89,997 2,981Hindalco Industries Ltd 226,263 1,448Hindustan Petroleum Corp Ltd 145,598 573Hindustan Unilever Ltd 17,862 567Housing Development Finance Corp Ltd 516,254 17,963ICICI Bank Ltd 1,028,994 10,246ICICI Bank Ltd ADR 559,759 11,078ICICI Lombard General Insurance Co Ltd 33,527 632Indian Bank 124,329 234Indian Hotels Co Ltd 409,927 997Indian Oil Corp Ltd 930,878 1,396IndusInd Bank Ltd 329,135 3,932Infosys Ltd 284,548 7,226Infosys Ltd ADR 535,478 13,553InterGlobe Aviation Ltd * 128,770 3,495IRB Infrastructure Developers Ltd * 701,023 2,145ITC Ltd 198,131 581Jindal Steel & Power Ltd * 78,563 399JM Financial Ltd 367,047 367Jubilant Foodworks Ltd 10,860 525Kotak Mahindra Bank Ltd 27,976 676Larsen & Toubro Ltd 84,662 2,159Mahindra & Mahindra Ltd 52,925 596Manappuram Finance Ltd 396,940 879Marico Ltd 92,161 636Maruti Suzuki India Ltd 11,799 1,179Nestle India Ltd 4,368 1,158

11SEI Institutional International Trust / Quarterly Report / December 31, 2021
SCHEDULE OF INVESTMENTS (Unaudited)December 31, 2021
Emerging Markets Equity Fund (Continued)
Description SharesMarket Value
($ Thousands)
COMMON STOCK (continued)Nippon Life India Asset Management Ltd 73,166 $ 346NTPC Ltd 619,930 1,037Oil & Natural Gas Corp Ltd 301,255 577Page Industries Ltd 1,174 638Persistent Systems Ltd 17,807 1,175Petronet LNG Ltd 2,144,290 6,242Power Grid Corp of India Ltd 593,745 1,633REC Ltd 461,906 831Reliance Industries Ltd 710,677 21,197SBI Cards & Payment Services Ltd * 280,483 3,502SBI Life Insurance Co Ltd 89,865 1,446Sona Blw Precision Forgings Ltd * 255,517 2,556Spandana Sphoorty Financial Ltd * 21,508 133State Bank of India 1,132,020 7,012Sun Pharmaceutical Industries Ltd 91,442 1,040Tata Consultancy Services Ltd 184,588 9,283Tech Mahindra Ltd 48,422 1,166Torrent Power Ltd 309,550 2,305UltraTech Cement Ltd 42,122 4,301United Breweries Ltd 110,264 2,353UPL Ltd 391,756 3,937Vedanta Ltd 225,314 1,034Wipro Ltd 127,637 1,228WNS Holdings Ltd ADR * 17,029 1,502
213,068Indonesia — 1.7%
Adaro Energy Tbk PT 6,137,327 971Astra International Tbk PT 12,642,700 5,064Bank Central Asia Tbk PT 6,727,140 3,456Bank Mandiri Persero Tbk PT 2,384,113 1,179Bank Negara Indonesia Persero Tbk PT 2,254,800 1,068Bank Rakyat Indonesia Persero Tbk PT 32,148,015 9,287Bukalapak.com PT Tbk * 29,961,700 905Indofood Sukses Makmur Tbk PT 4,282,700 1,903Kalbe Farma Tbk PT 8,894,800 1,009Merdeka Copper Gold Tbk PT * 8,199,600 2,246Sarana Menara Nusantara Tbk PT 4,806,658 379Telkom Indonesia Persero Tbk PT 21,428,600 6,082
33,549Malaysia — 0.4%
CIMB Group Holdings Bhd 1,107,174 1,448Frontken Corp Bhd 1,198,490 1,151Hong Leong Bank Bhd 208,227 931IHH Healthcare Bhd 631,800 1,113Inari Amertron Bhd 951,700 914Petronas Chemicals Group Bhd 580,958 1,244Sime Darby Bhd 1,053,204 586Telekom Malaysia Bhd 451,805 597
7,984Mexico — 1.8%
Alfa SAB de CV, Cl A 3,442,251 2,528America Movil SAB de CV ADR, Cl L 94,646 1,998
Description SharesMarket Value
($ Thousands)
COMMON STOCK (continued)Cemex SAB de CV ADR * 566,437 $ 3,840Coca-Cola Femsa SAB de CV 302,963 1,666Fomento Economico Mexicano SAB de CV 255,659 1,992Fomento Economico Mexicano SAB de
CV ADR 19,007 1,477Grupo Aeroportuario del Pacifico SAB de
CV ADR * 2,999 412Grupo Bimbo SAB de CV, Ser A 277,646 856Grupo Financiero Banorte SAB de CV, Cl O 1,837,725 11,958Grupo Mexico SAB de CV, Ser B 751,959 3,280Megacable Holdings SAB de CV 84,738 290Promotora y Operadora de Infraestructura
SAB de CV 93,200 728Wal-Mart de Mexico SAB de CV 859,393 3,201
34,226Netherlands — 0.1%
InPost SA * 123,913 1,493Norway — 0.1%
Yara International ASA 36,505 1,839Peru — 0.1%
Credicorp Ltd 14,124 1,724Philippines — 0.2%
BDO Unibank Inc 1,228,592 2,908International Container Terminal Services
Inc 73,628 289Monde Nissin Corp * 4,354,800 1,383
4,580Poland — 1.0%
Allegro.eu SA * 179,782 1,733Bank Polska Kasa Opieki SA 21,149 639Cyfrowy Polsat SA 106,626 920Dino Polska SA * 92,122 8,398LPP SA 184 785Polski Koncern Naftowy ORLEN SA 101,454 1,871Polskie Gornictwo Naftowe i Gazownictwo
SA 557,169 871Powszechny Zaklad Ubezpieczen SA 401,534 3,515
18,732Portugal — 0.1%
Jeronimo Martins SGPS SA 88,276 2,018Qatar — 0.1%
Industries Qatar QSC 136,658 581Qatar National Bank QPSC 128,814 714
1,295Russia — 4.1%
Alrosa PJSC 530,920 869Detsky Mir PJSC 1,287,672 2,142Gazprom PJSC 720,642 3,298Gazprom PJSC ADR 514,142 4,725LUKOIL PJSC ADR 244,297 21,929Magnit GDR * 171,110 2,483Magnit PJSC GDR 13,117 197

SEI Institutional International Trust / Quarterly Report / December 31, 202112
SCHEDULE OF INVESTMENTS (Unaudited)December 31, 2021
Emerging Markets Equity Fund (Continued)
Description SharesMarket Value
($ Thousands)
COMMON STOCK (continued)MMC Norilsk Nickel PJSC ADR 82,982 $ 2,545Mobile TeleSystems PJSC ADR 673,294 5,353Novatek PJSC 42,065 965Polyus PJSC 9,893 1,725Rosneft Oil Co PJSC 468,598 3,748Sberbank of Russia PJSC 841,978 3,296Sberbank of Russia PJSC ADR 1,093,116 17,236Surgutneftegas PJSC ADR (A) 579,616 3,060Yandex NV, Cl A * 74,035 4,479
78,050Saudi Arabia — 1.6%
Al Hammadi Co for Development and Investment 78,349 841
Al Rajhi Bank 125,657 4,745Alinma Bank 190,843 1,217Riyad Bank 453,328 3,269SABIC Agri-Nutrients Co 33,183 1,562Sahara International Petrochemical Co 137,842 1,545Saudi Arabian Mining Co * 42,175 882Saudi Basic Industries Corp 26,927 832Saudi British Bank/The 76,206 669Saudi Electricity Co 93,738 598Saudi Industrial Investment Group 73,635 612Saudi National Bank/The 453,241 7,774Saudi Tadawul Group Holding Co * 34,749 1,164Saudi Telecom Co 143,536 4,293United Electronics Co 22,631 817United International Transportation Co 44,744 556
31,376Singapore — 0.1%
TDCX Inc ADR * 65,563 1,256Yangzijiang Shipbuilding Holdings Ltd 741,483 737
1,993South Africa — 3.2%
Absa Group Ltd 204,064 1,950African Rainbow Minerals Ltd 42,322 613Anglo American Platinum Ltd 8,014 912Aspen Pharmacare Holdings Ltd 133,662 1,880Bid Corp Ltd 179,498 3,671Capitec Bank Holdings Ltd 24,630 3,148Cie Financiere Richemont SA 101,222 1,531FirstRand Ltd 306,268 1,167Gold Fields Ltd 92,117 1,005Gold Fields Ltd ADR 745,728 8,196Impala Platinum Holdings Ltd 82,486 1,163Kumba Iron Ore Ltd 31,056 895Mr Price Group Ltd 213,456 2,668MTN Group Ltd * 225,329 2,410Naspers Ltd, Cl N 104,450 16,178Nedbank Group Ltd 198,132 2,173Old Mutual Ltd 3,290,993 2,701Sasol Ltd * 100,810 1,636
Description SharesMarket Value
($ Thousands)
COMMON STOCK (continued)Shoprite Holdings Ltd 347,388 $ 4,547Sibanye Stillwater Ltd 160,017 492Standard Bank Group Ltd 76,086 668Vodacom Group Ltd 228,029 1,923
61,527South Korea — 12.5%
BGF retail Co Ltd 2,824 345BNK Financial Group Inc 86,324 609Celltrion Inc 2,827 472Cheil Worldwide Inc 138,007 2,627CJ CheilJedang Corp 23,076 7,520CJ ENM Co Ltd 41,053 4,786Coway Co Ltd 72,615 4,506DB HiTek Co Ltd 25,545 1,558DB Insurance Co Ltd 18,338 831DGB Financial Group Inc 44,254 349Doosan Fuel Cell Co Ltd *(A) 46,749 1,885E-MART Inc 6,871 873GS Engineering & Construction Corp 23,818 789GS Holdings Corp 71,136 2,325Hana Financial Group Inc 348,413 12,296Hankook Tire & Technology Co Ltd 89,658 2,984Hyundai Marine & Fire Insurance Co Ltd 36,648 706Hyundai Mobis Co Ltd 24,874 5,285Hyundai Motor Co 3,637 636Kakao Corp 30,645 2,888KakaoBank Corp *(A) 34,771 1,722KB Financial Group Inc 44,112 2,033KH Vatec Co Ltd * 107,386 2,408Kia Corp 115,956 7,968Korea Gas Corp * 24,162 794Korea Petrochemical Ind Co Ltd 12,072 1,842Kumho Petrochemical Co Ltd (A) 19,411 2,680LG Chem Ltd 7,882 4,081LG Electronics Inc 56,291 6,534LG Innotek Co Ltd 6,777 2,077LG Uplus Corp 80,472 919LX Semicon Co Ltd (A) 5,893 826Mando Corp *(A) 36,129 1,909NAVER Corp 17,777 5,659NCSoft Corp 13,441 7,274NICE Information Service Co Ltd 38,248 578Orion Corp/Republic of Korea 28,645 2,480POSCO ADR 23,007 1,341Samsung Biologics Co Ltd * 5,586 4,252Samsung Electro-Mechanics Co Ltd 9,343 1,551Samsung Electronics Co Ltd 1,180,655 77,611Samsung Engineering Co Ltd * 32,392 623Samsung SDI Co Ltd 5,334 2,927Samsung SDS Co Ltd 3,540 466Shinsegae Inc 4,133 880SK Hynix Inc 185,850 20,423

13SEI Institutional International Trust / Quarterly Report / December 31, 2021
SCHEDULE OF INVESTMENTS (Unaudited)December 31, 2021
Emerging Markets Equity Fund (Continued)
Description SharesMarket Value
($ Thousands)
COMMON STOCK (continued)SK Square Co Ltd * 105,997 $ 5,880SK Telecom Co Ltd 213,402 10,352SK Telecom Co Ltd ADR 13,129 350S-Oil Corp 17,443 1,257Solus Advanced Materials Co Ltd 27,758 2,077Soulbrain Co Ltd/New (A) 8,815 2,056Woori Financial Group Inc 90,586 961
239,061Switzerland — 0.1%
Wizz Air Holdings Plc * 22,025 1,249Taiwan — 14.7%
Accton Technology Corp 232,200 2,181Advanced Energy Solution Holding Co Ltd 21,000 1,393Asia Vital Components Co Ltd 305,000 972ASPEED Technology Inc 7,584 978Cathay Financial Holding Co Ltd 446,503 1,011Chailease Holding Co Ltd 709,445 6,742China Steel Corp 373,000 478ChipMOS Technologies Inc 293,000 515Chunghwa Telecom Co Ltd 844,000 3,553CTBC Financial Holding Co Ltd 12,580,000 11,778Delta Electronics Inc 707,000 7,056E.Sun Financial Holding Co Ltd 3,194,395 3,235Elite Material Co Ltd 172,000 1,732Evergreen Marine Corp Taiwan Ltd 154,000 797Formosa Plastics Corp 330,000 1,240Fubon Financial Holding Co Ltd 3,242,531 8,977Global Unichip Corp 49,000 1,039Hon Hai Precision Industry Co Ltd 342,149 1,285International Games System Co Ltd 16,000 459Keystone Microtech Corp 155,000 1,798LandMark Optoelectronics Corp 92,000 654Largan Precision Co Ltd 21,000 1,873Lite-On Technology Corp 387,341 893MediaTek Inc 497,628 21,362Merida Industry Co Ltd 239,000 2,826Micro-Star International Co Ltd 1,424,000 8,288momo.com Inc 12,000 706Nan Ya Plastics Corp 640,000 1,974Nan Ya Printed Circuit Board Corp 65,000 1,348Nien Made Enterprise Co Ltd 127,000 1,890Novatek Microelectronics Corp 82,000 1,593Parade Technologies Ltd 13,000 991Pou Chen 1,024,000 1,227Powertech Technology Inc 378,250 1,335President Chain Store Corp 92,000 908Realtek Semiconductor Corp 79,003 1,651RichWave Technology Corp 325,400 3,211Silergy Corp 22,790 4,155SinoPac Financial Holdings Co Ltd 2,159,729 1,259Taishin Financial Holding Co Ltd 1,676,624 1,148Taiwan Cement Corp 797,000 1,381
Description SharesMarket Value
($ Thousands)
COMMON STOCK (continued)Taiwan Paiho Ltd 719,000 $ 2,123Taiwan Semiconductor Manufacturing
Co Ltd 5,135,278 114,150Taiwan Semiconductor Manufacturing Co
Ltd ADR 105,778 12,726Tong Hsing Electronic Industries Ltd 387,313 4,164Unimicron Technology Corp 473,000 3,963Uni-President Enterprises Corp 2,712,000 6,712United Microelectronics Corp 2,445,272 5,753Vanguard International Semiconductor
Corp 593,000 3,376Winbond Electronics Corp 959,000 1,186Wiwynn Corp 164,000 6,599Yuanta Financial Holding Co Ltd 2,690,626 2,459
281,103Thailand — 1.8%
Advanced Info Service PCL 162,100 1,115Advanced Info Service PCL NVDR 210,000 1,445Bangkok Dusit Medical Services PCL NVDR 2,049,516 1,410Central Pattana PCL 1,380,700 2,333Home Product Center PCL 13,883,154 6,023Indorama Ventures PCL NVDR 951,700 1,233Kasikornbank PCL 505,500 2,145Land & Houses PCL 5,136,900 1,353Mega Lifesciences PCL NVDR 395,400 598Ngern Tid Lor PCL * 2,253,400 2,463PTT Exploration & Production PCL NVDR 260,700 920PTT PCL NVDR 6,625,000 7,526SCG Packaging PCL 561,600 1,162Siam Cement PCL/The 101,400 1,171Siam Cement PCL/The NVDR 54,000 624Thai Beverage PCL 2,374,650 1,163Thai Union Group PCL, Cl F 2,870,600 1,678
34,362Turkey — 0.5%
Akbank TAS 3,587,518 1,945BIM Birlesik Magazalar AS 255,447 1,179Haci Omer Sabanci Holding AS 629,042 627Turk Hava Yollari AO * 573,876 865Turkcell Iletisim Hizmetleri AS 555,920 773Turkiye Garanti Bankasi AS 3,267,388 2,773Turkiye Sise ve Cam Fabrikalari AS 1,062,654 1,070
9,232United Arab Emirates — 0.8%
Abu Dhabi Commercial Bank PJSC 644,794 1,498Aldar Properties PJSC 1,132,702 1,229Emaar Properties PJSC 5,820,642 7,741Emirates NBD Bank PJSC 386,520 1,414Emirates Telecommunications Group Co
PJSC 98,516 850Fertiglobe plc * 1,355,559 1,302

SEI Institutional International Trust / Quarterly Report / December 31, 202114
SCHEDULE OF INVESTMENTS (Unaudited)December 31, 2021
Emerging Markets Equity Fund (Continued)
Description SharesMarket Value
($ Thousands)
COMMON STOCK (continued)First Abu Dhabi Bank PJSC 312,486 $ 1,602
15,636United Kingdom — 1.3%
Anglo American PLC 165,658 6,766Endeavour Mining PLC 35,916 812Fix Price Group Ltd GDR 494,194 3,731Kaspi.KZ JSC GDR 33,578 3,989NAC Kazatomprom JSC GDR 30,730 1,129Network International Holdings PLC * 594,224 2,352Polymetal International PLC 149,028 2,647Polyus PJSC GDR 17,079 1,489Tullow Oil PLC *(A) 2,739,827 1,724
24,639United States — 0.1%
Pagseguro Digital Ltd, Cl A * 69,904 1,833XP Inc, Cl A * 29,939 860
2,693Vietnam — 0.3%
Hoa Phat Group JSC 987,121 2,010Vincom Retail JSC * 2,939,745 3,882
5,892
Total Common Stock (Cost $1,460,020) ($ Thousands) 1,810,152
PREFERRED STOCK — 1.6%Brazil — 0.5%
Banco Bradesco SA (B) 1,588,070 5,477Bradespar SA (B) 57,063 256Centrais Eletricas Brasileiras SA (B) 95,384 565Cia Energetica de Minas Gerais (B) 811,300 1,910Itau Unibanco Holding SA *(B) 275,396 1,036Itausa SA(B) 332,878 534
9,778Chile — 0.1%
Sociedad Quimica y Minera de Chile SA, Cl B(B) 53,860 2,749
South Korea — 1.0%Hyundai Motor Co (B) 58,398 4,889LG Chem Ltd (B) 9,723 2,345LG Electronics *(B) 27,143 1,493Samsung Electronics Co Ltd(B) 170,678 10,229
18,956
Total Preferred Stock (Cost $31,271) ($ Thousands) 31,483
DescriptionFace Amount (Thousands)
Market Value ($ Thousands)
DEBENTURE BOND — 0.0%Brazil — 0.0%
Vale, Ser 1997 0.000% (C)(D) BRL 8 $ –
Total Debenture Bond(Cost $—) ($ Thousands) –
Number of Rights
RIGHTS — 0.0%South Korea — 0.0%
Hyundai Engineering & Construction Co Ltd *‡‡ 256 –
Total Rights(Cost $—) ($ Thousands) –
Shares
AFFILIATED PARTNERSHIP — 0.6%SEI Liquidity Fund, L.P.
0.020% **†(E) 12,573,736 12,578
Total Affiliated Partnership(Cost $12,575) ($ Thousands) 12,578
CASH EQUIVALENT — 2.4%SEI Daily Income Trust, Government Fund,
Cl F0.010%**† 45,163,892 45,164
Total Cash Equivalent(Cost $45,164) ($ Thousands) 45,164
Total Investments in Securities — 99.1%(Cost $1,549,030) ($ Thousands) $ 1,899,377
15SEI Institutional International Trust / Quarterly Report / December 31, 2021
SCHEDULE OF INVESTMENTS (Unaudited)December 31, 2021
Emerging Markets Equity Fund (Continued)
SCHEDULE OF INVESTMENTS (Unaudited)December 31, 2021
Emerging Markets Equity Fund (Concluded)
A list of the open futures contracts held by the Fund at December 31, 2021, is as follows:
Type of ContractNumber of Contracts
Expiration Date
Notional Amount (Thousands) Value (Thousands)
Unrealized Appreciation (Thousands)
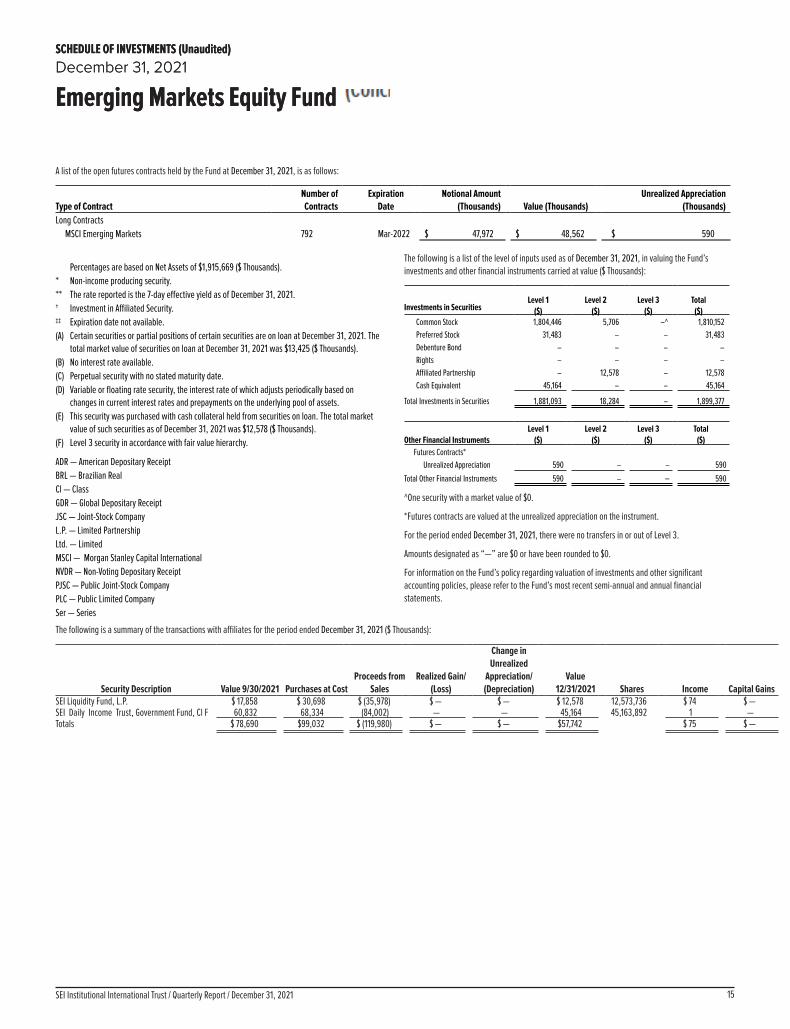
Long ContractsMSCI Emerging Markets 792 Mar-2022 $ 47,972 $ 48,562 $ 590
Percentages are based on Net Assets of $1,915,669 ($ Thousands).* Non-income producing security.** The rate reported is the 7-day effective yield as of December 31, 2021.† Investment in Affiliated Security.‡‡ Expiration date not available.(A) Certain securities or partial positions of certain securities are on loan at December 31, 2021. The
total market value of securities on loan at December 31, 2021 was $13,425 ($ Thousands).(B) No interest rate available.(C) Perpetual security with no stated maturity date.(D) Variable or floating rate security, the interest rate of which adjusts periodically based on
changes in current interest rates and prepayments on the underlying pool of assets.(E) This security was purchased with cash collateral held from securities on loan. The total market
value of such securities as of December 31, 2021 was $12,578 ($ Thousands).(F) Level 3 security in accordance with fair value hierarchy.
ADR — American Depositary ReceiptBRL — Brazilian RealCl — ClassGDR — Global Depositary ReceiptJSC — Joint-Stock CompanyL.P. — Limited PartnershipLtd. — LimitedMSCI — Morgan Stanley Capital InternationalNVDR — Non-Voting Depositary ReceiptPJSC — Public Joint-Stock CompanyPLC — Public Limited CompanySer — Series
The following is a list of the level of inputs used as of December 31, 2021, in valuing the Fund’s investments and other financial instruments carried at value ($ Thousands):
Investments in SecuritiesLevel 1
($)Level 2
($)Level 3
($)Total
($)Common Stock 1,804,446 5,706 –^ 1,810,152Preferred Stock 31,483 – – 31,483Debenture Bond – – – –Rights – – – –Affiliated Partnership – 12,578 – 12,578Cash Equivalent 45,164 – – 45,164
Total Investments in Securities 1,881,093 18,284 – 1,899,377
Other Financial InstrumentsLevel 1
($)Level 2
($)Level 3
($)Total
($)Futures Contracts*
Unrealized Appreciation 590 – – 590
Total Other Financial Instruments 590 – – 590
^One security with a market value of $0.
*Futures contracts are valued at the unrealized appreciation on the instrument.
For the period ended December 31, 2021, there were no transfers in or out of Level 3.
Amounts designated as “—” are $0 or have been rounded to $0.
For information on the Fund’s policy regarding valuation of investments and other significant accounting policies, please refer to the Fund’s most recent semi-annual and annual financial statements.
The following is a summary of the transactions with affiliates for the period ended December 31, 2021 ($ Thousands):
Security Description Value 9/30/2021 Purchases at Cost Proceeds from
Sales Realized Gain/
(Loss)
Change in Unrealized
Appreciation/(Depreciation)
Value 12/31/2021 Shares Income Capital Gains
SEI Liquidity Fund, L.P. $ 17,858 $ 30,698 $ (35,978) $ — $ — $ 12,578 12,573,736 $ 74 $ — SEI Daily Income Trust, Government Fund, Cl F 60,832 68,334 (84,002) — — 45,164 45,163,892 1 — Totals $ 78,690 $99,032 $ (119,980) $ — $ — $57,742 $ 75 $ —
mschweitzer
Stamp

SEI Institutional International Trust / Quarterly Report / December 31, 202116
SCHEDULE OF INVESSCHEDULE OF INVESTMENTTMENTS (Unaudited)S (Unaudited)December 31, 2021December 31, 2021
International FixInternational Fixed Income Funded Income Fund
DescriptionFace Amount (Thousands)
Market Value ($ Thousands)
GLOBAL BONDS — 92.9%Australia — 2.6%
Australia & New Zealand Banking Group MTN
5.000%, 08/16/2023 AUD 750 $ 581Australia Government Bond
4.750%, 04/21/2027 918 7824.500%, 04/21/2033 801 7493.750%, 04/21/2037 1,463 1,3083.250%, 04/21/2025 843 6563.000%, 03/21/2047 2,718 2,2062.750%, 06/21/2035 1,243 9992.750%, 05/21/2041 900 7032.500%, 05/21/2030 1,356 1,0532.250%, 05/21/2028 33 251.750%, 06/21/2051 609 3840.500%, 09/21/2026 682 4770.250%, 11/21/2025 1,211 848
Commonwealth Bank of Australia MTN 3.000%, 05/03/2022 EUR 330 3800.375%, 04/11/2024 455 525
Glencore Capital Finance DAC MTN 0.750%, 03/01/2029 450 498
Glencore Finance Europe MTN 1.500%, 10/15/2026 120 142
National Australia Bank 5.000%, 03/11/2024 AUD 750 5892.990%, 05/21/2031 (A) $ 520 521
National Australia Bank MTN 2.250%, 06/06/2025 EUR 206 253
Westpac Banking MTN 1.250%, 01/14/2033 310 383
Westpac Banking Corp MTN 0.500%, 05/17/2024 505 584
14,646
Austria — 1.5%JAB Holdings BV
1.000%, 12/20/2027 400 461Raiffeisen Bank International
2.875%, 06/18/2032 (D) 400 489Republic of Austria Government Bond (A)
4.150%, 03/15/2037 463 8292.400%, 05/23/2034 110 1592.100%, 09/20/2117 50 880.850%, 06/30/2120 214 2110.750%, 10/20/2026 1,922 2,3020.750%, 03/20/2051 454 5310.250%, 10/20/2036 706 7830.023%, 02/20/2031 730 8240.000%, 04/20/2025 (B) 647 747
DescriptionFace Amount (Thousands)
Market Value ($ Thousands)
GLOBAL BONDS (continued)Republic of Austria Government Bond,
Ser 97-6 6.250%, 07/15/2027 EUR 746 $ 1,162
8,586
Belgium — 1.8%Ageas
1.875%, 11/24/2051 (D) 200 227Anheuser-Busch InBev MTN
2.250%, 05/24/2029 GBP 205 2861.150%, 01/22/2027 EUR 230 272
Kingdom of Belgium Government Bond 4.250%, 03/28/2041 (A) 470 8813.750%, 06/22/2045 381 7103.000%, 06/22/2034 (A) 525 7932.600%, 06/22/2024 (A) 301 3691.700%, 06/22/2050 (A) 321 4361.600%, 06/22/2047 (A) 351 4661.000%, 06/22/2026 (A) 370 4471.000%, 06/22/2031 (A) 490 6030.900%, 06/22/2029 (A) 832 1,0170.800%, 06/22/2025 (A) 484 5750.500%, 10/22/2024 (A) 330 3870.200%, 10/22/2023 (A) 989 1,1410.007%, 10/22/2031 (A) 266 2970.000%, 10/22/2027 (A)(B) 1,133 1,309
Kingdom of Belgium Government Bond, Ser 44
5.000%, 03/28/2035 (A) 64 117 10,333
Brazil — 0.0%OEC Finance
4.375%, 10/25/2029 $ 108 47.125%, 12/26/2046 167 7
11
Canada — 7.3%1011778 BC ULC
3.875%, 01/15/2028 (A) 143 145Bank of Nova Scotia
0.010%, 03/18/2025 EUR 645 736Bell Canada MTN
4.700%, 09/11/2023 CAD 80 66Canada Housing Trust No. 1
2.250%, 12/15/2025 (A) 1,325 1,081Canadian Government Bond
5.750%, 06/01/2033 1,205 1,3693.500%, 12/01/2045 158 1702.750%, 12/01/2048 400 3912.750%, 12/01/2048 300 2932.500%, 06/01/2024 2,288 1,8742.250%, 06/01/2029 2,968 2,5081.500%, 06/01/2026 8,528 6,836

17SEI Institutional International Trust / Quarterly Report / December 31, 2021
SCHEDULE OF INVESTMENTS (Unaudited)December 31, 2021
International Fixed Income Fund (Continued)
DescriptionFace Amount (Thousands)
Market Value ($ Thousands)
GLOBAL BONDS (continued)1.500%, 06/01/2031 CAD 268 $ 2141.000%, 09/01/2022 525 4171.000%, 06/01/2027 1,375 1,075
Canadian Pacific Railway 1.350%, 12/02/2024 $ 805 806
Canadian When Issued Government Bond 2.000%, 12/01/2051 CAD 487 415
CPPIB Capital MTN 0.250%, 04/06/2027 EUR 1,765 2,025
Ontario Teachers' Finance Trust 2.000%, 04/16/2031 (A) $ 1,914 1,9230.500%, 05/06/2025 EUR 1,066 1,234
Ontario Teachers' Finance Trust MTN 0.900%, 05/20/2041 707 797
Province of Alberta Canada 0.625%, 04/18/2025 1,301 1,514
Province of British Columbia Canada 2.950%, 12/18/2028 CAD 1,653 1,4092.750%, 06/18/2052 835 711
Province of Ontario Canada 4.700%, 06/02/2037 1,355 1,3944.650%, 06/02/2041 540 5732.800%, 06/02/2048 2,200 1,8532.400%, 06/02/2026 585 480
Province of Ontario Canada MTN 0.250%, 12/15/2026 GBP 2,337 3,011
Province of Quebec Canada 6.250%, 06/01/2032 CAD 720 7903.500%, 12/01/2048 520 4983.100%, 12/01/2051 780 708
Province of Quebec Canada MTN 3.700%, 05/20/2026 AUD 568 444
PSP Capital 1.625%, 10/26/2028 (A) $ 1,814 1,808
Rogers Communications 4.000%, 06/06/2022 CAD 165 132
Royal Bank of Canada 0.248%, 01/05/2022 EUR 1,200 950
Royal Bank of Canada MTN 0.250%, 01/29/2024 189 217
Toronto-Dominion Bank 0.000%, 02/09/2024 (B) 490 560
Yamana 2.630%, 08/15/2031 (A) $ 221 212
41,639
Cayman Islands — 0.0%Odebrecht Holdco Finance Ltd
2.041%, 09/10/2058 (B) 311 2
China — 8.6%China Development Bank
4.880%, 02/09/2028 CNY 10,600 1,837
DescriptionFace Amount (Thousands)
Market Value ($ Thousands)
GLOBAL BONDS (continued)3.900%, 08/03/2040 CNY 4,280 $ 7133.700%, 10/20/2030 9,430 1,5433.660%, 03/01/2031 7,940 1,2963.650%, 05/21/2029 18,120 2,9513.480%, 01/08/2029 23,680 3,8153.390%, 07/10/2027 16,630 2,6633.230%, 01/10/2025 11,360 1,813
China Government Bond 3.810%, 09/14/2050 56,360 9,4653.720%, 04/12/2051 1,280 2133.270%, 11/19/2030 25,960 4,2133.030%, 03/11/2026 10,320 1,6483.020%, 10/22/2025 100 163.010%, 05/13/2028 52,640 8,3722.850%, 06/04/2027 17,710 2,8052.840%, 04/08/2024 13,310 2,1072.690%, 08/12/2026 8,090 1,2752.680%, 05/21/2030 9,380 1,450
Prosus NV MTN 2.031%, 08/03/2032 EUR 245 2761.985%, 07/13/2033 (A) 320 354
Weibo 3.500%, 07/05/2024 $ 200 206
49,031
Colombia — 0.6%Colombian TES
10.000%, 07/24/2024 COP 2,607,700 6867.750%, 09/18/2030 5,331,800 1,2777.500%, 08/26/2026 1,565,300 3827.250%, 10/18/2034 1,510,700 3407.000%, 06/30/2032 1,379,900 3096.000%, 04/28/2028 2,698,800 5995.750%, 11/03/2027 279,700 62
3,655
Czech Republic — 0.2%Czech Republic Government Bond
4.700%, 09/12/2022 CZK 7,470 3432.500%, 08/25/2028 14,630 6451.200%, 03/13/2031 8,010 315
1,303
Denmark — 0.3%Danske Bank MTN
5.875%, VAR EUR Swap Annual 7 Yr + 5.471% (C) EUR 344 396
Denmark Government Bond 4.500%, 11/15/2039 DKK 2,040 5540.000%, 11/15/2031 (B) 2,049 311
Kommunekredit MTN 0.125%, 09/26/2040 EUR 275 283
SEI Institutional International Trust / Quarterly Report / December 31, 202118
SCHEDULE OF INVESTMENTS (Unaudited)December 31, 2021
International Fixed Income Fund (Continued)
DescriptionFace Amount (Thousands)
Market Value ($ Thousands)
GLOBAL BONDS (continued)Orsted
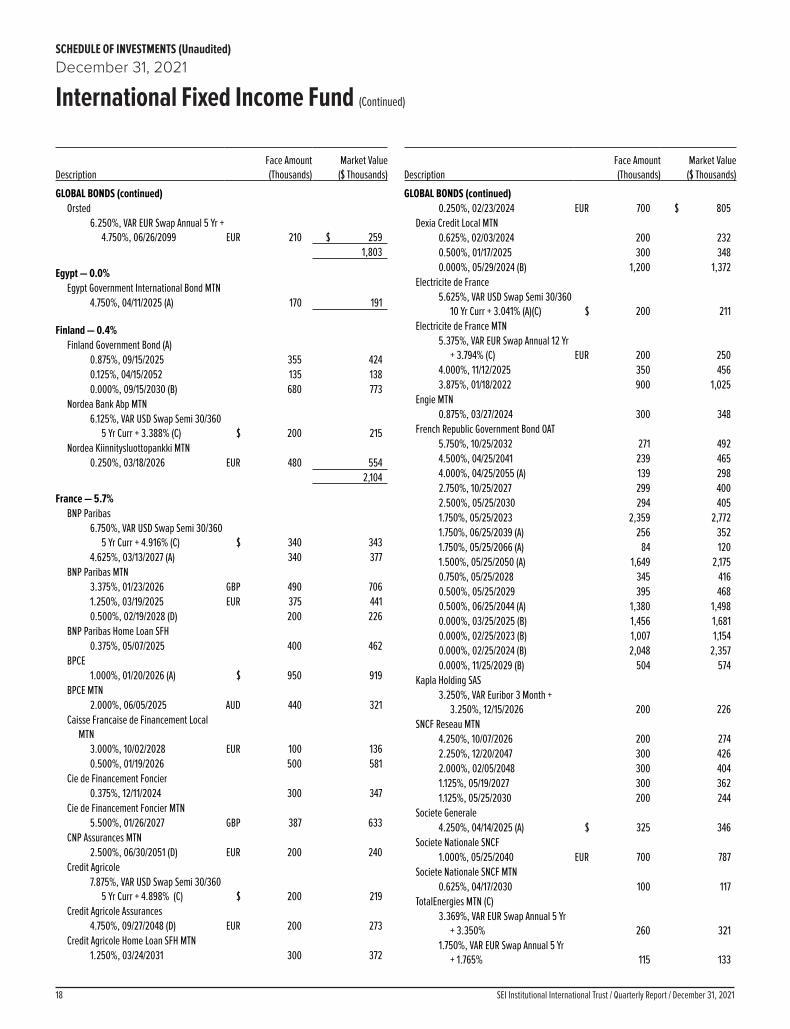
6.250%, VAR EUR Swap Annual 5 Yr + 4.750%, 06/26/2099 EUR 210 $ 259
1,803
Egypt — 0.0%Egypt Government International Bond MTN
4.750%, 04/11/2025 (A) 170 191
Finland — 0.4%Finland Government Bond (A)
0.875%, 09/15/2025 355 4240.125%, 04/15/2052 135 1380.000%, 09/15/2030 (B) 680 773
Nordea Bank Abp MTN 6.125%, VAR USD Swap Semi 30/360
5 Yr Curr + 3.388% (C) $ 200 215Nordea Kiinnitysluottopankki MTN
0.250%, 03/18/2026 EUR 480 554 2,104
France — 5.7%BNP Paribas
6.750%, VAR USD Swap Semi 30/360 5 Yr Curr + 4.916% (C) $ 340 343
4.625%, 03/13/2027 (A) 340 377BNP Paribas MTN
3.375%, 01/23/2026 GBP 490 7061.250%, 03/19/2025 EUR 375 4410.500%, 02/19/2028 (D) 200 226
BNP Paribas Home Loan SFH 0.375%, 05/07/2025 400 462
BPCE 1.000%, 01/20/2026 (A) $ 950 919
BPCE MTN 2.000%, 06/05/2025 AUD 440 321
Caisse Francaise de Financement Local MTN
3.000%, 10/02/2028 EUR 100 1360.500%, 01/19/2026 500 581
Cie de Financement Foncier 0.375%, 12/11/2024 300 347
Cie de Financement Foncier MTN 5.500%, 01/26/2027 GBP 387 633
CNP Assurances MTN 2.500%, 06/30/2051 (D) EUR 200 240
Credit Agricole 7.875%, VAR USD Swap Semi 30/360
5 Yr Curr + 4.898% (C) $ 200 219Credit Agricole Assurances
4.750%, 09/27/2048 (D) EUR 200 273Credit Agricole Home Loan SFH MTN
1.250%, 03/24/2031 300 372
DescriptionFace Amount (Thousands)
Market Value ($ Thousands)
GLOBAL BONDS (continued)0.250%, 02/23/2024 EUR 700 $ 805
Dexia Credit Local MTN 0.625%, 02/03/2024 200 2320.500%, 01/17/2025 300 3480.000%, 05/29/2024 (B) 1,200 1,372
Electricite de France 5.625%, VAR USD Swap Semi 30/360
10 Yr Curr + 3.041% (A)(C) $ 200 211Electricite de France MTN
5.375%, VAR EUR Swap Annual 12 Yr + 3.794% (C) EUR 200 250
4.000%, 11/12/2025 350 4563.875%, 01/18/2022 900 1,025
Engie MTN 0.875%, 03/27/2024 300 348
French Republic Government Bond OAT 5.750%, 10/25/2032 271 4924.500%, 04/25/2041 239 4654.000%, 04/25/2055 (A) 139 2982.750%, 10/25/2027 299 4002.500%, 05/25/2030 294 4051.750%, 05/25/2023 2,359 2,7721.750%, 06/25/2039 (A) 256 3521.750%, 05/25/2066 (A) 84 1201.500%, 05/25/2050 (A) 1,649 2,1750.750%, 05/25/2028 345 4160.500%, 05/25/2029 395 4680.500%, 06/25/2044 (A) 1,380 1,4980.000%, 03/25/2025 (B) 1,456 1,6810.000%, 02/25/2023 (B) 1,007 1,1540.000%, 02/25/2024 (B) 2,048 2,3570.000%, 11/25/2029 (B) 504 574
Kapla Holding SAS 3.250%, VAR Euribor 3 Month +
3.250%, 12/15/2026 200 226SNCF Reseau MTN
4.250%, 10/07/2026 200 2742.250%, 12/20/2047 300 4262.000%, 02/05/2048 300 4041.125%, 05/19/2027 300 3621.125%, 05/25/2030 200 244
Societe Generale 4.250%, 04/14/2025 (A) $ 325 346
Societe Nationale SNCF 1.000%, 05/25/2040 EUR 700 787
Societe Nationale SNCF MTN 0.625%, 04/17/2030 100 117
TotalEnergies MTN (C)3.369%, VAR EUR Swap Annual 5 Yr
+ 3.350% 260 3211.750%, VAR EUR Swap Annual 5 Yr
+ 1.765% 115 133

19SEI Institutional International Trust / Quarterly Report / December 31, 2021
SCHEDULE OF INVESTMENTS (Unaudited)December 31, 2021
International Fixed Income Fund (Continued)
DescriptionFace Amount (Thousands)
Market Value ($ Thousands)
GLOBAL BONDS (continued)1.625% (D) EUR 125 $ 141
TotalEnergies Capital International MTN 2.500%, 03/25/2026 400 500
UNEDIC ASSEO MTN 1.250%, 05/25/2033 700 869
Westfield America Management 2.625%, 03/30/2029 GBP 155 2112.125%, 03/30/2025 210 285
32,916
Germany — 6.3%ADLER Group
3.250%, 08/05/2025 EUR 200 197Bundesobligation
0.000%, 10/09/2026 (B) 3,665 4,260Bundesrepublik Deutschland
Bundesanleihe 4.000%, 01/04/2037 234 4323.250%, 07/04/2042 954 1,8151.500%, 05/15/2023 8,623 10,0991.250%, 08/15/2048 1,013 1,4921.000%, 08/15/2024 328 3890.500%, 02/15/2026 197 2340.170%, 08/15/2050 239 2630.000%, 08/15/2031 (B) 1,965 2,2750.000%, 05/15/2035 (B) 671 7650.000%, 05/15/2036 (B) 1,490 1,6920.000%, 08/15/2050 (B) 450 490
Cheplapharm Arzneimittel GmbH 3.500%, 02/11/2027 (A) 191 221
Daimler International Finance BV MTN 1.500%, 01/13/2022 GBP 650 8810.250%, 11/06/2023 EUR 430 492
Deutsche Bank MTN 1.000%, VAR Euribor 3 Month +
1.600%, 11/19/2025 400 463Deutsche Telekom MTN
1.750%, 12/09/2049 100 117Deutsche Telekom International Finance
BV MTN 0.625%, 04/03/2023 225 259
E.ON MTN 0.000%, 12/18/2023 (B) 550 627
HeidelbergCement Finance Luxembourg MTN
1.750%, 04/24/2028 120 1451.625%, 04/07/2026 400 479
HOCHTIEF MTN 1.750%, 07/03/2025 400 477
Kreditanstalt fuer Wiederaufbau 2.600%, 06/20/2037 JPY 228,000 2,6990.500%, 09/15/2027 EUR 510 601
DescriptionFace Amount (Thousands)
Market Value ($ Thousands)
GLOBAL BONDS (continued)0.125%, 06/07/2023 EUR 1,020 $ 1,172
Landwirtschaftliche Rentenbank MTN 0.625%, 05/18/2027 225 266
Merck Financial Services GmbH MTN 0.125%, 07/16/2025 400 457
Siemens Financieringsmaatschappij 1.200%, 03/11/2026 (A) $ 775 762
Volkswagen International Finance 3.875% (C)(D) EUR 300 3701.125%, 10/02/2023 400 464
Volkswagen Leasing GmbH MTN 1.125%, 04/04/2024 520 605
ZF Europe Finance BV 2.000%, 02/23/2026 200 228
36,188
Hungary — 0.2%Hungary Government Bond
3.000%, 06/26/2024 HUF 297,650 8921.500%, 08/23/2023 183,970 549
1,441
Indonesia — 1.0%Indonesia Treasury Bond
8.750%, 05/15/2031 IDR 7,551,000 6108.375%, 03/15/2034 30,106,000 2,3707.500%, 06/15/2035 2,199,000 1627.375%, 05/15/2048 11,283,000 8167.000%, 09/15/2030 2,959,000 2156.500%, 06/15/2025 6,598,000 4876.500%, 02/15/2031 16,859,000 1,1945.500%, 04/15/2026 1,557,000 111
5,965
Ireland — 1.0%AerCap Ireland Capital DAC
4.500%, 09/15/2023 $ 205 2153.300%, 01/30/2032 450 4591.150%, 10/29/2023 1,000 996
CRH Funding MTN 1.875%, 01/09/2024 EUR 310 365
Ireland Government Bond 1.500%, 05/15/2050 250 3271.100%, 05/15/2029 670 8231.000%, 05/15/2026 285 3430.113%, 10/18/2031 1,691 1,875
Smurfit Kappa Acquisitions ULC 2.875%, 01/15/2026 265 329
5,732
Israel — 0.1%Israel Government Bond - Fixed
5.500%, 01/31/2042 ILS 675 3452.000%, 03/31/2027 925 319

SEI Institutional International Trust / Quarterly Report / December 31, 202120
SCHEDULE OF INVESTMENTS (Unaudited)December 31, 2021
International Fixed Income Fund (Continued)
DescriptionFace Amount (Thousands)
Market Value ($ Thousands)
GLOBAL BONDS (continued)1.000%, 03/31/2030 ILS 593 $ 192
856
Italy — 5.1%Assicurazioni Generali MTN
5.500%, VAR Euribor 3 Month + 5.350%, 10/27/2047 EUR 230 317
Enel 1.875%, VAR EUR Swap Annual 5 Yr +
2.011% (C) 385 424Enel Finance International MTN
5.750%, 09/14/2040 GBP 145 2920.116%, 06/17/2027 EUR 195 216
Eni 3.375%, VAR EUR Swap Annual 5 Yr +
3.641% (C) 135 161Eni MTN
0.375%, 06/14/2028 130 146Intesa Sanpaolo MTN
2.125%, 05/26/2025 330 3970.750%, 12/04/2024 350 405
Italy Buoni Poliennali Del Tesoro 5.000%, 09/01/2040 (A) 1,586 2,7713.500%, 03/01/2030 (A) 336 4613.100%, 03/01/2040 (A) 122 1703.000%, 08/01/2029 1,609 2,1242.800%, 03/01/2067 (A) 150 1932.700%, 03/01/2047 (A) 55 732.450%, 09/01/2033 (A) 98 1262.150%, 03/01/2072 (A) 76 832.000%, 02/01/2028 542 6681.850%, 07/01/2025 (A) 2,274 2,7341.800%, 03/01/2041 (A) 247 2841.700%, 09/01/2051 (A) 311 3311.500%, 04/30/2045 (A) 847 9040.950%, 03/01/2023 3,272 3,7780.950%, 12/01/2031 (A) 2,794 3,1130.950%, 03/01/2037 (A) 1,549 1,6210.019%, 04/01/2026 4,173 4,6720.000%, 04/15/2024 (B) 1,429 1,625
Rimini Bidco 5.250%, VAR Euribor 3 Month +
5.250%, 12/14/2026 (A) 200 223Societa Cattolica Di Assicurazione SPA
4.250%, 12/14/2047 (D) 200 257UniCredit MTN
4.875%, VAR EUAMDB05 + 4.739%, 02/20/2029 220 268
1.250%, VAR Euribor 3 Month + 1.600%, 06/16/2026 460 536
29,373
DescriptionFace Amount (Thousands)
Market Value ($ Thousands)
GLOBAL BONDS (continued)Japan — 13.1%
Development Bank of Japan 2.300%, 03/19/2026 JPY 180,000 $ 1,709
Development Bank of Japan MTN 0.875%, 10/10/2025 EUR 1,145 1,342
Government of Japan 10 Year Bond 0.400%, 06/20/2025 JPY 516,200 4,5590.100%, 06/20/2026 74,300 6500.100%, 03/20/2027 71,550 627
Government of Japan 20 Year Bond 1.700%, 06/20/2033 1,313,700 13,3961.400%, 09/20/2034 503,250 5,0191.000%, 12/20/2035 50,000 4780.700%, 03/20/2037 38,450 3530.500%, 09/20/2036 537,200 4,8050.200%, 06/20/2036 185,200 1,590
Government of Japan 20 Year Bond, Ser 140
1.700%, 09/20/2032 33,600 340Government of Japan 20 Year Bond,
Ser 143 1.600%, 03/20/2033 40,300 406
Government of Japan 20 Year Bond, Ser 144 1.500%, 03/20/2033 98,300 982
Government of Japan 30 Year Bond 0.800%, 09/20/2047 709,500 6,4390.300%, 06/20/2046 74,600 607
Government of Japan 30 Year Bond, Ser 29 2.400%, 09/20/2038 133,650 1,540
Government of Japan 30 Year Bond, Ser 30 2.300%, 03/20/2039 472,800 5,407
Government of Japan 30 Year Bond, Ser 33 2.000%, 09/20/2040 301,350 3,344
Government of Japan 30 Year Bond, Ser 36 2.000%, 03/20/2042 358,500 4,016
Government of Japan 30 Year Bond, Ser 37 1.900%, 09/20/2042 166,850 1,848
Government of Japan 30 Year Bond, Ser 38 1.800%, 03/20/2043 207,550 2,268
Government of Japan 40 Year Bond 0.400%, 03/20/2056 331,950 2,613
Government of Japan 40 Year Bond, Ser 6 1.900%, 03/20/2053 38,700 449
Japan Finance Organization for Municipalities MTN
0.050%, 02/12/2027 EUR 440 499Japan Government Five Year Bond
0.100%, 09/20/2024 JPY 73,050 638Japan Government Ten Year Bond
0.100%, 09/20/2027 455,700 3,9950.100%, 03/20/2029 35,900 315

21SEI Institutional International Trust / Quarterly Report / December 31, 2021
SCHEDULE OF INVESTMENTS (Unaudited)December 31, 2021
International Fixed Income Fund (Continued)
DescriptionFace Amount (Thousands)
Market Value ($ Thousands)
GLOBAL BONDS (continued)Japan Government Thirty Year Bond
0.400%, 12/20/2049 JPY 116,200 $ 9390.300%, 06/20/2046 85,800 698
Japan Government Twenty Year Bond 1.800%, 09/20/2031 166,700 1,690
Mitsubishi UFJ Financial Group 0.339%, 07/19/2024 EUR 250 287
Nippon Life Insurance 2.750%, VAR US Treas Yield Curve
Rate T Note Const Mat 5 Yr + 2.653%, 01/21/2051 (A) $ 540 529
Nissan Motor 2.652%, 03/17/2026 EUR 165 201
NTT Finance 1.162%, 04/03/2026 (A) $ 345 338
74,916
Kuwait — 0.0%Equate Petrochemical MTN
2.625%, 04/28/2028 (A) 297 297
Luxembourg — 0.1%Prologis International Funding II
2.375%, 11/14/2030 EUR 200 255Vivion Investments Sarl
3.000%, 08/08/2024 100 111 366
Malaysia — 1.7%Malaysia Government Bond
4.392%, 04/15/2026 MYR 2,267 5724.232%, 06/30/2031 1,073 2694.181%, 07/15/2024 5,923 1,4683.955%, 09/15/2025 7,319 1,8133.885%, 08/15/2029 2,890 7083.828%, 07/05/2034 3,332 7963.795%, 09/30/2022 4,878 1,1853.757%, 05/22/2040 912 2093.733%, 06/15/2028 2,316 5663.502%, 05/31/2027 7,477 1,8193.478%, 06/14/2024 1,305 3182.632%, 04/15/2031 1,040 231
9,954
Mexico — 2.2%Mexican Bonos
8.000%, 09/05/2024 MXN 6,750 3358.000%, 11/07/2047 22,710 1,1007.750%, 11/23/2034 6,369 3137.750%, 11/13/2042 38,433 1,8227.500%, 06/03/2027 24,873 1,2195.750%, 03/05/2026 14,711 6785.750%, 03/05/2026 8,429 388
DescriptionFace Amount (Thousands)
Market Value ($ Thousands)
GLOBAL BONDS (continued)Mexican Bonos, Ser M20
10.000%, 12/05/2024 MXN 41,430 $ 2,1688.500%, 05/31/2029 10,038 5197.750%, 05/29/2031 36,583 1,807
Mexican Bonos, Ser M30 10.000%, 11/20/2036 24,980 1,4668.500%, 11/18/2038 5,364 276
Mexico Government International Bond 2.875%, 04/08/2039 EUR 280 321
12,412
Netherlands — 2.0%ABN AMRO Bank
3.324%, VAR US Treas Yield Curve Rate T Note Const Mat 5 Yr + 1.900%, 03/13/2037 (A) $ 400 400
ASR Nederland 3.375%, VAR EUR Swap Annual 5 Yr +
4.000%, 05/02/2049 EUR 255 319BNG Bank MTN
0.250%, 02/22/2023 1,260 1,445Cooperatieve Rabobank UA
4.375% (C)(D) 200 2500.250%, 10/30/2026 200 228
Cooperatieve Rabobank UA MTN 5.250%, 09/14/2027 GBP 195 3074.625%, 05/23/2029 130 2041.250%, 05/31/2032 EUR 300 373
Heineken MTN 1.000%, 05/04/2026 335 394
Nederlandse Waterschapsbank MTN 1.250%, 05/27/2036 281 3500.625%, 01/18/2027 225 265
Netherlands Government Bond (A)4.000%, 01/15/2037 236 4252.500%, 01/15/2033 806 1,1692.000%, 07/15/2024 491 5950.500%, 07/15/2026 613 7270.240%, 01/15/2038 1,437 1,5860.118%, 01/15/2052 421 4370.000%, 01/15/2027 (B) 685 7940.000%, 07/15/2031 (B) 1,014 1,157
Q-Park Holding 2.000%, 03/01/2027 (A) 122 131
11,556
New Zealand — 0.7%New Zealand Government Bond
5.500%, 04/15/2023 NZD 2,356 1,6933.000%, 04/20/2029 345 2472.750%, 04/15/2025 1,679 1,1722.750%, 04/15/2037 80 562.000%, 05/15/2032 225 149

SEI Institutional International Trust / Quarterly Report / December 31, 202122
SCHEDULE OF INVESTMENTS (Unaudited)December 31, 2021
International Fixed Income Fund (Continued)
DescriptionFace Amount (Thousands)
Market Value ($ Thousands)
GLOBAL BONDS (continued)1.750%, 05/15/2041 NZD 124 $ 721.500%, 05/15/2031 548 350
New Zealand Local Government Funding Agency Bond
4.500%, 04/15/2027 682 507 4,246
Norway — 1.6%DNB Boligkreditt MTN
0.375%, 11/20/2024 EUR 795 919Equinor MTN
6.875%, 03/11/2031 GBP 185 359Norway Government Bond (A)
3.000%, 03/14/2024 NOK 5,938 6962.000%, 05/24/2023 5,993 6882.000%, 04/26/2028 3,667 4241.750%, 03/13/2025 1,213 1391.750%, 02/17/2027 8,752 9971.750%, 09/06/2029 6,471 7361.500%, 02/19/2026 14,994 1,6931.375%, 08/19/2030 9,406 1,0391.250%, 09/17/2031 11,882 1,293
8,983
Peru — 0.0%Volcan Cia Minera SAA
4.375%, 02/11/2026 (A) $ 21 20
Poland — 0.1%Republic of Poland Government Bond
2.750%, 10/25/2029 PLN 1,493 3462.500%, 07/25/2027 1,860 428
774
Portugal — 0.6%EDP Finance BV MTN
0.375%, 09/16/2026 EUR 440 501Portugal Obrigacoes do Tesouro OT (A)
4.100%, 04/15/2037 277 4662.200%, 10/17/2022 775 9011.950%, 06/15/2029 492 6340.700%, 10/15/2027 735 871
3,373
Qatar — 0.0%Qatar Petroleum
2.250%, 07/12/2031 (A) $ 300 297
Romania — 0.2%Romania Government Bond
3.650%, 07/28/2025 RON 1,540 342Romanian Government International Bond
4.250%, 06/28/2023 2,655 608 950
DescriptionFace Amount (Thousands)
Market Value ($ Thousands)
GLOBAL BONDS (continued)Singapore — 2.6%
Singapore Government Bond 3.500%, 03/01/2027 SGD 2,671 $ 2,1823.375%, 09/01/2033 162 1383.125%, 09/01/2022 5,029 3,7943.000%, 09/01/2024 6,021 4,6982.875%, 07/01/2029 200 1612.750%, 07/01/2023 1,441 1,1012.750%, 04/01/2042 301 2482.750%, 03/01/2046 200 1652.250%, 08/01/2036 540 4162.125%, 06/01/2026 1,790 1,375
Temasek Financial I MTN 2.375%, 01/23/2023 (A) $ 495 503
14,781
Slovenia — 0.1%Slovenia Government Bond
1.250%, 03/22/2027 EUR 556 680
South Africa — 0.1%Anglo American Capital MTN
1.625%, 09/18/2025 220 2601.625%, 03/11/2026 230 271
Bidvest Group UK PLC 3.625%, 09/23/2026 (A) $ 230 229
760
South Korea — 1.2%Hyundai Capital Services MTN
3.500%, 03/30/2022 AUD 680 498Korea Housing Finance
0.010%, 06/29/2026 (A) EUR 150 170Korea Treasury Bond
2.625%, 09/10/2035 KRW 470,510 4092.000%, 06/10/2031 1,870,670 1,5371.875%, 06/10/2029 496,110 4081.500%, 12/10/2026 1,413,770 1,1581.500%, 12/10/2030 1,797,120 1,4181.250%, 03/10/2026 101,780 831.125%, 09/10/2025 1,252,200 1,023
6,704
Spain — 3.6%Banco Bilbao Vizcaya Argentaria
2.250%, 06/12/2024 EUR 200 241Banco de Sabadell
0.625%, 11/07/2025 (D) 400 456CaixaBank
1.250%, 01/11/2027 500 6021.125%, 11/12/2026 300 349
CaixaBank MTN 1.375%, 06/19/2026 300 353

23SEI Institutional International Trust / Quarterly Report / December 31, 2021
SCHEDULE OF INVESTMENTS (Unaudited)December 31, 2021
International Fixed Income Fund (Continued)
DescriptionFace Amount (Thousands)
Market Value ($ Thousands)
GLOBAL BONDS (continued)Grifols Escrow Issuer SA
3.875%, 10/15/2028 (A) EUR 100 $ 114Lorca Telecom Bondco
4.000%, 09/18/2027 130 150NH Hotel Group
4.000%, 07/02/2026 100 113Spain Government Bond
6.000%, 01/31/2029 80 1294.700%, 07/30/2041 (A) 654 1,2223.450%, 07/30/2066 (A) 272 4652.700%, 10/31/2048 (A) 604 9022.350%, 07/30/2033 (A) 658 8881.950%, 07/30/2030 (A) 124 1601.850%, 07/30/2035 (A) 862 1,1061.600%, 04/30/2025 (A) 259 3141.500%, 04/30/2027 (A) 393 4841.400%, 04/30/2028 (A) 904 1,1121.000%, 07/30/2042 (A) 886 9810.850%, 07/30/2037 (A) 313 3470.600%, 10/31/2029 (A) 174 2030.500%, 04/30/2030 (A) 418 4810.500%, 10/31/2031 (A) 1,503 1,6990.054%, 01/31/2028 3,295 3,7180.000%, 05/31/2024 (B) 2,802 3,2170.000%, 01/31/2026 (B) 770 881
20,687
Supra-National — 2.1%Asian Development Bank MTN
2.350%, 06/21/2027 JPY 410,000 4,044European Financial Stability Facility MTN
0.500%, 07/11/2025 EUR 1,420 1,661European Investment Bank
1.900%, 01/26/2026 JPY 50,000 469European Investment Bank MTN
1.250%, 05/12/2025 SEK 13,180 1,4910.875%, 12/15/2023 GBP 2,075 2,8100.250%, 10/14/2024 EUR 156 181
European Stability Mechanism MTN 1.000%, 09/23/2025 570 679
European Union MTN 0.700%, 07/06/2051 80 93
International Finance MTN 2.375%, 07/19/2023 CAD 1,000 808
12,236
Sweden — 0.9%Balder Finland MTN
1.375%, 05/24/2030 EUR 380 423Heimstaden Bostad Treasury BV MTN
1.375%, 03/03/2027 380 442Kommunivest I Sverige AB MTN
1.000%, 10/02/2024 SEK 5,830 655
DescriptionFace Amount (Thousands)
Market Value ($ Thousands)
GLOBAL BONDS (continued)Skandinaviska Enskilda Banken MTN
0.250%, 06/20/2024 EUR 460 $ 529Stadshypotek
0.500%, 07/11/2025 1,470 1,708Swedbank (C)
6.000%, VAR USD Swap Semi 30/360 5 Yr Curr + 4.106% $ 200 202
5.625%, VAR US Treas Yield Curve Rate T Note Const Mat 5 Yr + 4.134% 200 213
Swedbank Hypotek MTN 0.050%, 05/28/2025 EUR 195 223
Sweden Government Bond 0.125%, 05/12/2031 (A) SEK 5,545 603
4,998
Switzerland — 0.4%Credit Suisse Group (C)
7.500%, VAR USD Swap Semi 30/360 5 Yr Curr + 4.600% $ 286 302
7.500%, VAR USD Swap Semi 30/360 5 Yr Curr + 4.600% (A) 200 211
Government of Switzerland 1.500%, 04/30/2042 CHF 408 5831.250%, 06/11/2024 739 848
Swiss Re Finance Luxembourg 5.000%, VAR US Treas Yield Curve
Rate T Note Const Mat 5 Yr + 3.582%, 04/02/2049 (A) $ 200 224
2,168
Thailand — 0.3%Thailand Government Bond
4.875%, 06/22/2029 THB 16,455 5964.675%, 06/29/2044 17,119 6733.300%, 06/17/2038 3,522 1162.125%, 12/17/2026 7,336 2281.875%, 06/17/2049 3,746 91
1,704
United Arab Emirates — 0.0%DP World Crescent MTN
4.848%, 09/26/2028 $ 265 297
United Kingdom — 7.4%Aviva
6.125%, VAR UK Govt Bonds 5 Year Note Generic Bid Yield + 2.850%, 11/14/2036 GBP 220 348
Barclays MTN 4.000%, 06/26/2029 AUD 500 378
BAT Capital 4.906%, 04/02/2030 $ 105 118

SEI Institutional International Trust / Quarterly Report / December 31, 202124
SCHEDULE OF INVESTMENTS (Unaudited)December 31, 2021
International Fixed Income Fund (Continued)
DescriptionFace Amount (Thousands)
Market Value ($ Thousands)
GLOBAL BONDS (continued)BAT International Finance MTN
2.250%, 09/09/2052 GBP 100 $ 921.250%, 03/13/2027 EUR 333 385
BAT Netherlands Finance BV MTN 3.125%, 04/07/2028 160 202
BG Energy Capital MTN 2.250%, 11/21/2029 400 505
BP Capital Markets (C)3.625% (D) 495 6043.250% (D) 400 481
BP Capital Markets MTN 0.831%, 11/08/2027 130 151
British Telecommunications MTN 3.125%, 11/21/2031 GBP 108 152
Cadent Finance MTN 2.750%, 09/22/2046 100 1392.625%, 09/22/2038 100 138
CCEP Finance Ireland DAC 0.500%, 09/06/2029 EUR 335 376
Centrica MTN 4.375%, 03/13/2029 GBP 164 256
CK Hutchison Finance 16 II 0.875%, 10/03/2024 EUR 212 246
CK Hutchison Group Telecom Finance 1.500%, 10/17/2031 330 381
CNH Industrial Finance Europe MTN 2.875%, 05/17/2023 220 2601.750%, 09/12/2025 130 155
CPUK Finance MTN 3.690%, 08/28/2028 GBP 100 1493.588%, 08/28/2025 215 310
Delphi Automotive 1.500%, 03/10/2025 EUR 440 518
DS Smith MTN 1.375%, 07/26/2024 430 503
Gatwick Funding MTN 5.250%, 01/23/2024 GBP 250 363
Heathrow Funding MTN 2.750%, 08/09/2049 315 4171.875%, 05/23/2022 EUR 235 269
HSBC Holdings 6.000%, VAR EUR Swap Annual 5 Yr +
5.338% (C) 200 2463.000%, VAR BPSW1 + 1.650%,
07/22/2028 GBP 167 236HSBC Holdings MTN
6.000%, 03/29/2040 70 131Natwest Group
3.622%, VAR UK Govt Bonds 5 Year Note Generic Bid Yield + 3.550%, 08/14/2030 245 345
DescriptionFace Amount (Thousands)
Market Value ($ Thousands)
GLOBAL BONDS (continued)2.544%, VAR ICE LIBOR USD 3 Month
+ 2.320% (C) $ 200 $ 199Northumbrian Water Finance
6.875%, 02/06/2023 GBP 190 273Pinewood Finance
3.625%, 11/15/2027 (A) 170 229Santander UK MTN
1.250%, 09/18/2024 EUR 500 590Santander UK Group Holdings PLC MTN
3.625%, 01/14/2026 GBP 100 145Sky PLC MTN
2.250%, 11/17/2025 EUR 275 338Standard Chartered (A)
1.639%, VAR ICE LIBOR USD 3 Month + 1.510% (C) $ 500 483
1.456%, VAR US Treas Yield Curve Rate T Note Const Mat 1 Yr + 1.000%, 01/14/2027 355 344
Thames Water Utilities Finance MTN 4.625%, 06/04/2046 GBP 155 294
United Kingdom Gilt 5.000%, 03/07/2025 43 664.500%, 12/07/2042 356 7804.250%, 03/07/2036 56 1074.250%, 09/07/2039 53 1074.250%, 12/07/2040 1,418 2,9244.250%, 12/07/2046 476 1,0694.250%, 12/07/2049 245 5783.500%, 01/22/2045 1,001 1,9853.250%, 01/22/2044 457 8652.750%, 09/07/2024 868 1,2392.500%, 07/22/2065 1,101 2,3112.250%, 09/07/2023 19 261.750%, 09/07/2022 2,090 2,8591.750%, 09/07/2037 213 3131.500%, 07/22/2047 194 2821.250%, 10/22/2041 79 1081.250%, 07/31/2051 423 5871.000%, 04/22/2024 77 1050.875%, 10/22/2029 1,668 2,2630.750%, 07/22/2023 948 1,2890.625%, 06/07/2025 78 1050.625%, 07/31/2035 200 2530.625%, 10/22/2050 904 1,0760.500%, 10/22/2061 828 9470.375%, 10/22/2026 1,163 1,5420.250%, 07/31/2031 592 7490.125%, 01/31/2024 2,995 4,011
United Kingdom Gilt - Inflation Linked 1.250%, 11/22/2027 399 698
United Kingdom Treasury 4.750%, 12/07/2038 76 160

25SEI Institutional International Trust / Quarterly Report / December 31, 2021
SCHEDULE OF INVESTMENTS (Unaudited)December 31, 2021
International Fixed Income Fund (Continued)
DescriptionFace Amount (Thousands)
Market Value ($ Thousands)
GLOBAL BONDS (continued)Vodafone Group MTN
4.200%, 12/13/2027 AUD 490 $ 385Western Power Distribution West Midlands
PLC MTN 3.875%, 10/17/2024 GBP 230 330
Zurich Finance PLC MTN 6.625%, 10/30/2049 (D) 235 330
42,198
United States — 9.0%AbbVie
2.300%, 11/21/2022 $ 800 811Air Lease
2.100%, 09/01/2028 186 1791.875%, 08/15/2026 110 108
Air Lease MTN 2.875%, 01/15/2026 40 41
Aircastle 5.250%, 08/11/2025 (A) 261 2874.250%, 06/15/2026 4 44.125%, 05/01/2024 22 23
Ally Financial 4.700%, VAR H15T7Y + 3.481% (C) 116 120
Altria Group 3.125%, 06/15/2031 EUR 310 3922.200%, 06/15/2027 330 399
American Honda Finance 1.950%, 10/18/2024 159 1910.300%, 07/07/2028 320 360
American Tower 1.300%, 09/15/2025 $ 535 5270.875%, 05/21/2029 EUR 420 472
AT&T 2.875% (C)(D) 200 2281.650%, 02/01/2028 $ 870 852
Aviation Capital Group LLC (A)5.500%, 12/15/2024 80 883.500%, 11/01/2027 8 81.950%, 01/30/2026 108 1051.950%, 09/20/2026 231 224
Axalta Coating Systems LLC 3.375%, 02/15/2029 (A) 210 203
Bank of America MTN 2.375%, 06/19/2024 EUR 835 1,005
Becton Dickinson 1.336%, 08/13/2041 300 3251.213%, 02/12/2036 129 1430.632%, 06/04/2023 200 230
Berkshire Hathaway 0.500%, 01/15/2041 170 169
Berkshire Hathaway Finance 2.625%, 06/19/2059 GBP 144 219
DescriptionFace Amount (Thousands)
Market Value ($ Thousands)
GLOBAL BONDS (continued)Booking Holdings
2.375%, 09/23/2024 EUR 355 $ 4270.500%, 03/08/2028 110 126
Bristol-Myers Squibb 0.537%, 11/13/2023 $ 950 946
Broadcom 3.187%, 11/15/2036 (A) 185 185
Capital One Financial 1.650%, 06/12/2029 EUR 300 357
Carnival 1.000%, 10/28/2029 316 269
CCO Holdings 4.500%, 06/01/2033 (A) $ 127 129
CDW 2.670%, 12/01/2026 305 313
Centene 2.625%, 08/01/2031 128 125
Charles Schwab 5.375%, VAR US Treas Yield Curve
Rate T Note Const Mat 5 Yr + 4.971% (C) 395 431
0.750%, 03/18/2024 420 418Charter Communications Operating
3.900%, 06/01/2052 225 226Chubb INA Holdings
1.550%, 03/15/2028 EUR 325 3910.875%, 06/15/2027 115 1340.300%, 12/15/2024 190 217
Citigroup (C)4.150%, VAR US Treas Yield Curve
Rate T Note Const Mat 5 Yr + 3.000% $ 106 108
4.000%, VAR US Treas Yield Curve Rate T Note Const Mat 5 Yr + 3.597% 71 72
Citigroup MTN 0.750%, 10/26/2023 EUR 115 1330.500%, VAR Euribor 3 Month +
0.957%, 10/08/2027 505 574Comcast
0.250%, 05/20/2027 190 2140.064%, 09/14/2026 550 617
Continental Resources (A)5.750%, 01/15/2031 $ 126 1482.875%, 04/01/2032 170 166
CyrusOne 1.450%, 01/22/2027 EUR 254 294
Delta Airlines 4.500%, 10/20/2025 (A) $ 480 504
DH Europe Finance II 1.800%, 09/18/2049 EUR 105 126
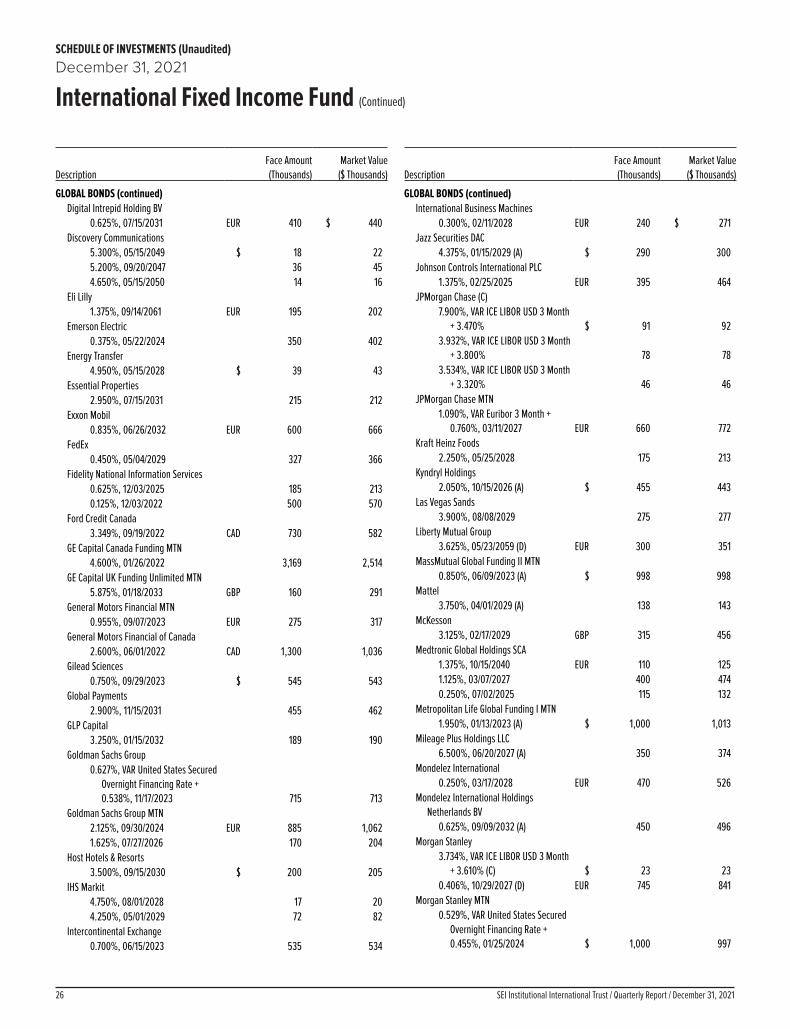
SEI Institutional International Trust / Quarterly Report / December 31, 202126
SCHEDULE OF INVESTMENTS (Unaudited)December 31, 2021
International Fixed Income Fund (Continued)
DescriptionFace Amount (Thousands)
Market Value ($ Thousands)
GLOBAL BONDS (continued)Digital Intrepid Holding BV
0.625%, 07/15/2031 EUR 410 $ 440Discovery Communications
5.300%, 05/15/2049 $ 18 225.200%, 09/20/2047 36 454.650%, 05/15/2050 14 16
Eli Lilly 1.375%, 09/14/2061 EUR 195 202
Emerson Electric 0.375%, 05/22/2024 350 402
Energy Transfer 4.950%, 05/15/2028 $ 39 43
Essential Properties 2.950%, 07/15/2031 215 212
Exxon Mobil 0.835%, 06/26/2032 EUR 600 666
FedEx 0.450%, 05/04/2029 327 366
Fidelity National Information Services 0.625%, 12/03/2025 185 2130.125%, 12/03/2022 500 570
Ford Credit Canada 3.349%, 09/19/2022 CAD 730 582
GE Capital Canada Funding MTN 4.600%, 01/26/2022 3,169 2,514
GE Capital UK Funding Unlimited MTN 5.875%, 01/18/2033 GBP 160 291
General Motors Financial MTN 0.955%, 09/07/2023 EUR 275 317
General Motors Financial of Canada 2.600%, 06/01/2022 CAD 1,300 1,036
Gilead Sciences 0.750%, 09/29/2023 $ 545 543
Global Payments 2.900%, 11/15/2031 455 462
GLP Capital 3.250%, 01/15/2032 189 190
Goldman Sachs Group 0.627%, VAR United States Secured
Overnight Financing Rate + 0.538%, 11/17/2023 715 713
Goldman Sachs Group MTN 2.125%, 09/30/2024 EUR 885 1,0621.625%, 07/27/2026 170 204
Host Hotels & Resorts 3.500%, 09/15/2030 $ 200 205
IHS Markit 4.750%, 08/01/2028 17 204.250%, 05/01/2029 72 82
Intercontinental Exchange 0.700%, 06/15/2023 535 534
DescriptionFace Amount (Thousands)
Market Value ($ Thousands)
GLOBAL BONDS (continued)International Business Machines
0.300%, 02/11/2028 EUR 240 $ 271Jazz Securities DAC
4.375%, 01/15/2029 (A) $ 290 300Johnson Controls International PLC
1.375%, 02/25/2025 EUR 395 464JPMorgan Chase (C)
7.900%, VAR ICE LIBOR USD 3 Month + 3.470% $ 91 92
3.932%, VAR ICE LIBOR USD 3 Month + 3.800% 78 78
3.534%, VAR ICE LIBOR USD 3 Month + 3.320% 46 46
JPMorgan Chase MTN 1.090%, VAR Euribor 3 Month +
0.760%, 03/11/2027 EUR 660 772Kraft Heinz Foods
2.250%, 05/25/2028 175 213Kyndryl Holdings
2.050%, 10/15/2026 (A) $ 455 443Las Vegas Sands
3.900%, 08/08/2029 275 277Liberty Mutual Group
3.625%, 05/23/2059 (D) EUR 300 351MassMutual Global Funding II MTN
0.850%, 06/09/2023 (A) $ 998 998Mattel
3.750%, 04/01/2029 (A) 138 143McKesson
3.125%, 02/17/2029 GBP 315 456Medtronic Global Holdings SCA
1.375%, 10/15/2040 EUR 110 1251.125%, 03/07/2027 400 4740.250%, 07/02/2025 115 132
Metropolitan Life Global Funding I MTN 1.950%, 01/13/2023 (A) $ 1,000 1,013
Mileage Plus Holdings LLC 6.500%, 06/20/2027 (A) 350 374
Mondelez International 0.250%, 03/17/2028 EUR 470 526
Mondelez International Holdings Netherlands BV
0.625%, 09/09/2032 (A) 450 496Morgan Stanley
3.734%, VAR ICE LIBOR USD 3 Month + 3.610% (C) $ 23 23
0.406%, 10/29/2027 (D) EUR 745 841Morgan Stanley MTN
0.529%, VAR United States Secured Overnight Financing Rate + 0.455%, 01/25/2024 $ 1,000 997

27SEI Institutional International Trust / Quarterly Report / December 31, 2021
SCHEDULE OF INVESTMENTS (Unaudited)December 31, 2021
International Fixed Income Fund (Continued)
DescriptionFace Amount (Thousands)
Market Value ($ Thousands)
GLOBAL BONDS (continued)Mozart Debt Merger Sub
3.875%, 04/01/2029 (A) $ 230 $ 229National Grid North America MTN
1.000%, 07/12/2024 EUR 300 348Netflix
3.625%, 05/15/2027 200 261Newell Brands
4.700%, 04/01/2026 $ 140 153NOV
3.600%, 12/01/2029 205 212Office Properties Income Trust
4.500%, 02/01/2025 270 285Olympus Water US Holding
3.875%, 10/01/2028 (A) EUR 100 114Omnicom Capital Holdings MTN
2.250%, 11/22/2033 GBP 252 339ONEOK
6.350%, 01/15/2031 $ 89 112Oracle
3.650%, 03/25/2041 160 162Organon
4.125%, 04/30/2028 (A) 290 295Paysafe Finance
3.000%, 06/15/2029 (A) EUR 245 262Philip Morris International
1.450%, 08/01/2039 115 1210.625%, 11/08/2024 285 328
Philip Morris International MTN 2.875%, 03/03/2026 170 213
Plains All American Pipeline 3.550%, 12/15/2029 $ 79 82
PNC Financial Services Group 3.300%, 03/08/2022 150 150
Principal Life Global Funding II 1.250%, 06/23/2025 (A) 315 311
Prudential Financial 5.875%, VAR ICE LIBOR USD 3 Month
+ 4.175%, 09/15/2042 199 203Public Storage
0.500%, 09/09/2030 EUR 260 286PVH
4.625%, 07/10/2025 $ 348 379Realty Income Corp
1.125%, 07/13/2027 GBP 385 506Sabra Health Care LP
3.900%, 10/15/2029 $ 280 293Schlumberger Finance France SAS
1.000%, 02/18/2026 EUR 305 358Southern
1.875%, 09/15/2081 (D) 200 221Starbucks Corp
1.300%, 05/07/2022 $ 350 351
DescriptionFace Amount (Thousands)
Market Value ($ Thousands)
GLOBAL BONDS (continued)Thermo Fisher Scientific Finance I BV
0.800%, 10/18/2030 EUR 260 $ 297Time Warner Cable
5.750%, 06/02/2031 GBP 295 499T-Mobile USA
3.375%, 04/15/2029 (A) $ 52 532.875%, 02/15/2031 77 762.625%, 02/15/2029 87 86
Toyota Motor Credit MTN 0.625%, 11/21/2024 EUR 465 538
Tyco Electronics Group 0.113%, 02/16/2029 308 336
UnitedHealth Group 1.250%, 01/15/2026 $ 175 174
US Bancorp MTN 0.850%, 06/07/2024 EUR 226 262
Verizon Communications 4.016%, 12/03/2029 $ 391 4382.100%, 03/22/2028 445 446
Verizon Communications MTN 4.750%, 02/17/2034 GBP 170 2954.050%, 02/17/2025 AUD 680 526
VF 0.250%, 02/25/2028 EUR 395 440
Vistra 7.000%, VAR US Treas Yield Curve
Rate T Note Const Mat 5 Yr + 5.740% (A)(C) $ 68 69
Vornado Realty 3.400%, 06/01/2031 334 341
Wells Fargo 3.900%, VAR US Treas Yield Curve
Rate T Note Const Mat 5 Yr + 3.453% (C) 132 136
Wells Fargo MTN 2.125%, 12/20/2023 GBP 345 4732.000%, 04/27/2026 EUR 210 2541.375%, 06/30/2022 GBP 195 2650.500%, 04/26/2024 EUR 500 575
Welltower 4.500%, 12/01/2034 GBP 140 231
Western Digital 3.100%, 02/01/2032 $ 78 792.850%, 02/01/2029 32 32
Western Union 2.750%, 03/15/2031 355 349

SEI Institutional International Trust / Quarterly Report / December 31, 202128
SCHEDULE OF INVESTMENTS (Unaudited)December 31, 2021
International Fixed Income Fund (Continued)
DescriptionFace Amount (Thousands)
Market Value ($ Thousands)
GLOBAL BONDS (continued)WPC Eurobond BV
1.350%, 04/15/2028 EUR 530 $ 611 51,675
Total Global Bonds
(Cost $534,082) ($ Thousands) 532,807
U.S. TREASURY OBLIGATIONS — 4.1%U.S. Treasury Bill
0.007%, 01/25/2022 (B) $ 17,657 17,657U.S. Treasury Bond
2.169%, 11/15/2050 (B) 1,346 769U.S. Treasury Inflation Indexed Bonds
0.125%, 10/15/2026 1,407 1,530U.S. Treasury Notes
0.500%, 03/31/2025 94 930.375%, 01/31/2026 20 190.125%, 11/30/2022 3,374 3,366
Total U.S. Treasury Obligations
(Cost $23,427) ($ Thousands) 23,434
MORTGAGE-BACKED SECURITIES — 0.2%Agency Mortgage-Backed Obligation — 0.2%
FHLMC Structured Agency Credit Risk Debt Notes, Ser 2016-HQA1, Cl M3
6.458%, VAR ICE LIBOR USD 1 Month + 6.350%, 09/25/2028 146 153
FHLMC Structured Agency Credit Risk Debt Notes, Ser 2017-DNA2, Cl M2
3.552%, VAR ICE LIBOR USD 1 Month + 3.450%, 10/25/2029 470 484
FNMA Connecticut Avenue Securities, Ser 2014-C04, Cl 2M2
5.108%, VAR ICE LIBOR USD 1 Month + 5.000%, 11/25/2024 53 54
FNMA Connecticut Avenue Securities, Ser 2016-C07, Cl 2M2
4.453%, VAR ICE LIBOR USD 1 Month + 4.350%, 05/25/2029 82 85
776Non-Agency Mortgage-Backed Obligation — 0.0%
Bear Stearns Adjustable Rate Mortgage Trust, Ser 2004-6, Cl 3A
0.000%, 09/25/2034(D) 9 8JPMorgan Mortgage Trust, Ser 2004-A5,
Cl 3A12.524%, 12/25/2034(D) 20 21
DescriptionFace Amount (Thousands)
Market Value ($ Thousands)
MORTGAGE-BACKED SECURITIES (continued)LSTAR Commercial Mortgage Trust,
Ser 2016-4, Cl A22.579%, 03/10/2049(A) $ 136 $ 137
166
Total Mortgage-Backed Securities
(Cost $930) ($ Thousands) 942
ASSET-BACKED SECURITY — 0.1%Other Asset-Backed Securities — 0.1%
Elmwood CLO XII, Ser 2021-5A, Cl D3.171%, VAR ICE LIBOR USD 3 Month +
3.050%, 01/20/2035 (A) 750 749
Total Asset-Backed Security (Cost $750) ($ Thousands) 749
Total Investments in Securities — 97.1%(Cost $559,189) ($ Thousands) $ 557,932

29SEI Institutional International Trust / Quarterly Report / December 31, 2021
SCHEDULE OF INVESTMENTS (Unaudited)December 31, 2021
International Fixed Income Fund (Continued)
A list of the open futures contracts held by the Fund at December 31, 2021, is as follows:
Type of ContractNumber of Contracts
Expiration Date
Notional Amount (Thousands) Value (Thousands)
Unrealized Appreciation/ (Depreciation) (Thousands)
Long ContractsAustralian 10-Year Bond 49 Mar-2022 $ 4,878 $ 4,958 $ 1Euro-BTP 2 Mar-2022 337 334 (4)Euro-Bund 23 Mar-2022 4,529 4,482 (104)Euro-Buxl – Mar-2022 5 – (8)Euro-OAT 29 Mar-2022 5,436 5,381 (74)Japanese 10-Year Bond 24 Mar-2022 32,000 31,612 (54)Japanese 10-Year Government Bond E-MINI 26 Mar-2022 3,472 3,423 (11)U.S. Long Treasury Bond 25 Mar-2022 3,945 4,011 66U.S. Ultra Long Treasury Bond 1 Mar-2022 206 197 (9)
54,808 54,398 (197)Short Contracts
Australian 3-Year Bond (5) Mar-2022 $ (403) $ (415) $ (2)Canadian 5-Year Bond (24) Mar-2022 (2,294) (2,327) (24)Canadian 10-Year Bond (14) Mar-2022 (1,545) (1,581) (24)Euro (240) Mar-2022 (33,963) (34,207) (244)Euro-Bob (4) Mar-2022 (607) (606) 4Euro-Schatz (100) Mar-2022 (12,708) (12,740) 19Long Gilt 10-Year Bond (22) Apr-2022 (3,699) (3,722) 19U.S. 2-Year Treasury Note (208) Apr-2022 (45,425) (45,380) 45U.S. 5-Year Treasury Note (137) Apr-2022 (16,575) (16,574) 1U.S. 10-Year Treasury Note (31) Mar-2022 (4,090) (4,044) 46Ultra 10-Year U.S. Treasury Note (73) Mar-2022 (10,567) (10,690) (123)
(131,876) (132,286) (283)$ (77,068) $ (77,888) $ (480)
A list of the forward foreign currency contracts held by the Fund at December 31, 2021, is as follows:
Counterparty Settlement DateCurrency to Deliver
(Thousands)Currency to Receive
(Thousands)
Unrealized Appreciation
(Depreciation) (Thousands)
Bank of America 01/11/22 USD 150 CHF 138 $ 2
Bank of America 01/11/22 AUD 213 USD 150 (5)
Bank of America 01/11/22 MXN 3,070 USD 148 (2)
Barclays PLC 01/07/22 INR 78,464 USD 1,035 (20)
Barclays PLC 01/11/22 USD 38 AUD 53 1
Barclays PLC 01/11/22 USD 151 GBP 113 2
Barclays PLC 01/11/22 USD 300 CNY 1,916 1
Barclays PLC 01/11/22 CHF 352 USD 385 (1)
Barclays PLC 01/11/22 USD 432 ZAR 7,010 7
Barclays PLC 01/11/22 ILS 2,941 USD 931 (14)
Barclays PLC 01/11/22 DKK 5,649 USD 864 —
Barclays PLC 01/11/22 EUR 60,765 USD 69,059 (52)
Barclays PLC 01/11/22 CNY 153,233 USD 23,970 (77)
BNP Paribas 01/11/22 AUD 215 USD 151 (5)
BNP Paribas 01/11/22 CNY 1,496 USD 235 —
BNP Paribas 01/11/22 CHF 1,661 USD 1,812 (12)
BNP Paribas 01/11/22 EUR 1,820 USD 2,057 (13)
BNP Paribas 01/11/22 MYR 9,582 USD 2,272 (30)
BNP Paribas 01/11/22 CAD 17,773 USD 13,881 (190)
BNP Paribas 01/11/22 CZK 32,479 USD 1,430 (56)
BNP Paribas 01/11/22 HUF 314,649 USD 961 (9)
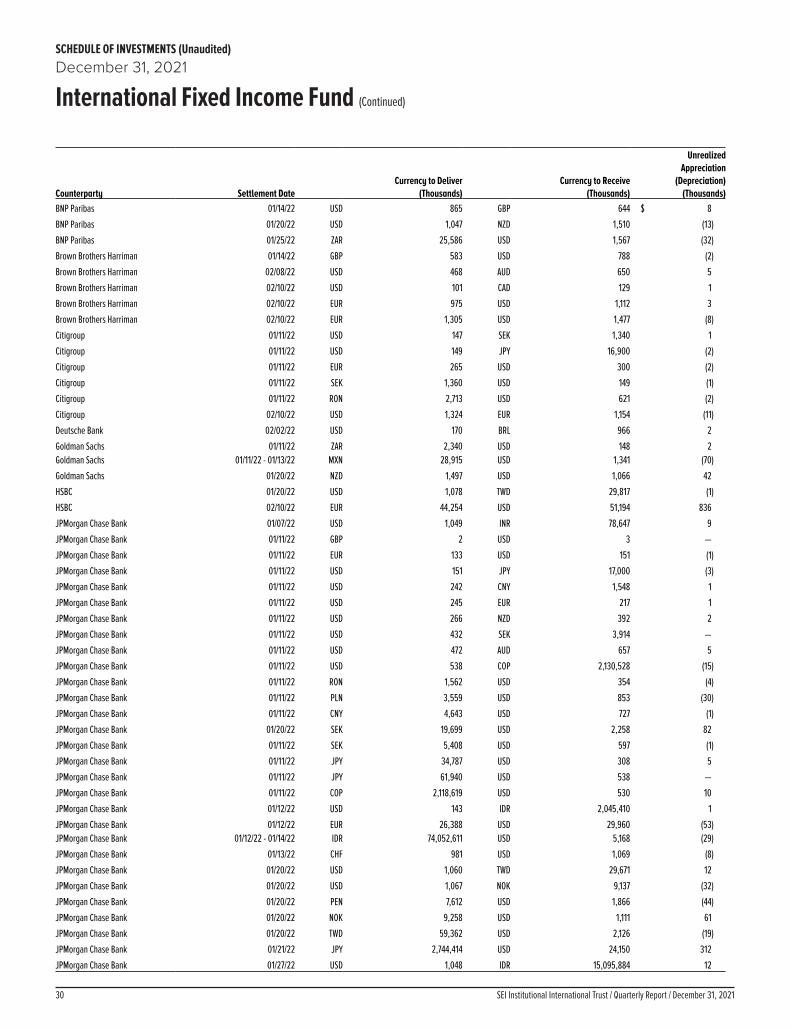
SEI Institutional International Trust / Quarterly Report / December 31, 202130
SCHEDULE OF INVESTMENTS (Unaudited)December 31, 2021
International Fixed Income Fund (Continued)
Counterparty Settlement DateCurrency to Deliver
(Thousands)Currency to Receive
(Thousands)
Unrealized Appreciation
(Depreciation) (Thousands)
BNP Paribas 01/14/22 USD 865 GBP 644 $ 8
BNP Paribas 01/20/22 USD 1,047 NZD 1,510 (13)
BNP Paribas 01/25/22 ZAR 25,586 USD 1,567 (32)
Brown Brothers Harriman 01/14/22 GBP 583 USD 788 (2)
Brown Brothers Harriman 02/08/22 USD 468 AUD 650 5
Brown Brothers Harriman 02/10/22 USD 101 CAD 129 1
Brown Brothers Harriman 02/10/22 EUR 975 USD 1,112 3
Brown Brothers Harriman 02/10/22 EUR 1,305 USD 1,477 (8)
Citigroup 01/11/22 USD 147 SEK 1,340 1
Citigroup 01/11/22 USD 149 JPY 16,900 (2)
Citigroup 01/11/22 EUR 265 USD 300 (2)
Citigroup 01/11/22 SEK 1,360 USD 149 (1)
Citigroup 01/11/22 RON 2,713 USD 621 (2)
Citigroup 02/10/22 USD 1,324 EUR 1,154 (11)
Deutsche Bank 02/02/22 USD 170 BRL 966 2
Goldman Sachs 01/11/22 ZAR 2,340 USD 148 2Goldman Sachs 01/11/22 - 01/13/22 MXN 28,915 USD 1,341 (70)
Goldman Sachs 01/20/22 NZD 1,497 USD 1,066 42
HSBC 01/20/22 USD 1,078 TWD 29,817 (1)
HSBC 02/10/22 EUR 44,254 USD 51,194 836
JPMorgan Chase Bank 01/07/22 USD 1,049 INR 78,647 9
JPMorgan Chase Bank 01/11/22 GBP 2 USD 3 —
JPMorgan Chase Bank 01/11/22 EUR 133 USD 151 (1)
JPMorgan Chase Bank 01/11/22 USD 151 JPY 17,000 (3)
JPMorgan Chase Bank 01/11/22 USD 242 CNY 1,548 1
JPMorgan Chase Bank 01/11/22 USD 245 EUR 217 1
JPMorgan Chase Bank 01/11/22 USD 266 NZD 392 2
JPMorgan Chase Bank 01/11/22 USD 432 SEK 3,914 —
JPMorgan Chase Bank 01/11/22 USD 472 AUD 657 5
JPMorgan Chase Bank 01/11/22 USD 538 COP 2,130,528 (15)
JPMorgan Chase Bank 01/11/22 RON 1,562 USD 354 (4)
JPMorgan Chase Bank 01/11/22 PLN 3,559 USD 853 (30)
JPMorgan Chase Bank 01/11/22 CNY 4,643 USD 727 (1)
JPMorgan Chase Bank 01/20/22 SEK 19,699 USD 2,258 82
JPMorgan Chase Bank 01/11/22 SEK 5,408 USD 597 (1)
JPMorgan Chase Bank 01/11/22 JPY 34,787 USD 308 5
JPMorgan Chase Bank 01/11/22 JPY 61,940 USD 538 —
JPMorgan Chase Bank 01/11/22 COP 2,118,619 USD 530 10
JPMorgan Chase Bank 01/12/22 USD 143 IDR 2,045,410 1
JPMorgan Chase Bank 01/12/22 EUR 26,388 USD 29,960 (53)JPMorgan Chase Bank 01/12/22 - 01/14/22 IDR 74,052,611 USD 5,168 (29)
JPMorgan Chase Bank 01/13/22 CHF 981 USD 1,069 (8)
JPMorgan Chase Bank 01/20/22 USD 1,060 TWD 29,671 12
JPMorgan Chase Bank 01/20/22 USD 1,067 NOK 9,137 (32)
JPMorgan Chase Bank 01/20/22 PEN 7,612 USD 1,866 (44)
JPMorgan Chase Bank 01/20/22 NOK 9,258 USD 1,111 61
JPMorgan Chase Bank 01/20/22 TWD 59,362 USD 2,126 (19)
JPMorgan Chase Bank 01/21/22 JPY 2,744,414 USD 24,150 312
JPMorgan Chase Bank 01/27/22 USD 1,048 IDR 15,095,884 12
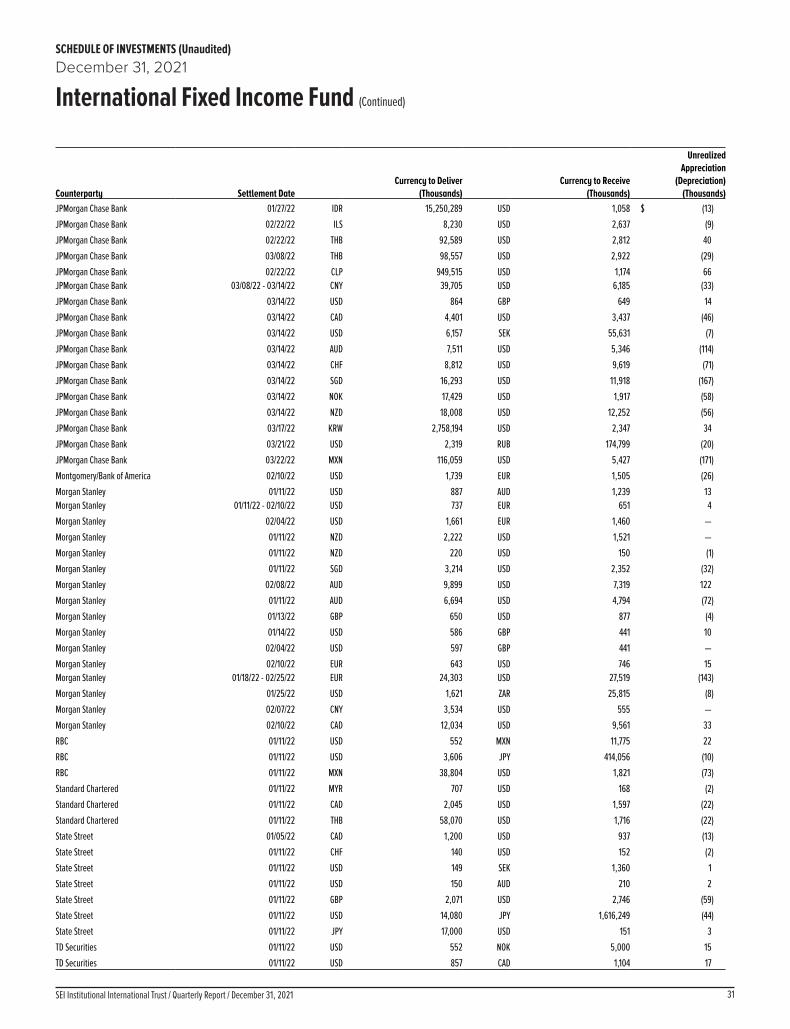
31SEI Institutional International Trust / Quarterly Report / December 31, 2021
SCHEDULE OF INVESTMENTS (Unaudited)December 31, 2021
International Fixed Income Fund (Continued)
Counterparty Settlement DateCurrency to Deliver
(Thousands)Currency to Receive
(Thousands)
Unrealized Appreciation
(Depreciation) (Thousands)
JPMorgan Chase Bank 01/27/22 IDR 15,250,289 USD 1,058 $ (13)
JPMorgan Chase Bank 02/22/22 ILS 8,230 USD 2,637 (9)
JPMorgan Chase Bank 02/22/22 THB 92,589 USD 2,812 40
JPMorgan Chase Bank 03/08/22 THB 98,557 USD 2,922 (29)
JPMorgan Chase Bank 02/22/22 CLP 949,515 USD 1,174 66JPMorgan Chase Bank 03/08/22 - 03/14/22 CNY 39,705 USD 6,185 (33)
JPMorgan Chase Bank 03/14/22 USD 864 GBP 649 14
JPMorgan Chase Bank 03/14/22 CAD 4,401 USD 3,437 (46)
JPMorgan Chase Bank 03/14/22 USD 6,157 SEK 55,631 (7)
JPMorgan Chase Bank 03/14/22 AUD 7,511 USD 5,346 (114)
JPMorgan Chase Bank 03/14/22 CHF 8,812 USD 9,619 (71)
JPMorgan Chase Bank 03/14/22 SGD 16,293 USD 11,918 (167)
JPMorgan Chase Bank 03/14/22 NOK 17,429 USD 1,917 (58)
JPMorgan Chase Bank 03/14/22 NZD 18,008 USD 12,252 (56)
JPMorgan Chase Bank 03/17/22 KRW 2,758,194 USD 2,347 34
JPMorgan Chase Bank 03/21/22 USD 2,319 RUB 174,799 (20)
JPMorgan Chase Bank 03/22/22 MXN 116,059 USD 5,427 (171)
Montgomery/Bank of America 02/10/22 USD 1,739 EUR 1,505 (26)
Morgan Stanley 01/11/22 USD 887 AUD 1,239 13Morgan Stanley 01/11/22 - 02/10/22 USD 737 EUR 651 4
Morgan Stanley 02/04/22 USD 1,661 EUR 1,460 —
Morgan Stanley 01/11/22 NZD 2,222 USD 1,521 —
Morgan Stanley 01/11/22 NZD 220 USD 150 (1)
Morgan Stanley 01/11/22 SGD 3,214 USD 2,352 (32)
Morgan Stanley 02/08/22 AUD 9,899 USD 7,319 122
Morgan Stanley 01/11/22 AUD 6,694 USD 4,794 (72)
Morgan Stanley 01/13/22 GBP 650 USD 877 (4)
Morgan Stanley 01/14/22 USD 586 GBP 441 10
Morgan Stanley 02/04/22 USD 597 GBP 441 —
Morgan Stanley 02/10/22 EUR 643 USD 746 15Morgan Stanley 01/18/22 - 02/25/22 EUR 24,303 USD 27,519 (143)
Morgan Stanley 01/25/22 USD 1,621 ZAR 25,815 (8)
Morgan Stanley 02/07/22 CNY 3,534 USD 555 —
Morgan Stanley 02/10/22 CAD 12,034 USD 9,561 33
RBC 01/11/22 USD 552 MXN 11,775 22
RBC 01/11/22 USD 3,606 JPY 414,056 (10)
RBC 01/11/22 MXN 38,804 USD 1,821 (73)
Standard Chartered 01/11/22 MYR 707 USD 168 (2)
Standard Chartered 01/11/22 CAD 2,045 USD 1,597 (22)
Standard Chartered 01/11/22 THB 58,070 USD 1,716 (22)
State Street 01/05/22 CAD 1,200 USD 937 (13)
State Street 01/11/22 CHF 140 USD 152 (2)
State Street 01/11/22 USD 149 SEK 1,360 1
State Street 01/11/22 USD 150 AUD 210 2
State Street 01/11/22 GBP 2,071 USD 2,746 (59)
State Street 01/11/22 USD 14,080 JPY 1,616,249 (44)
State Street 01/11/22 JPY 17,000 USD 151 3
TD Securities 01/11/22 USD 552 NOK 5,000 15
TD Securities 01/11/22 USD 857 CAD 1,104 17

SEI Institutional International Trust / Quarterly Report / December 31, 202132
SCHEDULE OF INVESTMENTS (Unaudited)December 31, 2021
International Fixed Income Fund (Continued)
Counterparty Settlement DateCurrency to Deliver
(Thousands)Currency to Receive
(Thousands)
Unrealized Appreciation
(Depreciation) (Thousands)
TD Securities 01/11/22 NOK 7,249 USD 801 $ (21)
TD Securities 01/11/22 GBP 19,253 USD 25,695 (380)
UBS 01/04/22 USD 171 BRL 966 2
UBS 01/11/22 USD 69 PLN 285 2
UBS 01/11/22 USD 85 AUD 119 2
UBS 01/11/22 USD 317 CNY 2,017 (1)
UBS 01/11/22 GBP 460 USD 609 (14)
UBS 01/11/22 EUR 1,115 USD 1,258 (10)
UBS 01/11/22 SEK 1,350 USD 149 —
UBS 01/11/22 CNY 3,459 USD 541 (2)
UBS 01/11/22 HUF 179,185 USD 549 (4)
UBS 01/11/22 JPY 7,357,250 USD 65,322 1,427
UBS 01/13/22 USD 1,038 MXN 21,929 32
UBS 01/13/22 USD 1,064 CHF 983 15
UBS 01/14/22 GBP 11,224 USD 15,228 27
UBS 02/17/22 CNY 113,307 USD 17,670 (99) $ 616
A list of open OTC swap agreements held by the Fund at December 31, 2021, is as follows:
Interest Rate Swaps
Counterparty Fund Pays Fund Receives Payment FrequencyTermination
Date Currency
Notional Amount
(Thousands)Value
(Thousands)
Upfront Payments
(Thousands)
Net Unrealized Appreciation
(Depreciation) (Thousands)
Deutsche BankChina 7-Day Reverse Repo
Rate 2.985% Quarterly 06/03/2024 CNY 23,220 $ 74 $ – $ 74
Deutsche BankChina 7-Day Reverse Repo
Rate 2.755% Quarterly 09/09/2024 CNY 31,000 73 – 73 $ 147 $ – $ 147
A list of the open centrally cleared swap agreements held by the Fund at December 31, 2021, is as follows:e
Interest Rate Swaps
Fund Pays Fund ReceivesPayment
Frequency Termination Date Currency
Notional Amount
(Thousands)Value
(Thousands)
Upfront Payments/
Receipts (Thousands)
Net Unrealized Appreciation
(Depreciation) (Thousands)
Overnight Brazilian Interbank Deposit Rate
4.915% Annually 01/02/2023 BRL 9,678 $ (112) $ – $ (112)
Overnight Brazilian Interbank Deposit Rate
4.94% Annually 01/02/2023 BRL 5,658 (65) – (65)
Overnight Brazilian Interbank Deposit Rate
4.945% Annually 01/02/2023 BRL 5,062 (58) – (58)
3-MONTH NZD RATE 2.58% Semi-Annually 11/01/2024 NZD 980 4 – 43-MONTH NZD RATE 2.0525% Semi-Annually 11/02/2024 NZD 2,620 7 – 7
Daily GBP Overnight Index Ave (SONIA) Rate
0.377% Annually 02/28/2025 GBP 1,230 (37) 2 (39)
2.8% Overnight CNY Interbank Deposit Rate
Quarterly 04/02/2026 CNY 12,090 32 – 32
1.395 Daily GBP Overnight Index Ave (SONIA) Rate
Annually 10/03/2047 GBP 460 (77) (95) 18
Daily GBP Overnight Index Ave (SONIA) Rate
0.1711% Annually 07/20/2050 GBP 85 (19) (18) (1)
0.5475% Daily GBP Overnight Index Ave (SONIA) Rate
Annually 08/04/2051 GBP 170 17 – 17
$ (308) $ (111) $ (197)

33SEI Institutional International Trust / Quarterly Report / December 31, 2021
SCHEDULE OF INVESTMENTS (Unaudited)December 31, 2021
International Fixed Income Fund (Continued)
SCHEDULE OF INVESTMENTS (Unaudited)December 31, 2021
International Fixed Income Fund (Concluded)
Percentages are based on Net Assets of $573,306 ($ Thousands).(A) Security exempt from registration under Rule 144A of the Securities Act of 1933. These securities
may be resold in transactions exempt from registration normally to qualified institutions. On December 31, 2021, the value of these securities amounted to $84,234 ($ Thousands), representing 14.7% of the Net Assets of the Fund.
(B) Zero coupon security. The rate shown on the Schedule of Investments is the security's effective yield at the time of purchase.
(C) Perpetual security with no stated maturity date.(D) Variable or floating rate security, the interest rate of which adjusts periodically based on
changes in current interest rates and prepayments on the underlying pool of assets.
AUD — Australian DollarBRL — Brazilian RealCAD — Canadian DollarCHF — Swiss FrancCl — ClassCLP — Chilean PesoCLO — Collateralized Loan ObligationCNY — Chinese Yuan OnshoreCOP — Colombian PesoCZK — Czech KorunaDAC — Designated Activity CompanyDKK — Danish KroneEUR — EuroFHLMC — Federal Home Loan Mortgage CorporationFNMA — Federal National Mortgage AssociationGBP — British Pound SterlingHUF — Hungarian ForintICE— Intercontinental ExchangeIDR — Indonesian RupiahILS — Israeli New SheckelsINR — Indian RupeeJPY — Japanese YenKRW — Korean WonLIBOR— London Interbank Offered RateLLC — Limited Liability CompanyL.P. — Limited PartnershipLtd. — LimitedMTN — Medium Term NoteMXN — Mexican PesoMYR — Malaysian RinggitNOK — Norwegian KroneNZD — New Zealand DollarOTC — Over The CounterPEN — Peruvian Nuevo SolPLC — Public Limited CompanyPLN — Polish ZlotyRON — Romanian LeuRUB — Russian RubleSEK — Swedish KronaSer — SeriesSGD — Singapore DollarTHB — Thai BahtTWD — Taiwan DollarULC — Unlimited Liability CompanyUSD — U.S. DollarVAR — Variable RateZAR — South African Rand
The following is a list of the level of inputs used as of December 31, 2021, in valuing the Fund’s investments and other financial instruments carried at value ($ Thousands):
Investments in SecuritiesLevel 1
($)Level 2
($)Level 3
($)Total
($)Global Bonds – 532,807 – 532,807U.S. Treasury Obligations 4,135 19,299 – 23,434Mortgage-Backed Securities – 942 – 942Asset-Backed Security – 749 – 749
Total Investments in Securities 4,135 553,797 – 557,932
Other Financial InstrumentsLevel 1
($)Level 2
($)Level 3
($)Total
($)Futures Contracts*
Unrealized Appreciation 201 – – 201Unrealized Depreciation (681) – – (681)
Forwards Contracts*Unrealized Appreciation – 3,344 – 3,344Unrealized Depreciation – (2,728) – (2,728)
OTC SwapsInterest Rate Swaps*
Unrealized Appreciation – 147 – 147Centrally Cleared Swaps
Interest Rate Swaps*Unrealized Appreciation – 78 – 78Unrealized Depreciation – (275) – (275)
Total Other Financial Instruments (480) 566 – 86
* Futures contracts, forwards contracts and swap contracts are valued at the net unrealized appreciation (depreciation) on the instrument.
For the period ended December 31, 2021, there were no transfers in or out of Level 3.
Amounts designated as "—" are $0 or have been rounded to $0.
For information on the Fund’s policy regarding valuation of investments and other significant accounting policies, please refer to the Fund’s most recent semi-annual and annual financial statements.
mschweitzer
Stamp

SEI Institutional International Trust / Quarterly Report / December 31, 202134
SCHEDULE OF INVESSCHEDULE OF INVESTMENTTMENTS (Unaudited)S (Unaudited)December 31, 2021December 31, 2021
Emerging MarkEmerging Markets Debt Fundets Debt Fund
DescriptionFace Amount (Thousands)
Market Value ($ Thousands)
GLOBAL BONDS — 94.8%Angola — 0.9%
Angolan Government International Bond 9.375%, 05/08/2048 $ 3,350 $ 3,2738.250%, 05/09/2028 1,085 1,088
Angolan Government International Bond MTN
9.125%, 11/26/2049 (A) 670 6429.125%, 11/26/2049 409 3928.000%, 11/26/2029 2,097 2,0658.000%, 11/26/2029 (A) 731 720
Republic of Angola Via Avenir II BV MTN 7.867%, VAR ICE LIBOR USD 6 Month
+ 7.500%, 07/01/2023 2,941 2,933Republic of Angola Via Avenir Issuer II
Ireland DAC 6.927%, 02/19/2027 2,538 2,367
13,480
Argentina — 1.1%Argentine Republic Government
International Bond 2.500%, 3.500%, 07/09/2022,
07/09/2041 (B) 6,317 2,2272.000%, 3.875%, 07/09/2022,
01/09/2038 (B) 3,404 1,2851.125%, 1.500%, 07/09/2022,
07/09/2035 (B) 1,389 4441.125%, 1.500%, 07/09/2022,
07/09/2046 (B) 1,056 3391.000%, 07/09/2029 8,469 3,0700.500%, 07/09/2029 EUR 13 50.500%, 0.750%, 07/09/2023,
07/09/2030 (B) $ 22,401 7,8410.125%, 07/09/2030 EUR 403 145
MSU Energy 6.875%, 02/01/2025 (A)(C) $ 285 226
Provincia de Buenos Aires MTN 2.000%, 3.000%, 09/01/2022,
09/01/2037 (B) EUR 666 208Provincia de Cordoba
5.000%, 12/10/2025 (A)(C) $ 540 406YPF
4.000%, 9.000%, 01/01/2023, 02/12/2026 (B) 707 564
16,760
Armenia — 0.1%Republic of Armenia International Bond
3.600%, 02/02/2031 1,005 936
Azerbaijan — 0.7%Republic of Azerbaijan International Bond
5.125%, 09/01/2029 1,711 1,864
DescriptionFace Amount (Thousands)
Market Value ($ Thousands)
GLOBAL BONDS (continued)Southern Gas Corridor CJSC
6.875%, 03/24/2026 (A) $ 1,437 $ 1,6516.875%, 03/24/2026 4,125 4,738
State Oil of the Azerbaijan Republic 6.950%, 03/18/2030 2,380 2,866
11,119
Bahrain — 0.8%Bahrain Government International Bond
7.000%, 01/26/2026 (A) 1,337 1,4677.000%, 10/12/2028 (A) 507 5506.750%, 09/20/2029 200 2156.125%, 08/01/2023 520 5476.000%, 09/19/2044 297 2695.625%, 09/30/2031 (A) 946 9295.625%, 09/30/2031 200 1965.450%, 09/16/2032 3,796 3,682
Bahrain Government International Bond MTN
5.250%, 01/25/2033 (A) 1,347 1,2664.250%, 01/25/2028 797 776
CBB International Sukuk Programme WLL 3.875%, 05/18/2029 (A) 1,094 1,067
Oil and Gas Holding BSCC (A)8.375%, 11/07/2028 (C) 560 6367.625%, 11/07/2024 794 856
12,456
Belarus — 0.2%Development Bank of the Republic of
Belarus JSC 6.750%, 05/02/2024 972 854
Republic of Belarus International Bond 6.378%, 02/24/2031 (A) 899 7136.378%, 02/24/2031 372 2956.200%, 02/28/2030 260 2056.200%, 02/28/2030 (A) 89 705.875%, 02/24/2026 1,364 1,205
3,342
Belize — 0.0%Belize Government International Bond
5.000%, 02/20/2038 1,173 592
Benin — 0.1%Benin Government International Bond
6.875%, 01/19/2052 EUR 158 1794.950%, 01/22/2035 389 4224.875%, 01/19/2032 102 113
714
Bermuda — 0.2%Bermuda Government International Bond
4.750%, 02/15/2029 $ 1,754 2,013

35SEI Institutional International Trust / Quarterly Report / December 31, 2021
SCHEDULE OF INVESTMENTS (Unaudited)December 31, 2021
Emerging Markets Debt Fund (Continued)
DescriptionFace Amount (Thousands)
Market Value ($ Thousands)
GLOBAL BONDS (continued)3.717%, 01/25/2027 $ 631 $ 6752.375%, 08/20/2030 221 220
2,908
Brazil — 5.9%Brazil Letras do Tesouro Nacional (H)
11.156%, 01/01/2025 BRL 34,000 4,5077.296%, 07/01/2023 14,000 2,1347.252%, 01/01/2024 58,000 8,4426.862%, 01/01/2022 25,000 4,488
Brazil Loan Trust 1 5.477%, 07/24/2023 (A) $ 108 111
Brazil Minas SPE via State of Minas Gerais 5.333%, 02/15/2028 1,905 1,9815.333%, 02/15/2028 1,176 1,2235.333%, 02/15/2028 (A) 157 163
Brazil Notas do Tesouro Nacional, Serie B 6.000%, 05/15/2045 BRL 818 5886.000%, 08/15/2050 281 204
Brazil Notas do Tesouro Nacional, Serie F 10.000%, 01/01/2023 71,369 12,61710.000%, 01/01/2025 67,744 11,96510.000%, 01/01/2027 47,871 8,39010.000%, 01/01/2029 38,391 6,64710.000%, 01/01/2031 22,316 3,834
Brazilian Government International Bond 5.625%, 01/07/2041 $ 757 7725.625%, 02/21/2047 709 7025.000%, 01/27/2045 2,329 2,1824.750%, 01/14/2050 1,460 1,2974.625%, 01/13/2028 801 8364.500%, 05/30/2029 274 2803.875%, 06/12/2030 200 1943.750%, 09/12/2031 5,651 5,3122.875%, 06/06/2025 1,437 1,460
Centrais Eletricas Brasileiras 4.625%, 02/04/2030 (A) 226 224
CSN Inova Ventures 6.750%, 01/28/2028 (A) 592 623
CSN Resources 4.625%, 06/10/2031 (A) 315 300
Gol Finance 7.000%, 01/31/2025 (A) 998 878
Iochpe-Maxion Austria GmbH 5.000%, 05/07/2028 (A) 341 334
MC Brazil Downstream Trading SARL 7.250%, 06/30/2031 (A) 888 884
Minerva Luxembourg 4.375%, 03/18/2031 (A) 297 283
MV24 Capital BV 6.748%, 06/01/2034 (A) 122 126
DescriptionFace Amount (Thousands)
Market Value ($ Thousands)
GLOBAL BONDS (continued)Nexa Resources
5.375%, 05/04/2027 (A) $ 2,591 $ 2,750Petrobras Global Finance BV
5.500%, 06/10/2051 457 424StoneCo
3.950%, 06/16/2028 (C) 1,270 1,118Suzano Austria GmbH (A)
7.000%, 03/16/2047 399 5056.000%, 01/15/2029 288 3335.000%, 01/15/2030 494 542
89,653
Cameroon — 0.0%Republic of Cameroon International Bond
5.950%, 07/07/2032 EUR 543 578
Cayman Islands — 0.1%Neon Capital MTN
2.015%, 01/06/2028 (D) JPY 265,619 1,921
Chile — 1.5%Alfa Desarrollo SpA
4.550%, 09/27/2051 (A) $ 227 224ATP Tower Holdings LLC
4.050%, 04/27/2026 (A) 255 254Banco de Credito e Inversiones
3.500%, 10/12/2027 (A) 1,046 1,117Bonos de la Tesoreria de la Republica
2.000%, 03/01/2035 CLP 1,087,313 1,2271.900%, 09/01/2030 1,312,249 1,5031.500%, 03/01/2026 636,931 738
Bonos de la Tesoreria de la Republica en pesos
4.500%, 03/01/2026 625,000 7202.800%, 10/01/2033 (A) 640,000 569
Cencosud 4.375%, 07/17/2027 (A) $ 1,819 1,948
Chile Government International Bond 3.625%, 10/30/2042 925 9783.250%, 09/21/2071 1,615 1,4943.100%, 05/07/2041 243 2383.100%, 01/22/2061 308 2852.550%, 01/27/2032 893 8912.550%, 07/27/2033 7,750 7,5372.450%, 01/31/2031 236 235
Empresa de los Ferrocarriles del Estado 3.830%, 09/14/2061 350 335
Empresa de Transporte de Pasajeros Metro 3.650%, 05/07/2030 (A) 217 230
Empresa Nacional del Petroleo 3.750%, 08/05/2026 749 7693.450%, 09/16/2031 (A) 331 315

SEI Institutional International Trust / Quarterly Report / December 31, 202136
SCHEDULE OF INVESTMENTS (Unaudited)December 31, 2021
Emerging Markets Debt Fund (Continued)
DescriptionFace Amount (Thousands)
Market Value ($ Thousands)
GLOBAL BONDS (continued)Nacional del Cobre de Chile
3.750%, 01/15/2031 (A)(C) $ 234 $ 2493.700%, 01/30/2050 (A) 452 4613.150%, 01/14/2030 800 8153.000%, 09/30/2029 224 226
23,358
China — 5.7%Blossom Joy
3.100% (D)(E) 202 205China Government Bond
3.810%, 09/14/2050 CNY 5,900 9913.720%, 04/12/2051 11,400 1,8943.530%, 10/18/2051 10,010 1,6273.280%, 12/03/2027 46,090 7,4583.270%, 11/19/2030 77,380 12,5573.130%, 11/21/2029 3,480 5573.020%, 10/22/2025 43,500 6,9353.020%, 05/27/2031 6,600 1,0523.010%, 05/13/2028 12,540 1,9942.880%, 11/05/2023 25,000 3,9582.850%, 06/04/2027 41,980 6,6492.690%, 08/12/2026 4,000 6312.680%, 05/21/2030 51,050 7,8911.990%, 04/09/2025 60,830 9,376
China Government International Bond 3.250%, 10/19/2023 $ 1,192 1,2431.875%, 12/03/2022 200 2021.250%, 10/26/2026 (A) 1,460 1,4550.550%, 10/21/2025 1,150 1,1180.400%, 10/21/2023 2,410 2,385
China Minmetals 3.750% (D)(E) 2,047 2,085
Chinalco Capital Holdings 4.250%, 04/21/2022 740 7454.100% (D)(E) 224 2322.125%, 06/03/2026 413 406
CNAC HK Finbridge 5.125%, 03/14/2028 246 2814.125%, 07/19/2027 713 7733.875%, 06/19/2029 1,156 1,2423.000%, 09/22/2030 561 568
Country Garden Holdings 4.800%, 08/06/2030 (C) 1,000 909
Dianjian Haiyu 4.300% (D)(E) 204 211
Dianjian International Finance 4.600% (D)(E) 303 311
Huarong Finance II MTN 5.500%, 01/16/2025 640 670
Leader Goal International Ltd MTN 4.250% (D)(E) 212 218
DescriptionFace Amount (Thousands)
Market Value ($ Thousands)
GLOBAL BONDS (continued)Meituan
3.050%, 10/28/2030 $ 204 $ 189Minmetals Bounteous Finance BVI
3.375% (D)(E) 805 826Powerchina Roadbridge Group British Virgin
Islands 3.080% (D)(E) 285 285
Shimao Group Holdings (C)5.600%, 07/15/2026 2,349 1,4455.200%, 01/30/2025 1,406 8724.750%, 07/03/2022 304 218
Sinopec Group Overseas Development 2018 2.700%, 05/13/2030 548 5592.300%, 01/08/2031 2,720 2,680
Sunac China Holdings 7.000%, 07/09/2025 214 1356.500%, 01/26/2026 206 127
Tencent Holdings Ltd MTN 3.240%, 06/03/2050 (A) 450 424
Wanda Properties International 7.250%, 01/29/2024 600 568
Wanda Properties Overseas 6.950%, 12/05/2022 200 1936.875%, 07/23/2023 232 222
87,572
Colombia — 5.4%Colombia Government International Bond
9.850%, 06/28/2027 COP 5,060,000 1,4117.375%, 09/18/2037 $ 1,009 1,1736.125%, 01/18/2041 2,378 2,4485.625%, 02/26/2044 132 1285.200%, 05/15/2049 4,260 3,9095.000%, 06/15/2045 4,204 3,7944.500%, 03/15/2029 3,861 3,9484.375%, 03/21/2023 COP 2,871,000 7014.125%, 02/22/2042 $ 5,113 4,2693.875%, 04/25/2027 1,466 1,4773.875%, 02/15/2061 2,153 1,6583.250%, 04/22/2032 1,726 1,5513.125%, 04/15/2031 794 7123.000%, 01/30/2030 1,457 1,332
Colombian TES 10.000%, 07/24/2024 COP 10,161,700 2,6747.750%, 09/18/2030 12,738,000 3,0517.500%, 08/26/2026 30,160,400 7,3577.250%, 10/18/2034 23,670,100 5,3247.250%, 10/26/2050 4,553,000 9627.000%, 03/26/2031 23,608,300 5,3557.000%, 03/26/2031 1,211,900 2757.000%, 06/30/2032 7,329,100 1,6426.250%, 11/26/2025 25,567,200 6,041
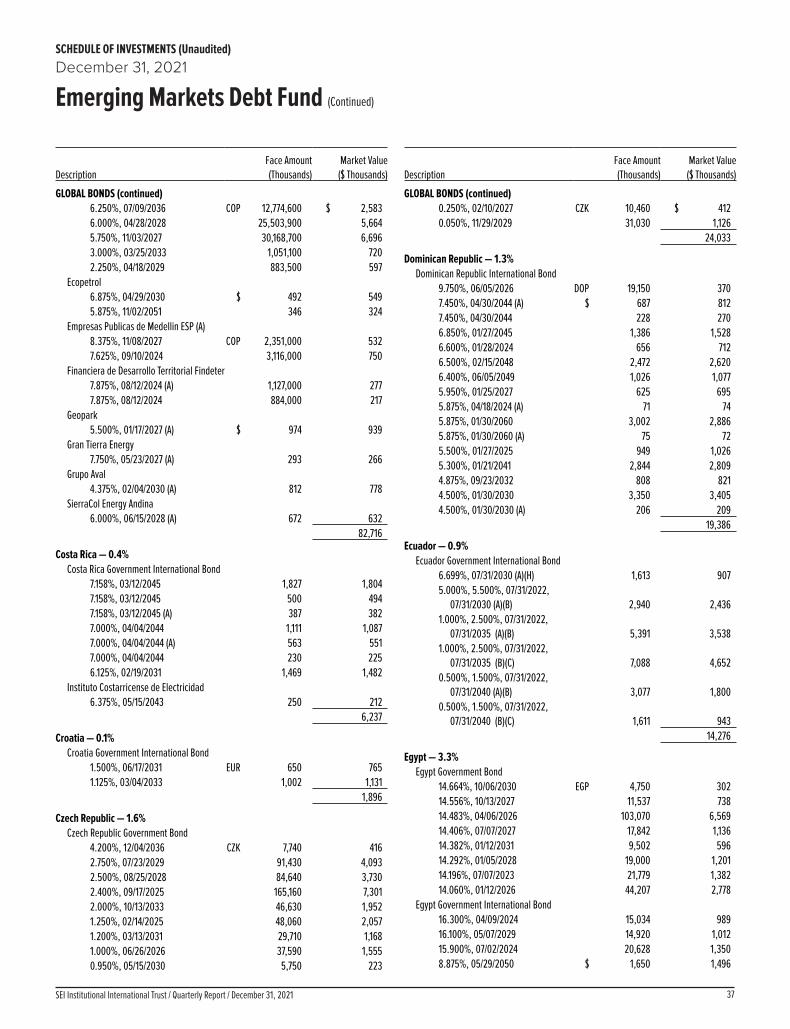
37SEI Institutional International Trust / Quarterly Report / December 31, 2021
SCHEDULE OF INVESTMENTS (Unaudited)December 31, 2021
Emerging Markets Debt Fund (Continued)
DescriptionFace Amount (Thousands)
Market Value ($ Thousands)
GLOBAL BONDS (continued)6.250%, 07/09/2036 COP 12,774,600 $ 2,5836.000%, 04/28/2028 25,503,900 5,6645.750%, 11/03/2027 30,168,700 6,6963.000%, 03/25/2033 1,051,100 7202.250%, 04/18/2029 883,500 597
Ecopetrol 6.875%, 04/29/2030 $ 492 5495.875%, 11/02/2051 346 324
Empresas Publicas de Medellin ESP (A)8.375%, 11/08/2027 COP 2,351,000 5327.625%, 09/10/2024 3,116,000 750
Financiera de Desarrollo Territorial Findeter 7.875%, 08/12/2024 (A) 1,127,000 2777.875%, 08/12/2024 884,000 217
Geopark 5.500%, 01/17/2027 (A) $ 974 939
Gran Tierra Energy 7.750%, 05/23/2027 (A) 293 266
Grupo Aval 4.375%, 02/04/2030 (A) 812 778
SierraCol Energy Andina 6.000%, 06/15/2028 (A) 672 632
82,716
Costa Rica — 0.4%Costa Rica Government International Bond
7.158%, 03/12/2045 1,827 1,8047.158%, 03/12/2045 500 4947.158%, 03/12/2045 (A) 387 3827.000%, 04/04/2044 1,111 1,0877.000%, 04/04/2044 (A) 563 5517.000%, 04/04/2044 230 2256.125%, 02/19/2031 1,469 1,482
Instituto Costarricense de Electricidad 6.375%, 05/15/2043 250 212
6,237
Croatia — 0.1%Croatia Government International Bond
1.500%, 06/17/2031 EUR 650 7651.125%, 03/04/2033 1,002 1,131
1,896
Czech Republic — 1.6%Czech Republic Government Bond
4.200%, 12/04/2036 CZK 7,740 4162.750%, 07/23/2029 91,430 4,0932.500%, 08/25/2028 84,640 3,7302.400%, 09/17/2025 165,160 7,3012.000%, 10/13/2033 46,630 1,9521.250%, 02/14/2025 48,060 2,0571.200%, 03/13/2031 29,710 1,1681.000%, 06/26/2026 37,590 1,5550.950%, 05/15/2030 5,750 223
DescriptionFace Amount (Thousands)
Market Value ($ Thousands)
GLOBAL BONDS (continued)0.250%, 02/10/2027 CZK 10,460 $ 4120.050%, 11/29/2029 31,030 1,126
24,033
Dominican Republic — 1.3%Dominican Republic International Bond
9.750%, 06/05/2026 DOP 19,150 3707.450%, 04/30/2044 (A) $ 687 8127.450%, 04/30/2044 228 2706.850%, 01/27/2045 1,386 1,5286.600%, 01/28/2024 656 7126.500%, 02/15/2048 2,472 2,6206.400%, 06/05/2049 1,026 1,0775.950%, 01/25/2027 625 6955.875%, 04/18/2024 (A) 71 745.875%, 01/30/2060 3,002 2,8865.875%, 01/30/2060 (A) 75 725.500%, 01/27/2025 949 1,0265.300%, 01/21/2041 2,844 2,8094.875%, 09/23/2032 808 8214.500%, 01/30/2030 3,350 3,4054.500%, 01/30/2030 (A) 206 209
19,386
Ecuador — 0.9%Ecuador Government International Bond
6.699%, 07/31/2030 (A)(H) 1,613 9075.000%, 5.500%, 07/31/2022,
07/31/2030 (A)(B) 2,940 2,4361.000%, 2.500%, 07/31/2022,
07/31/2035 (A)(B) 5,391 3,5381.000%, 2.500%, 07/31/2022,
07/31/2035 (B)(C) 7,088 4,6520.500%, 1.500%, 07/31/2022,
07/31/2040 (A)(B) 3,077 1,8000.500%, 1.500%, 07/31/2022,
07/31/2040 (B)(C) 1,611 943 14,276
Egypt — 3.3%Egypt Government Bond
14.664%, 10/06/2030 EGP 4,750 30214.556%, 10/13/2027 11,537 73814.483%, 04/06/2026 103,070 6,56914.406%, 07/07/2027 17,842 1,13614.382%, 01/12/2031 9,502 59614.292%, 01/05/2028 19,000 1,20114.196%, 07/07/2023 21,779 1,38214.060%, 01/12/2026 44,207 2,778
Egypt Government International Bond 16.300%, 04/09/2024 15,034 98916.100%, 05/07/2029 14,920 1,01215.900%, 07/02/2024 20,628 1,3508.875%, 05/29/2050 $ 1,650 1,496

SEI Institutional International Trust / Quarterly Report / December 31, 202138
SCHEDULE OF INVESTMENTS (Unaudited)December 31, 2021
Emerging Markets Debt Fund (Continued)
DescriptionFace Amount (Thousands)
Market Value ($ Thousands)
GLOBAL BONDS (continued)8.875%, 05/29/2050 (A) $ 5,366 $ 4,8648.700%, 03/01/2049 (A) 816 7248.700%, 03/01/2049 600 5327.903%, 02/21/2048 1,316 1,1027.903%, 02/21/2048 (A) 110 927.625%, 05/29/2032 (A) 4,906 4,6397.625%, 05/29/2032 4,332 4,096
Egypt Government International Bond MTN 8.500%, 01/31/2047 2,970 2,6288.150%, 11/20/2059 (A) 406 3468.150%, 11/20/2059 277 2367.600%, 03/01/2029 200 1987.500%, 02/16/2061 565 4617.300%, 09/30/2033 (A) 1,953 1,7977.300%, 09/30/2033 647 5957.053%, 01/15/2032 (A) 547 5046.375%, 04/11/2031 EUR 1,650 1,7326.375%, 04/11/2031 (A) 872 9166.125%, 01/31/2022 (A) $ 385 3875.800%, 09/30/2027 (A) 498 4785.625%, 04/16/2030 EUR 732 7514.750%, 04/11/2025 457 5154.750%, 04/11/2025 (A) 443 4994.750%, 04/16/2026 670 735
Egypt Treasury Bills 13.412%, 01/11/2022 (H) EGP 21,625 1,374
49,750
El Salvador — 0.4%El Salvador Government International Bond
9.500%, 07/15/2052 $ 3,953 2,4518.625%, 02/28/2029 249 1538.250%, 04/10/2032 459 2817.750%, 01/24/2023 1,630 1,3047.650%, 06/15/2035 (A) 149 847.625%, 02/01/2041 (A) 545 3087.625%, 02/01/2041 527 2987.125%, 01/20/2050 640 3506.375%, 01/18/2027 (A) 256 1555.875%, 01/30/2025 1,398 8815.875%, 01/30/2025 (A) 93 59
6,324
Ethiopia — 0.0%Ethiopia International Bond
6.625%, 12/11/2024 400 268Federal Democratic Republic of Ethiopia
6.625%, 12/11/2024 (A) 296 198 466
Gabon — 0.2%Gabon Government International Bond
7.000%, 11/24/2031 (A)(C) 1,846 1,805
DescriptionFace Amount (Thousands)
Market Value ($ Thousands)
GLOBAL BONDS (continued)6.375%, 12/12/2024 $ 415 $ 428
2,233
Georgia — 0.1%Georgia Government International Bond
2.750%, 04/22/2026 (A) 499 4962.750%, 04/22/2026 480 478
974
Ghana — 1.2%Ghana Government International Bond
10.750%, 10/14/2030 3,054 3,4148.950%, 03/26/2051 (A) 235 1888.875%, 05/07/2042 (A) 426 3458.875%, 05/07/2042 1,286 1,0408.750%, 03/11/2061 693 5488.750%, 03/11/2061 (A) 77 618.627%, 06/16/2049 (A) 593 4698.625%, 04/07/2034 2,648 2,1488.125%, 03/26/2032 (A) 160 1317.875%, 03/26/2027 (A) 653 5737.875%, 02/11/2035 1,114 8727.875%, 02/11/2035 (A) 1,956 1,5327.750%, 04/07/2029 870 7277.750%, 04/07/2029 (A) 413 3457.625%, 05/16/2029 (A) 908 7567.625%, 05/16/2029 995 8286.375%, 02/11/2027 (A) 451 3806.375%, 02/11/2027 1,616 1,361
Republic of Ghana 8.125%, 01/18/2026 (A) 204 188
Republic of Ghana Government Bonds 20.750%, 03/06/2023 GHS 1,920 31519.250%, 12/18/2023 5,450 872
Tullow Oil (A)10.250%, 05/15/2026 $ 351 3557.000%, 03/01/2025 1,241 1,013
18,461
Guatemala — 0.3%Guatemala Government Bond
6.125%, 06/01/2050 168 1925.375%, 04/24/2032 498 5554.900%, 06/01/2030 1,501 1,6164.650%, 10/07/2041 (A) 845 8444.650%, 10/07/2041 210 2104.500%, 05/03/2026 649 6833.700%, 10/07/2033 500 4933.700%, 10/07/2033 (A) 226 223
4,816
Honduras — 0.0%Honduras Government International Bond
6.250%, 01/19/2027 326 352
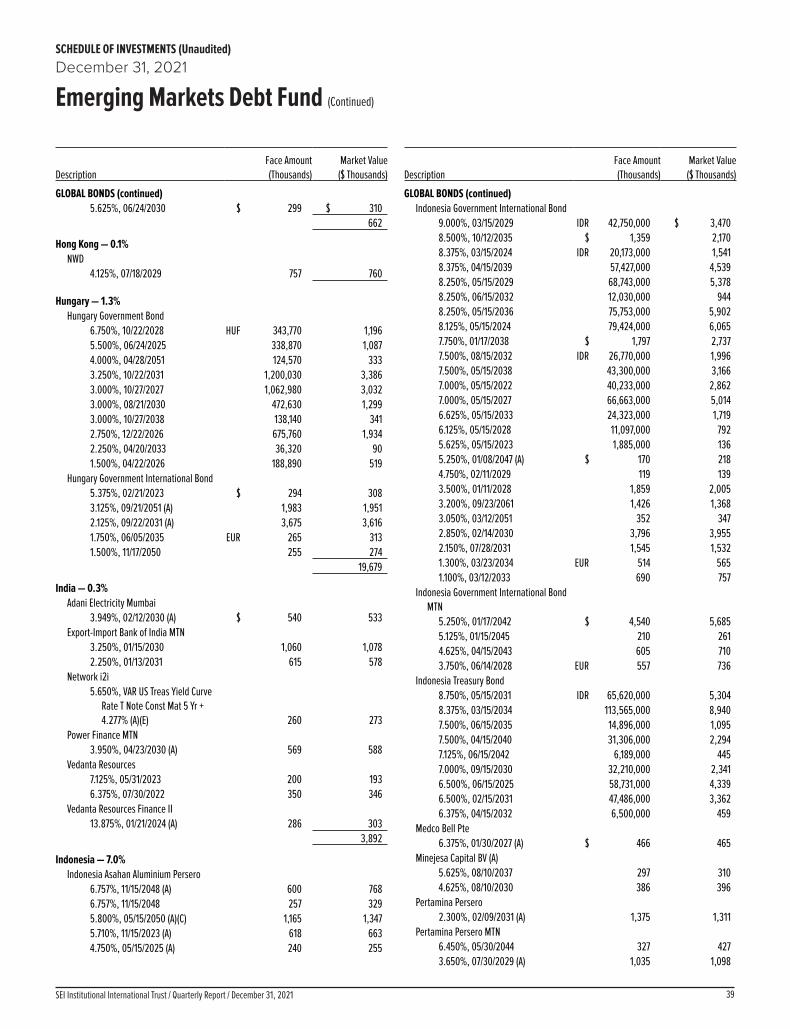
39SEI Institutional International Trust / Quarterly Report / December 31, 2021
SCHEDULE OF INVESTMENTS (Unaudited)December 31, 2021
Emerging Markets Debt Fund (Continued)
DescriptionFace Amount (Thousands)
Market Value ($ Thousands)
GLOBAL BONDS (continued)5.625%, 06/24/2030 $ 299 $ 310
662
Hong Kong — 0.1%NWD
4.125%, 07/18/2029 757 760
Hungary — 1.3%Hungary Government Bond
6.750%, 10/22/2028 HUF 343,770 1,1965.500%, 06/24/2025 338,870 1,0874.000%, 04/28/2051 124,570 3333.250%, 10/22/2031 1,200,030 3,3863.000%, 10/27/2027 1,062,980 3,0323.000%, 08/21/2030 472,630 1,2993.000%, 10/27/2038 138,140 3412.750%, 12/22/2026 675,760 1,9342.250%, 04/20/2033 36,320 901.500%, 04/22/2026 188,890 519
Hungary Government International Bond 5.375%, 02/21/2023 $ 294 3083.125%, 09/21/2051 (A) 1,983 1,9512.125%, 09/22/2031 (A) 3,675 3,6161.750%, 06/05/2035 EUR 265 3131.500%, 11/17/2050 255 274
19,679
India — 0.3%Adani Electricity Mumbai
3.949%, 02/12/2030 (A) $ 540 533Export-Import Bank of India MTN
3.250%, 01/15/2030 1,060 1,0782.250%, 01/13/2031 615 578
Network i2i 5.650%, VAR US Treas Yield Curve
Rate T Note Const Mat 5 Yr + 4.277% (A)(E) 260 273
Power Finance MTN 3.950%, 04/23/2030 (A) 569 588
Vedanta Resources 7.125%, 05/31/2023 200 1936.375%, 07/30/2022 350 346
Vedanta Resources Finance II 13.875%, 01/21/2024 (A) 286 303
3,892
Indonesia — 7.0%Indonesia Asahan Aluminium Persero
6.757%, 11/15/2048 (A) 600 7686.757%, 11/15/2048 257 3295.800%, 05/15/2050 (A)(C) 1,165 1,3475.710%, 11/15/2023 (A) 618 6634.750%, 05/15/2025 (A) 240 255
DescriptionFace Amount (Thousands)
Market Value ($ Thousands)
GLOBAL BONDS (continued)Indonesia Government International Bond
9.000%, 03/15/2029 IDR 42,750,000 $ 3,4708.500%, 10/12/2035 $ 1,359 2,1708.375%, 03/15/2024 IDR 20,173,000 1,5418.375%, 04/15/2039 57,427,000 4,5398.250%, 05/15/2029 68,743,000 5,3788.250%, 06/15/2032 12,030,000 9448.250%, 05/15/2036 75,753,000 5,9028.125%, 05/15/2024 79,424,000 6,0657.750%, 01/17/2038 $ 1,797 2,7377.500%, 08/15/2032 IDR 26,770,000 1,9967.500%, 05/15/2038 43,300,000 3,1667.000%, 05/15/2022 40,233,000 2,8627.000%, 05/15/2027 66,663,000 5,0146.625%, 05/15/2033 24,323,000 1,7196.125%, 05/15/2028 11,097,000 7925.625%, 05/15/2023 1,885,000 1365.250%, 01/08/2047 (A) $ 170 2184.750%, 02/11/2029 119 1393.500%, 01/11/2028 1,859 2,0053.200%, 09/23/2061 1,426 1,3683.050%, 03/12/2051 352 3472.850%, 02/14/2030 3,796 3,9552.150%, 07/28/2031 1,545 1,5321.300%, 03/23/2034 EUR 514 5651.100%, 03/12/2033 690 757
Indonesia Government International Bond MTN
5.250%, 01/17/2042 $ 4,540 5,6855.125%, 01/15/2045 210 2614.625%, 04/15/2043 605 7103.750%, 06/14/2028 EUR 557 736
Indonesia Treasury Bond 8.750%, 05/15/2031 IDR 65,620,000 5,3048.375%, 03/15/2034 113,565,000 8,9407.500%, 06/15/2035 14,896,000 1,0957.500%, 04/15/2040 31,306,000 2,2947.125%, 06/15/2042 6,189,000 4457.000%, 09/15/2030 32,210,000 2,3416.500%, 06/15/2025 58,731,000 4,3396.500%, 02/15/2031 47,486,000 3,3626.375%, 04/15/2032 6,500,000 459
Medco Bell Pte 6.375%, 01/30/2027 (A) $ 466 465
Minejesa Capital BV (A)5.625%, 08/10/2037 297 3104.625%, 08/10/2030 386 396
Pertamina Persero 2.300%, 02/09/2031 (A) 1,375 1,311
Pertamina Persero MTN 6.450%, 05/30/2044 327 4273.650%, 07/30/2029 (A) 1,035 1,098

SEI Institutional International Trust / Quarterly Report / December 31, 202140
SCHEDULE OF INVESTMENTS (Unaudited)December 31, 2021
Emerging Markets Debt Fund (Continued)
DescriptionFace Amount (Thousands)
Market Value ($ Thousands)
GLOBAL BONDS (continued)Perusahaan Listrik Negara
1.875%, 11/05/2031 (A) EUR 691 $ 754Perusahaan Listrik Negara MTN
6.150%, 05/21/2048 (A) $ 657 8116.150%, 05/21/2048 250 3084.375%, 02/05/2050 (A) 265 268
Perusahaan Penerbit SBSN Indonesia III 4.325%, 05/28/2025 1,673 1,831
Perusahaan Perseroan Persero Perusahaan Listrik Negara MTN
3.000%, 06/30/2030 565 561 107,190
Iraq — 0.1%Iraq International Bond
5.800%, 01/15/2028 1,340 1,280
Israel — 0.3%Bank Leumi Le-Israel
3.275%, VAR US Treas Yield Curve Rate T Note Const Mat 5 Yr + 1.631%, 01/29/2031 (A) 431 432
Bank of Israel Bill - Makam 0.000%, 02/02/2022 (H) ILS 8,000 2,570
Leviathan Bond 6.750%, 06/30/2030 (A) $ 394 423
State of Israel 4.500%, 04/03/2120 1,200 1,526
4,951
Ivory Coast — 0.4%Ivory Coast Government International Bond
6.875%, 10/17/2040 EUR 1,169 1,3866.625%, 03/22/2048 481 5436.625%, 03/22/2048 2,849 3,2135.875%, 10/17/2031 (A) 205 2395.750%, 12/31/2032 $ 417 4185.250%, 03/22/2030 EUR 321 372
6,171
Jamaica — 0.1%Digicel International Finance (A)
8.750%, 05/25/2024 $ 530 5448.750%, 05/25/2024 435 446
990
Jordan — 0.2%Jordan Government International Bond
7.375%, 10/10/2047 1,237 1,2497.375%, 10/10/2047 (A) 228 2305.850%, 07/07/2030 (A) 1,227 1,2394.950%, 07/07/2025 270 279
2,997
DescriptionFace Amount (Thousands)
Market Value ($ Thousands)
GLOBAL BONDS (continued)Kazakhstan — 1.5%
Development Bank of Kazakhstan JSC 4.125%, 12/10/2022 $ 770 $ 7872.950%, 05/06/2031 530 5262.950%, 05/06/2031 (A) 465 462
Kazakhstan Government International Bond 4.875%, 10/14/2044 510 6264.875%, 10/14/2044 (A) 318 391
KazMunayGas National JSC 6.375%, 10/24/2048 (A) 1,746 2,2916.375%, 10/24/2048 200 2625.750%, 04/19/2047 (A) 2,996 3,6585.750%, 04/19/2047 63 775.375%, 04/24/2030 (A) 984 1,1475.375%, 04/24/2030 4,663 5,4353.500%, 04/14/2033 1,832 1,898
KazTransGas JSC 4.375%, 09/26/2027 1,205 1,3104.375%, 09/26/2027 (A) 165 179
National Bank of Kazakhstan Notes 9.068%, 03/25/2022 (H) KZT 1,029,759 2,324
Tengizchevroil Finance International 3.250%, 08/15/2030 (A) $ 450 4492.625%, 08/15/2025 1,071 1,073
22,895
Kenya — 0.2%Kenya Government International Bond
8.250%, 02/28/2048 1,838 1,8657.000%, 05/22/2027 1,394 1,470
3,335
Kuwait — 0.1%Meglobal Canada ULC MTN
5.875%, 05/18/2030 (A) 222 269NBK SPC
1.625%, VAR United States Secured Overnight Financing Rate + 1.050%, 09/15/2027 (A) 680 662
NBK Tier 1 Financing 2 4.500%, VAR USD Swap Semi 30/360
6 Yr Curr + 2.832% (A)(E) 513 523 1,454
Lebanon — 0.2%Lebanon Government International Bond
8.250%, 05/17/2034 (F) 7,412 7318.200%, 05/17/2033 (F) 2,700 2676.650%, 04/22/2024 (F) 2,250 2366.000%, 01/27/2023 (F) 560 58
Lebanon Government International Bond MTN
8.250%, 04/12/2021 (F) 1,073 1107.000%, 03/20/2028 (F) 2,048 202

41SEI Institutional International Trust / Quarterly Report / December 31, 2021
SCHEDULE OF INVESTMENTS (Unaudited)December 31, 2021
Emerging Markets Debt Fund (Continued)
DescriptionFace Amount (Thousands)
Market Value ($ Thousands)
GLOBAL BONDS (continued)6.850%, 05/25/2029 (F) $ 387 $ 416.650%, 02/26/2030 (F) 3,095 3186.600%, 11/27/2026 (F) 1,613 1696.400%, 05/26/2023 (F) 1,555 1636.375%, 03/09/2020 (F) 2,750 2826.100%, 10/04/2022 (F) 3,174 3246.100%, 10/04/2022 (F) 569 58
2,959
Luxembourg — 0.0%Millicom International Cellular
6.250%, 03/25/2029 (A) 403 438
Macau — 0.0%Studio City Finance (A)
6.500%, 01/15/2028 371 3566.000%, 07/15/2025 87 85
441
Macedonia — 0.0%North Macedonia Government International
Bond 1.625%, 03/10/2028 EUR 150 160
Malaysia — 6.3%1MDB Energy
5.990%, 05/11/2022 $ 1,000 1,0101MDB Global Investments
4.400%, 03/09/2023 4,000 4,0384.400%, 03/09/2023 7,400 7,470
Malaysia Government Bond 5.248%, 09/15/2028 MYR 1,517 4034.935%, 09/30/2043 2,200 5774.921%, 07/06/2048 1,768 4624.642%, 11/07/2033 500 1294.392%, 04/15/2026 3,480 8784.254%, 05/31/2035 14,851 3,6844.232%, 06/30/2031 1,200 3014.181%, 07/15/2024 20,513 5,0834.065%, 06/15/2050 3,119 7314.059%, 09/30/2024 8,576 2,1223.955%, 09/15/2025 31,181 7,7253.906%, 07/15/2026 17,274 4,2803.900%, 11/30/2026 2,806 6963.899%, 11/16/2027 3,026 7493.885%, 08/15/2029 25,868 6,3393.882%, 03/10/2022 (C) 4,459 1,0743.828%, 07/05/2034 32,019 7,6463.800%, 08/17/2023 31,953 7,8383.795%, 09/30/2022 3,200 7783.757%, 04/20/2023 14,611 3,5703.757%, 05/22/2040 15,199 3,4813.733%, 06/15/2028 19,541 4,776
DescriptionFace Amount (Thousands)
Market Value ($ Thousands)
GLOBAL BONDS (continued)3.502%, 05/31/2027 MYR 7,185 $ 1,7483.480%, 03/15/2023 9,914 2,4163.478%, 06/14/2024 6,671 1,6263.418%, 08/15/2022 10,450 2,5292.632%, 04/15/2031 15,166 3,363
Malaysia Government Investment Issue 4.369%, 10/31/2028 1,200 3044.119%, 11/30/2034 5,564 1,3604.070%, 09/30/2026 6,500 1,616
Malaysia Wakala Sukuk 2.070%, 04/28/2031 $ 1,230 1,227
Petronas Capital MTN 4.550%, 04/21/2050 1,401 1,7303.500%, 04/21/2030 819 8852.480%, 01/28/2032 1,466 1,470
96,114
Mexico — 7.5%America Movil
7.125%, 12/09/2024 MXN 18,110 861Banco Mercantil del Norte (A)(E)
7.500%, VAR US Treas Yield Curve Rate T Note Const Mat 10 Yr + 5.470% $ 476 507
6.750%, VAR US Treas Yield Curve Rate T Note Const Mat 5 Yr + 4.967% 609 631
Banco Nacional de Comercio Exterior SNC 2.720%, VAR US Treas Yield Curve
Rate T Note Const Mat 5 Yr + 2.000%, 08/11/2031 (A) 1,191 1,176
Cemex (A)5.450%, 11/19/2029 750 8035.125%, VAR US Treas Yield Curve
Rate T Note Const Mat 5 Yr + 4.534% (E) 200 207
3.875%, 07/11/2031 572 570Comision Federal de Electricidad
7.350%, 11/25/2025 MXN 39,785 1,8465.750%, 02/14/2042 (A) $ 500 5454.750%, 02/23/2027 (A) 258 2853.348%, 02/09/2031 (A)(C) 391 383
FEL Energy VI Sarl 5.750%, 12/01/2040 (A) 191 191
Mexican Bonos 8.000%, 11/07/2047 MXN 63,171 3,0597.750%, 11/13/2042 126,957 6,0207.500%, 06/03/2027 (C) 172,700 8,4615.750%, 03/05/2026 48,685 2,242
Mexican Bonos, Ser M20 10.000%, 12/05/2024 168,804 8,8358.500%, 05/31/2029 96,220 4,9748.000%, 12/07/2023 3,082 153

SEI Institutional International Trust / Quarterly Report / December 31, 202142
SCHEDULE OF INVESTMENTS (Unaudited)December 31, 2021
Emerging Markets Debt Fund (Continued)
DescriptionFace Amount (Thousands)
Market Value ($ Thousands)
GLOBAL BONDS (continued)7.750%, 05/29/2031 MXN 69,748 $ 3,445
Mexican Bonos, Ser M30 8.500%, 11/18/2038 198,504 10,207
Mexican Udibonos 4.500%, 12/04/2025 102,518 5,3993.500%, 11/16/2023 66,254 3,299
Mexico City Airport Trust 5.500%, 07/31/2047 (A) $ 715 716
Mexico Government International Bond 4.600%, 02/10/2048 394 4204.350%, 01/15/2047 656 6814.280%, 08/14/2041 1,402 1,4533.771%, 05/24/2061 434 4003.750%, 04/19/2071 959 8622.659%, 05/24/2031 3,192 3,112
Mexico Government International Bond MTN
5.750%, 10/12/2110 2,756 3,1614.750%, 03/08/2044 1,672 1,820
Minera Mexico 4.500%, 01/26/2050 (A) 627 685
Petroleos Mexicanos 9.500%, 09/15/2027 280 3299.500%, 09/15/2027 169 1997.690%, 01/23/2050 4,994 4,8197.690%, 01/23/2050 (A) 427 4127.470%, 11/12/2026 MXN 15,660 6917.190%, 09/12/2024 45,182 2,0976.950%, 01/28/2060 (A) $ 308 2756.950%, 01/28/2060 159 1426.875%, 10/16/2025 1,167 1,2756.840%, 01/23/2030 2,693 2,7866.700%, 02/16/2032 (A) 1,054 1,0656.625%, 06/15/2035 5,196 4,9926.500%, 01/23/2029 (A) 785 8146.500%, 06/02/2041 1,540 1,3826.350%, 02/12/2048 678 5806.350%, 02/12/2048 (A) 430 3686.350%, 02/12/2048 981 8405.950%, 01/28/2031 (A) 540 5255.950%, 01/28/2031 1,490 1,4485.625%, 01/23/2046 253 2085.350%, 02/12/2028 (A) 279 2775.350%, 02/12/2028 201 200
Petroleos Mexicanos MTN 6.875%, 08/04/2026 713 7846.750%, 09/21/2047 5,767 5,1186.750%, 09/21/2047 553 4914.875%, 02/21/2028 EUR 755 858
DescriptionFace Amount (Thousands)
Market Value ($ Thousands)
GLOBAL BONDS (continued)Poinsettia Finance
6.625%, 06/17/2031 $ 4,600 $ 4,528 114,912
Mongolia — 0.3%Development Bank of Mongolia
7.250%, 10/23/2023 (A) 784 825Mongolia Government International Bond
5.125%, 04/07/2026 381 3903.500%, 07/07/2027 1,324 1,246
Mongolia Government International Bond MTN
8.750%, 03/09/2024 2,351 2,592 5,053
Morocco — 0.3%Morocco Government International Bond
5.500%, 12/11/2042 750 8274.000%, 12/15/2050 1,049 9513.000%, 12/15/2032 1,269 1,2092.375%, 12/15/2027 745 726
OCP 3.750%, 06/23/2031 (A) 202 196
3,909
Mozambique — 0.1%Mozambique International Bond
5.000%, 9.000%, 09/15/2023, 09/15/2031 (A)(B) 1,839 1,553
5.000%, 09/15/2031 200 169 1,722
Netherlands — 0.0%VEON Holdings BV
3.375%, 11/25/2027 (A) 549 536
Nigeria — 1.0%IHS Netherlands Holdco
8.000%, 09/18/2027 (A) 299 316Nigeria Government International Bond
9.248%, 01/21/2049 322 3278.747%, 01/21/2031 (A) 335 3518.747%, 01/21/2031 60 637.875%, 02/16/2032 4,165 4,0967.875%, 02/16/2032 (A) 495 4877.696%, 02/23/2038 2,902 2,6797.696%, 02/23/2038 (A) 601 555
Nigeria Government International Bond MTN
8.250%, 09/28/2051 (A) 2,759 2,5807.375%, 09/28/2033 1,982 1,8867.375%, 09/28/2033 (A) 336 3206.500%, 11/28/2027 (A) 667 6656.500%, 11/28/2027 130 129

43SEI Institutional International Trust / Quarterly Report / December 31, 2021
SCHEDULE OF INVESTMENTS (Unaudited)December 31, 2021
Emerging Markets Debt Fund (Continued)
DescriptionFace Amount (Thousands)
Market Value ($ Thousands)
GLOBAL BONDS (continued)6.125%, 09/28/2028 $ 665 $ 641
15,095
Oman — 1.0%Oman Government International Bond
7.375%, 10/28/2032 (A) 701 8177.000%, 01/25/2051 (A) 448 4687.000%, 01/25/2051 200 2096.750%, 10/28/2027 3,535 3,9596.750%, 01/17/2048 3,609 3,6676.750%, 01/17/2048 (A) 1,089 1,1066.250%, 01/25/2031 1,143 1,2496.250%, 01/25/2031 (A) 954 1,0424.750%, 06/15/2026 900 926
Oman Government International Bond MTN 6.000%, 08/01/2029 (A) 1,051 1,1316.000%, 08/01/2029 392 4224.875%, 02/01/2025 (A) 449 467
15,463
Pakistan — 0.4%Pakistan Government International Bond
8.250%, 09/30/2025 1,000 1,0807.875%, 03/31/2036 200 1936.875%, 12/05/2027 749 755
Pakistan Government International Bond MTN
8.875%, 04/08/2051 938 9316.000%, 04/08/2026 2,241 2,2376.000%, 04/08/2026 (A) 462 461
5,657
Panama — 1.3%Aeropuerto Internacional de Tocumen
5.125%, 08/11/2061 (A) 311 325AES Panama Generation Holdings SRL
4.375%, 05/31/2030 (A) 492 512Banco Nacional de Panama
2.500%, 08/11/2030 (A) 791 741Cable Onda
4.500%, 01/30/2030 (A) 208 213Empresa de Transmision Electrica
5.125%, 05/02/2049 (A) 635 701Panama Bonos del Tesoro
3.362%, 06/30/2031 548 551Panama Government International Bond
4.500%, 04/16/2050 534 5882.252%, 09/29/2032 7,627 7,236
Republic of Panama 9.375%, 04/01/2029 804 1,1528.125%, 04/28/2034 478 7054.500%, 04/01/2056 1,710 1,8844.300%, 04/29/2053 200 2153.870%, 07/23/2060 2,230 2,230
DescriptionFace Amount (Thousands)
Market Value ($ Thousands)
GLOBAL BONDS (continued)3.750%, 03/16/2025 $ 859 $ 9103.160%, 01/23/2030 1,762 1,824
19,787
Papua New Guinea — 0.0%Papua New Guinea Government
International Bond 8.375%, 10/04/2028 282 2848.375%, 10/04/2028 (A) 275 276
560
Paraguay — 0.4%Bioceanico Sovereign Certificate Ltd
2.471%, 06/05/2034 (H) 1,666 1,250Paraguay Government International Bond
6.100%, 08/11/2044 1,260 1,5485.400%, 03/30/2050 571 6524.950%, 04/28/2031 880 9882.739%, 01/29/2033 1,074 1,034
5,472
Peru — 2.5%ABY Transmision Sur
6.875%, 04/30/2043 (A) 261 337Fondo MIVIVIENDA
7.000%, 02/14/2024 (A) PEN 3,704 955Inkia Energy
5.875%, 11/09/2027 (A) $ 359 368Kallpa Generacion (A)
4.875%, 05/24/2026 263 2784.125%, 08/16/2027 936 969
Peruvian Government International Bond 8.750%, 11/21/2033 490 7638.200%, 08/12/2026 PEN 15 48.200%, 08/12/2026 3,397 9706.950%, 08/12/2031 2,780 7466.950%, 08/12/2031 154 416.950%, 08/12/2031 15,522 4,1686.900%, 08/12/2037 5,815 1,4816.850%, 02/12/2042 613 1546.350%, 08/12/2028 5,940 1,5656.350%, 08/12/2028 2,615 6896.150%, 08/12/2032 8,708 2,1895.940%, 02/12/2029 3,050 7825.700%, 08/12/2024 (A) 4,932 1,2775.400%, 08/12/2034 7,443 1,6995.400%, 08/12/2034 1,243 2845.350%, 08/12/2040 708 1515.200%, 09/12/2023 800 2053.750%, 03/01/2030 EUR 200 2693.230%, 07/28/2121 $ 2,746 2,3563.000%, 01/15/2034 1,046 1,0422.844%, 06/20/2030 173 1752.783%, 01/23/2031 3,876 3,857
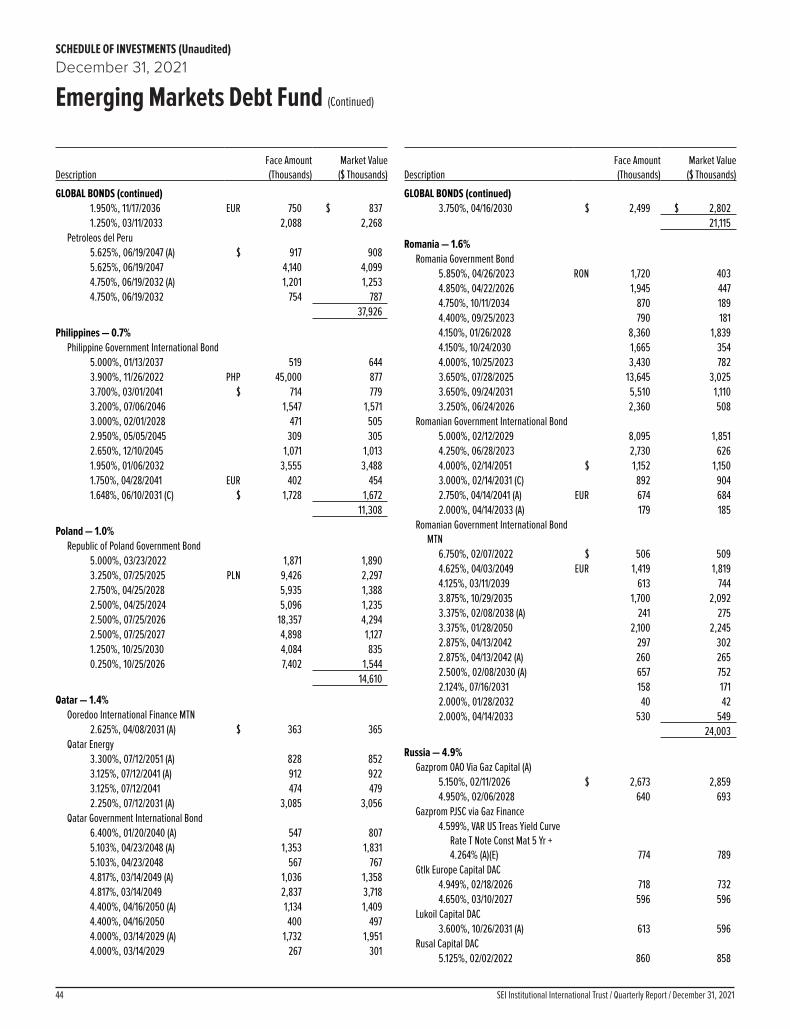
SEI Institutional International Trust / Quarterly Report / December 31, 202144
SCHEDULE OF INVESTMENTS (Unaudited)December 31, 2021
Emerging Markets Debt Fund (Continued)
DescriptionFace Amount (Thousands)
Market Value ($ Thousands)
GLOBAL BONDS (continued)1.950%, 11/17/2036 EUR 750 $ 8371.250%, 03/11/2033 2,088 2,268
Petroleos del Peru 5.625%, 06/19/2047 (A) $ 917 9085.625%, 06/19/2047 4,140 4,0994.750%, 06/19/2032 (A) 1,201 1,2534.750%, 06/19/2032 754 787
37,926
Philippines — 0.7%Philippine Government International Bond
5.000%, 01/13/2037 519 6443.900%, 11/26/2022 PHP 45,000 8773.700%, 03/01/2041 $ 714 7793.200%, 07/06/2046 1,547 1,5713.000%, 02/01/2028 471 5052.950%, 05/05/2045 309 3052.650%, 12/10/2045 1,071 1,0131.950%, 01/06/2032 3,555 3,4881.750%, 04/28/2041 EUR 402 4541.648%, 06/10/2031 (C) $ 1,728 1,672
11,308
Poland — 1.0%Republic of Poland Government Bond
5.000%, 03/23/2022 1,871 1,8903.250%, 07/25/2025 PLN 9,426 2,2972.750%, 04/25/2028 5,935 1,3882.500%, 04/25/2024 5,096 1,2352.500%, 07/25/2026 18,357 4,2942.500%, 07/25/2027 4,898 1,1271.250%, 10/25/2030 4,084 8350.250%, 10/25/2026 7,402 1,544
14,610
Qatar — 1.4%Ooredoo International Finance MTN
2.625%, 04/08/2031 (A) $ 363 365Qatar Energy
3.300%, 07/12/2051 (A) 828 8523.125%, 07/12/2041 (A) 912 9223.125%, 07/12/2041 474 4792.250%, 07/12/2031 (A) 3,085 3,056
Qatar Government International Bond 6.400%, 01/20/2040 (A) 547 8075.103%, 04/23/2048 (A) 1,353 1,8315.103%, 04/23/2048 567 7674.817%, 03/14/2049 (A) 1,036 1,3584.817%, 03/14/2049 2,837 3,7184.400%, 04/16/2050 (A) 1,134 1,4094.400%, 04/16/2050 400 4974.000%, 03/14/2029 (A) 1,732 1,9514.000%, 03/14/2029 267 301
DescriptionFace Amount (Thousands)
Market Value ($ Thousands)
GLOBAL BONDS (continued)3.750%, 04/16/2030 $ 2,499 $ 2,802
21,115
Romania — 1.6%Romania Government Bond
5.850%, 04/26/2023 RON 1,720 4034.850%, 04/22/2026 1,945 4474.750%, 10/11/2034 870 1894.400%, 09/25/2023 790 1814.150%, 01/26/2028 8,360 1,8394.150%, 10/24/2030 1,665 3544.000%, 10/25/2023 3,430 7823.650%, 07/28/2025 13,645 3,0253.650%, 09/24/2031 5,510 1,1103.250%, 06/24/2026 2,360 508
Romanian Government International Bond 5.000%, 02/12/2029 8,095 1,8514.250%, 06/28/2023 2,730 6264.000%, 02/14/2051 $ 1,152 1,1503.000%, 02/14/2031 (C) 892 9042.750%, 04/14/2041 (A) EUR 674 6842.000%, 04/14/2033 (A) 179 185
Romanian Government International Bond MTN
6.750%, 02/07/2022 $ 506 5094.625%, 04/03/2049 EUR 1,419 1,8194.125%, 03/11/2039 613 7443.875%, 10/29/2035 1,700 2,0923.375%, 02/08/2038 (A) 241 2753.375%, 01/28/2050 2,100 2,2452.875%, 04/13/2042 297 3022.875%, 04/13/2042 (A) 260 2652.500%, 02/08/2030 (A) 657 7522.124%, 07/16/2031 158 1712.000%, 01/28/2032 40 422.000%, 04/14/2033 530 549
24,003
Russia — 4.9%Gazprom OAO Via Gaz Capital (A)
5.150%, 02/11/2026 $ 2,673 2,8594.950%, 02/06/2028 640 693
Gazprom PJSC via Gaz Finance 4.599%, VAR US Treas Yield Curve
Rate T Note Const Mat 5 Yr + 4.264% (A)(E) 774 789
Gtlk Europe Capital DAC 4.949%, 02/18/2026 718 7324.650%, 03/10/2027 596 596
Lukoil Capital DAC 3.600%, 10/26/2031 (A) 613 596
Rusal Capital DAC 5.125%, 02/02/2022 860 858

45SEI Institutional International Trust / Quarterly Report / December 31, 2021
SCHEDULE OF INVESTMENTS (Unaudited)December 31, 2021
Emerging Markets Debt Fund (Continued)
DescriptionFace Amount (Thousands)
Market Value ($ Thousands)
GLOBAL BONDS (continued)Russian Federal Bond - OFZ
8.500%, 09/17/2031 RUB 128,684 $ 1,7468.150%, 02/03/2027 821,910 10,9057.950%, 10/07/2026 267,449 3,5197.750%, 09/16/2026 111,491 1,4567.700%, 03/23/2033 151,607 1,9467.700%, 03/16/2039 113,075 1,4347.650%, 04/10/2030 7,375 957.250%, 05/10/2034 100,213 1,2377.100%, 10/16/2024 41,950 5457.050%, 01/19/2028 527,737 6,6147.000%, 08/16/2023 53,118 6957.000%, 07/30/2036 86,250 1,0286.900%, 05/23/2029 143,960 1,7766.900%, 07/23/2031 378,884 4,6046.700%, 03/14/2029 448,334 5,4556.100%, 07/18/2035 80,580 8886.000%, 10/06/2027 16,284 1944.500%, 07/16/2025 593,849 7,032
Russian Federal Inflation Linked Bond 2.500%, 07/17/2030 29,487 378
Russian Foreign Bond - Eurobond 7.500%, 03/31/2030 $ 1 15.250%, 06/23/2047 1,000 1,2655.100%, 03/28/2035 5,200 6,1304.375%, 03/21/2029 (C) 7,600 8,366
Vnesheconombank Via VEB Finance 6.800%, 11/22/2025 580 6616.800%, 11/22/2025 (A) 150 171
75,264
Saudi Arabia — 1.6%Global Sukuk
1.602%, 06/17/2026 1,680 1,653KSA Sukuk
2.250%, 05/17/2031 (A) 1,716 1,700Saudi Arabian Oil MTN
4.250%, 04/16/2039 (A) 920 1,0374.250%, 04/16/2039 160 180
Saudi Government International Bond 5.250%, 01/16/2050 (A) 1,087 1,4315.250%, 01/16/2050 680 8954.375%, 04/16/2029 (A) 1,844 2,115
Saudi Government International Bond MTN 5.000%, 04/17/2049 (A) 200 2544.625%, 10/04/2047 (A) 390 4674.500%, 04/17/2030 (A) 463 5394.500%, 10/26/2046 580 6804.500%, 10/26/2046 (A) 663 7774.000%, 04/17/2025 2,038 2,1953.450%, 02/02/2061 1,302 1,3143.250%, 10/26/2026 (A) 1,497 1,594
DescriptionFace Amount (Thousands)
Market Value ($ Thousands)
GLOBAL BONDS (continued)3.250%, 10/22/2030 (A) $ 1,725 $ 1,8533.250%, 10/22/2030 1,258 1,3513.250%, 11/17/2051 (A) 1,380 1,3592.250%, 02/02/2033 (A) 2,954 2,879
24,273
Senegal — 0.2%Senegal Government International Bond
6.750%, 03/13/2048 1,666 1,6325.375%, 06/08/2037 EUR 368 3965.375%, 06/08/2037 (A) 152 1644.750%, 03/13/2028 (A) 113 130
2,322
Serbia — 0.3%Serbia International Bond
3.125%, 05/15/2027 320 3882.125%, 12/01/2030 $ 917 8581.650%, 03/03/2033 EUR 270 2851.500%, 06/26/2029 903 990
Serbia International Bond MTN 2.050%, 09/23/2036 1,141 1,185
Serbia Treasury Bonds 5.875%, 02/08/2028 RSD 38,770 4134.500%, 01/11/2026 27,640 276
4,395
South Africa — 5.2%Bidvest Group UK PLC
3.625%, 09/23/2026 (A) $ 344 342Eskom Holdings SOC
7.125%, 02/11/2025 (A) 2,948 3,0444.314%, 07/23/2027 453 445
Eskom Holdings SOC MTN 8.450%, 08/10/2028 (A) 619 6667.500%, 09/15/2033 ZAR 35,200 1,6636.750%, 08/06/2023 (A) $ 1,063 1,0916.750%, 08/06/2023 846 868
Republic of South Africa 10.500%, 12/21/2026 ZAR 107,533 7,4529.000%, 01/31/2040 62,829 3,4088.875%, 02/28/2035 120,098 6,7458.750%, 01/31/2044 126,009 6,5608.750%, 02/28/2048 166,404 8,6628.500%, 01/31/2037 259,512 13,7258.250%, 03/31/2032 62,881 3,5548.000%, 01/31/2030 57,160 3,3037.000%, 02/28/2031 55,780 2,9386.500%, 02/28/2041 23,055 9566.300%, 06/22/2048 $ 1,184 1,2286.250%, 03/31/2036 ZAR 73,304 3,2085.875%, 09/16/2025 $ 790 8735.750%, 09/30/2049 4,203 4,0395.650%, 09/27/2047 946 906

SEI Institutional International Trust / Quarterly Report / December 31, 202146
SCHEDULE OF INVESTMENTS (Unaudited)December 31, 2021
Emerging Markets Debt Fund (Continued)
DescriptionFace Amount (Thousands)
Market Value ($ Thousands)
GLOBAL BONDS (continued)5.000%, 10/12/2046 $ 357 $ 3234.850%, 09/27/2027 420 4424.850%, 09/30/2029 2,096 2,164
Sasol Financing USA 6.500%, 09/27/2028 360 3905.875%, 03/27/2024 442 4614.375%, 09/18/2026 351 353
Stillwater Mining Co 4.500%, 11/16/2029 218 210
80,019
South Korea — 0.1%Export-Import Bank of Korea MTN
8.000%, 05/15/2024 IDR 8,800,000 6547.250%, 12/07/2024 700,000 525.750%, 03/05/2024 12,200,000 867
Korea International Bond 1.000%, 09/16/2030 $ 550 520
2,093
Spain — 0.1%AI Candelaria Spain
7.500%, 12/15/2028 (A) 975 1,041
Sri Lanka — 0.6%Sri Lanka Government International Bond
7.850%, 03/14/2029 1,598 8017.550%, 03/28/2030 3,079 1,5246.850%, 03/14/2024 512 2676.850%, 11/03/2025 1,339 6866.825%, 07/18/2026 (A) 909 4596.825%, 07/18/2026 500 2536.750%, 04/18/2028 3,512 1,7636.750%, 04/18/2028 (A) 5,097 2,5596.350%, 06/28/2024 (A) 864 4506.200%, 05/11/2027 1,186 596
9,358
Supra-National — 0.6%Africa Finance
2.875%, 04/28/2028 (A) 1,679 1,665African Export-Import Bank
3.798%, 05/17/2031 (A) 200 204African Export-Import Bank MTN
3.994%, 09/21/2029 (A) 363 374Banque Ouest Africaine de Developpement
5.000%, 07/27/2027 (A) 865 9534.700%, 10/22/2031 (A) 683 7434.700%, 10/22/2031 280 305
European Bank for Reconstruction & Development MTN
6.450%, 12/13/2022 IDR 9,486,000 6785.200%, 05/28/2024 11,593,600 818
DescriptionFace Amount (Thousands)
Market Value ($ Thousands)
GLOBAL BONDS (continued)Inter-American Development Bank MTN
7.875%, 03/14/2023 IDR 44,650,000 $ 3,248 8,988
Taiwan — 0.0%TSMC Arizona
3.250%, 10/25/2051 $ 220 2322.500%, 10/25/2031 200 202
434
Tanzania — 0.0%AngloGold Ashanti Holdings
3.750%, 10/01/2030 229 231
Thailand — 2.8%Thailand Government Bond
5.670%, 03/13/2028 THB 3,000 1123.775%, 06/25/2032 181,773 6,3683.650%, 06/20/2031 78,000 2,6883.625%, 06/16/2023 30,000 9373.400%, 06/17/2036 193,984 6,4663.300%, 06/17/2038 89,772 2,9572.875%, 12/17/2028 62,796 2,0222.875%, 06/17/2046 3,431 1042.400%, 12/17/2023 88,000 2,7242.125%, 12/17/2026 15,000 4672.000%, 12/17/2031 311,337 9,3972.000%, 06/17/2042 7,000 1851.875%, 06/17/2022 20,000 6021.600%, 12/17/2029 7,000 2051.600%, 06/17/2035 27,023 7481.585%, 12/17/2035 8,000 2191.450%, 12/17/2024 85,200 2,5951.250%, 03/12/2028 60,314 1,8030.950%, 06/17/2025 67,000 2,006
42,605
Trinidad & Tobago — 0.0%Trinidad & Tobago Government
International Bond 4.500%, 08/04/2026 $ 482 493
Tunisia — 0.3%Banque Centrale de Tunisie International
Bond 6.375%, 07/15/2026 (A)(C) EUR 1,747 1,5056.375%, 07/15/2026 622 5365.750%, 01/30/2025 (A) $ 786 5965.750%, 01/30/2025 426 3235.625%, 02/17/2024 EUR 965 850
3,810

47SEI Institutional International Trust / Quarterly Report / December 31, 2021
SCHEDULE OF INVESTMENTS (Unaudited)December 31, 2021
Emerging Markets Debt Fund (Continued)
DescriptionFace Amount (Thousands)
Market Value ($ Thousands)
GLOBAL BONDS (continued)Turkey — 1.6%
Aydem Yenilenebilir Enerji 7.750%, 02/02/2027 (A) $ 655 $ 529
Hazine Mustesarligi Varlik Kiralama 5.800%, 02/21/2022 (A) 1,479 1,479
QNB Finansbank 6.875%, 09/07/2024 (A) 613 622
TC Ziraat Bankasi MTN 5.125%, 05/03/2022 (A) 1,063 1,060
Turkey Government Bond 12.600%, 10/01/2025 TRY 7,959 43711.700%, 11/13/2030 24,100 1,0459.000%, 05/04/2022 3,294 239
Turkey Government International Bond 10.600%, 02/11/2026 13,916 6897.250%, 12/23/2023 $ 1,061 1,0726.875%, 03/17/2036 2,482 2,3246.500%, 09/20/2033 2,606 2,3646.375%, 10/14/2025 200 1956.350%, 08/10/2024 294 2895.950%, 01/15/2031 1,965 1,7565.875%, 06/26/2031 2,001 1,7755.750%, 03/22/2024 200 1955.750%, 05/11/2047 69 565.125%, 02/17/2028 242 2164.875%, 10/09/2026 1,017 9204.750%, 01/26/2026 4,679 4,289
Turkiye Ihracat Kredi Bankasi (A)6.125%, 05/03/2024 247 2415.375%, 10/24/2023 1,033 996
Turkiye Sise ve Cam Fabrikalari 6.950%, 03/14/2026 (A) 500 510
Turkiye Vakiflar Bankasi TAO 6.500%, 01/08/2026 (A) 379 354
Ulker Biskuvi Sanayi 6.950%, 10/30/2025 871 820
Yapi ve Kredi Bankasi MTN 5.850%, 06/21/2024 (A)(C) 429 414
24,886
Uganda — 0.4%Republic of Uganda Government Bonds
17.000%, 01/16/2025 UGX 440,400 13717.000%, 04/03/2031 8,683,400 2,79116.375%, 03/04/2032 1,427,900 44816.250%, 11/08/2035 1,123,900 34616.000%, 05/06/2027 2,226,000 67414.250%, 06/22/2034 5,311,800 1,46110.000%, 09/07/2023 1,112,600 310
6,167
DescriptionFace Amount (Thousands)
Market Value ($ Thousands)
GLOBAL BONDS (continued)Ukraine — 1.8%
NAK Naftogaz Ukraine via Kondor Finance 7.625%, 11/08/2026 (A) $ 990 $ 8627.125%, 07/19/2024 EUR 720 738
NPC Ukrenergo 6.875%, 11/09/2026 (A) $ 1,231 1,074
State Agency of Roads of Ukraine 6.250%, 06/24/2028 1,683 1,4566.250%, 06/24/2028 (A) 363 314
Ukraine Government International Bond 17.000%, 05/11/2022 UAH 71,848 2,68115.840%, 02/26/2025 66,553 2,5969.750%, 11/01/2028 $ 751 7587.750%, 09/01/2024 (A) 131 1277.750%, 09/01/2025 (A) 1,832 1,7557.750%, 09/01/2026 (A) 428 4077.750%, 09/01/2026 1,905 1,8147.750%, 09/01/2027 (A) 223 2117.750%, 09/01/2027 2,115 2,0017.375%, 09/25/2032 1,778 1,5837.375%, 09/25/2032 (A) 295 2637.253%, 03/15/2033 724 6377.253%, 03/15/2033 (A) 297 2616.876%, 05/21/2029 4,519 3,9926.876%, 05/21/2029 (A) 281 2486.750%, 06/20/2026 EUR 1,299 1,4023.000%, 05/31/2040 (A)(D) $ 2,206 2,0051.258%, 05/31/2040 (D) 410 373
Ukreximbank Via Biz Finance 9.750%, 01/22/2025 238 241
27,799
United Arab Emirates — 1.7%Abu Dhabi Crude Oil Pipeline
4.600%, 11/02/2047 580 6864.600%, 11/02/2047 (A) 3,031 3,5833.650%, 11/02/2029 (A) 207 228
Abu Dhabi Government International Bond 4.125%, 10/11/2047 (A) 591 707
Abu Dhabi Government International Bond MTN
3.875%, 04/16/2050 260 3033.125%, 04/16/2030 (A) 1,286 1,3923.000%, 09/15/2051 720 7203.000%, 09/15/2051 (A) 519 5191.700%, 03/02/2031 970 9431.625%, 06/02/2028 966 954
DAE Funding LLC 3.375%, 03/20/2028 (A) 550 555
DP World MTN (A)6.850%, 07/02/2037 210 2765.625%, 09/25/2048 439 539

SEI Institutional International Trust / Quarterly Report / December 31, 202148
SCHEDULE OF INVESTMENTS (Unaudited)December 31, 2021
Emerging Markets Debt Fund (Continued)
DescriptionFace Amount (Thousands)
Market Value ($ Thousands)
GLOBAL BONDS (continued)4.700%, 09/30/2049 $ 134 $ 146
DP World Crescent MTN 4.848%, 09/26/2028 475 532
DP World Salaam 6.000%, VAR US Treas Yield Curve
Rate T Note Const Mat 5 Yr + 5.750% (E) 877 947
Emirate of Dubai Government International Bonds MTN
5.250%, 01/30/2043 490 565Finance Department Government of
Sharjah MTN (A)4.000%, 07/28/2050 1,627 1,4693.625%, 03/10/2033 842 825
Galaxy Pipeline Assets Bidco 2.940%, 09/30/2040 3,622 3,6052.940%, 09/30/2040 (A) 593 5902.625%, 03/31/2036 (A) 580 5672.160%, 03/31/2034 1,660 1,627
MDGH GMTN RSC MTN 4.500%, 11/07/2028 (A) 548 6313.950%, 05/21/2050 200 232
Sharjah Sukuk Program MTN 3.854%, 04/03/2026 359 379
UAE International Government Bond MTN 2.000%, 10/19/2031 (A) 2,240 2,234
25,754
United Kingdom — 0.2%Standard Chartered Bank MTN (A)
8.375%, 10/18/2039 IDR 20,797,000 1,6448.250%, 05/18/2029 14,336,000 1,121
2,765
United States — 0.5%JBS USA Food
5.750%, 01/15/2028 (A) $ 466 486JPMorgan Chase Bank MTN (A)
7.500%, 06/15/2035 IDR 41,500,000 3,0507.000%, 09/18/2030 (D) 57,637,000 4,189
Sagicor Financial 5.300%, 05/13/2028 (A) $ 520 533
8,258
Uruguay — 0.4%Republic of Uruguay
5.100%, 06/18/2050 170 225Uruguay Government International Bond
8.250%, 05/21/2031 UYU 13,840 2984.975%, 04/20/2055 $ 464 6084.375%, 01/23/2031 (C) 4,381 5,043
6,174
DescriptionFace Amount (Thousands)
Market Value ($ Thousands)
GLOBAL BONDS (continued)Uzbekistan — 0.2%
Republic of Uzbekistan Bond MTN 5.375%, 02/20/2029 $ 1,233 $ 1,311
Republic of Uzbekistan International Bond 3.900%, 10/19/2031 505 482
Republic of Uzbekistan International Bond MTN
3.700%, 11/25/2030 205 197Uzauto Motors AJ
4.850%, 05/04/2026 (A) 727 699Uzbekneftegaz JSC
4.750%, 11/16/2028 (A) 810 779 3,468
Venezuela — 0.2%Petroleos de Venezuela
9.750%, 05/17/2035 (F) 1,000 399.000%, 11/17/2021 (C)(F) 4,300 1616.000%, 05/16/2024 (F) 10,192 3956.000%, 05/16/2024 (F) 7,785 3026.000%, 11/15/2026 (F) 13,215 5135.500%, 04/12/2037 (F) 1,740 685.375%, 04/12/2027 (F) 4,563 177
Venezuela Government International Bond 9.250%, 09/15/2027 (F) 2,300 1389.250%, 05/07/2028 (F) 2,941 1768.250%, 10/13/2024 (F) 3,304 1987.750%, 10/13/2019 (F) 3,976 239
2,406
Vietnam — 0.1%Mong Duong Finance Holdings BV
5.125%, 05/07/2029 (A) 1,111 1,076
Zambia — 0.9%First Quantum Minerals (A)
7.500%, 04/01/2025 404 4156.875%, 03/01/2026 403 4196.875%, 10/15/2027 529 569
Zambia Government Bond 13.000%, 08/29/2026 ZMW 1,375 6213.000%, 12/18/2027 5,630 23313.000%, 01/25/2031 17,744 65511.000%, 01/25/2026 18,620 82011.000%, 06/28/2026 78,885 3,33310.000%, 06/28/2024 66,325 3,283
Zambia Government International Bond 8.970%, 07/30/2027 (F) $ 1,821 1,4045.375%, 09/20/2022 (F) 3,347 2,498

49SEI Institutional International Trust / Quarterly Report / December 31, 2021
SCHEDULE OF INVESTMENTS (Unaudited)December 31, 2021
Emerging Markets Debt Fund (Continued)
DescriptionFace Amount (Thousands)
Market Value ($ Thousands)
GLOBAL BONDS (continued)5.375%, 09/20/2022 (A)(F) $ 299 $ 223
13,914
Total Global Bonds
(Cost $1,531,809) ($ Thousands) 1,448,446
U.S. TREASURY OBLIGATION — 0.1%United States Treasury Bill
0.067%, 04/28/2022 (H) 2,292 2,291
Total U.S. Treasury Obligation (Cost $2,291) ($ Thousands) 2,291
Shares
AFFILIATED PARTNERSHIP — 2.0%SEI Liquidity Fund, L.P.
0.020% **†(G) 30,078,476 30,083
Total Affiliated Partnership (Cost $30,082) ($ Thousands) 30,083
Total Investments in Securities — 96.9%(Cost $1,564,182) ($ Thousands) $ 1,480,820
A list of the open futures contracts held by the Fund at December 31, 2021, is as follows:
Type of ContractNumber of Contracts
Expiration Date
Notional Amount (Thousands) Value (Thousands)
Unrealized Appreciation/ (Depreciation) (Thousands)
Long ContractsKorea 10-Year Bond 45 Mar-2022 $ 4,746 $ 4,705 $ (22)Korea 3-Year Bond 146 Mar-2022 13,427 13,401 28R186 Bond Future 500 Feb-2022 3,494 3,498 2R2030 Bond Future 576 Feb-2022 3,272 3,333 88R2032 Bond Future 816 Feb-2022 4,624 4,740 154R2035 Bond Future 600 Feb-2022 3,473 3,514 40R2040 Bond Future 232 Feb-2022 1,334 1,262 36R213 Bond Future 828 Feb-2022 4,823 4,521 86U.S. 2-Year Treasury Note 41 Apr-2022 8,950 8,945 (6)U.S. 10-Year Treasury Note 46 Mar-2022 5,968 6,002 34U.S. Ultra Long Treasury Bond 60 Mar-2022 11,640 11,827 188
65,751 65,748 628Short Contracts
Euro-Bob (137) Mar-2022 $ (20,742) $ (20,758) $ 143Euro-Bund (77) Mar-2022 (15,195) (15,006) 266Euro-Buxl (39) Mar-2022 (9,589) (9,169) 466U.S. 5-Year Treasury Note (12) Apr-2022 (1,450) (1,452) (1)U.S. Long Treasury Bond (6) Mar-2022 (953) (963) (10)
(47,929) (47,348) 864 $ 17,822 $ 18,400 $ 1,492

SEI Institutional International Trust / Quarterly Report / December 31, 202150
SCHEDULE OF INVESTMENTS (Unaudited)December 31, 2021
Emerging Markets Debt Fund (Continued)
A list of the open forward foreign currency contracts held by the Fund at December 31, 2021, is as follows:
Counterparty Settlement DateCurrency to Deliver
(Thousands)Currency to Receive
(Thousands)
Unrealized Appreciation
(Depreciation) (Thousands)
Barclays PLC 01/21/22 - 03/16/22 USD 2,434 TRY 36,845 $ 207
Barclays PLC 03/08/22 EUR 1,031 HUF 383,476 3
Barclays PLC 03/16/22 USD 1,067 MXN 22,721 30
Barclays PLC 03/16/22 USD 2,842 HUF 924,506 (7)
Barclays PLC 03/16/22 USD 6,677 ZAR 107,590 1
Barclays PLC 03/16/22 TRY 20,049 USD 1,223 (205)
Barclays PLC 03/16/22 ZAR 61,797 USD 3,805 (31)
Citigroup 01/10/22 KRW 4,380,924 USD 3,726 42Citigroup 01/13/22 - 06/15/22 USD 7,674 EGP 125,058 165
Citigroup 01/19/22 EUR 2,091 USD 2,433 54
Citigroup 03/16/22 USD 6,567 IDR 95,728,402 129
Citigroup 01/19/22 USD 2,452 IDR 34,734,495 (14)
Citigroup 01/21/22 EUR 1,212 PLN 5,667 25
Citigroup 01/21/22 PLN 25,989 EUR 5,607 (63)Citigroup 02/02/22 - 03/16/22 EGP 43,634 USD 2,718 (35)
Citigroup 02/09/22 IDR 42,458,016 USD 2,927 (53)
Citigroup 02/22/22 CNY 8,144 USD 1,267 (10)
Citigroup 03/03/22 USD 2,088 BRL 11,975 33
Citigroup 03/16/22 USD 911 CZK 20,597 25
Citigroup 03/16/22 USD 5,345 PEN 21,980 164
Citigroup 03/16/22 USD 2,190 CLP 1,908,531 29
Citigroup 03/16/22 USD 7,361 CLP 6,293,595 (46)
Citigroup 03/16/22 USD 6,883 ZAR 111,294 25
Citigroup 03/16/22 USD 3,093 ZAR 49,564 (17)
Citigroup 03/16/22 USD 12,471 RUB 942,566 (57)
Citigroup 03/16/22 USD 15,566 SGD 21,330 255
Citigroup 03/16/22 USD 24,680 PLN 100,985 252
Citigroup 03/16/22 MXN 26,522 USD 1,279 (2)
Citigroup 03/16/22 RON 33,886 USD 7,658 (79)
Citigroup 03/16/22 ZAR 8,910 USD 554 1
Citigroup 03/16/22 ZAR 25,691 USD 1,582 (12)
Citigroup 03/16/22 UAH 8,578 USD 307 —
Citigroup 03/16/22 UAH 114,704 USD 4,058 (43)
Citigroup 03/16/22 COP 15,102,130 USD 3,824 139
Citigroup 03/16/22 UGX 19,390,831 USD 5,221 (186)Citigroup 04/06/22 - 06/30/22 RON 22,999 EUR 4,567 (31)
Citigroup 06/30/22 EUR 462 RON 2,358 4
Deutsche Bank 01/05/22 USD 10,128 EUR 8,933 31
Deutsche Bank 01/21/22 EUR 1,024 PLN 4,725 6
Deutsche Bank 02/02/22 USD 951 EGP 15,308 22
Goldman Sachs 01/10/22 USD 280 TRY 3,716 (1)
Goldman Sachs 01/13/22 USD 1,390 EGP 21,941 6
Goldman Sachs 01/21/22 EUR 499 PLN 2,347 15
Goldman Sachs 01/21/22 TRY 3,274 USD 245 2
Goldman Sachs 02/02/22 USD 1,857 BRL 10,510 16
Goldman Sachs 02/02/22 BRL 17,141 USD 3,099 43

51SEI Institutional International Trust / Quarterly Report / December 31, 2021
SCHEDULE OF INVESTMENTS (Unaudited)December 31, 2021
Emerging Markets Debt Fund (Continued)
Counterparty Settlement DateCurrency to Deliver
(Thousands)Currency to Receive
(Thousands)
Unrealized Appreciation
(Depreciation) (Thousands)
Goldman Sachs 03/03/22 BRL 10,905 USD 1,903 $ (29)
Goldman Sachs 02/09/22 USD 1,141 IDR 16,509,620 18
Goldman Sachs 02/16/22 USD 1,348 VND 30,595,162 (8)Goldman Sachs 02/22/22 - 03/16/22 USD 2,385 CNY 15,312 13
Goldman Sachs 02/22/22 CNY 6,589 USD 1,027 (6)
Goldman Sachs 03/02/22 IDR 9,292,979 USD 642 (9)
Goldman Sachs 03/03/22 EUR 856 USD 969 (5)
Goldman Sachs 03/08/22 EUR 1,028 HUF 382,317 3
Goldman Sachs 03/16/22 USD 84 CLP 73,961 2
Goldman Sachs 03/16/22 USD 609 CZK 13,825 20
Goldman Sachs 03/16/22 USD 1,507 PEN 6,181 42
Goldman Sachs 03/16/22 USD 4,422 ZAR 71,362 7
Goldman Sachs 03/16/22 USD 6,111 RUB 459,977 (52)
Goldman Sachs 03/16/22 USD 7,019 MXN 151,079 276
Goldman Sachs 03/16/22 USD 7,435 THB 252,286 117
Goldman Sachs 03/16/22 USD 9,630 TWD 265,264 (11)
Goldman Sachs 03/16/22 USD 12,646 EUR 11,168 71
Goldman Sachs 03/16/22 MXN 15,193 USD 717 (17)
Goldman Sachs 03/16/22 EGP 21,941 USD 1,365 (14)
Goldman Sachs 03/16/22 UAH 60,229 USD 2,129 (24)
Goldman Sachs 03/16/22 THB 122,239 USD 3,619 (40)
Goldman Sachs 03/16/22 ZAR 10,280 USD 642 4
Goldman Sachs 03/16/22 ZAR 137,231 USD 8,468 (49)
Goldman Sachs 03/16/22 INR 576,667 USD 7,639 (43)
Goldman Sachs 03/16/22 PHP 743,749 USD 14,673 283
Goldman Sachs 03/16/22 COP 5,368,451 USD 1,329 19
Goldman Sachs 04/06/22 EUR 258 RON 1,294 1
Goldman Sachs 04/20/22 USD 1,203 KZT 533,579 (5)JPMorgan Chase Bank 01/05/22 - 03/16/22 USD 6,933 EUR 6,119 31JPMorgan Chase Bank 01/28/22 - 02/03/22 USD 1,415 EUR 1,215 (33)
JPMorgan Chase Bank 01/28/22 EUR 9,469 USD 11,119 346JPMorgan Chase Bank 01/05/22 - 02/03/22 EUR 4,703 USD 5,319 (30)
JPMorgan Chase Bank 01/10/22 USD 2,345 TWD 64,830 (1)
JPMorgan Chase Bank 01/11/22 USD 303 COP 1,206,751 (6)
JPMorgan Chase Bank 01/11/22 COP 12,783,153 USD 3,253 114
JPMorgan Chase Bank 01/12/22 USD 1,186 TRY 12,678 (237)JPMorgan Chase Bank 01/12/22 - 03/16/22 USD 6,181 IDR 89,920,166 110JPMorgan Chase Bank 01/12/22 - 01/14/22 PEN 13,693 USD 3,405 (29)JPMorgan Chase Bank 01/12/22 - 01/21/22 IDR 307,705,170 USD 21,370 (227)
JPMorgan Chase Bank 01/13/22 USD 316 EGP 4,983 1JPMorgan Chase Bank 01/13/22 - 03/16/22 EGP 64,525 USD 3,988 (113)JPMorgan Chase Bank 01/18/22 - 02/14/22 ZAR 329,218 USD 21,804 1,216
JPMorgan Chase Bank 02/14/22 ZAR 3,961 USD 243 (4)JPMorgan Chase Bank 01/19/22 - 02/09/22 USD 2,395 IDR 34,639,679 37JPMorgan Chase Bank 01/19/22 - 03/02/22 IDR 73,501,429 USD 5,078 (78)
JPMorgan Chase Bank 01/21/22 EUR 4,639 PLN 21,454 41
JPMorgan Chase Bank 01/21/22 PLN 8,590 EUR 1,860 (14)
JPMorgan Chase Bank 01/24/22 USD 256 KRW 303,896 (1)
JPMorgan Chase Bank 01/28/22 AUD 1,621 USD 1,172 (7)
JPMorgan Chase Bank 01/28/22 JPY 224,738 USD 2,054 102

SEI Institutional International Trust / Quarterly Report / December 31, 202152
SCHEDULE OF INVESTMENTS (Unaudited)December 31, 2021
Emerging Markets Debt Fund (Continued)
Counterparty Settlement DateCurrency to Deliver
(Thousands)Currency to Receive
(Thousands)
Unrealized Appreciation
(Depreciation) (Thousands)
JPMorgan Chase Bank 02/02/22 BRL 1,947 USD 344 $ (3)JPMorgan Chase Bank 02/04/22 - 03/01/22 USD 4,635 MYR 19,477 50
JPMorgan Chase Bank 02/14/22 USD 535 RON 2,362 5
JPMorgan Chase Bank 02/14/22 USD 6,409 RON 27,641 (78)
JPMorgan Chase Bank 03/16/22 USD 1,066 ZAR 17,214 2JPMorgan Chase Bank 02/14/22 - 03/16/22 USD 6,116 ZAR 94,488 (230)
JPMorgan Chase Bank 02/14/22 USD 299 PLN 1,252 11
JPMorgan Chase Bank 02/14/22 USD 14,920 PLN 59,584 (174)JPMorgan Chase Bank 02/14/22 - 03/16/22 USD 17,120 MXN 367,861 659JPMorgan Chase Bank 02/14/22 - 03/16/22 MXN 55,474 USD 2,622 (65)
JPMorgan Chase Bank 02/16/22 USD 1,121 ZMW 21,243 128
JPMorgan Chase Bank 02/16/22 USD 1,831 UAH 50,883 6
JPMorgan Chase Bank 02/22/22 USD 341 BRL 1,962 7
JPMorgan Chase Bank 02/22/22 USD 3,270 BRL 18,111 (55)
JPMorgan Chase Bank 02/22/22 USD 703 KRW 839,400 1
JPMorgan Chase Bank 02/22/22 USD 10,473 KRW 12,380,536 (82)JPMorgan Chase Bank 02/22/22 - 03/14/22 BRL 106,561 USD 18,583 (272)JPMorgan Chase Bank 03/07/22 - 03/14/22 USD 12,032 CNY 77,341 83
JPMorgan Chase Bank 03/08/22 EUR 2,189 HUF 812,458 2
JPMorgan Chase Bank 03/08/22 HUF 385,190 EUR 1,041 3
JPMorgan Chase Bank 03/14/22 USD 109 CZK 2,461 3
JPMorgan Chase Bank 03/16/22 USD 629 CZK 13,822 —
JPMorgan Chase Bank 03/14/22 CNY 907 USD 141 (1)
JPMorgan Chase Bank 03/14/22 CLP 1,345,499 USD 1,613 48
JPMorgan Chase Bank 03/16/22 EUR 787 CZK 20,196 22
JPMorgan Chase Bank 03/16/22 USD 1,173 CLP 1,009,358 —
JPMorgan Chase Bank 03/16/22 USD 4,041 HUF 1,301,376 (51)
JPMorgan Chase Bank 03/16/22 UAH 11,371 USD 408 1
JPMorgan Chase Bank 03/16/22 UAH 8,289 USD 294 (2)
JPMorgan Chase Bank 03/21/22 USD 160 THB 5,353 —
JPMorgan Chase Bank 03/21/22 USD 1,521 THB 50,939 3
JPMorgan Chase Bank 03/21/22 RUB 177,409 USD 2,354 20JPMorgan Chase Bank 04/06/22 - 06/30/22 EUR 5,550 RON 27,938 24
JPMorgan Chase Bank 06/30/22 EUR 348 RON 1,762 —
JPMorgan Chase Bank 06/30/22 RON 3,350 EUR 663 1
JPMorgan Chase Bank 06/30/22 RON 2,275 EUR 448 (1)
Merrill Lynch 03/16/22 USD 485 PEN 1,988 13
Merrill Lynch 03/16/22 THB 107,440 USD 3,222 6
Merrill Lynch 03/16/22 THB 81,330 USD 2,409 (26)
Morgan Stanley 01/10/22 USD 1,173 KRW 1,380,685 (11)
Morgan Stanley 01/11/22 ILS 8,000 USD 2,557 (13)
Morgan Stanley 03/08/22 EUR 828 PLN 3,837 6
Morgan Stanley 01/21/22 EUR 1,032 PLN 4,724 (3)
Morgan Stanley 02/02/22 USD 12,275 BRL 69,926 191
Morgan Stanley 02/02/22 EGP 37,845 USD 2,351 (54)Morgan Stanley 02/09/22 - 03/02/22 USD 3,872 IDR 56,096,601 60
Morgan Stanley 02/09/22 IDR 19,057,793 USD 1,328 (10)
Morgan Stanley 02/22/22 USD 1,736 CNY 11,137 10
Morgan Stanley 02/22/22 CNY 5,591 USD 869 (8)

53SEI Institutional International Trust / Quarterly Report / December 31, 2021
SCHEDULE OF INVESTMENTS (Unaudited)December 31, 2021
Emerging Markets Debt Fund (Continued)
Counterparty Settlement DateCurrency to Deliver
(Thousands)Currency to Receive
(Thousands)
Unrealized Appreciation
(Depreciation) (Thousands)
Standard Bank 01/19/22 USD 2,346 EUR 2,068 $ 6
Standard Bank 02/03/22 USD 3,813 EUR 3,294 (65)
Standard Bank 02/03/22 EUR 14,436 USD 16,713 288
Standard Bank 03/03/22 EUR 13,323 USD 15,130 (36)
Standard Bank 03/03/22 USD 2,086 BRL 11,975 35
Standard Bank 03/16/22 USD 907 IDR 13,131,152 12
Standard Bank 03/16/22 USD 1,396 PEN 5,711 35
Standard Bank 03/16/22 USD 3,340 MYR 14,179 65
Standard Bank 03/16/22 USD 3,589 CLP 3,038,181 (58)
Standard Bank 03/16/22 THB 40,665 USD 1,204 (13)
Standard Bank 03/16/22 COP 37,535,555 USD 9,414 253
Standard Chartered 01/03/22 USD 1,215 PHP 60,690 (25)Standard Chartered 01/03/22 - 01/20/22 PHP 266,008 USD 5,283 78
Standard Chartered 01/10/22 TWD 66,348 USD 2,398 —
Standard Chartered 01/21/22 PLN 4,503 EUR 979 (3)
Standard Chartered 01/24/22 KRW 400,531 USD 340 3
Standard Chartered 02/02/22 USD 1,681 BRL 9,647 38
Standard Chartered 02/02/22 BRL 5,120 USD 909 (3)
Standard Chartered 02/09/22 USD 296 IDR 4,264,659 3
Standard Chartered 06/30/22 EUR 191 RON 974 1
State Street 01/05/22 EUR 466 USD 528 (2)
State Street 02/03/22 USD 348 EUR 310 5 $ 3,457

SEI Institutional International Trust / Quarterly Report / December 31, 202154
SCHEDULE OF INVESTMENTS (Unaudited)December 31, 2021
Emerging Markets Debt Fund (Continued)
A list of open OTC swap agreements held by the Fund at December 31, 2021, are as follows:
Interest Rate Swaps
Counterparty Fund Pays Fund Receives Payment FrequencyTermination
Date Currency
Notional Amount
(Thousands)Value
(Thousands)
Upfront Payments
(Thousands)
Net Unrealized Appreciation
(Depreciation) (Thousands)
JPMorgan Chase 1-DAY-CLP - CLICP 3.430% Semi-Annually 05/10/2022 CLP 420,527 $ 2 $ – $ 2Goldman Sachs 28-DAY MXN - TIIE 5.900% Monthly 09/12/2022 MXN 75,956 (18) – (18)Goldman Sachs 1-DAY BRL - CETIP 11.985% Annually 01/02/2023 BRL 3,000 247 – 247Goldman Sachs 1-DAY BRL - CETIP 10.04% Annually 01/03/2023 BRL 5,012 292 – 292Goldman Sachs 3-MONTH RUB - MosPrime 7.072% Annually 04/02/2023 RUB 715,570 177 – 177
JPMorgan Chase 2.48% 3-MONTH MYR - KLIBOR Quarterly 10/27/2023 MYR 26,000 (3) – (3)Goldman Sachs 7.981% FIXED 3-MONTH ROB - MosPrime Annually 10/04/2024 RUB 321,998 (141) – (141)Goldman Sachs 28-DAY MXN - TIIE 6.355% Monthly 05/21/2025 MXN 23,145 (37) – (37)Goldman Sachs 28-DAY MXN - TIIE 6.205% Monthly 12/08/2025 MXN 16,624 (34) – (34)Goldman Sachs 28-DAY MXN - TIIE 6.165% Monthly 03/05/2026 MXN 47,200 (104) – (104)
JPMorgan Chase 28-DAY MXN - TIIE 6.13% Monthly 06/18/2026 MXN 40,000 (97) – (97)Citibank 1.8775 % FIXED 6-MONTH CZK - PRIBOR Annually 07/09/2026 CZK 39,645 (146) – (146)Citibank 1.822 % FIXED 6-MONTH CZK - PRIBOR Annually 07/12/2026 CZK 65,750 (249) – (249)Citibank 1.8282% FIXED 6-MONTH CZK - PRIBOR Annually 07/12/2026 CZK 70,763 (267) – (267)
Goldman Sachs 2.158 % FIXED 6-MONTH CZK - PRIBOR Annually 08/30/2026 CZK 89,310 (275) – (275)Goldman Sachs 28-DAY MXN - TIIE 6.381% Monthly 09/16/2026 MXN 26,000 (53) – (53)Goldman Sachs 5.3397 6-MONTH FBIL - MIBOR Semi-Annually 12/09/2026 INR 1,048,500 (35) – (35)
$ (741) $ – $ (741)
A list of open centrally cleared swap agreements held by the Fund at December 31, 2021, are as follows:
Interest Rate Swaps
Fund Pays Fund ReceivesPayment
Frequency Termination Date Currency
Notional Amount
(Thousands)Value
(Thousands)
Upfront Payments/
Receipts (Thousands)
Net Unrealized Appreciation
(Depreciation) (Thousands)
1-DAY BRL - CETIP 5.89% Annually 01/03/2022 BRL 27,057 $ (1) $ – $ (1)1-DAY-CLP - CLICP .36% Semi-Annually 06/17/2025 CLP 1,931,133 (288) – (288)1-DAY-CLP - CLICP 1.16% Semi-Annually 06/23/2025 CLP 2,335,691 (368) – (368)28-DAY MXN - TIIE 4.85 FIXED Monthly 07/25/2025 MXN 6,144 (24) – (24)
0.995% 6-MONTH THB - BKIBOR Semi-Annually 03/01/2026 THB 91,000 38 – 381.1% 6-MONTH THB - BKIBOR Semi-Annually 03/10/2026 THB 95,000 29 – 29
1-DAY-CLP – CLICP .26% Semi-Annually 03/16/2026 CLP 1,623,158 (225) – (225)28-DAY MXN - TIIE .815% Monthly 04/06/2026 MXN 27,590 (80) – (80)
5.145% FIXED 1-DAY FBIL - MIBOR Semi-Annually 08/27/2026 INR 200,000 13 – 135.148% FIXED 1-DAY FBIL - MIBOR Semi-Annually 09/02/2026 INR 200,000 13 – 130.733 FIXED 3-MONTH TWD - TAIBOR Quarterly 09/30/2026 TWD 67,400 4 – 4
0.742% FIXED 3-MONTH TWD - TAIBOR Quarterly 10/07/2026 TWD 68,000 3 – 3.875% 3-MONTH TWD - TAIBOR Quarterly 10/26/2026 TWD 70,000 (12) – (12)
2.99% FIXED 6-MONTH PLN - WIBOR Semi-Annually 11/08/2026 PLN 20,425 154 – 1546-MONTH CZK - PRIBOR 3.25% Semi-Annually 11/22/2026 CZK 65,964 (76) – (76)
28-DAY MXN - TIIE .45% FIXED Monthly 04/01/2025 MXN 27,064 (37) – (37)3.33 6-MONTH CZK - PRIBOR Semi-Annually 11/25/2026 CZK 62,485 (61) – (61)
10.29 % FIXED 1-DAY BRL - CETIP Annually 01/04/2027 BRL 2,660 3 – 328-DAY MXN - TIIE 7.51% Monthly 04/20/2027 MXN 8,110 2 – 2
5.37 1-DAY COP- COLUMBIA IBR Quarterly 06/21/2029 COP 1,800,000 24 – 246.9225% 28-DAY MXN - TIIE Monthly 08/31/2029 MXN 42,602 69 – 69
6.82% 28-DAY MXN - TIIE Monthly 09/10/2029 MXN 17,915 34 – 346-MONTH PLN - WIBOR 1.75% Annually 02/26/2030 PLN 4,531 (140) – (140)
1-DAY COP- COLUMBIA IBR 5.47% Quarterly 03/11/2030 COP 879,919 12 – 12.33% 1-DAY-CLP - CLICP Semi-Annually 06/05/2030 CLP 830,041 150 – 150.21% 1-DAY COP- COLUMBIA IBR Quarterly 07/08/2030 COP 266,911 (9) – (9)
1-DAY-CLP - CLICP .145% Semi-Annually 08/24/2030 CLP 444,725 (119) – (119)
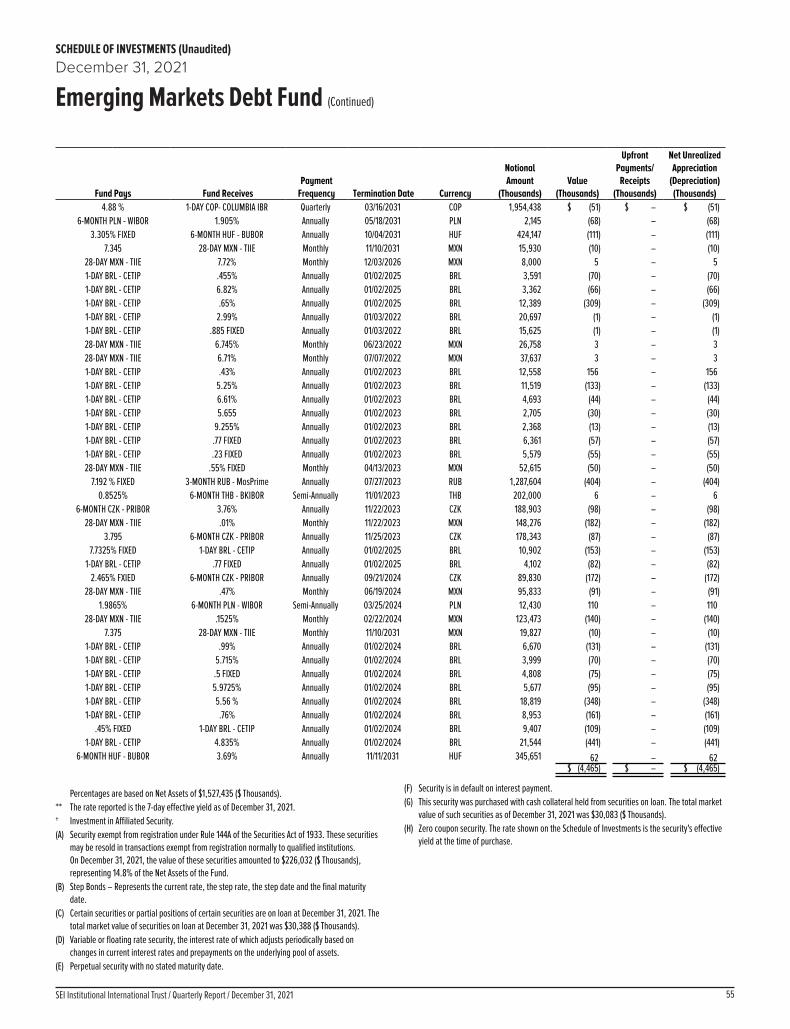
55SEI Institutional International Trust / Quarterly Report / December 31, 2021
SCHEDULE OF INVESTMENTS (Unaudited)December 31, 2021
Emerging Markets Debt Fund (Continued)
Fund Pays Fund ReceivesPayment
Frequency Termination Date Currency
Notional Amount
(Thousands)Value
(Thousands)
Upfront Payments/
Receipts (Thousands)
Net Unrealized Appreciation
(Depreciation) (Thousands)
4.88 % 1-DAY COP- COLUMBIA IBR Quarterly 03/16/2031 COP 1,954,438 $ (51) $ – $ (51)6-MONTH PLN - WIBOR 1.905% Annually 05/18/2031 PLN 2,145 (68) – (68)
3.305% FIXED 6-MONTH HUF - BUBOR Annually 10/04/2031 HUF 424,147 (111) – (111)7.345 28-DAY MXN - TIIE Monthly 11/10/2031 MXN 15,930 (10) – (10)
28-DAY MXN - TIIE 7.72% Monthly 12/03/2026 MXN 8,000 5 – 51-DAY BRL - CETIP .455% Annually 01/02/2025 BRL 3,591 (70) – (70)1-DAY BRL - CETIP 6.82% Annually 01/02/2025 BRL 3,362 (66) – (66)1-DAY BRL - CETIP .65% Annually 01/02/2025 BRL 12,389 (309) – (309)1-DAY BRL - CETIP 2.99% Annually 01/03/2022 BRL 20,697 (1) – (1)1-DAY BRL - CETIP .885 FIXED Annually 01/03/2022 BRL 15,625 (1) – (1)28-DAY MXN - TIIE 6.745% Monthly 06/23/2022 MXN 26,758 3 – 328-DAY MXN - TIIE 6.71% Monthly 07/07/2022 MXN 37,637 3 – 31-DAY BRL - CETIP .43% Annually 01/02/2023 BRL 12,558 156 – 1561-DAY BRL - CETIP 5.25% Annually 01/02/2023 BRL 11,519 (133) – (133)1-DAY BRL - CETIP 6.61% Annually 01/02/2023 BRL 4,693 (44) – (44)1-DAY BRL - CETIP 5.655 Annually 01/02/2023 BRL 2,705 (30) – (30)1-DAY BRL - CETIP 9.255% Annually 01/02/2023 BRL 2,368 (13) – (13)1-DAY BRL - CETIP .77 FIXED Annually 01/02/2023 BRL 6,361 (57) – (57)1-DAY BRL - CETIP .23 FIXED Annually 01/02/2023 BRL 5,579 (55) – (55)28-DAY MXN - TIIE .55% FIXED Monthly 04/13/2023 MXN 52,615 (50) – (50)
7.192 % FIXED 3-MONTH RUB - MosPrime Annually 07/27/2023 RUB 1,287,604 (404) – (404)0.8525% 6-MONTH THB - BKIBOR Semi-Annually 11/01/2023 THB 202,000 6 – 6
6-MONTH CZK - PRIBOR 3.76% Annually 11/22/2023 CZK 188,903 (98) – (98)28-DAY MXN - TIIE .01% Monthly 11/22/2023 MXN 148,276 (182) – (182)
3.795 6-MONTH CZK - PRIBOR Annually 11/25/2023 CZK 178,343 (87) – (87)7.7325% FIXED 1-DAY BRL - CETIP Annually 01/02/2025 BRL 10,902 (153) – (153)
1-DAY BRL - CETIP .77 FIXED Annually 01/02/2025 BRL 4,102 (82) – (82)2.465% FXIED 6-MONTH CZK - PRIBOR Annually 09/21/2024 CZK 89,830 (172) – (172)
28-DAY MXN - TIIE .47% Monthly 06/19/2024 MXN 95,833 (91) – (91)1.9865% 6-MONTH PLN - WIBOR Semi-Annually 03/25/2024 PLN 12,430 110 – 110
28-DAY MXN - TIIE .1525% Monthly 02/22/2024 MXN 123,473 (140) – (140)7.375 28-DAY MXN - TIIE Monthly 11/10/2031 MXN 19,827 (10) – (10)
1-DAY BRL - CETIP .99% Annually 01/02/2024 BRL 6,670 (131) – (131)1-DAY BRL - CETIP 5.715% Annually 01/02/2024 BRL 3,999 (70) – (70)1-DAY BRL - CETIP .5 FIXED Annually 01/02/2024 BRL 4,808 (75) – (75)1-DAY BRL - CETIP 5.9725% Annually 01/02/2024 BRL 5,677 (95) – (95)1-DAY BRL - CETIP 5.56 % Annually 01/02/2024 BRL 18,819 (348) – (348)1-DAY BRL - CETIP .76% Annually 01/02/2024 BRL 8,953 (161) – (161)
.45% FIXED 1-DAY BRL - CETIP Annually 01/02/2024 BRL 9,407 (109) – (109)1-DAY BRL - CETIP 4.835% Annually 01/02/2024 BRL 21,544 (441) – (441)
6-MONTH HUF - BUBOR 3.69% Annually 11/11/2031 HUF 345,651 62 – 62 $ (4,465) $ – $ (4,465)
Percentages are based on Net Assets of $1,527,435 ($ Thousands).** The rate reported is the 7-day effective yield as of December 31, 2021.† Investment in Affiliated Security.(A) Security exempt from registration under Rule 144A of the Securities Act of 1933. These securities
may be resold in transactions exempt from registration normally to qualified institutions. On December 31, 2021, the value of these securities amounted to $226,032 ($ Thousands), representing 14.8% of the Net Assets of the Fund.
(B) Step Bonds – Represents the current rate, the step rate, the step date and the final maturity date.
(C) Certain securities or partial positions of certain securities are on loan at December 31, 2021. The total market value of securities on loan at December 31, 2021 was $30,388 ($ Thousands).
(D) Variable or floating rate security, the interest rate of which adjusts periodically based on changes in current interest rates and prepayments on the underlying pool of assets.
(E) Perpetual security with no stated maturity date.
(F) Security is in default on interest payment.(G) This security was purchased with cash collateral held from securities on loan. The total market
value of such securities as of December 31, 2021 was $30,083 ($ Thousands).(H) Zero coupon security. The rate shown on the Schedule of Investments is the security's effective
yield at the time of purchase.

SEI Institutional International Trust / Quarterly Report / December 31, 202156
SCHEDULE OF INVESTMENTS (Unaudited)December 31, 2021
Emerging Markets Debt Fund (Continued)
AUD — Australian DollarBRL — Brazilian RealBUBOR— Budapest Interbank Offered RateCETIP— Central of Custody and Financial Settlement of SecuritiesCLICP — Sinacofi Chile Interbank Rate AvgCLP — Chilean PesoCNY — Chinese Yuan OnshoreCOP — Colombian PesoCZK — Czech KorunaDAC — Designated Activity CompanyDOP — Dominican PesoEGP — Egyptian PoundEUR — EuroFBIL — Financial Benchmarks India Pvt. Ltd.GHS — Ghanaian CediHUF — Hungarian ForintICE— Intercontinental ExchangeIDR — Indonesian RupiahILS — Israeli New Sheckels INR — Indian RupeeJPY — Japanese YenJSC — Joint-Stock CompanyKLIBOR — Kuala Lumpur Interbank Offered RateKRW — Korean WonKZT - Kazakhstani TengeLIBOR— London Interbank Offered RateLLC — Limited Liability CompanyL.P. — Limited PartnershipLtd. — LimitedMIBOR — Mumbai InterBank Overnight RateMosPrime— Moscow Prime Offered RateMTN — Medium Term NoteMXN — Mexican PesoMYR — Malaysian RinggitOTC — Over The CounterPEN — Peruvian Nuevo SolPHP— Philippine PesoPJSC — Public Joint-Stock CompanyPLC — Public Limited CompanyPLN — Polish ZlotyPRIBOR— Prague Interbank Offered RateRON — Romanian LeuRSD — Serbian DinarRUB — Russian RubleSer — SeriesSGD — Singapore DollarTAIBOR — Taipei Interbank Offered RateTHB — Thai BahtTIIE — Interbank Equilibrium Interest RateTRY — Turkish LiraTWD — Taiwan DollarUAH — Ukrainian HryvniaUGX — Ugandan ShillingULC — Unlimited Liability CompanyUSD — U.S. DollarUYU — Uruguayan PesoWIBOR— Warsaw Interbank Offered RateVAR — Variable RateVND — Vietnamese DongZAR — South African Rand
ZMW — Zambian Kwacha
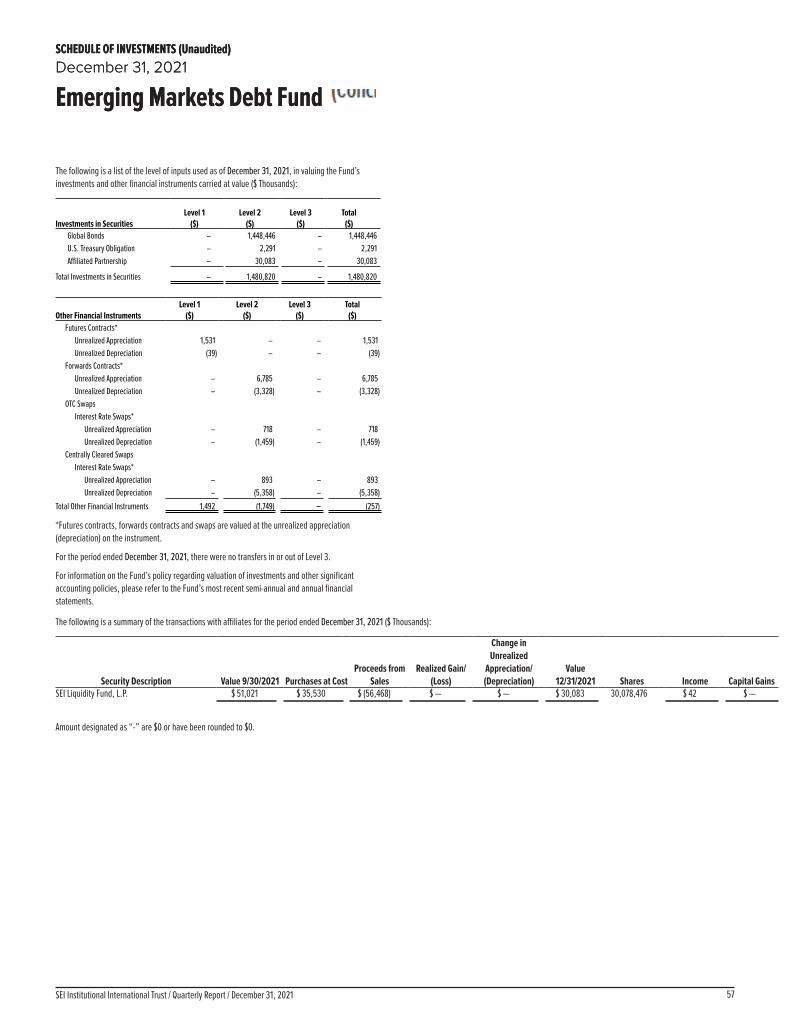
57SEI Institutional International Trust / Quarterly Report / December 31, 2021
SCHEDULE OF INVESTMENTS (Unaudited)December 31, 2021
Emerging Markets Debt Fund (Continued)
SCHEDULE OF INVESTMENTS (Unaudited)December 31, 2021
Emerging Markets Debt Fund (Concluded)
The following is a list of the level of inputs used as of December 31, 2021, in valuing the Fund’s investments and other financial instruments carried at value ($ Thousands):
Investments in SecuritiesLevel 1
($)Level 2
($)Level 3
($)Total
($)Global Bonds – 1,448,446 – 1,448,446U.S. Treasury Obligation – 2,291 – 2,291Affiliated Partnership – 30,083 – 30,083
Total Investments in Securities – 1,480,820 – 1,480,820
Other Financial InstrumentsLevel 1
($)Level 2
($)Level 3
($)Total
($)Futures Contracts*
Unrealized Appreciation 1,531 – – 1,531Unrealized Depreciation (39) – – (39)
Forwards Contracts*Unrealized Appreciation – 6,785 – 6,785Unrealized Depreciation – (3,328) – (3,328)
OTC SwapsInterest Rate Swaps*
Unrealized Appreciation – 718 – 718Unrealized Depreciation – (1,459) – (1,459)
Centrally Cleared SwapsInterest Rate Swaps*
Unrealized Appreciation – 893 – 893Unrealized Depreciation – (5,358) – (5,358)
Total Other Financial Instruments 1,492 (1,749) – (257)
*Futures contracts, forwards contracts and swaps are valued at the unrealized appreciation (depreciation) on the instrument.
For the period ended December 31, 2021, there were no transfers in or out of Level 3.
For information on the Fund’s policy regarding valuation of investments and other significant accounting policies, please refer to the Fund’s most recent semi-annual and annual financial statements.
The following is a summary of the transactions with affiliates for the period ended December 31, 2021 ($ Thousands):
Security Description Value 9/30/2021 Purchases at Cost Proceeds from
Sales Realized Gain/
(Loss)
Change in Unrealized
Appreciation/(Depreciation)
Value 12/31/2021 Shares Income Capital Gains
SEI Liquidity Fund, L.P. $ 51,021 $ 35,530 $ (56,468) $ — $ — $ 30,083 30,078,476 $ 42 $ —
Amount designated as “-” are $0 or have been rounded to $0.
mschweitzer
Stamp