Achieving the triple bottom line in the face of inherent trade-offs among social equity, economic...
6
Achieving the triple bottom line in the face of inherent trade-offs among social equity, economic return, and conservation Benjamin S. Halpern a,b,1 , Carissa J. Klein c,1 , Christopher J. Brown d , Maria Beger c , Hedley S. Grantham c,e , Sangeeta Mangubhai f , Mary Ruckelshaus g , Vivitskaia J. Tulloch c , Matt Watts c , Crow White h , and Hugh P. Possingham c a National Center for Ecological Analysis and Synthesis, Santa Barbara, CA 93101; b Center for Marine Assessment and Planning, University of California, Santa Barbara, CA 93106; c Australian Research Council Centre of Excellence for Environmental Decisions, School of Biological Sciences, and d Global Change Institute, University of Queensland, St. Lucia, QLD 4072, Australia; e Science and Knowledge, Conservation International, Arlington, VA 22202; f Indonesia Marine Program, The Nature Conservancy, Sanur, Bali 80228, Indonesia; g Natural Capital Project, Stanford University, Stanford, CA 94305; and h Bren School of Environmental Science and Management, University of California, Santa Barbara, CA 93106 Edited by Richard M. Cowling, Nelson Mandela Metropolitan University, Port Elizabeth, South Africa, and approved January 7, 2013 (received for review October 11, 2012) Triple–bottom-line outcomes from resource management and con- servation, where conservation goals and equity in social outcomes are maximized while overall costs are minimized, remain a highly sought-after ideal. However, despite widespread recognition of the importance that equitable distribution of benefits or costs across society can play in conservation success, little formal theory exists for how to explicitly incorporate equity into conservation planning and prioritization. Here, we develop that theory and implement it for three very different case studies in California (United States), Raja Ampat (Indonesia), and the wider Coral Tri- angle region (Southeast Asia). We show that equity tends to trade off nonlinearly with the potential to achieve conservation objec- tives, such that similar conservation outcomes can be possible with greater equity, to a point. However, these case studies also pro- duce a range of trade-off typologies between equity and conser- vation, depending on how one defines and measures social equity, including direct (linear) and no trade-off. Important gaps remain in our understanding, most notably how equity influences probability of conservation success, in turn affecting the actual ability to achieve conservation objectives. Results here provide an important foundation for moving the science and practice of conservation planning—and broader spatial planning in general—toward more consistently achieving efficient, equitable, and effective outcomes. marine protected areas | environmental justice | marine spatial planning | ecosystem-based management | social-ecological systems C onservation and resource management require decisions about where, when, and how to allocate limited financial, human, social, and/or political capital resources (1). Whether designing protected areas, prioritizing restoration activities and locations, or limiting, promoting, or allocating certain uses of the landscape or seascape, the spatial and temporal distribution of management actions requires decisions about who may benefit and who may pay costs (2, 3). A large body of literature on conservation and spatial planning has been developed to help guide management strategies and decisions to be as efficient as possible at meeting stated goals (e.g., refs. 4–7). However, the goal of equitable distribution of costs or benefits across indi- viduals or communities from use restrictions is rarely explicitly assessed in the planning process (8). A fundamental tenet of conservation planning is that identi- fying optimal allocations of actions in space and time requires formulating the problem with explicit objective(s), constraints, potential actions, and system models that translate those actions into outcomes (1, 9). Objectives can take different forms, but the ultimate aim is to find the feasible set of actions that maximizes the value of those objectives (e.g., maximum gain in value, mini- mum area needed to achieve the objective). In most biodiversity conservation optimization problems, objectives are biological and framed as quantities, such as species viability or habitat repre- sentation, that are usually traded off against, or constrained by, economic outcomes. In the context of spatial planning and eco- system-based management, objectives focus on particular serv- ices, but otherwise the problem formulation remains the same. In either case, economic outcomes are typically total cost (e.g., dollars spent) or opportunity cost (i.e., the monetary gains expected in the absence of conservation actions). Trade-offs can place in conflict those who prioritize economic versus biodiversity (or service) value (10); but in other cases, biodiversity conserva- tion and economic value positively covary (e.g., ref. 6), such that strategic planning can deliver win–win solutions. In many planning processes, there is awareness of social equity issues, where equity may be a function of, for example, equality of engagement in the planning process or reallocation of benefits or costs accrued under a management decision. In fact, achieving equity along with economic and environmental benefits—the “triple bottom line”—is commonly seen as the ideal outcome of conservation (11). However, rarely is equity incorporated into decision making in a formal way. Formalizing equity as a quan- tifiable and high-priority goal for conservation planning is fea- sible, as we discuss and demonstrate below. However, explicitly including this additional objective could compromise biodiversity conservation, or in other words create another potential trade- off among planning objectives (12). Equity relates to how a person or group perceives the pro- portional availability of goods and services (e.g., is a given pool of resources evenly distributed and/or available?) or the relative deprivation compared with others (e.g., do others have more than I do?) (13). Despite the stated importance of equity in management and decision-making processes (e.g., ref. 14), there is no formal theory for addressing it in the conservation or spatial planning literature. Furthermore, perceived or real inequity can turn interested and cooperative participants into vocal oppo- nents (15), leading to noncompliance or destructive actions (16, 17). Thus, equity can be a critical component of management and conservation success. Here, we explore the nature of potential Author contributions: B.S.H., C.J.K., C.J.B., M.B., H.S.G., M.R., V.J.T., C.W., and H.P.P. designed research; B.S.H., C.J.K., and C.J.B. performed research; B.S.H., C.J.K., C.J.B., and M.W. analyzed data; and B.S.H., C.J.K., C.J.B., M.B., H.S.G., S.M., M.R., V.J.T., C.W., and H.P.P. wrote the paper. The authors declare no conflict of interest. This article is a PNAS Direct Submission. 1 To whom correspondence may be addressed. E-mail: [email protected] or c.klein@ uq.edu.au. This article contains supporting information online at www.pnas.org/lookup/suppl/doi:10. 1073/pnas.1217689110/-/DCSupplemental. www.pnas.org/cgi/doi/10.1073/pnas.1217689110 PNAS Early Edition | 1 of 6 SUSTAINABILITY SCIENCE
-
Upload
independent -
Category
Documents
-
view
0 -
download
0
Transcript of Achieving the triple bottom line in the face of inherent trade-offs among social equity, economic...
Achieving the triple bottom line in the face of inherenttrade-offs among social equity, economic return,and conservationBenjamin S. Halperna,b,1, Carissa J. Kleinc,1, Christopher J. Brownd, Maria Begerc, Hedley S. Granthamc,e,Sangeeta Mangubhaif, Mary Ruckelshausg, Vivitskaia J. Tullochc, Matt Wattsc, Crow Whiteh, and Hugh P. Possinghamc
aNational Center for Ecological Analysis and Synthesis, Santa Barbara, CA 93101; bCenter for Marine Assessment and Planning, University of California, SantaBarbara, CA 93106; cAustralian Research Council Centre of Excellence for Environmental Decisions, School of Biological Sciences, and dGlobal Change Institute,University of Queensland, St. Lucia, QLD 4072, Australia; eScience and Knowledge, Conservation International, Arlington, VA 22202; fIndonesia MarineProgram, The Nature Conservancy, Sanur, Bali 80228, Indonesia; gNatural Capital Project, Stanford University, Stanford, CA 94305; and hBren School ofEnvironmental Science and Management, University of California, Santa Barbara, CA 93106
Edited by Richard M. Cowling, Nelson Mandela Metropolitan University, Port Elizabeth, South Africa, and approved January 7, 2013 (received for reviewOctober 11, 2012)
Triple–bottom-line outcomes from resource management and con-servation, where conservation goals and equity in social outcomesare maximized while overall costs are minimized, remain a highlysought-after ideal. However, despite widespread recognition ofthe importance that equitable distribution of benefits or costsacross society can play in conservation success, little formal theoryexists for how to explicitly incorporate equity into conservationplanning and prioritization. Here, we develop that theory andimplement it for three very different case studies in California(United States), Raja Ampat (Indonesia), and the wider Coral Tri-angle region (Southeast Asia). We show that equity tends to tradeoff nonlinearly with the potential to achieve conservation objec-tives, such that similar conservation outcomes can be possible withgreater equity, to a point. However, these case studies also pro-duce a range of trade-off typologies between equity and conser-vation, depending on how one defines and measures social equity,including direct (linear) and no trade-off. Important gaps remain inour understanding,most notably howequity influences probabilityof conservation success, in turn affecting the actual ability toachieve conservation objectives. Results here provide an importantfoundation for moving the science and practice of conservationplanning—and broader spatial planning in general—toward moreconsistently achieving efficient, equitable, and effective outcomes.
marine protected areas | environmental justice | marine spatial planning |ecosystem-based management | social-ecological systems
Conservation and resource management require decisionsabout where, when, and how to allocate limited financial,
human, social, and/or political capital resources (1). Whetherdesigning protected areas, prioritizing restoration activities andlocations, or limiting, promoting, or allocating certain uses of thelandscape or seascape, the spatial and temporal distribution ofmanagement actions requires decisions about who may benefitand who may pay costs (2, 3). A large body of literature onconservation and spatial planning has been developed to helpguide management strategies and decisions to be as efficient aspossible at meeting stated goals (e.g., refs. 4–7). However, thegoal of equitable distribution of costs or benefits across indi-viduals or communities from use restrictions is rarely explicitlyassessed in the planning process (8).A fundamental tenet of conservation planning is that identi-
fying optimal allocations of actions in space and time requiresformulating the problem with explicit objective(s), constraints,potential actions, and system models that translate those actionsinto outcomes (1, 9). Objectives can take different forms, but theultimate aim is to find the feasible set of actions that maximizesthe value of those objectives (e.g., maximum gain in value, mini-mum area needed to achieve the objective). In most biodiversity
conservation optimization problems, objectives are biological andframed as quantities, such as species viability or habitat repre-sentation, that are usually traded off against, or constrained by,economic outcomes. In the context of spatial planning and eco-system-based management, objectives focus on particular serv-ices, but otherwise the problem formulation remains the same.In either case, economic outcomes are typically total cost (e.g.,dollars spent) or opportunity cost (i.e., the monetary gainsexpected in the absence of conservation actions). Trade-offs canplace in conflict those who prioritize economic versus biodiversity(or service) value (10); but in other cases, biodiversity conserva-tion and economic value positively covary (e.g., ref. 6), such thatstrategic planning can deliver win–win solutions.In many planning processes, there is awareness of social equity
issues, where equity may be a function of, for example, equalityof engagement in the planning process or reallocation of benefitsor costs accrued under a management decision. In fact, achievingequity along with economic and environmental benefits—the“triple bottom line”—is commonly seen as the ideal outcome ofconservation (11). However, rarely is equity incorporated intodecision making in a formal way. Formalizing equity as a quan-tifiable and high-priority goal for conservation planning is fea-sible, as we discuss and demonstrate below. However, explicitlyincluding this additional objective could compromise biodiversityconservation, or in other words create another potential trade-off among planning objectives (12).Equity relates to how a person or group perceives the pro-
portional availability of goods and services (e.g., is a given poolof resources evenly distributed and/or available?) or the relativedeprivation compared with others (e.g., do others have morethan I do?) (13). Despite the stated importance of equity inmanagement and decision-making processes (e.g., ref. 14), thereis no formal theory for addressing it in the conservation or spatialplanning literature. Furthermore, perceived or real inequity canturn interested and cooperative participants into vocal oppo-nents (15), leading to noncompliance or destructive actions (16,17). Thus, equity can be a critical component of management andconservation success. Here, we explore the nature of potential
Author contributions: B.S.H., C.J.K., C.J.B., M.B., H.S.G., M.R., V.J.T., C.W., and H.P.P.designed research; B.S.H., C.J.K., and C.J.B. performed research; B.S.H., C.J.K., C.J.B., andM.W. analyzed data; and B.S.H., C.J.K., C.J.B., M.B., H.S.G., S.M., M.R., V.J.T., C.W., andH.P.P. wrote the paper.
The authors declare no conflict of interest.
This article is a PNAS Direct Submission.1To whom correspondence may be addressed. E-mail: [email protected] or [email protected].
This article contains supporting information online at www.pnas.org/lookup/suppl/doi:10.1073/pnas.1217689110/-/DCSupplemental.
www.pnas.org/cgi/doi/10.1073/pnas.1217689110 PNAS Early Edition | 1 of 6
SUST
AINABILITY
SCIENCE
trade-offs between equity and conservation objectives, test thistheory in three case studies from around the world, and outlinepotential modifications to the theory that future empirical workcould explore. Although our focus is on conservation planning,results are equally relevant to broader questions addressed withinspatial planning contexts. Our work suggests that triple–bottom-line solutions to conservation are possible, but that such solutionsdepend on the form of equity being pursued. Importantly, in-cluding equity as an explicit planning objective leads to clearerdelineation of trade-offs among multiple objectives.
Equity and Its Trade-OffsEquity can manifest itself in a number of ways, with importantimplications for how it gets incorporated into conservationplanning and the potential impacts it has on achieving conser-vation targets. There are two key dimensions to measuring eq-uity: (i) what is measured, which can include monetary loss orgain, access to resources gained or lost, and level of participationin a process (18), and (ii) how it is measured, either in absoluteor relative terms. The former defines the metric(s) used to assessequity; the latter determines how groups are compared witheach other. The metrics used essentially link to three classes ofproblems in conservation prioritization: economic benefits suchas money or rights to use resources are being distributed amonga suite of political entities (e.g., countries, states, regions, non-government organizations, or local governments) (19); conser-vation actions, such as reserves or restrictions on uses, are beingput in place that are believed to impact or benefit a variety ofcommunities or industries (20); and voice or opportunity is givento different groups in a deliberate process (e.g., stakeholder in-volvement or gender equity) (e.g., refs. 21, 22). Here, we em-pirically explore the first two problem types, but acknowledgethat participatory equity may be more important for achievingdesired outcomes than the other types of equity in some cases.Once the type of equity to be measured is defined, the target
objective for equity can be set in a number of ways. To date, mostpolicy has focused on avoiding extreme cases of inequity, inparticular those producing unethical conditions, within a frame-work of environmental justice (e.g., refs. 23, 24). More recently,attention has also focused on optimizing social equity throughinstances where all stakeholders are included in the planningprocess (18) or are affected equally by actions (12, 25, 26), and toa lesser extent through consideration of intergenerational equity(27, 28). It is typically assumed that increased equity comes at thecost of financially optimal conservation solutions, but the natureand shape of that trade-off is generally unknown (29). In theory,the trade-off could take any potential shape (Fig. S1), as is seenwith trade-offs among ecosystem services (10, 30). Through threecase study assessments, we evaluate the shape of these trade-offcurves and explore the implications of such trade-offs forachieving conservation objectives.
Case StudiesOur three case studies include the following: (i) the central coastof California (United States), where a network of marine pro-tected areas (MPAs) was recently created with consideration ofimpacts on local fisheries, (ii) an MPA in the southern RajaAmpat region of Indonesia where proposed no-take zones maydifferentially impact villages’ fishing access; and (iii) the CoralTriangle region where international aid money is being distrib-uted among six countries to mitigate threats to their marineresources. As such, these cases evaluate two different metrics ofequity—dollars and access—and for the Coral Triangle examplein particular we explore implications of considering absoluteversus relative (i.e., proportional) changes in equity.
California Marine Protected Areas. California recently completedan extensive, 8-y planning process to design and implement
a network of MPAs in its state waters, initiated by the MarineLife Protection Act (MLPA) (31). Synthesis of existing in-formation and development of new analytical frameworks pro-vided a vast array of information on the potential trade-offsbetween conservation and fisheries values under different MPAnetwork designs (32, 33). We focus here on the central Californiaregion within the MLPA process (Fig. S2A), because data for thearea are published and available (26). Previous analyses for thisregion focused on the trade-off between how well conservationobjectives were met within a given MPA network and the po-tential total costs to fisheries (7). Here, we focus on imple-menting marine reserves only (the MLPA process included lessrestrictive MPAs as well) and define equity as cost in dollars toeight separate commercial fisheries, and measure equity usingthe Gini coefficient [defined as the dissimilarity in costs orbenefits among different entities (Materials and Methods)]. Weexplore how different overall budget constraints on the com-bined value lost by fisheries interact with equity to influence thenature of the trade-off between conservation goals and equitablefisheries impact.Given budgets set to 3–20% of total fisheries value, equity
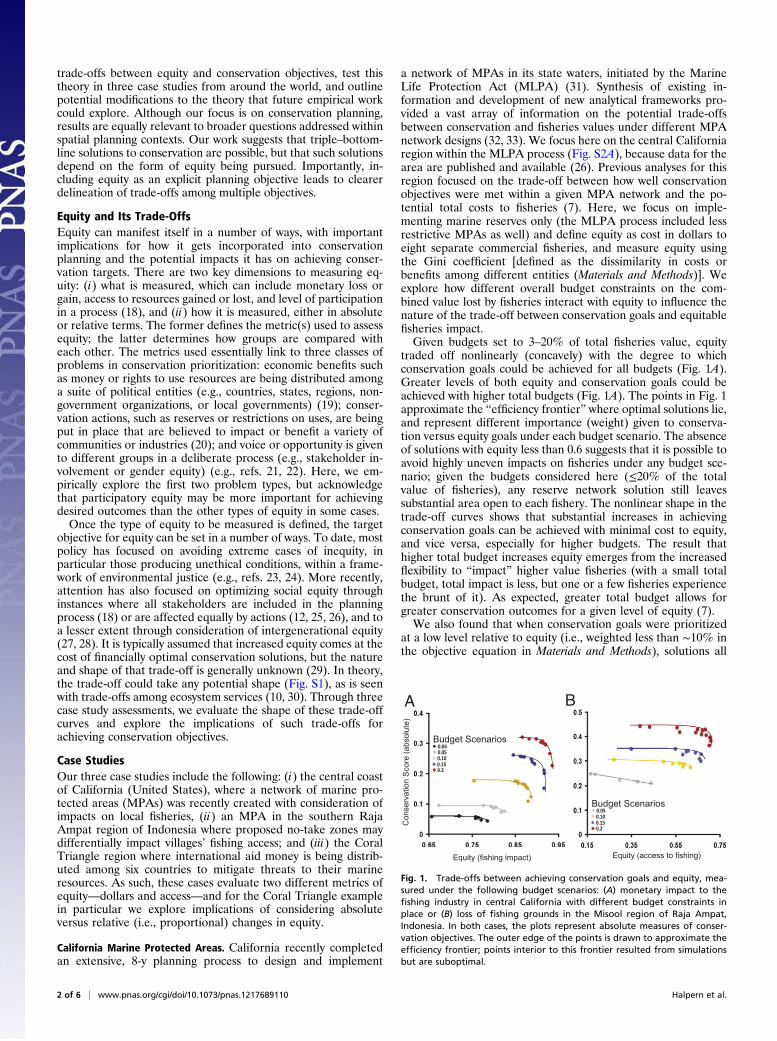
traded off nonlinearly (concavely) with the degree to whichconservation goals could be achieved for all budgets (Fig. 1A).Greater levels of both equity and conservation goals could beachieved with higher total budgets (Fig. 1A). The points in Fig. 1approximate the “efficiency frontier” where optimal solutions lie,and represent different importance (weight) given to conserva-tion versus equity goals under each budget scenario. The absenceof solutions with equity less than 0.6 suggests that it is possible toavoid highly uneven impacts on fisheries under any budget sce-nario; given the budgets considered here (≤20% of the totalvalue of fisheries), any reserve network solution still leavessubstantial area open to each fishery. The nonlinear shape in thetrade-off curves shows that substantial increases in achievingconservation goals can be achieved with minimal cost to equity,and vice versa, especially for higher budgets. The result thathigher total budget increases equity emerges from the increasedflexibility to “impact” higher value fisheries (with a small totalbudget, total impact is less, but one or a few fisheries experiencethe brunt of it). As expected, greater total budget allows forgreater conservation outcomes for a given level of equity (7).We also found that when conservation goals were prioritized
at a low level relative to equity (i.e., weighted less than ∼10% inthe objective equation in Materials and Methods), solutions all
Equity (access to fishing)
BA
Equity (fishing impact)
Budget Scenarios
Budget Scenarios
Con
serv
atio
n S
core
(abs
olut
e)
0.10
0.20.15
0.050.03
0.10
0.20.15
0.05
Fig. 1. Trade-offs between achieving conservation goals and equity, mea-sured under the following budget scenarios: (A) monetary impact to thefishing industry in central California with different budget constraints inplace or (B) loss of fishing grounds in the Misool region of Raja Ampat,Indonesia. In both cases, the plots represent absolute measures of conser-vation objectives. The outer edge of the points is drawn to approximate theefficiency frontier; points interior to this frontier resulted from simulationsbut are suboptimal.
2 of 6 | www.pnas.org/cgi/doi/10.1073/pnas.1217689110 Halpern et al.

converged on perfect equity plans without marine reserves (i.e.,no conservation gain but also no cost to any fishery; result notshown in Fig. 1). Solutions exist with modest conservation andhigh equity outcomes (Fig. S3), but the trade-off with equity(when equity is weighted highly, >90%) makes these solutionstoo costly, because much greater overall value of combinedobjectives can be achieved with the no-reserve solution. Usingsmaller (i.e., higher resolution) planning units could resolve thisissue by creating more planning options and thus greater flexi-bility. However, our results here are realistic because our reso-lution mirrors what was used in the actual planning process andis practical for most situations.
Southeast Misool Marine Protected Area. There is an ongoingprocess to zone a network of multiuse MPAs in Raja Ampat ineastern Indonesia to support biodiversity conservation and sus-tainable fisheries (12). We focus here on Southeast Misool MPA(Fig. S2B). Thirty villages have customary marine tenure andrights to the MPA, which governs where each village can fish.The tenure system in eastern Indonesia is complex, such thatdeclaring a no-take marine reserve within the larger MPA affectsdifferent individuals, families, clans, or villages. We simulated dif-ferent no-take reserve network designs and assessed their perfor-mance in representatively protecting different types of coral reefhabitat (and mitigating stressors to locations) and affecting equityacross villages in lost fishing grounds. We varied a constraint on themaximum area in no-take reserves as a proxy for different conser-vation budgets for the creation of marine reserves.Trade-offs were direct (close to linear) when total (area)
budgets were small (<10% of total area within theMPA placed inmarine reserves; Fig. 1B) and became weaker (concave) withlarger budgets. The concave shape suggests that initial gains inconservation objectives or equity can be achieved with minimalcost to the equity objective. When assessed as proportional ratherthan absolute differences in how well conservation objectiveswere achieved, most trade-off curves were nonlinear (Fig. S4).Interestingly, the point at which equity overrides conservation
objectives, forcing solutions to the zero-reserve outcome, is whenequity is prioritized only slightly more than conservation (i.e.,weighted >60–75%), rather than 90% as in the California ex-ample (Fig. S5). This difference emerges because solutions withreserves had lower equity scores in Southeast Misool than Cal-ifornia, due to the fact that about one-half of the coral reefhabitat features in the Misool MPA occurred in fewer than 20%of the fishing grounds. These sites are critical to achieving overallconservation objectives, causing greater inequity to villages thatfish those sites. This uneven distribution of key habitats thereforerequires higher weighting on conservation versus equity objec-tives to overcome this effect. As with the California example,higher resolution planning units would likely allow for solutionswith higher equity targets, but such small planning units aregenerally not feasible for implementation or enforcement.Habitats restricted to a few fishing grounds also cause a muchlarger range of equity values for conservation solutions on thefrontier in the Indonesia example than is seen in the Californiaexample.
Coral Triangle. The Coral Triangle is composed of six countries(Indonesia, Philippines, Malaysia, Timor Leste, Solomon Islands,and Papua New Guinea), divided into 16 ecoregions (Fig. S2C),whose waters contain the highest global coral biodiversity, but alsosome of the most threatened systems (34). The multilateral CoralTriangle Initiative on Coral Reefs, Fisheries, and Food Security(formalized in May 2009) is the focus of significant global con-servation attention with financial commitments of at least US$400million (www.coraltriangleinitiative.org).Previous work explored the costs and benefits of investing in
land versus marine conservation to help guide the distribution of
financial resources (35). Here, we expand this analysis and ex-plore two types of equity, the distribution of funds (total and percapita) to each ecoregion and the costs from restricted accessdue to MPA creation per ecoregion. We evaluated how the typeof equity affects conservation outcomes for the Coral Triangle,measured as the reduction in total fishing impact to reefs acrossthe Coral Triangle region. As such, this case study allows ex-ploration of two metrics of equity (access and money) and bothmethods of assessment (absolute and proportional). Further-more, we explore how decisions about whether to initially allo-cate portions of the total budget (or area set aside in marinereserves) equitably versus cost effectively influences outcomes.The difference reflects that budgets can be split between dif-ferent objectives (e.g., budget allocated each to equity and costeffectiveness objectives), with the order in which this is donepotentially affecting results. Such decisions are likely common toalmost any planning process.For the two scenarios that allocate low-to-moderate amounts
of money to ecoregions (US$80 and US$160 million), there isa nearly direct trade-off between equitable distribution and theability to achieve conservation objectives (i.e., mitigate fishingimpacts; Fig. 2A). For very high total budgets, the trade-off curvebecomes concave. This nonlinearity emerges because when morethan ∼60% of funding is allocated equitably, entire ecoregionsreceive sufficient funding to fully meet conservation objectivesbefore the total budget is spent for that region (and it is notreallocated to other regions). Thus, this nonlinearity is due inpart to the coarse scale of planning units; nonlinearity in theCalifornia example instead emerged from underlying biophysicalproperties of the system. Nearly identical results emerge whenmeasuring equity as per-capita allocation of funds (Fig. 2B). Anotable exception is the unexpected results for equitable-firstallocations at 75% and 80%—these two solutions have lowerequity than solutions that allocated less equitably first (65% and70%) because the smallest, least populated ecoregion contains
Con
serv
atio
n O
utco
me
(aba
ted
fishi
ng im
pact
, in
mill
ions
)
Equity
A B
C
Open symbol = cost effectively firstFilled symbol = equitable first
= lowest budget= moderate budget= highest budget
Fig. 2. Trade-off between measures of conservation impact (mitigatedfishing pressure) and the equity of distribution of that impact across ecor-egions in the Coral Triangle region for (A) total budget, (B) regional per-capita budget, and (C) total area protected. The open symbols representallocations that were done first cost effectively, and then equitably; theclosed symbols are the reverse. Each point represent 5% additional amountdistributed cost effectively or equitably first, respectively. In A and B, totalbudget is US$80 million, US$160 million, and US$650 million. In C, total areaset aside is 2,801 million, 5,602 million, or 22,408 million km2, representing5%, 10%, and 40% of the total region, respectively. The outer edge of thepoints is drawn to approximate the efficiency frontier; points interior to thisfrontier resulted from simulations but are suboptimal.
Halpern et al. PNAS Early Edition | 3 of 6
SUST
AINABILITY
SCIENCE
relatively cost-effective sites and, when resources are allocated atleast 30% cost effectively, the entire region receives protection.Once that proportion drops to 25%, resources are freed for allo-cation to other ecoregions, increasing inequity across ecoregions.These solutions are far inside the efficiency frontier and so shouldnever be selected, i.e., one could achieve the same amount of eq-uity but much higher conservation outcome with lower amounts offunds allocated first equitably (Fig. 2B).Surprisingly, there is no trade-off when equity is instead
measured as area within marine reserves (i.e., reduced access)for low and medium amounts of total area protected, such thatone should always strive for perfect equity in these cases becauseone can achieve the same conservation outcome at all levels ofequity (Fig. 2C). This result emerges because when equity in areaacross ecoregions is ignored, the most cost-effective sites areselected for protection, resulting in several ecoregions receivingalmost no protected areas (Table S1). Instead, when emphasis isplaced on achieving equity, a portion of each ecoregion must beprotected. In some cases, these protected places mitigate morethreat than in the more cost-effective scenarios, even thoughthey are not cost effective, i.e., considerably more expensive tomitigate equivalent amounts of threat. In this particular example,the trade-off between cost effectiveness and equity led to nearlyidentical conservation outcomes; it seems unlikely that thiswould hold in other cases.Two additional key results emerge from this case study. First,
for low and moderate budgets, there is essentially no difference ifone first allocates funds (or area) equitably and then selectslocations that cost effectively meet conservation objectives, orvice versa. This result does not imply that no trade-off existsbetween objectives—higher equity comes at the direct, linearcost to conservation—but it does mean that for any given level ofequity, one can allocate funds equitably first and still achieve thesame conservation outcomes.Second, for very large budgets, the trade-off becomes non-
linear, as noted above, but in ways that differ for approaches thatallocate resources first equitably versus cost effectively. “Cost-effective–first” solutions mitigate less threat than “equitable-first”solutions. This result emerges because equitable-first solutionsrequire area within each ecoregion to be protected, even if thoseareas are not the most cost effective over the entire region; theyreduce more threat, but at higher cost. We do not see this resultfor lower total budgets because no ecoregion is receiving suffi-cient funds to protect the whole area under these budgets, soboth equitable-first and cost-effective–first solutions select sim-ilar, cost-effective sites for protection. Furthermore, for thehighest total area budget (Fig. 2C), the equitable-first approachproduces the typical concave trade-off curve, whereas the cost-effective–first approach produces a split curve, with the initialhalf showing the typical concave trade-off, whereas the secondhalf shows a strong positive relationship. These solutions interiorto the frontier are inferior and should not be chosen, such thatone would always favor the full-equity solution in this latter re-gion of the curve and the low-equity, high-conservation solutionsin the early region of the curve (Fig. 2C). This split-curve resultemerges because cost-effective–first approaches will select thebest sites across the whole region first, leading to all sites withinsmall ecoregions being selected once equity reaches about 0.75;as equity increases beyond this, more expensive high-value sitesin other regions get selected, causing the conservation outcometo increase. The relative size of each region and the distributionof conservation targets within those regions should have a stronginfluence on the presence and shape of this split curve. The splitcurve is not seen when allocation is done equitably first becausethe priority is to have protected areas spread among regions,making it less likely that entire ecoregions will be protectedunder any given budget.
These stark differences in the nature and shape of the trade-off between equity and conservation objectives when using dif-ferent metrics (monetary cost versus access to areas) and methods(absolute versus per capita) highlight the critical importance ofdefining which metrics of equity and methods for assessing itmatter most to people engaged in, or affected by, a planningprocess. The set of optimal solutions will vary greatly underthese different approaches to incorporating equity, and manage-ment focus on an inappropriate metric could significantly decreasethe probability of success of a proposed solution.
Equity and the Probability of SuccessThe above analyses and discussion do not address an importantaspect of equity that may allow for combination of the twocurrencies into a single measure of triple–bottom-line outcomes.Highly inequitable solutions are more likely to fail because thosewho are disenfranchised from the benefits or outcomes of theprocess often feel little motivation to adhere to the agreement(15). Increases in equity are typically believed to improve theprobability of success by increasing likelihood of self-enforce-ment of new regulations because people perceive the regulationsas fair (36, 37), yet it is equally likely that management will fail ifthe needs or desires of particularly vocal or powerful minoritiesare not met. Most of these assumptions remain untested.Here, we simulate the consequences to conservation prioriti-
zation of considering both social equity and its impact on theprobability that a plan is enacted or upheld. Empirical assess-ment of these interactions would require a large sample ofconservation actions where equity and conservation effectivenessare measured, information that currently does not exist anda field of research that merits significant attention. For now, weassume probability of success increases asymptotically with in-creasing equity, and that extremely inequitable solutions havenear-zero probability of success and that the best case scenariohas very high but not guaranteed chance of success (Materialsand Methods). If instead probability of success peaked at mid-levels of equity, for example if powerful stakeholders influencethe outcome, then our results would be even more pronounced.We assume that expected conservation success is the product
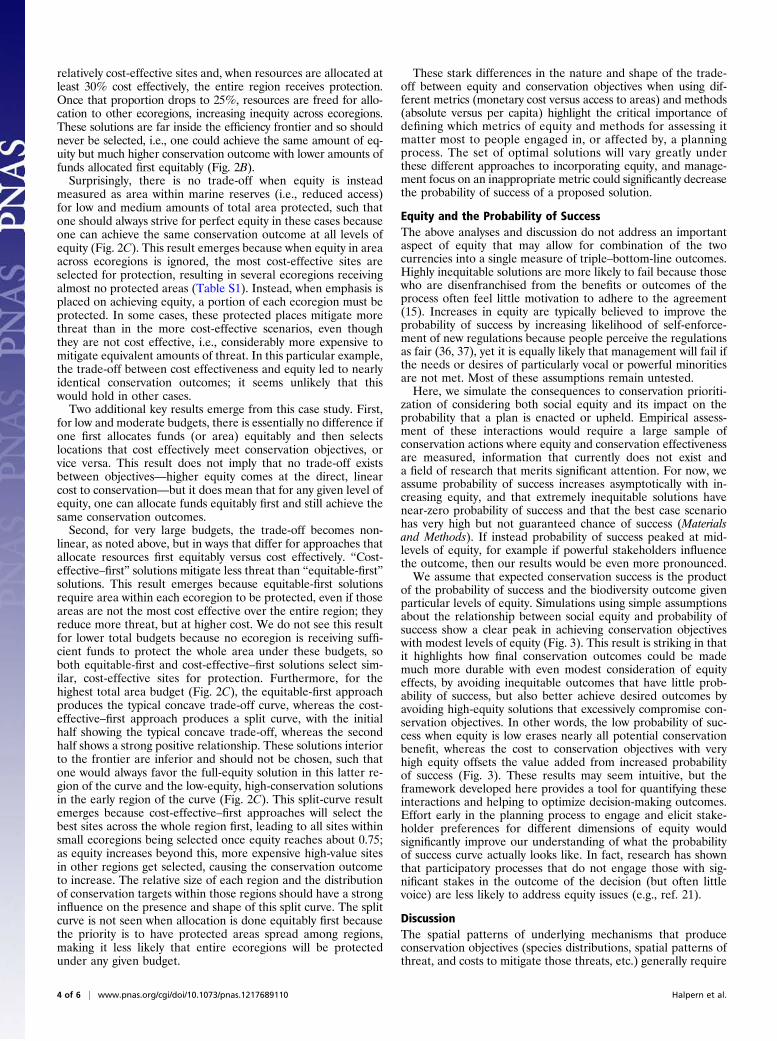
of the probability of success and the biodiversity outcome givenparticular levels of equity. Simulations using simple assumptionsabout the relationship between social equity and probability ofsuccess show a clear peak in achieving conservation objectiveswith modest levels of equity (Fig. 3). This result is striking in thatit highlights how final conservation outcomes could be mademuch more durable with even modest consideration of equityeffects, by avoiding inequitable outcomes that have little prob-ability of success, but also better achieve desired outcomes byavoiding high-equity solutions that excessively compromise con-servation objectives. In other words, the low probability of suc-cess when equity is low erases nearly all potential conservationbenefit, whereas the cost to conservation objectives with veryhigh equity offsets the value added from increased probabilityof success (Fig. 3). These results may seem intuitive, but theframework developed here provides a tool for quantifying theseinteractions and helping to optimize decision-making outcomes.Effort early in the planning process to engage and elicit stake-holder preferences for different dimensions of equity wouldsignificantly improve our understanding of what the probabilityof success curve actually looks like. In fact, research has shownthat participatory processes that do not engage those with sig-nificant stakes in the outcome of the decision (but often littlevoice) are less likely to address equity issues (e.g., ref. 21).
DiscussionThe spatial patterns of underlying mechanisms that produceconservation objectives (species distributions, spatial patterns ofthreat, and costs to mitigate those threats, etc.) generally require
4 of 6 | www.pnas.org/cgi/doi/10.1073/pnas.1217689110 Halpern et al.
inequitable distribution of resources to achieve optimal conser-vation outcomes. However, few planning processes focus solelyon achieving conservation objectives, given stakeholder interestin minimizing negative impact to specific groups or maximizingeconomic gain. This tension among values sits at the heart ofperceived and real trade-offs among conservation objectives,total economic gains (or losses), and social equity. To date, theissue of equity has largely been addressed indirectly, throughimplicit assumptions about spreading costs or benefits, or asa secondary concern, as with post hoc comparisons of the equityof outcomes (36). We have shown here that explicit assessmentof how equity influences the ability to achieve conservationoutcomes produces a more nuanced and realistic picture of theeffects of any given conservation objective on different groups,and may indicate under what conditions significant trade-offs arelikely to occur. Hopefully, applying this framework will lead tosolutions unrecognized without direct consideration of equity.The solutions that lie along the “frontier” in the case studies
are triple–bottom-line solutions, where one can optimize con-servation goals and equity while minimizing costs. Solutions in-terior to these frontier solutions (most of which are not plotted)are all possible and represent the many ways decision making canmiss the mark on the triple bottom line. As in other trade-offassessments (5, 6, 30), finding the frontier does not then prescribea single correct solution but instead presents the range of options,all optimal, that represent the trade-off between stated goals. Asthe case studies show, there is almost always a trade-off betweenbiodiversity conservation and equity, but the extent of this trade-off varies depending on the context and the exact formulation ofthe objective function. Ignoring issues of equity in conservationplanning will likely produce suboptimal outcomes and risks failurein prioritization efforts and durability of implemented actions.We have focused here on a few types of equity, namely the dis-
tribution of costs and access to resources. Although these two typesare likely the most common to conservation planning exercises,many other types clearly exist, most notably gender (16, 17), in-tergenerational (22, 23), and geographic equity [such as with globaltrade and its displacement of environmental impacts, and the cor-ollary, climate change impacts (38)]. These different kinds of socialand economic equity likely constrain conservation prioritizationand planning in different ways, yet to be explored formally.Two key assumptions affect our results and suggest impor-
tant areas for further research. First, we measured biodiversityobjectives by tracking how much threat was abated in a givenlocation. This is a proxy at best for true changes in conservationvalues and outcomes, and so the actual shape of the trade-off
between equity and conservation objectives may differ fromwhat we found here. Perhaps more importantly, threat abate-ment can be achieved more quickly than ultimate conservationgoals, such as number of species recovered to stable populationsizes. Because the consequences of social equity play out relativelyquickly whereas conservation goals tend to take time to achieve,full treatment of equity issues in conservation planning need toaddress the temporal as well as spatial components. Second, theshape of equity-probability curves characterizing how equityaffects the likelihood of success of a plan remains largely un-known. Empirical research focused on determining the shape ofthis curve would provide the key to combining the two currenciesinto a single metric, allowing for more accurate identification oftriple–bottom-line solutions.Conservation planning, whether in the ocean or on land, strives
to find optimal solutions in the face of inherent constraints. Tri-ple–bottom-line outcomes remain highly prized, but they cannotbe achieved regularly without formal approaches to consideringequity alongside the more traditional focus on minimizing costsand maximizing conservation objectives. Incorporating equitycan produce nonintuitive results, as with the California andRaja Ampat case studies where strong emphasis on equity leadsto zero-MPA solutions. More importantly, it produces realisticresults, and that realism will go a long way toward building stake-holder acceptance of management plans and outcomes.We have focused here on marine conservation planning
problems, but the approach and implications of the results arerelevant to a broader spatial planning context, where planningobjectives can include ecosystem services other than biodiversityconservation. Social and economic equity is almost always on theminds of stakeholders involved in these processes; the frame-work and theory we have developed here provides a means tomake such concerns explicit and quantitative.
Materials and MethodsIn each case study, we implemented marine reserves (i.e., no-take areas) andassumed that their implementation eliminates fishing from the reserveregion and that the fishing is not redistributed. The conservation benefit ofreserves varied across case studies, described below and in SI Text. Althoughthe type of equity measured in each case study was different, we use thesame metric to evaluate equity, the widely recognized and used Gini co-efficient (39). In our context here, the Gini coefficient measures the dis-similarity in costs or profits among different entities. It indicates thedifference between a perfectly equitable distribution and the actual distri-bution of a resource. Although the Gini coefficient is commonly used asa measure of inequality of wealth (40), it has also been applied to describeother types of inequalities (41–44). We adapt the Gini coefficient to measureequality rather than inequality by using its inverse (1 − Gini, henceforthreferred to as “equity”), where a value of 1 represents perfect equality anda value of zero represents maximal inequality (Eq. S1). Details for data usedin each case study are provided in SI Text.
California and Raja Ampat Case Studies. For the California and Raja Ampatcase studies, we examined the trade-off between conservation and equitygoals constrained by a fixed budget. The budget was defined as the totalmonetary cost to fisheries and the total area lost within fishing grounds,respectively. For California, we present trade-off curves with the budgetranging from 3% to 20% of the combined value of fisheries. Optimal solutionson the trade-off frontier were searched for using the objective function Obj =max [αE1μ + (1 − α)E2], subject to the budget constraint Σ(Ck) ≤ B, where αis the conservation weighting, E1 is the equity in habitat representation inreserves, E2 is the equity in fishery impacts of reserves, and μ is the minimumrepresentation of a habitat in reserves (Eq. S1; see Table S2 for parametersused to calculate E). Thus, a reserve plan with either low representation equityor low representation of a single habitat would have a low conservation score.Ck is the costs to each fishery of the reserves and B is the total budget (e.g., seeref. 45). Varying the conservation weighting 0–1 gives the optimal solution fordifferent points on the trade-off frontier. The set of possible reserves is toolarge to explore exhaustively (23610 possibilities in CA and 2670 in RA), so weused simulated annealing to find near-optimal solutions (46, 47). For allannealing simulations, we compared the objective function value for the
0
0.2
0.4
0.6
0.8
1
0 0.2 0.4 0.6 0.8 1Equity
Prob
abili
ty (d
ashe
d) o
r C
onse
rvat
ion
Obj
ectiv
e (s
olid
)
Fig. 3. The relationship between equity and biodiversity, and how proba-bility of success given different levels of equity modifies the ability to ach-ieve biodiversity conservation targets. the solid black line shows the trade-off between conservation objectives and equity. The dashed gray lines showtwo hypothetical shapes for the relationship between equity and probabilityof success, and the solid gray lines are the resulting consequences of theseprobability curves on the degree to which conservation objectives are met.
Halpern et al. PNAS Early Edition | 5 of 6
SUST
AINABILITY
SCIENCE

near-optimal solution to its value with no marine reserves, setting μ = 0 andE2 = 1. Although true optimal solutions cannot be found without an ex-haustive search, the performance of the optimization algorithm was checkedby comparing its results to outcomes from 1 million randomly sampled ma-rine reserve plans for each case study. The frontier found using simulatedannealing was considerably better than random.
Coral Triangle Case Study. We used the Coral Triangle boundaries andecoregions (n = 16) defined by Veron et al. (48) on the basis of coral diversityand endemism. We used the global coral reef atlas (49) to determine thepresence/absence of coral reefs for each 1-km2 cell in each ecoregion. Theobjective of this case study was to minimize fishing impacts on coral reefsthrough investment in marine reserves, given a fixed budget that could beused to compensate for changes in economic opportunity arising from givenactions, such as for lost fishing opportunity. To determine the priority ofan area for designation as a marine protected area, we calculated return oninvestment of protecting each 1-km2 reef unit, where return was measuredas reduction of fishing and investment as cost of reducing each threat.Using this information, we allocated resources using two different methods:(i) “cost-effective” allocation, where resources are allocated to coral reefswith the highest return on investment; (ii ) “equitable” allocation, whereresources are divided equitably between each of the 16 ecoregions, and
then allocated cost effectively within each ecoregion and visa versa. Weanalyzed the trade-off between conservation (i.e., reduction of fishingpressure) and equity (i.e., distribution of resources to ecoregions) for sce-narios that range from spending 100% of the budget cost effectively forconservation to 100% equitably for the community. We implemented dif-ferent types of budget constraints: (i) financial budget of $80 million, $160million, and $650 million; (ii) financial budget per capita, such that, whenallocated equitably, is split equally among people; and (iii) area budget ofprotecting 2,801, 5,602, and 22,408 km2 of coral reef (5%, 10%, and 40% ofthe total region, respectively). Financial budget constraints were based ona value that, when distributed equitably, was insufficient to protect anyecoregion entirely (US$160 million), and one-half and four times thatamount (for illustrative purposes). Area budget constraints were based ona 10% target (5,602 km2), a common target for protection, and equivalentone-half and four times changes as with the monetary budget.
ACKNOWLEDGMENTS. We thank Santiago Bucaram and Megan Saundersfor helpful discussions and two anonymous reviewers whose commentssignificantly improved the manuscript. Support was provided by an Austra-lian Research Council Discovery Grant and Postdoctoral Fellowship (ProjectDP110102153) (to C.J.K.) and the Australian Research Council Centre ofExcellence for Environmental Decisions.
1. Possingham HP, Ball IR, Andelman S (2000) Quantitative Methods for ConservationBiology, eds Ferson S, Burgman M (Springer, New York), pp 291–305.
2. de Groot R (2006) Function-analysis and valuation as a tool to assess land use conflictsin planning for sustainable, multi-functional landscapes. Landsc Urban Plan 75(3–4):175–186.
3. Adams VM, Pressey RL, Naidoo R (2010) Opportunity costs: Who really pays for con-servation? Biol Conserv 143(2):439–448.
4. Lester S, et al. (2009) Biological effects within no-take marine reserves: A globalsynthesis. Mar Ecol Prog Ser 384:33–46.
5. White C, Halpern BS, Kappel CV (2012) Ecosystem service tradeoff analysis revealsthe value of marine spatial planning for multiple ocean uses. Proc Natl Acad Sci USA109(12):4696–4701.
6. Nelson E, et al. (2009) Modeling multiple ecosystem services, biodiversity conserva-tion, commodity production, and tradeoffs at landscape scales. Front Ecol Environ7(1):4–11.
7. Klein CJ, et al. (2008) Striking a balance between biodiversity conservation and so-cioeconomic viability in the design of marine protected areas. Conserv Biol 22(3):691–700.
8. Tallis, H, Polasky S, Lozano JS, Wolny S (2012) Inclusive wealth accounting for regu-lating ecosystem services. Inclusive Wealth Report 2012. Measuring progress towardsustainability (Cambridge Univ Press, Cambridge, UK).
9. Margules CR, Nicholls AO, Pressey RL (1988) Selecting networks of reserves to maxi-mize biological diversity. Biol Conserv 43(1):63–76.
10. Cardinale BJ, et al. (2012) Biodiversity loss and its impact on humanity. Nature486(7401):59–67.
11. Ehrlich PR, Kareiva PM, Daily GC (2012) Securing natural capital and expanding equityto rescale civilization. Nature 486(7401):68–73.
12. Grantham HS, et al. (July 23, 2013) A comparison of zoning analyses to inform theplanning of a marine protected area network in Raja Ampat, Indonesia. Mar Policy38:184–194.
13. Loomis DK, Ditton RB (1993) Distributive justice in fisheries management. Fisheries(Bethesda, Md.) 18:14–18.
14. Jodha N, Russell D (1997) Beyond Fences: Seeking Social Sustainability in Conserva-tion, ed Borrini-Feyerabend G (IUCN, Gland, Switzerland).
15. Miller BW, Caplow SC, Leslie PW (2012) Feedbacks between conservation and social-ecological systems. Conserv Biol 26(2):218–227.
16. Fernandez PR (2007) Understanding relational politics in MPA governance in North-eastern Iloilo, Philippines. J Coast Res SI 50:38–42.
17. Beger M, Harborne AR, Dacles TP, Solandt J-L, Ledesma GL (2004) A frameworkof lessons learned from the community-based marine reserves and its effectivenessin guiding a new coastal management initiative in the Philippines. Environ Manage34(6):786–801.
18. Layzer JA (2002) Citizen participation and government choice in local environmentalcontroversies. Policy Stud J 30(2):193–207.
19. James AN, Gaston KJ, Balmford A (1999) Balancing the world’s accounts. Nature401(6751):323–324.
20. West PC, Igoe J, Brockington D (2006) Parks and peoples: The social impact of pro-tected areas. Annu Rev Anthropol 35:251–277.
21. Badola R, Hussain SA (2003) Conflict in paradise: Women and protected areas in theIndian Himalaya. Mt Res Dev 23:234–237.
22. Foale S, et al. (2013) Food security and the Coral Triangle Initiative.Mar Policy 38:174–183.
23. Adger WN, Paavola J, Huq S, Mace MJ (2006) Fairness in adaptation to climate change(MIT, Cambridge, MA).
24. Low N, Gleeson B (1998) Justice, Society and Nature (Routledge, London).
25. Halpern BS, White C, Lester SE, Costello C, Gaines SD (2011) Using portfolio theory toassess tradeoffs between return from natural capital and social equity across space.Biol Conserv 144(5):1499–1507.
26. Klein CJ, Steinback C, Watts ME, Scholz AJ, Possingham HP (2010) Spatial marinezoning for fisheries and conservation. Front Ecol Environ 8(7):349–353.
27. Portney PR, Weyant JP (1999) Discounting and Intergenerational Equity (Johns Hop-kins Univ Press, Baltimore, MD).
28. Lauwers L (2012) Intergenerational equity, efficiency, and constructibility. Econ The-ory 49(2):227–242.
29. Pascual U, Muradian R, Rodriguez LC, Duraiappah A (2010) Exploring the links be-tween equity and efficiency in payments for environmental services: A conceptualapproach. Ecol Econ 69(6):1237–1244.
30. Lester SE, et al. (2013) Evaluating tradeoffs among ecosystem services to informmarine spatial planning. Mar Policy 38:80–89.
31. California Department of Fish and Game (2008) California Marine Life Protection Act:Master Plan for Marine Protected Areas, revised draft January 2008 (California De-partment of Fish and Game, Sacramento, CA).
32. Airame S, et al. (2003) Applying ecological criteria to marine reserve design: A casestudy from the California Channel Islands. Ecol Appl 13(1):S170–S184.
33. Gleason M, et al. (2012) Science-based and stakeholder-driven marine protected areanetwork planning: A successful case study from north central California. Ocean CoastManage 53(2):52–68.
34. Burke L, Reytar K, Spalding M, Perry A (2012) Reefs at Risk Revisited (World ResourcesInstitute, Washington, DC).
35. Klein CJ, et al. (2010) Prioritizing land and sea conservation investments to protectcoral reefs. PLoS One 5(8):e12431.
36. White C, Costello C, Kendall BE, Brown CJ (2012) The value of coordinated man-agement of interacting ecosystem services. Ecol Lett 15(6):509–519.
37. Hoel AH (1998) Political uncertainty in international fisheries management. Fish Res37(1–3):239–250.
38. Rayner S, Malone EL (2001) Climate change, poverty, and intergenerational equity:The national level. Int J Glob Environ Issues 1(2):175–202.
39. Gini C (1921) Measurement of inequality and incomes. Econ J 31:124–126.40. Allison P (1978) Measures of inequality. Am Soc Rev 43(6):865–880.41. Barr LM, et al. (2011) A new way to measure the world’s protected area coverage.
PLoS One 6(9):e24707.42. Brown MC (1994) Using Gini-style indices to evaluate the spatial patterns of health
practitioners: Theoretical considerations and an application based on Alberta data.Soc Sci Med 38(9):1243–1256.
43. Damgaard C, Weiner J (2000) Describing inequality in plant size or fecundity. Ecology81(4):1139–1142.
44. Bradford JB, D’Amato AW (2012) Recognizing trade-offs in multi-objective landmanagement. Front Ecol Environ 10(4):210–216.
45. Game ET, Watts ME, Wooldridge S, Possingham HP (2008) Planning for persistence inmarine reserves: A question of catastrophic importance. Ecol Appl 18(3):670–680.
46. Ball I, Possingham HP, Watts ME (2009) Spatial Conservation Prioritisation: Quantita-tive Methods and Computational Tools, eds Moilanen A, Willson KA, Possingham HP(Oxford Univ Press, Oxford).
47. Cocks KD, Baird IA (1983) Using mathematical programming to address the multiplereserve selection problem: An example from the Eyre Penninsula, South Australia.Biol Conserv 49(3):113–130.
48. Veron JEN, deVantier L, Turak E, Green A, Kinnimonth S (2009) Delineating the CoralTriangle. Galaxea 11:91–100.
49. Spalding MD, Ravilious C, Green EP (2001) World Atlas of Coral Reefs (Univ ofCalifornia Press, Berkeley, CA).
6 of 6 | www.pnas.org/cgi/doi/10.1073/pnas.1217689110 Halpern et al.