Metabolic efficiency underpins performance trade-offs ... - Nature
10
ARTICLE Received 6 Sep 2013 | Accepted 4 Mar 2014 | Published 28 Mar 2014 Metabolic efficiency underpins performance trade-offs in growth of Arabidopsis thaliana Sabrina Kleessen 1 , Roosa Laitinen 2 , Corina M. Fusari 3,4 , Carla Antonio 5,6 , Ronan Sulpice 3,7 , Alisdair R. Fernie 5 , Mark Stitt 3 & Zoran Nikoloski 1 Growth often involves a trade-off between the performance of contending tasks; metabolic plasticity can play an important role. Here we grow 97 Arabidopsis thaliana accessions in three conditions with a differing supply of carbon and nitrogen and identify a trade-off between two tasks required for rosette growth: increasing the physical size and increasing the protein concentration. We employ the Pareto performance frontier concept to rank accessions based on their multitask performance; only a few accessions achieve a good trade-off under all three growth conditions. We determine metabolic efficiency in each accession and condition by using metabolite levels and activities of enzymes involved in growth and protein synthesis. We demonstrate that accessions with high metabolic efficiency lie closer to the performance frontier and show increased metabolic plasticity. We illustrate how public domain data can be used to search for additional contending tasks, which may underlie the sub-optimality in some accessions. DOI: 10.1038/ncomms4537 1 Systems Biology and Mathematical Modeling Group, Max Planck Institute of Molecular Plant Physiology, Am Muehlenberg 1, Potsdam-Golm D-14476, Germany. 2 Molecular Mechanisms of Adaptation Group, Max Planck Institute of Molecular Plant Physiology, Am Muehlenberg 1, Potsdam-Golm D-14476, Germany. 3 System Regulation Group, Max Planck Institute of Molecular Plant Physiology, Am Muehlenberg 1, Potsdam-Golm D-14476, Germany. 4 Instituto de Biotecnologı ´a, Centro Investigacio ´n en Ciencias Veterinarias y Agrono ´micas (CICVyA), Instituto Nacional de Tecnologı ´a Agropecuaria (INTA), Nicolas Repetto y de los Reseros s/n, 1686, Hurlingham, Buenos Aires, Argentina. 5 Central Metabolism Group, Max Planck Institute of Molecular Plant Physiology, Am Muehlenberg 1, Potsdam-Golm D-14476, Germany. 6 Instituto de Tecnologia Quı ´mica e Biolo ´gica, Universidade Nova de Lisboa, Avenue da Repu ´blica, 2780-157 Oeiras, Portugal. 7 NUI Galway, Plant Systems Biology Lab, Plant and AgriBiosciences Research Centre, Botany and Plant Science, C311 Aras de Brun, Galway, Ireland. Correspondence and requests for materials should be addressed to Z.N. (email: [email protected]). NATURE COMMUNICATIONS | 5:3537 | DOI: 10.1038/ncomms4537 | www.nature.com/naturecommunications 1 & 2014 Macmillan Publishers Limited. All rights reserved.
-
Upload
khangminh22 -
Category
Documents
-
view
1 -
download
0
Transcript of Metabolic efficiency underpins performance trade-offs ... - Nature
ARTICLE
Received 6 Sep 2013 | Accepted 4 Mar 2014 | Published 28 Mar 2014
Metabolic efficiency underpins performancetrade-offs in growth of Arabidopsis thalianaSabrina Kleessen1, Roosa Laitinen2, Corina M. Fusari3,4, Carla Antonio5,6, Ronan Sulpice3,7, Alisdair R. Fernie5,
Mark Stitt3 & Zoran Nikoloski1
Growth often involves a trade-off between the performance of contending tasks; metabolic
plasticity can play an important role. Here we grow 97 Arabidopsis thaliana accessions in three
conditions with a differing supply of carbon and nitrogen and identify a trade-off between two
tasks required for rosette growth: increasing the physical size and increasing the protein
concentration. We employ the Pareto performance frontier concept to rank accessions based
on their multitask performance; only a few accessions achieve a good trade-off under all three
growth conditions. We determine metabolic efficiency in each accession and condition by
using metabolite levels and activities of enzymes involved in growth and protein synthesis.
We demonstrate that accessions with high metabolic efficiency lie closer to the performance
frontier and show increased metabolic plasticity. We illustrate how public domain data can be
used to search for additional contending tasks, which may underlie the sub-optimality in
some accessions.
DOI: 10.1038/ncomms4537
1 Systems Biology and Mathematical Modeling Group, Max Planck Institute of Molecular Plant Physiology, Am Muehlenberg 1, Potsdam-Golm D-14476,Germany. 2Molecular Mechanisms of Adaptation Group, Max Planck Institute of Molecular Plant Physiology, Am Muehlenberg 1, Potsdam-Golm D-14476,Germany. 3 System Regulation Group, Max Planck Institute of Molecular Plant Physiology, Am Muehlenberg 1, Potsdam-Golm D-14476, Germany. 4 Institutode Biotecnologıa, Centro Investigacion en Ciencias Veterinarias y Agronomicas (CICVyA), Instituto Nacional de Tecnologıa Agropecuaria (INTA), NicolasRepetto y de los Reseros s/n, 1686, Hurlingham, Buenos Aires, Argentina. 5 Central Metabolism Group, Max Planck Institute of Molecular Plant Physiology,Am Muehlenberg 1, Potsdam-Golm D-14476, Germany. 6 Instituto de Tecnologia Quımica e Biologica, Universidade Nova de Lisboa, Avenue da Republica,2780-157 Oeiras, Portugal. 7 NUI Galway, Plant Systems Biology Lab, Plant and AgriBiosciences Research Centre, Botany and Plant Science, C311 Aras deBrun, Galway, Ireland. Correspondence and requests for materials should be addressed to Z.N. (email: [email protected]).
NATURE COMMUNICATIONS | 5:3537 | DOI: 10.1038/ncomms4537 | www.nature.com/naturecommunications 1
& 2014 Macmillan Publishers Limited. All rights reserved.

Living organisms perform many different and sometimescontending tasks, leading to trade-offs in which optimalperformance of one task comes at the cost of a sub-optimal
performance of another task. Trade-offs are influenced by theenvironment and their resolution depends on metabolic resourcesand plasticity1,2. One important environmental variable affectingplant growth is resource availability3–6. We first ask whether thereis a trade-off between two tasks during vegetative growth ofArabidopsis thaliana: the maximization of physical size and themaximization of protein concentration. We then apply twomethods to rank accessions: the first based solely on theperformance of tasks, and the second based on the efficiencywith which metabolic resources are deployed to perform tasks. Inaddition, we investigate whether the trade-off and the ranking ofaccessions are affected by the availability of carbon (C) andnitrogen (N) and the way in which it shapes the accession-specificmetabolic profiles.
Plants use light energy to transform CO2 and inorganic nutrientsinto a plethora of metabolic precursors that are used to drivegrowth. As plants are sessile, resource acquisition is constrained bytheir physical size. In land plants, the majority of a mature cell isoccupied by the vacuole, allowing the generation of a much largerphysical size per unit protein than is usually obtained by microbesor animals7. For simplification, we do not consider the impact ofshape and phenology on the relation between physical size andresource acquisition. On the other hand, proteins are required tocatalyse the transformation of resources into biomass. In particular,the majority of the protein in a plant leaf is involved inphotosynthesis8–10. We hypothesize that there is a trade-offbetween physical size and protein concentration. Whileproduction of leaves with a higher protein concentration willallow higher rates of photosynthesis and metabolism per unitbiomass, it also increases the costs of growth and decreases physicalsize, resulting in the occupation of less space and the acquisition ofsmaller amounts of resources. In particular, a decrease in rosettearea will decrease how much light is intercepted7,11,12. Plant sizeand protein concentration will additionally strongly depend ongrowth conditions, especially those affecting resource supply andallocation, such as daily irradiance and nitrogen availability13,14.
Trade-offs between tasks are not measured directly but arerather inferred from measurements of the correspondingphenotypic traits. To study the effect of resource acquisitionand allocation on trade-offs, the contending traits are measuredalong two orthogonal axes. One axis is given by a collection ofgenotypes, for example, accessions or species, and the other bydiffering environments. Inference of trade-offs from the resultinglarge multidimensional data set of trait scores is typically basedon correlation-driven methods. However, while a negativecorrelation between two traits may be indicative of trade-off15,16, it does not reveal what underlies the trade-off.Furthermore, correlation-driven methods do not allow thequantification and comparison of trade-offs in individualgenotypes and under different conditions.
This led us to ask whether more information can be extractedusing the Pareto performance and efficiency frontiers17–21
originating in engineering and the social sciences. While there canbe many feasible strategies to allocate resources to contending tasks,only a few of them result in an optimal trade-off21–23. A strategy,corresponding to a genotype24 in a given condition, provides anoptimal trade-off when a further increase in the performance of onetask is not possible without decreasing the performance of othertasks. Figure 1 schematically illustrates a simple example in whichtwo contending tasks are studied in one condition.
Four recent studies have illustrated the potential of the Paretoperformance frontier to describe trade-offs at the phenotypiclevel: Shoval et al.16 showed that trade-offs between tasks lead to
Pareto fronts in the shape of simple polygons, for example, lines,triangles or tetrahedrons, in trait space. The vertices of theresulting polygons may be regarded as specialists for a single task,represented by a linear combination of traits. Sheftel et al.25
extended this to show that slightly curved edges may arise under awider range of assumptions. Szekely et al.26 calculate the Paretofront of biological homeostasis circuits in the space of employedparameters. Moreover, Schuetz et al.27 used a metabolic model toprovide flux estimates28, and proposed that Escherichia coli hasevolved towards optimal flux distributions in one condition whileminimizing the changes required between conditions.
The performance frontier provides a concise description oftrade-offs, but does not explain why it adopts a given location, orwhy a particular genotype is located at or below the frontier(Fig. 1). The location of a genotype is presumably constrained bythe underlying factors that determine the trade-off between tasks.These factors can be analysed using the concept of relative Paretoefficiency29,30, which allows the comparison of different strategiesfor allocating finite amounts of resources between tasks.A resource allocation strategy is termed efficient if no otherallocation strategy exists that is able to improve the performanceof one task without decreasing the performance of other tasks orutilizing more of any individual resource30.
Here we first illustrate how the performance frontier can beused to analyse and reduce a large multidimensional data setdescribing the trade-off between fresh weight and proteinconcentrations in A. thaliana natural accessions growing in threeconditions. We regard metabolism as a production line with twooutputs: protein and fresh weight, and use the metabolite andenzyme activity profiles to describe the structure and resourcestate of this production line. By using the Pareto efficiencyconcept, we ask whether the structure of this production lineinfluences the trade-off between size and protein concentration indifferent accessions and conditions. The results reveal that whilesome accessions lie close to the performance frontier andare metabolically efficient, others show sub-optimality. As thefindings of such analyses are contingent on the tasks, accessionsand conditions used in the study, sub-optimality may indicatethat the considered tasks are in trade-off with other tasks,examined by mining public domain data sources.
Feasible
Paretofrontier
Score for task 2
Sco
re fo
r ta
sk 1
Infeasible
Figure 1 | Pareto performance concept. Schematic illustration of Pareto
performance. Two contending tasks are studied in one condition. The
performance of genotypes is scored with respect to the two tasks and is
depicted by the two axes. Each genotype is represented as a point in the
resulting 2D space. The genotypes with an optimal trade-off between the
two tasks form the Pareto performance frontier. The frontier arises due to
systemic constraints affecting the performance, and separates the feasible
from the infeasible region.
ARTICLE NATURE COMMUNICATIONS | DOI: 10.1038/ncomms4537
2 NATURE COMMUNICATIONS | 5:3537 | DOI: 10.1038/ncomms4537 | www.nature.com/naturecommunications
& 2014 Macmillan Publishers Limited. All rights reserved.

ResultsTrade-off between fresh weight and protein concentration. As afirst step, we investigated whether there is a trade-off betweenproduction of rosette fresh weight and protein concentration in apanel of Arabidopsis accessions (Supplementary Table 1). We relyon fresh weight, as it is the best indicator of plant size and is thekey parameter in many allometric relationships31,32. Our analysisuses ex situ data collected on these two phenotypic traits andmetabolic phenotypes in the rosette of the Arabidopsis accessionsin three contrasting but not overly stressful growth conditions.The panel contained 97 accessions selected to show substantialgenetic and geographical variation (Supplementary Table 1,Supplementary Fig. 1)33,34. The majority of the accessions comefrom Eurasia, together with some accessions from North Americaand Africa and derive from a range of growth habitats35,36. Theywere grown in a 8 h light/16 h dark photoperiod and high Nsupply in which growth was limited by C (LiC)37 and in a 12 hlight/12 h dark photoperiod at two levels of N fertilization, oneallowing close to maximal growth (OpN) and another in which Nlimited the growth (LiN)38. The levels of 48 metabolites and theactivities of eight enzymes in central metabolism were profiledto provide a metabolic phenotype in each growth condition(Supplementary Methods).
When an increase in performance of one task results in adecrease in performance of another task, the correspondingtraits will show a negative correlation. In our set of 97 accessions,the correlation between fresh weight and protein concentrationwas negative in all conditions: � 0.30 (P value¼ 0.0032,t-distribution) for OpN, � 0.40 (P value¼ 0.0877, t-distribution)for LiC and � 0.17 (P value¼ 0.0001, t-distribution) for LiN (seeSupplementary Fig. 2A–C, respectively). The negative relation-ship was strongest in LiC, and smaller and not significant in LiN,indicating that extent of the trade-off may be condition-dependent. A similar negative relationship was recently shownbetween N percentage, as a proxy of protein concentration, andthe dry to fresh mass ratio in 122 vascular plant species39 as wellas between N content and leaf weight in barley40, demonstratingthe generality of the trade-off between size and proteinconcentration within and across species, as well as itsimportance in an ecological context and in crop plants.
Accession fresh weight between conditions correlated moststrongly for the OpN/LiC comparison (0.47, P value¼ 0,t-distribution), followed by LiC/LiN (0.31, P value¼ 0.0017,t-distribution), and LiN/OpN (0.29, P value¼ 0.0046, t-distribu-tion) (Supplementary Fig. 3A–C, respectively). The sameorder was obtained when protein concentration wasused (0.34 (P value¼ 0.0006, t-distribution), 0.32 (Pvalue¼ 0.0016, t-distribution) and 0.16 (P value 0.1253, t-distribution) for OpN/LiC, LiC/LiN, and LiN/OpN, respectively)(Supplementary Fig. 3D–F, respectively). These values indicatedthat the rankings of accessions based on a single task do notchange dramatically between the three growth conditions, andpoint to a fairly robust trade-off situation in growth-related tasks.
Average performance frontier. While correlation analysis indi-cates that there may be a trade-off between two tasks, it does notprovide accession-specific information about the performance ofcontending tasks and how this is affected by the growth condi-tion. To provide this information, we investigated the trade-offbetween fresh weight and protein concentration with the help ofthe Pareto performance frontier. To obtain the performancefrontier for a given condition, the accession with the highestperformance for a given task is represented by a value of one, andall other accessions as a fraction of this value. When two (asin our case) or more tasks are considered, each accession is
represented as a point in a two- or multi-dimensional space,respectively. The coordinates of the corresponding point are givenby the normalized performance scores. The performance frontierfor an investigated condition can be approximated by thebounding segments or, if there are more than two tasks, a surfacefrom the convex hull connecting the best performers for eachtask. The resulting plots for each growth condition are providedin the Supplementary Information (Supplementary Fig. 4A–C).
To obtain an average performance frontier, which summarizesthe accession-specific trade-off between fresh weight and proteinconcentration in three contrasting environments, the followingprocedure was used (illustrated for Je-54 on Fig. 2). The scores forthe performance of an accession with respect to its fresh weightand protein concentration in three conditions build a triangle foreach accession. The centroid of the triangle corresponds to theaverage relative performance of each accession with respect to thetwo tasks. The extent to which performance was conservedbetween the three conditions is visualized by the size of the point,which is proportional to the area of the corresponding triangle; asmall point denotes a conserved performance in the threeconditions. The three lines arising from the centroid are directedtowards the vertices of the triangle. This procedure was repeatedfor all 97 accessions (Supplementary Table 2).
The visualization in Fig. 2 is more informative than acorrelation-based analysis because it characterizes performancefor multiple tasks and conditions in an accession-specific manner.Some accessions are better at accumulating protein, for example,Lov5 and Pt0, as shown in the upper part of Fig. 2, while othersare better performers with respect to fresh weight, for example,Wei1, Da112, Bsch2 and Bur-0, shown in the right part of Fig. 2.From the distribution of areas of the triangles, shown in the inlayin Fig. 2, we classified the accessions into three groups, supportedby robust statistics (Supplementary Table 3); the first groupincludes those performing similarly under all three conditions, forexample, Bla11, Da112 and Bur-0, the second, those with similarperformance under two conditions, for example, Bsch2, Lan-0and Pt0, and third includes those with quite divergent relativeperformance in all conditions, for example, Bay-0, Rubenzhnoe-1,Mt-0 and Lov5 (Supplementary Tables 3, 4). This classificationis difficult to obtain by separate consideration of thethree condition-specific performance frontiers (SupplementaryFig. 4A–C).
The dashed lines in Fig. 2 connects the best average performerfor fresh weight with the best average performer for proteinconcentration across all three conditions, using the boundingsegments from the convex hull. These lines approximate to theaverage performance frontier of the three conditions. Thedistribution of accessions around this performance frontier wasextremely unbalanced. Six accessions were close to or directly onthe performance frontier, namelyWei1, Bsch2, Da112,Mt-0, Est-1and Lov5.
To analyse the relationship between the distance from theaverage performance frontier and the trade-off between freshweight and protein concentration, we calculated the correlationbetween fresh weight and protein concentration for groups ofaccessions, starting with the 10 closest to the frontier, andprogressively increasing the set until it included all 97 accessions(Supplementary Fig. 5). The negative correlation between freshweight and protein was strongest for accessions closer to theaverage performance frontier, and became progressively weakeras more accessions were included. Figure 2 reveals that accessionslying well below the performance frontier fall into two groups;one shows a trend for a decreased fresh weight while retaining arelatively high protein concentration (an extreme representativeof this group is Bla11), while the other group exhibits a trend for adecreased protein concentration while retaining a relatively
NATURE COMMUNICATIONS | DOI: 10.1038/ncomms4537 ARTICLE
NATURE COMMUNICATIONS | 5:3537 | DOI: 10.1038/ncomms4537 | www.nature.com/naturecommunications 3
& 2014 Macmillan Publishers Limited. All rights reserved.

high fresh weight (an extreme representative of this group isRubezhnoe-1).
Thus, this two-dimensional (2D) visualization of the averageperformance frontier provides insights into performance of twotasks across multiple conditions. However, in any given study,the location of the performance frontier is contingent on the
investigated tasks, accessions and growth conditions, and that inparticular the occurrence of additional tasks that are notconsidered in the analysis can lead to apparent sub-optimality.The occurrence of many accessions well below the performancefrontier indicates that there may be more than the twoinvestigated tasks in trade-off. To investigate this possibility, wealso employed the approach of Shoval et al.16, which uses thecriterion of triangularity with the data on fresh weight andprotein concentration in each individual growth condition andtheir combination. This criterion was not significant atlevel a¼ 0.01 (permutation test with 10,000 repetitions)(Supplementary Fig. 6A–H). Moreover, since the data do notfall on a line, an additional task might not be in trade-off.
Metabolic efficiency. While the performance frontier providesphenomenological insights into accession-specific trade-offs,it does not reveal whether and how the observed phenotypicperformance relates to underlying cellular processes such asmetabolism. In the following, we consider the metabolism of eachaccession as a production line that allocates the availableresources, captured by metabolite and enzyme activity profiles,between two contending tasks: maximizing fresh weight andmaximizing protein concentration. Although only a fraction ofthe metabolic phenotype can be measured, due to the high con-nectivity in metabolic networks34, the profiles carry informationabout other unmeasured traits41. Regression-based analyseshave shown that metabolite and enzyme activity profilesprovide an integrative metabolic phenotype that is predictive ofbiomass33,34,42,43, heterosis44, and, to a lesser extent, abiotic stresstolerance in plants45.
In the following, we employ the Pareto efficiency principle forproduction systems30 to test whether the trade-off between freshweight and protein concentration is related to changes in resourceavailability and allocation in metabolism. Within this conceptualframework, an accession can be considered to be metabolicallyefficient if an attempt to further decrease any of its metabolicresources (inputs) or further increase any of the tasks (outputs)adversely affects other inputs or outputs, relative to all otherconsidered accessions. Metabolically efficient accessions can beidentified by solving a series of linear optimization problemsintegrating measurements of the inputs and outputs in theframework of data envelopment analysis (DEA). Themetabolically efficient accessions define the efficiency frontier; itenvelops the remaining accessions that are referred to asmetabolically inefficient. As in the analysis based on theperformance frontier, the identification of metabolically efficientaccessions is contingent on the investigated tasks, accessions andconditions. In addition to discriminating metabolically efficientfrom inefficient accessions, this approach allows inefficientaccessions to be ranked based on their distance from theefficiency frontier. Recent refinements of DEA based on theconcept of super-efficiency46,47 also make it possible to provide aranking of the accessions that are deemed fully efficient. As aresult, the metabolically efficient accessions receive a value of atleast one, while the inefficient a positive value smaller than one.
Metabolic profiling provides a high-dimensional metabolicphenotype. To determine the metabolic efficiency of accessionswe used a method that couples principal component analysis(PCA) with DEA, referred to as PCA–DEA48,49. Using theprincipal components (PCs) that explain 70% of the variance inthe condition-specific metabolic phenotypes as inputs and freshweight and protein concentration as two contending outputs, weidentified 15, 25 and 47 efficient accessions under OpN, LiN andLiC conditions, respectively (Fig. 3). This indicates that manyaccessions are able to adjust their metabolism to different C and
Triangle area
Num
ber
of a
cces
sion
s
0.000 0.005 0.010 0.015 0.020 0.025
0
50
100
150
Je−54
0.4 0.5 0.6 0.7 0.8 0.9
0.70
0.75
0.80
0.85
0.90
0.95
Normalized FW
Nor
mal
ized
pro
tein
con
cent
ratio
n
Est−1
Lan−0
Lov5
Wei1
Bay−0
Bla11
Rubezhnoe−1
Ang0
Mt−0Rsch−0
Pt0
Bsch2
Bur−0
Da112
Old−1
OpNLiNLiC
b
a
Figure 2 | Pareto performance frontier for the 97 considered Arabidopsis
accessions. (a) The condition-specific normalized fresh weight (FW) and
protein concentration provide the coordinates for the vertices of an
accession-specific triangle, for example, for Je-54. The larger spread of FW
in comparison to protein concentration is due to its nonlinear relationship to
the relative growth rate. The average performance with respect to the two
tasks across all three conditions is provided by the centroid of the triangle.
The centroid is used as a representative of an accession, and the size of the
associated point is proportional to the size of the respective triangle. The
colour coding of the three lines incident on each centroid denotes the
conditions, red for OpN, yellow for LiN and blue for LiC. The lines are
directed towards the vertices of the corresponding triangle. For clarity,
the vertices of the triangles are omitted from the plot. The dashed line
approximates the Pareto performance frontier. (b) The histogram of
accession-specific triangle areas for the three considered conditions
suggests the presence of three groups of accessions: those performing
similarly under all conditions (small triangle area), those differing in one
condition (average triangle area) and those divergent in the three
conditions (large triangle area).
ARTICLE NATURE COMMUNICATIONS | DOI: 10.1038/ncomms4537
4 NATURE COMMUNICATIONS | 5:3537 | DOI: 10.1038/ncomms4537 | www.nature.com/naturecommunications
& 2014 Macmillan Publishers Limited. All rights reserved.
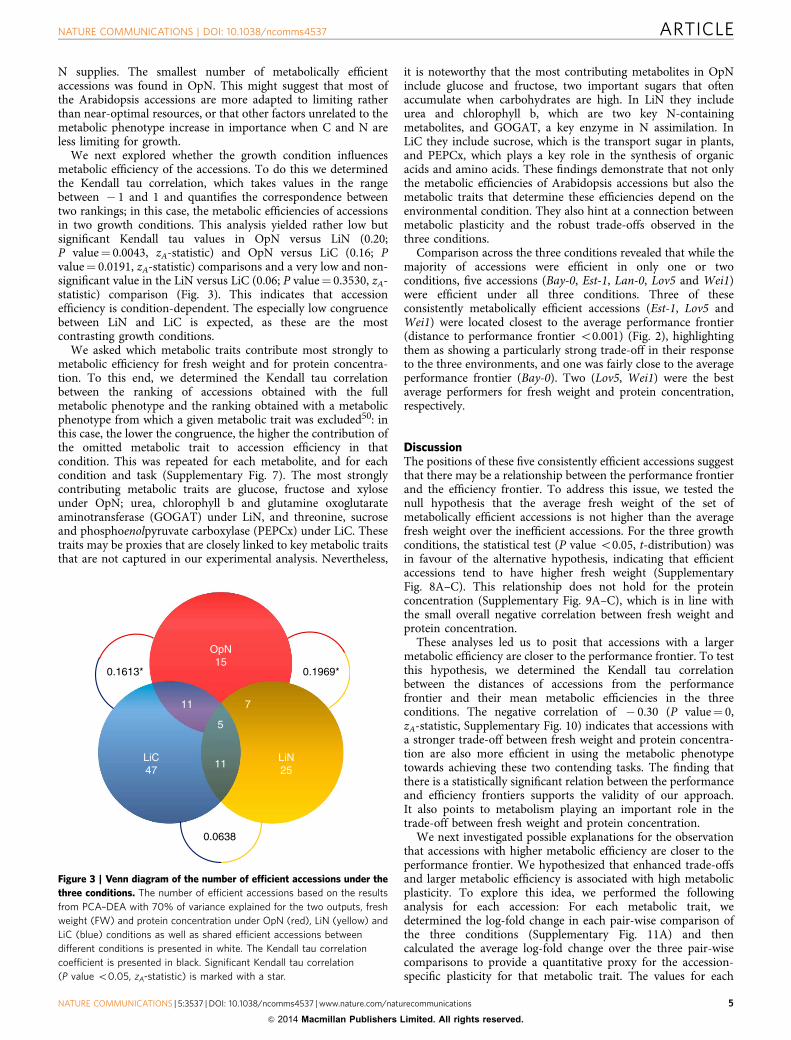
N supplies. The smallest number of metabolically efficientaccessions was found in OpN. This might suggest that most ofthe Arabidopsis accessions are more adapted to limiting ratherthan near-optimal resources, or that other factors unrelated to themetabolic phenotype increase in importance when C and N areless limiting for growth.
We next explored whether the growth condition influencesmetabolic efficiency of the accessions. To do this we determinedthe Kendall tau correlation, which takes values in the rangebetween � 1 and 1 and quantifies the correspondence betweentwo rankings; in this case, the metabolic efficiencies of accessionsin two growth conditions. This analysis yielded rather low butsignificant Kendall tau values in OpN versus LiN (0.20;P value¼ 0.0043, zA-statistic) and OpN versus LiC (0.16; Pvalue¼ 0.0191, zA-statistic) comparisons and a very low and non-significant value in the LiN versus LiC (0.06; P value¼ 0.3530, zA-statistic) comparison (Fig. 3). This indicates that accessionefficiency is condition-dependent. The especially low congruencebetween LiN and LiC is expected, as these are the mostcontrasting growth conditions.
We asked which metabolic traits contribute most strongly tometabolic efficiency for fresh weight and for protein concentra-tion. To this end, we determined the Kendall tau correlationbetween the ranking of accessions obtained with the fullmetabolic phenotype and the ranking obtained with a metabolicphenotype from which a given metabolic trait was excluded50: inthis case, the lower the congruence, the higher the contribution ofthe omitted metabolic trait to accession efficiency in thatcondition. This was repeated for each metabolite, and for eachcondition and task (Supplementary Fig. 7). The most stronglycontributing metabolic traits are glucose, fructose and xyloseunder OpN; urea, chlorophyll b and glutamine oxoglutarateaminotransferase (GOGAT) under LiN, and threonine, sucroseand phosphoenolpyruvate carboxylase (PEPCx) under LiC. Thesetraits may be proxies that are closely linked to key metabolic traitsthat are not captured in our experimental analysis. Nevertheless,
it is noteworthy that the most contributing metabolites in OpNinclude glucose and fructose, two important sugars that oftenaccumulate when carbohydrates are high. In LiN they includeurea and chlorophyll b, which are two key N-containingmetabolites, and GOGAT, a key enzyme in N assimilation. InLiC they include sucrose, which is the transport sugar in plants,and PEPCx, which plays a key role in the synthesis of organicacids and amino acids. These findings demonstrate that not onlythe metabolic efficiencies of Arabidopsis accessions but also themetabolic traits that determine these efficiencies depend on theenvironmental condition. They also hint at a connection betweenmetabolic plasticity and the robust trade-offs observed in thethree conditions.
Comparison across the three conditions revealed that while themajority of accessions were efficient in only one or twoconditions, five accessions (Bay-0, Est-1, Lan-0, Lov5 and Wei1)were efficient under all three conditions. Three of theseconsistently metabolically efficient accessions (Est-1, Lov5 andWei1) were located closest to the average performance frontier(distance to performance frontier o0.001) (Fig. 2), highlightingthem as showing a particularly strong trade-off in their responseto the three environments, and one was fairly close to the averageperformance frontier (Bay-0). Two (Lov5, Wei1) were the bestaverage performers for fresh weight and protein concentration,respectively.
DiscussionThe positions of these five consistently efficient accessions suggestthat there may be a relationship between the performance frontierand the efficiency frontier. To address this issue, we tested thenull hypothesis that the average fresh weight of the set ofmetabolically efficient accessions is not higher than the averagefresh weight over the inefficient accessions. For the three growthconditions, the statistical test (P value o0.05, t-distribution) wasin favour of the alternative hypothesis, indicating that efficientaccessions tend to have higher fresh weight (SupplementaryFig. 8A–C). This relationship does not hold for the proteinconcentration (Supplementary Fig. 9A–C), which is in line withthe small overall negative correlation between fresh weight andprotein concentration.
These analyses led us to posit that accessions with a largermetabolic efficiency are closer to the performance frontier. To testthis hypothesis, we determined the Kendall tau correlationbetween the distances of accessions from the performancefrontier and their mean metabolic efficiencies in the threeconditions. The negative correlation of � 0.30 (P value¼ 0,zA-statistic, Supplementary Fig. 10) indicates that accessions witha stronger trade-off between fresh weight and protein concentra-tion are also more efficient in using the metabolic phenotypetowards achieving these two contending tasks. The finding thatthere is a statistically significant relation between the performanceand efficiency frontiers supports the validity of our approach.It also points to metabolism playing an important role in thetrade-off between fresh weight and protein concentration.
We next investigated possible explanations for the observationthat accessions with higher metabolic efficiency are closer to theperformance frontier. We hypothesized that enhanced trade-offsand larger metabolic efficiency is associated with high metabolicplasticity. To explore this idea, we performed the followinganalysis for each accession: For each metabolic trait, wedetermined the log-fold change in each pair-wise comparison ofthe three conditions (Supplementary Fig. 11A) and thencalculated the average log-fold change over the three pair-wisecomparisons to provide a quantitative proxy for the accession-specific plasticity for that metabolic trait. The values for each
OpN15
LiN25
LiC47
5
11
11 7
0.1969*0.1613*
0.0638
Figure 3 | Venn diagram of the number of efficient accessions under the
three conditions. The number of efficient accessions based on the results
from PCA–DEA with 70% of variance explained for the two outputs, fresh
weight (FW) and protein concentration under OpN (red), LiN (yellow) and
LiC (blue) conditions as well as shared efficient accessions between
different conditions is presented in white. The Kendall tau correlation
coefficient is presented in black. Significant Kendall tau correlation
(P value o0.05, zA-statistic) is marked with a star.
NATURE COMMUNICATIONS | DOI: 10.1038/ncomms4537 ARTICLE
NATURE COMMUNICATIONS | 5:3537 | DOI: 10.1038/ncomms4537 | www.nature.com/naturecommunications 5
& 2014 Macmillan Publishers Limited. All rights reserved.
metabolic trait were combined and plotted to provide an overviewof the condition-dependent variation of each metabolic trait in agiven accession (Supplementary Fig. 11B). This procedure wascarried out for each of the analysed accessions (SupplementaryFig. 11C).
The resulting distributions characterize the plasticity of themetabolic phenotype in an accession-specific manner. Weinvestigated two properties of the distributions: skewness and95th percentile. The skewness quantifies the extent to which themedian of a distribution is shifted to one side of the mean:positive skewness is expected when majority of the metabolictraits show plasticity smaller than the mean (SupplementaryFig. 12). The skewness was positive in all accessions, with anaverage skewness of 2.3365 (s.d. 0.4035) over all accessions(Supplementary Table 5). Altogether, these results indicated thatmajority of metabolic traits show plasticity lower than the mean,and that this was the case for all accessions.
This led us to focus on the metabolic traits that are in the righttail of the distributions, that is, those with plasticity greater thanthe mean. To do this, we employed the 95th percentile, thequantity below which 95% of the values in the distribution fall:the larger its value, the more extreme the plasticity of fewmetabolic traits. The average 95th percentile of the accessions was2.7744 with a s.d. of 0.2796. This finding supports the earlierobservation that majority of traits show a relatively small averagelog-fold change. We next tested whether the 95th percentiles ofthe distributions correlate with the distance of accessions to theperformance frontier (Supplementary Fig. 11D,E, SupplementaryTable 5). The negative correlation (Kentall tau of � 0.14,P value¼ 0.0360, zA-statistic) indicated that accessions with ahigher plasticity in a small number of metabolic traits are indeedcloser to the performance frontier.
Metabolic traits that showed average log-fold changes largerthan the 95th percentile included are the following: spermidine,nitrate (NO3), raffinose and dehydroascorbate in the majority ofaccessions (including the five consistently efficient across thethree conditions) while arginine, glutamate, glutamine, glycine,isoleucine, proline-4-hydroxy and maltose were highly plastic inonly few accessions (Supplementary Table 5). Previous studieshave implicated these metabolites as changing as a result of Cor N limitation51,52. Altogether, these findings indicate thataccessions that are more metabolically efficient exhibit morepronounced plasticity in a small number of metabolic traits, andare positioned closer to the performance frontier.
Investigation of metabolic efficiencies also led to ask why thedistribution of accessions around the performance frontier ishighly unbalanced (Fig. 2). One possibility is that many of theaccessions are only adjusted to one condition in which they aremetabolically efficient. However, this cannot be the full explana-tion because 34 accessions are metabolically inefficient in all threeconditions (Supplementary Table 6). A more likely explanation isthat growth and survival of Arabidopsis requires the performanceof further tasks that are not considered in our study, and that theimportance of these unconsidered tasks varies, depending on theaccession and environment.
To test the hypothesis that other tasks may be in trade-off, weused scores that are publically available for 199 Arabidopsisaccessions for sets of germination, defence-related, ionomics,developmental and flowering traits53. We investigated fivescenarios with accessions that had full data sets for at least 50traits (Supplementary Fig. 13A–E). In the first three scenarios,missing values were imputed for all traits (excluding germination)over all remaining accessions, and the criterion of triangulationwas applied on all traits, defence and developmental, but only forthe 41 accessions also present in our data set (SupplementaryTable 7). In the last two scenarios, the missing values were
imputed only for the defence and developmental traits, andstatistical tests were applied with all accessions and only the41 accessions present also present in our data set. Interestingly,the criterion of triangularity was significant in the scenarios ofdefence and developmental traits for the 41 accessions withmissing values imputed based on all or only defence anddevelopments traits (P values¼ 0.0033 and 0, respectively,permutation test with 10,000 repetitions). Altogether thesefindings highlight two main aspects—first, the analysis inShoval et al.16, like ours, is contingent on the data used andgenotypes employed; second, some defence and developmental-related tasks might be in trade-off with increasing rosette sie andthe protein concentration. However, this statement is notconclusive on the basis of the current study alone.
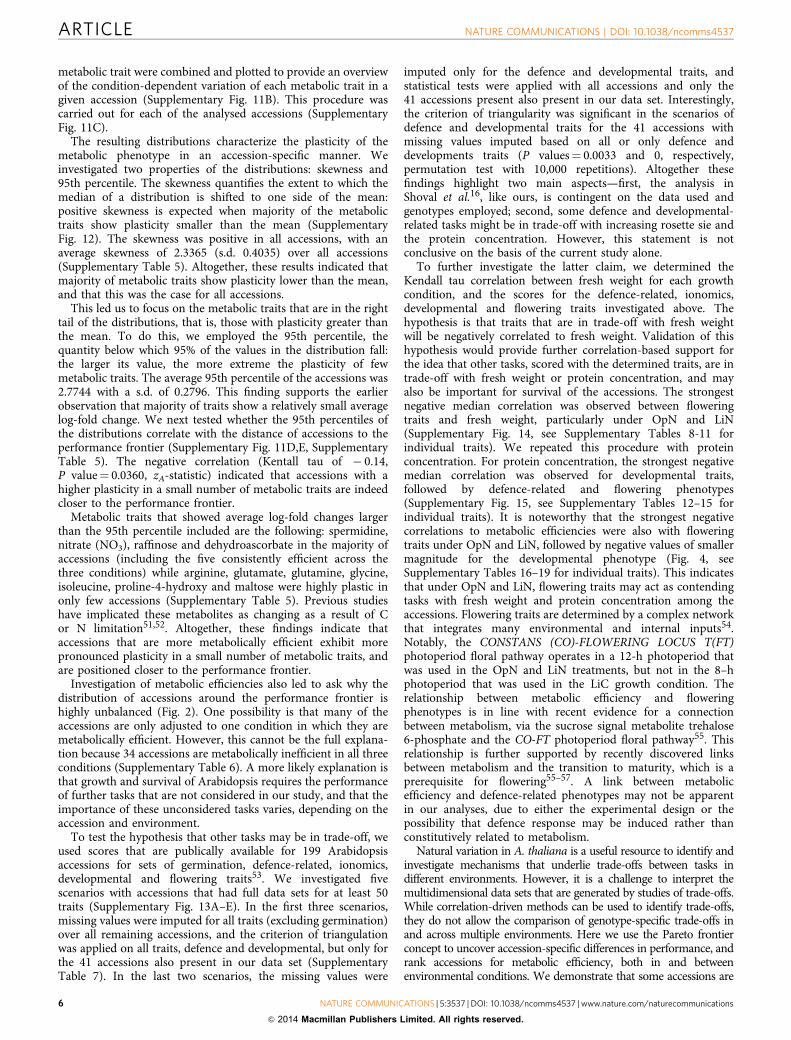
To further investigate the latter claim, we determined theKendall tau correlation between fresh weight for each growthcondition, and the scores for the defence-related, ionomics,developmental and flowering traits investigated above. Thehypothesis is that traits that are in trade-off with fresh weightwill be negatively correlated to fresh weight. Validation of thishypothesis would provide further correlation-based support forthe idea that other tasks, scored with the determined traits, are intrade-off with fresh weight or protein concentration, and mayalso be important for survival of the accessions. The strongestnegative median correlation was observed between floweringtraits and fresh weight, particularly under OpN and LiN(Supplementary Fig. 14, see Supplementary Tables 8-11 forindividual traits). We repeated this procedure with proteinconcentration. For protein concentration, the strongest negativemedian correlation was observed for developmental traits,followed by defence-related and flowering phenotypes(Supplementary Fig. 15, see Supplementary Tables 12–15 forindividual traits). It is noteworthy that the strongest negativecorrelations to metabolic efficiencies were also with floweringtraits under OpN and LiN, followed by negative values of smallermagnitude for the developmental phenotype (Fig. 4, seeSupplementary Tables 16–19 for individual traits). This indicatesthat under OpN and LiN, flowering traits may act as contendingtasks with fresh weight and protein concentration among theaccessions. Flowering traits are determined by a complex networkthat integrates many environmental and internal inputs54.Notably, the CONSTANS (CO)-FLOWERING LOCUS T(FT)photoperiod floral pathway operates in a 12-h photoperiod thatwas used in the OpN and LiN treatments, but not in the 8–hphotoperiod that was used in the LiC growth condition. Therelationship between metabolic efficiency and floweringphenotypes is in line with recent evidence for a connectionbetween metabolism, via the sucrose signal metabolite trehalose6-phosphate and the CO-FT photoperiod floral pathway55. Thisrelationship is further supported by recently discovered linksbetween metabolism and the transition to maturity, which is aprerequisite for flowering55–57. A link between metabolicefficiency and defence-related phenotypes may not be apparentin our analyses, due to either the experimental design or thepossibility that defence response may be induced rather thanconstitutively related to metabolism.
Natural variation in A. thaliana is a useful resource to identify andinvestigate mechanisms that underlie trade-offs between tasks indifferent environments. However, it is a challenge to interpret themultidimensional data sets that are generated by studies of trade-offs.While correlation-driven methods can be used to identify trade-offs,they do not allow the comparison of genotype-specific trade-offs inand across multiple environments. Here we use the Pareto frontierconcept to uncover accession-specific differences in performance, andrank accessions for metabolic efficiency, both in and betweenenvironmental conditions. We demonstrate that some accessions are
ARTICLE NATURE COMMUNICATIONS | DOI: 10.1038/ncomms4537
6 NATURE COMMUNICATIONS | 5:3537 | DOI: 10.1038/ncomms4537 | www.nature.com/naturecommunications
& 2014 Macmillan Publishers Limited. All rights reserved.

efficient across a range of conditions. We also show that metabolicallyefficient accessions are close to the average performance frontier in arange of growth conditions, demonstrating that there is considerableagreement between these two approaches. Further, accessions that liecloser to the average performance frontier show a higher metabolicplasticity for a small subset of metabolic traits, providing first insightsinto which features of metabolism contribute to phenotypic plasticity.Altogether, our findings indicate a relation between plasticity ofmetabolic phenotypes, metabolic efficiency and contending growth-related tasks. This approach can be readily extended to investigate awider range of tasks, environmental conditions and molecularphenotypes in different species.
MethodsDescription of the selection of used accessions and growth conditions as well asmetabolite and enzyme assays can be found in Supplementary Methods.
Genetic distance. The genetic distances between accessions are determined basedon the most comprehensive information existing about polymorphisms (200,155SNPs)58. This is available for 73 of the 97 investigated accessions. The resultingdistance matrix was used to build a tree by using a neighbor-joining algorithm59.Although the main branches partially separate the accessions according to thegeographic origin (for example, Northern, Western, Eastern and Southern Europe),there is still some admixture. A similar grouping pattern to ours was reported in astudy that used a comparable number of markers and accessions53.
Data envelopment analysis. DEA is a computational approach, based on linearprogramming (LP), which aims at determining the relative efficiency of entities,so-called decision-making units (DMUs), specified with their respective inputs andoutputs. In our framework, the DMUs correspond to the different Arabidopsisaccessions.
In contrast to other approaches for analysis of multidimensional data, allowingonly pair-wise combination of biochemical system levels (for example, metabolitesand transcripts, or proteins and metabolites), DEA is applicable across data frommultiple levels of biological organization. With the help of DEA, one can readilyidentify the best-performing accession by providing a ranking based on the relativeefficiency. Here we extend this approach to determine the reasons (representedby particular metabolic traits) responsible for the performance of a particularaccession. As opposed to other approaches for analysis of multivariate data, DEA
considers all input and all output levels simultaneously. To quantitatively combinethe multiple inputs and multiple outputs, DEA computes the relative efficiency ofeach individual accession with respect to all other accessions by employing theweighted averages, so that:
efficiency ¼weighted sumof outputsweighted sumof inputs
: ð1Þ
While this leads to respective aggregations of inputs and outputs, we point out that,unlike in other statistical techniques for multivariate data analysis, the aggregationsin DEA differ between accessions.
Consider a set of s accessions with each accession a, 1rars, with m inputs xai ,1rirm, generating n outputs yaj , 1rjrn. The efficiency of a particularaccession a is then given by the solution of a fractional programme, originallyproposed by60:
ea ¼ maxv;m
Pnj¼1 mjy
ajPm
i¼1 vixai
s:t:Pn
j¼1 mjyajPm
i¼1 vixai� 1; 8a
vi; mj � 0; 8i; j;
ð2Þ
where vi and mj correspond to the weights associated with the input i and theoutput j, respectively. We point out that this model, maximizing the linearcombination of outputs without requiring more of any of the observed inputs, isreferred to as the input-oriented model. Clearly, the reciprocal of the ratio of inputsto outputs results in another type of model, named output-oriented, whichminimizes the inputs while producing at least the given output levels30.We note that the qualitative findings from the input- and output-oriented models,with respect to the ranking of accessions based on the relative efficiencies, areequivalent.
With the help of the theory of fractional programming61, the fractionalprogramme in Equation (2) can be formulated as a LP problem by constrainingthe denominator of the objective function to one and only minimizing thenumerator.
Depending on the scale assumptions in calculating the relative efficiencies, thereare two basic DEA models, the CCR (Charnes, Cooper and Rhodes) model60 andits extension the BCC (Banker, Charnes and Cooper) model62. The formerformalizes the concept of constant returns to scale, whereby the output changes bythe same proportion as the input. On the other hand, the latter captures theconcept of variable returns to scale (VRS), comprising the three variants, namelyincreasing-, decreasing- and constant returns to scale. Clearly, any CCR-efficientaccession is also BCC-efficient. As a result, in the following, we focus on the moregeneral BCC model to consider also the effects of increasing- and decreasingreturns to scale.
The LP formulation for the BCC model is defined as follows:
ea ¼ maxv;m
Xn
j¼1
mjyaj � ua
s:t:Xm
i¼1
nixai ¼ 1
Xm
i¼1
nixai �Xn
j¼1
mjyaj þ ua � 0; 8a
vi; mj � 0; 8i; jua unconstrained:
ð3Þ
By the duality theorem, this problem is equivalent to the following LP:
ea ¼ minl;s
Ya
s:t:Xs
a¼1
laxai þ si ¼ Yaxai ; 8i
Xs
a¼1
layaj � si ¼ yaj ; 8j
Xs
a¼1
la ¼ 1
la; si; sj � 0; 8a; i; jYa unconstrained:
ð4Þ
where si and sj are the slacks of the input i and the output j, respectively, used toconvert the inequalities into equivalent equations and Ya gives the efficiency scorefor accession a. The vector l represents the weights of the accessions resulting fromthe LP given in Equation (4). By the strong duality theorem, the optimal value ofthe dual problem, given in Equation (4), equals the optimal value of the primal
Ken
dall
tau
−0.4
−0.2
0.0
0.2
0.4 OpNLiNLiC
Defenserelated (14)
Ionomics(18)
Developmental(27)
Flowering(23)
Figure 4 | Boxplots of Kendall tau coefficients from correlating the
efficiencies with different phenotypes. The correlation between
efficiencies under OpN (red), LiN (green) and LiC (blue) with defence-
related, ionomics, developmental and flowering phenotypes, respectively, is
presented in boxplots. The bottom and top of each box represent the first
and third quartiles of the distribution of the Kendall correlation coefficient,
respectively. The horizontal line inside each box is the median (second
quartile). The whiskers range between ±1.58 IQR n� 1/2, where IQR is
the interquartile range and n is the number of points in the distributions.
Data points outside this range are considered as outliers, indicated as
circles. The number of accessions considered in each phenotype is
presented in parenthesis.
NATURE COMMUNICATIONS | DOI: 10.1038/ncomms4537 ARTICLE
NATURE COMMUNICATIONS | 5:3537 | DOI: 10.1038/ncomms4537 | www.nature.com/naturecommunications 7
& 2014 Macmillan Publishers Limited. All rights reserved.

problem in Equation (3). The number of constraints for the primal programmedepends on the number of accessions, while that of the dual programme dependson the number of inputs and outputs.
An accession a is considered (fully) BCC-efficient in the VRS sense if thereexists a solution to Equation (4) such that the following two conditions aresatisfied:
1. Ya¼ 1.2. All slacks si, 1rirm, and sj, 1rjrn, are zero.
These two conditions define the so-called Pareto–Koopmans efficiency,whereby an accession is fully efficient when an attempt to improve on any of itsinputs or outputs will adversely affect some other inputs or outputs. The efficientaccessions define the Pareto efficiency frontier30.
Combination of PCA and DEA. If the number of analysed accessions, s, is lessthan the total number of inputs and outputs, mþ n, a large number of accessionsmay be predicted to be efficient (depending on the structure of the data set).To resolve this issue, arising due to the multidimensionality of the data, thenumber of constraints imposed in the formulation of DEA in Equation (3)needs to be reduced. Consequently, DEA has been combined with PCA toreduce the dimension of inputs and outputs while minimizing the loss ofinformation48.
PCA is a linear algebra technique that can be used to represent a set of possiblycorrelated variables into a set of uncorrelated variables called PCs. Each PC isrepresented as a linear combination of the original variables. The coefficients in thelinear combination are given by the eigenvectors from the eigenvalue decom-position of the covariance matrix for the analysed set of variables. The PCs areusually ordered by the percentage of the accounted variance, starting with thecomponent of the largest variance. It should be noted that the number of PCs is lessthan or equal to the number of original variables63.
The variance zk, (1rkrK) explained by the kth PC is calculated as:
zk ¼ jk=XK
l¼1jl ; ð5Þ
where K is the number of original variables and jl, (1r1rK) is the lthlargest eigenvalue of the covariance matrix for the K variables. The number ofPCs used in analyses depends on the percentage of variance to be explainedfor a particular purpose. Indeed, considering all PCs amounts to using theoriginal data set.
Formulation of PCA–DEA. The usage of PCs instead of the original data induces atransformation of the DEA model. Therefore, the inputs X and the outputs Y aretransformed through PCA.
Let LXk and LYk denote the matrices containing the coefficients of the linearcombinations rendering the PCs of the input and output data, respectively. The sizeof this matrix is reduced to the number of PCs that explain a pre-specifiedpercentage of the variance in the original data. Then, Xk ¼ LXk X and Yk ¼ LYk Y arethe k PCs, that is, linear combinations, of the variables in the data sets X and Y.Furthermore, the number of columns in Xk and Yk correspond to the number k ofPCs used to represent the input and output data.
Consequently, the general BCC model from Equation (3) for accession a can betransformed as follows:
ea ¼ maxU0 ;Uk ;V0 ;Vk ;ua
U0Ya0 þUkY
ak � ua
s:t:
V0X0 þVkXk �U0Y0 �UkYk þ ua � 0
V0Xa0 þVkX
ak ¼ 1
VkLXk � 0
UkLYk � 0
U0;V0 � 0
Vk;Uk; ua unconstrained:
ð6Þ
where U0 and V0 represent the vectors of weights for the inputs andoutputs, respectively, used with their original values, while Uk and Vk denotethe coefficients of the PCs used for the input and output data. SinceVkXk ¼ VkLXk X, where Vk represents a row vector of dual variables, theweights of the original input X can be expressed as VkLXk . We note that thesame holds for the output.
Furthermore, the corresponding dual programme can be rewritten as follows:
ea ¼ minl;s
Ya
s:t:
Xklþ LXk sXk ¼ YaX
ak
X0lþ sX0 ¼ YaXa0
Ykl� LYk sYk ¼ Ya
k
Y0l� sY0 ¼ Ya0X
l ¼ 1
Ya; l; sXk ; sX0 ; s
Yk ; s
Y0 � 0:
ð7Þ
The problem in Equation (7) is referred to as the envelopment problem. Like theprimal programme given in Equation (6), it provides weights for each accession,indicating those accessions of highest influence to the efficiency of the accession afor which the efficiency is calculated.
Since the number of outputs is really small in the considered data set PCA isonly applied on the inputs. Therefore, all constraints containing X and sX0 as well asYk and sYk are not included in the linear programs.
As suggested by Adler et al.64 all the values are divided by thecorresponding s.d. The correlation matrix of standardized inputs andPCs are calculated and finally the linear programs are used to deriveefficiency scores.
Ranking of efficient accessions. The general results of DEA and also PCA–DEAgroup the accessions into two sets, those that are efficient and therefore define thePareto efficiency frontier and those that are inefficient. In order to obtain acomplete ranking of all accessions, another approach or modification is required.Many mathematical and statistical techniques have been developed to rank bothefficient as well as inefficient DMUs in our case accessions. Adler et al.65
provide an overview about the general ranking methods applied in economics.Among others one approach to the ranking problem is that provided by thesuper-efficiency model, first published by Andersen and Petersen46. Thesuper-efficiency model involves executing the standard DEA model (in our caseVRS PCA–DEA), but under the assumption that the accession, a, being currentlyevaluated is excluded from the reference set. In the input-oriented case the modelprovides a measure of the proportional increase in the inputs for an accessionthat could take place without destroying the ‘efficient’ status of that accessionrelative to the frontier created by the remaining accessions. The unit obtains inthat case an efficiency score above one. The methodology enables an extremeefficient unit f to achieve an efficiency score greater than one by removing thefth constraint in the primal formulation. A problem of the calculation ofsuper-efficiency is that it is well known that under certain conditions, thesuper efficiency DEA model may not have feasible solutions for efficientaccessions. As shown for instance by Seiford and Zhu66 as well Dula andHickman67, infeasibility must occur in the case of the VRS super-efficiencymodel. The model of Lovell and Rouse47 identify and provide a feasible solutionfor all super-efficient units that are infeasible in the conventional VRSsuper-efficiency model. This modified DEA scales up the inputs (down theoutputs) of the accession under evaluation. The super-efficiency scores for allefficient accession without feasible solutions are then equal to the user-definedscaling factor b.
The modified super-efficiency model is defined as follows:
ea ¼ maxv;m;ua
Xn
j¼1
mjyaj þ ua
s:t:Xm
i¼1
nibxai �Xn
j¼1
mjyaj þ ua � 0; 8a
Xm
i¼1
nibxai ¼ 1
mj; ni � 0; 8i; jua unconstrained:
ð8Þ
Note that the scalar b41 must be sufficiently large to make it inefficient toensure that eao1. This is not guaranteed if the accession eao1 is extreme-efficient,which would lead to infeasibility for the general super-efficiency model and anefficiency score of 1, ea¼ 1, for the modified super-efficiency model of Lovelland Rouse47.
We further extend this modified super-efficiency model to use it also to rank theefficient accessions of the PCA–DEA approach, which has to deal in general withthe same problems as the conventional DEA. Then, for ranking the accessions of
ARTICLE NATURE COMMUNICATIONS | DOI: 10.1038/ncomms4537
8 NATURE COMMUNICATIONS | 5:3537 | DOI: 10.1038/ncomms4537 | www.nature.com/naturecommunications
& 2014 Macmillan Publishers Limited. All rights reserved.

the input-oriented VRS PCA–DEA we use the model as follows:
ea ¼ maxU0 ;Uk ;V0 ;Vk ;ua
U0Ya0 þUkY
ak � ua
s:t:
V0bX0 þVkbXk �U0Y0 �UkYk þ ua � 0
V0bXa0 þVkbXa
k ¼ 1
VkbLXk � 0
UkLYk � 0
U0;V0 � 0
Vk;Uk; ua unconstrained:
ð9Þ
Statistical analysis. The Kendall rank correlation coefficient, denoted by t,evaluates the degree of similarity between two sets of ranks over the same set ofobjects68. It can be determined by the following expression:
t ¼ number of concordant pairs� number of discordant pairstotal number of pairs
; ð10Þ
where a pair of ranked sets (xi,yi) and (xj,yj) (on the same set of objects) isconcordant if the order of both objects agree, that is, if both xi4xj and yi4yj orxioxj and yioyj. In contrast, a pair is discordant, if xioxj and yi4yj or if xi4xjand yioyj. If xi¼ xj or yi¼ yj, the pair is neither concordant nor discordant.
Larger (positive) values of t indicate a greater agreement between the two sets,while smaller (negative) values imply disagreement.
We use the Kendall rank coefficient in order to capture the effect of a particularinput on the resulting ranking of the accessions based on PCA–DEA. To this end,the influence of an input parameter t on the relative efficiency of a given accessionunder a condition c is determined by excluding t from the inputs and applyingPCA–DEA to obtain the efficiencies e� t
c under condition c. We then use Kendall’st to qualitatively discriminate between different inputs (that is, metabolic traits)with respect to their correspondence to the obtained efficiencies, resulting in:
ttc ¼ t ec; e� tc
� �; ð11Þ
where ec are the efficiencies including all inputs.
Investigation of metabolic plasticity. For the 48 metabolite and eight enzymeactivity profiles the absolute values of log-fold changes, FC between a pair ofconditions ci and cj are calculated by:
FCci ;cj ¼ log2cicj
��������: ð12Þ
The average FC over the three pairs of conditions (that is, OpN/LiC, OpN/LiN andLiN/LiC) is calculated as an indicator for the plasticity of each metabolic trait in theinvestigated conditions. For every accession the distribution of average absolutevalues of log-fold changes over all metabolic traits is then determined.Furthermore, the skewness of the resulting distributions is calculated as follows:
skew ¼1n
Pni¼1 xi � �xð Þ3
1n
Pni¼1ðxi � �xÞ2
� �3=2 ; ð13Þ
where n is the number of observations included in the distribution and �x is themean of observations, here, of average absolute values of FC for 56 metabolic traits.A negative value of the skewness denotes a longer left tail and a larger median ofthe distribution, whereas positive values indicate a longer right tail and a smallermedian, respectively. In addition, the 95th percentile, capturing the distribution ofvalues in the right tail of each distribution, is used to quantify the overall plasticityof metabolic traits showing large plasticity in the three conditions.
Investigation of the criterion of triangularity. We followed the approach ofShoval et al.16 by making use of the Pareto front software. To this end, weinvestigated the findings from five scenarios: The data set of Atwell et al.53 includes199 accessions and five types of traits: defence-related, ionomics, developmental,flowering and germination traits. From this list, we excluded the categorical traitswith binary values as well as the germination traits (as they are expected to havesmall effect on the later vegetative plant growth). We note that 41 of theseaccessions are also present in the set of genotypes that we analysed in our study(Supplementary Table 7). Scenario I: we removed 29 out of 199 accessions that didnot contain data about at least 50 traits; the missing values for the remainingaccessions were imputed for all traits by using the most recent robust imputationmethod suitable for mixed data types (that is, categorical and continuous) based onrandom forests via the missForest R package69; Scenario II: we removed 29 out of199 accessions that did not contain data about at least 50 traits; the missing valuesfor the remaining accessions were imputed for all traits by using random forestsimputation method; finally, only defence traits and developmental traits were used;Scenario III: like Scenario II but only for the 41 accession in the overlap betweenour set of genotypes and the population used in Atwell et al.53; Scenario IV: weremoved 29 out of 199 accessions that did not contain data about at least 50 traits;
the missing values for the remaining accessions were imputed for only defencetraits and developmental traits by using random forests imputation method via themissForest R package69; and Scenario V: like Scenario IV but only for the 41accession in the overlap between our set of genotypes and the population used inAtwell et al.53. These five scenarios were necessary to control and investigate theeffects of missing values and the way in which they were imputed. We note that thegermination traits were removed from the analysis in all five scenarios to alsofacilitate the comparison of findings and the application of PCA (requiring moreaccessions than traits in Scenarios III and V).
Implementation. All mathematical programming approaches are implemented inMATLAB 7.11.0. We use CPLEX v12.2 to solve the considered LP problems.Statistical analysis was conducted in the R 2.15.2 environment for statisticalcomputing.
References1. Nicotra, A. B. et al. Plant phenotypic plasticity in a changing climate. Trends
Plant Sci. 15, 684–692 (2010).2. West-Eberhard, M. J. Developmental Plasticity and Evolution (Oxford
University Press, 2003).3. Roff, D. A. Evolution Of Life Histories: Theory and Analysis (Chapman & Hall,
1992).4. Messina, F., Durham, S., Richards, J. & McArthur, D. Trade-off between plant
growth and defense? A comparison of sagebrush populations. Oecologia 131,43–51 (2002).
5. Obeso, J. R. The costs of reproduction in plants. New Phytol. 155, 321–348(2002).
6. Koenig, W. D. & Knops, J. M. H. Scale of mast-seeding and tree-ring growth.Nature 396, 225–226 (1998).
7. Marty, F. Plant vacuoles. Plant Cell 11, 587–600 (1999).8. Alberts, B. et al. Molecular Biology of the Cell 840–855 (Garland Science, 2007).9. Enquist, B. J. & Niklas, K. J. Global allocation rules for patterns of biomass
partitioning in seed plants. Science 295, 1517–1520 (2002).10. Pyl, E.-T. et al. Metabolism and growth in Arabidopsis depend on the daytime
temperature but are temperature-compensated against cool nights. Plant Cell24, 2443–2469 (2012).
11. Poorter, H. et al. Biomass allocation to leaves, stems and roots: meta-analyses ofinterspecific variation and environmental control. New Phytol. 193, 30–50(2012).
12. Buchanan, B., Gruissem, W. & Jones, R. Biochemistry & Molecular Biology ofPlants (Wiley, 2002).
13. Xu, G., Fan, X. & Miller, A. J. Plant nitrogen assimilation and use efficiency.Annu. Rev. Plant Biol. 63, 153–182 (2012).
14. Hirel, B., Le Gouis, J., Ney, B. & Gallais, A. The challenge of improving nitrogenuse efficiency in crop plants: towards a more central role for genetic variabilityand quantitative genetics within integrated approaches. J. Exp. Bot. 58,2369–2387 (2007).
15. Roff, D. A. Trade-offs between growth and reproduction: an analysis of thequantitative genetic evidence. J. Evol. Biol. 13, 434–445 (2000).
16. Shoval, O. et al. Evolutionary trade-offs, pareto optimality, and the geometry ofphenotype space. Science 336, 1157–1160 (2012).
17. Oster, G. F. & Wilson, E. O. Caste and Ecology in the Social Insects 372(Princeton University Press, 1978).
18. Farnsworth, K. D. & Niklas, K. J. Theories of optimization, form and functionin branching architecture in plants. Funct. Ecol. 9, 355–363 (1995).
19. El Samad, H., Khammash, M., Homescu, C. & Petzold, L. Optimal performanceof the heat-shock gene regulatory network. in World Congr. 16, 2206 (2005).
20. Kennedy, M. C. Functional–structural models optimize the placement of foliageunits for multiple whole-canopy functions. Ecol. Res. 25, 723–732 (2009).
21. Steuer, R. E. Multiple Criteria Optimization: Theory, Computation andApplication (Wiley, 1986).
22. Miettinen, K. M. Nonlinear Multiobjective Optimization (International Series inOperations Research and Management Science) (Kluwer Academic, 1999).
23. Rowley, C. K. & Schneider, F. The Encyclopedia of Public Choice (Springer,2003).
24. Noor, E. & Milo, R. Efficiency in evolutionary trade-offs. Science 336,1114–1115 (2012).
25. Sheftel, H., Shoval, O., Mayo, A. & Alon, U. The geometry of the Pareto front inbiological phenotype space. Ecol. Evol. 3, 1471–1483 (2013).
26. Szekely, P., Sheftel, H., Mayo, A. & Alon, U. Evolutionary tradeoffs betweeneconomy and effectiveness in biological homeostasis systems. PLoS Comput.Biol. 9, e1003163 (2013).
27. Schuetz, R., Zamboni, N., Zampieri, M., Heinemann, M. & Sauer, U.Multidimensional optimality of microbial metabolism. Science 336, 601–604(2012).
28. Schuetz, R., Kuepfer, L. & Sauer, U. Systematic evaluation of objective functionsfor predicting intracellular fluxes in Escherichia coli. Mol. Syst. Biol. 3, 119(2007).
NATURE COMMUNICATIONS | DOI: 10.1038/ncomms4537 ARTICLE
NATURE COMMUNICATIONS | 5:3537 | DOI: 10.1038/ncomms4537 | www.nature.com/naturecommunications 9
& 2014 Macmillan Publishers Limited. All rights reserved.

29. Cooper, W. W., Seiford, L. M. & Zhu, J. Handbook on Data EnvelopmentAnalysis 164, 1–39 (Springer (2011).
30. Cooper, W. W., Seiford, L. M. & Tone, K. Data Envelopment Analysis:A Comprehensive Text with Models, Applications, References and DEA-SolverSoftware 490 (Springer, 2007).
31. Niklas, K. J. & Enquist, B. J. On the vegetative biomass partitioning of seedplant leaves, stems, and roots. Am. Nat. 159, 482–497 (2002).
32. Atwell, B. B. J., Kriedemann, P. E. & Turnbull, C. G. N. In Plants in Action:Adaptation in Nature, Performance in Cultivation (MacMillan Education,1999).
33. Sulpice, R. et al. Starch as a major integrator in the regulation of plant growth.Proc. Natl Acad. Sci. USA 106, 10348–10353 (2009).
34. Sulpice, R. et al. Network analysis of enzyme activities and metabolite levels andtheir relationship to biomass in a large panel of Arabidopsis accessions. PlantCell 22, 2872–2893 (2010).
35. Weigel, D. Natural variation in Arabidopsis thaliana: from molecular geneticsto ecological genomics. Plant Physiol. 158, 2–22 (2011).
36. Koornneef, M., Alonso-Blanco, C. & Vreugdenhil, D. Naturally occurringgenetic variation in Arabidopsis thaliana. Annu. Rev. Plant Biol. 55, 141–172(2004).
37. Gibon, Y. et al. Adjustment of growth, starch turnover, protein content andcentral metabolism to a decrease of the carbon supply when Arabidopsis isgrown in very short photoperiods. Plant Cell Environ. 32, 859–874 (2009).
38. Tschoep, H. et al. Adjustment of growth and central metabolism to a mild butsustained nitrogen-limitation in Arabidopsis. Plant Cell Environ. 32, 300–318(2009).
39. Niinemets, U. et al. Do we underestimate the importance of leaf size in planteconomics? Disproportional scaling of support costs within the spectrum of leafphysiognomy. Ann. Bot. 100, 283–303 (2007).
40. Mickelson, S. Mapping of QTL associated with nitrogen storage andremobilization in barley (Hordeum vulgare L.) leaves. J. Exp. Bot. 54, 801–812(2003).
41. Liu, Y.-Y., Slotine, J.-J. & Barabasi, A.-L. Observability of complex systems.Proc. Natl Acad. Sci. USA. 110, 2460–2465 (2013).
42. Meyer, R. C. et al. The metabolic signature related to high plant growth rate inArabidopsis thaliana. Proc. Natl Acad. Sci. USA. 104, 4759–4764 (2007).
43. Schauer, N. et al. Comprehensive metabolic profiling and phenotyping ofinterspecific introgression lines for tomato improvement. Nat. Biotechnol. 24,447–454 (2006).
44. Riedelsheimer, C. et al. Genomic and metabolic prediction of complex heterotictraits in hybrid maize. Nat. Genet. 44, 217–220 (2012).
45. Hirayama, T. & Shinozaki, K. Research on plant abiotic stress responses in thepost-genome era: past, present and future. Plant J. 61, 1041–1052 (2010).
46. Andersen, P. & Petersen, N. C. A procedure for ranking efficient units in dataenvelopment analysis. Manage. Sci. 39, 1261–1264 (1993).
47. Lovell, C. A. K. & Rouse, A. P. B. Equivalent standard DEA models to providesuper-efficiency scores. J. Oper. Res. Soc. 54, 101–108 (2003).
48. Adler, N. & Golany, B. Evaluation of deregulated airline networks using dataenvelopment analysis combined with principal component analysis with anapplication to Western Europe. Eur. J. Oper. Res. 132, 260–273 (2001).
49. Adler, N. & Golany, B. Including principal component weights to improvediscrimination in data envelopment analysis. J. Oper. Res. Soc. 53, 985–991(2002).
50. Kleessen, S., Fernie, A. R. & Nikoloski, Z. A computational framework forevaluating the efficiency of Arabidopsis accessions in response to nitrogenstress reveals important metabolic mechanisms. Front. Plant Sci. 3, 217 (2012).
51. Araujo, W. L. et al. Identification of the 2-hydroxyglutarate and isovaleryl-CoAdehydrogenases as alternative electron donors linking lysine catabolism to theelectron transport chain of Arabidopsis mitochondria. Plant Cell 22, 1549–1563(2010).
52. Scheible, W.-R. et al. Genome-wide reprogramming of primary and secondarymetabolism, protein synthesis, cellular growth processes, and the regulatoryinfrastructure of Arabidopsis in response to nitrogen. Plant Physiol. 136,2483–2499 (2004).
53. Atwell, S. et al. Genome-wide association study of 107 phenotypes inArabidopsis thaliana inbred lines. Nature 465, 627–631 (2010).
54. Komeda, Y. Genetic regulation of time to flower in Arabidopsis thaliana. Annu.Rev. Plant Biol. 55, 521–535 (2004).
55. Wahl, V. et al. Regulation of flowering by trehalose-6-phosphate signaling inArabidopsis thaliana. Science 339, 704–707 (2013).
56. Yang, L., Xu, M., Koo, Y., He, J. & Poethig, R. S. Sugar promotes vegetativephase change in Arabidopsis thaliana by repressing the expression of MIR156Aand MIR156C. Elife 2, e00260–e00260 (2013).
57. Yu, S. et al. Sugar is an endogenous cue for juvenile-to-adult phase transition inplants. Elife 2, e00269–e00269 (2013).
58. Horton, M. W. et al. Genome-wide patterns of genetic variation in worldwideArabidopsis thaliana accessions from the RegMap panel. Nat. Genet. 44,212–216 (2012).
59. Felsenstein, J. PHYLIP—Phylogeny Inference Package (Version 3.2). Cladistics5, 164–166 (1989).
60. Charnes, A., Cooper, W. W. & Rhodes, E. Measuring the efficiency of decisionmaking units. Eur. J. Oper. Res. 2, 429–444 (1978).
61. Charnes, A. & Cooper, W. W. Programming with linear fractional functionals.Nav. Res. Logist. Q 9, 181–186 (1962).
62. Banker, R. D., Charnes, A. & Cooper, W. W. Some models for estimatingtechnical and scale inefficiencies in data envelopment analysis. Manage. Sci. 30,1078–1092 (1984).
63. Abdi, H. & Williams, L. J. Principal component analysis. Wiley Interdiscip. Rev.Comput. Stat. 2, 433–459 (2010).
64. Adler, N. & Yazhemsky, E. Improving discrimination in data envelopmentanalysis: PCA–DEA or variable reduction. Eur. J. Oper. Res. 202, 273–284(2010).
65. Adler, N., Friedman, L. & Sinuany-Stern, Z. Review of ranking methods in thedata envelopment analysis context. Eur. J. Oper. Res. 140, 249–265 (2002).
66. Seiford, L.M. & Zhu, J. Infeasibility of super-efficiency data envelopmentanalysis models. INFOR J. 37, 174–187 (1999).
67. Dula, J. H. & Hickman, B. L. Effects of excluding the column being scoredfrom the DEA envelopment LP technology matrix. J. Oper. Res. Soc. 48,1001–1012 (1997).
68. Abdi, H. In Encyclopedia of Measurement and Statistics. (ed. Salkind, N. J.)508–510 (Thousand Oaks, 2007).
69. Stekhoven, D. J. & Buhlmann, P. MissForest—non-parametric missing valueimputation for mixed-type data. Bioinformatics 28, 112–118 (2012).
AcknowledgementsC.M.F. was funded by the Alexander von Humboldt Foundation. We would like to thankMarco Todesco, Daniel Kliebenstein and Staffan Persson for helpful discussions.
Author contributionsS.K. and Z.N. designed and implemented the method; A.R.F. and M.S. conceived anddesigned the experiments; R.S. and C.A. performed the experiments; C.M.F. conductedthe genetic analysis; Z.N., S.K., C.M.F., R.L., A.R.F., M.S. and analysed and interpretedresults. All the authors discussed the results and wrote the manuscript.
Additional informationSupplementary Information accompanies this paper at http://www.nature.com/naturecommunications
Competing financial interests: The authors declare no competing financial interests.
Reprints and permission information is available online at http://npg.nature.com/reprintsandpermissions/
How to cite this article: Kleessen, S. et al. Metabolic efficiency underpins performancetrade-offs in growth of Arabidopsis thaliana. Nat. Commun. 5:3537 doi: 10.1038/ncomms4537 (2014).
ARTICLE NATURE COMMUNICATIONS | DOI: 10.1038/ncomms4537
10 NATURE COMMUNICATIONS | 5:3537 | DOI: 10.1038/ncomms4537 | www.nature.com/naturecommunications
& 2014 Macmillan Publishers Limited. All rights reserved.