NUTRITION AND METABOLIC ADAPTATION - University of ...
253
NUTRITION AND METABOLIC ADAPTATION: The Assessment and Impact of Dietary Manipulation on Metabolic and Cellular Perturbation. Matthew James Walter Furber A thesis submitted to the University of Hertfordshire in partial fulfilment of the requirements for the degree of Doctor of Philosophy. University of Hertfordshire School of Life and Medical Sciences December 2016
-
Upload
khangminh22 -
Category
Documents
-
view
5 -
download
0
Transcript of NUTRITION AND METABOLIC ADAPTATION - University of ...

NUTRITION AND METABOLIC ADAPTATION:
The Assessment and Impact of Dietary
Manipulation on Metabolic and Cellular
Perturbation.
Matthew James Walter Furber
A thesis submitted to the University of Hertfordshire in partial fulfilment
of the requirements for the degree of Doctor of Philosophy.
University of Hertfordshire
School of Life and Medical Sciences
December 2016

Page 1 of 253
Declaration I declare that this work has not previously been accepted in any substance for any degree and is not being concurrently submitted in candidature for any degree. Signed: ………………………………………………………. (Candidate) Print: …………………………………………………………. Date: ………………………………………………………….

Page 2 of 253
Synopsis
It is well established that improved nutritional strategies can enhance both health and
exercise performance. Scientific developments in recent years have furthered our
understanding of cellular metabolism, which in turn, has provided an additional
platform to investigate the impact of diet on health and adaptation. The overall aim of
this research programme was to build on the current understanding of dietary intake
in athletes and the impact dietary manipulation has on cellular and metabolic
adaptation at rest and in combination with endurance training.
It is postulated that nutrition is the most controllable risk factor impacting long-term
health and chronic disease (World-Health-Organization, 2003), and enhanced
knowledge of nutrition has been associated with improved dietary choices. A number
of nutrition knowledge questionnaires have been developed to assess this; however
the validity of each tool is reduced if implemented outside the target population. A valid
and reliable general and sport nutrition knowledge questionnaire had not yet been
developed. Using a parallel groups repeated measures study design (N = 101) the aim
of the first experimental Chapter (Chapter 4) was to develop a new tool to measure
general and sport nutrition knowledge in UK track and field athletes. Following the
questionnaire design 53 nutrition educated and 48 non-nutrition educated participants
completed the questionnaire on two occasions separated by three weeks. The results
of the process demonstrated face and construct validity from the development of the
question pool, content validity (the nutrition educated group scored > 30% higher that
the non-nutrition educated group), reliability (test - retest correlation of 0.98, p < 0.05)
and internal consistency (Chronbach’s alpha value > 0.7) as such establishing a new
tool (Nutrition knowledge Questionnaire for Athletes (NKQA)) for the assessment of
general and sport nutrition knowledge in track and field athletes.
Athletes’ diets are commonly reported as inadequate and previous work has
demonstrated a weak positive relationship between diet quality and nutrition
knowledge. Additionally a commercially available tool, the metabolic typing
questionnaire, claims to identify individual metabolic function and subsequently
prescribe a personalised diet to optimise health. Thus the aim of the second

Page 3 of 253
experimental Chapter (Chapter 5) was to quantify nutrition knowledge (using the
questionnaire developed in Chapter 4), measure diet intake and quality and investigate
the efficacy of the metabolic typing questionnaire in UK track and field athletes. Using
a parallel groups repeated measures design participants (UK track and field athletes
n = 59, and non-athletic control group n = 29) completed a food diary, the NKQA and
the metabolic typing questionnaire at two time points through the year (October and
April) to investigate seasonal change. The results of the metabolic typing
questionnaire concluded that 94.3% of the participants were the same dietary type
and would subsequently have been prescribed the same diet. Athletes possess
greater general and sport nutrition knowledge the non-athletes (60.4 ± 2.0 % vs. 48.6
± 1.5 %) and also had better diet quality (76.8 ± 10.5 % vs. 67.6 ± 2.6 %). However no
relationship was observed between individual nutrition knowledge score and diet
quality (r2 = 0.003, p = 0.63). No difference in dietary intake was observed between
power and endurance athletes; average diet intake consisted of 57.0% carbohydrate,
17.1% protein and 25.9% fat.
The metabolic typing diet is based around three different diets: high carbohydrate, high
protein and mixed diet. The results from Chapter 5 identified that the metabolic typing
questionnaire was not able to differentiate between metabolic function in healthy
individuals. Additionally all athletes, independent of event (power vs. endurance),
consumed similar diets. With such similarities a clearer understanding of the impact
such diets have at a cellular level is required. Therefore for the remainder of the thesis
it was decided to investigate the impact of dietary manipulation utilising more robust
measures.
Mitochondria are responsible for energy production; their quantity and density have
been associated with improved health and endurance performance. External stressors
such as energy reduction, carbohydrate restriction and exercise are potent stimulators
of transcription markers of mitochondrial biogenesis. Thus manipulating carbohydrate
and energy availability in vivo may enhance cellular adaptation and limited literature
exists on the impact increased protein intake has on this. The aim of Chapter 6 was
to investigate the impact of acute (7-day) continuous dietary manipulation on metabolic
markers, body composition and resting metabolic rate (RMR). Using a repeated
measures parallel group (N = 45) design, participants were randomly assigned one of

Page 4 of 253
four diets: high protein hypocaloric, high carbohydrate hypocaloric, high protein
eucaloric or high carbohydrate eucaloric. The macronutrient ratio of the high protein
diets was 40% protein, 30 % carbohydrate and 30% fat, the high carbohydrate diets
were 10% protein, 60% carbohydrate and 30% fat. Energy intake in the hypocaloric
diets was matched to resting metabolic rate (RMR). Participants consumed habitual
diet for 7-days then baseline measures were collected (skeletal muscle biopsy, dual
energy X-ray absorptiometry scan (DXA) and RMR, habitual diet was consumed for a
further 7-days and repeat testing was completed (these time points were used as a
control), the intervention diet was then consumed for 7-days and post measures were
collected.
The results of the skeletal muscle biopsy demonstrated no group x time interaction in
any marker, however a pre-post time difference subsequent to the high protein
hypocaloric diet (the diet which induced the greatest metabolic stress) was observed
in four transcriptional markers of mitochondrial biogenesis (pre-post intervention fold
increase: PCG1-α 1.27, AMPK 2.09, SIRT1 1.5, SIRT3 1.19, p < 0.05). The results of
the DXA scan demonstrated that the high protein hypocaloric group lost significantly
more fat mass than the high carbohydrate eucaloric group (-0.99 kg vs. -0.50 kg, p <
0.015). Irrespective of macronutrient ratio, no energy-matched between group
difference was observed in lean mass (LM) loss. However when matched for
macronutrient ratio the high protein diet attenuated LM loss to a greater extent that the
high carbohydrate diet, suggesting an important role of increased protein intake in the
maintenance of lean mass. No time point or group difference in RMR was observed.
This data suggests that a high protein low carbohydrate hypocaloric diet may provide
a stimulus to promote skeletal muscle metabolic adaptation.
The aim of the final experimental Chapter (Chapter 7) in this thesis was to explore the
impact exercise in combination with a high protein diet on metabolic adaptation,
substrate utilisation and exercise performance in well trained runners. Using a parallel
groups repeated measures study design the participants (well-trained endurance
runners, N = 16) consumed normal habitual diet for 7-days, then 7-days intervention
diet (high protein eucaloric or high carbohydrate eucaloric, same dietary ratios as
Chapter 6) and finally returned to habitual diet for 7-days, training was consistent
throughout. A pre exercise muscle biopsy was taken subsequent to each diet and
Page 5 of 253
immediately followed by a 10 km sub-maximal run and a time to exhaustion run (TTE)
at 95% of velocity at maximal aerobic capacity (vVO2max). Post intervention the high
protein group presented significant changes in sub-maximal substrate utilisation with
101% increase in fat oxidation (0.59 g•min-1, p = 0.0001). No changes were observed
in substrate utilisation in the high carbohydrate group. A trend towards a reduction in
average weekly running speed was observed in the PRO group (-0.9 km•h-1), the high
carbohydrate group maintained the same training speed. TTE was decreased (-23.3%,
p = 0.0003) in the high protein group subsequent to the intervention, no change was
observed in subsequent to the high carbohydrate diet. The high carbohydrate group
demonstrated preferential increases in markers of metabolic adaptations (fold
increase: AMPK = 1.44 and PPAR = 1.32, p < 0.05) suggesting that training intensity,
rather than carbohydrate restriction, may be a more profound driver of metabolic
adaptation. All performance measures, in both groups, returned to pre intervention
levels once habitual diet was returned; however the increased gene expression
observed in the high carbohydrate group remained elevated 7-days post intervention.
The increased metabolic stress imposed by reducing carbohydrate intake did not
increase transcriptional markers of mitochondrial biogenesis. For continuous
endurance training and high intensity endurance performance a high carbohydrate diet
is preferential to a high protein diet.

Page 6 of 253
Acknowledgements
I will definitely not be the first (or last) doctoral student to say the process was tough,
not just on me but everyone I know! Doing my Ph.D has been part of my identity over
the last 5-6 years. I am proud of my research, my thesis and my development
throughout this time.
I am so grateful for my girlfriend → fiancée → wife who has been with me throughout
the whole journey. Maxine Furber – you are my world. Your support, understanding
and love have been integral to my thesis completion; I look forward to having our
weekends back and raising our first child. Thank you for everything you have done – I
owe you a lot! I would also like to thank my family and friends who have lived this
journey with me, in particular my Mum, Dad and sister who’s love and understanding
have been incredible over the years.
I would like to take this opportunity to thank my supervisory team Dr Justin Roberts
and Dr Michael Roberts. In particular Justin, who, throughout this journey has been
nothing but supportive. I have been through a number of changes, roles and jobs
through the last 5 years; your guidance and advice over the Ph.D programme has kept
me on track. I look forward to future work (and friendship) together. Thank you.
My colleagues at the GSK Human Performance Lab have been phenomenal over the
last three years – thank you for all the help however big or small. I am forever grateful
for the flexibility, support and encouragement which have been bestowed.
Lastly I would like to thank all the participants who provided intellect, blood, sweat and
muscle. Without willing and diligent volunteers, these studies would not have been
completed.
Finally, to all who ask the question “How is the Ph.D going?” every time we
meet...........IT’S DONE!

Page 7 of 253
TABLE OF CONTENTS
Title Page
Declaration.................................................................................................. 1 Synopsis...................................................................................................... 2 Acknowledgments........................................................................................ 6 Table of Contents........................................................................................ 7 List of Figures.............................................................................................. 12 List of Tables................................................................................................ 15 Abbreviations............................................................................................... 17 Collaboration................................................................................................ 20 Preface......................................................................................................... 21
1 PRELUDE ......................................................................................................... 21
2 LITERATURE REVIEW .................................................................................... 23
2.1 PART 1 ...................................................................................................... 24
2.1.1 The theory and application of the metabolic typing diet. ..................... 24
2.1.2 A critical analysis of the metabolic typing diet. .................................... 25
2.1.3 Summary of the metabolic typing diet and its application. .................. 29
2.1.4 Carbohydrate and Protein requirements for speed and endurance
athletes. 30
2.1.5 The use of the metabolic typing diet as a tool for dietary prescription for
athletes. 32
2.1.6 Measuring nutrition knowledge in athletes. ......................................... 32
2.1.6.1 Nutrition knowledge and dietary intake. ........................................... 38
2.1.7 Summary. ........................................................................................... 39
2.2 PART 2 - The cellular regulation of mitochondrial biogenesis and the impact
of diet and exercise on metabolic adaptation. ....................................................... 40
2.2.1 A brief overview of mitochondrial physiology. ..................................... 40
2.2.2 Skeletal muscle metabolic control through the PGC-1α family of
transcription coactivators. ................................................................................. 43
2.2.3 The regulation of PGC-1α through eternal stressors. ......................... 46
2.3 Protein metabolism in a negative energy balance. ..................................... 52

Page 8 of 253
2.3.1 Nutrition manipulation to enhance endurance training adaptation in
skeletal muscle.................................................................................................. 54
2.4 Key methodological considerations. ........................................................... 58
2.4.1 Measuring Dietary Intake .................................................................... 58
2.5 Summary of literature and rationale for research ....................................... 61
2.5.1 Experimental questions raised from literature review ......................... 62
3 GENERAL METHODS ...................................................................................... 64
3.1 Dietary Intake Analysis .............................................................................. 65
3.2 Food diary analysis .................................................................................... 66
3.3 Food provision ........................................................................................... 66
3.4 Micro muscle biopsy sampling ................................................................... 68
3.4.1 Introducing the technique at the University of Hertfordshire and the
GSK Human Performance Lab.......................................................................... 68
3.4.2 The micro muscle-biopsy technique ................................................... 69
3.5 mRNA extraction and analysis ................................................................... 70
3.5.1 RNA Isolation ...................................................................................... 70
3.5.2 Reverse Transcription ......................................................................... 71
3.5.3 qPCR .................................................................................................. 71
3.5.4 Amplification Efficiency of qPCR assays............................................. 72
3.6 Dual energy X-ray absorptiometry (DXA) scan. ......................................... 72
3.7 Assessment of expired air using an online gas analyser. .......................... 73
3.8 Run testing using a treadmill. ..................................................................... 75
3.9 Measuring blood glucose and blood lactate ............................................... 77
3.10 Indirect calorimetry using the GEM Nutrition open circuit indirect
calorimeter. ........................................................................................................... 78
4 DEVELOPMENT OF A VALID AND RELIABLE NUTRITION KNOWLEDGE
QUESTIONNAIRE FOR ATHLETES. ...................................................................... 80
4.1 INTRODUCTION ....................................................................................... 82
4.1.1 Experimental hypotheses .................................................................... 83
4.2 METHODS ................................................................................................. 83
4.2.1 Study Design ...................................................................................... 83
4.2.2 Participants ......................................................................................... 85
4.2.3 Assessment of validity, reliability and statistical analysis. ................... 85

Page 9 of 253
4.2.3.1 Content validity of the NKQA: .......................................................... 85
4.2.3.2 Construct validity of the NKQA: ....................................................... 86
4.2.3.3 Test re-test of the NKQA: ................................................................ 86
4.2.3.4 Internal consistency of the NKQA: .................................................. 86
4.3 RESULTS .................................................................................................. 89
4.4 DISCUSSION ............................................................................................. 91
4.5 CONCLUSION ........................................................................................... 93
5 NUTRITION KNOWLEDGE, DIETARY INTAKE AND METABOLIC TYPE OF
UK TRACK ATHLETES. .......................................................................................... 94
5.1 Introduction ................................................................................................ 96
5.1.1 Aims and Objectives ........................................................................... 97
5.1.2 Experimental hypotheses. ................................................................... 97
5.2 Methods ..................................................................................................... 98
5.2.1 Participants ......................................................................................... 98
5.2.2 Study Protocol .................................................................................... 99
5.2.3 Experimental protocol. ........................................................................ 99
5.2.4 Nutrition Knowledge Questionnaire .................................................. 100
5.2.5 Metabolic Typing Questionnaire. ...................................................... 100
5.2.6 Diet Quality Index (DQI) .................................................................... 101
5.2.7 Dietary Intake .................................................................................... 102
5.2.8 Statistics ........................................................................................... 102
5.3 Results ..................................................................................................... 102
5.3.1 Time point analysis of the variables. ................................................. 103
5.3.2 Metabolic typing questionnaire ......................................................... 106
5.3.3 Metabolic type and dietary intake ..................................................... 107
5.3.4 Nutrition Knowledge Questionnaire. ................................................. 107
5.3.5 Predicted vs. actual dietary intake .................................................... 111
5.3.6 Diet quality. ....................................................................................... 112
5.4 Discussion................................................................................................ 114
5.5 Conclusion. .............................................................................................. 119
5.6 Limitations. ............................................................................................... 119
5.7 Future research for experimental Chapter. .............................................. 120

Page 10 of 253
6 THE IMPACT OF A HIGH PROTEIN DIET ON CELLULAR METABOLIC
ADAPTATION, BODY COMPOSITION AND RESTING METABOLIC RATE. ..... 121
6.1 Introduction .............................................................................................. 123
6.1.1 Aims and Objectives. ........................................................................ 124
6.2 Materials and Methods. ............................................................................ 125
6.2.1 Participants. ...................................................................................... 125
6.2.2 Study Protocol. ................................................................................. 126
6.2.3 Experimental protocol. ...................................................................... 126
6.2.4 Measurement of habitual dietary intake. ........................................... 127
6.2.5 Body composition assessment: Dual energy x-ray absorptiometry
(DXA) scan. ..................................................................................................... 128
6.2.6 Resting metabolic rate (RMR). .......................................................... 128
6.2.7 Micro muscle biopsy. ........................................................................ 129
6.2.8 Dietary prescription. .......................................................................... 129
6.2.9 Quantitative PCR (qPCR). ................................................................ 131
6.2.10 Data analysis of the qPCR assays .................................................... 131
6.2.11 Statistical analysis. ........................................................................... 131
6.3 Results ..................................................................................................... 132
6.3.1 Habitual dietary intake ...................................................................... 132
6.3.2 Gene expression ............................................................................... 133
6.3.3 Resting metabolic rate and body composition response to dietary
manipulation .................................................................................................... 136
6.4 Discussion................................................................................................ 137
6.5 Conclusions ............................................................................................. 141
6.6 Limitations. ............................................................................................... 142
6.7 Future research and next experimental Chapter ...................................... 143
7 THE IMPACT OF A 7-DAY HIGH PROTEIN DIET ON CELLULAR
ADAPTATION, SUBSTRATE UTILISATION AND ENDURANCE RUNNING
PERFORMANCE IN WELL-TRAINED RUNNERS. ............................................... 144
7.1 Introduction .............................................................................................. 146
7.1.1 Aims and Objectives ......................................................................... 147
7.2 Method ..................................................................................................... 148
7.2.1 Participants ....................................................................................... 148
7.2.2 Study Protocol .................................................................................. 149

Page 11 of 253
7.2.3 Experimental protocol. ...................................................................... 151
7.2.4 Familiarisation: .................................................................................. 151
7.2.5 Running Training .............................................................................. 153
7.2.6 Habitual Dietary Intake...................................................................... 153
7.2.7 Intervention Dietary prescription ....................................................... 153
7.2.8 Testing visit: ...................................................................................... 155
7.2.8.1 Body composition assessment: Dual energy x-ray absorptiometry
(DXA) scan. ................................................................................................. 155
7.2.8.2 Micro Muscle-Biopsy ..................................................................... 155
7.2.8.3 10 km steady state treadmill run ................................................... 155
7.2.8.4 95% maximal sustainable effort (MaxSE). ..................................... 156
7.2.9 Analysis ............................................................................................ 157
7.2.10 Calculation of contribution of energy expenditure ............................. 157
7.2.11 Quantitative PCR (qPCR) preparation and analysis. ........................ 158
7.2.12 Data analysis of the qPCR assays .................................................... 158
7.2.13 Statistical analysis. ........................................................................... 158
7.3 Results ..................................................................................................... 159
7.4 Discussion................................................................................................ 167
7.5 Conclusion ............................................................................................... 174
8 GENERAL DISCUSSION ............................................................................... 177
8.1 Study Perspectives .................................................................................. 178
8.1.1 Using the metabolic typing questionnaire in research for individualised
diet prescription. .............................................................................................. 178
8.1.2 Nutrition knowledge and dietary intake in UK athlete ........................ 179
8.1.3 Metabolic adaptation at rest .............................................................. 181
8.1.4 High protein diet in combination with endurance training. ................. 186
8.2 Overall study perspectives ....................................................................... 188
8.3 Application ............................................................................................... 189
8.4 Future research ........................................................................................ 191
9 REFERENCES................................................................................................ 193
10 APPENDICES ............................................................................................. 207

Page 12 of 253
List of Figures Figures correspond to relevant subsection in the thesis. Figure 2.1.1. Physiological phenotypic continuum of the metabolic demands for track
and field events ................................................................................................. 30
Figure 2.2.1. Illustrative representation of mitochondrial fusion, fission, transport and
mitophagy. ........................................................................................................ 42
Figure 2.2.2. Metabolic regulation of mitochondrial fission. ...................................... 42
Figure 2.2.3. The theoretical AMPK/SIRT1 – PGC-1α axis. ..................................... 46
Figure 2.2.4. PGC-1α deacetylation and transcriptional response to fasting in WT and
AMPKγ3 KO mice. ............................................................................................. 47
Figure 2.2.5. Effect of hypocaloric diets on AMPK phosphorylation and PGC-1α
acetylation. ........................................................................................................ 48
Figure 2.2.6. PGC-1α mRNA expression. ................................................................ 49
Figure 2.2.7. Time course response of skeletal muscle PGC-1α mRNA and protein
content. ............................................................................................................. 50
Figure 2.2.8. The activation of PGC1-α and its role in functioning as a co-activator. 51
Figure 2.3.1. Role of negative energy balance and reduced growth factors on MPS53
Figure 3.4.1. Example image of sites selected for the three biopsies. ..................... 70
Figure 3.8.1. Correlation between the selected treadmill belt speed and unloaded
calculated actual speed. .................................................................................... 76
Figure 3.8.2. Correlation between the selected treadmill belt speed and loaded
calculated actual speed. .................................................................................... 77
Figure 4.2.1. Schematic of processes completed to develop the NKQA. ................. 84
Figure 4.2.2. Items selected and concluded as valid and reliable which comprise the
final NKQA developed. ...................................................................................... 88
Figure 5.3.1. The NKQA score correlation between phases one and phase two of data
collection. ........................................................................................................ 103
Figure 5.3.2. Correlation in the DQI score achieved in phase one and phase two of
data collection. ................................................................................................ 104
Figure 5.3.3. The correlation in macronutrient intake (%) and total calorie intake
between phase one (P1) and phase two (P2) of data collection. .................... 105
Figure 5.3.4. The mean answer choice from the MTQ for each group (Mean ± SEM).
........................................................................................................................ 106

Page 13 of 253
Figure 5.3.5. Metabolic type classification using the Wolcott and Fahey (2000) method.
........................................................................................................................ 107
Figure 5.3.6. Overall NKQ score for each group. ................................................... 108
Figure 5.3.7. NKQ sub-category score from the END, POW and CON groups. ..... 109
Figure 5.3.8. Mean macronutrient intake (%). ........................................................ 110
Figure 5.3.9. Mean predicted vs. Actual dietary intake ........................................... 111
Figure 5.3.10. Diet quality index score (DQI) for each group. ................................ 112
Figure 5.3.11. Relationship between nutrition knowledge and diet quality, ............ 113
Figure 6.2.1. Schematic of experimental protocol. ................................................. 127
Figure 6.2.2. Participant undergoing a resting metabolic rate test using the GEM. 129
Figure 6.3.1. Effect of feeding 7-days diet intervention on mRNA expression at rest.
........................................................................................................................ 134
Figure 6.3.2. Effect of feeding 7-days diet intervention on body composition at rest.
........................................................................................................................ 135
Figure 6.3.3. Respiratory exchange ratio (RER) attained from the GEM test pre and
post dietary intervention (mean ± SEM) .......................................................... 137
Figure 7.2.1. Schematic of study design. ............................................................... 150
Figure 7.3.1.mRNA response (fold change from pre) to 7 day dietary intervention in
combination with endurance training. .............................................................. 161
Figure 7.3.2. Substrate oxidation rates during a 10 km steady state (~75% VO2max)
treadmill run at three time points. .................................................................... 162
Figure 7.3.3. Mean (bar) and individual (line) relative change (%) from pre intervention
maximal sustainable effort. ............................................................................. 163
Figure 7.3.4. Body composition changes subsequent to dietary intervention. ........ 164
Figure 7.3.5. Post intervention blood lactate, blood glucose and rating of perceived
exertion during a 10 km treadmill run at 75 % VO2max. .................................. 165
Figure 8.1.1. The relationship between nutrient manipulation and susceptibility to
metabolic syndrome through the, the AMPK/SIRT1 – PGC-1α pathway ........ 182
Figure 8.1.2. Role of negative energy balance and reduced growth factors on MPS
........................................................................................................................ 184
Figure 8.1.3. Flow diagram used to help athletes make an informed choice about
whether to increase protein and restrict carbohydrate intake on a rest day. ... 185
Figure 8.2.1. Flow diagram used to help make an informed choice about whether to
choose to train on a low carbohydrate diet or not............................................ 189

Page 14 of 253
LIST OF TABLES
Table correspond to relevant subsection in the thesis.
Table 2.1.1. Steps Taken to Assess for Validity and Reliability of a questionnaire
(Adapted from Kline (2007b)). ........................................................................... 35
Table 2.1.2. Nutrition knowledge of athletes versus non-athlete comparison groups
.......................................................................................................................... 37
Table 2.2.1. Selected list of transcription factors for which PGC-1α functions as a
coactivator. ........................................................................................................ 44
Table 2.3.1. Impact of a high fat, low carbohydrate diet on exercise performance. .. 56
Table 2.4.1. Overview of different methods for dietary assessment. ........................ 59
Table 2.4.2. Dietary analysis method used in studies involving athletes. ................. 60
Table 3.1.1 .Food diary example provided to the participant. ................................... 65
Table 3.3.1. Table used to calculate the participants daily energy intake for the
intervention diet. ................................................................................................ 67
Table 3.5.1. qPCR gene code and catalogue number.............................................. 72
Table 3.7.1. The coefficient of variation (CV) of the online gas analyser at different
power outputs and VO2. .................................................................................... 74
Table 3.8.1. Reliability and accuracy of the treadmill unloaded. ............................... 75
Table 3.8.2. Reliability and accuracy of the treadmill loaded with participant running.
.......................................................................................................................... 76
Table 3.9.1. Mean, standard deviation (SD) and coefficient of variation (CV) of the EKF
Biosen throughout the data collection phase of experimental Chapter 7. ......... 78
Table 4.2.1. Participant characteristics. .................................................................... 85
Table 4.3.1. Nutrition knowledge sub-section and total score. ................................. 89
Table 4.3.2. Internal reliability of the NKQA. ............................................................ 90
Table 5.2.1. Athlete grouping criteria........................................................................ 98
Table 5.2.2. Self-reported participant characteristics. .............................................. 99
Table 5.2.3. DQI components and scoring criteria.(Adapted from Haines et al. (1999)).
........................................................................................................................ 101
Table 5.3.1. The correlation of MTQ answers between phase one and two. .......... 104
Table 5.3.2 Habitual dietary intake represented as mean macronutrient grams (g),
relative to body weight (g•kg-1) and total calorie intake (kcal). ........................ 110
Table 6.2.1. Prescribed macronutrient breakdown for each group. ........................ 126

Page 15 of 253
Table 6.2.2. Lifestyle dependent physical activity multiplier used to calculate energy
intake. ............................................................................................................. 130
Table 6.2.3. Prescribed daily calorie intake and macronutrient breakdown for each
group throughout the 7-day intervention. ........................................................ 130
Table 6.3.1. Average daily habitual calorific intake and macronutrient breakdown for
each group prior to intervention diet. ............................................................... 132
Table 6.3.2. Resting metabolic rate (RMR) (kcal•day-1) pre and post 7-day dietary
intervention . ................................................................................................... 136
Table 7.2.1 Group characteristics. ......................................................................... 149
Table 7.2.2. Prescribed macronutrient ratio for the intervention diets. ................... 150
Table 7.2.3. Occupational and exercise physical activity multiplication factors. ..... 154
Table 7.2.4. Calculated mean dietary intake and macro nutrient breakdown for each
group during the 7-day intervention. ................................................................ 154
Table 7.3.1. Running distance and speed during each week of training throughout the
duration of the study. ....................................................................................... 159
Table 7.3.2. Habitual dietary intake during the study weeks with no dietary intervention
(mean ± SD and percentage (%) of total energy intake). ................................ 160
Table 7.3.3. Aerobic and anaerobic contribution towards energy production for the 10
km steady state run. ........................................................................................ 166
Table 7.3.4. Aerobic and anaerobic contribution towards energy production for the
MSE effort. ...................................................................................................... 166
Table 7.4.1. Effects of dietary manipulation on sub-maximal (50% VO2max) (A) and
TTE (90% VO2max) (B) cycling performance subsequent to 14-days high fat, low
carbohydrate diet ............................................................................................ 172

Page 16 of 253
List of Abbreviations The following abbreviations have been defined in the test in the first instance
ACSM American College of Sports Medicine
ADP Adenosine diphosphate
AMP Adenosine monophosphate
AMPK AMP-activated protein kinase
ANOVA Analysis of variance
ANS Autonomic nervous system
ATP Adenosine triphosphate
BM Body mass
BMI Body mass index
BMR Basal metabolic rate
CHO Carbohydrate
cm Centimetre
CNS Central nervous system
CON Control
Cp Crossing point
CV Coefficient of variation
DNA Deoxyribonucleic acid
DQI Diet quality index
DXA Dual energy X-ray absorptiometry
EAR Estimated average requirement
EI Energy intake
EM Energy matched
END Endurance
ER Energy restricted
ERR Estrogen-related receptor
FAT Fat
FFQ food frequency questionnaire
FM Fat mass
FOXO1 Forkhead box O1
FXR Farnesoid X receptor
g Grams
GAPDH Glyceraldehyde 3-phosphate dehydrogenase
GEM Gas Exchange Measurement
GEN General nutrition
GPS Global positioning satellite
GSK GlaxoSmithKline
h-1 Hour
HC High carbohydrate
HF High fat
HNF Hepatic nuclear factor
HP High protein

Page 17 of 253
HTA Human tissue act
HYD Hydration
kcal Kilogram calorie
kg Kilogram
km Kilometer
KO Knock out
LC Low carbohydrate
LF Low fat
LG Low glycogen
LKB1 Liver kinase B1
LM Lean mass
LP Low protein
LT Lactate threshold
MaxSE Maximal sustainable effort
min Minute
mL Millilitre
mm Millimetre
mmol Milimoles
MPB Muscle protein breakdown
MPS Muscle protein synthesis
mRNA Messenger ribonucleic acid
MT Metabolic type
MTQ Metabolic typing questionnaire
N Number of participants
NAD Nicotinamide adenine dinucleotide
NG Normal glycogen
NKQ Nutrition knowledge questionnaire
NKQA Nutrition knowledge questionnaire for athletes
NONUT No nutrition trained group
NRF Nuclear respiratory factor
NUT Nutrition trained group
oC Degrees Celsius
PAF Physical activity factor
OS Oxidative system
PCr Phosphocreatine
PGC-1α Proliferator persoxisome-acitvated receptor coactivator-1 alpha
POW Power
PPAR Peroxisome proliferator-activated receptors
PRO Protein
qPCR Quantitative polymerase chain reaction
RDA Recommended daily allowance
RMR Resting metabolic rate
RNA Ribonucleic acid
RNI Reference nutrient intake

Page 18 of 253
RPE Rating of perceived exertion
RPM Revolutions per minute
SD Standard deviation
SEM Standard error of mean
SIRT1 Silent information regulator T1
SOP Standard operating procedure
SPO Sport nutrition
SPSS Statistical Package for the Social Sciences
SS Steady state
TEA Thermic effect of activity
TEE Total energy expenditure
TEF Thermic effect of food
TP Time point
TR Thyroid receptor
TTE Time to exhaustion
UCP1 Uncoupling protein-1
UK United Kingdom
uL Microliter
VCO2 Volume of carbon dioxide
VO2 Volume of oxygen
VO2max Maximal oxygen consumption
WT Wild type

Page 19 of 253
Collaborations I would like to thank Charlotte Ashby and Emma Koppe, both GSK employees in the
RD Platform Technology & Science department. Their support, training and guidance
on the qPCR analysis of the muscle samples was invaluable.
Table of collaborations and contributions.
Chapter Collaborator Contribution
Chapter 6 Charlotte Ashby (CA)
and Emma Koppe
(EK).
Alongside MF, EK and CA helped develop the
qPCR methodology and supported with the
isolation, reverse transcription, quantification
and amplification of the extracted mRNA from
the muscle tissue (MF, CA and EK were
present throughout all extraction processes. All
equally contributed; ~33% of the process each)
Ana Antón-Solanas
(AAS).
MF developed the DXA scanning protocol.
AAS completed ~75% of the DXA scans in this
Chapter. The remaining 25% were completed
by MF.
Chapter 7 Charlotte Ashby
(CA).
Alongside MF, CA supported the isolation,
reverse transcription, quantification and
amplification of the extracted mRNA from the
muscle tissue (MF and CA were present
throughout all the extraction processes and
contributed equally; ~50% to the process each)

Page 20 of 253
Preface
Some of the results presented in this thesis have been published in the following communications: PEER REVIEWED PUBLICATIONS: Furber, M. J. W., Roberts, J. D., & Roberts, M. G. (2017). A valid and reliable nutrition
knowledge questionnaire for track and field athletes. BMC Nutrition, 3(1), 36. doi:10.1186/s40795-017-0156-0
Furber, M., Anton-Solanas, A., Koppe, E., Ashby, C., Roberts, M., & Roberts, J. A 7-
day high protein hypocaloric diet promotes cellular metabolic adaptations and attenuates lean mass loss in healthy males. Clinical Nutrition Experimental. doi:10.1016/j.yclnex.2017.05.002
CONFERENCE PRESENTATIONS: ACSM – June 2016 Oral Presentation: An Acute High Protein Diet Promotes Positive Cellular Metabolic Adaptations and Attenuates Lean Mass Loss in Healthy Males. GSK Human Performance Lab – November 2015 Symposium: Nutrition for Endurance Athletes The use of Metabolic Typing as a tool for Dietary Individualisation University of Hertfordshire Annual Life Science Conference – April 2014 Oral Presentation: Nutrition Knowledge and Metabolic Type in UK Track and Field Athletes.

Page 21 of 253
1 PRELUDE
The relationship between dietary intake and exercise performance has long been the
subject of research. It is now well established that nutritional intake can impact both
health and exercise performance and different exercise modalities may require
specific fuelling strategies (Thomas et al., 2016). With developments in research the
concept of personalised nutrition has rapidly progressed (Joost et al., 2007),
consequently a number of theories have been derived which claim to provide an
individual approach to dietary prescription. One such method is the metabolic typing
questionnaire, which, through a series of questions, claims to differentiate dietary
requirement and subsequently prescribe individual nutrition programmes (Walcott and
Fahey, 2000). With regards to the athletic population, despite this greater
understanding of dietary requirements, athletes’ diets are commonly reported as
inadequate. The reason for this is still unclear (Heaney et al., 2011), however it is
possibly related to the differing physiological demands of multiple sports and the varied
fuelling strategies required to fuel the metabolic processes (Phillips, 2006).
Mitochondria are responsible for energy production, mitochondrial quantity and
density have been linked with increased resting metabolic rate (Larsen et al., 2011)
and endurance performance (Psilander et al., 2013). The transcription coactivator
proliferator persoxisome-acitvated receptor coactivator-1 alpha (PGC-1α) has been
highlighted as a primary regulator of mitochondrial biogenesis which, in turn, is
activated by AMP-activated protein kinase (AMPK) and Silent information regulator T1
(SIRT1) both of which are stimulated by environmental stressors such as dietary
manipulation and endurance exercise.
Given the high training demands of the modern day athlete the ability to optimise
training adaptation from each session has become paramount. Increasing metabolic
stress during endurance exercise, by restricting carbohydrate availability, has been
demonstrated to up-regulate the cellular response and enhance exercise efficiency
(Hawley and Morton, 2014). However, the majority of research has demonstrated no
change or even a decrease in endurance performance when accompanied with
carbohydrate restriction (Burke, 2015). Generally, increasing dietary fat intake attains

Page 22 of 253
carbohydrate restriction. High protein, low carbohydrate diets are currently en vogue
and the impact of such diets, independently, and in combination with endurance
training, on skeletal muscle adaptation and endurance performance in vivo are yet to
be fully explored.
The literature review is comprised of two distinct parts. PART 1 introduces the theory
of metabolic typing and the underlying principles of its application, a brief overview on
the metabolic demands of speed and endurance exercise, and the scientific principles
of nutrition knowledge assessment. PART 2 is a critical analysis of the metabolic
pathways that control mitochondrial biogenesis, with particular reference to external
stressors such as dietary manipulation and exercise. Additionally PART 2 provides
review of the current literature surrounding the manipulation of dietary intake and the
impact this has on subsequent exercise performance. The aims of this series of
investigations are: (i) to assess nutrition knowledge and dietary habits of UK track and
field athletes, and (ii) to assess the efficacy of the metabolic typing questionnaire as a
tool to differentiate dietary individuality. The second phase of research is to provide
further insight into the impact of high protein diets on cellular and metabolic adaptation
at rest and accompanied with endurance exercise.

Page 23 of 253
2 LITERATURE REVIEW

Page 24 of 253
2.1 PART 1
2.1.1 The theory and application of the metabolic typing diet.
The method of prescribing population specific nutritional recommendations is not new
– for example, guidelines for infants, diabetics and pregnant women have existed for
decades, however with enhancements in genomic and metabolic research the concept
of personalised nutrition has rapidly progressed (Joost et al., 2007). More recent
advances have opened up the possibility for nutrition to be personalised to an
individual’s characteristics and not just group classification (Joost et al., 2007). The
metabolic typing diet (Walcott and Fahey, 2000) is a commercially available method
which utilises a self-assessment questionnaire to prescribe a diet suitable to match
metabolic type; claiming to be a personalised approach to nutrition. The questionnaire
is used by practitioners and consumers alike, however to date little scientific evidence
exists examining its application and effectiveness.
Individuality pervades every aspect of the human body, the internal anatomical
characteristics of humans are every bit as variable as the external characteristics
(Williams, 1956). These inherited differences extend to the structure and metabolism
of every cell and determine the speed and efficiency with which cells perform their
essential functions (Wolcott & Fahey 2000). The basis of this statement were built on
the foundations of Williams (1956) original work on biochemical individuality which
indicated that the variations of metabolic biochemistry are almost infinite. Adopting the
commonly accepted demarcation between being normal and abnormal as 0.95, it
would be assumed that 95% of the population is normal in respect to one measurable
item. However with two uncorrelated measurable items 90.2% (0.952) would be
classified as normal, and with 10 and 100 (9510 and 95100) uncorrelated items 0.6%
and 0.059% would be classified as normal, thus producing our very own ‘individual
self’. Homo sapiens are seen to be homogenous, however this highlights that we are
all fundamentally disparate (Williams, 1956). Such structural disparity could potentially
lead to differences in metabolic function.

Page 25 of 253
The fundamental principles of the metabolic typing diet are that biochemically disparity
exists within everyone, and two dominant regulators of human metabolism control
metabolic output: the oxidative system (OS) (the speed at which food is converted into
energy) and autonomic nervous system (ANS) (neurological control of metabolism via
the ANS and enteric nervous system) (Wolcott and Fahey 2000). Each system is then
subdivided into two further branches: fast oxidisers and slower oxidisers within the OS;
sympathetic and parasympathetic control within the ANS. Kristal and Haig (2002) state
that in everyone there lies a metabolic dominance within one of these systems, and
that these primary controls of metabolism (metabolic type) can have a predetermined
effect on metabolic function, requiring different nutrition strategies to optimise
metabolism.
In the preface of Kristal and Haig (2002) book titled ‘The Nutrition Solution: A Guide to
Your Metabolic Type’, the opening line states: “Most health-conscious people are
aware of the necessity to eat good food and take supplements”. Similar assumptions
within the opening line are synonymous throughout the book. Kristal and Haig (2002)
then proceed to highlight numerous cases where the application of a metabolic typing
diet has cured chronic health issues where traditional medicine has not been
successful. Equally Walcott and Fahey (2000) (book entitled ‘The Metabolic Typing
Diet’) highlight numerous cases of chronic illness being cured utilising the metabolic
typing diet. Superficially the method and application are logical, however with no
research on the application and a number of bold statements throughout the books,
caution should be applied if utilising the technique and further research is needed.
2.1.2 A critical analysis of the metabolic typing diet.
It is well established that changes in diet composition can produce large, rapid shifts
in oxidation rates and basal metabolic rate (Folch et al., 2001). It has also been shown
that when total energy is fixed and diet composition is altered, the body rapidly
changes oxidation rate in response to changes in intake (Burke et al., 2002).
Carbohydrate oxidation has also been shown to reduce with a decreased
carbohydrate intake and elevate with an increased intake (Peters and Leblanc, 2004).
The manipulation of diet to suit the energy needs of the individual could provide health

Page 26 of 253
and performance benefits (Burke, Millet & Tarnopolsky, 2006). However large inter-
individual responses to dietary manipulation have been observed, supporting the
theory that ‘not one diet fits all’ (Wolcott & Fahey 2000). Therefore it is important to
consider each individual as an individual, opening up the question whether metabolic
typing (i.e. matching dietary intake to individual needs) is able to provide this.
The ‘metabolic typing diet’ is based around the theory of homeostasis and the
importance of maintaining a stable equilibrium between independent physiological
variables. The theory states that imbalances within eight homeostatic controls (i) the
oxidative system (intracellular energy conversion); (ii) ANS (master regulator); (iii)
catabolic/anabolic system (oxidative metabolism); (iv) endocrine type (food selection
and weight control); (v) acid/alkaline balance (pH); (vi) prostaglandin balance
(inflammatory responses); (vii) constitutional type (link between food and metabolism)
and (viii) electrolyte balance (circulation and osmotic pressure) (Walcott and Fahey,
2000) can be corrected by the application of the metabolic typing diet.
Literature exists supporting both the impact dietary intake has on each of these
homeostatic controls and the subsequent impact this has on metabolism. It is well
understood that mitochondrial quantity and density can impact metabolic rate and
energy conversion, and reduced mitochondrial numbers are linked with diabetes (Su
et al., 2013). Furthermore the protein PGC-1α has been demonstrated to play a
primary role in the regulation of oxidative phosphorylation (Oxidative system) which is
impacted by nutrient availability (Lin et al., 2005). In a recent review article published
in Nature, Myers and Olson (2012) suggest that the CNS can, in some cases,
dominate the control of metabolic homeostasis by controlling the overall peripheral
response (ANS). The maintenance of muscle mass is achieved through a fine balance
between muscle protein synthesis and muscle protein breakdown. Nutrient deficiency
can results in a state of negative net muscle protein balance, resulting in catabolism
(Phillips and Van Loon, 2011) (catabolic/anabolic system). The control of appetite and
hunger are influenced by a number of circulating hormones; a disruption in hormone
secretion can lead to weight gain. Hormones such as insulin, glucagon, leptin and
ghrelin link the control of cellular energy metabolism to the central nervous system by
modulating short-term signals that determine meal initiation and termination as well as
energy balance (endocrine type) (Mastorakos and Zapanti, 2004). Chronic metabolic

Page 27 of 253
acidosis is associated with severe growth retardation in humans (Nash et al., 1972)
and it has been demonstrated to substantially decrease albumin synthesis,
contributing towards sustained negative nitrogen balance (acid/alkaline balance)
(Ballmer et al., 1995). The metabolic pathway of the immune cell relies heavily on
oxidative phosphorylation, which can be impacted by glucose and lipid availability
(Ganeshan and Chawla, 2014), and prostaglandins have been demonstrated to both
sustain homeostatic function and support the inflammatory response (prostaglandin
balance) (Ricciotti and FitzGerald, 2011). Finally it is well established that the quality
and quantity of food consumed impacts both the metabolic response and the control
of metabolism (Draznin et al., 2012) (constitutional type). As such, if a diet is able to
control or restore homeostatic balance in each of these systems, the body would be
in balance and a nutrition solution could optimise metabolism.
The metabolic typing questionnaire (Appendix One) is a commercially used method to
prescribe individualised dietary intake. Rather than directly measuring and analysing
each of these ‘homeostatic controls’, the metabolic typing diet uses a simple 65 item
questionnaire, with each item designed to represent an aspect or function/control of
one of the homeostatic mechanisms. Each item has up to three separate answers,
with choices classified as either A, B or C. The total number of each answer is
calculated and MT is then selected using the following criteria:
If the number of A answers was 5 or more higher than both B and C, then the
individual is classified as a ‘Carbohydrate Type’.
If the number of C answers was 5 or more higher than both A and B, then the
individual is classified as a ‘Protein Type’.
If the number of B answers was 5 or more higher than both A and C, then the
individual is classified as a ‘Mixed Type’.
Once completed, a diet regime and series of supplements are prescribed to match the
identified metabolic type. However, fundamentally the prescribed diets are either a
high protein, low carbohydrate diet (40–45% protein, 35–40 % carbohydrate); a high
carbohydrate, low protein diet (70% carbohydrate, 10% protein); or a mixed diet (50-
55% carbohydrate, 30% fat, 15-20% protein) (Appendix One), and therefore not quite
as personalised as originally stated.
Within the questionnaire it is important to consider the rational for the selection of each
item. Some of the questions in the Walcott and Fahey (2000) metabolic typing

Page 28 of 253
questionnaire are ambiguous and the justification for their presence is not obvious.
For example, question 6 in the metabolic typing questionnaire is:
Some people commonly experience chest pressure, a distinct sensation of pressure
in the chest area. It often makes people feel as though a weight is on their chest, and
tends to inhibit the ability to breathe. (Only answer if you suffer from chest pressure)
a.
b.
c. I have a tendency to get or have problems with chest pressure
According to this question only ‘protein types’ experience chest pressure. Without a
justification for the inclusion of this question, it may be presumed that the question
alludes to a link between chest pressure and metabolic acidosis. It is well established
that when bicarbonate levels in arterial blood are low, pH decreases, resulting in
acidosis and hyperventilation which may cause the sensation of chest pressure
(Delguercio et al., 1965). Walcott and Fahey (2000) discuss the importance of
balancing the blood pH to maintain metabolic equilibrium, stating that a high protein
diet (type C) increases acidosis. However a number of other factors could lead to
common chest pressure, an excellent paper from Jerlock et al. (2005) discuss the
implication of living with unexplained chest pressure, which cannot be attributed to
acidosis. A further example of an ambiguous question within the metabolic typing
questionnaire is on coughing:
Usually we think of coughing as something associated with illness. But some people
naturally cough easily and often even when they are not sick. Typically the cough will
be a dry cough and short in duration. If you are one of these people please highlight
the answer. (Only answer if you suffer from regular coughing)
a. I tend to cough every day
b.
c.
Once again, as with chest pressure, coughing is only associated with one particular
metabolic/dietary type. This particular question presumes that carbohydrate types
witness symptoms of unexplained coughing, where mixed or protein types do not. An
excellent paper from Sifrim et al. (2005) found that chronic unexplained coughing was

Page 29 of 253
clearly associated with weak acid gastro-oesophageal reflux. Thus a weak ability to
tolerate acid, not alkaline as the question insinuates. Numerous other question
examples exist which are hard to justify their inclusion. However some questions within
the questionnaire are supported with more robust science.
“What foods worsen your ability to concentrate?
a. Meat and/or fatty foods.
b. No particular kind of food seems to disrupt my concentration.
c. Fruit and vegetables and grain-based carbohydrates.”
It is well established that a meal low in fat and protein can impact blood glucose and
insulin levels, subsequently affecting alertness and concentration (Holt et al., 1999).
Thus, if a slow oxidiser performs best on a high fat and protein diet then a meal such
as fruit and/or simple carbohydrates may be detrimental to concentration and focus.
2.1.3 Summary of the metabolic typing diet and its application.
Measuring biomarkers and prescribing an intervention to enhance that particular
aspect of health has been used for decades (Grundy and Denke, 1990). Personalised
nutrition is becoming ever popular, and prescribing a diet individualised to a person’s
metabolic requirements may enhance health and reduce the chance of illness. The
metabolic typing diet claims to be a personalised approach to nutrition, and dependent
on the outcome of a 65 item questionnaire, will prescribe a diet to reset the bodies
homeostatic control, providing a nutrition solution to optimal health. The science
supporting the inclusion of some of the questions present within the questionnaire is
ambiguous. Numerous case studies have been reported demonstrating rapid
improvements in health and metabolic status utilising the metabolic typing diet,
however to date, no research exists on the effectiveness of the intervention, both as a
tool for individualising dietary intake and its subsequent use to improve health.
Furthermore it may be argued that the scientific robustness of the questionnaire is
lacking.

Page 30 of 253
2.1.4 Carbohydrate and Protein requirements for speed and endurance
athletes.
Energy balance is defined by two components: energy intake and energy expenditure.
Energy balance occurs when total energy intake (EI) is equal to total energy
expenditure (TEE). TEE in turn consists of the summation of basal metabolic rate
(BMR), the thermic effect of food (TEF) and the thermic effect of activity (TEA).
TEE = BMR + TEF + TEA
TEA = Planned exercise expenditure + spontaneous physical activity + non exercise
activity thermogenesis (Thomas et al., 2016)
Chronic perturbations in the two components can lead to fluctuations in body weight.
Managing nutritional intake to meet the energy demands of athletic training is key to
support adaptation and performance improvements (Thomas et al., 2016). The
individual events included within Track and Field cover the full range of the
physiological phenotypic characteristics (Figure 2.1.1). For events such as 100 metre
sprinting and marathon running a phenotypic dominance at each end of the continuum
is essential to perform at the highest level (Joyner et al., 2011, Trappe et al., 2015). A
large disparity in characteristics and physiological determinates of performance exist
at both ends. Elite power athletes are able to sustain extremely high energy outputs
(>20 kcal•min-1) at an intensity greater that 100% VO2max, with blood lactate levels in
excess of 20 mmol•L-1 for short periods of time (Stellingwerff et al., 2011). Whereas
endurance athletes can sustain a high aerobic output and levels >90% VO2max for
prolonged periods (Jeukendrup, 2011). Naturally, with such disparity in the
physiological characteristics of these athletes, recommendations for optimal energy
and nutritional intake vastly differ.
Figure 2.1.1. Physiological phenotypic continuum of the metabolic demands for track and field events

Page 31 of 253
Energy expenditure is very high for endurance athletes due to the volume and intensity
of training. It is well established that muscle glycogen is a rate limiter to endurance
performance (Bergstrom et al., 1967) and increased muscle glycogen stores pre
exercise can prolong subsequent endurance performance. As such carbohydrate
intake recommendations for endurance athletes are relatively high, ranging from 6-12
g•kg-1•d-1 (50–75% total energy intake) (American Dietetic et al., 2009).
For speed and power events, muscular strength and force development are key
performance indicators. Energy expenditure through physical activity is generally
lower than endurance athletes, however due to increased body mass and muscle
mass overall energy intake needs to be high to match energy expenditure. Due to the
supra-maximal and anaerobic nature of the training, carbohydrate requirements are
lower than endurance athletes, however given that multiple sprints are common to a
sprint training session depletion of muscle glycogen is possible (Gaitanos et al., 1993).
Sprinters should consume sufficient carbohydrate to maintain glycogen during
training; as such daily carbohydrate intake recommendations of 5g•kg-1•d-1 (40–50%
of daily energy intake) are generally sufficient for sprinters (American Dietetic et al.,
2009, Tipton et al., 2007).
The maintenance of muscle mass is a balance between muscle protein breakdown
(MPB) and muscle protein synthesis (MPS) (Phillips and Van Loon, 2011). During
exercise an increase in protein turnover occurs which increases the daily demand for
protein intake. The current UK Reference Nutrient Intake (RNI) for protein, set by the
British Nutrition Foundation, is 0.75g•kg-1•d-1, meeting the needs of ~97.5% of the
population. Whereas protein intake guidelines for athletes are designed to optimise
the adaptive response to the training stimulus (Thomas et al., 2016), with
recommendations ranging from 1.2 – 2.0g•kg-1•d-1 in athletes (Thomas et al., 2016). It
is well established that increased protein intake, and the timing of feeding is key in
supporting gains in muscle growth and strength (Phillips and Van Loon, 2011) and
individuals with a large muscle mass and higher protein turnover require more protein
to remain in a net muscle protein balance (Phillips and Van Loon, 2011). Generally a
larger muscle mass is required to perform well in strength and power sports relative to
endurance. Additionally, an increased amount of training is focussed on muscular
hypertrophy which providing a greater challenge to remain in a net muscle protein
balance. As such daily protein recommendations are higher in strength/power athletes;

Page 32 of 253
1.5-2.0 g•kg-1•d-1 of protein for strength and power athletes (Tipton et al., 2007) and
lower 1.2–1.7g•kg-1•d-1 for endurance athletes (Burke et al., 2007).
2.1.5 The use of the metabolic typing diet as a tool for dietary prescription for
athletes.
As discussed in Chapter 2.1.2 personalised nutritional programs are still in their
infancy. In general, nutritional recommendations for athletes are based on the
physiological requirements of the sport rather the nutritional needs of the athlete
(Thomas et al., 2016). Due to greater protein requirements for speed/power athletes
and increased carbohydrate needs for endurance athletes, along with the distinct
physiological differences of power and endurance events; it could be argued that the
two groups of athletes have different metabolic needs, thus metabolic type. Endurance
athletes maybe classified as metabolic type ‘A’ (carbohydrate type) and speed/power
athletes as metabolic type ‘C’ (protein types). A comprehensive grasp on the individual
metabolic requirements of the athlete may be gained by implementing the metabolic
typing questionnaire. The output will prescribe a specific diet to meet the individual’s
metabolic requirements, not just the physiological requirements of the event. This may
lead to improved health and sporting performance. As such the implementation of the
metabolic typing questionnaire in athletes may provide clearer recommendations for
individual dietary intake; however this is yet to be explored.
2.1.6 Measuring nutrition knowledge in athletes.
For millennia, it has been recognised that nutrition plays an important role in human
health. It is postulated that nutrition is the most controllable risk factor impacting long-
term health and chronic disease (World-Health-Organization, 2003), which can be
easily manipulated to improve exercise performance (Burke and Deakin, 2010).
Consequently, optimal health and sport nutrition strategies have been subject to
comprehensive research (Magkos and Yannakoulia, 2003). However the sport and
fitness industries are saturated with varying opinion, articles and internet material

Page 33 of 253
which can provide unsubstantiated nutrition claims (Smith-Rockwell et al., 2001), as
such, recommendations may be controversial and/or misinterpreted. Such contrasting
information could appear confusing to those without sufficient exposure to nutrition
education.
Athletes’ diets are commonly reported as being nutritionally inadequate (Heaney et
al., 2011). The underlying reasons for this are unclear, but may include: 1) the athlete
knows what to consume but does not do so; 2) the education messages given to the
athlete are inaccurate; 3) the athlete is not getting educated in nutrition; 4) the athlete
does not think nutrition is an important aspect of performance; and 5) the athlete thinks
their current nutrition habits are adequate (Heaney et al., 2011).
Nutrition knowledge, broadly defined, refers to knowledge of concepts and processes
related to nutrition and health including knowledge of diet and health, dietary
guidelines and recommendations specific to a particular population (Miller and
Cassady, 2015). It has been postulated that in order to make healthy food choices it
is important to have an internalised and comprehensive structure of nutritional
knowledge (Rasanen et al., 2003). A person may master some aspects of nutrition,
however if understanding of the connections between different nutritional facts is
incomplete the ability to translate this knowledge into decisions impacting good food
choice is compromised (Cotugna et al., 1992). To better understand nutritional
knowledge a range of nutrition knowledge questionnaires (NKQ) have been
developed, each with its own advantages and disadvantages and designed for a
specific target population; New Zealand rugby coaches (Zinn et al., 2005), South
African adolescents (Whati et al., 2005), elderly (Thomas et al., 1990), inpatients
(Anderson et al., 1988); all having limited application when removed from the target
population. Furthermore, few of the questionnaires address nutrition knowledge for an
athletic population, and none specific to the UK athlete (Table 2.1.2).
Designing a construct valid questionnaire requires a lot of time and a significant
attention to detail, thus reasonably it should be resorted to only if an existing instrument
cannot be found (Parmenter and Wardle, 1999). As such, many authors may select
existing or un-validated tools for ease of data collection; however the questionnaire
may not accurately access the research question. A primary advantage for designing

Page 34 of 253
a new measure is that it will, if designed correctly, ensure that the NKQ will directly
address the research question.
A test is referred to as valid if it measures what it claims to measure (Kline, 2007a), for
a questionnaire to be valid and reliable a series of psychometric measures must be
performed. Psychometrics, the science of measuring or scaling psychological
attributes, has a defined set of criteria to formulate a valid test. These include tests of
validity: content, construct and face, along with tests of reliability: test re-test and
internal consistency (Table 2.1.1) (Kline, 2007a). Additionally, when defining the scope
of the measure it is important to distinguish between ‘knowledge’ and ‘beliefs’.
Knowledge can be conceptualised as factually true and knowledge items can be
judged as correct or incorrect, where as beliefs may be more complex than just true
or false (Parmenter & Wardle 1999). If a questionnaire is to contain both ‘knowledge’
and ‘belief’ questions then it is imperative that the two question groups are dissociated
from each other within the results.
The use of a previously validated NKQ can be a very productive tool if selected wisely;
Jessri et al. (2010) assessed the nutritional knowledge of Iranian college students
using the psychometrically valid and reliable questionnaire developed by Zinn et al.
(2005). The questionnaire was previously designed specifically for New Zealand rugby
coaches; importantly however the questions were sport specific thus providing enough
evidence to draw a strong conclusion. However the use of previously validated
questionnaires can be equally ineffective; Pessi and Fayh (2011) evaluated the
nutritional knowledge of professional Brazilian track and field athletes and triathlete’s.

Page 35 of 253
Table 2.1.1. Steps Taken to Assess for Validity and Reliability of a questionnaire (Adapted from Kline (2007b)).
Measure Definition Method Statistical Analysis
Validity
Content
The extent to which a measure
represents all facets or the area
of interest
Questionnaire developed with expert opinion. N/A
Construct
The degree to which the test
measures what it claims to be measuring.
Questionnaire administered to
two different groups, with
different training in subject area.
Significant different scores achieved.
Independent samples T-
Test
Face
The extent to which a test is
subjectively viewed as
covering the concept it purports
to measure
Questionnaire appears to be
measuring what it claims to measure. N/A
Reliability
Test-retest
The degree to which test results
are consistent over time.
The correlation of the scores from a
set of subjects who have taken to test on two separate
occasions.
Pearson's Correlation
Internal
consistency
A measure of how well the items on the test measure
the same construct / idea.
To measure the inter-correlation of
the questions within the
questionnaire.
Chronbach's alpha
Thirty-seven males and 13 females (age 32.4±11.1 years) completed the 12 item
questionnaire (originally developed by Harnack et al. (1997) to assess the nutritional
knowledge, beliefs and attitudes of cancer patients). Although some of the questions
were relevant others were less so, with questions focused on the relationship between
food and cancer and whether food can prevent cancer. These were appropriate for
Harnack et al. (1997) however not so for Pessi and Fayh (2011). Seeking knowledge
about which foods impact cancer development is not essential knowledge for an
Page 36 of 253
athlete, as in general, an/the athlete primary nutritional concern is performance (not
combating chronic ill-health), thus due to the use of this tool caution should be had
with any conclusions drawn from the study. Pessi and Fayh (2011) found no
significance in their results however concluded that the majority of the athletes
presented satisfactory nutrition knowledge. This paper highlights the importance of
constructing a strong methodological design (Kline, 2007b). If the questionnaire
addressed various nutritional issues relevant to track and field athletes, the findings
may expose a specific gap in the athlete’s knowledge, thus offering an education
pathway for the user.
To the author’s knowledge, in the last 15 years only three studies have investigated
the nutrition knowledge of athletes relative to a non-athletic control (Table 2.1.2)
(Raymond-Barker et al., 2007, Cupisti et al., 2002, Spendlove et al., 2012). In a
population of young Italian females (athletes: n = 60, non-athletes n = 59, age = 14 to
18 years) spanning a range of sports, Cupisti et al. (2002) demonstrated that athletes
produced a significantly higher rate of correct answers on the nutrition knowledge
questionnaire relative to non-athletes (77.6 % vs. 71.6 %, p < 0.01). Although
statistically significant, the 6 % difference in NKQ score observed is relatively small.
The NKQ used was assessed for internal consistency, however the steps taken to
ensure construct validity were not present raising a question over the complexity of
the research tool. The high rate of correct answers (77.6%) is the second highest
reported from an athletic population and is almost as high as the mean correct
response of dietetic trained participants (86.2%; reported by Spendlove et al. (2012)).
Spendlove et al. (2012) demonstrated no significant difference in nutrition knowledge
between the elite Australian track and field athletes (57.6%) and non-athlete group
(63.1%), with the non-athlete group performing slightly better.
Both Raymond-Barker et al. (2007) and Spendlove et al. (2012) used the validated
general nutrition knowledge questionnaire developed by Parmenter and Wardle
(1999), however it was not specific to an athletic population. Due to the absence of a
sports nutrition section caution should be taken when extrapolating these results and
drawing conclusions on the nutrition knowledge of an athlete.

Page 37 of 253
Table 2.1.2. Nutrition knowledge of athletes versus non-athlete comparison groups
(Adapted from Heaney et al. (2011)).

Page 38 of 253
2.1.6.1 Nutrition knowledge and dietary intake.
The association between nutrition knowledge and dietary intake appears inconsistent
and it is likely that multiple factors modify the relationship (Worsley, 2002). One such
factor for the inconsistent associations between knowledge and dietary behaviour is
that knowledge can be poorly assessed. Despite this, Parmenter and Wardle (1999)
stated that, with a well-constructed nutrition questionnaire, strong associations
between nutrition intake and knowledge could be identified.
As an athlete becomes elite it can be assumed greater consideration to all factors
which can improve performance may be paid (Stoeber et al., 2007); nutrition being
one of these. It is often assumed that improving an athlete’s nutrition knowledge will
result in better dietary choices (Dallongeville et al., 2001) and understanding the
reasons that influence food choices may establish an effective way to improve
nutritional habit (Dallongeville et al., 2001). Quantifying nutrition knowledge via the use
of a questionnaire is a commonly used tool for assessment; however the association
between nutrition knowledge and nutritional intake is unclear. A systematic review of
nutrition knowledge in athletes (Heaney et al., 2011) found a weak positive association
between nutrition knowledge and diet quality (r = 0.44), however the evidence is
equivocal. A number of publications have demonstrated a positive relationship
(Parmenter and Wardle, 1999, Pirouznia, 2001, Weinsier et al., 1988, Sawyer-Morse
et al., 1989, Cho and Fryer, 1974) yet a majority found no significance (Stafleu et al.,
1996, Shepherd, 1992, Harrison et al., 1991, Axelson and Brinberg, 1992).
Harrison et al. (1991) investigated nutrition knowledge and dietary habits in 122 elite
and non-elite New Zealand athletes, finding that the elite athletes possessed greater
nutrition knowledge (67% vs. 58%) and their dietary habits were closer to the NZ
nutrition guidelines than those of the non-elite group. A moderate correlation between
nutrition knowledge and dietary habits (r = 0.44, p < 0.01) was observed; this
relationship was significantly stronger (p < 0.01) among the non-elite athletes (r = 0.62)
than the elite athletes (r = 0.23). In non-athletic individuals, Rasanen et al. (2003)
reported results from a longitudinal study of individuals who had no nutrition
counseling and those that did. The results demonstrated that at the 7-year visit that

Page 39 of 253
people in the counseled group ate less saturated fat and salt than people in the control
group; however total fat intake of the two groups did not differ significantly and was
greater than the governmental recommend fat intake. Concluding that nutritional
counseling influenced the types of fats eaten but did not reduce overall fat intake.
Rand, Pellett and Young (2003) completed a meta-analysis of 235 non-athletic
individuals gathered from 19 studies involving nitrogen balance as estimation of
protein requirements in healthy adults. The results showed that median estimated
average requirement (EAR) for protein was 0.65–0.83g•kg-1•d-1, corresponding to
44.5–58.1g•d-1 for an average 70 kg male. As discussed earlier, protein EAR for
athletes’ can be double that of sedentary adults due to the training and competitive
stressors placed on the body, with protein requirements up to 2 g•kg-1•d-1. However it
is commonly accepted that some body builders, strength and power athletes consume
significantly greater amounts, with reports of athletes frequently consuming > 2.5 g•kg-
1•d-1 (Forslund et al., 1999). These choices could be due to a number of reasons; (i)
the athlete believes what they are doing is correct; (ii) the scientific literature is being
ignored by the athlete; (iii) the athlete is unaware of the literature; (iv) correct
information is not disseminated to the athletes; (v) incorrect information is being given;
(vi) or that the athlete actually thrives on diets with such high quantities of protein.
However without any knowledge of correct practise, the implementation of the correct
strategy is unlikely (Zinn et al., 2005).
2.1.7 Summary.
To summarise, it has been suggested that athletes may have different nutrition
requirements dependent on their phenotype / physiological requirements of the sport.
However, current dietary recommendations focus mainly on the demands of the sport
rather than the nutrition demands of the individual. The metabolic typing diet is based
on a questionnaire which claims to prescribe a diet to meet the specific metabolic
requirements of the individual and improve health and performance. This has not been
investigated in an athletic population. Furthermore, a weak positive relationship exists
between nutrition knowledge and dietary intake, however nutritional intake is
commonly reported as inadequate in athletes. It is conceivable that measuring nutrition

Page 40 of 253
knowledge then providing education may result in improved nutrition choices in
athletes, although this has yet to be evidenced in UK track and field athletes.
2.2 PART 2 - The cellular regulation of mitochondrial biogenesis and the
impact of diet and exercise on metabolic adaptation.
The focus of this thesis is to investigate dietary habits and the impact diet has on some
metabolic and cellular processes. The first part of the literature review focused on diet
intake and metabolic function. Part 2 investigates the literature surrounding the
regulation of mitochondrial biogenesis and the effect of external stressors such as
carbohydrate restriction, calorie restriction and exercise on metabolic and cellular
responses at rest and during exercise. This provides a rationale for the experimental
work detailed later in the thesis.
2.2.1 A brief overview of mitochondrial physiology.
Two main theories exist concerning the origin of the mitochondria. Traditionally it is
thought that a eukaryote engulfed the mitochondrion actively via phagocytosis,
becoming the first host (Martin and Mentel, 2010). Alternatively, the host that first
acquired the mitochondrion may have been a prokaryote. It’s origin aside, it is widely
agreed that the first mitochondrion containing microfossils dates back 1.45 billion
years and have evolved to the ubiquitous organelle and the primary energy producer
of the cell we know it to be today (Martin and Mentel, 2010).
The mitochondrion is made of five distinct parts: The outer mitochondrial membrane,
the intermembrane space, the inner mitochondrial membrane, the cristae space and
the matrix, each plays a specific role in the organelles function. The outer membrane
contains a large number of porins that form channels allowing molecules with a
molecular weight ≥ 5,000 Daltons to freely diffuse in and out of the mitochondrion
(Martin and Mentel, 2010). Due to the permeability of the outer membrane, the inner-
membrane space houses concentrations of small molecules such as ions and sugars.
Larger proteins such as cytochrome, an essential component of the electron transport
chain, are also found in the innermembrane space. The inner mitochondrial membrane

Page 41 of 253
is protein rich and a number of key functions occur within it, including; the redox
reactions of oxidative phosphorylation, adenosine triphosphate (ATP) synthase and
mitochondrial protein fusion and fission. Encapsulated within the inner mitochondrial
membrane are numerous cristae, the folded shape of the cristae enhance the surface
area of the inner mitochondrial membrane, enabling an enhanced production of ATP.
Situated inside the inner membrane is the matrix, this space contains approximately
66% of total mitochondrial protein. The matrix is essential to the production of ATP as
it contains a concentrated mixture of hundreds of enzymes that play a key role in
substrate utilisation and the citric acid cycle, as such is vital for energy production
during exercise. With the mitochondria being demonstrated to have such a key role in
energy metabolism, a significant body of work has been focused around the
manipulation of mitochondrial biogenesis to help cure diseases (Lee et al., 1998)
through to enhancing sporting performance (Wright et al., 2007). During daily function,
sustained and prolonged ATP production is an essential requirement due to limited
stores of ATP within the skeletal muscle (Greenhaff et al., 1994), the mitochondria
primarily fulfils the role of ATP producer. With the high mechanical workload of the
skeletal muscle, muscle fibres are densely populated with mitochondria to meet the
energy demand.
Mitochondria are responsible for energy production via fatty-acid oxidation, β
oxidation, Krebs cycle, and oxidative phosphorylation. Increased mitochondrial
quantity and density have been linked with increased endurance performance
(Psilander et al., 2013), reduction in type 2 diabetes, increased resisting metabolic rate
(Larsen et al., 2011) and improved insulin sensitivity (Lee et al., 1998, De Feyter et
al., 2008, Patti et al., 2003, Petersen et al., 2004, Mootha et al., 2003), promoting both
health and exercise performance benefits. The process of mitochondrial biogenesis
requires the co-ordinated synthesis of > 1,000 proteins encoded by the nuclear
genome, with a contribution from mitochondrial DNA, and can be defined as the growth
or division of pre-existing mitochondria (Jornayvaz and Shulman, 2010). To maintain
health, mitochondria engage in several dynamic processes, including fusion (the
joining of two organelles into one), fission (the division of a single organelle into two),
transport (directed movement within a cell), and mitophagy (targeted and programmed
destruction) (Mishra and Chan, 2016) (Figure 2.2.1 and Figure 2.2.2). In addition to
the complex synthesis, the metabolic control of mitochondrial biogenesis is impacted

Page 42 of 253
by a number of environmental stressors such as exercise, calorie restriction, low
temperature and hypoxia leading to a dynamic state of biogenesis (Jornayvaz and
Shulman, 2010).
Figure 2.2.1. Illustrative representation of mitochondrial fusion, fission, transport and mitophagy.
The biochemical pathways which impinge the mitochondrial metabolism and dynamics (Mishra and Chan, 2016).
Figure 2.2.2. Metabolic regulation of mitochondrial fission.
Severe energy depletion can activate fission via elevation of ADP and AMP levels. AMP-sensing by AMPK results in phosphorylating a number of receptor proteins
initiating mitochondrial fission. (Adapted from Mishra and Chan (2016).

Page 43 of 253
2.2.2 Skeletal muscle metabolic control through the PGC-1α family of
transcription coactivators.
A seminal paper from Puigserver et al. (1998) first isolated PGC-1-α and demonstrated
its key role in the regulation of mitochondrial processes linked to adaptive
thermogenesis. In the subsequent years the fundamental functions of PGC-1α in
relation to the regulation and co-activation of mitochondrial biogenesis has been
further demonstrated, and it is now well established that the PGC-1α plays a crucial
role in the regulation of mitochondrial biogenesis (Liang and Ward, 2006)
The gene of the PGC-1α protein is located on chromosome 4 in humans and encodes
a protein containing 798 amino acids. PGC-1α has two putative nuclear localisation
signals and is located in the cell nucleus (Puigserver et al., 1998). It is found at high
levels where mitochondria are abundant and oxidative metabolism is highly active
(Liang and Ward, 2006). PGC-1α works as a co-transcriptional regulation factor that
induces mitochondrial biogenesis by initiating transcriptional coactivators. It also has
a crucial role in linking stimuli to induce internal metabolic response such as: adaptive
thermogenesis, glucose/fatty acid metabolism and fibre type switching in skeletal
muscle and heart development (Puigserver et al., 1998). The stimulation of
mitochondria genes, by PGC-1α, leads to increased enzymatic capacity for fatty-acid,
β oxidation, Krebs cycle, and oxidative phosphorylation. Furthermore deficiency of
PGC-1α mitochondrial numbers decreases respiratory capacity in oxidative muscle
fibres and reduces exercise capacity and fatigue index (Leone et al., 2005).
PGC-1α acts as a coactivator of a number of transcription factors (Table 2.2.1), of
which the nuclear receptor hormones PPARα (Vega et al., 2000) and nuclear
respiratory factor-1 (NRF-1) (Wu et al., 1999) command particular attention with
regards to mitochondrial synthesis. PPARα is enriched in tissues with high oxidative
energy demands dependent on mitochondrial fatty acid oxidation, and PPARα
interacts with PGC-1α to coactivate target genes involved in mitochondrial fatty acid
oxidation (Vega et al., 2000). In a 3T3-L1 pre-adiposities cell line and following a 6-
hour incubation in palmitate, Vega et al. (2000) demonstrated that over expression of

Page 44 of 253
both PGC-1α and PPARα resulted in increased mitochondrial flux through the fatty
acid oxidation pathway. With regards to NRF-1, in C2C12 muscle cell line the
presence of PGC-1α and NRF-1 increased the content of mitochondrial DNA by 80%
over the control (Wu et al., 1999), demonstrating the essential role PGC-1α plays in
regulation of mitochondrial biogenesis via NRF-1 and fatty acid oxidation with the
PPARα pathway.
Table 2.2.1. Selected list of transcription factors for which PGC-1α functions as a coactivator.
Transcription Factor Function
NRF1 Mitochondrial biogenesis
NRF2 Mitochondrial biogenesis
ERR-α/β/γ Mitochondrial biogenesis
PPAR Fatty acid oxidation
TR-β CPT-I induction
FXR Triglyceride metabolism
GR Gluconeogenesis
HNF-4α Gluconeogenesis
FOXO1 Gluconeogenesis
PPAR = proliferator peroxisome-acitvated receptor, NRF = nuclear respiratory factor, ERR = estrogen-related receptor, TR = thyroid receptor, CPT-1 = carnitine palmitoyltransferase-I, FXR = farnesoid X receptor, GR = glucocortoid receptor, HNF = hepatic nuclear factor, FOXO1 = forkhead box O1 (Adapted from Liang and Ward (2006))
PGC-1α phosphorylation occurs via several different pathways; AMP-activated protein
kinase (AMPK) and silent information regulator T1 (SIRT1) mediated deacetylation
(Gurd et al., 2009) have been demonstrated to regulate the expression of PGC-1α in
human muscle (Ruderman et al., 2010), both of which are stimulated by environmental
stressors. It is important to note that PGC-1α shares similar molecular structures and
functions as PGC-1β (binding sites and transcriptional activation), but PGC-1β also
plays a role in regulating mitochondrial biogenesis. However, unlike PGC-1α, PGC-1β
is not up-regulated in brown adipose tissue in response to cold, nor in the muscle in
response to exercise (Meirhaeghe et al., 2003), suggesting that PGC-1α and PGC-1β
are stimulated independently.

Page 45 of 253
AMPK is a fuel sensing enzyme that is activated by a decrease in the cell’s energy
availability, reflected by an increase in AMP/ATP ratio (Ruderman et al., 2010). When
a cell is energy stressed an increase in liver kinase B1 (LKB1) and Ca2+ occurs, which
can in turn and independently catalyze AMPK phosphorylation by altering the
AMP/ATP ratio. AMPK’s activation initiates metabolic and genetic processes, such as
fatty acid metabolism, which help to restore body ATP stores. Additionally, as AMPK
is a primary upstream initiator of mitochondrial biogenesis, increases in AMPK can
chronically increase the energy production capacity of the cell (Jager et al., 2007).
SIRT1 is widely expressed in a range of mammalian tissues including liver, skeletal
muscle, adipose tissue, pancreas, brain and endothelium (Ruderman et al., 2010).
With reference to skeletal muscle, SIRT1’s regulation is not a clear as AMPK. However
changes in SIRT1 have been attributed to increased NAD+ and NAD+/NADH ratio, with
reduced nutrient availability (Cohen et al., 2004) and energy expenditure (Suwa et al.,
2008) initiating a response in SIRT1.
Ruderman et al. (2010) suggest that an AMPK/SIRT1 axis exists, and hypothesise
that concurrently AMPK and SIRT1 may initiate the simultaneous activation of each
other. An increase in the NAD+/NADH ratio initiates the expression of SIRT1, which in
turn deacetylates and activates LKB1, activating AMPK. The activation of AMPK, by
energy deprivation or other means, may increase the NAD+/NADH and/or the activity
of Nampt resulting in the activation of SIRT1 (Fulco et al., 2008) (Figure 2.2.3). Either
way, independently or concurrently, AMPK and SIRT1 are well established as
upstream activators of PGC-1α, which in turn has been demonstrated as the primary
regulator of mitochondrial biogenesis (Liang and Ward, 2006).

Page 46 of 253
Figure 2.2.3. The theoretical AMPK/SIRT1 – PGC-1α axis.
(Adapted from Ruderman et al. (2010)).
2.2.3 The regulation of PGC-1α through eternal stressors.
A substantial body of evidence suggests that SIRT1 expression responds to both
increases and decreases in nutrient availability (Nemoto et al., 2005), along with
increases in energy expenditure (Suwa et al., 2008) (Figure 2.2.8). Additionally, AMPK
is stimulated by cellular stress that causes a depletion of ATP and elevation of AMP,
similar stressors such as calorie restriction (Itani et al., 2003), hypoglycaemia (Itani et
al., 2003) exercise (Fujii et al., 2000) and muscular contraction (Hutber et al., 1997)
results in increased AMPK expression (Jager et al., 2007). As such, increases in PGC-
1α mRNA expression have been observed in response to calorie restriction,
hypoglycaemia and endurance exercise (Itani et al., 2003) resulting in positive
metabolic perturbation. Due to the importance of mitochondria in metabolism and the
role of PGC-1α in mitochondrial biogenesis and subsequent energy production, a
number of nutrition and exercise strategies have been employed to increase the
expression of PGC-1α, and consequent mitochondrial biogenesis.
Energy reduction (fasting) is a potent stimulator of metabolic adaptation. Canto et al.
(2010) demonstrated this in a series of well-designed experiments. Following either a
20-hour fast or normal fed diet, wild type (WT) and AMPKγ3 KO mice were sacrificed
and quadriceps muscle tissue was extracted. A >2-fold increase (p < 0.05) was
observed in relative PGC-1α mRNA levels along with a significant reduction in PGC-
1α acetylation levels in the WT mice (Figure2.2.4), highlighting both an increased
PGC1-α

Page 47 of 253
expression and activity of PGC-1α in response to restricted energy availability.
Additionally, Canto et al. (2010) observed no change in PGC-1α mRNA levels or
acetylation in either the fed or fasted state in the AMPKγ3 KO mice, demonstrating the
key role AMPK plays in the activation of PGC-1α.
Figure 2.2.4. PGC-1α deacetylation and transcriptional response to fasting in WT and AMPKγ3 KO mice.
Fasting increase PGC-1α deacetylation and mRNA transcriptional response in WT mice, the impact of fasting is negated in AMPKγ3 KO mice. * indicates statistical significance from relative fed group (adapted from Canto et al. (2010))
Draznin et al. (2012) published a dual study investigating the effect dietary
macronutrient composition had on AMPK and SIRT1 expression and activity in human
skeletal muscle. The participants in study one were 21 healthy and lean (men = 11,
women = 10) individuals, where as the cohort in study two consisted of 18 obese
participants (men = 8, women = 10). Baseline data was collected then the participants
were randomly assigned to a dietary intervention; the lean group were placed on either
a low-fat/high-carbohydrate (LF/HC; 20% fat, 60% carbohydrate, 20% protein
eucaloric diet), a high-fat/low-carbohydrate (HF/LC; 50% fat, 30% carbohydrate, 20%
protein eucaloric diet) or overfeeding (40% calorific excess); the obese group were

Page 48 of 253
assigned to the same diet ratio, but the diets were hypocaloric (30% calorie restriction).
In study one, the lean participants showed no significant changes in body weight,
insulinemia, glycemia or observed lipid levels across the three conditions after 5-days
dietary manipulation. Total AMPK, SIRT1 and PGC-1α had no change, however
AMPK phosphorylation and PGC-1α deacetylation significantly increased (p < 0.05) in
the HF/LC group (Figure 2.2.5 A and B). In the obese group modest weight loss was
observed, and fasting insulinemia was significantly reduced in both groups. The HF/LC
hypocaloric diet significantly increased AMPK phosphorylation and PGC-1α
deacetylation, however in contrast the LF/HC hypocaloric diet significantly reduced
AMPK phosphorylation and PGC-1α deacetylation, suggesting high carbohydrate
intake prevents the activation of the AMPK-SIRT1 axis in skeletal muscle that would
otherwise be activated by a low calorie diet.
A B
Figure 2.2.5. Effect of hypocaloric diets on AMPK phosphorylation and PGC-1α acetylation.
Effect of a hypocaloric diet containing either low fat / high carbohydrate (HF/LC) or high fat / low carbohydrate (HF/LC) in obese individuals on phosphorylation of AMPK (A) and acetylation of PGC-1α (B). * indicates statistical (p < 0.05) significance from baseline (adapted from Draznin et al. (2012)).
The impact of a single bout of endurance exercise on PGC-1α mRNA expression is
fairly well explored and robust (Hawley and Morton, 2014). Additionally the effect of
endurance exercise independent to, and in combination with glycogen restriction on
PGC-1α expression and phosphorylation is well researched. Psilander et al. (2013)
demonstrated that in a normal glycogen state (478 ± 33 mmol•kg-1 dry weight muscle)
3-hours post a 60 minutes interval session (mean VO2max 65 ± 1 mL•kg-1•min-1) PGC-
1α expression was increased 2.5 fold. Whereas in a low glycogen (166 ± 21 mmol•kg-
*

Page 49 of 253
1 dry weight muscle) state an 8.1 fold increase was observed (Figure 2.2.6); clearly
demonstrating the role exercise alone and exercise in combination with restricted
glycogen availability has on PGC-1α expression.
Figure 2.2.6. PGC-1α mRNA expression.
PGC-1α mRNA expression (arbitrary units) 3-hour post 60 minute high intensity interval cycling in either normal glycogen (NG) or low glycogen (LG) condition (Psilander et al., 2013).
However in that study it is important to consider, that the low glycogen group had a
calorie deficit of 1,425 kcal relative to the normal glycogen group, also glycogen
restriction was reached through a significant increase in dietary fat rather than protein.
Fat intake increased from 6% in the high glycogen group to 77% in the low glycogen
group. As discussed earlier in this Chapter calorie restriction is also a potent stimulator
of PGC-1α, thus the calorie deficit may be a confounding factor in the conclusions of
this study. However, a similar fold response in PGC-1α mRNA expression was
observed following high intensity internal training in a fed state. Following 4 x 30
second all out sprints (4 minutes rest between) Gibala et al. (2009) demonstrated an
~2-fold (p < 0.05) increase in PGC-1α mRNA expression 3 hours post exercise which
supports that data observed from Psilander et al. (2013)
To date very limited literature exists exploring the time course response of PGC-1α
mRNA expression post exercise. Baar et al. (2002) investigated the adaptive response
of skeletal muscle during and subsequent to a five day endurance swimming

Page 50 of 253
intervention (2 x 3-hour swimming bouts with 45 minutes rest) in rats accustomed to
swimming. Baar et al. (2002) demonstrated a two-fold increase in PGC-1α mRNA
expression in the triceps 6 hours post exercise, PGC-1α protein concentration was
also increased two-fold 18-hours post exercise. A similar magnitude in PGC-1α protein
was observed 18 hours after the fifth day of the exercise protocol. This is an important
finding because increases in mRNA do not always result in a parallel increase in
protein, demonstrating that an increase in the expression of PGC-1α mRNA results in
an equivalent response in protein content.
A B
Figure 2.2.7. Time course response of skeletal muscle PGC-1α mRNA and protein content.
Time course skeletal muscle PGC-1α mRNA (A) and protein content (B) throughout 2 weeks of high-intensity interval training. (mean ± SEM). *Significantly different from Pre, §significantly different from all 24 h time points, #significantly different from 1st-4 h, †significantly different from 1st-24 h (p < 0.05) (adapted from Perry et al. (2010)).
Perry et al. (2010) published a study investigating the transcriptional and mitochondrial
protein response in untrained males (mean VO2peak of 45.5 mL•kg-1•min-1) throughout
a two-week period (7 sessions) of high-intensity interval training. PGC-1α mRNA
increased by >10-fold within four hours after the initial exercise session and returned
to pre exercise levels 24h into recovery (p <0.05; Figure 2.2.7 A). Each subsequent
session repeatedly stimulated increases in PGC-1α mRNA 4-hours after the session
followed by a return to the pre level by 24 hours (p <0.05). However, the magnitude of
the 4-hour increase after each training session was progressively decreased.

Page 51 of 253
Conversely, PGC-1α protein expression occurred later (23%, 24-hours after the 1st
session, p <0.05; Figure 2.2.7 B) than PGC-1α mRNA. Unlike the reduced PGC-1α
mRNA responses observed over seven training sessions, PGC-1α protein expression
continued to increase, attaining a plateau (+42%, p <0.05) by the 5–7th training
session.
This time course data may offer some insight into transcriptional response post
exercise, however it is important to consider that the participants were untrained and
exhibited an increase in VO2peak of 5.4 mL•kg-1•min-1 after completing seven training
sessions in two weeks. Such significant improvement following just seven training
sessions would not be observed in well trained individuals, more research is needed
to investigate the response in well trained individuals.
Figure 2.2.8. The activation of PGC1-α and its role in functioning as a co-activator.
Energy deprivation, glucose restriction and exercise increase SIRT’s, AMPK and p38 MAPK expression which, in turn, causes an increase in PGC-1α gene transcription. This increase NRF activity leading to increased mitochondrial DNA (mtDNA) and protein expression thus promoting mitochondrial biogenesis. An increase in PGC-1α also results in an PPAR activity and greater fatty acid (FA) oxidation. (Adapted from Jornayvaz and Shulman (2010)).
Page 52 of 253
As previously discussed it is well established that glycogen availability is a key factor
in the regulation of PGC-1α and a large number of athletes anecdotally follow a high
protein diet, thus restricting carbohydrate availability. To date, with regards to the
AMPK/SIRT1 – PGC-1α metabolic pathway, most the research in humans used fat as
the macronutrient manipulated to reduce carbohydrate intake and maintain energy
availability; protein intake is kept consistent. In rats, Nakazato and Song (2008)
investigated the impact a high protein diet has on oxidative properties and PGC-1α in
the gastrocnemius muscle. In three matched groups, 19 rats (four weeks old) were fed
either a control (15% protein, 71.3% carbohydrate), mid protein (25% protein, 41.3%
carbohydrate), or a high protein (35% protein, 31.3% carbohydrate) diet for four
weeks. Following this the rats were killed and target tissues were removed and frozen.
Energy intake across the three groups was isocaloric; however the high protein group
demonstrated a significantly lower body mass, body fat and skeletal muscle mass than
the control group. Importantly the high protein group exhibited a greater expression of
both succinate dehydrogenase and PGC-1α (p < 0.05) expression relative to the
control group. These differences in oxidation potential were only observed in muscle
fibres that were originally sparse of oxidative muscle tissue. Unfortunately Nakazato
and Song (2008) did not report the levels of coactivators, such as AMPK and SIRT1,
however it can be speculated that high protein—low carbohydrate diets mediate insulin
response to feedings along with a reduction in blood glucose, providing a stimulus
similar to that of hypoglycaemia and calorie restriction, which has previously been
demonstrated to increase the AMPK/SIRT1 axis.
2.3 Protein metabolism in a negative energy balance.
Skeletal muscle mass is maintained by a complex cascade of intracellular signalling
pathways, which are known to be influenced by energy availability, exercise, and
nutrient availability. In response to a negative energy balance, mRNA translation and
MPS may become down regulated as a result of lower insulin (growth factor) and
reduced energy availability (which as discussed previously Chapter 2.2.2, increases
the AMP/ADP ratio), as such causing myofibrillar degradation and decrease MPS, and
subsequent skeletal muscle mass (Figure 2.3.1) (Carbone et al., 2012).
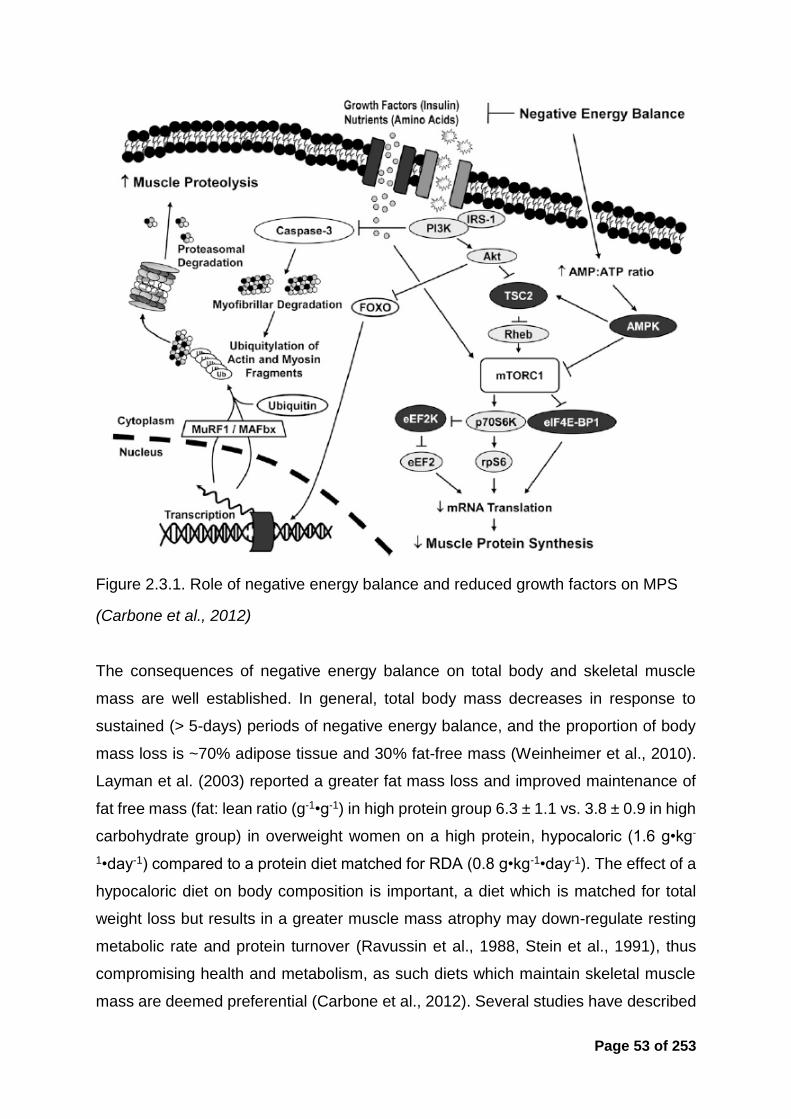
Page 53 of 253
Figure 2.3.1. Role of negative energy balance and reduced growth factors on MPS
(Carbone et al., 2012)
The consequences of negative energy balance on total body and skeletal muscle
mass are well established. In general, total body mass decreases in response to
sustained (> 5-days) periods of negative energy balance, and the proportion of body
mass loss is ~70% adipose tissue and 30% fat-free mass (Weinheimer et al., 2010).
Layman et al. (2003) reported a greater fat mass loss and improved maintenance of
fat free mass (fat: lean ratio (g-1•g-1) in high protein group 6.3 ± 1.1 vs. 3.8 ± 0.9 in high
carbohydrate group) in overweight women on a high protein, hypocaloric (1.6 g•kg-
1•day-1) compared to a protein diet matched for RDA (0.8 g•kg-1•day-1). The effect of a
hypocaloric diet on body composition is important, a diet which is matched for total
weight loss but results in a greater muscle mass atrophy may down-regulate resting
metabolic rate and protein turnover (Ravussin et al., 1988, Stein et al., 1991), thus
compromising health and metabolism, as such diets which maintain skeletal muscle
mass are deemed preferential (Carbone et al., 2012). Several studies have described

Page 54 of 253
the beneficial impact of consuming diets with a higher protein intake on muscle–
sparing (Skov et al., 1999, Rodriguez and Garlick, 2008). Although the literature
provides useful evidence, the exact mechanisms of increasing protein intake to
maintain skeletal muscle mass in dietary weight loss programmes is yet to be fully
understood.
Reducing energy availability (and carbohydrate intake) may be beneficial to the
adaptive response for the AMPK/SIRT1 – PGC-1α axis (Figure 2.2.8), however this
may have a detrimental impact on the maintenance of skeletal muscle mass through
the mTORC1 pathway (Figure 2.3.1), and compromising skeletal muscle mass. Also,
increasing dietary protein intake in a calorie deficient state has been demonstrated to
attenuate the catabolic response (Skov et al., 1999), which raises the question; does
a high protein diet in combination with endurance exercise have beneficial impact on
lean mass maintenance and the adaptive transcriptional pathways responsible for
improvements in endurance performance?
2.3.1 Nutrition manipulation to enhance endurance training adaptation in
skeletal muscle
It is well established that carbohydrate availability is rate limiting to endurance
performance (Bergstrom et al., 1967). Endogenous carbohydrate stores are only
sufficient to fuel approximately three hours of sub-maximal performance (Burke and
Hawley, 2002), where as fat stores, in the form of intra-muscular triglycerides, blood
lipids and adipose tissue, in even the leanest athlete, are sufficient to provide enough
fuel for numerous days of low intensity activity (Rapoport, 2010). Some early work
from Coyle et al. (1986) demonstrated that well trained athletes have a greater ability
to oxidise fat during prolonged moderate intensity exercise. Hawley et al. (1998)
progressed the research area with a paper discussing strategies to enhance fat
utilisation during exercise; and many “popular” diet books claimed that “fat loading”
strategies would enhance performance capabilities of endurance and ultra-endurance
athletes by making them better able to “tap into body fat stores” (Sears, 1995). In the
1980’s and 90’s a number of research papers were published highlighting the
possibility of a high fat diet improving endurance performance by enhancing the fat

Page 55 of 253
oxidation pathway (Phinney et al., 1983, Goedecke et al., 1999, Lambert et al., 1994).
However a review paper by Burke and Hawley (2002) stated:
“It is perplexing that in the face of marked changes in metabolism that favour fat
oxidation and the consequent sparing of muscle glycogen, fat-adaptation/CHO
restoration strategies do not provide clear benefits to the performance of prolonged
exercise.”
To the author’s knowledge a total of eleven studies have been published investigating
the impact of continuous multi-day (5-days to 28-days) low carbohydrate vs. high
carbohydrate diets on either high-intensity or sub-maximal endurance performance in
trained athletes. It is important to note that study design, feeding during and
performance measured differed throughout. In summary, with regards to high-intensity
exercise, five studies observed no change in performance, five showed that low
carbohydrate decreased performance (one was inconclusive, suggesting individual
response) and one showed an improvement (however this was subsequent to 150
minutes sub maximal cycling). With regards to sub-maximal endurance performance
nine studies demonstrated no change and two studies showed an improvement (Table
2.3.1). All studies highlighted above manipulated fat to restrict carbohydrate intake,
and classify the study design as low carbohydrate high fat (LCHF) (protein intake is
generally not referenced or not changed). Furthermore, all literature to date is on
cyclists (Havemann et al., 2006, Lambert et al., 1994, Goedecke et al., 1999,
Rowlands and Hopkins, 2002, Vogt et al., 2003, Burke et al., 2002, Carey et al., 2001,
Noakes, 2004, Burke et al., 2000, Lambert et al., 2001, O'Keeffe et al., 1989).
To date, only three studies have reported an improvement in exercise performance
following a ‘train low’ strategy. Hansen et al. (2005) used a 10-week unilateral
isokinetic leg kicking protocol in which one leg undertook 50% of sessions with lowered
glycogen (a twice a day training program with the second session commencing after
glycogen depletion from the first session) and the other leg undertook the same
training but glycogen was restored in-between sessions. The results reported a greater
increase (19.7 ± 2.4 min vs. 11.9 ± 1.3 min) in isokinetic leg kicking time to exhaustion
in the lowered glycogen leg. However with the outcome variable being an isolated
movement, with little application to sporting performance, the improvements in

Page 56 of 253
performance observed should be taken with caution when relating to full body exercise
performance.
Table 2.3.1. Impact of a high fat, low carbohydrate diet on exercise performance.
(adapted from Burke (2015))
Intensity
Impact of a low carbohydrate (high fat) diet on exercise performance
Improve No Change Decrease
Sub maximal 2 9 0
High intensity 1 5 4
Cochran et al. (2015) investigated the effect of restricted carbohydrate availability
between twice-a-day high-intensity training on a cycling time trial and repeated sprint
test. Active, male participants (N = 18, mean VO2peak = 44 ± 9 ml•kg-1•min-1) were
provided either a high carbohydrate (195 g carbohydrate) or low carbohydrate (17g
carbohydrate) meal in the three hours between training sessions 6-days a week over
a two week training period. The training-induced improvement of mean power output
during a 250-kJ TT performance was greater (p = 0.02) in the group that undertook
the second session with reduced CHO availability (PRE, 211 ± 66 W; POST, 244 ± 75
W) compared with the group that refuelled before that session (PRE, 203 ± 53 W;
POST, 219 ± 60 W). It is important to note that there was no difference between groups
in the improvement in the repeated sprints test (5 × 15s all out sprints) or mitochondrial
content. Another important consideration is the training status of the individuals, as
with the Perry et al. (2010) study, the participants were untrained individuals, as such
the amplitude of response is expected to be greater than in well trained individuals
(Ahtiainen et al., 2003).
Utilising a unique study design Marquet et al. (2016) investigated the impact of 3-week
sleeping with low carbohydrate availability, compared to regular daily carbohydrate
intake, on simulated Olympic distance triathlon performance. The sleep low group
completed a high-intensity workout with high carbohydrate availability the night before,
followed by an overnight fast and a prolonged submaximal workout the in the morning.
The control group completed the same training schedule but with normal carbohydrate

Page 57 of 253
intake. No difference in total carbohydrate intake was observed between groups. All
the sleep low participants reduced their 10km time trial performance following the
intervention (pre, 40:23 minutes ± 3:22; post, 39:10 minutes ± 3:02, p < 0.01), whereas
no change was observed in the control group (pre, 41:26 minutes ± 2:13; post, 41:24
minutes ± 2:43), also a significant reduction (p < 0.001) in body mass was also
observed in the sleep low group. Due to the ‘real world’ nature of the study design no
invasive mechanistic markers were assessed, however this further highlights that
carbohydrate is a potent mediator in the adaptive response to endurance training
(Hawley and Morton, 2014, Marquet et al., 2016).

Page 58 of 253
2.4 Key methodological considerations.
2.4.1 Measuring Dietary Intake
Measuring dietary intake is key to understanding what foods an individual is
consuming; however there is no truly accurate measure of dietary intake in free-living
people (Burke and Deakin, 2010). A wide range of analysis tools/methods have been
developed, each with their own strengths and limitations (Magkos and Yannakoulia,
2003). This literature review will not provide an in-depth analysis of each method,
however Table 2.4.1 provides a summary of the primary dietary analysis methods
used in research. For further reading please refer to the excellent articles from Magkos
and Yannakoulia (2003) and Burke and Deakin (2010).
Due to its flexibility, compliance and accuracy, estimated method using household
measures is generally seen as the most feasible method for research (Bingham et al.,
1994). Table 2.4.2 highlights the common methods used in an athletic population
(Burke et al., 2001). The 2–4 day estimated method using household measures was
the most popular method with 44.5% or research studies utilising the technique. In
total 76.7% used the estimated using household measures method over 1–12 days.
The accuracy of estimated diet records are deemed sufficient for the assessment of
groups, and a 3-day record including 2-week days and 1-weekend day meets the
requirements to assess individual intake (Magkos and Yannakoulia, 2003). Recording
periods of > 6-days have been used, however these are usually unsatisfactory due to
respondent fatigue (Thompson and Byers, 1994). Additionally, when assessing the
dietary intake of groups fewer days are required compared to individual analysis.
Basiotis et al. (1987) states that 14-days diet record are required to estimate the true
average intake of an individual, in comparison to just 3-days when calculating for
groups.

Page 59 of 253
Table 2.4.1. Overview of different methods for dietary assessment.
(adapted from Burke and Deakin (2010)).
Data Collection Method
Application Strengths Limitations
Weighed method using scales or computerised approaches
Assess food choices and eating habits mostly from 1 to 7-days
Weighing is considered an accurate method
Time-consuming to conduct and analyse
Requires trained personnel
Requires literate and co-operative respondents
Estimated method using household measures
Acceptable for research because better compliance than weighed method
Provides information about eating habits
Fairly valid for up to 5-days
Provides detailed information
Poor compliance after 4-days
Not representative of usual diet, unless repeated
Under estimates energy from 20 – 50 %
Duplicate food collections
Uses duplicate meals/foods for direct chemical analysis
Most accurate method
High respondent burden
Expensive to analyse
Distorts food choice
Under-reporting
Other biases poorly documented
24-hour recall
Used mainly to rank food or nutrient intake of groups of people Can be used to rank food and nutrient intakes of individuals, if repeated at random
Minimal distortion of food intake
Low respondent burden
Good response rate
Low administration cost
Memory/recall bias
Under estimates total energy intakes
Food frequency questionnaires (FFQ’s)
Mainly for ranking usual food or nutrient intakes of groups of people in qualitative or semi quantitative terms As screening tool to detect, measure or rank specific nutrients or food intakes in groups or individuals
Similar advantages to the 24-hour recall
Measures usual diet and may be more representative of ‘usual’ intake than repeated diet recall.
Quick to administer
Cost effective
Similar limitations to 24-hour recall
Less accurate than record methods
List of foods may not fully represent foods consumed by respondents
Difficulty quantifying portion sizes.
Over-estimation at low intakes, under estimation at high intakes.
Dietary history
Combines a 24-hour recall and FFQ Assessment of usual intakes of individuals in clinical practice
Comprehensive assessment of the usual nutrient intake, including seasonal changes
Time consuming to conduct
Dependent on highly trained interviewer
Dependent on memory and co-operation of the respondent
Tend to over-estimate nutrients intake

Page 60 of 253
Table 2.4.2. Dietary analysis method used in studies involving athletes.
(adapted from Burke et al. (2001)).
Dietary method Number of days
Number of population groups assessed
Percentage of studies
Household measures 1 to 3 5 2.7 2 4 2.1 3 66 34.9 4 14 7.4 4 to 7 20 10.6 5 4 2.1 6 2 1.1
7 27 14.3 9 1 0.5 10 1 0.5 12 1 0.5
Weighed 3 4 2.1 3 to 5 7 3.7 4 3 1.6 5 2 1.1 7 6 3.2
Dietary recall 7 1 0.5
24h recall N/A 6 3.2
FFQ N/A 2 1.1
Diet history N/A 6 3.2
Semi weighed 3 7 3.7
It is important to note that all dietary records and surveys are opposed by errors of
validity (accuracy of data collection) and reliability (how well the data reflects intake).
The three most common errors in self-reporting diaries are highlighted as:
The individual may alter their dietary intake during this period, therefore not
representing usual intake.
The individual may record a false diary, omitting or adding foods in an attempt
to make their diet look of better quality.
The individual may make fundamental errors in recording portion sizes and
weights. (Burke et al., 2001).

Page 61 of 253
Mertz et al. (1991) investigated the relationship between estimated energy intake and
actual dietary intake for body weight maintenance. A cohort of 263 free-living humans
completed a minimum of 7-days food record training from a dietician, followed by a
controlled diet of conventional foods for ≥ 45 days. The participants were required to
estimate food consumed using the household measures method. The results showed
on average 18% under reporting of calorie consumption (8% overestimated, 11% were
accurate to within 100 kcal and 81% under reported), however interestingly the
individuals who had a greater calorie intake estimated food intake more closely to
actual intake. With the populations of the current research being athletes, presumably
with higher calorie consumption, it could be hypothesised that the results are a more
accurate representation of actual intake relative to a non-athletic population (Mertz et
al., 1991). However (Magkos and Yannakoulia, 2003) reported a mean
underestimation of ~28 % relative to energy expenditure in athletes, but stated that
macronutrient ratios were representative of dietary intake.
Although no truly accurate method exists to measure dietary intake in free-living
individuals, measuring nutrition intake is a vital tool when assessing current habits of
an athlete. However when analysing, it is important to consider the potential errors of
measurement.
2.5 Summary of literature and rationale for research
It is well established that optimal nutritional intake can enhance both health and
endurance performance. It is commonly reported that athletes dietary intake is
nutritionally inadequate (Heaney et al., 2011), the reason for this is unclear, with some
research pointing towards inadequate nutrition knowledge contributing to poor food
choices. Current nutrition guidelines are tailored around the physiological and training
demands of the sport (Thomas et al., 2016). With enhancements in genomic and
metabolic research the concept of personalised nutrition has rapidly progressed (Joost
et al., 2007). The metabolic typing diet prescribes a diet individualised to the persons
needs based on the output of a 65 question questionnaire (Walcott and Fahey, 2000),
which claims to reset metabolic homeostasis, providing an optimum nutrition solution.

Page 62 of 253
However with no research the application of the metabolic typing questionnaire as a
tool to define metabolic type and dietary intake the area needs further exploration.
Optimising or enhancing the adaptation attained from a training session may lead to
subsequent improvement in exercise performance. Manipulating carbohydrate
availability is one such mechanism that has received a significant body of research in
recent years. Mitochondrial biogenesis is a desired metabolic training adaptation from
endurance exercise; this process is controlled by the AMPK/SIRT1 – PGC-1α axis.
Energy restriction, carbohydrate restriction and acute exercise are known to increase
the expression of AMPK/SIRT1 – PGC-1α axis; promoting mitochondrial biogenesis.
The exact method and the extent of manipulation of the external stressors are yet to
be fully described. The majority of human studies in this area manipulate fat to restrict
carbohydrate availability; the effect of increased protein intake on metabolic adaptation
of the AMPK/SIRT1 – PGC-1α axis at rest and in combination with endurance exercise
is yet to be fully explored. With high protein diets currently en vogue and numerous
reports stating that athletes are consuming high protein diets, further research into this
area is needed to help provide informed decisions.
2.5.1 Experimental questions raised from literature review
This review of literature has identified a number of areas that require further study and
consequently some of these will be addressed in the subsequent experimental
Chapters of the thesis by raising the following questions and hypotheses:
1. Can a commercially available metabolic typing questionnaire prescribe a diet
personalised to individual metabolic needs, and does an association exist
between metabolic type and sporting discipline?
Hypothesis – The application of the metabolic typing questionnaire will
identify endurance athletes as having a different metabolic type to speed
and power athletes.
2. What is the level of nutrition knowledge in UK Track and Field athletes, and
does a relationship exist between nutrition knowledge and dietary intake?

Page 63 of 253
Hypothesis – UK track and field athletes will have better nutrition
knowledge relative to a non-athletic group, also individuals with greater
nutrition knowledge will have better dietary intake.
3. What is the impact of increasing dietary protein intake independently or
concurrently in a hypocaloric diet on metabolic adaptation, body composition
and resting metabolic rate?
Hypothesis – Increased protein intake in a hypocaloric diet intake will
promote greater metabolic adaptation.
4. Does an isocaloric high protein diet, in combination with endurance training
have a preferential impact on metabolic adaptation, substrate utilisation and
exercise performance?
Hypothesis – A 7-day isocaloric high protein diet, in combination with
endurance training, will promote metabolic adaptation, enhance
substrate utilisation and improve subsequent exercise performance
compared to a high carbohydrate diet.
Specifically, the above questions and hypotheses will be addressed in the
subsequently experimental Chapters;
Chapter 4. To develop and validate a new reliable nutrition knowledge
questionnaire specific for athletes.
Chapter 5. To examine the current nutrition knowledge and dietary intake of
UK track and field athletes and investigate the application of the metabolic
typing questionnaire as a tool for personalised nutrition prescription.
Chapter 6. Examine the impact of acute energy restriction and increased
protein intake for 7-days on metabolic adaptation, body composition and resting
metabolic rate at rest.
Chapter 7. Investigate the impact 7-days endurance training in combination
with increased protein intake has on metabolic adaptation, substrate utilisation
and exercise performance.

Page 64 of 253
3 GENERAL METHODS

Page 65 of 253
This thesis presents data from four different studies. This Chapter describes common
or complex methodological procedures used throughout the course of the studies and
acts as a reference point for experimental Chapters presented later in this thesis.
3.1 Dietary Intake Analysis
The method: Dietary analysis is a method by which current habitual dietary intake can
be attained and measured. Subsequent to a review of the literature (refer to Chapter
2.4.1 for a critical analysis) the estimated method using household measures diet log
was selected as the tool to record and measure habitual dietary intake. The review of
literature concluded that 3–4 day’s estimated diet record is optimal for the research
design throughout this thesis.
Table 3.1.1 .Food diary example provided to the participant.
The protocol: Dietary intake analysis was completed in experimental Chapters 5, 6
and 7. Prior to the start of each study the participants were provided with a
comprehensive example of the completed food diary (Table 3.1.1). The importance of
accuracy and detail were emphasised, as was the importance of maintaining current
dietary habits and documenting all food and drink consumed. Participants were

Page 66 of 253
instructed to fill in the diet log throughout the day if possible and not leave till the
evening/next day. Participants were requested to record intake on two (Experimental
Chapter 5) and three (Experimental Chapter 6 and 7) week-days and one weekend
day during the specified week.
3.2 Food diary analysis
The method: Food diaries were inputted and analysed using a software package to
quantify dietary intake.
Reliability: For each phase of study the food diaries were analysed by the same
investigator. Due to a change in institution and licensing, the food diaries in Chapter 5
were analysed using Dietplan 6 (Forestfield Software Ltd, Horsham, UK) and in
Chapters 6 and 7 the food diaries were analysed using Nutritics (Nutritics LTD, Dublin,
Ireland). Both Dietplan6 and Nutritics are currently based on the same McCance and
Widdowson (2015) (6th edition) food and nutrient composition tables as published by
Public Health England, however in Chapter 5, the analytical software used, Dietplan6
was based on the 5th Edition of the McCance and Widdowson composition tables.
The protocol: Food and drink items were manually entered in a maximum of five
separate meal times: breakfast, snack, lunch, snack, and dinner. If the logged food
item was not present in the platform database and the participant did not provide the
macronutrient breakdown of the food item, the details of the food were searched for
on the internet and manually inputted into the database. As much attainable detail
about the item was entered, including all macro- and micro-nutrients. If the participant,
or other participants, consumed this food item at another time point the newly inputted
food item was selected.
3.3 Food provision
The method: For Chapters 6 and 7 the participants were provided with a diet for the
duration of the intervention. The macronutrient ratio’s were set by the investigative
team and provided as a brief to Soulmatefood® (Waterfoot, Lancashire) who created

Page 67 of 253
the diets specific to the participant’s requirements. The food packages were delivered
directly to the participant’s door.
Reliability: Due to the nature of diet creation and cooking, it is not possible to create a
diet matching the exact prescribed calorie intake. Due to this, a total of 34 (17 high
carbohydrate, 17 high protein) different diet menus were created starting at 1,075 kcal.
The bandwidth of each diet was 149 calories, and each diet was created to match the
median value of the band (Table 3.3.1), the largest diet provided 3,325 kcal. The
greatest possible difference between estimated intervention intake and prescribed diet
was 75 kcal•day-1. Participants were assigned the diet closest to their calculated
interventional energy intake.
Table 3.3.1. Table used to calculate the participants daily energy intake for the intervention diet.
Calculated energy intake range
(kcal•day-1)
Energy provided within intervention
diet
(kcal•day-1) Minimum Maximum
Diet A 1,000 1,149 1,075
Diet B 1,150 1,299 1,225
Diet C 1,300 1,449 1,375
Diet D 1,450 1,599 1,525
Diet F 1,600 1,749 1,675
Diet G 1,750 1,899 1,825
Diet H 1,900 2,049 1,975
Diet I 2,050 2,199 2,125
Diet J 2,200 2,349 2,275
Diet K 2,350 2,499 2,425
Diet L 2,500 2,649 2,575
Diet M 2,650 2,799 2,725
Diet N 2,800 2,949 2,875
Diet O 2,950 3,099 3,025
Diet P 3,100 3,249 3,175
Diet Q 3,250 3,399 3,325
The protocol: Each participant received two deliveries; the first delivery contained
three days food, the second four days food. Each day consisted of 5 pre packaged /
cooked meals (breakfast, morning snack, lunch, afternoon snack and dinner). Included

Page 68 of 253
with the delivery was a daily menu with consumption instructions. The participants
were required to refrain from consuming any additional foods and requested just to
drink water or drinks free from caffeine or energy.
3.4 Micro muscle biopsy sampling
The micro muscle biopsy method (Hayot et al., 2005) was used in Chapter 6 and 7 to
collect muscle tissue from the vastus lateralis muscle.
3.4.1 Introducing the technique at the University of Hertfordshire and the GSK
Human Performance Lab
Prior to initiation of this thesis the method of taking muscle biopsies had not been
undertaken at the University of Hertfordshire. In order to investigate the desired
research questions it was essential to introduce this technique into the institution. Due
to the title and invasive nature of the procedure, caution, diligence and a thorough
understanding of the technique were required to ensure the university regulatory body
allowed the technique to be introduced. From deciding muscle biopsies were essential
for the body of research, to taking the first pilot muscle biopsy at the University of
Hertfordshire, the process paperwork and training took approximately 12 months.
Substantial time was taken to develop the operating procedures and organise relevant
training. Refer to Appendix Two for the detailed standard operating procedure (SOP)
created to introduce the technique. In brief, the steps taken to introduce the technique
at the University of Hertfordshire were as follows:
1. Scoped technique and detail out stages needed for completion prior
implementation.
2. Discussed with the technical team.
3. Engaged with external expert to observe the technique.
4. Presented technique and method to the health and safety lead along
with ethics committee.
5. Completed external training.
6. Gained ethics approval for the technique.
7. Completed pilot biopsies.
Page 69 of 253
Subsequent to introducing the technique at the University of Hertfordshire, a change
in employment occurred and similar processes had to be undertaken to introduce the
technique to a new laboratory (GSK Human Performance Lab).
3.4.2 The micro muscle-biopsy technique
The reclining biopsy couch was cleaned with a sterilising solution; the participant then
sat or lay (dependent on comfort) on the couch. Muscle biopsies were obtained from
the approximated midpoint on the lateral aspect of the right vastus lateralis muscle. In
order to select the target biopsy site the participant was requested to contract the
selected quadriceps muscle group to define the vastus lateralis muscle, the selected
site was subsequently marked. A small amount of Betadine (Pardue Products, USA)
was poured on to sterile gauze and used to clean the biopsy site and surrounding area
(~15 x 15 cm2). Biopsy samples were obtained under local anaesthesia; 2 mL of 1 %
v/v without adrenaline Lidocaine Hydrochloride (Hameln Pharmaceuticals: cat. no
PL01502) was injected into the subcutaneous fat of the selected biopsy site. Once the
anaesthetic had taken effect (~5 minutes) a 14 gauge co-axial was inserted, at an ~30o
angle to the leg, through the skin and subcutaneous fat and ~2 cm into the muscle of
the biopsy site. The insertion needle of the co-axial was removed leaving the co-axial
in the leg. A disposable core biopsy instrument (TSK Stericut Biopsy Needle 14
Gauge, TSK Laboratories, Japan) was inserted through the co-axial and activated. A
single pass was used collecting approximately 10 – 20mg of muscle tissue. The core
biopsy instrument was immediately removed from the leg, and within ~10 seconds the
muscle tissue was removed from the biopsy instrument using a sterile scalpel
(disposable scalpel number 11, Swann-Morton, UK) and placed in liquid nitrogen to
be flash frozen. The muscle samples were stored in a -80 oC freezer under the HTA
license number 12202 until analysis. On subsequent visits, the repeat biopsies were
taken approximately 10 mm away laterally from the original biopsy site along the
vastus lateralis muscle (Figure 3.4.1).

Page 70 of 253
Figure 3.4.1. Example image of sites selected for the three biopsies.
The same site selection process was used for both Chapters involving the technique.
3.5 mRNA extraction and analysis
Quantitative Polymerase chain reaction (qPCR) was selected as the method for
quantification of mRNA expression instead of traditional PCR for a number of justified
reasons. Firstly qPCR measures the amplification as it occurs, whereas traditional
PCR only measures the accumulated PCR produce at the end of the PCR cycles. As
such, qPCR is quantitative because data is collected during the exponential growth
phase of PCR when the quantity of the PCR product is directly proportional to the
amount of template nucleic acid; traditional PCR provided semi quantification through
the intensity of the amplified band. Furthermore qPCR allows for quantification of gene
expression and is more sensitive than traditional PCR.
3.5.1 RNA Isolation
Human muscle biopsies were homogenised in 700 µL MagNA Pure LC RNA Isolation
Tissue Lysis buffer (Roche, Mannheim, Germany) in Roche MagNA Lyser Green bead
tubes at 6500 rpm for 30 seconds. After homogenisation, the tubes were centrifuged
for 10 minutes at 13,000 g before 350 µL of each homogenate was used for RNA
extraction. Total RNA was extracted using the MagNA Pure 96 Cellular RNA Large
Volume Kit on a MagNA Pure 96 (Roche, Mannheim, Germany), in an elution volume

Page 71 of 253
of 50 µL according to the manufacturer's protocol. RNA was stored at -80oC. RNA
concentrations were determined (A260) using a NanoQuant plate on a Tecan Infinite
200PRO. RNA quality (RNA integrity number equivalent, RINe) was assessed using
RNA ScreenTape on a 2200 TapeStation (Agilent, Santa Clara, USA).
3.5.2 Reverse Transcription
As a result of the large sample number and the automated process, RNA
concentration was not taken into account for each individual reaction. 14 µL of each
RNA sample was reverse transcribed in a total volume of 20 µL using the High capacity
cDNA reverse transcription kit (without RNase inhibitor, Applied Biosystems, Thermo
Fisher, Loughborough, UK). Reactions were performed in 96 well PCR plates on a
PTC-225 Peltier thermal cycler (MJ Research, Quebec, Canada) using the following
profile: 25°C for 10 minutes, 37°C for 60 minutes, 85°C for 5 minutes, 4°C hold. Minus
RT control reactions were set up for 14 samples, in which the RNA component was
replaced with nuclease free water (Ambion, Fisher Scientific, Loughborough, UK).
3.5.3 qPCR
For quantitative real-time PCR (qPCR), Human TaqMan® gene expression assays
were purchased as a 20X assay ready stock from Life Technologies (Carlsbad, USA)
(primers 18mM and probes mM) (Table 3.5.1). 1 µL cDNA was added to each qPCR
reaction mixture which also contained gene expression assay mix (primers 900 nM
final, probe 250 nM final), LightCycler 480 Probes Master and nuclease free water to
give a 5µL total reaction volume. Reactions were prepared in white multiwell 384
plates (Roche, Mannheim, German) using a Mosquito HV (TTP Labtech, Melbourn,
UK). The plates were sealed using optical seals (Roche, Mannheim, Germany) and
centrifuged at 290 g for two minutes before being run on a LightCycler® 480
instrument (Roche, Mannheim, Germany) with the following thermal cycling
parameters: initial de-naturation step 95°C for 10 minutes, followed by 45 cycles of
denaturation at 95°C for 10 seconds and primer annealing/extension at 60°C for 30
seconds. A cooling step at 40°C for 30 seconds was the final stage of the run.

Page 72 of 253
Table 3.5.1. qPCR gene code and catalogue number
Gene name Gene abbreviation
Code
Silent information regulator-T1 (SIRT1) SIRT1 Hs01009005_m1 Silent information regulator-T3 (SIRT3) SIRT3 Hs00953477_m1 AMP-activated protein kinase 1 (AMPK) PRKAA1 Hs01562315_m1 Peroxisome proliferator-activated receptor gamma coactivator 1-alpha (PGC-1α)
PPARGC1
Hs01016719_m1
Peroxisome proliferator-activated receptor delta (PPAR)
PPARD Hs00987011_m1
Glyceraldehyde 3-phosphate dehydrogenase (GAPDH)
GAPDH Hs99999905_m1
The crossing point (Cp) value for each sample was calculated using the second
derivative maximum method applied directly by the Roche software to the real-time
amplification curves. This value represents the cycle at which the increase of
fluorescence is highest and where the logarithmic phase of a PCR begins.
3.5.4 Amplification Efficiency of qPCR assays
The efficiency of each of the Taqman® assays on demand was confirmed by
performing standard curves in a 384 well qPCR assay on the LightCycler® 480 under
the same conditions as already described (Section 3.5.3). Six point standard curves
with 1 in 10 serial dilutions were prepared in nuclease free water for human plasmid
DNA for each of the genes being tested alongside Human genomic DNA with a top
concentration of 3e5 copies/µL and 1e5 copies/µL respectively. qPCR reactions were
performed in triplicate and the amplification efficiency calculated for each Taqman®
assay on the basis of the equation E = (10(–1/slope) – 1) × 100 with the logarithm of the
template concentration on the x axis and the average Cp plotted on the y axis.
3.6 Dual energy X-ray absorptiometry (DXA) scan.
The method: The DXA scan was used in experimental Chapters 6 and 7 to quantify
lean mass, fat free mass and body mass. It is described as a gold standard method of
body composition assessment (Fowke and Matthews, 2010).

Page 73 of 253
Quality assurance (QA) of the DXA scan (GE Lunar iDXA, GE Healthcare, UK) was
completed first thing in the morning every day throughout the data collection in
experimental Chapter 6 and 7 in accordance with the manufacture guidelines. QA
mode was selected on the enCORE software (version 14.10, GE Healthcare, Bucks,
UK). The calibration block was placed in position and lined up with the laser. The QA
was then started. The QA passed every time with a coefficient of variation (CV) for this
QA procedure of 0.07%.
Procedure: All metal and piercings were removed and fasted body mass was
measured using a digital column scale (Seca 704, Seca Ltd., Hamburg, Germany).
The participant was then positioned in the centre of the scanner table, using the
centreline on the table as a reference to align the patient. The participant’s hands were
turned on the side with thumbs pointing up and palms facing the body. Hands were
positioned as not to touch the legs and a small air gap (~1 cm) between the arms and
torso was ensured. The ankles were positioned ~20 cm apart, with a Velcro strap
placed around to support the legs and reduce movement. After verification that the
participant was positioned within the scan area the participant was requested to
remain still throughout the scan. For all participants the scan settings on the enCORE
software (version 14.10, GE Healthcare, Bucks, UK) was set to standard thickness
and a full body DXA scan (GE Lunar iDXA, GE Healthcare, UK) was performed. The
scan took approximately 7 minutes 16 seconds to complete. A fully trained operator
completed all scans.
Radiation is produced from the DXA scanner when electric voltage is supplied to, and
current flows through, the x-ray tube. During a measurement, the shutter opens to let
a beam of radiation pass through the scanner table and patient. Estimated skin
entrance dose from a single full body scan for under the standard thickness setting is
3 μGy (GE Lunar iDXA, GE Healthcare, UK), each participant received a maximum
radiation dosage of 9 μGy.
3.7 Assessment of expired air using an online gas analyser.

Page 74 of 253
The method: An online (i.e. continuously measured/real time) gas analyser (Metalyzer
3B, Cortex, Leipzig, Germany) was used in experimental Chapter 7 to measure
oxygen and carbon dioxide fractions, and volume of gas in inspired and expired air.
Reliability and calibration of the online gas analyser: The reliability data on the
Metalyzer was completed prior to the trial started; three participants completed the
same exercise protocol for three consecutive days at the same time of day. Using a
cycling protocol participant rode at 50, 100, 150, 200, 250 and 300 watts for 4 minutes.
The last 30 seconds of data collection for each stage was averaged and used to
calculate reliability.
Table 3.7.1. The coefficient of variation (CV) of the online gas analyser at different
power outputs and VO2.
Power (W) Absolute
VO2
(L•min-1)
Mean Coefficient of Variation (%)
HR VO2 VCO2 RER
50 1.16 6.02 5.49 8.13 3.17
100 1.66 3.11 2.22 4.33 2.70
150 2.13 2.98 2.41 2.17 1.36
200 2.71 1.20 2.54 2.25 1.02
250 3.26 0.98 3.20 3.37 1.34
300 3.91 1.05 1.63 1.96 1.05
Procedure: The analyser was warmed-up for a minimum of 45 minutes and calibrated
for oxygen (17 %) and carbon dioxide (5 %) fractions and gas volume (3 L syringe,
Hans Rudolph) as per manufacturer’s prescription. During the tests, the participant
breathed through a low dead space (70 mL) mouthpiece, low resistance turbine (<0.1
kPA•L-1•s-1 at 16 L•s-1), whilst inspired and expired gas was sampled continuously at
50 Hz. The analyser rise time and transit delay for O2 and CO2 were <100 ms and 800-
1200 ms respectively, using a dynamic calculation for each breath.

Page 75 of 253
3.8 Run testing using a treadmill.
The method: In Chapter 7 a protocol was designed using a treadmill to measure (i)
substrate utilisation during a sub maximal run and (ii) a maximal sustainable effort run.
As described in Chapter 7 the participant was directed to run on the treadmill at a set
speed. All experimental testing in experimental Chapter 7 was completed on the same
treadmill (Cosmed T170, Rome, Italy).
Reliability and calibration: Treadmill reliability and calibration were completed prior to
the study loaded and unloaded. The length of the treadmill belt was measured and a
mark was drawn on the belt and foot stand. The selected calibration speed was set on
the treadmill controller and once the belt was up to speed a stopwatch was started
and belt revolutions were counted every time the markers crossed each other using a
tally counter. Once 100 revolutions were completed the stopwatch was stopped and
time recorded. This was repeated twice (Table 3.8.1 and Figure 3.8.1 and Table 3.8.2
and Figure 3.8.2).
Table 3.8.1. Reliability and accuracy of the treadmill unloaded.
Time 100 belt revolutions (seconds)
Actual Speed
26/01/2016
No load
1 % gradient
4.155 m belt length
Speed (km•h-1)
Trial 1 Trial 2 Mean (m•s-1) (km•h-1)
5 296.6 297.36 296.98 1.40 5.04
10 147.79 147.78 147.79 2.81 10.12
15 99.42 98.14 98.78 4.21 15.14
20 74 74.12 74.06 5.61 20.19
25 59.97 58.97 59.47 6.98 25.15

Page 76 of 253
Figure 3.8.1. Correlation between the selected treadmill belt speed and unloaded
calculated actual speed.
Table 3.8.2. Reliability and accuracy of the treadmill loaded with participant running.
Time 100 belt revolutions (seconds)
Actual Speed
26/01/2016
91 kg load
1 % gradient
4.155 m belt length
Speed (km•h-1)
Trial 1 Trial 2 Mean (m•s-1) (km•h-1)
5 296.78 296.74 296.76 1.40 5.04
10 148.49 148.48 148.49 2.80 10.07
15 98.52 98.60 98.56 4.22 15.18
20 74.03 73.81 73.92 5.62 20.24
y = 1.0082xR² = 1
0
5
10
15
20
25
30
0 5 10 15 20 25 30
Sele
cte
d t
read
mill
sp
eed
(km
•h-1
)
Actual treadmill speed (km•h-1)

Page 77 of 253
Figure 3.8.2. Correlation between the selected treadmill belt speed and loaded
calculated actual speed.
3.9 Measuring blood glucose and blood lactate
The method: The EKF Biosen C_line (EFK Diagnostics, Barleben, Germany) was used
to measure blood glucose and lactate in Chapter 7.
Calibration and Reliability: Monthly reliability checks were carried out on the EKF
Biosen using glucose/lactate linearity check solution (02090102391A, EKF Biosen,
Barleben, Germany) with three concentrations 2, 7 and 12 mmol•L-1. Two separate
vials of each concentration were fun five times for reliability (Table 3.9.1).
y = 1.0111xR² = 1
0
5
10
15
20
25
30
0 5 10 15 20 25 30Sele
cte
d t
read
mill
sp
eed
(km
•h-1
)
Actual treadmill speed (km•h-1)

Page 78 of 253
Table 3.9.1. Mean, standard deviation (SD) and coefficient of variation (CV) of the EKF
Biosen throughout the data collection phase of experimental Chapter 7.
Date Concentration (mmol•L-1)
Reliability
Mean SD CV (%)
# 1 # 2 # 1 # 2 # 1 # 2
01/02/2016
2 1.97 1.93 0.01 0.02 0.45 0.87
7 6.94 7.03 0.01 0.02 0.10 0.30
18 17.62 18.25 0.02 0.05 0.11 0.26
22/03/2016
2 1.95 1.94 0.01 0.00 0.43 0.23
7 6.95 7.04 0.01 0.01 0.08 0.10
18 17.82 18.27 0.01 0.01 0.06 0.03
05/04/2016
2 1.97 1.96 0.02 0.01 0.83 0.56
7 7.15 7.11 0.01 0.02 0.17 0.21
18 18.33 18.50 0.02 0.03 0.10 0.15
The protocol: The selected finger was cleaned with an alcohol wipe and left to air dry.
The finger was then punctured with a capillary lancet, the first drop of blood was wiped
away and a sample of whole capillary blood was collected using a 20 µL capillary tube.
The capillary tube was checked to ensure no air bubbles were present. The capillary
tube was placed in a plastic vial containing 1 mL of haemolysing solution (Gluc/Lact
Haem Solution, EKF Diagnostics, Barleben, Germany) and shaken ten times to ensure
all the blood had exited the capillary tube and mixed evenly with the haemolysing
solution. The vial was then placed into the EKF Biosen and analysed for glucose and
lactate concentrations.
Analysis: The EKF Biosen uses an electrochemical dual-channel chip sensor to
analyse blood glucose and lactate concentrations. Blood lactate and glucose are
converted enzymatically with glucose oxidase and lactate oxidase producing H2O2
which is detected at the electrode and the current is proportional to the analyte
concentration.
3.10 Indirect calorimetry using the GEM Nutrition open circuit indirect
calorimeter.

Page 79 of 253
The Method: The GEM is an open circuit indirect calorimeter designed to measure
energy balance and substrate turnover.
Calibration: The GEM was turned on and warmed up for a minimum of 30 minutes
prior to calibration. The air flow through the hood was set to 50 litres•min-1 Using a
span gas of 1% CO2 and 21% O2 along with a zero gas of 99.998% N2 the GEM was
calibration according to manufactures guidelines. The GEM was calibrated prior to
every test.

Page 80 of 253
4 DEVELOPMENT OF A VALID AND
RELIABLE NUTRITION KNOWLEDGE
QUESTIONNAIRE FOR ATHLETES.

Page 81 of 253
Abstract
Background: Establishing an understanding of an athlete’s nutrition knowledge can
inform the coach/practitioner and support the development of the athlete. Thus the
purpose of the study was to develop a psychometrically valid and reliable tool to
assess general and sport nutrition knowledge. Methods: An 85 question questionnaire
was developed in consultation with a panel of experts. Ninety-eight participants from
the UK completed the questionnaire, and again three weeks later. The participants
were classified into two groups: those with nutrition (NUT, n = 53) training (sport
nutritionists and dietitians who were either practicing or undertaking a postgraduate
qualification in the field), and those without (NONUT, n = 48) training (professionals
and postgraduate students with no exposure to any form of nutrition training). Results:
Psychometric statistical analysis of the results was completed, resulting in the removal
of 23 questions for a total of 62 questions in the final questionnaire. The validated
questionnaire was then administered to 58 track and field athletes. Internal
consistency was assessed using Chronbach’s alpha (α > 0.7), Pearson’s correlation
(p < 0.05) was used to assess reliability. Construct validity was evaluated using a t-
test (p < 0.05). A total test retest correlation of 0.95 was achieved (sub-section range:
0.87–0.97). Internal consistency was accepted in each sub-section (α = 0.78–0.92)
and the nutrition-trained group scored significantly higher on the overall questionnaire
(80.4% vs 49.6%). Conclusion: The questionnaire satisfied all psychometric
measures and provides a new valid and reliable tool to assess general and sport
nutrition knowledge.

Page 82 of 253
4.1 INTRODUCTION
Nutrition plays an important role in human health, it is postulated that nutrition is the
most controllable risk factor impacting long-term health and chronic disease (World-
Health-Organization, 2003) and can be easily manipulated to improve exercise
performance (Burke and Deakin, 2010). Consequently, optimal health and sport
nutrition strategies have been subject to comprehensive research (Magkos and
Yannakoulia, 2003). However recommendations may be controversial and can be
misinterpreted, as such the sport and fitness industries are saturated with varying
opinion, articles and internet material which can provide unsubstantiated claims
(Smith-Rockwell et al., 2001). Furthermore athletes’ diets are commonly reported as
being nutritionally inadequate (Heaney et al., 2011). As described in Chapter 2.1.6 the
underlying reasons for this are unclear. Developing a valid and reliable tool to assess
knowledge with the potential of ruling out a knowledge issue, or having grounds for an
intervention to address inadequate knowledge, would prove valuable.
To develop a valid and reliable instrument to measure psychological attributes a
defined set of criteria needs to be met (Kline, 2007b),a predefined structure should be
followed and a series of measures must be performed (Kline, 2007b) (Refer to Table
2.2.1 in Chapter 2.2.1). A number of nutrition knowledge questionnaires have
previously been developed using a range validation methods, targeting specific
populations; New Zealand rugby coaches (Zinn et al., 2005), South African
adolescents (Whati et al., 2005), elderly (Thomas et al., 1990) and inpatients
(Anderson et al., 2002), however the validity of the instrument is reduced if used in
different populations.
Designing a valid and reliable tool to assess general and sport nutrition knowledge in
an athletic population may provide the accurate information needed to advise better
dietary choices and improve dietary intake (Spendlove et al., 2012). Currently, to the
authors’ knowledge, only two validated and reliable questionnaires exist which assess
sport nutrition knowledge. Rosenbloom et al. (2002) developed an 11-question tool for
the assessment of nutrition knowledge in division 1 collegiate athletes, however all
questions were performance nutrition related. Zinn et al. (2005) developed a
psychometrically valid and reliable sports nutrition knowledge questionnaire designed

Page 83 of 253
for the application on New Zealand rugby union coaches, which lacked a
comprehensive general nutrition knowledge section. There is a clear need for a
psychometrically validated nutrition knowledge measure that can investigate both
general and sport nutrition knowledge; the aims of this research were to develop a
valid and reliable general and sport nutrition knowledge questionnaire.
4.1.1 Experimental hypotheses
i) (H1) The steps taken to develop the questionnaire will result in a valid and
reliable questionnaire.
ii) (H0) The steps taken to develop the questionnaire will not result in a valid
and reliable questionnaire.
4.2 METHODS
4.2.1 Study Design
The project was approved by the University of Hertfordshire Life and Medical Sciences
ethics committee (protocol number LS/4/5/11P) and was designed to develop a new
tool for measuring nutrition knowledge in athletes. Eight separate processes were
used to generate the final version of the Nutrition Knowledge Questionnaire for
Athletes (NKQA), detailed in Figure 4.2.1. Following a comprehensive literature search
the topics and subsections of the questionnaire were developed. Each question was
discussed in an expert review meeting and critiqued for comprehension, detail and
relevance and was either ‘removed’, ‘changed’, or ‘left in’. The questionnaire was
uploaded online and administered to the participants twice in a test retest manner,
separated by a three-week period. This period was considered long enough for the
answers to be forgotten, but short enough to minimise any real change in nutrition
knowledge (Kline, 2007b). Participants were asked to record and note the time it took
to complete.

Page 84 of 253
Figure 4.2.1. Schematic of processes completed to develop the NKQA.

Page 85 of 253
At the time of the initial administration the participants were not made aware of the
second administration. The results from the first collection were used to assess
internal consistency and construct validity; the data from both collection phases was
used to assess reliability over time.
4.2.2 Participants
Two population groups with differing exposure to nutritional training were selected to
receive the questionnaire. The two groups were matched in education level, but with
different professional expertise. The nutrition group (NUT) (n = 53) consisted of sport
nutritionists and dietitians who were either practicing or undertaking a postgraduate
qualification in the field. The non-nutrition group (NONUT) (n = 48) consisted of a
range of professionals and postgraduate students with no exposure to any form of
nutrition training (Table 4.2.1). Participants were recruited via the use of an email flyer
and voluntarily contacted the research team to partake in the study.
Table 4.2.1. Participant characteristics.
Characteristics (sex)
1st collection (N = 101) 2nd collection (N = 98) NUT NONUT NUT NONUT
n % n % n % n %
Male 31 64 26 54 30 59 26 55 Female 22 36 22 46 21 41 21 46
NUT = nutrition trained group, NONUT = no nutrition training group.
4.2.3 Assessment of validity, reliability and statistical analysis.
4.2.3.1 Content validity of the NKQA:
The American College of Sports Medicine (American Dietetic et al., 2009) position
stand is an academic peer review synopsis on current literature and recommendations
in the field of sport nutrition and good nutrition practices for athletes, thus it was
adopted as the reference to develop the answer structure. The questionnaire was
developed from a pool of 210 questions. The questions were either adapted from
previous questionnaires (Zinn et al., 2005, Parmenter and Wardle, 1999) or contrived
from the use of literature searches and expert opinion. It was decided to have six

Page 86 of 253
definitive subsections within the questionnaire; carbohydrate, protein, fat, general
nutrition, fluid and sports nutrition. These six areas were deemed important to assess
as each impact either health, sporting performance or both. A meeting was held with
5 experts in the field (2 x graduate nutritionists – both with > 3 years experience
working in elite sport, 2 x nutritionists – both Senior Lecturers, 1 x physiologist –
Principal Lecturer) to discuss the merits of the questionnaire. Each question was
rigorously critiqued for its comprehension, relevance, accuracy and scientific support
and was either ‘removed’, ‘changed’, or ‘left in’. Consequentially 128 questions were
removed, 17 had wording changes, 3 were added and 65 remained un-changed,
resulting in an 85-question questionnaire. A number of questions included multiple
parts, for example: Are the following foods high or low in carbohydrate: Beef, Lentils
or Jelly babies? In total the 85 questions contained 145 parts, taking approximately
15-20 minutes to complete.
4.2.3.2 Construct validity of the NKQA:
To demonstrate that the questionnaire differentiated nutrition knowledge the construct
validity of the questionnaire was assessed. An independent sample t-test was
performed comparing the mean subsection and total scores achieved on the
questionnaire from both the NUT and NONUT groups. A significance of p ≤ 0.05 was
used.
4.2.3.3 Test re-test of the NKQA:
A test-retest measurement was used to assess reliability over time. A Pearson’s
Correlation was used to assess the correlation between the results from 98
participants who took the questionnaire at the two separate time points; a significance
of p ≤ 0.05 was selected.
4.2.3.4 Internal consistency of the NKQA:
Each of the six subsections were assessed separately for internal consistency as each
subsection addressed a different area of knowledge. A Chronbach’s Alpha, with a
minimum requirement of α > 0.7 was accepted to demonstrate sound internal
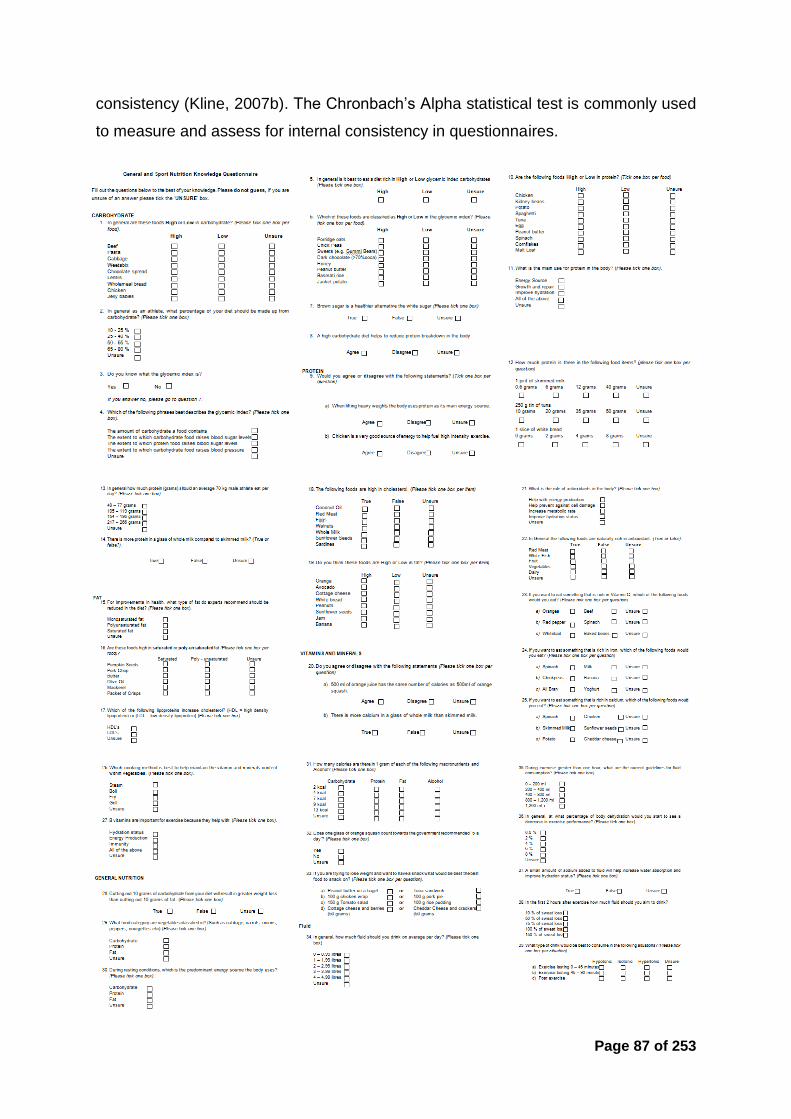
Page 87 of 253
consistency (Kline, 2007b). The Chronbach’s Alpha statistical test is commonly used
to measure and assess for internal consistency in questionnaires.

Page 88 of 253
Figure 4.2.2. Items selected and concluded as valid and reliable which comprise the final NKQA developed. The full questionnaire can be found in Appendix Three.

Page 89 of 253
4.3 RESULTS
The reliability and validity statistics for the final set of questions are displayed in Table
4.3.1 and Table 4.3.2. Response for the retest phase of the study was high with 51 of
the original 53 (96%) participants from the NUT group, and 47 of the original 48 (98%)
NONUT group completing the questionnaire for both test and retest phase. Three
participants did not respond to the invitation to complete the questionnaire for a second
time.
The NUT group achieved a significantly (p < 0.0001) higher score than the NONUT
group in each of the subsections. In both groups the fat subsection was the highest
scoring (84.9% and 58.2%, in NUT and NONUT, respectively t = 11.728, p < 0.0001),
whilst the lowest mean scores were observed in the fluid subsection (72.8% and
40.0% in NUT and NONUT, respectively, t = 9.723, p < 0.0001). Overall the NUT group
provided a correct answer for 80.4% of the questions, whereas the NONUT group
answered less than half (49.6%) the questions correctly (t = 20.90, p < 0.0001).
Table 4.3.1. Nutrition knowledge sub-section and total score.
Sub-section and total score achieved (mean, SD and percentage (%)) on the nutrition knowledge questionnaire for athletes by the NUT and NONUT groups.
Nutrition knowledge sub-section (n)
NUT
NONUT
Mean SD Percentage
(%) Mean SD
Percentage (%)
Carbohydrate (23) 19.1* 1.54 82.9 12.6 4.34 54.6 Protein (18) 13.9* 1.90 77.5 8.7 3.04 48.5 Fat (23) 19.5* 2.12 84.9 13.4 3.11 58.2 General NUT (31) 25.7* 3.60 82.9 16.3 3.53 52.6 Fluid (15) 10.9* 2.28 72.8 6.0 2.81 40.0 Sports nutrition (35) 27.9* 5.67 78.5 14.9 4.46 42.2 Total (145) 116.7* 10.8 80.4 71.9 10.63 49.6
* Scored significantly higher within category than the NONUT (p < 0.001). NUT = nutrition trained group, NONUT = no nutrition training group

Page 90 of 253
Table 4.3.2. Internal reliability of the NKQA.
Internal reliability of the NKQA for the first data collection, also test retest reliability and identical response rate over two data collection periods separated by three weeks.
NUT = nutrition trained group, NONUT = no nutrition training group. † = Chronbach’s alpha, * = Pearson’s correlation significant at p < 0.05
Strong test retest reliability (Table 4.3.2) was observed; the correlation for the total
questionnaire was 0.98 (p < 0.05), all of the subsections produced a correlation ≥ 0.87
(p < 0.05). The internal reliability (Table 4.3.2) for each of the subsections achieved
the psychometric requirements to determine reliability (Chronbach’s α > 0.7). The fat
subsection produced the lowest alpha level at 0.78; the sport nutrition subsection
produced the highest alpha level at 0.92.
The test retest results for all participants produced an identical response to the same
question 88.0% of the time, with the nutrition group exhibiting an identical response of
89.8% of the time and the NONUT group 86.1% of the time. The carbohydrate
subsection produced the highest number of identical responses in the nutrition group
with 94.5%, whereas the fat subsection produced the highest number of identical
responses with 93.7% for the non-nutrition group. The sports nutrition subsection
produced the lowest number of identical responses, with 84.5% and 82.4% for the
nutrition and non-nutrition groups respectively.
Nutrition knowledge sub-
section (n)
Internal reliability
†
Test – retest
correlation *
Identical responses from both tests (all)
(%)
Identical responses from both
tests (NUT) (%)
Identical responses from both
tests NONUT)
(%)
Carbohydrate (23) .84 .95 91.0 94.5 87.5 Protein (18) .81 .94 89.9 92.5 87.4 Fat (23) .78 .97 93.5 93.4 93.6 General NUT (31) .86 .92 87.7 90.8 84.5 Fluid (15) .82 .91 84.0 84.6 83.3 Sport nutrition (35) .92 .87 83.4 84.5 82.4 Total (145) N/A .98 88.0 89.8 86.1
Page 91 of 253
4.4 DISCUSSION
The aim of the present study was to develop a valid and reliable general and sport
nutrition knowledge questionnaire that can be used as a practical tool to assess
nutrition knowledge in track and field athletes.
The comprehensive and structured psychometric evaluation of the current
questionnaire demonstrated strong reliability and validity. The NUT group (who had
considerable training in the field of nutrition) produced > 30% (p < 0.05) more correct
responses than the NONUT group (who had no prior exposure to nutrition training)
throughout the questionnaire, such significant differences in the scores of the two
groups is sufficient to assume construct validity (Cronbach, 1951). Equally, the test
retest correlation (0.98, p < 0.05) demonstrated satisfactory internal reliability (Kline,
2007a) and internal consistency can also be assumed as each subsection produced
a Chronbach’s alpha value > 0.7 (Kline, 2007a). Therefore the H0 was rejected; a new
tool for the assessment of general and sport nutrition knowledge in track and field
athletes was established.
The length of the questionnaire was adequate to attain the relevant information
needed to draw conclusions about the responders’ nutrition knowledge, but not too
long to reduce compliance. It has been suggested that questionnaire length may
impact participant response, with longer questionnaires reducing compliance (Galesic
and Bosnjak, 2009), however in a recent meta-analysis (Rolstad et al., 2011) only
three of twenty-five studies investigating questionnaire length demonstrated a weak
correlation between questionnaire length and participant response. With 14 pages of
questions and an average completion time of 15 minutes 20 seconds the questionnaire
is of a moderate duration, the test re-test completion rate of the questionnaire was
high, with 98 of the original 101 participants completing the questionnaire on both
occasions. Thus, despite the questionnaire being longer than other nutrition
knowledge questionnaires it is reasonable to suggest that the length will not impact
completion and accuracy.
The test – retest correlation was high and consistent across all subsections (r = 0.93
± 0.04, range 0.87 – 0.97), and the total test – retest correlation for all 145 questions

Page 92 of 253
was 0.98. With such a strong test – retest reliability the questionnaire provides a tool,
which if administered over time (> 3 weeks between administrations) could be used to
assess the effectiveness of an intervention or nutrition education programme.
An inability to answer questions correctly can increase respondent bias (Meisenberg
and Williams, 2008), reducing the accuracy of a questionnaire. To control for this the
questionnaire included a briefing paragraph detailing the importance of not guessing,
also the presence of an ‘unsure’ answer choice provided the responder with an
answerable option. The results from both groups within this study produced a higher
number of identical responses across the test – retest period (89.8% vs. 86.1%; NUT
vs. NONUT), thus it is fair to assume that the respondent bias of the questionnaire
was low, indicative of a low percentage of questions with a guessed answer. A slightly
lower test re-test identical question response was observed in the NONUT group
relative to the NUT group, which could be attributed to lesser knowledge, confidence
and more indecisiveness in the answers chosen (Meisenberg and Williams, 2008).
However the NONUT group still produced a very high identical response rate of 86%,
as such this is of little concern to the validity and reliability of the questionnaire.
Previously, the most comprehensive psychometrically validated sport nutrition
knowledge questionnaire developed (Zinn et al., 2005) lacked a broad general nutrition
subsection, raising concerns over conclusions drawn about the participants’ general
nutrition knowledge. The current questionnaire includes 32 questions (95 parts)
addressing macronutrients and general nutrition, as such the range and quantity of
these questions are similar to that of a previously validated general nutrition
knowledge questionnaire for adults (Parmenter and Wardle, 1999), additionally a
further 33 questions (50 parts) address hydration and sport specific nutrition, thus
providing sufficient information for conclusions to be drawn about the specific areas of
the individuals general and or sport nutrition knowledge. The range of subsections
represents a greater depth of assessment than any current available tools.
A systematic review from Heaney et al. (2011) found a weak positive association (r <
0.44) between nutrition knowledge and improved dietary intake in athletic populations,
and the evidence supporting was inconclusive, as such the relationship between
enhanced nutrition knowledge and improved dietary choices is unclear. Furthermore,

Page 93 of 253
the validity of the sport specific nutrition knowledge assessment was inconsistent
within these studies. The questionnaire should be used as a tool to investigate the
knowledge of the athlete, not as a complete solution to comprehend nutrition
knowledge and dietary intake of the responder.
To date, this questionnaire is the most robust measure of nutrition knowledge in track
and field athletes; however it is important to note that this questionnaire was developed
to assess the knowledge of UK Track and Field athletes. If used for a different athletic
population the questionnaire is reduced in validity, as such if this NQKA is selected to
be used in a different athletic population it would be recommended to make subtle,
relevant changes to the questions and test the validity prior to use.
4.5 CONCLUSION
The NKQA provides a psychometrically validated and reliable tool for the assessment
of general and sport nutrition knowledge in UK track and field athletes. The included
questions cover a broad range of general and sport nutrition topics consequently the
differentiation in nutrition knowledge subsections are distinguishable from the results.
The questionnaire developed in this Chapter will be used to assess nutrition
knowledge in subsequent studies contributing towards this thesis.

Page 94 of 253
5 NUTRITION KNOWLEDGE, DIETARY
INTAKE AND METABOLIC TYPE OF UK
TRACK ATHLETES.

Page 95 of 253
Abstract
Background: Optomising nutritional intake can enhance health and sporting
performance, a number of factors influence dietary intake, nutrition knowledge being
one of these. Furthermore, personalised nutrition strategies are being implemented to
provide bespoke nutrition solutions for the individual, one such commonly used
programme, the Metabolic Typing Questionnaire is yet to be explored in a research
setting. Thus the aims of the chapter were to examine the current dietary habits and
assess the nutrition knowledge of UK track and field and also investigate the Metabolic
Typing Questionnaire as a tool to prescribe bespoke nutritional strategies. Method:
Eighty-eight participants were recruited and classified as either endurance athletes
(END, n = 29), power athletes (POW, n = 30) or control (CON, n = 29) and the
participants completed a metabolic typing questionnaire, food diary and NKQA at two
distinct time-points (October/November, and March/April). Results: The main findings
from this Chapter demonstrate that 94.3% of the participants were highlighted as
metabolic type B, athletes have greater nutrition knowledge than non-athletes (67.1 ±
3.2 vs. 65.0 ± 2.3 vs. 45.4 ± 1.8 %, END, POW, CON. p < 0.001). No difference in
dietary macronutrient ration is apparent between END and POW athletes
(carbohydrate = 413.4 ± 98.4 vs. 399.2 ± 113.7 g, protein = 111.8 ± 26.4 vs. 110.8 ±
37.5, fat = 75.0 ± 15.2 vs. 78.4 ± 30.7 g). No relationship exists between nutrition
knowledge and dietary intake in UK track and field athletes (r2 = 0.003, p = 0.63).
Conclusion: The results of a 65-questions metabolic typing questionnaire is not
sensitive enough to prescribe individualised diets for healthy or an athletic population.
UK track and field athletes possess greater nutrition knowledge than a matched control
group, however no difference exists between nutrition knowledge and the quality of
dietary intake.

Page 96 of 253
5.1 Introduction
As described in Chapter 2.1 it is well established that optimising nutritional strategies
can help improve health and sporting performance (Burke and Deakin, 2010), whilst
inadequate intake can be detrimental (Gleeson and Bishop, 2000). Consequently an
abundance of nutritional research exists. In an to attempt to formulise a set of nutrition
guidelines for athletes the ACSM publish regular position statements (Thomas et al.,
2016). However in general, nutritional recommendations are event specific; for
example speed and power athletes should consume a high protein diet and endurance
athletes a higher carbohydrate diet (Tipton et al., 2007). More recent advances in
science have opened up the possibility for nutrition to be personalised to an
individual’s characteristics; not just the disease state, goal or athletic event (Joost et
al., 2007). Once such tool for individual dietary prescription is the metabolic typing
questionnaire. The method utilises a 65-item self-assessment questionnaire to
prescribe a suitable diet to match metabolic type, designed to restore metabolic
homeostatic balance and optimise health (as previously described in 2.1.3). To date,
no research exists investigating the efficacy of the questionnaire. Power and
endurance athletes are an ideal population to investigate the sensitivity of the
questionnaire due to the phenotypic difference and physiological characteristic of the
athletes, it is hypothesised that difference in phenotype may be associated to
metabolic type.
In order to make healthy food choices it is important to have an internalised and
comprehensive structure of nutritional knowledge (Rasanen et al., 2003). A person
may master some aspects of nutrition, e.g. from the point of view of basic nutritional
sciences or nutrition-related diseases, however if understanding the connections
between different nutritional facts is incomplete the translation of this knowledge into
correct food decisions may not be established (Cotugna et al., 1992). Despite
significant research into optimal dietary intake, athletes’ diets are commonly reported
as being nutritionally inadequate (Heaney et al., 2011), the underlying reasons for this
are unclear.
Nutrition knowledge refers to knowledge of concepts and processes related to nutrition
and health; this may be extended to knowledge about specific nutrition topic which

Page 97 of 253
impacts an identifiable outcome such as sport nutrition for athletic performance (Miller
and Cassady, 2015). In order to make healthy food choices it has been stated that an
understanding of nutrition knowledge must be internalised (Rasanen et al., 2003).
Numerous nutrition knowledge questionnaires exist and selecting the correct tool is
essential for reliable assessment (Refer to Chapter 4 for a detailed description of the
processes and the steps taken to create a valid and reliable questionnaire for this
experimental Chapter). However, as described in detail in Chapter 4, the relationship
between nutrition knowledge and nutrition intake is not robust in athletes, with Heaney
et al. (2011) stating a weak positive correlation (r = 0.44). This relationship is yet to be
explored in UK track and field athletes.
5.1.1 Aims and Objectives
There are two primary aims of this piece or research, the first to investigate the
effectiveness of the MT questionnaire as a tool for dietary prescription, the second to
investigate the relationship between nutritional intake and nutrition knowledge within
UK track athletes.
5.1.2 Experimental hypotheses.
i) (H1) A commercially available metabolic typing questionnaire will accurately
differentiate metabolic type between power and endurance athletes.
(H0) A commercially available metabolic typing questionnaire will not be able to
differentiate metabolic type in power and endurance athaltes.
ii) (H2) Athletes will have greater nutrition knowledge than the non-athletic
population.
(H0) No difference in nutrition knowledge will be observed between athlete and
non-athlete populations.
iii) (H3) A positive relationship exists between dietary intake and nutrition
knowledge.
(H0) No relationship exists between dietary intake and nutrition knowledge.
iv) (H4) A distinct difference in dietary carbohydrate and protein macronutrient
intake will be observed between endurance and power athletes.
(H0) No difference in dietary carbohydrate or protein macronutrient intake will
be observed between endurance and power athletes.

Page 98 of 253
5.2 Methods
5.2.1 Participants
Ninety-two (42 female, 50 male) participants volunteered for this study. Sixty-one UK
track athletes were recruited at athletic events and via magazine advert (Appendix
Five), 29 students (undergraduate and postgraduate) with no athletic background or
nutrition training were recruited through university adverts acted as the control (CON)
group. The inclusion criteria for the athletic population included being ranked within
the top 150 senior athletes in the UK for their event and currently undertaking ≥ 4 event
specific training sessions per week. The average UK national ranking of the
participants at the end of the 2012 season was 40.3 ± 29.6 (mean ± SD, range 2nd –
133rd). Each athlete provided personal bests for self selected best two events, which
were verified, along with national ranking on the www.thepowerof10.info website, and
used for grouping allocation (Table 5.2.1).
Table 5.2.1. Athlete grouping criteria.
Group Primary event Second event
Power (POW) ≤ 800 m ≤ 400m Endurance (END) ≥ 800m ≥ 1,500m
Ninety-two participants completed the first phase of data collection (END n = 31, POW
n = 32, CON n = 29), with 88 (48 male, 40 female) completing both phases of data
collection (END n = 29, POW n = 30, CON n = 29, Table 5.2.2). All four participants
who dropped out were due to non-response from second questionnaire and were
removed from all data analysis. Informed consent was attained prior to the completion
of the first questionnaire. The study was approved by the University of Hertfordshire
Life and Medical Sciences ethics committee, protocol approval number: LS/4/5/11P.

Page 99 of 253
Table 5.2.2. Self-reported participant characteristics.
Age
(years)
Weight
(kg)
Height
(cm)
BMI
END (n = 29) 24.5 ± 4.8 62.6 ± 9.3 173 ± 1.1 20.9 ± 2.9
POW (n = 30) 25.4 ± 5.1 69.2 ± 10.4 174 ± 0.8 22.9 ± 2.4
CON (n = 29) 24.8 ± 4.4 72.5 ± 13.9 169 ± 1.3 25.2 ± 3.6
5.2.2 Study Protocol
Two questionnaires, a nutrition knowledge questionnaire for athletes (NKQA) (As
described in Chapter 4) and a metabolic typing questionnaire (MTQ) (Walcott and
Fahey, 2000), along with a 3-day food diary were distributed to the participants at two
time points throughout the athletic season: early season (October and November
2011) and the start of the competitive season (March and April 2012). Participants
completed both questionnaires either online, or by hand and returned to the lead
researcher. The food diaries were either emailed or downloaded by participants and
returned via email or post.
5.2.3 Experimental protocol.
The two questionnaires (NKQA and MTQ) were uploaded onto a secure clinical
research online survey platform (Bristol Online Surveys, University of Bristol). The link
to the questionnaires and instructions for completion were emailed to each participant.
The link directed the participant to the NKQA. Once completed, the questionnaire had
to be completed in one sitting, the participant was provided with an opportunity to either
pause or complete the MTQ immediately. If the participants had not completed the
MTQ within 48 hours of the NKQA a reminder email was sent. Upon completion of the
MTQ a link to download the food diary was provided. The participants were required
to complete a 3-day food diary using household measures on two consecutive
weekdays and one weekend day. The participants were contacted ~ 5 months later
via email and requested to complete the process again.

Page 100 of 253
5.2.4 Nutrition Knowledge Questionnaire
Preceding the nutrition knowledge questionnaire were three belief questions referring
to perceived habitual dietary intake. The nutrition knowledge questionnaire used in this
experimental Chapter was the NKQA developed in Chapter 4 of this thesis. The NKQ
was scored according the number of correct answers. If the participant answered
correctly the question was scored as 1, if the participant answered incorrectly, ticked
unsure or did not answer the question, the question was scored as 0.
5.2.5 Metabolic Typing Questionnaire.
Metabolic type was assessed using a commercially available 65-question metabolic
typing questionnaire (Walcott and Fahey, 2000) which was adapted for a UK
population (Appendix One). The adaptations were made to replace common American
foods with similar, more familiar, British food items for a UK population.
The metabolic typing questionnaire results were calculated according to the method
described by Walcott and Fahey (2000). Each answer choice was classified as either
and A, B or C. The subtotal of each answer category is then calculated and metabolic
type concluded:
If the number of A answers was 5 or more higher than both B and C, then the
participant was classified as a ‘Carbohydrate Type’ (Type A).
If the number of C answers was 5 or more higher than both A and B, then the
participant was classified as a ‘Protein Type’ (Type C).
If the number of B answers was 5 or more higher than both A and C, then the
participant was classified as a ‘Mixed Type’ (Type B).
If neither A, B or C were 5 or more higher than both of the other two then the
participant was classified as a ‘Mixed Type’ (Type B).
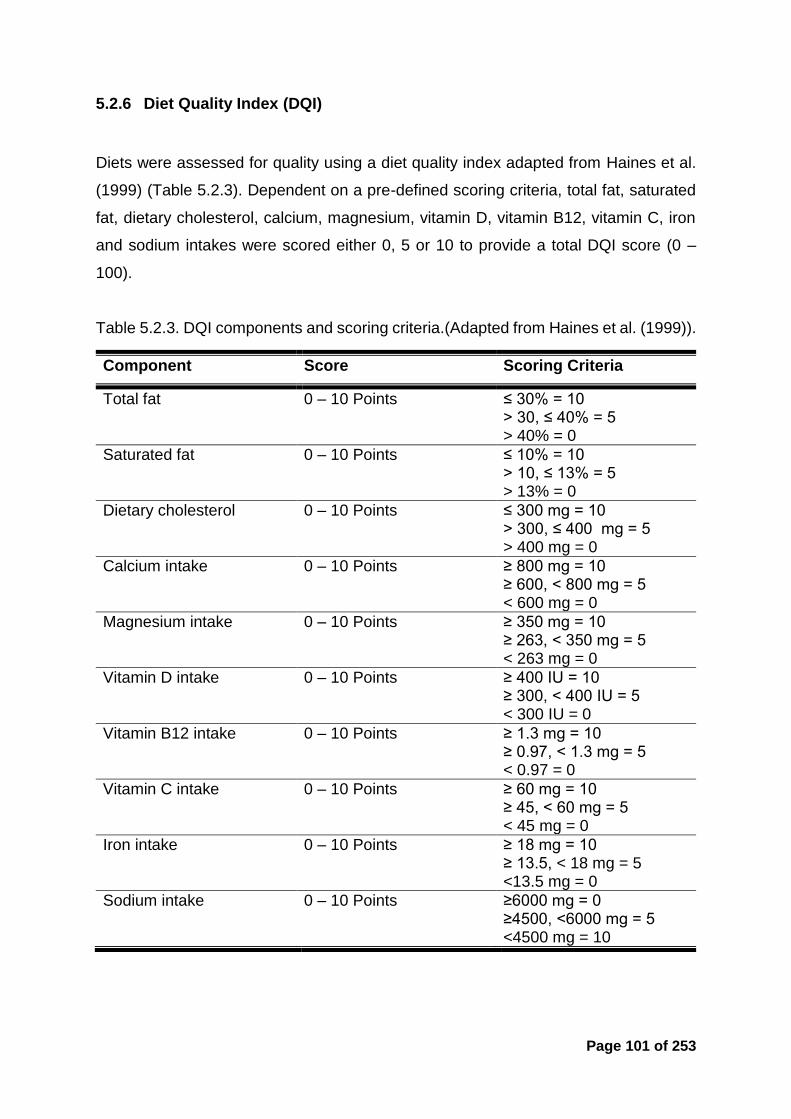
Page 101 of 253
5.2.6 Diet Quality Index (DQI)
Diets were assessed for quality using a diet quality index adapted from Haines et al.
(1999) (Table 5.2.3). Dependent on a pre-defined scoring criteria, total fat, saturated
fat, dietary cholesterol, calcium, magnesium, vitamin D, vitamin B12, vitamin C, iron
and sodium intakes were scored either 0, 5 or 10 to provide a total DQI score (0 –
100).
Table 5.2.3. DQI components and scoring criteria.(Adapted from Haines et al. (1999)).
Component Score Scoring Criteria
Total fat 0 – 10 Points ≤ 30% = 10 > 30, ≤ 40% = 5 > 40% = 0
Saturated fat 0 – 10 Points ≤ 10% = 10 > 10, ≤ 13% = 5 > 13% = 0
Dietary cholesterol 0 – 10 Points ≤ 300 mg = 10 > 300, ≤ 400 mg = 5 > 400 mg = 0
Calcium intake 0 – 10 Points ≥ 800 mg = 10 ≥ 600, < 800 mg = 5 < 600 mg = 0
Magnesium intake 0 – 10 Points ≥ 350 mg = 10 ≥ 263, < 350 mg = 5 < 263 mg = 0
Vitamin D intake 0 – 10 Points ≥ 400 IU = 10 ≥ 300, < 400 IU = 5 < 300 IU = 0
Vitamin B12 intake 0 – 10 Points ≥ 1.3 mg = 10 ≥ 0.97, < 1.3 mg = 5 < 0.97 = 0
Vitamin C intake 0 – 10 Points ≥ 60 mg = 10 ≥ 45, < 60 mg = 5 < 45 mg = 0
Iron intake 0 – 10 Points ≥ 18 mg = 10 ≥ 13.5, < 18 mg = 5 <13.5 mg = 0
Sodium intake 0 – 10 Points ≥6000 mg = 0 ≥4500, <6000 mg = 5 <4500 mg = 10

Page 102 of 253
5.2.7 Dietary Intake
Dietary intake was recorded and analysed as previously described in Chapter 3.1. The
following outputs were exported for analysis: daily calorie intake (kcal), water (ml),
carbohydrate (g), protein (g), fat (g), alcohol (g), saturated fat (g), cholesterol (mg),
calcium (mg), magnesium (mg), iron (mg), sodium (mg), vitamin D (IU), vitamin B12
(mg) and vitamin C (mg).
5.2.8 Statistics
Data were analysed using SPSS version 20.0.0 for Macintosh (IBM, Armonk, NY).
Kolmogorov-Smirnov tests of normality to assess the null hypothesis that data for
within-subjects analysis was normally distributed. However it should be noted that the
ANOVA procedure is robust to slight violations of normality within a dataset (Field,
2013). Mauchly’s sphericity test was used to assess the assumption of sphericity
within repeated-measures effects. Unless stated otherwise Mauchly’s test was
insignificant (p > 0.05), therefore the assumption of sphericity was accepted
A Pearson’s correlation was used to assess for a time-point correlation in both the
MTQ and NKQ, and assess the relationship between NKQA score and DQI. A one-
way analysis of variance (ANOVA) was used to assess between group differences in
the NKQ (total and sub-section) score, MTQ score and macronutrient intake, if
significance was identified a Bonferroni post hoc test was used to identify where the
difference lies. A paired sample t-test was used to identify difference between actual
and predicted dietary intake. All results are presented as mean ± SD (unless stated)
and a significance level of p ≤ 0.05 was accepted throughout.
5.3 Results
As detailed below in Figure 5.3.1, Figure 5.3.2 and Figure 5.3.3 (A, B, C, and D) along
with Table 5.3.1 a strong correlation exists and/or no time point difference was
observed between the two collection points for all variables measured. As such, for

Page 103 of 253
ease of discussion and the flow of analysis, the results section will provide description
and commentary on the data from the first phase of collection.
5.3.1 Time point analysis of the variables.
A strong correlation of r2 = 0.78 (p = 0.0001) was observed in the total score achieved
in all participants from phase one (81.9 ± 16.6) and phase two (84.7 ± 17.7) of data
collection, separated by ~ 5 months (Figure 5.3.1).
Figure 5.3.1. The NKQA score correlation between phases one and phase two of data collection.
(r2 = 0.78, p = 0.0001).
A significant (p < 0.0001) positive correlation was observed in each answer category
from the metabolic typing questionnaire between the two phases of data collection
(Table 5.3.1), also no difference was observed between the total number of answers
each category received at phase one and phase two (A; 11.8 ± 4.6 vs. 12.3 ± 5.1, B;
29.5 ± 6.3 vs. 29.5 ± 6.4, C; 14.5 ± 5.0 vs. 13.1 ± 4.7, Un; 9.2 ± 2.9 vs. 10.1 ± 4.6).
0 5 0 1 0 0 1 5 0
0
5 0
1 0 0
1 5 0
N K Q A s c o re p h a s e 2
NK
QA
sc
ore
ph
as
e 1

Page 104 of 253
Table 5.3.1. The correlation of MTQ answers between phase one and two.
Answer
(category)
Phase 1 – Phase 2 correlation
Correlation (r2)
Significance (p value)
A 0.547 < 0.0001 B 0.562 < 0.0001 C 0.590 < 0.0001 Un 0.422 < 0.0001
A significant (p < 0.0001) time point correlation was observed in grouped DQI score
attained between phase one (73.8 ± 11.7) and phase two (72.7 ± 12.2) (Figure 5.3.2,
r2 = .63). Additionally no within group time point difference in DQI score was observed
(END; 77.8 ± 9.0 vs. 76.1 ± 11.5, POW; 76.9 ± 12.1 vs. 76.4 ± 11.7, CON; 67.6 ± 13.9
vs. 65.7 ± 13.5, p > 0.05) (Figure 5.3.2).
Figure 5.3.2. Correlation in the DQI score achieved in phase one and phase two of data collection.
(r2 = .63, p < 0.0001)
0 2 0 4 0 6 0 8 0 1 0 0
0
5 0
1 0 0
D Q I P 1
DQ
I P
2

Page 105 of 253
A significant (p < 0.0001) time point correlation was observed in macronutrient (%)
and calorie (kcal) intake between phase one and phase two within all groups (PRO;
16.7 ± 4.8 vs. 16.4 ± 3.9, FAT; 27.0 ± 6.0 vs. 26.6 ± 5.4, CHO; 55.8 ± 7 vs. 56.3 ± 6,
kcal; 2422 ± 646 vs. 2389 ± 566) (Figure 5.3.3 A – D).
0 1 0 2 0 3 0 4 0 5 0
0
1 0
2 0
3 0
4 0
5 0
F a t in ta k e P 1 (% )
FA
T i
nta
ke
P2
(%
)
3 0 4 0 5 0 6 0 7 0 8 0
0
2 0
4 0
6 0
8 0
C H O in ta k e P 1 (% )
CH
O i
nta
ke
P2
(%
)
A B
0 1 0 2 0 3 0 4 0 5 0
0
1 0
2 0
3 0
4 0
P R O in ta k e P 1 (% )
PR
O i
nta
ke
P2
(%
)
0 1 0 0 0 2 0 0 0 3 0 0 0 4 0 0 0 5 0 0 0
0
1 0 0 0
2 0 0 0
3 0 0 0
4 0 0 0
K c a l in ta k e P 1
Kc
al
inta
ke
P2
C D
Figure 5.3.3. The correlation in macronutrient intake (%) and total calorie intake between phase one (P1) and phase two (P2) of data collection.
Macronutrient intake calculated using a 3-day food diary using household measures. FAT intake; r2 = 0.44, p < 0.0001 (A), CHO intake, r2 = 0.41, p < 0.0001 (B), PRO intake, r2 = 0.69, p < 0.0001 (C) and Kcal intake, r2 = 0.79, p < 0.0001
(D).

Page 106 of 253
5.3.2 Metabolic typing questionnaire
All three groups produced a similar response in respect to unanswered (Un) questions
(9.4 ± 0.4, 9.2 ± 0.4, 9.1 ± 0.7) and questions answered ‘B’ (29.2 ± 1.2, 29.5 ± 1.0,
29.8 ± 1.3) within the MTQ. Additionally no significant differences were observed
between the two athletic groups in any answer category. A main effect (f = 3.728, p =
0.028) was apparent in the ‘A’ and ‘C’ (f = 4.099, p = 0.02) answer categories, with the
CON group answering a significantly greater number of questions ‘A’ and ‘C’ relative
to the POW group (10.6 ± 0.7 vs. 13.6 ± 1.0, p = 0.032 and 15.7 ± 0.9 vs. 12.5 ± 0.7,
p = 0.25), no other differences were observed.
Figure 5.3.4. The mean answer choice from the MTQ for each group (Mean ± SEM).
* Denotes significance between POW and CON groups (p < 0.05).
Using the grouping criteria as outlined in Section 5.2.5, 94.3% (n =83 of 88) of the
participants were identified as type B (mixed type), only 2 participants (both from the
control group) were identified as type A (carbohydrate type) and 3 participants as type
C (protein type).
A B C U n
0
1 0
2 0
3 0
4 0
Nu
mb
er o
f a
ns
we
rs
E n d
P ow
C o n
**

Page 107 of 253
Figure 5.3.5. Metabolic type classification using the Wolcott and Fahey (2000) method.
5.3.3 Metabolic type and dietary intake
The results of the phase one data collection identified 2 participants (2.3%) as ‘type
A’, 3 (3.4%) as ‘type C’ and 83 (94.3%) as ‘type B’. Due to the low numbers identified
as type A and C it was not possible to complete statistical analysis, the following
descriptive results are reported. The habitual dietary intake of the participants who
highlighted as ‘type A’ (carbohydrate type) consisted of 57% carbohydrate, 19%
protein and 24% fat, compared to the 56% carbohydrate, 17% protein and 27% fat for
‘type B’ (mixed typed) and 55% carbohydrate, 14% protein and 31% fat for ‘type C’
(protein type) respectively.
5.3.4 Nutrition Knowledge Questionnaire.
A main effect was observed (f = 13.238, p < 0.0001) in total nutrition knowledge score,
determined by the completion of the NKQA developed in Chapter 4. Both the END (p
< 0.001) and POW (p < 0.001) groups scored significantly higher compared to the
CON group; no difference was observed between athletic groups (61.1 ± 2.3 vs. 59.7
± 1.8 vs. 48.6 ± 1.5%) (Figure 5.3.6).
C H O typ e M IX E D typ e P R O typ e
0
2 0
4 0
6 0
8 0
1 0 0P
arti
cip
an
t c
las
sif
ica
tio
n (
n)
P h a s e 1
P h a s e 2

Page 108 of 253
Figure 5.3.6. Overall NKQ score for each group.
* Denotes significance difference to control (p < 0.0001)
A main effect was observed with both athletic groups scoring higher than the control
group in the following sub sections on the NKQA: protein (END; 67.1 ± 3.2 vs. POW;
65.0 ± 2.3 vs. CON; 45.4 ± 1.8%, f = 22.534, p < 0.001), fat (END 67.5 ± 3.4 vs. POW
65.8 ± 2.9 vs. CON 54.6 ± 2.0, f = 6.094, p = 0.003), general nutrition (END 62.7 ± 2.2
vs. POW 61.7 ± 2.1 vs. CON 50.2 ± 1.9, f = 11.007, p < 0.001) and sport nutrition
(END 56.7 ± 2.6 vs. POW 53.8 ± 1.8 vs. CON 42.0 ± 2.7%, f = 10.447, p < 0.001)
(Figure 5.3.7). No significant difference was observed in the carbohydrate (END; 59.4
± 4.2 vs. POW; 59.0 ± 3.6 vs. CON; 55.7 ± 3.3%, f = 0.758, p = 0.278) or hydration
(END; 53.3 ± 3.6 vs. POW; 54.2 ± 3.3 vs. CON; 44.6 ± 3.6, f = 2.319, p = 0.105)
knowledge subsections. Interestingly, both athletic groups scored lowest in the
sections specific to sport, hydration and sports nutrition.
E n d u r a n c e P o w e r C o n tr o l
3 0
4 0
5 0
6 0
7 0
8 0
Co
rre
ct
An
sw
er
(%)
*
*

Page 109 of 253
Figure 5.3.7. NKQ sub-category score from the END, POW and CON groups.
* Denotes significance between the END and CON groups (p < 0.05), ** denotes significance between the POW and CON groups (p < 0.05) (mean ± SD).
No significant between group differences were observed in dietary carbohydrate
(END; 57.2 ± 5.82, POW; 56.6 ± 7.8, CON; 53.5 ± 7.0%, f = 2.499, p = 0.088), protein
(END; 16.9 ± 4.2, POW; 17.2 ± 6.0, CON; 16.2 ± 3.9%, f = 0.357, p = 0.701) or alcohol
(END; 0.4 ± 1.0, POW; 0.3 ± 0.7, CON; 0.6 ± 1.1%) consumption as a percentage of
macronutrient intake. The control group consumed a significantly greater amount of
dietary fat compared to both athletic groups (p < 0.05, END; 25.4 ± 4.5, POW; 26.3 ±
6.8, CON; 29.2 ± 6.0%, f = 3.556, p = 0.033) (Figure 5.3.8, A, B, C and D). With regards
to absolute dietary intake a significant group effect was observed in carbohydrate (f =
17.235, p = 0.000), protein (f = 112.361 p = 0.000), fat (f = 3.439, p = 0.037) and total
calories (f = 17.170, p = 0.000), with the control group consuming significantly less
carbohydrate (p = 0.000), protein (p = 0.000), and calories (p < 0.0001) compared to
both athletic groups. The control group also consumed significantly less fat (p = 0.014)
than the power group (Table 5.3.3). No difference was observed between the two
athletic groups.
C H O P R O F AT G E N H Y D S P O
05
3 0
4 0
5 0
6 0
7 0
8 0
9 0
Co
rre
ct
An
sw
er
(%)
E n d u ra n c e
P o w e r
C o n tro l
*
**
***
*** *
**

Page 110 of 253
Table 5.3.2 Habitual dietary intake represented as mean macronutrient grams (g), relative to body weight (g•kg-1) and total calorie intake (kcal).
END POW CON
CHO (g) 413.4 ± 98.4 ¥ 399.2 ± 113.7 ¥ 275.4 ± 53.5
g•kg-1 6.6 5.8 3.8
FAT (g) 75.0 ± 15.2 78.4 ± 30.7 * 63.1 ± 29.4
g•kg-1 1.2 1.1 0.9
PRO (g) 111.8 ± 26.4 ¥ 110.8 ± 37.5 ¥ 76.9 ± 26.0
g•kg-1 1.8 1.6 1.1
Calories (kcal) 2685 ± 447 ¥ 2642 ± 663 ¥ 1931 ± 516
* = significantly different from control group (p < 0.05). ¥ = significantly different from control group (p < 0.001)
E N D P O W C O N
05
4 0
5 0
6 0
7 0D
ieta
ry
CH
O i
nta
ke
(%
)
E N D P O W C O N
05
2 0
2 5
3 0
3 5
4 0
Die
tary
FA
T i
nta
ke
(%
) *
A B
E N D P O W C O N
0
5
1 0
1 5
2 0
2 5
Die
tary
PR
O i
nta
ke
(%
)
E N D P O W C O N
0 .0
0 .5
1 .0
1 .5
2 .0
Die
tary
AL
CO
in
tak
e (
%)
C D
Figure 5.3.8. Mean macronutrient intake (%).
Mean macronutrient intake (%), collected by a 3-day food diary using household measure during October – November 2011. END = endurance athletes, POW = power athletes, CON = control. Mean CHO intake (A), Mean FAT intake (B), Mean PRO intake (C) and Mean ALCO intake (D) (mean ± SD).* Denotes
significance between END and CON (p < 0.05).

Page 111 of 253
5.3.5 Predicted vs. actual dietary intake
All groups accurately predicted carbohydrate intake, with no significant difference
between predicted intake (as a percentage of total intake) and actual dietary intake
(as calculated by diet records) (Figure 5.3.9 A – C). The END and POW groups
significantly over predicted protein intake by 9.8 % and 13.3 % (END; 26.7 ± 1.4
vs.16.9 % ± 0.8%, t = 6.084, p = 0.000, POW; 29.5 ± 1.7 vs. 17.2 ± 1.1%, t = -2.526,
p = 0.014) and under predicted fat intake by 5.5 % and 4.4 % (END; 5.5 %; 19.8 ± 2.0
vs. 25.4 ± 0.8%, t = -2.608, p = 0.012, POW; 4.4 %; 21.9 ± 1.5 vs. 26.3 ± 1.4%, t =
6.196, p = 0.000) respectively (Figure 5.3.9). Whereas in the control group no
significant difference was observed between predicted and actual fat intake (26.7 ±
1.1 vs. 29.3 ± 1.1), but a 9.9% over estimation of dietary protein intake was observed
(26.0 ± 1.4 vs. 16.2 ± 0.7%, t = 6.471, p = 0.000, Figure 5.3.9 C).
C H O P R O F AT
0
2 0
4 0
6 0
8 0
EN
D d
ieta
ry
in
tak
e (
%) P re d ic te d
A c tu a l
* *
C H O P R O F AT
0
2 0
4 0
6 0
8 0
PO
W d
ieta
ry
in
tak
e (
%)
P re d ic te d
A c tu a l
* *
A B
C H O P R O F AT
0
2 0
4 0
6 0
8 0
CO
N d
ieta
ry
in
tak
e (
%)
P re d ic te d
A c tu a l
*
C
Figure 5.3.9. Mean predicted vs. Actual dietary intake
Mean macronutrient intake as calculated by a 3-day food diary using household measures. END athletes (A), POW athletes (B),CON participants (C). * denotes significant difference between actual and predicted (p < 0.05) (mean ± SD)

Page 112 of 253
5.3.6 Diet quality.
A group main effect was observed in diet quality (f = 5.675, p = 0.005). The quality of
diet for both athletic groups was significantly (END; 10.1% p = 0.006, POW; 8.4%, p =
0.03) greater than the control group with regards to DQI score (END = 77.7 ± 9.0,
POW = 76.0 ± 12.1, CON = 67.6 ± 2.6) (Figure 5.3.10). No relationship was observed
between DQI and NKQA score (Figure 5.3.11 A-D).
Figure 5.3.10. Diet quality index score (DQI) for each group.
Calculated from a 3-day food diary using household measures. * denotes significance between END and CON p = 0.006. ** Denotes significance between POW and CON p = 0.030.
E N D P O W C O N
05
6 0
7 0
8 0
9 0
1 0 0
Die
t q
ua
lity
in
de
x
(%) *
**

Page 113 of 253
5 0 6 0 7 0 8 0 9 0 1 0 0
0
2 0
4 0
6 0
8 0
1 0 0
D Q I s c o re E N D
NK
QA
sc
ore
EN
D
0 2 0 4 0 6 0 8 0 1 0 0
0
2 0
4 0
6 0
8 0
D Q I s c o re P O W
NK
QA
sc
ore
PO
W
A B
0 2 0 4 0 6 0 8 0 1 0 0
0
2 0
4 0
6 0
8 0
D Q I s c o re C O N
NK
QA
sc
ore
CO
N
0 2 0 4 0 6 0 8 0 1 0 0
0
2 0
4 0
6 0
8 0
1 0 0
D Q I s c o re A L L
NK
QA
sc
ore
AL
L
C D
Figure 5.3.11. Relationship between nutrition knowledge and diet quality,
Relationship between nutrition knowledge, measured using the nutrition knowledge questionnaire for athletes (NKQA), and diet quality, measured using the diet quality index (DQI) for each group (END = endurance athletes, POW = power athletes, CON = control group) and all participants grouped together (ALL). END; r2 = 0.05, p = 0.27 (A), POW; r2 = 0.06, p = 0.21 (B), CON: r2 = 0.00008, p
= 0.96 (C) and ALL; r2 = 0.003, p = 0.63 (D).

Page 114 of 253
5.4 Discussion
With regards to the research hypotheses, the following can be summarised:
It was hypothesised that a commercially available metabolic typing
questionnaire is able to identify metabolic type and prescribe a diet
personalised to meet the metabolic needs of the individual. As measured by the
outcome of a 65-item questionnaire, 94.3% of the participants were highlighted
as type B (mixed type). Therefore H0 is accepted, the questionnaire is not able
to prescribe individualised diets specific to metabolic function. Additionally no
association was observed between dietary intake of the different athletic groups
and metabolic type. Therefore it can be assumed that, unless all athletes
consume the same diet, the MTQ is not sensitive enough for individualised
dietary intake in athletes.
It was hypothesised that the athletic population have greater nutrition
knowledge than the non-athletic control group. In rejection of H0, as measured
by the NKQA, both athletic groups scored significantly higher than the control
group on the overall NKQA, athletes do have greater nutrition knowledge than
non-athletes.
It was hypothesised that a positive relationship exists between dietary intake
and nutrition knowledge. Although both athletic groups scored significantly
higher than the control group for DQI and NKQA, an r2 value of 0.003 was
demonstrated when correlating DQI and NKQA score across all participants.
Thus, although both athletic groups had better diet quality and nutrition
knowledge the H0 is accepted, no relationship exists between nutrition
knowledge and diet quality.
It was hypothesised that the macronutrient intake for carbohydrate and protein
would be significantly different between the endurance and power groups. As
measured by the 3-day diet record, no difference in macronutrient intake
between the two athletic groups existed, therefore H0 is accepted.
To the author’s knowledge, this is the first study to investigate the use of metabolic
typing questionnaire in a research situation. The results identified 94.3% (n = 83) of

Page 115 of 253
the participants as mixed types (type B), 2.3% (n = 2) as carbohydrate types (type A)
and 3.4% (n = 3) as protein types (type C). Such an overwhelming dominance of one
particular type has provided a number of questions about the application of the
metabolic typing questionnaire. Firstly, are the questions within the metabolic typing
questionnaire sufficient to distinguish between metabolic functions and subsequent
metabolic type, secondly; if the questionnaire is accurate and 94.3% of the population
are highlighted as a mixed type (thus should consume the same mixed diet) is the
method of dietary individualisation relevant for healthy individuals, and thirdly; is the
MTQ a valid tool for dietary individualisation prescription.
Due to the low number of individuals highlighted as either ‘carbohydrate type’ (type A)
or ‘protein type’ (type C) statistical analysis could not be completed. Interestingly there
is very little difference in the habitual dietary macronutrient intake of the 3 metabolic
‘types’ (Chapter 5.3.2), however the individuals identified as protein types habitually
consumed less protein than the carbohydrate types (14% vs. 19%). Both Walcott and
Fahey (2000) and Kristal and Haig (2002) state numerous case studies where the
application of the metabolic typing diet cured chronic illness where traditional medicine
had previously failed. However every case study example has one thing in common:
all the patients suffered from a predisposed metabolic or health disorder and the
subsequent dietary intervention prescribed significantly changed and improved the
health condition of the patient. No case studies in either book detail when the
application of the method was unsuccessful at improving health (of which it can be
presumed many cases exist). In general the athletes ate a balanced mixed diet (57%
CHO, 17% PRO and 26% FAT), as did the healthy control group (54% CHO, 16%
PRO and 29% FAT), diet quality was adequate in both populations and the participants
did not suffer from chronic or acute ill health. Taking this into account it can be
suggested that if an individual is not suffering from any significant health condition and
is eating a balanced diet, then the metabolic typing questionnaire is not sensitive
enough to prescribe an individualised diet. Research is needed, in clinical populations,
to investigate its efficacy in patients suffering from chronic ill health. Finally, a recent
review article concluded that genotype-based personalised nutrition is not developed
enough, or fully understood, to advise evidenced-based practice and further research
is needed (Senekal, 2012). As such, if personalised nutrition is not understood at a

Page 116 of 253
genotyping level, it is fair to assume that basing a diet on the outcome of a 65-item
questionnaire is probably not sufficient to prescribe an individualised diet.
The present study is the first to evaluate the nutrition knowledge of UK track and field
athletes relative to a non-athletic control group. The use of the valid and reliable
questionnaire developed specifically for this population adds to the robustness of the
results (Chapter 4). The results of the NKQA demonstrated that UK track and field
athletes have greater nutrition knowledge than a non-athletic control group (60.4% vs.
48.6%). In a similar study in a cohort of elite Australian athletes, Spendlove et al.
(2012) demonstrated no significant difference in nutrition knowledge between athletes
(57.6%) and a non-athlete group (63.1%). Although the findings of this study are in
disagreement to that of Spendlove et al. (2012) the nutrition knowledge scores of the
athletic cohorts from both studies are very similar (60.4% and 57.6%). It is important
to consider that both studies used a different questionnaire to assess nutrition
knowledge, however the NKQA used in this study was validated using a dietetic control
group, who scored 80.4% on the questionnaire, which is similar to the dietetic trained
calibration group (86.2%) used by Spendlove et al. (2012). As such, it is fair to assume
that both questionnaires are equally challenging. The non-athletic control group from
Spendlove et al. (2012) scored significantly higher than the results observed in this
study (63.1% vs. 48.6%), as such it may be assumed that the non-athletic Australian
control population who participated for the study had a better grasp of nutrition
knowledge than the control group used in this study (Spendlove et al., 2012).
A systematic review from Heaney et al. (2011) detailing research in nutrition
knowledge assessment of athletes up to 2011, highlights an average nutrition
knowledge score of 59 ± 11% (mean N = 79 ± 68) (excluding Douglas and Douglas
(1984) who had 943 participants). It is important to consider that the range of validated
questionnaires and level of athlete varies significantly through all these studies;
however these results provided a general cross sectional overview into nutritional
knowledge in athletes. Similar results can be concluded from this study with the mean
NKQ score of 60.4 ± 16.3, thus the overall nutrition knowledge of UK track and field
athletes are in line with previous literature.

Page 117 of 253
The highest scoring sub-categories in the NKQA for the athletic group were fat (66.6%)
and protein (66.0%), the carbohydrate (55.8%) and fat (54.7%) sub-sections produced
the highest scores for the control group (Figure 5.3.7). The protein sub-section
produced the greatest difference in scores KNQ score; the athletes scored 20.6%
higher than the control group (66.0% vs. 45.4%). This is interesting as the importance
of protein for exercise performance, recovery and growth and repair is well
documented in the literature (Tipton et al., 2007, Jeukendrup, 2011, Burke et al., 2007,
Phillips and Van Loon, 2011, Stellingwerff et al., 2011). Additionally, protein science
is a frequent topic of discussion in athletic magazine publications and websites,
potentially increasing the athletes’ exposure to protein science and its role in athletic
performance. In the 10 questions specific to whether a food item is high or low in
protein the athletic group scored 85% correct response. The athletes also had a strong
understanding of the role protein plays within the body, with 88% correct responses.
However when questioned about recommended daily allowances and how much
protein is in different food items the athletic group provided a correct response less
than 25% of the time. This clearly demonstrated that athletes understand what protein
is however more education is needed around protein quality and quantity.
As discussed in Chapter 2.1.4, it is understood that speed and power athletes have
different dietary requirements to endurance athletes, with literature stating a greater
protein need for speed and power athletes and increased carbohydrate demand for
endurance athletes (Tipton et al., 2007, Jeukendrup, 2011, Stellingwerff et al., 2011).
The results from the current study demonstrate no significant difference in
macronutrient intake between the two athletic groups. A higher fat intake in the control
group was the only significant difference observed in macronutrient intake (Figure
5.3.8). The DQI is not a reflection of macronutrient ratio, rather a focus on food quality
and micronutrients (Haines et al., 1999). When assessing for diet quality both the
endurance and power groups scored significantly (p < 0.05) higher in the DQI than the
control group, an average score ~9% better (Figure 5.3.6) which corroborate the
findings from Rash et al. (2008), who observed a mean DQI score of 76% in American
collegiate track athletes.
No between group difference was observed in the carbohydrate sub-section (59.2%
vs. 55.8%, NUT vs. NONUT). Interestingly a higher percentage of the control group
Page 118 of 253
said they knew what glycemic index was (65.5% vs. 55.9%), but on the 8 subsequent
questions referring to glycemic index (GI) both groups averaged 47%. However if the
participant answered ‘NO’ when asked if they knew what glycemic index was, they
were told to skip the remaining question on it, and of the participants who answered
the GI questions the athletes actually scored higher (85% vs. 72%).
Relatively little data exists on current dietary habits of track and field athletes. In
Japanese athletes, Sugiura et al. (1999) reported no difference in dietary intake
between sprint and endurance athletes (protein; 15 ± 2% vs. 16 ± 2%, fat; 32 ± 3% vs.
34 ± 5% and carbohydrate; 54 ± 5% vs. 51 ± 6%). The results corroborate the findings
from this study; no difference in dietary intake exists between speed and endurance
track and field athletes. Sugiura et al. (1999) also reported adequate diet quality, as
observed in this study. However it is important to contextualise and consider the
comparison of these two studies as the cultures and habitual dietary intake between
populations are vastly different (Finegold et al., 1974). It has not been possible to find
further literature to compare dietary intake in different track and field disciplines.
This is the first study to investigate the relationship between dietary quality and
nutrition knowledge of UK track and field athletes, demonstrating no relationship exists
between nutrition knowledge and diet quality (Figure 5.3.11) Interestingly both athletic
groups scored significantly higher on the NKQA (Figure 5.3.4) and DQI (Figure 5.3.6)
compared to the control group, but neither NKQA nor DQI were a predictor of the other.
It may be concluded that athletes have better nutrition knowledge and diet quality;
however no associations can be drawn between the two. To date the literature is
equivocal, recently Heaney et al. (2011) published a meta analysis partly on nutrition
knowledge and dietary intake. Out of the nine studies published, five reported a weak
positive association between nutrition knowledge and better dietary intake (r < 0.44),
the remaining four studies were unable to link nutrition knowledge to diet quality.
Interestingly three of the studies that demonstrated a positive relationship used non-
validated sport specific questions to assess diet quality, as such caution should be
taken when interpreting the results (Douglas and Douglas, 1984, Harrison et al., 1991,
Hamilton et al., 1994). Including the results from the current study, 50% of the research
in this area has demonstrated a weak positive relationship in nutrition knowledge and
Page 119 of 253
dietary quality and 50% demonstrated no relationships. Finally, most studies in
athletes with a robust design have demonstrated no relationship.
The findings from the diet logs, NKQA and DQI suggest that athletes have sound
fundamental nutrition knowledge and consume a high quality balanced diet. However
dietary intake is not tailored to the specific demands of their sporting discipline. The
NKQA results demonstrate athletes generally understand what macronutrients are,
however understanding of the amount of each macronutrient present in food items and
the current dietary recommendations for athletes are not as well grasped. This may
explain why no difference in dietary intake is observed between power and endurance
athletes.
5.5 Conclusion.
In conclusion, the data from the current study suggests a 65-item metabolic typing
questionnaire is not sensitive enough to prescribe individualise diets for healthy or
athletic populations and no association exists between metabolic type and habitual
dietary intake. Additionally, UK track and field athletes possess greater nutrition
knowledge than a population matched, non-athletic control and the diet quality of the
athletes is greater than that of the control group. However no association between diet
quality and nutrition knowledge was present.
5.6 Limitations.
The limitations of the experimental research Chapter are:
Dietary intake was measured using a 3-day food diary using estimated
household measures. As discussed in Chapter 2.4 dietary assessment in a
free-living population has limitations and may under-predict intake.
Diet quality index score is based on a snapshot of dietary intake which may
have been skewed by the study. A longitudinal analysis of dietary intake may
have provided a more comprehensive analysis of dietary intake, however this
increases participant burden and would compromise the study.

Page 120 of 253
Metabolic function was not directly assessed in this study thus further study is
needed to draw strong robust conclusions around the relationship between
metabolic type and metabolic function in athletes.
5.7 Future research for experimental Chapter.
The results from this experimental Chapter have provided evidence suggesting that
the metabolic typing questionnaire is not refined enough to differentiate sporting
classification and subsequently prescribe a diet to meet individual requirements. The
theory of metabolic typing is based on three diets: high carbohydrate, mixed and high
protein diet. The fundamental impact of such diets at a cellular level are yet to be fully
understood, thus the remaining Chapters in this thesis are to explore the impact of
high protein and high carbohydrate diets on cellular adaptation at rest and with
exercise training.

Page 121 of 253
6 THE IMPACT OF A HIGH PROTEIN DIET
ON CELLULAR METABOLIC
ADAPTATION, BODY COMPOSITION AND
RESTING METABOLIC RATE.

Page 122 of 253
Abstract: Background: Mitochondrial quantity and density are associated with increased
oxidative metabolism. It has been demonstrated that a high fat/low carbohydrate
(HF/LC) hypocaloric diet can up-regulate transcriptional markers of mitochondrial
biogenesis. The impact in vivo of a high protein/low carbohydrate (HP/LC) diet has on
these markers is still relatively unknown. The aims of the study were to investigate the
impact of acute (7-day) dietary manipulation on transcriptional markers of
mitochondrial biogenesis, body composition and resting metabolic rate. Method:
Forty-five healthy male participants were randomly assigned one of four dietary
conditions: energy matched high protein (PRO-EM), hypocaloric high protein (PRO-
ER), energy matched high carbohydrate (CHO-EM) or hypocaloric high carbohydrate
(CHO-ER). The macronutrient ratio of the high protein diet was 40:30:30 %
(PRO:CHO:FAT), the high carbohydrate groups were on 10:60:30 %. Energy intake
for the hypocaloric diets were calculated to match resting metabolic rate. Participants
visited the laboratory on 3 occasions each separated by 7 days. On each visit body
composition, resting metabolic rate and a muscle biopsy from the vastus lateralis was
collected. Prior to visit 1 and 2 habitual diet was consumed, between visit 2 and 3 the
intervention diet was consumed. Results: In the PRO-ER group AMPK, PGC-1α,
SIRT1 and SIRT3 mRNA expression were significantly increased (p < 0.05) post
intervention. Transcriptional markers were not affected in any of the other groups.
Despite ~30 % reduction in calorie intake no difference in lean mass (LM) loss was
observed between the PRO-ER and CHO-EM groups. Conclusion: The results from
this study demonstrated that a 7-day a high protein hypocaloric diet resulted in
increased mRNA transcriptional markers of mitochondrial biogenesis at rest, also
increased protein intake helped to maintain LM mass in a hypocaloric state.

Page 123 of 253
6.1 Introduction
Mitochondria are responsible for energy production via fatty-acid oxidation, β
oxidation, Krebs cycle, and oxidative phosphorylation. Mitochondria quantity and
density has been linked with increased endurance performance (Psilander et al.,
2013), reduction in type 2 diabetes, increased resisting metabolic rate and improved
insulin sensitivity (Lee et al., 1998, De Feyter et al., 2008, Patti et al., 2003, Petersen
et al., 2004, Mootha et al., 2003). A seminal paper from Puigserver et al. (1998) first
described peroxisome proliferator-activated receptor gamma coactivator 1-alpha
(PGC1-α), in the subsequent years PGC-1α had been identified as playing a key role
in the regulation and co-activation of mitochondrial biogenesis (Liang and Ward,
2006).
Both AMP-activated protein kinase (AMPK) and silent information regulator T1
(SIRT1) mediated deacetylation (Gurd et al., 2009) have been demonstrated to
regulate the expression of PGC-1α in human muscle (Ruderman et al., 2010). A
substantial body of evidence suggests that SIRT1 expression responds to decreases
in nutrient availability (Nemoto et al., 2005) and increases in energy expenditure
(Suwa et al., 2008). Similarly AMPK is stimulated by cellular stress that causes a
depletion of adenosine triphosphate (ATP) and elevation of AMP, such as calorie
restriction (Itani et al., 2003), hypoglycemia (Itani et al., 2003) exercise (Fujii et al.,
2000) and muscular contraction (Hutber et al., 1997). Subsequently increases in PGC-
1α expression can be observed in direct response to such stressors (Jager et al.,
2007). Acute hypocaloric HF/LC diet (50% fat, 30% carbohydrate and 20%, protein)
significantly increases AMPK phosphorylation and PGC-1α deacetylation, however no
change was observed in a hypocaloric LF/HC diet (20:60:20 %) (Draznin et al., 2012),
suggesting increased dietary carbohydrate availability prevents the activation of the
AMPK-SIRT1 axis in skeletal muscle that would otherwise be activated by a low calorie
diet.
The preservation of lean mass is important for the maintenance of quality of life
(Janssen et al., 2002), it is generally accepted that weight loss strategies which
preserve LM are preferential to those that results in skeletal muscle atrophy (Stiegler
and Cunliffe, 2006). During hypocaloric diet-induced weight loss approximately 20 –

Page 124 of 253
30% of mass lost is lean mass (LM) (Areta et al., 2014), increasing dietary protein is
one method which has been demonstrated to attenuate skeletal muscle atrophy in a
hypocaloric state (Stuart et al., 1990). The manipulation of carbohydrate intake as a
regulator of weight maintenance/loss is well documented demonstrating improved lipid
profile and fat oxidation (Boden et al., 2005, Hussain et al., 2012). However, the
majority of literature manipulates dietary fat – protein remains constant. A small
number of metabolic perturbation murine studies have manipulated protein intake and
it has been shown that a high protein intake (35 % protein) increases PGC-1α
expression relative to a control diet (15% protein) (Nakazato and Song, 2008).
Furthermore in periods of energy deficiency it has been demonstrated that resting
metabolic rate can be reduced (Friedlander et al., 2005), and in overweight and obese
individuals attempting to lose weight, dietary restriction can result in decreases in
muscle mass which may down-regulate the metabolic process, compromising healthy
weight management (Ravussin et al., 1988, Stein et al., 1991). Increased protein
intake in periods of energy restriction may support the maintenance of metabolic rate
(Carbone et al., 2012).
In this field most research focuses on increasing dietary fat to restrict carbohydrate
intake. However it is well documented that an increased protein intake can attenuate
LM loss and may be a preferable choice during weight loss. The impact high protein
low carbohydrate diets have on transcriptional markers of mitochondrial biogenesis is
not fully explored. This study was designed to investigate the impact of a high protein
low carbohydrate diet independently and with calorie restriction on metabolic
adaptation, body composition and RMR.
6.1.1 Aims and Objectives.
The primary aim of this piece of research was to see if manipulating dietary intake for
a 7-day period provided enough metabolic stress to cause a change in cellular
transcriptional response, body composition and resting metabolic rate.
The following hypotheses have been made for this body of research:
Page 125 of 253
i) (H1) The diet that provides the greatest metabolic stress (high protein
hypocaloric diet) will elicit the greatest mRNA transcriptional changes in skeletal
muscle.
(H0) No difference in skeletal muscle mRNA transcriptional response will exist
between groups.
ii) (H2) When matched for energy intake, diets with a high protein intake will
promote lean mass maintanence to a greater extent than the equivalent high
carbohydrate groups.
(H0) No difference in body composition will be observed between the groups
matched for energy intake.
iii) (H3) The high protein energy matched group will result in an increase in resting
metabolic rate.
(H0) No change in resting metabolic rate will occur in any of the groups
subsequent to the 7-day dietary intervention.
6.2 Materials and Methods.
6.2.1 Participants.
Forty-eight healthy males volunteered to participate in the study with 45 completing
(mean ± SD: age 26.0 ± 5.1 years; body mass 74.9 ± 10.2 kg; height 179.5 ± 5.9 cm).
One participant was removed due to non-dietary adherence, a second was removed
as inclusion criteria were not met and a third did not complete. Participants were
initially screened against pre-determined criteria to ensure they met the inclusion
criteria and were free from any medical condition that would preclude participation in
the study. Participants could not be following a restrictive dietary regime (vegetarian,
vegan) or suffer from any food allergies/intolerances. Participants could not be
participating in physical activity > 2 times per week and could not be consuming or
have consumed any dietary or protein supplements in the previous 2 weeks. The
experimental procedures and potential risks associated with the study were explained
and the participants gave written informed consent prior to participation. None of the
participants had a history of any neurological disease or musculoskeletal abnormality.
The University of Hertfordshire School of Life and Medical Sciences ethics committee
approved the study, protocol number LMS/PG/UH/00196.

Page 126 of 253
6.2.2 Study Protocol.
In a randomised repeated-measures parallel group study design, the participants were
assigned to one of four groups: energy matched high protein (PRO-EM, n = 11),
energy restricted high protein (PRO-ER, n = 12), energy matched high carbohydrate
(CHO-EM, n = 12) or energy restricted high carbohydrate (CHO-ER, n = 10) (Table
6.2.1). The participants attended the laboratory on three occasions, each separated
by 7-days. Before visit 1 (baseline) and visit 2 (pre) all participants remained on their
habitual diet, between visits 2 and visit 3 (post) the participants consumed the
randomly assigned intervention diet. All experimental procedures were completed in
the same order at the same time of the day. The baseline and pre assessments were
used as a control to demonstrate stability of the measures assessed, where no
differences were observed between these measures the pre measures were used for
analysis.
Table 6.2.1. Prescribed macronutrient breakdown for each group.
Prescribed calorific intake Carbohydrate (%)
Protein (%)
Fat (%)
PRO-EM Matched to estimated daily energy
requirements 30 40 30
PRO-ER Restricted to resting metabolic rate 30 40 30
CHO-EM Matched to estimated daily energy
requirements 60 10 30
CHO-ER Restricted to resting metabolic rate 60 10 30
(% = percentage of total daily calorific intake)
6.2.3 Experimental protocol.
Following an overnight fast the participants arrived at their allocated timeslot for each
testing visit (start time range: 07:30 – 09:30 am). The participants were requested to
arrive at the laboratory using the same mode of transport. Morning physical activity
was not permitted. Prior to the pre and baseline visits the participants completed a
standardised 4-day food dairy. The food diary was visually assessed for accuracy by

Page 127 of 253
the investigator and further detail was requested if required. An assessment of body
composition (DXA scan) was then undertaken, followed by the measurement of resting
metabolic rate. Finally a micro-muscle biopsy was collected (Figure 6.2.1).
Figure 6.2.1. Schematic of experimental protocol.
Inclusion criteria: Healthy males aged between 18 – 35 years with no identified chronic
illness and currently free from cold, flu or any musculoskeletal injury.
Exclusion criteria: Outside the range of 18 – 35 years, female, suffering from heart or
chronic illness. If currently following a restrictive dietary regime which excludes any
food groups (e.g. Vegan, Vegetarian), or if the participant is aware of any food
allergies. If consuming any nutrition supplements (or unwilling to abstain from taking
during the study), or on medication (beta-blockers, NSAID’s or recreational drugs).
6.2.4 Measurement of habitual dietary intake.
For the method used to calculate habitual dietary intake refer to Chapter 3.2.
Participants were requested to record intake on 3-week days and 1 weekend day each
week, a total of 8-days dietary intake was collected over the 2 week prior visit 1 and
visit 2.
Visit 1
Control Visit
Day 1
DXA scan
GEM assessment Micro muscle-
biopsy
Habitual diet 4-day food diary
Intervention diet
Screening, briefing and document provision
Visit 2
Control Visit
Day 8
Visit 3
Control Visit
Day 15
Habitual diet 4-day food diary
DXA scan
GEM assessment Micro muscle-
biopsy
DXA scan
GEM assessment Micro muscle-
biopsy

Page 128 of 253
6.2.5 Body composition assessment: Dual energy x-ray absorptiometry (DXA)
scan.
A DXA scanner was used to measure body composition. Please refer to Chapter 3.6
for details regarding the processes complete to measure body composition using the
DXA scanner.
6.2.6 Resting metabolic rate (RMR).
RMR was measured using indirect calorimetry (coefficient of variation = 1.48 %). All
assessments were completed in a temperature controlled environmental chamber
(temperature set to 24oC). The participants arrived at the laboratory in the morning in
an overnight fasted state. The participants were requested to expel as little energy as
possible prior to arrival. The participant lay in a supine position on a couch and a large
towel was placed over their body to maintain comfort. Once comfortable a metabolic
hood (Gas Exchange Measurement (GEM), GEMNutrition Ltd, UK) was placed over
the participant’s head. The participant was instructed to relax, breathe normally and
not to move or fall asleep (Figure 6.2.2). The GEM was set to collect respiratory bins
every 60 seconds for 20 minutes; the data analysed was from the final 5 minutes of
collection. Throughout the test the participant was observed through a window to
check for adherence. RMR was calculated using the modified Weir equation (Weir,
1949):
“RMR = 1.44 x (3.9 x VO2 + 1.1 x VCO2)”
(The modification of the equation negates the effect of nitrogen excretion, it is
generally accepted that the errors associated with collecting reliable nitrogen
samples are greater than the small error introduced by not including it)
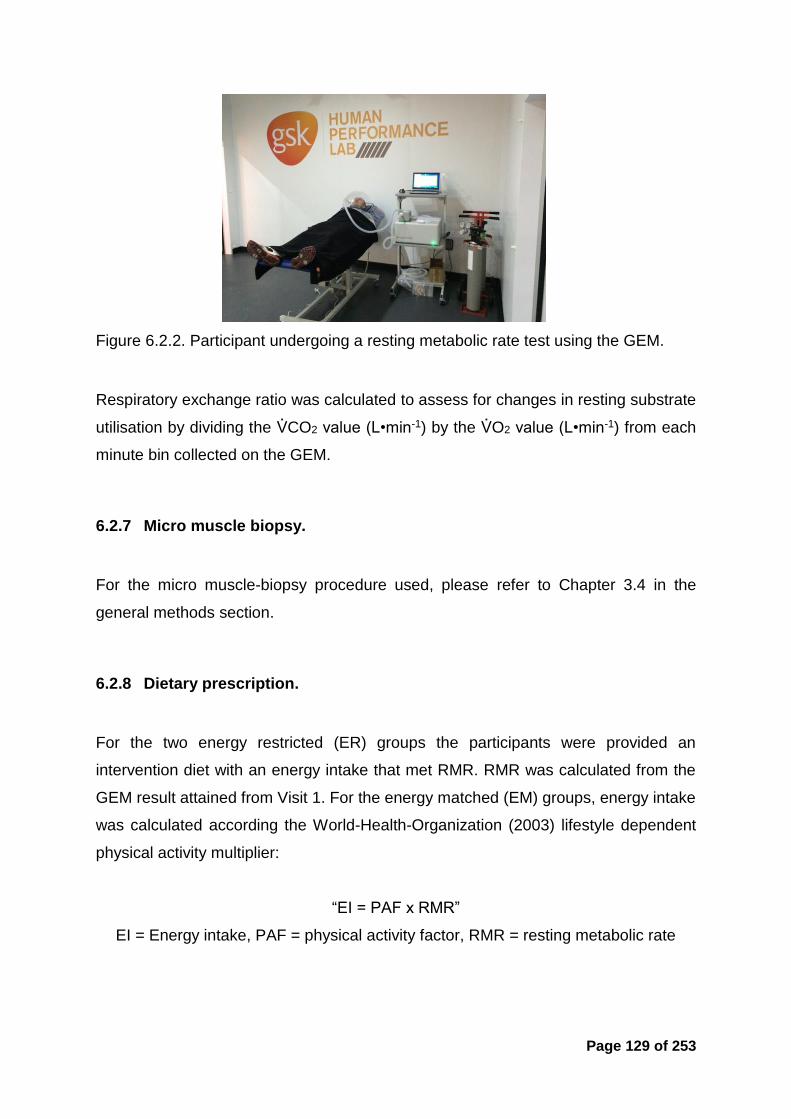
Page 129 of 253
Figure 6.2.2. Participant undergoing a resting metabolic rate test using the GEM.
Respiratory exchange ratio was calculated to assess for changes in resting substrate
utilisation by dividing the VCO2 value (L•min-1) by the VO2 value (L•min-1) from each
minute bin collected on the GEM.
6.2.7 Micro muscle biopsy.
For the micro muscle-biopsy procedure used, please refer to Chapter 3.4 in the
general methods section.
6.2.8 Dietary prescription.
For the two energy restricted (ER) groups the participants were provided an
intervention diet with an energy intake that met RMR. RMR was calculated from the
GEM result attained from Visit 1. For the energy matched (EM) groups, energy intake
was calculated according the World-Health-Organization (2003) lifestyle dependent
physical activity multiplier:
“EI = PAF x RMR”
EI = Energy intake, PAF = physical activity factor, RMR = resting metabolic rate

Page 130 of 253
RMR was attained from the GEM result on visit 1, and PAF was selected following a
series of lifestyle questions concerning daily activity levels, type of work and exercise
activity (Table 6.2.2).
Table 6.2.2. Lifestyle dependent physical activity multiplier used to calculate energy intake.
Activity level Calculation
Low 1.53 x RMR
Moderate 1.77 x RMR
Active 2.25 x RMR
(World-Health-Organization, 2003)
The intervention diets (Table 6.2.3) were calculated by the experimental team and
delivered to the participant’s door by Soulmate food. Refer to Section 3.3 in the general
methods for description of the process.
Table 6.2.3. Prescribed daily calorie intake and macronutrient breakdown for each group throughout the 7-day intervention.
Group
Dietary intake (kcal•day-
1)
CHO (•day-1) PRO (•day-1) FAT (•day-1)
g g•kg-1 g g•kg-1 g g•kg-1
PRO-EM 2828 ± 331 217 ± 26 3.0 ± 0.5 289 ± 34 4.0 ± 0.7 96 ± 11 1.3 ± 0.2
PRO-ER 1876 ± 116 143 ± 9 1.9 ± 0.3 191 ± 12 2.5 ± 0.4 64 ± 4 0.8 ± 0.1
CHO-EM 2881 ± 213 444 ± 33 6.1 ± 0.6 75 ± 6 1.0 ± 0.1 97 ± 7 1.3 ± 0.1
CHO-ER 1735 ± 246 267 ± 37 3.7 ± 0.7 45 ± 6 0.6 ± 0.1 59 ± 8 0.8 ± 0.2
(Mean ± SD). PRO-EM = high protein energy matched diet, PRO-ER = high protein
energy restricted diet, CHO-EM = high carbohydrate energy matched diet, CHO-ER =
high carbohydrate energy restricted diet.

Page 131 of 253
6.2.9 Quantitative PCR (qPCR).
The analysis of the gene expression in the muscle was quantified using qPCR. Refer
to Chapter 3.5 in the general methods for a detailed description of the RNA isolation,
reverse transcription, qPCR analysis and application efficiency techniques used in this
experimental Chapter.
6.2.10 Data analysis of the qPCR assays
The muscle biopsy qPCR raw Cp values were exported and normalised to the
housekeeper gene (GAPDH) using an analysis of covariance method. Relative fold
change in expression levels over baseline (visit 2) was then calculated using 2-ΔΔCT
method.
6.2.11 Statistical analysis.
Kolmogorov-Smirnov tests of normality to assess the null hypothesis that data for
within-subjects analysis was normally distributed. However it should be noted that the
ANOVA procedure is robust to slight violations of normality within a dataset (Field,
2013). Mauchly’s sphericity test was used to assess the assumption of sphericity
within repeated-measures effects. Unless stated otherwise Mauchly’s test was
insignificant (p > 0.05), therefore the assumption of sphericity was accepted
The muscle biopsy qPCR analysis raw Cp values were normalised to the housekeeper
gene (GAPDH) using an analysis of covariance method, before relative fold change
over TP1 (baseline) were calculated using 2-ΔΔCT.
mRNA data were analysed using a two factorial mixed design ANOVA (4 groups, 2
time points) with dietary intake (between) and time point (within) as the main variables.
Where a main time effect was observed a within group paired sample assessments
was used to identify where the time effect was. A Bonferroni post hoc test was used
to identify the location of significant interactions between groups (dietary intake). Visit
one (baseline) and visit two (pre) were used as control trials; a paired sample t-test
was run to determine a difference between the control trials. Where difference in

Page 132 of 253
baseline-pre was observed a mean of the two values was used for post comparison
(which is stated in the text), where no difference was observed, the pre value was
used for comparison. Pre-post intervention time point change was analysed using a
paired sample t-test.
Statistical significance was set at p ≤ 0.05. Statistical analysis was conducted using
the statistical package for the social science software program (SPSS; version 22,
IBM, Armonk, NY). All data are presented mean ± SEM unless specified.
6.3 Results
6.3.1 Habitual dietary intake
No main effects were observed for habitual total calorie intake or macronutrient
breakdown (Table 6.3.1). The mean daily calorific intake across all groups was 2,340
± 473 kcal•day-1 (range 2,192 ± 574 – 2423 ± 330 kcal•day-1)
Table 6.3.1. Average daily habitual calorific intake and macronutrient breakdown for each group prior to intervention diet.
(mean ± SD and percentage (%) of total energy intake).
Mean daily
calorie intake (kcal•day-1)
CHO PRO FAT
g•day-1
%
g•day-1
%
g•day-1
%
PRO-EM 2192 ± 173 232 ± 22 42.4 95 ± 6 17.2 86 ± 6 35.2
PRO-ER 2391 ± 133 267 ± 16 44.7 100 ± 8 16.7 93 ± 5 35.0
CHO-EM 2355 ± 152 274 ± 23 46.6 103 ± 9 17.5 89 ± 8 33.8
CHO-ER 2407 ± 107 307 ± 16 51.7 97 ± 7 16.0 84 ± 5 31.4
A total of 8-days dietary intake was collected over the 2 week prior visit 1 and visit 2;
participants were requested to record intake on 3 week days and 1 weekend day each
week using the estimated household measures method. (CHO = carbohydrate, PRO
= protein, FAT = fat). % = percentage of dietary intake
The PRO-ER groups lost significant greater BM relative to both CHO-EM and PRO-
EM, the same interactions were observed with the CHO-ER group.

Page 133 of 253
6.3.2 Gene expression
No significant difference was observed between TP1 and TP2 in any of the genes,
thus it can be assumed that any post intervention changes observed were due to the
intervention rather than the internal variability of the measure.
The output of statistical analysis demonstrated no group x time interaction in any of
the genes (PGC-1α: f = 0.900, p = 0.494, SIRT1: f =1.022, p = 0.447, AMPK: f = 2.827,
p = 0.29, SIRT3: f = 2.843, p = 0.128 and PPAR: f = 2.068, p = 0.145). However a time
effect was observed in some of the genes which warranted further exploration to
identify where the time difference existed (PGC-1α: f = 6.020, p = 0.048, SIRT1: f =
6.297, p = 0.037, AMPK; f = 15.263, p = 0.005 and SIRT3: f = 9.628, p = 0.015). Within
the PRO-ER group a significant pre-post intervention time point difference was
observed in PGC-1α (fold increase = 1.27, p = 0.0402), AMPK (fold increase = 2.09,
p = 0.027), SIRT1 (fold increase = 1.50, p = 0.026) and SIRT3 (fold increase = 1.19,
p = 0.010) mRNA expression. No time point gene expression changes were observed
in any other dietary group (Figure 6.3.1 A-E), or in the expression of PPAR mRNA.
A significant change in LM was observed post intervention as were significant group
differences. Post intervention, 3 of the groups lost LM (p < 0.05) (Figure 6.3.2 A), the
CHO-ER losing the greatest amount (-1.26 ± 0.14 kg), the PRO-ER losing -0.82 ± 0.3
kg and CHO-EM losing -0.53 ± 0.19 kg, respectively. LM was maintained in the PRO-
EM group (-0.21 ± 0.17 kg). The CHO-ER group lost significantly more LM than both
the PRO-EM and CHO-EM groups (p < 0.05), no difference in LM was observed
between the PRO-ER and CHO-EM groups.
The PRO-ER and CHO-ER groups lost significantly greater (p < 0.05) BM than both
CHO-EM and PRO-EM (Figure 6.3.2 C). No difference was observed between groups
matched for energy intake. All groups exhibited a significant loss in FM (p < 0.01) post
7-days dietary intervention (Figure 6.3.2 B). The PRO-ER lost the greatest amount of
FM (-0.99 ± 0.11 kg) and the CHO-EM group lost the least (-0.50 ± 0.14 kg). The
difference between these two groups was the only significant group difference
observed (p = 0.015).

Page 134 of 253
A B
P R O -E M P R O -E R C H O -E M C H O -E R
0 .0
0 .5
1 .0
1 .5
2 .0
PG
C-1
a m
RN
A
(fo
ld c
ha
ng
e r
ela
tiv
e t
o p
re
)
*
P R O -E M P R O -E R C H O -E M C H O -E R
0 .0
0 .5
1 .0
1 .5
2 .0
2 .5
3 .0
AM
PK
mR
NA
(fo
ld c
ha
ng
e r
ela
tvie
to
pre
)
*
C D
P R O -E M P R O -E R C H O -E M C H O -E R
0 .0
0 .5
1 .0
1 .5
2 .0
SIR
T1
mR
NA
(fo
ld c
ha
ng
e r
ela
tiv
e t
o p
re
)
*
P R O -E M P R O -E R C H O -E M C H O -E R
0 .0
0 .5
1 .0
1 .5
2 .0
SIR
T3
mR
NA
(fo
ld c
ha
ng
e r
ela
tiv
e t
o p
re
)*
E
P R O -E M P R O -E R C H O -E M C H O -E R
0 .0
0 .5
1 .0
1 .5
PP
AR
mR
NA
(fo
ld c
ha
ng
e r
ela
tvie
to
pre
)
Figure 6.3.1. Effect of feeding 7-days diet intervention on mRNA expression at rest.
Effect of 7-days high protein energy matched (PRO-EM), high protein energy restricted (PRO-ER), high carbohydrate energy matched (CHO-EM) or high carbohydrate energy restricted (CHO-ER) diet in healthy lean individuals on PCG-1α (A), AMPK (B), SIRT1 (C), SIRT3 (D) and PPAR (E) mRNA expression. Muscle samples were obtained following an overnight fast prior to the intervention and repeated again following 7-days dietary intervention (Post). Values are expressed as fold change (pre to post) after normalization to the reference gene (GAPDH) and are reported as the mean ± SE. For abbreviations of genes see Table 1. * = significant pre-post difference within group, p < 0.05.

Page 135 of 253
A post intervention reduction in BM was observed in all groups (p < 0.01, Figure 6.3.2
C). The PRO-EM group lost the least BM (-0.74 ± 0.24 kg) whereas the CHO-ER lost
the greatest (-2.21 ± 0.17 kg). Significant post intervention group differences were
observed (p < 0.01), this was not seen in groups matched for energy intake, however
both ER groups lost significantly more BM than EM groups.
A B
P R O -E M P R O -E R C H O -E M C H O -E R
-2 .0
-1 .5
-1 .0
-0 .5
0 .0
Pre
-po
st
lea
n m
as
s c
ha
ng
e (
kg
)
#
* *
P R O -E M P R O -E R C H O -E M C H O -E R
-1 .5
-1 .0
-0 .5
0 .0
Pre
-po
st
fat
ms
s c
ha
ng
e (
kg
)
# #
C
P R O -E M P R O -E R C H O -E M C H O -E R
-3 .5
-3 .0
-2 .5
-2 .0
-1 .5
-1 .0
-0 .5
0 .0
Pre
-po
st
bo
dy
ma
ss
ch
an
ge
(k
g)
#
* # #
* *
Figure 6.3.2. Effect of feeding 7-days diet intervention on body composition at rest.
Effect of feeding 7-days of either high protein energy matched (PRO-EM), high protein energy restricted (PRO-ER), high carbohydrate energy matched (CHO-EM) or a high carbohydrate energy restricted (CHO-ER) diet in healthy lean individuals on body composition. Pre-post lean mass change (kg) (A), Pre-post fat mass change (kg) (B). Pre-post body mass change (kg) (C). The data presented as mean ± SEM; * denotes significant difference between PRO-EM and PRO-ER, ** denotes significant difference between CHO-EM and CHO-ER, # denotes significant difference between PRO-EM and CHO-ER and ## denotes significant difference between PRO-ER and CHO-EM. (p < 0.05).

Page 136 of 253
6.3.3 Resting metabolic rate and body composition response to dietary
manipulation
No time or group interaction effects were observed in RMR (Table 6.3.2). Mean RMR
across all groups pre was 1910 ± 180 kcal vs. 1894 ± 184 post intervention.
Table 6.3.2. Resting metabolic rate (RMR) (kcal•day-1) pre and post 7-day dietary intervention .
RMR PRE (kcal•day-1)
RMR POST (kcal•day-1)
PRO-EM 1916 ± 73 1910 ± 70
PRO-ER 1904 ± 37 1950 ± 54
CHO-EM 1972 ± 38 1946 ± 44
CHO-ER 1848 ± 69 1768 ± 52
PRO-EM = high protein energy matched diet, PRO-ER = high protein energy restricted
diet, CHO-EM = high carbohydrate energy matched diet, CHO-ER = high carbohydrate
energy restricted diet (Mean ± SEM).
A significant time point interaction was observed in respiratory exchange ratio (f =
13.811, p = 0.005). No difference was observed in either of the energy-matched
groups, however RER significantly reduced subsequent to the intervention diet in both
the PRO-ER (p = 0.001) and the CHO-ER (p = 0.008) groups (Figure 6.3.3).

Page 137 of 253
Figure 6.3.3. Respiratory exchange ratio (RER) attained from the GEM test pre and post dietary intervention (mean ± SEM)
* Denotes significantly difference from pre (p < 0.01)
6.4 Discussion
With regards to the research hypothesis the following can be concluded:
i) It was hypothesised that a high protein hypocaloric diet would elicit the greatest
mRNA transcriptional changes in skeletal muscle. Subsequently H0 was
accepted as no group difference in mRNA expression was observed. As
measured by the mRNA attained from the muscle-biopsies no group x time
difference were observed in any of the transcriptional mRNA markers of
mitochondrial biogenesis. However a pre-post time point difference was
observed in four mRNA markers in the PRO-ER group.
ii) It was hypothesised that no difference in body composition would be observed
between the groups matched for energy intake. In rejection H0 body
composition was impacted by the intervention. As measured by the DXA scan,
significant post intervention between group differences in body mass, fat mass
or lean mass were observed
iii) It was hypothesised that the high protein energy matched group would result in
an increase in resting metabolic rate. In support of H0, as measured by the
GEM, no change in RMR was observed in either group or time point.
P R O -E M P R O -E R C H O -E M C H O -E R
0 .6
0 .7
0 .8
0 .9
1 .0
RE
R
**

Page 138 of 253
This is the first acute dietary intervention study in healthy sedentary males to
demonstrate that increased dietary protein intake in a hypocaloric state positively
increased mRNA expression of PGC-1α, AMPK and SIRT1 + 3.
In a myoblast cell line it has previously been demonstrated that both calorie and
carbohydrate restriction independently increase transcriptional markers of
mitochondrial biogenesis. Following 36 hours incubation in a low glucose solution (5
mM) a > 2.5 fold increase in PGC-1α transcriptional activity was observed relative to
a high glucose solution (25 mM), additionally the same authors also demonstrated that
following a 20-hour fast, relative PGC-1α mRNA levels were increased > 2 fold,
suggesting positive activity in vitro of energy and glucose restriction independently
(Canto et al., 2010). However, in vivo results from the current study demonstrated no
change in mRNA expression in the PRO-EM (carbohydrate restriction) or CHO-ER
(energy restriction) groups, suggesting that acute (7-day) carbohydrate restriction and
energy restriction independently do not exert sufficient metabolic stress to elicit
metabolic changes at an mRNA level. Furthermore the results from this study showed
that subsequent to a continuous, hypocaloric high protein diet low carbohydrate (40%
protein (~ 2.5 g•kg-1•day1) and ~33 % energy deficit) a small, but significant, increase
in resting mRNA expression of AMPK, SIRT1, SIRT3 and PGC-1α in the vastus
lateralis muscle was observed. It is important to recognise that no group difference
were observed in this study, however a non-significant trend towards a group
difference in AMPK (p = 0.056) and PGC-1α (p = 0.063) gene expression was
observed, which suggests the study may have been slightly under powered. The
outputs of a post-hoc power calculation suggests an effect size of 1.12 and sample
size of each group being n = 18 which corroborates this. These results imply that, in
contrast to independent restriction, the combination of energy and carbohydrate
restriction may provided sufficient metabolic stress to cause skeletal muscle
adaptation in order to cope with the restricted energy availability and meet energy
demands.
These results are corroborated by similar studies investigating the impact of high fat
feedings on mitochondrial biogenesis (Canto et al., 2010, Draznin et al., 2012). It was
shown that five days on a hypocaloric HF/LC diet positively increased phosphorylation
of AMPK and deacetylation of PGC-1α, whereas the hypocaloric LF/HC diet negatively

Page 139 of 253
reduced the phosphorylation of AMPK and deacetylation of PGC-1α (Draznin et al.,
2012). These results, along with the findings from the current study suggest that high
carbohydrate intake prevents the activation of the AMPK-SIRT1 axis that is otherwise
observed in a hypocaloric state. Furthermore, and importantly the method of
carbohydrate restriction does not seem important, increasing both dietary fat and/or
protein result in similar up-regulation of metabolic markers of mitochondrial
biogenesis.
It is considered that weight loss strategies which result in maintenance of LM and
promote greater FM loss are preferential (Patti et al., 2003). It has previously been
demonstrated that ~70 % of weight lost, induced by a hypocaloric diet, is attributed to
FM and 30 % from LM (Weinheimer et al., 2010). Furthermore Layman et al. (2003).
reported increased FM loss and improved maintenance of lean mass in obese women
with increased protein intake (1.6 g•kg-1•day-1 vs. 0.8 g•kg-1•day-1). Within a healthy
non-obese male population the results from this study demonstrate similar findings.
Although there was no difference in body composition changes between energy-
matched groups, some further considerations can be drawn. When matched for
macronutrient ratio, but manipulating energy intake the CHO-ER group lost
significantly more LM than the CHO-EM group, however no difference in LM loss was
observed between the PRO-ER and PRO-EM. This suggests that when restricting
energy intake but maintaining macronutrient ratio a high protein low carbohydrate diet
provides a sparing effect on lean mass loss relative to a high carbohydrate energy
restricted diet. Similarly to the mRNA data, visually the body composition data
suggests a group difference in energy matched groups may exist, but the study may
not have powered enough to identify. The post-hoc power calculation for body
composition suggests an effect size of 0.95 and a sample size of n = 26 per group.
When looking as the four groups together the PRO-ER group had a higher protein
intake relative to the CHO-EM group (2.5 g•kg-1•day-1 vs. 1.0 g•kg-1•day-1) and
although the calorie intake of the PRO-ER group was ~33 % less than that of the CHO-
EM group (total deficit of ~7,000 kcal over the 7-day intervention) no change in LM
was observed between groups, further highlighting the key role for protein in LM
maintenance. The mechanism of this is still not fully defined. The dietary protein intake
of the CHO-EM group was greater than the current reference nutrient intake in the UK
for adults of 0.75 g•kg-1•day-1 (Foundation, 2015), however it has been demonstrated

Page 140 of 253
the proteolysis of skeletal muscle is suppressed when consuming ≥ 1.5 g•kg-1•day-1 of
protein (Piatti et al., 1994). The PRO-ER group consumed 2.5 g•kg-1•day-1 of protein,
significantly above this threshold.
With regards to weight loss, although non-significant, the results suggest a number of
trends which warrant further exploration. Suggesting that when consuming a
hypocaloric diet dietary protein intake could positively impact LM and FM loss. When
looking and components of BM lost while following the continuous hypocaloric diet
(~33% energy deficit) both groups (high protein, low carbohydrate and high
carbohydrate) lost a significant amount of LM, approximately 44% of total BM loss in
the PRO-ER group was attributed to LM loss compared to 56% in the CHO-ER group.
This was coupled with a greater percentage of FM loss in the PRO-ER group (56% vs.
44% respectively). As such, it may be assumed that the increased dietary protein
intake in the PRO-ER group (2.5 g•kg-1 vs. 0.6 g•kg-1) attenuated LM loss by ~12 %
relative to a hypocaloric diet low in protein. A recent meta-analysis (Wycherley et al.,
2012) investigating the role of dietary protein intake and long term body composition
changes (12 ± 9 weeks) concluded higher protein diets led to greater BM loss (-0.79
kg), FM loss (-0.87 kg) and preserved more LM (+0.43 kg) relative to lower protein
diets. Although over a shorter period, the body composition results from the
hypocaloric groups observed in this study followed the same trends with -0.35 kg BM,
-0.09 kg FM and +0.44 kg LM body composition changes observed. It has been
demonstrated that a positive curvilinear (r2 = 0.92) relationship exists between LM and
RMR (Weinsier et al., 1992), and RMR is known to decline during prolonged (> 9
months) periods of energy restriction (Heshka et al., 1990). The thermic effect of
macronutrients should also be considered, protein has a greater thermic effect
compared with the equivalent energy intake of fat or carbohydrate (Malik and Hu,
2007). However the acute nature of the intervention was not long enough the elicit
change in RMR and no time point difference or group interaction was observed in
RMR, thus it may be assumed that the duration of the study was not long enough to
elicit changes in RMR, as such metabolic rate is not impacted by such a short dietary
intervention.
A marked reduction in RER post intervention was observed in both ER groups;
however caution should be taken when drawing strong conclusions from this data. Pre

Page 141 of 253
intervention both ER groups had a higher RER (PRO-ER = 0.89, CHO-ER = 0.85,
PRO-EM = 0.83, CHO-EM = 0.83) and post intervention all groups had an RER of
0.79. Thus a greater relative change was observed pre-post intervention in the ER
groups, but no group interaction was apparent. In mice and subsequent to 8 weeks on
a hypocaloric diet a significant reduction in RER was observed compared to relative
to energy matched diets (Solon-Biet et al., 2015). Similar to the results from this study,
RER was reduced to the same level in the hypocaloric group’s independent of dietary
protein intake (5% vs. 33% vs. 60%). Solon-Biet et al. (2015) also reported a significant
reduction in RER in the eucaloric high protein group relative to the eucaloric high
protein diet, however this was not to the amplitude of the any of the hypocaloric diets.
This suggests that in an eucaloric state restricted carbohydrate (increased protein
intake) results in a reduction in RER, however calorie restriction has a greater
metabolic impact, independent on macronutrient ratio.
Interestingly this study raises further considerations for dietary prescription studies and
methods used to measure energy intake. The mean calorie intake calculated from 2 x
4 day food diaries for each participant in the PRO-EM and CHO-EM groups were 2,192
± 574 kcal•day-1 and 2,355 ± 527 kcal•day-1, respectively. However, mean calculated
energy intake from RMR X Activity Factor (AF) were 2,828 ± 331 kcal•day-1 and 2,881
± 213 kcal•day-1, a difference of 636 and 526 kcal•day-1, respectively. Despite
meticulous effort to match the dietary intake of the PRO-EM and CHO-EM to energy
expenditure the results demonstrated a small reduction in BM in both group (0.74 kg
and 1.1 kg respectively), as such dietary prescription was slightly underestimated.
Despite this, habitual diet, as recorded using estimated household measures, under
predicted energy intake calculated using RMR x PA by ~20%, a similar figure to
previous findings in athletes (Magkos and Yannakoulia, 2003) (~28 %) and sedentary
participants (Stockley, 1985) (~20%).
6.5 Conclusions
Mitochondrial quantity and density have been linked with increased endurance
performance (Psilander et al., 2013) and a reduction in type 2 diabetes (Lee et al.,
1998, De Feyter et al., 2008, Patti et al., 2003, Petersen et al., 2004, Mootha et al.,

Page 142 of 253
2003). Also, it is suggested that dietary strategies that maintain LM are preferential.
This is the first study to demonstrate the impact of increased protein intake in a
hypocaloric diet on metabolic adaptation. The results from this study demonstrated
that a 7-day a high protein hypocaloric diet resulted in increased AMPK, SIRT1, SIRT3
and PGC-1α mRNA expression at rest, all of which are upstream markers of
mitochondrial biogenesis, however no between group effect was observed.
Additionally when maintaining macronutrient ratio and reducing energy intake, a high
protein diet attenuated LM loss greater than a high carbohydrate diet. Visual trends
suggest that a high protein, hypocaloric diet is preferential to a high carbohydrate,
hypocaloric diet with respect to cellular markers of fat metabolism and mitochondrial
biogenesis, also the maintenance of lean mass, however post-hoc power calculations
suggest the study was underpowered to identify the true difference. Further larger
studies are required to investigate this further, additionally future research is needed
to understand the long-term impact of a high protein hypocaloric diet on markers of
mitochondrial biogenesis and body composition.
6.6 Limitations.
The study was over a fixed acute period of time of 7-days and demonstrated a
metabolic effect. Measurements were collected pre and post; as such the time
course of the observed changes cannot be defined from these results. More
research is required to define the speed and amplitude of the changes
observed.
Participants were not observed throughout the trial. Every effort was made to
provide diets matched to the intervention requirements, but the participants
were not monitored daily throughout the trial. Thus assumptions have to be
made that dietary adherence was followed.
It has previously been demonstrated that increased mRNA expression
(measured in this study) is associated with increased acetylation and
phosphorylation of the genes, however due to the muscle sampling technique
this was not able to be measured.
The transcriptional mRNA measured in this study are upstream markers of
adaptation, they demonstrate the potential to adapt. Adaptation per se was not
directly assessed.

Page 143 of 253
6.7 Future research and next experimental Chapter
The results have demonstrated that increasing metabolic stress by calorie and
carbohydrate restriction positively promotes AMPK, SIRT1 and PGC-1α mRNA
expression, all of which are metabolic markers of mitochondrial biogenesis. It has
previously been demonstrated that endurance exercise is also a potent stimulator of
such genes. However in vivo the combination of a high protein diet and endurance
training is yet to be fully quantified, investigating this help provide further
understanding of the mechanisms and stimulators of mitochondrial biogenesis in vivo.

Page 144 of 253
7 THE IMPACT OF A 7-DAY HIGH PROTEIN
DIET ON CELLULAR ADAPTATION,
SUBSTRATE UTILISATION AND
ENDURANCE RUNNING PERFORMANCE
IN WELL-TRAINED RUNNERS.

Page 145 of 253
Background: It has been demonstrated that transcriptional markers of mitochondrial
biogenesis are sensitive to calorie restriction and a high protein low carbohydrate diet
(HP/LC). The aim of this experimental Chapter was to explore the impact of a HP/LC
diet in combination with endurance training on skeletal muscle metabolic adaptation,
substrate utilisation and exercise performance. Method: In a parallel groups repeated
measures study 16 well trained endurance runners (VO2max = 64.2 ± 5.6 mL•kg-1•min-
1) were randomised into two groups: High protein low carbohydrate (PRO) or a high
carbohydrate low protein (CHO). Participants completed 3 performance trials each
separated by 7 days, visit 1 after habitual diet, visit 2 after intervention diet and visit 3
after habitual diet. Each visit a resting muscle biopsy was collected followed by a 10
km steady state (SS) run and a time to exhaustion (TTE) trial at 95% vVO2max.
Results: A significant increase in AMPK (1.44 and 1.57 fold increase) and PPAR (1.32
and 1.29 fold increase) mRNA expression was observed post intervention and
remained elevated in the CHO group. AMPK (1.37 fold increase) was elevated post
intervention in the PRO group which returned to baseline levels subsequently.
Following the intervention diet the PRO group exhibited a 101 % increase in fat
oxidation and 27 % decrease in carbohydrate oxidation during the 10 km SS run (p <
0.001), no change was observed in oxidation rates in the CHO group. A significant
decrease in TTE was observed subsequent to the PRO intervention (-23.3%, p =
0.0003), no change was observed in the CHO group (6.5%, p = 0.051). Conclusion:
A 7-day high protein diet significantly increases sub-maximal fat oxidation, this change
was reverted back to pre-levels once returned to habitual diet for 7 day. The CHO
group promoted the greatest positive changes in mRNA transcriptional markers,
however only small changes were observed. The PRO diet significantly compromised
the ability to complete high intensity running.

Page 146 of 253
7.1 Introduction
Athletes cannot train indefinitely. Implementing an intervention which increases the
metabolic stress of a training session, potentially leading to enhanced adaption and
improving subsequent exercise performance can be attractive to an athlete (Holloszy
and Coyle, 1984). It is established that endogenous carbohydrate stores are only
sufficient to fuel ~3 hours of sub-maximal exercise performance (Burke and Hawley,
2002), whereas fat stores can provide enough fuel for multiple days of low intensity
activity (Rapoport, 2010). Numerous studies have demonstrated that improving
exercise efficiency and sparing muscle glycogen can enhance endurance
performance (Coyle et al., 1986), additionally it has been shown that well-trained
athletes have a greater ability to oxidise fat during prolonged moderate-intensity
exercise (1986). There is evidence showing that a high fat, low carbohydrate diet, in
combination with endurance training, enhances sub-maximal fat oxidation (Miller et
al., 1984, Lambert et al., 1994, Goedecke et al., 1999, Burke, 2015). However the
optimal dietary manipulation strategy to enhance metabolic adaptation has not yet
been defined, and more importantly for athletes, the impact this has on high intensity
performance is inconclusive (Hawley and Morton, 2014).
With respect to altitude training it is established that the benefits attained through
training in hypoxic conditions are exhausted within 14–21 days return to sea level
(Chapman et al., 2014). Within the current area of research, the primary aims of the
studies were focused on performance immediately post an acute low carbohydrate
diet. The longer term impact of continuous restricted carbohydrate intake on substrate
utilisation, metabolic adaptation and performance are yet to be fully quantified, and
importantly the effect of returning back to habitual dietary on such markers is not fully
understood.
Mitochondrial density and abundance has been linked to improved aerobic capacity,
energy metabolism and endurance performance all of which are desired adaptations
from endurance training (Hawley and Morton, 2014). This is discussed in detail in
Chapter 2.2.2 but briefly, it is fairly well established that a series of transcriptional
genes play an essential role in the activation of mitochondrial biogenesis and fatty acid
oxidation, including AMPK, SIRT1, PPAR and the master regulator PGC-1α

Page 147 of 253
(Ruderman et al., 2010). A substantial body of evidence has demonstrated that SIRT1
and AMPK both respond to increases in energy expenditure and reduced
carbohydrate availability and it has been suggested that increased dietary
carbohydrate intake prevents the activation of the AMPK-SIRT1 axis in skeletal muscle
(Draznin et al., 2012). As discussed earlier (Chapter 2.3.1) it was previously accepted
that high fat, low carbohydrate diets induce favorable shifts in substrate utilisation,
promoting greater fat oxidation, but subsequent high intensity exercise performance
is not enhanced and may be compromised (Burke and Hawley, 2002). However the
discovery of PGC-1α and the mechanistic understanding developed over the last 10
years has provided a platform to develop new strategies which lead to increased
transcriptional markers of mitochondrial biogenesis, fatty acid oxidation and potentially
exercise performance (Hawley and Morton, 2014).
The results in the previous experimental Chapter of this thesis demonstrated that a
high protein, hypocaloric diet significantly increased the expression of AMPK, PPAR
and PGC-1α at rest. This response was blunted in the high carbohydrate and eucaloric
groups suggesting that carbohydrate and energy availability blunt the metabolic
response. Similar results were observed by Draznin et al. (2012) when feeding a high
fat diet. Increased protein feedings have also been demonstrated to increase the fat
to lean mass ratio during weight loss (Layman et al., 2003), a favorable adaptation for
endurance runners. Carbohydrate restriction is generally achieved from increased
dietary fat intake and it is common for these diets to be poorly tolerated (Bartlett et al.,
2015), the impact of increased protein as a method to restrict carbohydrate intake
during endurance performance is yet to be fully explored. As such the aims of this
experimental Chapter were to investigate the impact of a high protein diet, in
combination with endurance training, on cellular, metabolic and performance markers
during sub-maximal and maximal running performance, and also to investigate the
impact of returning to a habitual diet on any observed adaptations/changes.
7.1.1 Aims and Objectives
There are two primary aims from this phase of research:
Page 148 of 253
To investigate the impact of a 7-day high protein or high carbohydrate diet, in
combination with endurance training, on skeletal muscle adaptation, substrate
utilisation and running exercise performance.
To observe the response of returning back to habitual dietary intake following
a 7-day high protein or high carbohydrate diet on skeletal muscle adaptation,
substrate utilisation and exercise performance
The following hypotheses have been made for this body of research:
i) (H1) A 7-day high protein, low carbohydrate diet, in combination with endurance
training, will promote positive cellular transcriptional adaptation to a greater
extent than a high carbohydrate, low protein diet.
(H0) No between group differences in cellular transcriptional response will be
apparent.
ii) (H2) A 7-day high protein, low carbohydrate diet, in combination with endurance
training will significantly increase sub-maximal fat utilisation.
(H0) No time point or between group differences in sub maximal substrate
utilisation will be apparent.
iii) (H3) 7-days consuming a high protein low, carbohydrate diet will result in a
decrease in high-intensity exercise performance.
(H0) No time point differences in maximal exercise performance will be
apparent.
iv) (H4) Adaptations occurring subsequent to consuming a high protein will be
maintained once reverted back to habitual dietary intake.
(H0) No observed adaptations will remain subsequent to returning to habitual
diet for 7-days.
7.2 Method
7.2.1 Participants
Twenty healthy males volunteered to participate in the study, with sixteen completing
(mean ± SD: age; 26.3 ± 4.5 years, body mass; 68.6 ± 4.5 kg, height; 180.4 ± 5.2 cm,
VO2max; 64.2 ± 5.6 mL•kg-1•min-1). Two participants dropped out due to injury, one
dropped out as a result of illness and one was unable to start the second trial following
7-days on the high protein diet. Participants were screened via telephone against pre-
determined criteria to ensure the inclusion criteria were met and were free from any
medical condition that would preclude their participant in the study. Participants could

Page 149 of 253
not be following a restrictive dietary regime or suffer from any food allergies or
intolerances. Participants must have run 10 km under 38 minutes or 5 km under 18
minutes in the past 12 months, with a running history > 2 years, training ≥ 4 times per
week with no significant change in training load or body mass in the previous 3 months.
The experimental procedures and potential risks associated with the study were
explained. Written informed consent was attained prior to the start of the study. The
study was approved by the University of Hertfordshire Life and Medical Sciences
Ethics Committee, protocol number LMS/PGR/UH/02227.
7.2.2 Study Protocol
In a randomised, experimenter-blinded, parallel groups, repeated-measures study
design, participants were assigned to one of two groups (Table 7.2.1); either energy
matched high protein (PRO) or energy matched high carbohydrate (CHO) (Table
7.2.2). The participants were not informed of group allocation, however due to the
nature of dietary intervention studies it was not possible to blind food items. The
participants attended the laboratory on four separate occasions, each separated by 7-
days (Figure 7.2.1). Visit 1 was for familiarisation. Between visits 1 and 2 participants
remained on their habitual diet and stable training programme, between visits 2 and
visit 3 participants consumed the prescribed intervention diet and between visits 3 and
4 participants returned to their habitual diet. The participants were requested to
complete the same training sessions each week throughout the duration of the study
and rest the day prior to each visit. All experimental procedures were completed in the
same order at the same time of the day.
Table 7.2.1 Group characteristics.
Group Height (cm)
Weight (kg)
Absolute VO2max (L•min-1)
PRO 179.4 ± 6.4 69.5 ± 3.3 4.38 ± 0.35
CHO 181.6 ± 3.5 67.6 ± 6.1 4.39 ± 0.28

Page 150 of 253
Table 7.2.2. Prescribed macronutrient ratio for the intervention diets.
Carbohydrate
(%)
Protein
(%)
Fat
(%)
PRO (n= 8) 30 40 30
CHO (n = 8) 60 10 30
PRO = Energy matched high protein diet, CHO = Energy matched high carbohydrate
diet.
Figure 7.2.1. Schematic of study design.
Inclusion criteria: Male aged between 18 – 35 years and has a 10 km running time ≤
38 minutes or 5 km running time ≤ 18 minutes which has been achieved in the last 48
months, is currently training ≥ 4 times per week and has no major training disruption
in the preceding 3 months. Participants must be in good general health with no
identified chronic illness and currently free from cold, flu or any musculoskeletal injury.
Exclusion criteria: If any medication has been taken within 14 days of the study start
or any regular use of over the counter herbal medication (occasional dosages of
paracetamol for pain relief is permitted). If currently following a restrictive dietary
regime which excludes any food groups (e.g. Vegan, Vegetarian), or if the participant
is aware of any food allergies. If consuming any nutrition supplements (or unwilling to
Visit 1 Familiarisation
Day 1
Visit 2 Pre
Day 8
Visit 3 Post
Day 15
Visit 4 End
Day 22
LT test VO2max
5 km 95 % max
effort
Biopsy 10 km
95 % max
effort
Biopsy 10 km
95 % max
effort
Biopsy 10 km
95 % max
effort
Habitual diet Habitual training
Intervention diet Habitual training
Habitual diet Habitual training

Page 151 of 253
abstain from taking during the study), or on medication (beta-blockers, NSAID’s or
recreational drugs).
7.2.3 Experimental protocol.
Following a 4-hour (minimum) fast, participants arrived at the laboratory at the same
time of day for each visit. Participants were advised to arrive at the laboratory using
the same mode of transport and requested to refrain from morning physical exertion.
Upon arrival a body composition (DXA scan) assessment was undertaken, followed
by a micro muscle-biopsy. Participants then completed a 10km run at 75% VO2max,
had five minutes rest, then completed a time to exhaustion (TTE) running trial at 95%
vVO2max. All exercise testing was performed in the same temperature controlled room
(20oC; 35% humidity), on the same treadmill, using the same online gas analyser (refer
to Chapter 3.7 and 3.8 for the calibration and reliability data of the online gas analyser
and the treadmill).
7.2.4 Familiarisation:
Following the study briefing and paperwork completion, participants were shown the
DXA scanner and the scanning protocol was described to them. Participants then
changed into running clothing. A resting whole blood capillary sample was collected
from the finger and height and weight were recorded. The participant then completed
a standardised 5-minute warm up at a running speed of 9 km•h-1. If desired the
participant completed self-directed stretching. Participants were fitted with a HR belt
(Polar T31 Coded, Polar Electro Ltd, Warwick, UK) and face mask and the
corresponding participant details were entered in to MetaSoft® Studio software
(Cortex, Leipzig, Germany). Via the face mask, respiratory data was collected using a
breath by breath online gas analyser (Metalyzer 3B (Cortex, Leipzig, Germany). All
testing was completed on one treadmill (Cosmed T170, Cosmed, Rome, Italy), which
was not moved throughout the experimental period. Fan cooling was provided
throughout all testing; a floor fan was positioned on the floor in front of the treadmill at
a 45° angle and set to an air speed of ~5.8 m•s-1. The same lactate threshold protocol

Page 152 of 253
was used for all participants: the treadmill was set to a 1% gradient and belt speed set
at 11 km•h-1, participants straddled the belt and once up to speed started to run on the
treadmill. Stage increments of 1 km•h-1 were used and each stage lasted 4 minutes.
Expired gas and HR were collected throughout, rating of perceived exertion (RPE)
(Borg, 1970) was collected at 3 minutes into each stage, at 3 minutes 30 seconds
participants were requested to straddle the belt and a finger prick capillary blood
sample was taken. After collection participants started running again and the next
stage commenced. The capillary blood sample was analysed immediately using an
EKF Biosen C line (EFK, Barleben, Germany) (refer to Chapter 3.9 for details),
cessation of the LT test occurred when blood lactate had reached > 4 mmol•L-1 and
or > 3 mmol•L-1 above resting blood lactate. A standardised 10 minutes rest between
the LT and VO2max test followed.
The protocol for the VO2max test was the same for all participants. The treadmill was
set to a 1% gradient, the participant was re-fitted with the HR belt and face mask. The
test started at 12 km•h-1 and increased at a gradual velocity of 1 km•h-1 every minute,
the test protocol was programmed in to MetaSoft® Studio and controlled automatically.
Expired gas and HR was collected throughout. Cessation of the test occurred upon
volitional fatigue. Verbal encouragement was allowed throughout. Using the
MetaSoft® Studio software the data output was selected to provide a 60 second rolling
average of the VO2 (L•min-1) values. The highest 60 second rolling average was
selected and calculated to a relative VO2max (mL•kg-1•min-1) for the participant:
VO2max (mL•kg-1•min-1) = (VO2 (L•min-1) x 1000) / Body mass (kg)
Participants had 20 minutes recovery, during this period ad-lib water consumption was
permitted. Following this rest period a 5 km steady state (SS) familiarisation run at
70% vVO2max (~75% VO2max) was completed under the same conditions as the 10
km SS exercise trial detailed below (Chapter 7.2.8.3). Once completed, participants
had 5 minutes recovery then completed a maximal sustainable effort at 95 % vVO2max
following the protocol detailed below (Chapter 7.2.8.4). Prior to departure participants
were provided with a food dairy (refer to Chapter 3.1) and a GPS watch (Garmin Vivo
Page 153 of 253
Active, Garmin Ltd, Schaffhausen, Switzerland) to log dietary intake and training
volume.
7.2.5 Running Training
It was important that any observed changes were due to the intervention diet and not
a deliberate change in training volume; as such training volume was controlled each
training week. Participants were requested to keep to the same weekly training
programme throughout the 3-week study and were requested to replicate, as closely
as possible, each training session on the same day and time each week, logging all
training sessions with the GPS watch provided. The training sessions were
automatically uploaded online (Garmin Connect, Garmin Ltd, Schaffhausen,
Switzerland) for the investigative team to monitor and download for later analysis.
7.2.6 Habitual Dietary Intake.
A 4-day food record using estimated household measures was used to collect habitual
dietary intake prior to the first and third testing sessions. Refer to Chapter 3.1 for
details describing the diet log process. Participants were requested to record dietary
intake on three week days and one weekend day between visit 1 and visit 2, repeating
this again between visit 3 and visit 4.
7.2.7 Intervention Dietary prescription
Individual calorie intake for the intervention diet was calculated using basal metabolic
rate (BMR) multiplied by a physical activity factor (PAF). The Henry (2005) equation
used to calculate BMR:
“BMR = 14.4 x weight (kg) + 313 x height (m) + 113”
PAF was calculated depended on occupational and exercise level using a modified
Harris and Benedict (1918) (Nutritics) equation:

Page 154 of 253
“PAL = (0.66 x occupational factor) + (1.33 x exercise factor)
Table 7.2.3. Occupational and exercise physical activity multiplication factors.
Occupation
level
Multiplication
factor
Exercise
level
Multiplication
factor
Sedentary 1.2 Light 1.375
Lightly 1.375 Moderate 1.55
Moderately 1.55 Very 1.725
Very 1.725 Extra 1.9
Extremely 1.9
Unless training twice a day the participant was deemed to be ‘Very’ active, if training
twice a day ‘Extra’ active was selected. Occupational multiplication factor was selected
through a series of work related questions. The calculated required energy intake was
then used to prescribe dietary intake as described in Chapter 3.3. As demonstrated in
the results in experimental Chapter 6, calculating and matching energy intake to
energy expenditure is challenging. It was important that the participants were not in a
negative energy balance for this study, therefore in addition to the calculated diet
intake, a further 500 kcal•day-1 macronutrient-matched meal was provided.
Participants were briefed that this was only to be consumed if hungry after consuming
the standard diet and were required to document if this additional meal was consumed.
Participants were required to refrain from consuming any additional food and
requested to drink water or drinks free from caffeine or additional energy.
Table 7.2.4. Calculated mean dietary intake and macro nutrient breakdown for each group during the 7-day intervention.
Group
Dietary intake (kcal•day-
1)
CHO (•day-1) PRO (•day-1) FAT (•day-1)
g g•kg-1 g g•kg-1 g g•kg-1
PRO 3185 ± 237 239 ± 18 3.4 ± 0.3 319 ± 24 4.6 ± 0.3
106 ± 8 1.5 ± 0.1
CHO 3281 ± 195 492 ± 29 7.3 ± 0.4 82 ± 5 1.2 ± 0.1
109 ± 7 1.5 ± 0.1

Page 155 of 253
Prescribed dietary intake (kcal•day-1, mean ± SD) and macronutrient breakdown for the prescribed intervention diets for both groups.
7.2.8 Testing visit:
7.2.8.1 Body composition assessment: Dual energy x-ray absorptiometry (DXA)
scan.
Body composition was measured using a DXA scanner; refer to Chapter 3.6 for
descriptions of the procedure.
7.2.8.2 Micro Muscle-Biopsy
Muscle tissue was attained using the micro muscle biopsy technique; refer to Chapter
3.4 for details describing the procedure.
7.2.8.3 10 km steady state treadmill run
Following a resting capillary blood sample, participants completed a standardised
warm-up consisting of a 5 minutes jog at 10 km•h-1 on the treadmill, followed by self-
directed stretching. A facemask (attached to the online gas analyser) was fitted and
stayed on throughout the trial. Participants were asked to straddle the treadmill and
the belt speed was set to the intensity representative of 75% VO2max (as calculated
from the familiarisation session). Once the treadmill belt was up to speed participants,
whilst holding on to the treadmill arms, stepped onto the belt and began running. As
soon as the participants let go of the treadmill arms the time was noted and the sub-
maximal exercise trial started. Participants had minimal visual or audible stimulus
throughout the trial. After each kilometer was completed the same words were
repeated to the participant: “Well done that is another kilometer completed, ‘X’ to go”,
a capillary blood sample and RPE were then collected. Participants were also informed
of the distance completed at 9,500 meters. At 9,850 meters the final capillary blood
sample and RPE were collected. As soon as the 10 kilometer run was completed

Page 156 of 253
participants held onto the arms of the treadmill, and straddled the belt. A stopwatch
was started immediately to time 5-minute recovery. The facemask was removed and
participants stepped off the treadmill (participants were permitted to walk and go to the
toilet if required during the recovery).
7.2.8.4 95% maximal sustainable effort (MaxSE).
As a means to justify the use of MaxSE as a measure of endurance performance. In
the London 2012 men’s 800 meter Olympic final 1.16 seconds separated the 8 runners
after 400 meters, with the leader going through in 49.28 seconds, a second lap of
51.63 seconds by the winner resulted in a world record time. The remaining field who
all ran, or were close to personal bests were separated by 2.86 seconds; the athletes
that slowed the least won. As with this example most middle distance running events
can be described as a maximal sustainable effort, as such the maximal sustainable
effort is a fair assessment of high intensity running performance.
The treadmill belt was set to 95% vVO2max (as calculated from the familiarisation
session), participants straddled the belt and the face mask was fitted again. Once the
5 minutes recovery was up participants supported their weight on the arms of the
treadmill and started running on the belt. Once up to speed participants let go and the
stopwatch was started to record the duration of the effort. No verbal or audible
encouragement was permitted throughout the trial. Participants ran until volitional
fatigue, once reached participants straddled the treadmill. The stopwatch was stopped
as soon as the participant reached out for the treadmill arms to support their weight.
Immediately upon volitional fatigue a final capillary blood sample was collected. The
same investigator timed all MaxSE efforts throughout the study. The coefficient of
variation (CV) of the MaxSE trial used in this study from 8 participants over two trials,
separated by 14-days, was 5.6%.

Page 157 of 253
7.2.9 Analysis
7.2.10 Calculation of contribution of energy expenditure
The aerobic and anaerobic contributions towards the energy expenditure of the
exercise trial were calculated using the following equations from Hill (1999):
“Energy cost of running = (Aerobic O2 + 2.3) + (PCr contribution) + (glycolytic
contribution)”
Aerobic O2 = Total O2 consumption mL•kg-1
PCr contribution = 37 mL O2•kg-1 muscle mass-1
Glycolytic contribution = 3 mL•kg body mass-1 per mmol•L-1 increase in lactate
above resting.
Muscle mass was calculated using the equations from Kim et al. (2002), the method
states an r value of 0.97 compared to magnetic resonance imaging (MRI) and report
a mean standard error of estimate of 1.63 kg.
“Total body skeletal muscle mass (SMM) (kg) = (1.13 x ALST) – 0.02 x age) + (0.61
x sex) + 0.97”
ALST = Total lean tissue of both right and left arms and legs (As quantified by DXA
scan, describe in Chapter 3.6). Sex: Female = 0, Male = 1
For example, the measured values for the MaxSE trial on visit 1 for participant 008:
Weight (kg) = 73.3
SMM (kg) = 35.2
Total oxygen consumption (mL•kg-1) = 134.4
Resting lactate (mmol•L-1) = 1.2
Max lactate mmol•L-1) = 8.4

Page 158 of 253
Therefore the total cost of running and subsequent aerobic and anaerobic components
are:
Energy cost of running = (134.4 + 2.3) + (37 x 35.2/73.3) + ((8.4 – 1.2) x 3) = 176.2
mL O2•kg-1 (77.6% aerobic and 22.4% anaerobic).
7.2.11 Quantitative PCR (qPCR) preparation and analysis.
Refer to Chapter 3.5 for the description of RNA isolation, reverse transcription, qPCR
analysis and the application efficiency techniques used in this study.
7.2.12 Data analysis of the qPCR assays
The muscle biopsy qPCR raw Cp values were exported and normalised to the
housekeeper gene (GAPDH) using an analysis of covariance method. Relative fold
change in expression levels over testing visit one were then calculated using 2-ΔΔCT
method.
7.2.13 Statistical analysis.
Kolmogorov-Smirnov tests of normality to assess the null hypothesis that data for
within-subjects analysis was normally distributed. However it should be noted that the
ANOVA procedure is robust to slight violations of normality within a dataset (Field,
2013). Mauchly’s sphericity test was used to assess the assumption of sphericity
within repeated-measures effects. Unless stated otherwise Mauchly’s test was
insignificant (p > 0.05), therefore the assumption of sphericity was accepted.
Group and time point effects were assessed using a two factorial mixed design
ANOVA (4 groups, 2 time points) with dietary intake (between) and time point (within)
as the main variables. To determine the location of the time point differences and
group interactions a Bonferroni post hoc test was used. Statistical significance was set

Page 159 of 253
at p ≤ 0.05. Statistical analysis was conducted using the statistical package for the
Social Science software program (SPSS; version 22, IBM, Armonk, NY). Data
presented as mean ± SEMs (unless stated).
7.3 Results
No group difference was observed in total training distance each week (p = 0.83), nor
were there any significant difference across any time points. However a trend towards
a reduction in average running speed was observed between week 1 and week 2 in
the PRO group (Table 7.3.1). In week 1 the mean speed of the training runs was 14.7
km•h-1 which decreased to 13.8 km•h-1 following the high protein intervention diet, and
increased back to 14.2 km•h-1 once reverted back to habitual diet.
Table 7.3.1. Running distance and speed during each week of training throughout the duration of the study.
Week 1 Week 2 Week 3
Distance (km)
Average pace
(km•h-1)
Distance (km)
Average pace
(km•h-1)
Distance (km)
Average pace
(km•h-1)
PRO 51 ± 26 14.7 ± 1.7 51 ± 28 13.8 ± 1.5 50 ± 28 14.2 ± 1.3 CHO 62 ± 20 13.9 ± 0.8 64 ± 24 14.1 ± 1.4 65 ± 22 13.9 ± 0.9
No change was observed in the resting mRNA content of PGC-1α, SIRT1 and SIRT3
at either time point in either group (Figure 7.3.1 A, C and D). However a 7-day high
carbohydrate diet resulted in a significant increase in resting AMPK mRNA expression
(1.44 fold increase relative to TP1, p < 0.05), the elevated mRNA expression was
maintained at TP3 (1.57 fold increase relative to TP1, p < 0.05) (Figure 7.3.1 B). The
PRO group exhibited a similar significant increase in AMPK mRNA expression
following the intervention diet (1.37 fold increase relative to TP1, p < 0.05); however
by TP3 it had returned back to TP1 levels. Within the CHO group the same trend
observed in AMPK was apparent for PPAR resting mRNA expression, with a 1.32 and
1.29 fold increase at TP2 and TP3 (p < 0.05) relative to TP1 respectively. No time
point interaction in PPAR was observed in the PRO group (Figure 7.3.1 E).

Page 160 of 253
Table 7.3.2. Habitual dietary intake during the study weeks with no dietary intervention (mean ± SD and percentage (%) of total energy intake).
Group Daily calorie intake
(kcal•day-1)
Carbohydrate Protein Fat
grams % grams % grams %
Week 1 PRO 2382 ± 895 292 50 119 20 78 30
CHO 2683 ± 471 352 49 129 19 102 32
Week 3 PRO 2419 ± 1041 300 49 120 20 90 31
CHO 2648 ± 461 319 48 116 18 105 34
The relative running intensity during the 10 km SS run was 75.6 ± 2.6 % VO2max, no
difference between groups was observed (PRO = 76.4 ± 3.2% and CHO = 74.7 ± 2.4%
VO2max). No difference in carbohydrate and fat oxidation was observed at any time
point during the 10 km SS trial across all three trials in the CHO group (Figure 7.3.2 B
and D). Whereas at time point 2 (following the intervention diet) a significant change
(p < 0.0001) in substrate utilisation was exhibited in the PRO group (Figure 7.3.2 A
and C). Mean fat oxidation increased from 0.29 ± 0.05 to 0.59 ± 0.05 g•min-1, an
increase of 101% relative to trial 1 (Figure 7.3.2 A). Additionally at time point 2, a
significant (p < 0.001) decrease of 27% (2.96 ± 0.18 to 2.15 ± 0.19 g•min-1) was
observed in carbohydrate oxidation. Both fat and carbohydrate oxidation returned to
pre intervention levels once reverted back to habitual dietary intake (Figure 7.3.2 A
and C).

Page 161 of 253
A) PGC-1α B) AMPK
T P 1 T P 2 T P 3
0 .0
0 .5
1 .0
1 .5
T im e p o in t
Fo
ld c
ha
ng
e
P R O C H O
T P 1 T P 2 T P 3
0 .0
0 .5
1 .0
1 .5
2 .0
T im e p o in t
Fo
ld c
ha
ng
e
P R O C H O
*#
*
C) SIRT1 D) SIRT3
T P 1 T P 2 T P 3
0 .0
0 .5
1 .0
1 .5
2 .0
T im e p o in t
Fo
ld c
ha
ng
e
P R O C H O
T P 1 T P 2 T P 3
0 .0
0 .5
1 .0
1 .5
2 .0
T im e p o in t
Fo
ld c
ha
ng
e
P R O C H O
E) PPAR
T P 1 T P 2 T P 3
0 .0
0 .5
1 .0
1 .5
2 .0
T im e p o in t
Fo
ld c
ha
ng
e
P R O C H O
* *
Figure 7.3.1.mRNA response (fold change from pre) to 7 day dietary intervention in combination with endurance training.
TP1 and TP3 are subsequent to 7 days habitual diet, TP2 is subsequent to either a high carbohydrate (CHO) or high protein (PRO) intervention diet. mRNA expression of PGC-1α (A), AMPK (B), SIRT1 (C), SIRT3 (D) and PPAR (E).* Denotes significantly different from TP1 (p < 0.05), (mean ± SEM).

Page 162 of 253
A) B)
C) D)
Figure 7.3.2. Substrate oxidation rates during a 10 km steady state (~75% VO2max) treadmill run at three time points.
The data demonstrated at TP1 and TP3 are subsequent to 7 days habitual diet, the data for TP2 is subsequent to 7-days intervention (high carbohydrate (CHO) or high protein (PRO)). Carbohydrate oxidation (g•min-1) in the high protein group (A), carbohydrate oxidation in the high carbohydrate group (B), fat oxidation in the high protein group (C) and fat oxidation in the high carbohydrate group (D). * Denotes significant difference compared to both TP1 and TP3 (p < 0.05) (mean ± SEM).
0 1 2 3 4 5 6 7 8 9 1 0
0 .0 0
1 .0 0
2 .0 0
3 .0 0
4 .0 0
D is ta n c e (k m )
CH
O o
xid
ati
on
(g
.min
-1)
P R O T P 1 P R O T P 2 P R O T P 3
* *
*
* * ** * * *
0 1 2 3 4 5 6 7 8 9 1 0
0 .0 0
1 .0 0
2 .0 0
3 .0 0
4 .0 0
D is ta n c e (k m )
CH
O o
xid
ati
on
(g
.min
-1)
C H O T P 1 C H O T P 2 C H O T P 3
0 1 2 3 4 5 6 7 8 9 1 0
0 .0
0 .2
0 .4
0 .6
0 .8
D is ta n c e (k m )
FA
T o
xid
ati
on
(g
.min
-1)
P R O T P 1 P R O T P 2 P R O T P 3
**
*
** *
* * * *
0 1 2 3 4 5 6 7 8 9 1 0
0 .0
0 .2
0 .4
0 .6
0 .8
D is ta n c e (k m )
FA
T o
xid
ati
on
(g
.min
-1)
C H O T P 1 C H O T P 2 C H O T P 3

Page 163 of 253
The results of the 95% MaxSE trial demonstrated a non-significant (p = 0.051)
increase of 6.5% in TTE at TP2 in the CHO group with 7 of the 8 participants improving
TTE relative to TP1 (Figure 7.3.3 B), this was returned to pre intervention levels at
TP3 (182.2 ± 44.4 vs. 184 ± 45.5 vs. 184 ± 38.9 seconds). On the contrary, TTE was
significantly reduced in the PRO group and at TP2 (-23.3%, p = 0.0003) following the
dietary intervention and all 8 participants exhibited a decrease in TTE (Figure 7.3.3 A),
upon returning to habitual diet TTE returned to TP1 performance (128.3 ± 29.3 vs.
98.4 ± 31.8 vs.125.3 ± 32.39 seconds) (Figure 7.3.3 A).
T P 1 T P 2 T P 3
-6 0
-4 0
-2 0
0
2 0
T im e p o in t P R O g ro u p
Ch
an
ge
fro
m p
re
(%
) 1
2
3
4
5
6
7
8
*
T P 1 T P 2 T P 3
-6 0
-4 0
-2 0
0
2 0
T im e p o in t C H O g ro u p
Ch
an
ge
fro
m p
re
(%
) 9
10
11
12
13
14
15
16
Figure 7.3.3. Mean (bar) and individual (line) relative change (%) from pre intervention maximal sustainable effort.
TTE from a 95% MaxSE trial. TP1 and TP3 are subsequent to 7 days habitual diet, TP2 is subsequent to either a high protein (A) or high carbohydrate (B) intervention diet.* = significant difference (p < 0.05) compared to TP1.
A)
B)

Page 164 of 253
Dietary intake was calculated to match energy expenditure. No significant time point
differences were observed in body mass, lean mass or fat mass in either group (Figure
7.3.4 A, B and C), demonstrating energy intake matched energy expenditure during
both the dietary intervention and habitual intake weeks.
With regards to RPE, blood lactate and blood glucose, no time point difference was
observed during 10 km SS trial in the CHO group (Figure 7.3.5 A – F). Resting blood
glucose was significantly (p < 0.05) lower in the PRO group following the intervention
diet compared to both time point 1 and 3, this was the only difference observed (4.1 ±
0.4 vs. 4.7 ± 0.6 and 4.9 ± 0.7 mmol•L-1). No change in body composition was
observed in either group throughout the trial (Figure 7.3.4 A – C).
A) BM B) LM
P R O C H O
0
1 0
6 0
6 5
7 0
7 5
BM
(k
g)
T P1 T P2 T P3 TP 1 T P2 T P3
P R O C H O
0
1 0
5 0
5 5
6 0
6 5
LM
(k
g)
T P1 T P2 T P3 TP 1 T P2 T P3
C) FM
P R O C H O
0
5
1 0
1 5
FM
(k
g)
T P1 T P2 T P3 TP 1 T P2 T P3
Figure 7.3.4. Body composition changes subsequent to dietary intervention.
Body composition; body mass (BM) (A), lean mass (LM) (B) and lat mass (FM) (C) following either 7-days habitual diet (TP1 and TP3) and 7-days intervention diet (high carbohydrate (CHO) or a high protein (PRO)) (TP2).

Page 165 of 253
A) PRO B) CHO
1 2 3 4 5 6 7 8 9 1 0
6
8
1 0
1 2
1 4
1 6
1 8
2 0
D is ta n c e (k m )
RP
E
T P 1 T P 2 T P 3
1 2 3 4 5 6 7 8 9 1 0
6
8
1 0
1 2
1 4
1 6
1 8
2 0
D is ta n c e (k m )
RP
E
T P 1 T P 2 T P 3
C) PRO D) CHO
R e s t 1 2 3 4 5 6 7 8 9 1 0
3
4
5
6
7
D is ta n c e (k m )
Blo
od
glu
co
se
(m
mo
l/L
)
T P 1 T P 2 T P 3
*
R e s t 1 2 3 4 5 6 7 8 9 1 0
0
2
4
6
8
D is ta n c e (k m )
Blo
od
glu
co
se
(m
mo
l/L
)
T P 1 T P 2 T P 3
E) PRO F) CHO
R e s t 1 2 3 4 5 6 7 8 9 1 0
0
2
4
6
D is ta n c e (k m )
Blo
od
la
cta
te (
mm
ol/
L)
T P 1 T P 2 T P 3
R e s t 1 2 3 4 5 6 7 8 9 1 0
0
1
2
3
4
5
D is ta n c e (k m )
Blo
od
la
cta
te (
mm
ol/
L)
T P 1 T P 2 T P 3
Figure 7.3.5. Post intervention blood lactate, blood glucose and rating of perceived exertion during a 10 km treadmill run at 75 % VO2max.
Impact of 7-days habitual diet (TP1 and TP3) and 7-days intervention diet (high carbohydrate (CHO) or a high protein (PRO)) (TP2) in combination with endurance training on RPE (A and B), blood glucose (C and D) and blood lactate (E and F) * = TP2 significantly different from TP1 and TP3 (p < 0.05) (mean ± SEM).

Page 166 of 253
Table 7.3.3. Aerobic and anaerobic contribution towards energy production for the 10 km steady state run.
Week 1 Week 2 Week 3
Aerobic
(%) Anaerobic
(%) Aerobic
(%) Anaerobic
(%) Aerobic
(%) Anaerobic
(%)
PRO 98.9 ± 0.3 1.1 ± 0.3 98.8 ± 0.3 1.2 ± 0.3 98.9 ± 0.2 1.1 ± 0.2
CHO 98.9 ± 0.2 1.1 ± 0.2 99.0 ± 0.2 1.0 ± 0.2 99.0 ± 0.2 1.0 ± 0.2
Table 7.3.4. Aerobic and anaerobic contribution towards energy production for the MSE effort.
Week 1 Week 2 Week 3
Aerobic
(%) Anaerobic
(%) Aerobic (%) §
Anaerobic (%) §
Aerobic (%) §
Anaerobic (%) §
PRO 74.2 ± 7.3 25.8 ± 7.3 65.4 ± 8.8*¥ 34.6 ± 8.8*¥ 74.9 ± 6.3 25.1 ± 6.3
CHO 79.5 ± 3.6 20.5 ± 3.6 82.9 ± 2.8* 17.1 ± 2.8* 82.1 ± 3.2 17.9 ± 3.2
* = significant difference from equivalent time point 1 result (p < 0.05)
¥ = significant difference from equivalent time point 1 result (p < 0.05)
§ = significant group interaction at the time point (p < 0.02)
No significant time point or group interactions were observed in either the aerobic or
anaerobic contribution to energy expenditure for the 10 km steady state run (Table
7.3.3). The dietary intervention resulted in significant changes in energy contribution
of the MaxSE. Following the high protein diet (week 2), a significant (p < 0.05)
reduction in aerobic energy contribution and a significant increase in anaerobic
contribution was observed relative to week 1 and week 3, no difference was observed
between weeks 1 and 3 (Table 7.3.4). Subsequent to the high carbohydrate
intervention diet (TP2) a significant increase in aerobic energy contribution and a
significant decrease in energy contribution were observed relative to week 1 in the
TTE trial, no other differences were observed in the carbohydrate group. No group
interaction was observed (p < 0.05) at week 1; however the aerobic and anaerobic
contribution towards energy expenditure were significantly different between groups
at weeks 2 and 3, with a greater aerobic contribution subsequent to the high
carbohydrate intervention.

Page 167 of 253
7.4 Discussion
With regards to the research hypotheses the following can be concluded:
i) As demonstrated from the analysis of muscle-biopsies and in rejection of the
H0, a 7-day high protein low carbohydrate diet in combination with endurance
training does not further enhance the mRNA transcriptional response.
ii) In rejection of the H0, a 7-day high protein low carbohydrate diet in combination
with endurance training resulted in a significant change in sub-maximal
substrate utilisation. A 101% increase in fat oxidation and 27% decrease in
carbohydrate oxidation were observed during a 10km steady state run. No
change was seen in the oxidation rates following a high carbohydrate diet.
iii) In rejection of the H0, 7-days consuming a high protein low carbohydrate diet in
combination with endurance training resulted in a 23% reduction in the time to
exhaustion trial.
iv) Adaptations that occurred subsequent to consuming a high protein diet, in
combination with endurance training, reverted back to pre intervention levels
once habitual diet was consumed again. Therefore the H0 was accepted, no
long-term adaptations were observed following the intervention diet.
The impact of an acute continuous high protein diet in combination with endurance
running training on metabolic adaptation, substrate utilisation and exercise
performance has previously not been investigated. As hypothesised, significant shifts
in substrate utilisation were observed following a 7-day high protein low carbohydrate
diet. However, and an important consideration, high intensity exercise performance
was significantly reduced (as reported by a 23% reduction in the maximal sustainable
effort trial). Contrary to this, no change in sub-maximal substrate utilisation was
observed when consuming a high carbohydrate (HC) diet for 7-days. Based on the
chosen p value (p < 0.05) the observed change in time to exhaustion (TTE) in the high
carbohydrate group was not significant (p = 0.051) however a trend towards
improvement was reported (~6.5% increase). The change in resting expression of
mRNA transcriptional proteins responsible for mitochondrial biogenesis and fatty acid

Page 168 of 253
oxidation was not as hypothesised. A significant (p < 0.05) increase in AMPK and
PPAR expression was observed in the CHO group, however no change in PGC-1α
mRNA expression was observed in either intervention group. Additionally this is the
first study to observe the effect of returning back to habitual diet subsequent to a low
carbohydrate intervention, demonstrating that all performance measures in both
groups returned to pre intervention levels. Interestingly however, the significant
increase in AMPK and PPAR mRNA expression in the HC group was maintained once
habitual diet was returned.
A recent review from Burke (2015) re-examined the literature for low carbohydrate
(high fat) diets and sports performance, highlighting twelve studies, all of which
assessed endurance performance using a cycling protocol, as such this was the first
study to investigate the impact of acute continuous low carbohydrate feedings in well
trained runners.
Endurance exercise is a potent stimulator of PGC-1α via the AMPK-SIRT1 pathway
(Norrbom et al., 2004) and increases in PGC-1α expression have been observed
following a single bout of endurance exercise (Perry et al., 2010). This response can
be further amplified when exercising in a low glycogen state (Psilander et al., 2013).
Furthermore it has been demonstrated in vitro (Canto et al., 2010) and in vivo (Draznin
et al., 2012) that reduced glucose and/or nutrient availability promote increased PGC-
1α, AMPK and SIRT1 mRNA expression. In untrained individuals over a 14-day
training period Perry et al. (2010) found a transient post exercise response in PGC-1α
expression, observing a 10-fold increase in PGC-1α mRNA expression subsequent to
the first bout of endurance cycling which was reduced to a 4-fold increase after the
seventh training session. In addition, with adequate glycogen availability Psilander et
al. (2013) found a 2.5-fold increase in PGC-1α mRNA expression following a single
bout of endurance cycling in well trained cyclists (VO2max = 65.4 ± 0.9 mL•kg-1•min-
1), and with the addition of glycogen restriction to the endurance session Psilander et
al. (2013) observed an 8.1-fold increase in expression; a similar amplitude to the
response observed in untrained individuals from Perry et al. (2010). These data sets
suggest that the transcriptional adaptive response is blunted when skeletal muscle
becomes accustomed to the exercise stress, and increasing the metabolic stress by
restricting glycogen availability may result in enhanced post exercise transcriptional

Page 169 of 253
adaptation. However the results from this experimental Chapter provide contradictory
evidence; demonstrating reduced carbohydrate intake in combination with endurance
training did not further increase resting PGC-1α mRNA expression.
As discussed above, previous literature has demonstrated that acute exercise with low
glycogen availability increased metabolic stress and subsequent mRNA expression of
transcriptional markers of mitochondrial biogenesis (Palacios et al., 2009, Psilander et
al., 2013). However the current study appears to suggest that a high carbohydrate
diet, in combination with endurance exercise, elicits the greatest changes in mRNA
expression. A small but significant increase in resting AMPK (1.44 fold increase) and
PPAR (1.32 fold increase) mRNA expression were observed following a continuous
high carbohydrate diet for 7-days in combination with endurance running training. In
the high protein group an increase in AMPK mRNA expression was observed following
the intervention, however this returned to pre intervention levels once habitual diet was
resumed (Figure 7.3.1). No significant time point difference in training distance or
running speed was observed in either group. However, it is important to consider that
a (non-significant) 0.9 km•h-1 reduction in average running speed between TP1 and
TP2 (intervention week) in the high protein group was observed. This reduction in
running speed was observed in seven of the eight participants (range -0.1 to -2.8 km•h-
1) in this group, suggesting that the reduction in dietary carbohydrate and/or the
increase in dietary protein impacted the participant’s ability to maintain training
intensity.
It has been suggested that training low carbohydrate availability reduces exercise
intensity and subsequently the quality of endurance training sessions (Burke et al.,
2002). As previously stated, it is assumed that a greater metabolic stress during
endurance exercise enhances mRNA expression. Both endurance exercise and
carbohydrate restriction are potent stimulators of mRNA expression (Psilander et al.,
2013). The high protein diet increased metabolic stress due to restricted carbohydrate
availability; however training intensity was subsequently impacted and reduced. Baar
et al. (2002) demonstrated a reduction in post exercise mRNA expression as skeletal
muscle became accustomed to metabolic stress. Although non-significant, the results
in this experimental Chapter suggest greater adaptation in the group that was able to
maintain training intensity. High intensity running performance was decreased in the
Page 170 of 253
high protein group who exhibited a 0.9 km•h-1 reduction in training speed subsequent
to the dietary intervention, subsequent TTE performance was significantly impacted
also (23.3% decrease). Taking these findings into account it could be hypothesised
that maintaining training intensity is the key stressor to stimulate the AMPK/SIRT1 –
PGC-1α metabolic pathway during repeated days of endurance running training. This
may explain the trend towards a difference in post interventional mRNA expression
between the two groups. Although restricting carbohydrate intake in the high protein
group increased metabolic stress, the hypothesised increased training adaptation may
have been compromised by the reduction in training intensity.
Furthermore, the results provide novel insight in to the long term adaptations of
endurance training on metabolic markers of mitochondrial biogenesis at rest. The
observed post intervention changes in AMPK and PPAR mRNA expression (1.44 and
1.32 fold increase, respectively) in the high carbohydrate group were maintained 7-
days following a return to habitual diet (1.57 fold and 1.29 fold increase, respectively),
where as the only cellular metabolic adaptation observed subsequent to the high
protein intervention (1.4 fold increase in AMPK expression) returned to pre intervention
levels. This suggests training intensity is a dominant stimulus in post endurance
training transcriptional gene response.
An important consideration is that post exercise muscle biopsies were not collected.
However the results from the previous experimental (Chapter 6) in this thesis, along
with Draznin et al. (2012) demonstrated that mRNA expression is sensitive to dietary
manipulation at rest and Baar et al. (2002) found that PGC-1 protein responds similar
to mRNA expression, thus an assumption can be made that an increase in mRNA
expression is accompanied by increased protein content.
Training in a glycogen depleted state, to enhance fat metabolism and reduce
carbohydrate oxidation is considered a positive adaptation for endurance performance
as it can spare muscle glycogen utilisation and prolong endurance exercise
(Goedecke et al., 1999). The majority of research in this field manipulates
carbohydrate intake by increasing dietary fat (Hawley and Morton, 2014), whereas it
was achieved by increasing dietary protein intake in this study. Muscle glycogen was
not measured, however seminal work from Hultman and Bergstrom (1967)

Page 171 of 253
demonstrated that consuming a very low carbohydrate diet for 7-days without
exercising resulted in a 32% reduction in muscle glycogen. Thus it is fair to assume
that the high protein intervention, in combination with endurance training, resulted in
significant reductions in muscle glycogen. The significant reduction in resting blood
glucose, and increase in fat oxidation, during the sub-maximal trial in the high protein
group corroborate this further.
Short-term (~2-4 days) exposure to a low carbohydrate diet reduces exercise capacity
by depleting liver and muscle stores of glycogen without producing a compensatory
increase in fat oxidation (Pitsiladis and Maughan, 1999); whereas longer-term (≥ 5
days) adherence can cause a range of adaptations which enhance the breakdown,
transportation and oxidation of fat in skeletal muscle (Burke, 2015). The results from
this study demonstrated that a 7-day high protein diet, in combination with endurance
training, had a profound impact on substrate utilisation during a 75% VO2max sub
maximal 10km steady-state run (Figure 7.3.2; p < 0.0001. A 101% increase in fat
oxidation (0.29 ± 0.05 to 0.59 ± 0.05 g•min-1) and a 27% decrease (2.96 ± 0.18 to 2.15
± 0.19 g•min-1) in carbohydrate oxidation was observed. No time point changes in
substrate utilisation were apparent in the high carbohydrate group. Although not
reported, it is important to acknowledge to potential impact of increased dietary protein
on substrate utilisation during exercise. Protein has a respiratory quotient of ~0.81
(Jeukendrup and Wallis, 2005), and increasing the protein content of the diet has been
demonstrated to increase protein metabolism (Garlick et al., 1999), however as protein
is not fully oxidised in vivo it is complex to quantify the effect. Additionally the equations
developed to calculate substrate oxidation during exercise (which were used in this
Chapter) assume negligible contributions of protein oxidation (Jeukendrup and Wallis,
2005).
The observed increase in fat oxidation subsequent to the high protein intervention,
coupled with a significant increase in AMPK mRNA expression (transcriptional
regulator linked to increased fatty acid oxidation), would suggest a significant
metabolic adaptation had occurred. However upon return to habitual diet, substrate
utilisation and AMPK expression in the high protein intervention returned to pre
intervention levels. This suggests that observed changes measured in response to
high protein feedings are not the initiation of a lasting adaptation, rather an acute

Page 172 of 253
temporal response to meet the energy demands of the exercise due to the reduction
in energy availability.
Lambert et al. (1994) found similar profound increases in fat oxidation during sub-
maximal cycling, demonstrating that a 14-day high fat low carbohydrate diet increased
fat oxidation by 87%, relative to a high carbohydrate low fat diet. Furthermore, Lambert
et al. (1994) observed a fat oxidation rate of 0.6 g•min-1 subsequent to a 14-day HF
(Table 7.4.1) diet, almost identical to the fat oxidation rate during the 10km SS run of
0.59 g•min-1 in this trial. following either 14-days high fat or high carbohydrate diet
Lambert et al. (1994) reported no significant difference in TTE between groups.
However caution should be taken with this observation. TTE in the high fat group was
8.3 ± 2.3 minutes compared to 12.5 ± 3.8 minutes (mean ± SEM) in the high
carbohydrate group. The standard error of mean in the TTE was very large and with a
small sample size (N = 5) it is no surprise that this did not prove statistically significant.
Practically, a 33.6% reduction in TTE at 90% VO2max was observed following 2-weeks
high fat diet, which in terms of performance is profound.
Table 7.4.1. Effects of dietary manipulation on sub-maximal (50% VO2max) (A) and TTE (90% VO2max) (B) cycling performance subsequent to 14-days high fat, low carbohydrate diet (Lambert et al., 1994)
A B
The results from the current study demonstrated a significant reduction in high
intensity exercise performance subsequent to a 7-day high protein diet, with a relative
decrease of 23.3% in TTE at time point 2. In the high carbohydrate group TTE was not
statistically (p = 0.051) difference, however a 6.5% increase in TTE was observed.
The 6.5% increase may not be significant, but similar to Lambert et al. (1994) SD was
large. The MaxSE trial used in this study had a CV of 5.6%, therefore it may be argued

Page 173 of 253
that a 6.5% increase in TTE is meaningful. Additionally in middle and long distance
events winning margins are often < 1%, thus a 6.5% increase could be seen as
profound. It is important to consider that Lambert et al. (1994) utilised a different
exercise modality, the exercise intensities were not matched and dietary manipulation
was different durations. However with the trends in results from both studies being
similar it may be suggested that high protein and high fat diets have similar effects on
high intensity exercise performance and substrate utilisation, and a high protein diet
is as effective as a high fat diet in increasing sub-maximal fat oxidation; however this
needs to be explored further.
The high protein diet significantly altered the aerobic and anaerobic contribution of
energy in the MaxSE trial. At TP1 an aerobic – anaerobic ratio of 2.9 (74.2 ± 7.3 and
25.8 ± 7.3) was recorded in the Max SE trial, this decreased to 1.9 (65.4 ± 8.8 and
34.6 ± 8.8) subsequent to the HP intervention, representative of a 12% reduction in
aerobic contribution. Whereas the high carbohydrate group exhibited a significant
increase in aerobic – anaerobic ratio at TP2 (3.8 vs. 4.8), a 4.2% increase in aerobic
contribution. After the HP intervention TTE was significantly reduced (-23.3%), as was
total energy expenditure. However as demonstrated in Figure 7.3.5 no pre - post time
point difference in blood lactate were observed, thus it is fair to assume that the
absolute anaerobic energy contribution to the MaxSE exercise was matched at both
time points. Therefore the observed shift in aerobic/anaerobic ratio is due to a
significant reduction in the absolute aerobic contribution to energy, which may be due
to two mechanisms. Firstly, as the mean TTE was 23.3% longer at TP1 the energy
cost for the effort was greater and as no time point difference in post TTE blood lactate
post was observed the increase in energy expenditure must have been produced
aerobically. Secondly, it may be that lactate production occurred faster at TP2 due to
reduced glycogen availability, which increased metabolic acidosis and subsequently
brought on exercise fatigue. Bergman and Brooks (1999) demonstrated no difference
in blood lactate concentration following graded exercise in a fed and fasted state, thus
it is fair to assume that the increase in TTE observed was due to increased glycogen
availability to fuel aerobic energy production.
A further consideration from the study is participant perception and adherence of the
diet. Following study completion the participants were informally asked how they felt

Page 174 of 253
on the diet. These insights and conversation were not formally logged, which is a
limitation, however it is important to report the discussions. None of the participants
on the high carbohydrate diet had any complaints about lack of energy and were able
to maintain consistent training. The participants on the high protein diet reported
differently. One participant had to drop out due to the inability to undertake training
whilst on the high protein diet. Another three participants reported that training felt
harder and maintaining running speed was tough. A further three reported a change
in toilet habits, with less regularity and a hardening of their stool. Similar considerations
have been suggested following continuous high fat diets. Burke and Hawley (2002)
reported a reduction in training capacity and increase in perceived effort in relation to
the quality of high-intensity training, in athletes that consumed an acute high fat diet.
Following acute exercise, it has been demonstrated that restricted glycogen availability
increases mRNA expression of transcriptional markers responsible for mitochondrial
biogenesis. However no research has looked at the longer term impact on resting
mRNA levels. The results from this study have demonstrated that training on a high
protein diet did not results to long term (7-day) adaptation. More recently the method
of periodising carbohydrate intake to match the needs of the training session (Burke,
2015), or possible sleeping with low carbohydrate availability (Marquet et al., 2016)
has been investigated with some success (Marquet et al., 2016, Cochran et al., 2015)
and it likely to be the most successful method. However the long term mechanistic
response of skeletal muscle adaptation to an endurance training stimulus is not yet
fully quantified and further research is required to understand the benefits of an
increased acute transcriptional response and the impact this has on longer term
adaptation.
7.5 Conclusion
In conclusion, this is the first investigation to determine the effects of a continuous high
protein diet, combined with endurance training, on cellular adaptation and both sub-
maximal and maximal exercise performance in runners. The results demonstrated that
7-days exposure to a high protein low carbohydrate diet resulted in significant
increases in fat oxidation during sub maximal exercise; despite this a significant

Page 175 of 253
reduction in TTE was observed. No significant changes were observed in the high
carbohydrate diet in any of the performance measures. All changes in the sub-maximal
performance markers observed in the high protein group were returned to pre
intervention levels once habitual diet was reverted for 7-days. In addition the results
demonstrated that a high carbohydrate diet in combination with endurance exercise
resulted in a greater transcriptional mRNA response in upstream markers responsible
for mitochondrial biogenesis which remained elevated 7-days after returning to
habitual diet.
The results also demonstrated that the increases in sub-maximal fat oxidation
subsequent to the high protein diet are of similar amplitude to that of high fat diet’s
cited in previous literature, suggesting that carbohydrate restriction is responsible for
the increase in fat oxidation – not increases in fat or protein intake.
Limitations:
Training was not prescribed. The aim of the study was to investigate the impact
of the diet, not training stimulus. As such the participants were required to
maintain current training load and replicate sessions. Positively, this study
design provided confidence that all observed changes were due to the diet
intervention. The participants were relatively well matched for running
performance; however there was quite a large deviation in total training volume.
Muscle glycogen was not measured. It is evident in the literature that a low
carbohydrate (<35%) in combination with endurance training will deplete
muscle glycogen stores. With current techniques, the only accurate method of
measuring muscle glycogen is via a biopsy. The micro muscle-biopsy technique
collected enough tissue for mRNA assessment, however this was not enough
to measure muscle glycogen also.
The study targeted a specific set of adaptive markers, with limited metabolite
and hormonal markers. To develop a wider picture on the whole body impact
of such diets on health a performance research is required encompassing
different markers.

Page 176 of 253
The transcriptional mRNA genes analysed are upstream markers of
mitochondrial biogenesis. To truly understand the long term and actual
adaptation direct markers of adaptation, such as mitochondrial numbers /
density / respiration would be required for assessment.
Post exercise gene expression or activity was not measured. The research
question throughout the thesis was to investigate resting gene expression.
Furthermore with study design as stated, it would have required a further 6
biopsies (total of 9 biopsies) throughout the trial which would have significantly
increased participant burden and discomfort. That aside, this would provide
further insight and would be a suggested direction for future research.

Page 177 of 253
8 GENERAL DISCUSSION

Page 178 of 253
8.1 Study Perspectives
A number of research issues have been explored and discussed through each
experimental Chapter. The aim of this Chapter is to bring together the pertinent
learning’s from each Chapter to scope the context, application and conclusion from
this thesis.
8.1.1 Using the metabolic typing questionnaire in research for individualised
diet prescription.
Individuals may respond differently to dietary intake and a significant amount of
research exists stating dietary intake has an impact on metabolic function (O'Sullivan
et al., 2011). Numerous commentaries have suggested that tailoring a diet to individual
needs will help promote optimal health. Much of the rationale for using the
commercially available metabolic typing questionnaire as a tool to prescribe dietary
individualisation were developed from the original work from Williams (1956) on
biochemical individuality, stating all humans are fundamentally disparate. Two book
publications (Walcott and Fahey, 2000, Kristal and Haig, 2002) highlight numerous
cases in which the application of the metabolic typing diet has cured chronic disease,
however limited literature exists on the application of the metabolic typing
questionnaire as a tool for individualised dietary prescription and Chapter 5 of this
thesis was the first to investigate the use metabolic typing questionnaire in a research
setting. Due to the limited literature caution should be taken when drawing conclusions
and, if relevant, more research is needed to fully understand its application. The basis
of the metabolic typing diet is that people are fundamentally different and thrive on
different diets, however in Chapter five 94.3% of the participants (N = 88) were
identified as the same mixed metabolic type and would subsequently be prescribed
the same diet, thus it may be assumed that the questionnaire is not able to identify the
relevant information to differentiate metabolic individuality and prescribe diets
accordingly. In further support of this conclusion, Walcott and Fahey (2000) and Kristal
and Haig (2002) state that metabolic control is dominated by either the fast or slow
oxidative system which the questionnaire is designed to highlight. Due to the different
physiological attributes of endurance and power athletes, it was hypothesised that

Page 179 of 253
metabolic dominance would also be different. However no relationship was observed
between metabolic type and athletic attributes further suggesting that the metabolic
typing questionnaire is not able to differentiate metabolic characteristics.
The principal that the results of questionnaire can accurately prescribe individualised
diets to improve health and performance is appealing. However new techniques and
knowledge such as genomics, metabolomics and nutriomics has yet to provide a clear
solution to provide dietary individualisation (Primrose et al., 2011), and without fully
comprehending the impact of dietary intake on metabolism more evidence and
research is needed before confidently using a tool to prescribe individualised diets. It
is highly unlikely this tool will be the metabolic typing questionnaire.
8.1.2 Nutrition knowledge and dietary intake in UK athlete
Nutrition intake plays an essential role in human health and as alluded to in previous
Chapters dietary intake in athletes is commonly reported as inadequate. Nutrition
knowledge refers to knowledge of concepts and processes related to nutrition and
health including knowledge of diet and health (Miller and Cassady, 2015) and it has
been suggested that poor nutrition knowledge may be a contributing factor towards
inadequate intake (Heaney et al., 2011). This relationship, however, appears
inconsistent and it is likely that multiple factors may modify diet intake (Worsley, 2002).
A suggested potential justification for this may be the poor quantification of nutrition
knowledge. A range of nutrition knowledge questionnaires have been developed,
however each questionnaire is population specific and validity is lost if utilised outside
of the initial target population (Parmenter and Wardle, 1999). The processes
completed in experimental Chapter 4 satisfy statistical validation and reliability
measures and provide a new valid and reliable tool to measure nutrition knowledge in
UK athletes (Appendix Four).
The results of the NKQA in Chapter 5 demonstrated that UK track and field athletes
have greater nutrition knowledge than a non-athletic control group (60.4% vs. 48.6%)
and the nutrition knowledge of the athletes were in line with previous literature from
different athletic populations (Spendlove et al., 2012, Heaney et al., 2011). A

Page 180 of 253
systematic review of nutrition knowledge in athletes concluded a weak positive
association between nutrition knowledge and diet quality (r = 0.44) (Heaney et al.,
2011), however the evidence is equivocal. This was the first study to investigate this
relationship in UK track and field athletes relative to a non-athletic control population.
Both athletic groups scored significantly higher on the NKQA and DQI compared to
the control group however no individual association between nutrition knowledge and
diet quality was apparent.
Corroborating previous literature, the results from Chapter 5 suggest that the quality
of dietary intake is more complex than just enhancing education. UK track and field
athlete were found to have better nutrition knowledge and higher dietary quality than
non-athletes, however the dietary intake of the two athletic groups (power and
endurance) were not different. With compelling literature demonstrating that
endurance athletes and power athletes require different macronutrient ratios to fuel
optimal performance this may be an area to focus education on (Tipton et al., 2007,
Jeukendrup, 2011, Thomas et al., 2016). Interestingly a group difference in diet quality
and nutrition knowledge was observed; the athletes demonstrated greater nutrition
knowledge and diet quality than the control group, however no relationship was
observed between diet quality and nutrition knowledge. This suggests that as a group,
athletes’ have greater nutrition knowledge than non-athletes, but nutrition knowledge
is not a predictor diet quality. An important consideration is that diet quality is
measured on micronutrient consumption and meeting / exceeding the RNI’s is ranked
as positive. Therefore as athletes had a higher calorie intake (i.e. athletes eat more)
the reported improved diet quality in athletes may be consequential from the volume
of food consumed. It appears that diet quality is more complex than just improving
nutrition knowledge. A vast body of research has been completed over recent years
and is yet to draw strong conclusions. It is clear the nutrition knowledge is a factor
which impacts dietary choice, but the level of the impact is yet to be fully quantified. It
appears that enhancing diet quality is more complex than just educating the athlete
and it is probable that motivations for improvement are highly individual.
Interestingly as a footnote to this, the control group in this study reported a nutrition
knowledge score of 48.6%. From a similar study in an Australian population,
Spendlove et al. (2012) reported the non-educated control group had a nutrition
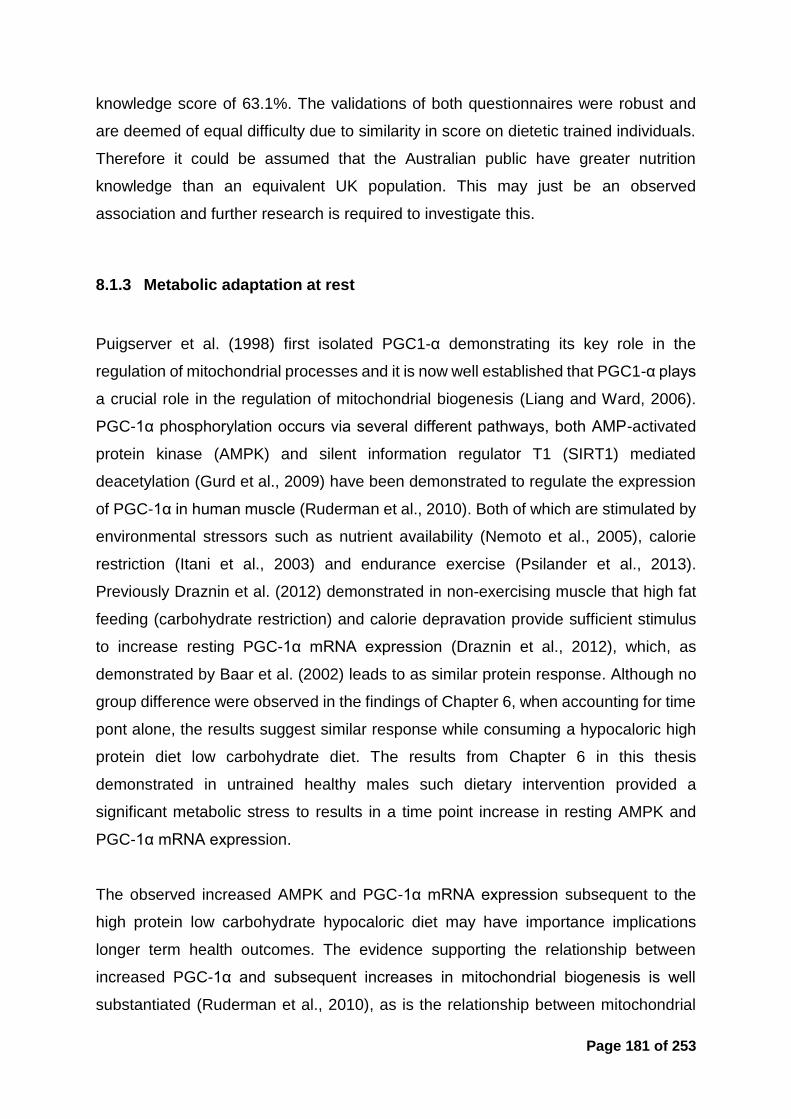
Page 181 of 253
knowledge score of 63.1%. The validations of both questionnaires were robust and
are deemed of equal difficulty due to similarity in score on dietetic trained individuals.
Therefore it could be assumed that the Australian public have greater nutrition
knowledge than an equivalent UK population. This may just be an observed
association and further research is required to investigate this.
8.1.3 Metabolic adaptation at rest
Puigserver et al. (1998) first isolated PGC1-α demonstrating its key role in the
regulation of mitochondrial processes and it is now well established that PGC1-α plays
a crucial role in the regulation of mitochondrial biogenesis (Liang and Ward, 2006).
PGC-1α phosphorylation occurs via several different pathways, both AMP-activated
protein kinase (AMPK) and silent information regulator T1 (SIRT1) mediated
deacetylation (Gurd et al., 2009) have been demonstrated to regulate the expression
of PGC-1α in human muscle (Ruderman et al., 2010). Both of which are stimulated by
environmental stressors such as nutrient availability (Nemoto et al., 2005), calorie
restriction (Itani et al., 2003) and endurance exercise (Psilander et al., 2013).
Previously Draznin et al. (2012) demonstrated in non-exercising muscle that high fat
feeding (carbohydrate restriction) and calorie depravation provide sufficient stimulus
to increase resting PGC-1α mRNA expression (Draznin et al., 2012), which, as
demonstrated by Baar et al. (2002) leads to as similar protein response. Although no
group difference were observed in the findings of Chapter 6, when accounting for time
pont alone, the results suggest similar response while consuming a hypocaloric high
protein diet low carbohydrate diet. The results from Chapter 6 in this thesis
demonstrated in untrained healthy males such dietary intervention provided a
significant metabolic stress to results in a time point increase in resting AMPK and
PGC-1α mRNA expression.
The observed increased AMPK and PGC-1α mRNA expression subsequent to the
high protein low carbohydrate hypocaloric diet may have importance implications
longer term health outcomes. The evidence supporting the relationship between
increased PGC-1α and subsequent increases in mitochondrial biogenesis is well
substantiated (Ruderman et al., 2010), as is the relationship between mitochondrial

Page 182 of 253
abundance/density and increased energy metabolism (Rodgers et al., 2008). A major
defect in type 2 diabetes and obesity can be defined as a lack of metabolic stability in
which the body, tissue and cells are not responsive to normal nutrient or hormonal
fluctuations. A clear example is insulin resistance in type 2 diabetes. Diet induced
metabolic adaptation may provide favorable adaptation decreasing susceptibility of
developing metabolic syndrome through the transcriptional pathway (Figure 8.1.1.),
however increased protein intake may have adverse effects on metabolic function, in
particular insulin sensitivity (Smith et al., 2016). A wider scope of research is required
to understand the full body impact of such diets.
Figure 8.1.1. The relationship between nutrient manipulation and susceptibility to metabolic syndrome through the, the AMPK/SIRT1 – PGC-1α pathway
(Adapted from Ruderman et al. (2010) with results from Chapter 6).
In a systemic review Wycherley et al. (2012) suggested that during weight loss induced
by a reduction in energy intake an increase in protein consumption provides additional
PGC1-α
Decreased susceptibility of
metabolic syndrome
High protein hypocaloric diet

Page 183 of 253
benefits including: enhancing the reductions in body mass and fat mass, mitigating
reductions in lean mass, and mitigating reductions in RMR. With regards to body
composition the data from Chapter 6 showed no difference in conditions that were
matched for energy intake (EM and ER), difference were only observed in groups
which were not balanced for energy intake (eucaloric vs. hypocaloric). Currently it is
understood that a series of intracellular networks influence the molecular regulation of
muscle protein turnover, and muscle mass regulation is a fine balance between
muscle protein breakdown (MPB) and muscle protein synthesis (MPS) (Phillips and
Van Loon, 2011). In a calorie restricted diet a high protein intake may have a sparing
effect on lean mass loss. In overweight women Layman et al. (2003) reported greater
fat mass loss and improved maintenance of fat free mass following a high protein diet
(1.6 g•kg-1•day-1) relative to a high carbohydrate diet with protein intakes set to meet
RDA (0.8 g•kg-1•day-1). The results from this study corroborate these findings,
demonstrating no difference in lean mass loss between the hypocaloric high protein
diet (2.5 g•kg-1•day-1 of protein) and the eucaloric high carbohydrate diet (2.5 g•kg-
1•day-1 of protein). Interestingly, subsequent to the high protein hypocaloric diet an
increase in AMPK mRNA expression was observed which is known to inhibit mTORC1
and subsequently down regulate MPS (Figure 8.1.2). This suggests that the observed
maintenance of lean mass subsequent to a hypocaloric high protein diet is resultant
of a decrease in protein breakdown rather than stimulating and increasing MPS.
However, although increasing dietary protein intake to more than the RDA in a state
of negative energy balance has been demonstrated to spare skeletal muscle
metabolism a thorough understanding of the underlying molecular mechanisms is not
fully developed. Such understanding is a requisite in the development of definitive
nutritional strategies to mitigate the detrimental effects of negative energy balance
(Carbone et al., 2012).

Page 184 of 253
Figure 8.1.2. Role of negative energy balance and reduced growth factors on MPS
(Adapted from Carbone et al. (2012)).
RMR accounts for ~65% of daily energy expenditure (Ravussin et al., 1986) and is
strongly correlated with lean mass. Subsequent to a high protein diet Wycherley et al.
(2012) attribute the observed increase in fat mass loss to a preservation of lean mass
which was associated with increased RMR. Furthermore this increase in RMR (and
calories burnt) via greater preservation of lean mass may also induce an increased
net energy deficit over time that will promote fat metabolism. The hypocaloric high
protein group lost significantly greater fat mass that the eucaloric high carbohydrate
groups, with no difference observed between any other groups. However due to the
acute nature of the dietary intervention no change in RMR was observed in any
experimental group. Further applied research is required to assess the combination of
negative energy balance and high protein dietary intake on cellular mechanisms
contributing to skeletal muscle mass maintenance and RMR increases.

Page 185 of 253
If fat mass loss is the goal of the dietary intervention the body composition and cellular
adaptation results observed in Chapter 6 suggest that a high protein hypocaloric diet
is more suitable for quick preferential changes in body composition. The increase in
AMPK and PGC-1α suggest that over time skeletal muscle may have a greater
capacity for aerobic metabolism as a result of increased mitochondrial biogenesis
which may have a preferential impact on metabolic rate, insulin sensitivity and
decreased susceptibility to metabolic syndrome. Individuals should consider the
purpose of the intervention prior to automatically restricting carbohydrate and calorie
intake (Figure 8.1.3), especially athletes. Further exploration into the impact of a high
protein hypocaloric diet over a prolonged period of time is required to better
understand the cellular, metabolic and transcriptional changes.
Figure 8.1.3. Flow diagram used to help athletes make an informed choice about
whether to increase protein and restrict carbohydrate intake on a rest day.

Page 186 of 253
8.1.4 High protein diet in combination with endurance training.
Increasing endurance exercise efficiency by increasing fat oxidation is understood to
enhance endurance performance (Burke and Hawley, 2002). Consuming a high fat
diet has been demonstrated to double fat oxidation during endurance exercise and
consequently spare muscle glycogen (Lambert et al., 1994). The exact mechanisms
for this are not defined, increased activity of β-hydroxyacyl-CoA-dehydrogenase,
cartinine palmitoyl transferase I and decrease pyruvate dehydrogenase have been
suggested to have a role (Helge and Kiens, 1997). Additionally increased inter
muscular triglyceride stores have been detected after a period of a high fat diet, thus
increasing the substrate pool may also influence fat oxidation (Jansson and Kaijser,
1982), also a high fat diet reduces the potential for glycogen oxidation (Stellingwerff et
al., 2006). Importantly in some cases low carbohydrate (high fat) diets have been
demonstrated to decrease high intensity endurance performance (O'Keeffe et al.,
1989). Limited literature exists on the metabolic response subsequent to high protein
feedings. After 7-day continuous high protein diet in combination with endurance
exercise the results of Chapter 7 demonstrated a profound shift towards fat oxidation.
Interestingly the amplitude of change was similar to that which was observed by
Lambert et al. (1994) following a high fat diet in cyclists. Therefore an assumption may
be made that an acute high protein diet increases sub-maximal fat oxidation to similar
amplitude to that of a high fat diet. Suggesting that if the exercise goal is to increase
fat oxidation and spare muscle glycogen utilisation, restricting carbohydrate intake is
key; the method used to restrict carbohydrate intake is not important. The reduction in
glycogen availability is the primary stimulus. However more research comparing a high
protein diet to a high fat diet is needed to further corroborate this. Importantly though,
that adaptations in substrate utilisation are not sustained following return to habitual
dietary intake.
In untrained athletes Perry et al. (2010) demonstrated a ‘saw tooth’ effect in PGC-1α
mRNA expression in response to endurance training. In a 14-day training study,
subsequent to the first training sessions a >10 fold increase in mRNA expression was
observed three hour post exercise, however by session seven (day 14) in the study

Page 187 of 253
the response was attenuated to a 4-fold increase, however no change in resting mRNA
was observed. Concurrently throughout the study PGC-1α protein content was
measured, and subsequent to a steep rise a plateau and possible slight decrease in
protein response was observed. This study from Perry et al. (2010) does not
demonstrate longer term mRNA and protein response, however this data suggests
that as untrained individuals become accustomed to the exercise, the training provided
less metabolic stress and the amplitude of post exercise transcriptional response is
dampened. It is well documented that glucose restriction increases PGC-1α
expression; as such restricting glycogen availability in combination with the training
stimulus has been demonstrated to increase metabolic stress and subsequently
increase transcriptional response 4 times (Psilander et al., 2013).
Numerous studies have demonstrated that a single bout of endurance exercise in a
glycogen depleted state increases post exercise PGC-1α expression to a greater
extent that exercise with glycogen availability (Hawley and Morton, 2014). However
the impact of continuous glycogen restriction in combination with endurance is less
well established. The studies from Cochran et al. (2015) and Perry et al. (2010) in
untrained participants demonstrated a positive adaptive response to endurance
training with and without carbohydrate restriction. In Chapter 6, in untrained individuals
at rest a similar increased adaptive response was observed subsequent to calorie and
carbohydrate restriction. However well-trained individuals in combination with
endurance training, continuous (7-day) glycogen restriction (high protein) did not
further enhance metabolic adaptation, and potentially may have even blunted this
response; the increased metabolic stress through glycogen restriction did not prove
sufficient to impact the cellular adaptive response. Interestingly an increase in resting
AMPK and PPAR mRNA expression was observed and maintained in the high
carbohydrate diet; it may also be argued that the high carbohydrate groups were under
less metabolic stress through dietary interventions. An important consideration in the
results from Chapter 7 was that training speed was able to be maintained in the high
carbohydrate groups – a 0.9 km•h-1 reduction was observed in the high protein groups.
Considering previous literature and the results from Chapter 7 it could be concluded
that at rest, in untrained muscle, increasing metabolic stress (hypocaloric low
carbohydrate diet) is sufficient to stimulate the cellular adaptation, however in well-
trained individuals this is not the case.

Page 188 of 253
In Chapter 7 the athletes who consumed a continuous high protein diet for 7-days
exhibited a mean reduction in training speed of 0.9 km•h-1, however the athletes on
the high carbohydrate diet were able to maintain training speed during the intervention.
Therefore the high protein group exhibited an increase in metabolic stress by
restricting glycogen availability and the high carbohydrate increased metabolic stress
by maintaining training intensity. In terms of exercise performance TTE in the high
carbohydrate group was significantly better; also the participants exhibited a more
favourable gene response. Thus it may be postulated that in well-trained athletes,
training intensity is the most important regulator of AMPK/SITR1 – PGC-1α metabolic
pathway. The increase in metabolic stress by reducing glycogen availability in the high
protein group was not enough to offset the reduction in training intensity.
8.2 Overall study perspectives
In Chapter 6 the high protein, hypocaloric group had a reduction in energy intake of
~1,000 kcal•day-1 (1,876 kcal) and in Chapter 7 the estimated mean additional energy
expedited from running training was ~800 kcal•day-1 (45 mins – 60 mins running per
day), the same macronutrient ratios were utilised in each Chapter. It was
demonstrated in Chapter 6 that the reduction in calorie and carbohydrate intake
provided sufficient metabolic stress to promote cellular adaptation, however in
experimental Chapter 7, utilising the same dietary ratios the additional energy
expended through running training did not enhance adaptation. Contrary to this, the
high carbohydrate group who were able to maintain training intensity exhibited a
preferential adaptive cellular response. Considering that in Chapter 6 no change was
observed in the cellular adaptive at rest in hypocaloric high carbohydrate group, but
the equivalent carbohydrate restricted (high protein) diet did, suggests that in vivo
restricted carbohydrate intake is a more potent regulator of metabolic adaptation of
mitochondrial biogenesis than calorie restriction at rest. However in well trained
athletes and accompanied with running training, exercise intensity replaces energy
availability as the dominant stimulator of metabolic adaptation, as such emphasis
should be made on the maintenance of training intensity rather than carbohydrate
and/or energy restriction for endurance athletes (Figure 8.2.1)

Page 189 of 253
There seems to be a fine balance between fuel availability, increasing metabolic stress
and maintaining exercise intensity to optimising training adaptation. The exact protocol
to optimise this is yet to be defined. However, the greater understanding we have of
the mechanistic processes involved in the adaptive response to training, the closer we
will be to answering this question.
Figure 8.2.1. Flow diagram used to help make an informed choice about whether to
choose to train on a low carbohydrate diet or not.
8.3 Application

Page 190 of 253
The questionnaire developed in Chapter 4 provides a tool for practitioners and
athletes to measure nutritional knowledge, define gaps in nutrition knowledge,
and for use in evidence based intervention and practice.
The metabolic typing questionnaire is not able to differentiate metabolic function
in healthy individuals and caution should be taken by those intending to
implement it.
The endurance and power athletes in the study consumed very similar diets.
Literature is evident demonstrating that a higher protein intake may benefit
power athletes and increased carbohydrate may benefit endurance athletes.
Coaches, practitioners and athletes should consider this and assess for dietary
adequacy to meet required training demands.
Athletes possess sound nutrition knowledge; however education around
macronutrient quantities present in foods may enhance knowledge – potentially
improving practice.
At rest, consuming a diet which restricts carbohydrate intake in a hypocaloric
state promotes preferential metabolic adaptations commonly associated with
endurance training. The implications of this Chapter suggest two key
applications. Firstly, for a non-athletic individual aiming to lose weight, a high
protein, hypocaloric diet results in preferential body composition changes,
greater fat loss and less skeletal muscle loss. Secondly, this suggests that for
an athlete, on a non-training day, restricting carbohydrate intake may promote
preferential metabolic cellular adaptations that are associated with endurance
training.
Furthermore the results suggest that in well-trained runners it is imperative to
maintain intensity during endurance training to promote preferential adaptation
and performance. However as stated in previous literature, if training intensity
is able to be maintained then restricting glycogen availability may result in
greater adaptation.
For athletes looking to enhance fat metabolism during endurance exercise, a
high protein diet, in combination with endurance training, seems to promote
similar increases in fat oxidation during sub-maximal running as high fat diets
stated in previous literature. It has been documented that high fat diets can be

Page 191 of 253
un-enjoyable to consume; as such a high protein diet which results in the same
adaptation maybe a more enjoyable may and a preferable alternative.
8.4 Future research
The completion of this thesis has raised a number of questions that would benefit from
future research to provide greater comprehension:
1. Dietary intake in UK track and field athletes was similar in both the speed and
endurance cohorts. It is well documented that the different physiological
demands of the events require differing nutrition strategies to optimise
performance. Were the observed results specific to the assessed cohort, if not
why are athletes not following guidelines?
2. What are the shorter and longer-term impacts of consuming a high protein
hypocaloric diet? Are the same adaptations observed subsequent to a single
day’s dietary interventions? Are the observed adaptation further enhanced if
the diet is maintained?
3. On a rest day, if an athlete consumed a high protein hypocaloric diet would this
enhance adaptation?
4. Is the a ‘sweet spot’ where a small compromise training intensity and increased
metabolic stress due to glycogen restriction results in a preferential adaptation
– if so what is it?
5. What is the impact of consuming a high protein diet vs. high fat diet in
combination with endurance training on metabolic and cellular response? Is an
increased protein intake more effective than increased fat?
6. What is the longer-term impact of training with a high protein diet? Experimental
Chapter 7 demonstrated no adaptive response to the high protein diet 7-days
post intervention. However as with altitude training it takes approximately 4
weeks to elicit adaptation which lasts up to 30-days on returned to sea level.
Would a similar adaptive response be observed if the dietary intervention in the
current study was longer?
7. Given that post exercise biopsies were not taken and the exercise was
completed in a glycogen depleted state, further work is warranted to identify if,

Page 192 of 253
subsequent to a high protein diet, refuelling skeletal muscle glycogen pre
performance test attenuates the observed decrease in high intensity exercise
performance.

Page 193 of 253
9 REFERENCES

Page 194 of 253
AHTIAINEN, J. P., PAKARINEN, A., ALEN, M., KRAEMER, W. J. & HAKKINEN, K. 2003. Muscle hypertrophy, hormonal adaptations and strength development during strength training in strength-trained and untrained men. Eur J Appl Physiol, 89, 555-63.
AMERICAN DIETETIC, A., DIETITIANS OF, C., AMERICAN COLLEGE OF SPORTS, M., RODRIGUEZ, N. R., DI MARCO, N. M. & LANGLEY, S. 2009. American College of Sports Medicine position stand. Nutrition and athletic performance. Medicine and science in sports and exercise, 41, 709-31.
ANDERSON, A. S., BELL, A., ADAMSON, A. & MOYNIHAN, P. 2002. A questionnaire assessment of nutrition knowledge--validity and reliability issues. Public health nutrition, 5, 497-503.
ANDERSON, A. S., UMAPATHY, D., PALUMBO, L. & PEARSON, D. W. M. 1988. Nutrition knowledge assessed by a structures questionnaire in a group of medical in-patients. Journal of Human Nutrition and Dietetics, 1, 39-46.
ARETA, J. L., BURKE, L. M., CAMERA, D. M., WEST, D. W., CRAWSHAY, S., MOORE, D. R., STELLINGWERFF, T., PHILLIPS, S. M., HAWLEY, J. A. & COFFEY, V. G. 2014. Reduced resting skeletal muscle protein synthesis is rescued by resistance exercise and protein ingestion following short-term energy deficit. Am J Physiol Endocrinol Metab, 306, E989-97.
AXELSON, M. L. & BRINBERG, D. 1992. The measurement and conceptualization of nutrition knowledge. Journal of Nutrition Education, 24, 239-246.
BAAR, K., WENDE, A. R., JONES, T. E., MARISON, M., NOLTE, L. A., CHEN, M., KELLY, D. P. & HOLLOSZY, J. O. 2002. Adaptations of skeletal muscle to exercise: rapid increase in the transcriptional coactivator PGC-1. FASEB J, 16, 1879-86.
BALLMER, P. E., MCNURLAN, M. A., HULTER, H. N., ANDERSON, S. E., GARLICK, P. J. & KRAPF, R. 1995. Chronic metabolic acidosis decreases albumin synthesis and induces negative nitrogen balance in humans. J Clin Invest, 95, 39-45.
BARTLETT, J. D., HAWLEY, J. A. & MORTON, J. P. 2015. Carbohydrate availability and exercise training adaptation: too much of a good thing? Eur J Sport Sci, 15, 3-12.
BASIOTIS, P. P., WELSH, S. O., CRONIN, F. J., KELSAY, J. L. & MERTZ, W. 1987. Number of days of food intake records required to estimate individual and group nutrient intakes with defined confidence. J Nutr, 117, 1638-41.
BERGMAN, B. C. & BROOKS, G. A. 1999. Respiratory gas-exchange ratios during graded exercise in fed and fasted trained and untrained men. J Appl Physiol (1985), 86, 479-87.
BERGSTROM, J., HERMANSEN, L., HULTMAN, E. & SALTIN, B. 1967. Diet, muscle glycogen and physical performance. Acta Physiol Scand, 71, 140-50.
BINGHAM, S. A., GILL, C., WELCH, A., DAY, K., CASSIDY, A., KHAW, K. T., SNEYD, M. J., KEY, T. J., ROE, L. & DAY, N. E. 1994. Comparison of dietary assessment methods in nutritional epidemiology: weighed records v. 24 h recalls, food-frequency questionnaires and estimated-diet records. Br J Nutr, 72, 619-43.
BODEN, G., SARGRAD, K., HOMKO, C., MOZZOLI, M. & STEIN, T. P. 2005. Effect of a low-carbohydrate diet on appetite, blood glucose levels, and insulin

Page 195 of 253
resistance in obese patients with type 2 diabetes. Ann Intern Med, 142, 403-11.
BORG, G. 1970. Perceived exertion as an indicator of somatic stress. Scand J Rehabil Med, 2, 92-8.
BURKE, L. & DEAKIN, V. 2010. Clinical Sports Nutrition, New South Wales; Australia, McGraw-Hill.
BURKE, L. M. 2015. Re-Examining High-Fat Diets for Sports Performance: Did We Call the 'Nail in the Coffin' Too Soon? Sports Med, 45 Suppl 1, S33-49.
BURKE, L. M., ANGUS, D. J., COX, G. R., CUMMINGS, N. K., FEBBRAIO, M. A., GAWTHORN, K., HAWLEY, J. A., MINEHAN, M., MARTIN, D. T. & HARGREAVES, M. 2000. Effect of fat adaptation and carbohydrate restoration on metabolism and performance during prolonged cycling. J Appl Physiol (1985), 89, 2413-21.
BURKE, L. M., COX, G. R., CULMMINGS, N. K. & DESBROW, B. 2001. Guidelines for daily carbohydrate intake: do athletes achieve them? Sports medicine, 31, 267-99.
BURKE, L. M. & HAWLEY, J. A. 2002. Effects of short-term fat adaptation on metabolism and performance of prolonged exercise. Med Sci Sports Exerc, 34, 1492-8.
BURKE, L. M., HAWLEY, J. A., ANGUS, D. J., COX, G. R., CLARK, S. A., CUMMINGS, N. K., DESBROW, B. & HARGREAVES, M. 2002. Adaptations to short-term high-fat diet persist during exercise despite high carbohydrate availability. Med Sci Sports Exerc, 34, 83-91.
BURKE, L. M., MILLET, G. & TARNOPOLSKY, M. A. 2007. Nutrition for distance events. J Sports Sci, 25 Suppl 1, S29-38.
CANTO, C., JIANG, L. Q., DESHMUKH, A. S., MATAKI, C., COSTE, A., LAGOUGE, M., ZIERATH, J. R. & AUWERX, J. 2010. Interdependence of AMPK and SIRT1 for metabolic adaptation to fasting and exercise in skeletal muscle. Cell Metab, 11, 213-9.
CARBONE, J. W., MCCLUNG, J. P. & PASIAKOS, S. M. 2012. Skeletal muscle responses to negative energy balance: effects of dietary protein. Adv Nutr, 3, 119-26.
CAREY, A. L., STAUDACHER, H. M., CUMMINGS, N. K., STEPTO, N. K., NIKOLOPOULOS, V., BURKE, L. M. & HAWLEY, J. A. 2001. Effects of fat adaptation and carbohydrate restoration on prolonged endurance exercise. J Appl Physiol (1985), 91, 115-22.
CHAPMAN, R. F., LAYMON STICKFORD, A. S., LUNDBY, C. & LEVINE, B. D. 2014. Timing of return from altitude training for optimal sea level performance. J Appl Physiol (1985), 116, 837-43.
CHO, M. & FRYER, B. A. 1974. What foods do physical education majors and basic nutrition students recommend for athletes? J Am Diet Assoc, 65, 541-4.
COCHRAN, A. J., MYSLIK, F., MACINNIS, M. J., PERCIVAL, M. E., BISHOP, D., TARNOPOLSKY, M. A. & GIBALA, M. J. 2015. Manipulating Carbohydrate Availability Between Twice-Daily Sessions of High-Intensity Interval Training Over 2 Weeks Improves Time-Trial Performance. Int J Sport Nutr Exerc Metab, 25, 463-70.
COHEN, H. Y., MILLER, C., BITTERMAN, K. J., WALL, N. R., HEKKING, B., KESSLER, B., HOWITZ, K. T., GOROSPE, M., DE CABO, R. & SINCLAIR, D.

Page 196 of 253
A. 2004. Calorie restriction promotes mammalian cell survival by inducing the SIRT1 deacetylase. Science, 305, 390-2.
COTUGNA, N., SUBAR, A. F., HEIMENDINGER, J. & KAHLE, L. 1992. Nutrition and cancer prevention knowledge, beliefs, attitudes, and practices: the 1987 National Health Interview Survey. J Am Diet Assoc, 92, 963-8.
COYLE, E. F., COGGAN, A. R., HEMMERT, M. K. & IVY, J. L. 1986. Muscle glycogen utilization during prolonged strenuous exercise when fed carbohydrate. J Appl Physiol (1985), 61, 165-72.
CRONBACH, L. J. 1951. Coefficent alpha and the internal structure of tests. Psychometrika, 16, 297-234.
CUPISTI, A., D'ALESSANDRO, C., CASTROGIOVANNI, S., BARALE, A. & MORELLI, E. 2002. Nutrition knowledge and dietary composition in Italian adolescent female athletes and non-athletes. Int J Sport Nutr Exerc Metab, 12, 207-19.
DALLONGEVILLE, J., MARECAUX, N., COTTEL, D., BINGHAM, A. & AMOUYEL, P. 2001. Association between nutrition knowledge and nutritional intake in middle-aged men from Northern France. Public Health Nutr, 4, 27-33.
DE FEYTER, H. M., LENAERS, E., HOUTEN, S. M., SCHRAUWEN, P., HESSELINK, M. K., WANDERS, R. J., NICOLAY, K. & PROMPERS, J. J. 2008. Increased intramyocellular lipid content but normal skeletal muscle mitochondrial oxidative capacity throughout the pathogenesis of type 2 diabetes. FASEB J, 22, 3947-55.
DELGUERCIO, L. R., FEINS, N. R., COHN, J. D., COOMARASWAMY, R. P., WOLLMAN, S. B. & STATE, D. 1965. Comparison of Blood Flow during External and Internal Cardiac Massage in Man. Circulation, 31, SUPPL 1:171-80.
DOUGLAS, P. D. & DOUGLAS, J. G. 1984. Nutrition knowledge and food practices of high school athletes. J Am Diet Assoc, 84, 1198-202.
DRAZNIN, B., WANG, C., ADOCHIO, R., LEITNER, J. W. & CORNIER, M. A. 2012. Effect of dietary macronutrient composition on AMPK and SIRT1 expression and activity in human skeletal muscle. Horm Metab Res, 44, 650-5.
FIELD, A. P. 2013. Discovering statistics using IBM SPSS Statistics, London, Sage publications.
FINEGOLD, S. M., ATTEBERY, H. R. & SUTTER, V. L. 1974. Effect of diet on human fecal flora: comparison of Japanese and American diets. Am J Clin Nutr, 27, 1456-69.
FORSLUND, A. H., EL-KHOURY, A. E., OLSSON, R. M., SJODIN, A. M., HAMBRAEUS, L. & YOUNG, V. R. 1999. Effect of protein intake and physical activity on 24-h pattern and rate of macronutrient utilization. Am J Physiol, 276, E964-76.
FOUNDATION, B. N. 2015. Nutrition Requirements. In: FOUNDATION, B. N. (ed.). nutrition.org.uk.
FOWKE, J. H. & MATTHEWS, C. E. 2010. PSA and body composition by dual X-ray absorptiometry (DXA) in NHANES. Prostate, 70, 120-5.
FRIEDLANDER, A. L., BRAUN, B., POLLACK, M., MACDONALD, J. R., FULCO, C. S., MUZA, S. R., ROCK, P. B., HENDERSON, G. C., HORNING, M. A., BROOKS, G. A., HOFFMAN, A. R. & CYMERMAN, A. 2005. Three weeks of caloric restriction alters protein metabolism in normal-weight, young men. Am J Physiol Endocrinol Metab, 289, E446-55.

Page 197 of 253
FUJII, N., HAYASHI, T., HIRSHMAN, M. F., SMITH, J. T., HABINOWSKI, S. A., KAIJSER, L., MU, J., LJUNGQVIST, O., BIRNBAUM, M. J., WITTERS, L. A., THORELL, A. & GOODYEAR, L. J. 2000. Exercise induces isoform-specific increase in 5'AMP-activated protein kinase activity in human skeletal muscle. Biochem Biophys Res Commun, 273, 1150-5.
FULCO, M., CEN, Y., ZHAO, P., HOFFMAN, E. P., MCBURNEY, M. W., SAUVE, A. A. & SARTORELLI, V. 2008. Glucose restriction inhibits skeletal myoblast differentiation by activating SIRT1 through AMPK-mediated regulation of Nampt. Dev Cell, 14, 661-73.
GAITANOS, G. C., WILLIAMS, C., BOOBIS, L. H. & BROOKS, S. 1993. Human muscle metabolism during intermittent maximal exercise. J Appl Physiol (1985), 75, 712-9.
GALESIC, M. & BOSNJAK, M. 2009. Effects of Questionnaire Length on Participation and Indicators of Response Quality in a Web Survey. Public Opinion Quarterly, 73, 349-360.
GANESHAN, K. & CHAWLA, A. 2014. Metabolic regulation of immune responses. Annu Rev Immunol, 32, 609-34.
GARLICK, P. J., MCNURLAN, M. A. & PATLAK, C. S. 1999. Adaptation of protein metabolism in relation to limits to high dietary protein intake. Eur J Clin Nutr, 53 Suppl 1, S34-43.
GIBALA, M. J., MCGEE, S. L., GARNHAM, A. P., HOWLETT, K. F., SNOW, R. J. & HARGREAVES, M. 2009. Brief intense interval exercise activates AMPK and p38 MAPK signaling and increases the expression of PGC-1alpha in human skeletal muscle. J Appl Physiol (1985), 106, 929-34.
GLEESON, M. & BISHOP, N. C. 2000. Special feature for the Olympics: effects of exercise on the immune system: modification of immune responses to exercise by carbohydrate, glutamine and anti-oxidant supplements. Immunol Cell Biol, 78, 554-61.
GOEDECKE, J. H., CHRISTIE, C., WILSON, G., DENNIS, S. C., NOAKES, T. D., HOPKINS, W. G. & LAMBERT, E. V. 1999. Metabolic adaptations to a high-fat diet in endurance cyclists. Metabolism, 48, 1509-17.
GREENHAFF, P. L., NEVILL, M. E., SODERLUND, K., BODIN, K., BOOBIS, L. H., WILLIAMS, C. & HULTMAN, E. 1994. The metabolic responses of human type I and II muscle fibres during maximal treadmill sprinting. J Physiol, 478 ( Pt 1), 149-55.
GRUNDY, S. M. & DENKE, M. A. 1990. Dietary influences on serum lipids and lipoproteins. J Lipid Res, 31, 1149-72.
GURD, B. J., YOSHIDA, Y., LALLY, J., HOLLOWAY, G. P. & BONEN, A. 2009. The deacetylase enzyme SIRT1 is not associated with oxidative capacity in rat heart and skeletal muscle and its overexpression reduces mitochondrial biogenesis. J Physiol, 587, 1817-28.
HAINES, P. S., SIEGA-RIZ, A. M. & POPKIN, B. M. 1999. The Diet Quality Index revised: a measurement instrument for populations. J Am Diet Assoc, 99, 697-704.
HAMILTON, C. Y., SCHILLER, M. R. & BOYNE, L. 1994. Nutrition attitudes, practices, and views of selected Ohio WIC participants. J Am Diet Assoc, 94, 899-901.
HANSEN, A. K., FISCHER, C. P., PLOMGAARD, P., ANDERSEN, J. L., SALTIN, B. & PEDERSEN, B. K. 2005. Skeletal muscle adaptation: training twice every second day vs. training once daily. J Appl Physiol (1985), 98, 93-9.

Page 198 of 253
HARNACK, L., BLOCK, G., SUBAR, A., LANE, S. & BRAND, R. 1997. Association of cancer prevention-related nutrition knowledge, beliefs, and attitudes to cancer prevention dietary behavior. J Am Diet Assoc, 97, 957-65.
HARRIS, J. A. & BENEDICT, F. G. 1918. A Biometric Study of Human Basal Metabolism. Proc Natl Acad Sci U S A, 4, 370-3.
HARRISON, J., HOPKINS, W. G., MACFARLANE, D. J. & WORSLEY, A. 1991. Nutrition knowledge and dietary habits of elite and non-elite athletes. Australian Journal of Nutrition and Dietetics, 48, 124-127.
HAVEMANN, L., WEST, S. J., GOEDECKE, J. H., MACDONALD, I. A., ST CLAIR GIBSON, A., NOAKES, T. D. & LAMBERT, E. V. 2006. Fat adaptation followed by carbohydrate loading compromises high-intensity sprint performance. J Appl Physiol (1985), 100, 194-202.
HAWLEY, J. A., BROUNS, F. & JEUKENDRUP, A. 1998. Strategies to enhance fat utilisation during exercise. Sports Med, 25, 241-57.
HAWLEY, J. A. & MORTON, J. P. 2014. Ramping up the signal: promoting endurance training adaptation in skeletal muscle by nutritional manipulation. Clin Exp Pharmacol Physiol, 41, 608-13.
HAYOT, M., MICHAUD, A., KOECHLIN, C., CARON, M. A., LEBLANC, P., PREFAUT, C. & MALTAIS, F. 2005. Skeletal muscle microbiopsy: a validation study of a minimally invasive technique. Eur Respir J, 25, 431-40.
HEANEY, S., O'CONNOR, H., MICHAEL, S., GIFFORD, J. & NAUGHTON, G. 2011. Nutrition knowledge in athletes: a systematic review. International journal of sport nutrition and exercise metabolism, 21, 248-61.
HELGE, J. W. & KIENS, B. 1997. Muscle enzyme activity in humans: role of substrate availability and training. Am J Physiol, 272, R1620-4.
HENRY, C. J. 2005. Basal metabolic rate studies in humans: measurement and development of new equations. Public Health Nutr, 8, 1133-52.
HESHKA, S., YANG, M. U., WANG, J., BURT, P. & PI-SUNYER, F. X. 1990. Weight loss and change in resting metabolic rate. Am J Clin Nutr, 52, 981-6.
HILL, D. W. 1999. Energy system contributions in middle-distance running events. J Sports Sci, 17, 477-83.
HOLLOSZY, J. O. & COYLE, E. F. 1984. Adaptations of skeletal muscle to endurance exercise and their metabolic consequences. J Appl Physiol Respir Environ Exerc Physiol, 56, 831-8.
HOLT, S. H., DELARGY, H. J., LAWTON, C. L. & BLUNDELL, J. E. 1999. The effects of high-carbohydrate vs high-fat breakfasts on feelings of fullness and alertness, and subsequent food intake. Int J Food Sci Nutr, 50, 13-28.
HULTMAN, E. & BERGSTROM, J. 1967. Muscle glycogen synthesis in relation to diet studied in normal subjects. Acta Med Scand, 182, 109-17.
HUSSAIN, T. A., MATHEW, T. C., DASHTI, A. A., ASFAR, S., AL-ZAID, N. & DASHTI, H. M. 2012. Effect of low-calorie versus low-carbohydrate ketogenic diet in type 2 diabetes. Nutrition, 28, 1016-21.
HUTBER, C. A., HARDIE, D. G. & WINDER, W. W. 1997. Electrical stimulation inactivates muscle acetyl-CoA carboxylase and increases AMP-activated protein kinase. Am J Physiol, 272, E262-6.
ITANI, S. I., SAHA, A. K., KUROWSKI, T. G., COFFIN, H. R., TORNHEIM, K. & RUDERMAN, N. B. 2003. Glucose autoregulates its uptake in skeletal muscle: involvement of AMP-activated protein kinase. Diabetes, 52, 1635-40.

Page 199 of 253
JAGER, S., HANDSCHIN, C., ST-PIERRE, J. & SPIEGELMAN, B. M. 2007. AMP-activated protein kinase (AMPK) action in skeletal muscle via direct phosphorylation of PGC-1alpha. Proc Natl Acad Sci U S A, 104, 12017-22.
JANSSEN, I., HEYMSFIELD, S. B. & ROSS, R. 2002. Low relative skeletal muscle mass (sarcopenia) in older persons is associated with functional impairment and physical disability. J Am Geriatr Soc, 50, 889-96.
JANSSON, E. & KAIJSER, L. 1982. Effect of diet on the utilization of blood-borne and intramuscular substrates during exercise in man. Acta Physiol Scand, 115, 19-30.
JERLOCK, M., GASTON-JOHANSSON, F. & DANIELSON, E. 2005. Living with unexplained chest pain. J Clin Nurs, 14, 956-64.
JESSRI, M., JESSRI, M., RASHIDKHANI, B. & ZINN, C. 2010. Evaluation of Iranian college athletes' sport nutrition knowledge. Int J Sport Nutr Exerc Metab, 20, 257-63.
JEUKENDRUP, A. E. 2011. Nutrition for endurance sports: marathon, triathlon, and road cycling. J Sports Sci, 29 Suppl 1, S91-9.
JEUKENDRUP, A. E. & WALLIS, G. A. 2005. Measurement of substrate oxidation during exercise by means of gas exchange measurements. Int J Sports Med, 26 Suppl 1, S28-37.
JOOST, H. G., GIBNEY, M. J., CASHMAN, K. D., GORMAN, U., HESKETH, J. E., MUELLER, M., VAN OMMEN, B., WILLIAMS, C. M. & MATHERS, J. C. 2007. Personalised nutrition: status and perspectives. Br J Nutr, 98, 26-31.
JORNAYVAZ, F. R. & SHULMAN, G. I. 2010. Regulation of mitochondrial biogenesis. Essays Biochem, 47, 69-84.
JOYNER, M. J., RUIZ, J. R. & LUCIA, A. 2011. The two-hour marathon: who and when? J Appl Physiol (1985), 110, 275-7.
KIM, J., WANG, Z., HEYMSFIELD, S. B., BAUMGARTNER, R. N. & GALLAGHER, D. 2002. Total-body skeletal muscle mass: estimation by a new dual-energy X-ray absorptiometry method. Am J Clin Nutr, 76, 378-83.
KLINE, P. 2007a. The Handbook of Psychological Tes, London, UK, Routledge. KLINE, P. 2007b. The Handbook of Psychological Testing, London, UK,
Routledge. KRISTAL, H. J. & HAIG, J. M. 2002. The Nutrition Solution: A Guide to Your
Metabolic Type, North Atlantic Books, California, United States of America.
LAMBERT, E. V., GOEDECKE, J. H., ZYLE, C., MURPHY, K., HAWLEY, J. A., DENNIS, S. C. & NOAKES, T. D. 2001. High-fat diet versus habitual diet prior to carbohydrate loading: effects of exercise metabolism and cycling performance. Int J Sport Nutr Exerc Metab, 11, 209-25.
LAMBERT, E. V., SPEECHLY, D. P., DENNIS, S. C. & NOAKES, T. D. 1994. Enhanced endurance in trained cyclists during moderate intensity exercise following 2 weeks adaptation to a high fat diet. Eur J Appl Physiol Occup Physiol, 69, 287-93.
LARSEN, F. J., SCHIFFER, T. A., SAHLIN, K., EKBLOM, B., WEITZBERG, E. & LUNDBERG, J. O. 2011. Mitochondrial oxygen affinity predicts basal metabolic rate in humans. FASEB J, 25, 2843-52.
LAYMAN, D. K., BOILEAU, R. A., ERICKSON, D. J., PAINTER, J. E., SHIUE, H., SATHER, C. & CHRISTOU, D. D. 2003. A reduced ratio of dietary carbohydrate to protein improves body composition and blood lipid profiles during weight loss in adult women. J Nutr, 133, 411-7.

Page 200 of 253
LEE, H. K., SONG, J. H., SHIN, C. S., PARK, D. J., PARK, K. S., LEE, K. U. & KOH, C. S. 1998. Decreased mitochondrial DNA content in peripheral blood precedes the development of non-insulin-dependent diabetes mellitus. Diabetes Res Clin Pract, 42, 161-7.
LEONE, T. C., LEHMAN, J. J., FINCK, B. N., SCHAEFFER, P. J., WENDE, A. R., BOUDINA, S., COURTOIS, M., WOZNIAK, D. F., SAMBANDAM, N., BERNAL-MIZRACHI, C., CHEN, Z., HOLLOSZY, J. O., MEDEIROS, D. M., SCHMIDT, R. E., SAFFITZ, J. E., ABEL, E. D., SEMENKOVICH, C. F. & KELLY, D. P. 2005. PGC-1alpha deficiency causes multi-system energy metabolic derangements: muscle dysfunction, abnormal weight control and hepatic steatosis. PLoS Biol, 3, e101.
LIANG, H. & WARD, W. F. 2006. PGC-1alpha: a key regulator of energy metabolism. Adv Physiol Educ, 30, 145-51.
LIN, J., HANDSCHIN, C. & SPIEGELMAN, B. M. 2005. Metabolic control through the PGC-1 family of transcription coactivators. Cell Metab, 1, 361-70.
MAGKOS, F. & YANNAKOULIA, M. 2003. Methodology of dietary assessment in athletes: concepts and pitfalls. Curr Opin Clin Nutr Metab Care, 6, 539-49.
MALIK, V. S. & HU, F. B. 2007. Popular weight-loss diets: from evidence to practice. Nat Clin Pract Cardiovasc Med, 4, 34-41.
MARQUET, L. A., BRISSWALTER, J., LOUIS, J., TIOLLIER, E., BURKE, L. M., HAWLEY, J. A. & HAUSSWIRTH, C. 2016. Enhanced Endurance Performance by Periodization of Carbohydrate Intake: "Sleep Low" Strategy. Med Sci Sports Exerc, 48, 663-72.
MARTIN, W. & MENTEL, M. 2010. The origin of mitochondria. Nature Education, 3, 58.
MASTORAKOS, G. & ZAPANTI, E. 2004. The hypothalamic-pituitary-adrenal axis in the neuroendocrine regulation of food intake and obesity: the role of corticotropin releasing hormone. Nutr Neurosci, 7, 271-80.
MCCANCE & WIDDOWSON. 2015. Composition of foods integrated dataset (CoFID) [Online]. https://www.gov.uk/government/publications/composition-of-foods-integrated-dataset-cofid. [Accessed 28 August 2015].
MEIRHAEGHE, A., CROWLEY, V., LENAGHAN, C., LELLIOTT, C., GREEN, K., STEWART, A., HART, K., SCHINNER, S., SETHI, J. K., YEO, G., BRAND, M. D., CORTRIGHT, R. N., O'RAHILLY, S., MONTAGUE, C. & VIDAL-PUIG, A. J. 2003. Characterization of the human, mouse and rat PGC1 beta (peroxisome-proliferator-activated receptor-gamma co-activator 1 beta) gene in vitro and in vivo. Biochem J, 373, 155-65.
MEISENBERG, G. & WILLIAMS, A. 2008. Are acquiescent and extreme response styles related to low intelligence and education. Personality and Individual Differences, 1539-1550.
MERTZ, W., TSUI, J. C., JUDD, J. T., REISER, S., HALLFRISCH, J., MORRIS, E. R., STEELE, P. D. & LASHLEY, E. 1991. What are people really eating? The relation between energy intake derived from estimated diet records and intake determined to maintain body weight. Am J Clin Nutr, 54, 291-5.
MILLER, L. M. & CASSADY, D. L. 2015. The effects of nutrition knowledge on food label use. A review of the literature. Appetite, 92, 207-16.
MILLER, W. C., BRYCE, G. R. & CONLEE, R. K. 1984. Adaptations to a high-fat diet that increase exercise endurance in male rats. J Appl Physiol Respir Environ Exerc Physiol, 56, 78-83.

Page 201 of 253
MISHRA, P. & CHAN, D. C. 2016. Metabolic regulation of mitochondrial dynamics. J Cell Biol, 212, 379-87.
MOOTHA, V. K., LINDGREN, C. M., ERIKSSON, K. F., SUBRAMANIAN, A., SIHAG, S., LEHAR, J., PUIGSERVER, P., CARLSSON, E., RIDDERSTRALE, M., LAURILA, E., HOUSTIS, N., DALY, M. J., PATTERSON, N., MESIROV, J. P., GOLUB, T. R., TAMAYO, P., SPIEGELMAN, B., LANDER, E. S., HIRSCHHORN, J. N., ALTSHULER, D. & GROOP, L. C. 2003. PGC-1alpha-responsive genes involved in oxidative phosphorylation are coordinately downregulated in human diabetes. Nat Genet, 34, 267-73.
MYERS, M. G., JR. & OLSON, D. P. 2012. Central nervous system control of metabolism. Nature, 491, 357-63.
NAKAZATO, K. & SONG, H. 2008. Increased oxidative properties of gastrocnemius in rats fed on a high-protein diet. J Nutr Biochem, 19, 26-32.
NASH, M. A., TORRADO, A. D., GREIFER, I., SPITZER, A. & EDELMANN, C. M., JR. 1972. Renal tubular acidosis in infants and children. Clinical course, response to treatment, and prognosis. J Pediatr, 80, 738-48.
NEMOTO, S., FERGUSSON, M. M. & FINKEL, T. 2005. SIRT1 functionally interacts with the metabolic regulator and transcriptional coactivator PGC-1{alpha}. J Biol Chem, 280, 16456-60.
NOAKES, T. 2004. Fat adaptation and prolonged exercise performance. J Appl Physiol (1985), 96, 1243; author reply 1243-4.
NORRBOM, J., SUNDBERG, C. J., AMELN, H., KRAUS, W. E., JANSSON, E. & GUSTAFSSON, T. 2004. PGC-1alpha mRNA expression is influenced by metabolic perturbation in exercising human skeletal muscle. J Appl Physiol (1985), 96, 189-94.
O'KEEFFE, K. A., KEITH, R. E., WILSON, G. D. & BLESSING, D. L. 1989. Dietary carbohydrate intake and endurance exercise performance of trained female cyclists. Nutrition Research, 9, 819-830.
O'SULLIVAN, A., GIBNEY, M. J. & BRENNAN, L. 2011. Dietary intake patterns are reflected in metabolomic profiles: potential role in dietary assessment studies. Am J Clin Nutr, 93, 314-21.
PALACIOS, O. M., CARMONA, J. J., MICHAN, S., CHEN, K. Y., MANABE, Y., WARD, J. L., 3RD, GOODYEAR, L. J. & TONG, Q. 2009. Diet and exercise signals regulate SIRT3 and activate AMPK and PGC-1alpha in skeletal muscle. Aging (Albany NY), 1, 771-83.
PARMENTER, K. & WARDLE, J. 1999. Development of a general nutrition knowledge questionnaire for adults. European journal of clinical nutrition, 53, 298-308.
PATTI, M. E., BUTTE, A. J., CRUNKHORN, S., CUSI, K., BERRIA, R., KASHYAP, S., MIYAZAKI, Y., KOHANE, I., COSTELLO, M., SACCONE, R., LANDAKER, E. J., GOLDFINE, A. B., MUN, E., DEFRONZO, R., FINLAYSON, J., KAHN, C. R. & MANDARINO, L. J. 2003. Coordinated reduction of genes of oxidative metabolism in humans with insulin resistance and diabetes: Potential role of PGC1 and NRF1. Proc Natl Acad Sci U S A, 100, 8466-71.
PERRY, C. G., LALLY, J., HOLLOWAY, G. P., HEIGENHAUSER, G. J., BONEN, A. & SPRIET, L. L. 2010. Repeated transient mRNA bursts precede increases in transcriptional and mitochondrial proteins during training in human skeletal muscle. J Physiol, 588, 4795-810.

Page 202 of 253
PESSI, A. & FAYH, A. P. 2011. Evaluation of the Nutritional Knowledge of Professional Track and Field and Triathlon Athletes. Revista Brasilerira de Medicina do Esporte, 14.
PETERS, S. J. & LEBLANC, P. J. 2004. Metabolic aspects of low carbohydrate diets and exercise. Nutr Metab (Lond), 1, 7.
PETERSEN, K. F., DUFOUR, S., BEFROY, D., GARCIA, R. & SHULMAN, G. I. 2004. Impaired mitochondrial activity in the insulin-resistant offspring of patients with type 2 diabetes. N Engl J Med, 350, 664-71.
PHILLIPS, S. M. 2006. Dietary protein for athletes: from requirements to metabolic advantage. Appl Physiol Nutr Metab, 31, 647-54.
PHILLIPS, S. M. & VAN LOON, L. J. 2011. Dietary protein for athletes: from requirements to optimum adaptation. J Sports Sci, 29 Suppl 1, S29-38.
PHINNEY, S. D., BISTRIAN, B. R., EVANS, W. J., GERVINO, E. & BLACKBURN, G. L. 1983. The human metabolic response to chronic ketosis without caloric restriction: preservation of submaximal exercise capability with reduced carbohydrate oxidation. Metabolism, 32, 769-76.
PIATTI, P. M., MONTI, F., FERMO, I., BARUFFALDI, L., NASSER, R., SANTAMBROGIO, G., LIBRENTI, M. C., GALLI-KIENLE, M., PONTIROLI, A. E. & POZZA, G. 1994. Hypocaloric high-protein diet improves glucose oxidation and spares lean body mass: comparison to hypocaloric high-carbohydrate diet. Metabolism, 43, 1481-7.
PIROUZNIA, M. 2001. The association between nutrition knowledge and eating behavior in male and female adolescents in the US. Int J Food Sci Nutr, 52, 127-32.
PITSILADIS, Y. P. & MAUGHAN, R. J. 1999. The effects of exercise and diet manipulation on the capacity to perform prolonged exercise in the heat and in the cold in trained humans. J Physiol, 517 ( Pt 3), 919-30.
PRIMROSE, S., DRAPER, J., ELSOM, R., KIRKPATRICK, V., MATHERS, J. C., SEAL, C., BECKMANN, M., HALDAR, S., BEATTIE, J. H., LODGE, J. K., JENAB, M., KEUN, H. & SCALBERT, A. 2011. Metabolomics and human nutrition. Br J Nutr, 105, 1277-83.
PSILANDER, N., FRANK, P., FLOCKHART, M. & SAHLIN, K. 2013. Exercise with low glycogen increases PGC-1alpha gene expression in human skeletal muscle. Eur J Appl Physiol, 113, 951-63.
PUIGSERVER, P., WU, Z., PARK, C. W., GRAVES, R., WRIGHT, M. & SPIEGELMAN, B. M. 1998. A cold-inducible coactivator of nuclear receptors linked to adaptive thermogenesis. Cell, 92, 829-39.
RAPOPORT, B. I. 2010. Metabolic factors limiting performance in marathon runners. PLoS Comput Biol, 6, e1000960.
RASANEN, M., NIINIKOSKI, H., KESKINEN, S., HELENIUS, H., TALVIA, S., RONNEMAA, T., VIIKARI, J. & SIMELL, O. 2003. Parental nutrition knowledge and nutrient intake in an atherosclerosis prevention project: the impact of child-targeted nutrition counselling. Appetite, 41, 69-77.
RASH, C. L., MALINAUSKAS, B. M., DUFFRIN, M. W., BARBER-HEIDAL, K. & OVERTON, R. F. 2008. Nutrition-related knowledge, attitude, and dietary intake of college track athletes. The Sport Journal, 11, 48-54.
RAVUSSIN, E., LILLIOJA, S., ANDERSON, T. E., CHRISTIN, L. & BOGARDUS, C. 1986. Determinants of 24-hour energy expenditure in man. Methods and results using a respiratory chamber. J Clin Invest, 78, 1568-78.

Page 203 of 253
RAVUSSIN, E., LILLIOJA, S., KNOWLER, W. C., CHRISTIN, L., FREYMOND, D., ABBOTT, W. G., BOYCE, V., HOWARD, B. V. & BOGARDUS, C. 1988. Reduced rate of energy expenditure as a risk factor for body-weight gain. N Engl J Med, 318, 467-72.
RAYMOND-BARKER, P., PETROCZI, A. & QUESTED, E. 2007. Assessment of nutritional knowledge in female athletes susceptible to the Female Athlete Triad syndrome. J Occup Med Toxicol, 2, 10.
RICCIOTTI, E. & FITZGERALD, G. A. 2011. Prostaglandins and inflammation. Arterioscler Thromb Vasc Biol, 31, 986-1000.
RODGERS, J. T., LERIN, C., GERHART-HINES, Z. & PUIGSERVER, P. 2008. Metabolic adaptations through the PGC-1a and SIRT1 pathways. Federation of European Biochemical Societies, 582, 46-53.
RODRIGUEZ, N. R. & GARLICK, P. J. 2008. Introduction to Protein Summit 2007: exploring the impact of high-quality protein on optimal health. Am J Clin Nutr, 87, 1551S-1553S.
ROLSTAD, S., ADLER, J. & RYDEN, A. 2011. Response burden and questionnaire length: is shorter better? A review and meta-analysis. Value Health, 14, 1101-8.
ROSENBLOOM, C. A., JONNALAGADDA, S. S. & SKINNER, R. 2002. Nutrition knowledge of collegiate athletes in a Division I National Collegiate Athletic Association institution. Journal of the American Dietetic Association, 102, 418-20.
ROWLANDS, D. S. & HOPKINS, W. G. 2002. Effects of high-fat and high-carbohydrate diets on metabolism and performance in cycling. Metabolism, 51, 678-90.
RUDERMAN, N. B., XU, X. J., NELSON, L., CACICEDO, J. M., SAHA, A. K., LAN, F. & IDO, Y. 2010. AMPK and SIRT1: a long-standing partnership? Am J Physiol Endocrinol Metab, 298, E751-60.
SAWYER-MORSE, M. K., SMOLIK, T., MOBLEY, C. & SAEGERT, M. 1989. Nutrition beliefs, practices, and perceptions of young dancers. J Adolesc Health Care, 10, 200-2.
SEARS, B. 1995. The Zone Diet: A Dietary Road Map, New York: , Regan Books. SENEKAL, M. 2012. Genotype-based personalised nutrition for obesity
prevention and treatment: are we there yet? South African Journal of Clinical Nutrition, 25, 9-14.
SHEPHERD, R. 1992. Nutrition Society--Nutrition and Behaviour Group. Symposium on Nutrition and Cognitive Efficiency, held at University of Reading, 3 April 1992. Appetite, 19, 157-8.
SIFRIM, D., DUPONT, L., BLONDEAU, K., ZHANG, X., TACK, J. & JANSSENS, J. 2005. Weakly acidic reflux in patients with chronic unexplained cough during 24 hour pressure, pH, and impedance monitoring. Gut, 54, 449-54.
SKOV, A. R., TOUBRO, S., RONN, B., HOLM, L. & ASTRUP, A. 1999. Randomized trial on protein vs carbohydrate in ad libitum fat reduced diet for the treatment of obesity. Int J Obes Relat Metab Disord, 23, 528-36.
SMITH-ROCKWELL, M., NICKOLS-RICHARDSON, S. M. & THYE, F. W. 2001. Nutrition knowledge, opinions, and practices of coaches and athletic trainers at a division 1 university. Int J Sport Nutr Exerc Metab, 11, 174-85.
SMITH, G. I., YOSHINO, J., KELLY, S. C., REEDS, D. N., OKUNADE, A., PATTERSON, B. W., KLEIN, S. & MITTENDORFER, B. 2016. High-Protein

Page 204 of 253
Intake during Weight Loss Therapy Eliminates the Weight-Loss-Induced Improvement in Insulin Action in Obese Postmenopausal Women. Cell Rep, 17, 849-861.
SOLON-BIET, S. M., MITCHELL, S. J., COOGAN, S. C., COGGER, V. C., GOKARN, R., MCMAHON, A. C., RAUBENHEIMER, D., DE CABO, R., SIMPSON, S. J. & LE COUTEUR, D. G. 2015. Dietary Protein to Carbohydrate Ratio and Caloric Restriction: Comparing Metabolic Outcomes in Mice. Cell Rep, 11, 1529-34.
SPENDLOVE, J. K., HEANEY, S. E., GIFFORD, J. A., PRVAN, T., DENYER, G. S. & O'CONNOR, H. T. 2012. Evaluation of general nutrition knowledge in elite Australian athletes. Br J Nutr, 107, 1871-80.
STAFLEU, A., VAN STAVEREN, W. A., DE GRAAF, C., BUREMA, J. & HAUTVAST, J. G. 1996. Nutrition knowledge and attitudes towards high-fat foods and low-fat alternatives in three generations of women. Eur J Clin Nutr, 50, 33-41.
STEIN, T. P., RUMPLER, W. V., LESKIW, M. J., SCHLUTER, M. D., STAPLES, R. & BODWELL, C. E. 1991. Effect of reduced dietary intake on energy expenditure, protein turnover, and glucose cycling in man. Metabolism, 40, 478-83.
STELLINGWERFF, T., MAUGHAN, R. J. & BURKE, L. M. 2011. Nutrition for power sports: middle-distance running, track cycling, rowing, canoeing/kayaking, and swimming. J Sports Sci, 29 Suppl 1, S79-89.
STELLINGWERFF, T., SPRIET, L. L., WATT, M. J., KIMBER, N. E., HARGREAVES, M., HAWLEY, J. A. & BURKE, L. M. 2006. Decreased PDH activation and glycogenolysis during exercise following fat adaptation with carbohydrate restoration. Am J Physiol Endocrinol Metab, 290, E380-8.
STIEGLER, P. & CUNLIFFE, A. 2006. The role of diet and exercise for the maintenance of fat-free mass and resting metabolic rate during weight loss. Sports Med, 36, 239-62.
STOCKLEY, L. 1985. Changes in habitual food intake during weighed inventory surveys and duplication diet collections. A short review. Ecology of Food and Nutrition, 17, 263-269.
STOEBER, J., OTTO, K., PESCHECK, E., BECKER, C. & STOLL, O. 2007. Perfectionism and competitive anxiety in athletes: Differentiating striving for perfection and negative reactions to imperfection. Personality and Individual Differences, 42, 959-969.
STUART, C. A., SHANGRAW, R. E., PETERS, E. J. & WOLFE, R. R. 1990. Effect of dietary protein on bed-rest-related changes in whole-body-protein synthesis. Am J Clin Nutr, 52, 509-14.
SU, S., KUO, C. & LIU, C. 2013. Diabetes and Mitochondria. The Changhua Journal of Medicine, 11, 1-7.
SUGIURA, K., SUZUKI, I. & KOBAYASHI, K. 1999. Nutritional intake of elite Japanese track-and-field athletes. Int J Sport Nutr, 9, 202-12.
SUWA, M., NAKANO, H., RADAK, Z. & KUMAGAI, S. 2008. Endurance exercise increases the SIRT1 and peroxisome proliferator-activated receptor gamma coactivator-1alpha protein expressions in rat skeletal muscle. Metabolism, 57, 986-98.
THOMAS, D. T., ERDMAN, K. A. & BURKE, L. M. 2016. American College of Sports Medicine Joint Position Statement. Nutrition and Athletic Performance. Med Sci Sports Exerc, 48, 543-68.

Page 205 of 253
THOMAS, S. E., KENDRICK, O. W. & EDDY, J. M. 1990. Modification of a Nutritional Questionnaire for Older Adults and the ability of its knowledge and attitude evaluations to predict dietary adequacy. Journal of nutrition for the elderly, 9, 35-63.
THOMPSON, F. E. & BYERS, T. 1994. Dietary assessment resource manual. J Nutr, 124, 2245S-2317S.
TIPTON, K. D., JEUKENDRUP, A. E., HESPEL, P. & INTERNATIONAL ASSOCIATION OF ATHLETICS, F. 2007. Nutrition for the sprinter. J Sports Sci, 25 Suppl 1, S5-15.
TRAPPE, S., LUDEN, N., MINCHEV, K., RAUE, U., JEMIOLO, B. & TRAPPE, T. A. 2015. Skeletal muscle signature of a champion sprint runner. J Appl Physiol (1985), 118, 1460-6.
VEGA, R. B., HUSS, J. M. & KELLY, D. P. 2000. The coactivator PGC-1 cooperates with peroxisome proliferator-activated receptor alpha in transcriptional control of nuclear genes encoding mitochondrial fatty acid oxidation enzymes. Mol Cell Biol, 20, 1868-76.
VOGT, M., PUNTSCHART, A., HOWALD, H., MUELLER, B., MANNHART, C., GFELLER-TUESCHER, L., MULLIS, P. & HOPPELER, H. 2003. Effects of dietary fat on muscle substrates, metabolism, and performance in athletes. Med Sci Sports Exerc, 35, 952-60.
WALCOTT, W. L. & FAHEY, T. 2000. The Metabolic Typing Diet, Broadway Books, New York, United States of America.
WEINHEIMER, E. M., SANDS, L. P. & CAMPBELL, W. W. 2010. A systematic review of the separate and combined effects of energy restriction and exercise on fat-free mass in middle-aged and older adults: implications for sarcopenic obesity. Nutr Rev, 68, 375-88.
WEINSIER, R. L., BOKER, J. R., MORGAN, S. L., FELDMAN, E. B., MOINUDDIN, J. F., MAMEL, J. J., DIGIROLAMO, M., BORUM, P. R., READ, M. S. & BROOKS, C. M. 1988. Cross-sectional study of nutrition knowledge and attitudes of medical students at three points in their medical training at 11 southeastern medical schools. Am J Clin Nutr, 48, 1-6.
WEINSIER, R. L., SCHUTZ, Y. & BRACCO, D. 1992. Reexamination of the relationship of resting metabolic rate to fat-free mass and to the metabolically active components of fat-free mass in humans. Am J Clin Nutr, 55, 790-4.
WEIR, J. B. 1949. New methods for calculating metabolic rate with special reference to protein metabolism. J Physiol, 109, 1-9.
WHATI, L. H., SENEKAL, M., STEYN, N. P., NEL, J. H., LOMBARD, C. & NORRIS, S. 2005. Development of a reliable and valid nutritional knowledge questionnaire for urban South African adolescents. Nutrition, 21, 76-85.
WILLIAMS, R. J. 1956. Biochemical individuality; the basis for the genetotrophic concept.
WORLD-HEALTH-ORGANIZATION 2003. Diet, nutrition, and the prevention of chronic diseases: report of a joint WHO/FAO expert consultation, Diamond Pocket Books (P) Ltd.
WRIGHT, D. C., HAN, D.-H., GARCIA-ROVES, P. M., GEIGER, P. C., JONES, T. E. & HOLLOSZY, J. O. 2007. Exercise-induced mitochondrial biogenesis begins before the increase in muscle PGC-1α expression. Journal of Biological Chemistry, 282, 194-199.
Page 206 of 253
WU, Z., PUIGSERVER, P., ANDERSSON, U., ZHANG, C., ADELMANT, G., MOOTHA, V., TROY, A., CINTI, S., LOWELL, B., SCARPULLA, R. C. & SPIEGELMAN, B. M. 1999. Mechanisms controlling mitochondrial biogenesis and respiration through the thermogenic coactivator PGC-1. Cell, 98, 115-24.
WYCHERLEY, T. P., MORAN, L. J., CLIFTON, P. M., NOAKES, M. & BRINKWORTH, G. D. 2012. Effects of energy-restricted high-protein, low-fat compared with standard-protein, low-fat diets: a meta-analysis of randomized controlled trials. Am J Clin Nutr, 96, 1281-98.
ZINN, C., SCHOFIELD, G. & WALL, C. 2005. Development of a psychometrically valid and reliable sports nutrition knowledge questionnaire. Journal of science and medicine in sport, 8, 346-51.

Page 207 of 253
10 APPENDICES

Page 208 of 253
Appendix Contents
Appendix One
Metabolic typing questionnaire
Appendix Two
Metabolic typing diet examples
Appendix Three
Micro muscle biopsy SOP
Appendix Four
Nutrition Knowledge Questionnaire for Athletes.
Appendix Five:
1. Example of Recruitment Information.
2. Example of Consent Form
3. Example of Health Screen
4. Example of Muscle biopsy Screen

Page 209 of 253
Appendix One
Metabolic typing questionnaire
1) Anger and Irritability Sometimes we all get angry for good reason. But for some people, feelings of anger
or irritability occur frequently. Skip this question if you do not experience anger or
irritability that is affected by food.
a. When I feel angry, eating meat or fatty food seems to make it worse. b. Sometimes eating relieves my anger and it does not really matter what I eat. c. I often notice that feelings of anger or irritability have abated after I eat
something heavy and fatty like meat.
2) Anxiety Do not answer this question if you do not experience anxiety that is influenced by food.
a. When I feel anxious fruits or vegetables calm me down. b. Eating almost anything helps alleviate my anxiety. c. Heavy fatty food improves the way I feel and lessens my feelings of anxiety.
3) Ideal Breakfast What kind of breakfast gives you the greatest energy, sense of well-being, peak
performance, and satisfies your hunger the longest?
a. Either no breakfast or something light like fruit and/or toast or cereal and/or milk or yogurt.
b. egg(s), toast, fruit c. something heavy like eggs, bacon or sausage, hash browns, toast, or steak
and eggs
4) Meal Preference If you were to at a buffet dinner and were to cut loose and order anything without any
guilt, what would the meal consist of?
a. Lighter foods such as chicken, turkey, light fish, salads, vegetables, and I would sample various deserts.
b. I would chose a combination of both a and c. c. Heavy rich, rich fatty foods: roast beef, beef stroganoff, pork chops, ribs,
salmon, potatoes, gravy, few vegetables, or maybe a small salad with vinaigrette or blue cheese dressing; cheesecake or no desert.

Page 210 of 253
5) Climate Please select the choice that best describes how temperature affects you.
a. I do best in warm or hot weather, I can’t take the cold. b. Temperature does not matter that much. I do pretty well whether it is hot or
cold. c. I do best in cool or cold temperatures. Can’t take the heat.
6) Chest Pressure Some people commonly experience chest pressure, a distinct sensation of pressure
in the chest area. It often makes people feel as though a weight is on their chest, and
tends to inhibit the ability to breathe. (Only answer if you suffer from chest pressure)
a. b. c. I have a tendency to get or have problems with chest pressure.
7) Coffee Please indicate how coffee affects you.
a. I do well on coffee (as long as I do not drink to much) b. I can take it of leave it. c. I do not do well with coffee. It makes me jittery, jumpy, nervous, hyper,
nauseated, shaky, or hungry.
8) Appetite at breakfast. Appetites vary from day to day, but what is your overall tendency for your appetite at
breakfast?
a. Low, weak, or lacking. b. Normal. Don’t notice it being weak or strong. c. Noticeably strong or above average.
9) Appetite at lunch. Please highlight the answer that typically describes your appetite at lunch.
a. Low, weak of lacking. b. Normal, Do not notice it being either strong or weak. c. Noticeably strong or above average.
10) Appetite at dinner. Please highlight the answer that typically describes your appetite at dinner.
a. Low, weak of lacking. b. Normal, Do not notice it being either strong or weak. c. Noticeably strong or above average.
11) Concentration What foods worsen your ability to concentrate?
a. Meat and/or fatty foods.

Page 211 of 253
b. No particular kind of food seems to disrupt my concentration. c. Fruit and vegetables and grain-based carbohydrates.
12) Coughing Usually we think of coughing as something associated with illness. But some people
naturally cough easily and often even when they are not sick. Typically the cough will
be a dry cough and short in duration. If you are one of these people please highlight
the answer.
a. I tend to cough every day
13) Cracking skin. Some people have a problem with their skin cracking for no apparent reason. This
typically occurs on the fingertips or on the feet, especially on the heal. If you are one
of these people please highlight the answer.
a. b. c. I have a tendency to have problems with skin cracking.
14) Cravings Most people have cravings for sugar when blood glucose is low; however do you have
any craving for other foods?
a. Vegetables, fruits, grain-based products (bread, cereal, crackers) b. c. Salty, fatty foods (peanuts, cheese, crisps, meats..etc)
15) Dandruff If you have a tendency to get dandruff please highlight the answer below
a. b. c. I tend to get dandruff.
16) Depression Depression is often alleviated of worsened by what you eat. If you suffer from
depression and have noticed a connection to food, select the appropriate choice below.
a. I seem to feel more depressed after eating meats and fatty foods (and less depressed after eating vegetables and fruits).
b. c. I seem to feel more depressed after eating vegetables and fruit (and less
depressed after eating meats and fatty foods).

Page 212 of 253
17) Desserts What is your general feeling towards having deserts after dinner?
a. I really love sweets and/or I often need something sweet with a meal in order to feel satisfied.
b. I enjoy desert from time to time, but can really take it or leave it. c. I do not really care for desserts the much; I may like something fatty or salty
instead (like cheese, chips, popcorn) for a snack after a meal.
18) Dessert preferences What are your favorite types of desserts? Which would you choose more often?
a. Cakes, cookies and fruit pie. b. Truly no preference, I would choose different kinds each day. c. Heavier fatty types, like cheesecake creamy French pastries.
19) Ideal Dinner What kind of meal works best for you at dinner time?
a. Something light, like skinless chicken breast, rice, salad, maybe a little desert. b. Most foods work fine for me. c. I definitely do better with a heavier meal.
20) Ear colour Please describe the response that best describes your ear colour.
a. My ears tend to be pale, lighter than my skin tone. b. My ears tend to be the same shade as my face. c. My ears tend to be pink, red or darker than my face.
21) Eating before bed. Eating before bed can help some people sleep, whilst is can clearly disrupt others
sleep. How does eating anything before bed affect your sleep?
a. It disrupts of worsens my sleep. b. It does not seem to make a difference, I can take it of leave it. c. It usually helps me sleep better.
22) Eating heavy foods before bed What reaction do you have when eating heavy foods such as red meats, fowl, cheese
and pastry before bed?
a. It prevents or disturbs my sleep. b. It is usually ok, as long as I do not eat too much. c. It improves my sleep.
23) Eating light foods before bed. What reaction do you have when eating light foods such as bread, toast, cereal, fruit
or yogurt before bed?

Page 213 of 253
a. I usually do not do well eating before sleep, but I definitely do better with lighter food.
b. I can take it or leave it. c. It’s better than nothing, but I do better with heavier food.
24) Eating sweets before bed How do sweets affect your sleep?
a. Sweets do not interfere with me sleep at all. b. Sweets sometimes bother my sleep. c. I clearly do not do well eating sweets before sleep.
25) Eating frequently How often do you need to eat in order to maximize your well-being and productivity?
a. 2 to 3 meals a day, and either no snacks, or a light snack. b. 3 times a day, usually no snacks. c. 3 meals or more a day and snacks, often something substantial.
26) Eating Habits What is your attitude towards food?
a. I am unconcerned with food and eating; may forget to eat; rarely think about food; eat because I have to than because I want to.
b. I enjoy food, enjoy eating, rarely miss a meal, but do not really focus on food in any way.
c. I love food, love to eat, food is a big or central part of my life.
27) Eye moisture Which of the following best describes your eyes?
a. My eyes tend to be dry. b. I do no notice one way or the other. c. My eyes tend to be very moist, even to the point of tearing.
28) Skipping meals What happens to you when you go 4 hours or more without eating or skip a meal
altogether?
a. Does not bother me, I can easily forget to eat. b. I may not be at my best, but it does not really bother me. c. I definitely feel worse, getting irritable, jittery, weak, tired, low on energy,
depressed, or other negative symptoms.
29) Facial colouring How would you characterize your facial colouring?
a. I am noticeably on the pale side. b. I have average colouring. c. I am noticeably darker (not from the sun), pink or flushed.
30) Facial complexion

Page 214 of 253
How would you describe your facial complexion?
a. More dull and pasty. b. Average. c. Bright, radiant, clear.
31) Fatty foods Value judgment aside, how much do you like or dislike fatty foods in general?
a. I do not really like fatty foods. b. They are fine in moderation. c. I love them and crave them and I would like them often if I knew they were
good for me.
32) Fingernail thickness How would you characterize the thickness of your fingernails?
a. My nails tend to be thick, strong and hard. b. Seem average thickness. c. I definitely seem to have thin and/or weak nails.
33) Fruit salad lunch How would you feel after eating a (large) fruit salad with a little cottage cheese or yogurt
for lunch?
a. It satisfies me; I do well on it and do not get hungry until dinner. b. I do pretty well, but usually need a snack before dinner. c. Pretty bed results. I usually get sleepy, tired, spacey, depressed anxious,
irritable and/or hunger as a result and definitely need to eat something else before dinner.
34) Gaining weight Which of the following bests describes your tendency to gain weight?
a. Meats and fatty foods cause me to gain weight. b. No particular foods cause me to gain weight, but I will gain weight if I eat too
much and do not get enough exercise. c. I tend to gain weight eating too many carbohydrates (bread, pasta, other
grains product, and/or fruit and vegetables.
35) Gag reflex How would you best describe your gag reflex?
a. I rarely, if ever gag; it is hard to make me gag. b. I probably have a normal gag reflex. c. I easily gag and/or often gag.
36) Goose bumps Are you prone to goose bumps?
a. I often get goose bumps. b. I occasionally get goose bumps.

Page 215 of 253
c. I rarely, if ever get goose bumps.
37) Energy boosters What kind of foods generally boost your energy – and give you lasting energy?
a. Fruit, candy or pastry restores and gives me lasting energy. b. Just about any food restores lasting food. c. Meat and fatty food restores my energy and well – being.
38) Heavy-fat-meal reaction Please choose the option the best describes your reaction to a high fat meal.
a. It decreases my well – being and energy, or makes me sleepy, or too full, or cause indigestion
b. Causes no special reaction in one way or another. c. Increases my well – being; makes me feel good, energetic, satisfied, like ‘I
had a good meal’.
39) Hunger feelings What kind of hunger feelings do you generally get from your body?
a. I rarely get hungry or feel real hunger, or have weak hunger feelings that pass quickly, or can easily go long periods without eating, or can forget about food altogether.
b. I have pretty normal hunger around meal times or when I am late for meals. c. I often feel hungry, need to eat regularly and often, may get strong hunger
sensations.
40) Energy drain What kind of foods take your energy levels down a notch or two instead of giving you
the boost you were looking for?
a. Meat and fatty foods generally makes me more tired, lowers my energy even more.
b. No foods in particular seems to take me down on a regular basis. c. Fruit, pastry, or candy makes me worse, usually giving me a quick lift then a
crash.
41) Insect bite or sting How do insect bites or stings affect you?
a. Reactions tend to be mild and weak and tend to go away quickly. b. Average reaction. c. Clearly strong reaction, stronger than most, can involve above – average
swelling, pain, itching, bruising, redness), and can take a long time to go away, even leaving discolouration after.
42) Insomnia There are many types on insomnia. But with a certain type of insomnia, people
routinely wake up in the middle of the night for reasons other than having to have to
use the bathroom. Typically with this type of insomnia, people need to eat something

Page 216 of 253
in order to fall back to sleep again. With this in mind, which one of the following applies
to you?
a. I never/very rarely get this type of insomnia. b. I occasionally wake up and need to eat to get back to sleep. c. I often wake up and need to eat in order to go back to sleep. Eating
something before going to sleep helps this problem or shortens the time that I am awake.
43) Itching eyes From time to time everyone can experience itching eyes. This can happen when you
have a cold, hay fever of allergies. But for many people itching eyes can be a common
occurrence even when the above conditions are not present. This is the focus of the
question. (Only answer this question if it applies to you).
a. b. c. I tend to get itching eyes often, even though I do not have a cold, allergy or
hay fever.
44) Itching Skin This question concerns itching skin that is not due to bites or stings. Everyone’s skin
itches from time to time. But some people find their skin itches regally on a daily basis,
typically scalp, arms and calves. Because they are so used to it they may not even be
conscious of the frequent scratching. (Only answer this question if it applies to you).
a. b. c. My skin tends to itch often.
45) Meal portions When you eat out do you generally eat more than others, less than others, or about
the same as others?
a. I do not eat that much, definitely less than the average. b. I do not seem to eat more, or less than others. c. I generally eat large portions of food, usually more than others.
46) Nose moisture Please select the answer that best describes you when you are not ill or suffering from
an allergic reaction.
a. My nose often seems too dry. b. I do not notice my nose being too dry or too moist. c. My nose often tends to run.
47) Fruit juice between meals If you are hungry between meals, how does drinking a glass of fruit juice affect you?
a. It energizes me, satisfies me and works well until my next meal. b. It is ok but it is not often the best snack for me.

Page 217 of 253
c. Overall bad result. Can make me light headed, hungry after, jittery, shaky, nauseated, anxious, depressed etc.
48) Personality Which of the following options best describes your natural tendency in social
gatherings; or your preference with respect to day-to-day interactions with other
people.
a. I seem to be more aloof, withdrawn or introverted. b. I am pretty average, neither introverted nor extroverted. c. I tend to be more social, a ‘people person’, or extroverted.
49) Potatoes Whether you think potatoes are good for you or not, how do you feel about potatoes?
a. I do not really care for them that much or I do not really like them. b. I can take them or leave them. c. I love them; I could eat them almost every day.
50) Red meat When you normally eat red meat how do you feel afterwards?
a. It decreases my energy and wellbeing. Can make me depressed and irritable. b. I do not notice either one way or another. c. I definitely feel good or better when I eat red meat.
51) Pupil size Your pupils are the black centre portion or your eyes. The iris is the coloured section
the surrounds the pupil. This question concerns the size of your pupil compares to the
iris. Average means the pupil and the iris are approximately the same size. Larger
means that the width of the pupil is clearly larger that the width of the iris. Smaller
means that the width of the pupil is clearly smaller that the width of the iris. To answer
first look in the mirror, but do so in an average lighted room, not too bright of too dark.
a. The size of my pupil seems to be larger than my iris b. The size of my pupil seems to be the same size. c. The size of my pupil seems to be smaller than my iris.
52) Salad for lunch. If you ate a large vegetarian salad at lunch, what affect would it have on your
productivity in the afternoon?
a. I do pretty well with that kind of lunch. b. I can get by, but it is not the best type of lunch for me. c. Bad results. Makes me feel either sleepy, tired, lethargic, hyper nervous of
irritable.
53) Saliva quantity Pleased select the option that most accurately characterizes your saliva production.
a. My mouth tends to be dry a lot of the time.

Page 218 of 253
b. I do not notice that I have too little or too much saliva. c. I tend to have a lot of saliva, or I have a tendency to drool.
54) Salty foods Whether or not you feel that salt is good or bad for you, how do you feel about salt?
a. Foods often taste too salty, or I like my food only very slightly salted. b. I do not really notice salt one way or another. Rarely seem to like too much or
too little. Just use an average amount on foods. c. I really love salt, or crave it. Like a lot of salt on foods, to the point that others
think my food it too salty.
55) Snacking Assume for the question that you eat 3 meals per day. If this is the case do you typically
need to snack, or to eat something between meals? Or are those 3 meals all you need
for peak performance?
a. I rarely if ever want or need snacks. b. I occasionally want or need to snack between meals. c. I often want or need to snack between meals.
56) Snack preference Which of the following best describes your preference for snacks that you perform best
on?
a. I generally do not need snacks, but if I do have one I usually prefer something sweet.
b. I generally want snacks and do pretty well on anything. c. I definitely want and need snacks in order to do my best. Do poorly on
sweets, but do well on protein and fat (meat, chicken, cheese, eggs and nuts).
57) Sneezing We usually think of sneezing in connections with colds and allergies. But some people
sneeze daily as a matter of course, even when they are not sick or plagued with
allergies. For example some people sneeze routinely after eating. This question
pertains to brief sneezing attacks, just one or two sneezes – not continuous, prolonged
sneezing attacks. With this in mind, which best describes you?
a. I almost never sneeze, unless I have allergies. b. I do sneeze from time to time when not sick or allergic, but not regularly. c. I often regularly tend to sneeze and/or usually sneeze a little after eating.

Page 219 of 253
58) Sociability How would you describe you natural, innate tendency towards sociability, apart from
the way your family and friends have influenced you in this?
a. I tend to be a little antisocial, in that I enjoy being alone, feel awkward in social gathering or parties, and usually prefer to leave early or not go at all.
b. I am in the middle, not really antisocial, but also not particularly compelled to be with others.
c. I tend to be very social, a ‘people person’, and love company and to be with others, prefer not to be alone.
59) Sour foods Which best describes your reaction to sour foods?
a. I generally do not care for sour foods. b. I do not feel one way or the other. I do not like or dislike them more than any
other food. c. I definitely like (some) sour foods or crave them.
60) Physical and mental stamina Stamina refers to physical endurance, or the ability to work long hours without
exhaustion. What type of foods best support your stamina?
a. My stamina is better when I eat lighter foods like chicken, fish, fruit, vegetables or grains.
b. My stamina is better when I eat pretty much any wholesome food. c. My stamina is better when I eat heavy foods or fatty foods.
61) Consuming sweets How do you react when you eat sweets all by themselves?
a. Sweets do not bother me even if I eat them by themselves. Generally sweets satisfy my appetite and do not produce bad reactions.
b. I am sometimes bothered when eating sweets by themselves, and often they do not satisfy my appetite.
c. I usually do not do well eating sweets by themselves. They usually produce some manner of a bad reaction and/or create a desire for more sweets.
62) Meat for breakfast How do you feel after eating meat for breakfast, as opposed to going without it?
a. I do not feel as well as I do without it. Tends to make me sleepier, lethargic, angry, irritable, thirsty, or causes me to lose my energy by midmorning.
b. I can take it or leave it, it varies. c. I feel much better with it: more energetic, have good stamina, keeps me going
without getting hungry before lunch.
63) Red meat for lunch How do you feel when eating red meat for lunch, as opposed to going without it?
a. I do not feel as well as I do without it. Tends to make me sleepier, lethargic, angry, irritable, thirsty, or causes me to lose my energy by mid-afternoon.

Page 220 of 253
b. I can take it or leave it, it varies. c. I feel much better with it: more energetic, have good stamina, keeps me going
without getting hungry before dinner.
64) Red meat for dinner How do you feel when eating red meat for dinner, as opposed to going without it?
a. I do not feel as well as I do without it. Tends to make me sleepier, lethargic, b. angry, irritable, thirsty, or causes me to lose my energy. c. I can take it or leave it, it varies. d. I feel much better with it: more energetic, have good stamina, keeps me going
without getting hungry before bedtime
65) Dinner preference. If you had a long night ahead of you, which dinner would you choose to give you the
best stamina alertness and energy?
a. Dinner plate 1 – Skinless chicken breast, rice salad and apple pie. b. Dinner plate 2 – Combination plate, including a little bit from both plates 1 and
3. c. Dinner plate 3 – Pot roast cooked with carrots, onions and potatoes, served
with biscuits and gravy. Cheesecake.

Page 221 of 253
Appendix Two
Metabolic Typing Diet Examples

Page 222 of 253
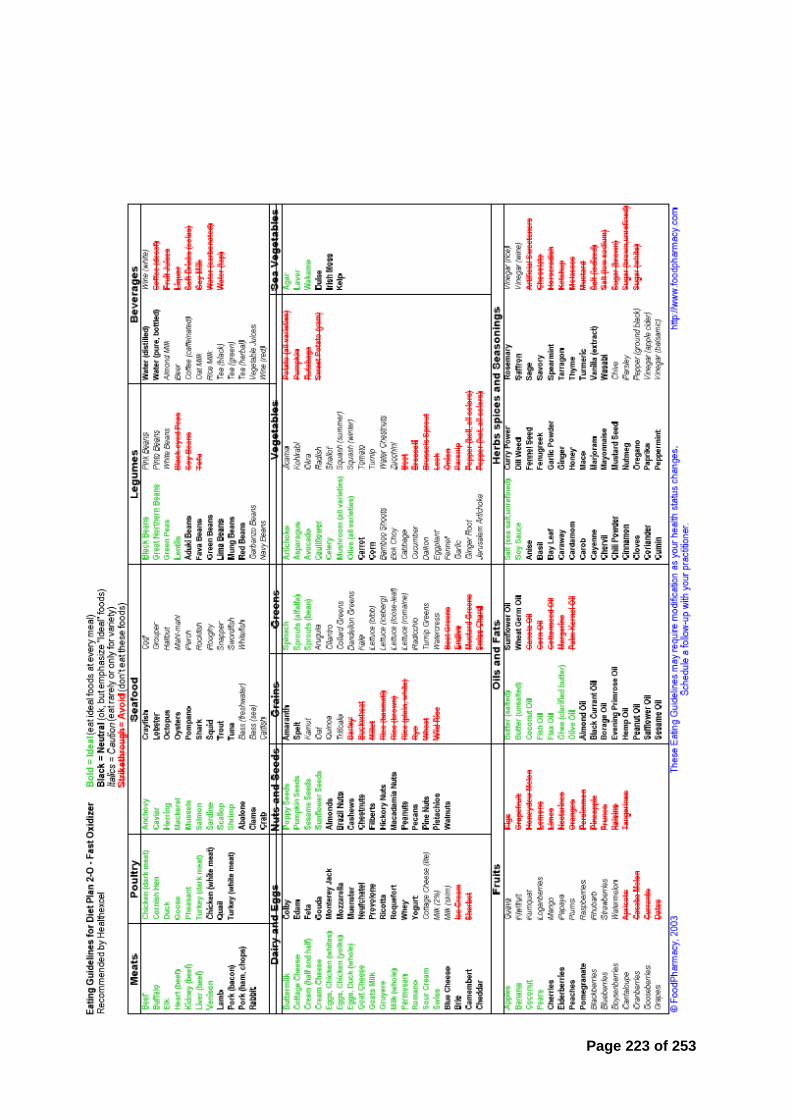
Page 223 of 253

Page 224 of 253

Page 225 of 253

Page 226 of 253

Page 227 of 253
Appendix Three
Micro Muscle Biopsy SOP
PURPOSE:
To describe the surgical procedure for the removal of muscle tissue from human
participants for the purpose of biochemical, histochemical and molecular analysis.
SCOPE:
This procedure is applied to the persons performing the procedure and those involved
in assisting.
RESPONSIBILITIES:
The lead researcher (researcher who takes the biopsy) is fully responsible
for the procedure and the appropriate experience of those assisting in the
procedure.
All those participating in the procedure MUST read the appropriate RA’s and
SOP.
REFERENCES:
NHS good hand washing techniques
Protocol of safe working 1.4
Human Tissue Authority, Code of Practice 9: Research
Automatic Biopsy Instrument instructions
Lidocaine information sheet
Current risk assessment for muscle biopsy
EQUIPMENT AND MATERIALS:
Equipment
o Biopsy instrument
o Micro biopsy needle and cannula
o Surgical trolley
o Liquid nitrogen – Stored in Dewar
o Blunt edged forceps (tweezers)
o Steel sample well
o Sharps bin

Page 228 of 253
o Cryo-gloves
Materials
o Biopsy couch
o Blue r oll
o Hydrex surgical hand scrub
o Betadine surgical scrub for skin antiseptic
o Sterile drape
o Gauze
o Latex free gloves
o Disposable plastic apron
o 2.5 ml syringe with 25G needle
o Sterile surgical scalpel blade (No. 11)
o Plasters
o Cryovials (5 ml)
o Ice
o -80 oC freezer
Chemicals
o Lidocaine hydrochloride (1% w/v)
PROCEDURE
ONLY carry out the procedure if the participant has been informed of the full
procedure, signed all relevant documents and provided informed consent.
It should be ensured that the participant has had no previous complications
when having blood or biopsy taken.
It should be ensured that the participant has no known allergies.
Check all equipment is in full working order, and the room has adequate
lighting.
All procedures should be preformed in aseptic manner with aid from an
assistant (i.e. the assistant opens all packaging without touching the
equipment).
Lay out all equipment needed for the procedure in a neat/easy to access order.
Wash hands thoroughly with Hydrex surgical hand scrub, following the SOP for
good hand washing technique.
Open the sterile drape and place it on the stainless steel trolley.
Expose the target thigh; ensuring all clothing is rolled up/removed to avoid any
contact with the biopsy area.
Pour a sufficient amount of Betadine onto a double thickness piece of gauze.
Prepare the biopsy site by rubbing the Betadine over an area sufficient to
ensure the biopsy site is sterile and can be touched and manipulated (cover
and area approximately 15 x 15 cm).

Page 229 of 253
Place the gauze on the thigh on an area that is covered in Betadine for use
later.
Ask the participant to contract their quadriceps to help define an appropriate
biopsy site on the Vastus Lateralis muscle.
Using a water soluble pen, draw a circle around the area isolated for the biopsy
site (approximately 2 - 3 cm diameter). Re-rub the biopsy site with the Betadine
ensuring the pen mark is covered.
Open the 2.5ml syringe and needle package along with the ampule of lidocaine
hydrochloride (1 % w/v).
Draw up approximately 2.5 ml of lidocaine hydrochloride (1% w/v) into the
syringe. Expel any air bubbles present in the syringe.
Inject the Lidocaine hydrochloride under the surface of the skin in multiple
directions. Take care during the procedure to ensure it is not being injected into
a small blood vessel.
Allow a minimum of 5 minutes for the anesthetic to take effect. (If during this
time any sign of allergic reaction is seen, follow the procedure outlined in 7.5.2)
Whilst waiting for the anesthetic to take effect open up the sterile semi-
automated biopsy instrument pack and cannula and place on the sterile drape.
Loosen all sheath and components.
Once anesthetic has taken effect, insert the cannula through the skin, sub-
cutaneous fat and fascia into the Vastus Lateralis. (A significant amount of
pressure is needed to pierce the fascia).
Prime (as per manufacture guidelines) the biopsy instrument.
Insert the primed biopsy instrument all the way into the cannula and activate
(sampling the muscle tissue)
Remove the instrument immediately from the cannula.
Whilst being held by the investigator the sheath of the needle is opened to
expose the tissue. With sterile scalpel blade the tissue sample is removed from
the needle (ensuring the biopsy instrument is not touched by a non-sterile
object – this allows for repeat samples).
If further samples are required, up to 4 passed can occur through the cannular
on the same occasion using the same needle.
The assistant freezes the tissue appropriately and places sample into storage
according to the relevant SOP (See 7.0 – 7.7).
Remove the cannula (and place in the sharps bin), using the gauze with
Betadine on apply pressure on the biopsy site (for a minimum of 5 minutes)
Once the bleeding has stopped place a plaster over the biopsy site.
Instruct the participant on all aftercare and how to change the dressing.
The plaster is kept on for 24 hours and must be kept dry.
All contaminated consumables are disposed of using the correct SOP for
disposure of clinical waste.
The investigator and assistant must wash hands appropriately.

Page 230 of 253
The biopsy instrument is cleaned and steralised according to the manufactures
guidelines (see manufactures guidelines) (or disposed of if single use)
TISSUE STORAGE AND RENDERING ACELLULAR
Place the steel sample bowl on to the polystyrene base.
Using Cryo-gloves pour approximately 100 ml of liquid nitrogen in to a steel
bowl.
Using a sterile blade (Swann Morton No.11) scrape the muscle tissue from the
biopsy needle.
IT IS IMPERATIVE THAT NOTHING OTHER THAN THE STERILE BLADE
TOUCHES THE NEEDLE IF REPEAT SAMPLES ARE TO BE TAKEN.
Place the muscle tissue into the liquid nitrogen; leave until the liquid nitrogen
has evaporated. (If the tissue is not fully frozen, pour another 50 mls of liquid
nitrogen into the metal beaker).
Once frozen, using clean blunt forceps place the tissue into a cryovial, label
and store in a -80 freezer with the intent to render acellular.
From the time the sample is taken a maximum of 7-days storage is allowed.
The acellular rendering of the sample within 7-days complies with the Human
Tissue Authority (HTA) guidelines (Licensing for research code
60: http://www.hta.gov.uk/legislationpoliciesandcodesofpractice/codesofpracti
ce/code9research.cfm?FaArea1=customwidgets.content_view_1&cit_id=764&
cit_parent_cit_id=757) (Also HTA licensing flow chart).
Extract the DNA/RNA within 7 days via the proposed method the render the
tissue acellular.
SPECIAL NOTES: HEALTH & SAFETY
Read appropriate risk assessment for this procedure
o Summary of risk for experimenter
Low temperature hazard
Sharps hazard
Biohazard
Key safety issues (to minimize above risk)
o Low temperature hazard: ALWAYS wear a long sleeved lab coat,
thermally insulated gloves and suitable footwear and safety glasses
when handling liquid nitrogen.
o Sharps hazard: Handle all needles and surgical blades with care and
dispose of appropriately and immediately after use.
o Biohazard: Lead investigator must have been offered HEP B
vaccination, and wear disposable gown and sterile gloves when handling
the equipment, samples and contaminated materials. All sterile
equipment must be handled by the lead investigator ONLY. Remove and
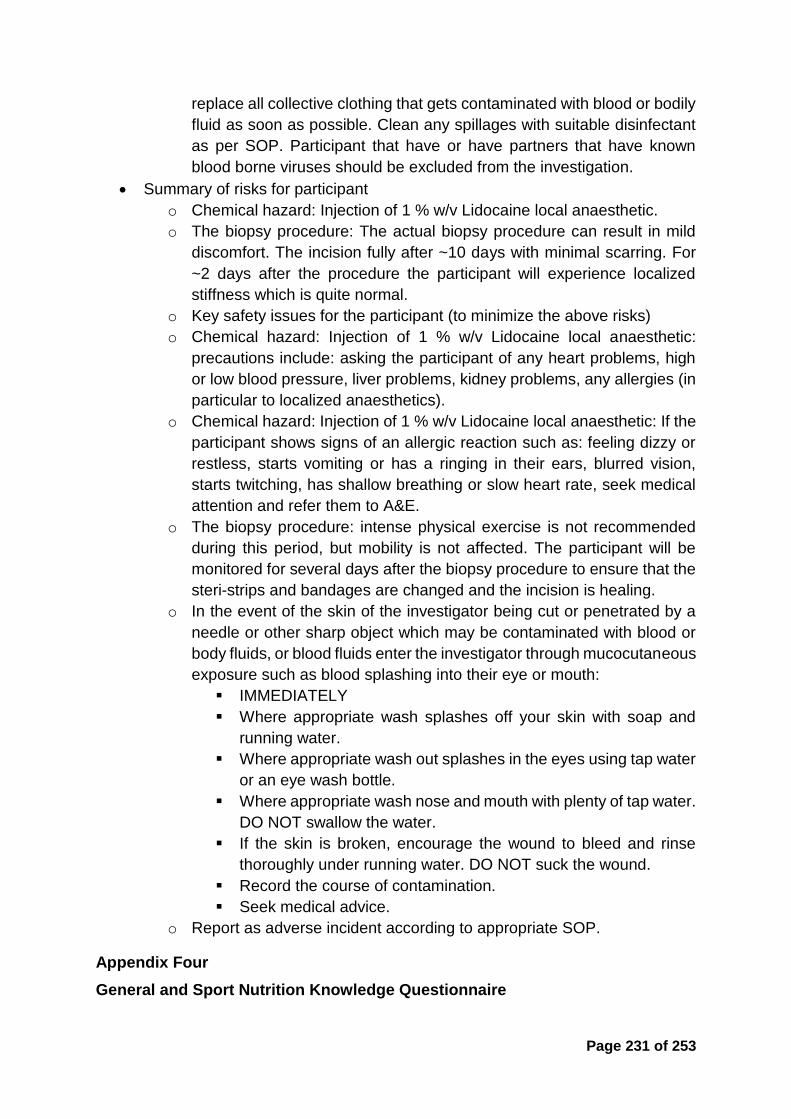
Page 231 of 253
replace all collective clothing that gets contaminated with blood or bodily
fluid as soon as possible. Clean any spillages with suitable disinfectant
as per SOP. Participant that have or have partners that have known
blood borne viruses should be excluded from the investigation.
Summary of risks for participant
o Chemical hazard: Injection of 1 % w/v Lidocaine local anaesthetic.
o The biopsy procedure: The actual biopsy procedure can result in mild
discomfort. The incision fully after ~10 days with minimal scarring. For
~2 days after the procedure the participant will experience localized
stiffness which is quite normal.
o Key safety issues for the participant (to minimize the above risks)
o Chemical hazard: Injection of 1 % w/v Lidocaine local anaesthetic:
precautions include: asking the participant of any heart problems, high
or low blood pressure, liver problems, kidney problems, any allergies (in
particular to localized anaesthetics).
o Chemical hazard: Injection of 1 % w/v Lidocaine local anaesthetic: If the
participant shows signs of an allergic reaction such as: feeling dizzy or
restless, starts vomiting or has a ringing in their ears, blurred vision,
starts twitching, has shallow breathing or slow heart rate, seek medical
attention and refer them to A&E.
o The biopsy procedure: intense physical exercise is not recommended
during this period, but mobility is not affected. The participant will be
monitored for several days after the biopsy procedure to ensure that the
steri-strips and bandages are changed and the incision is healing.
o In the event of the skin of the investigator being cut or penetrated by a
needle or other sharp object which may be contaminated with blood or
body fluids, or blood fluids enter the investigator through mucocutaneous
exposure such as blood splashing into their eye or mouth:
IMMEDIATELY
Where appropriate wash splashes off your skin with soap and
running water.
Where appropriate wash out splashes in the eyes using tap water
or an eye wash bottle.
Where appropriate wash nose and mouth with plenty of tap water.
DO NOT swallow the water.
If the skin is broken, encourage the wound to bleed and rinse
thoroughly under running water. DO NOT suck the wound.
Record the course of contamination.
Seek medical advice.
o Report as adverse incident according to appropriate SOP.
Appendix Four
General and Sport Nutrition Knowledge Questionnaire

Page 232 of 253
Fill out the questions below to the best of your knowledge. Please do not guess, if you are
unsure of an answer please tick the ‘UNSURE’ box.
CARBOHYDRATE
1. In general are these foods High or Low in carbohydrate? (Please tick one box per
food).
High Low Unsure
Beef
Pasta
Cabbage
Weetabix
Chocolate spread
Lentils
Wholemeal bread
Chicken
Jelly babies
2. In general as an athlete, what percentage of your diet should be made up from
carbohydrate? (Please tick one box)
10 - 25 %
25 - 40 %
50 - 65 %
65 - 80 %
Unsure
3. Do you know what the glycemic index is?
Yes No
If you answer no, please go to question 7.
4. Which of the following phrases best describes the glycemic index? (Please tick one
box).
The amount of carbohydrate a food contains
The extent to which carbohydrate food raises blood sugar levels
The extent to which protein food raises blood sugar levels
The extent to which carbohydrate food raises blood pressure
Unsure
5. In general is it best to eat a diet rich in High or Low glycemic index carbohydrates
(Please tick one box).

Page 233 of 253
High Low Unsure
6. Which of these foods are classified as High or Low in the glycemic index? (Please tick
one box per food).
High Low Unsure
Porridge oats
Chick Peas
Sweets (e.g. Gummi Bears)
Dark chocolate (>70%coca)
Honey
Peanut butter
Basmati rice
Jacket potato
7. Brown sugar is a healthier alternative the white sugar (Please tick one box)
True False Unsure
8. A high carbohydrate diet helps to reduce protein breakdown in the body.
Agree Disagree Unsure
PROTEIN
9. Would you agree or disagree with the following statements? (Tick one box per
question).
a) When lifting heavy weights the body uses protein as its main energy source.
Agree Disagree Unsure
b) Chicken is a very good source of energy to help fuel high intensity exercise.
Agree Disagree Unsure
10. Are the following foods High or Low in protein? (Tick one box per food)

Page 234 of 253
High Low Unsure
Chicken
Kidney beans
Potato
Spaghetti
Tuna
Egg
Peanut butter
Spinach
Cornflakes
Malt Loaf
11. What is the main use for protein in the body? (Please tick one box).
Energy Source
Growth and repair
Improve hydration
All of the above
Unsure
12. How much protein is there in the following food items? (please tick one box per
question)
1 pint of skimmed milk
0.6 grams 6 grams 12 grams 40 grams Unsure
250 g tin of tuna
10 grams 20 grams 35 grams 50 grams Unsure
1 slice of white bread
0 grams 2 grams 4 grams 8 grams Unsure
13. In general how much protein (grams) should an average 70 kg male athlete eat per
day? (Please tick one box)
49 – 77 grams
105 – 119 grams
154 – 196 grams
217 – 266 grams
Unsure

Page 235 of 253
14. There is more protein in a glass of whole milk compared to skimmed milk? (True or
false?).
True False Unsure
FAT
15. For improvements in health, what type of fat do experts recommend should be reduced
in the diet? (Please tick one box).
Monosaturated fat
Polyunsaturated fat
Saturated fat
Unsure
16. Are these foods high in saturated or poly-unsaturated fat (Please tick one box per
food)?
Saturated Poly - unsaturated Unsure
Pumpkin Seeds
Pork Chop
Butter
Olive Oil
Mackerel
Packet of Crisps
17. Which of the following lipoproteins increase cholesterol? (HDL = high density
lipoprotein) or (LDL = low density lipoprotein) (Please tick one box)
HDL’s
LDL’s
Unsure
18. The following foods are high in cholesterol. (Please tick one box per item)
True False Unsure
Coconut Oil
Red Meat
Eggs
Walnuts
Whole Milk
Sunflower Seeds
Sardines
19. Do you think these foods are High or Low in fat? (Please tick one box per item).

Page 236 of 253
High Low Unsure
Orange
Avocado
Cottage cheese
White bread
Peanuts
Sunflower seeds
Jam
Banana
VITAMINS AND MINERALS
20. Do you agree or disagree with the following statements (Please tick one box per
question)
a) 500 ml of orange juice has the same number of calories as 500ml of orange
squash.
Agree Disagree Unsure
b) There is more calcium in a glass of whole milk than skimmed milk.
True False Unsure
21. What is the role of antioxidants in the body? (Please tick one box)
Help with energy production
Help prevent against cell damage
Increase metabolic rate
Improve hydration status
Unsure
22. In General the following foods are naturally rich in antioxidant. (True or false).
True False Unsure
Red Meat
White Fish
Fruit
Vegetables
Dairy
Unsure

Page 237 of 253
23. If you want to eat something that is rich in Vitamin C, which of the following foods would
you eat? (Please tick one box per question)
a) Oranges Beef Unsure
b) Red pepper Spinach Unsure
c) Whitebait Baked beans Unsure
24. If you want to eat something that is rich in iron, which of the following foods would you
eat? (Please tick one box per question)
a) Spinach Milk Unsure
b) Chickpeas Banana Unsure
c) All Bran Yoghurt Unsure
25. If you want to eat something that is rich in calcium, which of the following foods would
you eat? (Please tick one box per question)
a) Spinach Chicken Unsure
b) Skimmed Milk Sunflower seeds Unsure
c) Potato Cheddar cheese Unsure
26. Which cooking method is best to help maintain the vitamin and minerals content within
vegetables. (Please tick one box).
Steam
Boil
Fry
Grill
Unsure
27. B vitamins are important for exercise because they help with: (Please tick one box).
Hydration status
Energy Production
Immunity
All of the above
Unsure
GENERAL NUTRITION

Page 238 of 253
28. Cutting out 10 grams of carbohydrate from your diet will result in greater weight loss
than cutting out 10 grams of fat. (Please tick one box).
True False Unsure
29. What food category are vegetables classified in? (Such as cabbage, carrots, onions,
peppers, courgettes etc) (Please tick one box).
Carbohydrate
Protein
Fat
Unsure
30. During resting conditions, which is the predominant energy source the body uses?
(Please tick one box).
Carbohydrate
Protein
Fat
Unsure
31. How many calories are there in 1 gram of each of the following macronutrients and
Alcohol? (Please tick one box)
Carbohydrate Protein Fat Alcohol
2 kcal
4 kcal
7 kcal
9 kcal
13 kcal
Unsure
32. Does one glass of orange squash count towards the government recommended ‘5 a
day’? (Please tick one box)
Yes
No
Unsure
33. If you are trying to lose weight and want to have a snack what would be best the best
food to snack on? (Please tick one box per question).

Page 239 of 253
a) Peanut butter on a bagel or Tuna sandwich
b) 100 g chicken wrap or 100 g pork pie
c) 150 g Tomato salad or 100 g rice pudding
d) Cottage cheese and berries or Cheddar Cheese and crackers
(50 grams) (50 grams
Fluid
34. In general, how much fluid should you drink on average per day? (Please tick one box)
0 – 0.99 litres
1 – 1.99 litres
2 – 2.99 litres
3 – 3.99 litres
4 – 4.99 litres
Unsure
35. During exercise greater than one hour, what are the current guidelines for fluid
consumption? (Please tick one box).
0 – 200 ml
200 – 400 ml
400 – 800 ml
800 – 1,200 ml
1,200 ml +
36. In general, at what percentage of body dehydration would you start to see a decrease
in exercise performance? (Please tick one box).
0.5 %
2 %
4 %
6 %
8 %
Unsure
37. A small amount of sodium added to fluid will help increase water absorption and
improve hydration status? (Please tick one box).
True False Unsure
38. In the first 2 hours after exercise how much fluid should you aim to drink?
10 % of sweat loss

Page 240 of 253
50 % of sweat loss
75 % of sweat loss
100 % of sweat loss
150 % of sweat loss
39. What type of drink would be best to consume in the following situations? (Please tick
one box per situation).
Hypotonic Isotonic Hypertonic Unsure
a) Exercise lasting 0 – 45 minutes
b) Exercise lasting 45 – 90 minutes
c) Post exercise
40. How much carbohydrate is there in an isotonic sports drink? (Please tick one box).
0 – 3 %
4 – 8 %
8 – 11 %
12 – 15 %
Unsure
41. The following drinks are isotonic. (Please tick one box per question)
True False Unsure
a) Lucozade Sport
b) Gatorade
c) Red Bull
d) Water
e) Forgoodness Shakes
SPORTING PERFORMANCE AND SUPPLEMENTATION Please note, if you have not heard of any of the supplements listed below or are unsure of how they work, please tick the UNSURE box.
42. A high protein meal 1 hour before competing in a power event is recommended to
enhance performance. (Please tick one box)
True False Unsure
43. A high carbohydrate meal 2 – 4 hours pre exercise can lead to improvements in
endurance performance. (True or false?)

Page 241 of 253
True False Unsure
44. Which of the following drinks contains the highest amount of carbohydrate? (Please
Tick one box)
500 ml Coke
500 ml Powerade
500 ml full fat milk
500 ml orange squash
Unsure
45. In general, which of the following meals would be recommended to eat 3 hours before
training? (Please Tick one box per question).
a) Steak and chips or Cous cous and tuna
b) Mars bar and crisps or Bread and jam sandwich
c) Chicken sandwich or Cornish Pasty
d) Pasta and pesto or Green leaf salad
46. In general, what would be the best item to snack on in the 30 minutes pre exercise?
(Please tick one box per question).
a) Jelly babies or Peanuts
b) Chocolate or Banana
c) Sunflower seeds or ½ a white bread jam sandwich
d) Cereal Bar or 50g low fat crisps
47. For a power athlete trying to increase muscle mass how much protein should they be
eating per day (g/kg BM = grams per kilogram of body mass). (Please tick one box).
0.5 – 0.9 g.kg BM
1.0 – 1.4 g.kg BM
1.5 – 2.0 g.kg BM
2.1 – 2.5 g.kg BM
2.6 – 3.0 g.kg BM
Unsure
48. If using a whey protein supplement, how much protein (in grams) do guidelines state
should be consumed in one serving? (Please tick one box).
10 – 17 g
18 – 24 g

Page 242 of 253
25 – 30 g
31 - 37 g
38 – 45g
Unsure
49. If competing twice in one day, morning and evening:
a) When is the optimum time to eat after the first event? (Please tick one box).
0 – 45 minutes
45 – 90 minutes
90 – 125 minutes
Eat after the second race.
Unsure
b) Is it more important to replace carbohydrate, protein or fat after the first event?
(Please tick one box).
Carbohydrate
Protein
Fat
Unsure
50. When carbohydrate loading, what percentage of your diet should come from
carbohydrate? (Please tick one box).
45%
60%
75%
90%
Unsure
51. Ideally, what percentage body fat would a world-class athlete have in the following
events? (Please tick one box per discipline)
Sprinter Long Jumper Marathon Runner
0 – 3 % 0 – 3 % 0 – 3 %

Page 243 of 253
4 – 8 % 4 – 8 % 4 – 8 %
10 – 14 % 10 – 14 % 10 – 14 %
16 – 20 % 16 – 20 % 16 – 20 %
Unsure Unsure Unsure
52. Is it always beneficial to have a isotonic sports drink in the 60 minutes pre event?
(Please tick one box)
Yes
No
Unsure
53. What food group is made up of amino acid’s? (Please tick one box)
Carbohydrate
Protein
Fat
Unsure
54. If an amino acid is termed ‘essential’ what does this mean? (Please tick one box)
You should consume this in your diet
It is produced in the body
Should eat it before you exercise
Unsure
55. Immediately post exercise is it best to consume high or low glycemic index
carbohydrates? (Please tick one box).
High GI
Low GI
Unsure
56. Salt tablets could be used as a preventative if you regularly suffer from cramp during
exercise. (Please tick one box)
Agree Disagree Unsure
57. Supplementing with caffeine will result in a decrease in performance in the following
events? (Tick as many as relevant).
True False Unsure
Sprinting
Long Jump

Page 244 of 253
800 m
Shot Putt
Marathon
All or the above
58. Supplementing creatine has the same effect as supplementing with whey protein
(Please tick one box).
True False Unsure
59. In general, which athletic group would benefit from supplementing creatine
monohydrate? (Tick as many as relevant).
Speed and power
Endurance
Unsure
60. If using creatine how much is recommended you should take per day? (Please tick one
box).
1 gram
3 grams
5 grams
7 grams
9 grams
Unsure
61. Which type of athlete, has research has shown, could benefit from taking sodium
bicarbonate as a performance aid? (Please tick one box)
100 – 200 meters
400 – 1500 meters
5,000 – Marathon
Throwers
Unsure
62. What are the physiological benefits of taking sodium bicarbonate? (Please tick one
box)
Increase energy production
Increase free radical removal
Improve hydration status
Maintain blood pH

Page 245 of 253
Increase maximal voluntary contraction
Unsure

Page 246 of 253
Appendix Five
Recruitment adverts

Page 247 of 253
Ethics approval example

Page 248 of 253
Consent form example
Informed Consent Form
You have agreed to participate in a research study at the GSK Human Performance Lab (HPL), titled: Adapt and Perform SESSION PROCEDURES: You hereby agree that you have had and understand all session procedures explained to you either orally or in writing. You have also read the Research Participant Information Sheet and had any questions answered to your satisfaction. During some assessment procedures you will be undertaking physical exercise at or near the extent of your capacity and there is possible risk in the physical exercise at that level, for example, episodes of transient light headedness, abnormal blood pressure, chest discomfort, and nausea. You understand that this may occur though the GSK HPL staff will take all proper care in the conduct of the assessment and you will fully assume that risk. Possible risk of certain blood borne diseases (HIV, Hepatitis B) is associated with any blood sampling that may occur and GSK HPL staff will take all proper care in the conduct of the blood sampling to reduce this. Where session procedures pose additional and specific risks, you will be provided with additional full written details to enable you to provide informed consent. HEALTH: Health risks do exist when exercising. It is important that you notify the GSK HPL staff, and your trainer or team physician, of any unusual physical symptoms that develop during or after your time in the GSK HPL. You are required to complete the Medical Disclosure Form overleaf to inform GSK HPL staff of any illness or physical condition you have that may contribute to the level of risk. Information you disclose may be shared with your medical staff if deemed in the best interests of your health and/or performance. HUMAN BIOLOGICAL SAMPLES: GSK represents and warrants that any human biological samples collected (blood, urine and muscle) in the GSK HPL will be obtained in material compliance with all applicable laws, regulations and any generally accepted ethical guidelines regarding the, collection, storage, transfer, subsequent use and disposal. You hereby provide informed consent that any human biological samples provided by you may be used for sport science and sports nutrition research purposes. Any remaining unused sample will be discarded once a specific piece of sport science or sports nutrition research has been completed. Storage of human biological samples by the GSK Human Performance Lab is in accordance with requirements of the UK Human Tissue Authority under HTA license number 12202. Any human biological tissue collected will be retained for ≤ 12 months. The HBS will be disposed of once analysed. YOUR DATA: You agree that GSK (including, for the avoidance of doubt, GSK affiliates) may use, store and process your personal data for GSK HPL research and development or other purposes (including publication or marketing claims), but your personal identity will not be shared with third parties without your permission. You agree that GSK may share such data

Page 249 of 253
with third parties for storage, processing and R&D purposes. You agree that personal data that you provide or which may be collected in the course of this study may be transferred to, stored and processed in your country of residence or any other country in which GSK or its affiliates, subcontractors or agents maintain facilities, including the United States and outside the European Economic Area (“EEA”). GSK is committed to using commercially reasonable means to ensure that your personally identifiable information is protected appropriately, and in accordance with applicable data protection laws, and uses a variety of security technologies and procedures to help protect your personally identifiable information from unauthorized access, use, or disclosure. CONFIDENTIALITY: You shall maintain in strictest confidence any information acquired during your participation at the GSK HPL (including the location of the GSK HPL), whether that information relates to GSK, an affiliate or a third party, and there should be no disclosure to any third party of this information both during and after your participation. PARTICIPATION: Your participation in this study is voluntary and you may refuse to participate or withdraw at any time without having to give reason, without penalty or loss of benefits to which you are otherwise entitled. WAIVER: You acknowledge that your participation in this study is at your own risk and you have disclosed to GSK all relevant medical conditions. GSK, and third parties involved in the operation of the GSK HPL, shall be released from all liability to you with respect to any loss or damage suffered by you (in relation to injury, accuracy of the results or otherwise), to the fullest extent permissible by law. GSK does not attempt to limit its liability for death or personal injury caused by negligence. Thank you. SmithKline Beecham Limited, trading as GlaxoSmithKline Consumer Healthcare and its affiliates (“GSK”) Signed __________________________________________ (Participant Date __________________________________________ Name __________________________________________ Authorisation I am satisfied that the above-named has given informed consent to participate in a research study at the GSK HPL Signed __________________________________________ (to be signed by HPL Principal Investigator) Date __________________________________________ Name (Print) __________________________________________

Page 250 of 253
Medical screen example
PRE-TEST MEDICAL Screen
Please answer the following questions as accurately as possible Please tick
Yes No
Has your doctor ever said that you have a heart condition and that you
should only do physical activity recommended by a doctor?
Are you suffering from any form of illness, or have you done so in the
last 4 weeks?
If yes, please specify what and when:
Are you currently on any prescribed medication and/or have you taken
any medication today?
If yes, please specify:
Are you suffering from any form of injury, bone or joint problem, or have
you done so in the last 4 weeks?
If yes, please specify what and when:
Do you have exercise-induced asthma or exercise-induced
bronchoconstriction?
If yes, do you have your inhaler with you?
Do you have any allergies?
If yes, please specify:
Do you have diabetes?
If yes, please specify whether Type I or II:

Page 251 of 253
Do you have any blood disorder or infection (eg Haemophilia, Anaemia,
Hepatitis, HIV/AIDS)?
If yes, please specify:
Have/Do you suffer from stress fractures?
If yes, please specify:
Have you ever had a Bone Density study (DEXA) done?
If yes, please specify:
Are there any other conditions or reasons that may prevent you from
safely completing this testing session?
If yes, please specify:
I (print name) ________________________________________________________________ confirm that
the above information is accurate and that I am in a suitable condition to complete the performance
assessment session at the GSK HPL. I will inform GSK HPL staff of any change in my condition at any
future performance assessment sessions.
Signed __________________________________________________ (to be signed by a parent /
guardian if under 16)
Date __________________________________________________
Authorised ___________________________________________________ (to be signed by HPL
Scientist)

Page 252 of 253
Muscle biopsy medical screen
To help us ensure your safety and wellbeing please answer the following questions.
1. Have you ever had a negative or allergic reaction to local anesthetic (e.g. during dental
or surgical procedures)?
No ☐ Yes ☐
2. Do you have any tendency toward easy bleeding or bruising (e.g with minor cuts or
shaving)?
No ☐ Yes ☐
3. Are you currently taking any medications that may increase the chance of bleeding or
bruising (e.g. Aspirin, Coumadin, Anti-inflammatories, Plavix)?
No ☐ Yes ☐
4. Do you have any blood clotting or other disorders that you are aware of?
No ☐ Yes ☐
5. Do you carry and EpiPen for any reason? Is so, please specify reason.
No ☐ Yes__________________________________
6. Have you ever fainted or do you have a tendency to faint when undergoing or watching
medical procedures?
No ☐ Yes ☐
7. Have you ever had a muscle biopsy before, if so were there any complications?
No ☐ Yes ☐
Complications .
8. Are you allergic to plasters?
No ☐ Yes ☐
9. Will you contact the researcher who did the biopsy directly if you have any concerns
about the biopsy site including: excessive redness, swelling, infection, pain or stiffness of
the leg?
No ☐ Yes ☐
10. Are you willing to visit the researcher who did the biopsy 7 – 10 days following the biopsy
for an assessment of the biopsy site?
No ☐ Yes ☐
Subject Name (print) :_____________________________
Subject Signature :_______________________________ Date :_________________
Signature of Person Conducting Assessment:_______________________________