Pre-Feasibility Study Olive Cultivation - ().
21
Pre-Feasibility Study OLIVE CULTIVATION Small and Medium Enterprises Development Authority Ministry of Industries & Production Government of Pakistan www.smeda.org.pk HEAD OFFICE 4th Floor, Building No. 3, Aiwan-e-Iqbal Complex, Egerton Road, Lahore Tel: (92 42) 111 111 456, Fax: (92 42) 36304926-7 [email protected] REGIONAL OFFICE PUNJAB REGIONAL OFFICE SINDH REGIONAL OFFICE KPK REGIONAL OFFICE BALOCHISTAN 3 rd Floor, Building No. 3, Aiwan-e-Iqbal Complex, Egerton Road Lahore, Tel: (042) 111-111-456 Fax: (042) 36304926-7 [email protected] 5 TH Floor, Bahria Complex II, M.T. Khan Road, Karachi. Tel: (021) 111-111-456 Fax: (021) 5610572 [email protected] Ground Floor State Life Building The Mall, Peshawar. Tel: (091) 9213046-47 Fax: (091) 286908 [email protected] Bungalow No. 15-A Chaman Housing Scheme Airport Road, Quetta. Tel: (081) 831623, 831702 Fax: (081) 831922 [email protected] December 2011
-
Upload
khangminh22 -
Category
Documents
-
view
1 -
download
0
Transcript of Pre-Feasibility Study Olive Cultivation - ().

Pre-Feasibility Study
OLIVE CULTIVATION
Small and Medium Enterprises Development Authority
Ministry of Industries & Production
Government of Pakistan
www.smeda.org.pk
HEAD OFFICE
4th Floor, Building No. 3, Aiwan-e-Iqbal Complex, Egerton Road,
Lahore
Tel: (92 42) 111 111 456, Fax: (92 42) 36304926-7
REGIONAL OFFICE
PUNJAB REGIONAL OFFICE
SINDH REGIONAL OFFICE
KPK REGIONAL OFFICE
BALOCHISTAN
3rd
Floor, Building No. 3,
Aiwan-e-Iqbal Complex,
Egerton Road Lahore,
Tel: (042) 111-111-456
Fax: (042) 36304926-7
5TH
Floor, Bahria
Complex II, M.T. Khan Road,
Karachi.
Tel: (021) 111-111-456
Fax: (021) 5610572
Ground Floor
State Life Building
The Mall, Peshawar.
Tel: (091) 9213046-47
Fax: (091) 286908
Bungalow No. 15-A
Chaman Housing Scheme
Airport Road, Quetta.
Tel: (081) 831623, 831702
Fax: (081) 831922
December 2011
Pre-Feasibility Study Olive Cultivation
PREF-115/December, 2011
1
DISCLAIMER
The purpose and scope of this information memorandum is to introduce the subject
matter and provide a general idea and information on the said area. All the material
included in this document is based on data/information gathered from various
sources and is based on certain assumptions. Although, due care and diligence has
been taken to compile this document, the contained information may vary due to any
change in any of the concerned factors, and the actual results may differ substantially
from the presented information. SMEDA does not assume any liability for any
financial or other loss resulting from this memorandum in consequence of
undertaking this activity. Therefore, the content of this memorandum should not be
relied upon for making any decision, investment or otherwise. The prospective user
of this memorandum is encouraged to carry out his/her own due diligence and gather
any information he/she considers necessary for making an informed decision.
The content of the information memorandum does not bind SMEDA in any legal or
other form.
DOCUMENT CONTROL
Document No. PREF-115
Prepared by SMEDA-Punjab
Approved by Provisional Chief- Punjab
Issued by Library Officer
Issued Date December, 2011

Pre-Feasibility Study Olive Cultivation
PREF-115/December, 2011
2
1 EXECUTIVE SUMMARY ................................................................................ 3
2 INTRODUCTION .............................................................................................. 4
2.1 GENERAL ........................................................................................................ 4
2.2 PROJECT BRIEF................................................................................................ 5
2.3 OPPORTUNITY RATIONALE .............................................................................. 6
2.4 ADVANTAGES OF OLIVE OIL ........................................................................... 6
2.5 VIABLE ECONOMIC FARM SIZE ....................................................................... 6
2.6 PROJECT COST ................................................................................................ 6
2.7 PROCESS FLOW CHART ................................................................................... 7
3 CURRENT INDUSTRY STRUCTURE ........................................................... 7
3.1 PRESENT PRODUCTION OF OIL SEEDS IN PAKISTAN ........................................ 7
4 TECHNICAL ANALYSIS ................................................................................. 8
4.1 SUGGESTED AREAS FOR OLIVE CULTIVATION ................................................ 8
4.2 PLANTATION & GROWTH REQUIREMENTS ...................................................... 9
4.3 PLANTING AN OLIVE TREE .............................................................................. 9
4.4 FERTILIZERS ON PRODUCTION ......................................................................... 9
4.5 MATERIAL AVAILABILITY ............................................................................. 10
4.6 IRRIGATION OF OLIVE ORCHARDS ................................................................. 11
4.7 TIME OF IRRIGATION ..................................................................................... 11
4.8 SELECTION OF PLANT AND ITS IMPORTANCE ................................................. 11
4.9 EXPECTED PRODUCTION ............................................................................... 11
5 LAND AND INFRASTRUCTURE REQUIREMENT ................................. 12
5.1 TOTAL LAND AND BUILDING COVERED AREA .............................................. 12
5.2 MODE OF LAND ACQUISITION ....................................................................... 12
5.3 UTILITIES REQUIRED ..................................................................................... 12
6 MACHINERY AND EQUIPMENT ............................................................... 12
7 HUMAN RESOURCE REQUIREMENT ...................................................... 14
7.1 NUMBER OF STAFF REQUIRED ....................................................................... 14
8 KEY SUCCESS FACTORS............................................................................. 14
8.1 GUIDELINES FOR SUCCESSFUL CULTIVATION ................................................. 14
9 PROJECT ECONOMICS................................................................................ 15
10 FINANCIAL ANALYSIS ............................................................................. 16
10.1 PROJECTED INCOME STATEMENT ............................................................... 16
10.2 PROJECTED CASH FLOW STATEMENT ........................................................ 17
10.3 PROJECTED BALANCE SHEET ..................................................................... 18
11 KEY ASSUMPTIONS .................................................................................. 19

Pre-Feasibility Study Olive Cultivation
PREF-115/December, 2011
3
1 EEXXEECCUUTTIIVVEE SSUUMMMMAARRYY
Pakistan, a developing country, having population of 177.10 million is the sixth most populous country in the world, whose demand is rising due to steady economic growth. Despite the fact that Pakistan is overwhelmingly an agrarian economy, it is unable to produce edible oil sufficient for domestic requirements. Agriculture contributes 23 percent of the GDP, 42 percent of the total work force is employed to the agriculture sector and also contributes substantially to Pakistan's export earnings.
Agriculture Commodities and Textiles Products accounts for 62.6% of Pakistan's total exports, 33% of which are Raw or Low value added products. One of the challenges to the economy of Pakistan is the edible oil deficit. Edible oil is considered as a necessity and not a luxury product and hence its demand is relatively inelastic and grows with time. There are many reasons behind the shortcoming like; lack of awareness of farmers, ignorance of policy makers regarding oilseed crops and technological deficiency in oilseed production etc. The crop that is responsible for 57 % of edible oil production is cotton seed which is primarily a fiber crop. The statistics shows that the demand for edible oil is increasing day by day due to eating habits of people of Pakistan. Local production does not meet the demand which indicates a huge potential for growing oil seeds.
Olives have been mentioned seven times in the Quran and its health benefits have been propounded in Prophetic medicine. The Vitamin E contained in Olives is the body's primary fat-soluble antioxidant. Anti-oxidants help to strengthen the body's immune system; reducing the severity of asthma, cancer, osteoarthritis, and rheumatoid arthritis, premature ageing, as well as delaying the effects of ageing.
Olive Oil is sold at the highest price as compared to other edible Oils.
Growing Olive trees is a profitable business and olive trees have more than 250 years of life and it can grow on barren lands. On an average an olive plant produces 20 to 35 kg of olive fruits per year which contain more than 12 % of oil contents. The olive fruit can be sold out in the market at the rate of Rs. 73/- per kg and extracted oil can be sold at the rate of Rs. 500/- per liters. Growing Olive in 50 acres with modern farm management techniques can be a long lasting business. It is recommended that land should be purchased in the suggested rural areas. The total cost of project in this feasibility is Rs. 37.781 million. The olive plants start giving fruits at the age of four to six years so cost incurred for initial four years is included in pre operating cost in this pre-feasibility.

Pre-Feasibility Study Olive Cultivation
PREF-115/December, 2011
4
2 IINNTTRROODDUUCCTTIIOONN
2.1 GGeenneerraall
Pakistan, a developing country, having population of 177.10 million is the sixth most populous country in the world, whose demand is rising due to steady economic growth. Despite the fact that Pakistan is overwhelmingly an agrarian economy, it is unable to produce edible oil sufficient for domestic requirements. Agriculture sector contributes 23 percent of the GDP, 42 percent of the total work force is employed to the agriculture sector and also contributes substantially to Pakistan's export earnings. Agriculture Commodities and Textile products accounts for 62.6% of Pakistan's total exports, 33% of which are Raw or Low value added products. One of the challenges to the economy of Pakistan is the edible oil deficit. Edible oil is considered as a necessity and not a luxury product and hence its demand is relatively inelastic and grows with time. There are many reasons behind the shortcoming like; lack of awareness of farmers, ignorance of policy makers regarding oilseed crops and technological deficiency in oilseed production etc. The crop that is responsible for 57 % of edible oil production is cotton seed which is primarily a fiber crop. On the other hand, smuggling is also an important factor in edible oil deficit. Demand for Edible oil in the neighboring countries (Afghanistan in particular) has been very high due to which smuggling of edible oil from Pakistan has been increased.1 High dependency on few crops leads to disastrous effects on overall oil production when for some reasons the yield of those crops is declined. Indigenous production of edible oil is below the consumption levels with a very wide gap between the production and consumption. Pakistan is heavily dependent on imported edible oils to meet the local demand which is increasing by each passing year. This gap is bridged through import of edible oil worth more than Rs. 45.0 billion annually. Presently the oilseed production only met about 30% of the requirements and 70%
remaining demand proportion is covered with imports.2 This increasing percentage of edible oil imports contributes heavily to the ever increasing food expenditure of household. The most common Pakistani food includes a good quantity of edible oil which is the reason behind high consumption growth rates. At the time of independence Pakistan was self-reliant in edible oil but Pakistan began to import some small quantities of edible oil to supplement domestic production. Since 1969-70, edible oil consumption began to grow at exorbitant rates and domestic production failed to cope up with it, as a result edible oil deficit started to grow. Cultivation of edible oil is not popular among the farming community due to a number of reasons. Reported area under sunflower, rapeseed and mustard, sesame, cottonseed and canola in 2004-05 was 7,70,000 acres, 6,12,000 acres, 66,000 acres,
1 Economic Survey of Pakistan, 2010-11 2 Pakistan Oil Seed Development Board

Pre-Feasibility Study Olive Cultivation
PREF-115/December, 2011
5
79,79,000 acres and 288,000 acres respectively. Ratio of edible oil extracted from cotton has declined and it is estimated that in 2008, the country would get some 500,000 tons edible oil from cotton seeds which is 16.7% less than previous year. The private sector has announced to purchase sunflower seeds at Rs1200 per 40 kilogram this year against Rs900 per 40 kilogram last year. This increase in the purchase price of sunflower seeds (33%) apparently seems to give incentive to the farmers to bring more area under sunflower cultivation.3 There is a lot of potential for olive cultivation in Pakistan. The estimates have revealed that if eight million wild olive trees present in different provinces are grafted and converted into the productive olive then there is a potential of earning a maximum of one billion dollars annually. 4 Similarly, we may earn a maximum of 9 billion dollars annually if olive cultivation is made on cultivable potential waste lands. The olive appears to have been native to Asia, being one of the earliest trees cultivated by man. The trees belong to oleaceae family and comprise 30 genera with 600 species. The plant is xerophitic upon species of tree the olea-europea or Europium olive. Olive is an integral part of the diet of the people of the Mediterranean lands and is a source of fat in diet of these people. Olive oil is widely used in countries where fats are scarce. In Indo-Pak sub-continent a wild olive, olea cuspida is found within the northwest Himalayas and other adjoining hills but cultivated olive olea Europea is not grown anywhere on commercial scale. This plant is locally known as Zytoon in Urdu. The importance of olive oil has also been narrated several times in the Holy Quran. During the mid of last century (around 1950s), a number of grafted olive plants of several varieties were imported and planted in Kashmir, Fort Sandeman (Zhob), Peshawar, Swat, Rawalpindi, Sargodha, and Jhelum districts. 5
2.2 PPrroojjeecctt BBrriieeff
The proposed project is designed as Olive farming unit, spreading over a land area of 50 acres. Growing Olive in 50 acres with modern farm management techniques can be a long lasting business. It is recommended that land should be purchased in the suggested rural areas. The total cost of project in this pre-feasibility is Rs. 37.781 million including land, plantation and working capital. The olive plants starts giving fruits at the age of four to six years so the cost incurred during the initial four years is required which is included in pre operating cost in this pre-feasibility. However the fruit bearing capacity of plant depends upon the nature of plant and land on which it is cultivated. Plants usually start giving fruits at the age of four to six years.
3 Pakistan Oil Seed Development Board 4 Pakistan Oil Seed Development Board 5 Economic Survey of Pakistan 2010-11

Pre-Feasibility Study Olive Cultivation
PREF-115/December, 2011
6
2.3 OOppppoorrttuunniittyy RRaattiioonnaallee
There are several reasons for growing oil fruits: Cultivation on marginal lands without replacing other crops; To lessen the import bill of edible oil; Olive is labor extensive venture, creation of more jobs will improve the
socio-economic conditions; Drought resistant and environment friendly; Wide adaptability, not only in arid areas but also in plains of the Punjab; Fruit bearing in Lahore, Kasur, Sahiwal, Faisalabad, Layyah, Bhakkar and
Mianwali showing great potential in Punjab; More economic returns compared to other field crop; No extra care and attention compared to other fruit crops; Longest productive life (200-250 years) than all other fruit trees.
2.4 AAddvvaannttaaggeess ooff OOlliivvee OOiill
The Vitamin E contained in Olives is the body's primary fat-soluble antioxidant. Anti-oxidants help to strengthen the body's immune system; reducing the severity of asthma, cancer, osteoarthritis, and rheumatoid arthritis, premature ageing, as well as delaying the effects of ageing.
Used as a balm, it fortifies and moisturizes the skin, combating dry skin and softening it. It also combats against acne.
Help against wrinkles and delaying the effects of old age. Help combat against strokes, heart-disease, high blood pressure and diabetes. The decoction of olive leaves in water is effective against mouth and lip
ulcers and allergic dermatitis also. Tea of Olive leaves helps against high blood pressure.
2.5 VViiaabbllee EEccoonnoommiicc FFaarrmm SSiizzee
The proposed project can be started at any capacity but due to its economic commercial viability we are proposing 50 acres land for its cultivation in this Pre-feasibility study.
2.6 PPrroojjeecctt CCoosstt
The proposed project of Olive farming needs capital investment of about Rs. 37.195 million. This includes machinery and equipment. In addition to this, a sum of Rs. 0.586 million is also required as working capital. The total project cost amounts to Rs. 37.781 million.

Pre-Feasibility Study Olive Cultivation
PREF-115/December, 2011
7
2.7 PPrroocceessss FFllooww CChhaarrtt
FFiigguurree 22--11:: PPrroodduuccttiioonn ffllooww ooff OOlliivvee FFrruuiitt PPrroodduuccttiioonn
Selection of
Plants Soil Fertilization Transplantation
Harvesting Shipment for Oil Extraction
Land Preparation
Grading Brine Solution Treatment
3 CCUURRRREENNTT IINNDDUUSSTTRRYY SSTTRRUUCCTTUURREE
3.1 PPrreesseenntt PPrroodduuccttiioonn ooff OOiill SSeeeeddss iinn PPaakkiissttaann
The Production of Oil seed crops in Pakistan is very low and potentials have not been utilized so far. The demand of edible oil and oil seeds is fulfilled by imports. The major oilseed crops include sunflower, canola, rapeseed & mustard and cottonseed. The total availability of edible oil in 2009-10 was 2.9 million tons. Local production of edible oil was 662 thousand tons which accounted for 23 percent of total availability in the country, while the remaining 77 percent availability was ensured through imports. During the year 2010-11 (July- March), a quantity of 1.7 million tons edible oil/oilseeds worth US$ 1.65 billion has been imported. The local production in 2010-11 is provisionally estimated at 696 thousand tons. Total availability from all sources is thus reduced to 2.35 million tons so far. The area and production of oilseed crops during 2009-10 and 2010-11 is given in Table below.
TTaabbllee 33--11:: AArreeaa aanndd PPrroodduuccttiioonn MMaajjoorr OOiill SSeeeedd CCrrooppss iinn PPaakkiissttaann66
Crop Production (2009-10) Production (2010-11)
Area
(000Acres)
Seeds
(000
Tons)
Oil
(000Ton
s)
Area
(000Acres)
Seeds
(000
Tons)
Oil
(000Tons)
Cotton Seeds
7,591 3,240 389 6,450 2,934 352
Rapeseeds/Mustard
486 160 51 439 157 50
6 Economic Survey of Pakistan, 2010-11

Pre-Feasibility Study Olive Cultivation
PREF-115/December, 2011
8
Sunflower 872 513 195 1,108 643 244
Canola 142 70 27 233 131 50
Total 9,091 3,983 662 8,230 3,865 696
The above mentioned table clearly shows almost negligible production of oil seeds which cannot meet the demand of edible oil in the country. It indicates the potential of edible oil seeds farming in general. Olive oil has shows tremendous demand all over the world and if locally produced it can benefit both the farmers and the country.
4 TTEECCHHNNIICCAALL AANNAALLYYSSIISS
Olive fruit production in Pakistan is not an organized sector so there is need to understand its technical parameters which are explained in the following headings.
4.1 SSuuggggeesstteedd AArreeaass ffoorr OOlliivvee CCuullttiivvaattiioonn
Followings are suggested areas for Olive cultivation by Pakistani agrarians:
TTaabbllee 44--11:: SSuuggggeesstteedd AArreeaass ffoorr OOlliivvee CCuullttiivvaattiioonn77
Sr. No. Area
1 Narowal
2 Sialkot
3 Gujrat
4 Jhelum
5 Rawalpindi
6 Islamabad
7 Attock
8 Chakwal
9 Khushab
10 Mianwali
7 Barani Agriculture Research Institute(BARI), Chakwal

Pre-Feasibility Study Olive Cultivation
PREF-115/December, 2011
9
4.2 PPllaannttaattiioonn && GGrroowwtthh RReeqquuiirreemmeennttss
Olive plants show its growth well on poor soils even without fertilizer. It can also thrive in rocky and shallow soils. There are few essential requirements for healthy growth of plants. Following are the requirements:
Hot dry summer Being successfully grown under rain fed conditions (200-900 mm annual
rainfall)
Winter chilling requirement (150-300 hours at temperature below 7°C)
Flowering temperature 25°- 30°C (March) Varieties vary in temperature requirement
Italian – most cold tolerant (-8°C) North African (Moroccan & Tunisian) most tolerant to high temperature
(36°- 41°C) Variety of soil type (from sandy to clay) best soil light well drained
4.3 PPllaannttiinngg aann OOlliivvee TTrreeee
It is very important to grow the olive plants according to recommended standards as it affects the fruit bearing capacity of the plants. Plants should be planted in square system and distance should be 20x20 feet between the plants on the plain land and on sloppy land it may not be less the 15x15 feet.
Layout: Square system; Planting Distance: 20x20 feet (in plain lands), 15x15 feet (in slopes or hilly
areas); Pit Digging: The measurement of pit should be 1m3 (3x3x3 feet); Pit Filling: Pit must be filled by a homogenous mixture of soil, silt and FYM
with the ratio 1:1:1. 2-3 irrigation must be applied for proper decay of FYM; Plating of olive trees can be done in two seasons: spring and autumn. Spring
planting should be preferred because of provision of longer growth period.8
The distance between the plants is 20 feet and the space between the plants can be utilized for cultivation of other crops for initial six to ten years of age of the plants. However it is recommended that such crops should be cultivated between the plants which have low height and require less irrigation.
4.4 FFeerrttiilliizzeerrss oonn PPrroodduuccttiioonn
Using fertilizers containing Nitrogen, Phosphorus and Potash, the yield of the crop can be maximized. Proper fertilizer application plays vital role in good growth and optimum fruit yield. Proper combination of FYM, Phosphorus, Potassium and
8 Barani Agriculture Research Institute(BARI), Chakwal

Pre-Feasibility Study Olive Cultivation
PREF-115/December, 2011
10
Nitrogen provided balanced nutrients to fulfill needs of developing and mature fruiting trees. Detailed year wise fertilizer’s requirements are given in table below:
TTaabbllee 44--22:: FFeerrttiilliizzeerr RReeqquuiirreemmeennttss99
Age of Plant
(years)
Farm Yard
Manure(FYM)
Kg/plant/year
Chemical Fertilizer g/plant/year
N (g) P (g) K (g)
1 -- -- --
2 5 200 100 --
3 10 300 150 150
4 15 400 200 200
5 20 500 250 250
6 25 600 300 300
7 30 700 350 350
8 35 800 400 400
9 and more 40 1000 500 500
TTaabbllee 44--33:: TTiimmee ooff FFeerrttiilliizzaattiioonn1100
S.
No
Type of
Fertilizer Time of application Remarks
1 FYM December Well Rotten
2 Urea (Nitrogen)
1. Three weeks Before flowering (First to second week of Feb.) 2. After fruit setting (Last week of April)
Any other type can also be used (DAP, Nitrophos)
3 Phosphorous
1. Three weeks Before flowering (First to second week of Feb.) 2. After fruit setting (Last week of April)
(DAP, TSP, SSP)
4 Potash December (Also can mix with FYM)
(SOP, MOP)
4.5 MMaatteerriiaall AAvvaaiillaabbiilliittyy
Fertilizers of all kinds are available locally. Pesticides of different natures are also available locally. Water is available from canal or can be used from peter engine.
9 As per Agronomist of Barani Agriculture Research Institute(BARI), Chakwal 10 As per Agronomist of Barani Agriculture Research Institute(BARI), Chakwal
Pre-Feasibility Study Olive Cultivation
PREF-115/December, 2011
11
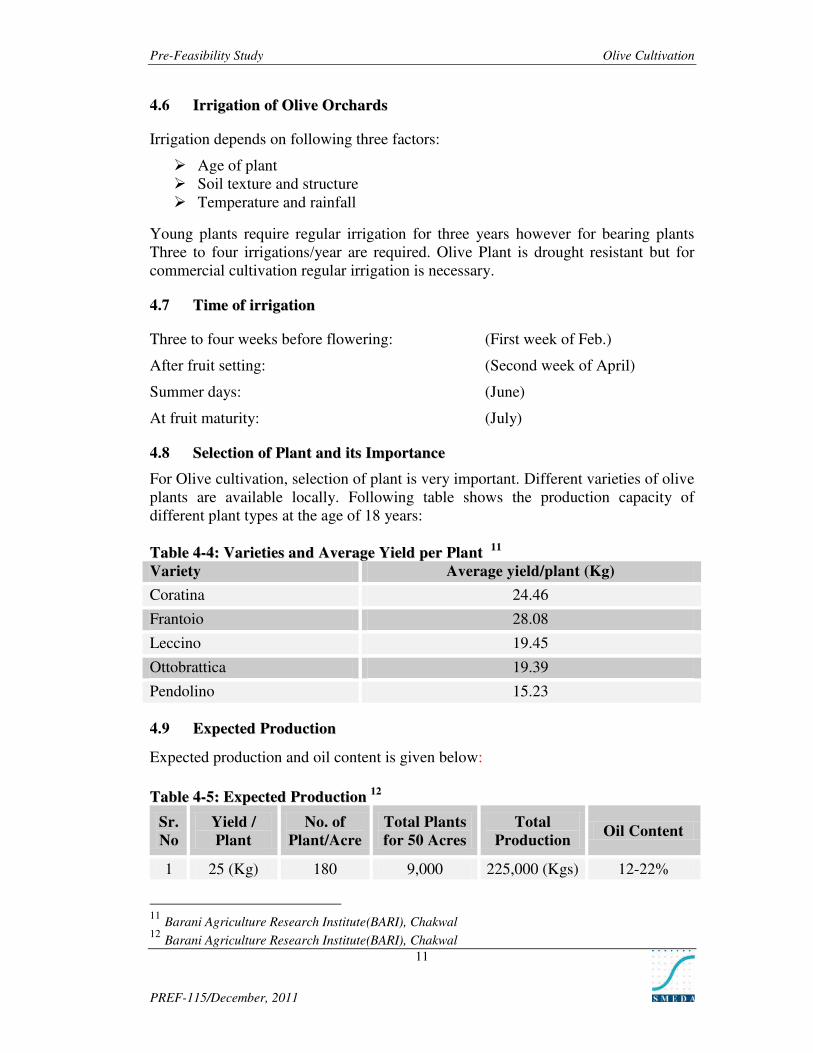
4.6 IIrrrriiggaattiioonn ooff OOlliivvee OOrrcchhaarrddss
Irrigation depends on following three factors:
Age of plant Soil texture and structure Temperature and rainfall
Young plants require regular irrigation for three years however for bearing plants Three to four irrigations/year are required. Olive Plant is drought resistant but for commercial cultivation regular irrigation is necessary.
4.7 TTiimmee ooff iirrrriiggaattiioonn
Three to four weeks before flowering: (First week of Feb.)
After fruit setting: (Second week of April)
Summer days: (June)
At fruit maturity: (July)
4.8 SSeelleeccttiioonn ooff PPllaanntt aanndd iittss IImmppoorrttaannccee
For Olive cultivation, selection of plant is very important. Different varieties of olive plants are available locally. Following table shows the production capacity of different plant types at the age of 18 years:
TTaabbllee 44--44:: VVaarriieettiieess aanndd AAvveerraaggee YYiieelldd ppeerr PPllaanntt 1111
Variety Average yield/plant (Kg)
Coratina 24.46
Frantoio 28.08
Leccino 19.45
Ottobrattica 19.39
Pendolino 15.23
4.9 EExxppeecctteedd PPrroodduuccttiioonn
Expected production and oil content is given below:
TTaabbllee 44--55:: EExxppeecctteedd PPrroodduuccttiioonn 1122
Sr.
No
Yield /
Plant
No. of
Plant/Acre
Total Plants
for 50 Acres
Total
Production Oil Content
1 25 (Kg) 180 9,000 225,000 (Kgs) 12-22%
11 Barani Agriculture Research Institute(BARI), Chakwal 12 Barani Agriculture Research Institute(BARI), Chakwal

Pre-Feasibility Study Olive Cultivation
PREF-115/December, 2011
12
However yield of plant also depends upon following factors: Alternate Bearing Soil Moisture (drought) Management of Irrigation Nutrition Soil type Pruning
5 LLAANNDD AANNDD IINNFFRRAASSTTRRUUCCTTUURREE RREEQQUUIIRREEMMEENNTT
5.1 TToottaall LLaanndd aanndd BBuuiillddiinngg CCoovveerreedd AArreeaa
Following are breakup of Land and building cost:
TTaabbllee 55--11:: LLaanndd AArreeaa
Description Area
Agriculture Land (Acre) 50
Total Per Acre Cost 400,000
Total Cost of Land 20,000,000
TTaabbllee 55--22:: CCoovveerreedd AArreeaa rreeqquuiirreemmeenntt
Sr.
No. Particulars
Area
Sq Feet
Cost
per Sq
Feet
Amount
in Rs.
1 Management Building 400 1,200 480,000
2 Store 400 850 340,000
3 Grounds 4,000 25 100,000
Total 920,000
5.2 MMooddee ooff LLaanndd AAccqquuiissiittiioonn
Agricultural land can be purchased or taken on lease for the implementation of the proposed project. As project life is more than 200 years so it is proposed that land should be purchased.
5.3 UUttiilliittiieess RReeqquuiirreedd
Electricity
Diesel (for tube well operations)
Water
6 MMAACCHHIINNEERRYY AANNDD EEQQUUIIPPMMEENNTT
Following plant and machinery is required for an Olive Cultivation Farm at 50 Acres. The Oil extraction machinery is not included in this pre-feasibility study. Oil

Pre-Feasibility Study Olive Cultivation
PREF-115/December, 2011
13
Extraction Machinery is available at Agriculture Departments of almost every district. Machinery is also available at Barani Agriculture Research Institute at different districts. Currently Government of Punjab is providing facility to the Olive growers to extract Olive Oil free of cost.
TTaabbllee 66--11:: TToooollss,, EEqquuiippmmeenntt aanndd PPrreeppaarraattiioonn ccoosstt
S.No Description Cost Per Acre Total Cost (50 Acres)
1 Drip irrigation system 60,000 3,000,000
2 Tank(Water Reservoir) 10,000 500,000
3 Boring Cost 300,000
4 Diesel Pump 150,000
5 Misc. Instrument cost 200,000
6 Pit Digging (Rs. 40 per Plant x 180 No. of Plants)
7,200 360,000
7 Pit Filling (Rs. 20 per Plant x 180 No. of Plants)
3,600 180,000
8 Plant Cost (Rs. 50 per Plant x 180 No. of Plants)
9,000 450,000
Total 5,140,000
TTaabbllee 66--22:: DDeettaaiillss ooff FFuurrnniittuurree aanndd FFiixxttuurreess
Sr.
No Particulars Quantity Rate Amount in Rs.
1 Furniture Set 1 50,000 50,000
2 Electric Wiring and Lighting
1 35,000 35,000
Total 85,000
TTaabbllee 66--33:: DDeettaaiillss ooff OOffffiiccee EEqquuiippmmeenntt
Sr.
No Particulars Quantity Rate Amount in Rs.
1 Computers with UPS 2 30,000 60,000
2 Printer 1 12,000 12,000
3 Telephones 2 1,000 2,000
4 Generator 5 KVA China made
1 45,000 45,000
Total 119,000

Pre-Feasibility Study Olive Cultivation
PREF-115/December, 2011
14
7 HHUUMMAANN RREESSOOUURRCCEE RREEQQUUIIRREEMMEENNTT
Following Human Resource will be required for the project:
7.1 NNuummbbeerr ooff SSttaaffff RReeqquuiirreedd
TTaabbllee 77--11:: NNuummbbeerr ooff SSttaaffff rreeqquuiirreedd1133
Description Number Monthly Salary per
person (Rs.) Annual Salary (Rs)
CEO 1 73,205 878,460
Farm Manager 1 29,282 351,384
Accountant 1 17,569 210,830
Labor 5 10,981 658,845
Total 7 2,099,519
8 KKEEYY SSUUCCCCEESSSS FFAACCTTOORRSS
The commercial viability of the project depends upon the regular and consistent supply of good quality hybrid seeds and fertilizers.
The other important aspect is the need for strong linkages with the local market and progressive olive purchaser.
8.1 GGuuiiddeelliinneess ffoorr ssuucccceessssffuull ccuullttiivvaattiioonn
Following principles need to be pursued for the best productivity of Olive fruit: 1. Timely control of pests, diseases and exercise of preventive measures. 2. Timely irrigation and fertilization. 3. Timely training and grading of plantation. 4. Post harvest includes protection from direct sunlight.
13 These salaries are taken at 5th year of Plant’s age which is 1st year of operations.

Pre-Feasibility Study Olive Cultivation
PREF-115/December, 2011
15
9 PPRROOJJEECCTT EECCOONNOOMMIICCSS
TTaabbllee 99--11:: PPrroojjeecctt’’ss CCoosstt,, FFiinnaanncciinngg PPllaann aanndd EExxppeecctteedd RReettuurrnnss Capital Investment Rs. in actuals
Land 20,000,000
Building/Infrastructure 920,000
Machinery & equipment 5,140,000
Furniture & fixtures 85,000
Office equipment 119,000
Pre-operating costs 10,931,495
Total Capital Costs 37,195,495
Working Capital Rs. in actuals
Equipment spare part inventory 8,567
Raw material inventory 77,140
Cash 500,000
Total Working Capital 585,706
Total Investment 37,781,201
Initial Financing Rs. in actuals
Debt 50% 18,890,601
Equity 50% 18,890,601
Equity Project
Internal Rate of Return (IRR) 35% 28%
Payback Period (yrs) 4.32 4.69
Net Present Value (NPV) 12,235,429 21,343,856
Pre-Feasibility Study Olive Cultivation
PREF-115/December, 2011
16
10 FFIINNAANNCCIIAALL AANNAALLYYSSIISS
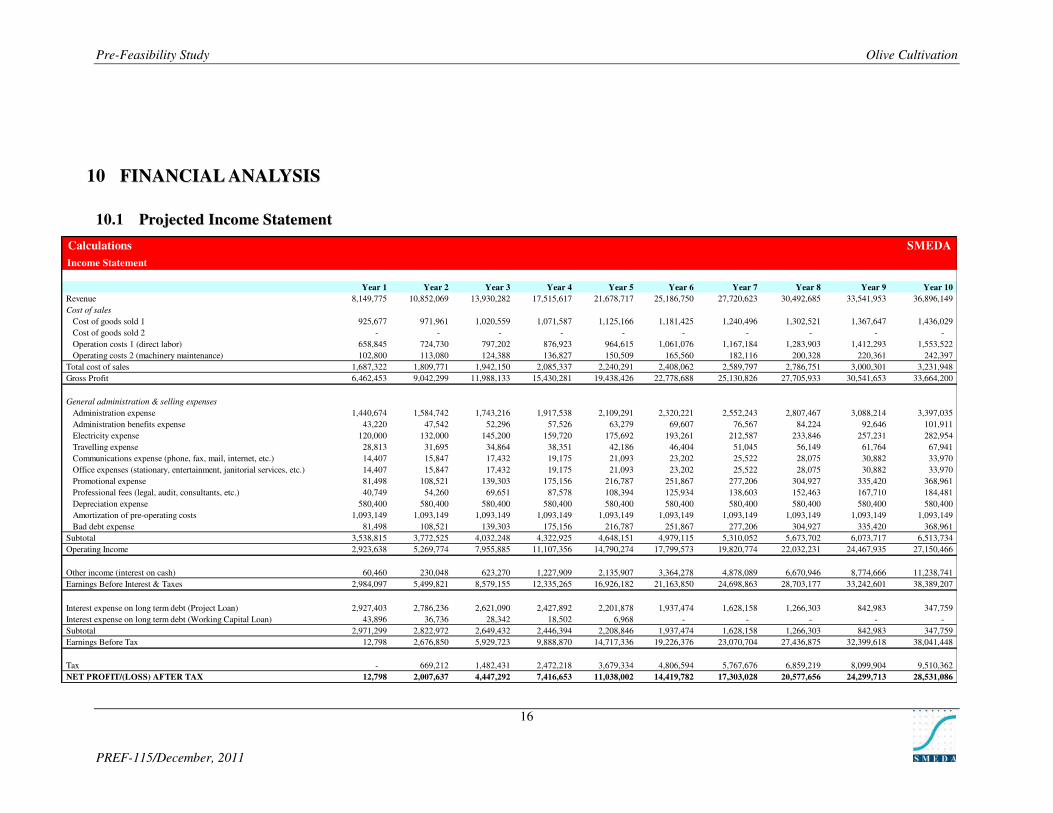
10.1 PPrroojjeecctteedd IInnccoommee SSttaatteemmeenntt
Calculations SMEDA
Income Statement
Year 1 Year 2 Year 3 Year 4 Year 5 Year 6 Year 7 Year 8 Year 9 Year 10
Revenue 8,149,775 10,852,069 13,930,282 17,515,617 21,678,717 25,186,750 27,720,623 30,492,685 33,541,953 36,896,149
Cost of sales
Cost of goods sold 1 925,677 971,961 1,020,559 1,071,587 1,125,166 1,181,425 1,240,496 1,302,521 1,367,647 1,436,029
Cost of goods sold 2 - - - - - - - - - -
Operation costs 1 (direct labor) 658,845 724,730 797,202 876,923 964,615 1,061,076 1,167,184 1,283,903 1,412,293 1,553,522
Operating costs 2 (machinery maintenance) 102,800 113,080 124,388 136,827 150,509 165,560 182,116 200,328 220,361 242,397
Total cost of sales 1,687,322 1,809,771 1,942,150 2,085,337 2,240,291 2,408,062 2,589,797 2,786,751 3,000,301 3,231,948
Gross Profit 6,462,453 9,042,299 11,988,133 15,430,281 19,438,426 22,778,688 25,130,826 27,705,933 30,541,653 33,664,200
General administration & selling expenses
Administration expense 1,440,674 1,584,742 1,743,216 1,917,538 2,109,291 2,320,221 2,552,243 2,807,467 3,088,214 3,397,035
Administration benefits expense 43,220 47,542 52,296 57,526 63,279 69,607 76,567 84,224 92,646 101,911
Electricity expense 120,000 132,000 145,200 159,720 175,692 193,261 212,587 233,846 257,231 282,954
Travelling expense 28,813 31,695 34,864 38,351 42,186 46,404 51,045 56,149 61,764 67,941
Communications expense (phone, fax, mail, internet, etc.) 14,407 15,847 17,432 19,175 21,093 23,202 25,522 28,075 30,882 33,970
Office expenses (stationary, entertainment, janitorial services, etc.) 14,407 15,847 17,432 19,175 21,093 23,202 25,522 28,075 30,882 33,970
Promotional expense 81,498 108,521 139,303 175,156 216,787 251,867 277,206 304,927 335,420 368,961
Professional fees (legal, audit, consultants, etc.) 40,749 54,260 69,651 87,578 108,394 125,934 138,603 152,463 167,710 184,481
Depreciation expense 580,400 580,400 580,400 580,400 580,400 580,400 580,400 580,400 580,400 580,400
Amortization of pre-operating costs 1,093,149 1,093,149 1,093,149 1,093,149 1,093,149 1,093,149 1,093,149 1,093,149 1,093,149 1,093,149
Bad debt expense 81,498 108,521 139,303 175,156 216,787 251,867 277,206 304,927 335,420 368,961
Subtotal 3,538,815 3,772,525 4,032,248 4,322,925 4,648,151 4,979,115 5,310,052 5,673,702 6,073,717 6,513,734
Operating Income 2,923,638 5,269,774 7,955,885 11,107,356 14,790,274 17,799,573 19,820,774 22,032,231 24,467,935 27,150,466
Other income (interest on cash) 60,460 230,048 623,270 1,227,909 2,135,907 3,364,278 4,878,089 6,670,946 8,774,666 11,238,741
Earnings Before Interest & Taxes 2,984,097 5,499,821 8,579,155 12,335,265 16,926,182 21,163,850 24,698,863 28,703,177 33,242,601 38,389,207
Interest expense on long term debt (Project Loan) 2,927,403 2,786,236 2,621,090 2,427,892 2,201,878 1,937,474 1,628,158 1,266,303 842,983 347,759
Interest expense on long term debt (Working Capital Loan) 43,896 36,736 28,342 18,502 6,968 - - - - -
Subtotal 2,971,299 2,822,972 2,649,432 2,446,394 2,208,846 1,937,474 1,628,158 1,266,303 842,983 347,759
Earnings Before Tax 12,798 2,676,850 5,929,723 9,888,870 14,717,336 19,226,376 23,070,704 27,436,875 32,399,618 38,041,448
Tax - 669,212 1,482,431 2,472,218 3,679,334 4,806,594 5,767,676 6,859,219 8,099,904 9,510,362
NET PROFIT/(LOSS) AFTER TAX 12,798 2,007,637 4,447,292 7,416,653 11,038,002 14,419,782 17,303,028 20,577,656 24,299,713 28,531,086

Pre-Feasibility Study Olive Cultivation
PREF-115/December, 2011
17
10.2 PPrroojjeecctteedd CCaasshh FFllooww SSttaatteemmeenntt
Calculations SMEDA
Cash Flow Statement
Year 0 Year 1 Year 2 Year 3 Year 4 Year 5 Year 6 Year 7 Year 8 Year 9 Year 10
Operating activities
Net profit 12,798 2,007,637 4,447,292 7,416,653 11,038,002 14,419,782 17,303,028 20,577,656 24,299,713 28,531,086
Add: depreciation expense 580,400 580,400 580,400 580,400 580,400 580,400 580,400 580,400 580,400 580,400
amortization of pre-operating costs 1,093,149 1,093,149 1,093,149 1,093,149 1,093,149 1,093,149 1,093,149 1,093,149 1,093,149 1,093,149
Deferred income tax - 639,301 - - (0) (128,500) (128,500) (128,500) (128,500) (128,500)
Accounts receivable (669,845) (111,053) (237,555) (273,844) (318,429) (315,252) (248,298) (218,052) (239,233) (263,156)
Finished goods inventory (17,761) (1,123) (1,376) (1,490) (1,613) (1,734) (1,879) (2,052) (2,224) (2,413)
Equipment inventory (8,567) (1,328) (1,534) (1,771) (2,046) (2,363) (2,729) (3,152) (3,641) (4,205) 31,336
Raw material inventory (77,140) (7,907) (8,717) (9,611) (10,596) (11,682) (12,879) (14,200) (15,655) (17,260) 185,646
Accounts payable 92,336 5,492 5,859 6,256 6,683 7,144 7,642 8,181 8,764 (10,403)
Cash provided by operations (85,706) 1,081,843 4,203,552 5,876,387 8,808,482 12,384,148 15,639,381 18,588,191 21,891,486 25,590,604 30,017,147
Financing activities
Project Loan - principal repayment (831,089) (972,257) (1,137,403) (1,330,600) (1,556,614) (1,821,018) (2,130,334) (2,492,189) (2,915,509) (3,410,733)
Working Capital Loan - principal repayment (41,563) (48,724) (57,117) (66,957) (78,492) - - - - -
Additions to Project Loan 18,597,747 - - - - - - - - - -
Additions to Working Capital Loan 292,853 - - - - - - - - - -
Issuance of shares 18,890,601 - - - - - - - - - -
Purchase of (treasury) shares
Cash provided by / (used for) financing activities 37,781,201 (872,653) (1,020,980) (1,194,520) (1,397,557) (1,635,106) (1,821,018) (2,130,334) (2,492,189) (2,915,509) (3,410,733)
Investing activities
Capital expenditure (37,195,495) - - - - - - - - - -
Acquisitions
Cash (used for) / provided by investing activities (37,195,495) - - - - - - - - - -
NET CASH 500,000 209,190 3,182,571 4,681,867 7,410,924 10,749,042 13,818,362 16,457,857 19,399,297 22,675,095 26,606,413

Pre-Feasibility Study Olive Cultivation
PREF-115/December, 2011
18
10.3 PPrroojjeecctteedd BBaallaannccee SShheeeett
Calculations SMEDA
Balance Sheet
Year 0 Year 1 Year 2 Year 3 Year 4 Year 5 Year 6 Year 7 Year 8 Year 9 Year 10
Current assets
Cash & Bank 500,000 709,190 3,891,761 8,573,629 15,984,553 26,733,595 40,551,957 57,009,814 76,409,111 99,084,206 125,690,620
Accounts receivable 669,845 780,898 1,018,453 1,292,297 1,610,726 1,925,978 2,174,276 2,392,328 2,631,560 2,894,717
Finished goods inventory 17,761 18,885 20,261 21,751 23,363 25,098 26,977 29,029 31,253 33,666
Equipment spare part inventory 8,567 9,895 11,428 13,200 15,245 17,608 20,338 23,490 27,131 31,336 -
Raw material inventory 77,140 85,047 93,764 103,375 113,971 125,653 138,532 152,731 168,386 185,646 -
Total Current Assets 585,706 1,491,737 4,796,736 9,728,917 17,427,817 28,510,945 42,661,903 59,387,288 79,025,985 101,964,002 128,619,002
Fixed assets
Land 20,000,000 20,000,000 20,000,000 20,000,000 20,000,000 20,000,000 20,000,000 20,000,000 20,000,000 20,000,000 20,000,000
Building/Infrastructure 920,000 874,000 828,000 782,000 736,000 690,000 644,000 598,000 552,000 506,000 460,000
Machinery & equipment 5,140,000 4,626,000 4,112,000 3,598,000 3,084,000 2,570,000 2,056,000 1,542,000 1,028,000 514,000 -
Furniture & fixtures 85,000 76,500 68,000 59,500 51,000 42,500 34,000 25,500 17,000 8,500 -
Office vehicles - - - - - - - - - - -
Office equipment 119,000 107,100 95,200 83,300 71,400 59,500 47,600 35,700 23,800 11,900 -
Total Fixed Assets 26,264,000 25,683,600 25,103,200 24,522,800 23,942,400 23,362,000 22,781,600 22,201,200 21,620,800 21,040,400 20,460,000
Intangible assets
Pre-operation costs 10,931,495 9,838,345 8,745,196 7,652,046 6,558,897 5,465,747 4,372,598 3,279,448 2,186,299 1,093,149 -
Legal, licensing, & training costs - - - - - - - - - - -
Total Intangible Assets 10,931,495 9,838,345 8,745,196 7,652,046 6,558,897 5,465,747 4,372,598 3,279,448 2,186,299 1,093,149 -
TOTAL ASSETS 37,781,201 37,013,682 38,645,132 41,903,763 47,929,114 57,338,693 69,816,100 84,867,937 102,833,084 124,097,552 149,079,002
Current liabilities
Accounts payable 92,336 97,827 103,687 109,942 116,625 123,769 131,411 139,592 148,355 137,953
Total Current Liabilities - 92,336 97,827 103,687 109,942 116,625 123,769 131,411 139,592 148,355 137,953
Other liabilities
Deferred tax - 639,301 639,301 639,301 639,301 510,801 382,301 253,801 125,301 (3,199)
Long term debt (Project Loan) 18,597,747 17,766,658 16,794,402 15,656,999 14,326,399 12,769,784 10,948,766 8,818,432 6,326,243 3,410,733 -
Long term debt (Working Capital Loan) 292,853 251,290 202,566 145,449 78,492 - - - - - -
Total Long Term Liabilities 18,890,601 18,017,948 17,636,268 16,441,748 15,044,191 13,409,085 11,459,567 9,200,733 6,580,043 3,536,034 (3,199)
Shareholders' equity
Paid-up capital 18,890,601 18,890,601 18,890,601 18,890,601 18,890,601 18,890,601 18,890,601 18,890,601 18,890,601 18,890,601 18,890,601
Retained earnings 12,798 2,020,435 6,467,727 13,884,380 24,922,382 39,342,164 56,645,193 77,222,849 101,522,562 130,053,648
Total Equity 18,890,601 18,903,399 20,911,036 25,358,328 32,774,981 43,812,983 58,232,765 75,535,793 96,113,449 120,413,163 148,944,249
TOTAL CAPITAL AND LIABILITIES 37,781,201 37,013,682 38,645,132 41,903,763 47,929,114 57,338,693 69,816,100 84,867,937 102,833,084 124,097,552 149,079,002
Liabilities & Shareholders' Equity
Assets

Pre-Feasibility Study Olive Cultivation
PREF-115/December, 2011
19
11 KKEEYY AASSSSUUMMPPTTIIOONNSS
TTaabbllee 1111--11:: EEccoonnoommyy rreellaatteedd AAssssuummppttiioonnss
Electricity Growth Rate 10%
Wage Growth Rate 10%
Cost of Goods Sold Growth Rate 5%
Traveling Expenses 2% of Administration Expenses
Communication Expenses 1% of Administration Expenses
Office Expenses (Stationery, Entertainment, etc)
1% of Administration Expenses
Promotional Expenses 1 % of Revenue
Professional Fee (Consultant) 0.5% of Revenue
Bad Debt Expense 1% of Revenue
Administrative Benefit Expense 3% of Administration Expenses
TTaabbllee 1111--22:: CCaasshh FFllooww AAssssuummppttiioonnss
Accounts Payable cycle (in days) 30
Accounts Receivable cycle (in days) 30
Equipment Spare Part inventory (in months) 1
Raw Material Inventory (in months) 1
TTaabbllee 1111--33:: FFiinnaanncciiaall AAssssuummppttiioonnss
Project Life (years) 10
Debt Ratio 50%
Equity Ratio 50%
Interest Rate on Long Term Loan 16%
Interest Rate on Short Term Loan 16%
Debt Tenure (Years) 5
Payments in a Year for Long Term Loan 4
TTaabbllee 1111--44:: DDeepprreecciiaattiioonn AAssssuummppttiioonn
Depreciation Method Straight Line Method
Building depreciation rate 5%
Machinery & Equipment depreciation rate 10%
Office Equipment and Vehicle depreciation rate 10%
Furniture & Fixtures depreciation rate 10%

Pre-Feasibility Study Olive Cultivation
PREF-115/December, 2011
20
TTaabbllee 1111--55:: PPrree OOppeerraattiinngg CCoosstt
Particulars Year 1 Year 2 Year 3 Year 4
Admin Expenses
CEO 50,000 55,000 60,500 66,550
Farm Manager 20,000 22,000 24,200 26,620
Accountant 12,000 13,200 14,520 15,972
Labor 7,500 8,250 9,075 9,983
Total Salary at the end of 4th
year 6,655,194
Cultivation Cost
Diesel for Pump (25 liter per day x Rs. 95 diesel rate x 330 No of days to be irrigate)
783,750 822,938 864,084 907,289
Fertilizer and Sprays (Rs. 1600 per acre x 50 No. of Acres)
80,000 84,000 88,200 92,610
Repairing (Rs. 440 per acre x 50 No. of Acres)
22,000 23,100 24,255 25,468
Miscellaneous (Rs. 1,200 per acre x 50 No. of Acres)
60,000 63,000 66,150 69,458
Total Cultivation Cost Year Wise
(@ 5 % Growth) 945,750 993,038 1,042,689 1,094,825
Total Cultivation Cost at the end
of 4th
year 4,076,301
Miscellaneous Expenses for 4
years 200,000
Total Pre Operating Cost 10,931,495