SHIFTING CULTIVATION IN MANIPUR: LAND, LABOUR AND ...
23
Marchang Reimeingam* SHIFTING CULTIVATION IN MANIPUR: LAND, LABOUR AND ENVIRONMENT Journal of Rural Development, Vol. 36 No. (1) pp. 97-119 NIRD&PR, Hyderabad. ABSTRACT Shifting cultivation is the main source of livelihood system in the hill areas of Manipur, one of the north-eastern States in India. It is widely prevalent due to lack of alternative farm employment. Its inputs are crude and traditional in nature resulting in subsistence income. Shifting cultivation is labour-intensive and has a traditional character. Empirical evidence shows that rapid population growth has increased the use of forest land for shifting cultivation in Manipur. The system’s cycle has substantially declined due to population pressure on land thereby reducing the productivity. It has resulted in environmental degradation and problems of forest land re-vegetation. It has also led to a huge loss of forest resources every year. Its production is mostly organic due to sparingly use of inorganic fertilisers. Institutional changes in the form of private ownership of land have resulted in commercialisation of forest products like timber and firewood. Land use and forest laws need to be strengthened to safeguard and protect forest land. Ensuring food security and restructuring of land ownership system from community to private may reduce the practice of shifting cultivation and conserve forest cover. *Assistant Professor, Institute for Social and Economic Change, Dr. VKRV Rao Road, Nagarabhavi PO, Bengaluru – 560072 (Karnataka). Email: [email protected]. Introduction Shifting cultivation, commonly known as jhumming, is largely confined to the North Eastern Region (NER) of India (Report of Task Force on Shifting Cultivation, Ministry of Agriculture, 1983). Ministry of Agriculture (1983), as cited in the Forest Survey of India (FSI) (1987)estimated that shifting cultivation was practised in 13 States of India: extensively in Arunachal Pradesh, Assam, Manipur, Meghalaya, Mizoram, Nagaland and Tripura in the North Eastern Region and Odisha and restrictedly in Andhra Pradesh, Bihar, Kerala, Karnataka, Madhya Pradesh, Maharashtra, Sikkim and West Bengal. Shifting cultivation, an age-old agricultural system, has been a way of
-
Upload
khangminh22 -
Category
Documents
-
view
1 -
download
0
Transcript of SHIFTING CULTIVATION IN MANIPUR: LAND, LABOUR AND ...

Shifting Cultivation in Manipur: Land, Labour and Environment 97
Journal of Rural Development, Vol. 36, No. 1, January - March : 2017
Marchang Reimeingam*
SHIFTING CULTIVATION INMANIPUR: LAND, LABOURAND ENVIRONMENT
Journal of Rural Development, Vol. 36 No. (1) pp. 97-119NIRD&PR, Hyderabad.
ABSTRACT
Shifting cultivation is the main source of livelihood system in the hill areas of
Manipur, one of the north-eastern States in India. It is widely prevalent due to lack of
alternative farm employment. Its inputs are crude and traditional in nature resulting in
subsistence income. Shifting cultivation is labour-intensive and has a traditional
character. Empirical evidence shows that rapid population growth has increased the
use of forest land for shifting cultivation in Manipur. The system’s cycle has substantially
declined due to population pressure on land thereby reducing the productivity. It has
resulted in environmental degradation and problems of forest land re-vegetation. It
has also led to a huge loss of forest resources every year. Its production is mostly organic
due to sparingly use of inorganic fertilisers. Institutional changes in the form of private
ownership of land have resulted in commercialisation of forest products like timber and
firewood. Land use and forest laws need to be strengthened to safeguard and protect
forest land. Ensuring food security and restructuring of land ownership system from
community to private may reduce the practice of shifting cultivation and conserve forest
cover.
*Assistant Professor, Institute for Social and Economic Change, Dr. VKRV Rao Road, Nagarabhavi PO,Bengaluru – 560072 (Karnataka). Email: [email protected].
Introduction
Shifting cultivation, commonly known
as jhumming, is largely confined to the North
Eastern Region (NER) of India (Report of Task
Force on Shifting Cultivation, Ministry of
Agriculture, 1983). Ministry of Agriculture
(1983), as cited in the Forest Survey of India (FSI)
(1987)estimated that shifting cultivation was
practised in 13 States of India: extensively in
Arunachal Pradesh, Assam, Manipur,
Meghalaya, Mizoram, Nagaland and Tripura in
the North Eastern Region and Odisha and
restrictedly in Andhra Pradesh, Bihar, Kerala,
Karnataka, Madhya Pradesh, Maharashtra,
Sikkim and West Bengal. Shifting cultivation, an
age-old agricultural system, has been a way of
Marchang Reimeingam98
Journal of Rural Development, Vol. 36, No. 1, January - March : 2017
life for a large number of indigenous ethnic
groups. Ministry of Development of North
Eastern Region (MODONER) and North East
Council (NEC) in North Eastern Region’s Vision
2020 published in 2008 remarked that shifting
cultivation is widely practised in the hills by the
ethnic tribal people. Its practice is contentious
due to its harmful environmental costs. It is
commonly practised in the hill areas of
Manipur, one of the north-eastern States of
India. It is “operative chiefly in the regions
where more technologically advanced systems
of agriculture have not become economically
or culturally possible or in regions where the
land has not yet been appropriated by people
with greater political or cultural power”
(Sachchidananda, 1989:5). Nevertheless, it leads
to loss of forest cover causing land degradation
and deforestation that is one of the forest
issues in Manipur.
People living in hill areas of the State are
recognised as Scheduled Tribes (STs) by the
Government of India. In 2011, 36.44 per cent of
the total 2.6 million people of Manipur lived in
the five hill districts. STs comprise 35.12 per
cent of the State population.They largely
practise shifting cultivation as the permanent
terrace cultivation is limited in the foothills.
Shifting cultivation is a labour-intensive mode
of agricultural activity. It has a traditional
characteristic that is similarly stretched by
Mellor (1962) concerning traditional
agriculture where land and labour are highly
complementary to each other. Productivity is
low, multi-cropping method is adopted and
use of human labour is the main input and
labour is reciprocal in nature under the system
(Gupta, 2006). MODONER and NEC (2008) also
noted that the productivity under shifting
cultivation is low. According to FSI (2011), the
loss of forest cover was by 190 km2 during
December 2006/January 2007 to January/
February 2009 (satellite data) in Manipur. Such
loss in the forest cover is mainly because of
extensive practice of shifting cultivation (FSI,
1987, 1995, 2005, 2011 and 2013).Shifting
cultivation contributed to soil erosion,
deforestation and destabilisation of the
ecology (FSI, 1987 and MODONER and NEC,
2008). However, under it the use of chemical
fertilisers and pesticides is insignificant
(Kerkhoff and Sharma, 2006). Directorate of
Economics and Statistics (2014) data on
fertiliser usage in the hills of Manipur show an
insignificant amount, implying organic
agricultural production under shifting
cultivation. With this backdrop the present
paper1 evaluates the changing patterns of
shifting cultivation under the forest
environment and growing labour force in the
hills of Manipur. It also studies the patterns and
trends of land use, forest cover, agriculture,
forest income and agricultural productivity
with special reference to shifting cultivation in
recent times.
Methodology
The paper evaluates the changing
patterns of shifting cultivation arising due to
population growth and development linking
it with the environmental issues in the hills of
Manipur in recent decades, using secondary
data of agricultural statistics, crop estimation
Shifting Cultivation in Manipur: Land, Labour and Environment 99
Journal of Rural Development, Vol. 36, No. 1, January - March : 2017
survey and statistical abstracts published by
the Directorate of Economics and Statistics
(DES), Government of Manipur, Forest Survey
of India (FSI) and Population Census.On the
basis of the practice of shifting cultivation the
hill districts of Manipur are classified into hill
areas covering the districts of Senapati,
Tamenglong, Chandel, Churachandpur and
Ukhrul; and the valley areas consisting of the
districts of Imphal East, Imphal West, Thoubal
and Bishnupur. The study examines the status,
type and density of forest cover emphasising
on the hill areas. It assesses the contribution of
agriculture and forestry and logging, that
affects the forest cover largely by the system
of shifting cultivation, in the gross state
domestic product (at constant prices).
Moreover, the land use pattern of Manipur is
analysed in comparison with the national
pattern. Next, the system of shifting cultivation
is elaborated. It is followed by an examination
of the nature and extent of practice of shifting
cultivation by considering the area under rice
classified by types (shifting or permanent
including terrace) of cultivation particularly in
hill areas. Further, the share of combined
cultivators and agricultural labourers as
workers in agriculture is briefly analysed along
with an examination of extent of economic
participation of population measured by
Workers’ Population Ratio (WPR). Number of
shifting cultivators is being estimated based on
census data on agricultural workers due to
non-availability of data on it. The number and
size of shifting cultivators in the hills is
estimated by assuming 60 per cent of the
agricultural workers (cultivators and
agricultural labourers) as shifting cultivators
since the system is more labour-intensive than
permanent/terrace cultivation. It further,
evaluates the shifting cultivation environment
emphasising on the cycle, fertility and
productivity of shifting cultivation. The overall
agricultural production and yield of Manipur
is being examined; later the hill specific
agricultural production and yield is analysed
in order to assess the difference in productivity
in the hills where shifting cultivation is
predominant and use of chemical fertilisers is
insignificant and the valley that is predominant
by stable wet land cultivation using improved
seeds and chemical fertilisers.
Land and Forest
About 90 per cent of the total
geographical area of Manipur (22327 km2) is
located in the hill districts and the rest is in the
valleys. Forest cover shows a gradual
improvement in the State from below 17,000
to over 17,000 km2 from 2001 to 2011 despite
wide practice of shifting cultivation in the hills.
In 2013, the FSI recorded a decline in the forest
area by about 100km2 from the previous record.
Moreover, the area of forest cover in the hills,
in particular, remains almost unchanged over
the recent years. Almost all (98 per cent) forest
cover in Manipur is concentrated in the hills.
In terms of the share of forest cover in
geographical areas of the State, Manipur
ranked 7th among the Indian States and UTs
(FSI, 2013). The forest cover is slightly more than
three-fourths of the total geographical area of
Marchang Reimeingam100
Journal of Rural Development, Vol. 36, No. 1, January - March : 2017
Manipur. The hills of Manipur (20089 km2) are
mostly covered by forest with a whopping
share of about 83 per cent in 2013. Forest cover
in the hills hovers at this proportion due to an
extension of human settlement,
developmental activities like road or dam
construction besides the practice of shifting
cultivation affecting the land rejuvenation and
re-vegetation process. In the valleys, forest
cover stood at about 16 per cent of the entire
geographical area of 2238 km2.
FSI (2005) defined ‘reserved forest’ as ‘an
area so constituted under the provision of the
Indian Forest Act or other State Forest Acts
having full degree of protection’. In reserved
forests all activities are prohibited unless
permitted. Protected forest is an area notified
under the provisions of the Indian Forest Act
or other State Forest Acts having limited
degree of protection. In protected forest all
activities are permitted unless prohibited. The
State’s forest is mostly unclassified type of
forest with a share of close to 68 per cent of
the total forest area. The State’s total forest area
was 15154 km2 in 1991. Out of which about 10,
27 and 63 per cent were categorised as
reserved, protected and unclassified forest,
respectively. It has increased to 17418 km2in
2001 and remains unchanged till 2013.
Reserved and protected forests’ share has
declined to 8 and 24 per cent, respectively;
however, unclassified forest share grew to 68
per cent in 2013. Data of reserved, protected
or unclassified forests figures remains
unchanged from 2001 till 2013 which raises a
serious question about its authenticity for data
users. Nevertheless, the protected forest forms
the second largest type of forest with close to
one quarter of the entire forest area. The
decline of reserved forest is due to land
encroachment (Hueiyen News Service, 2011).
Same reason could explain the declining share
of protected forest. With an increase of
population the protected forest that is not well
defined and safeguarded is being cleared for
human settlement (example: house
construction) thereby reducing the protected
forest area.
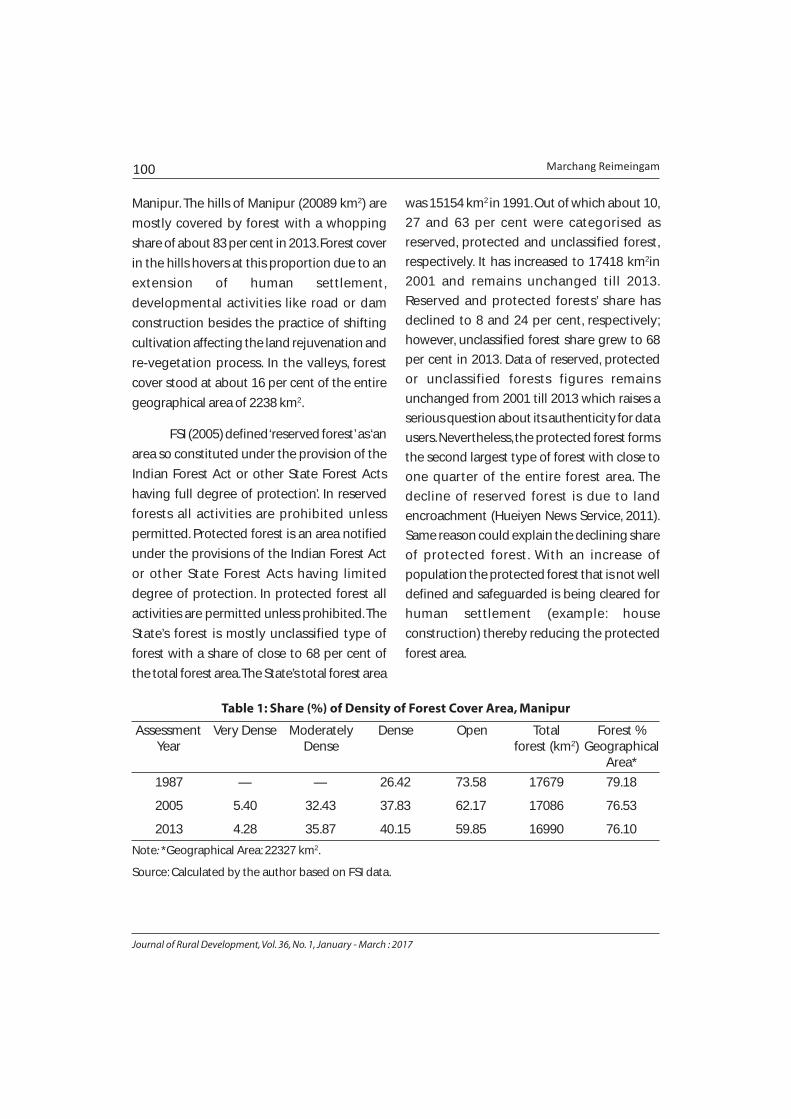
Table 1: Share (%) of Density of Forest Cover Area, Manipur
Assessment Very Dense Moderately Dense Open Total Forest %Year Dense forest (km2) Geographical
Area*
1987 — — 26.42 73.58 17679 79.18
2005 5.40 32.43 37.83 62.17 17086 76.53
2013 4.28 35.87 40.15 59.85 16990 76.10
Note: *Geographical Area: 22327 km2.
Source: Calculated by the author based on FSI data.

Shifting Cultivation in Manipur: Land, Labour and Environment 101
Journal of Rural Development, Vol. 36, No. 1, January - March : 2017
Prior to 2005, the dense forest was not
subdivided into very or moderately dense. FSI
(1987) defined dense forest as all lands covered
with tree of crown density >40 per cent and
open as crown density between 10 and 40 per
cent. Both classifications were used up to 2001.
In addition, scrub is also defined as crown
density <10 per cent. However, FSI (2013)
similar to FSI (2005) classified forest into very
dense forest i.e., all lands with tree canopy
density of >70 per cent, moderately dense
forest i.e. canopy density between 40 to 70 per
cent and open forest i.e., canopy density
between 10 and 40 per cent. Besides these a
scrub was classified as a degraded forest land
of canopy density <10 per cent. Canopy density
is the percentage area of land covered by the
canopy, i.e. cover of branches and foliage
formed by the crowns of trees.
The conditions of forest keep on
changing due to human intervention. The share
of dense forest including very dense and
moderately dense forests is always lesser than
the open forest. However, the share of dense
forest has increased due to the improvement
i.e., re-vegetation and afforestation in the open
forest. In 1987, just about a quarter of the forest
was classified as dense forest and the rest three
quarters were in the form of open forest
(Table1). After more than two decades in 2013
the share of dense forest has substantially
increased to about 40 per cent. The definition
for dense forest remains the same in all the
years of assessment. The increase of dense
forest is largely contributed by the moderately
dense forest. The share (and also absolute) of a
very dense forest has declined by slightly more
than one percentage point in 2013 (4.28 per
cent) from 2005 (5.40 per cent). This is largely
due to the practice of shifting cultivation
especially in the hill areas of Manipur. The
degradation of dense forest is due to the
practice of shifting cultivation (IBCN,2011).
Overall, the size of forest area has gradually
declined; as a result, the share of forest cover
in the total geographical area has also declined
over the years. The decrease in forest cover is
due to shifting cultivation practices besides
harvesting of short rotational plantations,
clearances in encroached areas, biotic
pressures, developmental activities and so on
and so forth (FSI, 2013). Specific reasons of
decrease in the forest cover in Manipur are
practice of shifting cultivation and biotic
pressure in major parts of the State (FSI, 2013).
However, Sastry et al., (2007:28) pointed out
that in Manipur like in other north-eastern
States “there is no simple relationship between
shifting cultivation and forest loss, implying
dynamic changes in forest cover due to
interacting effects of various factors”.
Table 2 shows the share of density of
forest cover in the hills and valleys of Manipur.
The forest cover in the hills was improving
during 2001-2005, however, thereafter it
declined. The improvement was due to
conservation measures such as afforestation
activities and participation of locals for better
protection measures in plantation and
traditional forest areas,etc (FSI, 2013). The
combined share of very and moderately dense
forest area has increased. However, the share

Marchang Reimeingam102
Journal of Rural Development, Vol. 36, No. 1, January - March : 2017
of very dense forest, which is recorded only in
the hills, has declined due to shifting
cultivation, practised only in hill areas. In the
valleys, the share of dense forest is dwindling
resulting in rise of open forest over the recent
years. Loss of forest is a major environmental
concern in the State irrespective of whether
degradation or deforestation is mostly taking
place in the hills or valleys. Deforestation and
degradation of land and forest management
challenges such as indigenous people enjoying
their traditional or customary rights/privileges
on land, lack of institutional support to
communities, etc., are major issues of forest in
Manipur (Sastry et al.,2007). Moreover,
deforestation is caused by expansion of
residential area, forest conversion for
permanent pasture and agriculture, intensive
shifting cultivation, infrastructure expansion,
etc., and forest degradation due to selective
logging, shifting cultivation, mining,
deterioration of regeneration processes, etc.
Table 2: Share (%) of Density of Forest Cover Area in Hills and Valleys, Manipur
Forest type Hills Valleys Manipur
2001 2005 2013 2001 2005 2013 2001 2005 2013
Very dense (a) — 5.51 4.38 — — — — 5.40 4.28
Moderately dense (b) — 32.50 36.13 — 28.82 23.36 — 32.43 35.87
Dense (a + b) 33.86 38.02 40.51 24.79 28.82 23.36 33.74 37.83 40.15
Open 66.14 61.98 59.49 75.21 71.18 76.64 66.26 62.17 59.85
Total forest (km2) 16688 16746 16639 238 340 351 16926 17086 16990
Note: Prior to 2005, the dense forest was not sub-divided into very or moderately dense. — Data not available.
Source: Calculated by the author based on FSI data.
Forest exploitation for shifting
cultivation and other forest products is
significant in the State. Majority (71 per cent)
of the forest products were from timber (teak
and others), firewood, charcoal and post and
pole and the rest (29 per cent) was from minor
forest products such as cane, stone, sand,
bamboo, etc., in the total forest production
value of `13.53 million in 2007-08 (DES,
2014).As per the CSO (2013),forestry and
logging contribution to Gross State Domestic
Product (GSDP) was `49.3 million in 1980-81
(at 1980-81 prices) that increased to `1907.9
million in 2012-13 (at 2004-05 prices). It
constituted 2.26 per cent of the GSDP in 1980-
81; however, in 2012-13, with a slight
improvement, it contributed to 2.36 per cent
of GSDP. Moreover, contribution of agriculture
to GSDP has substantially declined, particularly
due to improvement in industrial sector, to
about 22 per cent in 2012-13 from 43 per cent
in 1980-81.

Shifting Cultivation in Manipur: Land, Labour and Environment 103
Journal of Rural Development, Vol. 36, No. 1, January - March : 2017
Land Use Pattern
In Manipur, land use is administered
through the Manipur Land Revenue and Land
Reforms Act, 1960. The Act is applicable in the
entire State of Manipur except the hill areas
(MLR & LR Act 1960). Land in the hills of Manipur
is owned by the community; however, private/
individual land ownership also prevails in
certain areas. Usually land is owned by the
community through the shifting cultivators;
however, gradually private ownership of land
has emerged (Maithani, 2005). Sachchidananda
(1989:37) wrote that “in most of the hill areas
of north-east India, land is owned by the
community as a whole. Individual ownership
of land recognised in certain areas is usually
confined to homestead and settled farm land”.
Land ownership system differs across ethnic
groups and villages in the State. Some ethnic
groups or villages follow community, clan or
kinship and private or individual land
ownership systems. Private land is owned by
an individual for housing, permanent
cultivation, farming, etc. Community lands are
controlled and managed by the villagers as a
whole. Community land ownership system
could partially be hindering development,
investment and adoption of modern
technology in shifting cultivation system.
Further, lands of tribal people cannot be sold
to the non-tribal people. In Manipur,
agricultural land is used for various reasons
including shifting, terrace and permanent
cultivation.DES (2014) ascertained that
permanent cultivation is mostly practised in
the valley, whereas shifting and terrace
cultivation is generally practised in the hills.
Forest areas are also clear for temporary land
use such as plantations and permanent land
use like construction of road or terrace farming.
The land classified for different uses in Manipur
vis-à-vis India is presented in Table 3. Over 90
per cent of the entire geographical area of land
is reported for land utilisation in the State as
well as in the country. Out of the total reporting
land for utilisation, over 80 per cent is forest
land in Manipur against only 23 per cent for
India and the remaining is distributed for
various other land use classifications. Out of the
total reporting area for land utilisation, about
11 per cent was under net area shown in 1996-
97 in Manipur. It remains at the same level till
2009-10; however, in 2010-11, it has increased
to slightly over 16 per cent, that has reduced
the forest area. It indicates that land use pattern
is not uniformly distributed across the years. In
other words, a change in the forest area is
occasionally due to intensity of shifting
cultivation. In India, the net area remains high
at about 46 per cent. A comparison of the share
of net area sown between the State and the
country highlights that there is scope to extend
agriculture or agricultural land in the State.
In Manipur, lands under permanent
pasture and other grazing, lands under
miscellaneous tree crops and groves, cultivable
wasteland, current fallow lands and fallow lands
other than current fallows constituted less than
one per cent of the entire reporting land for
utilisation. Moreover, about one per cent of the
reporting land is not available for cultivation.
On the contrary, at the country level these lands
Marchang Reimeingam104
Journal of Rural Development, Vol. 36, No. 1, January - March : 2017
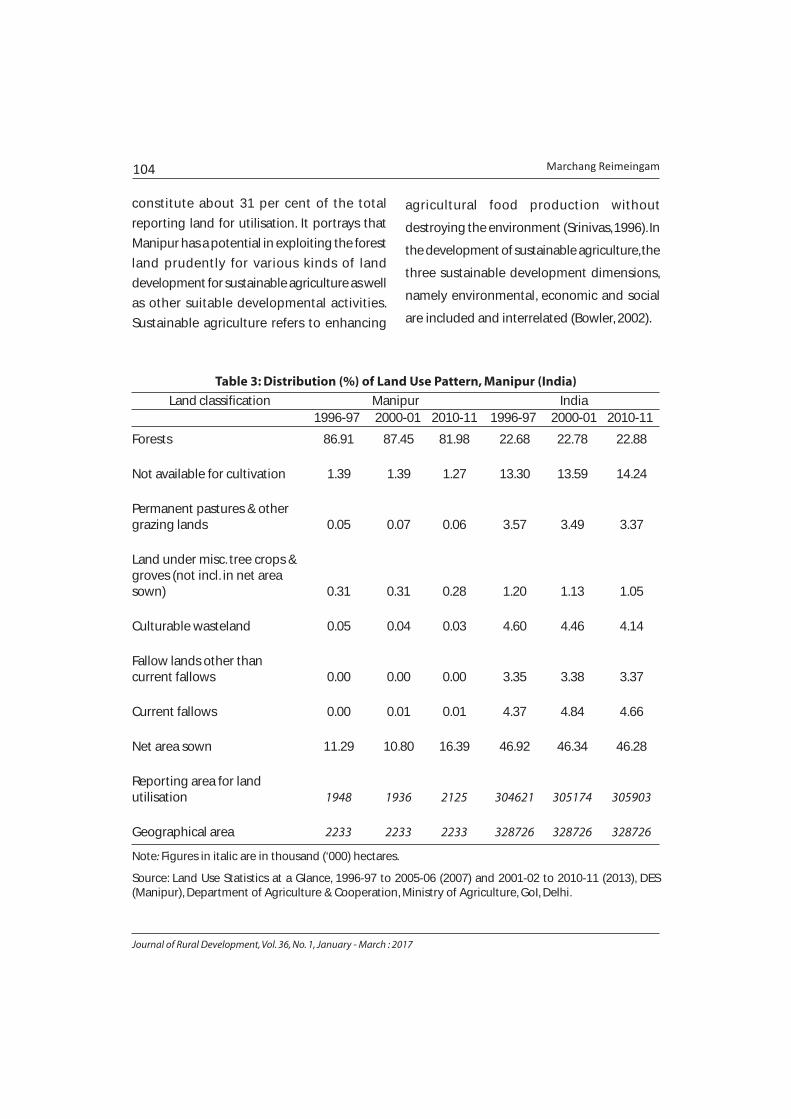
constitute about 31 per cent of the total
reporting land for utilisation. It portrays that
Manipur has a potential in exploiting the forest
land prudently for various kinds of land
development for sustainable agriculture as well
as other suitable developmental activities.
Sustainable agriculture refers to enhancing
agricultural food production without
destroying the environment (Srinivas, 1996). In
the development of sustainable agriculture, the
three sustainable development dimensions,
namely environmental, economic and social
are included and interrelated (Bowler, 2002).
Table 3: Distribution (%) of Land Use Pattern, Manipur (India)
Land classification Manipur India1996-97 2000-01 2010-11 1996-97 2000-01 2010-11
Forests 86.91 87.45 81.98 22.68 22.78 22.88
Not available for cultivation 1.39 1.39 1.27 13.30 13.59 14.24
Permanent pastures & othergrazing lands 0.05 0.07 0.06 3.57 3.49 3.37
Land under misc. tree crops &groves (not incl. in net areasown) 0.31 0.31 0.28 1.20 1.13 1.05
Culturable wasteland 0.05 0.04 0.03 4.60 4.46 4.14
Fallow lands other thancurrent fallows 0.00 0.00 0.00 3.35 3.38 3.37
Current fallows 0.00 0.01 0.01 4.37 4.84 4.66
Net area sown 11.29 10.80 16.39 46.92 46.34 46.28
Reporting area for landutilisation 1948 1936 2125 304621 305174 305903
Geographical area 2233 2233 2233 328726 328726 328726
Note: Figures in italic are in thousand (‘000) hectares.
Source: Land Use Statistics at a Glance, 1996-97 to 2005-06 (2007) and 2001-02 to 2010-11 (2013), DES(Manipur), Department of Agriculture & Cooperation, Ministry of Agriculture, GoI, Delhi.
Shifting Cultivation in Manipur: Land, Labour and Environment 105
Journal of Rural Development, Vol. 36, No. 1, January - March : 2017
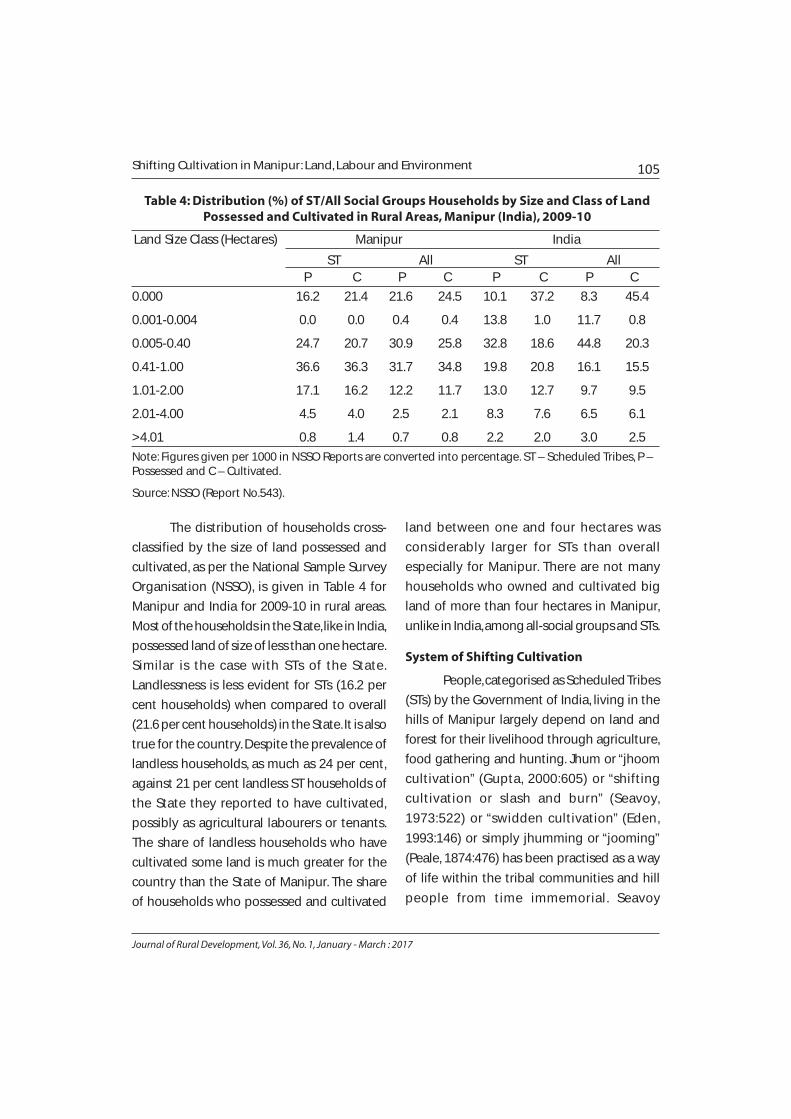
Table 4: Distribution (%) of ST/All Social Groups Households by Size and Class of LandPossessed and Cultivated in Rural Areas, Manipur (India), 2009-10
The distribution of households cross-
classified by the size of land possessed and
cultivated, as per the National Sample Survey
Organisation (NSSO), is given in Table 4 for
Manipur and India for 2009-10 in rural areas.
Most of the households in the State, like in India,
possessed land of size of less than one hectare.
Similar is the case with STs of the State.
Landlessness is less evident for STs (16.2 per
cent households) when compared to overall
(21.6 per cent households) in the State. It is also
true for the country. Despite the prevalence of
landless households, as much as 24 per cent,
against 21 per cent landless ST households of
the State they reported to have cultivated,
possibly as agricultural labourers or tenants.
The share of landless households who have
cultivated some land is much greater for the
country than the State of Manipur. The share
of households who possessed and cultivated
land between one and four hectares was
considerably larger for STs than overall
especially for Manipur. There are not many
households who owned and cultivated big
land of more than four hectares in Manipur,
unlike in India, among all-social groups and STs.
System of Shifting Cultivation
People, categorised as Scheduled Tribes
(STs) by the Government of India, living in the
hills of Manipur largely depend on land and
forest for their livelihood through agriculture,
food gathering and hunting. Jhum or “jhoom
cultivation” (Gupta, 2000:605) or “shifting
cultivation or slash and burn” (Seavoy,
1973:522) or “swidden cultivation” (Eden,
1993:146) or simply jhumming or “jooming”
(Peale, 1874:476) has been practised as a way
of life within the tribal communities and hill
people from time immemorial. Seavoy
Land Size Class (Hectares) Manipur India
ST All ST AllP C P C P C P C
0.000 16.2 21.4 21.6 24.5 10.1 37.2 8.3 45.4
0.001-0.004 0.0 0.0 0.4 0.4 13.8 1.0 11.7 0.8
0.005-0.40 24.7 20.7 30.9 25.8 32.8 18.6 44.8 20.3
0.41-1.00 36.6 36.3 31.7 34.8 19.8 20.8 16.1 15.5
1.01-2.00 17.1 16.2 12.2 11.7 13.0 12.7 9.7 9.5
2.01-4.00 4.5 4.0 2.5 2.1 8.3 7.6 6.5 6.1
>4.01 0.8 1.4 0.7 0.8 2.2 2.0 3.0 2.5
Note: Figures given per 1000 in NSSO Reports are converted into percentage. ST – Scheduled Tribes, P –Possessed and C – Cultivated.
Source: NSSO (Report No.543).
Marchang Reimeingam106
Journal of Rural Development, Vol. 36, No. 1, January - March : 2017
(1973:522) defined shifting cultivation as
“clearing a patch of forest by felling and
burning trees and then cultivating this land for
one or more years before abandoning it in
favour of other patches”. After cropping each
patch is allowed to revert to secondary growth
for a number of years before it is re-cleared and
re-cultivated. The shifting cultivation system,
according to Payn (1892), as quoted in Hodson
(1911:15) cited in Shimray (2004:1699) is the
“primitive mode of agriculture all over the
world and widely practiced, even yet, where
virgin forest land is abundant, for in such
circumstances it is the most economical
method, because it produces the largest net
return.” Ninan (1992) noted that shifting
cultivation is an agricultural system which is
characterised by a rotation of field rather than
of crops, by short period of cropping
alternating with long fallow periods and by
clearing by means of slash and burn. Burning
under shifting cultivation reduces labour input
for physical clearance, produces ash for
valuable fertilisers, leaching effect increases the
availability of soil nutrients to plants and may
kill fungal diseases and noxious insects
(Forestry Department, 1985). The ashes
produced from burning were used as manures
(DES, 2007). The “system of cultivation is mainly
by what is called jooming [jhumming] where
forest trees are felled and the site used for two
years only, when, in consequence of the growth
of rank weeds, fresh forest is again joomed
[jhumed], and a system of permanent culture
of one spot is impossible” (Peale, 1874:476-477).
It is both a labour-intensive and land-extensive
process of cultivation. Shifting cultivation
occupies a distinct place in the tribal economy
and constitutes a vital part of the lifestyle and
socio-economic set-up of hill and tribal regions.
Spencer (1966) as cited in Thomas (1968)
regards shifting cultivation as one form of
tropical agriculture and brings together data
derived from many different approaches: area,
commodity, economy, culture, technology,
history, and government. “Policymakers,
governments and analysts have often assumed
that shifting cultivation is universally
unsustainable and destructive of forests and
wildlife”(Kerkhoff and Sharma, 2006:6).
Moreover, they have failed to recognise the
varied land use types involved in it and also
failed to understand the cultural knowledge of
the shifting cultivators in particular and
indigenous people in general.
Practice of Shifting Cultivation
Shifting cultivation takes place in an
earmarked forest area for cultivation and then
the forest is cleared by slashing trees, etc., using
traditional tools, then slashed trees are dried
and subsequently burnt to enhance soil fertility.
It uses traditional and unscientific tools like
dagger, sword, axe, hoe, digging, sickle, etc.
Earlier, the fallow period between the two
shifting cultivation cycles was considerable, for
regeneration of vegetations and soil fertility,
which has reduced significantly due to the
population pressure. The system is practised
among the indigenous people. Roy, Xavier and
William (2012) noted that ILO Convention
No.169 Article No.14 specifically recognised the
rights of ownership and possession of the
Shifting Cultivation in Manipur: Land, Labour and Environment 107
Journal of Rural Development, Vol. 36, No. 1, January - March : 2017
people concerned over the lands which they
traditionally occupy including the rights of
shifting cultivators. Further, ILO Convention
No.107 safeguards land and resource rights of
the indigenous people. ILO Convention No.111
guaranteed that shifting cultivators may
exercise the right to practise a traditional
occupation. Moreover, the United Nations
Declaration on the Rights of Indigenous People
recognises several rights for the communities
practising shifting cultivation.
In Manipur, shifting cultivation is
prominently practised by the ethnic groups of
Nagas, Kukis, Mizos, Zhomis, etc. Few STs also
practise terrace cultivation on the slope of the
hills. Under the system a land is usually tilled
for one year and then allowed to lie fallow for
some seven to ten years. The same land is tilled
for two or three years. At present under the
system land is tilled for a year due to decline in
fertility of soil, then keep it fallow for some
years. For example in Nagaland, jhum fields are
deserted after the first year mainly due to
labour constraints and / or decline in soil
fertility (Jamir and Lianchawii, 2013). The years
of keeping fallow land depend on variation on
population pressure in different areas. The
“Kukis removed their villages to fresh sites
when the land was used, but the Nagas, who
showed great attachment to their village sites,
would proceed to great distances to cultivate,
notwithstanding the labour of carrying back
their harvests” (Godden, 1898:7). Nagas burn
their field and grow rice, millets, corns, taro
potatos and so on. Some fields are terrace-
styled for growing rice and taros. “Naga
cultivation is said to have included rice, pea,
several varieties of small grain, Indian corn,
yams, chillies, ginger, garlic, pumpkins and
other vegetables, and cotton; gardens with
sugarcane, almonds and wild raspberries are
mentioned for North Kachar” (Godden,
1898:10). Shakespear (1909:371-372) observed
that “(Kuki) clans practice jhum cultivation, that
is, they fell a piece of jungle and when
sufficiently dry, burn it and then dibble in the
seed, and seldom cultivate the same piece of
land for more than two years in succession.”
Shimray (2004) has remarked that some
Nagas such as Tangkhul, Mao, Zeliangrong and
Maring practise both shifting cultivation as well
as sedentary terraced cultivation. A large
proportion of Naga population is engaged in
shifting cultivation. Ramakrishnan (1980) as
cited in Shimray (2004) points out that shifting
cultivation constituted the earliest form of
agriculture and provided the basic needs of
man. It also placed him in harmony with nature,
of which he was an integral part and on which
was dependent for survival.Shifting cultivation
is deeply rooted and linked with indigenous
ethnic culture (MEF and GBPIHED, 2009).
Terraced cultivation is also practised in Naga
society but it is confined to the lower gradient
of the mountain ranges and to narrow river
banks and valleys.
In Manipur, 1.13 per cent of the total
geographical area (22327 km2) was under
shifting cultivation, cultivating rice in 1992-93
that has increased to 1.78 per cent in 2000-01
that further increased to 2.04 per cent in 2005-

Marchang Reimeingam108
Journal of Rural Development, Vol. 36, No. 1, January - March : 2017
06. Specifically, 1.26, 1.98 and 2.27 per cent of
the total hill areas (20089 km2) was under
shifting cultivation in the respective years. It
clearly shows an ever-increasing practice of
shifting cultivation. This trend is caused by
population growth coupled with
underdevelopment in the hills. Non-availability
of suitable employment in non-agricultural
sector for the unemployed living in the hills is
forcing them to engage in farm activity in the
predominant system of shifting cultivation.
Non-agricultural employment is mostly
available and concentrated in the urban
centres. Specifically formal non-farm jobs are
concentrated in the valley areas in Manipur. It
implies that shifting cultivation can be reduced
by generating and delivering non-farm jobs in
construction, transportation, services, etc., in
the hill areas. Mellor (1962) mentioned that lack
of non-farm employment opportunities keeps
the rural labour in agriculture.
Rice is the staple food both in the hills
and the valleys of Manipur. Rice continues to
dominate acreage of all the crops in the State
(DES, 2014). Rice is mainly cultivated under the
system of permanent, terrace and jhum
(shifting) cultivations. Table 5 gives a share of
area under rice by type of cultivation in the
State. The State records only 17 per cent under
shifting cultivation and the rest under
permanent including terrace cultivation in the
total cultivated area in 1992-93. The share of
area under shifting cultivation has increased to
about 27 per cent in 2005-06. It implies that
increasingly more forest land is brought under
shifting cultivation. This is due to the rapid
population growth and pressure on land. The
population density, according to Census of
India, in the State has increased dramatically
from 82 in 1991 to 115 in 2011. Population
pressure has induced extension of agricultural
land. Area under rice has increased by about 15
thousand hectares, due to increase of land for
shifting cultivation, from 1992-93 to 2005-06.
Table 5: Share (%) of Area under Rice by Type of Cultivation, Manipur
In the hill areas, people are largely
depending on cultivation for their livelihood.
Cultivated area has increased by close to 20,000
hectares from the early 1990s to the mid-2000s.
Shifting cultivation is practised only in the hills,
as there is no data record of it in the valleys.
Presently, it formed most of the rice cultivation
in the hills. In 1992-93,shifting cultivation
accounted for about 40 per cent of the 64000
hectares of cultivated land. Later in 2005-06,
Year Hills Valleys Manipur
Perma- Jhum Total Perma- Jhum Total Perma- Jhum Totalnent* (‘000 He- nent* (‘000 He- nent* (‘000 He-
ctares) ctares) ctares)
1992-93 60.44 39.56 63.80 100.00 - 87.39 83.31 16.69 151.19
2005-06 44.84 55.16 82.67 100.00 - 83.59 72.57 27.43 166.26
Note: - Not available. *includes terrace cultivation.
Source: Statistical Abstract of Manipur (2001 and 2007), DES, Government of Manipur.
Shifting Cultivation in Manipur: Land, Labour and Environment 109
Journal of Rural Development, Vol. 36, No. 1, January - March : 2017
about 55 per cent of rice cultivated land is
under it. Permanent and terrace cultivation
occupies and plays an important role in rice
cultivation in the hills. However, due to
difficulties arising from financial and
technological constraints and irrigational
problems in establishing, it has forced the
growing population into shifting cultivation. In
the hills, permanent and terrace cultivation
areas in absolute figures declined marginally
by about 2000 hectares from about 39000
hectares in 1992-93 to about 37000 hectares
in 2005-06. However, shifting cultivation has
contributed to a major change in cultivation.
Area under shifting cultivation has almost
doubled in 2005-06 (about 45000 hectares)
from 1992-93 (about 25000 hectares). This has
a serious implication on land and environment
in the State specifically in the hill areas
requiring the attention of policy makers to
make shifting cultivation sustainable.
Labour in Shifting Cultivation
In an economy with a labour surplus due
to population booming and a scarce capital
there is a greater tendency of labour
absorption in agriculture in general and
shifting cultivation in particular in the hill areas.
Bhattacharya and Nanda (2005) mentioned
that all works in shifting cultivation are
performed by the manual labour without using
plough or animal power. Moreover, family
labour is the main source of labour supply in it.
Frequently labour are pooled together among
the cultivators from other households on
reciprocal basis to perform a huge work, by
engaging large number of workers,that needs
to be completed in a day like harvesting.
Similarly, Sachchidananda (1989) pointed out
that human labour is mainly operative and
labour patterns are frequently cooperative in
shifting cultivation. Further, he wrote that 73.5
per cent of the tribal population of Manipur
were shifting cultivators. In Manipur, labour
under shifting cultivation is mainly used in
underbrushing, felling, burning, secondary
clearing, dibbling (i.e. planting with a tool),
sowing, hand weeding, spraying weeds,
harvesting, transporting, threshing, winnowing,
drying and harvesting. Secondary crop labour
is also used for construction of hut (farm house)
or farmstead and wooden fencing and for farm
guarding from potential attack of wild animals
and birds. The use of labour in the State under
shifting cultivation is similar with the labour
used for the hill shifting cultivation in Malaysia
described by Cramb (1988). In Malaysia, the
average labour input per hectare from
underbrushing, felling to harvesting of
secondary crops and miscellaneous activities
(including visiting farm) is 209 days per hectare
(Cramb,1988). Similar number of labour days is
expected to prevail for Manipur since the
labour requirement in shifting cultivation is
intensive.
In Manipur, more than half of the
population (excluding 0-6 years of age)
participated in economic activities, measured
by workers’ population ratio (WPR), in recent
years ( Table 6). The rate of economic
participation was greater in the hills by few
percentage points than in the valleys. In the
Marchang Reimeingam110
Journal of Rural Development, Vol. 36, No. 1, January - March : 2017
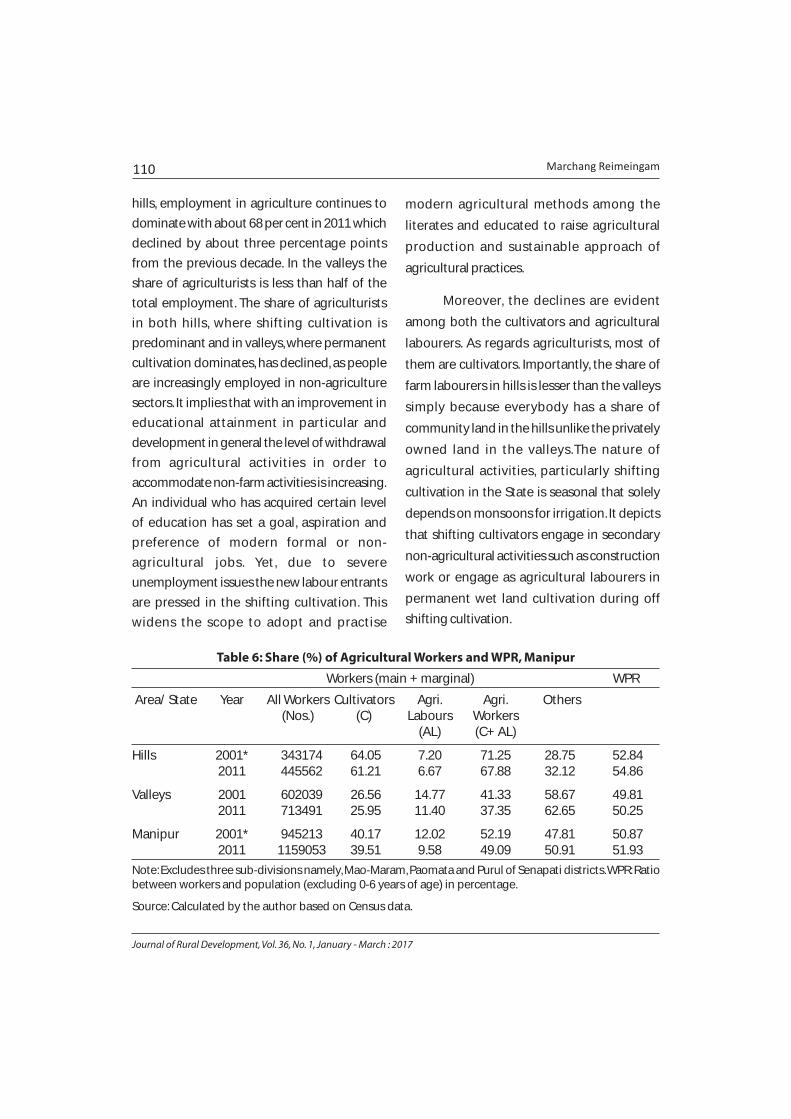
hills, employment in agriculture continues to
dominate with about 68 per cent in 2011 which
declined by about three percentage points
from the previous decade. In the valleys the
share of agriculturists is less than half of the
total employment. The share of agriculturists
in both hills, where shifting cultivation is
predominant and in valleys, where permanent
cultivation dominates, has declined, as people
are increasingly employed in non-agriculture
sectors. It implies that with an improvement in
educational attainment in particular and
development in general the level of withdrawal
from agricultural activities in order to
accommodate non-farm activities is increasing.
An individual who has acquired certain level
of education has set a goal, aspiration and
preference of modern formal or non-
agricultural jobs. Yet, due to severe
unemployment issues the new labour entrants
are pressed in the shifting cultivation. This
widens the scope to adopt and practise
modern agricultural methods among the
literates and educated to raise agricultural
production and sustainable approach of
agricultural practices.
Moreover, the declines are evident
among both the cultivators and agricultural
labourers. As regards agriculturists, most of
them are cultivators. Importantly, the share of
farm labourers in hills is lesser than the valleys
simply because everybody has a share of
community land in the hills unlike the privately
owned land in the valleys.The nature of
agricultural activities, particularly shifting
cultivation in the State is seasonal that solely
depends on monsoons for irrigation. It depicts
that shifting cultivators engage in secondary
non-agricultural activities such as construction
work or engage as agricultural labourers in
permanent wet land cultivation during off
shifting cultivation.
Table 6: Share (%) of Agricultural Workers and WPR, Manipur
Workers (main + marginal) WPR
Area/ State Year All Workers Cultivators Agri. Agri. Others(Nos.) (C) Labours Workers
(AL) (C+ AL)
Hills 2001* 343174 64.05 7.20 71.25 28.75 52.842011 445562 61.21 6.67 67.88 32.12 54.86
Valleys 2001 602039 26.56 14.77 41.33 58.67 49.812011 713491 25.95 11.40 37.35 62.65 50.25
Manipur 2001* 945213 40.17 12.02 52.19 47.81 50.872011 1159053 39.51 9.58 49.09 50.91 51.93
Note: Excludes three sub-divisions namely, Mao-Maram, Paomata and Purul of Senapati districts. WPR: Ratiobetween workers and population (excluding 0-6 years of age) in percentage.
Source: Calculated by the author based on Census data.
Shifting Cultivation in Manipur: Land, Labour and Environment 111
Journal of Rural Development, Vol. 36, No. 1, January - March : 2017
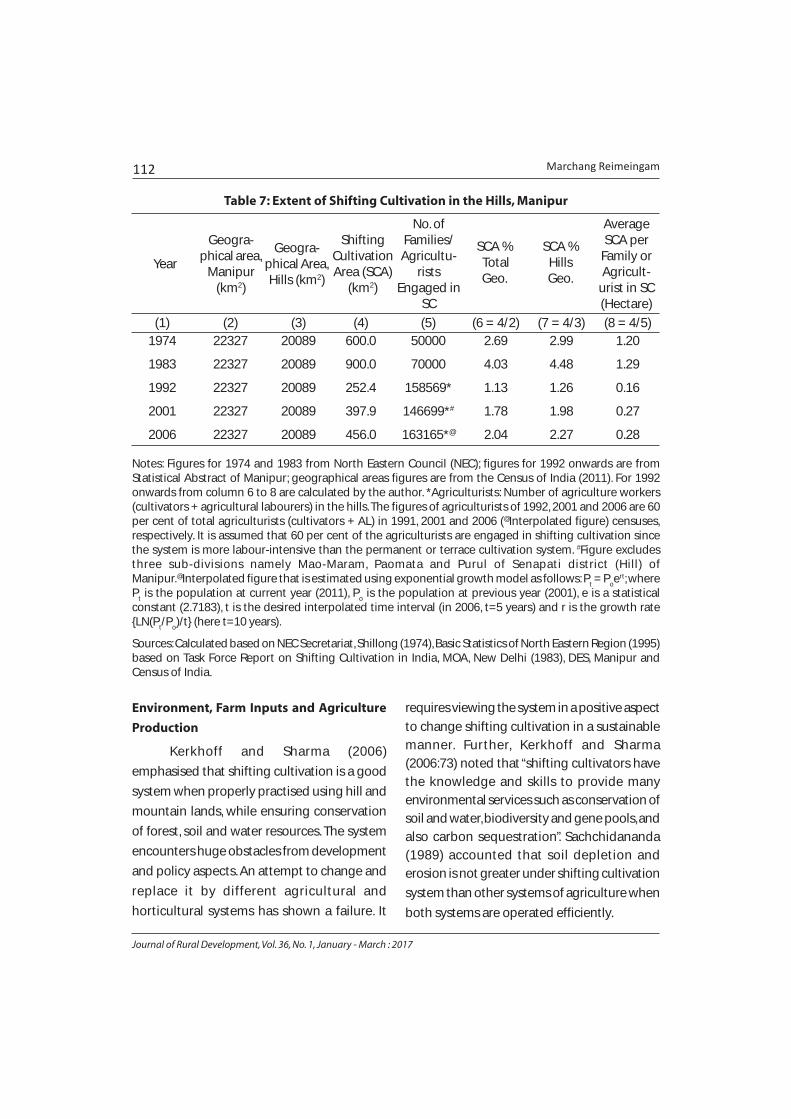
A large number of people continue to
engage in shifting cultivation in the hills of
Manipur (Table 7). It is ever-increasing due to
population growth and without sufficient
employment alternatives.There are no clear
and exact records on shifting cultivators.
Limited estimates are available which require
validation. Nevertheless, there are some
estimates on shifting cultivators. For instance,
NEC (1974) estimated that about 50000
families were shifting cultivators in Manipur.
Later in 1983, the Task Force Report on Shifting
Cultivation in India estimated 70000 shifting
cultivators in the State. Furthermore, using
census data and assuming that 60 per cent of
the agriculturists (cultivators plus agricultural
labourers) were engaged in shifting cultivation
where labour was intensive in nature gives a
huge size of close to 0.158 million shifting
cultivators in the hill districts of Manipur in
1991. In the following decade in 2001, the
number of persons working under shifting
cultivation has reduced to 0.147 million
partially due to the exclusion of three sub-
divisions of Senapati district located in the hill
area of the State. Later in 2006, the number of
shifting cultivators rose marginally to 0.163
million. Similar estimates show that 0.181
million workers were engaged as shifting
cultivators in the hills of the State in 2011.
Overall, the size of shifting cultivators has
systematically increased due to rapid
population growth and lack of adequate job
opportunities outside agriculture. In recent
decades, the growth of population in the State
has been moderately slowing down as the level
of literacy has improved, birth and death rates
have declined, living cost has become dearer,
etc. The rate of literacy in the State has
improved substantially from about 5 per cent
in 1941 in the period of pre-merger with the
Indian Union to about 11 per cent in 1951 just
after the princely Manipur kingdom merged
with the Indian Union in 1949. At present,
Manipur has attained over 79 per cent literacy
rate. Education has mainly contributed in
reducing population growth as people are
better informed, more knowledgeable, more
responsible or sensible for economic
implications specifically employment. Despite
of it, large portion of rural labour is depending
on farm activities more specifically shifting
cultivation in the hill areas of the State.
The shifting cultivators cultivated 2.04
per cent of the total geographical area of
Manipur in 2006. More precisely, 2.27 per cent
of the hill areas were under shifting cultivation
in the same year that increased from 1.26 per
cent in 1992. Concurrently, the number of
shifting cultivators also increased. This does not
reduce the per capita availability of land area
under shifting cultivation. For instance, the
average per family land availability rose from
1.20 hectares in 1974 to 1.29 hectares in 1983
(data relatively comparable). Similarly, the per
capita availability of land rose from 0.16 hectare
in 1992 to 0.28 hectare in 2006. It implies that
when the fertility of land has declined, each
cultivator is attempting to produce targeted
subsistence production, and the cycle of jhum
cultivation has further reduced.
Marchang Reimeingam112
Journal of Rural Development, Vol. 36, No. 1, January - March : 2017
Environment, Farm Inputs and Agriculture
Production
Kerkhoff and Sharma (2006)
emphasised that shifting cultivation is a good
system when properly practised using hill and
mountain lands, while ensuring conservation
of forest, soil and water resources. The system
encounters huge obstacles from development
and policy aspects. An attempt to change and
replace it by different agricultural and
horticultural systems has shown a failure. It
requires viewing the system in a positive aspect
to change shifting cultivation in a sustainable
manner. Further, Kerkhoff and Sharma
(2006:73) noted that “shifting cultivators have
the knowledge and skills to provide many
environmental services such as conservation of
soil and water, biodiversity and gene pools, and
also carbon sequestration”. Sachchidananda
(1989) accounted that soil depletion and
erosion is not greater under shifting cultivation
system than other systems of agriculture when
both systems are operated efficiently.
Table 7: Extent of Shifting Cultivation in the Hills, Manipur
Year
Geogra-phical area,
Manipur(km2)
Geogra-phical Area,Hills (km2)
ShiftingCultivationArea (SCA)
(km2)
No. ofFamilies/
Agricultu-rists
Engaged inSC
SCA % TotalGeo.
SCA %HillsGeo.
AverageSCA per
Family orAgricult-
urist in SC(Hectare)
(1) (2) (3) (4) (5) (6 = 4/2) (7 = 4/3) (8 = 4/5)1974 22327 20089 600.0 50000 2.69 2.99 1.20
1983 22327 20089 900.0 70000 4.03 4.48 1.29
1992 22327 20089 252.4 158569* 1.13 1.26 0.16
2001 22327 20089 397.9 146699*# 1.78 1.98 0.27
2006 22327 20089 456.0 163165*@ 2.04 2.27 0.28
Notes: Figures for 1974 and 1983 from North Eastern Council (NEC); figures for 1992 onwards are fromStatistical Abstract of Manipur; geographical areas figures are from the Census of India (2011). For 1992onwards from column 6 to 8 are calculated by the author. *Agriculturists: Number of agriculture workers(cultivators + agricultural labourers) in the hills. The figures of agriculturists of 1992, 2001 and 2006 are 60per cent of total agriculturists (cultivators + AL) in 1991, 2001 and 2006 (@Interpolated figure) censuses,respectively. It is assumed that 60 per cent of the agriculturists are engaged in shifting cultivation sincethe system is more labour-intensive than the permanent or terrace cultivation system. #Figure excludesthree sub-divisions namely Mao-Maram, Paomata and Purul of Senapati district (Hill) ofManipur.@Interpolated figure that is estimated using exponential growth model as follows: P
t = P
oert; where
Pt is the population at current year (2011), P
o is the population at previous year (2001), e is a statistical
constant (2.7183), t is the desired interpolated time interval (in 2006, t=5 years) and r is the growth rate{LN(P
t/P
o)/t} (here t=10 years).
Sources: Calculated based on NEC Secretariat, Shillong (1974), Basic Statistics of North Eastern Region (1995)based on Task Force Report on Shifting Cultivation in India, MOA, New Delhi (1983), DES, Manipur andCensus of India.

Shifting Cultivation in Manipur: Land, Labour and Environment 113
Journal of Rural Development, Vol. 36, No. 1, January - March : 2017
Table 8: Estimates of Area, Production and Yield of Total Foodgrains, Manipur (India)
The cycle of shifting cultivation has
shortened in recent years due to booming of
population pressure. It has been reduced to 4-
5 years in most of the places (Bhattacharya and
Nanda, 2005). The shortening of shifting
cultivation cycle from around 20 to 30 years to
about four to five years or even less, owing to
the population pressure on land and other
factors is held responsible for the land
degradation in areas affected by shifting
cultivation (Ninan, 1992). As “population
pressure increases, the shading [shifting] cycle
is progressively shortened” (Seavoy, 1973:528).
The “exponential population growth and
shifting cultivation are causally linked to
deforestation and environmental degradation”
(Jarosz, 1993:366).Shifting cultivation erodes
soil and destabilises the ecosystem (FSI, 1987).
It can sustain with longer cycles at about 15-
20 years (Bhattacharya and Nanda, 2005). The
change in the cycle alters the fertility of soil and
productivity of agricultural production.
Year Area (lakh Production Yield (Kg./ Population Per CapitaHectares) (lakh Tonnes) Hectare) (No. in million)* Production#
(Kg)
Manipur India Manipur India Manipur India Manipur India Manipur India
1990-91 1.62 1404.28 2.86 1824.93 1763 1300 1.84 838.6 155 218
2000-01 1.68 1210.48 3.96 1968.14 2359 1626 2.17 1028.6 183 191
2011-12 2.79 1247.55 6.69 2593.23 2397 2079 2.86 1210.9 234 214
Note: *Census years; 2011 population figure is used for 2011-12; 1991 population of India excludes J&K;2001 population of Manipur excludes three sub-divisions. #Production divided by population.
Source: Author’s calculation based on State-wise Area Production and Yield Statistics (1996-97 to 2005-06)and (Major Crops-1996-97 to 2011-12), DES (Manipur), Department of Agriculture & Cooperation, MoA(Delhi).
In Manipur, the overall production of
foodgrains has dramatically increased along
with an increase in the area of cultivation and
more specifically due to the increase in yield
(Table 8). Yield of foodgrains is much greater
in the State than at the country level, that is
mostly contributed by the permanent wet land
cultivation. Interestingly, the per capita
foodgrain production has systematically
increased from 155 kg in 1990-91 to 234 kg in
2011-12 in Manipur, following the country level,
particularly after the turn of new millennium.
The per capita consumption rate of foodgrains
(cereals plus pulses) per annum is
approximately 197 kg (DES, 2014). DES (2014)
pointed out that rice is the staple food in the
State. Rice is grown extensively both in the hill
and valley areas. It accounts for about 95 per
cent of the State’s total foodgrain production
in 2009-10. DES (2007) estimated that based
on per capita rice consumption of 193.38 kg
per annum, Manipur has a shortage of rice
Marchang Reimeingam114
Journal of Rural Development, Vol. 36, No. 1, January - March : 2017
production by 62000 tonnes in 2001-02 that
has substantially increased to 108000 tonnes
in 2006-07.The increase of per capita foodgrain
production in the State is contributed by use
of high-yielding variety (HYV) and improved
variety (IV) of seeds. For instance, in Manipur
49.24 per cent of the total area under paddy
was under HYVs and IVs in 2000-01 that has
increased to 54.71 per cent in 2011-12
(DES,2014).
According to DES (2014), the adoption
of HYV of paddy in the hill districts is negligible
while that of improved varieties is quite
encouraging. A share of 7.22 per cent in 2011-
12 which has declined from 9.37 per cent in
2000-01 of the total area under paddy was
cultivated with HYV and IV in the hills and rest
of the areas were under other local varieties. In
the valleys, HYV and IV paddy cultivation
comprised about 80 per cent in 2000-01 and
92 per cent in 2011-12. It indicates that increase
in foodgrain production is largely contributed
by the use of HYV and IV foodgrains and also
successful adoption of double cropping with
an improved irrigation facility in the State’s
valley. Moreover, use of fertilisers [urea,
diammonium phosphate (DAP), muriate of
potash (MOP), mussoorie rock phosphate
(M.Phos), single super phosphate (SSP)] in
agriculture has substantially declined from
56.70 to 23.40 thousand tonnes during 2002-
03 to 2012-13 in the State. In 2012-13, out of
the total 23395 tonnes of fertilisers (urea, DAP,
etc.) 3.85 per cent was used in the hill districts
and the rest 96.15 per cent in the valley districts.
Similarly, out of the 10844 tonnes of chemical
fertilisers (nitrogenous, phosphate and
potassium i.e. NPK), 3.95 per cent was used in
the hill districts and the rest 96.05 per cent in
the valley districts. In the hills, use of fertilisers
is very low and insignificant corroborating with
the less use of HYV and IV seeds. Fertilisers are
usually used in the wet land or permanent
cultivation suggesting that shifting cultivation
system did not use chemical fertilisers as farm
inputs. It indicates that agriculture produce
under the system of shifting cultivation in the
hills of the State are organic in nature.
The decline in the cycle of shifting
cultivation degrades land and reduces the soil
nutrients and soil fertility due to inadequate
re-vegetation effects on the agriculture
productivity. Literature shows that under
shifting cultivation the produce is in diversity
ranging from cereals, pulses, tubers to spices.
Moreover, the cropping pattern as well as the
productivity of crops depend primarily on
inputs (seeds, plant protection chemicals and
plant nutrients like fertilisers and manures),
soils and climatic conditions such as rainfall,
temperature, wind, dew, hailstorm, sunshine
and radiation (DES, 2007).
A multi-cropping is usually practised
under shifting cultivation system from time
immemorial to meet the need of household
consumption in traditional society. More than
a century ago, Godden (1898) remarked that,
crops under shifting cultivation, for example
Shifting Cultivation in Manipur: Land, Labour and Environment 115
Journal of Rural Development, Vol. 36, No. 1, January - March : 2017
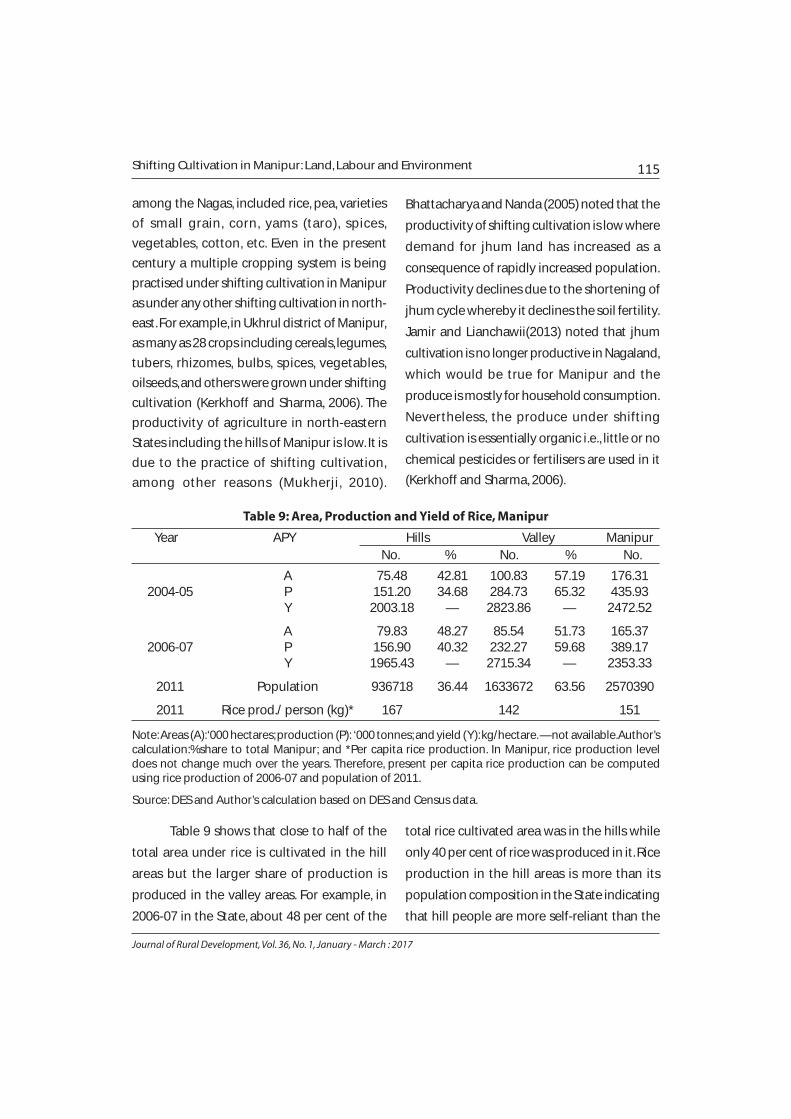
Table 9 shows that close to half of the
total area under rice is cultivated in the hill
areas but the larger share of production is
produced in the valley areas. For example, in
2006-07 in the State, about 48 per cent of the
total rice cultivated area was in the hills while
only 40 per cent of rice was produced in it. Rice
production in the hill areas is more than its
population composition in the State indicating
that hill people are more self-reliant than the
Table 9: Area, Production and Yield of Rice, Manipur
among the Nagas, included rice, pea, varieties
of small grain, corn, yams (taro), spices,
vegetables, cotton, etc. Even in the present
century a multiple cropping system is being
practised under shifting cultivation in Manipur
as under any other shifting cultivation in north-
east. For example, in Ukhrul district of Manipur,
as many as 28 crops including cereals, legumes,
tubers, rhizomes, bulbs, spices, vegetables,
oilseeds, and others were grown under shifting
cultivation (Kerkhoff and Sharma, 2006). The
productivity of agriculture in north-eastern
States including the hills of Manipur is low. It is
due to the practice of shifting cultivation,
among other reasons (Mukherji, 2010).
Bhattacharya and Nanda (2005) noted that the
productivity of shifting cultivation is low where
demand for jhum land has increased as a
consequence of rapidly increased population.
Productivity declines due to the shortening of
jhum cycle whereby it declines the soil fertility.
Jamir and Lianchawii(2013) noted that jhum
cultivation is no longer productive in Nagaland,
which would be true for Manipur and the
produce is mostly for household consumption.
Nevertheless, the produce under shifting
cultivation is essentially organic i.e., little or no
chemical pesticides or fertilisers are used in it
(Kerkhoff and Sharma, 2006).
Year APY Hills Valley ManipurNo. % No. % No.
A 75.48 42.81 100.83 57.19 176.312004-05 P 151.20 34.68 284.73 65.32 435.93
Y 2003.18 — 2823.86 — 2472.52
A 79.83 48.27 85.54 51.73 165.372006-07 P 156.90 40.32 232.27 59.68 389.17
Y 1965.43 — 2715.34 — 2353.33
2011 Population 936718 36.44 1633672 63.56 2570390
2011 Rice prod./ person (kg)* 167 142 151
Note: Areas (A): ‘000 hectares; production (P): ‘000 tonnes; and yield (Y): kg/hectare. —not available.Author’scalculation:%share to total Manipur; and *Per capita rice production. In Manipur, rice production leveldoes not change much over the years. Therefore, present per capita rice production can be computedusing rice production of 2006-07 and population of 2011.
Source: DES and Author’s calculation based on DES and Census data.
Marchang Reimeingam116
Journal of Rural Development, Vol. 36, No. 1, January - March : 2017
valley counterpart in terms of rice production
and availability. The per capita rice production
at present is more in the hills at 167 kg against
the valley’s 142 kg per annum. Both the hills
and the valleys face a shortage of rice when
compared with the DES (2007) estimates of
193.38 kg of per capita rice consumption
annually. Further, it’s not surprising that the
yield of rice production in the hills, where larger
share of rice cultivated area was under shifting
cultivation, was lower by almost one-third of
the yield in the valley, where only permanent
cultivation is practised. The yield has declined
over the years in the hills as well as in the valleys
resulting in overall fall in the yield in the State,
that is becoming a matter of concern.
Conclusion
The practice of shifting cultivation has
resulted in the reduction of the forest area in
the hills of Manipur. Population growth which
mainly supplies the rural agricultural labour has
raised the demand for tillable agriculture land
thereby reducing the forest cover. Moreover, in
Manipur the reserved and protected forest has
eventually declined due to land encroachment
for development and human settlement. Forest
land re-vegetation is also taking place as dense
forest improves particularly in the hills.
Concurrently, contribution from agriculture in
the State’s revenue has declined substantially;
however, income from forestry and logging has
improved in recent times. The actual cultivated
land (i.e. net sown area) in Manipur has
increased remarkably as more and more rural
labour is pressed into shifting cultivation. In the
hills more than half of the rice cultivated area
was under shifting cultivation. The system’s
nature of intensive labour activity has absorbed
majority of the agriculture workers in it in the
hills where majority of the workers are
engaged as agricultural workers unlike in the
valleys. It is to be noted that about 2 per cent
of the entire hills’ geographical areas was under
shifting cultivation. Therefore, it requires
adoption of appropriate land-use planning to
avoid land degradation and deforestation in
the hills. The per capita shifting cultivation land
has increased due to the decline in productivity
and soil fertility. Agriculture productivity is
considerably lower in the hills due to the
practice of shifting cultivation where
traditional inputs including seeds are used; but
chemical fertilisers and HYV seeds are not used.
Interestingly, hill people are self-sustaining in
terms of rice production as per capita rice
production is greater in the hills than in the
valley.The pressure of shifting cultivators on
land has eventually reduced the fallow period
resulting in poor land rejuvenation and
replenishment of soil fertility. It is crucial to set
a minimum of five years for one complete cycle
for shifting cultivation in order to adequately
re-vegetate and regenerate soil fertility.
Arrangement of alternative to shifting
cultivation is needed with a provision of
sufficient working capital to ensure cultivators
to adopt and use inputs efficiently.Ensuring
Shifting Cultivation in Manipur: Land, Labour and Environment 117
Journal of Rural Development, Vol. 36, No. 1, January - March : 2017
Notes
1 A revised paper that was presented in the International Seminar on “Natural Resource and
National Accounts in South Asia” organised by CEENR-ISEC, Bengaluru (India), during 5-6
February, 2015.
food security and restructuring of land
ownership system from community to
individual or private may reduce the practice
of shifting cultivation and conserve forest
cover. Shifting cultivation cannot be
completely removed since it has linkages with
indigenous ethnic culture.
Marchang Reimeingam118
Journal of Rural Development, Vol. 36, No. 1, January - March : 2017
References
1 Bhattacharya, B. and Nanda S. K (2005), “Shifting Cultivation in North-east India: TechnologicalAlternatives and Extension Implication”, in Bandopadhyay A., Sundaram K. V., Moni M., Kundu P.Sand Mrityunjay M. Jha (Eds.), “Sustainable Agriculture: Issues in Production, Management, Agronomyand ICT Application”, Delhi, Northern Book Centre.
2 Bowler, Ian (2002), “Developing Sustainable Agriculture”, Geography, 87(3), 205-212.
3 Cramb, R. A (1988), “The Use and Productivity of Labour in Shifting Cultivation: An East MalaysianCase Study”, paper presented at the 32nd annual conference of the Australian Agricultural EconomicsSociety, La Trobe University, Melbourne, February 8–11.
4 Central Statistics Organisation (2013), (October 16, 2013> http://mospi.nic.in/Mospi_New/admin/publication.aspx).
5 DES (2001), “Statistical Abstract of Manipur 2001”, Imphal, Directorate of Economics& Statistics.
6 DES (2007), “Report on Crop Estimation Survey: Manipur 2006-07”, Imphal, Directorate of Economics& Statistics.
7 DES (2014), “Economic Survey Manipur 2013-14”, Imphal, Directorate of Economics & Statistics.
8 Eden, Michael. J(1993), “Swidden Cultivation in Forest and Savanna in Lowland Southwest PapuaNew Guinea”, Human Ecology, 21(2), pp. 145-166.
9 Forestry Department(1985), “Changes in Shifting Cultivation in Africa”, FAO Forestry Paper 50,(February 15, 2015> http://www.fao.org/docrep/r5265e/r5265e06.htm#TopOfPage).
10 FSI (1987), “TheState of Forest Report”, Dehra Dun, Ministry of Environment and Forests.
11 FSI, (1995), “TheState of Forest Report”, Dehra Dun, Ministry of Environment and Forests.
12 FSI, (2005), “State of Forest Report”, Dehra Dun: Ministry of Environment and Forests.
13 FSI (2011), “India State of Forest Report”, Dehra Dun: Ministry of Environment and Forest.
14 FSI (2013), “India State of Forest Report”, Dehra Dun: Ministry of Environment and Forest.
15 Godden, Gertrude M (1898), “Naga and Other Frontier Tribes of North-East India”, The Journal of theAnthropological Institute of Great Britain and Ireland, 27, 2-51.
16 Gupta, A. K (2000), “Shifting Cultivation and Conservation of Biological Diversity in Tripura, NortheastIndia”, Human Ecology, 28(4), 605-629.
17 Gupta, S (2006), “Manipur State Development Report”, Imphal: Planning Department.
18 Hueiyen News Service (2011), “Reserved Forest Area in Manipur Reducing: Reports”, E-Pao, March 28(January 1, 2015>http://e-pao.net/GP.asp?src=18..290311.mar11).
19 IBCN (2011), “Important Bird Areas in India – Manipur”, Indian Bird Conservation Network, December30 (January 12, 2015> http://ibcn.in/wp-content/uploads/2011/12/30-735_753-manipur.pdf ).
20 Jamir, R. N and Lianchawii (2013), “Sustainable Land and Ecosystem Management in ShiftingCultivation Areas of Nagaland”, Dehradun: Directorate of Extension Indian Council of ForestryResearch and Education.
21 Jarosz, Lucy (1993), “Defining and Explaining Tropical Deforestation: Shifting Cultivation andPopulation Growth in Colonial Madagascar (1896-1940)”, Economic Geography, 69, 366-379.

Shifting Cultivation in Manipur: Land, Labour and Environment 119
Journal of Rural Development, Vol. 36, No. 1, January - March : 2017
22 Kerkhoff, Elisabeth and Eklabya Sharma (2006), “Debating Shifting Cultivation in the EasternHimalayas: Farmers’ Innovations as Lessons for Policy”, Kathmandu: International Centre forIntegrated Mountain Development.
23 Maithani, B. P(2005), “Shifting Cultivation in North-East India: Policies Issues and Options”, DelhiMittal Publication.
24 MEF and GBPIHED (2009), “Governance for Sustaining Himalayan Ecosystem Guidelines & BestPractices”, Delhi, Ministry of Environment & Forests and G.B. Pant Institute of Himalayan Environment& Development.
25 Mellor, John W (1962), “The Process of Agricultural Development in Low-Income Countries”, Journalof Farm Economics, 44(3), 700-716.
26 Ministry of Agriculture (1983), “Task Force on Shifting Cultivation”, Delhi, Ministry of Agriculture.
27 MLR & LR Act (1960), “Directorate of Settlement and Land Records”, (January 17, 2015> http://manipurrev.nic.in/notes/MLRLRAct.pdf ).
28 MODONER and NEC (2008), “North Eastern Region Vision 2020”, Delhi: Ministry of Development ofNorth Eastern Region and North East Council.
29 Mukherji, G. B (2010), “Report of the Task Force to Look into Problems of Hill States and Hill Areasand to Suggest Ways to Ensure that these States and Areas do not Suffer in Any Way Because oftheir Peculiarities”, Delhi, Planning Commission.
30 Ninan, K. N (1992), “Economics of Shifting Cultivation in India”, Economic and Political Weekly, 27(13),A2-A6.
31 Peale, S. E (1874), “The Nagas and Neighbouring Tribes”, The Journal of the Anthropological Institute ofGreat Britain and Ireland, 3, 476-481.
32 Roy, R. D., Xavier B. and William M’Vidouboulou S (2012), “Study on Shifting Cultivation and theSocio-Cultural Integrity of Indigenous Peoples”, Economic and Social Council, United Nations, NewYork (February 20, 2015> http://daccess-dds-ny.un.org/doc/UNDOC/GEN/N12/241/85/PDF/N1224185.pdf?OpenElement).
33 Sachchidananda (1989), “Shifting Cultivation in India, Delhi, Concept Publishing Company.
34 Sastry, K. L. N. et al (2007), “Nationwide Forest Encroachment Mapping Using Remote Sensing andGIS Techniques - Manipur State”, Ahmedabad: Manipur Forest Department and Manipur StateRemote Sensing Applications Centre and Space Applications Centre –ISRO.
35 Seavoy, Ronald E (1973), “The Shading Cycle in Shifting Cultivation”, Annals of the Association ofAmerican Geographers, 63(4), 522-528.
36 Shakespear, J (1909), “TheKuki-Lushai Clans”, The Journal of the Royal Anthropological Institute of GreatBritain and Ireland, 39, 371-385.
37 Shimray, U. A (2004), “Women’s Work in Naga Society: Household Work, Workforce Participation andDivision of Labour”, Economic and Political Weekly, 39(17), 1698-1711.
38 Srinivas, K. Ravi (1996), “Sustainable Agriculture, Biotechnology and Emerging Global Trade Regime”,Economic and Political Weekly, 31(29), 1922-1923.
39 Thomas, William L. Jr. (1968), “Shifting Cultivation in South Eastern Asia” by J. E. Spencer (1966),Geographical Review, 58(1), 148-149.