manipur - 2013-14 - Directorate of Economics and Statistics
336
1 ECONOMIC SURVEY MANIPUR 2013-14 DIRECTORATE OF ECONOMICS & STATISTICS GOVERNMENT OF MANIPUR IMPHAL
-
Upload
khangminh22 -
Category
Documents
-
view
0 -
download
0
Transcript of manipur - 2013-14 - Directorate of Economics and Statistics

1
ECONOMIC SURVEY
MANIPUR 2013-14
DIRECTORATE OF ECONOMICS & STATISTICS
GOVERNMENT OF MANIPUR
IMPHAL

2
P R E F A C E
The Economic Survey, Manipur, 2013-14 presents a broad analysis of the latest
economic situation of the state based on performance appraisal data collected from various
sources. It is the 18th issue of the series.
The salient feature of the state’s economy is briefly discussed in Part-I and supporting
statistical tables are presented in Part - II. Some of the chapters/tables have been modified in
the present issue on the basis of the data-base made available by the different
Agencies/Departments.
It is hoped that with the active co-operation of different Organisations/ Departments,
the Directorate will be able to make improvements in the quality and contents of the publication
in its future issues. The co-operation and help extended spontaneously by different
Departments of the Government, local bodies and private institutions are gratefully
acknowledged. I am happy to put on record, my appreciation to all the officers and staff of the
Economic Analysis (EA) Unit of the Directorate for their untiring efforts put in for preparation
of this publication. The co-operation extended by the Printing Press Unit of the Directorate in
binding the publication is gratefully acknowledged. The contribution of the officials engaged
in taking copies and also of the Graphics Section in designing cover are also acknowledged
with thanks.
I, sincerely, hope that this publication will prove to be useful to the planners, policy
makers, social workers and researcher will help in enhancing their understanding on the socio-
economic scenario of Manipur State.
Suggestions for improvements in its future issue are most welcome.
Dated/Imphal Peijonna Kamei
The 18th June 2014 i/c Joint Director
Directorate of Econ. & Statistics,
Manipur

3
---
F O R E W O R D
Statistical Information is one of the basic requirements in today’s fast changing society
not only to understand and analyses various emerging issues and chalk out remedial measures
but also to ensure effective implementation of developmental plans. It is an undeniable fact
that there is an increasing awareness of the needs for planning and decision making on the basis
of authentic numerical facts. Therefore, the task of documentation of data covering various
socio-economic aspects becomes inevitable. The Directorate of Economics & Statistics as the
nodal agency for all statistical activities in Manipur provides valuable services to meet the
needs of data-users.
It gives me immense pleasure to release the 18th issue of the publication entitled
“Economic Survey Manipur 2013-14”. It contains X Chapters presenting latest available data
with broad analysis of the state’s economy in Part I and Statistical Tables in Part II. Various
Central and State Government Organisations and other Institutions have provided valuable
helps and co-operations by making available of the required information in the preparation of
this publication. I hope they will continue to extend their active co-operation in future too.
It is hoped that this publication will be a great use to the planners, policy makers,
administrators, social workers and research workers and will help in enhancing their
understanding on the socio-economic scenario of Manipur State.
Suggestions for improvements in its future issue are most welcome.
Dated/Imphal Rajesh Agrawal
The 15th June 2014 Commissioner, Economics & Statistics,
Government of Manipur
-----

4
CONTENTS
Chapter PART – I Page No.
I GENERAL OBSERVATION i
II DEMOGRAPHIC FEATURES 1
III STATE INCOME AND PRICES 25
IV STATE BUDGET AND PLANNING 39
V AGRICULTURE AND ALLIED SECTORS 63
Agriculture 63
Horticulture 73
Veterinary and Animal Husbandry 75
Forestry 78
Fisheries 83
VI RURAL DEVELOPMENT AND CO-OPERATION 85
VII INDUSTRIES AND MINERALS 99
VIII ECONOMIC INFRASTRUCTURE 123
Power 123
Irrigation 135
Transport and Communication 143
Banking 149
IX SOCIAL INFRASTRUCTURE 153
Education 153
Science and Technology 163
Ecology and Environment 166
Food and Civil Supplies 167
Health and Family Welfare Services 171
Water Supply and Sanitation 176
Development of Scheduled Tribes, Scheduled Castes and OBC 179
Social Welfare 183
Arts and Culture 186
Tourism 188
Empowerment of Women 190
Poverty 192
Labour and Employment 192
X MISCELLANEOUS 199
Economic Census 199
PART – II
STATISTICAL TABLES 209

5
PART – I

6
CHAPTER I
GENERAL OBSERVATION
Manipur, one of the states situated in the North Eastern Region of India, is an isolated
hill-girt state stretching between 92°58´E to 94°45´E longitudes and 23°50´N to 25°42´N
latitudes. It is a charming place encircled by nine hill ranges on all sides with a small and
beautiful oval shaped valley at the centre. The State has 352 kms. long international border
with Burma (Myanmar) to the south-east and 502 kms. long border with the adjacent states of
Nagaland on the north, Cachar District of Assam on the west and Chin Hills (Myanmar) and
Mizoram on the south and the south-west and Surma Tract and upper Chindwin of Myanmar
(Burma) on the East. The altitude of the State above the mean sea level varies from 790 metres
to 2020 metres. It has sub-tropical temperate climate. The annual rainfall of Manipur, as
recorded by ICAR, Lamphelpat is 1639.1 mm. in 2013. The State has a salubrious climate.
1.1 Manipur, though tiny in size, has a distinct history of its own. The recorded history
of Manipur can be obtained from the State Royal chronicle called the Cheitharol Kumpaba
which covers the period from 33 AD to 1890 AD. During this period, altogether 74 (seventy
four) kings ruled the State, of which Nongda Lairen Pakhangba (33 AD to 154 AD) was the
first and last was Kulachandra. Manipur was then a tiny independent kingdom.
1.1.1 Manipur lost her independence to the British India in the year 1891. From 1892
onwards it became a princely native state under the political control of Government of British
India. Accordingly, the administration of the state came under the influence of a political agent
by vesting all executive powers in him. This British Paramouncy continued till 1947 in which
India got independence.
1.1.2 According to a merger agreement signed on 21st September, 1949 between
Maharaja Budhachandra, the then king of Manipur and the government of India, the state was
merged into India as a part “C” State on the 15th October, 1949 and administered by the
President of India through a Chief Commissioner. Manipur ceased to be a part “C” State on the
1st November, 1956 and became a Union Territory under the Union Territorial Council
Act, 1956. The Territorial Council consisting of 30 elected members and 2(two) nominated
members was constituted on 16-8-1957. However, the Territorial Council was replaced by a

7
Territorial Legislative Assembly of 30 members and 2(two) nominated members from 23-
7-1963. Manipur became a full-fledged state within the Indian Union with a Governor as the
Head of the state on the 21st January,1972 and the members of the Legislative Assembly was
increased to 60. The first popular Ministry, after attaining statehood, was installed on March
20, 1972.
1.2 Manipur has a geographical area of 22,327 sq.kms. which constitutes 0.7 percent
of the total land surface of India. Ninety Percent of the total geographical area of the state i.e.
20,089 sq.kms. is covered by hills, the remaining area is a small valley covering only 2,238
sq.kms. and accounting for only one-tenth of the total area of the state.
1.2.1 According to 2011 Census, the population of the state is 28.56 lakhs registering a
population density of 128 per sq.km. The population has increased by 5.62 lakhs during the
decade 2001 to 2011. Out of the total population of the state, 14.39 lakhs were males and the
rest 14.17 lakhs were females. There are 7 (seven) scheduled castes communities and 33 (thirty-
three) different scheduled tribes of different ethnic groups presenting complicated socio-
economic phenomena. There is apparent disparity in the level of income and consumption
between the rich and the poor, between the urban elite and the rural poor, between the haves
and have-nots and between the public living in the hills and in the valley.
1.2.2 The state has 51 towns (28 statutory towns and 23 census towns) and 2,588
villages as per 2011 census. Imphal is the capital city of Manipur. It has a population of about
2.71 lakhs and has almost all the facilities of a modern city. About 48 kms. away from Imphal
towards south-east lies the Loktak Lake, the largest fresh water lake in the North-Eastern
Region of India. This lake which covers an area of 216 sq.kms., is the biggest natural source
of fish supply which is one of the important food items of the people of the state.
1.3 The state of Manipur splits up naturally into two tracts viz. the hills and the dales.
The hill comprises of five districts namely (i) Senapati; (ii) Tamenglong; (iii) Churachandpur;
(iv) Chandel; and (v) Ukhrul, while the valley consists of four districts viz. (i) Imphal East; (ii)
Imphal West; (iii) Bishnupur; and (iv) Thoubal. The valley areas of Manipur has two
constituent parts, one of which is the Imphal valley in the heart of the state and the other is Jiri
valley in the west beyond the pale of hill ranges bordering the Cachar District of Assam. The
districts were further divided into sub-divisions. There are altogether 38 (thirty eight) sub-
divisions. Table No. 1(a) of Part II gives a picture of Manipur State in figures at a glance and
Table No. 1(b) shows the structure of the districts and administrative divisions.

8
1.4 Demographic Features: Population of a country is its most important asset and demographic indicator. The
population of Manipur as per 2011 census was 28.56 lakhs comprising 14.39 lakhs of males
and 14.17 lakhs of females. Population of Manipur constitutes nearly 0.24 percent of the total
population of India.
The density of population of Manipur as per 2011 census was 128 persons per sq.km. as
against 103 persons per sq. km. in 2001 census. The sex ratio for the state as a whole has
improved from 974 females per 1000 males in 2001 to 985 females per 1000 males in 2011.
1.4.1 The population growth rate of Manipur is found to be higher than that of India. The
population growth rate of Manipur in 2011 is 24.50 per cent as against 24.86 per cent in 2001
and 29.29 per cent in 1991. While the population growth rate of India in 2011 is 17.70 per cent
as against 21.56 per cent in 2001 and 23.85 per cent in 1991.
1.4.2 In terms of literacy, Manipur ranks fifth among the North Eastern States of India as per
2011 census. The literacy rate has increased from 70.50 percent in 2001 to 79.21 percent in
2011. Among the males, it has increased from 80.30 percent in 2001 to 86.06 percent in 2011,
whereas among females, it has increased from 60.50 percent in 2001 to 72.37 percent in 2011.
1.5 State Domestic Product :
The State Domestic Product and the per capita income reflect overall performance of
the state’s economy during a given period. The growth in State Domestic Product of Manipur
is largely dependent on agricultural productions.
1.5.1 The Gross State Domestic Product (GSDP) of Manipur for 2012-13 at current prices is
estimated to be Rs. 11,983 crores as against Rs.10,504 crores for the year 2011-12 registering
an increase of 14.07 percent. At constant (2004-05) prices, GSDP in 2012-13 is estimated at
Rs. 7,892 crores as against Rs. 7231 crores in the previous year showing an increase of 9.13
percent. The average annual exponential growth rates between 2004-05 to 2012-13 are worked
out to be 10.60 percent and 5.38 percent for current and constant prices respectively.
1.5.2 The Net State Domestic Product (NSDP) at current prices for the year 2012-13 is
estimated at Rs. 10,489 crores as compared to Rs. 9,216 crores for 2011-12 registering an
increase of 13.82 percent over the previous year. Per capita income at current prices is worked

9
out to be Rs. 36,474 in 2012-13 as compared to Rs. 32,641 in 2011-12 indicating an increase
of 11.74 percent.
1.5.3 And the Net State Domestic Product (NSDP) at constant (2004-05) prices for the year
2012-13 is placed at Rs. 6,901 crores, which is higher than that of the preceding year by about
8.84 percent. The per capita income at constant (2004-05) prices for the year 2012-13 is
estimated at Rs. 23,996 which is higher than that of the preceding year by about 6.85 percent.
1.6 Price Situation :
Prices serve as signals to producers and consumers. It is the value of goods and services
in terms of money. Prices represent the terms on which people and firms exchange different
commodities. In fact, households buy goods and sell factors of production where
firms/businesses sell goods and buy factors of production. Everything has a price and price
level played an important role in the economy of a Country/State. The rising trend of prices in
the state continued to be a matter of great concern for the economy of the state.
1.6.1 In order to assess the price situation in the state, the Directorate of Economics &
Statistics, Manipur collects on a regular basis, the retail prices of consumer goods and services
from all the District Headquarters market. In addition to the retail prices, the Directorate also
collects wholesale prices of some selected commodities for Imphal ( Khwai) market. The
wholesale price of rice (medium) per quintal in 2011 was recorded to be Rs.2,313. In case of
arhar dal, price per quintal in 2011 was recorded to be Rs. 7,083 which is about 98 times those
prevalent in 1961.
1.6.2 The retail price is the price which the ultimate consumer pays when buying from a
retailer. Therefore, it would be interesting to have a look in the movements of retail prices in
respect of Manipur State. The retail price of rice(fine) stood at Rs.24.50 per kg. during the year
2013. In the case of arhar dal, the price during the year 2012 and 2013, were Rs. 80.00 and Rs.
80.00 per kg.
1.7 Budgetary Position :
State Budget shows the complete picture of the estimated receipts and expenditure of
the State. Aggregate receipt is estimated to be Rs.31,113.40 crores in 2013-14 (BE) including
Rs. 8,19.47 crores of revenue receipts and Rs.22,493.93 crores of capital receipts (including

10
Public Account). The revenue receipts is estimated to increase by 10.76 percent in 2013-14
(BE) over the previous year 2012-13 (RE) and capital receipt also is estimated to decrease by
0.03 percent. The overall increase in receipts is accounted to be 2.74 percent. The aggregate
expenditure (revenue and capital disbursements) in 2013-14 is anticipated to be Rs. 31,491.62
crores which is about 4.50 percent more than that of 2012-13. The overall deficit anticipated
during the financial year 2013-14 is Rs.378.22 crores.
1.8 Plan Size : Out of the total proposed outlay of Rs. 8,154 crores for the Eleventh Five Year Plan
(2007-12), Rs. 2,425.92 crores is proposed for the annual plan, 2009-10. During the Tenth
Plan (2002-07), the State’s allotment as approved by the Planning Commission was Rs. 2,804
crores which is about 15.55 percent more than the size of the Ninth Five Year Plan. However,
the actual expenditure incurred during 2002-03, 2003-04, 2004-05, 2005-06 and 2006-07 were
Rs. 197.27 crores, Rs. 286.62 crores, Rs. 601.05 crores, Rs. 667.27 crores and Rs.
1,045.56 crores respectively.
1.8.1 Out of the total Proposed outlay of Rs.8,154 crores of the Eleventh Plan, the highest
priority is given to Social Services with Rs. 3,229.27 crores which is 39.60% of the total outlay
followed by Energy with Rs. 1,505.20 crores and Irrigation & Flood Control with Rs. 772.38
crores.
1.8.2 In the Agreed outlay of Rs.1,660.00 crores for the Annual Plan, 2008-09, Irrigation and
Flood Control has been given an outlay of Rs.267.20 crores (16.10 percent). The Energy sector
received Rs.123.50 crores (7.44 percent). Industry and Minerals sector has been given an outlay
of Rs.90.36 crores (5.44 percent). The transport sector is provided with an outlay of Rs.26.75
crores (1.61 percent). The outlay for the other sectors were Rs.595.56 crores (35.88 percent)
for General Economic Services, Rs.42.30 crores (2.55 percent) for Rural Development,
Rs.67.19 crores (4.05 percent) for the Special Area Programmes, Rs.25.40 crores (1.53 percent)
for Science , Technology and Environment and Rs.26.56 crores (1.60 percent) for Agriculture
and Allied Activities. The Social Service sector including Education, Health, Water Supply
and Welfare of scheduled tribes and castes etc., has been given an outlay of Rs.382.69 crores
(23.05 percent). The General Services sector is provided with an outlay of Rs.12.50 crores i.e.,
0.75 percent of the total outlay.
For the Twelfth five year plan ( 2012-17), projected outlay of Rs. 20,457.91 crores has
been proposed. General Economic Services gets with Rs. 394.45 and Top Priority at social
services with Rs. 10,554.26 crores and Irrigation & Flood Control with Rs. 3,159.41 crores.

11
1.9 Agriculture and Allied Sector :
Agriculture sector has a vital place in the economy of the state. It contributes a major
share to the State Domestic Product. 52.19 percent of the workers in Manipur are engaged as
cultivators and Agricultural labourers. However, the performance of agriculture in the state
mainly depends on timely rainfall and weather conditions. Permanent cultivation is generally
practised in the valley districts while terrace cultivation is practised in some pockets of the hills
where jhuming or shifting cultivation is widely adopted in most of the hills. Rice is the staple
food and is grown in hill and plain areas and it accounts for about 95 percent of the total
foodgrain production of the State in 2009-10. The production of rice in 2011-12 is estimated
at 3.87 lakh tonnes which is more than the preceding year’s rice output of 3.77 lakh tonnes. In
case of maize, production in 2011-12 is estimated to be 11.28 thousand tonnes as against 11.91
thousand tonnes in the preceding year.
1.9.1 Horticulture :
Manipur is suitable for the development of horticulture. Besides, there is ample scope
for bringing more land under fruit cultivation in the hill areas. Even in the plains, soil conditions
are conducive to production of citrus fruits, banana, guava, peaches, apricot, papaya etc. There
is sufficient scope for cultivation of pineapples in the medium high range of the hills in
Manipur. The major fruits grown in the state are pineapple, orange, lemon, banana, guava,
peaches etc. Now-a-days apples are grown in the hills of Manipur. For the promotion of healthy
growth of horticulture in Manipur, it is essential to develop horticultural marketing. The
average annual production of fruits and vegetables during the year 2011-12 was 4.06 lakh MT
and 2.00 lakh MT respectively.
1.9.2 Livestock:
According to the livestock census conducted in 2007, there were 7.87 lakhs livestock
in Manipur. Of these 3.42 lakhs were cattle, 0.62 lakhs were buffaloes and 3.14 lakhs were
pigs. The poultry population was recorded to be 22.89 lakhs. The main livestock productions
in the state are milk, egg and meat. The total milk production in 2011-12 was 78.82 thousand

12
tonnes which was 1.05 percent greater than the production of 78.00 thousand tonnes in
2010-11. The estimated production of eggs in 2011-12 was numbering at 1,160.87 lakhs
showing an increase of 2.10 percent over the production of 1,137.04 lakhs in 2010-11. The
estimated meat production for the year 2011-12 was 18.15 thousand tonnes which was less than
2.68 per cent over the production of 20.68 thousand tonnes in 2010-11.
1.9.3 Forest:
The state has vast area of forest covering as much as 17,418 sq.kms. which forms about
78 percent of the total geographical area of the state. The actual area under forest is about 15
percent higher than the recorded forests area of the state. Of the total forests area, reserved
forests and protected forests accounts for 1,467 sq.kms. and 4,171 sq.kms. during 2009-10. The
remaining 11,780 sq.kms. is treated as ‘Unclassed forest’. The important major forests products
are timber, firewoods, bamboos, cane etc. The production of timber other than teak has shown
a decline from 8.85 thousand cubic metres in 2006-07 to 8.31 thousand cubic metres in 2007-
08. The Forest Department have distributed 6,50,000 seedlings under the scheme of Social
Forestry during 2009-10.
1.9.4 Fisheries:
Though the state has no marine fishery, it has vast inland fishery resources like ponds,
tanks, natural lakes, marshy areas, swampy areas, rivers, reservoirs, submerged cropped land,
low lying paddy fields etc. The target source of fish is the Loktak Lake. The production of fish
in Manipur for the year 2011-12 was estimated to be 22.20 thousand tonnes as against the 20.20
thousand tonnes in 2010-11.
1.10 Rural Development:
Manipur lives in villages. The rural population constitutes about 74.89 percent of the
total population. Enhancement in the quality of life of the economically weaker sections of the
society has been one of the basic objectives of development planning of the state. In order to
achieve this goal a number of programmes viz., NREGS (National Rural Employment
Guaranteed Scheme), SGSY (Swarnjayanti Gram Swarozgar Yojana), SGRY (Sampoorna

13
Grameen Rozgar Yojana), IAY (Indira Awaas Yojana), PMGY (Pradhan Mantri Gramodaya
Yojana), PMGSY (Pradhan Mantri Gram Sadak Yojana) etc. have been implemented in the
state. These programmes ensure minimum wage to rural workers and enable them to acquire
assets and income through Self-employment ventures. Under NREGS, 164.31 lakhs (up-to
January, 2011) manday have been generated and 451 SHG were formed under SGSY normal,
during 2010-11. Houses Constructed and upgraded under IAY and Roads Constructed under
PMGSY is shown in table no. 6.4 and 6.5.
1.11 Manufacturing: Inspite of the fact that Manipur is endowed with mineral and forest resources,
industrialisation has been painfully slow in the state. This is because of shyness of capital, acute
transport bottleneck, shortage of power and lack of entrepreneurial activity and technical skills.
Despite persistent efforts made by the Government, the state continues to be an industrially
backward state. Various policies and programmes with the provisions of packages of incentives
and concessions could do little in this regard. Almost all the public undertaking industries of
the state were facing financial problems and there was paucity of fund for maintenance. So the
Government has decided to wind up at least five of its loss making industries as the proposals
for privatisation also fails as there were no takers. Manipur Cycle Corporation Ltd. (MCCL),
Manipur Cement Ltd. (MCL), Manipur Spinning Mills Corporation Ltd. (MSMCL), Manipur
Pulp and Allied Products Ltd. (MPAPL) and Manipur Drugs and Pharmaceutical Ltd. (Govt.
Sector) are the public undertaking industries to be wind up. The only industrial activity worth
the name in the state is handloom and handicrafts. The handloom industry accounts for a good
number of female workers in the working population. The products are in great demand within
the state and also even in the national and international markets.
1.11.1 Small Scale Industries (SSI) is an important segment of the economy of the state. It is
contributing substantially in the form of production, employment and export, thus playing a
vital role in fulfilling the socio-economic objectives. For speedy growth of small-scale
industries, Government had brought about simplifications in the SSI registration procedures.
By the end of March 2006, the number of registered permanent SSI stood at 10,264 with an
investment of Rs.43.27 crores in plants and machineries and providing employment to at least
53,719 persons where annual production was estimated to be Rs.183.72 crores.
1.12 Indo Myanmar Border Trade :

14
The Indo Myanmar Border Trade was operationalised from 12th April, 1995. The
Central Government is making an effort to frame a policy for development of trade with South
East Asia under India’s Look East Policy. In connection with the border trade, the then Union
Minister of State visited Imphal and Moreh on 29th September, 2006 and announced for
development of Moreh Town by creating an integrated Check Post (ICP) adjacent to
international boundary within Land Customs Station, Moreh. The State Government was
entrusted the task of acquiring land measuring 45.50 acres at the cost of about Rs. 125 crores.
With the objective of promoting people to people contact for promotion of the bilateral trade,
a team of Myanmar delegation visited Manipur on 28th February, 2007 and also a one-day
interaction programme was held on 1st March, 2007 at Imphal by the traders and officials of
both sides.
1.13 Sericulture :
Manipur has 4 (four) varieties of Silk viz., Mulberry, Eri, Muga and Oak Tasar. To
provide employment particularly to womenfolk, Manipur Sericulture Project was initiated with
the assistance of the Government of Japan through Government of India, 94.71% plantation
was achieved. With the help of Central Silk Board, the Catalytic Development Programme
(CDP) has been implemented since 2003-04. During 2007-08, Catalytic Development
Programme is being implemented with financial assistance of Rs. 1.12 crores from the Central
Silk Board and Ministry of Textiles.
1.14 Power:
Though power plays a vital role in the development of the state, Manipur is facing the
problem of power shortage. The state continues to be deficit in electric energy. Purchase of
power from outside the state has been rising at a higher rate. During the year 2011-12, the total
installed capacity of power in the state was 45,020 kw. The total availability of power from all
sources was 6401.38 lakh kwh. as against the estimated requirement of 8,380 lakh kwh in 2010-
11 (up to December, 2010). The estimated per capita availability of power stood at 230.93
kwh. in 2010-11 (up to December, 2010).
1.14.1 Under Rural Electrification programme, 1766 villages have been electrified as on 31st
March, 2011 which is about 69.97 percent of the total number of villages.

15
1.14.2 The Manipur Renewable Energy Development Agency (MANIREDA) has renovalid
and modernized Gelnel hydro project 400 kw at Senapati district and 2 wind Solar Hybrid
power plants 10 kw each were commissioned at Ukhrul district during 2009-10. Distribution
of Home lighting solar latrine and installation of solar street lighting were continued upto 2009-
10.
1.15 Transport and Communication:
The state has neither railways nor navigable waterways and the transport system is
synonymous with road communication. The only major functional railhead linking Manipur
with the rest of India is at Dimapur town of Nagaland state which is 215 kms. away from
Imphal. A railhead has been extended from Silchar to Jiribam. It covers only 1.5 kms. of
railway line over the state of Manipur. Manipur has air links with Kolkata, New Delhi, Silchar,
Guwahati and Aizawl.
1.15.1 The state has a very poor road communication facility. Highways/Roads are regarded
as arteries and veins of a state which are essential for its overall growth. The main artery of
communication is the 325 kms. long National Highway No.39 connecting Imphal with
Dimapur in the neighbouring state of Nagaland. From Imphal it runs in the south-east for
another 110 kms. to the International border town of Moreh on the Indo-Myanmar border. The
transport cost on this road is very high in view of transport service during night time and one-
way trade movement because of little exports from Manipur. Another road of considerable
economic importance is the 225 kms. long National Highways No. 53 viz. New Cachar Road,
connecting Imphal with Silchar in Assam via Jiribam on the western fringe of the Manipur
valley. The National Highways covering 967 kms. by the end of March, 2005 constituted 11.18
percent of the total road length of the state and the State Highways covering 668 kms. accounts
for 7.72 percent of the total road length of the state. The state had a total road length of 8,648
kms. of which the length of surfaced and unsurfaced roads were 4,573 kms. and 4,075 kms.
respectively.
1.16 Banking :
The need for a well-developed banking system in the economic life of a state can hardly
be exaggerated. The number of offices of commercial banks in 2008 was 76 including 33 in
Rural, 20 in Semi-Urban and 23 in Urban area. By the end of March, 2009 there were altogether
81 scheduled commercial banks (Rural-35, Semi-Urban-21 and Urban-25) in the state. The
average population per bank offices of the state was about 39 thousands according to the Report
on Quarterly Statistics on Deposits and Credit of Scheduled Commercial Banks brought out by

16
the Reserve Bank of India. The per capita deposits and per capita credit were to the tune of
Rs.17,090 and Rs.5,141 respectively in 2012.
1.17 Education: Education, being the base for the development of human resources, improving those
infrastructures related with it continued to be one of the main objectives of the state
Government. Implementation of various programmes, schemes/projects has been taken up to
achieve overall quality education. The total number of educational institutions (Schools,
Colleges, Universities) in the state during the year 2002-2003 stood at 4284 showing an
increase of 2.41 percent over that of the previous year. The total number of educational
institutions (excluding Colleges and Universities) in the state is 3979 during the year 2009-
2010. The enrolment of school students has increased by 17.09 per cent during 2002-2003 over
that of the previous year. While the overall literacy rate was 59.89 per cent in 1991, 70.50 per
cent in 2001, it has increased to 79.21 per cent(excluding Mao-Maram, Purul and Paomata Sub-
divisions) in 2011 census. The teacher pupil ratio was 1:10 during the year 2009-2010.
1.18.1 In 2007, free text books worth Rs. 3.96 crores was provided to 2,76,120 students
(SC/ST) of class I to VIII under the Sarva Shiksha Abhiyan (SSA) scheme.
1.18 Public Distribution System:
Public Distribution System is operating through a network of fair price shops in the
state to provide the essential commodities at a reasonable price fixed by the Government. The
total number of fair price shops functioning in the state by the end of March, 2007 was 2,551.
During 2007-08, through the network of Fair Price Shops, under Targeted Public Distribution
System, 68,274 tonnes of rice and 4,178 tonnes of sugar were distributed. Construction of
2,500 tonnes capacity Godown under SPA has also been taken up to enhance storage capacity
of foodgrains in Tamenglong and Churachandpur Districts.
1.19 Health Services:
Medical facilities in the state were mainly provided by the state Government. Medical
and Health care facilities were available to the people of Manipur through a network of 550
hospitals/dispensaries with a total manpower of 888 (2005-06) doctors and 1,055 (2005-06)
nurses, midwives and dias. The number of beds available was 2,405. Out of 278.5 thousands

17
patients treated in 2009-10, 21.1 thousands were indoor patients while 257.4 thousands were
outdoor patients.
1.20 Water Supply :
The National Water policy aims at providing safe drinking water and basic sanitations
to all sections of the society with special attention to the needs of the people of the rural and
urban areas. Under the Rural water Supply Programme (centrally sponsored scheme of
Minimum Need Programme (MNP) and Accelerated Rural Water Supply
Programme)(ARWSP), 2388 habitation are covered as on 1.4.2010. Out of which only 40.52
per cent of the habitation were fully covered while 42.68 per cent were partially covered. To
bridge the gap between the demand and supply of safe drinking water in the urban areas, a
project report for augmentation of water supply for Imphal city phase–I has been formulated.
During the Ninth Plan, the extension of existing Kangchup plant has been commissioned under
Externally Aided Project (EAP) with French assistance.
1.21 Sanitation :
With the objective of improving the sanitary condition of Imphal City, Sewerage
Project with French Assistance has been started and targeted for completion in October, 2009.
The project was taken up at an estimated cost of Rs. 134.75 crores (Rs. 92.21 crores and Rs.
41.54 crores as State and EAP components respectively) covering Imphal Municipal Ward No.
1, 2, 3, 4, 5, 6, 14, 15, 24, 25 and 26. The expenditure expected to be incurred during 2007-08
was Rs. 13.50 crores under the State Plan and Rs. 3.36 crores under EAP component. The work
is being continued and the completion is targeted by March, 2012.
1.22 Tourism :
The state has immense scope for promotion of tourism. It has a salubrious climate,
exotic greenery and rich flora besides the rich culture. Keibul Lamjao National Park, the only
habitat of Brow Antlered Deer, on the bank of Loktak lake, INA (Indian National Army)
Memorial at Moirang, Siroi National Park at Ukhrul, Loktak lake, the biggest fresh water lake
in the North-East of India, Khongjom War Memorial at Khongjom are the major tourist spots
of the state. Efforts are being made to develop an eco-tourism park at Nongmaiching and Sadu
Chiru waterfalls as tourist sports. During the year 2012-13, 768 foreign tourists and 1,31,803

18
domestic tourists ; 1,932 foreign tourist and 1,21,032 domestic tourist in 2013-14 came to the
state.
1.23 Empowerment of women:
To empower women and bring them into the mainstream, an enabling environment with
requisite policies and programmes, institutional machineries at various levels and adequate
resources has been created. There is substantial increase in the number of educated women in
the state. From a mere 0.04 female literacy rate in 1901, it rose to 60.50 percent as per 2001
census and 72.37 per cent in 2011 census.
1.24 Employment Situation:
Employment situation in the state is not much encouraging as compared to other states
of India. As per the employment exchange statistics, the number of persons newly registered
in 17 employment Exchanges in the state during the year 2010-11 was 16,057 persons. The
number of persons on live register of all employment exchanges stood at 6,89,119 persons as
on 31st March, 2011.
1.24.1 Economic Census is the complete count of all entrepreneurial units located within the
Geographical boundaries of the country. Five Economic Censuses have been conducted in the
year 1977, 1980, 1990, 1998 and 2005.
As per the results of the Fifth Economic Census 2005, there are 1,04,732 enterprises in
the State engaged in different economic activities other than crop production and plantation.
Out of which, 54.98% are in the rural areas and 45.02% in the urban areas. Total number of
persons working in all the enterprises is found to be 2,36,076 of which 1,20,355 and 1,15,721
workers are respectively engaged in economic activities operated in rural and urban areas of
the state.
1.25 Poverty:
The number of person below poverty line is 3.76 lakhs (22.3%) and 0.20 lakhs (3.3%) in
the rural and urban Manipur respectively according to 61st Round (2004-05) of NSS.
1.26 Pattern of Consumption:
Consumer behaviours of various households are different according to time and space.
Within the same time and space, the pattern of consumption is different from household to
household according to income and the types of economic activities pursued. The standard of
living of the people of a state/country is reflected in the nature of consumption by the people

19
of the state/country. The incidence of poverty is measured by the level of consumption
expenditure.
1.26.1 According to the 61st Round (July, 2004 to June, 2005) of National Sample Survey
(NSS), the Monthly Per Capita Expenditure (MPCE) in the rural areas of Manipur was
Rs.614.20 whereas in the case of urban areas, it was Rs.726.38. This indicates that the quality
of life in the urban areas are better than those in the rural areas. From the available results of
the 64th Round (July, 2007 – June, 2008), the monthly per capita expenditure in rural areas of
Manipur on food and non-food was Rs. 431.08 and Rs. 411.84 respectively while the total
MPCE was found to be Rs. 842.92.
1.26.2 According to the 68th Round (July, 2011 to June, 2012) of NSS, the MPCE in rural
and urban areas of Manipur was Rs. 1,501.92 and Rs. 1,482.67 respectively. The survey results
showed that the MPCE on food (Rs. 812.78) is higher than on non-food (Rs. 689.14) in rural
areas while in the urban areas, the MPCE on food (Rs. 777.64) is higher than on non-food
(Rs. 705.03) in Manipur.

20
CHAPTER II
DEMOGRAPHIC FEATURES
Population of a country is its most important asset and resource for all kinds of
development. In terms of size of population, Manipur is the fourth largest State in the North
Eastern Region of India. Population of Manipur constitutes 6.24 percent of the total population
of 8 (eight) north eastern states including Sikkim where it comprises nearly 0.24 percent of the
total population of India. Population pressure is found to be increasing day by day reducing the
man-land ratio from about 1: 7.85 hectares in 1901 to 1: 0.78 hectares in 2011. With such a
size of population to support on so small area, the State of Manipur finds itself in great difficulty
in making any significant dent on its poverty and economic backwardness.
2.1 Area and population: Manipur is a small State with an area of 22,327 sq.kms. which constitutes 0.7 percent
of the Indian Union according to 2011 Census. It is situated in the far flung north-eastern border
of India. In terms of area, Manipur ranks twentieth among the states of India and fourth in the
north-eastern states of India. Manipur ranked first in terms of sex-ratio amongst the north-
eastern states of India according to Census 2011. The following Table No. 2.1 gives a
comparative picture of the population statistics of North-Eastern States of India.
Table No. 2.1 Population Statistics of North Eastern States of India
North Eastern
States/All India
Area
(sq. km.)
Population Decennial
Growth Rate
(2001-2011)
Density (per sq. km.)
2011 2001 Census 2011 Census
1 2 3 4 5 6
1. Arunachal Pradesh 83,743 10,97,968 13,83,727 26.03 17
2. Assam 78,438 2,66,55,528 3,12,05,576 17.07 398
3. Manipur 22,327 22,93,896 28,55,794 24.50 128
4. Meghalaya 22,429 23,18,822 29,66,889 27.95 132
5. Mizoram 21,081 8,88,573 10,97,206 23.48 52
6. Nagaland 16,579 19,90,036 19,78,502 - 0.58 119
7. Sikkim 7,096 5,40,851 6,10,577 12.89 86
8. Tripura 10,486 31,99,203 36,73,917 14.84 350
North Eastern States 2,62,179 3,89,84,877 4,57,72,188 17.40 175
All India 32,87,263 102,87,37, 436 121,08,54,977 17.70 368
Source: Office of the Registrar General of India.

21
The total geographical area of the State was recorded as 22,347 sq. kms. in 1961
Census. It was recorded as 22,356 sq. kms. in 1971 Census however it was recorded as 22,327
sq. kms. in 1981 Census. The area of the State has remained the same as 22,327 sq.kms. in
1991, 2001 and 2011 Censuses.
Geo-climatically, the state may be clubbed into 2 (two) regions such as the hill and the
valley. The valley region is very small with an area of 2,238 sq. kms. which is 10 percent of
the total State area, but this is one of the most thickly populated region of the state. The hill
constitutes 20,089 sq. kms. i.e., 90 percent of the total State area and therefore, it is
approximately 9 times the size of the valley area. The density of population per sq. km. in the
hill is 61 as against 730 in the valley. District-wise break-up of area and population of Manipur
as per the final result of 2011 Census is presented in Table No. 2.2.
Table No. 2.2
Area and Population of Manipur by Districts according to 2011 Census
Region/District Area Population Population
Density
(per sq. km.) Sq. km. P.C. to total ’000 Nos. P.C. to total
1 2 3 4 5 6
A. Hill 20,089 90.0 1222 42.8 61
Senapati 3,271 14.7 479 16.8 146
Tamenglong 4,391 19.7 141 4.9 32
Churachandpur 4,570 20.5 274 9.6 60
Chandel 3,313 14.8 144 5.0 44
Ukhrul 4,544 20.3 184 6.5 40
B. Valley 2,238 10.0 1633 57.2 730
Imphal East 709 3.2 456 16.0 643
Imphal West 519 2.3 518 18.1 998
Bishnupur 496 2.2 237 8.3 479
Thoubal 514 2.3 422 14.8 821
Manipur 22,327 100.0 2,856 100.0 128
Source : Office of the Registrar General of India

22
The population of Manipur as per the 2011 Census was 28.6 lakhs consisting of 14.4 lakhs
males and 14.2 lakhs females. In absolute term, the population of Manipur has increased by
5.62 lakhs during the decade 2001-2011. The population of Manipur has grown steadily during
the period from 1901 to 1951. The growth of population was found quite faster during the
decades 1951-1961 and 1961-1971. Then, the growth is somehow checked during the decade
1971-1981 and the growth rates is declined further during the following two decades 1991-
2001 and 2001-2011. The decadal growth rate in 2011 over 2001 was found to be 24.50 percent.
The population trend of Manipur from the year 1901 onwards can be seen in Table No. 2.3.
Table No. 2.3
Census Population of Manipur from 1901 to 2011
Year
Person Male Female
Absolute
Number
Decadal
variation in
p.c.
Absolute
Number
Decadal
variation in
p.c.
Absolute
Number
Decadal
variation in
p.c.
1 2 3 4 5 6 7
1901 2,84,465 – 1,39,632 – 1,44,833 –
1911 3,46,222 21.71 1,70,666 22.23 1,75,556 21.21
1921 3,84,016 10.92 1,88,119 10.23 1,95,897 11.59
1931 4,45,606 16.04 2,15,815 14.72 2,29,791 17.30
1941 5,12,069 14.92 2,49,183 15.46 2,62,886 14.40
1951 5,77,635 12.80 2,83,685 13.85 2,93,950 11.82
1961 7,80,037 35.04 3,87,058 36.44 3,92,979 33.69
1971 10,72,753 37.53 5,41,675 39.95 5,31,078 35.14
1981 14,20,953 32.46 7,21,006 33.11 6,99,947 31.80
1991 18,37,149 29.29 9,38,359 30.15 8,98,790 28.41
2001 22,93,896 24.86 11,61,952 23.83 11,31,944 25.94
2011 28,55,794 24.50 14,38,586 23.81 14,17,208 25.20
Source : Office of the Registrar General of India

23
2.2 Growth of Population:
In 1901, the population of Manipur was 2.84 lakhs which rose to 22.94 lakhs in 2001 and
then to 28.56 lakhs in 2011. It is observed that during this period, Manipur`s population had
increased by 22.86 lakh persons which was about 9 times of 1901. Table No. 2.4 presents the
decennial growth rates of Manipur as compared to those of all India.
Table No. 2.4
Population Growth of Manipur vis-à-vis India during the period from 1901 to 2011
Census Year
Total Population
(in lakhs)
Decennial growth
(percent)
Manipur All-India Manipur All-India
1 2 3 4 5
1901 2.84 2,383.96 – –
1911 3.46 2,520.93 (+) 21.71 (+) 5.75
1921 3.84 2,513.21 (+) 10.92 (-) 0.31
1931 4.46 2,789.77 (+) 16.04 (+) 11.00
1941 5.12 3,186.61 (+) 14.92 (+) 14.22
1951 5.78 3,610.88 (+) 12.80 (+) 13.31
1961 7.80 4,392.34 (+) 35.04 (+) 21.51
1971 10.73 5,481.60 (+) 37.53 (+) 24.80
1981 14.21 6,833.29 (+) 32.46 (+) 24.66
1991 18.37 8,463.03 (+) 29.29 (+) 23.85
2001 22.94 10,287.37 (+) 24.86 (+) 21.56
2011 28.56 12,108.55 (+) 24.50 (+) 17.70
Source: Office of the Registrar General of India
The population growth of Manipur during the period from 1901 to 1951 showed a
slower growth rate but during the decade 1951-1961 a very high percentage of growth rate was
observed which stood at 35.04 percent. However, the decade 1961-1971 registered highest
growth rate which was recorded to 37.53 percent. Thereafter, the decadal growth rate decreased
to 32.46 percent in 1971-1981, 29.29 percent in the decade 1981-1991 and it further declined
to 24.86 percent in 1991-2001 and 24.50 percent in 2001-2011.The district wise absolute
growth in the total population in 2011 over 2001 is shown in Table No. 2.5.

24
Table No 2.5 District wise absolute growth (2001-2011) of total Population, Manipur
District/State
Population Absolute
Population
Growth
2001 Census 2011 Census
Male Female Total Male Female Total
1 2 3 4 5 6 7 8
Senapati 146548 137073 283621 247323 231825 479148 195527
Tamenglong 58014 53485 111499 72371 68280 140651 29152
Churachandpur 117232 110673 227905 138820 135323 274143 46238
Chandel 59741 58586 118327 74579 69603 144182 25855
Ukhrul 73465 67313 140778 94718 89280 183998 43220
Imphal East 198371 196505 394876 226094 230019 456113 61237
Imphal West 221781 222601 444382 255054 262938 517992 73610
Bishnupur 104550 103818 208368 118782 118617 237399 29031
Thoubal 182250 181890 364140 210845 211323 422168 58028
Manipur 1161952 1131944 2293896 1438586 1417208 2855794 561898
Considering the literacy rates, low sex ratios, higher mean age at marriage, changes in
consumption patterns, various health interventions, people’s awareness of small family norms,
lesser immigrations etc., it was naturally expected to have a lesser growth rate in the decade
2001-2011. The decade 2001-2011 registered a growth rate of 24.50 percent as against 17.50
percent of All-India. The average annual arithmetic, geometric and exponential growth rates
are shown in Table No. 2.6.
Table No. 2.6
Population growth rate from Censuses
Period
Average annual percentage growth rate
Manipur All-India
Arithmetic Geometric Exponential Arithmetic Geometric Exponential
1 2 3 4 5 6 7
1901-11 2.17 1.98 1.96 0.58 0.56 0.56
1911-21 1.09 1.04 1.03 (-) 0.03 (-) 0.03 (-) 0.03
1921-31 1.60 1.50 1.48 1.10 1.05 1.04
1931-41 1.49 1.40 1.38 1.42 1.34 1.33
1941-51 1.28 1.21 1.20 1.33 1.26 1.25
1951-61 3.50 3.05 3.00 2.15 1.98 1.96
1961-71 3.75 3.23 3.19 2.48 2.24 2.22
1971-81 3.25 2.85 2.81 2.47 2.23 2.20
1981-91 2.93 2.60 2.57 2.39 2.16 2.14
1991-01 2.49 2.25 2.22 2.15 1.97 1.95
2001-11 2.45 2.22 2.19 1.77 1.64 1.63
Note: Radical sign for positive variations is not indicated

25
In most of the districts, growth rate has declined during the decade 2001-2011 except
Ukhrul and Imphal East districts. The most populous district of the State according to 2011
Census is Imphal West District while the least populated is Tamenglong District. The valley
districts accounts for 61.54 percent of State’s population in 2001 and it constitutes 57.2 percent
of the State in 2011. In 2011 Census, the valley area of the State shares 57.2 percent of the
State total population whereas the hill area account for 42.8 percent. There is high tendency of
migration of people from the hills to valley areas but migration from the valley to the hill areas
are very much less in general. The following Table No. 2.7 indicates the district-wise decennial
growth rates of population since 1991.
Table No. 2.7 Decennial population growth rates of the districts of Manipur
Region/District Area
(sq. km.)
Population (’00 nos.) Decennial Growth
(Percentage)
1991 2001 2011 1991-2001
2001-2011
1 2 3 4 5 6 7
A. Hill 20,089 6,512 8,821 12,221 35.46 38.54
Senapati 3,271 2,084 2,836 4,791 36.08 68.94
Tamenglong 4,391 863 1,115 1,407 29.20 26.19
Churachandpur 4,570 1,762 2,279 2,741 29.34 20.27
Chandel 3,313 710 1,183 1,442 66.62 21.89
Ukhrul 4,544 1,093 1,408 1,840 28.82 30.68
B. Valley 2,238 11,860 14,118 16,337 19.04 15.72
Imphal East 709 3,305 3,949 4,561 0.28 15.50
Imphal West 519 3,808 4,444 5,180 16.70 16.56
Bishnupur 496 1,808 2,084 2,374 15.27 13.92
Thoubal 514 2,939 3,641 4,222 23.89 15.96
Manipur 22,327 18,372 22,939 28,558 24.86 24.50
2.3 Future Population :

26
The population of Manipur is expected to be of the order of 35.45 lakhs as on 1st March,
2021 while the mid-year population is estimated at 35.90 lakhs as on 1st October, 2021. Table
No. 2.8 presents the estimated population of Manipur for the years from 2011 (as on 1st
October) to 2021.
Table No. 2.8 Estimated population of Manipur as on 1st March and 1st October.
Year Population
as on 1st March as on 1st October
1 2 3
2011 28,55,794 28,92,527
2012 29,18,583 29,56,123
2013 29,82,664 30,21,029
2014 30,48,063 30,87,269
2015 31,14,805 31,54,869
2016 31,82,914 32,23,854
2017 32,52,417 32,94,251
2018 33,23,340 33,66,087
2019 33,95,710 34,39,388
2020 34,69,554 35,14,181
2021 35,44,899 35,90,495
If current trend continues, the population of Manipur will be 35.90 lakhs by October, 2021.
2.4 Density of Population:
Density of population refers to the number of persons living per sq. km. of geographical
area. It is used to find out whether a region or country is thickly populated or thinly populated.
In 1971, it was only 48 persons per sq. k.m. which rose to 64 in 1981 and further to 82 in 1991.
According to 2011 Census, density of population of Manipur was 128 persons per sq. km. as
against 103 persons per sq. km. in 2001 Census. The following Table No. 2.9 presents the
Census-wise population density of Manipur.

27
Table No. 2.9 Population Density of Manipur
Census Year Population
(in lakhs)
Sex Ratio
(females per 1000 males)
Density
(per sq. km.)
1 2 3 4
1911 3.46 1,029 15
1921 3.84 1,041 17
1931 4.46 1,065 20
1941 5.12 1,055 23
1951 5.78 1,036 26
1961 7.80 1,015 35
1971 10.73 980 48
1981 14.21 971 64
1991 18.37 958 82
2001 22.94 974 103
2011 28.56 985 128
Among the districts, Imphal West District had the highest density which is followed by
Thoubal. The lowest was recorded in Tamenglong District with only 32 persons per sq. km. in 2011
as evident from Table No. 2.10.
Table No. 2.10
Distribution of area, population, sex ratio and density of population by districts
of Manipur as per 2011 Census
District Area
(in sq. km.)
Population
(in ’000)
Sex Ratio
(females per 1000 males)
Density
(per sq. km.)
1 2 3 4 5
1. Senapati 3,271 479 937 146
2. Tamenglong 4,391 141 943 32
3. Churachandpur 4,570 274 975 60
4. Chandel 3,313 144 933 44
5. Ukhrul 4,544 184 943 40
6. Imphal East 709 456 1,017 643
7. Imphal West 519 518 1,031 998
8. Bishnupur 496 237 999 479
9. Thoubal 514 422 1,002 821

28
Manipur 22,327 2,856 985 128
All India 32,87,263 121,08,55 943 368
Source: Office of the Registrar General, India
2.5 Sex Ratio:
Sex ratio is one of the important indicators for studying the status of women in a
State/Country and to have an idea on the probable future population of the State/Country. The
sex ratio has been steadily declining from 1901 to 1991 census. The sex ratio of the State in
2011 was found to be slightly higher than 2001 which stood at 985. Table No. 2.11 present the
rural-urban sex ratio of Manipur.
Table No. 2.11 Sex Ratio of population
Year Sex ratio (females per 1000 males)
Rural Urban Combined
1 2 3 4
1901 1,038 1,036 1,037
1911 1,023 1,051 1,029
1921 1,029 1,091 1,041
1931 1,048 1,137 1,065
1941 1,044 1,102 1,055
1951 1,039 633 1,036
1961 1,018 985 1,015
1971 980 981 980
1981 971 969 971
1991 951 975 958
2001 963 1009 974
2011 969 1026 985
2.6 Rural and Urban Population:
It is true to say that Manipur lives in rural areas. According to 2001 Census, the number
of villages was 2391. Of which 2315 were inhabited while 76 were uninhabited. On the other
hand, the number of towns was 33. About 74.89 % of the total population live in the rural areas
whereas only 25.11 % of the total population are found in the urban areas.
29
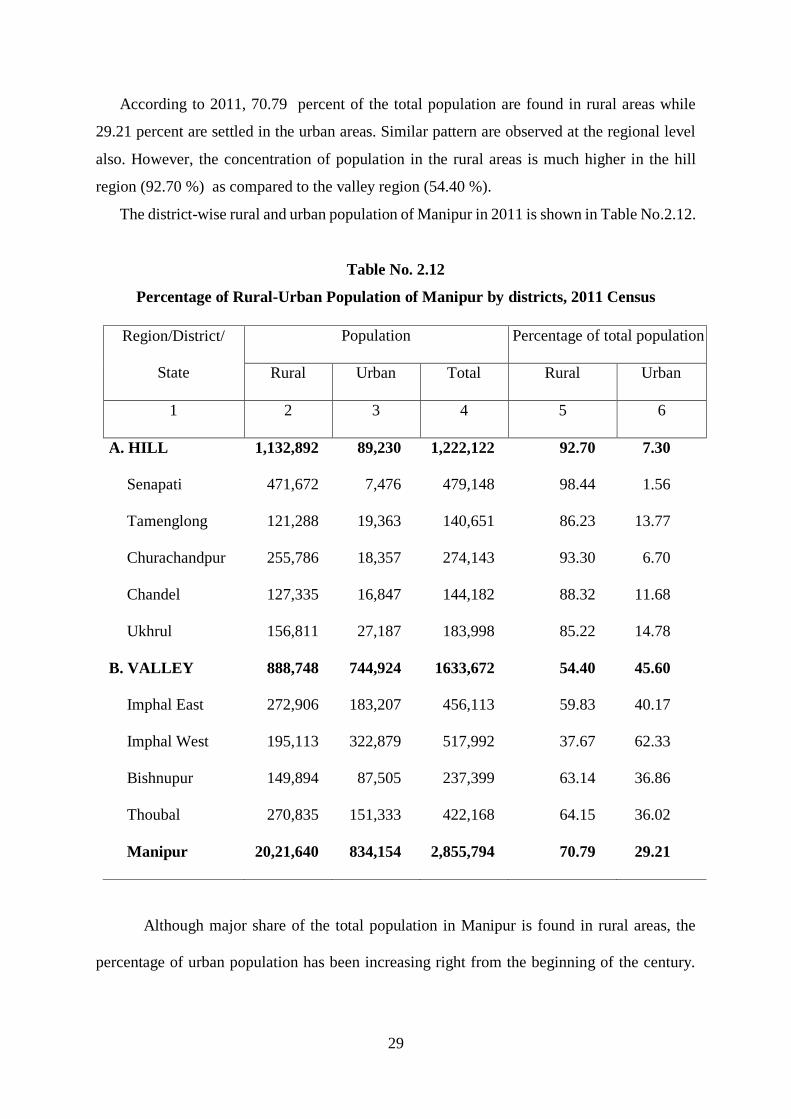
According to 2011, 70.79 percent of the total population are found in rural areas while
29.21 percent are settled in the urban areas. Similar pattern are observed at the regional level
also. However, the concentration of population in the rural areas is much higher in the hill
region (92.70 %) as compared to the valley region (54.40 %).
The district-wise rural and urban population of Manipur in 2011 is shown in Table No.2.12.
Table No. 2.12
Percentage of Rural-Urban Population of Manipur by districts, 2011 Census
Region/District/
State
Population Percentage of total population
Rural Urban Total Rural Urban
1 2 3 4 5 6
A. HILL 1,132,892 89,230 1,222,122 92.70 7.30
Senapati 471,672 7,476 479,148 98.44 1.56
Tamenglong 121,288 19,363 140,651 86.23 13.77
Churachandpur 255,786 18,357 274,143 93.30 6.70
Chandel 127,335 16,847 144,182 88.32 11.68
Ukhrul 156,811 27,187 183,998 85.22 14.78
B. VALLEY 888,748 744,924 1633,672 54.40 45.60
Imphal East 272,906 183,207 456,113 59.83 40.17
Imphal West 195,113 322,879 517,992 37.67 62.33
Bishnupur 149,894 87,505 237,399 63.14 36.86
Thoubal 270,835 151,333 422,168 64.15 36.02
Manipur 20,21,640 834,154 2,855,794 70.79 29.21
Although major share of the total population in Manipur is found in rural areas, the
percentage of urban population has been increasing right from the beginning of the century.

30
The following Table No. 2.13 shows the absolute growth in the Rural-Urban population of
Manipur.
Table No. 2.13 Rural-Urban Population of Manipur
Year Population
Rural Urban Total
1 2 3 4
1921 3,04,013 80,003 3,84,016
1931 3,59,802 85,804 4,45,606
1941 4,12,353 99,716 5,12,069
1951 5,74,773 2,862 5,77,635
1961 7,12,320 67,717 7,80,037
1971 9,31,261 1,41,492 10,72,753
1981 10,45,493 3,75,460 14,20,953
1991 13,31,504 5,05,645 18,37,149
2001 17,17,928 5,75,968 22,93,896
2011 20,21,640 8,34,154 28,55,794
The census figures generally indicate that the average annual arithmetic growth rate of
urban population had been higher than rural population. From 1901 to 2011, the average annual
growth of population has increased from 2.17 percent in 1901-1911 to 2.49 percent in 1991-
2001. A decrease in the average arithmetic growth rate of population in the 2001-2011 census
to 2.45 percent over 2.49 percent in 1991-2001 Census is observed from Table No. 2.14 below.
Table No. 2.14 Rural-Urban growth of population
Period
Average annual arithmetic growth rate
of population in P.C.
Rural-Urban
Growth
differential Rural Urban Total
1 2 3 4 5
1901-11 2.79 0.33 2.17 (+) 2.46
1911-21 1.19 0.72 1.09 (+) 0.47
1921-31 1.84 0.73 1.60 (+) 1.11
1931-41 1.46 1.62 1.49 (-) 0.16
1941-51 3.94 (-) 9.71 1.28 (-) 5.77
1951-61 2.39 226.61 3.50 (-) 224.22
1961-71 3.07 10.89 3.75 (-) 7.82
1971-81 1.23 16.54 3.25 (-) 15.31
1981-91 2.74 3.47 2.93 (-) 0.73
1991-01 2.90 1.39 2.49 (+) 1.51
2001-11 1.77 4.48 2.45 (-) 2.71

31
2.7 Urbanisation:
Urbanisation stands for growth of towns and non-agricultural activities. It is generally
associated with the growth of industrialization, trade and commerce. According to 2011
census, a total of 8,34,154 population were found in the urban area constituting 51 towns (28
statutory and 23 census towns) in the state. It appears that the process of urbanization has been
very slow in the state which perhaps indicates a slower occupational shift. The number of towns
and cities has grown at a low rate from 1 (one) town in 1951 to 51 in 2011 during the last 60
years period. However, the urban population has increased as can be seen from Table No. 2.15
which shows the growth in urban population of the state since 1921 and the percentage of rural
and urban population to the total population of Manipur.
Table No. 2.15 Urbanisation in Manipur
Year No. of Towns Urban
population
Percentage to total Population
Urban Rural
1 2 3 4 5
1921 1 80,003 20.83 79.17
1931 1 85,804 19.26 80.74
1941 1 99,716 19.47 80.53
1951 1 2,862 0.50 99.50
1961 1 67,717 8.68 91.32
1971 8 1,41,492 13.19 86.81
1981 32 3,75,460 26.42 73.58
1991 31 5,05,645 27.52 72.48
2001 33 5,75,968 25.11 74.89
2011 51 8,34,154 29.21 70.79
A comparative picture between Manipur and North Eastern States of India, as regards
urbanization shows that Manipur is second among the North Eastern States of India in terms
of urban population according to 2011 Census as can be seen from Table No. 2.16. The
percentage of urban population of North Eastern States of India and all India according to
population censuses from 1971 is shown in Table No. 2.17.
Table No. 2.16 Percentage of Rural/Urban population in North Eastern States of
India 2011 Census
North Eastern
States/All India
Population Percentage to total
State /India Population
Rural Urban Total Rural Urban
1 2 3 4 5 6
1. Arunachal Pradesh 1066358 317369 1383727 77.06 22.94
2. Assam 26807034 4398542 31205576 85.90 14.10
3. Manipur 2021640 834154 2855794 70.79 29.21
4. Meghalaya 2371439 595450 2966889 79.93 20.07
5. Mizoram 525435 571771 1097206 47.89 52.11

32
6. Nagaland 1407536 570966 1978502 71.14 28.86
7. Sikkim 456999 153578 610577 74.85 25.15
8. Tripura 2712464 961453 3673917 73.83 26.17
North Eastern States 37368905 8403283 45772188 68.81 18.36
All-India 833748852 377106125 1210854977 68.81 31.14
Table No. 2.17
Percentage of Urban Population in North Eastern States of Indiavis.-a-vis India
according to Population Censuses
State/All India 1971 1981 1991 2001 2011
1 2 3 4 5 6
1. Arunachal Pradesh 3.70 6.56 12.80 20.75 22.94
2. Assam 8.82 9.88 11.10 12.90 14.10
3. Manipur 13.19 26.42 27.52 25.11 29.21
4. Meghalaya 14.55 18.07 18.60 19.58 20.07
5. Mizoram 11.36 24.67 46.10 49.63 52.11
6. Nagaland 9.95 15.52 17.21 17.23 28.86
7. Sikkim 9.37 16.15 9.10 11.07 25.15
8. Tripura 10.43 10.99 15.30 17.06 26.17
India 19.91 23.34 25.70 27.81 31.14
2.7 Literacy Rate: The extent of literacy reflects the qualitative aspect of the population. Higher literacy
emancipates economic and social backwardness. The literacy rate had shown an increase from
59.9 percent in 1991 to 79.21 percent in 2011. The following Table No. 2.18 presents the male
female break-up of literacy percentage.
Table No. 2.18 Male-Female literacy rate of Manipur
Year Literacy rate
Male Female Person
1 2 3 4
1921 7.65 0.15 3.82
1931 6.40 0.30 3.25
1941 9.77 0.61 5.06
1951 20.77 2.38 11.41
1961 45.12 15.93 30.42
1971 46.04 19.53 32.91
1981 53.29 29.06 41.35

33
1991 71.63 47.60 59.89
2001 * 80.30 60.50
70.50
2011 * 86.06 72.37 79.21
* Excluding Mao Maram, Paomata and Purul sub-division of Senapati District
The literacy rates for 1951, 1961 and 1971 relate to population aged five years and
above where the rates for the censuses from 1981 onwards relate to the population aged seven
years and above. According to 2011 Census, the percentage of literacy in Manipur (79.21%) is
higher than the All-India (72.99%) average. Table No. 2.19 provides the male-female break-
up of literacy rates of North Eastern States and All-India as per 2011 Census.
Table No. 2.19
Literacy Rate of North Eastern States of India and All-India, 2011 Census
State/India Literacy Rate (Percentage)
Male Female Person
1 2 3 4
1. Arunachal Pradesh 72.55 57.70 65.38
2. Assam 77.85 66.27 72.19
3. Manipur* 86.06 72.37 79.21
4. Meghalaya 77.95 72.89 74.43
5. Mizoram 93.35 89.27 91.33
6. Nagaland 82.75 76.11 79.55
7. Sikkim 86.55 75.61 81.42
8. Tripura 91.53 82.73 87.22
All India 80.89 64.64 72.99
* Excludes 3 sub-divisions of Senapati district viz., Mao Maram, Paomata and
Purul.
It would be seen that the literacy rate of Manipur are found to be better as compared to
that of all India both for males and females.
As recorded in 2011 census, Imphal West District ranked first among the districts of
Manipur with 86.08 percent literates which is followed by Churachandpur District with 82.78
percent. Table No. 2.20 presents the district-wise literacy rate of Manipur.
Table No. 2.20
District-wise Literacy rates as per 2011 Census in respect of Manipur State.
District/State Literacy Rate (percentage) Rank
Male Female Person
1 2 3 4 5
1. Senapati* 79.98 68.07 74.13 7
2. Tamenglong 76.09 63.69 70.05 9
3. Churachandpur 86.97 78.50 82.78 2
4. Chandel 77.78 63.96 71.11 8
34
5. Ukhrul 85.25 76.95 81.35 4
6. Imphal East 88.77 75.32 81.95 3
7. Imphal West 92.24 80.17 86.08 1
8. Bishnupur 85.11 66.68 75.85 5
9. Thoubal 85.00 64.09 74.47 6
Manipur 86.06 72.37 79.21 -
* Excludes 3 sub-divisions viz., Mao Maram, Paomata and Purul.
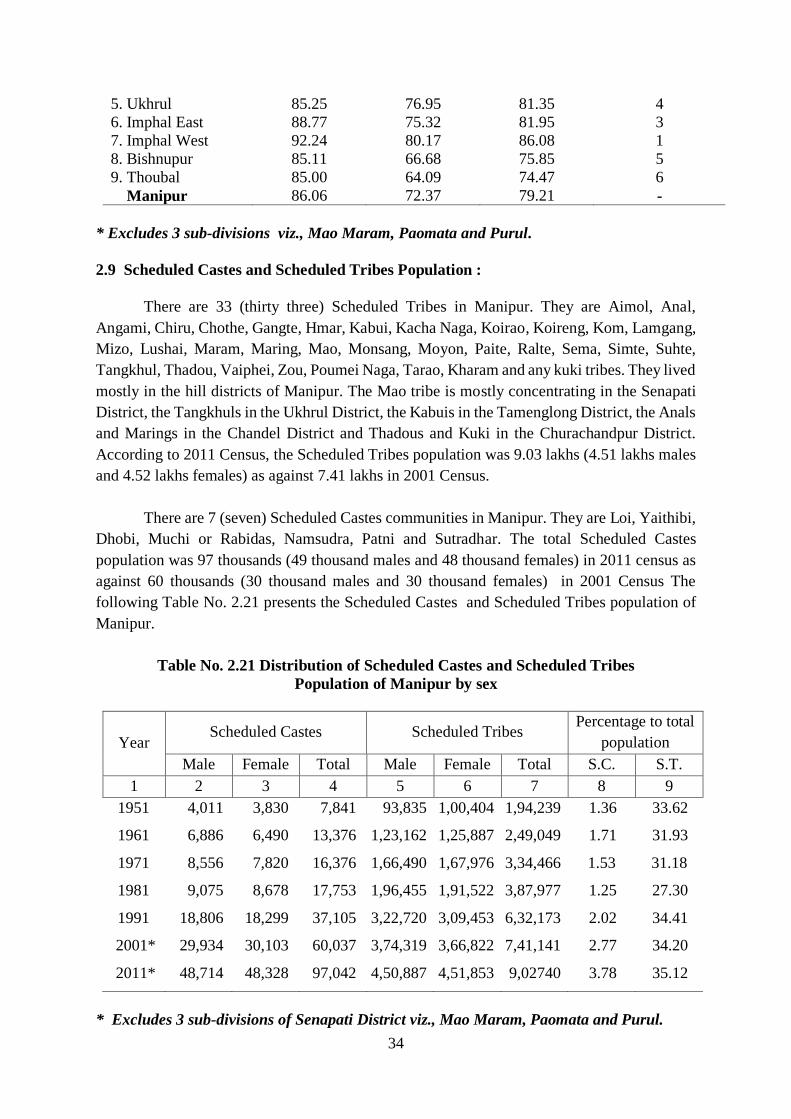
2.9 Scheduled Castes and Scheduled Tribes Population :
There are 33 (thirty three) Scheduled Tribes in Manipur. They are Aimol, Anal,
Angami, Chiru, Chothe, Gangte, Hmar, Kabui, Kacha Naga, Koirao, Koireng, Kom, Lamgang,
Mizo, Lushai, Maram, Maring, Mao, Monsang, Moyon, Paite, Ralte, Sema, Simte, Suhte,
Tangkhul, Thadou, Vaiphei, Zou, Poumei Naga, Tarao, Kharam and any kuki tribes. They lived
mostly in the hill districts of Manipur. The Mao tribe is mostly concentrating in the Senapati
District, the Tangkhuls in the Ukhrul District, the Kabuis in the Tamenglong District, the Anals
and Marings in the Chandel District and Thadous and Kuki in the Churachandpur District.
According to 2011 Census, the Scheduled Tribes population was 9.03 lakhs (4.51 lakhs males
and 4.52 lakhs females) as against 7.41 lakhs in 2001 Census.
There are 7 (seven) Scheduled Castes communities in Manipur. They are Loi, Yaithibi,
Dhobi, Muchi or Rabidas, Namsudra, Patni and Sutradhar. The total Scheduled Castes
population was 97 thousands (49 thousand males and 48 thousand females) in 2011 census as
against 60 thousands (30 thousand males and 30 thousand females) in 2001 Census The
following Table No. 2.21 presents the Scheduled Castes and Scheduled Tribes population of
Manipur.
Table No. 2.21 Distribution of Scheduled Castes and Scheduled Tribes
Population of Manipur by sex
Year Scheduled Castes Scheduled Tribes
Percentage to total
population
Male Female Total Male Female Total S.C. S.T.
1 2 3 4 5 6 7 8 9
1951 4,011 3,830 7,841 93,835 1,00,404 1,94,239 1.36 33.62
1961 6,886 6,490 13,376 1,23,162 1,25,887 2,49,049 1.71 31.93
1971 8,556 7,820 16,376 1,66,490 1,67,976 3,34,466 1.53 31.18
1981 9,075 8,678 17,753 1,96,455 1,91,522 3,87,977 1.25 27.30
1991 18,806 18,299 37,105 3,22,720 3,09,453 6,32,173 2.02 34.41
2001* 29,934 30,103 60,037 3,74,319 3,66,822 7,41,141 2.77 34.20
2011* 48,714 48,328 97,042 4,50,887 4,51,853 9,02740 3.78 35.12
* Excludes 3 sub-divisions of Senapati District viz., Mao Maram, Paomata and Purul.

35
According to the 2011 Census, about 94 percent of the scheduled tribe population are
found in the hill districts of Manipur while the remaining 6 percent are in the valley districts.
In the case of the scheduled caste population, about 98 percent are concentrated in the valley
districts as against 2 percent in the hill districts. The distribution of the scheduled tribe and
scheduled caste population in the districts of Manipur in 2011 is shown in Table No. 2.22
Table No. 2.22
Districtwise distribution of Scheduled Tribes and Scheduled Castes Population in
Manipur, 2011 Census
District/State Scheduled Tribe (ST) Scheduled Castes (SC)
% to total
population
Male Female Total % Male Female Total % ST SC
1 2 3 4 5 6 7 8 9 10 11
A. Hill 423273 422554 845827 93.70 1129 838 1967 2.03 90.30 0.21
Senapati * 77127 77401 154528 17.12 387 327 714 0.74 79.76 0.37
Tamenglong 68226 66400 134626 14.91 17 5 22 0.02 95.72 0.02
Churachandpur 126328 128459 254787 28.22 244 199 443 0.46 92.94 0.16
Chandel 63622 64658 128280 14.21 321 219 540 0.56 88.97 0.37
Ukhrul 87970 85636 173606 19.23 160 88 248 0.26 94.35 0.13
B. Valley 27614 29299 56913 6.30 47585 47490 95075 97.97 3.48 5.82
Imphal East 13500 14157 27657 3.06 8055 7784 15839 16.32 6.06 3.47
Imphal West 11560 12601 24161 2.68 8308 8222 16530 17.03 4.66 3.19
Bishnupur 1625 1662 3287 0.36 11085 11028 22113 22.79 1.38 9.31
Thoubal 929 879 1808 0.20 20137 20456 40593 41.83 0.43 9.62
Manipur 450887 451853 902740 100.00 48714 48328 97042 100.00 35.12 3.78
* Excludes Mao-Maram, Paomata and Purul sub-division.
A picture of the percentage of Scheduled Castes and Scheduled Tribes population in
the North Eastern States of India and All India according to 2011 Census can be seen from
Table No. 2.23.
Table No. 2.23 Percentage of Scheduled Castes and Scheduled Tribes in North
Eastern States of India and All India, 2011 Census.
State/All India Total Population
(in’000)
Percentage to total Population
Scheduled Castes Scheduled Tribes
1 2 3 4
1. Arunachal Pradesh 1384 - 68.79
2. Assam 31206 7.15 12.45
3. Manipur * 2570 3.78 35.12

36
4. Meghalaya 2967 0.58 86.15
5. Mizoram 1097 0.11 94.43
6. Nagaland 1979 - 86.48
7. Sikkim 1068 2.65 19.33
8. Tripura 3674 17.83 31.76
India* 1210570 16.63 8.61
* Excludes figures of Mao-Maram, Paomata and Purul Sub-division of Senapati
District of Manipur.
2.10 Population by Religion : Attempts are made to provide a picture of the religious pursuits of the people of
Manipur. However, the analysis is to be made excluding the estimated population of 3 sub-
divisions (Mao Maram, Paomata and Purul) of Senapati District as the estimations are made at
the sub-division level only. For the purpose of the present analysis, the total population of
Manipur in 2001 is taken as 21,66,788 excluding the said 3 sub-divisions. The State of Manipur
is inhabited by different ethnic and religious groups. The Hindus who constitute about 46
(forty-six) percent of the total population are mostly settling in the 4 valley districts. The
Muslims who constitute about 8 percent of the total population are also settling in the valley
areas. Most of the tribes are Christians and they are mostly settling in the hills. Other small
communities like Sikhs, Buddhists, Jains and others etc. constitute 10 percent of the State’s
population. The distribution of the population of Manipur by religious communities may be
seen in the Table No. 2.24 below:
Table No. 2.24 Distribution of Population by Religion in Manipur (1951-2001)
Religious
Communities
Population Percentage
increase
1991-2001 1951 1961 1971 1981 1991 2001*
1 2 3 4 5 6 7 8
1. Hindu 3,47,325 4,81,112 6,32,597 8,53,180 10,59,470 9,96,894 (-) 5.91
2. Muslim 37,197 48,588 70,969 99,327 1,33,535 1,90,939 4.30
3. Christian 68,394 1,52,043 2,79,243 4,21,702 6,26,669 7,37,578 17.70
4. Sikh 50 523 1,028 992 1,301 1,653 27.06
5. Buddhist 33 325 495 473 711 1,926 170.89
6. Jain 150 778 1,408 975 1,337 1,461 9.27
7. Others 1,24,486 - 83,167 35,490 14,066 2,35,280 1572.69
8. Religions
not stated
-
96,668
3,846
8,814
60
1,057
1661.67
Total 5,77,635 7,80,037 10,72,753 14,20,953 18,37,149 21,66,788 17.94

37
* Excluding Mao Maram, Paomata and Purul Sub-division of Senapati District
Source: Office of the Registrar General of India.
2.11 Age Composition: The population stabilization requires the stabilization of the age-composition of the
population. The changes in the level of fertility and mortality affects the age distribution of the
population in the subsequent years. The age-sex distribution of the population has also been
changing. Due to decrease in fertility, the population in the younger age-group 0-14 years had
decreased from 43.1 percent in 1961 to 35.2 percent in 1991. The proportion of population in
the working age-group 15-59 years increased from 52.3 percent in 1911 to about 55 percent in
1981 and again increased to 58 percent in 1991 Census. It further increased to 61 percent in
2001.
With the improved health care in the State, the life expectancy of the people has also
increased resulting in the higher proportion of senior citizens in the State. The population in
the age group of 60 years and above has increased from 4.2 percent in 1911 to 6.9 percent in
2001. The distribution of population by age-group is presented in Table no. 2.25 below:
Table No. 2.25
Percentage Distribution of population in different age groups
Year Age group
0-14 15-59 60 and above All ages
1 2 3 4 5
1911 43.5 52.3 4.2 100.0
1921 41.0 53.2 5.8 100.0
1931 42.6 52.5 4.9 100.0
1941 41.5 53.1 5.4 100.0
1951 40.3 53.6 6.1 100.0
1961 43.1 51.1 5.8 100.0
1971 42.5 51.4 6.1 100.0
1981 39.3 54.7 6.0 100.0
1991 35.2 57.7 6.1 100.0
2001* 32.6 60.5 6.9 100.0
* Excluding Mao Maram, Paomata and Purul Sub-division of Senapati District
Source: Office of the Registrar General of India.
2.12 Birth, Death and Mortality Rates:

38
With the implementation of various socio-economic upliftment programmes, birth and
death rates have been continuously decreasing since independence. In the rural areas of
Manipur, the birth rate of population per annum falls from 19.0 in 2001 to 14.2 in 2011 where
the rural death rate is declining from 4.8 to 4.1 in the same period. The urban birth rate
registered a fall from 15.9 in 2001 to 15.0 in 2011 where the urban death rate falls from 6.1 to
4.2 in the same period. The rural-urban birth, death and infant mortality rates in Manipur are
presented in Table No. 2.26 and North Eastern States of India, vis-à-vis All India are presented
in the Table No. 2 (d) of part-II.
Table No. 2.26 Estimated Birth, Death and Infant Mortality Rates in Manipur
(2001 to 2011)
Item Year
2001 2004 2005 2006 2007 2008 2009 2010 2011 1 2 3 4 5 6 7 8 9 10
1. Birth rate:
Rural 19.0 13.3 14.5 13.5 14.4 15.9 15.4 14.8 14.2
Urban 15.9 15.8 15.5 13.1 15.2 15.7 15.5 15.3 15.0
Combined 18.2 13.9 14.7 13.4 14.6 15.8 15.4 14.9 14.4
2. Death rate:
Rural 4.8 4.3 4.0 4.4 4.2 4.8 4.6 4.3 4.1
Urban 6.1 4.4 4.4 4.6 4.9 5.4 5.0 4.0 4.2
Combined 5.1 4.3 4.1 4.5 4.4 5.0 4.7 4.2 4.1
3. Natural
Growth
rate:
Rural 14.2 9.0 10.5 9.1 10.2 11.1 10.8 10.5 10.2
Urban 9.9 11.5 11.1 8.6 10.3 10.3 10.5 11.3 10.2
Combined 13.1 9.6 10.7 9.0 10.2 10.9 10.7 10.7 10.3
4. Infant
Mortality
rate:
Rural 19 13 12 11 13 16 18 15 11
Urban 23 19 14 11 9 8 11 9 12
Combined 20 14 13 11 12 14 16 14 11
Source: Sample Registration System Bulletin, Registrar General of India.
2.13 Economic Classification:
The result obtained in the last decennial Census 2011 reveals that 45.09 percent of the
populations are workers whose main activity is participation in any economically productive
activities.
39
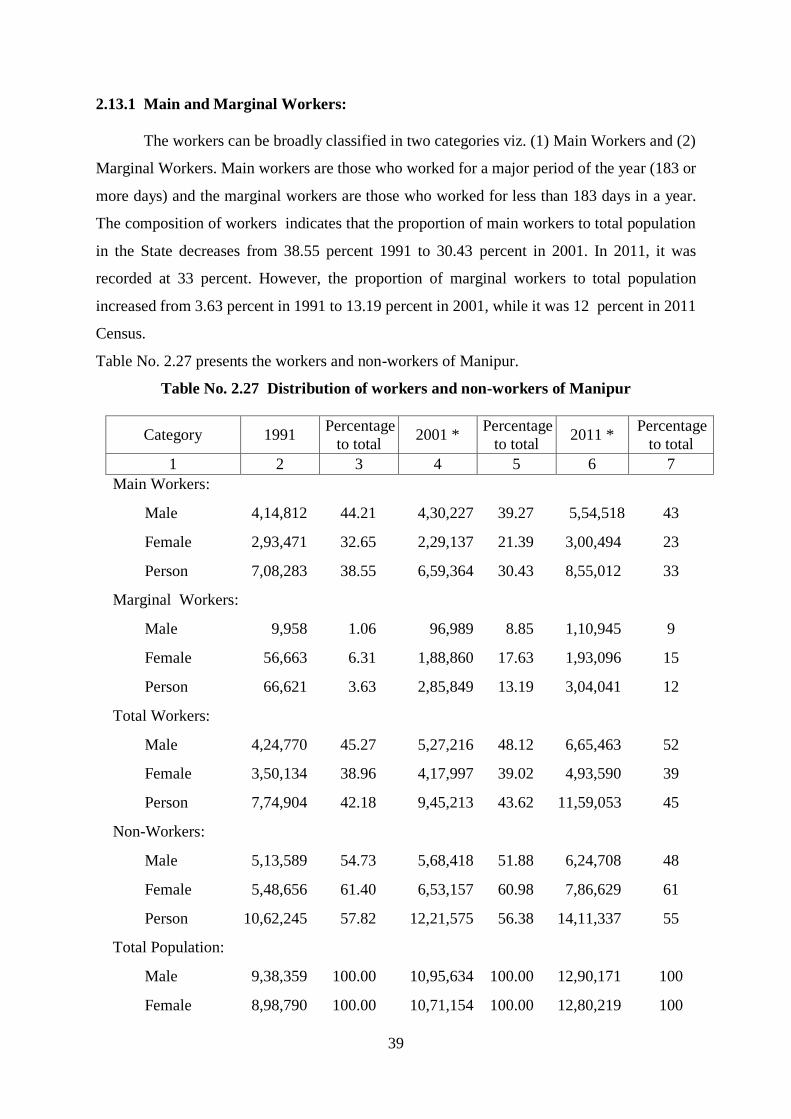
2.13.1 Main and Marginal Workers:
The workers can be broadly classified in two categories viz. (1) Main Workers and (2)
Marginal Workers. Main workers are those who worked for a major period of the year (183 or
more days) and the marginal workers are those who worked for less than 183 days in a year.
The composition of workers indicates that the proportion of main workers to total population
in the State decreases from 38.55 percent 1991 to 30.43 percent in 2001. In 2011, it was
recorded at 33 percent. However, the proportion of marginal workers to total population
increased from 3.63 percent in 1991 to 13.19 percent in 2001, while it was 12 percent in 2011
Census.
Table No. 2.27 presents the workers and non-workers of Manipur.
Table No. 2.27 Distribution of workers and non-workers of Manipur
Category 1991 Percentage
to total 2001 *
Percentage
to total 2011 *
Percentage
to total
1 2 3 4 5 6 7
Main Workers:
Male 4,14,812 44.21 4,30,227 39.27 5,54,518 43
Female 2,93,471 32.65 2,29,137 21.39 3,00,494 23
Person 7,08,283 38.55 6,59,364 30.43 8,55,012 33
Marginal Workers:
Male 9,958 1.06 96,989 8.85 1,10,945 9
Female 56,663 6.31 1,88,860 17.63 1,93,096 15
Person 66,621 3.63 2,85,849 13.19 3,04,041 12
Total Workers:
Male 4,24,770 45.27 5,27,216 48.12 6,65,463 52
Female 3,50,134 38.96 4,17,997 39.02 4,93,590 39
Person 7,74,904 42.18 9,45,213 43.62 11,59,053 45
Non-Workers:
Male 5,13,589 54.73 5,68,418 51.88 6,24,708 48
Female 5,48,656 61.40 6,53,157 60.98 7,86,629 61
Person 10,62,245 57.82 12,21,575 56.38 14,11,337 55
Total Population:
Male 9,38,359 100.00 10,95,634 100.00 12,90,171 100
Female 8,98,790 100.00 10,71,154 100.00 12,80,219 100

40
Person 18,37,149 100.00 21,66,788 100.00 25,70,390 100
* Excluding Mao-Maram, Paomata and Purul Sub-Divisions of Senapati District.
2.13.2 Composition of Workers : The district-wise distribution of workers according to economic classification as per
2011 census are presented in Table No. 2.28 and Table No. 2.29.
Table No. 2.28 Distribution of workers by cultivators, Agricultural Labourers,
Household Industry and other workers in 2011 Census
District/State Total
Workers (Main + Marginal)
Cultivators Agricultural
Labourers
Household
Industry
Other
Workers
1 2 3 4 5 6
1. Senapati * 88065 58987 7353 3117 18608
2. Tamenglong 70675 48849 1924 1710 18192
3. Churachandpur 122655 64834 8282 5067 44472
4. Chandel 76238 43255 8315 3040 21628
5. Ukhrul 87929 56815 3852 2233 25029
6. Imphal East 194848 36355 20250 21826 116417
7. Imphal West 213387 37107 12870 19918 143492
8. Bishnupur 109937 34358 15109 11567 48903
9. Thoubal 195319 77331 33106 21017 63865
Manipur 1159053 457891 111061 89495 500606
* Excluding Mao-Maram, Paomata and Purul Sub-Divisions.
Source: Publications of the Office of the Registrar General of India.
Table No. 2.29 Workers and Non-workers of Manipur by Districts (2011 Census)
District/State Total
Population
Main
Workers
Marginal
Workers
Total
Workers
Non-
Workers
P.C. of
workers
to total
population
1 2 3 4 5 6 7
1. Senapati * 193744 66574 21491 88065 105679 7.49
2. Tamenglong 140651 55979 14696 70675 69976 4.96

41
3. Churachandpur 274143 89779 32876 122655 151488 10.73
4. Chandel 144182 53753 22485 76238 67944 4.81
5. Ukhrul 183998 67724 20205 87929 96069 6.81
6. Imphal East 456113 145343 49505 194848 261265 18.51
7. Imphal West 517992 166009 47378 213387 304605 21.58
8. Bishnupur 237399 76423 33514 109937 127462 9.03
9. Thoubal 422168 133428 61891 195319 226849 16.07
Manipur 2570390 855012 304041 1159053 1411337 100
* Excluding Mao-Maram, Paomata and Purul Sub-Divisions.
Source: Publications of the Office of the Registrar General of India.
A comparative picture of Workers and Non-Workers of the North-Eastern States of
India is presented in Table No. 2.30. Among the North-Eastern States of India, the percentage
of workers to the total population is highest in Sikkim with 50.47 % while it is lowest in Assam
with 38.36 %. In respect of Manipur, the percentage of workers and non-workers to total State
population are 45 % and 55 % respectively.
Table No. 2.30
Distribution of Workers and Non-Workers of North-Eastern States
of India, 2011 Census.
(In nos.)
State
Main Workers
Cultivator Agricultural
Labourer
Household
Industry
Other
Workers Total
1 2 3 4 5 6
Arunachal Pradesh 2,48,120 20,259 4,728 2,05,614 4,78,721
Assam 31,38,554 9,03,294 2,42,071 44,03,204 86,87,123
Manipur* 3,65,712 43,774 44,586 4,00,940 8,55,012
Meghalaya 4,11,270 1,14,642 11,969 3,83.694 9,21,575
Mizoram 2,02,514 26,464 5,459 1,80,593 4,15,030
Nagaland 4,20,379 22,571 9,525 2,88,704 7,41,179
Sikkim 82,707 11,582 2,888 1,33,220 2,30,397
Tripura 2,46,707 2,01,863 19,296 6,09,153 10,77,019

42
North-Eastern States 51,15,963 13,44,449 3,40,522 66,05,122 1,34,06.056
All India 9,58,41,357 8,61,66,871 1,23,31,464 16,81,06,728 36,24,46,420
Contd.
Table No. 2.30
Distribution of Workers and Non-Workers of North-Eastern States
of India, 2011 Census.
State
Marginal Workers
Cultivator Agricultural
Labourer
Household
Industry
Other
Workers Total
1 7 8 9 10 11
Arunachal Pradesh 54,603 15,912 3,637 34,784 1,08,936
Assam 9,23,073 9,42,052 2,49,250 11,68,192 32,82,567
Manipur* 92,179 67,287 44,909 99,666 3,04,041
Meghalaya 83,405 83,722 8,519 88,398 2,64,044
Mizoram 27,089 15,323 2,393 26,870 71,675
Nagaland 1,17,323 40,391 13,313 61,916 2,32,943
Sikkim 34,694 14,404 2,255 26,388 77,741
Tripura 49,240 1,51,755 22,200 1,69,307 3,92,502
North-Eastern States 1,381,606 1,330,846 346,476 1,675,421 4,734,449
All India 2,28,51,283 5,81,62,962 60,04,843 3,22,77,803 11,92,96,891
Contd.
State Total Workers
(Main+Marginal) Non-Workers Total Population
% of workers to
total population
1 12 13 14 15
Arunachal Pradesh 5,87,657 7,96,070 13,83,727 42.47
Assam 11,969,690 1,92,35,886 3,12,05,576 38.36
Manipur* 1,159,053 14,11,337 25,70,390 45.10
Meghalaya 1,185,619 17,81,270 29,66,889 39.96

43
Mizoram 486,705 6,10,501 10,97,206 44.36
Nagaland 974,122 10,04,380 19,78,502 49.24
Sikkim 308,138 3,02,439 6,10,577 50.47
Tripura 1,469,521 22,04,396 36,73,917 39.99
North-Eastern State 18,140,505 27,346,279 45,486,784 39.88
All India 481,743,311 72,88,26,262 1,21,05,69,573 39.79
Concld.
* Excluding 3 sub-division of Senapati District viz., Mao Maram, Paomata and Purul.
2.13.3 Work Participation Rate :
As per 2011 Census, the work participation rates of males and females of Manipur were
52 percent and 39 percent respectively as compared with All-India rates of 53 percent of males
and 26 percent of females. Table No. 2.31 shows the work participation rate of North Eastern
States and All-India as per 2011 Census.
Table No. 2.31 Work Participation Rate of North Eastern States of India and All-India
as per 2011 Census
State/India Rural Urban Combined
Male Female Person Male Female Person Male Female Person
1 2 3 4 5 6 7 8 9 10
Arunachal
Pradesh
48.49 39.49 44.10 50.91 21.31 36.97 34.44 49.06 42.47
Assam 53.06 23.69 38.68 56.79 14.86 36.41 53.59 22.46 38.36
Manipur* 52.38 41.21 46.86 49.87 33.17 41.41 51.58 38.56 45.09
Meghalaya 47.04 34.97 41.05 47.68 23.59 35.63 47.17 32.67 39.96
Mizoram 53.91 41.86 48.03 50.89 31.05 40.98 52.35 36.16 44.36
Nagaland 55.67 52.26 54.02 47.95 25.87 37.44 53.42 44.74 49.24
Sikkim 61.03 44.63 53.34 57.52 24.80 41.90 60.16 39.57 50.47
Tripura 55.35 26.28 41.15 56.97 16.00 36.76 55.77 23.57 39.99
All India 53.03 30.02 41.83 53.76 15.44 35.31 53.26 25.51 39.79

44
* Excludes Mao-Maram, Paomata and Purul Subdivision of Senapati District
Source: Office of the Registrar General, India.

45
CHAPTER III
STATE INCOME AND PRICES
State Domestic Product (SDP) is one of the most important economic indicators to
measure the growth and structural changes in the economy of the State. State Domestic Product
is also approximated as the “State Income” particularly when income earned by the citizens of
the State from outside the State is negligible.
The estimates of State Domestic Product are prepared both at constant and current
prices. The estimates of SDP at constant prices reflect the growth in production, while the
estimates at current prices depict the combined effect of growth in production as well as
changes in price levels of goods and services produced.
3.1 Gross State Domestic Product (GSDP):
The money value of all the goods and services produced by the State during a specified
period, generally one year before making any adjustment for Consumption of Fixed Capital
(CFC) is known as GSDP. The GSDP of Manipur from 2004-05 to 2012-13 at current and
constant (2004-05) prices are presented in Table No. 3.1.
Table No. 3.1 Revised Gross State Domestic Product of Manipur, 2004-05 to 2012-13
(Rs. in lakhs)
Year
At current prices At constant (2004-05) prices
GSDP Annual Growth
Rate(%) GSDP
Annual Growth
Rate(%)
1 2 3 4 5
2004-05 5,13,336 - 5,13,336 -
2005-06 5,71,758 11.38 5,45,906 6.34
2006-07 6,13,722 7.34 5,56,775 1.99
2007-08 6,78,253 10.51 5,89,952 5.96
2008-09 7,39,936 9.09 6,28,659 6.56
2009-10 8,25,426 11.55 6,71,986 6.89
2010-11 9,13,719 10.70 6,68,061 (-)0.58
2011-12(Q) 10,50,434 14.96 7,23,127 8.24
2012-13(A) 11,98,254 14.07 7,89,166 9.13
Q : Quick Estimates A : Advance Estimates
Source: Directorate of Economics & Statistics, Manipur
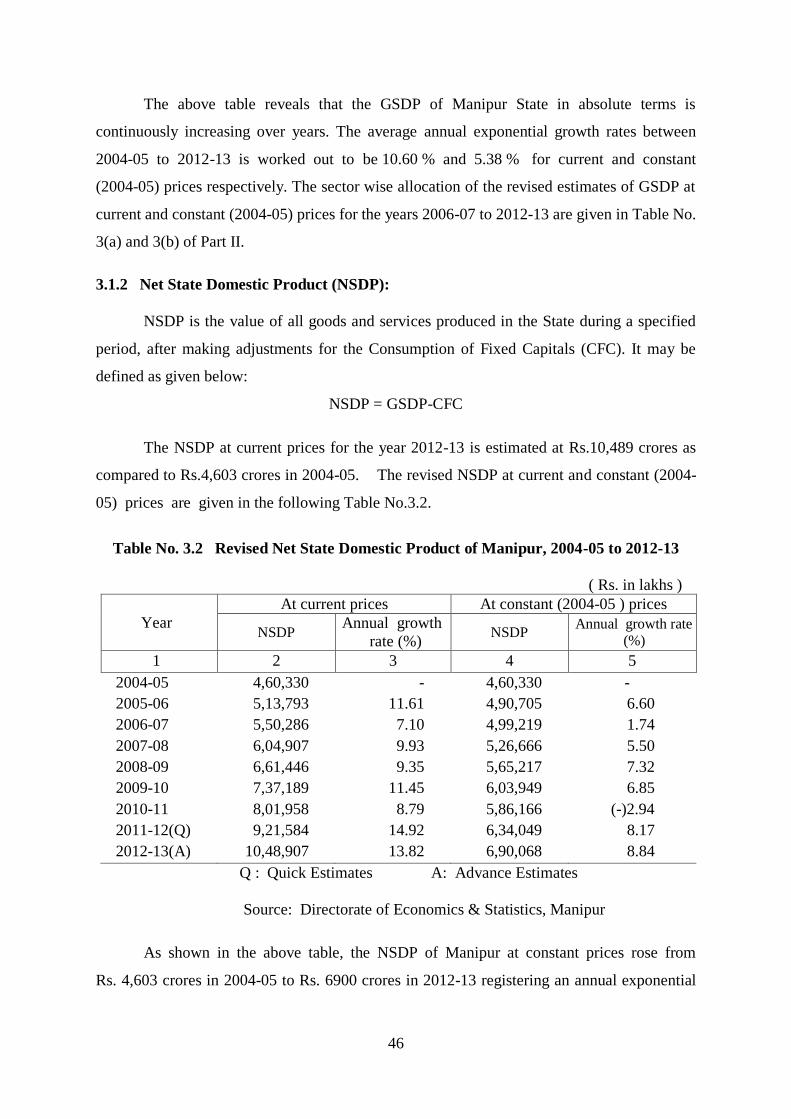
46
The above table reveals that the GSDP of Manipur State in absolute terms is
continuously increasing over years. The average annual exponential growth rates between
2004-05 to 2012-13 is worked out to be 10.60 % and 5.38 % for current and constant
(2004-05) prices respectively. The sector wise allocation of the revised estimates of GSDP at
current and constant (2004-05) prices for the years 2006-07 to 2012-13 are given in Table No.
3(a) and 3(b) of Part II.
3.1.2 Net State Domestic Product (NSDP):
NSDP is the value of all goods and services produced in the State during a specified
period, after making adjustments for the Consumption of Fixed Capitals (CFC). It may be
defined as given below:
NSDP = GSDP-CFC
The NSDP at current prices for the year 2012-13 is estimated at Rs.10,489 crores as
compared to Rs.4,603 crores in 2004-05. The revised NSDP at current and constant (2004-
05) prices are given in the following Table No.3.2.
Table No. 3.2 Revised Net State Domestic Product of Manipur, 2004-05 to 2012-13
( Rs. in lakhs )
Year
At current prices At constant (2004-05 ) prices
NSDP Annual growth
rate (%) NSDP
Annual growth rate
(%)
1 2 3 4 5
2004-05 4,60,330 - 4,60,330 -
2005-06 5,13,793 11.61 4,90,705 6.60
2006-07 5,50,286 7.10 4,99,219 1.74
2007-08 6,04,907 9.93 5,26,666 5.50
2008-09 6,61,446 9.35 5,65,217 7.32
2009-10 7,37,189 11.45 6,03,949 6.85
2010-11 8,01,958 8.79 5,86,166 (-)2.94
2011-12(Q) 9,21,584 14.92 6,34,049 8.17
2012-13(A) 10,48,907 13.82 6,90,068 8.84
Q : Quick Estimates A: Advance Estimates
Source: Directorate of Economics & Statistics, Manipur
As shown in the above table, the NSDP of Manipur at constant prices rose from
Rs. 4,603 crores in 2004-05 to Rs. 6900 crores in 2012-13 registering an annual exponential

47
growth rate of 5.06 %. The sector-wise estimates of Net State Domestic Product at current and
constant prices are shown in Table No. 3(c) and 3(d) of Part II.
3.1.3 Sectoral Composition :
The economy of the State can be broadly classified into three major sectors, such as,
primary sector, secondary sector and tertiary sector. Sectoral composition of gross and net SDP
are presented in Table No. 3.3 and 3.4.
Table No. 3.3 Percentage Contribution of Gross State Domestic Product of Manipur
by major sectors at Current and Constant ( 2004-05) Prices
Year
At current prices At constant (2004-05 ) prices
Primary
Sector
Secondary
Sector
Tertiary
Sector Total
Primary
Sector
Secondary
Sector
Tertiary
Sector Total
1 2 3 4 5 6 7 8 9
2004-05 24.75 36.66 38.59 100.00 24.75 36.66 38.59 100.00
2005-06 24.18 36.53 39.29 100.00 23.19 37.03 39.78 100.00
2006-07 24.24 36.32 39.44 100.00 22.76 37.15 40.09 100.00
2007-08 23.77 36.59 39.64 100.00 23.63 36.10 40.27 100.00
2008-09 24.81 33.14 42.05 100.00 24.26 34.70 41.04 100.00
2009-10 26.76 31.48 41.76 100.00 25.78 34.66 39.56 100.00
2010-11 24.32 24.96 50.72 100.00 21.21 29.69 49.10 100.00
2011-12(Q) 22.60 23.53 53.89 100.00 19.67 28.85 51.48 100.00
2012-13(A) 21.83 22.27 55.90 100.00 18.60 24.84 53.56 100.00
Q : Quick Estimates A : Advance Estimates
Source: Directorate of Economics & Statistics, Manipur
Table No. 3.4 Percentage Contribution of Net State Domestic Product of Manipur
by major sectors at Current and Constant ( 2004-05 ) Prices
Year
At current prices At constant (2004-05 ) prices
Primary
Sector
Secondary
Sector
Tertiary
Sector Total
Primary
Sector
Secondary
Sector
Tertiary
Sector Total
1 2 3 4 5 6 7 8 9
2004-05 25.09 36.86 38.05 100.00 25.09 36.86 38.05 100.00
2005-06 24.87 36.74 38.39 100.00 23.76 37.29 38.95 100.00
2006-07 24.78 36.54 38.68 100.00 23.13 37.46 39.41 100.00
2007-08 24.40 36.77 38.83 100.00 24.25 36.22 39.53 100.00
2008-09 25.60 32.97 41.43 100.00 24.99 34.57 40.44 100.00
2009-10 27.70 31.10 41.20 100.00 26.71 34.48 38.81 100.00
2010-11 25.36 24.49 50.15 100.00 22.06 29.45 48.49 100.00
2011-12(Q) 23.56 22.89 53.55 100.00 20.47 28.45 51.08 100.00

48
2012-13(A) 22.80 21.54 55.66 100.00 19.41 27.37 53.22 100.00
Q : Quick Estimates A : Advance Estimates
Source: Directorate of Economics & Statistics, Manipur
(i) Primary sector consists of agriculture including livestock, forestry & logging,
fishing and Mining/Quarrying. Agriculture proper and livestock contribute a major
share within the primary sector.
(ii) Secondary sector includes manufacturing (Registered and un-registered),
construction, electricity, gas and water supply.
(iii) Tertiary sector consists of transport, storage, communication, trade, hotels &
restaurants, banking and insurance, real estate, ownership of dwelling, business
services and legal services, public administration and other services.
3.1.3 Per Capita Income:
Per Capita Income is generally considered as the most effective indicator for
ascertaining the economic welfare of a state. It enables one to know the average size of the
income and the standard of living of the people.
The net per capita income of Manipur is worked out to be Rs. 23,093 and Rs. 20,106
in 2007-08 at current and constant (2004-05) prices respectively as against Rs. 18,640 in 2004-
05.
The net per capita income at current and constant (2004-05) prices in 2012-13 are
estimated to be Rs. 36,474 and Rs. 23,996 respectively showing an increase of 11.74 % and
6.85 % over the previous year. The trend of the net per capita of Manipur and India at current
and constant (2004-05) prices are presented in Table No. 3.5 below:
Table No. 3.5 Net Per Capita Income at Current and Constant (2004-05) Prices
(Manipur vis-à-vis India)
(in Rs.)
Year
At Current Prices At Constant (2004-05) Prices
Manipur
Annual
Growth
Rate
All
India
Annual
Growth
Rate
Manipur
Annual
Growth
Rate
All
India
Annual
Growth
Rate
1 2 3 4 5 6 7 8 9
2004-05 18,640 - 24,143 - 18,640 - 24,143 -
2005-06 20,395 9.42 27,131 12.4 19,479 4.50 26,015 7.8
2006-07 21,419 5.02 31,206 15.0 19,431 (-)0.25 28,067 7.9
2007-08 23,093 7.82 35,825 14.8 20,106 3.47 30,332 8.1
2008-09 24,773 7.27 40,775 13.8 21,169 5.29 31,754 4.7
2009-10 27,095 9.37 46,249 13.4 22,147 4.86 33,901 6.8
2010-11 29,684 8.61 54,021 16.8 21,146 (-)4.73 36,202 6.8
2011-12(Q) 32,641 12.82 61,855 14.5 22,457 6.20 38,048 5.1

49
2012-13(A) 28,931 11.74 67,839 9.67 23,996 6.85 38,856 2.12
Q : Quick Estimates A : Advance Estimates
Source: 1. National Accounts Statistics 2013 & Press Note 31st Jan., 2014
2. Directorate of Economics & Statistics, Manipur
3.1.5 Growth Trend:
The growth of GSDP at current prices is found to be increasing in absolute terms during
2004-05 to 2012-13. However, the income from the major sectors showed fluctuations as
evident from the growth trend shown in Table No. 3.6. The annual growth trend of the NSDP
is also irregular as evident from Table No. 3.7.
Table No. 3.6 Annual growth trend in the GSDP at current prices
Year Primary Secondary Tertiary Total GSDP
1 2 3 4 5
2004-05 - - - -
2005-06 8.86 10.98 13.38 11.38
2006-07 7.59 6.73 7.75 7.34
2007-08 8.35 11.31 11.11 10.51
2008-09 13.90 -1.19 15.71 9.09
2009-10 20.33 5.95 10.79 11.55
2010-11 0.59 -12.21 34.43 10.70
2011-12(Q) 6.84 8.36 22.11 14.96
2012-13(A) 10.15 7.97 18.38 14.07
Q : Quick Estimates A : Advance Estimates
Source: Directorate of Economics & Statistics, Manipur
Table No. 3.7 Annual growth trend in the NSDP at current prices
Year Primary Secondary Tertiary Total NSDP
1 2 3 4 5
2004-05 - - - -
2005-06 10.65 11.25 12.60 11.61
2006-07 6.72 6.50 7.93 7.10
2007-08 8.25 10.61 10.35 9.93
2008-09 14.71 -1.95 16.67 9.35
2009-10 20.59 5.13 10.83 11.45
2010-11 -0.41 -14.33 32.42 8.79
2011-12(Q) 6.77 7.39 22.71 14.92

50
2012-13(A) 10.17 7.11 18.29 13.82
Q : Quick Estimates A : Advance Estimates
Source: Directorate of Economics & Statistics, Manipur
The gross state domestic product at current prices of Manipur in 2004-05 was estimated
to be Rs.5,133 crores. It rose to Rs. 6,782 crores in 2007-08 registering an annual exponential
growth rate of 9.73 percent and further it is estimated at Rs. 11,983 crores in 2012-13(A). The
annual exponential growth rate during the period from 2004-05 to 2012-13 (A) is worked out
to be 11.18 percent.
The gross state domestic product of Manipur at constant (2004-05) prices went up from
Rs. 5,133 crores in 2004-05 to Rs. 5,899 crores in 2007-08 and then to Rs. 7,892 crores in
2012-13(A). The annual exponential growth rate of GSDP at constant (2004-05) prices during
the period of 8 (Eight) years span is worked out to be 5.52 percent.
3.2 Prices:
Every commodity/item produced bears a price. They are based on the factors of
production. Prices are the signals to both producers and consumers. It is the value of goods and
services in terms of money. In fact, households buy goods and sell factors of production
whereas the producers (firms/business house) sell goods and buy factors of production. Every
price level plays an important role in the economy of a state/country.
In an open economy, the price situation in the State is bound to be influenced by the
price behaviour in the country. Price stability is essential for sustaining the momentum of
growth and ensuring equitable distribution of benefits. For assessing the price situation of the
state, the Directorate of Economics & Statistics, Govt. of Manipur collects on a regular basis,
the retail prices of essential commodities and cost of services to consumers from selected
centres in urban and rural areas. The movements in these prices are reflected in the wholesale
price index numbers as well as consumer price index numbers of different subsets of the
population such as urban non-manual employees, Industrial workers, agricultural labourers etc.
3.2.1 Consumer Price Index Number:
The Consumer Price Index Numbers which were popularly termed as Cost of
Living Index Numbers are designed to measure by means of appropriate weighting, the average
change in the prices paid by the ultimate consumers for specified quantities of goods and
services.

51
There are three essential ingredients of Consumer Price Index Numbers (CPIN), namely
(i) the relative importance of consumer goods and services expressed as the percentage share
of expenditure on items in relation to the total consumption expenditure known as “Weighting
Diagram”, (ii) Base year prices which are generally taken as the 12 months average to remove
the seasonal effects, and (iii) current prices.
3.3.2 Consumer Price Index Number for Industrial Workers:
The Consumer Price Index Numbers for Industrial Workers are of vital importance for
millions of employees whose wages are closely linked to the movement of these index
numbers. Manipur State does not have any industrial complex and CPI-IW for Manipur is not
yet constructed. The All-India Consumer Price Index Number for industrial workers is a better
indicator of the increase in the price level of the items of common consumption. The following
Table No. 3.8 presents All India Consumer Price Index Number (General Index) for Industrial
Workers (1982=100) and a new series (2001=100) is also presented in the
part – II Table No. 3(k).
Table No. 3.8 Monthly All India Consumer Price Index Number for Industrial
Workers
(Base : 1982 = 100)
Month 2006 2007 2008 2009 2010 2011 2012 2013
1 2 3 4 5 6 7 8 9
January 551 588 620 685 796 870 917 1023
February 551 593 625 685 787 857 921 1032
March 551 588 634 685 787 857 931 1037
April 556 593 639 695 787 861 949 1046
May 560 597 644 699 796 866 954 1056
June 569 602 648 708 806 875 963 1070
July 574 611 662 741 824 894 982 1088
August 574 616 671 750 824 898 991 1097
September 579 616 676 755 829 912 995 1102
October 588 620 685 764 838 917 1005 1116
November 588 620 685 778 843 921 1009 1125
December 588 620 681 782 857 912 1014 1107
Annual 569 605 656 727 815 887 969 1075
Source: Ministry of Labour Bureau, Shimla.

52
The All-India annual average general index number stood at 969 in 2012 which is about
9.24 percent higher as compared to 2011 level of 887. All-India annual average of Food Group
index for 2009 has increased to 768, a rise of 12.78 percent over 2008 level of 681. While in
the new series of (2001=100), the All India annual average general index stood at 209 in 2012
which is about 8.85 percent higher as compared to 2011 level of 192. All-India annual average
of Food group index for 2012 has increased to 216, a rise of 5.88 percent over 2011 level of
204. All-India consumer price index number for the years 2002 to 2013 of (1982=100) and
(2001=100) series are presented in the following Table No. 3.9.
Table No. 3.9 All India Consumer Price Index Numbers for Industrial Workers
Year
Consumer Price Index Number
(1982=100)
Consumer Price Index Number
(2001=100)
General Food
Percentage change
over previous Year General Food
Percentage change
over previous Year
General Food General Food
1 2 3 4 5 6 7 8 9
2002 477 474 - - 103 104 - -
2003 496 490 3.98 3.38 107 107 3.88 2.88
2004 514 504 3.63 2.86 111 110 3.74 2.80
2005 536 520 4.28 3.17 116 116 4.50 5.45
2006 569 559 6.16 7.50 123 122 6.03 5.17
2007 605 612 5.27 9.48 131 134 6.50 9.84
2008 656 681 8.43 11.27 142 149 8.49 11.19
2009 727 768 10.82 12.78 157 168 10.56 12.75
2010 815 868 12.10 13.02 176 190 12.10 13.09
2011 887 932 8.83 7.37 192 204 9.09 7.37
2012 969 1021 9.24 9.55 209 223 8.85 9.31
2013 1075 1163 10.94 13.91 232 254 11.00 13.90
Linking Factor : Food - 4.58, General- 4.63
Source: Indian Labour Journal, Ministry of Labour, Simla.
3.2.3 Consumer Price Index Numbers for Agricultural Labourers: The Consumer Price Index Numbers for Agricultural Labourers is constructed and
released by the Labour Bureau, Simla based on the price data furnished by National Sample

53
Survey Office (NSSO), Government of India. The Labour Bureau has started compiling a new
series for CPI number for agricultural labourers with 1986-87 as the base year w.e.f.
November, 1995 replacing the old series (1960-61 = 100) with improved methodology and
wider coverage. The new series are being compiled separately for Agricultural and Rural
Labourers. The annual average indices for General and Food Groups are presented in Table
No. 3.10 for Agricultural as well as Rural Labourers.
Table No. 3.10 Consumer Price Index Numbers for Agricultural Labourers and Rural
Labourers (CPIN – AL/RL)
(Base: 1986-87 = 100)
Category Year
Manipur All India
General Index Food General
Index Food
1 2 3 4 5 6
Agricultural Labourers 2005 316 293 348 341
2006 331 311 372 366
2007 351 332 402 394
2008 384 362 439 440
2009 431 414 494 500
2010 494 474 550 559
2011 574 530 602 599
2012 619 - 655 -
2013 679* - 732** -
Percentage Increase during 2005-06 4.74 6.14 6.89 7.33
2006-07 6.04 6.75 8.06 7.65
2007-08 9.40 9.40 9.20 11.68
2008-09 13.42 15.64 12.53 14.94
2009-10 14.62 14.49 11.34 11.80
2010-11 16.19 11.81 9.45 7.16
2011-12 7.84 - 8.80 -
2012-13 9.69 - 11.76 -
Rural Labourers 2005 317 293 351 341
2006 332 311 373 366
2007 352 332 403 399
2008 385 363 440 440
2009 400 385 458 464
2010* 489 481 552 563
2011 577 532 602 600
2012 620 - 656 -
2013 682* - 733** -
Percentage Increase during 2005-06 4.73 6.14 6.27 7.33
2006-07 6.02 6.75 8.04 9.62
2007-08 8.24 9.34 9.18 10.28
2008-09 13.12 6.06 4.09 5.45

54
2009-10 10.90 24.94 20.52 21.34
2010-11 20.71 13.43 10.26 7.91
2011-12 7.45 - 8.97 -
2012-13 10.00 - 11.74 -
* Only nine months ** Only eleven months - Not Available
Note: No sign is indicated for positive variation
Source: Ministry of Labour Bureau, Simla
The above table shows that the increase in annual General Index of Agricultural
Labourers for calendar year 2011 ( only five months) over the previous year 2010 is 17.62
percent in Manipur while the change in the annual average General Index in respect of the
Rural Labourer in 2011 ( only five months) over 2010 is 18.00 percent.
3.2.4 Consumer Index Number for Urban Non-Manual Employees:
Considering the importance of the Consumer Price Index Number, Central Statistical
Organisation (CSO), Govt. of India had conducted a Middle Class Family Living Survey at 59
centers during 1982-83. Imphal Town is also covered as one of the centres. C.S.O. released
the new series of consumer price index numbers for urban non-manual employees (1984-85 =
100). The movements of the Consumer Price Index Numbers for urban non-manual employees
of Manipur may be seen from Table No. 3.11.
Table No. 3.11 Consumer Index Numbers for Urban Non-Manual Employees of
Manipur (CPIN – UNME)
(1984-85 = 100)
Year Food, Beverage
& tobacco
Fuel &
light Housing
Clothing &
foot-wear Misc.
General
Index
1 2 3 4 5 6 7
1995 260 207 358 246 225 260
1996 271 229 350 251 246 273
1997 291 257 350 255 273 292
1998 322 272 350 284 287 315
1999 356 280 351 298 305 341
2000 357 320 375 303 338 353
2001 360 372 471 305 355 372
2002 362 365 478 306 364 375
2003 369 384 553 309 393 393
2004 370 394 618 313 410 405
2005 385 437 658 327 423 425
2006 413 489 733 328 453 460
2007 454 497 791 338 468 495
2008 NA NA NA NA NA 519
Jan. NA NA NA NA NA 517
Feb. NA NA NA NA NA 519
March NA NA NA NA NA 522
NA: Not Available
Source: Central Statistical Office, Govt. of India

55
Note :- Price collection of CPI(UNME) was discontinued with effect from April, 2008 as per press
release No. M-120/2/2005-PCL dated 20/1/2009, Central Statistical Office , MoSPI, Govt.
of India.
The movement of the consumer price index number of Imphal town in comparison with
those of Kohima, Guwahati, Agartala, Shillong and all-India are shown in Table No. 3(e) of
Part II.
With the initiation of the Central Statistical Office to compile a new series of CPI for
entire urban population viz., CPI (U) at State/Union Territories and All India level, the
construction of CPI (UNME) has been discontinued.
,3.2.5 Consumer Price Index Numbers for Rural, Urban and combined (base 2010=100)
The Central Statistical Office (CSO), Ministry of Statistics and Programme
Implementation has introduced a new series of Consumer Price Indices (CPI) for all-India and
States/UTs separately for rural, urban and combined for the purpose of intra temporal price
comparison with effect from January, 2011 with 2010 as the base year. The provisional
Consumer Price Index is shown at Table No. 3.12
Table No. 3.12. Consumer Price Indices (CPI) for Rural and Urban areas and
Combined for the month of January 2014.
Base : 2010=100
Sl.
No. Sub-Group/Group
Manipur All India
Rural Urban Combined Rural Urban Combined
1 2 3 4 5 6 7 8
1. Food, beverages and tobacco - - - 113 112 113
2. Fuel and light 105 105 105 122 117 120
3. Clothing, bedding and footwear 102 103 103 122 123 122
4. Housing - 100 100 - 112 112
5. Miscellaneous 102 104 102 115 111 113
6. General 102 104 103 115 112 114
- Not Available
Source : Central Statistical Office, MOSPI, Government of India.
3.2.6 Farm Harvest Price Index Number :
The Directorate of Economics & Statistics, Manipur constructed Farm Harvest Price
Index Numbers of principal crops of Manipur with 1961-62 as the base year. The Farm Harvest
Price Index in the year 2011-12 stood at 6,666 as against 6,722 in 2010-11 showing a decrease
of 0.83 percent over the previous year. The following Table No. 3.13 shows the indices since
2001-02.
Table No. 3.13 Index Number of Farm Harvest Price of Principal Crops of Manipur
(1961-62 =100)
Year General
Index
Food
grains Cereals Pulses
Non-
Foodgrains Oilseeds
Misc.
Crops
1 2 3 4 5 6 7 8
2001-02 3,059 3,057 3,053 4,445 3,102 2,115 3,285
2002-03 3,325 3,311 3,305 5,002 3,847 3,274 3,953

56
2003-04 3,419 3,411 3,405 5,365 3,688 3,474 3,728
2004-05 2,951 2,925 2,915 5,833 3,889 3,359 3,986
2005-06 3,823 3,818 3,810 6,413 3,979 3,421 4,082
2006-07 3,852 3,829 3,819 7,002 4,660 3,483 4,877
2007-08 3,984 3,950 3,937 7,851 5,201 3,732 5,472
2008-09 4,506 4,476 4,464 8,087 5,561 4,479 5,761
2009-10 5,300 5,283 5,270 9,271 5,919 4,976 6,093
2010-11 6,722 6,690 6,679 10,266 7,834 5,225 8,315
2011-12 6,666 6,619 6,598 13,124 8,308 5,424 8,840
Source: Directorate of Economics & Statistics, Manipur
3.2.7 Wholesale Price :
The wholesale price is generally taken as the rate at which a relatively large transaction
of purchase usually for further sale is effected. It measures the rate of inflation but could not
reveal the real increase in the burden to be borne by the ultimate consumers/households. The
following Table No. 3.14 represents price behaviours of Manipur during the period 1981 to
2011. The monthly average wholesale prices of some selected commodities for 2010 and 2011
are shown in Table No.3(f) and 3(g) of Part II.
Table No. 3.14 Average Wholesale Prices of some selected commodities
(in Rs.)
Sl.
No. Item Unit 1981 1991 2001 2002 2003 2004
1 2 3 4 5 6 7 8 9
1. Rice (Medium) Qtl. 301.25 610.21 1102.73 1175.00 1300.00 1075.00
2. Sugar (Open market) Qtl. 590.63* 979.58 1719.55 1700.00 1650.00 1837.50
3. Salt (Bag) 70 kg. 37.65 94.21 163.50 162.00 186.67 180.00
4. Mustard Oil
(imported)
15 kg. 236.46 472.86 625.96 692.50 910.00 882.50
5. Milk 100 lit. 287.83 700.00 NT NT NT NT
6. Potato (imported) Qtl. 189.13 299.12 652.05 707.50 600.00 800.00
7. Onion Qtl. 239.90 565.83 924.63 787.50 900.00 1200.00
8. Chillies Qtl. 1629.18 4100.00 NT NT NT NT
9. Arhar Dal Qtl. 520.58 1503.75 2715.00 2875.00 2900.00 2875.00
10. Firewood (splitted) Qtl. 35.99 70.83 179.73 180.00 NT NT
(in Rs.) Sl.
No. Item Unit 2005 2006 2007 2008 2009 2010 2011
1 2 3 10 11 12 13 14 15 16
1. Rice
(Medium)
Qtl. 1187.50 1350.00 1350.00 1600 2200 2250 2313
2. Sugar (Open
market)
Qtl. 2100.00 2200.00 1775.00 2065 2900 3375 3475
3. Salt (Bag) 70 kg. 205.00 240.00 300.00 350 742 570 490
4. Mustard Oil
(imported)
15 kg. 795.00 780.00 930.00 1218 1020
1065 1266

57
5. Milk 100 lit. NT NT NT NT NT NT NT
6. Potato
(imported)
Qtl. 750.00 900.00 1107.00 788 1600 1325 1281
7. Onion Qtl. 900.00 1200.00 1025.00 850.00 1500.00 2625 2188
8. Chillies Qtl. NT NT NT NT NT NT NT
9. Arhar Dal Qtl. 2900.00 2875.00 2950.00 3100.00 4200.00 6350 7083
10. Firewood
(splitted)
Qtl. NT NT NT 200.00 200.00 425 474
* Relates to 1980 NT – No Transaction
Source: A.O. (M.I.), Manipur
It will be seen from the above table that the price of Arhar Dal per quintal in 2010 was
recorded to be about Rs.7,833 which is about 108 times in 1961. The annual exponential
increase in price of Arhar dal during the period under consideration is found to be 9.56 percent.
A high growth rate is found in rice (medium). The price of Rice (Medium) in 2010 is recorded
at Rs.2,450 per quintal which is 65 times higher than the price prevalent in 1961 registering
annual exponential growth rate of 8.53 percent. The price of Onion per quintal in 2010 is
reported to be about Rs. 2,325 which is about 38 times the price paid in 1961. The annual
exponential growth rate is worked out to be 7.44 percent.
All India wholesale Price Index Number of all commodities in the year 2012-13 stood
at 313.9 as against 292.4 in 2011-12 depicting an increase of 7.35 percent over the previous
year. In 2012-13, the wholesale price index of fuel, power, light and lubricants group (only fuel
power) is found to be 481.1 as against 473.5 in 2011-12. The broad commodity group-wise,
All India Wholesale Price Index Numbers along with annual inflation rates are shown in the
following Table No. 3.15.
Table No. 3.15 All India Wholesale Price Index Numbers
(1993-94=100)
Year
Index of Wholesale Prices Annual
Inflation
rate Primary
Articles
Fuel, Power,
Light &
Lubricant
Manufactured
products
All
Commodities
1 2 3 4 5 6
2000-01 162.5 208.1 141.7 155.7 6.27
2001-02 168.4 226.7 144.3 161.3 3.59
2002-03 174.0 239.2 148.1 166.8 3.40
2003-04 181.5 254.5 156.5 175.9 5.45
2004-05 188.1 280.2 166.3 187.3 6.48
2005-06 193.6 306.8 171.4 195.6 4.43
2006-07 209.1 324.0 179.0 206.3 5.47

58
2007-08 224.7 327.0 187.9 215.7 4.56
2008-09 247.3 351.4 203.1 233.9 5.52
2009-10 291.4 370.1* 203.6 244.2 4.40
2010-11 343.1 415.5* 216.4 268.2 9.83
2011-12 376.8 473.5* 232.0 292.4 9.02
2012-13 413.8 481.1* 244.6 313.9 7.35
* Only Fuel & Power
A new series with a base year of (2004-05) has also been compiled. In which All India
Wholesale Price Index Number of all commodities in the year 2012-13 stood at 167.6 as against
156.1 in 2011-12 depicting an increase of 7.37 per cent over the previous year. In 2012-13 the
Wholesale Price Index Number of fuel & power is found to be 171.7 as against 169.0 in 2011-
12. The All India Wholesale Price Index umber (2004-05) is presented in Table No. 3(l) of
part-II.
3.2.8 Retail Prices:
The Retail Price is the price which the ultimate consumer pays when buying from a
retailer. Therefore, it would be interesting to have a look in the movements of retail prices in
respect of Manipur State. The following Table No. 3.16 presents retail prices of some selected
items for the period 1991 to 2013 and the monthly average retail prices of some selected
commodities for 2012 and 2013 are shown in Table No. 3(h) and 3 (i) of part-II.
Table No. 3.16
Average Retail Prices of some selected commodities (Imphal Khwai Bazar)
(in Rs.) Sl.
no. Item Unit 1991 2001 2005 2006 2007 2008 2009 2010 2011 2012 2013
1 2 3 4 5 6 7 8 9 10 11 12 13 14
1. Rice
(fine)
Kg. 6.72 12.54 13.00 15.00 14.00 19.00 23.00 25.00* 25 21.66 24.50
2. Sugar Kg. 10.39 19.50 22.50 24.00 24.00 22.00 30.00 40.00 40 36.00 39.33
3. Salt Kg. 2.00 7.04 7.00 7.00 7.00 9.00 11.00 12.00 13
14.00 14.83
4. Mustard
oil(local)
kg. 41.83 48.42 60.00 60.50 72.00 92.00 85.00 80.00# 85# 100.00 112.50
5. Milk Lit. 8.00 15.83 15.00 15.00 20.00 20.00 20.00 24.00 28 29.83 39.16
6. Potato Kg. 4.33 9.00 11.00 12.00 13.00 10.00 18.00 17.00 15 18.08 20.83
7. Onion Kg. 5.97 15.17 13.00 11.00 20.00 15.00 18.00 20.00 28 20.08 36.25
8. Chillies
(dry)
Kg. 60.80 94.17 80.00 120.00 275.00 200.00 150.00
150.00 200 228.83 183.33

59
9. Arhar
Dal
Kg. 15.58 29.33 36.00 36.00 46.00 53.00 70.00 90.00 80 80.00 80.00
10. Firewood
(Splitted)
40
Kgs.
31.00 71.89 70.00 75.00 90.00 90.00 90.00 133.00 200 299.16 250.00
* : Local # : Imported
Source: Directorate of Economics & Statistics, Govt. of Manipur
It is evident that the retail price of Arhar dal is found to have increased by 107 times in
2011 as compared to 1961 position. In the case of rice (fine), the increase during the period of
1961-2011 is worked out to be about 68 times. The increase in the retail price of firewood
(splitted) is worked out to be about 33 times in 2011 as compared to 1961 price.

60
CHAPTER IV
STATE BUDGET AND PLANNING
A budget is the statement of the financial plan of a Government. It contains the details
of revenue and expenditure of the last completed financial year, the probable revenue and
expenditure estimates for the current year and the estimates of the anticipated revenue and
proposed expenditure for the next financial year. Thus, the budget is an important financial
document which serves as a useful instrument of economic and monetary policy.
4.1.1 State Budget : The budget of a State for every financial year (1st April to 31st March) is prepared by
the State Government. State Budget gives complete picture of the estimated receipts and
expenditure of the State. It shows the financial accounts of the previous year and revised
estimates of current year and the budget estimates of the coming year.
The accounts of the Government are kept in three parts viz.,Part I-Consolidated Fund,
Part II - Contingency Fund and Part III-Public Account.
The budget relating to Part I i.e., the Consolidated Fund consists of revenue and
expenditure of the State Government which are presented under three divisions viz., Revenue
Account, Capital Account and Debt Account. The revenue account consists of revenue receipts
and expenditure met out of these revenues. Capital account consists of capital receipts (market
loans, external assistance, repayment of debt etc.) and the expenditure met out of these capital
receipts. The Contingency Fund refers to the fund which is at the disposal of the Government
meant to meet unforeseen and emergent expenditure pending authorization of the Legislature.
The State Legislature has not yet constituted the Contingency Fund in Manipur and as such the
accounts of the Government of Manipur are shown under Part I and III only. Part III i.e., the
Public Account comprises of unfunded debt, deposits and advances, and remittances.
The combined effect of the transaction in the Consolidated Fund and the Public Account
presents the overall budgetary position with the surplus (+) or deficit (-) thereof. The overall
budgetary position of Manipur for the last few years is shown in Table No. 4.1.

61
Table No. 4.1 Overall Budgetary Position of Manipur
(Rs. in lakhs)
Sl.
No
Receipt/
Disbursement
2005-06
(Accounts)
2006-07
(Accounts) 2007-08
(Accounts)
2008-09
(Accounts)
2009-10
(Accounts)
1 2 3 4 5 6 7
I RECEIPT
1. Revenue 240894.94 286273.96 350826.72 387261.82 387313.46
Receipt (32.20) (23.92) (17.92) (14.43) (14.35)
2. Capital 507170.70 910492.52 1606837.63 2296042.72 2312099.70
Receipt (67.80) (76.08) (82.08) (85.57) (85.65)
Total 748065.64 1196766.48 1957664.35 2683304.54 2699413.16
(100.00) (100.00) (100.00) (100.00) (100.00)
II DISBURSEMENT
1. Revenue 200450.67 241464.69 229252.31 262228.14 301439.41
Expenditure (27.17) (19.77) (11.81) (9.76) (11.15)
2. Capital 537441.96 979984.14 1712735.62 2423994.73 2401589.75
Expenditure (72.83) (80.23) (88.19) (90.24) (88.85)
Total 737892.63 1221448.83 1941987.93 2686222.87 2703029.16
(100.00) (100.00) (100.00) (100.00) (100.00)
Overall Surplus (+)/
Deficit (-) (+)10173.01 (-)24682.35 (+)15676.42 (-)2918.33 (-)3616.00
(Rs. in lakhs)
Sl.
No.
Receipt/
Disbursement
2010-11
(Accounts)
2011-2012
(Accounts)
2012-13
(RE)
2013-14
(BE)
Percentage
variation
(2013-14)
1 2 8 9 10 11 12
I RECEIPT
1. Revenue 542994.38 565354.83 778189.09 861947.26 (+)10.76
Receipt (18.98) (25.99) (25.70) (27.70)
2. Capital 2317368.78 1609982.52 2250031.02 2249393.02 (-)0.03
Receipt (81.02) (74.01) (74.30) (72.30)
Total 2860363.16 2175337.35 3028220.11 3111340.28 (+) 2.74
(100.00) (100.00) (100.00) (100.00)
II DISBURSEMENT
1. Revenue 407800.66 500692.49 587490.47 669295.06 (+)13.92
Expenditure (14.46) (22.39) (19.49) (21.25)
2. Capital 2412985.95 1735703.09 2426204.14 2479867.04 (+) 2.21
Expenditure (85.54) (77.61) (80.51) (78.75)
Total 2820786.61 2236395.58 3013694.61 3149162.10 (+) 4.50
(100.00) (100.00) (100.00) (100.00)
Overall Surplus (+)/
Deficit (-)
(+)39576.55 (-)61058.23
(+)14525.50 (-)37821.82
RE : Revised Estimates BE : Budget Estimates
Note:- Figures in parenthesis indicate percentages to total.
Source:- (1) Finance Accounts, Government of Manipur
(2) Annual Financial Statement, Government of Manipur.

62
Since 1980-81, there has been significant increase in the State Revenue and
Expenditure. The total revenue receipts of the State was found to be increasing from Rs.110.94
crores in 1980-81 to Rs.8619.47 crores in 2013-14 (B.E.) as evident from Table No. 4(a) of
Part II. The capital receipt is expected to be Rs. 22493.93 crores in 2013-14 (B.E.) as against
Rs. 563.79 crores in 1980-81. The Revenue expenditure increased from Rs.69.70 crores
in1980-81 to 6692.95 crores in 2013-14 (B.E.). The Capital expenditure in absolute term was
increased from Rs.611.54 crores in 1980-81 to Rs.24798.67 crores in 2013-14 (B.E.). In 1980-
81, the revenue expenditure accounts for 10.24 percent of the total expenditure which increased
to only 21.25 percent in 2013-14(BE).
The budget for 2012-13(R.E.) shows a surplus of Rs. 145.25 crores. The overall budget
for the year 2013-14 envisages total receipts of Rs.31113.42 crores from both revenue and
capital accounts. The total expenditure is estimated at Rs.31491.62 crores in 2013-14 showing
overall deficit of Rs. 378.22 crores. The deficit in the Government budget represents the gap
between its receipts and expenditure.
The revenue deficit is the excess of revenue expenditure over revenue receipts and
represents the financing of the revenue expenditure by borrowings etc. In other words, the
existence of revenue deficit indicated that the revenue receipts of the State Government were
not able to meet its revenue expenditure and therefore the current obligations are met through
borrowed funds. The state had persistent revenue deficit during the period 2001-02 to 2003-
04. From the 2004-05 onwards, the State had revenue surplus which continued during the last
5(five) years as evident from Table No. 4.2. The substantial increase in the central grants to the
state has been instrumental in maintaining the revenue surplus.
Table No. 4.2 Trend in Revenue Receipts and Expenditure of Manipur
(Rs.In lakhs)
Item 2009-10 2010-11 2011-12 2012-13(RE) 2013-14(BE)
1 2 3 4 5 6
A. Revenue receipts 387313.46 542994.38 565354.83 778189.09 861947.26
1. Tax revenue 79359174 125761.96 152209.64 176053.00 206072.00
1.1 Share of Central Taxes 59756.00 99057.00 115403.00 132905.00 156885.00
1.2 State Taxes 19603.74 26704.96 36806.64 43148.00 49187.00
2. Non-Tax Revenue 307953.72 417232.42 413145.19 602136.09 655875.26
2.1 Central Grants-in-aid 283979.34 391244.47 381992.24 565155.61 612897.86
2.2 State 23974.38 25987.95 31152.95 36980.48 42977.40
B. Revenue Expenditure 301439.41 407800.66 483026.29 587490.47 669845.13
1. Social Services 89115.77 123864.86 143928.59 179639.26 168951.21
2. Economic Services 94194.64 119679.00 125737.36 167100.77 245400.90
3. General Services 118129.00 164274.80 213360.34 240750.44 255493.02
C. Surplus (+)/Deficit (-) (+)85874.05 (+)135193.72 (+)82328.54 (+)190698.62 (+)192102.13
RE : Revised Estimates BE : Budget Estimates

63
4.1.2 Revenue of State Government:
State Government has two sources of income viz., Tax Revenue and Non-Tax Revenue.
Tax Revenue is further sub-divided into (a) Share in Central taxes and (b) State’s own tax.
Non-tax revenue is divided into (a) State’s own non-tax and (b) grant and contributions from
the Central Government.
4.1.2.1 Revenue from taxes:
The tax revenue includes taxes on property and capital transactions, commodities and
services. Sales tax comprising about 85.22 % of state’s own tax revenue in 2010-11 is expected
to be only 78.45% 2013-14. The revenue from state excise tax is also expected to go up by
14.06% while taxes on property and capital transaction which is expected to increase by 13.98
% in 2013-14 over the previous year and taxes on commodities and services are expected to
increase by 14.00 percent in the same period. The total tax revenue is anticipated to increase
by about 17.05 percent in 2013-14 over the previous year. Table No. 4.3 provides the tax and
non-tax revenue of the State Government.
Table No. 4.3 Revenue Receipts from tax and non-tax revenue of Manipur (Rs. in lakhs)
Category of Receipts
Year
2010-11 2011-12 2012-13
(RE) 2013-14
(BE) %tage
variation
1 2 3 4 5 6
TAX REVENUE A. Taxes on property and capital
transaction of which
(i) Land Revenue 129.06 83.59 96.00 109.00 13.54 (ii) Stamps & Registration fee 356.65 482.06 549.00 626.00 14.03 (iii) Other taxes 1876.76 2159.81 3439.00 3920.00 13.99 Sub-Total (A) 2362.47 2725.46 4084.00 4655.00 13.98
B. Taxes on commodities and services, of which
(i) Sales tax 22756.96 29691.84 33849.00 38588.00 14.00 (ii) Taxes on Vehicles 443.60 1321.30 1717.00 1957.00 13.98 (iii) State Excise 661.18 980.35 1117.00 1274.00 14.06 (iv) Taxes on goods & passengers 90.17 140.35 160.00 182.00 13.04 (v) Taxes & duties on Electricity 0.26 33.66 39.00 44.00 12.82 (vi) Other taxes and duties 390.32 1913.68 2182.00 2487.00 13.98 Sub-Total (B): 24342.49 34081.18 39064.00 44532.00 14.00
C. States' own tax revenue (A+B) 26704.96 36806.64 43148.00 49187.00 14.00
D. Share in Central taxes 99057.00 115403.00 132905.00 156885.00 18.04 Total (I) 125761.96 152209.64 176053.00 206072.00 17.05 NON-TAX REVENUE of which
(i) Grants from the centre 391244.47 381992.24 565155.61 612897.86 8.45 (ii) Other non-tax revenue 25987.95 31152.95 36980.48 42977.40 16.22 Total (II) 417232.42 413145.19 602136.09 655875.26 8.92
Grand total of Revenue Receipts(I+II)
542994.38 565354.83 7778189.09 861947.26 10.76
RE : Revised Estimates BE : Budget Estimates.
Source: (i) Finance Accounts, Government of Manipur.
(ii) Annual Financial Statement, Government of Manipur.

64
4.1.2.2 Non-Tax Revenue: Non-Tax Revenue of the State consists of interest receipts, dividends and receipts from
general services, social and community services and economic services. The budget for 2013-
14(BE) gives details of revenue from the non-tax sources as Rs.429.77 crores as against
Rs.369.80 crores in 2012-13 (RE). Grants from Central Government increased from Rs.
3819.92 crores in 2011-12 to Rs. 5651.56 crores in 2012-13 (RE). However, the total grant
received was Rs. 6128.98 crores in 2013-14 (B.E.). The trends in revenue and capital receipts
are presented in Table No.4 (a) of Part II.
The total revenue receipt of the State has been estimated at Rs. 7781.89 crores in the
Revised Estimates of 2012-13 as against Rs 5653.55 crores in 2011-12 showing an increase of
37.65 percent over the actual estimates of 2011-12. The budget estimates shows total revenue
receipts of Rs. 8619.47 crores in 2013-14. The following Table No.4.4 shows the revenue
receipts from 2005-06 to 2013-14.
Table No.4.4 Revenue Receipts from 2005-06 to 2013-14
(Rs. in lakhs)
Year
Tax Revenue Non-Tax Revenue
Share in
Central Taxes
State's Own
Tax Revenue Total Own Non-Tax
1 2 3 4 5
2005-06 34214.00 9495.08 43709.08 7646.03
2006-07 43638.00 12151.44 55789.44 18104.19
2007-08 55043.00 14741.67 69784.67 16471.33
2008-09 58081.00 17006.67 75087.67 25346.04
2009-10 59756.00 19603.74 79359.74 23974.38
2010-11 99057.00 26704.96 125761.96 25987.95
2011-12 115403.00 36806.64 152209.64 31152.95
2012-13 (RE) 132905.00 43148.00 176053.00 36980.48
2013-14 (BE) 156885.00 49187.00 206072.00 42977.40
Year
Non-Tax Revenue Total
Revenue receipts
Per Capita
revenue receipts
(in Rs.) Grants &
Contributions Total
1 6 7 8 9
2005-06 189539.83 197185.86 240894.94 9562.28
2006-07 212380.33 230484.52 286273.96 11142.64
2007-08 264570.72 281042.05 350826.72 13393.25
2008-09 286828.11 312174.15 387261.82 14504.31
2009-10 283979.34 307953.72 387313.46 14235.18
2010-11 391244.47 417232.42 542994.38 20046.75
2011-12 381992.24 413145.19 565354.83 20023.99
2012-13 (RE) 565155.61 602136.09 778189.09 27562.25
2013-14 (BE) 612897.86 655875.26 861947.26 30528.84
RE: Revised Estimates BE: Budget Estimates
Source: 1. Finance Accounts, Government of Manipur.
2. Annual Financial Statement, Government of Manipur.
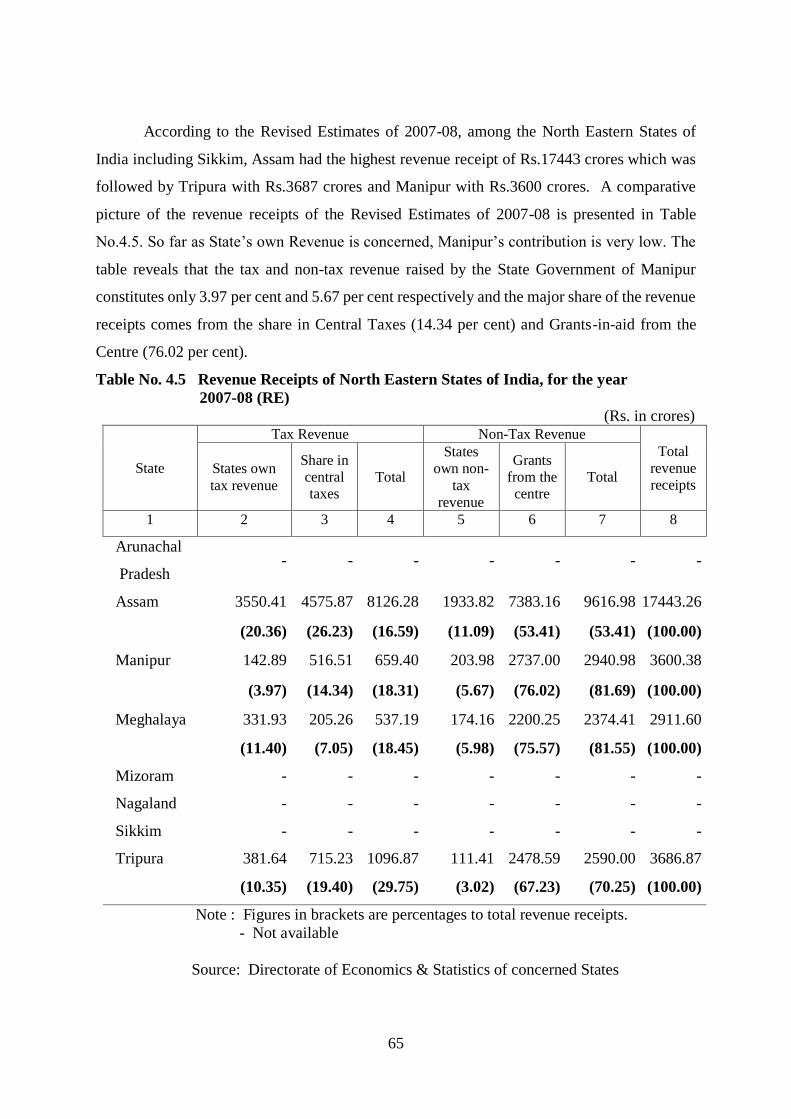
65
According to the Revised Estimates of 2007-08, among the North Eastern States of
India including Sikkim, Assam had the highest revenue receipt of Rs.17443 crores which was
followed by Tripura with Rs.3687 crores and Manipur with Rs.3600 crores. A comparative
picture of the revenue receipts of the Revised Estimates of 2007-08 is presented in Table
No.4.5. So far as State’s own Revenue is concerned, Manipur’s contribution is very low. The
table reveals that the tax and non-tax revenue raised by the State Government of Manipur
constitutes only 3.97 per cent and 5.67 per cent respectively and the major share of the revenue
receipts comes from the share in Central Taxes (14.34 per cent) and Grants-in-aid from the
Centre (76.02 per cent).
Table No. 4.5 Revenue Receipts of North Eastern States of India, for the year
2007-08 (RE)
(Rs. in crores)
State
Tax Revenue Non-Tax Revenue
Total
revenue
receipts
States own
tax revenue
Share in
central
taxes
Total
States
own non-
tax
revenue
Grants
from the
centre
Total
1 2 3 4 5 6 7 8
Arunachal
Pradesh - - - - - - -
Assam 3550.41 4575.87 8126.28 1933.82 7383.16 9616.98 17443.26
(20.36) (26.23) (16.59) (11.09) (53.41) (53.41) (100.00)
Manipur 142.89 516.51 659.40 203.98 2737.00 2940.98 3600.38
(3.97) (14.34) (18.31) (5.67) (76.02) (81.69) (100.00)
Meghalaya 331.93 205.26 537.19 174.16 2200.25 2374.41 2911.60
(11.40) (7.05) (18.45) (5.98) (75.57) (81.55) (100.00)
Mizoram - - - - - - -
Nagaland - - - - - - -
Sikkim - - - - - - -
Tripura 381.64 715.23 1096.87 111.41 2478.59 2590.00 3686.87
(10.35) (19.40) (29.75) (3.02) (67.23) (70.25) (100.00)
Note : Figures in brackets are percentages to total revenue receipts.
- Not available
Source: Directorate of Economics & Statistics of concerned States

66
4.1.3 Expenditure of State Government:
The expenditure of State Government can be classified into two heads viz.,
Developmental expenditure and Non-Developmental expenditure.
4.1.3.1 Developmental Expenditure:
Developmental expenditure comprises economic and social services. Social services
include education, arts and culture, sports, health services, social security and welfare including
scheduled castes, scheduled tribes and backward classes, labour and employment, housing and
urban development, natural calamities, information and publicity etc., while Economic
Services include agriculture and allied services, industry and mining, rural development, water
and power development, transport and communication, science, technology & environment
and general economic services. Expenditure on social services is expected to decrease by 5.95
percent from Rs.1796.39 crores in 2012-13 (RE) to Rs.1689.51 crores in 2013-14 (BE) while
the expenditure on economic services increases from Rs. 1478.77 crores in 2012-13 (R.E.) to
Rs. 2100.63 crores in 2013-14 (BE). Developmental expenditure is Rs. 3467.40 crores in 2012-
13 as against Rs.2873.32 crores in 2011-12 thereby showing an increase of 20.68 percent. The
developmental expenditure in 2013-14 is expected to be Rs.4143.52 crores as against Rs.
3467.40 crores in 2012-13 showing an increase of 19.50 percent. Details of the developmental
and non-developmental expenditure of accounts are presented in Table No.4.6.
Table No. 4.6 Revenue Expenditure under Developmental and Non-Developmental
Expenditure of State Government (Rs. in lakhs)
Category of Expenditure
Year
2010-11 2011-12 2012-13
(RE)
2013-14
(BE)
1 2 3 4 5
1 DEVELOPMENTAL EXPENDITURE
A Economic Services of which
(i) Agriculture & allied activities 38367.65 39703.12 45639.02 48851.43
(ii) Rural Development & Special Area
Programme 12744.41 13535.81 22460.63 30585.41
(iii) Irrigation & flood control 6667.10 7803.31 7844.40 8008.30
(iv) Energy 21156.31 27340.93 32558.63 37562.96
(v) Industry & Minerals 7426.57 9698.02 11295.28 11418.91
(vi) Transport 10040.27 13674.50 14391.93 15447.63
(vii) Science, Technology & Environment 1467.44 1998.82 2425.20 4788.40
(viii) General Economic Services 10498.50 11982.84 11261.52 53399.70
Sub-Total (A) : 108368.25 125737.35 147876.61 210062.74
B Compensation and Assignment to Local
Bodies and PRIs 11310.75 17666.20 19224.16 35338.16
Contd.

67
Table No. 4.6 Revenue Expenditure under Developmental and Non-Developmental
Expenditure of State Government
(Rs. in lakhs)
Category of Expenditure
Year
2010-11 2011-12 2012-13
(RE)
2013-14
(BE)
1 2 3 4 5
C Social Services of which
(i) Education including Arts & Culture 56902.37 65587.50 85686.31 86909.02
(ii) Health & Family welfare 20932.72 25169.56 26142.78 28227.20
(iii) Housing & Urban Development
including water supply & sanitation 10229.69 12076.35 13993.53 10533.40
(iv) Information & Broadcasting 466.13 519.32 565.38 592.69
(v) Social security & welfare including
Nutrition, STs, SCs & OBCs 33173.67 37640.36 51506.75 40889.51
(vi) Labour & Employment 1059.87 1473.97 1370.79 1419.47
(vii) Natural calamities & others 1082.41 1461.53 373.72 379.92
Sub-Total (C): 123846.86 143928.59 179639.26 168951.21
Total (I) : 243525.86 287332.14 346740.03 414352.11
II NON-DEVELOPMENTAL
EXPENDITURE
Revenue Expenditure under General
Services
(i) Organs of State 5228.35 7708.91 8705.36 8543.70
(ii) Fiscal Services 3406.51 4233.63 4544.42 4502.61
(iii) Interest Payment & Servicing
of deft 38686.78 42316.03 44383.98 45763.30
(iv) Administrative Services 76883.43 96073.49 103966.73 109464.80
(v) Pension & Miscellaneous General
Services 40069.73 63028.08 79149.95 86668.54
Total (II) : 164274.80 213360.34 240750.44 254942.95
Grand Total (I + II) 407800.66 500692.48 587490.47 669295.06
RE: Revised Estimates BE: Budget Estimates Concld.
4.1.3.2 Non-Developmental Expenditure Non-developmental expenditure includes general administrative services, fiscal
services, debt services and grants-in-aid to local bodies. Revenue expenditure under Non-
developmental expenditure is Rs.2133.60 crores in 2011-12 as against Rs. 1642.75 crores in
2010-11 showing an increase of 29.88 percent. The Non-developmental expenditure is
estimated to be Rs. 2407.50 crores in 2012-13 showing an increase of 12.84 percent over the
previous year. In 2013-14 the expenditure is estimated at Rs. 2549.43 crores. Under Non-
developmental expenditure, the expenditure on interest payments and servicing of debt have
been increased from Rs. 423.16 crores in 2011-12 to Rs 443.84 crores in 2012-13 and Rs.
457.63 crores in 2013-14. Expenditure on administrative services is anticipated to increase by
5.29 percent in 2013-14 over the previous year and pension and miscellaneous general services

68
is expected to increase by 9.50 percent in 2013-14 over the previous year 2012-13. Expenditure
on the organs of the State has shown a decrease of 1.85 % in 2013-14 over the previous year
2012-13. The trends in developmental and non-developmental expenditure (Revenue +
Capital) are shown in the Table No. 4(b) of part II of this publication.
4.1.4 Plan and Non-Plan Expenditure :
The total expenditure amounts to Rs.9397.78 crores in 2013-14 which shows an increase
of 16.86 percent over the previous year. The shares of the plan and non-plan expenditure are
presented in Table No.4.7.
Table No. 4.7 Plan and Non-plan expenditure of Manipur
Year
Expenditure (Rs. In lakhs)
Non-plan Plan Centrally sponsored
Plan Scheme
Total
Expenditure
1 2 3 4 5
1980-81 5608.77 4731.95 - 10340.72
1990-91 26697.61 16496.99 3151.41 46346.01
1995-96 46894.08 28018.76 4484.48 79397.32
1996-97 54120.27 37101.71 6063.92 97285.90
1997-98 61532.22 36378.00 6790.11 104700.33
1998-99 60930.68 35391.73 4178.77 100501.18
1999-00 109199.47 55540.64 6435.03 171175.14
2000-01 93739.61 28831.68 4521.97 127093.26
2001-02 113819.11 28723.07 8799.92 151342.10
2002-03 127638.30 19728.85 10213.93 157581.08
2003-04 127552.06 28832.04 14002.55 170386.65
2004-05 139697.30 63478.71 14061.01 217237.03
2005-06 159231.27 83210.30 19591.17 262032.74
2006-07 199706.66 103706.27 24749.05 328161.98
2007-08 181092.83 129972.00 28979.23 340044.06
2008-09 213523.33 160137.13 35247.74 408908.20
2009-10 230370.68 174321.67 55525.36 460217.71
2010-11 298043.15 247052.89 54510.37 599606.41
2011-12 392260.86 233613.12 44359.56 670233.54
2012-13 (RE) 462902.66 264167.44 77115.22 804185.32
2013-14 (BE) 490782.99 366740.92 82254.19 939778.10
Contd.

69
Table No. 4.7 Plan and Non-plan expenditure of Manipur
Year
Percentage to total expenditure
Non-plan Plan Centrally sponsored
Plan Scheme Total Expenditure
1 6 7 8 9
1980-81 54.24 45.76 - 100.00
1990-91 57.61 35.59 6.80 100.00
1995-96 59.06 35.29 5.65 100.00
1996-97 55.63 38.14 6.23 100.00
1997-98 58.77 34.75 6.48 100.00
1998-99 60.63 35.21 4.16 100.00
1999-00 63.79 32.45 3.76 100.00
2000-01 73.76 22.68 3.56 100.00
2001-02 75.21 18.98 5.81 100.00
2002-03 81.00 12.52 6.48 100.00
2003-04 74.86 16.92 8.22 100.00
2004-05 64.31 29.22 6.47 100.00
2005-06 60.77 31.75 7.48 100.00
2006-07 60.86 31.60 7.54 100.00
2007-08 53.26 38.22 8.52 100.00
2008-09 52.22 39.16 8.62 100.00
2009-10 52.22 39.16 8.62 100.00
2010-11 50.05 37.88 12.07 100.00
2011-12 58.53 34.85 6.62 100.00
2012-13 (RE) 57.56 32.85 9.59 100.00
2013-14 (BE) 52.22 39.02 8.76 100.00
RE : Revised Estimates BE : Budget Estimates Concld. Source:- (i) Finance Accounts, Govt. of Manipur
(ii) Annual Financial Statement, Govt. of Manipur.
The total revenue expenditure of the State has been estimated at Rs. 6692.95 crores in
the Budget Estimates of 2013-14 as against Rs. 5874.90 crores in 2012-13 (R.E.) showing an
increase of 13.92 %. The per capita revenue expenditure which was Rs.3384 in 1996-97 has
increased to Rs. 19874 in 2012-13 and is anticipated to increase to Rs. 22155 in 2013-14. The
total plan and non-plan expenditure under revenue expenditure are shown in Table No. 4.8.

70
Table No. 4.8 Revenue Expenditure from 1996-97 to 2013-14
(Rs in lakhs)
Year
Total Revenue Expenditure
State Plan State Non-plan
Expenditure Percentage Expenditure Percentage
1 2 3 4 5
1996-97 12351.03 17.39 53784.02 75.72
1997-98 13151.17 16.60 60570.50 76.43
1998-99 14587.92 18.45 60839.81 76.94
1999-00 20058.29 14.88 108958.62 80.83
2000-01 14590.11 12.99 93514.12 83.24
2001-02 12543.89 9.38 113920.53 85.14
2002-03 7719.42 5.45 127641.92 90.20
2003-04 13636.71 9.32 125909.49 86.03
2004-05 20452.10 12.39 139631.55 84.56
2005-06 31660.22 15.79 159247.33 79.45
2006-07 29382.21 12.17 199464.74 82.61
2007-08 36050.10 15.72 181261.36 79.07
2008-09 35517.78 13.55 213222.60 81.31
2009-10 52984.75 17.58 230450.03 76.45
2010-11 86644.68 21.25 297944.02 73.06
2011-12 82725.16 16.52 392582.93 78.41
2012-13 (RE) 95311.36 16.22 445267.94 75.79
2013-14 (BE) 155445.40 23.23 473250.82 70.71
Year
Total Revenue Expenditure Index
of
Growth
Per capita
Revenue
Expenditure
(in Rupees)
Central Plan Total
Expenditure Expenditure Percentage
1 6 7 8 9 10
1996-97 4895.64 6.89 71030.69 211 3383.63
1997-98 5522.60 6.97 79244.27 236 3689.55
1998-99 3648.80 4.61 79076.53 235 3599.46
1999-00 5781.71 4.29 134798.62 401 6000.34
2000-01 4239.50 3.77 112343.73 334 4891.66
2001-02 7331.21 5.48 133795.63 398 5757.62
2002-03 6149.22 4.35 141510.56 421 5967.93
2003-04 6800.68 4.65 146346.88 436 6046.84
2004-05 5035.17 3.05 165118.82 492 6686.14
2005-06 9543.15 4.76 200450.70 597 7956.86
2006-07 12617.74 5.22 241464.69 719 9398.53
2007-08 11940.85 5.21 229252.31 683 8752.00
2008-09 13487.76 5.14 262228.14 781 9821.36
2009-10 18004.63 5.97 301439.41 898 11079.00
2010-11 23211.96 5.69 407800.66 1215 14711.65
2011-12 25384.40 5.07 500692.49 1492 17309.86
2012-13 (RE) 46911.17 7.99 587490.47 1751 19873.68
2013-14 (BE) 40598.84 6.07 669295.06 1995 22154.54
, RE : Revised Estimates BE : Budget Estimates

71
4.2 Planning:
Planning is generally taken to mean a State-planned economy. The Government
prepares Plan in the field of economic, social and general services not only to raise the income
of the economy but also for bringing about all-round development of an economy.
4.2.1 Five Year Plans:
The Government of India set up the Planning Commission in 1950. The purpose of the
Planning Commission was to assess carefully the human and physical resources of the state and
to prepare plans for the effective use of these resources. The first five-year plan of India was
presented to the Parliament of India on 8th December, 1951 by the first Indian Prime Minister,
Jawaharlal Nehru. After the launching of the First Five Year Plan on 1st April, 1951, subsequent
five-year plans followed. In between, there had been some annual plans.
With the launching of the First Five Year Plan in 1951 for India, the Process of Planned
Economic Development also started in Manipur. The first five-year plan of the State was
launched with a total outlay of Rs. 1.55 crores only. The outlay for the first three Five Year
Plans for Manipur was only Rs.20.68 crores. The Third Five Year Plan period beginning from
the 1st April, 1966 and ending on 31st March, 1969 are known as the period of plan holiday or
Annual plan. During this period, three annual plans were prepared with an investment of
Rs.10.14 crores. Fourth Five Year Plan began on 1st April, 1969 and lasted till 31st March, 1974
with an investment of Rs.30.25 crores. During the 4th Five Year Plan period the process of most
of the economic development in Manipur has been initiated. The Fifth Five Year Plan of the
State started on 1st April, 1974. This plan was to continue till 31st March, 1979 but was
terminated a year in advance by March, 1978. The Sixth Five Year Plan beginning on the 1st
April, 1980 covered the five year period of 1980-85. The size of the Sixth Five Year Plan was
quite big as compared to the previous plans with an allocation of Rs.240 crores and that of the
Seventh plan was again found to be bigger by about 1.79 times of the Sixth Plan, with Rs.430
crores spreading over the period 1985-90.
There were 2 (two) annual plans such as 1990-91 and 1991-92 between the intervening
periods of the 7th and the 8th plans. The 8th plan with an allocation of Rs.979 crores was launched
during the period 1992-97. The Ninth, Tenth, and Eleventh Five Year plan covered the period
from 1997-98 to 2001-2002, 2002-2003 to 2006-2007 and 2007-2008 to 2001-20012
respectively with an outlay of Rs.2426.69 crores, Rs. 2804.00 crores and Rs.8154.00 crores.
The Twelfth Five Year Plan is being implemented now. Table No. 4.9 shows the growth of plan
outlay and expenditure of Manipur since 1st Five Year Plan.

72
Table No. 4.9 Growth of Plan Outlay and Expenditure in respect of Manipur State
(Rs. in crores)
Plan Year
Outlay Expenditure
Total
Growth in
percentage
between plan
period
Total
Growth in
percentage
between
plan period
1 2 3 4 5 6
First Plan 1951-56 1.55 - 1.03 -
Second Plan 1956-61 6.25 303.22 5.97 479.61
Third Plan 1961-66 12.88 106.08 12.81 114.57
Three Annual Plans 1966-69 10.13 - 7.20 -
Fourth Plan 1969-74 30.25 134.86 31.00 142.00
Fifth Plan 1974-78 92.86 206.98 66.62 114.90
Annual Plan 1978-80 59.26 - 61.13 -
Sixth Plan 1980-85 240.00 158.45 262.93 294.67
Seventh Plan 1985-90 430.00 79.17 523.27 99.01
Annual Plan 1990-92 365.00 - 358.48 -
Eighth Plan 1992-97 979.00 127.67 1209.69 131.18
Ninth Plan 1997-02 2426.69 147.87 1848.65 52.82
Tenth Plan 2002-07 2804.00 15.55 2741.40 48.29
Eleventh Plan 2007-12 8154.00@ 190.80 9218.94* 236.29
Twelfth Plan 2012-17 20457.91@ 150.89 - -
@ Projected Outlay *Anticipated Expenditure
Source: Planning Department, Manipur
4.2.2 Plan Size :
The size of the State’s Tenth Five Year Plan (2002-07) as approved by the planning
commission was Rs.2804.00 crores which is about 15.55 percent higher than the size of the
Ninth Five Year Plan. The proposed outlay for the Eleventh and Twelfth Five year Plan
is Rs. 8154 crores and Rs.20458 crores respectively. The proposed outlay by major sectors
are presented in Table No.4.10.

73
Table No. 4.10 Growth of plan outlay over the five year plan periods by major sectors
at current prices
(Rs. in crores)
Sectors
Agreed
outlays
Ninth
Plan
(1997-02)
Projected
outlay
Tenth
plan
(2002-07)
Proposed
outlay
Eleventh
Plan
(2007-12)
Tentative
Projected
Outlay
12th Plan
(2012-17)
Percentage
variation
(Eleventh
to Twelfth
Plan)
1 2 3 4 5 6
I Agriculture &
Allied Activities 183.17 96.42 385.95 630.95 (+)63.48
II Rural Development 61.20 81.98 192.79 929.17 (+)381.96
III Special Area programmes 0.00 22.88 347.24 332.25 (-)4.32
IV Irrigation & Flood Control 320.60 368.54 772.38 3159.41 (+)309.05
V Energy 335.34 236.23 1505.20 1533.75 (+)1.90
VI Industry & Minerals 126.51 332.94 656.14 427.16 (-)34.90
VII Transport 399.68 223.49 403.16 1105.05 (+)174.10
VIII Communication 0.00 0.00 0.00 0.00 0.00
IX Science , Technology &
Environment 9.00 34.65 180.91 1126.80 (+)522.85
X General Economic
Services 133.67 295.22 157.98 394.45 (+)149.68
XI Social Services 569.64 1015.22 3229.27 10554.26 (+)226.83
XII General Services 287.88 96.45 322.98 264.67 (-)18.05
Grand Total 2426.69 2804.00 8154.00 20457.91 (+)150.89
Source: Planning Department, Govt. of Manipur.
During the Ninth Five Year Plan, the actual expenditure incurred was Rs.1848.65
crores. The year-wise actual expenditure incurred in the Ninth Five Year Plan were Rs.363.78
crores (1997-98), Rs.353.92 crores (1998-99), Rs.555.40 crores (1999-00), Rs.288.32 crores
(2000-01) and Rs. 287.23 crores (2001-02).
Out of the total outlay of Rs.2804.00 crores for the Tenth Five Year Plan, the actual
annual expenditure for the years 2002-03 to 2006-07 were Rs.197.27 crores, Rs.286.62
crores Rs. 601.05 crores, Rs. 667.27 crores and Rs. 1045.56 crores respectively. The actual
74
expenditure for the annual plan 2007-08 was Rs.1336.50 crores and the agreed outlay for the
annual plan 2008-09 is Rs.1660.00 crores. The sector-wise outlays and expenditures are shown
in Table No. 4.11. The State plan outlay and expenditure are shown in Table No. 4(c) of Part
II of this publication.
Table No. 4.11 Plan outlay and Expenditure by major sector
(Rs. in crores)
Sectors
Ninth Plan (1997-2002)
Outlay Percentage
to total outlay Expenditure
Percentage
to total
expenditure
1 2 3 4 5
I Agriculture & Allied Activities 183.17 7.55 94.97 5.14
II Rural Development 61.20 2.52 81.47 4.41
III Special Area programmes 0.00 0.00 6.76 0.36
IV Irrigation & Flood Control 320.60 13.21 241.54 13.07
V Energy 335.34 13.82 358.94 19.42
VI Industry & Minerals 126.51 5.21 94.07 5.09
VII Transport 399.68 16.47 256.38 13.87
VIII Communication 0.00 0.00 0.00 0.00
IX Science, Technology
& Environment 9.00 0.37 6.17 0.33
X General Economic Services 133.67 5.51 45.76 2.47
XI Social Services 569.64 23.48 622.78 33.69
XII General Services 287.88 11.86 39.81 2.15
Grand Total 2426.69 100.00 1848.65 100.00
(Rs. in crores)
Sectors
Tenth Plan (2002-2007)
Outlay Percentage
to total outlay Expenditure
Percentage
to total
expenditure
1 6 7 8 9
I Agriculture & Allied Activities 96.42 3.44 97.07 3.54
II Rural Development 81.98 2.92 142.06 5.18
III Special Area programmes 22.88 0.82 95.10 3.47
IV Irrigation & Flood Control 368.54 13.14 465.82 16.99
V Energy 236.22 8.42 187.19 6.77
VI Industry & Minerals 332.94 11.87 164.84 6.01
VII Transport 223.48 7.97 263.32 9.61
VIII Communication 0.00 0.00 0.00 0.00
IX Science, Technology
& Environment 34.65 1.24 48.55 1.77
X General Economic Services 295.22 10.53 69.58 2.54
XI Social Services 1015.22 36.21 1062.96 38.77

75
XII General Services 96.45 3.44 201.28 7.34
Grand Total 2804.00 100.00 2741.40 100.00
Contd
Table No. 4.11 Plan outlay and Expenditure by major sector
(Rs. in crores)
Sectors
Annual Plan Twelfth Five
Year Plan
2012-17 2007-08 2008-09 2009-10 2010-11 2011-12
Actual
Expdtr.
Actual
Expdtr.
Actual
Expdtr.
Actual
Expdtr.
Anticipated
Expdtr.
Projected
Outlay
1 10 11 12 13 14 15
I Agriculture & Allied
Activities
33.27 39.79 57.35 62.16 70.55
630.95
II Rural Development 41.21 84.45 100.85 54.09 57.99 929.17
III Special Area programmes 14.33 19.70 19.70 62.54 79.19 332.24
IV Irrigation & Flood Control 237.79 334.86 327.26 293.77 408.28 3159.41
V Energy 103.73 83.48 170.56 134.96 171.31 1533.75
VI Industry & Minerals 79.65 18.58 33.06 36.75 43.81 427.16
VII Transport 2.9.61 301.31 316.39 115.86 260.08 1105.05
VIII Communication 0.00 0.00 0.00 0.00 0.00 0.00
IX Science , Technology &
Environment
15.11 24.09 9.95 66.46 123.93 1126.80
X General Economic Services 21.74 24.39 23.05 68.11 435.39 394.45
XI Social Services 491.30 550.76 680.17 728.46 1090.15 10554.26
XII General Services 60.83 55.37 78.95 56.95 136.31 264.67
Grand Total 1308.57 1535.78 1817.49 1680.11 2876.99 20457.91
Concld. Source: 1. Planning Department, Manipur.
2. Finance Accounts.
3. Annual Financial Statement.
4.3 Finance Commission: The Indian Union has a federal constitution and accordingly public finance in India has a federal
set-up. Till 1950, the allocation of resources between state and centre is through “The Govt. of India
Act, 1935”, which has divided financial resources into four classes viz.,
(i) exclusively federal resources;
(ii) exclusively principal resources;
(iii) taxes to be levied and collected by the centre but receipts to be assigned to the
provinces; and
(iv) taxes which were to be shared between the Centre and the Provinces.
Then, with a statutory provision in the constitution regarding appointment of a Finance
Commission (FC) to review the working of the finance relation between the centre and the states, the
first Finance Commission was accordingly appointed in Nov., 1951, under the Chairmanship of Shri

76
K.C. Neogy. It submitted its report in Dec., 1952. The recommendations of the Commission were
accepted in their entirety by the government which involved the assignment of a large share of income-
tax to the states, the allocation of 40 percent of the net proceeds of excise duties on tobacco, matches
and vegetable products to the states and the payments of increased and additional grants-in-aid to a
number of states.
Another Finance Commission was appointed in 1956 under the Chairmanship of Shri
K. Santhanam. The Government accepted the recommendations of this Commission also and
gave effect to them with effect from 1957-58. Likewise, for every five year, a new finance
commission gives its recommendations for the next five year coming under the Article 280,
which provides for constituting a Finance Commission at the expiration of every fifth year or
at such earlier time, as the President of India considers necessary. The recommendations of
those commissions are based on a detailed assessment of the financial position of the central
and state governments and vide consultation with almost all sections of state holders. The
commission usually visits the states, sponsors studies, and holds consultation with experts and
their recommendations are usually backed up by detailed reasons disclosing methodology
adopted by them.
As done by previous commission, the thirteenth finance commission (2010-15) also
made recommendations based on a detailed assessment of the financial position of the Central
and the State Governments, as well as substantial information and economic data gathered
through consultations, submission and research studies. The commission held 123 (One
Hundred and Twenty three) meetings and also meeting with economist and other representation
of State Governments. Subsequently, the commission submitted its report in December, 2009.
The total transfers recommended for Manipur for the award period (2010-15) was Rs. 13567.5
crores constituting Rs. 6541.2 crores as share in Central Taxes and Duties and Rs. 7026.3 crores
as Grants-in-Aid.
4.3.1 Thirteenth Finance Commission (FC-XIII):
The FC-XIII was constituted on November 3, 2007 under the chairmanship of Dr. Vijay
L. Kelkar to make recommendations for the period 2010-15. Dr. Indira Rajaraman, Professor
Emeritus, Dr. Sanjiv Mishra (who was subsequently appointed in place of Dr. Abusaleh
Shariff) and Professor Atul Sharma were appointed as full time members while Shri B.K.
Chaturvadi was appointed as a part-time member and Shri Sumit Bose as Secretary.

77
The FC-XIII has taken cognizance of the prevailing fiscal and macro-economic
situation particularly the need to sustain the growth momentum, while bringing about fiscal
consolidation. Accordingly, its endeavour has been to recommend a scheme of transfers that
could serve the objectives, both of equity and efficiency, and result in fiscal transfer that are
predictable and stable. These transfers in the form of tax devolution and grants are meant to
correct the vertical imbalances relating to transfer from the Central Government to the State
Governments taken together and also the horizontal imbalances which relates to allocation of
transfers among the State Governments.
Vertical Devolution :
The Commission has recommended that the share of the states in the net proceeds of
shareable central taxes be 32 per cent every year for the period for the award. With the
exemptions of all goods from the payment of duty, under the Additional Duties of Excise
(Goods of Special Importance) Act, 1957, from 1st March, 2006, the centre has made suitable
adjustments in excise duty on Sugar and Tobacco products. The three goods covered under the
tax rental agreement, viz., textiles, tobacco and sugar continue to remain in the list of declared
goods under the Central Sales Tax Act, 1956 thus binding the states to prescribed rates in case
states decides to levy Value Added Tax (VAT) on these commodities. The FC-XIII have not
earmarked any portion of the recommended 32 per cent states’ share in shareable net central
tax revenue as attributable to additional duties of excise in lieu of sales tax and have not
recommended any reduction in the share of the states in the event of levy of VAT on textiles,
tobacco and sugar by them.
The commission has treated proceeds of service tax as part of the divisible pool for the
purpose of determining the states’ share in central taxes. In term of the 88th Amendment to the
Indian Constitution (which is yet to be notified), the power to levy service tax is vested with
the centre and distribution of the tax proceeds between the union and states shall be in
accordance with the principles to be determined by the Parliament. In this regard, the
commission had endorsed the recommendation of the FC-XII that in the event of such
notification, it should be ensured that the revenue accruing to a state under the notification
should not be less than the share that would accrue to it, had the entire service tax proceeds
been part of the shareable pool.
While recommending the states’ share in net central taxes, the commission has taken in
to account the overall central transfers to states on revenue account in relation to gross revenue

78
receipts of the centre. The Commission recommended an indicative ceiling on overall transfers
to States on revenue account at 39.5 per cent of the centre’s gross revenue receipts.
Horizontal Devolution :
Regarding the determination of the inter se shares of states in tax devolution, the
Finance Commission has used equity and efficiency as the two guiding principles. The
principle of equity addresses the problem of differences in revenue raising capacity and cost
disabilities across states. When capacity is assessed on the basis of observed revenue collected,
there is the risk of moral hazard in making the states lax in terms of improving their revenue
effort and managing their finances prudently. The principle of efficiency is intended to address
this issue and to motivate the states to exploit their resource base and manage their fiscal
operations in a cost effective manner. The FC-XIII recommendation on horizontal sharing is
also guided by these two principles.
The Criteria and the weights assigned for determination of inter se share of states in tax
devolution are summarised below :
Table No. 4.12 Criteria and Weights for Tax Devolution
Sl. No. Criteria Relative Weights (per cent)
1 2 3
1. Population 25.0
2. Area 10.0
3. Fiscal Capacity Distance 47.5
4. Fiscal Discipline 17.5
Source: Report of the Thirteenth Finance Commission, 2010-15
A comparative picture of the inter se share of the North-Eastern States of India in the
Union Tax excluding Service Tax and in the Service Tax are presented in Table No. 4.13
below :
Table No. 4.13 Inter se share of North Eastern States in the union tax and service tax.
Sl.
No.
North Eastern States
(NES)
Shares of NES in net proceeds of
central taxes excluding Service tax
(per cent)
Share of NES in
Service tax
(per cent)
1 2 3 4
1. Arunachal Pradesh 0.328 0.332
2. Assam 3.628 3.685
3. Manipur 0.451 0.458
4. Meghalaya 0.408 0.415

79
5. Mizoram 0.269 0.273
6. Nagaland 0.314 0.318
7. Sikkim 0.239 0.243
8. Tripura 0.511 0.519
Source: Report of the Thirteenth Finance Commission, 2010-15.
Grants-in-Aid under Art. 275 (i) of the Indian Constitution
The FC-XIII has recommended grants-in-aid amounting to Rs. 3,18,581 crores for the
award period 2010-15 for different purposes. The amount allocated for Manipur out of the total
is as indicated below:
Particulars Grants-in-Aid (Rs. crores)
Total Manipur
I Local Bodies 87,519 315.9
II Disaster Relief (including for capacity building) 26,373 40.9
III Post devolution Non-plan Revenue Deficit 51,800 6056.6
IV Performance Incentive 1,500 0.0
V Elementary Education 24,068 15.0
VI Environment 15,000 158.3
(a) Protection of Forest 5,000 150.3
(b) Renewable Energy 5,000 -
(c) Water Sector Management 5,000 8.0
VII Improving Out comes 14,446 38.6
(a) Reduction in Infant Mortality Rates 5,000 -
(b) Improvement in Supply of Justice 5,000 11.6
(c) Incentive for Issuing Unique Identification 2,989 4.0
(d) District Innovation fund 616 9.0
(e) Improvement of Statistical System 616 9.0
(f) Employee and Pension Data base 225 5.0
VIII Maintenance of Roads and Bridges 19,930 100.0
IX State specific needs 27,945 301.0
X Implementation of model Goods & Services Tax 50,000 -
Total 3,18,581 7,026.3

80
Note: - (1) The state allocation for item no. VI (b), VII (a) and X is not shown as the
allocation is to be done depending on the future performance of the state in the
respective areas.
(2) Total may not tally due to rounding off.
Source: Report of the Thirteenth Finance Commission, 2010-15.
Local Bodies :
The Tenth Finance Commission (FC-X) had first made a provision for explicitly
supporting local bodies through grants subsequent to the passage of the 73rd and 74th
amendments to the constitution of India in 1993. Since then, there has been a considerable
progress in the empowerment of Panchayati Raj Institutions (PRIs) and municipalities.
The FC-XIII also recommended that grants be given to local bodies. The amount
recommended for the local bodies in Manipur is detailed in the Table No. 4.14.
Table No. 4.14 Grants recommended for the Local Bodies of Manipur by the 13th
Finance Commission.
( Rs in Crores)
Particulars 2010-11 2011-12 2012-13 2013-14 2014-15
1 2 3 4 5 6
1. General Basic Grants 28.00 32.50 38.00 45.00 53.30
2. General Performance Grants 0.00 11.10 26.10 30.70 36.30
3. Special Areas Basic Grants 1.80 1.80 1.80 1.80 1.80
4. Special Areas Performance Grants 0.00 0.90 1.80 1.80 1.80
Source : Report of the Thirteenth Finance Commission, 2010-15
Disaster relief :
The financing of disaster relief is an important aspect of federal fiscal relation in India.
The states have different disaster proneness profiles and varying levels of economic
development which implies that the coping capacity of each state to deal with disaster is not
same. An ironical fact is that the poorer states are often the most disaster prone. Consequently,
the financing of disaster relief has come to be firmly accepted as a joint endeavor of the Central
and State Governments.

81
The subject of funding relief expenditure has been recognized by every finance
commission since the second. The existing system of financing relief expenditure mainly
revolves around the Calamity Relief Funds (CRFs) maintained at the state level and the
National Calamity Contingency Fund (NCCF) at the central level.
Calamity Relief Fund (CRF) :
The CRF is maintained in the public account of the state to be used to meet expenditure
for providing immediate relief to victims of cyclone, drought, earthquake, fire, flood, tsunami,
hailstorm, landslide, avalanche, cloud burst and pest attacks. The FC-XIII has recommended
that the CRF be merged into the State Disaster Response Funds (SDRFs) of the respective
states. The commission also recommended the funding of the SDRFs in the ratio of 75:25 by
the central and State Governments respectively for the general category states and 90:10 for
the special category states. The recommended size of the SDRF for Manipur is Rs. 39.90 crores.
The annual contribution of the Centre and the State Government for the period from 2010-11
to 2014-15 is shown below Table No. 4.15.
Table No. 4.15 Centre’s and State’s share in the Disaster Relief Fund for
Manipur, 2010-11 to 2014-15.
Year Share (Rs. crores)
Central State Total
1 2 3 4
2010-11 6.50 0.72 7.22
2011-12 6.82 0.76 7.58
2012-13 7.16 0.80 7.96
2013-14 7.52 0.84 8.36
2014-15 7.90 0.88 8.78
Source : Report of the Thirteenth Finance Commission, 2010-15
In order to reduce the impact of a disaster on human life and property, trained manpower
who can effectively deal with complex situation are required. Therefore, measures are
necessary to be taken to build capacity amongst those handling response and creating
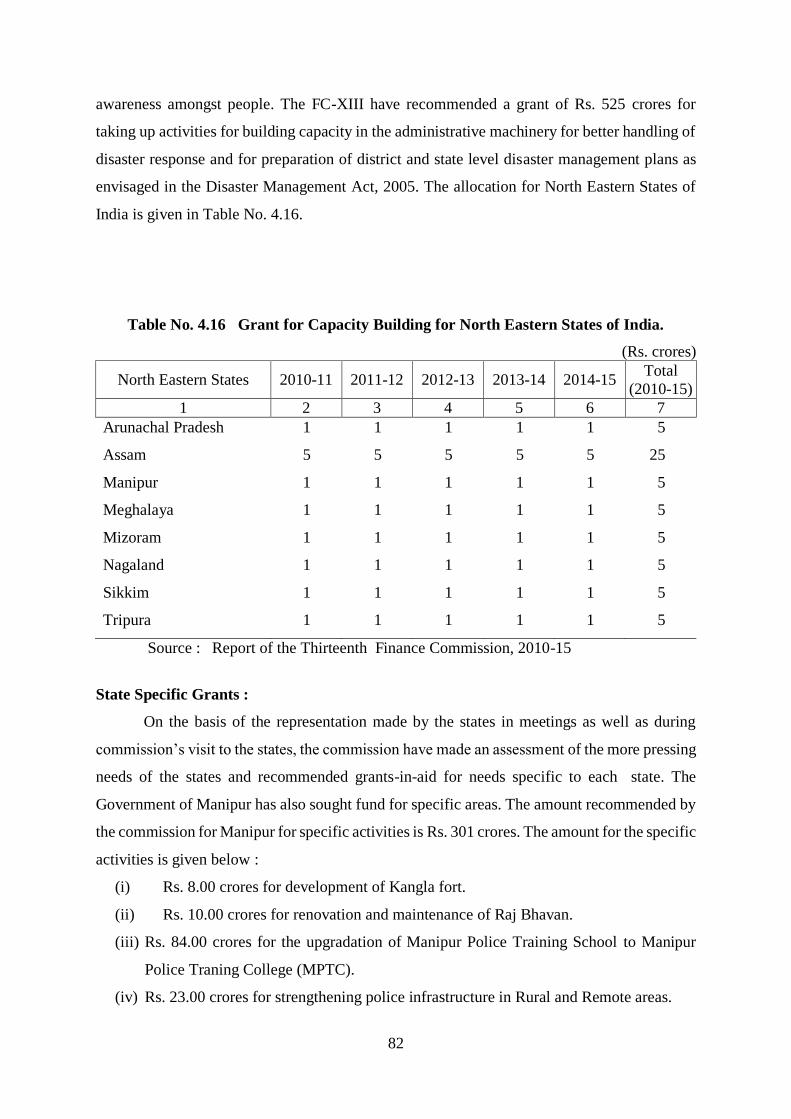
82
awareness amongst people. The FC-XIII have recommended a grant of Rs. 525 crores for
taking up activities for building capacity in the administrative machinery for better handling of
disaster response and for preparation of district and state level disaster management plans as
envisaged in the Disaster Management Act, 2005. The allocation for North Eastern States of
India is given in Table No. 4.16.
Table No. 4.16 Grant for Capacity Building for North Eastern States of India.
(Rs. crores)
North Eastern States 2010-11 2011-12 2012-13 2013-14 2014-15 Total
(2010-15)
1 2 3 4 5 6 7
Arunachal Pradesh 1 1 1 1 1 5
Assam 5 5 5 5 5 25
Manipur 1 1 1 1 1 5
Meghalaya 1 1 1 1 1 5
Mizoram 1 1 1 1 1 5
Nagaland 1 1 1 1 1 5
Sikkim 1 1 1 1 1 5
Tripura 1 1 1 1 1 5
Source : Report of the Thirteenth Finance Commission, 2010-15
State Specific Grants :
On the basis of the representation made by the states in meetings as well as during
commission’s visit to the states, the commission have made an assessment of the more pressing
needs of the states and recommended grants-in-aid for needs specific to each state. The
Government of Manipur has also sought fund for specific areas. The amount recommended by
the commission for Manipur for specific activities is Rs. 301 crores. The amount for the specific
activities is given below :
(i) Rs. 8.00 crores for development of Kangla fort.
(ii) Rs. 10.00 crores for renovation and maintenance of Raj Bhavan.
(iii) Rs. 84.00 crores for the upgradation of Manipur Police Training School to Manipur
Police Traning College (MPTC).
(iv) Rs. 23.00 crores for strengthening police infrastructure in Rural and Remote areas.

83
(v) Rs. 25.00 crores for improvement and upgradation of internal roads, sewage and
drainage, water, street lighting and basic urban amenities at Moreh.
(vi) Rs. 100.00 crores for maintenance of the main Sports Complex at Imphal, in line with
international standards.
(vii) Rs. 51.00 crores for the construction of administrative infrastructure for Autonomous
District Councils.
Besides grants for local bodies, disaster management and state specific grants, other
grants awarded in respect of Manipur as per the recommendations of the FC-XIII is shown
below :
Table No. 4.17 Grants-in-aid to Manipur recommended by the FC–XIII.
(Rs. in crores)
Grants 2010-11 2011-12 2012-13 2013-14 2014-15 Total
(2010-15)
1 2 3 4 5 6 7
1. Non-Plan Revenue Deficit 1186.00 1105.00 1379.00 1272.00 1114.00 6057.00
2. Elementary Education 3.00 3.00 3.00 3.00 3.00 15.00
3. Forests 18.79 18.79 37.58 37.58 37.58 150.32
4. Water Sector - 2.00 2.00 2.00 2.00 8.00
5. Maintenance of Roads and
Bridges
- 22.00 24.00 26.00 28.00 100.00
Source : Report of the Thirteenth Finance Commission, 2010-15

84
CHAPTER V
AGRICULTURE AND ALLIED SECTORS
The economy of Manipur state being primarily dependent on agriculture, emphasis has
been given on augmenting agricultural production of the state. Agriculture still occupies the
most prominent position in the state’s economy. Traditionally, people in the hills cultivate on
high slopes and abandon the plots after a few years in the practice of jhuming or shifting
cultivation. Arable land is by and large marginal and hence agriculture had persistently been
on subsistence level in Manipur.
5.1.1 Agriculture :
Agriculture, being the main occupation of the people of Manipur, it has an important
place in the economy of the state. Agriculture sector contributes a major share to the total state
domestic product and provides employment to about 57.04 % of the total workers in Manipur.
In fact, the state domestic product fluctuates depending on the performance of agricultural
sector. Despite the crucial importance of this primary sector in the state’s economy, the
irregular and erratic behaviour of monsoon accompanied by inadequate irrigation facilities
have resulted in severe fluctuations in agricultural production. Agriculture becomes a living
proposition rather than a commercial proposition. Thus, from the view point of employment
and income, agriculture plays a very crucial role in the state’s economy.
5.1.2 Rainfall :
The irrigation system in Manipur is not fully developed and therefore the main source
of water for agricultural purpose is rain water. The prospects of agriculture in the state depend
largely on timely occurrence of rains. It is particularly so in the case of Kharif season where
production and productivity of crops are dependent not only in the quantum of rains, but also
its equitable distribution over the days/months of the seasons. The distribution of rainfall over
months as recorded by the ICAR, Manipur at Lamphelpat are shown in Table No. 5.1 and Table
No. 5(a) of part II of this publication presents the annual rainfall recorded during the years from
1995 to 2013.

85
Table No. 5.1 Monthly Rainfall recorded in 2008 to 2013.
Months
Rainfall in (m.m.)
2008 2009 2010 2011 2012 2013
1 2 3 4 5 6 7
January 34.2 0.0 6.9 17.5 26.4 0.0
February 21.0 20.8 0.3 2.8 6.0 1.7
March 69.6 50.9 128.1 47.6 73.2 31.8
April 17.8 78.8 229.5 38.9 151.3 83.6
May 94.6 156.4 193.7 274.7 102.3 335.1
June 260.2 69.3 238.4 383.2 213.8 135.5
July 210.2 181.1 296.1 298.8 209.0 254.1
August 244.5 303.5 103.6 278.4 113.0 414.3
September 150.8 131.3 262.3 146.6 180.6 291.3
October 87.6 166.0 195.0 49.3 161.5 90.3
November 1.7 15.6 12.6 1.3 88.3 0.0
December 8.7 0.0 59.2 0.0 0.0 1.4
Total 1200.9 1173.7 1725.7 1539.1 1325.4 1639.1
Source : ICAR, Manipur, Lamphelpat.
5.1.3 Size of Holding :
The agricultural holding/land holding is the amount of land held by a farmer. In
Manipur, arable land is limited and majority of the farming community have small and
marginal land holdings which make them difficult to practice any subsistence farming. The
area of operational holding is about 172 thousand hectares operated by 150.4 thousand farmers
as per the agricultural census 2005-06. It can be seen from the Table No. 5.2 that the average
size of operational holdings for Manipur has slightly decreased from 1.15 hectares in 2000-01
to 1.14 hectares in 2005-06. The area operated in small and marginal holdings accounted for
59.77 percent in 2005-06.
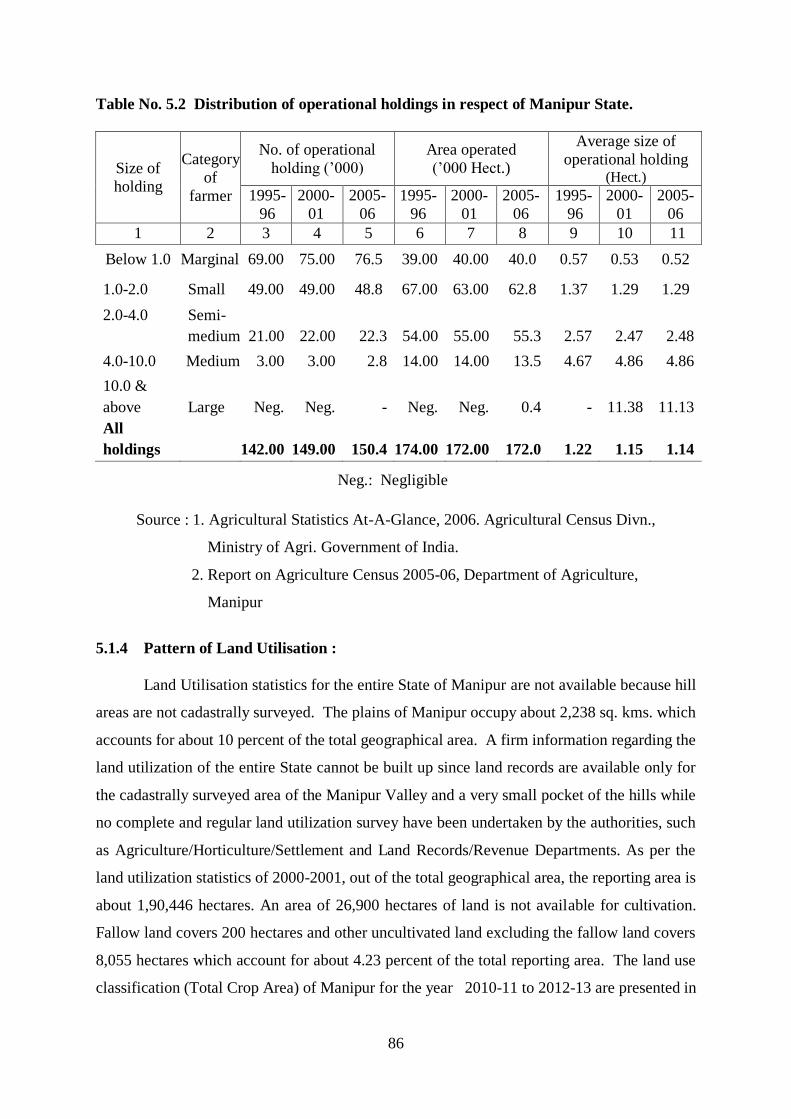
86
Table No. 5.2 Distribution of operational holdings in respect of Manipur State.
Size of
holding
Category
of
farmer
No. of operational
holding (’000)
Area operated
(’000 Hect.)
Average size of
operational holding (Hect.)
1995-
96
2000-
01
2005-
06
1995-
96
2000-
01
2005-
06
1995-
96
2000-
01
2005-
06
1 2 3 4 5 6 7 8 9 10 11
Below 1.0 Marginal 69.00 75.00 76.5 39.00 40.00 40.0 0.57 0.53 0.52
1.0-2.0 Small 49.00 49.00 48.8 67.00 63.00 62.8 1.37 1.29 1.29
2.0-4.0 Semi-
medium 21.00 22.00 22.3 54.00 55.00 55.3 2.57 2.47 2.48
4.0-10.0 Medium 3.00 3.00 2.8 14.00 14.00 13.5 4.67 4.86 4.86
10.0 &
above Large Neg. Neg. - Neg. Neg. 0.4 - 11.38 11.13
All
holdings
142.00 149.00 150.4 174.00 172.00 172.0 1.22 1.15 1.14
Neg.: Negligible
Source : 1. Agricultural Statistics At-A-Glance, 2006. Agricultural Census Divn.,
Ministry of Agri. Government of India.
2. Report on Agriculture Census 2005-06, Department of Agriculture,
Manipur
5.1.4 Pattern of Land Utilisation :
Land Utilisation statistics for the entire State of Manipur are not available because hill
areas are not cadastrally surveyed. The plains of Manipur occupy about 2,238 sq. kms. which
accounts for about 10 percent of the total geographical area. A firm information regarding the
land utilization of the entire State cannot be built up since land records are available only for
the cadastrally surveyed area of the Manipur Valley and a very small pocket of the hills while
no complete and regular land utilization survey have been undertaken by the authorities, such
as Agriculture/Horticulture/Settlement and Land Records/Revenue Departments. As per the
land utilization statistics of 2000-2001, out of the total geographical area, the reporting area is
about 1,90,446 hectares. An area of 26,900 hectares of land is not available for cultivation.
Fallow land covers 200 hectares and other uncultivated land excluding the fallow land covers
8,055 hectares which account for about 4.23 percent of the total reporting area. The land use
classification (Total Crop Area) of Manipur for the year 2010-11 to 2012-13 are presented in
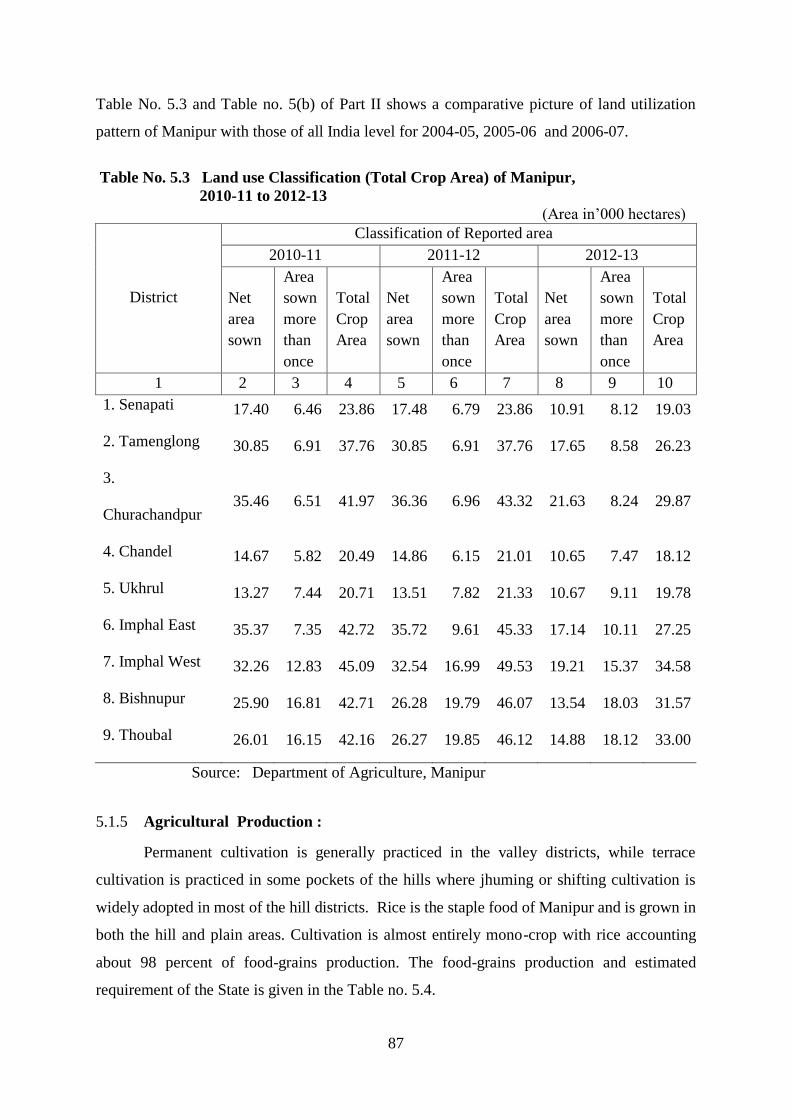
87
Table No. 5.3 and Table no. 5(b) of Part II shows a comparative picture of land utilization
pattern of Manipur with those of all India level for 2004-05, 2005-06 and 2006-07.
Table No. 5.3 Land use Classification (Total Crop Area) of Manipur,
2010-11 to 2012-13
(Area in’000 hectares)
District
Classification of Reported area
2010-11 2011-12 2012-13
Net
area
sown
Area
sown
more
than
once
Total
Crop
Area
Net
area
sown
Area
sown
more
than
once
Total
Crop
Area
Net
area
sown
Area
sown
more
than
once
Total
Crop
Area
1 2 3 4 5 6 7 8 9 10
1. Senapati 17.40 6.46 23.86 17.48 6.79 23.86 10.91 8.12 19.03
2. Tamenglong 30.85 6.91 37.76 30.85 6.91 37.76 17.65 8.58 26.23
3.
Churachandpur 35.46 6.51 41.97 36.36 6.96 43.32 21.63 8.24 29.87
4. Chandel 14.67 5.82 20.49 14.86 6.15 21.01 10.65 7.47 18.12
5. Ukhrul 13.27 7.44 20.71 13.51 7.82 21.33 10.67 9.11 19.78
6. Imphal East 35.37 7.35 42.72 35.72 9.61 45.33 17.14 10.11 27.25
7. Imphal West 32.26 12.83 45.09 32.54 16.99 49.53 19.21 15.37 34.58
8. Bishnupur 25.90 16.81 42.71 26.28 19.79 46.07 13.54 18.03 31.57
9. Thoubal 26.01 16.15 42.16 26.27 19.85 46.12 14.88 18.12 33.00
Source: Department of Agriculture, Manipur
5.1.5 Agricultural Production :
Permanent cultivation is generally practiced in the valley districts, while terrace
cultivation is practiced in some pockets of the hills where jhuming or shifting cultivation is
widely adopted in most of the hill districts. Rice is the staple food of Manipur and is grown in
both the hill and plain areas. Cultivation is almost entirely mono-crop with rice accounting
about 98 percent of food-grains production. The food-grains production and estimated
requirement of the State is given in the Table no. 5.4.

88
Table No. 5.4 Estimated requirement of household consumption of food-grains in
Manipur (’000 tonnes)
Year
Production Requirement
Cereals Pulses Food
grains Cereals Pulses
Food
grains 1 2 3 4 5 6 7
1999-00 375.69 3.23 378.92 429.13 13.67 442.80
2000-01 392.59 3.16 395.75 434.51 13.83 448.34
2001-02 397.35 3.04 400.39 443.89 14.12 458.01
2002-03 343.94 3.13 347.07 452.94 14.41 467.35
2003-04 388.77 3.24 392.01 462.31 14.71 477.02
2004-05 444.83 4.49 449.32 471.73 15.01 486.74
2005-06 394.01 4.38 398.39 481.22 15.32 496.54
2006-07 397.44 5.24 402.68 490.76 15.62 506.38
2007-08 414.59 4.64 419.23 500.36 15.93 516.29
2008-09 408.46 5.19 413.65 510.02 16.23 526.25
2009-10 366.08 5.26 371.34 519.73 16.54 536.27
2010-11 389.28 5.33 394.61 529.50 16.85 546.35
Year Short-fall
Cereals Pulses Food grains 1 8 9 10
1999-00 53.44 10.44 63.88
2000-01 41.92 10.67 52.59
2001-02 46.54 11.08 57.62
2002-03 109.00 11.28 120.28
2003-04 73.54 11.47 85.01
2004-05 26.90 10.52 37.42
2005-06 87.21 10.94 98.15
2006-07 93.32 10.38 103.70
2007-08 85.77 11.29 97.06
2008-09 101.56 11.04 112.60
2009-10 153.65 11.28 164.93
2010-11 140.22 11.21 151.74
Note : Per-capita consumption rate of food-grains per annum
Cereals- 191.02 kgs., Pulses- 6.08 kgs.
Source : Directorate of Economics & Statistics, Govt. of Manipur.
During 2010-11, the food-grain production was 394.61 thousand tonnes thereby
showing a increase of 6.27 percent from the previous year of 371.34 thousand tonnes in
2009-10. The estimated requirement of food grains for human consumption excluding
livestock/poultry/seed/wastage etc. in the state would be of the order of 546.35 thousand tonnes
in 2010-11. The shortfall of foodgrains in the year 2010-11 was about 151.74 thousand tonnes.
The production of rice in 2011-12 is higher than the previous year’s record.

89
The production of rice for Manipur for the year 2011-12 was estimated at 3.87 lakh
tonnes as against 3.77 lakh tonnes in 2010-11. In case of maize, the estimated area, the average
yield and production for the agricultural year 2011-12 was recorded as 5.90 thousand hectares,
1910.59 kgs. per hectare and 11.28 thousand tonnes respectively. The area, yield and
production under cereal crops are depicted in the following Table No. 5.5.
Table No. 5.5 Estimated area and production of cereal crops
Area : ’000 hectares
Yield rate : kg./hectare
Production : ’000 tonnes
Year Rice Maize
Area Yield Production Area Yield Production
1 2 3 4 5 6 7
2001-02 162.57 2,382.11 387.26 5.06 1,994.07 10.09
2002-03 153.11 2,192.35 335.67 3.54 2,336.16 8.27
2003-04 157.83 2,415.51 381.24 2.34 3,217.95 7.53
2004-05 176.31 2,472.52 435.93 3.22 2,763.98 8.90
2005-06 166.26 2322.09 386.07 2.85 2785.96 7.94
2006-07 165.37 2353.33 389.17 3.34 2476.05 8.27
2007-08 166.15 2444.48 406.15 2.96 2851.35 8.44
2008-09 168.40 2357.20 396.96 4.28 2686.76 11.50
2009-10 169.37 2092.44 354.37 4.81 2435.86 11.71
2010-11 168.78 2235.81 377.37 5.01 2376.14 11.91
2011-12 172.83 2240.18 387.17 5.90 1910.59 11.28
Source : Directorate of Economics & Statistics, Manipur. Among the districts, Thoubal District had the highest production of rice with 70.97
thousand tonnes (18.33 percent) which was followed by Imphal East with 66.04 thousand tonnes
(17.06 per cent). The lowest was recorded in Chandel District having only 18.69 thousand
tonnes (4.83 per cent) during the year 2011-12.The following Table No. 5.6 presents the district-
wise area, production and average yield of cereal crops in Manipur during 2011-12.
Table No. 5.6 Districtwise Area, Production and Average Yield of Cereal Crops
in Manipur, 2011-12
Area : ’000 hectares
Yield rate : kg./hectare
Production : ’000 tonnes
District Rice Maize
Area Yield rate Production Area Yield rate Production 1 2 3 4 5 6 7
1. Senapati 17.04 2038.62 34.75 1.45 569.53 0.83
2. Tamenglong 9.24 2066.00 19.10 - - -
3. Churachandpur 25.23 1568.35 39.56 1.93 2576.90 4.98
4. Chandel 8.16 2290.92 18.69 0.15 2810.08 0.43
5. Ukhrul 16.49 2340.58 38.59 2.37 2130.35 5.04
6. Imphal East 25.27 2613.28 66.04 - - -
7. Imphal West 22.87 2839.18 64.93 - - -
8. Bishnupur 19.17 1801.79 34.54 - - -
9. Thoubal 29.36 2417.20 70.97 - - -
Manipur 172.83 2240.18 387.17 5.90 1910.59 11.28
- Nil Source : Directorate of Economics & Statistics, Manipur.

90
5.1.6 Index Number of Agricultural production :
The index number of agricultural production (Base : Triennium ending 1999-
2000=100) was 106.32 in 2006-2007. It increased to 111.59 in 2007-2008. And the index
number of foodgrains production was 110.85 in 2007-2008 as against the 106.22 in 2006-2007
showing a increase of 4.36 percent over that of the previous year. The index number of non-
foodgrains production was substantially increased to 133.14 in 2007-2008 from index number
of 111.32 in 2006-2007.
The index number of cereals production with the triennium ending 1999-2000 as the
base year showed a mixed trend. The index of production under cereals (including Paddy and
maize) during 2008-2009 were 108.63 as against the 110.85 in 2007-2008 showing a decrease
of 2.00 percent over that of the previous year. The index of production under pulses (including
gram and other pulses) was 293.63 in 2008-2009. The index of production of oilseeds in the
state during the period was 26.42, condiments spices was 113.28, fruits and vegetables was
201.78 and miscellaneous crops (including sugarcane and tobacco) was 23.07. The following
Table No. 5.7 presents the index number of agricultural production for the sub-group of crops.
The index numbers of agricultural production of principal crops in the state are given in Table
No. 5(c) of Part II.
Table no. 5.7 Index Numbers of agricultural production of Manipur by
sub-group of crops.
(Triennium ending 1999-00=100)
Sub-group of crops Weight
Year
2000-
01
2003-
04
2004-
05
2005-
06
2006-
07
2007-
08
2008-
09
1 2 3 4 5 6 7 8 9
Cereals 99.38 104.21 104.05 118.98 105.37 106.22 110.85 108.63
Pulses 0.62 143.64 142.73 204.09 147.27 230.84 205.73 293.39
Foodgrains 81.24 104.21 104.05 118.98 105.37 106.22 110.85 108.63
Oilseeds 1.80 116.98 47.17 92.45 54.72 79.24 64.15 26.42
Fibres 0.08 50.00 - - - - 233.33 -
Condiments & spices 6.53 95.99 174.44 163.41 110.02 138.10 108.27 113.28
Fruits & vegetables 68.96 95.14 120.84 108.43 127.66 115.90 244.68 201.78
Misc. crops 22.63 122.26 54.53 49.47 11.58 82.43 84.10 23.07
Non-foodgrains 18.76 99.01 111.87 100.48 110.95 111.32 133.14 175.54
All crops 100.00 104.10 105.52 118.61 105.48 106.32 111.59 109.98
- Not available
Source : Directorate of Economics & Statistics, Govt. of Manipur.
5.1.7 High yielding Varieties (HYV) Programme :
The High Yielding Varieties Programmes which are introduced in India since the mid-
sixties play a significant role in boosting agricultural production. However, the adoption of
HYVs in the State has been found to be very slow particularly in the hill areas and also with
regard to other crops except for paddy.

91
According to the results of Crop Estimation survey conducted by the Directorate of
Economics & Statistics, the estimated area under HYVs and Improved varieties (IV) of paddy
in 2011-12 is less than the previous year. The total area under HYVs and IVs of paddy
constitutes about 54.71 percent of the total area under paddy in 2011-12 as against 58.75 percent
in 2010-11.
The adoption of HYVs of paddy in the hill districts perhaps due to surface configuration
of the hill areas continued to be negligible while that of IVs is quite encouraging. The proportion
in the hill areas for the HYVs and IVs was 7.22 percent in 2011-12 as against 16.69 percent in
2010-11. The percentage of areas under local varieties, HYVs and IVs of paddy to total area
under paddy during 2000-01 to 2011-12 are shown in Table No. 5.8.
Table No. 5.8 Percentage of area under HYVs, IVs and local varieties of paddy to total
area under paddy, 2000-01 to 2011-12
Region Varieties
of Seed 2000-01 2001-02 2002-03 2003-04 2004-05 2005-06
1 2 3 4 5 6 7 8
1. Hills HYV+IV 9.37 16.92 11.98 17.99 16.82 11.75
Others 90.63 83.08 88.02 82.01 83.18 88.25
Total 100.00 100.00 100.00 100.00 100.00 100.00
2. Valley HYV+IV 79.66 81.41 48.08 57.46 87.89 74.64
Others 20.34 18.59 51.92 42.54 12.11 25.36
Total 100.00 100.00 100.00 100.00 100.00 100.00
State HYV+IV 49.24 53.00 30.93 38.19 57.47 43.37
Others 50.76 47.00 69.07 61.81 42.53 56.63
Total 100.00 100.00 100.00 100.00 100.00 100.00
Region Varieties
of Seed 2006-07 2007-08 2008-09 2009-10 2010-11 2011-12
1 2 9 10 11 12 13 14
1. Hills HYV+IV 15.73 16.54 17.60 16.43 16.69 7.22
Others 84.27 83.46 82.40 83.57 83.31 92.78
Total 100.00 100.00 100.00 100.00 100.00 100.00
2. Valley HYV+IV 63.25 81.12 66.32 79.36 92.81 92.13
Others 36.75 18.88 33.68 20.64 7.19 7.87
Total 100.00 100.00 100.00 100.00 100.00 100.00
State HYV+IV 40.31 52.99 44.71 52.30 58.75 54.71
Others 59.69 47.01 55.29 47.70 41.25 45.29
Total 100.00 100.00 100.00 100.00 100.00 100.00
Source : Directorate of Economics & Statistics, Govt. of Manipur.

92
During 2010-11, it was found that HYVs of paddy were mainly used in the valley areas
of the state. Of these total areas of 168.78 thousand hectares under paddy, the area under HYVs
paddy was found to be 36.82 thousand hectares which was 20.55 percent of the total area under
paddy in the state. Out of 36.82 thousand hectares under HYVs, 33.47 thousand hectares was
found in the valley and the remaining 3.34 thousand hectares was found in the hill areas. With
the irrigation potentials created under major, medium and minor irrigation projects, double
cropping has been adopted more successfully in a number of pockets of the valley districts of
Manipur.
5.1.8 Application of Fertilizer :
Chemical fertilizers play an important role in increasing the agricultural production
particularly when used with the high yielding varieties which are responsive to recommended
doses of fertilizers. The increase in agricultural production was possible as a result of adoption
of quality seeds, appropriate doses of fertilizers and plant protection chemicals, coupled with
assured irrigation. The improved and certified seeds have been the catalyst for making inputs
cost effective. The fertilizer consumption was 59.05 thousand tonnes in 2003-04 and it
decreased to 17.12 thousand tonnes in 2011-12 and 23.40 thousand tonnes in 2012-13. The
trend in the consumption of fertilizers during 2002-03 to 2012-13 can be seen in Table No. 5.9.
Districtwise consumption and distribution of fertilizers during 2011-12 and 2012-13 are shown
in Table No. 5(d) and 5(e) of part II of this publication respectively.
Table No. 5.9 Consumption of fertilizers in Manipur during 2002-03 to 2012-13 (in ’000 tonnes)
Year Fertilizers
Total Urea DAP MOP M. Phos S.S.P.
1 2 3 4 5 6 7
2002-03 45.68 5.00 2.86 - 3.16 56.70
2003-04 47.25 5.37 2.32 3.42 0.69 59.05
2004-05 34.53 4.19 1.59 - 2.93 44.14
2005-06 25.35 2.43 1.21 - 1.60 30.59
2006-07 28.27 6.50 2.18 - 3.75 40.70
2007-08 28.76 6.24 2.17 0.03 3.01 40.21
2008-09 19.14 3.52 2.46 - 2.07 27.19
2009-10 22.56 1.67 0.61 0.06 1.29 26.19
2010-11 10.28 2.01 0.05 0.02 1.07 13.88
2011-12 13.64 1.79 0.73 - 0.97 17.12
2012-13 18.84 2.25 0.81 - 1.50 23.40 Source : Agriculture Department, Govt. of Manipur.

93
5.1.9 Commercial Crops :
The development of commercial crops like cotton, kabrangchak, oilseeds and sugarcane
is very essential for enhancing the growth of agro-based industries in the State of Manipur. The
estimated areas under some important commercial crops are given below in Table No. 5.10.
Table no. 5.10 Estimated area under important commercial crops.
(Area in ’000 hectares)
Year Cotton Kabrangchak Oilseeds Sugarcane
1 2 3 4 5
2001-02 0.09 - 1.66 0.65
2002-03 - - 2.62 0.32
2003-04 - - 1.15 0.33
2004-05 - - 2.13 0.30
2005-06 - - 1.57 0.07
2006-07 0.20 - 1.90 0.50
2007-08 0.21 - 2.08 0.51
2008-09 0.01 0.02 0.63 0.14
2009-10 0.22 - 1.62 0.14
2010-11 - - 1.72 0.79
- Nil Source : Directorate of Economics & Statistics, Govt. of Manipur.
5.1.10 Irrigation Facilities :
An important negative aspect of the current strategy for raising agricultural production
is increasing reliance on non-perennial irrigation due to the absence of timely and adequate
rainfall. Therefore, the various programmes undertaken for providing irrigation facilities
produce salutary effects. Out of the estimated area of 172.83 thousand hectares, 24.57 thousand
hectares were found to be irrigated which accounted for 14.22 percent to the total area under
paddy during 2010-11. The district-wise irrigated and un-irrigated area under cereal crops in
2011-12 is given in Table No. 5.11.
Table No. 5.11 District-wise estimates of irrigated area under cereal crops during the
agricultural year 2011-12 in Manipur.
(Area in ’000 hect.)
Sl.
No. District/State
Not Irrigated Irrigated Total Grand
Total Paddy Maize Paddy Maize Paddy Maize
1 2 3 4 5 6 7 8 9
1. Senapati 13.21 1.42 3.83 0.03 17.04 1.45 18.49
2. Tamenglong 9.25 - - - 9.25 - 9.25
3. Churachandpur 25.23 1.93 - - 25.23 1.93 27.16
4. Chandel 8.16 0.15 - - 8.16 0.15 8.31
5. Ukhrul 16.48 2.27 - - 16.48 2.37 18.85
Hill-Total 72.33 5.87 3.83 0.03 76.16 5.90 82.06
6. Imphal East 25.27 - - - 25.27 - 25.27
7. Imphal West 17.81 - 5.06 - 22.87 - 22.87
8. Bishnupur 3.49 - 15.68 - 19.17 - 19.17
9. Thoubal 29.36 - - - 29.36 - 29.36
Valley-Total 75.93 - 20.74 - 96.67 - 96.67
State Total 148.26 5.87 24.57 0.03 172.83 5.90 178.73
Source : Directorate of Economics & Statistics, Govt. of Manipur.

94
5.2 Horticulture :
Manipur has plenty of scope and potential to grow various horticultural crops because
of varied agro-climatic conditions. The major fruits grown in the state are pineapple, lemon,
orange, banana, guava, peaches etc.
5.2.1 Area under Fruits & Vegetables:
Growing of fruits and vegetables on small plots of land provides additional income to
the farmers undertaking crop husbandry enterprises. Another advantage of growing fruits is
that these can be grown on uneven and undulating lands. In this way, it gives additional
benefits as forests cover for such lands which are liable to run off and erosion.
At present, the reliable estimates of the total acreage of the various fruits and vegetables
are not available for the state. The following Table No. 5.12 shows estimates on data collected
in the Crop Estimation Survey conducted by the Directorate of Economics & Statistics,
Manipur.
Table No. 5.12 Area under some fruits and vegetables in Manipur during 2004-05 to
2011-12.
(Area in ’000 hectares)
Name of the
crop 2004-05 2005-06 2006-07 2007-08 2008-09 2009-10 2010-11 2011-12
1 2 3 4 5 6 7 8 9
Pineapple 1.45 0.04 0.59 1.96 0.32 0.54 1.45 1.38
Orange 1.74 1.69 3.40 4.98 4.94 4.59 2.91 2.54
Lemon 0.31 0.34 0.10 0.03 0.54 0.73 0.63 0.13
Papaya 0.17 0.00 - 0.05 0.09 0.26 0.51 0.37
Arum 9.33 9.94 9.48 9.47 6.72 8.80 8.33 7.74
Banana 3.87 4.42 4.20 9.36 7.51 8.41 5.29 6.94
Passion fruit 0.39 1.77 1.57 1.47 1.19 1.19 1.06 0.14
Bean 3.29 3.62 5.01 4.97 5.54 6.03 6.61 6.42
Cabbage 2.42 3.20 2.75 4.11 4.45 5.49 5.21 5.58
Cauliflower 0.60 1.46 0.57 0.18 0.56 1.55 2.73 1.83
Pea 2.14 1.87 1.55 1.64 2.67 3.20 3.37 3.36
Potato 2.96 4.87 2.87 1.95 3.34 5.87 6.37 5.52
Source : Directorate of Economics & Statistics, Govt. of Manipur.

95
The cultivation of horticulture crops is by and large practised as non-commercial
enterprise by farmers in their homestead and orchard, it hardly helps in development of proper
market of horticultural crops. But in recent years, cultivation of horticultural crops like
pineapple, potato and vegetables are being developed on commercial scale in many places of
the state. As per the estimates built up by the Directorate of Horticulture, average annual
production of fruits, vegetables and spices during the year 2011-12 were 4,05,870 MT,
2,00,343 MT and 1,13,692 MT respectively as against 3,71,601 MT, 1,92,955 MT and 1,07,298
MT in 2010-11. The horticultural production of Manipur for the period from 1999-00 to 2011-
12 is given in Table No. 5.13.
Table No. 5.13 Horticulture Production of Manipur for the last few years
( in lakh MT )
Year Fruits Vegetables Spices 1 2 3 4
1999-00 1.18 0.48 0.43
2000-01 1.18 0.48 -
2001-02 1.03 0.45 0.43
2002-03 1.34 0.47 0.48
2003-04 2.22 0.57 0.53
2004-05 1.93 0.63 0.57
2005-06 1.89 0.67 0.56
2006-07 2.29 0.92 0.68
2007-08 2.74 0.11 0.75
2008-09 3.48 1.74 0.96
2009-10 2.84 2.13 1.04
2010-11 3.72 1.93 1.07
2011-12 4.06 2.00 1.14
Source : Directorate of Horticulture & Soil Conservation, Manipur.
To promote healthy growth of horticulture in Manipur, it is essential to develop
horticulture marketing and improve transport system as the present low level of horticulture
production is due to perishable nature coupled with improper marketing facilities.
5.2.2 Cropping Pattern : Rice continues to dominate acreage of all the crops with 168.78 thousand hectares (64.96
percent of cropped area in the State) in 2010-11 as against 169.37 thousand hectares (64.82
percent) in 2009-10. Area under cereals was 178.73 thousand hectares (67.41 percent) in 2011-
12 as against 173.80 (66.89 percent) in 2010-11. The area under pulses was 15.97 thousand
hectares or 6.02 percent of the cropped area of the State in 2011-12 as against 15.36 thousand
hectares or 5.90 percent in 2010-11. The foodgrains alone accounted for 72.80 percent of the
sown area during the year 2010-11. While 0.64 percent area was occupied by oilseeds and the
remaining 25.93 percent area was occupied by Cotton, Sugarcane and others. The following
Table No. 5.14 gives an idea of the cropping pattern of Manipur.

96
Table No. 5.14 Cropping Pattern of Manipur (Area in’000 hect.)
Year
Name of Crops
Cereals Pulses Oilseeds Cotton Sugar
cane
Other Misc.
crops Total
1 2 3 4 5 6 7 8
2001-02 167.63 5.96 1.66 0.09 0.65 40.17 216.16
(77.55) (2.76) (0.77) (0.04) (0.30) (18.58) (100.00)
2002-03 156.65 7.80 2.62 * 0.32 47.81 215.20
(72.79) (3.62) (1.22) * (0.15) (22.22) (100.00)
2003-04 160.17 5.06 1.15 * 0.33 63.16 229.87
(69.68) (2.20) (0.50) * (0.14) (27.48) (100.00)
2004-05 179.53 9.23 2.13 * 0.30 50.47 241.66
(74.29) (3.82) (0.88) * (0.13) (20.88) (100.00
2005-06 169.11 8.31 1.36 * 0.06 54.90 233.74
(72.35) (3.55) (0.58) * (0.03) (23.49) (100.00)
2006-07 168.71 10.57 1.94 0.21 0.50 53.56 235.49
(71.64) (4.49) (0.82) (0.09) (0.21) (22.75) (100.00)
2007-08 169.11 12.51 2.08 0.21 0.51 57.17 241.59
(70.00) (5.18) (0.86) (0.09) (0.21) (23.66) (100.00)
2008-09 172.68 13.06 0.63 0.01 0.14 62.30 248.82
(69.40) (5.25) (0.25) (0.00) (0.06) (25.04) (100.00)
2009-10 174.18 15.52 2.54 0.22 0.21 68.61 261.28
(66.66) (5.94) (0.97) (0.09) (0.08) (26.26) (100.00)
2010-11 173.80 15.36 1.72 0.08 0.79 68.07 259.82
(66.89) (5.9) (0.66) (0.03) (0.31) (26.20) (100.00)
2011-12 178.73 15.97 1.69 0.45 0.28 68.02 265.14
(67.41) (6.02) (0.64) (0.17) (0.11) (25.65) (100.00)
* Nil Source : Directorate of Economics & Statistics, Manipur.
Note : (1) For the years from 1999-2000 onwards, soyabean is excluded from pulses and
included in oilseeds according to the CSO’s classification of agricultural items.
(2) Figures in brackets are percentage shares to the respective total.
5.3 Veterinary and Animal Husbandry : Amongst the allied sectors of Agriculture, Livestock/Poultry is another important sector.
Development of animal husbandry is an essential feature as livestock plays a pivotal role
particularly in the state’s rural economy. A large number of small and marginal farmers,
agricultural labourers and other economically weaker sections depend upon livestock for
gainful employment.
The primary objective of animal husbandry development activities is to augment animal
based products like milk, meat, egg, wool, hide and skins etc. Inorder to ensure a steady growth
of these livestock and poultry products and also by-products, the department of Veterinary and
Animal Husbandry Services has taken up development programmes such as (i) animal health
and disease control, (ii) cattle development, (iii) pig breeding, (iv) poultry development, (v)
feed and fodder development and (vi) dairy development and milk supply schemes.
5.3.1 Livestock Wealth :

97
The main categories of livestock reared in Manipur are cattle, buffalo, sheep, goat, dog,
pig, etc. Cattles and buffaloes provide motive power in wet cultivation. Rearing of pigs and
poultry are found to be very important sources of income generating activities. The total
livestock population according to livestock census, 2007 was recorded to be 7.87 lakhs as
against 11.03 lakhs in the livestock census, 2003. Thus, there was a decrease of 28.65 percent
in the livestock population of the State. Cattle population constitutes 43.46 percent of the total
livestock population. In 2007, the total cattle population was about 3 lakhs as compared to 4
lakhs in 2003 census. The total number of buffaloes was 62.17 thousand in 2007, as compared
to 77.4 thousands in 2003. The total number of sheep and goats in 2007 census were 59
thousands as compared to 39 thousands in 2003 census. In case of poultry, the total population
in 2007 census was 22.89 lakhs as compared to 29.41 lakhs in 2003. Livestock and poultry
population of Manipur State according to livestock censuses is given in Table No. 5.15 and
district-wise livestock and poultry population according to 2007 livestock census is presented
in Table No. 5(f) of part II.
Table No. 5.15 Livestock & Poultry Population of Manipur
Category
Census Year
1997 2003 2007 P.C. Variation
No.
(in ’000)
P.C. to
total
Livestock
No.
(in ’000)
P.C. to
total
Livestoc
k
No.
(in
’000)
P.C. to
total
Livestock
2003
over
1997
2007
over
2003
1 2 3 4 5 6 7 8 9
Cattle 508 42.37 418 37.90 342 43.46 (-)17.72 (-)18.18
Buffalo 95 7.92 77 6.98 62 7.88 (-)18.95 (-)19.48
Sheep 8 0.67 6 0.55 8 1.01 (-)25.00 33.33
Goat 33 2.75 33 2.99 51 6.48 0.00 54.55
Horse/Pony 2 0.17 2 0.18 - - 0.00 -
Pig 388 32.36 415 37.62 314 39.90 (+)6.96 (-)24.34
Mithun - - - - 10 1.27 - -
Other Livestock 165 13.76 152 13.78 - - (-)7.88 -
Total Livestock 1,199 100.00 1,103 100.00 787 100.00 (-)8.01 (-)28.65
Total Poultry 3,057 - 2,941 - 2,289 - (-)3.75 (-)22.17
Source : Livestock Census reports, Directorate of Veterinary &
Animal Husbandry Services.
5.3.2 Animal Health and Disease Control :
To keep livestock and poultry healthy and also to protect them from a number of deathly
epidemic diseases, the Department has formed a network of veterinary services such as
Hospitals, Dispensaries and Veterinary aid Centers throughout the State for treatment and
control of diseases. By the end of March 2012, there were in all 55 veterinary hospitals, 143
(109 veterinary dispensaries and 34 Aid centers) dispensaries functioning in the State. The
extent of work done by these institutions during 2004-05 to 2011-12 is given in Table No. 5(g)
of part II.
5.3.3 Livestock Products :
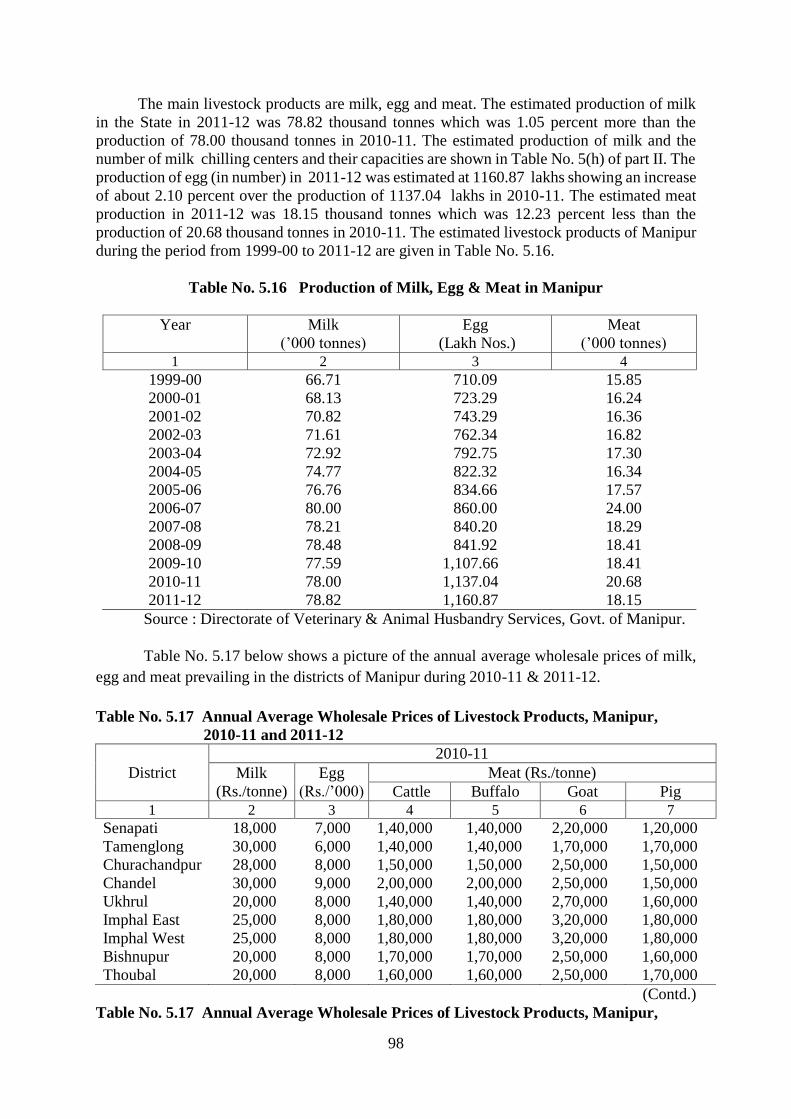
98
The main livestock products are milk, egg and meat. The estimated production of milk
in the State in 2011-12 was 78.82 thousand tonnes which was 1.05 percent more than the
production of 78.00 thousand tonnes in 2010-11. The estimated production of milk and the
number of milk chilling centers and their capacities are shown in Table No. 5(h) of part II. The
production of egg (in number) in 2011-12 was estimated at 1160.87 lakhs showing an increase
of about 2.10 percent over the production of 1137.04 lakhs in 2010-11. The estimated meat
production in 2011-12 was 18.15 thousand tonnes which was 12.23 percent less than the
production of 20.68 thousand tonnes in 2010-11. The estimated livestock products of Manipur
during the period from 1999-00 to 2011-12 are given in Table No. 5.16.
Table No. 5.16 Production of Milk, Egg & Meat in Manipur
Year Milk
(’000 tonnes)
Egg
(Lakh Nos.)
Meat
(’000 tonnes) 1 2 3 4
1999-00 66.71 710.09 15.85
2000-01 68.13 723.29 16.24
2001-02 70.82 743.29 16.36
2002-03 71.61 762.34 16.82
2003-04 72.92 792.75 17.30
2004-05 74.77 822.32 16.34
2005-06 76.76 834.66 17.57
2006-07 80.00 860.00 24.00
2007-08 78.21 840.20 18.29
2008-09 78.48 841.92 18.41
2009-10 77.59 1,107.66 18.41
2010-11 78.00 1,137.04 20.68
2011-12 78.82 1,160.87 18.15
Source : Directorate of Veterinary & Animal Husbandry Services, Govt. of Manipur.
Table No. 5.17 below shows a picture of the annual average wholesale prices of milk,
egg and meat prevailing in the districts of Manipur during 2010-11 & 2011-12.
Table No. 5.17 Annual Average Wholesale Prices of Livestock Products, Manipur,
2010-11 and 2011-12
District
2010-11
Milk
(Rs./tonne)
Egg
(Rs./’000)
Meat (Rs./tonne)
Cattle Buffalo Goat Pig 1 2 3 4 5 6 7
Senapati 18,000 7,000 1,40,000 1,40,000 2,20,000 1,20,000
Tamenglong 30,000 6,000 1,40,000 1,40,000 1,70,000 1,70,000
Churachandpur 28,000 8,000 1,50,000 1,50,000 2,50,000 1,50,000
Chandel 30,000 9,000 2,00,000 2,00,000 2,50,000 1,50,000
Ukhrul 20,000 8,000 1,40,000 1,40,000 2,70,000 1,60,000
Imphal East 25,000 8,000 1,80,000 1,80,000 3,20,000 1,80,000
Imphal West 25,000 8,000 1,80,000 1,80,000 3,20,000 1,80,000
Bishnupur 20,000 8,000 1,70,000 1,70,000 2,50,000 1,60,000
Thoubal 20,000 8,000 1,60,000 1,60,000 2,50,000 1,70,000
(Contd.)
Table No. 5.17 Annual Average Wholesale Prices of Livestock Products, Manipur,

99
2010-11 and 2011-12
District
2011-12
Milk
(Rs./tonne)
Egg
(Rs./’000)
Meat (Rs./tonne)
Cattle Buffalo Goat Pig
1 8 9 10 11 12 13
Senapati 20,000 8,000 1,50,000 1,50,000 2,40,000 1,40,000
Tamenglong 32,000 6,000 1,50,000 1,50,000 1,80,000 1,70,000
Churachandpur 30,000 9,000 1,60,000 1,60,000 2,60,000 1,70,000
Chandel 30,000 9,000 2,50,000 2,50,000 2,50,000 1,50,000
Ukhrul 22,000 9,000 1,60,000 1,60,000 2,58,000 1,70,000
Imphal East 26,000 10,000 2,00,000 2,00,000 3,50,000 1,90,000
Imphal West 26,000 10,000 2,00,000 2,00,000 3,50,000 1,90,000
Bishnupur 20,000 8,000 1,50,000 1,50,000 2,40,000 1,40,000
Thoubal 20,000 9,000 1,70,000 1,70,000 2,60,000 1,80,000
(Concld)
Source : Directorate of Veterinary & Animal Husbandry, Manipur.
5.4 Forestry :
For a hilly State like Manipur, forest products are the most important natural resources
for environmental protection and maintaining ecological balance. According to Forest Report,
2009 by Forest Survey of India (FSI), Dehradun, the forest cover of Manipur is 17,280 sq. kms.
as against 17,219 sq. kms. in 2003 and 17086 sq. kms. in 2005. The distribution of forest cover
according to the FSI is shown in the Table No.5.18
Table No. 5.18 District wise Forest Area in Manipur
(State of Forest Report 2009, FSI Dehradun)
(Area in sq. km.)
District
Geogra-
phical
Area
Forest Cover Percen-
tage Very
Dense
Moderately
Dense
Open
Forest
Total
1 2 3 4 5 6 7
Senapati 3,271 233 940 1,130 2,303 70.41
Tamenglong 4,391 264 1,584 2,063 3,911 89.07
Churachandpur 4,570 37 1,169 3,068 4,274 93.52
Chandel 3,313 0 734 2,065 2,799 84.49
Ukhrul 4,544 167 976 2,504 3,647 80.26
Imphal East 669 0 43 173 216 32.29
Imphal West 559 0 24 30 54 9.66
Bishnupur 496 0 0 20 20 4.03
Thoubal 514 0 4 52 56 10.89
Total 22,327 701 5,474 11,105 17,280 72.40
Source : Annual Administrative Report, Forest Department, 2009-10.
Forest plays threefold roles i.e., protective, productive and aesthetic, each being equally
important. Based on the legal status, the forest can be categorised as reserved, protected and
unclassed forests. Reserved Forest is one which is permanently dedicated either to the
production of timber or to other forest produces and in which right of grazing and cultivation
is seldom allowed. In protected forests, these rights are allowed subject to a few mild
restrictions. Unclassed Forest consists largely of inaccessible forest or unoccupied waste.

100
During 2009-10, the percentage distribution of reserved forests, protected forests and unclassed
forests are 8.42, 23.95 and 67.63 respectively. Area under forests by legal status is presented
in Table No. 5.19.
Table No. 5.19 Area under Forests by legal status
(Area in sq. km.)
Year Reserved
Forests
Protected
Forests
Unclassed
Forests
Other
Forests
Forest not Under the
Control of
Forest Deptt.
Total
1 2 3 4 5 6 7
1990-91 1,463 4,171 9,520 - - 15,154
1995-96 1,467 4,171 11,983 - - 17,621
1999-00 1,467 4,171 11,780 - - 17,418
2000-01 1,467 4,171 11,780 - - 17,418
2001-02 1,467 4,171 11,780 - - 17,418
2002-03 1,467 4,171 11,780 - - 17,418
2003-04 1,467 4,171 11,780 - - 17,418
2004-05 1,467 4,171 11,780 - - 17,418
2005-06 1,467 4,171 11,780 - - 17,418
2006-07 1,467 4,171 11,780 - - 17,418
2007-08 1,467 4,171 11,780 - - 17,418
2008-09 1,467 4,171 11,780 - - 17,418
2009-10 1,467 4,171 11,780 - - 17,418
Source : Forest Department, Govt. of Manipur. 5.4.1 Classification of Forests :
Area under forest includes all lands classed as forests under any legal enactment dealing
with forests or administered as forests whether state owned or private and whether wooded or
maintained as potential forest land. The area of crops raised in the forests and grazing lands or
area open for grazing within the forests are generally included under the forests area.
5.4.2 Division of Forests :
In spite of its smallness in size, the state’s vegetation is rich and varied in character.
This is because of the different climatic conditions found in the state and its peculiar
physiography. The forest area of the state falls into four distinct zones viz. (i) Burma Border
Forests (ii) Ukhrul Pine Forests (iii) Forest overlooking the valley and (iv) Barak Drainage
Forests. The Burma Border Forests lie along the Indo-Burma Border. The Kabaw Valley marks
the eastern boundary of these forests. The Ukhrul pine forests are scattered almost all over the
hills surrounding the valley area. The Barak Drainage forests area situated in the hills of the
west of valley area along the cost of the Barak river and its tributaries viz. Jiri, Tuivai, Leimatak
and Makru.
The main timber species available in Manipur are Teak, Uningthou, Khasi-pine,
Dipterecarpes species (Yangou and Khangra), Michelia Champa (Leihao), Terminalia species

101
(Tolhao), Cedrela Toona (Tairen), Schima Walliechii (Usoi) etc. The quality of timber
available in Manipur is very suitable for furniture and construction purposes.
5.4.3 Forest Products :
With a view to maintaining ecological balance, the Government has restricted the
felling of trees in the forest areas. As a result, the felling of trees is done on limited scale. The
estimated production of timber in 2007-08 (about 8.3 thousand cubic metres which valued at
Rs. 68.04 lakhs) is less than the production of 8.9 thousand cubic metres in 2006-07 valued at
Rs. 82.59 lakhs. The estimated production of firewood in 2007-08 is 21.52 thousand tonnes
(valued at 11.86 lakhs) as compared with 90.32 thousand tonnes produced in 2006-07 (valued
at Rs.13.52 lakhs). The value of forest products in 2007-08 is estimated at Rs135.31 lakhs as
compared with Rs.144.14 lakhs in 2006-07. Bamboo is accounted for Rs. 5.85 lakhs in the
value of minor forest products in 2007-08. The production and value of forest products is
given in the Table No.5(i) of part II of this publication and a picture of the revenue collected
from various forest product can be seen from the table given below :
Table No. 5.20. Revenue collected from various forest product in Manipur during
2001-02 to 2011-12
Sl. No. Year Revenue Collected
(Rs. Lakhs)
1 2 3
1. 2001-02 73.44
2. 2002-03 77.53
3. 2003-04 95.30
4. 2004-05 69.42
5. 2005-06 145.28
6. 2006-07 144.14
7. 2007-08 135.29
8. 2008-09 102.29
9. 2009-10 202.65
10. 2010-11 198.36
11. 2011-12 324.29
Source : Annual Administrative report, Department of Forest. 5.4.4 Economic and Commercial Plantation :
One of the most important activities of forestry sector is raising of suitable plantation
and their subsequent maintenance. In addition to the plantation by the Forest Department, the
plantation schemes that are being implemented in the State are artificial plantation, a forestation
creation of plantation crop, social forestry and recreation forests. Besides, plants that are
naturally regenerated are also added over large areas every year to facilitate sustained growth.
And also final plantation/restocking over 540 Ha. was taken up during the year 2007-08. A
scheme for Rubber Plantation was also taken up to produce rubber as well as uplift the economy
of the local people by providing employment to the backward families and to rehabilitate the
wastelands. In spite of its vast forest resources, its share in the state income is very negligible
and the expenditure is much greater than its revenue. The revenue and expenditure under
forestry and wild life are given in Table No. 5.21.
Table No. 5.21 Revenue Receipts and Expenditure on Forestry and Wild life, Manipur
(Rs. In lakhs)

102
Year Receipts Expenditure Net Revenue/Deficit
1 2 3 4
2000-01 97.22 1,443.03 (-)1,345.81
2001-02 75.28 1,506.56 (-)1,431.28
2002-03 81.16 1,279.63 (-)1,198.47
2003-04 100.92 1,516.44 (-)1,415.52
2004-05 74.32 1814.72 (-)1,740.40
2005-06 149.37 2,617.15 (-)2,467.78
2006-07 151.67 3,495.69 (-)3,344.02
2007-08 145.17 30,79.50 (-)2,934.33
2008-09 102.48 3,095.05 (-)2,992.57
2009-10 225.20 3,841.13 (-)3,615.93
2010-11 210.03 5,886.63 (-)5,676.60
2011-12
(RE)
231.04 6,773.25 (-)6,542.21
2012-13
(BE)
254.15 6,553.56 (-)6,299.41
RE=Revised Estimates BE=Budget Estimates
Source : 1. Annual Financial Statement, Govt. of Manipur
2. Finance Accounts, Govt. of Manipur.
5.4.4.1 Social Forestry :
Social Forestry scheme is constituted by three major components viz., (i) Farm Forestry
Extension ( Distribution of Seedlings ), (ii) Fuelwood and Fodder Plantation and (iii) Roadside
Plantation.
Under the Farm Forestry Extension scheme the people are encouraged to take up
plantation activities in their own fields not only to meet their daily requirements of firewood
but also to supplement their income by selling the firewood and fodder from these plantations.
During 2009-10, 6.50 lakhs seedings were distributed as against 6.41 lakhs in 2008-09.
In order to maintain ecological balance, the Fuel wood and Fodder Plantation scheme
was taken up. Under the scheme the Forest Department taken up plantation on community and
Panchayat land to develop woods and maintain it up to the third year of plantation. Thereafter,
the plantation are hand over to the villagers. During 2008-09, plantations of over 600 ha. and
advance work over 635 ha. were carried out. During 2009-10, final plantations over 635 ha.
and advance work over 495 ha. were carried out.
Roadside plantation refers to the plantation of ornamental species in single or double
rows along the National/State highways with the objectives of improving the aesthetic beauty
of the surroundings and also provide protection to the roadside.

103
5.4.5 Soil and Water Conservation :
Soil and water are the most important natural resources. Therefore, it is necessary to
take up measures for its management and conservation utilising the best technologies available,
otherwise these resources might get rapidly depleted threatening the very survival of man and
animal. The programme of soil and water conservation is, therefore, implemented in Manipur
for ensuring proper management, maintenance and conservation of the vital resources of soil
and water by two Departments namely Horticulture and Forest.
Soil erosion is a constant menace, in the hilly terrain of Manipur, which is mainly
caused due to the practice of shifting cultivation commonly termed as jhum cultivation. It is
highly land extensive and labour intensive with small capital returns and is considered to be a
destructive process because large areas under forests are burnt every year for preparation of
jhum fields and thereby resulting in soil erosion and ecological disturbance. During 2007-08,
the total expenditure incurred on schemes for soil conservation was Rs. 108.63 lakhs.
5.4.6 Wild Life Management :
The wild life (protection ) Act, 1972 is provided for setting up National Parks and
Sanctuaries for wild life. The basic ideas of these National Parks and Sanctuaries are to provide
natural habitats for the wild life. The aim is not only to protect and preserve what remains of
wild fauna and flora but also to augment the costly national heritage. In Manipur, at present
there are 5 (five) Wild life Sanctuaries and 2 National Parks, covering an area of 788 .10 sq.
kms. Table No. 5.22 presents the areas and location of the Sanctuaries and National Parks in
Manipur.
Table No. 5.22 Area and Location of Wild Life Sanctuaries and National Parks in
Manipur.
Sl.
No. Particulars Location (District) Area in sq. km.
1 2 3 4
i) Keibul Lamjao National Park Bishnupur 40.00
ii) Yangoupokpi Lokchao Wildlife Sanctuary Chandel 184.80
iii) Bunning Wildlife Sanctuary* Tamenglong 115.80
iv) Zeliad Wildlife Sanctuary* Tamenglong 21.00
v) Kailam Wildlife Sanctuary* Churachandpur 187.50
vi) Jiri-Makru Wildlife Sanctuary* Tamenglong 198.00
vii) Shiroi Hill National Park* Ukhrul 41.00
(* iii to vii declared under section 18 WLPA 1972, process for final constitution is under progress)
Source: Statistical Bulletin of Manipur Forest: 1999-2000,
Forest Department, Government of Manipur
During 2007, schemes for development and management of wild life and its habitat,
control of poaching and illegal trade of wild life, assistance for captive breeding and
rehabilitation of endangered species were taken up. An expenditure of Rs. 42.64 lakhs was
incurred for the purpose.

104
5.5 Fisheries :
Fish is the main food item of the majority of the people in the State, particularly the
Meiteis who are mainly concentrated in the valley.
5.5.1 Fishery Resources :
The State has no marine fisheries. It has vast potential of fisheries resources comprising
ponds, tanks, natural lakes, marshy areas, swampy areas, rivers, reservoirs, submerged cropped
land, low lying paddy fields etc. The largest source of fish is the Loktak Lake.
The total water area in Manipur State have shrunk from around 1,00,000 ha. in 1990 to
around 56,461.5 ha. in 2009-10. About 18,000 ha of water areas have been brought under fish
culture operation. The details of fishery resources in the State are given in Table No. 5.23.
Table No. 5.23 Fishery Resources in Manipur
Sl.No. Particulars Water area (in hect.)
1 2 3
1. Lakes, reservoirs, tanks, canals etc. 13,221.45
2. Water-logged marshy and swampy lands, beels 11,536.23
3. Biomass 8,596.50
4. Submerged crop land 3,480.50
5. Rivers and streams 13,888.27
6. Water-logged areas converted into agricultural lands 1,738.10
7. Low-lying paddy field 4,000.00
Total 56,461.05
Source : Fisheries Department, Manipur
The swamps and marshy areas are lying barren without any effective utilisation. The
lakes, reservoirs, beels, tanks, canals, etc. cover an area of about 13,221.45 ha. whereas rivers,
streams etc. account for 13,888.27 ha.
These swamps can be profitably utilized for culture of various indigeneous natural
fishes such as Ukabi (Anabas tesdudineus), Ngamu (Lata fish), Ngaton (Labeo bata), Ngakrijou
(Lepidocephalichthys SPP), Sareng Khoibi (Botia SPP), Nganap (Pengia SPP), Ngatin (Labeo
Pangusia), Ngakra (Barbus tor), Ngasang (Esomus denricus), Phabounga (Puntius SPP),
Ngamhai (Chanda SPP), Pengba (Osteobrama belangeri) etc.
5.5.2 Fish Products :
The production of fish in Manipur for the year 2011-12 was estimated to be 22.20
thousand tonnes as against same production of 20.20 thousand tonnes in 2010-11. The per

105
capita production of fish for 2011-12 was 8.08 kgs as compared to the estimated per capita
requirements of 10.50 kgs., registering a shortfall of 2.42 kgs. per head per annum and the per
capita production fish for 2010-11 was 8.01 kgs. as compared to the estimated per capita
requirements at 10.50 kgs., with a short fall of 2.49 kgs. per head per annum. The growth of
fish production is shown in the Table No. 5.24 below and Table No. 5(j) of Part II presents the
revenue and expenditure under fisheries.
Table No. 5.24 Production of fish and fish seed of Manipur
Year
Fish Production
(in ’000 tonnes)
Fish seed production
(in million) No. of
fish
seed
Farm
No. of
Experi-
mental
fish farm
Estimated
requirement
of fish
(in ’000 tonnes) Target Achieve-
ment Target
Achieve-
ment
1 2 3 4 5 6 7 8
2003-04 17.50 17.60 117.50 117.00 19 NA 23.83
2004-05 18.00 17.80 118.00 118.00 18 NA 23.00
2005-06 21.50 18.22 119.00 123.00 18 NA NA
2006-07 22.00 18.50 120.00 120.00 18 NA NA
2007-08 19.00 18.60 119.00 120.00 18 NA 27.50
2008-09 19.50 18.80 125.00 125.00 NA NA 28.03
2009-10 19.70 19.20 134.00 127.00 NA NA 28.57
2010-11 20.20 20.20 134.00 128.00 NA NA 29.11
2011-12* 22.20 22.20 134.00 134.00 NA NA 28.86
NA : Not Available *Anticipated
Source : Annual Administrative Report, Department of Fisheries, 2011-12
It will be seen from the above table that the total requirement of fish far exceeds its
indigenous production. Large quantities of fishes are being imported from outside the State
every year to fill this gap. The estimated requirement of fish for the year 2004-2005 was 23.00
thousand tonnes whereas the actual fish production was 17.80 thousand tonnes. This huge gap
is to be met by harnessing the vast fishery resources of State by adopting advanced scientific
techniques of fish culture and consolidating the available infrastructures already laid and by
introducing new schemes and projects. This could enable to meet not only the requirement of
fish in the State but also could export to neighboring States like Assam, Nagaland, Mizoram
and even to the neighboring country, Myanmar.
CHAPTER VI
RURAL DEVELOPMENT AND CO-OPERATIVE
Manipur lives in villages. Out of the total population, 22, 93,896 of the State in 2001,
74.89 percent were living in the villages while only 5.76 lakhs people, which constitutes 25.11

106
percent of total population, live in urban areas. Thus 74.89 percent of the population inhabiting
in 99.38 percent of the geographical areas which makes rural state, cannot be taken lightly in
any strategy.
6.1 Rural Development:
Improvement in the quality of life of the economically weaker sections of the society is
also one of the basic objectives of development planning. As far as rural development is
concerned, the Department of Rural Development and Panchayati Raj Manipur is the nodal
agency to ensure implementation of various programmes for accelerating the pace of
development in rural areas of the State through District Rural Development Agencies
(DRDAs)/Panchayati Raj Institutions (PRIs). A number of programmes viz. NREGS, SGSY,
JGSY, EAS, IAY, PMGY, PMGSY etc. have been under implementation in the State to ensure
minimum wage to rural workers and enable them to acquire assets and income through self
employment ventures. In this context, it would be appropriate to evaluate various
developmental schemes and programmes launched in the State to uplift the standard of living
of the rural population of Manipur.
6.1.1 Mahatma Gandhi National Rural Employment Guaranteed Scheme (MGNREGS)
The MGNREGS formerly known as National Rural Employment Guaranteed Scheme
(NREGS) is a new and unique job scheme introduced by the Government of India to provide at
least 100 days of guaranteed wage employment to enhance livelihood security in rural areas in
a financial year. The scheme is implemented as a Centrally Sponsored Scheme (CSS) on cost
sharing basis between the Centre and State in the ratio of 90:10. The employment scheme is
provided to adult members of every households who are willing to do unskilled manual work.
The NREGS was launched initially on 13th April, 2006 at District Headquarter,
Tamenglong by distributing Job Cards to registered applicants. The total number of households
for which job cards have been issued was 18,568 in 2006-07. During 2007-08, Chandel and
Churachandpur districts have also been covered under the scheme. Imphal East, Imphal West,
Thoubal, Bishnupur, Senapati and Ukhrul have also been covered during 2008-09.
As required under the NREGS, the Government of Manipur has formulated a scheme
called the Manipur Rural Employment Guarantee Scheme (MREGS). The scheme will focus on
the following works:
(i) Water conservation and water harvesting;
(ii) Drought proofing (including afforestration and tree plantation);
(iii) Irrigation Canals including micro and minor irrigation works;
(iv) Provision of irrigation facility to land owned by households belonging to
Scheduled Castes and Scheduled Tribes or to land of beneficiaries of land reforms

107
or that of the beneficiaries under the Indira Awaas Yojna of the Government of
India.
(v) Renovation of traditional water bodies including desilting of tanks;
(vi) Land Development;
(vii) Flood control and protection works including drainage in water logged areas;
(viii) Rural connectivity to provide all weather access; and
(ix) Any other work which may be notified by the Central Government in consultation
with the State Government.
The achievement of the scheme during 2010-11 is shown in the table below :
Table No. 6.1 Achievement of the MREGS during 2010-11
(Rs. In lakhs)
Sl.
No. Name of District
Release of fund (Rs. in lakhs) Households
casual job
cards (No.)
Employment
Generated (in
lakh
mandays)
Central share
State share State
Sanctioned Receipt
1 2 3 4 5 6 7
1. Senapati 5937.98 5937.98 0 78151 43.397
2. Tamenglong 1535.88 1535.88 0 26296 11.08
3. Churachandpur 6158.68 6158.68 0 52931 29.12
4. Chandel 866.08 866.08 209.52 31188 9.35
5. Ukhrul 3209.59 3209.59 324.78 45400 28.14
6. Imphal East 1353.76 1353.76 0 65349 9.43
7. Imphal West 798.94 798.94 162.28 52811 26.48
8. Bishnupur 14.59 14.59 250.28 36276 3.036
9. Thoubal 521.9 521.9 53.16 54979 4.273
Manipur 20397.42 20397.42 1000.02 443381 164.31
Source : Annual Report for Mahatma Gandhi National Rural Employment Guarantee Scheme
(upto 31st January, 2011)
6.1.2 Swarnjayanti Gram Swarozgar Yojana (SGSY):
The scheme was launched on 1st April, 1999 with which erstwhile schemes viz., IRDP,
DWCRA, TRYSEM, MWS, SITRA, GKY etc. were all disbanded.
The SGSY aims at improving the family incomes of the rural poor. It establishes a large
number of micro-enterprises in the rural areas whose beneficiaries could be both individuals
and groups (self help group). The objective of the scheme is to bring every assisted poor
families above the poverty line in three years. Efforts are to be made to cover 30 (thirty)
percent of the poor in every block in the next five years with the emphasis on encouraging self-
help group. This scheme covers all aspects of self-employment like organization of rural poor
into Self-Help Group (SHG) and their capacity building, training, planning of activity lusters
infrastructure development financial assistance and subsidy and marketing supports etc.

108
The scheme is being implemented as a centrally sponsored scheme on a cost sharing
ratio of 75:25 between the centre and state. During the last three years since the introduction
of this scheme, Govt. of India has released a sum of Rs.1,190.00 lakhs as the 1st installment
central share for the year 1999-00. During 2002-03, no fund was released by the Govt. of India
under normal SGSY, however, in 2003-2004 an amount of Rs.56.75 lakhs and Rs.33.247 lakhs
were released by the Central Govt. and State Govt. respectively. During 2008-09, the
Government of India and the State Government have released Rs. 351.58 lakh and Rs. 27.49
lakh respectively for normal SGSY. 215 SHGs were formed under normal SGSY. During
2009-10, the Government of India and the State Government have released Rs. 364.94 lakhs
and Rs. 114.05 lakhs respectively for normal SGSY and 383 SHGs were also formed during
the year.
Under Swarnjayanti Gram Swarozgar Yojana (SGSY), the total allocation of fund is
Rs. 1340.00 lakhs during the year 2010-11 including State Matching Share of Rs. 134.00 lakhs
of which Govt. of India had released Rs. 723.55 lakhs for both normal and special SGSY and
the State Govt. also released Rs. 106.71 lakhs as State Share. A status Report under
SGSY(Normal) for the year 2010-11 is shown at Table No. 6.2.
Table No. 6.2 Status Report under SGSY for the year, 2010-11 SGSY (Normal)
(Rs. in lakhs)
District/State
Fund Release
Expenditure
Physical
Target
(in
SHGs)
Achievement Central State Total
1 2 3 4 5 6 7
Senapati 146.33 16.25 162.58 165.91 133 133
Tamenglong - 0.59 0.59 5.40 33 -
Churachandpur 49.99 17.07 67.06 12.50 89 24
Chandel 284.89 28.27 313.16 187.00 301 145
Ukhrul 34.74 7.38 42.12 5.90 72 40
Imphal East 37.01 16.53 53.54 45.75 140 31
Imphal West 59.56 7.62 67.18 71.80 105 14
Bishnupur 46.26 5.14 51.40 4.31 82 48
Thoubal 64.77 7.86 72.63 24.19 115 16
Total 723.55 106.71 830.26 522.76 1070 451
- Not available
Source : Annual Administrative Report, Department of Rural Development and Panchayati Raj,
Manipur.
6.1.2 Sampoorna Grameen Rozgar Yojana (SGRY):
SGRY was launched in 2001-02 by merging the erstwhile scheme of Jawahar Gram
Samidhi Yojana (JGSY) and the Employment Assurance Scheme (EAS). The total amount of
fund and foodgrains released under the scheme under SGRY-I and SGRY-II during the year
2003-04 to 2007-08 is shown in Table No. 6.3.
Table No. 6.3 Performance Under Sampoorna Grameen Rozgar Yojana (SGRY) during
2003-04 to 2007-08.
Year/District Fund Released (Rs. in lakhs) Foodgrain Released (MT)

109
1 2 3
2003-04 1662.95 16670
2004-05 2588.60 19545
2005-06 2750.45 18620
2006-07 2360.48 11206
2007-08 1836.80 8556 *
Senapati 399.16 1268
Tamenglong - -
Churachandpur - -
Chandel - -
Ukhrul 264.96 1402
Imphal East 323.15 1232
Imphal West 266.21 1847
Bishnupur 258.89 1306
Thoubal 324.43 1501
* Allotted
Source : Department of Rural Development and Panchayati Raj, Manipur.
6.1.3 Indira Awaas Yojana (IAY):
The Government of India is implementing Indira Awaas Yojana (IAY) with the
objective of providing dwelling units (houses) free of cost to the members of Scheduled Castes,
Scheduled Tribes and free-bonded labourers living below poverty line in rural areas. An
additional component for conversion of unserviceable kutcha houses to semi-pucca houses has
also been added. From 1999-00, the criteria for allocation of funds to states has been changed
from poverty ratio to equally reflect the poverty ratio and the housing shortage in the state. The
funding pattern of the scheme is 75:25 as central and state sharing basis. Of the total fund, 80%
is for the new construction while 20% is for upgradation.
During the year 2004-05, 4,771 number of houses were constructed under this scheme.
3,665 new houses were constructed during 2005-06. In 2006-07, a sum of Rs.796.19 lakhs
were released and 4,914 houses were constructed. During 2007-08 (upto 31.12.2007), a sum of
Rs. 996.76 lakhs was released and 2,441 houses were constructed and 1,314 houses were up
graded. In 2008-09, a total amount of Rs. 2319.97 lakhs (including Rs. 207.91 of special
pakage, Chandel district) was released and 3,836 houses were constructed and 1,531 houses
were upgraded including 1,359 houses constructed under special pakage of Chandel district. In
2009-10, a total amount of Rs. 1,799.20 lakhs (including 171.87 lakhs of special Package of
Chandel district) were released and 5,320 houses (including 1,500 houses of special Pakage
of Chandel district) were constructed and 953 houses were upgraded. For the year 2010-11, a
sum of Rs. 1724.319 lakhs was released and utilized Rs. 1547.876 lakhs under the Scheme.
Altogether 4600 houses were constructed including up-gradation against the target of 9848
dwelling units comprising 5517 nos. for new construction and 4331 nos. for up-gradation
during the year. The districtwise fund released and number of houses constructed under IAY
scheme for the year 2010-11 is given below:
Table No. 6.4 Districtwise financial and physical achievement under the Indira Awaas
Yojana (IAY)

110
(Rs. in lakhs)
Sl.
No.
District/State
2010-11 Physical
Achievement
(New+
upgraded)
Amount
released
Physical Target
New Up-gradation Total
1 2 3 4 5 6 7
1 Senapati 371.7 714 577 1291 719
2 Tamenglong 223.56 738 596 1334 603
3 Churachandpur 349.39 1152 932 2084 1786
4 Chandel 152.677 504 407 911 48
5 Ukhrul 157.822 372 300 672 193
6 Imphal East 235.544 837 628 1465 661
7 Imphal West 85.456 303 229 532 75
8 Bishnupur 51.56 204 153 357 31
9 Thoubal 96.61 693 509 1202 484
Total 1724.319 5517 4331 9848 4600
Source: Annual Administrative Report, Department of Rural Development and
Panchayati Raj, Manipur.
6.1.4 Pradhan Mantri Gramodaya Yojana (PMGY):
The scheme was introduced in 2000-01 with the objective of focussing on village level
development in five critical areas i.e. health, primary education, drinking water, housing and
rural roads, with the overall objective of improving the quality of life of people in the rural
areas. It is cent per cent centrally sponsored scheme. Under the scheme, 1703 houses were
constructed during the year 2001-2002. However in 2002-03, the Government of India did not
release any fund under PMGY.
6.1.4.1 Pradhan Mantri Gram Sadak Yojana (PMGSY):
The scheme has been introduced in the state during the year 2000-01 by way of
substituting the erstwhile Rural Roads Scheme under BMS (Basic Minimum Services). It aims
at providing road connectivity through good all weather roads to all rural habitations with a
population of more than 1000 persons by the year 2003 and those with a population of more
than 500 persons by the year 2007. The Central Govt. will bear cent percent of the fund
allocated under this scheme.
A sum of Rs. 10.00 lakhs was released by the state government during 2004-05 to meet
the administrative cost in connection with the implementation of works under PMGSY. Out of
a total amount of Rs. 1500 lakhs, Rs. 682 lakhs and Rs. 818 lakhs were released under the
scheme during 2004-05 for Phase I and Phase II respectively. For Phase III, IV and V, the
detailed project reports for construction of 58 roads covering 557 kms. to connect 71 villages
at the projected cost of Rs. 155 crores was prepared and submitted to the State Technical
Agency, Silchar, during the year 2005-06. However, the PMGSY Phase III, IV and V have

111
been clubbed as Phase V at an approved cost of Rs.152.32 crores in 2006-07, covering 47 new
roads having a road length of 455.84 km. connecting 93 habitations and upgradation of 11
existing roads with a length of 100.36 km. benefiting 45 habitations under Bharat Nirman
Scheme.
As on 31st January, 2011, 677 Road Works with a road length of 4680.34 km. were
completed. 171 Nos. of balance roads in Phase-I were discontinued and 3 Nos. of roads in
Phase-II will be completed in Phase-VIII. The remaining 9 Nos. of roads in Phase-V and 112
Nos. of roads in Phase-VI are targeted for completion by March, 2011 and by September, 2011
respectively. The Expenditure so far was Rs. 456.12 crores. The Physical and Financial
Progress of PMGSY Road Works as on 31st January, 2011 is given in Table No. 6.5 below:
Table No. 6.5 Physical and Financial Progress of PMGSY Road Works
as on 31-01-2011.
(Rs. in crores)
Phase
No. of
Road
Works
Approved
No. of Road
Works
Completed
Length of
Road Works
Completed
(in km.)
Sanctioned
Amount
Amount
released
Expenditure
1 2 3 4 5 6 7
I 637 466 2300.00 40.00 40.00 32.08
II 130 127 710.64 80.72 64.33 83.42
V
(III, IV, V
clubbed)
62 53 549.39 152.33 154.33 138.27
VI 143 13 924.83 363.66 179.83 201.55
VII 69 0 195.48 231.65 0.00 0.80
Total 1041 677 4680.34 868.39 438.49 456.12
Source : Annnual Administrative Report, Department of Rural Development and
Panchayati Raj, 2010-11
Rs. 231.65 crores was sanctioned and 69 Road Works were approved for Phase-VII.
6.1.5 MLA Local Area Development Programme (MLALADP) Under the MLA Local Area Development Programme, the State Government provide
funds for taking up various developmental works according to the needs of the 60 (Sixty)
Assembly Constituencies. Each Assembly Constituency was provided Rs. 10 lakhs in 2001-
02, Rs. 15 lakhs in 2002-03, Rs. 10 lakhs in 2003-04. During 2004-05 to 2006-07, Rs. 1800
lakhs was released annually while in 2007-08, 2008-09, 2009-10 and 2010-11, a sum of Rs.
2,100 lakhs, Rs. 2,400 lakhs, Rs. 2,700 lakhs and Rs. 3,000 lakhs respectively was released.
The districtwise fund released during 2010-11 is shown in Table no. 6.6.

112
Table No. 6.6 Districtwise fund released during 2010-11, under MLA Local Area
Development Programme (MLALADP)
Sl. No. Name of District No. of MLAs Fund released to DRDAs
(Rs. In lakhs) 1 2 3 4
1. Senapati 06 300.00
2. Tamenglong 03 150.00
3. Churachandpur 06 300.00
4. Chandel 02 100.00
5. Ukhrul 03 150.00
6. Imphal East 11 550.00
7. Imphal West 13 650.00
8. Bishnupur 06 300.00
9. Thoubal 10 500.00
Total 60 3000.00
Source : Department of Rural Development and Panchayati Raj, Manipur.
6.1.5.1 Integrated Wasteland Development Programme (IWDP)
IWDP was launched in 1989 and brought into effect from 1st April 1995 by the
Government of India. Under the programme, the total wasteland area planned to be
covered/treated was 6389 hectares, 49,000 hectares, 63,500 hectares and 11,055 hectares
during 2004-05, 2005-06, 2006-07 and 2007-08 respectively. The districtwise central and state
shares released under the scheme and the area to be covered during 2008-09 is given below:
Table No. 6.7 Districtwise Fund released under IWDP and Area to be covered during
2008-09
Sl. No. District
Fund released (Rs. in lakhs)
Area to be covered
(in hect.) Central State Total
1 2 3 4 5 6
1. Senapati 4,200 250.80 21.00 271.80
2. Tamenglong - - - -
3. Churachandpur - - - -
4. Chandel 3,888 312.06 19.50 332.10
5. Ukhrul - - 29.13 29.13
6. Imphal East 901 49.30 4.75 54.05
7. Imphal West 1,800 99.00 9.00 108.00
8. Bishnupur 2,933 161.01 15.00 176.01
9. Thoubal 911 49.39 5.24 54.63
Total 14,633 922.10 103.62 1,025.72
Source: Department of Rural Development and Panchayati Raj, Manipur.
6.2 Panchayat:
In a democratic set-up, panchayats play a vital role in inculcating community feelings
among the rural folks. In the state, panchayats are carrying out manifold developmental and
judicial functions for the upliftment of the villages. The village panchayat is a forum for local
self-government which is composed of elected representatives of the village people. The
Panchayat Samiti looks after all the development works at the block level.
The Panchayati Raj Institutions were first set-up in Manipur in 1960, by adopting the
U.P. Panchayat Act, 1947. The first General Election to Panchayat was held in the year 1964.

113
The Manipur Legislative Assembly passed the Manipur Panchayat Act 1975 and this Act came
into force on 10thJan.,1978. Under the Manipur Panchayati Raj Act 1975, the first election to
Panchayats was held in May, 1978. The 73rd constitution Amendment Act 1992 on Panchayati
Raj was passed by the Parliament and received the assent of the President of India and enforced
in all the states w.e.f. 24.4.94.
The first General Election to Panchayat under this new Act 1994 was held on 31.1.97
and the second General Election was held on 30.8.02. There are 2 (two) tier system of
Panchayati Raj such as Gram Panchayat at village level and Zilla Parishad at district level.
Though, the population of Manipur has by now crossed the 20 lakhs limit, the formation of the
Panchayat Samiti is yet to be done.
In 2007, election was not held for 1 (one) seat of Pradhan and 31 (thirty one) seats of
gram Panchyat. The detail of the election held on 19th September, 2007 is shown in Table No.
6.8.
Table No. 6.8 Number of Member of Zilla Parishads, Pradhans and member of Gram
Panchayat elected in the election held on 19.9.2007.
Item Member of
Zilla Parishad
Pradhan of Gram
Panchayat
Member of Gram
Panchayat
1 2 3 4
1. Women (Reserved for
General)
19 53 525
2. Scheduled Tribe 2 3 34
2.1 Women 1 1 20
2.2 Men 1 2 14
3. Scheduled Caste 2 3 36
3.1 Women 2 1 14
3.2 Men - 2 22
4. Unreserved 38 105 916
4.1 Women 8 5 111
4.2 Men 30 100 807
5. Total 61 164 1511
5.1 Women 29 60 670
5.2 Men 32 104 841
Note: No election was held in the seat of 1 (one) Pradhan and 31 (thirtyone) members in the
Gram Panchayats.
Source: Department of Rural Development and Panchayati Raj, Manipur.
According to Article No. 243 D (3) of the Panchayati Raj Act 1994 not less than one-third
(including the number of seats reserved for women belonging to the Scheduled Castes and
Scheduled Tribes) of the total number of seats to be filled by direct election in every Panchayat
to be reserved for women and such seats to be allotted by rotation to different constituencies in a
Panchayat, where according to Article No. 243 D (4) not less than one-third of the total number
of offices of Chairpersons in the Panchayats at each level is to be reserved for women. A
comparative picture of the number of elected members of panchayats in the north eastern region
of India is presented in Table No. 6.9.
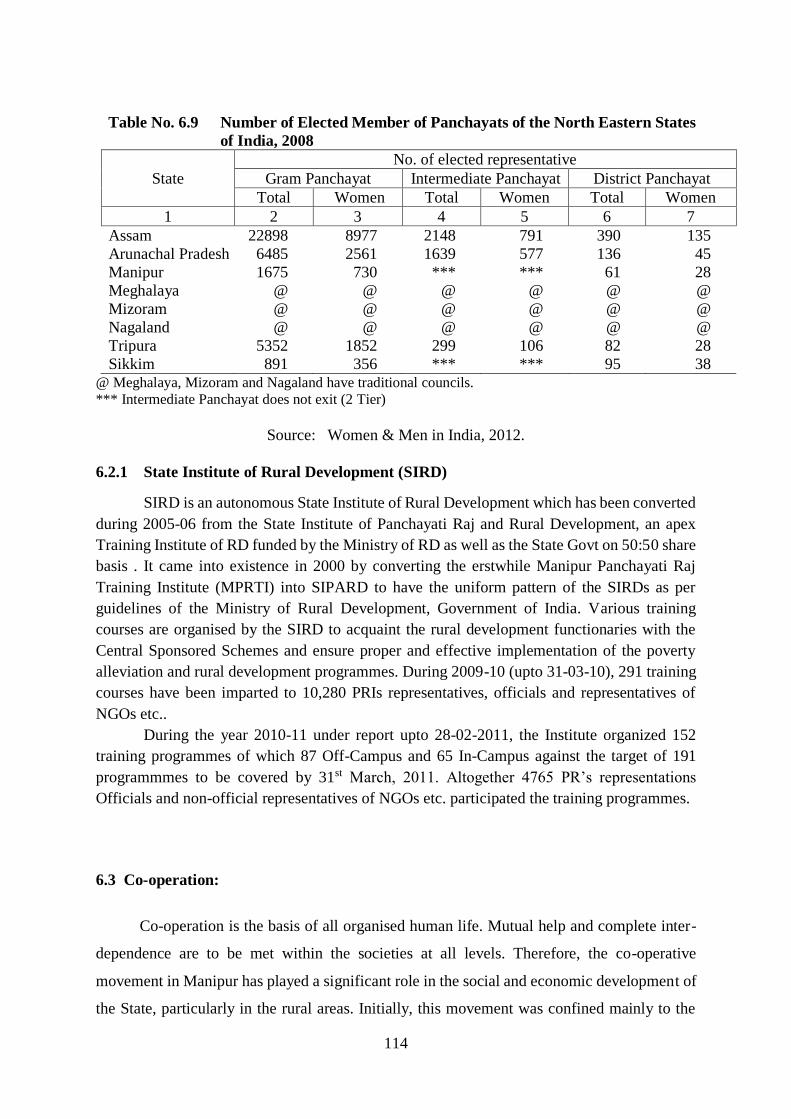
114
Table No. 6.9 Number of Elected Member of Panchayats of the North Eastern States
of India, 2008
State
No. of elected representative
Gram Panchayat Intermediate Panchayat District Panchayat
Total Women Total Women Total Women
1 2 3 4 5 6 7
Assam 22898 8977 2148 791 390 135
Arunachal Pradesh 6485 2561 1639 577 136 45
Manipur 1675 730 *** *** 61 28
Meghalaya @ @ @ @ @ @
Mizoram @ @ @ @ @ @
Nagaland @ @ @ @ @ @
Tripura 5352 1852 299 106 82 28
Sikkim 891 356 *** *** 95 38 @ Meghalaya, Mizoram and Nagaland have traditional councils.
*** Intermediate Panchayat does not exit (2 Tier)
Source: Women & Men in India, 2012.
6.2.1 State Institute of Rural Development (SIRD)
SIRD is an autonomous State Institute of Rural Development which has been converted
during 2005-06 from the State Institute of Panchayati Raj and Rural Development, an apex
Training Institute of RD funded by the Ministry of RD as well as the State Govt on 50:50 share
basis . It came into existence in 2000 by converting the erstwhile Manipur Panchayati Raj
Training Institute (MPRTI) into SIPARD to have the uniform pattern of the SIRDs as per
guidelines of the Ministry of Rural Development, Government of India. Various training
courses are organised by the SIRD to acquaint the rural development functionaries with the
Central Sponsored Schemes and ensure proper and effective implementation of the poverty
alleviation and rural development programmes. During 2009-10 (upto 31-03-10), 291 training
courses have been imparted to 10,280 PRIs representatives, officials and representatives of
NGOs etc..
During the year 2010-11 under report upto 28-02-2011, the Institute organized 152
training programmes of which 87 Off-Campus and 65 In-Campus against the target of 191
programmmes to be covered by 31st March, 2011. Altogether 4765 PR’s representations
Officials and non-official representatives of NGOs etc. participated the training programmes.
6.3 Co-operation:
Co-operation is the basis of all organised human life. Mutual help and complete inter-
dependence are to be met within the societies at all levels. Therefore, the co-operative
movement in Manipur has played a significant role in the social and economic development of
the State, particularly in the rural areas. Initially, this movement was confined mainly to the

115
field of agricultural credit. Later, it rapidly spread to other fields like agro-processing, agro-
marketing, rural industries, consumer stores, social services etc.
The growth of co-operative movement is regarded as one of the important instruments
of economic, social and cultural development as well as human advancement in the State.
Today, co-operative movement experienced a phenomenon change in its dimensions where
it touched every corner of human life and where we can find food co-operatives, production
co-operatives, farm and rural co-operatives, handloom co-operatives, marketing co-operatives
etc. The number of industrial and non-industrial co-operative societies as on 31st March is given
in the following Table No. 6.10.
Table No. 6.10 Number of Industrial and Non-Industrial Co-operative Societies
in Manipur (as on 31st March)
Item Industrial Non-Industrial Total
2009* 2010 2009* 2010 2009* 2010
1 2 3 4 5 6 7
1. Senapati 74 205 185 349 259 554
2. Tamenglong 114 111 156 159 270 270
3. Churachandpur 198 189 377 397 575 586
4. Chandel 51 48 104 118 155 166
5. Ukhrul 188 191 439 440 627 631
6. Imphal East 553 522 463 494 1016 1016
7. Imphal West 541 534 468 467 1009 1001
8. Bishnupur 333 324 332 412 665 736
9. Thoubal 342 367 348 351 690 718
10. State Level Co-operative Societies 4 4 17 17 21 21
11. Primary Bank in Imphal under
direct control of RCS - - 9 9 9 9
Manipur 2397 2630 2899 3078 5296 5708
* Culled out from Annual Administrative Report, Department of Cooperation
Source: Co-operative Department, Govt. of Manipur.
As on 31st March 2012, there were 5,376 Co-operative Societies with 6.04 lakhs number
of members. Some important characteristics of the Co-operative movement in the state since
2000-01 to 2011-12 are presented in Table No. 6.11 below:
Table No. 6.11 Important characteristics of Co-operative movement in Manipur

116
Year Number of
Cooperative
Societies
No. of Member
(in lakhs)
Paid-up Share
(Rs.in crores)
Working Capital
(Rs. in crores)
1 2 3 4 5
2000-01 5,029 4.87 21.03 161.00
2001-02 4,868 4.67 32.27 182.00
2002-03 4,832 4.19 34.47 131.35
2003-04 4,732 4.49 34.45 219.00
2004-05 4,697 4.94 43.87 257.95
2005-06 5,380 5.33 44.92 285.96
2006-07 5,588 5.44 57.30 311.57
2007-08 5,088 4.84 63.74 387.38
2008-09 5,296 5.02 68.43 467.85
2009-10 5,708 5.07 72.35 516.90
2010-11 5,493 5.08 72.45 516.98
2011-12 5,376 6.04 72.63 517.18
Source: 1. Co-operative Department, Govt. of Manipur.
2. Annual Administrative Report, Department of Cooperation.
From experiences gained in the recent past, it is felt that farmers/growers of
agricultural/horticultural crops particularly farmers of fruits and vegetables are facing
marketing problems. Farmers could not dispose off their produces at the remunerative prices
as cold storage and export facilities are yet to be made available. Procurement as well as
marketing of agricultural produces may be developed and modernized by strengthening the
Manipur Co-operative Marketing Societies at the state level as well as all supply and marketing
societies in the five hill districts.
Primary Agricultural Credit Societies (PACS) are basically multipurpose. The main
functions of the societies are to extend financial supports such as short-term crop loans,
medium term and long term loans on agricultural purposes, storage and distribution of
consumer items, chemical fertilizers and marketing of agricultural produces. The PACS are
known as Gram Panchayat Level Multipurpose Cooperative Societies (GPLMPCS) in the
valley while in the Hill, they are called Large Size Multipurpose Cooperative Societies
(LAMPS). As on 31st March, 2012, there are 152 GPLMPCS and 71 LAMPS.
In general, the Cooperatives in Manipur are not functioning satisfactorily due to
problems like inadequate funds, inefficient management, lack of coordination etc. Out of the
total of 5376, the number of dormant and defunct Societies during 2011-12 are 1428 and 623
respectively. A picture of the Cooperative Societies in Manipur during 2011-12 is shown in
Table No. 6.12
Table No. 6.12 Basic Statistical information of the Cooperative Societies in Manipur
for the year 2011-12.
(Rs. in lakhs)
Sl.
No. Type of Societies
No. of
Societies
No. of
Members
Paid up
Share
Working
Capital
1 2 3 4 5 6

117
I CREDIT SOCIETIES
A State Level Banks
(Agricutural Credit)
i) Manipur State Cooperative Bank Ltd. 1 13399 4044.60 25721.10
ii) Manipur State Land Development
Cooperative Bank Ltd.
(Non-Agricultural Credit)
1 2772 38.68 183.55
iii) Manipur SC /ST Development
Cooperative Bank Ltd. 1 404 13.19 20.00
B Primary Banks :
(Agricultural Credit) :
i) United Farmers Development
Cooperative Bank Ltd. 1 742 3.31 10.11
ii) Manipur Farmers Development
Cooperative Bank Ltd. 1 555 1.24 1.60
iii) Manipur Agricultural Development
Cooperative Bank Ltd.
(Non-Agricultural Credit)
1 591 2.56 2.56
iv) Imphal Urban Cooperative Bank Ltd. 1 19703 332.78 19277.82
v) Manipur Industrial Cooperative Bank Ltd 1 3753 14.59 232.19
vi) Manipur Women’s Cooperative Bank Ltd. 1 5798 100.59 36.07
vii) Bishnupur Urban Cooperative Bank Ltd. 1 1024 3.50 5.00
viii) Thoubal Urban Cooperative Bank Ltd 1 102 2.43 2.43
ix) Chandel Primary Cooperative Bank Ltd. 1 100 1.00 1.00
x) Manipur Hill & Backward Development
Cooperative Bank Ltd. 1 3591 167.46 597.58
xi) Mercantile Cooperative Bank Ltd. 1 53 0.25 49.20
xii) Lamka Urban Cooperative Bank Ltd. 1 1089 15.14 17.69
xiii) Moirang Primary Cooperative Bank Ltd. 1 2715 26.70 266.92
xiv) Manipur State Housing Dev. Coop. Bank
Ltd. 1 515 4.85 4.85
C Thrift & Credit Cooperative Societies 94 7582 36.02 98.55
D Primary Agricultural Credit
Cooperative Societies :
i) G.P. Level 152 87412 346.81 469.48
ii) LAMPS 71 40447 87.30 148.91
iii) Service 8 790 5.43 0.47
Contd.
Table No. 6.12 Basic Statistical information of the Cooperative Societies in Manipur for
the year 2011-12.
(Rs.in lakhs)
Sl.
No. Type of Societies
No. of
Societies
No. of
Members
Paid up
Share
Working
Capital

118
1 2 3 4 5 6
II NON-CREDIT SOCIETIES
A State Level :
i) Manipur Milk Producers Union 1 71 4.12 4.12
ii) Manipur State apex Housing C. S. Ltd. 1 157 161.75 845.83
iii) Manipur State Fisheries Cooperative
Fedn.
1 104 5.00 5.55
iv) Manipur Apex Coop. Marketing Society
Ltd.
1 363 74.23 209.72
v) Manipur State Coop. Consumers Fedn. 1 598 49.17 87.82
vi) Manipur State SC/ST Dev. Coop. Fedn. 1 49 11.93 21.98
vii) Manipur State Piggery Farmers Coop.
Fedn.
1 53 40.98 30.98
viii) Manipur State Poultry Farmers Coop.
Fedn.
1 77 1.38 1.38
ix) All Manipur Apex Transport C.S. Ltd. 1 27 15.52 16.07
x) All Manipur Tours & Travels Dev. C.S.
Ltd.
1 63 0.32 0.32
xi) Manipur State Cooperative Union 1 830 0.00 0.00
xii) Manipur State Social Forestry and
Environment Protection Cooperative
Fedn.
1 85 0.85 0.85
xiii) Federation of Urban Cooperative Banks
and Credit Societies Ltd.
1 27 0.00 0.00
xiv) Manipur State Minorities Dev.C.S. 1 216 42.19 43.39
B District Level
i) District Supply and Marketing
Cooperatives
9 1419 88.38 16.902
C Primaries :
i) Marketing 47 1972 37.80 41.14
ii) Consumers 137 8672 77.29 147.85
iii) Housing 215 7115 235.30 1018.08
iv) Transport 78 4615 27.83 74.07
v) Dairy, Cattle Breeading & Rearing 467 10435 60.48 84.81
vi) Fruits & Vegetables 309 10399 40.91 47.09
vii) Pisciculture 312 18406 81.70 118.68
viii) Labour Contract 283 8178 15.47 75.65
Contd.
Table No. 6.12 Basic Statistical information of the Cooperative Societies in Manipur
for the year 2011-12
(Rs. in lakhs)
Sl.
No. Type of Societies
No. of
Societies
No. of
Members
Paid up
Share
Working
Capital
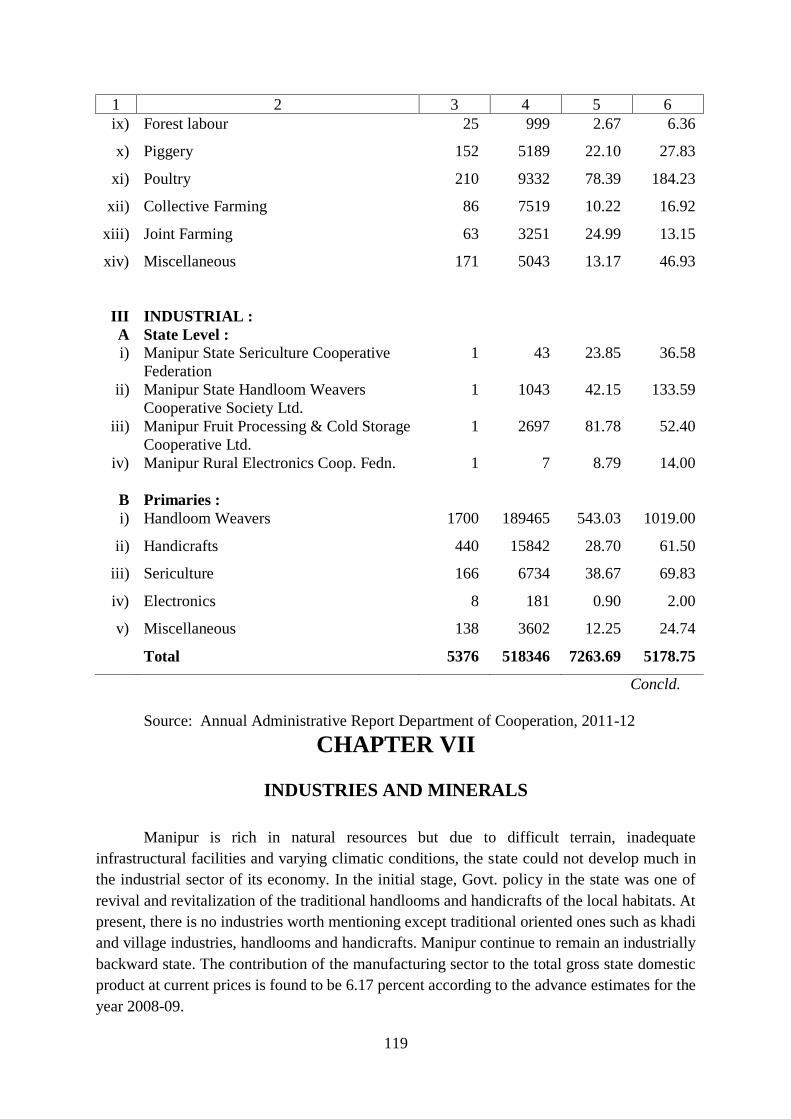
119
1 2 3 4 5 6
ix) Forest labour 25 999 2.67 6.36
x) Piggery 152 5189 22.10 27.83
xi) Poultry 210 9332 78.39 184.23
xii) Collective Farming 86 7519 10.22 16.92
xiii) Joint Farming 63 3251 24.99 13.15
xiv) Miscellaneous 171 5043 13.17 46.93
III INDUSTRIAL :
A State Level :
i) Manipur State Sericulture Cooperative
Federation
1 43 23.85 36.58
ii) Manipur State Handloom Weavers
Cooperative Society Ltd.
1 1043 42.15 133.59
iii) Manipur Fruit Processing & Cold Storage
Cooperative Ltd.
1 2697 81.78 52.40
iv) Manipur Rural Electronics Coop. Fedn. 1 7 8.79 14.00
B Primaries :
i) Handloom Weavers 1700 189465 543.03 1019.00
ii) Handicrafts 440 15842 28.70 61.50
iii) Sericulture 166 6734 38.67 69.83
iv) Electronics 8 181 0.90 2.00
v) Miscellaneous 138 3602 12.25 24.74
Total 5376 518346 7263.69 5178.75
Concld.
Source: Annual Administrative Report Department of Cooperation, 2011-12
CHAPTER VII
INDUSTRIES AND MINERALS
Manipur is rich in natural resources but due to difficult terrain, inadequate
infrastructural facilities and varying climatic conditions, the state could not develop much in
the industrial sector of its economy. In the initial stage, Govt. policy in the state was one of
revival and revitalization of the traditional handlooms and handicrafts of the local habitats. At
present, there is no industries worth mentioning except traditional oriented ones such as khadi
and village industries, handlooms and handicrafts. Manipur continue to remain an industrially
backward state. The contribution of the manufacturing sector to the total gross state domestic
product at current prices is found to be 6.17 percent according to the advance estimates for the
year 2008-09.

120
Keeping in mind the trend of industrial development and the present local conditions
of the state and in consonance with industrial policy of the Government of India, the Govt. of
Manipur in its policy announcement of 1990, has decided to focus attention to the small scale
and agro-based industries without discouraging the medium and large-scale industries. It is
expected to serve the objective of employment generation and dispersal of industries in rural
and urban areas.
The New Industrial policy, 1996 of the state has laid emphasis on creating a strong
industrial base and employment opportunities in the state through provision of various growth
inducing factors based on locally available resources. It is based on locally available raw
materials and minerals. In order to promote rapid industrialization, the State Government has
over the years been offering attractive package of incentives and concessions to invigorate
industries.
7.1.1 Rapid Industrialization:
Industrialization implies the creation and growth of factories, mills, power plants and
so on. It refers to the development of manufacturing and other related activities. Without rapid
industrialization, economic development is almost impossible. The state Government has made
persistent efforts for rapid industrialization of the state thereby generating more employment
opportunities, alleviation of poverty and removal of economic disparities. Almost all the Public
Sector undertaking like those shown below were facing financial problems and paucity of fund
for maintenance inspite of providing package of incentives and concessions as laid out in its
industrial policies and programmes.
(1) Manipur Cycles Corporation Ltd. (MCCL)
(2) Manipur Cement Ltd. (MCL)
(3) Manipur Spinning Mills Corporation Ltd.(MSMCL)
(4) Manipur Pulp & Allied Products Ltd.(MPAPL)
(5) Manipur Food Industries Corporation Ltd. (MFIC)
(6) Manipur Drugs And Pharmaceutical Ltd.(MSDPL)
(7) Manipur Handloom & Handicrafts Development Corporation Ltd.(MHHDCL)
(8) Manipur Electronic Development Corporation Ltd. (MANITRON)
(9) Manipur Industrial Development Corporation Ltd. (MANIDCO)
As a result, the Government has decided to wind up five companies namely Manipur
Cycles Corporation Ltd. (MCCL), Manipur Cement Ltd. (MCL), Manipur Spinning Mills
Corporation Ltd. (MSMCL), Manipur Drugs and Pharmaceutical Ltd. (Joint Sector) and
Manipur Pulp & Allied Products Ltd.(MPAPL), as they are all loss making industries.
Proposals for privatization also failed as there were no buyer of the units. Regarding MDPL,
the Government has been consulting the central Government for its viability. As for Manipur
Vanaspati & Allied Industries Ltd., the Company was about to wind up but for the stay order
issued by the Guwahati High Court. MHHDC, MANITRON and MANIDCO will be
revitalized so as enable to stand themselves with one time assistance. Proposals for revival of
these three corporations were submitted to the State Government for inclusion in the

121
memorandum to the Twelfth Finance Commission. The staff of the Public Sector undertakings
which are under process of winding up were already retrenched. Regarding the MFIC, the
process has been reviewed and it shall continue as Implementing Agency of the Food Park
Project set up at Nilakuthi.
A sum of Rs. 7.50 lakhs has been provided in 2006-07(B.E.) to be released as grants-
in-aid to those corporation which are under the process of winding up for payment of
salaries/wages of the staff retained to complete the updating of accounts of these companies.
There is also a proposal voluntary retirement of 7 staff of MANIDCO during 2008-09 and Rs.
33.28 lakhs was allotted for this purpose during 2009-10 and no fund was allotted to public
sector undertakings (PSUs) which are under process of winding up.
7.1.2. Small-Scale Industries:
Small-Scale Industries (SSI) is an important segment of the economy, contributing
substantially in the form of production, employment and exports. It has continued to play a
vital role in the fulfillment of socio-economic objectives. The principal factor for defining
small-scale Industries has always been based on the size of investment. Small-Scale Industries
are those industries whose investment in fixed assets such as plants and machineries does not
exceed Rs.100.00 lakhs (Rs.1 crore). This has been brought down from earlier limit of
Rs.300.00 lakhs (Rs.3 crores) w.e.f. 24.12.99 in order to give a fillip to small units with low
investments. The investment limit for tiny units continues to be Rs.25.00 lakhs. Investment in
plant and machinery in respect of industry related Small-Scale Service and Business
Enterprises (SSSBE) was increased to Rs.10.00 lakhs from Rs.5.00 lakhs. According to these
new definitions, all the industrial units except those of cottage and village industries in Manipur
belong to the category of small-scale industries.
For speedy growth of small-scale industries, the Government has already brought about
simplifications in the SSI registration procedures. By the end of March, 2006 the number of
registered permanent Small Scale Industries both SIDO (Small Industries Development
Organisation ) and NON-SIDO stood at 10,264 with an investment of Rs.43.27 crores in plants
and machineries and providing employment to 53,719 persons where annual production was
estimated to be Rs.183.72 crores. The growth of Small-Scale Industries over the years is shown
in the following Table No. 7.1.
Table No. 7.1 Growth of Registered Permanent (PMT) Industrial units Employment,
Investment and production (as on 31st March)

122
Year No. of
Units
No. of
Employ-
ment
Average no.
of Employ-
ment per
unit
Investment
(Rs.in crore)
Average
investment
per unit (Rs. in
thousands)
Production (Rs. in crore)
Average
per unit
production (Rs.in lakh)
1 2 3 4 5 6 7 8
1994-95 8341 42613 5.1 26.41 31.66 123.16 1.48
1995-96 8612 43842 5.1 28.23 32.78 127.05 1.48
1996-97 8910 45460 5.1 29.51 33.12 133.90 1.50
1997-98 9088 46464 5.1 30.72 33.80 139.39 1.53
1998-99 9240 47388 5.1 31.53 34.12 143.33 1.55
1999-00 9415 48514 5.2 33.19 35.25 150.69 1.60
2000-01 9635 49792 5.2 35.05 36.38 157.66 1.64
2001-02 9744 50364 5.2 36.07 37.02 162.30 1.67
2002-03 9867 51123 5.2 37.70 38.21 168.80 1.71
2003-04 9993 51842 5.2 39.37 39.39 173.08 1.73
2004-05 10151 52857 5.2 41.38 40.76 177.79 1.75
2005-06 10264 53719 5.2 43.27 42.16 183.72 1.79
Source: Commerce & Industries Deptt., Govt. of Manipur.
It is evident from the above table that average employment per unit of manufacturing
enterprises in Manipur is around 5(five) only during the period from 1994-95 to 2005-06. There
is positive correlations between the average per unit employment and investment in plants and
machineries with r = 0.97. The average employment per unit is worked out to be 5.15 persons
where average investment in plants and machineries is worked out to be Rs.34.37 crores. The
average production per unit is found to be Rs.1.48 lakhs in 1994-95 which slowly increased
from year to year. It stood at Rs.1.79 lakhs in 2005-06.
A total of 111 manufacturing units are found registered in Manipur during 2006-07 as
against 113 (101 SIDO and 12 NON-SIDO) in 2005-06. Among the districts, Imphal East

123
Imphal West districts have the highest number of registered industrial (SIDO & NON-SIDO)
units with 30 each (27.03% each) followed by Thoubal district with 23 (20.72%) units. The
lowest was recorded in Tamenglong district having only 1 (0.90%)unit. The district-wise SIDO
& NON-SIDO break-up of industrial units, employment, investment and production during
2006-07 are presented in Table No.7.2.
Table No.7.2 Growth of Registered Industrial Units, employment, investment and
production in Manipur during 2006-07
District Number of Units Number of Employment SIDO NON-SIDO TOTAL SIDO NON-SIDO TOTAL
1 2 3 4 5 6 7
Senapati 5 0 5 27 0 27
Tamenglong 1 0 1 7 0 7
Churachandpur 5 4 9 55 82 137
Chandel 0 0 0 0 0 0
Ukhrul 0 0 0 0 0 0
Imphal West 18 12 30 103 78 181
Imphal East 21 9 30 215 50 265
Bishnupur 11 2 13 93 17 110
Thoubal 20 3 23 228 29 257
Manipur 81 30 111 728 256 984
Contd.
Table No.7.2 Growth of Registered Industrial Units, employment, investment and
production in Manipur during 2006-07
District Investment (Rs.in lakhs) Value of Production (Rs. in lakhs)
SIDO NON-SIDO TOTAL SIDO NON-SIDO TOTAL
1 8 9 10 11 12 13
Senapati 13.08 0 13.08 39.15 0 39.15
Tamenglong 0.60 0 0.60 0.62 0 0.62
Churachandpur 20.85 8.20 29.05 21.41 8.36 29.77
Chandel 0 0 0 0 0 0
Ukhrul 0 0 0 0 0 0

124
Imphal West 35.86 2.18 38.04 87.28 14.28 101.56
Imphal East 17.38 3.71 21.09 95.37 41.58 136.95
Bishnupur 5.86 1.07 6.93 47.96 6.67 54.63
Thoubal 34.56 3.12 37.68 187.93 30.87 218.80
Manipur 128.19 18.28 146.47 479.72 101.76 581.48
Concld.
Source: Commerce & Industries Department, Manipur.
7.1.3 Handloom :
Handloom industry is the largest cottage industry in the state. It is a traditional cottage
industry providing avenues of employment opportunities to the people of Manipur. Basically,
it is a labour-intensive family occupation in which all the members of a family can participate.
Majority of the handloom weavers in the state are self-employed artisans who are carrying on
their profession in their own homes with the assistance of their family members in pre-loom
and post loom process. Manipur ranks the fourth position in terms of the number of looms in
the country. It has more than 2.8 lakhs looms comprising of fly shuttle, throw shuttle and loin-
looms with a weaver population of more than 4.62 lakhs which is 2nd position among the states
according to National Handloom Census, 1995-96.
In artistic weaving also there are many accountable designs which are still famous such
as Ningthou Phee, Lamthang Khulak, Khamen-Chatpa, Shamilanmi, Moirangphee, Lashing
Phee, Leiroom, Hijamayek, Tindongbi, Leirong, Akoibi designs etc. Each design has its own
history as to how and by whom they were invented. In the art of design and printing, Manipur
can be proud of possessing good knowledge of dyeing of fast colour on various kinds of hard
printing of cloths since time immemorial by using indigenous plant leaves etc.
As Manipur has adequate potential for development of handloom industry various
welfare as well as handloom development scheme for promotion and development of handloom
industry including employment generating programme are taken up in the State. Most of the
scheme supporting the weavers is Centrally Sponsored Schemes (CSS). For the provision of
welfare measures and better working conditions to handloom weavers, a package of group
insurance scheme, health package scheme, workshed cum-housing scheme, project package
scheme, integrated handloom village development project etc. are being implemented in the
handloom sector.
7.1.3.1 Project Package Scheme:
The project package scheme, being implemented since 1992-93, is one of the major
schemes to provide the requisite support to weavers in an integrated and co-ordinated manner.
The scheme envisages formulation and implementation of specific need base projects for
development by a particular handloom product or development of a particular area of weavers.

125
Altogether 2194 weavers were assisted under this scheme involving a sum of Rs.92.95 lakhs
as central share during the year 2001-2002.
During 2002-03, a sum of Rs.26.25 lakhs were released under the scheme as 2nd
installment to the beneficiaries as state share in respect of the 12 projects sanctioned in 1994-
95. The final installment of Rs.46.65 lakhs is yet to be released. The Govt. of India also released
Rs.62.84 lakhs and Rs.81.48 lakh as grant and loan respectively to the beneficiaries in respect
of the 30 projects sanctioned in 2000-2001. 173 weavers were assisted during 2003-2004
involving an amount of Rs.22.80 lakhs and Rs.65.29 lakhs as central share and state share
respectively under the scheme.
7.1.3.2 Integrated Handloom Village Development project: Integrated Handloom Village Development project (IHVDP) aims at providing a
comprehensive support in all areas covering all types of facilities in terms of skilled
upgradation, productivity infrastructure and to give fillip to the motivation level. Construction
of common facility centre, workshed, supply of looms, imparting training programme and
providing of infrastructure are the main components of the scheme. During the year 2001-2002,
altogether a total of 2,647 weavers were assisted with margin money to the tune of Rs.68.22
lakhs as central share and a sum of Rs.2.26 lakhs were paid as stipend to 60 weavers for
undergoing training.
7.1.3.3 Deen Dayal Hathkargha Protsahan Yojana :
Deen Dayal Hathkargha Protsahan (DDHP) Yojana was a newly introduced scheme for
women belonging to the SC/ST/OBC as a promotional scheme of handloom sector. It is a
centrally sponsored scheme which has come into force with effect from 01.04.2000. Product
development, production support, institutional support, imparting training programme,
providing of infrastructure, marketing support etc. both at macro & micro level in an integrated
and co-ordinated manner for an overall development of the handloom sector are the main
components of the scheme. The pattern of assistance between the central and the state is 90:10
unless specified for the component. The amount sanctioned by the central and state
Government for the assistance of Cooperative Societies during 2005-06 to 2007-08 is shown
at Table No. 7.3
Table No. 7.3 Physical and Financial Performance under DDHP Yojana in Manipur by
the State Government
Year Amount Sanctioned
(Rs. in lakhs)
Number of Beneficiaries
Co-op. Societies Weavers
1 2 3 4
2005-06 200.50 - 5110
2006-07 270.50 495 1590
2007-08 400.00 869 -
- Not Available
Source: Commerce & Industries Department, Manipur

126
7.1.4 Handicrafts:
Handicrafts are another important industry in the state. It has its own unique identity
amongst the various crafts of the country. Handicrafts industry of Manipur may be mentioned
with special accounts for contributing to the economic structure and development of the state.
The handicrafts of Manipur are treated in high class in themselves, drawing the main theme
and subject matter from episode of Khamba Thoibi and latter Radha Krishna background of
their religions belief and designs depiction of Pakhangba. With simple processes of indigenous
nature, craftsman here produce handicrafts of excellence in the form of cloths embroidery, cane
and bamboo, ivory, stone and wood carving, metal crafts, deer horn decoratives and supari,
walking sticks, dolls and toys etc. Various kouna products, artistic weaving, wood carving etc.
have a distinct place of its own.
The State Government has made full efforts for overall development of handloom and
handicrafts industries in the state. Manipur Handloom & Handicrafts Development Corporation
and Manipur Development Society are the two agencies of the state government taking utmost
efforts for production and marketing of handloom and handicrafts products. Manipur State
Handloom Weavers Co-operative Society is apex co-operative society taking pivotal role in
the co-operative sector for development of handloom & handicrafts in the state. There is also
departmental raw-materials bank to meet the requirement of various types and quality of yarn
of weavers at reasonable price. The Mechanised Dye House now run under the Deptt. is also
making full efforts to make available quality dyed yarn for the weavers of the State. Although
there are various schemes for the growth and development of handloom and handicrafts in the
state, only few could be implemented due to want of fund. Among the North Eastern States,
Manipur has got the highest number of handicrafts artisans
as can be seen in Table No. 7.4. In order to provide financial assistance and also give due
recognition to eminent craftspersons, the following schemes has been implemented during
2006-07.
(a) State Award to Master Craftsman,
(b) Modernisation of handicrafts and
(c) Development of Kouna product
Table No. 7.4 Number of handicrafts artisans in the North Eastern States
of India, 2004-05
Sl.No. North Eastern States Number of handicrafts artisan (in lakhs)
1 2 3

127
1. Arunachal Pradesh 1.57 2. Assam 2.05
3. Manipur 4.01
4. Meghalaya 1.68
5. Mizoram 0.69
6. Nagaland 1.83
7. Tripura 2.91
8. Sikkim -
7.1.5 District Industries Centre : District industries Centre (DIC) came into limelight in pursuance of the Industrial
Policy Resolutions of the Government of India adopted in 1977. The DICs were established in
all the District Headquarters with 2 (two) sub centres at Jiribam and Kangpokpi sub-division
of Manipur. Its emphasis is laid on dispersal of industries in the district headquarters, small
towns and rural areas. The intention of the policy makers is to make the DICs to work as
catalysts for promotion of cottage and small industries. It provides all the resources with its facilities required by the entrepreneurs including identification of suitable schemes, preparation
of feasibility reports, arrangements for supply of machinery and equipments, provision of raw-
materials and facilities for marketing and extension services. Various schemes like
Seed/Margin Money, Self-Employment for Educated Unemployed Youths and Prime
Minister’s Rozgar Yojana were instrumental in the growth of industries in the state.
7.1.5.1 Prime Minister’s Rozgar Yojana : A special scheme ‘Prime Minister’s Rozgar Yojana (PMRY)’ has been drawn up to be
operated through the District Industries Centre for providing self employment opportunities to
educated unemployed youths. The Scheme covered all educated unemployed youths who
passed or failed matric or ITI passed or having undergone Government sponsored technical
course for a minimum duration of six months and within the age group of 18 to 35 years
(relaxed upto 40 years for the North Eastern States and 45 years for SC/ST, Ex-Serviceman,
physically handicapped persons & women). Beneficiaries of the PMRY scheme were selected
from the relatively less affluent sections of the society, whose annual family income does not
exceed Rs.24,000 (relaxed upto Rs.40,000 per annum for North Eastern States.) PMRY scheme
provided loans, financial assistance to educated unemployed persons who are willing to employ
in any one of the trades viz., industry, service and business. The scheme was launched on 2nd
Oct., 1993. The PMRY beneficiaries in Manipur during 2007-08 was only 13 (thirteen) against
the targeted number of 1,700.
Table No. 7.5 Performance under PMRY scheme
Year Target
Sanctioned Disbursed
Number Amount
(Rs. in lakhs) Number
Amount
(Rs. in lakhs)
1 2 3 4 5 6
1999-00 1350 1035 891.60 281 197.35
2000-01 1000 113 70.60 100 58.36
2001-02 1100 642 485.77 642 400.18
2002-03 1300 717 539.73 33 21.57

128
2003-04 1200 606 - - -
2004-05 - - - - -
2005-06 1500 99 84.05 633 -
2006-07 1500 31 - - -
2007-08 1700 13 - - -
Source : Annual Administrative Report of Commerce and Industries
The above table shows the overall performance of the scheme during the year from
1999-2000 to 2007-08.
7.1.5.2 Integrated Handloom Development Scheme (IHDS)
The IHDS is a new Centrally Sponsored Scheme introduced to facilitate the sustainable
development of handloom weavers located in and outside identified handloom clusters within
a range of 300-500 looms in to a cohesive self-managing and competitive socio-economic unit.
Under this scheme, a sum of Rs. 800.00 lakhs was provided in 2009-10 which is meant
to give benefit to 1395 nos. Primary Handloom Weavers Cooperative Societies for covering
44640 weavers under the component of Market Incentive and 33nos. of Handloom Cluster
Development projects set up covering 5115 weavers providing yarn, looms and its accessories,
training, margin money for obtaining bank loan, computer aided textile design, deputing
designers in each cluster, exhibition, buyer-seller meet, exposure visits to advanced clusters
etc.
7.1.5.3 Prime Minister’s Employment Generation Programme (PMEGP)
This scheme has been implemented by the District Industries Centre (DIC) with Khadi
& Village Industries Commission as Nodal Agency at the National level. In addition to the
DIC other implementing agencies of the scheme are Khadi & Village Industries Commission
State office and Manipur Khadi & Village Industries Board. The total target of beneficiaries
under the scheme for Manipur during 2008-09 was 195 projects. During 2009-10, 89 nos. of
loan proposals were sanctioned by the bank against the state target of 118 alloted to DIC under
the programme. The total margin money in respect of those 89 beneficiaries was Rs. 78.01
lakhs and the total employment to be generated was estimated at 551 members.
7.1.6 Khadi and Village Industries:
The Khadi and Village Industries Commission (KVIC) was established by the Govt. of
India in the year 1957. The Khadi and Village Industries is not only providing employment to
people in rural and semi-urban areas at low investment per job, but also utilises local skill
resources and provides part-time as well as full time work to rural artisans, women and
minorities. It was only in the year 1966 that the State Board for the development of Khadi and
Village Industries was constituted by the Government of Manipur. The traditional sector of
industries fall within the purview of organisations such as Khadi and Village Industries
Commission. The KVIC include artisans in tiny industrial units and defines it as any industry

129
located in a village or town inhabited by population not exceeding 10,000 which produces
goods and renders services with or without the use of power in which the fixed capital per head
does not exceed Rs.15,000. In the State, the KVIC has given special attention for economic
upliftment of the Scheduled Castes/Scheduled Tribes and women in general.
The production of KVI sector was to the tune of Rs.49.47 crores in the year 2006-07 as
against Rs.49.42 crores in 2005-06 showing an increase of 0.10 percent over the previous year.
The total amount earned in the year 2006-07 was Rs.52.14 crores whereas the earning was
Rs.52.09 crores in the year 2005-06. And the total number of employees in KVI sectors was
36 thousands in 2006-07. The amount of Grants and Loans distributed to various Industries
under REGP (VI) in respect of Khadi and Village Industries Board, Manipur during 2007-08
to 2009-10 and Districtwise Number of Bee-Keepers, Outturn Price and value of Honey in
Manipur for the year 2010-11 and 2011-12 are shown in Table No. 7(e) and 7(f) of part II of
this publication respectively. A comparative picture of North Eastern Region is also given in
Table No. 7(a) of Part II.
Table No. 7.6 Performance of KVI of Manipur
(Rs. In lakhs)
Item 2007 (As on 31st Dec.)
1 2
Unit (No.) 17,496
Sales 5,643.74
Production 5,382.74
Employment (No.) 36,710
Source: AAR, 2007 Manipur Khadi and Village Industries Board.
The above table shows the performance of KVI in Manipur during 2007. A sum of
Rs.59 lakhs were provided as grants-in-aid to meet the establishment charges of the Khadi and
Village Industries Board during the period.
7.1.7 Indo-Myanmar Border Trade Promotion :
The opening of the Border Trade Between India and Myanmar was an important
achievement during the Eighth plan period. The Indo-Myanmar Border Trade was inaugurated
in 12th April 1995 by the then Union Minister of State for Commerce as a follow-up measure
of the Trade Agreement signed between India and Myanmar on the 21ST Jan., 1994 at New
Delhi. Subsequently exchange of 22 items have been allowed by the residents across the border.
The development has to boost up the export potential of India/Manipur by creating adequate
infrastructure for promotion of export oriented industrial units. To facilitate the trade, trade
centers are being constructed at Moreh and another at Imphal. The importance of setting up of

130
trade centers for providing facilities to the trades and entrepreneurs of Manipur with the new
avenue of opening up of regulated border trade between Myanmar and India was considered
by Planning Commission, Government of India.
Accordingly, the Centre is to provide infrastructural facilities such as
telecommunication, export-import information cell, show room-cum-sales counters,
conference hall, boarding and lodging facilities, guest-room and restaurants, bank and other
relevant Govt. extension counters to facilitate the trades/businessmen/ entrepreneurs in creating
a business like congenial atmosphere. However, the Director General of Foreign Trade has
permitted the bilateral/border trade along with the Indo-Myanmar border as per the prevailing
customary practices for the commodities namely, mustard/rape seed, pulses and beans, fresh
vegetables, fruits, garlics, onion, chillies, spices (excluding nutmeg, maee, cloves, cassia &
cinnamon), bamboo, minor forest products (excluding teak), betel nuts and leaves, food items
for local consumption, tobacco, tomato, reed broom, sesame, resin, corriander seeds,
soyabeans, roasted sunflower seeds, katha, ginger etc. During the period 2001-02, the volume
of export and import was Rs.1.25 crores and Rs.8.30 crores respectively as per the report of the
Land Customs Station, Moreh. During the year 2002-03, the value of export and import was
Rs.3.66 crores and Rs.1.17 crores respectively. The main items of exports were wheat flour,
bleaching powder, fenugreek seeds, Ani seeds, Cumin seeds, Soyabari, dry chillies, agarbati,
suman rose powder, Pea, Garlic, Dry Buffallo Offal etc. while the import items were Betel
nuts, Turmeric, Red Kidney bean (Rajma), Kuth roots, gram. Resin, reed-brooms, dry ginger
etc.
Table No. 7.7 shows the quantity and value of export and import commodities during
the year 2004-05. During the period, the value of export and import was Rs.6.15 crores and
Rs.5.27 crores respectively.
Table No.7.7 Quantity and Value of Exports and Imports of merchandise in the
Indo Myanmar Border Trade during the year 2004-2005
Sl.
No. Name of Commodity Unit Quantity
Value
(Rs. in lakhs)
1 2 3 4 5
1.
EXPORT
Wheat flour
MT
1887.71
183.74
2. Soyabari „ 359.41 149.15
3. Cumin seed „ 68.30 68.30
4. Soray Milk Powder „ 13.00 8.97
5. E/Buffalo Offal No. 346.38 115.84
6. D/Buffalo Offal

131
7. Detonating fuse Kg. 54,952 88.14
8. Bullet Proof Jacket, Single
Rifle with telescope sight
and ammunition
Nos. 6
5
888
0.47
Total Export: 614.61
1.
IMPORT
Dry ginger
MT
524.43
48.68
2. Betel Nut „ 2076.00 446.14
3. Turmeric Powder „ 33.50 3.31
4. Kuth Roots „ 56.00 4.68
5. Surpentina Roots „ 2151.00 3.16
6. Round hog CFT 10751.30 20.71
Total Import 526.68
Source: Directorate of Commerce and Industries, Manipur
With the objectives of promoting people to people contact for promotion of the bi-
lateral trade, a team of Myanmar Delegation comprising 3 (three) officials and 28 other trade
related bodies visited Manipur on 28th Feb., 2007 and also a One-Day interaction programme
was held on 1st March, 2007 at the State Government House, Imphal by the traders and officials
of both sides.
7.1.8 Industrial Growth Centres:
Growth Centres are large villages or small towns which have the potential to become
the nuclei for the socio-economic development of the surrounding area. The Growth Centres
can be identified by the different orders with respect to the quality and quantity of services and
facilities, service area and population. A growth centre of lowest order should have services
such as agricultural input centre, primary and middle school, maternity and child care centres
and daily market. At highest level, it must have manufacturing industries, hospitals, colleges
etc.
The pace of development of backward areas is a cause for concern. With the doing away
of the system of licensing of industries and coming into play of market forces, the industries
tend to gravitate towards already developed areas which provide better infrastructure, easier
availability of skilled work force and forward and backward linkages in terms of availability
of raw-materials and markets for products. Thus, the regional imbalances in industrial
development may tend to increase. So it is imperative to take special measures to promote
development of industries in backward areas.
For tackling the problem of regional imbalances in industrial development, to some
extent at least, the Growth Centres Schemes was initiated in the Eighth Plan.
Under the Growth Centres Schemes, the central Govt. has approved the Industrial
Growth Centre Project at Lamlai-Napet at a project cost of Rs.30.00 crores of which Rs.15.00
crores will be the Govt. of India contribution, Rs.5.00 crores as State Govt. contribution,
Rs.4.00 crores as loan and equity contribution from the financial institutions and Rs.6.00 crores
as loans and equity from other sources. A sum of Rs.1.50 crores was sanctioned and released
by the Government of India. A proposal for shifting the site of the Centre is under examination.
7.1.8.1 Food Processing Industries (FPI)

132
During the year 2007-08, a plan fund of Rs. 970 lakhs was provided for Food Processing
Industries.
For the further development of FPI, the following promotional Schemes have been
taken up.
i) Food Processing Training Centre, Porompat
ii) Regional Extension Service Centre (Rice Mill), Porompat
iii) Quality Control Laboratory for FPI
iv) Training on FPI
v) Market Promotion
vi) Mobile Food Processing-cum-Training Unit
7.1.8.2 Food Park :
The Foundation Stone for a Food Park was laid down on 10.11.2006 at Nilakuthi in an
area of about 31 acres of land with a project cost of Rs. 1361.45 lakhs. During 2006-07, the
State and Central Government have released a sum of Rs. 272 lakhs and Rs. 160 lakhs
respectively. NABARD has agreed to extend a term loan of Rs. 620 lakhs for the project. The
project cost was revised to Rs. 3172.40 lakhs and NABARD has also agreed to rise its term
loan to Rs. 1574.16 lakhs. The approved provision of fund for the year 2009-10 was Rs.
1196.00 lakhs.
The implementing agency of the Food Park Project is the Manipur Food Industries
Corporation Ltd. The State Government is planning to upgrade the proposed Food Park into
Mega Food Park. There will be 40-50 Food Processing Units for which common facilities like
Cold storage, warehousing, Quality Control Lab., Weight Bridge, Post Office, Bank, Water &
Power supply will be made available in the Food Park. For the convenience of the food
processing units, construction of a bridge connecting the Park at Nilakuthi and NH-39 over
Imphal River has also started.
7.1.9 Bamboo Processing Industries :
Considering the fact that Manipur share about 25% of the total growing stock of
bamboo of the North Eastern Region of India and 14% of the country, Manipur State stands to
prominently benefit from the national programme for bamboo development. The bamboo
growing area within and around Jiribam, covering the bamboo abundant area of Tamenglong
district and Tipaimukh area of Churachandpur district is about 2969 sq. km., which is about
80% of the total bamboo growing area in Manipur.
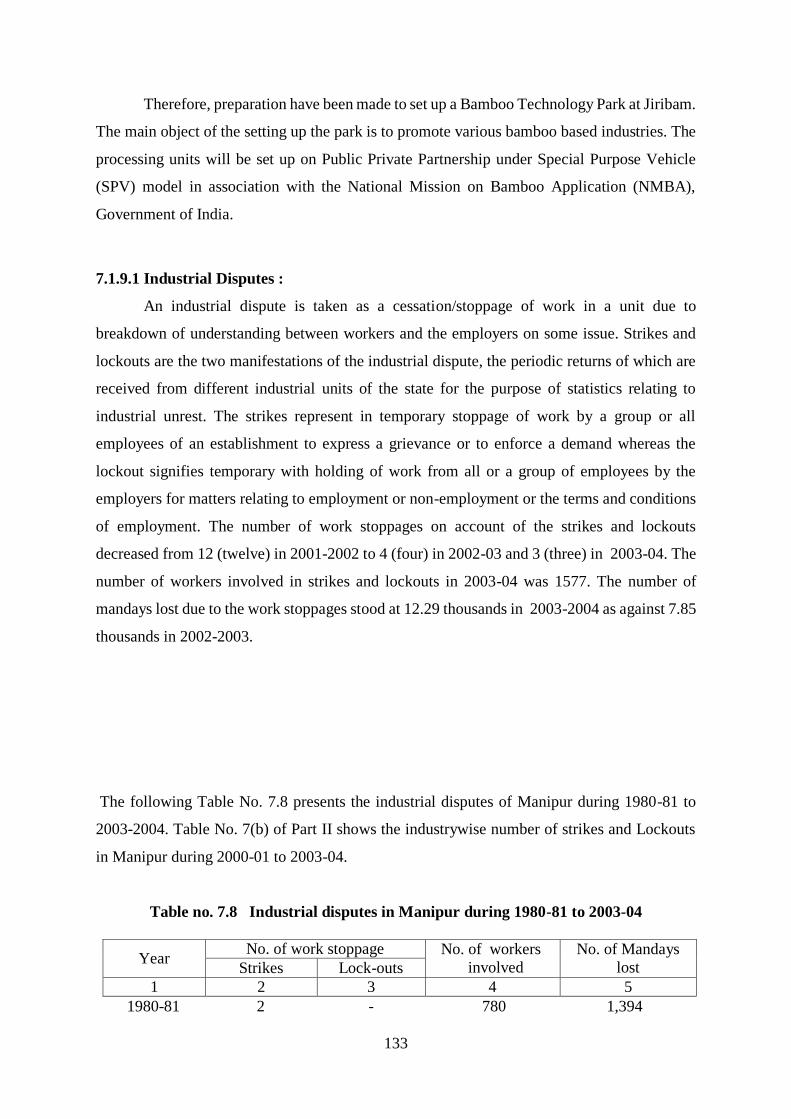
133
Therefore, preparation have been made to set up a Bamboo Technology Park at Jiribam.
The main object of the setting up the park is to promote various bamboo based industries. The
processing units will be set up on Public Private Partnership under Special Purpose Vehicle
(SPV) model in association with the National Mission on Bamboo Application (NMBA),
Government of India.
7.1.9.1 Industrial Disputes :
An industrial dispute is taken as a cessation/stoppage of work in a unit due to
breakdown of understanding between workers and the employers on some issue. Strikes and
lockouts are the two manifestations of the industrial dispute, the periodic returns of which are
received from different industrial units of the state for the purpose of statistics relating to
industrial unrest. The strikes represent in temporary stoppage of work by a group or all
employees of an establishment to express a grievance or to enforce a demand whereas the
lockout signifies temporary with holding of work from all or a group of employees by the
employers for matters relating to employment or non-employment or the terms and conditions
of employment. The number of work stoppages on account of the strikes and lockouts
decreased from 12 (twelve) in 2001-2002 to 4 (four) in 2002-03 and 3 (three) in 2003-04. The
number of workers involved in strikes and lockouts in 2003-04 was 1577. The number of
mandays lost due to the work stoppages stood at 12.29 thousands in 2003-2004 as against 7.85
thousands in 2002-2003.
The following Table No. 7.8 presents the industrial disputes of Manipur during 1980-81 to
2003-2004. Table No. 7(b) of Part II shows the industrywise number of strikes and Lockouts
in Manipur during 2000-01 to 2003-04.
Table no. 7.8 Industrial disputes in Manipur during 1980-81 to 2003-04
Year No. of work stoppage No. of workers
involved
No. of Mandays
lost Strikes Lock-outs
1 2 3 4 5
1980-81 2 - 780 1,394

134
1985-86 2 - 499 2,978
1990-91 8 - 3,234 53,572
1991-92 7 - 1,434 17,737
1992-93 7 - 2,021 31,840
1993-94 10 - 303 16,624
1994-95 3 - 459 7,911
1995-96 8 - 1,990 42,301
1996-97 12 - 1,385 85,658
1997-98 7 - 2,738 41,711
1998-99 2 - 656 10,070
1999-00 1 - 351 10,881
2000-01 6 - 1,073 16,713
2001-02 12 - 2,819 49,551
2002-03 4 - 766 7,846
2003-04 3 - 1,577 12,289
Source: Office of the Labour Commissioner, Manipur.
Among the North-Eastern States, the number of industrial disputes recorded in Assam
was 4 (four) while in Manipur it was 2 (two) in 2005. The number of mandays lost due to
industrial disputes in Assam was 112.23 thousands and followed by Manipur with 19.2
thousands. But in case of the states of Mizoram, Meghalaya, Arunachal Pradesh, Nagaland,
Sikkim and Tripura, no such disputes was recorded during the said period. Table No. 7.9 shows
the number of industrial disputes during 2005.
Table No. 7.9 Number of Industrial disputes in North Eastern States of India Vis-a-Vis
All India during 2005
(in nos.)
State Disputes Workers Mandays lost
1 2 3 4
ArunachaPradesh -
-
4
-
-
19485
-
-
112226
Assam
Manipur

135
Mizoram 2
-
-
-
-
-
456
600
-
-
-
-
-
29,13,601
19200
-
-
-
-
-
2,96,64,999
Meghalaya
Nagaland
Sikkim
Tripura
All India
- NA
Source: Statistical Abstract, India, 2007.
7.1.10 Results of the Annual Survey of Industries
The summary results of the Annual Survey of Industries (ASI) reveal some idea about
different characteristics of registered factory sector in the State. The available results show that
Manipur had a total number of 1,127 employees engaged in 61 registered factories in 2001-02.
The total value of output, value of input and net value added were of the order of Rs.18.97
crores, Rs.15.57 crores and Rs.2.57 crores respectively. The important characteristics of
Annual survey of industries pertaining to the state during 2007-08 are presented in Table
No.7.10 and the salient features of ASI during the year 2000-01 to 2004-05 & 2007-08
are shown in Table No. 7(c) of Part II.
Table No. 7.10 Important Characteristics of Annual Survey of Industries of Manipur
for the year 2007-08
Characteristics Unit Industry Code
151 153 154 201 269 Others All
1 2 3 4 5 6 7 8 9
Factories No. 3 4 3 13 37 9 69
Fixed Capital Rs.in lakhs 100 204 126 76 590 46 1141
Working Capital „ 18 605 32 43 147 20 831
Invested Capital „ 104 726 140 184 783 69 2006

136
Gross value of
Plant & Machineries „ 0 186 41 34 213 1 475
Total Employees No. NA NA NA NA NA NA NA
Total Workers No. NA NA NA NA NA NA NA
Total Output Rs.in lakhs 66 3196 131 234 2051 146 5825
Total Input „ 49 3003 90 170 1216 96 4623
Gross Value Added „ 17 193 41 64 835 50 1202
Depreciation „ 1 25 13 5 59 3 107
Net-Value Added „ 16 168 38 59 776 48 1096
NA : Not Available
Description of the Industry Codes.
151 – Production, processing and preservation of meat, fish, fruit vegetables, oil and fats
153 - Manufacture of grain mill products, starches and starch products and
prepared animal feeds.
154 - Manufacture of other food products.
201 - Saw milling and planning of wood.
269 - Manufacture of non, metallic mineral products (n.e.c.).
Other Industry.
*Source: Annual Survey of Industries.
7.2 Minerals:
Minerals provide a base for the rapid industrialization. It is imperative, therefore, that
proper attention is paid to their development. The State Government has formulated a New
Mineral Policy (NMP). It is to develop mineral-based industries by identifying lack of
infrastructure, lack of investment and flow of credit from banks and exploration of local
resources and manpower to achieve the industrial growth. With the objective of the
strengthening organisational set up, streamlining of mineral administrative machineries,
augmentation and intensification of mineral exploration, commencement of mining activities
and participation in general water exploration and geo-physical investigations, it is proposed
to provide sufficient fund during the Ninth Five Year Plan. To achieve the objectives phasing
programme for exploration and investigation of minerals, collaborative efforts for
strengthening of the Geology and Mining Division is initiated by creating Mining section. So
far 58 percent of the total area of Manipur has been covered by systematic geological mapping
and 42 percent still remains to be covered.
7.2.1 Mineral Resources:
The Geological Survey of India (GSI) has undertaken systematic survey in the three
districts of Manipur viz. Ukhrul, Churachandpur and Chandel and discovered considerable
quantities of valuable mineral deposits like limestone, copper, lignite, nickel, chromite,
asbestos, salt etc. Some of the important mineral resources are given below.
7.2.1.1 Limestone:

137
Limestone is an important material for manufacturing of cement. It is mainly available
in different parts of Ukhrul District viz. Hundung, Mata, Khangoi, Sokpao, Lambui and Kasom.
It is also available between 32/4 and 32/6 milestone on Imphal Moreh Road in Chandel
District. Only in Ukhrul District, the total inferred deposit of limestone has been estimated to
6.35 million tonnes and 5.76 million tonnes at Phungyar and Meiring respectively.
7.2.1.2 Asbestos:
The veins and veinlets of antigorite and chrysotile asbestos have been found in the
massive serpentine bearing rocks near Moreh, Nepali Basti and Kwatha but none of these
occurrences seem to be of economic importance. A small quantity of asbestos is also available
in the eastern part of Ukhrul District.
7.2.1.3 Chromite:
Deposits of chromite containing metallurgical grade have been located near the Shiroi
hill of the Ukhrul District and hinted the possibility of large deposits in future. Besides, quantity
of chromite is also available near the Nepali Basti of Chandel District covering an area of about
90 sq. km. and having maximum thickness of 0.3 metre.
7.2.1.4 Copper:
The Geological Survey of India (GSI) has found copper in the Chandel District and
Nickel containing copper sulphate, chalcopyrite, chalcocite and metals at Nungau and kongal
Thana. A small quantity of copper is also available at Ningthi & Kwatha of the Chandel District
and Humie of the Ukhrul District.
7.2.1.5 Nickel:
Nickel associated with the serpentinite rock has been located at Nampesh and Kwatha
areas of the Chandel District. The GSI in their geochemical and other methods has found
metallic nickel dispersed in the soil in fairy high concentration of nickel varying upto 0.9
percent. Soil samples in the Moreh area containing weathered serpentinite rock also show the
availability of nickel varying from 0.24 to 0.9 percent.
7.2.1.6 Lignite:
The GSI has found deposits of lignite in Kangvai village of Turenloo valley of
Churachandpur District. The total quantity of lignite has been estimated at 12,262 tonnes which
can be used in manufacturing cement in the cement plant in Ukhrul district.
7.2.1.7 Salt:
Salt is mainly available in Waikhong, Sikhong, Chandrakhong and Keithel Manbi.
Most of the salt springs are being tapped by driving one metre diameter lined wells for
manufacture of salt in a small-scale.
7.2.2 Mineral Production:

138
The total mineral production of Manipur in 1990-91 and 1991-92 were 130 tonnes and
64 tonnes with a value of Rs.114 thousands and Rs.42 thousands respectively. However the
mineral production in 1993-94 and 1994-95 were 642 tonnes and 784 tonnes respectively.
The production had decreased from 470 tonnes in 1995-96 to 62 tonnes in 1996-97. The
production slightly increase to 68 tonnes in 1997-98. There is no production of minerals since
1998-99 as no mining work was taken up. The performance of minerals production is shown
in the following Table No. 7.11.
Table No. 7.11 Production of Minerals in respect of Manipur State
Year District Number of
Mines
Quantity
(Tonnes)
Value
(Rs. in `000)
1 2 3 4 5
1990-91 Chandel
Ukhrul
1
0
130
0
114
0
1991-92 Chandel
Ukhrul
1
0
64
0
42
0
1992-93 Chandel
Ukhrul
0
1
0
158
0
95
1993-94 Chandel
Ukhrul
0
1
0
642
0
499
1994-95 Chandel
Ukhrul
0
1
0
784
0
612
1995-96 Chandel
Ukhrul
0
1
0
470
0
519
1996-97 Chandel
Ukhrul
0
1
0
62
0
69
1997-98 Chandel
Ukhrul
0
1
0
68
0
128
Source: Indian Bureau of Mines, Ministry of Steel and Mines, Nagpur.
Among the entire North East states, Manipur is the only state which produced chromite.
During the period 1995-96 to 1997-98, 600 thousand tonnes of chromite was produced in
Manipur. And the value of production of chromite was Rs.6.34 crores during the same period.
Again the value of production of minor minerals was Rs.14.89 crores during the year 1995-
1996 and the value of production remains stagnant during the succeeding years (1995-1996 to
1997-1998). A comparative picture of the mineral production of NESs is presented in Table
No. 7.12.
Table No. 7.12 Mineral Production of North Eastern States of India during 1995-96 to
1997-98
(Value Rs.in ’ 000)
State Mineral Unit 1995-1996
No. of Mines Quantity Value
1 2 3 4 5 6

139
Arunachal Pradesh
Petroleum Limestone
’ 000 tonnes
’ 000 tonnes
0 1
28 0
88732 24
Minor minerals 0 0 1523
Assam Coal ’ 000 tonnes 5 822 609102
Natural gas m.c.m. 0 1510 1661000
Petroleum ’ 000 tonnes 0 5043 15981267
Lime Stone ’ 000 tonnes 3 411 33637
Minor minerals 0 0 1876
Manipur Chromite Tonne 1 470 519
Minor minerals 0 0 1489
Mizoram Minor minerals - - - -
Meghalaya Coal ’ 000 tonnes 0 3248 2406768
Limestone ’ 000 tonnes 2 277 22040
Minor minerals 0 0 7302
Nagaland Minor minerals - - - -
Tripura Natural gas m.c.m. 0 130 143000
Minor minerals 0 0 462
(Value in Rs. ’ 000)
State Minerals Unit of
Quantity
1996-1997
No. of Mines Quantity Value
1 2 3 7 8 9
Arunachal
Pradesh
Petroleum
Limestone ’ 000 tonnes
’ 000 tonnes
0
0
36
0
114084
0
Minor minerals 0 0 1523
Assam Coal ’ 000 tonnes 6 752 557232
Natural gas m.c.m. 0 1698 1867800
Petroleum ’ 000 tonnes 0 4811 15246059
Limestone ’ 000 tonnes 3 449 41384
Minor minerals 0 0 1876
Manipur Chromite Tonne 1 62 69
Minor minerals 0 0 1489
Mizoram Minor minerals - - - -
Meghalaya Coal ’ 000 tonnes 0 0 0
Limestone ’ 000 tonnes 2 279 31137
Minor minerals 0 0 7302
Nagaland Minor minerals - - - -
Tripura Natural gas m.c.m. 0 154 169400
Minor minerals 0 0 462 Contd.
Table No. 7.12 Mineral Production of North Eastern States of India during 1995-96 to
1997-98
(Value in Rs.’ 000)
State Mineral Unit 1997-1998
No. of Mines Quantity Value

140
1 2 3 10 11 12
Arunachal
Pradesh
Petroleum
Limestone ’ 000 tonnes
’ 000 tonnes
0
0
25
0
86725
0
Minor minerals 0 0 1523
Assam Coal ’ 000 tonnes 6 687 509070
Natural gas m.c.m. 0 1773 2508795
Petroleum ’ 000 tonnes 0 5130 17795970
Limestone ’ 000 tonnes 3 438 74296
Minor minerals 0 0 6382
Manipur Chromite Tonne 1 68 128
Minor minerals 0 0 2432
Mizoram Minor minerals - - - 4793
Meghalaya Coal ’ 000 tonnes 0 0 0
Limestone ’ 000 tonnes 2 201 22210
Minor minerals - - 332
Nagaland Minor minerals - - - 279
Tripura Natural gas m.c.m. 0 196 277340
Minor minerals 0 0 462
m.c.m. : Million Cubic Metre - Not Available Concld.
Source: Basic Statistics of North Eastern Region, 2002, Shillong
7.3 Sericulture: Sericulture plays a vital role in the improvement of economic conditions of the artisans
of the Manipur state. It is an important labour-intensive and agro-based industry generating
employment opportunities for the rural people with lowest investment cost. Sericulture has a
long tradition and has been practised by the farmers from time immemorial but on a limited
scale. But the sericulture industry was confined only in a few villages. Mulberry silk worm
rearing and reeling was confined to four villages viz Khurkhul, Leimaram, Pheiyeng and
Thongjao etc. whereas Eri silk rearing was conducted for domestic consumption by the
womenfolk. Silk weaving industry was confined to another four villages viz. Chingmeirong
Kabo Leikai, Thangmeiband, Awang Kongpal and Maibam Leikai only. And the sericulture
industry has been extended to other villages and also to the hill districts of the state during the
plan period.
During the Ninth Five Year Plan, the Department has implemented 13 plan schemes for
the development of four varieties of silk worm i.e. Eri (feeds on castor leaves), Muga (feeds on
Som & Soalu leaves), Oak Tasar (feeds on oak leaves) and Mulberry Silk (feeds on mulberry
leaves), culture as a subsidiary occupation in the lower belt hill areas of the state. So far, under
this scheme 25,486 hectares of land had been brought under plantation of silkworm Food Plants
and 21,968 families had been engaged in sericulture industry. During the year 2004-05, the
estimated production of oak tasar cocoons was 12.70 lakhs cocoon for a value of Rs 6.35 lakhs
as against the 8.10 lakhs cocoon for a value of Rs 4.05 lakhs in
2003-2004. Details of sericultural production is shown in Table No.7.13 and district-wise
sericultural production during the years 2006-07, 2007-08 and 2008-09 are presented in Table
No. 7(d) of Part II.
Table No. 7.13 Sericultural production and value in respect of Manipur State
Sl.
No. Item Unit 2007-08 2008-09 2009-10 2010-11 2011-12

141
Source: Department of Sericulture, Govt. of Manipur
The total production of raw silk in Manipur during 2010-11(Provisional) was 333
metric tonne and in 2006-07, it was 447 metric tonne. The production of raw silk in North
Eastern States during 2006-07 and 2010-11 are presented in Table No. 7.14.
Table No. 7.14 Production of Raw Silk in North Eastern States during
2010-11(Provisional)
(Metric Tonne)
State
2006-07 2010-11
Mulberry
Silk
Non-Mulberry Silk Mulberry
Silk
Non-Mulberry Silk
Tasar Eri Muga Tasar Eri Muga
1 2 3 4 5 6 7 8 9
Arunachal
Pradesh - - 5 1 1 - 16 1
Assam 11 - 740 107 17 - 1710 108
Manipur 70 3 374 - 108 3 221 1
Meghalaya 1 - 202 6 7 - 480 11
Mizoram 6 - 4 - 18 - 6 -
Nagaland 1 - 115 - 4 1 273 1
Tripura 5 - - - 14 - - -
Sikkim - - - - 14 - 1 -
- Nil
Source: Statistical Abstract, India, 2012. (Central Silk Board, Ministry of Textiles)
7.3.1 Manipur Sericulture Project:
1 2 3 4 5 6 7 8
1. Cocoon Production
(i) Tasar Lakh Nos. 67.32 75.04 49.63 60.00 80.00
(ii) Eri Lakh Kg. 2.96 2.98 340.00 263.65 289.45
(iii) Mulberry - do - 6.70 6.55 714.34 708.00 787.03
(iv) Muga Lakh Nos. 15.68 14.60 14.70 14.70 20.00
2. Value of Cocoon
produced
(i) Tasar Rs. in lakhs 47.13 52.53 24.81 30.00 1.80
(ii) Eri ,, 237.00 595.74 272.00 211.00 3.50
(iii) Mulberry ,, 803.99 851.93 1071.51 1062.00 2.25
(iv) Muga ,, 15.68 14.60 5.88 5.88 1.00

142
During the Ninth Five Year Plan, the State Govt. had taken up a project entitled
“Manipur Sericulture Project” with assistance from OECF (Overseas Economic Co-operation
Fund) now renamed as JBIC, Japan in order to increase the annual production of silk yarn to
the tune of 328 MT. Under this project, the advance technology and sophisticated machineries
used in Japan could be transferred to India with a view to increase the production of raw silk
in terms of both quality and quantity so as to meet the demand of international market. The
project also envisage development of sericulture facilities covering (a) Construction of
infrastructural facilities such as Seed Farm, Grainages, Research Station, District Storage and
Cocoon marketing Centres, (b) Development of Plantation of Mulberry and Eri, (c)
Construction of reeling and spinning facilities, twisting, etc. (d) Development of technical
training centres for rendering technical assistance & training etc. The overall development plan
on this project has been formulated including a total 2,720 hectares of Mulberry, 1,500 hectares
of Eri and functioning all the necessary supporting facilities. The project has been implemented
with an outlay of Rs.490.59 crores since 20th July, 1998, in two phases.
The Phase – 1, Manipur Sericulture Project was started with the employment of Project
Consultant since June, 1998. The total outlay of this phase is Rs.134.52 crores, of which, OECF
project loan fund covers Rs.116.19 crores (86.37 percent) and the remaining Rs.18.33 crores
(13.63 percent) is the state share. In this phase – 1 stage of implementation 1020 hectares in
the mulberry sector and 200 hectares in the eri sector will be covered. The phase was expected
to be completed by March, 2005.
The implementation of the phase – II was to commence from the 2002/2003 fiscal year
subject to the successful implementation of phase – I stage development to cover 1700 hectares
of mulberry and 1300 hectares in case of the eri sector.
7.3.2 Catalytic Development Programme (CDP) :
With the help of the Central Silk Board (CSB), the State Government has implemented
the CDP since 2003-04. The Central Silk Board has approved 23 micro-schemes for
implementation in Manipur with an output of Rs. 228.04 lakhs during the Tenth Plan Period
(2002-07). The number of beneficiaries and amount released under the schemes is shown at
Table No. 7.15
Table No. 7.15 Physical and Financial Performance of the CDP in Manipur

143
Year
Number of Beneficiaries Amount released
(Rs. in lakhs)
Mulberry Eri Muga Oak
Tasar Total Central State Total
1 2 3 4 5 6 7 8 9
2003-04 74 100 149 55 378 23.72 2.50 26.22
2004-05 102 120 152 200 574 46.34 5.06 51.40
2005-06 65 150 152 400 767 74.51 8.19 82.70
2006-07 24 100 95 400 619 46.94 5.19 52.13
2007-08 260 594 - - 854 - - -
2008-09 44 45 - - 89 - - -
- Not Available
Source : Annual Administrative Report, Department of Sericulture
Under this programme, Cluster Development Project, as special project, is introduced
for the Eleventh Five Year Plan period (2007-2012), which will be aided by the CSB, MOT,
and Government of India as catalyst. For the year 2007-08 and 2008-09, a sum of Rs. 5.18
crores and Rs. 35.62 lakhs respectively has been released by CSB for promotion of Mulberry
and Eri sectors. The number of beneficiaries were 854 and 89 during the year 2007-08
and 2008-09 respectively.
CHAPTER VIII
ECONOMIC INFRASTRUCTURE
Infrastructure is defined as the physical framework of facilities through which goods
and services are provided to the public. It is an umbrella term for many activities referred to as
‘social overhead capital’ which results in facilities and services and are usually provided free
(as in the case of roads) or at reduced charges (as in the case of electricity). The economic
infrastructure supports primarily the economic activities and its components being utilities such
as power, irrigation, transport and communication etc.

144
8.1 Power:
Power or electricity is the most convenient and versatile form of energy. It plays a key
role in the industrial, agricultural and commercial sectors of the economy and is also the most
crucial source of supplying domestic energy requirements. The demand has, therefore, been
growing at a rate faster than other forms of energy.
The power supply position in Manipur showed a marked improvement with the
commissioning of the Loktak Hydro Electric Project in August, 1984. The demand of power
was met mainly from Grid Power and a little from diesel and hydro generation. More emphasis
was given to utilize Loktak Hydro Power to the maximum extent possible and to curtail the
uneconomical generation of power from diesel generating sets. The installed capacity of power
in the State as on 31st March, 2004 was 12.10 MW of which 76.86 percent was diesel and the
remaining 23.14 percent was hydro power. A comparative picture of installed capacity of
power in the North Eastern States of India is shown in Table No. 8.1
Table No. 8.1 Installed Capacity of Power in North Eastern Region of India
(as on 31. 3. 2004)
(MW)
State Hydro Thermal G.T. Diesel Total
1 2 3 4 5 6
1. Arunachal Pradesh 32.28 0.00 0.00 27.70 59.98
2. Assam 2.00 24.50 574.50 20.70 621.70
3. Manipur 2.80 0.00 - 9.30 12.10
4. Meghalaya 185.20 0.00 - - 185.20
5. Mizoram 5.40 0.00 - 19.10 24.50
6. Nagaland 19.30 0.00 - 3.26 22.56
7. Tripura 16.00 0.00 106.50 6.10 128.60
Central Sector
1. Doyang 75.00 0.00 - - 75.00
2. Loktak 105.00 0.00 - - 105.00
3. Ranganadi 405.00 0.00 - - 405.00
4. Khangdong 75.00 0.00 - - 75.00
5. Kopili 200.00 0.00 - - 200.00
6. Kathalguri 0.00 0.00 294.66 - 294.66

145
7. AGTPP 0.00 0.00 84.00 - 84.00
Total 1122.98 24.50 1059.66 86.16 2293.30
Sources: Basic Statistics of NER, 2006.
8.1.1 Power Generation: The installed capacity of power in the state has remained the same as 11,845 KW during
1999-00 to 2001-02. However, during 2002-03 the installed capacity increased to 47,252 in
2002-03 KW. During the year 2003-04 the installed capacity reduced to 47,052 KW. Then
there was an increase from the years 2004-05 to the tune of 47,252 KW as shown in Table No.
8.2. The installed capacity was 46,212 KW, 44,820 KW, 45,420 KW, 45,020 KW and 45,020
KW in 2007-08, 2008-09, 2009-10 2010-11 and 2011-12 respectively.
Hydro Power generation depends on supply of water. The total quantity generated in
1999-00 was 8.29 lakh kwh which increased to 42.80 lakh kwh during 2003-04. The generation
came down to 14.325 lakh kwh in 2004-05 to 3.140 lakh kwh in 2005-06. The total power
generated during 2006-07, 2007-08, 2008-09, 2009-10, 2010-11 and 2011-12 were 31.05 lakh
kwh, 17.30 lakh kwh, 6.460 lakh kwh, 20.105 lakh kwh, 19.301 lakh kwh and16.150 lakh kwh
respectively. The installed capacity and generation of power in the state over the period from
2003-04 to 2011-12 are presented in Table No. 8.2. District-wise installed capacity and
generation of Power during the year 2010-11 and 2011-12 are given in Table No. 8(a) of part
II.
Table No. 8.2 Installed capacity and generation of electricity in Manipur.
Year Installed Capacity (KW) Electricity generated (in lakh kwh)
1 2 3
2003-04 47,052 42.80
2004-05 47,252 14.325
2005-06 47,252 3.140
2006-07 47,252 31.053
2007-08 46,212 17.304
2008-09 44,820 6.460
2009-10 45,420 20.105
2010-11 45,020 19.301
2011-12 45,020 16.150
Source: Electricity Department, Manipur.
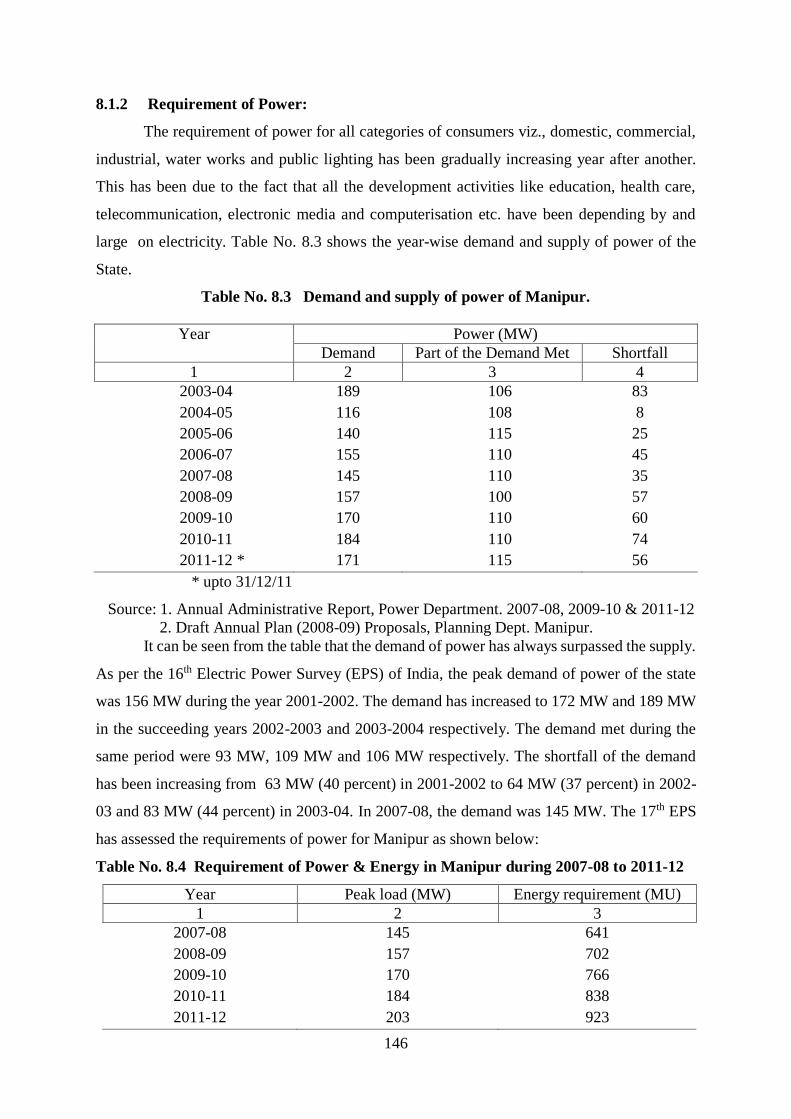
146
8.1.2 Requirement of Power: The requirement of power for all categories of consumers viz., domestic, commercial,
industrial, water works and public lighting has been gradually increasing year after another.
This has been due to the fact that all the development activities like education, health care,
telecommunication, electronic media and computerisation etc. have been depending by and
large on electricity. Table No. 8.3 shows the year-wise demand and supply of power of the
State.
Table No. 8.3 Demand and supply of power of Manipur.
Year Power (MW)
Demand Part of the Demand Met Shortfall
1 2 3 4
2003-04 189 106 83
2004-05 116 108 8
2005-06 140 115 25
2006-07 155 110 45
2007-08 145 110 35
2008-09 157 100 57
2009-10 170 110 60
2010-11 184 110 74
2011-12 * 171 115 56
* upto 31/12/11
Source: 1. Annual Administrative Report, Power Department. 2007-08, 2009-10 & 2011-12
2. Draft Annual Plan (2008-09) Proposals, Planning Dept. Manipur.
It can be seen from the table that the demand of power has always surpassed the supply.
As per the 16th Electric Power Survey (EPS) of India, the peak demand of power of the state
was 156 MW during the year 2001-2002. The demand has increased to 172 MW and 189 MW
in the succeeding years 2002-2003 and 2003-2004 respectively. The demand met during the
same period were 93 MW, 109 MW and 106 MW respectively. The shortfall of the demand
has been increasing from 63 MW (40 percent) in 2001-2002 to 64 MW (37 percent) in 2002-
03 and 83 MW (44 percent) in 2003-04. In 2007-08, the demand was 145 MW. The 17th EPS
has assessed the requirements of power for Manipur as shown below:
Table No. 8.4 Requirement of Power & Energy in Manipur during 2007-08 to 2011-12
Year Peak load (MW) Energy requirement (MU)
1 2 3
2007-08 145 641
2008-09 157 702
2009-10 170 766
2010-11 184 838
2011-12 203 923

147
Source: Draft Annual plan – 2012-13
It is expected to have an increasing trend in the demand of power due to increase in
population, enterprises and modernisation/mechanisation of various economic activities but the
annual demand assessed by the power department showed an irregular fluctuation which could
be examined further.
8.1.3 Availability of Power: The power supply in Manipur depends entirely on the share of power allocated from
the Central sector plants namely, Loktak Hydro Electric Plant, Kopili-Khangdong Hydro
Electric Plant, Assam Gas Based Power Plant at Kathalguri and Agartala Gas Turbine power
plant at Ramchandranagar, Eastern Regional Electricity Board, Meghalaya State Electricity
Board, Ranganadi Hydro Electric Plant and Doyang Hydro Electric Plant in the North Eastern
region. The availability, however, decreases in the lean season when the generation is reduced
following the recession of water levels in the rain fed reservoirs of the Central sector Hydel
plants. Sometimes, the availability of the power from these plants was so poor that even the
demand of vital installations like hospital, radio station, doordarshan kendra and other
telecommunication stations could not be met. When the water levels in the Hydel plants went
down below minimum draw down level, the generation is likely to be stopped anytime if rain
does not come.
Therefore, the shortage of power is the major cause for the slow development in the
state. The state continues to be deficit in electric energy. Purchases of power from outside the
state have been rising at a higher rate. The total purchased quantity for 2000-01 was 3,556.24
lakh kwh of the total availability. This has risen to 4,651.21 lakh kwh i.e. 90.86 percent of the
availability during 2009-10. As per 16th & 17th Electric Power Supply (EPS) of Central
Electricity Authority, the estimated requirement of power has increased from 584.0 MU
(Million Units) during 2000-01 to 766.0 MU during 2009-10 showing an increase of 31.16
percent over the period. The per capita availability of power has been reducing and stood at
188.15 units in 2009-10. Table No. 8.5 provides the power availability in the state since 2000-
01 to 2011-12
Table No. 8.5 Power availability in respect of Manipur State
Year
Power (Lakh KWH)
Require-
ment Generated Purchased
Free Energy
from Loktak
Hydro Electric
Project
Total
Available
(Col. 3 to
Col. 5)
Short-fall
Per Capita
availability
(KWH)

148
1 2 3 4 5 6 7 8
2000-01 5,840 4.29 3,556.24 655.38 4,215.91 1,624.09 183.57
2001-02 6,430 6.67 3,798.26 677.55 4,482.48 1,947.52 184.81
2002-03 7,080 35.77 4,271.84 656.47 4,964.08 2,115.92 209.38
2003-04 7,800 42.80 4,310.74 594.35 4,947.89 2,852.11 117.85
2004-05 8,570 14.33 5,715.36 741.10 6,470.79 2,099.21 262.02
2005-06 6,530* 3.14 5209.86 689.62 5,902.62 627.38 234.30
2006-07 6,770* 31.05 4412.16 553.29 4,996.50 1,773.5 194.48
2007-08 6,410* 17.30 5720.30 707.70 6,445.30 Nil 246.06
2008-09 7,020* 6.46 5504.25 587.69 6,098.40 921.60 228.41
2009-10 7,660* 20.11 4651.21 447.86 5,119.18 2,540.82 188.15
2010-11 8,380 20.11 5672.18 709.09 6401.38 1978.62 230.93
2011-12^ - 16.50 5643.14 610.49 6270.13 - 216.77
* The power requirement is as per Report of the 18th Electric Power Survey of India.
^ Up to Dec., 2011
- Not Available
Note: From 2004-05 to 2011-12 energy was purchased from Central Sector Power Plant
and Unscheduled Interchanged (UI)
Source: 1. Electricity Department, Manipur.
2. Annual Administrative Report, Power Department 2011-12
The generation of all the central sector Power Project of North Eastern Region are
shared among the states of the region as per the allocation made by the Govt. of India leaving
20% as unallocated share. During the year 2011-12 the allocated share of power for Manipur
from the Central Sector Generating Stations of the North-Eastern Region is as given in Table
No. 8.6.
Table No. 8.6 Share of Power for Manipur from Central Sector, 2011-12
Sl.
No. Name of the Project
Installed
Capacity MW
Share of Manipur
Percent MW
1 2 3 4 5
1. Loktak Hydro Electric Project
(NHPC) 105* 30.15 31.66
2. Kopili-Khangdong Hydro Electric
Project (NEEPCO)
275
7.25 19.94
3. Assam Gas Based Power Plant
(AGBPP) kathalguri (NEEPCO) 291 8.16 23.73
4. Agartala Gas Turbine Power Plant
Ramchandranagar (NEEPCO) 84 8.18 6.87

149
5. Ranganadi Hydro Electric Project 405 8.37 34.00
6. Doyang Hydro Electric
Project(Nagaland) 75 7.92
5.94
7. TSECL a) Baramura(Tripura)-IV 21 25 5.25
b)Baramura(Tripura)-V
21 25 5.25
Total 1277 10.39 132.64
* De-rated installed capacity
Source: Annual Administrative Report 2011-12, Power Department.
In order to meet the domestic demand, the state, thus continued to purchase power from
neighbouring states through Central sector projects. During the year 1998-99, the state received
174076 MWH power from Loktak Hydro Electric Project, 1,03,874 MWH from KHEP (Kopili
Hydro Electric Project), 31,326 MWH power from AGTPP (Agartala Gas Turbine Power
Project), 108785 MWH from AGBPP (Assam Gas Based Power Project) and 28,534 MWH
power from MESEB (Meghalaya State Electricity Board). The Electricity received by the state
from NHPC and NEEPCO was 1,74,076 MWH and 2,43,985 MWH respectively. State-wise
energy exchange between the constituents of the North Eastern Region during the year 1998-
99 is presented in Table No. 8.7.
Table No. 8.7 Energy Exchange Between the Constituents of the North Eastern Region
during the year 1998-99
(in MWH)
From/to Arunachal
Pradesh Assam Manipur
Megha-
laya Mizoram Nagaland Tripura Total
1 2 3 4 5 6 7 8 9
Loktak 29,228 1,44,983 1,74,076 23,033 35,357 42,281 75,588 5,24,546
KHEP 38,010 5,54,983 1,03,874 66,567 55,481 70,322 7,914 8,97,151
AGTPP 4,043 1,08,504 31,326 1,099 8,211 30,724 35,458 2,19,365
AGBPP 10,642 5,11,050 1,08,785 3,887 19,179 47,128 29,468 7,30,139
E- Region - 36,706 - - - - - 36,706
MESEB - 1,39,627 28,534 - - - - 1,68,161
Tripura - - - - 52,850 - - 52,850
Total 81,923 14,95,853 4,46,595 94,586 1,71,078 1,90,455 1,48,428 26,28,918
Source : Basic Statistics of North Eastern Region, 2000.
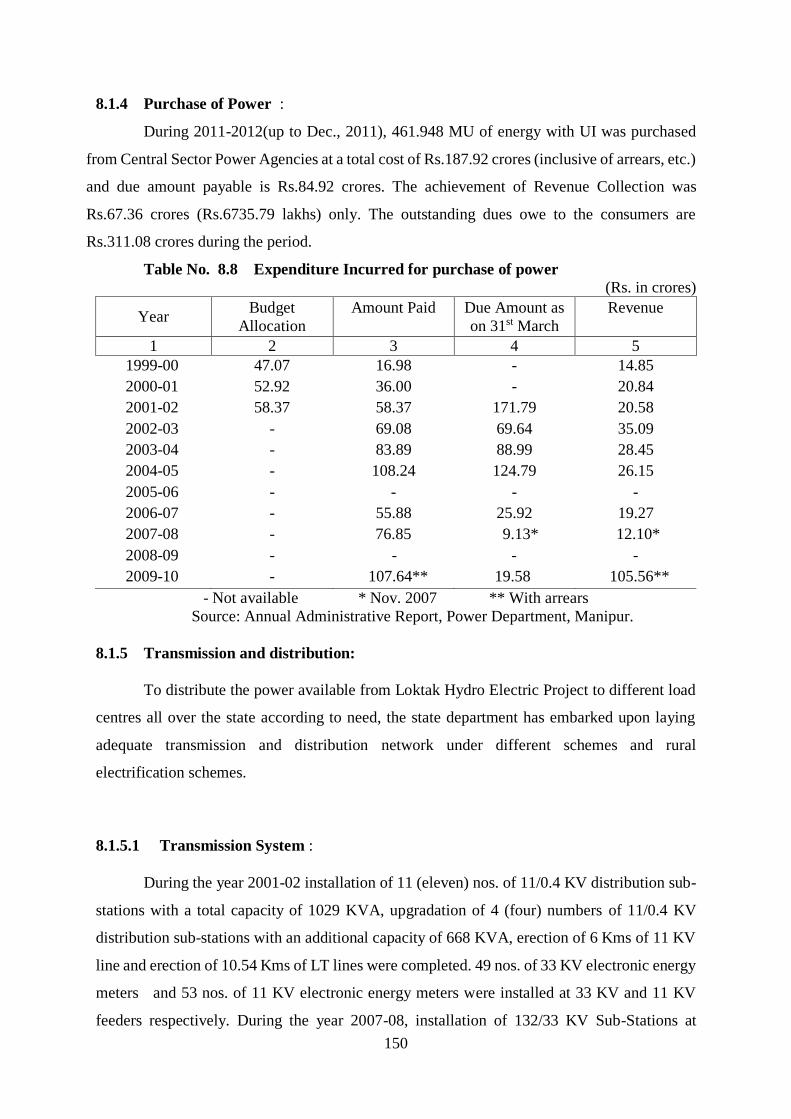
150
8.1.4 Purchase of Power : During 2011-2012(up to Dec., 2011), 461.948 MU of energy with UI was purchased
from Central Sector Power Agencies at a total cost of Rs.187.92 crores (inclusive of arrears, etc.)
and due amount payable is Rs.84.92 crores. The achievement of Revenue Collection was
Rs.67.36 crores (Rs.6735.79 lakhs) only. The outstanding dues owe to the consumers are
Rs.311.08 crores during the period.
Table No. 8.8 Expenditure Incurred for purchase of power
(Rs. in crores)
Year Budget
Allocation
Amount Paid
Due Amount as
on 31st March
Revenue
1 2 3 4 5
1999-00 47.07 16.98 - 14.85
2000-01 52.92 36.00 - 20.84
2001-02 58.37 58.37 171.79 20.58
2002-03 - 69.08 69.64 35.09
2003-04 - 83.89 88.99 28.45
2004-05 - 108.24 124.79 26.15
2005-06 - - - -
2006-07 - 55.88 25.92 19.27
2007-08 - 76.85 9.13* 12.10*
2008-09 - - - -
2009-10 - 107.64** 19.58 105.56**
- Not available * Nov. 2007 ** With arrears
Source: Annual Administrative Report, Power Department, Manipur.
8.1.5 Transmission and distribution:
To distribute the power available from Loktak Hydro Electric Project to different load
centres all over the state according to need, the state department has embarked upon laying
adequate transmission and distribution network under different schemes and rural
electrification schemes.
8.1.5.1 Transmission System :
During the year 2001-02 installation of 11 (eleven) nos. of 11/0.4 KV distribution sub-
stations with a total capacity of 1029 KVA, upgradation of 4 (four) numbers of 11/0.4 KV
distribution sub-stations with an additional capacity of 668 KVA, erection of 6 Kms of 11 KV
line and erection of 10.54 Kms of LT lines were completed. 49 nos. of 33 KV electronic energy
meters and 53 nos. of 11 KV electronic energy meters were installed at 33 KV and 11 KV
feeders respectively. During the year 2007-08, installation of 132/33 KV Sub-Stations at

151
Jiribam (2 x 20 MVA capacity) along with associated 132 KV lines (2Kms) is scheduled to be
completed and commissioned. Up to the end of 2009-10 there were 7 nos. of 132/33 KV Sub-
Station with a total capacity of 211.30 MVA and 43 nos. of 33/11 KV Sub-Station with a total
capacity of 270.55 MVA.
8.1.5.2 Rural Electrification:
Manipur is a small state with an area of 22,327 sq. Kms. and population about 23 lakhs
people. Over 75 percent of the population lives in rural areas comprising 2,524 inhabited
villages as on 21st January, 2009. By the end of 2009,-10, 2002 villages were electrified.
Accordingly, the state has made a good progress in rural electrification achieving 79.32 percent
of the total villages up to the end of 31st March, 2010. The district-wise number of villages
electrified in Manipur are presented in Table No. 8.9 and the number of villages electrified
during the year 1997-98 to 2011-12 are indicated in Table No. 8(b) of part II.
Table No. 8.9 District-wise rural electrification in Manipur as on 31st December, 2011
District/State
Number of village Percentage of villages
Electrified Not-electrified Total Electrified Not-electrified
1 2 3 4 5 6
Senapati 368 244 612 60.13 39.87
Tamenglong 113 58 171 66.08 33.92
Churachandpur 248 296 544 45.59 54.41
Chandel 296 54 350 84.57 15.43
Ukhrul 132 66 198 66.67 33.33
Imphal East 252 6 258 97.67 2.33

152
Imphal West 157 27 184 85.33 14.67
Bishnupur 72 2 74 97.30 2.70
Thoubal 128 5 133 96.24 3.76
MANIPUR 1766 758 2524 69.97 30.03
Source : 1. Electricity Department, Government of Manipur
2. Annual Administrative Report Department of Power, 2011-12
8.1.5.3 Pattern of Power Consumption:
The overall consumption of electricity increased from 1972.06 lakh kwh in 2008-09 to
2200.30 lakh kwh in 2009-10. The pattern of consumption of power in the state shows that the
domestic consumption was highest compared to others. In 2009-10, it rose to 1274.85 lakh
kw. In 2009-10, domestic consumption accounted for 57.94 percent of the total followed by
28.54 percent and 7.28 percent consumption by public water work and bulk water supply work
and commercial & small power sector respectively. An idea about the pattern of power
consumption in the state from 2004-05 to 2011-12 may be had from the Table No. 8.10 given
below:
Table No. 8.10 Category-wise Number of Consumers and Consumption of Power in
Manipur
Year
Domestic Commercial and
Small Power Industrial Street Lighting
No. of
Consu-
mers
Electricity
Consumed
(in lakh
kwh)
No. of
Consu-
mers
Electricity
Consumed
(in lakh
kwh)
No. of
Consu-
mers
Electricity
Consumed
(in lakh
kwh)
No. of
Consu-
mers
Electricity
Consumed
(in lakh
kwh)
1 2 3 4 5 6 7 8 9
2004-05 1,59,653 1134.16 8,870 122.98 1,908 80.43 341 31.72
2005-06 1,62,702 1204.67 9,084 126.62 1,941 81.53 340 33.94
2006-07 1,66,696 1149.31 9,216 126.33 1,948 85.47 340 42.88
2007-08 1,68,055 1179.16 9,296 126.73 1,962 88.59 338 33.06
2008-09 1,71,185 1201.16 9,511 142.19 2,008 86.75 345 31.99
2009-10 1,74,425 1274.85 9,725 160.09 2,042 87.96 585 42.30

153
2010-11 1,79,580 - 10,406 - 2,196 - 740 -
2011-12* 1,85,050 - 10,205 - 2,375 - 572 -
Year
Irrigation and
Agriculture
Public water work and
bulk supply and others
Total
Per capita
consump-
tion of
electricity
(in Kwh)
No. of
Consu-
mers
Electricity
Consumed
(in lakh
kwh)
No. of
Consu-
mers
Electricity
Consumed
(in lakh
wh)
No. of
Consu-
mers
Electricity
Consumed
(in lakh
kwh)
1 10 11 12 13 14 15 16
2004-05 60 2.07 521 396.39 1,71,263 1767.75 71.58
2005-06 60 4.92 524 428.35 1,74,651 1880.02 74.63
2006-07 60 0.99 540 469.10 1,78,800 1874.08 72.94
2007-08 60 0.94 544 545.56 1,80,255 1974.04 75.36
2008-09 60 1.21 577 508.75 1,83,686 1972.06 73.86
2009-10 64 7.05 649 628.05 1,87,490 2200.30 80.87
2010-11 61 - 678 - 1,93,661 - -
2011-12* 60 - 624 - 1,98,886 - -
Note : Per capita consumption is calculated by using Projected population. - Not available
Source : 1. Electricity Department, Government of Manipur.
2. Annual Administrative Report, Power Department, Manipur,
2004-05 to 2011-2012.
3. Department of Economics & Statistics, Manipur.
8.1.5.4 Energy Consumption :
The household sector is the largest consumer of energy in Manipur, accounting 40 to
50 percent of total energy consumption. The bulk of energy consumed by households consists
of traditional fuels such as firewood, animal dung and agricultural residues.
In urban areas, a growing demand for modern household fuels such as LPG, electricity
and Kerosene is creating additional concern. The percentage distribution of households using
different fuels for cooking are presented in Table No. 8.11 below:
Table No. 8.1 Percentage of households using different fuels for cooking in Manipur
and All India, 2002.
Item Manipur All India

154
1 2 3
Cowdung 0.00 7.82
Electricity 0.00 0.10
Coal/Coke/Lignite 0.00 1.60
Charcoal 0.10 0.00
L.P.G. 28.26 20.14
Fire wood and chips 69.84 60.52
Gobar Gas 0.00 0.20
Kerosene 1.70 4.91
Source : Compendium of Environment Statistics, 2006 CSO, New Delhi
8.1.6 Power Development :
Manipur has no sufficient generation of its own but it needs more power to meet the
growing demand. Electricity has become an essential commodity and therefore it requires
attention of all sections of the society viz. non-government organizations, social workers and
general public besides the Government. The power scenario of Manipur is shown in Table No.
8(c) Part II of this publication.
8.1.6.1 Hydro Power Development :
Hydro-electric power plays a major role in the field of power development in the state.
But the performance of the hydro-power stations has been seasonably variable. The mini/micro
hydel projects are suitable for remote areas where the sub-transmission system is hard to reach.
The state government started taking up various Micro Hydel, Medium/Small Hydro Electric
Projects and Mini/Micro Hydro Electric projects. The 3 (three) Micro Hydel projects viz.
Gelnel Stage II MHP (2x100kw), Tuipokpi MHP (2x250 kw) and Maklang MHP (3x500 kw)
were proposed for implementation under capital subsidy programme during the year 2001-
2002. The Maklang Micro Hydel Project is scheduled to be completed during the Tenth Five
Year Plan. Under Medium/Small Hydro Electric Projects, Irang (4x15 MW), Barak (3x30MW)
and Maklang Tuyungbi (3x15 MW) were proposed for survey and investigation during the

155
Tenth Five Year Plan. A comparative picture of the mini/micro hydel projects upto 3 MW
capacity ending 1997-98 is indicated in Table No. 8.12 below:
Table No. 8.12 List of Installed on-going micro/mini hydel projects upto 3 MW
Capacity in the North Eastern States of India
North Eastern
State/All India
Project installed Project under Consideration
Number Capacity(MW) Number Capacity
(MW)
1 2 3 4 5
1. Arunachal
Pradesh 30 20.15 17 20. 63
2. Assam 2 2.20 - -
3. Manipur 6 4.10 4 3.50
4. Meghalaya 1 1.51 7 0.28
5. Mizoram 9 5.36 9 8.80
6. Nagaland 5 3.17 4 5.50
7. Sikkim 8 9.25 2 3.20
8. Tripura 2 1.01 1 0.10
All India 210 144.28 214 241.87
Source: Compendium of Environment Statistics, 1998 CSO, New Delhi.
8.1.6.2 Water-Power Development:
Water-power is derived from the running rivers and lakes in the form of electricity.
Dams and anicuts are constructed and the river water is made to run huge water turbines.
Electricity so produced from water-power is known as hydro electric power. About 64 percent
of electricity generated in the state is from hydel sources. The other important use of water is
in irrigation.
8.2 Irrigation:
The state, although small in geographical area is comparatively rich in water resources
specially in surface water. There are number of lakes in the valley such as Loktak, Ikopat,
Kharungpat, Lamjaopat and Pumlelpat. In addition to this, the state has two major river basins

156
viz the Barak river basin and the Manipur river basin. The average annual yield of the two
major basins of the state has been broadly estimated to be 1.8487 million hectare metre (14.98
million acre feet.)
8.2.1 Major and Medium Irrigation Projects:
The state did not have any major and medium irrigation project up to 1972-73 and
agriculture was solely dependent on capricious rainfall. Hence, assured water supply for
irrigation is of utmost importance.
In fact, major, medium and multipurpose irrigation projects have been introduced very
late in the state. Major and medium irrigation was started only from the 4th plan period onwards.
The state has so far taken up 8 projects under the major, medium and multipurpose irrigation
projects. Of these 8 projects, 3 projects namely Thoubal Project, Singda dam Project and
Khuga dam Project are multipurpose. Loktak Lift Irrigation (LLI) is the major project and four
are medium projects namely, Imphal Barage, Khoupum Dam, Sekmai Barrage and Dolaithabi
projects. The Loktak Lift Irrigation Project is one of the biggest lift irrigation project in the
North Eastern Region of India. Among these eight projects, three of them are on-going which
are (i) Khuga Multipurpose Project, (ii) Thoubal Multipurpose Project & (iii) Dolaithabi
Barrage Project. These 8 projects on completion will give an ultimate annual irrigation
potential of 1,09,785 ha. with water supply and power components of 19 MGD and 10 MW
respectively.
Khoupum Dam Project, LLI Project, Imphal Barrage and Sekmai Barrage Projects have
already been completed and given irrigation benefits. The Singda Multipurpose Project was
approved by the Planning Commission in the year 1974 and its construction was started from
1975. The irrigation and water supply components of the project was completed in 1995-96.
Since then, irrigation potential of 4000 ha. has been created and 4 MGD of raw water is
supplied to state PHE Deptt. Out of this 8 Major and Medium Irrigation and Multipurpose
Projects Khoupum Dam, Imphal Barrage, Sekmai Barrage, Loktak Lift irrigation, Singda
Multipurpose Project and the Barrage component at Keithelmanbi and a part of left Canal of
Thoubal Multipurpose Project have been completed. The ongoing projects are (i) Khuga
Multipurpose Project (ii) Head Work and remaining Part of Canal System of Thoubal
Multipurpose Project and (iii) Dolaithabi Barrage project.

157
From the completed and partially completed projects Irrigation potential of 36,847 ha
has been created up to 2008-09 with utilization of 27,000 ha. In addition 1,200 ha and 900 ha
of low lying areas of Loushipat and Poiroupat respectively have been reclaimed by Thoubal
Multipurpose Project.
Appreciable Progress of the ongoing Major and Medium irrigation and Multipurpose
projects could not be achieved onwards 2003-2004 up till date owing to financial constraint
coupled with the prevailing law and order in the state.
The Khuga multipurpose project was sanctioned for Rs. 15.00 crores in 1980 by the
Planning Commission . The Project will create 1500 ha of annual irrigation Supply of 5 MGD
of raw water for water supply and generate 1.50 Mw of power. The Project works were taken
up in 1982-83. Owing to rescission of the 1st contract and fixation of 2nd contract in 1986, law
& order situations, financial constraints, ethnic clashes etc., completion of the Project has been
delayed and rescheduled in 2010-11. The progressive expenditure upto March, 2010 is Rs.
357.76 crores. The budget provision for 2010-11 is Rs. 33.15 crores.
The dam has been completed to the extent of 77%, spillway to the extent of 80%, main
and branch canal to the extent of 84%, distributaries to the extent of 68%, hydro power to the
extent of 60% and water supply.
The Thoubal Multipurpose Project was approved by the Planning Commission in 1980
for Rs.47.25 crores. The project when completed will create irrigation potential of 33,400 ha.,
10 MGD of drinking water and generate 7.50 MW of hydro-power. The barrage component
has been completed in 1991. The dam has been completed to the extent of 16%, Spillway to
the extent of 29%, main and branch canal to the extent of 80%, distributaries to the extent of
50%, rehabitation and resettlement to the extent of 30% and hydro power component is in
initial stage. The completion of the project has been delayed and targeted in 2011-12. The
progressive expenditure upto March, 2010 is Rs. 723.74 crore and a provision for the year
2010-11 was Rs. 167.59 crores.
The Dolaithabi Project was sanctioned for Rs.18.86 crores by the Planning Commission
and sanctioned by the state Government in 1992. The Project was originally planned for
completion by 1996-97. However, owing to rescission of the original contract, financial
constraint etc. the work is now targeted for completion during 2011-12. The Budget provision
for 2010-11 is Rs. 66.51 crores. The project will create an irrigation potential of 7,545 ha.

158
Land acquisition for barrage has been completed and 75% for canals was completed.
Foundation excavation for main barrage has been completed and 42% of concrete work has
been completed and earth work for diversion channel to the extent of 80%.
Additional irrigation potential of 61,950 ha, 15.00 MGD of water supply and 10.75
MW of power will be accrued to the state on completion of the ongoing projects. Out of these
5MGD of raw water is also supplied from Khuga Multipurpose Project to the State PHED.
Table No. 8.13 shows the overall benefits to be accrued to state on completion of the said
projects in the Eleventh Plan.
Table No. 8.13 Irrigation potential/benefit to be accrued to the state during
the Eleventh Plan
Name of projects
Benefit to be accrued
Irrigation potential (HA) Water Supply
(MGD)
Power
(MW)
1 2 3 4
1. Multipurpose Project
(i) Khuga
(ii) Thoubal
2. Medium Project
(i) Dolaithabi
15000
33400
7545
5.00
10.00
-
1.75
7.50
-
Source: Annual Administrative Report 2009-10 Irrigation and Flood Control Deptt.
The cumulative irrigation potential to be created under major, medium and
multipurpose irrigation projects up to the end of Fifth, Sixth, Seventh, Eighth, Ninth and Tenth
Plan were 800 ha., 40,000 ha., 59,000 ha., 63,100 ha., 28,500 ha. and 28,500 ha. respectively.
The short-fall is due to restriction in the command area, encroachment, heavy siltation of the
canal beds etc. By the middle of XIth Plan the irrigation potential from completed/partly
completed projects was 36,847 ha. with utilisation of 27,000 ha.
It is proposed to complete all the ongoing projects within the Eleventh Five Year Plan
period. Three new projects viz. Dam on Iril river at Yangoi, Dam on Chakpi river at
Chakpikarong, Dam on Sekmai river at Kangoi Hiranpham and Transfer of Chakpi Water to
Loktak lake are proposed to be taken up during the Eleventh Plan (2007-12).

159
Irrigation Programme which was initially started with meagre plan investment of
Rs.1.41 crores during the Fourth Plan has been increased to the order of Rs.20 crores,
Rs.40 crores , Rs.74 crores, Rs.125 crores and Rs. 222 crores during the 5th, 6th, 7th, 8th and 9th
plan respectively. During the Tenth Plan the outlay for Major and Medium irrigation was
Rs.414.57 crores. The projected outlay for the Eleventh Plan is Rs.386.14 crores and that the
annual plan for 2009-10 is proposed to be Rs.223.59 crores.
8.2.2. Minor Irrigation:
The scope of minor irrigation is very high due to the existence of numerous small
valleys in the far flung hill districts and gentle slopes all over the state where permanent
terraced fields are to be constructed for cultivation. Even though minor irrigation scheme is
very small, their overall impact is quite substantial. The schemes are inexpensive, easy to build,
maintain and operate within the short gestation period. Even for plain areas in the valley
districts supplemented irrigation is to be provided during the dry spell of monsoon and drought
by minor irrigation schemes, whereas in the permanent terraced field in the hill districts,
irrigation is to be provided by Contour Canals throughout the monsoon as water from the
elevated terraced plots reaches towards the lower plots (basin). Therefore, emphasis is to be
laid on the Minor Irrigation Scheme.
By the end of Ninth Plan, the irrigation potential created was 45294 ha against which
5280 ha. was utilized. Since the minor irrigation scheme plays a vital role in the state, maximum
priorities are given to accelerate the minor irrigation activities. The scheme-wise programmes
to be taken up during the Eleventh Plan are(i) River Lift Irrigation (RLI) (ii) Surface Flow
Scheme and (iii) Construction of Tube Wells. (iv) Roof-top rain water harvesting.
8.2.2.1 River Lift Irrigation:
River Lift Irrigation is very significant during the rabi and first crops of paddy. Under
this scheme, 6 (six) numbers of pumping sets are targeted to be provided in the command area
of 450 hectare in the hills whereas 20 (twenty) numbers of pumping sets will be provided in
the command area of 4000 hectare in the valley. During the Eleventh Plan, the projected outlay
is Rs.940.12 lakhs with the target to create irrigation potential of 5,000 hectare and proposed
outlay for annual plan 2009-10 is Rs. 350.00 lakhs.
8.2.2.2 Surface Flow Scheme :

160
Surface Flow Scheme provides irrigation during kharif. The scheme is essential to grow
H.Y.V. of rice to safeguard against reduction in yield and in proper water management and to
respond to higher input of fertilizers to get proper yield. The scheme is supplemented with
drainage and waste water disposal to eliminate water logging and salinity. During the Tenth
Plan, a new scheme known as Tank Irrigation will be taken up as a pilot demonstration. Under
this scheme, it is to construct water harvesting structure at the foot hill as a big tank and also at
the gorges of hill stream as low head dams specially in the hill areas. It is targeted to create
irrigation potential of 10,000 hectare. During the Eleventh Plan the projected outlay for the
scheme is Rs. 1745.20 lakhs with a target of creating 23,000 hectares of Irrigation potential.
The annual plan outlay for the scheme for 2009-10 is Rs. 450.00 lakhs.
8.2.2.3 Construction of Tube wells:
Under this scheme-wise Programme, tapping of ground water through tube wells is
taken up to provide irrigation water even during lean season and also to enhance double
cropping and provide maximum irrigation potential. During the Eleventh Plan, Rs. 100.00
lakhs is proposed with the target of creating irrigation potential of 500 hectares and the annual
plan outlay is Rs. 100.00 lakhs.
8.2.3 Flood Control : The state has two main river basins viz. (i) the Barak basin and (ii) the Manipur river
basin. The Barak river which is the main river in the Barak basin, originates from the hill in the
northern part of Manipur and ultimately flows into the Cachar district of Assam without
traversing through the valley areas of the State. It, therefore, does not affect the valley much
so far as flood is concerned.
The Manipur River which is the main drainage channel of Manipur valley then flows
towards Burma through the southern hills. The major river in this basin are (i) Imphal/Manipur,
(ii) Iril, (iii) Thoubal, (iv) Nambul, (v) Nambol, (vi) Wangjing,(vii) Sekmai, (viii) Khuga (ix)
Merakhong and (x) Kongba etc. The main river viz the Imphal river originates from the hills
near Kangpokpi about 45 kms. from Imphal and is joined by the lril river at Lilong, 10 kms.
south of Imphal and by Thoubal river at the Irong Ichin near Mayang Imphal, the Sekmai river
at Sekmaijin. After this, the Imphal river is known as Manipur river. The Khuga river joins the
Manipur river near Ithai, upstream of Ithai Barrage. The Manipur river is connected with the
Loktak lake through a natural cut called Khordak. The Loktak Lake is the biggest water
expanse in the State. The lake occupies prominent place in the hydrological system of the State.

161
The average area of the lake is 216 sq. kms. All the rivers originating from western hill viz. the
Nambul, the Merakhong, the Nambol, the Thongjaorok, the Ningthoukhong, the Potsangbam,
the Khujairok and the Moirang rivers etc. drain into this lake along with a number of other
smaller streams and streamlets. Other major lakes such as Ikokpat, Kharungpat, Lamjaopat,
Pumlelpat which are on the left side of the Manipur river are also connected with this river
through a number of natural drainages. All these major lakes act as flood reservoir of the rivers
of the Manipur basin.
Ecological changes such as heavy deforestation and Jhum cultivation in upper
catchments of the rivers, reclamation of low lying areas which earlier serves as flood reservoirs
and inadequate carrying capacity of the rivers are some of the major factors contributing to the
flood problems. The flood control works have been taken up in a systematic manner since the
3rd Five Year Plan after the devastating flood of 1966. Floods occurred in the state in 1966,
1967, 1974, 1976, 1980, 1982, 1984, 1985, 1986, 1987, 1989, 1997 and 2002 causes heavy
damages to properties, crops, and loss of human lives and miseries in the state. A separate flood
control division had been set up in 1980 and a master plan was prepared.
Flood control measures in the state mostly consists of construction of new embankment,
strengthening of existing bunds, improvement of drainage, construction of sluices, special
protection and erosion control etc. The state has also started formulation of basin-wise/sub-
basin-wise flood control project. Flood control projects for the rivers which have been causing
maximum flood damages are being taken up on priority. Projects of other rivers are also
formulated for taking up in a gradual manner.
The main objectives of the Eleventh Plan is the completion of the ongoing schemes
viz. Nambul River flood control project Phase I (Part I & II), Phase II (Part II,III & IV) and
five drainage Projects and construction of new River embankment and improvements of the
existing embankments etc. and continuation of the ongoing schemes of Nambul river flood
control project Phase (I, II, III & IV) Waishel flood control scheme (11.40-19.60 km.)
Merakhong River flood control project (16.50) and Wangjing River flood control Project
(17.26 km.). In addition to these, new 9 (nine) flood control schemes and Resectioning of 6
(six) Drainage schemes are also to be included during the plan period. The proposed outlay for
the eleventh plan is Rs. 55.00 crores and the enhanced outlay for the annual plan 2007-08,
2008-09 and 2009-10 is Rs. 13.00 crores, Rs. 63.00 crores and Rs. 17.00 crores respectively.
The budget provision of 2010-11 is Rs. 32.00 crores.

162
8. 2.4 Command Area Development Programme:
Command Area Development (CAD) programme, 50 (fifty) percent centrally
sponsored continuing scheme of the Ministry of Water Resources, Govt. of India was
implemented in Manipur with the creation of Command Area Development Authority (CADA)
since the Year 1982-1983 in the selected Command Area of Loktak Lift Irrigation Project.
The scope and objective of the CAD Programme is to integrate all the activities crucial
for increasing agricultural productivity and production in the command area of irrigation
projects leading to better utilisation of irrigation potentials created by Major & Medium and
Minor Irrigation Projects. The main works are construction of field element, field drains, land
leveling etc. and conducting adaptive trials,training of farmers in irrigation, water management,
enforcement of Warabandi for suitable distribution of irrigation water to the farmer’s field etc.
Initially, CAD programme was implemented in the Loktak Lift Irrigation Project having a
Cultivable Command Area (CCA) of 24.00 thousand ha in the year 1982-83. The next CAD
programme was taken up in the Command Area of Sekmai Barrage Project in 1986-87.
Similarly, the third programme for Imphal Barrage has also been started from 1993-94. The
CAD programme for Thoubal Multipurpose Project (Barrage Component) are taken up under
CADP in the commands of Minor Irrigation Scheme in the year 1995-96.Later, the Government
of India has also included one medium Irrigation project and 8(eight) clusters of Minor
Irrigation projects in the year 2000-01 and implementation of Command Area Development
and Water Management (CADWM) Programme have already been stated since 2003-04.
Details of the development projects, its CCA & ultimate irrigation potentials are presented in
Table No.8.14.
Table No. 8.14 Command Area Development Projects
( in '000 ha. )
Sl.
No. Name of Project
Culturable
Command Area
Ultimate
irrigation potential
1 2 3 4
1. Loktak Lift Irrigation 24.000 40.000
2. Sekmai Barrage Project 5.000 8.500
3. Imphal Barrage Project 4.800 6.000
4. Thoubal Multipurpose Project 17.350 30.000
5. Singda Dam Project 2.400 4.100
6. Khuga Dam project (KDP-I) 10.000 15.000
7. Khoupum Dam project(KDP-2) 0.600 1.000
8. Haipi and Lamlang MI project 0.945 1.607
9. Aihang, Sitalok and Serou MI Project 1.464 2.599
10. Ethei Maru MI Project 2.000 3.400
11. Saikot, Masemlok and Wangoo MI Project 1.123 1.986
12. MI project phase – II 22.685 38.566
Total:- 92.367 152.758

163
Source : Draft Annual Plan, Planning Deptt., Manipur.
Out of above projects, Loktak Lift Irrigation, Sekmai Barrage, Thoubal Multipurpose
(Barrage Component of 2400 Ha. CCA), Singda Dam Multipurpose, Imphal Barrage and 8
(eight) M.I. scheme/projects have been completed under CADWM programme. During the
Annual Plan 2007-08, three cluster of new MI Scheme and during 2009-10, two new major
projects have been included in the CADWM programme and the project details is shown at
Table No. 8.15.
Table No. 8.15 Three Cluster of New MI Schemes started during the year 2007-08 and
two major project during 2009-10.
(Area in ’000 hectares)
Sl.
No. Name of the Project
Culturable
Command Area
(CCA)
Ultimate
Irrigation
Potential (UIP)
1 2 3 4
1. Cluster of 28 M.I. Schemes in Imphal East and Imphal
West District 6.665 11.3305
2. Cluster of 37 M.I. schemes in Thoubal, Ukhrul,
Chendel and Churachandpur District 6.420 10.9140
3. Cluster of 21 M.I. Schemes in Bishnupur District 9.600 16.3200
Sub-Total 22.685 38.5645
4. Khuga Multipurposed Project in Churachandpur &
Bishnupur District
9.575 14.7550
5. Thoubal Multipurpose Project (Barrage Component
Phase-II) in Thoubal, Imphal East & Senapati
Districts
2.485 3.8000
Sub-Total 12.060 18.5550
Grand Total 34.745 57.1195
Source : Annual Administrative Report 2009-10, Department of Command Area Development
The above 3(three) MI schemes have already created irrigation potential scattered in
the districts of Manipur and the last two new major projects are been started in the district of
Churachandpur, Bishnupur and Thoubal, Imphal East and Senapati districts respectively.
8.3 Transport and Communication: Transport and Communication is the basic infrastructure needed for generation of
economic activity and for bringing about prosperity and well being in the state. A well
developed transport and communication system plays a vital role in ensuring sustained
economic growth. Development activities of this sector generated large employment
opportunities. Manipur is served by two means of transport viz., roads and airways. The
existing facilities of transport and communication are not adequate which continued to be a
major constraint in the development process of the state.

164
8.3.1 Road:
Roads are the lifeline of the people of the state as the only means of transport for the
state is the surfaced communication and road link in the accessible terrains. As such road has
a special importance as vital infrastructure for economic development of the state. High
priority is given in the plans and programme for construction of roads to develop the economy.
8.3.1.1 National Highway:
National Highway is a highway which is declared as such under the National Highway
Act, 1956. The National Highway system is the primary road grid of the state.
Highways and roads are regarded as arteries and veins of a state which are essential for
its growth. The main artery of communication is the National High-way No.39 connecting
lmphal with Dimapur in the neighboring state of Nagaland. It runs through Mao in the extreme
north of Manipur to the International border town of Moreh in the south-east. Dimapur is the
railhead for road traffic to the state and in fact, this road is for so long her life line. The road
passes through the hilly area of Senapati District and part of Nagaland Hill touching Kohima
in between. The transport cost on this road is very high in view of frequent landslides on the
hill tracts, restriction of transport services during night time due to unexpected events and one
way trade movement because of little exports from Manipur.
Another road of' considerable economic importance is the 225 kms. long National
Highway No. 53 viz. New Cachar Road, connecting Imphal with Jirighat in Manipur Assam
border. It passes through dense forests and difficult terrains of Tamenglong District which
remained, by far, the most inaccessible district in the state. The opening of this road brings the
District closer to other parts, helps in exploring untapped resources of the district and give
incentives for more production and general development besides being a second life-line for
the state. For this, State of Manipur, the road needs further development in order to be the main
life-line of the state.
8.3.1.2 State Highways and Major District Roads:
The state Highways and major district roads form the secondary road system and take
care of collection and distributary functions. The total length of State Highways was 1623 kms.
at the end of March, 1998 and it has decreased to 675 kms. by the end of March, 1999 showing
a decrease of 58.41 percent over the previous year. The total length of State Highways in the

165
state has remained unchanged till the end of 31st March, 2002. The total length of the National
Highways and State High-ways as on 31st March 2005 was 967 kms and 668 kms respectively.
The road length maintained by the Public Works Department (PWD) and Zilla Parishad
(ZP) was 8.648 thousand kms. as on 31st March 2005. The classification of this road length
(8.648 kms.) according to category of road viz. National Highways, State Highways, Major
District Roads, Other District Roads, Inter Village Roads and OMNP are presented in Table
No.8.16.
Table No. 8.16 Length of Road in Manipur
(In kms.)
Classification of Road As on 31st March
1995 1999 2000
1 2 3 4
National Highways 434.00 957 957
State Highways 1,158.00 675 675
Major District Roads 1,029.00 964 964
Other District Roads 797.00 1,013 1,013
Inter Village Roads 2,518.00 3,563 3,563
Other Minimum Needs Programme (OMNP) 132.00 - -
All Roads 6,068.00 7,172 7,172
Surfaced 4,333.00 4,427 4,427
Un-surfaced 1,735.00 2,745 2,745
Contd.
Table No. 8.16 Length of Road in Manipur
(In kms.)
Classification of Road As on 31st March
2001 2002 2003 2004 2005
1 5 6 7 8 9
National Highways 957 957 967 967 967
State Highways 675 675 668 668
Major District Roads 964 964 964 964 964
Other District Roads 1,013 1,013 1,013 1,013 1013
Inter Village Roads 3,563 3,563 5,036 5,036 5036
Other Minimum Needs Programme (OMNP) - - - - -
All Roads 7,172 7,172 8,638 8,648 8,648
Surfaced 4,427 4,427 4,573 4,573 4,573
Un-surfaced 2,745 2,745 4,075 4,075 4,075
- Not available Concld.
Source: P.W.D. Manipur

166
During the period from 1998-99 to 2001-2002 the length of National High-way, State
Highways, Major District Roads, Other District Road and Inter Village Roads remained
stagnant at 957 kms., 675 kms. 964 kms., 1013 kms and 3563 kms. respectively. The length of
National Highways, state High-ways, Major District Roads, Others Districts Road and Inter
village Roads as on 31st March 2005 were 967 kms., 668 kms., 964 kms., 1013 kms. and 5036
kms. respectively. Of the total road length the surfaced and unsurfaced road length were 52.88
percent and 47.12 percent respectively.
8.3.2 Road transport:
Road transport is the most dominant mode of transport in the state. There is consumers
preference for this mode of transport as it has advantages of timeliness in the movement of
goods and passengers.
8.3.2.1 Manipur State Road Transport Corporation:
In view of the geographical feature of Manipur, Road Transport is the only cheap and
quick means of transport for the state. Consequently, there is need for greater thrust towards
providing safe, comfortable, cheap and adequate facilities for transportation of passengers and
essential commodities. With this in view, the existence of a State Road Transport Corporation
Ltd. and its improvement is essential in the public interest.
The Manipur State Road Transport Corporation (MSRTC) plays an important social
role in covering areas/routes which are not considered attractive and profitable for the private
sector road transport enterprises. The fleet position for the year 2001-2002 were 25 buses, 29
trucks, and 3 (three) light vehicles.
Greater mobility of people has a crucial role in the economic and social growth of the
country. Public sector role in passenger transport has been increasing since enactment of the
Road Transport Corporation Act, 1950 which provided efficient, economic, adequate and
coordinating public transport on business principles. MSRTC has played a very important role
in bringing national integrity and communal harmony by operating its services in the remote
areas.
8.3.3 Motor Vehicle:
Motor transport is primarily responsibility of the state Government. The number of
motor vehicle registered in the state as on 31st March 2009 was 1,56,896 showing an increase
of 6.93 percent over that of the previous year. Of the total number of vehicles in operation as

167
on 31st March 2009 in the state, 68.94 percent were two wheeler, 2.77 percent were three
wheelers (Auto Rickshaw) 16.96 percent were light motor vehicles (Cars, Jeeps, Taxi) and
8.95 percent were heavy motor vehicles (buses, trucks) and the remaning 2.38 percent were
Tractor, Mini Bus & others. The details of motor vehicles in operation in the state are presented
in Table No. 8.17.
Table No. 8.17. Number of Motor Vehicles registered in Manipur
Type of Vehicles As on 31st March
2006 2007 2008 2009 2010*
1 2 3 4 5 6
Bus 1913 1969 2062 2094 1483
Truck 8586 9063 9436 11948 6769
Auto Rickshaw 2697 8758 4096 4344 8604
Mini Bus 657 665 665 666 476
Tempo 38 Nil Nil Nil Nil
Car 12063 12439 13327 15749 11377
Jeep 8568 8937 9146 10283 5058
Tractors 1295 1604 1686 1759 2040
Two Wheelers 86931 93595 105465 108169 101762
Taxi 377 407 412 585 1027
Others 270 423 435 1299 502
Total 123395 137860 146730 156896 139098
* Excluded Chandel District
Source : Directorate of Transport, Govt. of Manipur.
8.3.4 Communication:
Allied to the transport system is the communication system. The communication system
comprises of postal services, telegraph services, telephone services etc. There has been a steady
growth in the postal and telecommunication facilities in the state. There were 697 post offices
and 1 telegraph office in the corrected upto 31st December, 2011. The population served per
post office was 3644 at the end of March 2006. The following Table No. 8.18 gives a picture
of the postal facilities in the state of Manipur.
Table No. 8.18 Postal Facilities in Manipur
(in nos.)
Year Post Office Population served
Per Post Office Telegraph Office
Combined Post
and Telegraph
1 2 3 4 5
1999-00 693 3265 2 47
2000-01 692 3342 2 47
2001-02 691 3457 2 47
2002-03 694 3442 2 47
2003-04 697 3501 3 47

168
2004-05 697 3572 3 47
2005-06 697 3644 3 47
2006-07 697 NA 2 NA
2007-08 697 NA 1 NA
2008-09 697 NA 1 NA
2009-10 697 NA 1 NA
2010-11* 697 NA 1 NA
NA : Not Available * Corrected upto 31-12-2011
Source : 1. Directorate of Postal Services, Manipur.
2. Office of the Telecom District Manager, Imphal.
There were 48245 telephone connection in the state as on 31st March 2006 showing an
increase of 3.94 percent over the previous year, 2004-2005. However, from 2006-07 onward
the number of telephone connection shows a decline. There were 47631 connection in the year
2006-07 and again in the year 2007-08 there were 34507 connection which depicts a decrease
of 27.55% over the previous year 2006-07. However, in the year 2009-10 there were 32613
connection against 31241 connection in the previous year 2008-09 with an increased of 4.39
percent. But, in the year 2010-11, there were 28458 conecctions decreasing 12.74 present over
the previous year 2009-10 which were 32613. The growth of telecommunication facilities in
the state is shown in Table No. 8.19 and the districtwise telecommunication facilities in
Manipur for the year 2010-11 is shown in Table No. 8.20 and the same information for the year
2009-10 is shown in Table No. 8(f) of Part- II.
Table No. 8.19 Telecommunication facilities in Manipur
Year No. of public call offices * No. of telephone connection
1 2 3
1999-00 1460 25494
2000-01 1895 29453
2001-02 1892 33945
2002-03 2495 41468
2003-04 1733 44192
2004-05 1705 46417
2005-06 1803 48245
2006-07 2119 47631
2007-08 2269 34507
2008-09 3666 31241
2009-10 3816 32613

169
2010-11 2013 28458
* Includes Local/STD/Trunk
Source : Office of the Telecom, District Manager, Imphal.
Table No. 8.20 Districtwise Telecommunication facilities in Manipur, 2010-11.
(in nos.)
Sl.
No. District/State
Telegraph
Office
Telephone
Exchange
Combined
Offices
Telephone
Working (DEL)
P.C.Os.
Local/STD/Trunk
1 2 3 4 5 6
1. Senapati - 10 - 1980 130
2. Tamenglong - 2 - 580 66
3. Churachandpur - 3 - 1247 84
4. Chandel - 4 - 1466 223
5. Ukhrul - 1 - 840 125
6. Imphal East - 6 - 2951 188
7. Imphal West 1 13 - 15665 885
8. Bishnupur - 6 - 427 10
9. Thoubal - 7 - 3302 302
Manipur State 1 52 - 28458 2013
- Nil Source : Office of the Telecom, District Manager, Imphal.
8.4 Banking:
A bank is an institution which deals mainly in credit by way of accepting deposits of
money for the purpose of lending or investment, from the public repayable on demand or
otherwise and withdrawable by cheque, draft, order or otherwise. The need for a well-
developed banking system in the economic life of the state can hardly be exaggerated. Growth
of industry and trade has necessitated the development of banks and other financial institutions.
8.4.1 Scheduled Commercial Banks : Commercial Banks constitute the most important segment of the banking organizations.
Their main functions are to accept deposits and to provide short term loans. They also discount
bills of exchange and perform a number of subsidiary and general utility functions. In India,
Scheduled Commercial Banks are categorized into five different groups according to their
ownership and/or nature of operation. These bank groups are (i) State Bank of India and its
associates, (ii) Nationalised Banks, (iii) Regional Rural Banks, (iv) Foreign Banks and (v)
Other Indian Scheduled Commercial Banks (in the private sector).
The total number of scheduled commercial banking offices in Manipur was 95 as on
31st March 2012 of which State Bank of India accounted for 26 offices .Manipur Rural Banks
had the highest number of offices in the state with a total of 28 offices, followed by the State
Bank of India and United bank of India with 26 and 16 respectively in the state. The number
of various commercial banking offices operating in the state excluding Scheduled Cooperative
Banks is shown in Table No. 8.21. A comparative statement showing the number of Scheduled
Commercial Banks in the North Eastern States of India is presented at Table No. 8(d) of part
II.
Table No. 8.21 Number of Scheduled Commercial Banks & their offices in Manipur

170
(as on 31st March )
Name of Banks Year
2007 2008 2009 2010 2011 2012 2013
1 2 3 4 5 6 7 8
A. State Bank of India and its
associates
State Bank Of India 18 17 20 20 22 28 29
B. Nationalized Banks
1. Allahabad Banks 1 1 1 1 1 1 1
2. Axis Bank - - 1 1 2 2 4
3. Bank of Baroda 3 3 3 3 3 3 3
4. Central Bank of India 3 3 3 3 3 4 5
5. ICICI Bank - - 1 1 1 2 5
6. Indian Overseas Bank 1 1 1 1 1 1 2
7. Punjab and Sind Bank 2 2 2 2 2 2 4
8. Punjab National Bank 2 2 2 2 2 2 2
9. United Commercial Bank 2 2 2 2 2 2 4
10. United Bank Of India 15 15 15 15 15 16 16
11. Vijaya Bank 2 2 2 2 2 3 4
12. Bank of India - - - - - 1 2
13. HDFC Bank - - - - 1 3 3
14.Bank of Maharashtra - - - - - - 1
15.Canara Bank - - - - - - 1
16.IDBI Bank - - - - - - 1
C. Public Sector Banks (A+B) 49 48 53 53 57 70 87
D. Regional Rural Bank
Manipur Rural Bank 28 28 28 28 28 28 28
E. All Scheduled Commercial
Banks 77 76 81 81 85 98 115
Source : Statistical Tables Relating to Banks in India 2012-13, RBI.
The Banking scenario of Manipur has undergone a sea-change over the years. There
was only 37 (thirty seven) numbers of scheduled commercial bank offices during the year 1981.
The number was more than double during the year 1991 and it was recorded as 87 (eighty
seven). As on 31st March 2012 there was only 95 (ninety five) scheduled commercial
banking offices in the state. Out of the total number of 95 offices, 44.21 percent were in the
rural areas, 24.21 percent in the semi-urban areas and 31.58 percent in the urban areas. As on
31st March 2009, the average population per bank offices of the state was 39.09 thousands. The
distribution of scheduled commercial bank offices of Manipur are presented in Table No. 8.22.
Table No. 8.22 Distribution of Scheduled Commercial Bank Offices of Manipur
(As on 31st March)
Year Number of Offices
Rural Semi Urban Urban Total
1 2 3 4 5
2005 40 15 23 78
2006 36 19 23 78

171
2007 34 20 23 77
2008 33 20 23 76
2009 35 21 25 81
2010 35 20 26 81
2011 36 21 28 85
2012 43 30 25 98
2013 50 35 30 115
Source : Statistical Tables Relating to Banks in India 2012-13, RBI.
8.4.2 Growth of Deposits and Credit: The aggregate deposits of Scheduled Commercial Banks in the State during the year
2011 was Rs.3,53,700 lakhs. The volume of the deposits to these banks in the year 2012 was
Rs.4,23,500 lakhs which shows an increase of 19.73 percent from that of previous year. The
volume of total credit deployed by these banks was Rs.1,15,900 lakhs as on 31st March 2011
which increased to Rs.1,27,400 lakhs as on 31st March 2012. Thus, an increase of 9.92% was
observed in March, 2012 over that of March, 2011. The trends in deposit and credit of
scheduled commercial banks of the state over the past few years may be seen in the Table No.
8.23 and a comparative picture of deposits and credits of North-Eastern Region are presented
in Table No. 8.(e) of part II.
Table No. 8.23 Deposits and Credits of Scheduled Commercial Banks of Manipur
(as on 31st March)
(Rs. in lakhs)
Year
State bank
of India Nationalised Banks Regional Rural Banks
Deposit Credit Deposit Credit Deposit Credit
1 2 3 4 5 6 7
2003 30300 5900 31100 10600 2500 1400
2004 39400 8500 39400 13600 3100 1600
2005 42800 19300 50700 18100 3700 2400
2006 56200 32800 60500 20200 4700 3500
2007 68700 42300 70200 30800 5100 3600
2008 90500 50300 87000 32800 5500 3300
2009 108700 55800 114500 32700 7200 3000
2010 115200 68300 139500 40100 8200 3000
2011 146900 63100 168500 48800 9500 3300

172
2012 187100 71800 189000 51000 13300 3600
2013 246200 77500 214500 62300 13600 4600
Year
Other Scheduled Commercial
Banks
All Scheduled Commercial
Banks
Credit Deposit
Ratio
(percent) Deposit Credit Deposit Credit
1 8 9 10 11 12
2003 - - 63900 18000 28.17
2004 - - 81900 23800 29.06
2005 - - 97200 39800 40.95
2006 - - 121400 61500 50.66
2007 - - 144000 76900 53.40
2008 - - 183000 86400 47.21
2009 6400 100 236800 91600 38.68
2010 13400 700 276300 112100 40.57
2011 28800 700 353700 115900 32.77
2012 34100 1000 423500 127400 30.08
2013 61200 2500 535500 146900 27.43
- Not available
Source : Statistical Tables Relating to Banks in India 2012-13, RBI.

173
It will be seen from the above table that the credit deposit ratio (CDR) of scheduled
commercial banks in Manipur as on 31st March, 2012 has been worked out at 30.08 percent. as
against the ratio of 32.77 percent showing a decrease over the previous years.
The per Capita deposits of these banks in the state as on 31st March 2012 was Rs.17090
as against Rs.14443 as on 31st March 2011. The Per Capita Credit of these banks in the state
was Rs.5141 on 31st March 2012 showing an increase of 8.62 percent over the previous year.
The banking scenario of Manipur are shown in Table No. 8.24.
Table No. 8.24 Banking Scenario of Manipur (as on 31st March)
(Rs. in lakhs)
Year
No. of
Bank
offices
Deposits
Credit
Deposits
per Bank
Credit per
Bank
Per capita
deposits
(in Rs.)
Per capita
credit
(in Rs.)
1 2 3 4 5 6 7 8
2002 79 61100 15500 773.42 196.20 2519.08 639.05
2003 79 63900 18000 831.00 232.00 2351.00 658.00
2004 77 81900 23800 1065.00 309.00 2856.00 829.00
2005 78 97200 39800 1246.00 510.00 3386.00 1386.00
2006 78 121400 61500 1556.00 787.00 4126.00 2087.00
2007 77 144000 76900 1823.00 975.00 4781.00 2556.00
2008 76 183000 86400 2408.00 1137.00 5953.00 2811.00
2009 80 236800 91600 2960.00 1145.00 7573.00 2929.00
2010 81 254700 108400 3144.44 1338.27 11413.00 4630.00
2011 85 315400 111900 3710.59 1316.47 14443.00 4733.00
2012 95 376100 122800 3958.95 1292.63 17090.00 5141.00
Note : Out of 95 Scheduled Commercial Banks, only 87 nos. of Banks reported for this table.
Source: Statistical Tables Relating to Banks in India 2011-12, RBI.

174
CHAPTER IX
SOCIAL INFRASTRUCTURE
Development of social infrastructure is a crucial need for the welfare state. State
Government of Manipur has been making several efforts continuously for all-round
development prioritising the sectors like education, public health, water supply, social welfare,
employment etc., for uplifting the quality of life of the people of the state.
9.1 Education:
Education is a life long process by which an individual acquires and accumulates
knowledge, skills, attitudes and insights. It starts from the cradle and ends at the grave for an
individual. And life experiences are given to child through the informal agencies like family,
social groups (clubs, associations, political parties, literary circle, debating societies, library,
mass media radio, television, cinema, museum, tour etc.) and also through the agencies of
formal education such as schools, colleges, universities etc. However, education is one of the
principal factors influencing the quality of the state’s labour force. It has an important role in
the socio-economic development of the State. Its contribution to economic growth and its
impact on population controls life expectancy, infant mortality, improving nutritional status
and strengthening civil institutions is well recognised. As per National Policy on Education,
priority has been accorded to the universalisation of primary education for children in the age
group of 6 to 14 years.
9.1.1 Progress of Education:
There has been a great deal of accomplishment in the field of education since 1950-51.
The number of educational institutions has increased from 538 in 1950-51 to over 4222 by the
end of 2004-2005. Out of these 4222 institutions, 4089 were schools, 62 colleges and two
universities. Table No. 9.1 shows the number of recognised educational institutions of various
type and a comparative picture of the total number of recognised educational institutions in
North-East States (2003-04) are presented in Table No. 9(a) of part II.
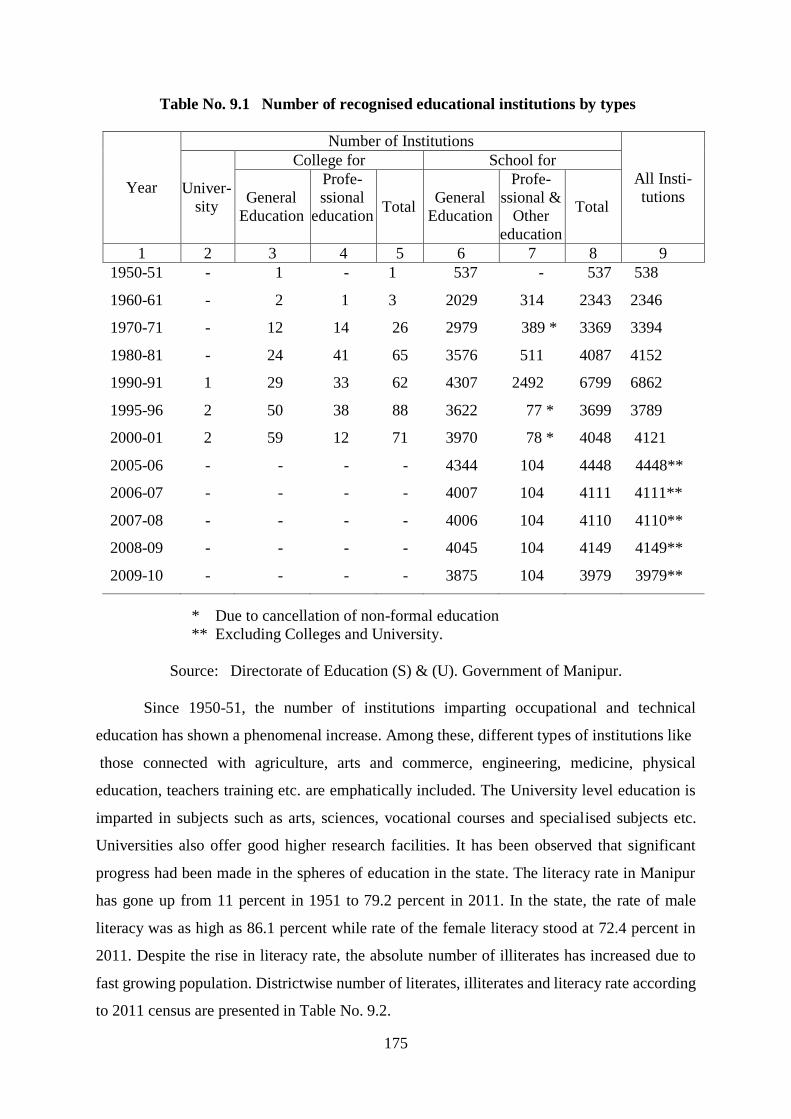
175
Table No. 9.1 Number of recognised educational institutions by types
Year
Number of Institutions
All Insti-
tutions Univer-
sity
College for School for
General
Education
Profe-
ssional
education Total
General
Education
Profe-
ssional &
Other
education
Total
1 2 3 4 5 6 7 8 9
1950-51 - 1 - 1 537 - 537 538
1960-61 - 2 1 3 2029 314 2343 2346
1970-71 - 12 14 26 2979 389 * 3369 3394
1980-81 - 24 41 65 3576 511 4087 4152
1990-91 1 29 33 62 4307 2492 6799 6862
1995-96 2 50 38 88 3622 77 * 3699 3789
2000-01 2 59 12 71 3970 78 * 4048 4121
2005-06 - - - - 4344 104 4448 4448**
2006-07 - - - - 4007 104 4111 4111**
2007-08 - - - - 4006 104 4110 4110**
2008-09 - - - - 4045 104 4149 4149**
2009-10 - - - - 3875 104 3979 3979**
* Due to cancellation of non-formal education
** Excluding Colleges and University.
Source: Directorate of Education (S) & (U). Government of Manipur.
Since 1950-51, the number of institutions imparting occupational and technical
education has shown a phenomenal increase. Among these, different types of institutions like
those connected with agriculture, arts and commerce, engineering, medicine, physical
education, teachers training etc. are emphatically included. The University level education is
imparted in subjects such as arts, sciences, vocational courses and specialised subjects etc.
Universities also offer good higher research facilities. It has been observed that significant
progress had been made in the spheres of education in the state. The literacy rate in Manipur
has gone up from 11 percent in 1951 to 79.2 percent in 2011. In the state, the rate of male
literacy was as high as 86.1 percent while rate of the female literacy stood at 72.4 percent in
2011. Despite the rise in literacy rate, the absolute number of illiterates has increased due to
fast growing population. Districtwise number of literates, illiterates and literacy rate according
to 2011 census are presented in Table No. 9.2.

176
Table No. 9.2 Districtwise Number of literates and illiterate persons and literacy rates
of Manipur according to 2011 census
Sl.
No. State/District
No. of literate No. of illiterate
Person Male Female Person Male Female
1 2 3 4 5 6 7 8
Manipur 1768181 960015 808166 802209 330156 472053
1. Senapati* 124182 68169 56013 69562 30739 38823
2. Tamenglong 85006 47403 37603 55645 24968 30677
3. Churachandpur 195935 104013 91922 78208 34807 43401
4. Chandel 90302 51053 39249 53880 23526 30354
5. Ukhrul 129829 70148 59631 54169 24570 29599
6. Imphal East 324664 173314 151350 131449 52780 78669
7. Imphal West 392626 205985 186641 125366 49069 76297
8. Bishnupur 156333 87313 69020 81060 31469 591
9. Thoubal 259304 152617 116687 152864 58228 94636
Table No. 9.2 Districtwise Number of literate and illiterate persons and literacy rates
of Manipur according to 2011 census
Sl.
No. State/District
Literacy rate
Person Male Female
1 2 9 10 11
Manipur 79.2 86.1 72.4
1. Senapati* 74.1 80.0 68.1
2. Tamenglong 70.1 76.1 63.7
3. Churachandpur 82.8 87.0 78.5
4. Chandel 71.1 77.8 64.0
5. Ukhrul 81.4 85.3 77.0
6. Imphal East 82.0 88.8 75.3
7. Imphal West 86.1 92.2 80.2
8. Bishnupur 75.9 85.1 66.7
9. Thoubal 74.5 85.0 64.1
*Excluding Mao-Maram, Paomata and Purul Sub-Divisions Concld.
Source: Directorate of Census Operations, Manipur.

177
9.1.2 School Education :
As per the National Policy on Education 1986, a target had been set for the
universalisation of primary education for children in the age group of 6 to 14 years. Under this
policy, three aspects of elementary education viz. (i) universal access and enrolment (ii)
universal retention of children upto 14 years of age and (iii) substantial improvement in the
quality of education are to be achieved.
Several programmes like National Programme of Nutrition support to primary
education (mid-day meal scheme) and promotion of girls’ education were also undertaken in
the state. Under mid-day meal scheme, the state is providing 3kgs. of rice per student per month
to the students of class I to V reading in 2997 Govt. and aided schools having primary classes.
Under the scheme (Expanded Operation Black Board) of the Govt. of India, minimum teaching
learning materials, like teachers equipment, teaching learning materials, games materials, play
materials, books for library, furniture etc. were procured for 398 upper primary schools of the
state during 2002-03. The total enrolment at the primary stage (Class I to V) decreased from
199.23 thousands in 2008-09 to 136.03 thousands in 2009-10. Of these, the relative share of
girls’ enrolment increased from 48.43 percent in 2008-09 to 50.85 percent in 2009-10. Total
enrolment at the middle/upper primary stage (Class VI to VIII) in 2009-10 is 291.12 thousands
as against 389.99 thousands in 2008-09. The relative share of girls’ enrolment was 51.08
percent in 2009-10 as against 47.98 percent in 2008-09. Table No. 9.3 presents the number of
students enrolled by stages.
Table No. 9.3 Sex-wise Students enrolment by stage/classes
Year
Schools
Primary (Class I to V) Middle/Upper Primary
(Class VI to VIII)
Boys Girls Total Boys Girls Total
1 2 3 4 5 6 7
2001-02 1,09,206 1,03,986 2,13,192 80,271 71,181 1,51,452
2002-03 1,83,711 1,71,642 3,55,353 64,098 60,488 1,24,586
2003-04 1,14,378 1,04,391 2,18,769 95,533 85,915 1,81,448
2004-05 1,14,820 1,11,466 2,26,286 96,316 86,711 1,83,027
2005-06 1,01,204 1,11,844 2,13,048 96,165 86,605 1,82,770
2006-07 1,13,484 1,10,575 2,24,059 96,656 88,645 1,85,301
2007-08 1,10,634 1,06,493 2,17,127 96,807 89,202 1,96,009
2008-09 1,02,949 96,674 1,99,623 99,932 90,437 1,90,369
2009-10 66,853 69,178 1,36,031 75,566 79,526 1,55,092
Contd.

178
Table No. 9.3 Sex-wise Students enrolment by stages/classes
Year
Schools
Elementary (Class I to VIII)
Boys Girls Total
1 8 9 10
2001-02 1,89,477 1,75,167 3,64,644
2002-03 2,47,809 2,32,130 4,79,939
2003-04 2,09,911 1,90,306 4,00,217
2004-05 2,11,136 1,98,177 4,09,313
2005-06 1,97,369 1,98,449 3,95,818
2006-07 2,10,140 1,99,220 4,09,360
2007-08 2,07,441 1,95,695 4,03,136
2008-09 2,01,881 1,87,111 3,89,992
2009-10 1,42,419 1,48,704 2,91,123
Concld.
The school level education is primarily looked after by the State Government. The high
school stage of education comprising of classes from class IX to X are under the academic
control of the Board of Secondary Education, Manipur. And Higher Secondary Schools
Education comprising of class XI to XII comes under the control of Council of Higher
Secondary Education, Manipur. The total number of high and higher secondary schools in the
state were 786 by the end of 2009-10. The enrolment of students for high and higher secondary
classes has increased by 13.70 percent during 2009-10 over the previous year 2008-09. And
the average number of students per teacher in 2009-10 was 10 for high/higher secondary
schools. The position about the number of high/higher secondary schools enrolment of students
and the strength of teachers are presented in the following Table No. 9.4.
Table No. 9.4 Number of high/higher secondary schools, students and teachers in
Manipur

179
(in nos.)
Year
High/Higher
Secondary
School
Student Teacher
Students
per
Teacher Boy Girl Total
1 2 3 4 5 6 7
1995-96 539 1,06,830 90,332 1,97,162 9,690 20
2000-01 614 1,25,344 1,11,121 2,36,465 12,097 20
2001-02 659 1,33,375 1,16,309 2,49,884 12,060 21
2002-03 652 1,25,033 1,14,579 2,39,612 12,324 19
2003-04 706 NA NA NA NA NA
2004-05 706 NA NA NA NA NA
2005-06 1,093 1,35,650 1,25,664 2,61,314 12,431 15
2006-07 744 1,37,543 1,26,226 2,63,769 13,392 14
2007-08 743 2,78,668 1,29,218 4,07,886 14,706 14
2008-09 763 1,47,041 1,34,573 2,81,614 10,060 19
2009-10 786 1,65,140 1,55,069 3,20,209 14,869 10
NA – Not Available
The Board of Secondary Education and the Council of Higher Secondary Education,
Manipur conducts the High School Leaving Certificate (HSLC) and Higher Secondary School
Leaving Certificate (HSSLC) Examinations respectively. Table No. 9.5 shows the result of
H.S.L.C. Examinations in the state from 2007-08 to 2009-10.
Table No. 9.5 Results of H.S.L.C. Examinations of Manipur
Year
H.S.L.C. Examination
Number of Student
Male Female
Appeared Passed P.c. of
passed
Appeared Passed P.c. of
passed
1 2 3 4 5 6 7
2007-08 12206 7787 63.80 12403 6606 53.26
2008-09 13888 8699 62.64 13796 6989 50.66
2009-10 14093 9338 66.26 13188 7139 54.13
Year
H.S.L.C. Examination Percentage ratio
of passed Female to
Male student Number of Student
Total
Appeared Passed P.c. of passed
1 8 9 10 11
2007-08 24609 14393 58.49 0.83
2008-09 27684 15688 56.67 0.81
2009-10 27281 16477 60.40 0.82
- Not Available
Source : Board of Higher Secondary Education, Manipur.
9.1.2.1 Sarva Shiksha Abhiyan (SSA)

180
On 22nd June, 2004, an outlay of Rs. 4,601.13 lakhs was approved for implementation
of SSA in Manipur. The objective of the SSA Project is to ensure universal education for
children in the age group of 6-14 years. During 2004-05, the grant released by the Central and
State Government was Rs. 17.25 crores and 3.68 crores respectively. Under the scheme, text
book were provided to 2,34,299 girls and ST/SC children in class I-VIII in 2005-06. During
2006-07, 3,21,951 girls, ST/SC children in class I-VIII were given text books worth Rs. 150
per child. Again during the year 2007-08, free text books worth Rs. 3.96 crores have been
provided to 2,76,120 students of ST/SC and all girls in the Government and Aided Schools of
68,159 school children are covered out of a total of 74,368 class I-VIII.
9.1.3 Higher Education/Colleges:
Higher education plays a crucial role in the national development process. The matters
relating to higher education are looked after by Directorate of Higher Education (U). The total
number of colleges for General Education in the state at the end of 2005 was 62 (all types
including private colleges). All these colleges had teaching facilities for higher degree courses.
Table No. 9.6 shows the number of colleges, students enrolled and number of teachers.
Table No. 9.6 Number of Colleges, Students and Teachers for general education of
Manipur
Year College Student
Teacher Students
per teacher Boy Girl Total
1 2 3 4 5 6 7
1960-61 2 1,771 243 2,014 71 28
1970-71 12 7,767 2,385 10,152 368 28
1980-81 24 12,847 7,712 20,559 1,045 20
1990-91 29 22,427 16,597 39,024 1,025 38
1995-96 50 26,655 18,678 45,333 2,541 18
1996-97 50 23,560 20,017 43,577 2,695 16
1997-98 51 24,249 20,600 44,849 2,898 15
1998-99 50 24,411 21,407 45,818 2,898 16
1999-00 58 15,489 16,312 31,801 2,841 11
2000-01 25 * 10,053 * 8,611 * 18,664 * 1,267 * 15
2002-03 62 11,135 10,539 21,674 NA NA
2003-04 62 8,727 8,003 16,730 NA NA
2004-05 62 8,711 7,494 16,205 NA NA
NA: Not Available * Excluding Private Colleges
Source: Directorate of Education (U). Govt. of Manipur.
The above table shows an increasing trend in the number of colleges, students
enrolment as well as in the number of teachers. The average number of students per teacher in
2000-01 was 15 for colleges.
9.1.4 Technical Education :

181
Technical education is basically meant to produce trained manpower in adequate
numbers for speedy economic development of the state. Training have been diversified and
programmes modified to take care of the needs of the modern development in technology. At
the end of the Sixth Plan, the state had only a polytechnic having diploma courses in Civil,
Electrical and Mechanical Engineering etc. But the existing arrangements for educating at
degree level is by reserving specified number of seats in different Engineering Colleges of the
country through the Ministry of Human Resource Development. One Engineering College
(Govt. College of Technology) was started during the annual plan 1998-99 in 3 (three) courses
viz., Civil, Computer Science, Electronic & Communication Engineering with per intake
capacity of 30 (thirty) each further the produce of technically trained manpower for the
upliftment of economic development of the state. Still, inspite of all these, progress of technical
education is at a slow pace and the state is lagging behind and is quite below the level of the
other states in the development of technical education.
9.1.5 Industrial Training Institute:
There are 7 (seven) Industrial Training Institutes in the state which are imparting
various engineering and non-engineering training courses based on locally suitable self-
employment activities under two schemes viz., Craftsman training and Apprenticeship training.
Under the aegis of the Government of India (DGET), training are also imparted in the new
diversified fields so as to meet the technological advancement. During the Tenth Plan, 5 (five)
Industrial Training Institutes are proposed to be set up at Imphal East, Thoubal, Bishnupur,
Tamenglong and Chandel.
9.1.6 Non-Formal Education:
To achieve the goal of universalisation of elementary education and fulfillment of the
constitutional objectives, Non-Formal Education (NFE) for the elementary age group children
is being developed as an alternative supportive system of formal schooling. The State Council
of Educational Research and Training (SCERT), has been working for the upliftment of the
quality of education in the elementary stage of education as well as the goal of the
universalisation of elementary education by adopting proper strategies non-formal educational
schemes for drop-out and non-starters in the age group of 0-14. The SCERT has also been
entrusted with the implementation of the schemes of vocationalisation of education at plus two
stage for self-employment as one of the main objectives. This scheme is equally
shared by Central and State Governments. It is basically aimed at providing the institutional
infrastructure necessary both for coverage of non-enrolled and non-attending children and

182
strengthening the academic inputs of the action programme of non-formal education. During
the Ninth Plan period, 3122 non-formal education centres have been functioning through 55
NFE projects with the total enrolment of 90,000 learners all over the state. Under the
vocationalisation of education 8 schools were covered and 3 booklets were published. The
proposed outlay for the Tenth Five Year Plan (2002-07) is Rs.900.00 lakhs of which a sum of
Rs.200.00 lakhs is proposed for the Annual Plan (2002-03).
9.1.7 Adult Education:
The “National Literacy Mission” (NLM) was established in 1988 by the Government
of India with the aim of successful implementation of strategies of eradicating illiteracy in the
age group of 15 to 35 years. Following prescribed detailed guidelines for the implementation
of total literacy campaign, the state Government has taken a policy decision to implement Total
Literacy Campaign (TLC) in a phase manner. During the Ninth Plan (1997-2002) it was
182argeted to eradicate 2.12 lakhs illiterate population in the age group of 15 to 35 years and
retention of literacy skills for the new literates by the introduction of complete course of the
programmes of Basic Literacy and post literacy followed by continuing Education Programme
in phases through Jana Shikshan Nitayamas (JSN) centres. Out of this 2.12 lakhs population,
1.92 lakhs are to be covered under centre based projects and the remaining 0.20 lakhs
population are to be taken care of by the Post-Literacy and continuing phasewise education
programmes through JSN centres. It is proposed to eradicate 1,92,914 (87,257 males &
1,05,657 females) illiterate populations in the age group of 15 to 35 years during the Tenth plan
(2002-2007). It also aim at the retention of literacy skills as well as improvement of skill of the
neo-literates.
A State Literacy Mission Authority (SLMA), Manipur was constituted as per the
directive given by the NLM Authority, Government of India. In 2004-05, the TLC was
launched is all the nine (9) districts of Manipur, through the District Literacy Societies (DLSs).
The project is funded on sharing basis by the Government of India and the State Government
in the ratio of 2:1 and 4:1 is respect of the Valley and Hill districts respectively. There are three
literacy phases in the TLC programme. In each phase, a primer/book need to be completed by
adult learners. The teacher are volunteers mostly educated unemployed youths, club members,
women societies members, church members, retired teachers etc. The districtwise physical
achievement of the TLC as on March 2007 is shown in Table No. 9.7.
Table No. 9.7 Physical achievement of TLC as on March, 2007
(in nos.)

183
District/State Target Enrolment Persons completed Primer
I II III
1 2 3 4 5 6
Senapati 67000 66560 66560 62682 39086
Tamenglong 16000 16027 14821 13162 9468
Churachandpur 20200 20213 20051 17682 15108
Chandel 18200 18600 18400 11486 10211
Ukhrul 15000 15000 15000 12963 11716
Imphal East 32000 32200 32200 30601 20930
ImphalWest 30000 30200 30200 29526 18026
Bishnupur 20300 20300 20300 18464 13419
Thoubal 39400 40000 40000 28192 26534
Manipur 258100 259100 257532 224758 164498
NB : TLC- Programe was concluded during 2006-07 in all District of the State.
9.1.7.1 Post Literacy Programme (PLP)
The PLP was launched in Manipur during 2006-07 with the following objectives :
(i) Remedy the deficiency of learning in the literacy phases or, in other woods, build up
literacy skills satisfactory standards;
(ii) Retention, re-enforcement, stabilization and upgrading of literacy skills and improvement of
functional skills;
(iii) Application in living and working situations but this need to be encouraged by positive
measure. Through application of literacy, people begin to participate in the development
process.
The programme is funded by the Central and State Government in the ratio of 2:1 and 4:1 in
the Valley and Hill districts respectively. The target groups of the programme are :-
(i) Drop outs of TLC,
(ii) Uncovered (gap between figures of TLC survey and enrolment),
(iii) Neo-literates and
(iv) New entrants/school drop out who are in the age group of 15 years and above.
The physical achievement of post literacy programme at the conclusion of the programme
is given below :-
Physical achievement of PLP at the conclusion of the programme, 2009
District Target Enrolment PL-1 Completer 1 2 3 4
Senapati 67000 70141 50998
Tamenglong 16000 11683 MOP learners of P-III
completed - 2426
Churachandpur 20200 20670 15635
Chandel 18200 18314 10974
Ukhrul 15000 15125 13506
Imphal East 32000 33065 22910
ImphalWest 30000 30604 18881
Bishnupur 20300 20108 16534
Thoubal 39400 37620 25260
Grand Total 258100 257330 174698*
* Excluding Tamenglong
9.2 Science and Technology:

184
Science and Technology plays a vital role in the process of development and
transformation of a traditional agrarian economy into a modern Industrial economy.
Development in the fields of Science and Technology in Manipur is carried out under the
auspices of the State Government. The Government has been consistently laying emphasis on
the development of Science and Technology as a major instrument for achieving national goals
of self-reliance and Socio-economic development.
Set up in January, 1985, the Science and Technology Department has been a Nodal
Agency in the State for planning, co-ordinating and promoting science and technology for
achieving the socio-economic objectives through meaningful applications in numerous
developmental programmes. In view of the growing significance of Information Technology,
the Department of Science and Technology was renamed as Department of Science &
Technology and Information Technology. The Department has reverted to its original name of
Department of Science & Technology from 5-9-2009.
Not only being an implementing agency, the department of Science & Technology also
encourages the use of non-conventional sources of energy to minimise the excessive use of
forest products. The Department also provides a feasible alternative for supplying energy to
locations which cannot be provided with conventional sources of energy. Altogether, 16
(sixteen) schemes were implemented by the department under 3 (three) major schemes viz. (i)
Scientific Research, (ii) Development of non-conventional sources of energy and (iii) Integrate
Rural Energy planning.
9.2.1 Scientific Research:
Under scientific research centre, the Department had undertaken several scheme viz. (i)
Science Centres and Science popularisation, (ii) S & T. Entrepreneurship Development
Programmes, (iii) Human Resource Development, (iv) Research and Development, (V) State
Remote Sensing Centre and (vi) State Computer centre etc., to give a main thrust of all-round
activities in the popularisation of science for welfare of various communities. To develop
scientific temper among the students and people of the state, the Department had already set
up 8 (eight) District Science Centres, 30 (thirty) District level science Model laboratories.
Besides, the programmes like science symposia, science quiz/essay/seminars/workshops,
national children's science congress, science excursion etc. were very effective in raising the
level of science popularisation among the younger generation.
One Tissue Culture Laboratory at Manipur University and one Food Testing Laboratory
at D.M. College of science were set up under the Research and Development scheme. Another
185
project on ‘Micro-Propagation of certain orchids of Manipur using tissue culture techniques’
was also completed by making the products available to the progressive growers. And it was
found effective with remarkable progress in production of orchids during 1997-98.
The State Remote Sensing Centre had taken up a project on "Natural Resources" and
completed the projects on ‘Application of Remote Sensing Techniques in Geological Studies
in Manipur’ and ‘Integrated Mission for sustainable development of Imphal District’. The
Remote Sensing Centre has Installed ARC/INFO, GIS software to supplement the existing
image processing computer facility. The State Computer Centre plays the role of introducing
innovative and appropriate computer application for Government departments with the
objective of improving efficiency and productivity. Training on Computer operations and use
of software were provided in various departments. Facility of AUTOCAD drafting was
successfully introduced in departments like PWD. An Online INTRANET based Govt./Public
information system has been set up. The Department is also providing computers and Modems
under the scheme of computer for homes and computers were offered to schools at low cost for
use under school Computers Education. During 2009-10, the Manipur Remote Sensing
Application Centre (MARSAC) has taken up schemes like Land Use/Land Cover of Manipur,
Wasteland Mapping of Manipur, Land Degradation Mapping of Manipur, Urban Information
system for Imphal and Kakching municipalities etc.
9.2.2 Non-Conventional Sources of Energy:
Under this Non-Conventional sources of energy, 5 (five) schemes namely bio-gas/bio-
energy, solar energy, solar thermal system, wind energy and improved chulhas were taken up
in the state. Bio-gas as a domestic cooking fuel is found suitable in Manipur. During the Tenth
Plan, 800 bio-gas plants were to be constructed.
Solar energy like photovoltaic system (SPV system) are found to be a technically
acceptable solutions for providing lighting to remote and non-electrified villages of the State.
During 2007-08, Solar Home Lighting System was taken up in 39 villages and 100 Nos. Solar
Street Lighting Systems was installed for Heirok area and in 2008-09, 4 Nos. was installed for
Imphal Airport.
Solar Thermal system is to provide hot water systems to Govt./Private agencies and is
found suitable in the State. 1000 LPD Solar Heaters in govt. buildings and 50 LPD Solar Water
Heaters are also made available to the public at subsidized rate. Wind energy is another source
of non-conventional energy. During 2007-08, promotion of 3 Wind Solar Hybrid Power of 10

186
kw each and installation of 10kw Wind Solar Hybrid was done during 2008-09. During 2009-
10 2 Wind Solar Hybrid power plants 10kw each were commissioned at Ukhrul district.
Under Hydro energy sector, 1 pico hydel project 5 kw was commissioned at Senapati
district, trial run for micro hydel project 25 kw at Ukhrul district was carried out and renovation
& modernisation of Gelnel small hydro project 400 kw at Senapati district was completed
during 2009-10. The outlay and expenditure during 2009-10 was Rs. 300.00 (RE) and Rs.
300.00 lakhs (actual) respectively.
9.2.3 Integrated Rural Energy Programme (IREP):
The implementation of Integrated Rural Energy Programme (IREP) covered 5 blocks,
7 blocks and 12 blocks during 1992-93, 1993-94 and 1995-96 respectively and 7 blocks in
1997-98. The programme covered 19 IREP Blocks upto 1998-99. Various energy devices like
bio-gas, Improved chulha, solar lantern tube-light with electronic choke and solar cooker and
pressure cooker, improved crematorium, compact fluorescent lamp etc., were made available
to the beneficiaries for efficient use of energy.
During the year 2009-10, the IREP Scheme funds are proposed to be provided to the
Zilla Parishads of Valley Districts as part of the devolution of powers to the Institutions of Zilla
Parishads and to the Deputy Commissioners for the Hill Districts. The items taken up during
the year are LED Reading Light system totaling 10000 units in 4 valley districts of Manipur
which will help public, particularly students.
The actual expenditure for 2009-10 under the IREP scheme was Rs. 20.00 lakhs.
9.3 Ecology and Environment :
It is now universally accepted that environmental pollution on one hand and
deforestation and population explosion on the other hand are threatening the very existence of
life on the earth. The situation can improve only if people from all walks of life realize the
importance of environmental protection.
In view of right measures to check the environmental pollution and for maintaining and
preserving ecological balance in the state by implementing various programmes, the Ecology
& Environment office, under Forest and Environment Deptt., has been doing a foreman service.
It launches various awareness programmes among the people.

187
For a meaningful enforcement of the Acts and Rules laid down by the Ministry of
Environment and Forest, Government of India, the Department is implementing 5 (five)
schemes viz., (i) Environmental education/Awareness Programme; (ii) Environmental
Research and Monitoring; (iii) Eco-.Development Programme; (iv) Prevention and control of
population and (v) Direction and Administration. During the Ninth Plan, the financial
assistance has been given to about 400 NGOS/Clubs/Academic Institutions/Organisations for
organizing environmental education/awareness programmes to promote the local environment
conscious citizens. The Department also took up various environmental monitoring works of
some major rivers viz. Imphal, Nambul, Iril etc. and wetlands like Loktak Lake, Phumlenpat,
Ikokpat etc. Besides, the real quality of Kangla Moat is also being monitored. The State
Botanical Garden has been set up at Khonghampat. The Department is also providing grant-in-
aid to the Manipur Pollution Control Board which is playing a major role in preventing air and
water pollution in the state. During the Tenth Plan (2002-07), the department proposes
improvement of seven ecological parks in seven districts. It is also taking up the
schemes/projects on ‘Solid Waste management’ and laboratory augmentation with French and
Austria assistance under Externally Aided Project (EAP). A sum of Rs. 495.00 lakhs is agreed
for the Tenth Plan of which Rs. 253.00 lakhs was approved for the Annual Plan 2005-06.
9.4 Food and Civil Supplies:
1n a welfare state like Manipur, one of the important task is to make the essential
commodities available to the common man at reasonable prices through the public distribution
system. Besides food grains, the Directorate of Food and Civil Supplies also arranges
distribution of kerosene and sugar at controlled prices. Department has changed its name to
Department of Consumer Affairs, Food & Public Distribution.
9.4.1 Public Distribution System :
Public distribution System is an important constituent of the strategy for poverty
alleviation. PDS is operated under the joint responsibility of the Central and State
Governments. The Central Govt. takes the responsibilities for procurement, storage,
transportation and bulk allocation of foodgrains at subsidised rates whereas the State Govt. on
their part will operate a network of fair price shops through which the essential commodities
in the prescribed quantity at prices fixed by the Government will be provided to the target
group. The Deptt. has been making all necessary efforts to procure adequate quantities of
foodgrains and other commodities to ensure its availability to the public. It procured PDS rice
and levy sugar from the central pool against the allocation made by the Government of India

188
for every month within a validity period. During the year 2006-07, 58.57 thousand tonnes of
rice and 7.18 thousand tonnes of levy sugar and 8.35 thousand tonnes of wheat were procured.
The projected target for procurement of PDS rice, sugar, wheat, edible oil are shown in Table
No. 9.8.
Table No. 9.8 Procurement of different Commodities
(in tonnes)
Year Procurement of
Rice Sugar Wheat Edible Oil
1 2 3 4 5
1999-00 43176.00 7158.90 120.00 -
2000-01 27005.47 7775.40 - -
2001-02 21691.01 9489.00 - -
2002-03 39930.35 5967.00 9250.00 -
2003-04 43921.55 3379.85 21164.85 -
2004-05 35781.15 3387.79 16724.61 -
2005-06 28033.83 4737.27 14674.40 -
2006-07 58,571,84 7,176.61 8,353.00 -
Source: Annual Administrative Report, F.C.S., Manipur.
The distribution of Rice, Wheat, Sugar and Kerosene through the Public Distribution
System (PDS) was continued during the year 2006-07 in the State. During the year 2006-07,
50.75 thousand tonnes of rice, 5.75 thousand tonnes of wheat and 6.51 thousand tonnes of Levy
Sugar were distributed through PDS in the State as against 21.08 thousand tonnes of rice, 11.06
thousand tonnes of wheat and 4.30 thousand tonnes of Levy Sugar in 2005-06. The distribution
of essential commodities during 1999-00 to 2006-07 are given in Table No. 9.9.
Table No. 9.9 Distribution of different Commodities (In ‘000 tonnes)
Year Distribution
Rice Wheat Sugar
1 2 3 4
1999-00 41.11 0.12 6.74
2000-01 22.61 - 6.73
2001-02 22.73 - 11.20
2002-03 44.13 5.85 6.00

189
2003-04 42.05 20.86 3.34
2004-05 33.69 16.72 3.43
2005-06 21.08 11.06 4.30
2006-07 50.75 5.75 6.51
-Not available
Source: Annual Administrative Report, F.C.S., Manipur.
9.4.2 Targeted Public Distribution System:
With a view to making PDS more responsive to the needs of the poor, the Govt. of India
introduced TPDS (Targeted Public Distribution System) from 1st June, 1997 and the same have
been implemented in Manipur w.e.f. 1st Sept. 1997. This system attempts to target families
below poverty line (BPL) at heavily subsidised rates. The identification of BPL families is
within the limit of 40.86 percent of the total State’s household. The district-wise number of
households below and above poverty line for the year 2009-10 are shown in Table No. 9.10.
Table No. 9.10 Families below poverty line and above poverty line of the Manipur
State during 2009-10
District Number of Households
Below Poverty Line Above Poverty Line Total
1 2 3 4
1. Senapati 11,362 36,016 47,378
2. Tamenglong 4,395 11,270 15,665
3. Churachandpur 9,881 23,109 32,990
4. Chandel 4,180 11,869 16,049
5. Ukhrul 6,240 14,264 20,504
6. Imphal East 17,651 40,318 57,969
7. Imphal West 21,438 45,001 66,439
8. Bishnupur 10,298 21,150 31,448
9 Thoubal 16,955 37,596 54,551
Total 1,02,400 2,40,593 3,42,993
Source: Annua1 Administrative, Report, 2009-10,
Food & Civil Supplies Deptt., Govt. of Manipur.
The Government of India had allotted 35136 MT of BPL rice and 34320 MT of APL
rice quota during the year 2001-2002 to Manipur State. The State Government had lifted
21691.055 MT of BPL rice against the allocation which was distributed to 1,30,000 BPL
families at the rate of 10 kgs. per family per month. But since April, 2002 the distribution
was fixed at 35 kgs. per family per month.
The number of authorised fair price Shops in the state in 2001-02 was 2551.
The distribution of food grains through the public distribution system during 2001-02 was 35
kgs. per family per month in the BPL group. In view of the difficult terrain and sparse

190
population in the hill areas, it is still felt that there is urgent need for opening more fair price
shops. Table No. 9.11 shows the number of fair price shops since 1995-96, 1999-00 to 2006-
07 and the district-wise fair price shops and S.K. Oil Sub- Dealers in Manipur under PDS are
shown in Table No. 9(b) of Part II.
Table No. 9.11 Number of Fair Price Shops in Manipur
Year
Rural Urban Total
Govern-
ment
Co-
operative Total
Govern-
ment
Co-
operative Total
Govern-
ment
Co-
operative Total
1 2 3 4 5 6 7 8 9 10
1995-
96
1,723 11 1,734 175 19 194 1,898 30 1,928
1999-
00
- - - - - - - - 1,927
2000-
01
- - - - - - - - 2,551
2001-
02
- - - - - - - - 2,551
2002-
03
- - - - - - - - -
2003-
04
- - - - - - - - 2,551
2004-
05
- - - - - - - - 2,551
2005-
06
- - - - - - - - 2,551
2006-
07
- - - - - - - - 2,551
- Not Available
-
Source: Food & Civil Supplies Deptt., Govt. of Manipur.
9.4.3 Antyodaya Anna Yojana: The Antyodaya Anna Yojana (AAY) has been launched in the state w.e.f. January,
2002. It aims at ensuring food security for all including those in the category of below poverty
line (BPL) who have minimum purchasing capacity to create a hunger free India in the next
five years. It is to reform and improve the public distribution system (PDS) so as to serve the
poorest of the poor in rural and urban areas. AAY families will be identified out of the total
BPL families who would be provided foodgrains at the rates of 35 kgs per family per month at
the rate of Rs.3.47/kg. for rice. This scheme covers 63,600 AAY families in the state. During
the year 2009-10, (under AAY scheme), the number of beneficiaries was 63,600.
9.4.4 Distribution of Foodgrains at Specially subsidised prices in ITDP areas :
With a view to strengthening the PDS in the Integrated Tribal Development Programme
(ITDP) areas, the Government launched “Revamped PDS” programme. The Revamped Public

191
Distribution System is operationa1 in the tribal areas of the state. Taking into consideration the
inadequate purchasing power of the tribals, the State Government launched a scheme known
as ‘Specially subsidised Pub1ic Distribution Scheme’ for the tribal areas in the state, which is
being implemented in 10 (ten) Principal Distribution Centres (PDC) viz., Senapati, Ukhrul,
Chandel, Churachandpur, Tamenglong, Paomata, Kamjong, Parbung, Tengnoupal and New
Kaiphundai.
9.4.5 Storage Facilities:
At present, there are 47 (fortyseven) numbers of food storage facilities in the state. Out
of which 1 (one) each in Thoubal and Bishnupur districts, 2(two) in Imphal East District 11
(eleven) in Imphal West district, 7 (seven) in Senapati districts, 5 (five) in Tamenglong
districts, 6(six) in Chandel District and 9 (nine) each in Churachandpur and Ukhrul districts.
The overall storage capacity is 26,000 MT.
Construction of 2,500 MT capacity Godown under Special Plan Assistance (SPA) have
been taken up to enhance storage capacity of foodgrains in Tamenglong and Churachandpur
districts in 2007-08.
9.5 Health and Family Welfare Services:
Medical facilities in the state were mainly provided by the State Government. It is the
basic social input for healthy and efficient human resources. The Health and Family Welfare
Department is providing services such as public health, control of communicable diseases,
health education, family welfare, maternal and child health care through a network of 14 Civil
Hospitals, 80 Primary Health Centres, 420 Primary Health Sub-Centres, 16 Community/ Urban
Health Centres, 20 Dispensaries as on 3l-3-2010. Special attention was also given from time
to time to eradicate diseases like malaria, leprosy, T.B., Iodine Deficiency and Aids. Table No.
9.12 shows the number of hospitals/dispensaries and the number of beds available.
Table No. 9.12 Number of hospitals/dispensaries and beds available in Manipur
(in nos.)
Year
Hospital
(including
PHC/UHC/
CHC)
Dispen-
saries
(including
PHSC’s)
Total
Population
in '000 per
hospital/
dispensaries
Bed Population
per bed

192
1 2 3 4 5 6 7
2002-03 101 440 541 4.38 2,395 990
2003-04 101 440 541 4.47 2,310 1,048
2004-05 101 440 541 4.56 2,405 1,027
2005-06 101 440 541 4.66 2,290 1,100
2006-07 - - - - - -
2007-08 100 440 540 4.85 - 1,754*
2008-09 100 440 540 4.94 - 1,697#
2009-10 110 440 550 4.95 2,405 1,125
2010-11 106 440 546 5.23 1,609 1,775
* Base on estimated population 2006. # excluding RIMS - Not available
Source: 1. RIMS and Directorate of Health Services, Govt. of Manipur.
2. Annual Administrative Report Directorate of Health Services.
During the year 2010-11, medical health care facilities were available to the people of
Manipur through a network of 546 hospitals/dispensaries with bed population ratio of 1:1,775.
The coverage of population per doctor/nurse is indicated in Table No. 9.13 below.
Table No. 9.13 Number of doctors and nurses employed and patients treated in
Manipur
Year
Person employed Population in’000 per Patients treated (in ’000 nos.)
Doctors
Nurses
Mid-wives
& Dias
Doctors
Nurses
Mid-wives
& Dias
Indoor Outdoor Total
1 2 3 4 5 6 7 8
2002-03 945 1,148 2.51 2.07 60.9 1,095.9 1,156.8
2003-04 914 1,070 2.65 2.27 62.9 1,229.4 1,292.3
2004-05 910 1,019 2.71 2.42 60.5 1,172.9 1,233.4
2005-06 888 1,055 2.84 2.39 51.8 1,023.8 1,075.6
2006-07* 700 924 3.67 2.78 37.0 101.3 138.3
2007-08* 700 924 3.74 2.83 22.7 379.6 402.2
2008-09* 672 981 3.97 2.72 20.9 350.4 371.3
2009-10* 593 956 4.59 2.85 21.1 257.4 278.5
*Excluding RIMS
Source : 1. RIMS & Directorate of Health Services, Government of Manipur.
2. Annual Administrative Report Directorate of Health Services.
9.5.1 State Health and Family Welfare Programme :
A brief description of various health and family welfare programmes carried out in the
state during 2004-2005 is summarized below:

193
9.5.1.1 Rural Health Scheme:
Under this scheme health guides are engaged for providing better health care to the
people in the state. They are also significantly contributing towards malaria surveillance,
family welfare and immunization activities.
9.5.1.2. National Malaria Eradication Programme (NMEP):
This programme was implemented in the state as a Centrally Sponsored Scheme from
December, 1994. During 2009-10, 1.15 lakhs blood slides were collected and examined and
1069 positive cases were found.
The programme could tackle malaria problems more effectively. Youth and voluntary
organisations have been actively involved in malaria control activities. Since March, 2004, the
nomenclature of the programme, NAMP has been changed to National Vector Borne Disease
Control Programme (NVBDCP).
9.5.1.3 National Leprosy Control Programme (NLCP):
This programme was started during 1955 as a control programme under ‘Mono-Drug
Therapy’ giving more stress on survey, Education and Treatment. The objective of the
programme is to reduce the number of active leprosy cases by fifty percent. National Leprosy
Eradication programme was introduced on 1984 with an objective of eradicating leprosy by
2000. The main trategies were active case detection and promt treatment with Multi-Drug
Therapy to reduce case load and transmission. Manipur has achieved the National Goal of
prevalence rate of less than 1 per 10,000 population at the end of 2000-01. As on today
Prevalence Rate of Manipur is 0.15 per 10,000 population which is one of the lowest in India.
9.5.1.4 National T .B. Control Programme (NTCP):
Under this programme, 100 bedded T.B. Hospital at Chingmeirong, 2 T.B. Clinics, one
each at Churachandpur and Ukhrul and 4 District T.B. control centres one each at Imphal,
Senapati, Tamenglong and Chandel are functioning since 1984-85.
The B.C.G. vaccination programme which is one of the most important Component of
the T.B. Control Programme continued to provide B.C.G. vaccination to all eligible Children.
R.N.T.C.P. project funded by the World Bank has been complemented in all the
districts of Manipur State. Under the project, at present, there are more than 500 DOTS (Direcly

194
Observed Treatment Short Course) Centres, 13 TUs (Tuberculosis Units) and 49 DMCs
(Designated Microscopy Centres).
9.5.1.5 National Programme for Control of Blindness (NPCB):
The objective of this programme is to reduce the incidence of blindness from the
estimated level of 1.35% to 0.7%. During 2007-08, 2008-09 and 2009-10 the number of
patients treated with Cataract Operation under NPCB was 210, 268 and 934 respectively.
9.5.1.6 Maternal Child Health-Cum-Expanded Programme on Immunisation: In order to curb the infant mortality rate and to provide safeguard against serious
diseases, an intensive ‘Child Immunisation Programme’ is being implemented in the State.
The objective of the programme is to cover 100 percent of pregnant women with 2 or a boosters
dose of T.T. and at least 85 percent of the infants with 3 doses of D.P.T. and Polio and one
dose of B.C.G and measles vaccine. Performance of the Programme was remarkable during
2000-01.
9.5.1.7 National Aids Control Programme : AIDS (Acquired Immuno Deficiency Syndrome) has become a major public health
problem in the state since 1990. It is affecting a number of youths in Manipur. According to
the National AIDS Control Organisation (NACO), Manipur ranks third highest as regarding
the total number of HIV positive cases next to Maharashtra and Tamil Nadu states. The State
Government with the help of National AIDS Control Organisation took up various activities in
order to advert this looming catastrophic. The following measures were taken up (i) 100 percent
blood safety has been achieved in all the blood banks in Manipur (ii) AIDS education in school
has been introduced beginning from class VI, VII, VIII and X (iii) More than 81 percent of
doctors and 80 percent of nurses/paramedicals have been trained in AIDS and related problems
(iv) For the first time in India, the Manipur state AIDS policy was implemented (v) the number
of NGOs financially supported by the National AIDS Control Programme has been increased
(vi) Broaden partnership with NGOs. During the years 2004 and 2005, 6,854 and 1,745 nos. of
blood samples were screened out of which 2,019 in 2004 and 515 in 2005 were reported to be
of HIV positive cases. During the year 2002 (upto Oct.), 4,495 nos. of blood samples were
screened and 1,191 were reported as HIV positive. During 2005, 63 AIDS cases were reported
of which 14 were died. Table No. 9.14 shows the yearly trends of HIV/AIDS surveillance.
Table No. 9.14 Yearly Trends of HIV/AIDS Surveillance of Manipur (in Nos.)

195
Year Blood samples
screened HIV positive
cases Aids cases
Deaths due to AIDS
1 2 3 4 5
1999 3,436 1,037 196 29
2000 4,859 1,242 203 18
2001 4,329 1,192 286 51
2002 6,195 1,389 632 73
2003 5,423 1,419 1,187 133
2004 6,854 2,019 461 65
2005 1,745 515 63 14
Source: Manipur State AIDS Control Society, Imphal.
Among the districts, Ukhrul district had the highest Sero-positive rate (HIV positive
cases) followed by Chandel and Churachandpur districts. The rates were recorded as 43.86
percent, 34.51 percent and 33.01 percent respectively as on 31st March, 2005. The district-wise
distribution of HIV Positive Cases (Sero-Surveillance) was presented in Table No. 9.15.
Table No. 9.15 District-wise distribution of HIV Positive Cases (Sero-Surveillance) as
31st March, 2005
(in Nos.)
District Blood Samples
Screened
HIV Positive
Cases
Sero-Positivity
rate (percent)
District
(percent)
1 2 3 4 5
Senapati 2,389 591 24.74 4.02
Tamenglong 366 45 12.30 0.31
Churachandpur 3,026 999 33.01 6.79
Bishnupur 3,751 774 20.63 5.26
Thoubal 6,948 1,300 18.91 8.83
Imphal West 45,726 9,401 20.56 63.89
Imphal East
Ukhrul 1,546 678 43.86 4.61
Chandel 1,643 567 34.51 3.85
Total 65,395 14,355 21.95 97.55
Unknown 9,927 360 3.63 2.45
Manipur 75,322 14,751 19.54 100.00
Source: Annual Administrative Report, 2004-2005,
Directorate of Health Services, Govt. of Manipur.
It is observed that the maximum number of HIV positive cases are found in the age
group of 21 to 30 years (both in the case of male and female) followed by age group of 31 to
40 years. The minimum number of HIV positive cases are found in the age group of 0 to 10
years Table No. 9.16 presents the age-sex proportion of HIV positive cases (Sero-Surveillance)
in Manipur.

196
Table No. 9.16 Age-sex proportion of HIV positive cases (Sero-Survelliance) in
Manipur as on Oct., 2002
Age Group Number HIV positive
cases (percent) Male Female Total
1 2 3 4 5
0 - 10 219 151 370 3.50
11 - 20 770 150 920 8.72
21 - 30 4,830 1,099 5,929 56.16
31 - 40 2,229 528 2,757 26.12
41 & above 444 137 581 5.50
All ages 8,492 2,065 10,557 100.00
Unknown - - 7 -
Manipur 8,492 2,065 10,564 -
Source: Manipur State AIDS Control Society, Imphal.
9.5.1.8 National Iodine Deficiency Disorder Control Programme ( NIDDCP)
Iodine deficiency is also one of the major public health problem in Manipur. The
objective of this programme is to reduce the prevalence rate to below 5% as against 13% in
1996 and to achieve 100% household consumption of iodized salt.
9.5.1.9 National Rural Health Mission(NRHM)
Inorder to provide accessible, affordable and accountable quality health services even
to the poorest households in the remotest rural region, the NRHM was launched in 12th April,
2005. In the North Eastern Region of India, the North Eastern Regional Resource Centre is
playing a critical role in developing need-based programmes in the region. In Manipur, Health
Societies were formed at State and district level. Rogi Kalyan Samiti were established at J.N.
Hospital. District Hospitals of Churachandpur and Bishnupur were started upgrating to Indian
Public Health Standard (IPHS) level. Sufficient manpower including AYUSH doctors and
ASHAs has been deployed for implementing this programme. During April to December,
2008, 5347 women were benefitted under Janani Suraksha Yojana (JSY) and 47 percent of
infant were fully immunized up to November 2008.
9.6 Water Supply and Sanitation :
Water is a chemical compound. It is a basic necessity of life. One of the essential
services rendered by any state is ‘safe drinking water supply’. Safe drinking water supply and
basic sanitation are vital human needs for health and efficiency. Every year, diseases and death,
particularly of children and drudgery of women are directly attributable to lack of these

197
essentials. Considering these needs, the National Water Policy gave highest priority to water
and sanitation especially in rural areas as the urban areas is provided with piped water supply.
9.6.1 Rural Water Supply:
Rural Water Supply facilities are provided to the people in rural areas under centrally
sponsored Minimum Need Programme (MNP) and Accelerated Rural Water Supply
Programme (ARWSP). The total number of habitations in rural areas in Manipur as on 1st April,
2007 was 2,868. Out of which 788 (27.48 per cent) habitations were fully provided with
drinking water facilities. Up to the 1st April of 2010, 1,163 (40.52 per cent) out of 2870
habitations were fully provided with drinking water facilities with an increase of 13.04 per cent
over 2007. The status of coverage of habitations are given in Table No. 9.17
Table No. 9.17 Number of Habitation Covered by Rural Water Supply
as on 1st April, 2010
Status Total number of habitations Percentage of habitations covered
1 2 3
F.C. habitations 1,163 40.52
N.C. habitations 482 16.80
P.C. habitations 1,225 42.68
Total 2,870 100.00
F.C. – Fully Covered, N.C. – Not Covered P.C. – Partially Covered
Source: Annual Administrative Report, 2004-05, 2007-08 and 2009-10
P.H.E. Deptt., Manipur.
9.6.2 Urban Water Supply :
Urban Water Supply facilities are provided to the people in urban areas under two
divisions viz. Imphal Water Supply and other Accelerated Urban Water Supply Programme
(AUWSP). There are 33 towns in the state with a population of 5.76 lakhs as per 2001 census.
Water Supply facilities presently extended to some of the towns are at rural standard. In the
urban areas, drinking water supply facilities are provided through piped water supply systems.
9.6.2.l Imphal Water Supply: The water demand of Imphal City and its suburbs by the end of 31-3-2010 has been
assessed at 101.92 MLD. The total installed capacity of the existing treatment plants for Imphal
Water Supply was 101.37 MLD. But the actual production is hardly 70.00 MLD (having a
shortage of 31.92 MLD). The water requirement by the end of 2036 is expected to be 156.46
MLD. The Department has formulated a project report for augmentation of water supply for

198
Imphal City Phase-I (capacity 29.50 MLD) to bridge the present gap of 31.92 MLD and also
future gap between the ever increasing demand and the supply.
The main achievement during the Tenth Plan was the completion of Replacement of
pipeline from Leimakhong to Kangchup and Kangchup to Iroisemba and construction of 6.81
MLD capacity water Treatment Plan at Irilbung (95% completed), the same at Canchipur 6.81
MLD capacity (85% completed), Ground Water Supply at Potsangbam & Sekmai PH-II, 6.81
MLD (90% completed) under Augmentation of Water Supply for Imphal City PH-I
(29.50MLD) (NLPR). Commissioned one RCC Overhead Tank Service Reservoir near
Assembly Complex and replacement of old pipes and extention of clear water main pipes was
also done.
9.6.2.2 Other Towns (Water Supply):
The water demand for all other towns was estimated 30.10 MLD in 2008 AD. The
anticipated water demand will be around 31.60 MLD by 2011 AD. All these towns have been
extended with water supply facility at the rural standard (i.e. at the rate of 40 litres per capita
per day). Upgradation of water supply schemes of other towns at the urban standard of supply
i.e. 70 lpcd (litres per capita per day) are taken up in phases since the Ninth Five Year Plan
Period (1997-2002). Upto the Tenth Plan augmentation of schemes for 18 towns were
achieved to cover under Accelerated Urban Water Supply Programme (AUWSP). So far
augmentation works to 14 towns have been completed by the end of 2008-09 and 4 town during
2009-10.
In addition 6 (six) other towns are also to be further augmented under urban
Infrastructure Development Scheme for Small and Medium Town (UISSMT) are taken up
during 2009-10 with a service level of 135 lpcd as against the existing urban standard of 70
lpcd.
9.6.3 Sanitation :
Sanitation covers arrangements for drainage of rain water and effluents, collection and
disposal of garbage and removal of human excreta. Proper sanitation is necessary condition for
improvement in general health standards, productivity of labour force and quality of life.
Sanitation has two aspects to it viz. (i) Rural Sanitation and (ii) Urban Sanitation.

199
9.6.4 Rural Sanitation :
Rural Sanitation has been one of the most neglected sectors. In this regard, Rural in
Manipur has remained as primitive as ever. The Government of India has now restructured
Rural Sanitation Programme under the name of Total Sanitation Campaign with an objective
of to provide sanitary latrines to every household of the state. So far 17 nos. of Rural Sanitation
Mark/Production centre has been established and 32,764 nos. of Individual household latrines,
142 nos. of Sanitary Complex and 787 nos. of Sanitary Latrines for schools have been
constructed. In addition total sanitary has been achieved in Maklang village (Imphal West
district) and Utlou (Bishnupur district).
9.6.5 Urban Sanitation : For the upliftment of Urban Sanitation and drainage of the urban areas, a technical
clearance of Rs. 36.69 crores has been given by the Ministry of Urban Development,
Government of India, New Delhi, for the construction of 5 (five) basines viz. Nambul, Waishel,
Kongba, Imphal and Chandranadi basins of Greater Imphal area. Construction of 47,226 RM.
of pucca drain and resectioning of 51,661 RM. were completed by the end of March 2007. The
length of the pucca drain constructed during the year 2007-2008 was 5000 RMs. and the length
of resectioning was 0.00 RM. as against a target of construction of 5000 of pucca drain and
6000 RM. of resection of the existing natural drains.
For the conveyance and treatment of sewage for Imphal town and Imphal Sewerage
Project (Phase-l of Zone-I) has been accepted by the DEA, Government of India. The Project
which kicked off from the month of September, 2002 is firstly targeted to be completed within
4 (four) years but the completion is again targeted by March 2012.
9.7 Development of Scheduled Tribes, Scheduled Castes and Other Backward Classes: Of the total population of 21.67 lakhs of the state as per 2001 census which excludes
the three sub-divisions of Senapati District, viz., Mao-Maram, Paomata and Purul, Scheduled
Tribes and Scheduled Castes population constitutes 34.20 percent (741141 persons) and 2.77
percent (60037 persons) respectively. The majority of the scheduled tribe people live in the
five hill districts of the state which is tribal sub-plan area and on the other hand, the
scheduled castes people mostly resides in the three valley districts. The tribal sub-plan covers
about 90 percent of the total geographical area of the state of 22,327 Sq. kms. According to the
Tribal Bench Mark Survey 1982, 92 percent of the total families are cu1tivators of which 72
percent are engaged in jhum cultivation. The distribution of total working force in the
scheduled tribes and scheduled castes are indicated in the Table No. 9.l8 below.

200
Table No. 9.18 Distribution of working force in respect of Scheduled Castes and
Scheduled Tribes
Category Scheduled Tribe Scheduled Caste Total 1 2 3 4
(a) Cultivator 2,38,715 7,948 2,46,663
(b) Agricultura1 Labourer 6,620 1,912 8,532
(c) Livestock, forestry, fishing &
other allied activities 1,273 101 1,374
(d) Household Industries 2,961 617 3,578
(e) Other workers 34,161 2,370 36,531
Total 2,83,730 12,948 2,96,678
Source : Draft Ninth Five Year Plan, 1997-2002, Directorate for Development
of Tribals and Backward Classes, Manipur.
The State is implementing various development and welfare programmes for socio-
economic and educationa1 development of the scheduled castes, scheduled tribes and other
backward classes.
9.7.1 Welfare of Scheduled Castes & Scheduled Tribes: The Department of Development of Tribal and Scheduled Castes of the state
implemented various developmental and welfare programme for the speedy development in
the sphere of educational, social and economical status of the target group people. Various
schemes/programmes were undertaken during 2007-08. The approved outlay for the year is
Rs.2370 lakhs under this sector.
9.7.1.1 Infrastructure development programme : Under this scheme the Department took up various works like construction/repair/
renovation of inter village roads/wooden bridges, schools and hostel buildings etc. During the
year, 2009-10, construction of Residential School building at Gamnom Saparmaina, Tribal
market at New Lambulane, Imphal, ST. Hostel at Senapati and Tamenglong, Community Halls,
Marketing Sheds, Hostel Buildings and construction and reparing of Inter Village Roads and
Wooden Bridges were taken up in the scheduled tribes areas.
9.7.1.2 Family Oriented Scheme :
During the year 2009-10, 2130 nos. of S.T. and 238 nos. of S.C. families, are covered
under Rural Shelter programme. Under the Animal Husbandry based programme and
programme for encouragement of Tribal Arts and culture, the Department is awarded financial
201
assistance to 633 nos. of ST. families and 350 nos. of ST. youth club/voluntary organizations
respectively.
9.7.1.3 Housing Scheme:
Under this scheme 1950 members of scheduled tribe families and 60 numbers of
scheduled castes families are targeted to cover during the year, 2005-06.
9.7.1.4 Post Matric Scholarship and other assistances :
Under this scheme, the department awarded Post Matric Scholarship to 2,300
Scheduled Caste students up to the end of the February, 2006 and 35664 Scheduled Tribe
students up to the end of January, 2008 and 50,072 Scheduled Tribe and 1,614 Scheduled
Castes students upto the end of 2009-10.
9.7.2 Minorities and other Backward Classes :
Established in the year 1998, the Department of Minorities and Other Backward Classes
(MOBC) had taken up various schemes/programmes for the welfare and upliftment of
minorities and other backward class communities of the state. The common list of OBCs of
Manipur have been included in the central list of OBCS w.e.f. 24th May, 1995, based on which
certificates may be issued to the persons seeking benefits reserved in favour of OBCs.
Generally, persons belonging to the families which annual income are below Rs. 1.00 (one)
lakh comes under this category of OBCs. The meetei and meitei pangal (muslims) constitute
the major of OBCs and minorities who are mostly inhabited in the four valley districts. The
common list of OBC in respect of Manipur are presented in Table No. 9.19.
Table No. 9.19 Common list of Other Backward Classes in respect of Manipur
Name of Caste/Communities
Number
State list of
OBCs
Mandal list
1 2 3

202
A. 1. Badi (Nepali) 4 2 2. Damei (Nepali) * 4 7
3. Gaimay (Nepali) 4 10
4. Kami (Nepali) 4 17
5. Sarki (Nepali) 4 41
B. Meitei/Meetei (including Meitei Brahmin,
Meitei/Meetei Sanamahi and Meitei Rajkumar) 1 30
C. Meitei Pangal 2 30
D. Teli (who have been domiciled in Manipur
for 10 years and their descendants) 3 47
* Those living in Manipur as member of the domiciled community
since the 9th July, 1947 and their descendents.
9.7.2.1 Post Matric Scholarship-OBC (100% CSS) : This is a centrally sponsored scheme under Ministry of Special Justice and
Empowerment, Government of India. During the year 2009-10, the Government of India
sanctioned Rs. 115.48 lakhs to award scholarship to 10980 OBC students. An amount of Rs.
200.00 lakhs is proposed for 2010-11.
9.7.2.2 Post-Matric Scholarship-Minority (100%CSS)
This is centrally sponsored and containing programme. A sum of Rs. 284.73 lakhs was
utilized during 2009-10 for 97 renewal and 3325 fresh students.
9.7.2.3 Pre-Matric Scholarship-OBC (50:50) (SS:CSS)
This is a continuing programme. An amount of Rs. 100.00 lakhs (State Share) was
utilized to award scholarship to 28000 OBC students. An amount Rs. 60.00 lakhs is allocated
for 2010-11 as state share.
9.7.2.4 Pre-Matric Scholarship-Minority (25:75) (SS:CSS)
This is a continuing programme . A sum of Rs. 50.00 lakhs state share was utilized for
1248 students and another amount of Rs. 310.29 lakhs as central share will utilized soon for
9332 students. An amount of Rs. 80.00 lakhs is allocated for 2010-11 as state share.
9.7,2.5 Implementation of NGOs Scheme:
The scheme has been taken up to assist various NGOs working in their respective fields.
This is a centrally sponsored scheme with the central assistance of 90 percent. The remaining
10 percent are to be borned by the NGOs. So far 30 project proposals have been forwarded to
the Government of India.
9.7.2.6 Skill Development Programme :

203
An amount of Rs. 54.88 lakhs was utilized for implementation of schemes such as
Remedial Coaching Paramedical, Mobile repairing, Bamboo Craft training and Reed making
under this programme during 2009-10.
9.7.2.7 Pre-examination Coaching for weaker section :
The scheme will give benefit to those candidates who are going to apply for competitive
examinations conducted by Central and State Govt. for professional courses. 5 Centres are
running under this programme. Under this scheme, 90% of the project cost will be borne by
the Government of India and 10% by the NGOs.
9.7.2.8 Moulan Azad Education Foundation :
The scheme is exclusively for the minority muslim community for establishment of
residentia1 schools/hoste1s for strengthening new trade courses in technical or professional
institutions.
9.7.2.9 Wakf Board, Manipur :
During the year 2009-10, the State Govt. have released a sum of Rs. 33.00 1akhs as grant-
in-aid for meeting the overhead office expenditures and implement development schemes by
the Wakf Board, Manipur. An amount of Rs. 33.00 lakhs is allocated for 2010-11.
9.7.2.10 Economic Development Programme :
Under this Programme, 7573 numbers of beneficiaries belonging to both Minority and
OBC communities have been benefited at a cost of Rs. 655.85 lakhs. An amount of Rs. 3396.75
lakhs is proposed to cover 34,500 nos. of families during the period 2005-2011.
9.7.2.11 Women Empowerment :
Realising the importance of the roles played by the women of the state, the Deptt. has
implemented skill upgradation and Self-help group training-cum-Micro Credit Programme.
9.8 Social Welfare :
In a welfare state, the Social Welfare Programme aims at the welfare of the weaker
sections of society like destitutes, infirms, physically and mentally handicapped etc. To protect
them from injustice and all forms of exploitations, Government is running various institutions
such as Anganwadi Centres, Destitute Homes, Children Homes or Orphanage etc.
9.8.1 Integrated Child Development Services (ICDS) :

204
For all-round development of children-mentally, emotionally and physically, 38 ICDS
project centres are now being run by the Department spreading over the 9 (nine) districts of
Manipur, Covering 33 blocks and 1 (one) urban ICDS project. For overall control and
supervision of various welfare programmes, 1 (one) ICDS cell at the State Head Quarter at
state level and 6 ICDS cells at District level have been established. As on 31st March, 2010,
there are 9418 Angawadi Centre and 236 Mini Angawadi Centres functioning under the 38
ICDS projects including one urban Project. These centres are actively associated with the
programme in giving nutrition, education, demonstration, health and immunisation of children
etc. During 2009-10, 90640 boys and 90535 girls within the age group of 3 to 6 years had been
given the knowledge of Pre-School education and 347886 children of 6 months to 6 years and
69224 Pregnant and Lactating Mothers were been given Supplementary Nutrition. The
number of institutions engaging in social welfare activities are shown in Table No. 9.20.
Table No. 9.20 Number of Organisations/lnstitutions engaging in Social Welfare as on
31st March of the year from 1995-96 to 2010-11.
(in Nos.)
Organisations/Institutions 1995-96 2000-01 2001-02 2002-03 2003-04 2004-05
1 2 3 4 5 6 7
Anganwadi Centre 4,157 4,300 4,461 4,501 4,501 4,501
ICDS Project 34 34 34 34 34 34
Blind School 1 1 1 1 1 1
Deaf and Mute School 1 1 1 1 1 1
Children Home/Orphanage 8 8 8 8 8 8
Destitute Women Home 2 1 1 1 1 1
Anganwadi Training Centre 2 4 1 1 1 1
Contd.
(in Nos.)
Organisations/Institutions 2005-06 2006-07 2007-08 2008-09 2009-10 2010-11
1 8 9 10 11 12 13
Anganwadi Centre 4501 4501 7369 9107 9418 9425
ICDS Project 34 34 38 38 38 38
Blind School 1 1 1 1 1 1
Deaf and Mute School 1 1 1 1 1 1
Children Home/Orphanage 8 8 8 8 8 8
Destitute Women Home 1 1 1 1 1 1
Anganwadi Training Centre 34 34 34 34 34 34
Concld.
Source: Directorate of Social Welfare, Govt. of Manipur.
The Department has been extending grant-in-aid to 8 (eight) destitute Homes run by
eminent NGOs for care and maintenance of the destitute, orphan and neglected children.
Altogether 321 destitute/orphan/neglected children have been provided shelter and care in these

205
Homes. A sum of Rs. 60.00 per child per month in the age group of 6 to 14 years were given
to 288 school going destitute children living below poverty line.
The State Bal Bhavan at Khuman Lampak, which is recreational-cum-educational
centres, has been providing training facilities in various fields like music, dance, science, home
management, computer etc. But kendras in the tribal areas of Senapati and Churachandpur
districts has been opened for the benefits of the children of this remote areas by providing
facilities under Bal Bhavan.
9.8.2. Welfare of Aged & Infirmed:
Under MOAP (Manipur Old Age Pension) Rules, 4172 old persons were given old age
pensions at the rate of Rs. 100.00 per month per head up to Feb., 2002. During the year 2004-
05, the Government has been providing old age pension to 26,907 persons in the state. The
pension was paid to the destitutes above 60 years of age and having none to support them. The
district-wise loans and grants distributed to the economically weaker sections of Manipur is
indicated in Table No. 9.21.
Table No. 9.21 Loans and Grants Distributed by the Government to the economically
weaker sections in Manipur during 2004-2005
District/State
Old Age Pension Assistance to Dependent
Children
No. of
beneficiaries Amount (in Rs.)
No. of
beneficiaries
Amount (in
Rs.)
1 2 3 4 5
Senapati 1845 22,14,000 NA NA
Tamenglong 719 8,62,800 NA NA
Churachandpur 1916 22,99,200 NA NA
Ukhrul 1733 20,79,600 NA NA
Chandel 940 11,28,000 NA NA
Hill Total 7,153 85,83,600 NA NA
Imphal East 5383 64,59,600 NA NA
Imphal West 7421 89,05,200 NA NA
Bishnupur 2414 28,96,800 NA NA
Thoubal 4536 54,43,200 NA NA
Valley Total 19,754 2,37,04,800 NA NA
Manipur 26,907 3,22,88,400 NA NA
Source: Directorate of Social Welfare, Govt. of Manipur.

206
Besides this scheme other two schemes viz. National Maternity Benefit Scheme and
National Family Benefit Scheme were implemented under National Social Assistance
Programme (NSAP) for giving financial assistance to the family below poverty 1ine. Under
National Maternity Benefit Scheme, .the financial assistance is given to the family below
poverty line on the birth of a child whereas under National Family Benefit Scheme, the
financial assistance is given to the family belonging to below poverty line when the head of the
family who is primary bread winner of the family dies. Under the NFB Scheme 2,700 families
were benefited during the year 2006-07.
9.8.3 Welfare of the women : The department accommodated 11 (eleven) working women at the department’s
working Ladies Hostel at Takyel. An annual state grant was also given to one Destitute Women
Home at Imphal. Under centrally sponsored scheme of “Balika Samardhi Yojana” (BSY), 3208
girl child were given benefits of Rs.500 each as post delivery grant. This grant has been given
through the mother of the girl child. The Kishore Shakti Yojana (KSY) renamed from the
erstwhile Adolescent Girls Scheme (AGS) has been launched in 13 ICDS Projects in Manipur
with an aim of laying healthy foundation of girlhood to become womenhood of the Girl-Child
in the age-group of 11 to 18 years.
9.8.3.1 Welfare of Disabled women : Under this Scheme, 2 (two) special schools viz. Govt. Blind School and Govt. Deaf and
Mute School have been successfully continuing its educational programmes.for the disabled
children (blind, deaf and mute). The monthly diet allowance of ;Rs. 500.00 per month have
been provided to the hostellers of these two schools. Disabled students, scholarship were also
extended to 142 students. With the implementation of a central scheme known as “Grameen
Purnavas Yojana”, 18 wheel chairs/tri-cycles were distributed to the disabled persons.
9.8.3.2 Correctional Services : With the enforcement of Juvenile Justice Act, 1986, in the state, the Department has
been implementing the Central Sponsored Scheme of "A Programme for Juvenile Justice." One
observation Home, one Juvenile Home and one Special Home has been established under this
scheme. The observation and Special Homes has been engaging and handling the Juvenile
delinquents sent by Juvenile Court Magistrate. During the year 2001-02, 2 (two)
boys/delinquent Juveniles have been kept at the Home under orders of Juvenile Court.
9.9 Arts and Culture : The department of Arts and Culture, which came into existence in January, 1990, is
engaged in activities of (i) preservation of cultural heritage, (ii) promotion of art and culture.
To promote and preserve the rich cultural heritage of the state, the department has been
organising a number of Cultural Programmes inside and outside the state.
9.9.1 Fine Art Education : Under Fine Art Education, grant-in-aid to Manipur State Kala Academy and Imphal
Art College was extended for organising festivals/seminar/symposium etc. During the year
2001-02, Shri Shri Bal Mukunda Dev Music College and Govt. Dance College were
established. The construction of cultural complex has been taken up during the said year.

207
The Imphal Art College, the only College of its kind in Manipur has been functioning
as a standard college comparable to other Arts Colleges of other states. The College has been
affiliated to Manipur University. The total number of students during the year 2001-02 was 97.
A total of 9 (nine) lecturers and 6 (six) students of this college were awarded State Kala
Academy Award.
The Government Dance College has been functioning with the objectives of
propagation and spread of knowledge of Manipur Dance, its pristine, purity among the people
of' Manipur and other states of India. Altogether 77 student were undergoing various courses
in the fields of classical Manipur Dance and Folk dances of Manipuri Laiharouba, Kabui dance
and Mao dance etc. During the year 2001-02, 366 students were enrolled in Govt. Music
College (now renamed as Shri Shri Bal Mukunda Dev Music College).
9.9.2 Promotion of Arts & Culture: The Manipur State Kala Academy, a composite Centre of Sahitya, Fine Arts and Dance
& Music are regularly implementing various programmes in order to promote the unique
cultural heritage of the state. 64 cultural personalities have got National Awards in different
fields of culture w.e.f. 1956 till date. The Academy is conducting Sumang Leela Festival in
regular basis. Under promotion of Art and Culture, the grant-in-aids are extended to voluntary
organisation working in the, field of theatre, dance and music, public libraries and also to
Manipur Film Development Corporation. The Manipur Film Development Corporation Limited came into existence on 1.5.1987.
It was established with the objective of upliftment of film industry in the state. Till date
Manipur could produce 56 feature films and 50 documentary films. These have earned
prestigious awards both at the national (10 nos.) and international (9 nos.) levels. This is
definitely no mean achievement as the film lovers of the state toil under impossible
circumstances.
9.9.3 Archives: The state Archives collects a number of valuable old records from the government
departments/semi government offices/custodian and from individuals for preservation. The
reprographic unit and micro film units have also been maintained to take necessary measures
for the preservation and rehabilitation of the valuable records. Till the year 2001-02, the state Archives is preserving the number of 25,522 noncurrent
records including books, papers, maps, photographs etc. which are more than 25 years old and
the number of 18,812 other record which are less than 25 years old. A proposal for construction
of a permanent ‘Stack Area’ within March 2008 was submitted under the 12th Finance
Commission as first phase.
9.9.4 Library:
There are 10 (ten) Government public libraries in Manipur. This includes 1 (one) central
library at Imphal, 8 (eight) hill district libraries, and one branch library of the State Central
Library, Impha1 at Ningthoukhong of Bishnupur district. Moreover, there are 130 beneficiary,
libraries run by clubs/voluntary organisations/libraries which are reorganised by the State
Government and treated as public libraries. After the State Central Library was burnt on
13.4.05, the library started running in the new building at the State Central Library and
Manipur State Archives at Keishampat. Now, there are 47,234 books and 51 Nos. of
regular News paper/journals. The following Table No. 9.22 shows the number of books
available and the number of borrowers for the years 2007-08 to 2009-10 in Manipur.

208
Table No. 9.22 Number of books available in the Libraries in Manipur 2007-08 to
2009-10
Year No. of books available No. of borrowers 1 2 3
2007-08 19,500 NA
2008-09 31,500 NA
2009-10 47,234 400
Source: Annual Administrative Report, Department of Arts & Culture
9.9.5 Archaeology : The State Archaeology office has been conducting numerous systematic exploration
and scientific excavation at different parts of the state.The important Pre-historic sites of (i)
Khangkhui Cave, Ukhrul district (ii) Napachik Wangoo, Bishnupur district (iii) Nongpok
Keithelmanbi, Thoubal district (iv) Tharon Cave and Rock Shifters Tamenglong district etc.
were the results of these systematic excavation and exploration. Besides these, Proto-historic
and historical sites of (i) Sekta Kei Mound, Sekta, Imphal East district (2) Khamrou, Imphal
West district (3) Sangai Yumpham. Langthabal and (4) Koutruk, Imphal West district etc. have
also been discovered and excavated. Till date 37 historical monuments have been declared as
protected monuments and 861 Antiquites and Art objects have been registered.
Under the State Plan Assistance, the State Archaeology will develop the Maharaja
Gambhir Singh Memorial Samadhi, Langthabal within 2007-08.
9.9.6 Museum :
Having been established on 23rd September, 1969, Manipur State Museum has now
become a full-fledge Museum. At present, it has 7 Gallaries viz. (i) Ethnological Gallary (2)
Archaeological Gallary (3) Natural History Gallary (4) Children’s Gallery (5) Art Gallery and
(6) Jallan's Gallery (7) Hiyang Hiren open Art Gallary. There is also one Museum at the INA
Memorial Complex, Moirang where the museum objects of the 2nd world war particularly for
the Indian National Army (INA) has been exhibiting. The latest collection by the State Museum
are given below :
(a) Personal belongings of (L) Potsangbam Mani Singh, Nongthombam/Pukhramba (C 1891-
1995 A.D.) (b) Tribal ornaments (c) A very rare fossil (tooth) of Elephant presented by
Sadokpam Rajeshwor Singh, Phaknung Awang Leikai (d) 50 (fifty)nos. of stamps presented
by O. Tomba Singh (e) Shami Lanmi Phee presented by Meisnam Lalini Devi, Wangkhei and
(f) Personal property of (L) Ph. Madhumangol Sharma, who served as Hanjaba during Maharaj
Budhachandra (1941-1955).

209
9.10 Tourism :
The State of Manipur, though tiny in size has immense scope for promotion of tourism
with an area of only 22,327 Sq. kms. It is situated in the eastern-most fringe of the country. It
has a salubrious climate, exotic greenery and rich flora besides the rich culture. The state can
broadly be divided into two parts, the valley and the hill. The location of the valley is such that
it is being surrounded by a rows of rolling hills forming preventive barrier isolating the state
from the rest of the country.
There are many places in Manipur which can be developed as tourist centres. Keibul
Lamjao National Park on the bank of the Loktak Lake, the only habitat of Brow Antlered Deer
locally known as ‘Sangai’. INA (Indian National Army) Memorial at Moirang where INA
hoisted tricolour flag for the first time on Indian soil, Siroy National Park at Ukhrul, Loktak
lake, the biggest fresh water lake in the North-Eastern Region and Khongjom War Memorial,
where the last war of Manipur Independence was fought, are the major tourist spot of the state.
Besides there are other places which are worth seeing and which possessed immence potential
for developing into a good tourist spot.
In order to facilitate the movement of tourist in the state, the Directorate of Tourism,
Manipur has been providing various infrastructura1 facilities for incoming tourists. The
Directorate is managing the tourist homes at Sendra. Moirang, Phubala, Churachandpur, Kaina,
Khongjom, Tamenglong and Ukhru1 for accommodation of tourist visiting the areas. Hotel
Imphal at the heart of capital town Imphal has been improved with modern amenities.
To improve tourism industry, various schemes/projects are taken up under the central
prioritised schemes at different locations such as Tourist Home at Jiribam and Rengpang.
Besides these, the way-side amenities at Kangpokpi, Khonghampat, Litan, Santing are also
completed. In order to provide accommodation to tourist, the Directorate has also taken up
steps for construction of Yatri-Niwas and Health Resort at Imphal.
9.10.1 Progress of Tourism :
The tourist traffic in Manipur is very encouraging. The arrival of foreign and domestic
tourists during the year 2010-11 was 431 and 1,16,652 thousands respectively. As a new
guideline was issued by the Ministry of Tourism, Government of India which considered only
tourist who stay overnight as tourist, by excluding daytime visitors and also as some of tourist
Home are presently occupied by security personnels, the total number of tourist during 2011-
12 was 1,33,826 as against 1,17,083 in 2010-11, with a an increased of 16743 over 2010-11.
The volume of tourists traffic and magnitude of revenue earnings in the state are presented in
Table No. 9.23 and the district-wise tourists spots and tourist during 2010-11 & 2011-12 are
shown in Table No. 9(d) of Part II.

210
Table No. 9.23 Progress of Tourism in Manipur
Year No. of
tourist spot
No. of tourist Revenue
(Rs. in lakhs) Foreign Domestic Total
1 2 3 4 5 6
1994-95 29 370 82,798 83,168 1.86
1995-96 29 288 84,025 84,313 1.70
1996-97 29 219 87,074 87,293 2.11
1997-98 31 173 91,620 91,793 5.19
1998-99 31 294 89,664 89,958 0.64
1999-00 29 335 99,399 99,734 18.55
2000-01 29 409 1,03,854 1,04,263 0.74
2001-02 41 131 73,842 73,973 1.00
2002-03 41 227 89,829 90,056 0.70
2003-04 41 296 93,430 93,726 0.93
2004-05 41 248 97,054 97,302 NA
2005-06 41 348 93,331 93,679 NA
2006-07 42 263 1,20,572 1,20,835 NA
2007-08 54 460 1,01,000 1,01,460 NA
2008-09 54 271 1,15,300 1,15,571 NA
2009-10 54 405 1,27,524 1,27,929 NA
2010-11 54 431 1,16,652 1,17,083 NA
2011-12 54 602 1,33,224 1,33,826 NA
2012-13 57 768 1,31,803 1,32,571 NA
2013-14 57 1932 1,21,032 1,22,964 NA
Source: Directorate of Tourism, Manipur.
9.11 Empowerment of Women :
It is a well-known fact that the goal of poverty alleviation cannot he achieved without
the full and active participation of women who constitute a large section of work force. Thus
women’s empowerment is critical to the process of the development. Bringing women into the
mainstream of development is a major concern of the Government. Despite significant steps
undertaken for protection of women's rights and promoting their welfare, the status of women
continues to remain backward. The main cause for this is illiteracy and ignorance. In order to
empower women and bring them into the mainstream, an enabling environment with requisite
policies and programmes, institutional mechanisms at various levels and adequate financial
resources has been created. The year 2001 was declared as the Women’s Empowerment Year
by the Government of India. With gradual spread of education and empowerment, the position
of women has begun to change.
9.11.1 Females Literacy Rate :
There is a substantial increase in the number of educated women in the state. It is a fact
that after 1961 onwards the progress of women’s education in Manipur is higher, than that of
all India. From a mere 0.04 female literacy rate in 1901, it rose to 47.60 in 1991. According to

211
2001census, the female literacy is 53.70 percent. The female literacy rate of Manipur and All-
India during 1901 to 2011 are presented in Table No. 9.24.
Table No. 9.24 Female Literacy rate of Manipur vis-a~vis All-India
Census Year Manipur All-India
Persons Female Persons Female
1 2 3 4 5
1901 0.93 0.04 5.30 0.60
1911 2.05 0.12 5.90 1.10
1921 3.82 0.15 7.20 1.80
1931 3.25 0.30 9.50 2.90
1941 5.06 0.61 16.10 7.30
1951 11.41 2.38 18.33 * 8.86 *
1961 30.42 15.93 28.31 15.34
1971 32.91 19.53 34.45 21.97
1981 41.35 29.06 43.57 29.75
1991 59.89 47.60 52.21 39.29
2001 70.50 60.50 64.80 53.70
2011 79.21 72.37 72.97 64.64
*Excludes Jammu & Kashmir
9.11.2 Women in the Workforce:
Women constitute a significant part of the work force in the state. Amongst rural
women workers, a majority are employed in agriculture as labourers and cultivators. Women
as agricultural workers generally participate in all operations except ploughing. They are
engaged in transplanting, weeding, applying fertilizers and also harvesting the produce. In the
Urban areas, women workers are primarily employed in the unorganised sector such as
household industries, petty trades and services, construction works etc. According to 2011
census, 42.59 percent of the total workers in Manipur are women. The main and marginal
workers among females constitute 60.88 percent and 39.12 percent of the total female workers
respectively. Out of the total 3,00,494 main female workers,1,33,582 (44.46 percent) were
cultivators, 20,171 (6.71 percent) were agricultural labourers whereas the remaining 1,46,741
(48.83 percent) were engaged in other sectors like manufacturing, Processing, Servicing and

212
Repairing other than Household Industries and other services etc. Table No. 9.25 provides the
total female workers and non-workers of Manipur.
Table No. 9.25 Female workers and non-workers in respect of Manipur according to
2011 census
District/State Female Dependency
ratio Workers Non-workers Total
1 2 3 4 5
Senapati 37,867 56,969 94,836 150.44
Tamenglong 33,438 34,842 68,280 104.20
Churachandpur 52,061 83,262 1,35,323 159.90
Ukhrul 41,396 47,884 89,280 115.67
Chandel 33,623 35,980 69,603 107.01
Hill Total 1,98,385 2,58,937 4,57,322 130.52
Imphal East 77,286 1,52,733 2,30,019 197.62
Imphal West 84,847 1,78,091 2,62,938 209.90
Bishnupur 47,130 71,487 1,18,617 151.68
Thoubal 85,942 12,581 2,11,323 145.89
Valley Total 2,95,205 5,27,692 8,22,897 178.75
Manipur 4,93,590 7,86,629 12,80,219 159.37
9.12 Poverty:
Though the term poverty could not be defined precisely and though its concept and
content varies from country to country, in the Indian context, it manifests itself in its starvest
form as a visual of semi-starved, ill-clad, deprived millions of countrymen, thousands of them
dying everyday from malnutrition, ill-health and lack of basic amenities.
Poverty is a curse. It degrades human life. In fact, it is the root cause of all other
problems. It is synonymous with poor quality of life, deprivation, malnutrition, illiteracy and
low human resources.
The eradication of poverty has been an integral component of the strategy for economic
development. Defining a poverty line is the first step in estimating poverty. It is cut-off line
that separates the poor from non-poor, given size distribution of population by per-capita
consumer expenditure classes.
According to the 61st Round of the NSSO’s Sample Survey (July 2004 to June, 2005),
the poverty ratio (on a 30 day recall basis) fell to 17.3% in 2004-05 from 28.54% in 1999-2000.
It declined from 40.04 % to 22.3% in rural areas and from 7.47% to 3.3% in urban areas. Thus

213
the incidence of poverty expressed as a percentage of people living below the poverty line has
steadily declined from 50.01 % in 1973-74 to 17.3 % in 2004-05. The number of persons below
poverty line in 2004-05 was 3.95 lakhs as against 5.86 lakhs in 1973-74 . The percentage of
population bellow poverty line are presented in Table No. 9.26 and the poverty ratio at the
National and state level are shown in Table No.9(e) of part II.
Table No. 9.26 Number and percentage of population below poverty line in respect of
Manipur
(No. in lakhs)
Year
Rural Urban Combined
No. of
persons
Percentage
of Persons
No. of
persons
Percentage
of Persons
No. of
persons
Percentage
of Persons
1 2 3 4 5 6 7
1973-74 5.11 52.57 0.75 37.16 5.86 50.01
1977-78 6.09 59.82 1.11 37.58 7.20 54.83
1983-84 4.71 42.60 1.13 26.38 5.84 38.08
1987-88 4.68 39.35 0.85 17.34 5.53 32.93
1993-94 6.33 45.01 0.47 7.73 6.80 33.78
1999-00 6.53 40.04 0.66 7.47 7.19 28.54
2004-05 3.76 22.30 0.20 3.30 3.95 17.30
Source : Press Information Bureau, Govt. of Manipur.
(Based on 61st Round of NSS)
9.13 Labour and Employment :
The Department of Labour and Employment keeps an account of the existing working
force and the likely addition to it from time to time. The main function of the Labour
Department is to take necessary measures for the welfare of the labours working in the various
establishments of the state. It also amended rules and regulation to regulate the daily or weekly
hours of work, overtime holidays with pay, annual leave etc. concerning with labours and to
check employment of children and young persons etc. The Department is throughout two
schemes viz. (i) Administration of labour laws for enforcement, of minimum wages and labour
laws at the rural areas and (ii) legal aid to labour to protect the interest of rural labours by giving
legal aid to the workmen. These schemes were implemented during the Ninth Five Year Plan.
Besides these schemes, two more new schemes were proposed to be implemented during the
Tenth Five Year Plan period. The schemes are (i) Survey on child labour and Rehabilitation
and (ii) Survey on Bonded labour and Rehabilitation. It has also been proposed to conduct
surveys on the child labour below the age of 14 (fourteen) years employed in hazardous and
non-hazardous employment and on bonded labour system throughout the state for monitoring
the conditions of the child and bonded labours and rehabilitations.
9.13.1 Minimum Wages:

214
To protect the interest of the agricultura1 labourers, the minimum wages for unskilled
as well as skilled labourers have been revised from time to time. The minimum wage rates
fixed by the Govt. from the year 1990-91 to 2005-2006 are given below in Table No. 9.27.
Table No. 9.27 Average Daily wage rates of Manipur (in Rs.)
Year Unskilled Skilled
Hill Valley Hill Valley
1 2 3 4 5
1990-91 26.70 23.70 30.20 27.20
1991-92 26. 70 23.70 30.20 27.20
1992-93 38.70 35.00 41.50 38.50
1993-94 41.30 38.30 44.80 41.80
1994-95 43.94 40.94 47.44 44.44
1995-96 47.65 44.65 54.65 51.65
1996-97 50.50 47.50 57.50 54.50
1997-98 50.50 47.50 57.50 54.50
1998-99 64.25 61.25 67.55 64.55
1999-00 65.65 62.65 65.65 62.65
2000-01 65.05 62.05 65.05 62.05
2001-02 65.05 62.05 76.00 73.00
2002-03 65.05 62.05 76.00 73.00
2003-04 65.05 62.05 78.15 75.15
2004-05 73.45 70.45 80.45 77.45
2005-06 72.40 72.40 79.40 79.40
Source: Office of the Labour Commissioner, Govt. of Manipur
9.13.2 Manpower and Employment Schemes:
The State Employment Service has been working in three levels viz. (i) State level (ii)
District level and (iii) Town level. The main objectives of the employment service are (a) to
assist the employment seekers in finding suitable jobs according to qualification and experience
(b) to assist employers by providing suitable workers (c) to collect information regarding
employment opportunities, training facilities etc. and (d) to guide young persons and
employment seekers in re-orienting their training programme etc. according to the market
needs and (e) to motivate job seekers towards self employment by giving, upto-date
information of self employment opportunities.

215
The generation of employment opportunities is one of the main objectives of the
economic development in the state. Therefore, the employment opportunities and employment
in various categories of the population is quite, essential. Estimated employment in public and
private sectors of Manipur are 97 percent and 3 percent persons respectively as compared to
the 71 percent and 29 percent persons of all India.
9.13.3 Employment Situation:
17 (seventeen) Employment Exchange were opened for giving employment assistance
to the job seekers of the state. The number of persons newly registered in the employment
exchanges in the state during the year 2008-09 was 37,033 (including8,057 females) persons
as against 22,825 persons during the year 2007-08 showing an increasing of 62.25 percent. The
vacancies notified in 2008-09 was 4,667as against the 3,170 during the year 2007-08. There
were 2 persons placed in appointment during the year 2007-08 and 210 persons in 2008-09.
The consolidated Live Register of all Employment Exchanges stood at 6,42,247 (including
1,77,214 females) persons as on 31st March, 2009. The following Table No. 9.28 gives the
number of persons under the Live Register of the employment exchange in the state from 1995-
96 to 2010-11.
Table No. 9.28 Number of Registrants and placements effected by Employment
Exchanges of Manipur
Year
Particulars
No. of
Employment
Exchanges
No. of persons
registered
during the year
No. of
registrants
on the live
register
No. of
vacancies
notified
Submi-
ssion
made
No. of persons
placed in
appointments
1 2 3 4 5 6 7
1995-96 11 30,135 2,76,157 596 16,246 143
1996-97 12 27,938 2,99,881 1,959 64,326 579
1997-98 13 31,007 3,22,253 642 17,103 429
1998-99 13 37,861 3,54,269 1,108 51,327 162
1999-00 15 35,760 3,87,890 2,083 74,609 69
2000-01 16 14,777 3,97,304 451 14,197 2
2001-02 16 15,866 4,09,652 55 1,301 -
2002-03 17 10,027 4,17,338 215 2,735 5
2003-04 17 32,466 4,48,435 1,469 30,294 -
2004-05 17 43,857 4,91,476 1,019 20,984 -
2005-06 17 58,458 5,48,704 3,273 1,05,882 489
2006-07 17 35,475 5,83,653 3,011 74,339 357
2007-08 17 22,825 6,05,840 3,170 52,707 2
2008-09 17 37,033 6,42,247 4,667 61,923 210
2009-10 17 31,607 - 2,344 29,512 3
2010-11 17 16,057 6,89,119 1,096 19,339 644
- Not available

216
Source: Directorate of Employment, Govt. of Manipur.
Due to ever-increasing number of educated Job seekers including technical and
professional job-seekers, the problem of unemployment is continuing to be a matter of serious
concern to the state's economy. This perennial problem can be observed from the data made
available by the State Employment Exchange. According to the Live Register of Employment
Exchange, the total number of educated job-seekers was recorded as 685.34 thousands as on
31st March., 2011 as against 673.81 thousands as on 31st March, 2010 showing an increase of
1.71 percent over the previous year.
Of these 685.34 thousands educated job-seekers, 249.53 thousands were under matric
227.78 thousands were matriculate, 112.55 thousands were intermediate level, 74.03 thousands
were graduates (including arts, science, commerce, technical and law), 13.07 thousands were
post graduate (including arts, science, commerce, agriculture and law and others) and 8.38
thousands were diploma holders (including Engineering and Technology and others). The
category-wise number of educated job-seekers is shown in Table No. 9.29 and a break-up of
Scheduled Caste & Scheduled Tribe educated job seekers are given in Table No. 9(f) of Part
II. Table No. 9.29 Category wise number of educated job seekers in Manipur for the year
2010-11
Level of Education Candidate Percentage
to total Male Female Total
1 2 3 4 5
1. Under Matric 2,18,755 30,772 2,49,527 36.40
2. Matriculate 1,52,208 75,576 2,27,784 33.24
3. P.U.C./ Intermediate/ Higher
Secondary 71,746 40,806 1,12,552 16.42
4. Graduate 46,156 36,253 74,025 10.80
(a) Science 12,370 8,011 20,381 2.97
(b) Arts 25,232 20,775 46,007 6.71
(c) Commerce 1,116 520 1,636 0.24
(d) Engineering 1,865 265 2,130 0.31
(e) Medical 352 1,404 1,756 0.26
(f) Agriculture/Agri-Engineering 435 153 588 0.09
(g) Law 299 153 452 0.07
(h) Education 284 584 868 0.13
(i) Veterinary 167 40 207 0.03
5.Diploma holder 4,036 3,870 8,384 1.22
(a) Engineering and Technology 3,380 3,817 7,197 1.05
(b) Others 656 531 1,187 0.17
6. Post-Graduate 7,003 6,069 13,072 1.92
(i) Arts 3,446 3,210 6,656 0.97
(ii) Science 2,758 2,421 5,179 0.76
(iii) Commerce 510 222 732 0.11
(iv) Agriculture 41 23 64 0.01
(v) Education 24 55 79 0.01
(v) Law 10 8 18 0.00
(vi) Others 214 130 344 0.05

217
Total 4,95,868 1,89,476 6,85,344 100.00
Source: Directorate of Employment, Govt. of Manipur.
9.13.4 Employment in Organised Sector :
The total number of persons employed in the organised sector in the state was 80.6
thousands as on 31st March, 2005. Out of the total persons employed in organized sector, 78.0
thousands was public sector and the remaining 2.6 thousands was private sector. In the public
sector the share of employment in Central Govt. was 5.77 percent State Govt. was 79.36
percent, Quasi Central & State Govt. were 5.38 percent and 4.36 percent respectively. The
employment in the organised (public and private) sectors are presented in Table No. 9.30 and
the break-up of public and private sectors of employment are shown in Table No. 9(g) of Part
II.
Table No. 9.30 Employment in organised sector of Manipur (as on 31st March)
('000 nos.)
Year
Employment in organised sector Percentage change over previous
year
Public Private Total Public Private Total
1 2 3 4 5 6 7
1995-96 73.4 5.2 78.6 - - -
1996-97 74.2 5.3 79.6 1.09 1.92 1.14
1997-98 74.7 5.8 80.5 0.67 9.43 1.26
1998-99 76.1 6.0 82.1 1.87 3.45 1.99
1999-00 75.8 6.2 82.0 (-) 0.39 3.33 (-) 0.12
2000-01 76.5 6.6 83.1 0.92 6.45 1.34
2001-02 76.2 6.6 82.8 (-) 0.39 0.00 (-) 0.36
2002-03 NA NA NA - - -
2003-04 78.0 2.6 80.6 2.36 (-)60.61 (-)2.66
2004-05 78.0 2.6 80.6 0.00 0.00 0.00
NA – Not Available
Source: Statistical Abstract of India.
9.13.5 Employment in State and Central Government :
There are 806 establishments of State Government in the state which is having
employment 65,208 employees as on 31st March, 2009. Out of this establishments, the State
Government establishments accounts for 746 nos., the local bodies 12 nos. and the quasi

218
government state 48. Table No. 9.31 provides the district-wise number of establishments in
public sector as on 31st March, 2009 and the no. of establishments in public sector are shown
in Table No. 9(h) of part II.
Table No. 9.31 District-wise number of establishment in Public Sector during 2010-11
District/State
Number of establishments
Central
Govt.
State
Govt.
Quasi Govt. Local
Bodies
Total
Central State
1 2 3 4 5 6 7
Senapati - 56 - 2 2 60
Tamenglong - 49 - 1 1 51
Churachandpur - 49 - 3 1 53
Chandel - 50 - 1 1 52
Ukhrul - 73 - 2 1 76
Imphal East - 126 - 6 1 133
Imphal West - 210 - 25 2 237
Bishnupur - 61 - 1 1 63
Thoubal - 61 - 1 2 64
Manipur - 735 - 42 12 789
- Not available
Source: Directorate of Employment, Government of Manipur.
As per the census of Govt. employees, the total number of employees working under
the State Government was 58,172 as on 31st March, 2009. This shows a decrease of employees
as compared with 60,982 employees as on 30th June, 2006. The number of employees working
under State Quasi Govt. decrease to 2,459 in 2009 from 7,844 in 2006 however, employees of
Local bodies rise to 4,577 from 3,868 in 2006. Table No. 9.32 presents the number of
employees in public sector and the district-wise male-female break-up of employees in public
sector are shown in Table No.9(i) of part II.
Table No. 9.32 Number of employees in Public Sector in Manipur
Item
2008-09 2009-10 2010-11 Percen-
tage
change
over the
previous
year
Male Female Total Male Female Total Male Female Total
1 2 3 4 5 6 7 8 9 10 11
I. Central Govt. - - - - - - - - - -
II. State Govt. 43,921 14,251 58,172 39,808 12,708 52,516 41,588 12,687 54,275 (+)3.35
III. Quasi Govt.
(Central) - - - - - - - - -
-

219
IV. Quasi Govt.
(State) 1,901 558 2,459 1,074 441 1,515 1,054 402 1,456 (-)3.89
V. Local bodies 3,073 1,504 4,577 2,957 1,462 4,419 4,132 2,474 6,606 (+)49.49
Total 48,895 16,313 65,208 43,839 14,611 58,450 46,774 15,563 62,337 (+)6.65
-Not available
Source: Directorate of Employment, Govt. of Manipur
9.13.6 Shops and Commercial Establishments:
During the year 2002-03, the total number of commercial establishments was 1947
giving employment to 2,475 employees. Out of this total number of 1,947 establishments,
1,535 were shops, 97 were commercial establishments and 315 were hotel & restaurants. The
number of workers employed in these establishments (shops, commercial establishments, hotel
& restaurants) were 1,497,330 and 648 respectively. The number of towns establishment as
well as in respect of shops, commercial establishments and hotels & restaurants are shown in
Table No. 9.33.
Table No. 9.33 Number of Shops, Commercial Establishments, Hotels Restaurants and
worker employed
Year No. of
Town
Shops Commercial
Establishments
Hotel &
Restaurants Total
No. Emplo-
yees
No. Emplo-
yees
No. Emplo-
yees
No. Emplo-
yees
1 2 3 4 5 6 7 8 9 10
1980-81 32 53 142 23 297 18 200 94 639
1990-91 31 1,143 1,488 84 417 237 883 1,464 2,788
2000-01 31 1,339 1,449 96 351 285 747 1,720 2,547
2001-02 33 1,470 1,475 97 358 315 665 1,882 2,498
2002-03 33 1,535 1,497 97 330 315 648 1,947 2,475
2010-11 51 2,589 2,431 193 581 123 450 2,905 3,462
Source: Office of the Labour Commissioner, Manipur

220
CHAPTER IX
SOCIAL INFRASTRUCTURE
Development of social infrastructure is a crucial need for the welfare state. State
Government of Manipur has been making several efforts continuously for all-round
development prioritising the sectors like education, public health, water supply, social welfare,
employment etc., for uplifting the quality of life of the people of the state.
9.1 Education:
Education is a life long process by which an individual acquires and accumulates
knowledge, skills, attitudes and insights. It starts from the cradle and ends at the grave for an
individual. And life experiences are given to child through the informal agencies like family,
social groups (clubs, associations, political parties, literary circle, debating societies, library,
mass media radio, television, cinema, museum, tour etc.) and also through the agencies of
formal education such as schools, colleges, universities etc. However, education is one of the
principal factors influencing the quality of the state’s labour force. It has an important role in
the socio-economic development of the State. Its contribution to economic growth and its

221
impact on population controls life expectancy, infant mortality, improving nutritional status
and strengthening civil institutions is well recognised. As per National Policy on Education,
priority has been accorded to the universalisation of primary education for children in the age
group of 6 to 14 years.
9.1.2 Progress of Education:
There has been a great deal of accomplishment in the field of education since 1950-51.
The number of educational institutions has increased from 538 in 1950-51 to over 4222 by the
end of 2004-2005. Out of these 4222 institutions, 4089 were schools, 62 colleges and two
universities. Table No. 9.1 shows the number of recognised educational institutions of various
type and a comparative picture of the total number of recognised educational institutions in
North-East States (2003-04) are presented in Table No. 9(a) of part II.
Table No. 9.1 Number of recognised educational institutions by types
Year
Number of Institutions
All Insti-
tutions Univer-
sity
College for School for
General
Education
Profe-
ssional
education Total
General
Education
Profe-
ssional &
Other
education
Total
1 2 3 4 5 6 7 8 9
1950-51 - 1 - 1 537 - 537 538
1960-61 - 2 1 3 2029 314 2343 2346
1970-71 - 12 14 26 2979 389 * 3369 3394
1980-81 - 24 41 65 3576 511 4087 4152
1990-91 1 29 33 62 4307 2492 6799 6862
1995-96 2 50 38 88 3622 77 * 3699 3789
2000-01 2 59 12 71 3970 78 * 4048 4121
2005-06 - - - - 4344 104 4448 4448**
2006-07 - - - - 4007 104 4111 4111**
2007-08 - - - - 4006 104 4110 4110**
2008-09 - - - - 4045 104 4149 4149**
2009-10 - - - - 3875 104 3979 3979**

222
* Due to cancellation of non-formal education
** Excluding Colleges and University.
Source: Directorate of Education (S) & (U). Government of Manipur.
Since 1950-51, the number of institutions imparting occupational and technical
education has shown a phenomenal increase. Among these, different types of institutions like
those connected with agriculture, arts and commerce, engineering, medicine, physical
education, teachers training etc. are emphatically included. The University level education is
imparted in subjects such as arts, sciences, vocational courses and specialised subjects etc.
Universities also offer good higher research facilities. It has been observed that significant
progress had been made in the spheres of education in the state. The literacy rate in Manipur
has gone up from 11 percent in 1951 to 79.2 percent in 2011. In the state, the rate of male
literacy was as high as 86.1 percent while rate of the female literacy stood at 72.4 percent in
2011. Despite the rise in literacy rate, the absolute number of illiterates has increased due to
fast growing population. Districtwise number of literates, illiterates and literacy rate according
to 2011 census are presented in Table No. 9.2.
Table No. 9.2 Districtwise Number of literates and illiterate persons and literacy rates
of Manipur according to 2011 census
Sl.
No. State/District
No. of literate No. of illiterate
Person Male Female Person Male Female
1 2 3 4 5 6 7 8
Manipur 1768181 960015 808166 802209 330156 472053
1. Senapati* 124182 68169 56013 69562 30739 38823
2. Tamenglong 85006 47403 37603 55645 24968 30677
3. Churachandpur 195935 104013 91922 78208 34807 43401
4. Chandel 90302 51053 39249 53880 23526 30354
5. Ukhrul 129829 70148 59631 54169 24570 29599
6. Imphal East 324664 173314 151350 131449 52780 78669
7. Imphal West 392626 205985 186641 125366 49069 76297
8. Bishnupur 156333 87313 69020 81060 31469 591
9. Thoubal 259304 152617 116687 152864 58228 94636
Table No. 9.2 Districtwise Number of literate and illiterate persons and literacy rates
of Manipur according to 2011 census
State/District Literacy rate

223
Sl. No.
Person Male Female
1 2 9 10 11
Manipur 79.2 86.1 72.4
1. Senapati* 74.1 80.0 68.1
2. Tamenglong 70.1 76.1 63.7
3. Churachandpur 82.8 87.0 78.5
4. Chandel 71.1 77.8 64.0
5. Ukhrul 81.4 85.3 77.0
6. Imphal East 82.0 88.8 75.3
7. Imphal West 86.1 92.2 80.2
8. Bishnupur 75.9 85.1 66.7
9. Thoubal 74.5 85.0 64.1
*Excluding Mao-Maram, Paomata and Purul Sub-Divisions Concld.
Source: Directorate of Census Operations, Manipur.
9.1.2 School Education :
As per the National Policy on Education 1986, a target had been set for the
universalisation of primary education for children in the age group of 6 to 14 years. Under this
policy, three aspects of elementary education viz. (i) universal access and enrolment (ii)
universal retention of children upto 14 years of age and (iii) substantial improvement in the
quality of education are to be achieved.
Several programmes like National Programme of Nutrition support to primary
education (mid-day meal scheme) and promotion of girls’ education were also undertaken in
the state. Under mid-day meal scheme, the state is providing 3kgs. of rice per student per month
to the students of class I to V reading in 2997 Govt. and aided schools having primary classes.
Under the scheme (Expanded Operation Black Board) of the Govt. of India, minimum teaching
learning materials, like teachers equipment, teaching learning materials, games materials, play
materials, books for library, furniture etc. were procured for 398 upper primary schools of the
state during 2002-03. The total enrolment at the primary stage (Class I to V) decreased from
199.23 thousands in 2008-09 to 136.03 thousands in 2009-10. Of these, the relative share of
girls’ enrolment increased from 48.43 percent in 2008-09 to 50.85 percent in 2009-10. Total
enrolment at the middle/upper primary stage (Class VI to VIII) in 2009-10 is 291.12 thousands
as against 389.99 thousands in 2008-09. The relative share of girls’ enrolment was 51.08

224
percent in 2009-10 as against 47.98 percent in 2008-09. Table No. 9.3 presents the number of
students enrolled by stages.
Table No. 9.3 Sex-wise Students enrolment by stage/classes
Year
Schools
Primary (Class I to V) Middle/Upper Primary
(Class VI to VIII)
Boys Girls Total Boys Girls Total
1 2 3 4 5 6 7
2001-02 1,09,206 1,03,986 2,13,192 80,271 71,181 1,51,452
2002-03 1,83,711 1,71,642 3,55,353 64,098 60,488 1,24,586
2003-04 1,14,378 1,04,391 2,18,769 95,533 85,915 1,81,448
2004-05 1,14,820 1,11,466 2,26,286 96,316 86,711 1,83,027
2005-06 1,01,204 1,11,844 2,13,048 96,165 86,605 1,82,770
2006-07 1,13,484 1,10,575 2,24,059 96,656 88,645 1,85,301
2007-08 1,10,634 1,06,493 2,17,127 96,807 89,202 1,96,009
2008-09 1,02,949 96,674 1,99,623 99,932 90,437 1,90,369
2009-10 66,853 69,178 1,36,031 75,566 79,526 1,55,092
Contd.
Table No. 9.3 Sex-wise Students enrolment by stages/classes
Year
Schools
Elementary (Class I to VIII)
Boys Girls Total
1 8 9 10
2001-02 1,89,477 1,75,167 3,64,644
2002-03 2,47,809 2,32,130 4,79,939
2003-04 2,09,911 1,90,306 4,00,217
2004-05 2,11,136 1,98,177 4,09,313
2005-06 1,97,369 1,98,449 3,95,818
2006-07 2,10,140 1,99,220 4,09,360
2007-08 2,07,441 1,95,695 4,03,136
2008-09 2,01,881 1,87,111 3,89,992
2009-10 1,42,419 1,48,704 2,91,123
Concld.

225
The school level education is primarily looked after by the State Government. The high
school stage of education comprising of classes from class IX to X are under the academic
control of the Board of Secondary Education, Manipur. And Higher Secondary Schools
Education comprising of class XI to XII comes under the control of Council of Higher
Secondary Education, Manipur. The total number of high and higher secondary schools in the
state were 786 by the end of 2009-10. The enrolment of students for high and higher secondary
classes has increased by 13.70 percent during 2009-10 over the previous year 2008-09. And
the average number of students per teacher in 2009-10 was 10 for high/higher secondary
schools. The position about the number of high/higher secondary schools enrolment of students
and the strength of teachers are presented in the following Table No. 9.4.
Table No. 9.4 Number of high/higher secondary schools, students and teachers in
Manipur
(in nos.)
Year
High/Higher
Secondary
School
Student Teacher
Students
per
Teacher Boy Girl Total
1 2 3 4 5 6 7
1995-96 539 1,06,830 90,332 1,97,162 9,690 20
2000-01 614 1,25,344 1,11,121 2,36,465 12,097 20
2001-02 659 1,33,375 1,16,309 2,49,884 12,060 21
2002-03 652 1,25,033 1,14,579 2,39,612 12,324 19
2003-04 706 NA NA NA NA NA
2004-05 706 NA NA NA NA NA
2005-06 1,093 1,35,650 1,25,664 2,61,314 12,431 15
2006-07 744 1,37,543 1,26,226 2,63,769 13,392 14
2007-08 743 2,78,668 1,29,218 4,07,886 14,706 14
2008-09 763 1,47,041 1,34,573 2,81,614 10,060 19
2009-10 786 1,65,140 1,55,069 3,20,209 14,869 10
NA – Not Available
The Board of Secondary Education and the Council of Higher Secondary Education,
Manipur conducts the High School Leaving Certificate (HSLC) and Higher Secondary School
Leaving Certificate (HSSLC) Examinations respectively. Table No. 9.5 shows the result of
H.S.L.C. Examinations in the state from 2007-08 to 2009-10.

226
Table No. 9.5 Results of H.S.L.C. Examinations of Manipur
Year
H.S.L.C. Examination
Number of Student
Male Female
Appeared Passed P.c. of
passed
Appeared Passed P.c. of
passed
1 2 3 4 5 6 7
2007-08 12206 7787 63.80 12403 6606 53.26
2008-09 13888 8699 62.64 13796 6989 50.66
2009-10 14093 9338 66.26 13188 7139 54.13
Year
H.S.L.C. Examination Percentage ratio
of passed Female to
Male student Number of Student
Total
Appeared Passed P.c. of passed
1 8 9 10 11
2007-08 24609 14393 58.49 0.83
2008-09 27684 15688 56.67 0.81
2009-10 27281 16477 60.40 0.82
- Not Available
Source : Board of Higher Secondary Education, Manipur.
9.1.2.1 Sarva Shiksha Abhiyan (SSA)
On 22nd June, 2004, an outlay of Rs. 4,601.13 lakhs was approved for implementation
of SSA in Manipur. The objective of the SSA Project is to ensure universal education for
children in the age group of 6-14 years. During 2004-05, the grant released by the Central and
State Government was Rs. 17.25 crores and 3.68 crores respectively. Under the scheme, text
book were provided to 2,34,299 girls and ST/SC children in class I-VIII in 2005-06. During
2006-07, 3,21,951 girls, ST/SC children in class I-VIII were given text books worth Rs. 150
per child. Again during the year 2007-08, free text books worth Rs. 3.96 crores have been
provided to 2,76,120 students of ST/SC and all girls in the Government and Aided Schools of
68,159 school children are covered out of a total of 74,368 class I-VIII.
9.1.4 Higher Education/Colleges:
Higher education plays a crucial role in the national development process. The matters
relating to higher education are looked after by Directorate of Higher Education (U). The total
number of colleges for General Education in the state at the end of 2005 was 62 (all types
including private colleges). All these colleges had teaching facilities for higher degree courses.
Table No. 9.6 shows the number of colleges, students enrolled and number of teachers.
Table No. 9.6 Number of Colleges, Students and Teachers for general education of

227
Manipur
Year College Student
Teacher Students
per teacher Boy Girl Total
1 2 3 4 5 6 7
1960-61 2 1,771 243 2,014 71 28
1970-71 12 7,767 2,385 10,152 368 28
1980-81 24 12,847 7,712 20,559 1,045 20
1990-91 29 22,427 16,597 39,024 1,025 38
1995-96 50 26,655 18,678 45,333 2,541 18
1996-97 50 23,560 20,017 43,577 2,695 16
1997-98 51 24,249 20,600 44,849 2,898 15
1998-99 50 24,411 21,407 45,818 2,898 16
1999-00 58 15,489 16,312 31,801 2,841 11
2000-01 25 * 10,053 * 8,611 * 18,664 * 1,267 * 15
2002-03 62 11,135 10,539 21,674 NA NA
2003-04 62 8,727 8,003 16,730 NA NA
2004-05 62 8,711 7,494 16,205 NA NA
NA: Not Available * Excluding Private Colleges
Source: Directorate of Education (U). Govt. of Manipur.
The above table shows an increasing trend in the number of colleges, students
enrolment as well as in the number of teachers. The average number of students per teacher in
2000-01 was 15 for colleges.
9.1.4 Technical Education : Technical education is basically meant to produce trained manpower in adequate
numbers for speedy economic development of the state. Training have been diversified and
programmes modified to take care of the needs of the modern development in technology. At
the end of the Sixth Plan, the state had only a polytechnic having diploma courses in Civil,
Electrical and Mechanical Engineering etc. But the existing arrangements for educating at
degree level is by reserving specified number of seats in different Engineering Colleges of the
country through the Ministry of Human Resource Development. One Engineering College
(Govt. College of Technology) was started during the annual plan 1998-99 in 3 (three) courses
viz., Civil, Computer Science, Electronic & Communication Engineering with per intake
capacity of 30 (thirty) each further the produce of technically trained manpower for the
upliftment of economic development of the state. Still, inspite of all these, progress of technical
education is at a slow pace and the state is lagging behind and is quite below the level of the
other states in the development of technical education.
9.1.5 Industrial Training Institute:
There are 7 (seven) Industrial Training Institutes in the state which are imparting
various engineering and non-engineering training courses based on locally suitable self-

228
employment activities under two schemes viz., Craftsman training and Apprenticeship training.
Under the aegis of the Government of India (DGET), training are also imparted in the new
diversified fields so as to meet the technological advancement. During the Tenth Plan, 5 (five)
Industrial Training Institutes are proposed to be set up at Imphal East, Thoubal, Bishnupur,
Tamenglong and Chandel.
9.1.6 Non-Formal Education:
To achieve the goal of universalisation of elementary education and fulfillment of the
constitutional objectives, Non-Formal Education (NFE) for the elementary age group children
is being developed as an alternative supportive system of formal schooling. The State Council
of Educational Research and Training (SCERT), has been working for the upliftment of the
quality of education in the elementary stage of education as well as the goal of the
universalisation of elementary education by adopting proper strategies non-formal educational
schemes for drop-out and non-starters in the age group of 0-14. The SCERT has also been
entrusted with the implementation of the schemes of vocationalisation of education at plus two
stage for self-employment as one of the main objectives. This scheme is equally
shared by Central and State Governments. It is basically aimed at providing the institutional
infrastructure necessary both for coverage of non-enrolled and non-attending children and
strengthening the academic inputs of the action programme of non-formal education. During
the Ninth Plan period, 3122 non-formal education centres have been functioning through 55
NFE projects with the total enrolment of 90,000 learners all over the state. Under the
vocationalisation of education 8 schools were covered and 3 booklets were published. The
proposed outlay for the Tenth Five Year Plan (2002-07) is Rs.900.00 lakhs of which a sum of
Rs.200.00 lakhs is proposed for the Annual Plan (2002-03).
9.1.7 Adult Education:
The “National Literacy Mission” (NLM) was established in 1988 by the Government
of India with the aim of successful implementation of strategies of eradicating illiteracy in the
age group of 15 to 35 years. Following prescribed detailed guidelines for the implementation
of total literacy campaign, the state Government has taken a policy decision to implement Total
Literacy Campaign (TLC) in a phase manner. During the Ninth Plan (1997-2002) it was
228argeted to eradicate 2.12 lakhs illiterate population in the age group of 15 to 35 years and
retention of literacy skills for the new literates by the introduction of complete course of the
programmes of Basic Literacy and post literacy followed by continuing Education Programme
in phases through Jana Shikshan Nitayamas (JSN) centres. Out of this 2.12 lakhs population,

229
1.92 lakhs are to be covered under centre based projects and the remaining 0.20 lakhs
population are to be taken care of by the Post-Literacy and continuing phasewise education
programmes through JSN centres. It is proposed to eradicate 1,92,914 (87,257 males &
1,05,657 females) illiterate populations in the age group of 15 to 35 years during the Tenth plan
(2002-2007). It also aim at the retention of literacy skills as well as improvement of skill of the
neo-literates.
A State Literacy Mission Authority (SLMA), Manipur was constituted as per the
directive given by the NLM Authority, Government of India. In 2004-05, the TLC was
launched is all the nine (9) districts of Manipur, through the District Literacy Societies (DLSs).
The project is funded on sharing basis by the Government of India and the State Government
in the ratio of 2:1 and 4:1 is respect of the Valley and Hill districts respectively. There are three
literacy phases in the TLC programme. In each phase, a primer/book need to be completed by
adult learners. The teacher are volunteers mostly educated unemployed youths, club members,
women societies members, church members, retired teachers etc. The districtwise physical
achievement of the TLC as on March 2007 is shown in Table No. 9.7.
Table No. 9.7 Physical achievement of TLC as on March, 2007
(in nos.)
District/State Target Enrolment Persons completed Primer
I II III
1 2 3 4 5 6
Senapati 67000 66560 66560 62682 39086
Tamenglong 16000 16027 14821 13162 9468
Churachandpur 20200 20213 20051 17682 15108
Chandel 18200 18600 18400 11486 10211
Ukhrul 15000 15000 15000 12963 11716
Imphal East 32000 32200 32200 30601 20930
ImphalWest 30000 30200 30200 29526 18026
Bishnupur 20300 20300 20300 18464 13419
Thoubal 39400 40000 40000 28192 26534
Manipur 258100 259100 257532 224758 164498
NB : TLC- Programe was concluded during 2006-07 in all District of the State.
9.1.7.1 Post Literacy Programme (PLP)
The PLP was launched in Manipur during 2006-07 with the following objectives :
(i) Remedy the deficiency of learning in the literacy phases or, in other woods, build up
literacy skills satisfactory standards;
(ii) Retention, re-enforcement, stabilization and upgrading of literacy skills and improvement of
functional skills;

230
(iii) Application in living and working situations but this need to be encouraged by positive
measure. Through application of literacy, people begin to participate in the development
process.
The programme is funded by the Central and State Government in the ratio of 2:1 and 4:1 in
the Valley and Hill districts respectively. The target groups of the programme are :-
(i) Drop outs of TLC,
(ii) Uncovered (gap between figures of TLC survey and enrolment),
(iii) Neo-literates and
(iv) New entrants/school drop out who are in the age group of 15 years and above.
The physical achievement of post literacy programme at the conclusion of the programme
is given below :-
Physical achievement of PLP at the conclusion of the programme, 2009
District Target Enrolment PL-1 Completer 1 2 3 4
Senapati 67000 70141 50998
Tamenglong 16000 11683 MOP learners of P-III
completed - 2426
Churachandpur 20200 20670 15635
Chandel 18200 18314 10974
Ukhrul 15000 15125 13506
Imphal East 32000 33065 22910
ImphalWest 30000 30604 18881
Bishnupur 20300 20108 16534
Thoubal 39400 37620 25260
Grand Total 258100 257330 174698*
* Excluding Tamenglong
9.2 Science and Technology:
Science and Technology plays a vital role in the process of development and
transformation of a traditional agrarian economy into a modern Industrial economy.
Development in the fields of Science and Technology in Manipur is carried out under the
auspices of the State Government. The Government has been consistently laying emphasis on
the development of Science and Technology as a major instrument for achieving national goals
of self-reliance and Socio-economic development.
Set up in January, 1985, the Science and Technology Department has been a Nodal
Agency in the State for planning, co-ordinating and promoting science and technology for
achieving the socio-economic objectives through meaningful applications in numerous
developmental programmes. In view of the growing significance of Information Technology,
the Department of Science and Technology was renamed as Department of Science &
Technology and Information Technology. The Department has reverted to its original name of
Department of Science & Technology from 5-9-2009.
231
Not only being an implementing agency, the department of Science & Technology also
encourages the use of non-conventional sources of energy to minimise the excessive use of
forest products. The Department also provides a feasible alternative for supplying energy to
locations which cannot be provided with conventional sources of energy. Altogether, 16
(sixteen) schemes were implemented by the department under 3 (three) major schemes viz. (i)
Scientific Research, (ii) Development of non-conventional sources of energy and (iii) Integrate
Rural Energy planning.
9.2.1 Scientific Research:
Under scientific research centre, the Department had undertaken several scheme viz. (i)
Science Centres and Science popularisation, (ii) S & T. Entrepreneurship Development
Programmes, (iii) Human Resource Development, (iv) Research and Development, (V) State
Remote Sensing Centre and (vi) State Computer centre etc., to give a main thrust of all-round
activities in the popularisation of science for welfare of various communities. To develop
scientific temper among the students and people of the state, the Department had already set
up 8 (eight) District Science Centres, 30 (thirty) District level science Model laboratories.
Besides, the programmes like science symposia, science quiz/essay/seminars/workshops,
national children's science congress, science excursion etc. were very effective in raising the
level of science popularisation among the younger generation.
One Tissue Culture Laboratory at Manipur University and one Food Testing Laboratory
at D.M. College of science were set up under the Research and Development scheme. Another
project on ‘Micro-Propagation of certain orchids of Manipur using tissue culture techniques’
was also completed by making the products available to the progressive growers. And it was
found effective with remarkable progress in production of orchids during 1997-98.
The State Remote Sensing Centre had taken up a project on "Natural Resources" and
completed the projects on ‘Application of Remote Sensing Techniques in Geological Studies
in Manipur’ and ‘Integrated Mission for sustainable development of Imphal District’. The
Remote Sensing Centre has Installed ARC/INFO, GIS software to supplement the existing
image processing computer facility. The State Computer Centre plays the role of introducing
innovative and appropriate computer application for Government departments with the
objective of improving efficiency and productivity. Training on Computer operations and use
of software were provided in various departments. Facility of AUTOCAD drafting was
successfully introduced in departments like PWD. An Online INTRANET based Govt./Public
232
information system has been set up. The Department is also providing computers and Modems
under the scheme of computer for homes and computers were offered to schools at low cost for
use under school Computers Education. During 2009-10, the Manipur Remote Sensing
Application Centre (MARSAC) has taken up schemes like Land Use/Land Cover of Manipur,
Wasteland Mapping of Manipur, Land Degradation Mapping of Manipur, Urban Information
system for Imphal and Kakching municipalities etc.
9.2.2 Non-Conventional Sources of Energy:
Under this Non-Conventional sources of energy, 5 (five) schemes namely bio-gas/bio-
energy, solar energy, solar thermal system, wind energy and improved chulhas were taken up
in the state. Bio-gas as a domestic cooking fuel is found suitable in Manipur. During the Tenth
Plan, 800 bio-gas plants were to be constructed.
Solar energy like photovoltaic system (SPV system) are found to be a technically
acceptable solutions for providing lighting to remote and non-electrified villages of the State.
During 2007-08, Solar Home Lighting System was taken up in 39 villages and 100 Nos. Solar
Street Lighting Systems was installed for Heirok area and in 2008-09, 4 Nos. was installed for
Imphal Airport.
Solar Thermal system is to provide hot water systems to Govt./Private agencies and is
found suitable in the State. 1000 LPD Solar Heaters in govt. buildings and 50 LPD Solar Water
Heaters are also made available to the public at subsidized rate. Wind energy is another source
of non-conventional energy. During 2007-08, promotion of 3 Wind Solar Hybrid Power of 10
kw each and installation of 10kw Wind Solar Hybrid was done during 2008-09. During 2009-
10 2 Wind Solar Hybrid power plants 10kw each were commissioned at Ukhrul district.
Under Hydro energy sector, 1 pico hydel project 5 kw was commissioned at Senapati
district, trial run for micro hydel project 25 kw at Ukhrul district was carried out and renovation
& modernisation of Gelnel small hydro project 400 kw at Senapati district was completed
during 2009-10. The outlay and expenditure during 2009-10 was Rs. 300.00 (RE) and Rs.
300.00 lakhs (actual) respectively.
9.2.3 Integrated Rural Energy Programme (IREP):
The implementation of Integrated Rural Energy Programme (IREP) covered 5 blocks,
7 blocks and 12 blocks during 1992-93, 1993-94 and 1995-96 respectively and 7 blocks in
1997-98. The programme covered 19 IREP Blocks upto 1998-99. Various energy devices like
bio-gas, Improved chulha, solar lantern tube-light with electronic choke and solar cooker and

233
pressure cooker, improved crematorium, compact fluorescent lamp etc., were made available
to the beneficiaries for efficient use of energy.
During the year 2009-10, the IREP Scheme funds are proposed to be provided to the
Zilla Parishads of Valley Districts as part of the devolution of powers to the Institutions of Zilla
Parishads and to the Deputy Commissioners for the Hill Districts. The items taken up during
the year are LED Reading Light system totaling 10000 units in 4 valley districts of Manipur
which will help public, particularly students.
The actual expenditure for 2009-10 under the IREP scheme was Rs. 20.00 lakhs.
9.3 Ecology and Environment :
It is now universally accepted that environmental pollution on one hand and
deforestation and population explosion on the other hand are threatening the very existence of
life on the earth. The situation can improve only if people from all walks of life realize the
importance of environmental protection.
In view of right measures to check the environmental pollution and for maintaining and
preserving ecological balance in the state by implementing various programmes, the Ecology
& Environment office, under Forest and Environment Deptt., has been doing a foreman service.
It launches various awareness programmes among the people.
For a meaningful enforcement of the Acts and Rules laid down by the Ministry of
Environment and Forest, Government of India, the Department is implementing 5 (five)
schemes viz., (i) Environmental education/Awareness Programme; (ii) Environmental
Research and Monitoring; (iii) Eco-.Development Programme; (iv) Prevention and control of
population and (v) Direction and Administration. During the Ninth Plan, the financial
assistance has been given to about 400 NGOS/Clubs/Academic Institutions/Organisations for
organizing environmental education/awareness programmes to promote the local environment
conscious citizens. The Department also took up various environmental monitoring works of
some major rivers viz. Imphal, Nambul, Iril etc. and wetlands like Loktak Lake, Phumlenpat,
Ikokpat etc. Besides, the real quality of Kangla Moat is also being monitored. The State
Botanical Garden has been set up at Khonghampat. The Department is also providing grant-in-
aid to the Manipur Pollution Control Board which is playing a major role in preventing air and
water pollution in the state. During the Tenth Plan (2002-07), the department proposes

234
improvement of seven ecological parks in seven districts. It is also taking up the
schemes/projects on ‘Solid Waste management’ and laboratory augmentation with French and
Austria assistance under Externally Aided Project (EAP). A sum of Rs. 495.00 lakhs is agreed
for the Tenth Plan of which Rs. 253.00 lakhs was approved for the Annual Plan 2005-06.
9.4 Food and Civil Supplies:
1n a welfare state like Manipur, one of the important task is to make the essential
commodities available to the common man at reasonable prices through the public distribution
system. Besides food grains, the Directorate of Food and Civil Supplies also arranges
distribution of kerosene and sugar at controlled prices. Department has changed its name to
Department of Consumer Affairs, Food & Public Distribution.
9.4.2 Public Distribution System :
Public distribution System is an important constituent of the strategy for poverty
alleviation. PDS is operated under the joint responsibility of the Central and State
Governments. The Central Govt. takes the responsibilities for procurement, storage,
transportation and bulk allocation of foodgrains at subsidised rates whereas the State Govt. on
their part will operate a network of fair price shops through which the essential commodities
in the prescribed quantity at prices fixed by the Government will be provided to the target
group. The Deptt. has been making all necessary efforts to procure adequate quantities of
foodgrains and other commodities to ensure its availability to the public. It procured PDS rice
and levy sugar from the central pool against the allocation made by the Government of India
for every month within a validity period. During the year 2006-07, 58.57 thousand tonnes of
rice and 7.18 thousand tonnes of levy sugar and 8.35 thousand tonnes of wheat were procured.
The projected target for procurement of PDS rice, sugar, wheat, edible oil are shown in Table
No. 9.8.
Table No. 9.8 Procurement of different Commodities
(in tonnes)
Year Procurement of
Rice Sugar Wheat Edible Oil
1 2 3 4 5
1999-00 43176.00 7158.90 120.00 -
2000-01 27005.47 7775.40 - -
2001-02 21691.01 9489.00 - -
2002-03 39930.35 5967.00 9250.00 -

235
2003-04 43921.55 3379.85 21164.85 -
2004-05 35781.15 3387.79 16724.61 -
2005-06 28033.83 4737.27 14674.40 -
2006-07 58,571,84 7,176.61 8,353.00 -
Source: Annual Administrative Report, F.C.S., Manipur.
The distribution of Rice, Wheat, Sugar and Kerosene through the Public Distribution
System (PDS) was continued during the year 2006-07 in the State. During the year 2006-07,
50.75 thousand tonnes of rice, 5.75 thousand tonnes of wheat and 6.51 thousand tonnes of Levy
Sugar were distributed through PDS in the State as against 21.08 thousand tonnes of rice, 11.06
thousand tonnes of wheat and 4.30 thousand tonnes of Levy Sugar in 2005-06. The distribution
of essential commodities during 1999-00 to 2006-07 are given in Table No. 9.9.
Table No. 9.9 Distribution of different Commodities (In ‘000 tonnes)
Year Distribution
Rice Wheat Sugar
1 2 3 4
1999-00 41.11 0.12 6.74
2000-01 22.61 - 6.73
2001-02 22.73 - 11.20
2002-03 44.13 5.85 6.00
2003-04 42.05 20.86 3.34
2004-05 33.69 16.72 3.43
2005-06 21.08 11.06 4.30
2006-07 50.75 5.75 6.51
-Not available
Source: Annual Administrative Report, F.C.S., Manipur.
9.4.2 Targeted Public Distribution System:
With a view to making PDS more responsive to the needs of the poor, the Govt. of India
introduced TPDS (Targeted Public Distribution System) from 1st June, 1997 and the same have
been implemented in Manipur w.e.f. 1st Sept. 1997. This system attempts to target families
below poverty line (BPL) at heavily subsidised rates. The identification of BPL families is
within the limit of 40.86 percent of the total State’s household. The district-wise number of
households below and above poverty line for the year 2009-10 are shown in Table No. 9.10.

236
Table No. 9.10 Families below poverty line and above poverty line of the Manipur
State during 2009-10
District Number of Households
Below Poverty Line Above Poverty Line Total
1 2 3 4
1. Senapati 11,362 36,016 47,378
2. Tamenglong 4,395 11,270 15,665
3. Churachandpur 9,881 23,109 32,990
4. Chandel 4,180 11,869 16,049
5. Ukhrul 6,240 14,264 20,504
6. Imphal East 17,651 40,318 57,969
7. Imphal West 21,438 45,001 66,439
8. Bishnupur 10,298 21,150 31,448
9 Thoubal 16,955 37,596 54,551
Total 1,02,400 2,40,593 3,42,993
Source: Annua1 Administrative, Report, 2009-10,
Food & Civil Supplies Deptt., Govt. of Manipur.
The Government of India had allotted 35136 MT of BPL rice and 34320 MT of APL
rice quota during the year 2001-2002 to Manipur State. The State Government had lifted
21691.055 MT of BPL rice against the allocation which was distributed to 1,30,000 BPL
families at the rate of 10 kgs. per family per month. But since April, 2002 the distribution
was fixed at 35 kgs. per family per month.
The number of authorised fair price Shops in the state in 2001-02 was 2551.
The distribution of food grains through the public distribution system during 2001-02 was 35
kgs. per family per month in the BPL group. In view of the difficult terrain and sparse
population in the hill areas, it is still felt that there is urgent need for opening more fair price
shops. Table No. 9.11 shows the number of fair price shops since 1995-96, 1999-00 to 2006-
07 and the district-wise fair price shops and S.K. Oil Sub- Dealers in Manipur under PDS are
shown in Table No. 9(b) of Part II.
Table No. 9.11 Number of Fair Price Shops in Manipur
Year
Rural Urban Total
Govern-
ment
Co-
operative Total
Govern-
ment
Co-
operative Total
Govern-
ment
Co-
operative Total
1 2 3 4 5 6 7 8 9 10
1995-
96
1,723 11 1,734 175 19 194 1,898 30 1,928
1999-
00
- - - - - - - - 1,927

237
2000-
01
- - - - - - - - 2,551
2001-
02
- - - - - - - - 2,551
2002-
03
- - - - - - - - -
2003-
04
- - - - - - - - 2,551
2004-
05
- - - - - - - - 2,551
2005-
06
- - - - - - - - 2,551
2006-
07
- - - - - - - - 2,551
- Not Available
-
Source: Food & Civil Supplies Deptt., Govt. of Manipur.
9.4.3 Antyodaya Anna Yojana: The Antyodaya Anna Yojana (AAY) has been launched in the state w.e.f. January,
2002. It aims at ensuring food security for all including those in the category of below poverty
line (BPL) who have minimum purchasing capacity to create a hunger free India in the next
five years. It is to reform and improve the public distribution system (PDS) so as to serve the
poorest of the poor in rural and urban areas. AAY families will be identified out of the total
BPL families who would be provided foodgrains at the rates of 35 kgs per family per month at
the rate of Rs.3.47/kg. for rice. This scheme covers 63,600 AAY families in the state. During
the year 2009-10, (under AAY scheme), the number of beneficiaries was 63,600.
9.4.5 Distribution of Foodgrains at Specially subsidised prices in ITDP areas :
With a view to strengthening the PDS in the Integrated Tribal Development Programme
(ITDP) areas, the Government launched “Revamped PDS” programme. The Revamped Public
Distribution System is operationa1 in the tribal areas of the state. Taking into consideration the
inadequate purchasing power of the tribals, the State Government launched a scheme known
as ‘Specially subsidised Pub1ic Distribution Scheme’ for the tribal areas in the state, which is
being implemented in 10 (ten) Principal Distribution Centres (PDC) viz., Senapati, Ukhrul,
Chandel, Churachandpur, Tamenglong, Paomata, Kamjong, Parbung, Tengnoupal and New
Kaiphundai.
9.4.5 Storage Facilities:
At present, there are 47 (fortyseven) numbers of food storage facilities in the state. Out
of which 1 (one) each in Thoubal and Bishnupur districts, 2(two) in Imphal East District 11
(eleven) in Imphal West district, 7 (seven) in Senapati districts, 5 (five) in Tamenglong

238
districts, 6(six) in Chandel District and 9 (nine) each in Churachandpur and Ukhrul districts.
The overall storage capacity is 26,000 MT.
Construction of 2,500 MT capacity Godown under Special Plan Assistance (SPA) have
been taken up to enhance storage capacity of foodgrains in Tamenglong and Churachandpur
districts in 2007-08.
9.5 Health and Family Welfare Services:
Medical facilities in the state were mainly provided by the State Government. It is the
basic social input for healthy and efficient human resources. The Health and Family Welfare
Department is providing services such as public health, control of communicable diseases,
health education, family welfare, maternal and child health care through a network of 14 Civil
Hospitals, 80 Primary Health Centres, 420 Primary Health Sub-Centres, 16 Community/ Urban
Health Centres, 20 Dispensaries as on 3l-3-2010. Special attention was also given from time
to time to eradicate diseases like malaria, leprosy, T.B., Iodine Deficiency and Aids. Table No.
9.12 shows the number of hospitals/dispensaries and the number of beds available.
Table No. 9.12 Number of hospitals/dispensaries and beds available in Manipur
(in nos.)
Year
Hospital
(including
PHC/UHC/
CHC)
Dispen-
saries
(including
PHSC’s)
Total
Population
in '000 per
hospital/
dispensaries
Bed Population
per bed
1 2 3 4 5 6 7
2002-03 101 440 541 4.38 2,395 990
2003-04 101 440 541 4.47 2,310 1,048
2004-05 101 440 541 4.56 2,405 1,027
2005-06 101 440 541 4.66 2,290 1,100
2006-07 - - - - - -
2007-08 100 440 540 4.85 - 1,754*
2008-09 100 440 540 4.94 - 1,697#
2009-10 110 440 550 4.95 2,405 1,125
2010-11 106 440 546 5.23 1,609 1,775
* Base on estimated population 2006. # excluding RIMS - Not available
Source: 1. RIMS and Directorate of Health Services, Govt. of Manipur.
2. Annual Administrative Report Directorate of Health Services.

239
During the year 2010-11, medical health care facilities were available to the people of
Manipur through a network of 546 hospitals/dispensaries with bed population ratio of 1:1,775.
The coverage of population per doctor/nurse is indicated in Table No. 9.13 below.
Table No. 9.13 Number of doctors and nurses employed and patients treated in
Manipur
Year
Person employed Population in’000 per Patients treated (in ’000 nos.)
Doctors
Nurses
Mid-wives
& Dias
Doctors
Nurses
Mid-wives
& Dias
Indoor Outdoor Total
1 2 3 4 5 6 7 8
2002-03 945 1,148 2.51 2.07 60.9 1,095.9 1,156.8
2003-04 914 1,070 2.65 2.27 62.9 1,229.4 1,292.3
2004-05 910 1,019 2.71 2.42 60.5 1,172.9 1,233.4
2005-06 888 1,055 2.84 2.39 51.8 1,023.8 1,075.6
2006-07* 700 924 3.67 2.78 37.0 101.3 138.3
2007-08* 700 924 3.74 2.83 22.7 379.6 402.2
2008-09* 672 981 3.97 2.72 20.9 350.4 371.3
2009-10* 593 956 4.59 2.85 21.1 257.4 278.5
*Excluding RIMS
Source : 1. RIMS & Directorate of Health Services, Government of Manipur.
2. Annual Administrative Report Directorate of Health Services.
9.5.1 State Health and Family Welfare Programme :
A brief description of various health and family welfare programmes carried out in the
state during 2004-2005 is summarized below:
9.5.1.2 Rural Health Scheme:
Under this scheme health guides are engaged for providing better health care to the
people in the state. They are also significantly contributing towards malaria surveillance,
family welfare and immunization activities.
9.5.1.3. National Malaria Eradication Programme (NMEP):
This programme was implemented in the state as a Centrally Sponsored Scheme from
December, 1994. During 2009-10, 1.15 lakhs blood slides were collected and examined and
1069 positive cases were found.
240
The programme could tackle malaria problems more effectively. Youth and voluntary
organisations have been actively involved in malaria control activities. Since March, 2004, the
nomenclature of the programme, NAMP has been changed to National Vector Borne Disease
Control Programme (NVBDCP).
9.5.1.3 National Leprosy Control Programme (NLCP):
This programme was started during 1955 as a control programme under ‘Mono-Drug
Therapy’ giving more stress on survey, Education and Treatment. The objective of the
programme is to reduce the number of active leprosy cases by fifty percent. National Leprosy
Eradication programme was introduced on 1984 with an objective of eradicating leprosy by
2000. The main trategies were active case detection and promt treatment with Multi-Drug
Therapy to reduce case load and transmission. Manipur has achieved the National Goal of
prevalence rate of less than 1 per 10,000 population at the end of 2000-01. As on today
Prevalence Rate of Manipur is 0.15 per 10,000 population which is one of the lowest in India.
9.5.1.4 National T .B. Control Programme (NTCP):
Under this programme, 100 bedded T.B. Hospital at Chingmeirong, 2 T.B. Clinics, one
each at Churachandpur and Ukhrul and 4 District T.B. control centres one each at Imphal,
Senapati, Tamenglong and Chandel are functioning since 1984-85.
The B.C.G. vaccination programme which is one of the most important Component of
the T.B. Control Programme continued to provide B.C.G. vaccination to all eligible Children.
R.N.T.C.P. project funded by the World Bank has been complemented in all the
districts of Manipur State. Under the project, at present, there are more than 500 DOTS (Direcly
Observed Treatment Short Course) Centres, 13 TUs (Tuberculosis Units) and 49 DMCs
(Designated Microscopy Centres).
9.5.1.5 National Programme for Control of Blindness (NPCB):
The objective of this programme is to reduce the incidence of blindness from the
estimated level of 1.35% to 0.7%. During 2007-08, 2008-09 and 2009-10 the number of
patients treated with Cataract Operation under NPCB was 210, 268 and 934 respectively.
9.5.1.6 Maternal Child Health-Cum-Expanded Programme on Immunisation:

241
In order to curb the infant mortality rate and to provide safeguard against serious
diseases, an intensive ‘Child Immunisation Programme’ is being implemented in the State.
The objective of the programme is to cover 100 percent of pregnant women with 2 or a boosters
dose of T.T. and at least 85 percent of the infants with 3 doses of D.P.T. and Polio and one
dose of B.C.G and measles vaccine. Performance of the Programme was remarkable during
2000-01.
9.5.1.7 National Aids Control Programme : AIDS (Acquired Immuno Deficiency Syndrome) has become a major public health
problem in the state since 1990. It is affecting a number of youths in Manipur. According to
the National AIDS Control Organisation (NACO), Manipur ranks third highest as regarding
the total number of HIV positive cases next to Maharashtra and Tamil Nadu states. The State
Government with the help of National AIDS Control Organisation took up various activities in
order to advert this looming catastrophic. The following measures were taken up (i) 100 percent
blood safety has been achieved in all the blood banks in Manipur (ii) AIDS education in school
has been introduced beginning from class VI, VII, VIII and X (iii) More than 81 percent of
doctors and 80 percent of nurses/paramedicals have been trained in AIDS and related problems
(iv) For the first time in India, the Manipur state AIDS policy was implemented (v) the number
of NGOs financially supported by the National AIDS Control Programme has been increased
(vi) Broaden partnership with NGOs. During the years 2004 and 2005, 6,854 and 1,745 nos. of
blood samples were screened out of which 2,019 in 2004 and 515 in 2005 were reported to be
of HIV positive cases. During the year 2002 (upto Oct.), 4,495 nos. of blood samples were
screened and 1,191 were reported as HIV positive. During 2005, 63 AIDS cases were reported
of which 14 were died. Table No. 9.14 shows the yearly trends of HIV/AIDS surveillance.
Table No. 9.14 Yearly Trends of HIV/AIDS Surveillance of Manipur (in Nos.)
Year Blood samples
screened
HIV positive
cases
Aids
cases
Deaths due to
AIDS
1 2 3 4 5
1999 3,436 1,037 196 29
2000 4,859 1,242 203 18
2001 4,329 1,192 286 51
2002 6,195 1,389 632 73
2003 5,423 1,419 1,187 133
2004 6,854 2,019 461 65
2005 1,745 515 63 14
Source: Manipur State AIDS Control Society, Imphal.

242
Among the districts, Ukhrul district had the highest Sero-positive rate (HIV positive
cases) followed by Chandel and Churachandpur districts. The rates were recorded as 43.86
percent, 34.51 percent and 33.01 percent respectively as on 31st March, 2005. The district-wise
distribution of HIV Positive Cases (Sero-Surveillance) was presented in Table No. 9.15.
Table No. 9.15 District-wise distribution of HIV Positive Cases (Sero-Surveillance) as
31st March, 2005
(in Nos.)
District Blood Samples
Screened
HIV Positive
Cases
Sero-Positivity
rate (percent)
District
(percent)
1 2 3 4 5
Senapati 2,389 591 24.74 4.02
Tamenglong 366 45 12.30 0.31
Churachandpur 3,026 999 33.01 6.79
Bishnupur 3,751 774 20.63 5.26
Thoubal 6,948 1,300 18.91 8.83
Imphal West 45,726 9,401 20.56 63.89
Imphal East
Ukhrul 1,546 678 43.86 4.61
Chandel 1,643 567 34.51 3.85
Total 65,395 14,355 21.95 97.55
Unknown 9,927 360 3.63 2.45
Manipur 75,322 14,751 19.54 100.00
Source: Annual Administrative Report, 2004-2005,
Directorate of Health Services, Govt. of Manipur.
It is observed that the maximum number of HIV positive cases are found in the age
group of 21 to 30 years (both in the case of male and female) followed by age group of 31 to
40 years. The minimum number of HIV positive cases are found in the age group of 0 to 10
years Table No. 9.16 presents the age-sex proportion of HIV positive cases (Sero-Surveillance)
in Manipur.
Table No. 9.16 Age-sex proportion of HIV positive cases (Sero-Survelliance) in
Manipur as on Oct., 2002
Age Group Number HIV positive
cases (percent) Male Female Total
1 2 3 4 5
0 - 10 219 151 370 3.50
11 - 20 770 150 920 8.72
21 - 30 4,830 1,099 5,929 56.16
31 - 40 2,229 528 2,757 26.12
41 & above 444 137 581 5.50
All ages 8,492 2,065 10,557 100.00
Unknown - - 7 -

243
Manipur 8,492 2,065 10,564 -
Source: Manipur State AIDS Control Society, Imphal.
9.5.1.10 National Iodine Deficiency Disorder Control Programme ( NIDDCP)
Iodine deficiency is also one of the major public health problem in Manipur. The
objective of this programme is to reduce the prevalence rate to below 5% as against 13% in
1996 and to achieve 100% household consumption of iodized salt.
9.5.1.11 National Rural Health Mission(NRHM)
Inorder to provide accessible, affordable and accountable quality health services even
to the poorest households in the remotest rural region, the NRHM was launched in 12th April,
2005. In the North Eastern Region of India, the North Eastern Regional Resource Centre is
playing a critical role in developing need-based programmes in the region. In Manipur, Health
Societies were formed at State and district level. Rogi Kalyan Samiti were established at J.N.
Hospital. District Hospitals of Churachandpur and Bishnupur were started upgrating to Indian
Public Health Standard (IPHS) level. Sufficient manpower including AYUSH doctors and
ASHAs has been deployed for implementing this programme. During April to December,
2008, 5347 women were benefitted under Janani Suraksha Yojana (JSY) and 47 percent of
infant were fully immunized up to November 2008.
9.6 Water Supply and Sanitation :
Water is a chemical compound. It is a basic necessity of life. One of the essential
services rendered by any state is ‘safe drinking water supply’. Safe drinking water supply and
basic sanitation are vital human needs for health and efficiency. Every year, diseases and death,
particularly of children and drudgery of women are directly attributable to lack of these
essentials. Considering these needs, the National Water Policy gave highest priority to water
and sanitation especially in rural areas as the urban areas is provided with piped water supply.
9.6.2 Rural Water Supply:
Rural Water Supply facilities are provided to the people in rural areas under centrally
sponsored Minimum Need Programme (MNP) and Accelerated Rural Water Supply
Programme (ARWSP). The total number of habitations in rural areas in Manipur as on 1st April,
2007 was 2,868. Out of which 788 (27.48 per cent) habitations were fully provided with
drinking water facilities. Up to the 1st April of 2010, 1,163 (40.52 per cent) out of 2870
habitations were fully provided with drinking water facilities with an increase of 13.04 per cent
over 2007. The status of coverage of habitations are given in Table No. 9.17

244
Table No. 9.17 Number of Habitation Covered by Rural Water Supply
as on 1st April, 2010
Status Total number of habitations Percentage of habitations covered
1 2 3
F.C. habitations 1,163 40.52
N.C. habitations 482 16.80
P.C. habitations 1,225 42.68
Total 2,870 100.00
F.C. – Fully Covered, N.C. – Not Covered P.C. – Partially Covered
Source: Annual Administrative Report, 2004-05, 2007-08 and 2009-10
P.H.E. Deptt., Manipur.
9.6.2 Urban Water Supply :
Urban Water Supply facilities are provided to the people in urban areas under two
divisions viz. Imphal Water Supply and other Accelerated Urban Water Supply Programme
(AUWSP). There are 33 towns in the state with a population of 5.76 lakhs as per 2001 census.
Water Supply facilities presently extended to some of the towns are at rural standard. In the
urban areas, drinking water supply facilities are provided through piped water supply systems.
9.6.2.l Imphal Water Supply: The water demand of Imphal City and its suburbs by the end of 31-3-2010 has been
assessed at 101.92 MLD. The total installed capacity of the existing treatment plants for Imphal
Water Supply was 101.37 MLD. But the actual production is hardly 70.00 MLD (having a
shortage of 31.92 MLD). The water requirement by the end of 2036 is expected to be 156.46
MLD. The Department has formulated a project report for augmentation of water supply for
Imphal City Phase-I (capacity 29.50 MLD) to bridge the present gap of 31.92 MLD and also
future gap between the ever increasing demand and the supply.
The main achievement during the Tenth Plan was the completion of Replacement of
pipeline from Leimakhong to Kangchup and Kangchup to Iroisemba and construction of 6.81
MLD capacity water Treatment Plan at Irilbung (95% completed), the same at Canchipur 6.81
MLD capacity (85% completed), Ground Water Supply at Potsangbam & Sekmai PH-II, 6.81
MLD (90% completed) under Augmentation of Water Supply for Imphal City PH-I
(29.50MLD) (NLPR). Commissioned one RCC Overhead Tank Service Reservoir near
Assembly Complex and replacement of old pipes and extention of clear water main pipes was
also done.

245
9.6.2.2 Other Towns (Water Supply):
The water demand for all other towns was estimated 30.10 MLD in 2008 AD. The
anticipated water demand will be around 31.60 MLD by 2011 AD. All these towns have been
extended with water supply facility at the rural standard (i.e. at the rate of 40 litres per capita
per day). Upgradation of water supply schemes of other towns at the urban standard of supply
i.e. 70 lpcd (litres per capita per day) are taken up in phases since the Ninth Five Year Plan
Period (1997-2002). Upto the Tenth Plan augmentation of schemes for 18 towns were
achieved to cover under Accelerated Urban Water Supply Programme (AUWSP). So far
augmentation works to 14 towns have been completed by the end of 2008-09 and 4 town during
2009-10.
In addition 6 (six) other towns are also to be further augmented under urban
Infrastructure Development Scheme for Small and Medium Town (UISSMT) are taken up
during 2009-10 with a service level of 135 lpcd as against the existing urban standard of 70
lpcd.
9.6.3 Sanitation :
Sanitation covers arrangements for drainage of rain water and effluents, collection and
disposal of garbage and removal of human excreta. Proper sanitation is necessary condition for
improvement in general health standards, productivity of labour force and quality of life.
Sanitation has two aspects to it viz. (i) Rural Sanitation and (ii) Urban Sanitation.
9.6.4 Rural Sanitation :
Rural Sanitation has been one of the most neglected sectors. In this regard, Rural in
Manipur has remained as primitive as ever. The Government of India has now restructured
Rural Sanitation Programme under the name of Total Sanitation Campaign with an objective
of to provide sanitary latrines to every household of the state. So far 17 nos. of Rural Sanitation
Mark/Production centre has been established and 32,764 nos. of Individual household latrines,
142 nos. of Sanitary Complex and 787 nos. of Sanitary Latrines for schools have been
constructed. In addition total sanitary has been achieved in Maklang village (Imphal West
district) and Utlou (Bishnupur district).
9.6.5 Urban Sanitation :
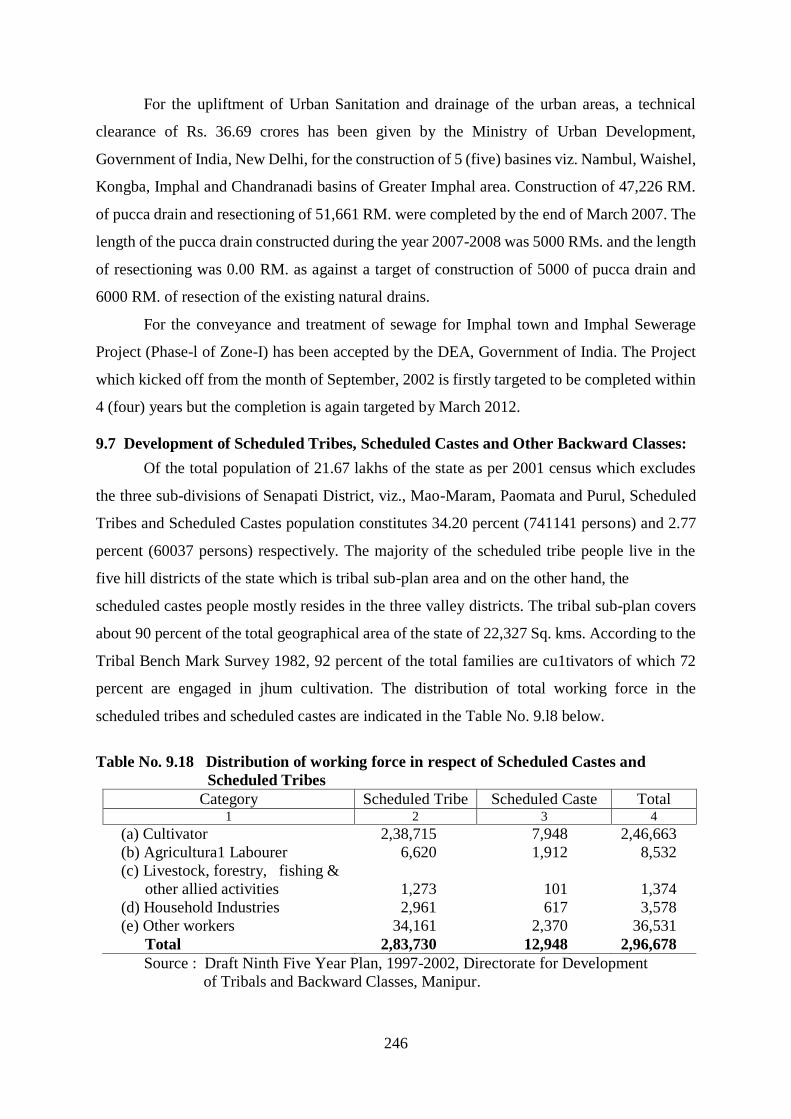
246
For the upliftment of Urban Sanitation and drainage of the urban areas, a technical
clearance of Rs. 36.69 crores has been given by the Ministry of Urban Development,
Government of India, New Delhi, for the construction of 5 (five) basines viz. Nambul, Waishel,
Kongba, Imphal and Chandranadi basins of Greater Imphal area. Construction of 47,226 RM.
of pucca drain and resectioning of 51,661 RM. were completed by the end of March 2007. The
length of the pucca drain constructed during the year 2007-2008 was 5000 RMs. and the length
of resectioning was 0.00 RM. as against a target of construction of 5000 of pucca drain and
6000 RM. of resection of the existing natural drains.
For the conveyance and treatment of sewage for Imphal town and Imphal Sewerage
Project (Phase-l of Zone-I) has been accepted by the DEA, Government of India. The Project
which kicked off from the month of September, 2002 is firstly targeted to be completed within
4 (four) years but the completion is again targeted by March 2012.
9.7 Development of Scheduled Tribes, Scheduled Castes and Other Backward Classes: Of the total population of 21.67 lakhs of the state as per 2001 census which excludes
the three sub-divisions of Senapati District, viz., Mao-Maram, Paomata and Purul, Scheduled
Tribes and Scheduled Castes population constitutes 34.20 percent (741141 persons) and 2.77
percent (60037 persons) respectively. The majority of the scheduled tribe people live in the
five hill districts of the state which is tribal sub-plan area and on the other hand, the
scheduled castes people mostly resides in the three valley districts. The tribal sub-plan covers
about 90 percent of the total geographical area of the state of 22,327 Sq. kms. According to the
Tribal Bench Mark Survey 1982, 92 percent of the total families are cu1tivators of which 72
percent are engaged in jhum cultivation. The distribution of total working force in the
scheduled tribes and scheduled castes are indicated in the Table No. 9.l8 below.
Table No. 9.18 Distribution of working force in respect of Scheduled Castes and
Scheduled Tribes
Category Scheduled Tribe Scheduled Caste Total 1 2 3 4
(a) Cultivator 2,38,715 7,948 2,46,663
(b) Agricultura1 Labourer 6,620 1,912 8,532
(c) Livestock, forestry, fishing &
other allied activities 1,273 101 1,374
(d) Household Industries 2,961 617 3,578
(e) Other workers 34,161 2,370 36,531
Total 2,83,730 12,948 2,96,678
Source : Draft Ninth Five Year Plan, 1997-2002, Directorate for Development
of Tribals and Backward Classes, Manipur.

247
The State is implementing various development and welfare programmes for socio-
economic and educationa1 development of the scheduled castes, scheduled tribes and other
backward classes.
9.7.1 Welfare of Scheduled Castes & Scheduled Tribes: The Department of Development of Tribal and Scheduled Castes of the state
implemented various developmental and welfare programme for the speedy development in
the sphere of educational, social and economical status of the target group people. Various
schemes/programmes were undertaken during 2007-08. The approved outlay for the year is
Rs.2370 lakhs under this sector.
9.7.1.1 Infrastructure development programme : Under this scheme the Department took up various works like construction/repair/
renovation of inter village roads/wooden bridges, schools and hostel buildings etc. During the
year, 2009-10, construction of Residential School building at Gamnom Saparmaina, Tribal
market at New Lambulane, Imphal, ST. Hostel at Senapati and Tamenglong, Community Halls,
Marketing Sheds, Hostel Buildings and construction and reparing of Inter Village Roads and
Wooden Bridges were taken up in the scheduled tribes areas.
9.7.1.2 Family Oriented Scheme :
During the year 2009-10, 2130 nos. of S.T. and 238 nos. of S.C. families, are covered
under Rural Shelter programme. Under the Animal Husbandry based programme and
programme for encouragement of Tribal Arts and culture, the Department is awarded financial
assistance to 633 nos. of ST. families and 350 nos. of ST. youth club/voluntary organizations
respectively.
9.7.1.3 Housing Scheme:
Under this scheme 1950 members of scheduled tribe families and 60 numbers of
scheduled castes families are targeted to cover during the year, 2005-06.
9.7.1.4 Post Matric Scholarship and other assistances :
Under this scheme, the department awarded Post Matric Scholarship to 2,300
Scheduled Caste students up to the end of the February, 2006 and 35664 Scheduled Tribe

248
students up to the end of January, 2008 and 50,072 Scheduled Tribe and 1,614 Scheduled
Castes students upto the end of 2009-10.
9.7.2 Minorities and other Backward Classes :
Established in the year 1998, the Department of Minorities and Other Backward Classes
(MOBC) had taken up various schemes/programmes for the welfare and upliftment of
minorities and other backward class communities of the state. The common list of OBCs of
Manipur have been included in the central list of OBCS w.e.f. 24th May, 1995, based on which
certificates may be issued to the persons seeking benefits reserved in favour of OBCs.
Generally, persons belonging to the families which annual income are below Rs. 1.00 (one)
lakh comes under this category of OBCs. The meetei and meitei pangal (muslims) constitute
the major of OBCs and minorities who are mostly inhabited in the four valley districts. The
common list of OBC in respect of Manipur are presented in Table No. 9.19.
Table No. 9.19 Common list of Other Backward Classes in respect of Manipur
Name of Caste/Communities
Number
State list of
OBCs
Mandal list
1 2 3
A. 1. Badi (Nepali) 4 2
2. Damei (Nepali) * 4 7
3. Gaimay (Nepali) 4 10
4. Kami (Nepali) 4 17
5. Sarki (Nepali) 4 41
B. Meitei/Meetei (including Meitei Brahmin,
Meitei/Meetei Sanamahi and Meitei Rajkumar) 1 30
C. Meitei Pangal 2 30
D. Teli (who have been domiciled in Manipur
for 10 years and their descendants) 3 47
* Those living in Manipur as member of the domiciled community
since the 9th July, 1947 and their descendents.

249
9.7.2.1 Post Matric Scholarship-OBC (100% CSS) : This is a centrally sponsored scheme under Ministry of Special Justice and
Empowerment, Government of India. During the year 2009-10, the Government of India
sanctioned Rs. 115.48 lakhs to award scholarship to 10980 OBC students. An amount of Rs.
200.00 lakhs is proposed for 2010-11.
9.7.2.2 Post-Matric Scholarship-Minority (100%CSS)
This is centrally sponsored and containing programme. A sum of Rs. 284.73 lakhs was
utilized during 2009-10 for 97 renewal and 3325 fresh students.
9.7.2.3 Pre-Matric Scholarship-OBC (50:50) (SS:CSS)
This is a continuing programme. An amount of Rs. 100.00 lakhs (State Share) was
utilized to award scholarship to 28000 OBC students. An amount Rs. 60.00 lakhs is allocated
for 2010-11 as state share.
9.7.2.4 Pre-Matric Scholarship-Minority (25:75) (SS:CSS)
This is a continuing programme . A sum of Rs. 50.00 lakhs state share was utilized for
1248 students and another amount of Rs. 310.29 lakhs as central share will utilized soon for
9332 students. An amount of Rs. 80.00 lakhs is allocated for 2010-11 as state share.
9.7,2.5 Implementation of NGOs Scheme:
The scheme has been taken up to assist various NGOs working in their respective fields.
This is a centrally sponsored scheme with the central assistance of 90 percent. The remaining
10 percent are to be borned by the NGOs. So far 30 project proposals have been forwarded to
the Government of India.
9.7.2.6 Skill Development Programme :
An amount of Rs. 54.88 lakhs was utilized for implementation of schemes such as
Remedial Coaching Paramedical, Mobile repairing, Bamboo Craft training and Reed making
under this programme during 2009-10.
9.7.2.7 Pre-examination Coaching for weaker section :
The scheme will give benefit to those candidates who are going to apply for competitive
examinations conducted by Central and State Govt. for professional courses. 5 Centres are
running under this programme. Under this scheme, 90% of the project cost will be borne by
the Government of India and 10% by the NGOs.
9.7.2.8 Moulan Azad Education Foundation :
250
The scheme is exclusively for the minority muslim community for establishment of
residentia1 schools/hoste1s for strengthening new trade courses in technical or professional
institutions.
9.7.2.9 Wakf Board, Manipur :
During the year 2009-10, the State Govt. have released a sum of Rs. 33.00 1akhs as grant-
in-aid for meeting the overhead office expenditures and implement development schemes by
the Wakf Board, Manipur. An amount of Rs. 33.00 lakhs is allocated for 2010-11.
9.7.2.10 Economic Development Programme :
Under this Programme, 7573 numbers of beneficiaries belonging to both Minority and
OBC communities have been benefited at a cost of Rs. 655.85 lakhs. An amount of Rs. 3396.75
lakhs is proposed to cover 34,500 nos. of families during the period 2005-2011.
9.7.2.12 Women Empowerment :
Realising the importance of the roles played by the women of the state, the Deptt. has
implemented skill upgradation and Self-help group training-cum-Micro Credit Programme.
9.8 Social Welfare :
In a welfare state, the Social Welfare Programme aims at the welfare of the weaker
sections of society like destitutes, infirms, physically and mentally handicapped etc. To protect
them from injustice and all forms of exploitations, Government is running various institutions
such as Anganwadi Centres, Destitute Homes, Children Homes or Orphanage etc.
9.8.1 Integrated Child Development Services (ICDS) :
For all-round development of children-mentally, emotionally and physically, 38 ICDS
project centres are now being run by the Department spreading over the 9 (nine) districts of
Manipur, Covering 33 blocks and 1 (one) urban ICDS project. For overall control and
supervision of various welfare programmes, 1 (one) ICDS cell at the State Head Quarter at
state level and 6 ICDS cells at District level have been established. As on 31st March, 2010,
there are 9418 Angawadi Centre and 236 Mini Angawadi Centres functioning under the 38
ICDS projects including one urban Project. These centres are actively associated with the
programme in giving nutrition, education, demonstration, health and immunisation of children
etc. During 2009-10, 90640 boys and 90535 girls within the age group of 3 to 6 years had been
given the knowledge of Pre-School education and 347886 children of 6 months to 6 years and

251
69224 Pregnant and Lactating Mothers were been given Supplementary Nutrition. The
number of institutions engaging in social welfare activities are shown in Table No. 9.20.
Table No. 9.20 Number of Organisations/lnstitutions engaging in Social Welfare as on
31st March of the year from 1995-96 to 2010-11.
(in Nos.)
Organisations/Institutions 1995-96 2000-01 2001-02 2002-03 2003-04 2004-05
1 2 3 4 5 6 7
Anganwadi Centre 4,157 4,300 4,461 4,501 4,501 4,501
ICDS Project 34 34 34 34 34 34
Blind School 1 1 1 1 1 1
Deaf and Mute School 1 1 1 1 1 1
Children Home/Orphanage 8 8 8 8 8 8
Destitute Women Home 2 1 1 1 1 1
Anganwadi Training Centre 2 4 1 1 1 1
Contd.
(in Nos.)
Organisations/Institutions 2005-06 2006-07 2007-08 2008-09 2009-10 2010-11
1 8 9 10 11 12 13
Anganwadi Centre 4501 4501 7369 9107 9418 9425
ICDS Project 34 34 38 38 38 38
Blind School 1 1 1 1 1 1
Deaf and Mute School 1 1 1 1 1 1
Children Home/Orphanage 8 8 8 8 8 8
Destitute Women Home 1 1 1 1 1 1
Anganwadi Training Centre 34 34 34 34 34 34
Concld.
Source: Directorate of Social Welfare, Govt. of Manipur.
The Department has been extending grant-in-aid to 8 (eight) destitute Homes run by
eminent NGOs for care and maintenance of the destitute, orphan and neglected children.
Altogether 321 destitute/orphan/neglected children have been provided shelter and care in these
Homes. A sum of Rs. 60.00 per child per month in the age group of 6 to 14 years were given
to 288 school going destitute children living below poverty line.
The State Bal Bhavan at Khuman Lampak, which is recreational-cum-educational
centres, has been providing training facilities in various fields like music, dance, science, home
management, computer etc. But kendras in the tribal areas of Senapati and Churachandpur
districts has been opened for the benefits of the children of this remote areas by providing
facilities under Bal Bhavan.
9.8.2. Welfare of Aged & Infirmed:
Under MOAP (Manipur Old Age Pension) Rules, 4172 old persons were given old age
pensions at the rate of Rs. 100.00 per month per head up to Feb., 2002. During the year 2004-
05, the Government has been providing old age pension to 26,907 persons in the state. The

252
pension was paid to the destitutes above 60 years of age and having none to support them. The
district-wise loans and grants distributed to the economically weaker sections of Manipur is
indicated in Table No. 9.21.
Table No. 9.21 Loans and Grants Distributed by the Government to the economically
weaker sections in Manipur during 2004-2005
District/State
Old Age Pension Assistance to Dependent Children
No. of
beneficiaries Amount (in Rs.)
No. of
beneficiaries
Amount (in
Rs.)
1 2 3 4 5
Senapati 1845 22,14,000 NA NA
Tamenglong 719 8,62,800 NA NA
Churachandpur 1916 22,99,200 NA NA
Ukhrul 1733 20,79,600 NA NA
Chandel 940 11,28,000 NA NA
Hill Total 7,153 85,83,600 NA NA
Imphal East 5383 64,59,600 NA NA
Imphal West 7421 89,05,200 NA NA
Bishnupur 2414 28,96,800 NA NA
Thoubal 4536 54,43,200 NA NA
Valley Total 19,754 2,37,04,800 NA NA
Manipur 26,907 3,22,88,400 NA NA
Source: Directorate of Social Welfare, Govt. of Manipur.
Besides this scheme other two schemes viz. National Maternity Benefit Scheme and
National Family Benefit Scheme were implemented under National Social Assistance
Programme (NSAP) for giving financial assistance to the family below poverty 1ine. Under
National Maternity Benefit Scheme, .the financial assistance is given to the family below
poverty line on the birth of a child whereas under National Family Benefit Scheme, the
financial assistance is given to the family belonging to below poverty line when the head of the
family who is primary bread winner of the family dies. Under the NFB Scheme 2,700 families
were benefited during the year 2006-07.
9.8.3 Welfare of the women : The department accommodated 11 (eleven) working women at the department’s
working Ladies Hostel at Takyel. An annual state grant was also given to one Destitute Women
Home at Imphal. Under centrally sponsored scheme of “Balika Samardhi Yojana” (BSY), 3208
girl child were given benefits of Rs.500 each as post delivery grant. This grant has been given

253
through the mother of the girl child. The Kishore Shakti Yojana (KSY) renamed from the
erstwhile Adolescent Girls Scheme (AGS) has been launched in 13 ICDS Projects in Manipur
with an aim of laying healthy foundation of girlhood to become womenhood of the Girl-Child
in the age-group of 11 to 18 years.
9.8.3.1 Welfare of Disabled women : Under this Scheme, 2 (two) special schools viz. Govt. Blind School and Govt. Deaf and
Mute School have been successfully continuing its educational programmes.for the disabled
children (blind, deaf and mute). The monthly diet allowance of ;Rs. 500.00 per month have
been provided to the hostellers of these two schools. Disabled students, scholarship were also
extended to 142 students. With the implementation of a central scheme known as “Grameen
Purnavas Yojana”, 18 wheel chairs/tri-cycles were distributed to the disabled persons.
9.8.3.2 Correctional Services : With the enforcement of Juvenile Justice Act, 1986, in the state, the Department has
been implementing the Central Sponsored Scheme of "A Programme for Juvenile Justice." One
observation Home, one Juvenile Home and one Special Home has been established under this
scheme. The observation and Special Homes has been engaging and handling the Juvenile
delinquents sent by Juvenile Court Magistrate. During the year 2001-02, 2 (two)
boys/delinquent Juveniles have been kept at the Home under orders of Juvenile Court.
9.10 Arts and Culture : The department of Arts and Culture, which came into existence in January, 1990, is
engaged in activities of (i) preservation of cultural heritage, (ii) promotion of art and culture.
To promote and preserve the rich cultural heritage of the state, the department has been
organising a number of Cultural Programmes inside and outside the state.
9.9.2 Fine Art Education : Under Fine Art Education, grant-in-aid to Manipur State Kala Academy and Imphal
Art College was extended for organising festivals/seminar/symposium etc. During the year
2001-02, Shri Shri Bal Mukunda Dev Music College and Govt. Dance College were
established. The construction of cultural complex has been taken up during the said year.
The Imphal Art College, the only College of its kind in Manipur has been functioning
as a standard college comparable to other Arts Colleges of other states. The College has been
affiliated to Manipur University. The total number of students during the year 2001-02 was 97.
A total of 9 (nine) lecturers and 6 (six) students of this college were awarded State Kala
Academy Award.
The Government Dance College has been functioning with the objectives of
propagation and spread of knowledge of Manipur Dance, its pristine, purity among the people
of' Manipur and other states of India. Altogether 77 student were undergoing various courses
in the fields of classical Manipur Dance and Folk dances of Manipuri Laiharouba, Kabui dance
and Mao dance etc. During the year 2001-02, 366 students were enrolled in Govt. Music
College (now renamed as Shri Shri Bal Mukunda Dev Music College).
9.9.2 Promotion of Arts & Culture: The Manipur State Kala Academy, a composite Centre of Sahitya, Fine Arts and Dance
& Music are regularly implementing various programmes in order to promote the unique
cultural heritage of the state. 64 cultural personalities have got National Awards in different

254
fields of culture w.e.f. 1956 till date. The Academy is conducting Sumang Leela Festival in
regular basis. Under promotion of Art and Culture, the grant-in-aids are extended to voluntary
organisation working in the, field of theatre, dance and music, public libraries and also to
Manipur Film Development Corporation. The Manipur Film Development Corporation Limited came into existence on 1.5.1987.
It was established with the objective of upliftment of film industry in the state. Till date
Manipur could produce 56 feature films and 50 documentary films. These have earned
prestigious awards both at the national (10 nos.) and international (9 nos.) levels. This is
definitely no mean achievement as the film lovers of the state toil under impossible
circumstances.
9.9.3 Archives: The state Archives collects a number of valuable old records from the government
departments/semi government offices/custodian and from individuals for preservation. The
reprographic unit and micro film units have also been maintained to take necessary measures
for the preservation and rehabilitation of the valuable records. Till the year 2001-02, the state Archives is preserving the number of 25,522 noncurrent
records including books, papers, maps, photographs etc. which are more than 25 years old and
the number of 18,812 other record which are less than 25 years old. A proposal for construction
of a permanent ‘Stack Area’ within March 2008 was submitted under the 12th Finance
Commission as first phase.
9.9.5 Library:
There are 10 (ten) Government public libraries in Manipur. This includes 1 (one) central
library at Imphal, 8 (eight) hill district libraries, and one branch library of the State Central
Library, Impha1 at Ningthoukhong of Bishnupur district. Moreover, there are 130 beneficiary,
libraries run by clubs/voluntary organisations/libraries which are reorganised by the State
Government and treated as public libraries. After the State Central Library was burnt on
13.4.05, the library started running in the new building at the State Central Library and
Manipur State Archives at Keishampat. Now, there are 47,234 books and 51 Nos. of
regular News paper/journals. The following Table No. 9.22 shows the number of books
available and the number of borrowers for the years 2007-08 to 2009-10 in Manipur.
Table No. 9.22 Number of books available in the Libraries in Manipur 2007-08 to
2009-10
Year No. of books available No. of borrowers 1 2 3
2007-08 19,500 NA
2008-09 31,500 NA
2009-10 47,234 400
Source: Annual Administrative Report, Department of Arts & Culture
9.9.5 Archaeology : The State Archaeology office has been conducting numerous systematic exploration
and scientific excavation at different parts of the state.The important Pre-historic sites of (i)
Khangkhui Cave, Ukhrul district (ii) Napachik Wangoo, Bishnupur district (iii) Nongpok
Keithelmanbi, Thoubal district (iv) Tharon Cave and Rock Shifters Tamenglong district etc.

255
were the results of these systematic excavation and exploration. Besides these, Proto-historic
and historical sites of (i) Sekta Kei Mound, Sekta, Imphal East district (2) Khamrou, Imphal
West district (3) Sangai Yumpham. Langthabal and (4) Koutruk, Imphal West district etc. have
also been discovered and excavated. Till date 37 historical monuments have been declared as
protected monuments and 861 Antiquites and Art objects have been registered.
Under the State Plan Assistance, the State Archaeology will develop the Maharaja
Gambhir Singh Memorial Samadhi, Langthabal within 2007-08.
9.9.7 Museum :
Having been established on 23rd September, 1969, Manipur State Museum has now
become a full-fledge Museum. At present, it has 7 Gallaries viz. (i) Ethnological Gallary (2)
Archaeological Gallary (3) Natural History Gallary (4) Children’s Gallery (5) Art Gallery and
(6) Jallan's Gallery (7) Hiyang Hiren open Art Gallary. There is also one Museum at the INA
Memorial Complex, Moirang where the museum objects of the 2nd world war particularly for
the Indian National Army (INA) has been exhibiting. The latest collection by the State Museum
are given below :
(a) Personal belongings of (L) Potsangbam Mani Singh, Nongthombam/Pukhramba (C 1891-
1995 A.D.) (b) Tribal ornaments (c) A very rare fossil (tooth) of Elephant presented by
Sadokpam Rajeshwor Singh, Phaknung Awang Leikai (d) 50 (fifty)nos. of stamps presented
by O. Tomba Singh (e) Shami Lanmi Phee presented by Meisnam Lalini Devi, Wangkhei and
(f) Personal property of (L) Ph. Madhumangol Sharma, who served as Hanjaba during Maharaj
Budhachandra (1941-1955).
9.10 Tourism :
The State of Manipur, though tiny in size has immense scope for promotion of tourism
with an area of only 22,327 Sq. kms. It is situated in the eastern-most fringe of the country. It
has a salubrious climate, exotic greenery and rich flora besides the rich culture. The state can
broadly be divided into two parts, the valley and the hill. The location of the valley is such that
it is being surrounded by a rows of rolling hills forming preventive barrier isolating the state
from the rest of the country.
There are many places in Manipur which can be developed as tourist centres. Keibul
Lamjao National Park on the bank of the Loktak Lake, the only habitat of Brow Antlered Deer
locally known as ‘Sangai’. INA (Indian National Army) Memorial at Moirang where INA
hoisted tricolour flag for the first time on Indian soil, Siroy National Park at Ukhrul, Loktak
lake, the biggest fresh water lake in the North-Eastern Region and Khongjom War Memorial,

256
where the last war of Manipur Independence was fought, are the major tourist spot of the state.
Besides there are other places which are worth seeing and which possessed immence potential
for developing into a good tourist spot.
In order to facilitate the movement of tourist in the state, the Directorate of Tourism,
Manipur has been providing various infrastructura1 facilities for incoming tourists. The
Directorate is managing the tourist homes at Sendra. Moirang, Phubala, Churachandpur, Kaina,
Khongjom, Tamenglong and Ukhru1 for accommodation of tourist visiting the areas. Hotel
Imphal at the heart of capital town Imphal has been improved with modern amenities.
To improve tourism industry, various schemes/projects are taken up under the central
prioritised schemes at different locations such as Tourist Home at Jiribam and Rengpang.
Besides these, the way-side amenities at Kangpokpi, Khonghampat, Litan, Santing are also
completed. In order to provide accommodation to tourist, the Directorate has also taken up
steps for construction of Yatri-Niwas and Health Resort at Imphal.
9.10.1 Progress of Tourism :
The tourist traffic in Manipur is very encouraging. The arrival of foreign and domestic
tourists during the year 2010-11 was 431 and 1,16,652 thousands respectively. As a new
guideline was issued by the Ministry of Tourism, Government of India which considered only
tourist who stay overnight as tourist, by excluding daytime visitors and also as some of tourist
Home are presently occupied by security personnels, the total number of tourist during 2011-
12 was 1,33,826 as against 1,17,083 in 2010-11, with a an increased of 16743 over 2010-11.
The volume of tourists traffic and magnitude of revenue earnings in the state are presented in
Table No. 9.23 and the district-wise tourists spots and tourist during 2010-11 & 2011-12 are
shown in Table No. 9(d) of Part II.
Table No. 9.23 Progress of Tourism in Manipur
Year No. of
tourist spot
No. of tourist Revenue
(Rs. in lakhs) Foreign Domestic Total
1 2 3 4 5 6
1994-95 29 370 82,798 83,168 1.86
1995-96 29 288 84,025 84,313 1.70
1996-97 29 219 87,074 87,293 2.11
1997-98 31 173 91,620 91,793 5.19
1998-99 31 294 89,664 89,958 0.64
1999-00 29 335 99,399 99,734 18.55
2000-01 29 409 1,03,854 1,04,263 0.74
2001-02 41 131 73,842 73,973 1.00
2002-03 41 227 89,829 90,056 0.70
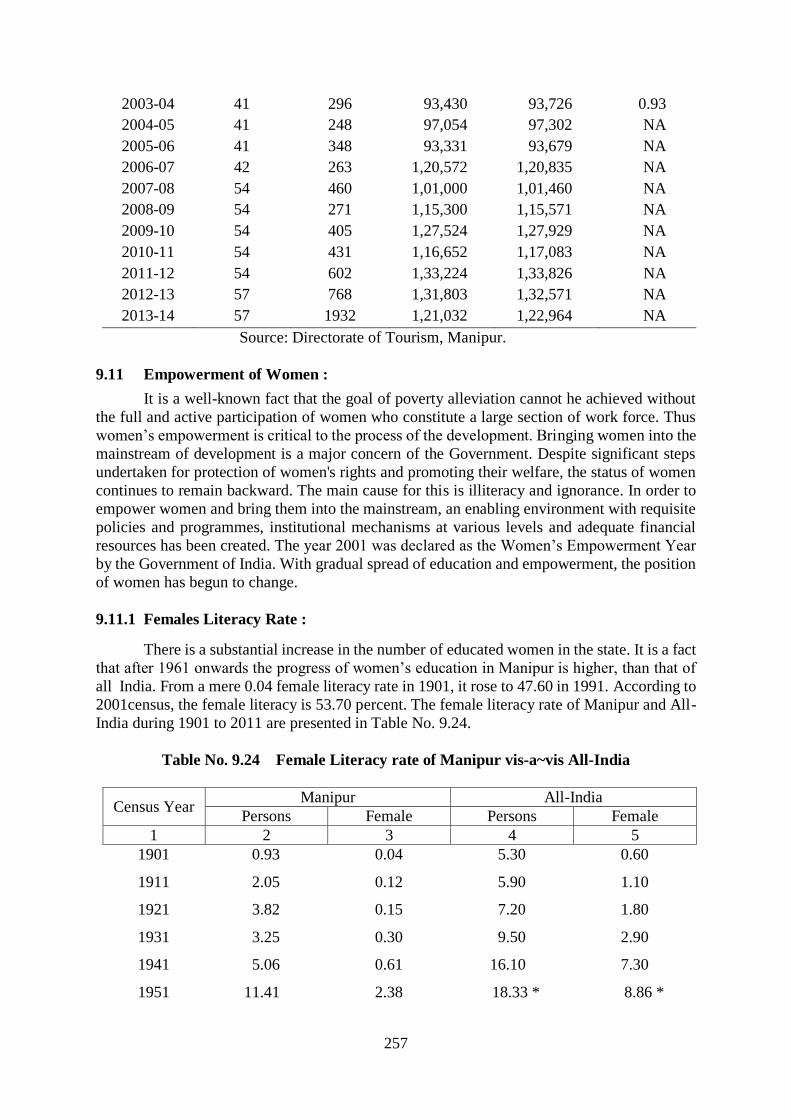
257
2003-04 41 296 93,430 93,726 0.93
2004-05 41 248 97,054 97,302 NA
2005-06 41 348 93,331 93,679 NA
2006-07 42 263 1,20,572 1,20,835 NA
2007-08 54 460 1,01,000 1,01,460 NA
2008-09 54 271 1,15,300 1,15,571 NA
2009-10 54 405 1,27,524 1,27,929 NA
2010-11 54 431 1,16,652 1,17,083 NA
2011-12 54 602 1,33,224 1,33,826 NA
2012-13 57 768 1,31,803 1,32,571 NA
2013-14 57 1932 1,21,032 1,22,964 NA
Source: Directorate of Tourism, Manipur.
9.11 Empowerment of Women :
It is a well-known fact that the goal of poverty alleviation cannot he achieved without
the full and active participation of women who constitute a large section of work force. Thus
women’s empowerment is critical to the process of the development. Bringing women into the
mainstream of development is a major concern of the Government. Despite significant steps
undertaken for protection of women's rights and promoting their welfare, the status of women
continues to remain backward. The main cause for this is illiteracy and ignorance. In order to
empower women and bring them into the mainstream, an enabling environment with requisite
policies and programmes, institutional mechanisms at various levels and adequate financial
resources has been created. The year 2001 was declared as the Women’s Empowerment Year
by the Government of India. With gradual spread of education and empowerment, the position
of women has begun to change.
9.11.1 Females Literacy Rate :
There is a substantial increase in the number of educated women in the state. It is a fact
that after 1961 onwards the progress of women’s education in Manipur is higher, than that of
all India. From a mere 0.04 female literacy rate in 1901, it rose to 47.60 in 1991. According to
2001census, the female literacy is 53.70 percent. The female literacy rate of Manipur and All-
India during 1901 to 2011 are presented in Table No. 9.24.
Table No. 9.24 Female Literacy rate of Manipur vis-a~vis All-India
Census Year Manipur All-India
Persons Female Persons Female
1 2 3 4 5
1901 0.93 0.04 5.30 0.60
1911 2.05 0.12 5.90 1.10
1921 3.82 0.15 7.20 1.80
1931 3.25 0.30 9.50 2.90
1941 5.06 0.61 16.10 7.30
1951 11.41 2.38 18.33 * 8.86 *

258
1961 30.42 15.93 28.31 15.34
1971 32.91 19.53 34.45 21.97
1981 41.35 29.06 43.57 29.75
1991 59.89 47.60 52.21 39.29
2001 70.50 60.50 64.80 53.70
2011 79.21 72.37 72.97 64.64
*Excludes Jammu & Kashmir
9.11.2 Women in the Workforce:
Women constitute a significant part of the work force in the state. Amongst rural
women workers, a majority are employed in agriculture as labourers and cultivators. Women
as agricultural workers generally participate in all operations except ploughing. They are
engaged in transplanting, weeding, applying fertilizers and also harvesting the produce. In the
Urban areas, women workers are primarily employed in the unorganised sector such as
household industries, petty trades and services, construction works etc. According to 2011
census, 42.59 percent of the total workers in Manipur are women. The main and marginal
workers among females constitute 60.88 percent and 39.12 percent of the total female workers
respectively. Out of the total 3,00,494 main female workers,1,33,582 (44.46 percent) were
cultivators, 20,171 (6.71 percent) were agricultural labourers whereas the remaining 1,46,741
(48.83 percent) were engaged in other sectors like manufacturing, Processing, Servicing and
Repairing other than Household Industries and other services etc. Table No. 9.25 provides the
total female workers and non-workers of Manipur.
Table No. 9.25 Female workers and non-workers in respect of Manipur according to
2011 census
District/State Female Dependency
ratio Workers Non-workers Total
1 2 3 4 5
Senapati 37,867 56,969 94,836 150.44
Tamenglong 33,438 34,842 68,280 104.20
Churachandpur 52,061 83,262 1,35,323 159.90
Ukhrul 41,396 47,884 89,280 115.67

259
Chandel 33,623 35,980 69,603 107.01
Hill Total 1,98,385 2,58,937 4,57,322 130.52
Imphal East 77,286 1,52,733 2,30,019 197.62
Imphal West 84,847 1,78,091 2,62,938 209.90
Bishnupur 47,130 71,487 1,18,617 151.68
Thoubal 85,942 12,581 2,11,323 145.89
Valley Total 2,95,205 5,27,692 8,22,897 178.75
Manipur 4,93,590 7,86,629 12,80,219 159.37
9.12 Poverty:
Though the term poverty could not be defined precisely and though its concept and
content varies from country to country, in the Indian context, it manifests itself in its starvest
form as a visual of semi-starved, ill-clad, deprived millions of countrymen, thousands of them
dying everyday from malnutrition, ill-health and lack of basic amenities.
Poverty is a curse. It degrades human life. In fact, it is the root cause of all other
problems. It is synonymous with poor quality of life, deprivation, malnutrition, illiteracy and
low human resources.
The eradication of poverty has been an integral component of the strategy for economic
development. Defining a poverty line is the first step in estimating poverty. It is cut-off line
that separates the poor from non-poor, given size distribution of population by per-capita
consumer expenditure classes.
According to the 61st Round of the NSSO’s Sample Survey (July 2004 to June, 2005),
the poverty ratio (on a 30 day recall basis) fell to 17.3% in 2004-05 from 28.54% in 1999-2000.
It declined from 40.04 % to 22.3% in rural areas and from 7.47% to 3.3% in urban areas. Thus
the incidence of poverty expressed as a percentage of people living below the poverty line has
steadily declined from 50.01 % in 1973-74 to 17.3 % in 2004-05. The number of persons below
poverty line in 2004-05 was 3.95 lakhs as against 5.86 lakhs in 1973-74 . The percentage of
population bellow poverty line are presented in Table No. 9.26 and the poverty ratio at the
National and state level are shown in Table No.9(e) of part II.
Table No. 9.26 Number and percentage of population below poverty line in respect of
Manipur
(No. in lakhs)
Year
Rural Urban Combined
No. of
persons
Percentage
of Persons
No. of
persons
Percentage
of Persons
No. of
persons
Percentage
of Persons
1 2 3 4 5 6 7
1973-74 5.11 52.57 0.75 37.16 5.86 50.01
1977-78 6.09 59.82 1.11 37.58 7.20 54.83
1983-84 4.71 42.60 1.13 26.38 5.84 38.08
1987-88 4.68 39.35 0.85 17.34 5.53 32.93

260
1993-94 6.33 45.01 0.47 7.73 6.80 33.78
1999-00 6.53 40.04 0.66 7.47 7.19 28.54
2004-05 3.76 22.30 0.20 3.30 3.95 17.30
Source : Press Information Bureau, Govt. of Manipur.
(Based on 61st Round of NSS)
9.14 Labour and Employment :
The Department of Labour and Employment keeps an account of the existing working
force and the likely addition to it from time to time. The main function of the Labour
Department is to take necessary measures for the welfare of the labours working in the various
establishments of the state. It also amended rules and regulation to regulate the daily or weekly
hours of work, overtime holidays with pay, annual leave etc. concerning with labours and to
check employment of children and young persons etc. The Department is throughout two
schemes viz. (i) Administration of labour laws for enforcement, of minimum wages and labour
laws at the rural areas and (ii) legal aid to labour to protect the interest of rural labours by giving
legal aid to the workmen. These schemes were implemented during the Ninth Five Year Plan.
Besides these schemes, two more new schemes were proposed to be implemented during the
Tenth Five Year Plan period. The schemes are (i) Survey on child labour and Rehabilitation
and (ii) Survey on Bonded labour and Rehabilitation. It has also been proposed to conduct
surveys on the child labour below the age of 14 (fourteen) years employed in hazardous and
non-hazardous employment and on bonded labour system throughout the state for monitoring
the conditions of the child and bonded labours and rehabilitations.
9.13.1 Minimum Wages:
To protect the interest of the agricultura1 labourers, the minimum wages for unskilled
as well as skilled labourers have been revised from time to time. The minimum wage rates
fixed by the Govt. from the year 1990-91 to 2005-2006 are given below in Table No. 9.27.
Table No. 9.27 Average Daily wage rates of Manipur (in Rs.)
Year Unskilled Skilled
Hill Valley Hill Valley
1 2 3 4 5
1990-91 26.70 23.70 30.20 27.20
1991-92 26. 70 23.70 30.20 27.20
1992-93 38.70 35.00 41.50 38.50
1993-94 41.30 38.30 44.80 41.80
1994-95 43.94 40.94 47.44 44.44
1995-96 47.65 44.65 54.65 51.65

261
1996-97 50.50 47.50 57.50 54.50
1997-98 50.50 47.50 57.50 54.50
1998-99 64.25 61.25 67.55 64.55
1999-00 65.65 62.65 65.65 62.65
2000-01 65.05 62.05 65.05 62.05
2001-02 65.05 62.05 76.00 73.00
2002-03 65.05 62.05 76.00 73.00
2003-04 65.05 62.05 78.15 75.15
2004-05 73.45 70.45 80.45 77.45
2005-06 72.40 72.40 79.40 79.40
Source: Office of the Labour Commissioner, Govt. of Manipur
9.13.2 Manpower and Employment Schemes:
The State Employment Service has been working in three levels viz. (i) State level (ii)
District level and (iii) Town level. The main objectives of the employment service are (a) to
assist the employment seekers in finding suitable jobs according to qualification and experience
(b) to assist employers by providing suitable workers (c) to collect information regarding
employment opportunities, training facilities etc. and (d) to guide young persons and
employment seekers in re-orienting their training programme etc. according to the market
needs and (e) to motivate job seekers towards self employment by giving, upto-date
information of self employment opportunities.
The generation of employment opportunities is one of the main objectives of the
economic development in the state. Therefore, the employment opportunities and employment
in various categories of the population is quite, essential. Estimated employment in public and
private sectors of Manipur are 97 percent and 3 percent persons respectively as compared to
the 71 percent and 29 percent persons of all India.
9.13.3 Employment Situation:
17 (seventeen) Employment Exchange were opened for giving employment assistance
to the job seekers of the state. The number of persons newly registered in the employment
exchanges in the state during the year 2008-09 was 37,033 (including8,057 females) persons
as against 22,825 persons during the year 2007-08 showing an increasing of 62.25 percent. The
vacancies notified in 2008-09 was 4,667as against the 3,170 during the year 2007-08. There
were 2 persons placed in appointment during the year 2007-08 and 210 persons in 2008-09.
The consolidated Live Register of all Employment Exchanges stood at 6,42,247 (including
1,77,214 females) persons as on 31st March, 2009. The following Table No. 9.28 gives the

262
number of persons under the Live Register of the employment exchange in the state from 1995-
96 to 2010-11.
Table No. 9.28 Number of Registrants and placements effected by Employment
Exchanges of Manipur
Year
Particulars
No. of
Employment
Exchanges
No. of persons
registered
during the year
No. of
registrants
on the live
register
No. of
vacancies
notified
Submi-
ssion
made
No. of persons
placed in
appointments
1 2 3 4 5 6 7
1995-96 11 30,135 2,76,157 596 16,246 143
1996-97 12 27,938 2,99,881 1,959 64,326 579
1997-98 13 31,007 3,22,253 642 17,103 429
1998-99 13 37,861 3,54,269 1,108 51,327 162
1999-00 15 35,760 3,87,890 2,083 74,609 69
2000-01 16 14,777 3,97,304 451 14,197 2
2001-02 16 15,866 4,09,652 55 1,301 -
2002-03 17 10,027 4,17,338 215 2,735 5
2003-04 17 32,466 4,48,435 1,469 30,294 -
2004-05 17 43,857 4,91,476 1,019 20,984 -
2005-06 17 58,458 5,48,704 3,273 1,05,882 489
2006-07 17 35,475 5,83,653 3,011 74,339 357
2007-08 17 22,825 6,05,840 3,170 52,707 2
2008-09 17 37,033 6,42,247 4,667 61,923 210
2009-10 17 31,607 - 2,344 29,512 3
2010-11 17 16,057 6,89,119 1,096 19,339 644
- Not available
Source: Directorate of Employment, Govt. of Manipur.
Due to ever-increasing number of educated Job seekers including technical and
professional job-seekers, the problem of unemployment is continuing to be a matter of serious
concern to the state's economy. This perennial problem can be observed from the data made
available by the State Employment Exchange. According to the Live Register of Employment
Exchange, the total number of educated job-seekers was recorded as 685.34 thousands as on
31st March., 2011 as against 673.81 thousands as on 31st March, 2010 showing an increase of
1.71 percent over the previous year.
Of these 685.34 thousands educated job-seekers, 249.53 thousands were under matric
227.78 thousands were matriculate, 112.55 thousands were intermediate level, 74.03 thousands
were graduates (including arts, science, commerce, technical and law), 13.07 thousands were
post graduate (including arts, science, commerce, agriculture and law and others) and 8.38

263
thousands were diploma holders (including Engineering and Technology and others). The
category-wise number of educated job-seekers is shown in Table No. 9.29 and a break-up of
Scheduled Caste & Scheduled Tribe educated job seekers are given in Table No. 9(f) of Part
II.

264
Table No. 9.29 Category wise number of educated job seekers in Manipur for the year
2010-11
Level of Education Candidate Percentage
to total Male Female Total
1 2 3 4 5
1. Under Matric 2,18,755 30,772 2,49,527 36.40
2. Matriculate 1,52,208 75,576 2,27,784 33.24
3. P.U.C./ Intermediate/ Higher
Secondary 71,746 40,806 1,12,552 16.42
4. Graduate 46,156 36,253 74,025 10.80
(a) Science 12,370 8,011 20,381 2.97
(b) Arts 25,232 20,775 46,007 6.71
(c) Commerce 1,116 520 1,636 0.24
(d) Engineering 1,865 265 2,130 0.31
(e) Medical 352 1,404 1,756 0.26
(f) Agriculture/Agri-Engineering 435 153 588 0.09
(g) Law 299 153 452 0.07
(h) Education 284 584 868 0.13
(i) Veterinary 167 40 207 0.03
5.Diploma holder 4,036 3,870 8,384 1.22
(a) Engineering and Technology 3,380 3,817 7,197 1.05
(b) Others 656 531 1,187 0.17
6. Post-Graduate 7,003 6,069 13,072 1.92
(i) Arts 3,446 3,210 6,656 0.97
(ii) Science 2,758 2,421 5,179 0.76
(iii) Commerce 510 222 732 0.11
(iv) Agriculture 41 23 64 0.01
(v) Education 24 55 79 0.01
(v) Law 10 8 18 0.00
(vi) Others 214 130 344 0.05
Total 4,95,868 1,89,476 6,85,344 100.00
Source: Directorate of Employment, Govt. of Manipur.
9.13.4 Employment in Organised Sector :
The total number of persons employed in the organised sector in the state was 80.6
thousands as on 31st March, 2005. Out of the total persons employed in organized sector, 78.0
thousands was public sector and the remaining 2.6 thousands was private sector. In the public
sector the share of employment in Central Govt. was 5.77 percent State Govt. was 79.36
percent, Quasi Central & State Govt. were 5.38 percent and 4.36 percent respectively. The
employment in the organised (public and private) sectors are presented in Table No. 9.30 and

265
the break-up of public and private sectors of employment are shown in Table No. 9(g) of Part
II.
Table No. 9.30 Employment in organised sector of Manipur (as on 31st March)
('000 nos.)
Year
Employment in organised sector Percentage change over previous
year
Public Private Total Public Private Total
1 2 3 4 5 6 7
1995-96 73.4 5.2 78.6 - - -
1996-97 74.2 5.3 79.6 1.09 1.92 1.14
1997-98 74.7 5.8 80.5 0.67 9.43 1.26
1998-99 76.1 6.0 82.1 1.87 3.45 1.99
1999-00 75.8 6.2 82.0 (-) 0.39 3.33 (-) 0.12
2000-01 76.5 6.6 83.1 0.92 6.45 1.34
2001-02 76.2 6.6 82.8 (-) 0.39 0.00 (-) 0.36
2002-03 NA NA NA - - -
2003-04 78.0 2.6 80.6 2.36 (-)60.61 (-)2.66
2004-05 78.0 2.6 80.6 0.00 0.00 0.00
NA – Not Available
Source: Statistical Abstract of India.
9.13.5 Employment in State and Central Government :
There are 806 establishments of State Government in the state which is having
employment 65,208 employees as on 31st March, 2009. Out of this establishments, the State
Government establishments accounts for 746 nos., the local bodies 12 nos. and the quasi
government state 48. Table No. 9.31 provides the district-wise number of establishments in
public sector as on 31st March, 2009 and the no. of establishments in public sector are shown
in Table No. 9(h) of part II.
Table No. 9.31 District-wise number of establishment in Public Sector during 2010-11
District/State
Number of establishments
Central
Govt.
State
Govt.
Quasi Govt. Local
Bodies
Total
Central State
1 2 3 4 5 6 7
Senapati - 56 - 2 2 60
Tamenglong - 49 - 1 1 51
Churachandpur - 49 - 3 1 53
Chandel - 50 - 1 1 52

266
Ukhrul - 73 - 2 1 76
Imphal East - 126 - 6 1 133
Imphal West - 210 - 25 2 237
Bishnupur - 61 - 1 1 63
Thoubal - 61 - 1 2 64
Manipur - 735 - 42 12 789
- Not available
Source: Directorate of Employment, Government of Manipur.
As per the census of Govt. employees, the total number of employees working under
the State Government was 58,172 as on 31st March, 2009. This shows a decrease of employees
as compared with 60,982 employees as on 30th June, 2006. The number of employees working
under State Quasi Govt. decrease to 2,459 in 2009 from 7,844 in 2006 however, employees of
Local bodies rise to 4,577 from 3,868 in 2006. Table No. 9.32 presents the number of
employees in public sector and the district-wise male-female break-up of employees in public
sector are shown in Table No.9(i) of part II.
Table No. 9.32 Number of employees in Public Sector in Manipur
Item
2008-09 2009-10 2010-11 Percen-
tage
change
over the
previous
year
Male Female Total Male Female Total Male Female Total
1 2 3 4 5 6 7 8 9 10 11
I. Central Govt. - - - - - - - - - -
II. State Govt. 43,921 14,251 58,172 39,808 12,708 52,516 41,588 12,687 54,275 (+)3.35
III. Quasi Govt.
(Central) - - - - - - - - -
-
IV. Quasi Govt.
(State) 1,901 558 2,459 1,074 441 1,515 1,054 402 1,456 (-)3.89
V. Local bodies 3,073 1,504 4,577 2,957 1,462 4,419 4,132 2,474 6,606 (+)49.49
Total 48,895 16,313 65,208 43,839 14,611 58,450 46,774 15,563 62,337 (+)6.65
-Not available
Source: Directorate of Employment, Govt. of Manipur
9.13.6 Shops and Commercial Establishments:
During the year 2002-03, the total number of commercial
establishments was 1947 giving employment to 2,475 employees. Out of this total number of
1,947 establishments, 1,535 were shops, 97 were commercial establishments and 315 were
hotel & restaurants. The number of workers employed in these establishments (shops,
commercial establishments, hotel & restaurants) were 1,497,330 and 648 respectively. The
number of towns establishment as well as in respect of shops, commercial establishments and
hotels & restaurants are shown in Table No. 9.33.

267
Table No. 9.33 Number of Shops, Commercial Establishments, Hotels Restaurants and
worker employed
Year No. of
Town
Shops Commercial
Establishments
Hotel &
Restaurants Total
No. Emplo-
yees
No. Emplo-
yees
No. Emplo-
yees
No. Emplo-
yees
1 2 3 4 5 6 7 8 9 10
1980-81 32 53 142 23 297 18 200 94 639
1990-91 31 1,143 1,488 84 417 237 883 1,464 2,788
2000-01 31 1,339 1,449 96 351 285 747 1,720 2,547
2001-02 33 1,470 1,475 97 358 315 665 1,882 2,498
2002-03 33 1,535 1,497 97 330 315 648 1,947 2,475
2010-11 51 2,589 2,431 193 581 123 450 2,905 3,462
Source: Office of the Labour Commissioner, Manipur

268
PART – II
STATISTICAL TABLES

269
Table No. 1(a)
MANIPUR AT-A-GLANCE, 2013
1. Manipur’s State Insignia
*State Emblem Kangla Shaa
*State Animal Sangai
(Cervus eldi eldi)
*State Bird Nongin
(Syrmaticus huminae huminae)
*State Flower Siroy Lily
(Lilium macklinae sealy)
*State Tree Uningthou
(Phoebe hainesiana)
*State Fish (declared on 15 th Nov., 2007) Pengba
(Osteobrama Belangeri val.)
2. General Particulars:
a) Latitude 23°50′N to 25°42′N
b) Longitude 92°58′E to 94°45′E
c) Altitude (metre) above MSL 790
d) Annual Rainfall (mm), 2013 1639.1#
3. Area and Population (2011 Census)
a) Geographical Area (sq. km.) 22,327
b) Population (in nos.)
i) Person 28,55,794
ii) Male 1438586
iii) Female 1417208
iv) Sex Ratio (Female per ’000 males) 985
v) Literacy Rate (%)** 79.21
(a) Male 86.06
(b) Female 72.37
vi) Scheduled Castes** 97042
vii) Scheduled Tribes** 902740
viii) Main workers** 855012
ix) Marginal workers** 304041
x) Non-workers** 1411337
xi) Households** 3,75,095
xii) Inhabited Village 2588
xiii) Uninhabited Village 63
xiv) Town 51
4. Administrative Set-up, 2001 (in nos.)
(a) District 9
(b) Sub-Division 38
(c) Block 41
(d) Gram Panchayat 165
(e) Vidhan Sabha seat 60
(f) Lok Sabha seat 2
(g) Rajya Sabha seat 1
5. Net Per Capita Income, 2012-13 (Advance
Estimates (a) At Current Prices (in Rs.)
36474
(b) At Constant (2004-05) Prices (in Rs.) 23996
# ICAR Lamphelpat
** Excluding Mao-Maram, Paomata and Purul Sub-division

270
6. State Budget/Plan (Rs. in Crores)
(a) 2013-14 (BE)
(i) Revenue Receipts 8619.47
(ii) Revenue Expenditure 6692.95
(iii) Capital Receipts 22493.93
(iv) Capital Expenditure 24798.67
(v) Overall surplus (+)/deficit (-) (-)378.22
(b) Twelfth Plan, (2012-2017)
(i) Projected Outlay(Rs. in lakhs) 20457.91
(ii) Proposed Plan Outlay for 2012-13(Rs. in lakhs) 368075.07
7. Agriculture, 2010-11
(a) Area under Rice (’000 hect.) 168.78
(b) Production of Rice (’000 tonnes) 377.37
(c) Production of foodgrain, (’000 tonnes) 394.61
(d) Area under oilseeds, (’000 hectares) 0.66
8. Food and Civil Supplies, 2007-08
(a) Rice distributed (tonnes) 68,274
(b) Sugar distributed (tonnes) 4,178
9. Veterinary & Animal Husbandry, 2009-10 (in nos.)
(a) Veterinary Hospitals 55
(b) Veterinary Dispensaries 109
(c) Livestock Census, 2007 (in nos.)
(i) Cattle 3,41,956
(ii) Poultry 22,89,067
10. Forestry, 2010-11
(a) Total Forest Area (in sq. km.)
(i) Reserved Forests 1,467
(ii) Protected Forests 4,171
(iii) Unclassed Forests 11,780
(b) Revenue from Forestry and wild life (Rs. in lakhs),2010-11 210.03*
(c) No. of seedling distributed under the scheme of
Social Forestry.(2009-2010) 6,50,000
11. Fisheries, 2010-11
(a) Fish Farm-2007-08 (nos.) 18
(b) Fishery Revenue-2011-12 ( Rs. in lakhs) 11.77(RE)*
(c) Fish Production (tonne) 222,00
(d) Fish seed production (No. in million) 134
12. Rural Development and Cooperation, 2010-11
(a) No. of Houses constructed under the scheme of Rural
Housing (Indira Awas Yojana)
(b) No. of Dwelling units upgraded (as on 31st Jan.,2011) (a+b)=4600
(c) PMGSY
(i) No. of Roads constructed/upgraded 677
(ii) Total length covered (km.) 4,680.34
(iii) No. of Villages provided connectivity 2008-09 110
(d) Voluntary organizations registered, 2007-08 18,191
(e) Cooperative Societies(2011-12) 5,376 RE : Revised Estimates * Finance Accounts

271
Table No. 1(b)
Administrative Divisions of Manipur
(2001 Census)
District/Sub-Division Head Quarter Area in
sq.km.
Population
(in nos.)
No. of Village
Inhabited Uninhabited Total
1 2 3 4 5 6 7
1. Senapati 3,271 2,83,621 607 18 625
i) Mao Maram Tadubi 69,131 * 69 5 74
ii) Paomata Paomata 27,065 * 20 - 20
iii) Purul Purul 30,912 * 27 - 27
iv) Sadar Hills West Kangpokpi 60,945 122 - 122
v) Saitu Gamphazol Gamnom
Sapermeina
44,130 149 12 161
vi) Sadar Hills East Saikul 51,438 220 1 221
2. Tamenglong 4,391 1,11,499 171 - 171
i) Tamenglong North Tamei 21,907 29 - 29
ii) Tamenglong West Tousem 21,819 53 - 53
iii) Tamenglong Tamenglong 37,036 33 - 33
iv) Nungba Nungba 30,737 56 - 56
3. Churachandpur 4,570 2,27,905 540 6 546
i) Tipaimukh Parbung 25,409 40 - 40
ii) Thanlon Thanlon 22,057 47 - 47
iii) Churachandpur
North
Henglep 28,380 117 1 118
iv) Churachandpur Churachandpur 1,32,156 280 4 284
v) Singhat Singhat 19,903 56 1 57
4. Chandel 3,313 1,18,327 350 11 361
i) Machi Machi 17,087 58 1 59
ii) Tengnoupal Moreh 31,762 66 9 75
iii) Chandel Chandel 26,276 86 1 87
iv) Chakpikarong Chakpikarong 43,202 140 - 140
5. Ukhrul 4,544 1,40,778 198 - 198
i) Ukhrul North Chingai 25,151 27 - 27
ii) Ukhrul Central Ukhrul 79,191 66 - 66
iii) Kamjong Chassad Kamjong 12,937 41 - 41
iv) Phungyar Phaisat Phungyar 13,293 35 - 35
v) Ukhrul South Kasom Khullen 10,206 29 - 29
6. Imphal East 709 3,94,876 197 7 204
i) Jiribam Jiribam 37,828 50 1 51
ii) Sawombung Sawombung 74,143 66 1 67
iii) Porompat Porompat 2,12,767 48 2 50
iv) Keirao Bitra Keirao Bitra 70,138 33 3 36
Contd.

272
* Estimated Population
Table No. 1(b)
Administrative Divisions of Manipur
(2001 Census)
District/
Sub-Division Head Quarter
Area in
sq.km.
Population
(in nos.)
No. of Village
Inhabited Uninhabited Total
1 2 3 4 5 6 7
7. Imphal West 519 4,44,382 114 20 134
i) Lamsang Lamsang 57,589 46 15 61
ii) Patsoi Patsoi 71,115 28 5 33
iii) Lamphelpat Lamphelpat 1,95,380 10 - 10
iv) Wangoi Wangoi 1,20,298 30 - 30
8. Thoubal 514 3,64,140 90 13 103
i) Lilong Lilong 72,651 17 - 17
ii) Thoubal Thoubal 1,72,635 46 3 49
iii) Kakching Kakching 1,18,854 27 10 37
9. Bishnupur 496 2,08,368 48 1 49
i) Nambol Nambol 53,571 14 - 14
ii) Bishnupur Bishnupur 54,361 13 - 13
iii) Moirang Moirang 1,00,436 21 1 22
Manipur 38 (Sub-divisions) 22,327 22,93,896 2315 76 2,391
Concld.

273
Table No. 1(c )
Population of States/Union Territories of India by sex and percentage share of
population in total population : 2011 (Provisional)
Sl.
No. India/States/Union Territory
Total Population
Persons Males Females
Percentage
share in total
Population
1 2 3 4 5 6
INDIA* 1,21,08,54,977 62,32,70,258 58,75,84,719 100.00
1. Andaman & Nicobar Islands 3,79,944 2,02,330 1,77,614 0.03
2. Andhra Pradesh 8,46,65,533 4,25,09,881 4,21,55,652 7.00
3. Arunachal Pradesh 13,82,611 7,20,232 6,62,379 0.11
4. Assam 3,11,69,272 1,59,54,927 1,52,14,345 2.58
5. Bihar 10,38,04,637 5,41,85,347 4,96,19,290 8.58
6. Chandigarh 10,54,686 5,80,282 4,74,404 0.09
7. Chhattisgarh 2,55,40,196 1,28,27,915 1,27,12,281 2.11
8. Dadra & Nagar Haveli 3,42,853 1,93,178 1,49,675 0.03
9. Daman & Diu 2,42,911 1,50,100 92,811 0.02
10. Goa 14,57,723 7,40,711 7,17,012 0.12
11. Gujarat 6,03,83,628 3,14,82,282 2,89,01,346 4.99
12. Hariyana 2,53,53,081 1,35,05,130 1,18,47,951 2.09
13. Himachal Pradesh 68,56,509 34,73,892 33,82,617 0.57
14. Jammu & Kashmir 1,25,48,926 66,65,561 58,83,365 1.04
15. Jharkhand 3,29,66,238 1,69,31,688 1,60,34,550 2.72
16. Karnataka 6,11,30,704 3,10,57,742 3,00,72,962 5.05
17. Kerala 3,33,87,677 1,60,21,290 1,73,66,387 2.76
18. Lakshadweep 64,429 33,106 31,323 0.01
19. Madhya Pradesh 7,25,97,565 3,76,12,920 3,49,84,645 6.00
20. Maharashtra 11,23,72,972 5,83,61,397 5,40,11,575 9.29
21. Manipur* 28,55,794 14,38,586 14,17,208 0.24
22. Meghalaya 29,64,007 14,92,668 14,71,339 0.24
23. Mizoram 10,91,014 5,52,339 5,38,675 0.09
24. Nagaland 19,80,602 10,25,707 9,54,895 0.16
25. NCT of Delhi 1,67,53,235 89,76,410 77,76,825 1.38
26. Orissa 4,19,47,358 2,12,01,678 2,07,45,680 3.47
27. Puducherry 12,44,464 6,10,485 6,33,979 0.10
28. Punjab 2,77,04,236 1,46,34,819 1,30,69,417 2.29
29. Rajasthan 6,86,21,012 3,56,20,086 3,30,00,926 5.67
30. Sikkim 6,07,688 3,21,661 2,86,027 0.05
31. Tamil Nadu 7,21,38,958 3,61,58,871 3,59,80,087 5.96
32. Tripura 36,71,032 18,71,867 17,99,165 0.30
33. Uttar Pradesh 19,95,81,477 10,45,96,415 9,49,85,062 16.49
34. Uttarakhand 1,01,16,752 51,54,178 49,62,574 0.84
35. West Bengal 9,13,47,736 4,69,27,389 4,44,20,347 7.55
*Final Result of 2011 Census
Source : Office of the Registrar General and Commissioner Census, India

274
Table No. 1(d)
Distribution of population, Sex ratio, density and decadal growth
rate of population of States/UTs of India 2011 (Provisional)
State/
UT
Code
India/States/Union Territory Sex ratio (females
per 1000 males)
Density
(per sq. km.)
Decadal growth
rate
1 2 3 4 5
INDIA* 943 368 17.70
1. Jammu & Kashmir 883 124 23.71
2. Himachal Pradesh 974 123 12.81
3. Punjab 893 550 13.73
4. Chandigarh 818 9,252 17.10
5. Uttarkhand 963 189 19.17
6. Hariyana 877 573 19.90
7. NCT of Delhi 866 11,297 20.96
8. Rajasthan 926 201 21.44
9. Uttar Pradesh 908 828 20.09
10. Bihar 916 1,102 25.07
11. Sikkim 889 86 12.36
12. Arunachal Pradesh 920 17 25.92
13. Ngaland 931 119 -0.47
14. Manipur* 985 128 24.50
15. Mizoram 975 52 22.78
16. Tripura 961 350 14.75
17. Meghalaya 986 132 27.82
18. Assam 954 397 16.93
19. West Bengal 947 1,029 13.93
20. Jharkhand 947 414 22.34
21. Orissa 978 269 13.97
22. Chhattisgarh 991 189 22.59
23. Madhya Pradesh 930 236 20.30
24. Gujarat 918 308 19.17
25. Daman & Diu 618 2,169 53.54
26. Dadra & Nagar Haveli 775 698 55.50
27. Maharashtra 925 365 15.99
28. Andhra Pradesh 992 308 11.10
29. Karnataka 968 319 15.67
30. Goa 968 394 8.17
31. Lakshadweep 946 2,013 6.23
32. Kerala 1,084 859 4.86
33. Tamil Nadu 995 555 15.60
34. Puducherry 1,038 2,598 27.72
35. Andaman & Nicobar Islands 878 46 6.68
*Final Result of 2011 Census
Source : Office of the Registrar General and Commissioner Census, India
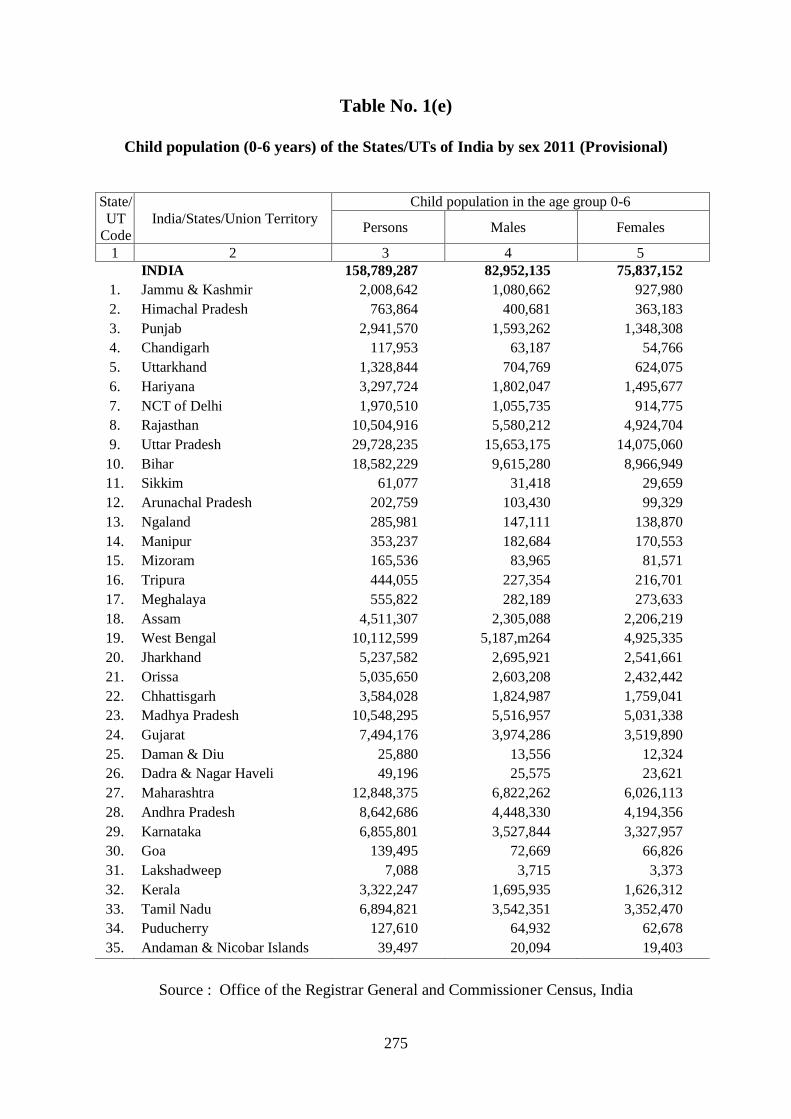
275
Table No. 1(e)
Child population (0-6 years) of the States/UTs of India by sex 2011 (Provisional)
State/
UT
Code
India/States/Union Territory
Child population in the age group 0-6
Persons Males Females
1 2 3 4 5
INDIA 158,789,287 82,952,135 75,837,152
1. Jammu & Kashmir 2,008,642 1,080,662 927,980
2. Himachal Pradesh 763,864 400,681 363,183
3. Punjab 2,941,570 1,593,262 1,348,308
4. Chandigarh 117,953 63,187 54,766
5. Uttarkhand 1,328,844 704,769 624,075
6. Hariyana 3,297,724 1,802,047 1,495,677
7. NCT of Delhi 1,970,510 1,055,735 914,775
8. Rajasthan 10,504,916 5,580,212 4,924,704
9. Uttar Pradesh 29,728,235 15,653,175 14,075,060
10. Bihar 18,582,229 9,615,280 8,966,949
11. Sikkim 61,077 31,418 29,659
12. Arunachal Pradesh 202,759 103,430 99,329
13. Ngaland 285,981 147,111 138,870
14. Manipur 353,237 182,684 170,553
15. Mizoram 165,536 83,965 81,571
16. Tripura 444,055 227,354 216,701
17. Meghalaya 555,822 282,189 273,633
18. Assam 4,511,307 2,305,088 2,206,219
19. West Bengal 10,112,599 5,187,m264 4,925,335
20. Jharkhand 5,237,582 2,695,921 2,541,661
21. Orissa 5,035,650 2,603,208 2,432,442
22. Chhattisgarh 3,584,028 1,824,987 1,759,041
23. Madhya Pradesh 10,548,295 5,516,957 5,031,338
24. Gujarat 7,494,176 3,974,286 3,519,890
25. Daman & Diu 25,880 13,556 12,324
26. Dadra & Nagar Haveli 49,196 25,575 23,621
27. Maharashtra 12,848,375 6,822,262 6,026,113
28. Andhra Pradesh 8,642,686 4,448,330 4,194,356
29. Karnataka 6,855,801 3,527,844 3,327,957
30. Goa 139,495 72,669 66,826
31. Lakshadweep 7,088 3,715 3,373
32. Kerala 3,322,247 1,695,935 1,626,312
33. Tamil Nadu 6,894,821 3,542,351 3,352,470
34. Puducherry 127,610 64,932 62,678
35. Andaman & Nicobar Islands 39,497 20,094 19,403
Source : Office of the Registrar General and Commissioner Census, India

276
Table No. 1(f)
Population aged 7 years and above in the States/UTs of India by sex 2011 (Provisional)
State/
UT
Code
India/States/Union Territory
Population aged 7 years and above
Persons Males Females
1 2 3 4 5
INDIA 1,051,404,135 540,772,113 510,632,022
1. Jammu & Kashmir 10,540,284 5,584,899 4,955,385
2. Himachal Pradesh 6,092,645 3,073,211 3,019,434
3. Punjab 24,762,666 13,041,557 11,721,109
4. Chandigarh 936,733 517,095 419,638
5. Uttarkhand 8,787,908 4,449,409 4,338,499
6. Hariyana 22,055,357 11,703,083 10,352,274
7. NCT of Delhi 14,782,725 7,920,675 6,862,050
8. Rajasthan 58,116,096 30,039,874 28,076,222
9. Uttar Pradesh 169,853,242 88,943,240 80,910,002
10. Bihar 85,222,408 44,570,067 40,652,341
11. Sikkim 546,611 290,243 256,368
12. Arunachal Pradesh 1,179,852 616,802 563,050
13. Ngaland 1,694,621 878,596 816,025
14. Manipur 2,368,519 1,187,080 1,181,439
15. Mizoram 925,478 468,374 457,104
16. Tripura 3,226,977 1,644,513 1,582,464
17. Meghalaya 2,408,185 1,210,479 1,197,706
18. Assam 26,657,965 13,649,839 13,008,126
19. West Bengal 81,235,137 41,740,125 39,495,012
20. Jharkhand 27,728,656 14,235,767 13,492,889
21. Orissa 36,911,708 18,598,470 18,313,238
22. Chhattisgarh 21,956,168 11,002,928 10,953,240
23. Madhya Pradesh 62,049,270 32,095,963 29,953,307
24. Gujarat 52,889,452 27,507,996 25,381,456
25. Daman & Diu 217,031 136,544 80,487
26. Dadra & Nagar Haveli 293,657 167,603 126,054
27. Maharashtra 99,524,597 51,539,135 47,985,462
28. Andhra Pradesh 76,022,847 38,061,551 37,961,296
29. Karnataka 54,274,903 27,529,898 26,745,005
30. Goa 1,318,228 668,042 650,186
31. Lakshadweep 57,341 29,391 27,950
32. Kerala 30,065,430 14,325,355 15,740,075
33. Tamil Nadu 65,244,137 32,616,520 32,627,617
34. Puducherry 1,116,854 545,553 571,301
35. Andaman & Nicobar Islands 340,447 182,236 158,211
Source : Office of the Registrar General and Commissioner Census, India
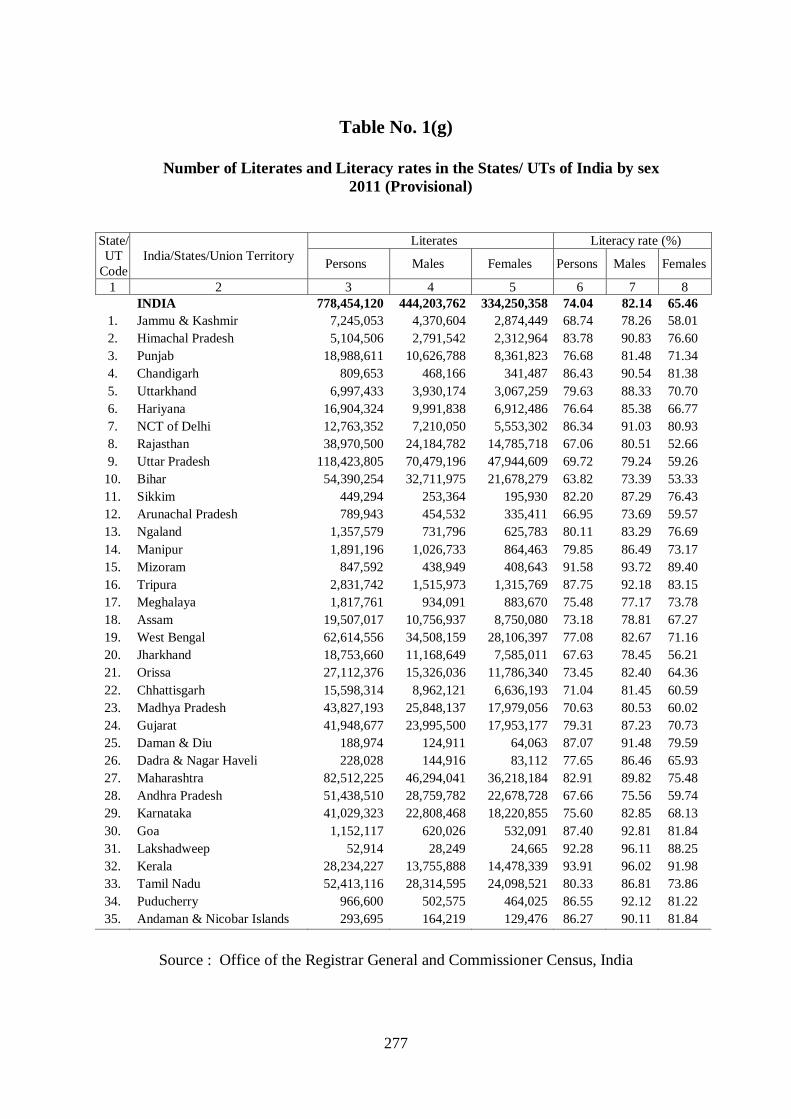
277
Table No. 1(g)
Number of Literates and Literacy rates in the States/ UTs of India by sex
2011 (Provisional)
State/
UT
Code
India/States/Union Territory
Literates Literacy rate (%)
Persons Males Females Persons Males Females
1 2 3 4 5 6 7 8
INDIA 778,454,120 444,203,762 334,250,358 74.04 82.14 65.46
1. Jammu & Kashmir 7,245,053 4,370,604 2,874,449 68.74 78.26 58.01
2. Himachal Pradesh 5,104,506 2,791,542 2,312,964 83.78 90.83 76.60
3. Punjab 18,988,611 10,626,788 8,361,823 76.68 81.48 71.34
4. Chandigarh 809,653 468,166 341,487 86.43 90.54 81.38
5. Uttarkhand 6,997,433 3,930,174 3,067,259 79.63 88.33 70.70
6. Hariyana 16,904,324 9,991,838 6,912,486 76.64 85.38 66.77
7. NCT of Delhi 12,763,352 7,210,050 5,553,302 86.34 91.03 80.93
8. Rajasthan 38,970,500 24,184,782 14,785,718 67.06 80.51 52.66
9. Uttar Pradesh 118,423,805 70,479,196 47,944,609 69.72 79.24 59.26
10. Bihar 54,390,254 32,711,975 21,678,279 63.82 73.39 53.33
11. Sikkim 449,294 253,364 195,930 82.20 87.29 76.43
12. Arunachal Pradesh 789,943 454,532 335,411 66.95 73.69 59.57
13. Ngaland 1,357,579 731,796 625,783 80.11 83.29 76.69
14. Manipur 1,891,196 1,026,733 864,463 79.85 86.49 73.17
15. Mizoram 847,592 438,949 408,643 91.58 93.72 89.40
16. Tripura 2,831,742 1,515,973 1,315,769 87.75 92.18 83.15
17. Meghalaya 1,817,761 934,091 883,670 75.48 77.17 73.78
18. Assam 19,507,017 10,756,937 8,750,080 73.18 78.81 67.27
19. West Bengal 62,614,556 34,508,159 28,106,397 77.08 82.67 71.16
20. Jharkhand 18,753,660 11,168,649 7,585,011 67.63 78.45 56.21
21. Orissa 27,112,376 15,326,036 11,786,340 73.45 82.40 64.36
22. Chhattisgarh 15,598,314 8,962,121 6,636,193 71.04 81.45 60.59
23. Madhya Pradesh 43,827,193 25,848,137 17,979,056 70.63 80.53 60.02
24. Gujarat 41,948,677 23,995,500 17,953,177 79.31 87.23 70.73
25. Daman & Diu 188,974 124,911 64,063 87.07 91.48 79.59
26. Dadra & Nagar Haveli 228,028 144,916 83,112 77.65 86.46 65.93
27. Maharashtra 82,512,225 46,294,041 36,218,184 82.91 89.82 75.48
28. Andhra Pradesh 51,438,510 28,759,782 22,678,728 67.66 75.56 59.74
29. Karnataka 41,029,323 22,808,468 18,220,855 75.60 82.85 68.13
30. Goa 1,152,117 620,026 532,091 87.40 92.81 81.84
31. Lakshadweep 52,914 28,249 24,665 92.28 96.11 88.25
32. Kerala 28,234,227 13,755,888 14,478,339 93.91 96.02 91.98
33. Tamil Nadu 52,413,116 28,314,595 24,098,521 80.33 86.81 73.86
34. Puducherry 966,600 502,575 464,025 86.55 92.12 81.22
35. Andaman & Nicobar Islands 293,695 164,219 129,476 86.27 90.11 81.84
Source : Office of the Registrar General and Commissioner Census, India
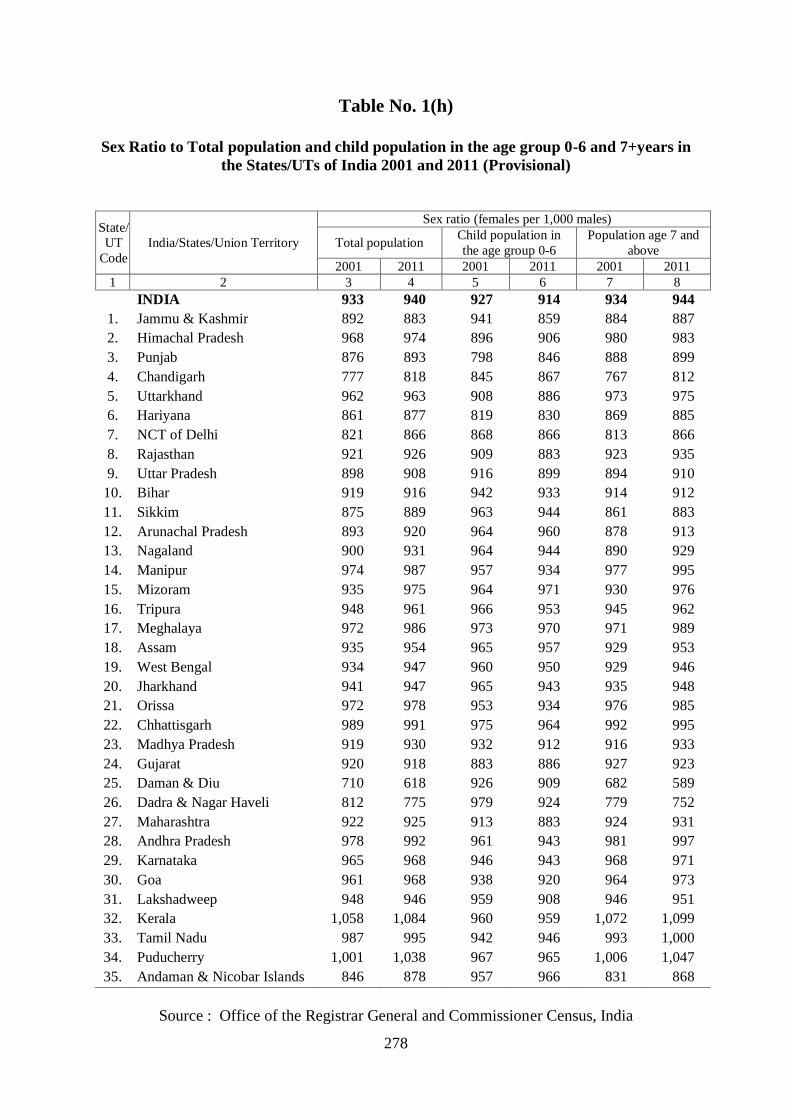
278
Table No. 1(h)
Sex Ratio to Total population and child population in the age group 0-6 and 7+years in
the States/UTs of India 2001 and 2011 (Provisional)
State/
UT
Code
India/States/Union Territory
Sex ratio (females per 1,000 males)
Total population Child population in
the age group 0-6
Population age 7 and
above
2001 2011 2001 2011 2001 2011
1 2 3 4 5 6 7 8
INDIA 933 940 927 914 934 944
1. Jammu & Kashmir 892 883 941 859 884 887
2. Himachal Pradesh 968 974 896 906 980 983
3. Punjab 876 893 798 846 888 899
4. Chandigarh 777 818 845 867 767 812
5. Uttarkhand 962 963 908 886 973 975
6. Hariyana 861 877 819 830 869 885
7. NCT of Delhi 821 866 868 866 813 866
8. Rajasthan 921 926 909 883 923 935
9. Uttar Pradesh 898 908 916 899 894 910
10. Bihar 919 916 942 933 914 912
11. Sikkim 875 889 963 944 861 883
12. Arunachal Pradesh 893 920 964 960 878 913
13. Nagaland 900 931 964 944 890 929
14. Manipur 974 987 957 934 977 995
15. Mizoram 935 975 964 971 930 976
16. Tripura 948 961 966 953 945 962
17. Meghalaya 972 986 973 970 971 989
18. Assam 935 954 965 957 929 953
19. West Bengal 934 947 960 950 929 946
20. Jharkhand 941 947 965 943 935 948
21. Orissa 972 978 953 934 976 985
22. Chhattisgarh 989 991 975 964 992 995
23. Madhya Pradesh 919 930 932 912 916 933
24. Gujarat 920 918 883 886 927 923
25. Daman & Diu 710 618 926 909 682 589
26. Dadra & Nagar Haveli 812 775 979 924 779 752
27. Maharashtra 922 925 913 883 924 931
28. Andhra Pradesh 978 992 961 943 981 997
29. Karnataka 965 968 946 943 968 971
30. Goa 961 968 938 920 964 973
31. Lakshadweep 948 946 959 908 946 951
32. Kerala 1,058 1,084 960 959 1,072 1,099
33. Tamil Nadu 987 995 942 946 993 1,000
34. Puducherry 1,001 1,038 967 965 1,006 1,047
35. Andaman & Nicobar Islands 846 878 957 966 831 868
Source : Office of the Registrar General and Commissioner Census, India

279
Table No. 2(a)
Geographical Area and Population by States/UT’s
according to 2011 census
Sl.
No.
State/
Union Territory
Area Population
(Sq. km.)
1 2 3 4
STATE
1. Andhra Pradesh 2,75,045 8,45,80,777
2. Arunachal Pradesh 83,743 13,83,727
3. Assam 78,438 3,12,05,576
4. Bihar 94,163 10,40,99,452
5. Chhattisgarh 1,35,191 2,55,45,198
6. Goa 3,702 14,58,545
7. Gujarat 1,96,024 6,04,39,692
8. Haryana 44,212 2,53,51,462
9. Himachal Pradesh 55,673 68,64,602
10. Jammu & Kashmir 2,22,236 1,25,41,302
11. Jharkhand 79,714 3,29,88,134
12. Karnataka 1,91,791 6,10,95,297
13. Kerala 38,852 3,34,06,061
14. Madhya Pradesh 3,08,252 7,26,26,809
15. Maharashtra 3,07,713 11,23,74,333
16. Manipur 22,327 28,55,794
17. Meghalaya 22,429 29,66,889
18. Mizoram 21,081 10,97,206
19. Nagaland 16,579 19,78,502
20. Orissa 1,55,707 4,19,74,218
21. Punjab 50,362 2,77,43,338
22. Rajasthan 3,42,239 6,85,48,437
23. Sikkim 7,096 6,10,577
24. Tamil Nadu 1,30,060 7,21,47,030
25. Tripura 10,486 36,73,917
26. Uttaranchal 53,483 1,00,86,292
27. Uttar Pradesh 2,40,928 19,98,12,341
28. West Bengal 88,752 9,12,76,115
Contd.

280
Table No. 2(a)
Sl.
No.
State/
Union Territory
Area
(Sq. km.)
Population
1 2 3 4
UNION TERRITORY
1. Andaman & Nicobar Islands 8,249 3,80,581
2. Chandigarh 114 10,55,540
3. Dadra and Nagar Haveli 491 3,43,709
4. Daman and Diu 111 2,43,247
5. Delhi 1,483 1,67,87,941
6. Lakshadweep 30 64,473
7. Pondicherry 490 12,47,953
ALL INDIA 32,87,469 1,21,08,54,977
Concld.
Source: Registrar General and Census Commissioner of India, New Delhi
Table No. 2(b) Population Trend, Manipur Vis-à-vis All-India
Census
Year
Population
(in lakh)
Sex Ratio
(females per 1000
males)
Density
(per sq.km.) Literacy rate
Manipur All-India Manipur All-India Manipur All-India Manipur All-India
1 2 3 4 5 6 7 8 9
1901 2.84 2,383.96 1,037 972 13 77 0.9 5.3
1911 3.46 2,520.93 1,029 964 15 82 2.1 5.9
1921 3.84 2,513.21 1,041 955 17 81 3.8 7.2
1931 4.46 2,789.77 1,065 950 20 90 3.3 9.5
1941 5.12 3,186.61 1,055 945 23 103 5.1 16.1
1951 5.78 3,610.88 1,036 946 26 117 11.4 18.3
1961 7.80 4,392.35 1,015 941 35 142 30.4 28.3
1971 10.73 5,481.60 980 930 48 177 32.9 34.5
1981 14.21 6,833.29 971 934 64 216 41.4 43.6
1991 18.37 8,463.03 958 927 82 267 59.9 52.2
2001 22.94 10,287.37 974 933 103 313 70.5* 64.8
2011 28.56 12,108.56 985 943 128 368 79.21* 72.9

281
* Excludes 3 (three) sub-divisions of Senapati district viz., Mao-Maram, Paomata and Purul.
Table No. 2(c)
Selected Basic Statistics of Manipur According to Census 1981-2011
Sl. No. Item Unit 1981 1991 2001 2011
1 2 3 4 5 6 7
1. Area Sq.km. 22,327 22,327 22,327 22,327
2. Population Lakh 14.21 18.37 22.94 28.56
3. Decadal Growth rate Percent 32.46 29.29 24.86 24.50
4. Density Per sq.km. 64 82 103 128
5. Sex Ratio Female per
1000 males
971
958
974
985
6. Literacy Percent 41.4 59.9 70.53* 79.21*
7. Urban Population Percent 26.42 27.52 25.11 29.21
8. Rural Population Percent 73.58 72.48 74.89 70.79
9. Scheduled Castes
Population.
Percent 1.25 2.02 2.77* 3.78*
10. Scheduled Tribes
Population
Percent 27.30 34.41 34.20* 35.12*
* Excluding three Sub-divisions of Senapati District.
Table No. 2 (d)
Estimated Birth rate, Death rate, and Natural growth rate and Infant mortality rate,
North Eastern States of India, Vis-à-vis All India, 2011
Item Arunachal
Pradesh
Assam Mani-
pur
Megha-
laya
Mizo-
ram
Naga-
land
Sikkim Tripura All
India
1 2 3 4 5 6 7 8 9 10
1. Birth rate:
Rural 21.4 24.0 14.2 26.2 20.6 16.3 17.7 15.1 23.3
Urban 14.2 15.5 15.0 14.6 12.6 15.5 16.6 11.0 17.6
Combined 19.8 22.8 14.4 24.1 16.6 16.1 17.6 14.3 21.8
2. Death rate:
Rural 6.8 8.4 4.1 8.3 5.4 3.4 5.9 4.9 7.6
Urban 2.5 5.6 4.2 5.5 3.4 2.9 3.5 5.4 5.7
Combined 5.8 8.0 4.1 7.8 4.4 3.3 5.6 5.0 7.1
3. Natural
Growth rate:
Rural 14.7 15.6 10.2 17.9 15.2 12.9 11.8 10.2 15.7
Urban 11.6 9.9 10.8 9.1 9.2 12.5 13.1 5.6 11.9
Combined 14.0 14.8 10.3 16.3 12.2 12.8 12.0 9.4 14.7
4. Infant
mortality rate:
Rural 36 58 11 54 43 21 28 31 48
Urban 10 34 12 38 19 20 17 19 29
Combined 32 55 11 52 34 21 26 29 44

282
Source: Sample Registration System Bulletin, Registrar General of India.
Table No. 3(a)
Gross State Domestic Product of Manipur by Industries of Origin at Current Prices,
2006-07 to 2012-13
(Rs.Lacs)
Industries of Origin 2006-07 2007-08 2008-09 2009-10 2010-11 2011-12(Q) 2012-13(A)
1 2 3 4 5 6 7 8
1. Agriculture including
livestock
114029 126420 144593 178583 173040 182558 201233
2. Forestry and logging 21975 21148 24907 27390 33522 35769 39565
3. Fishing Agri. and Allied 12766 13618 14083 14934 15659 19085 20721
4. Mining and Quarrying 0 0 0 0 0 0 0
a. Sub-Total :PRIMARY 148770 161186 183583 220907 222221 237412 261519
5. Manufacturing 29394 35547 36225 38962 45874 50749 56617
5.1 Registered 651 1149 1508 2047 4248 4794 5204
5.2 Unregistered 28743 34398 34717 36915 41626 45955 51413
6. Construction 171903 187201 183999 190168 141558 147325 152708
7. Electricity, Gas & Water
Supply
21629 25402 24978 30671 40658 49087 57547
b. Sub-Total: SECONDARY 222925 248150 245202 259801 228090 247161 266872
8. Transport, Storage &
Communication
18855 20386 23560 28012 31823 40627 46551
8.1 Railway 0 0 0 0 0 1 1
8.2 Transport by other means 11188 12219 14553 16466 18971 24360 28717
8.3 Storage 144 172 204 250 303 365 441
8.4 Communication 7523 7995 8803 11296 12549 15901 17392
9. Trade, Hotel and Restaurants
46520 51780 56791 65502 67560 74445 81923
10. Banking and Insurance 10633 11827 12318 15604 21782 26728 28443
11. Real Estate, Ownership of
dwelling,Business Services & Legal Services
27152 29789 32070 35770 40248 44812 49552
12. Public Administration 67948 78292 90777 93808 189506 208722 260757
13. Other Services 70918 76843 95635 106025 112489 170527 202637
c. Sub-Total : Tertiary 242026 268917 311151 344718 463408 565861 669863
14. State Domestic Product
(Rs. Lacs)
613722 678253 739936 825426 913719 1050434 1198254
15. Population ( 00) 25692 26194 26700 27208 27720 28234 28758
16. State Per Capita
Income(Rs.)
23888 25893 27713 30338 32962 37205 41667
Q : Quick Estimates A : Advance Estimates
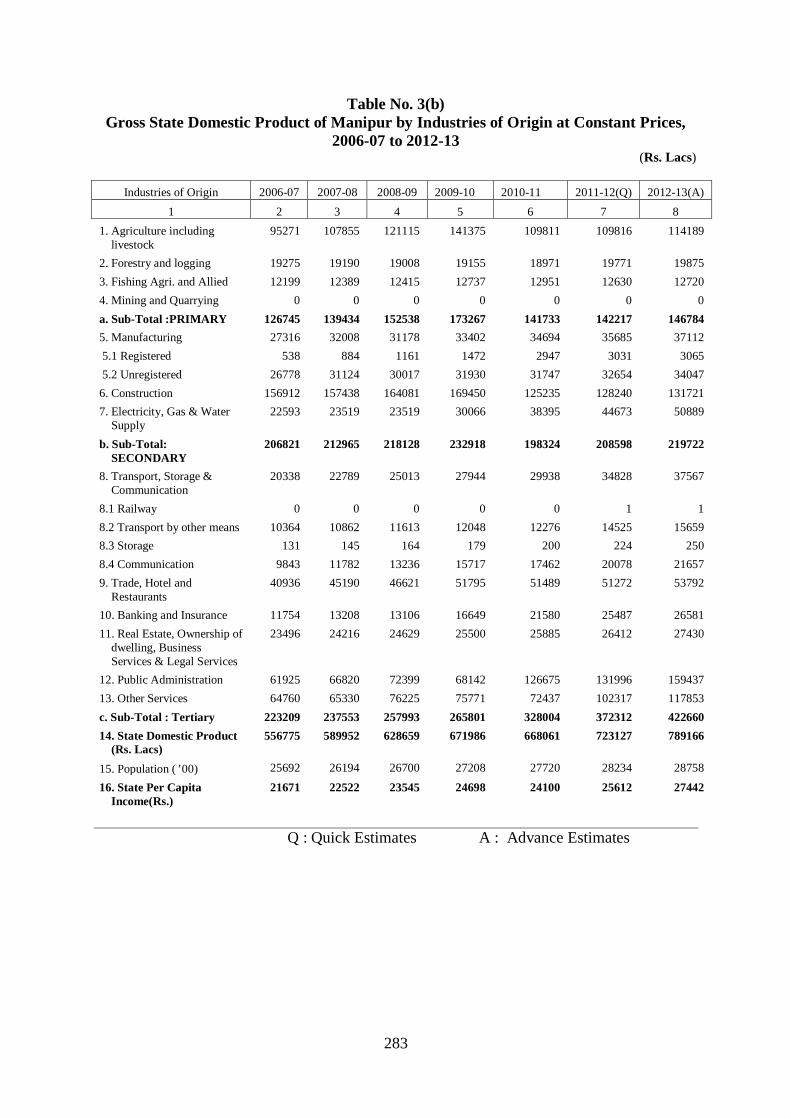
283
Table No. 3(b)
Gross State Domestic Product of Manipur by Industries of Origin at Constant Prices,
2006-07 to 2012-13 (Rs. Lacs)
Industries of Origin 2006-07 2007-08 2008-09 2009-10 2010-11 2011-12(Q) 2012-13(A)
1 2 3 4 5 6 7 8
1. Agriculture including
livestock
95271 107855 121115 141375 109811 109816 114189
2. Forestry and logging 19275 19190 19008 19155 18971 19771 19875
3. Fishing Agri. and Allied 12199 12389 12415 12737 12951 12630 12720
4. Mining and Quarrying 0 0 0 0 0 0 0
a. Sub-Total :PRIMARY 126745 139434 152538 173267 141733 142217 146784
5. Manufacturing 27316 32008 31178 33402 34694 35685 37112
5.1 Registered 538 884 1161 1472 2947 3031 3065
5.2 Unregistered 26778 31124 30017 31930 31747 32654 34047
6. Construction 156912 157438 164081 169450 125235 128240 131721
7. Electricity, Gas & Water
Supply
22593 23519 23519 30066 38395 44673 50889
b. Sub-Total:
SECONDARY
206821 212965 218128 232918 198324 208598 219722
8. Transport, Storage &
Communication
20338 22789 25013 27944 29938 34828 37567
8.1 Railway 0 0 0 0 0 1 1
8.2 Transport by other means 10364 10862 11613 12048 12276 14525 15659
8.3 Storage 131 145 164 179 200 224 250
8.4 Communication 9843 11782 13236 15717 17462 20078 21657
9. Trade, Hotel and
Restaurants
40936 45190 46621 51795 51489 51272 53792
10. Banking and Insurance 11754 13208 13106 16649 21580 25487 26581
11. Real Estate, Ownership of
dwelling, Business
Services & Legal Services
23496 24216 24629 25500 25885 26412 27430
12. Public Administration 61925 66820 72399 68142 126675 131996 159437
13. Other Services 64760 65330 76225 75771 72437 102317 117853
c. Sub-Total : Tertiary 223209 237553 257993 265801 328004 372312 422660
14. State Domestic Product
(Rs. Lacs)
556775 589952 628659 671986 668061 723127 789166
15. Population ( 00) 25692 26194 26700 27208 27720 28234 28758
16. State Per Capita
Income(Rs.)
21671 22522 23545 24698 24100 25612 27442
Q : Quick Estimates A : Advance Estimates

284
Table No. 3(c)
Net State Domestic Product of Manipur by Industries of Origin at Current Prices,
2006-07 to 2012-13 (Rs. Lacs)
Industries of Origin 2006-07 2007-08 2008-09 2009-10 2010-11 2011-12(Q) 2012-13(A)
1 2 3 4 5 6 7 8
1. Agriculture including
livestock
103477 114834 132631 264452 156865 165494 182422
2. Forestry and logging 21709 20860 24592 27049 33133 35354 39106
3. Fishing Agri. and Allied 11177 11920 12103 12690 13355 16277 17672
4. Mining and Quarrying 0 0 0 0 0 0 0
a. Sub-Total :PRIMARY 136363 147614 169326 204191 203353 217125 239200
5. Manufacturing 24540 30268 30334 31974 38081 42128 46999
5.1 Registered 505 976 1317 1557 3523 3976 4316
5.2 Unregistered 24035 29292 29017 30417 34558 38152 42683
6. Construction 167158 181974 174761 180216 134146 139611 144713
7. Electricity, Gas & Water
Supply
9364 10161 12970 17068 24169 29179 34209
b. Sub-Total: SECONDARY 201062 222403 218065 229258 196396 210918 225921
8. Transport, Storage & Communication
16205 17566 20108 23564 26450 33776 38766
8.1 Railway 0 0 0 0 0 1 1
8.2 Transport by other means 9840 10691 12756 14342 16338 20979 24732
8.3 Storage 133 157 185 227 270 325 393
8.4 Communication 6232 6718 7167 8995 9842 12471 13640
9. Trade, Hotel and
Restaurants
44913 49799 54200 62632 63592 70073 77112
10. Banking and Insurance 10437 11620 12123 15359 21467 26341 28032
11. Real Estate, Ownership of
dwelling,
Business Services &
Legal Services
21054 22590 23348 25601 28185 31381 34701
12. Public Administration 54307 62299 76068 79034 159182 175323 219032
13. Other Services 65945 71016 88208 97550 103333 156647 186143
c. Sub-Total : Tertiary 212861 234890 274055 303740 402209 493541 583786
14. State Domestic Product
(Rs. Lacs)
550286 604907 661446 737189 801958 921584 1048907
15. Population ( 00) 25692 26194 26700 27208 27720 28234 28758
16. State Per Capita
Income(Rs.)
21419 23093 24773 27095 28931 32641 36474
Q : Quick Estimates A : Advance Estimates

285
Table No. 3(d)
Net State Domestic Product of Manipur by Industries of Origin at Constant
(2004-2005) Prices, 2006-07 to 2012-13 (Rs. Lacs)
Industries of Origin 2006-07 2007-08 2008-09 2009-10 2010-11 2011-12 (Q) 2012-13 (A)
1 2 3 4 5 6 7 8
1. Agriculture including
livestock
85797 98061 111722 131442 99390 99395 103353
2. Forestry and logging 19036 18947 18755 18919 18726 19515 19618
3. Fishing Agri. and Allied 10657 10720 10760 10939 11189 10912 10989
4. Mining and Quarrying 0 0 0 0 0 0 0
a. Sub-Total :PRIMARY 115490 127728 141237 161300 129305 129822 133960
5. Manufacturing 22950 27440 26146 27662 28559 29374 30550
5.1 Registered 403 728 956 1061 2361 2428 2455
5.2 Unregistered 22547 26712 25190 26601 26198 26946 28095
6. Construction 152487 152716 156398 161186 119316 122179 125496
7. Electricity, Gas & Water
Supply
11560 10576 12856 19402 24777 28828 32840
b. Sub-Total: SECONDARY 186997 190732 195400 208258 172652 180381 188886
8. Transport, Storage & Communication
17896 20275 22125 24311 25760 29958 32315
8.1 Railway 0 0 0 0 0 1 1
8.2 Transport by other means 9093 9466 10120 10259 10129 11990 12926
8.3 Storage 121 132 149 162 177 198 221
8.4 Communication 8682 10677 11856 13890 15454 17769 19167
9. Trade, Hotel and
Restaurants
39468 43475 44613 49574 48587 48382 50760
10. Banking and Insurance 11573 13023 12938 16446 21330 25192 26273
11. Real Estate, Ownership of
dwelling,
Business Services & Legal
Services
18058 18256 18567 18103 17707 18068 18764
12. Public Administration 49537 52971 60458 56982 105384 109811 132640
13. Other Services 60200 60206 69879 68983 65441 92435 106470
c. Sub-Total : Tertiary 196732 208206 228580 234399 284209 323846 367222
14. State Domestic Product
(Rs. Lacs)
499219 526666 565217 603949 586166 634049 690068
15. Population ( 00) 25692 26194 26700 27208 27720 28234 28758
16. State Per Capita
Income(Rs.)
19431 20106 21169 22197 21146 224457 23996
Q : Quick Estimates A : Advance Estimates

286
Table No. 3(e)
Consumer Price Index Numbers for Urban Non-Manual Employees of selected Centres
of the North-Eastern Region of India
(Base: 1984-85 = 100)
Year Imphal Kohima Guwahati Agartala Shillong All-India
1 2 3 4 5 6 7
1991 181 209 168 182 193 177
1992 206 234 194 209 215 199
1993 216 250 204 231 229 212
1994 231 264 219 250 246 231
1995 260 281 222 273 242 252
1996 273 300 275 290 288 276
1997 292 321 290 317 312 297
1998 315 354 320 346 339 330
1999 341 388 350 389 356 348
2000 353 409 374 407 374 366
2001 372 423 391 429 402 386
2002 375 449 401 457 418 402
2003 393 460 410 479 432 416
2004 405 482 424 500 443 432
2005 425 530 445 520 458 451
2006 460 564 474 551 488 478
2007 495 609 505 582 549 509
2008* 519 642 519 590 582 523
* January to October, 2008
Source: Central Statistical Organisation, New Delhi.

287
Table No. 3(f)
Monthly Average Wholesale Price of some selected commodities for the year 2010
(in Rs.)
Sl.
No.
Name of
Commodities
Unit January Feb March April May June
1 2 3 4 5 6 7 8 9
1 Rice(Local) Qtl. - - - - - 2500
2. Sugar Qtl. - - - - - 3850
3 Salt 70 kg - - - - - -
4 Mustard Oil Qtl. - - - - - 1160
5 Milk Qtl. - - - - - N T
6 Potato Qtl. - - - - - 1825
7 Onion Qtl. - - - - - 2050
8 Chilies Qtl. - - - - - N T
9 Arthar DAl Qtl. - - - - - N T
10 Firewood (splitted) 40 kg. - - - - - 325
Sl.
No.
Name of Commodities Unit July Aug. Sept. Oct. Nov. Dec. Average
1 2 3 10 11 12 13 14 15 16
1 Rice(Local) Qtl. 2600 - - - 2300 2400 2450
2. Sugar Qtl. 3600 - - - 3450 3300 3550
3 Salt 70 kg - - - - 490 490 490
4 Mustard Oil Qtl. 1150 - - - 1110 1130 1138
5 Milk Qtl. N T - - - N T N T N T
6 Potato Qtl. 1700 - - - 1300 1350 1544
7 Onion Qtl. 1800 - - - 3100 2350 2325
8 Chilies Qtl. N T - - - N T N T N T
9 Arthar DAl Qtl. 8500 - - - 7500 7500 7833
10 Firewood(splitted) 40 Kg. 300 - - - 450 450 381
N T – No Transaction - Not available
Note : Date collection for January to May is not done due to strike
Source :- A. O. (M.I.) , Manipur.

288
Table No. 3(g)
Monthly Average Wholesale Price of some selected commodities for the year 2011
(in Rs.)
Sl.
No.
Name of
Commodities
Unit Jan. Feb March April May June July
1 2 3 4 5 6 7 8 9 10
1 Rice(Local) Qtl. 2400 2400 2400 2400 2500 2500 2500
2. Sugar Qtl. 3700 3500 3500 3500 3500 3450 3400
3 Salt Qtl. 490 490 490 490 490 490 490
4 Mustard Oil Qtl. 1200 1170 1150 1150 1140 1150 1180
5 Milk 100 Litre N T N T N T N T N T N T N T
6 Potato Qtl. 950 750 975 950 1000 1200 1200
7 Onion Qtl. 3500 2500 1350 1100 1300 1500 1800
8 Chilies Qtl. N T N T N T N T N T N T N T
9 Arthar DAl Qtl. 7500 7500 7000 7000 7000 7000 6000
10 Firewood (splitted) Qtl. 438 450 450 450 450 475 475
Sl.
No.
Name of
Commodities
Unit July Aug. Sept. Oct. Nov. Dec. Average
1 2 3 10 11 12 13 14 15 16
1 Rice(Local) Qtl. 2500 2500 2500 2500 2450 1900 2413
2 Sugar Qtl. 3400 3400 N T N T 3200 3600 3475
3 Salt Qtl. 490 490 N T N T N T N T 490
4 Mustard Oil Qtl. 1180 1300 1400 1500 1450 1400 1266
5 Milk 100 Litre N T N T N T N T N T N T N T
6 Potato Qtl. 1200 1800 2300 1800 1450 1000 1281
7 Onion Qtl. 1800 2700 3000 3000 2500 2000 2188
8 Chilies Qtl. N T N T N T N T N T N T N T
9 Arthar DAl Qtl. 6000 6500 8000 7500 6500 7500 7083
10 Firewood
(splitted)
Qtl. 475 500 500 500 500 500 474
NT : No Transaction
Source :- A.O. (M.I.), Manipur.

289
Table Table No. 3(h)
Monthly Average Retail Price of some selected commodities for the year 2012
(in Rs.)
Sl.
No.
Name of
Commodities Unit January Feb March April May June
1 2 3 4 5 6 7 8 9
1 Rice(Local) Kg. 24.00 24.00 21.00 21.00 21.00 21.00
2. Sugar Kg. 35.00 35.00 35.00 35.00 35.00 35.00
3 Salt Kg. 14.00 14.00 14.00 14.00 14.00 14.00
4 Mustard Oil Kg. 100.00 100.00 100.00 100.00 100.00 100.00
5 Milk Litre 28.00 28.00 28.00 28.00 28.00 28.00
6 Potato Kg. 15.00 12.00 12.00 12.00 18.00 18.00
7 Onion Kg. 20.00 15.00 15.00 15.00 18.00 18.00
8 Chilies(Dry) Kg. 260.00 260.00 260.00 260.00 260.00 240.00
9 Arhar DAL Kg. 80.00 80.00 80.00 80.00 80.00 80.00
10 Firewood (splitted) 40 Kg. 200.00 200.00 200.00 200.00 200.00 250.00
Sl.
No.
Name of
Commodities Unit July Aug. Sept. Oct. Nov. Dec. Average
1 2 3 10 11 12 13 14 15 16
1 Rice(Local) Kg. 21.00 21.00 21.00 21.00 22.00 22.00 21.66
2 Sugar Kg. 35.00 35.00 38.00 38.00 38.00 38.00 36.00
3 Salt Kg. 14.00 14.00 14.00 14.00 14.00 14.00 14.00
4 Mustard Oil Kg. 100.00 100.00 100.00 100.00 100.00 100.00 100.00
5 Milk Litre 30.00 30.00 30.00 30.00 35.00 35.00 29.83
6 Potato Kg. 25.00 25.00 20.00 20.00 20.00 20.00 18.08
7 Onion Kg. 25.00 25.00 20.00 20.00 20.00 30.00 20.08
8 Chilies(Dry) Kg. 200.00 200.00 200.00 200.00 200.00 200.00 228.83
9 Arhar DAL Kg. 80.00 80.00 80.00 80.00 80.00 80.00 80.00
10 Firewood(splitted) 40 kg 250.00 250.00 250.00 250.00 250.00 250.00 229.16
Source :- District Office, Imphal West District.

290
Table No. 3(i)
Monthly Average Retail Price of some selected commodities for the year 2013
(Imphal Khwai Bazar)
(in Rs.)
Sl.
No.
Name of
Commodities Unit January Feb March April May June
1 2 3 4 5 6 7 8 9
1. Rice(Local) Kg. 22.00 22.00 22.00 22.00 22.00 22.00
2. Sugar Kg. 38.00 38.00 38.00 38.00 38.00 38.00
3. Salt Kg. 14.00 14.00 14.00 14.00 14.00 14.00
4. Mustard Oil Kg. 100.00 100.00 115.00 115.00 115.00 115.00
5. Milk Litre 35.00 35.00 40.00 40.00 40.00 40.00
6. Potato Kg. 20.00 15.00 10.00 12.00 12.00 20.00
7. Onion Kg. 25.00 24.00 24.00 24.00 24.00 24.00
8. Chilies(Dry) Kg. 200.00 200.00 180.00 180.00 180.00 180.00
9. Arhar DAL Kg. 80.00 80.00 80.00 80.00 80.00 80.00
10. Firewood (splitted) 40 Kg. 250.00 250.00 250.00 250.00 250.00 250.00
Sl.
No.
Name of
Commodities Unit July Aug. Sept. Oct. Nov. Dec. Average
1 2 3 10 11 12 13 14 15 16
1 Rice(Local) Kg. 26.00 26.00 26.00 28.00 28.00 28.00 24.50
2 Sugar Kg. 38.00 38.00 42.00 42.00 42.00 42.00 39.33
3 Salt Kg. 14.00 16.00 16.00 16.00 16.00 16.00 14.83
4 Mustard Oil Kg. 115.00 115.00 115.00 115.00 115.00 115.00 112.50
5 Milk Litre 40.00 40.00 40.00 40.00 40.00 40.00 39.16
6 Potato Kg. 24.00 25.00 26.00 26.00 30.00 30.00 20.83
7 Onion Kg. 40.00 40.00 40.00 65.00 65.00 40.00 36.25
8 Chilies(Dry) Kg. 180.00 180.00 180.00 180.00 180.00 180.00 183.33
9 Arhar DAL Kg. 80.00 80.00 80.00 80.00 80.00 80.00 80.00
10 Firewood(splitted) 40 kg 250.00 250.00 250.00 250.00 250.00 250.00 250.00
Source :- District Office, Imphal West District.

291
Table No. 3(j)
Retail Price of some selected essential commodities prevalent at Imphal Khwai Bazar
for the year 2013 (in Rs.)
Sl. No. Name of
Commodities Specification Unit January Feb. March April May June
1 2 3 4 5 6 7 8 9 10
1 Milled Rice local Kg. 22.00 22.00 22.00 22.00 22.00 22.00 2. Arthar Dal imported Kg. 80.00 80.00 80.00 80.00 80.00 80.00
3 Moong Dal -do- Kg. 85.00 85.00 85.00 85.00 85.00 85.00
4 Masur Dal -do- Kg. 60.00 60.00 60.00 60.00 60.00 60.00
5 Urd Dal -do- Kg. 80.00 80.00 80.00 80.00 80.00 80.00 6 Milk Fluid local Litre 35.00 35.00 40.00 40.00 40.00 40.00
7 Mustard Oil imported Kg. 100.00 100.00 115.00 115.00 115.00 115.00
8 Meat pork Kg. 200.00 100.00 190.00 190.00 190.00 190.00
9 Meat beef Kg. 200.00 200.00 200.00 200.00 200.00 200.00 10 Egg import Dozen 52.00 52.00 52.00 52.00 48.00 52.00
11 Potato -do- Kg. 20.00 15.00 10.00 12.00 12.00 20.00
12 Onion -do- Kg. 25.00 24.00 24.00 24.00 24.00 24.00
13 Brinjal local Kg. 30.00 40.00 40.00 40.00 40.00 40.00 14 Cauliflower -do- Kg. 40.00 15.00 15.00 15.00 15.00 15.00
15 Cabbage -do- Kg. 20.00 10.00 10.00 10.00 10.00 10.00
16 Pinapple -do- Kg. 20.00 20.00 30.00 30.00 NA NA
17 Sugar open market Kg. 38.00 38.00 38.00 38.00 38.00 38.00 18 Salt import Kg. 14.00 14.00 14.00 14.00 14.00 14.00
19 Dry chillies local Kg. 200.00 200.00 180.00 180.00 180.00 180.00
20 Firewood splitted 40 Kg. 250.00 250.00 250.00 250.00 250.00 250.00
Sl. No.
Name of Commodities
Specifi-cation
Unit July Aug. Sept. Oct. Nov. Dec. Average
1 2 3 4 11 12 13 14 15 16 17
1 Milled Rice local Kg. 26.00 26.00 26.00 28.00 28.00 28.00 24.50
2. Arthar Dal imported Kg. 80.00 80.00 80.00 80.00 80.00 80.00 80.00 3 Moong Dal -do- Kg. 85.00 85.00 85.00 85.00 85.00 85.00 85.00
4 Masur Dal -do- Kg. 60.00 60.00 60.00 60.00 60.00 60.00 60.00
5 Urd Dal -do- Kg. 80.00 80.00 80.00 80.00 80.00 80.00 80.00
6 Milk Fluid local Litre 40.00 40.00 40.00 40.00 40.00 40.00 39.16 7 Mustard Oil imported Kg. 115.00 115.00 115.00 115.0 115.0 115.00 112.50
8 Meat pork Kg. 160.00 160.00 200.00 200.00 200.00 200.00 190.00
9 Meat beef Kg. 180.00 180.00 250.00 250.00 250.00 250.00 213.33
10 Egg import Dozen 52.00 52.00 52.00 52.00 52.00 52.00 51.66 11 Potato -do- Kg. 24.00 25.00 26.00 26.oo 30.00 30.00 20.83
12 Onion -do- Kg. 40.00 40.00 40.00 65.00 65.00 40.00 36.25
13 Brinjal local Kg. 40.00 40.00 40.00 40.00 40.00 40.00 38.33
14 Cauliflower -do- Kg. 50.00 65.00 65.00 65.00 20.00 20.00 33.33
15 Cabbage -do- Kg. 10.00 10.00 20.00 10.00 10.00 10.00 11.66
16 Pinapple -do- Kg. NA NA NA NA NA NA 8.33
17 Sugar open market Kg. 38.00 38.00 38.00 42.00 42.00 42.00 39.33 18 Salt import Kg. 14.00 16.00 16.00 16.00 16.00 16.00 14.83
19 Dry chillies local Kg. 180.00 180.00 180.00 180.00 180.00 180.00 183.33
20 Firewood splitted 40Kg. 250.00 250.00 250.00 250.00 250.00 250.00 250.00
N A – Not Available
Source :- District Statistical Office, Imphal West District.

292
Table No. 3(k)
All India Consumer Price Index of Industrial Workers
(Base: 2001=100)
Month 2005 2006 2007 2008 2009 2010 2011 2012 2013
1 2 3 4 5 6 7 8 9 10
January 113.6 119.0 127.0 133.9 147.9 172 188 198 221
February 113.4 119.0 128.1 135.0 147.9 170 185 199 223
March 113.4 119.0 127.0 136.9 147.9 170 185 201 224
April 114.3 120.1 128.1 138.0 150.1 170 186 205 226
May 113.8 121.0 128.9 139.1 151.0 172 187 206 228
June 114.3 122.9 130.0 140.0 152.9 174 189 208 231
July 116.2 124.0 132.0 143.0 160.0 178 193 212 235
August 116.6 124.0 133.0 144.9 162.0 178 194 214 237
Sept. 113.0 117.1 133.0 146.0 163.0 179 197 215 238
October 118.4 127.0 133.9 147.9 165.0 181 198 217 241
Nov. 119.4 127.0 133.9 147.9 168.0 182 199 218 243
Dec. 118.8 127.0 133.9 147.1 168.9 185 197 219 239
Annual 116.0 123.0 131.0 142.0 157.0 176 192 209 232
Table No. 3 (I)
All India Wholesale Price Index Number
Base: 2004-05 = 100
Year
Index of Wholesale Price
Primary
Articles
Fuel &
Power Lubricants
Manufactured
Products
All
Commodities
Annual
Inflation
rate
1 2 3 4 5 6 7
2005-06 102.9 109.5 - 103.1 104.4 -
2006-07 111.1 115.6 - 107.6 110.1 5.46
2007-08 123.9 121.0 145.8 113.3 116.5 5.81
2008-09 137.5 135.0 171.1 120.2 125.9 8.07
2009-10 154.9 132 174.5 122.4 130.4 3.57
2010-11 182.4 148.3 192.6 130.1 143.2 9.82
2011-12 200.3 169.0 230.4 139.5 156.1 9.01
2012-13 220.0 171.7 244.6 147.1 167.6 7.37

293
Table No. 4(a)
Trends in Revenue and Capital Receipts in Manipur State
(Rs. in lakhs)
Year State’s Own
Tax Revenue
Share in Central
taxes
Total tax
revenue
Total non-tax
revenue
1 2 3 4 5
1980-81 255.37 752.58 1007.95 10086.02
1985-86 702.47 5594.45 6296.92 16330.16
1990-91 1246.30 11324.08 12570.38 26448.53
1995-96 2790.10 16580.53 19370.63 49797.79
2000-01 4907.29 16352.00 21259.29 83202.58
2001-02 5100.98 14214.00 19314.98 98362.90
2002-03 6516.08 18812.00 25328.08 107470.53
2003-04 6823.66 24089.00 30912.66 111058.75
2004-05 8139.40 28702.04 36841.44 137434.41
2005-06 9495.08 34214.00 43709.08 197185.80
2006-07 12151.44 43638.00 55789.44 230484.52
2007-08 14741.67 55043.00 69784.67 281042.05
2008-09 17006.67 58081.00 75087.67 312174.15
2009-10 19603.74 59756.00 79359.74 307953.72
2010-11 26704.96 99057.00 125761.96 417232.42
2011-12 36806.64 115403.00 152209.64 413145.19
2012-13(RE) 43148.00 132905.00 176053.00 602136.09
2013-14(BE) 49187.00 156885.00 206072.00 655875.26
(Rs. in lakhs)
Year Total revenue receipts Total capital receipts Aggregate receipts
1 6 7 8
1980-81 11093.97 56378.81 67472.78
1985-86 22627.08 111852.02 134479.10
1990-91 39018.91 72001.84 111020.75
1995-96 69168.42 108752.16 177920.58
2000-01 104461.87 256661.82 361123.69
2001-02 117677.88 254550.53 372228.41
2002-03 132798.61 314835.82 447634.43
2003-04 141971.41 263784.22 405755.63
2004-05 174275.85 532044.68 706320.53
2005-06 240894.90 507170.70 748065.64
2006-07 285273.96 910492.52 1196766.48
2007-08 350826.72 1606837.63 195766.35
2008-09 387261.82 2296042.72 2683304.54
2009-10 387313.46 2312099.70 2699413.16
2010-11 542994.38 2317368.78 2860363.16

294
2011-12 565354.83 1609982.52 2175337.35
2012-13(RE) 778189.09 2250031.02 3028220.11
2013-14(BE) 861947.26 2249393.02 3111340.28
RE – Revised Estimates BE – Budget Estimates Source: Finance Accounts, Government of Manipur and Annual Financial Statement.
Table No. 4(b)
Developmental and Non-Developmental Expenditure of Manipur
Year
Expenditure (Rs. in lakhs) Expenditure as percentage to total
Total
Develop-
mental
Non-
Develop-
mental
Total
Develop-
mental
Non-
Develop-
mental
1 2 3 4 5 6 7
1991-92 51684.84 38733.82 12951.02 100.00 74.94 25.06
1992-93 47857.07 34302.73 13554.34 100.00 71.68 28.32
1993-94 55695.38 39745.00 15950.38 100.00 71.36 28.64
1994-95 65325.15 46063.57 19261.58 100.00 70.51 29.49
1995-96 79397.32 41587.09 37810.23 100.00 52.38 47.62
1996-97 97285.90 72324.58 24961.32 100.00 74.34 25.66
1997-98 104700.33 76683.24 28017.09 100.00 73.24 26.76
1998-99 100501.18 70747.47 29753.71 100.00 70.39 29.61
1999-00 171175.14 114841.50 56333.64 100.00 67.09 32.91
2000-01 127093.26 75419.94 51673.32 100.00 59.34 40.66
2001-02 151342.10 94678.40 56663.70 100.00 62.56 37.44
2002-03 157581.08 92003.67 65577.41 100.00 58.38 41.62
2003-04 170386.65 106853.65 63533.00 100.00 62.71 37.29
2004-05 217237.01 145358.84 71878.17 100.00 66.91 33.09
2005-06 262032.72 170970.99 91061.73 100.00 65.25 34.75
2006-07 328161.97 227681.81 100480.16 100.00 69.38 30.62
2007-08 340044.06 236430.51 103613.55 100.00 69.53 30.47
2008-09 408908.24 293967.36 114940.88 100.00 71.89 28.11
2009-10 460217.20 331786.74 128430.46 100.00 72.09 27.91
2010-11 59960641 408855.75 190750.66 100.00 68.19 31.81
2011-12(RE) 756279.89 504815.38 251464.55 100.00 66.75 33.25
2012-13(BE) 898683.96 539539.20 359144.76 100.00 60.04 39.96
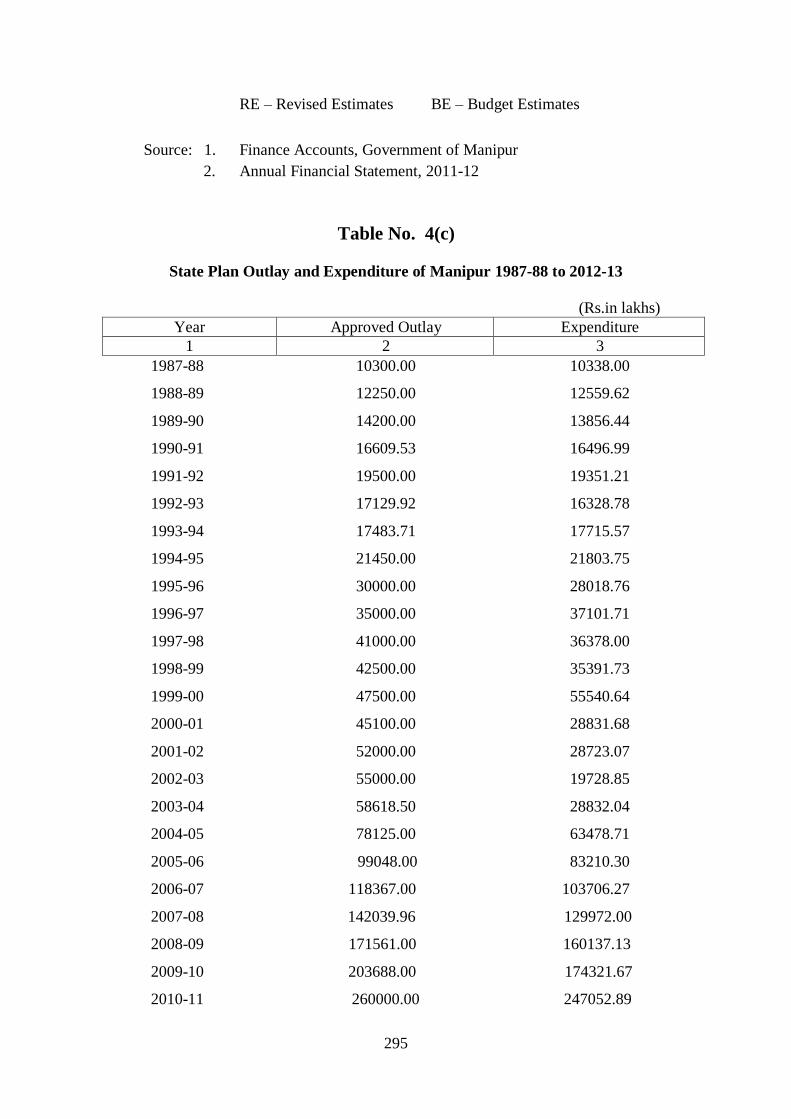
295
RE – Revised Estimates BE – Budget Estimates
Source: 1. Finance Accounts, Government of Manipur
2. Annual Financial Statement, 2011-12
Table No. 4(c)
State Plan Outlay and Expenditure of Manipur 1987-88 to 2012-13
(Rs.in lakhs)
Year Approved Outlay Expenditure
1 2 3
1987-88 10300.00 10338.00
1988-89 12250.00 12559.62
1989-90 14200.00 13856.44
1990-91 16609.53 16496.99
1991-92 19500.00 19351.21
1992-93 17129.92 16328.78
1993-94 17483.71 17715.57
1994-95 21450.00 21803.75
1995-96 30000.00 28018.76
1996-97 35000.00 37101.71
1997-98 41000.00 36378.00
1998-99 42500.00 35391.73
1999-00 47500.00 55540.64
2000-01 45100.00 28831.68
2001-02 52000.00 28723.07
2002-03 55000.00 19728.85
2003-04 58618.50 28832.04
2004-05 78125.00 63478.71
2005-06 99048.00 83210.30
2006-07 118367.00 103706.27
2007-08 142039.96 129972.00
2008-09 171561.00 160137.13
2009-10 203688.00 174321.67
2010-11 260000.00 247052.89

296
2011-12 321000.00 233613.12
2012-13 368075.07† 264167.44*
*Anticipated Expenditure †Proposed outlay
Source : 1. Draft Annual Plan, Proposals Planning Department, Manipur
2. Finance Accounts, Government of Manipur.
Table No. 5(a)
Rainfall in different centres of Manipur
(In mm.)
Year
Imphal
Raj
Bhavan
Lamphel-
pat
(IFCD)
Wangbal
/DSO,
Thoubal
Litan/
DSO,
Ukhrul
Kang-
pokpi/
DSO,
Sena-
pati
Tameng-
long
Bishnu-
pur
Tulihal
Airport
ICAR
Lamphel
1 2 3 4 5 6 7 8 9 10
1995 627.4 666.9 1128.1 1293.4 2567.4 1543.0 - - -
1996 679.2 542.5 907.9 1126.7 2211.4 813.1 - - -
1997 1123.5 949.8 1014.4 1013.8 2039.9 1354.9 - - -
1998 1029.9 - 1168.8 1361.3 2340.0 2249.5 - - -
1999 570.1 692.8 1053.7 1379.0 2419.8 - - - -
2000 1117.7 1178.4 1358.5 1387.6 2222.0 1474.5 - - -
2001 967.2 993.5 1140.2 1049.3 2486.0 1509.2 - - -
2002 914.05 971.50 875.10 1145.50 1524.0 - - - -
2003 901.8 1038.15 981.90 1086.0 1657.0 - - - -
2004 908.0 995.45 400.4 361.25 464.00 - - 154.40 1566.4
2005 - - - - - 4231.3 - 1396.30 1467.2
2006 - - 472.4 966.6 711.2 2513.9 1131.1 822.30 1033.6
2007 - - 1179.3 1306.81 1313.2 - 1791.2 824.0 1522.0
2008 - - 437.5 - 883.3 533.0 497.45 - 1200.9
2009 - - 679.9 - - - - - 1173.7
2010 - - - - - - - - 1725.7

297
2011 - - - - - - - - 1539.1
2012 - - - - - - - - 1325.4
2013 - - - - - - - - 1639.1
- Not Available
Source: Rainguage Station of Manipur.
Table No. 5(b)
Pattern of Land Utilisation Statistics for the year 2004-05, 2005-06 and 2006-07.
(Area in ’000 hectares)
Sl.
No. Particulars
2004-05 2005-06 2006-07
Manipur* All India Manipur* All India Manipur* All India
1 2 3 4 5 6 7 8
Reporting area for land
utilization statistics
(item 1-7) 1,966 3,05,313 1,951 3,05,269 1,952 -
1. Forests 1,693 69,725 1,693 69,785 1,693 -
2. Not available for
cultivation 27 42,341 27 42,503 27 -
3. Permanent pastures and
other grazing land 1 10,423 1 10,415 1 -
4. Land under misc. tree
crops & groves
(not included in net
area sown) 6 3,378 6 3,376 6 -
5. Culturable waste land 1 13,164 1 13,123 1 -
6. Fallow lands - 25,143 - 24,176 - -
6.1 Fallow land other than
current fallows (a) 10,715 (a) 10,504 (a) -
6.2 Current fallows (a) 14,428 (a) 13,672 (a) -
7. Net Area sown 238 1,41,139 223 1,41,891 224 -
8. Area sown more than
once (a) 49,283 - 50,904 - -
9. Total cropped area 238 1,90,422 223 1,92,795 224 -

298
(a) Below 500 hectares
* The figures are taken from the latest forestry statistics publication, agriculture census, or are
estimated based on latest available year data received from the States/Uts respectively.
Source: Directorate of Economics and statistics,
Ministry of Agriculture (SA India, 2007)
Table No. 5(c)
Index Number of agricultural production by crops
1999-2000 = 100
Name of crops
Triennium ending
Weight
Year
2001-
02
2002-
03
2003-
04
2004-
05
2005-
06
2006-
07
2007-
08
2008-
09
1 2 3 4 5 6 7 8 9 10
Rice 97.01 105.73 91.64 104.08 119.02 104.40 106.25 110.88 108.64
Maize 2.99 89.29 73.19 66.64 78.76 70.27 73.18 74.69 101.77
Gram 2.99 - - - - - - - -
Other Pulses 97.01 133.92 174.89 142.73 197.80 192.95 230.84 205.73 293.39
Soyabean 32.91 151.92 65.38 73.08 96.15 38.46 69.23 9.62 42.31
Sesamum 31.01 40.82 4.08 81.63 193.88 116.32 191.84 91.84 42.86
Rape & Mustard 36.08 45.61 175.44 1.75 15.79 19.30 3.51 91.23 1.75
Jute 57.14 - - - - - - - -
Cotton 42.86 100.00 - - - - - 233.33 -
Banana 76.69 122.55 107.59 114.79 107.31 122.57 116.47 259.55 208.26
Tapioca 0.21 130.77 515.38 - - - - - -
Potato 22.69 115.89 160.86 189.87 112.83 185.64 109.40 74.34 127.33
Sweet Potato 0.41 16.00 16.00 - 184.00 - - 632.00 644.00
Sugarcane 99.80 107.17 52.75 54.42 49.47 11.56 82.43 84.10 23.07
Tobacco 0.20 - - - - - - - -

299
Misc. Crops 22.65 107.38 52.86 54.53 49.47 11.58 82.43 84.10 23.07
- Not available
Source: Directorate of Economics & Statistics, Government of Manipur.
Table No. 5(d)
District-wise Consumption of Fertilizers during 2011-12 in Manipur
(in tonnes)
Name of District Name of fertilizer
Total Urea DAP MOP SSP M/Phos
1 2 3 4 5 6 7
Senapati 416 54 - - - 470
Tamenglong 48 - - - - 48
Churachandpur 209 9 - - - 218
Chandel 100 - - - - 100
Ukhrul 120 - - - - 120
Imphal East 2690 310 150 156 - 3306
Imphal West 2306 360 175 189 - 3030
Bishnupur 2609 400 146 242 - 3397
Thoubal 5137 653 257 383 - 6430
Manipur 13,635 1,786 728 970 - 17,119
Table No. 5(d) contd.
District-wise Consumption of Fertilizers during 2012-13 in Manipur
(in tonnes)
Name of District Name of fertilizer
Total Urea DAP MOP SSP M/Phos
1 8 9 10 11 12 13
Senapati 310 60 - - - 370
Tamenglong 80 - - - - 80
Churachandpur 260 - - - - 260
Chandel 90 - - - - 90
Ukhrul 100 - - - - 100
Imphal East 3350 360 150 260 - 4120
Imphal West 3600 430 160 300 - 4490

300
Bishnupur 4050 530 185 410 - 5175
Thoubal 7000 870 310 530 - 8710
Manipur 18,840 2,250 805 1,500 - 23,395
- Not available
Source: Department of Agriculture, Government of Manipur.
Table No. 5(e)
District-wise distribution of Chemical Fertilizers during 2011-12 in Manipur
(Quantity in Tonnes) (Value in Rs. lakh 0.00)
Name of District Nitrogeneous Phosphate Potassic Total
Quantity Value Quantity Value Quantity Value Quantity Value
1 2 3 4 5 6 7 8 9
Senapati 201 28.43 25 11.64 - - 226 40.07
Tamenglong 22 2.76 - - - - 22 2.76
Churachandpur 98 12.76 4 1.94 - - 102 14.70
Chandel 46 5.74 - - - - 46 5.74
Ukhrul 55 6.89 - - - - 55 6.89
Imphal East 1293 180.56 167 84.00 90 33.00 1550 297.56
Imphal West 1125 162.74 196 98.41 105 38.50 1426 299.65
Bishnupur 1273 183.51 223 112.87 88 32.12 1584 328.50
Thoubal 2480 249.96 362 182.93 154 56.54 2996 589.43
Manipur 6593 933.35 977 491.70 437 160.16 8007 1585.21
Table No. 5(e) contd.
District-wise distribution of Chemical Fertilizers during 2012-13 in Manipur
(Quantity in Tonnes) (Value in Rs. lakh 0.00)
Name of District Nitrogeneous Phosphate Potassic Total
Quantity Value Quantity Value Quantity Value Quantity Value
1 10 11 12 13 14 15 16 17
Senapati 154 22.86 28 12.94 - - 182 35.80
Tamenglong 36 4.59 - - - - 36 4.59
Churachandpur 122 15.27 - - - - 122 15.27
Chandel 42 5.16 - - - - 42 5.16
Ukhrul 46 5.74 - - - - 46 5.74
Imphal East 1606 222.66 207 106.23 90 33.00 1903 361.89
Imphal West 1733 242.92 245 125.72 96 35.20 2074 403.84

301
Bishnupur 1959 277.19 311 159.38 111 40.70 2391 477.27
Thoubal 3377 475.20 485 245.90 186 68.20 4048 789.30
Manipur 9075 1271.59 1276 650.17 483 177.10 10834 2098.86
- Not available
Source: Department of Agriculture, Government of Manipur.
Table No. 5(f)
District-wise Livestock and Poultry Population of Manipur
according to 2007 Livestock Census
(in nos.)
District/State Cattle Buffalo Sheep Goat Horse &
Ponies
1 2 3 4 5 6
Senapati 62,491 23,569 5,955 8,271 -
Tamenglong 17,425 7,541 159 5,096 -
Churachandpur 28,448 7,574 930 14,584 -
Chandel 24,519 5,547 542 3,411 -
Ukhrul 22,953 11,149 - 2,078 -
Imphal East 49,511 1,542 453 9,387 -
Imphal West 50,461 1,042 370 2,694 -
Bishnupur 37,400 1,101 - 202 -
Thoubal 48,748 3,102 287 4,854 -
Manipur 3,41,956 62,167 8,696 50,577 -
(in nos.)
District/State Pig Mithun Total
Livestock Poultry
1 7 8 9 10
Senapati 62,387 1,124 1,63,797 -
Tamenglong 31,542 1,822 63,585 -
Churachandpur 33,335 1,345 86,216 -
Chandel 35,795 4,692 74,506 -
Ukhrul 24,516 1,041 61,737 -
Imphal East 23,855 - 84,748 -

302
Imphal West 39,375 - 93,942 -
Bishnupur 22,090 - 60,793 -
Thoubal 41,017 - 98,008 -
Manipur 3,13,912 10,024 7,87,332 22,89,067
- Not available
Source: Directorate of Veterinary and Animal Husbandry Services, Manipur.
Table No. 5(g)
Achievement made under animal health and diseases Control programme
during 2004-05 to 2011-12 (in number)
Sl.
No. Item
Achievements
2004-05 2005-06 2006-07 2007-08
1 2 3 4 5 6
1. Cases treated:
(i) In-patient - - - -
(ii) Out-patient 1,21,529 1,21,606 1,42,153 1,58,207
(iii) Old-patient 68 112 64 15
Total 1,21,597 1,21,718 1,42,217 1,58,222
2. Castration performed 505 731 1,316 1,383
3. Diagnostic cases performed in the laboratory 1,221 2,442 1,873 4,244
4. Vaccination performed
(i) Rinderpest - - - -
(ii) Haemorrhagic septicaemia crania 26,030 42,143 51,295* -
(iii) Ranikhet - - - 600
(iv) Foot and mouth disease - 23,258 27,916 32,395
(v) Black Quarter (BQ+HS) 1,950 - - -
(vi) Others 2,954 45,580 57,014 32,551
5. A.I. calves 4,882 5,345 5,500 4,226
6. A.I. done 11,925 12,882 13,068 9,437
7. Operation performed 546 611 259 168
7.1 Major 14 13 18 11
7.2 Minor 532 598 241 157
(in number)

303
Sl.
No. Item
Achievements
2008-09 2009-10 2010-12 2011-12
1 2 7 8 9 10
1. Cases treated:
(i) In-patient - - - -
(ii) Out-patient 1,81,426 1,53,851 1,67,950 1,71,612
(iii) Old-patient - - - -
Total 1,81,426 1,53,851 1,67,950 1,71,612
2. Castration performed 1,351 1,422 2,704 2,948
3. Diagnostic cases performed in the laboratory 2,388 2,372 2,671 2,723
4. Vaccination performed
(i) Rinderpest - - - -
(ii) Haemorrhagic septicaemia crania 97,940* 91,489* 54,726 59,628
(iii) Ranikhet 500 700 1,370 500
(iv) Foot and mouth disease 39,200 34,729 28,606 25,897
(v) Black Quarter (BQ+HS) - - - -
(vi) Others 23,935 20,080 22,339 21,774
5. No. of A.I. calves 6,145 5,870 7,118 6,998
6. No. of A.I. done 12,143 16,258 14,491 16,070
7. Operation performed 504 382 384 383
7.1 Major 230 24 237 260
7.2 Minor 274 362 147 123
- Not Available * Including B.Q.
Source: Directorate of Veterinary and Animal Husbandry Services, Government of Manipur.
Table No. 5(h)
Number of Milk Plants and Milk Chilling Centres and their capacity
Year
Estimated
Production of
milk (’000 tonnes)
Milk Plants Milk Chilling Centres
Number Capacity
(in litres) Number
Capacity
(in litres)
1 2 3 4 5 6
1990-91 82.16 1 1,000 2 500
1991-92 82.78 1 1,000 2 500
1992-93 83.86 1 1,000 2 500
1993-94 84.29 1 1,000 2 500
1994-95 63.70 1 1,000 2 500
1995-96 60.01 1 1,000 2 500
1996-97 61.24 1 1,000 2 500

304
1997-98 62.00 1 1,000 2 500
1998-99 64.74 1 1,000 2 500
1999-00 66.71 1 1,000 2 500
2000-01 68.13 1 1,000 2 500
2001-02 70.82 1 1,000 2 500
2002-03 71.31 - - - -
2003-04 72.92 - - - -
2004-05 74.77 - - - -
2005-06 76.76 - - - -
2006-07 80.00 - - - -
2007-08 78.21 - - - -
- Not Available
Source: Directorate of Veterinary and Animal Husbandry Services,
Government of Manipur.
Table No. 5(i)
Outturn and Value of Forest Production of Manipur
(Value: Rs. in lakhs) Sl.
No. Name of Product Unit
2001-02 2002-03 2003-04
Quantity Value Quantity Value Quantity Value
1 2 3 4 5 6 7 8 9
I. Major Forest
Product
1. Teak Cum. - - 114.607 2.39 648.55 14.78
2. Timber other than
teak
Cum. 3,983.478 20.01 228.976 4.83 860.54 3.27
3. Fire wood Ton 32,309.768 10.09 50,071.568 15.91 36,601.363 11.23
4. Charcoal Qtl. 239.793 0.59 96.748 0.39 1,036
0.49
5. Post & Pole No. 101 0.06 - - - -
Sub-Total: - - 30.75 - 23.52 - 29.77
II. Minor Forest
Product

305
1. Cane Rm. 95,500 0.27 118.000 0.22 108,000 0.30
2. Stone Cum. 62.099 11.71 68,541.618 10.38 1,21,269.52 21.24
3. Sand Cum. 49.038 5.58 59,568.31 6.06 52,680.07 6.24
4. Earth Cum. 2,609.500 0.35 2.119 0.33 10,475 1.18
5. Thatching Grass Bdls. 21,700 0.04 22,120 0.05 6,173 0.02
6. Bamboo Nos. 27,21,873 12.21 14,24,125 10.85 14,20,958 4.98
7. Wild Cardamon Qtl. - - - - - -
8. Broom Kg. 4,03,467 4.13 5,705.865 0.90 4,67,446 0.98
9. Agar Qtl. - - - - - -
10. Dalchini Qtl. 90 0.37 835.98 3.15 635.88 3.18
11. Others - - 2.71 - 3.14 - 14.74
Sub-Total - - 37.371 - 35.08 - 52.86
Contd.
- Not Available
Table No. 5(i)
Outturn and Value of Forest Production of Manipur
(Value: Rs. in lakhs)
Sl.
No. Name of Product Unit
2004-05 2005-06
Quantity Value Quantity Value
1 2 3 10 11 12 13
I. Major Forest Product
1. Teak Cum. 149.161 2.62 286.651 7.40
2. Timber other than teak Cum. 3,174.22 8.43 8,784.8464 60.76
3. Fire wood Ton. 16,624.515
(tonne)
12.99 23,960.855
(tonne)
13.65
4. Charcoal Qtl. 1,550 0.61 777 0.55
5. Post & Pole No. 38 0.05 - -
Sub-Total: - - 24.70 - 82.36
II. Minor Forest Product
1. Cane Rm. 6,29,000 1.39 1,57,000 0.47

306
2. Stone Cum. 81,835.42 16.09 1,22,586.29 20.92
3. Sand Cum. 52,228.69 5.60 53,972 6.69
4. Earth Cum. 8,350 1.17 19,736 2.46
5. Thatching Grass Bdls. 5,356 0.02 5,625 0.02
6. Bamboo Nos. 7,16,320 3.43 8,87,470 4.31
7. Wild Cardamon Qtl. - - - -
8. Broom Kg. 3,86,600 0.64 3,83,800 0.67
9. Agar Qtl. - - - -
10. Dalchini Qtl. 17,600 0.68 - -
11. Others - - 8.61 - 5.90
Sub-Total - - 37.63 - 41.45
Contd.
- Not Available
Table No. 5(i)
Outturn and Value of Forest Production of Manipur
(Value: Rs. in lakhs)
Sl.
No. Name of Product Unit 2006-07 2007-08
Quantity Value Quantity Value
1 2 3 14 15 16 17
I. Major Forest Product
1. Teak Cum. 259.52 4.78 270.82 15.35
2. Timber other than
teak
Cum. 8,851.80 82.59 8,308.53 68.04
3. Fire wood Ton. 90,323.40 13.52 21,515.65 11.86
4. Charcoal Qtl. 525.50 0.39 530.00 0.31
Sub-Total: - - 101.28 - 95.56
II. Minor Forest Product
1. Cane Rm. 1,96,000 0.53 1,16,200 0.69
2. Stone Cum. 80,756.70 12.47 94,985.08 15.94
3. Sand Cum. 65,552.40 6.40 58,172.75 6.21

307
4. Earth Cum. 4,118.00 0.67 1,497.00 0.30
5. Thatching Grass Bdls. 9,500 0.02 8,400 0.02
6. Bamboo Nos. 13,34,385 5.90 17,09,290 5.85
7. Wild Cardamon Qtl. - - - -
8. Broom Kg. 3,34,200 0.53 3,63,400 0.63
9. Agar Qtl. - - - -
10. Dalchini Qtl. 0 0 0 0
11. Others - - 16.34 - 10.11
Sub-Total - - 42.86 - 39.75
- Not Available Concld.
Source: Forest Department, Government of Manipur.

308
Table No. 5(j)
Revenue Receipts and Expenditure from fisheries
(Rs.in lakhs)
Year Receipts Expenditure Revenue
surplus (+)/deficit (-)
1 2 3 4
1990-91 5.20 297.38 (-) 292.18
1991-92 5.11 326.70 (-) 321.59
1992-93 4.73 331.63 (-) 326.90
1993-94 4.92 388.00 (-) 383.08
1994-95 5.63 395.06 (-) 389.43
1995-96 6.75 512.54 (-) 505.79
1996-97 4.36 561.99 (-) 557.63
1997-98 5.99 619.54 (-) 613.55
1998-99 5.69 590.21 (-) 585.52
1999-00 11.38 1,035.70 (-)1,024.32
2000-01 6.09 766.27 (-) 760.18
2001-02 3.62 882.25 (-) 878.63
2002-03 7.90 838.46 (-) 830.56
2003-04 4.68 892.07 (-) 887.39
2004-05 6.50 966.11 (-)959.61
2005-06 2.27 1,281.43 (-)1,279.16
2006-07 5.57 1,040.84 (-)1,035.27
2007-08 5.61 1,187.88 (-)1,182.27
2008-09 11.95 1,289.94 (-)1,277.99
2009-10 8.16 1,735.72 (-)1,727.56
2010-11 9.72 2,387.00 (-)2,377.28
2011-12 (RE) 10.70 2,674.20 (-)2,663.50
2012-13 (BE) 11.77 2,808.74 (-)2,796.97
RE:– Revised Estimates, BE:– Budget Estimates
Source: 1. Finance Accounts, Government of Manipur.
2. Annual Financial Statements, Government of Manipur.

309
Table No. 7(a)
Performance Under Khadi & Village Industries in North-Eastern Region, 2003-04
(Rs. in lakhs)
State Production Sales Employment
(nos. in lakhs) Earnings
1 2 3 4 5
Arunachal Pradesh 468.54 583.21 0.01 185.42
Assam 8017.93 9981.51 1.21 3446.50
Manipur 6029.24 6069.88 0.62 2690.18
Meghalaya 3202.03 3297.21 0.26 1998.65
Mizoram 4057.80 4218.02 0.25 1661.08
Nagaland 4773.70 5200.28 0.30 3155.35
Sikkim 441.18 532.45 0.07 134.85
Tripura 3603.89 4255.19 0.30 1252.43
Source: Basic Statistics of North Eastern Region, 2002, NEC Shillong.
Table No. 7(b)
Industry-wise number of Strikes and Lock-outs
Year Name of Industry
No. of work stoppages No. of
workers
No. of
Mandays
lost Strikes Lock-outs
1 2 3 4 5 6
2001-02 (i) Public services in local bodies,
department & offices engaged
in administration
1
-
314
5338
(ii) do 1 - 314 3140
(iii) Weaving & Finishing of cotton
textiles on Handlooms
1
-
120
1440
(iv) do 1 - 120 2640
(v) do 1 - 120 2880
(vi) Manufacture of television
receiver, receiption operators
radio broad-casting, radio
telephony/telegraphy video
recording on reproduction
operation, turn-tables record
players, cassette-players, loud
speakers amplifires and sound
amplifires & prerecorded audio/
video records/tapes
1
-
85
1275
Contd.

310
Table No. 7(b)
Industry-wise number of Strikes and Lock-outs
Year Name of Industry
No. of work
stoppages No. of
workers
No. of
Mandays
lost Strikes Lock-outs
1 2 3 4 5 6
2001-02 (i) Weaving & Finishing of cotton
textiles on Handlooms
1
-
120
360
(ii) Manufacture of Television
receivers, receiption operators
radio broad-casting, radio tele-
phony/telegraphy video recor-
ding on reproduction operation,
turn-tables record players,
cassette-players, and other
sound reproducing operators,
loud speakers amplifires and
sound amplifires & pre recorded
audio/ video records/ tapes
1
-
85
1275
(iii) General Public Service
activities of the local
Government bodies.
1
-
250
2750
(iv) - do - 1 - 250 5750
(v) - do - 1 - 250 6000
(vi) - do - 1 - 250 4500
(vii) Raining of silk worms produc-
tion of silkworm cocoons
1
-
307
3091
(viii) - do - 1 - 307 7675
(ix) General Public Service
activities of the local
Government bodies.
1
-
250
4000
(x) - do - 1 - 250 5500
(xi) - do - 1 - 250 5750
(xii) - do - 1 - 250 3750
2002-03 (i) General Public Service
activities of the local
Government bodies.
1
-
250
2000
(ii) - do - 1 - 250 500
(iii) - do - 1 - 250 5250
(iv) Activities of Trade Union 1 - 16 96
Contd.

311
Table No. 7(b)
Industry-wise number of Strikes and Lock-outs
Year Name of Industry
No. of work stoppages No. of
workers
No. of
Mandays
lost Strikes Lock-outs
1 2 3 4 5 6
2003-04 (i) General Public Service
activities of the local
Government bodies.
1
-
250
3750
(ii) - do - 1 - 250 1000
(iii) General construction (including
alteration, addition, repair and
maintenance) of non-residential
building carried out on own
account basis or on a fee or
contract basis
1
-
1077
7539
Concld.
Source: Office of the Labour Commissioner, Manipur
Table No. 7(c)
Gross/Net Value Added from Industries (Factories Sector) in respect of
Manipur during 2000-01 to 2007-08
Characteristics Unit Year
2000-01 2001-02 2002-03 2003-04 2004-05 2007-08
1 2 3 4 5 6 7 8
Factories No. 59 61 44 45 55 69
Productive capital Rs. in crores 7.18 9.31 5.20 4.40 14.00 19.72
Invested capital ,, 7.41 8.90 7.84 8.00 13.00 20.06
Persons engaged No. 814 1127 1225 1231 1835 NA
Workers ,, 695 992 1048 1090 1607 NA
Value of output Rs. in crores 17.73 18.96 20.42 18.00 35.00 58.25
Gross value added ,, 2.39 3.39 5.04 4.00 7.00 12.02
Depreciation ,, 0.49 0.83 0.77 1.00 1.00 1.07
Net value added ,, 1.90 2.56 4.27 3.00 6.00 10.96
Source: 1. Statistical Abstract of India, 2007.
2. Annual Survey of Industries 2007-08, Government of India

312
Table No. 7(d)
District-wise Sericultural Statistics of Manipur 2010-11 to 2013-14
District/State
2010-11 2011-12
No.of
farms
Cocoon Production No.of
farms
Cocoon Production
Mulberry (MT)
Eri (MT)
Tasar
(lakhs
nos.)
Muga
(lakhs
nos.)
Mulberry (MT)
Eri (MT)
Tasar
(lakhs
nos.)
Muga
(lakhs
nos.)
1 2 3 4 5 6 2 3 4 5 6 Senapati 10 75.76 20.62 41.48 0.00 10 53.80 3.55 34.50 0.00
Tamenglong 4 18.78 7.46 0.28 0.00 4 23.12 3.84 1.25 0.00
Churachandpur 14 47.55 3.55 7.49 2.82 14 81.37 4.22 6.75 3.66
Chandel 6 42.57 3.92 3.97 0.00 6 52.91 8.06 9.25 0.00
Ukhrul 7 65.42 4.85 2.60 0.00 7 68.03 5.95 1.25 0.00
Imphal East 26 106.92 58.98 2.98 9.38 26 195.20 86.40 5.00 11.83
Imphal West 13 41.46 18.10 0.28 1.88 13 60.03 18.72 7.00 3.24
Bishnupur 6 117.31 80.58 0.24 0.00 6 104.49 73.15 10.00 0.00
Thoubal 9 192.23 65.59 0.23 0.62 9 148.08 85.56 5.00 1.27
Manipur 95 708.00 263.65 60.00 14.70 95 787.03 289.45 80.00 20.00
District/State
2012-13 2013-14
No. of
farms
Cocoon Production No. of
farms
Cocoon Production
Mulberry (MT)
Eri (MT)
Tasar
(lakhs
nos.)
Muga
(lakhs
nos.)
Mulberry (MT)
Eri (MT)
Tasar
(lakhs
nos.)
Muga
(lakhs
nos.)
1 2 3 4 5 6 2 3 4 5 6 Senapati 10 91.00 4.62 31.42 0.00 10 73.49 5.39 41.34 0.00
Tamenglong 4 13.41 4.99 1.35 0.00 4 33.58 5.87 1.96 0.00
Churachandpur 14 84.00 5.49 15.99 4.68 14 109.98 6.45 21.51 5.75
Chandel 6 18.06 10.48 8.65 0.00 6 70.56 12.41 13.13 0.00
Ukhrul 7 78.30 7.74 1.35 0.00 7 88.57 9.04 1.96 0.00
Imphal East 26 514.50 111.35 13.87 15.15 26 260.35 131.57 19.56 19.00
Imphal West 13 38.00 24.33 6.48 4.15 13 82.73 28.56 9.50 5.25
Bishnupur 6 62.01 95.00 2.16 0.00 6 137.71 111.39 3.07 0..00
Thoubal 9 135.72 111.00 5.40 1.63 9 199.03 130.22 7.82 2.00
Manipur 95 1035.00 375.00 86.67 25.61 95 1056.00 440.90 119.85 32.00
Source: Department of Sericulture, Government of Manipur.
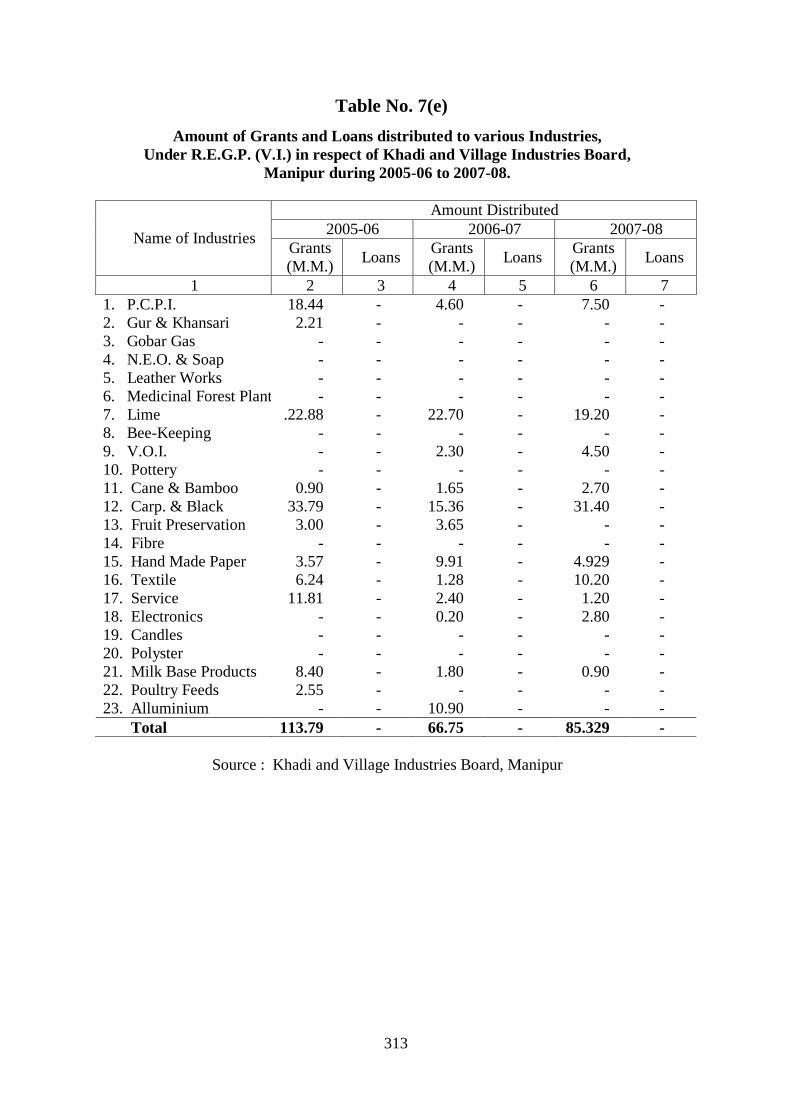
313
Table No. 7(e)
Amount of Grants and Loans distributed to various Industries,
Under R.E.G.P. (V.I.) in respect of Khadi and Village Industries Board,
Manipur during 2005-06 to 2007-08.
Name of Industries
Amount Distributed
2005-06 2006-07 2007-08
Grants
(M.M.) Loans
Grants
(M.M.) Loans
Grants
(M.M.) Loans
1 2 3 4 5 6 7
1. P.C.P.I. 18.44 - 4.60 - 7.50 -
2. Gur & Khansari 2.21 - - - - -
3. Gobar Gas - - - - - -
4. N.E.O. & Soap - - - - - -
5. Leather Works - - - - - -
6. Medicinal Forest Plants - - - - - -
7. Lime .22.88 - 22.70 - 19.20 -
8. Bee-Keeping - - - - - -
9. V.O.I. - - 2.30 - 4.50 -
10. Pottery - - - - - -
11. Cane & Bamboo 0.90 - 1.65 - 2.70 -
12. Carp. & Black 33.79 - 15.36 - 31.40 -
13. Fruit Preservation 3.00 - 3.65 - - -
14. Fibre - - - - - -
15. Hand Made Paper 3.57 - 9.91 - 4.929 -
16. Textile 6.24 - 1.28 - 10.20 -
17. Service 11.81 - 2.40 - 1.20 -
18. Electronics - - 0.20 - 2.80 -
19. Candles - - - - - -
20. Polyster - - - - - -
21. Milk Base Products 8.40 - 1.80 - 0.90 -
22. Poultry Feeds 2.55 - - - - -
23. Alluminium - - 10.90 - - -
Total 113.79 - 66.75 - 85.329 -
Source : Khadi and Village Industries Board, Manipur

314
Table No. 7(f)
Districtwise Number of Bee-Keepers, Outturn Price and value of Honey
in Manipur for the year 2010-11.
Name of District No. of Bee
Keepers
Production of
Honey in Kgs.
Price per Kgs.
(Rs.)
Value
(Rs. In lakhs)
1 2 3 4 5
1. Senapati 769 8,950 180/- 16.11
2. Tamenglong 278 3,225 180/- 5.81
3. Churachandpur 938 10,965 180/- 19.74
4. Chandel 519 6,067 180/- 10.92
5. Ukhrul 1,090 12,702 180/- 22.86
6. Imphal East 1,771 20,696 180/- 37.25
7. Imphal West 1,591 18,520 180/- 33.34
8. Bishnupur 744 8,640 180/- 15.55
9. Thoubal 1,483 17,790 180/- 31.14
Total 9,183 1,07,066 180/- 192.72
Districtwise Number of Bee-Keepers, Outturn Price and value of Honey
in Manipur for the year 2011-12.
Name of District No. of Bee
Keepers
Production of
Honey in Kgs.
Price per Kgs.
(Rs.)
Value
(Rs. In lakhs)
1 2 3 4 5
1. Senapati 769 8,950 180/- 16.11
2. Tamenglong 278 3,225 180/- 5.81
3. Churachandpur 940 10,995 180/- 19.79
4. Chandel 526 6,137 180/- 11.05
5. Ukhrul 1,090 12,702 180/- 22.86
6. Imphal East 1,771 20,696 180/- 37.25
7. Imphal West 1,591 18,520 180/- 33.34
8. Bishnupur 744 8,640 180/- 15.55
9. Thoubal 1,483 17,301 180/- 31.14
Total 9,192 1,07,166 180/- 192.90
Source : Khadi and Village Industries Board, Manipur

315
Table No. 8(a)
District-wise Installed Capacity and electricity Generated during 2010-11
District / State Installed Capacity (MW) Generated (Million KWH)
Total Hydro Diesel Total Hydro Diesel
1 2 3 4 5 6 7
Senapati 36.900 0.900 36.000 0.9093 0.9093 0
Tamenglong 0.048 0 0.048 0 0 0
Churachandpur 0.448 0 0.448 0 0 0
Chandel 0.400 0.400 0 0 0 0
Ukhrul 1.500 1.500 0 0 0 0
Imphal East 0.476 0 0.476 0 0 0
Imphal West 5.248 0 5.248 1.0208 0 1.0208
Bishnupur 0 0 0 0 0 0
Thoubal 0 0 0.000 0 0 0
Manipur 45.020 2.800 42. 220 1.9301 0.9083 1.0208
Source: Department of Electricity, Government of Manipur.
Table No. 8(a)
District-wise Installed Capacity and electricity Generated during 2011-12
District / State Installed Capacity (MW) Generated (Million KWH)
Total Hydro Diesel Total Hydro Diesel
1 2 3 4 5 6 7
Senapati 36.900 0.900 36.000 0.7395 0.7395 0
Tamenglong 0.048 0 0.048 0 0 0
Churachandpur 0.448 0 0.448 0 0 0
Chandel 0.400 0.400 0 0 0 0
Ukhrul 1.500 1.500 0 0 0 0
Imphal East 0.476 0 0.476 0 0 0
Imphal West 5.248 0 5.248 0.8755 0 0.8755
Bishnupur 0 0 0 0 0 0
Thoubal 0 0 0.000 0 0 0
Manipur 45.020 2.800 42. 220 1.6150 0.7395 0.8755
Source: Department of Electricity, Government of Manipur.
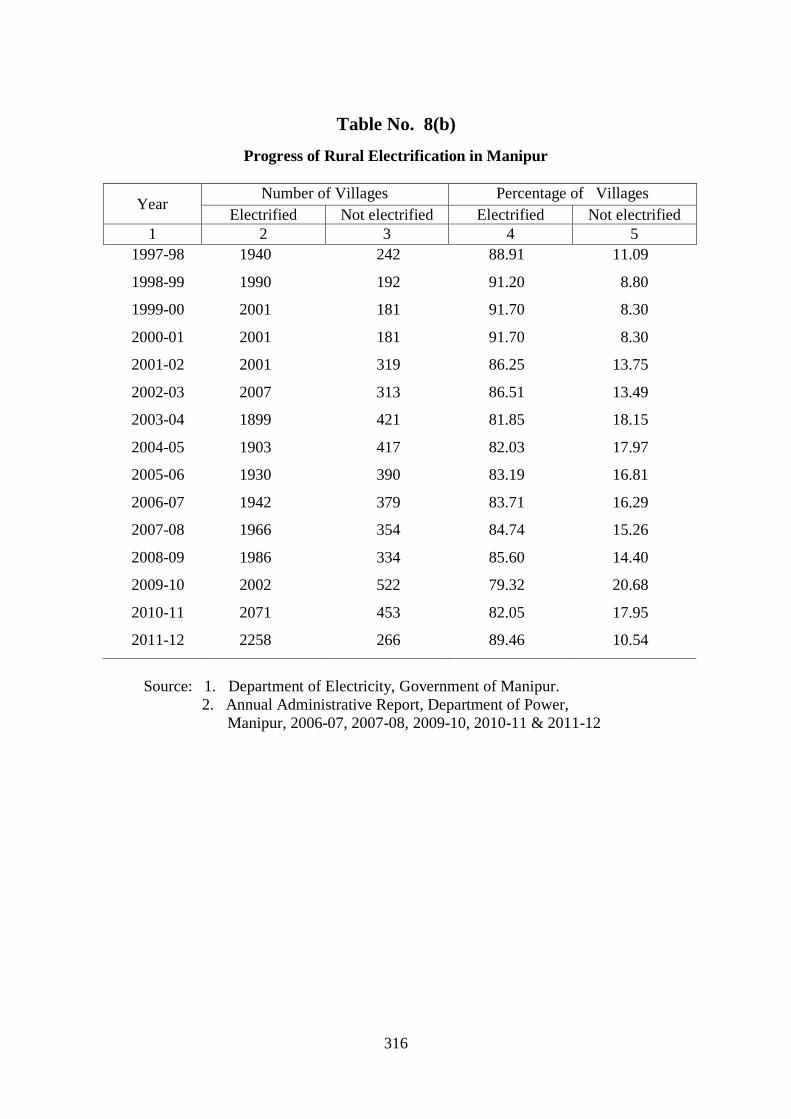
316
Table No. 8(b)
Progress of Rural Electrification in Manipur
Year Number of Villages Percentage of Villages
Electrified Not electrified Electrified Not electrified
1 2 3 4 5
1997-98 1940 242 88.91 11.09
1998-99 1990 192 91.20 8.80
1999-00 2001 181 91.70 8.30
2000-01 2001 181 91.70 8.30
2001-02 2001 319 86.25 13.75
2002-03 2007 313 86.51 13.49
2003-04 1899 421 81.85 18.15
2004-05 1903 417 82.03 17.97
2005-06 1930 390 83.19 16.81
2006-07 1942 379 83.71 16.29
2007-08 1966 354 84.74 15.26
2008-09 1986 334 85.60 14.40
2009-10 2002 522 79.32 20.68
2010-11 2071 453 82.05 17.95
2011-12 2258 266 89.46 10.54
Source: 1. Department of Electricity, Government of Manipur.
2. Annual Administrative Report, Department of Power,
Manipur, 2006-07, 2007-08, 2009-10, 2010-11 & 2011-12
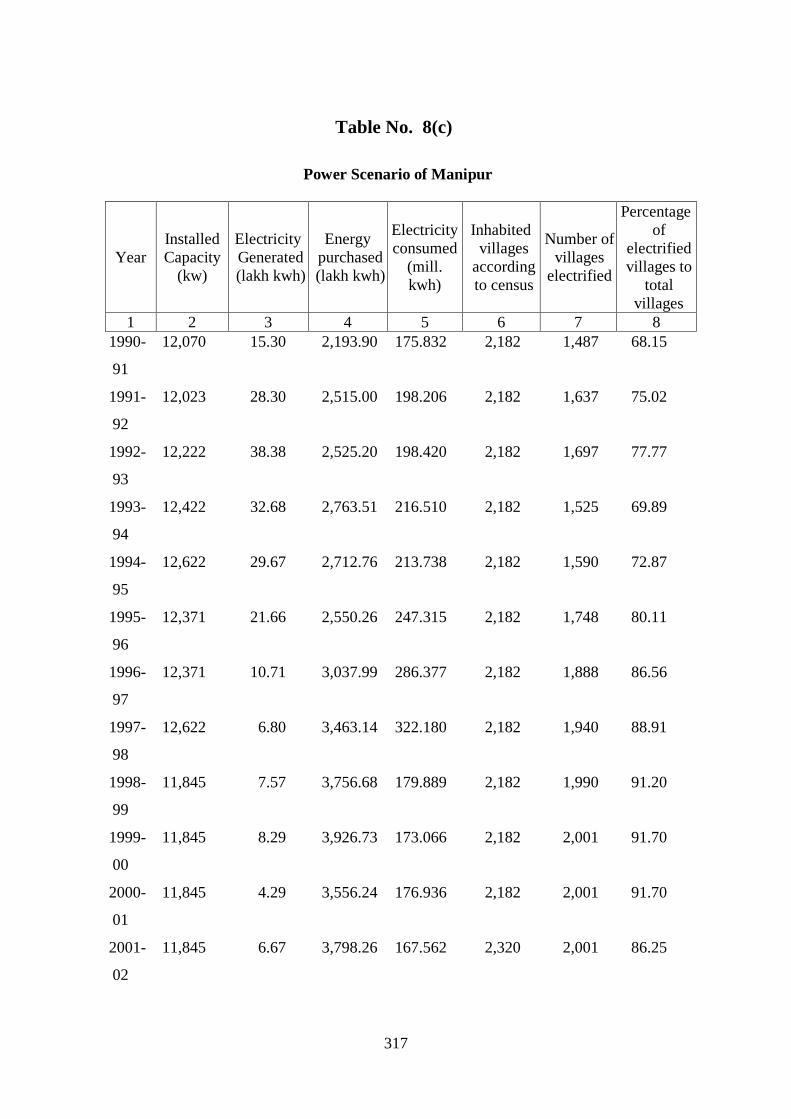
317
Table No. 8(c)
Power Scenario of Manipur
Year
Installed
Capacity
(kw)
Electricity
Generated
(lakh kwh)
Energy
purchased
(lakh kwh)
Electricity
consumed
(mill.
kwh)
Inhabited
villages
according
to census
Number of
villages
electrified
Percentage
of
electrified
villages to
total
villages
1 2 3 4 5 6 7 8
1990-
91
12,070 15.30 2,193.90 175.832 2,182 1,487 68.15
1991-
92
12,023 28.30 2,515.00 198.206 2,182 1,637 75.02
1992-
93
12,222 38.38 2,525.20 198.420 2,182 1,697 77.77
1993-
94
12,422 32.68 2,763.51 216.510 2,182 1,525 69.89
1994-
95
12,622 29.67 2,712.76 213.738 2,182 1,590 72.87
1995-
96
12,371 21.66 2,550.26 247.315 2,182 1,748 80.11
1996-
97
12,371 10.71 3,037.99 286.377 2,182 1,888 86.56
1997-
98
12,622 6.80 3,463.14 322.180 2,182 1,940 88.91
1998-
99
11,845 7.57 3,756.68 179.889 2,182 1,990 91.20
1999-
00
11,845 8.29 3,926.73 173.066 2,182 2,001 91.70
2000-
01
11,845 4.29 3,556.24 176.936 2,182 2,001 91.70
2001-
02
11,845 6.67 3,798.26 167.562 2,320 2,001 86.25

318
2002-
03
47,252 35.77 4,271.84 165.645 2,320 2,007 86.51
2003-
04
47,052 42.80 4,313.49 165.383 2,320 1,899 81.85
2004-
05
47,252 14.325 5,712.60 141.254 2,320 1,903 82.03
2005-
06
47,252 3.140 5,209.86 299.815 2,320 1,930 83.19
2006-
07
47,252 31.053 4,412.16 221.882 2,320 1,942 83.71
2007-
08
46,212 6.02 4,252.31 334.964 2,320 1,966 84.74
2008-
09
44,820 6.46 6,159.38 301.602 2,320 1,986 85.60
2009-
10
45.420 20.105 4651.21 290.369 2,524* 2002 79.32
2010-
11
45.020 19.301 - - - - -
2011-
12
45.020 16.150 - - - - -
* as on 21-01-2009 - Not available
Source: Department of Electricity, Government of Manipur.
Table No. 8(d) Number of Scheduled Commercial Banks and their Offices in
North Eastern States of India as on 31st March
Sl.
No Name of Banks Arunachal Pradesh Assam Manipur
2011 2012 2013 2011 2012 2013 2011 2012 2013
1 2 3 4 5 6 7 8 9 10 11
1. Allahabad Bank 1 1 1 66 67 68 1 1 1
2. Andhra Bank - - - 4 5 7 - - - 3. Assam Gramin Vikas Bank - - - 368 367 367 - - -
4. Arunachal Pradesh Rural Bank 18 18 18 - - - - - -
5. Axis Bank 1 1 1 26 30 34 2 2 4 6. Bank of Baroda 1 1 1 20 23 24 3 3 3
7. Bank of India 1 1 1 14 22 39 - 1 2
8. Bank of Maharashtra 1 1 1 4 7 8 - - 1
9 Bank of Rajasthan - - - - - - - - - 10. Cachar Gramin Bank - - - - - - - - -
11. Canara Bank 1 1 2 24 28 35 - - 1

319
12. Central Bank of India 1 1 6 114 122 128 - 4 5
13. Centurion Bank of Punjab - - - - - - 3 - - 14. Corporation Bank - - - 6 6 8 - - -
15. Dena Bank - - - 5 6 6 - - -
16. Federal Bank - - - 6 10 12 - - -
17. Global Trust Bank - - - - - - - - - 18. HDFC Bank 2 4 4 28 32 40 1 3 3
19. HSBC - - - 1 1 1 - 2 -
20. ICICI Bank 1 1 1 22 32 37 1 - 5
21. IDBI Ltd. 1 1 1 4 9 14 - - 1 22. Indian Bank 1 2 2 29 32 34 - 1 -
23. Indian Overseas Bank - 1 1 22 24 26 1 - 2
24. Indusind Bank - - - 6 6 8 - - -
25. ING Vysya Bank - - - 1 1 1 - - - 26. Ka Bank Nongkyndong Ri Khasi Jaintia - - - - - - - - -
27. Karnataka Bank - - - 1 1 1 - - -
28. Kotak Mahindra Bank - - - 3 3 3 - - -
29. Langpi Dehangi Rural Bank - - - 42 42 42 - - - 30. Lakhimi Gaonua bank - - - - - - - - -
31. Manipur Rural Bank - - - - - - 28 28 28
32. Meghalaya Rural Bank - - - - - - - - -
33. Mizoram Rural Bank - - - - - - - - - 34. Nagaland Rural Bank - - - - - - - - -
35. Oriental Bank of Commerce 1 1 1 7 7 8 - - -
36. Pragyotish Gaonua Bank - - - - - - - - -
37. Punjab and Sind bank - 1 1 8 8 8 2 2 4
38. Punjab National Bank 1 - - 60 64 65 2 2 2
39. South Indian Bank - - - 2 2 2 - - -
40. Standard Chartered Grindlays Bank - - - 1 1 1 - - -
41. State Bank of Bikaner & Jaipur - - - 1 1 1 - - -
42. State Bank of India 44 49 51 280 292 300 22 28 29
43. Subansiri Gaonua Bank - - - - - - - - -
44. Syndicate Bank 1 1 1 10 14 19 - - -
45. Tripura Gramin Bank - - - - - - - - -
46. United Commercial Bank 2 2 2 107 109 130 2 2 4
47. Union Bank of India 1 1 1 62 63 63 - - -
48. United Bank of India 3 3 3 190 191 195 15 16 16
49. UTI Bank - - - - - - - - -
50. Vijaya Bank 4 5 5 15 15 15 2 3 4
51. Yes Bank 1 1 1 4 4 4 - - -
Total: 88 98 106 1563 1647 1754 85 98 115
Contd.
Source: Statistical Tables Relating to Banks in India, 2012-13, RBI.
Table No. 8(d)
Number of Scheduled Commercial Banks and their Offices in
North Eastern States of India as on 31st March
Sl.
No. Name of Banks Meghalaya Mizoram Nagaland
2011 2012 2013 2011 2012 2013 2011 2012 2013
1 2 12 13 14 15 16 17 18 19 20
1. Allahabad Bank 1 2 2 - - - 4 4 4
2. Andhra Bank 1 1 1 - - - - - - 3. Assam Gramin Vikas Bank - - - - - - - - -
4. Arunachal Pradesh Rural Bank - - - - - - - - -
5. Axis Bank 4 4 4 1 1 1 4 4 6
6. Bank of Baroda 3 3 5 1 1 1 4 4 5 7. Bank of India 2 3 4 - 1 2 - 1 2
8. Bank of Maharashtra - 1 1 - 1 1 - - 1
9 Bank of Rajasthan - - - - - - - - -
10. Cachar Gramin Bank - - - - - - - - -

320
11. Canara Bank 3 3 4 - 1 1 - 1 1
12. Central Bank of India 5 6 9 1 1 2 2 2 5 13. Centurion Bank of Punjab - - - - - - - - -
14. Corporation Bank 1 1 1 - - - - - -
15. Dena Bank 1 1 1 - - - - - -
16. Federal Bank 1 2 2 - 1 1 1 1 2 17. Global Trust Bank - - - - - - - - -
18. HDFC Bank 5 9 13 1 4 6 3 3 3
19. HSBC - - - - - - - - -
20. ICICI Bank 3 3 4 1 1 1 2 4 6 21. IDBI Ltd. 1 1 2 1 1 1 1 2 3
22. Indian Bank 2 2 2 - - - 1 1 1
23. Indian Overseas Bank 1 1 1 - - 1 - - -
24. Indusind Bank - - 1 1 1 1 - - 1 25. ING Vysya Bank - - - - - - - - -
26. Ka Bank Nongkyndong Ri Khasi Jaintia - - - - - - - - -
27. Karnataka Bank - - - - - - - - -
28. Kotak Mahindra Bank 1 1 1 - - - - - - 29. Langpi Dehangi Rural Bank - - - - - - - - -
30. Lakhimi Gaonua bank - - - - - - - - -
31. Manipur Rural Bank - - - - - - - - -
32. Meghalaya Rural Bank 55 55 55 - - - - - - 33. Mizoram Rural Bank - - - 60 62 64 - - -
34. Nagaland Rural Bank - - - - - - 9 10 10
35. Oriental Bank of Commerce 1 1 1 - - - - - -
36. Pragyotish Gaonua Bank - - - - - - - - - 37. Punjab and Sind bank - - 1 - - 1 1 1 1
38. Punjab National Bank 8 9 9 1 1 1 1 1 1
39. South Indian Bank 1 1 1 - - 1 - 1 1
40. Standard Chartered Grindlays Bank - - - - - - - - - 41. State Bank of Bikaner & Jaipur - - - - - - - - -
42. State Bank of India 94 96 96 27 32 32 52 56 58
43. Subansiri Gaonua Bank - - - - - - - - -
44. Syndicate Bank 3 5 5 1 1 1 1 1 1
45. Tripura Gramin Bank - - - - - - - - -
46. United Commercial Bank 4 5 5 1 1 2 2 3 4
47. Union Bank of India 5 5 5 - - 1 1 1 1 48. United Bank of India 13 14 15 2 2 2 2 2 2
49. UTI Bank - - - - - - - - -
50. Vijaya Bank 3 4 4 2 2 2 5 5 5
51. Yes Bank 1 1 1 1 1 1 - - -
Total: 223 240 256 102 116 127 96 108 124
Contd.
Source: Statistical Tables Relating to Banks in India, 2012-2013, RBI.
Table No. 8(d)
Number of Scheduled Commercial Banks and their Offices in
North Eastern States of India as on 31st March
Sl.
No. Name of Banks Sikkim Tripura
2011 2012 2013 2011 2012 2013
1 2 21 22 23 24 27 26
1. Allahabad Bank 1 1 1 1 1 2 2. Andhra Bank 1 1 1 - 1 1
3. Assam Gramin Vikas Bank - - - - - -
4. Arunachal Pradesh Rural Bank - - - - - - 5. Axis Bank 3 3 3 3 4 5
6. Bank of Baroda 1 1 1 2 3 3
7. Bank of India 1 1 1 1 2 6
8. Bank of Maharashtra 1 1 1 - 1 1

321
9 Bank of Rajasthan - - - - - -
10. Cachar Gramin Bank - - - - - - 11. Canara Bank 2 4 4 3 5 7
12. Central Bank of India 15 15 16 3 4 6
13. Centurion Bank of Punjab - - - - - -
14. Corporation Bank 1 1 1 1 1 1 15. Dena Bank 1 1 2 - - -
16. Federal Bank - - - - - 1
17. Global Trust Bank - - - - - -
18. HDFC Bank 4 4 4 3 3 3 19. HSBC - - - - - -
20. ICICI Bank 2 2 3 1 5 5
21. IDBI Ltd. 1 2 3 1 1 2
22. Indian Bank 1 1 1 2 2 3 23. Indian Overseas Bank 1 1 2 2 3 4
24. Indusind Bank 1 1 2 2 2 2
25. ING Vysya Bank - - - - - -
26. Ka Bank Nongkyndong Ri Khasi Jaintia - - - - - - 27. Karnataka Bank - - - - - -
28. Kotak Mahindra Bank - - - - - 1
29. Langpi Dehangi Rural Bank - - - - - -
30. Lakhimi Gaonua bank - - - - - - 31. Manipur Rural Bank - - - - - -
32. Meghalaya Rural Bank - - - - - -
33. Mizoram Rural Bank - - - - - -
34. Nagaland Rural Bank - - - - - - 35. Oriental Bank of Commerce 2 2 2 1 1 1
36. Pragyotish Gaonua Bank - - - - - -
37. Punjab and Sind bank - - - 1 1 2
38. Punjab National Bank 1 1 1 1 1 2 39. South Indian Bank - - - 1 1 1
40. Standard Chartered Grindlays Bank - - - - - -
41. State Bank of Bikaner & Jaipur - - - - - -
42. State Bank of India 31 32 32 42 45 49
43. Subansiri Gaonua Bank - - - - - -
44. Syndicate Bank 1 1 1 1 1 3
45. Tripura Gramin Bank - - - 116 116 116
46. United Commercial Bank 2 4 4 9 12 13
47. Union Bank of India 7 7 8 5 6 7
48. United Bank of India 2 2 2 45 51 53
49. UTI Bank - - - - - - 50. Vijaya Bank 1 1 1 1 2 2
51. Yes Bank 1 1 1 1 1 1
Total: 85 91 98 249 278 303
Concld.
Source: Statistical Tables Relating to Banks in India, 2012-2013, RBI.

322
Table No. 8(e)
Deposits & Credits of Scheduled Commercial Banks of North Eastern Region of India
(as on 31st March)
(Rs. in crores)
State
2012 2013
Deposit Credit Credit-Deposit
Ratio (%) Deposit Credit
Credit-Deposit
Ratio (%)
1 2 3 4 5 6 7
Arunachal Pradesh 5755 1327 23.06 6790 1470 21.65
Assam 58504 20230 34.58 66960 22503 33.61
Manipur 3761 1228 32.65 4607 1398 30.35
Meghalaya 9703 2458 25.33 11971 2802 23.41
Mizoram 2265 901 39.78 2782 972 34.94
Nagaland 4827 1508 31.24 5373 1711 31.84
Tripura 7406 1957 26.42 8534 2287 26.80
Sikkim 3608 1200 33.26 4303 1211 28.14
North Eastern
Region 95829 30809 32.15 111320 34354 30.86
All India 4615800 3551757 76.95 5246957 4054040 77.26
Source: Quarterly Statistics on Deposits & Credits of Scheduled Commercial Banks, March
2012-13, RBI.
Table No. 8(f)
Districtwise Tele Communication facilities in Manipur 2009-10
(in nos.)
Sl.
No. District/State
Telegraph
Office
Telephone
Exchange
Combined
Office
Telephone
Working
(DEL)
P.C.Os.
(Local/STD/
Trunk)
1 2 3 4 5 6 7
1. Senapati Nil 10 Nil 1862 159
2. Tamenglong Nil 2 Nil 514 59
3. Churachandpur Nil 4 Nil 2754 145
4. Chandel Nil 3 Nil 1298 228
5. Ukhrul Nil 1 Nil 746 100
6. Imphal East Nil 6 Nil 3093 511
7. Imphal West 1 12 Nil 15648 2132
8. Bishnupur Nil 7 Nil 2238 133
9. Thoubal Nil 8 Nil 3088 199
Manipur State 1 53 Nil 31214 3666

323
Source : Office of the Telecom, District Manager, Imphal.
Table No. 9(a)
Number of Educational Institutions in the North-Eastern States of India, 2003-04
(Number)
Sl.
No. Institutions
Arunachal Pradesh
Assam Manipur Meghalaya Mizoram Nagaland Tripura
1 2 3 4 5 6 7 8 9
1. University* 1 5 2 1 1 1 1
2. Board of Secondary
Education
- 2 2 1 1 1 1
3. Arts/Science & Commerce
Colleges
9 320 58 48 27 34 14
4. Engineering Colleges - 2 3 2 - - 2
5. Medical Colleges 1 7 1 1 1 1 1
6. Agricultural Colleges - 2 - - - 1 -
7. Veterinary Colleges - 2 - - - - -
8. Teacher Training Colleges - 41 5 4 1 4 1
9. Law College - 20 3 3 2 3 1
10. Other College - 3 2 - - - 3
11. High/Higher Secondary
Schools
214 5374 706 711 512 379 652
12. High School - - - - - - -
13. Middle School 495 8143 831 1759 939 480 185
14. Primary School 1371 30068 2552 5851 1481 1520 684
15. Pre-primary School 22 199 1 - - - 5127
16. Schools for vocational
Professional (1)
2 27 7 7 1 3 4
17. Schools for special
education (2) 1 8 1 1 2 3 1
* 2004-05
(1) include institution imparting instructions in Diploma/Certificate Courses at School level
in Agricultural/Forestry, Medicine, Teachers Training, Industrial (Art & Crafts), Music &
Fine Arts.
(2) ) include institution imparting instructions in Diploma/Certificate Courses at School level
for handicapped and reformatory/certified.

324
Source : Statistical Abstract of India, 2007.
Table No. 9(b)
District-wise number of fair price shops and S.K.Oil Sub-Dealers
in Manipur under PDS
District/State Fair Price Shop Agents S.K. Oil Sub-Dealers
1 2 3
Senapati 128 128
Tamenglong 119 37
Churachandpur 168 137
Chandel 123 135
Ukhrul 129 144
Imphal East 474 478
Imphal West 621 610
Bishnupur 292 735
Thoubal 497 344
Manipur 2551 2747
Source : 1. Annual Administrative Report 2006-07,
Food & Civil Supplies Department, Government of Manipur.
Table No. 9(c)
Loans and Grants Distributed by the State Govt. to economically weaker sections
in Manipur during 1995-96 to 2003-04
Year
Old Age Pension Assistance to Dependent Children
No. of
beneficiaries
Amount
(in Rs.)
No. of
beneficiaries
Amount
(in Rs.)
1 2 3 4 5
1995-96 3,333 39,99,600 272 1,79,897
1996-97 3,333 39,99,600 240 85,006
1997-98 3,541 42,49,200 232 98,360
1998-99 3,452 41,38,000 219 1,49,575
1999-00 3,974 47,64,800 283 2,03,760
2000-01 3,982 47,84,400 257 90,974
2001-02 4,172 62,58,500 288 1,82,336
2002-03 4,242 49,98,000 384 2,40,360
2003-04 10,254 1,22,90,700 554 3,98,880

325
Source: Department of Social Welfare, Manipur.
Table No. 9(d)
District-wise number of tourist spots and tourist during 2012-13 and 2013-14
Sl.
No. District/State
2012-13 2013-14
No. of
tourist
spot
Number of tourist No. of
tourist
spot
Number of tourist
Foreign Domestic Total Foreign Domestic Total
1 2 3 4 5 6 7 8 9 10
1. Senapati 5 - 584 584 5 209 347 556
2. Tamenglong 3 - 3,412 3,412 3 08 2,576 2,584
3. Churachandpur 6 - 5,601 5,601 6 298 4,266 4,564
4. Chandel 3 - 14,604 14,604 3 30 15,217 15,247
5. Ukhrul 4 - 4,687 4,687 4 62 3,675 3,737
6. Imphal East 12 108 19,145 19,253 12 132 17,939 18,071
7. Imphal West 9 660 83,770 84,430 9 1,136 77,012 78,148
8. Bishnupur 10 - - - 10 44 - 44
9 Thoubal 5 - - - 5 13 - 13
Manipur 57 768 1,31,803 1,32,571 57 1,932 1,21,032 1,22,964
Source: Directorate of Tourism, Manipur.
Note : As per guideline issued by the Ministry of Tourism, visitors who visits only during daytime and
does not stay over-night are not considered as tourist. The number of visitors both domestic and foreign
visiting Khongjom/Moirang/Phubala/Churachandpur/Moreh Toueist Home are recorded as nil as the
same are presently occupied by security personnels.
Table No. 9(e)
Percentage of population below poverty line, India vis-à-vis Manipur
Year Rural Urban Combined
Manipur India Manipur India Manipur India
1 2 3 4 5 6 7
1973-74 52.7 56.4 37.1 49.2 50.0 54.9
1977-78 59.8 53.1 37.6 47.4 54.8 51.8
1983-84 42.6 45.6 26.4 42.2 38.1 44.8
1987-88 39.4 39.1 17.3 40.1 32.9 39.3
1993-94 45.0 37.3 7.7 32.4 33. 8 36.0

326
1999-00 40.0 27.1 7.5 23.6 28.5 26.1
2004-05 22.3 28.3 3.3 25.7 17.3 27.5
Table No. 9(f)
Distribution of Scheduled Caste and Scheduled Tribe educated job-seekers in Manipur
as on 31st March, 2009.
Sl.
No. Category
Job-seekers
Scheduled
Castes
Scheduled
Tribes Total
Percentage
to total
1 2 3 4 5 6
1. Under Matric 1,569 82,193 83,762 44.13
2. Matriculate 2,189 60,166 62,356 32.85
3. Intermediate 905 24,539 25,444 13.40
4. Graduates 705 13,395 14,600 7.69
5. Medicine/Technology 13 574 587 0.31
6. Engineering/ graduate - - - -
7. Agriculture /graduate - - - -
8. Agri-Engineering/Technology 40 251 291 0.15
9. Post-Graduates 114 1,505 1,619 0.85
10. Diploma Holder in
Engineering Tech.
167 961 1,128 0.60
11. Others 7 27 34 0.02
Total 5,709 1,84,111 1,89,820 100.00
Source : Directorate of Employment, Government of Manipur.
Table No. 9(g) Employment in Public and Private Sectors of North Eastern States
as on 31st March, 2007-08.
(’000 Nos.)
States
Public Sector Private Sector
Centr
al
Govt
State
Govt
Quasi-Govt. Local
Bodie
s
Large
Estts.
Small
Estts.
Grand
Total Central State
1 2 3 4 5 6 7 8 9
Arunachal Pradesh - - - - - - - -
Assam 69.0 309.0 86.0 49.0 13.0 638.0 9.0 1173.0
Manipur 4.0 61.0 5.0 3.0 4.0 2.0 1.0 80.0
Meghalaya 16.6 38.0 8.0 8.0 3.0 7.0 2.0 82.6
Mizoram 0.8 33.0 1.0 2.0 3.0 1.0 - 40.8
Nagaland 4.0 62.0 3.0 1.0 1.0 2.0 3.0 76.0

327
Sikkim - - - - - - - -
Tripura 7.0 121.0 3.0 7.0 9.0 13.0 - 160.0
Large Estts. :- Establishments employing 25 or more workers. – Not available
Source: Statistical Abstract of India, 2011.
Table No. 9(h)
Number of Establishment in Public Sector in Manipur from
1990-91 to 2005-06,2008-09 and 2010-11.
Year
Establishment
Central
Govt.
State
Govt.
Central Quasi
Govt.
State Quasi
Govt.
Local
Bodies
1 2 3 4 5 6
1990-91 - 515 - 10 12
1991-92 - 537 - 11 12
1992-93 - 569 - 25 10
1993-94 - 622 - 40 10
1994-95 - 655 - 43 10
1995-96 - 672 - 48 10
1996-97 - 689 - 50 10
1997-98 - 692 - 51 10
1998-99 - 700 - 51 11
1999-00 - 700 - 51 11
2000-01 - 705 - 51 11
2001-02 - 708 - 51 11
2002-03 - 716 - 124 12
2003-04 - 717 - 124 12
2004-05 - 466 - 94 6
2005-06 42 735 74 122 12
2008-09 - 746 - 48 12
2010-11 - 735 - 42 12
- Not available
Source: Directorate of Employment, Government of Manipur.

328
Table No. 9(i)
Number of Employees in Public Sector in Manipur as on 31st March, 2010-11.
District
Employees
Central Govt. State Govt. Quasi Govt. Central
Male Female Total Male Female Total Male Female Total
1 2 3 4 5 6 7 8 9 10
Senapati - - - 2,066 512 2,578 - - -
Tamenglong - - - 2,243 237 2,480 - - -
Churachandpur - - - 2,996 985 3,981 - - -
Ukhrul - - - 3,295 654 3,949 - - -
Chandel - - - 2,638 398 3,036 - - -
Imphal East - - - 7,931 2,612 10,543 - - -
Imphal West - - - 13,582 4,825 18,407 - - -
Bishnupur - - - 2,286 1,457 3,743 - - -
Thoubal - - - 4,551 1,007 5,558 - - -
Total - - - 41,588 12,687 54,275 - - -
District
Employees
Quasi Govt. State Local Bodies Grand Total
Male Female Total Male Female Total Male Female Total
1 11 12 13 14 15 16 17 18 19
Senapati 33 5 38 1,157 750 1,907 3,256 1,267 4,523
Tamenglong 35 5 40 473 239 712 2,751 481 3,232
Churachandpur 47 12 59 830 444 1,274 3,873 1,441 5,314
Ukhrul 26 12 38 682 546 1,228 4,003 1,212 5,215
Chandel 7 1 8 605 430 1,035 3,250 829 4,079
Imphal East 265 49 314 9 1 10 8,205 2,662 10,867
Imphal West 632 315 947 323 49 372 14,537 5,189 19,726
Bishnupur 4 2 6 8 1 9 2,298 1,460 3,758
Thoubal 5 1 6 45 14 59 4,601 1,022 5,623
Total 1,054 402 1,456 4,132 2,474 6,606 46,774 15,563 62,337
- Not available
Source : Directorate of Employment, Manipur

329
Table No. 10(a)
SALIENT FEATURES OF THE 5th ECONOMIC CENSUS (2005)
IN RESPECT OF MANIPUR
(Excluding Crop Production and Plantation)
Sl.
No. Item Rural Urban Combined
1 2 3 4 5
1. a) Total Number of establishments
b) Rural-Urban Share of establishments (%)
57581
54.98
47151
45.02
104732
100.00
2. Percentage of establishments
a) Agricultural
b) Non-Agricultural
9.99
90.01
5.39
94.61
7.92
92.08
3. a) Number of establishments
i) with premises
ii) without premises
iii) having 10 or more workers
b) Rural-Urban share of establishments
i) With premises
ii) Without premises
iii) having 10 or more workers
42646
14935
557
74.06
25.94
1.0
37458
9693
624
79.44
20.56
1.4
80104
24628
1181
76.48
23.52
1.1
4. Annual average Growth Rate(%) in establishments over Economic Census 1998 4.84 3.69 4.30
5. a) Number of persons employed
b) Rural-Urban Percentage share in employment
120355
50.98
115721
49.02
236076
100.00
6. Percentage of hired workers to the total persons employed
32.33 45.75 38.91
7. Percentage of total adult female workers to the total persons employed. 34.34 32.30 33.34
8. Annual average Growth rate (%) in the total
Employment over Economic Census 1998 3.46 1.63 2.52
Source: Directorate of Economics & Statistics, Government of Manipur

330
Table No. 10(b)
Economic Census 1977, 1980, 1990, 1998 and 2005 At-A-Glance
Sl.
No. Item
Economic Census
1977 1980 1990 1998 2005
1 2 3 4 5 6 7
1. Number of Enterprises 10,858 34,745 61,264 80,489 1,04,732
1.1 Own Account Enterprises NC 25,527 46,571 59,998 83,649
1.2 Establishments 10,858 9,218 14,693 20,491 21,083
2. Persons usually working in 60,604 1,04,959 1,57,368 2,00,726 2,36,076
2.1 Own Account Enterprises NC - 70,955 83,542 1,24,489
2.2 Establishments 60,604 86,413 1,17,184 1,11,587
3. Average number of workers per
enterprises
-
-
2
2
2
4. Average number of workers per
establishment
-
-
6
6
5
5. Hired workers in all
establishments
55,817
55,715
76,520
1,03,921 91,853
6.
Number of enterprises according to
principal characteristics
-
-
-
- -
6.1 Seasonal - 2,911 3,765 140 3,515
6.2 Without premises - 6,800 12,223 12,506 24,628
6.3 With power/fuel - 4,605 9,045 12,387 24,571
6.4 Social group of owner - - - - -
6.4.1 Scheduled castes - 870 2,138 1,841 3,881
6.4.2 Scheduled tribes - 5,544 9,756 9,311 14,697
6.5 Type of ownership - - - - -
6.5.1 Private - - 10,666 15,787 16,941
6.5.2 Co-operative - - 180 159 -
6.5.3 Public - - - 4,545 4,142
NC:– Not Covered - Not Available
Source: Directorate of Economics & Statistics, Government of Manipur.
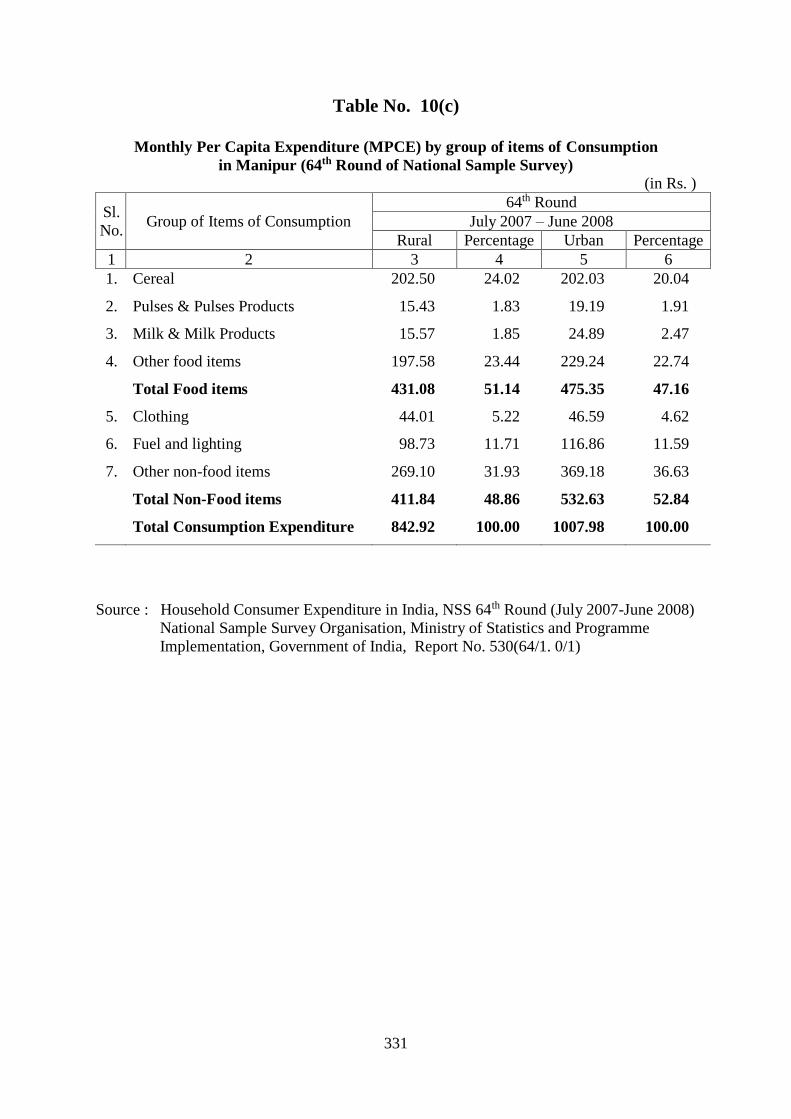
331
Table No. 10(c)
Monthly Per Capita Expenditure (MPCE) by group of items of Consumption
in Manipur (64th Round of National Sample Survey)
(in Rs. )
Sl.
No. Group of Items of Consumption
64th Round
July 2007 – June 2008
Rural Percentage Urban Percentage
1 2 3 4 5 6
1. Cereal 202.50 24.02 202.03 20.04
2. Pulses & Pulses Products 15.43 1.83 19.19 1.91
3. Milk & Milk Products 15.57 1.85 24.89 2.47
4. Other food items 197.58 23.44 229.24 22.74
Total Food items 431.08 51.14 475.35 47.16
5. Clothing 44.01 5.22 46.59 4.62
6. Fuel and lighting 98.73 11.71 116.86 11.59
7. Other non-food items 269.10 31.93 369.18 36.63
Total Non-Food items 411.84 48.86 532.63 52.84
Total Consumption Expenditure 842.92 100.00 1007.98 100.00
Source : Household Consumer Expenditure in India, NSS 64th Round (July 2007-June 2008)
National Sample Survey Organisation, Ministry of Statistics and Programme
Implementation, Government of India, Report No. 530(64/1. 0/1)

332
Table No. 10(d)
Monthly Per Capita Expenditure (MPCE) by sub-group of items and sector,
North Eastern States and All India (64th Round of National Sample Survey, 2007-08)
(in Rs. )
Sl.
No.
North Eastern
States/All India
Rural Urban
Food Non-food Total
Expenditure Food Non-food
Total
Expenditure
1 2 3 4 5 6 7 8
1. Arunachal Pradesh 562.26 525.22 1087.48 NA NA NA
2. Assam 478.63 320.16 798.79 677.46 774.46 1451.92
3. Manipur 431.08 411.84 842.92 475.35 532.63 1007.98
4. Meghalaya 469.66 434.68 904.34 NA NA NA
5. Mizoram NA NA NA 764.30 1035.93 1800.23
6. Nagaland 731.84 603.62 1335.46 NA NA NA
7. Sikkim 474.94 441.94 916.88 NA NA NA
8. Tripura 472.68 329.00 801.68 NA NA NA
North Eastern
States
500.10 422.67 922.77 640.20 819.60 1459.80
All-India 404.33 368.03 772.36 582.43 889.11 1471.54
NA : Not Available
Source : Household Consumer Expenditure in India, NSS 64th Round (July 2007-June 2008)
National Sample Survey Organisation, Ministry of Statistics and Programme
Implementation, Government of India, Report No. 530(64/1. 0/1)

333
Table No. 11
Number of Crimes (IPC Cases) in Manipur during 2006 and 2007
Sl. No. Heads of Crime 2006 2007
1 2 3 4
1. Murder 205 240
2. Attempt to Murder 265 377
3. Culpable Homicide not amounting to Murder 4 2
4. Rape 40 20
5. Kidnapping & Abduction 129 150
5.1
5.2
Female
Male
49
80
83
67
6. Dacoity 2 3
7. Robbery 8 12
8. Burglary 55 69
9. Theft 292 454
9.1.
9.2
Auto thefts
Other thefts
105
187
152
302
10. Rioting 60 73
11. Cheating 82 93
12. Counterfeiting 9 4
13. Arson 117 64
14. Molestation 33 70
15. Motor Accident 521 536
16. Extortion 204 245
17. Other IPC cases 860 847
Total 2886 3259
Source : Police Department, Manipur
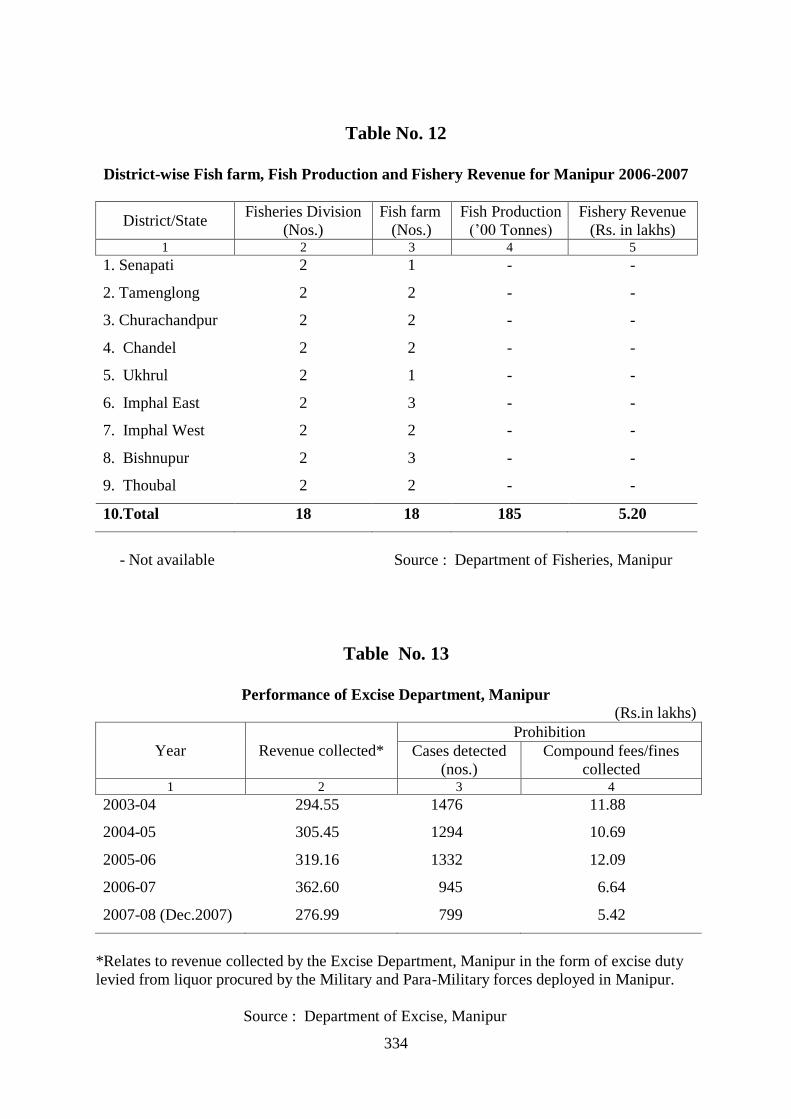
334
Table No. 12
District-wise Fish farm, Fish Production and Fishery Revenue for Manipur 2006-2007
District/State Fisheries Division
(Nos.)
Fish farm
(Nos.)
Fish Production
(’00 Tonnes)
Fishery Revenue
(Rs. in lakhs) 1 2 3 4 5
1. Senapati 2 1 - -
2. Tamenglong 2 2 - -
3. Churachandpur 2 2 - -
4. Chandel 2 2 - -
5. Ukhrul 2 1 - -
6. Imphal East 2 3 - -
7. Imphal West 2 2 - -
8. Bishnupur 2 3 - -
9. Thoubal 2 2 - -
10.Total 18 18 185 5.20
- Not available Source : Department of Fisheries, Manipur
Table No. 13
Performance of Excise Department, Manipur
(Rs.in lakhs)
Year Revenue collected*
Prohibition
Cases detected
(nos.)
Compound fees/fines
collected 1 2 3 4
2003-04 294.55 1476 11.88
2004-05 305.45 1294 10.69
2005-06 319.16 1332 12.09
2006-07 362.60 945 6.64
2007-08 (Dec.2007) 276.99 799 5.42
*Relates to revenue collected by the Excise Department, Manipur in the form of excise duty
levied from liquor procured by the Military and Para-Military forces deployed in Manipur.
Source : Department of Excise, Manipur

335
Table No. 14
National Parks and Wildlife Sanctuaries in North Eastern States of India
(As on 31st July 2004)
(Area in sq. kms.)
State/All India National Park Wildlife sanctuaries Total
No. Area No. Area No. Area
1 2 3 4 5 6 7
Arunachal Pradesh 2 2468 11 7606 13 10075
Assam 5 1978 16 888 21 2866
Manipur 1 40 5 707 6 747
Meghalaya 2 267 3 34 5 302
Mizoram 2 200 5 775 7 975
Nagaland 1 202 3 20 4 222
Sikkim 1 1784 6 265 7 2049
Tripura - - 4 603 4 603
All-India 90 36882 502 120051 592 156934
Source : Statistical Abstract of India, 2005 and 2006
Table No. 15 Employment in the Public and Private Sectors in North Eastern States of India, 2003-04
(As on 31st March)
(’000 number)
State/All
India
Public sector Private Sector Grand total
(Col. 2 to
Col. 8)
Central
Govt.
State
Govt.
Quasi Govt. Local
Bodies
Larger
Estts.
Smaller
Estts. Central State
1 2 3 4 5 6 7 8 9
Assam 76.0 313.5 69.5 53.1 13.0 563.6 8.4 1097.2
Manipur 4.5 61.9 4.2 3.4 4.0 2.0 0.6 80.6
Meghalaya 16.6 37.7 7.8 7.7 2.8 7.2 2.1 81.9
Mizoram 0.8 33.5 1.3 1.5 3.0 1.4 - 41.5
Nagaland 4.4 59.0 2.4 1.9 0.3 2.0 1.5 71.5
Tripura 2.0 92.6 4.2 2.8 8.9 12.5 0.4 123.3
All India 3027.4 7221.9 3302.8 2519.1 2125.6 7233.9 1012.0 26442.7
Larger Estts.-Establishments employing 25 or more workers.
Smaller Estts.- Establishments employing 10 to 24 workers.

336
Source : Statistical Abstract of India, 2005 and 2006
Appendix
Retail Price of some selected essential commodities prevalent at
Imphal Khwai Bazar for the year 2012 (in Rs.)
Sl. No. Name of
Commodities Specification Unit January Feb. March April May June
1 2 3 4 5 6 7 8 9 10
1 Milled Rice local Kg. 24.00 24.00 21.00 21.00 21.00 21.00 2. Arthar Dal imported Kg. 80.00 80.00 80.00 80.00 80.00 80.00
3 Moong Dal -do- Kg. 85.00 85.00 85.00 85.00 85.00 85.00
4 Masur Dal -do- Kg. 60.00 60.00 60.00 60.00 60.00 60.00
5 Urd Dal -do- Kg. 80.00 80.00 80.00 80.00 80.00 80.00 6 Milk Fluid local Litre 28.00 28.00 28.00 28.00 28.00 28.00
7 Mustard Oil imported Kg. 100.00 100.00 100.00 100.00 100.00 100.00
8 Meat pork Kg. 180.00 180.00 180.00 180.00 180.00 190.00
9 Meat beef Kg. 150.00 150.00 150.00 150.00 180.00 190.00 10 Egg import Dozen 50.00 50.00 50.00 50.00 50.00 50.00 11 Potato -do- Kg. 15.00 12.00 12.00 12.00 18.00 18.00
12 Onion -do- Kg. 20.00 15.00 15.00 15.00 18.00 18.00
13 Brinjal local Kg. 25.00 25.00 25.00 25.00 12.00 12.00 14 Cauliflower -do- Kg. 15.00 15.00 15.00 15.00 20.00 20.00
15 Cabbage -do- Kg. 10.00 15.00 15.00 15.00 15.00 15.00 16 Pinapple -do- Kg. 20.00 20.00 N.A. 20.00 20.00 20.00
17 Sugar open market Kg. 35.00 35.00 35.00 35.00 35.00 35.00 18 Salt import Kg. 14.00 14.00 14.00 14.00 14.00 14.00
19 Dry chillies local Kg. 260.00 260.00 260.00 260.00 260.00 240.00
20 Firewood splitted 40 Kg. 200.00 200.00 200.00 200.00 200.00 250.00
Sl.
No.
Name of
Commodities Specification Unit July Aug. Sept. Oct. Nov. Dec. Average
1 2 3 4 11 12 13 14 15 16 17
1 Milled Rice local Kg. 21.00 21.00 21.00 21.00 22.00 22.00 21.67 2. Arthar Dal imported Kg. 80.00 80.00 80.00 80.00 80.00 80.00 80.00
3 Moong Dal -do- Kg. 85.00 85.00 85.00 85.00 85.00 85.00 85.00
4 Masur Dal -do- Kg. 60.00 60.00 60.00 60.00 60.00 60.00 60.00
5 Urd Dal -do- Kg. 80.00 80.00 80.00 80.00 80.00 80.00 80.00 6 Milk Fluid local Litre 30.00 30.00 30.00 30.00 35.00 35.00 29.83
7 Mustard Oil imported Kg. 100.00 100.00 100.00 100.00 100.00 100.00 100.00
8 Meat pork Kg. 190.00 190.00 190.00 190.00 200.00 200.00 187.50
9 Meat beef Kg. 190.00 180.00 190.00 190.00 200.00 200.00 176.00 10 Egg import Dozen 52.00 52.00 52.00 52.00 52.00 52.00 51.00
11 Potato -do- Kg. 25.00 25.00 20.00 20.00 20.00 20.00 18.08
12 Onion -do- Kg. 25.00 25.00 20.00 20.00 20.00 30.00 20.08
13 Brinjal local Kg. 15.00 15.00 15.00 40.00 30.00 30.00 22.41 14 Cauliflower -do- Kg. 20.00 35.00 40.00 50.00 40.00 40.00 27.08
15 Cabbage -do- Kg. 15.00 15.00 15.00 20.00 20.00 20.00 15.83
16 Pinapple -do- Kg. 20.00 20.00 20.00 20.00 20.00 20.00 18.33
17 Sugar open market Kg. 35.00 35.00 38.00 38.00 38.00 38.00 36.00 18 Salt import Kg. 14.00 14.00 14.00 14.00 14.00 14.00 14.00
19 Dry chillies local Kg. 200.00 200.00 200.00 200.00 200.00 200.00 228.33
20 Firewood splitted 40Kg. 250.00 250.00 250.00 250.00 250.00 250.00 229.16
N A – Not Available
Source :- District Statistical Office, Imphal West District.