Sponsored by - Directorate Of Economics & Statistics ...
330
Revised Draft HUMAN DEVELOPMENT REPORT OF THE STATE OF UTTARAKHAND Sponsored by Directorate of Economics & Statistics Department of Planning Government of Uttarakhand Institute for Human Development (IHD) Plot No. 84, FIE, Patparganj Industrial Area, Delhi-110092 Email: [email protected] /Website: ihdindia.org 14 December 2018
-
Upload
khangminh22 -
Category
Documents
-
view
0 -
download
0
Transcript of Sponsored by - Directorate Of Economics & Statistics ...
1
Revised Draft
HUMAN DEVELOPMENT REPORT OF THE STATE OF UTTARAKHAND
Sponsored by Directorate of Economics & Statistics
Department of Planning Government of
Uttarakhand
Institute for Human Development (IHD) Plot No. 84, FIE, Patparganj Industrial Area,
Delhi-110092 Email: [email protected] /Website: ihdindia.org
14 December 2018
Contents
CHAPTERS
1. INTRODUCTION ...................................................................................................................... 01
2. HUMAN DEVELOPMENT IN UTTARAKHAND .......................................................................... 19
3. PROMOTING LIVELIHOODS – INCOME AND EMPLOYMENT ................................................. 40
4. AGRICULTURE: ENHANCING LIVELIHOODS ................................................................................. 85
5. URBANISATION AND URBAN GOVERNANCE IN UTTARAKHAND ............................................. 111
6. MANAGING MIGRATION ........................................................................................................... 129
7. STRENGTHENING SOCIAL PROTECTION – EDUCATION ....................................................... 157
8. STRENGTHENING SOCIAL PROTECTION HEALTH ................................................................. 183
9. TOURISM .............................................................................................................................. 211
10. ENVIRONMENT, NATURAL RESOURCE MANAGEMENT, AND NATURAL DISASTER ............. 248
11. GENDER ...................................................................................................................................... 281
12. WAY FORWARD .................................................................................................................. 308
2
1
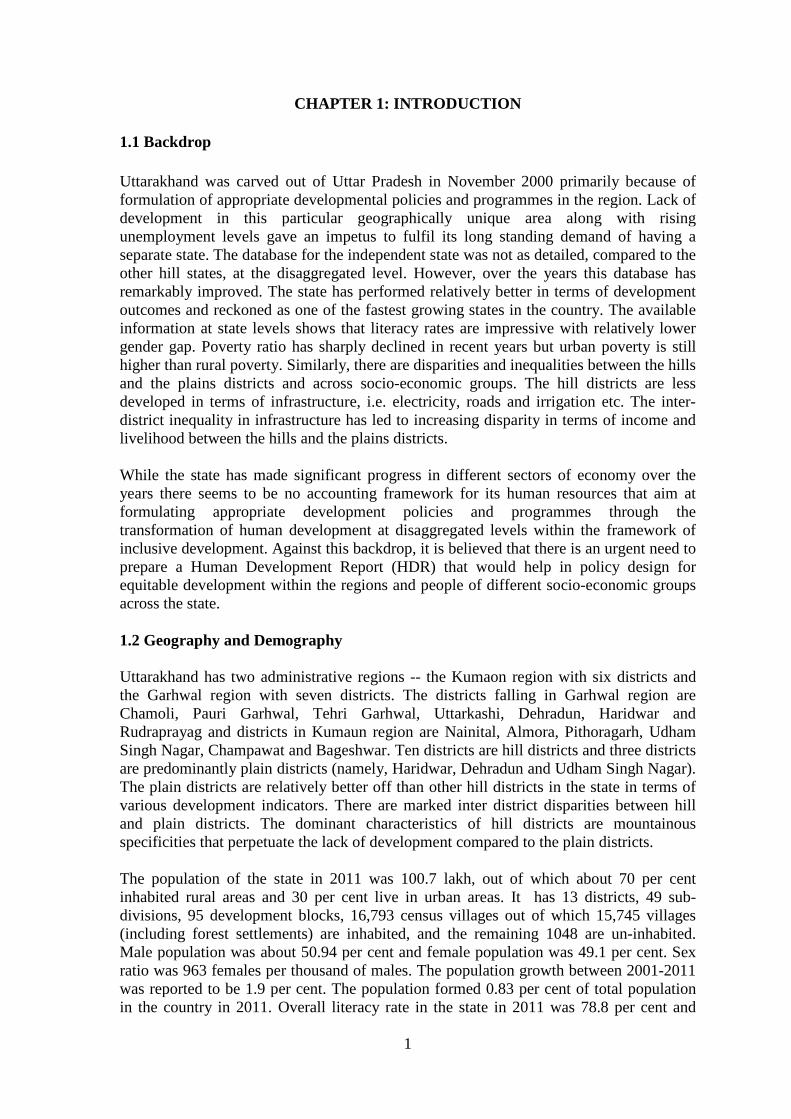
CHAPTER 1: INTRODUCTION
1.1 Backdrop Uttarakhand was carved out of Uttar Pradesh in November 2000 primarily because of formulation of appropriate developmental policies and programmes in the region. Lack of development in this particular geographically unique area along with rising unemployment levels gave an impetus to fulfil its long standing demand of having a separate state. The database for the independent state was not as detailed, compared to the other hill states, at the disaggregated level. However, over the years this database has remarkably improved. The state has performed relatively better in terms of development outcomes and reckoned as one of the fastest growing states in the country. The available information at state levels shows that literacy rates are impressive with relatively lower gender gap. Poverty ratio has sharply declined in recent years but urban poverty is still higher than rural poverty. Similarly, there are disparities and inequalities between the hills and the plains districts and across socio-economic groups. The hill districts are less developed in terms of infrastructure, i.e. electricity, roads and irrigation etc. The inter-district inequality in infrastructure has led to increasing disparity in terms of income and livelihood between the hills and the plains districts. While the state has made significant progress in different sectors of economy over the years there seems to be no accounting framework for its human resources that aim at formulating appropriate development policies and programmes through the transformation of human development at disaggregated levels within the framework of inclusive development. Against this backdrop, it is believed that there is an urgent need to prepare a Human Development Report (HDR) that would help in policy design for equitable development within the regions and people of different socio-economic groups across the state. 1.2 Geography and Demography
Uttarakhand has two administrative regions -- the Kumaon region with six districts and the Garhwal region with seven districts. The districts falling in Garhwal region are Chamoli, Pauri Garhwal, Tehri Garhwal, Uttarkashi, Dehradun, Haridwar and Rudraprayag and districts in Kumaun region are Nainital, Almora, Pithoragarh, Udham Singh Nagar, Champawat and Bageshwar. Ten districts are hill districts and three districts are predominantly plain districts (namely, Haridwar, Dehradun and Udham Singh Nagar). The plain districts are relatively better off than other hill districts in the state in terms of various development indicators. There are marked inter district disparities between hill and plain districts. The dominant characteristics of hill districts are mountainous specificities that perpetuate the lack of development compared to the plain districts. The population of the state in 2011 was 100.7 lakh, out of which about 70 per cent inhabited rural areas and 30 per cent live in urban areas. It has 13 districts, 49 sub-divisions, 95 development blocks, 16,793 census villages out of which 15,745 villages (including forest settlements) are inhabited, and the remaining 1048 are un-inhabited. Male population was about 50.94 per cent and female population was 49.1 per cent. Sex ratio was 963 females per thousand of males. The population growth between 2001-2011 was reported to be 1.9 per cent. The population formed 0.83 per cent of total population in the country in 2011. Overall literacy rate in the state in 2011 was 78.8 per cent and
2
male and female literacy rate was 87.4 and 70.0 per cent, respectively which was higher than the corresponding rates at All India level. Sex ratio was also favourable in the state but the child sex ratio (0-6 years) was lower compared to All India. The demographic profile between the hill and plain areas shows some interesting features. Population growth during 2001-11 in the hill areas has declined faster and recorded less than 1 per cent growth while urban area has showed significant growth. Population growth in the state is reported higher than that of All India. The reason for low growth of population in the hill areas is primarily due to out-migration motivated largely by socio-economic reasons. Population growth rate between age group 0-6 years has been comparatively lower to that of the plain areas and also that of All India. Overall sex ratio is recorded positive in the hill area that signifies the huge male outmigration and leaving females behind that precisely pushes the sex ratio much higher when compared with the plain areas. However, sex ratio in the age group 0-6 is unfavourable both in the hill and plain areas because of a strong cultural preference for male child. It was found that child sex ratio in the state has been witnessing a decline over the last decade. However, in a recent National Family and Health Survey-4 (NFHS) (2015-16), the reported state sex ratio was at 1015 and child sex ratio was at 888. The Scheduled caste population in the state was 19 per cent and the hill areas particularly accounts a higher proportion at 21 per cent. The percentage of Schedules tribe population is around half of that of All India but accounts for minuscule proportions in the hill areas. Percentage of Muslims in the state is almost equal to that of All India but forms higher share (23 per cent) in the plain areas. Urban population constitutes (30 per cent) in the state which is almost identical to the All India level share but in plain areas it is much higher (42 per cent). Workers (main plus marginal) constitute about 44 per cent in the hill areas and 34 per cent in the plain areas. However, male work participation rate (WPR) is higher in the plain areas compared to that of hill areas but female WPR is extraordinarily higher in the hill areas compared to their counterparts in the plains. 1.3 Human Development: An Approach
The idea of development for long has typically been identified with people’s relative affluence in terms of material wealth. Historically, wealth or income has served as an ‘index’ or ‘metric’ of the level of development. It takes the form of a comparison of levels of income across societies, and such a comparison typically requires levels of per capita income, that is, average income of individuals across societies. This approach of evaluation of development, however, comes with many criticisms as statistically average income level is heavily biased towards extreme values, assigns higher weight to high per capita income and tends to oust people from the focus of the development agenda. It is argued that although wealth or income is a necessary ‘means’ to better lives but not an ‘end’ in itself, which is engaging in and performing of valuable activities that are considered worthwhile and important in evaluating the quality of human life. Hence, the human development assessment based on quality of life occupies the centre-stage and replaces the income approach over time. The human development approach rests on the capabilities framework pioneered and developed over a long period of time by well-known scholars (Sen, 1989; Nassbaum,
3
1995 and 2000)*. The quality of human life in the capability approach viewed as a combination of various doing and beings that an individual considers worthwhile and her/his well-being depends on what she/he manages to do or be. The various doings and beings in life are together called functionings, which can range from the very basic to quite complex ones. The ability to engage in functions of diverse types is called capability. In other words, to measure capabilities of an individual is to measure the size of the possible combinations of functionings that are potentially achievable by that individual. Those functionings may range from being very elementary such as being alive, in good health, well-nourished to somewhat more complex, such as being able to know and to participate in the life of the community and so on (Zambrano,2011)†. It is therefore worthwhile to note that which functionings one ought to keep track of for the individuals in a given space who can then evolve over time and vary both across and within space. The measurement of these functionings denotes a particular level of capabilities that would entail multiple indicators. In this sense, Human Development Index (HDI) is a synthetic measure of capabilities defining a particular set of functionings, which determine a state of being – higher value of the index, therefore, is suggestive of enhanced capabilities defining an alternative set of functionings; hence, improved state of being. The HDI devised by the United National Development Programme (UNDP) way back in 1990 is a composite index which attempts to quantify ‘capability’. The index comprises of three dimensions – long and healthy life, knowledge and a decent standard of living – denoting some ‘basic’ capabilities. These basic capabilities are minimally required for human life, which effectively describe the deprivation threshold. Each dimension is measured through one or more indicators depicting certain level of achievements in respective dimension. The details of various HDI are discussed further in the following chapters. 1.4 Study Framework or Approach The capabilities approach determines achievements and wellbeing but various ‘means’ and their relations to capability are also important determinants of the level of achievements and well-being. There are various ‘means’ in the forms of commodities and services along with other social contexts including institutions, norms, practices etc. that affect the capability set of individuals as well as their choices, thereby implicating the achieved functionings. The relations between ‘means’ and ‘capability’ are hugely diverse. The capability approach acknowledges and accommodates such inherent diversities both, at the level of individuals and socially. These are recognised as ‘conversion factors’ which can be of three types –personal, social, and institutional & environmental. Personal factors comprise bodily capacity of individuals, skills, intelligence etc. Social factors include social structures, norms, culture and customs, institutions and environmental factors entails public policies, climate, geographical location etc. Having ‘means’ alone, thus, are not sufficient for functioning, differential functionings may still result due to diverse ‘conversion factors’ affecting individuals. * Sen, A; (1989; 2000): Commodités and Capabilities; Oxford University Press; Delhi and Nassbaum (1995; 2000). †Zambrano, E (2011: Functionings, Capabilities and the 2010Human Development Index; HDR Research Paper; 2011/11 (November); UNDP
4
It is thus, various personal, social and institutional & environmental factors-together called ‘conversion factors’ which mediate between ‘means’ and ‘ends’ resulting in differential achievements and well-being. In the capability framework, the notion of advantage is used to refer to these diverse condition and contingencies affecting choice option. The goals of the human development approach are therefore, two fold – understanding differential functionings, that is, achievements or well-being from the perspective of capability differentials and also to understand the differential well-being in terms of diversity of advantages. This framework has been adopted to assess the status of human development in the present study. This study has tried to locate specific issues within the broad framework of human development achievements and enhancing capabilities beyond income and focuses on reaching healthcare, nutrition, education, housing facilities, better and health environment other services such as drinking water and electricity to the common people, so that they can enjoy an enriched life in a safe environment. It also examines the situation closely for all vulnerable groups such as women, schedule caste and poor population etc. in Uttarakhand. Evidently, while looking at various indicators of human development one cannot ignore certain specific issues important for mountain or hilly state like Uttarakhand. It is worth noting that demographic diversities, quality of life and access to basic infrastructure along with sustainability of environmental concerns have serious implications for human development outcomes. These, along with other forms of vulnerabilities relating to life and livelihood, and gaps in level of capabilities across diverse socio-economic cases has been highlighted clearly in the HDR to put the overall level of human development in right perspective. This report presents Human Development Index (HDI), Gender Development Index (GDI), and Multiple Poverty Index (MPI), which offer insights with regards to the varying degree of achievement in human development across districts in multiple dimensions of human development such as health, education and income etc. In the context of above discussed framework, it is essential to understand some existing human development potential and challenges in Uttarakhand. 1.5 Human Development Potential and Challenges in Uttarakhand The state was carved out of the mountainous north-western part of Uttar Pradesh. As discussed earlier, out of 13 districts of the state, three southern districts namely Dehradun, Udham Singh Nagar and Haridwar are largely plain and remaining 10 districts are mostly hilly. Majority of the people (70 per cent) of Uttarakhand resides in rural areas and in particular most hilly districts people live (around 90 per cent) in rural areas. It is rich in natural resource such as water and forest and mineral deposits like limestone, marbles, rock phosphate, dolomite, copper, gypsum etc. With about two-third of the area under forest cover, it contributes towards procurement of raw materials for several economic activities through minor forest produce, rare species of aromatic and medicinal plants. In addition, a wide network of rivers, power plants, commercial opportunities in horticulture, floricultures & agriculture, and tourism has huge potentials for economic and social development of the state. Just stepping into its eighteenth year of statehood, the Uttarakhand government has made tremendous efforts towards all round progress. It is one of the fastest growing economies in the country with a double digit growth rate of 15.3 per cent per annum during 2004-05
5
to 2014-15, which is significantly higher than all India of around 7 per cent during the same period. The growth in recent years has slowed down but still registered above average growth of 7 per cent per annum during 2011-12 to 2017-18. The per capita income of the state has also increased at a higher rate than the national average, which is significantly higher for 2017–18 at INR 1.57 lakh compared to national average INR at 1.13 lakh. Agriculture plays the major role with almost half of the workforce (49 per cent) involved in it, but contributing only 11 per cent to the state income, while 22 per cent of the workforce involved in the secondary sector and 29 per cent in tertiary sector contributes about 37 per cent and 52 per cent of state income respectively in 2011-12. The important feature of the economy is the steep rise in the share of secondary sector, while tertiary sector also registered perceptible increase between 2004-05 and 2011-12 and in recent period from 2011-12 to 2015-16. The prominent sub-sectors are construction and manufacturing in the secondary sector, while trade, hotel & restaurants catering mainly the tourism and hospitality industry in the tertiary sector during 2005-2012 and also 2012-18. In recent period, the primary sector grew somewhat sluggishly during 2011-12 to 2017-18 at 1.07 per cent (AGCR) and secondary sector posted growth 6.1 per cent, while tertiary sector recorded growth 7.2 per cent. About two-third of the workers was involved in self-employment activities in the state compared to almost half at all India level, which has declined by 6 percentage points during 2005-12. About only 17 per cent people were engaged in regular and 13 per cent in casual employment and the share of employment in the former regular increased (by 4 percentage points) more than latter (by 2 percentage points) during the same period. The performance of the state has also been rather good in the social sectors. The literacy rate in the state (79 per cent) is better than the all India level (74 per cent), which has also improved by 8 percentage points between 2001 and 2011. The GER at upper primary and secondary level of the state is higher than all India. The health indicators have also improved, with infant mortality rate marginally declining from 42 per thousand live births in 2005 to 40 in 2015. Similarly, the state also performed well in reducing maternal mortality ratio at 292 per lakh live births in 2010-12, which was comparatively higher than all India level of 178 per lakh live births. About 69 per cent of the eligible women in the state deliver births in safe conditions – either in a health institution or in presence of trained health providers. The state has also performed well in immunization coverage among children aged 12-23 months. About 58 per cent of eligible children in the state receive full doses of all recommended immunization and the prospect of achieving universal immunization is high. The sex ratio in Uttarakhand at 947 is higher than the national average. The poverty level of the state is around 11 per cent, which is significantly less than the national average of around 22 per cent in 2011-12 and also declined over the years. The main agricultural crops grown in the hill districts of the State are paddy, wheat, mandua, sawan (millet) and pulses. Mixed cropping is common which helps in maintaining crop diversity and reduces the risk of environment uncertainty. At present about 19 per cent of the area is under fruit & vegetable production, sugarcane and fodder production. The hill areas provide excellent agro-climatic conditions for growing a variety of fruits, vegetables and medicinal and aromatic plants that have good domestic and export markets. Studies have clearly shown that diversification of agriculture in
6
favour of horticulture and vegetable production results in increasing both employment and per worker income. There is tremendous scope for developing horticulture and vegetable crops in the hill districts of Uttarakhand. In addition the climate of the state is ideal for growing flowers all-round the years. The production of flower has reached 2,760 tons in 2014-15. The hill districts of the state also offer a unique landscape for different types of tourism and environment-friendly resort amenities. These districts are well known for Hindu pilgrimage, famous glaciers, trekking and expedition places. There is vast scope for promoting health tourism, adventure sports and wildlife and cultural tourism. Hill districts offer a vast potential for the development of tourism as an industry. The tourism sector contributes approximately 25 per cent of the state’s GDP. The state received 30 million tourists annually. It is estimated that about 80-85 per cent of the domestic tourists came to Uttarakhand for religious purposes because of destinations like Haridwar, Rishikesh, Badrinath, Kedarnath, Gangotri and Yamunotri. The region offers a unique environment for various types of pollution free and precision-based enterprises (e.g. electronics) and services like hotels and resorts. There is vast scope for promoting new concepts of tourism like pilgrimage tourism, health tourism, wildlife tourism, cultural tourism and trekking, adventure sports, river rafting, skiing, angling and aero sports and winter sports. Tourism is identified as one of the State’s key SDP drivers. The state is rich in water resources with a niche for the generation of hydro-electricity. The estimated potential of power generation is about 27,000MW of which 3618 MW has been harnessed. The region can utilise this huge potential not only to meet the growing domestic power needs but it can also export the surplus to other States. This can be one of the important sources of revenue generation. Development of micro and mini projects would be environmentally most appropriate for utilising water resources. With a greater involvement of the private sector the resources can be utilised efficiently and optimally. The development and disaster have a very close and multi-dimensional relationship. The relationship between disaster and development is very clearly visible in the Uttarakhand region. Road, buildings, hydro energy project, tourist relation infrastructure and sand and stone collection from river channels are the main development activities, which influence the vulnerability of landscapes and local communities to natural hazards. The disaster in 2013 can be attributed to widespread and exceptionally heavy rainfall across the state. The entire state was hit by ‘heavy’ (64.5-124.4mm) to ‘very heavy’ (124.5-244.4 mm) rainfall, resulting into flash floods and landslides in numerous areas. The disaster in Kedarnath area, where it causes unprecedented devastation has been a subject of several of debate and several assessments. The state faced huge loss of infrastructure, life and livelihood due to these disasters. Challenges However, as a counterpoint to the above positives, the state faces many daunting challenges with respect to human development. It even now has a huge human development deficit compared to national level as well as most of the other states of the country. Around half of the people involved in agriculture even though the cultivable areas is less than 15 per cent of the total geographical area. The growth in the state’s economy has
7
been impressive in the industrial and services sectors but it is entirely limited to the plain districts with limited employment opportunities for rest of the people from hill districts. Most of the service and industrial economic activities located in plain district only. There is no major manufacturing unit in the mountain regions. There is a huge regional disparity/inequality between rural-urban and plain-hill districts of the state. The plain districts are relatively better off than the hill districts in terms of economic indicators. The relative development ranking of the districts, based on composite index value, clearly shows that the hill districts are at the bottom rung while plain districts (namely Udham Singh Nagar, Haridwar, and Dehradun) are far ahead (GIDS,2017)‡ (Figure-1.1). In the hills, the dependency on agriculture is more and yet it suffers from several problems as almost 91 per cent of agriculture land is small and marginal holdings with low productivity. The hill area comprises of only 14 per cent of the total grossed cropped area of the state, while plains comprise 86 per cent of the same. Poor to moderate soil fertility on the mountain slopes limits agricultural production. Groundwater irrigation and tube well are largely restricted to the plain. According to GIDS recent study, almost 70 per cent of the working population of hill districts were employed in agriculture as cultivators and agriculture labour. In the plain districts the corresponding figure is 36 per cent. Similarly, yet another important district-level poverty and inequality study shows that the plain districts form the richest quartile group in the rural sector while the hill districts fall in the bottom of the ladder in the state (2017).§ There is large employment deficit as well. The quality of employment among workers is poor – in 2011-12 around two-third of the workers in the state were self-employed. Only around 17 per cent were in regular wage/salaried employment. In rural areas, the share of self-employed and casual labour was relatively much higher, and the proportion of regular wage/salary workers was much lower (nearly around one-fourth of urban areas). Also, there is wide disparity in access to quality employment among various social groups and across rural and urban areas and hills and plains. The lack of employment opportunities outside the farm sector led to high adult unemployment and large scale out-migration from hill to plains and outside the state, mainly in search of livelihood and employment. The rate of unemployment in the state is a major challenge due to lack of sufficient employment opportunities. The unemployment rate of the state (3.1 per cent), which is more than the national level (2.2 per cent) with females (3.9 per cent) more unemployed than males (2.7 per cent) in 2011-12. In particular, youth (15-29 years) unemployment rate (14.3 per cent) by UPS status reported significantly more compared to all India level (7.6 per cent). The manufacturing subsector recorded highest growth but it also causes widespread pollution. Paper and pulp industries, sugar mills, distilleries and other industries routinely discharge effluents directly into important tributaries of the Ganga. Massive growth of tourism and commercial activities in Haridwar also causes serious air pollution. ‡Giri Institute of Development Studies (2017), Development of Composite Indicators to Measure Backwardness of Districts in Uttarakhand. § Giri Institute of Development Studies (2017), Estimation of District Level Poverty in Uttarakhand
8
Hydropower development is another thrust areas of economic growth in the state. According to recent information, the state government has identified about 450 hydro-electric projects in the state. However, this is likely to cause a variety of environmental and social problems throughout their life cycles. The fragmented rivers alter their ecosystems and reduce riverine biodiversity. There is significant deforestation in the pre-construction and construction phases when roads are built and houses established. This often destabilise mountains slopes, endangering lives and livelihood. Displacement of local populations and loss of access to local livelihood resources add to the environment dimension. Hence, dam building and hydro power have been debated issues in development activity due to pressure from environmentalist and other religious groups. Another most important issue is natural calamities and disaster, which resulted in huge loss of the state in terms of infrastructure, income, livelihood opportunities and humans. The recent disaster of cloud burst in Kedarnath has huge loss of state resources, livelihood and tourisms. The improvement in social sectors also comes with its caveats. While the status of elementary education has registered improvement, initiatives are needed for higher and tertiary education. Net Enrolment Ratio (NER) levels are quite low at 45.6 per cent for the secondary level and only around 37.7 per cent at the Senior Secondary level. Higher education and technical education are areas that need improvement in access. In terms of access to treated tap water, open defecation and access to electricity Uttarakhand is doing far better than all India but there are considerable inter-district variations. In fact, the variation is significantly high across the districts. From the above accounts, it is obvious that Uttarakhand has a huge challenge for achieving a higher levels of human development Not only the levels of various indicators are low, but huge disparities and inequalities exist across social groups, gender and regions/district as well as between rural and urban areas. Thus from the lens of human development, which essentially entails widening the scope of people’s choices and capabilities so that they can effectively participate in the development process, Uttarakhand has an unfinished agenda, to say the least. With regard to the three basic tenets of living a long and healthy life, to be educated and to have access to resources needed for a decent standard of living the state has made good progress in terms of the social sectors such as health and education. In terms of combating employment and livelihood opportunities, the state needs to strategize on all fronts since the challenge of particularly for hill areas is severe. Further, overall poverty has declined but the poverty in hill districts is still higher compared to plains. The poverty, of late, has been acknowledged to be multi-dimensional and the ambit of human development has expanded to include many other issues such as gender equity, access to a basic standard of living including access to water and sanitation facilities and some other amenities. So the state must take advantage of its vast natural resources in terms of forest resources and minerals, chart out a path for sustainable development in order to generate employment opportunities, revitalize agriculture which is the main source of livelihood for the vast majority of population, so that the challenges of attaining the human development goals in future can be met forthwith. This Uttarakhand Human Development Report (UHRD) is an important initiative towards addressing these challenges which would identify the problems both at state, sub-regional
9
as well as district levels and also provide broader strategies for meeting the numerous challenges. It will address the challenge and provide strategies not only in terms of various issues and indicators, but also separately for vulnerable groups such as tribals, scheduled castes, backward castes, women as well as those residing in hilly/remote areas. It will help the state government and other agencies in monitoring the progress in their efforts and suitably changing the strategies. Most of the states of India have prepared Human Development Reports and in some states two to three reports have been prepared. In our view, Uttarakhand Human Development Report 2018 is an important document for the state. This report will help to accelerate the state’s initiatives to reduce various regional (regions, rural/urban; hill/plain) and social disparities (social groups, gender, religions) and provide technical support to design policy interventions that promote inclusive human development. 1.6 Objectives of the Report
It is in this background that this study aims to: (a) assess the overall level of human development achieved in the State of Uttarakhand over the last decade, and (b) institutionalize integration of human development in the planning process in Uttarakhand to achieve faster, more inclusive and environmentally sustainable growth. The UK HDR, which is the first Report of the State, has the following broad objectives: To assess the progress of various indicators of human development such as
income, livelihood and levels of living, access to employment, health and education, overall empowerment of the vulnerable groups, sustainability and environment, justice and equality, etc. during recent past;
To measure the gaps in the various indicators of human development across
various districts of Uttarakhand and depending upon the availability of data across various groups.
To prepare various composite indices relating to human development to capture
the disparities across districts. Such indices include Human Development Index (HDI), Gender Inequality Index (GII) and Gender Development Index (GDI). Depending upon the availability data from a primary survey, Health Poverty Index (HPI) will also be calculated across districts and across various groups.
To analyse and examine the status of internationally defined sustainable
development goals of the state. To identify the critical challenges in achieving higher levels of human
development in the state, both at state levels and district levels as well as for vulnerable groups.
To delineate broad policies and strategies for enhancing human development in
the state so as to enhance livelihoods and bridge disparities for promoting inclusion and achieve the sustainable development goals.
10
1.7 Methodology The report cover various aspects of human development such as quality of life the people of the state, which depend upon, to a great extent, on employment and livelihood opportunities, educational attainment, the state of health and health services available, access to basic civic services and infrastructure, water, environment and forest resources in the hilly state. In this context the analysis of all these issues are based on available various secondary sources of data as well as primary survey conducted in the 13 districts of the state. 1.7.1 Human development indices Human development report of Uttarakhand remain incomplete unless districts are compared on the basis of composite index of human development that compares districts according to the average level of capability enjoyed by the people in respective districts. Following UNDP’s methodology, three types of indices at district level namely Human Development Index (HDI), Gender Development Index (GDI) and Multidimensional Poverty Index (MPI) have been developed. 1. Human Development Index (HDI) UNDP’s HDI has three dimensions of long and healthy life captured through life expectancy at birth, knowledge measured by mean and expected years of schooling and standard of living captured through per capita income (Table 1). 2. Gender Development Index (GDI) Gender Development Index (GDI) measures gender inequalities in achievement in three basic dimensions of human development: health, measured by female and male life expectancy at birth; education, measured by female and male expected years of schooling for children and female and male mean years of schooling for adults ages 25 and older; and command over economic resources, measured by female and male estimated per capita earned income (Table 1). 3. Multidimensional-Poverty Index (MPI) The Multidimensional Poverty Index (MPI) identifies multiple deprivations at the household level in education, health and standard of living (Table 1). 1.7.2. Secondary Sources The secondary source, involves both national databases as well as state-level data from the economic surveys, have been used to depict the trends in key parameters related to the human development outcomes. To gain understanding on the functioning and impacts (coverage, utilization etc.) of the important public welfare programmes, MIS data from the relevant ministries/departments at the central/state level have been collated and analyzed, again to examine trends, patterns and differentials. The major sources include Census 2011; Department of Planning, Directorate of Economics & Statistics (DES), Uttarakhand; Finance Department, Government of Uttarakhand; Central Statistical
11
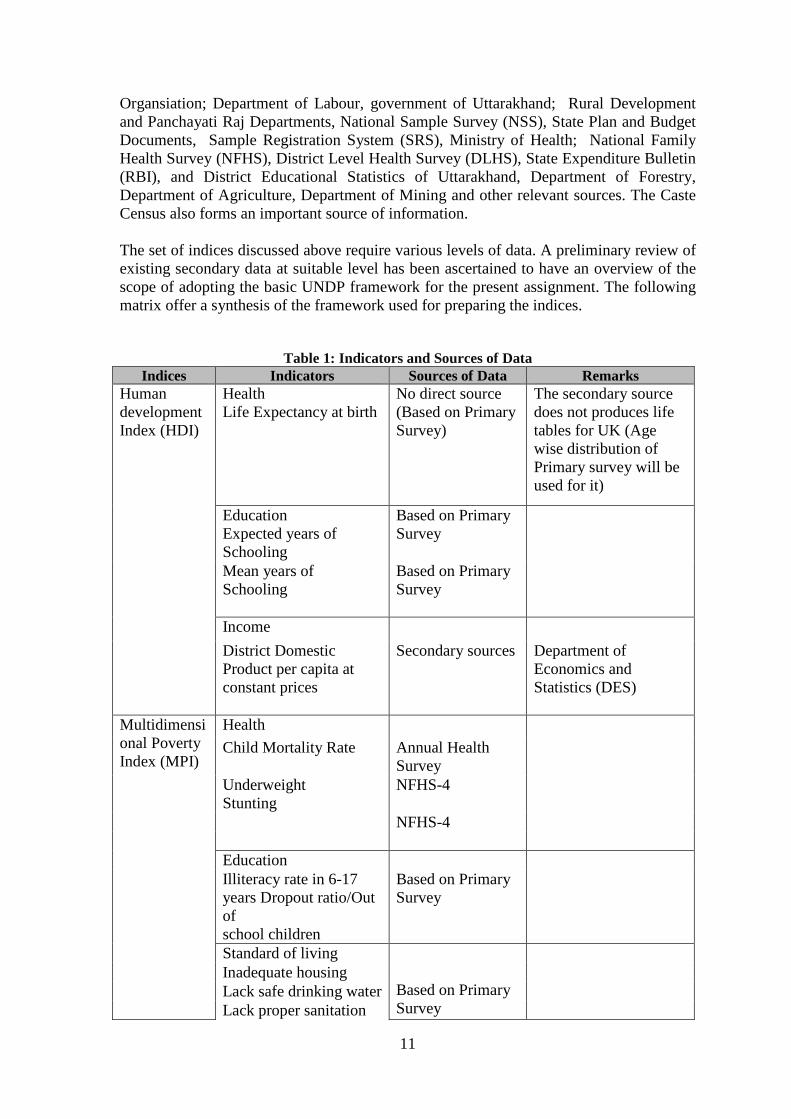
Organsiation; Department of Labour, government of Uttarakhand; Rural Development and Panchayati Raj Departments, National Sample Survey (NSS), State Plan and Budget Documents, Sample Registration System (SRS), Ministry of Health; National Family Health Survey (NFHS), District Level Health Survey (DLHS), State Expenditure Bulletin (RBI), and District Educational Statistics of Uttarakhand, Department of Forestry, Department of Agriculture, Department of Mining and other relevant sources. The Caste Census also forms an important source of information. The set of indices discussed above require various levels of data. A preliminary review of existing secondary data at suitable level has been ascertained to have an overview of the scope of adopting the basic UNDP framework for the present assignment. The following matrix offer a synthesis of the framework used for preparing the indices.
Table 1: Indicators and Sources of Data
Indices Indicators Sources of Data Remarks Human development Index (HDI)
Health Life Expectancy at birth
No direct source (Based on Primary Survey)
The secondary source does not produces life tables for UK (Age wise distribution of Primary survey will be used for it)
Education Expected years of Schooling
Based on Primary Survey
Mean years of Schooling
Based on Primary Survey
Income District Domestic Product per capita at constant prices
Secondary sources Department of Economics and Statistics (DES)
Multidimensional Poverty Index (MPI)
Health Child Mortality Rate Annual Health
Survey
Underweight Stunting
NFHS-4
NFHS-4 Education Illiteracy rate in 6-17 years Dropout ratio/Out of school children
Based on Primary Survey
Standard of living Based on Primary Survey
Inadequate housing Lack safe drinking water Lack proper sanitation
12
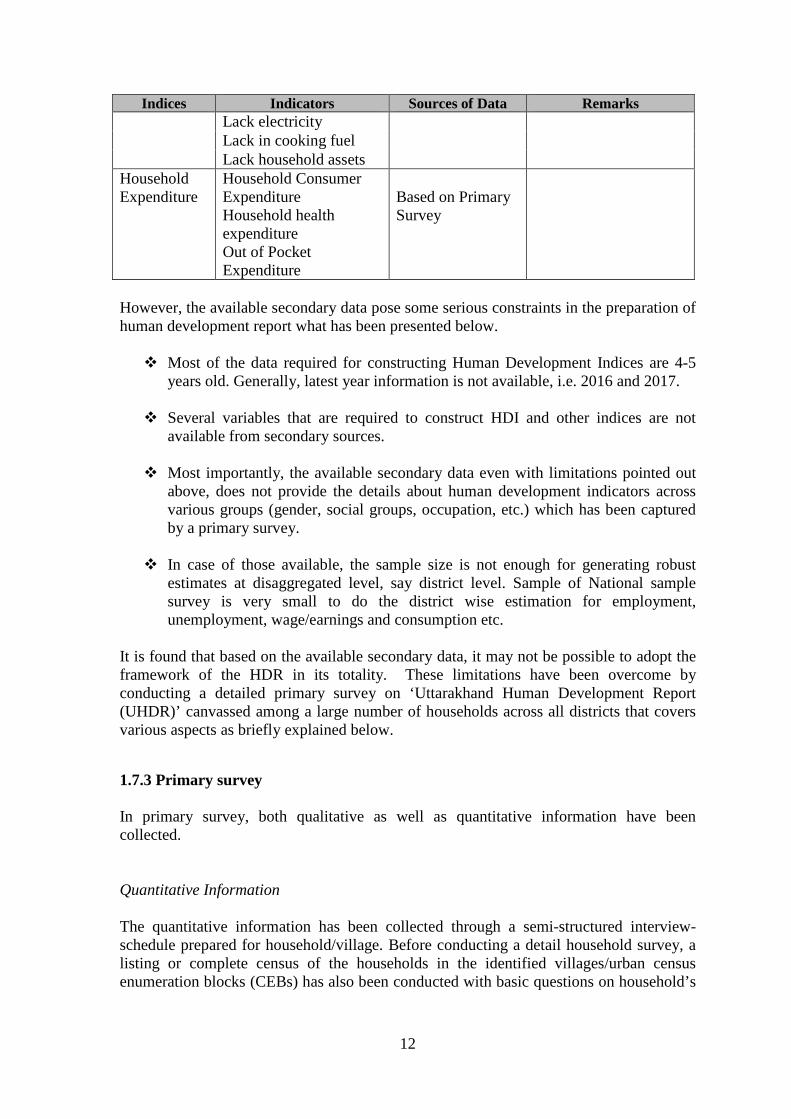
Indices Indicators Sources of Data Remarks Lack electricity Lack in cooking fuel Lack household assets
Household Expenditure
Household Consumer Expenditure Household health expenditure Out of Pocket Expenditure
Based on Primary Survey
However, the available secondary data pose some serious constraints in the preparation of human development report what has been presented below. Most of the data required for constructing Human Development Indices are 4-5
years old. Generally, latest year information is not available, i.e. 2016 and 2017. Several variables that are required to construct HDI and other indices are not
available from secondary sources. Most importantly, the available secondary data even with limitations pointed out
above, does not provide the details about human development indicators across various groups (gender, social groups, occupation, etc.) which has been captured by a primary survey.
In case of those available, the sample size is not enough for generating robust
estimates at disaggregated level, say district level. Sample of National sample survey is very small to do the district wise estimation for employment, unemployment, wage/earnings and consumption etc.
It is found that based on the available secondary data, it may not be possible to adopt the framework of the HDR in its totality. These limitations have been overcome by conducting a detailed primary survey on ‘Uttarakhand Human Development Report (UHDR)’ canvassed among a large number of households across all districts that covers various aspects as briefly explained below.
1.7.3 Primary survey In primary survey, both qualitative as well as quantitative information have been collected. Quantitative Information The quantitative information has been collected through a semi-structured interview-schedule prepared for household/village. Before conducting a detail household survey, a listing or complete census of the households in the identified villages/urban census enumeration blocks (CEBs) has also been conducted with basic questions on household’s

13
characteristics. The detail survey includes different aspects of human development as given below. Demographic details of household members (age, gender, marital status, duration
of stay, main occupation/economic activity, years/levels of education, child education and health status, migration status etc.).
Basic services (type of dwelling, access to drinking water, toilet, waste-disposition, electricity, energy-sources, assets etc.)
Education (year of schooling, enrolment, type of educational facility attended, access parameters, regularity, satisfaction with schooling, mid-day meals etc.)
Health and healthcare (illnesses – acute and chronic, sources of treatment, sources of financing, hospitalization, disabilities, mental health, subjective assessment/ratings of health status, maternal and child health including preventive aspects, mortality, cause of death by verbal autopsy, health aspects of the elderly, perception on government health facilities and quality of care)
Consumption and Sources of Income (a short module on consumption expenditure similar to the National Sample Survey Organisation (NSSO), major sources of income, income earned, poverty perceptions)
Livelihoods (detailed information on major occupation/income sources, regularity of earnings and other labour market aspects, special emphasis on women’s work and use of time, wages, social security)
Impact of Public Programmes (public perception assessment on functioning, access, utilization and impacts of selected important public welfare programmes, e.g., SSA, ICDS, PDS, MNREGA, IAY, BRGF, MSDP etc. with special focus on state government developmental schemes)
A separate section includes questions on tourism, environment, disaster has also part of the questionnaire.
The people’s perception domain covers public services like health, education, public transportation & communication, Public Distribution System (PDS) etc.
However, certain aspects for above reliable district level data is already available from secondary sources, such information has not been collected from primary survey after due consultation with the state officials. Qualitative Information In addition, the qualitative information gathered by conducting focus group discussions (FGDs) among the beneficiaries of various government programmes in sectors relevant to human development (e.g. RSBY, JSY, MGNREGS etc), self-help groups members, women, unemployed youth, and SCs/STs women etc. In-depth interviews with key informants (KIs) such as district level officials and other government officials from various departments have been conducted to know their perceptions, experience and
14
success at different human development issues. In addition, some selected case studies of success and failures of government and people’s initiatives have also been recorded to draw lessons. As mentioned above, this enabled not only to capture the required variables but also enabled to see the variation in human development indicators across different socio-economic groups e.g. SCs/STs/OBCs/Others, male/female and other vulnerable groups. District Level Workshop In addition district level workshops were also organised in each district headquarter to discusses the various human development challenges and prospects from district level official, non-government organisation and political representatives. 1.7.4 Sample The quantitative data for the HDR has been collected, from a sample of households carefully and scientifically drawn from a sampling frame comprising rural and urban units (villages and towns/cities) of the state. Further, the sampling design has been prepared to allow for analyzing variation across social and economic groups, ethnicity and geographic regions. Again, the sampling design ensures that the estimates for key human development indicators up to district level are robust, comparable and standardized. In accordance with such expected attributes, the sampling design and methodology has been prepared after consulting with national level sampling experts (Annexure 1.1). In total, 56,873 households with 33,989 households from rural areas and 22,884 households from urban areas were listed to get the basic information (Listing questionnaire given in annexure). From the listing exercise, total 8845 sample households were selected with 6828 households from rural areas and 2017 from urban areas for the detail interviews. 1.8 Broad Theme of the Report Uttarakhand is one of the fastest growing economies in the country. It has witnessed massive growth in capital investments due to a more conducive industrial policy and generous tax benefits. Literacy rate, GER at elementary and secondary level of the state is higher than all India level. Health indicators such as infant mortality rates, maternal mortality rate, institutional delivery and immunization performance of the state has improved and better than all India level. However, disparities and inequalities between the hill and the plain districts and across socio-economic groups are huge. The hill region districts are less developed in terms of economic infrastructure. The inter-district inequality in infrastructure has led to increasing disparity in terms of income and livelihood between the hills and the plains. Some of the hill districts have per capita income less than half of the plain districts. There is a high adult unemployment and underemployment in the hill districts due to absence of employment alternatives to farming, which is fragmented, small farms and low productive. There has been huge out-migration from rural areas (mostly hilly) to urban areas in the state and rest of the country.

15
Natural calamities and disaster result in huge loss in terms of infrastructure, income, livelihood opportunities and human lives. Environment and pollution issues are challenges in the growth of tourism, industry and hydro-electric power projects. Thus, the state has the challenge for achieving a sustainable and inclusive growth which can lead to high level of human development. The development issues and challenges in the state are: Regional inequality and disparity between hill and plain districts Income, employment and livelihood issues Human resource development Environmental Concerns
The present Human Development Report makes an attempt to analyse the themes that are discussed broadly in the Sustainable Development Goals (SDGs) within the framework of inclusive development and addresses the main challenges and present a way forward in order to have a more broad based and equitable development towards the wellbeing of the state’s people. 1.9. Reading of the Report The report is organised in twelve chapters. This section is followed by the chapter related to the three key dimensions of human development: income, employment and livelihood. The next chapter exclusively deals with features of migration in Uttarakhand. Chapter four concerns with the condition of land and status of agriculture in the state and the fifth addresses another important dimension of human development – education and skill development. Chapter six pertains to an assessment of health of the population and short-comings and potential of the states healthcare system; the seventh chapter draws inferences from the previous chapter while addressing the case of gender and well-being of children; chapter eight aims to address urbanisation and urban governance; the ninth chapter deals with tourism and Uttarakhands prospects; the tenth chapter deals with, environment, natural resource management and natural disaster. The eleventh chapter presents the various Human Development Indices alongside the sustainable developmental goals. The last chapter presents a conclusion with certain pointers suggesting a way forward.
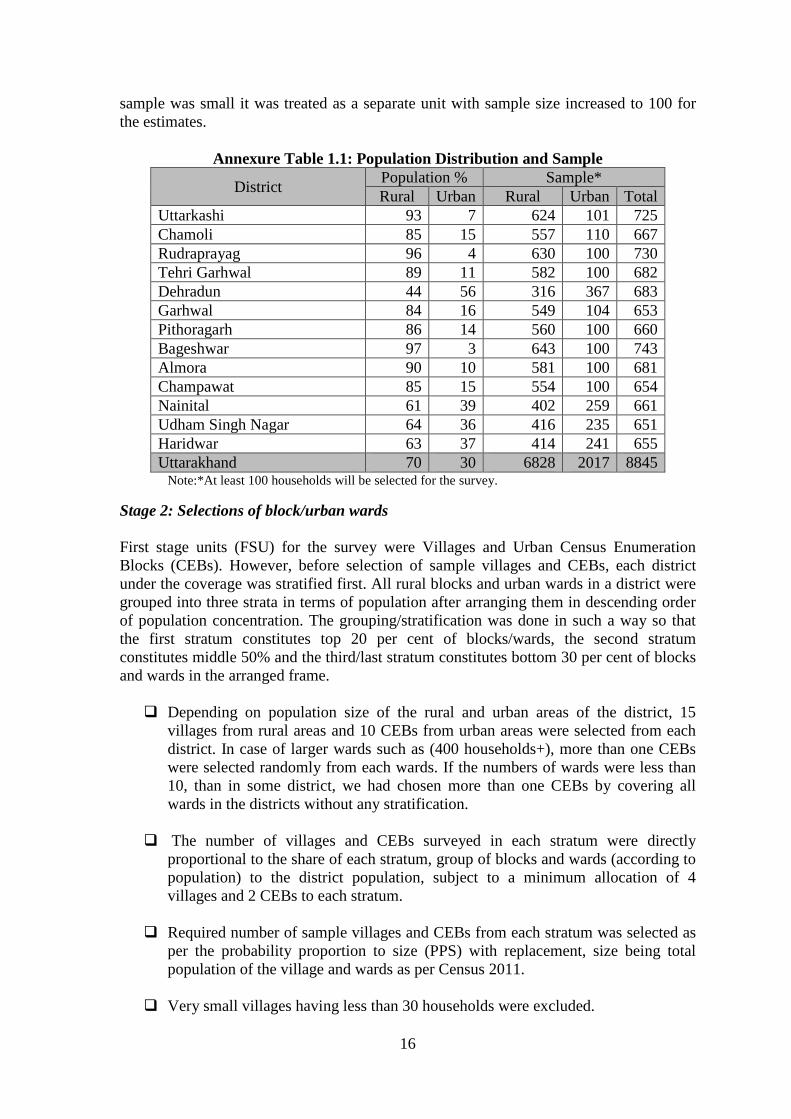
Annexure The minimum sample size for each district was calculated by using Slovin’s formula on the population to get the robust estimates. The formula is nY = N / (1 + Ne2), where N=Population, ny=estimated sample, e= alpha level at confidence interval of 96 per cent. This was estimated about 650 households for a population of above 1 lakh for each district including 5 per cent design effect at state level to get the robust estimations. Further, muti-stage sampling method was used to arrive at the second stage unit of the survey (FSU), i.e. households. Stage 1: Selection of districts The district level sample was further distributed into rural and urban areas by its population ratio as per census, 2011 for each district. The district, where the urban
16
sample was small it was treated as a separate unit with sample size increased to 100 for the estimates.
Annexure Table 1.1: Population Distribution and Sample
District Population % Sample* Rural Urban Rural Urban Total
Uttarkashi 93 7 624 101 725 Chamoli 85 15 557 110 667 Rudraprayag 96 4 630 100 730 Tehri Garhwal 89 11 582 100 682 Dehradun 44 56 316 367 683 Garhwal 84 16 549 104 653 Pithoragarh 86 14 560 100 660 Bageshwar 97 3 643 100 743 Almora 90 10 581 100 681 Champawat 85 15 554 100 654 Nainital 61 39 402 259 661 Udham Singh Nagar 64 36 416 235 651 Haridwar 63 37 414 241 655 Uttarakhand 70 30 6828 2017 8845
Note:*At least 100 households will be selected for the survey.
Stage 2: Selections of block/urban wards First stage units (FSU) for the survey were Villages and Urban Census Enumeration Blocks (CEBs). However, before selection of sample villages and CEBs, each district under the coverage was stratified first. All rural blocks and urban wards in a district were grouped into three strata in terms of population after arranging them in descending order of population concentration. The grouping/stratification was done in such a way so that the first stratum constitutes top 20 per cent of blocks/wards, the second stratum constitutes middle 50% and the third/last stratum constitutes bottom 30 per cent of blocks and wards in the arranged frame. Depending on population size of the rural and urban areas of the district, 15
villages from rural areas and 10 CEBs from urban areas were selected from each district. In case of larger wards such as (400 households+), more than one CEBs were selected randomly from each wards. If the numbers of wards were less than 10, than in some district, we had chosen more than one CEBs by covering all wards in the districts without any stratification.
The number of villages and CEBs surveyed in each stratum were directly proportional to the share of each stratum, group of blocks and wards (according to population) to the district population, subject to a minimum allocation of 4 villages and 2 CEBs to each stratum.
Required number of sample villages and CEBs from each stratum was selected as per the probability proportion to size (PPS) with replacement, size being total population of the village and wards as per Census 2011.
Very small villages having less than 30 households were excluded.
17
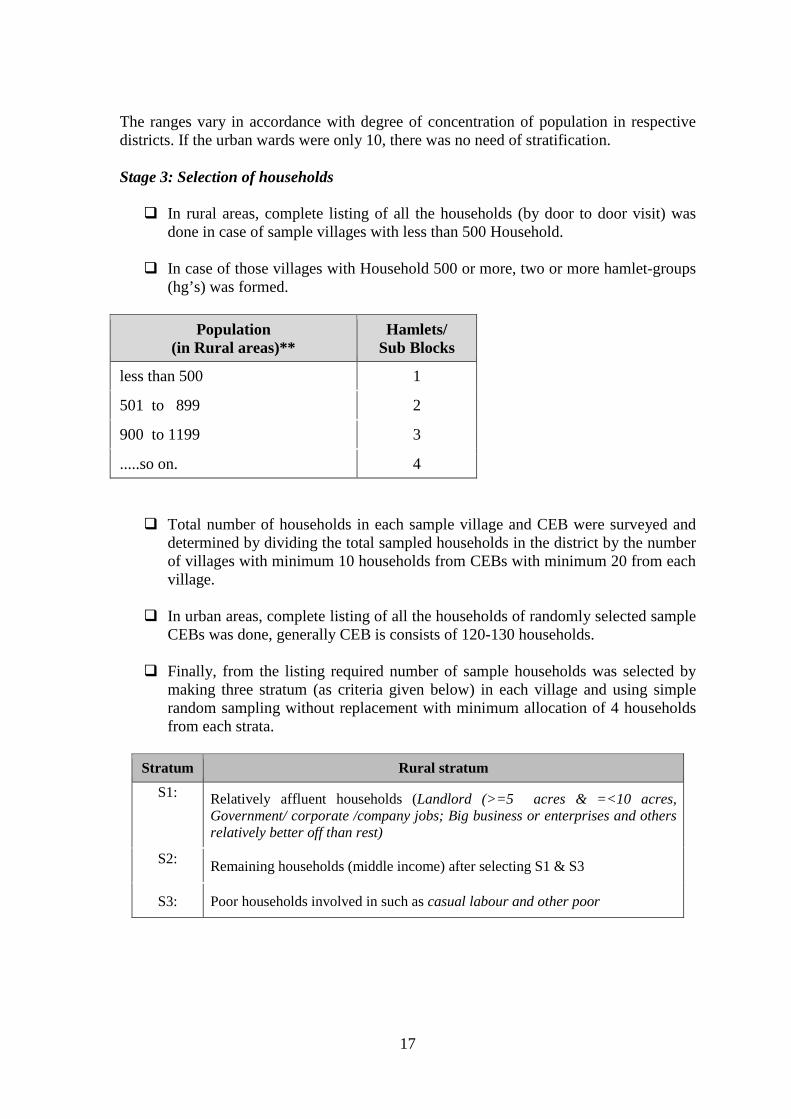
The ranges vary in accordance with degree of concentration of population in respective districts. If the urban wards were only 10, there was no need of stratification. Stage 3: Selection of households In rural areas, complete listing of all the households (by door to door visit) was
done in case of sample villages with less than 500 Household.
In case of those villages with Household 500 or more, two or more hamlet-groups (hg’s) was formed.
Total number of households in each sample village and CEB were surveyed and determined by dividing the total sampled households in the district by the number of villages with minimum 10 households from CEBs with minimum 20 from each village.
In urban areas, complete listing of all the households of randomly selected sample CEBs was done, generally CEB is consists of 120-130 households.
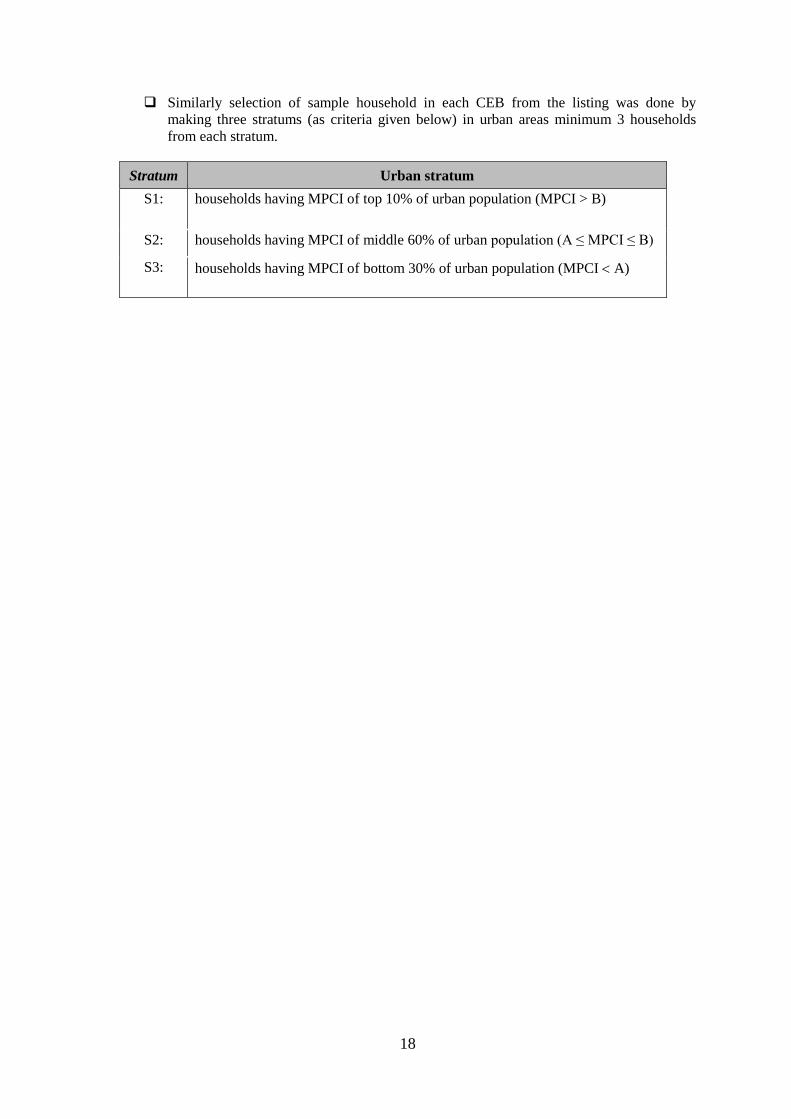
Finally, from the listing required number of sample households was selected by making three stratum (as criteria given below) in each village and using simple random sampling without replacement with minimum allocation of 4 households from each strata.
Stratum Rural stratum
S1: Relatively affluent households (Landlord (>=5 acres & =<10 acres, Government/ corporate /company jobs; Big business or enterprises and others relatively better off than rest)
S2: Remaining households (middle income) after selecting S1 & S3
S3: Poor households involved in such as casual labour and other poor
Population (in Rural areas)**
Hamlets/ Sub Blocks
less than 500 1
501 to 899 2
900 to 1199 3
.....so on. 4
18
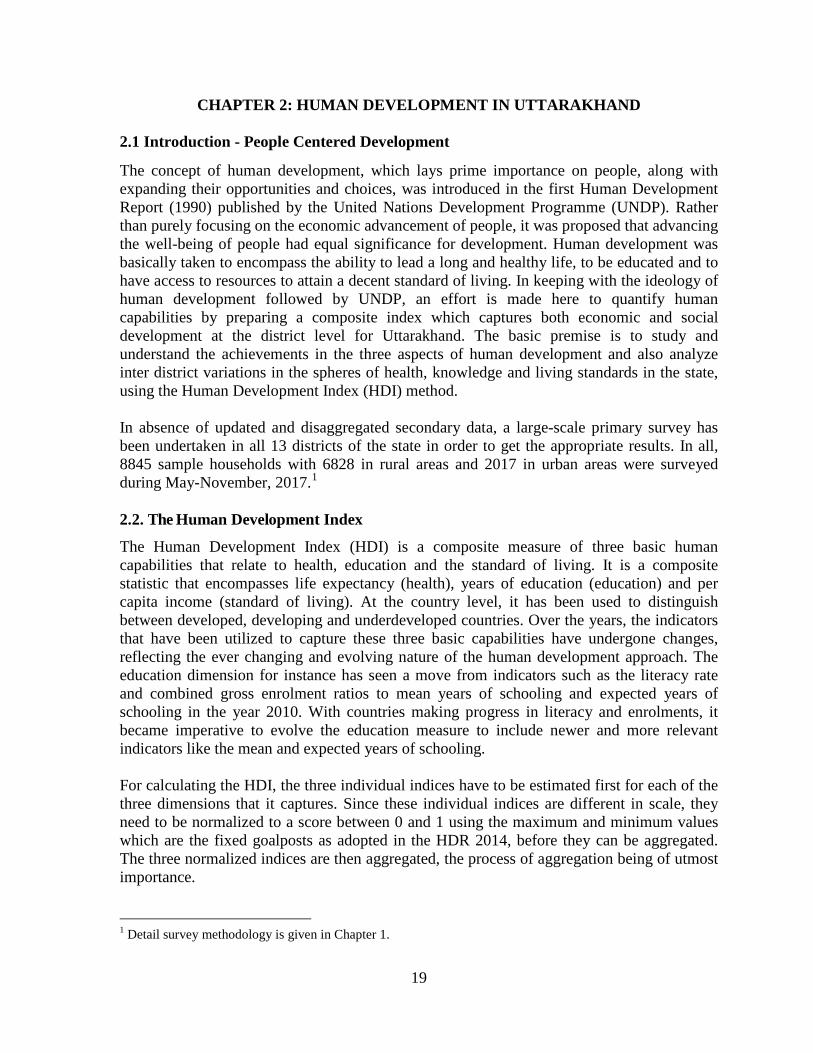
Similarly selection of sample household in each CEB from the listing was done by making three stratums (as criteria given below) in urban areas minimum 3 households from each stratum.
Stratum Urban stratum S1: households having MPCI of top 10% of urban population (MPCI > B)
S2: households having MPCI of middle 60% of urban population (A ≤ MPCI ≤ B)
S3: households having MPCI of bottom 30% of urban population (MPCI < A)
19
CHAPTER 2: HUMAN DEVELOPMENT IN UTTARAKHAND 2.1 Introduction - People Centered Development
The concept of human development, which lays prime importance on people, along with expanding their opportunities and choices, was introduced in the first Human Development Report (1990) published by the United Nations Development Programme (UNDP). Rather than purely focusing on the economic advancement of people, it was proposed that advancing the well-being of people had equal significance for development. Human development was basically taken to encompass the ability to lead a long and healthy life, to be educated and to have access to resources to attain a decent standard of living. In keeping with the ideology of human development followed by UNDP, an effort is made here to quantify human capabilities by preparing a composite index which captures both economic and social development at the district level for Uttarakhand. The basic premise is to study and understand the achievements in the three aspects of human development and also analyze inter district variations in the spheres of health, knowledge and living standards in the state, using the Human Development Index (HDI) method. In absence of updated and disaggregated secondary data, a large-scale primary survey has been undertaken in all 13 districts of the state in order to get the appropriate results. In all, 8845 sample households with 6828 in rural areas and 2017 in urban areas were surveyed during May-November, 2017.1 2.2. The Human Development Index
The Human Development Index (HDI) is a composite measure of three basic human capabilities that relate to health, education and the standard of living. It is a composite statistic that encompasses life expectancy (health), years of education (education) and per capita income (standard of living). At the country level, it has been used to distinguish between developed, developing and underdeveloped countries. Over the years, the indicators that have been utilized to capture these three basic capabilities have undergone changes, reflecting the ever changing and evolving nature of the human development approach. The education dimension for instance has seen a move from indicators such as the literacy rate and combined gross enrolment ratios to mean years of schooling and expected years of schooling in the year 2010. With countries making progress in literacy and enrolments, it became imperative to evolve the education measure to include newer and more relevant indicators like the mean and expected years of schooling. For calculating the HDI, the three individual indices have to be estimated first for each of the three dimensions that it captures. Since these individual indices are different in scale, they need to be normalized to a score between 0 and 1 using the maximum and minimum values which are the fixed goalposts as adopted in the HDR 2014, before they can be aggregated. The three normalized indices are then aggregated, the process of aggregation being of utmost importance. 1 Detail survey methodology is given in Chapter 1.
20
Initially, the Human Development Indices were calculated by taking the simple arithmetic average of the three individual dimensions. Despite its elegance, the method faced severe criticism (Mishra and Nathan, 2014)2 for it allowed ‘perfect substitutions’ among the dimensions. It was argued that any loss in one dimension, under a simple average, would get fully compensated by an equivalent gain in any of the other two dimensions. Also, higher achievements in one dimension tended to obscure failures in the remaining dimensions. The UNDP then revised (UNDP, 2010; 2013, 2016) the method of aggregation by opting for the geometric mean while aggregating the three-dimensional values. The geometric mean method had an implicit normative judgment such that improvements in the lowest dimension contributed the most to improvements in overall human development. In this report, we estimate the HDI based on UNDP’s new method (2016) with some modifications to contextualize and capture the myriad forms of diversities in the state (annexure 1). 2.3 The Components of HDI for Uttarakhand – District Level Analysis A recent study by Mukherjee, Chakraborty and Sikdar (NIPFP, 2014) estimates the HDI for the Indian states across three decades. The HDI for Uttarakhand state, according to their estimates, has shown an improvement from 0.247 in 2004-05, to 0.378 in 2009-10 and then to 0.426 in 2011-12. The state ranking in HDI has also shown improvements and stands at 11 in 2011-12. Another study of HDIs and inequality adjusted HDIs (IHDI) of the Indian states by Suryanarayana, Agrawal and Prabhu (2012) finds the HDI for Uttarakhand as 0.515 (rank 7) and IHDI at 0.345 (rank 10). Here, the HDI and IHDI for Uttarakhand rank above the all India averages of 0.504 and 0.343 respectively. Given the paucity of relevant and more recent data for calculating the various dimensions that go into estimating the Human Development Index for any state or district, the HDI Survey, 2017, made an attempt to collect and analyze relevant data to calculate the HDI for Uttarakhand state as well as for its thirteen districts. In the following sections, we elaborate upon the various indicators used for calculating the individual dimensions of the HDI and the methodology used for calculating the composite HDI index is given in Annexure 1. District level data is presented for the individual dimensions as well to get a more disaggregated understanding of the health, education and standard of living scenario in the state. Then the district level HDIs are presented and analyzed. 2.3.1. Health Life Expectancy at Birth To capture the probability of leading a long and healthy life for the populace, the life expectancy at birth is used as a measure of the realized achievements in the health dimension. The life expectancy at birth is taken as “the number of years a new-born infant could expect to live if prevailing patterns of age-specific mortality rates at the time of birth
2 Mishra, Srijit and Hippu Salk Kristle Nathan(2014), Measuring HDI-The Old, The New and The Elegant: Implication for Multidimensional Development and Social Inclusiveness, LSE, Asia Research Centre working paper, 63
21
were to stay the same throughout the child’s life,” (UNDP. 2010. p. 224). It is however, an indicator of very long-term improvements in health status. The data source for life expectancy at birth in the Indian context is the Sample Registration System (SRS). This data is available only at the All India and state levels and is usually disaggregated by sex and area. The latest available SRS data(2012-16) estimates the life expectancy at birth for Uttarakhand to be71.5years, which was higher that the All India figure of 68.5 years. Females in the state show higher life expectancy at 74.8 years vis-à-vis males at 68.5 years. The female and male life expectancy rate for Uttarakhand was also higher than the all India figures of 70.2 and 67.4 years for females and males respectively. In urban life expectancy is marginally higher (72.9 years) compared to rural areas (71 years), which is also higher than all India figures i.e. 67.4 years in rural areas, and 72.2 in urban areas. The higher than India life expectancy rates in Uttarakhand can be taken to reflect the functioning of health facilities in the state as life expectancy at birth in turn depends on age-specific mortality patterns. In the Uttarakhand, low rates of infant, child and adult mortality could be perpetuating high rates of life expectancy. According to SRS data (2012-16), the infant, child and adult mortality rates of Uttarakhand were lower than all India including male and female.
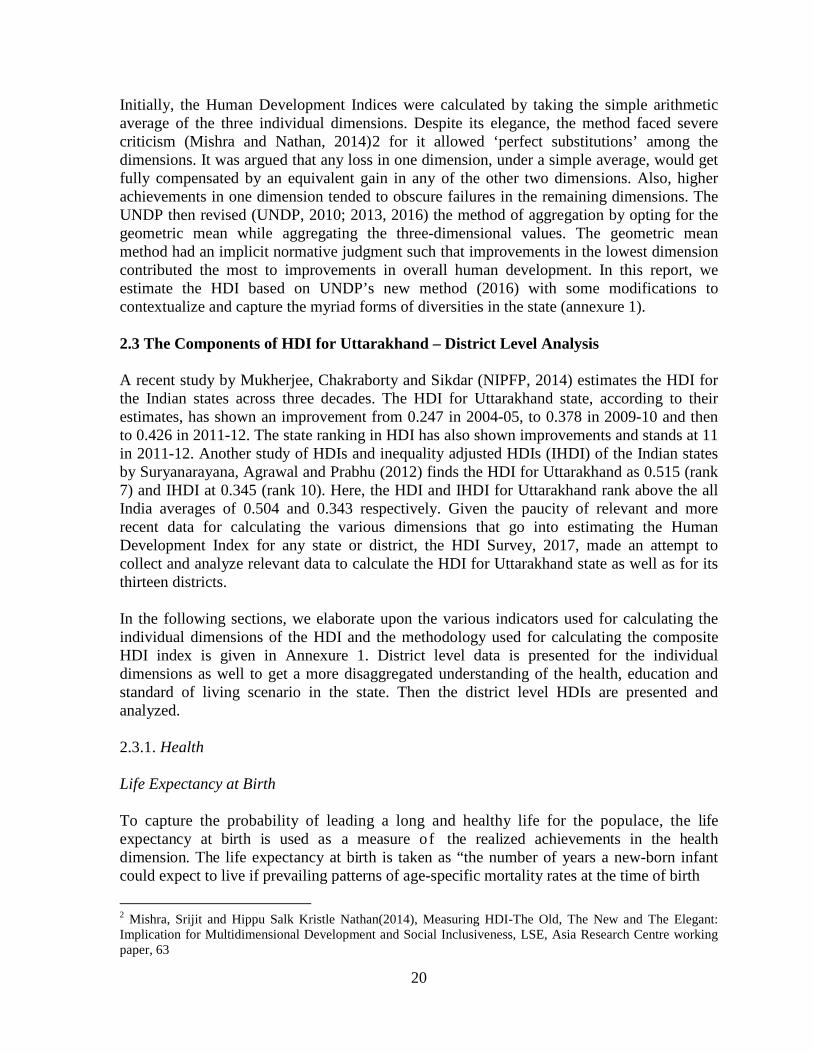
Table 2.1: Uttarakhand: District-wise Life Expectancy at Birth, 2017
Source: HDR Survey, 2017
Based on calculations using the Uttarakhand HDR Survey data, life expectancy at birth in the state3 was found to be 71.5 years in 2017. Inter-district variations in the same were also observed (Fig. 2.1).Of the thirteen districts in the state, only four districts had life expectancy rates above the state average of 71.5 years, Pithoragarh showcasing the highest at 72.1 years. The remaining nine districts had life expectancy rates below the state average with Haridwar at the bottom at 67.7 years. 2.3.2 Education 3The estimates were obtained by the standard Chiang Method. The higher estimates of life expectancy in these districts could be a reflection of the smaller number of reported deaths here.
67.7 68.7
70.2 70.2 70.5 70.6 70.7 71.0 71.0 71.3 71.5 71.7 71.9 72.1

22
Mean Years of Schooling The education index in the HDI comprises two indicators viz., the mean years of schooling for adults aged 25 years and older and the expected years of schooling for children in the school entering age. The mean years of schooling (MYS) is based on the duration of schooling of a child at every level of education and it replaced the literacy rate as an indicator of educational achievement. This indicator portrays better educational achievements of the people than literacy rate (HDR, 2010). The data for the mean years of schooling is derived from the available data on educational attainments, since data on the distribution of population by age and educational attainments is require data given point of time to arrive at this educational attainment indicator. The officially required number of years of schooling for each level of education is then applied as a multiplier to the age-education frequency distribution to get the mean years of schooling for the given distribution4.
Figure 2.2: Uttarakhand: District –wise Mean Years of Schooling
Source: HDR Survey, 2017
The HDR Survey, 2017 estimates for the mean years of schooling put the figure at 7.5years for Uttarakhand. Inter-district variations reveal that the mean years of schooling ranges from 6.3 years in Champawat to 8.6 years in Dehradun. Uttarkashi, Pithoragarh, Bageshwar, Nainital, Pauri Garhwal and Dehradun are districts with mean years of schooling higher than the state average while Champawat, Hardwar, USNagar, Almora, Rudraprayag, Tehri Garhwal and Chamoli are districts with mean years of schooling lesser than the state average. A clear gender divide of around two and a half yearsin the mean years of schooling is observed, 8.9 years for males and much lower at 6.3 years for females (Figure2).As far as the MYS among females is concerned, the lowest was found again in Champawat(4.9 years)
4 It may, however, be noted that the MYS has figured as an indicator under the education component in the HDRs of previous years and typically excluded years spent repeating individual grades. This comes with the fact that the estimation is done for individuals aged 25 years and above.
6.3 6.5 6.7 7.3 7.4 7.4 7.5 7.5 7.7 8.0 8.0 8.2 8.4 8.6
23
and highest in Dehradun(7.5 years). However, the MYS among the males was found highest in Pauri Garhwal (10.2 years) and lowest in Haridwar(7.6 year).
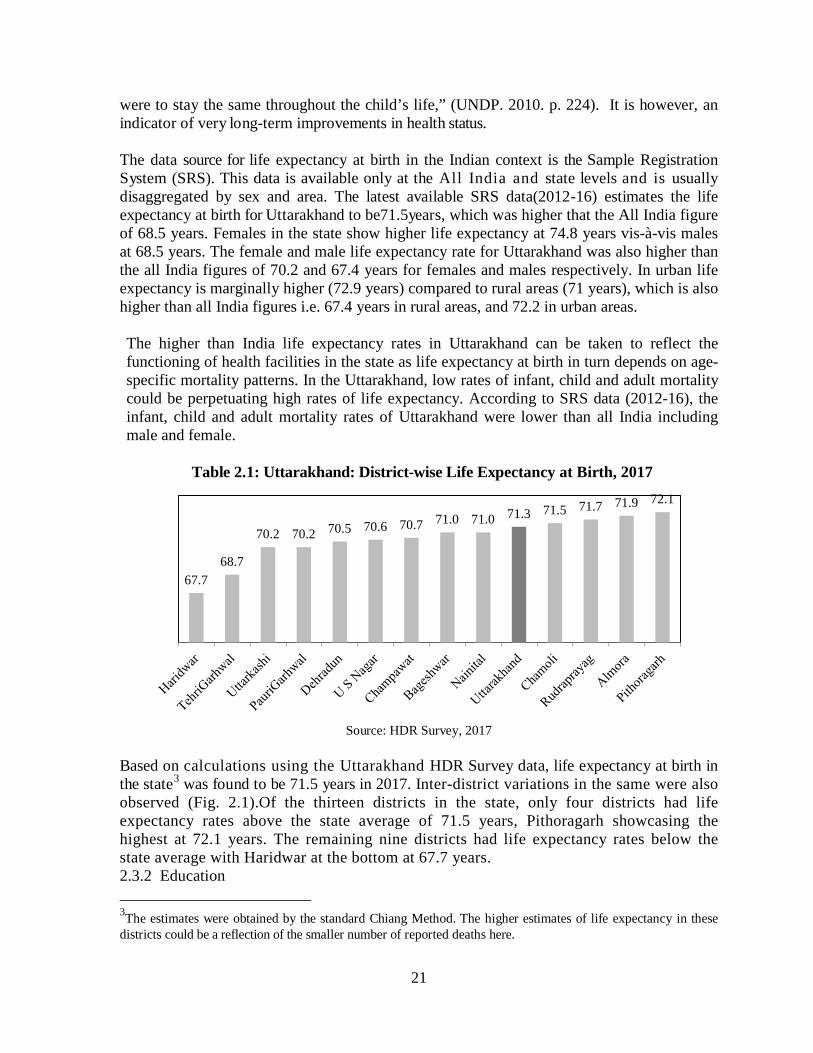
Expected Years of Schooling The second indicator of educational achievements in the HDI is the expected years of schooling (EYS),the estimates of which are based on enrolments by age at all the levels of education and the number of school going age children in the population, for each level of education. Thus, the EYS is a measure of the number of years of schooling a child at the start of his or her education is expected to receive if the current rate of enrolments is maintained throughout the child’s life. The advantages of using this indicator are that it represents a measure which takes into account both the stock and flow dimensions of the schooling system. It captures knowledge accumulation under the formal school system such that a higher value of the EYS is taken to reflect higher accumulated knowledge.
Figure 2.3: Expected Years of Schooling
Source: HDR Survey, 2017
The estimates for the expected years of schooling reveal that in Uttarakhand, given the existing enrolment patterns, on an average a child can be expected to complete at least the secondary level of schooling once he or she starts going to school (EYS = 11.2 years). Only the three districts of Nainital, U S Nagar and Haridwar (Fig. 2.3) show expected years of schooling less than the secondary level pointing towards the need to research reasons for the same as well as the implementation of commensurate policy measures to enhance the same. Pithoragarh district has the maximum expected years of schooling of around 13 years. A marginal rural-urban and male-female bias exists for this indicator, although in an unexpected direction. Surprisingly, the EYS in rural areas (11.3 years) is marginally higher than that for urban areas (11.1 years). Similarly, female children can be expected to have higher years of schooling (11.4 years) as compared to their male counterparts (11.1 years).
10.2 10.4 10.9 11.2 11.6 11.6 11.8 11.8 12.0 12.0 12.1 12.2 12.3 12.5
24
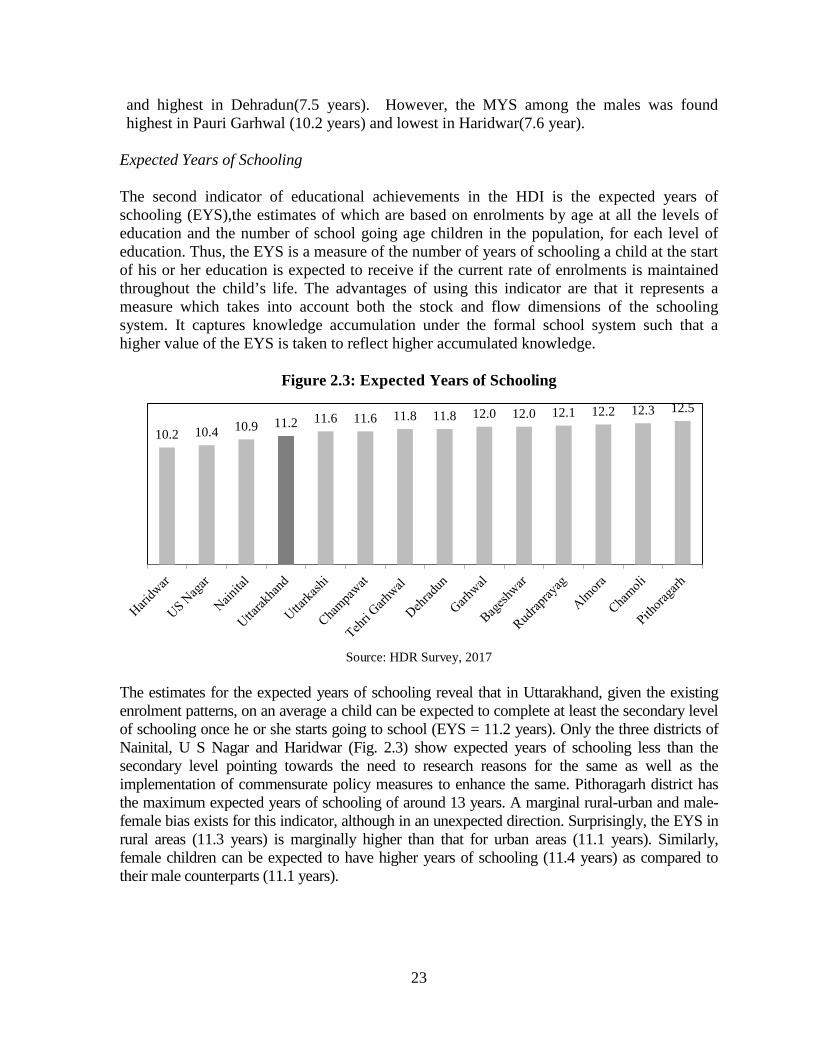
2.3.3 Standard of Living District Income Per Capita The standard of living component of the Human Development Index is usually measured using an income based indicator. The ideology behind using an income based indicator (UNDP 1990) has been that the indicator needed to capture and reflect the command over resources needed for a decent standard of living. This required data on access to land, credit, income and other sources. Lack of reliable and easily available data for such measures of income led to the use of GDP per capita as the income dimension for HDI calculations. Subsequently, the Gross National Income (GNI) per capita was adopted (UNDP 2010) as the income measure and it was adjusted by the Purchasing Power Parity (PPP), allowing for cross country comparisons. However, it has been researched that income has the peculiar effect of diminishing returns to human development when income levels rise. Thus, the income capturing indicator needs to be adjusted for this feature and various methods have been applied in the HDRs for doing that. For the purposes of our calculations of the HDI, the GNI per capita was replaced with the Net District Domestic Product (NDDP) (Department of Economics and Statistics, (DES), Government of Uttarakhand, 2017-18. As per the advance estimates from the DES2017-18, the estimated average per capita NDDP in Uttarakhand was INR157.4 thousand in 2017-18. Across the state, the plains districts of Haridwar, Dehradun and US Nagar reported a higher per capita NDDP compared to the state average. Haridwar had the highest per capita NDDP at INR 254 thousands and Rudraprayag reported the lowest per capita NDDP in the state at INR 83.5 thousand.
Figure 2.4: Per Capita Net District Domestic Product (NDDP) –in Rs. 000’
Source: DES Uttarakhand, 2018
83.5 83.7 89.2 90.6 96.8 100.1 101.7 110.0 115.1 118.4
157.4 187.3 195.9
254.1
25
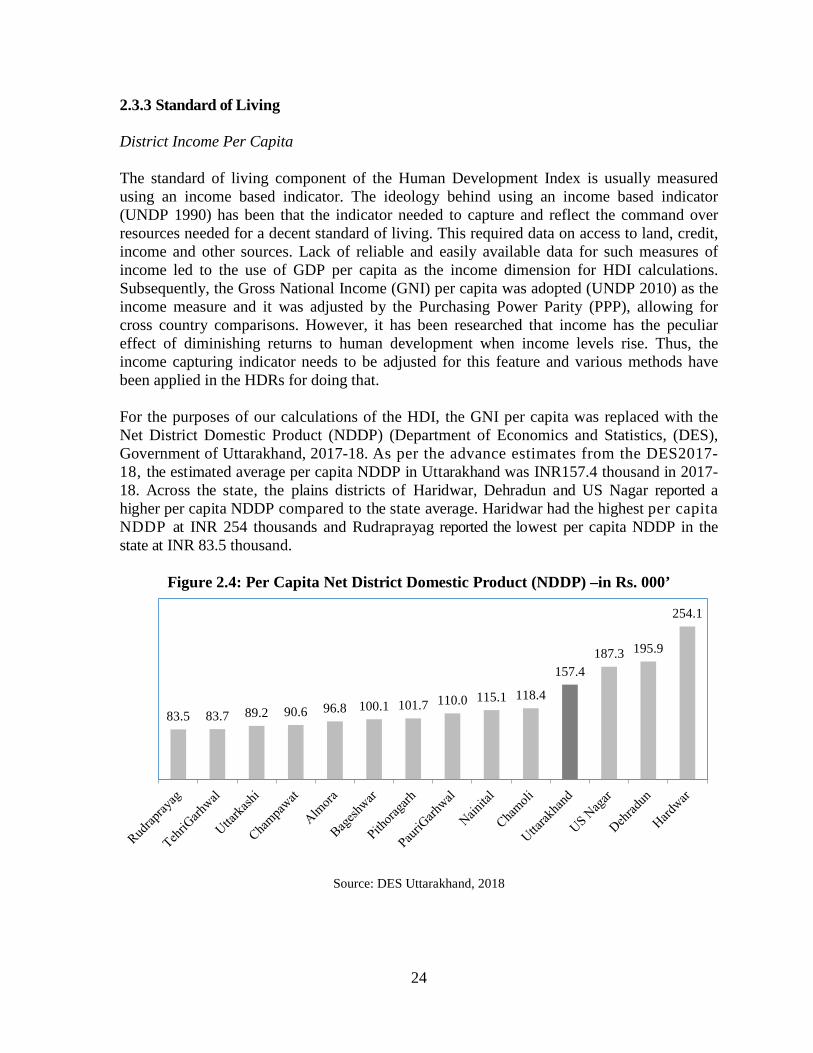
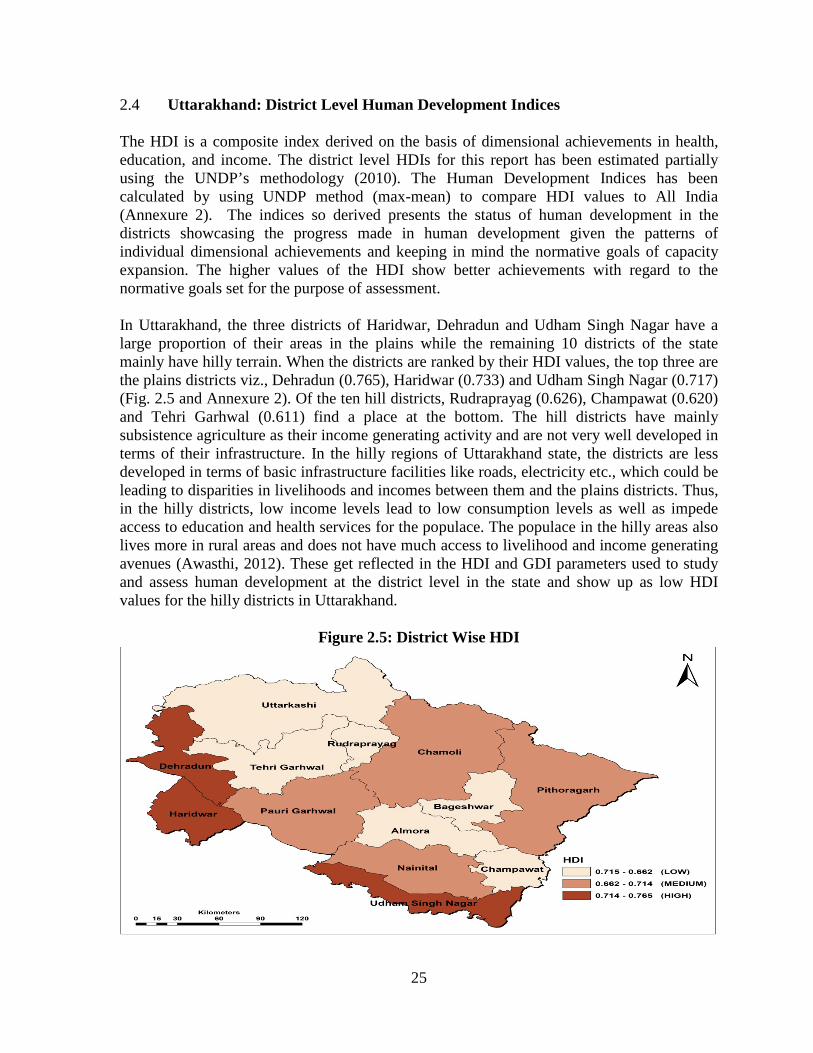
2.4 Uttarakhand: District Level Human Development Indices The HDI is a composite index derived on the basis of dimensional achievements in health, education, and income. The district level HDIs for this report has been estimated partially using the UNDP’s methodology (2010). The Human Development Indices has been calculated by using UNDP method (max-mean) to compare HDI values to All India (Annexure 2). The indices so derived presents the status of human development in the districts showcasing the progress made in human development given the patterns of individual dimensional achievements and keeping in mind the normative goals of capacity expansion. The higher values of the HDI show better achievements with regard to the normative goals set for the purpose of assessment. In Uttarakhand, the three districts of Haridwar, Dehradun and Udham Singh Nagar have a large proportion of their areas in the plains while the remaining 10 districts of the state mainly have hilly terrain. When the districts are ranked by their HDI values, the top three are the plains districts viz., Dehradun (0.765), Haridwar (0.733) and Udham Singh Nagar (0.717) (Fig. 2.5 and Annexure 2). Of the ten hill districts, Rudraprayag (0.626), Champawat (0.620) and Tehri Garhwal (0.611) find a place at the bottom. The hill districts have mainly subsistence agriculture as their income generating activity and are not very well developed in terms of their infrastructure. In the hilly regions of Uttarakhand state, the districts are less developed in terms of basic infrastructure facilities like roads, electricity etc., which could be leading to disparities in livelihoods and incomes between them and the plains districts. Thus, in the hilly districts, low income levels lead to low consumption levels as well as impede access to education and health services for the populace. The populace in the hilly areas also lives more in rural areas and does not have much access to livelihood and income generating avenues (Awasthi, 2012). These get reflected in the HDI and GDI parameters used to study and assess human development at the district level in the state and show up as low HDI values for the hilly districts in Uttarakhand.
Figure 2.5: District Wise HDI
26
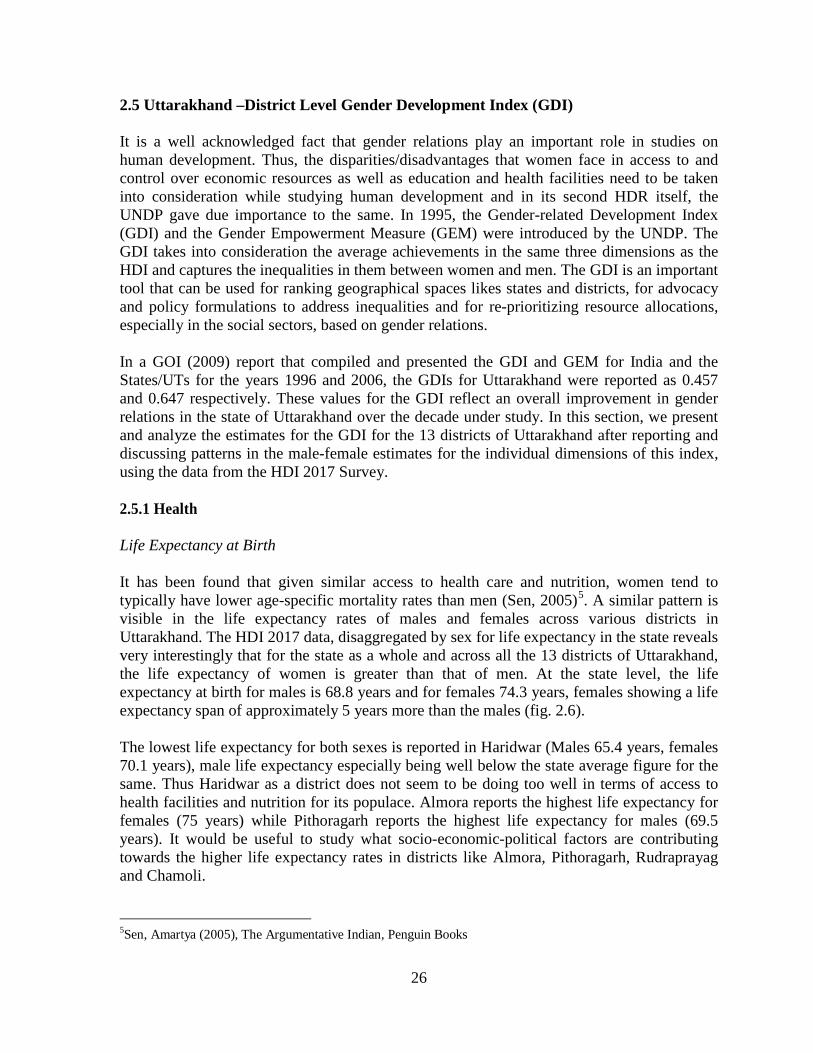
2.5 Uttarakhand –District Level Gender Development Index (GDI) It is a well acknowledged fact that gender relations play an important role in studies on human development. Thus, the disparities/disadvantages that women face in access to and control over economic resources as well as education and health facilities need to be taken into consideration while studying human development and in its second HDR itself, the UNDP gave due importance to the same. In 1995, the Gender-related Development Index (GDI) and the Gender Empowerment Measure (GEM) were introduced by the UNDP. The GDI takes into consideration the average achievements in the same three dimensions as the HDI and captures the inequalities in them between women and men. The GDI is an important tool that can be used for ranking geographical spaces likes states and districts, for advocacy and policy formulations to address inequalities and for re-prioritizing resource allocations, especially in the social sectors, based on gender relations. In a GOI (2009) report that compiled and presented the GDI and GEM for India and the States/UTs for the years 1996 and 2006, the GDIs for Uttarakhand were reported as 0.457 and 0.647 respectively. These values for the GDI reflect an overall improvement in gender relations in the state of Uttarakhand over the decade under study. In this section, we present and analyze the estimates for the GDI for the 13 districts of Uttarakhand after reporting and discussing patterns in the male-female estimates for the individual dimensions of this index, using the data from the HDI 2017 Survey. 2.5.1 Health Life Expectancy at Birth It has been found that given similar access to health care and nutrition, women tend to typically have lower age-specific mortality rates than men (Sen, 2005)5. A similar pattern is visible in the life expectancy rates of males and females across various districts in Uttarakhand. The HDI 2017 data, disaggregated by sex for life expectancy in the state reveals very interestingly that for the state as a whole and across all the 13 districts of Uttarakhand, the life expectancy of women is greater than that of men. At the state level, the life expectancy at birth for males is 68.8 years and for females 74.3 years, females showing a life expectancy span of approximately 5 years more than the males (fig. 2.6). The lowest life expectancy for both sexes is reported in Haridwar (Males 65.4 years, females 70.1 years), male life expectancy especially being well below the state average figure for the same. Thus Haridwar as a district does not seem to be doing too well in terms of access to health facilities and nutrition for its populace. Almora reports the highest life expectancy for females (75 years) while Pithoragarh reports the highest life expectancy for males (69.5 years). It would be useful to study what socio-economic-political factors are contributing towards the higher life expectancy rates in districts like Almora, Pithoragarh, Rudraprayag and Chamoli. 5Sen, Amartya (2005), The Argumentative Indian, Penguin Books
27
Figure 2.6: Uttarakhand – District wise Life Expectancy at Birth disaggregated by sex, 2017
Source: HDR Survey, 2017
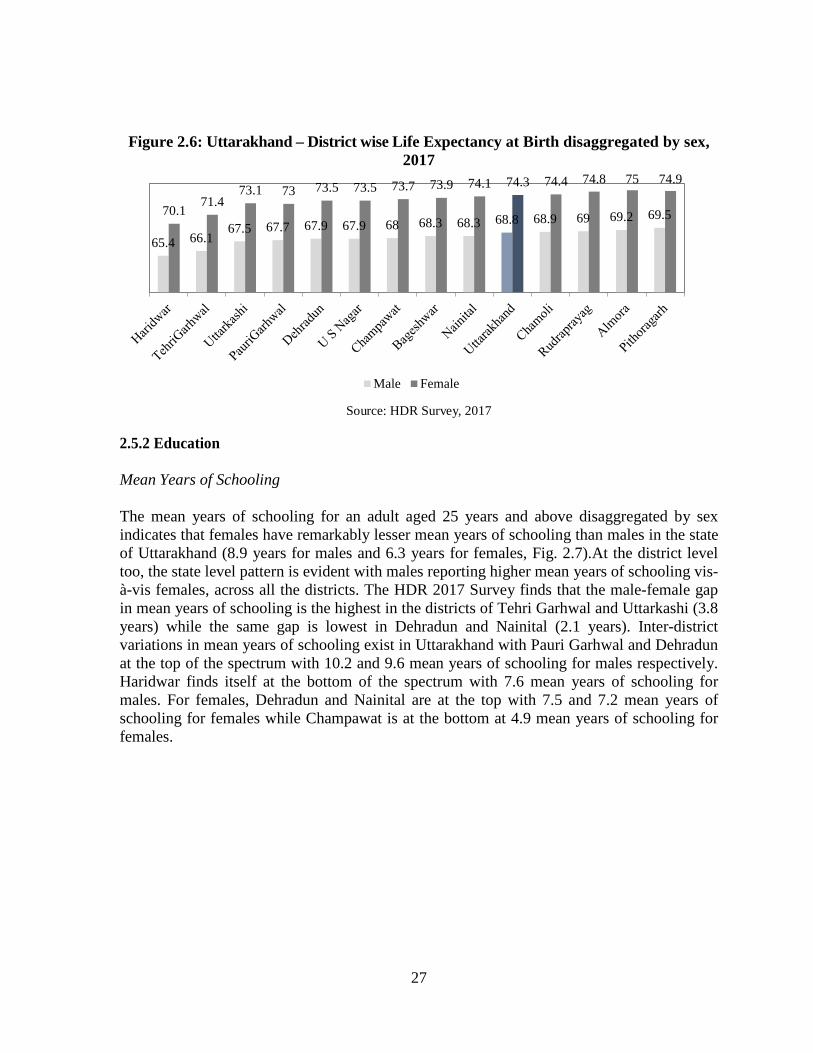
2.5.2 Education Mean Years of Schooling The mean years of schooling for an adult aged 25 years and above disaggregated by sex indicates that females have remarkably lesser mean years of schooling than males in the state of Uttarakhand (8.9 years for males and 6.3 years for females, Fig. 2.7).At the district level too, the state level pattern is evident with males reporting higher mean years of schooling vis-à-vis females, across all the districts. The HDR 2017 Survey finds that the male-female gap in mean years of schooling is the highest in the districts of Tehri Garhwal and Uttarkashi (3.8 years) while the same gap is lowest in Dehradun and Nainital (2.1 years). Inter-district variations in mean years of schooling exist in Uttarakhand with Pauri Garhwal and Dehradun at the top of the spectrum with 10.2 and 9.6 mean years of schooling for males respectively. Haridwar finds itself at the bottom of the spectrum with 7.6 mean years of schooling for males. For females, Dehradun and Nainital are at the top with 7.5 and 7.2 mean years of schooling for females while Champawat is at the bottom at 4.9 mean years of schooling for females.
65.4 66.1 67.5 67.7 67.9 67.9 68 68.3 68.3 68.8 68.9 69 69.2 69.5 70.1
71.4 73.1 73 73.5 73.5 73.7 73.9 74.1 74.3 74.4 74.8 75 74.9
Male Female
28
Figure 2.7: Uttarakhand: District Level Mean Years of Schooling by Sex
Source: HDR Survey
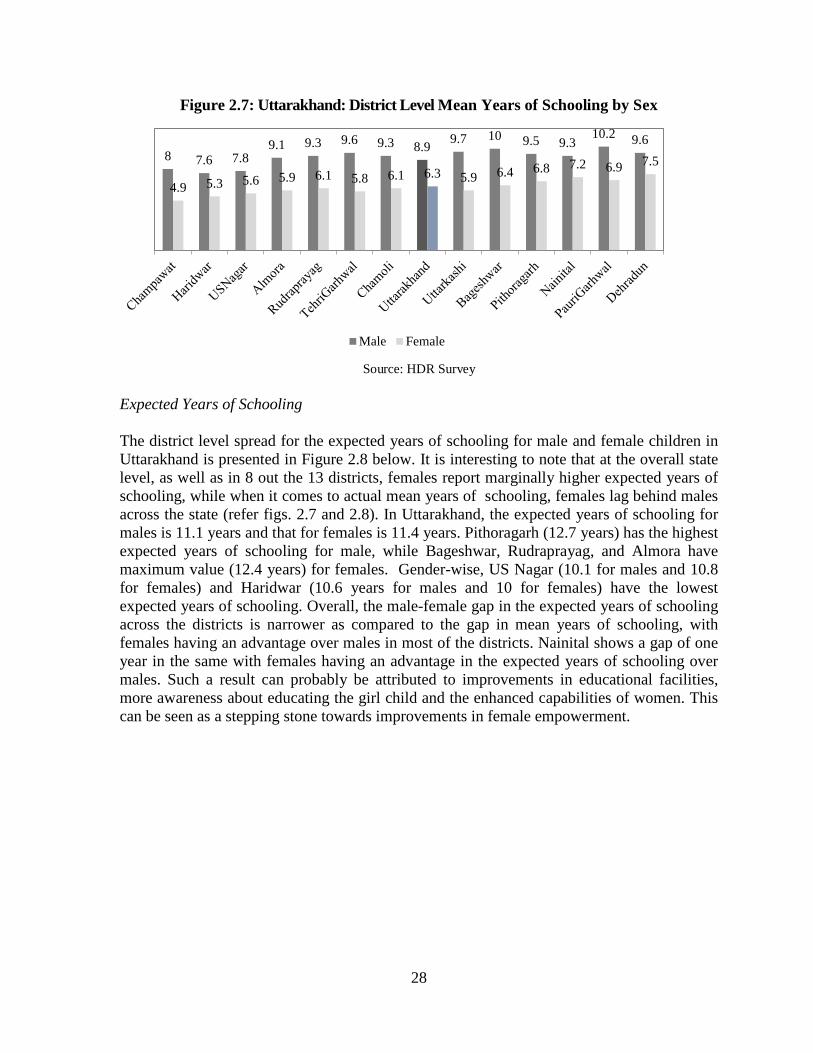
Expected Years of Schooling The district level spread for the expected years of schooling for male and female children in Uttarakhand is presented in Figure 2.8 below. It is interesting to note that at the overall state level, as well as in 8 out the 13 districts, females report marginally higher expected years of schooling, while when it comes to actual mean years of schooling, females lag behind males across the state (refer figs. 2.7 and 2.8). In Uttarakhand, the expected years of schooling for males is 11.1 years and that for females is 11.4 years. Pithoragarh (12.7 years) has the highest expected years of schooling for male, while Bageshwar, Rudraprayag, and Almora have maximum value (12.4 years) for females. Gender-wise, US Nagar (10.1 for males and 10.8 for females) and Haridwar (10.6 years for males and 10 for females) have the lowest expected years of schooling. Overall, the male-female gap in the expected years of schooling across the districts is narrower as compared to the gap in mean years of schooling, with females having an advantage over males in most of the districts. Nainital shows a gap of one year in the same with females having an advantage in the expected years of schooling over males. Such a result can probably be attributed to improvements in educational facilities, more awareness about educating the girl child and the enhanced capabilities of women. This can be seen as a stepping stone towards improvements in female empowerment.
8 7.6 7.8 9.1 9.3 9.6 9.3 8.9 9.7 10 9.5 9.3
10.2 9.6
4.9 5.3 5.6 5.9 6.1 5.8 6.1 6.3 5.9 6.4 6.8 7.2 6.9 7.5
Male Female
29
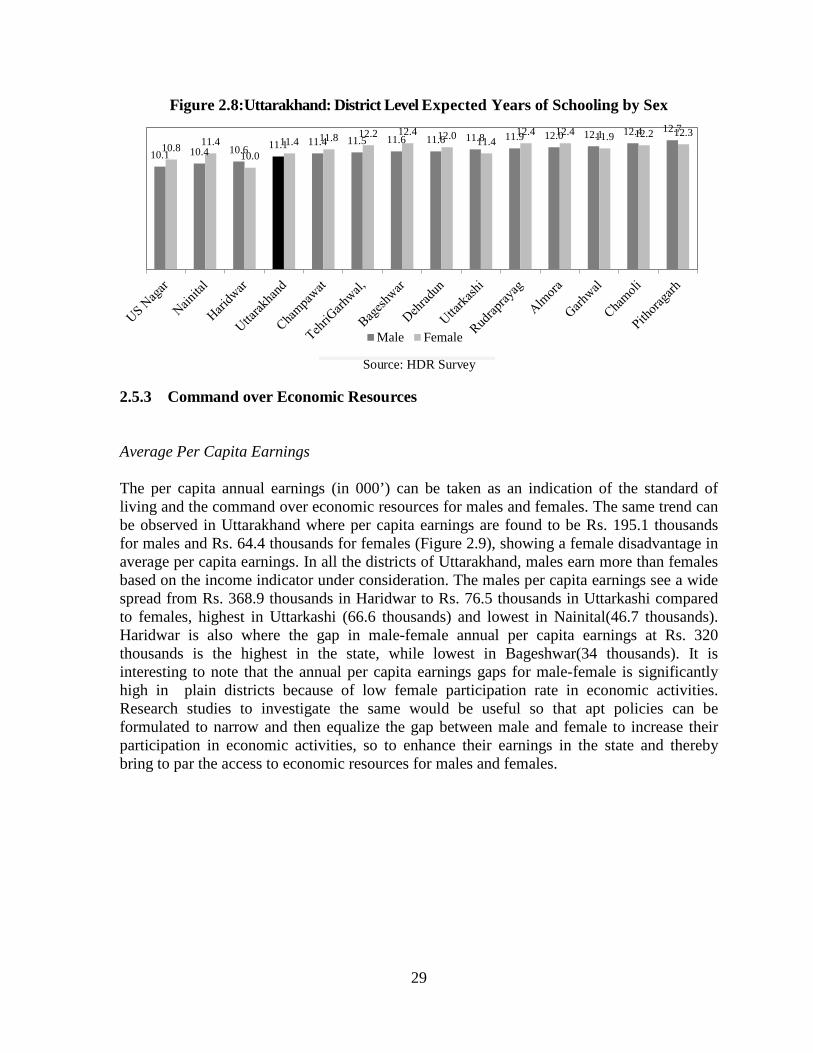
Figure 2.8:Uttarakhand: District Level Expected Years of Schooling by Sex
Source: HDR Survey
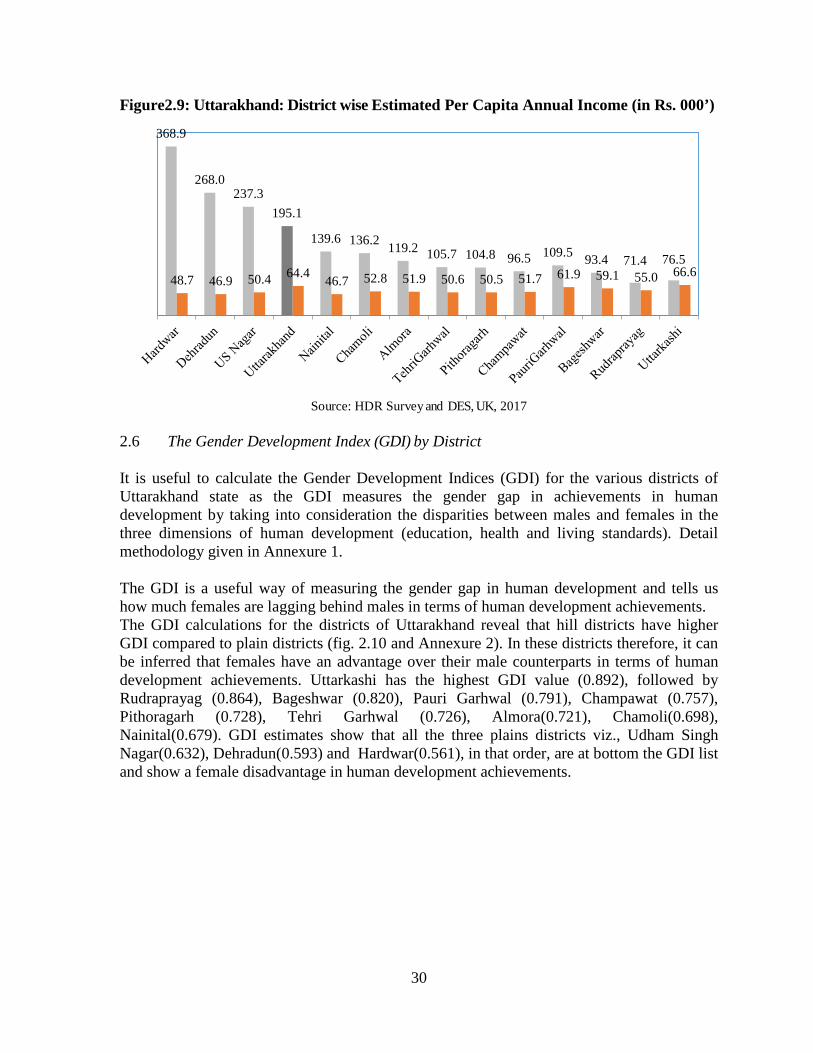
2.5.3 Command over Economic Resources Average Per Capita Earnings The per capita annual earnings (in 000’) can be taken as an indication of the standard of living and the command over economic resources for males and females. The same trend can be observed in Uttarakhand where per capita earnings are found to be Rs. 195.1 thousands for males and Rs. 64.4 thousands for females (Figure 2.9), showing a female disadvantage in average per capita earnings. In all the districts of Uttarakhand, males earn more than females based on the income indicator under consideration. The males per capita earnings see a wide spread from Rs. 368.9 thousands in Haridwar to Rs. 76.5 thousands in Uttarkashi compared to females, highest in Uttarkashi (66.6 thousands) and lowest in Nainital(46.7 thousands). Haridwar is also where the gap in male-female annual per capita earnings at Rs. 320 thousands is the highest in the state, while lowest in Bageshwar(34 thousands). It is interesting to note that the annual per capita earnings gaps for male-female is significantly high in plain districts because of low female participation rate in economic activities. Research studies to investigate the same would be useful so that apt policies can be formulated to narrow and then equalize the gap between male and female to increase their participation in economic activities, so to enhance their earnings in the state and thereby bring to par the access to economic resources for males and females.
10.1 10.4 10.6 11.1 11.4 11.5 11.6 11.6 11.8 11.9 12.0 12.1 12.4 12.7
10.8 11.4 10.0
11.4 11.8 12.2 12.4 12.0 11.4 12.4 12.4 11.9 12.2 12.3
Male Female
30
Figure2.9: Uttarakhand: District wise Estimated Per Capita Annual Income (in Rs. 000’)
Source: HDR Survey and DES, UK, 2017
2.6 The Gender Development Index (GDI) by District It is useful to calculate the Gender Development Indices (GDI) for the various districts of Uttarakhand state as the GDI measures the gender gap in achievements in human development by taking into consideration the disparities between males and females in the three dimensions of human development (education, health and living standards). Detail methodology given in Annexure 1. The GDI is a useful way of measuring the gender gap in human development and tells us how much females are lagging behind males in terms of human development achievements. The GDI calculations for the districts of Uttarakhand reveal that hill districts have higher GDI compared to plain districts (fig. 2.10 and Annexure 2). In these districts therefore, it can be inferred that females have an advantage over their male counterparts in terms of human development achievements. Uttarkashi has the highest GDI value (0.892), followed by Rudraprayag (0.864), Bageshwar (0.820), Pauri Garhwal (0.791), Champawat (0.757), Pithoragarh (0.728), Tehri Garhwal (0.726), Almora(0.721), Chamoli(0.698), Nainital(0.679). GDI estimates show that all the three plains districts viz., Udham Singh Nagar(0.632), Dehradun(0.593) and Hardwar(0.561), in that order, are at bottom the GDI list and show a female disadvantage in human development achievements.
368.9
268.0 237.3
195.1
139.6 136.2 119.2 105.7 104.8 96.5 109.5 93.4 71.4 76.5 48.7 46.9 50.4 64.4 46.7 52.8 51.9 50.6 50.5 51.7 61.9 59.1 55.0 66.6
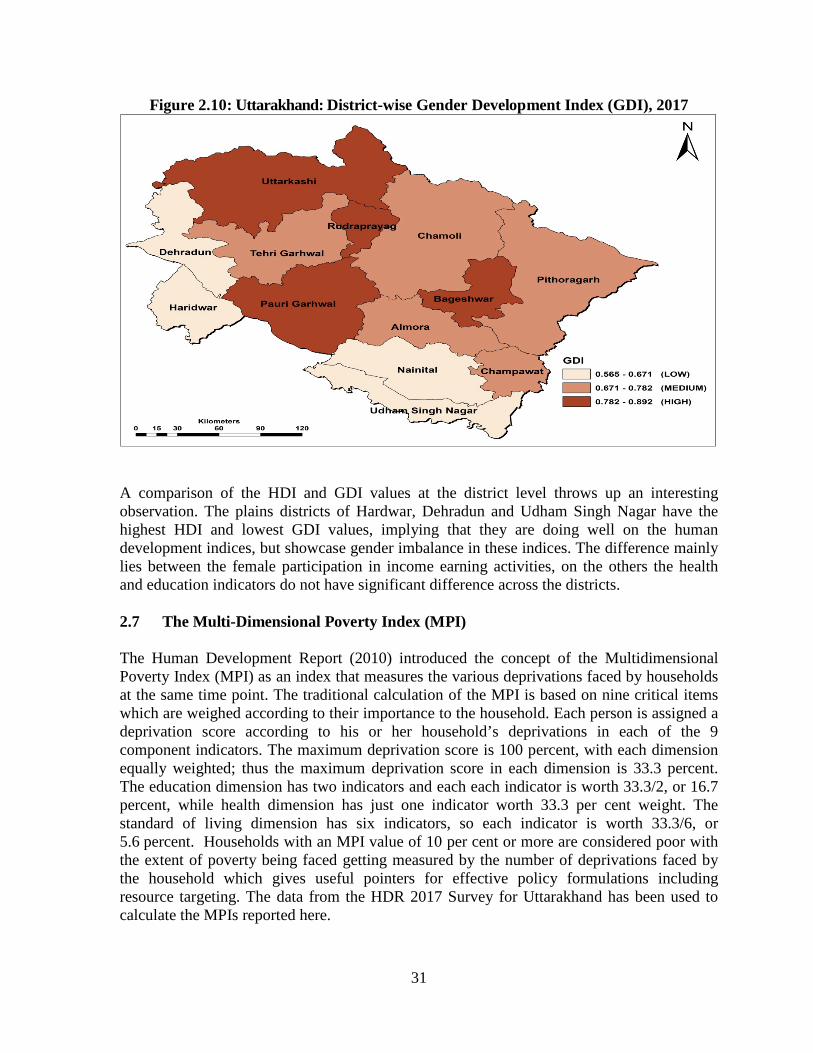
31
Figure 2.10: Uttarakhand: District-wise Gender Development Index (GDI), 2017
A comparison of the HDI and GDI values at the district level throws up an interesting observation. The plains districts of Hardwar, Dehradun and Udham Singh Nagar have the highest HDI and lowest GDI values, implying that they are doing well on the human development indices, but showcase gender imbalance in these indices. The difference mainly lies between the female participation in income earning activities, on the others the health and education indicators do not have significant difference across the districts. 2.7 The Multi-Dimensional Poverty Index (MPI) The Human Development Report (2010) introduced the concept of the Multidimensional Poverty Index (MPI) as an index that measures the various deprivations faced by households at the same time point. The traditional calculation of the MPI is based on nine critical items which are weighed according to their importance to the household. Each person is assigned a deprivation score according to his or her household’s deprivations in each of the 9 component indicators. The maximum deprivation score is 100 percent, with each dimension equally weighted; thus the maximum deprivation score in each dimension is 33.3 percent. The education dimension has two indicators and each each indicator is worth 33.3/2, or 16.7 percent, while health dimension has just one indicator worth 33.3 per cent weight. The standard of living dimension has six indicators, so each indicator is worth 33.3/6, or 5.6 percent. Households with an MPI value of 10 per cent or more are considered poor with the extent of poverty being faced getting measured by the number of deprivations faced by the household which gives useful pointers for effective policy formulations including resource targeting. The data from the HDR 2017 Survey for Uttarakhand has been used to calculate the MPIs reported here.
32
2.7.1 The Indicators Health District level health indicator used for calculations of the Health dimension as a component of the MPI is presented in Table 2.1 below. The health dimension as per UNDP (2016) includes child mortality rate, underweight and stunting rates. However, the HDR survey due to data limitations on child mortality–(child had died in the household within five years prior to the survey) of low frequency and nutrition - body mass index (underweight) which did not covered in the survey. Hence, we have used a proxy variable for health—households having no access to institutional birth to capture the health dimension across the districts from the HDR survey, 2017. In terms of percentage of households having no access to intuitional delivery is more than 30 per cent in hilly districts of Chamoli (38.7 per cent), Pithoragarh(32.4 per cent), Champawat(32.1 per cent) and Tehri Garhwal(28.7 per cent), while relatively less in Hardwar(18.3 per cent), Udham Singh Nagar(11.9 per cent), Nainital (15 per cent), and Dehradun (15.8 per cent). Education The education indicators used for constructing the Education Index for the MPI are given in Table 2.1 below. The survey collected data on school attainment by looking at whether at least six years of schooling had been completed by the members of the survey households. This was measured by collecting data on households where no household member had completed a minimum of six years of schooling. The data thus collected was aggregated to arrive at the proportion of households with no members having completed six years of schooling. In this dimension, Dehradun and Haridwar district fares very well with only 3.4 percent of households where no members have completed six years of schooling. US Nagar (7.5 per cent) has a higher percentage of households where no members have completed six years of schooling. Another indicator used for education is school attendance, where whether a school-age child (upto grade 8) is not attending school. US Nagar again had the highest percentage of children not enrolled in school and Dehradun has the lowest. Education index was lowest for Dehradun, indicating lower deprivation, whereas US Nagar had the highest index, which means there is more extent of deprivation in education attainment. Standard of Living Six standard of living indicators for the households were used to arrive at the standard of living index, the third component of the MPI. The district wise data along with the index is given in Table 2.1 below. The standard of living of the households was measured by the six indicators. Having a home with dirt, sand or dung floor--the home is Kutcha and is a mud house/wooden house/bamboo house or made of some other material. While the state average shows close to
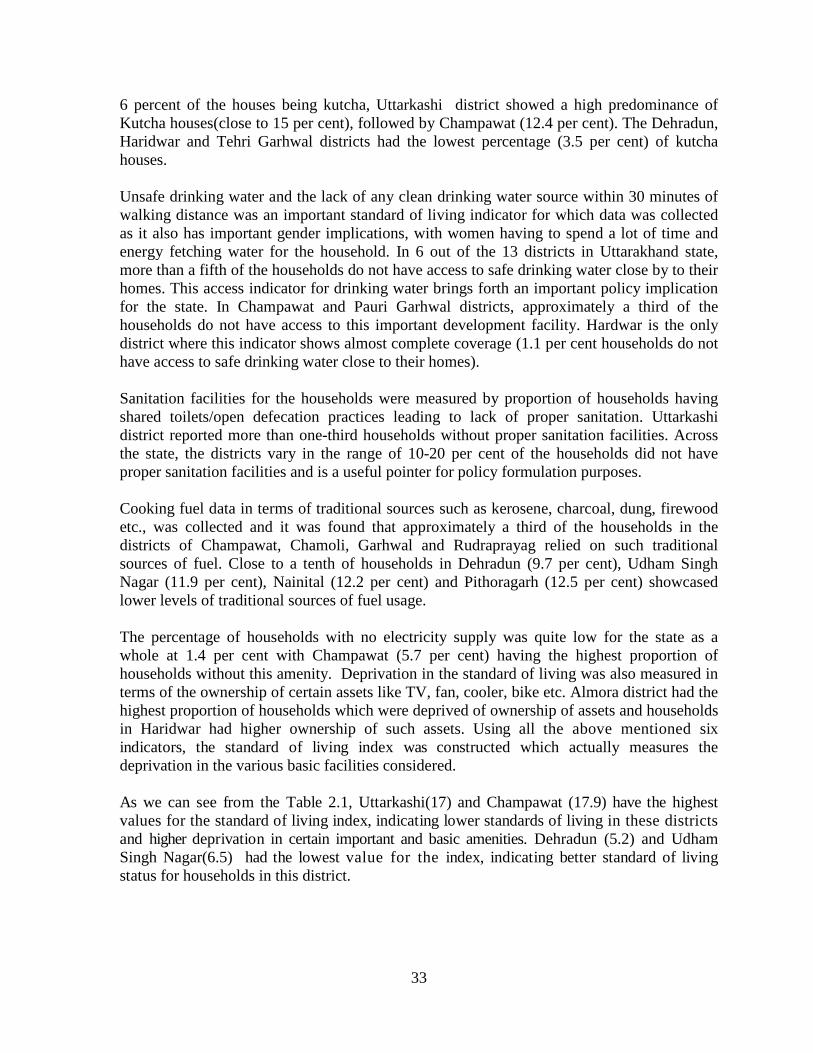
33
6 percent of the houses being kutcha, Uttarkashi district showed a high predominance of Kutcha houses(close to 15 per cent), followed by Champawat (12.4 per cent). The Dehradun, Haridwar and Tehri Garhwal districts had the lowest percentage (3.5 per cent) of kutcha houses. Unsafe drinking water and the lack of any clean drinking water source within 30 minutes of walking distance was an important standard of living indicator for which data was collected as it also has important gender implications, with women having to spend a lot of time and energy fetching water for the household. In 6 out of the 13 districts in Uttarakhand state, more than a fifth of the households do not have access to safe drinking water close by to their homes. This access indicator for drinking water brings forth an important policy implication for the state. In Champawat and Pauri Garhwal districts, approximately a third of the households do not have access to this important development facility. Hardwar is the only district where this indicator shows almost complete coverage (1.1 per cent households do not have access to safe drinking water close to their homes). Sanitation facilities for the households were measured by proportion of households having shared toilets/open defecation practices leading to lack of proper sanitation. Uttarkashi district reported more than one-third households without proper sanitation facilities. Across the state, the districts vary in the range of 10-20 per cent of the households did not have proper sanitation facilities and is a useful pointer for policy formulation purposes. Cooking fuel data in terms of traditional sources such as kerosene, charcoal, dung, firewood etc., was collected and it was found that approximately a third of the households in the districts of Champawat, Chamoli, Garhwal and Rudraprayag relied on such traditional sources of fuel. Close to a tenth of households in Dehradun (9.7 per cent), Udham Singh Nagar (11.9 per cent), Nainital (12.2 per cent) and Pithoragarh (12.5 per cent) showcased lower levels of traditional sources of fuel usage. The percentage of households with no electricity supply was quite low for the state as a whole at 1.4 per cent with Champawat (5.7 per cent) having the highest proportion of households without this amenity. Deprivation in the standard of living was also measured in terms of the ownership of certain assets like TV, fan, cooler, bike etc. Almora district had the highest proportion of households which were deprived of ownership of assets and households in Haridwar had higher ownership of such assets. Using all the above mentioned six indicators, the standard of living index was constructed which actually measures the deprivation in the various basic facilities considered. As we can see from the Table 2.1, Uttarkashi(17) and Champawat (17.9) have the highest values for the standard of living index, indicating lower standards of living in these districts and higher deprivation in certain important and basic amenities. Dehradun (5.2) and Udham Singh Nagar(6.5) had the lowest value for the index, indicating better standard of living status for households in this district.
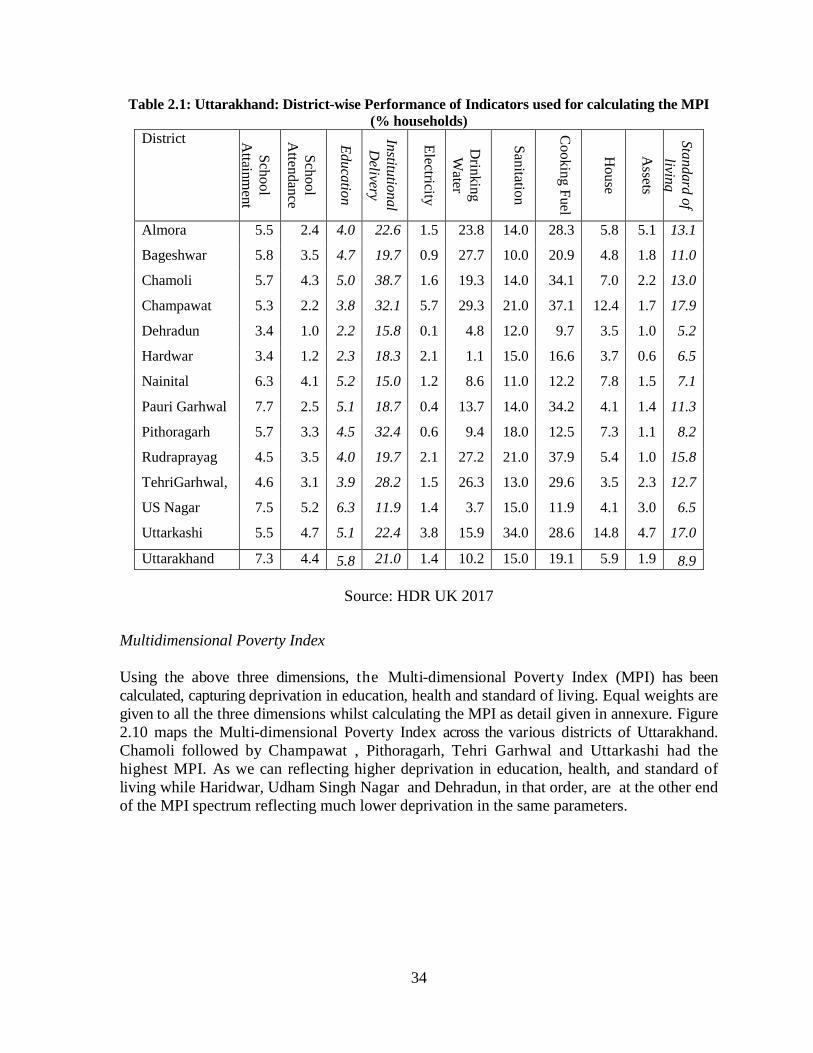
34
Table 2.1: Uttarakhand: District-wise Performance of Indicators used for calculating the MPI (% households)
District
School A
ttainment
School A
ttendance
Education
Institutional D
elivery
Electricity
Drinking W
ater
Sanitation
Cooking Fuel
House
Assets
Standard of living
Almora 5.5 2.4 4.0 22.6 1.5 23.8 14.0 28.3 5.8 5.1 13.1
Bageshwar 5.8 3.5 4.7 19.7 0.9 27.7 10.0 20.9 4.8 1.8 11.0
Chamoli 5.7 4.3 5.0 38.7 1.6 19.3 14.0 34.1 7.0 2.2 13.0
Champawat 5.3 2.2 3.8 32.1 5.7 29.3 21.0 37.1 12.4 1.7 17.9
Dehradun 3.4 1.0 2.2 15.8 0.1 4.8 12.0 9.7 3.5 1.0 5.2
Hardwar 3.4 1.2 2.3 18.3 2.1 1.1 15.0 16.6 3.7 0.6 6.5
Nainital 6.3 4.1 5.2 15.0 1.2 8.6 11.0 12.2 7.8 1.5 7.1
Pauri Garhwal 7.7 2.5 5.1 18.7 0.4 13.7 14.0 34.2 4.1 1.4 11.3
Pithoragarh 5.7 3.3 4.5 32.4 0.6 9.4 18.0 12.5 7.3 1.1 8.2
Rudraprayag 4.5 3.5 4.0 19.7 2.1 27.2 21.0 37.9 5.4 1.0 15.8
TehriGarhwal, 4.6 3.1 3.9 28.2 1.5 26.3 13.0 29.6 3.5 2.3 12.7
US Nagar 7.5 5.2 6.3 11.9 1.4 3.7 15.0 11.9 4.1 3.0 6.5
Uttarkashi 5.5 4.7 5.1 22.4 3.8 15.9 34.0 28.6 14.8 4.7 17.0
Uttarakhand 7.3 4.4 5.8 21.0 1.4 10.2 15.0 19.1 5.9 1.9 8.9
Source: HDR UK 2017
Multidimensional Poverty Index Using the above three dimensions, the Multi-dimensional Poverty Index (MPI) has been calculated, capturing deprivation in education, health and standard of living. Equal weights are given to all the three dimensions whilst calculating the MPI as detail given in annexure. Figure 2.10 maps the Multi-dimensional Poverty Index across the various districts of Uttarakhand. Chamoli followed by Champawat , Pithoragarh, Tehri Garhwal and Uttarkashi had the highest MPI. As we can reflecting higher deprivation in education, health, and standard of living while Haridwar, Udham Singh Nagar and Dehradun, in that order, are at the other end of the MPI spectrum reflecting much lower deprivation in the same parameters.
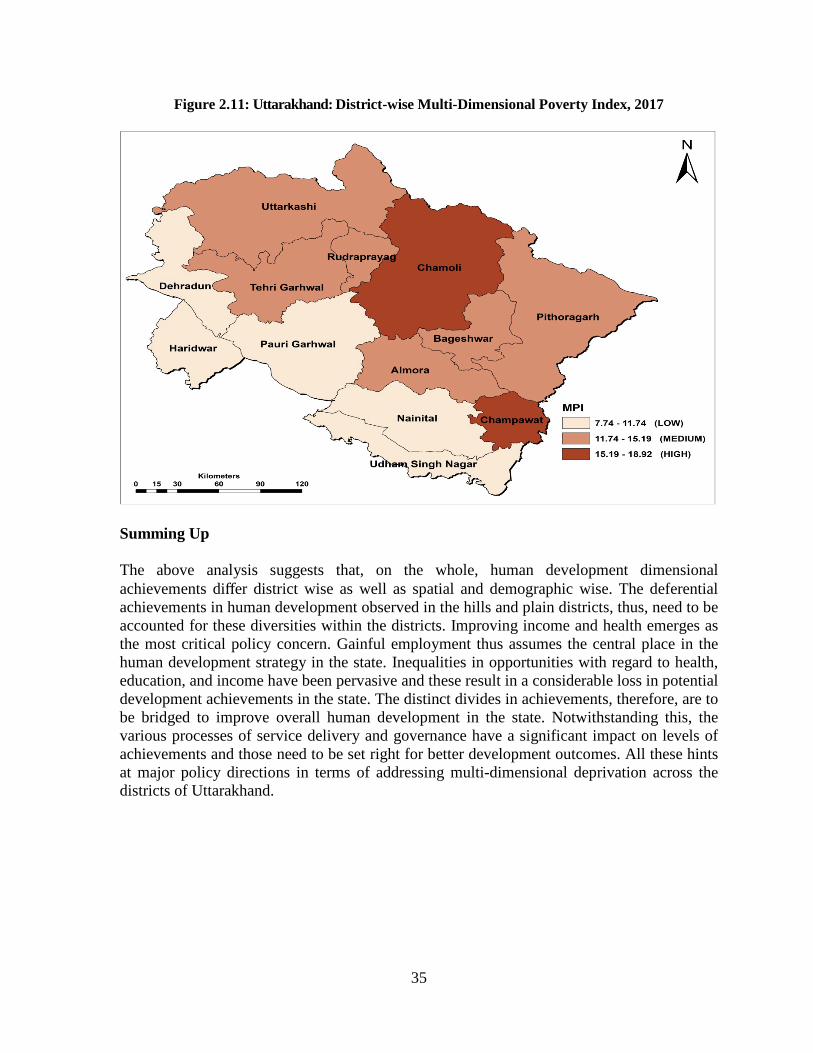
35
Figure 2.11: Uttarakhand: District-wise Multi-Dimensional Poverty Index, 2017
Summing Up The above analysis suggests that, on the whole, human development dimensional achievements differ district wise as well as spatial and demographic wise. The deferential achievements in human development observed in the hills and plain districts, thus, need to be accounted for these diversities within the districts. Improving income and health emerges as the most critical policy concern. Gainful employment thus assumes the central place in the human development strategy in the state. Inequalities in opportunities with regard to health, education, and income have been pervasive and these result in a considerable loss in potential development achievements in the state. The distinct divides in achievements, therefore, are to be bridged to improve overall human development in the state. Notwithstanding this, the various processes of service delivery and governance have a significant impact on levels of achievements and those need to be set right for better development outcomes. All these hints at major policy directions in terms of addressing multi-dimensional deprivation across the districts of Uttarakhand.
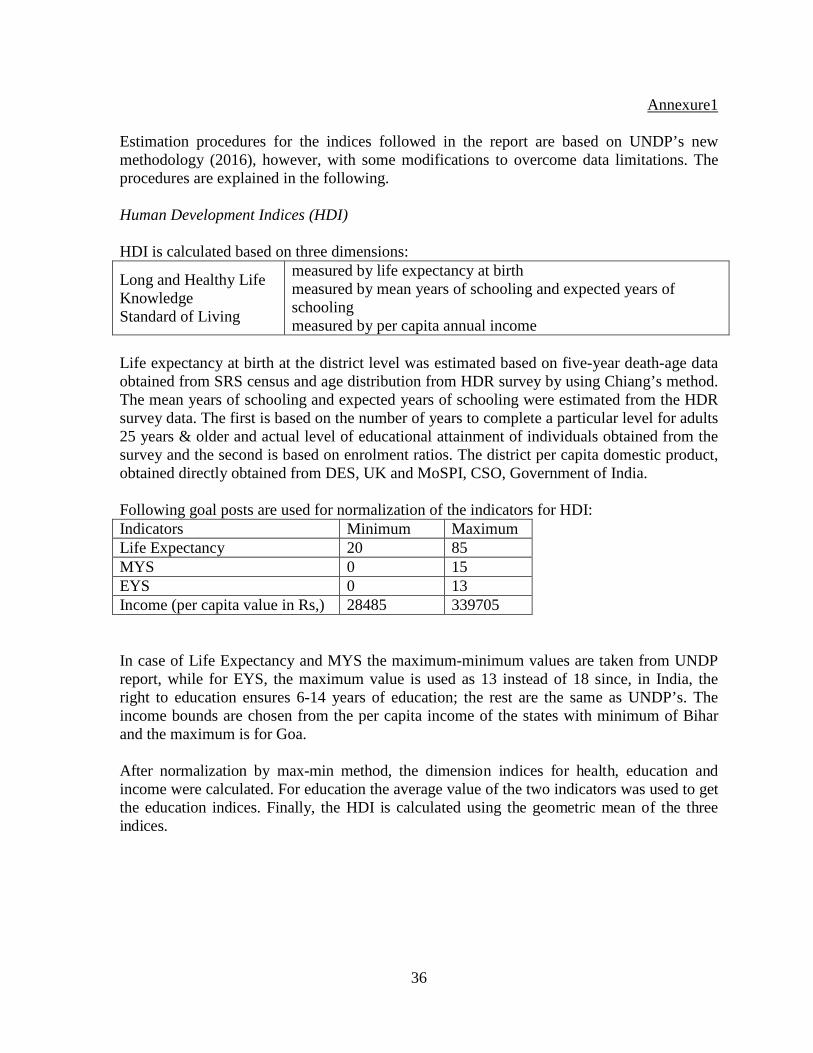
36
Annexure1 Estimation procedures for the indices followed in the report are based on UNDP’s new methodology (2016), however, with some modifications to overcome data limitations. The procedures are explained in the following. Human Development Indices (HDI) HDI is calculated based on three dimensions:
Long and Healthy Life Knowledge Standard of Living
measured by life expectancy at birth measured by mean years of schooling and expected years of schooling measured by per capita annual income
Life expectancy at birth at the district level was estimated based on five-year death-age data obtained from SRS census and age distribution from HDR survey by using Chiang’s method. The mean years of schooling and expected years of schooling were estimated from the HDR survey data. The first is based on the number of years to complete a particular level for adults 25 years & older and actual level of educational attainment of individuals obtained from the survey and the second is based on enrolment ratios. The district per capita domestic product, obtained directly obtained from DES, UK and MoSPI, CSO, Government of India. Following goal posts are used for normalization of the indicators for HDI: Indicators Minimum Maximum Life Expectancy 20 85 MYS 0 15 EYS 0 13 Income (per capita value in Rs,) 28485 339705 In case of Life Expectancy and MYS the maximum-minimum values are taken from UNDP report, while for EYS, the maximum value is used as 13 instead of 18 since, in India, the right to education ensures 6-14 years of education; the rest are the same as UNDP’s. The income bounds are chosen from the per capita income of the states with minimum of Bihar and the maximum is for Goa. After normalization by max-min method, the dimension indices for health, education and income were calculated. For education the average value of the two indicators was used to get the education indices. Finally, the HDI is calculated using the geometric mean of the three indices.
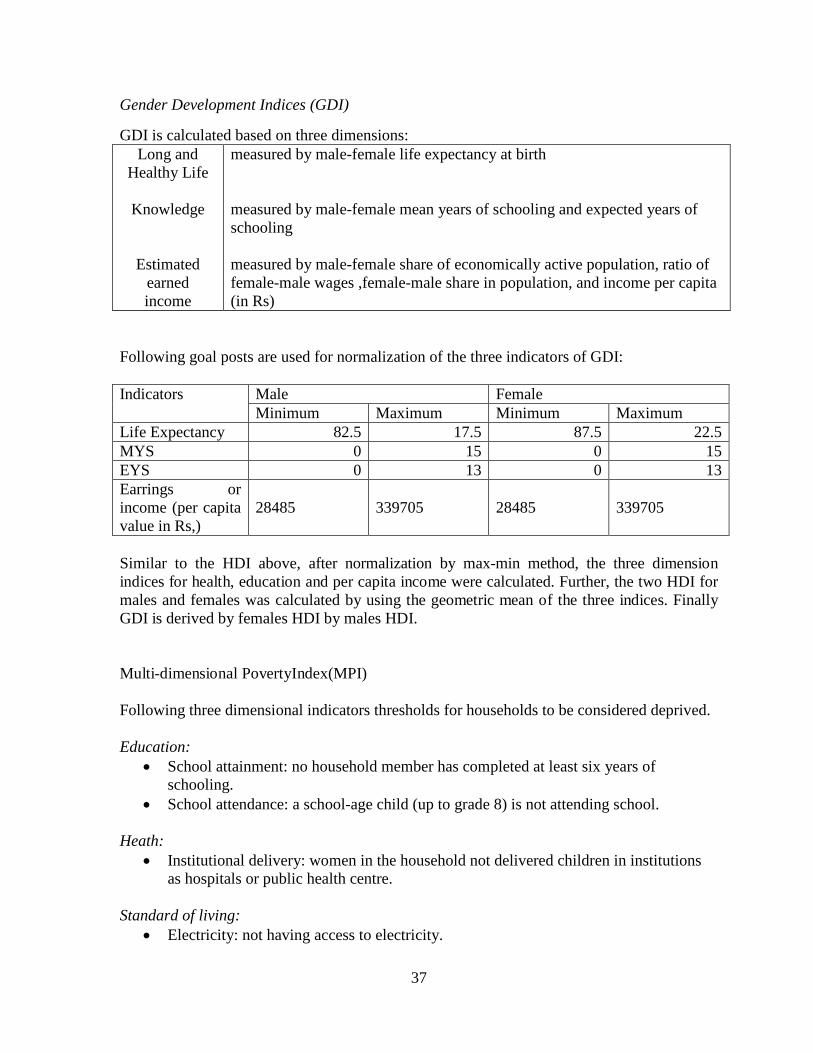
37
Gender Development Indices (GDI)
GDI is calculated based on three dimensions: Long and
Healthy Life
Knowledge
Estimated earned income
measured by male-female life expectancy at birth
measured by male-female mean years of schooling and expected years of schooling measured by male-female share of economically active population, ratio of female-male wages ,female-male share in population, and income per capita (in Rs)
Following goal posts are used for normalization of the three indicators of GDI: Indicators Male Female
Minimum Maximum Minimum Maximum Life Expectancy 82.5 17.5 87.5 22.5 MYS 0 15 0 15 EYS 0 13 0 13 Earrings or income (per capita value in Rs,)
28485 339705 28485 339705
Similar to the HDI above, after normalization by max-min method, the three dimension indices for health, education and per capita income were calculated. Further, the two HDI for males and females was calculated by using the geometric mean of the three indices. Finally GDI is derived by females HDI by males HDI. Multi-dimensional PovertyIndex(MPI) Following three dimensional indicators thresholds for households to be considered deprived. Education:
• School attainment: no household member has completed at least six years of schooling.
• School attendance: a school-age child (up to grade 8) is not attending school. Heath:
• Institutional delivery: women in the household not delivered children in institutions as hospitals or public health centre.
Standard of living:
• Electricity: not having access to electricity.
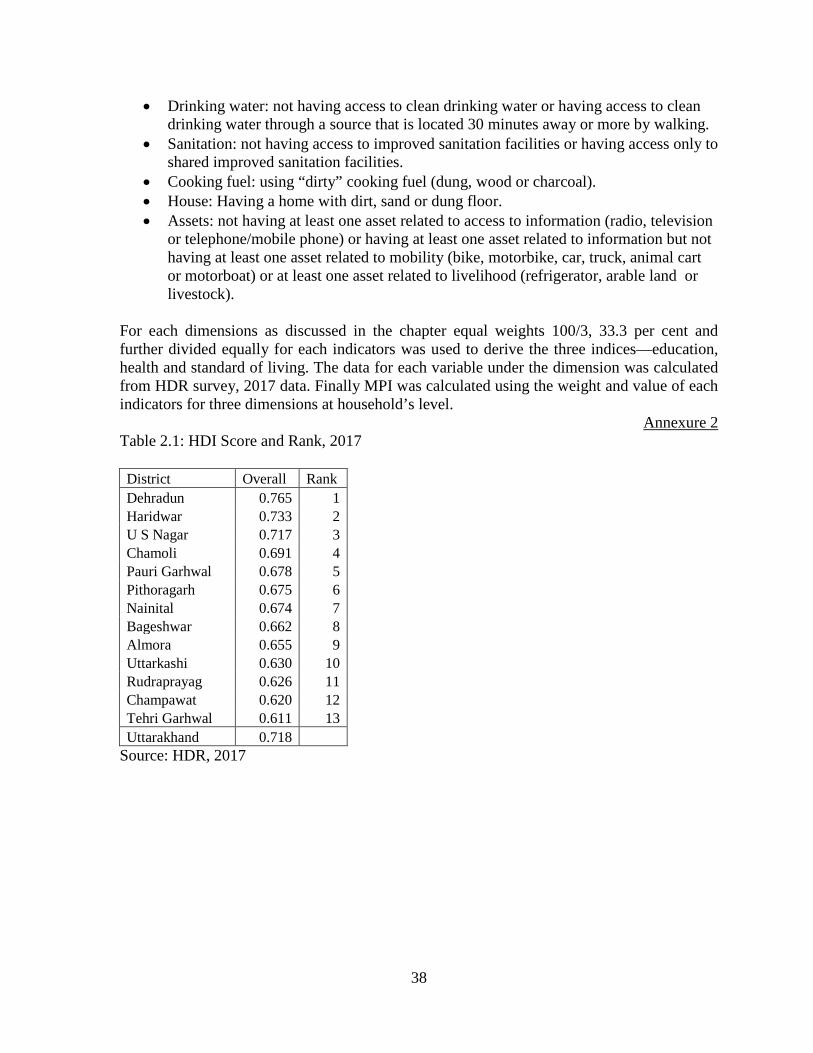
38
• Drinking water: not having access to clean drinking water or having access to clean drinking water through a source that is located 30 minutes away or more by walking.
• Sanitation: not having access to improved sanitation facilities or having access only to shared improved sanitation facilities.
• Cooking fuel: using “dirty” cooking fuel (dung, wood or charcoal). • House: Having a home with dirt, sand or dung floor. • Assets: not having at least one asset related to access to information (radio, television
or telephone/mobile phone) or having at least one asset related to information but not having at least one asset related to mobility (bike, motorbike, car, truck, animal cart or motorboat) or at least one asset related to livelihood (refrigerator, arable land or livestock).
For each dimensions as discussed in the chapter equal weights 100/3, 33.3 per cent and further divided equally for each indicators was used to derive the three indices—education, health and standard of living. The data for each variable under the dimension was calculated from HDR survey, 2017 data. Finally MPI was calculated using the weight and value of each indicators for three dimensions at household’s level.
Annexure 2 Table 2.1: HDI Score and Rank, 2017 District Overall Rank Dehradun 0.765 1 Haridwar 0.733 2 U S Nagar 0.717 3 Chamoli 0.691 4 Pauri Garhwal 0.678 5 Pithoragarh 0.675 6 Nainital 0.674 7 Bageshwar 0.662 8 Almora 0.655 9 Uttarkashi 0.630 10 Rudraprayag 0.626 11 Champawat 0.620 12 Tehri Garhwal 0.611 13 Uttarakhand 0.718
Source: HDR, 2017
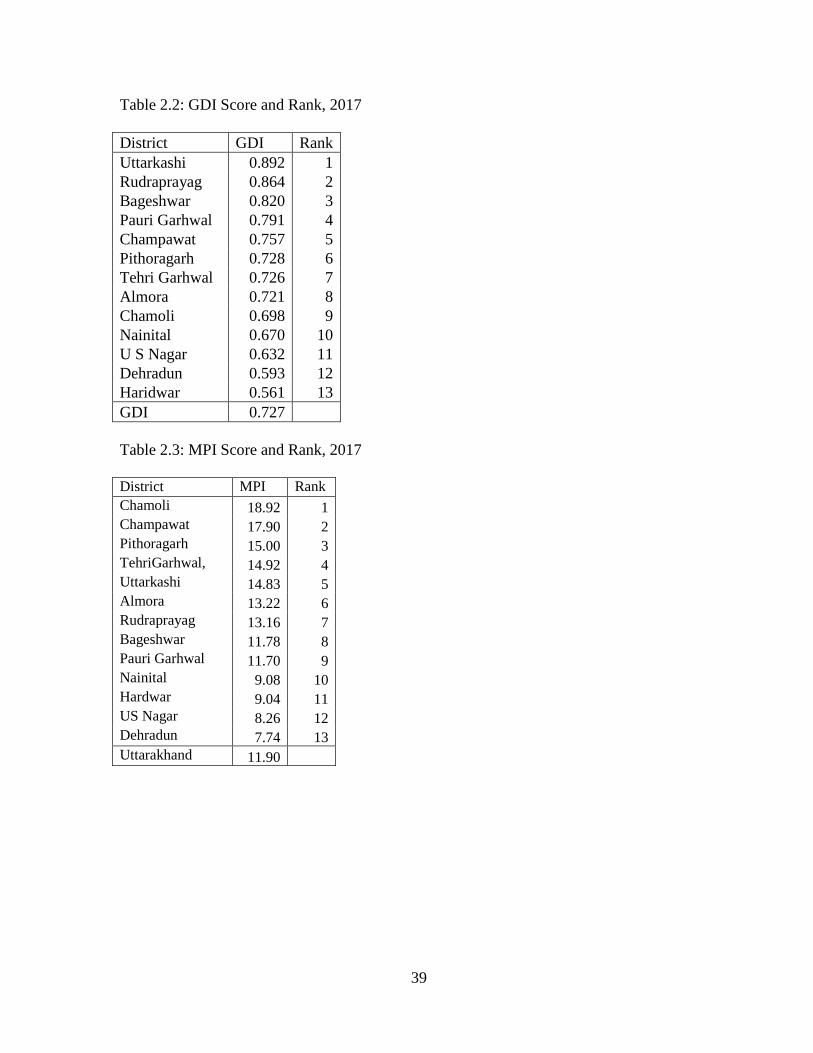
39
Table 2.2: GDI Score and Rank, 2017 District GDI Rank Uttarkashi 0.892 1 Rudraprayag 0.864 2 Bageshwar 0.820 3 Pauri Garhwal 0.791 4 Champawat 0.757 5 Pithoragarh 0.728 6 Tehri Garhwal 0.726 7 Almora 0.721 8 Chamoli 0.698 9 Nainital 0.670 10 U S Nagar 0.632 11 Dehradun 0.593 12 Haridwar 0.561 13 GDI 0.727
Table 2.3: MPI Score and Rank, 2017 District MPI Rank Chamoli 18.92 1 Champawat 17.90 2 Pithoragarh 15.00 3 TehriGarhwal, 14.92 4 Uttarkashi 14.83 5 Almora 13.22 6 Rudraprayag 13.16 7 Bageshwar 11.78 8 Pauri Garhwal 11.70 9 Nainital 9.08 10 Hardwar 9.04 11 US Nagar 8.26 12 Dehradun 7.74 13 Uttarakhand 11.90
40
CHAPTER 3: PROMOTING LIVELIHOODS – INCOME AND EMPLOYMENT
3.1. Introduction The aim of economic development is to improve the quality of life of people by providing them with basic necessities coupled with adequate livelihood opportunities. The provisioning of as well as access to livelihood opportunities is fundamental for addressing and alleviating issues such as poverty, vulnerability, and inequality. It needs to be added that having mere access to livelihood opportunities is not enough, as it is the nature of opportunities and the r e tu rns f rom these oppor tun i t i e s t ha t gain importance in social development. Thus, the creation of adequate livelihood opportunities becomes a critical policy intervention for catering to the needs of an ever-increasing, job-seeking population. The state of Uttarakhand is predominantly a mountainous region, comprising 13 districts of which 10 are mountainous and 3 are plains. The mountainous regions occupy 85 percent of the state’s geographical area and 48 percent of the state’s population resides in them. Of this population, a large majority (85 percent) lives in the rural areas. Therefore, when undertaking any study of the socio-economic characteristics of Uttarakhand, the existence of such a geographical population spread needs to be kept in mind. Development research on Uttarakhand over the years shows evidence of a widening gap between residents in plain and hill districts of the state in terms of livelihood opportunities and poverty (Suryanarayana and Mamgain, 2017). The plain districts namely Dehradun, Udham Singh Nagar and Haridwar are relatively better off, as compared to rest of the hill districts (Awasthi, 2012; Mamgain, 2004). A majority of the people in rural parts of mountain areas depend on subsistence agriculture for their livelihoods. It has been found that the unique physical 'specificities' of these areas which includes inaccessibility (lack of access to infrastructure, markets, technologies, and information), fragility, and marginality have mainly contributed to their under- development (Papola, 2002). Further the limited fragmented, scattered and rain-fed land available for cultivation results in poor output or income. Hence, one of the main issues of concern for the state is in addressing the development disparities that exits between the hill and plain districts. In this context, we present in this chapter the status of the Uttarakhand economy with focus on employment and livelihoods of the populace, the analysis laying emphasis on disaggregation at the rural-urban, hills-plains and male-female levels using NSS data for two rounds, 61st (2004-05) and 68th (2011-12) as well as the HDR 2017 Survey data. Patterns and trends in GSDP, GSDP per capita, employment- unemployment, structural composition of economy and employment, status of employment, occupational distribution, income/wages, poverty, and inequality. The importance and effectiveness of employment-livelihood related government schemes and regional placement of industries is studied with the aim of
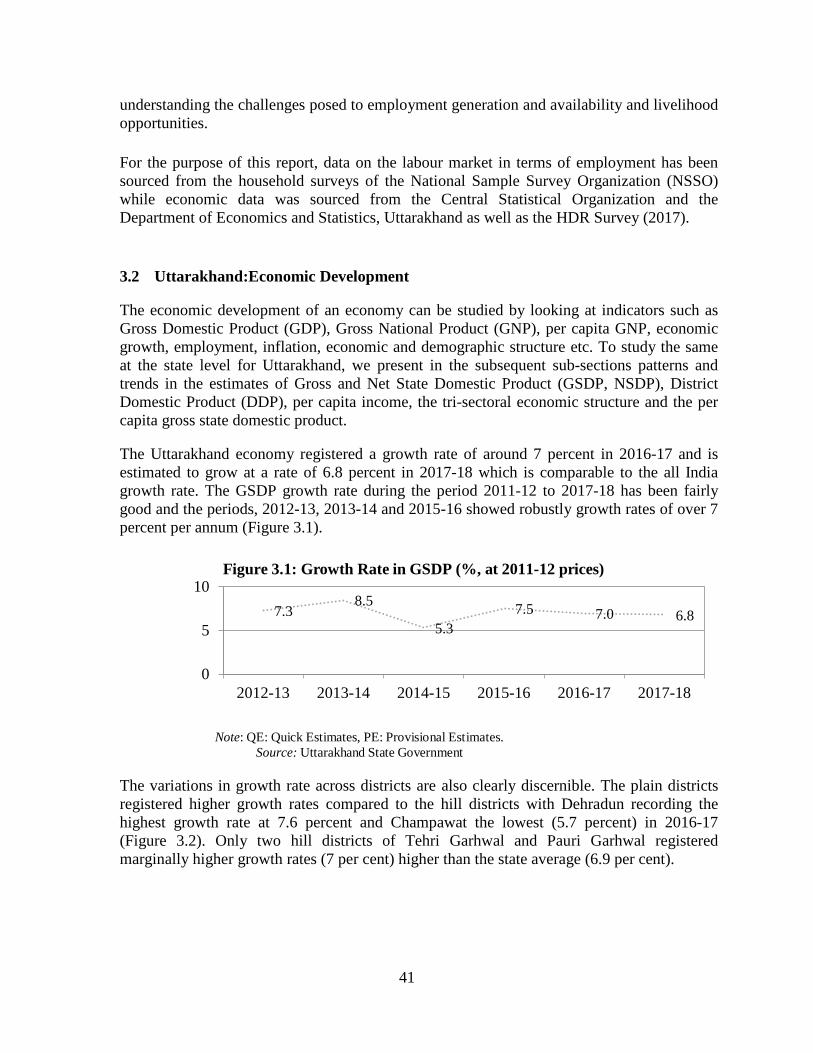
41
understanding the challenges posed to employment generation and availability and livelihood opportunities. For the purpose of this report, data on the labour market in terms of employment has been sourced from the household surveys of the National Sample Survey Organization (NSSO) while economic data was sourced from the Central Statistical Organization and the Department of Economics and Statistics, Uttarakhand as well as the HDR Survey (2017). 3.2 Uttarakhand:Economic Development The economic development of an economy can be studied by looking at indicators such as Gross Domestic Product (GDP), Gross National Product (GNP), per capita GNP, economic growth, employment, inflation, economic and demographic structure etc. To study the same at the state level for Uttarakhand, we present in the subsequent sub-sections patterns and trends in the estimates of Gross and Net State Domestic Product (GSDP, NSDP), District Domestic Product (DDP), per capita income, the tri-sectoral economic structure and the per capita gross state domestic product. The Uttarakhand economy registered a growth rate of around 7 percent in 2016-17 and is estimated to grow at a rate of 6.8 percent in 2017-18 which is comparable to the all India growth rate. The GSDP growth rate during the period 2011-12 to 2017-18 has been fairly good and the periods, 2012-13, 2013-14 and 2015-16 showed robustly growth rates of over 7 percent per annum (Figure 3.1).
Figure 3.1: Growth Rate in GSDP (%, at 2011-12 prices)
Note: QE: Quick Estimates, PE: Provisional Estimates. Source: Uttarakhand State Government
The variations in growth rate across districts are also clearly discernible. The plain districts registered higher growth rates compared to the hill districts with Dehradun recording the highest growth rate at 7.6 percent and Champawat the lowest (5.7 percent) in 2016-17 (Figure 3.2). Only two hill districts of Tehri Garhwal and Pauri Garhwal registered marginally higher growth rates (7 per cent) higher than the state average (6.9 per cent).
7.3 8.5
5.3 7.5 7.0 6.8
0
5
10
2012-13 2013-14 2014-15 2015-16 2016-17 2017-18
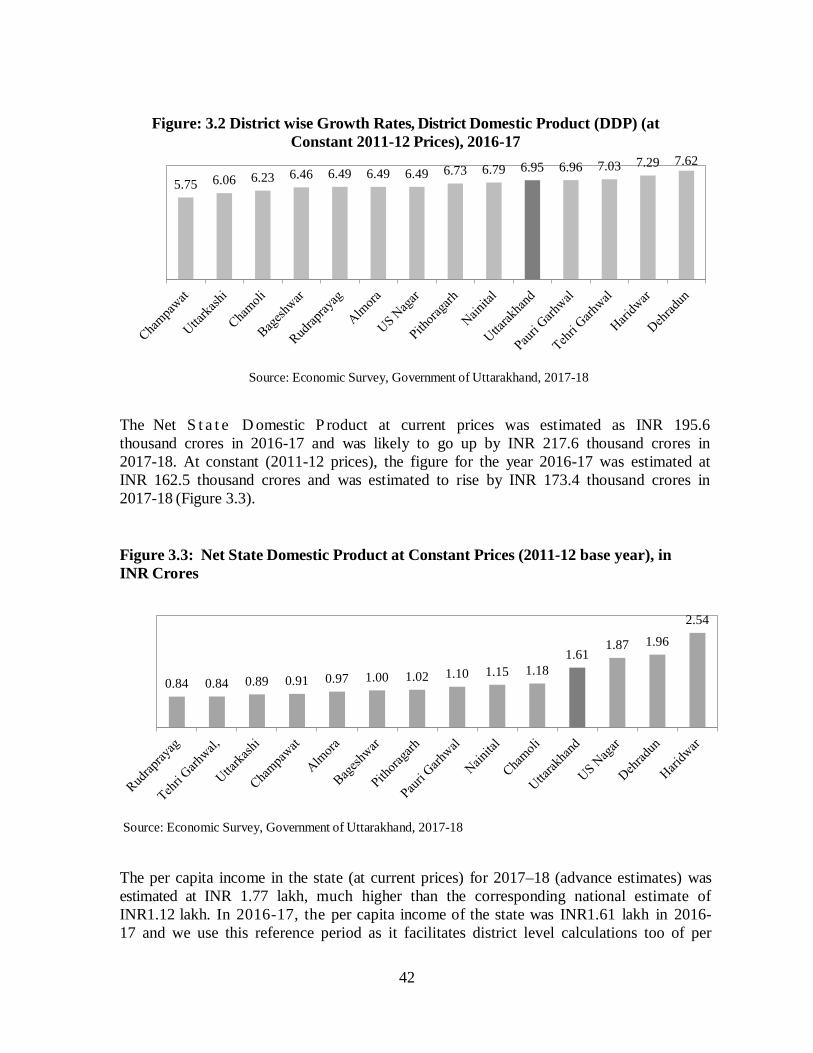
42
Figure: 3.2 District wise Growth Rates, District Domestic Product (DDP) (at
Constant 2011-12 Prices), 2016-17
Source: Economic Survey, Government of Uttarakhand, 2017-18
The Net S t a t e D omestic P roduct at current prices was estimated as INR 195.6 thousand crores in 2016-17 and was likely to go up by INR 217.6 thousand crores in 2017-18. At constant (2011-12 prices), the figure for the year 2016-17 was estimated at INR 162.5 thousand crores and was estimated to rise by INR 173.4 thousand crores in 2017-18 (Figure 3.3). Figure 3.3: Net State Domestic Product at Constant Prices (2011-12 base year), in INR Crores
Source: Economic Survey, Government of Uttarakhand, 2017-18 The per capita income in the state (at current prices) for 2017–18 (advance estimates) was estimated at INR 1.77 lakh, much higher than the corresponding national estimate of INR1.12 lakh. In 2016-17, the per capita income of the state was INR1.61 lakh in 2016-17 and we use this reference period as it facilitates district level calculations too of per
5.75 6.06 6.23 6.46 6.49 6.49 6.49 6.73 6.79 6.95 6.96 7.03 7.29 7.62
0.84 0.84 0.89 0.91 0.97 1.00 1.02 1.10 1.15 1.18 1.61
1.87 1.96 2.54
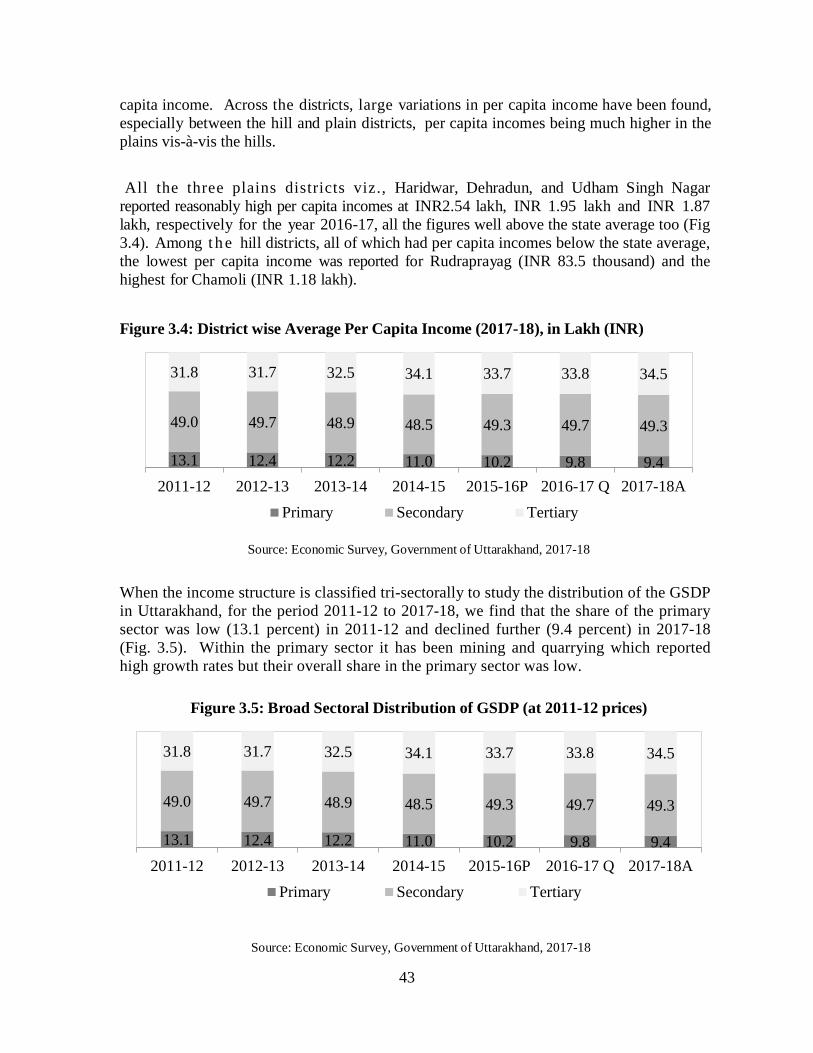
43
capita income. Across the districts, large variations in per capita income have been found, especially between the hill and plain districts, per capita incomes being much higher in the plains vis-à-vis the hills. All the three plains districts viz., Haridwar, Dehradun, and Udham Singh Nagar reported reasonably high per capita incomes at INR2.54 lakh, INR 1.95 lakh and INR 1.87 lakh, respectively for the year 2016-17, all the figures well above the state average too (Fig 3.4). Among t h e hill districts, all of which had per capita incomes below the state average, the lowest per capita income was reported for Rudraprayag (INR 83.5 thousand) and the highest for Chamoli (INR 1.18 lakh). Figure 3.4: District wise Average Per Capita Income (2017-18), in Lakh (INR)
Source: Economic Survey, Government of Uttarakhand, 2017-18
When the income structure is classified tri-sectorally to study the distribution of the GSDP in Uttarakhand, for the period 2011-12 to 2017-18, we find that the share of the primary sector was low (13.1 percent) in 2011-12 and declined further (9.4 percent) in 2017-18 (Fig. 3.5). Within the primary sector it has been mining and quarrying which reported high growth rates but their overall share in the primary sector was low.
Figure 3.5: Broad Sectoral Distribution of GSDP (at 2011-12 prices)
Source: Economic Survey, Government of Uttarakhand, 2017-18
13.1 12.4 12.2 11.0 10.2 9.8 9.4
49.0 49.7 48.9 48.5 49.3 49.7 49.3
31.8 31.7 32.5 34.1 33.7 33.8 34.5
2011-12 2012-13 2013-14 2014-15 2015-16P 2016-17 Q 2017-18APrimary Secondary Tertiary
13.1 12.4 12.2 11.0 10.2 9.8 9.4
49.0 49.7 48.9 48.5 49.3 49.7 49.3
31.8 31.7 32.5 34.1 33.7 33.8 34.5
2011-12 2012-13 2013-14 2014-15 2015-16P 2016-17 Q 2017-18APrimary Secondary Tertiary
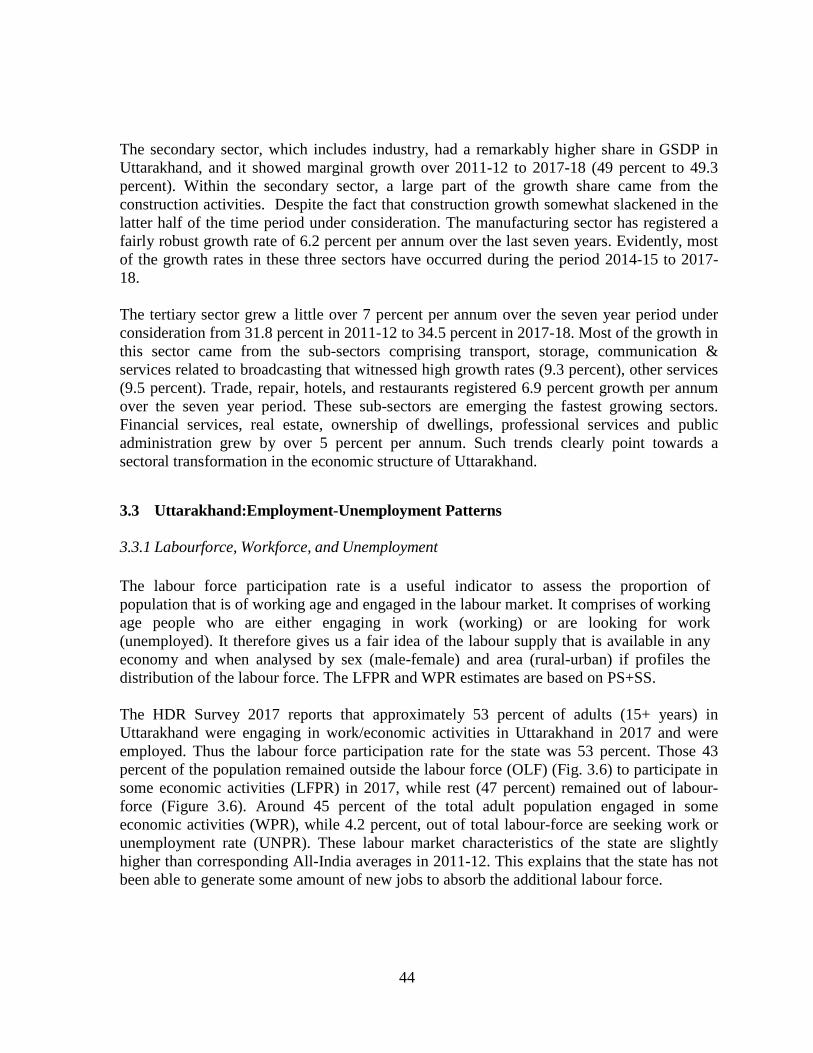
44
The secondary sector, which includes industry, had a remarkably higher share in GSDP in Uttarakhand, and it showed marginal growth over 2011-12 to 2017-18 (49 percent to 49.3 percent). Within the secondary sector, a large part of the growth share came from the construction activities. Despite the fact that construction growth somewhat slackened in the latter half of the time period under consideration. The manufacturing sector has registered a fairly robust growth rate of 6.2 percent per annum over the last seven years. Evidently, most of the growth rates in these three sectors have occurred during the period 2014-15 to 2017-18. The tertiary sector grew a little over 7 percent per annum over the seven year period under consideration from 31.8 percent in 2011-12 to 34.5 percent in 2017-18. Most of the growth in this sector came from the sub-sectors comprising transport, storage, communication & services related to broadcasting that witnessed high growth rates (9.3 percent), other services (9.5 percent). Trade, repair, hotels, and restaurants registered 6.9 percent growth per annum over the seven year period. These sub-sectors are emerging the fastest growing sectors. Financial services, real estate, ownership of dwellings, professional services and public administration grew by over 5 percent per annum. Such trends clearly point towards a sectoral transformation in the economic structure of Uttarakhand. 3.3 Uttarakhand:Employment-Unemployment Patterns 3.3.1 Labourforce, Workforce, and Unemployment The labour force participation rate is a useful indicator to assess the proportion of population that is of working age and engaged in the labour market. It comprises of working age people who are either engaging in work (working) or are looking for work (unemployed). It therefore gives us a fair idea of the labour supply that is available in any economy and when analysed by sex (male-female) and area (rural-urban) if profiles the distribution of the labour force. The LFPR and WPR estimates are based on PS+SS. The HDR Survey 2017 reports that approximately 53 percent of adults (15+ years) in Uttarakhand were engaging in work/economic activities in Uttarakhand in 2017 and were employed. Thus the labour force participation rate for the state was 53 percent. Those 43 percent of the population remained outside the labour force (OLF) (Fig. 3.6) to participate in some economic activities (LFPR) in 2017, while rest (47 percent) remained out of labour-force (Figure 3.6). Around 45 percent of the total adult population engaged in some economic activities (WPR), while 4.2 percent, out of total labour-force are seeking work or unemployment rate (UNPR). These labour market characteristics of the state are slightly higher than corresponding All-India averages in 2011-12. This explains that the state has not been able to generate some amount of new jobs to absorb the additional labour force.
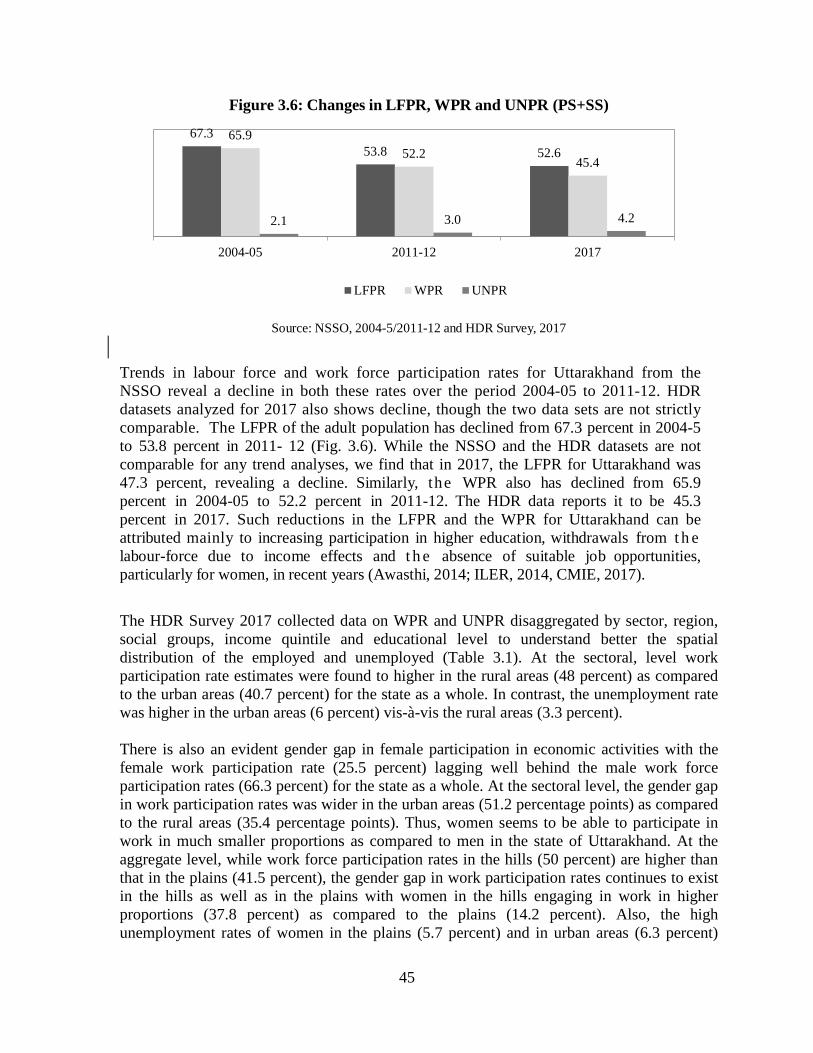
45
Figure 3.6: Changes in LFPR, WPR and UNPR (PS+SS)
Source: NSSO, 2004-5/2011-12 and HDR Survey, 2017
Trends in labour force and work force participation rates for Uttarakhand from the NSSO reveal a decline in both these rates over the period 2004-05 to 2011-12. HDR datasets analyzed for 2017 also shows decline, though the two data sets are not strictly comparable. The LFPR of the adult population has declined from 67.3 percent in 2004-5 to 53.8 percent in 2011- 12 (Fig. 3.6). While the NSSO and the HDR datasets are not comparable for any trend analyses, we find that in 2017, the LFPR for Uttarakhand was 47.3 percent, revealing a decline. Similarly, the WPR also has declined from 65.9 percent in 2004-05 to 52.2 percent in 2011-12. The HDR data reports it to be 45.3 percent in 2017. Such reductions in the LFPR and the WPR for Uttarakhand can be attributed mainly to increasing participation in higher education, withdrawals from t h e labour-force due to income effects and t h e absence of suitable job opportunities, particularly for women, in recent years (Awasthi, 2014; ILER, 2014, CMIE, 2017). The HDR Survey 2017 collected data on WPR and UNPR disaggregated by sector, region, social groups, income quintile and educational level to understand better the spatial distribution of the employed and unemployed (Table 3.1). At the sectoral, level work participation rate estimates were found to higher in the rural areas (48 percent) as compared to the urban areas (40.7 percent) for the state as a whole. In contrast, the unemployment rate was higher in the urban areas (6 percent) vis-à-vis the rural areas (3.3 percent). There is also an evident gender gap in female participation in economic activities with the female work participation rate (25.5 percent) lagging well behind the male work force participation rates (66.3 percent) for the state as a whole. At the sectoral level, the gender gap in work participation rates was wider in the urban areas (51.2 percentage points) as compared to the rural areas (35.4 percentage points). Thus, women seems to be able to participate in work in much smaller proportions as compared to men in the state of Uttarakhand. At the aggregate level, while work force participation rates in the hills (50 percent) are higher than that in the plains (41.5 percent), the gender gap in work participation rates continues to exist in the hills as well as in the plains with women in the hills engaging in work in higher proportions (37.8 percent) as compared to the plains (14.2 percent). Also, the high unemployment rates of women in the plains (5.7 percent) and in urban areas (6.3 percent)
67.3 53.8 52.6
65.9 52.2
45.4
2.1 3.0 4.2
2004-05 2011-12 2017
LFPR WPR UNPR
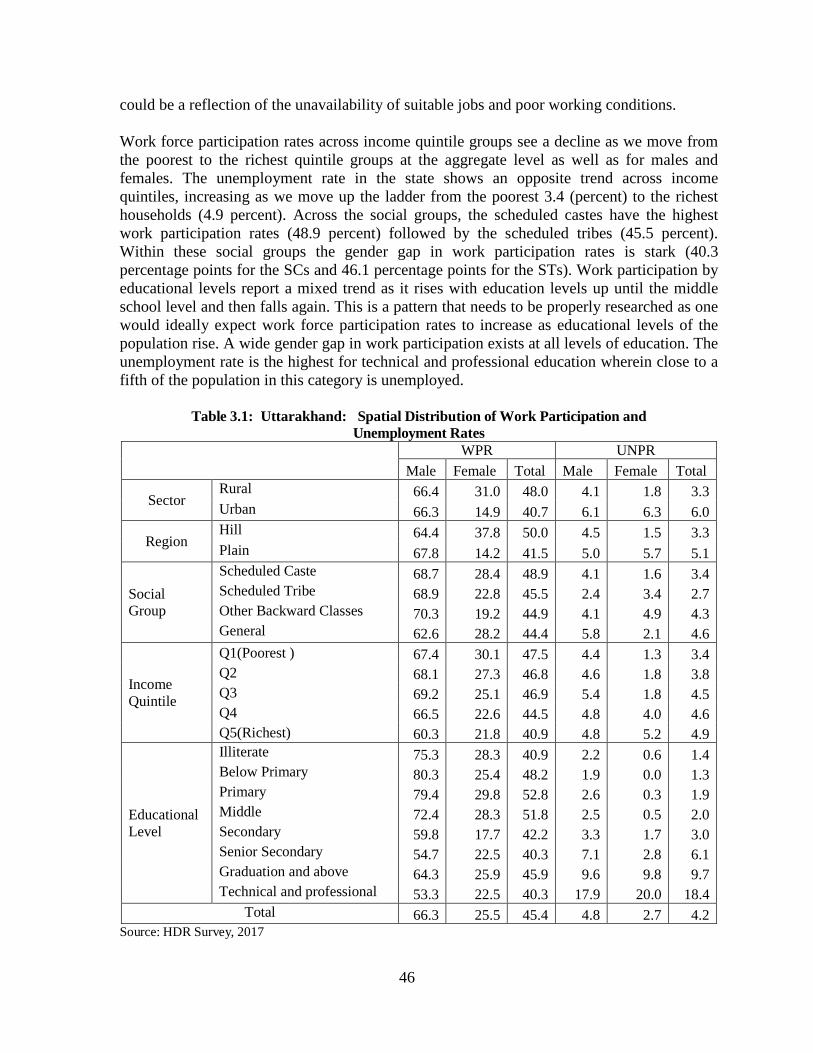
46
could be a reflection of the unavailability of suitable jobs and poor working conditions. Work force participation rates across income quintile groups see a decline as we move from the poorest to the richest quintile groups at the aggregate level as well as for males and females. The unemployment rate in the state shows an opposite trend across income quintiles, increasing as we move up the ladder from the poorest 3.4 (percent) to the richest households (4.9 percent). Across the social groups, the scheduled castes have the highest work participation rates (48.9 percent) followed by the scheduled tribes (45.5 percent). Within these social groups the gender gap in work participation rates is stark (40.3 percentage points for the SCs and 46.1 percentage points for the STs). Work participation by educational levels report a mixed trend as it rises with education levels up until the middle school level and then falls again. This is a pattern that needs to be properly researched as one would ideally expect work force participation rates to increase as educational levels of the population rise. A wide gender gap in work participation exists at all levels of education. The unemployment rate is the highest for technical and professional education wherein close to a fifth of the population in this category is unemployed.
Table 3.1: Uttarakhand: Spatial Distribution of Work Participation and Unemployment Rates
WPR UNPR
Male Female Total Male Female Total
Sector Rural 66.4 31.0 48.0 4.1 1.8 3.3 Urban 66.3 14.9 40.7 6.1 6.3 6.0
Region Hill 64.4 37.8 50.0 4.5 1.5 3.3 Plain 67.8 14.2 41.5 5.0 5.7 5.1
Social Group
Scheduled Caste 68.7 28.4 48.9 4.1 1.6 3.4 Scheduled Tribe 68.9 22.8 45.5 2.4 3.4 2.7 Other Backward Classes 70.3 19.2 44.9 4.1 4.9 4.3 General 62.6 28.2 44.4 5.8 2.1 4.6
Income Quintile
Q1(Poorest ) 67.4 30.1 47.5 4.4 1.3 3.4 Q2 68.1 27.3 46.8 4.6 1.8 3.8 Q3 69.2 25.1 46.9 5.4 1.8 4.5 Q4 66.5 22.6 44.5 4.8 4.0 4.6 Q5(Richest) 60.3 21.8 40.9 4.8 5.2 4.9
Educational Level
Illiterate 75.3 28.3 40.9 2.2 0.6 1.4 Below Primary 80.3 25.4 48.2 1.9 0.0 1.3 Primary 79.4 29.8 52.8 2.6 0.3 1.9 Middle 72.4 28.3 51.8 2.5 0.5 2.0 Secondary 59.8 17.7 42.2 3.3 1.7 3.0 Senior Secondary 54.7 22.5 40.3 7.1 2.8 6.1 Graduation and above 64.3 25.9 45.9 9.6 9.8 9.7 Technical and professional 53.3 22.5 40.3 17.9 20.0 18.4
Total 66.3 25.5 45.4 4.8 2.7 4.2 Source: HDR Survey, 2017
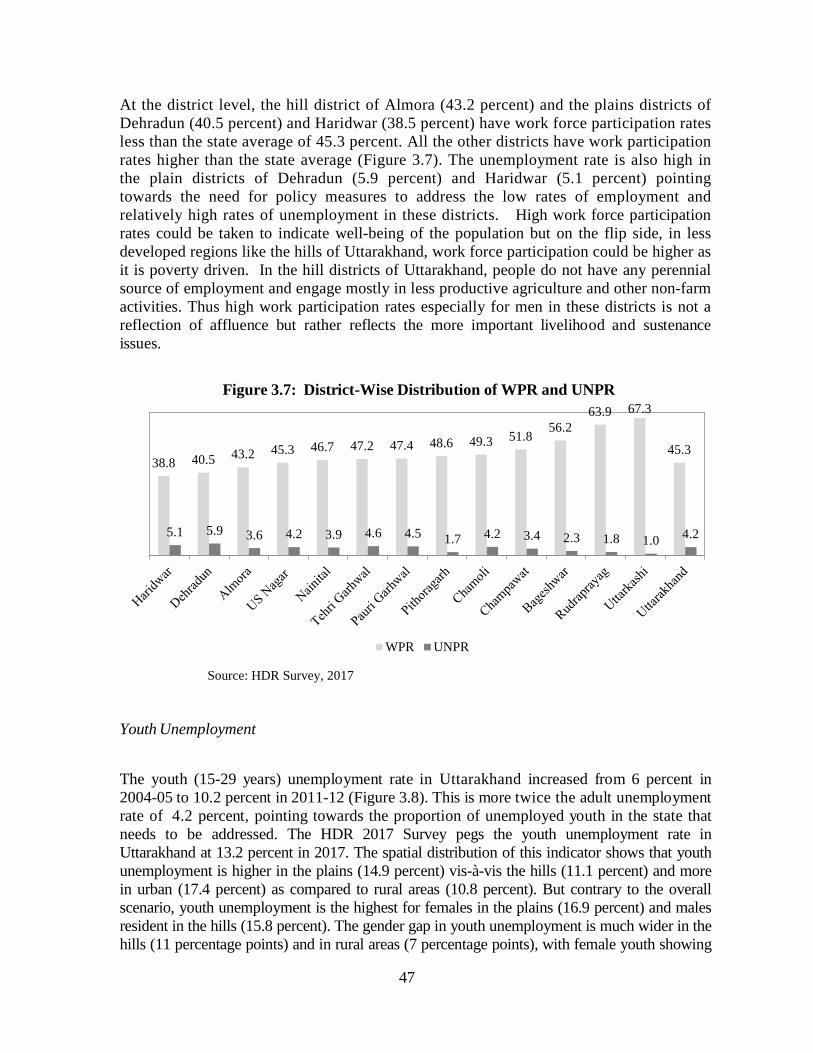
47
At the district level, the hill district of Almora (43.2 percent) and the plains districts of Dehradun (40.5 percent) and Haridwar (38.5 percent) have work force participation rates less than the state average of 45.3 percent. All the other districts have work participation rates higher than the state average (Figure 3.7). The unemployment rate is also high in the plain districts of Dehradun (5.9 percent) and Haridwar (5.1 percent) pointing towards the need for policy measures to address the low rates of employment and relatively high rates of unemployment in these districts. High work force participation rates could be taken to indicate well-being of the population but on the flip side, in less developed regions like the hills of Uttarakhand, work force participation could be higher as it is poverty driven. In the hill districts of Uttarakhand, people do not have any perennial source of employment and engage mostly in less productive agriculture and other non-farm activities. Thus high work participation rates especially for men in these districts is not a reflection of affluence but rather reflects the more important livelihood and sustenance issues.
Figure 3.7: District-Wise Distribution of WPR and UNPR
Source: HDR Survey, 2017 Youth Unemployment The youth (15-29 years) unemployment rate in Uttarakhand increased from 6 percent in 2004-05 to 10.2 percent in 2011-12 (Figure 3.8). This is more twice the adult unemployment rate of 4.2 percent, pointing towards the proportion of unemployed youth in the state that needs to be addressed. The HDR 2017 Survey pegs the youth unemployment rate in Uttarakhand at 13.2 percent in 2017. The spatial distribution of this indicator shows that youth unemployment is higher in the plains (14.9 percent) vis-à-vis the hills (11.1 percent) and more in urban (17.4 percent) as compared to rural areas (10.8 percent). But contrary to the overall scenario, youth unemployment is the highest for females in the plains (16.9 percent) and males resident in the hills (15.8 percent). The gender gap in youth unemployment is much wider in the hills (11 percentage points) and in rural areas (7 percentage points), with female youth showing
38.8 40.5 43.2 45.3 46.7 47.2 47.4 48.6 49.3 51.8 56.2
63.9 67.3
45.3
5.1 5.9 3.6 4.2 3.9 4.6 4.5 1.7 4.2 3.4 2.3 1.8 1.0 4.2
WPR UNPR
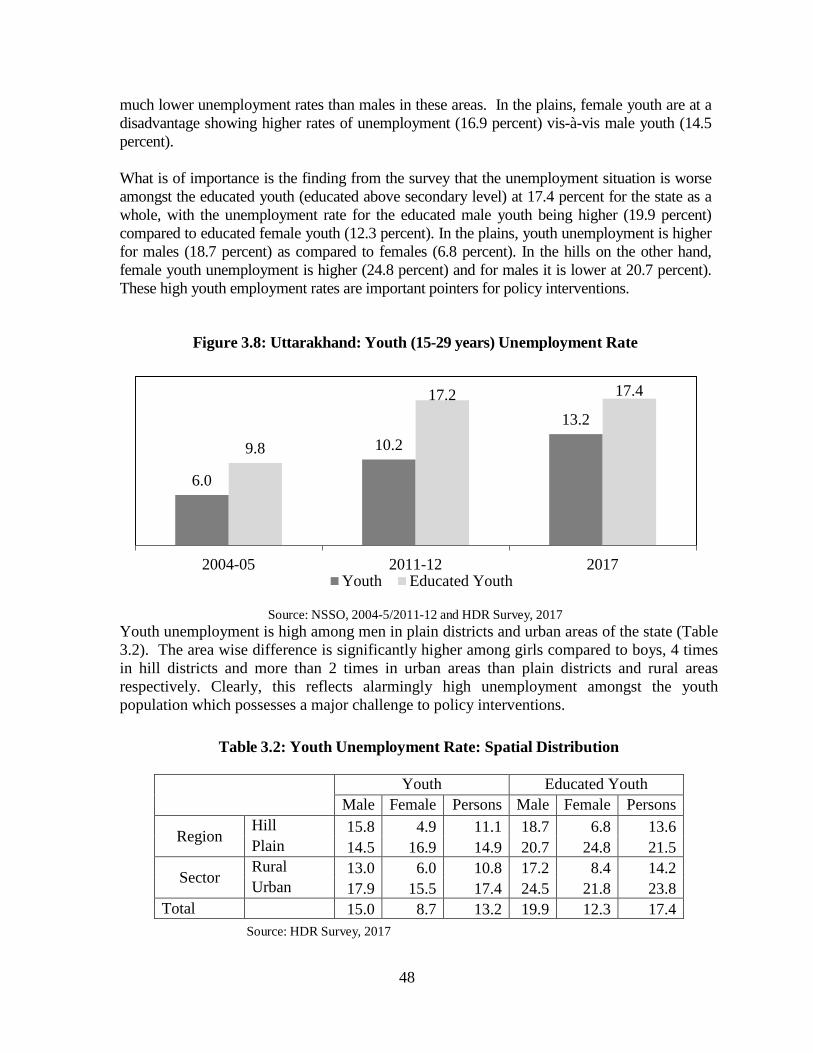
48
much lower unemployment rates than males in these areas. In the plains, female youth are at a disadvantage showing higher rates of unemployment (16.9 percent) vis-à-vis male youth (14.5 percent). What is of importance is the finding from the survey that the unemployment situation is worse amongst the educated youth (educated above secondary level) at 17.4 percent for the state as a whole, with the unemployment rate for the educated male youth being higher (19.9 percent) compared to educated female youth (12.3 percent). In the plains, youth unemployment is higher for males (18.7 percent) as compared to females (6.8 percent). In the hills on the other hand, female youth unemployment is higher (24.8 percent) and for males it is lower at 20.7 percent). These high youth employment rates are important pointers for policy interventions.
Figure 3.8: Uttarakhand: Youth (15-29 years) Unemployment Rate
Source: NSSO, 2004-5/2011-12 and HDR Survey, 2017
Youth unemployment is high among men in plain districts and urban areas of the state (Table 3.2). The area wise difference is significantly higher among girls compared to boys, 4 times in hill districts and more than 2 times in urban areas than plain districts and rural areas respectively. Clearly, this reflects alarmingly high unemployment amongst the youth population which possesses a major challenge to policy interventions.
Table 3.2: Youth Unemployment Rate: Spatial Distribution
Youth Educated Youth
Male Female Persons Male Female Persons
Region Hill 15.8 4.9 11.1 18.7 6.8 13.6 Plain 14.5 16.9 14.9 20.7 24.8 21.5
Sector Rural 13.0 6.0 10.8 17.2 8.4 14.2 Urban 17.9 15.5 17.4 24.5 21.8 23.8
Total 15.0 8.7 13.2 19.9 12.3 17.4 Source: HDR Survey, 2017
6.0
10.2 13.2
9.8
17.2 17.4
2004-05 2011-12 2017Youth Educated Youth
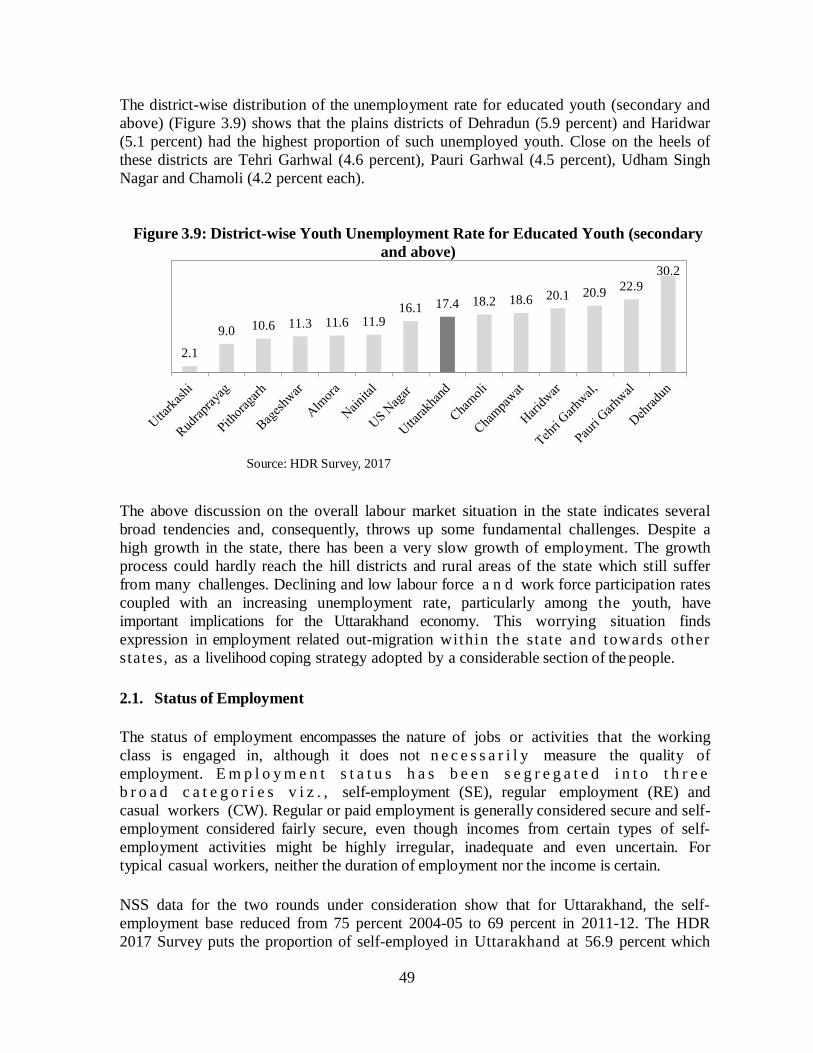
49
The district-wise distribution of the unemployment rate for educated youth (secondary and above) (Figure 3.9) shows that the plains districts of Dehradun (5.9 percent) and Haridwar (5.1 percent) had the highest proportion of such unemployed youth. Close on the heels of these districts are Tehri Garhwal (4.6 percent), Pauri Garhwal (4.5 percent), Udham Singh Nagar and Chamoli (4.2 percent each).
Figure 3.9: District-wise Youth Unemployment Rate for Educated Youth (secondary and above)
Source: HDR Survey, 2017 The above discussion on the overall labour market situation in the state indicates several broad tendencies and, consequently, throws up some fundamental challenges. Despite a high growth in the state, there has been a very slow growth of employment. The growth process could hardly reach the hill districts and rural areas of the state which still suffer from many challenges. Declining and low labour force a n d work force participation rates coupled with an increasing unemployment rate, particularly among the youth, have important implications for the Uttarakhand economy. This worrying situation finds expression in employment related out-migration within the state and towards other states, as a livelihood coping strategy adopted by a considerable section of the people. 2.1. Status of Employment The status of employment encompasses the nature of jobs or activities that the working class is engaged in, although it does not n e c e s s a r i l y measure the quality of employment. E m p l o y m e n t s t a t u s h a s b e e n s e g r e g a t e d i n t o t h r e e b r o a d c a t e g o r i e s v i z . , self-employment (SE), regular employment (RE) and casual workers (CW). Regular or paid employment is generally considered secure and self-employment considered fairly secure, even though incomes from certain types of self-employment activities might be highly irregular, inadequate and even uncertain. For typical casual workers, neither the duration of employment nor the income is certain. NSS data for the two rounds under consideration show that for Uttarakhand, the self-employment base reduced from 75 percent 2004-05 to 69 percent in 2011-12. The HDR 2017 Survey puts the proportion of self-employed in Uttarakhand at 56.9 percent which
2.1
9.0 10.6 11.3 11.6 11.9 16.1 17.4 18.2 18.6 20.1 20.9 22.9
30.2
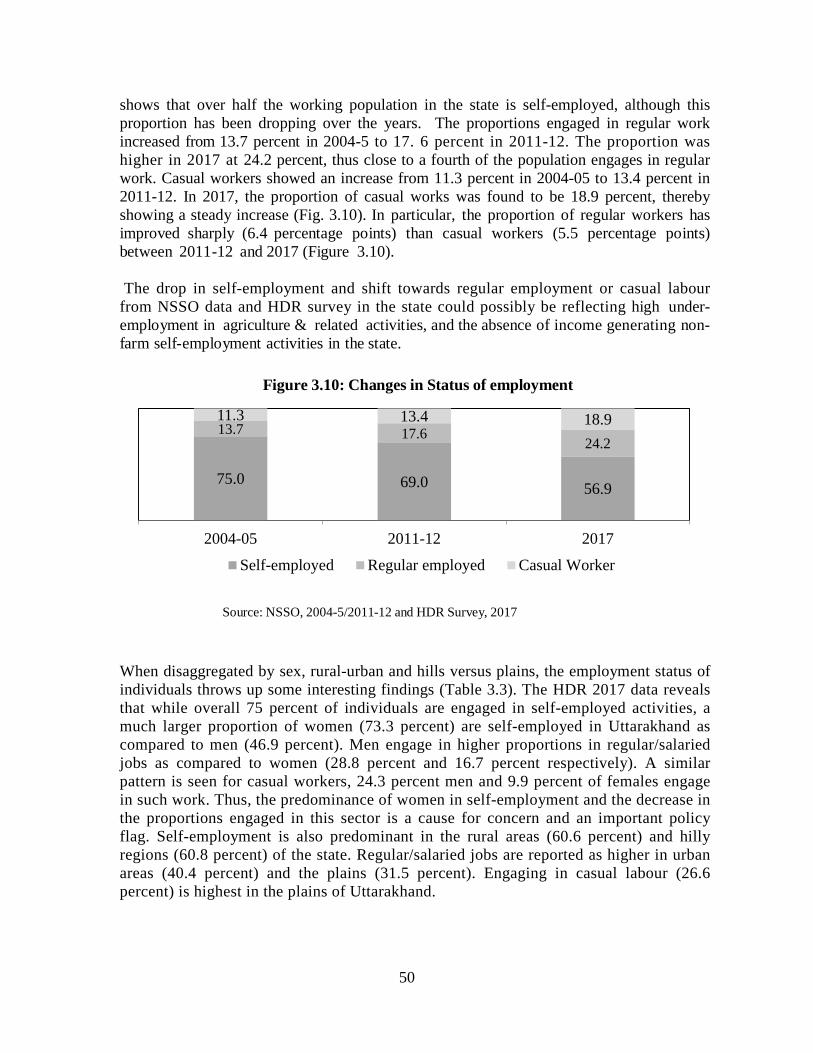
50
shows that over half the working population in the state is self-employed, although this proportion has been dropping over the years. The proportions engaged in regular work increased from 13.7 percent in 2004-5 to 17. 6 percent in 2011-12. The proportion was higher in 2017 at 24.2 percent, thus close to a fourth of the population engages in regular work. Casual workers showed an increase from 11.3 percent in 2004-05 to 13.4 percent in 2011-12. In 2017, the proportion of casual works was found to be 18.9 percent, thereby showing a steady increase (Fig. 3.10). In particular, the proportion of regular workers has improved sharply (6.4 percentage points) than casual workers (5.5 percentage points) between 2011-12 and 2017 (Figure 3.10). The drop in self-employment and shift towards regular employment or casual labour from NSSO data and HDR survey in the state could possibly be reflecting high under-employment in agriculture & related activities, and the absence of income generating non-farm self-employment activities in the state.
Figure 3.10: Changes in Status of employment
Source: NSSO, 2004-5/2011-12 and HDR Survey, 2017
When disaggregated by sex, rural-urban and hills versus plains, the employment status of individuals throws up some interesting findings (Table 3.3). The HDR 2017 data reveals that while overall 75 percent of individuals are engaged in self-employed activities, a much larger proportion of women (73.3 percent) are self-employed in Uttarakhand as compared to men (46.9 percent). Men engage in higher proportions in regular/salaried jobs as compared to women (28.8 percent and 16.7 percent respectively). A similar pattern is seen for casual workers, 24.3 percent men and 9.9 percent of females engage in such work. Thus, the predominance of women in self-employment and the decrease in the proportions engaged in this sector is a cause for concern and an important policy flag. Self-employment is also predominant in the rural areas (60.6 percent) and hilly regions (60.8 percent) of the state. Regular/salaried jobs are reported as higher in urban areas (40.4 percent) and the plains (31.5 percent). Engaging in casual labour (26.6 percent) is highest in the plains of Uttarakhand.
75.0 69.0 56.9
13.7 17.6 24.2
11.3 13.4 18.9
2004-05 2011-12 2017
Self-employed Regular employed Casual Worker

51
Table 3.3: Spatial Distribution of Employment Status Status Sex Area Region
Male Female Rural Urban Hills Plains Self-employment 46.9 73.3 60.6 42.3 60.8 41.9 Regular/Salaried 28.8 16.7 20.1 40.4 22.3 31.5 Casual 24.3 9.9 19.3 17.3 16.9 26.6 Total 100.0 100.0 100.0 100.0 100.0 100.0
Source: HDR Survey, 2017 The District-wise employment status shows variations across districts in terms of all the three categories considered. In the five hill districts of Rudraprayag, Pithoragarh, Bageshwar, Uttarkashi and Champawat, over two-thirds of the populace was self-employed in 2017, well above the state average of 57.1 percent (Figure 3.11). The plains districts of Dehradun, Udham Singh Nagar and Haridwar were ranked at the bottom for proportions of the population self-employed (40.8 percent, 40.9 percent and 44.4 percent respectively). Thus we find that self-employment is higher in the hills vis-à-vis the plains. Regular employment is high in the hills of Tehri Garhwal, Pauri Garhwal, Nainital and Almora and in the plains of Dehradun where over a third of the population is employed. Employment as casual labour was the highest in the plains district of Udham Singh Nagar (32.2 percent) and Haridwar (26.3 percent) followed by the hill district of Chamoli (26.0 percent).
Figure 3.11: District-wise Employment Status
Source: HDR Survey, 2017 It is not just the mere availability of work that is important to enhance livelihoods of the populace, the nature, regularity and returns from work are also equally if not more important. The poor cannot really afford to remain idle and therefore the observed LFPR and WPR are high in the rural and hill regions where most people engage in low-paying work such as self-employment and in family enterprises including petty vending activities. The HDR 2017 Survey has shown that more than three-fourths of the workers are either engaged in self-employment or i n casual work. Although the employment in regular work has been on a rise in recent years, particularly among women, its quality, remuneration and impermanent nature are issues that need proper research and
40.8 40.9 44.4 45.4 46.9 48.6 59.4 59.6 65.8 66.8 67.0 67.8 72.1 57.1
38.4 26.9 29.2 39.2 35.8 33.7 22.5 14.4 14.9 17.9 21.0 13.9 15.4 24.1
20.8 32.2 26.3 15.5 17.3 17.7 18.0 26.0 19.3 15.3 12.0 18.4 12.5 18.8
Self-Empoyed Regular Workers Casual Labour
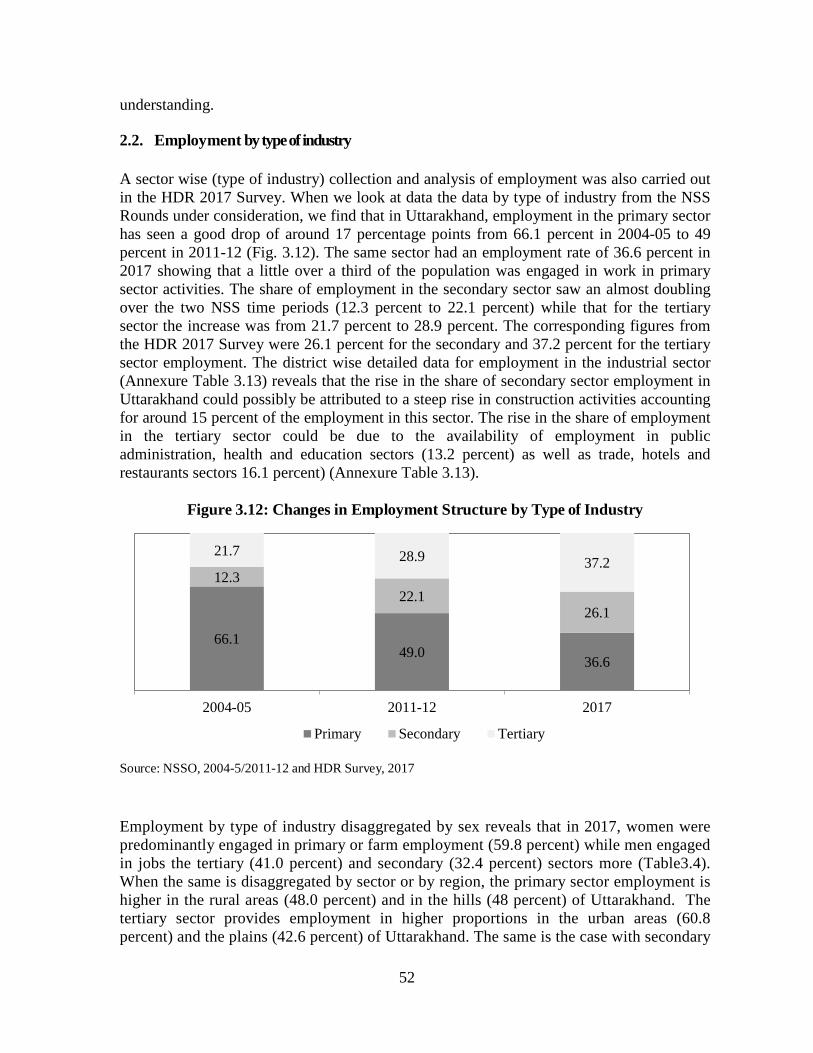
52
understanding. 2.2. Employment by type of industry A sector wise (type of industry) collection and analysis of employment was also carried out in the HDR 2017 Survey. When we look at data the data by type of industry from the NSS Rounds under consideration, we find that in Uttarakhand, employment in the primary sector has seen a good drop of around 17 percentage points from 66.1 percent in 2004-05 to 49 percent in 2011-12 (Fig. 3.12). The same sector had an employment rate of 36.6 percent in 2017 showing that a little over a third of the population was engaged in work in primary sector activities. The share of employment in the secondary sector saw an almost doubling over the two NSS time periods (12.3 percent to 22.1 percent) while that for the tertiary sector the increase was from 21.7 percent to 28.9 percent. The corresponding figures from the HDR 2017 Survey were 26.1 percent for the secondary and 37.2 percent for the tertiary sector employment. The district wise detailed data for employment in the industrial sector (Annexure Table 3.13) reveals that the rise in the share of secondary sector employment in Uttarakhand could possibly be attributed to a steep rise in construction activities accounting for around 15 percent of the employment in this sector. The rise in the share of employment in the tertiary sector could be due to the availability of employment in public administration, health and education sectors (13.2 percent) as well as trade, hotels and restaurants sectors 16.1 percent) (Annexure Table 3.13).
Figure 3.12: Changes in Employment Structure by Type of Industry
Source: NSSO, 2004-5/2011-12 and HDR Survey, 2017 Employment by type of industry disaggregated by sex reveals that in 2017, women were predominantly engaged in primary or farm employment (59.8 percent) while men engaged in jobs the tertiary (41.0 percent) and secondary (32.4 percent) sectors more (Table3.4). When the same is disaggregated by sector or by region, the primary sector employment is higher in the rural areas (48.0 percent) and in the hills (48 percent) of Uttarakhand. The tertiary sector provides employment in higher proportions in the urban areas (60.8 percent) and the plains (42.6 percent) of Uttarakhand. The same is the case with secondary
66.1 49.0 36.6
12.3 22.1
26.1
21.7 28.9 37.2
2004-05 2011-12 2017
Primary Secondary Tertiary
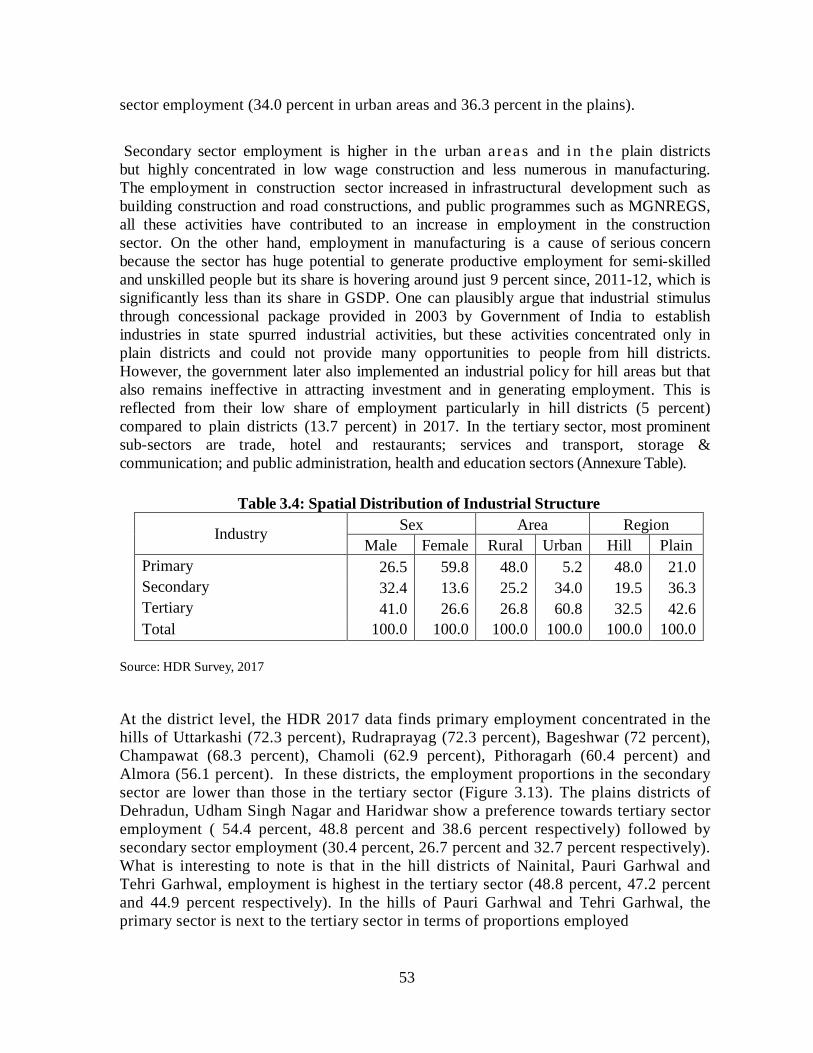
53
sector employment (34.0 percent in urban areas and 36.3 percent in the plains). Secondary sector employment is higher in the urban areas and in the plain districts but highly concentrated in low wage construction and less numerous in manufacturing. The employment in construction sector increased in infrastructural development such as building construction and road constructions, and public programmes such as MGNREGS, all these activities have contributed to an increase in employment in the construction sector. On the other hand, employment in manufacturing is a cause of serious concern because the sector has huge potential to generate productive employment for semi-skilled and unskilled people but its share is hovering around just 9 percent since, 2011-12, which is significantly less than its share in GSDP. One can plausibly argue that industrial stimulus through concessional package provided in 2003 by Government of India to establish industries in state spurred industrial activities, but these activities concentrated only in plain districts and could not provide many opportunities to people from hill districts. However, the government later also implemented an industrial policy for hill areas but that also remains ineffective in attracting investment and in generating employment. This is reflected from their low share of employment particularly in hill districts (5 percent) compared to plain districts (13.7 percent) in 2017. In the tertiary sector, most prominent sub-sectors are trade, hotel and restaurants; services and transport, storage & communication; and public administration, health and education sectors (Annexure Table).
Table 3.4: Spatial Distribution of Industrial Structure
Industry Sex Area Region Male Female Rural Urban Hill Plain
Primary 26.5 59.8 48.0 5.2 48.0 21.0 Secondary 32.4 13.6 25.2 34.0 19.5 36.3 Tertiary 41.0 26.6 26.8 60.8 32.5 42.6 Total 100.0 100.0 100.0 100.0 100.0 100.0
Source: HDR Survey, 2017
At the district level, the HDR 2017 data finds primary employment concentrated in the hills of Uttarkashi (72.3 percent), Rudraprayag (72.3 percent), Bageshwar (72 percent), Champawat (68.3 percent), Chamoli (62.9 percent), Pithoragarh (60.4 percent) and Almora (56.1 percent). In these districts, the employment proportions in the secondary sector are lower than those in the tertiary sector (Figure 3.13). The plains districts of Dehradun, Udham Singh Nagar and Haridwar show a preference towards tertiary sector employment ( 54.4 percent, 48.8 percent and 38.6 percent respectively) followed by secondary sector employment (30.4 percent, 26.7 percent and 32.7 percent respectively). What is interesting to note is that in the hill districts of Nainital, Pauri Garhwal and Tehri Garhwal, employment is highest in the tertiary sector (48.8 percent, 47.2 percent and 44.9 percent respectively). In the hills of Pauri Garhwal and Tehri Garhwal, the primary sector is next to the tertiary sector in terms of proportions employed
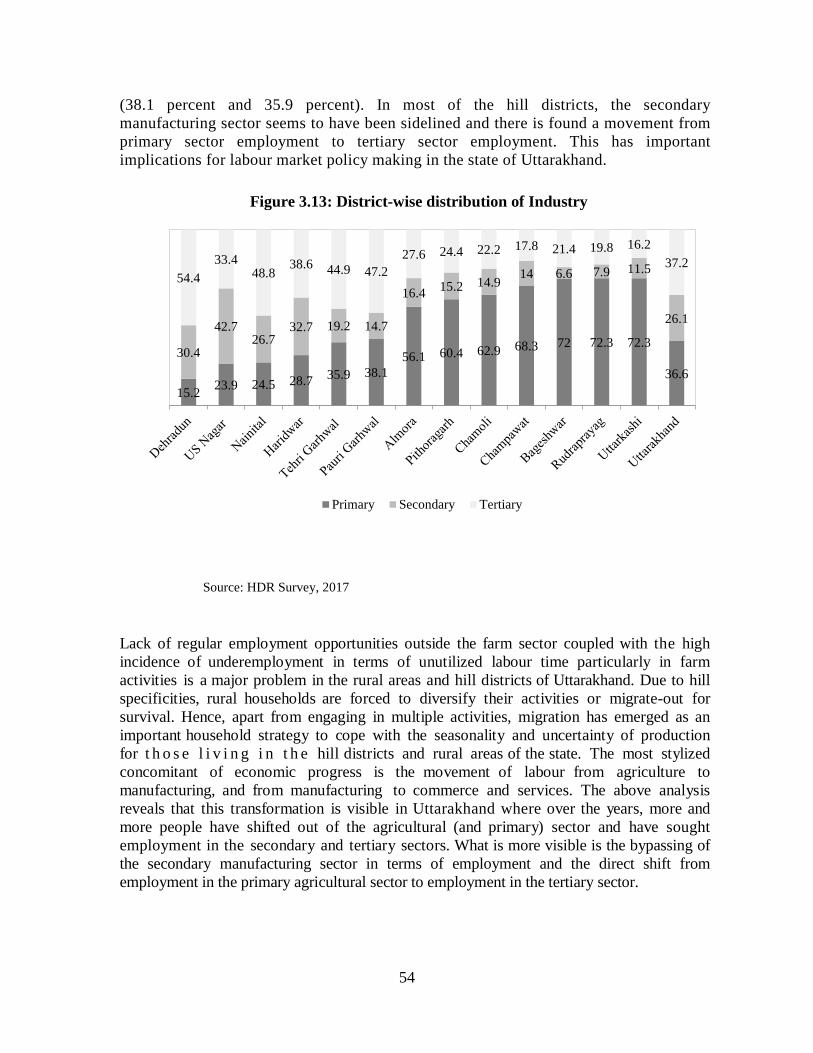
54
(38.1 percent and 35.9 percent). In most of the hill districts, the secondary manufacturing sector seems to have been sidelined and there is found a movement from primary sector employment to tertiary sector employment. This has important implications for labour market policy making in the state of Uttarakhand.
Figure 3.13: District-wise distribution of Industry
Source: HDR Survey, 2017
Lack of regular employment opportunities outside the farm sector coupled with the high incidence of underemployment in terms of unutilized labour time particularly in farm activities is a major problem in the rural areas and hill districts of Uttarakhand. Due to hill specificities, rural households are forced to diversify their activities or migrate-out for survival. Hence, apart from engaging in multiple activities, migration has emerged as an important household strategy to cope with the seasonality and uncertainty of production for t h o s e l i v i n g i n t h e hill districts and rural areas of the state. The most stylized concomitant of economic progress is the movement of labour from agriculture to manufacturing, and from manufacturing to commerce and services. The above analysis reveals that this transformation is visible in Uttarakhand where over the years, more and more people have shifted out of the agricultural (and primary) sector and have sought employment in the secondary and tertiary sectors. What is more visible is the bypassing of the secondary manufacturing sector in terms of employment and the direct shift from employment in the primary agricultural sector to employment in the tertiary sector.
15.2 23.9 24.5 28.7 35.9 38.1 56.1 60.4 62.9 68.3 72 72.3 72.3
36.6 30.4
42.7 26.7
32.7 19.2 14.7
16.4 15.2 14.9 14 6.6 7.9 11.5
26.1
54.4 33.4
48.8 38.6 44.9 47.2
27.6 24.4 22.2 17.8 21.4 19.8 16.2 37.2
Primary Secondary Tertiary
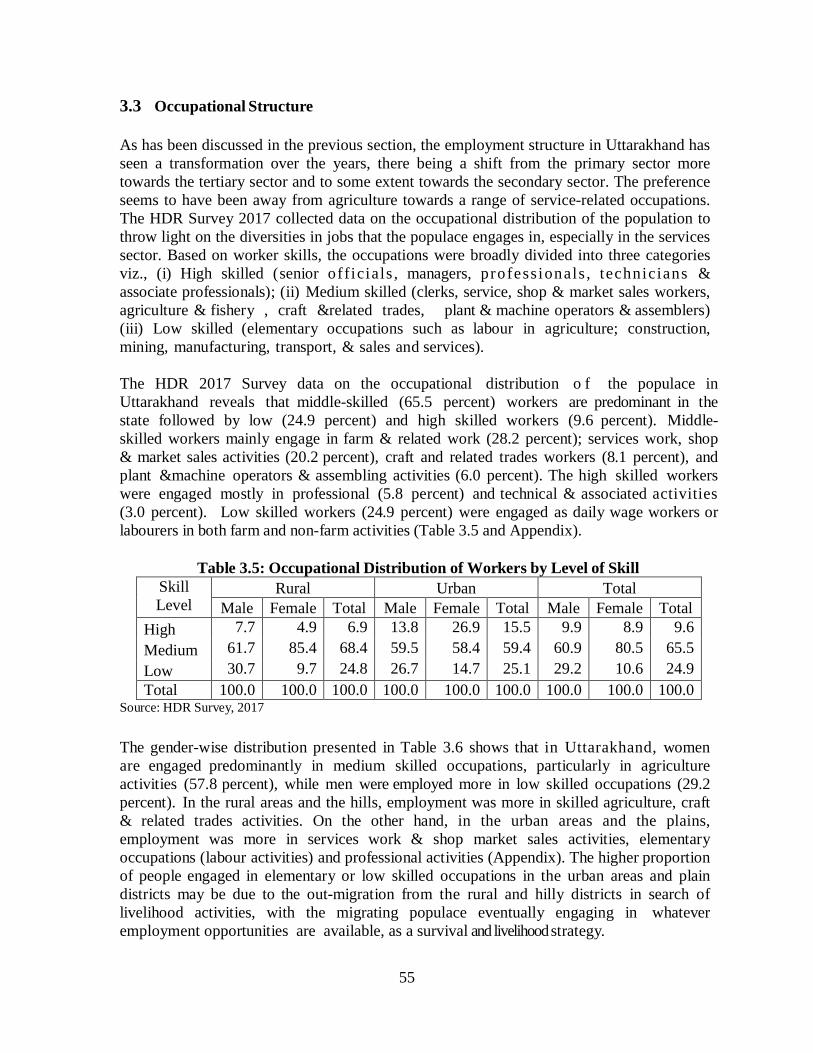
55
3.3 Occupational Structure As has been discussed in the previous section, the employment structure in Uttarakhand has seen a transformation over the years, there being a shift from the primary sector more towards the tertiary sector and to some extent towards the secondary sector. The preference seems to have been away from agriculture towards a range of service-related occupations. The HDR Survey 2017 collected data on the occupational distribution of the population to throw light on the diversities in jobs that the populace engages in, especially in the services sector. Based on worker skills, the occupations were broadly divided into three categories viz., (i) High skilled (senior officials , managers, profess ionals , technicians & associate professionals); (ii) Medium skilled (clerks, service, shop & market sales workers, agriculture & fishery , craft &related trades, plant & machine operators & assemblers) (iii) Low skilled (elementary occupations such as labour in agriculture; construction, mining, manufacturing, transport, & sales and services). The HDR 2017 Survey data on the occupational distribution o f the populace in Uttarakhand reveals that middle-skilled (65.5 percent) workers are predominant in the state followed by low (24.9 percent) and high skilled workers (9.6 percent). Middle-skilled workers mainly engage in farm & related work (28.2 percent); services work, shop & market sales activities (20.2 percent), craft and related trades workers (8.1 percent), and plant &machine operators & assembling activities (6.0 percent). The high skilled workers were engaged mostly in professional (5.8 percent) and technical & associated activities (3.0 percent). Low skilled workers (24.9 percent) were engaged as daily wage workers or labourers in both farm and non-farm activities (Table 3.5 and Appendix).
Table 3.5: Occupational Distribution of Workers by Level of Skill Skill Level
Rural Urban Total Male Female Total Male Female Total Male Female Total
High 7.7 4.9 6.9 13.8 26.9 15.5 9.9 8.9 9.6 Medium 61.7 85.4 68.4 59.5 58.4 59.4 60.9 80.5 65.5 Low 30.7 9.7 24.8 26.7 14.7 25.1 29.2 10.6 24.9 Total 100.0 100.0 100.0 100.0 100.0 100.0 100.0 100.0 100.0
Source: HDR Survey, 2017
The gender-wise distribution presented in Table 3.6 shows that in Uttarakhand, women are engaged predominantly in medium skilled occupations, particularly in agriculture activities (57.8 percent), while men were employed more in low skilled occupations (29.2 percent). In the rural areas and the hills, employment was more in skilled agriculture, craft & related trades activities. On the other hand, in the urban areas and the plains, employment was more in services work & shop market sales activities, elementary occupations (labour activities) and professional activities (Appendix). The higher proportion of people engaged in elementary or low skilled occupations in the urban areas and plain districts may be due to the out-migration from the rural and hilly districts in search of livelihood activities, with the migrating populace eventually engaging in whatever employment opportunities are available, as a survival and livelihood strategy.
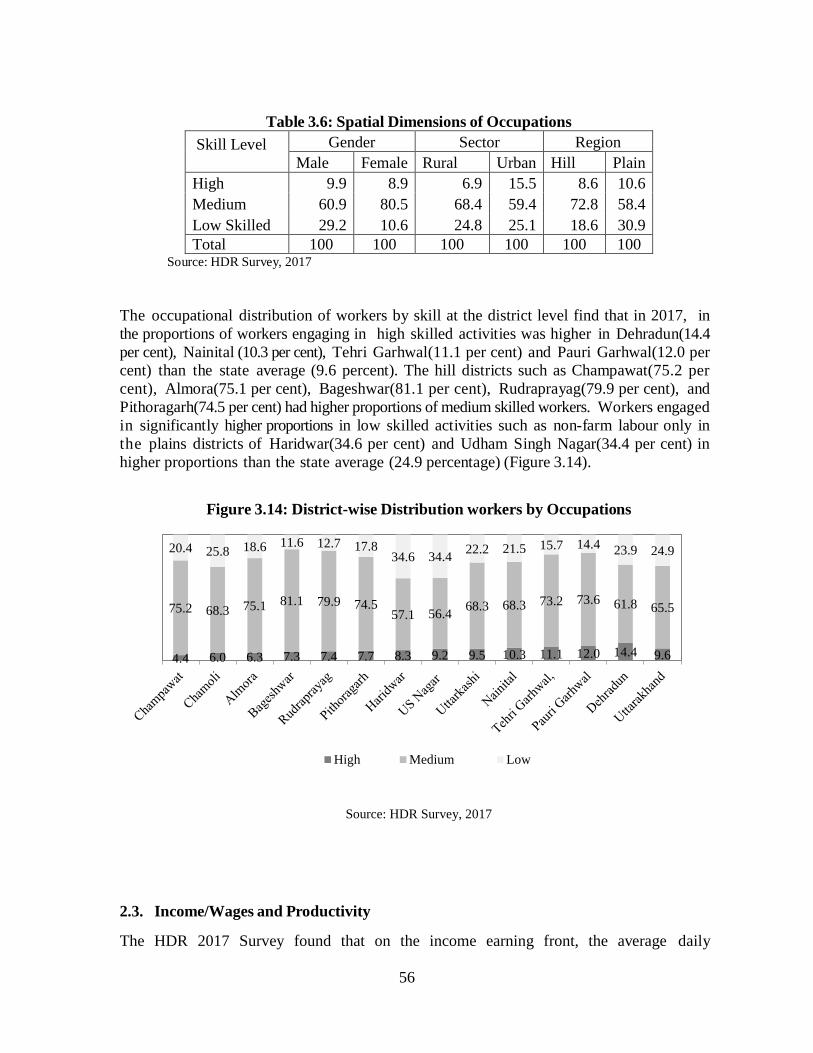
56
Table 3.6: Spatial Dimensions of Occupations
Skill Level
Gender Sector Region Male Female Rural Urban Hill Plain
High 9.9 8.9 6.9 15.5 8.6 10.6 Medium 60.9 80.5 68.4 59.4 72.8 58.4 Low Skilled 29.2 10.6 24.8 25.1 18.6 30.9 Total 100 100 100 100 100 100
Source: HDR Survey, 2017 The occupational distribution of workers by skill at the district level find that in 2017, in the proportions of workers engaging in high skilled activities was higher in Dehradun(14.4 per cent), Nainital (10.3 per cent), Tehri Garhwal(11.1 per cent) and Pauri Garhwal(12.0 per cent) than the state average (9.6 percent). The hill districts such as Champawat(75.2 per cent), Almora(75.1 per cent), Bageshwar(81.1 per cent), Rudraprayag(79.9 per cent), and Pithoragarh(74.5 per cent) had higher proportions of medium skilled workers. Workers engaged in significantly higher proportions in low skilled activities such as non-farm labour only in the plains districts of Haridwar(34.6 per cent) and Udham Singh Nagar(34.4 per cent) in higher proportions than the state average (24.9 percentage) (Figure 3.14).
Figure 3.14: District-wise Distribution workers by Occupations
Source: HDR Survey, 2017 2.3. Income/Wages and Productivity
The HDR 2017 Survey found that on the income earning front, the average daily
4.4 6.0 6.3 7.3 7.4 7.7 8.3 9.2 9.5 10.3 11.1 12.0 14.4 9.6
75.2 68.3 75.1 81.1 79.9 74.5 57.1 56.4 68.3 68.3 73.2 73.6 61.8 65.5
20.4 25.8 18.6 11.6 12.7 17.8 34.6 34.4 22.2 21.5 15.7 14.4 23.9 24.9
High Medium Low
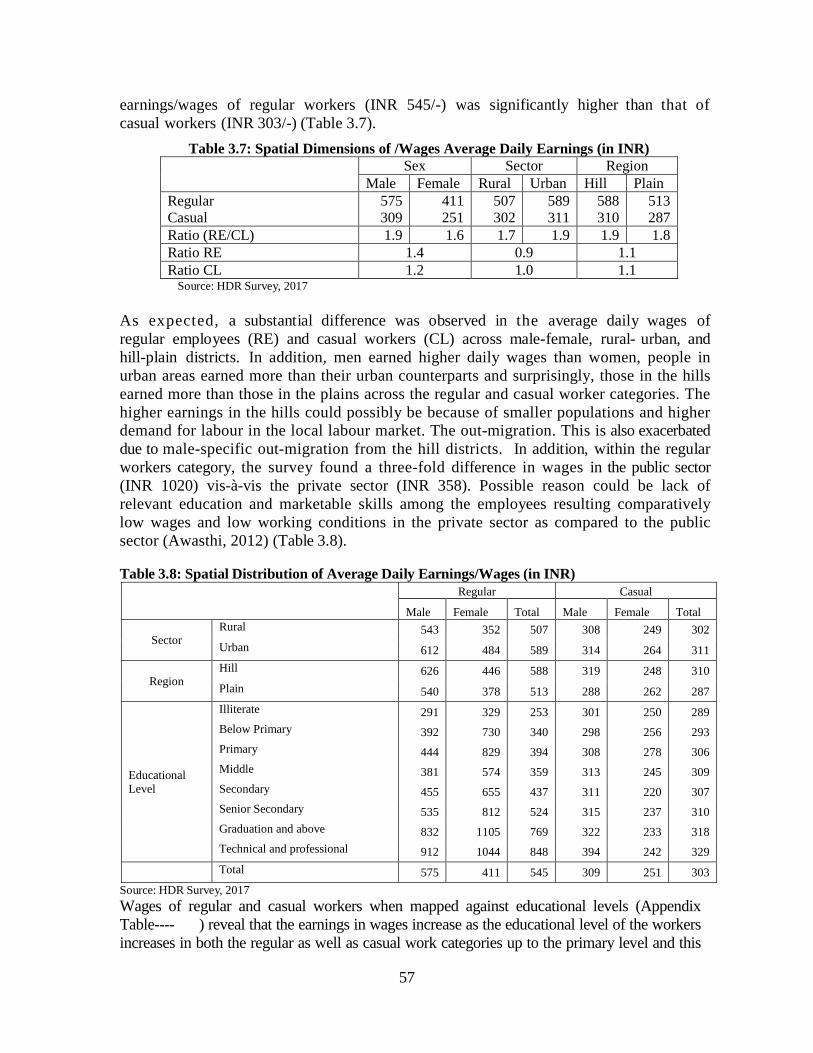
57
earnings/wages of regular workers (INR 545/-) was significantly higher than that of casual workers (INR 303/-) (Table 3.7).
Table 3.7: Spatial Dimensions of /Wages Average Daily Earnings (in INR)
Sex Sector Region
Male Female Rural Urban Hill Plain Regular 575 411 507 589 588 513 Casual 309 251 302 311 310 287 Ratio (RE/CL) 1.9 1.6 1.7 1.9 1.9 1.8 Ratio RE 1.4 0.9 1.1 Ratio CL 1.2 1.0 1.1
Source: HDR Survey, 2017 As expected, a substantial difference was observed in the average daily wages of regular employees (RE) and casual workers (CL) across male-female, rural- urban, and hill-plain districts. In addition, men earned higher daily wages than women, people in urban areas earned more than their urban counterparts and surprisingly, those in the hills earned more than those in the plains across the regular and casual worker categories. The higher earnings in the hills could possibly be because of smaller populations and higher demand for labour in the local labour market. The out-migration. This is also exacerbated due to male-specific out-migration from the hill districts. In addition, within the regular workers category, the survey found a three-fold difference in wages in the public sector (INR 1020) vis-à-vis the private sector (INR 358). Possible reason could be lack of relevant education and marketable skills among the employees resulting comparatively low wages and low working conditions in the private sector as compared to the public sector (Awasthi, 2012) (Table 3.8). Table 3.8: Spatial Distribution of Average Daily Earnings/Wages (in INR)
Regular Casual
Male Female Total Male Female Total
Sector Rural 543 352 507 308 249 302 Urban 612 484 589 314 264 311
Region Hill 626 446 588 319 248 310 Plain 540 378 513 288 262 287
Educational Level
Illiterate 291 329 253 301 250 289 Below Primary 392 730 340 298 256 293 Primary 444 829 394 308 278 306 Middle 381 574 359 313 245 309 Secondary 455 655 437 311 220 307 Senior Secondary 535 812 524 315 237 310 Graduation and above 832 1105 769 322 233 318 Technical and professional 912 1044 848 394 242 329
Total 575 411 545 309 251 303
Source: HDR Survey, 2017 Wages of regular and casual workers when mapped against educational levels (Appendix Table---- ) reveal that the earnings in wages increase as the educational level of the workers increases in both the regular as well as casual work categories up to the primary level and this

58
holds for both rural and urban areas and the hills as well as the plains and rightly so. There is a sudden dip in wages at the middle school level after which the wages again show an increase as the educational levels rise, peaking at the technical and professional education levels. The reason for the dip in wages at the middle school level higher earning level of primary educated persons are of higher age group and they managed to get government jobs in earlier times. In addition, there was a significant difference in per day earnings between public and private regular workers at a low level of education but the gap reduces at a higher level of education. A clear female advantage is seen in wage earnings in regular work while in casual work, with the men earning more than the women across all the education categories. Figure 3.15 maps the returns to education for regular workers taking the value for illiterates as 1 and we find that there is an improvement in the daily earnings of regular workers as their educational level increases. Figure 3.15: The Returns to Education for Regular Workers
3.5. Poverty and Inequality Monthly per capita expenditure In 2017, the average monthly per capita expenditure (MPCE) of the state was INR 2928, rural areas having lower MPCE vis a vis the urban areas (Rs 2673 and Rs 3417, respectively) and the hilly regions also reporting lower MPCE as compared to the plains regions (Rs 2849 and Rs 3000 respectively) (Table 3.9). In terms of social groups it was found that the Scheduled tribes (Rs 3109) and General castes (Rs 3231) had comparatively higher MPCE. Table 3.9: Spatial and Social Group Distribution of Monthly per Capita Expenditure households (in INR)
1.0
2.0
3.0
4.0
Illiterate BelowPrimary
Primary Middle Secondary SeniorSecondary
Graduation& above
Technical &professional
Male Female All
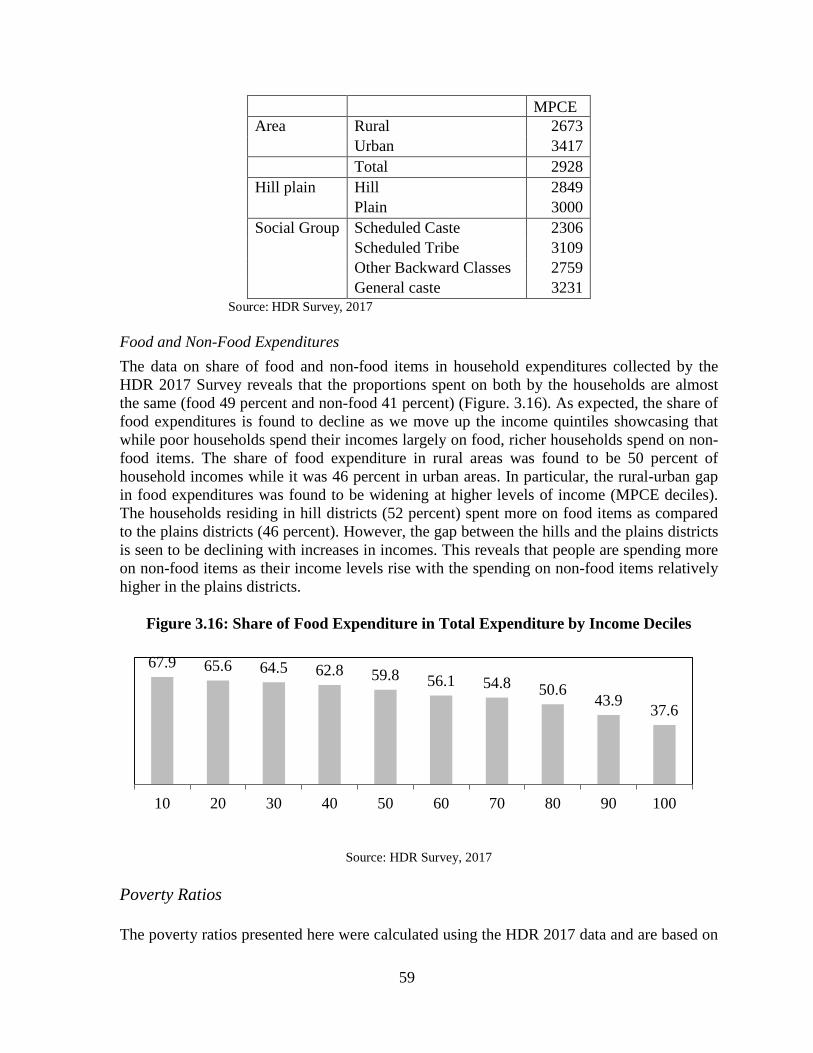
59
MPCE Area Rural 2673
Urban 3417
Total 2928 Hill plain Hill 2849
Plain 3000 Social Group Scheduled Caste 2306
Scheduled Tribe 3109 Other Backward Classes 2759 General caste 3231
Source: HDR Survey, 2017 Food and Non-Food Expenditures
The data on share of food and non-food items in household expenditures collected by the HDR 2017 Survey reveals that the proportions spent on both by the households are almost the same (food 49 percent and non-food 41 percent) (Figure. 3.16). As expected, the share of food expenditures is found to decline as we move up the income quintiles showcasing that while poor households spend their incomes largely on food, richer households spend on non-food items. The share of food expenditure in rural areas was found to be 50 percent of household incomes while it was 46 percent in urban areas. In particular, the rural-urban gap in food expenditures was found to be widening at higher levels of income (MPCE deciles). The households residing in hill districts (52 percent) spent more on food items as compared to the plains districts (46 percent). However, the gap between the hills and the plains districts is seen to be declining with increases in incomes. This reveals that people are spending more on non-food items as their income levels rise with the spending on non-food items relatively higher in the plains districts.
Figure 3.16: Share of Food Expenditure in Total Expenditure by Income Deciles
Source: HDR Survey, 2017 Poverty Ratios The poverty ratios presented here were calculated using the HDR 2017 data and are based on
67.9 65.6 64.5 62.8 59.8 56.1 54.8 50.6 43.9 37.6
10 20 30 40 50 60 70 80 90 100
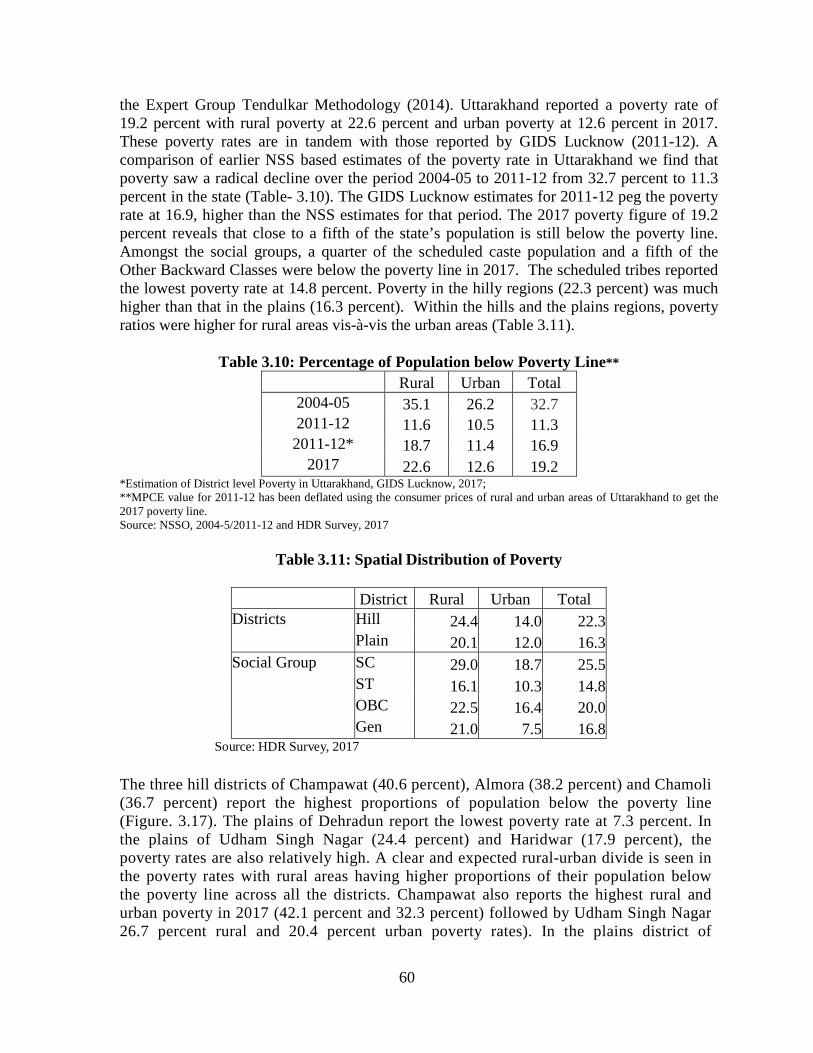
60
the Expert Group Tendulkar Methodology (2014). Uttarakhand reported a poverty rate of 19.2 percent with rural poverty at 22.6 percent and urban poverty at 12.6 percent in 2017. These poverty rates are in tandem with those reported by GIDS Lucknow (2011-12). A comparison of earlier NSS based estimates of the poverty rate in Uttarakhand we find that poverty saw a radical decline over the period 2004-05 to 2011-12 from 32.7 percent to 11.3 percent in the state (Table- 3.10). The GIDS Lucknow estimates for 2011-12 peg the poverty rate at 16.9, higher than the NSS estimates for that period. The 2017 poverty figure of 19.2 percent reveals that close to a fifth of the state’s population is still below the poverty line. Amongst the social groups, a quarter of the scheduled caste population and a fifth of the Other Backward Classes were below the poverty line in 2017. The scheduled tribes reported the lowest poverty rate at 14.8 percent. Poverty in the hilly regions (22.3 percent) was much higher than that in the plains (16.3 percent). Within the hills and the plains regions, poverty ratios were higher for rural areas vis-à-vis the urban areas (Table 3.11).
Table 3.10: Percentage of Population below Poverty Line** Rural Urban Total
2004-05 35.1 26.2 32.7 2011-12 11.6 10.5 11.3 2011-12* 18.7 11.4 16.9
2017 22.6 12.6 19.2 *Estimation of District level Poverty in Uttarakhand, GIDS Lucknow, 2017; **MPCE value for 2011-12 has been deflated using the consumer prices of rural and urban areas of Uttarakhand to get the 2017 poverty line. Source: NSSO, 2004-5/2011-12 and HDR Survey, 2017
Table 3.11: Spatial Distribution of Poverty
District Rural Urban Total Districts Hill 24.4 14.0 22.3
Plain 20.1 12.0 16.3 Social Group SC 29.0 18.7 25.5
ST 16.1 10.3 14.8 OBC 22.5 16.4 20.0 Gen 21.0 7.5 16.8
Source: HDR Survey, 2017 The three hill districts of Champawat (40.6 percent), Almora (38.2 percent) and Chamoli (36.7 percent) report the highest proportions of population below the poverty line (Figure. 3.17). The plains of Dehradun report the lowest poverty rate at 7.3 percent. In the plains of Udham Singh Nagar (24.4 percent) and Haridwar (17.9 percent), the poverty rates are also relatively high. A clear and expected rural-urban divide is seen in the poverty rates with rural areas having higher proportions of their population below the poverty line across all the districts. Champawat also reports the highest rural and urban poverty in 2017 (42.1 percent and 32.3 percent) followed by Udham Singh Nagar 26.7 percent rural and 20.4 percent urban poverty rates). In the plains district of
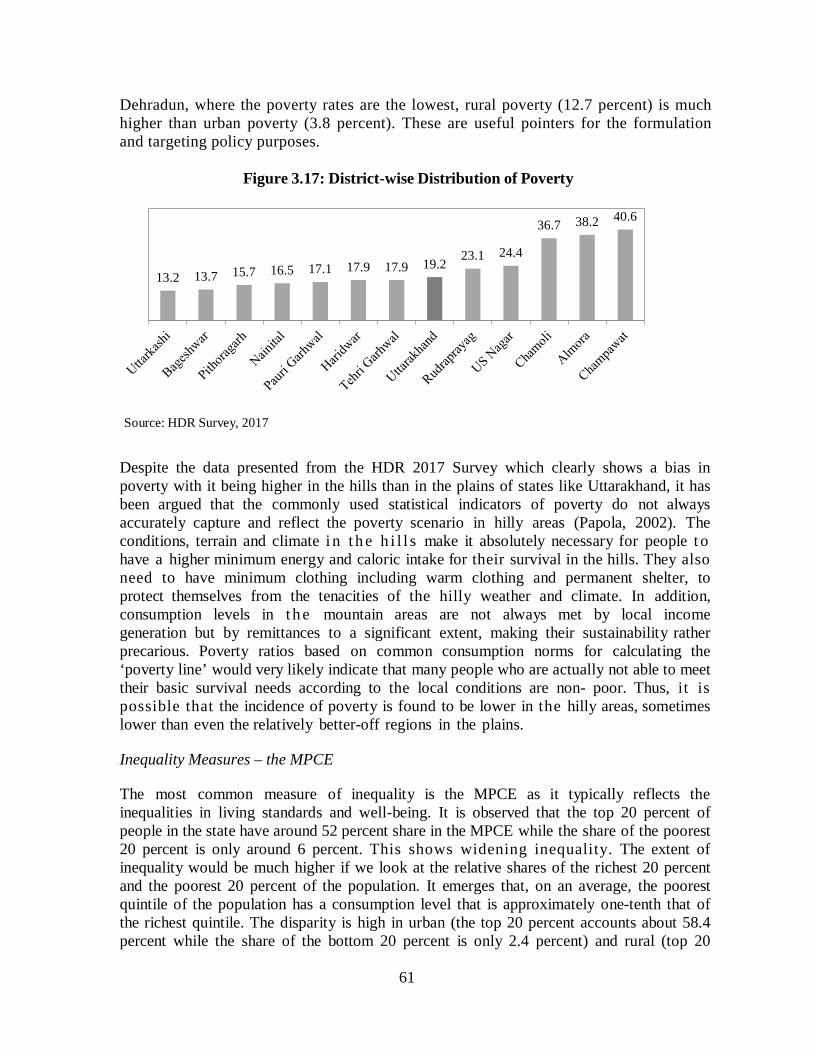
61
Dehradun, where the poverty rates are the lowest, rural poverty (12.7 percent) is much higher than urban poverty (3.8 percent). These are useful pointers for the formulation and targeting policy purposes.
Figure 3.17: District-wise Distribution of Poverty
Source: HDR Survey, 2017
Despite the data presented from the HDR 2017 Survey which clearly shows a bias in poverty with it being higher in the hills than in the plains of states like Uttarakhand, it has been argued that the commonly used statistical indicators of poverty do not always accurately capture and reflect the poverty scenario in hilly areas (Papola, 2002). The conditions, terrain and climate i n t h e h i l l s make it absolutely necessary for people t o have a higher minimum energy and caloric intake for their survival in the hills. They also need to have minimum clothing including warm clothing and permanent shelter, to protect themselves from the tenacities of the hilly weather and climate. In addition, consumption levels in t h e mountain areas are not always met by local income generation but by remittances to a significant extent, making their sustainability rather precarious. Poverty ratios based on common consumption norms for calculating the ‘poverty line’ would very likely indicate that many people who are actually not able to meet their basic survival needs according to the local conditions are non- poor. Thus, it is possible that the incidence of poverty is found to be lower in the hilly areas, sometimes lower than even the relatively better-off regions in the plains. Inequality Measures – the MPCE The most common measure of inequality is the MPCE as it typically reflects the inequalities in living standards and well-being. It is observed that the top 20 percent of people in the state have around 52 percent share in the MPCE while the share of the poorest 20 percent is only around 6 percent. This shows widening inequality. The extent of inequality would be much higher if we look at the relative shares of the richest 20 percent and the poorest 20 percent of the population. It emerges that, on an average, the poorest quintile of the population has a consumption level that is approximately one-tenth that of the richest quintile. The disparity is high in urban (the top 20 percent accounts about 58.4 percent while the share of the bottom 20 percent is only 2.4 percent) and rural (top 20
13.2 13.7 15.7 16.5 17.1 17.9 17.9 19.2 23.1 24.4
36.7 38.2 40.6
62
percent consumes about 47.2 percent and bottom 20 percent consumes 8.3 percent). District-wise the disparity between the bottom and top 20 percent is more in Bageshwar, Chamoli, Uttarkashi, and Dehradun than the state average. (Appendix) The Gini Coefficient as a Measure of Inequality The Gini Coefficient calculated for Uttarakhand using the HDR 2017 Survey data was estimated as 0.44, which was more than the national average of 0.30 in 2011-12 (GIDS, 2017). Across regions, the Gini coefficient was high in rural areas (0.46) as compared to urban areas (0.39), and in hill districts (0.48) as compared to the plains districts (0.41). In t h e rural areas and t h e hill districts, the inequality is more among the higher income group households and substantially less among t h e lower income groups. Similarly, across social groups, among general caste and scheduled tribes inequality is more than among the other groups. Again, the inequality within the higher income group in each social group is substantially higher than for the other households (Table 3.12). Table 3.12: Spatial Distribution of Inequality
District GE(-1) GE(0) GE(1) GE(2) Gini Sector Rural 0.39 0.37 0.69 7.21 0.46
Urban 0.29 0.26 0.30 0.55 0.39 Region Hill 0.42 0.40 0.78 8.51 0.48
Plain 0.32 0.28 0.33 0.66 0.41 Caste SC 0.28 0.28 0.54 7.94 0.40
ST 0.42 0.42 0.78 5.66 0.49 OBC 0.34 0.31 0.55 6.08 0.42 GEN 0.40 0.35 0.51 2.57 0.45
Uttarakhand 0.37 0.34 0.55 4.23 0.44 Note: GE classes of measurements are Generalised Entropy measures. GE(0) gives more weights to lower tail of the income distribution, GE(1) gives equal weights and GE(2) gives more weights to the upper tail of income distribution. Source: HDR Survey, 2017 The district-wise distribution of inequalities presented in Figure 3.18 shows four different poverty and inequality patterns viz., (i) low poverty and high inequality (Uttarkashi, Bageshwar, Pithoragarh, Dehradun); (ii) high poverty and high inequality (Chamoli); (iii) high poverty and low inequality (Champawat, Rudraprayag and Almora) and rest of the districts have (iv) either moderate or low poverty/inequality. Hence, the low poverty level districts do not necessarily have low inequalities as well such as the mountainous districts like Uttarkashi, Bageshwar, Pithoragarh and the plains district of Dehradun.
Figure 3.18: District-wise Distribution of Inequality
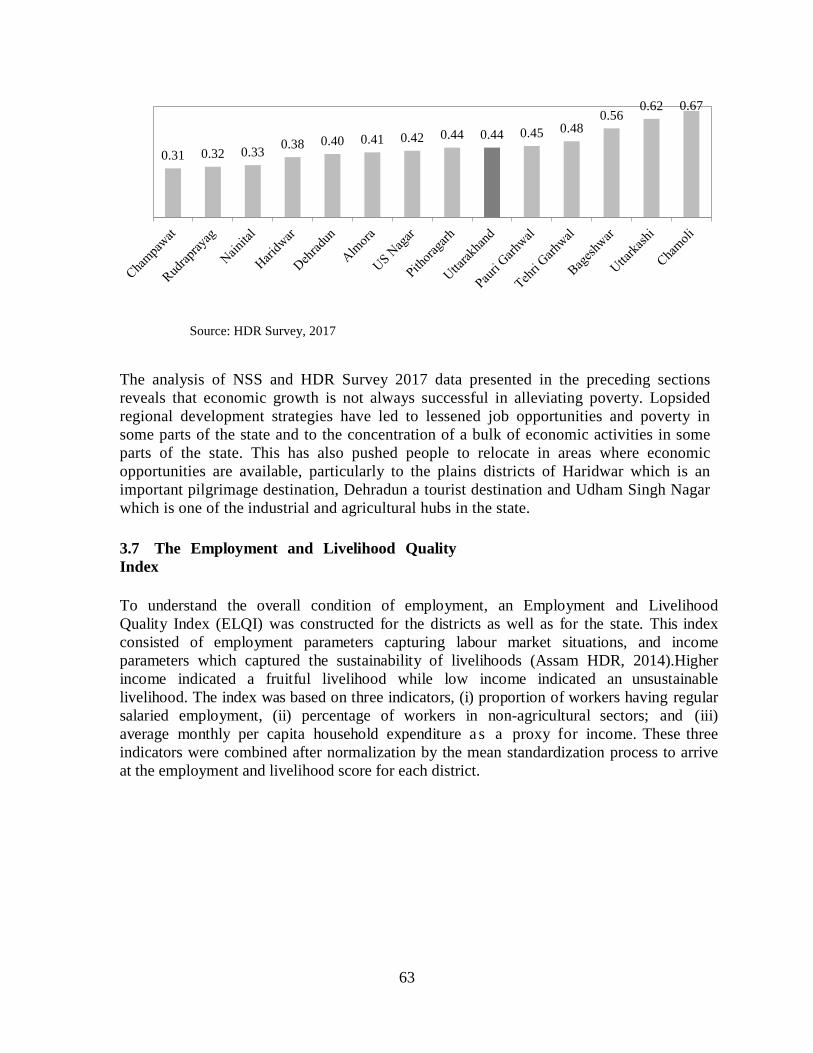
63
Source: HDR Survey, 2017 The analysis of NSS and HDR Survey 2017 data presented in the preceding sections reveals that economic growth is not always successful in alleviating poverty. Lopsided regional development strategies have led to lessened job opportunities and poverty in some parts of the state and to the concentration of a bulk of economic activities in some parts of the state. This has also pushed people to relocate in areas where economic opportunities are available, particularly to the plains districts of Haridwar which is an important pilgrimage destination, Dehradun a tourist destination and Udham Singh Nagar which is one of the industrial and agricultural hubs in the state. 3.7 The Employment and Livelihood Quality Index To understand the overall condition of employment, an Employment and Livelihood Quality Index (ELQI) was constructed for the districts as well as for the state. This index consisted of employment parameters capturing labour market situations, and income parameters which captured the sustainability of livelihoods (Assam HDR, 2014).Higher income indicated a fruitful livelihood while low income indicated an unsustainable livelihood. The index was based on three indicators, (i) proportion of workers having regular salaried employment, (ii) percentage of workers in non-agricultural sectors; and (iii) average monthly per capita household expenditure a s a proxy for income. These three indicators were combined after normalization by the mean standardization process to arrive at the employment and livelihood score for each district.
0.31 0.32 0.33 0.38 0.40 0.41 0.42 0.44 0.44 0.45 0.48 0.56
0.62 0.67
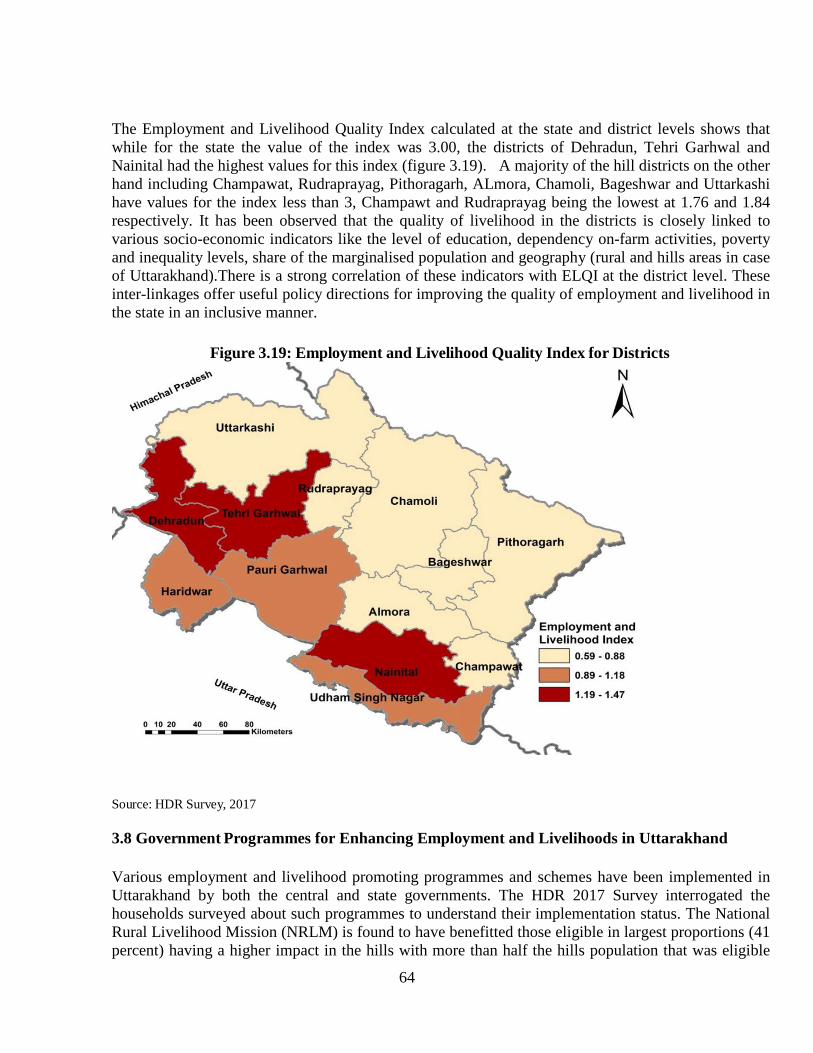
64
The Employment and Livelihood Quality Index calculated at the state and district levels shows that while for the state the value of the index was 3.00, the districts of Dehradun, Tehri Garhwal and Nainital had the highest values for this index (figure 3.19). A majority of the hill districts on the other hand including Champawat, Rudraprayag, Pithoragarh, ALmora, Chamoli, Bageshwar and Uttarkashi have values for the index less than 3, Champawt and Rudraprayag being the lowest at 1.76 and 1.84 respectively. It has been observed that the quality of livelihood in the districts is closely linked to various socio-economic indicators like the level of education, dependency on-farm activities, poverty and inequality levels, share of the marginalised population and geography (rural and hills areas in case of Uttarakhand).There is a strong correlation of these indicators with ELQI at the district level. These inter-linkages offer useful policy directions for improving the quality of employment and livelihood in the state in an inclusive manner.
Figure 3.19: Employment and Livelihood Quality Index for Districts
Source: HDR Survey, 2017
3.8 Government Programmes for Enhancing Employment and Livelihoods in Uttarakhand Various employment and livelihood promoting programmes and schemes have been implemented in Uttarakhand by both the central and state governments. The HDR 2017 Survey interrogated the households surveyed about such programmes to understand their implementation status. The National Rural Livelihood Mission (NRLM) is found to have benefitted those eligible in largest proportions (41 percent) having a higher impact in the hills with more than half the hills population that was eligible
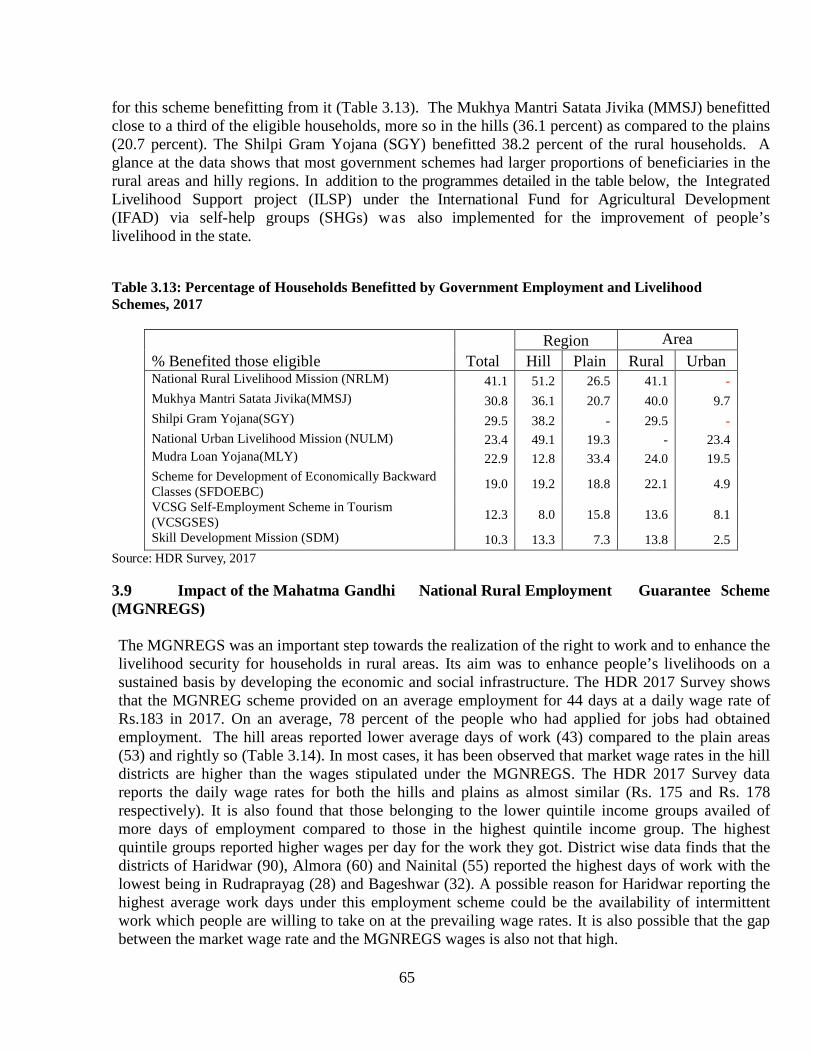
65
for this scheme benefitting from it (Table 3.13). The Mukhya Mantri Satata Jivika (MMSJ) benefitted close to a third of the eligible households, more so in the hills (36.1 percent) as compared to the plains (20.7 percent). The Shilpi Gram Yojana (SGY) benefitted 38.2 percent of the rural households. A glance at the data shows that most government schemes had larger proportions of beneficiaries in the rural areas and hilly regions. In addition to the programmes detailed in the table below, the Integrated Livelihood Support project (ILSP) under the International Fund for Agricultural Development (IFAD) via self-help groups (SHGs) was also implemented for the improvement of people’s livelihood in the state. Table 3.13: Percentage of Households Benefitted by Government Employment and Livelihood Schemes, 2017
% Benefited those eligible Total Region Area
Hill Plain Rural Urban National Rural Livelihood Mission (NRLM) 41.1 51.2 26.5 41.1 - Mukhya Mantri Satata Jivika(MMSJ) 30.8 36.1 20.7 40.0 9.7 Shilpi Gram Yojana(SGY) 29.5 38.2 - 29.5 - National Urban Livelihood Mission (NULM) 23.4 49.1 19.3 - 23.4 Mudra Loan Yojana(MLY) 22.9 12.8 33.4 24.0 19.5 Scheme for Development of Economically Backward Classes (SFDOEBC) 19.0 19.2 18.8 22.1 4.9
VCSG Self-Employment Scheme in Tourism (VCSGSES) 12.3 8.0 15.8 13.6 8.1
Skill Development Mission (SDM) 10.3 13.3 7.3 13.8 2.5 Source: HDR Survey, 2017 3.9 Impact of the Mahatma Gandhi National Rural Employment Guarantee Scheme (MGNREGS) The MGNREGS was an important step towards the realization of the right to work and to enhance the livelihood security for households in rural areas. Its aim was to enhance people’s livelihoods on a sustained basis by developing the economic and social infrastructure. The HDR 2017 Survey shows that the MGNREG scheme provided on an average employment for 44 days at a daily wage rate of Rs.183 in 2017. On an average, 78 percent of the people who had applied for jobs had obtained employment. The hill areas reported lower average days of work (43) compared to the plain areas (53) and rightly so (Table 3.14). In most cases, it has been observed that market wage rates in the hill districts are higher than the wages stipulated under the MGNREGS. The HDR 2017 Survey data reports the daily wage rates for both the hills and plains as almost similar (Rs. 175 and Rs. 178 respectively). It is also found that those belonging to the lower quintile income groups availed of more days of employment compared to those in the highest quintile income group. The highest quintile groups reported higher wages per day for the work they got. District wise data finds that the districts of Haridwar (90), Almora (60) and Nainital (55) reported the highest days of work with the lowest being in Rudraprayag (28) and Bageshwar (32). A possible reason for Haridwar reporting the highest average work days under this employment scheme could be the availability of intermittent work which people are willing to take on at the prevailing wage rates. It is also possible that the gap between the market wage rate and the MGNREGS wages is also not that high.
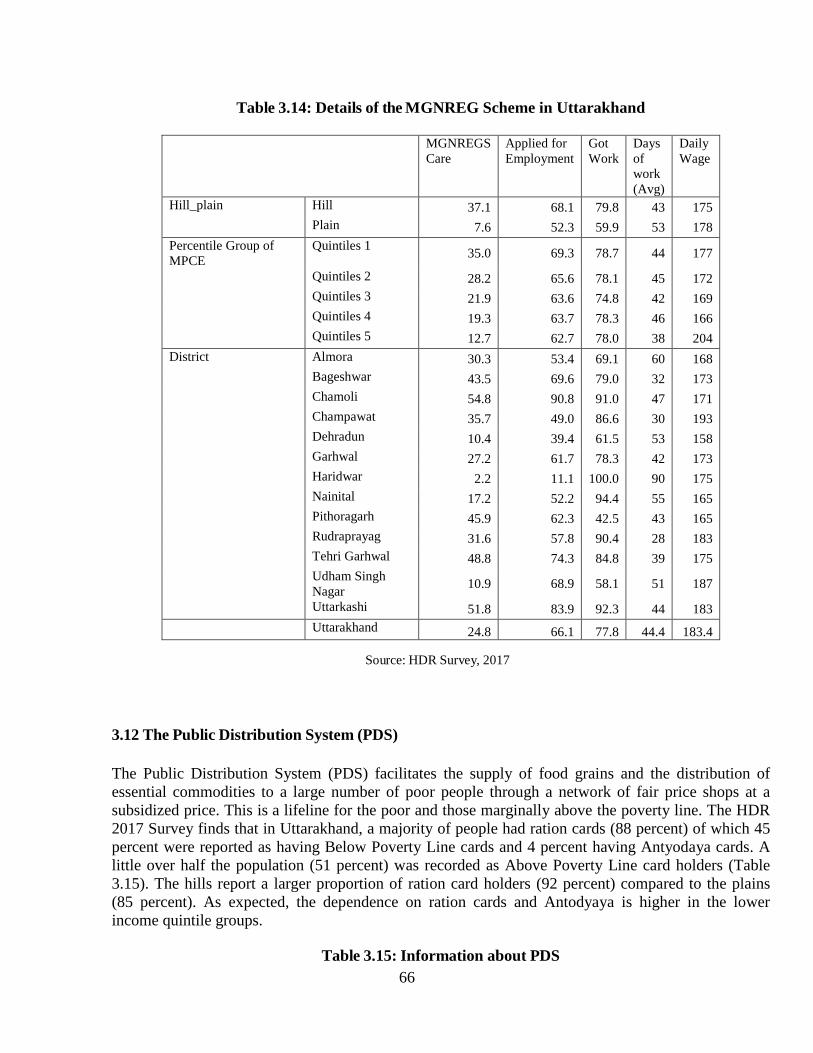
66
Table 3.14: Details of the MGNREG Scheme in Uttarakhand
MGNREGS Care
Applied for Employment
Got Work
Days of work (Avg)
Daily Wage
Hill_plain Hill 37.1 68.1 79.8 43 175 Plain 7.6 52.3 59.9 53 178 Percentile Group of MPCE
Quintiles 1 35.0 69.3 78.7 44 177
Quintiles 2 28.2 65.6 78.1 45 172 Quintiles 3 21.9 63.6 74.8 42 169 Quintiles 4 19.3 63.7 78.3 46 166 Quintiles 5 12.7 62.7 78.0 38 204 District
Almora 30.3 53.4 69.1 60 168 Bageshwar 43.5 69.6 79.0 32 173 Chamoli 54.8 90.8 91.0 47 171 Champawat 35.7 49.0 86.6 30 193 Dehradun 10.4 39.4 61.5 53 158 Garhwal 27.2 61.7 78.3 42 173 Haridwar 2.2 11.1 100.0 90 175 Nainital 17.2 52.2 94.4 55 165 Pithoragarh 45.9 62.3 42.5 43 165 Rudraprayag 31.6 57.8 90.4 28 183 Tehri Garhwal 48.8 74.3 84.8 39 175 Udham Singh Nagar 10.9 68.9 58.1 51 187
Uttarkashi 51.8 83.9 92.3 44 183
Uttarakhand 24.8 66.1 77.8 44.4 183.4
Source: HDR Survey, 2017 3.12 The Public Distribution System (PDS) The Public Distribution System (PDS) facilitates the supply of food grains and the distribution of essential commodities to a large number of poor people through a network of fair price shops at a subsidized price. This is a lifeline for the poor and those marginally above the poverty line. The HDR 2017 Survey finds that in Uttarakhand, a majority of people had ration cards (88 percent) of which 45 percent were reported as having Below Poverty Line cards and 4 percent having Antyodaya cards. A little over half the population (51 percent) was recorded as Above Poverty Line card holders (Table 3.15). The hills report a larger proportion of ration card holders (92 percent) compared to the plains (85 percent). As expected, the dependence on ration cards and Antodyaya is higher in the lower income quintile groups.
Table 3.15: Information about PDS
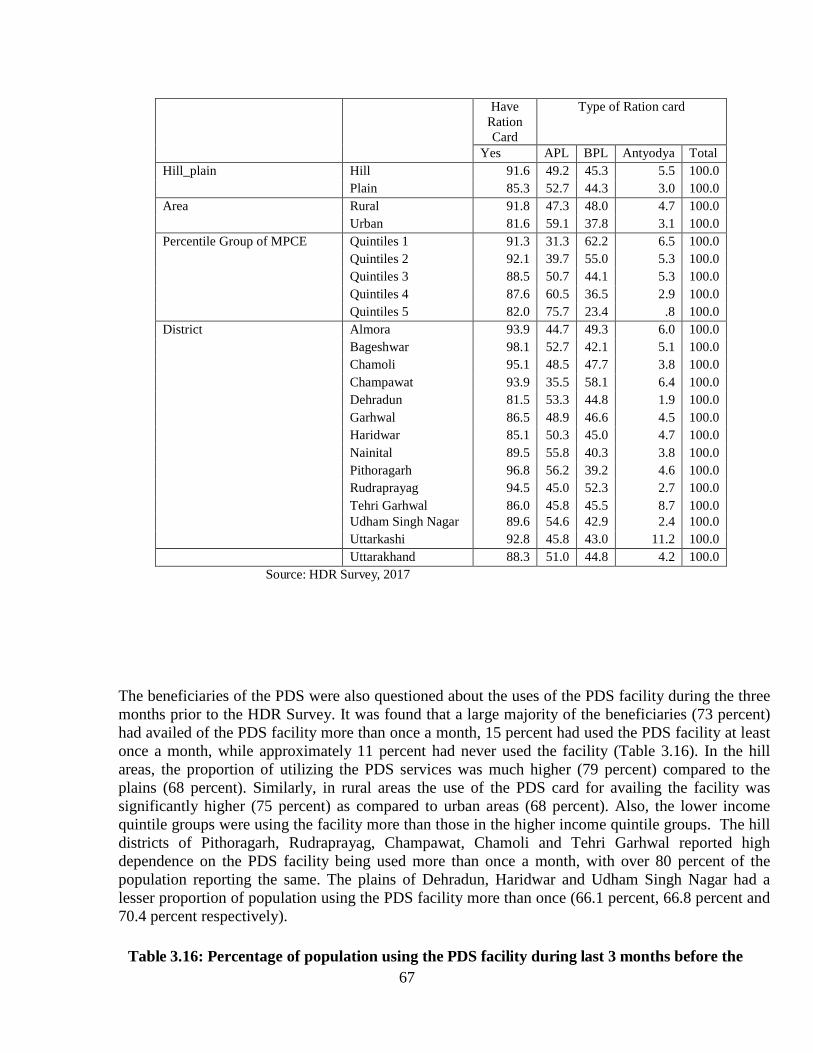
67
Have Ration Card
Type of Ration card
Yes APL BPL Antyodya Total Hill_plain Hill 91.6 49.2 45.3 5.5 100.0
Plain 85.3 52.7 44.3 3.0 100.0 Area Rural 91.8 47.3 48.0 4.7 100.0
Urban 81.6 59.1 37.8 3.1 100.0 Percentile Group of MPCE Quintiles 1 91.3 31.3 62.2 6.5 100.0
Quintiles 2 92.1 39.7 55.0 5.3 100.0 Quintiles 3 88.5 50.7 44.1 5.3 100.0 Quintiles 4 87.6 60.5 36.5 2.9 100.0 Quintiles 5 82.0 75.7 23.4 .8 100.0
District Almora 93.9 44.7 49.3 6.0 100.0 Bageshwar 98.1 52.7 42.1 5.1 100.0 Chamoli 95.1 48.5 47.7 3.8 100.0 Champawat 93.9 35.5 58.1 6.4 100.0 Dehradun 81.5 53.3 44.8 1.9 100.0 Garhwal 86.5 48.9 46.6 4.5 100.0 Haridwar 85.1 50.3 45.0 4.7 100.0 Nainital 89.5 55.8 40.3 3.8 100.0 Pithoragarh 96.8 56.2 39.2 4.6 100.0 Rudraprayag 94.5 45.0 52.3 2.7 100.0 Tehri Garhwal 86.0 45.8 45.5 8.7 100.0 Udham Singh Nagar 89.6 54.6 42.9 2.4 100.0 Uttarkashi 92.8 45.8 43.0 11.2 100.0
Uttarakhand 88.3 51.0 44.8 4.2 100.0 Source: HDR Survey, 2017
The beneficiaries of the PDS were also questioned about the uses of the PDS facility during the three months prior to the HDR Survey. It was found that a large majority of the beneficiaries (73 percent) had availed of the PDS facility more than once a month, 15 percent had used the PDS facility at least once a month, while approximately 11 percent had never used the facility (Table 3.16). In the hill areas, the proportion of utilizing the PDS services was much higher (79 percent) compared to the plains (68 percent). Similarly, in rural areas the use of the PDS card for availing the facility was significantly higher (75 percent) as compared to urban areas (68 percent). Also, the lower income quintile groups were using the facility more than those in the higher income quintile groups. The hill districts of Pithoragarh, Rudraprayag, Champawat, Chamoli and Tehri Garhwal reported high dependence on the PDS facility being used more than once a month, with over 80 percent of the population reporting the same. The plains of Dehradun, Haridwar and Udham Singh Nagar had a lesser proportion of population using the PDS facility more than once (66.1 percent, 66.8 percent and 70.4 percent respectively).
Table 3.16: Percentage of population using the PDS facility during last 3 months before the
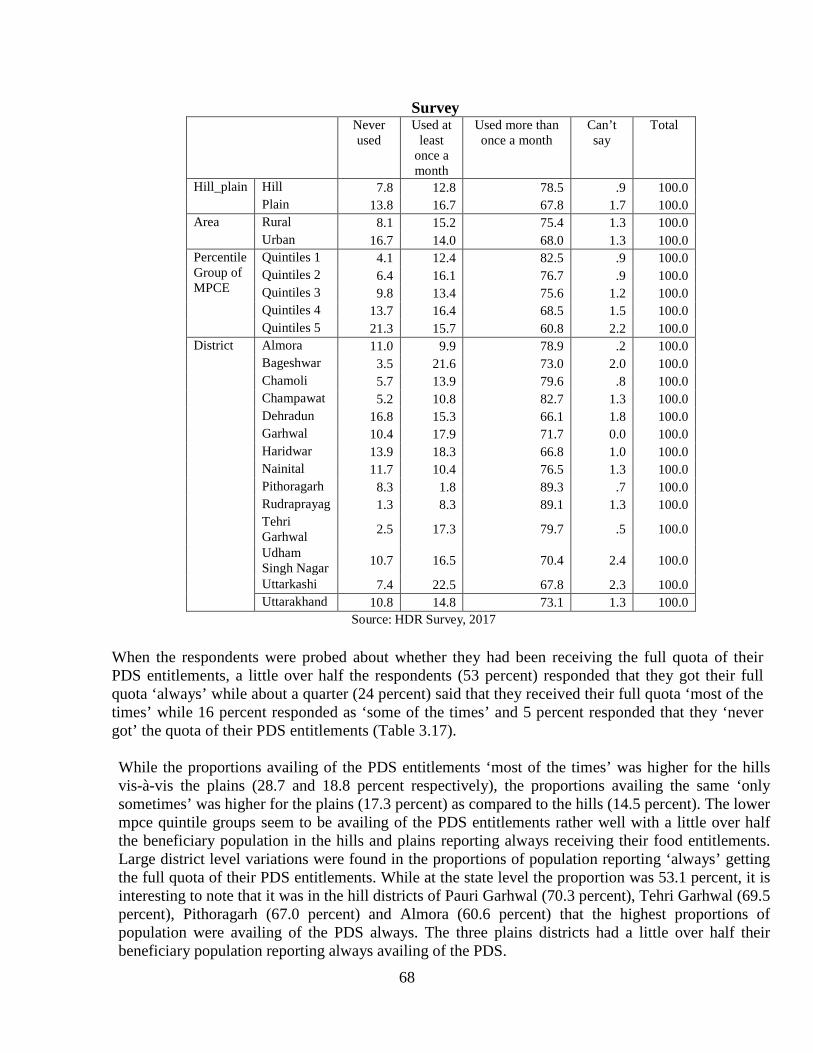
68
Survey Never
used Used at
least once a month
Used more than once a month
Can’t say
Total
Hill_plain Hill 7.8 12.8 78.5 .9 100.0 Plain 13.8 16.7 67.8 1.7 100.0
Area Rural 8.1 15.2 75.4 1.3 100.0 Urban 16.7 14.0 68.0 1.3 100.0
Percentile Group of MPCE
Quintiles 1 4.1 12.4 82.5 .9 100.0 Quintiles 2 6.4 16.1 76.7 .9 100.0 Quintiles 3 9.8 13.4 75.6 1.2 100.0 Quintiles 4 13.7 16.4 68.5 1.5 100.0 Quintiles 5 21.3 15.7 60.8 2.2 100.0
District Almora 11.0 9.9 78.9 .2 100.0 Bageshwar 3.5 21.6 73.0 2.0 100.0 Chamoli 5.7 13.9 79.6 .8 100.0 Champawat 5.2 10.8 82.7 1.3 100.0 Dehradun 16.8 15.3 66.1 1.8 100.0 Garhwal 10.4 17.9 71.7 0.0 100.0 Haridwar 13.9 18.3 66.8 1.0 100.0 Nainital 11.7 10.4 76.5 1.3 100.0 Pithoragarh 8.3 1.8 89.3 .7 100.0 Rudraprayag 1.3 8.3 89.1 1.3 100.0 Tehri Garhwal 2.5 17.3 79.7 .5 100.0
Udham Singh Nagar 10.7 16.5 70.4 2.4 100.0
Uttarkashi 7.4 22.5 67.8 2.3 100.0 Uttarakhand 10.8 14.8 73.1 1.3 100.0
Source: HDR Survey, 2017 When the respondents were probed about whether they had been receiving the full quota of their PDS entitlements, a little over half the respondents (53 percent) responded that they got their full quota ‘always’ while about a quarter (24 percent) said that they received their full quota ‘most of the times’ while 16 percent responded as ‘some of the times’ and 5 percent responded that they ‘never got’ the quota of their PDS entitlements (Table 3.17). While the proportions availing of the PDS entitlements ‘most of the times’ was higher for the hills vis-à-vis the plains (28.7 and 18.8 percent respectively), the proportions availing the same ‘only sometimes’ was higher for the plains (17.3 percent) as compared to the hills (14.5 percent). The lower mpce quintile groups seem to be availing of the PDS entitlements rather well with a little over half the beneficiary population in the hills and plains reporting always receiving their food entitlements. Large district level variations were found in the proportions of population reporting ‘always’ getting the full quota of their PDS entitlements. While at the state level the proportion was 53.1 percent, it is interesting to note that it was in the hill districts of Pauri Garhwal (70.3 percent), Tehri Garhwal (69.5 percent), Pithoragarh (67.0 percent) and Almora (60.6 percent) that the highest proportions of population were availing of the PDS always. The three plains districts had a little over half their beneficiary population reporting always availing of the PDS.
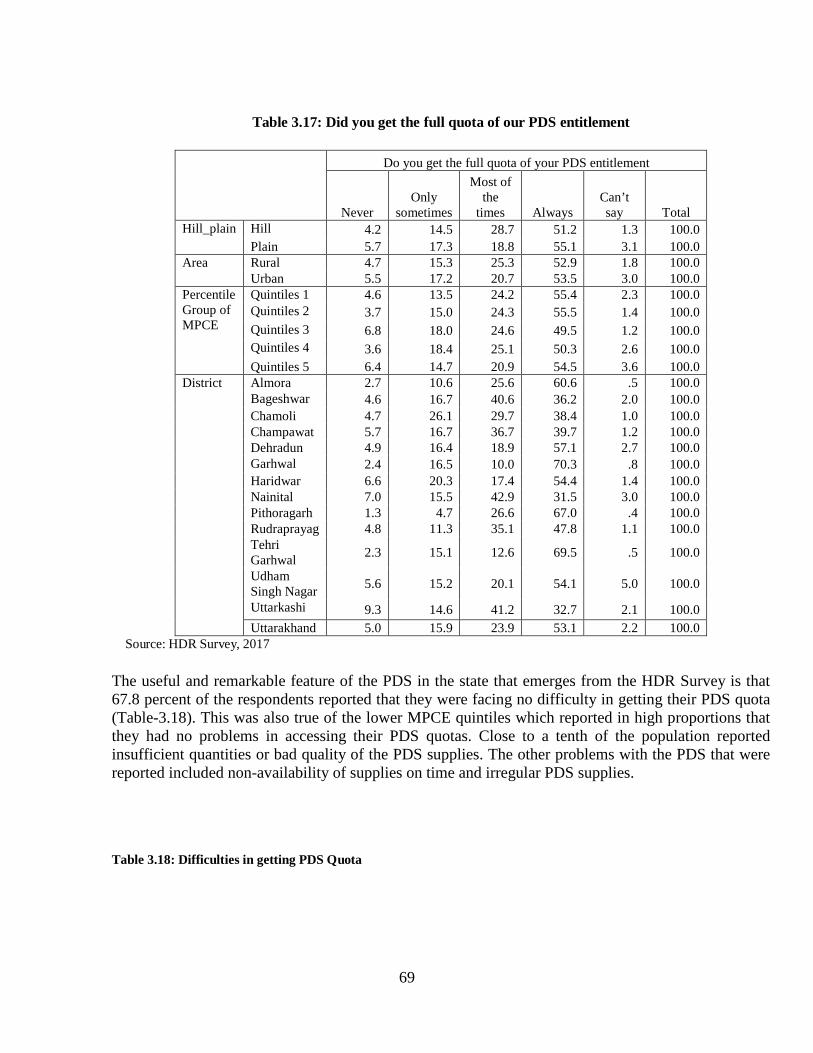
69
Table 3.17: Did you get the full quota of our PDS entitlement
Do you get the full quota of your PDS entitlement
Never Only
sometimes
Most of the
times Always Can’t say Total
Hill_plain Hill 4.2 14.5 28.7 51.2 1.3 100.0 Plain 5.7 17.3 18.8 55.1 3.1 100.0
Area Rural 4.7 15.3 25.3 52.9 1.8 100.0 Urban 5.5 17.2 20.7 53.5 3.0 100.0
Percentile Group of MPCE
Quintiles 1 4.6 13.5 24.2 55.4 2.3 100.0 Quintiles 2 3.7 15.0 24.3 55.5 1.4 100.0 Quintiles 3 6.8 18.0 24.6 49.5 1.2 100.0 Quintiles 4 3.6 18.4 25.1 50.3 2.6 100.0 Quintiles 5 6.4 14.7 20.9 54.5 3.6 100.0
District Almora 2.7 10.6 25.6 60.6 .5 100.0 Bageshwar 4.6 16.7 40.6 36.2 2.0 100.0 Chamoli 4.7 26.1 29.7 38.4 1.0 100.0 Champawat 5.7 16.7 36.7 39.7 1.2 100.0 Dehradun 4.9 16.4 18.9 57.1 2.7 100.0 Garhwal 2.4 16.5 10.0 70.3 .8 100.0 Haridwar 6.6 20.3 17.4 54.4 1.4 100.0 Nainital 7.0 15.5 42.9 31.5 3.0 100.0 Pithoragarh 1.3 4.7 26.6 67.0 .4 100.0 Rudraprayag 4.8 11.3 35.1 47.8 1.1 100.0 Tehri Garhwal 2.3 15.1 12.6 69.5 .5 100.0
Udham Singh Nagar 5.6 15.2 20.1 54.1 5.0 100.0
Uttarkashi 9.3 14.6 41.2 32.7 2.1 100.0 Uttarakhand 5.0 15.9 23.9 53.1 2.2 100.0
Source: HDR Survey, 2017
The useful and remarkable feature of the PDS in the state that emerges from the HDR Survey is that 67.8 percent of the respondents reported that they were facing no difficulty in getting their PDS quota (Table-3.18). This was also true of the lower MPCE quintiles which reported in high proportions that they had no problems in accessing their PDS quotas. Close to a tenth of the population reported insufficient quantities or bad quality of the PDS supplies. The other problems with the PDS that were reported included non-availability of supplies on time and irregular PDS supplies. Table 3.18: Difficulties in getting PDS Quota
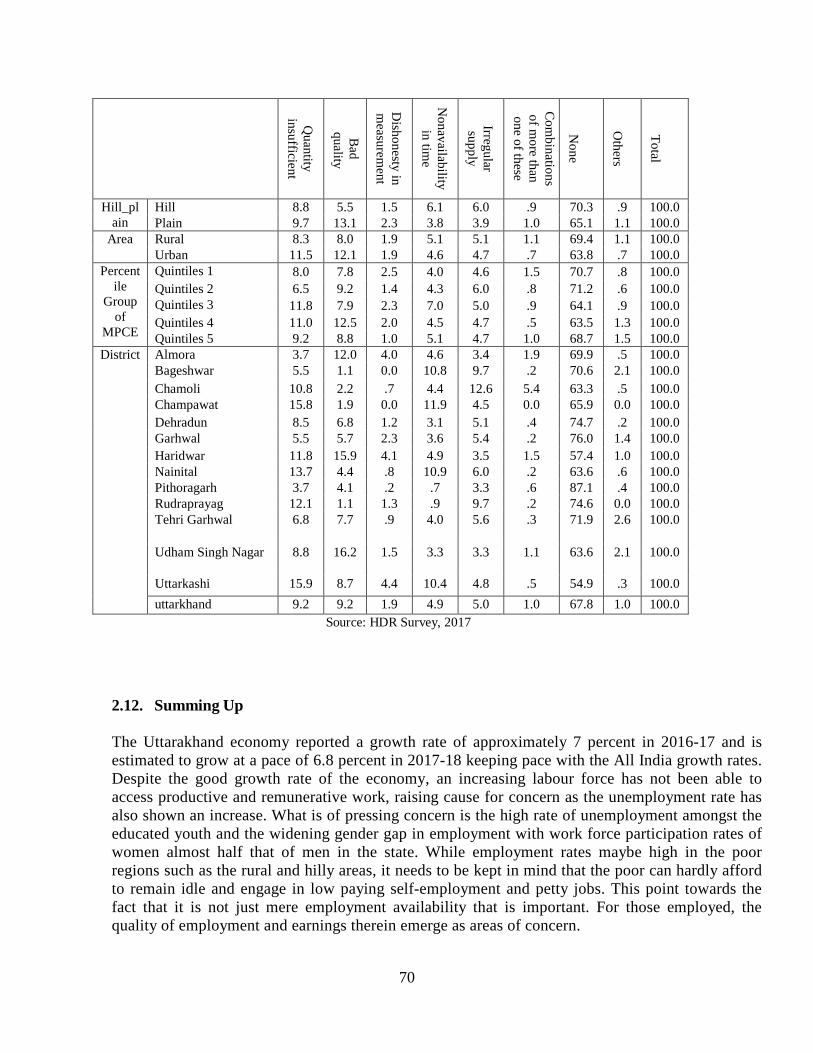
70
Quantity
insufficient
Bad
quality
Dishonesty in
measurem
ent
Nonavailability
in time
Irregular supply
Com
binations of m
ore than one of these
None
Others
Total
Hill_plain
Hill 8.8 5.5 1.5 6.1 6.0 .9 70.3 .9 100.0 Plain 9.7 13.1 2.3 3.8 3.9 1.0 65.1 1.1 100.0
Area Rural 8.3 8.0 1.9 5.1 5.1 1.1 69.4 1.1 100.0 Urban 11.5 12.1 1.9 4.6 4.7 .7 63.8 .7 100.0
Percentile
Group of
MPCE
Quintiles 1 8.0 7.8 2.5 4.0 4.6 1.5 70.7 .8 100.0 Quintiles 2 6.5 9.2 1.4 4.3 6.0 .8 71.2 .6 100.0 Quintiles 3 11.8 7.9 2.3 7.0 5.0 .9 64.1 .9 100.0 Quintiles 4 11.0 12.5 2.0 4.5 4.7 .5 63.5 1.3 100.0 Quintiles 5 9.2 8.8 1.0 5.1 4.7 1.0 68.7 1.5 100.0
District Almora 3.7 12.0 4.0 4.6 3.4 1.9 69.9 .5 100.0 Bageshwar 5.5 1.1 0.0 10.8 9.7 .2 70.6 2.1 100.0 Chamoli 10.8 2.2 .7 4.4 12.6 5.4 63.3 .5 100.0 Champawat 15.8 1.9 0.0 11.9 4.5 0.0 65.9 0.0 100.0 Dehradun 8.5 6.8 1.2 3.1 5.1 .4 74.7 .2 100.0 Garhwal 5.5 5.7 2.3 3.6 5.4 .2 76.0 1.4 100.0 Haridwar 11.8 15.9 4.1 4.9 3.5 1.5 57.4 1.0 100.0 Nainital 13.7 4.4 .8 10.9 6.0 .2 63.6 .6 100.0 Pithoragarh 3.7 4.1 .2 .7 3.3 .6 87.1 .4 100.0 Rudraprayag 12.1 1.1 1.3 .9 9.7 .2 74.6 0.0 100.0 Tehri Garhwal 6.8 7.7 .9 4.0 5.6 .3 71.9 2.6 100.0
Udham Singh Nagar 8.8 16.2 1.5 3.3 3.3 1.1 63.6 2.1 100.0
Uttarkashi 15.9 8.7 4.4 10.4 4.8 .5 54.9 .3 100.0 uttarkhand 9.2 9.2 1.9 4.9 5.0 1.0 67.8 1.0 100.0
Source: HDR Survey, 2017
2.12. Summing Up The Uttarakhand economy reported a growth rate of approximately 7 percent in 2016-17 and is estimated to grow at a pace of 6.8 percent in 2017-18 keeping pace with the All India growth rates. Despite the good growth rate of the economy, an increasing labour force has not been able to access productive and remunerative work, raising cause for concern as the unemployment rate has also shown an increase. What is of pressing concern is the high rate of unemployment amongst the educated youth and the widening gender gap in employment with work force participation rates of women almost half that of men in the state. While employment rates maybe high in the poor regions such as the rural and hilly areas, it needs to be kept in mind that the poor can hardly afford to remain idle and engage in low paying self-employment and petty jobs. This point towards the fact that it is not just mere employment availability that is important. For those employed, the quality of employment and earnings therein emerge as areas of concern.

71
While the government of Uttarakhand has initiated Skill Development Mission (SDM) Plans to provide placement–linked skill training to the educated unemployed youth in the state, the effectiveness of such programmes needs proper monitoring and implementation. The government has also recently started establishing growth centers in villages of the hill districts and exploring possibilities for using natural resources like the abundance of aromatic plants to make different products engaging the local youth. The Uttarakhand economy while the secondary sector is seen to dominate in the sectoral distribution of the GSDP, the primary and tertiary sectors have a larger share in employment. A shift is seen in the employment structure with workers moving away from the primary sector and towards the tertiary sector seeking employment in trade, repair, hotels and restaurants, transport, storage and communication. The occupational spread shows that there has been a discernible move of workers from the agriculture sector to a myriad of service related occupations. It is the middle skilled workers who form a large proportion of the workforce in the state. In terms of wages, the earnings of regular workers are found to be higher than those for casual workers across the state. The incomes of regular workers increases in the levels of education, with graduates and technical/professional workers earning more than three times higher income than the illiterates. There is an urgent need for state intervention in the labour market to make available gainful employment for the entrants into the labour force. A skilled and educated labour force also needs to be built through proper education and training.
The starkly evident disparities across a large majority of employment, growth, per capita, poverty and inequality indicators between the hills and the plains in Uttarakhand puts focus on the need for suitable policy initiatives to bridge the disadvantages and unbalanced development faced by the hill districts in the state. Women play a prominent role in operating and managing most agricultural and household activities, more so in the hills due to huge male outmigration, including working in the fields, rearing cattle, fuel, fodder and water collection including cooking and childcare. . They are thus considered the backbone of the hill economy in Uttarakhand. Yet they continue to largely engage in low productive agriculture and related activities in the hill districts and in domestic & care activities along with remaining underemployed due to lack of suitable jobs in the plains. Women need to be given more rights such as land ownership, particularly in the hill districts and in rural areas, as without ownership of land, they are disadvantaged in terms of securing credit, entering into contracts, or undertaking other non-farm activities. Encouraging women’s ownership of land is a key measure that improves and encourages women’s entrepreneurship and promotes their participation in non-farm productive activities. Given the benefits of empowering women to improve the socio-economic status of the households, especially in the hills and rural areas of Uttarakhand, it is recommended that women’s empowerment in the state be enhanced with legislation for encouraging female ownership of land. To provide productive assets and income generating employment opportunities to the poor, many state and centrally sponsored schemes have been implemented in Uttarakhand. The MGNREG Scheme is an important demand-driven employment guarantee programme that has been providing employment for those who depend on casual work for their livelihood. Although the overall days of employment are low (one and half months) for this scheme, t he dependence on such employment is higher among the lower quintile income groups compared to the highest quintile groups.

72
In Uttarakhand, the PDS is an important means of sustenance and a majority of the people have ration cards (88%) of which 45 percent are reported as having BPL cards and 4 percent having Antyodya cards. Dependence of ration cards is huge in the hill areas and in rural areas as compared to t h e plains and urban areas. There are few problems associated with the PDS and a large majority of respondents (68 percent) faced no difficulty in getting their PDS quotas. At the industrial policy level, the real challenge is to create an environment-friendly micro and small enterprises sector in the hill districts. In particular, it is imperative to create an industry-friendly environment for attracting new investments and linking local based industries with the local markets. In this context, the ‘MSME policy 2015’, the ‘Mega Industrial and Investment policy 2015’ and the ‘Start-up Policy 2016’ could provide a supportive regulatory environment for boosting investments and employment.
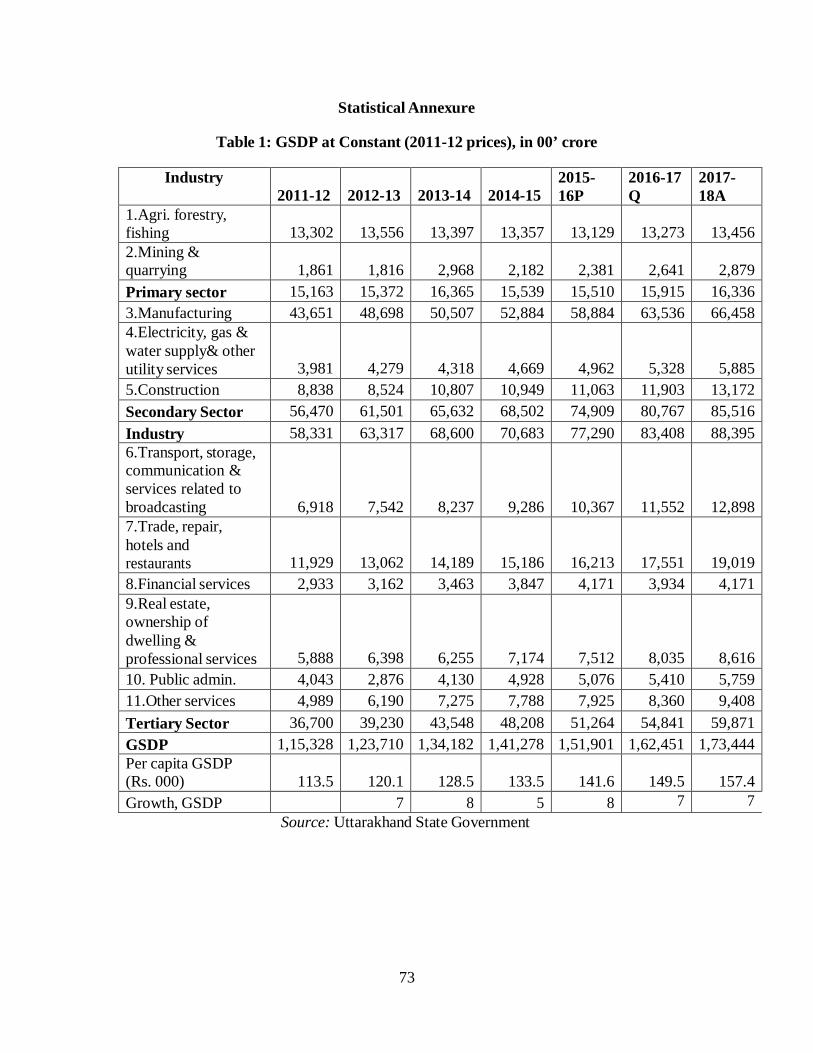
73
Statistical Annexure
Table 1: GSDP at Constant (2011-12 prices), in 00’ crore
Industry 2011-12
2012-13
2013-14
2014-15
2015- 16P
2016-17 Q
2017- 18A
1.Agri. forestry, fishing
13,302
13,556
13,397
13,357
13,129
13,273
13,456
2.Mining & quarrying
1,861
1,816
2,968
2,182
2,381
2,641
2,879
Primary sector 15,163 15,372 16,365 15,539 15,510 15,915 16,336 3.Manufacturing 43,651 48,698 50,507 52,884 58,884 63,536 66,458 4.Electricity, gas & water supply& other utility services
3,981
4,279
4,318
4,669
4,962
5,328
5,885 5.Construction 8,838 8,524 10,807 10,949 11,063 11,903 13,172 Secondary Sector 56,470 61,501 65,632 68,502 74,909 80,767 85,516 Industry 58,331 63,317 68,600 70,683 77,290 83,408 88,395 6.Transport, storage, communication & services related to broadcasting
6,918
7,542
8,237
9,286
10,367
11,552
12,898 7.Trade, repair, hotels and restaurants
11,929
13,062
14,189
15,186
16,213
17,551
19,019 8.Financial services 2,933 3,162 3,463 3,847 4,171 3,934 4,171 9.Real estate, ownership of dwelling & professional services
5,888
6,398
6,255
7,174
7,512
8,035
8,616 10. Public admin. 4,043 2,876 4,130 4,928 5,076 5,410 5,759 11.Other services 4,989 6,190 7,275 7,788 7,925 8,360 9,408 Tertiary Sector 36,700 39,230 43,548 48,208 51,264 54,841 59,871 GSDP 1,15,328 1,23,710 1,34,182 1,41,278 1,51,901 1,62,451 1,73,444 Per capita GSDP (Rs. 000)
113.5
120.1
128.5
133.5
141.6
149.5
157.4
Growth, GSDP 7 8 5 8 7 7 Source: Uttarakhand State Government

74
Table 2: GSDP Growth by Economic Sectors (2011-12 prices)
Industry
2011- 2014- 2011- 12 to 15 to 12 to 2014- 2017- 2017- 15 18 18
1.Agri. forestry, fishing 0.1 0.18 0.16 2.Mining & quarrying 4.06 7.18 6.43 Primary sector 0.61 1.26 1.07 3.Manufacturing 4.91 5.88 6.19 4.Electricity, gas & water supply& other utility services 4.07 5.96 5.74 5.Construction 5.5 4.73 5.87 Secondary Sector 4.94 5.7 6.1 Industry 4.91 5.75 6.11 6.Transport, storage, communication & services related to broadcasting
7.63 8.56 9.3
7.Trade, repair, hotels and restaurants 6.22 5.79 6.89 8.Financial services 7.01 2.04 5.15 9.Real estate, ownership of dwelling & professional services
5.06 4.68 5.59
10. Public admin. 5.07 3.97 5.18 11.Other services 11.78 4.83 9.48 Tertiary Sector 7.05 5.56 7.24 GSDP 5.2 5.26 6 Per capita GSDP (Rs.) 4.15 4.21 4.79 Growth, GSDP
Source: Uttarakhand State Government Table 3: Labour Market Characteristics
Rural Urban Total Male Female Total Male Female Total Male Female Total
LFPR 2004-05 82.4 65.7 73.8 75.7 19.8 49.1 80.5 54.2 67.3 2011-12 71.1 43.8 56.9 73.8 15.0 45.3 71.9 36.5 53.8 2017 69.1 31.6 49.5 70.5 15.8 43.2 69.6 26.2 47.3 WPR 2004-05 80.8 65.4 72.8 72.6 17.8 46.5 78.5 53.5 65.9 2011-12 69.2 42.9 55.5 72.5 12.0 43.1 70.1 35.1 52.2 2017 66.3 31.0 47.9 66.2 14.9 40.6 66.3 25.5 45.3 UNR 2004-05 2.0 0.4 1.3 4.1 10.3 5.3 2.6 1.3 2.1 2011-12 2.8 2.1 2.5 1.8 20.0 4.7 2.5 4.0 3.0 2017 4.1 1.8 3.3 6.1 5.9 6.0 4.8 2.7 4.2
Source: NSS various rounds and HDR Survey, 2017
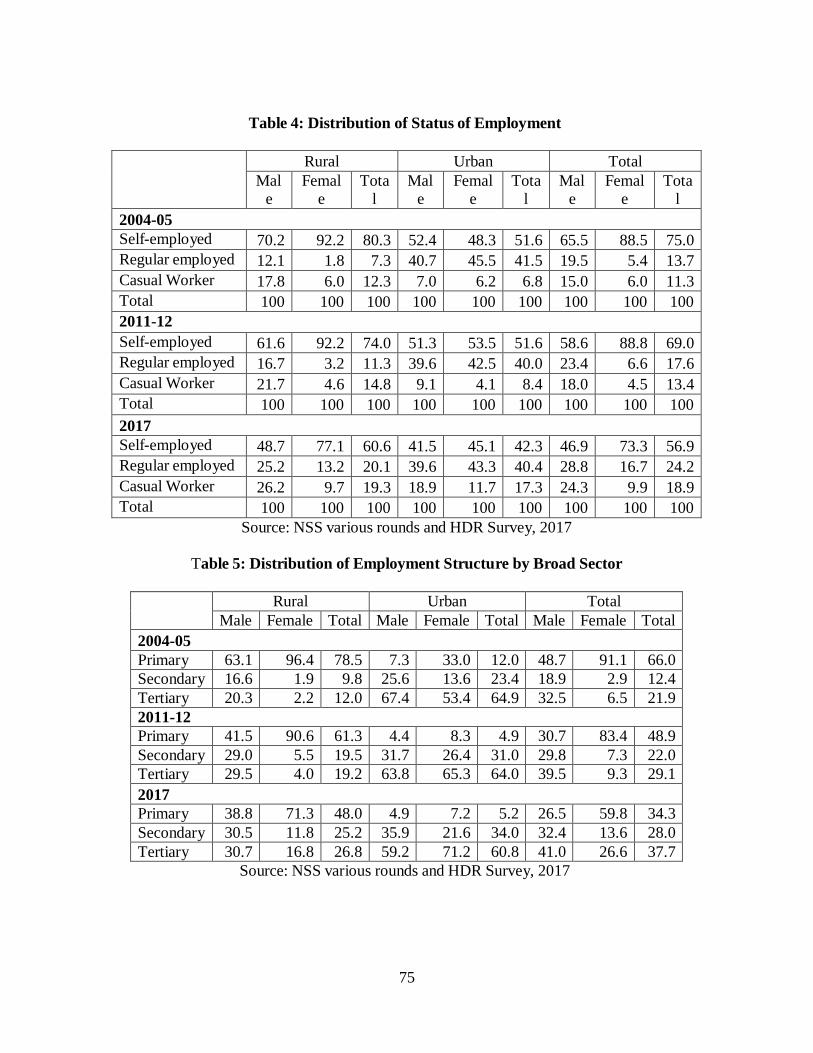
75
Table 4: Distribution of Status of Employment Rural Urban Total
Mal e
Femal e
Tota l
Mal e
Femal e
Tota l
Mal e
Femal e
Tota l
2004-05 Self-employed 70.2 92.2 80.3 52.4 48.3 51.6 65.5 88.5 75.0 Regular employed 12.1 1.8 7.3 40.7 45.5 41.5 19.5 5.4 13.7 Casual Worker 17.8 6.0 12.3 7.0 6.2 6.8 15.0 6.0 11.3 Total 100 100 100 100 100 100 100 100 100 2011-12 Self-employed 61.6 92.2 74.0 51.3 53.5 51.6 58.6 88.8 69.0 Regular employed 16.7 3.2 11.3 39.6 42.5 40.0 23.4 6.6 17.6 Casual Worker 21.7 4.6 14.8 9.1 4.1 8.4 18.0 4.5 13.4 Total 100 100 100 100 100 100 100 100 100 2017 Self-employed 48.7 77.1 60.6 41.5 45.1 42.3 46.9 73.3 56.9 Regular employed 25.2 13.2 20.1 39.6 43.3 40.4 28.8 16.7 24.2 Casual Worker 26.2 9.7 19.3 18.9 11.7 17.3 24.3 9.9 18.9 Total 100 100 100 100 100 100 100 100 100
Source: NSS various rounds and HDR Survey, 2017
Table 5: Distribution of Employment Structure by Broad Sector
Rural Urban Total Male Female Total Male Female Total Male Female Total
2004-05 Primary 63.1 96.4 78.5 7.3 33.0 12.0 48.7 91.1 66.0 Secondary 16.6 1.9 9.8 25.6 13.6 23.4 18.9 2.9 12.4 Tertiary 20.3 2.2 12.0 67.4 53.4 64.9 32.5 6.5 21.9 2011-12 Primary 41.5 90.6 61.3 4.4 8.3 4.9 30.7 83.4 48.9 Secondary 29.0 5.5 19.5 31.7 26.4 31.0 29.8 7.3 22.0 Tertiary 29.5 4.0 19.2 63.8 65.3 64.0 39.5 9.3 29.1 2017 Primary 38.8 71.3 48.0 4.9 7.2 5.2 26.5 59.8 34.3 Secondary 30.5 11.8 25.2 35.9 21.6 34.0 32.4 13.6 28.0 Tertiary 30.7 16.8 26.8 59.2 71.2 60.8 41.0 26.6 37.7
Source: NSS various rounds and HDR Survey, 2017
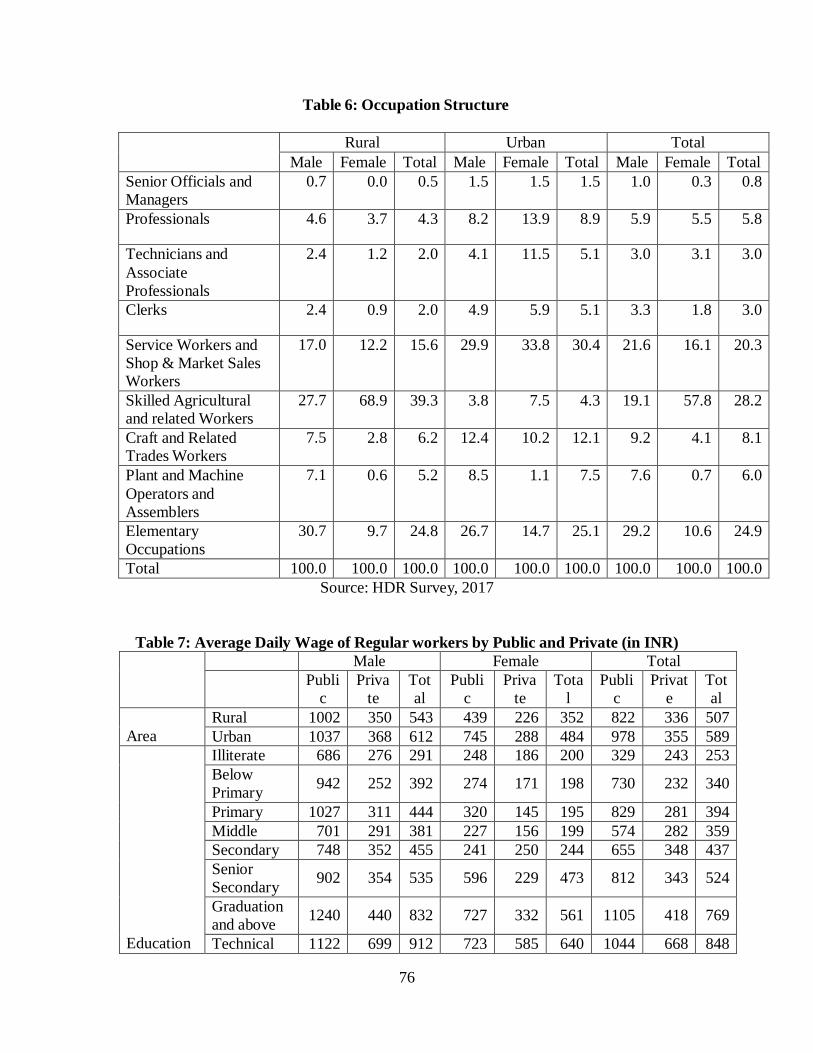
76
Table 6: Occupation Structure Rural Urban Total
Male Female Total Male Female Total Male Female Total Senior Officials and Managers
0.7 0.0 0.5 1.5 1.5 1.5 1.0 0.3 0.8
Professionals 4.6 3.7 4.3 8.2 13.9 8.9 5.9 5.5 5.8
Technicians and Associate Professionals
2.4 1.2 2.0 4.1 11.5 5.1 3.0 3.1 3.0
Clerks 2.4 0.9 2.0 4.9 5.9 5.1 3.3 1.8 3.0
Service Workers and Shop & Market Sales Workers
17.0 12.2 15.6 29.9 33.8 30.4 21.6 16.1 20.3
Skilled Agricultural and related Workers
27.7 68.9 39.3 3.8 7.5 4.3 19.1 57.8 28.2
Craft and Related Trades Workers
7.5 2.8 6.2 12.4 10.2 12.1 9.2 4.1 8.1
Plant and Machine Operators and Assemblers
7.1 0.6 5.2 8.5 1.1 7.5 7.6 0.7 6.0
Elementary Occupations
30.7 9.7 24.8 26.7 14.7 25.1 29.2 10.6 24.9
Total 100.0 100.0 100.0 100.0 100.0 100.0 100.0 100.0 100.0 Source: HDR Survey, 2017
Table 7: Average Daily Wage of Regular workers by Public and Private (in INR) Male Female Total
Publi c
Priva te
Tot al
Publi c
Priva te
Tota l
Publi c
Privat e
Tot al
Area
Rural 1002 350 543 439 226 352 822 336 507 Urban 1037 368 612 745 288 484 978 355 589
Education
Illiterate 686 276 291 248 186 200 329 243 253 Below Primary
942
252
392
274
171
198
730
232
340
Primary 1027 311 444 320 145 195 829 281 394 Middle 701 291 381 227 156 199 574 282 359 Secondary 748 352 455 241 250 244 655 348 437 Senior Secondary
902
354
535
596
229
473
812
343
524
Graduation and above
1240
440
832
727
332
561
1105
418
769
Technical 1122 699 912 723 585 640 1044 668 848
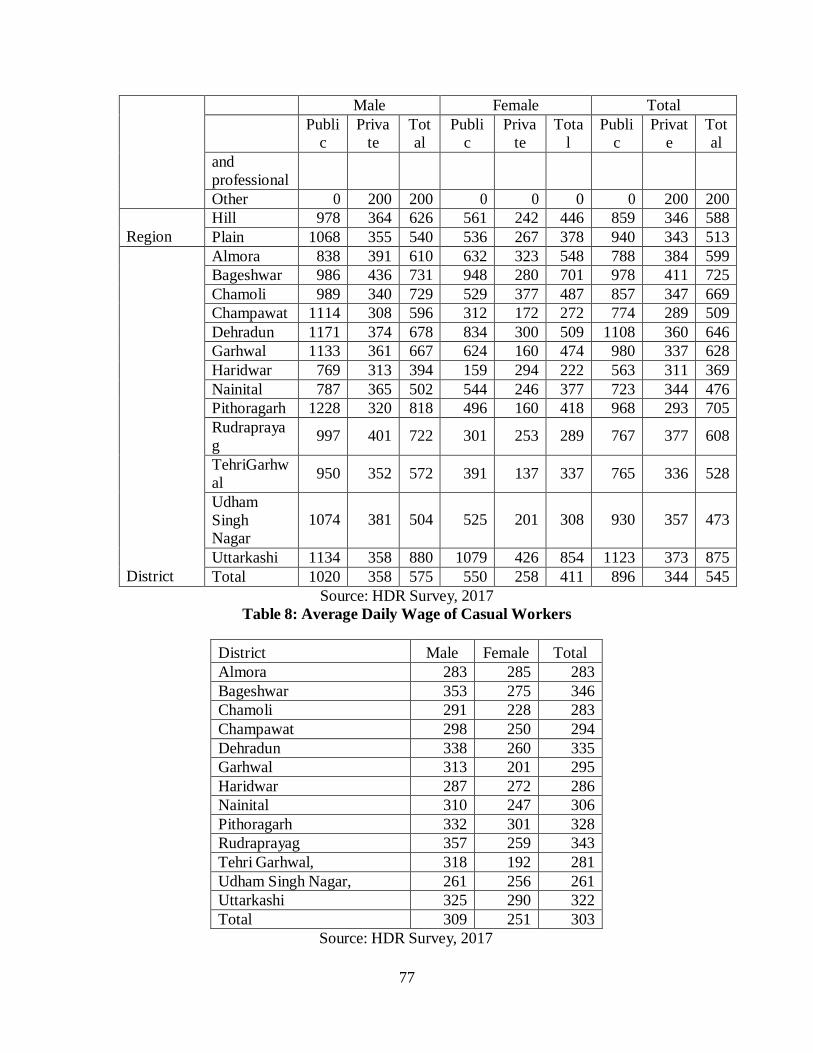
77
Male Female Total Publi
c Priva
te Tot al
Publi c
Priva te
Tota l
Publi c
Privat e
Tot al
and professional
Other 0 200 200 0 0 0 0 200 200 Region
Hill 978 364 626 561 242 446 859 346 588 Plain 1068 355 540 536 267 378 940 343 513
District
Almora 838 391 610 632 323 548 788 384 599 Bageshwar 986 436 731 948 280 701 978 411 725 Chamoli 989 340 729 529 377 487 857 347 669 Champawat 1114 308 596 312 172 272 774 289 509 Dehradun 1171 374 678 834 300 509 1108 360 646 Garhwal 1133 361 667 624 160 474 980 337 628 Haridwar 769 313 394 159 294 222 563 311 369 Nainital 787 365 502 544 246 377 723 344 476 Pithoragarh 1228 320 818 496 160 418 968 293 705 Rudrapraya g
997
401
722
301
253
289
767
377
608
TehriGarhw al
950
352
572
391
137
337
765
336
528
Udham Singh Nagar
1074
381
504
525
201
308
930
357
473
Uttarkashi 1134 358 880 1079 426 854 1123 373 875 Total 1020 358 575 550 258 411 896 344 545
Source: HDR Survey, 2017 Table 8: Average Daily Wage of Casual Workers
District Male Female Total Almora 283 285 283 Bageshwar 353 275 346 Chamoli 291 228 283 Champawat 298 250 294 Dehradun 338 260 335 Garhwal 313 201 295 Haridwar 287 272 286 Nainital 310 247 306 Pithoragarh 332 301 328 Rudraprayag 357 259 343 Tehri Garhwal, 318 192 281 Udham Singh Nagar, 261 256 261 Uttarkashi 325 290 322 Total 309 251 303
Source: HDR Survey, 2017
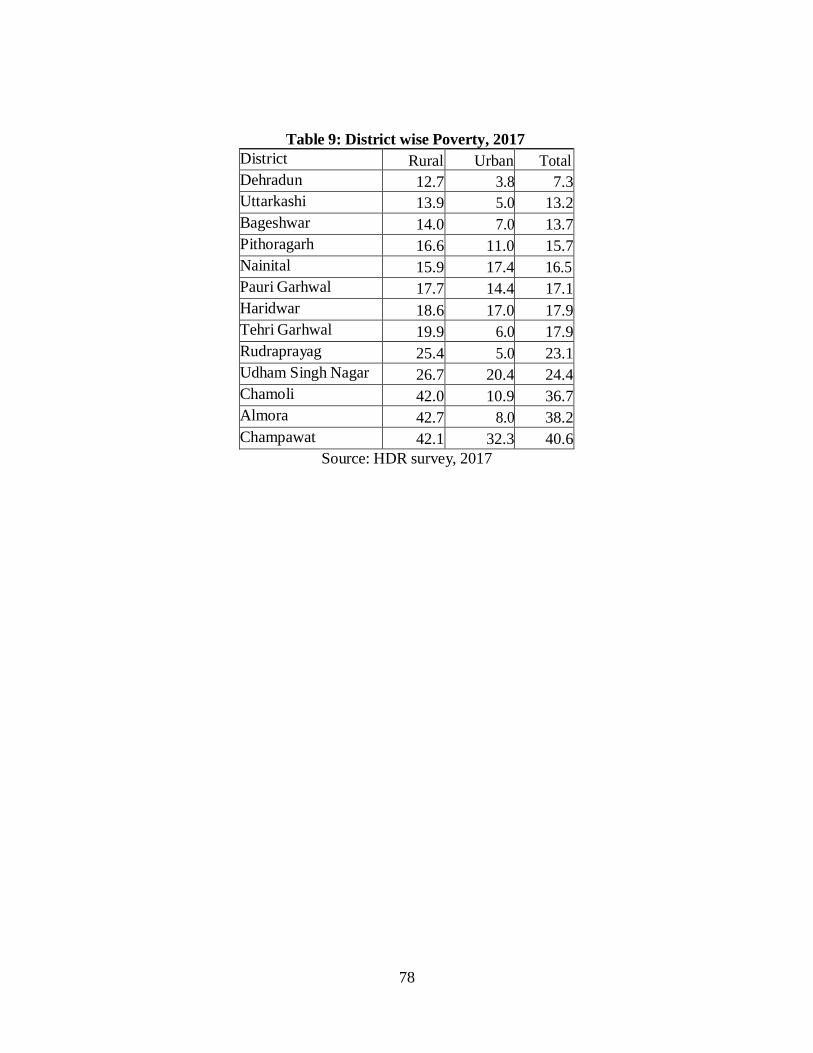
78
Table 9: District wise Poverty, 2017 District Rural Urban Total Dehradun 12.7 3.8 7.3 Uttarkashi 13.9 5.0 13.2 Bageshwar 14.0 7.0 13.7 Pithoragarh 16.6 11.0 15.7 Nainital 15.9 17.4 16.5 Pauri Garhwal 17.7 14.4 17.1 Haridwar 18.6 17.0 17.9 Tehri Garhwal 19.9 6.0 17.9 Rudraprayag 25.4 5.0 23.1 Udham Singh Nagar 26.7 20.4 24.4 Chamoli 42.0 10.9 36.7 Almora 42.7 8.0 38.2 Champawat 42.1 32.3 40.6
Source: HDR survey, 2017
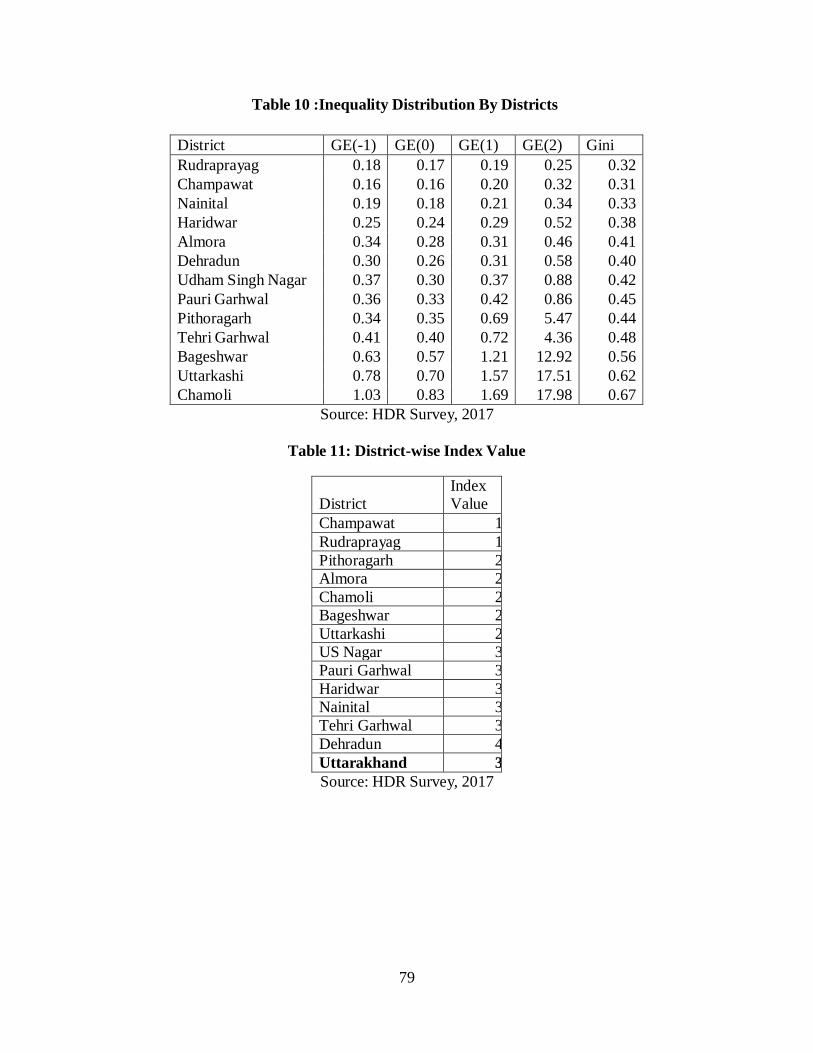
79
Table 10 :Inequality Distribution By Districts
District GE(-1) GE(0) GE(1) GE(2) Gini Rudraprayag 0.18 0.17 0.19 0.25 0.32 Champawat 0.16 0.16 0.20 0.32 0.31 Nainital 0.19 0.18 0.21 0.34 0.33 Haridwar 0.25 0.24 0.29 0.52 0.38 Almora 0.34 0.28 0.31 0.46 0.41 Dehradun 0.30 0.26 0.31 0.58 0.40 Udham Singh Nagar 0.37 0.30 0.37 0.88 0.42 Pauri Garhwal 0.36 0.33 0.42 0.86 0.45 Pithoragarh 0.34 0.35 0.69 5.47 0.44 Tehri Garhwal 0.41 0.40 0.72 4.36 0.48 Bageshwar 0.63 0.57 1.21 12.92 0.56 Uttarkashi 0.78 0.70 1.57 17.51 0.62 Chamoli 1.03 0.83 1.69 17.98 0.67
Source: HDR Survey, 2017
Table 11: District-wise Index Value
District
Index Value
Champawat 1
Rudraprayag 1
Pithoragarh 2
Almora 2
Chamoli 2
Bageshwar 2
Uttarkashi 2
US Nagar 3
Pauri Garhwal 3
Haridwar 3
Nainital 3
Tehri Garhwal 3
Dehradun 4
Uttarakhand 3
Source: HDR Survey, 2017

80
Table 12: District Domestic product (in Lakh INR) District DDP Almora 0.97 Bageshwar 1.00 Chamoli 1.18 Champawat 0.91 Dehradun 1.96 Haridwar 2.54 Nainital 1.15 Pauri Garhwal 1.10 Pithoragarh 1.02 Rudraprayag 0.84 Tehri Garhwal, 0.84 US Nagar 1.87 Uttarkashi 0.89 Uttarakhand 1.61
Source: HDR Survey, 2017
Table 13: District-Wise Broad Industrial Structure District Primary Secondary Tertiary Total
Dehradun 15.2 30.4 54.4 100 US Nagar 23.9 42.7 33.4 100 Nainital 24.5 26.7 48.8 100 Haridwar 28.7 32.7 38.6 100 Tehri Garhwal 35.9 19.2 44.9 100 Pauri Garhwal 38.1 14.7 47.2 100 Almora 56.1 16.4 27.6 100 Pithoragarh 60.4 15.2 24.4 100 Chamoli 62.9 14.9 22.2 100 Champawat 68.3 14.0 17.8 100 Bageshwar 72.0 6.6 21.4 100 Rudraprayag 72.3 7.9 19.8 100 Uttarkashi 72.3 11.5 16.2 100 Uttarakhand 36.6 26.1 37.2 100
Source: HDR Survey, 2017
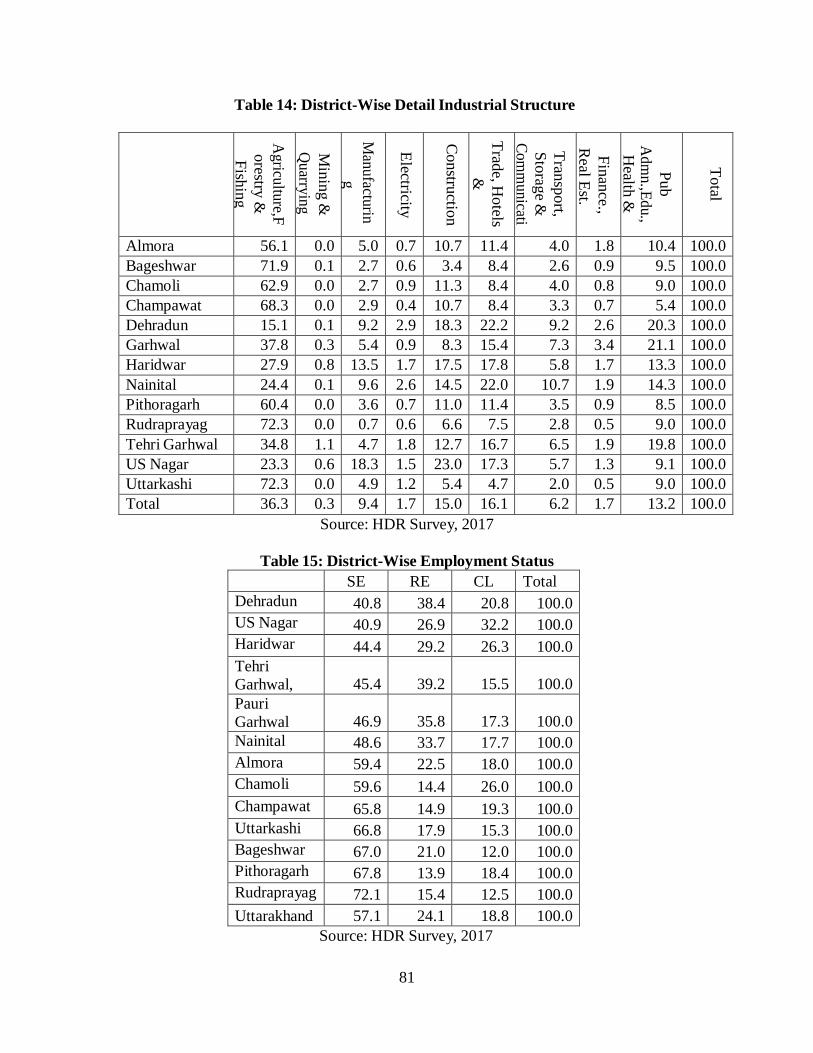
81
Table 14: District-Wise Detail Industrial Structure A
griculture,F orestry &
Fishing
Mining &
Q
uarrying
Manufacturin
g
Electricity
Construction
Trade, Hotels
&
Transport, Storage &
Com
municati
Finance., Real Est.
Pub A
dmn.,Edu.,
Health &
Total
Almora 56.1 0.0 5.0 0.7 10.7 11.4 4.0 1.8 10.4 100.0 Bageshwar 71.9 0.1 2.7 0.6 3.4 8.4 2.6 0.9 9.5 100.0 Chamoli 62.9 0.0 2.7 0.9 11.3 8.4 4.0 0.8 9.0 100.0 Champawat 68.3 0.0 2.9 0.4 10.7 8.4 3.3 0.7 5.4 100.0 Dehradun 15.1 0.1 9.2 2.9 18.3 22.2 9.2 2.6 20.3 100.0 Garhwal 37.8 0.3 5.4 0.9 8.3 15.4 7.3 3.4 21.1 100.0 Haridwar 27.9 0.8 13.5 1.7 17.5 17.8 5.8 1.7 13.3 100.0 Nainital 24.4 0.1 9.6 2.6 14.5 22.0 10.7 1.9 14.3 100.0 Pithoragarh 60.4 0.0 3.6 0.7 11.0 11.4 3.5 0.9 8.5 100.0 Rudraprayag 72.3 0.0 0.7 0.6 6.6 7.5 2.8 0.5 9.0 100.0 Tehri Garhwal 34.8 1.1 4.7 1.8 12.7 16.7 6.5 1.9 19.8 100.0 US Nagar 23.3 0.6 18.3 1.5 23.0 17.3 5.7 1.3 9.1 100.0 Uttarkashi 72.3 0.0 4.9 1.2 5.4 4.7 2.0 0.5 9.0 100.0 Total 36.3 0.3 9.4 1.7 15.0 16.1 6.2 1.7 13.2 100.0
Source: HDR Survey, 2017
Table 15: District-Wise Employment Status SE RE CL Total Dehradun 40.8 38.4 20.8 100.0 US Nagar 40.9 26.9 32.2 100.0 Haridwar 44.4 29.2 26.3 100.0 Tehri Garhwal,
45.4
39.2
15.5
100.0
Pauri Garhwal
46.9
35.8
17.3
100.0
Nainital 48.6 33.7 17.7 100.0 Almora 59.4 22.5 18.0 100.0 Chamoli 59.6 14.4 26.0 100.0 Champawat 65.8 14.9 19.3 100.0 Uttarkashi 66.8 17.9 15.3 100.0 Bageshwar 67.0 21.0 12.0 100.0 Pithoragarh 67.8 13.9 18.4 100.0 Rudraprayag 72.1 15.4 12.5 100.0 Uttarakhand 57.1 24.1 18.8 100.0
Source: HDR Survey, 2017
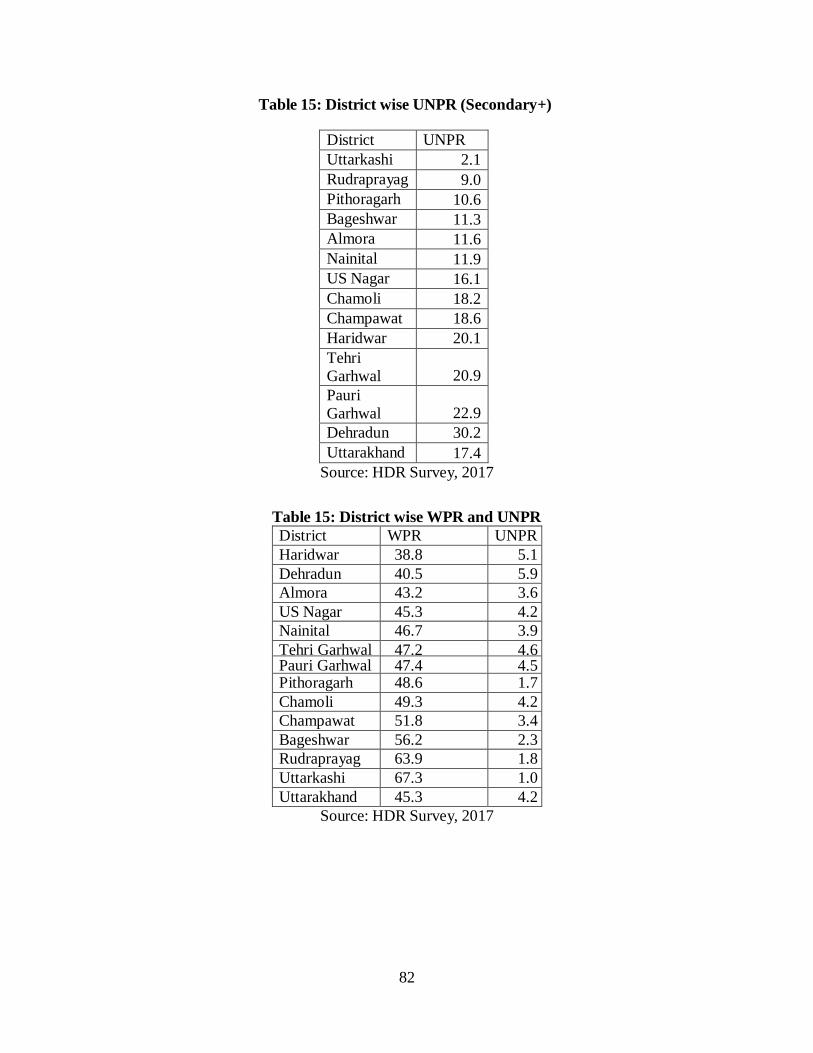
82
Table 15: District wise UNPR (Secondary+)
District UNPR Uttarkashi 2.1 Rudraprayag 9.0 Pithoragarh 10.6 Bageshwar 11.3 Almora 11.6 Nainital 11.9 US Nagar 16.1 Chamoli 18.2 Champawat 18.6 Haridwar 20.1 Tehri Garhwal
20.9
Pauri Garhwal
22.9
Dehradun 30.2 Uttarakhand 17.4
Source: HDR Survey, 2017
Table 15: District wise WPR and UNPR District WPR UNPR Haridwar 38.8 5.1 Dehradun 40.5 5.9 Almora 43.2 3.6 US Nagar 45.3 4.2 Nainital 46.7 3.9 Tehri Garhwal 47.2 4.6 Pauri Garhwal 47.4 4.5 Pithoragarh 48.6 1.7 Chamoli 49.3 4.2 Champawat 51.8 3.4 Bageshwar 56.2 2.3 Rudraprayag 63.9 1.8 Uttarkashi 67.3 1.0 Uttarakhand 45.3 4.2
Source: HDR Survey, 2017
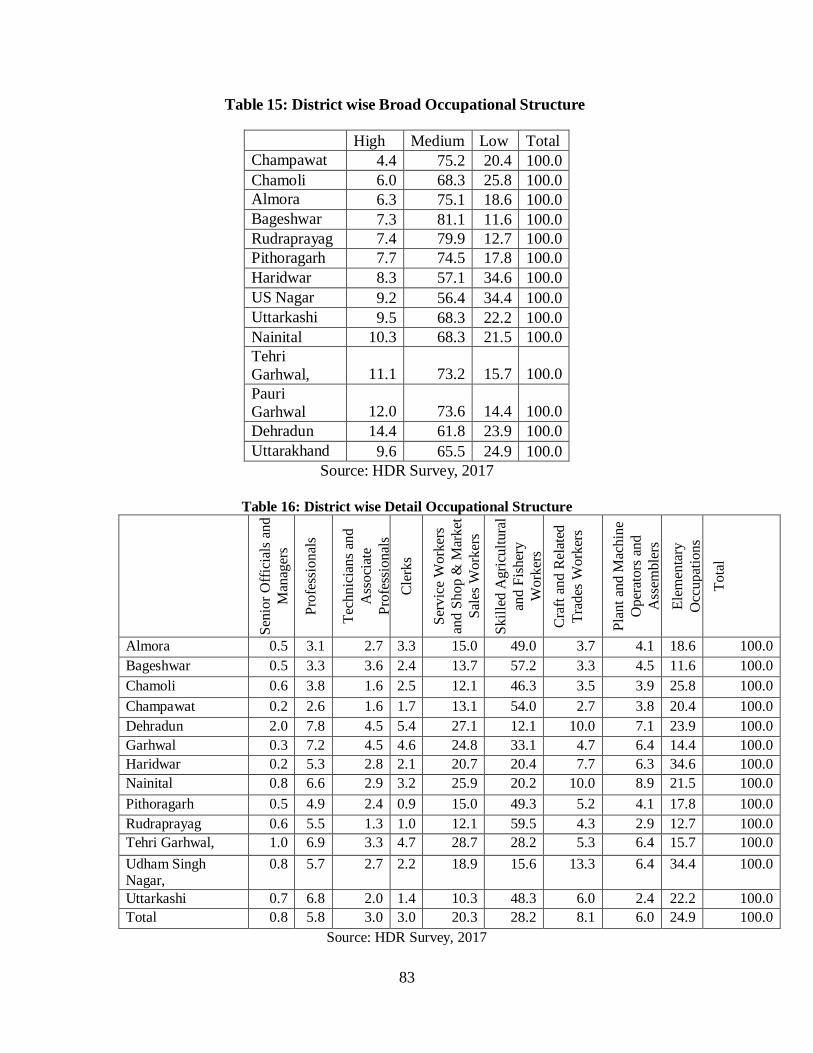
83
Table 15: District wise Broad Occupational Structure
High Medium Low Total Champawat 4.4 75.2 20.4 100.0 Chamoli 6.0 68.3 25.8 100.0 Almora 6.3 75.1 18.6 100.0 Bageshwar 7.3 81.1 11.6 100.0 Rudraprayag 7.4 79.9 12.7 100.0 Pithoragarh 7.7 74.5 17.8 100.0 Haridwar 8.3 57.1 34.6 100.0 US Nagar 9.2 56.4 34.4 100.0 Uttarkashi 9.5 68.3 22.2 100.0 Nainital 10.3 68.3 21.5 100.0 Tehri Garhwal,
11.1
73.2
15.7
100.0
Pauri Garhwal
12.0
73.6
14.4
100.0
Dehradun 14.4 61.8 23.9 100.0 Uttarakhand 9.6 65.5 24.9 100.0
Source: HDR Survey, 2017
Table 16: District wise Detail Occupational Structure
Seni
or O
ffici
als a
nd
Man
ager
s
Prof
essi
onal
s
Tech
nici
ans a
nd
Ass
ocia
te
Prof
essi
onal
s
Cle
rks
Serv
ice
Wor
kers
an
d Sh
op &
Mar
ket
Sale
s Wor
kers
Sk
illed
Agr
icul
tura
l an
d Fi
sher
y W
orke
rs
Cra
ft an
d R
elat
ed
Trad
es W
orke
rs
Plan
t and
Mac
hine
O
pera
tors
and
A
ssem
bler
s
Elem
enta
ry
Occ
upat
ions
Tota
l
Almora 0.5 3.1 2.7 3.3 15.0 49.0 3.7 4.1 18.6 100.0 Bageshwar 0.5 3.3 3.6 2.4 13.7 57.2 3.3 4.5 11.6 100.0 Chamoli 0.6 3.8 1.6 2.5 12.1 46.3 3.5 3.9 25.8 100.0 Champawat 0.2 2.6 1.6 1.7 13.1 54.0 2.7 3.8 20.4 100.0 Dehradun 2.0 7.8 4.5 5.4 27.1 12.1 10.0 7.1 23.9 100.0 Garhwal 0.3 7.2 4.5 4.6 24.8 33.1 4.7 6.4 14.4 100.0 Haridwar 0.2 5.3 2.8 2.1 20.7 20.4 7.7 6.3 34.6 100.0 Nainital 0.8 6.6 2.9 3.2 25.9 20.2 10.0 8.9 21.5 100.0 Pithoragarh 0.5 4.9 2.4 0.9 15.0 49.3 5.2 4.1 17.8 100.0 Rudraprayag 0.6 5.5 1.3 1.0 12.1 59.5 4.3 2.9 12.7 100.0 Tehri Garhwal, 1.0 6.9 3.3 4.7 28.7 28.2 5.3 6.4 15.7 100.0 Udham Singh Nagar,
0.8 5.7 2.7 2.2 18.9 15.6 13.3 6.4 34.4 100.0
Uttarkashi 0.7 6.8 2.0 1.4 10.3 48.3 6.0 2.4 22.2 100.0 Total 0.8 5.8 3.0 3.0 20.3 28.2 8.1 6.0 24.9 100.0
Source: HDR Survey, 2017
84
References Assam Human Development (2014), Government of Assam, 2014
Awasthi, I.C. (2010), Migration Patterns in Hill Economy of Uttarakhand: Evidence from Field Enquiry, The Indian Economic Journal, Vol.57, No.4, January-March
Awasthi I. C. (2012): “Livelihood Diversities in Mountain Economy: Constraints andOpportunities, Concept Publishing, New Delhi.
GIDS (2017) ‘Development of Composite Indicators to Measure Backwardness of Districts in Uttarakhand’ study report submitted to DES, Government of Uttarakhand
GIDS(2017), ‘Estimation of District level Poverty in Uttarakhand’ study report submitted to DES, Government of Uttarakhand
Government of India (2013): “Poverty Estimates for 2011-12”, Planning Commission, New Delhi.
Economic Survey, 2017-18, DES, Government of Uttarakhand
Papola, T.S. (2002), Poverty in Mountain Areas of the Hindu Kush Himalayas: Some Basic Issues in Measurement, Diagnosis and Alleviation, International Centre for Integrated Mountain Development (ICIMOD), Kathmandu.
Papola, T.S. (2002), Poverty in Mountain Areas: Nature, Causes, and Alleviation Strategy, in Poverty Alleviation in Mountain Areas of China, (Eds:Bhadra, B.; Richter, J.; Khanal, N. R.; Jodha, N. S), proceedings of the International Conference held from 11-15 November, 2002, in Chengdu, China.
Papola, T.S. (2012) Globalisation and the Indian Himalayan States: Mitigating or Accentuating Marginalisation?, Man and Society---AJournal of North-East Studies, Volume IX, Summer. Indian Council of Social Science Research, North Eastern Regional Centre, Shillong, Meghalaya.
Mamgain, Rajendra P. (2004), Employment, Migration and Livelihoods in the Hill Economy of Uttarakhand, Ph.D. Thesis submitted to Jawaharlal Nehru University, New Delhi.
Mamgain Rajendra P. and D. N. Reddy (2016): “Outmigration from the Hill Region of Uttarakhand: Magnitude, Challenges and Policy Options”, Giri Institute of Development Studies Lucknow, Working Paper No. 218.
Vision Document (2018), Government of Uttarakhand, 2018
85
CHAPTER 4: AGRICULTURE: ENHANCING LIVELIHOODS 4.1.–Background – The Importance of Agriculture in Uttarakhand Uttarakhand is located in the Western Himalayan region sharing its interstate boundaries with Himachal Pradesh and Uttar Pradesh and international boundaries with Nepal and China. The state has an area of 53,483 km2 of which 86 percent is mountainous and 65 percent is covered by forests. There are 13 districts in the state which are grouped into two divisions namely the Kumaon division and the Garhwal division. The Kumaon division comprises Almora, Nainital, Pithorgarh, Champawat, Bageshwar and Udham Singh Nagar while the Garhwal division consists of Uttarkashi, Chamoli, Tehri Garhwal, Pauri Garhwal, Dehradun, Haridwar and Rudraprayag. According to the Census 2011, the state is the 20th most populous in the country and 19th in terms of total geographical area. It has a population of 10.08 million, of which 5.13 million are male and 4.95 million are females. Approximately 52 percent of the state’s population lives in the plains districts which accounts for about 15.63 percent of the total geographic area of the state. The tropical humid climate of the state supports a diverse and rich base of vegetation, trees, flora and fauna. Like many parts of India, agriculture plays a significant role in the Uttarakhand economy with 70 percent of the rural population engaging in this sector for their livelihood. Poor infrastructure and lack of alternative means of livelihood have led a majority of people to be dependent on agriculture for their incomes and subsistence. Uttarakhand is the leading producer of non-seasonal vegetables like peas, potatoes, cabbage etc. A large number of orchards in Uttarakhand produce various fruits like apples, pears, litchi etc. The local production of fruits has stimulated the growth of a large processing industry in the state. The percentage of agricultural workers in the total workforce of Uttarakhand was 58.4 percent in 2011. This was similar to the All India proportion of 58.2 percent for agricultural workers (Table 4.1). While at the country level, male agricultural workers as a proportion of total workers was around 61 percent, it was much lower at 39 percent for females, but in the case of Uttarakhand state, female workers in agriculture (52.2 percent) are a larger proportion than their male counterparts (47.8 percent) establishing the fact that agriculture employs a larger proportion of female workers.
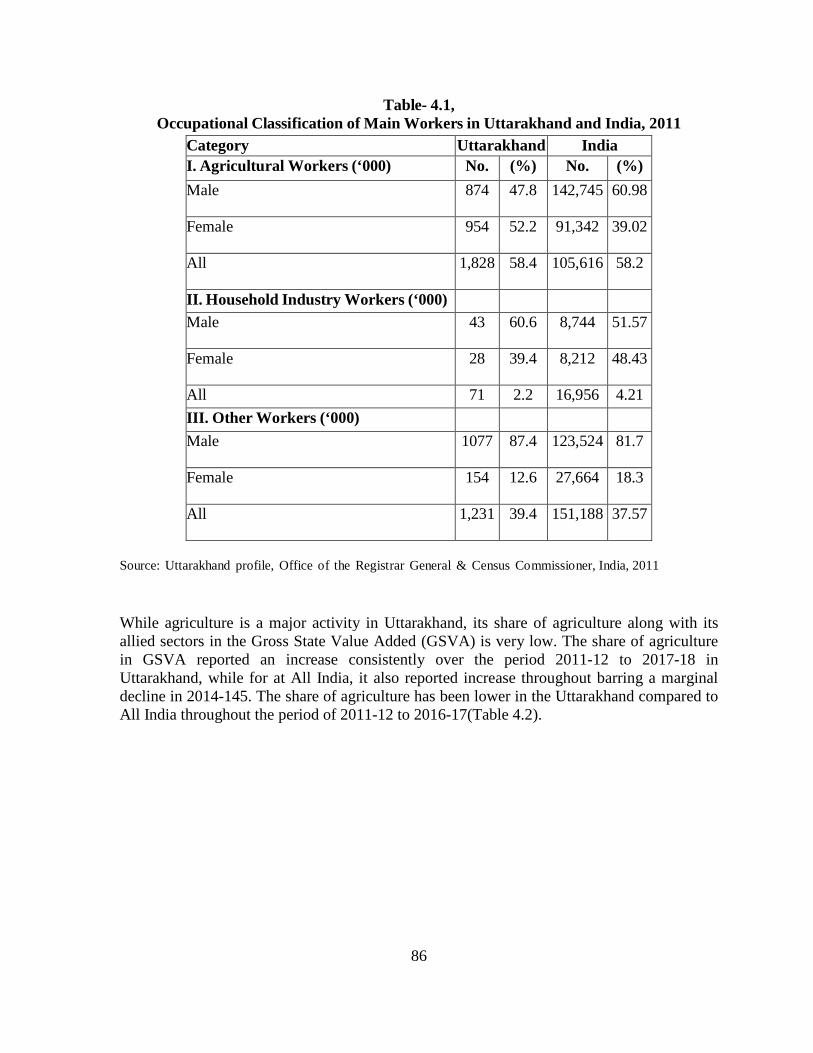
86
Table- 4.1, Occupational Classification of Main Workers in Uttarakhand and India, 2011
Category Uttarakhand India I. Agricultural Workers (‘000) No. (%) No. (%) Male 874 47.8 142,745 60.98
Female 954 52.2 91,342 39.02
All 1,828 58.4 105,616 58.2
II. Household Industry Workers (‘000) Male 43 60.6 8,744 51.57
Female 28 39.4 8,212 48.43
All 71 2.2 16,956 4.21 III. Other Workers (‘000) Male 1077 87.4 123,524 81.7
Female 154 12.6 27,664 18.3
All 1,231 39.4 151,188 37.57
Source: Uttarakhand profile, Office of the Registrar General & Census Commissioner, India, 2011 While agriculture is a major activity in Uttarakhand, its share of agriculture along with its allied sectors in the Gross State Value Added (GSVA) is very low. The share of agriculture in GSVA reported an increase consistently over the period 2011-12 to 2017-18 in Uttarakhand, while for at All India, it also reported increase throughout barring a marginal decline in 2014-145. The share of agriculture has been lower in the Uttarakhand compared to All India throughout the period of 2011-12 to 2016-17(Table 4.2).
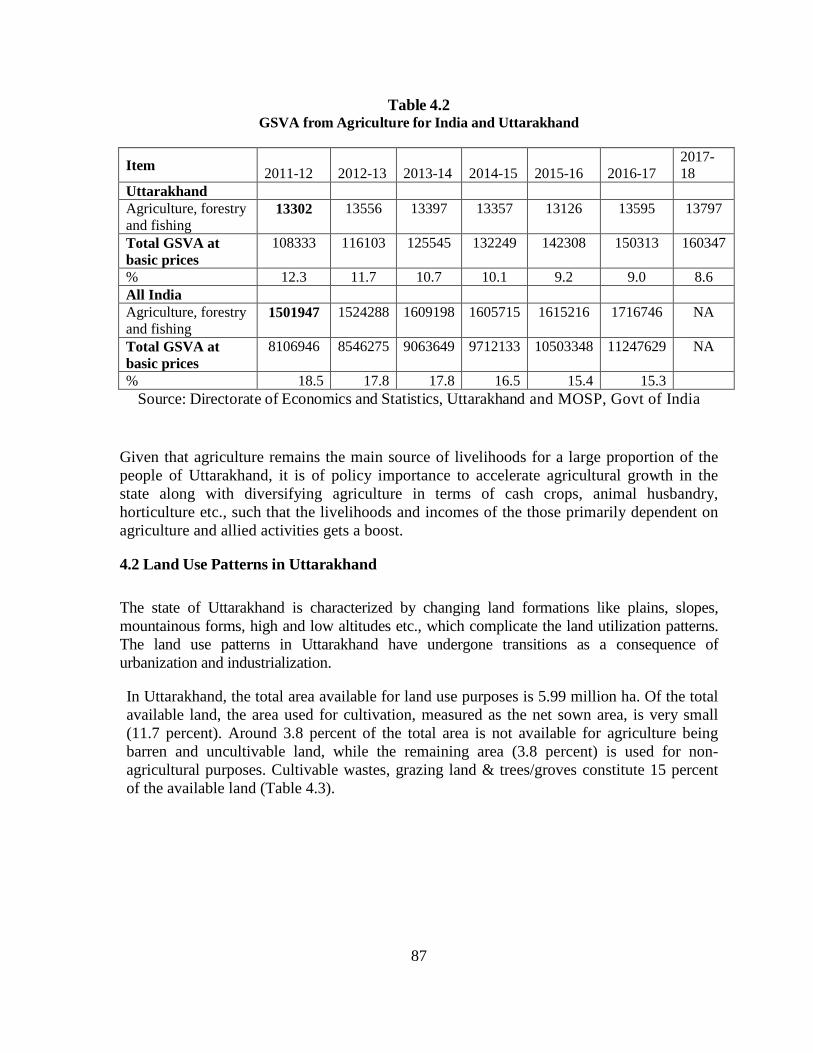
87
Table 4.2 GSVA from Agriculture for India and Uttarakhand
Item 2011-12 2012-13 2013-14 2014-15 2015-16 2016-17 2017-18
Uttarakhand Agriculture, forestry and fishing
13302 13556 13397 13357 13126 13595 13797
Total GSVA at basic prices
108333 116103 125545 132249 142308 150313 160347
% 12.3 11.7 10.7 10.1 9.2 9.0 8.6 All India Agriculture, forestry and fishing
1501947 1524288 1609198 1605715 1615216 1716746 NA
Total GSVA at basic prices
8106946 8546275 9063649 9712133 10503348 11247629 NA
% 18.5 17.8 17.8 16.5 15.4 15.3 Source: Directorate of Economics and Statistics, Uttarakhand and MOSP, Govt of India
Given that agriculture remains the main source of livelihoods for a large proportion of the people of Uttarakhand, it is of policy importance to accelerate agricultural growth in the state along with diversifying agriculture in terms of cash crops, animal husbandry, horticulture etc., such that the livelihoods and incomes of the those primarily dependent on agriculture and allied activities gets a boost. 4.2 Land Use Patterns in Uttarakhand The state of Uttarakhand is characterized by changing land formations like plains, slopes, mountainous forms, high and low altitudes etc., which complicate the land utilization patterns. The land use patterns in Uttarakhand have undergone transitions as a consequence of urbanization and industrialization. In Uttarakhand, the total area available for land use purposes is 5.99 million ha. Of the total available land, the area used for cultivation, measured as the net sown area, is very small (11.7 percent). Around 3.8 percent of the total area is not available for agriculture being barren and uncultivable land, while the remaining area (3.8 percent) is used for non-agricultural purposes. Cultivable wastes, grazing land & trees/groves constitute 15 percent of the available land (Table 4.3).
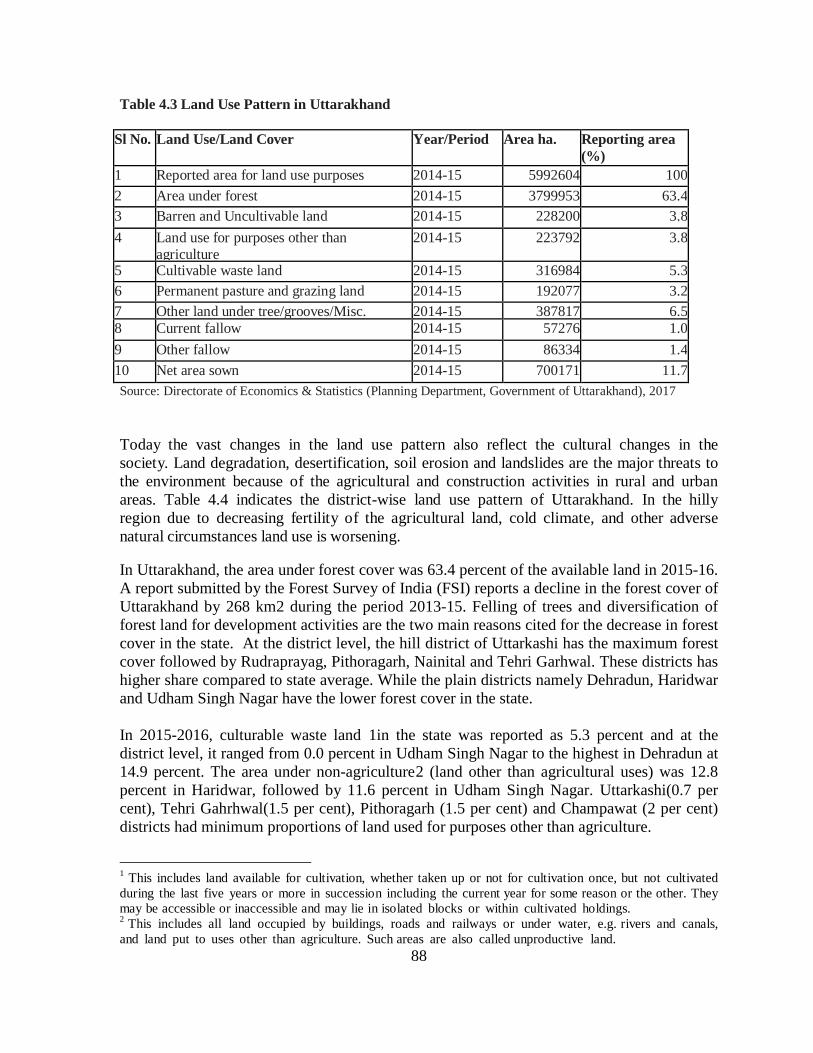
88
Table 4.3 Land Use Pattern in Uttarakhand
Sl No. Land Use/Land Cover Year/Period Area ha. Reporting area (%)
1 Reported area for land use purposes 2014-15 5992604 100 2 Area under forest 2014-15 3799953 63.4 3 Barren and Uncultivable land 2014-15 228200 3.8 4 Land use for purposes other than
agriculture 2014-15 223792 3.8
5 Cultivable waste land 2014-15 316984 5.3 6 Permanent pasture and grazing land 2014-15 192077 3.2 7 Other land under tree/grooves/Misc. 2014-15 387817 6.5 8 Current fallow 2014-15 57276 1.0 9 Other fallow 2014-15 86334 1.4 10 Net area sown 2014-15 700171 11.7 Source: Directorate of Economics & Statistics (Planning Department, Government of Uttarakhand), 2017
Today the vast changes in the land use pattern also reflect the cultural changes in the society. Land degradation, desertification, soil erosion and landslides are the major threats to the environment because of the agricultural and construction activities in rural and urban areas. Table 4.4 indicates the district-wise land use pattern of Uttarakhand. In the hilly region due to decreasing fertility of the agricultural land, cold climate, and other adverse natural circumstances land use is worsening. In Uttarakhand, the area under forest cover was 63.4 percent of the available land in 2015-16. A report submitted by the Forest Survey of India (FSI) reports a decline in the forest cover of Uttarakhand by 268 km2 during the period 2013-15. Felling of trees and diversification of forest land for development activities are the two main reasons cited for the decrease in forest cover in the state. At the district level, the hill district of Uttarkashi has the maximum forest cover followed by Rudraprayag, Pithoragarh, Nainital and Tehri Garhwal. These districts has higher share compared to state average. While the plain districts namely Dehradun, Haridwar and Udham Singh Nagar have the lower forest cover in the state. In 2015-2016, culturable waste land 1in the state was reported as 5.3 percent and at the district level, it ranged from 0.0 percent in Udham Singh Nagar to the highest in Dehradun at 14.9 percent. The area under non-agriculture2 (land other than agricultural uses) was 12.8 percent in Haridwar, followed by 11.6 percent in Udham Singh Nagar. Uttarkashi(0.7 per cent), Tehri Gahrhwal(1.5 per cent), Pithoragarh (1.5 per cent) and Champawat (2 per cent) districts had minimum proportions of land used for purposes other than agriculture.
1 This includes land available for cultivation, whether taken up or not for cultivation once, but not cultivated during the last five years or more in succession including the current year for some reason or the other. They may be accessible or inaccessible and may lie in isolated blocks or within cultivated holdings. 2 This includes all land occupied by buildings, roads and railways or under water, e.g. rivers and canals, and land put to uses other than agriculture. Such areas are also called unproductive land.
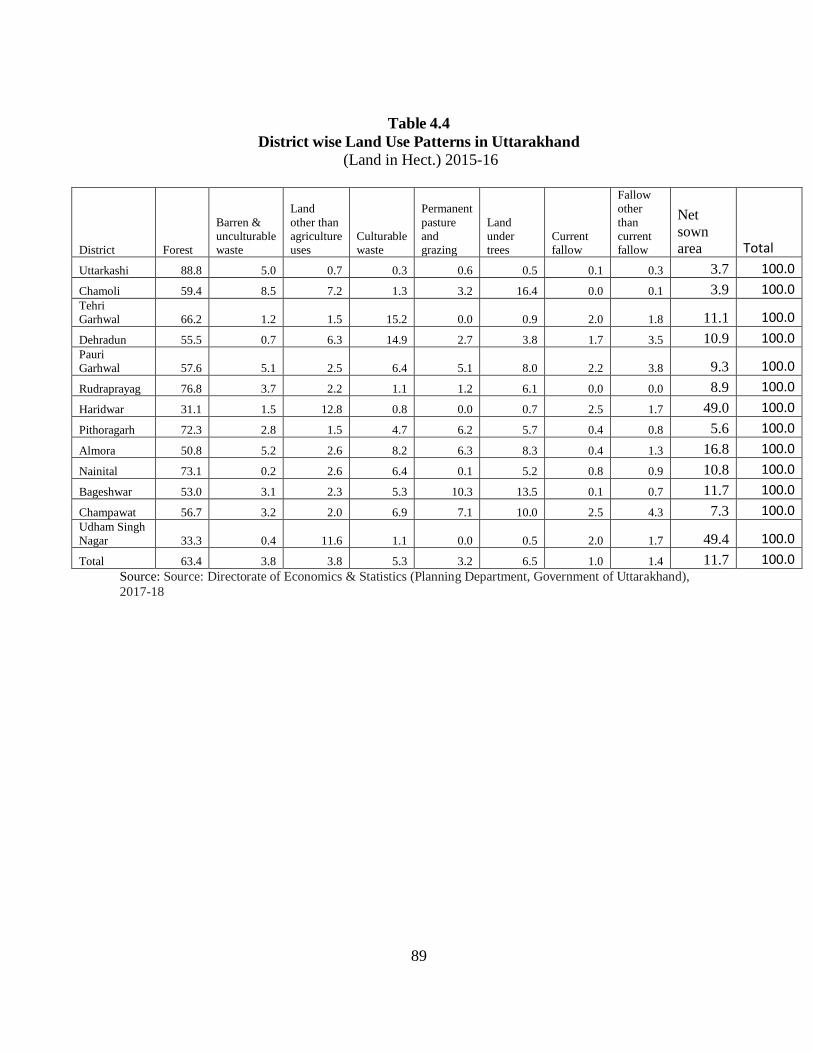
89
Table 4.4
District wise Land Use Patterns in Uttarakhand (Land in Hect.) 2015-16
District Forest
Barren & unculturable waste
Land other than agriculture uses
Culturable waste
Permanent pasture and grazing
Land under trees
Current fallow
Fallow other than current fallow
Net sown area Total
Uttarkashi 88.8 5.0 0.7 0.3 0.6 0.5 0.1 0.3 3.7 100.0 Chamoli 59.4 8.5 7.2 1.3 3.2 16.4 0.0 0.1 3.9 100.0 Tehri Garhwal 66.2 1.2 1.5 15.2 0.0 0.9 2.0 1.8 11.1 100.0 Dehradun 55.5 0.7 6.3 14.9 2.7 3.8 1.7 3.5 10.9 100.0 Pauri Garhwal 57.6 5.1 2.5 6.4 5.1 8.0 2.2 3.8 9.3 100.0 Rudraprayag 76.8 3.7 2.2 1.1 1.2 6.1 0.0 0.0 8.9 100.0 Haridwar 31.1 1.5 12.8 0.8 0.0 0.7 2.5 1.7 49.0 100.0 Pithoragarh 72.3 2.8 1.5 4.7 6.2 5.7 0.4 0.8 5.6 100.0 Almora 50.8 5.2 2.6 8.2 6.3 8.3 0.4 1.3 16.8 100.0 Nainital 73.1 0.2 2.6 6.4 0.1 5.2 0.8 0.9 10.8 100.0 Bageshwar 53.0 3.1 2.3 5.3 10.3 13.5 0.1 0.7 11.7 100.0 Champawat 56.7 3.2 2.0 6.9 7.1 10.0 2.5 4.3 7.3 100.0 Udham Singh Nagar 33.3 0.4 11.6 1.1 0.0 0.5 2.0 1.7 49.4 100.0 Total 63.4 3.8 3.8 5.3 3.2 6.5 1.0 1.4 11.7 100.0
Source: Source: Directorate of Economics & Statistics (Planning Department, Government of Uttarakhand), 2017-18

90
The highest share of reported area is in Chamoli (14.2 percent) followed by Uttarkashi (13.6 percent), Pithoragarh (12.5 percent) and Pauri Garhwal (11.2 per cent). The share is relatively less in Rudraprayag, Haridwar, Champawat (3.9 percent each) and Bageshwar (3.5 percent).
Table 4.5: Share of Reported Areas by Districts (%) District % Uttarkashi 13.6 Chamoli 14.2 Tehri Garhwal 8.1 Dehradun 6.1 Pauri Garhwal 11.2 Rudraprayag 3.9 Haridwar 3.9 Pithoragarh 12.5 Almora 7.8 Nainital 6.8 Bageshwar 3.5 Champawat 3.9 Udham Singh Nagar 4.7 Total 100.0
Source: Directorate of Economics & Statistics, 2017-18
4.3 Irrigated Area
The area is assumed to be irrigated for cultivation through sources like canals, tanks, tube-wells, other wells and other sources. The Irrigation Department of the state has attained expertise in the last 50 years in construction and maintenance of Civil Works of Hydropower Projects, which include Ichari Dam, Chhibro-Khodri Power Houses, Asan Barrage, Dhalipur-Dhakrani Power Houses, Ram Ganga Darn and Chilla Hydropower (Uttarakhand Irrigation Department). Irrigated area as a proportion of net irrigated area to net area sown is 47 percent in Uttarakhand with the plains districts having a much higher share in the proportions of net sown area that are irrigated. Udham Singh Nagar had the highest proportion of the irrigated area (97 percent) followed by Haridwar (94 percent), Nainital (60 percent) and Dehradun (53 percent). The hills districts reporting low area and lowest has been reported in Chamoli (4.7 percent), Almora (7.3 percent) (Table 4.6).
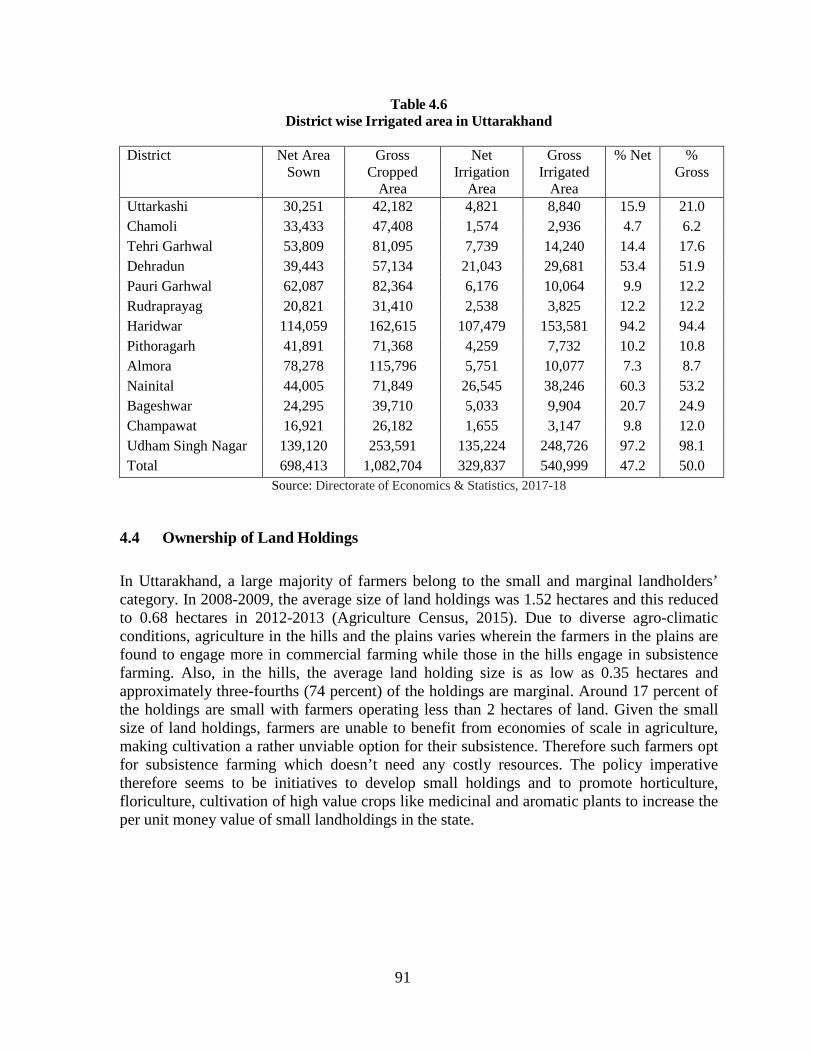
91
Table 4.6 District wise Irrigated area in Uttarakhand
District Net Area
Sown Gross
Cropped Area
Net Irrigation
Area
Gross Irrigated
Area
% Net % Gross
Uttarkashi 30,251 42,182 4,821 8,840 15.9 21.0 Chamoli 33,433 47,408 1,574 2,936 4.7 6.2 Tehri Garhwal 53,809 81,095 7,739 14,240 14.4 17.6 Dehradun 39,443 57,134 21,043 29,681 53.4 51.9 Pauri Garhwal 62,087 82,364 6,176 10,064 9.9 12.2 Rudraprayag 20,821 31,410 2,538 3,825 12.2 12.2 Haridwar 114,059 162,615 107,479 153,581 94.2 94.4 Pithoragarh 41,891 71,368 4,259 7,732 10.2 10.8 Almora 78,278 115,796 5,751 10,077 7.3 8.7 Nainital 44,005 71,849 26,545 38,246 60.3 53.2 Bageshwar 24,295 39,710 5,033 9,904 20.7 24.9 Champawat 16,921 26,182 1,655 3,147 9.8 12.0 Udham Singh Nagar 139,120 253,591 135,224 248,726 97.2 98.1 Total 698,413 1,082,704 329,837 540,999 47.2 50.0
Source: Directorate of Economics & Statistics, 2017-18 4.4 Ownership of Land Holdings In Uttarakhand, a large majority of farmers belong to the small and marginal landholders’ category. In 2008-2009, the average size of land holdings was 1.52 hectares and this reduced to 0.68 hectares in 2012-2013 (Agriculture Census, 2015). Due to diverse agro-climatic conditions, agriculture in the hills and the plains varies wherein the farmers in the plains are found to engage more in commercial farming while those in the hills engage in subsistence farming. Also, in the hills, the average land holding size is as low as 0.35 hectares and approximately three-fourths (74 percent) of the holdings are marginal. Around 17 percent of the holdings are small with farmers operating less than 2 hectares of land. Given the small size of land holdings, farmers are unable to benefit from economies of scale in agriculture, making cultivation a rather unviable option for their subsistence. Therefore such farmers opt for subsistence farming which doesn’t need any costly resources. The policy imperative therefore seems to be initiatives to develop small holdings and to promote horticulture, floriculture, cultivation of high value crops like medicinal and aromatic plants to increase the per unit money value of small landholdings in the state.
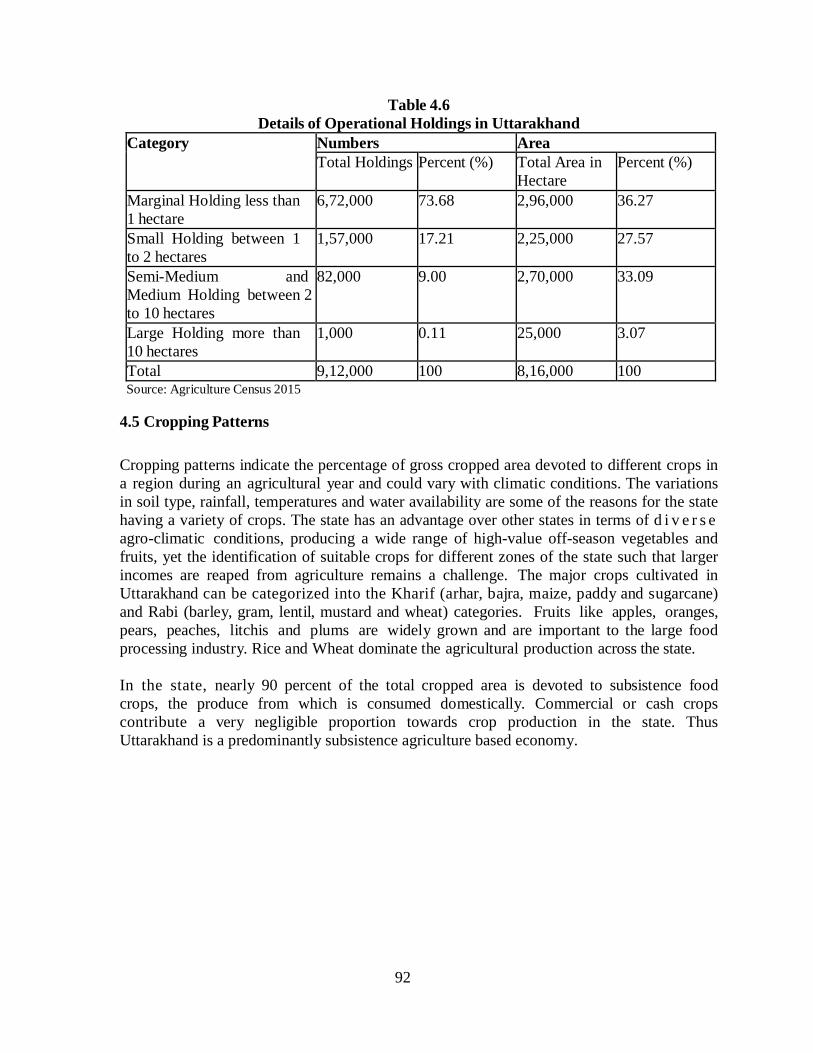
92
Table 4.6 Details of Operational Holdings in Uttarakhand
Category Numbers Area Total Holdings Percent (%) Total Area in
Hectare Percent (%)
Marginal Holding less than 1 hectare
6,72,000 73.68 2,96,000 36.27
Small Holding between 1 to 2 hectares
1,57,000 17.21 2,25,000 27.57
Semi-Medium and Medium Holding between 2 to 10 hectares
82,000 9.00 2,70,000 33.09
Large Holding more than 10 hectares
1,000 0.11 25,000 3.07
Total 9,12,000 100 8,16,000 100 Source: Agriculture Census 2015 4.5 Cropping Patterns Cropping patterns indicate the percentage of gross cropped area devoted to different crops in a region during an agricultural year and could vary with climatic conditions. The variations in soil type, rainfall, temperatures and water availability are some of the reasons for the state having a variety of crops. The state has an advantage over other states in terms of d i v e r s e agro-climatic conditions, producing a wide range of high-value off-season vegetables and fruits, yet the identification of suitable crops for different zones of the state such that larger incomes are reaped from agriculture remains a challenge. The major crops cultivated in Uttarakhand can be categorized into the Kharif (arhar, bajra, maize, paddy and sugarcane) and Rabi (barley, gram, lentil, mustard and wheat) categories. Fruits like apples, oranges, pears, peaches, litchis and plums are widely grown and are important to the large food processing industry. Rice and Wheat dominate the agricultural production across the state. In the state, nearly 90 percent of the total cropped area is devoted to subsistence food crops, the produce from which is consumed domestically. Commercial or cash crops contribute a very negligible proportion towards crop production in the state. Thus Uttarakhand is a predominantly subsistence agriculture based economy.
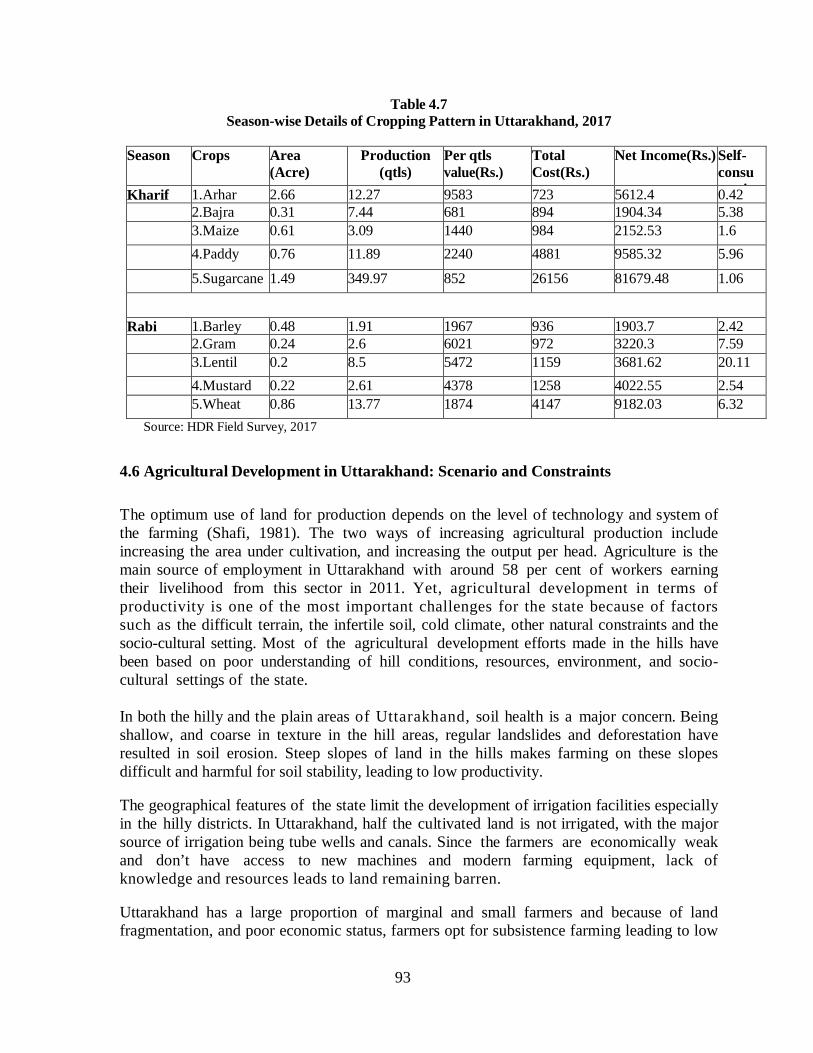
93
Table 4.7 Season-wise Details of Cropping Pattern in Uttarakhand, 2017
Season Crops Area
(Acre) Production
(qtls) Per qtls value(Rs.)
Total Cost(Rs.)
Net Income(Rs.) Self-consu
ti
Kharif 1.Arhar 2.66 12.27 9583 723 5612.4 0.42 2.Bajra 0.31 7.44 681 894 1904.34 5.38 3.Maize 0.61 3.09 1440 984 2152.53 1.6 4.Paddy 0.76 11.89 2240 4881 9585.32 5.96 5.Sugarcane 1.49 349.97 852 26156 81679.48 1.06 Rabi 1.Barley 0.48 1.91 1967 936 1903.7 2.42 2.Gram 0.24 2.6 6021 972 3220.3 7.59 3.Lentil 0.2 8.5 5472 1159 3681.62 20.11 4.Mustard 0.22 2.61 4378 1258 4022.55 2.54 5.Wheat 0.86 13.77 1874 4147 9182.03 6.32
Source: HDR Field Survey, 2017 4.6 Agricultural Development in Uttarakhand: Scenario and Constraints The optimum use of land for production depends on the level of technology and system of the farming (Shafi, 1981). The two ways of increasing agricultural production include increasing the area under cultivation, and increasing the output per head. Agriculture is the main source of employment in Uttarakhand with around 58 per cent of workers earning their livelihood from this sector in 2011. Yet, agricultural development in terms of productivity is one of the most important challenges for the state because of factors such as the difficult terrain, the infertile soil, cold climate, other natural constraints and the socio-cultural setting. Most of the agricultural development efforts made in the hills have been based on poor understanding of hill conditions, resources, environment, and socio-cultural settings of the state. In both the hilly and the plain areas of Uttarakhand, soil health is a major concern. Being shallow, and coarse in texture in the hill areas, regular landslides and deforestation have resulted in soil erosion. Steep slopes of land in the hills makes farming on these slopes difficult and harmful for soil stability, leading to low productivity. The geographical features of the state limit the development of irrigation facilities especially in the hilly districts. In Uttarakhand, half the cultivated land is not irrigated, with the major source of irrigation being tube wells and canals. Since the farmers are economically weak and don’t have access to new machines and modern farming equipment, lack of knowledge and resources leads to land remaining barren. Uttarakhand has a large proportion of marginal and small farmers and because of land fragmentation, and poor economic status, farmers opt for subsistence farming leading to low
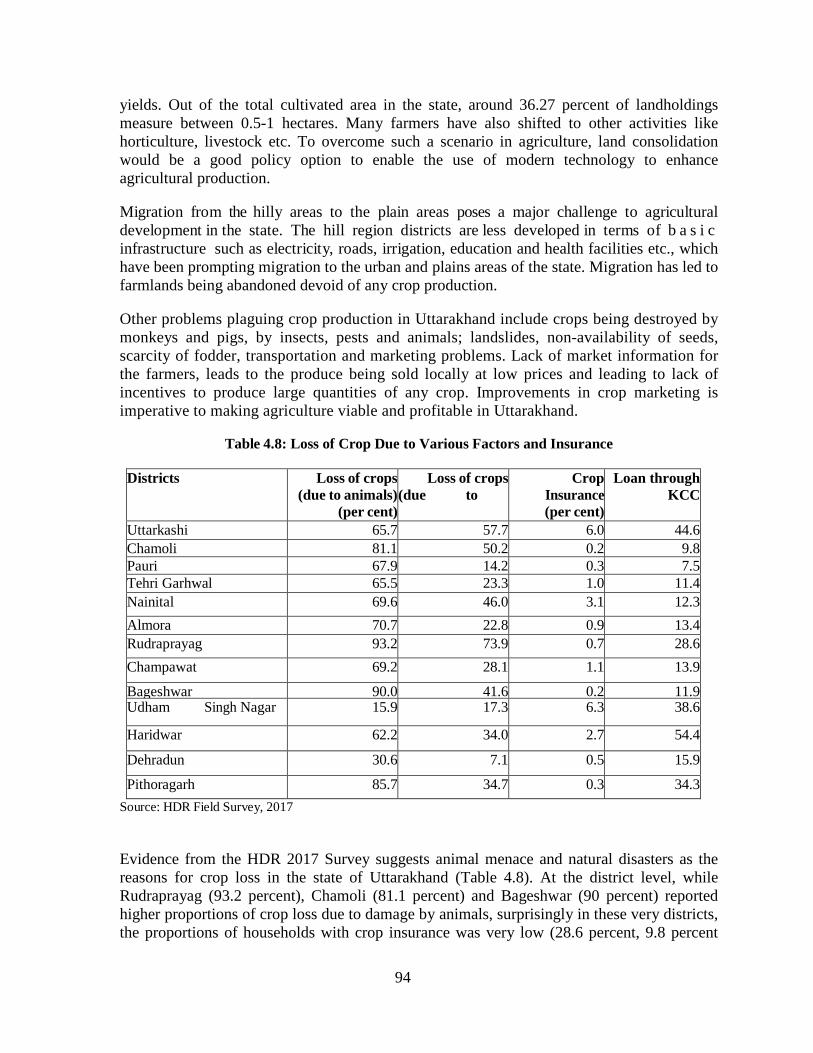
94
yields. Out of the total cultivated area in the state, around 36.27 percent of landholdings measure between 0.5-1 hectares. Many farmers have also shifted to other activities like horticulture, livestock etc. To overcome such a scenario in agriculture, land consolidation would be a good policy option to enable the use of modern technology to enhance agricultural production. Migration from the hilly areas to the plain areas poses a major challenge to agricultural development in the state. The hill region districts are less developed in terms of b a s i c infrastructure such as electricity, roads, irrigation, education and health facilities etc., which have been prompting migration to the urban and plains areas of the state. Migration has led to farmlands being abandoned devoid of any crop production. Other problems plaguing crop production in Uttarakhand include crops being destroyed by monkeys and pigs, by insects, pests and animals; landslides, non-availability of seeds, scarcity of fodder, transportation and marketing problems. Lack of market information for the farmers, leads to the produce being sold locally at low prices and leading to lack of incentives to produce large quantities of any crop. Improvements in crop marketing is imperative to making agriculture viable and profitable in Uttarakhand.
Table 4.8: Loss of Crop Due to Various Factors and Insurance Districts Loss of crops
(due to animals) (per cent)
Loss of crops (due to
Crop Insurance (per cent)
Loan through KCC
Uttarkashi 65.7 57.7 6.0 44.6 Chamoli 81.1 50.2 0.2 9.8 Pauri 67.9 14.2 0.3 7.5 Tehri Garhwal 65.5 23.3 1.0 11.4 Nainital 69.6 46.0 3.1 12.3 Almora 70.7 22.8 0.9 13.4 Rudraprayag 93.2 73.9 0.7 28.6 Champawat 69.2 28.1 1.1 13.9 Bageshwar 90.0 41.6 0.2 11.9 Udham Singh Nagar 15.9 17.3 6.3 38.6
Haridwar 62.2 34.0 2.7 54.4 Dehradun 30.6 7.1 0.5 15.9 Pithoragarh 85.7 34.7 0.3 34.3
Source: HDR Field Survey, 2017 Evidence from the HDR 2017 Survey suggests animal menace and natural disasters as the reasons for crop loss in the state of Uttarakhand (Table 4.8). At the district level, while Rudraprayag (93.2 percent), Chamoli (81.1 percent) and Bageshwar (90 percent) reported higher proportions of crop loss due to damage by animals, surprisingly in these very districts, the proportions of households with crop insurance was very low (28.6 percent, 9.8 percent
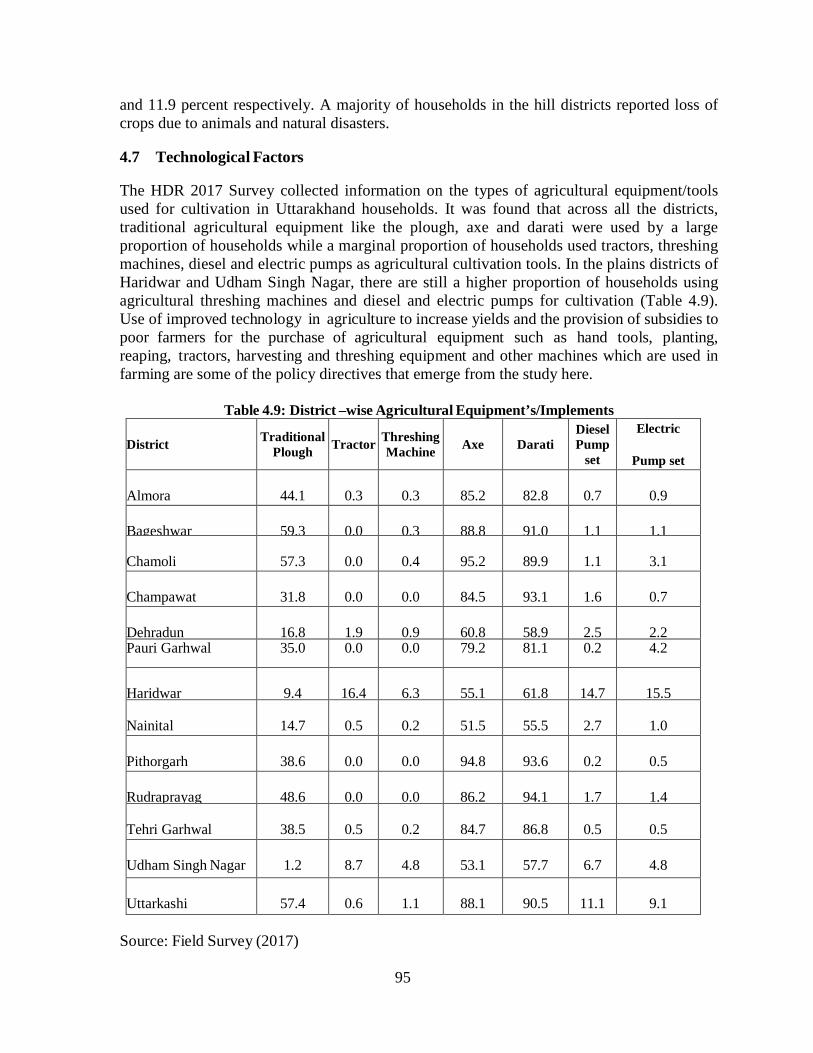
95
and 11.9 percent respectively. A majority of households in the hill districts reported loss of crops due to animals and natural disasters. 4.7 Technological Factors The HDR 2017 Survey collected information on the types of agricultural equipment/tools used for cultivation in Uttarakhand households. It was found that across all the districts, traditional agricultural equipment like the plough, axe and darati were used by a large proportion of households while a marginal proportion of households used tractors, threshing machines, diesel and electric pumps as agricultural cultivation tools. In the plains districts of Haridwar and Udham Singh Nagar, there are still a higher proportion of households using agricultural threshing machines and diesel and electric pumps for cultivation (Table 4.9). Use of improved technology in agriculture to increase yields and the provision of subsidies to poor farmers for the purchase of agricultural equipment such as hand tools, planting, reaping, tractors, harvesting and threshing equipment and other machines which are used in farming are some of the policy directives that emerge from the study here.
Table 4.9: District –wise Agricultural Equipment’s/Implements
District Traditional Plough Tractor Threshing
Machine Axe Darati Diesel Pump
set
Electric
Pump set Almora
44.1
0.3
0.3
85.2
82.8
0.7
0.9
Bageshwar
59.3
0.0
0.3
88.8
91.0
1.1
1.1
Chamoli
57.3
0.0
0.4
95.2
89.9
1.1
3.1
Champawat
31.8
0.0
0.0
84.5
93.1
1.6
0.7
Dehradun
16.8
1.9
0.9
60.8
58.9
2.5
2.2
Pauri Garhwal 35.0 0.0 0.0 79.2 81.1 0.2 4.2
Haridwar
9.4
16.4
6.3
55.1
61.8
14.7
15.5
Nainital
14.7
0.5
0.2
51.5
55.5
2.7
1.0
Pithorgarh
38.6
0.0
0.0
94.8
93.6
0.2
0.5
Rudraprayag
48.6
0.0
0.0
86.2
94.1
1.7
1.4
Tehri Garhwal
38.5
0.5
0.2
84.7
86.8
0.5
0.5
Udham Singh Nagar
1.2
8.7
4.8
53.1
57.7
6.7
4.8
Uttarkashi
57.4
0.6
1.1
88.1
90.5
11.1
9.1
Source: Field Survey (2017)
96
4.7 Organic Farming Organic farming is a way of farming which excludes the use of chemical fertilizers, insecticides etc. and is primarily based on the principles of use of natural organic inputs and biological plant protection measures. Recognizing the health and environment related benefits of organic farming, the Uttarakhand government has taken many initiatives to promote the same in the state including initiatives like Organic Uttarakhand, Ecologic Governance and Ecological Sustainability Plan. The Uttarakhand State Organic Certification Agency was also set up by the government which is an independent wing of t h e State Seed and Organic Production Agency that certifies the organic production and handling systems in the state as per the National and International Organic Standards.
Box 4.1: Organic Farming in Uttarakhand – Some Success Stories
Girish Joshi, Jajut village, Pithoragarh district, a Master Trainer who is committed to bio-agriculture, is growing onions using 3 tons’ compost per acre, CPP and liquid manures. Last year, he grew 15 percent extra onions and a growth in bulbs was also observed. In Champawat, Tea plantation at 22 sites covering an area of 209.6 hectares has been developed with a unique organic tea variety – orthodox black leaf tea (the China hybrid ‘Camelia Sinensis’) providing employment opportunities to large number of people, particularly women. The tea is in huge demand in both the national and international markets.
Source: HDR, 2017
4.8 Irrigation There are 2 types of agricultural practices in the state, rain-fed and the irrigated. Most of the agricultural activity in Uttarakhand depends on the rains, which are unpredictable and irregular. The net irrigated area of the state was 3.36 lacs ha in 2010-2011 and as a proportion of net sown area it was 48 percent implying that half the cultivated land in Uttarakhand is not irrigated. Irrigation facilities varies from district to district, in the hilly districts of the state, irrigated area to sown area was way much smaller than observed in the plain districts (Table 4.10).

97
Table 4.10 District and Region-wise Total Irrigated Land (Mean)
Own cultivated land (Acre)
Leased/Mortgaged in Land (Acre)
Leased/ Mortgaged Out land (Acre)
Total Cultivated Land (Acre)
Areas
Hill 0.13 0.01 0.02 0.14 Plain 0.62 0.06 0.06 0.69
Districts Almora 0.14 0.00 0.02 0.14 Bageshwar 0.10 0.00 0.01 0.10 Chamoli 0.13 0.00 0.01 0.13 Champawat 0.08 0.00 0.01 0.08 Dehradun 0.27 0.03 0.02 0.30 Pauri 0.06 0.01 0.03 0.07 Haridwar 0.70 0.07 0.11 0.77 Nainital 0.22 0.03 0.04 0.24 Pithorgarh 0.09 0.00 0.04 0.09 Rudraprayag 0.11 0.00 0.02 0.11 Tehri Garhwal 0.11 0.00 0.03 0.12 Udham Singh Nagar
0.81 0.08 0.02 0.88
Uttarkashi 0.27 0.01 0.02 0.27
Source: HDR Field Survey, 2017 4.9 Regulations in Agricultural Marketing in Uttarakhand The efficient functioning of agricultural markets contributes towards the welfare of the producers as well as the consumers. In Uttarakhand, the agricultural marketing mechanisms are ridden by problems such as fragmented supply chain, dominance of multiple market players leading to high wastages thereby adversely affecting efficient marketing (GOI,2013). As mentioned earlier, while agriculture is a dominant occupation in Uttarakhand, the difficult terrain, remote and inaccessible villages and weak infrastructure make it very difficult for agriculture to be a viable livelihood proposition for the populace. Agricultural marketing in Uttarakhand is governed by the Agriculture Produce Market Committee (APMC) Act. This Act was amended in the state in the year 2011. There are 27 principal market yards, 31 sub market yards and 27 weekly markets for the marketing of agricultural produce in the state (Table 4.11 The districts of Udham Singh Nagar, Haridwar, Nainital, Champawat and Dehradun have principal markets, with three of them being plains districts. In the hill districts, the markets do not function efficiently and the state also lacks regulated markets for agricultural produce. Districts in the hill regions like Chamoli, Pithoragarh, Uttarkashi, Tehri and Almora do not have functioning agricultural markets leading farmers to sell their produce in the nearby states. The absence of regulated markets, storage and processing facilities in the agricultural sector leads to inefficiencies in the
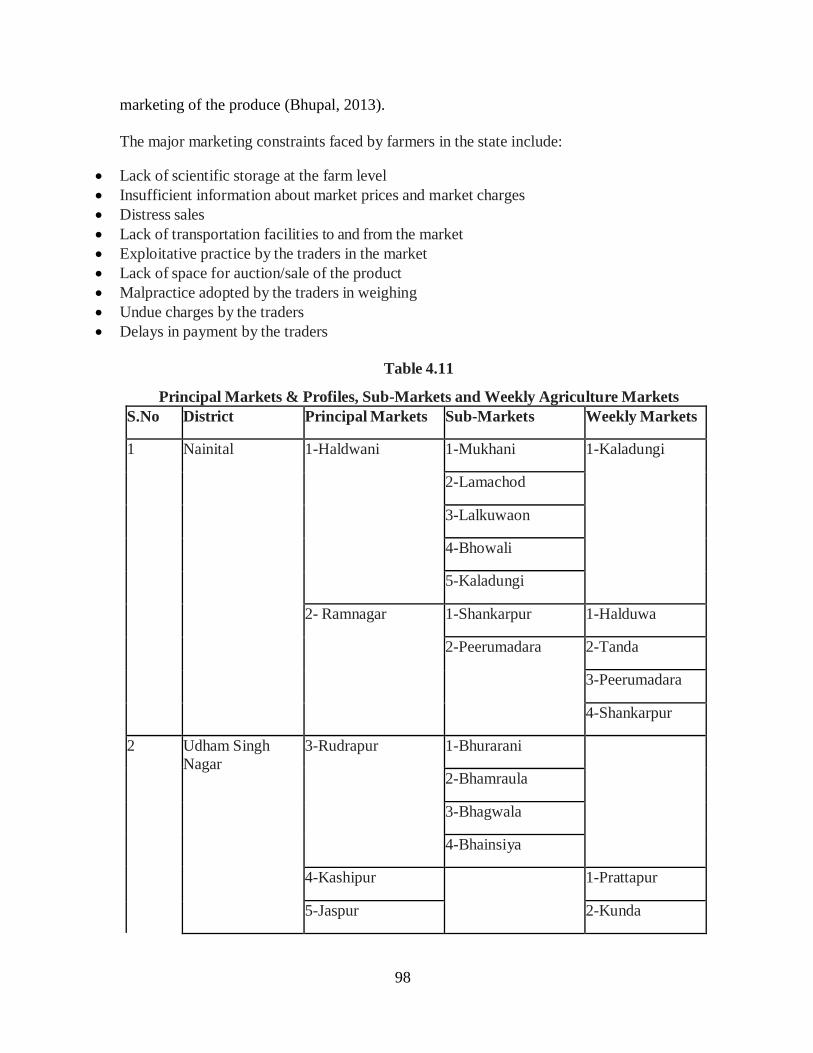
98
marketing of the produce (Bhupal, 2013). The major marketing constraints faced by farmers in the state include:
• Lack of scientific storage at the farm level • Insufficient information about market prices and market charges • Distress sales • Lack of transportation facilities to and from the market • Exploitative practice by the traders in the market • Lack of space for auction/sale of the product • Malpractice adopted by the traders in weighing • Undue charges by the traders • Delays in payment by the traders
Table 4.11
Principal Markets & Profiles, Sub-Markets and Weekly Agriculture Markets S.No District Principal Markets Sub-Markets Weekly Markets
1 Nainital 1-Haldwani 1-Mukhani 1-Kaladungi
2-Lamachod
3-Lalkuwaon
4-Bhowali
5-Kaladungi
2- Ramnagar 1-Shankarpur 1-Halduwa
2-Peerumadara 2-Tanda
3-Peerumadara
4-Shankarpur
2 Udham Singh Nagar
3-Rudrapur 1-Bhurarani
2-Bhamraula
3-Bhagwala
4-Bhainsiya
4-Kashipur 1-Prattapur
5-Jaspur 2-Kunda
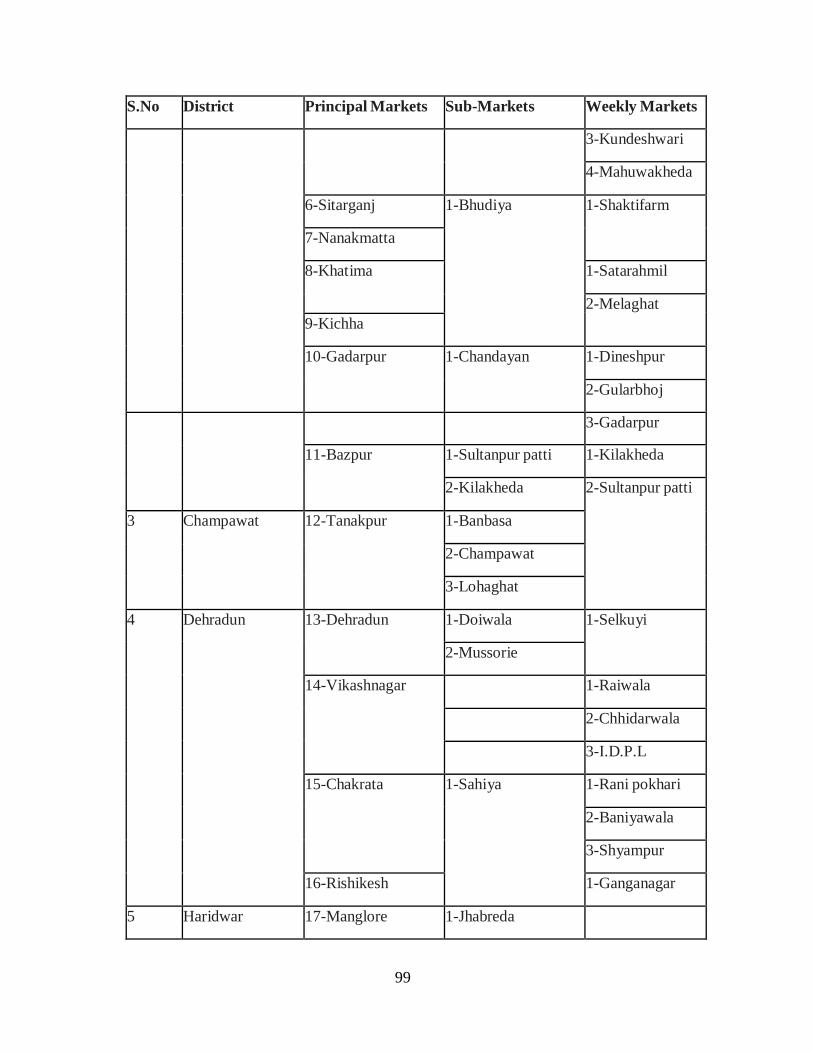
99
S.No District Principal Markets Sub-Markets Weekly Markets
3-Kundeshwari
4-Mahuwakheda
6-Sitarganj 1-Bhudiya 1-Shaktifarm
7-Nanakmatta
8-Khatima 1-Satarahmil
2-Melaghat 9-Kichha
10-Gadarpur 1-Chandayan 1-Dineshpur
2-Gularbhoj
3-Gadarpur
11-Bazpur 1-Sultanpur patti 1-Kilakheda
2-Kilakheda 2-Sultanpur patti
3 Champawat 12-Tanakpur 1-Banbasa
2-Champawat
3-Lohaghat
4 Dehradun 13-Dehradun 1-Doiwala 1-Selkuyi
2-Mussorie
14-Vikashnagar 1-Raiwala
2-Chhidarwala
3-I.D.P.L
15-Chakrata 1-Sahiya 1-Rani pokhari
2-Baniyawala
3-Shyampur
16-Rishikesh 1-Ganganagar
5 Haridwar 17-Manglore 1-Jhabreda
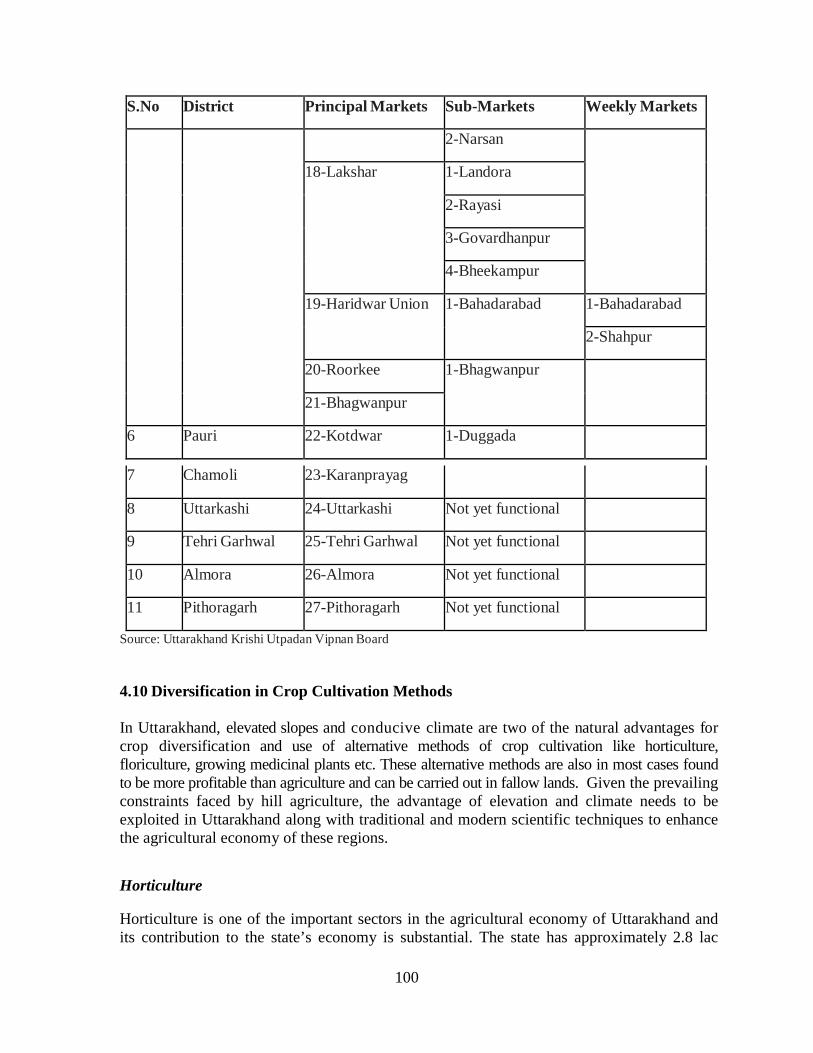
100
S.No District Principal Markets Sub-Markets Weekly Markets
2-Narsan
18-Lakshar 1-Landora
2-Rayasi
3-Govardhanpur
4-Bheekampur
19-Haridwar Union 1-Bahadarabad 1-Bahadarabad
2-Shahpur
20-Roorkee 1-Bhagwanpur
21-Bhagwanpur
6 Pauri 22-Kotdwar 1-Duggada
7 Chamoli 23-Karanprayag
8 Uttarkashi 24-Uttarkashi Not yet functional
9 Tehri Garhwal 25-Tehri Garhwal Not yet functional
10 Almora 26-Almora Not yet functional
11 Pithoragarh 27-Pithoragarh Not yet functional
Source: Uttarakhand Krishi Utpadan Vipnan Board 4.10 Diversification in Crop Cultivation Methods In Uttarakhand, elevated slopes and conducive climate are two of the natural advantages for crop diversification and use of alternative methods of crop cultivation like horticulture, floriculture, growing medicinal plants etc. These alternative methods are also in most cases found to be more profitable than agriculture and can be carried out in fallow lands. Given the prevailing constraints faced by hill agriculture, the advantage of elevation and climate needs to be exploited in Uttarakhand along with traditional and modern scientific techniques to enhance the agricultural economy of these regions.
Horticulture Horticulture is one of the important sectors in the agricultural economy of Uttarakhand and its contribution to the state’s economy is substantial. The state has approximately 2.8 lac

101
hectares of land under horticultural practices. To increase the farm incomes beyond the base subsistence levels earned by traditional farming techniques, encouraging horticulture, especially in the waste and fallow lands in the hills could help in supplementing farm incomes in the state. The ongoing switch of farmers from growing traditional crops to cash crops can also be addressed. The geographical attributes and climatic conditions of the state make it ideal for the production of temperate and subtropical fruit crops. In hilly areas, fruits like apple, pear, peach, plum and walnut are produced while mango, litchi, orange, lemon, guava and pomegranate are mostly grown in the plain areas. The state has a special advantage of producing off-season vegetables in the hilly areas, which gets a good price in the market. Evidence from the HDR 2017 Primary Survey suggest that, among the fruits, mango (20.8 per cent), apple (14.6 per cent) and litchi (9.4 per cent) occupied the top 3 positions in the state in terms of area under horticultural crops. Mango (25 per cent) and apple (16.4 per cent) were the two most produced fruits in Uttarakhand. Potatoes, peas and tomatoes were the most important vegetable crops (Table 4.12). The share of potatoes in total production of vegetables was much higher due to the yield advantage. In case of spices, garlic, ginger and turmeric were the spices produced in higher proportions.
Table 4.12
Area and Production of Major Horticultural Crops in Uttarakhand: Fruits
S.No. Fruits Area (In Acre) Production (In qtls)
Per cent Per cent 1. Apple 14.6 16.1 2. Citrus Fruit 6.5 8.0 3. Litchi 9.4 10.7 4. Mango 20.8 25.0 5. Pear 2.4 4.4 6. Other fruits
(Malta, apricot, plum, plum, guava, peach etc.)
46.2 35.7
Total 100.0 100.0 Source: HDR Survey (2017)
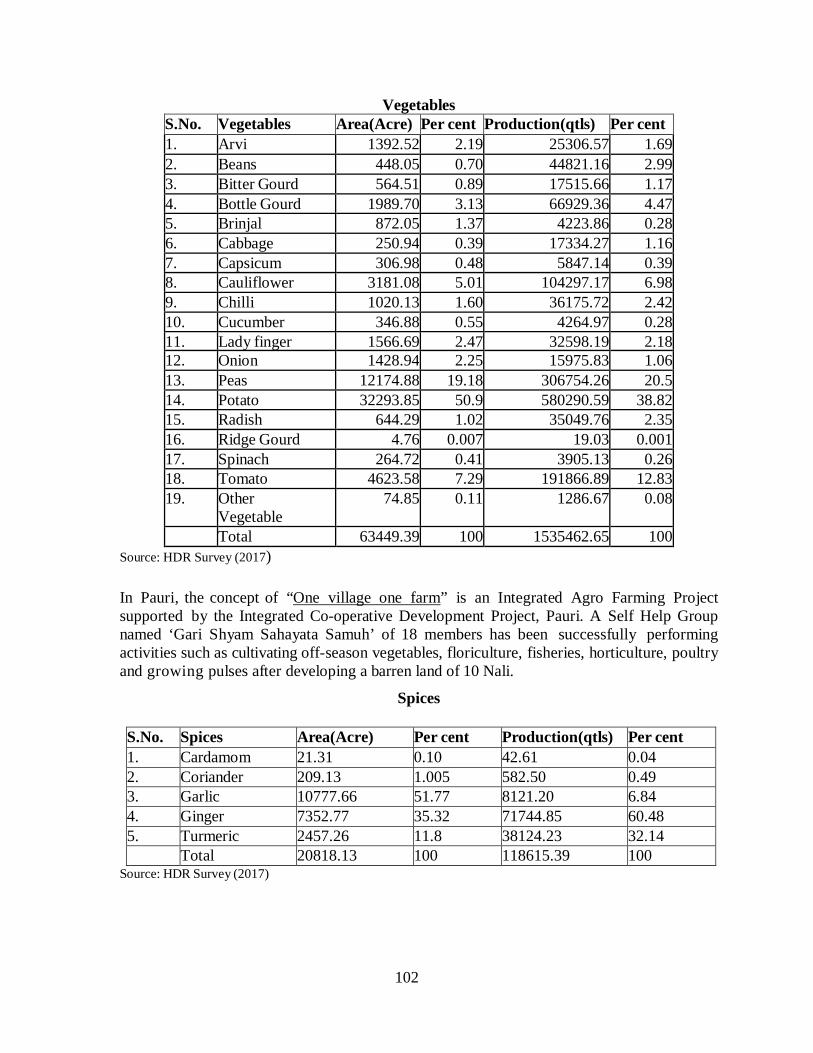
102
Vegetables S.No. Vegetables Area(Acre) Per cent Production(qtls) Per cent 1. Arvi 1392.52 2.19 25306.57 1.69 2. Beans 448.05 0.70 44821.16 2.99 3. Bitter Gourd 564.51 0.89 17515.66 1.17 4. Bottle Gourd 1989.70 3.13 66929.36 4.47 5. Brinjal 872.05 1.37 4223.86 0.28 6. Cabbage 250.94 0.39 17334.27 1.16 7. Capsicum 306.98 0.48 5847.14 0.39 8. Cauliflower 3181.08 5.01 104297.17 6.98 9. Chilli 1020.13 1.60 36175.72 2.42 10. Cucumber 346.88 0.55 4264.97 0.28 11. Lady finger 1566.69 2.47 32598.19 2.18 12. Onion 1428.94 2.25 15975.83 1.06 13. Peas 12174.88 19.18 306754.26 20.5 14. Potato 32293.85 50.9 580290.59 38.82 15. Radish 644.29 1.02 35049.76 2.35 16. Ridge Gourd 4.76 0.007 19.03 0.001 17. Spinach 264.72 0.41 3905.13 0.26 18. Tomato 4623.58 7.29 191866.89 12.83 19. Other
Vegetable 74.85 0.11 1286.67 0.08
Total 63449.39 100 1535462.65 100 Source: HDR Survey (2017)
In Pauri, the concept of “One village one farm” is an Integrated Agro Farming Project supported by the Integrated Co-operative Development Project, Pauri. A Self Help Group named ‘Gari Shyam Sahayata Samuh’ of 18 members has been successfully performing activities such as cultivating off-season vegetables, floriculture, fisheries, horticulture, poultry and growing pulses after developing a barren land of 10 Nali.
Spices S.No. Spices Area(Acre) Per cent Production(qtls) Per cent 1. Cardamom 21.31 0.10 42.61 0.04 2. Coriander 209.13 1.005 582.50 0.49 3. Garlic 10777.66 51.77 8121.20 6.84 4. Ginger 7352.77 35.32 71744.85 60.48 5. Turmeric 2457.26 11.8 38124.23 32.14 Total 20818.13 100 118615.39 100
Source: HDR Survey (2017)
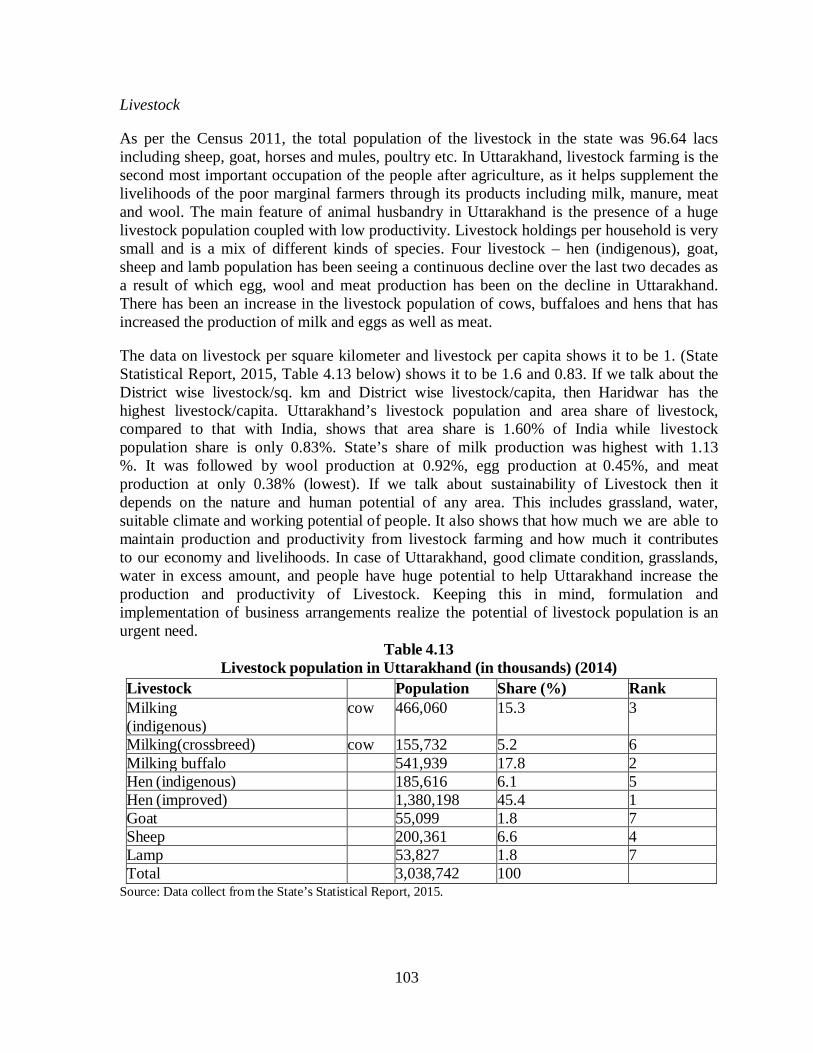
103
Livestock As per the Census 2011, the total population of the livestock in the state was 96.64 lacs including sheep, goat, horses and mules, poultry etc. In Uttarakhand, livestock farming is the second most important occupation of the people after agriculture, as it helps supplement the livelihoods of the poor marginal farmers through its products including milk, manure, meat and wool. The main feature of animal husbandry in Uttarakhand is the presence of a huge livestock population coupled with low productivity. Livestock holdings per household is very small and is a mix of different kinds of species. Four livestock – hen (indigenous), goat, sheep and lamb population has been seeing a continuous decline over the last two decades as a result of which egg, wool and meat production has been on the decline in Uttarakhand. There has been an increase in the livestock population of cows, buffaloes and hens that has increased the production of milk and eggs as well as meat. The data on livestock per square kilometer and livestock per capita shows it to be 1. (State Statistical Report, 2015, Table 4.13 below) shows it to be 1.6 and 0.83. If we talk about the District wise livestock/sq. km and District wise livestock/capita, then Haridwar has the highest livestock/capita. Uttarakhand’s livestock population and area share of livestock, compared to that with India, shows that area share is 1.60% of India while livestock population share is only 0.83%. State’s share of milk production was highest with 1.13 %. It was followed by wool production at 0.92%, egg production at 0.45%, and meat production at only 0.38% (lowest). If we talk about sustainability of Livestock then it depends on the nature and human potential of any area. This includes grassland, water, suitable climate and working potential of people. It also shows that how much we are able to maintain production and productivity from livestock farming and how much it contributes to our economy and livelihoods. In case of Uttarakhand, good climate condition, grasslands, water in excess amount, and people have huge potential to help Uttarakhand increase the production and productivity of Livestock. Keeping this in mind, formulation and implementation of business arrangements realize the potential of livestock population is an urgent need.
Table 4.13 Livestock population in Uttarakhand (in thousands) (2014)
Livestock Population Share (%) Rank Milking (indigenous)
cow 466,060 15.3 3
Milking(crossbreed) cow 155,732 5.2 6 Milking buffalo 541,939 17.8 2 Hen (indigenous) 185,616 6.1 5 Hen (improved) 1,380,198 45.4 1 Goat 55,099 1.8 7 Sheep 200,361 6.6 4 Lamp 53,827 1.8 7 Total 3,038,742 100
Source: Data collect from the State’s Statistical Report, 2015.
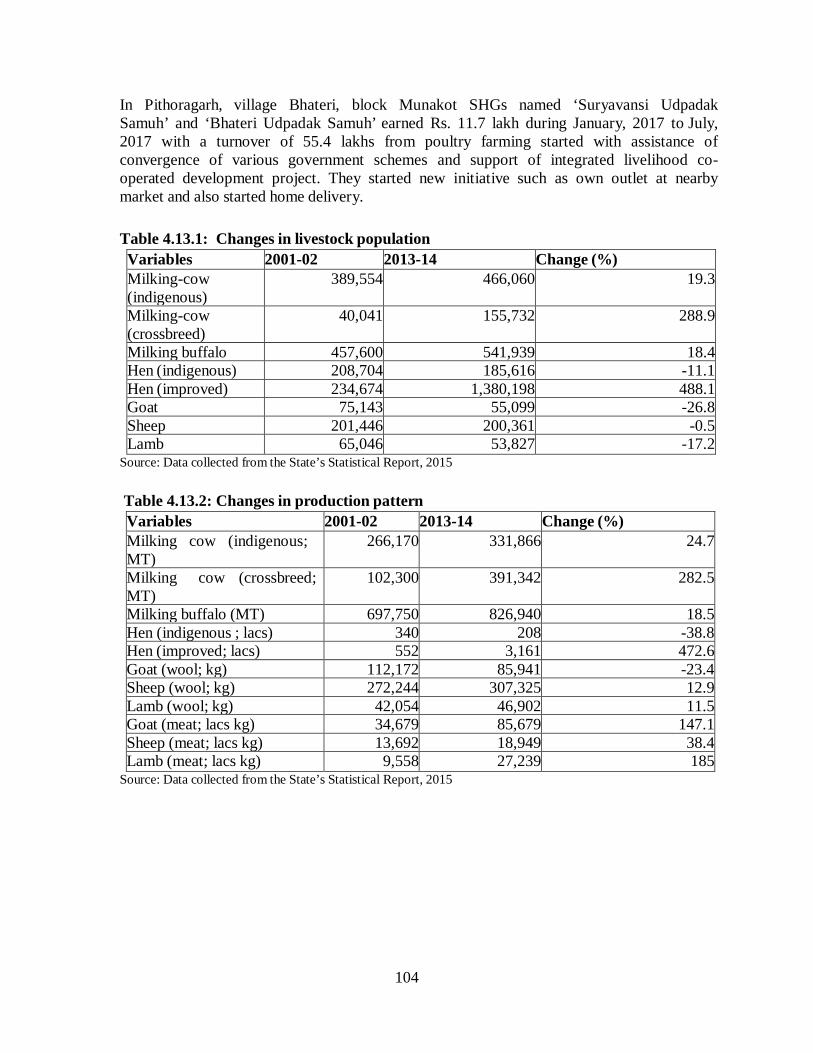
104
In Pithoragarh, village Bhateri, block Munakot SHGs named ‘Suryavansi Udpadak Samuh’ and ‘Bhateri Udpadak Samuh’ earned Rs. 11.7 lakh during January, 2017 to July, 2017 with a turnover of 55.4 lakhs from poultry farming started with assistance of convergence of various government schemes and support of integrated livelihood co- operated development project. They started new initiative such as own outlet at nearby market and also started home delivery.
Table 4.13.1: Changes in livestock population
Variables 2001-02 2013-14 Change (%) Milking-cow (indigenous)
389,554 466,060 19.3
Milking-cow (crossbreed)
40,041 155,732 288.9
Milking buffalo 457,600 541,939 18.4 Hen (indigenous) 208,704 185,616 -11.1 Hen (improved) 234,674 1,380,198 488.1 Goat 75,143 55,099 -26.8 Sheep 201,446 200,361 -0.5 Lamb 65,046 53,827 -17.2
Source: Data collected from the State’s Statistical Report, 2015 Table 4.13.2: Changes in production pattern
Variables 2001-02 2013-14 Change (%) Milking cow (indigenous; MT)
266,170 331,866 24.7
Milking cow (crossbreed; MT)
102,300 391,342 282.5
Milking buffalo (MT) 697,750 826,940 18.5 Hen (indigenous ; lacs) 340 208 -38.8 Hen (improved; lacs) 552 3,161 472.6 Goat (wool; kg) 112,172 85,941 -23.4 Sheep (wool; kg) 272,244 307,325 12.9 Lamb (wool; kg) 42,054 46,902 11.5 Goat (meat; lacs kg) 34,679 85,679 147.1 Sheep (meat; lacs kg) 13,692 18,949 38.4 Lamb (meat; lacs kg) 9,558 27,239 185
Source: Data collected from the State’s Statistical Report, 2015
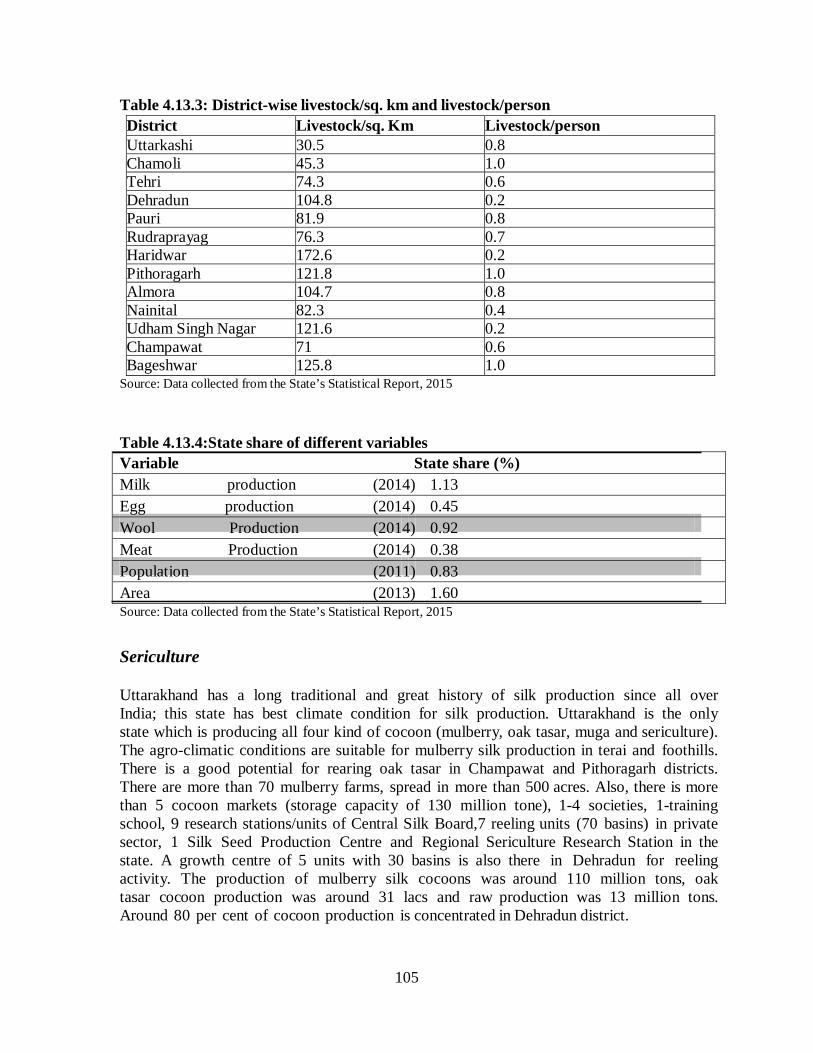
105
Table 4.13.3: District-wise livestock/sq. km and livestock/person
District Livestock/sq. Km Livestock/person Uttarkashi 30.5 0.8 Chamoli 45.3 1.0 Tehri 74.3 0.6 Dehradun 104.8 0.2 Pauri 81.9 0.8 Rudraprayag 76.3 0.7 Haridwar 172.6 0.2 Pithoragarh 121.8 1.0 Almora 104.7 0.8 Nainital 82.3 0.4 Udham Singh Nagar 121.6 0.2 Champawat 71 0.6 Bageshwar 125.8 1.0
Source: Data collected from the State’s Statistical Report, 2015 Table 4.13.4:State share of different variables Variable State share (%) Milk production (2014) 1.13 Egg production (2014) 0.45 Wool Production (2014) 0.92 Meat Production (2014) 0.38 Population (2011) 0.83 Area (2013) 1.60 Source: Data collected from the State’s Statistical Report, 2015 Sericulture Uttarakhand has a long traditional and great history of silk production since all over India; this state has best climate condition for silk production. Uttarakhand is the only state which is producing all four kind of cocoon (mulberry, oak tasar, muga and sericulture). The agro-climatic conditions are suitable for mulberry silk production in terai and foothills. There is a good potential for rearing oak tasar in Champawat and Pithoragarh districts. There are more than 70 mulberry farms, spread in more than 500 acres. Also, there is more than 5 cocoon markets (storage capacity of 130 million tone), 1-4 societies, 1-training school, 9 research stations/units of Central Silk Board,7 reeling units (70 basins) in private sector, 1 Silk Seed Production Centre and Regional Sericulture Research Station in the state. A growth centre of 5 units with 30 basins is also there in Dehradun for reeling activity. The production of mulberry silk cocoons was around 110 million tons, oak tasar cocoon production was around 31 lacs and raw production was 13 million tons. Around 80 per cent of cocoon production is concentrated in Dehradun district.
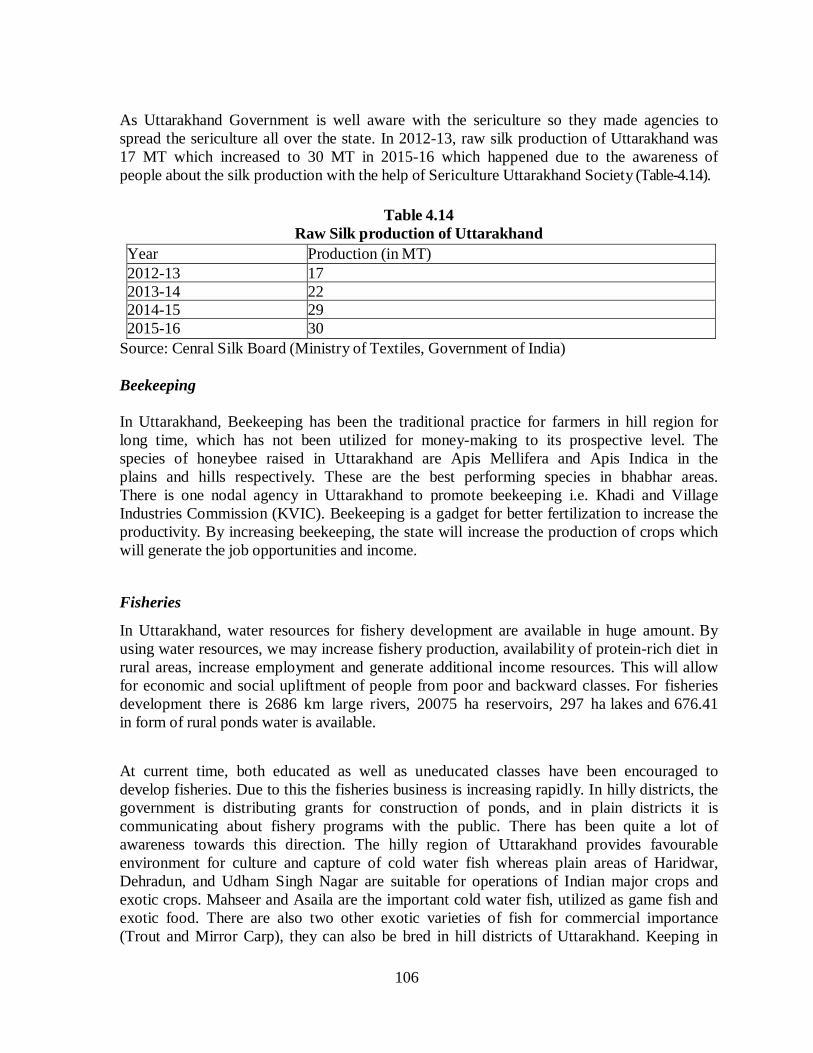
106
As Uttarakhand Government is well aware with the sericulture so they made agencies to spread the sericulture all over the state. In 2012-13, raw silk production of Uttarakhand was 17 MT which increased to 30 MT in 2015-16 which happened due to the awareness of people about the silk production with the help of Sericulture Uttarakhand Society (Table-4.14).
Table 4.14 Raw Silk production of Uttarakhand
Year Production (in MT) 2012-13 17 2013-14 22 2014-15 29 2015-16 30
Source: Cenral Silk Board (Ministry of Textiles, Government of India) Beekeeping In Uttarakhand, Beekeeping has been the traditional practice for farmers in hill region for long time, which has not been utilized for money-making to its prospective level. The species of honeybee raised in Uttarakhand are Apis Mellifera and Apis Indica in the plains and hills respectively. These are the best performing species in bhabhar areas. There is one nodal agency in Uttarakhand to promote beekeeping i.e. Khadi and Village Industries Commission (KVIC). Beekeeping is a gadget for better fertilization to increase the productivity. By increasing beekeeping, the state will increase the production of crops which will generate the job opportunities and income. Fisheries
In Uttarakhand, water resources for fishery development are available in huge amount. By using water resources, we may increase fishery production, availability of protein-rich diet in rural areas, increase employment and generate additional income resources. This will allow for economic and social upliftment of people from poor and backward classes. For fisheries development there is 2686 km large rivers, 20075 ha reservoirs, 297 ha lakes and 676.41 in form of rural ponds water is available. At current time, both educated as well as uneducated classes have been encouraged to develop fisheries. Due to this the fisheries business is increasing rapidly. In hilly districts, the government is distributing grants for construction of ponds, and in plain districts it is communicating about fishery programs with the public. There has been quite a lot of awareness towards this direction. The hilly region of Uttarakhand provides favourable environment for culture and capture of cold water fish whereas plain areas of Haridwar, Dehradun, and Udham Singh Nagar are suitable for operations of Indian major crops and exotic crops. Mahseer and Asaila are the important cold water fish, utilized as game fish and exotic food. There are also two other exotic varieties of fish for commercial importance (Trout and Mirror Carp), they can also be bred in hill districts of Uttarakhand. Keeping in
107
mind about the demand of fish seed in the state, fresh efforts are being made by the department to increase the capacity of fishery seed production in Uttarakhand. Under the development of Game Fisheries scheme, licenses have been issued for fishing in the lakes and rivers for domestic and foreign tourists, so that tourism can be promoted in Uttarakhand. In present, angling licenses are being issued at Nainital, Bhimtal, Sattal, Nukuchiyalal and Baranganga Hatheri (Chamoli). For the purpose of connecting fisheries and employment opportunities to Scheduled Castes and Scheduled Tribes, scheduled caste deployment and tribal sub-plan is being conducted, under which ponds are constructed in mountainous and meadow areas. Housing and drinking water facilities are being provided to the weak fishermen community through National Fisheries Welfare Scheme. VIII. Success Stories/Innovative Practice • In Pithoragarh, village Bhateri, block Munakot SHGs named ‘Surryavanshi Udpadak
Samuh’ and ‘Bhateri Udpadak Samuh’ earned Rs 11.7 lakh during January, 2017 to July, 2017 with a turnover of 55.4 lakhs from poultry farming started with assistance of convergence of various government schemes and support of integrated livelihood co-operated development project. They started new initiative such as own outlet at nearby market and also started home delivery.
• In Pauri “One village one farm” is an Integrated Agro farming Project supported by
Integrated Co-Operative Development Project Pauri. SHG named ‘Gari Shyam Sahayata Samuh’ of 18 members successfully performing activities such as off- season vegetables, floriculture, fisheries, horticulture, poultry and pulses cultivation after developing a barren land of 10 Nali.
• In Udham Singh Nagar, Sri Satendra Choudhari from village Shahdoura, Sri Vinay pal
Singh from village Rikhi and Sri Om Prakash from Aitpur village of block Kitchha adopted innovative practice of trench system by ensuring appropriate interval between two plants which increased their yield 25-30% more than the earlier traditional farming practices. They also used the middle space for mix farming such as wheat, barley, peas, mustard, gram, cabbage, onion, tomato, chilli, brinjal etc., resulting in doubling their overall income.
• In Almora, a specific iron plough was invented by Mr. Vishwakarma. This has been
developed according to the geographical condition of hilly areas. Three types of iron ploughs were developed one for high altitude, second for mid-altitude, and third for valleys. This kind of plough has huge demand in hilly areas of other district; it is easy to carry and plough more areas at the same time with great efficiency.
• In Bageshwar, Jeevan Lal from village Sunargaon of block Kanda has won many state
and national level awards for his innovative practices by performing many activities such as eco-tourism, adopted from home-stay concept and rearing indigenous breed of

108
cow named Badri, which produce high value milk combining bio-gas plant, cattle shed, green house, poly house and bee keeping etc. Many foreign tourists, students visited his place every year.
• In Nainital, Prayavarniya pravodhini (NGO) focussing on community awareness and
development programme through its innovative idea—Community Radio. Its focus areas are: education, promoting aromatic and ornamental plants, wall painting on social issues and skill development of local artisans. This NGO depends on government aid but often faces lack of financial assistance.
• Han’s foundation has provided 132 gas connections and infrastructure such as tables and
chairs to schools for mid-day meal preparation and proper sitting arrangements. • In Haridwar, 10 SHGs in Kangadi are manufacturing jute bags and involved in Prasad
distribution in Maa Mansa devi and Maa Chandi devi temple. Manufacturing of sanitary napkins is also done by 10 SHGs and installed vending machine at SIDKUL Organic jelly production is also being undertaken by them.
• In Champawat, Himalayan Vikas Samiti, focusing on education and solar energy,
initiated digital school with the help of solar projector in 50 remote villages. Source: “Progress Report”, Institute for Human Development, Delhi (2017) 4.20. Conclusion In Uttarakhand, majority of people are engaged in agricultural and allied activities but the state has not been able to improve its agricultural growth in the past years. Majority of the population in the state is classified as rural and lives in hilly areas. This large geographical area has rain-fed subsistence agriculture, which is hilly. Hilly areas have difficult terrain, infertile soil, cold climate, and other natural constraint which makes it very difficult for the farmers to do agricultural activities and also due to these factors productivity of the crops are very less. “Hill farming is still awaiting special attention from the government as much of the state’s agriculture budget comes from the Centre and most of the agro-development schemes are centrally sponsored” (Reported by Hindustan Times). One of the major challenges is to provide local employment and income for the people living in rural areas of the state. The hills don’t have industries, which results in lack of service sector, hence development of the agriculture sector remains the only option for the state. Apart from hilly areas there are lots of rivers and valleys in the state where irrigational and other technological measures cannot be implemented properly. Productivity of the major crops in the state is very low so there is urgent need to increase their productivity. In order to increase productivity, use of chemical fertilizers should be avoided instead organic farming practices should be introduced. For sustainable development of agriculture, it is necessary to introduce organic farming which will enrich soil and increase soil depth. Farmers of the state still use traditional methods for farming, instead
109
modern machinery should be used. Government should provide these machineries to the farmers at a subsidized price. There is an alarming problem of animal menace in the state which should be taken care of by crop insurance and also by loan from the government. Allied activities like horticulture, livestock, beekeeping etc. are more profitable than the agricultural activities so there is need for diversification in the state. Horticulture can also become an impressive tool for increasing the development in hilly areas as well as income of farmers beyond the subsistence level which they managed from the traditional crops. There is less food production than actual requirement in maximum area of the state. Immediate attention is required from the government and individuals of the state towards the conservation of the land, particularly the agricultural land.
Suggestions: Agriculture and Allied Sectors
• Land consolidation (Chakbandi) and Cluster farming. • Schemes should be made universal not only for SC/ST. • Set up seed and fodder bank. • Set up local preservation centres for milk and milk products. • Ensure easy accessibility of credit and setting up local mandi. • Processing unit of perishable items should be established in the local areas to minimise the cost of transportation. • Promote organic farming and branding of organic products. • Loss of crops due to animal’s menace should be covered under Prime Minister Crop Insurance Scheme. • Solar pumps to install to lift water at high altitudes. • More focus on mushroom production and bee keeping. • Regular exposure visit of progressive farmers outside the state, to learn new techniques in the context of hill farming.
Source: “Workshop Report”, Institute for Human Development, Delhi (2017)

110
Reference Ahmad, Mumtaj (2002),” Agricultural development in Uttarakhand”, Department of Geography, Aligarh Muslim University Government of India, Central Statistical Organization --------------------------, Ministry of Agriculture and Farmers Welfare, Department of Agriculture, Cooperation and Farmers Welfare, Mechanization & Technology Division ------------------------- (2014), MINISTRY OF AGRICULTURE, DEPARTMENT OF AGRICULTURE & CO-OPERATION, AGRICULTURE CENSUS DIVISION ------------------------- (2015),” State at a Glance: Uttarakhand”, Forest and climate change, G.B Pant Institute of Himalayan Environment & Development. Government of Mizoram (2013), Mizoram Human Development Report, Institute for Human Development, New Delhi. Government of Uttarakhand, Uttarakhand Animal Husbandry Department
-------------------------------------, “Directorate of Economics & Statistics”, Planning department -------------------------------------, Uttarakhand Fisheries Department -------------------------------------, Uttarakhand Horticulture Department -------------------------------------, Uttarakhand Irrigation Department -------------------------------------, Uttarakhand Sericulture Department Nagarwalla, Darab J. and Rakesh Agrawal, State chapter- Uttarakhand, Kalpvriksha Sah, Renuka (2017), “Changing Land use Pattern in Uttarakhand”, Post-Doctoral Research Fellow, Department of Geography, D. S. B. Campus, Kumaun University Nainital, January. Tuteja, Usha (2015), “Agriculture Profile of Uttarakhand”, Agricultural Economics

111
CHAPTER: 5 URBANISATION AND URBAN GOVERNANCE IN UTTARAKHAND
5.1 Introduction In 2011, approximately 70 percent of Uttarakhand’s population was reported as living in rural areas (Census 2011), a little over the All India figure of 69 per cent. The average growth rate of the urban population (4 per cent) in the state has been three times that of the rural population growth rate (1.2 percent) indicating rapid urbanisation. Located in the foothills of the Himalayan ranges, with 86 percent of its geographical area covered by hills, development of appropriate facilities like transport, education and health services has been a challenge for the state, leading to migration from the hills into the plains The state’s industrial policy has also contributed to the exodus of people from the hilly areas. Uttarakhand has remarkably improved its rank in terms of Ease of Doing Business from 23rd in 2015 to 9th in 2016 as per the ranking system initiated by the Department of Industrial Policy and Promotion (DIPP) of the Ministry of Commerce1. The state has taken several steps to boost the tourism sector. The MSME policy and the start-up policy, 2018 have been formulated to provide a supportive regulatory environment to MSMEs for doing business. The Chief Minister has introduced the Mukhya Mantri Gram Swarozgar Yojana (MMGSY) for industries based in rural areas. Yet, all these industry boosting activities have been concentrated in the four urbanised districts of the state viz., Dehradun, Nainital, Hardwar and Udham Singh Nagar, thereby encouraging rapid urbanization coupled in-migration into these districts which puts excessive pressures on infrastructure. High economic and environmental costs dissuade industrialization in the hilly areas of the state. Given the state government restrictions on construction and other industrial activities in the hill and forest areas, the growth of industries in terms of Micro, Small and Medium Enterprises (MSMEs) in these four districts has in turn led to increased migration into these areas. In the absence of proper land planning, rapid urbanization in the plains and the cities has led to the proliferation of slums (As per census of India 2011, Rudrapur in Udham Singh Nagar reporting 60 percent of its total population living in slums).
Rapid urbanization doesn’t always lead to inclusive growth and development. Planned urbanization needs to be coupled with spatially distributed employment opportunities and infrastructure facilities. The HDR 2017 Survey of 2000 household in Uttarakhand throws some useful light on the process of urbanisation in the state and the implications therein. 5.2 Urbanisation 5.2.1 Extent of Urbanisation It has been projected that the state of Uttaranchal will be the 7th most urbanized state in India by the year 2021 (UUSDA, 2011) with a third of its population as urban (37 percent). Over the decadal period 2001-2011, the population of the state grew by 20
1 http://eodb.dipp.gov.in/ReportView.aspx?st_id=5&r_id=0
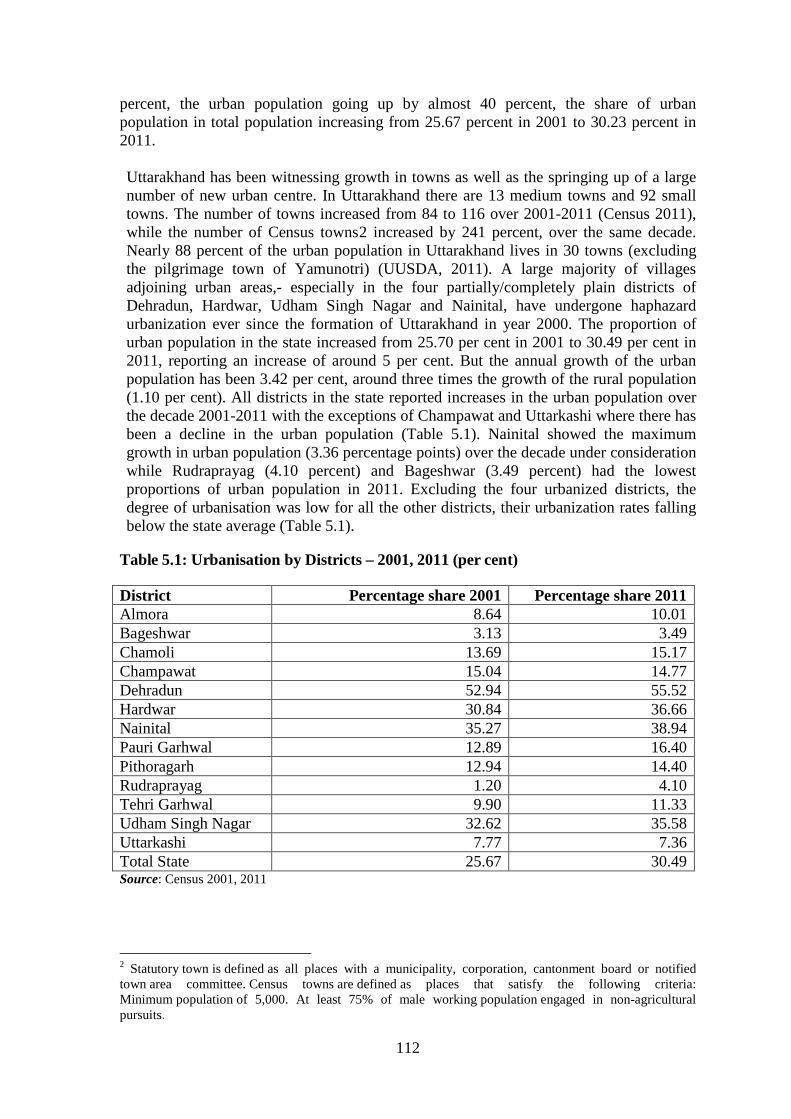
112
percent, the urban population going up by almost 40 percent, the share of urban population in total population increasing from 25.67 percent in 2001 to 30.23 percent in 2011. Uttarakhand has been witnessing growth in towns as well as the springing up of a large number of new urban centre. In Uttarakhand there are 13 medium towns and 92 small towns. The number of towns increased from 84 to 116 over 2001-2011 (Census 2011), while the number of Census towns2 increased by 241 percent, over the same decade. Nearly 88 percent of the urban population in Uttarakhand lives in 30 towns (excluding the pilgrimage town of Yamunotri) (UUSDA, 2011). A large majority of villages adjoining urban areas,- especially in the four partially/completely plain districts of Dehradun, Hardwar, Udham Singh Nagar and Nainital, have undergone haphazard urbanization ever since the formation of Uttarakhand in year 2000. The proportion of urban population in the state increased from 25.70 per cent in 2001 to 30.49 per cent in 2011, reporting an increase of around 5 per cent. But the annual growth of the urban population has been 3.42 per cent, around three times the growth of the rural population (1.10 per cent). All districts in the state reported increases in the urban population over the decade 2001-2011 with the exceptions of Champawat and Uttarkashi where there has been a decline in the urban population (Table 5.1). Nainital showed the maximum growth in urban population (3.36 percentage points) over the decade under consideration while Rudraprayag (4.10 percent) and Bageshwar (3.49 percent) had the lowest proportions of urban population in 2011. Excluding the four urbanized districts, the degree of urbanisation was low for all the other districts, their urbanization rates falling below the state average (Table 5.1).
Table 5.1: Urbanisation by Districts – 2001, 2011 (per cent) District Percentage share 2001 Percentage share 2011 Almora 8.64 10.01 Bageshwar 3.13 3.49 Chamoli 13.69 15.17 Champawat 15.04 14.77 Dehradun 52.94 55.52 Hardwar 30.84 36.66 Nainital 35.27 38.94 Pauri Garhwal 12.89 16.40 Pithoragarh 12.94 14.40 Rudraprayag 1.20 4.10 Tehri Garhwal 9.90 11.33 Udham Singh Nagar 32.62 35.58 Uttarkashi 7.77 7.36 Total State 25.67 30.49 Source: Census 2001, 2011
2 Statutory town is defined as all places with a municipality, corporation, cantonment board or notified town area committee. Census towns are defined as places that satisfy the following criteria: Minimum population of 5,000. At least 75% of male working population engaged in non-agricultural pursuits.

113
Champawat and Uttarkashi districts have witnessed a relative decline in urban population, while Nainital showed maximum growth. Rudraprayag and Bageshwar are the least urbanised districts. 5.2.2 The Growth of Slums
Dehradun city witnessed a 4 per cent increase in slum population, (22 to 26 per cent) during the last decade as per census of India (2001-2011). The state also has a significant number of shelter less population that is increasing with a threat to quality of life. According to data from the State Slum Settlement Development Committee, there were at least 582 slum settlements across the State. According to the Statistical Compendium, Directorate of Economic and Statistics 0f the State Government (2016-17), more than 15 per cent of the city population lives in slums. There are 74 statutory towns with 31 slum reported towns. The total slum population in Uttarakhand was around 14.5 lakh. The report, based on Census and NSS data, estimates slum vulnerability on six dimensions - magnitude of slum population/household, availability of basic household amenities in slum households, housing condition of slum households, possession of household assets in slum households, social dimensions and access to banking facilities among slum households. According to the report of 2011, level of vulnerability of slum dwellers in Uttarakhand is 0.79 lying in bottom five. Further the state showed a negative trend in slum vulnerability from 2001 to 20113.
5.2.2 Effect of Migration on Urbanisation
Uttarakhand has been witnessing continuous migration from the hill regions to the plains, mainly from the rural parts to the urban parts of these regions. T h e H D R 2 0 1 7 S u r v e y h a s r e p o r t e d t h a t more than one-third m i g r a n t households in t he u rban a reas are long term migrants from rural hills. Long term migrants from the urban hills to the urban plains is also substantial (30 per cent), signifying strong pulls from the urban plains. Data on migration collected during the HDR 2017 Survey shows that in Uttarakhand migration from the hills is far higher than migration out of the plains (31.2 percent and 3.8 percent). Long term out migration is also as expected higher from rural areas than urban areas (28.9 and 9.8 percent) (Appendix Tables 5.2 and 5.3). Long term out migration from the rural hills is almost three times more than that from the urban hill regions (35.3 and 11.5 percent of households respectively), which could be an indication of better infrastructure in the urban hill regions. With a vast area of the rural hills under forest cover, economic activities in terms of production and employment are expensive in remote hilly terrains. Long term migrating households are in much lower proportions in the rural and urban areas of the plains regions (2.6 and 5.3 percent respectively). The low proportions of households migrating out of the rural plains region could indicate the existence of good infrastructure and the availability of better livelihood and job opportunities.
3 http://nbo.nic.in/Images/PDF/SLUMS_IN_INDIA_Slum_Compendium_2015_English.pdf
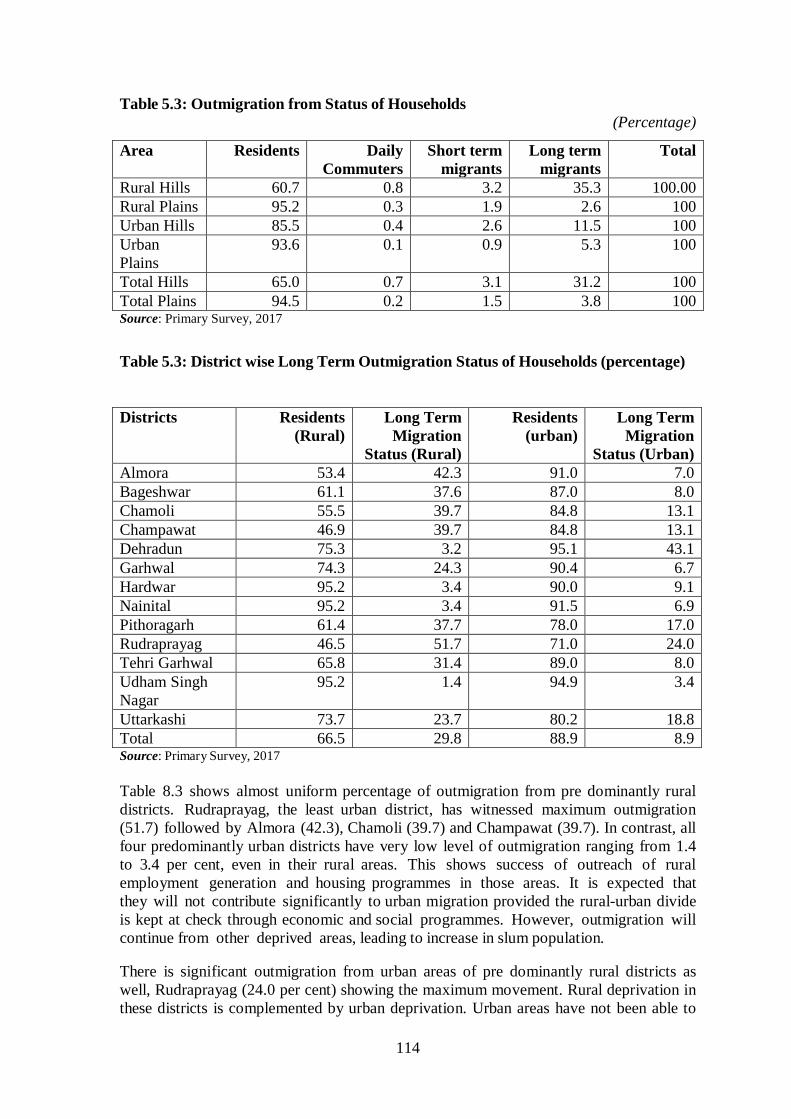
114
Table 5.3: Outmigration from Status of Households (Percentage)
Area Residents Daily Commuters
Short term migrants
Long term migrants
Total
Rural Hills 60.7 0.8 3.2 35.3 100.00 Rural Plains 95.2 0.3 1.9 2.6 100 Urban Hills 85.5 0.4 2.6 11.5 100 Urban Plains
93.6 0.1 0.9 5.3 100
Total Hills 65.0 0.7 3.1 31.2 100 Total Plains 94.5 0.2 1.5 3.8 100 Source: Primary Survey, 2017
Table 5.3: District wise Long Term Outmigration Status of Households (percentage) Districts Residents
(Rural) Long Term
Migration Status (Rural)
Residents (urban)
Long Term Migration
Status (Urban) Almora 53.4 42.3 91.0 7.0 Bageshwar 61.1 37.6 87.0 8.0 Chamoli 55.5 39.7 84.8 13.1 Champawat 46.9 39.7 84.8 13.1 Dehradun 75.3 3.2 95.1 43.1 Garhwal 74.3 24.3 90.4 6.7 Hardwar 95.2 3.4 90.0 9.1 Nainital 95.2 3.4 91.5 6.9 Pithoragarh 61.4 37.7 78.0 17.0 Rudraprayag 46.5 51.7 71.0 24.0 Tehri Garhwal 65.8 31.4 89.0 8.0 Udham Singh Nagar
95.2 1.4 94.9 3.4
Uttarkashi 73.7 23.7 80.2 18.8 Total 66.5 29.8 88.9 8.9 Source: Primary Survey, 2017 Table 8.3 shows almost uniform percentage of outmigration from pre dominantly rural districts. Rudraprayag, the least urban district, has witnessed maximum outmigration (51.7) followed by Almora (42.3), Chamoli (39.7) and Champawat (39.7). In contrast, all four predominantly urban districts have very low level of outmigration ranging from 1.4 to 3.4 per cent, even in their rural areas. This shows success of outreach of rural employment generation and housing programmes in those areas. It is expected that they will not contribute significantly to urban migration provided the rural-urban divide is kept at check through economic and social programmes. However, outmigration will continue from other deprived areas, leading to increase in slum population. There is significant outmigration from urban areas of pre dominantly rural districts as well, Rudraprayag (24.0 per cent) showing the maximum movement. Rural deprivation in these districts is complemented by urban deprivation. Urban areas have not been able to

115
generate adequate economic attraction to retain the population within the districts. In contrast, the predominantly urban districts of Dehradun, Hardwar, Nainital and Udham Singh Nagar have witnessed very low proportion of outmigration. There is not much impact on decongestion of city population. Dehradun, being chosen as one of the Smart Cities, is likely to attract more investment with stronger pull factor. Already, it has the highest number of slums in the state. 5.2.3 Urbanisation and Rural - Urban Wage Differentials A major indicator of economic well-being is the difference between rural wage and urban wage. However, not much difference is observed in the state so far as casual labourers are concerned. It may indicate that low wages in rural areas are complemented with low wages in urban areas also. For the casual workers, in four districts, rural wage has been found to be higher than urban wage. The successful implementation of rural employment programmes majority account for that. It has been observed in largely urbanised districts of Udham Singh Nagar and Hardwar as well. Otherwise, there is not much difference in rural and urban wage excepting in Chamoli. The difference is much more evident in case of regular workers with the exception of Nainital and Udham Singh Nagar, where rural wages are higher than urban wage (Table 8.4). The difference is very high in Almora and Tehri Garhwal, where rural wage is almost half of urban wage. In Uttarakhand, factories provide more employment than the MSME sector. Majority of MSME are in the informal sector. In Udham Singh Nagar with high concentration of MSME, rural wage is more than urban wage in both casual and regular categories, indicating low level of wages in the informal sector, especially for the unskilled and semi-skilled labour. Increasing migration has led to a shortage of labour in rural areas, thereby increasing the wage rate. Rigorous implementation of rural development and employment programmes is likely to check migration and bring equality of wages.
Table 5.4: Differential in the Rural/Urban Wage Rate (Percent)
Casual Worker Regular Worker District Rural/Urban Rural/urban Almora 0.91 0.52 Bageswar 1.01 0.80 Chamoli 0.68 0.80 Champawat 0.97 0.70 Dehradun 0.91 0.66 Garhwal 0.95 0.76 Hardwar 1.03 0.66 Nainital 0.89 1.26 Pithoragarh 1.07 0.88 Rudraprayag 0.94 0.94 Tehri Garhwal 0.96 0.58 Udham Singh Nagar 1.01 1.12 Uttarkashi 0.85 0.78 Total 0.94 0.85
Source: Primary Survey, 2017 [*Ratio of rural wages to urban wage or earning per day]
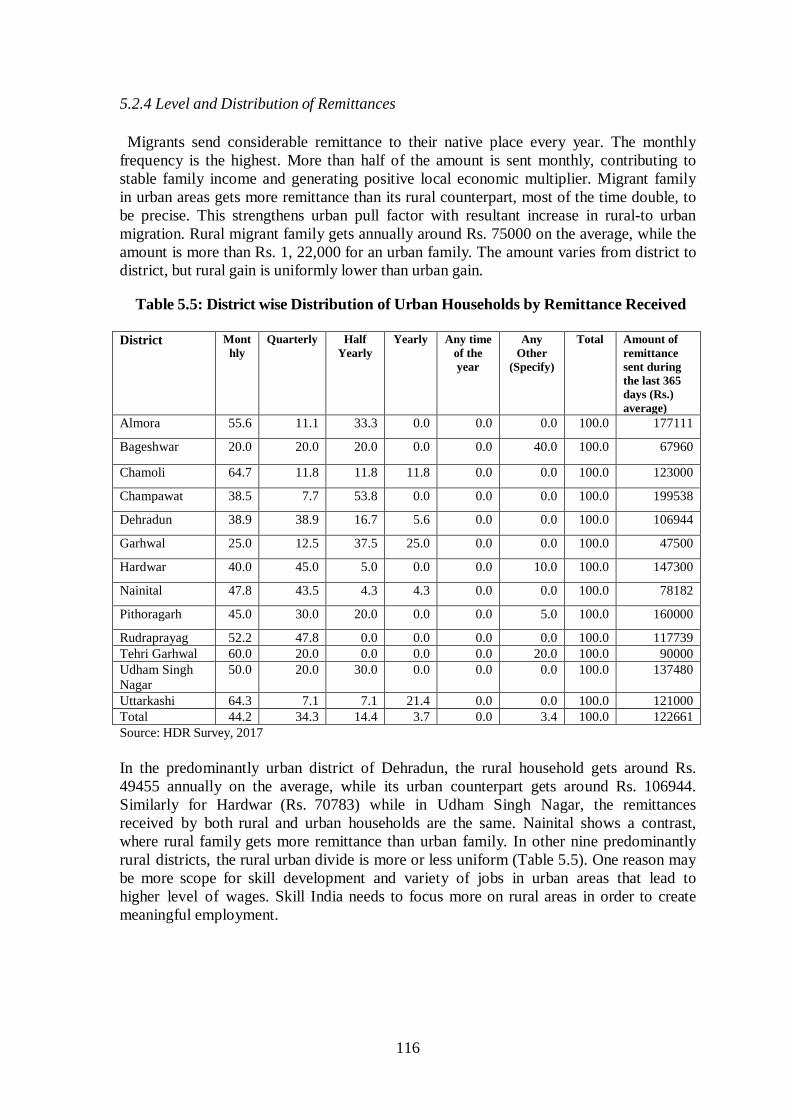
116
5.2.4 Level and Distribution of Remittances Migrants send considerable remittance to their native place every year. The monthly
frequency is the highest. More than half of the amount is sent monthly, contributing to stable family income and generating positive local economic multiplier. Migrant family in urban areas gets more remittance than its rural counterpart, most of the time double, to be precise. This strengthens urban pull factor with resultant increase in rural-to urban migration. Rural migrant family gets annually around Rs. 75000 on the average, while the amount is more than Rs. 1, 22,000 for an urban family. The amount varies from district to district, but rural gain is uniformly lower than urban gain.
Table 5.5: District wise Distribution of Urban Households by Remittance Received
District Monthly
Quarterly Half Yearly
Yearly Any time of the year
Any Other
(Specify)
Total Amount of remittance sent during the last 365 days (Rs.) average)
Almora 55.6 11.1 33.3 0.0 0.0 0.0 100.0 177111
Bageshwar 20.0 20.0 20.0 0.0 0.0 40.0 100.0 67960
Chamoli 64.7 11.8 11.8 11.8 0.0 0.0 100.0 123000
Champawat 38.5 7.7 53.8 0.0 0.0 0.0 100.0 199538
Dehradun 38.9 38.9 16.7 5.6 0.0 0.0 100.0 106944
Garhwal 25.0 12.5 37.5 25.0 0.0 0.0 100.0 47500
Hardwar 40.0 45.0 5.0 0.0 0.0 10.0 100.0 147300
Nainital 47.8 43.5 4.3 4.3 0.0 0.0 100.0 78182
Pithoragarh 45.0 30.0 20.0 0.0 0.0 5.0 100.0 160000
Rudraprayag 52.2 47.8 0.0 0.0 0.0 0.0 100.0 117739 Tehri Garhwal 60.0 20.0 0.0 0.0 0.0 20.0 100.0 90000 Udham Singh Nagar
50.0 20.0 30.0 0.0 0.0 0.0 100.0 137480
Uttarkashi 64.3 7.1 7.1 21.4 0.0 0.0 100.0 121000 Total 44.2 34.3 14.4 3.7 0.0 3.4 100.0 122661 Source: HDR Survey, 2017
In the predominantly urban district of Dehradun, the rural household gets around Rs. 49455 annually on the average, while its urban counterpart gets around Rs. 106944. Similarly for Hardwar (Rs. 70783) while in Udham Singh Nagar, the remittances received by both rural and urban households are the same. Nainital shows a contrast, where rural family gets more remittance than urban family. In other nine predominantly rural districts, the rural urban divide is more or less uniform (Table 5.5). One reason may be more scope for skill development and variety of jobs in urban areas that lead to higher level of wages. Skill India needs to focus more on rural areas in order to create meaningful employment.
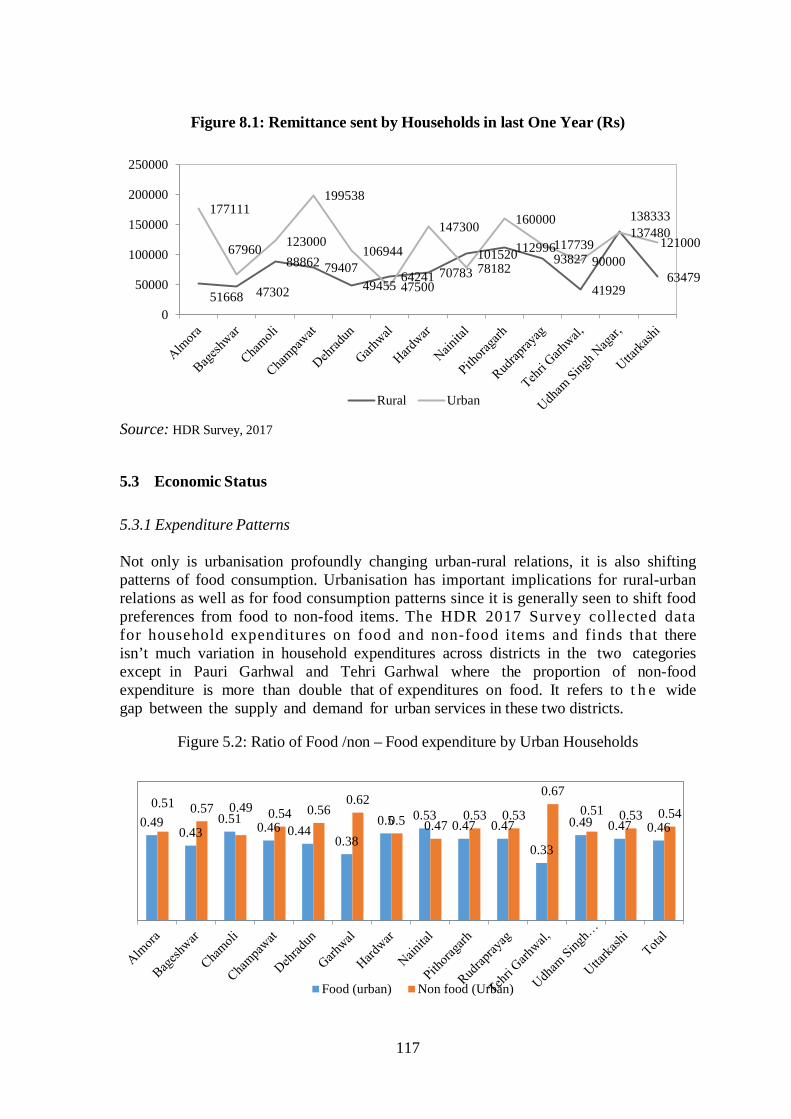
117
Figure 8.1: Remittance sent by Households in last One Year (Rs)
Source: HDR Survey, 2017 5.3 Economic Status 5.3.1 Expenditure Patterns Not only is urbanisation profoundly changing urban-rural relations, it is also shifting patterns of food consumption. Urbanisation has important implications for rural-urban relations as well as for food consumption patterns since it is generally seen to shift food preferences from food to non-food items. The HDR 2017 Survey collected data for household expenditures on food and non-food items and finds that there isn’t much variation in household expenditures across districts in the two categories except in Pauri Garhwal and Tehri Garhwal where the proportion of non-food expenditure is more than double that of expenditures on food. It refers to t h e wide gap between the supply and demand for urban services in these two districts.
Figure 5.2: Ratio of Food /non – Food expenditure by Urban Households
51668 47302
88862 79407 49455
64241 70783 101520 112996
93827
41929
138333
63479
177111
67960 123000
199538
106944
47500
147300
78182
160000
117739 90000
137480 121000
0
50000
100000
150000
200000
250000
Rural Urban
0.49 0.43
0.51 0.46 0.44 0.38
0.5 0.53 0.47 0.47
0.33
0.49 0.47 0.46
0.51 0.57 0.49 0.54 0.56 0.62
0.5 0.47 0.53 0.53
0.67 0.51 0.53 0.54
Food (urban) Non food (Urban)
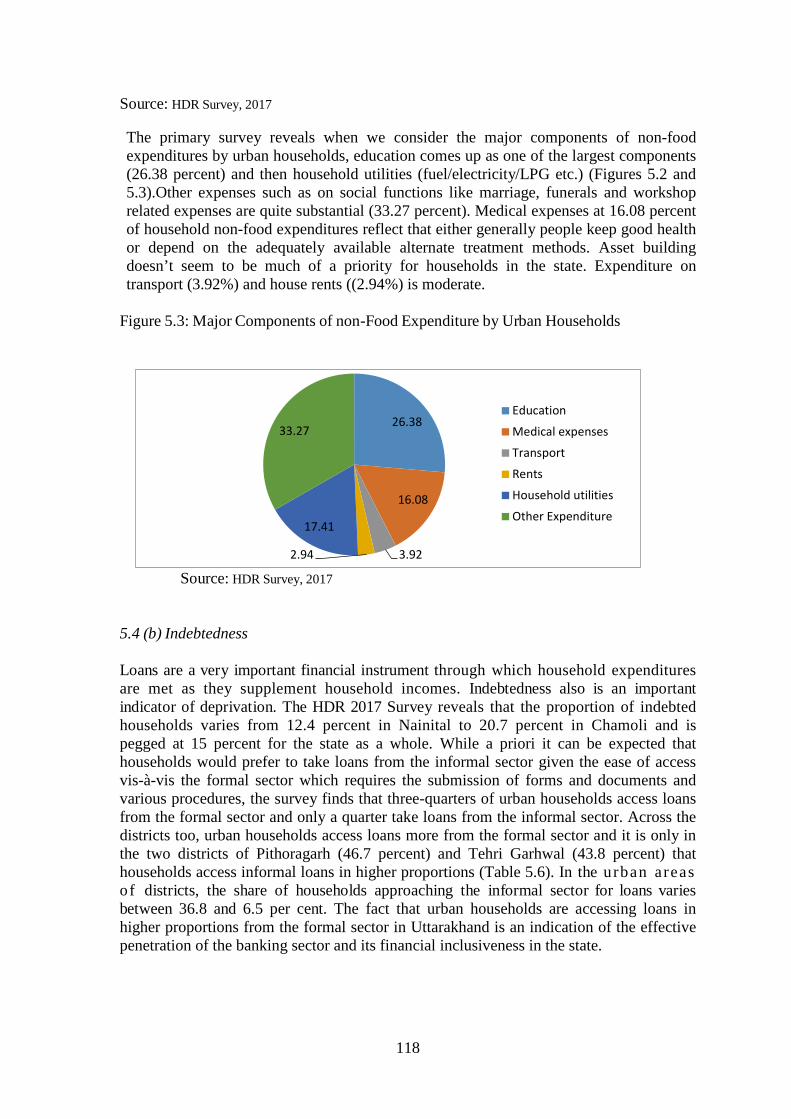
118
Source: HDR Survey, 2017 The primary survey reveals when we consider the major components of non-food expenditures by urban households, education comes up as one of the largest components (26.38 percent) and then household utilities (fuel/electricity/LPG etc.) (Figures 5.2 and 5.3).Other expenses such as on social functions like marriage, funerals and workshop related expenses are quite substantial (33.27 percent). Medical expenses at 16.08 percent of household non-food expenditures reflect that either generally people keep good health or depend on the adequately available alternate treatment methods. Asset building doesn’t seem to be much of a priority for households in the state. Expenditure on transport (3.92%) and house rents ((2.94%) is moderate.
Figure 5.3: Major Components of non-Food Expenditure by Urban Households
Source: HDR Survey, 2017
5.4 (b) Indebtedness Loans are a very important financial instrument through which household expenditures are met as they supplement household incomes. Indebtedness also is an important indicator of deprivation. The HDR 2017 Survey reveals that the proportion of indebted households varies from 12.4 percent in Nainital to 20.7 percent in Chamoli and is pegged at 15 percent for the state as a whole. While a priori it can be expected that households would prefer to take loans from the informal sector given the ease of access vis-à-vis the formal sector which requires the submission of forms and documents and various procedures, the survey finds that three-quarters of urban households access loans from the formal sector and only a quarter take loans from the informal sector. Across the districts too, urban households access loans more from the formal sector and it is only in the two districts of Pithoragarh (46.7 percent) and Tehri Garhwal (43.8 percent) that households access informal loans in higher proportions (Table 5.6). In the urban areas of districts, the share of households approaching the informal sector for loans varies between 36.8 and 6.5 per cent. The fact that urban households are accessing loans in higher proportions from the formal sector in Uttarakhand is an indication of the effective penetration of the banking sector and its financial inclusiveness in the state.
26.38
16.08
3.92 2.94
17.41
33.27 Education
Medical expenses
Transport
Rents
Household utilities
Other Expenditure
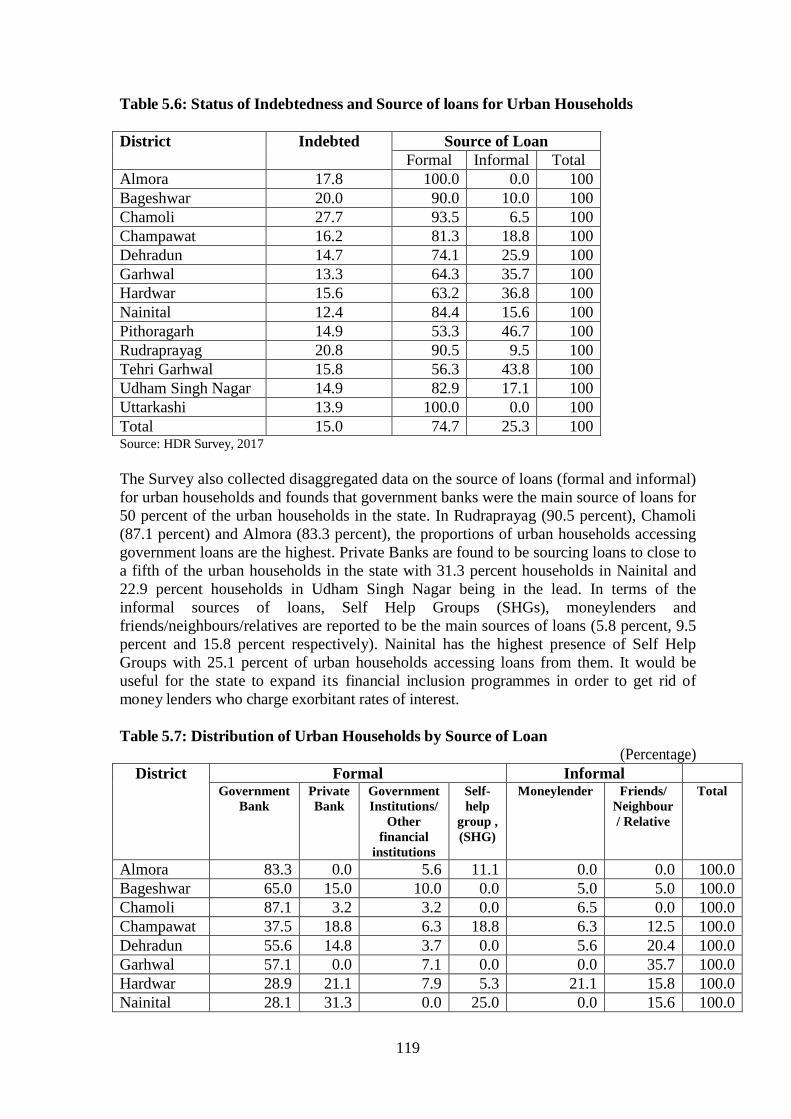
119
Table 5.6: Status of Indebtedness and Source of loans for Urban Households District Indebted Source of Loan
Formal Informal Total Almora 17.8 100.0 0.0 100 Bageshwar 20.0 90.0 10.0 100 Chamoli 27.7 93.5 6.5 100 Champawat 16.2 81.3 18.8 100 Dehradun 14.7 74.1 25.9 100 Garhwal 13.3 64.3 35.7 100 Hardwar 15.6 63.2 36.8 100 Nainital 12.4 84.4 15.6 100 Pithoragarh 14.9 53.3 46.7 100 Rudraprayag 20.8 90.5 9.5 100 Tehri Garhwal 15.8 56.3 43.8 100 Udham Singh Nagar 14.9 82.9 17.1 100 Uttarkashi 13.9 100.0 0.0 100 Total 15.0 74.7 25.3 100 Source: HDR Survey, 2017 The Survey also collected disaggregated data on the source of loans (formal and informal) for urban households and founds that government banks were the main source of loans for 50 percent of the urban households in the state. In Rudraprayag (90.5 percent), Chamoli (87.1 percent) and Almora (83.3 percent), the proportions of urban households accessing government loans are the highest. Private Banks are found to be sourcing loans to close to a fifth of the urban households in the state with 31.3 percent households in Nainital and 22.9 percent households in Udham Singh Nagar being in the lead. In terms of the informal sources of loans, Self Help Groups (SHGs), moneylenders and friends/neighbours/relatives are reported to be the main sources of loans (5.8 percent, 9.5 percent and 15.8 percent respectively). Nainital has the highest presence of Self Help Groups with 25.1 percent of urban households accessing loans from them. It would be useful for the state to expand its financial inclusion programmes in order to get rid of money lenders who charge exorbitant rates of interest. Table 5.7: Distribution of Urban Households by Source of Loan
(Percentage) District Formal Informal
Government Bank
Private Bank
Government Institutions/
Other financial
institutions
Self-help
group , (SHG)
Moneylender Friends/ Neighbour/ Relative
Total
Almora 83.3 0.0 5.6 11.1 0.0 0.0 100.0 Bageshwar 65.0 15.0 10.0 0.0 5.0 5.0 100.0 Chamoli 87.1 3.2 3.2 0.0 6.5 0.0 100.0 Champawat 37.5 18.8 6.3 18.8 6.3 12.5 100.0 Dehradun 55.6 14.8 3.7 0.0 5.6 20.4 100.0 Garhwal 57.1 0.0 7.1 0.0 0.0 35.7 100.0 Hardwar 28.9 21.1 7.9 5.3 21.1 15.8 100.0 Nainital 28.1 31.3 0.0 25.0 0.0 15.6 100.0
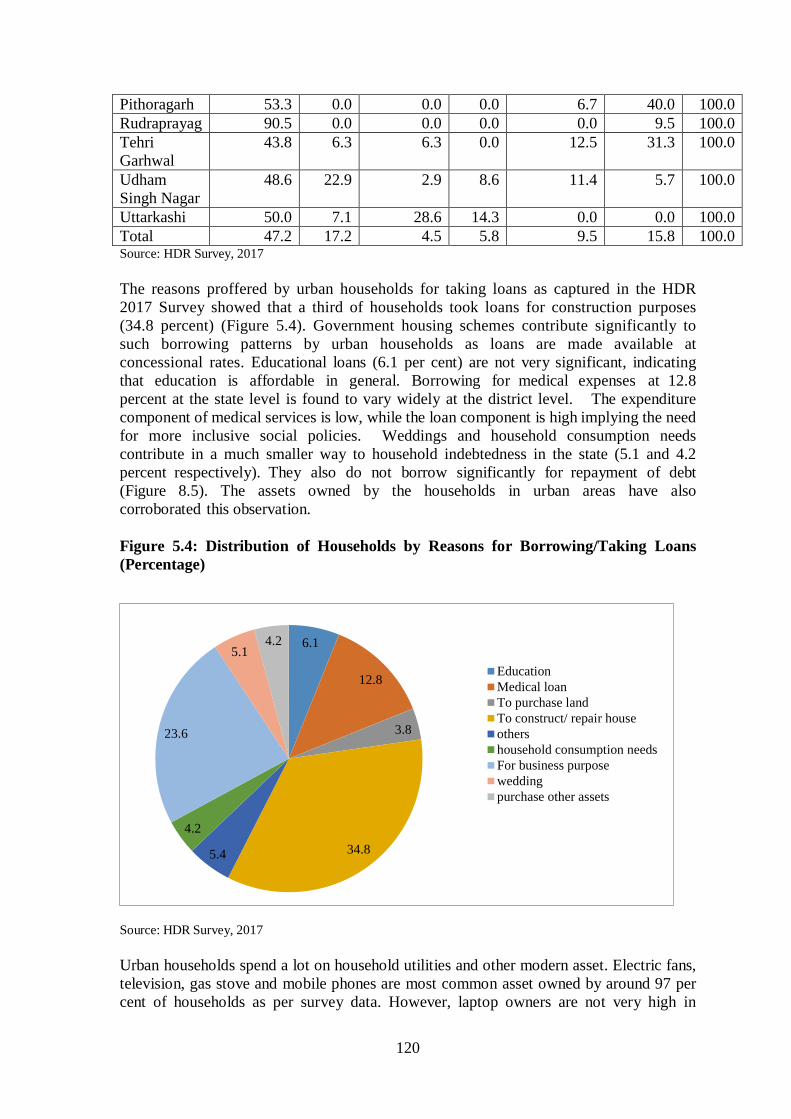
120
Pithoragarh 53.3 0.0 0.0 0.0 6.7 40.0 100.0 Rudraprayag 90.5 0.0 0.0 0.0 0.0 9.5 100.0 Tehri Garhwal
43.8 6.3 6.3 0.0 12.5 31.3 100.0
Udham Singh Nagar
48.6 22.9 2.9 8.6 11.4 5.7 100.0
Uttarkashi 50.0 7.1 28.6 14.3 0.0 0.0 100.0 Total 47.2 17.2 4.5 5.8 9.5 15.8 100.0 Source: HDR Survey, 2017 The reasons proffered by urban households for taking loans as captured in the HDR 2017 Survey showed that a third of households took loans for construction purposes (34.8 percent) (Figure 5.4). Government housing schemes contribute significantly to such borrowing patterns by urban households as loans are made available at concessional rates. Educational loans (6.1 per cent) are not very significant, indicating that education is affordable in general. Borrowing for medical expenses at 12.8 percent at the state level is found to vary widely at the district level. The expenditure component of medical services is low, while the loan component is high implying the need for more inclusive social policies. Weddings and household consumption needs contribute in a much smaller way to household indebtedness in the state (5.1 and 4.2 percent respectively). They also do not borrow significantly for repayment of debt (Figure 8.5). The assets owned by the households in urban areas have also corroborated this observation. Figure 5.4: Distribution of Households by Reasons for Borrowing/Taking Loans (Percentage)
Source: HDR Survey, 2017 Urban households spend a lot on household utilities and other modern asset. Electric fans, television, gas stove and mobile phones are most common asset owned by around 97 per cent of households as per survey data. However, laptop owners are not very high in
6.1
12.8
3.8
34.8 5.4
4.2
23.6
5.1 4.2
EducationMedical loanTo purchase landTo construct/ repair houseothershousehold consumption needsFor business purposeweddingpurchase other assets
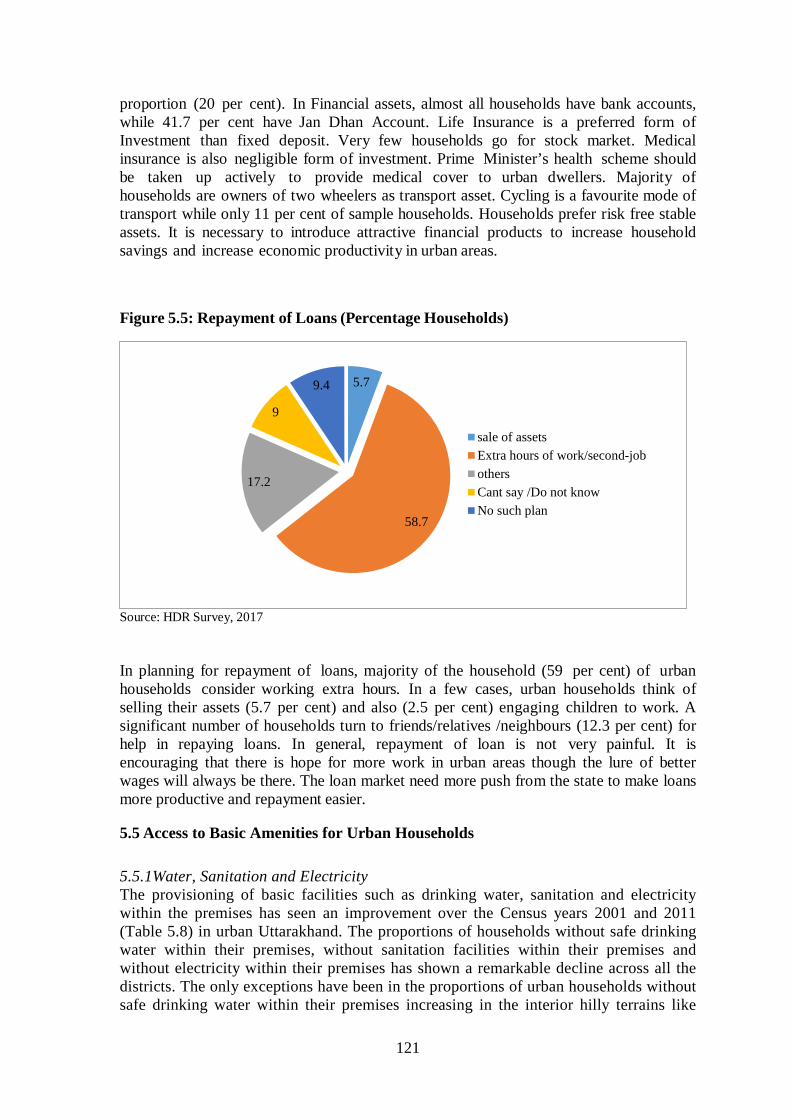
121
proportion (20 per cent). In Financial assets, almost all households have bank accounts, while 41.7 per cent have Jan Dhan Account. Life Insurance is a preferred form of Investment than fixed deposit. Very few households go for stock market. Medical insurance is also negligible form of investment. Prime Minister’s health scheme should be taken up actively to provide medical cover to urban dwellers. Majority of households are owners of two wheelers as transport asset. Cycling is a favourite mode of transport while only 11 per cent of sample households. Households prefer risk free stable assets. It is necessary to introduce attractive financial products to increase household savings and increase economic productivity in urban areas.
Figure 5.5: Repayment of Loans (Percentage Households)
Source: HDR Survey, 2017 In planning for repayment of loans, majority of the household (59 per cent) of urban households consider working extra hours. In a few cases, urban households think of selling their assets (5.7 per cent) and also (2.5 per cent) engaging children to work. A significant number of households turn to friends/relatives /neighbours (12.3 per cent) for help in repaying loans. In general, repayment of loan is not very painful. It is encouraging that there is hope for more work in urban areas though the lure of better wages will always be there. The loan market need more push from the state to make loans more productive and repayment easier. 5.5 Access to Basic Amenities for Urban Households 5.5.1Water, Sanitation and Electricity The provisioning of basic facilities such as drinking water, sanitation and electricity within the premises has seen an improvement over the Census years 2001 and 2011 (Table 5.8) in urban Uttarakhand. The proportions of households without safe drinking water within their premises, without sanitation facilities within their premises and without electricity within their premises has shown a remarkable decline across all the districts. The only exceptions have been in the proportions of urban households without safe drinking water within their premises increasing in the interior hilly terrains like
5.7
58.7
17.2
9
9.4
sale of assetsExtra hours of work/second-jobothersCant say /Do not knowNo such plan
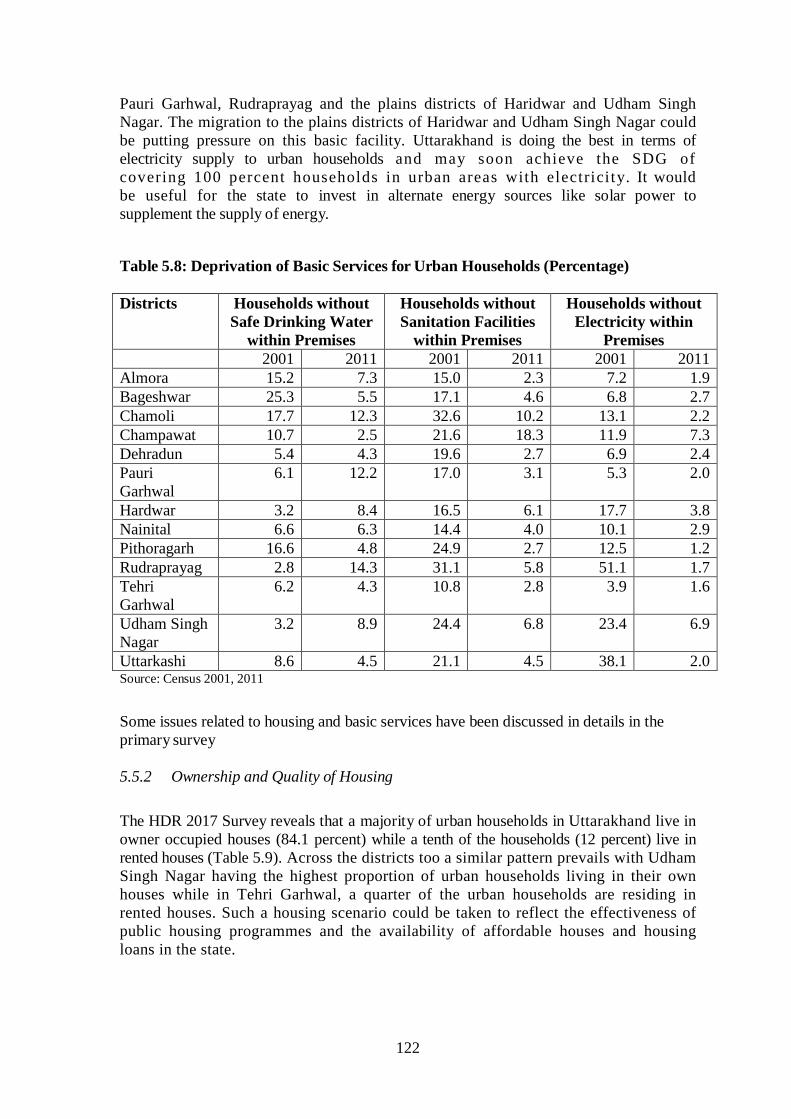
122
Pauri Garhwal, Rudraprayag and the plains districts of Haridwar and Udham Singh Nagar. The migration to the plains districts of Haridwar and Udham Singh Nagar could be putting pressure on this basic facility. Uttarakhand is doing the best in terms of electricity supply to urban households and may soon achieve the SDG of covering 100 percent households in urban areas with electrici ty. It would be useful for the state to invest in alternate energy sources like solar power to supplement the supply of energy. Table 5.8: Deprivation of Basic Services for Urban Households (Percentage) Districts Households without
Safe Drinking Water within Premises
Households without Sanitation Facilities
within Premises
Households without Electricity within
Premises 2001 2011 2001 2011 2001 2011 Almora 15.2 7.3 15.0 2.3 7.2 1.9 Bageshwar 25.3 5.5 17.1 4.6 6.8 2.7 Chamoli 17.7 12.3 32.6 10.2 13.1 2.2 Champawat 10.7 2.5 21.6 18.3 11.9 7.3 Dehradun 5.4 4.3 19.6 2.7 6.9 2.4 Pauri Garhwal
6.1 12.2 17.0 3.1 5.3 2.0
Hardwar 3.2 8.4 16.5 6.1 17.7 3.8 Nainital 6.6 6.3 14.4 4.0 10.1 2.9 Pithoragarh 16.6 4.8 24.9 2.7 12.5 1.2 Rudraprayag 2.8 14.3 31.1 5.8 51.1 1.7 Tehri Garhwal
6.2 4.3 10.8 2.8 3.9 1.6
Udham Singh Nagar
3.2 8.9 24.4 6.8 23.4 6.9
Uttarkashi 8.6 4.5 21.1 4.5 38.1 2.0 Source: Census 2001, 2011 Some issues related to housing and basic services have been discussed in details in the primary survey 5.5.2 Ownership and Quality of Housing The HDR 2017 Survey reveals that a majority of urban households in Uttarakhand live in owner occupied houses (84.1 percent) while a tenth of the households (12 percent) live in rented houses (Table 5.9). Across the districts too a similar pattern prevails with Udham Singh Nagar having the highest proportion of urban households living in their own houses while in Tehri Garhwal, a quarter of the urban households are residing in rented houses. Such a housing scenario could be taken to reflect the effectiveness of public housing programmes and the availability of affordable houses and housing loans in the state.

123
Table 5.9: Distribution of Urban Households by Ownership of Houses (Percentage) District Own Rent/Hired Govt
Provided Employer Provided
Others(Specify) Total
Almora 80.0 9.0 11.0 0.0 0.0 100.0 Bageshwar 86.0 14.0 0.0 0.0 0.0 100.0 Chamoli 86.4 11.8 1.8 0.0 0.0 100.0 Champawat 90.9 5.1 1.0 0.0 3.0 100.0 Dehradun 83.1 12.3 3.5 .5 .5 100.0 Garhwal 68.3 25.0 6.7 0.0 0.0 100.0 Hardwar 83.0 16.6 .4 0.0 0.0 100.0 Nainital 86.9 7.3 2.7 2.7 .4 100.0 Pithoragarh 81.0 18.0 0.0 1.0 0.0 100.0 Rudraprayag 82.0 18.0 0.0 0.0 0.0 100.0 Tehri Garhwal
41.0 21.0 33.0 3.0 2.0 100.0
Udham Singh Nagar
95.3 4.3 0.0 0.0 .4 100.0
Uttarkashi 78.2 18.8 1.0 1.0 1.0 100.0 Total 84.1 12.0 2.9 .6 .4 100.0 Source: Census 2001, 2011
The HDR 2017 Survey found that 84 percent of the houses lived in pucca houses in the state. (Need the data to do proper analysis). The state may boast of satisfactory housing for urban households. Majority of them lives in pucca houses, the percentage varying from 78 to 95 (Figure8.6). In Dehradun, the proportion of households having semi-pucca or Kutcha houses is very low. This is a significant development, keeping in mind that the city has the highest number of slum population. But in Hardwar, Nainital and Udham Singh Nagar, there are significant proportions of households living in low quality houses. These are the districts with considerable slum population as well. In Chamoli, Champawat and Pithoragarh, the proportion of low quality houses is quite high. However, with proper implementation of housing programmes and increasing accessibility of loans, it does not seem impossible to achieve the objective of housing for all in urban areas. Figure 5.6: Quality of Houses (Percent HH)
2.2
12.8
84
0.4 0.3 0.2
Kutchamade ofmudSemi-pucca
Pucca
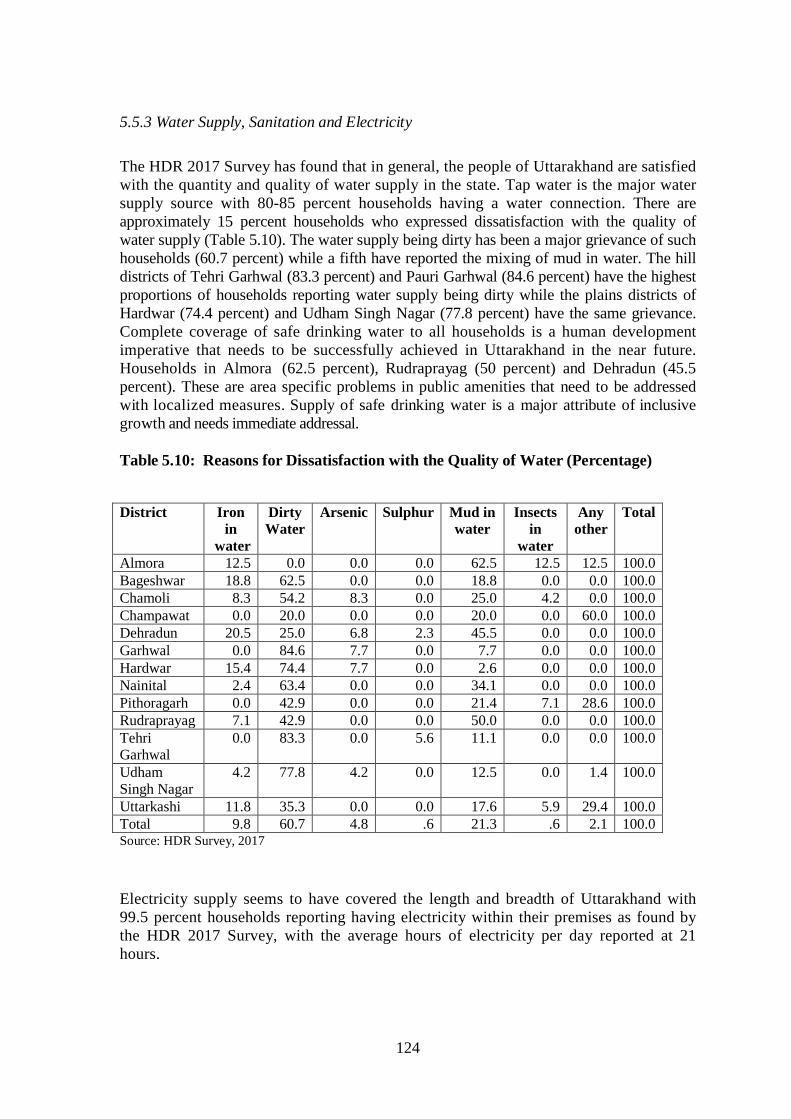
124
5.5.3 Water Supply, Sanitation and Electricity The HDR 2017 Survey has found that in general, the people of Uttarakhand are satisfied with the quantity and quality of water supply in the state. Tap water is the major water supply source with 80-85 percent households having a water connection. There are approximately 15 percent households who expressed dissatisfaction with the quality of water supply (Table 5.10). The water supply being dirty has been a major grievance of such households (60.7 percent) while a fifth have reported the mixing of mud in water. The hill districts of Tehri Garhwal (83.3 percent) and Pauri Garhwal (84.6 percent) have the highest proportions of households reporting water supply being dirty while the plains districts of Hardwar (74.4 percent) and Udham Singh Nagar (77.8 percent) have the same grievance. Complete coverage of safe drinking water to all households is a human development imperative that needs to be successfully achieved in Uttarakhand in the near future. Households in Almora (62.5 percent), Rudraprayag (50 percent) and Dehradun (45.5 percent). These are area specific problems in public amenities that need to be addressed with localized measures. Supply of safe drinking water is a major attribute of inclusive growth and needs immediate addressal. Table 5.10: Reasons for Dissatisfaction with the Quality of Water (Percentage) District Iron
in water
Dirty Water
Arsenic Sulphur Mud in water
Insects in
water
Any other
Total
Almora 12.5 0.0 0.0 0.0 62.5 12.5 12.5 100.0 Bageshwar 18.8 62.5 0.0 0.0 18.8 0.0 0.0 100.0 Chamoli 8.3 54.2 8.3 0.0 25.0 4.2 0.0 100.0 Champawat 0.0 20.0 0.0 0.0 20.0 0.0 60.0 100.0 Dehradun 20.5 25.0 6.8 2.3 45.5 0.0 0.0 100.0 Garhwal 0.0 84.6 7.7 0.0 7.7 0.0 0.0 100.0 Hardwar 15.4 74.4 7.7 0.0 2.6 0.0 0.0 100.0 Nainital 2.4 63.4 0.0 0.0 34.1 0.0 0.0 100.0 Pithoragarh 0.0 42.9 0.0 0.0 21.4 7.1 28.6 100.0 Rudraprayag 7.1 42.9 0.0 0.0 50.0 0.0 0.0 100.0 Tehri Garhwal
0.0 83.3 0.0 5.6 11.1 0.0 0.0 100.0
Udham Singh Nagar
4.2 77.8 4.2 0.0 12.5 0.0 1.4 100.0
Uttarkashi 11.8 35.3 0.0 0.0 17.6 5.9 29.4 100.0 Total 9.8 60.7 4.8 .6 21.3 .6 2.1 100.0 Source: HDR Survey, 2017 Electricity supply seems to have covered the length and breadth of Uttarakhand with 99.5 percent households reporting having electricity within their premises as found by the HDR 2017 Survey, with the average hours of electricity per day reported at 21 hours.
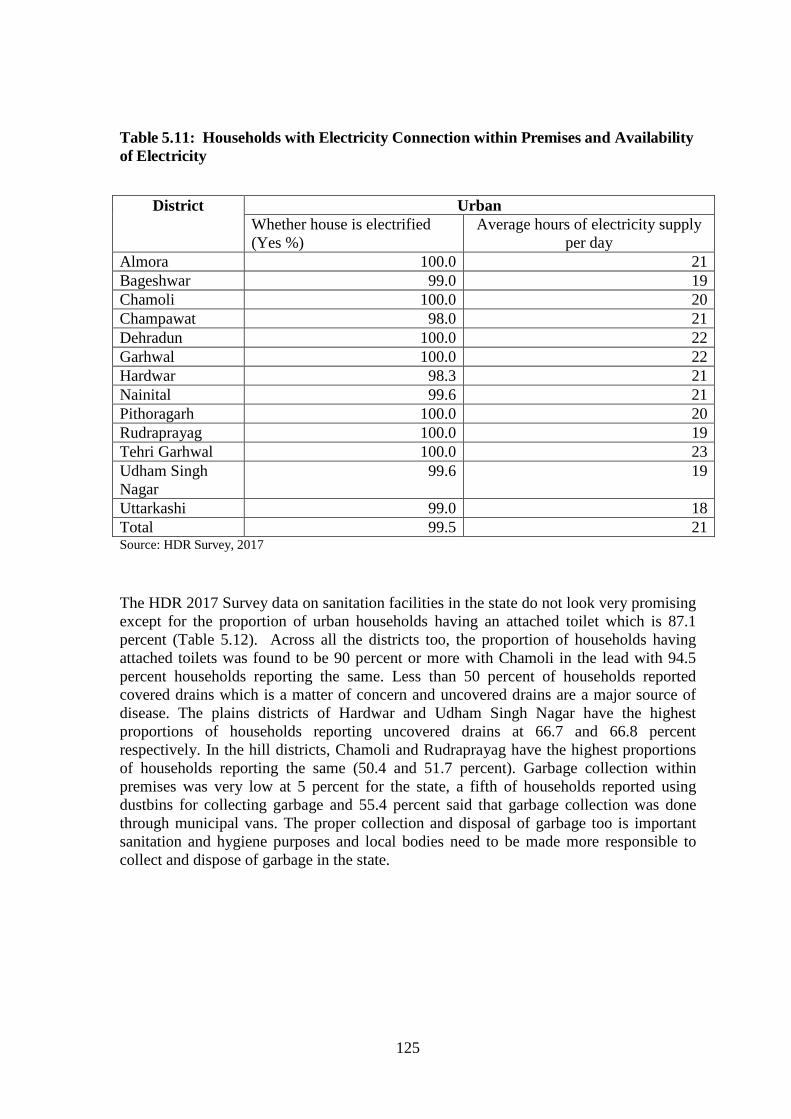
125
Table 5.11: Households with Electricity Connection within Premises and Availability of Electricity
District Urban Whether house is electrified (Yes %)
Average hours of electricity supply per day
Almora 100.0 21 Bageshwar 99.0 19 Chamoli 100.0 20 Champawat 98.0 21 Dehradun 100.0 22 Garhwal 100.0 22 Hardwar 98.3 21 Nainital 99.6 21 Pithoragarh 100.0 20 Rudraprayag 100.0 19 Tehri Garhwal 100.0 23 Udham Singh Nagar
99.6 19
Uttarkashi 99.0 18 Total 99.5 21 Source: HDR Survey, 2017 The HDR 2017 Survey data on sanitation facilities in the state do not look very promising except for the proportion of urban households having an attached toilet which is 87.1 percent (Table 5.12). Across all the districts too, the proportion of households having attached toilets was found to be 90 percent or more with Chamoli in the lead with 94.5 percent households reporting the same. Less than 50 percent of households reported covered drains which is a matter of concern and uncovered drains are a major source of disease. The plains districts of Hardwar and Udham Singh Nagar have the highest proportions of households reporting uncovered drains at 66.7 and 66.8 percent respectively. In the hill districts, Chamoli and Rudraprayag have the highest proportions of households reporting the same (50.4 and 51.7 percent). Garbage collection within premises was very low at 5 percent for the state, a fifth of households reported using dustbins for collecting garbage and 55.4 percent said that garbage collection was done through municipal vans. The proper collection and disposal of garbage too is important sanitation and hygiene purposes and local bodies need to be made more responsible to collect and dispose of garbage in the state.
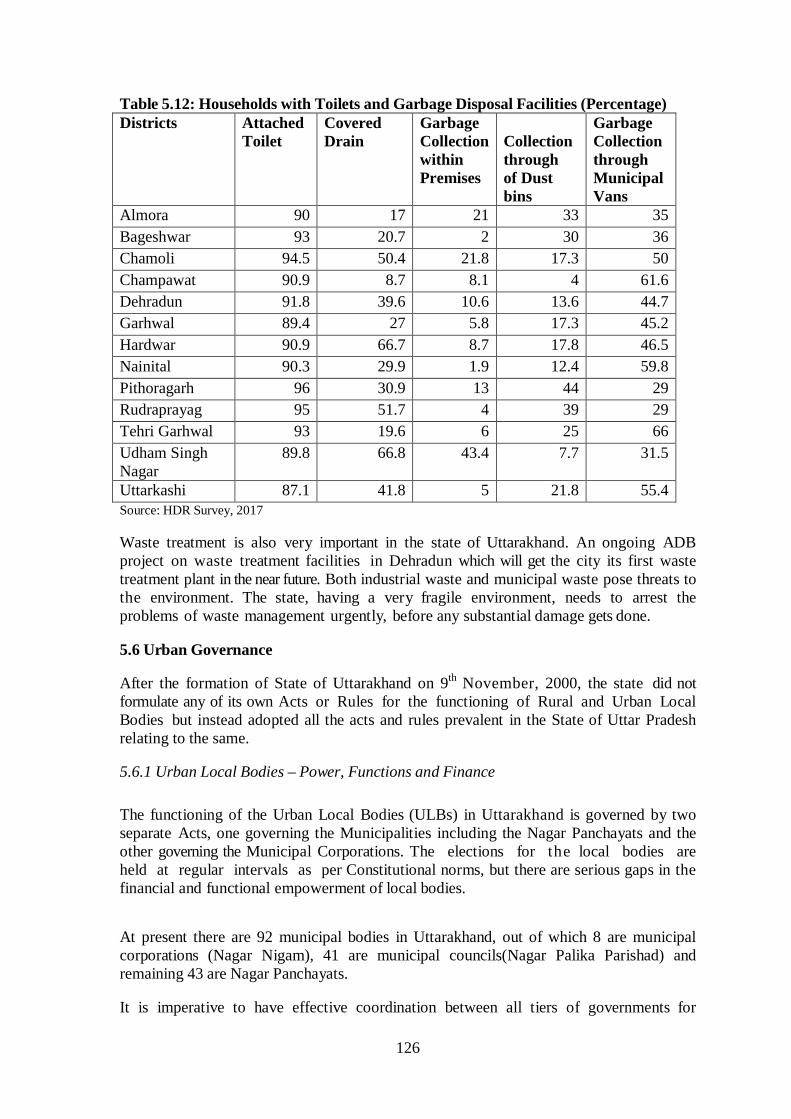
126
Table 5.12: Households with Toilets and Garbage Disposal Facilities (Percentage) Districts Attached
Toilet Covered Drain
Garbage Collection within Premises
Collection through of Dust bins
Garbage Collection through Municipal Vans
Almora 90 17 21 33 35 Bageshwar 93 20.7 2 30 36 Chamoli 94.5 50.4 21.8 17.3 50 Champawat 90.9 8.7 8.1 4 61.6 Dehradun 91.8 39.6 10.6 13.6 44.7 Garhwal 89.4 27 5.8 17.3 45.2 Hardwar 90.9 66.7 8.7 17.8 46.5 Nainital 90.3 29.9 1.9 12.4 59.8 Pithoragarh 96 30.9 13 44 29 Rudraprayag 95 51.7 4 39 29 Tehri Garhwal 93 19.6 6 25 66 Udham Singh Nagar
89.8 66.8 43.4 7.7 31.5
Uttarkashi 87.1 41.8 5 21.8 55.4 Source: HDR Survey, 2017 Waste treatment is also very important in the state of Uttarakhand. An ongoing ADB project on waste treatment facilities in Dehradun which will get the city its first waste treatment plant in the near future. Both industrial waste and municipal waste pose threats to the environment. The state, having a very fragile environment, needs to arrest the problems of waste management urgently, before any substantial damage gets done. 5.6 Urban Governance
After the formation of State of Uttarakhand on 9th November, 2000, the state did not formulate any of its own Acts or Rules for the functioning of Rural and Urban Local Bodies but instead adopted all the acts and rules prevalent in the State of Uttar Pradesh relating to the same. 5.6.1 Urban Local Bodies – Power, Functions and Finance
The functioning of the Urban Local Bodies (ULBs) in Uttarakhand is governed by two separate Acts, one governing the Municipalities including the Nagar Panchayats and the other governing the Municipal Corporations. The elections for the local bodies are held at regular intervals as per Constitutional norms, but there are serious gaps in the financial and functional empowerment of local bodies. At present there are 92 municipal bodies in Uttarakhand, out of which 8 are municipal corporations (Nagar Nigam), 41 are municipal councils(Nagar Palika Parishad) and remaining 43 are Nagar Panchayats. It is imperative to have effective coordination between all tiers of governments for

127
sustainable human settlement planning and management. In the state, the ULBs are deprived of many activities and power. Previously, the ULBs were running primary schools, dispensaries, veterinary hospitals etc. Some of them were also looking after water supply. Mussoorie and Nainital were also generating and distributing electricity. Gradually, all these activities have been taken over by the state. All properties and assets connected with these functions were also transferred to the agency to which the functions were transferred without any compensation being paid to the ULBs. In the past, the ULB had the power to approve building plans as per their bye-laws and they ensured that the plans were followed in actual practice. This power has now been passed into the hands of the development authorities. The ULBs have lost some important sources of revenue like octroi and toll tax, which were abolished by the state, without adequately compensating the ULBs for the recurring loss. Development charges and fees for approval of building plans are also no longer available to the ULBs. The ULBs thus have suffered serious loss of independence and have become subordinate agencies of the state. They cannot make any appointments unless the state government has created the post and granted permission to the fill in the post. Nagar Palika Parishads and Nagar Panchayats do not have any mandatory power to raise revenue unlike the Nagar Nigams, which is empowered to levy property taxes including water, drainage and conservancy taxes and the like. ULBs are not even able to effectively exercise the limited power that they have due to lack of funds and inadequate administrative capacity. They suffer from twin problems of inadequate staff and lack of domain expertise among the staff to deal with urban management. There has been no norm regarding staff strength of ULBs.
However, under Atal Mission for Rejuvenation and Urban Transformation (AMRUT) programme, the state government has prioritized the ULBs based on their financial strength to disburse financial assistance to financially weak ones. The ULBs with higher proportion of urban poor also have been earmarked for prioritization for financial disbursement. The state has made allocation to different ULBs within the state consistent with the urban profile of the state. 5.6.2 Urban Development Programmes and Public Involvement
There are at present 37 central and state schemes operational in the state. Local bodies are not involved meaningfully in any of the schemes except in the disbursement of funds. Funds are deposited directly through banks, with limited role for local bodies rather than identifying the beneficiaries. They should be able to prioritize the schemes appropriate for their areas. The HDR 2017 Survey reveals that people are not aware of many of the programmes. The Survey finds that awareness levels are high amongst the urban households for o n l y 9 out of the 37 e x i s t i n g Central Government schemes including t h e Indira Awas Yojana (83.3 percent the Rajiv Awas Yojana (75.1 percent), the Prime Minister’s Awas Yojana (71.0 percent), ICDS (92.2 percent), Mid-day Meal Scheme (91.2 percent), Jan Dhan Yojana (83.8 percent), Pension Schemes (92 percent) and Ujjwal Yojana (82.8 percent).Awareness level is as low as 1 per cent for some of the schemes. Local c i v i c bodies have a very important role to play in spreading awareness about government schemes.
128
The HDR 2017 Survey reports that the mid-day meal has benefitted urban households the most in terms of coverage. Integrated Child Development Services ( ICDS) has been able to cover 68.5 per cent of sample beneficiaries while 49.1 per cent of eligible beneficiaries have been covered under National Urban Livelihood Mission (NULM). The levels of awareness strongly influence the success of the government schemes. Effective monitoring by the local bodies would definitely improve the coverage of public schemes in Uttarakhand. The Survey also found the beneficiaries reporting that they were satisfied with the schemes as they had been advertised about properly and the distribution processes were quite systematic. While the beneficiaries suggested that there could be more monetary benefits, the centrally sponsored schemes were found to be better placed in terms of their disbursements thereby the beneficiaries reporting higher levels of satisfaction for the same. Citizen participation and coordination with the local bodies would also eventually contribute towards higher levels of satisfaction for the beneficiaries. Students from various colleges could be engaged for generating awareness, helping in the disbursement of schemes and involving the beneficiaries to easily avail of the schemes and their benefits. The HDR Survey highlights the need for transparency which could contribute significantly towards the impact of various government schemes in urban areas.
129
CHAPTER: 6 MANAGING MIGRATION 6.1 Backdrop Migration in Uttarakhand is a common phenomenon, particularly in the hill districts. Migration out-flows in this state can be traced to the broad frameworks of underdevelopment theory and the structuralist postulations which put forth forces that influence decisions to migrate. Both these theoretical strands on migration tend to reinforce one another and are closely related to each other, having important underpinnings to explain the causes of out-migration from this region (Awasthi, 2010). Out-migration is therefore not an unusual event but a constant response to the fragile resource base (land and forest), environmental degradation and hence livelihood insecurity in Uttarakhand. It has been argued that the relationship between the uplands (hills) and lowlands (urban areas/plains) puts the former in a disadvantageous position because the resources from the highland are pulled into the lowland, with little or no value additions to the former (Jodha, 1997, 2000). Such an unequal highland and lowland relationship tends to create a low economic base for the former, resulting in limited employment and livelihood opportunities (mostly in agriculture), for the growing labour force in this region. With limited livelihood opportunities outside agriculture in the highlands, o u t - migration becomes an important livelihood diversification strategy. Relatively higher literacy rates and higher educational attainments in the hills have not helped in restricting out-migration. Rather, the process has been accentuated due to the lack of employment opportunities in the region. Studies on migration for Uttarakhand point towards huge and increasing male-specific out-migration from the region (Sharma, 1980; Khanka, 1984; Bora, 1986, 1987). The main reason for such out-migration has been cited as economic backwardness of the region, wherein out migration and economic underdevelopment reinforce each other and produce a vicious circle, further accentuating the process of underdevelopment (Joshi, 1980). Some field studies also validate increasing mobility of the population from different parts of the underdeveloped region primarily for economic reasons (Breman, 1978, 1985; Ghosh and Sharma 1995; Bora, 1996; de Haan, 1999). What is important to note is that the nature, causes, patterns and consequences of out-migration have changed over time. In the past, the primary reason for long term male out migration was for jobs and earning a living, with strong linkages to one’s home, often called the “money order economy” (Bora, 1996). With development taking root in the hill regions, long-term migration has become permanent out-migration leading to many villages becoming ghost villages in these areas. Migration not just for employment, but also better educational opportunities has led to loose or no linkages with the place of origin.
6.2 Characteristics of Out-migration in Uttarakhand
In the literature, there are three types of migration outflows namely, short term migrants, long term migrants and t h e permanently shifted migrants. As per t h e
130
National Sample Survey Organization (NSSO) conceptual framework, all persons migrating for less than nine months during the last one-year are considered as short-term migrants. Persons migrating for a total of nine months or more during the last one-year are regarded as long-term migrants. Permanently migrated persons, on the other hand, are those who were earlier a member of the household but have permanently settled elsewhere along with other family members but maintains some sort of social and economic transactions back with the place of origin through remittance and occasional visits. Migrating households are defined as those households from where at least one family member reports migration, and those who do not report any migration from the household are defined as non-migrating households. Micro level studies in the Uttarakhand hill areas report that 42 to 57 per cent households have at least one out-migrant (Khanka, 1984; Bora, 1987, 1996). Yet another study find that 48 percent households reported out-migration, 34 percent reported long-term migration, 16 percent reported permanent migration and 4 per cent reported short-term migration (Awasthi, 2010).
The state of Uttarakhand was created in November 2000 and its development path since its formation has been one of reasonably high economic growth (figures cited here would be useful). What is of consequence is the fact that economic growth in the state has been mainly focused in the three plain districts, leaving the ten hill districts lagging. While the plains districts have had a large proportion of economic opportunities, the residents of the hill districts have predominantly been earning their livelihoods from agriculture and agricultural labour. This lopsided development has led to large outmigration from the hill areas towards the plains. Data from the Population Census 2011reveals slow growth of population for the hill districts of the state, with Almora and Pauri Garhwal showing an absolute decline in population over the decade 2001 to 2011 which is evidence enough for outmigration in large numbers (Mamgain and Reddy, 2016). Lack of economic opportunities and increasing pressures on the local economy have been cited as the two possible reasons for such outmigration. Therefore, migration in the context of a state like Uttarakhand needs to be studied keeping the several aspects related to migration in mind such its magnitude, regions/areas more/less prone to migration and the reasons for the same, the development and technological interventions that could bring back the migrants and retain them in their home areas, as well as demographic changes and infrastructural developments in the plains vis-à-vis the hills.
6.3 Uttarakhand Out-Migration: HDR 2017 Survey Findings The HDR 2017 Survey in Uttarakhand collected data on out-migration across all the 13 districts in the state and provides new insights into the recent trends and patterns of migration. In the survey, short term (3 to 12 months), long-term out migrants (12 months or more) and daily commuters were considered. To study migration patterns at the state and district levels, we consider short term and long term migration to represent the set of out migrants. Out-migration has been considered in the study both within state and outside states.
131
The Survey covered 8450 households, using a robust sample design. The total population for the sample was recorded at 2,482,333, with 65.76 percent residing in rural areas and 34.24 per cent in the urban areas. Social group decomposition of the population had 50 percent in the general category, close to a third as OBCs (27%), a fifth as Scheduled castes (18.4%) and 4.5 percent as Scheduled Tribes. In the rural area, the general population is slightly higher (52%), while OBC, SC and ST constitute 24 %, 18 % and 5% respectively. In the urban areas, OBC is higher (33%) and general (46%) and ST (3%) population are lower compared to their percent in rural areas. The distribution of population by social groups broadly follows the pattern of decennial census, 2011. For the purposes of collecting data on migration, the questionnaire was canvassed on the head or other members (in case head of the household was not available at the time of enumeration or not in a position to give response due to old age or illness or other reasons) of the sample households. Those already migrated out of the household were considered as ceased to be members of that household and were left out of the estimations. 6.3.1 The Magnitude of migration
Individual Level Migration The HDR Survey data at the individual level finds that close to a tenth (7.7 percent) of the sample population in the state was migrants (short and long term) with rural migrants recording a much higher proportion (9.1 percent) as compared to urban migrants (3.0 percent) (Table 6.1). Some of the main findings from the survey on migration are first, there is a stark variation in the proportion of migrants in the sample population between the hills and the plains districts. The hill districts had close to a tenth of the population (9.6 percent) as migrants while in the plains, its share was a miniscule 1.3 percent of the sample population (Annexure Table 6.1). Second, from table 6.1 it is also very evident that the highest proportion of migrants are from the rural areas of the hills, followed by the urban areas of the hills (4.1 percent) and this is an important finding of the survey. Third, these migrants from the rural and urban parts of the hills are predominantly long-term migrants constituting 8.7 percent of the out migrating hill population. Inter district variations in the proportion of migrants (short and long term) in Uttarakhand are more prominent for long term migration. Long term rural out migration is higher than urban out migration for almost all the districts of the state. Long term out migration from rural areas is also reported as much lesser for the plains districts vis-à-vis the hills districts. Rudraprayag district has the highest proportion of out migrating populace in both rural (13.9 percent) and urban areas (6.6 percent). Almora, Chamoli, Pithoragarh and Champawat are the other hill districts that report close to a tenth of the populace in rural areas migrating out.

132
Table: 6.1 Migration Status: Individual
Area
Resident Daily
commuters short term Migrant
Long term migrant Total
Number % Numbe
r % Number % Number % Number % Rural Hill 24618 89.1 57 0.2 262 0.9 2695 9.8 27632 100.0
Plain 5796 98.8 4 0.1 30 0.5 37 .6 5867 100.0 Total 30414 90.8 61 0.2 292 0.9 2732 8.2 33499 100.0
Urban Hill 5365 95.9 6 0.1 37 0.7 189 3.4 5597 100.0 Plain 3916 98.4 1 0.0 9 0.2 52 1.3 3978 100.0 Total 9281 96.9 7 0.1 46 0.5 241 2.5 9575 100.0
Total Hill 29983 90.2 63 0.2 299 0.9 2884 8.7 33229 100.0 Plain 9712 98.6 5 0.1 39 0.4 89 0.9 9845 100.0 Total 39695 92.2 68 0.2 338 0.8 2973 6.9 43074 100.0
Source: HDR Survey, 2017 Household Level Migration
In the HDR 2017 Survey, migration at the household level has been defined as those households from which at least one family member reports migration, while those who do not report any migration from the household have been defined as non-migrating households. Micro level studies conducted in the Uttarakhand hill areas indicate that 42 to 57 per cent households report at least one out-migrant (Khanka, 1984; Bora, 1987, 1996; Awasthi, 2010).
The magnitude of households that have at least one migrant (short term or long term) is found as 27.8 per cent for Uttarakhand implying that almost on in every three households has a migrant. However, the magnitude differs significantly between the hill and plain districts. In the hill districts, the proportion of households having at least one migrant is reported as 34.3 per cent while for the plain districts it is 5.3 per cent (Table 6.2). The rural-urban disparity is also stark with more than a third of the households in rural hills areas having at least one migrant vis-à-vis 10.8 percent in the urban areas of the state. The data again supports the previous finding that the hill areas have a higher proportion of households with a least one migrant in both rural (38.5 percent) as well as urban areas (14.1 percent) as compared to the rural and urban areas of the plains (4.5 and 6.2 percent respectively).
Short term migration accounts for about 2.7 per cent of the population in the state, out of which the hill districts report about 3.2 per cent and the plains districts 1.5 per cent. Daily commuters are insignificant (0.6%) with a higher share for the hill districts (0.7%) compared to the plain districts (0.2%). What is of consequence is the rates of long term migration and here we primarily focus on reporting the findings of the HDR 2017 Survey on long term migration at the household level at the state and district levels of Uttarakhand.
The extent of long term migration, varies quite a bit across the districts of Uttarakhand (Annexure Table 6.2). As expected, the hill districts showcase higher rates of long term outmigration vis-à-vis the plains districts, the migration being higher from the rural areas of the hill districts. In the hill district of Rudraprayag, close to half the population (48 percent)
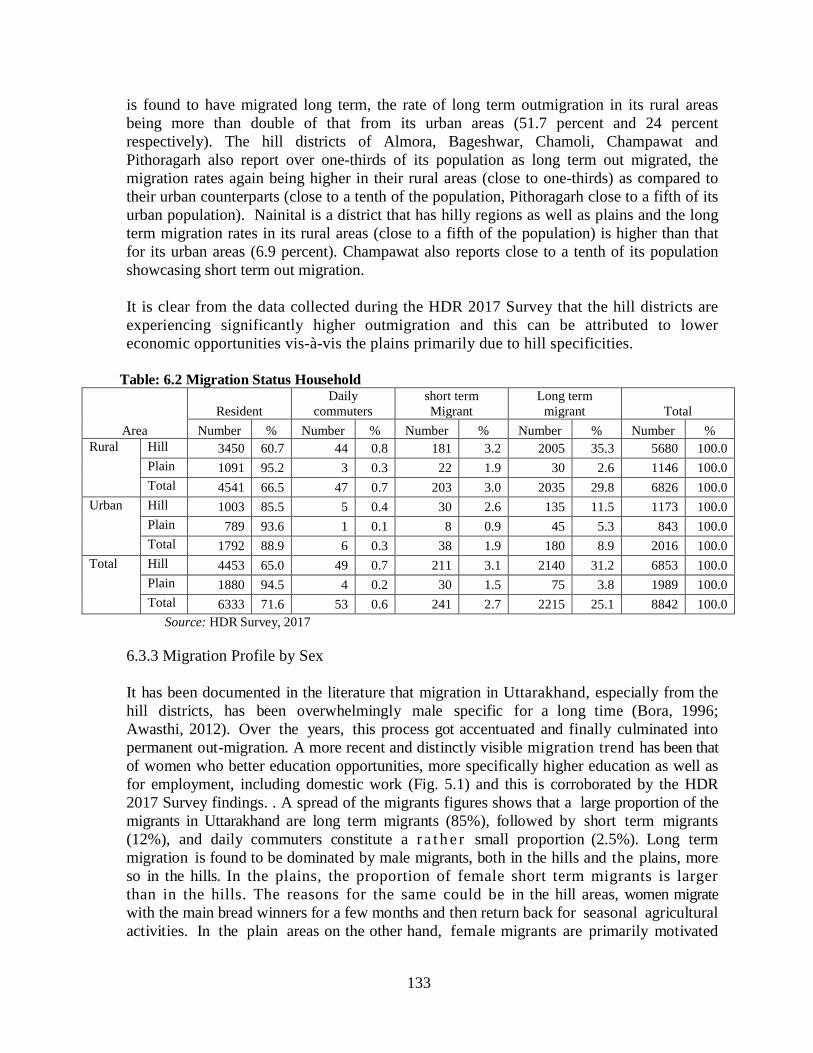
133
is found to have migrated long term, the rate of long term outmigration in its rural areas being more than double of that from its urban areas (51.7 percent and 24 percent respectively). The hill districts of Almora, Bageshwar, Chamoli, Champawat and Pithoragarh also report over one-thirds of its population as long term out migrated, the migration rates again being higher in their rural areas (close to one-thirds) as compared to their urban counterparts (close to a tenth of the population, Pithoragarh close to a fifth of its urban population). Nainital is a district that has hilly regions as well as plains and the long term migration rates in its rural areas (close to a fifth of the population) is higher than that for its urban areas (6.9 percent). Champawat also reports close to a tenth of its population showcasing short term out migration. It is clear from the data collected during the HDR 2017 Survey that the hill districts are experiencing significantly higher outmigration and this can be attributed to lower economic opportunities vis-à-vis the plains primarily due to hill specificities.
Table: 6.2 Migration Status Household
Area Resident
Daily commuters
short term Migrant
Long term migrant Total
Number % Number % Number % Number % Number % Rural Hill 3450 60.7 44 0.8 181 3.2 2005 35.3 5680 100.0
Plain 1091 95.2 3 0.3 22 1.9 30 2.6 1146 100.0 Total 4541 66.5 47 0.7 203 3.0 2035 29.8 6826 100.0
Urban Hill 1003 85.5 5 0.4 30 2.6 135 11.5 1173 100.0 Plain 789 93.6 1 0.1 8 0.9 45 5.3 843 100.0 Total 1792 88.9 6 0.3 38 1.9 180 8.9 2016 100.0
Total Hill 4453 65.0 49 0.7 211 3.1 2140 31.2 6853 100.0 Plain 1880 94.5 4 0.2 30 1.5 75 3.8 1989 100.0 Total 6333 71.6 53 0.6 241 2.7 2215 25.1 8842 100.0
Source: HDR Survey, 2017
6.3.3 Migration Profile by Sex It has been documented in the literature that migration in Uttarakhand, especially from the hill districts, has been overwhelmingly male specific for a long time (Bora, 1996; Awasthi, 2012). Over the years, this process got accentuated and finally culminated into permanent out-migration. A more recent and distinctly visible migration trend has been that of women who better education opportunities, more specifically higher education as well as for employment, including domestic work (Fig. 5.1) and this is corroborated by the HDR 2017 Survey findings. . A spread of the migrants figures shows that a large proportion of the migrants in Uttarakhand are long term migrants (85%), followed by short term migrants (12%), and daily commuters constitute a r a t h e r small proportion (2.5%). Long term migration is found to be dominated by male migrants, both in the hills and the plains, more so in the hills. In the plains, the proportion of female short term migrants is larger than in the hills. The reasons for the same could be in the hill areas, women migrate with the main bread winners for a few months and then return back for seasonal agricultural activities. In the plain areas on the other hand, female migrants are primarily motivated
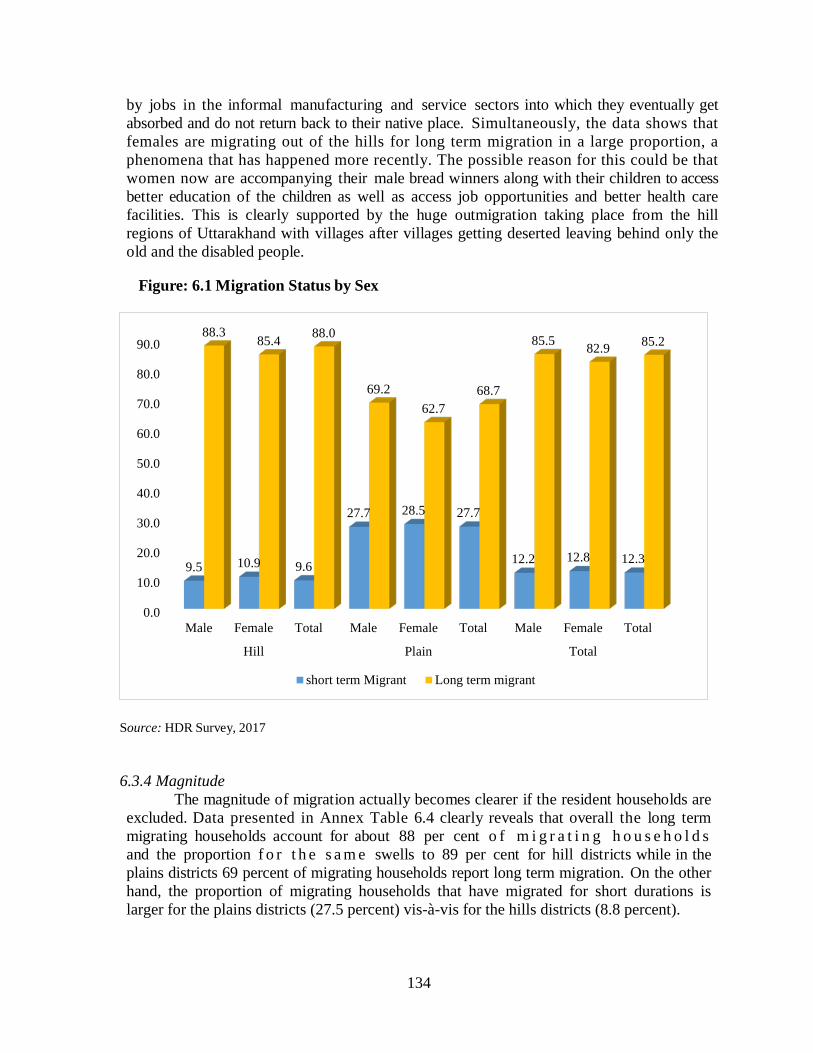
134
by jobs in the informal manufacturing and service sectors into which they eventually get absorbed and do not return back to their native place. Simultaneously, the data shows that females are migrating out of the hills for long term migration in a large proportion, a phenomena that has happened more recently. The possible reason for this could be that women now are accompanying their male bread winners along with their children to access better education of the children as well as access job opportunities and better health care facilities. This is clearly supported by the huge outmigration taking place from the hill regions of Uttarakhand with villages after villages getting deserted leaving behind only the old and the disabled people.
Figure: 6.1 Migration Status by Sex
Source: HDR Survey, 2017
6.3.4 Magnitude
The magnitude of migration actually becomes clearer if the resident households are excluded. Data presented in Annex Table 6.4 clearly reveals that overall the long term migrating households account for about 88 per cent o f m i g r a t i n g h o u s e h o l d s and the proportion f o r t h e s a m e swells to 89 per cent for hill districts while in the plains districts 69 percent of migrating households report long term migration. On the other hand, the proportion of migrating households that have migrated for short durations is larger for the plains districts (27.5 percent) vis-à-vis for the hills districts (8.8 percent).
0.0
10.0
20.0
30.0
40.0
50.0
60.0
70.0
80.0
90.0
Male Female Total Male Female Total Male Female Total
Hill Plain Total
9.5 10.9 9.6
27.7 28.5 27.7
12.2 12.8 12.3
88.3 85.4 88.0
69.2 62.7
68.7
85.5 82.9 85.2
short term Migrant Long term migrant
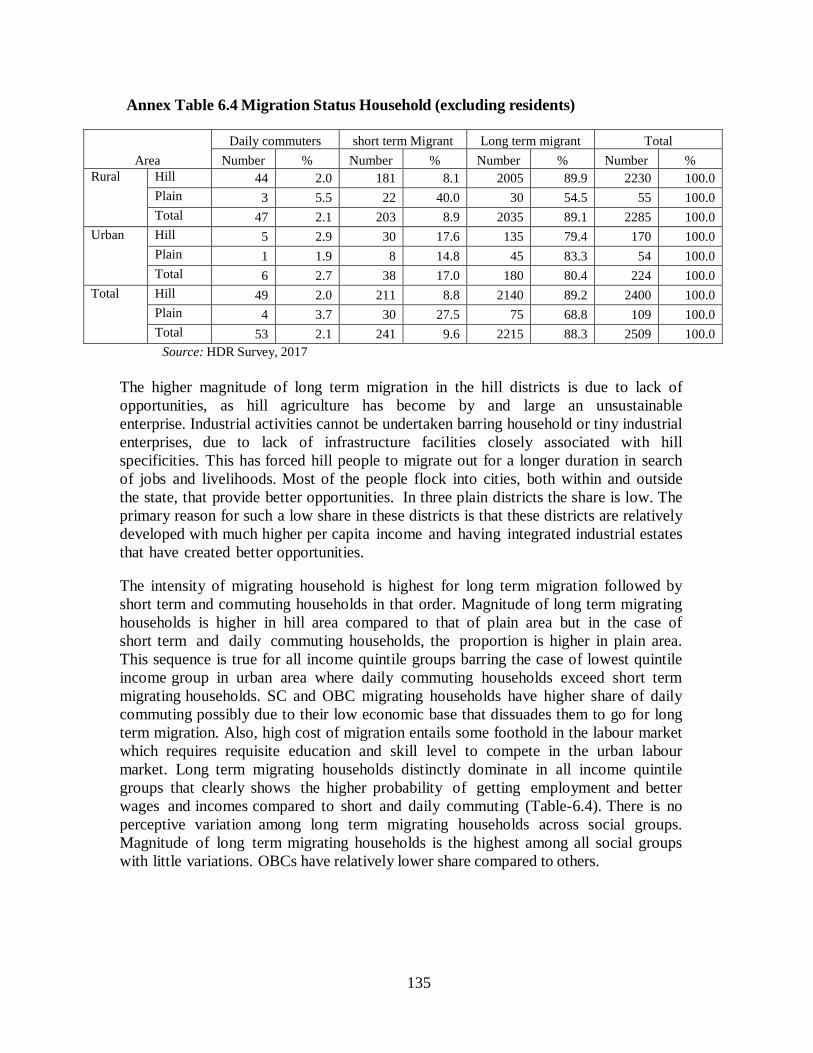
135
Annex Table 6.4 Migration Status Household (excluding residents)
Area Daily commuters short term Migrant Long term migrant Total
Number % Number % Number % Number % Rural Hill 44 2.0 181 8.1 2005 89.9 2230 100.0
Plain 3 5.5 22 40.0 30 54.5 55 100.0 Total 47 2.1 203 8.9 2035 89.1 2285 100.0
Urban Hill 5 2.9 30 17.6 135 79.4 170 100.0 Plain 1 1.9 8 14.8 45 83.3 54 100.0 Total 6 2.7 38 17.0 180 80.4 224 100.0
Total Hill 49 2.0 211 8.8 2140 89.2 2400 100.0 Plain 4 3.7 30 27.5 75 68.8 109 100.0 Total 53 2.1 241 9.6 2215 88.3 2509 100.0
Source: HDR Survey, 2017
The higher magnitude of long term migration in the hill districts is due to lack of opportunities, as hill agriculture has become by and large an unsustainable enterprise. Industrial activities cannot be undertaken barring household or tiny industrial enterprises, due to lack of infrastructure facilities closely associated with hill specificities. This has forced hill people to migrate out for a longer duration in search of jobs and livelihoods. Most of the people flock into cities, both within and outside the state, that provide better opportunities. In three plain districts the share is low. The primary reason for such a low share in these districts is that these districts are relatively developed with much higher per capita income and having integrated industrial estates that have created better opportunities. The intensity of migrating household is highest for long term migration followed by short term and commuting households in that order. Magnitude of long term migrating households is higher in hill area compared to that of plain area but in the case of short term and daily commuting households, the proportion is higher in plain area. This sequence is true for all income quintile groups barring the case of lowest quintile income group in urban area where daily commuting households exceed short term migrating households. SC and OBC migrating households have higher share of daily commuting possibly due to their low economic base that dissuades them to go for long term migration. Also, high cost of migration entails some foothold in the labour market which requires requisite education and skill level to compete in the urban labour market. Long term migrating households distinctly dominate in all income quintile groups that clearly shows the higher probability of getting employment and better wages and incomes compared to short and daily commuting (Table-6.4). There is no perceptive variation among long term migrating households across social groups. Magnitude of long term migrating households is the highest among all social groups with little variations. OBCs have relatively lower share compared to others.
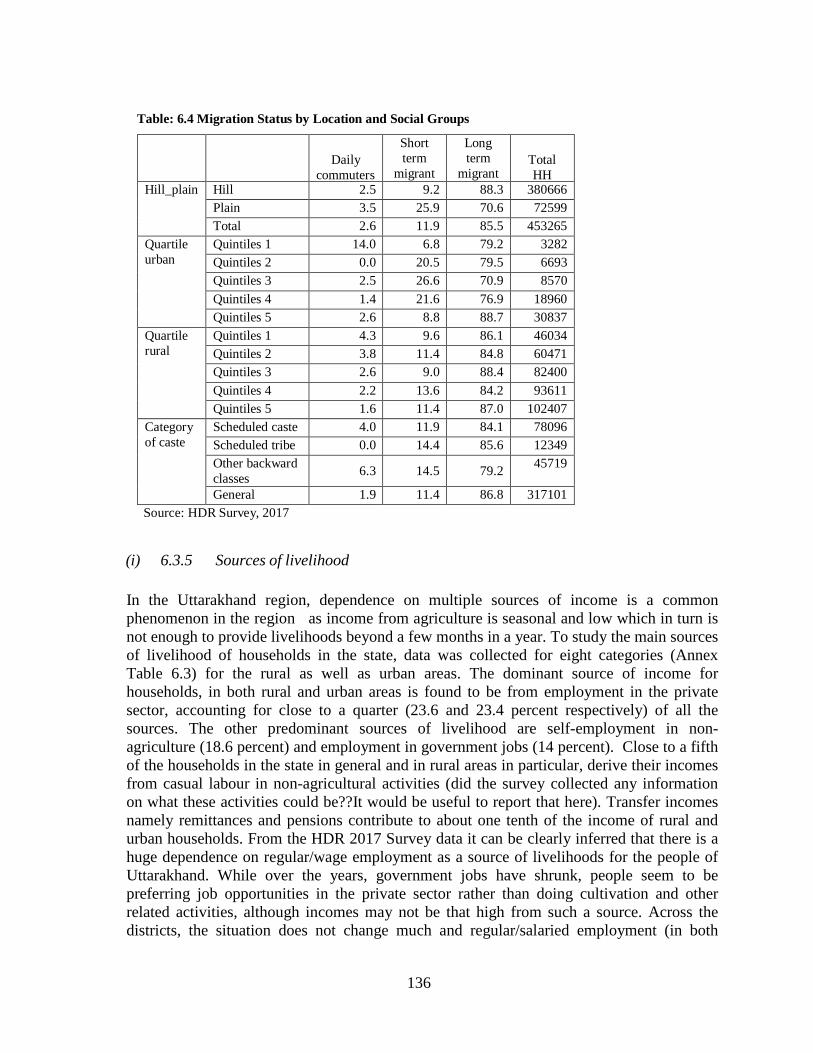
136
Table: 6.4 Migration Status by Location and Social Groups
Daily
commuters
Short term
migrant
Long term
migrant
Total HH
Hill_plain Hill 2.5 9.2 88.3 380666 Plain 3.5 25.9 70.6 72599 Total 2.6 11.9 85.5 453265
Quartile urban
Quintiles 1 14.0 6.8 79.2 3282 Quintiles 2 0.0 20.5 79.5 6693 Quintiles 3 2.5 26.6 70.9 8570 Quintiles 4 1.4 21.6 76.9 18960 Quintiles 5 2.6 8.8 88.7 30837
Quartile rural
Quintiles 1 4.3 9.6 86.1 46034 Quintiles 2 3.8 11.4 84.8 60471 Quintiles 3 2.6 9.0 88.4 82400 Quintiles 4 2.2 13.6 84.2 93611 Quintiles 5 1.6 11.4 87.0 102407
Category of caste
Scheduled caste 4.0 11.9 84.1 78096 Scheduled tribe 0.0 14.4 85.6 12349 Other backward classes
6.3
14.5
79.2 45719
General 1.9 11.4 86.8 317101 Source: HDR Survey, 2017 (i) 6.3.5 Sources of livelihood
In the Uttarakhand region, dependence on multiple sources of income is a common phenomenon in the region as income from agriculture is seasonal and low which in turn is not enough to provide livelihoods beyond a few months in a year. To study the main sources of livelihood of households in the state, data was collected for eight categories (Annex Table 6.3) for the rural as well as urban areas. The dominant source of income for households, in both rural and urban areas is found to be from employment in the private sector, accounting for close to a quarter (23.6 and 23.4 percent respectively) of all the sources. The other predominant sources of livelihood are self-employment in non-agriculture (18.6 percent) and employment in government jobs (14 percent). Close to a fifth of the households in the state in general and in rural areas in particular, derive their incomes from casual labour in non-agricultural activities (did the survey collected any information on what these activities could be??It would be useful to report that here). Transfer incomes namely remittances and pensions contribute to about one tenth of the income of rural and urban households. From the HDR 2017 Survey data it can be clearly inferred that there is a huge dependence on regular/wage employment as a source of livelihoods for the people of Uttarakhand. While over the years, government jobs have shrunk, people seem to be preferring job opportunities in the private sector rather than doing cultivation and other related activities, although incomes may not be that high from such a source. Across the districts, the situation does not change much and regular/salaried employment (in both
137
private and government) contributes the highest to household incomes. In a majority of the districts, wage/salary employment in the private sector is found to be the highest income generating source for households. Uttarkashi is one district that reports a third of its population self-employed in agriculture at the overall level and in its rural areas. Being a high hill zone district, Uttarkashi producing a large variety of fruits (apple, pear, walnut, plum, citrus etc.,) and vegetables (potatoes, peas, tomatoes, french beans, cabbage etc.,) providing good cash income for the people. Districts like Haridwar, Dehradun, Udham Singh Nagar and Nainital are reported to be providing better self-employment opportunities in non-agricultural activities (a fifth of the households). Close to a third of households in Udham Singh Nagar report incomes from casual labour in non-agriculture. This district is agriculturally prosperous and provides many employment opportunities in the non- agriculture sector, through linkage effects. Transfer income is reported as the highest income contributing source in Rudraprayag district (22%).
Disaggregation by area reveals the rural-urban dynamics in terms of variations in the contribution to the share of household income. In the rural areas of the state, close to a fourth of household’s source their livelihoods mainly from employment and salaries earned from the private sector, a fifth from by casual labour in non-agriculture and 17.7 percent from employment in agriculture. In the urban areas in contrast, a quarter of households surveyed earned their livelihoods from employment in non-agricultural activities, 23.4 percent from private sector jobs and close to a fifth from employment in government jobs. The commonality in the two sectors is employment in private sector salaried jobs for rural and urban households, thus showcasing a preference for such jobs. District level disaggregation of the same data shows that for the plains districts, the livelihood patterns remain more or less the same as at the state level disaggregated by rural-urban. In rural parts of the plains districts, casual labour in non-agriculture, self-employment in non-agriculture and private employment are predominantly where households are employed. In rural parts of Haridwar, the proportion of households deriving livelihood from employment in agriculture is also high (30 percent). Urban parts of the plains districts have households sourcing their livelihoods from employment in private salaried jobs, self-employment in non-agriculture and as casual labour in non-agriculture. Urban Dehradun also has households deriving livelihoods from employment in government jobs. The hills districts report a predominance of household employment in salaried private jobs in their rural areas and a tilt more towards salaried employment in government jobs in their urban areas. Urban parts of Tehri Garhwal have a little over half the population employed in government jobs indicating how the public sector is an important source of livelihood in the hilly districts of the state. Nainital which is a mix of hills and plains reports higher proportions of households deriving their livelihoods from self-employment in non-agriculture and salaried private jobs in its rural and urban sectors.
138
6.4 Migration into Uttarakhand
6.4.1 Patterns
The survey also made an attempt to study and understand the origin of in-migrants into the state of Uttarakhand from the surveyed households by enquiring about their place of birth. Inter-district migration as well as migration from Uttar Pradesh from its Bijnaur, Bareilly, Mau, Pilibhit and Ballia d i s t r ict s was repor ted . District wise data for place of origin of in-migrants reveals that the migrants are from within the state itself and it is basically inter-district migration taking place. Also, what is interesting is that across the districts, the majority of in-migrants are from rural areas of the same district. Such migration has been the trend in recent years in Uttarakhand where people flock into the areas of the district headquarters or nearby urban centres to a c c e s s b e t t e r q u a l i t y education for their children as well as better health care facilities. As a result of such migration, many villages have turned into ghost villages or have been left with the old and disabled who are forced to engage in agricultural cultivation for their livelihoods (Annex Table- 6.5).
The survey questionnaire also probed inter-state migration to find out about the states from which migrants have moved into Uttarakhand. The states of Uttar Pradesh (42%), of which Uttarakhand was once a part prior to year 2000 (Annexure Table-6.5), Bihar (3%), Delhi and West Bengal (1%) are where the migrants into Uttarakhand are predominantly from. There are settlers from Nepal (0.4%) and Bangladesh (1.3%) as well. Across the districts too, inter-district migration is predominant and along with migrants originating from Uttar Pradesh are a high proportion. Haridwar (65%), Udham Singh Nagar (56%), Nainital, Rudraprayag (42%), Champawat and Dehradun (38%) have a high proportion of migrants from Uttar Pradesh. Migrants from Bihar are settled mostly in Rudraprayag (10.5 percent), Dehradun (4.2 percent) and Udham Singh Nagar (3.5 percent). Migrants from Delhi are reported in Uttarkashi, Bageshwar and Champawat. The main motivations for such inter-state migration into Uttarakhand could be business and trade. Cross-country migration into Uttarakhand was also reported in the HDR 2017 Survey. Nepalese migrants are reported predominantly in Bageshwar (7.5 percent), C h a m p a w a t ( 4 . 8 p e r c e n t ) , Chamoli (3 .9 percent ) and Tehri Garhwal (3.3 percent). Porous borders and extreme poverty has led to such migration in these districts. Cross-border migrants from Bangladesh are found to be settled in Udham Singh Nagar (6.9 percent) which could be because of a better agriculture base in this district and the availability of non-farm job opportunities. 6.4.2 The Process of First Migration To further understand patterns of migration in Uttarakhand, the HDR 2018 probed the migrating household members about the process of first migration of the migrating member(s). Basically, the idea was to probe whether the migration took place alone, with family members, with members of the community or village, with any acquaintances
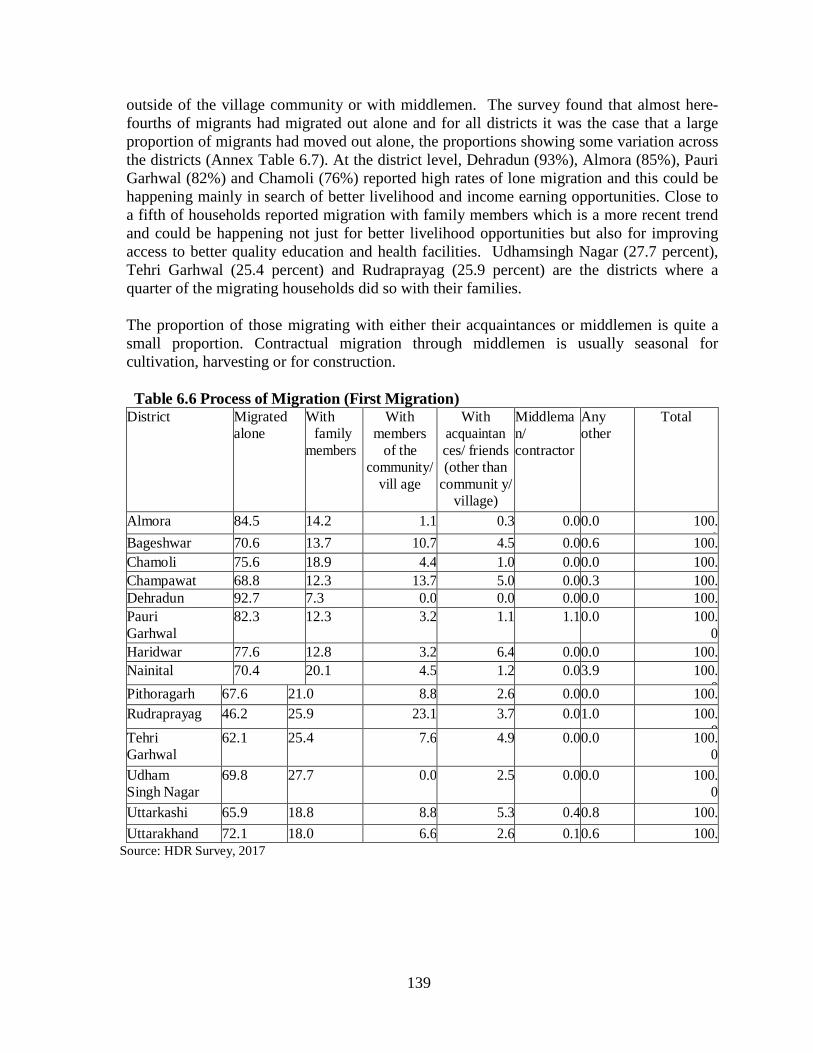
139
outside of the village community or with middlemen. The survey found that almost here-fourths of migrants had migrated out alone and for all districts it was the case that a large proportion of migrants had moved out alone, the proportions showing some variation across the districts (Annex Table 6.7). At the district level, Dehradun (93%), Almora (85%), Pauri Garhwal (82%) and Chamoli (76%) reported high rates of lone migration and this could be happening mainly in search of better livelihood and income earning opportunities. Close to a fifth of households reported migration with family members which is a more recent trend and could be happening not just for better livelihood opportunities but also for improving access to better quality education and health facilities. Udhamsingh Nagar (27.7 percent), Tehri Garhwal (25.4 percent) and Rudraprayag (25.9 percent) are the districts where a quarter of the migrating households did so with their families. The proportion of those migrating with either their acquaintances or middlemen is quite a small proportion. Contractual migration through middlemen is usually seasonal for cultivation, harvesting or for construction. Table 6.6 Process of Migration (First Migration)
District Migrated alone
With family
members
With members
of the community/
vill age
With acquaintan ces/ friends (other than
communit y/ village)
Middleman/ contractor
Any other
Total
Almora 84.5 14.2 1.1 0.3 0.0 0.0 100. 0 Bageshwar 70.6 13.7 10.7 4.5 0.0 0.6 100. Chamoli 75.6 18.9 4.4 1.0 0.0 0.0 100. Champawat 68.8 12.3 13.7 5.0 0.0 0.3 100. Dehradun 92.7 7.3 0.0 0.0 0.0 0.0 100. Pauri
Garhwal 82.3 12.3 3.2 1.1 1.1 0.0 100.
0 Haridwar 77.6 12.8 3.2 6.4 0.0 0.0 100.
Nainital 70.4 20.1 4.5 1.2 0.0 3.9 100. 0 Pithoragarh 67.6 21.0 8.8 2.6 0.0 0.0 100. Rudraprayag
46.2 25.9 23.1 3.7 0.0 1.0 100.
0 Tehri Garhwal
62.1 25.4 7.6 4.9 0.0 0.0 100. 0
Udham Singh Nagar
69.8 27.7 0.0 2.5 0.0 0.0 100. 0
Uttarkashi 65.9 18.8 8.8 5.3 0.4 0.8 100. 0 Uttarakhand 72.1 18.0 6.6 2.6 0.1 0.6 100. Source: HDR Survey, 2017
140
6.5 Reasons for Migration 6.5.1 The Pull and Push Factors There are various socio-economic and cultural factors that govern the process of out-migration. The most common reasons cited in the literature on migration include low income and unemployment, factors that push out the migrants with promises of better livelihood opportunities for. Some studies also show that out-migration is caused principally by distress reasons (Deshingkar et. al., 2004) or mass poverty and lack of employment opportunities or a combination of these along with other reasons (Sharma, 1997; Deshingkar et. al., 2004). There are also some studies which indicate that migration is not always motivated by push reasons and that people do tend to out-migrate to enhance their income opportunities and seize better opportunities at the destination area (Deshingkar and Start, 2003; Deshingkar et. al., 2004). The fact of the matter is that the push and pull reasons for migration are not co-terminus and are linked to each other and therefore may occur simultaneously due to the enormous diversity in migration patterns across different regions (Srivastava, 2005; ICIMOD/IFAD, 2010).
The reasons for migration have been broadly categorised into push and pull factors in Lee’s framework. Push factors refer to a state of unemployment and low incomes at the source area while pull factors are linked to better economic prospects, better educational facilities and availability of jobs at the destination.
In Uttarakhand, the reasons for out-migration can primarily be attributed to a combination of push factors like lack of employment, low income, subsistence agriculture and pull factors like better opportunities for employment, ability to successfully get employment and children’s education etc. The HDR Survey 2018 conclusively identifies push factors such as employment search, social / political problems, displacement by development projects, health reasons etc as possible reasons for out migration. The pull factors identified include better employment prospects, being able to secure employment successfully, business, education/training opportunities etc.
The three employment related reasons that encourage out migration as found from the HDR 2018 Survey are (i) search for employment (push factor), (ii) availability of better employment opportunities (pull factor) and (iii) securing employment at the place of migration. Amongst these, the search for employment’ emerges as the major reason for out-migration (39 percent households) from Uttarakhand, clearly pointing towards shrinking job opportunities in the state that forces people to move out under employment duress (Figure-6.2). Across the districts, there exist variations in the intensity of ‘search for jobs/employment’ by the migrating households. In the hill districts of Almora (72 percent), Champawat (51 percent) and Tehri Garhwal (44 percent), search for employment appears to be the predominant and decisive motivation for households to migrate (Annexure Table 6.5). The second important reason for out-migration given by the migrating households is ‘got the employment’ viz., the ability to secure employment and get absorbed in the work force and this accounted for about one-third of the out-migration in the state. The pull factor of successfully getting jobs has led to high rates of out-migration especially from the two plains
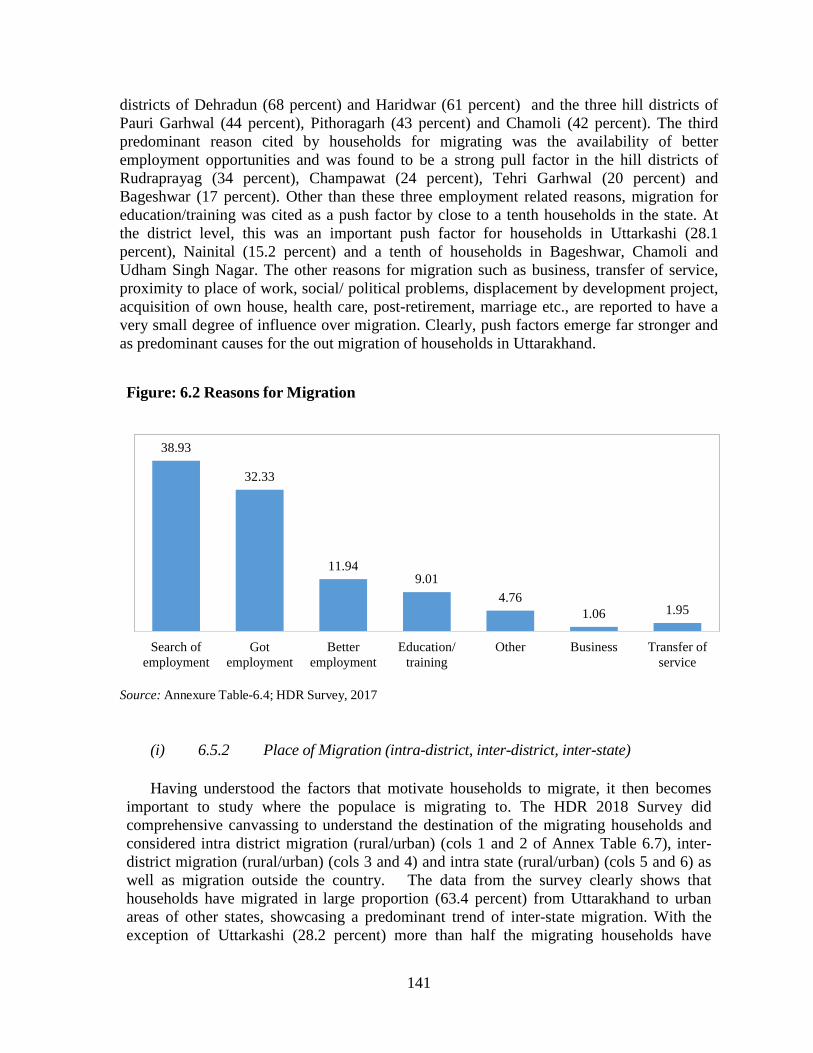
141
districts of Dehradun (68 percent) and Haridwar (61 percent) and the three hill districts of Pauri Garhwal (44 percent), Pithoragarh (43 percent) and Chamoli (42 percent). The third predominant reason cited by households for migrating was the availability of better employment opportunities and was found to be a strong pull factor in the hill districts of Rudraprayag (34 percent), Champawat (24 percent), Tehri Garhwal (20 percent) and Bageshwar (17 percent). Other than these three employment related reasons, migration for education/training was cited as a push factor by close to a tenth households in the state. At the district level, this was an important push factor for households in Uttarkashi (28.1 percent), Nainital (15.2 percent) and a tenth of households in Bageshwar, Chamoli and Udham Singh Nagar. The other reasons for migration such as business, transfer of service, proximity to place of work, social/ political problems, displacement by development project, acquisition of own house, health care, post-retirement, marriage etc., are reported to have a very small degree of influence over migration. Clearly, push factors emerge far stronger and as predominant causes for the out migration of households in Uttarakhand.
Figure: 6.2 Reasons for Migration
Source: Annexure Table-6.4; HDR Survey, 2017
(i) 6.5.2 Place of Migration (intra-district, inter-district, inter-state)
Having understood the factors that motivate households to migrate, it then becomes important to study where the populace is migrating to. The HDR 2018 Survey did comprehensive canvassing to understand the destination of the migrating households and considered intra district migration (rural/urban) (cols 1 and 2 of Annex Table 6.7), inter-district migration (rural/urban) (cols 3 and 4) and intra state (rural/urban) (cols 5 and 6) as well as migration outside the country. The data from the survey clearly shows that households have migrated in large proportion (63.4 percent) from Uttarakhand to urban areas of other states, showcasing a predominant trend of inter-state migration. With the exception of Uttarkashi (28.2 percent) more than half the migrating households have
38.93
32.33
11.94 9.01
4.76 1.06 1.95
Search ofemployment
Gotemployment
Betteremployment
Education/training
Other Business Transfer ofservice
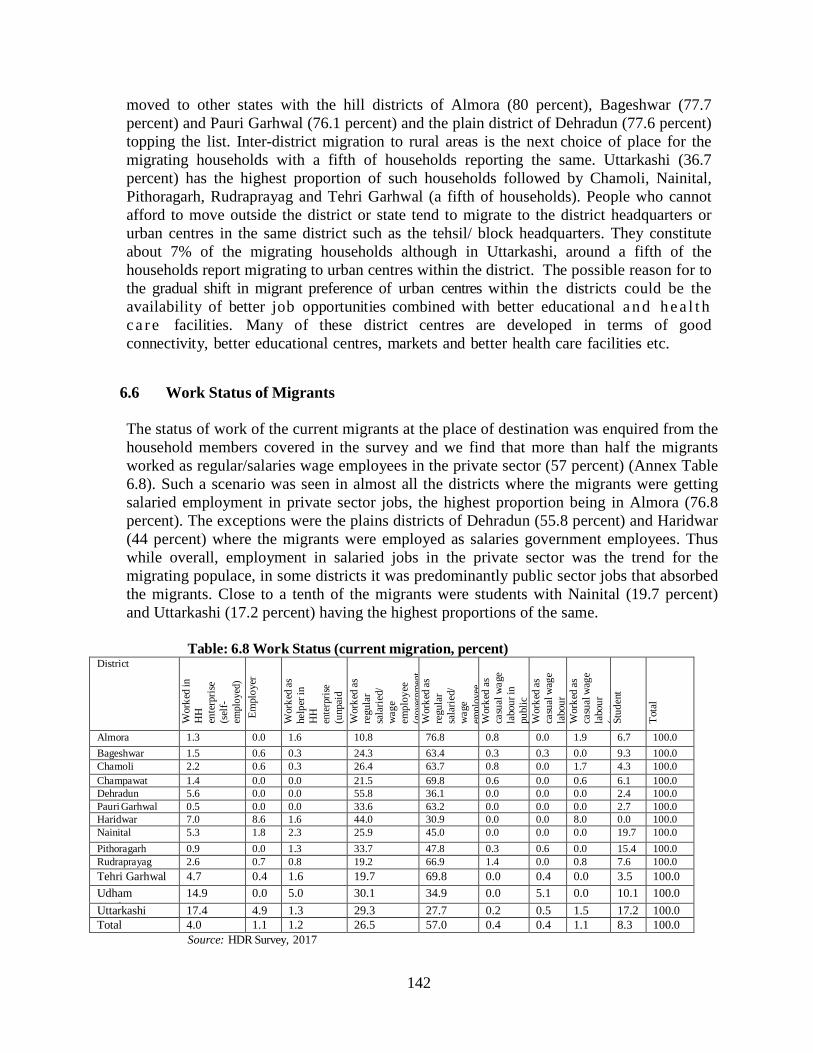
142
moved to other states with the hill districts of Almora (80 percent), Bageshwar (77.7 percent) and Pauri Garhwal (76.1 percent) and the plain district of Dehradun (77.6 percent) topping the list. Inter-district migration to rural areas is the next choice of place for the migrating households with a fifth of households reporting the same. Uttarkashi (36.7 percent) has the highest proportion of such households followed by Chamoli, Nainital, Pithoragarh, Rudraprayag and Tehri Garhwal (a fifth of households). People who cannot afford to move outside the district or state tend to migrate to the district headquarters or urban centres in the same district such as the tehsil/ block headquarters. They constitute about 7% of the migrating households although in Uttarkashi, around a fifth of the households report migrating to urban centres within the district. The possible reason for to the gradual shift in migrant preference of urban centres within the districts could be the availability of better job opportunities combined with better educational a n d h e a l t h c a r e facilities. Many of these district centres are developed in terms of good connectivity, better educational centres, markets and better health care facilities etc.
6.6 Work Status of Migrants
The status of work of the current migrants at the place of destination was enquired from the household members covered in the survey and we find that more than half the migrants worked as regular/salaries wage employees in the private sector (57 percent) (Annex Table 6.8). Such a scenario was seen in almost all the districts where the migrants were getting salaried employment in private sector jobs, the highest proportion being in Almora (76.8 percent). The exceptions were the plains districts of Dehradun (55.8 percent) and Haridwar (44 percent) where the migrants were employed as salaries government employees. Thus while overall, employment in salaried jobs in the private sector was the trend for the migrating populace, in some districts it was predominantly public sector jobs that absorbed the migrants. Close to a tenth of the migrants were students with Nainital (19.7 percent) and Uttarkashi (17.2 percent) having the highest proportions of the same.
Table: 6.8 Work Status (current migration, percent)
District
Wor
ked
in
HH
en
terp
rise
(sel
f- em
ploy
ed)
Empl
oyer
Wor
ked
as
help
er in
H
H
ente
rpris
e (u
npai
d W
orke
d as
re
gula
r sa
larie
d/
wag
e em
ploy
ee
(gov
ernm
ent
Work
ed as
re
gula
r sa
larie
d/
wag
e em
ploy
ee
Wor
ked
as
casu
al w
age
labo
ur in
pu
blic
W
orke
d as
ca
sual
wag
e la
bour
Wor
ked
as
casu
al w
age
labo
ur
(non
Stud
ent
Tota
l
Almora 1.3 0.0 1.6 10.8 76.8 0.8 0.0 1.9 6.7 100.0 Bageshwar 1.5 0.6 0.3 24.3 63.4 0.3 0.3 0.0 9.3 100.0 Chamoli 2.2 0.6 0.3 26.4 63.7 0.8 0.0 1.7 4.3 100.0 Champawat 1.4 0.0 0.0 21.5 69.8 0.6 0.0 0.6 6.1 100.0 Dehradun 5.6 0.0 0.0 55.8 36.1 0.0 0.0 0.0 2.4 100.0 Pauri Garhwal 0.5 0.0 0.0 33.6 63.2 0.0 0.0 0.0 2.7 100.0 Haridwar 7.0 8.6 1.6 44.0 30.9 0.0 0.0 8.0 0.0 100.0 Nainital 5.3 1.8 2.3 25.9 45.0 0.0 0.0 0.0 19.7 100.0 Pithoragarh 0.9 0.0 1.3 33.7 47.8 0.3 0.6 0.0 15.4 100.0 Rudraprayag 2.6 0.7 0.8 19.2 66.9 1.4 0.0 0.8 7.6 100.0 Tehri Garhwal 4.7 0.4 1.6 19.7 69.8 0.0 0.4 0.0 3.5 100.0 Udham Si h
14.9 0.0 5.0 30.1 34.9 0.0 5.1 0.0 10.1 100.0 Uttarkashi 17.4 4.9 1.3 29.3 27.7 0.2 0.5 1.5 17.2 100.0 Total 4.0 1.1 1.2 26.5 57.0 0.4 0.4 1.1 8.3 100.0
Source: HDR Survey, 2017
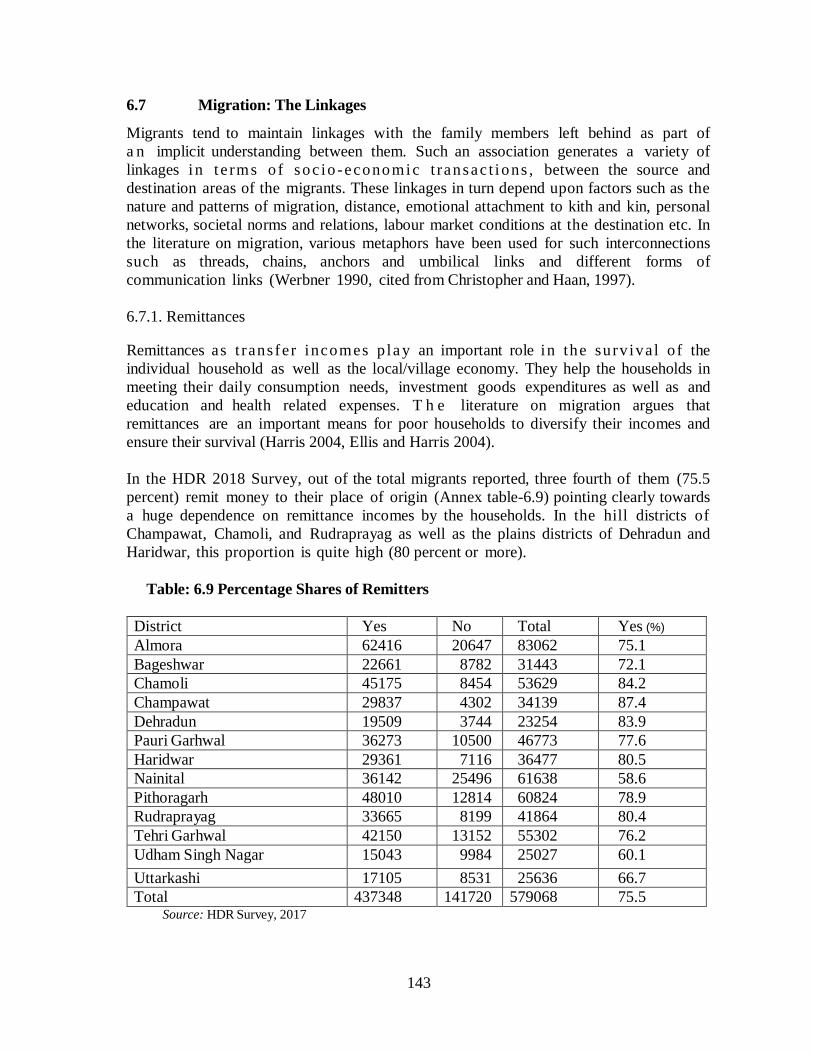
143
6.7 Migration: The Linkages
Migrants tend to maintain linkages with the family members left behind as part of a n implicit understanding between them. Such an association generates a variety of linkages i n t e rms o f soc io -economic t ransac t ions , between the source and destination areas of the migrants. These linkages in turn depend upon factors such as the nature and patterns of migration, distance, emotional attachment to kith and kin, personal networks, societal norms and relations, labour market conditions at the destination etc. In the literature on migration, various metaphors have been used for such interconnections such as threads, chains, anchors and umbilical links and different forms of communication links (Werbner 1990, cited from Christopher and Haan, 1997). 6.7.1. Remittances
Remittances as t ransfer incomes p la y an important role in the surv ival of the individual household as well as the local/village economy. They help the households in meeting their daily consumption needs, investment goods expenditures as well as and education and health related expenses. T h e literature on migration argues that remittances are an important means for poor households to diversify their incomes and ensure their survival (Harris 2004, Ellis and Harris 2004). In the HDR 2018 Survey, out of the total migrants reported, three fourth of them (75.5 percent) remit money to their place of origin (Annex table-6.9) pointing clearly towards a huge dependence on remittance incomes by the households. In the hill districts of Champawat, Chamoli, and Rudraprayag as well as the plains districts of Dehradun and Haridwar, this proportion is quite high (80 percent or more).
Table: 6.9 Percentage Shares of Remitters
District Yes No Total Yes (%)
Almora 62416 20647 83062 75.1 Bageshwar 22661 8782 31443 72.1 Chamoli 45175 8454 53629 84.2 Champawat 29837 4302 34139 87.4 Dehradun 19509 3744 23254 83.9 Pauri Garhwal 36273 10500 46773 77.6 Haridwar 29361 7116 36477 80.5 Nainital 36142 25496 61638 58.6 Pithoragarh 48010 12814 60824 78.9 Rudraprayag 33665 8199 41864 80.4 Tehri Garhwal 42150 13152 55302 76.2 Udham Singh Nagar 15043 9984 25027 60.1 Uttarkashi 17105 8531 25636 66.7 Total 437348 141720 579068 75.5
Source: HDR Survey, 2017
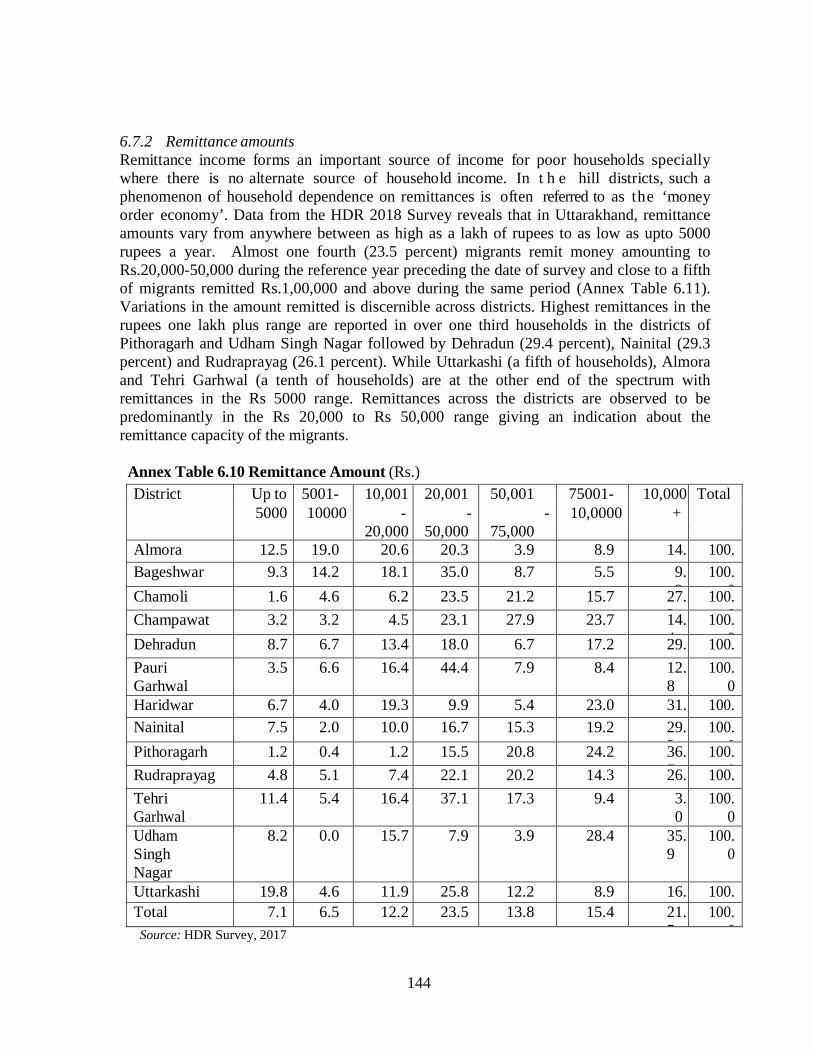
144
6.7.2 Remittance amounts Remittance income forms an important source of income for poor households specially where there is no alternate source of household income. In t h e hill districts, such a phenomenon of household dependence on remittances is often referred to as the ‘money order economy’. Data from the HDR 2018 Survey reveals that in Uttarakhand, remittance amounts vary from anywhere between as high as a lakh of rupees to as low as upto 5000 rupees a year. Almost one fourth (23.5 percent) migrants remit money amounting to Rs.20,000-50,000 during the reference year preceding the date of survey and close to a fifth of migrants remitted Rs.1,00,000 and above during the same period (Annex Table 6.11). Variations in the amount remitted is discernible across districts. Highest remittances in the rupees one lakh plus range are reported in over one third households in the districts of Pithoragarh and Udham Singh Nagar followed by Dehradun (29.4 percent), Nainital (29.3 percent) and Rudraprayag (26.1 percent). While Uttarkashi (a fifth of households), Almora and Tehri Garhwal (a tenth of households) are at the other end of the spectrum with remittances in the Rs 5000 range. Remittances across the districts are observed to be predominantly in the Rs 20,000 to Rs 50,000 range giving an indication about the remittance capacity of the migrants.
Annex Table 6.10 Remittance Amount (Rs.)
District Up to 5001- 10,001 20,001 50,001 75001- 10,000
Total 5000 10000 - - - 10,0000 +
20,000 50,000 75,000 Almora 12.5 19.0 20.6 20.3 3.9 8.9 14.
100.
Bageshwar 9.3 14.2 18.1 35.0 8.7 5.5 9.3
100. 0 Chamoli 1.6 4.6 6.2 23.5 21.2 15.7 27.
2 100.
0 Champawat 3.2 3.2 4.5 23.1 27.9 23.7 14.4
100. 0 Dehradun 8.7 6.7 13.4 18.0 6.7 17.2 29.
4 100.
0 Pauri Garhwal
3.5 6.6 16.4 44.4 7.9 8.4 12.8
100. 0
Haridwar 6.7 4.0 19.3 9.9 5.4 23.0 31.
100. Nainital 7.5 2.0 10.0 16.7 15.3 19.2 29.
3 100.
0 Pithoragarh 1.2 0.4 1.2 15.5 20.8 24.2 36.7
100. 0 Rudraprayag
4.8 5.1 7.4 22.1 20.2 14.3 26.
1 100.
0 Tehri Garhwal
11.4 5.4 16.4 37.1 17.3 9.4 3.0
100. 0
Udham Singh Nagar
8.2 0.0 15.7 7.9 3.9 28.4 35.9
100. 0
Uttarkashi 19.8 4.6 11.9 25.8 12.2 8.9 16.
100. Total 7.1 6.5 12.2 23.5 13.8 15.4 21.
5 100.
0 Source: HDR Survey, 2017
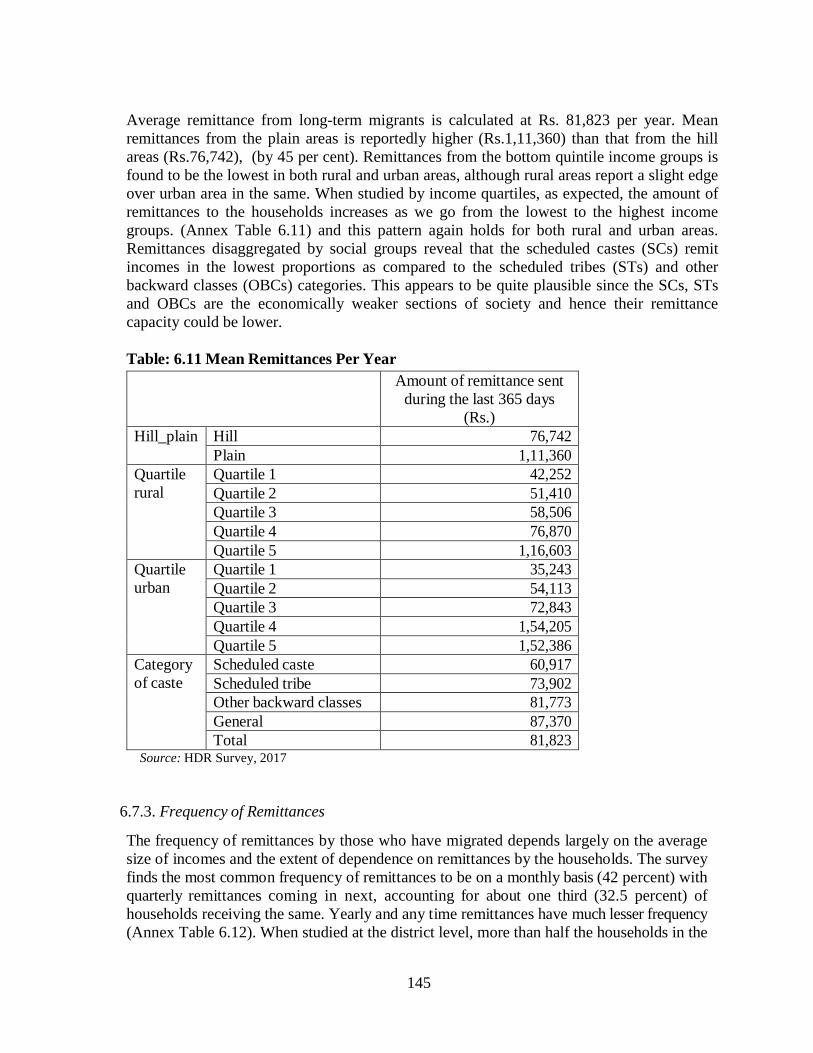
145
Average remittance from long-term migrants is calculated at Rs. 81,823 per year. Mean remittances from the plain areas is reportedly higher (Rs.1,11,360) than that from the hill areas (Rs.76,742), (by 45 per cent). Remittances from the bottom quintile income groups is found to be the lowest in both rural and urban areas, although rural areas report a slight edge over urban area in the same. When studied by income quartiles, as expected, the amount of remittances to the households increases as we go from the lowest to the highest income groups. (Annex Table 6.11) and this pattern again holds for both rural and urban areas. Remittances disaggregated by social groups reveal that the scheduled castes (SCs) remit incomes in the lowest proportions as compared to the scheduled tribes (STs) and other backward classes (OBCs) categories. This appears to be quite plausible since the SCs, STs and OBCs are the economically weaker sections of society and hence their remittance capacity could be lower. Table: 6.11 Mean Remittances Per Year
Amount of remittance sent during the last 365 days
(Rs.) Hill_plain Hill 76,742
Plain 1,11,360 Quartile rural
Quartile 1 42,252 Quartile 2 51,410 Quartile 3 58,506 Quartile 4 76,870 Quartile 5 1,16,603
Quartile urban
Quartile 1 35,243 Quartile 2 54,113 Quartile 3 72,843 Quartile 4 1,54,205 Quartile 5 1,52,386
Category of caste
Scheduled caste 60,917 Scheduled tribe 73,902 Other backward classes 81,773 General 87,370 Total 81,823
Source: HDR Survey, 2017
6.7.3. Frequency of Remittances
The frequency of remittances by those who have migrated depends largely on the average size of incomes and the extent of dependence on remittances by the households. The survey finds the most common frequency of remittances to be on a monthly basis (42 percent) with quarterly remittances coming in next, accounting for about one third (32.5 percent) of households receiving the same. Yearly and any time remittances have much lesser frequency (Annex Table 6.12). When studied at the district level, more than half the households in the
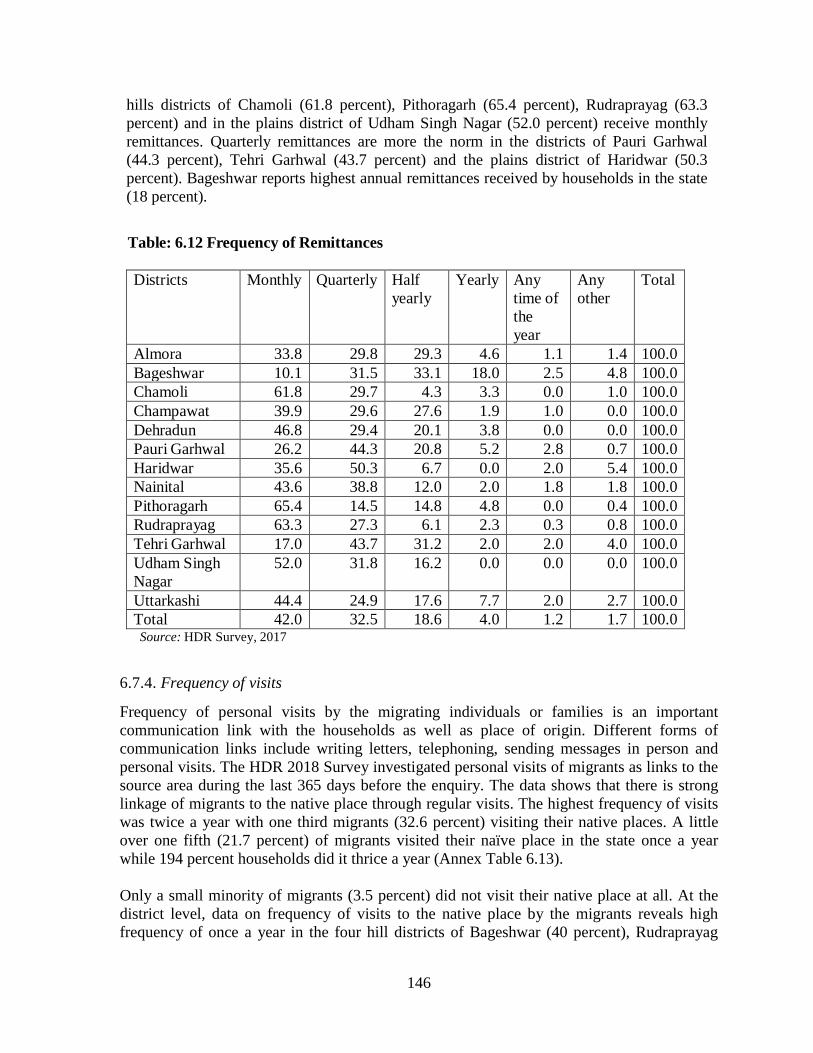
146
hills districts of Chamoli (61.8 percent), Pithoragarh (65.4 percent), Rudraprayag (63.3 percent) and in the plains district of Udham Singh Nagar (52.0 percent) receive monthly remittances. Quarterly remittances are more the norm in the districts of Pauri Garhwal (44.3 percent), Tehri Garhwal (43.7 percent) and the plains district of Haridwar (50.3 percent). Bageshwar reports highest annual remittances received by households in the state (18 percent).
Table: 6.12 Frequency of Remittances
Districts Monthly Quarterly Half yearly
Yearly Any time of the year
Any other
Total
Almora 33.8 29.8 29.3 4.6 1.1 1.4 100.0 Bageshwar 10.1 31.5 33.1 18.0 2.5 4.8 100.0 Chamoli 61.8 29.7 4.3 3.3 0.0 1.0 100.0 Champawat 39.9 29.6 27.6 1.9 1.0 0.0 100.0 Dehradun 46.8 29.4 20.1 3.8 0.0 0.0 100.0 Pauri Garhwal 26.2 44.3 20.8 5.2 2.8 0.7 100.0 Haridwar 35.6 50.3 6.7 0.0 2.0 5.4 100.0 Nainital 43.6 38.8 12.0 2.0 1.8 1.8 100.0 Pithoragarh 65.4 14.5 14.8 4.8 0.0 0.4 100.0 Rudraprayag 63.3 27.3 6.1 2.3 0.3 0.8 100.0 Tehri Garhwal 17.0 43.7 31.2 2.0 2.0 4.0 100.0 Udham Singh Nagar
52.0 31.8 16.2 0.0 0.0 0.0 100.0
Uttarkashi 44.4 24.9 17.6 7.7 2.0 2.7 100.0 Total 42.0 32.5 18.6 4.0 1.2 1.7 100.0 Source: HDR Survey, 2017
6.7.4. Frequency of visits
Frequency of personal visits by the migrating individuals or families is an important communication link with the households as well as place of origin. Different forms of communication links include writing letters, telephoning, sending messages in person and personal visits. The HDR 2018 Survey investigated personal visits of migrants as links to the source area during the last 365 days before the enquiry. The data shows that there is strong linkage of migrants to the native place through regular visits. The highest frequency of visits was twice a year with one third migrants (32.6 percent) visiting their native places. A little over one fifth (21.7 percent) of migrants visited their naïve place in the state once a year while 194 percent households did it thrice a year (Annex Table 6.13).
Only a small minority of migrants (3.5 percent) did not visit their native place at all. At the district level, data on frequency of visits to the native place by the migrants reveals high frequency of once a year in the four hill districts of Bageshwar (40 percent), Rudraprayag

147
(36.3 percent), Pithoragarh (32 percent) and Chamoli (31.2 percent). Approximately half the migrants make a visit twice a year to their native place in the hill district of Champawat and close to a third do so in the hill dostricts of Chamoli (34.5 percent) and Rudraprayag (38 percent) and a third in the plains district of Haridwar (38.4 percent). Migrants visiting thrice a year are much lesser in proportion with approximately a third doing so in the plains district of Haridwar (30.7 percent) and a quarter doing so in the hills of Tehri Garhwal (25.2 percent) and plains of Dehradun (24.4 percent) and Udham Singh Nagar (22.4 percent). Such visits by the migrants to their native place clearly establish strong social and economic transaction links between the migrants and their place of origin.
Table: 6.13 Frequency to visit Native Place in last 365 days District Nil 1 2 3 4 5 Above5 Total
Almora 1.1 15.6 34.9 15.4 3.0 0.8 29.1 100.0 Bageshwar 3.1 40.0 23.5 22.7 5.6 2.5 2.6 100.0 Chamoli 1.8 31.2 34.5 11.6 11.9 3.3 5.7 100.0 Champawat 2.1 20.7 54.7 15.4 4.1 1.2 1.8 100.0 Dehradun 5.1 3.3 44.3 24.4 5.9 3.3 13.6 100.0 Pauri Garhwal 4.0 16.7 27.0 31.4 8.4 7.4 5.2 100.0 Haridwar 2.2 9.2 38.4 30.7 14.1 2.2 3.2 100.0 Nainital 2.6 22.2 31.1 20.6 8.1 4.3 11.1 100.0 Pithoragarh 0.3 32.0 26.6 10.5 14.9 3.5 12.3 100.0 Rudraprayag 10.5 36.3 38.0 8.6 2.8 0.6 3.2 100.0 Tehri Garhwal 7.0 13.9 29.1 25.2 14.8 4.3 5.8 100.0 Udham Singh Nagar
4.9 19.9 19.9 25.5 22.4 2.6 4.9 100.0
Uttarkashi 5.7 13.3 23.7 24.4 13.3 3.5 16.0 100.0 Total 3.5 21.7 32.6 19.4 9.5 3.0 10.2 100.0 Source: HDR Survey, 2017
6.8. Conclusions
It is widely known that individuals and households derive their incomes by engaging in diverse and multiple activities. Migration is definitely one of the important livelihood sources and in the hill districts of Uttarakhand specially, it is a conscious household strategy to enhance income as an involuntary response to various socio-economic factors. Migration of individuals and households has implications for both the source and destination areas. At the source areas specially, it depletes human resources and in particular able bodied stock, and turns villages into empty or ghost villages, a clear manifestation of mass scale out-migration. Nearly, 8 per cent of sample population was recorded as migrants and in the hill districts it was higher (10.7 per cent). At the household level, the extent of migrating households was around 28 per cent and in the hill districts it was significantly higher (38.5%) corroborating the high levels of out migration from the hill districts of the state.
148
Regular wage/salary employment in t h e private sector is reported a s t h e m a i n d r a w the dominant source of incomes of households (24 percent). . Self-employment in non-agricultural activities, casual labour in non-agriculture and earnings from government jobs are the other important sources of h o u s e h o l d income.
Out-migration in Uttarakhand can primarily be attributed to a combination of push and pull factors like lack of unemployment, low income, subsistence agriculture and better opportunities for employment and children’s education etc. ‘Search for employment’ has emerges as the single major reason for outmigration clearly showcasing the shrinking job opportunities in the state. This factor shows large inter-district variations as well. Remittances play an important role for the individual households as well as the village economy and they form one of the main sources of income for those who largely depend on such transfer incomes.
Migration is conspicuous phenomenon resulting primarily due to low economic base and low employment and earning opportunities in the region. From the policy point of view, addressing migration issue is a great challenge. Enhancing economic base and livelihood opportunities through focusing on niche activities, in which the region has comparative advantages, like horticulture, tourism and amenity services, micro hydel plants and provisioning of better educational and health services can eventually help restrict out out-migration.
References Awasthi, I.C. (210), Migration Patterns in Hill Economy of Uttarakhand: Evidence from Field Enquiry, in the Indian Economic Journal, January-March 2010, Vol.57 (4).
Bora, R.S. (1986), “Migration for Survival”, The Economic Times. Special Silver Jubilee Issue Feature, December, 19.
————. (1996), Himalayan Migration: A Study of the Hill Region of U.P. New Delhi: Sage Publication.
Breman, J. (1978), “Seasonal Migration and Cooperative Capitalism: Crushing of Cane and Labour by Sugar Factories of Bardoli”, Economic and Political Weekly (31-33). October 13.
————(1985), Of Peasants Migrants and Paupers: Rural Labour Circulation and Capitalist Production in Western India, Delhi: Oxford University Press.
Christopher McDowell and Arjan de Haan (1997), Migration and Sustainable Livelihoods:
A Critical Review of Literature, IDS Working Paper 65, Sussex, UK.
Deshingkar, Priya and Sven Grimm (2004), Voluntary Internal Migration: An Update, Paper Commissioned jointly by the Urban and Rural Change Team and the Migration Team within the Policy Division of the British Government’sDepartment for
149
International Development. Deshingkar, P. and D. Start (2003), Seasonal Migration for Livelihoods, Coping,
Accumulation and Exclusion, Working Paper No 220, Overseas Development Institute, London.
Ghosh, P.P. and A.N. Sharma (1995), “Seasonal Migration of Rural Labour in Bihar”, Labour and Development 1(1), July-December.
Haan, Arjan De (1999), “Livelihoods and Poverty: The Role of Migration—A Critical Review of the Migration Literature”, The Journal of Development Studies 36(2), December, Sussex, UK.
Jain, Anmol (2010), Labour Migration and Remittances in Uttarakhand, IFAD/ICIMOD,
A Case Study Report.
Jodha, N.S. (1997), Highland—Lowland Economic Linkages, 1997/8. Kathmandu: ICIMOD. ————. (2000), “Poverty Alleviation and Sustainable Development in Mountain Areas: Role of Highland-Lowland Links in the Context of Rapid Globalisation in Growth”, in Banskota et al. (eds.) Poverty Alleviation and SustainableResource Management in the Mountain Areas of South Asia. Kathmandu: ICIMOD.
Khanka, S.S. (1988), Labour Force, Employment and Unemployment in a Backward Economy. New Delhi: Himalaya Publishing House.
Mamgain, Rajendra P. and D.N. Reddy (2016), “Outmigration from Hill Region of Uttarakhand: Magnitude, Challenges and Policy Options”, GIDS Working Paper No. 216, Giri Institute of Development Studies, Lucknow
Sharma Alakh, N. (1997), People on the Move: Nature and Implications of Migration in a
Backward Economy, Vikas Publishing House, New Delhi. Srivastava, R.S. (2005), Internal Migration Links with Poverty and
Development , Country paper,presented at the Regional Conference on Migration and Development in Asia, Lan Zhou,China, 14-16 March.
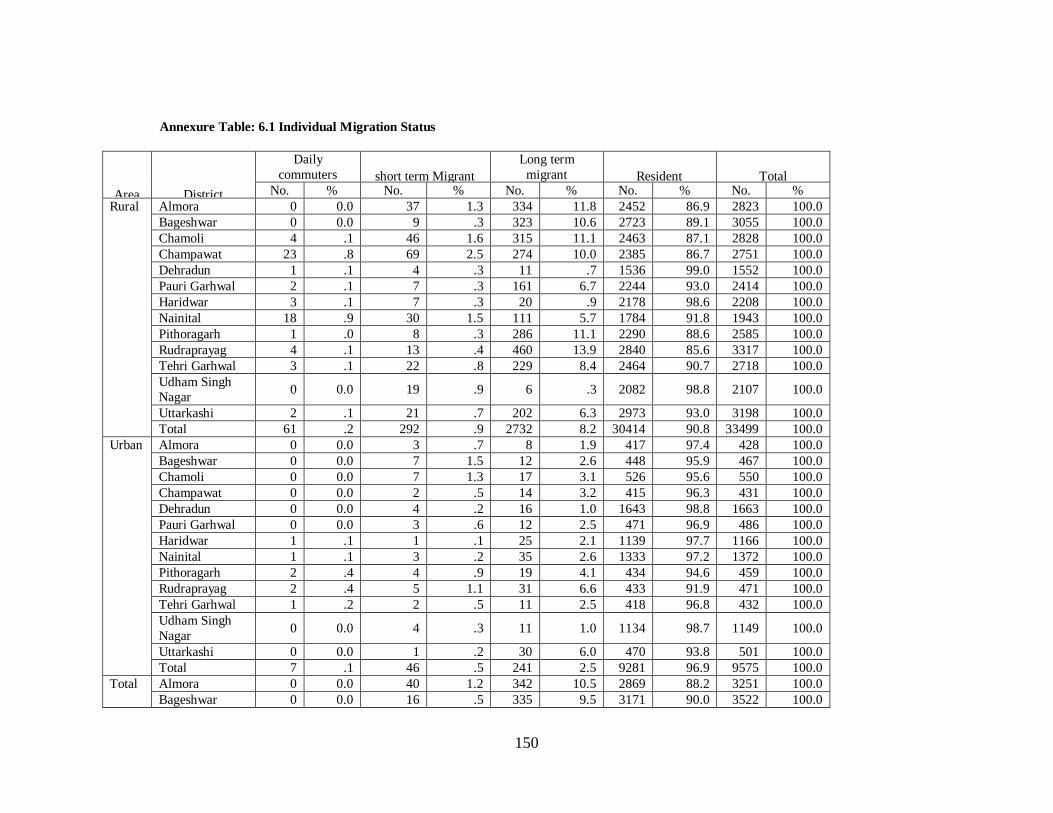
150
Annexure Table: 6.1 Individual Migration Status
Area
District
Daily commuters
short term Migrant
Long term migrant
Resident
Total
No. % No. % No. % No. % No. % Rural Almora 0 0.0 37 1.3 334 11.8 2452 86.9 2823 100.0
Bageshwar 0 0.0 9 .3 323 10.6 2723 89.1 3055 100.0 Chamoli 4 .1 46 1.6 315 11.1 2463 87.1 2828 100.0 Champawat 23 .8 69 2.5 274 10.0 2385 86.7 2751 100.0 Dehradun 1 .1 4 .3 11 .7 1536 99.0 1552 100.0 Pauri Garhwal 2 .1 7 .3 161 6.7 2244 93.0 2414 100.0 Haridwar 3 .1 7 .3 20 .9 2178 98.6 2208 100.0 Nainital 18 .9 30 1.5 111 5.7 1784 91.8 1943 100.0 Pithoragarh 1 .0 8 .3 286 11.1 2290 88.6 2585 100.0 Rudraprayag 4 .1 13 .4 460 13.9 2840 85.6 3317 100.0 Tehri Garhwal 3 .1 22 .8 229 8.4 2464 90.7 2718 100.0 Udham Singh Nagar
0
0.0
19
.9
6
.3
2082
98.8
2107
100.0 Uttarkashi 2 .1 21 .7 202 6.3 2973 93.0 3198 100.0 Total 61 .2 292 .9 2732 8.2 30414 90.8 33499 100.0
Urban Almora 0 0.0 3 .7 8 1.9 417 97.4 428 100.0 Bageshwar 0 0.0 7 1.5 12 2.6 448 95.9 467 100.0 Chamoli 0 0.0 7 1.3 17 3.1 526 95.6 550 100.0 Champawat 0 0.0 2 .5 14 3.2 415 96.3 431 100.0 Dehradun 0 0.0 4 .2 16 1.0 1643 98.8 1663 100.0 Pauri Garhwal 0 0.0 3 .6 12 2.5 471 96.9 486 100.0 Haridwar 1 .1 1 .1 25 2.1 1139 97.7 1166 100.0 Nainital 1 .1 3 .2 35 2.6 1333 97.2 1372 100.0 Pithoragarh 2 .4 4 .9 19 4.1 434 94.6 459 100.0 Rudraprayag 2 .4 5 1.1 31 6.6 433 91.9 471 100.0 Tehri Garhwal 1 .2 2 .5 11 2.5 418 96.8 432 100.0 Udham Singh Nagar
0
0.0
4
.3
11
1.0
1134
98.7
1149
100.0 Uttarkashi 0 0.0 1 .2 30 6.0 470 93.8 501 100.0 Total 7 .1 46 .5 241 2.5 9281 96.9 9575 100.0
Total Almora 0 0.0 40 1.2 342 10.5 2869 88.2 3251 100.0 Bageshwar 0 0.0 16 .5 335 9.5 3171 90.0 3522 100.0

151
Area
District
Daily commuters
short term Migrant
Long term migrant
Resident
Total
No. % No. % No. % No. % No. % Chamoli 4 .1 53 1.6 332 9.8 2989 88.5 3378 100.0 Champawat 23 .7 71 2.2 288 9.1 2800 88.0 3182 100.0 Dehradun 1 .0 8 .2 27 .8 3179 98.9 3215 100.0 Pauri Garhwal 2 .1 10 .3 173 6.0 2715 93.6 2900 100.0 Haridwar 4 .1 8 .2 45 1.3 3317 98.3 3374 100.0 Nainital 19 .6 33 1.0 146 4.4 3117 94.0 3315 100.0 Pithoragarh 3 .1 12 .4 305 10.0 2724 89.5 3044 100.0 Rudraprayag 6 .2 18 .5 491 13.0 3273 86.4 3788 100.0 TehriGarhwal 4 .1 24 .8 240 7.6 2882 91.5 3150 100.0 Udham Singh Nagar
0
0.0
23
.7
17
.5
3216
98.8
3256
100.0 Uttarkashi 2 .1 22 .6 232 6.3 3443 93.1 3699 100.0 Total 68 .2 338 .8 2973 6.9 39695 92.2 43074 100.0 Source: Primary Survey, 2017
Annexure Table: 6.2 Migration Status Household
Migration Status Household
Area
District
Resident
Daily commuters
short term Migrant
Long term migrant
Total
% No. % No. % No. % No. % No. Rural Almora 53.4 310 0.0 0 4.3 25 42.3 246 100.0 581
Bageshwar 61.1 393 0.0 0 1.2 8 37.6 242 100.0 643 Chamoli 55.5 309 .5 3 4.3 24 39.7 221 100.0 557 Champawat 46.9 260 3.1 17 10.3 57 39.7 220 100.0 554 Dehradun 95.3 301 .3 1 1.3 4 3.2 10 100.0 316 Pauri Garhwal 74.3 407 .4 2 1.1 6 24.3 133 100.0 548 Haridwar 95.2 394 .5 2 1.0 4 3.4 14 100.0 414 Nainital 72.6 291 3.5 14 5.2 21 18.7 75 100.0 401 Pithoragarh 61.4 344 .2 1 .7 4 37.7 211 100.0 560 Rudraprayag 46.5 293 .5 3 1.3 8 51.7 326 100.0 630 Tehri Garhwa 65.8 383 .5 3 2.2 13 31.4 183 100.0 582 Udham Singh Nagar,
95.2
396
0.0
0
3.4
14
1.4
6
100.0
416 Uttarkashi 73.7 460 .2 1 2.4 15 23.7 148 100.0 624
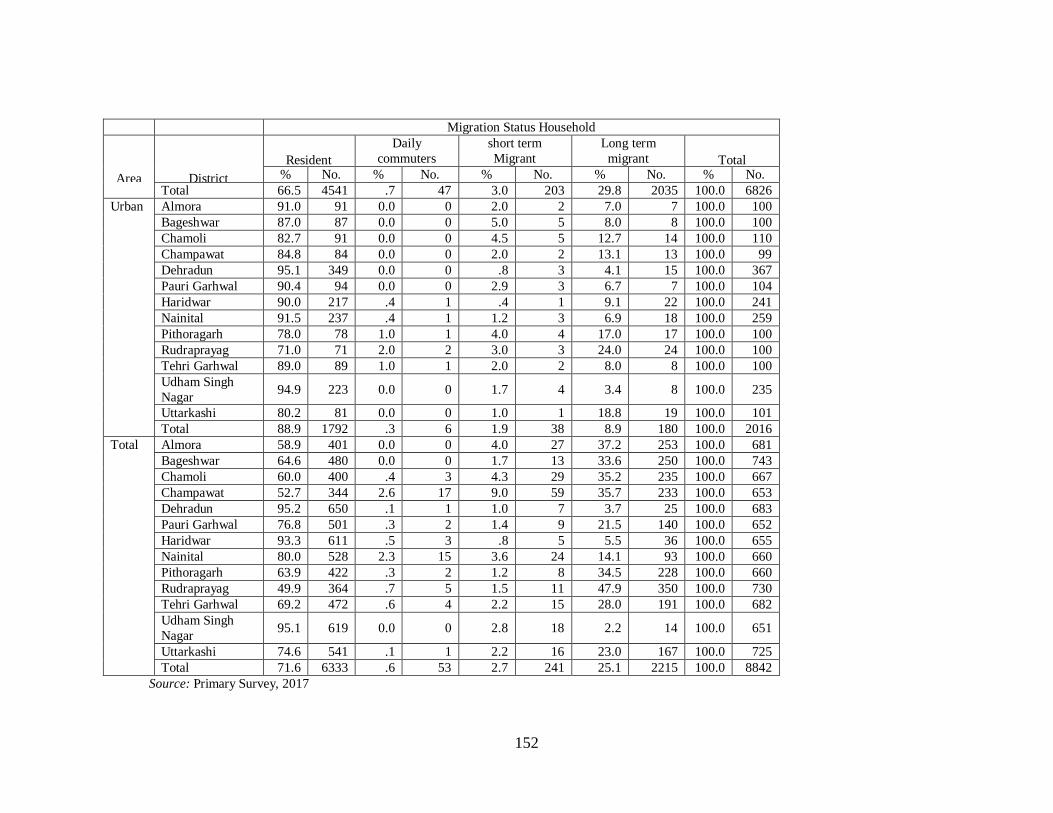
152
Migration Status Household
Area
District
Resident
Daily commuters
short term Migrant
Long term migrant
Total
% No. % No. % No. % No. % No. Total 66.5 4541 .7 47 3.0 203 29.8 2035 100.0 6826
Urban Almora 91.0 91 0.0 0 2.0 2 7.0 7 100.0 100 Bageshwar 87.0 87 0.0 0 5.0 5 8.0 8 100.0 100 Chamoli 82.7 91 0.0 0 4.5 5 12.7 14 100.0 110 Champawat 84.8 84 0.0 0 2.0 2 13.1 13 100.0 99 Dehradun 95.1 349 0.0 0 .8 3 4.1 15 100.0 367 Pauri Garhwal 90.4 94 0.0 0 2.9 3 6.7 7 100.0 104 Haridwar 90.0 217 .4 1 .4 1 9.1 22 100.0 241 Nainital 91.5 237 .4 1 1.2 3 6.9 18 100.0 259 Pithoragarh 78.0 78 1.0 1 4.0 4 17.0 17 100.0 100 Rudraprayag 71.0 71 2.0 2 3.0 3 24.0 24 100.0 100 Tehri Garhwal 89.0 89 1.0 1 2.0 2 8.0 8 100.0 100 Udham Singh Nagar
94.9
223
0.0
0
1.7
4
3.4
8
100.0
235 Uttarkashi 80.2 81 0.0 0 1.0 1 18.8 19 100.0 101 Total 88.9 1792 .3 6 1.9 38 8.9 180 100.0 2016
Total Almora 58.9 401 0.0 0 4.0 27 37.2 253 100.0 681 Bageshwar 64.6 480 0.0 0 1.7 13 33.6 250 100.0 743 Chamoli 60.0 400 .4 3 4.3 29 35.2 235 100.0 667 Champawat 52.7 344 2.6 17 9.0 59 35.7 233 100.0 653 Dehradun 95.2 650 .1 1 1.0 7 3.7 25 100.0 683 Pauri Garhwal 76.8 501 .3 2 1.4 9 21.5 140 100.0 652 Haridwar 93.3 611 .5 3 .8 5 5.5 36 100.0 655 Nainital 80.0 528 2.3 15 3.6 24 14.1 93 100.0 660 Pithoragarh 63.9 422 .3 2 1.2 8 34.5 228 100.0 660 Rudraprayag 49.9 364 .7 5 1.5 11 47.9 350 100.0 730 Tehri Garhwal 69.2 472 .6 4 2.2 15 28.0 191 100.0 682 Udham Singh Nagar
95.1
619
0.0
0
2.8
18
2.2
14
100.0
651 Uttarkashi 74.6 541 .1 1 2.2 16 23.0 167 100.0 725 Total 71.6 6333 .6 53 2.7 241 25.1 2215 100.0 8842
Source: Primary Survey, 2017
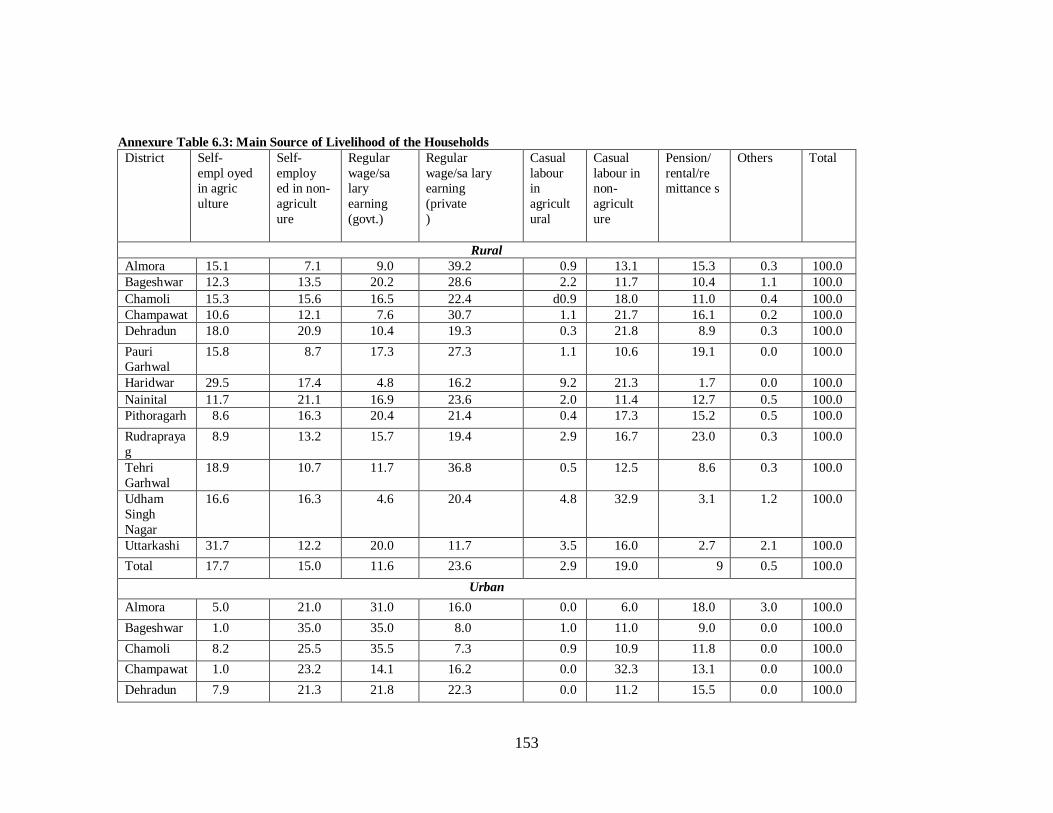
153
Annexure Table 6.3: Main Source of Livelihood of the Households
District Self- empl oyed in agric ulture
Self- employ ed in non- agricult ure
Regular wage/sa lary earning (govt.)
Regular wage/sa lary earning (private )
Casual labour in agricult ural
Casual labour in non- agricult ure
Pension/ rental/re mittance s
Others Total
Rural Almora 15.1 7.1 9.0 39.2 0.9 13.1 15.3 0.3 100.0 Bageshwar 12.3 13.5 20.2 28.6 2.2 11.7 10.4 1.1 100.0 Chamoli 15.3 15.6 16.5 22.4 d0.9 18.0 11.0 0.4 100.0 Champawat 10.6 12.1 7.6 30.7 1.1 21.7 16.1 0.2 100.0 Dehradun 18.0 20.9 10.4 19.3 0.3 21.8 8.9 0.3 100.0 Pauri Garhwal
15.8 8.7 17.3 27.3 1.1 10.6 19.1 0.0 100.0
Haridwar 29.5 17.4 4.8 16.2 9.2 21.3 1.7 0.0 100.0 Nainital 11.7 21.1 16.9 23.6 2.0 11.4 12.7 0.5 100.0 Pithoragarh 8.6 16.3 20.4 21.4 0.4 17.3 15.2 0.5 100.0 Rudrapraya g
8.9 13.2 15.7 19.4 2.9 16.7 23.0 0.3 100.0
Tehri Garhwal
18.9 10.7 11.7 36.8 0.5 12.5 8.6 0.3 100.0
Udham Singh Nagar
16.6 16.3 4.6 20.4 4.8 32.9 3.1 1.2 100.0
Uttarkashi 31.7 12.2 20.0 11.7 3.5 16.0 2.7 2.1 100.0 Total 17.7 15.0 11.6 23.6 2.9 19.0 9 0.5 100.0
Urban Almora 5.0 21.0 31.0 16.0 0.0 6.0 18.0 3.0 100.0 Bageshwar 1.0 35.0 35.0 8.0 1.0 11.0 9.0 0.0 100.0 Chamoli 8.2 25.5 35.5 7.3 0.9 10.9 11.8 0.0 100.0 Champawat 1.0 23.2 14.1 16.2 0.0 32.3 13.1 0.0 100.0 Dehradun 7.9 21.3 21.8 22.3 0.0 11.2 15.5 0.0 100.0
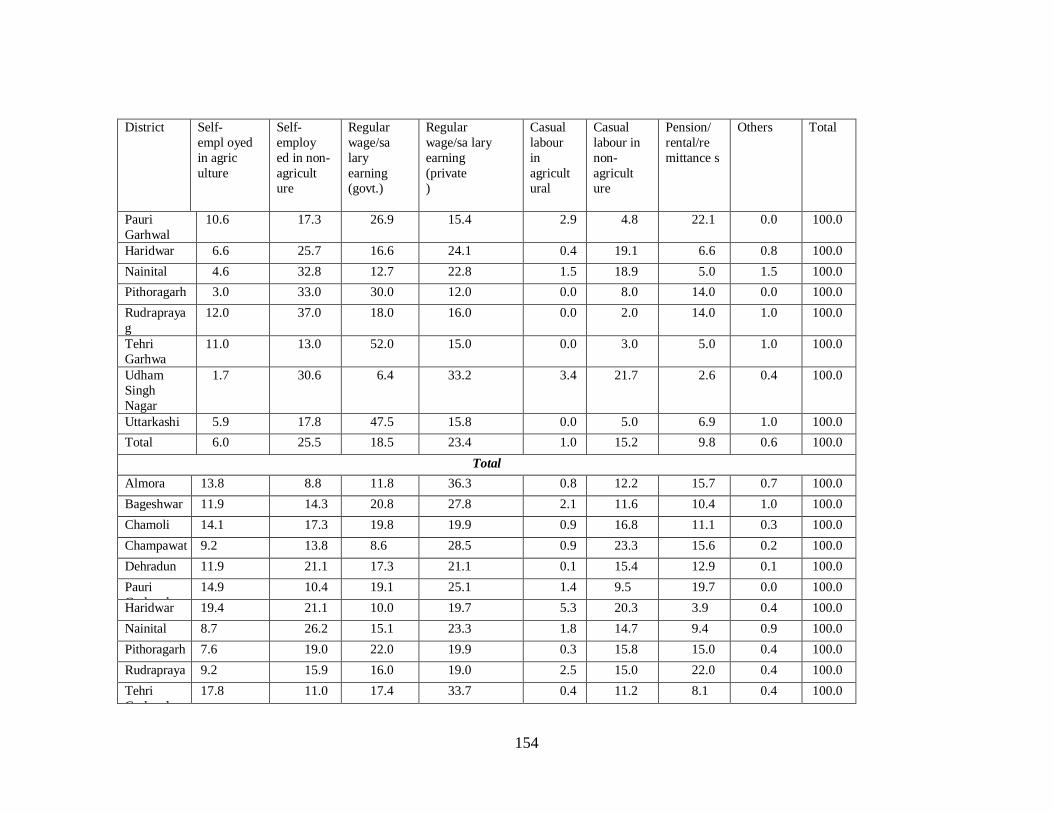
154
District Self- empl oyed in agric ulture
Self- employ ed in non- agricult ure
Regular wage/sa lary earning (govt.)
Regular wage/sa lary earning (private )
Casual labour in agricult ural
Casual labour in non- agricult ure
Pension/ rental/re mittance s
Others Total
Pauri Garhwal
10.6 17.3 26.9 15.4 2.9 4.8 22.1 0.0 100.0
Haridwar 6.6 25.7 16.6 24.1 0.4 19.1 6.6 0.8 100.0 Nainital 4.6 32.8 12.7 22.8 1.5 18.9 5.0 1.5 100.0 Pithoragarh 3.0 33.0 30.0 12.0 0.0 8.0 14.0 0.0 100.0 Rudrapraya g
12.0 37.0 18.0 16.0 0.0 2.0 14.0 1.0 100.0
Tehri Garhwa
11.0 13.0 52.0 15.0 0.0 3.0 5.0 1.0 100.0
Udham Singh Nagar
1.7 30.6 6.4 33.2 3.4 21.7 2.6 0.4 100.0
Uttarkashi 5.9 17.8 47.5 15.8 0.0 5.0 6.9 1.0 100.0 Total 6.0 25.5 18.5 23.4 1.0 15.2 9.8 0.6 100.0
Total Almora 13.8 8.8 11.8 36.3 0.8 12.2 15.7 0.7 100.0 Bageshwar 11.9 14.3 20.8 27.8 2.1 11.6 10.4 1.0 100.0 Chamoli 14.1 17.3 19.8 19.9 0.9 16.8 11.1 0.3 100.0 Champawat 9.2 13.8 8.6 28.5 0.9 23.3 15.6 0.2 100.0 Dehradun 11.9 21.1 17.3 21.1 0.1 15.4 12.9 0.1 100.0 Pauri G h l
14.9 10.4 19.1 25.1 1.4 9.5 19.7 0.0 100.0 Haridwar 19.4 21.1 10.0 19.7 5.3 20.3 3.9 0.4 100.0 Nainital 8.7 26.2 15.1 23.3 1.8 14.7 9.4 0.9 100.0 Pithoragarh 7.6 19.0 22.0 19.9 0.3 15.8 15.0 0.4 100.0 Rudrapraya
9.2 15.9 16.0 19.0 2.5 15.0 22.0 0.4 100.0 Tehri G h l
17.8 11.0 17.4 33.7 0.4 11.2 8.1 0.4 100.0
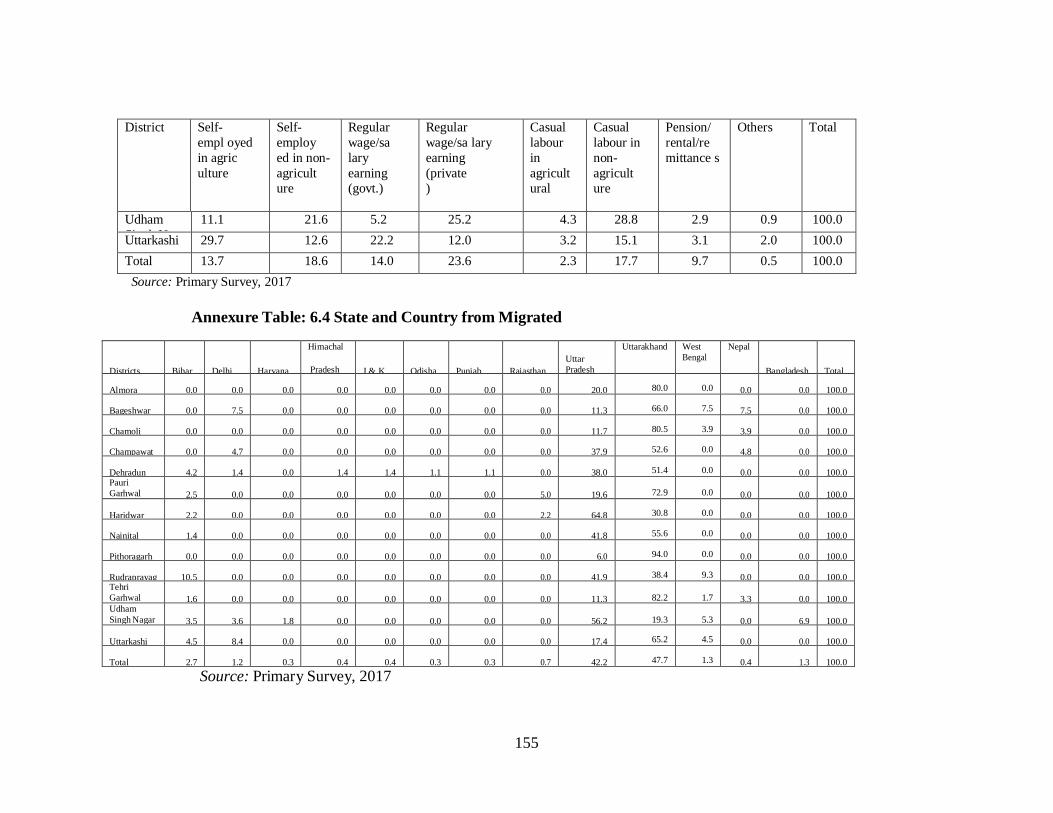
155
District Self- empl oyed in agric ulture
Self- employ ed in non- agricult ure
Regular wage/sa lary earning (govt.)
Regular wage/sa lary earning (private )
Casual labour in agricult ural
Casual labour in non- agricult ure
Pension/ rental/re mittance s
Others Total
Udham Si h N
11.1 21.6 5.2 25.2 4.3 28.8 2.9 0.9 100.0 Uttarkashi 29.7 12.6 22.2 12.0 3.2 15.1 3.1 2.0 100.0 Total 13.7 18.6 14.0 23.6 2.3 17.7 9.7 0.5 100.0 Source: Primary Survey, 2017
Annexure Table: 6.4 State and Country from Migrated
Districts
Bihar
Delhi
Haryana
Himachal
Pradesh
J & K
Odisha
Punjab
Rajasthan
Uttar Pradesh
Uttarakhand West Bengal
Nepal
Bangladesh
Total
Almora
0.0
0.0
0.0
0.0
0.0
0.0
0.0
0.0
20.0
80.0
0.0 0.0
0.0
100.0
Bageshwar
0.0
7.5
0.0
0.0
0.0
0.0
0.0
0.0
11.3
66.0
7.5 7.5
0.0
100.0
Chamoli
0.0
0.0
0.0
0.0
0.0
0.0
0.0
0.0
11.7
80.5
3.9 3.9
0.0
100.0
Champawat
0.0
4.7
0.0
0.0
0.0
0.0
0.0
0.0
37.9
52.6
0.0 4.8
0.0
100.0
Dehradun
4.2
1.4
0.0
1.4
1.4
1.1
1.1
0.0
38.0
51.4
0.0 0.0
0.0
100.0
Pauri Garhwal
2.5
0.0
0.0
0.0
0.0
0.0
0.0
5.0
19.6
72.9 0.0
0.0
0.0
100.0
Haridwar
2.2
0.0
0.0
0.0
0.0
0.0
0.0
2.2
64.8
30.8 0.0
0.0
0.0
100.0
Nainital
1.4
0.0
0.0
0.0
0.0
0.0
0.0
0.0
41.8
55.6 0.0
0.0
0.0
100.0
Pithoragarh
0.0
0.0
0.0
0.0
0.0
0.0
0.0
0.0
6.0
94.0 0.0
0.0
0.0
100.0
Rudraprayag
10.5
0.0
0.0
0.0
0.0
0.0
0.0
0.0
41.9
38.4 9.3
0.0
0.0
100.0 Tehri Garhwal
1.6
0.0
0.0
0.0
0.0
0.0
0.0
0.0
11.3
82.2
1.7 3.3
0.0
100.0
Udham Singh Nagar
3.5
3.6
1.8
0.0
0.0
0.0
0.0
0.0
56.2
19.3
5.3 0.0
6.9
100.0
Uttarkashi
4.5
8.4
0.0
0.0
0.0
0.0
0.0
0.0
17.4
65.2
4.5 0.0
0.0
100.0
Total
2.7
1.2
0.3
0.4
0.4
0.3
0.3
0.7
42.2
47.7
1.3 0.4
1.3
100.0
Source: Primary Survey, 2017
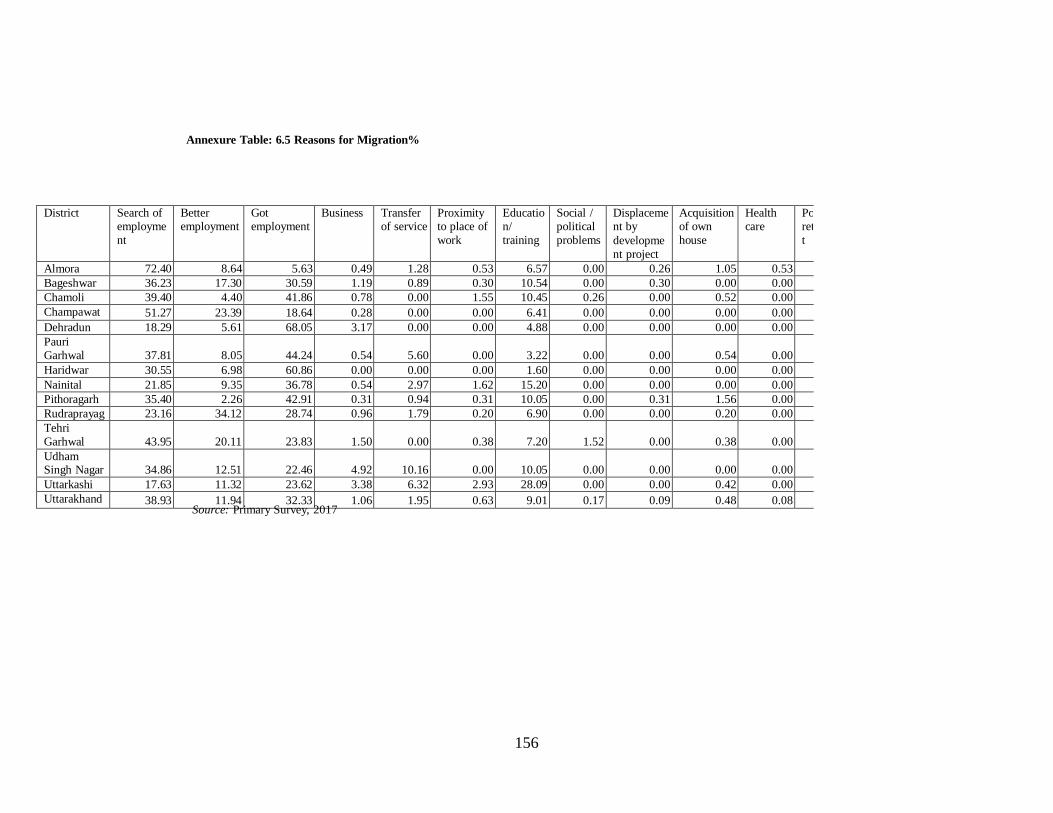
156
District Search of employme nt
Better employment
Got employment
Business Transfer of service
Proximity to place of work
Educatio n/ training
Social / political problems
Displaceme nt by developme nt project
Acquisition of own house
Health care
Po ret t
Almora 72.40 8.64 5.63 0.49 1.28 0.53 6.57 0.00 0.26 1.05 0.53 Bageshwar 36.23 17.30 30.59 1.19 0.89 0.30 10.54 0.00 0.30 0.00 0.00 Chamoli 39.40 4.40 41.86 0.78 0.00 1.55 10.45 0.26 0.00 0.52 0.00 Champawat 51.27 23.39 18.64 0.28 0.00 0.00 6.41 0.00 0.00 0.00 0.00 Dehradun 18.29 5.61 68.05 3.17 0.00 0.00 4.88 0.00 0.00 0.00 0.00 Pauri Garhwal
37.81
8.05
44.24
0.54
5.60
0.00
3.22
0.00
0.00
0.54
0.00
Haridwar 30.55 6.98 60.86 0.00 0.00 0.00 1.60 0.00 0.00 0.00 0.00 Nainital 21.85 9.35 36.78 0.54 2.97 1.62 15.20 0.00 0.00 0.00 0.00 Pithoragarh 35.40 2.26 42.91 0.31 0.94 0.31 10.05 0.00 0.31 1.56 0.00 Rudraprayag 23.16 34.12 28.74 0.96 1.79 0.20 6.90 0.00 0.00 0.20 0.00 Tehri Garhwal
43.95
20.11
23.83
1.50
0.00
0.38
7.20
1.52
0.00
0.38
0.00
Udham Singh Nagar
34.86
12.51
22.46
4.92
10.16
0.00
10.05
0.00
0.00
0.00
0.00
Uttarkashi 17.63 11.32 23.62 3.38 6.32 2.93 28.09 0.00 0.00 0.42 0.00 Uttarakhand 38.93 11.94 32.33 1.06 1.95 0.63 9.01 0.17 0.09 0.48 0.08
Annexure Table: 6.5 Reasons for Migration%
Source: Primary Survey, 2017

157
CHAPTER 7: STRENGTHENING SOCIAL PROTECTION - EDUCATION
7.1 Introduction Education is an important tool for fostering human development. It gives individuals the capabilities to enhance and improve their own human resources and fosters improved well-being and livelihoods. Education through its effect of enhancing individual capabilities, raises the income earning capabilities of people, makes them aware of their rights and empowers them to demand what is due to them. Education generates many positive externalities thereby enhancing welfare of society (Tilak, 2008). It is also known to have positive implications for the welfare of future generations through intergenerational effects with better educated parents having healthier and more educated children (Dreze and Sen, 2002). The Sustainable Development Goal 4 emphasizes the need for quality education that is inclusive and equitable, one that promotes life-long learning opportunities for all by 2030. The importance of education cannot be emphasized enough in any study of human development and in this Uttarakhand Human Development Report we study and analyse issues plaguing educational infrastructure and attainments, policy imperatives and the various ways in which educational access and attainment shortcomings at different levels of education and how these gaps can be effectively tackled and addressed.
7.2 Status of Education 7.2.1 General Education Level The HDR 2017 Survey collected data on various education related indicators for Uttarakhand. The data on general education levels of the 15 years and above population presented in Table 7.1 reveals that approximately 28 percent of the population had completed primary or upper primary level of education in 2017. A fifth each of the adult population had completed the secondary and higher secondary levels of education. A much smaller 16 percent of the adult population reported completing higher education (graduation, post-graduation and professional courses). Approximately 16 percent of the population was illiterate in the state. District wise variations also were reported in the levels of education of the adult population with the hills districts of Champawat (34.09 percent), Nainital (28.11 percent) and Pithoragarh (28.7 percent) as well as the plains districts of Haridwar (36.44 percent) and Udham Singh Nagar (28.77 percent) reporting the highest proportions of adult population that has completed the primary and upper primary levels of education. While these districts have the highest proportions of populations completing primary and upper primary levels of education, they are not commensurate in showcasing high proportions of population completing secondary and higher secondary levels of education which is worth mentioning. Districts such as Almora, Bageshwar, Chamoli, Pithoragarh and Rudraprayag which report approximately a fifth of their adult populations as having completed the secondary and higher secondary levels, had lower proportions of the adult populace having
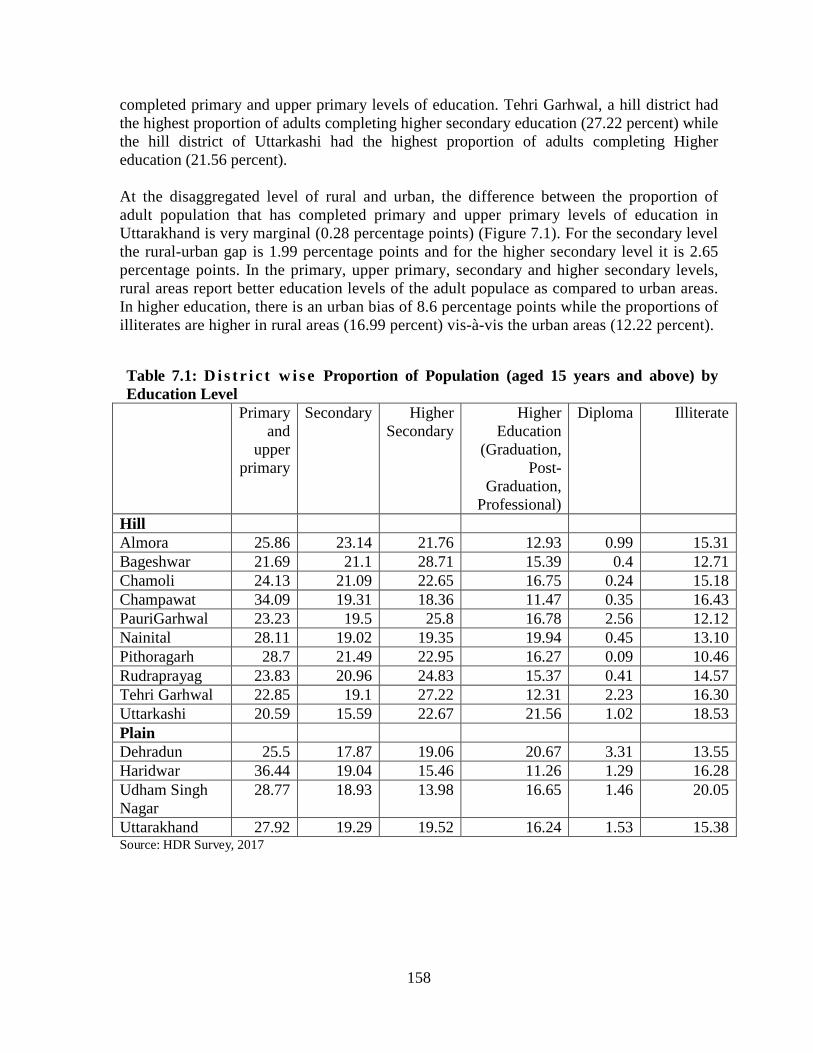
158
completed primary and upper primary levels of education. Tehri Garhwal, a hill district had the highest proportion of adults completing higher secondary education (27.22 percent) while the hill district of Uttarkashi had the highest proportion of adults completing Higher education (21.56 percent). At the disaggregated level of rural and urban, the difference between the proportion of adult population that has completed primary and upper primary levels of education in Uttarakhand is very marginal (0.28 percentage points) (Figure 7.1). For the secondary level the rural-urban gap is 1.99 percentage points and for the higher secondary level it is 2.65 percentage points. In the primary, upper primary, secondary and higher secondary levels, rural areas report better education levels of the adult populace as compared to urban areas. In higher education, there is an urban bias of 8.6 percentage points while the proportions of illiterates are higher in rural areas (16.99 percent) vis-à-vis the urban areas (12.22 percent).
Table 7.1: D i s t r i c t w i s e Proportion of Population (aged 15 years and above) by Education Level
Primary and
upper primary
Secondary Higher Secondary
Higher Education
(Graduation, Post-
Graduation, Professional)
Diploma Illiterate
Hill Almora 25.86 23.14 21.76 12.93 0.99 15.31 Bageshwar 21.69 21.1 28.71 15.39 0.4 12.71 Chamoli 24.13 21.09 22.65 16.75 0.24 15.18 Champawat 34.09 19.31 18.36 11.47 0.35 16.43 PauriGarhwal 23.23 19.5 25.8 16.78 2.56 12.12 Nainital 28.11 19.02 19.35 19.94 0.45 13.10 Pithoragarh 28.7 21.49 22.95 16.27 0.09 10.46 Rudraprayag 23.83 20.96 24.83 15.37 0.41 14.57 Tehri Garhwal 22.85 19.1 27.22 12.31 2.23 16.30 Uttarkashi 20.59 15.59 22.67 21.56 1.02 18.53 Plain Dehradun 25.5 17.87 19.06 20.67 3.31 13.55 Haridwar 36.44 19.04 15.46 11.26 1.29 16.28 Udham Singh Nagar
28.77 18.93 13.98 16.65 1.46 20.05
Uttarakhand 27.92 19.29 19.52 16.24 1.53 15.38 Source: HDR Survey, 2017
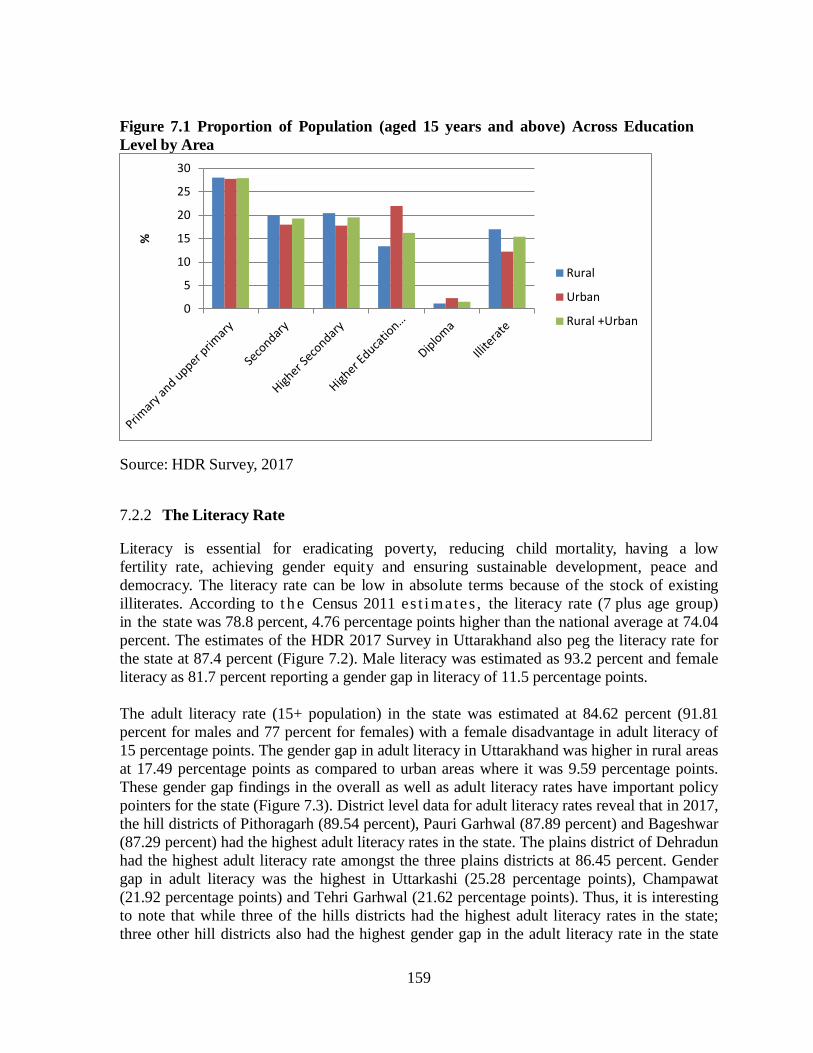
159
Figure 7.1 Proportion of Population (aged 15 years and above) Across Education Level by Area
Source: HDR Survey, 2017
7.2.2 The Literacy Rate Literacy is essential for eradicating poverty, reducing child mortality, having a low fertility rate, achieving gender equity and ensuring sustainable development, peace and democracy. The literacy rate can be low in absolute terms because of the stock of existing illiterates. According to t h e Census 2011 es t imates , the literacy rate (7 plus age group) in the state was 78.8 percent, 4.76 percentage points higher than the national average at 74.04 percent. The estimates of the HDR 2017 Survey in Uttarakhand also peg the literacy rate for the state at 87.4 percent (Figure 7.2). Male literacy was estimated as 93.2 percent and female literacy as 81.7 percent reporting a gender gap in literacy of 11.5 percentage points. The adult literacy rate (15+ population) in the state was estimated at 84.62 percent (91.81 percent for males and 77 percent for females) with a female disadvantage in adult literacy of 15 percentage points. The gender gap in adult literacy in Uttarakhand was higher in rural areas at 17.49 percentage points as compared to urban areas where it was 9.59 percentage points. These gender gap findings in the overall as well as adult literacy rates have important policy pointers for the state (Figure 7.3). District level data for adult literacy rates reveal that in 2017, the hill districts of Pithoragarh (89.54 percent), Pauri Garhwal (87.89 percent) and Bageshwar (87.29 percent) had the highest adult literacy rates in the state. The plains district of Dehradun had the highest adult literacy rate amongst the three plains districts at 86.45 percent. Gender gap in adult literacy was the highest in Uttarkashi (25.28 percentage points), Champawat (21.92 percentage points) and Tehri Garhwal (21.62 percentage points). Thus, it is interesting to note that while three of the hills districts had the highest adult literacy rates in the state; three other hill districts also had the highest gender gap in the adult literacy rate in the state
0
5
10
15
20
25
30
%
Rural
Urban
Rural +Urban

160
(Appendix Table 7.1A). The youth literacy rate (15 to 24 age group of population) in the state was estimated at 98.78 percent (98.31 percent for males and 98.06 percent for females) with a female disadvantage in adult literacy of 0.25 percentage points (Figure 7.3). District level data for youth literacy rates reveal that in 2017, there are not district wise variations in terms of youth literacy rates. Among the hill districts, Baleshwar (99.86), Pithoragarh (99.83) and Bageshwar (99.86) had the highest youth literacy rates in the state (Appendix Table 7.2A). The plains district of Dehradun had the highest youth literacy rate amongst the three plains districts at 99.01 percent. Thus, it is interesting to note that while three of the hills districts had the highest adult literacy rates in the state; these districts also had the highest youth literacy rates in the state.
Figure 7.2: Literacy rates (7 + in Uttarakhand)
Figure 7.3: Adult and Youth Literacy rates in Uttarakhand
Source: HDR Survey, 2017
0102030405060708090
100
HDR survey census 2011 census 2001
% Male
Female
Total
0102030405060708090
100
Male Female Person Male Female Person
Adult Youth
Rural
Urban
Rural+Urban

161
7.2.3. The Gross Enrolment Ratio
The Gross Enrolment Ratio (GER) is defined as the total enrolment in classes or grades at a specific level of education, regardless of age, expressed as a percentage of the school- age population corresponding to the same level of education in a given school year. By definition, GER may be greater than 100 since overage children are often also enrolled. The GER at the primary and upper primary levels in Uttarakhand were estimated at 99.29, 86.69 percent at the secondary level and 85.72 percent at the higher secondary levels, which further drops to 75.53 percent at the std IX and X levels in 2017 (Table 7.2) These dropping GERs reflect the problems of retention in the schooling system in Uttarakhand and make the SDG 4.1 for the state of ensuring by 2030 that all girls and boys complete free, equitable and quality primary and secondary education leading to relevant and effective learning outcomes a difficult target to achieve. Efforts to achieve 100 percent enrolments coupled with retention and educational achievements in the schooling system are an important human development imperative for the state.
Table 7.2: Gross Enrolment Ratio at Selected Levels of Education Year Classes
I-V Classes VI-VIII
Class IX-X* Classes XI-XII
2005-06 119.89 89.88 62.23 2015-16 99.29 86.69 85.72 75.53 Source: DISE various rounds * Figure for 2005-06 is for school level IX-XII Age specific enrolment rates for Uttarakhand collected by the HDR 2017 Survey reveal that the enrolment rates were highest in the state for the 6-14 years age group (97.7 percent) there being no gender bias in this indicator of schooling (Figure 7.4) and the goal of universal enrolment for this age group seemingly not too difficult a task to accomplish with the right policy impetus. The enrolment rates drop as we move to the higher age brackets being 89.3 percent in the 15-16 age group; 74.7 percent for the 17-18 age group and 41.5 percent for the 19-24 age group. Even though in the lower age groups, higher proportions of girls are reported as enrolled in school, their enrolment gets reduced with increasing age. It is also a serious concern that in the age groups of 17-18 years and 19-24 years, only 75 per cent and 42 per cent of gi r l s r espect ive l y a re r epor t ed as pursuing some education (Figure 7.4).
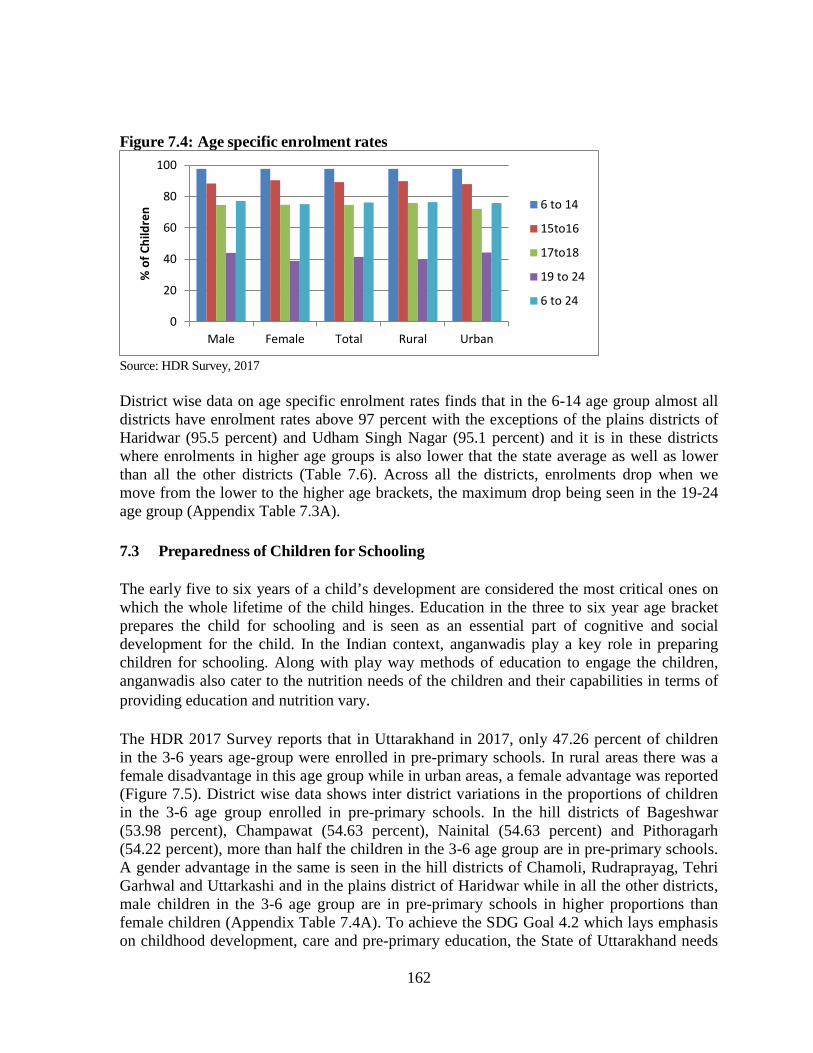
162
Figure 7.4: Age specific enrolment rates
Source: HDR Survey, 2017 District wise data on age specific enrolment rates finds that in the 6-14 age group almost all districts have enrolment rates above 97 percent with the exceptions of the plains districts of Haridwar (95.5 percent) and Udham Singh Nagar (95.1 percent) and it is in these districts where enrolments in higher age groups is also lower that the state average as well as lower than all the other districts (Table 7.6). Across all the districts, enrolments drop when we move from the lower to the higher age brackets, the maximum drop being seen in the 19-24 age group (Appendix Table 7.3A). 7.3 Preparedness of Children for Schooling The early five to six years of a child’s development are considered the most critical ones on which the whole lifetime of the child hinges. Education in the three to six year age bracket prepares the child for schooling and is seen as an essential part of cognitive and social development for the child. In the Indian context, anganwadis play a key role in preparing children for schooling. Along with play way methods of education to engage the children, anganwadis also cater to the nutrition needs of the children and their capabilities in terms of providing education and nutrition vary. The HDR 2017 Survey reports that in Uttarakhand in 2017, only 47.26 percent of children in the 3-6 years age-group were enrolled in pre-primary schools. In rural areas there was a female disadvantage in this age group while in urban areas, a female advantage was reported (Figure 7.5). District wise data shows inter district variations in the proportions of children in the 3-6 age group enrolled in pre-primary schools. In the hill districts of Bageshwar (53.98 percent), Champawat (54.63 percent), Nainital (54.63 percent) and Pithoragarh (54.22 percent), more than half the children in the 3-6 age group are in pre-primary schools. A gender advantage in the same is seen in the hill districts of Chamoli, Rudraprayag, Tehri Garhwal and Uttarkashi and in the plains district of Haridwar while in all the other districts, male children in the 3-6 age group are in pre-primary schools in higher proportions than female children (Appendix Table 7.4A). To achieve the SDG Goal 4.2 which lays emphasis on childhood development, care and pre-primary education, the State of Uttarakhand needs
0
20
40
60
80
100
Male Female Total Rural Urban
% o
f Chi
ldre
n 6 to 14
15to16
17to18
19 to 24
6 to 24
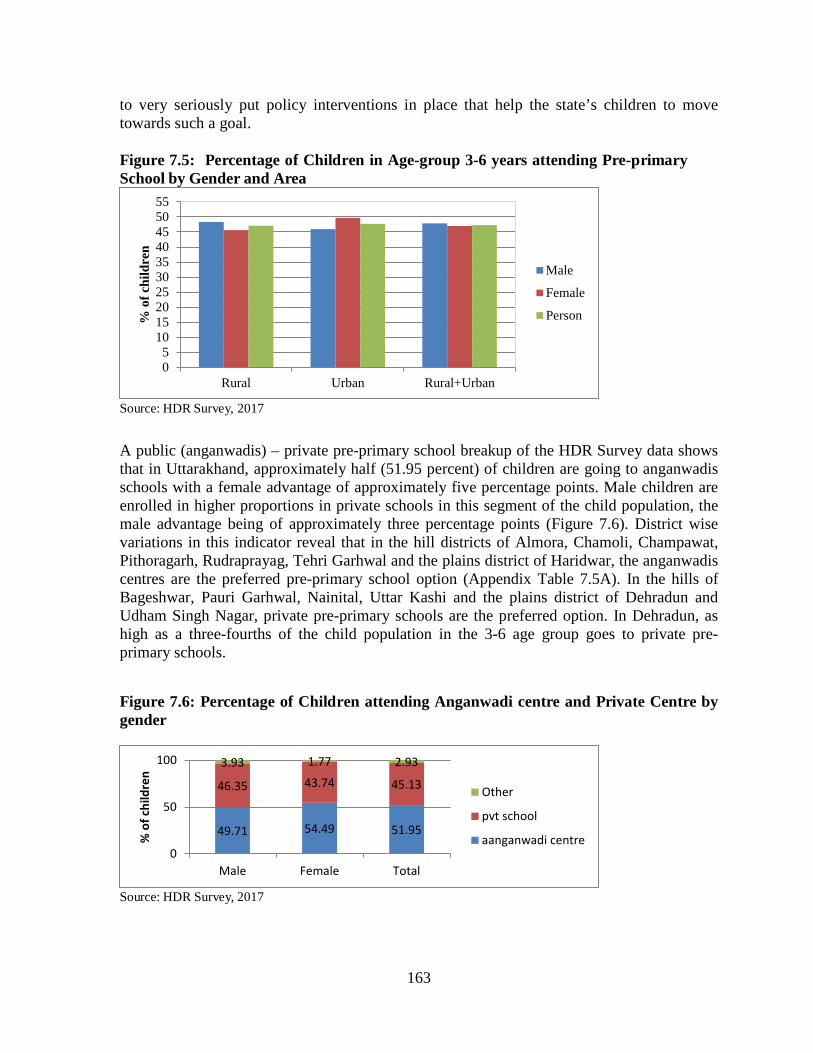
163
to very seriously put policy interventions in place that help the state’s children to move towards such a goal. Figure 7.5: Percentage of Children in Age-group 3-6 years attending Pre-primary School by Gender and Area
Source: HDR Survey, 2017 A public (anganwadis) – private pre-primary school breakup of the HDR Survey data shows that in Uttarakhand, approximately half (51.95 percent) of children are going to anganwadis schools with a female advantage of approximately five percentage points. Male children are enrolled in higher proportions in private schools in this segment of the child population, the male advantage being of approximately three percentage points (Figure 7.6). District wise variations in this indicator reveal that in the hill districts of Almora, Chamoli, Champawat, Pithoragarh, Rudraprayag, Tehri Garhwal and the plains district of Haridwar, the anganwadis centres are the preferred pre-primary school option (Appendix Table 7.5A). In the hills of Bageshwar, Pauri Garhwal, Nainital, Uttar Kashi and the plains district of Dehradun and Udham Singh Nagar, private pre-primary schools are the preferred option. In Dehradun, as high as a three-fourths of the child population in the 3-6 age group goes to private pre-primary schools.
Figure 7.6: Percentage of Children attending Anganwadi centre and Private Centre by gender
Source: HDR Survey, 2017
05
10152025303540455055
Rural Urban Rural+Urban
% o
f chi
ldre
n
Male
Female
Person
49.71 54.49 51.95
46.35 43.74 45.13
3.93 1.77 2.93
0
50
100
Male Female Total
% o
f chi
ldre
n
Other
pvt school
aanganwadi centre

164
7.4 Access to School Accessibility of schools has an important role to play in enrolments, attendance and retention. In the hilly areas specially, school accessibility is a major impediment to children’s education, more so for the girls. In Uttarakhand, the HDR 2017 Survey finds that a little over half the households in the state have a school within one kilometer radius, although inter-district variations do exist in the same (Table 7.3). The hill district Almora has the lowest proportion of households (approximately one third, 35.83 percent) that have access to a school within one kilometer while the plains districts of Udham Singh Nagar and Haridwar are at the other end of the spectrum (69.15 percent and 62.06 percent respectively). Also, over a third of households (37.24 percent) in Almora reported school access between 1 to 2 kilometers, 15.14 percent had access 2 to 4 kms while a tenth reported distance from school as more than five kilometers. This aptly showcases the difficulty in access to schooling that household in the hilly region of the state face and needs commensurate policy attention. The ratios of primary to upper primary schools (2.17), upper primary to secondary schools (2.33) and secondary to higher secondary schools (1.58) (Tables 7.4) reveals the shortage of schools at various levels of higher education in the state. Table 7.3: Proportion of Households by distance from School (in %)
Hill Within 1 km 1 to 2 km 2 to 4 km >5km
Almora 35.83 37.24 15.14 11.79 Bageshwar 40.26 38.55 15.38 5.81 Chamoli 44.20 37.87 11.43 6.5 Champawat 44.9 38.27 8.05 8.78 PauriGarhwal 47.32 31.84 13.02 7.82 Nainital 52.84 31.14 10.67 5.35 Pithoragarh 46.82 41.02 7.11 5.05 Rudraprayag 52.17 35.72 5.45 6.66 TehriGarhwal 46.69 29.53 17.75 6.03 Uttarkashi 52.25 19.42 13.32 15.01 Plain Dehradun 48.07 37.18 9.53 5.22 Haridwar 62.06 22.99 6.76 8.19 Udham Singh Nagar 69.15 16.47 7.75 6.63 Uttarakhand 52.27 30.19 10.22 7.32
Source: HDR Survey, 2017 Table 7.4 Ratio of Number of Schools by Levels
Uttarakhand All India
Primary/Upper primary 2.17 1.99 Upper Primary/Secondary 2.33 2.54 Secondary/Higher Secondary
1.58
2.12
Source: DISE 2015-16
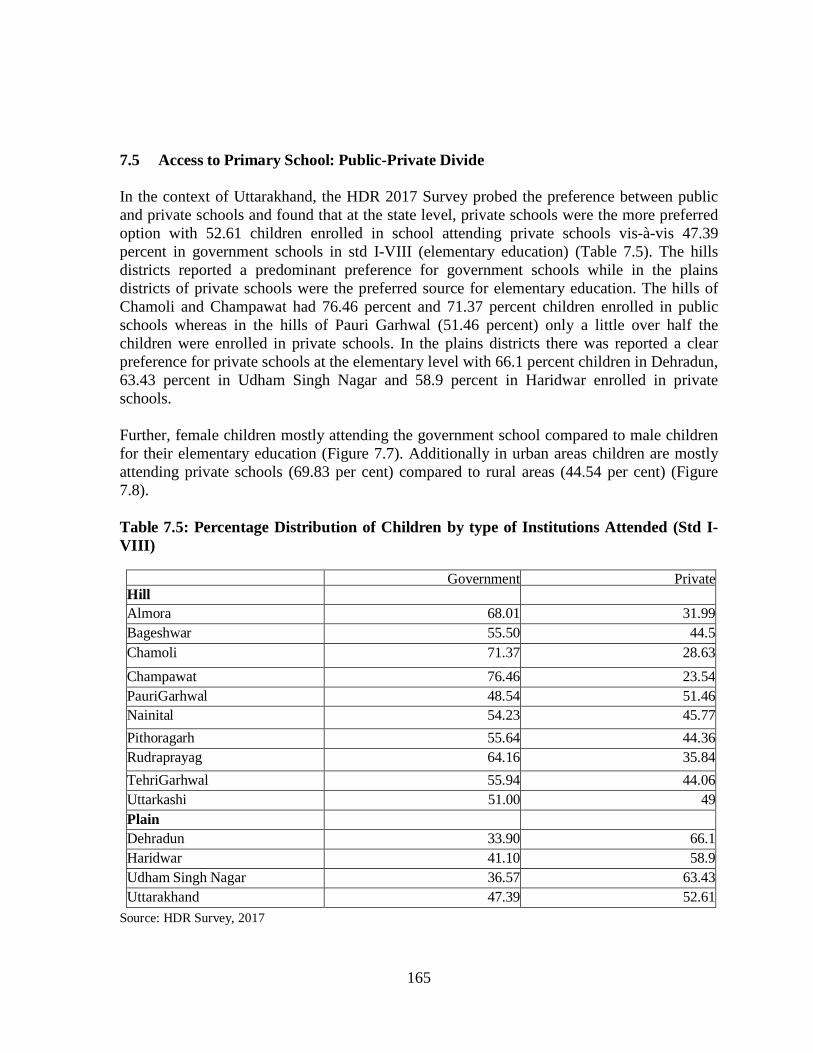
165
7.5 Access to Primary School: Public-Private Divide
In the context of Uttarakhand, the HDR 2017 Survey probed the preference between public and private schools and found that at the state level, private schools were the more preferred option with 52.61 children enrolled in school attending private schools vis-à-vis 47.39 percent in government schools in std I-VIII (elementary education) (Table 7.5). The hills districts reported a predominant preference for government schools while in the plains districts of private schools were the preferred source for elementary education. The hills of Chamoli and Champawat had 76.46 percent and 71.37 percent children enrolled in public schools whereas in the hills of Pauri Garhwal (51.46 percent) only a little over half the children were enrolled in private schools. In the plains districts there was reported a clear preference for private schools at the elementary level with 66.1 percent children in Dehradun, 63.43 percent in Udham Singh Nagar and 58.9 percent in Haridwar enrolled in private schools. Further, female children mostly attending the government school compared to male children for their elementary education (Figure 7.7). Additionally in urban areas children are mostly attending private schools (69.83 per cent) compared to rural areas (44.54 per cent) (Figure 7.8). Table 7.5: Percentage Distribution of Children by type of Institutions Attended (Std I-VIII) Government Private Hill Almora 68.01 31.99 Bageshwar 55.50 44.5 Chamoli 71.37 28.63 Champawat 76.46 23.54 PauriGarhwal 48.54 51.46 Nainital 54.23 45.77 Pithoragarh 55.64 44.36 Rudraprayag 64.16 35.84 TehriGarhwal 55.94 44.06 Uttarkashi 51.00 49 Plain Dehradun 33.90 66.1 Haridwar 41.10 58.9 Udham Singh Nagar 36.57 63.43 Uttarakhand 47.39 52.61
Source: HDR Survey, 2017
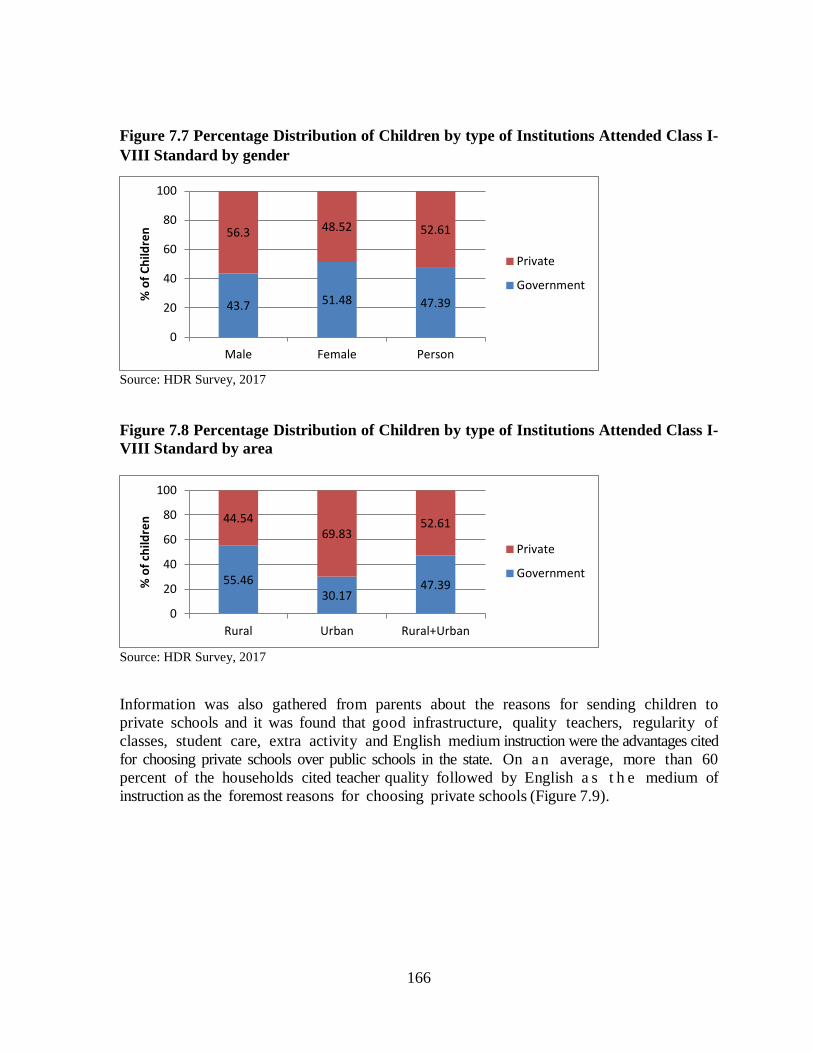
166
Figure 7.7 Percentage Distribution of Children by type of Institutions Attended Class I-VIII Standard by gender
Source: HDR Survey, 2017 Figure 7.8 Percentage Distribution of Children by type of Institutions Attended Class I-VIII Standard by area
Source: HDR Survey, 2017
Information was also gathered from parents about the reasons for sending children to private schools and it was found that good infrastructure, quality teachers, regularity of classes, student care, extra activity and English medium instruction were the advantages cited for choosing private schools over public schools in the state. On a n average, more than 60 percent of the households cited teacher quality followed by English a s t h e medium of instruction as the foremost reasons for choosing private schools (Figure 7.9).
43.7 51.48 47.39
56.3 48.52 52.61
0
20
40
60
80
100
Male Female Person
% o
f Chi
ldre
n
Private
Government
55.46 30.17
47.39
44.54 69.83
52.61
0
20
40
60
80
100
Rural Urban Rural+Urban
% o
f chi
ldre
n
Private
Government
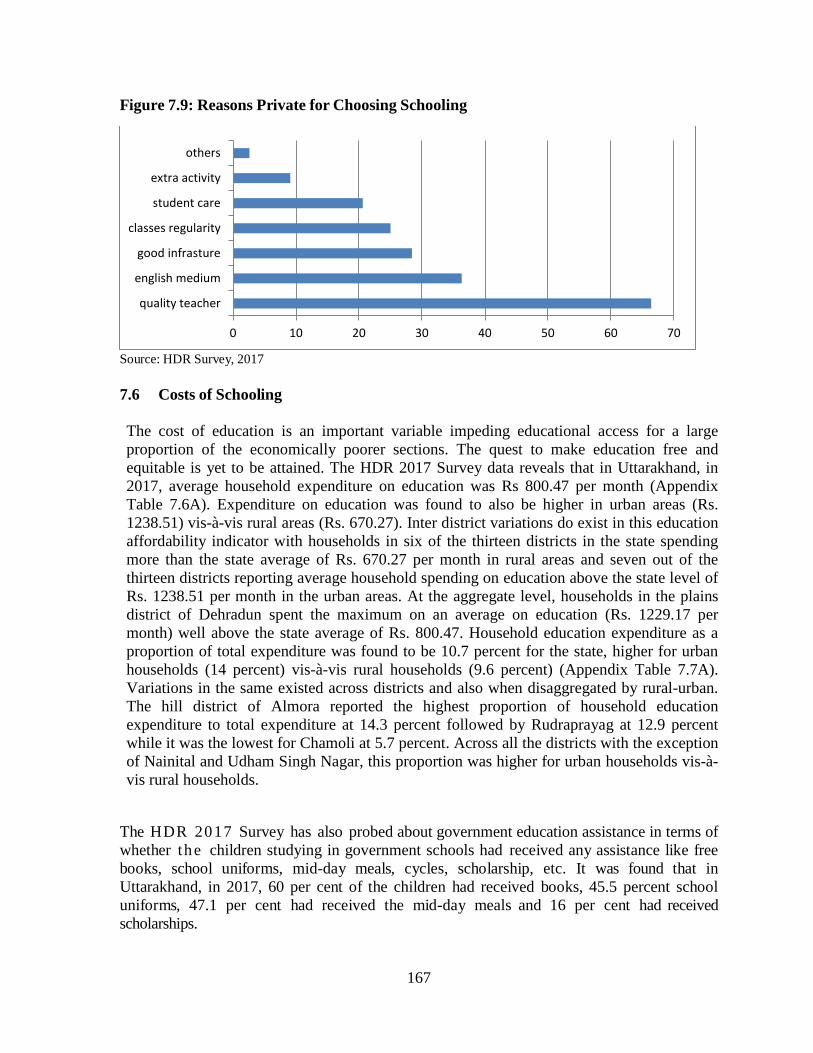
167
Figure 7.9: Reasons Private for Choosing Schooling
Source: HDR Survey, 2017 7.6 Costs of Schooling The cost of education is an important variable impeding educational access for a large proportion of the economically poorer sections. The quest to make education free and equitable is yet to be attained. The HDR 2017 Survey data reveals that in Uttarakhand, in 2017, average household expenditure on education was Rs 800.47 per month (Appendix Table 7.6A). Expenditure on education was found to also be higher in urban areas (Rs. 1238.51) vis-à-vis rural areas (Rs. 670.27). Inter district variations do exist in this education affordability indicator with households in six of the thirteen districts in the state spending more than the state average of Rs. 670.27 per month in rural areas and seven out of the thirteen districts reporting average household spending on education above the state level of Rs. 1238.51 per month in the urban areas. At the aggregate level, households in the plains district of Dehradun spent the maximum on an average on education (Rs. 1229.17 per month) well above the state average of Rs. 800.47. Household education expenditure as a proportion of total expenditure was found to be 10.7 percent for the state, higher for urban households (14 percent) vis-à-vis rural households (9.6 percent) (Appendix Table 7.7A). Variations in the same existed across districts and also when disaggregated by rural-urban. The hill district of Almora reported the highest proportion of household education expenditure to total expenditure at 14.3 percent followed by Rudraprayag at 12.9 percent while it was the lowest for Chamoli at 5.7 percent. Across all the districts with the exception of Nainital and Udham Singh Nagar, this proportion was higher for urban households vis-à-vis rural households.
The HDR 2017 Survey has also probed about government education assistance in terms of whether the children studying in government schools had received any assistance like free books, school uniforms, mid-day meals, cycles, scholarship, etc. It was found that in Uttarakhand, in 2017, 60 per cent of the children had received books, 45.5 percent school uniforms, 47.1 per cent had received the mid-day meals and 16 per cent had received scholarships.
0 10 20 30 40 50 60 70
quality teacher
english medium
good infrasture
classes regularity
student care
extra activity
others
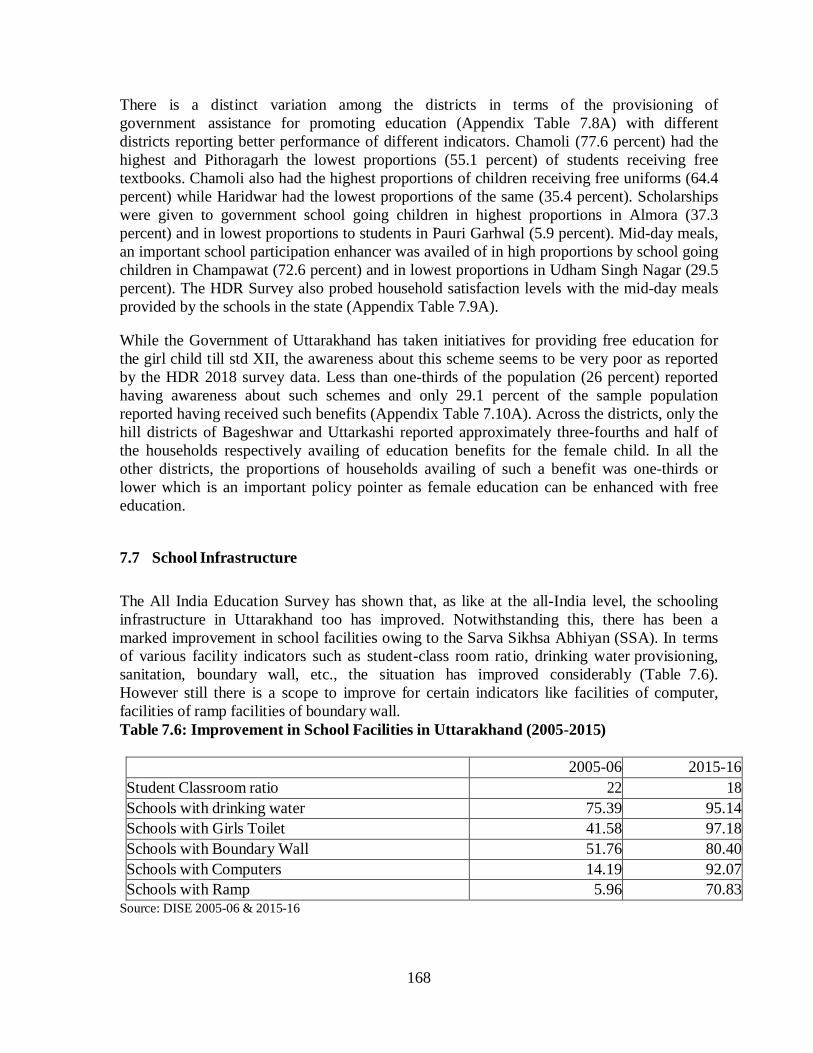
168
There is a distinct variation among the districts in terms of the provisioning of government assistance for promoting education (Appendix Table 7.8A) with different districts reporting better performance of different indicators. Chamoli (77.6 percent) had the highest and Pithoragarh the lowest proportions (55.1 percent) of students receiving free textbooks. Chamoli also had the highest proportions of children receiving free uniforms (64.4 percent) while Haridwar had the lowest proportions of the same (35.4 percent). Scholarships were given to government school going children in highest proportions in Almora (37.3 percent) and in lowest proportions to students in Pauri Garhwal (5.9 percent). Mid-day meals, an important school participation enhancer was availed of in high proportions by school going children in Champawat (72.6 percent) and in lowest proportions in Udham Singh Nagar (29.5 percent). The HDR Survey also probed household satisfaction levels with the mid-day meals provided by the schools in the state (Appendix Table 7.9A). While the Government of Uttarakhand has taken initiatives for providing free education for the girl child till std XII, the awareness about this scheme seems to be very poor as reported by the HDR 2018 survey data. Less than one-thirds of the population (26 percent) reported having awareness about such schemes and only 29.1 percent of the sample population reported having received such benefits (Appendix Table 7.10A). Across the districts, only the hill districts of Bageshwar and Uttarkashi reported approximately three-fourths and half of the households respectively availing of education benefits for the female child. In all the other districts, the proportions of households availing of such a benefit was one-thirds or lower which is an important policy pointer as female education can be enhanced with free education. 7.7 School Infrastructure The All India Education Survey has shown that, as like at the all-India level, the schooling infrastructure in Uttarakhand too has improved. Notwithstanding this, there has been a marked improvement in school facilities owing to the Sarva Sikhsa Abhiyan (SSA). In terms of various facility indicators such as student-class room ratio, drinking water provisioning, sanitation, boundary wall, etc., the situation has improved considerably (Table 7.6). However still there is a scope to improve for certain indicators like facilities of computer, facilities of ramp facilities of boundary wall. Table 7.6: Improvement in School Facilities in Uttarakhand (2005-2015) 2005-06 2015-16 Student Classroom ratio 22 18 Schools with drinking water 75.39 95.14 Schools with Girls Toilet 41.58 97.18 Schools with Boundary Wall 51.76 80.40 Schools with Computers 14.19 92.07 Schools with Ramp 5.96 70.83
Source: DISE 2005-06 & 2015-16
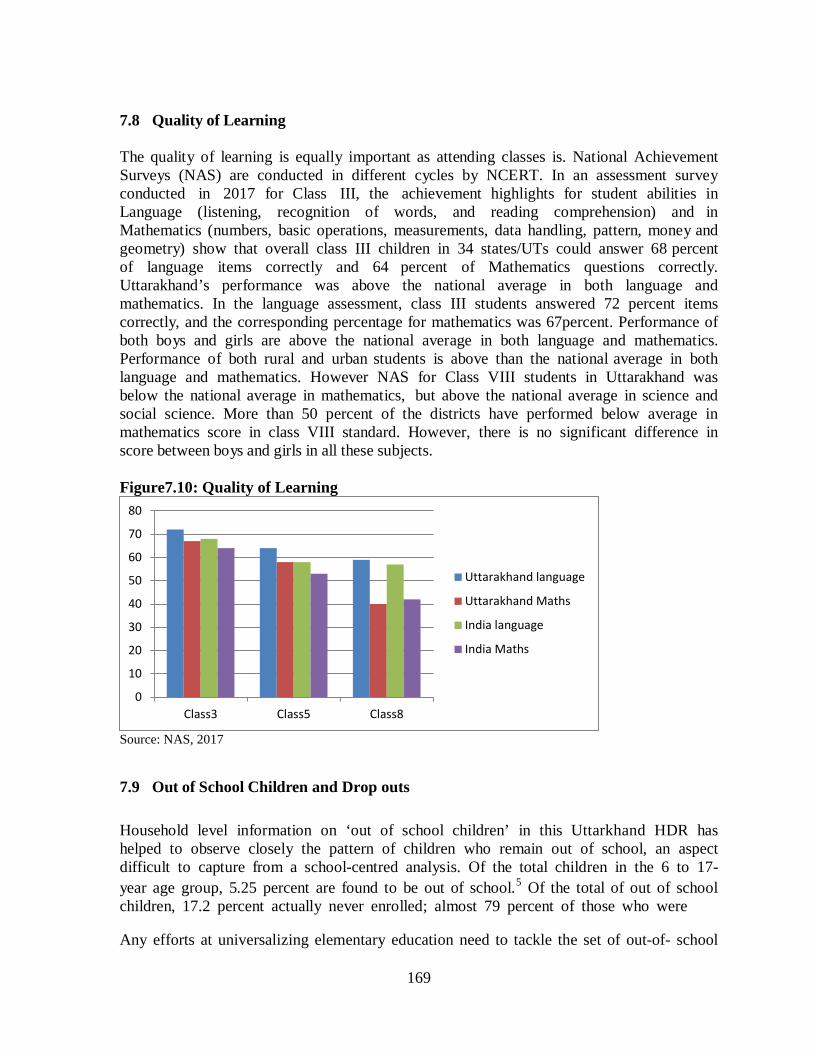
169
7.8 Quality of Learning The quality of learning is equally important as attending classes is. National Achievement Surveys (NAS) are conducted in different cycles by NCERT. In an assessment survey conducted in 2017 for Class III, the achievement highlights for student abilities in Language (listening, recognition of words, and reading comprehension) and in Mathematics (numbers, basic operations, measurements, data handling, pattern, money and geometry) show that overall class III children in 34 states/UTs could answer 68 percent of language items correctly and 64 percent of Mathematics questions correctly. Uttarakhand’s performance was above the national average in both language and mathematics. In the language assessment, class III students answered 72 percent items correctly, and the corresponding percentage for mathematics was 67percent. Performance of both boys and girls are above the national average in both language and mathematics. Performance of both rural and urban students is above than the national average in both language and mathematics. However NAS for Class VIII students in Uttarakhand was below the national average in mathematics, but above the national average in science and social science. More than 50 percent of the districts have performed below average in mathematics score in class VIII standard. However, there is no significant difference in score between boys and girls in all these subjects. Figure7.10: Quality of Learning
Source: NAS, 2017 7.9 Out of School Children and Drop outs Household level information on ‘out of school children’ in this Uttarkhand HDR has helped to observe closely the pattern of children who remain out of school, an aspect difficult to capture from a school-centred analysis. Of the total children in the 6 to 17- year age group, 5.25 percent are found to be out of school.5 Of the total of out of school children, 17.2 percent actually never enrolled; almost 79 percent of those who were Any efforts at universalizing elementary education need to tackle the set of out-of- school
0
10
20
30
40
50
60
70
80
Class3 Class5 Class8
Uttarakhand language
Uttarakhand Maths
India language
India Maths
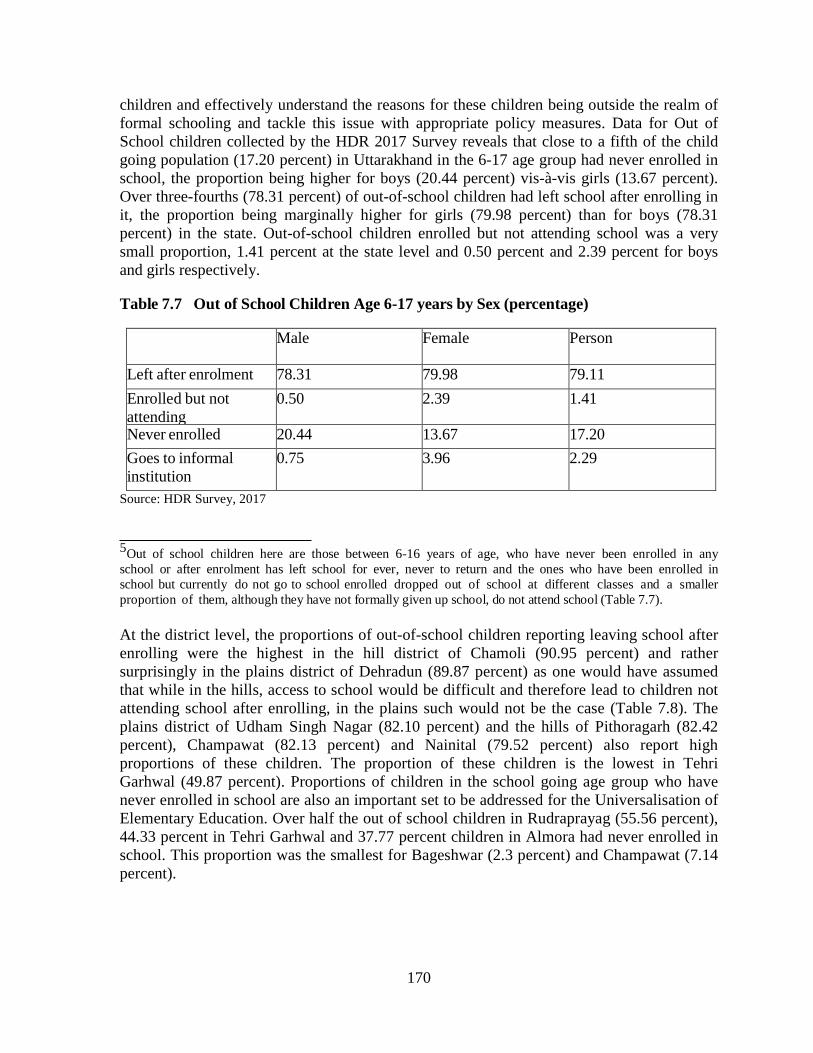
170
children and effectively understand the reasons for these children being outside the realm of formal schooling and tackle this issue with appropriate policy measures. Data for Out of School children collected by the HDR 2017 Survey reveals that close to a fifth of the child going population (17.20 percent) in Uttarakhand in the 6-17 age group had never enrolled in school, the proportion being higher for boys (20.44 percent) vis-à-vis girls (13.67 percent). Over three-fourths (78.31 percent) of out-of-school children had left school after enrolling in it, the proportion being marginally higher for girls (79.98 percent) than for boys (78.31 percent) in the state. Out-of-school children enrolled but not attending school was a very small proportion, 1.41 percent at the state level and 0.50 percent and 2.39 percent for boys and girls respectively. Table 7.7 Out of School Children Age 6-17 years by Sex (percentage) Male Female Person
Left after enrolment 78.31 79.98 79.11 Enrolled but not attending
0.50 2.39 1.41
Never enrolled 20.44 13.67 17.20 Goes to informal institution
0.75 3.96 2.29
Source: HDR Survey, 2017 5Out of school children here are those between 6-16 years of age, who have never been enrolled in any school or after enrolment has left school for ever, never to return and the ones who have been enrolled in school but currently do not go to school enrolled dropped out of school at different classes and a smaller proportion of them, although they have not formally given up school, do not attend school (Table 7.7). At the district level, the proportions of out-of-school children reporting leaving school after enrolling were the highest in the hill district of Chamoli (90.95 percent) and rather surprisingly in the plains district of Dehradun (89.87 percent) as one would have assumed that while in the hills, access to school would be difficult and therefore lead to children not attending school after enrolling, in the plains such would not be the case (Table 7.8). The plains district of Udham Singh Nagar (82.10 percent) and the hills of Pithoragarh (82.42 percent), Champawat (82.13 percent) and Nainital (79.52 percent) also report high proportions of these children. The proportion of these children is the lowest in Tehri Garhwal (49.87 percent). Proportions of children in the school going age group who have never enrolled in school are also an important set to be addressed for the Universalisation of Elementary Education. Over half the out of school children in Rudraprayag (55.56 percent), 44.33 percent in Tehri Garhwal and 37.77 percent children in Almora had never enrolled in school. This proportion was the smallest for Bageshwar (2.3 percent) and Champawat (7.14 percent).
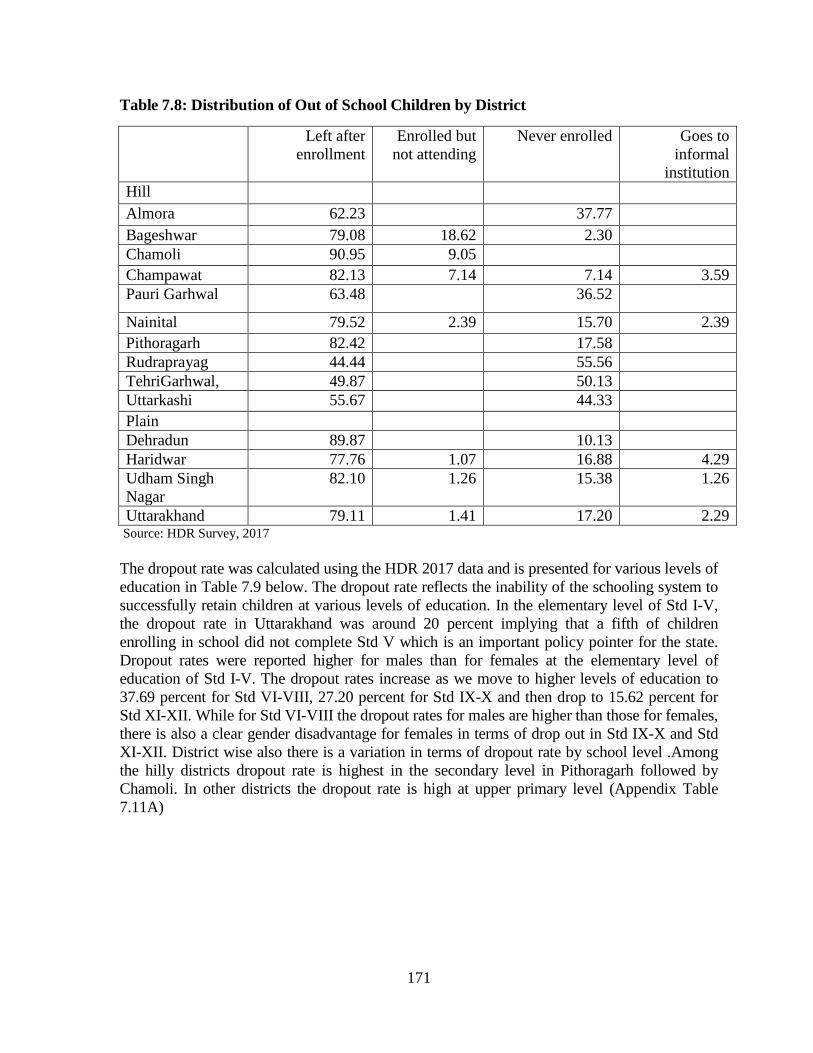
171
Table 7.8: Distribution of Out of School Children by District
Left after enrollment
Enrolled but not attending
Never enrolled Goes to informal
institution Hill Almora 62.23 37.77 Bageshwar 79.08 18.62 2.30 Chamoli 90.95 9.05 Champawat 82.13 7.14 7.14 3.59 Pauri Garhwal 63.48 36.52
Nainital 79.52 2.39 15.70 2.39 Pithoragarh 82.42 17.58 Rudraprayag 44.44 55.56 TehriGarhwal, 49.87 50.13 Uttarkashi 55.67 44.33 Plain Dehradun 89.87 10.13 Haridwar 77.76 1.07 16.88 4.29 Udham Singh Nagar
82.10 1.26 15.38 1.26
Uttarakhand 79.11 1.41 17.20 2.29 Source: HDR Survey, 2017 The dropout rate was calculated using the HDR 2017 data and is presented for various levels of education in Table 7.9 below. The dropout rate reflects the inability of the schooling system to successfully retain children at various levels of education. In the elementary level of Std I-V, the dropout rate in Uttarakhand was around 20 percent implying that a fifth of children enrolling in school did not complete Std V which is an important policy pointer for the state. Dropout rates were reported higher for males than for females at the elementary level of education of Std I-V. The dropout rates increase as we move to higher levels of education to 37.69 percent for Std VI-VIII, 27.20 percent for Std IX-X and then drop to 15.62 percent for Std XI-XII. While for Std VI-VIII the dropout rates for males are higher than those for females, there is also a clear gender disadvantage for females in terms of drop out in Std IX-X and Std XI-XII. District wise also there is a variation in terms of dropout rate by school level .Among the hilly districts dropout rate is highest in the secondary level in Pithoragarh followed by Chamoli. In other districts the dropout rate is high at upper primary level (Appendix Table 7.11A)
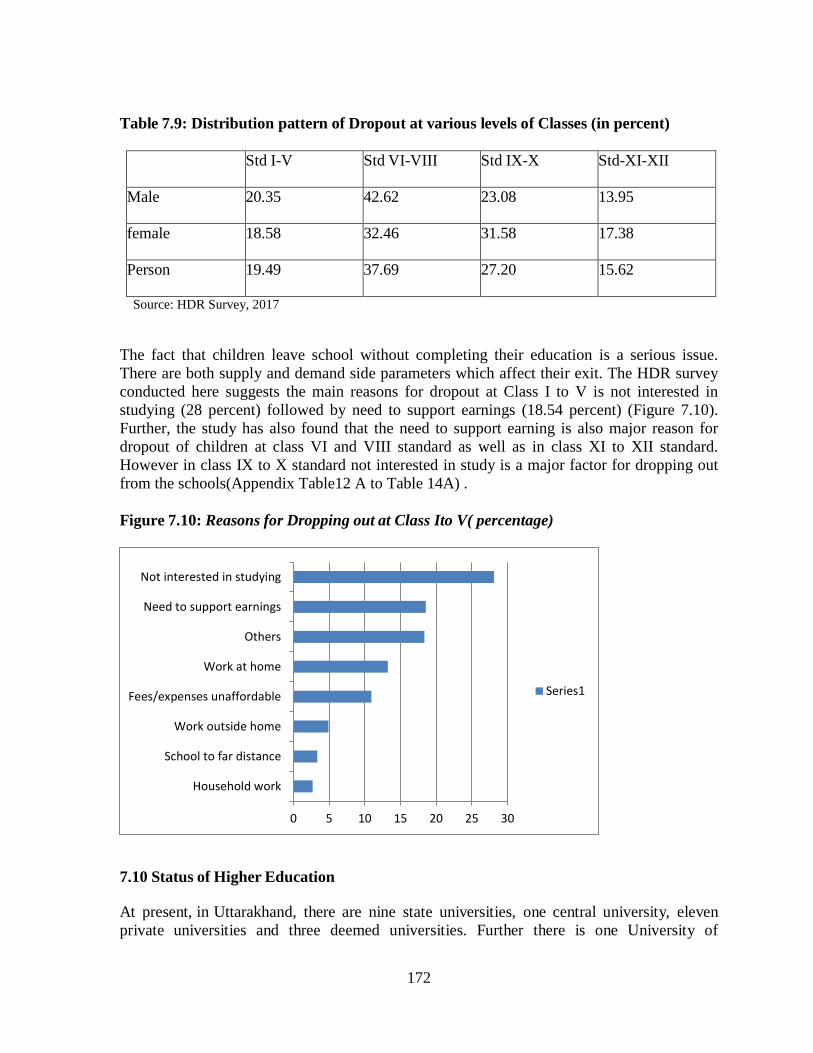
172
Table 7.9: Distribution pattern of Dropout at various levels of Classes (in percent) Std I-V Std VI-VIII Std IX-X Std-XI-XII
Male 20.35 42.62 23.08 13.95
female 18.58 32.46 31.58 17.38
Person 19.49 37.69 27.20 15.62
Source: HDR Survey, 2017 The fact that children leave school without completing their education is a serious issue. There are both supply and demand side parameters which affect their exit. The HDR survey conducted here suggests the main reasons for dropout at Class I to V is not interested in studying (28 percent) followed by need to support earnings (18.54 percent) (Figure 7.10). Further, the study has also found that the need to support earning is also major reason for dropout of children at class VI and VIII standard as well as in class XI to XII standard. However in class IX to X standard not interested in study is a major factor for dropping out from the schools(Appendix Table12 A to Table 14A) . Figure 7.10: Reasons for Dropping out at Class Ito V( percentage)
7.10 Status of Higher Education At present, in Uttarakhand, there are nine state universities, one central university, eleven private universities and three deemed universities. Further there is one University of
0 5 10 15 20 25 30
Household work
School to far distance
Work outside home
Fees/expenses unaffordable
Work at home
Others
Need to support earnings
Not interested in studying
Series1
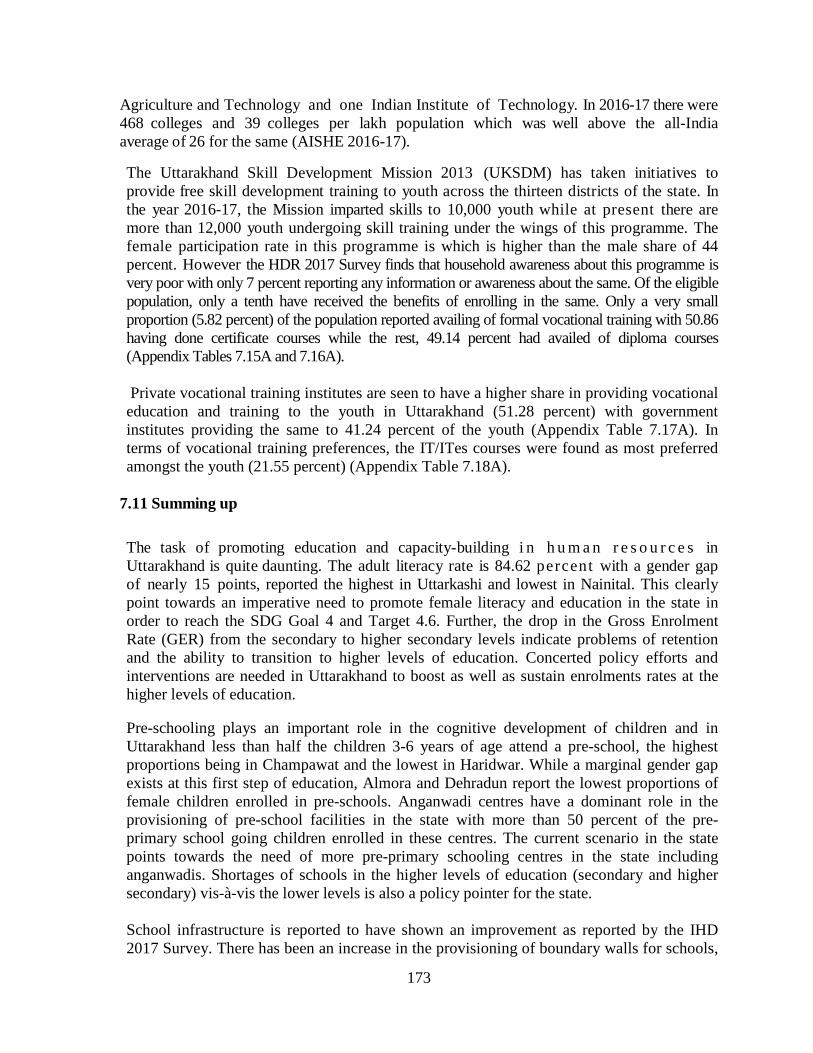
173
Agriculture and Technology and one Indian Institute of Technology. In 2016-17 there were 468 colleges and 39 colleges per lakh population which was well above the all-India average of 26 for the same (AISHE 2016-17). The Uttarakhand Skill Development Mission 2013 (UKSDM) has taken initiatives to provide free skill development training to youth across the thirteen districts of the state. In the year 2016-17, the Mission imparted skills to 10,000 youth while at present there are more than 12,000 youth undergoing skill training under the wings of this programme. The female participation rate in this programme is which is higher than the male share of 44 percent. However the HDR 2017 Survey finds that household awareness about this programme is very poor with only 7 percent reporting any information or awareness about the same. Of the eligible population, only a tenth have received the benefits of enrolling in the same. Only a very small proportion (5.82 percent) of the population reported availing of formal vocational training with 50.86 having done certificate courses while the rest, 49.14 percent had availed of diploma courses (Appendix Tables 7.15A and 7.16A). Private vocational training institutes are seen to have a higher share in providing vocational education and training to the youth in Uttarakhand (51.28 percent) with government institutes providing the same to 41.24 percent of the youth (Appendix Table 7.17A). In terms of vocational training preferences, the IT/ITes courses were found as most preferred amongst the youth (21.55 percent) (Appendix Table 7.18A).
7.11 Summing up The task of promoting education and capacity-building i n h u m a n r e s o u r c e s in Uttarakhand is quite daunting. The adult literacy rate is 84.62 percent with a gender gap of nearly 15 points, reported the highest in Uttarkashi and lowest in Nainital. This clearly point towards an imperative need to promote female literacy and education in the state in order to reach the SDG Goal 4 and Target 4.6. Further, the drop in the Gross Enrolment Rate (GER) from the secondary to higher secondary levels indicate problems of retention and the ability to transition to higher levels of education. Concerted policy efforts and interventions are needed in Uttarakhand to boost as well as sustain enrolments rates at the higher levels of education. Pre-schooling plays an important role in the cognitive development of children and in Uttarakhand less than half the children 3-6 years of age attend a pre-school, the highest proportions being in Champawat and the lowest in Haridwar. While a marginal gender gap exists at this first step of education, Almora and Dehradun report the lowest proportions of female children enrolled in pre-schools. Anganwadi centres have a dominant role in the provisioning of pre-school facilities in the state with more than 50 percent of the pre-primary school going children enrolled in these centres. The current scenario in the state points towards the need of more pre-primary schooling centres in the state including anganwadis. Shortages of schools in the higher levels of education (secondary and higher secondary) vis-à-vis the lower levels is also a policy pointer for the state. School infrastructure is reported to have shown an improvement as reported by the IHD 2017 Survey. There has been an increase in the provisioning of boundary walls for schools,
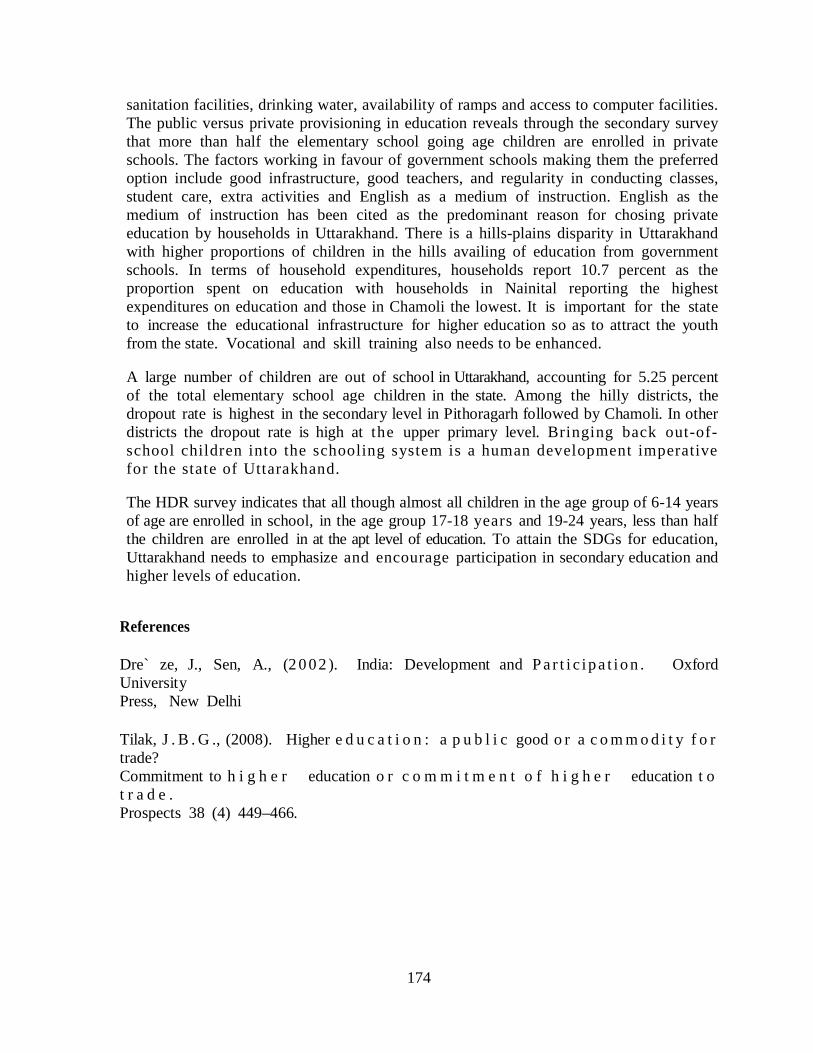
174
sanitation facilities, drinking water, availability of ramps and access to computer facilities. The public versus private provisioning in education reveals through the secondary survey that more than half the elementary school going age children are enrolled in private schools. The factors working in favour of government schools making them the preferred option include good infrastructure, good teachers, and regularity in conducting classes, student care, extra activities and English as a medium of instruction. English as the medium of instruction has been cited as the predominant reason for chosing private education by households in Uttarakhand. There is a hills-plains disparity in Uttarakhand with higher proportions of children in the hills availing of education from government schools. In terms of household expenditures, households report 10.7 percent as the proportion spent on education with households in Nainital reporting the highest expenditures on education and those in Chamoli the lowest. It is important for the state to increase the educational infrastructure for higher education so as to attract the youth from the state. Vocational and skill training also needs to be enhanced. A large number of children are out of school in Uttarakhand, accounting for 5.25 percent of the total elementary school age children in the state. Among the hilly districts, the dropout rate is highest in the secondary level in Pithoragarh followed by Chamoli. In other districts the dropout rate is high at the upper primary level. Bringing back out-of-school children into the schooling system is a human development imperative for the state of Uttarakhand. The HDR survey indicates that all though almost all children in the age group of 6-14 years of age are enrolled in school, in the age group 17-18 years and 19-24 years, less than half the children are enrolled in at the apt level of education. To attain the SDGs for education, Uttarakhand needs to emphasize and encourage participation in secondary education and higher levels of education.
References Dre` ze, J., Sen, A., (2 0 02 ). India: Development and P a r t i c ip a t io n . Oxford University Press, New Delhi Tilak, J . B . G ., (2008). Higher e d u c a t i o n : a p u b l i c good o r a c o m m o d i t y f o r trade? Commitment to h i g h e r education o r c o m m i t m e n t o f h i g h e r education t o t r a d e . Prospects 38 (4) 449–466.
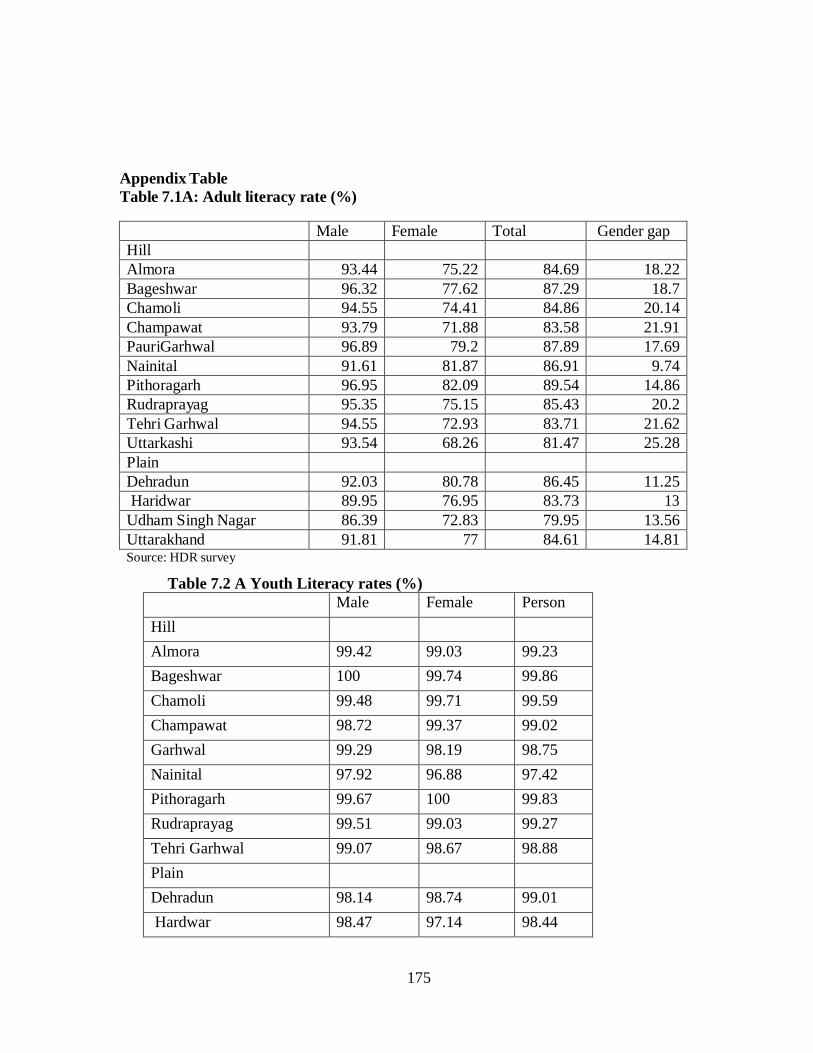
175
Appendix Table Table 7.1A: Adult literacy rate (%) Male Female Total Gender gap Hill Almora 93.44 75.22 84.69 18.22 Bageshwar 96.32 77.62 87.29 18.7 Chamoli 94.55 74.41 84.86 20.14 Champawat 93.79 71.88 83.58 21.91 PauriGarhwal 96.89 79.2 87.89 17.69 Nainital 91.61 81.87 86.91 9.74 Pithoragarh 96.95 82.09 89.54 14.86 Rudraprayag 95.35 75.15 85.43 20.2 Tehri Garhwal 94.55 72.93 83.71 21.62 Uttarkashi 93.54 68.26 81.47 25.28 Plain Dehradun 92.03 80.78 86.45 11.25 Haridwar 89.95 76.95 83.73 13
Udham Singh Nagar 86.39 72.83 79.95 13.56 Uttarakhand 91.81 77 84.61 14.81 Source: HDR survey
Table 7.2 A Youth Literacy rates (%) Male Female Person Hill Almora 99.42 99.03 99.23 Bageshwar 100 99.74 99.86 Chamoli 99.48 99.71 99.59 Champawat 98.72 99.37 99.02 Garhwal 99.29 98.19 98.75 Nainital 97.92 96.88 97.42 Pithoragarh 99.67 100 99.83 Rudraprayag 99.51 99.03 99.27 Tehri Garhwal 99.07 98.67 98.88 Plain Dehradun 98.14 98.74 99.01 Hardwar 98.47 97.14 98.44
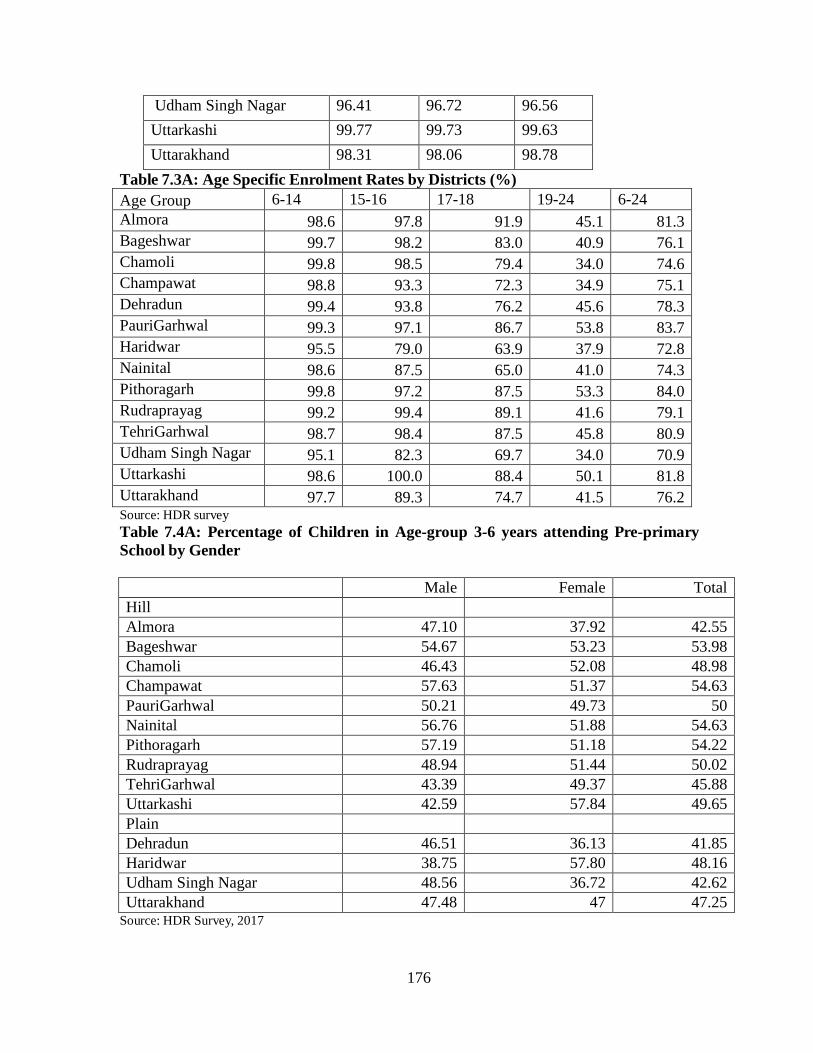
176
Udham Singh Nagar 96.41 96.72 96.56 Uttarkashi 99.77 99.73 99.63 Uttarakhand 98.31 98.06 98.78
Table 7.3A: Age Specific Enrolment Rates by Districts (%) Age Group 6-14 15-16 17-18 19-24 6-24 Almora 98.6 97.8 91.9 45.1 81.3 Bageshwar 99.7 98.2 83.0 40.9 76.1 Chamoli 99.8 98.5 79.4 34.0 74.6 Champawat 98.8 93.3 72.3 34.9 75.1 Dehradun 99.4 93.8 76.2 45.6 78.3 PauriGarhwal 99.3 97.1 86.7 53.8 83.7 Haridwar 95.5 79.0 63.9 37.9 72.8 Nainital 98.6 87.5 65.0 41.0 74.3 Pithoragarh 99.8 97.2 87.5 53.3 84.0 Rudraprayag 99.2 99.4 89.1 41.6 79.1 TehriGarhwal 98.7 98.4 87.5 45.8 80.9 Udham Singh Nagar 95.1 82.3 69.7 34.0 70.9 Uttarkashi 98.6 100.0 88.4 50.1 81.8 Uttarakhand 97.7 89.3 74.7 41.5 76.2 Source: HDR survey Table 7.4A: Percentage of Children in Age-group 3-6 years attending Pre-primary School by Gender
Male Female Total Hill Almora 47.10 37.92 42.55 Bageshwar 54.67 53.23 53.98 Chamoli 46.43 52.08 48.98 Champawat 57.63 51.37 54.63 PauriGarhwal 50.21 49.73 50 Nainital 56.76 51.88 54.63 Pithoragarh 57.19 51.18 54.22 Rudraprayag 48.94 51.44 50.02 TehriGarhwal 43.39 49.37 45.88 Uttarkashi 42.59 57.84 49.65 Plain Dehradun 46.51 36.13 41.85 Haridwar 38.75 57.80 48.16 Udham Singh Nagar 48.56 36.72 42.62 Uttarakhand 47.48 47 47.25
Source: HDR Survey, 2017
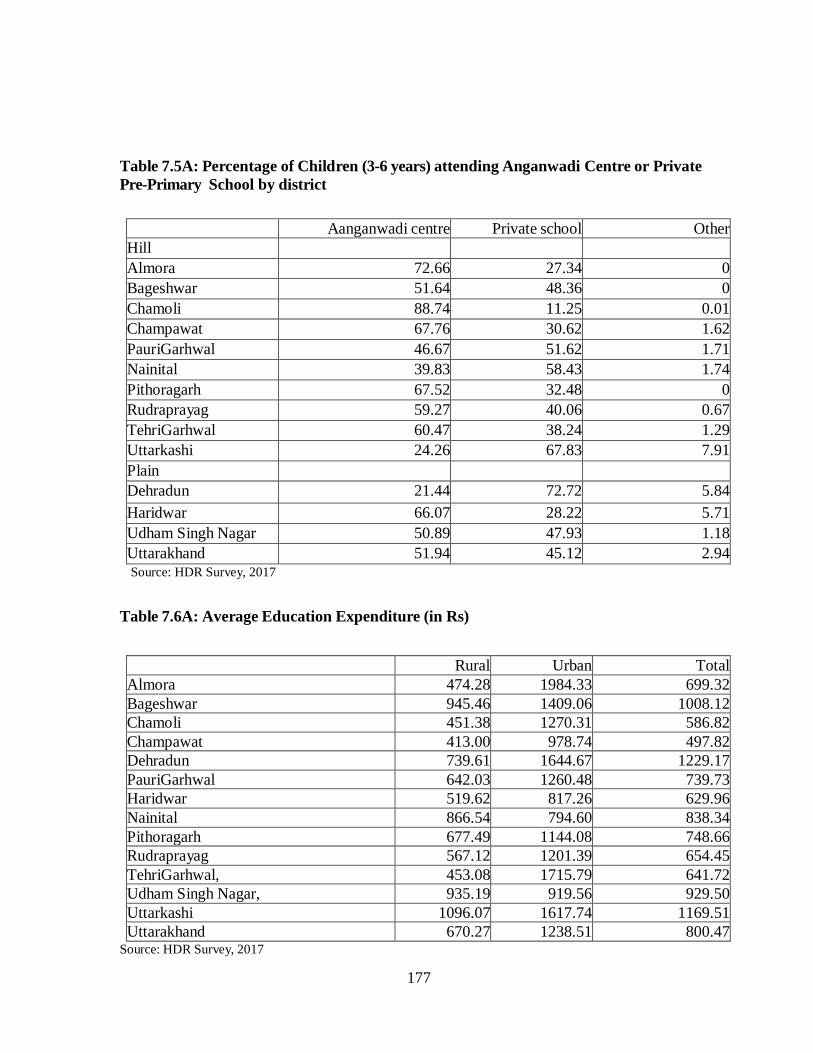
177
Table 7.5A: Percentage of Children (3-6 years) attending Anganwadi Centre or Private Pre-Primary School by district
Aanganwadi centre Private school Other Hill Almora 72.66 27.34 0 Bageshwar 51.64 48.36 0 Chamoli 88.74 11.25 0.01 Champawat 67.76 30.62 1.62 PauriGarhwal 46.67 51.62 1.71 Nainital 39.83 58.43 1.74 Pithoragarh 67.52 32.48 0 Rudraprayag 59.27 40.06 0.67 TehriGarhwal 60.47 38.24 1.29 Uttarkashi 24.26 67.83 7.91 Plain Dehradun 21.44 72.72 5.84 Haridwar 66.07 28.22 5.71 Udham Singh Nagar 50.89 47.93 1.18 Uttarakhand 51.94 45.12 2.94
Source: HDR Survey, 2017
Table 7.6A: Average Education Expenditure (in Rs)
Rural Urban Total Almora 474.28 1984.33 699.32 Bageshwar 945.46 1409.06 1008.12 Chamoli 451.38 1270.31 586.82 Champawat 413.00 978.74 497.82 Dehradun 739.61 1644.67 1229.17 PauriGarhwal 642.03 1260.48 739.73 Haridwar 519.62 817.26 629.96 Nainital 866.54 794.60 838.34 Pithoragarh 677.49 1144.08 748.66 Rudraprayag 567.12 1201.39 654.45 TehriGarhwal, 453.08 1715.79 641.72 Udham Singh Nagar, 935.19 919.56 929.50 Uttarkashi 1096.07 1617.74 1169.51 Uttarakhand 670.27 1238.51 800.47
Source: HDR Survey, 2017
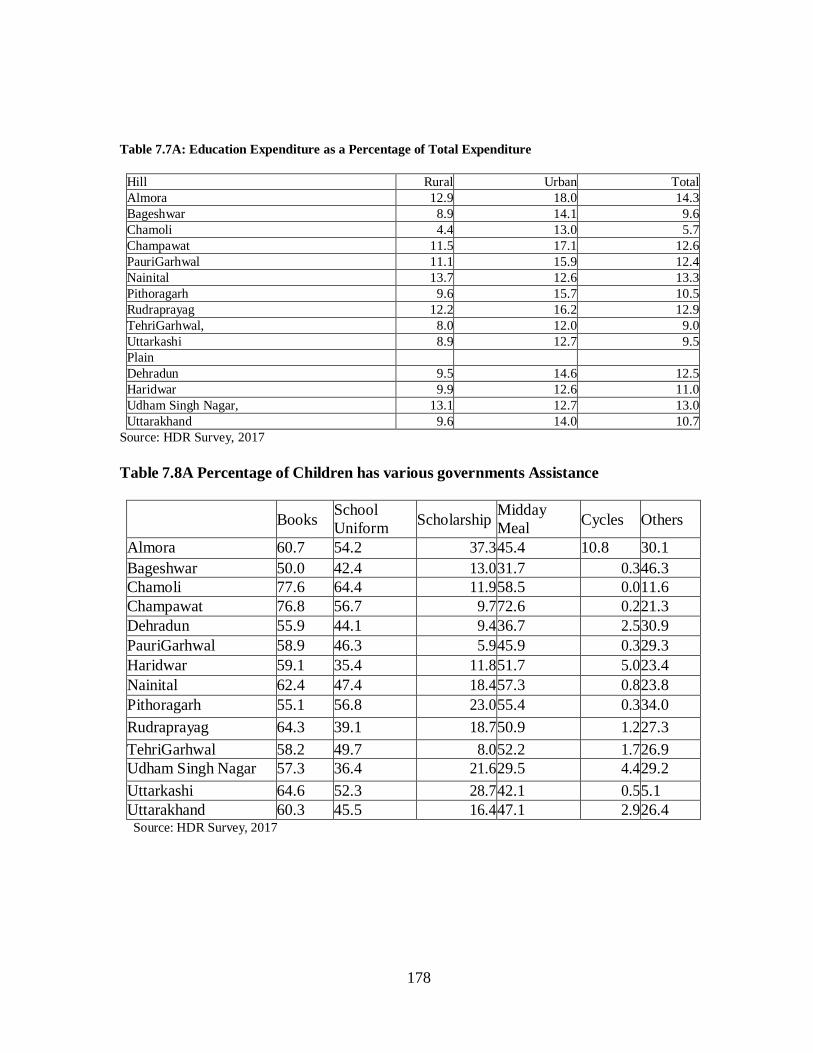
178
Table 7.7A: Education Expenditure as a Percentage of Total Expenditure
Hill Rural Urban Total Almora 12.9 18.0 14.3 Bageshwar 8.9 14.1 9.6 Chamoli 4.4 13.0 5.7 Champawat 11.5 17.1 12.6 PauriGarhwal 11.1 15.9 12.4 Nainital 13.7 12.6 13.3 Pithoragarh 9.6 15.7 10.5 Rudraprayag 12.2 16.2 12.9 TehriGarhwal, 8.0 12.0 9.0 Uttarkashi 8.9 12.7 9.5 Plain Dehradun 9.5 14.6 12.5 Haridwar 9.9 12.6 11.0 Udham Singh Nagar, 13.1 12.7 13.0 Uttarakhand 9.6 14.0 10.7
Source: HDR Survey, 2017 Table 7.8A Percentage of Children has various governments Assistance
Books School Uniform
Scholarship Midday Meal
Cycles
Others
Almora 60.7 54.2 37.3 45.4 10.8 30.1 Bageshwar 50.0 42.4 13.0 31.7 0.3 46.3 Chamoli 77.6 64.4 11.9 58.5 0.0 11.6 Champawat 76.8 56.7 9.7 72.6 0.2 21.3 Dehradun 55.9 44.1 9.4 36.7 2.5 30.9 PauriGarhwal 58.9 46.3 5.9 45.9 0.3 29.3 Haridwar 59.1 35.4 11.8 51.7 5.0 23.4 Nainital 62.4 47.4 18.4 57.3 0.8 23.8 Pithoragarh 55.1 56.8 23.0 55.4 0.3 34.0 Rudraprayag 64.3 39.1 18.7 50.9 1.2 27.3 TehriGarhwal 58.2 49.7 8.0 52.2 1.7 26.9 Udham Singh Nagar 57.3 36.4 21.6 29.5 4.4 29.2 Uttarkashi 64.6 52.3 28.7 42.1 0.5 5.1 Uttarakhand 60.3 45.5 16.4 47.1 2.9 26.4
Source: HDR Survey, 2017
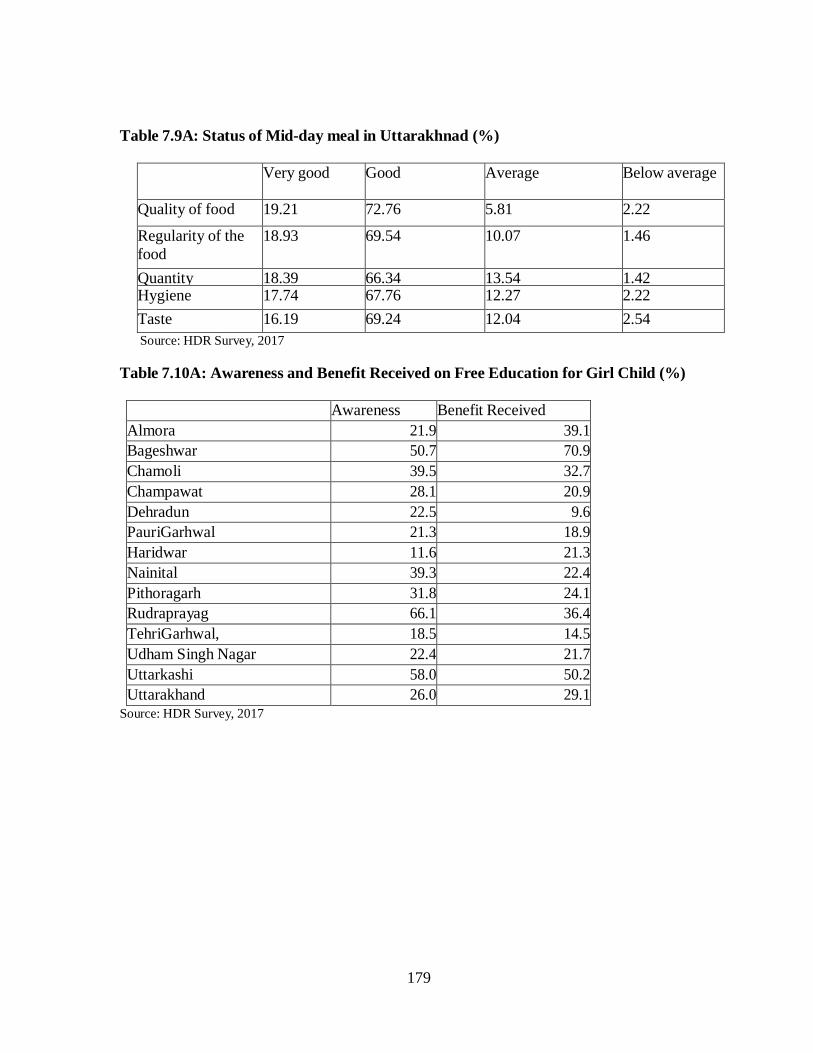
179
Table 7.9A: Status of Mid-day meal in Uttarakhnad (%)
Very good Good Average Below average
Quality of food 19.21 72.76 5.81 2.22
Regularity of the food
18.93 69.54 10.07 1.46
Quantity 18.39 66.34 13.54 1.42 Hygiene 17.74 67.76 12.27 2.22 Taste 16.19 69.24 12.04 2.54
Source: HDR Survey, 2017 Table 7.10A: Awareness and Benefit Received on Free Education for Girl Child (%) Awareness Benefit Received Almora 21.9 39.1 Bageshwar 50.7 70.9 Chamoli 39.5 32.7 Champawat 28.1 20.9 Dehradun 22.5 9.6 PauriGarhwal 21.3 18.9 Haridwar 11.6 21.3 Nainital 39.3 22.4 Pithoragarh 31.8 24.1 Rudraprayag 66.1 36.4 TehriGarhwal, 18.5 14.5 Udham Singh Nagar 22.4 21.7 Uttarkashi 58.0 50.2 Uttarakhand 26.0 29.1
Source: HDR Survey, 2017
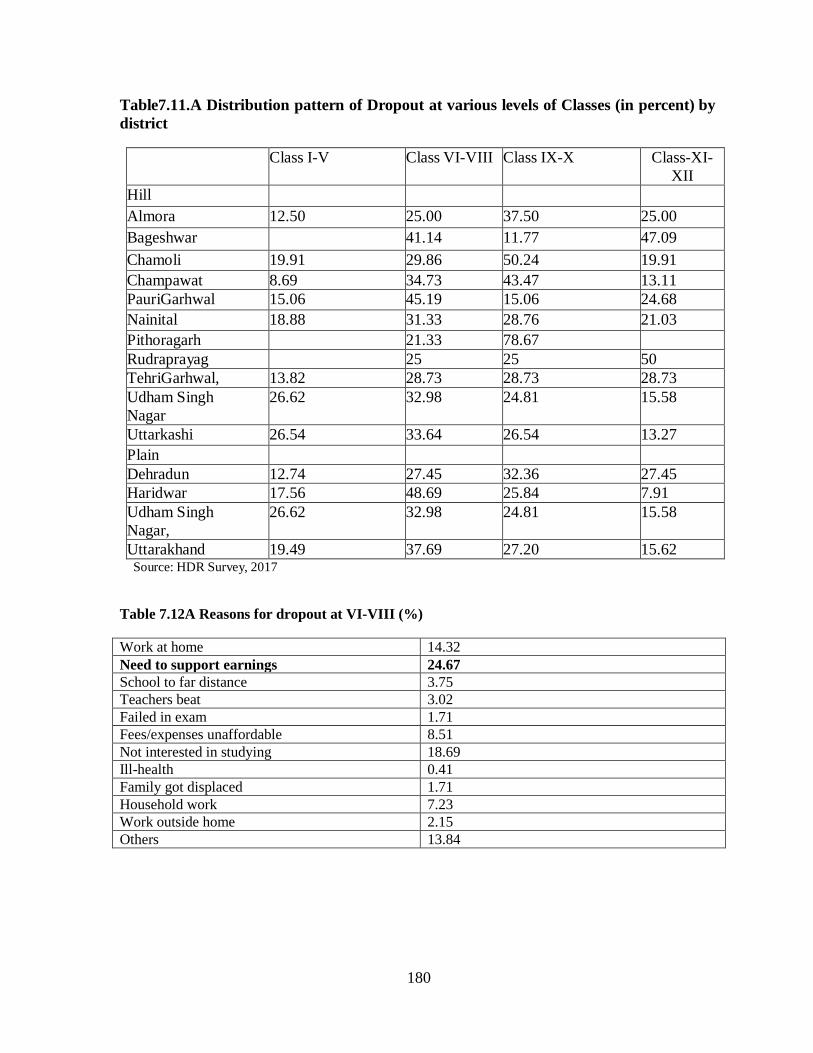
180
Table7.11.A Distribution pattern of Dropout at various levels of Classes (in percent) by district Class I-V Class VI-VIII Class IX-X Class-XI-
XII Hill Almora 12.50 25.00 37.50 25.00 Bageshwar 41.14 11.77 47.09 Chamoli 19.91 29.86 50.24 19.91 Champawat 8.69 34.73 43.47 13.11 PauriGarhwal 15.06 45.19 15.06 24.68 Nainital 18.88 31.33 28.76 21.03 Pithoragarh 21.33 78.67 Rudraprayag 25 25 50 TehriGarhwal, 13.82 28.73 28.73 28.73 Udham Singh Nagar
26.62 32.98 24.81 15.58
Uttarkashi 26.54 33.64 26.54 13.27 Plain Dehradun 12.74 27.45 32.36 27.45 Haridwar 17.56 48.69 25.84 7.91 Udham Singh Nagar,
26.62 32.98 24.81 15.58
Uttarakhand 19.49 37.69 27.20 15.62 Source: HDR Survey, 2017 Table 7.12A Reasons for dropout at VI-VIII (%)
Work at home 14.32 Need to support earnings 24.67 School to far distance 3.75 Teachers beat 3.02 Failed in exam 1.71 Fees/expenses unaffordable 8.51 Not interested in studying 18.69 Ill-health 0.41 Family got displaced 1.71 Household work 7.23 Work outside home 2.15 Others 13.84
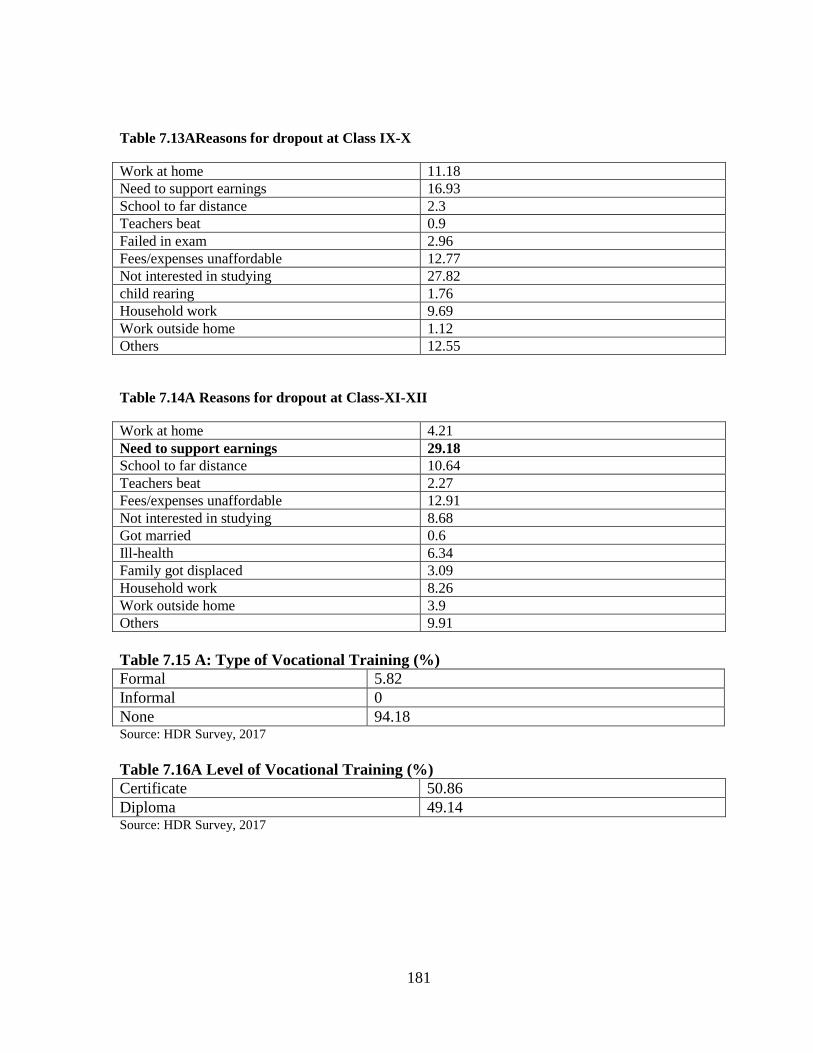
181
Table 7.13AReasons for dropout at Class IX-X
Work at home 11.18 Need to support earnings 16.93 School to far distance 2.3 Teachers beat 0.9 Failed in exam 2.96 Fees/expenses unaffordable 12.77 Not interested in studying 27.82 child rearing 1.76 Household work 9.69 Work outside home 1.12 Others 12.55
Table 7.14A Reasons for dropout at Class-XI-XII
Work at home 4.21 Need to support earnings 29.18 School to far distance 10.64 Teachers beat 2.27 Fees/expenses unaffordable 12.91 Not interested in studying 8.68 Got married 0.6 Ill-health 6.34 Family got displaced 3.09 Household work 8.26 Work outside home 3.9 Others 9.91 Table 7.15 A: Type of Vocational Training (%) Formal 5.82 Informal 0 None 94.18 Source: HDR Survey, 2017 Table 7.16A Level of Vocational Training (%) Certificate 50.86 Diploma 49.14 Source: HDR Survey, 2017
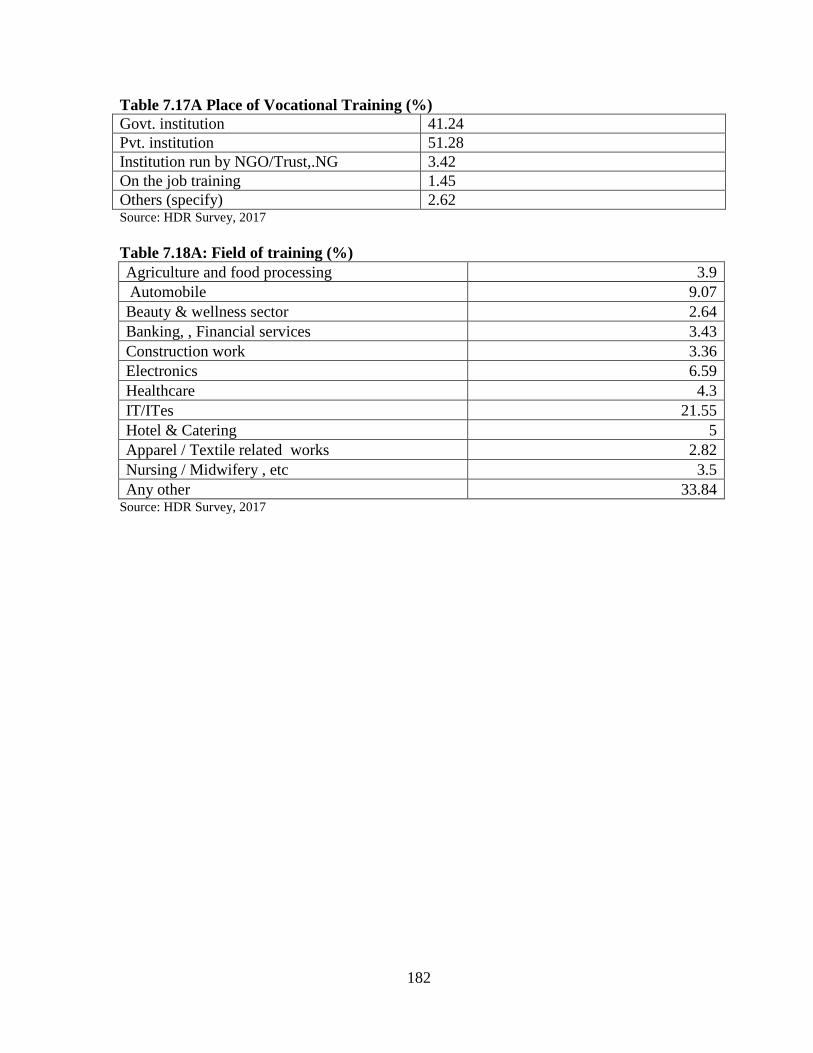
182
Table 7.17A Place of Vocational Training (%) Govt. institution 41.24 Pvt. institution 51.28 Institution run by NGO/Trust,.NG 3.42 On the job training 1.45 Others (specify) 2.62 Source: HDR Survey, 2017 Table 7.18A: Field of training (%) Agriculture and food processing 3.9 Automobile 9.07 Beauty & wellness sector 2.64 Banking, , Financial services 3.43 Construction work 3.36 Electronics 6.59 Healthcare 4.3 IT/ITes 21.55 Hotel & Catering 5 Apparel / Textile related works 2.82 Nursing / Midwifery , etc 3.5 Any other 33.84
Source: HDR Survey, 2017
183
CHAPTER 8: STRENGTHENING SOCIAL PROTECTION - HEALTH
8.1 Introduction Health is one of three basic and important tenets of human development concept one of the three indicators used while calculating the human development index (HDI). The access to and availability of health care facilities is an important enabling factor and determinant of advances in human capabilities as well as human development. Under the Sustainable Development Goals (SDGs), the importance of health is captured in Goal-3 which calls for ensuring good health and well- being of the populace. Safeguarding the health and well-being of individuals of all ages is the cornerstone of sustainable development because morbidity as well as mortality have far reaching impacts on not just economic growth but on human capabilities and development too. In the Indian context and more specifically, in the case of Uttarakhand, with its regional demarcations of hills and plains, the status of the health of its populace and the bottlenecks/impediments in their successful attainment become important when studying and analyzing human development for the state. The topographical setup in Uttarakhand is such that far-flung villages and habitats, more so in the hills, lead to difficulties in the provisioning of as well as access to basic health infrastructure facilities and services for the populace which hinder the overall well-being of the people. The rural-urban as well as hills versus plains disparities get reflected in the important human development indicators that capture the various aspects of good health. This Human Development Report for Uttarakhand state presents a snapshot view of the prevailing health scenario in the state as well as the thirteen districts based on the household survey of the HDR 2017 and trains its focus on indicators capturing maternal health, child health, burden of disease, health expenditures by disease type, per capita health expenditures and the utilization of health facilities for short and long term illnesses. The data highlighting the disparities between the hills and the plains, rural-urban as well as between the social groups for various health related indicators are presented and analyzed. 8.2 Health Personnel
Health personnel play an important role in reaching medical aid to the populace. The availability of general physicians, doctors, surgeons and various health specialists, especially in the rural and far flung hill areas is an important determinant of the health and longevity of the people living there. Data from the HDR 2017 Survey (Tables 8.1 and 8.2) clearly highlights the acute shortage of various health related personnel in the state run Primary Health Centres (PHCs). Primary Health Centres are the first and most important point of contact between the surrounding community (more so in the rural and hilly areas) and the health personnel and provide an integrated system of curative and preventive health care. Data from the Survey suggests that for the hills and the plains, there are around two PHCs per lakh population which is dismally lesser than the norm (as per the Indian Public Health

184
System which advocates for one PHC per 20,000 population in a Hilly or Tribal region) and is an issue that needs urgent attention and addressing through policy interventions. The number of doctors and paramedics per lakh population is approximately 13 and 39 respectively. Moreover, there are minimally small number of other health centres (3 percent) for a lakh population which further worsens access to health facilities. While the number of maternity and child care centres are also low at around 19 per lakh population, the number of hospital beds is also low at 1032 per lakh population. The percentage of sanctioned posts in the health sector that are lying is also worrying. More than half the posts (55.78 percent) for allopathic doctors at PHCs, 82.5 percent of posts for pediatricians at Community Health Centres (CHCs), 93.67 percent posts of physicians at CHCs, 91 percent posts of OBGs and 92.77 percent of sanctioned posts for surgeons are vacant in the state reflecting a very dismal scenario in the public health sector which caters to a large proportion of specially the poor and underprivileged population in Uttarakhand. The Uttarakhand Vision 2030 document also lays emphasis on the need to strengthen the health system in order to be ab le to success fu l ly meet the shifting health priorities associated with demographic and epidemiological transitions and changing public expectations in the state. Table 8.1: Availability of health personnel by population (in lakhs)- 2018 Health Personnel 2016
No. of doctors per lakh population (hills and plains) 13.91 No. of paramedicals per lakh population (hills and plains) 38.57 No. of hospitals beds per lakh population (hills and plains) 1032 No. of PHC per lakh population (hills and plains) 2.58 No. of maternity and child care centre per lakh population (hills and plains) 18.97 No. of other health centres per lakh population (hills and plains) 3.44 Number of persons covered under health insurance(R) 24,28,275 Number of persons covered under health insurance(U) 33,53,350
Number of persons covered under health insurance (T) 57,81,625
Source: Uttarakhand Government, Uttarakhand 2030 Vision report, 2018 Table 8.2: Current Availability of Health Personnel in Uttarakhand-2018
Cadre Sanctioned In Position Vacant Vacant as a Share of Sanctioned Posts (%)
Allopathic Doctors at PHC 147 65 82 55.78 Surgeon at CHC 83 6 77 92.77 OBG at CHC 79 7 72 91.00 Physician at CHC 79 5 74 93.67 Paediatrician at CHC 80 14 66 82.50 Total Specialists at CHC 321 32 289 91.00 Source: Uttarakhand Government, Uttarakhand 2030 Vision report, 2018
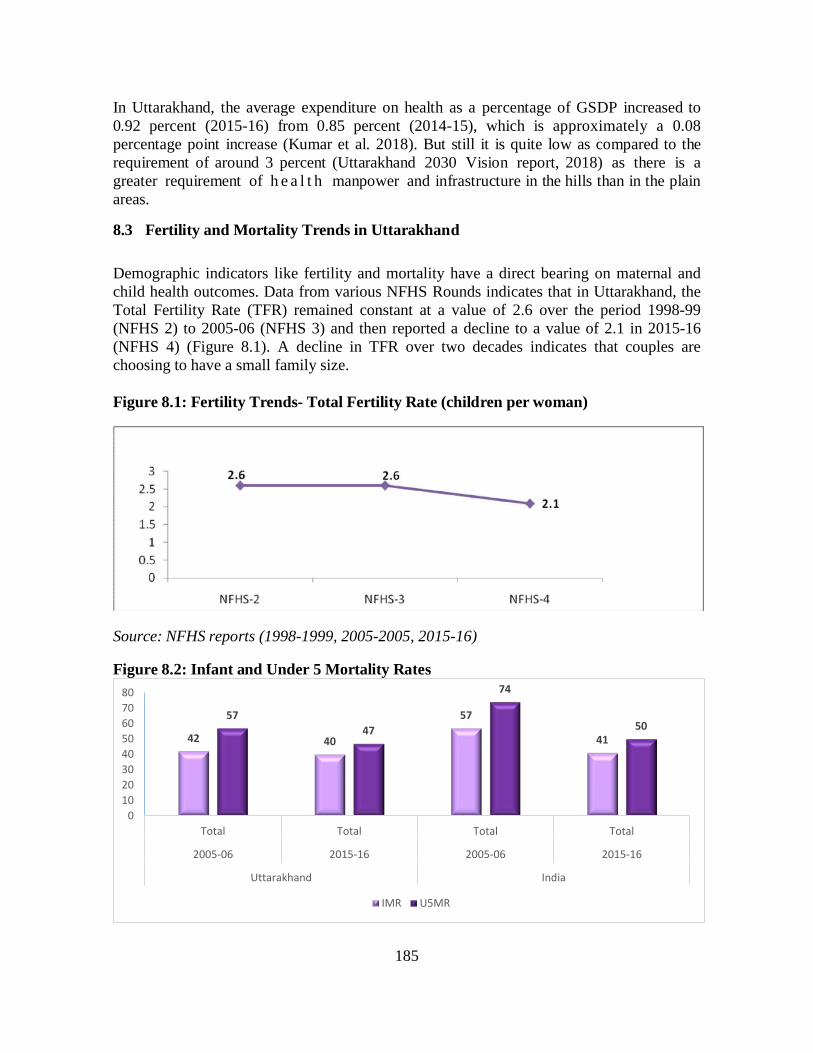
185
In Uttarakhand, the average expenditure on health as a percentage of GSDP increased to 0.92 percent (2015-16) from 0.85 percent (2014-15), which is approximately a 0.08 percentage point increase (Kumar et al. 2018). But still it is quite low as compared to the requirement of around 3 percent (Uttarakhand 2030 Vision report, 2018) as there is a greater requirement of h e a l t h manpower and infrastructure in the hills than in the plain areas. 8.3 Fertility and Mortality Trends in Uttarakhand Demographic indicators like fertility and mortality have a direct bearing on maternal and child health outcomes. Data from various NFHS Rounds indicates that in Uttarakhand, the Total Fertility Rate (TFR) remained constant at a value of 2.6 over the period 1998-99 (NFHS 2) to 2005-06 (NFHS 3) and then reported a decline to a value of 2.1 in 2015-16 (NFHS 4) (Figure 8.1). A decline in TFR over two decades indicates that couples are choosing to have a small family size. Figure 8.1: Fertility Trends- Total Fertility Rate (children per woman)
Source: NFHS reports (1998-1999, 2005-2005, 2015-16) Figure 8.2: Infant and Under 5 Mortality Rates
42 40
57
41
57 47
74
50
01020304050607080
Total Total Total Total
2005-06 2015-16 2005-06 2015-16
Uttarakhand India
IMR U5MR
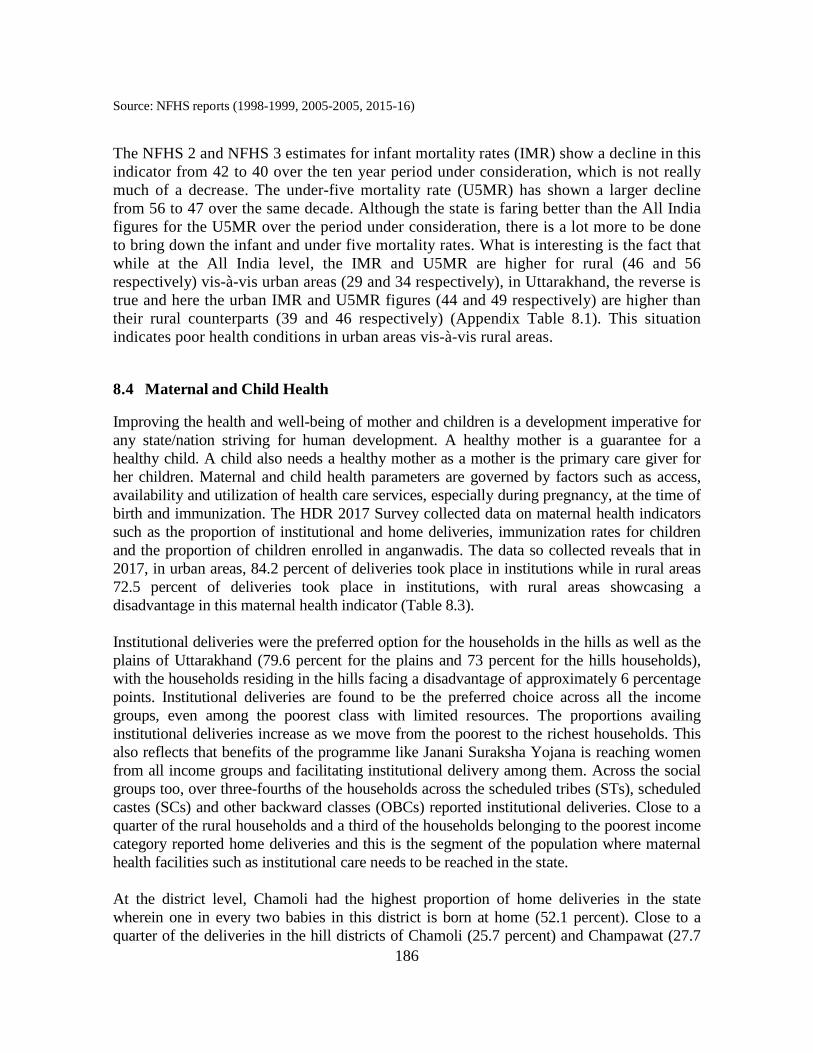
186
Source: NFHS reports (1998-1999, 2005-2005, 2015-16) The NFHS 2 and NFHS 3 estimates for infant mortality rates (IMR) show a decline in this indicator from 42 to 40 over the ten year period under consideration, which is not really much of a decrease. The under-five mortality rate (U5MR) has shown a larger decline from 56 to 47 over the same decade. Although the state is faring better than the All India figures for the U5MR over the period under consideration, there is a lot more to be done to bring down the infant and under five mortality rates. What is interesting is the fact that while at the All India level, the IMR and U5MR are higher for rural (46 and 56 respectively) vis-à-vis urban areas (29 and 34 respectively), in Uttarakhand, the reverse is true and here the urban IMR and U5MR figures (44 and 49 respectively) are higher than their rural counterparts (39 and 46 respectively) (Appendix Table 8.1). This situation indicates poor health conditions in urban areas vis-à-vis rural areas. 8.4 Maternal and Child Health Improving the health and well-being of mother and children is a development imperative for any state/nation striving for human development. A healthy mother is a guarantee for a healthy child. A child also needs a healthy mother as a mother is the primary care giver for her children. Maternal and child health parameters are governed by factors such as access, availability and utilization of health care services, especially during pregnancy, at the time of birth and immunization. The HDR 2017 Survey collected data on maternal health indicators such as the proportion of institutional and home deliveries, immunization rates for children and the proportion of children enrolled in anganwadis. The data so collected reveals that in 2017, in urban areas, 84.2 percent of deliveries took place in institutions while in rural areas 72.5 percent of deliveries took place in institutions, with rural areas showcasing a disadvantage in this maternal health indicator (Table 8.3). Institutional deliveries were the preferred option for the households in the hills as well as the plains of Uttarakhand (79.6 percent for the plains and 73 percent for the hills households), with the households residing in the hills facing a disadvantage of approximately 6 percentage points. Institutional deliveries are found to be the preferred choice across all the income groups, even among the poorest class with limited resources. The proportions availing institutional deliveries increase as we move from the poorest to the richest households. This also reflects that benefits of the programme like Janani Suraksha Yojana is reaching women from all income groups and facilitating institutional delivery among them. Across the social groups too, over three-fourths of the households across the scheduled tribes (STs), scheduled castes (SCs) and other backward classes (OBCs) reported institutional deliveries. Close to a quarter of the rural households and a third of the households belonging to the poorest income category reported home deliveries and this is the segment of the population where maternal health facilities such as institutional care needs to be reached in the state. At the district level, Chamoli had the highest proportion of home deliveries in the state wherein one in every two babies in this district is born at home (52.1 percent). Close to a quarter of the deliveries in the hill districts of Chamoli (25.7 percent) and Champawat (27.7
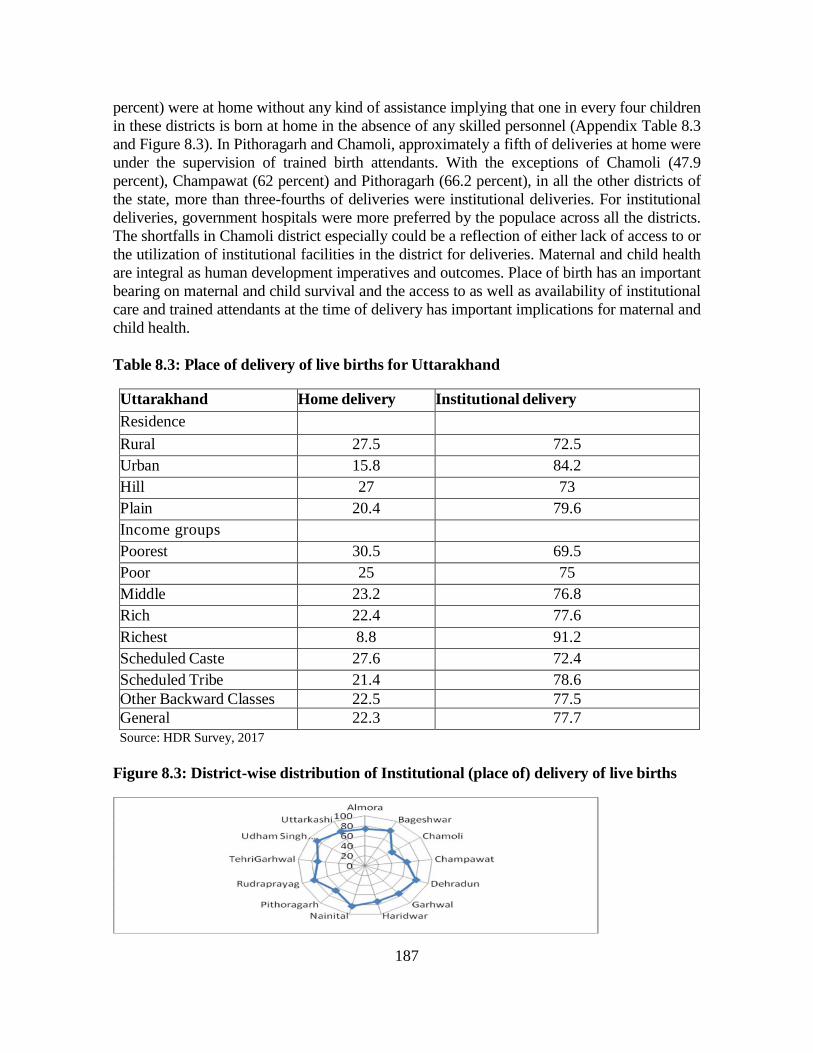
187
percent) were at home without any kind of assistance implying that one in every four children in these districts is born at home in the absence of any skilled personnel (Appendix Table 8.3 and Figure 8.3). In Pithoragarh and Chamoli, approximately a fifth of deliveries at home were under the supervision of trained birth attendants. With the exceptions of Chamoli (47.9 percent), Champawat (62 percent) and Pithoragarh (66.2 percent), in all the other districts of the state, more than three-fourths of deliveries were institutional deliveries. For institutional deliveries, government hospitals were more preferred by the populace across all the districts. The shortfalls in Chamoli district especially could be a reflection of either lack of access to or the utilization of institutional facilities in the district for deliveries. Maternal and child health are integral as human development imperatives and outcomes. Place of birth has an important bearing on maternal and child survival and the access to as well as availability of institutional care and trained attendants at the time of delivery has important implications for maternal and child health. Table 8.3: Place of delivery of live births for Uttarakhand Uttarakhand Home delivery Institutional delivery Residence Rural 27.5 72.5 Urban 15.8 84.2 Hill 27 73 Plain 20.4 79.6 Income groups Poorest 30.5 69.5 Poor 25 75 Middle 23.2 76.8 Rich 22.4 77.6 Richest 8.8 91.2 Scheduled Caste 27.6 72.4 Scheduled Tribe 21.4 78.6 Other Backward Classes 22.5 77.5 General 22.3 77.7
Source: HDR Survey, 2017 Figure 8.3: District-wise distribution of Institutional (place of) delivery of live births
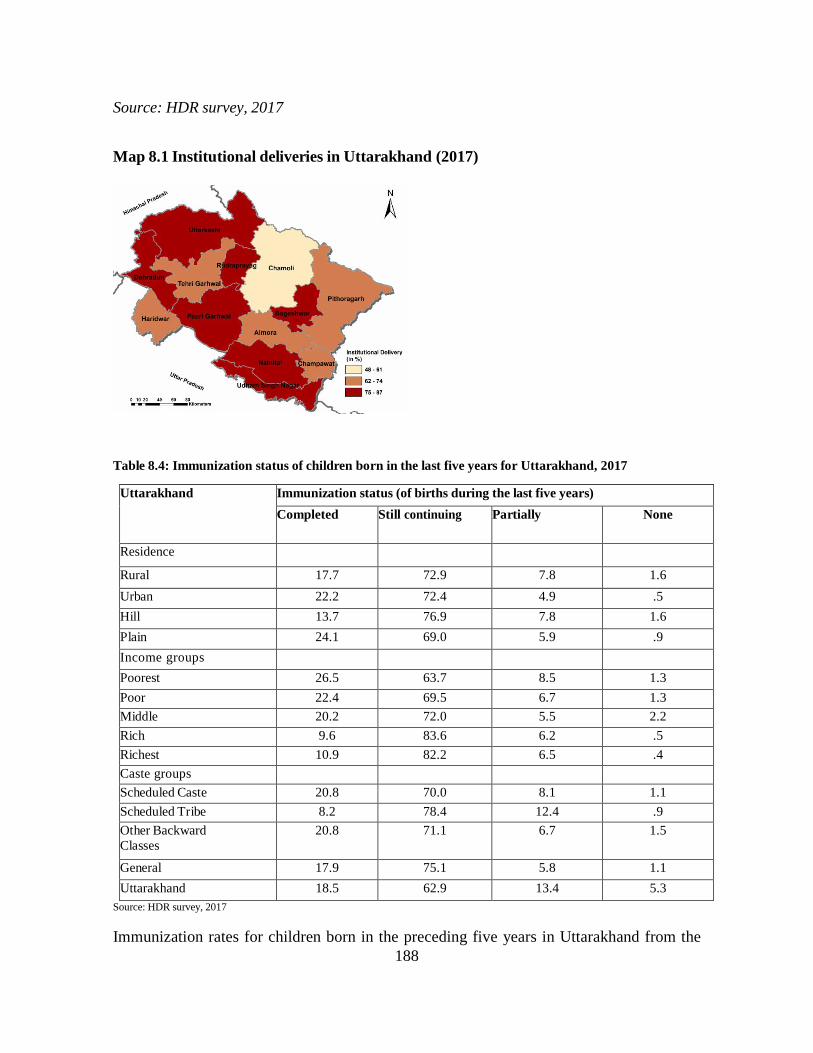
188
Source: HDR survey, 2017 Map 8.1 Institutional deliveries in Uttarakhand (2017)
Table 8.4: Immunization status of children born in the last five years for Uttarakhand, 2017
Uttarakhand Immunization status (of births during the last five years) Completed Still continuing Partially None
Residence
Rural 17.7 72.9 7.8 1.6 Urban 22.2 72.4 4.9 .5 Hill 13.7 76.9 7.8 1.6 Plain 24.1 69.0 5.9 .9 Income groups Poorest 26.5 63.7 8.5 1.3 Poor 22.4 69.5 6.7 1.3 Middle 20.2 72.0 5.5 2.2 Rich 9.6 83.6 6.2 .5 Richest 10.9 82.2 6.5 .4 Caste groups Scheduled Caste 20.8 70.0 8.1 1.1 Scheduled Tribe 8.2 78.4 12.4 .9 Other Backward Classes
20.8 71.1 6.7 1.5
General 17.9 75.1 5.8 1.1 Uttarakhand 18.5 62.9 13.4 5.3
Source: HDR survey, 2017 Immunization rates for children born in the preceding five years in Uttarakhand from the
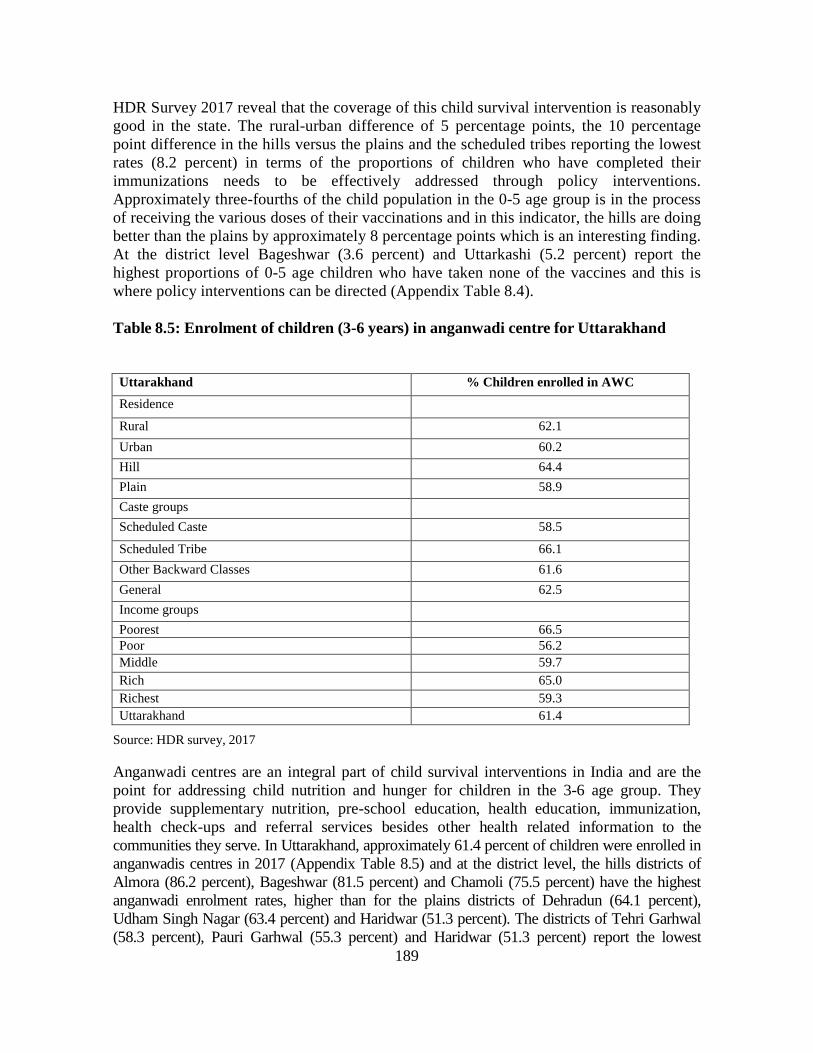
189
HDR Survey 2017 reveal that the coverage of this child survival intervention is reasonably good in the state. The rural-urban difference of 5 percentage points, the 10 percentage point difference in the hills versus the plains and the scheduled tribes reporting the lowest rates (8.2 percent) in terms of the proportions of children who have completed their immunizations needs to be effectively addressed through policy interventions. Approximately three-fourths of the child population in the 0-5 age group is in the process of receiving the various doses of their vaccinations and in this indicator, the hills are doing better than the plains by approximately 8 percentage points which is an interesting finding. At the district level Bageshwar (3.6 percent) and Uttarkashi (5.2 percent) report the highest proportions of 0-5 age children who have taken none of the vaccines and this is where policy interventions can be directed (Appendix Table 8.4). Table 8.5: Enrolment of children (3-6 years) in anganwadi centre for Uttarakhand Uttarakhand % Children enrolled in AWC Residence Rural 62.1 Urban 60.2 Hill 64.4 Plain 58.9 Caste groups Scheduled Caste 58.5
Scheduled Tribe 66.1 Other Backward Classes 61.6 General 62.5 Income groups Poorest 66.5 Poor 56.2 Middle 59.7 Rich 65.0 Richest 59.3 Uttarakhand 61.4
Source: HDR survey, 2017 Anganwadi centres are an integral part of child survival interventions in India and are the point for addressing child nutrition and hunger for children in the 3-6 age group. They provide supplementary nutrition, pre-school education, health education, immunization, health check-ups and referral services besides other health related information to the communities they serve. In Uttarakhand, approximately 61.4 percent of children were enrolled in anganwadis centres in 2017 (Appendix Table 8.5) and at the district level, the hills districts of Almora (86.2 percent), Bageshwar (81.5 percent) and Chamoli (75.5 percent) have the highest anganwadi enrolment rates, higher than for the plains districts of Dehradun (64.1 percent), Udham Singh Nagar (63.4 percent) and Haridwar (51.3 percent). The districts of Tehri Garhwal (58.3 percent), Pauri Garhwal (55.3 percent) and Haridwar (51.3 percent) report the lowest
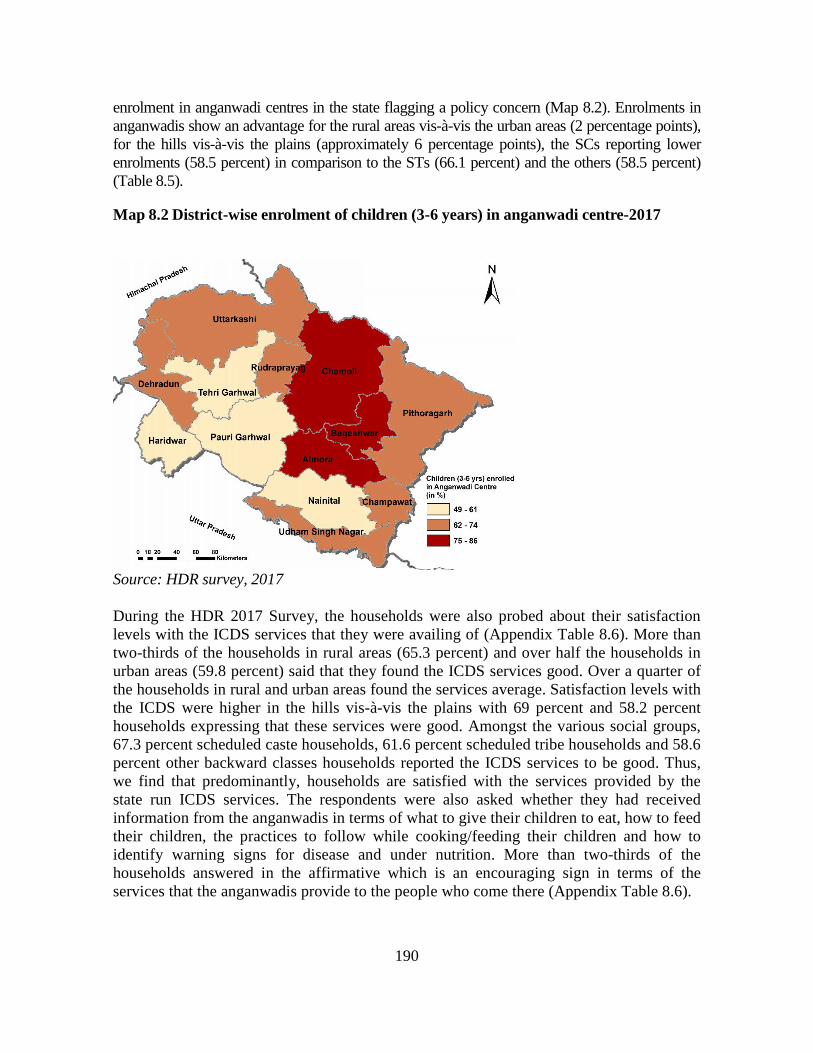
190
enrolment in anganwadi centres in the state flagging a policy concern (Map 8.2). Enrolments in anganwadis show an advantage for the rural areas vis-à-vis the urban areas (2 percentage points), for the hills vis-à-vis the plains (approximately 6 percentage points), the SCs reporting lower enrolments (58.5 percent) in comparison to the STs (66.1 percent) and the others (58.5 percent) (Table 8.5). Map 8.2 District-wise enrolment of children (3-6 years) in anganwadi centre-2017
Source: HDR survey, 2017 During the HDR 2017 Survey, the households were also probed about their satisfaction levels with the ICDS services that they were availing of (Appendix Table 8.6). More than two-thirds of the households in rural areas (65.3 percent) and over half the households in urban areas (59.8 percent) said that they found the ICDS services good. Over a quarter of the households in rural and urban areas found the services average. Satisfaction levels with the ICDS were higher in the hills vis-à-vis the plains with 69 percent and 58.2 percent households expressing that these services were good. Amongst the various social groups, 67.3 percent scheduled caste households, 61.6 percent scheduled tribe households and 58.6 percent other backward classes households reported the ICDS services to be good. Thus, we find that predominantly, households are satisfied with the services provided by the state run ICDS services. The respondents were also asked whether they had received information from the anganwadis in terms of what to give their children to eat, how to feed their children, the practices to follow while cooking/feeding their children and how to identify warning signs for disease and under nutrition. More than two-thirds of the households answered in the affirmative which is an encouraging sign in terms of the services that the anganwadis provide to the people who come there (Appendix Table 8.6).

191
District-wise distribution of services received by children under the ICDS programme suggests that the services are rated better in hilly districts as compared to the plains districts, probably because the plains are largely urban areas with more health services options available (Appendix Table 8.7). Information dissemination by the anganwadis is also found to be better in the in hill districts in terms of feeding practice and, identification of disease signals vis-a-vis the plains districts.
8.5 Disease Burden and Utilization of Health Facilities
Information on morbidity patterns including short term and long term illnesses was collected by the HDR 2017 Survey at the individual level to cover the last 365 days period (Figure 8.4). While short term illnesses were identified as those that had a span of less than a month, long term illnesses were classified as those spanning more than a month. The data on morbidity shows the high prevalence of diseases like fever (35 percent), cold and cough (11.1 percent) and joint and bone diseases (6.2 percent). Gender distribution of illnesses doesn’t show any varying pattern between the sexes with both males and females reporting high incidence of fever and coughs and colds. Males report relatively higher incidence of diabetes, cardio-vascular problems and accidents and injuries vis-à-vis women. Figure 8.4: Distribution of Illnesses by Type of Illness
Source: HDR survey, 2017
The HDR 2017 Survey data also find that households in Uttarakhand rely more on private health care givers for short term and long term illnesses (77.6 and 76.6 percent respectively) as compared to government health care facilities (22.1 percent or short term
Fever
Cough &
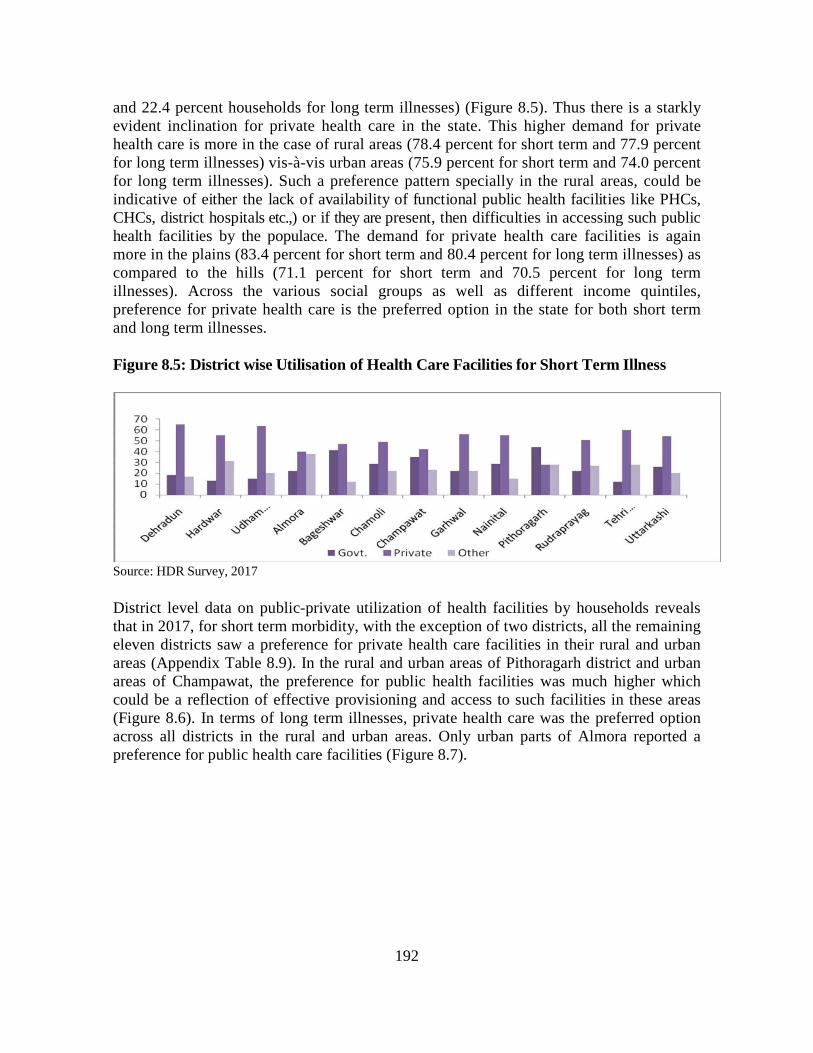
192
and 22.4 percent households for long term illnesses) (Figure 8.5). Thus there is a starkly evident inclination for private health care in the state. This higher demand for private health care is more in the case of rural areas (78.4 percent for short term and 77.9 percent for long term illnesses) vis-à-vis urban areas (75.9 percent for short term and 74.0 percent for long term illnesses). Such a preference pattern specially in the rural areas, could be indicative of either the lack of availability of functional public health facilities like PHCs, CHCs, district hospitals etc.,) or if they are present, then difficulties in accessing such public health facilities by the populace. The demand for private health care facilities is again more in the plains (83.4 percent for short term and 80.4 percent for long term illnesses) as compared to the hills (71.1 percent for short term and 70.5 percent for long term illnesses). Across the various social groups as well as different income quintiles, preference for private health care is the preferred option in the state for both short term and long term illnesses. Figure 8.5: District wise Utilisation of Health Care Facilities for Short Term Illness
Source: HDR Survey, 2017 District level data on public-private utilization of health facilities by households reveals that in 2017, for short term morbidity, with the exception of two districts, all the remaining eleven districts saw a preference for private health care facilities in their rural and urban areas (Appendix Table 8.9). In the rural and urban areas of Pithoragarh district and urban areas of Champawat, the preference for public health facilities was much higher which could be a reflection of effective provisioning and access to such facilities in these areas (Figure 8.6). In terms of long term illnesses, private health care was the preferred option across all districts in the rural and urban areas. Only urban parts of Almora reported a preference for public health care facilities (Figure 8.7).
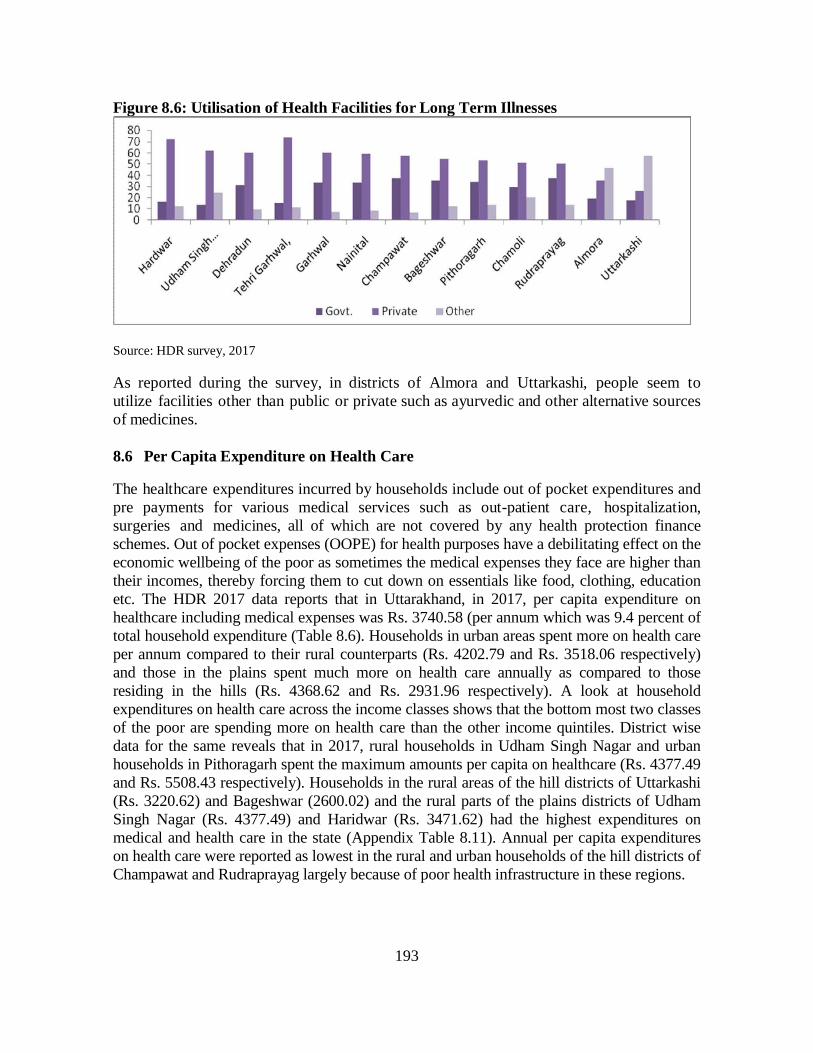
193
Figure 8.6: Utilisation of Health Facilities for Long Term Illnesses
Source: HDR survey, 2017 As reported during the survey, in districts of Almora and Uttarkashi, people seem to utilize facilities other than public or private such as ayurvedic and other alternative sources of medicines. 8.6 Per Capita Expenditure on Health Care The healthcare expenditures incurred by households include out of pocket expenditures and pre payments for various medical services such as out-patient care, hospitalization, surgeries and medicines, all of which are not covered by any health protection finance schemes. Out of pocket expenses (OOPE) for health purposes have a debilitating effect on the economic wellbeing of the poor as sometimes the medical expenses they face are higher than their incomes, thereby forcing them to cut down on essentials like food, clothing, education etc. The HDR 2017 data reports that in Uttarakhand, in 2017, per capita expenditure on healthcare including medical expenses was Rs. 3740.58 (per annum which was 9.4 percent of total household expenditure (Table 8.6). Households in urban areas spent more on health care per annum compared to their rural counterparts (Rs. 4202.79 and Rs. 3518.06 respectively) and those in the plains spent much more on health care annually as compared to those residing in the hills (Rs. 4368.62 and Rs. 2931.96 respectively). A look at household expenditures on health care across the income classes shows that the bottom most two classes of the poor are spending more on health care than the other income quintiles. District wise data for the same reveals that in 2017, rural households in Udham Singh Nagar and urban households in Pithoragarh spent the maximum amounts per capita on healthcare (Rs. 4377.49 and Rs. 5508.43 respectively). Households in the rural areas of the hill districts of Uttarkashi (Rs. 3220.62) and Bageshwar (2600.02) and the rural parts of the plains districts of Udham Singh Nagar (Rs. 4377.49) and Haridwar (Rs. 3471.62) had the highest expenditures on medical and health care in the state (Appendix Table 8.11). Annual per capita expenditures on health care were reported as lowest in the rural and urban households of the hill districts of Champawat and Rudraprayag largely because of poor health infrastructure in these regions.
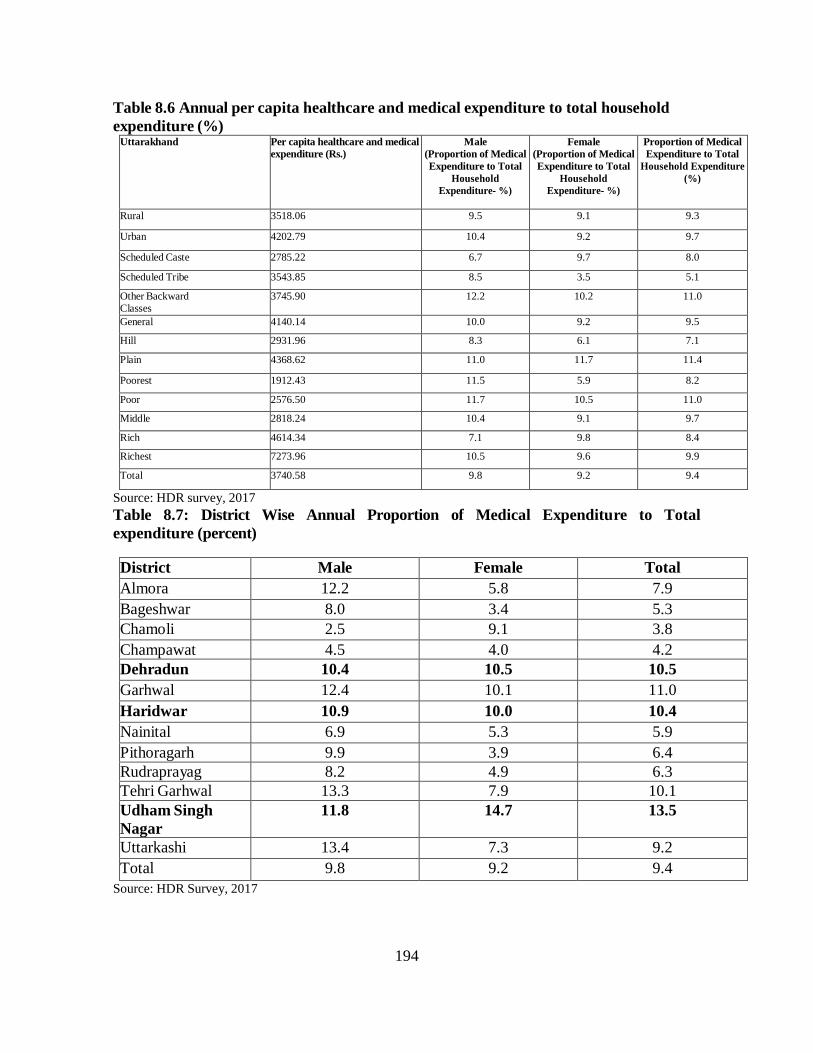
194
Table 8.6 Annual per capita healthcare and medical expenditure to total household expenditure (%)
Uttarakhand Per capita healthcare and medical expenditure (Rs.)
Male (Proportion of Medical Expenditure to Total
Household Expenditure- %)
Female (Proportion of Medical Expenditure to Total
Household Expenditure- %)
Proportion of Medical Expenditure to Total
Household Expenditure (%)
Rural 3518.06 9.5 9.1 9.3
Urban 4202.79 10.4 9.2 9.7
Scheduled Caste 2785.22 6.7 9.7 8.0
Scheduled Tribe 3543.85 8.5 3.5 5.1
Other Backward Classes
3745.90 12.2 10.2 11.0
General 4140.14 10.0 9.2 9.5
Hill 2931.96 8.3 6.1 7.1
Plain 4368.62 11.0 11.7 11.4
Poorest 1912.43 11.5 5.9 8.2
Poor 2576.50 11.7 10.5 11.0
Middle 2818.24 10.4 9.1 9.7
Rich 4614.34 7.1 9.8 8.4
Richest 7273.96 10.5 9.6 9.9
Total 3740.58 9.8 9.2 9.4
Source: HDR survey, 2017 Table 8.7: District Wise Annual Proportion of Medical Expenditure to Total expenditure (percent) District Male Female Total Almora 12.2 5.8 7.9 Bageshwar 8.0 3.4 5.3 Chamoli 2.5 9.1 3.8 Champawat 4.5 4.0 4.2 Dehradun 10.4 10.5 10.5 Garhwal 12.4 10.1 11.0 Haridwar 10.9 10.0 10.4 Nainital 6.9 5.3 5.9 Pithoragarh 9.9 3.9 6.4 Rudraprayag 8.2 4.9 6.3 Tehri Garhwal 13.3 7.9 10.1 Udham Singh Nagar
11.8 14.7 13.5
Uttarkashi 13.4 7.3 9.2 Total 9.8 9.2 9.4
Source: HDR Survey, 2017
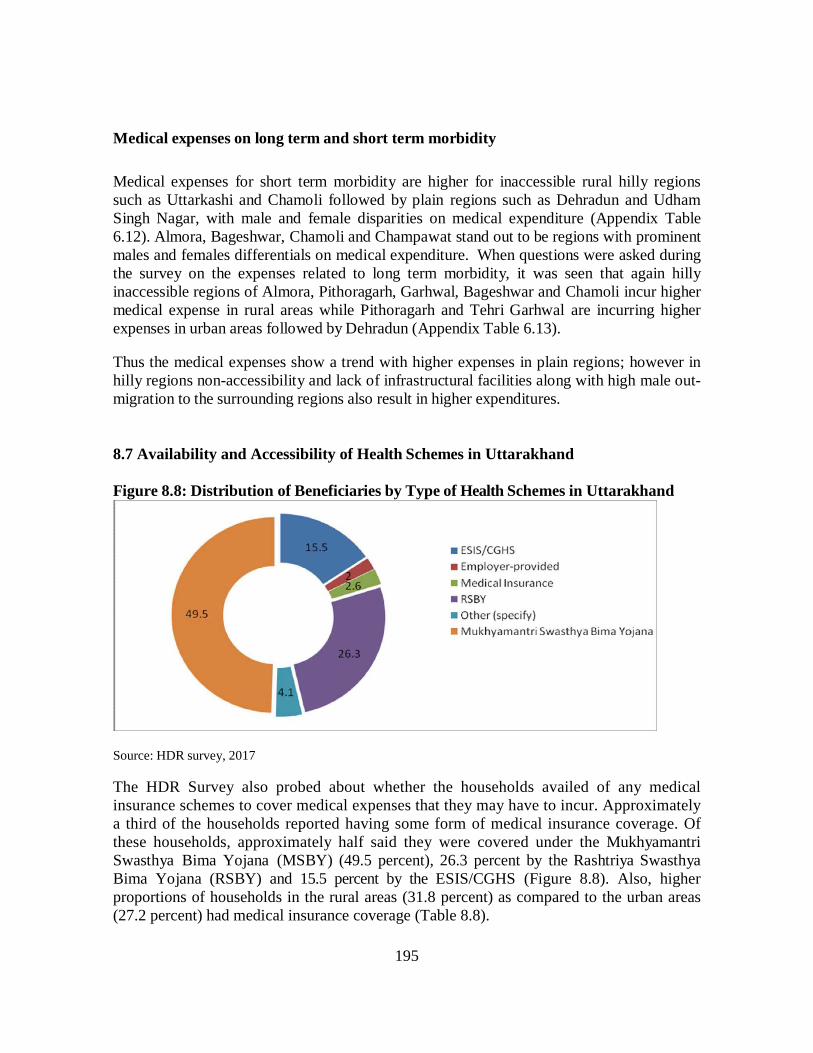
195
Medical expenses on long term and short term morbidity Medical expenses for short term morbidity are higher for inaccessible rural hilly regions such as Uttarkashi and Chamoli followed by plain regions such as Dehradun and Udham Singh Nagar, with male and female disparities on medical expenditure (Appendix Table 6.12). Almora, Bageshwar, Chamoli and Champawat stand out to be regions with prominent males and females differentials on medical expenditure. When questions were asked during the survey on the expenses related to long term morbidity, it was seen that again hilly inaccessible regions of Almora, Pithoragarh, Garhwal, Bageshwar and Chamoli incur higher medical expense in rural areas while Pithoragarh and Tehri Garhwal are incurring higher expenses in urban areas followed by Dehradun (Appendix Table 6.13). Thus the medical expenses show a trend with higher expenses in plain regions; however in hilly regions non-accessibility and lack of infrastructural facilities along with high male out-migration to the surrounding regions also result in higher expenditures. 8.7 Availability and Accessibility of Health Schemes in Uttarakhand Figure 8.8: Distribution of Beneficiaries by Type of Health Schemes in Uttarakhand
Source: HDR survey, 2017 The HDR Survey also probed about whether the households availed of any medical insurance schemes to cover medical expenses that they may have to incur. Approximately a third of the households reported having some form of medical insurance coverage. Of these households, approximately half said they were covered under the Mukhyamantri Swasthya Bima Yojana (MSBY) (49.5 percent), 26.3 percent by the Rashtriya Swasthya Bima Yojana (RSBY) and 15.5 percent by the ESIS/CGHS (Figure 8.8). Also, higher proportions of households in the rural areas (31.8 percent) as compared to the urban areas (27.2 percent) had medical insurance coverage (Table 8.8).
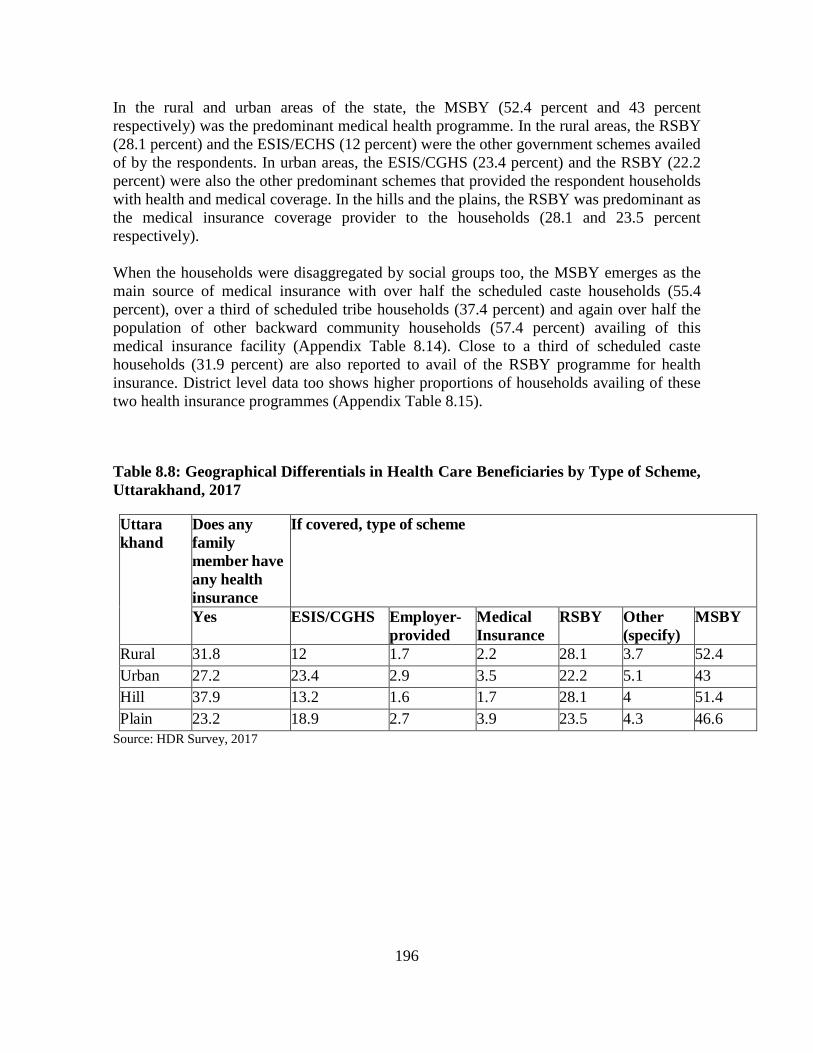
196
In the rural and urban areas of the state, the MSBY (52.4 percent and 43 percent respectively) was the predominant medical health programme. In the rural areas, the RSBY (28.1 percent) and the ESIS/ECHS (12 percent) were the other government schemes availed of by the respondents. In urban areas, the ESIS/CGHS (23.4 percent) and the RSBY (22.2 percent) were also the other predominant schemes that provided the respondent households with health and medical coverage. In the hills and the plains, the RSBY was predominant as the medical insurance coverage provider to the households (28.1 and 23.5 percent respectively). When the households were disaggregated by social groups too, the MSBY emerges as the main source of medical insurance with over half the scheduled caste households (55.4 percent), over a third of scheduled tribe households (37.4 percent) and again over half the population of other backward community households (57.4 percent) availing of this medical insurance facility (Appendix Table 8.14). Close to a third of scheduled caste households (31.9 percent) are also reported to avail of the RSBY programme for health insurance. District level data too shows higher proportions of households availing of these two health insurance programmes (Appendix Table 8.15). Table 8.8: Geographical Differentials in Health Care Beneficiaries by Type of Scheme, Uttarakhand, 2017 Uttara khand
Does any family member have any health insurance
If covered, type of scheme
Yes ESIS/CGHS Employer- provided
Medical Insurance
RSBY Other (specify)
MSBY
Rural 31.8 12 1.7 2.2 28.1 3.7 52.4 Urban 27.2 23.4 2.9 3.5 22.2 5.1 43 Hill 37.9 13.2 1.6 1.7 28.1 4 51.4 Plain 23.2 18.9 2.7 3.9 23.5 4.3 46.6
Source: HDR Survey, 2017
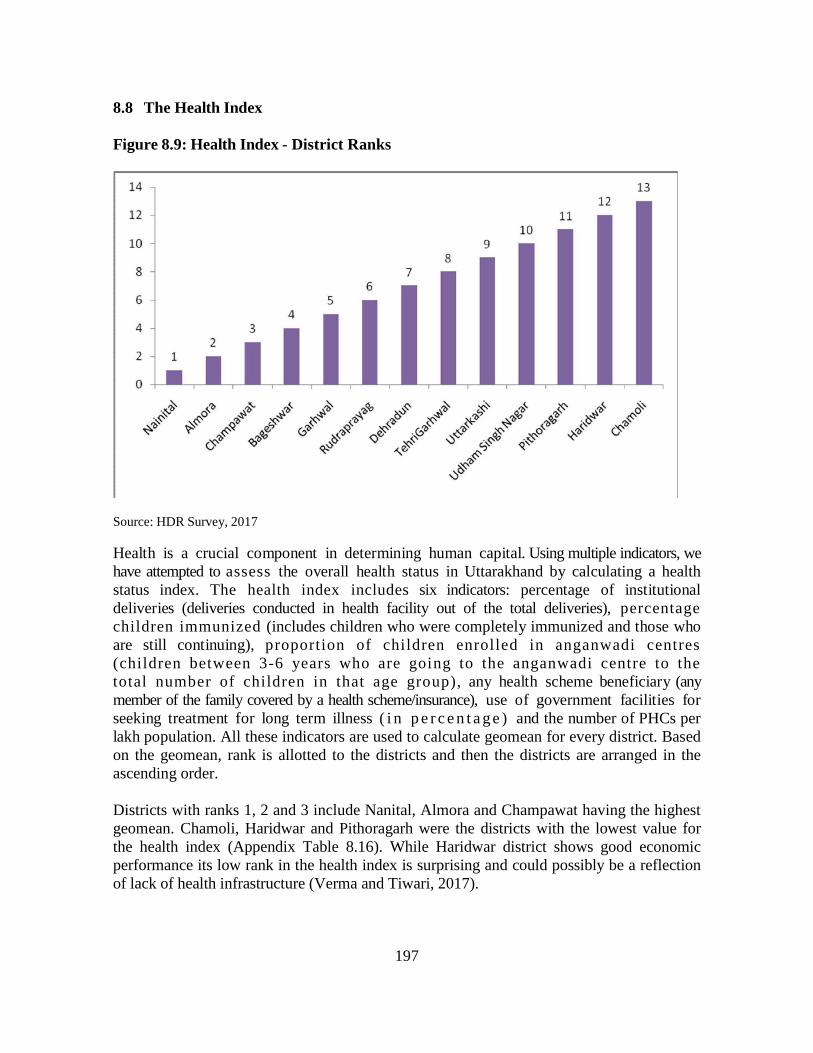
197
8.8 The Health Index Figure 8.9: Health Index - District Ranks
Source: HDR Survey, 2017 Health is a crucial component in determining human capital. Using multiple indicators, we have attempted to assess the overall health status in Uttarakhand by calculating a health status index. The health index includes six indicators: percentage of institutional deliveries (deliveries conducted in health facility out of the total deliveries), percentage children immunized (includes children who were completely immunized and those who are still continuing), proportion of children enrolled in anganwadi centres (children between 3-6 years who are going to the anganwadi centre to the total number of children in that age group), any health scheme beneficiary (any member of the family covered by a health scheme/insurance), use of government facilities for seeking treatment for long term illness ( i n p e r c e n t a g e ) and the number of PHCs per lakh population. All these indicators are used to calculate geomean for every district. Based on the geomean, rank is allotted to the districts and then the districts are arranged in the ascending order. Districts with ranks 1, 2 and 3 include Nanital, Almora and Champawat having the highest geomean. Chamoli, Haridwar and Pithoragarh were the districts with the lowest value for the health index (Appendix Table 8.16). While Haridwar district shows good economic performance its low rank in the health index is surprising and could possibly be a reflection of lack of health infrastructure (Verma and Tiwari, 2017).
198
8.9 Summing up and the way forward
This chapter brings forth some of the pressing issues concerning the health scenario in Uttarakhand, highlighting spatial, geographical and other differentials that are reflected through various health indicators such as infrastructure, morbidity and mortality patterns, health expenditures as well as maternal and child health at the state as well as district levels. Health infrastructure in Uttarakhand suffers from an acute shortage of Primary Health Care Centres which are the first point of contact for those seeking health care. There is the added scarcity of health personnel, with a large proportion of unfilled vacancies in the existing health centres. Insufficient numbers of trained health personnel is an inescapable impediment for the successful provisioning of health care especially to the poor and adversely affects efforts at reducing maternal and child mortality. To have a desirable impact on health outcomes including mortality and morbidity in Uttarakhand, by improving the availability and accessibility of improved health facilities and services, the shortfalls in health infrastructure and health personnel need to be immediately addressed by Uttarakhand state. Although Uttarakhand has attained replacement levels of fertility (TFR of 2.1), there is still a pressing need for improving maternal health outcomes by raising the rates of institutional deliveries in both rural and urban areas, more especially in rural areas and for the marginalised sections of the society. To achieve this end, strengthening health care facilities including the availability of health care centres, personnel and equipment would contribute to ensuring safe deliveries and reducing any delivery-related-complications. Increasing and strengthening the number of delivery facility points that work round the clock, especially in rural areas, would go a long way in reducing maternal and child mortality rates in the state. The HDR Survey brings forth the high prevalence of long term illnesses related especially to joints that needs concerted attention. The higher dependence on private health facilities for short and long term illnesses and large out of pocket expenses on health care specially for the households residing in hills and the vulnerable households calls out clearly for improved and easily accessible public health care facilities in the state.
By promoting the enrolment of children in anganwadi centres from the current rate of approximately 60 percent in a majority of the districts would promote improvements in child nutrition and hence survival. Wider dissemination of information to mothers at the anganwadi centres about identifying danger signs in terms of child health would result in timely identification and promoting health seeking behaviour. Generating greater community awareness about the importance of child immunization and completing the whole vaccination course required for children is imperative. Active involvement of the government in the effective implementation of health care programmes, their monitoring and evaluation and ensuring accountability of the stakeholders can ensure that healthcare benefits reach all t h e b e n e f i c i a r i e s , especially the most deprived, poor and vulnerable.

199
References Institute for Human Development. 2018. Uttarakhand 2030 Vision Document. International Institute for Population Sciences (IIPS) and ICF. 2017. National Family Health Survey (NFHS-4), 2015-16: India. Mumbai: IIPS. International Institute for Population Sciences (IIPS) and Macro International. (2007). National Family Health Survey (NFHS-3), 2005–06: India: Volume I. Mumbai: IIPS. Kumar, A.; Nema, A.; Hazarika, J.; and Sachdeva, H. Social Sector Expenditure of States Pre & Post Fourteenth Finance Commission (2014-15 & 2015-16). Perspective. NITI Aayog. New Delhi. http://niti.gov.in/writereaddata/files/document_publication/Social%20Sector%20Expendi ture%20of%20States_%20Paper.pdf accessed on May 14, 2018.
Ministry of Health and Family Welfare. (2016). Household Health expenditures in India (2013-2014). National Health Mission. Government of India. https://mohfw.gov.in/sites/default/files/38300411751489562625.pdf accessed on May 2, 2018. Ministry of Health and Family Welfare (MoHFW). 2016-17. Rural Health Statistics. National Health Mission. Government of India. Statistics Division. https://nrhm- mis.nic.in/Pages/RHS2017.aspx?RootFolder=%2FRURAL%20HEALTH%20STATISTI CS%2F%28A%29RHS%20- %202017&FolderCTID=0x01200057278FD1EC909F429B03E86C7A7C3F31&View=% 7B9029EB52-8EA2-4991-9611-FDF53C824827%7D accessed on May 2, 2018.
Verma, C. S. and Tiwari, S. (2017). Development of Composite Indicators to Measure Backwardness of Districts in Uttarakhand. Giri Institute of Development Studies, Lucknow.
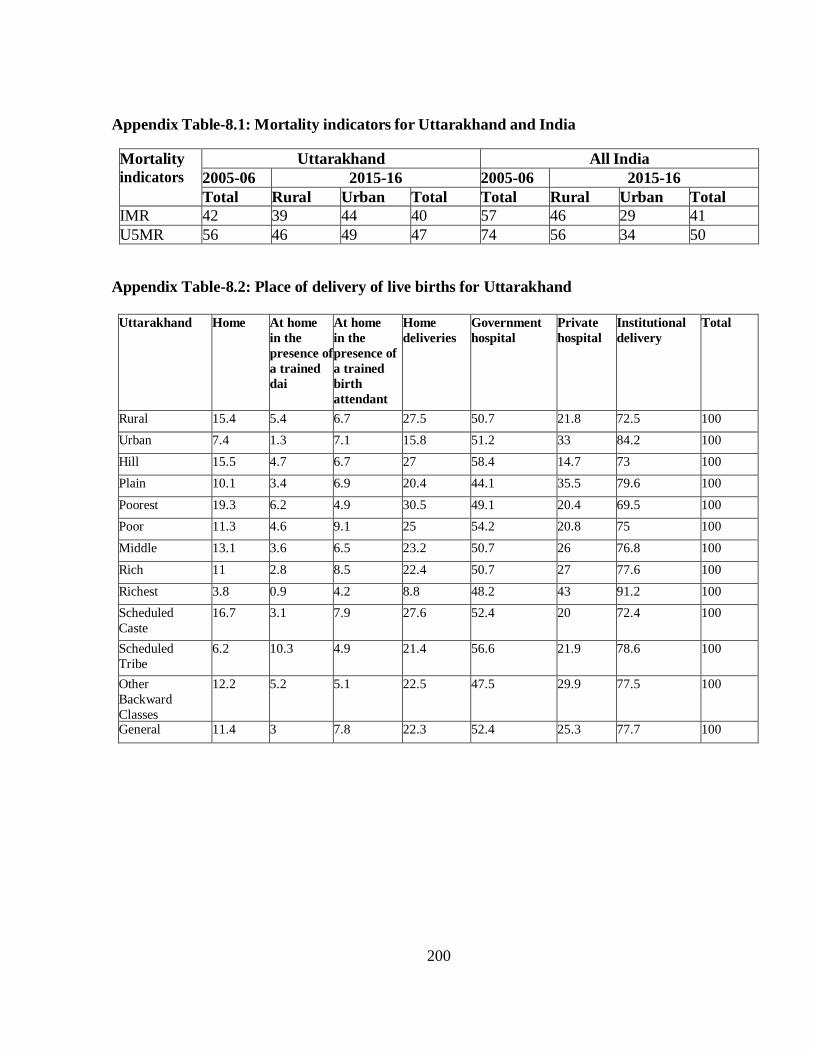
200
Appendix Table-8.1: Mortality indicators for Uttarakhand and India Mortality indicators
Uttarakhand All India 2005-06 2015-16 2005-06 2015-16 Total Rural Urban Total Total Rural Urban Total
IMR 42 39 44 40 57 46 29 41 U5MR 56 46 49 47 74 56 34 50
Appendix Table-8.2: Place of delivery of live births for Uttarakhand
Uttarakhand Home At home in the presence of a trained dai
At home in the presence of a trained birth attendant
Home deliveries
Government hospital
Private hospital
Institutional delivery
Total
Rural 15.4 5.4 6.7 27.5 50.7 21.8 72.5 100 Urban 7.4 1.3 7.1 15.8 51.2 33 84.2 100 Hill 15.5 4.7 6.7 27 58.4 14.7 73 100 Plain 10.1 3.4 6.9 20.4 44.1 35.5 79.6 100 Poorest 19.3 6.2 4.9 30.5 49.1 20.4 69.5 100 Poor 11.3 4.6 9.1 25 54.2 20.8 75 100 Middle 13.1 3.6 6.5 23.2 50.7 26 76.8 100 Rich 11 2.8 8.5 22.4 50.7 27 77.6 100 Richest 3.8 0.9 4.2 8.8 48.2 43 91.2 100 Scheduled Caste
16.7 3.1 7.9 27.6 52.4 20 72.4 100
Scheduled Tribe
6.2 10.3 4.9 21.4 56.6 21.9 78.6 100
Other Backward Classes
12.2 5.2 5.1 22.5 47.5 29.9 77.5 100
General 11.4 3 7.8 22.3 52.4 25.3 77.7 100
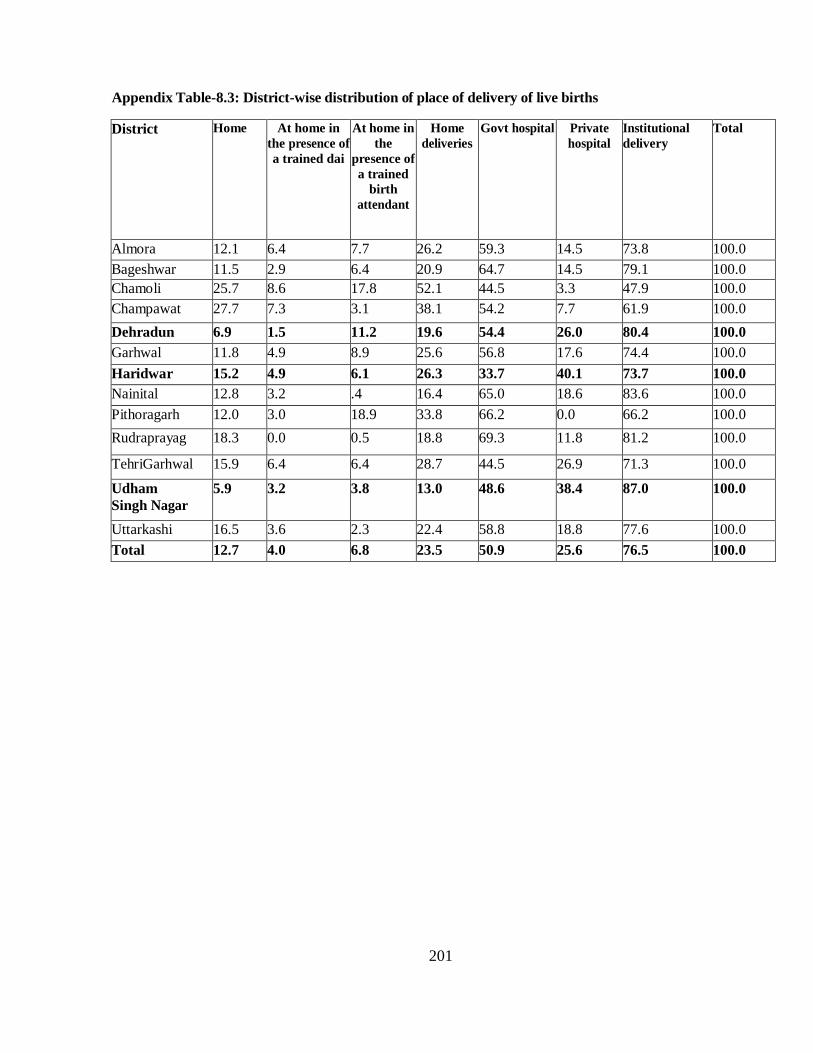
201
Appendix Table-8.3: District-wise distribution of place of delivery of live births District Home At home in
the presence of a trained dai
At home in the
presence of a trained
birth attendant
Home deliveries
Govt hospital Private hospital
Institutional delivery
Total
Almora 12.1 6.4 7.7 26.2 59.3 14.5 73.8 100.0 Bageshwar 11.5 2.9 6.4 20.9 64.7 14.5 79.1 100.0 Chamoli 25.7 8.6 17.8 52.1 44.5 3.3 47.9 100.0 Champawat
27.7 7.3 3.1 38.1 54.2 7.7 61.9 100.0 Dehradun 6.9 1.5 11.2 19.6 54.4 26.0 80.4 100.0 Garhwal 11.8 4.9 8.9 25.6 56.8 17.6 74.4 100.0 Haridwar 15.2 4.9 6.1 26.3 33.7 40.1 73.7 100.0 Nainital 12.8 3.2 .4 16.4 65.0 18.6 83.6 100.0 Pithoragarh 12.0 3.0 18.9 33.8 66.2 0.0 66.2 100.0 Rudraprayag
18.3 0.0 0.5 18.8 69.3 11.8 81.2 100.0
TehriGarhwal
15.9 6.4 6.4 28.7 44.5 26.9 71.3 100.0
Udham Singh Nagar
5.9 3.2 3.8 13.0 48.6 38.4 87.0 100.0
Uttarkashi 16.5 3.6 2.3 22.4 58.8 18.8 77.6 100.0 Total 12.7 4.0 6.8 23.5 50.9 25.6 76.5 100.0
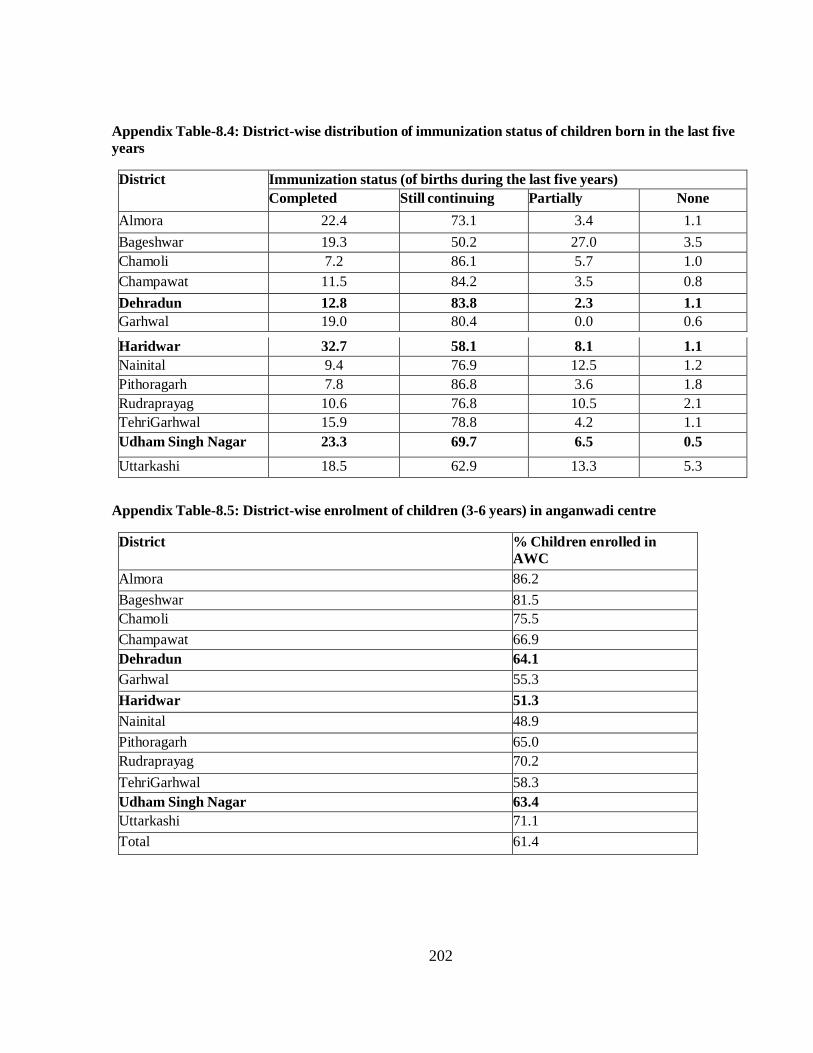
202
Appendix Table-8.4: District-wise distribution of immunization status of children born in the last five years District Immunization status (of births during the last five years)
Completed Still continuing Partially None Almora 22.4 73.1 3.4 1.1 Bageshwar 19.3 50.2 27.0 3.5 Chamoli 7.2 86.1 5.7 1.0 Champawat 11.5 84.2 3.5 0.8 Dehradun 12.8 83.8 2.3 1.1 Garhwal 19.0 80.4 0.0 0.6
Haridwar 32.7 58.1 8.1 1.1 Nainital 9.4 76.9 12.5 1.2 Pithoragarh 7.8 86.8 3.6 1.8 Rudraprayag 10.6 76.8 10.5 2.1 TehriGarhwal 15.9 78.8 4.2 1.1 Udham Singh Nagar 23.3 69.7 6.5 0.5 Uttarkashi 18.5 62.9 13.3 5.3
Appendix Table-8.5: District-wise enrolment of children (3-6 years) in anganwadi centre District % Children enrolled in
AWC Almora 86.2 Bageshwar 81.5 Chamoli 75.5 Champawat 66.9 Dehradun 64.1 Garhwal 55.3 Haridwar 51.3 Nainital 48.9 Pithoragarh 65.0 Rudraprayag 70.2 TehriGarhwal 58.3 Udham Singh Nagar 63.4 Uttarkashi 71.1 Total 61.4
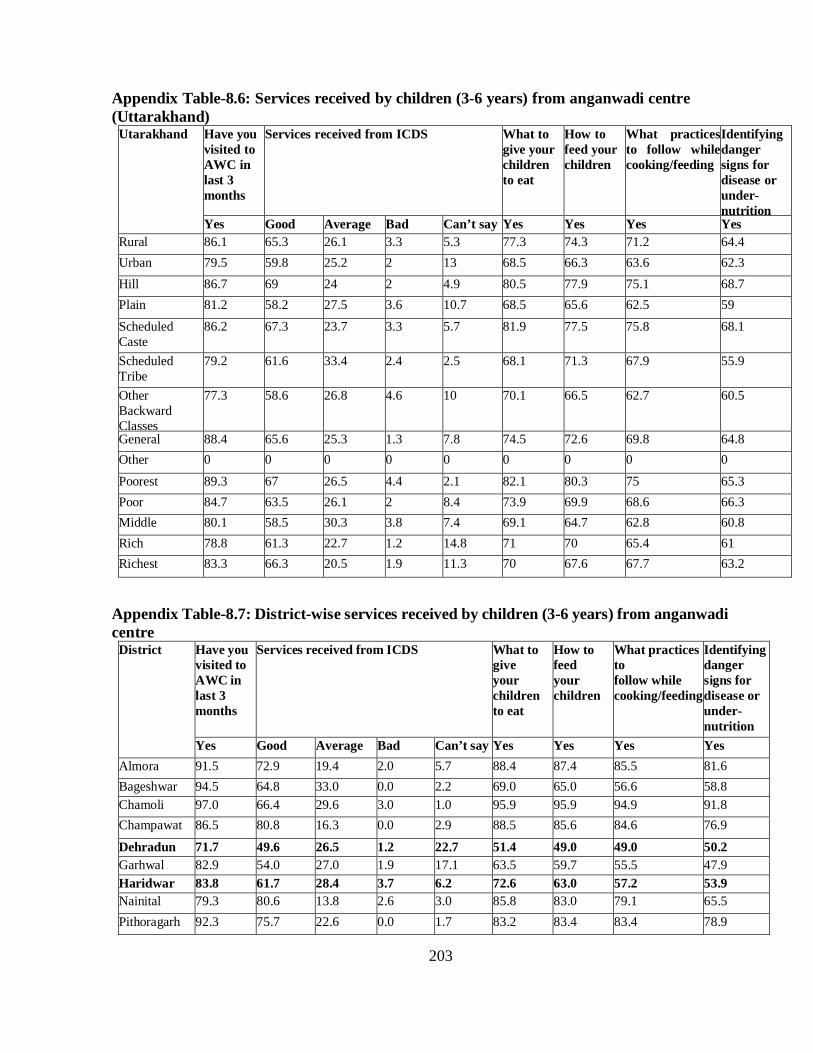
203
Appendix Table-8.6: Services received by children (3-6 years) from anganwadi centre (Uttarakhand)
Utarakhand Have you visited to AWC in last 3 months
Services received from ICDS What to give your children to eat
How to feed your children
What practices to follow while cooking/feeding
Identifying danger signs for disease or under- nutrition
Yes Good Average Bad Can’t say Yes Yes Yes Yes Rural 86.1 65.3 26.1 3.3 5.3 77.3 74.3 71.2 64.4 Urban 79.5 59.8 25.2 2 13 68.5 66.3 63.6 62.3 Hill 86.7 69 24 2 4.9 80.5 77.9 75.1 68.7 Plain 81.2 58.2 27.5 3.6 10.7 68.5 65.6 62.5 59 Scheduled Caste
86.2 67.3 23.7 3.3 5.7 81.9 77.5 75.8 68.1
Scheduled Tribe
79.2 61.6 33.4 2.4 2.5 68.1 71.3 67.9 55.9
Other Backward Classes
77.3 58.6 26.8 4.6 10 70.1 66.5 62.7 60.5
General 88.4 65.6 25.3 1.3 7.8 74.5 72.6 69.8 64.8 Other 0 0 0 0 0 0 0 0 0 Poorest 89.3 67 26.5 4.4 2.1 82.1 80.3 75 65.3 Poor 84.7 63.5 26.1 2 8.4 73.9 69.9 68.6 66.3 Middle 80.1 58.5 30.3 3.8 7.4 69.1 64.7 62.8 60.8 Rich 78.8 61.3 22.7 1.2 14.8 71 70 65.4 61 Richest 83.3 66.3 20.5 1.9 11.3 70 67.6 67.7 63.2
Appendix Table-8.7: District-wise services received by children (3-6 years) from anganwadi centre
District Have you visited to AWC in last 3 months
Services received from ICDS What to give your children to eat
How to feed your children
What practices to follow while cooking/feeding
Identifying danger signs for disease or under- nutrition
Yes Good Average Bad Can’t say Yes Yes Yes Yes Almora 91.5 72.9 19.4 2.0 5.7 88.4 87.4 85.5 81.6 Bageshwar 94.5 64.8 33.0 0.0 2.2 69.0 65.0 56.6 58.8 Chamoli 97.0 66.4 29.6 3.0 1.0 95.9 95.9 94.9 91.8 Champawat 86.5 80.8 16.3 0.0 2.9 88.5 85.6 84.6 76.9
Dehradun 71.7 49.6 26.5 1.2 22.7 51.4 49.0 49.0 50.2 Garhwal 82.9 54.0 27.0 1.9 17.1 63.5 59.7 55.5 47.9 Haridwar 83.8 61.7 28.4 3.7 6.2 72.6 63.0 57.2 53.9 Nainital 79.3 80.6 13.8 2.6 3.0 85.8 83.0 79.1 65.5 Pithoragarh 92.3 75.7 22.6 0.0 1.7 83.2 83.4 83.4 78.9
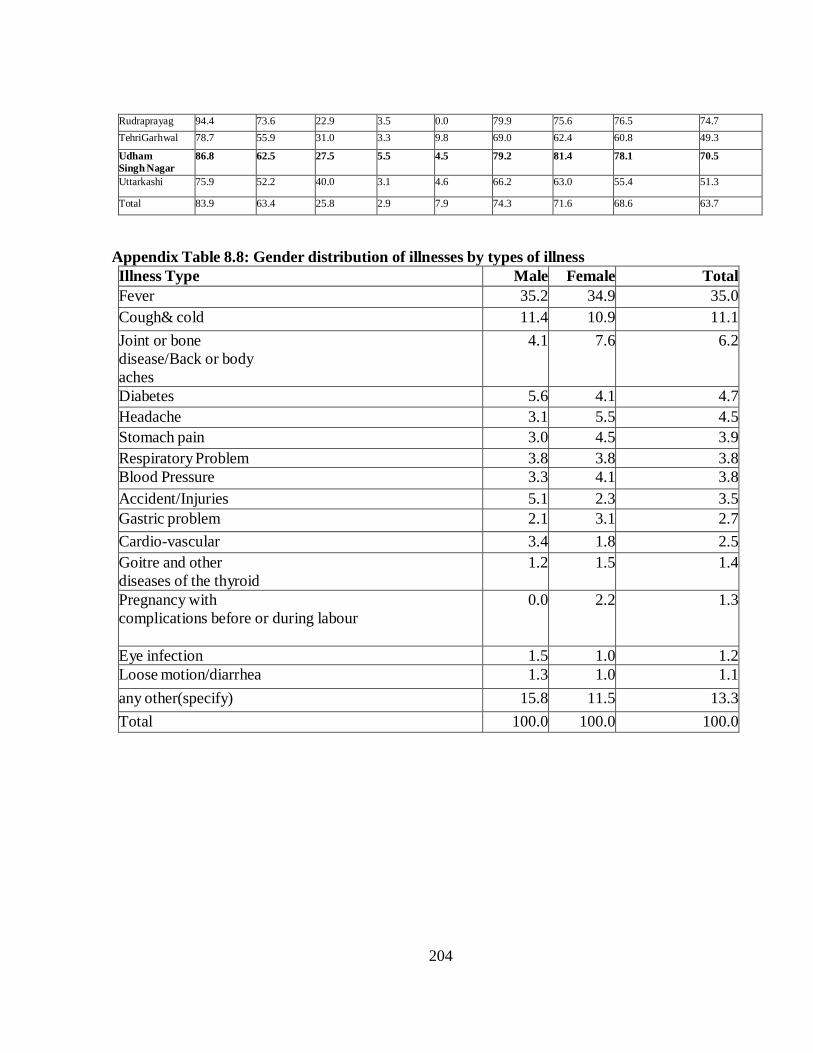
204
Rudraprayag 94.4 73.6 22.9 3.5 0.0 79.9 75.6 76.5 74.7 TehriGarhwal 78.7 55.9 31.0 3.3 9.8 69.0 62.4 60.8 49.3 Udham Singh Nagar
86.8 62.5 27.5 5.5 4.5 79.2 81.4 78.1 70.5 Uttarkashi 75.9 52.2 40.0 3.1 4.6 66.2 63.0 55.4 51.3 Total 83.9 63.4 25.8 2.9 7.9 74.3 71.6 68.6 63.7
Appendix Table 8.8: Gender distribution of illnesses by types of illness Illness Type Male Female Total Fever 35.2 34.9 35.0 Cough& cold 11.4 10.9 11.1 Joint or bone disease/Back or body aches
4.1 7.6 6.2
Diabetes 5.6 4.1 4.7 Headache 3.1 5.5 4.5 Stomach pain 3.0 4.5 3.9 Respiratory Problem 3.8 3.8 3.8 Blood Pressure 3.3 4.1 3.8 Accident/Injuries 5.1 2.3 3.5 Gastric problem 2.1 3.1 2.7 Cardio-vascular 3.4 1.8 2.5 Goitre and other diseases of the thyroid
1.2 1.5 1.4
Pregnancy with complications before or during labour
0.0 2.2 1.3
Eye infection 1.5 1.0 1.2 Loose motion/diarrhea 1.3 1.0 1.1 any other(specify) 15.8 11.5 13.3 Total 100.0 100.0 100.0
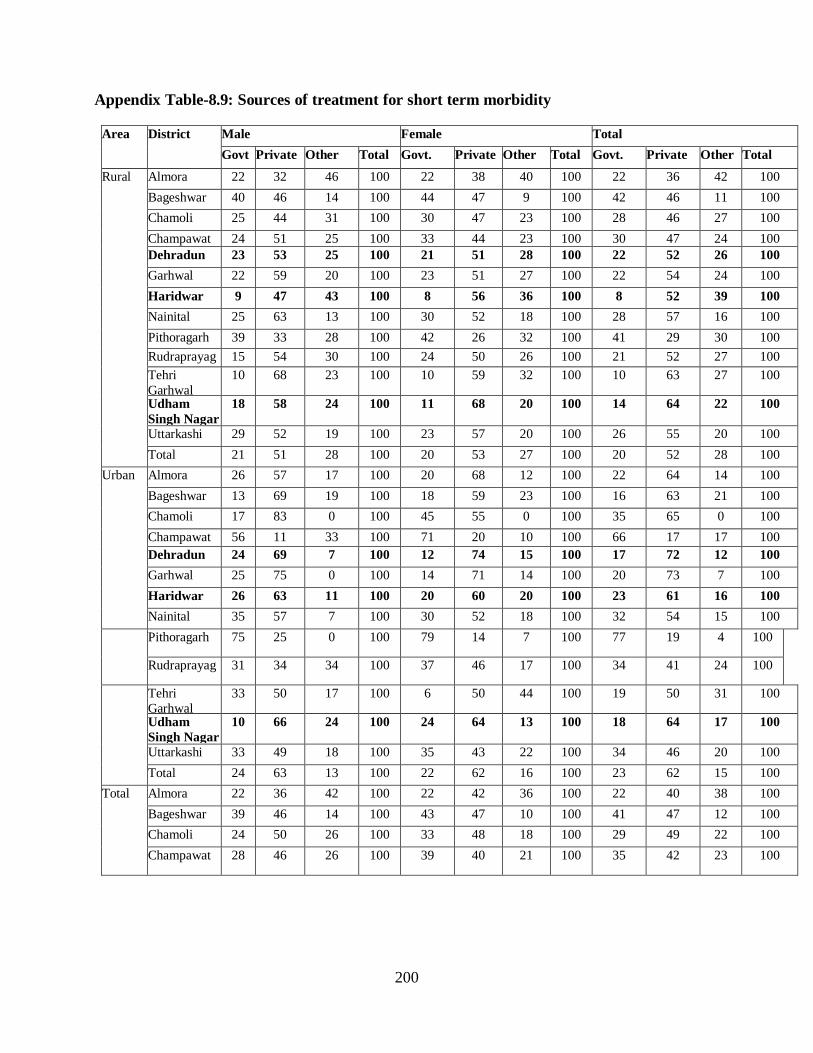
200
Appendix Table-8.9: Sources of treatment for short term morbidity
Area District Male Female Total Govt
Private Other Total Govt. Private Other Total Govt. Private Other Total Rural Almora 22 32 46 100 22 38 40 100 22 36 42 100
Bageshwar 40 46 14 100 44 47 9 100 42 46 11 100 Chamoli 25 44 31 100 30 47 23 100 28 46 27 100 Champawat
24 51 25 100 33 44 23 100 30 47 24 100 Dehradun 23 53 25 100 21 51 28 100 22 52 26 100 Garhwal 22 59 20 100 23 51 27 100 22 54 24 100 Haridwar 9 47 43 100 8 56 36 100 8 52 39 100 Nainital 25 63 13 100 30 52 18 100 28 57 16 100 Pithoragarh
39 33 28 100 42 26 32 100 41 29 30 100 Rudraprayag
15 54 30 100 24 50 26 100 21 52 27 100 Tehri Garhwal
10 68 23 100 10 59 32 100 10 63 27 100
Udham Singh Nagar
18 58 24 100 11 68 20 100 14 64 22 100
Uttarkashi 29 52 19 100 23 57 20 100 26 55 20 100 Total 21 51 28 100 20 53 27 100 20 52 28 100
Urban Almora 26 57 17 100 20 68 12 100 22 64 14 100 Bageshwar 13 69 19 100 18 59 23 100 16 63 21 100 Chamoli 17 83 0 100 45 55 0 100 35 65 0 100 Champawat
56 11 33 100 71 20 10 100 66 17 17 100 Dehradun 24 69 7 100 12 74 15 100 17 72 12 100 Garhwal 25 75 0 100 14 71 14 100 20 73 7 100 Haridwar 26 63 11 100 20 60 20 100 23 61 16 100 Nainital 35 57 7 100 30 52 18 100 32 54 15 100
Pithoragarh
75 25 0 100 79 14 7 100 77 19 4 100
Rudraprayag
31 34 34 100 37 46 17 100 34 41 24 100
Tehri Garhwal
33 50 17 100 6 50 44 100 19 50 31 100
Udham Singh Nagar
10 66 24 100 24 64 13 100 18 64 17 100
Uttarkashi 33 49 18 100 35 43 22 100 34 46 20 100 Total 24 63 13 100 22 62 16 100 23 62 15 100
Total Almora 22 36 42 100 22 42 36 100 22 40 38 100 Bageshwar 39 46 14 100 43 47 10 100 41 47 12 100 Chamoli 24 50 26 100 33 48 18 100 29 49 22 100 Champawat
28 46 26 100 39 40 21 100 35 42 23 100
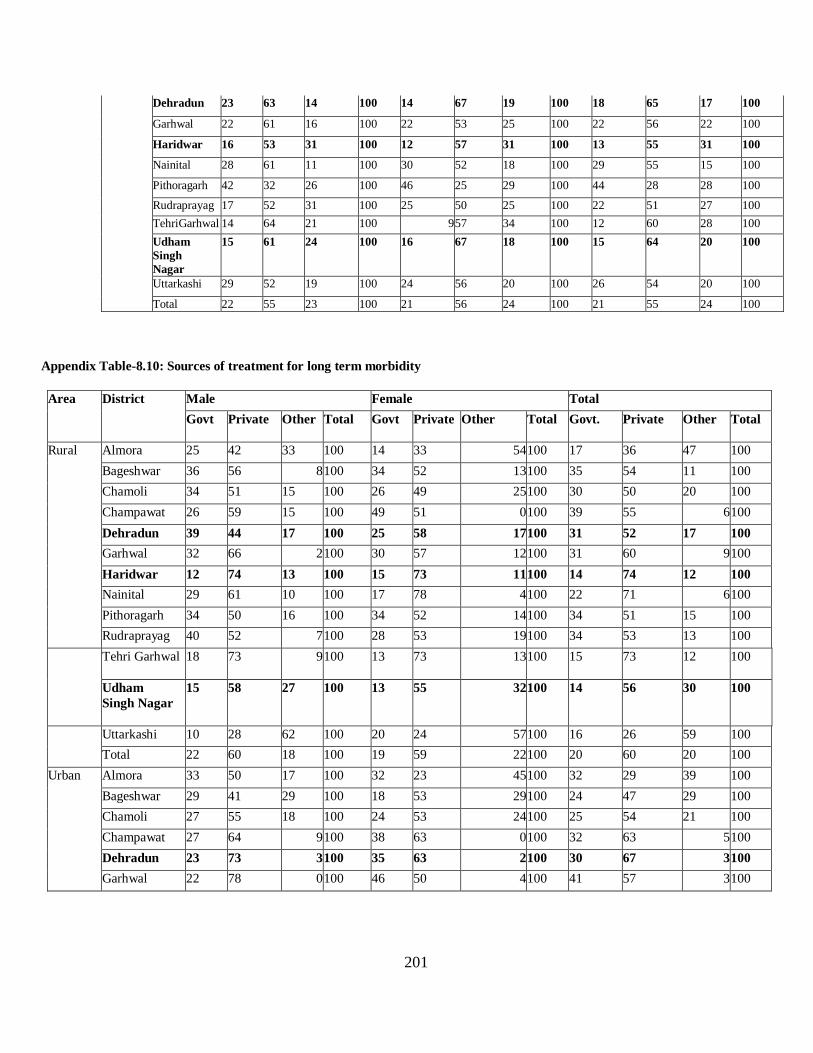
201
Dehradun 23 63 14 100 14 67 19 100 18 65 17 100 Garhwal 22 61 16 100 22 53 25 100 22 56 22 100 Haridwar 16 53 31 100 12 57 31 100 13 55 31 100 Nainital 28 61 11 100 30 52 18 100 29 55 15 100 Pithoragarh
42 32 26 100 46 25 29 100 44 28 28 100 Rudraprayag
17 52 31 100 25 50 25 100 22 51 27 100 TehriGarhwal
14 64 21 100 9 57 34 100 12 60 28 100 Udham Singh Nagar
15 61 24 100 16 67 18 100 15 64 20 100
Uttarkashi 29 52 19 100 24 56 20 100 26 54 20 100 Total 22 55 23 100 21 56 24 100 21 55 24 100
Appendix Table-8.10: Sources of treatment for long term morbidity
Area District Male Female Total Govt
Private
Other
Total Govt
Private
Other Total
Govt. Private Other
Total
Rural Almora 25 42 33 100 14 33 54 100 17 36 47 100 Bageshwar 36 56 8 100 34 52 13 100 35 54 11 100 Chamoli 34 51 15 100 26 49 25 100 30 50 20 100 Champawat 26 59 15 100 49 51 0 100 39 55 6 100 Dehradun 39 44 17 100 25 58 17 100 31 52 17 100 Garhwal 32 66 2 100 30 57 12 100 31 60 9 100 Haridwar 12 74 13 100 15 73 11 100 14 74 12 100 Nainital 29 61 10 100 17 78 4 100 22 71 6 100 Pithoragarh 34 50 16 100 34 52 14 100 34 51 15 100 Rudraprayag 40 52 7 100 28 53 19 100 34 53 13 100
Tehri Garhwal
18 73 9 100 13 73 13 100 15 73 12 100
Udham Singh Nagar
15 58 27 100 13 55 32 100 14 56 30 100
Uttarkashi 10 28 62 100 20 24 57 100 16 26 59 100 Total 22 60 18 100 19 59 22 100 20 60 20 100
Urban Almora 33 50 17 100 32 23 45 100 32 29 39 100 Bageshwar 29 41 29 100 18 53 29 100 24 47 29 100 Chamoli 27 55 18 100 24 53 24 100 25 54 21 100 Champawat 27 64 9 100 38 63 0 100 32 63 5 100 Dehradun 23 73 3 100 35 63 2 100 30 67 3 100 Garhwal 22 78 0 100 46 50 4 100 41 57 3 100
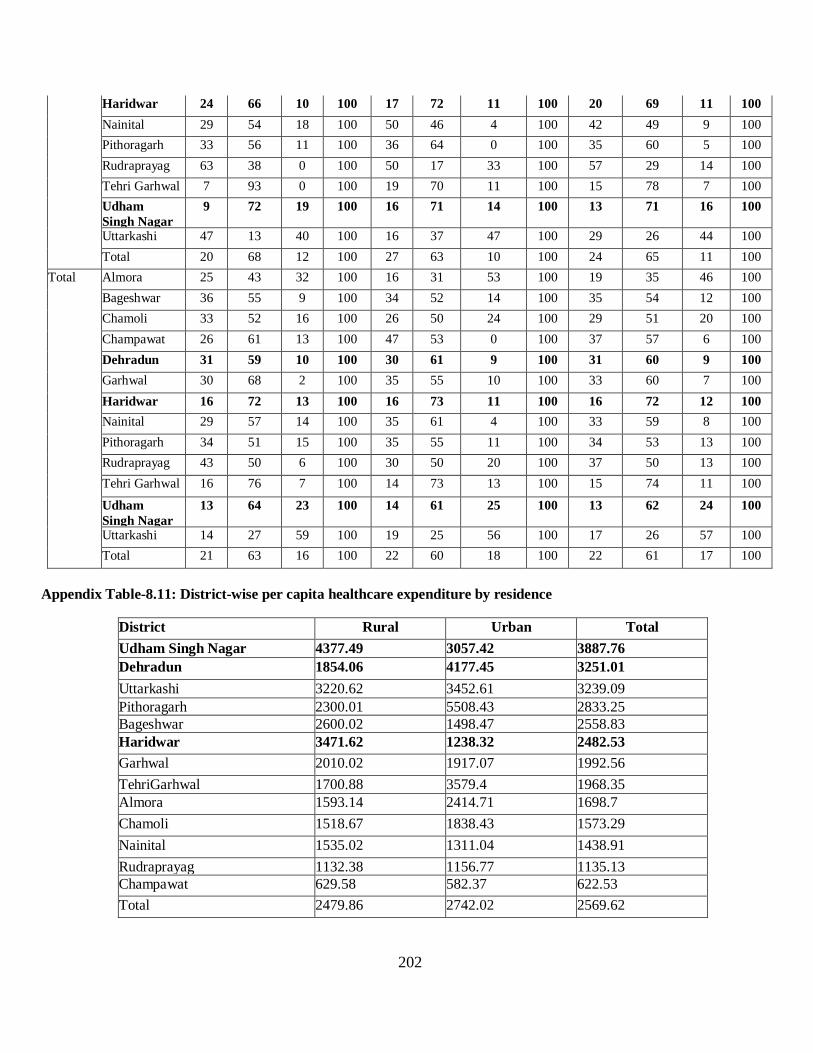
202
Haridwar 24 66 10 100 17 72 11 100 20 69 11 100 Nainital 29 54 18 100 50 46 4 100 42 49 9 100 Pithoragarh 33 56 11 100 36 64 0 100 35 60 5 100 Rudraprayag 63 38 0 100 50 17 33 100 57 29 14 100 Tehri Garhwal
7 93 0 100 19 70 11 100 15 78 7 100 Udham Singh Nagar
9 72 19 100 16 71 14 100 13 71 16 100
Uttarkashi 47 13 40 100 16 37 47 100 29 26 44 100 Total 20 68 12 100 27 63 10 100 24 65 11 100
Total Almora 25 43 32 100 16 31 53 100 19 35 46 100 Bageshwar 36 55 9 100 34 52 14 100 35 54 12 100 Chamoli 33 52 16 100 26 50 24 100 29 51 20 100 Champawat 26 61 13 100 47 53 0 100 37 57 6 100 Dehradun 31 59 10 100 30 61 9 100 31 60 9 100 Garhwal 30 68 2 100 35 55 10 100 33 60 7 100 Haridwar 16 72 13 100 16 73 11 100 16 72 12 100 Nainital 29 57 14 100 35 61 4 100 33 59 8 100 Pithoragarh 34 51 15 100 35 55 11 100 34 53 13 100 Rudraprayag 43 50 6 100 30 50 20 100 37 50 13 100 Tehri Garhwal
16 76 7 100 14 73 13 100 15 74 11 100 Udham Singh Nagar
13 64 23 100 14 61 25 100 13 62 24 100
Uttarkashi 14 27 59 100 19 25 56 100 17 26 57 100 Total 21 63 16 100 22 60 18 100 22 61 17 100
Appendix Table-8.11: District-wise per capita healthcare expenditure by residence
District Rural Urban Total Udham Singh Nagar 4377.49 3057.42 3887.76 Dehradun 1854.06 4177.45 3251.01 Uttarkashi 3220.62 3452.61 3239.09 Pithoragarh 2300.01 5508.43 2833.25 Bageshwar 2600.02 1498.47 2558.83 Haridwar 3471.62 1238.32 2482.53 Garhwal 2010.02 1917.07 1992.56 TehriGarhwal 1700.88 3579.4 1968.35 Almora 1593.14 2414.71 1698.7 Chamoli 1518.67 1838.43 1573.29 Nainital 1535.02 1311.04 1438.91 Rudraprayag 1132.38 1156.77 1135.13 Champawat 629.58 582.37 622.53 Total 2479.86 2742.02 2569.62
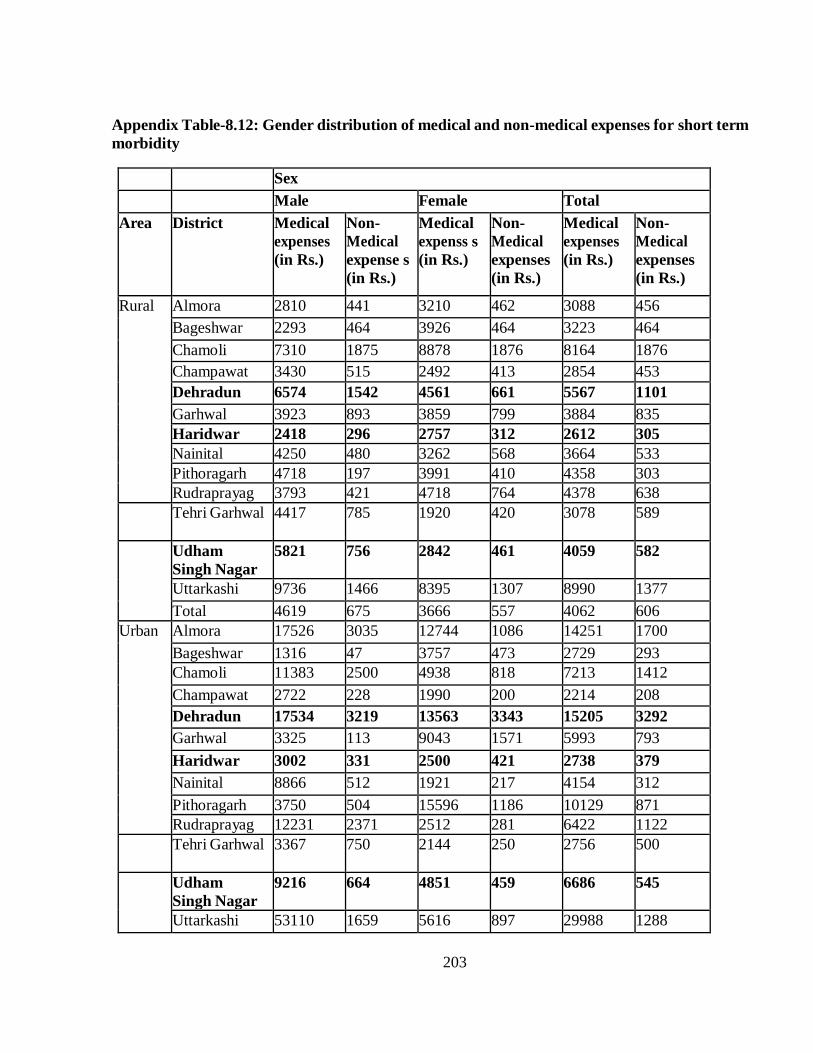
203
Appendix Table-8.12: Gender distribution of medical and non-medical expenses for short term morbidity Sex Male Female Total Area District Medical
expenses (in Rs.)
Non- Medical expense s (in Rs.)
Medical expenss s (in Rs.)
Non- Medical expenses (in Rs.)
Medical expenses (in Rs.)
Non- Medical expenses (in Rs.)
Rural Almora 2810 441 3210 462 3088 456 Bageshwar 2293 464 3926 464 3223 464 Chamoli 7310 1875 8878 1876 8164 1876 Champawat 3430 515 2492 413 2854 453 Dehradun 6574 1542 4561 661 5567 1101 Garhwal 3923 893 3859 799 3884 835 Haridwar 2418 296 2757 312 2612 305 Nainital 4250 480 3262 568 3664 533 Pithoragarh 4718 197 3991 410 4358 303 Rudraprayag 3793 421 4718 764 4378 638
Tehri Garhwal
4417 785 1920 420 3078 589
Udham Singh Nagar
5821 756 2842 461 4059 582
Uttarkashi 9736 1466 8395 1307 8990 1377 Total 4619 675 3666 557 4062 606
Urban
Almora 17526 3035 12744 1086 14251 1700 Bageshwar 1316 47 3757 473 2729 293 Chamoli 11383 2500 4938 818 7213 1412 Champawat 2722 228 1990 200 2214 208 Dehradun 17534 3219 13563 3343 15205 3292 Garhwal 3325 113 9043 1571 5993 793 Haridwar 3002 331 2500 421 2738 379 Nainital 8866 512 1921 217 4154 312 Pithoragarh 3750 504 15596 1186 10129 871 Rudraprayag 12231 2371 2512 281 6422 1122
Tehri Garhwal
3367 750 2144 250 2756 500
Udham Singh Nagar
9216 664 4851 459 6686 545
Uttarkashi 53110 1659 5616 897 29988 1288

204
Sex Male Female Total Area District Medical
expenses (in Rs.)
Non- Medical expense s (in Rs.)
Medical expenss s (in Rs.)
Non- Medical expenses (in Rs.)
Medical expenses (in Rs.)
Non- Medical expenses (in Rs.)
Total 10509 1390 6713 1274 8280 1322 Total Almora 4827 797 4463 544 4575 622
Bageshwar 2260 450 3920 464 3206 458 Chamoli 7914 1967 8048 1653 7989 1790 Champawat 3351 483 2415 381 2766 419 Dehradun 13385 2584 10857 2537 11976 2558 Garhwal 3827 768 4343 871 4137 830 Haridwar 2632 309 2673 347 2655 330 Nainital 5856 491 2678 415 3862 444 Pithoragarh 4634 224 5171 489 4902 356 Rudraprayag 4770 647 4493 715 4596 690
Tehri Garhwal
4210 778 1959 390 3019 572
Udham Singh Nagar
7063 722 3554 460 5003 569
Uttarkashi 13163 1481 8226 1282 10439 1371 Total 6498 903 4645 788 5413 836
Appendix Table-8.13: Gender distribution of medical and non-medical expenses for long term morbidity Male Female Total Area District Medical
expense s (in Rs.)
Non- Medical expense s (in Rs.)
Medical expense s (in Rs.)
Non- Medical expense s (in Rs.)
Medical expense s (in Rs.)
Non- Medical expense s (in Rs.)
Rural Almora 36828 2277 10372 866 18658 1308 Bageshwar 41836 3989 19229 1739 28343 2646 Chamoli 38598 7228 19232 3193 28334 5090 Champawat 7781 1189 5650 995 6549 1077 Dehradun 29769 2801 9717 626 17920 1516 Garhwal 45294 5128 20850 3646 29756 4186 Haridwar 21635 1923 16578 1505 18897 1697 Nainital 14197 2065 16007 1333 15278 1627 Pithoragarh 41356 6447 21885 1864 32957 4470
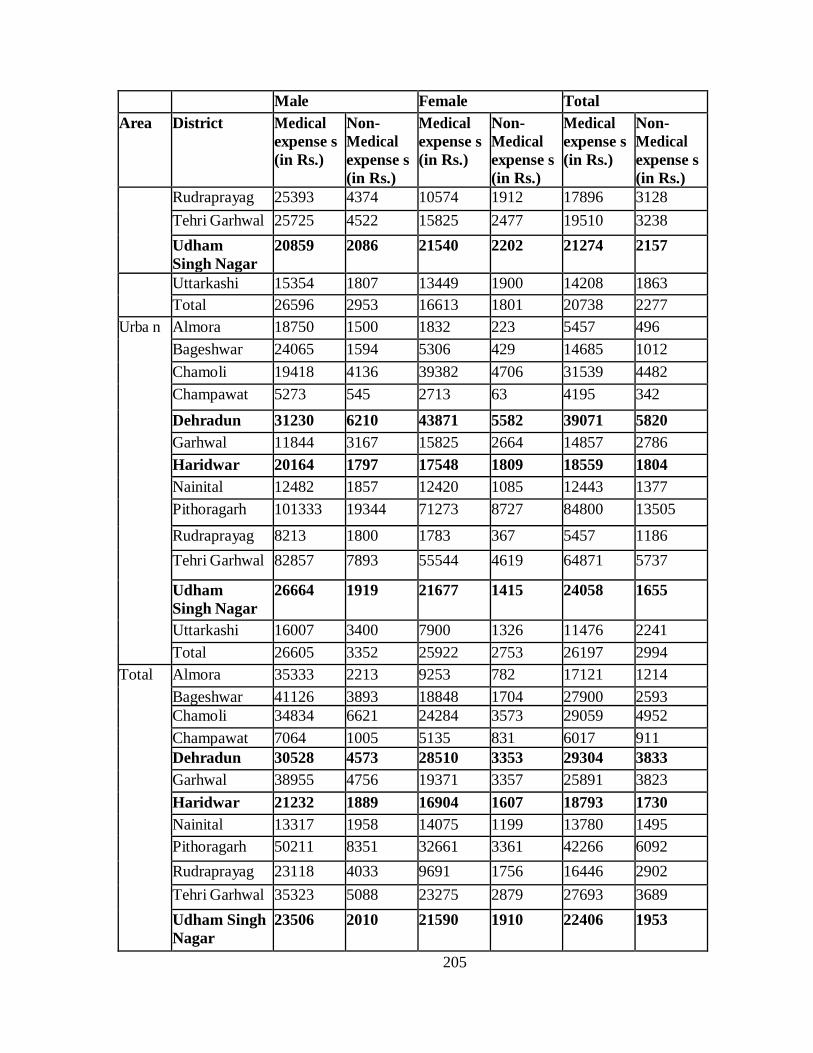
205
Male Female Total Area District Medical
expense s (in Rs.)
Non- Medical expense s (in Rs.)
Medical expense s (in Rs.)
Non- Medical expense s (in Rs.)
Medical expense s (in Rs.)
Non- Medical expense s (in Rs.)
Rudraprayag 25393 4374 10574 1912 17896 3128 Tehri Garhwal
25725 4522 15825 2477 19510 3238 Udham Singh Nagar
20859 2086 21540 2202 21274 2157
Uttarkashi 15354 1807 13449 1900 14208 1863 Total 26596 2953 16613 1801 20738 2277
Urba n Almora 18750 1500 1832 223 5457 496 Bageshwar 24065 1594 5306 429 14685 1012 Chamoli 19418 4136 39382 4706 31539 4482 Champawat 5273 545 2713 63 4195 342 Dehradun 31230 6210 43871 5582 39071 5820 Garhwal 11844 3167 15825 2664 14857 2786 Haridwar 20164 1797 17548 1809 18559 1804 Nainital 12482 1857 12420 1085 12443 1377 Pithoragarh 101333 19344 71273 8727 84800 13505
Rudraprayag 8213 1800 1783 367 5457 1186 Tehri Garhwal
82857 7893 55544 4619 64871 5737
Udham Singh Nagar
26664 1919 21677 1415 24058 1655
Uttarkashi 16007 3400 7900 1326 11476 2241 Total 26605 3352 25922 2753 26197 2994
Total Almora 35333 2213 9253 782 17121 1214 Bageshwar 41126 3893 18848 1704 27900 2593 Chamoli 34834 6621 24284 3573 29059 4952 Champawat 7064 1005 5135 831 6017 911 Dehradun 30528 4573 28510 3353 29304 3833 Garhwal 38955 4756 19371 3357 25891 3823 Haridwar 21232 1889 16904 1607 18793 1730 Nainital 13317 1958 14075 1199 13780 1495 Pithoragarh 50211 8351 32661 3361 42266 6092 Rudraprayag 23118 4033 9691 1756 16446 2902 Tehri Garhwal
35323 5088 23275 2879 27693 3689 Udham Singh Nagar
23506 2010 21590 1910 22406 1953
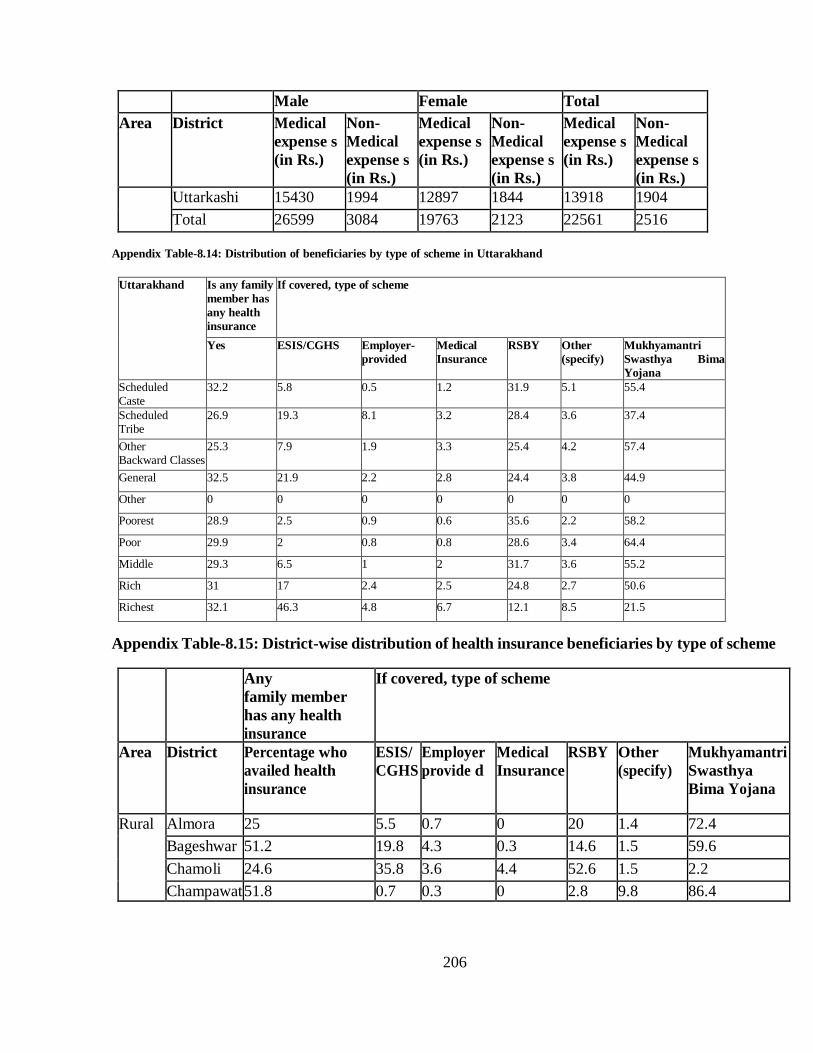
206
Male Female Total Area District Medical
expense s (in Rs.)
Non- Medical expense s (in Rs.)
Medical expense s (in Rs.)
Non- Medical expense s (in Rs.)
Medical expense s (in Rs.)
Non- Medical expense s (in Rs.)
Uttarkashi 15430 1994 12897 1844 13918 1904 Total 26599 3084 19763 2123 22561 2516
Appendix Table-8.14: Distribution of beneficiaries by type of scheme in Uttarakhand
Uttarakhand Is any family member has any health insurance
If covered, type of scheme
Yes ESIS/CGHS Employer- provided
Medical Insurance
RSBY Other (specify)
Mukhyamantri Swasthya Bima Yojana
Scheduled Caste
32.2 5.8 0.5 1.2 31.9 5.1 55.4
Scheduled Tribe
26.9 19.3 8.1 3.2 28.4 3.6 37.4
Other Backward Classes
25.3 7.9 1.9 3.3 25.4 4.2 57.4
General 32.5 21.9 2.2 2.8 24.4 3.8 44.9 Other 0 0 0 0 0 0 0 Poorest 28.9 2.5 0.9 0.6 35.6 2.2 58.2 Poor 29.9 2 0.8 0.8 28.6 3.4 64.4 Middle 29.3 6.5 1 2 31.7 3.6 55.2 Rich 31 17 2.4 2.5 24.8 2.7 50.6 Richest 32.1 46.3 4.8 6.7 12.1 8.5 21.5
Appendix Table-8.15: District-wise distribution of health insurance beneficiaries by type of scheme Any
family member has any health insurance
If covered, type of scheme
Area District Percentage who availed health insurance
ESIS/CGHS
Employer provide d
Medical Insurance
RSBY Other (specify)
Mukhyamantri Swasthya Bima Yojana
Rural
Almora 25 5.5 0.7 0 20 1.4 72.4 Bageshwar 51.2 19.8 4.3 0.3 14.6 1.5 59.6 Chamoli 24.6 35.8 3.6 4.4 52.6 1.5 2.2 Champawat 51.8 0.7 0.3 0 2.8 9.8 86.4
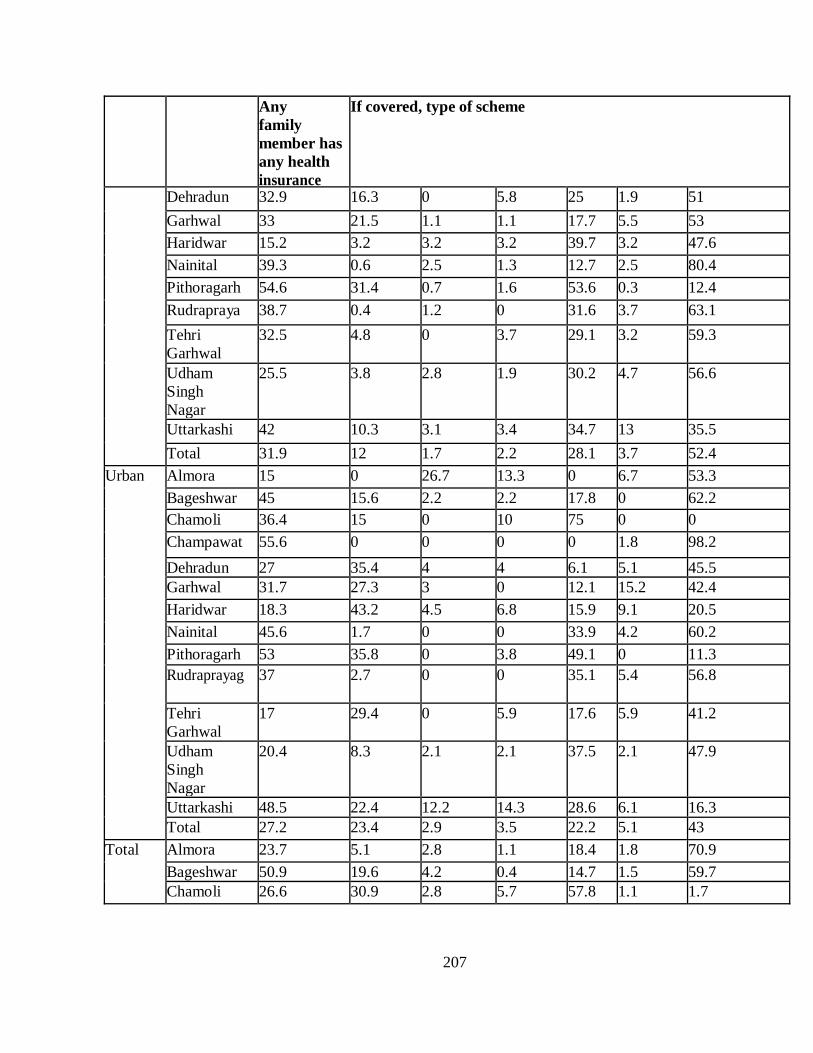
207
Any family member has any health insurance
If covered, type of scheme
Dehradun 32.9 16.3 0 5.8 25 1.9 51 Garhwal 33 21.5 1.1 1.1 17.7 5.5 53 Haridwar 15.2 3.2 3.2 3.2 39.7 3.2 47.6 Nainital 39.3 0.6 2.5 1.3 12.7 2.5 80.4 Pithoragarh 54.6 31.4 0.7 1.6 53.6 0.3 12.4 Rudrapraya
38.7 0.4 1.2 0 31.6 3.7 63.1 Tehri Garhwal
32.5 4.8 0 3.7 29.1 3.2 59.3
Udham Singh Nagar
25.5 3.8 2.8 1.9 30.2 4.7 56.6
Uttarkashi 42 10.3 3.1 3.4 34.7 13 35.5 Total 31.9 12 1.7 2.2 28.1 3.7 52.4
Urban
Almora 15 0 26.7 13.3 0 6.7 53.3 Bageshwar 45 15.6 2.2 2.2 17.8 0 62.2 Chamoli 36.4 15 0 10 75 0 0 Champawat 55.6 0 0 0 0 1.8 98.2 Dehradun 27 35.4 4 4 6.1 5.1 45.5 Garhwal 31.7 27.3 3 0 12.1 15.2 42.4 Haridwar 18.3 43.2 4.5 6.8 15.9 9.1 20.5 Nainital 45.6 1.7 0 0 33.9 4.2 60.2 Pithoragarh 53 35.8 0 3.8 49.1 0 11.3 Rudraprayag 37 2.7 0 0 35.1 5.4 56.8
Tehri Garhwal
17 29.4 0 5.9 17.6 5.9 41.2
Udham Singh Nagar
20.4 8.3 2.1 2.1 37.5 2.1 47.9
Uttarkashi 48.5 22.4 12.2 14.3 28.6 6.1 16.3 Total 27.2 23.4 2.9 3.5 22.2 5.1 43
Total
Almora 23.7 5.1 2.8 1.1 18.4 1.8 70.9 Bageshwar 50.9 19.6 4.2 0.4 14.7 1.5 59.7 Chamoli 26.6 30.9 2.8 5.7 57.8 1.1 1.7

208
Any family member has any health insurance
If covered, type of scheme
Champawat 52.4 0.6 0.3 0 2.3 8.5 88.3
Dehradun 29.3 26.9 2.2 4.8 14.5 3.7 47.9
Garhwal 32.7 22.6 1.5 0.9 16.7 7.3 51.1
Haridwar 16.6 22.7 3.8 5 28.1 6.1 34.4
Nainital 42 1.1 1.4 0.7 22.5 3.3 71
Pithoragarh 54.4 32.1 0.5 2 52.9 0.3 12.2
Rudraprayag 38.5 0.7 1.1 0 31.9 3.9 62.4
Tehri Garhwal wal
30.3 6.7 0 3.9 28.2 3.4 57.8
Udham Singh Nagar
23.6 5.2 2.6 1.9 32.5 3.9 53.8
Uttarkashi 42.5 11.4 3.9 4.4 34.2 12.4 33.8
Total 30.3 15.5 2.1 2.6 26.3 4.1 49.5
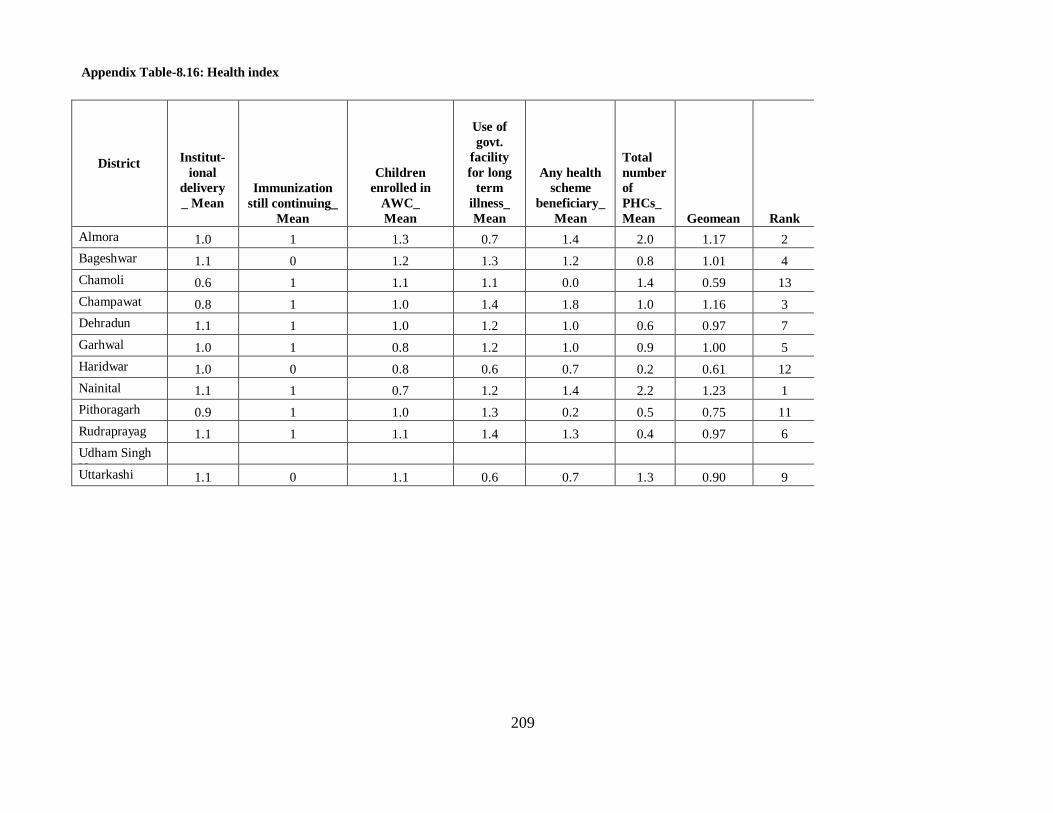
209
District
Institut- ional
delivery _ Mean
Immunization still continuing_
Mean
Children enrolled in
AWC_ Mean
Use of govt.
facility for long
term illness_ Mean
Any health scheme
beneficiary_ Mean
Total number of PHCs_ Mean
Geomean
Rank Almora 1.0 1
1.3 0.7 1.4 2.0 1.17 2 Bageshwar 1.1 0
1.2 1.3 1.2 0.8 1.01 4 Chamoli 0.6 1
1.1 1.1 0.0 1.4 0.59 13 Champawat 0.8 1
1.0 1.4 1.8 1.0 1.16 3 Dehradun 1.1 1
1.0 1.2 1.0 0.6 0.97 7 Garhwal 1.0 1
0.8 1.2 1.0 0.9 1.00 5 Haridwar 1.0 0
0.8 0.6 0.7 0.2 0.61 12 Nainital 1.1 1
0.7 1.2 1.4 2.2 1.23 1 Pithoragarh 0.9 1
1.0 1.3 0.2 0.5 0.75 11 Rudraprayag 1.1 1
1.1 1.4 1.3 0.4 0.97 6 Udham Singh N
Uttarkashi 1.1 0
1.1 0.6 0.7 1.3 0.90 9
Appendix Table-8.16: Health index

210
Abbreviations CHC Community Health Centres ICDS Integrated Child Development Services IMR Infant Mortality Rate MoHFW Ministry of Health and Family Welfare MSBY Mukhyamantri Swasthya BimaYojana NFHS National Family Health Survey OOPE Out of Pocket Expenditures RSBY Rashtriya Swasthya BimaYojana SDG Sustainable Development Goals TFR Total Fertility Rate U5MR Under 5 Mortality Rate

211
211
CHAPTER 9: TOURISM
1. Introduction
Tourism plays a major role in mountain economies in the form of income generation, creation of employment and livelihood for local population, greater investment of government in Infrastructure creation, and serves as a marketing platform for sale of traditionally produced goods such as handlooms, handicrafts, khadi etc. United Nations General Assembly, through a resolution adopted on 22 December 2015, declared 2017 as ‘International Year of Sustainable Tourism for Development’. The resolution recognises that well designed and well managed tourism can make contribution to three dimensions of sustainable development – economic, social and environmental, has close linkages to other sectors and can create decent jobs and generate trade opportunities1. World Tourism Organisation (WTO) & United Nations Environment Programme (UNEP) define sustainable tourism as: ‘Tourism that takes full account of its current and future economic, social and environmental impacts, addressing the needs of visitors, the industry, the environment and host communities.’ (UNEP and WTO, 2005) Making tourism more sustainable means taking into account these impacts and needs in the planning, development and operation of tourism. Within this principle, the tourism sector features as targets in three of the 17 Sustainable Development Goals (SDGs), namely SDG 8 on ‘Decent Work and Economic Growth’, SDG 12 on ‘Responsible Consumption and Production’ and SDG 14 on ‘Life below Water’. 9.1 International Perspective International tourism is world’s largest industry. The direct contribution of travel and tourism to world GDP in 2016 was USD 2,306 billion (3.1% of GDP). The total contribution of travel and tourism to employment (including wider effects from investment, the supply chain and induced income) was 292,220,000 jobs in 2016 (9.6% of total employment). (World Travel & Tourism Council, 2017)
Alps mountain range in Europe, stretching over Austria, France, Germany, Liechtenstein, Monaco, Italy, Slovenia and Switzerland offers an assortment of tourist destinations. With Alpine Convention in force, Alps is a great exemplar of sustainable tourism. The objective of the convention is to protect the natural environment of the Alps, while promoting its development. The convention requires the signatory states to stagger and diversify the supply of and demand for tourism over space and time; include sustainable tourism objectives when deciding policies related to spatial planning, transport, agriculture, forestry and environment; share responsibility; provide support to the economically weaker areas; undertake common measures, in particular in the field of cross-border cooperation; harmonise and develop tourism-related research and knowledge; foster the training of tourism professionals and the provision of information to the public. (Alpine Convention, 2013)
Andes in South America, which is the longest mountain chain on earth, encompases Peru, Colombia, Chile, Venezuela, Argentina, Ecuador and Bolivia. Tourism in Andes has boosted the economic levels of these middle income countries of South America. It has not only increased the employment rate in these countries but also increased the education 1Source: http://www.un.org/en/ga/search/view_doc.asp?symbol=A/RES/70/193&referer=/english/&Lang=E (Accessed on 7 May 2018)
212
levels and improved the health facilities from the wealth flowing through tourism. Despite the popularity of Andes as tourist destination, there is less emphasis on conservation value and ecological impact of anthropogenic use.
Hindu Kush – Himalayan region is an 800 km long mountain range that stretches near the Afghan-Pakistan border, from central Afghanistan to northern Pakistan and spread over India, Pakistan, Bhutan, Bangladesh, China, Myanmar, Nepal and Afghanistan. The region is endowed with diverse gene pools and species, thereby hosting a rich variety of flora and fauna. Biodiversity is the basis for many tourism activities in the Hindu Kush Himalaya (HKH). Scenic landscapes, forests, lakes, mountains, and farmlands attract many tourists to the region. Iconic bird and animal species are also major attractions. Considering the diverse nature of ecosystem, geo-political differences, difference in conservation and development priorities, the role of Inter-Governmental organisation like International Centre for Integrated Mountain Development (ICIMOD) has been realised to be important. ICIMOD, a regional knowledge development and learning centre is serving the eight regional member countries of the Hindu Kush Himalayas and based in Kathmandu, Nepal. ICIMOD aims to assist mountain people to understand these changes, adapt to them, and make the most of new opportunities, while addressing upstream-downstream issues. ICIMOD is working to develop an economically and environmentally sound mountain ecosystem to improve the living standards of mountain populations and to sustain vital ecosystem services for the billions of people living downstream – now, and for the future. (Chhetri, 2014) 9.2 Tourism in Indian Mountain Economies The scenic landscape view, favourable climatic conditions, forest wealth, water resources and production of unique or niche products (e.g. fruits, vegetables, flowers, seeds, medicinal plants etc.) offer natural comparative advantage to mountainous regions over non mountainous regions. Among the mountainous states, developmental strategies, infrastructural development, diversity in tourist attractions, investment in tourism as well as taxes and subsidies to promote tourism act as artificial comparative advantages. Thus success of tourism within some of these mountainous economies depends on links of tourism to other government departments, hassle free access to information, good transportation and connectivity in terms of good roads, rail or airports, cleanliness of tourist spots, availability of good accommodation facilities, culinary variety and speciality, safety concerns, banking facilities, internet connectivity and last but not the least, warm behaviour of people. Diversity in tourist attraction can be harnessed by tapping potential of adventure sports, river rafting, winter sports, trekking, amusement parks, yoga and spiritual practices, pilgrimage tourism, rural tourism and eco-tourism. Tourism is one of the main drivers of growth in mountain economies of India. There are a total of 11 mountain states in India. Some examples of such economies, which have done commendable progress in tourism are Himachal Pradesh, Sikkim and Jammu & Kashmir among many others. Tourism sector in Himachal Pradesh has been given high priority and it is being realised as a major engine of growth for future. The contribution of tourism sector to state GDP is 7%2. To give boost to tourism, Asian Development Bank (ADB) has approved loan assistance worth US $95.16 million to the state, under Tranche-1 and Tranche-3. To strengthen the tourist infrastructure in the state, the tourism department of 2 Economic Survey Himachal Pradesh 2016-17, Economics & Statistics Department, Govt. of Himachal Pradesh
213
Himachal Pradesh has submitted a project worth Rs 100 crore to Ministry of Tourism, Government of India, under ‘Swadesh Darshan’ scheme. The Department of Tourism is also encouraging private sector to develop tourism related infrastructure in the state under Public Private Partnership (PPP) mode. Currently under PPP model, work on four ropeway projects is going on. The state is also developing airports at various places such as Kangra, Baddi and Bhunter to improve the connectivity to tourist destinations. For rural tourism, in particular, Himachal Pradesh with its scheme ‘Har Gaon ki Kahani’ has shown an exemplary way for how villages can become an attractive tourist destination. Anecdotes on the individual culture, customs, rituals for festivals/marriages and traditional tales were expected to attract tourists to experience their way of life and would give a boost to employment in the rural areas of Himachal Pradesh as visits by tourists increase (The Hindu, 09 June 2010). Tourism in Sikkim has emerged as the new profession of the Sikkimese people with its vast natural potential. Promotion of village tourism, homestay, cultural tourism, trekking tourism, ecotourism, wellness tourism, flori–tourism and adventure tourism has given fillip to the tourism trade in the state where a large of number of people are engaged under different employment opportunities. The budget estimate of capital expenditure on Tourism by the state in 2016-17, on tourism was a staggering 4.1%3. As per budget estimates of 2016-17, tourism in Sikkim formed 1% of state’s own non-tax revenues4. In budget 2017-18, tourism and civil aviation was allocated US$ 18.325. Sikkim has mighty snow-capped peaks including the Kanchenjunga, the world’s 3rd highest peak, which attracts a large number of tourists from across the globe. Apart from 10 mountain peaks, Sikkim has 84 glaciers, 315 glacial lakes (including the Tsomgo, Gurudongmar & Khecheopalri), 5 hot springs & 8 mountain passes – making it an ideal tourist location. Sikkim government is also promoting health tourism in the state to utilise its medical infrastructure and boost the economy. The state had 28 primary health centres, 197 sub-centres, two community health centres and five district hospitals as of November 20176. As per budget 2017-18, mobile technology like M-Tourism, which is integration of Information and Communication Technology (ICT) and tourism, is implemented by state. In Jammu & Kashmir, tourism is the backbone of the economy. Tourism sector accounts for around 6.98% of State’s GDP. The total capital expenditure on tourism in 2016-17 was Rs 156.04 crore and the government spending on tourism was 0.12% of GSDP7.J&K has always been a premier tourist destination in the country. The lush green tourist resorts of Gulmarg, Pahalgam, Yousmarg, Kokernag and golden meadows of Sonamarg have remained an attraction for the centuries. Jammu, the city of temples, has been an important destination for pilgrimage tourism. The Ladakh region has been a much sought-after destination especially for the foreign tourists, for its salt water as well as fresh water lakes and monasteries. The Ministry of Tourism, GoI has sanctioned 15 projects at a cost of Rs. 82.97 crore under the ‘Swadesh Darshan’ scheme and released 16.59 crore as 20% mobilization advance for implementation of the projects. The state is developing border
3 Medium Terms Fiscal Plan for Sikkim: 2016-17, Finance, Revenue and Expenditure Department, Govt. of Sikkim 4 Finance, Accounts and State Budget 2016-17, Govt. of Sikkim 5 Finance, Revenue, and Expenditure Department, Govt. of Sikkim, Budget 2017-18 6 Central Bureau of Health Intelligence, Government of India, Sample Registration System (SRS) Bulletin, NHRM 7 Economic Survey Jammu & Kashmir 2017, Directorate of Economics & Statistics, Government of Jammu & Kashmir
214
tourism at Suchetgarh, amusement park at Srinagar, World class tourist amenities with smart solar illumination at Katra which is famous for Mata Vaishno Devi, Ice skating ring at pahalgam, hikers and climbers park at Panikar and light and sound show with water fountain at Sher-e-Kashmir International Conference Centre (SKICC) in Srinagar. Among many more such investments, Hazratbal Shrine in Srinagar is being developed at a cost of Rs 42.02 Crore under ‘PRASAD’ scheme. 9.3 Tourism in Uttarakhand ‘Dev Bhoomi’ Uttarkhand since ancient times has been a tourist attraction for international as well as domestic tourists. World famous chardham – Shri Badrinath, Kedarnath, Gangotri and Yamunotri; Hemkund; Lokpal; Nanakmatta; Meetha-Reetha sahib and Piran Kaliyar are the tourist attarctions for pilgrimage tourism. Apart from pilgrimage, the state spawns vast variety of flora and fauna and along with Corbett and Rajaji National Park, it is nature lover’s paradise. Nainital and Mussoorie are hill station attractions of the state. Tourism has been one of the main sources of employment generation, with the sector estimated to generate 90 jobs per Rs 10 lakhs of investment8. Though there is no separate account of tourism’s share in GSDP in Economic Survey 2017-18 of Uttarakhand, tourism including trade, hotel and restaurants form 13.57% share of GSDP9. The number of tourists arrival has been steadily rising year by year from 117.08 lakh in 2002 to 347.23 lakh in 2017, except for 2011 and 2013. The budget outlay for tourism department has gradually declined from 0.67% of GSDP in 2004-05 to 0.28% of GSDP in 2017-1810. Government of India has allocated Rs 8037.34 crores for development of Tehri lake and nearby area under ‘Swadesh Darshan’ scheme. Tourism department is encouraging Public Private Partnership (PPP) mode of investment for construction of ropeway from Kaddukhal to Surkunda devi, Thuligad to Purnagiri, Janki chatti to Yamunotri and Ghangariya to Hemkund sahib. The private investors have been shortlisted for the projects. The state is heavily investing on hotel, restaurants, amusement parks, spas and ropeways to open up opportunities for tourism. 9.3.1 Existing Types of Tourism (i) Pilgrimage Tourism Uttarakhand has many religious sites. The char dham – Yamunotri, Gangotri, Badrinath and Kedharnath has huge number of tourists pouring in for pilgrimage every year. Badrinath temple is a Hindu temple dedicated to Vishnu in Badrinath town of Uttarakhand. It is placed on the bank of Alaknanda River at an elevation of 3,133 m. The number of visitors visiting Badrinath over the years is as follows (Table 9.1). 8 Annual report 2015-16, Ministry of Tourism 9 Economic Survey 2017-18 Uttarakhand, Directorate of Economics and Statistics, Government of Uttarakhand 10 Economic Survey 2017-18 Uttarakhand, Directorate of Economics and Statistics, Government of Uttarakhand

215
Table 9.1: Number of tourists visiting Badrinath (1990-2016) Years No of tourists visiting Badrinath 1990 3,62,757 1991 3,55,772 1992 4,12,597 1993 4,76,523 1994 3,47,415 1995 4,61,435 1996 4,65,992 1997 3,61,313 1998 3,40,510 1999 3,40,100 2000 7,35,200 2001 4,22,647 2002 4,48,517 2003 5,80,913 2004 4,93,914 2005 5,66,524 2006 7,41,256 2007 9,01,262 2008 9,11,333 2009 9,16,925 2010 9,21,950 2011 9,81,000 2012 9,85,998 2013 4,97,744 2014 1,80,000 2015 3,59,146 2016 6,24,745 Source: badrikedar.org Graph 9.1: Number of tourists visiting Badrinath (1990-2016)
Kedarnath is a Hindu temple dedicated to Lord Shiva. It is on the Garhwal Himalayan range near the Mandakini River in Kedarnath, Uttarakhand in India. Due to extreme weather conditions, the temple is open only between the ends of April to November. The
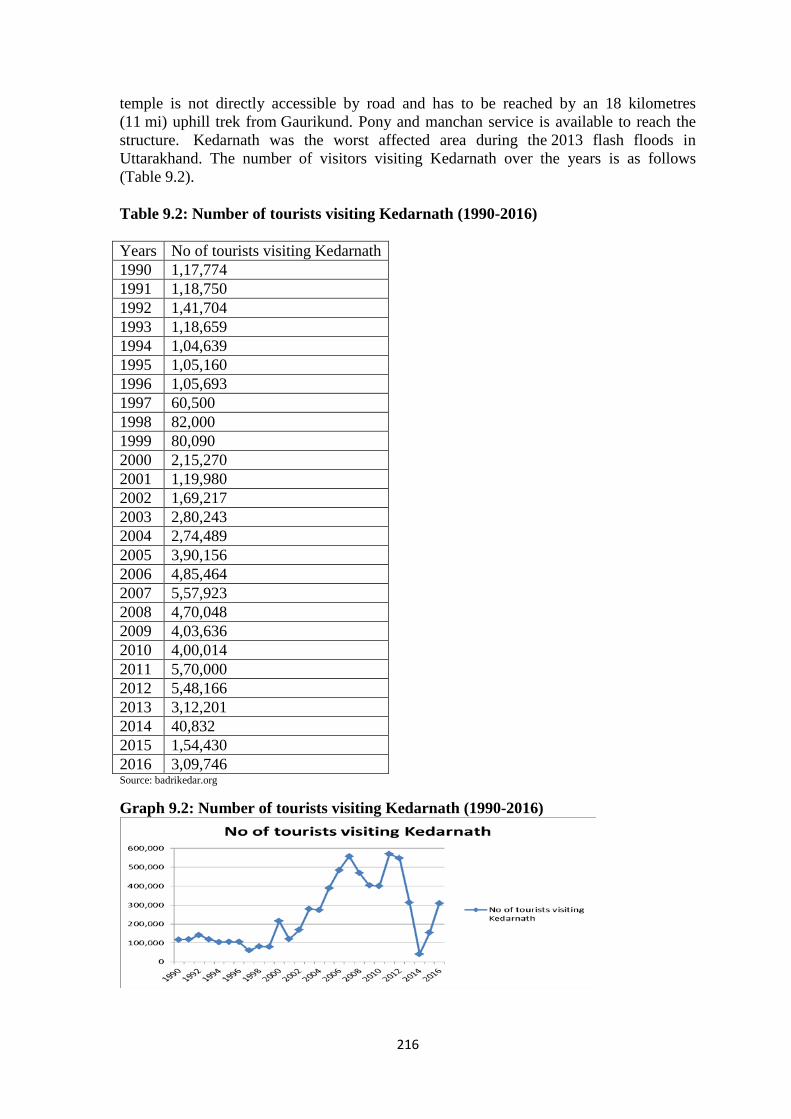
216
temple is not directly accessible by road and has to be reached by an 18 kilometres (11 mi) uphill trek from Gaurikund. Pony and manchan service is available to reach the structure. Kedarnath was the worst affected area during the 2013 flash floods in Uttarakhand. The number of visitors visiting Kedarnath over the years is as follows (Table 9.2). Table 9.2: Number of tourists visiting Kedarnath (1990-2016) Years No of tourists visiting Kedarnath 1990 1,17,774 1991 1,18,750 1992 1,41,704 1993 1,18,659 1994 1,04,639 1995 1,05,160 1996 1,05,693 1997 60,500 1998 82,000 1999 80,090 2000 2,15,270 2001 1,19,980 2002 1,69,217 2003 2,80,243 2004 2,74,489 2005 3,90,156 2006 4,85,464 2007 5,57,923 2008 4,70,048 2009 4,03,636 2010 4,00,014 2011 5,70,000 2012 5,48,166 2013 3,12,201 2014 40,832 2015 1,54,430 2016 3,09,746 Source: badrikedar.org Graph 9.2: Number of tourists visiting Kedarnath (1990-2016)
217
The dip in tourist outflows in year 2014 for pilgrimage to both Kedrinath and Badrinath is due to flash floods in Uttarakhand in 2013. Gangotri is a town and a Nagar Panchayat (municipality) in Uttarkashi district in the state of Uttarakhand, India. It is a Hindu pilgrim town on the banks of the river Bhagirathi and origin of River Ganges. The sacred shrine of Yamunotri, source of the river Yamuna, is the westernmost shrine in the Garhwal Himalayas, perched atop a flank of Bandar Poonch Parvat. The chief attraction at Yamunotri is the temple devoted to the Goddess Yamuna and the holy thermal springs at Janki Chatti. These two places also attract a large foot fall of tourists for pilgrimage. Haridwar, literally translated as Gateway to God, is one of the seven holiest places for Hindus, located on the banks of River Ganges. It is the place where river Ganga descends to the plains. Haridwar is situated at an altitude of 314 m. It serves as a gateway to the Char Dham. The other famous places of pilgrimage include Hemkund sahib, Meetha reetha sahib, Nanak Matta and Piran Kaliyar sharif. Apart from these famous holy places, there are not so much known places such as Tarkeshwar Mahadev temple, Bhavishya Badri temple, Tugnath, Gaumakh, Binsar mahadev, Rudranath, Kalpeshwar temple, Pandukeshwar, Vishnu prayag, Jageshwar Dham, Bhadraj Temple, Dhanaulti, Lakhamandal, Bagnath Temple, Neelkanth Mahadev Temple, Baijnath, Kunjapuri Devi, Chandrashila and Triyuginarayan temple. There is some mythological aspect connected to these places and tourism at such places could be explored by improving access to such places by better road infrastructure and bus connectivity. (ii) Adventure Tourism Uttarakhand is a haven for adventure and allied sports like river rafting, mountaineering activities like rock climbing and trekking, aero sports like paragliding and bungee jumping, game fishing etc. Private sector partnership is being encouraged by the state to develop adventure tourism11. (iii) River rafting The state has ‘Uttarakhand River Rafting / Kayaking (Amendment) Rules 2016’, the aspects of which are explained below
• Ganga, Kali, Tons, Yamuna, Alaknanda, Gori, Saryu, Bhagirathi, Pinder, Kosi and Ram are the rivers on which license permits for rafting and kayaking are issued.
• Applicants are granted permit for a maximum of five years. • A technical committee constituted by the department shall examine all
rafting/rescue equipment and guides for security and rescue. • Operators who seek permit for more than 5 rafts will be levied double fees and a
maximum permit for 10 rafts can be granted. • New applicants shall be granted priority rather than those seeking permission for
increasing the number of rafts. • Penalty as per rules will be recovered from a person operating without permit.
The amendment in 2015, under Rule 3-2 aimed to lengthen the season for all the rivers. In 2016, the rule was again amended to extend the rafting season for two sections of the two rivers, as shown in the table below (9.3).
11 Uttarakhand Tourism Policy-2017,Uttarakhand Tourism Development Board, Government of Uttarakhand
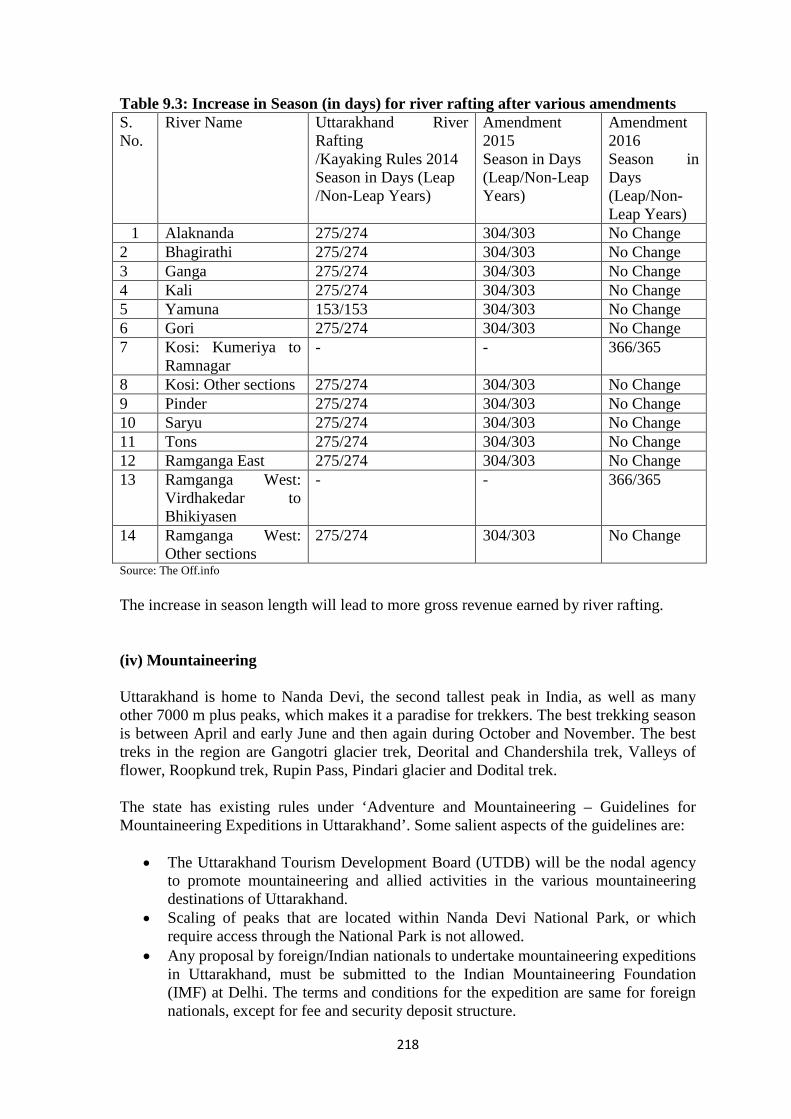
218
Table 9.3: Increase in Season (in days) for river rafting after various amendments S. No.
River Name Uttarakhand River Rafting /Kayaking Rules 2014 Season in Days (Leap /Non-Leap Years)
Amendment 2015 Season in Days (Leap/Non-Leap Years)
Amendment 2016 Season in Days (Leap/Non-Leap Years)
1 Alaknanda 275/274 304/303 No Change 2 Bhagirathi 275/274 304/303 No Change 3 Ganga 275/274 304/303 No Change 4 Kali 275/274 304/303 No Change 5 Yamuna 153/153 304/303 No Change 6 Gori 275/274 304/303 No Change 7 Kosi: Kumeriya to
Ramnagar - - 366/365
8 Kosi: Other sections 275/274 304/303 No Change 9 Pinder 275/274 304/303 No Change 10 Saryu 275/274 304/303 No Change 11 Tons 275/274 304/303 No Change 12 Ramganga East 275/274 304/303 No Change 13 Ramganga West:
Virdhakedar to Bhikiyasen
- - 366/365
14 Ramganga West: Other sections
275/274 304/303 No Change
Source: The Off.info The increase in season length will lead to more gross revenue earned by river rafting. (iv) Mountaineering Uttarakhand is home to Nanda Devi, the second tallest peak in India, as well as many other 7000 m plus peaks, which makes it a paradise for trekkers. The best trekking season is between April and early June and then again during October and November. The best treks in the region are Gangotri glacier trek, Deorital and Chandershila trek, Valleys of flower, Roopkund trek, Rupin Pass, Pindari glacier and Dodital trek. The state has existing rules under ‘Adventure and Mountaineering – Guidelines for Mountaineering Expeditions in Uttarakhand’. Some salient aspects of the guidelines are:
• The Uttarakhand Tourism Development Board (UTDB) will be the nodal agency to promote mountaineering and allied activities in the various mountaineering destinations of Uttarakhand.
• Scaling of peaks that are located within Nanda Devi National Park, or which require access through the National Park is not allowed.
• Any proposal by foreign/Indian nationals to undertake mountaineering expeditions in Uttarakhand, must be submitted to the Indian Mountaineering Foundation (IMF) at Delhi. The terms and conditions for the expedition are same for foreign nationals, except for fee and security deposit structure.
219
• IMF shall refer an application to the State Government on behalf of the expedition team at least four weeks before the proposed commencement of the expedition. Proposals sent directly to the state will not be entertained.
(v) Aero Sports ‘Uttarakhand Foot Launch Aero sport Rules 2017’ has specific rules framed for aero sports, which are summarised below12:
• Any applicant who wishing to participate in commercial paragliding activities will apply for permit to the District Tourism Development Officer (D.T.D.O.) of the concerning District in prescribed form at Annexure-'A'. between 1st of April to 30th of June every year.
• Activities which are covered under commercial paragliding include Tandem paragliding only.
• The concern D.T.D.O. shall scrutinize these applications initially and put up the same before the Technical Committee, which shall fix date time & venue for the scrutiny / inspection of the documents, equipments conducting practical / physical tests & guides before 16th of August each year. On approval of the applicant’s application, he will be issued operator permit.
• Initial operator permit will be issued for a period of 5 years. • Any applicant who wishing to participate in non-commercial paragliding activities
will apply for permit to the D.T.D.O. of the concerning district at least one month prior to the date proposed for the event / activity in prescribed form at Annexure-'B'.
• Activities which are covered under non-commercial paragliding include Solo paragliding / visiting solo pilots Tandem non-commercial paragliding Participation in paragliding competitions Training for paragliding
Though the rules take in consideration the safety aspects, there is no provision of incentives for aero sports. Such initiatives should be taken to increase the number of operators for aero sports. (vi) Game fishing Uttarakhand is an ideal place for sport fishing as it is home to many rivers, streams and water bodies like Ganga, Kosi, Alaknanda, Yamuna, Ramganga etc. and spawns many species of fishes like Gonch, Carps, Mahseer, Trouts etc. Uttarakhand Tourism Development Board should identify such important water bodies that can be given to private investors to open fishing camps. The department should train locals to work as fishing guides to increase livelihood opportunities. The department should also make available quality equipments to tourists on rental basis. The state should rope in other departments like fisheries, irrigation, forest department etc. to ease out the permit process.
12 Uttarakhand Foot Launch Aero sport Rules 2017, Uttarakhand Tourism Development Board, Government of Uttarakhand.
220
(vii) Rural Tourism Uttarakhand has its own Rural Tourism Policy13, the aspects of which are highlighted below
• The Policy is applicable for Rural areas under the following categories: Village cluster (3-10 villages) Single village Individuals
• A committee headed by the District Collector shall be constituted with District Tourism officer as the member secretary.
• The applicants can avail the benefits of loan interest subsidy under this scheme over and above the benefits applicable under the Veer Chandra Garhwali Self Employment Scheme. The loan interest subsidies will be provided under following categories:
Haridware (Tourism Infrastructure) Software (Training etc)
• Agri/Farm tourism concepts shall be dovetailed along with rural tourism to enhance product value.
(viii) Home stays Home stay is a form of tourism that allows tourists to stay at the houses of local families. This type of tourism enables visitors to experience the rural lifestyle, culture and cuisine of the host community. This concept is already popular in hilly states of Sikkim, Himachal Pradesh, Kerala, J&K etc. Homestay in Uttarakhand can provide a means of livelihood in far flung districts and address the problem of shortage of accommodation for visitors in rural and far flung areas which have potential for tourism. It can potentially become a platform for marketing of local cuisines and handicrafts. The state agencies must support in standardization and capacity building in homestays. The communities should be incentivised and support should be provided to build a standard homestay with the basic necessities like attached bathroom with western toilets (min 30 sq. ft.), clean potable water, airy room (min. 100-150 sq. ft.), clean and hygienic bed linen, covers, towels etc. The districts for homestay are classified as per the following categories:
• Category A – Far Flung District from urban centres • Category B – Relatively easily accessible districts
‘Homestay Policy 2015 (Amendment II, 2017)’ has the following aspects:
• District Registration Committee headed by the District Collector shall be constituted with District Tourism officer as the member secretary.
• Three categories of homestays- gold, silver and bronze shall be decided by the recommendations of the committee based on visits to the units and facilities provided by them.
• The validity shall be for two years • The owner along with his family shall be residing in the unit
13 Uttarakhand Tourism Policy-2017,Uttarakhand Tourism Development Board, Government of Uttarakhand
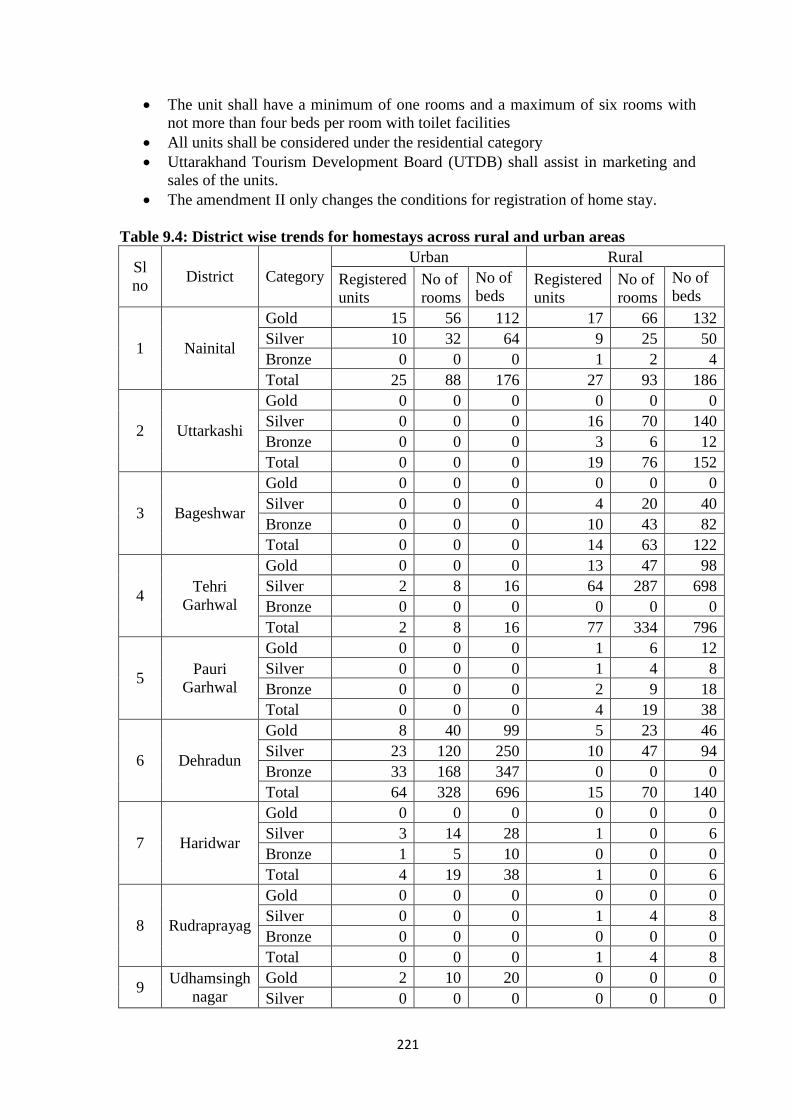
221
• The unit shall have a minimum of one rooms and a maximum of six rooms with not more than four beds per room with toilet facilities
• All units shall be considered under the residential category • Uttarakhand Tourism Development Board (UTDB) shall assist in marketing and
sales of the units. • The amendment II only changes the conditions for registration of home stay.
Table 9.4: District wise trends for homestays across rural and urban areas
Sl no District Category
Urban Rural Registered units
No of rooms
No of beds
Registered units
No of rooms
No of beds
1 Nainital
Gold 15 56 112 17 66 132 Silver 10 32 64 9 25 50 Bronze 0 0 0 1 2 4 Total 25 88 176 27 93 186
2 Uttarkashi
Gold 0 0 0 0 0 0 Silver 0 0 0 16 70 140 Bronze 0 0 0 3 6 12 Total 0 0 0 19 76 152
3 Bageshwar
Gold 0 0 0 0 0 0 Silver 0 0 0 4 20 40 Bronze 0 0 0 10 43 82 Total 0 0 0 14 63 122
4 Tehri Garhwal
Gold 0 0 0 13 47 98 Silver 2 8 16 64 287 698 Bronze 0 0 0 0 0 0 Total 2 8 16 77 334 796
5 Pauri Garhwal
Gold 0 0 0 1 6 12 Silver 0 0 0 1 4 8 Bronze 0 0 0 2 9 18 Total 0 0 0 4 19 38
6 Dehradun
Gold 8 40 99 5 23 46 Silver 23 120 250 10 47 94 Bronze 33 168 347 0 0 0 Total 64 328 696 15 70 140
7 Haridwar
Gold 0 0 0 0 0 0 Silver 3 14 28 1 0 6 Bronze 1 5 10 0 0 0 Total 4 19 38 1 0 6
8 Rudraprayag
Gold 0 0 0 0 0 0 Silver 0 0 0 1 4 8 Bronze 0 0 0 0 0 0 Total 0 0 0 1 4 8
9 Udhamsingh nagar
Gold 2 10 20 0 0 0 Silver 0 0 0 0 0 0
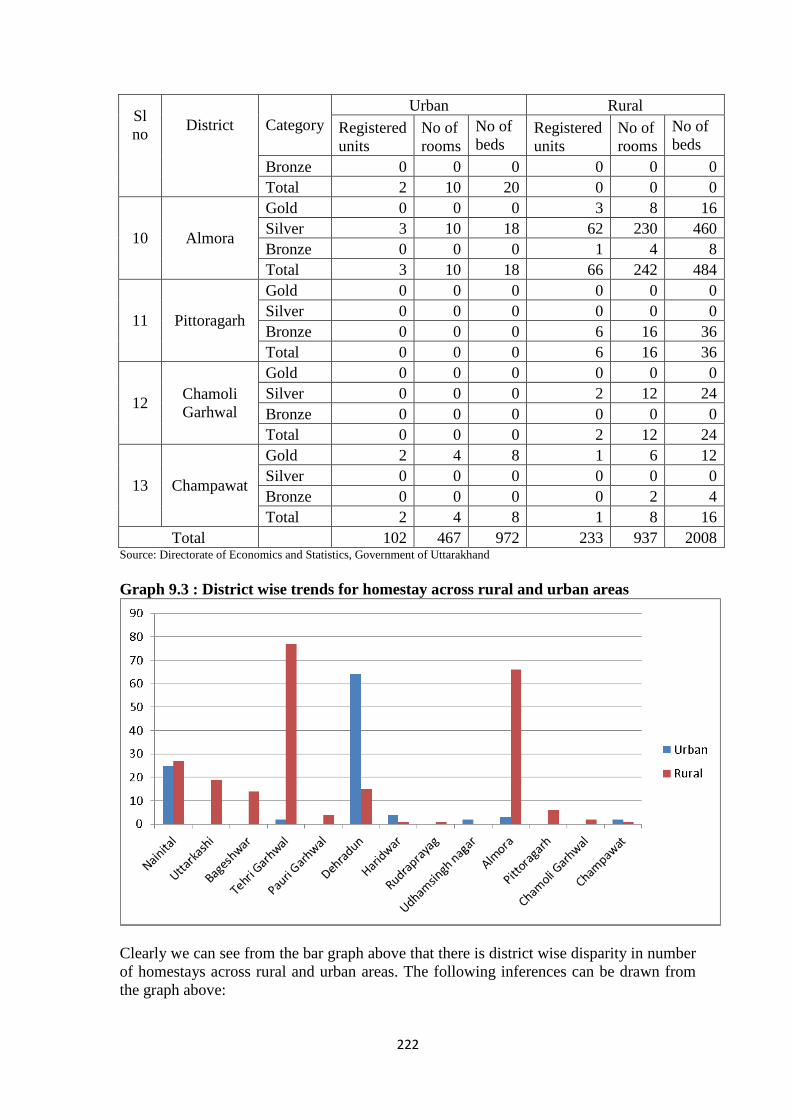
222
Sl no District Category
Urban Rural Registered units
No of rooms
No of beds
Registered units
No of rooms
No of beds
Bronze 0 0 0 0 0 0 Total 2 10 20 0 0 0
10 Almora
Gold 0 0 0 3 8 16 Silver 3 10 18 62 230 460 Bronze 0 0 0 1 4 8 Total 3 10 18 66 242 484
11 Pittoragarh
Gold 0 0 0 0 0 0 Silver 0 0 0 0 0 0 Bronze 0 0 0 6 16 36 Total 0 0 0 6 16 36
12 Chamoli Garhwal
Gold 0 0 0 0 0 0 Silver 0 0 0 2 12 24 Bronze 0 0 0 0 0 0 Total 0 0 0 2 12 24
13 Champawat
Gold 2 4 8 1 6 12 Silver 0 0 0 0 0 0 Bronze 0 0 0 0 2 4 Total 2 4 8 1 8 16
Total 102 467 972 233 937 2008 Source: Directorate of Economics and Statistics, Government of Uttarakhand Graph 9.3 : District wise trends for homestay across rural and urban areas
Clearly we can see from the bar graph above that there is district wise disparity in number of homestays across rural and urban areas. The following inferences can be drawn from the graph above:
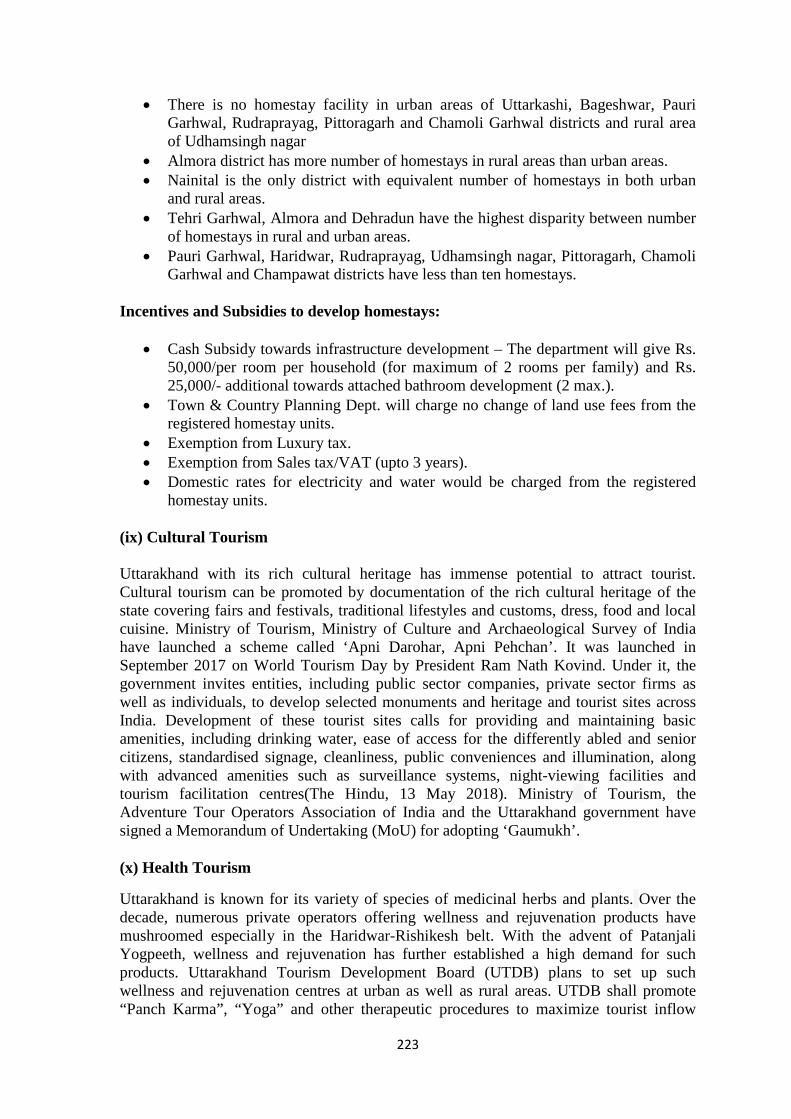
223
• There is no homestay facility in urban areas of Uttarkashi, Bageshwar, Pauri Garhwal, Rudraprayag, Pittoragarh and Chamoli Garhwal districts and rural area of Udhamsingh nagar
• Almora district has more number of homestays in rural areas than urban areas. • Nainital is the only district with equivalent number of homestays in both urban
and rural areas. • Tehri Garhwal, Almora and Dehradun have the highest disparity between number
of homestays in rural and urban areas. • Pauri Garhwal, Haridwar, Rudraprayag, Udhamsingh nagar, Pittoragarh, Chamoli
Garhwal and Champawat districts have less than ten homestays. Incentives and Subsidies to develop homestays:
• Cash Subsidy towards infrastructure development – The department will give Rs. 50,000/per room per household (for maximum of 2 rooms per family) and Rs. 25,000/- additional towards attached bathroom development (2 max.).
• Town & Country Planning Dept. will charge no change of land use fees from the registered homestay units.
• Exemption from Luxury tax. • Exemption from Sales tax/VAT (upto 3 years). • Domestic rates for electricity and water would be charged from the registered
homestay units.
(ix) Cultural Tourism Uttarakhand with its rich cultural heritage has immense potential to attract tourist. Cultural tourism can be promoted by documentation of the rich cultural heritage of the state covering fairs and festivals, traditional lifestyles and customs, dress, food and local cuisine. Ministry of Tourism, Ministry of Culture and Archaeological Survey of India have launched a scheme called ‘Apni Darohar, Apni Pehchan’. It was launched in September 2017 on World Tourism Day by President Ram Nath Kovind. Under it, the government invites entities, including public sector companies, private sector firms as well as individuals, to develop selected monuments and heritage and tourist sites across India. Development of these tourist sites calls for providing and maintaining basic amenities, including drinking water, ease of access for the differently abled and senior citizens, standardised signage, cleanliness, public conveniences and illumination, along with advanced amenities such as surveillance systems, night-viewing facilities and tourism facilitation centres(The Hindu, 13 May 2018). Ministry of Tourism, the Adventure Tour Operators Association of India and the Uttarakhand government have signed a Memorandum of Undertaking (MoU) for adopting ‘Gaumukh’. (x) Health Tourism
Uttarakhand is known for its variety of species of medicinal herbs and plants. Over the decade, numerous private operators offering wellness and rejuvenation products have mushroomed especially in the Haridwar-Rishikesh belt. With the advent of Patanjali Yogpeeth, wellness and rejuvenation has further established a high demand for such products. Uttarakhand Tourism Development Board (UTDB) plans to set up such wellness and rejuvenation centres at urban as well as rural areas. UTDB shall promote “Panch Karma”, “Yoga” and other therapeutic procedures to maximize tourist inflow
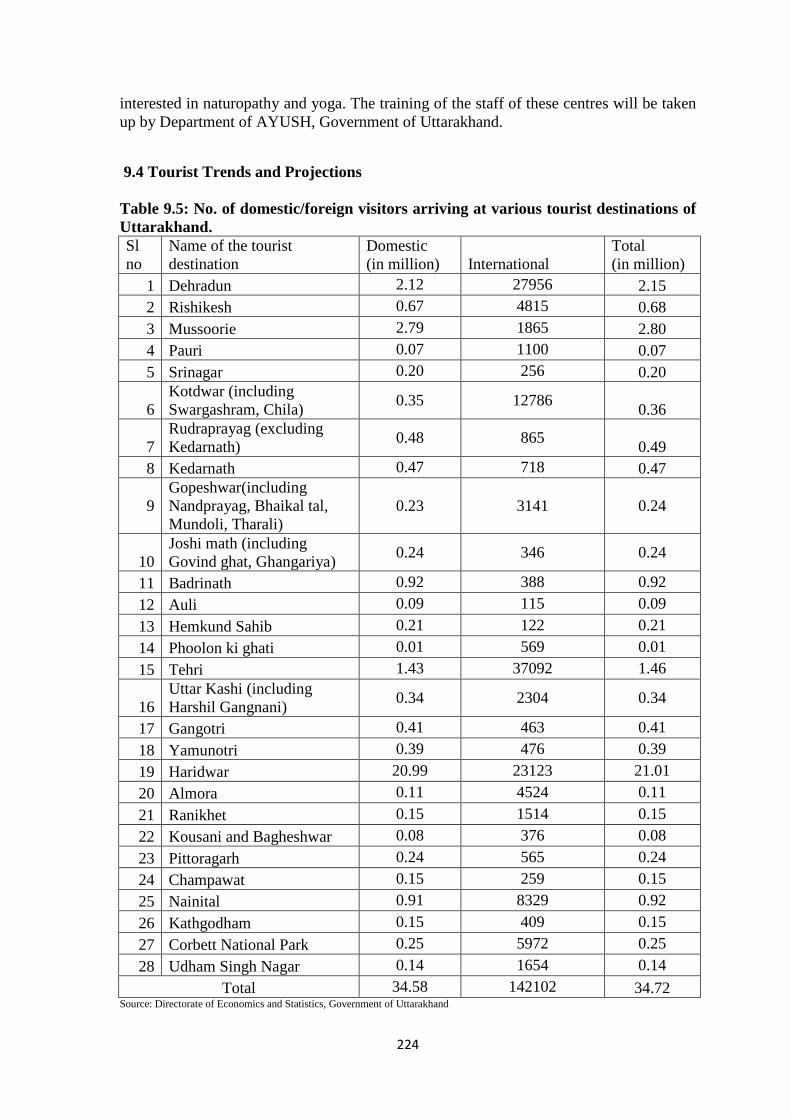
224
interested in naturopathy and yoga. The training of the staff of these centres will be taken up by Department of AYUSH, Government of Uttarakhand.
9.4 Tourist Trends and Projections Table 9.5: No. of domestic/foreign visitors arriving at various tourist destinations of Uttarakhand. Sl no
Name of the tourist destination
Domestic (in million) International
Total (in million)
1 Dehradun 2.12 27956 2.15 2 Rishikesh 0.67 4815 0.68 3 Mussoorie 2.79 1865 2.80 4 Pauri 0.07 1100 0.07 5 Srinagar 0.20 256 0.20
6 Kotdwar (including Swargashram, Chila) 0.35 12786 0.36
7 Rudraprayag (excluding Kedarnath) 0.48 865 0.49
8 Kedarnath 0.47 718 0.47
9 Gopeshwar(including Nandprayag, Bhaikal tal, Mundoli, Tharali)
0.23 3141 0.24
10 Joshi math (including Govind ghat, Ghangariya) 0.24 346 0.24
11 Badrinath 0.92 388 0.92 12 Auli 0.09 115 0.09 13 Hemkund Sahib 0.21 122 0.21 14 Phoolon ki ghati 0.01 569 0.01 15 Tehri 1.43 37092 1.46
16 Uttar Kashi (including Harshil Gangnani) 0.34 2304 0.34
17 Gangotri 0.41 463 0.41 18 Yamunotri 0.39 476 0.39 19 Haridwar 20.99 23123 21.01 20 Almora 0.11 4524 0.11 21 Ranikhet 0.15 1514 0.15 22 Kousani and Bagheshwar 0.08 376 0.08 23 Pittoragarh 0.24 565 0.24 24 Champawat 0.15 259 0.15 25 Nainital 0.91 8329 0.92 26 Kathgodham 0.15 409 0.15 27 Corbett National Park 0.25 5972 0.25 28 Udham Singh Nagar 0.14 1654 0.14
Total 34.58 142102 34.72 Source: Directorate of Economics and Statistics, Government of Uttarakhand
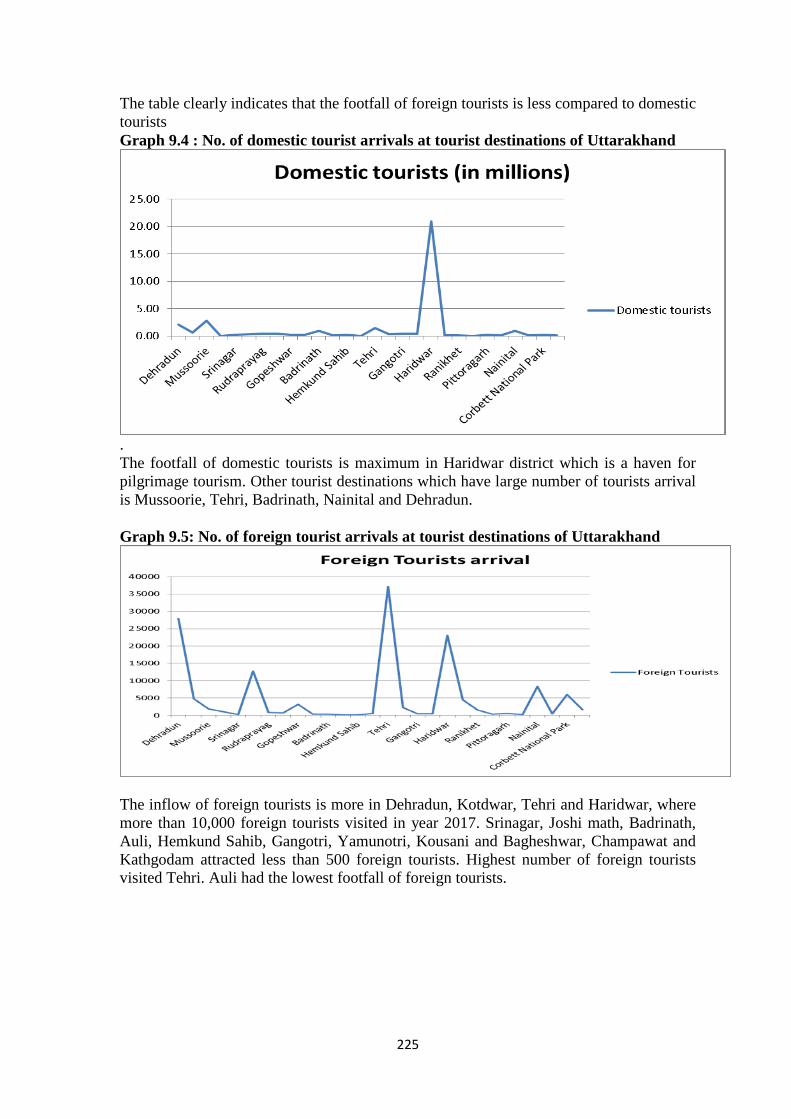
225
The table clearly indicates that the footfall of foreign tourists is less compared to domestic tourists Graph 9.4 : No. of domestic tourist arrivals at tourist destinations of Uttarakhand
. The footfall of domestic tourists is maximum in Haridwar district which is a haven for pilgrimage tourism. Other tourist destinations which have large number of tourists arrival is Mussoorie, Tehri, Badrinath, Nainital and Dehradun. Graph 9.5: No. of foreign tourist arrivals at tourist destinations of Uttarakhand
The inflow of foreign tourists is more in Dehradun, Kotdwar, Tehri and Haridwar, where more than 10,000 foreign tourists visited in year 2017. Srinagar, Joshi math, Badrinath, Auli, Hemkund Sahib, Gangotri, Yamunotri, Kousani and Bagheshwar, Champawat and Kathgodam attracted less than 500 foreign tourists. Highest number of foreign tourists visited Tehri. Auli had the lowest footfall of foreign tourists.
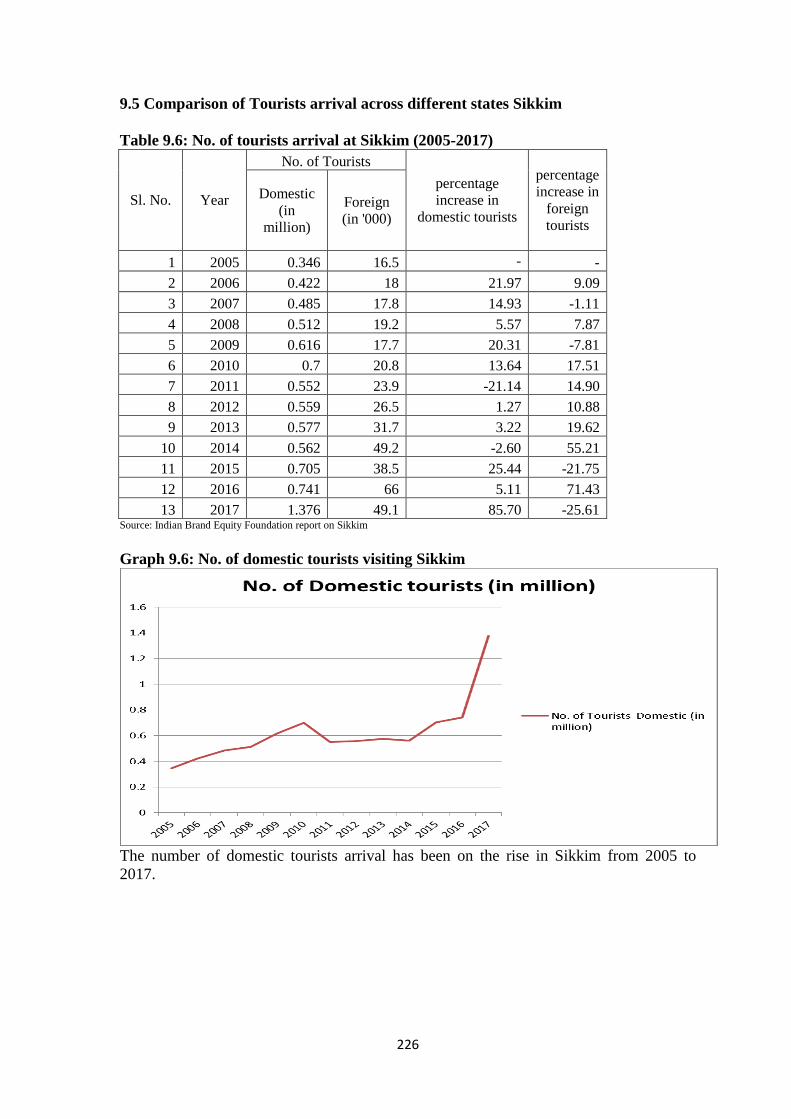
226
9.5 Comparison of Tourists arrival across different states Sikkim Table 9.6: No. of tourists arrival at Sikkim (2005-2017)
Sl. No. Year
No. of Tourists percentage increase in
domestic tourists
percentage increase in
foreign tourists
Domestic (in
million)
Foreign (in '000)
1 2005 0.346 16.5 - - 2 2006 0.422 18 21.97 9.09 3 2007 0.485 17.8 14.93 -1.11 4 2008 0.512 19.2 5.57 7.87 5 2009 0.616 17.7 20.31 -7.81 6 2010 0.7 20.8 13.64 17.51 7 2011 0.552 23.9 -21.14 14.90 8 2012 0.559 26.5 1.27 10.88 9 2013 0.577 31.7 3.22 19.62
10 2014 0.562 49.2 -2.60 55.21 11 2015 0.705 38.5 25.44 -21.75 12 2016 0.741 66 5.11 71.43 13 2017 1.376 49.1 85.70 -25.61
Source: Indian Brand Equity Foundation report on Sikkim Graph 9.6: No. of domestic tourists visiting Sikkim
The number of domestic tourists arrival has been on the rise in Sikkim from 2005 to 2017.
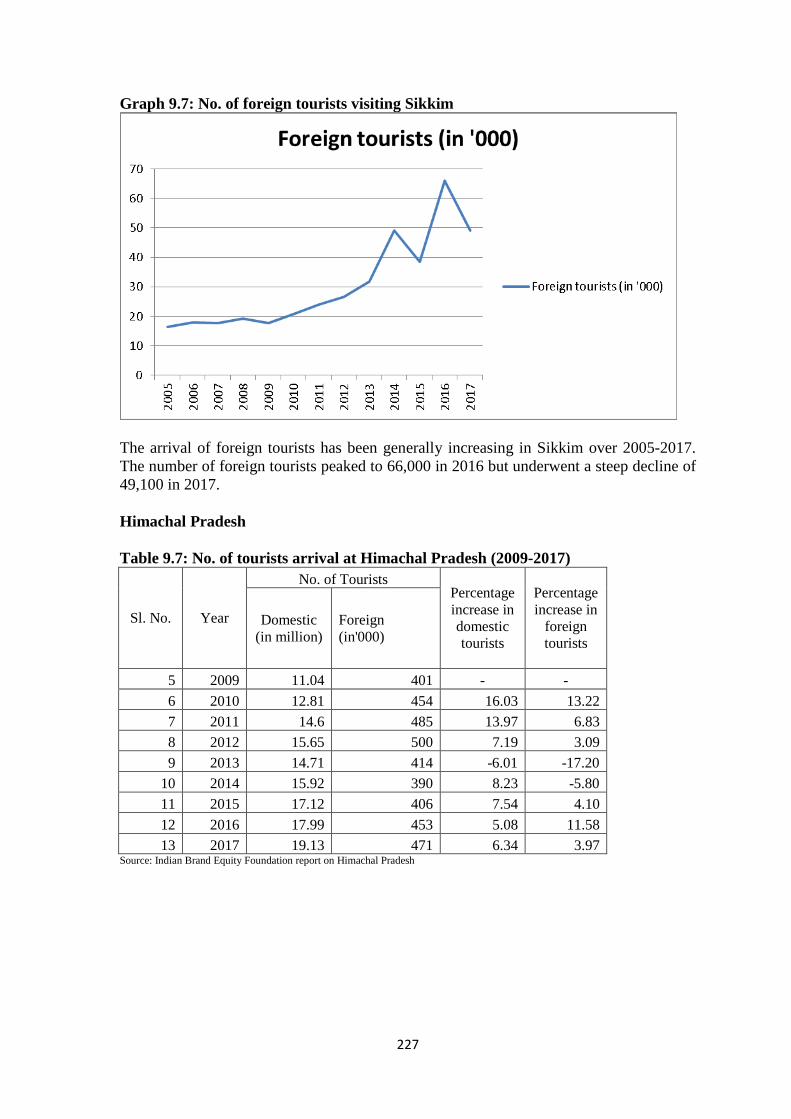
227
Graph 9.7: No. of foreign tourists visiting Sikkim
The arrival of foreign tourists has been generally increasing in Sikkim over 2005-2017. The number of foreign tourists peaked to 66,000 in 2016 but underwent a steep decline of 49,100 in 2017. Himachal Pradesh Table 9.7: No. of tourists arrival at Himachal Pradesh (2009-2017)
Sl. No. Year
No. of Tourists Percentage increase in domestic tourists
Percentage increase in
foreign tourists
Domestic (in million)
Foreign (in'000)
5 2009 11.04 401 - - 6 2010 12.81 454 16.03 13.22 7 2011 14.6 485 13.97 6.83 8 2012 15.65 500 7.19 3.09 9 2013 14.71 414 -6.01 -17.20
10 2014 15.92 390 8.23 -5.80 11 2015 17.12 406 7.54 4.10 12 2016 17.99 453 5.08 11.58 13 2017 19.13 471 6.34 3.97
Source: Indian Brand Equity Foundation report on Himachal Pradesh
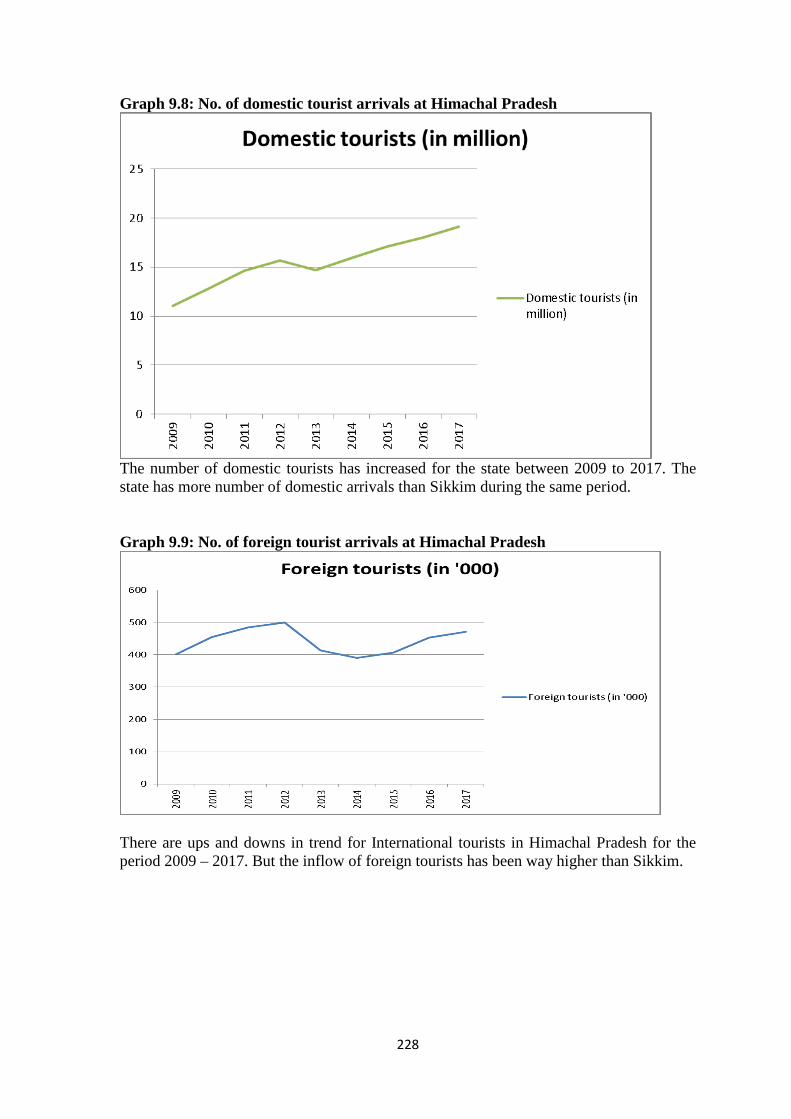
228
Graph 9.8: No. of domestic tourist arrivals at Himachal Pradesh
The number of domestic tourists has increased for the state between 2009 to 2017. The state has more number of domestic arrivals than Sikkim during the same period. Graph 9.9: No. of foreign tourist arrivals at Himachal Pradesh
There are ups and downs in trend for International tourists in Himachal Pradesh for the period 2009 – 2017. But the inflow of foreign tourists has been way higher than Sikkim.

229
Uttarakhand Table 9.8: No. of tourists arrival at Uttarakhand (2005-2017)
Sl. No. Year No. of Tourists percentage
increase in domestic tourists
percentage increase in
foreign tourists Domestic
Tourists (in million)
Foreign Tourists (in '000)
1 2005 16.28 92.74 - - 2 2006 19.36 96.26 18.90 3.80 3 2007 22.15 106.15 14.44 10.27 4 2008 23.06 112.42 4.11 5.91 5 2009 23.15 118.24 0.39 5.18 6 2010 30.97 136.46 33.76 15.41 7 2011 26.67 142.69 -13.90 4.56 8 2012 28.33 140.52 6.24 -1.52 9 2013 21.03 103.60 -25.77 -26.28
10 2014 22.52 109.95 7.10 6.13 11 2015 29.30 111.09 30.08 1.04 12 2016 31.66 112.80 8.09 1.53 13 2017 34.58 142.10 9.21 25.98
Indian Brand Equity Foundation report on Uttarakhand Graph 9.10: No. of domestic tourist arrivals at Uttarakhand
The number of domestic tourists visiting Uttarakhand has increased over 2005-2017. There was a decline in number of tourists in 2013 and 2014 as is clear from the graph above due to flash floods in Uttarakhand in 2013.
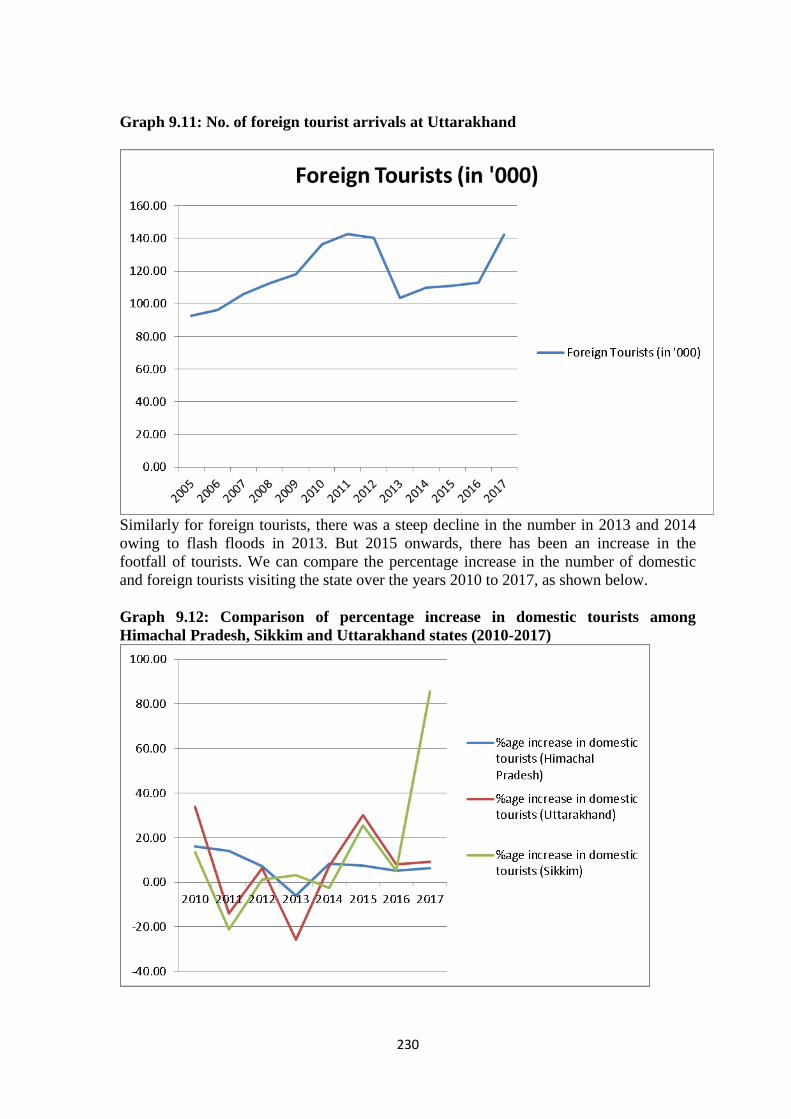
230
Graph 9.11: No. of foreign tourist arrivals at Uttarakhand
Similarly for foreign tourists, there was a steep decline in the number in 2013 and 2014 owing to flash floods in 2013. But 2015 onwards, there has been an increase in the footfall of tourists. We can compare the percentage increase in the number of domestic and foreign tourists visiting the state over the years 2010 to 2017, as shown below. Graph 9.12: Comparison of percentage increase in domestic tourists among Himachal Pradesh, Sikkim and Uttarakhand states (2010-2017)
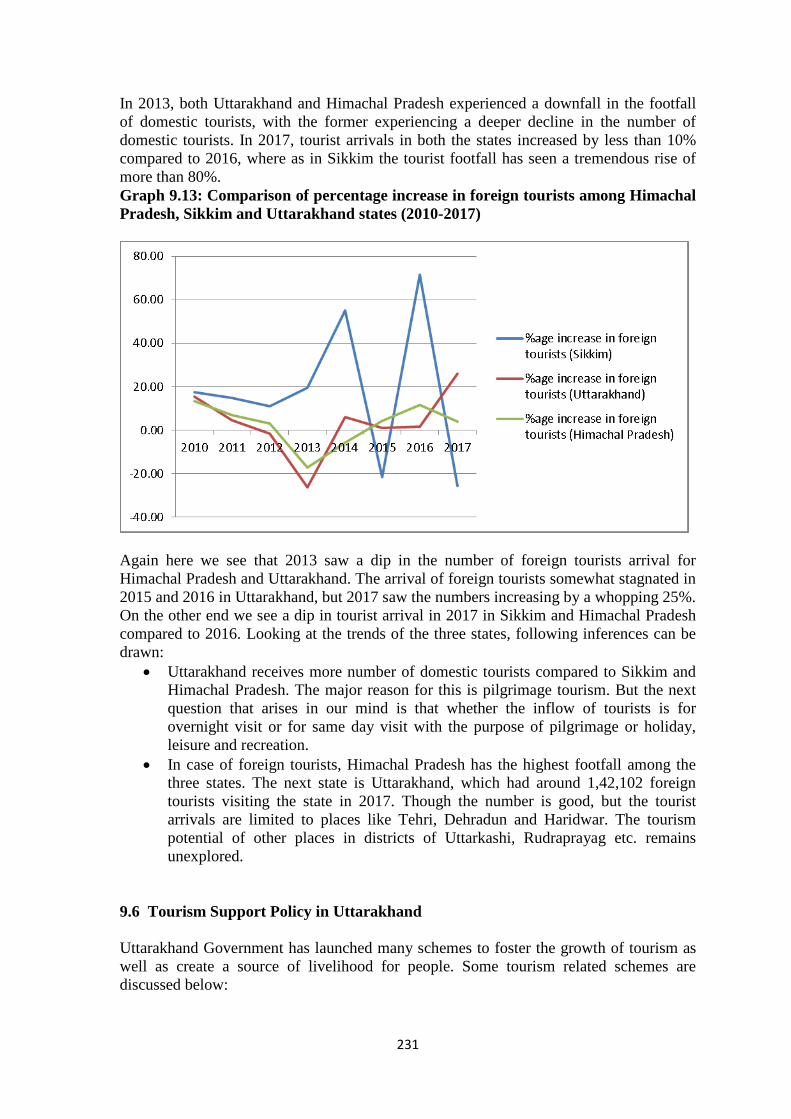
231
In 2013, both Uttarakhand and Himachal Pradesh experienced a downfall in the footfall of domestic tourists, with the former experiencing a deeper decline in the number of domestic tourists. In 2017, tourist arrivals in both the states increased by less than 10% compared to 2016, where as in Sikkim the tourist footfall has seen a tremendous rise of more than 80%. Graph 9.13: Comparison of percentage increase in foreign tourists among Himachal Pradesh, Sikkim and Uttarakhand states (2010-2017)
Again here we see that 2013 saw a dip in the number of foreign tourists arrival for Himachal Pradesh and Uttarakhand. The arrival of foreign tourists somewhat stagnated in 2015 and 2016 in Uttarakhand, but 2017 saw the numbers increasing by a whopping 25%. On the other end we see a dip in tourist arrival in 2017 in Sikkim and Himachal Pradesh compared to 2016. Looking at the trends of the three states, following inferences can be drawn:
• Uttarakhand receives more number of domestic tourists compared to Sikkim and Himachal Pradesh. The major reason for this is pilgrimage tourism. But the next question that arises in our mind is that whether the inflow of tourists is for overnight visit or for same day visit with the purpose of pilgrimage or holiday, leisure and recreation.
• In case of foreign tourists, Himachal Pradesh has the highest footfall among the three states. The next state is Uttarakhand, which had around 1,42,102 foreign tourists visiting the state in 2017. Though the number is good, but the tourist arrivals are limited to places like Tehri, Dehradun and Haridwar. The tourism potential of other places in districts of Uttarkashi, Rudraprayag etc. remains unexplored.
9.6 Tourism Support Policy in Uttarakhand
Uttarakhand Government has launched many schemes to foster the growth of tourism as well as create a source of livelihood for people. Some tourism related schemes are discussed below:
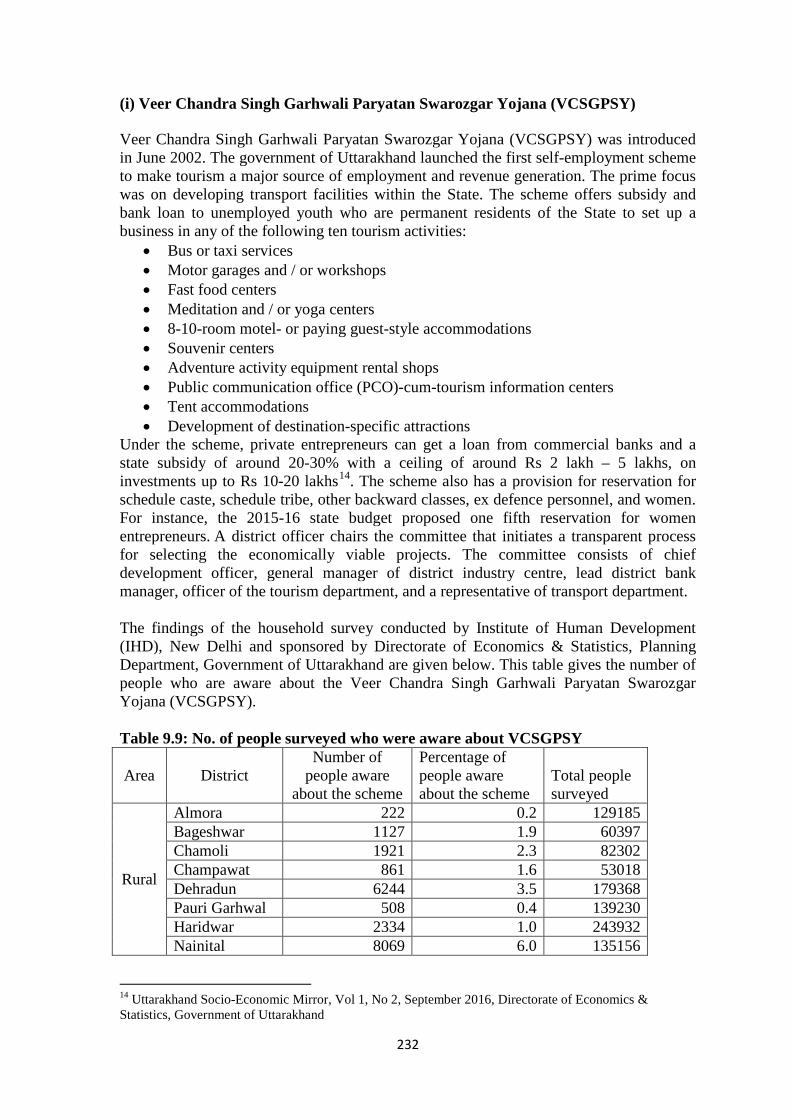
232
(i) Veer Chandra Singh Garhwali Paryatan Swarozgar Yojana (VCSGPSY) Veer Chandra Singh Garhwali Paryatan Swarozgar Yojana (VCSGPSY) was introduced in June 2002. The government of Uttarakhand launched the first self-employment scheme to make tourism a major source of employment and revenue generation. The prime focus was on developing transport facilities within the State. The scheme offers subsidy and bank loan to unemployed youth who are permanent residents of the State to set up a business in any of the following ten tourism activities:
• Bus or taxi services • Motor garages and / or workshops • Fast food centers • Meditation and / or yoga centers • 8-10-room motel- or paying guest-style accommodations • Souvenir centers • Adventure activity equipment rental shops • Public communication office (PCO)-cum-tourism information centers • Tent accommodations • Development of destination-specific attractions
Under the scheme, private entrepreneurs can get a loan from commercial banks and a state subsidy of around 20-30% with a ceiling of around Rs 2 lakh – 5 lakhs, on investments up to Rs 10-20 lakhs14. The scheme also has a provision for reservation for schedule caste, schedule tribe, other backward classes, ex defence personnel, and women. For instance, the 2015-16 state budget proposed one fifth reservation for women entrepreneurs. A district officer chairs the committee that initiates a transparent process for selecting the economically viable projects. The committee consists of chief development officer, general manager of district industry centre, lead district bank manager, officer of the tourism department, and a representative of transport department. The findings of the household survey conducted by Institute of Human Development (IHD), New Delhi and sponsored by Directorate of Economics & Statistics, Planning Department, Government of Uttarakhand are given below. This table gives the number of people who are aware about the Veer Chandra Singh Garhwali Paryatan Swarozgar Yojana (VCSGPSY). Table 9.9: No. of people surveyed who were aware about VCSGPSY
Area District Number of
people aware about the scheme
Percentage of people aware about the scheme
Total people surveyed
Rural
Almora 222 0.2 129185 Bageshwar 1127 1.9 60397 Chamoli 1921 2.3 82302 Champawat 861 1.6 53018 Dehradun 6244 3.5 179368 Pauri Garhwal 508 0.4 139230 Haridwar 2334 1.0 243932 Nainital 8069 6.0 135156
14 Uttarakhand Socio-Economic Mirror, Vol 1, No 2, September 2016, Directorate of Economics & Statistics, Government of Uttarakhand
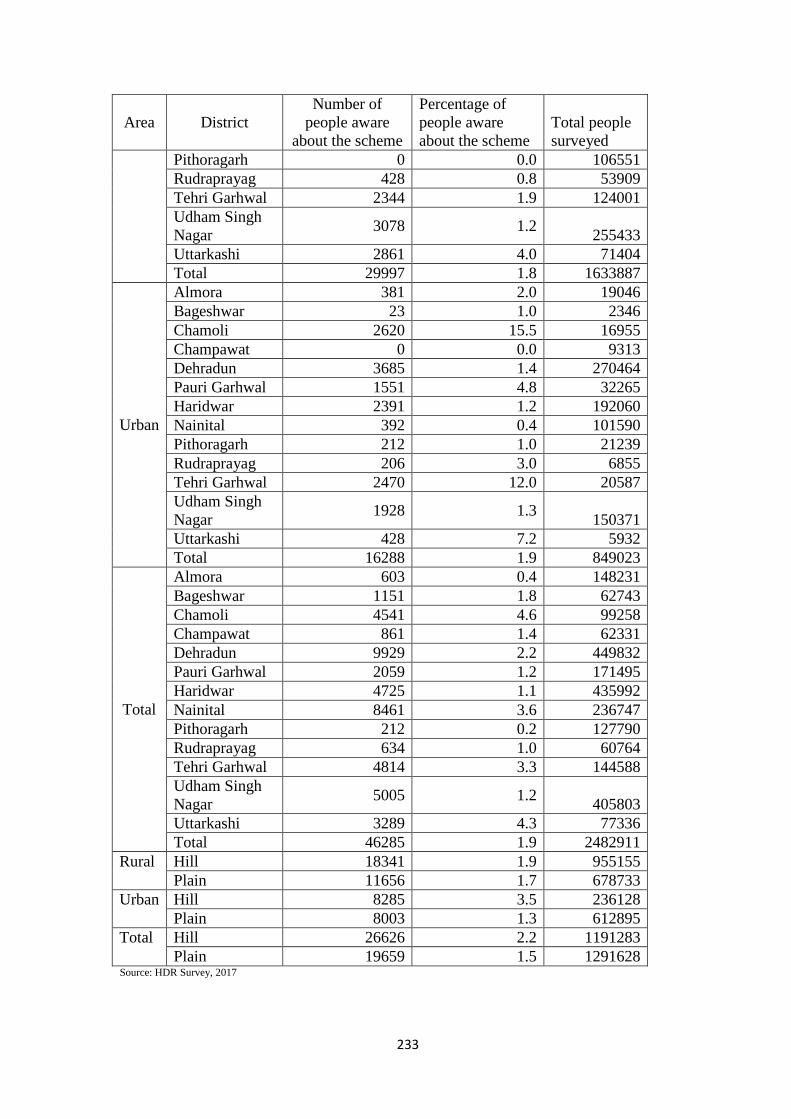
233
Area District Number of
people aware about the scheme
Percentage of people aware about the scheme
Total people surveyed
Pithoragarh 0 0.0 106551 Rudraprayag 428 0.8 53909 Tehri Garhwal 2344 1.9 124001 Udham Singh Nagar 3078 1.2 255433 Uttarkashi 2861 4.0 71404 Total 29997 1.8 1633887
Urban
Almora 381 2.0 19046 Bageshwar 23 1.0 2346 Chamoli 2620 15.5 16955 Champawat 0 0.0 9313 Dehradun 3685 1.4 270464 Pauri Garhwal 1551 4.8 32265 Haridwar 2391 1.2 192060 Nainital 392 0.4 101590 Pithoragarh 212 1.0 21239 Rudraprayag 206 3.0 6855 Tehri Garhwal 2470 12.0 20587 Udham Singh Nagar 1928 1.3 150371 Uttarkashi 428 7.2 5932 Total 16288 1.9 849023
Total
Almora 603 0.4 148231 Bageshwar 1151 1.8 62743 Chamoli 4541 4.6 99258 Champawat 861 1.4 62331 Dehradun 9929 2.2 449832 Pauri Garhwal 2059 1.2 171495 Haridwar 4725 1.1 435992 Nainital 8461 3.6 236747 Pithoragarh 212 0.2 127790 Rudraprayag 634 1.0 60764 Tehri Garhwal 4814 3.3 144588 Udham Singh Nagar 5005 1.2 405803 Uttarkashi 3289 4.3 77336 Total 46285 1.9 2482911
Rural Hill 18341 1.9 955155 Plain 11656 1.7 678733
Urban Hill 8285 3.5 236128 Plain 8003 1.3 612895
Total Hill 26626 2.2 1191283 Plain 19659 1.5 1291628
Source: HDR Survey, 2017
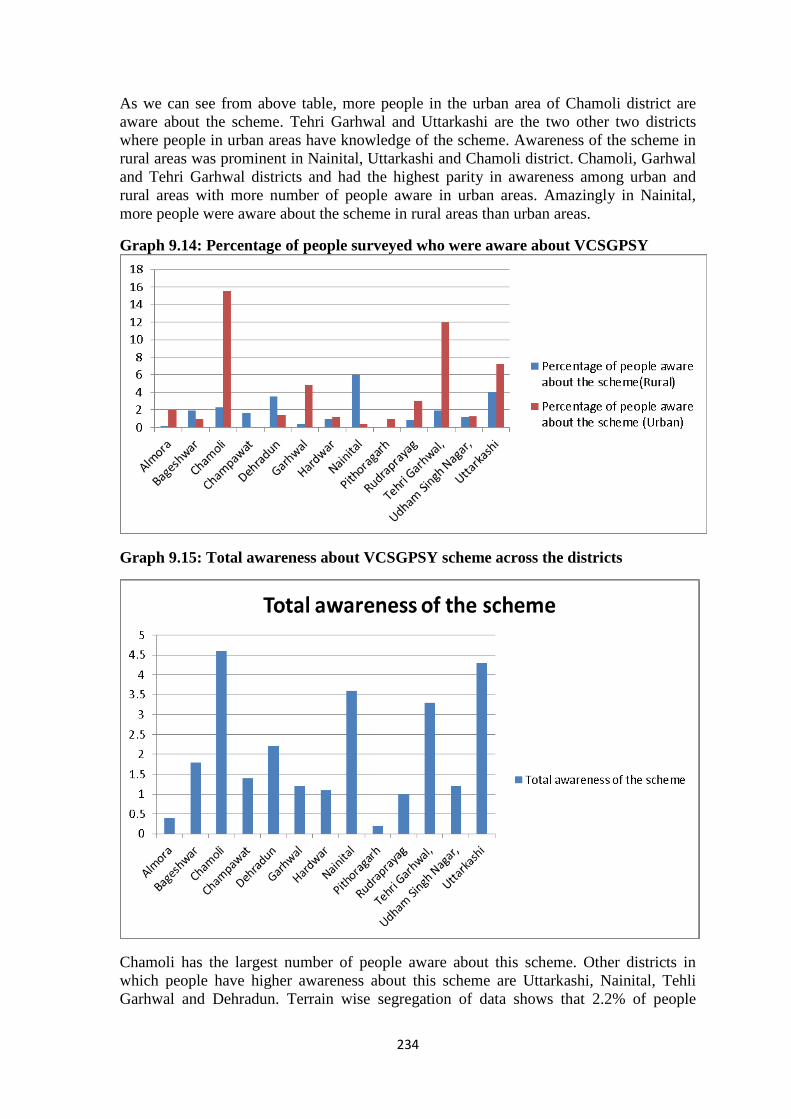
234
As we can see from above table, more people in the urban area of Chamoli district are aware about the scheme. Tehri Garhwal and Uttarkashi are the two other two districts where people in urban areas have knowledge of the scheme. Awareness of the scheme in rural areas was prominent in Nainital, Uttarkashi and Chamoli district. Chamoli, Garhwal and Tehri Garhwal districts and had the highest parity in awareness among urban and rural areas with more number of people aware in urban areas. Amazingly in Nainital, more people were aware about the scheme in rural areas than urban areas.
Graph 9.14: Percentage of people surveyed who were aware about VCSGPSY
Graph 9.15: Total awareness about VCSGPSY scheme across the districts
Chamoli has the largest number of people aware about this scheme. Other districts in which people have higher awareness about this scheme are Uttarkashi, Nainital, Tehli Garhwal and Dehradun. Terrain wise segregation of data shows that 2.2% of people
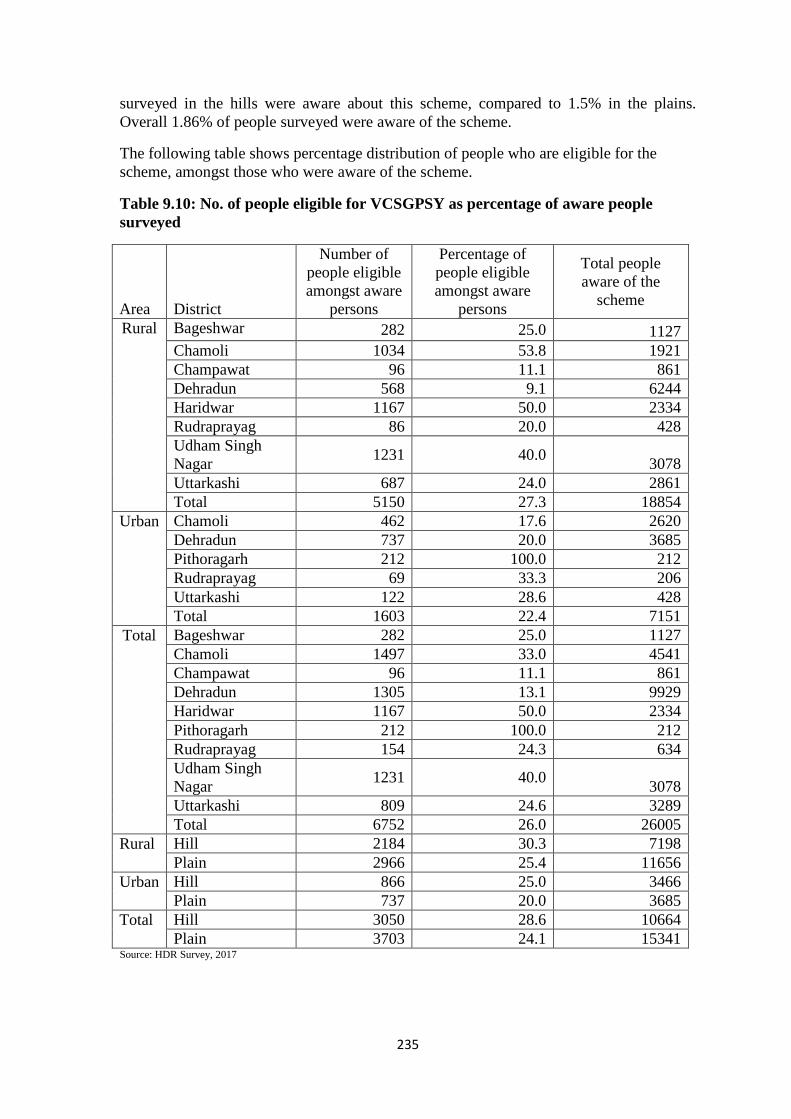
235
surveyed in the hills were aware about this scheme, compared to 1.5% in the plains. Overall 1.86% of people surveyed were aware of the scheme.
The following table shows percentage distribution of people who are eligible for the scheme, amongst those who were aware of the scheme.
Table 9.10: No. of people eligible for VCSGPSY as percentage of aware people surveyed
Area District
Number of people eligible amongst aware
persons
Percentage of people eligible amongst aware
persons
Total people aware of the
scheme
Rural Bageshwar 282 25.0 1127 Chamoli 1034 53.8 1921 Champawat 96 11.1 861 Dehradun 568 9.1 6244 Haridwar 1167 50.0 2334 Rudraprayag 86 20.0 428 Udham Singh Nagar 1231 40.0 3078 Uttarkashi 687 24.0 2861 Total 5150 27.3 18854
Urban Chamoli 462 17.6 2620 Dehradun 737 20.0 3685 Pithoragarh 212 100.0 212 Rudraprayag 69 33.3 206 Uttarkashi 122 28.6 428 Total 1603 22.4 7151
Total Bageshwar 282 25.0 1127 Chamoli 1497 33.0 4541 Champawat 96 11.1 861 Dehradun 1305 13.1 9929 Haridwar 1167 50.0 2334 Pithoragarh 212 100.0 212 Rudraprayag 154 24.3 634 Udham Singh Nagar 1231 40.0 3078 Uttarkashi 809 24.6 3289 Total 6752 26.0 26005
Rural Hill 2184 30.3 7198 Plain 2966 25.4 11656
Urban Hill 866 25.0 3466 Plain 737 20.0 3685
Total Hill 3050 28.6 10664 Plain 3703 24.1 15341
Source: HDR Survey, 2017
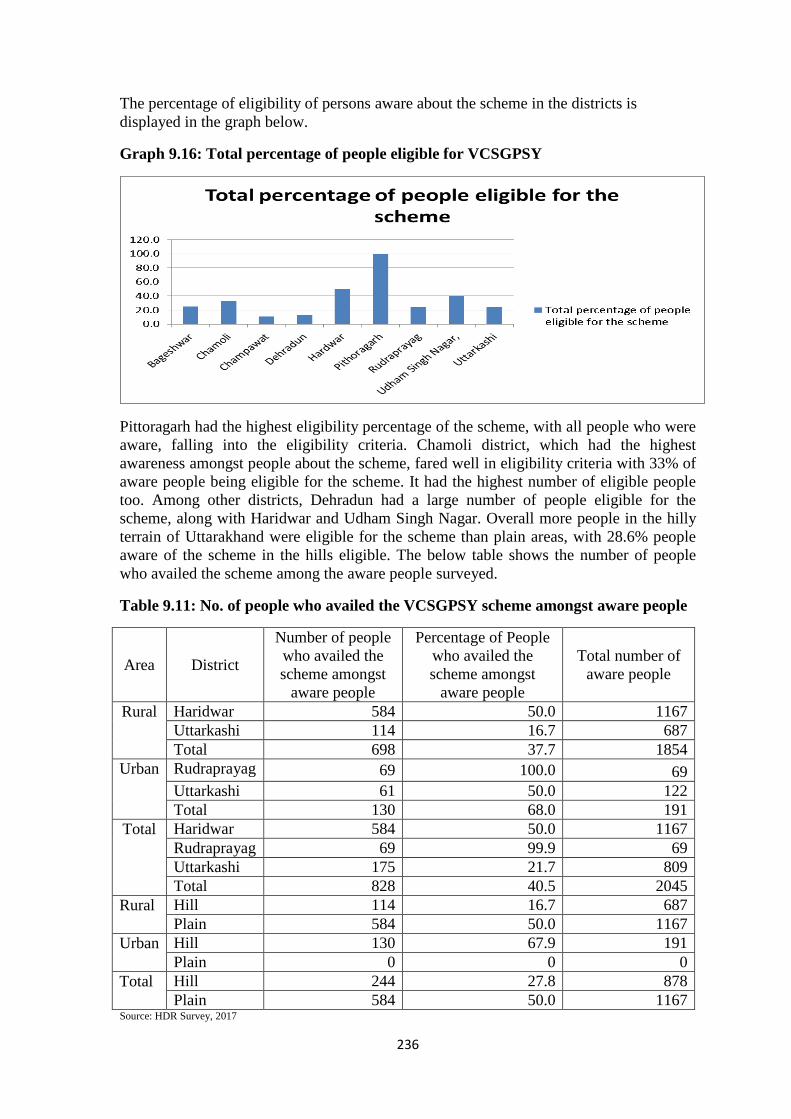
236
The percentage of eligibility of persons aware about the scheme in the districts is displayed in the graph below.
Graph 9.16: Total percentage of people eligible for VCSGPSY
Pittoragarh had the highest eligibility percentage of the scheme, with all people who were aware, falling into the eligibility criteria. Chamoli district, which had the highest awareness amongst people about the scheme, fared well in eligibility criteria with 33% of aware people being eligible for the scheme. It had the highest number of eligible people too. Among other districts, Dehradun had a large number of people eligible for the scheme, along with Haridwar and Udham Singh Nagar. Overall more people in the hilly terrain of Uttarakhand were eligible for the scheme than plain areas, with 28.6% people aware of the scheme in the hills eligible. The below table shows the number of people who availed the scheme among the aware people surveyed.
Table 9.11: No. of people who availed the VCSGPSY scheme amongst aware people
Area District
Number of people who availed the scheme amongst
aware people
Percentage of People who availed the scheme amongst
aware people
Total number of aware people
Rural Haridwar 584 50.0 1167 Uttarkashi 114 16.7 687 Total 698 37.7 1854
Urban Rudraprayag 69 100.0 69 Uttarkashi 61 50.0 122 Total 130 68.0 191
Total Haridwar 584 50.0 1167 Rudraprayag 69 99.9 69 Uttarkashi 175 21.7 809 Total 828 40.5 2045
Rural Hill 114 16.7 687 Plain 584 50.0 1167
Urban Hill 130 67.9 191 Plain 0 0 0
Total Hill 244 27.8 878 Plain 584 50.0 1167
Source: HDR Survey, 2017

237
As we can see from the table above, among people surveyed, only 3 districts had people who were aware of the scheme and availed its benefits. Maximum people who availed the benefit of the scheme belonged to rural areas of Haridwar. Similarly in Uttarkashi more people in rural areas had benefitted from the scheme compared to urban areas. In urban areas having plain terrain, nobody availed benefit of the scheme amongst the people who were aware and eligible for the scheme. Overall more people residing in plain areas were benefitting from the scheme. Government should thus raise more awareness about the scheme and provide more incentives to rope in more people.
The survey also measured the level of satisfaction among the people who were availing the benefits of this scheme.
Table 9.12: Satisfaction level among the people who availed the benefit of VCSGPSY
Area District Little bit
To some extent
Total
Rural Haridwar 0 584 584 Uttarkashi 0 114 114 Total 0 698 698
Urban Rudraprayag 0 69 69 Uttarkashi 61 0 61 Total 61 69 130
Total Haridwar 0 584 584 Rudraprayag 0 69 69 Uttarkashi 61 114 175 Total 61 767 828
Rural Hill 0 114 114 Plain 0 584 584
Urban Hill 61 69 130 Plain 0 0 0
Total Hill 61 183 244 Plain 0 584 584
Source: HDR Survey, 2017
Though there was no overall dissatisfaction regarding the scheme, but the satisfaction level was little low in urban areas of Uttarkashi district. Apart from that people in Rudraprayag and Haridwar districts were satisfied with the scheme to some extent.
9.7 Development of Human Resource
To facilitate development of human resource, Uttarakhand government has established Government Institute of Hotel Management (GIHM) in Almora and Dehradun districts. In 2015-16, state government inaugurated GIHM in Tehri district. The following numbers of youth were imparted training in hotel management in the institute over recent years.
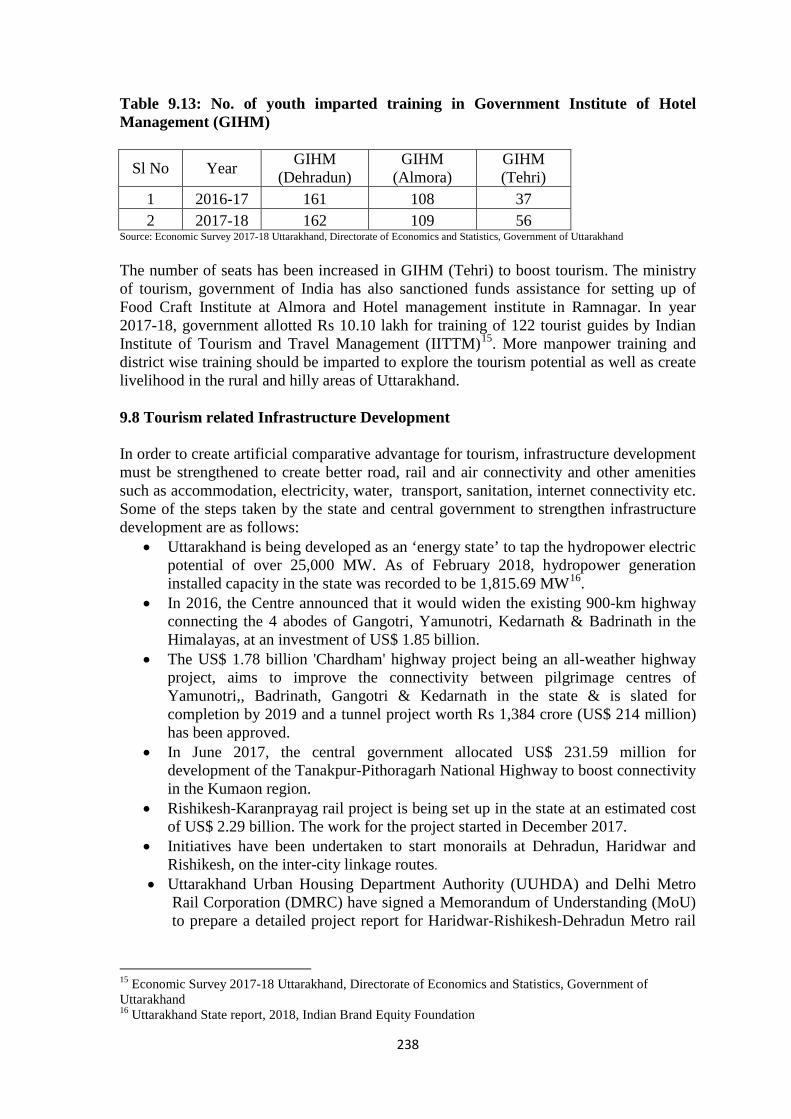
238
Table 9.13: No. of youth imparted training in Government Institute of Hotel Management (GIHM)
Sl No Year GIHM (Dehradun)
GIHM (Almora)
GIHM (Tehri)
1 2016-17 161 108 37 2 2017-18 162 109 56
Source: Economic Survey 2017-18 Uttarakhand, Directorate of Economics and Statistics, Government of Uttarakhand The number of seats has been increased in GIHM (Tehri) to boost tourism. The ministry of tourism, government of India has also sanctioned funds assistance for setting up of Food Craft Institute at Almora and Hotel management institute in Ramnagar. In year 2017-18, government allotted Rs 10.10 lakh for training of 122 tourist guides by Indian Institute of Tourism and Travel Management (IITTM)15. More manpower training and district wise training should be imparted to explore the tourism potential as well as create livelihood in the rural and hilly areas of Uttarakhand. 9.8 Tourism related Infrastructure Development In order to create artificial comparative advantage for tourism, infrastructure development must be strengthened to create better road, rail and air connectivity and other amenities such as accommodation, electricity, water, transport, sanitation, internet connectivity etc. Some of the steps taken by the state and central government to strengthen infrastructure development are as follows:
• Uttarakhand is being developed as an ‘energy state’ to tap the hydropower electric potential of over 25,000 MW. As of February 2018, hydropower generation installed capacity in the state was recorded to be 1,815.69 MW16.
• In 2016, the Centre announced that it would widen the existing 900-km highway connecting the 4 abodes of Gangotri, Yamunotri, Kedarnath & Badrinath in the Himalayas, at an investment of US$ 1.85 billion.
• The US$ 1.78 billion 'Chardham' highway project being an all-weather highway project, aims to improve the connectivity between pilgrimage centres of Yamunotri,, Badrinath, Gangotri & Kedarnath in the state & is slated for completion by 2019 and a tunnel project worth Rs 1,384 crore (US$ 214 million) has been approved.
• In June 2017, the central government allocated US$ 231.59 million for development of the Tanakpur-Pithoragarh National Highway to boost connectivity in the Kumaon region.
• Rishikesh-Karanprayag rail project is being set up in the state at an estimated cost of US$ 2.29 billion. The work for the project started in December 2017.
• Initiatives have been undertaken to start monorails at Dehradun, Haridwar and Rishikesh, on the inter-city linkage routes.
• Uttarakhand Urban Housing Department Authority (UUHDA) and Delhi Metro Rail Corporation (DMRC) have signed a Memorandum of Understanding (MoU) to prepare a detailed project report for Haridwar-Rishikesh-Dehradun Metro rail
15 Economic Survey 2017-18 Uttarakhand, Directorate of Economics and Statistics, Government of Uttarakhand 16 Uttarakhand State report, 2018, Indian Brand Equity Foundation
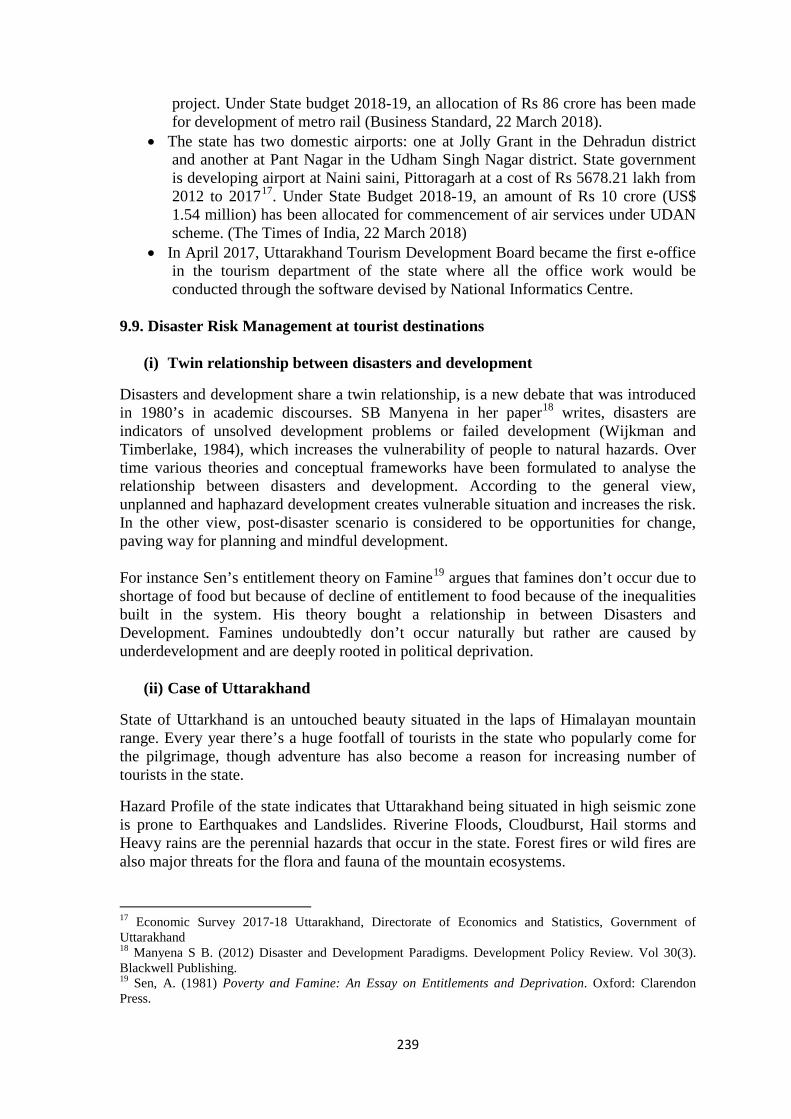
239
project. Under State budget 2018-19, an allocation of Rs 86 crore has been made for development of metro rail (Business Standard, 22 March 2018).
• The state has two domestic airports: one at Jolly Grant in the Dehradun district and another at Pant Nagar in the Udham Singh Nagar district. State government is developing airport at Naini saini, Pittoragarh at a cost of Rs 5678.21 lakh from 2012 to 201717. Under State Budget 2018-19, an amount of Rs 10 crore (US$ 1.54 million) has been allocated for commencement of air services under UDAN scheme. (The Times of India, 22 March 2018)
• In April 2017, Uttarakhand Tourism Development Board became the first e-office in the tourism department of the state where all the office work would be conducted through the software devised by National Informatics Centre.
9.9. Disaster Risk Management at tourist destinations
(i) Twin relationship between disasters and development
Disasters and development share a twin relationship, is a new debate that was introduced in 1980’s in academic discourses. SB Manyena in her paper18 writes, disasters are indicators of unsolved development problems or failed development (Wijkman and Timberlake, 1984), which increases the vulnerability of people to natural hazards. Over time various theories and conceptual frameworks have been formulated to analyse the relationship between disasters and development. According to the general view, unplanned and haphazard development creates vulnerable situation and increases the risk. In the other view, post-disaster scenario is considered to be opportunities for change, paving way for planning and mindful development. For instance Sen’s entitlement theory on Famine19 argues that famines don’t occur due to shortage of food but because of decline of entitlement to food because of the inequalities built in the system. His theory bought a relationship in between Disasters and Development. Famines undoubtedly don’t occur naturally but rather are caused by underdevelopment and are deeply rooted in political deprivation.
(ii) Case of Uttarakhand
State of Uttarkhand is an untouched beauty situated in the laps of Himalayan mountain range. Every year there’s a huge footfall of tourists in the state who popularly come for the pilgrimage, though adventure has also become a reason for increasing number of tourists in the state.
Hazard Profile of the state indicates that Uttarakhand being situated in high seismic zone is prone to Earthquakes and Landslides. Riverine Floods, Cloudburst, Hail storms and Heavy rains are the perennial hazards that occur in the state. Forest fires or wild fires are also major threats for the flora and fauna of the mountain ecosystems.
17 Economic Survey 2017-18 Uttarakhand, Directorate of Economics and Statistics, Government of Uttarakhand 18 Manyena S B. (2012) Disaster and Development Paradigms. Development Policy Review. Vol 30(3). Blackwell Publishing. 19 Sen, A. (1981) Poverty and Famine: An Essay on Entitlements and Deprivation. Oxford: Clarendon Press.
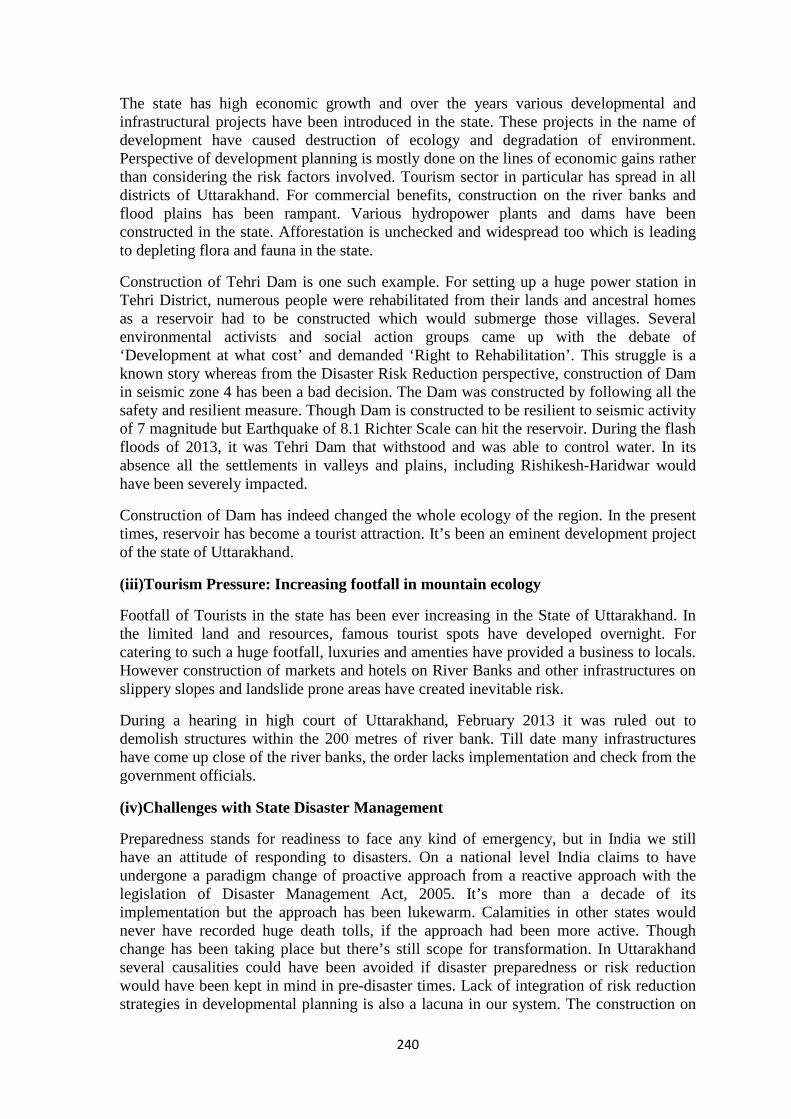
240
The state has high economic growth and over the years various developmental and infrastructural projects have been introduced in the state. These projects in the name of development have caused destruction of ecology and degradation of environment. Perspective of development planning is mostly done on the lines of economic gains rather than considering the risk factors involved. Tourism sector in particular has spread in all districts of Uttarakhand. For commercial benefits, construction on the river banks and flood plains has been rampant. Various hydropower plants and dams have been constructed in the state. Afforestation is unchecked and widespread too which is leading to depleting flora and fauna in the state.
Construction of Tehri Dam is one such example. For setting up a huge power station in Tehri District, numerous people were rehabilitated from their lands and ancestral homes as a reservoir had to be constructed which would submerge those villages. Several environmental activists and social action groups came up with the debate of ‘Development at what cost’ and demanded ‘Right to Rehabilitation’. This struggle is a known story whereas from the Disaster Risk Reduction perspective, construction of Dam in seismic zone 4 has been a bad decision. The Dam was constructed by following all the safety and resilient measure. Though Dam is constructed to be resilient to seismic activity of 7 magnitude but Earthquake of 8.1 Richter Scale can hit the reservoir. During the flash floods of 2013, it was Tehri Dam that withstood and was able to control water. In its absence all the settlements in valleys and plains, including Rishikesh-Haridwar would have been severely impacted.
Construction of Dam has indeed changed the whole ecology of the region. In the present times, reservoir has become a tourist attraction. It’s been an eminent development project of the state of Uttarakhand.
(iii)Tourism Pressure: Increasing footfall in mountain ecology
Footfall of Tourists in the state has been ever increasing in the State of Uttarakhand. In the limited land and resources, famous tourist spots have developed overnight. For catering to such a huge footfall, luxuries and amenties have provided a business to locals. However construction of markets and hotels on River Banks and other infrastructures on slippery slopes and landslide prone areas have created inevitable risk.
During a hearing in high court of Uttarakhand, February 2013 it was ruled out to demolish structures within the 200 metres of river bank. Till date many infrastructures have come up close of the river banks, the order lacks implementation and check from the government officials.
(iv)Challenges with State Disaster Management
Preparedness stands for readiness to face any kind of emergency, but in India we still have an attitude of responding to disasters. On a national level India claims to have undergone a paradigm change of proactive approach from a reactive approach with the legislation of Disaster Management Act, 2005. It’s more than a decade of its implementation but the approach has been lukewarm. Calamities in other states would never have recorded huge death tolls, if the approach had been more active. Though change has been taking place but there’s still scope for transformation. In Uttarakhand several causalities could have been avoided if disaster preparedness or risk reduction would have been kept in mind in pre-disaster times. Lack of integration of risk reduction strategies in developmental planning is also a lacuna in our system. The construction on
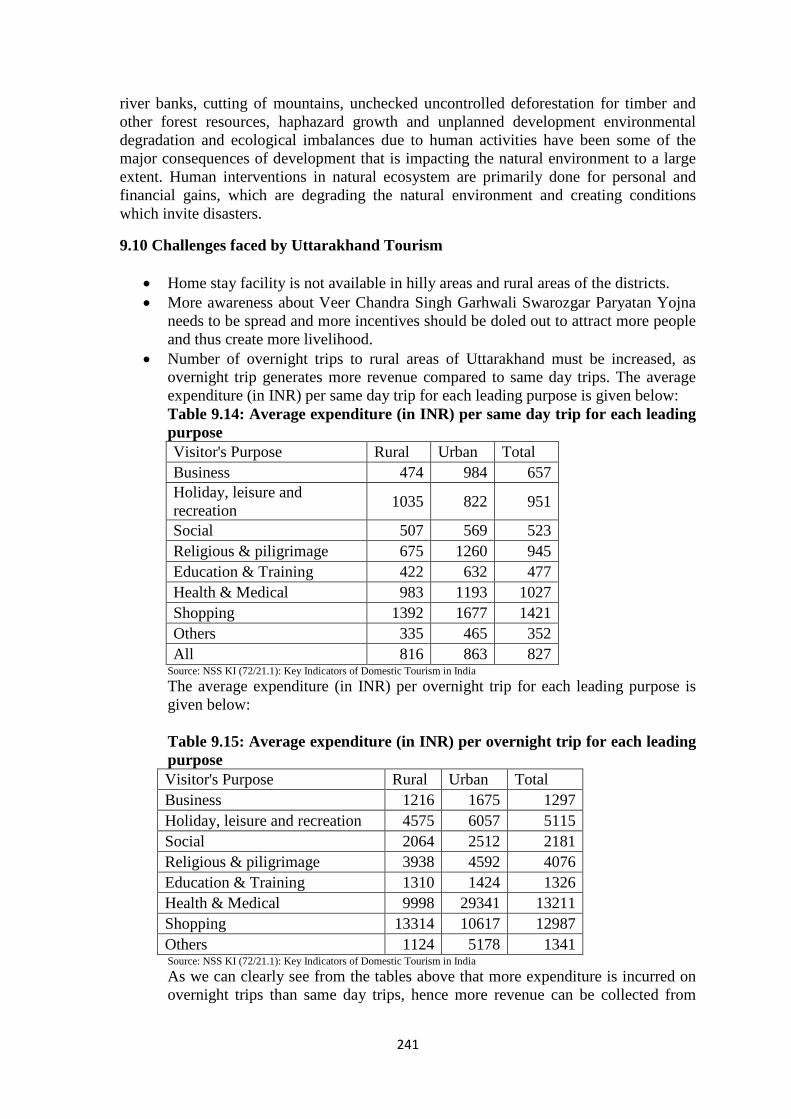
241
river banks, cutting of mountains, unchecked uncontrolled deforestation for timber and other forest resources, haphazard growth and unplanned development environmental degradation and ecological imbalances due to human activities have been some of the major consequences of development that is impacting the natural environment to a large extent. Human interventions in natural ecosystem are primarily done for personal and financial gains, which are degrading the natural environment and creating conditions which invite disasters.
9.10 Challenges faced by Uttarakhand Tourism
• Home stay facility is not available in hilly areas and rural areas of the districts. • More awareness about Veer Chandra Singh Garhwali Swarozgar Paryatan Yojna
needs to be spread and more incentives should be doled out to attract more people and thus create more livelihood.
• Number of overnight trips to rural areas of Uttarakhand must be increased, as overnight trip generates more revenue compared to same day trips. The average expenditure (in INR) per same day trip for each leading purpose is given below: Table 9.14: Average expenditure (in INR) per same day trip for each leading purpose Visitor's Purpose Rural Urban Total Business 474 984 657 Holiday, leisure and recreation 1035 822 951
Social 507 569 523 Religious & piligrimage 675 1260 945 Education & Training 422 632 477 Health & Medical 983 1193 1027 Shopping 1392 1677 1421 Others 335 465 352 All 816 863 827
Source: NSS KI (72/21.1): Key Indicators of Domestic Tourism in India The average expenditure (in INR) per overnight trip for each leading purpose is given below: Table 9.15: Average expenditure (in INR) per overnight trip for each leading purpose Visitor's Purpose Rural Urban Total Business 1216 1675 1297 Holiday, leisure and recreation 4575 6057 5115 Social 2064 2512 2181 Religious & piligrimage 3938 4592 4076 Education & Training 1310 1424 1326 Health & Medical 9998 29341 13211 Shopping 13314 10617 12987 Others 1124 5178 1341
Source: NSS KI (72/21.1): Key Indicators of Domestic Tourism in India As we can clearly see from the tables above that more expenditure is incurred on overnight trips than same day trips, hence more revenue can be collected from
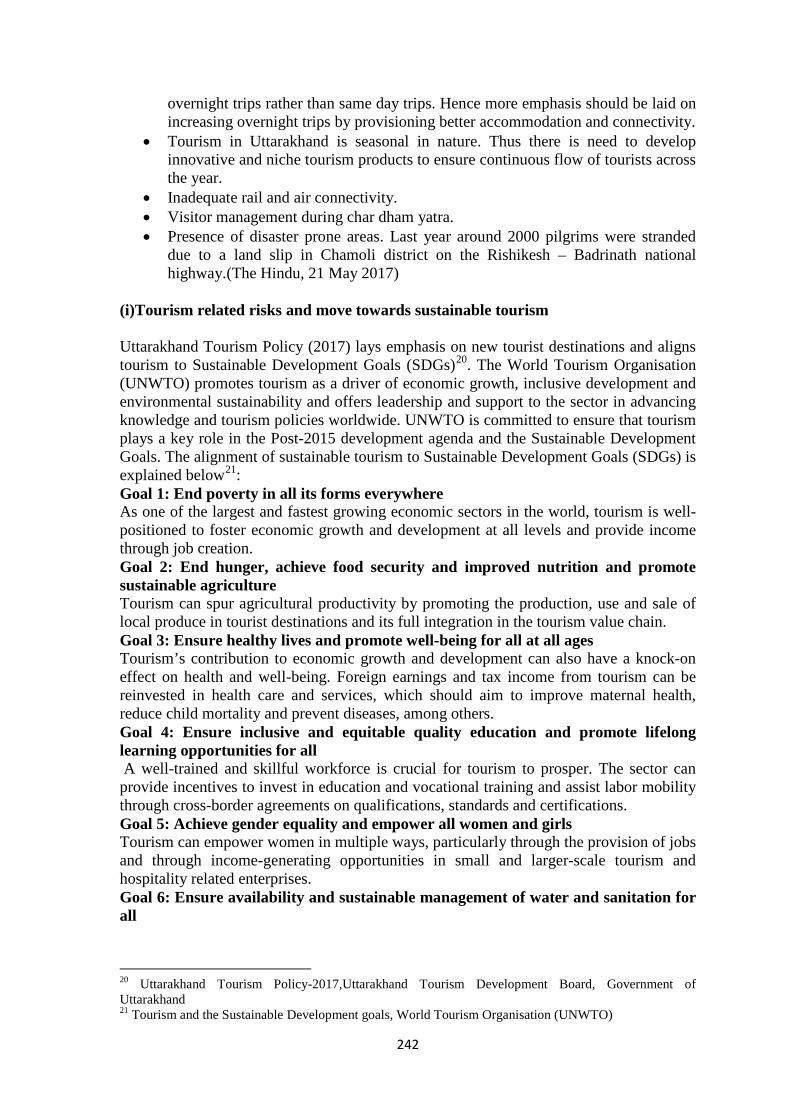
242
overnight trips rather than same day trips. Hence more emphasis should be laid on increasing overnight trips by provisioning better accommodation and connectivity.
• Tourism in Uttarakhand is seasonal in nature. Thus there is need to develop innovative and niche tourism products to ensure continuous flow of tourists across the year.
• Inadequate rail and air connectivity. • Visitor management during char dham yatra. • Presence of disaster prone areas. Last year around 2000 pilgrims were stranded
due to a land slip in Chamoli district on the Rishikesh – Badrinath national highway.(The Hindu, 21 May 2017)
(i)Tourism related risks and move towards sustainable tourism Uttarakhand Tourism Policy (2017) lays emphasis on new tourist destinations and aligns tourism to Sustainable Development Goals (SDGs)20. The World Tourism Organisation (UNWTO) promotes tourism as a driver of economic growth, inclusive development and environmental sustainability and offers leadership and support to the sector in advancing knowledge and tourism policies worldwide. UNWTO is committed to ensure that tourism plays a key role in the Post-2015 development agenda and the Sustainable Development Goals. The alignment of sustainable tourism to Sustainable Development Goals (SDGs) is explained below21: Goal 1: End poverty in all its forms everywhere As one of the largest and fastest growing economic sectors in the world, tourism is well-positioned to foster economic growth and development at all levels and provide income through job creation. Goal 2: End hunger, achieve food security and improved nutrition and promote sustainable agriculture Tourism can spur agricultural productivity by promoting the production, use and sale of local produce in tourist destinations and its full integration in the tourism value chain. Goal 3: Ensure healthy lives and promote well-being for all at all ages Tourism’s contribution to economic growth and development can also have a knock-on effect on health and well-being. Foreign earnings and tax income from tourism can be reinvested in health care and services, which should aim to improve maternal health, reduce child mortality and prevent diseases, among others. Goal 4: Ensure inclusive and equitable quality education and promote lifelong learning opportunities for all A well-trained and skillful workforce is crucial for tourism to prosper. The sector can provide incentives to invest in education and vocational training and assist labor mobility through cross-border agreements on qualifications, standards and certifications. Goal 5: Achieve gender equality and empower all women and girls Tourism can empower women in multiple ways, particularly through the provision of jobs and through income-generating opportunities in small and larger-scale tourism and hospitality related enterprises. Goal 6: Ensure availability and sustainable management of water and sanitation for all
20 Uttarakhand Tourism Policy-2017,Uttarakhand Tourism Development Board, Government of Uttarakhand 21 Tourism and the Sustainable Development goals, World Tourism Organisation (UNWTO)

243
Tourism can play a critical role in achieving water access and security, as well as hygiene and sanitation for all. The efficient use of water in tourism sector, coupled with appropriate safety measures, waste water management, pollution control and technological efficiency can be key to safeguarding our most precious resource. Goal 7: Ensure access to affordable, reliable, sustainable and modern energy for all As a sector that requires substantial energy input, tourism can accelerate the shift toward renewable energy and increase its share in the global energy mix. Consequently, by promoting sound and long-term investments in sustainable energy sources, tourism can help to reduce greenhouse gas emissions, mitigate climate change and contribute to innovative and new energy solutions in urban, regional and remote areas. Goal 8: Promote sustained, inclusive and sustainable economic growth, full and productive employment and decent work for all Tourism is one of the driving forces of global economic growth and currently provides for 1 in 11 jobs worldwide. By giving access to decent work opportunities in the tourism sector, society can benefit from increased skills and professional development. The sector’s contribution to job creation is recognized in Target 8.9 “By 2030, devise and implement policies to promote sustainable tourism that creates jobs and promotes local culture and products”. Goal 9: Build resilient infrastructure, promote inclusive and sustainable industrialization and foster innovation Tourism development relies on good public and privately supplied infrastructure and an innovative environment. The sector can also incentivize national governments to upgrade their infrastructure and retrofit their industries, making them more sustainable, resource-efficient and clean, as a means to attract tourists and other sources of foreign investment. Goal 10: Reduce inequality within and among countries Tourism can be a powerful tool for community development and reducing inequalities if it engages local populations and all key stakeholders in its development. Tourism can contribute to urban renewal and rural development and reduce regional imbalances by giving communities the opportunity to prosper in their place of origin. Tourism is also an effective means for developing countries to take part in the global economy. Goal 11: Make cities and human settlements inclusive, safe, resilient and sustainable A city that is not good for its citizens is not good for tourists. Sustainable tourism has the potential to advance urban infrastructure and universal accessibility, promote regeneration of areas in decay and preserve cultural and natural heritage, assets on which tourism depends. Goal 12: Ensure sustainable consumption and production patterns A tourism sector that adopts sustainable consumption and production (SCP) practices can play a significant role in accelerating the global shift towards sustainability. To do so, as set in Target 12.b of Goal 12, it is imperative to “Develop and implement tools to monitor sustainable development impacts for sustainable tourism which creates jobs, promotes local culture and products”. The Sustainable Tourism Programme (STP) of the 10-Year Framework of Programmes on Sustainable Consumption and Production Patterns (10YFP) aims at developing such SCP practices, including resource efficient initiatives that result in enhanced economic, social and environmental outcomes. Goal 13: Take urgent action to combat climate change and its impacts Tourism contributes to and is affected by climate change. It is, therefore, in the sector’s own interest to play a leading role in the global response to climate change. By lowering
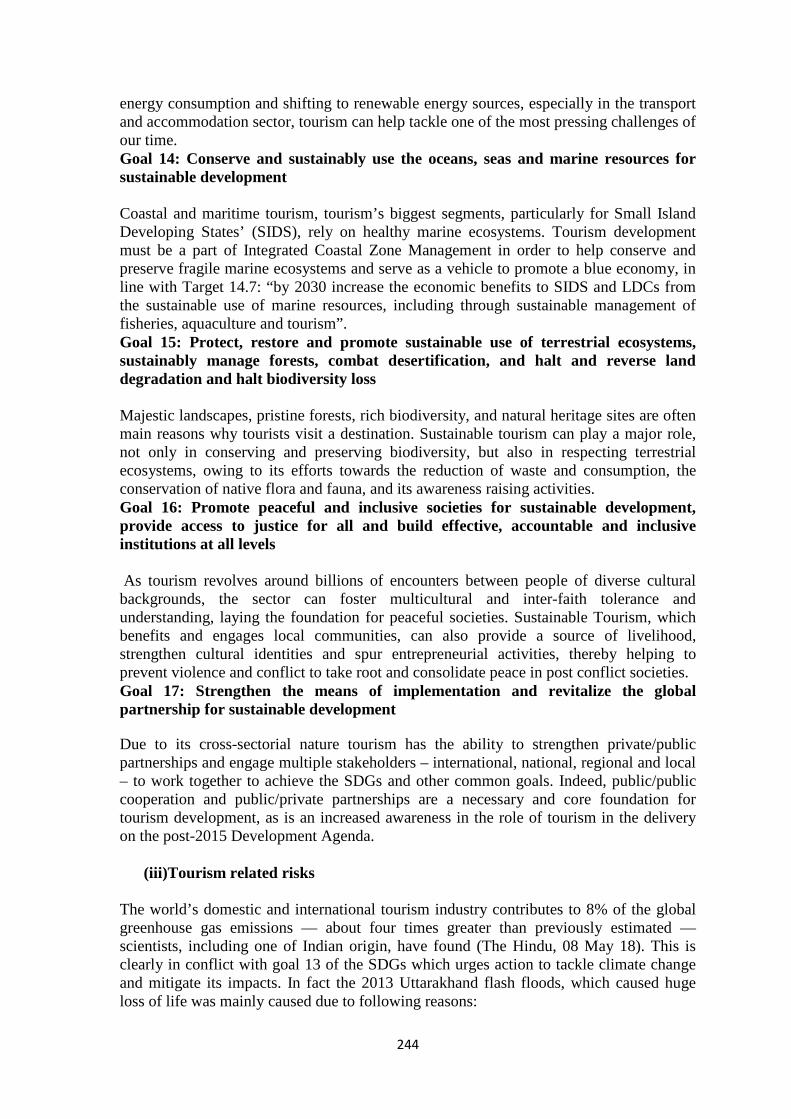
244
energy consumption and shifting to renewable energy sources, especially in the transport and accommodation sector, tourism can help tackle one of the most pressing challenges of our time. Goal 14: Conserve and sustainably use the oceans, seas and marine resources for sustainable development Coastal and maritime tourism, tourism’s biggest segments, particularly for Small Island Developing States’ (SIDS), rely on healthy marine ecosystems. Tourism development must be a part of Integrated Coastal Zone Management in order to help conserve and preserve fragile marine ecosystems and serve as a vehicle to promote a blue economy, in line with Target 14.7: “by 2030 increase the economic benefits to SIDS and LDCs from the sustainable use of marine resources, including through sustainable management of fisheries, aquaculture and tourism”. Goal 15: Protect, restore and promote sustainable use of terrestrial ecosystems, sustainably manage forests, combat desertification, and halt and reverse land degradation and halt biodiversity loss Majestic landscapes, pristine forests, rich biodiversity, and natural heritage sites are often main reasons why tourists visit a destination. Sustainable tourism can play a major role, not only in conserving and preserving biodiversity, but also in respecting terrestrial ecosystems, owing to its efforts towards the reduction of waste and consumption, the conservation of native flora and fauna, and its awareness raising activities. Goal 16: Promote peaceful and inclusive societies for sustainable development, provide access to justice for all and build effective, accountable and inclusive institutions at all levels As tourism revolves around billions of encounters between people of diverse cultural backgrounds, the sector can foster multicultural and inter-faith tolerance and understanding, laying the foundation for peaceful societies. Sustainable Tourism, which benefits and engages local communities, can also provide a source of livelihood, strengthen cultural identities and spur entrepreneurial activities, thereby helping to prevent violence and conflict to take root and consolidate peace in post conflict societies. Goal 17: Strengthen the means of implementation and revitalize the global partnership for sustainable development Due to its cross-sectorial nature tourism has the ability to strengthen private/public partnerships and engage multiple stakeholders – international, national, regional and local – to work together to achieve the SDGs and other common goals. Indeed, public/public cooperation and public/private partnerships are a necessary and core foundation for tourism development, as is an increased awareness in the role of tourism in the delivery on the post-2015 Development Agenda.
(iii)Tourism related risks The world’s domestic and international tourism industry contributes to 8% of the global greenhouse gas emissions — about four times greater than previously estimated — scientists, including one of Indian origin, have found (The Hindu, 08 May 18). This is clearly in conflict with goal 13 of the SDGs which urges action to tackle climate change and mitigate its impacts. In fact the 2013 Uttarakhand flash floods, which caused huge loss of life was mainly caused due to following reasons:
245
• Destruction of ecology of the mountains due to unplanned development. • Exponential increase in the number of vehicles. • Reduction in forest cover.
The toll that the disaster took on lives was also due to absence of tourism management and poor crowd management. Moreover, the inaccurate and incomplete prediction by meteorological department could not help in adaptive actions. 9.11 Learning from Success Stories Bharat Patwal – Sankri Saund, Dist. Uttarkashi In 2009, Bharat Patwal encouraged many families to provide home stay facilities in Sankri Saund village in Uttarakashi district of Uttarakhand. Currently 7 families are providing home stay accommodation and 14-15 families, through Mr Patwal have applied for registration to provide home stay. Jeevan Lal – Kanda, Dist. Bageshwar Jeevan lal has made his village in remote Kanda as an ideal tourist spot. It has shown way for concept of voluntary tourism. Tourists not only stay in the 5 rooms Jeevan’s Paying Guest, but also use their skills to bring about a difference. The project also helps generate employment in an area where there are very few employment schemes. Foreigners who flock Kanda in large numbers, make their stay meaningful. They begin their day with a shramdaan, leading to a cleaner environment. They involve themselves in different chores. They go trekking, chase butterflies but also give lesson in working English to the poor Dalit and backward people. And in the evening, they enjoy a sumptuous Kumauni meal with Jeevan’s family. Many houses here are even repaired by the volunteers (ROSEKANDA, 2017).
9.12. Recommendations for Tourism • Separate accounting of tourism’s share in Gross State Domestic Product (GSDP)
in Economic Survey of Uttarakhand. Currently tourism’s share is extrapolated from trade, repair, hotel and restaurants share in GSDP.
• Creation of home stay facility in urban areas of Uttarkashi, Bageshwar, Pauri Garhwal, Rudraprayag, Pittoragarh and Chamoli Garhwal districts and rural area of Udhamsingh nagar.
• To encourage more private firms under ‘Apni Darohar, Apni Pehchan’ scheme of Ministry of Tourism, Govt of India to take up projects for providing and maintaining basic amenities, including drinking water, ease of access for the differently abled and senior citizens, standardised signage, cleanliness, public conveniences and illumination, along with advanced amenities such as surveillance systems, night-viewing facilities and tourism facilitation centres at a particular under Corporate Social Responsibility (CSR) schemes.
• Provision of more incentives and spreading awareness for Veer Chandra Singh Garhwali Paryatan Swarozgar Yojana (VCSGPSY) to create more livelihoods and have a wider outreach. Loans for building home stay facility are not provided under the scheme and inclusion of this criterion should be considered.
• Better tourism management and crowd management at chardham yatra. A common board for the temples like Thirumala Tirupati Devsthana (TTD) board should be formed for chardham yatra and nearby temples for creation of sufficient resources and tourism management.

246
• Flexible rules under Uttarakhand Foot Launch Aero sport Rules 2017, for encouraging more people to take up commercial paragliding activities.
• With tourism’s increasing carbon foot print globally, more sustainable tourism must be followed to maintain the ecological balance in the mountains. There is no mention of tourism’s impact on climate in Uttarakhand Tourism Policy (2017).
• Halts in yatra due to incessant snowfall results in stranding of tourists. Recently incessant snowfall prompted authorities to temporarily halt the yatra to Kedarnath and prevent devotees from moving beyond Linchauli and Bhimbali (The Economic Times, 08 May 2018). Preparedness must be made to ensure that such halts do not cause inconvenience to tourists.
• Footfall of foreign tourists must be increased by providing better air, rail and road connectivity between famous tourist spots. Haridwar had the highest foreign tourists arrival. Other districts which have good foreign tourist inflows are Mussoorie, Tehri, Badrinath, Nainital and Dehradun. Recently the ministries of Civil Aviation and Tourism planned to jointly develop a strategy to improve air connectivity to popular tourist destinations, like the temples of Khajuraho in Madhya Pradesh and cave monuments of Ajanta and Ellora in Maharashtra (The Hindu, 18 May 2018). Such initiatives must be taken for Uttarakhand as well.
• Establishment of effective disaster management systems and procedures at the community, district and state levels will require good governance. Governments and administrations cannot do everything by themselves, and civil society must be engaged by the state as an active partner in disaster management.
References
Making Tourism More Sustainable. (2005). Making Tourism More Sustainable. UNEP, WTO.
Chhetri, N. (2014). Reconciling Mountain Biodiversity Conservation in a Changing Climate: A Hindu Kush Himalayan Perspective. Conservation Science: Translating Knowledge into Actions, 17-27.
Alpine Convention (2013). Sustainable Tourism in The Alps. Italy: Permanent Secretariat of the Alpine Convention.
World Travel and Tourism Council, (2017). Travel & Tourism: Economic Impact 2017 World.
ROSEKANDA. (2017, February 8). Uttarakhand Village Paves Way For Voluntary Tourism. Retrieved May 18, 2018, from Rural Organisation for Social Elevation, Kanda: http://volunteeringindiahimalayarosekanda.org/uttarakhand-village-paves-way-voluntary-tourism/
UN General assembly resolution A/RES/70/193
Source:http://www.un.org/en/ga/search/view_doc.asp?symbol=A/RES/70/193&referer=/english/&Lang=E (Accessed on 7 May 2018)
Economic Survey Himachal Pradesh 2016-17, Economics & Statistics Department, Govt. of Himachal Pradesh
247
Medium Terms Fiscal Plan for Sikkim: 2016-17, Finance, Revenue and Expenditure Department, Govt. of Sikkim Finance, Accounts and State Budget 2016-17, Govt. of Sikkim Finance, Revenue, and Expenditure Department, Govt. of Sikkim, Budget 2017-18 Central Bureau of Health Intelligence, Government of India, Sample Registration System (SRS) Bulletin, NHRM Economic Survey Jammu & Kashmir 2017, Directorate of Economics & Statistics, Government of Jammu & Kashmir Annual report 2015-16, Ministry of Tourism, Government of India Economic Survey 2017-18 Uttarakhand, Directorate of Economics and Statistics, Government of Uttarakhand Uttarakhand Tourism Policy-2017,Uttarakhand Tourism Development Board, Government of Uttarakhand Uttarakhand Foot Launch Aero sport Rules 2017, Uttarakhand Tourism Development Board, Government of Uttarakhand Tourism and the Sustainable Development goals, World Tourism Organisation (UNWTO)
Sen, A. (1981) Poverty and Famine: An Essay on Entitlements and Deprivation. Oxford: Clarendon Press.
Manyena S B. (2012) Disaster and Development Paradigms. Development Policy Review. Vol 30(3). Blackwell Publishing.
Uttarakhand Socio-Economic Mirror, Vol 1, No 2, September 2016, Directorate of Economics & Statistics, Government of Uttarakhand Uttarakhand State report, 2018, Indian Brand Equity Foundation (IBEF).
Wijkman, A. and Timberlake, L. (1984) Natural Disaster: Acts of God or Acts of Man? London: Earthscan.

248
CHAPTER: 10 ENVIRONMENT, NATURAL RESOURCE MANAGEMENT, AND NATURAL DISASTER
10.1 Introduction
Mountain habitats share certain similar bio-climatic features and concerns across the world. These relate primarily to the changing mountain environment as a result of the degradation of resources owing to their excessive use (Awasthi et al., 2014). The dominant scenario characterizing most of the mountain regions in developing countries, particularly in the Hindu Kush Himalayan region, is the widening gap between development efforts, such as investments and public interventions, and, corresponding achievements in term of measurable economic gains as well as qualitative changes such as the health and production potential of the natural resource base and environmental consequences. Over the last half-century, several alarming trends have emerged which are clearly visible in this region. These include persistent negative changes in crop yields, availability of mountain products, the economic wellbeing of mountain people and the overall condition of the environment and natural resources (Reiger 1981). These changes are considered to be indicators of unsustainability. The almost parallel emergence of unsustainability indicators, along with the acceleration in development efforts in mountain areas, is a matter of serious concern and it calls for a fresh look at the conventional approaches to mountain development (Jodha, 2014).
The Himalayan region in India covers Jammu & Kashmir (J&K), Himachal Pradesh, Uttarakhand, Sikkim, Arunachal Pradesh, Nagaland, Manipur, Mizoram, Tripura, Meghalaya and Darjeeling district of West Bengal, and the Karbi Anglong and North Cachar districts of Assam.
The Himalayas are the world’s youngest mountain range and are susceptible to erosion and landslides, seismic activity, rainstorms, and cloudbursts, since they consist mostly of sedimentary and metamorphic rocks and are also tectonically very active. The vulnerability of the region to heavy rainfall and environmental disasters has increased as a result of unplanned development including construction of roads, dams, etc., excessive footfall of tourists, traffic that exceeds the carrying capacity of the region, degraded forest cover, road widening, increase in the amount of non-biodegradable waste, illegal building activity and so on, without giving due regard to environmental safety concerns. The biggest flash flood in the region that occurred in mid-June 2013, resulted in colossal devastation of lives and property. Cloudbursts and heavy to very heavy rainfall hit several parts of the higher reaches within Uttarakhand. This unprecedented rainfall resulted in a sudden increase in water levels giving rise to flash floods in the Mandakini, Alakananda, Bhagirathi and other river basins and also caused extensive river bed and toe erosion as well as landslides at various locations. The worst impact was in the Mandakini river valley around the Kedarnath shrine region (Rudraprayag district) and its downstream areas. Rock falls resulted in the partial blockade and impoundment on the river channel to the left of Kedarnath. Adding to this, continuous rains and the melting of the Chorabari glacier caused waters in the lake to rise. The lake’s weak moraine barrier gave way and a huge volume of water along with large glacial boulders came down the channel to the east, devastating Kedarnath town, Rambara, Gaurikund and other places in its wake. The flooded
249
rivers reaching downstream and carrying a large amount of debris and sediment caused further devastation in the lower districts, although to a lesser extent when compared to the higher Himalayan districts of Uttarakhand1. Other environmental threats that persist in the state include: forest fires, air and water pollution, land degradation, wildlife poaching, loss of bio-diversity, etc.2
In this chapter, we begin with a discussion on the main natural resources of the state. This is followed by a discussion on the various environmental concerns for Uttarakhand, including climate change that impacts human development status via loss of life, livelihoods, environmental degradation and so on. Here we supplement the secondary information by data obtained from the primary survey carried out in the state. Finally, we focus on the imperative and pressing need for natural resource management, protecting the mountain eco-system including the human populace and highlight the major initiatives by the government for the protection and conservation of the environment.
10.2 Natural resources in Uttarakhand
Owing to its largely mountainous regions, Uttarakhand state is endowed with unique ecosystems. The northern region of the state is part of the great Himalayan range, covered with snow and glaciers. Two of the Indian subcontinent's major rivers – the Ganga and the Yamuna – also originate from the glaciers of Uttarakhand. Other parts of Uttarakhand are covered with dense forests that make up the bulk of the natural resources base.
The state lies in the Himalayan range and has a highly diversified topography. The climate and vegetation vary greatly with elevation, from glaciers at the highest elevations to subtropical forests at the lower elevations. The highest elevations are covered with ice and bare rocks. Three districts which lie mainly in the plains are Dehradun, Udham Singh Nagar and Haridwar. The rest of the thirteen districts lie primarily in the hilly regions.
About 63 percent of the reported area of Uttarakhand is covered with forest. Of the agricultural land, 34 percent is concentrated in Haridwar and Udham Singh Nagar and 21 percent in Almora and Pauri Garhwal.
10.2.1 Forests
Forests are crucial to the survival and prosperity of humans and other species as they not only provide food security and shelter, but are also instrumental in fighting climate change, and protecting bio-diversity as well as the homes of indigenous populations. It has been observed that
1India Uttarakhand Disaster June 2013: Joint Rapid Damage and Needs Assessment accessed at https://openknowledge.worldbank.org/handle/10986/16759?show=full on 15th November 2018 2 Nair and Singh 2014 accessed at https://www.researchgate.net/publication/273630282_Understanding_the_Causes_of_Uttarakhand_Disaster_of_June_2013_A_Scientific_Review,NIDM (2015) accessed at http://nidm.gov.in/pdf/pubs/ukd-p1.pdf, media report accessed at https://www.downtoearth.org.in/news/natural-disasters/man-made-reasons-for-uttarakhand-disaster-41407
250
human actions are fundamentally, and to a great extent irreversibly, changing the diversity of life on earth. Most of these changes represent a loss of biodiversity3.
Uttarakhand is very rich in forest cover. As reported by land-use data,4 Ministry of Agriculture, forests (3800 thousand hectares) cover about 63 percent of the reported area for land utilization in the state (5992 thousand hectares). In terms of geographic area, the forest cover ascertained with the help of satellite data for October-December 2015, was found to be 45.43 percent, compared to the corresponding all-India figure of 21.54 percent.
However, nearly 55 percent of forestland in the state is concentrated in Uttarkashi, Chamoli, Pauri Garhwal and Tehri Garhwal. There are 165 forest settlements in the forestland. Out of these, 70 villages are located in Almora (24), Nainital (26), and Dehradun (20)5. Around 60 percent of the population in such villages lives in Nainital and another 28 percent in Udham Singh Nagar and Haridwar. Thus, forests in areas such as Nainital, Udham Singh Nagar, and Haridwar are highly stressed and face the threat of degradation.
With a high share of forested area, there is limited scope for expanding the area under forest cover in Uttarakhand. The percentage change in forest cover at present is negative. The quality of forest cover is also important, and the baseline for the total land area covered by dense forests as a share of the total forest cover is 34 percent. The baseline for afforestation (including all types of plantations) is 18,251 hectares.
Status of Forests
In Uttarakhand, 9 percent of the geographical area is under Very Dense Forests (VDF), 24 percent of total forest cover under Moderate Dense Forests (MDF), 12 percent under Open Forests (OF), around 1 percent under scrub forest and 53 percent under Non Forest areas6.
3 http://www.un.org/sustainabledevelopment/biodiversity/ and https://www.hcvnetwork.org/resources/folder. 2006-09-29.6584228415/CommonVisionRefDoc.080910.pdf accessed on 22nd May, 2018. 4 Ministry of Agriculture, GoI, for 2013-14, cited in Forest Survey of India (2017). 5 Other districts that have such unreported villages include Uttarkashi (17), Udham Singh Nagar (16), Pauri Garhwal (14), Pithoragarh (13), Chamoli (12), and Tehri Garhwal (11), Haridwar and Champawat (5 each), and Bageshwar (2). 6 Forest Survey of India (2017) accessed at http://fsi.nic.in/isfr2017/uttarakhand-isfr-2017.pdf on 20th November.

251
Figure 10.1 Forest Cover in Uttarakhand
9.29%
24.09%
12.42
53.86%
0.72%
Forest Cover of Uttarakhand
Very Dense Forest
Mod. Dense Forest
Open Forest
Non Forest
Scrub
Source: Forest Survey of India, Dehradun, 2017
In terms of Forest Canopy Density Classes, the state has 4969 sq km under very dense forest, 12,884 sq km under moderately dense forest and 6442 sq km under open forest. The Reserved, Protected, and Unclassed Forests are 69.86 percent, 26.01 percent, and 4.13 percent respectively as a proportion of the recorded forest area. It is important to improve the quality of the forest cover, that is, to turn some part of the moderately dense forest (accounting for 24 percent of the total forest cover) into dense forest, and some part of the open forest (accounting for 12 percent of the total forest cover) into moderately dense forest.
The district wise forest cover is given below (Table 10.1):
Table 10.1 District-wise Forest Cover in Uttarakhand (area in sq km) District Geographical
area 2017 Assessment % of GA Change* Scrub
Very Dense Forest
Mod. Dense Forest
Open Forest
Total
Almora 3144 199 837 682 1718 54.64 17 6 Bageshwar 2241 162 762 337 1261 56.27 -10 1 Chamoli 8030 443 1580 686 2709 33.74 -15 1 Champawat 1766 367 593 264 1224 69.31 -11 7 Dehradun 3088 636 626 343 1605 51.98 5 87 Pauri Garhwal 5329 552 1925 917 3394 63.69 76 96 Haridwar 2360 75 277 236 588 24.92 0.3 6 Nainital 4251 765 1742 541 3048 71.7 -35 10 Pithoragarh 7090 505 965 608 2078 29.31 -5 39

252
Rudraprayag 1984 252 580 309 1141 57.51 37 9 Tehri Garhwal 3642 272 1085 708 2065 56.7 7 97 Udham Singh Nagar
2542 150 193 93 436 17.15 -14 3
Uttarkashi 8016 591 1719 718 3028 37.77 -26 21 Grand Total 53483 4969 12884 6442 24295 45.43 23 383 *Change compared to updated 2015 assessment Source: India State Forest Report, 2017
Forests are also a source of income for those dwelling in and around the forests. Besides timber, there are many valuable non-timber forest products (NTFP), such as nuts (walnuts, pine nuts), medicinal herbs, and plants, bamboo shoots, and high-value mushrooms. The major resources relating to forest areas are briefly listed below.
(A) Timber resources: Plantations are raised on the plains for commercial use. These include varieties like teak, sal, eucalyptus, poplar etc. Coniferous trees like Deodar grown on the hills also provide timber. In 2016-17, the state had a production of 184149 cu. m round of timber, and 54578 cu. m. stack of firewood7.
(B) Non Timber Forest Produce: These include resin from commercially useful Chir Pine, bamboos, fuel and fodder for use by local people, etc. Jatropha curcas is also being grown chiefly as a potential alternative for petroleum. In 2016-17, the state had a production of 171894 quintal of resin (NTFP).
(C) Minerals, stones, and sand: They are extracted from riverbeds when the rivers reach the plains. The extraction also enables river training (keeping the river bed deeper, to prevent floods).
(D) Tourism resources: Forests have a rich aesthetic value which enriches the ecotourism prospects for the state.
Forests remove carbon dioxide from the atmosphere, and when they store more carbon than they lose in a given year, they serve as a net carbon sink and offset a portion of society’s greenhouse gas emissions, which leads to warming of the environment. The total carbon Stock of forests in Uttarakhand was 284.664 million tonnes (1043.768 million tonnes of carbon dioxide equivalent) which was 4.02 precent of the total forest carbon of the country. Thus, the forests in Uttarakhand contribute towards containing the harmful impacts of climate change.
Medicinal Plants and Herbs
Uttarakhand is a storehouse for a diverse range of flora and fauna and rare species of plants including a rich variety of herbs, medicinal and aromatic plant species. This enables the state to offer immense opportunities for the development of export-oriented units based on such products. The state is home to more than 175 species of rare medicinal, aromatic & herbal plants with 625 Ha area under their cultivation (Forest Department, Uttarakhand). Recognizing the potential of this sector, the state government has already declared it as a ‘herbal state’. These
7 Uttarakhand at a Glance 2016-17.
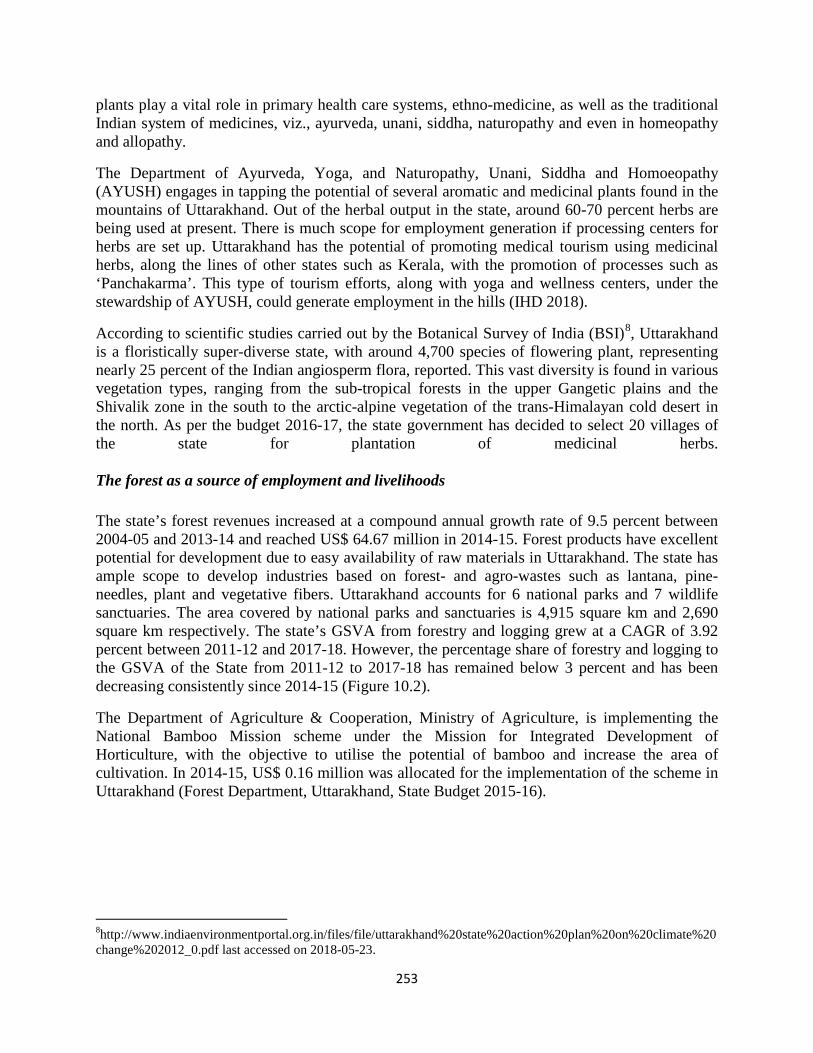
253
plants play a vital role in primary health care systems, ethno-medicine, as well as the traditional Indian system of medicines, viz., ayurveda, unani, siddha, naturopathy and even in homeopathy and allopathy.
The Department of Ayurveda, Yoga, and Naturopathy, Unani, Siddha and Homoeopathy (AYUSH) engages in tapping the potential of several aromatic and medicinal plants found in the mountains of Uttarakhand. Out of the herbal output in the state, around 60-70 percent herbs are being used at present. There is much scope for employment generation if processing centers for herbs are set up. Uttarakhand has the potential of promoting medical tourism using medicinal herbs, along the lines of other states such as Kerala, with the promotion of processes such as ‘Panchakarma’. This type of tourism efforts, along with yoga and wellness centers, under the stewardship of AYUSH, could generate employment in the hills (IHD 2018).
According to scientific studies carried out by the Botanical Survey of India (BSI)8, Uttarakhand is a floristically super-diverse state, with around 4,700 species of flowering plant, representing nearly 25 percent of the Indian angiosperm flora, reported. This vast diversity is found in various vegetation types, ranging from the sub-tropical forests in the upper Gangetic plains and the Shivalik zone in the south to the arctic-alpine vegetation of the trans-Himalayan cold desert in the north. As per the budget 2016-17, the state government has decided to select 20 villages of the state for plantation of medicinal herbs. The forest as a source of employment and livelihoods
The state’s forest revenues increased at a compound annual growth rate of 9.5 percent between 2004-05 and 2013-14 and reached US$ 64.67 million in 2014-15. Forest products have excellent potential for development due to easy availability of raw materials in Uttarakhand. The state has ample scope to develop industries based on forest- and agro-wastes such as lantana, pine-needles, plant and vegetative fibers. Uttarakhand accounts for 6 national parks and 7 wildlife sanctuaries. The area covered by national parks and sanctuaries is 4,915 square km and 2,690 square km respectively. The state’s GSVA from forestry and logging grew at a CAGR of 3.92 percent between 2011-12 and 2017-18. However, the percentage share of forestry and logging to the GSVA of the State from 2011-12 to 2017-18 has remained below 3 percent and has been decreasing consistently since 2014-15 (Figure 10.2).
The Department of Agriculture & Cooperation, Ministry of Agriculture, is implementing the National Bamboo Mission scheme under the Mission for Integrated Development of Horticulture, with the objective to utilise the potential of bamboo and increase the area of cultivation. In 2014-15, US$ 0.16 million was allocated for the implementation of the scheme in Uttarakhand (Forest Department, Uttarakhand, State Budget 2015-16).
8http://www.indiaenvironmentportal.org.in/files/file/uttarakhand%20state%20action%20plan%20on%20climate%20change%202012_0.pdf last accessed on 2018-05-23.
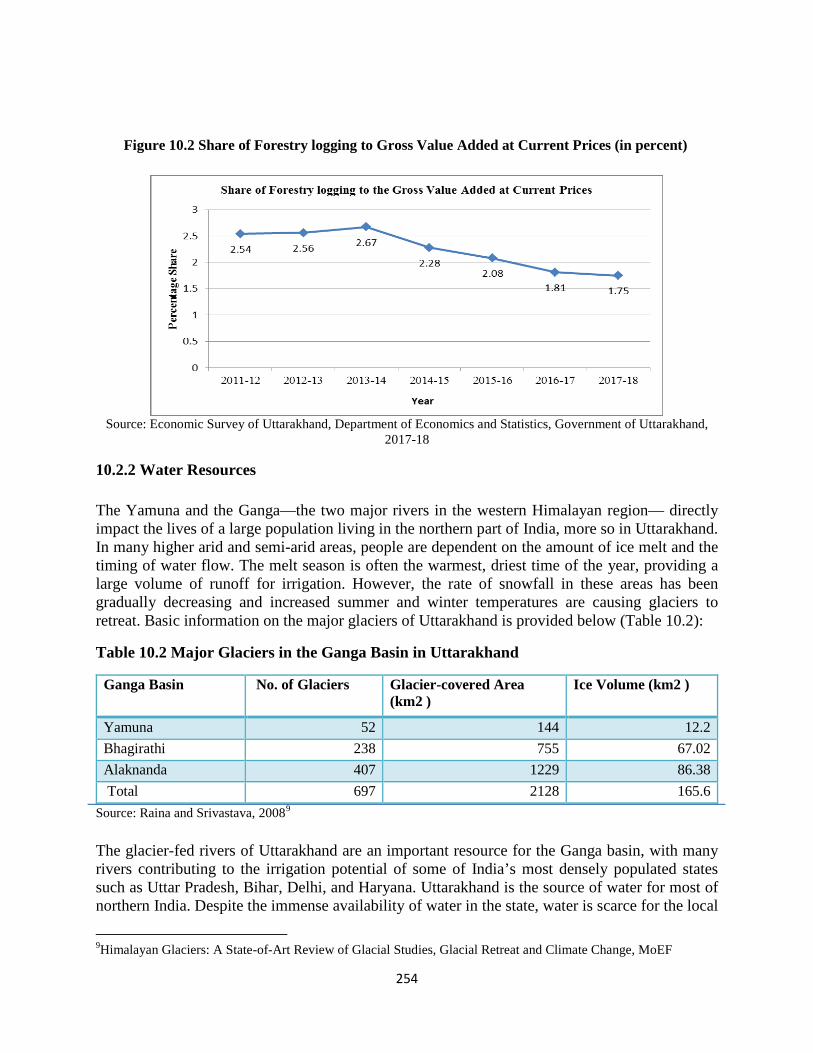
254
Figure 10.2 Share of Forestry logging to Gross Value Added at Current Prices (in percent)
Source: Economic Survey of Uttarakhand, Department of Economics and Statistics, Government of Uttarakhand,
2017-18
10.2.2 Water Resources
The Yamuna and the Ganga—the two major rivers in the western Himalayan region— directly impact the lives of a large population living in the northern part of India, more so in Uttarakhand. In many higher arid and semi-arid areas, people are dependent on the amount of ice melt and the timing of water flow. The melt season is often the warmest, driest time of the year, providing a large volume of runoff for irrigation. However, the rate of snowfall in these areas has been gradually decreasing and increased summer and winter temperatures are causing glaciers to retreat. Basic information on the major glaciers of Uttarakhand is provided below (Table 10.2):
Table 10.2 Major Glaciers in the Ganga Basin in Uttarakhand
Ganga Basin No. of Glaciers Glacier-covered Area (km2 )
Ice Volume (km2 )
Yamuna 52 144 12.2 Bhagirathi 238 755 67.02 Alaknanda 407 1229 86.38 Total 697 2128 165.6
Source: Raina and Srivastava, 20089
The glacier-fed rivers of Uttarakhand are an important resource for the Ganga basin, with many rivers contributing to the irrigation potential of some of India’s most densely populated states such as Uttar Pradesh, Bihar, Delhi, and Haryana. Uttarakhand is the source of water for most of northern India. Despite the immense availability of water in the state, water is scarce for the local
9Himalayan Glaciers: A State-of-Art Review of Glacial Studies, Glacial Retreat and Climate Change, MoEF

255
people, for drinking, domestic use and irrigation. The conservation of water bodies is an area of importance for the state and already 11 rivers/riverlets are covered under the Namami Gange Project, accounting for the afforestation of 1000 hectares of river/riverlets10. The area covered under pits and ponds (chal-khal) is 215 hectares (2016-17). The state has already identified watersheds at macro, meso and micro levels and many are being treated / managed. The state has identified 8 catchments, 26 watersheds, 110 sub-watersheds and 1,110 micro watersheds. Out of the 1,110 micro-watersheds, 584 are under treatment and 302 cannot be treated as they are located in snowy and highly precipitous areas. The inclusion of rooftop rainwater harvesting in building byelaws has been made compulsory in the state11.
The 2017 primary survey conducted by IHD reveals people’s perceptions regarding water supply. While tap/piped water has reached a majority of the urban residents, the survey found that in rural areas, around 65 percent of the respondent households had access to tap water, while 21 percent had access to water from tube wells/hand pumps (Figure 10.3), indicating that a sizeable share of people still do not have access to tap water. Around 16.8 percent respondents felt that the water supply was insufficient while 18 percent of total respondents were dissatisfied with the quality of water. Dirty and muddy water supply were cited as the major problems, indicating that perhaps there was contamination of water.
Figure 10.3 Major sources of Drinking Water in Rural Uttarakhand
Source: IHD Survey 2017
Thus, despite the presence of glaciers and perennial rivers in the state, in addition to plenty of rainfall, the availability of water in the state is not up to expectations, particularly because water runs off in the hilly terrains instead of getting accumulated. This compels women to walk long distances in the mountainous region merely to access water. Therefore, ensuring the sustainability of water sources, water management and water recycling are crucial issues for this state that elicit policy consideration. While the state government is introducing modern techniques to solve the problem of drinking water, it needs to also rejuvenate traditional methods of water harvesting to provide drinking water to the people. The geographic hardships of the state have given rise to various traditional methods of water conservation, prime examples of which are the nauley, dharey, chal and khal, which are now being restored to solve the water crisis 10 Ministry of Water Resources 2017 11 UAPCC 2014
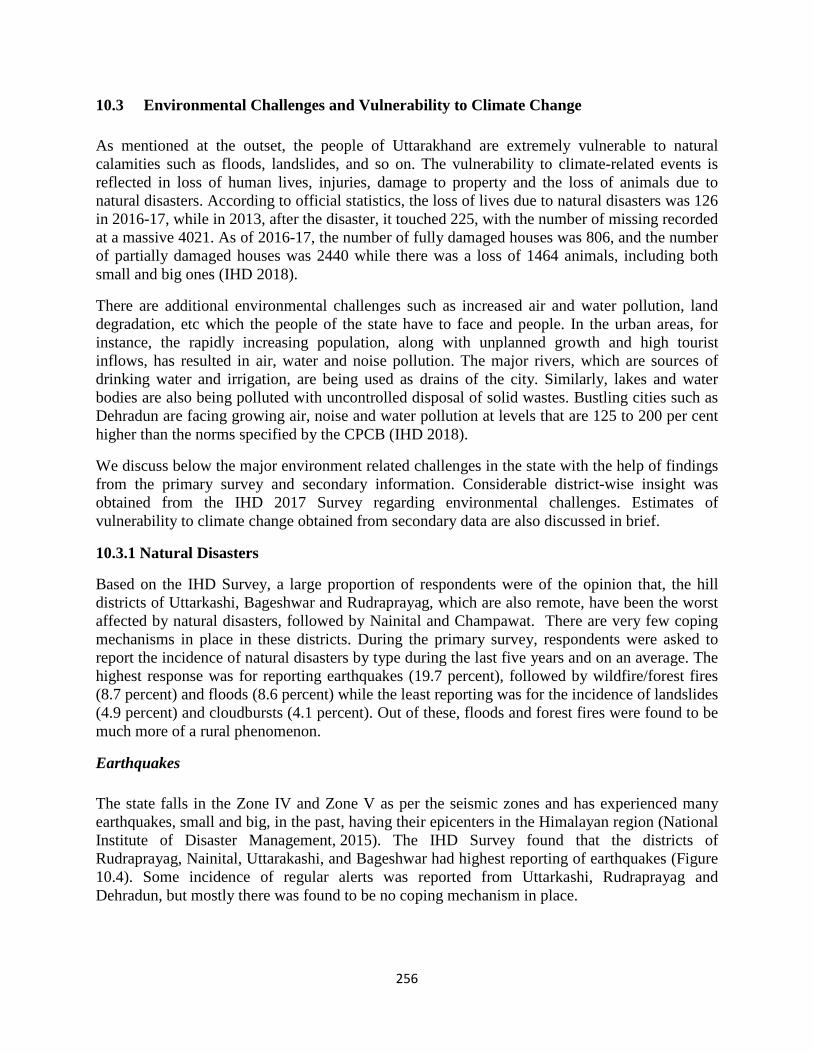
256
10.3 Environmental Challenges and Vulnerability to Climate Change
As mentioned at the outset, the people of Uttarakhand are extremely vulnerable to natural calamities such as floods, landslides, and so on. The vulnerability to climate-related events is reflected in loss of human lives, injuries, damage to property and the loss of animals due to natural disasters. According to official statistics, the loss of lives due to natural disasters was 126 in 2016-17, while in 2013, after the disaster, it touched 225, with the number of missing recorded at a massive 4021. As of 2016-17, the number of fully damaged houses was 806, and the number of partially damaged houses was 2440 while there was a loss of 1464 animals, including both small and big ones (IHD 2018).
There are additional environmental challenges such as increased air and water pollution, land degradation, etc which the people of the state have to face and people. In the urban areas, for instance, the rapidly increasing population, along with unplanned growth and high tourist inflows, has resulted in air, water and noise pollution. The major rivers, which are sources of drinking water and irrigation, are being used as drains of the city. Similarly, lakes and water bodies are also being polluted with uncontrolled disposal of solid wastes. Bustling cities such as Dehradun are facing growing air, noise and water pollution at levels that are 125 to 200 per cent higher than the norms specified by the CPCB (IHD 2018).
We discuss below the major environment related challenges in the state with the help of findings from the primary survey and secondary information. Considerable district-wise insight was obtained from the IHD 2017 Survey regarding environmental challenges. Estimates of vulnerability to climate change obtained from secondary data are also discussed in brief.
10.3.1 Natural Disasters
Based on the IHD Survey, a large proportion of respondents were of the opinion that, the hill districts of Uttarkashi, Bageshwar and Rudraprayag, which are also remote, have been the worst affected by natural disasters, followed by Nainital and Champawat. There are very few coping mechanisms in place in these districts. During the primary survey, respondents were asked to report the incidence of natural disasters by type during the last five years and on an average. The highest response was for reporting earthquakes (19.7 percent), followed by wildfire/forest fires (8.7 percent) and floods (8.6 percent) while the least reporting was for the incidence of landslides (4.9 percent) and cloudbursts (4.1 percent). Out of these, floods and forest fires were found to be much more of a rural phenomenon.
Earthquakes
The state falls in the Zone IV and Zone V as per the seismic zones and has experienced many earthquakes, small and big, in the past, having their epicenters in the Himalayan region (National Institute of Disaster Management, 2015). The IHD Survey found that the districts of Rudraprayag, Nainital, Uttarakashi, and Bageshwar had highest reporting of earthquakes (Figure 10.4). Some incidence of regular alerts was reported from Uttarkashi, Rudraprayag and Dehradun, but mostly there was found to be no coping mechanism in place.

257
Figure 10.4 Percentage Share of Respondents who Reported Earthquakes
Source: IHD Survey 2017
Wildfire/Forest fire
Early in 2018, as the temperature increased in the state, more than 2000 hectares of land were affected by forest fires12. Uttarakhand experiences repeated incidence of forest fires and these cause great loss to the forest ecosystem, diversity of flora and fauna and economic wealth. The longer term environmental impacts of such forest fires can be severe. For example, the black carbon deposits in the glaciers from the smoke and ash of forest fires can lead to the faster melting of ice. High temperatures without adequate atmospheric moisture comprise one of the important reasons for forest fires in Uttarakhand.
Rudraprayag, Uttarkashi, Champawat and Bageswar were found to have the maximum reporting of forest fires, according to the household survey (Figure 10.5). Rudraprayag, where two-thirds of the respondents reported wildfires, seemed to be particularly vulnerable. In Champawat and Rudraprayag, around one-third people said that the rescue team was always ready to fight fires, but mostly there was no coping mechanism available.
12 https://indianexpress.com/article/india/uttarakhand-forest-fires-burn-more-than-2000-hectares-of-land-in-2018-cm-trivendra-rawat-reprimands-officials-5188649/ accessed on 23rd November 2018

258
Figure 10.5 Percentage Share of Respondents who Reported Wild Fires
Source: IHD Survey 2017
Floods
The flash floods and landslides in 2013 and the collateral damage in terms of loss of lives, property, and livelihoods are still fresh in public memory. The districts of Bageshwar, Chamoli, Pithoragarh, Rudraprayag and Uttarkashi were the worst affected. Over and above the loss of lives, more than four thousand people went missing, bridges and roads collapsed, while houses crumpled in many villages, and huge swathes of agricultural land got completely washed away. It also had an adverse impact on local livelihoods, especially on tourism.
Uttarkashi, Bageshwar, Rudraprayag and Pauri Garhwal districts showed the highest response for floods during the household survey (Figure 10.6). In all the districts affected by floods, 60-96 percent response was that there is no coping mechanism in place. The loss of life/property/assets/livelihoods, etc. from floods was reported as far greater as compared to earthquakes.
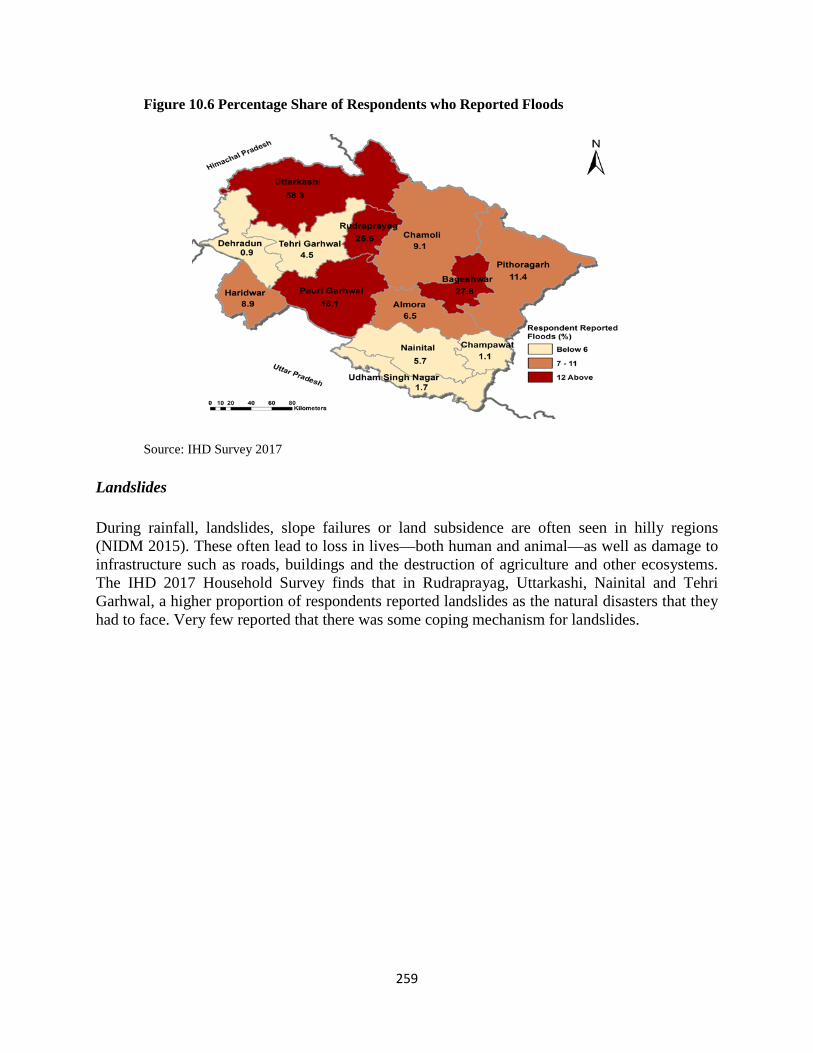
259
Figure 10.6 Percentage Share of Respondents who Reported Floods
Source: IHD Survey 2017
Landslides
During rainfall, landslides, slope failures or land subsidence are often seen in hilly regions (NIDM 2015). These often lead to loss in lives—both human and animal—as well as damage to infrastructure such as roads, buildings and the destruction of agriculture and other ecosystems. The IHD 2017 Household Survey finds that in Rudraprayag, Uttarkashi, Nainital and Tehri Garhwal, a higher proportion of respondents reported landslides as the natural disasters that they had to face. Very few reported that there was some coping mechanism for landslides.
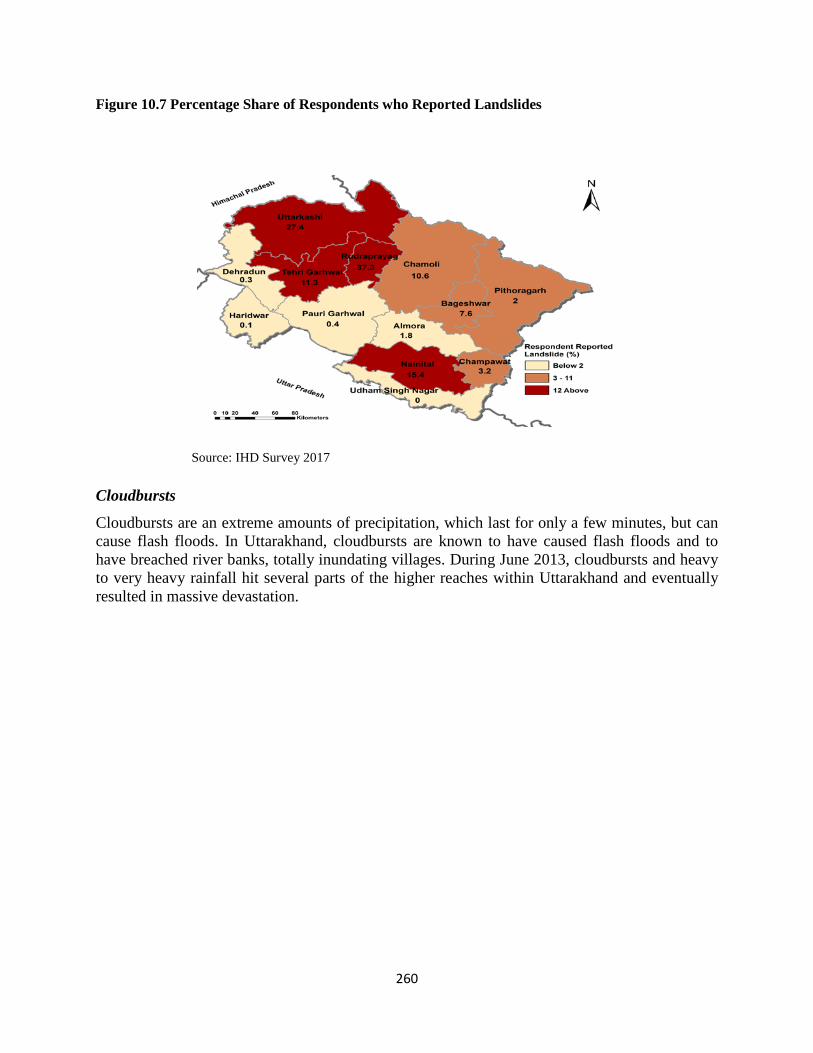
260
Figure 10.7 Percentage Share of Respondents who Reported Landslides
Source: IHD Survey 2017
Cloudbursts
Cloudbursts are an extreme amounts of precipitation, which last for only a few minutes, but can cause flash floods. In Uttarakhand, cloudbursts are known to have caused flash floods and to have breached river banks, totally inundating villages. During June 2013, cloudbursts and heavy to very heavy rainfall hit several parts of the higher reaches within Uttarakhand and eventually resulted in massive devastation.
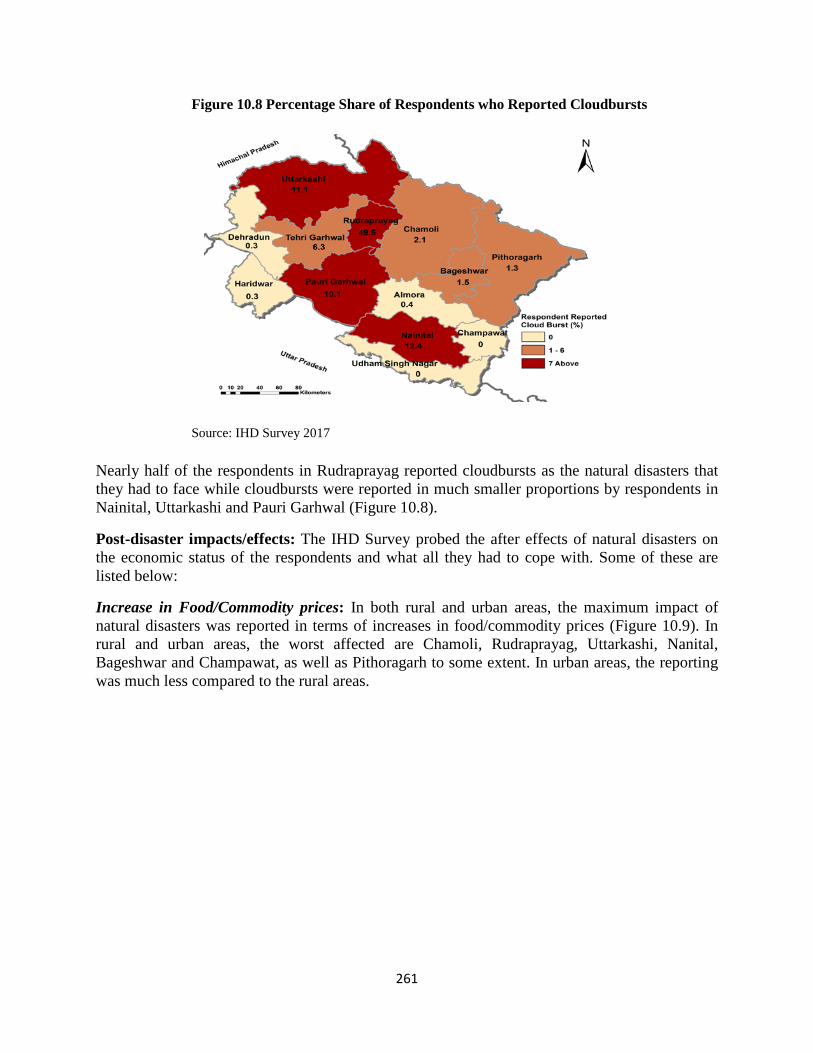
261
Figure 10.8 Percentage Share of Respondents who Reported Cloudbursts
Source: IHD Survey 2017
Nearly half of the respondents in Rudraprayag reported cloudbursts as the natural disasters that they had to face while cloudbursts were reported in much smaller proportions by respondents in Nainital, Uttarkashi and Pauri Garhwal (Figure 10.8).
Post-disaster impacts/effects: The IHD Survey probed the after effects of natural disasters on the economic status of the respondents and what all they had to cope with. Some of these are listed below:
Increase in Food/Commodity prices: In both rural and urban areas, the maximum impact of natural disasters was reported in terms of increases in food/commodity prices (Figure 10.9). In rural and urban areas, the worst affected are Chamoli, Rudraprayag, Uttarkashi, Nanital, Bageshwar and Champawat, as well as Pithoragarh to some extent. In urban areas, the reporting was much less compared to the rural areas.
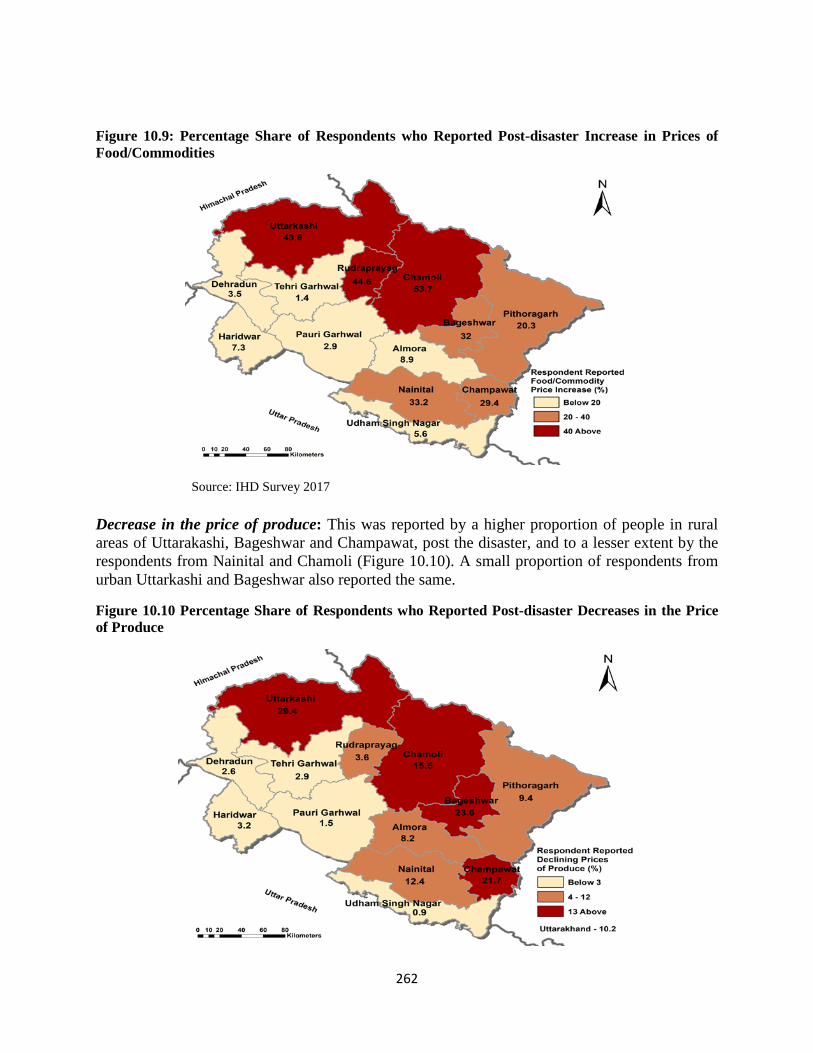
262
Figure 10.9: Percentage Share of Respondents who Reported Post-disaster Increase in Prices of Food/Commodities
Source: IHD Survey 2017
Decrease in the price of produce: This was reported by a higher proportion of people in rural areas of Uttarakashi, Bageshwar and Champawat, post the disaster, and to a lesser extent by the respondents from Nainital and Chamoli (Figure 10.10). A small proportion of respondents from urban Uttarkashi and Bageshwar also reported the same.
Figure 10.10 Percentage Share of Respondents who Reported Post-disaster Decreases in the Price of Produce
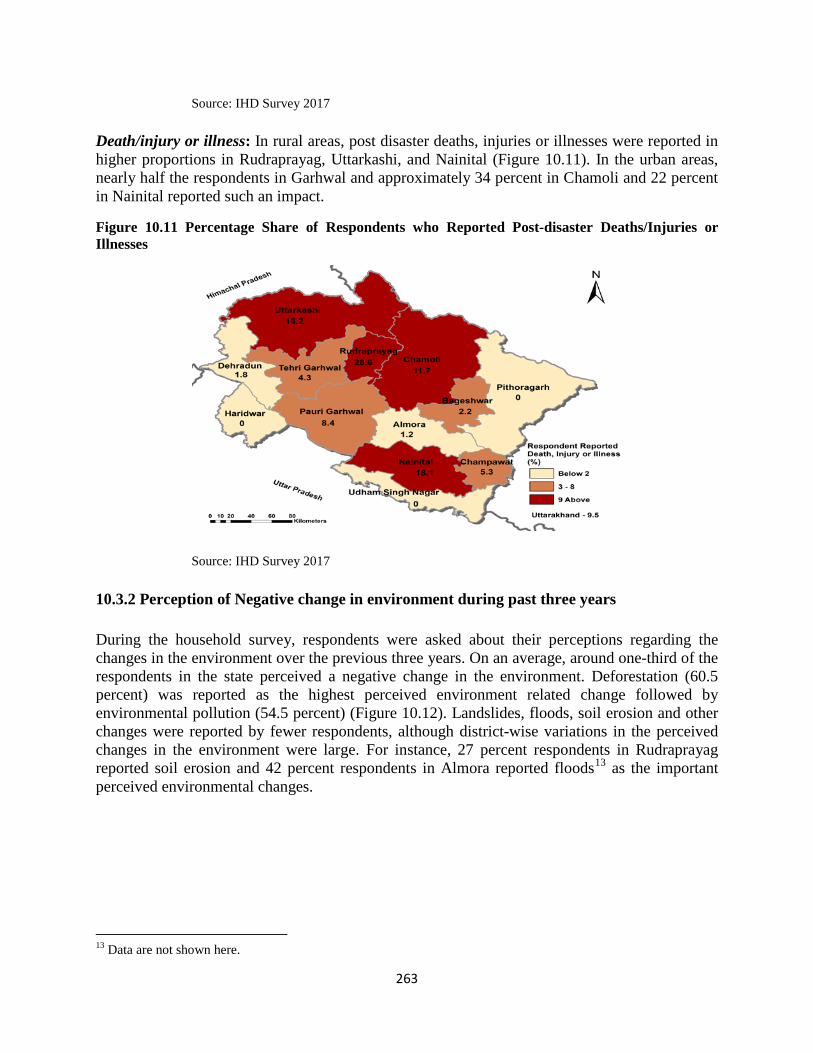
263
Source: IHD Survey 2017
Death/injury or illness: In rural areas, post disaster deaths, injuries or illnesses were reported in higher proportions in Rudraprayag, Uttarkashi, and Nainital (Figure 10.11). In the urban areas, nearly half the respondents in Garhwal and approximately 34 percent in Chamoli and 22 percent in Nainital reported such an impact.
Figure 10.11 Percentage Share of Respondents who Reported Post-disaster Deaths/Injuries or Illnesses
Source: IHD Survey 2017
10.3.2 Perception of Negative change in environment during past three years
During the household survey, respondents were asked about their perceptions regarding the changes in the environment over the previous three years. On an average, around one-third of the respondents in the state perceived a negative change in the environment. Deforestation (60.5 percent) was reported as the highest perceived environment related change followed by environmental pollution (54.5 percent) (Figure 10.12). Landslides, floods, soil erosion and other changes were reported by fewer respondents, although district-wise variations in the perceived changes in the environment were large. For instance, 27 percent respondents in Rudraprayag reported soil erosion and 42 percent respondents in Almora reported floods13 as the important perceived environmental changes.
13 Data are not shown here.
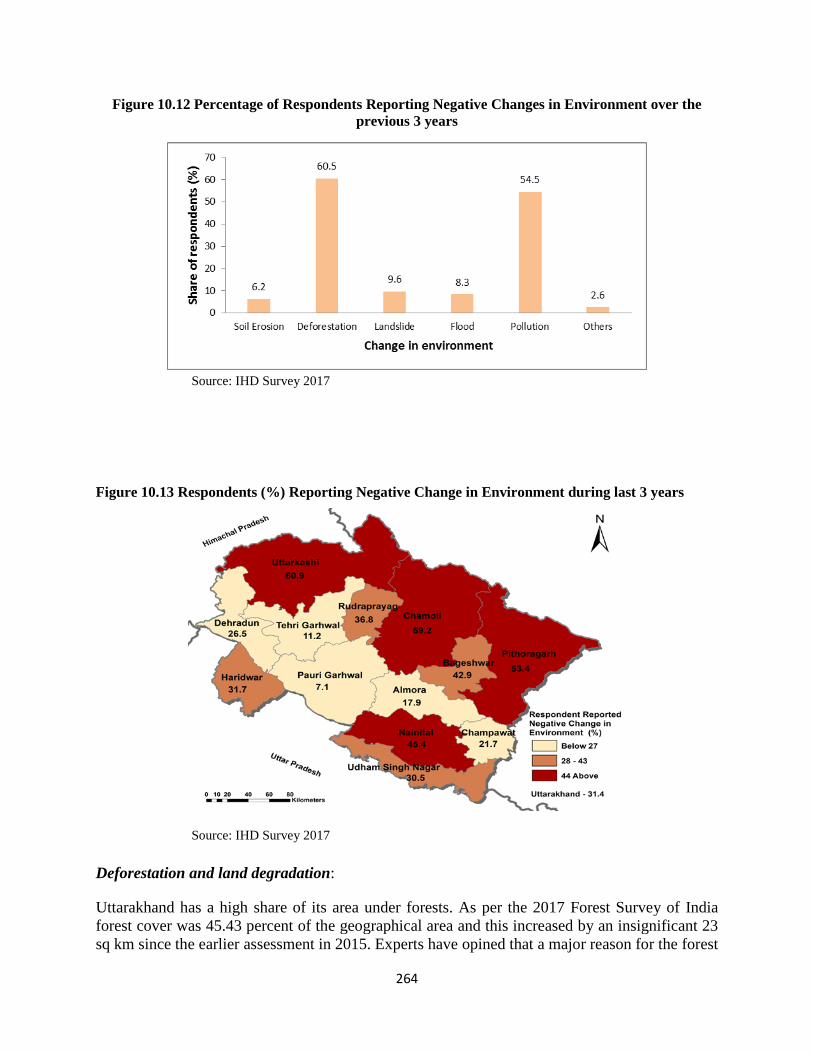
264
Figure 10.12 Percentage of Respondents Reporting Negative Changes in Environment over the previous 3 years
Source: IHD Survey 2017 Figure 10.13 Respondents (%) Reporting Negative Change in Environment during last 3 years
Source: IHD Survey 2017
Deforestation and land degradation:
Uttarakhand has a high share of its area under forests. As per the 2017 Forest Survey of India forest cover was 45.43 percent of the geographical area and this increased by an insignificant 23 sq km since the earlier assessment in 2015. Experts have opined that a major reason for the forest
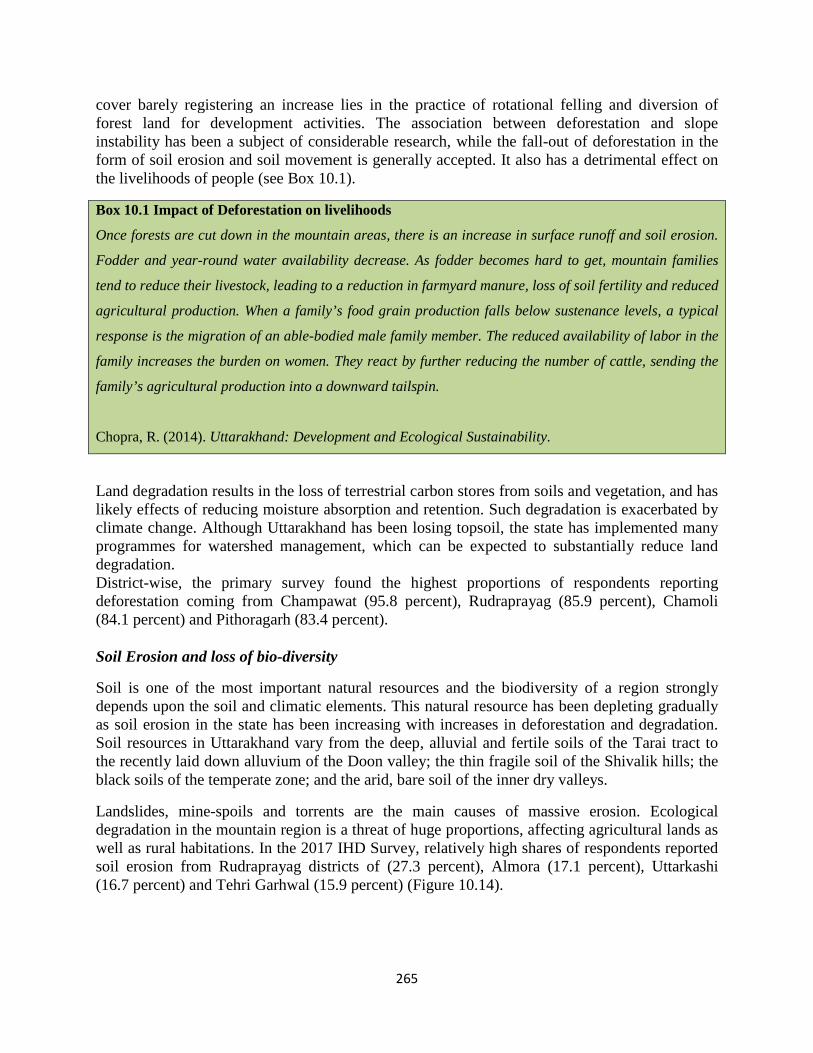
265
cover barely registering an increase lies in the practice of rotational felling and diversion of forest land for development activities. The association between deforestation and slope instability has been a subject of considerable research, while the fall-out of deforestation in the form of soil erosion and soil movement is generally accepted. It also has a detrimental effect on the livelihoods of people (see Box 10.1).
Box 10.1 Impact of Deforestation on livelihoods
Once forests are cut down in the mountain areas, there is an increase in surface runoff and soil erosion.
Fodder and year-round water availability decrease. As fodder becomes hard to get, mountain families
tend to reduce their livestock, leading to a reduction in farmyard manure, loss of soil fertility and reduced
agricultural production. When a family’s food grain production falls below sustenance levels, a typical
response is the migration of an able-bodied male family member. The reduced availability of labor in the
family increases the burden on women. They react by further reducing the number of cattle, sending the
family’s agricultural production into a downward tailspin.
Chopra, R. (2014). Uttarakhand: Development and Ecological Sustainability.
Land degradation results in the loss of terrestrial carbon stores from soils and vegetation, and has likely effects of reducing moisture absorption and retention. Such degradation is exacerbated by climate change. Although Uttarakhand has been losing topsoil, the state has implemented many programmes for watershed management, which can be expected to substantially reduce land degradation. District-wise, the primary survey found the highest proportions of respondents reporting deforestation coming from Champawat (95.8 percent), Rudraprayag (85.9 percent), Chamoli (84.1 percent) and Pithoragarh (83.4 percent). Soil Erosion and loss of bio-diversity
Soil is one of the most important natural resources and the biodiversity of a region strongly depends upon the soil and climatic elements. This natural resource has been depleting gradually as soil erosion in the state has been increasing with increases in deforestation and degradation. Soil resources in Uttarakhand vary from the deep, alluvial and fertile soils of the Tarai tract to the recently laid down alluvium of the Doon valley; the thin fragile soil of the Shivalik hills; the black soils of the temperate zone; and the arid, bare soil of the inner dry valleys.
Landslides, mine-spoils and torrents are the main causes of massive erosion. Ecological degradation in the mountain region is a threat of huge proportions, affecting agricultural lands as well as rural habitations. In the 2017 IHD Survey, relatively high shares of respondents reported soil erosion from Rudraprayag districts of (27.3 percent), Almora (17.1 percent), Uttarkashi (16.7 percent) and Tehri Garhwal (15.9 percent) (Figure 10.14).
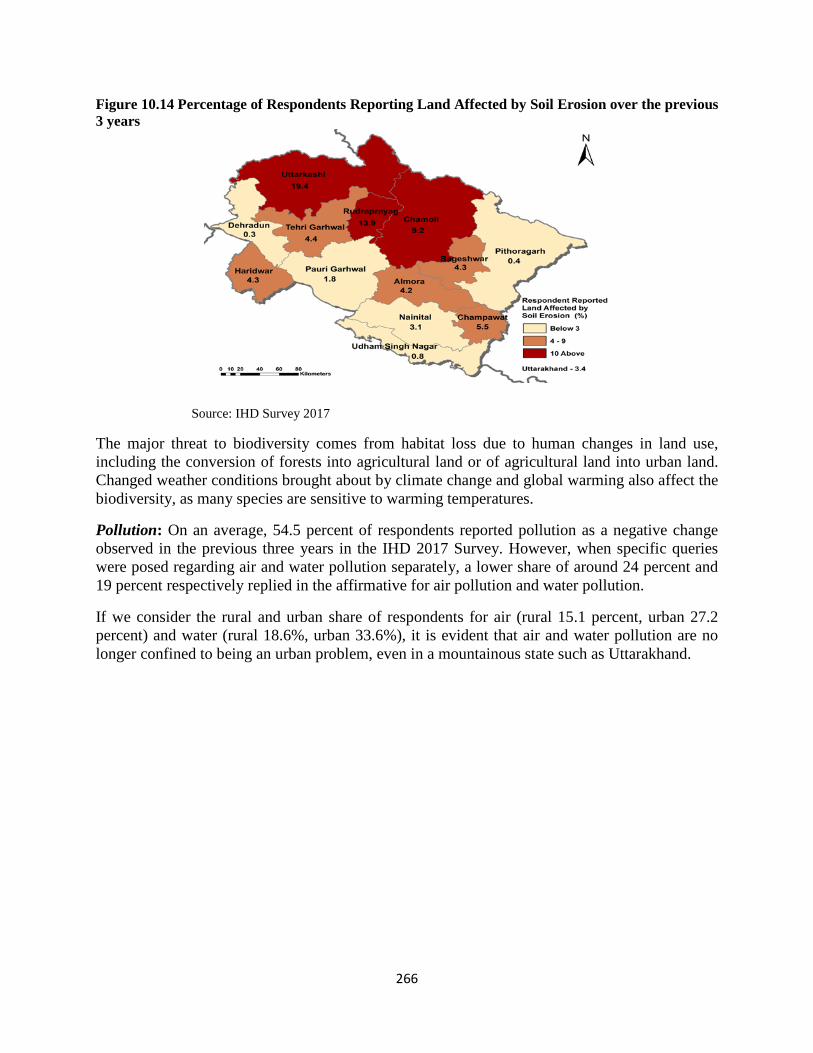
266
Figure 10.14 Percentage of Respondents Reporting Land Affected by Soil Erosion over the previous 3 years
Source: IHD Survey 2017
The major threat to biodiversity comes from habitat loss due to human changes in land use, including the conversion of forests into agricultural land or of agricultural land into urban land. Changed weather conditions brought about by climate change and global warming also affect the biodiversity, as many species are sensitive to warming temperatures.
Pollution: On an average, 54.5 percent of respondents reported pollution as a negative change observed in the previous three years in the IHD 2017 Survey. However, when specific queries were posed regarding air and water pollution separately, a lower share of around 24 percent and 19 percent respectively replied in the affirmative for air pollution and water pollution.
If we consider the rural and urban share of respondents for air (rural 15.1 percent, urban 27.2 percent) and water (rural 18.6%, urban 33.6%), it is evident that air and water pollution are no longer confined to being an urban problem, even in a mountainous state such as Uttarakhand.

267
Figure 10.15 Percentage Respondents Reporting having experienced Air Pollution over the previous 3 years
Source: IHD Survey 2017
Dehradun, Uttarakashi, Nainital, Hardwar and Udham Singh Nagar were districts where higher proportions of respondents reported air pollution (Figure 10.15). Highest share of respondents reported water pollution from Nainital, Uttarkashi, Udham Singh Nagar, and Dehradun (Figure 10.16).
Figure 10.16 Percentage Respondents Reporting having experienced Water Pollution during last 3 years
Source: IHD Survey 2017
10.3.3 Climate Change
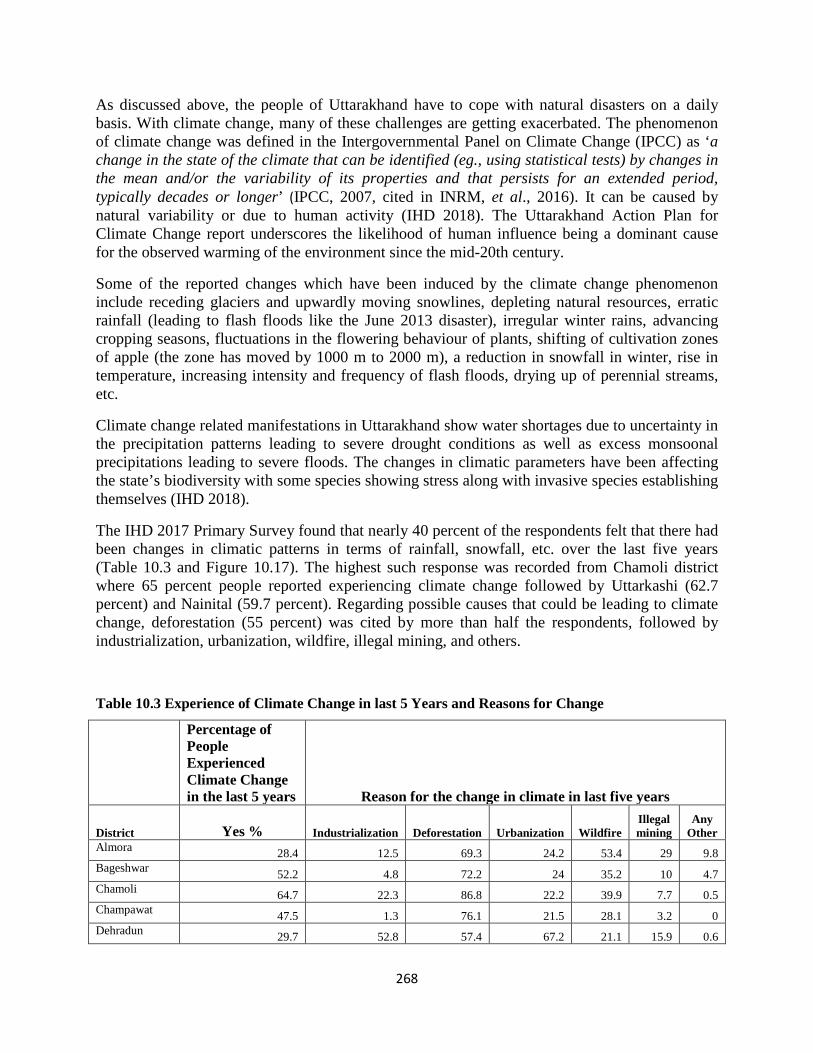
268
As discussed above, the people of Uttarakhand have to cope with natural disasters on a daily basis. With climate change, many of these challenges are getting exacerbated. The phenomenon of climate change was defined in the Intergovernmental Panel on Climate Change (IPCC) as ‘a change in the state of the climate that can be identified (eg., using statistical tests) by changes in the mean and/or the variability of its properties and that persists for an extended period, typically decades or longer’ (IPCC, 2007, cited in INRM, et al., 2016). It can be caused by natural variability or due to human activity (IHD 2018). The Uttarakhand Action Plan for Climate Change report underscores the likelihood of human influence being a dominant cause for the observed warming of the environment since the mid-20th century.
Some of the reported changes which have been induced by the climate change phenomenon include receding glaciers and upwardly moving snowlines, depleting natural resources, erratic rainfall (leading to flash floods like the June 2013 disaster), irregular winter rains, advancing cropping seasons, fluctuations in the flowering behaviour of plants, shifting of cultivation zones of apple (the zone has moved by 1000 m to 2000 m), a reduction in snowfall in winter, rise in temperature, increasing intensity and frequency of flash floods, drying up of perennial streams, etc.
Climate change related manifestations in Uttarakhand show water shortages due to uncertainty in the precipitation patterns leading to severe drought conditions as well as excess monsoonal precipitations leading to severe floods. The changes in climatic parameters have been affecting the state’s biodiversity with some species showing stress along with invasive species establishing themselves (IHD 2018).
The IHD 2017 Primary Survey found that nearly 40 percent of the respondents felt that there had been changes in climatic patterns in terms of rainfall, snowfall, etc. over the last five years (Table 10.3 and Figure 10.17). The highest such response was recorded from Chamoli district where 65 percent people reported experiencing climate change followed by Uttarkashi (62.7 percent) and Nainital (59.7 percent). Regarding possible causes that could be leading to climate change, deforestation (55 percent) was cited by more than half the respondents, followed by industrialization, urbanization, wildfire, illegal mining, and others.
Table 10.3 Experience of Climate Change in last 5 Years and Reasons for Change
Percentage of People Experienced Climate Change in the last 5 years Reason for the change in climate in last five years
District Yes % Industrialization Deforestation Urbanization Wildfire Illegal mining
Any Other
Almora 28.4 12.5 69.3 24.2 53.4 29 9.8 Bageshwar 52.2 4.8 72.2 24 35.2 10 4.7 Chamoli 64.7 22.3 86.8 22.2 39.9 7.7 0.5 Champawat 47.5 1.3 76.1 21.5 28.1 3.2 0 Dehradun 29.7 52.8 57.4 67.2 21.1 15.9 0.6
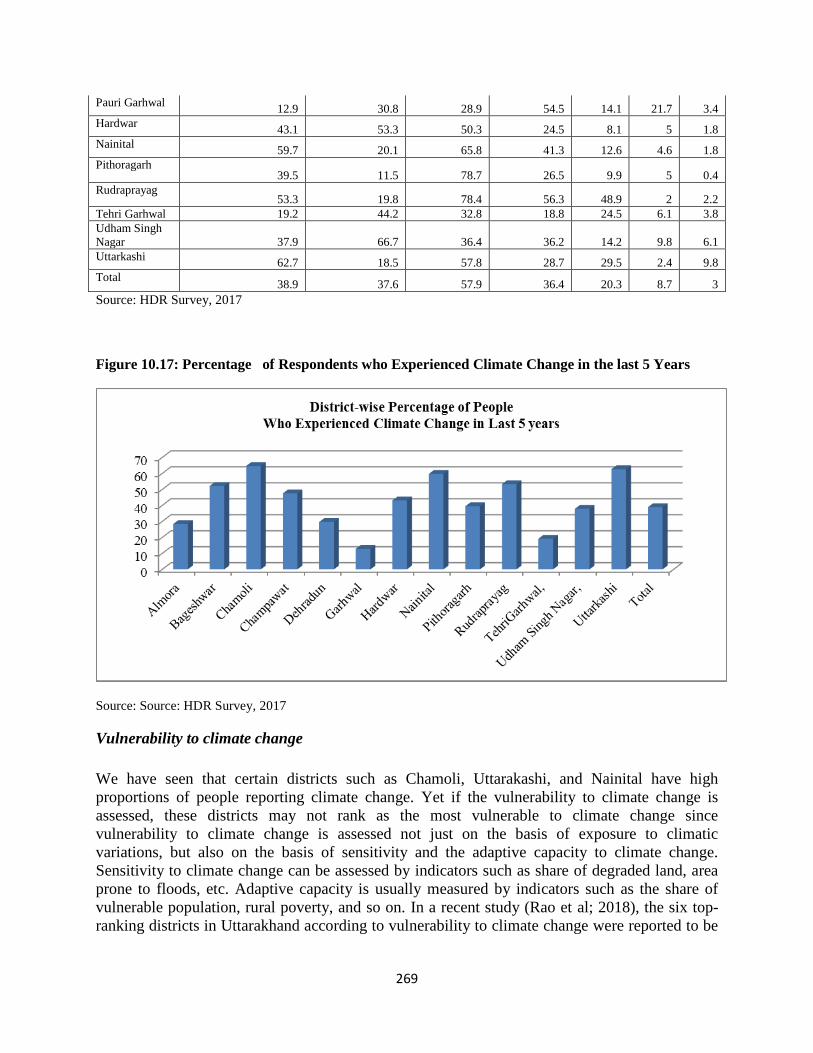
269
Pauri Garhwal 12.9 30.8 28.9 54.5 14.1 21.7 3.4 Hardwar 43.1 53.3 50.3 24.5 8.1 5 1.8 Nainital 59.7 20.1 65.8 41.3 12.6 4.6 1.8 Pithoragarh
39.5 11.5 78.7 26.5 9.9 5 0.4 Rudraprayag
53.3 19.8 78.4 56.3 48.9 2 2.2 Tehri Garhwal 19.2 44.2 32.8 18.8 24.5 6.1 3.8 Udham Singh Nagar 37.9 66.7 36.4 36.2 14.2 9.8 6.1 Uttarkashi 62.7 18.5 57.8 28.7 29.5 2.4 9.8 Total 38.9 37.6 57.9 36.4 20.3 8.7 3 Source: HDR Survey, 2017
Figure 10.17: Percentage of Respondents who Experienced Climate Change in the last 5 Years
Source: Source: HDR Survey, 2017
Vulnerability to climate change
We have seen that certain districts such as Chamoli, Uttarakashi, and Nainital have high proportions of people reporting climate change. Yet if the vulnerability to climate change is assessed, these districts may not rank as the most vulnerable to climate change since vulnerability to climate change is assessed not just on the basis of exposure to climatic variations, but also on the basis of sensitivity and the adaptive capacity to climate change. Sensitivity to climate change can be assessed by indicators such as share of degraded land, area prone to floods, etc. Adaptive capacity is usually measured by indicators such as the share of vulnerable population, rural poverty, and so on. In a recent study (Rao et al; 2018), the six top-ranking districts in Uttarakhand according to vulnerability to climate change were reported to be
270
Pithoragarh, Bageshwar, Almora, Chamoli, Champawat and Uttarkashi (Table 10.4). It is also seen that that all the top four ranked districts had low adaptive capacity to climate change.
Table 10.4 Ranking of Districts in Uttarakhand by Vulnerability to Climate Change
District Exposure Sensitivity Adaptive Capacity Vulnerability Rank Pithoragarh 3 1 12 1 Bageshwar 4 2 13 2 Almora 7 3 9 3 Chamoli 1 5 8 4 Champawat 2 6 7 5 Uttarkashi 11 4 11 6 Source: Rao et al 2018
Another estimate (INRM 2016), however, assesses Champawat and Tehri Garhwal as districts which are highly vulnerable to climate change and contrary to the above set of estimates, finds Chamoli and Pithoragarh as districts with low vulnerability (Table 10.5).
Table 10.5 Ranking of Districts in Uttarakhand by Vulnerability to Climate Change
Vulnerability Districts Very high vulnerability Champawat, Tehri Garhwal High vulnerability Hardwar, Almora, Bageshwar Moderate vulnerability Uttarkashi, Pauri Garhwal, Rudraprayag, Udham Singh Nagar Low vulnerability Chamoli, Pithoragarh Very low vulnerability Dehradun, Nainital Source: INRM 2016 10.3.4 Factors compounding disasters and environmental challenges
Uttarakhand has been growing at a fairly high rate of 7 percent or above in the last six years, with the exception of 2014-15, following the disaster of 2013. The concomitant developmental efforts in the state have also inadvertently resulted in accentuating and exacerbating the impact of disasters and environmental changes. The large hydroelectric projects (HEP) in the state with dams built across the rivers are a case in point. While it is natural for a state endowed with abundant water resources to try and harness the same for electricity generation to help it in its development activities, the environmental fall-out of the same has been unprecedented, highlighting the need to weigh the trade-off carefully. Overall, a typical HEP has a host of life-cycle environmental and social impacts which have been presented in brief in the Box 10.2.
In October 2013, following the disaster in June the same year, an Expert Body was set up under the Ministry of Environment and Forest to assess how 24 on-going/under construction HEPs in Uttarakhand were contributing to environmental degradation. The findings of this report clearly state that in terms of the environmental impact, first, minimal river flows released downstream of the HEPs have been leading to loss of river integrity, disruption of fish migration, loss of aquatic biota and diversity. Second, river water quality has been severely impacted due to unscientific and unlawful muck dumping from roads and tunnel construction. The self-cleansing ability of rivers has also seen a decline. Third, there has been a loss of ecosystems including biodiversity
271
along the rim of the Tehri reservoir. And fourth, slope stability has been a persistent issue. Even after dams have been built, landslides have been occurring repeatedly due to repeated raising and lowering of water level in the Tehri reservoir. Land subsistence and fissures, too have been observed. The social impact has been the drying of springs and damage to housing due to blasting. The aggravation of disasters in the Himalayan region has been due to the river water carrying huge amount of sediments while the dams have not been built to handle large sediments. This also has an impact on the glaciers.
Box 10.2 Environmental Impacts of Hydro Power Projects in Uttarakhand
Activity Impact Pre-project Construction Construction of approach road -Land acquisition leading to displacement, loss of home ,
livelihoods -Deforestation -Disposal of debris and earth
Construction of housing for staff and labour
-Deforestation -Pollution due to release of sewage
Quarrying Noise pollution, slope destabilization, disruption of underground seepage, damage to houses
Project Construction Tunnelling Air and noise pollution, slope destabilization, damage to
houses, disturbing wildlife, drying of springs, disposal of muck into rivers, psychological trauma to people and animals due to repeated blasts
Project Operation Dam Construction Disruption of river flow Testing of tunnels Slope destabilization often leading to loss of tree cover, land,
livelihoods, etc. Water shortage and release Sedimentation, disruption of river flow Laying of power lines Deforestation (loss of wildlife habitat), soil erosion
Source: Environmental Impacts of Hydro Power Projects in Uttarakhand: Governance and Audit Issues; presentation by Ravi Chopra, accessed at http://iced.cag.gov.in/wp-content/uploads/C-25/iCED%20Presentation%20-%20Mr.%20Ravi%20Chopra.pdf on 26th November 2018.
272
10.4 Natural Resource Management and Government initiatives
The natural resources of the region provide life supporting, provisioning, regulating, and cultural ‘eco-system’ services to millions of locals as well as people living downstream. Livelihoods are almost totally based on natural resources that is, water, forest, agriculture, etc. About three-fourths of the state’s population is rural virtually dependent on agriculture. With over 15 important rivers and over a dozen major glaciers, Uttarakhand is a valuable freshwater reserve.
Forest Management and Biodiversity Conservation Uttarakhand has a high proportion of land under forest cover which means that the scope for expanding the area under forest cover is limited. However, the state has a strong tradition of community forest management, run by the Van Panchayats, whose primary concern has been the conservation of forests.
The watershed management programmes in villages that are being implemented upstream of hydro-electricity generation plants can be utilised to reduce land degradation in the following way. These generation plants depend upon the good quality water, that is, with sediments below a certain level. Upstream villages can be paid for providing water of the requisite quality. This system of payments for good quality water as an eco-system service was tried out in hydro-electric plants in Nepal and has worked to reduce land degradation. Offering an incentive to provide good quality water could then strengthen watershed management in upstream villages. The mitigating effects of better land management on carbon storage also need to be taken into account. Tree storage of carbon is recognised and rewarded under the UNFCC’s REDD programme. In a similar fashion, carbon that is stored in soil and vegetation, also needs to be recognised and rewarded (IHD 2018).
Recent government initiatives to conserve natural resources and protect the environment
Efficient management of natural resources, such that they leave minimum ecological footprints, combined with the effective disposal and mitigation of toxic wastes and environmental pollutants are crucial for sustainable development. Highlighting the need to conserve our water resources, recent Court directives in the state have tried to protect natural resources such as the Ganga and Yamuna rivers as well as the Gangotri and Yamunotri glaciers from pollution by declaring them ‘living entities’ with rights to be protected. The HC order also said that, “rivers, streams, rivulets, lakes, air, meadows, dales, jungles, forests wetlands, grasslands, springs and waterfalls” in Uttarakhand must be given “corresponding rights, duties and liabilities of a living person, in order to preserve and conserve them”14. Uttarakhand has rapidly industrialized in the recent past. In this context, the need to reduce consumption of energy from fossil fuels and firewood must be emphasized. In early 2017, the high court in the state banned mining across the state for four months and ordered officials to constitute a high-level committee to recommend guidelines to 14 https://www.hindustantimes.com/india-news/uttarakhand-high-court-declares-gangotri-yamunotri-glaciers-as-living-entities/story-q1e7sjBnAGefEKT5cpezkO.html accessed on 21st November 2018. The Supreme Court, however, has subsequently opined that Ganga and Yamuna cannot be declared to be living entities.
273
stop illegal mining and to reclaim mined areas15. However, subsequently this order was stayed by the Supreme Court, which found the blanket ban difficult to justify.
Uttarakhand Action Plan on Climate Change
The government of Uttarakhand has already taken the important step of formulating an Action Plan on Climate Change (UAPCC 2014), in accordance with the National Action Plan on Climate Change. For Uttarakhand, it was deemed that adaptation has more significance than mitigation, as the contribution of the state to the GHG pool is miniscule compared to the developed states in the country. The climate response strategy has key elements such as accelerating inclusive economic growth, promoting sustainable development, securing and diversifying livelihoods and safeguarding ecosystem services. Further, the strategy is not to be viewed as a stand-alone action as it is planned to be integrated into the regular developmental planning processes. The challenge for the state is to holistically converge existing initiatives and make additional efforts to integrate climate concerns and response measures into all aspects of the development process, from policy and planning to implementation. The state has adopted this as the underlying principle in the formulation of the Uttarakhand Action Plan for Climate Change (UAPCC) and aims to become a green and carbon neutral state by 2020.
The Uttarakhand Green Energy Cess Act, 201416
This is an Act to promote electricity production from renewable power sources on the basis of a private developer and community co-operation and for incidental matters. In the Uttarakhand Green Cess Act 2014, the state government proposes to impose a levy on power which is being generated in the state but is transmitted outside for usage of other states. The cess would also be imposed on the power supplied to commercial and industrial units. The state government intends to promote private entrepreneurs and community participation in the power sector with the corpus collected from the cess.
Uttarakhand Disaster Recovery Project (World Bank Assisted)
Based on the findings from the Joint Rapid Damage Needs and Assessment, which involved multi-sector assessments of damages after a disaster has taken place, the Uttarakhand Disaster Recovery Project (UDRP) was launched. The objective of the UDRP is to restore housing and rural connectivity, build resilience of the local communities in Uttarakhand and to increase the technical capacity of the state entities to respond promptly and effectively to an eligible crisis or emergency. There are six components to the project: resilient infrastructure reconstruction, rural road connectivity, technical assistance and capacity building for disaster risk management, financing disaster response expenses, implementation support and the contingency emergency response.
Uttarakhand Emergency Assistance Project (ADB Assisted)
15 http://www.indiawaterportal.org/articles/uttarakhand-conserve-its-natural-resources accessed on November 14th 2018. 16 http://www.lawsofindia.org/pdf/uttarakhand/2015/2015UK3.pdf accessed on 20th October 2018
274
The Uttarakhand Emergency Assistance Project has been launched, through the State Disaster Management Authority (SDMA), to assist the Government of Uttarakhand to meet reconstruction needs due to the disaster in Uttarakhand in June 2013 that severely affected several parts of Uttarakhand. The expected outcome of the project is the restoration of basic public and social infrastructure, improve disaster preparedness, project management, and institutional effectiveness. The revised high flood levels of the rivers, natural streams, and drainage channels will be considered while designing facilities, geotechnical studies will be undertaken and slope stabilization measures will be considered for slide zones, wherever applicable.
10.5 Ongoing Mitigation Measures by the Government
The importance of quality water provision and waste management has received much attention in the context of sustainable development. Various schemes such as the Swachh Bharat Abhiyan, National River Conservation Programme, Swajal Dhara, Namami Gange Solid Waste Management, Urban Sewage Treatment Plants, Rural Water and Sewerage Scheme and Jalagam/Watershed Management Plans have been brought in by the government at the Central and state levels. The following section assesses the situation on the ground in Uttarakhand.
Solid and Liquid Waste Management:
Waste management is a critical issue for the state of Uttarakhand given the fragility of its eco-system. If not addressed urgently, it may become the major cause of pollution for all the critical riverine systems and valleys.
The IHD 2017 Survey data found that 12 percent of the respondents in rural areas still practised open defecation. The incidence of open defecation was found to be highest in Uttarkashi (25 percent), Rudraprayag (20 percent) and Champawat (20 percent). This was observed despite the fact that rural Uttarakhand was declared as Open Defecation Free (ODF) in June 2017 as a part of the Swachh Bharat Mission initiative.
A recent report of the Comptroller and Auditor General of India (CAG) has mentioned that the declaration of the state as ODF was “incorrect”17. The CAG report for 2016-2017, carried out in seven of the state’s 13 districts, mentioned that the state government’s claim of “making all the 265 villages in 132 Gram Panchayats of seven districts open defecation free was found to be incorrect”. The CAG report also mentioned that during the time of the audit, the state government had made “no significant progress” in constructing Community Sanitation Complexes and Solid and Liquid Waste Management structures.
The above report observed the following:
• Municipal garbage was being indiscriminately dumped on the slopes of the hills.
• The Sewage Treatment Plants at Devprayag and Rishikesh were under-utilised due to deficient planning and lack of coordination between the executing agencies.
17 https://cag.gov.in/sites/default/files/audit_report_files/Chapter_1_Social_General_and_Economic_Sectors_Non-PSUs_Government_of_Report_No_1_of_2018_-_Government_of_Uttarakhand.pdf accessed on 27th November 2018
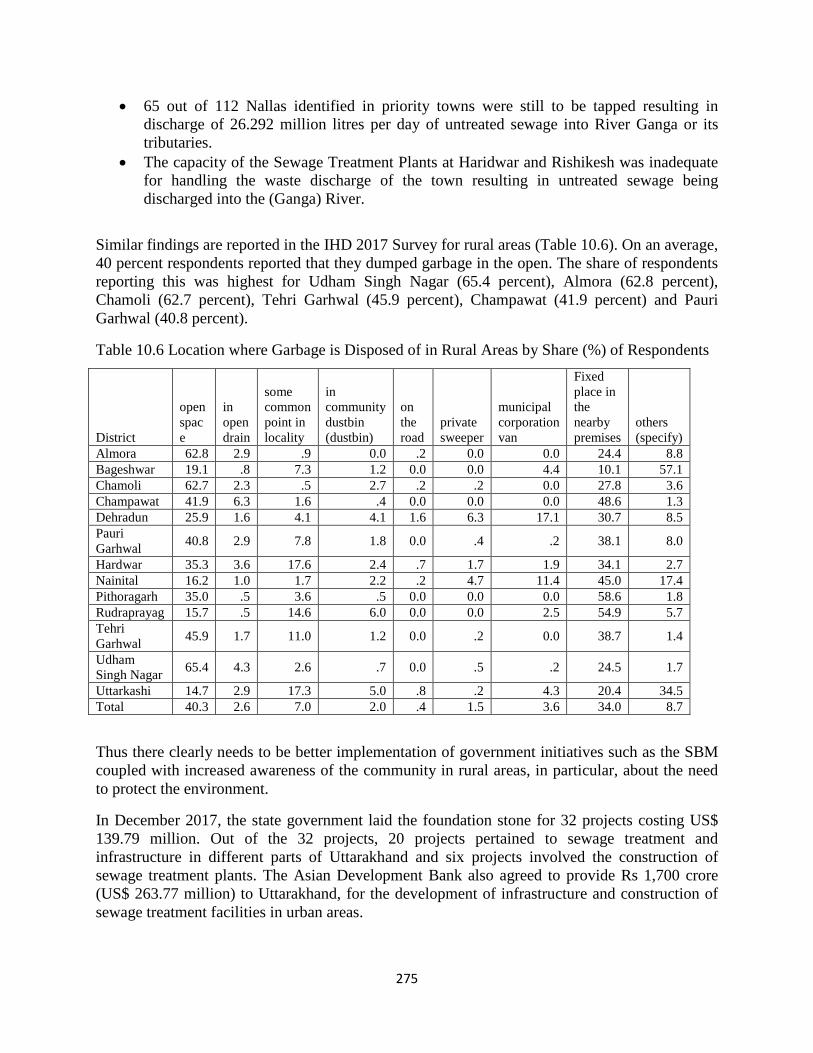
275
• 65 out of 112 Nallas identified in priority towns were still to be tapped resulting in discharge of 26.292 million litres per day of untreated sewage into River Ganga or its tributaries.
• The capacity of the Sewage Treatment Plants at Haridwar and Rishikesh was inadequate for handling the waste discharge of the town resulting in untreated sewage being discharged into the (Ganga) River.
Similar findings are reported in the IHD 2017 Survey for rural areas (Table 10.6). On an average, 40 percent respondents reported that they dumped garbage in the open. The share of respondents reporting this was highest for Udham Singh Nagar (65.4 percent), Almora (62.8 percent), Chamoli (62.7 percent), Tehri Garhwal (45.9 percent), Champawat (41.9 percent) and Pauri Garhwal (40.8 percent).
Table 10.6 Location where Garbage is Disposed of in Rural Areas by Share (%) of Respondents
District
open space
in open drain
some common point in locality
in community dustbin (dustbin)
on the road
private sweeper
municipal corporation van
Fixed place in the nearby premises
others (specify)
Almora 62.8 2.9 .9 0.0 .2 0.0 0.0 24.4 8.8 Bageshwar 19.1 .8 7.3 1.2 0.0 0.0 4.4 10.1 57.1 Chamoli 62.7 2.3 .5 2.7 .2 .2 0.0 27.8 3.6 Champawat 41.9 6.3 1.6 .4 0.0 0.0 0.0 48.6 1.3 Dehradun 25.9 1.6 4.1 4.1 1.6 6.3 17.1 30.7 8.5 Pauri Garhwal 40.8 2.9 7.8 1.8 0.0 .4 .2 38.1 8.0
Hardwar 35.3 3.6 17.6 2.4 .7 1.7 1.9 34.1 2.7 Nainital 16.2 1.0 1.7 2.2 .2 4.7 11.4 45.0 17.4 Pithoragarh 35.0 .5 3.6 .5 0.0 0.0 0.0 58.6 1.8 Rudraprayag 15.7 .5 14.6 6.0 0.0 0.0 2.5 54.9 5.7 Tehri Garhwal 45.9 1.7 11.0 1.2 0.0 .2 0.0 38.7 1.4
Udham Singh Nagar 65.4 4.3 2.6 .7 0.0 .5 .2 24.5 1.7
Uttarkashi 14.7 2.9 17.3 5.0 .8 .2 4.3 20.4 34.5 Total 40.3 2.6 7.0 2.0 .4 1.5 3.6 34.0 8.7
Thus there clearly needs to be better implementation of government initiatives such as the SBM coupled with increased awareness of the community in rural areas, in particular, about the need to protect the environment.
In December 2017, the state government laid the foundation stone for 32 projects costing US$ 139.79 million. Out of the 32 projects, 20 projects pertained to sewage treatment and infrastructure in different parts of Uttarakhand and six projects involved the construction of sewage treatment plants. The Asian Development Bank also agreed to provide Rs 1,700 crore (US$ 263.77 million) to Uttarakhand, for the development of infrastructure and construction of sewage treatment facilities in urban areas.
276
The Swajal Department Open Community Meetings on household sanitation, cleanliness, water and waste management need to be organised regularly. Street campaigns through school children on rainwater harvesting, health, waste management, an awareness campaign for adolescent girls to adopt napkins and healthy practices are being practiced gradually. Hoardings and wall paintings to make people aware of adopting hygienic practices are also being started.
The Uttarakhand Jal Sansthan faces the challenges of supplying water to every village and town according to their demand, ensuring quality water and providing connectivity of drinking water and toilets to every household. To come through with the challenges, a need-based survey of every village to stop wastage of water would be a step in the right direction. Rainwater harvesting systems in every village also need to be encouraged.
The recent World Bank aided Uttarakhand Water Supply and Sanitation Program for Peri-Urban Areas aims to increase access to improved water supply services in peri-urban areas in Uttarakhand and comprises six sub-sectoral components: (a) Urban Water Supply, (b) Urban Sanitation, (c) Rural Water Supply, (d) Rural Sanitation, (e) Peri-urban Water Supply, and (f) Peri-urban Sanitation. As part of the Urban Water Supply component, the state envisages treated and pressurized piped water supply for all households by 2030, with at least 60 percent metered connections. The Urban Sanitation component has two sub-components: (a) enhancing the coverage of Individual Household Latrines and (b) expansion of sewer network. The Fisheries Jalashaya Vikas Yojana is a departmental flagship programme. However, lack of proper planning and continuous exploitation of local fish is resulting in the extinction of rare species.
Control of Emissions
In Uttarakhand, there has been persistent use of wood for cooking, in the hilly regions, in particular. This has the twin negative impacts on the environment in terms of depleting the forest cover and contributing to emissions which lead to climate change and warming of the environment. To reduce GHG emissions and even more as a measure to improve the health and well-being of rural women and children, it is necessary to bring about a switch in cooking fuel from wood and other solid biomass to LPG or electricity. The Government of India’s Ujjwala Yojana has been a major initiative in this direction. The IHD 2017 primary survey has found that in rural areas, 72.4 percent of respondents reported using LPG rather than wood, although on an average, a quarter of respondents continued to use firewood for cooking. The share of respondents reporting use of firewood was found be high in Champawat (51 percent), Rudraprayag (41.5 percent), Pauri Garhwal (39.7 percent) and Chamoli (39.1percent).
Green Roads: A green economy creates growth while improving the environment and people’s lives. Conservation of ecosystems and the provision of sustainable clean energy are at the heart of any agenda for a green economy18. In this context, the concept called "Green Road" has emerged in hill road construction practices and has evolved from the lessons learnt in the past and decade-long experiences in hill road constructions and maintenance. This is an environment-friendly and labour-based construction technique which utilizes a mass balancing approach. It is a low-cost solution which focuses on the use of locally available materials and techniques in a
18 http://www.icimod.org
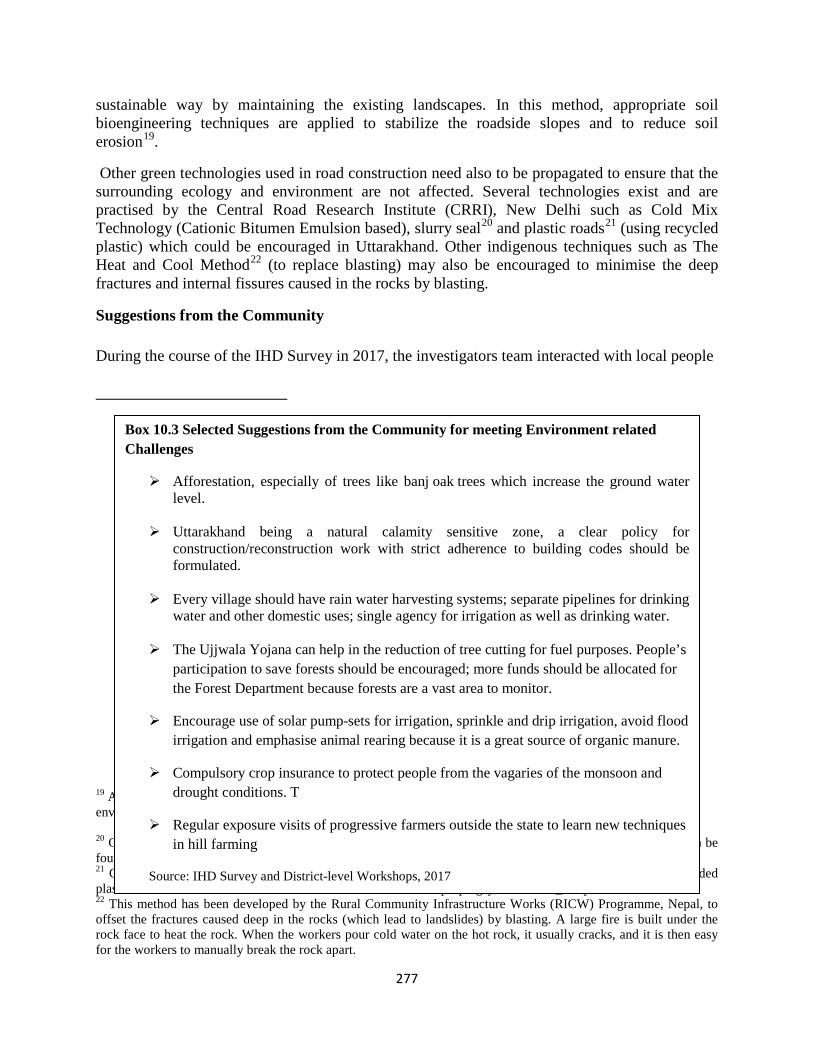
277
sustainable way by maintaining the existing landscapes. In this method, appropriate soil bioengineering techniques are applied to stabilize the roadside slopes and to reduce soil erosion19.
Other green technologies used in road construction need also to be propagated to ensure that the surrounding ecology and environment are not affected. Several technologies exist and are practised by the Central Road Research Institute (CRRI), New Delhi such as Cold Mix Technology (Cationic Bitumen Emulsion based), slurry seal20 and plastic roads21 (using recycled plastic) which could be encouraged in Uttarakhand. Other indigenous techniques such as The Heat and Cool Method22 (to replace blasting) may also be encouraged to minimise the deep fractures and internal fissures caused in the rocks by blasting.
Suggestions from the Community
During the course of the IHD Survey in 2017, the investigators team interacted with local people
19 Acharya et al (2013), “Green Road: an ecological road construction method for the preservation of mountain environment and landscape in Nepal” 20 Central Road Research Institute, New Delhi Further information on the benefits of Cold Mix Technology can be found on http://pmgsy.nic.in/cationic.pdf. 21 Civil Engineering Department (CED) of Bokaro Steel Plant and has developed a technique for using discarded plastic material in roads. Further information can be found on http://pmgsy.nic.in/WM_RR.pdf 22 This method has been developed by the Rural Community Infrastructure Works (RICW) Programme, Nepal, to offset the fractures caused deep in the rocks (which lead to landslides) by blasting. A large fire is built under the rock face to heat the rock. When the workers pour cold water on the hot rock, it usually cracks, and it is then easy for the workers to manually break the rock apart.
Box 10.3 Selected Suggestions from the Community for meeting Environment related Challenges
Afforestation, especially of trees like banj oak trees which increase the ground water level.
Uttarakhand being a natural calamity sensitive zone, a clear policy for
construction/reconstruction work with strict adherence to building codes should be formulated.
Every village should have rain water harvesting systems; separate pipelines for drinking
water and other domestic uses; single agency for irrigation as well as drinking water. The Ujjwala Yojana can help in the reduction of tree cutting for fuel purposes. People’s
participation to save forests should be encouraged; more funds should be allocated for the Forest Department because forests are a vast area to monitor.
Encourage use of solar pump-sets for irrigation, sprinkle and drip irrigation, avoid flood irrigation and emphasise animal rearing because it is a great source of organic manure.
Compulsory crop insurance to protect people from the vagaries of the monsoon and drought conditions. T
Regular exposure visits of progressive farmers outside the state to learn new techniques in hill farming
Source: IHD Survey and District-level Workshops, 2017
278
local people and conducted workshops in each district, meeting district level officials to gather views and suggestions from the grassroots regarding various human development related issues. Some of the highlight findings are shared here. Agriculture, particularly in the hill areas, was reported as being greatly impacted by climate change and natural disasters. The adverse impact in terms of soil erosion, rainfall, movement in food and product prices, etc. were discussed. In this context, useful and environment-friendly remedial suggestions were put forward at the district and village levels, which are presented in Box 10.3.
10.6 Summing Up and Policy Suggestions
In a hill state, human development is greatly impacted by the natural environment that the populace lives in. Their activities, in turn, profoundly impact the fragile mountain environment. In order to co-exist in harmony, environmental forces need to be respected and protected such that in the quest for economic progress, the environmental balance is not compromised. It is ultimately in the interest of the people that the natural resources and environment in the state are protected and enhanced.
We have seen that the people of the state, especially in the hill districts, are affected by natural disasters such as floods, earthquakes, cloudbursts, forest fires and so on, on a regular basis, and yet there are very few coping mechanisms in place. The state government has drawn up a long-term strategy with detailed outlines for improvement in ‘Technical Assistance and Capacity Building’ for disaster risk management23. Conducting Hazard, Risk, Vulnerability and Capacity (HRVC) analyses, augmenting preparedness, ensuring proper land-use and installing monitoring and warning systems are crucial aspects of managing disasters. The IHD 2017 Survey showcases clearly that there is still very little preparedness on the ground for tackling disasters, although some warning system processes through SMS have been initiated.
Regarding deforestation, as has been pointed out by the UAPCC, given the high forest cover, the state has little scope to increase forest cover and must focus on improving the share of moderately dense forests into dense forests and some part of the open forests into moderately dense forests.
To combat climate change, it is essential to contain GHGs and given the low contribution of the state to emissions as compared to the country as a whole, the state needs to focus on adaptation measures so that it becomes more and more resilient to climate change. More community participation in the management of forest resources via Van Panchayats, watershed management, promoting and protecting bio-diversity as well as promoting sustainable agriculture with organic farming are some of the measures that could be undertaken. Switching to greener fuels is also an important initiative where people’s participation is tantamount and the IHD Survey reports that even in rural areas, a greater number of people are using LPG in place of wood as fuel. It extremely important that the people who continue to use firewood are converted to LPG-users with the help of schemes such as the Ujjwala Mission, with provision of sufficient incentives.
23 For details, see IHD (2018)
279
Sanitation habits including open defecation and garbage disposal are areas that need attention, especially in rural areas, as indicated by the Survey. In this context, there is the need to raise community awareness for cleaner habits in keeping with the Swachh Bharat Mission as well as containing the disposal of non-biodegradable wastes such as plastics, in order to restore and retain the pristine quality of rivers and the hillside in the scenic and beautiful state of Uttarakhand, and so on.
Water and land resources in the state have also been substantially affected by the large hydropower projects and the renewable or green energy option has already been receiving a boost in the state in keeping with the national commitment towards renewable energy production24. The adoption of green or sustainable approaches to building roads, construction, initiating seismic assessments of buildings, etc., are ways that can help the state in achieving a sustainably higher levels of human development and economic growth.
The state government needs to implement strict rules and policies to control pollution caused by motorized vehicles by creating awareness amongst the motoring public in particular and the public at large, on the effects of vehicular pollution. Pollution-checking facilities should be provided at petrol pumps and workshops, the standards of various pollutants according to the relevant rules including the Motor Vehicles Act need to be enforced and the enforcement of environmental pollution control in the state should be facilitated.
The IHD 2017 Survey shows clearly the extent to which the people in the hill districts are impacted by natural disasters and climate change and how the post-disaster impact is felt through rising prices of food as well as falling prices of produce. Considering that agriculture is the key sector in hilly districts upon which the livelihoods of the people are dependent, adaptation of sustainable farming methods to withstand variable climate, switching to organic farming process, diversifying into newer sectors such as horticulture and aromatic plants, adoption of integrated farming methods, crop insurance, etc., are all strategies that can help the farmers benefit as well as protect their fluctuating fortunes25. Again, the hill districts of the state also have enormous potential for providing livelihoods in the tourism sector with the help of expansion of homestays, promotion of adventure sports such as river rafting, and so on, while respecting the boundaries of the carrying capacity of a tourist destination26. Thus, ensuring remunerative ecological livelihoods for mountain dwellers needs to be a priority area for human development in Uttarakhand.
It is imperative that Uttarakhand heeds the lessons emerging from the 2013 tragedy, especially in the context of the repeated indications of climate change. Environmentally sustainable development is the basic prerequisite for disaster mitigation. Equitable development will reduce the numbers of vulnerable populations. Governments, local community and civil society organizations must all come together to be active partners in embarking on an environment-friendly and sustainable development process in the state, which is also associated with enhanced human development.
24 For details, see discussion on SDG 7 in IHD (2018). 25 For details, see discussion on SDG 2 in IHD (2018). 26 For details, see discussion on SDG 8 in IHD (2018).
280
References
Awasthi, I.C, Mehta, G. and Mamgain, R. (2014). Uttarakhand Disaster: Lessons and way forward. Impact Assessment of Disaster and Trends in Sustaining Recovery in Uttarakhand. [Online] Lucknow: Giri Institute of Development Studies. Available at: http://gids.org.in [Accessed 22 May 2018].
Acharya
Papola, T. (2014). Uttarakhand Disaster: Beyond Rescueand Relief. Lessons & Learning from Disasters: Uttarakhand State.
Ministry of Environment and forest, Government of Uttarakhand (2017). Uttarakhand Action Plan of Climate Change, Government of Uttarakhand.
UNDP HDR. (2007).
Government of Uttarakhand (2012). State Action Plan on Climate Change.
Planning Commission, Government of India (2009). Uttarakhand Development Report. New Delhi: Academic Foundation.
Joshi, B.K. (2014). Environment and Development in a Sustainability Framework: An Exploration in the Context of Uttarakhand. Paper written for presentation at the ICSSR-UNIL Joint Seminar on "Social Dynamics: Indian and Swiss approaches", September 9-10, 2014, Bengaluru, India.
Government of Uttarakhand (2014). Uttarakhand Action Plan on Climate Change.
Forest Survey of India. (Undated) ‘India State of Forest Report 2011’, Forest Survey of India, Dehradun, pp. 236–237
National Disaster Management Authority (NDMA) (n.d.) ‘National Policy on Disaster Management, 2009’, NDMA, New Delhi, p. 1.
Chopra, R. (2014). Uttarakhand: Development and Ecological Sustainability. [ebook] New Delhi: Oxfam India. Available at: https://www.oxfamindia.org/sites/default/files/WP8UttarakhandDevpEcoSustainabiit3.pdf [Accessed 25 May 2018].
Jain, D., Environmental Changes and Biodiversity in Uttarakhand. [Online] Biology Discussion. Available at: http://www.biologydiscussion.com/biodiversity/environmental-changes-and-biodiversity-in-uttarakhand/4557 [Accessed 25 May 2018].
281
Aaheim, A., Dhakal, K. and Orlov, A. (2017). Socio-Economic Consequences of Climate Change in Hindu-Kush Himalaya. [Online] Icimod.org. Available at: http://www.icimod.org/?q=16949 [Accessed 25 May 2018].
Uttarakhand the Spiritual Sovereign of India. (2018). [ebook] India Brand Equity Foundation. Available at: https://www.ibef.org/download/Uttarakhand-April-2018.pdf [Accessed 25 May 2018].
Moef.nic.in. (2018). Introduction | Ministry of Environment & Forests, Government of India. [Online] Available at: http://www.moef.nic.in/division/introduction-22 [Accessed 25 May 2018].
Fsi.nic.in. (2018). [Online] Available at: http://fsi.nic.in/isfr2017/uttarakhand-isfr-2017.pdf [Accessed 25 May 2018].
Directorate of Economics and Statistics, Government of Uttarakhand (2018). Economic Survey Uttarakhand, 2017-18. Dehradun.
Kaur, R. and Lokgariwar, C. (2013). Uttarakhand - ravaged by God or Governance? [Online] Indiawaterportal.org. Available at: http://www.indiawaterportal.org/articles/uttarakhand-ravaged-god-or-governance [Accessed 25 May 2018].
Iquestgreen.wordpress.com. (2012). Uttarakhand and its Natural Resources. [Online] Available at: https://iquestgreen.wordpress.com/2012/03/06/uttarakhand-and-its-natural-resources/ [Accessed 25 May 2018].
Jodha, N. (1992). Mountain Perspective and Sustainability: A Framework for Development Strategies. New Delhi: Oxford and IBH Publishing Co. Pvt. Ltd.
Institute for Human Development (2018). Uttarakhand: Vision 2030. New Delhi.

282
CHAPTER 11: GENDER 11.1 Background Human development takes into account all the aspects necessary for the process of development; however the development may not be evenly spread across all the sections of the society. Gender inequality has always been a concern in human development of an economy. Gender equality means that the rights, responsibilities and opportunities of an individual should not be constrained by his or her gender. Equal rights and opportunities should be provided be it male or female. All human beings are free to develop their personal abilities and make choices without the limitations set by strict gender roles. In India, it has been observed that women have always been on the receiving end, they lack proper education, access to proper healthcare, lack of political participation and economic independence owing to inequality between men and women. This discrimination is due to traditions and values, religious norms, caste rules and social taboos which tend to restrict women’s lives in terms of the various opportunities that she might want to seek and because of these restrictions they get confined to traditional work and opportunities. Human development would always be incomplete due to this disparity. In this context the chapter covers the aspects of gender inequality in the state of Uttarakhand. The chapter comprises of gender differences in health and well-being (overall sex ratio, child sex ratio, infant mortality, under five mortality rate), educational attainment (literacy rate, gross and net enrolment rate, dropout rate), economic participation, political participation, decision making, crimes and violence, and child marriage. Finally, the chapter discusses about Gender Development Index (GDI) and to assess the disparities across districts of Uttarakhand. 11.2.Health and Survival There is a large variation found in the ratio of both child and adult males to females across the world, while some regions have shortage of males and others a shortage of females (UNDP, 2013).In India, women are not only discriminated on the basis of their level of education but also in terms of their access to basic healthcare facilities. Women are highly vulnerable to diseases and sickness as compared to their male counterparts. Due to this gender bias in healthcare facilities the problems of women get highly aggravated. In the following section we discuss the imbalance of female and male ratios. 11.2.1. Overall Sex Ratio According to Census 2011, the overall sex ratio of Uttarakhand (963) was higher than All India (940).The sex ratio of Uttarakhand has increased over the years in urban area (39 points) and declined in rural area (7 points). The district wise sex ratio shows highest in Almora(1138) and lowest in Hardiwar(880) as per 2011 Census. There has been major increase in sex ratio since 2001 in districts such as Tehri Garhwal, Dehradun, Nainital(Annexure Table 11A.1).
283
The primary survey data also confirms similar trends i.e. increasing sex ratio in the state in 2017-18. However, the picture across district differs as it shows Garhwal and Udham Singh Nagar districts have highest and lowest overall sex ratio respectively (Annexure Table 11A.2). It has been observed that hill districts have higher sex ratio which might be due to non-economic activities in these districts because of which men have started to migrate for employment and women stick to their origin place. Another reason could be the facility of sex determination test and easy termination of pregnancies (if baby girl is determined) which leads to female birth less than male birth. 11.2.2. Child Sex Ratio According to Census 2011, child sex ratio of India was 914 females per 1000 males.Total child sex ratio in Uttarakhand were 890 as per Census 2011. It declined in 2011 in urban area(49points) and declined in rural area as well (9 points). A district wise data shows in 2011 Census the highest child sex ratio was in Almora(921) and lowest in Pithoragarh(815).It can be noticed there has been a considerable decline in the child sex ratio from 2001 to 2011 except in district where the child sex ratio has increased (Annexure Table6A.3).From NFHS-4, mostly child sex ratio has declined district wise. The major decline in child sex ratio is in Garhwal(199 points) (Annexure Table 11A.4). Some of the reasons for neglect of girl child and low child sex ratio are son preference and the belief that it is only the son who can perform the last rites, that lineage and inheritance runs through the male line, sons will look after parents in old age, men are the bread winners etc. Exorbitant dowry demand is another reason for female foeticide/infanticide. Small family norm coupled with easy availability of sex determination tests may be a catalyst in the declining child sex ratio, further facilitated by easy availability of pre-conception sex selection facilities (Ministry of Health and Family Welfare). 11.2.3. Infant Mortality Rate According to NFHS 3 and NFHS 4, All India IMR was 57 and 41 respectively7. In Uttarakhand IMR is lower than national average for both NFHS 3(15 points) and NFHS 4(1 point). Urban areas of Uttarakhand show a slightly higher level at 44 as compared to 38 in rural areas (Figure 7.3).Boys have a slightly higher mortality rate than girls during the neonatal period (in the first month of life). Between ages 1 and 5 years, girls have higher mortality rates than boys. Children born to mothers under age 20 and age 30-39 are more likely to die during infancy than children born to mothers in the prime childbearing age (20-29 years). Infant mortality is 50 for mothers age 30-39, compared with 38 for mothers age 20-29. Having children too close together is especially risky. Children born less than two years after a previous birth are more than two times as likely to die in infancy as children whose mothers waited four or more years between births. Infant mortality rates are also higher for Muslims than for Hindus and are higher for other backward classes than for scheduled

284
castes. The infant mortality rate is much higher for children whose mothers have no schooling (69 per 1,000 live births) than for children whose mothers have completed 10 or more years of schooling (24 per 1,000 live births).8 11.2.4. Under Five Mortality Rate All India under five mortality rate (U5MR) has reduced from 74 (NFHS-3) to50(NFHS- 4). Figure 4 shows under five mortality rate in Uttarakhand is lower than All India by 17 points (NFHS-3) and 3 points (NFHS-4). This reduction in U5MR could be due to improvement in health facilities. With improvement in female literacy which plays a positive role, women now understand the importance of cleanliness and hygiene and take better care of their children’s health. According to the first Annual Health Survey, Uttarakhand was marked as the safest state in India for child to be born in, given its relatively low infant mortality rate. Within Uttarakhand, three districts—Pithoragarh, Rudraprayag and Almora are safest for new borns as they have the lowest infant mortality rate (IMR), neo-natal mortality rate (NNMR) and under-5 mortality (U5MR) rate.9 11.3. Education Educational Attainment is an important factor to reduce gender parity. Higher level of education would lead to a reduction in social and economic differences between men and women and women would be able to have greater participation in decision making. This section discusses the gender differences in terms of literacy rate, enrolment and dropout rates. 11.3.1. Literacy Rate According to 2011 Census, total literacy rate of Uttarakhand is 78.8 per cent, which is lesser than All India (74.0 per cent). In Uttarakhand, male literacy rate (87.4 per cent) is 1.25 times higher than that of female literacy rate (70.0 per cent). Literacy rate of female has always been less than the literacy rate of male. District wise table shows literacy rate for male is highest in Dehradun (84.2 per cent) and lowest in Udham Singh Nagar (73.1 per cent).The lowest male literacy rate is recorded highest in Chamoli (93.4 per cent) and lowest in Haridwar (81.0 per cent), this could be due to the fact that male population has been migrating from hills to plain districts in search of better jobs, hence they concentrate less on attaining education resulting in reduction of male literacy rate in these districts. The literacy rate for female is highest in Dehradun (78.5 per cent) and lowest in Uttarkashi (62.4 per cent) (Annexure Table 11A.5 and 11A.6). District wise Gender gap in literacy rate is also calculated and from Table 11.1 it is evident that gender gap is highest in Uttarkashi (26.4 per cent) and lowest in Dehradun (10.9 per cent).
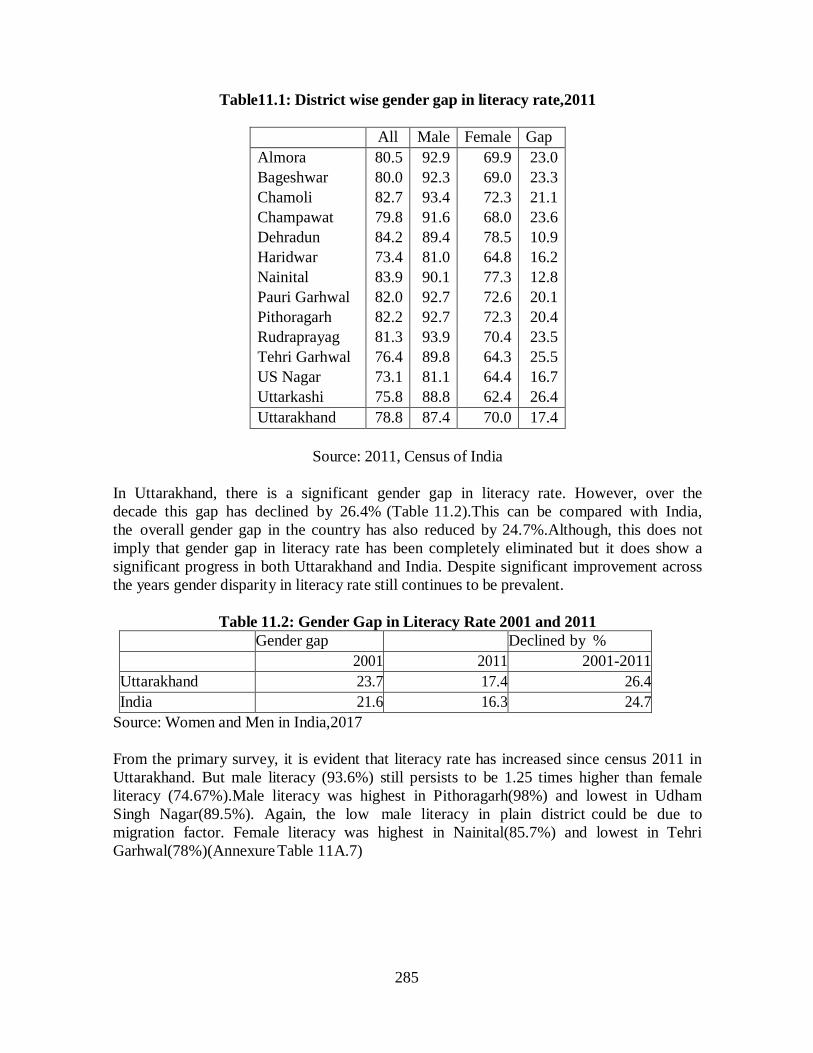
285
Table11.1: District wise gender gap in literacy rate,2011
All Male Female Gap Almora 80.5 92.9 69.9 23.0 Bageshwar 80.0 92.3 69.0 23.3 Chamoli 82.7 93.4 72.3 21.1 Champawat 79.8 91.6 68.0 23.6 Dehradun 84.2 89.4 78.5 10.9 Haridwar 73.4 81.0 64.8 16.2 Nainital 83.9 90.1 77.3 12.8 Pauri Garhwal 82.0 92.7 72.6 20.1 Pithoragarh 82.2 92.7 72.3 20.4 Rudraprayag 81.3 93.9 70.4 23.5 Tehri Garhwal 76.4 89.8 64.3 25.5 US Nagar 73.1 81.1 64.4 16.7 Uttarkashi 75.8 88.8 62.4 26.4 Uttarakhand 78.8 87.4 70.0 17.4
Source: 2011, Census of India
In Uttarakhand, there is a significant gender gap in literacy rate. However, over the decade this gap has declined by 26.4% (Table 11.2).This can be compared with India, the overall gender gap in the country has also reduced by 24.7%.Although, this does not imply that gender gap in literacy rate has been completely eliminated but it does show a significant progress in both Uttarakhand and India. Despite significant improvement across the years gender disparity in literacy rate still continues to be prevalent.
Table 11.2: Gender Gap in Literacy Rate 2001 and 2011 Gender gap Declined by % 2001 2011 2001-2011 Uttarakhand 23.7 17.4 26.4 India 21.6 16.3 24.7
Source: Women and Men in India,2017 From the primary survey, it is evident that literacy rate has increased since census 2011 in Uttarakhand. But male literacy (93.6%) still persists to be 1.25 times higher than female literacy (74.67%).Male literacy was highest in Pithoragarh(98%) and lowest in Udham Singh Nagar(89.5%). Again, the low male literacy in plain district could be due to migration factor. Female literacy was highest in Nainital(85.7%) and lowest in Tehri Garhwal(78%)(Annexure Table 11A.7)

286
11.3.2. Gross and Net Enrolment Ratios According to School Report Card of 2016-17, gross enrolment ratio (GER) in primary and upper primary schools of Uttarakhand is 96.41 and 86.73 respectively. In India, number of students enrolled in primary school are less(1.29 points) and students enrolled in upper primary school are higher(4 points) as compared to Uttarakhand. Table 11.3 also shows that higher no. of children in Uttarakhand are sent to primary schools and lesser importance is given to upper primary schools.
Table 11.3: Gross Enrolment Ratio
Primary
Upper Primary
Uttarakhand 96.41 86.73 India 95.12 90.73 Source: U-DISE, School Report Card,2016-17
The net enrolment ratio (NER) is higher in India for both primary and upper primary schools as compared to Uttarakhand. For primary it is higher by 1.91 points and for upper primary it is higher by 6.4 points.
Table 11.4: Net Enrolment Ratio
Primary
Upper Primary
Uttarakhand 81.71 66.29 India 83.62 72.69 Source: U-DISE, School Report Card, 2016-17
11.3.3 Dropout Rate From Primary survey it has been observed in Uttarakhand, highest percentage of male and female dropout rate is observed in upper primary classes(VI-VIII). And it is also observed in secondary and higher secondary, female dropout rate is higher than male dropout rate. A district wise survey shows that usually female dropout rate is higher than male and it mostly occurs during upper primary and secondary classes. In districts like, Bageshwar, Chamoli, Tehri Garhwal and Uttarakshi, female dropout rate is highest during senior secondary class(Annexure Table 11A.8). Through this survey it can be concluded that due to higher percentage of female dropout rate there is a disparity in the society. The major reason of this high percentage could be the involvement of women in household activities and thus lesser importance is given to their education. Also, the above mentioned districts have lesser population residing in urban areas and due to this female lack opportunities and participate lesser in the economic activities. This shows that gender based disparity in education still prevails.
287
11.4 Economic Participation 11.4.1 Work Participation Rate Women’s participation in economic activity has increased over the years at the national level. This has far-reaching implications, not only in terms of the human resources available and the size of the working population, but also in terms of the economic empowerment of women. Expanding educational achievements, the felt need for economic independence, and changing social perceptions are perhaps the major contributing factors for an increase in the women’s Work Participation Rate. The work participation rate of women in Uttarakhand is about 26.68 percent, according to 2011 Census. From the district wise table it is evident that total workforce of female is lesser than that of male except in Rudraprayag where the female workforce is higher and in Bageshwar it is the same for both male and female(Annexure Table 11A.9). From the primary survey, female workforce participation is highest in Rudraprayag both in rural and urban area (Annexure Table 11A.10). This may be due to higher percentage of female working population (48%) as compared to male working population (46%) in this district. The lowest female workforce participation for both urban and rural was recorded. 11.4.2 Women’s Involvement in non-economic activities Non-economic activities are performed with the aim of providing services to others without any monetary gain. Generally women are responsible for a greater share of non- economic activities i.e. they perform domestic duties, they are engaged in collection of goods, they need to look after care economy and also fetch water. All in all they face greater burden of work in unpaid activities when compared to men. From the primary survey conducted, Figure 11.5 shows in rural areas of Uttarakhand higher number of females are involved in domestic duties (35.20 per cent) when compared to males(1.84 per cent). It can also be noticed that both male and female are involved in education as well. Though the number of female students is slight lesser than male students (5.14 percentage points) still being a student, females perform part of the domestic activities as well. This shows a huge gender disparity as both male and female are students still males perform lesser in the household or domestic activities. Along with domestic activities females are also engaged in free collection of goods such as vegetables, roots, firewood, cattle feed, grazing. In these non-economic activities also rural females of Uttarakhand are more involved than their male counterparts. In our country, a male performing such non-economic activities is considered a sign of stigma, and not much of a respect is given to such activities. Males are expected to be the breadwinner of the family who would earn wages by performing economic activities while females are expected to perform both in economic as well as non-economic activities and their involvement in domestic activities is not considered a sign of stigma.

288
11.4.3 Women Drudgery and Participation in the Productive Work Hill women are more deprived than men folk primarily because women bear the brunt of burden of cultivation and house chore activities while the men are the breadwinners. The drudgery of hill women is enormous as they work for about 12-14 hours per day. Even the men folk whose main activity is cultivation are relatively less burdened than their counterparts as they perform the specific tasks of cultivation such as ploughing, sowing, hoeing, ditching and threshing. Another issue is structural rigidity in agricultural sector, in particular the female labour force with high amount of drudgery, that provides a little or no opportunity for upward mobility and skill formation, that raises issue of another kind. Women get hardly any time for their engagement in productive activities. The reasons for not participation in the productive work has been analysed from the evidences gathered from the field survey. The results clearly reflects that non-availability of work, child care and personal commitment at home, non-availability of transport facility, non- availability of child care facility at work places have been stated some of the important reasons in that order (Annexure Table 11A.10 A). Non-availability of work is the prime reason for all social groups barring scheduled tribe women, who stated child care and home commitment is the prime reason but for scheduled caste women non-availability of work is more serious and frightening. Hill and rural women face the brunt of non- availability of work more compared to plain and urban areas. Non-availability of work is more severely felt in the lowest quintile groups. Non-availability of work among women in Chamoli, Pauri Garhwal and Tehri Garhwal has been reported extraordinarily high, ranging between 75 to 95 per cent. 11.4.4 Quality of Employment Permanent or regular employees usually have better quality work because in addition to their wages they also receive social security benefits, subsidized healthcare etc. Self- employed and Casual workers do not have social protection benefits and their income is also not fixed. Figure-7.6 shows that in Uttarakhand both male and female are equally involved in self-employed work. However, higher percentage of males are involved in regular salaried jobs which means that low level of social security benefits are provided to females and as it is evident from the figure that higher percentage of female tend to work as casual labourers with less/no remuneration. Women’s share in contributing as unpaid family worker is six times higher than men. From the primary survey(Annexure Table 11A.12) it is clear that women are discriminated on the basis of their status of work wherein they face lesser wages and lesser benefits.
289
Mushroom Cultivation: A better livelihood opportunity Divya Rawat is using mushroom cultivation as a way of curbing migration and providing livelihoods to people in Uttarakhand. This is also helping repopulate many “ghost villages” in the state. She is known to be “The Mushroom Lady”. Tea plantation at 22 sites covering an area of 209.6 hectare Champawat district has developed tea plantation at 22 sites with an unique tea variety-orthodox black leaf tea (China hybrid ‘Camelia Sinensis’) providing employment opportunities to large number of people particularly women. The tea is in huge demand in both national and international market. SUCCESS STORIES 11.5. Empowerment 11.5.1 Decision Making Capacity Decision making capacity gives way to empowerment. Women are likely to participate in matters of both private and public decision making given that they have greater amount of knowledge, economic assets and income earning capacity. This could further boost their confidence and self-esteem. Rural women of Uttarakhand share abundant responsibilities and perform a wide spectrum of duties in running the family, maintaining the household, attending to farm labour, tending domestic animals etc. In spite of all these responsibilities, they have little role in decision making in different matters of their private and public life. Women’s access to decision making can be seen as the key indicator of gender equality in a society. Decision making is a basic process that underlines all functions of family resource management. According to a survey conducted by Kumaun University, Nainital (2016) in Almora and Nainital district women’s participation level was examined regarding their domestic, economic and political activities. Domestic activities include purchase of food items, buying of domestic goods, purchase of cloths, education of children, home decoration, new house construction, vaccination of children and participation in decisions related to marriage and other rituals. According to the survey rural women play a significant role in decision making of domestic activities in the districts being examined. There were around 60 per cent respondents’ whose participation level was high and medium in domestic activities. However, there were 1 per cent women respondents’ whose participation level was nil. There was no significant variation among women of different castes. Irrespective of their caste background their role was the same. Also, it was recorded that women respondents’ with higher education had maximum participation in domestic activities as compared to other respondent’s with lower level of education.
290
From NFHS 3(2005-06) survey, in Uttarakhand 71.5% of married women participated in household decisions. And NFHS 4 shows, 89.8% women participated in household decisions which were higher than all India (Annexure Table 11A.13). This reveals that women in Uttarakhand have a significant role to play in household management. 11.5.2 Political Participation The extent of women’s access to political decision making can be seen as a key indicator of gender equality in society.After 73rd and 74th constitutional amendment women have sufficient representation at the grass-root level political institutions i.e. Panchayat Raj institutions at rural level and local self government at urban level. It is between 33 to50 percent in different states. But in real life, their access to political power structure still has to be achieved. They have not been able to fully exercise their power despite gaining important positions in local bodies.During an election male candidate gets higher support in comparison to women candidates as women are considered to be weaker leaders. According to new Panchayat Raj Act, there is a provision for reservation of 50 percent seats for women in village panchayats in the state of Uttarakhand. According to a survey conducted by Kumaun University, Nainital (2016) in Almora and Nainital district, women were the ‘Gram Pradhans’ of the sample village, however they were least aware about their duties and responsibilities and usually their husbands or any other male member of their family were performing duties on their behalf. A women’s political participation is hampered by the burden of outdoor activities, household duties which she needs to perform and social cultural values based on patriarchy. Among different political activities, women’s highest participation had been seen in voting. According to the survey conducted it was noted that respondents were aware about their voting rights and highest awareness was seen among the respondents of 35to50 age group. Also, it revealed that among the caste category there was no significant difference in voting pattern of the respondents. However, the percentage of general category respondents was higher. The impact of education on voting behaviour had also been examined. It was noted that each educational category was found to have same voting pattern. Maximum respondents of each educational level voted in Panchayat election and minimum in parliament election. No positive influence of education had been seen on the voting pattern of respondents. The following table reveals the percentage of women representatives in Panchayati Raj Institutions was higher in Uttarakhand (58%) as compared to all India(46%).
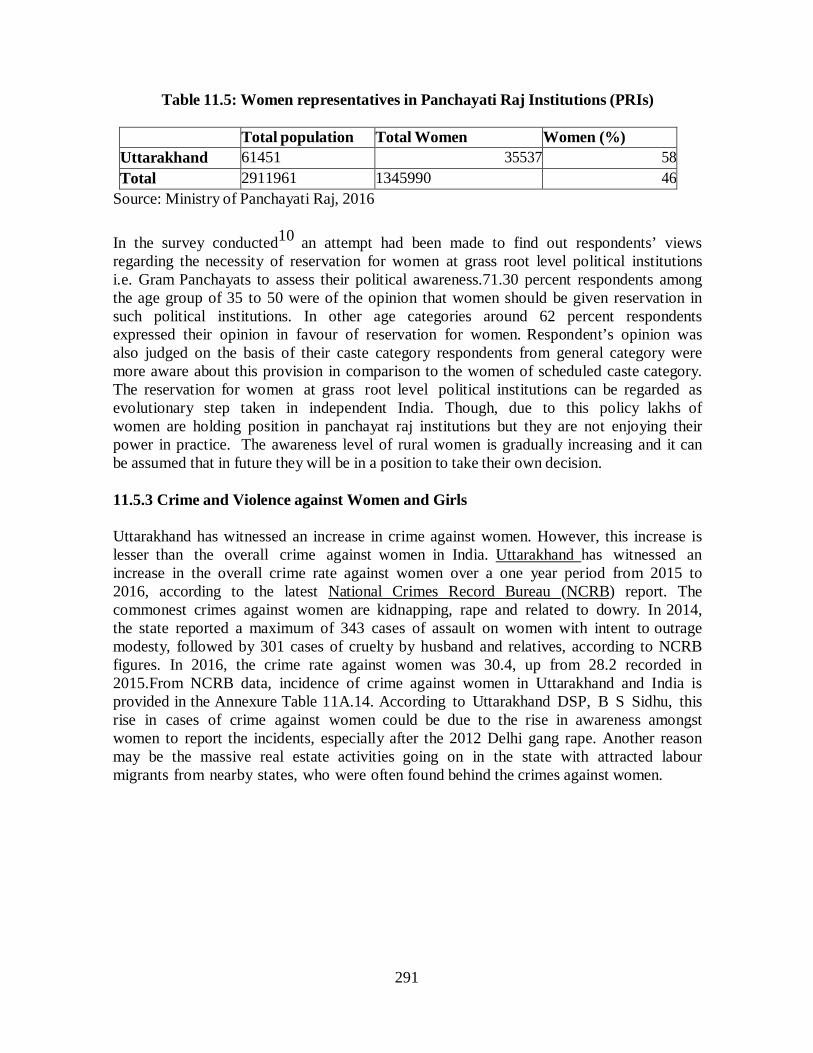
291
Table 11.5: Women representatives in Panchayati Raj Institutions (PRIs) Total population Total Women Women (%) Uttarakhand 61451 35537 58 Total 2911961 1345990 46
Source: Ministry of Panchayati Raj, 2016 In the survey conducted10 an attempt had been made to find out respondents’ views regarding the necessity of reservation for women at grass root level political institutions i.e. Gram Panchayats to assess their political awareness.71.30 percent respondents among the age group of 35 to 50 were of the opinion that women should be given reservation in such political institutions. In other age categories around 62 percent respondents expressed their opinion in favour of reservation for women. Respondent’s opinion was also judged on the basis of their caste category respondents from general category were more aware about this provision in comparison to the women of scheduled caste category. The reservation for women at grass root level political institutions can be regarded as evolutionary step taken in independent India. Though, due to this policy lakhs of women are holding position in panchayat raj institutions but they are not enjoying their power in practice. The awareness level of rural women is gradually increasing and it can be assumed that in future they will be in a position to take their own decision. 11.5.3 Crime and Violence against Women and Girls Uttarakhand has witnessed an increase in crime against women. However, this increase is lesser than the overall crime against women in India. Uttarakhand has witnessed an increase in the overall crime rate against women over a one year period from 2015 to 2016, according to the latest National Crimes Record Bureau (NCRB) report. The commonest crimes against women are kidnapping, rape and related to dowry. In 2014, the state reported a maximum of 343 cases of assault on women with intent to outrage modesty, followed by 301 cases of cruelty by husband and relatives, according to NCRB figures. In 2016, the crime rate against women was 30.4, up from 28.2 recorded in 2015.From NCRB data, incidence of crime against women in Uttarakhand and India is provided in the Annexure Table 11A.14. According to Uttarakhand DSP, B S Sidhu, this rise in cases of crime against women could be due to the rise in awareness amongst women to report the incidents, especially after the 2012 Delhi gang rape. Another reason may be the massive real estate activities going on in the state with attracted labour migrants from nearby states, who were often found behind the crimes against women.
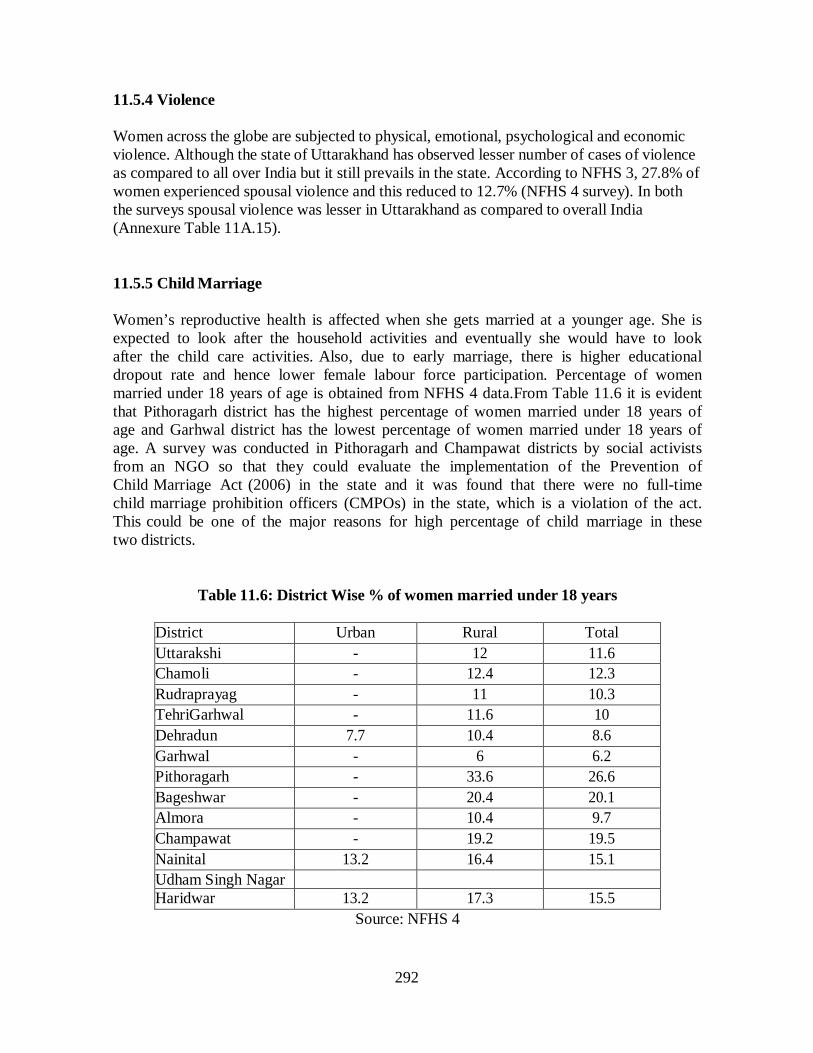
292
11.5.4 Violence Women across the globe are subjected to physical, emotional, psychological and economic violence. Although the state of Uttarakhand has observed lesser number of cases of violence as compared to all over India but it still prevails in the state. According to NFHS 3, 27.8% of women experienced spousal violence and this reduced to 12.7% (NFHS 4 survey). In both the surveys spousal violence was lesser in Uttarakhand as compared to overall India (Annexure Table 11A.15). 11.5.5 Child Marriage Women’s reproductive health is affected when she gets married at a younger age. She is expected to look after the household activities and eventually she would have to look after the child care activities. Also, due to early marriage, there is higher educational dropout rate and hence lower female labour force participation. Percentage of women married under 18 years of age is obtained from NFHS 4 data.From Table 11.6 it is evident that Pithoragarh district has the highest percentage of women married under 18 years of age and Garhwal district has the lowest percentage of women married under 18 years of age. A survey was conducted in Pithoragarh and Champawat districts by social activists from an NGO so that they could evaluate the implementation of the Prevention of Child Marriage Act (2006) in the state and it was found that there were no full-time child marriage prohibition officers (CMPOs) in the state, which is a violation of the act. This could be one of the major reasons for high percentage of child marriage in these two districts.
Table 11.6: District Wise % of women married under 18 years
District Urban Rural Total Uttarakshi - 12 11.6 Chamoli - 12.4 12.3 Rudraprayag - 11 10.3 TehriGarhwal - 11.6 10 Dehradun 7.7 10.4 8.6 Garhwal - 6 6.2 Pithoragarh - 33.6 26.6 Bageshwar - 20.4 20.1 Almora - 10.4 9.7 Champawat - 19.2 19.5 Nainital 13.2 16.4 15.1 Udham Singh Nagar
Haridwar 13.2 17.3 15.5
Source: NFHS 4
293
11.6. Government Interventions Gender inequality hinders the development process of a country. The state can play a crucial role in improving the well- being of men and women. The state policies should focus on expanding the economic horizon to increase the participation of women in productive activities. Improving the economic status of women is also important not only for ensuring equity or social justice, but also for promoting faster economic growth. The low status of women is likely to lead to a slow rate of growth of the economy in the long run. Some policy measures Institutions should be reformed to ensure equal rights for men and women in terms of social, legal and economic opportunities. Economic development in a country can lead to equal participation. Economic development refers to an expansion in investment in infrastructure for fuel, transport, and provision of safe drinking water. This would mean that women and girls would have to invest lesser time in household activities. Also, this will help women in improving their health and they can participate in income generating activities and would also help school girls in their school attendance. The combined effects of institutional reforms and economic development usually take time to be realised. Hence, in the short and medium term, active measures are required. These are: (i) reducing the cost of schooling, (ii) redesigning financial institutions by simplifying banking procedures and delivering financial services closer to homes, markets, and workplace, (iii) implementing gender sensitive land reforms that provide joint ownership to both husband and wife, or enable women to hold independent land titles, and (iv) providing public support for out-of-home child care services. Most of the above measures will reduce the amount of time spent by women and girls on their unpaid work. Thus, it will allow women to engage themselves in more productive and paid work and train girls to attend schools (World Bank2000). There is a strong case for state intervention to promote gender equality through these measures. There is no doubt that women of Uttarakhand have always been actively participating in many movements and play a significant role in representing the issues related to society. Even after all this, they are still an excluded group of our society. They are not equal to men of Uttarakhand in many terms. They are excluded in development processes as well. In such a scenario, self-help groups by women are playing a constructive role in resolving this problem. The government has reserved one-third seats for women in Panchayati Raj institutions for self-government and is promoting women van Panchayat (elected council to manage village forests), and innovative government programmes such as Mahila Samakya (women’s empowerment) by mobilising women for self-empowerment.
294
Other schemes by the government for women empowerment are: Uttarakhand Women Integrated Development Scheme: It aims to minimise the
workload in the daily life of women by developing decision making capacity in women, creating understanding amongst the women on Panchayati Raj System and Women self-employment.
Nanda Devi KanyaDhanYojana: This scheme is launched with the help of women
and child welfare department. This scheme focuses on financial help to girls at the time of their studies after school. The main benefit of the scheme is that the girl child receives a huge fixed deposit amount at the time of adulthood
. Uttarakhand State Women Commission: To stop the harassment of women, to
remove any type of discrimination of women and to bring quality in their life by their overall empowerment, the State Government has constituted the State Women Commission. A representative of minimum one member has been given from each district so that the problem of women is solved rapidly and easily at local level. The commission has one Chairman, two Vice Chairmen and a Secretary.
11.7. Schemes from primary survey Integrated Child Development Services Schemes (ICDS) The ICDS Services is India’s response to the challenge of meeting the holistic need of the child. It is one of the world’s largest and most unique outreach programme for early childhood care and development. The objectives of the scheme are to improve the nutritional and health status of children below six years of age, reduce the incidence of mortality, school dropouts, achieve effective coordinates of policy and implementation among various departments to promote child development, enhance the capability of the mother to look after the normal health and nutritional needs of child, through proper health.11 From the primary survey conducted it had been recorded that in Almora district 89.2% of people were benefited from this scheme. The scheme could be one of the reasons of high child sex ratio (Census, 2011), low infant and under five mortality rate. The lowest percentage of people benefited from this scheme were from Garhwal(55.8%), which might be because only 21.2% of the total population was eligible for this scheme and also due to lack of proper immunization of
11 Department of Women and Child Development
295
children and care of anaemic mothers in this district. Area wise and caste wise benefit is not so much significant (Annexure Table 11A.16). Gaura Devi KanyaDhan Yojana The Gaura Devi KanyaDhan Yojana 2017 aims to provide financial assistance to the girls of the state's BPL class. Under this scheme, a sum of 51 thousand rupees will be given in seven instalments from the birth of a child to the marriage. The goal of this scheme is to provide financial support to the girls after they pass 12th. The government will provide 50 thousand rupees as financial help.12 From primary survey, highest percentage of population who got benefited from this scheme belonged to rural areas and general category. And along district wise, in Almora(59%),highest percentage of population got benefited as the enrolment in government schools in Almora is declining, so this scheme has helped to increase participation of girls in schools due to the financial assistance provided.Lowest percentage of population were benefited in Dehradun(6%) and Pithoragarh(7%), this might be due to low sex ratio and child sex ratio in these districts due to which this scheme has not made any significant change in these districts. (Annexure Table 11A.16) Ujjwala Yojana In India, poor households have limited access to cooking gas (LPG). The motive of this scheme is to provide LPG connections to BPL households which will ensure universal coverage of cooking gas in the country. This measure will empower women and protect their health. It will reduce drudgery and the time spent on cooking. It will also provide employment for rural youth in the supply chain of cooking gas. As per the primary data, in rural areas of Uttarakhand higher percentage of population has been benefited from this scheme as compared to urban areas. The benefits in Uttarkashi(36%) and Champawat(31%) districts have been significant(Annexure Table 11A.16). In Champawat, 93.4% of the population is aware about this scheme which makes them attain higher benefits compared to other districts. Mukhyamantri satat aajivika yojana This scheme focuses on providing skill training to poor, widows, economically backward women, and young girls. The aim is to provide skill training to women and girls so that they can get employment opportunities in the state. During the skill training period, government would distribute scholarship of Rs.10,000/- and one-time grant of Rs.50,000/- after completion of skill training in Uttarakhand. It is evident from the primary data, Bageshwar district has been benefited significantly from this scheme (78.9%). And rural areas attained higher benefits as compared to urban areas. (Annexure Table 11A.16)
296
11.8. Summary This chapter reveals the gender differences in social and economic well beingin the state of Uttarakhand. There is difference in the living conditions and socio-economic conditions. A strong gender disparity due to difference in literacy rate, difference in healthcare, lack of women empowerment in terms of decision making capacity and political participation. And women are also subject to violence and crimes which worsens their position in the society. A high incidence of adult motherhood and child mortality possess a serious challenge to the overall well-being of adult female and girl child in the state. Due to higher incidence of women married under the age of 18 years, they are deprived of proper education and this further lowers female labour force participation. The total female workforce is lesser than male workforce in the state. Political participation of female is lesser as they are considered to be weaker leaders as compared to male candidates. The chapter also covers the policy measures taken by the government of Uttarakhand and how the schemes have benefited the different districts of the state.
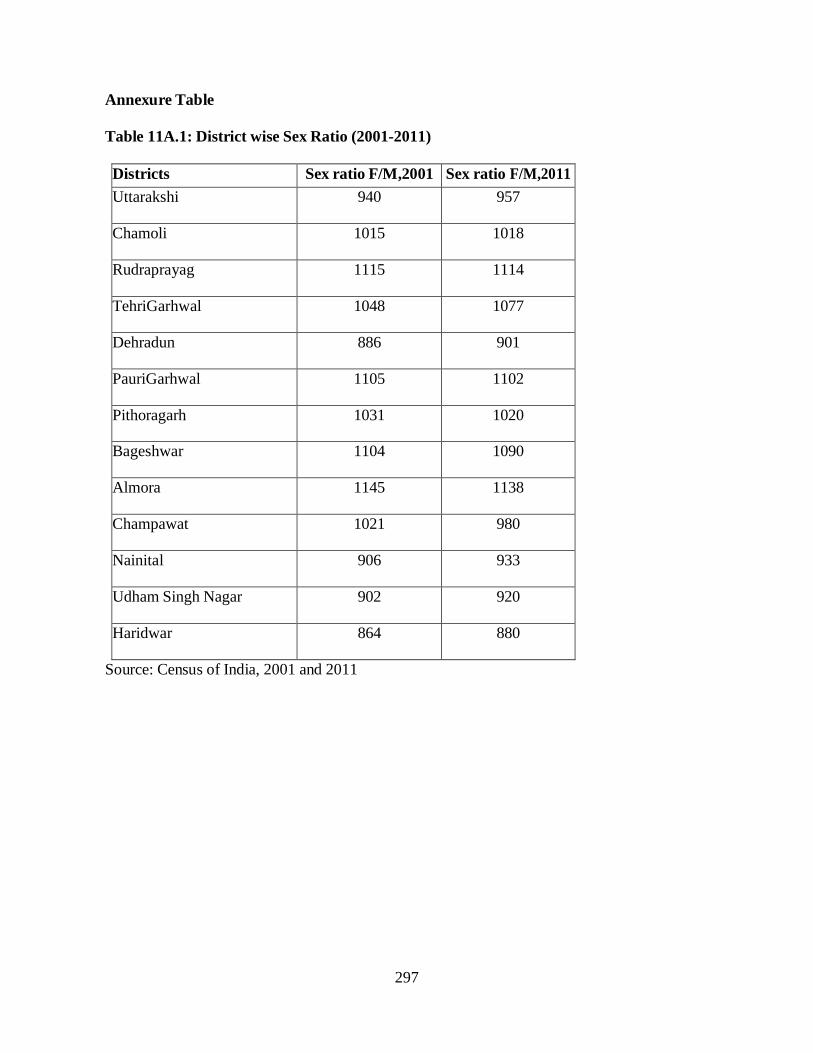
297
Annexure Table Table 11A.1: District wise Sex Ratio (2001-2011) Districts Sex ratio F/M,2001 Sex ratio F/M,2011 Uttarakshi 940 957
Chamoli 1015 1018
Rudraprayag 1115 1114
TehriGarhwal 1048 1077
Dehradun 886 901
PauriGarhwal 1105 1102
Pithoragarh 1031 1020
Bageshwar 1104 1090
Almora 1145 1138
Champawat 1021 980
Nainital 906 933
Udham Singh Nagar 902 920
Haridwar 864 880
Source: Census of India, 2001 and 2011

298
Table 11A.2: Overall Sex Ratio, 2017 District Rural Urban Total Almora 1217 986 1185 Bageshwar 1131 965 1124 Chamoli 1153 970 1117 Champawat 1122 967 1098 Dehradun 921 1009 971 PauriGarhwal 1226 1057 1189 Hardwar 956 935 947 Nainital 961 973 967 Pithoragarh 1129 1037 1113 Rudraprayag 1254 977 1220 Tehri Garhwal 1130 995 1110 Udham Singh Nagar 942 868 915 Uttarkashi 1010 888 1000 Total 1038 959 1010
Source: Primary Survey, IHD 2017 Table11 A.3: District wise Child Sex Ratios (0-6 Years), 2001-2011 Districts Child sex ratio 0-6
years, district wise,2001
Child sex ratio 0-6 years, district wise,2011
Uttarakshi 942 916
Chamoli 934 889
Rudraprayag 953 904
Tehri Garhwal 927 896
Dehradun 894 889
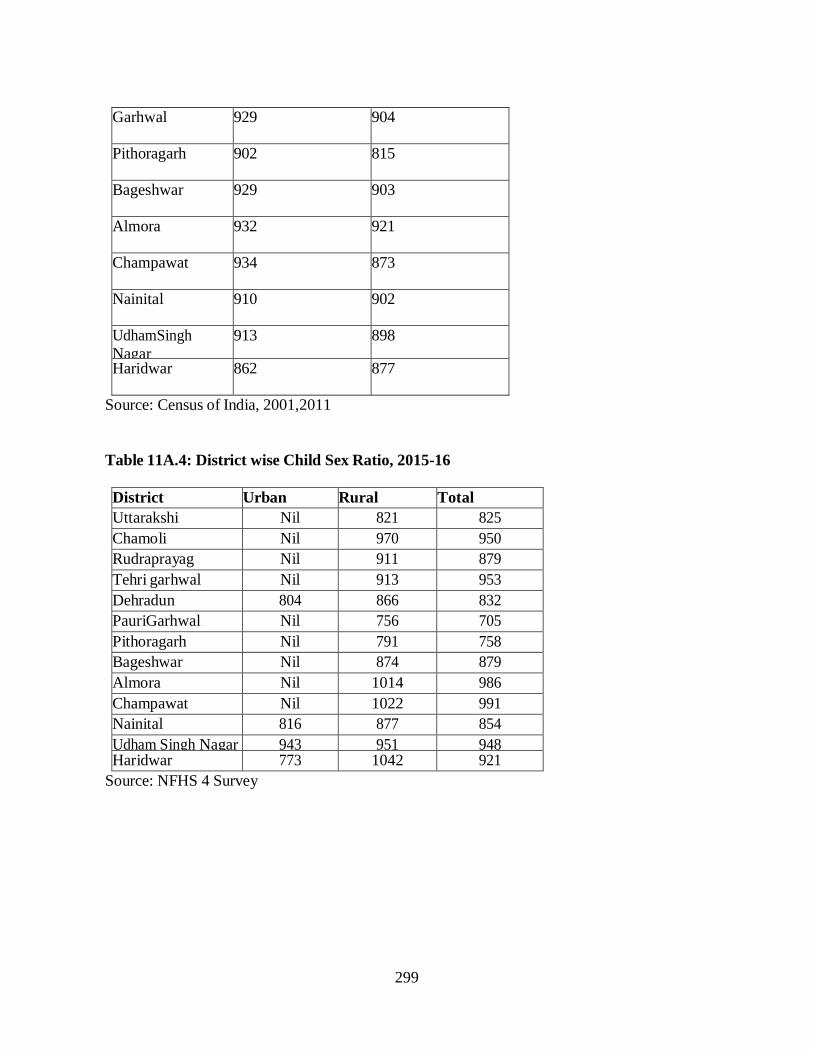
299
Garhwal 929 904
Pithoragarh 902 815
Bageshwar 929 903
Almora 932 921
Champawat 934 873
Nainital 910 902
UdhamSingh Nagar
913 898
Haridwar 862 877
Source: Census of India, 2001,2011 Table 11A.4: District wise Child Sex Ratio, 2015-16 District Urban Rural Total Uttarakshi Nil 821 825 Chamoli Nil 970 950 Rudraprayag Nil 911 879 Tehri garhwal Nil 913 953 Dehradun 804 866 832 PauriGarhwal Nil 756 705 Pithoragarh Nil 791 758 Bageshwar Nil 874 879 Almora Nil 1014 986 Champawat Nil 1022 991 Nainital 816 877 854 Udham Singh Nagar 943 951 948 Haridwar 773 1042 921
Source: NFHS 4 Survey
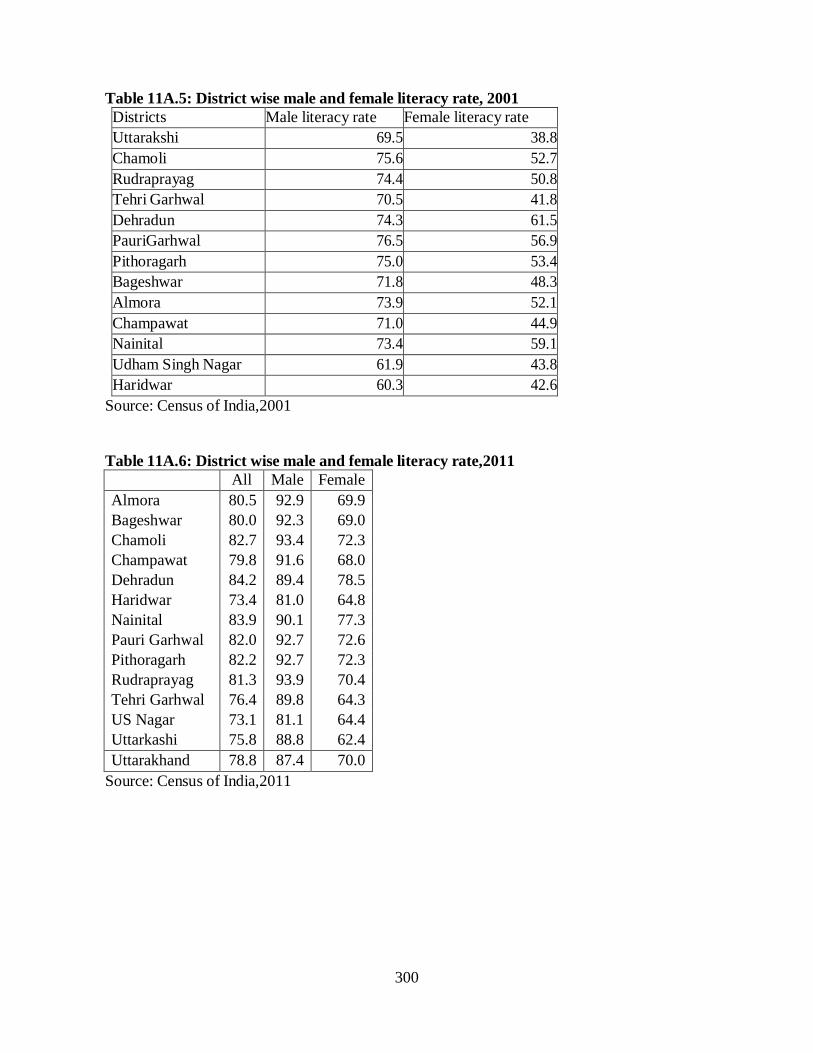
300
Table 11A.5: District wise male and female literacy rate, 2001 Districts Male literacy rate Female literacy rate Uttarakshi 69.5 38.8 Chamoli 75.6 52.7 Rudraprayag 74.4 50.8 Tehri Garhwal 70.5 41.8 Dehradun 74.3 61.5 PauriGarhwal 76.5 56.9 Pithoragarh 75.0 53.4 Bageshwar 71.8 48.3 Almora 73.9 52.1 Champawat 71.0 44.9 Nainital 73.4 59.1 Udham Singh Nagar 61.9 43.8 Haridwar 60.3 42.6
Source: Census of India,2001 Table 11A.6: District wise male and female literacy rate,2011 All Male Female Almora 80.5 92.9 69.9 Bageshwar 80.0 92.3 69.0 Chamoli 82.7 93.4 72.3 Champawat 79.8 91.6 68.0 Dehradun 84.2 89.4 78.5 Haridwar 73.4 81.0 64.8 Nainital 83.9 90.1 77.3 Pauri Garhwal 82.0 92.7 72.6 Pithoragarh 82.2 92.7 72.3 Rudraprayag 81.3 93.9 70.4 Tehri Garhwal 76.4 89.8 64.3 US Nagar 73.1 81.1 64.4 Uttarkashi 75.8 88.8 62.4 Uttarakhand 78.8 87.4 70.0
Source: Census of India,2011
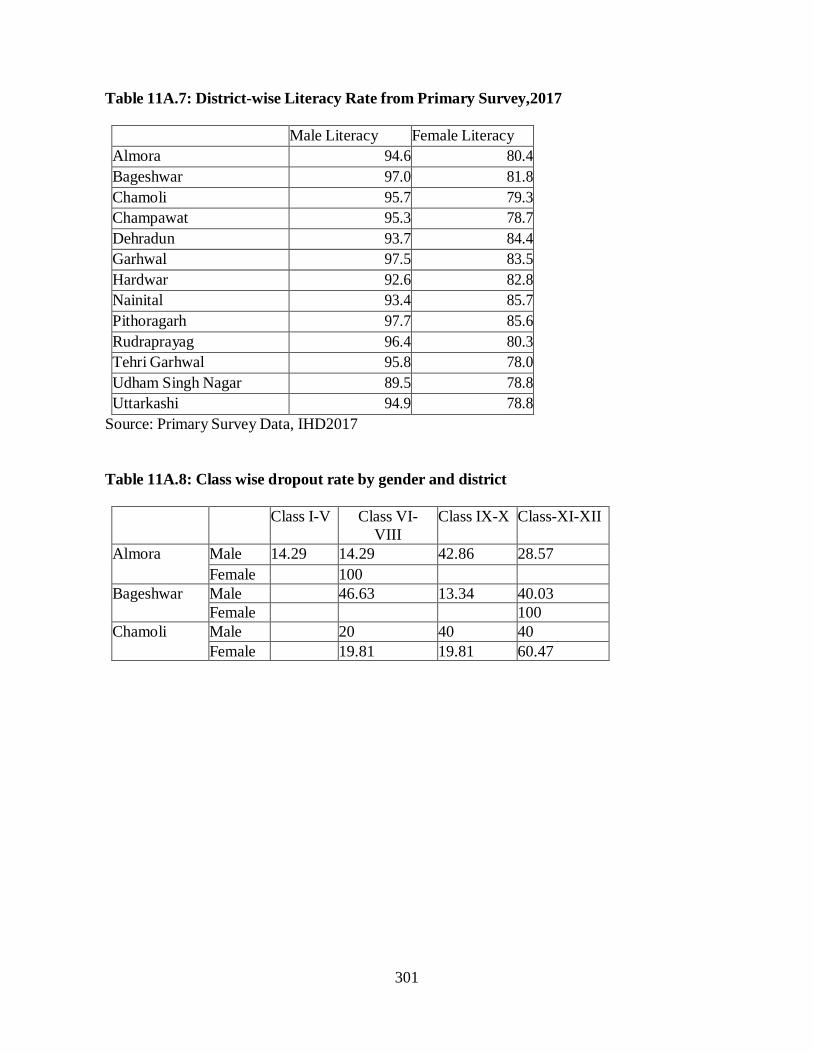
301
Table 11A.7: District-wise Literacy Rate from Primary Survey,2017 Male Literacy Female Literacy Almora 94.6 80.4 Bageshwar 97.0 81.8 Chamoli 95.7 79.3 Champawat 95.3 78.7 Dehradun 93.7 84.4 Garhwal 97.5 83.5 Hardwar 92.6 82.8 Nainital 93.4 85.7 Pithoragarh 97.7 85.6 Rudraprayag 96.4 80.3 Tehri Garhwal 95.8 78.0 Udham Singh Nagar 89.5 78.8 Uttarkashi 94.9 78.8
Source: Primary Survey Data, IHD2017 Table 11A.8: Class wise dropout rate by gender and district Class I-V Class VI-
VIII Class IX-X Class-XI-XII
Almora Male 14.29 14.29 42.86 28.57 Female 100
Bageshwar Male 46.63 13.34 40.03 Female 100
Chamoli Male 20 40 40 Female 19.81 19.81 60.47
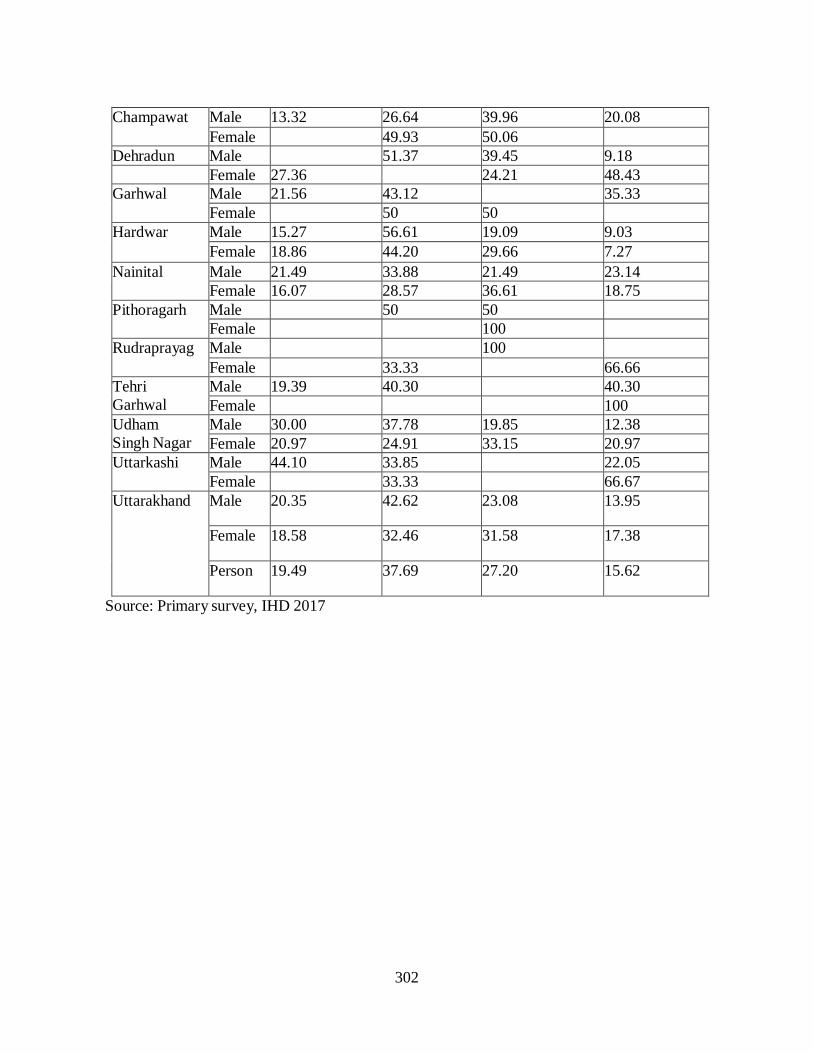
302
Champawat Male 13.32 26.64 39.96 20.08
Female 49.93 50.06 Dehradun Male 51.37 39.45 9.18 Female 27.36 24.21 48.43 Garhwal Male 21.56 43.12 35.33
Female 50 50 Hardwar Male 15.27 56.61 19.09 9.03
Female 18.86 44.20 29.66 7.27 Nainital Male 21.49 33.88 21.49 23.14
Female 16.07 28.57 36.61 18.75 Pithoragarh Male 50 50
Female 100 Rudraprayag Male 100
Female 33.33 66.66 Tehri Garhwal
Male 19.39 40.30 40.30 Female 100
Udham Singh Nagar
Male 30.00 37.78 19.85 12.38 Female 20.97 24.91 33.15 20.97
Uttarkashi Male 44.10 33.85 22.05 Female 33.33 66.67
Uttarakhand Male 20.35 42.62 23.08 13.95
Female 18.58 32.46 31.58 17.38
Person 19.49 37.69 27.20 15.62
Source: Primary survey, IHD 2017
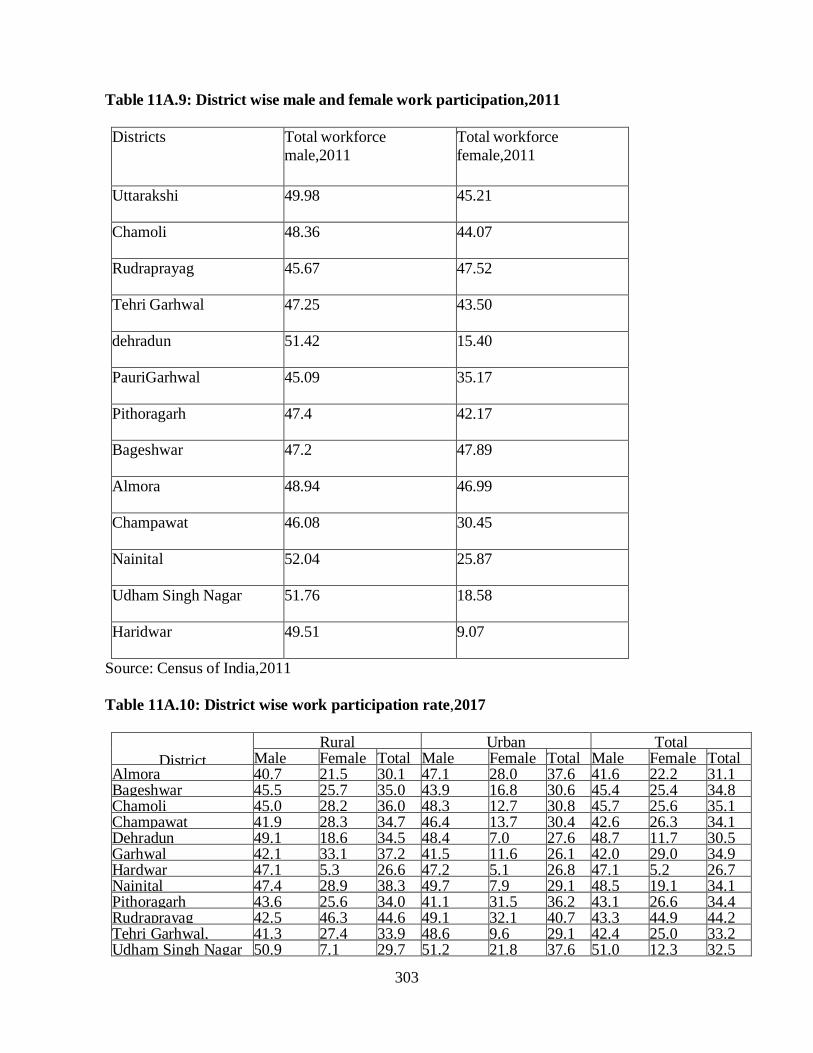
303
Table 11A.9: District wise male and female work participation,2011 Districts Total workforce
male,2011 Total workforce female,2011
Uttarakshi 49.98 45.21
Chamoli 48.36 44.07
Rudraprayag 45.67 47.52
Tehri Garhwal 47.25 43.50
dehradun 51.42 15.40
PauriGarhwal 45.09 35.17
Pithoragarh 47.4 42.17
Bageshwar 47.2 47.89
Almora 48.94 46.99
Champawat 46.08 30.45
Nainital 52.04 25.87
Udham Singh Nagar 51.76 18.58
Haridwar 49.51 9.07
Source: Census of India,2011 Table 11A.10: District wise work participation rate,2017
District Rural Urban Total
Male Female Total Male Female Total Male Female Total Almora 40.7 21.5 30.1 47.1 28.0 37.6 41.6 22.2 31.1 Bageshwar 45.5 25.7 35.0 43.9 16.8 30.6 45.4 25.4 34.8 Chamoli 45.0 28.2 36.0 48.3 12.7 30.8 45.7 25.6 35.1 Champawat 41.9 28.3 34.7 46.4 13.7 30.4 42.6 26.3 34.1 Dehradun 49.1 18.6 34.5 48.4 7.0 27.6 48.7 11.7 30.5 Garhwal 42.1 33.1 37.2 41.5 11.6 26.1 42.0 29.0 34.9 Hardwar 47.1 5.3 26.6 47.2 5.1 26.8 47.1 5.2 26.7 Nainital 47.4 28.9 38.3 49.7 7.9 29.1 48.5 19.1 34.1 Pithoragarh 43.6 25.6 34.0 41.1 31.5 36.2 43.1 26.6 34.4 Rudraprayag 42.5 46.3 44.6 49.1 32.1 40.7 43.3 44.9 44.2 Tehri Garhwal, 41.3 27.4 33.9 48.6 9.6 29.1 42.4 25.0 33.2 Udham Singh Nagar 50.9 7.1 29.7 51.2 21.8 37.6 51.0 12.3 32.5

304
Uttarkashi 47.9 38.6 43.2 40.6 13.1 27.7 47.3 36.7 42.0 Total 46.3 20.8 33.3 48.3 11.0 30.0 47.0 17.5 32.2
Source: Primary Survey, IHD2017 Table 11A.10 A Reason of Women’s not participation in the productive work Social
reasons Financially Well- off/ Not felt need for earning money
Child care / personal commitments in home
Non availability of work
Non availabili ty of transport facility to the work place
Non availability of child care facility to the work place
Category of caste Scheduled Caste 14.0 17.4 42.7 51.3 33.1 32.4 Scheduled Tribe 35.1 26.3 55.9 48.1 48.7 25.1 Other Backward Classes 17.0 18.4 38.4 46.5 37.3 22.7 General 8.4 23.5 39.4 47.1 34.9 34.4 Other 0.0 0.0 0.0 0.0 0.0 0.0
Hill_plain Hill 12.1 13.0 42.6 62.1 43.1 39.6 Plain 14.7 25.2 39.7 39.8 31.9 24.4
Area Rural 16.8 21.6 46.0 49.9 39.8 28.2 Urban 7.5 18.9 30.2 43.9 28.2 33.5
Percentile Group of MPCE
Quintiles 1 5 7
9 4
31 0
58 7
41 3
20 8
Quintiles 2 27.1 23.4 43.9 49.0 39.7 33.5 Quintiles 3 15.0 20.2 44.3 43.8 31.1 31.9 Quintiles 4 15.6 24.0 43.0 41.6 31.6 30.8 Quintiles 5 6.2 32.4 44.3 43.7 36.1 35.7
District Almora 11.4 18.5 43.5 24.5 16.8 35.9 Bageshwar 3.2 21.0 23.5 35.2 24.8 21.2 Chamoli 6.6 5.3 44.7 94.7 69.7 46.0 Champawat 80.0 0.0 0.0 0.0 0.0 60.0 Dehradun 5.4 14.2 23.0 35.5 29.7 33.1 PauriGarhwal 14.6 20.5 48.1 79.5 73.5 36.2 Hardwar 13.6 14.8 41.1 46.6 31.8 17.3 Nainital 25.0 3.8 15.2 64.1 3.8 25.5 Pithoragarh 10.9 8.4 70.9 91.6 83.1 59.1 Rudraprayag 18.8 15.9 36.2 31.4 21.7 34.8 Tehri Garhwal 8.2 33.3 66.7 75.1 33.6 75.1 Udham Singh Nagar 19.7 33.2 48.0 40.5 33.1 21.6 Uttarkashi 8.6 17.3 27.5 25.7 22.3 18.9 Uttarakhand 13.8 20.8 40.8 47.9 36.0 29.9
Source: Primary Survey, IHD2017
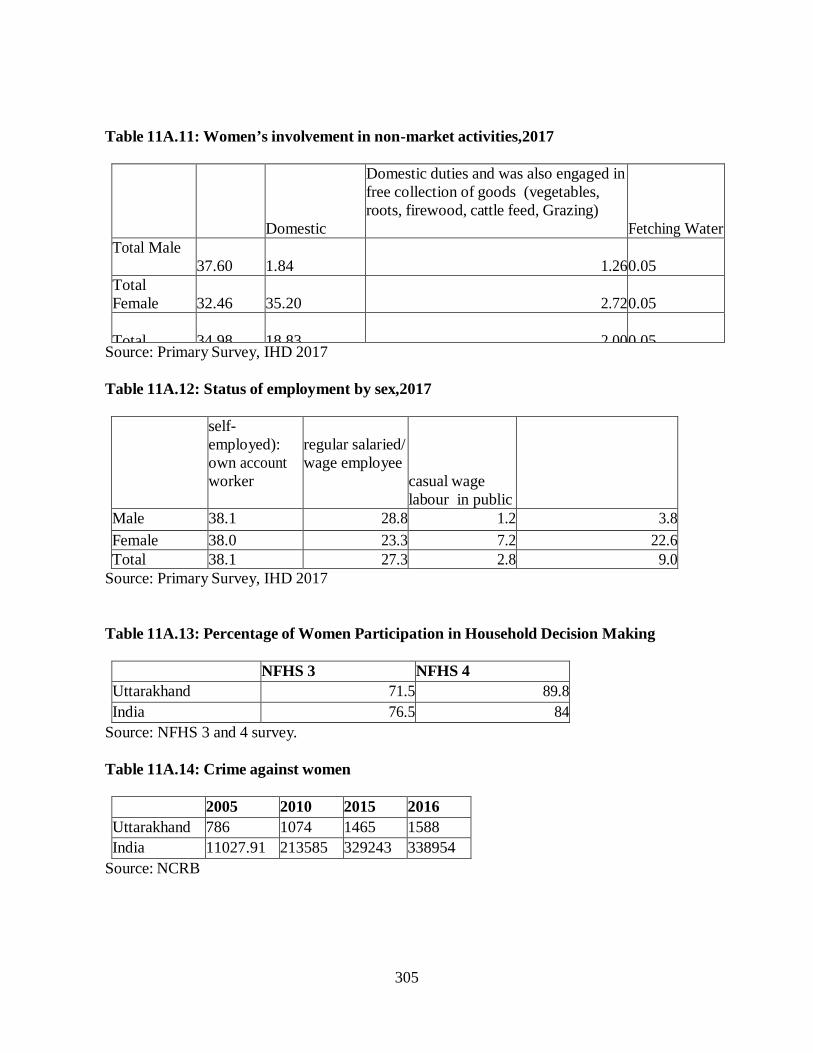
305
Table 11A.11: Women’s involvement in non-market activities,2017
Domestic
Domestic duties and was also engaged in free collection of goods (vegetables, roots, firewood, cattle feed, Grazing)
Fetching Water
Total Male 37.60
1.84
1.26
0.05
Total Female
32.46
35.20
2.72
0.05
Total
34 98
18 83
2 00
0 05
Source: Primary Survey, IHD 2017 Table 11A.12: Status of employment by sex,2017 self-
employed): own account worker
regular salaried/ wage employee
casual wage labour in public
Male 38.1 28.8 1.2 3.8 Female 38.0 23.3 7.2 22.6 Total 38.1 27.3 2.8 9.0
Source: Primary Survey, IHD 2017 Table 11A.13: Percentage of Women Participation in Household Decision Making NFHS 3 NFHS 4 Uttarakhand 71.5 89.8 India 76.5 84
Source: NFHS 3 and 4 survey. Table 11A.14: Crime against women 2005 2010 2015 2016 Uttarakhand 786 1074 1465 1588 India 11027.91 213585 329243 338954
Source: NCRB
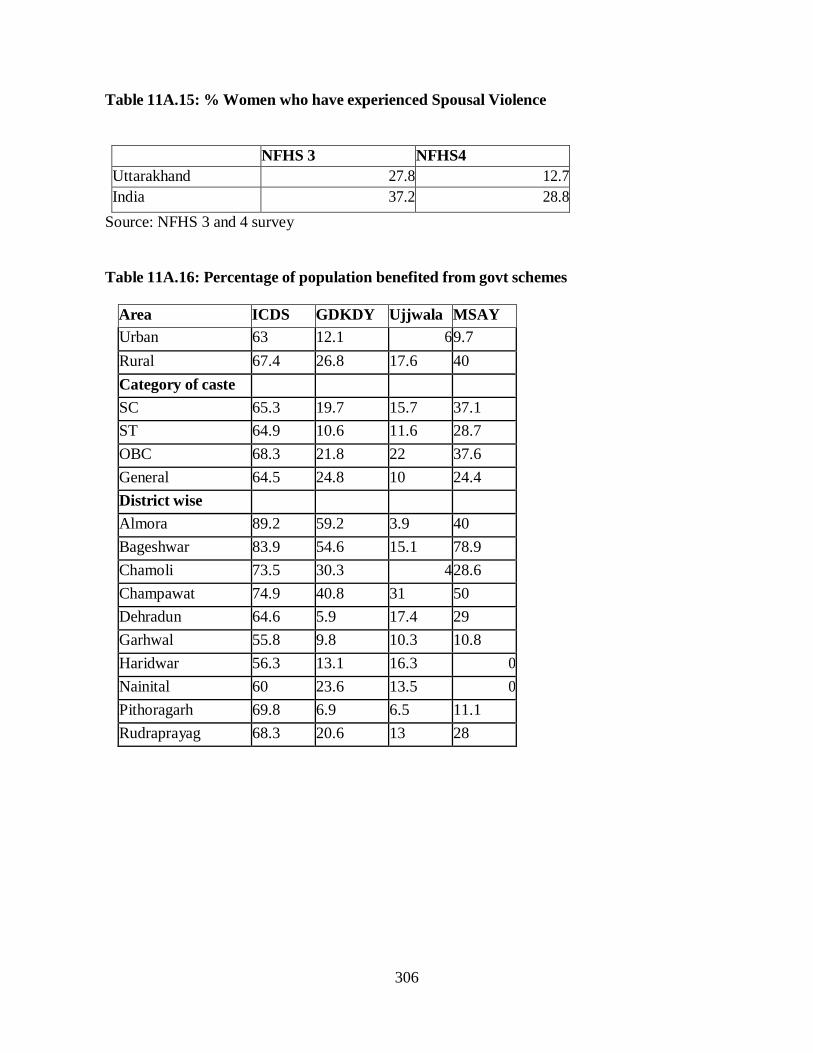
306
Table 11A.15: % Women who have experienced Spousal Violence NFHS 3 NFHS4 Uttarakhand 27.8 12.7 India 37.2 28.8
Source: NFHS 3 and 4 survey Table 11A.16: Percentage of population benefited from govt schemes
Area ICDS GDKDY
Ujjwala MSAY Urban 63 12.1 6 9.7 Rural 67.4 26.8 17.6 40 Category of caste SC 65.3 19.7 15.7 37.1 ST 64.9 10.6 11.6 28.7 OBC 68.3 21.8 22 37.6 General 64.5 24.8 10 24.4 District wise Almora 89.2 59.2 3.9 40 Bageshwar 83.9 54.6 15.1 78.9 Chamoli 73.5 30.3 4 28.6 Champawat 74.9 40.8 31 50 Dehradun 64.6 5.9 17.4 29 Garhwal 55.8 9.8 10.3 10.8 Haridwar 56.3 13.1 16.3 0 Nainital 60 23.6 13.5 0 Pithoragarh 69.8 6.9 6.5 11.1 Rudraprayag 68.3 20.6 13 28

307
Tehri Garhwal 58.2 20.7 10 33.5 Udham Singh Nagar
69.2
21.3
16.1
37.2
Uttarkashi 73.5 47.9 36.2 50.8 Total 65.9 22 14.6 30.8
Source: Primary Survey, IHD 2017
References Pathak, I. (2016). Women Participation in Decision Making and Women Drudgery in High Hilly Districts of Uttarakhand. Uttarakhand. Censusindia.gov.in. (2011). Census of India: Primary Census Abstract. Available at: http://censusindia.gov.in/pca/pca.aspx Downtoearth.org.in. (2013). Uttarakhand safest for newborns: first annual health survey. Available at: http://www.downtoearth.org.in/news/uttarakhand-safest-for- newborns-first-annual-health-survey-40977 National Family Health Survey (NFHS-4) INDIA, 2015-16, UTTARAKHAND. (2017). [ebook] Available at: http://rchiips.org/NFHS/NFHS- 4Reports/Uttarakhand.pdf Mospi.nic.in. (2017). Women and Men in India-2017 | Ministry of Statistics and Program Implementation | Government Of India. Available at: http://mospi.nic.in/publication/women-and-men-india-2017 2018, i., elections, k., 2018, b. and Pant, N. (2015). Uttarakhand: In 15 years, over 200% rise in crimes against women. https://www.hindustantimes.com/. Available at: https://www.hindustantimes.com/dehradun/uttarakhand-in-15-years- over-200-rise-in-crimes-against-women/story- RVYZNWQCgtFc0Un1dBIh0L.htm Azad, S. (2017). Uttarakhand sees rise in rate of crime against women - Times of India. The Times of India. Available at: https://timesofindia.indiatimes.com/city/dehradun/uttarakhand-sees-rise-in-rate- of-crime-against-women/articleshow/61884816.cms Ncrb.gov.in. (2016). National Crime Records Bureau. [online] Available at: http://ncrb.gov.in/
308
Uttarakhand Stories - Connect to Uttarakhand with eUttarakhand and Share Stories. (2015). Women Empowerment in the hills of Uttarakhand, Women Empowerment in Uttarakhand. Available at: http://www.euttarakhand.com/women-empowerment-in-uttarakhand Downtoearth.org.in. (2013). Uttarakhand safest for newborns: first annual health survey. Available at: http://www.downtoearth.org.in/news/uttarakhand-safest-for- newborns-first-annual-health-survey-40977 Rchiips.org. (2016). National Family Health Survey. Available at: http://rchiips.org/NFHS/factsheet_NFHS-4.shtml Rchiips.org. (2006). National Family Health Survey. Available at: http://rchiips.org/nfhs/nfhs3.shtml Uttarakhand Stories - Connect to Uttarakhand with eUttarakhand and Share Stories. (2015). Women Empowerment in the hills of Uttarakhand, Women Empowerment in Uttarakhand. Available at: http://www.euttarakhand.com/women-empowerment-in-uttarakhand Translate.google.com. (2018). Google Translate. Available at: https://translate.google.com/translate?hl=en&sl=hi&u=http://pradhanmantrivikasy ojana.in/gaura-devi-kanya-dhan-yojana-uttarakhand/&prev=search Mahajan, M. (2017). MukhyamantriMahilaSatatAajivika Yojana for Women in Uttarakhand / - GovInfo.me. Available at:https://govinfo.me/mukhyamantri-mahila-satat-aajivika-yojna-women- uttarakhand/ Vikaspedia.in. (n.d.). Pradhan Mantri Ujjwala Yojana — Vikaspedia. Available at: http://vikaspedia.in/energy/policy-support/pradhan-mantri-ujjwala-yojana [Accessed 25 May 2018]
309
CHAPTER: 12 WAY FORWARD
12.1 Progress and Potentials
The aforesaid analysis in different chapters clearly shows that there are bright spots in terms of its strengths and achievements but there are gloomy spots as well which pose challenges in the development process. The strengths are expressed in terms of forest and water wealth, favourable agro climatic conditions. The hills of the state provide excellent agro-climatic conditions for growing a variety of fruits, vegetables and medicinal and aromatic plants. It has unique landscape of the state has vast scope for promoting health tourism, adventure sports and wildlife and cultural tourism. State is rich in water resources with a niche for the generation of hydro-electricity. It has huge mineral deposits like limestone, marbles, rock phosphate, dolomite, copper, gypsum etc. It has witnessed massive growth in capital investments arising from conducive industrial policy and generous tax benefits.
Literacy rate, GER at elementary and secondary level of the state is higher than all India level. Health indicators such as Infant mortality rates, maternal mortality rate, institutional delivery and immunization performance of the state has improved and better than all India level.
The state has been reckoned one of the fastest growing states. Economy has registered a growth rate around 7 per cent in 2016-17 and it is estimated to grow by 6.8 per cent in 2017-18 which is comparable to All India growth rates. The GSDP growth rate during 2011-12 to 2017-18 has been fairly good and 2012-13, 2013-14 and 2015-16 has been robust registered over 7 per cent per annum. Average per capita income of the state has been estimated to be INR1.61 lakh in 2016-17 and in plain districts it is much higher compared to hill districts. Haridwar, Dehradun and Udham Singh Nagar have INR2.54 lakh, INR1.95 lakh and INR1.87 lakh, respectively for the year 2016-17.
There has been distinct sectoral shift and the reliance on primary (producing) sector has declined substantively over the years, even lower than all India. Primary sector contributes to 10.5 per cent to the GSDP and secondary and tertiary sectors contribute 49.7 per cent and 39.7 per cent, respectively in 2017-18 at current prices. 12.2 Challenges The dismal spots are also clearly visible in the state that poses massive challenges. These challenges are growing disparities and inequalities between the hills and the plains districts and across socio-economic groups. Hill districts of the state pose some specific problems and within it there exists wide diversity and variability both in terms of resource endowments, development potential as well as constraints. It is predominantly a hilly and mountainous region with undulating topography, varied climate, limited arable land and difficult agricultural conditions. This has resulted in a low economic base. Although, agriculture is the main occupation of the hill people yet it suffers from several inherent maladies. Landholdings are small, fragmented and scattered. Preponderance of cultivators in tiny size of land parcels is most common barring the plane or tarai region -- Dehradun,
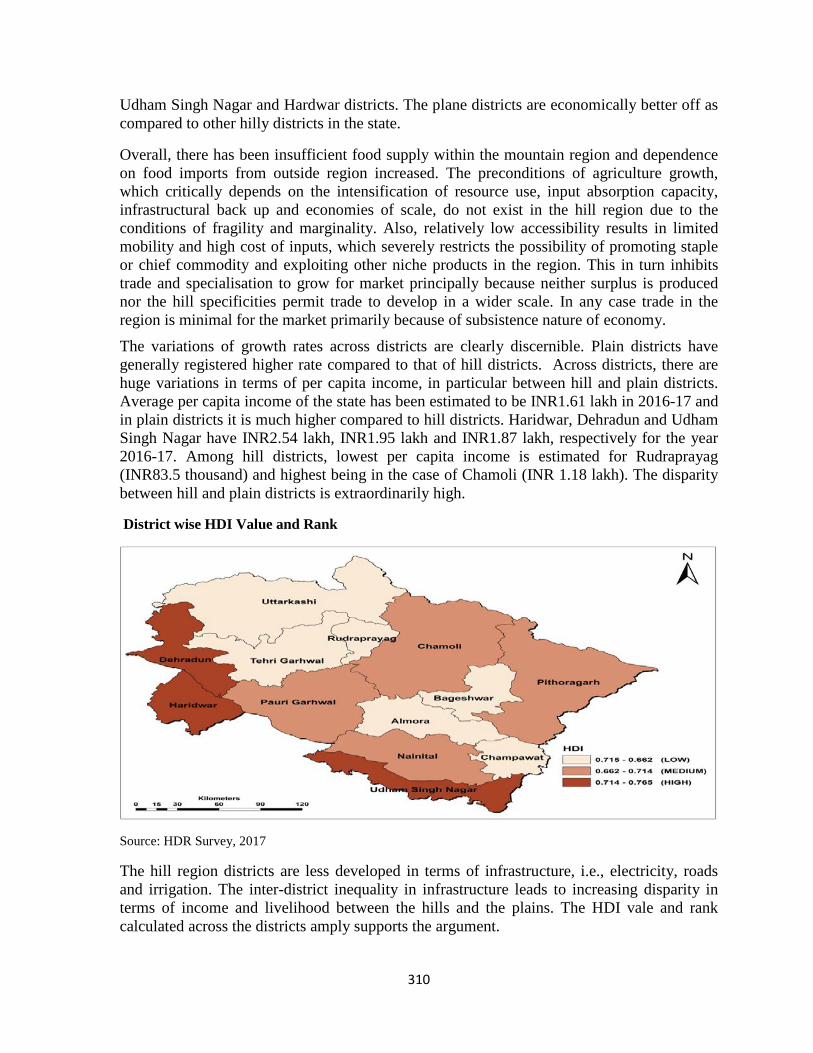
310
Udham Singh Nagar and Hardwar districts. The plane districts are economically better off as compared to other hilly districts in the state.
Overall, there has been insufficient food supply within the mountain region and dependence on food imports from outside region increased. The preconditions of agriculture growth, which critically depends on the intensification of resource use, input absorption capacity, infrastructural back up and economies of scale, do not exist in the hill region due to the conditions of fragility and marginality. Also, relatively low accessibility results in limited mobility and high cost of inputs, which severely restricts the possibility of promoting staple or chief commodity and exploiting other niche products in the region. This in turn inhibits trade and specialisation to grow for market principally because neither surplus is produced nor the hill specificities permit trade to develop in a wider scale. In any case trade in the region is minimal for the market primarily because of subsistence nature of economy. The variations of growth rates across districts are clearly discernible. Plain districts have generally registered higher rate compared to that of hill districts. Across districts, there are huge variations in terms of per capita income, in particular between hill and plain districts. Average per capita income of the state has been estimated to be INR1.61 lakh in 2016-17 and in plain districts it is much higher compared to hill districts. Haridwar, Dehradun and Udham Singh Nagar have INR2.54 lakh, INR1.95 lakh and INR1.87 lakh, respectively for the year 2016-17. Among hill districts, lowest per capita income is estimated for Rudraprayag (INR83.5 thousand) and highest being in the case of Chamoli (INR 1.18 lakh). The disparity between hill and plain districts is extraordinarily high.
District wise HDI Value and Rank
Source: HDR Survey, 2017
The hill region districts are less developed in terms of infrastructure, i.e., electricity, roads and irrigation. The inter-district inequality in infrastructure leads to increasing disparity in terms of income and livelihood between the hills and the plains. The HDI vale and rank calculated across the districts amply supports the argument.
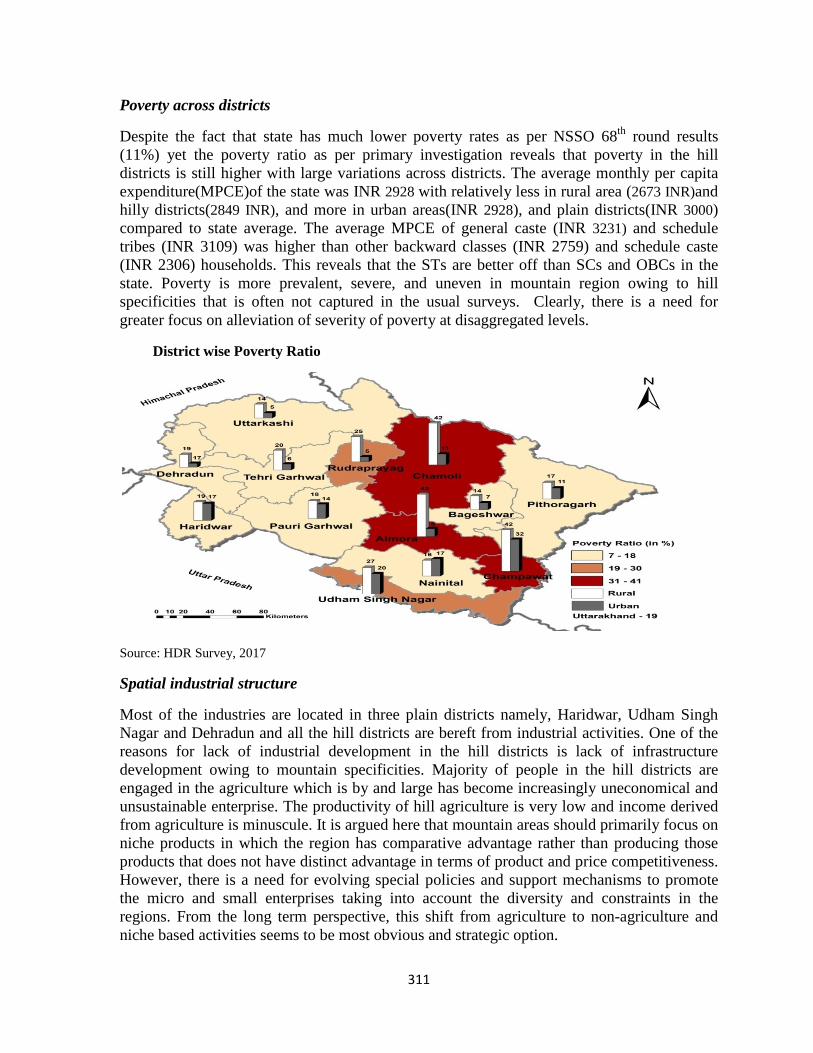
311
Poverty across districts
Despite the fact that state has much lower poverty rates as per NSSO 68th round results (11%) yet the poverty ratio as per primary investigation reveals that poverty in the hill districts is still higher with large variations across districts. The average monthly per capita expenditure(MPCE)of the state was INR 2928 with relatively less in rural area (2673 INR)and hilly districts(2849 INR), and more in urban areas(INR 2928), and plain districts(INR 3000) compared to state average. The average MPCE of general caste (INR 3231) and schedule tribes (INR 3109) was higher than other backward classes (INR 2759) and schedule caste (INR 2306) households. This reveals that the STs are better off than SCs and OBCs in the state. Poverty is more prevalent, severe, and uneven in mountain region owing to hill specificities that is often not captured in the usual surveys. Clearly, there is a need for greater focus on alleviation of severity of poverty at disaggregated levels.
District wise Poverty Ratio
Source: HDR Survey, 2017
Spatial industrial structure
Most of the industries are located in three plain districts namely, Haridwar, Udham Singh Nagar and Dehradun and all the hill districts are bereft from industrial activities. One of the reasons for lack of industrial development in the hill districts is lack of infrastructure development owing to mountain specificities. Majority of people in the hill districts are engaged in the agriculture which is by and large has become increasingly uneconomical and unsustainable enterprise. The productivity of hill agriculture is very low and income derived from agriculture is minuscule. It is argued here that mountain areas should primarily focus on niche products in which the region has comparative advantage rather than producing those products that does not have distinct advantage in terms of product and price competitiveness. However, there is a need for evolving special policies and support mechanisms to promote the micro and small enterprises taking into account the diversity and constraints in the regions. From the long term perspective, this shift from agriculture to non-agriculture and niche based activities seems to be most obvious and strategic option.
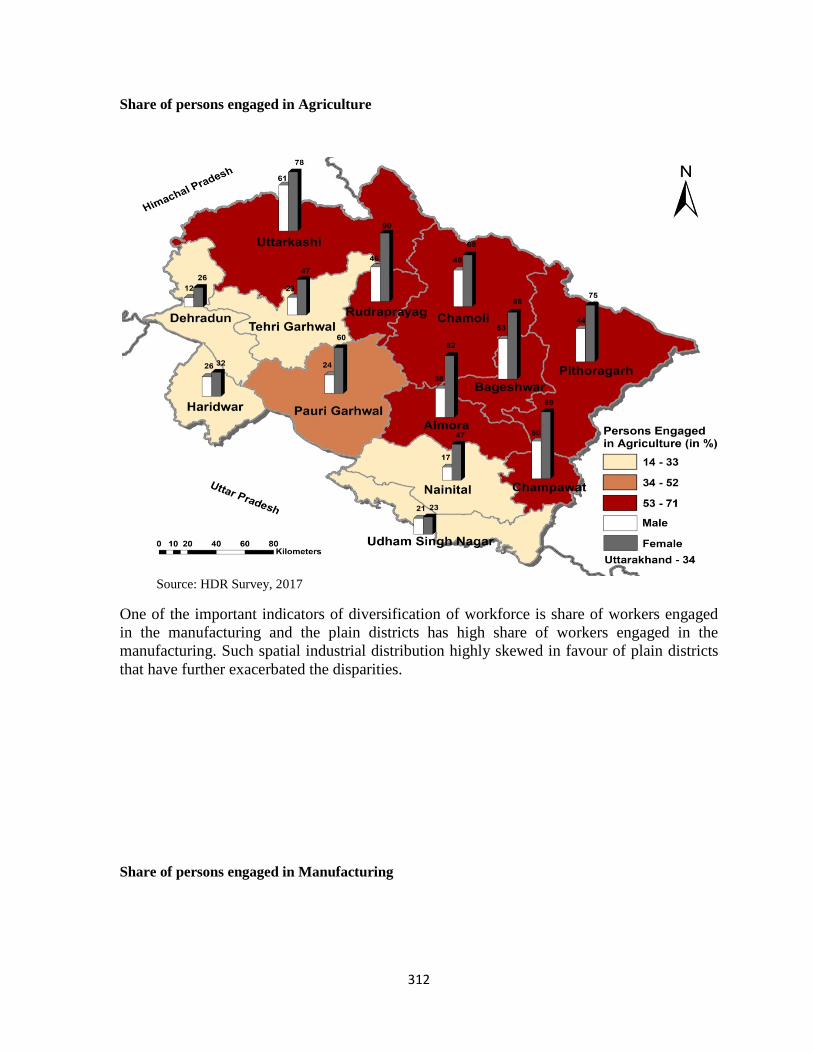
312
Share of persons engaged in Agriculture
Source: HDR Survey, 2017
One of the important indicators of diversification of workforce is share of workers engaged in the manufacturing and the plain districts has high share of workers engaged in the manufacturing. Such spatial industrial distribution highly skewed in favour of plain districts that have further exacerbated the disparities.
Share of persons engaged in Manufacturing
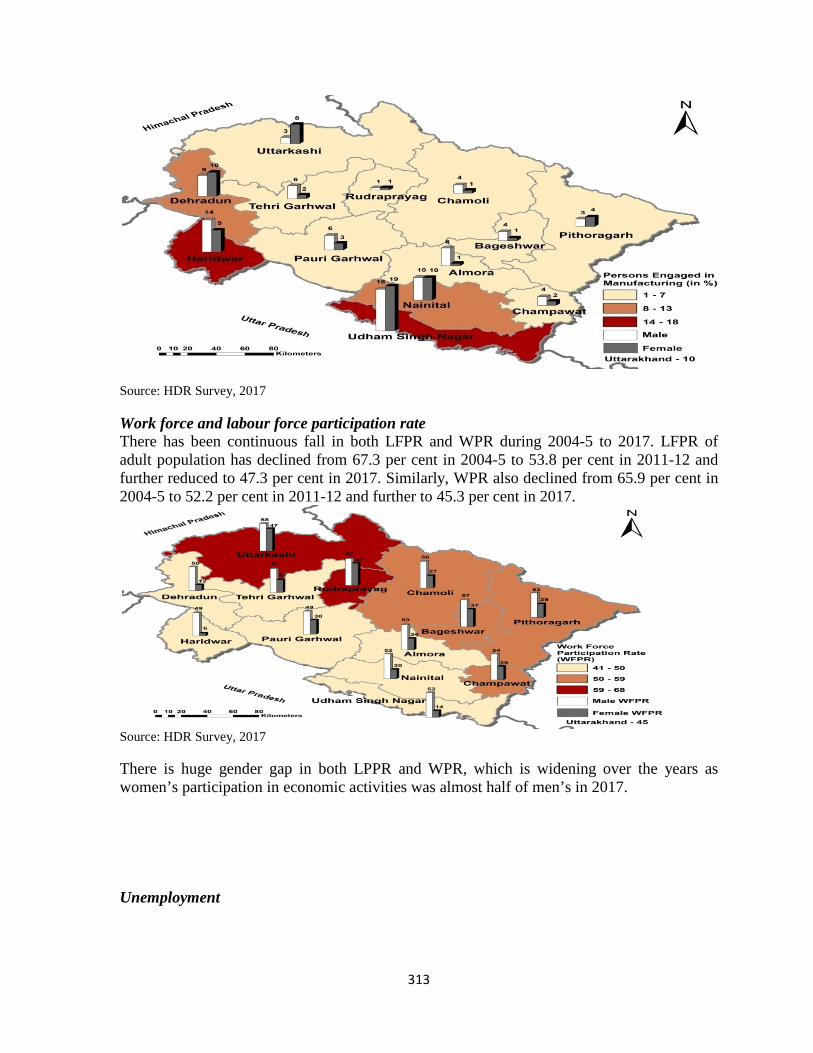
313
Source: HDR Survey, 2017 Work force and labour force participation rate There has been continuous fall in both LFPR and WPR during 2004-5 to 2017. LFPR of adult population has declined from 67.3 per cent in 2004-5 to 53.8 per cent in 2011-12 and further reduced to 47.3 per cent in 2017. Similarly, WPR also declined from 65.9 per cent in 2004-5 to 52.2 per cent in 2011-12 and further to 45.3 per cent in 2017.
Source: HDR Survey, 2017 There is huge gender gap in both LPPR and WPR, which is widening over the years as women’s participation in economic activities was almost half of men’s in 2017. Unemployment
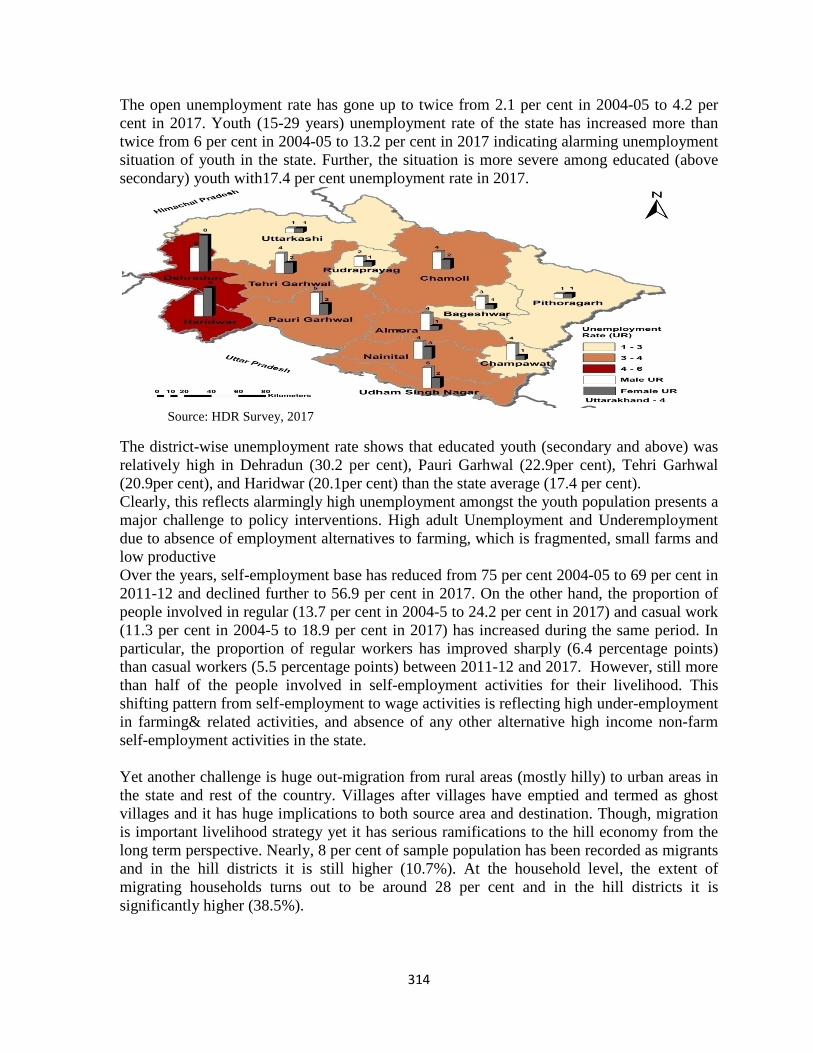
314
The open unemployment rate has gone up to twice from 2.1 per cent in 2004-05 to 4.2 per cent in 2017. Youth (15-29 years) unemployment rate of the state has increased more than twice from 6 per cent in 2004-05 to 13.2 per cent in 2017 indicating alarming unemployment situation of youth in the state. Further, the situation is more severe among educated (above secondary) youth with17.4 per cent unemployment rate in 2017.
Source: HDR Survey, 2017
The district-wise unemployment rate shows that educated youth (secondary and above) was relatively high in Dehradun (30.2 per cent), Pauri Garhwal (22.9per cent), Tehri Garhwal (20.9per cent), and Haridwar (20.1per cent) than the state average (17.4 per cent). Clearly, this reflects alarmingly high unemployment amongst the youth population presents a major challenge to policy interventions. High adult Unemployment and Underemployment due to absence of employment alternatives to farming, which is fragmented, small farms and low productive Over the years, self-employment base has reduced from 75 per cent 2004-05 to 69 per cent in 2011-12 and declined further to 56.9 per cent in 2017. On the other hand, the proportion of people involved in regular (13.7 per cent in 2004-5 to 24.2 per cent in 2017) and casual work (11.3 per cent in 2004-5 to 18.9 per cent in 2017) has increased during the same period. In particular, the proportion of regular workers has improved sharply (6.4 percentage points) than casual workers (5.5 percentage points) between 2011-12 and 2017. However, still more than half of the people involved in self-employment activities for their livelihood. This shifting pattern from self-employment to wage activities is reflecting high under-employment in farming& related activities, and absence of any other alternative high income non-farm self-employment activities in the state. Yet another challenge is huge out-migration from rural areas (mostly hilly) to urban areas in the state and rest of the country. Villages after villages have emptied and termed as ghost villages and it has huge implications to both source area and destination. Though, migration is important livelihood strategy yet it has serious ramifications to the hill economy from the long term perspective. Nearly, 8 per cent of sample population has been recorded as migrants and in the hill districts it is still higher (10.7%). At the household level, the extent of migrating households turns out to be around 28 per cent and in the hill districts it is significantly higher (38.5%).
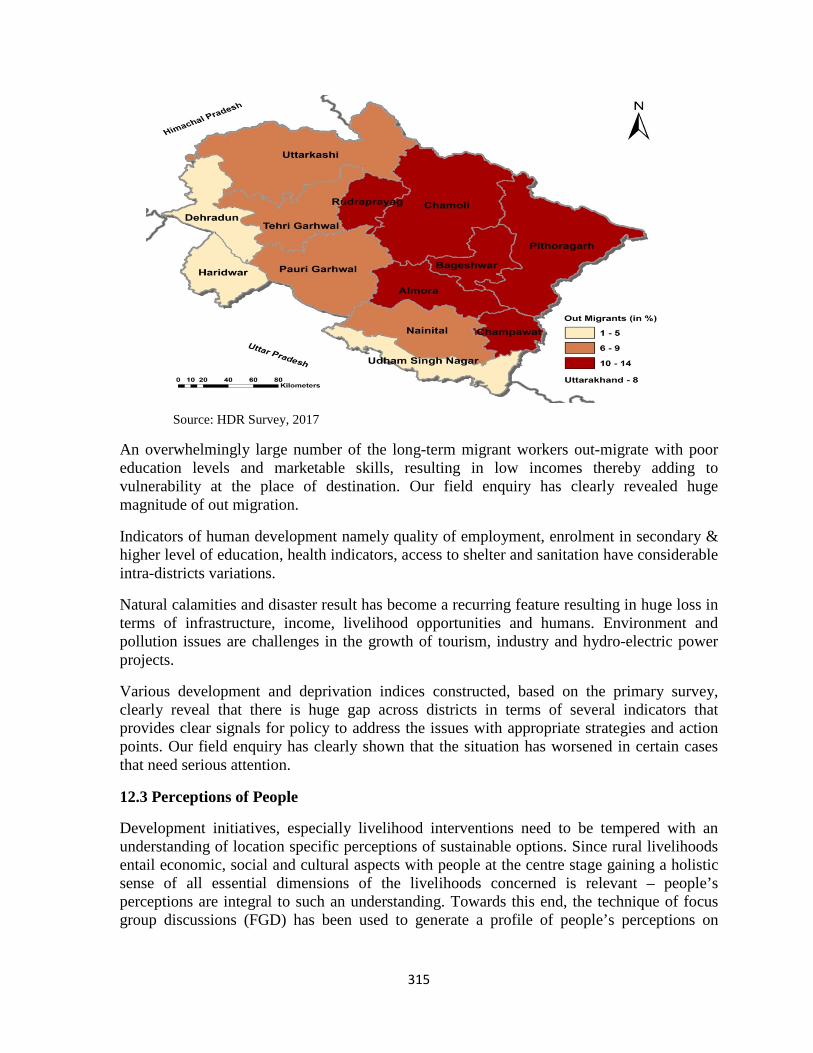
315
Source: HDR Survey, 2017
An overwhelmingly large number of the long-term migrant workers out-migrate with poor education levels and marketable skills, resulting in low incomes thereby adding to vulnerability at the place of destination. Our field enquiry has clearly revealed huge magnitude of out migration.
Indicators of human development namely quality of employment, enrolment in secondary & higher level of education, health indicators, access to shelter and sanitation have considerable intra-districts variations.
Natural calamities and disaster result has become a recurring feature resulting in huge loss in terms of infrastructure, income, livelihood opportunities and humans. Environment and pollution issues are challenges in the growth of tourism, industry and hydro-electric power projects.
Various development and deprivation indices constructed, based on the primary survey, clearly reveal that there is huge gap across districts in terms of several indicators that provides clear signals for policy to address the issues with appropriate strategies and action points. Our field enquiry has clearly shown that the situation has worsened in certain cases that need serious attention.
12.3 Perceptions of People
Development initiatives, especially livelihood interventions need to be tempered with an understanding of location specific perceptions of sustainable options. Since rural livelihoods entail economic, social and cultural aspects with people at the centre stage gaining a holistic sense of all essential dimensions of the livelihoods concerned is relevant – people’s perceptions are integral to such an understanding. Towards this end, the technique of focus group discussions (FGD) has been used to generate a profile of people’s perceptions on
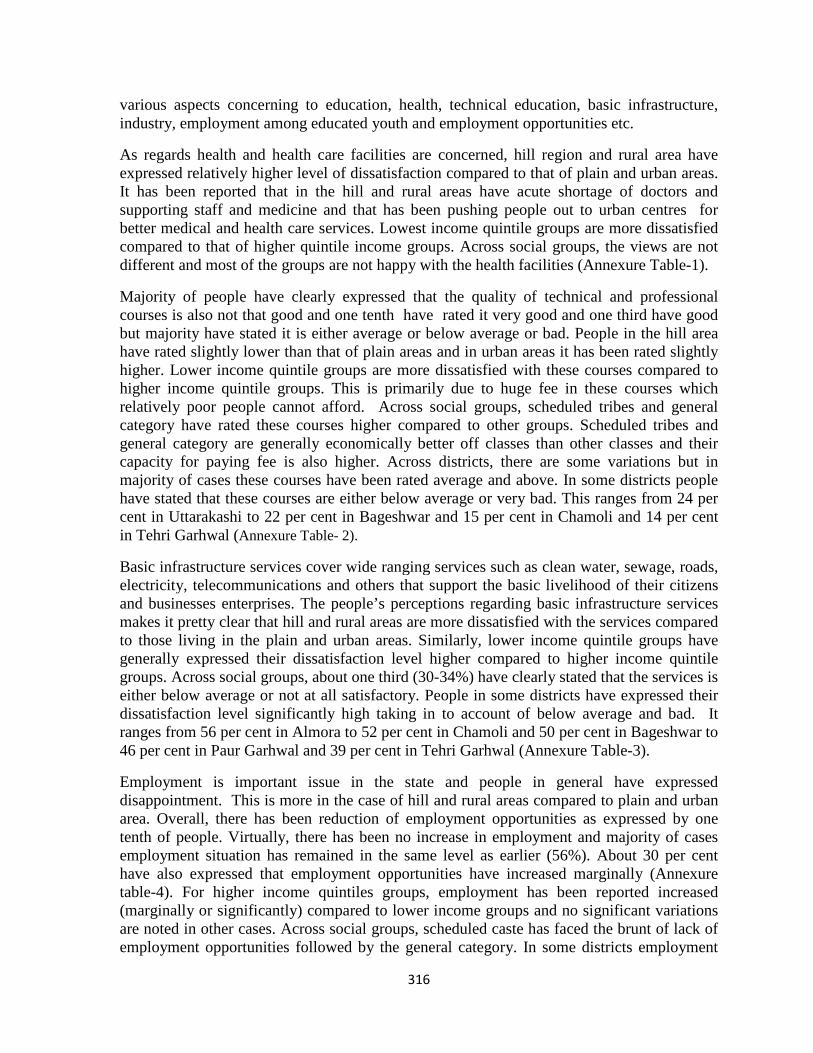
316
various aspects concerning to education, health, technical education, basic infrastructure, industry, employment among educated youth and employment opportunities etc.
As regards health and health care facilities are concerned, hill region and rural area have expressed relatively higher level of dissatisfaction compared to that of plain and urban areas. It has been reported that in the hill and rural areas have acute shortage of doctors and supporting staff and medicine and that has been pushing people out to urban centres for better medical and health care services. Lowest income quintile groups are more dissatisfied compared to that of higher quintile income groups. Across social groups, the views are not different and most of the groups are not happy with the health facilities (Annexure Table-1).
Majority of people have clearly expressed that the quality of technical and professional courses is also not that good and one tenth have rated it very good and one third have good but majority have stated it is either average or below average or bad. People in the hill area have rated slightly lower than that of plain areas and in urban areas it has been rated slightly higher. Lower income quintile groups are more dissatisfied with these courses compared to higher income quintile groups. This is primarily due to huge fee in these courses which relatively poor people cannot afford. Across social groups, scheduled tribes and general category have rated these courses higher compared to other groups. Scheduled tribes and general category are generally economically better off classes than other classes and their capacity for paying fee is also higher. Across districts, there are some variations but in majority of cases these courses have been rated average and above. In some districts people have stated that these courses are either below average or very bad. This ranges from 24 per cent in Uttarakashi to 22 per cent in Bageshwar and 15 per cent in Chamoli and 14 per cent in Tehri Garhwal (Annexure Table- 2).
Basic infrastructure services cover wide ranging services such as clean water, sewage, roads, electricity, telecommunications and others that support the basic livelihood of their citizens and businesses enterprises. The people’s perceptions regarding basic infrastructure services makes it pretty clear that hill and rural areas are more dissatisfied with the services compared to those living in the plain and urban areas. Similarly, lower income quintile groups have generally expressed their dissatisfaction level higher compared to higher income quintile groups. Across social groups, about one third (30-34%) have clearly stated that the services is either below average or not at all satisfactory. People in some districts have expressed their dissatisfaction level significantly high taking in to account of below average and bad. It ranges from 56 per cent in Almora to 52 per cent in Chamoli and 50 per cent in Bageshwar to 46 per cent in Paur Garhwal and 39 per cent in Tehri Garhwal (Annexure Table-3).
Employment is important issue in the state and people in general have expressed disappointment. This is more in the case of hill and rural areas compared to plain and urban area. Overall, there has been reduction of employment opportunities as expressed by one tenth of people. Virtually, there has been no increase in employment and majority of cases employment situation has remained in the same level as earlier (56%). About 30 per cent have also expressed that employment opportunities have increased marginally (Annexure table-4). For higher income quintiles groups, employment has been reported increased (marginally or significantly) compared to lower income groups and no significant variations are noted in other cases. Across social groups, scheduled caste has faced the brunt of lack of employment opportunities followed by the general category. In some districts employment
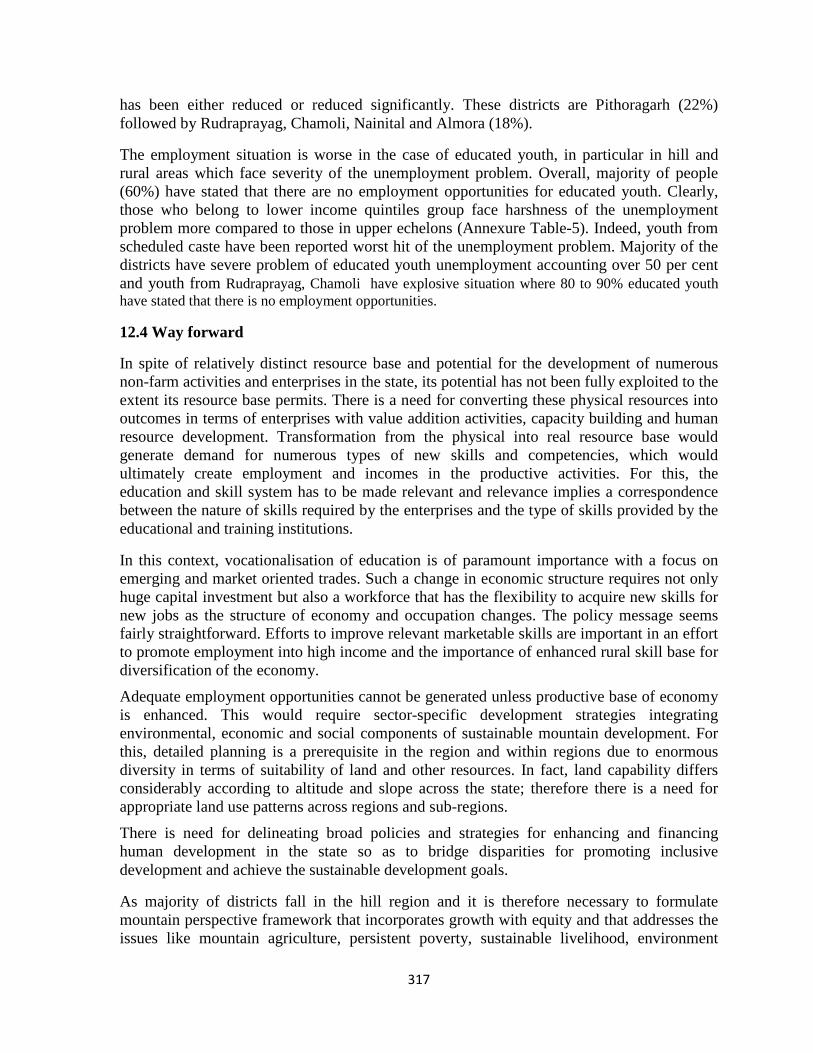
317
has been either reduced or reduced significantly. These districts are Pithoragarh (22%) followed by Rudraprayag, Chamoli, Nainital and Almora (18%).
The employment situation is worse in the case of educated youth, in particular in hill and rural areas which face severity of the unemployment problem. Overall, majority of people (60%) have stated that there are no employment opportunities for educated youth. Clearly, those who belong to lower income quintiles group face harshness of the unemployment problem more compared to those in upper echelons (Annexure Table-5). Indeed, youth from scheduled caste have been reported worst hit of the unemployment problem. Majority of the districts have severe problem of educated youth unemployment accounting over 50 per cent and youth from Rudraprayag, Chamoli have explosive situation where 80 to 90% educated youth have stated that there is no employment opportunities.
12.4 Way forward
In spite of relatively distinct resource base and potential for the development of numerous non-farm activities and enterprises in the state, its potential has not been fully exploited to the extent its resource base permits. There is a need for converting these physical resources into outcomes in terms of enterprises with value addition activities, capacity building and human resource development. Transformation from the physical into real resource base would generate demand for numerous types of new skills and competencies, which would ultimately create employment and incomes in the productive activities. For this, the education and skill system has to be made relevant and relevance implies a correspondence between the nature of skills required by the enterprises and the type of skills provided by the educational and training institutions.
In this context, vocationalisation of education is of paramount importance with a focus on emerging and market oriented trades. Such a change in economic structure requires not only huge capital investment but also a workforce that has the flexibility to acquire new skills for new jobs as the structure of economy and occupation changes. The policy message seems fairly straightforward. Efforts to improve relevant marketable skills are important in an effort to promote employment into high income and the importance of enhanced rural skill base for diversification of the economy.
Adequate employment opportunities cannot be generated unless productive base of economy is enhanced. This would require sector-specific development strategies integrating environmental, economic and social components of sustainable mountain development. For this, detailed planning is a prerequisite in the region and within regions due to enormous diversity in terms of suitability of land and other resources. In fact, land capability differs considerably according to altitude and slope across the state; therefore there is a need for appropriate land use patterns across regions and sub-regions. There is need for delineating broad policies and strategies for enhancing and financing human development in the state so as to bridge disparities for promoting inclusive development and achieve the sustainable development goals.
As majority of districts fall in the hill region and it is therefore necessary to formulate mountain perspective framework that incorporates growth with equity and that addresses the issues like mountain agriculture, persistent poverty, sustainable livelihood, environment
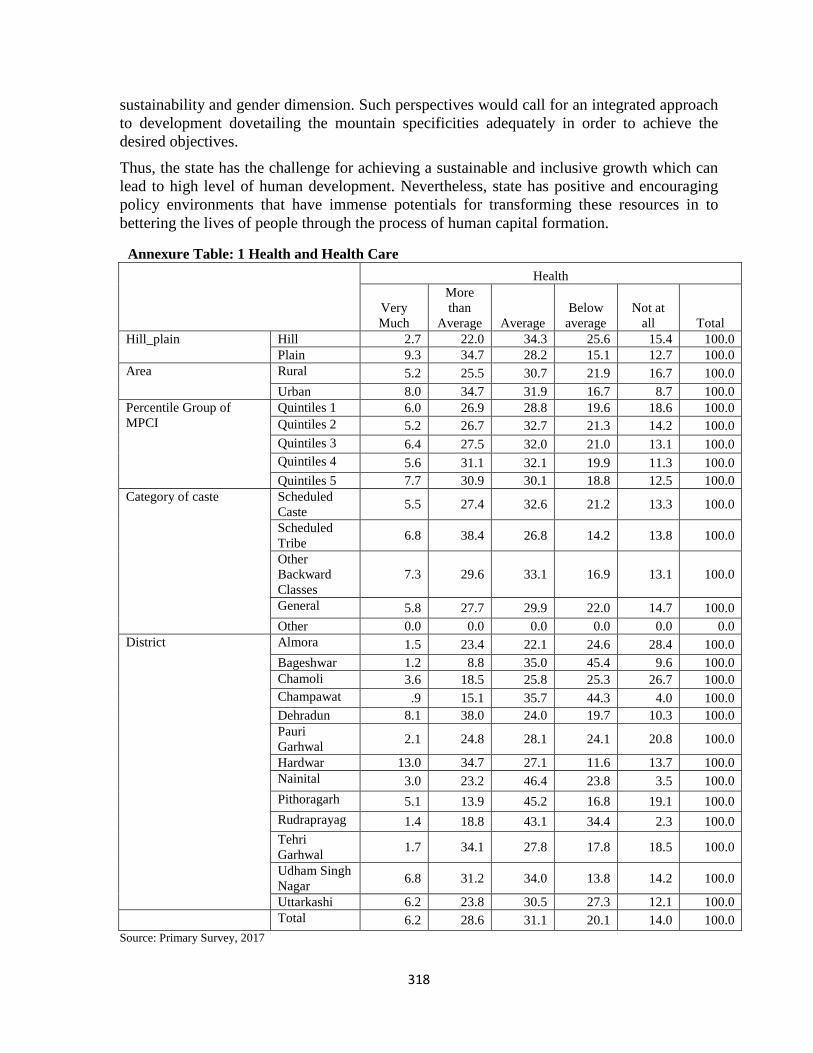
318
sustainability and gender dimension. Such perspectives would call for an integrated approach to development dovetailing the mountain specificities adequately in order to achieve the desired objectives. Thus, the state has the challenge for achieving a sustainable and inclusive growth which can lead to high level of human development. Nevertheless, state has positive and encouraging policy environments that have immense potentials for transforming these resources in to bettering the lives of people through the process of human capital formation.
Annexure Table: 1 Health and Health Care
Health
Very Much
More than
Average Average Below
average Not at
all Total Hill_plain Hill 2.7 22.0 34.3 25.6 15.4 100.0
Plain 9.3 34.7 28.2 15.1 12.7 100.0 Area Rural 5.2 25.5 30.7 21.9 16.7 100.0
Urban 8.0 34.7 31.9 16.7 8.7 100.0 Percentile Group of MPCI
Quintiles 1 6.0 26.9 28.8 19.6 18.6 100.0 Quintiles 2 5.2 26.7 32.7 21.3 14.2 100.0 Quintiles 3 6.4 27.5 32.0 21.0 13.1 100.0 Quintiles 4 5.6 31.1 32.1 19.9 11.3 100.0 Quintiles 5 7.7 30.9 30.1 18.8 12.5 100.0
Category of caste Scheduled Caste 5.5 27.4 32.6 21.2 13.3 100.0
Scheduled Tribe 6.8 38.4 26.8 14.2 13.8 100.0
Other Backward Classes
7.3 29.6 33.1 16.9 13.1 100.0
General 5.8 27.7 29.9 22.0 14.7 100.0 Other 0.0 0.0 0.0 0.0 0.0 0.0
District Almora 1.5 23.4 22.1 24.6 28.4 100.0 Bageshwar 1.2 8.8 35.0 45.4 9.6 100.0 Chamoli 3.6 18.5 25.8 25.3 26.7 100.0 Champawat .9 15.1 35.7 44.3 4.0 100.0 Dehradun 8.1 38.0 24.0 19.7 10.3 100.0 Pauri Garhwal 2.1 24.8 28.1 24.1 20.8 100.0
Hardwar 13.0 34.7 27.1 11.6 13.7 100.0 Nainital 3.0 23.2 46.4 23.8 3.5 100.0 Pithoragarh 5.1 13.9 45.2 16.8 19.1 100.0 Rudraprayag 1.4 18.8 43.1 34.4 2.3 100.0 Tehri Garhwal 1.7 34.1 27.8 17.8 18.5 100.0
Udham Singh Nagar 6.8 31.2 34.0 13.8 14.2 100.0
Uttarkashi 6.2 23.8 30.5 27.3 12.1 100.0 Total 6.2 28.6 31.1 20.1 14.0 100.0
Source: Primary Survey, 2017
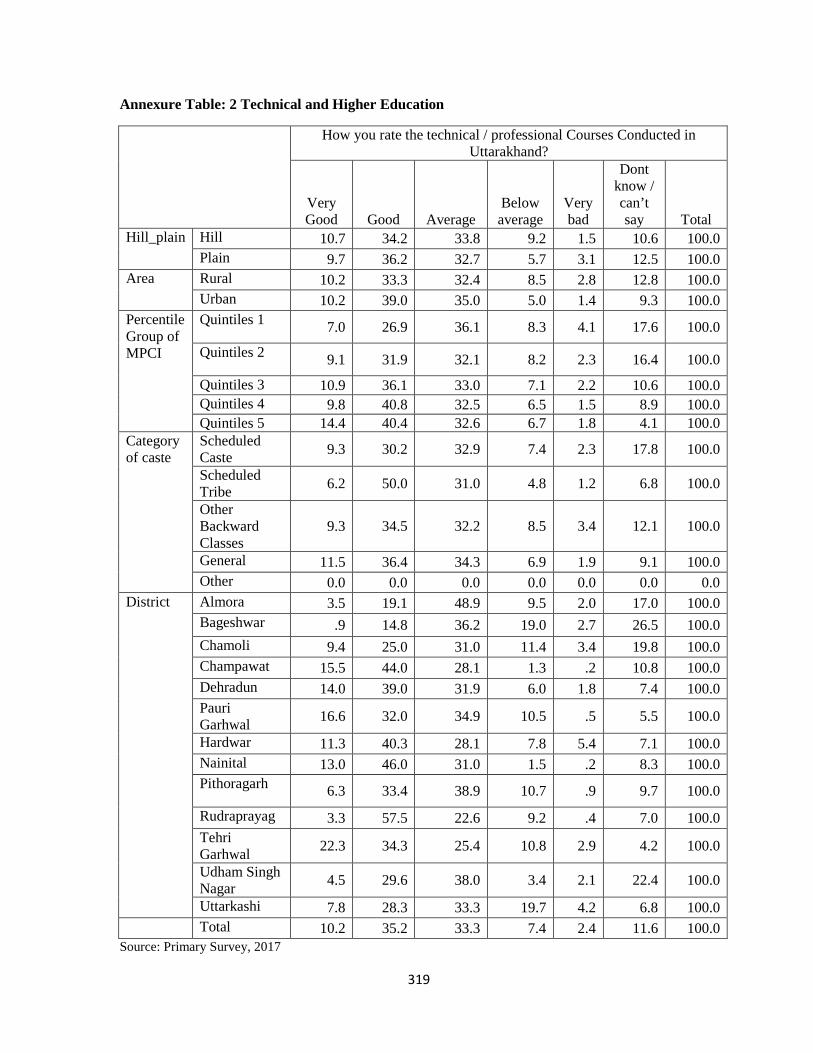
319
Annexure Table: 2 Technical and Higher Education
How you rate the technical / professional Courses Conducted in Uttarakhand?
Very Good Good Average
Below average
Very bad
Dont know / can’t say Total
Hill_plain Hill 10.7 34.2 33.8 9.2 1.5 10.6 100.0 Plain 9.7 36.2 32.7 5.7 3.1 12.5 100.0
Area Rural 10.2 33.3 32.4 8.5 2.8 12.8 100.0 Urban 10.2 39.0 35.0 5.0 1.4 9.3 100.0
Percentile Group of MPCI
Quintiles 1 7.0 26.9 36.1 8.3 4.1 17.6 100.0
Quintiles 2 9.1 31.9 32.1 8.2 2.3 16.4 100.0
Quintiles 3 10.9 36.1 33.0 7.1 2.2 10.6 100.0 Quintiles 4 9.8 40.8 32.5 6.5 1.5 8.9 100.0 Quintiles 5 14.4 40.4 32.6 6.7 1.8 4.1 100.0
Category of caste
Scheduled Caste 9.3 30.2 32.9 7.4 2.3 17.8 100.0
Scheduled Tribe 6.2 50.0 31.0 4.8 1.2 6.8 100.0
Other Backward Classes
9.3 34.5 32.2 8.5 3.4 12.1 100.0
General 11.5 36.4 34.3 6.9 1.9 9.1 100.0 Other 0.0 0.0 0.0 0.0 0.0 0.0 0.0
District Almora 3.5 19.1 48.9 9.5 2.0 17.0 100.0 Bageshwar .9 14.8 36.2 19.0 2.7 26.5 100.0 Chamoli 9.4 25.0 31.0 11.4 3.4 19.8 100.0 Champawat 15.5 44.0 28.1 1.3 .2 10.8 100.0 Dehradun 14.0 39.0 31.9 6.0 1.8 7.4 100.0 Pauri Garhwal 16.6 32.0 34.9 10.5 .5 5.5 100.0
Hardwar 11.3 40.3 28.1 7.8 5.4 7.1 100.0 Nainital 13.0 46.0 31.0 1.5 .2 8.3 100.0 Pithoragarh 6.3 33.4 38.9 10.7 .9 9.7 100.0
Rudraprayag 3.3 57.5 22.6 9.2 .4 7.0 100.0 Tehri Garhwal 22.3 34.3 25.4 10.8 2.9 4.2 100.0
Udham Singh Nagar 4.5 29.6 38.0 3.4 2.1 22.4 100.0
Uttarkashi 7.8 28.3 33.3 19.7 4.2 6.8 100.0 Total 10.2 35.2 33.3 7.4 2.4 11.6 100.0
Source: Primary Survey, 2017
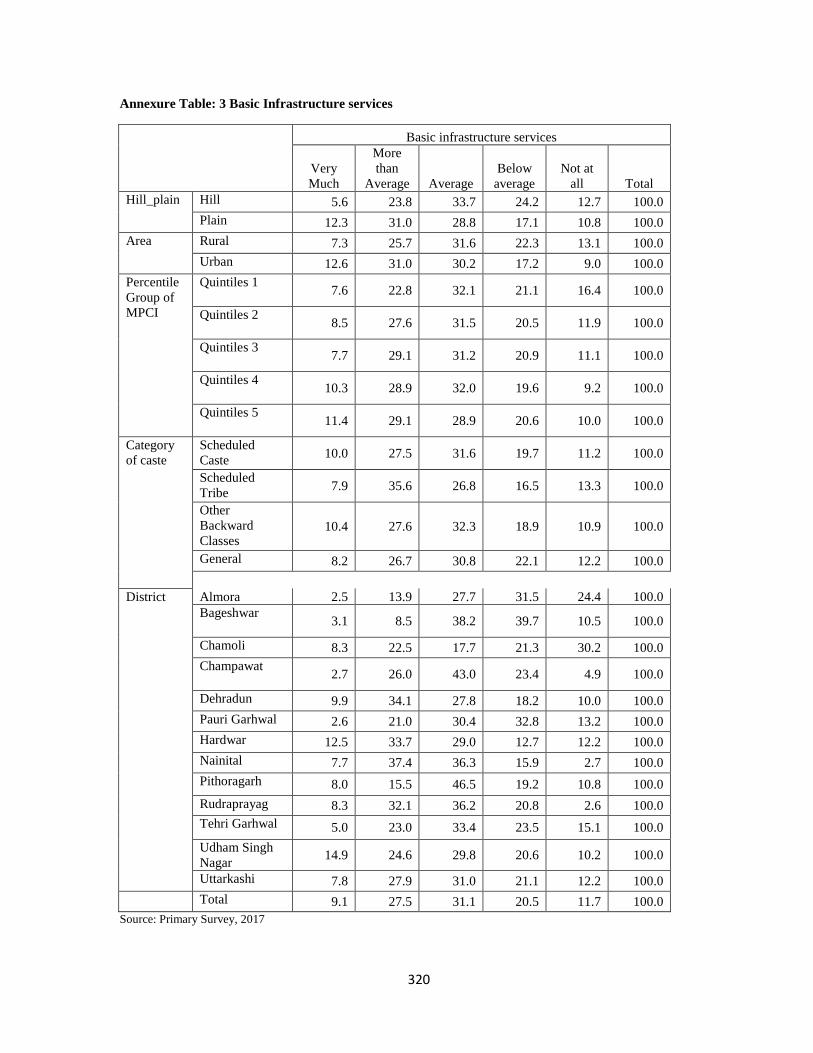
320
Annexure Table: 3 Basic Infrastructure services
Basic infrastructure services
Very Much
More than
Average Average Below
average Not at
all Total Hill_plain Hill 5.6 23.8 33.7 24.2 12.7 100.0
Plain 12.3 31.0 28.8 17.1 10.8 100.0 Area Rural 7.3 25.7 31.6 22.3 13.1 100.0
Urban 12.6 31.0 30.2 17.2 9.0 100.0 Percentile Group of MPCI
Quintiles 1 7.6 22.8 32.1 21.1 16.4 100.0
Quintiles 2 8.5 27.6 31.5 20.5 11.9 100.0
Quintiles 3 7.7 29.1 31.2 20.9 11.1 100.0
Quintiles 4 10.3 28.9 32.0 19.6 9.2 100.0
Quintiles 5 11.4 29.1 28.9 20.6 10.0 100.0
Category of caste
Scheduled Caste 10.0 27.5 31.6 19.7 11.2 100.0
Scheduled Tribe 7.9 35.6 26.8 16.5 13.3 100.0
Other Backward Classes
10.4 27.6 32.3 18.9 10.9 100.0
General 8.2 26.7 30.8 22.1 12.2 100.0
District Almora 2.5 13.9 27.7 31.5 24.4 100.0 Bageshwar 3.1 8.5 38.2 39.7 10.5 100.0
Chamoli 8.3 22.5 17.7 21.3 30.2 100.0 Champawat 2.7 26.0 43.0 23.4 4.9 100.0
Dehradun 9.9 34.1 27.8 18.2 10.0 100.0 Pauri Garhwal 2.6 21.0 30.4 32.8 13.2 100.0 Hardwar 12.5 33.7 29.0 12.7 12.2 100.0 Nainital 7.7 37.4 36.3 15.9 2.7 100.0 Pithoragarh 8.0 15.5 46.5 19.2 10.8 100.0 Rudraprayag 8.3 32.1 36.2 20.8 2.6 100.0 Tehri Garhwal 5.0 23.0 33.4 23.5 15.1 100.0 Udham Singh Nagar 14.9 24.6 29.8 20.6 10.2 100.0
Uttarkashi 7.8 27.9 31.0 21.1 12.2 100.0
Total 9.1 27.5 31.1 20.5 11.7 100.0 Source: Primary Survey, 2017

321
Annexure Table: 4 Employment Opportunities
Is employment opportunities have increased of the state level in the years?
Increased significantly
Increased marginally
Same as earlier Reduced
Reduced significantly Total
Hill_plain Hill .8 20.5 63.4 13.9 1.5 100.0 Plain 6.5 37.1 46.6 8.3 1.5 100.0
Area Rural 3.3 28.2 55.6 11.2 1.8 100.0 Urban 4.6 31.1 52.8 10.6 .8 100.0
Percentile Group of MPCI
Quintiles 1 3.5 26.7 58.8 10.1 .8 100.0 Quintiles 2 3.1 29.9 53.8 11.5 1.6 100.0 Quintiles 3 4.2 28.8 55.0 10.5 1.5 100.0 Quintiles 4 4.3 29.6 52.1 11.7 2.3 100.0 Quintiles 5 3.6 30.8 53.5 11.1 1.0 100.0
Category of caste
Scheduled Caste 3.0 25.4 56.2 14.3 1.2 100.0
Scheduled Tribe 1.9 40.8 48.7 7.0 1.6 100.0
Other Backward Classes
6.1 33.5 50.3 8.5 1.6 100.0
General 2.8 27.1 57.2 11.4 1.5 100.0
District Almora .4 19.8 63.1 15.9 .7 100.0 Bageshwar .7 11.0 77.7 9.1 1.5 100.0 Chamoli .2 15.0 66.7 16.4 1.7 100.0 Champawat 1.1 24.2 52.2 17.7 4.8 100.0 Dehradun 1.6 32.4 53.9 11.2 .9 100.0 Pauri Garhwal 1.3 22.6 66.3 7.7 2.1 100.0
Hardwar 11.1 38.7 44.6 4.2 1.3 100.0 Nainital .5 21.4 60.5 17.0 .6 100.0 Pithoragarh .5 12.4 65.1 21.4 .7 100.0 Rudraprayag .4 19.8 61.7 16.9 1.3 100.0 Tehri Garhwal .8 31.1 62.4 4.1 1.6 100.0
Udham Singh Nagar 6.4 39.8 42.0 9.7 2.1 100.0
Uttarkashi 2.9 22.9 61.9 10.0 2.3 100.0 Total 3.8 29.2 54.7 11.0 1.5 100.0
Source: Primary Survey, 2017
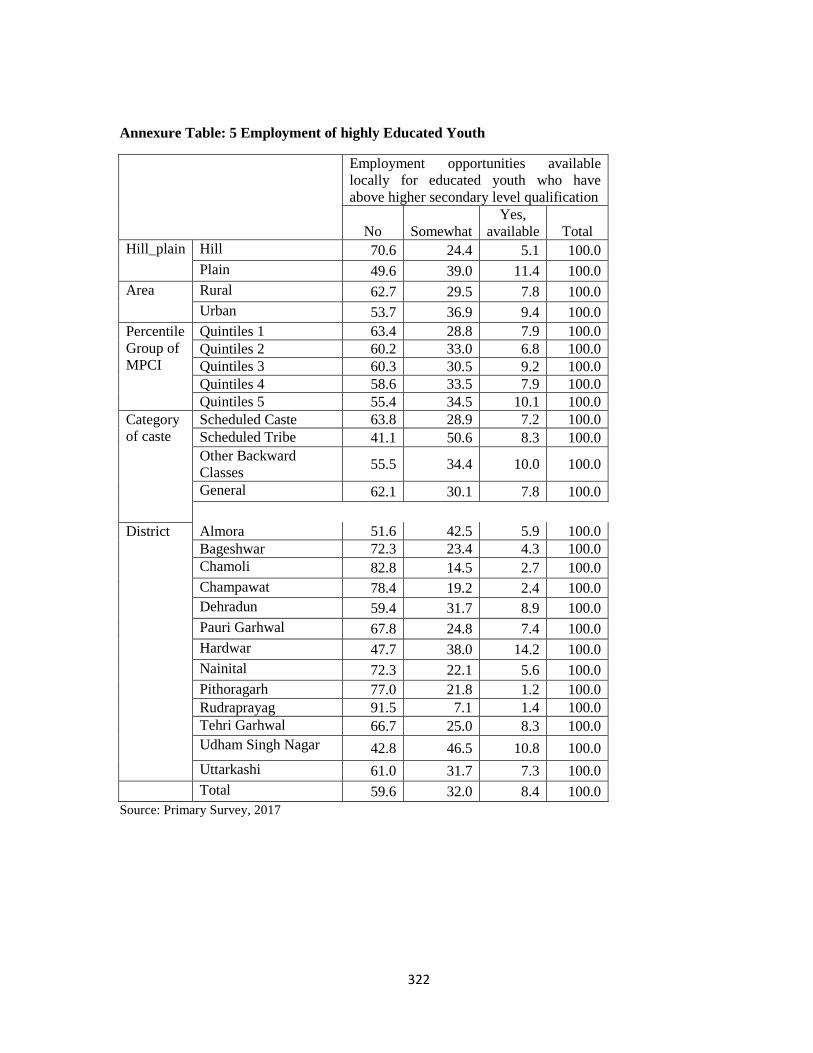
322
Annexure Table: 5 Employment of highly Educated Youth
Employment opportunities available locally for educated youth who have above higher secondary level qualification
No Somewhat Yes,
available Total Hill_plain Hill 70.6 24.4 5.1 100.0
Plain 49.6 39.0 11.4 100.0 Area Rural 62.7 29.5 7.8 100.0
Urban 53.7 36.9 9.4 100.0 Percentile Group of MPCI
Quintiles 1 63.4 28.8 7.9 100.0 Quintiles 2 60.2 33.0 6.8 100.0 Quintiles 3 60.3 30.5 9.2 100.0 Quintiles 4 58.6 33.5 7.9 100.0 Quintiles 5 55.4 34.5 10.1 100.0
Category of caste
Scheduled Caste 63.8 28.9 7.2 100.0 Scheduled Tribe 41.1 50.6 8.3 100.0 Other Backward Classes 55.5 34.4 10.0 100.0
General 62.1 30.1 7.8 100.0
District Almora 51.6 42.5 5.9 100.0 Bageshwar 72.3 23.4 4.3 100.0 Chamoli 82.8 14.5 2.7 100.0 Champawat 78.4 19.2 2.4 100.0 Dehradun 59.4 31.7 8.9 100.0 Pauri Garhwal 67.8 24.8 7.4 100.0 Hardwar 47.7 38.0 14.2 100.0 Nainital 72.3 22.1 5.6 100.0 Pithoragarh 77.0 21.8 1.2 100.0 Rudraprayag 91.5 7.1 1.4 100.0 Tehri Garhwal 66.7 25.0 8.3 100.0 Udham Singh Nagar 42.8 46.5 10.8 100.0 Uttarkashi 61.0 31.7 7.3 100.0
Total 59.6 32.0 8.4 100.0 Source: Primary Survey, 2017