PROFITABILITY, EXTERNALITIES AND POLICY IN THE INTER AND INTRA FIRM ADOPTION OF NEW TECHNOLOGY: THE...
31
1 PROFITABILITY, EXTERNALITIES AND POLICY IN THE INTER AND INTRA FIRM ADOPTION OF NEW TECHNOLOGY: THE EXAMPLE OF E-BUSINESS ACTIVITIES IN THE UK * by Giuliana Battisti, Alessandra Canepa and Paul Stoneman # of the Universities of Aston, York and Warwick First version June 2004. This version August 10th 2005 Abstract: Using data from the third UK Community Innovation Survey and modelling the inter and intra firm usage of e-business activities in 2000 in the UK as a snapshot of a continuing integrated process, this paper addresses the justification of policy intervention in new technology adoption. The model estimates indicate that the usage of basic and enhanced e-business reflects rank effects (different firms receive different returns from usage), market intermediated externalities (e.g. stock and order effects) and also non-market intermediated externalities (e.g. learning or epidemic effects). The general policy implications of the existence of these different effects are then discussed. JEL Classification: O3 Key Words: Technological diffusion, e-business, technology policy * We would like to thank participants in the Workshop on Information Technology and the New Industry and Labour Market Dynamics, MERIT Maastricht, June 3-4 th , 2004, the European Network for Industrial Policy (EUNIP) Conference, Birmingham University,13-15 December 2004, the Winter Conference of The Network of Industrial Economists, University of Nottingham, 14th December 2004, members of the bi weekly Industrial Organization Workshop in the Department of Economics at Warwick University and the participants to in the CIS useruser group workshop at the Department of Trade and Industry (DTI) headquarters in London on 15 July 2005 for their useful comments on earlier versions of this paper. Of course all errors and omissions that remain are the responsibility of the authors alone. # Corresponding author: E Mail [email protected] , Tel: +44(0)2476 523038. Warwick Business School, University of Warwick, Coventry, CV4 7AL, UK
-
Upload
independent -
Category
Documents
-
view
2 -
download
0
Transcript of PROFITABILITY, EXTERNALITIES AND POLICY IN THE INTER AND INTRA FIRM ADOPTION OF NEW TECHNOLOGY: THE...
1
PROFITABILITY, EXTERNALITIES AND POLICY IN THE INTER AND INTRA FIRM
ADOPTION OF NEW TECHNOLOGY: THE EXAMPLE OF E-BUSINESS ACTIVITIES
IN THE UK*
by
Giuliana Battisti, Alessandra Canepa and Paul Stoneman#
of the Universities of Aston, York and Warwick
First version June 2004. This version August 10th 2005
Abstract: Using data from the third UK Community Innovation Survey and modelling the inter and intra firm usage of e-business activities in 2000 in the UK as a snapshot of a continuing integrated process, this paper addresses the justification of policy intervention in new technology adoption. The model estimates indicate that the usage of basic and enhanced e-business reflects rank effects (different firms receive different returns from usage), market intermediated externalities (e.g. stock and order effects) and also non-market intermediated externalities (e.g. learning or epidemic effects). The general policy implications of the existence of these different effects are then discussed. JEL Classification: O3 Key Words: Technological diffusion, e-business, technology policy
* We would like to thank participants in the Workshop on Information Technology and the New Industry and Labour Market Dynamics, MERIT Maastricht, June 3-4th, 2004, the European Network for Industrial Policy (EUNIP) Conference, Birmingham University,13-15 December 2004, the Winter Conference of The Network of Industrial Economists, University of Nottingham, 14th December 2004, members of the bi weekly Industrial Organization Workshop in the Department of Economics at Warwick University and the participants to in the CIS useruser group workshop at the Department of Trade and Industry (DTI) headquarters in London on 15 July 2005 for their useful comments on earlier versions of this paper. Of course all errors and omissions that remain are the responsibility of the authors alone. # Corresponding author: E Mail [email protected], Tel: +44(0)2476 523038. Warwick Business School, University of Warwick, Coventry, CV4 7AL, UK
2
1. INTRODUCTION
The ultimate objective of this paper is to address issues relating to rationales for and instruments
of policy intervention in the diffusion of technology taking account of both inter and intra firm
adoption processes. Inter firm diffusion concerns the pattern of first adoption of a new technology
across firms whereas intra firm diffusion concerns the spreading usage of that technology within
such firms. Although there is a large academic literature addressing intervention in R&D (i.e. the
generation of new technology) the literature addressing intervention in the diffusion process is
much more limited (see, for example, Stoneman and Diederen, 1994). Moreover the extant policy
literature nearly wholly concerns inter firm diffusion, although intra firm diffusion is at least as
important in the overall spread of new technology (Battisti and Stoneman, 2003). In fact, the
diffusion literature has primarily concerned itself with inter firm diffusion (see for example the
paucity of references on intra firm diffusion in a recent survey, Hall, 2004) and there is only a
small literature on intra firm diffusion (see among those studies Battisti, 2000 and Battisti and
Stoneman, 2005). In order to discuss intervention it is thus necessary for us to gain some further
insight particularly into the intra firm diffusion process. We do that by offering a reduced form
integrated (inter plus intra) model that extends the limited intra firm literature, and then apply that
model to data on the use of a particular IT technology in the UK, e-business. This allows one to
disentangle the impact of market intermediated and non-intermediated effects, after controlling for
a number of firm characteristics and environmental factors, upon the extent of use of e-business
both across and within, firms. The main data source employed for this purpose is the third UK
Community Innovation Survey (CIS3), which we believe has not been used in this way before.
The results of this study are used to explore policy implications in terms of the needs for
intervention in, and the use of particular policy instruments upon, the intra and inter firm diffusion
of e-business in particular but more importantly, innovations in general.
The data source is discussed in section 2 and used to provide information upon e-business use in
the UK. The degree of extra information available from usage indicators as opposed to other
innovation indicators is also discussed. In section 3 the modelling of intra firm diffusion is
discussed and a simple integrated inter and intra firm diffusion model is presented. In section 4
this is applied to the data and the drivers of e-business use isolated. The policy implications of the
results are discussed in Section 5. Section 6 contains conclusions.
3
2. THE COMMUNITY INNOVATION SURVEY
The Community Innovation Survey is a pan European survey instrument designed to gather
information on the extent of innovation in European firms. CIS3 was the third round of data
collection. In the UK this survey was administered by the Office of National Statistics on behalf
of the Department of Trade and Industry. It was carried out in 2001 and relates to innovative
activities between 1998 and 2000. The survey was addressed to enterprises (which we here call
firms, although this is misleading for multiplant firms) with more than 10 employees, in both
manufacturing and service industries, with responses being voluntary. We have been given
privileged access by the Department of Trade and Industry to the individual returns1 although we
are unable to identify respondents. From an original sample of 126,775 records on the Inter
Departmental Business Register, the questionnaire was sent to a stratified (by industry and firm
size) sample of 19,602 enterprises and 8,173 responses were eventually registered which represent
the sample for the work reported here. We have no reason to believe that there are any particular
biases in this final sample2.
The advantage of the CIS3 for current purposes is that in addition to data on the inter firm usage
of a particular technology, e-business, it also contains data upon a particular indicator of intra firm
usage for that technology, (as well as additional data upon other indicators of innovativeness and
firm characteristics3). Data upon intra firm diffusion is quite rare and it is this availability that has
conditioned the choice of technology to be studied. For current purposes e-business is defined as
the use of the Internet for business purposes. In CIS3, Question 17.2 is:
17.2 Can you indicate the extent of your enterprise’s use of e-business activities over the period
1998 – 2000 (please tick all that apply)
a. Basic Internet presence
b. Internet used for information
c. Customers can place orders through the Internet site
d. Commerce with other businesses through the Internet site
The list of offered responses to Q 17.2 does not include a “no use” choice. Although there may be
non-respondents to this question for other reasons, we measure non-users by the number of non-
1 For which we are most grateful to the Department of Trade and Industry. 2 Although we are not aware of any formal checking of this for CIS3, a post survey random sample of 317 non respondents in CIS2 showed no bias in the returned sample (Economic Trends, October 1998) 3 Data on e-business in the UK has been collected also by the E-Commerce Survey carried out by the Office of National Statistics and represents an alternative resource for future research. Nonetheless, we have tried to integrate the info in the CIS3 dataset with the 2000 e-business survey but that the number of firms present in both surveys is quite limited.
4
respondents to this question in the sample4. Of the total sample of 8173 enterprises there are 1376
non respondents/non-users. Thus, by 2000, 83.2% of all enterprises are engaged in e-business to
some degree. This is our indicator of the extent of inter firm diffusion in 2000.
Intra firm diffusion is often measured by indicators such as the proportion of the firm’s capital
stock that embodies the new technology, or the proportion of output produced using the new
technology, or, say, in the current situation, the proportion of employees connected to the internet.
Our data source does not provide information on such measures. We are able however to consider
intra firm diffusion via a different metric. As e-business spreads, one might not only expect the
number of users in the firm to increase but also for the range of tasks that they perform using the
technology (also or alternatively) to increase and/or for the tasks that they perform using the
technology to increase in sophistication. Although respondents to the questionnaire were asked to
tick all that apply, it was clear that respondents did not follow this instruction. We are thus unable
to use the number of tasks performed by users as a metric for intra firm diffusion in this research.
We are thus limited to using the sophistication of tasks performed as a measure of intra firm
diffusion. This is very similar to Forman, Goldfarb, and Greenstein (2002, 2003) who, using
similar data to that available here, and looking at Internet usage in the US, draw a distinction
between participation (is the Internet used) and enhancement (how extensive are the uses to which
it is put)5.
There is some dispute in the literature as to whether one can devise a simple index of
enhancement or sophistication. Bridgewater and Arnott (2004) for example discuss this issue. In
this paper we are restricted by the data available and cannot proceed other than by interpreting
responses already made. Of the sample of 8173 firms, in response to Q17.2, 63.4% ticked (a),
64.8% ticked (b), 16.5% ticked (c), 17.3% ticked (d) and 8.2% ticked both (c) and (d). It is not
clear however that response (a) represents more (less) enhanced or sophisticated usage than
response (b). Response (a) may just mean that the firm has an ISP whereas (b) may just mean that
the firm has done a Google search. Response (d) essentially means that the firm has purchased via
the web whereas response (c) essentially means that the firm has sold through the web. We may
infer that these latter two activities are more “enhanced” than the first two but little else. Also, in
4 We explored the proportion of firms who claimed in CIS2 to be using the Internet (34% of the sample), who also replied to CIS3 (243) but did not respond to Q17.2. Of the 243 firms only 13 did not respond to Q17.2 which leads us to believe that any error introduced by our assumption will be small. To further check the validity of our assumption we also explored the characteristics of the 1376 non- respondents/users and we found that they are mostly small firms with little other innovative activity. This again leads us to believe that our assumption is not unreasonable. 5 There are a number of parallels between this work and that of Forman et al (2002, 2003). The main difference however is that the aforementioned US studies are primarily concerned with geographic dispersion and locational effects which are not our main focus of interest.
5
terms of intra firm diffusion, it is not necessarily the case that (c) is a precursor to (d) or vice
versa, although one would consider (a) and (b) as natural precursors to both (c) and (d). In the
circumstances we define for empirical purposes just two categories6 of e-business usage (Category
0 being non use).
Category 1: Basic usage, shown by indicating (a) and/or (b) but not (c) nor (d).
Category 2: Enhanced usage, shown by indicating (c) and/or (d)
A firm that falls within category 2 is defined as exhibiting more extensive intra firm diffusion than
a firm that falls within category 1. As stated above, although requested to tick all that apply, not
all respondents did so. We have thus assumed that all firms in Category 2 have also a basic
Internet presence (but definitely not vice versa), which would seem to be nested in the former,
even though not all firms indicating enhanced use have also ticked for basic usage. Thus the sum
of users in categories 1 and 2 indicates total inter firm diffusion whereas the proportion of users in
category 2 indicates the (average) extent of intra firm diffusion.
Table 1 presents some of the detailed information upon the pattern of inter and intra firm usage of
e-business in 2000. The data is presented as proportions of the sample of enterprises that fall into
categories 0, 1 or 2. The data indicates that in 2000, 83.2% of the sample use the internet to some
degree with 57.5% being basic users and 25.6% being enhanced users (which may be compared to
the US figures estimated by Forman et al (2002) of 88.6% of the sample being users and 12.6%
being enhanced users). The extent of use (from 71.2 to 94.9%) and the extent of enhancement
(from 11% to 32.3%) differ across industries (listed in Appendix 1), and firm size as measured by
number of employees.
These data indicate:
(i) Inter firm usage is an incomplete indicator of the overall usage of a new technology, for
although in 2000 83.2% of firms consider themselves to be e-business users, only 26% are
using the technology at anything other than a basic level. The full diffusion of the
technology is thus quite limited. Battisti and Stoneman (2003) similarly find that for other
technologies intra firm diffusion lags behind inter firm diffusion.
6 In some early exercise we did consider a less broad brush approach, with many more categories of intra firm usage, but unless one has a clear a priori ordering of levels of enhancement it is not possible to interpret the findings in terms of intra firm diffusion

6
Table 1: Patterns of e-business usage, UK, 2000
Non users (%)
Basic users (%)
Enhanced users (%)
Row Total =100% (Count)
All firms 16.8 57.53 25.63 8173 Within industry distribution of use (within industry proportion of adopters; SIC classification).
10-14 22.0 66.9 11.0 127 15-22 17.8 56.3 25.9 1005 23-29 14.5 56.6 28.9 1121 30-33 5.1 63.4 31.5 527 34-35 8.1 66.6 25.3 344 36-37 16.0 65.5 18.5 443 40-41 13.2 62.3 24.5 53
45 28.8 57.1 14.0 947 51 16.5 54.9 28.6 1041
60-64 20.3 50.5 29.2 773 65-67 13.3 54.3 32.3 405 70-74 15.7 58.3 26.0 1386 Total 16.8 57.5 25.6 8173
Usage by size (number of employees)
10-49 22.9 53.5 23.7 4761 50-249 9.4 65.2 25.3 2023 250-499 6.5 62.3 31.2 722 500-999 7.5 60.9 31.6 402 1000+ 6.4 53.8 39.8 264 Total 16.8 57.5 25.6 8173
(ii) Inter firm usage is not necessarily a reliable indicator of the extent of intra firm usage and
thus data on the latter contains new information. For example, across industries we
observe that industries 30 – 33 have the highest percentage of (basic plus enhanced) users,
but 65 – 67 have the highest proportion of enhanced users with a much lower level of
overall use. Similarly, although the proportion of enhanced users increases with firm size,
the proportion of users in total (basic plus enhanced) does not monotonically increase
with size.
(iii) Inter firm usage and intra firm usage are not completely predictable by other innovation
indicators and thus provide extra information. Thus for example (data available from the
authors on request), the raw data, using pair wise correlations indicate that although firms
that have introduced other innovations are more likely to have introduced e-business and
also use e-business at an enhanced level there is no monotonic relationship of usage to
R&D spend.

7
3. AN INTEGRATED DIFFUSION MODEL
The diffusion literature has tended to separately model inter and intra firm diffusion, developing
and applying quite distinct models. Exceptions are the work of Battisti (2000) and Battisti and
Stoneman (2003, 2005) which can be considered early attempts to bring together the two analyses
by proposing a two-step approach linking the decision to adopt and the decision to extensively use
a new technology. In this study we sympathize with that approach and propose an alternative
model where both the inter and intra firm diffusion analysis are undertaken simultaneously. This
has the distinct advantage of bringing to the analysis of intra firm diffusion many of the new
insights recently developed for the study of inter firm diffusion.
Most of the limited intra firm literature builds upon the seminal work of Mansfield (1963, 1968)
based upon the epidemic learning process (a more recent example being the study of the diffusion
of E mail by Astebro, 1995). However, Stoneman and Battisti, 1997 have shown that this
approach provides only a partial explanation (if any) of the intra firm process. One way forward in
modelling intra firm diffusion is thus to attempt to bring over from the analysis of inter firm
diffusion some of the recent advances in approach made there. A first step in that direction can be
found in Battisti (2000) where a stock based model has been proposed.
There are a number of ways to classify the inter firm literature but a fundamental distinction is
that between equilibrium and disequilibrium approaches (a fascinating story of the historical
development of the field is provided by David, 2003). The classic disequilibrium approach is
again the Mansfield (1968) epidemic model whereby diffusion is a process of adjustment to a
fixed end point. The adjustment is driven by uncertainty reduction as a result of information
spreading in reaction to usage and, as a result, the diffusion process is self-propagating.
Karshenas and Stoneman (1993) classify the inter firm equilibrium models present in the literature
mainly into three approaches. Their common ground is that at a point in time diffusion extends
only to the point where it is profitable (or most profitable) to adopt the new technology. Over time
the cost of adoption, or the size of returns, or the distribution of returns (across potential users)
change and the diffusion path is then mapped out. However in the three different approaches there
are three main drivers of profitability. The first is rank effects in that firms have different
characteristics and thus different returns. The second is stock effects whereby one firm’s adoption
impacts (negatively) upon the profitability of further adoption by others (and also the profitability
of existing adopters). Finally there are order effects whereby returns are determined by positions
in the order of adoption and one firm’s adoption reduces the returns to all other non-adopters as
they are moved down the order.
8
Following Karshenas and Stoneman (1993) we believe that there is considerable advantage in
constructing an encompassing model reflecting all of the different strands in the literature and then
letting the data indicate what is and is not empirically relevant. This will then also indicate to us
the empirical foundations upon which any policy discussion should be built. Thus in the joint
modelling of inter and intra firm diffusion our model is designed to reflect both the several
equilibrium (i.e. rank, stock and order) approaches and the disequilibrium (i.e. epidemic learning)
modelling tradition.
The model we present is a reduced form. Define Пij(t) as the gross expected profit gain in time t to
firm i in industry j from the use of a first unit of a new technology or the extension of use of a new
technology by one unit. Define Pi(t) as the expected adoption7 cost to firm i in time t of a unit of
new technology8 with all potential adopters being assumed price takers. For the sake of simplicity
assume that the investor has myopic expectations upon both adoption costs and the gross profit
gains (see Ireland and Stoneman, 1986, for a relaxation of this assumption) and is risk neutral (see
Stoneman, 1981 for a more formal model with uncertainty). A firm will then introduce a unit of
the new technology or enhance usage if the profit gain from so doing exceeds the cost i.e. if Пij(t)
≥ Pi(t).
The profit gain to the firm from innovation arises from a number of intermediate benefits. E-
business may be considered as both a process and a product innovation. It can affect, for example,
the way in which goods are marketed and distributed, how information is provided and how goods
are paid for. It may also affect internal order processing, stock levels, scheduling and other
internal factors. The profit gains from using and extending e-business use may thus arise from a
number of different sources such as increases in market shares, increased selling prices, reduced
marketing costs and or processing costs etc. The gains may also have some network elements
with profit generating potential increasing with the number of other users.
Reflecting the nature of the technology and the several different theoretical approaches to
diffusion, we assume that Пij(t) is a function of the following.
7 Astebro (2002) in his inter firm study on the adoption of CNC and CAD specifically separates out capital and non capital costs of adoption. For e-business the capital costs might be quite a small proportion of total adoption costs. However, as we are unable to measure adoption costs in total or by sub division we just talk of adoption costs in aggregate. 8 If the buyers do not have myopic expectations then this term would also reflect the benefits of waiting, see Ireland and Stoneman (1986), but as we have no intertemporal data it is of little interest in the current context.
9
(i) xi(t), the extent of usage of the new technology by firm i in time t (which for a non user
will be zero). This extends the concept of stock effects through to the intra firm case (and
may also encompass an intra firm order effect, but it is not clear exactly what such an
effect would be). In principle it could also reflect internal network externalities. The
overall impact may be positive or negative depending on the strength of stock and order
vs. the network effects but we do not believe e-business to have particularly strong
internal network effects, and thus assume it to be negative. In fact if the overall impact
were positive then the firm would only choose corner solutions (zero usage or 100%
usage) and not intermediate (basic) usage.
(ii) firm characteristics, yet to be specified (a vector Fi(t)), extending the concept of rank
effects
(iii) other industry characteristics (a vector Fj(t)) reflecting further rank effects.
(iv) the extent of industry usage of new technology (yj(t)), reflecting between firm stock and
order effects, upon the basis that the payoff to the firm depends upon what other firms are
doing. These effects are generally expected to be negative unless network effects are
particularly strong.
(v) two “experience” terms, to reflect the epidemic arguments, the first being a measure of the
firm’s own experience, Ei(t), (often proxied by time since own first adoption) the second
being the experience that the firm gains from observing other users, Ej(t), (often proxied
by the extent of diffusion in time t)9.
We thus write that:
(1) Пij(t) = Пij(xi(t), Fi(t), Fj(t), yj(t), Ei(t), Ej(t)).
Defining xi(t)* to satisfy (2)
(2) Пij(xi(t)*, Fi(t), Fj(t), yj(t), Ei(t), Ej(t)) = Pi(t)
so that
(3a) xi*(t) = G{Fi(t), Fj(t), yj(t), Ej(t), Ei(t), Pi(t)}
9 These variables may just be entered as reflections of the firm’s knowledge base, but more formally, it can be argued that as the costs and benefits of adoption have been expressed as expectations, such expectations are being allowed to approach their “true” means as experience increases (for a more sophisticated Bayesian approach see Stoneman, 1981). This approach may be from above or from below but it is generally assumed to be from below and as a result there is a positive self-propagating force driving diffusion. In principle however the approach might be from above in which case the force is negative.
10
xi*(t) is the firm’s desired or optimal level of use of the new technology at time t. This desired
extent of inter and intra firm diffusion will extend over time as either Pi(t) declines or Fj(t), Fi(t),
Ei(t), Ej(t) or yj(t) change.
The essence of a diffusion model is that it is dynamic providing insights in to the spread of a
technology over time. That is the character of the above model. However the data available to us
is a single cross section that provides one snap shot of the state of that dynamic process in the year
200010. It is thus obviously not possible to explore the dynamics of the process to any degree.
Instead we intend to use the model to predict the factors that should be considered as determinants
of in inter and intra firm usage in the year 2000. The cross section approach is also used by
Forman et. al. (2002, 2003) and Hollenstein (2004) in similar analyses. To the extent that actual
usage xi(t) does not diverge from xi*(t) one may directly apply equation (3a) to the cross section
data (all rhs variables are dated at time t). If , however, there is some time intensive adjustment
process that leads to divergences between xi*(t) and xi(t) then such an application will yield biased
estimates. In the absence of any insight or data that would enable us to explore any such
divergences we proceed assuming that they are not present and thus xi*(t) = xi(t) and we can write
(3a) as (3).
(3) xi(t) = G{Fi(t), Fj(t), yj(t), Ei(t), Ej(t), Pi(t)}.
We use (3) to model the determinants of e-business usage in 2000 based upon the existing inter
firm literature as well as the data availability. In particular we model the extent of rank effects
(Fi(t), Fj(t)) via the following indicators:
(i) Firm size measured by the number of employees in 199811 divided by 5 (Employ). Size
may pick up a number of other firm characteristics such as efficiency, management abilities (see
Astebro, 1995) and perhaps past innovations and may also reflect any scale economies that there
might be in e-business usage (for example as software only has to be written once whatever the
number of users there may well be significant scale economies). It may also pick up whether the
unit cost of technology varies with firm size. Firm size has a long history as a deterministic factor
in diffusion studies (see for example Mansfield (1968), Hannan and MacDowell (1984),
10 Originally it had been expected that we would be able to construct a panel from a sample that is common to CIS 2 and CIS 3 and responses to questions on Internet usage in CIS 2. However the overlap was only 786 firms of whom 243 did not report on Internet usage in CIS2. Moreover there was no information in CIS 2 on enhanced usage. 11 It is possible to measure size by turnover but this dramatically reduces the sample size, although the results for the reduced sample were little different from those presented here.
11
Karshenas and Stoneman (1993), Saloner and Shephard (1995), Colombo and Mosconi (1995),
and Astebro (2002)) it generally being found that size of the establishment exerts a significant and
positive impact upon technology adoption.
(ii-iii) Indicators of firms innovativeness such as the dummy variables, ProdNov and ProcNov
taking the value one if the firm introduced a product or a process new to the market between 1998
and 2000 and zero otherwise. These variables should reflect the fact that firms that adopt
innovative work practices and/or products are more prone to adopt ad hoc technological
innovations in support of their activities (see Pil and MacDuffie 1996, Bresnahan et al. 2002,
Battisti et al 2005 etc). Therefore, they are believed to be good predictor of the use of e-business.
(iv) R&D Intensity, R&D, which takes the value one if the firm reports R&D activity in the
period 1998 – 2000 and zero otherwise. We also experimented with a continuous R&D variable
(R&D employees as % of total employees) but this was collinear with firm size and also led to a
considerable reduction in sample size. This variable reflects the Schumpeterian hypothesis that
formalised R&D exerts a positive impact upon the use of a technology, in line with Cohen and
Levinthal (1989).
(v) Dummy variables, Mngt which takes the value one if the enterprise indicates that
advanced management techniques (e.g. knowledge management, quality circles) were introduced
during the period 1998-2000 and zero otherwise and Org which takes the value one if the
enterprise indicates that major organisational structures (e.g. investors in people, diversification)
were introduced during the period 1998-2000 and zero otherwise. These variables reflect the
argument that managerial innovations may be complementary to the use of other technologies and
therefore enhance the use of e-business (see, for example, Colombo and Mariotti 1987, Cainarca
et al. 1990, Colombo and Mosconi 1995, Greenan 2003, for empirical evidence in support of this
hypothesis).
(vi) The covariates PropSci and PropOth measuring the proportion of the firm’s employees
with a degree in 2000 in (a) science and engineering subjects and (b) other subjects. The
importance of skills has been emphasised by, for example, the pioneering work of Finegold and
Soskice (1988) who first defined the concept of the low skills/ low quality equilibrium and more
specifically by work on the links between innovation and skills (e.g. Bartel and Lichtenberg, 1987,
Caroli and Van Reenan, 2001 and Bresnahan et. al. 2002).
(vii) A series of industry dummy variables to reflect environmental factors such as different
industry conditions, markets, and types of innovations and payoffs to firms in different industries

12
(SICj). The industrial classification follows the SIC 92, but the industries have been grouped into j
wider subgroups as defined in Appendix 112.
yj(t) and Ej(t) are the two variables that pick up the effects on firm i of diffusion taking place in
other firms. yj(t) reflects stock (and order effects) whereas Ej(t) reflects the firm’s epidemic type
learning from the experience of others. In the absence of time series data, within sample variance
is introduced by arguing that these variables are industry specific. However, the only available
variable(s) that will proxy these effects are variables that measure the extent of industry usage.
Industry usage is made up of the breadth and depth of use and thus two indicators are used:
(viii) Interj(t), the proportion of firms in the industry who have adopted e-business (i.e. both basic
and enhanced and measured as 100% – proportion of non-users)
(ix) Intraj(t) the proportion of firms in the industry who fall into the category of having an
enhanced level of e-business usage.
As it improved numerical stability of the model without significantly affecting other parameter
estimates, these variables are entered as logit transformations. Unfortunately this approach will
not be able to separate out the stock and order from the learning effects. However, as the former
are expected to act negatively on the firm’s adoption of new technology while the latter is
expected to operate positively, the sign(s) of the coefficients on the two variables used will enable
some insight into (i) whether there are externalities and (ii) whether the stock and order effects are
stronger than the learning effects.
The other two firm level variables in the G function are Ei(t) and Pi(t). Ei(t) is a variable that
reflects the firms own experience of the new technology whereas Pi(t) is the cost of acquiring the
new technology. In a single data cross section it is not possible to measure the former13 and no
variance is expected across the sample in the latter14, which is thus implicitly considered as
included in the constant term.
12 We also experimented with other firm specific variables present in the dataset such as a dummy reflecting export activity and therefore competitive pressures but this considerably reduced the sample size. 13 In CIS 2 respondents were asked to indicate whether they used the Internet between 1994 and 1996. This represented a potential means to measure experience, however as the union of the CIS2 and CIS3 samples was only 786 enterprises and 243 did not report on Internet usage in 1996 we did not explore further. 14 Except perhaps in that the website for a larger firm may cost more but this will be reflected in the firm size variable.
13
4. ESTIMATES
We have estimated the diffusion model presented in the previous section in two ways (with results
reported in sections 4.1 and 4.2 below). The first is a traditional bivariate logit version reflecting
standard inter firm diffusion modelling of the decision to adopt e-business. The second is a
multinomial specification to model the extent of use of e-business by the adopting firms. This is
essentially intra firm modelling. Following Battisti and Stoneman (2003, 2005) we use the same
covariates (detailed in equation 3) for both model specifications. This allows us to compare and
contrast the rank, stock (order) and epidemic effects upon the adoption and the extent of use of e-
business by the adopting firms in the sample.
For both models the sample size is 5822 of the original 8173, a reduction resulting from missing
data points15. Initial estimates of a fully loaded model indicated a number of industry dummy
variables that were not significant and thus we proceeded with the estimation of a more restricted
model. In the literature it has been shown (see Mickey and Greenland, 1989, for example) that for
logistic regression the use of a p-value = 0.05 often fails to identify variables known to be
important and we thus follow the recommendation that the 0.25 level be used as a screening
criterion for variable selection. The remaining dummies in the restricted model are for wide
industry groupings, 15-22, 23-29, 36-37, 60-64 and 65-67 (see SIC 92 classification in appendix).
4.1. Inter-firm diffusion of e-business activities
For the bivariate logit estimates of the model detailed in equation (3) x(t) takes the value 1 if the
firm is an adopter in/by 2000 and zero otherwise. We should note that as at this date 83% of the
sample had already adopted e-business to some degree, in inter firm terms the sample is thus very
late in the diffusion process and we thus expected many of the effects to be downplayed relative to
what might have been found at an earlier date. For this model the predictive power has been
determined estimating the ROC (Receiver Operating Characteristic) curve for non-users versus
users (see for example Green and Swets (1974) for an excellent review on ROC techniques). In
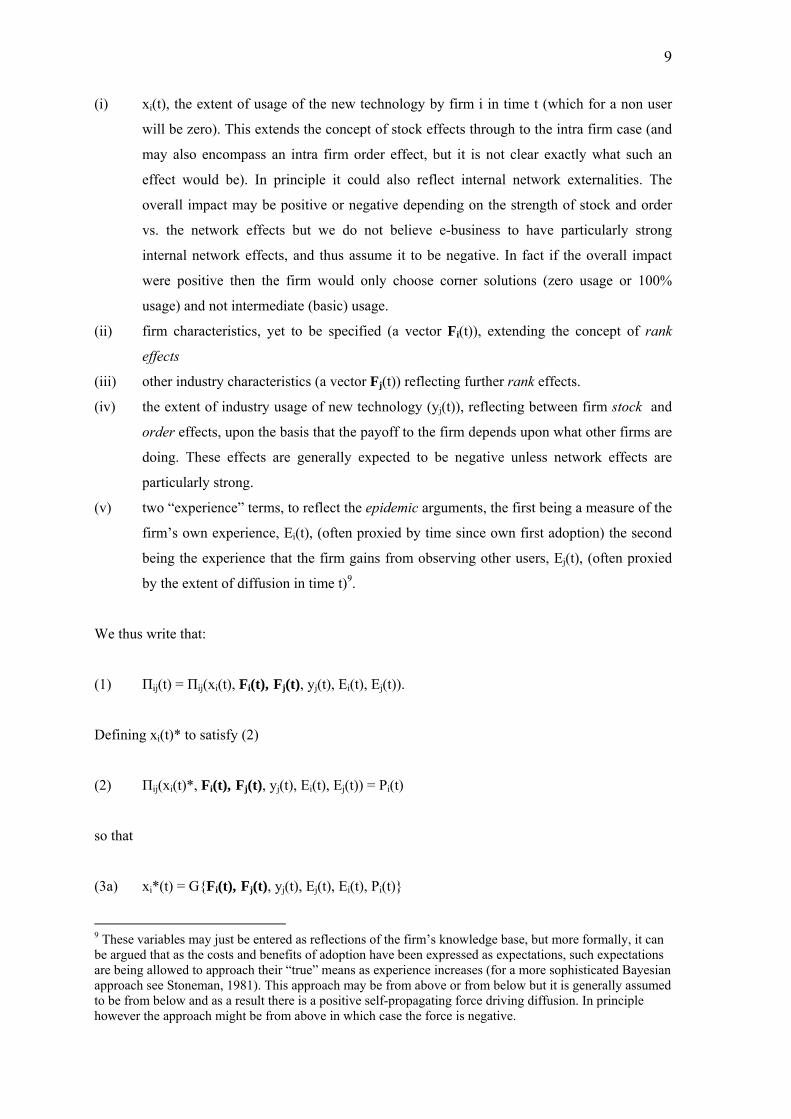
Figure 1 we report on the y-axis the Sensitivity measured by fraction of adopters xj=1 correctly
classified while on the x-axis we report ‘1-Specificity’, measured as the fraction of non adopters,
xj=0, wrongly classified by our model. For this model the area under the ROC curve is 0.80. Given
15 A number of statistical tests have been carried out to test for possible sample selection bias. We found no statistical differences between the distribution of the key variables in the reduced (5822) and full sample (8173). The same can be said of the distribution of firms across industries and of the distribution over non-use, basic use and enhanced use (details available from the authors upon request).
14
the cross-sectional nature of our data, this indicates that the estimated model exhibits good
predictive ability16.
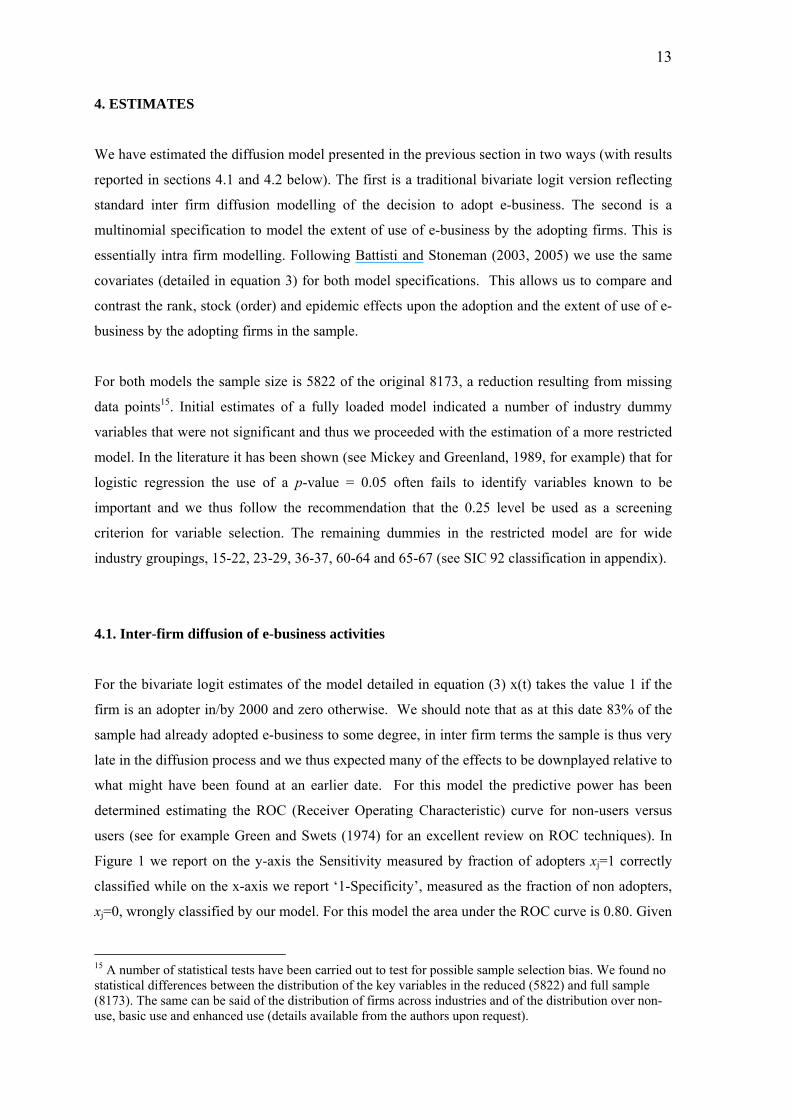
Figure 1. Receiver Operating Characteristic (ROC) Curve: inter-firm model
Area under ROC curve = 0.8007
Sen
sitiv
ity
1 - Specificity0.00 0.25 0.50 0.75 1.00
0.00
0.25
0.50
0.75
1.00
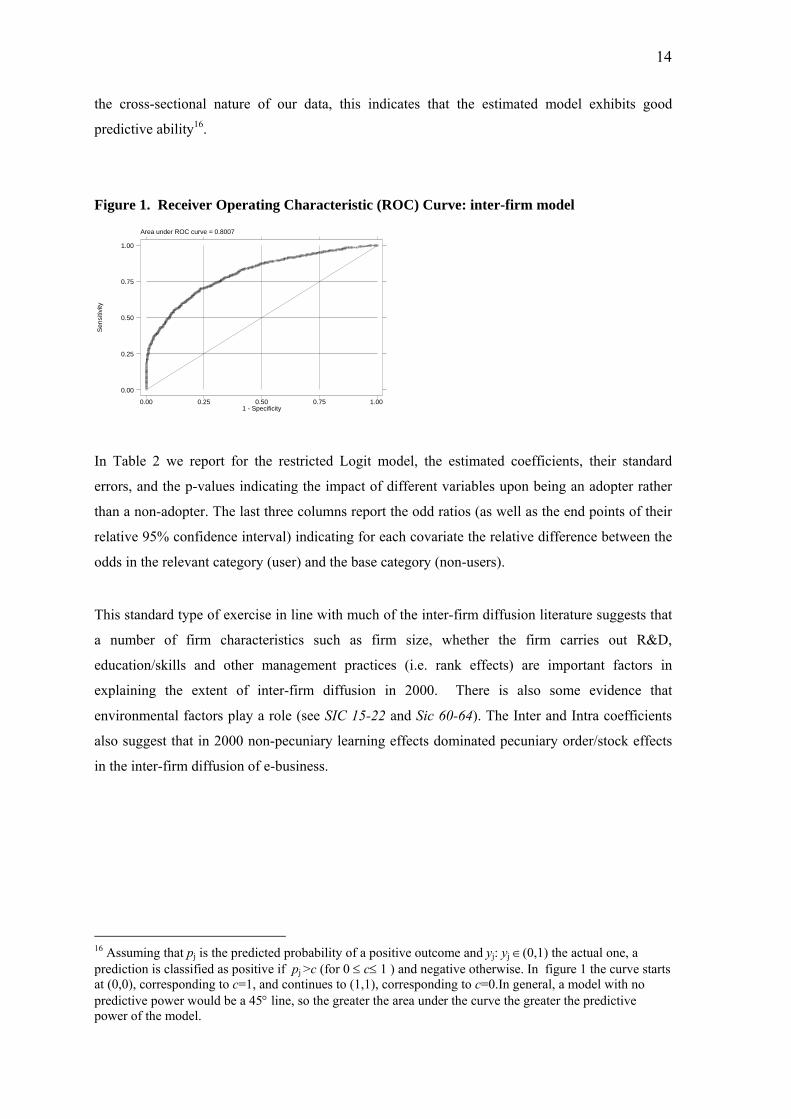
In Table 2 we report for the restricted Logit model, the estimated coefficients, their standard
errors, and the p-values indicating the impact of different variables upon being an adopter rather
than a non-adopter. The last three columns report the odd ratios (as well as the end points of their
relative 95% confidence interval) indicating for each covariate the relative difference between the
odds in the relevant category (user) and the base category (non-users).
This standard type of exercise in line with much of the inter-firm diffusion literature suggests that
a number of firm characteristics such as firm size, whether the firm carries out R&D,
education/skills and other management practices (i.e. rank effects) are important factors in
explaining the extent of inter-firm diffusion in 2000. There is also some evidence that
environmental factors play a role (see SIC 15-22 and Sic 60-64). The Inter and Intra coefficients
also suggest that in 2000 non-pecuniary learning effects dominated pecuniary order/stock effects
in the inter-firm diffusion of e-business.
16 Assuming that pj is the predicted probability of a positive outcome and yj: yj ∈(0,1) the actual one, a prediction is classified as positive if pj >c (for 0 ≤ c≤ 1 ) and negative otherwise. In figure 1 the curve starts at (0,0), corresponding to c=1, and continues to (1,1), corresponding to c=0.In general, a model with no predictive power would be a 45° line, so the greater the area under the curve the greater the predictive power of the model.
15
Table 2. Inter firm diffusion: results of fitting a logistic model
Odds Ratios xj
Coef.a
Std. Err.
Wald Test
P>z Value [95% C.I]c
Employ 0.039 0.005 7.660 0.000 1.040 1.030 1.050 ProcNov 0.324 0.331 0.980 0.326 1.383 0.724 2.644 ProdNov 0.451 0.287 1.570 0.116 1.570 0.894 2.758 R&D 0.804 0.176 4.580 0.000 2.234 1.583 3.152 Mngt 0.539 0.151 3.560 0.000 1.714 1.274 2.305 Org 0.813 0.149 5.440 0.000 2.254 1.681 3.021 PropOth 0.008 0.003 2.540 0.011 1.008 1.002 1.014 PropSci 0.047 0.009 5.340 0.000 1.049 1.031 1.067 Sic15-22 -0.248 0.142 -1.750 0.081 0.780 0.591 1.031 Sic23-29 -0.157 0.157 -1.000 0.316 0.854 0.628 1.162 Sic36-37 -0.049 0.213 -0.230 0.818 0.952 0.628 1.445 Sic60-64 -0.404 0.174 -2.320 0.020 0.667 0.474 0.939 Sic65-67 0.001 0.260 0.000 0.996 1.001 0.602 1.665 Inter 0.488 0.207 2.360 0.018 1.629 1.086 2.443 Intra 0.808 0.139 5.810 0.000 2.244 1.709 2.948 Cons 1.173 0.392 2.990 0.003 - - - NOTE: Number of observations =5822. LR χ2(15)=684.28 (p-value: 0.000). Log Likelihood = -1678.57 a Comparison group = non-users. bOdds ratio confidence intervals that includes unity indicates that the odds ratio of the covariate in the relevant category (users) is not different from the odds ratio in the base category (non- users). Odds ratios significantly different from 1 in bold
4.2. Inter and Intra-firm diffusion of e-business activities
In this paper we emphasise intra firm diffusion and in order to explore the relative importance of
the different effects upon the decision to extensively use e-business (intra firm diffusion) we
decompose the dependent variable x(t) (see equation 3) into three mutually exclusive categories
reflecting the adoption decision and the intensity of use of e-business by the adopting firms i.e.
non adopter (0) and if adopter, basic (1) or enhanced user (2). A multinomial logit specification is
then chosen to best reflect the nature of the firm’s mutually exclusive choices where distance
(from 0 to 1 and 1 to 2) is not necessarily symmetric or where adoption is not necessarily
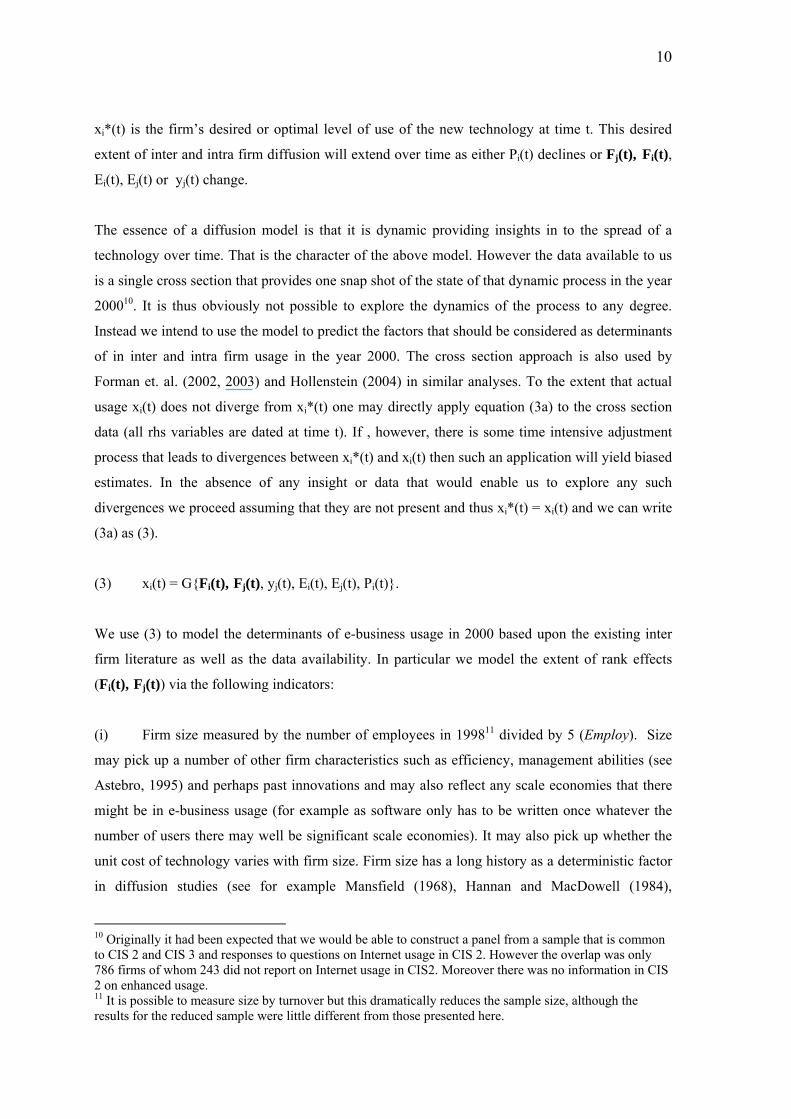
sequential or ‘ordered’17. For this model the predictive power has again been determined
estimating the ROC (Receiver Operating Characteristic) curve this time however for both non-
users versus basic users and non-users versus enhanced-users. In Figure 2a (2b), we report on the
y-axis the Sensitivity measured by the fraction of basic users xj=1 (advanced users, xj =2) correctly
classified while on the x-axis we report ‘1-Specificity’ measured as the fraction of non users, xj=0
17 Nonetheless, we have also estimated the model as an ordered logit. The predicted marginal effects in the two models are very similar except that the industry dummies perform less well in the ordered model. Calculating the Likelihood Ratio test confirms that the ordered logit model fits less well than the multinomial (details available on request). Moreover, given that the multinomial model has superior
16
(non-users, xj=1) wrongly classified by our model. In our case the areas under the ROC curve are
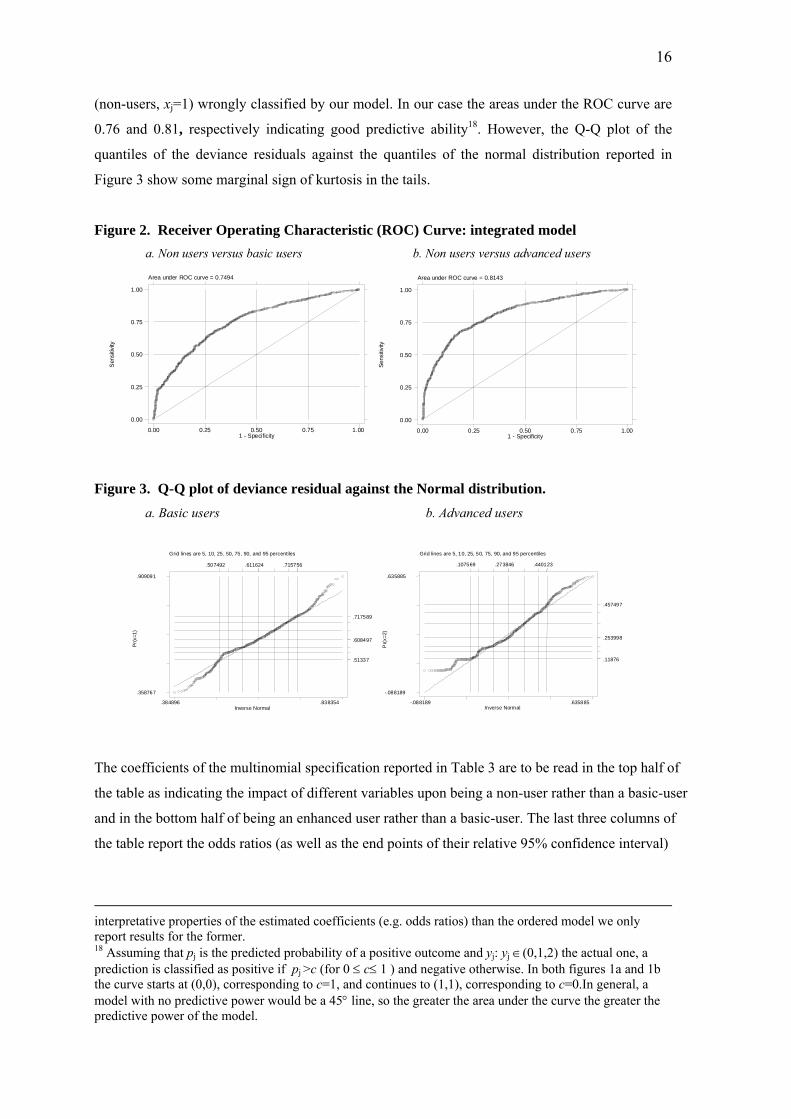
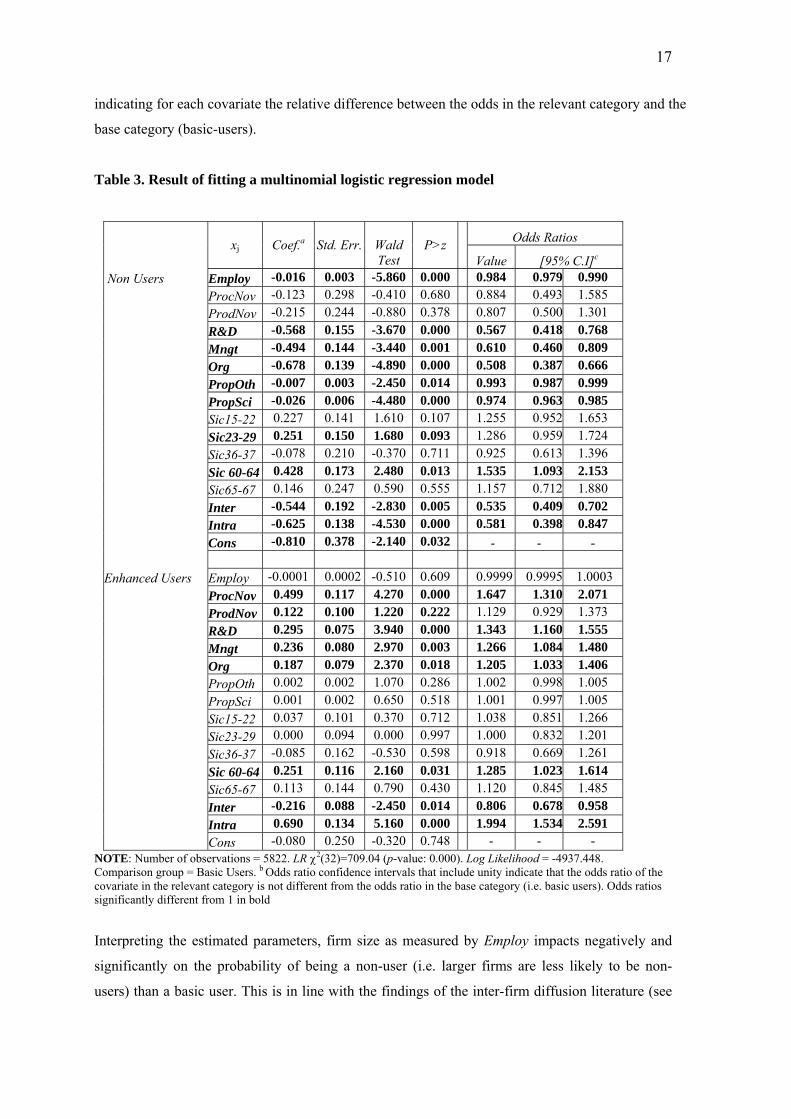
0.76 and 0.81, respectively indicating good predictive ability18. However, the Q-Q plot of the
quantiles of the deviance residuals against the quantiles of the normal distribution reported in
Figure 3 show some marginal sign of kurtosis in the tails.
Figure 2. Receiver Operating Characteristic (ROC) Curve: integrated model a. Non users versus basic users b. Non users versus advanced users
Area under ROC curve = 0.7494
Sen
sitiv
ity
1 - Specificity0.00 0.25 0.50 0.75 1.00
0.00
0.25
0.50
0.75
1.00
Area under ROC curve = 0.8143
Sens
itivity
1 - Specificity0.00 0.25 0.50 0.75 1.00
0.00
0.25
0.50
0.75
1.00
Figure 3. Q-Q plot of deviance residual against the Normal distribution. a. Basic users b. Advanced users
Grid lines are 5, 10, 25, 50, 75, 90, and 95 percentiles
Pr(x
=1)
Inverse Normal .384896 .838354
.611624 .715756 .507492
.358767
.909091
.51337
.608497
.717589
Grid lines are 5, 10, 25, 50, 75, 90, and 95 percentiles
Pr(x
=2)
Inverse Normal-.088189 .635885
.273846 .440123.107569
-.088189
.635885
.11876
.253998
.457497
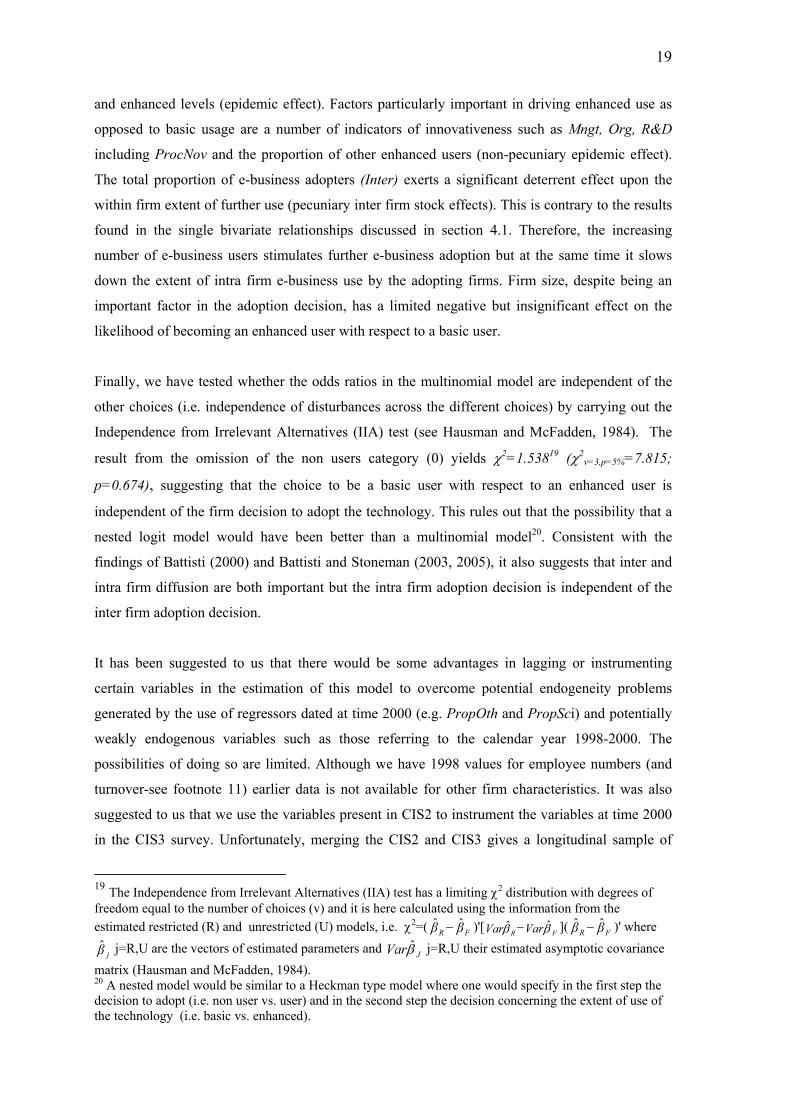
The coefficients of the multinomial specification reported in Table 3 are to be read in the top half of
the table as indicating the impact of different variables upon being a non-user rather than a basic-user
and in the bottom half of being an enhanced user rather than a basic-user. The last three columns of
the table report the odds ratios (as well as the end points of their relative 95% confidence interval)
interpretative properties of the estimated coefficients (e.g. odds ratios) than the ordered model we only report results for the former. 18 Assuming that pj is the predicted probability of a positive outcome and yj: yj ∈(0,1,2) the actual one, a prediction is classified as positive if pj >c (for 0 ≤ c≤ 1 ) and negative otherwise. In both figures 1a and 1b the curve starts at (0,0), corresponding to c=1, and continues to (1,1), corresponding to c=0.In general, a model with no predictive power would be a 45° line, so the greater the area under the curve the greater the predictive power of the model.
17
indicating for each covariate the relative difference between the odds in the relevant category and the
base category (basic-users).
Table 3. Result of fitting a multinomial logistic regression model
Odds Ratios
xj
Coef.a
Std. Err.
Wald Test
P>z Value [95% C.I]c
Non Users Employ -0.016 0.003 -5.860 0.000 0.984 0.979 0.990 ProcNov -0.123 0.298 -0.410 0.680 0.884 0.493 1.585 ProdNov -0.215 0.244 -0.880 0.378 0.807 0.500 1.301 R&D -0.568 0.155 -3.670 0.000 0.567 0.418 0.768 Mngt -0.494 0.144 -3.440 0.001 0.610 0.460 0.809 Org -0.678 0.139 -4.890 0.000 0.508 0.387 0.666 PropOth -0.007 0.003 -2.450 0.014 0.993 0.987 0.999 PropSci -0.026 0.006 -4.480 0.000 0.974 0.963 0.985 Sic15-22 0.227 0.141 1.610 0.107 1.255 0.952 1.653 Sic23-29 0.251 0.150 1.680 0.093 1.286 0.959 1.724 Sic36-37 -0.078 0.210 -0.370 0.711 0.925 0.613 1.396 Sic 60-64 0.428 0.173 2.480 0.013 1.535 1.093 2.153 Sic65-67 0.146 0.247 0.590 0.555 1.157 0.712 1.880 Inter -0.544 0.192 -2.830 0.005 0.535 0.409 0.702 Intra -0.625 0.138 -4.530 0.000 0.581 0.398 0.847 Cons -0.810 0.378 -2.140 0.032 - - - Enhanced Users Employ -0.0001 0.0002 -0.510 0.609 0.9999 0.9995 1.0003 ProcNov 0.499 0.117 4.270 0.000 1.647 1.310 2.071 ProdNov 0.122 0.100 1.220 0.222 1.129 0.929 1.373 R&D 0.295 0.075 3.940 0.000 1.343 1.160 1.555 Mngt 0.236 0.080 2.970 0.003 1.266 1.084 1.480 Org 0.187 0.079 2.370 0.018 1.205 1.033 1.406 PropOth 0.002 0.002 1.070 0.286 1.002 0.998 1.005 PropSci 0.001 0.002 0.650 0.518 1.001 0.997 1.005 Sic15-22 0.037 0.101 0.370 0.712 1.038 0.851 1.266 Sic23-29 0.000 0.094 0.000 0.997 1.000 0.832 1.201 Sic36-37 -0.085 0.162 -0.530 0.598 0.918 0.669 1.261 Sic 60-64 0.251 0.116 2.160 0.031 1.285 1.023 1.614 Sic65-67 0.113 0.144 0.790 0.430 1.120 0.845 1.485 Inter -0.216 0.088 -2.450 0.014 0.806 0.678 0.958 Intra 0.690 0.134 5.160 0.000 1.994 1.534 2.591 Cons -0.080 0.250 -0.320 0.748 - - -
NOTE: Number of observations = 5822. LR χ2(32)=709.04 (p-value: 0.000). Log Likelihood = -4937.448. Comparison group = Basic Users. b Odds ratio confidence intervals that include unity indicate that the odds ratio of the covariate in the relevant category is not different from the odds ratio in the base category (i.e. basic users). Odds ratios significantly different from 1 in bold
Interpreting the estimated parameters, firm size as measured by Employ impacts negatively and
significantly on the probability of being a non-user (i.e. larger firms are less likely to be non-
users) than a basic user. This is in line with the findings of the inter-firm diffusion literature (see

18
also table 2). We see also that enhanced usage, is negatively related to firm size and thus large
firms are less likely to be enhanced users. However, the estimated coefficient is very small and
insignificant. Moreover, it does not significantly differ between enhanced-user and basic users
(see the odds ratio in the second part of the table). This implies that large firms are more likely to
adopt e-business but do not necessarily have faster intra firm diffusion. In other words, enhanced
usage is not the prerogative of large firms. This is a result found by Battisti (2000) for the intra
firm diffusion of other technologies.
Procnov and Prodnov, indicating the introduction of product and process innovations, impact
negatively on the probability of being a non-user, thus more innovative firms are more likely to
use e-business. However in both cases the p value exceeds 0.25. Procnov and Prodnov impact
positively and significantly on enhanced usage. However, only the odds ratio of Procnov is
significantly greater than one (95% CI for the odds: 1.31 to 2.071) indicating that process
innovators are far more likely to be enhanced users than basic users. Other indicators of
innovative firms, Mngt, Org, R&D all impact negatively on non-usage and positively on enhanced
usage and are significant. Overall these results generally tend to reinforce a view that a firm that is
innovative in one dimension may also be innovative in another i.e. in the adoption and
enhancement of e-business usage.
The skills variables PropOth and PropSci have a negative and significant effect on non-use and
thus a greater proportion of graduates lead to a higher probability of basic use. For enhanced use
(with respect to basic use) both variables carry positive coefficients but are not significant. The
same can be said about the corresponding odds ratios that are not significantly different from one.
This is might be consistent with a view that skills, as measured by the two variables available, are
important to adoption but they are not a discriminating factor in the decision to extend e-business
use. The sign of Inter and Intra are both negative and significant in the non-users results, implying
that more adopters and more intensive use encourage basic use. This is consistent with dominant
non-pecuniary information based epidemic or spillover effects (rather than pecuniary effects).
With respect to enhanced use, Inter carries a negative coefficient and Intra a positive coefficient.
Thus wider inter-firm adoption discourages further enhanced firm’s use whereas more enhanced
use by adopting firms encourages further enhanced firm’s use. While the result for basic use is
consistent with the presence of pecuniary stock effects, the result for enhanced use is consistent
with an epidemic effect.
In summary these estimates indicate that factors particularly quantitatively important in
encouraging basic use as opposed to non-use are firm size, other indicators of innovativeness (but
not ProdNov or ProcNov), the proportion of graduates employed and usage by other firms at basic
19
and enhanced levels (epidemic effect). Factors particularly important in driving enhanced use as
opposed to basic usage are a number of indicators of innovativeness such as Mngt, Org, R&D
including ProcNov and the proportion of other enhanced users (non-pecuniary epidemic effect).
The total proportion of e-business adopters (Inter) exerts a significant deterrent effect upon the
within firm extent of further use (pecuniary inter firm stock effects). This is contrary to the results
found in the single bivariate relationships discussed in section 4.1. Therefore, the increasing
number of e-business users stimulates further e-business adoption but at the same time it slows
down the extent of intra firm e-business use by the adopting firms. Firm size, despite being an
important factor in the adoption decision, has a limited negative but insignificant effect on the
likelihood of becoming an enhanced user with respect to a basic user.
Finally, we have tested whether the odds ratios in the multinomial model are independent of the
other choices (i.e. independence of disturbances across the different choices) by carrying out the
Independence from Irrelevant Alternatives (IIA) test (see Hausman and McFadden, 1984). The
result from the omission of the non users category (0) yields χ2=1.53819 (χ2v=3,p=5%=7.815;
p=0.674), suggesting that the choice to be a basic user with respect to an enhanced user is
independent of the firm decision to adopt the technology. This rules out that the possibility that a
nested logit model would have been better than a multinomial model20. Consistent with the
findings of Battisti (2000) and Battisti and Stoneman (2003, 2005), it also suggests that inter and
intra firm diffusion are both important but the intra firm adoption decision is independent of the
inter firm adoption decision.
It has been suggested to us that there would be some advantages in lagging or instrumenting
certain variables in the estimation of this model to overcome potential endogeneity problems
generated by the use of regressors dated at time 2000 (e.g. PropOth and PropSci) and potentially
weakly endogenous variables such as those referring to the calendar year 1998-2000. The
possibilities of doing so are limited. Although we have 1998 values for employee numbers (and
turnover-see footnote 11) earlier data is not available for other firm characteristics. It was also
suggested to us that we use the variables present in CIS2 to instrument the variables at time 2000
in the CIS3 survey. Unfortunately, merging the CIS2 and CIS3 gives a longitudinal sample of
19 The Independence from Irrelevant Alternatives (IIA) test has a limiting χ2 distribution with degrees of freedom equal to the number of choices (v) and it is here calculated using the information from the estimated restricted (R) and unrestricted (U) models, i.e. χ2=( − )'[ − ]( − )' where
j=R,U are the vectors of estimated parameters and j=R,U their estimated asymptotic covariance matrix (Hausman and McFadden, 1984).
Rβ̂ Fβ̂ RVarβ̂ FVarβ̂ Rβ̂ Fβ̂
jβ̂ JVarβ̂
20 A nested model would be similar to a Heckman type model where one would specify in the first step the decision to adopt (i.e. non user vs. user) and in the second step the decision concerning the extent of use of the technology (i.e. basic vs. enhanced).
20
only 10% the size of the observed CIS3 sample21. Of these enterprises, 31% did not report on
Internet usage in 1996 reducing the usable sample to 543 enterprises. Therefore we did not
explore this possibility further. Instead, in order to rule out criticisms based upon the potential
endogeneity problem, Burke et al. (1992) suggest a modified version of Utts’s Rainbow test (see
Utts (1982) for more details)22. Utts’s original test involves partitioning the total sample into a
number of sub-samples and comparing the sum of the squared residuals derived from estimation
using all the sample observations to the corresponding quantity obtained using only a partition of
the sample. In our case, a test statistics for endogeneity can be carried out by means of the
likelihood ratio (LR) test. In particular, let (for i=1,…, n) be the covariate under consideration,
the maximised log-likelihood using the full sample of observations and (r=1,..,R) the
corresponding function obtained by estimation using only the rth sub-sample of reordered data.
Under the null hypothesis of exogeneity the i.i.d. observations can be ranked by increasing values
of without affecting the validity of conventional large sample procedures. Thus, the resulting
statistic
ik
0L rL
ik
01
2[ ]R
Rr
rLR L=
= − − L∑) )
is asymptotically 2χ distributed with degrees of freedom equal to
( 1)q pυ = − × (where q is the number of categories and p is the number of parameters to be
estimated).
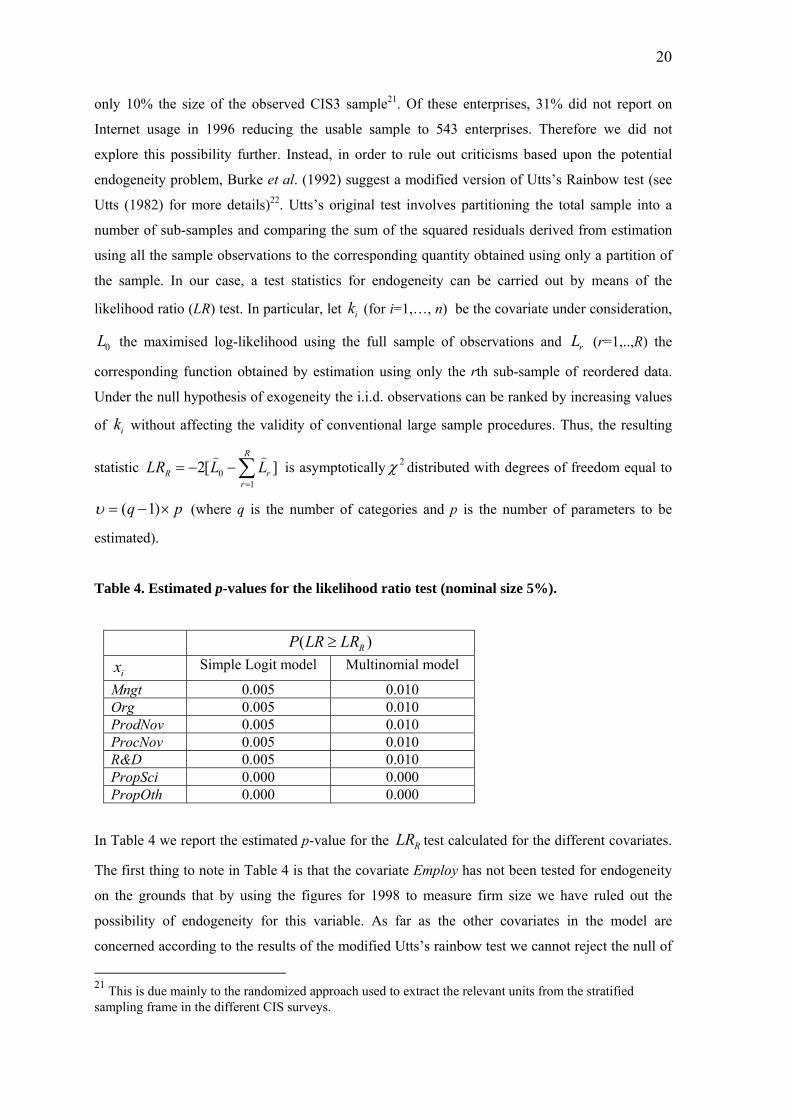
Table 4. Estimated p-values for the likelihood ratio test (nominal size 5%).
( )RP LR LR≥
ix Simple Logit model Multinomial model
Mngt 0.005 0.010 Org 0.005 0.010 ProdNov 0.005 0.010 ProcNov 0.005 0.010 R&D 0.005 0.010 PropSci 0.000 0.000 PropOth 0.000 0.000
In Table 4 we report the estimated p-value for the test calculated for the different covariates.
The first thing to note in Table 4 is that the covariate Employ has not been tested for endogeneity
on the grounds that by using the figures for 1998 to measure firm size we have ruled out the
possibility of endogeneity for this variable. As far as the other covariates in the model are
RLR
concerned according to the results of the modified Utts’s rainbow test we cannot reject the null of
21 This is due mainly to the randomized approach used to extract the relevant units from the stratified sampling frame in the different CIS surveys.

21
exogeneity for any of the potential exogenous and the weakly potentially exogenous variables for
either the single logit specification or its multinomial counterpart.
5. POLICY IMPLICATIONS
lthough there are some differences in the results of the inter firm model and the integrated model
) rank effects, with firms of different characteristics getting different returns from using or
(ii) intermediated stock and/or order effects as indicated by the negative impact of
(iii) ther network effects whereby one firms usage provides non market
hese findings extend our understanding of the drivers of diffusion in that they extend to the intra
A
(e.g. firm size being relevant to adoption but not to enhanced use) and the data shows that the
extent of inter firm diffusion is not necessarily a good predictor of the extent of intra firm
diffusion, in both the inter and intra firm diffusion of e-business activities there are indications
that the diffusion process reflects:
(i
extending usage of new technology, as evidenced by the impact of firm size, other
indicators of innovativeness and industry dummies upon basic and enhanced usage in
2000;
market
inter on enhanced use.
epidemic and perhaps o
intermediated spillovers to other users as evidenced by the negative impact of inter and
intra on non use and the positive impact of intra on enhanced use.
T
firm process arguments previously reserved for inter firm diffusion. In this section we explore the
policy implications of the results as regards both the need for intervention and potential policy
instruments. Our vision however is policy in general as opposed to policies purely with respect to
e-business usage, which we see only as an empirical example. First we consider rank effects and
then (stock, order and epidemic) externalities. An initial point to note is that our analysis has
indicated that by the year 2000 the inter firm diffusion process for e-business is pretty much
complete (in excess of 80% of firms are users). However intra firm usage is still quite limited. If
policy is to stimulate usage there is thus much more to do to encourage enhancement rather than
basic use. We believe that this is common to many technologies after their early years (Battisti
and Stoneman, 2003).
22 We are grateful to Les Godfrey for his useful advice and discussions on this type of endogeneity test.

22
The importance of rank effects indicates that the patterns of both inter and intra firm diffusion
reflect the different benefits and returns obtained by firms of different characteristics. Firms with
different innovation capabilities, of different sizes and in different industries adopt technology at
different times and at different rates. The underlying rational for this according to our model is
that to some degree at least this reflects that different firms get different payoffs from technology
usage. This finding has an initial message23 that does not always seem to be clear to policy makers
viz. that potential users of a technology may be heterogeneous in various characteristics that affect
the size of the profit to be gained (for a wider based discussion of such issues see David, 2003).
Current users will be those that have seen that the technology can yield a profit gain and have thus
adopted. This does not necessarily mean that such gains are available to non-users of different
characteristics. Non-users may well be non-users because the technology does not yield them a
profit gain. To justify intervention and to stimulate further usage on the grounds that past adopters
have gained profits from use of a new technology is not sufficient, for the observation does not of
itself indicate that further adopters of differing characteristics can also get a positive return from
adoption. If non users for whom usage is not profitable are to be encouraged to adopt new
chnology there must be a further argument that the prices underlying the profitability calculation
s but diffusion that is too fast if they have perfect foresight. If the supply sector is
ompetitive then diffusion would be too slow under myopia but welfare optimising under perfect
n a world where rank effects are important is thus a matter of the
te
do not reflect social costs and benefits.
More formally, Ireland and Stoneman (1986) explore a rank effect inter firm model to which an
intertemporally profit maximising supply sector is added (see David and Olsen (1986) for an
alternative approach in a similar frame)24. They show that if the supply sector is monopolised then
its pricing will generate diffusion that is welfare optimal if the buyers have myopic price
expectation
c
foresight.
It would appear that the argument can be extended to incorporate issues of intra firm diffusion
although we do not intend to do that formally here. The need for intervention in both inter and
intra firm diffusion processes i
23 A second message is that the payoff to usage may come from several intermediate contributions such as product innovation or the need to meet environmental and other standards, and need not come from productivity improvement. Productivity gains per se are not the ultimate objective of firms undertaking innovation activity but are in fact just one of a number of possible intermediate returns (and not the most important at that). It may well be the case therefore that innovation does not reflect (or is not accurately reflected) in the productivity statistics. This does not necessarily mean that innovation is failing or weak. The quote attributed originally to Solow that computers are everywhere except in the productivity statistics need not therefore be necessarily a matter for concern. 24 These models essentially endogenise Pi(t) the unit cost of the technology.

23
structure of the supply industry (which can be observed) and the nature of firms’ technological
expectations (which cannot).
If intervention is desired in the face of rank effects the main policy instruments to be employed
would be subsidies (or taxes) to particular classes of users. Given our findings one might expect
these to relate primarily to the encouragement of enhanced rather than basic usage. However, if
the supply industry is monopolised then the monopolist may appropriate that subsidy via changes
in its intertemporal pricing schedule. In the presence of myopia, the closer is the supply sector to
being perfectly competitive the greater will be the need for government intervention and also the
countering of government policy by the action of monopoly supplying firms will be minimised.
owever, with perfect foresight, intervention will be needed more if monopoly suppliers are
ccess of policy is
lso likely to ride on buyers’ expectations and the supply side market structure.
Tu
e consumption
set of a consumer, the utility function of a consumer or the production function of a producer.
lled distributional externalities) are external effects intermediated by
e market and encompass the stock and order effects. Technological externalities (sometimes
provides an unambiguous signal of incomplete private appropriation of the costs and or benefits of
H
present and they are also the most likely to counteract the policy. Thus the su
a
rning to the issue of externalities, Laffont (1988) defines an externality as
“… the indirect effect of a consumption activity or a production activity on th
By indirect we mean that the effect concerns an agent other than the one exerting this
economic activity and that this effect does not work through the price system.”
The Laffont (1988) definition rules out as externalities two types of effects that are part of our
model. The first is intra firm intertemporal effects whereby for example, learning from own
current experience or the impact on future profit gains from current adoption, affect the firms own
future decisions. This is reasonable for these are expected to be taken account of in the firm’s own
decision making. Secondly the definition rules out effects that work through the price system.
Thus the impact of yj(t) on the payoff to firm i, (between firm stock and order effects) are not to
be considered as externalities. On the other hand inter firm learning is not intermediated by the
market and is a classic externality and is to be treated as such. Kaivanto, 2004 provides a useful
classification between “pecuniary externalities” and “technological externalities” where pecuniary
externalities (sometimes ca
th
called real income externalities) are the other effects that are not so intermediated (and encompass
the learning effects, Ej(t)).
The presence of technological externalities (externalities transmitted outside the market system)

24
the firm’s actions. If one firm’s behaviour causes an inappropriated benefit to another firm by, for
example, improving that other firms knowledge base then the true social benefits of the actions are
ot gained by the decision maker and there will be under investment in the new technology. The
decisions do not display a
ystematic bias ex ante, they may be either over cautious or over risky and thus in our context
reduced incentive and lead to a welfare
provement. There may thus a positive benefit from the externalities and corrective action is not
users to compensate for the unremunerated externalities that they generate. It is clear however that
n
diffusion path will be sub optimal.
It is argued however that pecuniary externalities (those transmitted by the price system) do not
imply market failure. Scitovsky (1954) shows that the addition of pecuniary externalities to the
assumptions underpinning a perfect market does not result in a Pareto inferior equilibrium.
However Laffont (1988) shows that if the market for contingent claims is incomplete – as one
might expect to generally be the case, then pecuniary externalities do detract from social welfare.
However (Loong and Zeckhauser, 1982) show that the associated
s
there may have been over or under investment in the new technology.
One might also argue that pecuniary externalities are the prerogative of oligopolistic markets.
Such effects imply that one firm’s adoption of a new technology will reduce (or in the case of
some network technologies even increase) the potential return to another adopter either through
the impact upon market prices or input costs. In a perfectly competitive world such pecuniary
externalities would not exist. All firms would be price takers and no firm’s actions would be
important enough to affect the market. As oligopolistic markets will already be not at the social
optimum, whether the market is over or under investing in new technology is generally not
possible to say. For example, one might think that if there are oligopolistic markets then firms will
be producing less than (and pricing higher than) the social optimum. This is likely to mean that in
the absence of pecuniary externalities the incentives to invest will be too low. However if there
are pecuniary externalities that are positive (such that part of the return to the firm comes from a
reduced return to other firms) this may offset the
im
desired. This is however a very conditional statement.
Our empirical results indicate that there are technological externalities in the diffusion of e-
business in the UK. This is seen in the sign and significance of measured coefficient of Inter and
Intra on basic use and Intra on enhanced use. As detailed above it is generally accepted that in the
presence of such externalities economic actors will not be able to fully appropriate the full social
costs and benefits of their actions and thereby their decisions will be sub optimal - a market failure
will exist. In general diffusion will be too slow. Government intervention will be recommended
and that intervention would centre on either information provision by government or a subsidy to
25
as a general issue the policy should target both inter and intra firm use of new technologies, but as
e-business is so widely used at a basic level, targeting of enhanced use would be most effective in
is case.
ternalities will be greatest (ceteris parabus) when the supply sector is
ompetitive25.
uniary externalities indicate a need for
tervention and if so what that intervention should be.
th
However, as argued elsewhere (Stoneman and Diederen, 1994) the role of the supply sector has to
be considered. If the supply sector is monopolised a single supplier may undertake intertemporal
pricing (or advertising) that internalises any technological externalities, essentially pricing low (or
supplying information) in the early years of the technology to increase demand at a later date
through endogenous information spreading, the supplier then obtaining a return to this action
through higher prices at these later dates. Of course if the supply industry has a large number of
firms then any one supplier is unlikely to be able to capture the future profits resulting from his
own early price reductions or advertising and the externalities are not likely to be internalised. In
addition if the supply sector is monopolised the sector may through higher prices in fact capture
for itself any government subsidies to the diffusion process. This suggests that, as in the case of
rank effects, the need for and potential effectiveness of government intervention to compensate
technological ex
c
Our analysis above does not rule out that pecuniary externalities may also exist (Inter has a
negative impact on enhanced use). Although it is less well accepted, as discussed above, this may
also imply a case for intervention, but the nature of that case and the direction of intervention are
not clear (at least partly because of the Theorem of the Second Best). However if intervention is to
be undertaken, the nature of the supply industry again has to be considered. If there are benefits
from being an early adopter, because one may take market share and profits from later adopters,
then it is within the capability of a monopolised supply sector to intertemporally price
discriminate to internalise those externalities to itself and thus impact upon the diffusion path. If
the supply sector is not monopolised then that is unlikely to be possible. If the supply industry can
internalise these externalities, the extra profits may encourage development of the technology and
thus be desirable, however there is no guarantee that the diffusion path will be more or less
socially desirable. The structure of the supply industry would also determine to some degree how
far government subsidies would be internalised by that industry and thus the reaction to policy.
Overall however it is difficult to prescribe whether pec
in
25 The welfare arguments would be further complicated if we were to consider home and overseas suppliers.
26
There may also be other market failures in the economy that would affect the optimality of the
diffusion path, for example there may be monopoly power in factor markets. It might also be the
case that the whole national system of innovation in the economy needs improvements to for
xample training and education, capital markets, taxation regimes, corporate governance. Such
sues however, although important, are beyond the scope of this paper.
rs, only 25.6% are enhanced users. Further usage of this technology must thus
oncentrate upon greater depth (enhancement) rather than greater breadth (further spreading of
gh each of the four classes of hypothesised effects has an impact upon diffusion
ere are differences in the way they affect adoption (inter firm diffusion) and extent of use (intra
ning as well as of market
ediated pecuniary externalities such as stock effects are found to affect the firm’s extent of use.
e
is
6. CONCLUSIONS
Using enterprise level data from the third Community Innovation Survey this paper maps out the
pattern of e-business usage in the UK in 2000, the indicators of basic and enhanced usage then
being used to reflect the extent of inter and intra firm diffusion. Diffusion or usage is much less
studied than other innovation indicators, especially R&D. The diffusion literature moreover
largely concentrates upon inter firm diffusion whereas here we emphasise in addition the intra
firm aspect. The data shows that the extent of inter firm diffusion is not necessarily a good
predictor of the extent of intra firm diffusion. We show that although by 2000 83.2% of sample
firms are use
c
basic usage).
We have constructed a joint model of inter and intra firm diffusion and estimated it as both (i)
constructed a traditional simple inter firm model that reflecting rank, stock, order and epidemic
effects and (ii) a model to joint model of use and the extent of use. Both models were estimated
using a snapshot of adoption and usage in the UK in 2000 as proscribed by the data available. It is
shown that althou
th
firm diffusion).
A number of rank effects, reflecting differences between firms, are found to be significant but the
direction and the intensity of their impact upon inter and intra firm diffusion is not always the
same (as seen for example with the firm size effect). Stock, order and epidemic effects are
reflected in the impact of the within industry number of adopters and other firms usage (both intra
and intra firm indicators here being used to measure this) on individual adoption and extent of use.
Evidence of non-market mediated externalities such as epidemic lear
m
No evidence was found of market mediated pecuniary externalities.
27
The results with respect to e-business provide a basis upon which to build a more general
discussion of the needs and instruments of diffusion policy. Our results indicate that adoption and
therefore basic usage of e-business was already widespread by 2000 and thus intervention in
diffusion processes, except in the very early years, may well be most effectively directed at the
enhancement of use (which is exactly the aspect about which we know least). We have isolated
rank effects as significant explanators of enhanced usage and thus it is not necessarily the case that
all basic users can make a gain from enhanced usage. However there may be social gains from
stimulating enhanced usage if that use is sub optimal because of users' expectations and the supply
sector market structure. Technological externalities have also been identified in the spread of basic
and enhanced e-business usage. This is a classic rationale for market failure and would suggest
intervention. Finally there may also be pecuniary externalities but we are unable to say whether
this implies diffusion that is too extensive or too limited. The primary instruments available for
intervention are subsidies (taxes) to usage and information provision. The effectiveness of such
easures will depend upon the extent to which suppliers are able to appropriate the benefits for
emselves.
Astebro 95), “The Effect of Management and Social Interaction on the Intra Firm Diffusion
.
g New Technology”, Review of Economics and Statistics, LXIX, 1- 11.
.
Inte
m
th
REFERENCES
, T. (19
of Electronic Mail Systems”, IEEE Transactions on Engineering Management, 42, 4, 319
–331.
Astebro, T. (2002) ‘Non-capital Investment Costs and the Adoption of CAD and CNC in US
Metalworking Industries’, RAND Journal of Economics, Winter 2002, 33, 4, 672-688
Bartel, A. and F. R. Lichtenberg (1987), “The Comparative Advantage of Educated Workers in
Implementin
Battisti, G. (2000), ‘The Intra-Firm Diffusion of New Technologies’, PhD Thesis, Warwick
University.
Battisti, G. and P. Stoneman, (2003) ‘Inter Firm and Intra Firm Effects in the Diffusion of New
Process Technologies’, Research Policy, 32, 1641-1655
Battisti, G. and P. Stoneman (2005) “The intra-firm diffusion of new process technologies”,
rnational Journal of Industrial Organization, 23, 1-22.
Bridgewater, S. and D. Arnott, ‘The Internet and International Markets: Benefits and Barriers’,
Academy of International Business Conference, June, 2004.

28
Bresnahan, T. F., Brynolfsson, E. and L. M. Hitt (2002), “Information Technology, Workplace
Organisation and the Demand for Skilled Labour; Firm-Level evidence”, Quarterly
Journal of Economics, 117, 339 – 376.
Burke, L., Godfrey L.G., Mcaleer, M. (1992). ‘Modification of the Rainbow Test’. In ‘The
Implementation and Constructive Use of Misspecification Tests in Econometrics’.
Cainarc
ation’, Small Business Economics, 2, 129-140.
rench Establishments’ Quarterly Journal of Economics, 116, 1447–
Cohen,
, 99, 569-96.
of Multiple Technologies’, The Journal of Industrial Economics, 63, 11,
Colomb
ory of Zvi Griliches (1930 – 1999), Paris, August, 2003 (this draft December)
Economiche, 40, (4), Oct – Dec, 738 –
Finegol nd prescription,
Forman
us of Commercial Internet Use”, NBER WP 9287, Oct.
l Village, Urban Density and Industry Composition”, NBER
Green, ev. Ed.
Greenan 003) “Organisational change, technology, employment and skills: An empirical
Manchester University Press, Manchester.
a, G., Colombo, M. G. and S. Mariotti (1990), ‘Firm Size and the Adoption of Flexible
Autom
Caroli, E. and J. Van Reenen (2001) ‘Skill Biased Organizational Change? Evidence from a Panel
data of British and F
1492.
W. and D. Levinthal (1989), ‘Innovation and Learning: the Two faces of R&D, Economic
Journal
Colombo, M. and R. Mosconi (1995), ‘Complementarity and Cumulative Learning Effects in the
Early Diffusion
13-48.
o, M. and S. Mariotti (1987), ‘L’Innovazione di Processo nell’industria Italiana’,
L’Industria, 1.
David, P. (2003) “Zvi Griliches on Diffusion, Lags and Productivity Growth, ...connecting the
dots”, Paper presented at the Conference on R&D Education and Productivity, held in
mem
David, P. and T.Olsen (1986), “Equilibrium Dynamics of Diffusion when Incremental
Technological Innovations are Foreseen” Ricerche
70.
d, D. and Soskice, D. (1988) The failure of British training: analysis a
Oxford Review of Economic Policy, 4, 3, 21 -53.
, C., Goldfarb, A., and S. Greenstein (2002) “Digital Dispersion: An Industrial and
Geographic Cens
Forman, C., Goldfarb, A., and S. Greenstein (2003)“How did Location Affect Adoption of the
Commercial internet: Globa
WP 9979, Sept.
D. M. and J. A. Swets (1974). Signal Detection Theory and Psychophysics, R
Huntington, NY: Krieger.
, N. (2
study of French manufacturing”, Cambridge Journal of Economics, 27, 287-316.
29
Hall, B.,(2004), “Innovation and Diffusion”, NBER Working Paper No.10212, NBER, Cambridge
Mass.
Hannan, T. H. and J. M. McDowell (1984), ‘The Determinants of Technology Adoption: the Case
of the Banking Firm’, RAND Journal of Economics, 15, 328-335.
n J. and McFadden (1984), ‘A Specification Test for the Multinomial LoHausma git Model’
Hollens Adoption of Information and Communication
amics, 15, 315 – 342.
Kaivant s, Externalities and the Economic Justification of Public
Karshen
new process technologies: an Empirical Model’, RAND Journal of
and Technological Change, Blackwell,
Laffont ublic Economics, MIT Press, Cambridge, Mass.
arkets Are Incomplete”, 97, 171 - 179
ation”. American Journal of Epidemiology, 129, 125-137.
Scitovs of External Economies”, Journal of Political Economy, 62,
Saloner , (1995), ‘Adoption of Technologies with Network Effects: an
Econometrica, 52, 1219-1240.
tein, H (2004), “Determinants of the
Technologies (ICT): An Empirical Analysis based on firm level data for the Swiss
business sector”, Structural Change and Economic Dyn
Ireland, N. and P. Stoneman , (1986), “Technological Diffusion, Expectations and Welfare”,
Oxford Economic Papers, 38, 283 -304
o, K., (2004), “Spin Off
Expenditure on R&D”, Lancaster University, January
as, M. and P. Stoneman (1993), ‘Rank, Stock, Order and Epidemic Effects in the
diffusion of
Economics, 24, 4, 503-28.
Karshenas, M. and P. Stoneman (1995), ‘Technological Diffusion’ in P. Stoneman (ed.)
Handbook of the Economics of Innovation
Cambridge.
, J-J. (1988), Fundamentals of P
Loong, L.H. and R. Zeckhauser (1982), “Pecuniary Externalities Do Matter When Contingent
Claim M
Mansfield, E. (1963), ‘Intrafirm Rates of Diffusion of an Innovation’, The Review of Economics
and Statistics, XLV, 348-359.
Mansfield, E. (1968), Industrial Research and Technological Innovation, W.W. Norton, New
York.
Mickey, J. and S. Greenland, (1989). “A study of the Impact of Confounder-Selection Criteria on
Effect Estim
Pil, T.D. and P. MacDuffie (1996) "The adoption of high involvement work practices", Industrial
Relations, 35, 423-455.
ky, T. (1954). “Two Concepts
143 – 151.
, G. and A. Shephard
Empirical Examination of the Adoption of Automated Teller Machines’, Rand Journal of
Economics, 26, (3), 479-501.

30
Stoneman, P. (1981), 'Intra Firm Diffusion, Bayesian Learning and Profitability', Economic
Journal, 91, 375-388.
ational Journal of Industrial Engineering, 4, 2, 270-
82.
Stoneman, P and P. Diederen, (1994) Technology Diffusion and Public Policy, Economic Journal,
104, 918–30.
Utts, J.M. (1982). ‘The rainbow test for lack of fit in regression’. Communication in Statistics –
Theory and Methods, 11, 2801-15.
Stoneman, P. and G. Battisti (1997), ‘Intra-firm Diffusion of New Technologies: the Neglected
Part of Technology Transfer’ Intern

31
APPENDIX 1: 1992 SIC CODES BY WIDE INDUSTRY GROUPING.
SIC 1992 CODE Industry 10 Mining of Coal 11 Extraction of Oil and Gas 14 Other Mining and Quarrying 15 Food & Beverages 16 Tobacco 17 Textiles 18 Clothes 19 Leather 20 Wood 21 Paper 22 Publishing 23 Coke, Petroleum & Nuclear Fuel 24 Chemicals 25 Rubber and Plastic 26 Other Non-Metallic Mineral Products 27 Basic Metals 28 Fabricated Metal Products 29 Machinery and Equipment 30 Office Machinery and Computers 31 Electrical Machinery 32 Radio, Television & Communication 33 Medical / Optical Instruments 34 Motor Vehicles 35 Other Transport 36 Furniture 37 Recycling 40 Electricity, Gas and Water Supply 41 Collection, Purification & Distribution of Water 45 Construction 51 Wholesale
60 Land Transport 61 Water Transport 62 Air Transport 64 Post & Telecommunications 65 Financial Intermediation 66 Insurance & Pensions 67 Financial Intermediation (Activities Auxiliary) 70 Real Estate 71 Renting of Machinery and Equipment 72 Computer & Related Activities 73 Research & Development 74 Business Activities