PUBLIC UTILITY COMMISSION TREATMENT OF ENVIRONMENTAL EXTERNALITIES
212
NRRI 94-10 PUBLIC UTILITY COMMISSION TREATMENT OF ENVIRONMENTAL EXTERNALITIES Kenneth Rose, Ph.D. Senior Institute Economist Paul A. Centolella, Esq. Senior Economist Science Applications International Corporation Benjamin F. Hobbs, Ph.D. Institute Associate and Professor Case Western Reserve University June 1994 This report was prepared by The National Regulatory Research Institute (NRRI) with funding provided by participating member commissions of the National Association of Regulatory Utility Commissioners (NARUC). The views and opinions of the authors do not necessarily state or reflect the views, opinions, or policies of the NRRI, the NARUC, or NARUC member commissions.
-
Upload
independent -
Category
Documents
-
view
3 -
download
0
Transcript of PUBLIC UTILITY COMMISSION TREATMENT OF ENVIRONMENTAL EXTERNALITIES

NRRI 94-10
PUBLIC UTILITY COMMISSION TREATMENT OFENVIRONMENTAL EXTERNALITIES
Kenneth Rose, Ph.D.Senior Institute Economist
Paul A. Centolella, Esq.Senior Economist
Science Applications International Corporation
Benjamin F. Hobbs, Ph.D.Institute Associate and
ProfessorCase Western Reserve University
June 1994
This report was prepared by The National Regulatory Research Institute (NRRI) with fundingprovided by participating member commissions of the National Association of RegulatoryUtility Commissioners (NARUC). The views and opinions of the authors do not necessarilystate or reflect the views, opinions, or policies of the NRRI, the NARUC, or NARUC membercommissions.
iii
EXECUTIVE SUMMARY
Many public utility commissions in the United States are considering the
environmental consequences or externalities from the generation and distribution of electric
power. These environmental externalities are the costs to society that are not reflected either
in the cost of the resources that produce electricity or in the price of the electricity paid by
consumers. Commissions have adopted various methods to internalize these costs in an
attempt to have utility costs reflect the actual cost of electricity production and distribution to
society. These considerations are in addition to existing environmental standards prescribed
by state and federal legislation.
The consideration of environmental externalities by state commissions has occurred
through least-cost or integrated resource planning processes. Externalities are dealt with on a
qualitative basis only, explicitly quantified, or on both a qualitative and quantitative basis.
The states that quantify externalities use a percentage "adder" to resource costs, apply a
scoring system in a competitive bidding process, or monetize specific pollutants.
Traditionally, environmental externalities have been addressed though command-and-
control environmental legislation at the state and federal levels and implemented by state and
federal environmental regulators. Command-and-control generally refers to environmental
standards that are applied at the pollution source and across sources irrespective of emission
control costs. Current environmental policy, however, is a combination of command-and-
control policies, taxes, and emissions-trading and offset programs both at the state and federal
levels.
Emission taxes and trading programs, in general, can achieve a desired emissions level
at a lower overall cost than command-and-control programs. The cost-savings potential of
these market-based programs comes from the choice sources are given as to how they will
comply with the requirements. Sources are allowed to select the method that is the lowest
cost for their facilities: (1) control emissions, (2) purchase an emission credit or allowance or
iv
pay the emission tax, or (3) some combination of these options. The sources, it is presumed,
have better access to information on what are the best options than regulators could readily
obtain. An emission-allowance market or a tax can motivate a source to seek the lowest-cost
options for compliance by providing an economic incentive to minimize control costs.
Overall, this is a more efficient means of internalizing environmental costs than government
decree since control occurs at the lower-cost sources; relatively higher-cost sources purchase
allowances from the lower-cost sources or pay the tax. Environmental regulators are
currently considering or instituting more market-based environmental programs. Examples
are the Clean Air Act's allowance trading program and California's South Coast Air Quality
Management District emissions offset program.
Environmental programs that affect only new resources--such as adders--are a less
effective and more costly means of environmental control than emissions trading or taxes.
These methods can have only an incremental impact on existing environmental damage since
they only apply to new resources. Emission-control options that affect system operations and
existing emissions are more cost-effective; that is, they remove emissions at a lower cost per
unit (tons, pounds, and so on) and have a more immediate and a more appreciative positive
impact on the environment. The most cost-effective control strategies are a mix of dispatch
changes, emission controls, fuel changes and, lastly, resource additions. Environmental
programs that can encourage utilities to adopt these control strategies include emission taxes
and trading. The cost-effectiveness of these market-based programs--as with any other form
of environmental regulation--is highly dependant on the policies of the economic regulatory
agencies. For example, the Clean Air Act's allowance trading program has not fully realized
its potential cost savings due in large part to the behavior of the state commissions and the
Federal Energy Regulatory Commission.
It may be beneficial to ratepayers and society for commissions to first consider
assisting in the development of market-based programs and adopt policies that encourage
their efficient use. Commissions are generally limited statutorily from directly implementing
trading or tax programs. To date, commissions have sought to influence only the choice of

v
supply or demand options for new resource needs. However, under their existing authority
state commissions may also attempt to more directly influence existing emissions. This
would have the advantage of more directly influencing existing emissions and perhaps
achieving emission reductions at costs that approximate market-based programs.
Before deciding to take a more active role in environmental management,
commissions should consider at least three factors: (1) their authority within their state to
regulate environmental impacts, (2) the role different state agencies play in the determination,
development, and implementation of environmental regulations and the commission's most
effective role, and (3) the inherently limited scope of the commission's influence on polluting
sources with their state.
Commissions have an advantage in terms of being able to analyze emission reduction
options and costs and instituting policies that affect utility behavior. As the economic
regulator, commissions are in a better position to encourage utilities to implement
environmental programs in an effective manner through ratemaking and oversight authority.
Environmental regulators clearly have an advantage with respect to calculating social cost and
with respect to having authority for implementing more efficient market-based environmental
programs. Environmental regulators have better access to environmental damage
information, are better acquainted with existing environmental requirements and possible new
options, and are in a better position to institute cost-effective programs to address existing
emissions.
This asymmetry of authority and information suggests that the best approach may be a
cooperative one, where the two agencies exchange information and work together to develop
and implement environmental programs. Commissions, in order to have an impact on
existing emissions in a cost-effective and timely manner, could cooperate with the
environmental agencies in their state to develop and implement existing environmental
programs or to develop new ones. This does not suggest or argue for a diminished role for
state commissions in environmental management, but an evolving one. This new role would
require more cooperation and coordination with environmental regulators, more reliance on
vi
performance-based regulation in place of cost-based regulation, and more regional regulatory
activity. It also will require commissions to adjust regulatory practices to encourage utilities
under their jurisdiction to comply with environmental requirements in a cost-effective
manner.
As the electric service industry becomes increasingly more competitive, the future role
of state commissions in environmental management will continue to be debated. What type
of environmental policy and utility regulation is compatible with a more competitive industry?
In the future, the industry is likely to have more independent power production, more
wholesale wheeling, and possible retail wheeling. State commissions may have less direct
control over approving the development of new resources. This may lead to the development
of regional institutions and incentive-based policy tools to address environmental externalities
and other market imperfections. Overall, emission limits with trading may be an especially
appropriate means of emission control in a competitive environment where multiple sources
exist under different jurisdictions.

vii
TABLE OF CONTENTS
Page
LIST OF FIGURES ............................................................................................. x
LIST OF TABLES............................................................................................... xi
FOREWORD .................................................................................................xiii
PREFACE............................................................................................................ xv
ACKNOWLEDGEMENTS ................................................................................. xvii
CHAPTER
1 Introduction and Scope of Report: The Policy Context for Consideration of Environmental Externalities by Public Utility Commissions ....... 1
Public Utility Commissions and Accounting for Environmental Externalities ................................................................... 1The Policy Debate on Commission Consideration of Environmental Externalities ................................................................... 3Scope of Report........................................................................................ 5
2 Economic Rationale for Treatment of EnvironmentalExternalities ....................................................................................... 7
3 Policy Options for Controlling Environmental Externalities ............. 19
Environmental Regulation: Progress Toward InternalizingEnvironmental Costs ........................................................................... 20
Regulation: Options for Improving Considerationof Environmental Externalities and InternalizingEnvironmental Costs ........................................................................... 36
viii
TABLE OF CONTENTS--Continued
Page
4 Public Utility Commission Action on EnvironmentalExternalities ....................................................................................... 51
Virginia .................................................................................................... 57Ohio ...................................................................................................... 58Maine ..................................................................................................61Connecticut .............................................................................................. 67Vermont.................................................................................................... 71Wisconsin................................................................................................. 74Massachusetts........................................................................................... 78New York ................................................................................................. 87Status of Commission Externality Consideration..................................... 92
5 Resource Acquisition and Operating Strategies forEnvironmental Improvement ........................................................... 93
Multiobjective Framework for Evaluating Resource Optionsand Operating Strategies...................................................................... 96
Short-Run Operations............................................................................... 99Medium-Term Operations Planning......................................................... 105Resource Acquisition Decisions............................................................... 107Effects of Rates on Loads, Costs, and Emissions..................................... 110
6 Environmental Policies and Utility Decisions ...................................... 113
Command-and-Control Regulations......................................................... 113Constrained Emissions ............................................................................. 115Taxes and Emissions Allowances ............................................................ 117Requirements for Considering External Costs ......................................... 120Examples of Efficient Operational Strategies for Environmental
Improvement ....................................................................................... 123
ix
TABLE OF CONTENTS--Continued
Page
7 The Role of State Public Utility Commissions in Environmental Regulation: Adapting to a Changing Regulatory Climate................ 131
Need for Cooperative Action on the Environment................................... 131
Some Implementation Consideration ....................................................... 137The Changing Industry and Regulatory Structure.................................... 141
APPENDICES
A A Simple Linear Programming IRP Model ......................................... 143
B Assumptions for the Environmental IRP Example ............................. 147
x
LIST OF FIGURES
Page
2-1 Overconsumption of a Good Because of a Negative Externality ............. 11
2-2 Optimal Level of Emissions Under a Tax or Permit Trading System ...................................................................................... 13
2-3 Effect of an Uncertain Marginal-Control Cost Curve on EmissionLevels with an Emission Tax or Permit Trading ................................. 16
5-1 Tradeoff Plot: CO2 Versus Cost for Seven Plans ..................................... 97
5-2 Effect of Emissions Dispatch Upon Emissions and Cost UnderPlan A.................................................................................................. 102
5-3 Comparison of Plan A With and Without Option of CofiringUnder Emissions Dispatch................................................................... 107
5-4 Identification of Efficient Combinations of Resource andOperating Strategies ............................................................................ 109
5-5 Effect of Rate Feedback Upon Emissions and Costs of Plan P................ 111
6-1 Inefficiency of a Ban on New Coal and Combustion TurbineFacilities .............................................................................................. 114
6-2 Environmental Least-Cost Planning: Imposition of a CO2 Cap ............... 116
6-3 Effect of CO2 Tax of $15 per Ton Upon Plan Choice.............................. 118
6-4 Incremental Cost of Emissions Reduction by Emissions Dispatchfor TVA ............................................................................................... 126
6-5 Distribution of NOx Emissions in San Francisco Bay Area UnderDifferent NOx Dispatch Penalties ........................................................ 128
6-6 Effect of Emissions Dispatch Upon Emissions in New England.............. 130
7-1 Hypothetical Example of the Social Welfare Loss From TakingNo Action Compared With an Emission Tax That Is SetAbove the Optimal .............................................................................. 139
7-2 Hypothetical Marginal-Control Cost Curve and

xi
Four Levels of Reduction....................................................................... 140

xii
LIST OF TABLES
Page
4-1 Summary of Externality Policies in Selected States................................. 53
4-2 Massachusetts DPUC Externality Values................................................. 84
4-3 New York PSC External Cost Valuations ................................................ 89
5-1 Overview of Utility Planning and Operations Problems .......................... 94
5-2 Merit Order (Capacity Factor) of Generating Plants UnderDifferent Dispatch Strategies............................................................... 103
6-1 Per-Unit Utility and Societal Cost Calculations:Three-Resource Comparison ............................................................... 122
6-2 Total Utility System Cost and Societal Cost Calculations:Three-Resource Comparison ............................................................... 124
B-1 Miscellaneous Data for Linear Programming Example ........................... 147
B-2 Generating Unit Data, Linear Programming IRP Model.......................... 148
B-3 Demand-Side Program Characteristics, Linear ProgrammingIRP Model ........................................................................................... 149

xiv
FOREWORD
Public utility commissions have taken an increased interest in the environmentalimpact of electric power production and supply. The issue of whether and to what extentcommissions should play an active part in environmental management has been, to say theleast, controversial. This report outlines the basic economic rationale for the consideration ofenvironmental externalities, reviews policies to internalize environmental costs, describes theactions of eight commissions on this issue, and analyzes the affect of different environmentalregulatory options on utility system operations and costs. Finally the report discusses the roleof the state commission in the development and implementation of environmental policy.
Douglas N. JonesDirector, NRRIColumbus, OhioJune 1994


xvi
PREFACE
Although this report was a joint and coordinated effort, authors can be identified withspecific chapters. Kenneth Rose was project leader and author of Chapters 1, 2, and 7; PaulCentolella was the author of Chapters 3 and 4; and Benjamin Hobbs was the author ofChapters 5, 6, and the appendices.

xvii

xviii
ACKNOWLEDGEMENTS
The authors thank the reviewers of this report for their comments and suggestions:Janice A. Beecher, John Borrows, Kenneth W. Costello, Otto C. Doering, III, Douglas N.Jones, and Leigh Riddick. Also, the authors thank Francine Sevel for her editing of the draftand Marilyn Reiss for her customary patience and skill in preparing the earlier drafts and thefinal manuscript. The authors, of course, are responsible for any remaining errors.

1
BACKGROUND AND INTRODUCTION
CHAPTER ONE
Behind any discussion on whether there are desirable alternatives to utility
service disconnection for residential customers who fail to pay their bills is an
underlying debate on the proper role of economic regulation of public utilities. The
debate includes questions of whether state public utility commissions can or should
expand their roles, often without expressed and explicit legislative mandate, beyond
that encompassed by traditional ratemaking to accomplish social goals. Some believe
that the proper role of a state public service commission does not include the pursuit of
social goals, whether those social goals be economic development or preventing social
distress to low-income customers. Pricing gas and electricity based on need rather
than demand abandons cost-of-service pricing and makes utilities quasi-welfare
agencies. Others contend that it is appropriate for state public service commissions to
provide or oversee utility provision of certain limited social assistance, such as budget
counseling, referral services, and financial assistance, because they are aimed at
preventing social distress, such as the disconnection of low-income residential utility
service. The outcome of this debate, however, does not require resorting to polar
extremes. The fact is that legislatures and commissions believe that the real question
is to what extent should the public utility commission provide or encourage the utility to
pursue social goals and to what end.
The underlying assumption of this study is that commissions should encourage
utility actions that minimize disconnections (thus maximizing service), provided those
actions do not unduly adversely affect utility service arrearage and bad debt.

2
Preference is given to programs that minimize distortion of pricing and billing of
services. Preference is also given to programs that minimize the reliance on subsidies
and utility class cross-subsidies.
THE OCCASION
This study occurs as traditionally vertically-integrated electric and local gas
distribution companies, under the jurisdiction of state public utility commissions, are
facing increasing pressures to become more competitive by reducing costs. These
competitive pressures come from the more open and competitive wholesale electric
and gas markets, where the commodity price of gas now fluctuates at market-driven
levels and wholesale power is also becoming more market-driven.
For gas utilities, this increased competitive pressures was facilitated by Federal
Energy Regulatory Commission (FERC) Orders 436 and 636, which implement federal
policies to provide access to the gas markets at the wellhead. Orders 436 and 636
allow local gas distribution companies and, by state policy in most states, large
industrial customers direct access to purchase gas at the wellhead. With the
deregulation of gas prices, the existence of a gas supply surplus, and the opening of
wellhead access to gas producers, the stage was set for the development of robust gas
markets. Allowing large industrial customers to purchase gas at the wellhead helps to
expose cross-subsidies that were implicit under traditional cost of service allocations.
However, most state commissions take these cross-subsidies into account either by
allowing the local distribution company (LDC) (1) to implement "top-down" gas
transportation pricing to collect the same fixed costs from a gas transportation customer
as it does from gas purchase customers or (2) to enter into a special contract with a
customer that may be willing and able to bypass the LDC.
For vertically-integrated electric utilities, the enactment of the Energy Policy Act
of 1992 (EPAct) facilitated the development of a more robust and open wholesale
power market. EPAct provides for mandatory wheeling of power to wholesale power

3
customers and allows the development of independent power producers (IPPs) that can
meet certain requirements to qualify as exempt wholesale generators (EWGs). Thus,
increased supply and demand for wholesale power are possible. There are also many
utilities with overcapacity, with power to sell on the wholesale power market. These
factors set the stage for the development of a robust power market, under
circumstances in many ways similar to those that led to the development of a robust
gas commodities market.
However, in the case of vertically-integrated electric utilities, there is no
requirement of retail wheeling to the ultimate customer. Indeed, EPAct expressly
forbids the Federal Energy Regulatory Commission (FERC) from ordering retail
wheeling. Instead, a savings provision of EPAct preserves the authority of state
commissions to regulate or not to regulate retail franchise areas.
As presented in Figure 1-1 below, traditional cost-of-service allocations usually
result in an allocation of the cost of capital burden that favors residential customers
over industrial customers. However, as industrial customers are given choices, they
will seek to drive down their cost of capital allocation. As discussed below, they will
also seek to escape the burdens of any demand-side management or social service
programs that favor other customer classes.
Further, as vertically-integrated electric utilities and local gas distribution
companies find themselves under competitive pressures to provide services at the
lowest possible costs, they will find it tempting to cut social service, conservation, and
demand-side management programs. Those programs do not directly contribute to
their ability to deliver their product to the customer at the lowest price. (Even if
demand-side management programs can be demonstrated to result in a lower total bill
for energy services, competitive pressures result in an effort to provide customers with
the services that they want at the lowest possible price.) Further, there are allegations
by customers with choices (typically industrial) that they have to share in the cost of
social service, conservation, and demand-side management programs while realizing
very little corresponding benefit. Instead, the major benefits of social service,
conservation, and demand-side management
4
Figure 1-1 Here.
FIG. 1-1. THE ONGOING SHIFT IN THE ALLOCATION OF THE CAPITAL RECOVERY BURDEN
FROM INDUSTRIAL TO RESIDENTIAL CUSTOMERS (SOURCE: ROBERT E.BURNS, THE NATIONAL REGULATORY RESEARCH INSTITUTE'S NEW

5
COMMISSIONER TUTORIAL).

6
programs are alleged to go to residential customers, who are typically thought of as
core customers with few choices.
This report is also occasioned by cutbacks in funding of federal social service
programs, in particular, the funding of the federal Low-Income Heating Assistance
Program (LIHEAP), the principal federal program providing federal funding to provide
energy assistance to low-income customers. Indeed, the Clinton Administration
proposed to reduce the federal LIHEAP budget from $1.475 billion for Fiscal Year 1994
to $730 million for Fiscal Year 1995. LIHEAP funding provided energy assistance to an
estimated 5.2 million households, or 14 million individuals in 1993. The proposed 49
percent cutback of LIHEAP funding would significantly affect the 70 percent of LIHEAP
recipients who have an annual income of $8,000 or less, many of whom are elderly or
single-parent households. Although opposed in a Resolution of the Executive
Committee of the National Association of Regulatory Utility Commissioners at its Winter
1994 Meeting, the proposed cutback on LIHEAP funding was passed by Congress.
Further cutbacks in funding of LIHEAP might possibly occur in the future.
Indeed, in late February 1995 the House Appropriations subcommittee cut
$1.319 billion for LIHEAP funding for Fiscal Year 1996; and in early March 1995, the
full House Appropriations Committee voted to cut the LIHEAP funding for Fiscal Year
1995. The NARUC Executive Committee adopted a resolution at its Winter 1995
meeting, urging Congress to reject any cuts in or recision to LIHEAP funding and to
adopt a LIHEAP budget as requested by the Administration for Fiscal Years 1996 and
1997. President Clinton vetoed a recision of current LIHEAP funding. The current
House Bill has no specific funding for LIHEAP. Instead, LIHEAP would be rolled-in as
a part of a "super grant" to the states. The current Senate Bill will continue LIHEAP as
a separately funded block-grant program at $1.3 billion. Many believe that a
compromise in the Conference Committee will occur, with the likely result being a
cutback in LIHEAP funding.
This report also deals with alternatives to service disconnections for water
utilities. Although there is no pressure placed on the water utility industry from
7
emerging competition, nevertheless, the development of state commission policies that
require or encourage alternatives to water service disconnection has recently taken on
increased importance. In the past, water utility service has been taken for granted as a
low-cost utility service, where service disconnection because of an inability to pay was
an issue for only very few customers. However, recent increases in the cost of water
utility service, caused primarily by infrastructure replacement and secondarily by the
cost of complying with the Safe Drinking Water Act as well as the increased demand of
water, have made water utility services (drinking water, storm-water management, and
waste-water services) less affordable, particularly for low-income residential customers.
No longer can the cost of water service be taken for granted. Increasingly, low-income
residential customers are finding it difficult to pay their bills and finding alternatives to
disconnecting water service has become desirable.
ORGANIZATION OF THE REPORT
This report deals with alternatives to disconnection for electric, gas, and water
utility service. Energy utilities are making a transition into a more competitive
environment and these competitive pressures have direct implications on the
appropriate regulatory approach to help assure that a utility either institutes or
maintains an approach that provides alternatives to disconnection of energy utility
services. The realities of emerging competitive pressures may force hard choices and
innovative approaches to maintain and enhance alternative measures to utility
disconnection for electric and gas utilities.
For water utility service, there is little indication of competition or impending
competition. Therefore, a more straightforward discussion of alternatives to
disconnection is appropriate.
Figure 1-2 shows which state commission staffs responded to the survey. (As in
other NRRI surveys three attempts were made to solicit a response from each state.)
In subsequent figures and tables, the reader should keep in mind that

8
fig 1-2

9
the figure only shows those state commissions where a particular type of program is
known to exist. It does not necessarily mean that there is not such a program in a state
that did not respond to the survey. In subsequent figures, state commissions that have
a program are shaded; those that do not have a program are left blank; and state
commissions that did not respond are crosshatched. In Table 1-1, the alternatives to
disconnection to electric and gas utility service are enumerated and described.
Chapters 2, 3 and 4 of this report concerns an evaluation of the impact and
effectiveness of programs that are alternatives to utility service disconnection for
electric and gas service.
The authors review the electric and gas service disconnection policies of the
various states in Chapter 2, including prior notice requirements, winter restriction
moratoria, date-based moratoria, temperature-based moratoria, prior commission
approval requirements, and service limiters. The pros and cons of each policy are
presented. In Chapter 3, the authors conduct a similar review of the billing and pricing
arrangement policies of the various states that are presented as part of a strategy to
create alternatives to electric and gas utility service disconnection. The pros and cons
of each policy are discussed. In Chapter 4, the authors review nonprice, preventive,
customer service assistance programs that help to create alternatives to electric and
gas utility service disconnection. The discussion also includes pros and cons of each
policy. Alternatives for utility disconnection for water service are discussed in Chapter
5. In Chapter 6, the authors provide an empirical analysis of the survey results of
alternatives to utility service disconnections for electric and gas service. Finally, in
Chapter 7, the authors develop and discuss a positive alternative approach on how
state commissions might create incentives for their energy utilities to actively pursue
alternatives to utility service disconnection in an increasingly competitive environment
and a positive approach toward developing alternatives to disconnection of water
service in a monopoly environment.

10
TABLE 1-1
ALTERNATIVES TO SERVICE DISCONNECTION USED IN THE ENERGY SECTOR
Measure Description
Prior notice Formal notice given by a utility company to residential customers before terminating servicedue to nonpayment.
Winter restrictions Procedures other than prior notice that restrict utility disconnection for nonpayment duringthe winter months.
Date-based winter moratoria Policies that prohibit winter service termination between during specified dates.
Temperature-based moratoria Policies that prohibit service termination when the temperature falls below a certain level.
Commission-approved Policies that prohibit disconnections subject to approval of the public utilities commission ondisconnections a case-by-case basis
Payment arrangements A utility company arrangement in which payment-troubled customers pay arrearage in futureinstallments in order to avoid disconnection or to reconnect utility service.
Temporary service guarantee A short-term guarantee of service during the winter months if a payment-troubled customerspays a minimum amount of the monthly bill or a certain percentage of annual householdincome.
Budget billing Level payments made throughout the year that allow the customer to defer costs of highenergy consumption until later months when energy consumption is lower.
Payment extension Deferral of a utility payment due date to coincide with a fixed-income customer's receipt ofSocial Security, pension, or other monthly income.
Arrearage forgiveness Forgiveness of arrearage for select low-income customers who have demonstrated a good-faith effort to pay their utility bills.
Lifeline rate A baseline rate that is less than the actual cost of service for the utility.
Service limiter A device that temporarily restricts a household's normal utility consumption.
Below-market conservation loan A below-market-rate loan from a utility to a low-income residential customer for financing theinstallation of conservation measures.
Utility-funded weatherization The use of utility funds to pay for the weatherization of low-income homes.
Energy audits Free or very low-cost home energy audits to determine existence and location of homeenergy leaks.
Budget counseling Counseling by utility personnel to payment-troubled customers to assist in the reduction orelimination of payment problems through the teaching of money management skills.
Referral Referral of payment-troubled customers to utility and community-sponsored assistanceprograms.
Source: U.S. Department of Health and Human Services, LIHEAP [Low-Income HomeEnergy Assistance Program] Report to Congress for Fiscal Year 1990 (Washington,DC: U.S. Department of Health and Human Services, 1991), 145.

7
CHAPTER 2
ECONOMIC RATIONALE FOR TREATMENTOF ENVIRONMENTAL EXTERNALITIES
The recognition of externalities and possible solutions has a long history in economics.
The literature on this subject dates back to Alfred Marshall and Arthur Cecil Pigou (together
they span from the late 19th century through the 1940s). Pigou in particular did a
considerable amount of work in this area in his book first published in 1920, The Economics
of Welfare.1 Pigou was among the first to write about the possibility that private and public
interests may not always coincide and that government intervention may be necessary. He
stated the problem as follows:
In general industrialists are interested, not in the social, but onlyin the private, net product of their operations.. . .[S]elf-interestwill tend to bring about equality in the values of the marginalprivate net products of resources invested in different ways. Butit will not tend to bring about equality in the values of themarginal social net products except when marginal private netproduct and marginal social net product are identical. Whenthere is a divergence between these two sorts of marginal netproducts, self-interest will not, therefore, tend to make thenational dividend a maximum; and, consequently, certainspecific acts of interference with normal economic processesmay be expected, not to diminish, but to increase the dividend.2
Pigou identified and defined the problem of what was later designated as externalities.
While the strict economic definition has varied over the decades, Pigou's original definition is
both useful and generally consistent with recent work in the area:
1 A.C. Pigou, The Economics of Welfare, 4th ed. (London: MacMillan and Co., Limited,1932, reprinted 1952).
2 Ibid., 172.
8
Here the essence of the matter is that one person A, in the courseof rendering some service, for which payment is made, to asecond person B, incidentally also renders services or disservicesto other persons (not producers of like services), of such a sortthat payment cannot be exacted from the benefited parties orcompensation enforced on behalf of the injured parties.3
More recent writers prefer a broader definition that would include activities beyond
those "for which payment is made." For example, Cornes and Sandler4 use a broader
definition proposed by Meade:5
An external economy (diseconomy) is an event which confers anappreciable benefit (inflicts an appreciable damage) on someperson or persons who were not fully consenting parties inreaching the decision or decisions which led directly orindirectly to the event in question.6
Meade's definition has two key features: (1) the effect of the externality must be "appreciable"
and (2) the effect of the externality falls on a third party or parties who were not a part of the
transaction.
An example of an external benefit (a positive externality) is a flower garden in front of
a house. The owner (or someone else) goes to the trouble and expense to plant
3 Ibid., 183.
4 Richard Cornes and Todd Sandler, The Theory of Externalities, Public Goods, and ClubGoods (Cambridge, MA: Cambridge University Press, 1986).
5 J.E. Meade, The Theory of Economic Externalities in The Control of EnvironmentalPollution and Similar Social Costs, as quoted in ibid., 29.
6 Cornes and Sandler, The Theory of Externalities, Public Goods, and Club Goods, 29.

9
and tend the garden. Passers-by see the flowers, and presumably, get some enjoyment out of
what they see (assuming no crowds gather and cause congestion). The home-owner in this
simple example is not compensated by the individuals who enjoy the view. An example of an
external cost (a negative externality) is a factory that emits pollutants into the air as part of the
firm's production. The emissions travel down-wind to a nearby community, where it results
in higher laundry bills, increased frequency of house paintings, and higher health-care costs,
among other costs to the residents. These costs imposed on the community are not considered
as part of the economic decisions made by the owners of the factory.
In general, an externality that causes an "appreciable" misallocation of resources is the
type that may require government intervention. A subcategory of externalities, however,
pecuniary externalities, results from those activities of an individual(s) or a firm(s) affecting
another individual(s) but not causing a misallocation of resources.7 In these cases,
government intervention is not necessary. An example is the current changes in the electric
services industry. The structural reorganization occurring in the industry is largely the result
of the change in the scale economies of electric generation, other technical reasons, and
policy changes. The effect of competition from other producers on utility investments is a
pecuniary externality. Indeed, this change is likely to result in an improvement in resource
use (due to an increased incentive to minimize costs). The effect of competition, therefore, on
utility investments and the calls for compensation for "stranded investment" cannot be, strictly
speaking, based on an externalities argument.8
7 William J. Baumol and Wallace E. Oates, The Theory of Environmental Policy, 2d ed.(Cambridge, MA: Cambridge University Press, 1988), 29-31.
8 Baumol and Oates (ibid., 30) state "the price effects that constitute the pecuniaryexternalities are merely the normal competitive mechanism for the reallocation of resources inresponse to changes in demands or factor supplies."

10
Of concern here is the category of externalities that do cause a misallocation of
resources and are sufficiently large to warrant government action.9 The presence of an
externality, pollution in the production of electricity for example, causes the production and
consumption of electricity (and other products and services such as health care) to be different
than if the externality did not exist. Figure 2-1 depicts a market condition when the marginal
social cost (MSC) is greater than the marginal private costs (MPC).10 In this case, a negative
externality exist, such as with electric generation in the absence of or with insufficient
environmental regulation. If it is assumed that MPC equals the price, then the quantity qp - qs
is the amount of overconsumption of the product. The solution to the problem then may
appear to be a matter of raising MPC to equal MSC.11 However, as will be shown, the matter
of how to solve the problem raised by the externality is complicated.
9 There is an important vein in the literature that questions the need for government actionswith externalities. See Ronald H. Coase, "The Problem of Social Cost," Journal of Law andEconomics 3 (October 1960): 1-44. This article was largely a response to Pigou. The issuesraised in this literature are not explored here since it is assumed, in the case of environmentalexternalities, the transaction costs are sufficiently high and there are a large number ofaffected individuals and sources that preclude a noninterventionist solution (for a discussionof this point see Baumol and Oates, The Theory of Environmental Policy, 32-35). A broaderview, however, would consider the political process as the response. In this case,commissions, legislators, environmentalists, the authors of this report, and others are simplypart of the equilibrating process.
10 The marginal cost curves are depicted upward sloping based on recent work that suggestsfor the relevant range of output, this is the case. See, for example, Herbert G. Thompson, Jr.and Lynda L. Wolf, "Regional Differences in Nuclear and Fossil-Fuel Generation ofElectricity," Land Economics 69, no. 3 (August 1993): 234-248. Also note that in the case ofpecuniary externalities, there would be no difference between the two curves.
11 Often in discussions of negative externalities in electricity generation and distribution,the solution is presented as a matter of adding to the MPC. Clearly, as will be explained later,this is not what states are doing.

11
Fig. 2-1. Overconsumption of a good because of a negative externality (Source:Several authors use a similar construct. See, for example, A. MyrickFreeman III, Dallas Burtraw, Winston Harrington, and Alan J. Krupnick,Accounting for Environmental Costs in Electric Utility Resource SupplyPlanning, Discussion Paper QE92-14 (Washington, D.C.: Resources for theFuture, April 1992)).
In general, an externality is a category of market failure. That is, they occur, as Pigou
surmised, when the operation of private markets by themselves will not equate social costs
and private costs and maximize social welfare. The problem often is defined as the absence
12
of a market or lack of well-defined property rights. Optimal or efficient solutions, therefore,
often center on the creation of a market by a regulatory authority or legislators.
In his book, Pigou proposed two solutions to the problem of externalities: a tax system
such as a effluent fee for negative externalities (often referred to in the literature as a
Pigouvian tax) and a bounty or subsidy for positive externalities. Drawing on this early work,
others later introduced the idea of marketable permits.12 While these solutions each have their
advantages and disadvantages (discussed below) they are closely related in concept and
economic basis. Since environmental externalities are a type of negative externality, this will
be the primary focus of the discussion.
The way the market-based alternatives work for negative externalities is shown
graphically in Figure 2-2. The horizontal axis in the figure represents tons of the emissions
removed (for example, SO2, NOx, or VOC) and the vertical axis represents the dollar cost or
benefit. The marginal control cost curve is upward sloping because the cost of reducing
emissions is progressively more costly as more tons are removed. Put another way, the first
few tons of emissions removed have a relatively low cost. For example, a utility can reduce
its utilization of its dirtier units and switch to operating its cleaner but more expensive units.13
However, as these options are exhausted the utility must adopt more costly measures, such as
fuel switching, and then more capital-intensive technologies, such as scrubbers. This
marginal control cost will vary by utility system. For purposes of illustration, assume the
curve in the figure represents the aggregate marginal cost of all sources of emissions in a
given area.
12 John Harkness Dales, Pollution, Property, and Prices (Toronto: University of TorontoPress, 1968) and formalized by W. David Montgomery, "Markets in Licenses and EfficientPollution Control Programs," Journal of Economic Theory 5, no. 3 (1972): 395-418.
13 For illustrative purposes, emissions by utilities of pollutants such as SO2, NOx, and VOCsare considered here. However, the analysis can be applied to other environmentalexternalities as well, such as the environmental damage caused by the production anddistribution of a particular fuel.

13
The marginal social-benefit curve represents the benefits to society from the emissions
reduced. It is downward sloping because of the decline in value of each

14
Fig. 2-2. Optimal level of emissions under a tax or permit trading system (Source:Baumol and Oates, The Theory of Environmental Policy, 59).
subsequent ton removed. The first several thousand tons removed may have a great deal of
value to society, for example, by lowering health care costs. The last few tons removed,
however, may have only a comparatively small benefit to society.14
14 Of course this depends on the pollutant. Small amounts of lead or mercury may stillhave a considerable impact on society; they impair children's mental abilities for example. Conversely, the last few tons removed of CO2 may have a negligible benefit for the globalenvironment (after considerable reductions have occurred).

15
The intersection of the two curves, the point where marginal social benefit is equal to
the marginal control cost, represents the level of emissions that maximizes social welfare.
The problem is, How does the environmental regulator achieve this optimum level of
emission reduction? Economists have suggested two alternatives. First, the regulator can set
an emission tax or emission fee (dollars per ton) equal to to in Figure 2-2. Emission sources
will then find the point where their marginal control cost is equal to the emission tax and
reduce their emissions by that amount, in this case qo. Up to that point emission sources find
it less expensive to reduce their emissions by that amount rather than pay the emission tax
(their marginal control cost is less than the tax, up to qo).
A second alternative to internalize environmental costs is for the regulator to first
determine the desired reduction of emissions then set a cap on the total level of emissions. If
the total emissions before controls is R and the desired reduction is qo (as in Figure 2-2,
assuming, for the moment, that the regulator knows the optimum quantity to reduce), then the
environmental regulator would set the cap, say P, at R - qo. The environmental regulator
would then issue P permits and allow sources to trade the permits. Sources would buy
permits from others when the price of the permits is less than their own control cost and
would sell permits when the price is above their control cost. This would continue until the
price of the permit is equal to to, the optimal emission tax and the marginal control cost at qo.
This is basically the type of system, with some modification, created by the U.S. Clean Air
Act Amendments of 1990 to reduce and limit SO2 emissions from electric power plants. In
theory, both the tax and permit methods achieve the same level of controls at the same cost.
An important point is that both methods reach the desired level of emission control at
minimum cost. The traditional "command-and-control" approach to reducing emissions--
requiring each source to reduce emissions by a certain amount irrespective of each source's
control cost--is unlikely to lead to the lowest-cost solution.15 The primary reason for this is
15 Command-and-control actually takes many different forms. In this report it refers to theissuance of standards by the environmental regulator that are generally applied to all sourcesof pollution.

16
because each source has different control costs, has different control options available to
them, and has better access to information on their system's operations and control options
than the information the environmental regulator can readily obtain.16 These methods allow
more flexibility in selection of control options, allow for changes over time in technology and
cost, and provide more incentive to find and use innovative control options. Both emission
taxes and permit trading minimize cost, maximize social welfare, and result in the optimum
level of emission reduction.
It previously was assumed that the regulator knew the marginal control cost and
marginal social-benefit curves in order to set the optimal tax or optimal number of permits. It
can be assumed, however, that the environmental regulator always has less-than-perfect
information. Figure 2-3 depicts the effect of predicting the wrong marginal control cost
curve. Here, it is assumed that the regulator does know the marginal social benefit curve with
certainty but believes the marginal control cost is higher, at MCpredicted, than the actual
marginal control cost, MCactual. If an emission tax is chosen, then the regulator will set it at f
in the belief that the true equilibrium is B. The result is that instead of emissions being
reduced by qp, as expected, they are reduced by qf (again, because it is less expensive for
sources to reduce their emissions than pay the tax up to the quantity qf). Emissions are
reduced too much with a loss in social welfare of AEC.
If a permit trading system was chosen instead, the reduction target would be set at qp
with the result of too little reduction in emissions and a social welfare loss of DAB. Thus,
when the predicted marginal control cost is above the actual, the permit system results in too
little emission reduction and the emission tax results in too much reduction. The opposite
occurs when the predicted marginal control cost is below the actual marginal cost, that is, the
tax will result in too little reduction and permit trading
16 Presumably environmental regulators can also get this information but at a relatively highcost.

17
Fig. 2-3. Effect of an uncertain marginal-control cost curve on emission levels withan emission tax or permit trading (Source: Baumol and Oates, The Theory ofEnvironmental Policy, 62-63).
too much. A similar analysis can be done for the case when the marginal social-benefit curve
is different than what was predicted.17
17 Baumol and Oates (The Theory of Environmental Policy, 63-73) also note that themagnitude of distortion (welfare loss) will depend on the shape and relative slopes of themarginal cost and benefit curves.
18
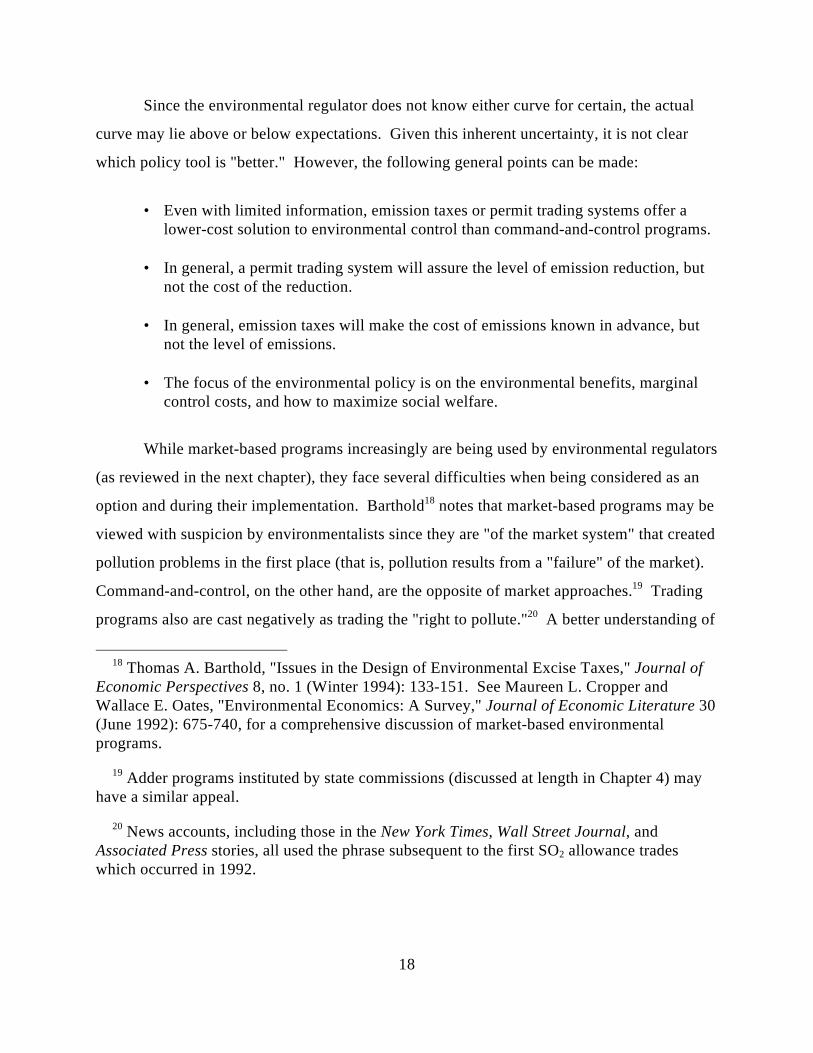
Since the environmental regulator does not know either curve for certain, the actual
curve may lie above or below expectations. Given this inherent uncertainty, it is not clear
which policy tool is "better." However, the following general points can be made:
• Even with limited information, emission taxes or permit trading systems offer alower-cost solution to environmental control than command-and-control programs.
• In general, a permit trading system will assure the level of emission reduction, butnot the cost of the reduction.
• In general, emission taxes will make the cost of emissions known in advance, butnot the level of emissions.
• The focus of the environmental policy is on the environmental benefits, marginalcontrol costs, and how to maximize social welfare.
While market-based programs increasingly are being used by environmental regulators
(as reviewed in the next chapter), they face several difficulties when being considered as an
option and during their implementation. Barthold18 notes that market-based programs may be
viewed with suspicion by environmentalists since they are "of the market system" that created
pollution problems in the first place (that is, pollution results from a "failure" of the market).
Command-and-control, on the other hand, are the opposite of market approaches.19 Trading
programs also are cast negatively as trading the "right to pollute."20 A better understanding of
18 Thomas A. Barthold, "Issues in the Design of Environmental Excise Taxes," Journal ofEconomic Perspectives 8, no. 1 (Winter 1994): 133-151. See Maureen L. Cropper andWallace E. Oates, "Environmental Economics: A Survey," Journal of Economic Literature 30(June 1992): 675-740, for a comprehensive discussion of market-based environmentalprograms.
19 Adder programs instituted by state commissions (discussed at length in Chapter 4) mayhave a similar appeal.
20 News accounts, including those in the New York Times, Wall Street Journal, andAssociated Press stories, all used the phrase subsequent to the first SO2 allowance tradeswhich occurred in 1992.

19
how markets can be created by governments to alleviate negative externalities can reduce
these misperceptions.
Another problem arises in implementing these programs when they are applied to the
price-regulated utility industry. In these cases, as with the SO2 trading market created by the
Clean Air Act Amendments of 1990, the regulatory treatment by the commissions determines
the level of the savings realized from these programs.21 Thus far, as documented previously,
commissions have yet to adjust their policies to encourage appropriate use of the SO2 trading
market (as buyers or sellers). As a result, the SO2 market has yet to be broadly utilized by
utilities and the anticipated savings has yet to be fully realized.22
The methods used to date by state public utility commissions to account for
externalities (as briefly described in Chapter 1) are substantially different than those described
above. Chapter 4 discusses, in detail, the specific determinations and procedures used by
eight states. Chapter 7 discusses the interaction between environmental and economic
regulation.
21 Kenneth Rose et al., Public Utility Commission Implementation of The Clean Air Act'sAllowance Trading Program (Columbus, OH: The National Regulatory Research Institute,May 1992), Chapters 7 and 9; Douglas R. Bohi and Dallas Burtraw, "Utility InvestmentBehavior and the Emission Trading Market," Resources and Energy 14 (1992): 129-53; andKenneth Rose, Alan S. Taylor, and Mohammad Harunuzzaman, Regulatory Treatment ofElectric Utility Clean Air Act Compliance Strategies, Costs, and Emission Allowances(Columbus, OH: The National Regulatory Research Institute, December 1993).
22 Ibid., Regulatory Treatment of Electric Utility Clean Air Act Compliance Strategies,Costs, and Emission Allowances, Chapter 2.

19
CHAPTER 3
POLICY OPTIONS FOR CONTROLLING ENVIRONMENTAL EXTERNALITIES
This chapter provides a broad survey of alternative policies being pursued or available
to environmental and utility regulators to address environmental externalities. It examines
both the movement toward requiring sources to internalize the cost of externalities through
market-based systems of environmental regulation and options available to utility regulators
for incorporating externality considerations in utility resource planning or other aspects of
utility operations.
Before many state utility commissions, the question of externality valuation has been
stalled by controversy or uncertainty regarding how to value specific externalities. If current
ambient environmental quality is to be maintained, accommodating economic growth will
likely require increasingly stringent and potentially more costly environmental controls. The
consideration of externalities, in part, involves not an issue of whether, but of when and how
environmental factors will be considered.
Energy and environmental policy typically have been fragmented, with different
organizations responsible for utility regulation and environmental protection. Also, no single
approach to externality consideration has emerged as dominant. At the state level,
environmental protection agencies have set uniform technology-based standards using limited
information regarding how to cost-effectively achieve environmental objectives. The
attention of state environmental agencies is divided among many categories of sources, types
of emissions, and air quality, water quality, and waste disposal issues. In the past, public
utility commissions typically have accepted environmental regulations as constraints, not
always inquiring as to whether environmental regulations represented the most cost-effective
way to achieve environmental quality. While in some states the emergence of facility siting
boards in the 1970s began to bring together utility and environmental regulators in the context
of permitting for specific facilities, the environmental impact of introducing the facility into
20
the existing utility system was often neglected. Historically, the environmental impacts
resulting from the operation of integrated electric utility systems, the cost-effectiveness of
controlling specific sources or of measures to reduce those impacts, and the incentives (or
disincentives) created by regulation have seldom been examined in a systematic fashion.
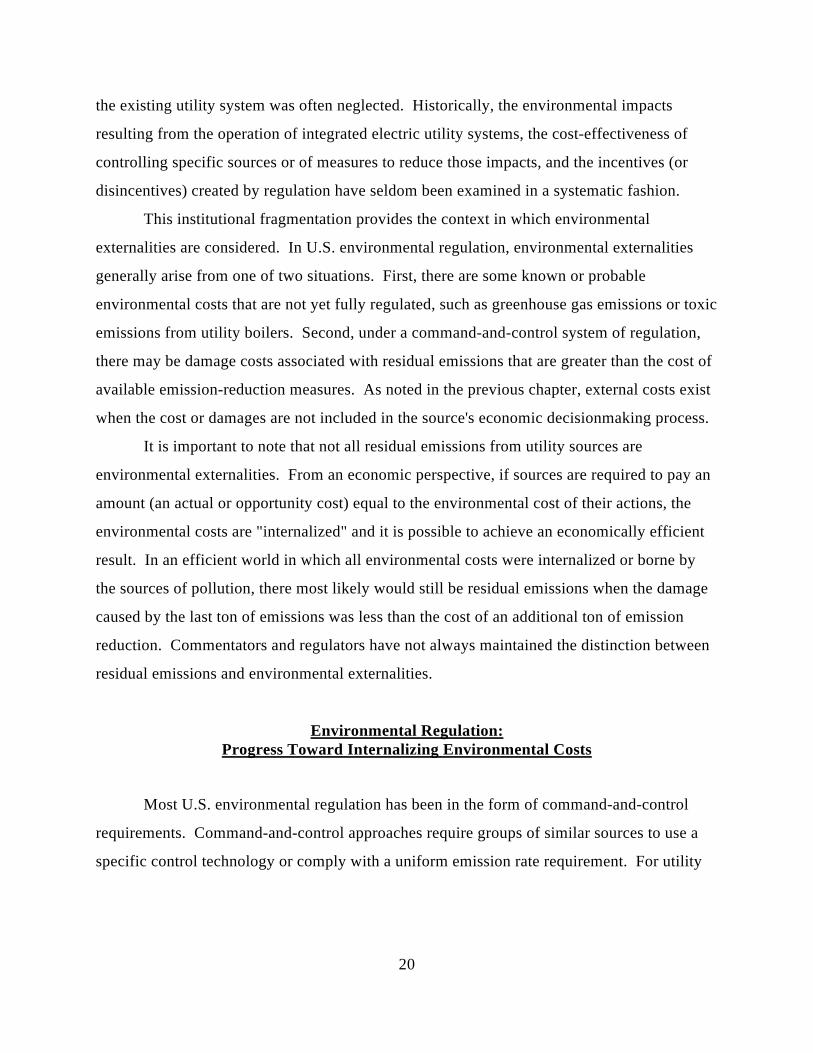
This institutional fragmentation provides the context in which environmental
externalities are considered. In U.S. environmental regulation, environmental externalities
generally arise from one of two situations. First, there are some known or probable
environmental costs that are not yet fully regulated, such as greenhouse gas emissions or toxic
emissions from utility boilers. Second, under a command-and-control system of regulation,
there may be damage costs associated with residual emissions that are greater than the cost of
available emission-reduction measures. As noted in the previous chapter, external costs exist
when the cost or damages are not included in the source's economic decisionmaking process.
It is important to note that not all residual emissions from utility sources are
environmental externalities. From an economic perspective, if sources are required to pay an
amount (an actual or opportunity cost) equal to the environmental cost of their actions, the
environmental costs are "internalized" and it is possible to achieve an economically efficient
result. In an efficient world in which all environmental costs were internalized or borne by
the sources of pollution, there most likely would still be residual emissions when the damage
caused by the last ton of emissions was less than the cost of an additional ton of emission
reduction. Commentators and regulators have not always maintained the distinction between
residual emissions and environmental externalities.
Environmental Regulation:Progress Toward Internalizing Environmental Costs
Most U.S. environmental regulation has been in the form of command-and-control
requirements. Command-and-control approaches require groups of similar sources to use a
specific control technology or comply with a uniform emission rate requirement. For utility

21
air emissions this is typically expressed in pounds of emissions per million Btu of boiler heat
input. Command-and-control regulation developed as a result of
(1) historical limitations on emissions monitoring technology, (2) fear that more sophisticated
approaches could be circumvented, and (3) the apparent administrative efficiency and fairness
of uniform standards.1 In the 1970s, there were significant questions regarding the ability to
reliably monitor emissions on a continuous basis, and to track and analyze the large volume
of data produced by Continuous Emissions Monitoring Systems (CEMS).2 Command-and-
control regulations could be enforced using periodic spot-checks to determine whether
emissions control technology was in place and operating properly. Although monitoring and
data management technology have advanced substantially over the last twenty years,
substantial portions of the regulatory system continue to follow a command-and-control
model.
Command-and-control air pollution control requirements typically must be met either
through the use of a specified fuel or by the installation of a specified combustion or
postcombustion control technology. Once these measures have been taken, there is little or
no value to the source to achieve further emission reductions through improved efficiency or
changes in operations. For an electric utility this means that the potential environmental
benefits of demand-side management, improvements in generating unit heat rate, power
purchases from cleaner sources, or emissions ("full cost") unit commitment and dispatching
are not recognized for purposes of environmental compliance. Frequently, additional
emission reductions that could be made at a marginal cost that is lower than the cost of some
required reductions and potentially lower than incremental environmental damage costs. This
is clearly not an economically efficient result.
1 For a defense of command-and-control regulation, see Latin, "Ideal Versus RealRegulatory Efficiency: Implementation of Uniform Standards and `Fine-Tuning' RegulatoryReform," Stanford Law Review 37 (1985): 1267.
2 For a history of the development of CEMS technology and requirements, see James A.Jahnke, Continuous Emission Monitoring (New York: Van Nostrand Reinhold, 1993), 1-30.
22
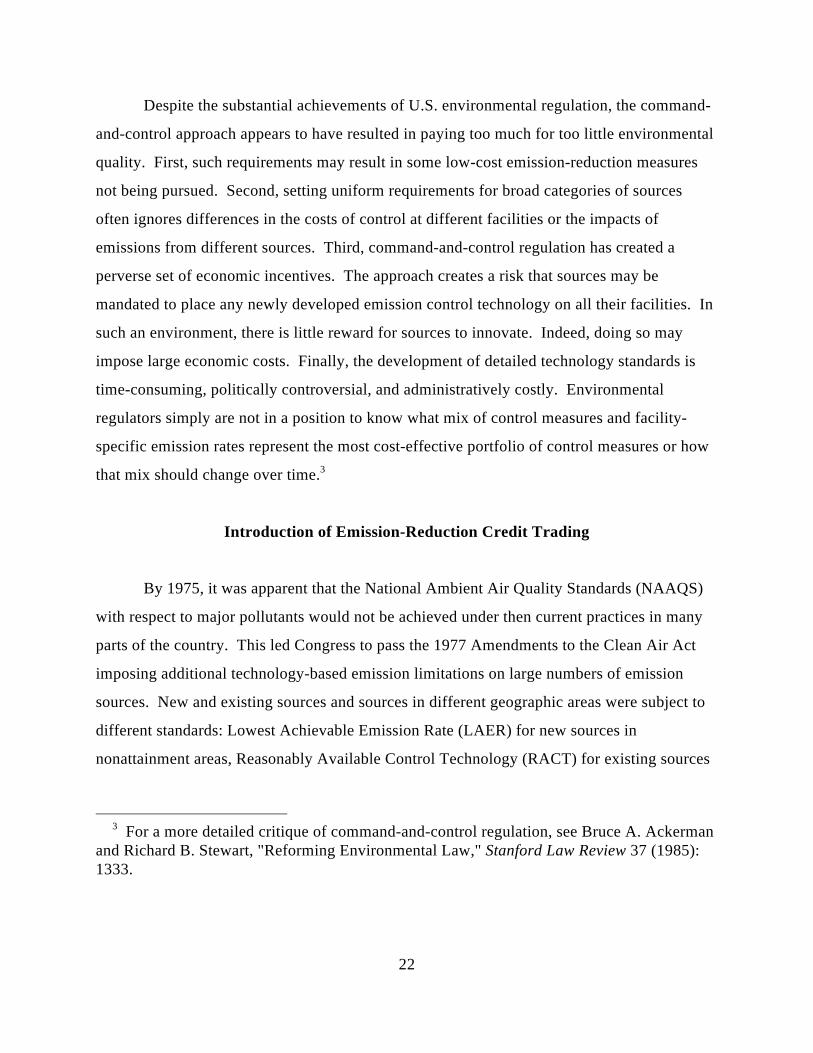
Despite the substantial achievements of U.S. environmental regulation, the command-
and-control approach appears to have resulted in paying too much for too little environmental
quality. First, such requirements may result in some low-cost emission-reduction measures
not being pursued. Second, setting uniform requirements for broad categories of sources
often ignores differences in the costs of control at different facilities or the impacts of
emissions from different sources. Third, command-and-control regulation has created a
perverse set of economic incentives. The approach creates a risk that sources may be
mandated to place any newly developed emission control technology on all their facilities. In
such an environment, there is little reward for sources to innovate. Indeed, doing so may
impose large economic costs. Finally, the development of detailed technology standards is
time-consuming, politically controversial, and administratively costly. Environmental
regulators simply are not in a position to know what mix of control measures and facility-
specific emission rates represent the most cost-effective portfolio of control measures or how
that mix should change over time.3
Introduction of Emission-Reduction Credit Trading
By 1975, it was apparent that the National Ambient Air Quality Standards (NAAQS)
with respect to major pollutants would not be achieved under then current practices in many
parts of the country. This led Congress to pass the 1977 Amendments to the Clean Air Act
imposing additional technology-based emission limitations on large numbers of emission
sources. New and existing sources and sources in different geographic areas were subject to
different standards: Lowest Achievable Emission Rate (LAER) for new sources in
nonattainment areas, Reasonably Available Control Technology (RACT) for existing sources
3 For a more detailed critique of command-and-control regulation, see Bruce A. Ackermanand Richard B. Stewart, "Reforming Environmental Law," Stanford Law Review 37 (1985):1333.
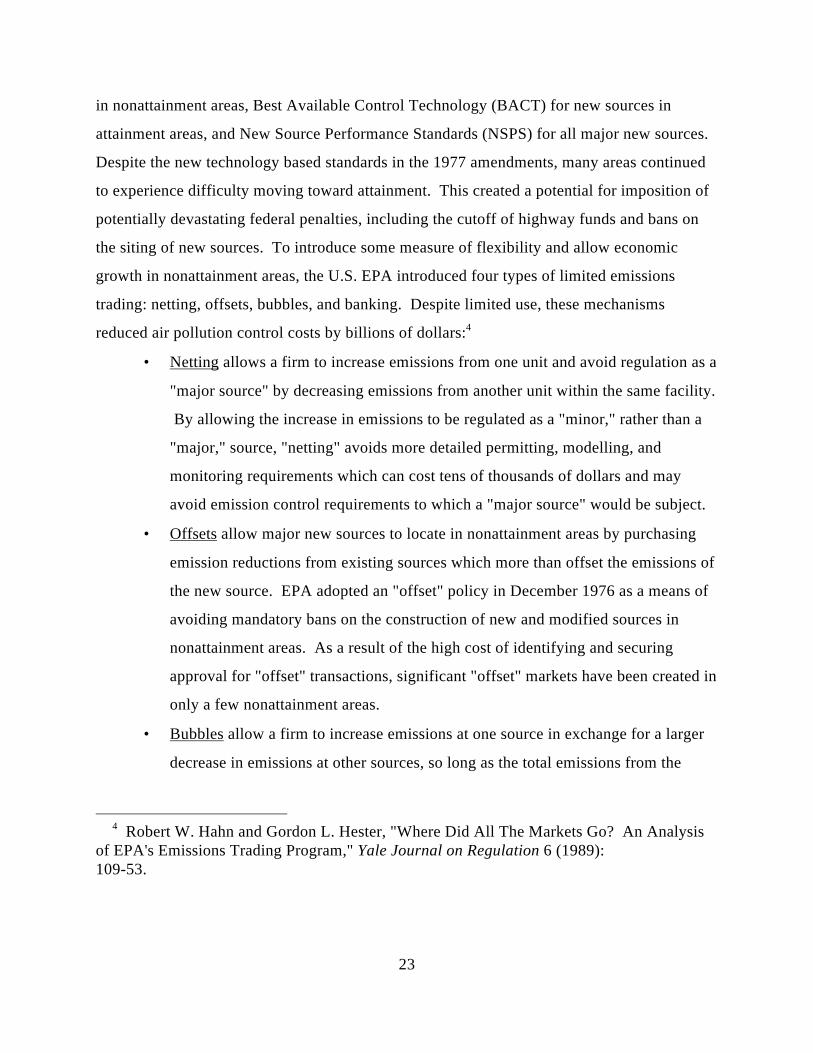
23
in nonattainment areas, Best Available Control Technology (BACT) for new sources in
attainment areas, and New Source Performance Standards (NSPS) for all major new sources.
Despite the new technology based standards in the 1977 amendments, many areas continued
to experience difficulty moving toward attainment. This created a potential for imposition of
potentially devastating federal penalties, including the cutoff of highway funds and bans on
the siting of new sources. To introduce some measure of flexibility and allow economic
growth in nonattainment areas, the U.S. EPA introduced four types of limited emissions
trading: netting, offsets, bubbles, and banking. Despite limited use, these mechanisms
reduced air pollution control costs by billions of dollars:4
• Netting allows a firm to increase emissions from one unit and avoid regulation as a
"major source" by decreasing emissions from another unit within the same facility.
By allowing the increase in emissions to be regulated as a "minor," rather than a
"major," source, "netting" avoids more detailed permitting, modelling, and
monitoring requirements which can cost tens of thousands of dollars and may
avoid emission control requirements to which a "major source" would be subject.
• Offsets allow major new sources to locate in nonattainment areas by purchasing
emission reductions from existing sources which more than offset the emissions of
the new source. EPA adopted an "offset" policy in December 1976 as a means of
avoiding mandatory bans on the construction of new and modified sources in
nonattainment areas. As a result of the high cost of identifying and securing
approval for "offset" transactions, significant "offset" markets have been created in
only a few nonattainment areas.
• Bubbles allow a firm to increase emissions at one source in exchange for a larger
decrease in emissions at other sources, so long as the total emissions from the
4 Robert W. Hahn and Gordon L. Hester, "Where Did All The Markets Go? An Analysisof EPA's Emissions Trading Program," Yale Journal on Regulation 6 (1989):109-53.

24
covered facility(ies) do not exceed the sum of all the sources' individual emission
limits. Only a small number of approved "bubbling" transactions have involved
trades between different facilities. Frequent changes in EPA's "bubble" policy and
the resulting uncertainty have discouraged extensive use of this mechanism.
• Since 1979, EPA had allowed states to establish emission banking programs,
enabling firms to save emission-reduction credits. There has been relatively little
activity in formal "banking" programs, although more extensive informal
"banking" has occurred in some jurisdictions.
Each of these programs resulted in the creation and trading or banking of "Emission-
Reduction Credits" (ERCs). The creation and transfer of such credits are subject to prior
regulatory approval. To receive certification, an emission reduction was required to be
surplus to that required to meet existing requirements, enforceable by state and federal
authorities, permanent, and quantifiable in comparison to an established level of baseline
emissions.5 The cost and difficulty of securing regulatory approval have substantially limited
the creation and transfer of emission-reduction credits. Trading applications have required
costly air modelling, months to be approved, and rigorous regulatory and public review.
Litigation regarding EPA's authority to allow trading and a lack of market mechanisms to
efficiently identify trading partners also contributed to relatively limited use of these
mechanisms.6 It should be noted, however, that the emergence of emission brokers has
created more effective markets for ERCs in some airsheds in the last few years.
Emission Caps in the South CoastAir Quality Management District (SCAQMD)
5 51 Federal Register, 43829 (December 4, 1986).
6 For a history and economic analysis of ERC trading programs, see T. H. Tietenberg,Emissions Trading and Exercise in Reforming Pollution Policy (Washington, D.C.: Resourcesfor the Future, Inc., 1985).

25
Prior to passage of the 1990 Clean Air Act Amendments, environmental regulators in
Southern California's SCAQMD began developing programs to address the area's extreme
ozone problems by providing utility sources with greater compliance flexibility. Relying on
state statutory authority, SCAQMD implemented a utility NOx cap in August 1989. A cap
establishes a quantity limitation or average emission rate for a firm or select group of sources,
but does not permit trading with sources outside the bubble covering the firm or group.
SCAQMD Rule 1135 establishes system-wide NOx caps for utility emissions from
Southern California Edison, the Los Angeles Department of Water and Power, and the cities
of Burbank, Glendale, and Pasadena.7 The rule contains three NOx emission limitations.
First, it sets declining maximum daily NOx emission rates expressed in pounds of emissions
per net megawatthour (MWh) of generation for the total utility system generation in the
SCAQMD area. This limitation is daily because the residence time of NOx emissions in the
air basin is short. Because total or average district-wide rates are utilized, the utility can
adjust its generation and power purchases to meet this limit. Moreover, because the emission
rate is expressed in pounds per net MWh, improvements in unit heat rate can contribute to
meeting the requirement. Second, the rule imposes on Southern California Edison and the
Los Angeles Department of Water and Power (effective on December 31, 1999) and on the
cities of Burbank, Glendale, and Pasadena (effective December 31, 1989) a maximum daily
total number of pounds of NOx emissions. Third, beginning in 2000, each of these systems
also will be limited to a maximum annual tonnage of NOx emissions. The rule also permits
the municipal facilities (Los Angeles Department of Water and Power and the cities of
Burbank, Pasadena, and Glendale) the option of linking their power systems to form a
municipal bubble with shared daily emission limitations. Southern California Edison is not
permitted to participate in the municipal bubble.
7 SCAQMD, Rule 1135. Emissions of Oxides of Nitrogen from Electric Power GeneratingSystems, Adopted August 4, 1989, Amended December 21, 1990 and July 19, 1991.

26
Development of the 1990 Clean Air Act Amendments
During the 1980s, a number of researchers completed studies that found that
command-and-control approaches to regulating various pollutants were producing control
costs ranging from nearly double to twenty-two times that which would be expected from an
efficient market-based system of regulation achieving the same degree of emission reduction.8
Such findings led policymakers to examine the potential of market-based systems of
environmental regulation to reduce compliance costs and provide greater assurance of
environmental quality. The 1990 Clean Air Act Amendments include two fundamental
market-based reforms: the Title IV Acid Deposition Control SO2 Allowance Program and the
Title I Economic Incentive Program.
1990 Clean Air Act Amendments: Title IV SO2 Allowances
Electric utilities are planning and implementing strategies to comply with the SO2
Allowance Program contained in Title IV of the 1990 Clean Air Act Amendments.9 Under
Title IV, 263 units at 110 named generating plants will become subject to SO2 emission-
allowance limitations during phase I, which begins in 1995. Virtually all existing commercial
electric generating facilities in the continental U.S. will be subject to phase II, which begins in
8 For a review of a series of studies, see Tietenberg, Emissions Trading and Exercise inReforming Pollution Policy. With respect to acid rain control, see also ICF Resources, Inc.,Economic, Environmental, and Coal Market Impacts of SO2 Emissions Trading UnderAlternative Acid Rain Control Proposals, prepared for The Office of Policy, Planning andEvaluation, U.S. Environmental Protection Agency (Fairfax, VA: ICF Resources, Inc., March1989).
9 42 U.S.C. § 7651 et seq. (1990); 40 C.F.R. Parts 72-75. An overview of the allowancesystem is in Chapter 1 of K. Rose, R. E. Burns, J. S. Coggins, M. Harunuzzaman, and T. W.Viezer, Public Utility Commission Implementation of the Clean Air Act's Allowance TradingProgram (Columbus, OH: The National Regulatory Research Institute, 1992).
27
year 2000. Title IV is designed to achieve a 10-million-ton reduction in SO2 emissions from
1980 levels. During phase II, the Act sets a permanent ceiling of 8.95 million allowances on
total annual allowance allocations to utilities. An allowance is a limited right to emit a single
ton of SO2 either during the year for which the allowance is issued or, if banked and not used,
during any subsequent year. Allowances will be allocated to affected units based upon their
historical fuel usage and emission rates. Emissions at affected sources will be tracked through
the use of CEMS and the reporting of quality assured data. Emissions in excess of a source's
available allowances will result in a reduction in the allowances allocated in the next
subsequent year, a $2,000-per-ton penalty, and potential criminal prosecution. Additional
sources may "opt-in" to the allowance system.
The allowance system is a fundamental departure from past air quality regulation.
Subject to limited exceptions, allowances are a fungible commodity which can be traded
between utilities in different states or banked for future use. To date, over $125 million in
allowances have been traded.10 Each allowance has a distinct serial number to facilitate
trading and accounting. Allowances may not be used prior to the year for which they are
issued, but trading in future year allowances is permitted. U.S. EPA sponsors an annual
allowance auction to ensure liquidity in the market and private brokers offer computer bulletin
board services to facilitate trading.
The allowance system internalizes the acid deposition costs of SO2 emissions by
attaching potential economic value to each ton of emissions. For every ton of emissions, the
utility either must pay to acquire an allowance, or suffer an opportunity cost, in that, in the
absence of the emissions, the utility would be in a position to sell allowances.
10 M. Murray, "Dealing in Dirt," California Lawyer (December 1993): 24. However, itshould be noted that the cost and price in most allowance transactions have not beendisclosed. Also, not all transactions have been made public. Thus, this number maysignificantly understate the market activity. A review of the allowance market as ofDecember 1993 is in Chapter 2 of K. Rose, A. S. Taylor, and M. Harunuzzaman, RegulatoryTreatment of Electric Utility Clean Air Act Compliance Strategies, Costs, and EmissionAllowances (Columbus, OH: The National Regulatory Research Institute, 1993).

28
The allowance system constitutes a fundamental change in environmental compliance.
First, the allowance system makes it possible to use a range of pollution prevention and
control measures that would not be recognized under traditional command-and-control
regulations, including emission reductions achieved through changes in unit commitment and
dispatch, conservation programs, power purchases, improvements in unit heat rates, and
enhancements to transmission and distribution efficiency. Second, it places responsibility for
selecting the most cost-effective mix of compliance strategies on utility planners, subject to
review by state utility regulators.11 Third, as allowance trading develops, the market price of
allowances should drive utility compliance and operating decisions. For example, algorithms
for unit commitment and dispatch that incorporate the value of emission allowances will
become the least-cost approach to dispatching generation. Also, utilities are expected to
select strategies by comparing the incremental cost of each ton of emission reduction
associated with a given strategy to the market price for emission allowances. This should
shift compliance activities around the country to the utility systems and facilities where
reductions can be most economically achieved. Finally, the opportunity to achieve gains by
selling allowances could provide an ongoing economic incentive to develop less costly means
of emissions control.12 The U.S. EPA has estimated that savings from the allowance system
could exceed one billion dollars per year.
1990 Clean Air Act Amendments:Title I Economic Incentive Programs
11 The economic regulation of utilities, however, can distort the utility's decisionmakingprocess away from the most cost-effective compliance strategies. See Rose et al., PublicUtility Commission Implementation, Chapters 7 and 9; or Ibid., Regulatory Treatment ofElectric Utility Clean Air Act Compliance Strategies, Costs, and Emission Allowances.
12 See P. Centolella, "Securing the Benefits of Market-Based Environmental Regulation,"The New Clean Air Act: Compliance and Opportunity, R. Lock and D. Harkawik, eds.(Arlington, VA: Public Utilities Reports, Inc., 1991).
29
The 1990 Clean Air Act Amendments also authorize the inclusion in Title I State and
Federal Implementation Plans (SIPs and FIPs) of Economic Incentive Programs (EIPs),
including emission fees, emission-allowance systems, and other economic incentives for
achieving emission reductions. Title I includes detailed provisions that rely partly on
economic incentives to address one of the most intractable air quality problems: urban smog,
the result of tropospheric ozone (O3) formation. O3 is formed in a photochemical reaction
involving two precursors: NOx and VOCs. Despite a 10 percent reduction in total VOC
emissions and a 30 percent decline in VOC emissions from mobile sources, in the decade
following the 1977 Clean Air Act Amendments only limited progress had been made toward
the achievement of O3 standards. For 1988, U.S. EPA estimated that more than 100 cities,
containing nearly half of the U.S. population, experienced one or more violations of the O3
standard.13 As a result of that experience and a series of modelling studies, the 1990
Amendments placed increased emphasis on strategies that combined NOx and VOC
reductions. Electric utilities account for 32 percent to 35 percent of U.S. NOx emissions and a
small fraction of VOC emissions.14
Title I establishes a five-step system of classifying O3 nonattainment areas; each more
severe classification is subject to cumulative or more stringent controls. The Act requires
serious or severe areas that are unable to achieve emission-reduction milestones to bump up to
higher classifications, adopt contingency measures, or implement EIPs.15 In extreme
nonattainment areas, adoption of incentive programs is mandatory in the event of a failure to
achieve any emission-reduction milestone.16 The philosophy of Title I is that when
13 U.S. Environmental Protection Agency, National Air Quality and Emissions TrendsReport, 1988, Office of Air Quality Planning and Standards, No. EPA-450/4-90-002 (March,1990).
14 National Research Council, Rethinking the Ozone Problem in Urban and Regional AirPollution (Washington, D.C.: National Academy Press, 1991).
15 42 U.S.C. §7511a(g)(3).
16 42 U.S.C. §7511a(g)(5).

30
prescriptive measures may be inadequate or inefficient air quality agencies should rely on
EIPs.
The 1990 Amendments generally authorized the use of EIPs in state implementation
plans17 and specifically for nonattainment areas.18 The U.S. EPA has issued rules governing
EIPs that allow states substantially greater flexibility than the prior EPA emissions trading
policies which governed ERC trading programs. The rules require the EIPs to be state and
federally enforceable, nondiscriminatory, and consistent with timely attainment of air quality
standards and other requirements of the Act. Additionally, programs for nonattainment areas
for which credit is taken in an attainment demonstration must have quantifiable impacts, that
is, surplus to those of other regulations credited in such demonstrations.19 Areas with
significant O3 nonattainment problems are beginning to examine the possibility of
implementing EIPs with respect to NOx, and possibly VOC, emissions.
Economic incentive programs for NOx control have the potential to accelerate the
achievement of environmental objectives while substantially reducing the cost of emission
control for electric utilities and other sources. First, an effective EIP may make it possible to
avoid an expensive second stage of RACT requirements at existing units. The RACT
standards, which are projected to be necessary in New England and other serious
nonattainment areas, in the absence of an effective EIP, include at least the combination of
low NOx burners and selective noncatalytic reduction technology.20 New England Electric
17 42 U.S.C. §7410(a)(2)(A).
18 42 U.S.C. §7502(c)(6).
19 Final Rule and Guidance, 59 Federal Register, 16690 (April 17, 1994).
20 Ozone Transport Commission, OTC Memorandum of Understanding on the Need toReduce Stationary Source NOx Emissions and Activities to Develop Technical Support forRegulatory Development (Washington, D.C.: Ozone Transport Commission, March 10,1992); Northeast States for Coordinated Air Use Management, NESCAUM Stationary SourceCommittee Recommendation on NOx RACT for Utility Boilers (Boston, MA: NESCAUM,March 25, 1992).

31
Power recently agreed to install this combination of technologies at its 750 MW Salem
Harbor plant at a capital cost of $25 million, with expected operating costs of $3 to $5 million
per year. Considering the total annual reduction in NOx emissions, the utility expects the
combined cost to be about $2,000 per ton of NOx removed.21 Second, an EIP could take a
seasonal approach, recognizing that NOx contributes to O3 formation only during warm,
sunny summer months, and at specific relative concentrations of NOx and VOC emissions. Of
the fifty-five areas which exceeded the O3 standard during the period of 1989 through 1991,
only six did so on more than ten days per year.22 Third, incentive programs might take
advantage of geographic differences in the contribution of NOx emissions to ozone formation.
Utilities could be encouraged to simply shift generation away from urban areas during
periods of high O3 formation.
Illinois Title I NOx EIP Proposal
In September 1993, the Illinois Environmental Protection Agency released for public
comment a draft proposal for a NOx emissions trading system for northeastern Illinois.23 The
proposal was the product of a collaborative design team that included representatives of the
Illinois EPA, Commonwealth Edison, and the Environmental Defense Fund. All or portions
of eight counties in northeastern Illinois, which are classified as severe ozone nonattainment
areas, would be included in the program.
21 "New England Power to Cut Salem Unit NOx Using Experimental Process," UtilityEnvironment Report (November 27, 1992), 15-16.
22 U.S. Environmental Protection Agency, "EPA Data Show Steady Progress in CleaningNation's Air," EPA Environmental News (October 19, 1992).
23 "Draft Proposal: Design for NOx Trading System," Unpublished paper, Illinois EPA,September 22, 1993, Chicago, Illinois.
32
The Illinois draft proposal would create a seasonal NOx marketable permit program
from May 1 through September 15, based on the occurrence of ozone exceedances in Chicago
and downwind nonattainment areas. The proposal recommends that emission units that emit
at five or more tons per season, located at stationary sources emitting twenty-five tons or
more per season, be required to participate in the program. Such sources account for over 86
percent of stationary source NOx emissions during the four and one-half month ozone
season.24 Smaller sources would be allowed to opt into the program. Additionally,
mechanisms would be considered to give credit for old car scrappage programs or the
accelerated use of clean fuels in vehicle fleets. Seventy-one percent of NOx emissions in the
region are from mobile sources, while only 27 percent originate at stationary point sources.25
The proposal would establish the Northeast Illinois Clean Air Market (NICAM).
Affected sources would be able to exchange NOx Trading Units (NTU), with each NTU equal
to 200 pounds of NOx emissions. An NTU could be banked from year to year for up to three
ozone seasons. The Illinois EPA would establish a market exchange system in which
participating sources, brokers, and other parties could open accounts and engage in trading
activity. Although an NTU could not be used prior to the season for which it was issued,
trading in future-year NTUs would be permitted. The Illinois EPA also would establish a
regular account monitoring and review system to protect against improper activities. To
ensure market liquidity, a portion of the NTUs would be set aside and sold at auction each
year.
Beginning in 1997, each affected source would be allocated NTUs and be expected to
have sufficient NTUs to cover its seasonal NOx emissions. Allocations would be based on a
fixed percentage of emissions during a baseline period, such as 1992 through 1995. The
allocation of NTUs would decline from year to year based on the total NOx reduction that is
necessary to achieve emission-reduction milestones and attainment by the year 2007. This
24 Ibid.
25 Ibid.

33
deadline is set by the 1990 Clean Air Act Amendments, and the required reduction will be
based on air quality modelling for the Illinois EPA's attainment demonstration.

34
Many of the sources covered by the proposal could be required to install CEMS under
a pending U.S. EPA rulemaking on enhanced monitoring. Until the federal rule is final, the
proposal does not address how monitoring will be addressed at smaller sources that may not
be required to install CEMS.
A second unresolved issue is the disposition of NTUs from inactive or shutdown
sources. One option under consideration is that such NTUs could be retained by the state and
used in a community bank to facilitate economic development.
The Illinois proposal could have a significant effect on reducing utility NOx control
costs. Eight of the sixty-three sources which would be required to participate are utility power
plants. These eight sources together account for 57 percent of the seasonal emissions from all
sources covered by the program.
SCAQMD's RECLAIM Program
In October of 1993, SCAQMD also adopted its Regional Clean Air Incentives Market
(RECLAIM) program.26 RECLAIM is an emissions trading program for NOx and SO2
emissions covering most major stationary sources in the South Coast Air Basin. Electric
generation is included in the RECLAIM NOx program, but due to Title IV it is not included in
the RECLAIM SO2 trading program. Under each program, affected sources receive annual
allocations of RECLAIM trading credits (RTCs). The credits are denominated in pounds of
emissions in a given year and expire at the conclusion of that year. Credits may be transferred
from source to source, provided that the transfer applies to the current compliance year the
seller indicates that the RTC has become available. The RTC must become available as a
result of (1) process change,
(2) addition of control equipment, (3) production decrease, (4) equipment or facility
26 SCAQMD, Regulation XX, Rule 2000, et seq.

35
shutdown, or (5) if the seller is not a RECLAIM facility, the cause has been previously
reported. To ensure enforcement, the rule provides for continuous emissions monitoring and
administrative penalties. The district maintains a listing of the ownership of trading credits.
Sources must report emissions and a reconciliation with trading credit holdings on a quarterly
and annual basis. The rule also provides that emission-reduction credits and external offsets
may be recognized in the allocation of RTCs. Also, the rule allows for the generation of
trading credits through mobile source programs to scrap older high-emitting automobiles.
Northeast States for Coordinated Air Use Management NOx Proposal
A proposal for a regional NOx cap or system of NOx caps, structured as a marketable
permit system, is under consideration by the Northeast States for Coordinated Air Use
Management (NESCAUM). NESCAUM is the regional air policy support and coordination
agency for air regulators in the states of Connecticut, Maine, Massachusetts, New Hampshire,
New Jersey, New York, Rhode Island, and Vermont. Since April 1992, NESCAUM has been
exploring the feasibility of a multistate, market-based emissions trading program which could
include elements from the federal Title IV SO2 emission-allowance system, the South Coast
Air Basin's utility-wide NOx cap system, and SCAQMD's RECLAIM program. NESCAUM
is investigating a market-based NOx regulation because it offers increased certainty of
achieving emission reductions, greater flexibility for sources in meeting reduction targets to
choose the lowest-cost option available, and the potential for incidental reductions in
emissions of SO2, particulates, air toxics, and CO2 by encouraging energy conservation and
fuel switching. NESCAUM is currently undertaking a study to address technical and policy
issues including the determination of baseline emissions, the number and types of sources to
be included, the geographic scope of the system, and the administrative procedures necessary
to administer a multistate trading system and integrate such a system into permits and state

36
implementation plans.27 The specific structure of the NESCAUM plan has not yet been
determined.
Other Potential Applications of NOx EIPs
NOx EIPs similar to those being implemented in the South Coast Air Quality
Management district and under consideration in Illinois and the Northeast could largely
internalize the environmental costs of NOx emissions associated with ozone nonattainment.
Other serious and severe O3 nonattainment areas that could consider this approach include:
other portions of central and southern California; southeastern Texas; the New Orleans
metropolitan area; southeastern Wisconsin and western Michigan; the Atlanta metropolitan
area; and the remainder of the Northeast Ozone transport region, which includes the states of
Delaware, Maryland, and Pennsylvania and the District of Columbia metropolitan area. NOx
EIP is particularly attractive because it offers a potentially less costly strategy than the
alternative of a second phase of RACT standards on all existing sources, which otherwise
could be required under the 1990 Clean Air Act Amendments.
Market-Based Regulation and Greenhouse Gases
Because greenhouse gases are a uniformly mixed global pollutant, there has been
substantial interest in using market-based approaches in structuring any greenhouse gas
reduction program. The international Framework Convention on Climate Change28 authorizes
joint implementation that could develop into a system of emissions trading at an international
27 NESCAUM, Development of a Market-Based Emissions Cap System for NOx in theNESCAUM Region: Project Summary for Section 105 State Air Grant Funds for Market-Based Initiatives (Boston, MA: NESCAUM, September 1992).
28 This is an agreement signed by 161 countries at the Earth Summit held in 1992 in Rio deJaneiro, Brazil.

37
level. In its initial 1993 budget proposals, the Clinton Administration proposed the use of
energy taxes to partially internalize the risks associated with growing atmospheric
concentrations of greenhouse gases. Although these proposals were not accepted in the 1993
budget package, the Administration has articulated an objective of stabilizing greenhouse gas
emissions at 1990 levels by the end of the decade and is negotiating a series of voluntary
reduction agreements with utilities under its Climate Challenge program.29 In part, to provide
a basis for recognizing current greenhouse gas reductions in any future mandatory control
program, Section 1605 of the 1992 Energy Policy Act creates a database to track and allow
for voluntary reporting of activities leading to reductions in greenhouse gas emissions. The
U.S. Department of Energy is currently developing protocols for such reporting. Other
functions of Section 1605 include providing public recognition for reduction activities, social
learning regarding activities being pursued, and evaluation of progress toward greenhouse gas
stabilization.
Regulation: Options for Improving Consideration ofEnvironmental Externalities and Internalizing Environmental Costs
In Chapter 1, this report described how utility regulators to date have relied on
qualitative consideration or adders to take externalities into consideration in reviewing utility
resource plans and have seldom considered externalities outside of the resource planning and
procurement process. In the next chapter, detailed case studies regarding how externality
considerations have been implemented in eight states are provided. In other portions of the
report, limitations of the adder approach and of limiting consideration of externalities to
resource planning are discussed. In this section, policy options that may be available to utility
regulators, other than adders or qualitative consideration in resource planning, that could
29 For a comprehensive overview of programs to encourage voluntary greenhouse gasreductions, see Climate Change Action Plan (Washington, D.C.: Office of the President,1993).

38
improve commission practices are discussed. For example, by utilizing the environmental
performance standard option discussed below, utility regulators could achieve many of the
economic efficiencies inherent in the market-based systems of environmental regulation
discussed in the preceding section.
Some commissions have adopted relatively high adder values based on the cost of
complying with command-and-control requirements, but have applied those values only to the
planning and acquisition of new resources. Applied in this context, adders have limited
impact on near-term costs and emissions. Moreover, when major new resources are needed,
such adder values may not accurately reflect the damage which would be caused by residual
emissions. It should be remembered that command-and-control environmental standards,
such as LAER (applied to new units in nonattainment areas), are designed not only to achieve
emission objectives, but also to allocate costs between new and existing units. Indeed, new
units in nonattainment areas may be required to meet both LAER emission rates and purchase
offsets for their residual emissions at a greater than one-to-one ratio. In this case, a more
stringent LAER standard implies that fewer offsetting emission reductions would be
purchased and area emissions could be higher than would occur under a less stringent LAER
standard.
While a great deal of attention has been given to the development of adder values in
resource planning, it is often overlooked that there are relatively inexpensive pollution
prevention and emission-reduction measures which are not addressed either by adders as
currently applied or by command-and-control environmental regulation. Because command-
and-control, which continues to be the dominant form of environmental regulation for most
pollutants, requires only that a particular technology or emission rate (for example, pounds
per mmBtu) standard be met, measures such as changes in unit commitment and dispatch,
heat rate improvements, or demand-side management (both conservation and replacement of
fossil fuel end uses with more efficient electrotechnologies) are neither recognized nor
encouraged by most environmental regulations. In many cases, such measures could provide
a significant, immediate environmental improvement at an incremental cost below even

39
conservative estimates of the environmental damages associated with residual utility
emissions.
One of the best options available to utility regulators is to work with environmental
regulators to support the development of market-based systems of environmental regulation.
However, it is not always possible to rely solely on environmental regulators adopting
market-based systems which will efficiently internalize environmental costs. Environmental
regulators work within a comparatively inflexible framework for developing and
implementing state implementation plans for meeting emission-reduction milestones and
ambient air quality standards. Environmental regulators, burdened with implementing
statutory command-and-control requirements for thousand of sources, may find it difficult to
develop a new framework for regulation. In an ideal situation, utility and environmental
regulators would closely coordinate their polices selecting the mix of policy options which
most effectively balances reducing environmental risks and limiting emission-reduction costs.
However, given environmental regulation by command-and-control standards, utility
commissions may wish to encourage adoption of inexpensive measures with incremental
costs less than the damage costs associated with residual emissions.
This section identifies policies which could be used to encourage the adoption of such
measures or to build consensus regarding preferred economic and environmental strategies. It
can be difficult and costly to develop comprehensive and reliable damage-cost assessments.
However, even a less than comprehensive assessments may identify minimum values with an
acceptable degree of reliability. This section also identifies on-going efforts to improve and
implement damage costing methodologies.
Again, it is important that regulators place the issue of externalities into perspective.
Not all residual emissions are externalities and not all externalities have a value sufficient to
significantly change utility resource planning or operational practices. To date, it has
primarily been externality valuations associated with SO2, NOx, and CO2 that have appeared
to be significant for utility resource planing purposes. Market-based systems of regulation
already are beginning to internalize the acid deposition impacts of utility SO2 emissions and

40
are being developed in several states and regions for NOx emissions. Utility greenhouse gas
emissions (and in some parts of the country NOx emissions) continue to present significant
externality issues. Following the completion in 1993 and 1994 of U.S. EPA studies related to
utility emissions of air toxics and mercury,30 air toxics also may become a significant issue.
Other issues, such as electromagnetic fields, water use, impacts on endangered species, or
effects on scenic, historic, or cultural sites may continue to be significant, primarily at a
regional, site, or project-specific level. By focusing on the significant utility system impacts
of key environmental pollutants (or fuel cycle impacts where data are available), utility
regulators can have a meaningful impact on improving environmental quality and reducing
possible future control costs.
The options examined in this section include:
• Improved Damage Cost Assessments. Damage cost assessment may provide a
reasonable floor for estimating externality costs. The results of damage cost
assessments may be used in setting adders, case-by-case trade-off analysis, or in
internalizing environmental costs through performance standards.
• Multi-Attribute Trade-Off Analysis. In the absence of consensus regarding
environmental valuation, it can be useful to examine the frontier of tradeoffs
among a variety of policy options. This may occur either in the context of
selecting among specific resource alternatives or in designing a performance
standard to more fully internalize externality costs.
• Environmental Performance Standards. By extending incentive regulation to
environmental practices, utility regulators lead utilities to act as if environmental
costs were internalized. Such an approach may be applied either to specific
30 42 U.S.C. § 7412 (m) and (n).

41
environmental issues, such as enforcement of utility Climate Challenge
commitments or to a broader index of utility environmental performance.
• Green Pricing. Green pricing tariffs provide environmentally-conscious
consumers the option to pay a premium rate in return for additional investments in
renewable or other environmentally benign resources.
Improved Damage Cost Assessment
Comprehensive damage cost valuation represents a preferred approach to valuing
environmental externalities. However, developing complete damage cost assessments is a
difficult process. The path of damages must be traced through consecutive steps:
• A geographic and time-specific inventory of emissions;
• a representation of the dispersion of emissions in space and time;
• determination of chemical reactions generated by emissions in the environment;
• identification of the populations of humans, plants, animals, and materials affected
by the emissions and their chemical products;
• for each of these populations, determination of a dose-response relationship; and
• for each response, a valuation of significant impacts.
There are a number of efforts under way to make or improve damage cost assessments.
In addition to the New York study described in the next chapter, three other efforts deserve
specific mention.
• The California Energy Commission developed an Air Quality Valuation Model.
The model uses a damage function approach to translate emissions from electric
42
supply options at various locations into specific air quality impacts. Results from
initial analyses were included in the Energy Commission's 1992 Electricity Report.
Additional work is now under way to include acid deposition, ecosystem effects,
mobile source emissions, environmental impacts on water quality and biological
resources, and hazardous wastes.
• In preparation of a Draft Environmental Impact Statement (DEIS) for its resource
programs, Bonneville Power Administration conducted a series of studies to
estimate damage costs associated with specific resource options.31 Separate
studies of air quality and visibility effects, human health effects, and ecological
effects were conducted to produce the original physical effects data needed to
evaluate the impacts of different power generation scenarios. The physical effects
data were then incorporated into an economic analysis, combining price data for
market goods, such as crops, with values produced by contingent and hedonic
valuation studies for nonmarket goods, to calculate the total cost associated with
the environmental effects of each of the alternatives. Contingent valuation
analysis estimates the economic value of health and environmental risks based on
survey respondents' reported willingness to pay to avoid those risks. Hedonic
valuation measures the values implicit in differences in the observed market value
of otherwise similar employment opportunities, goods, and services. The basic
techniques used in the DEIS to value environmental impacts were market prices
for traded goods, contingent valuation, hedonic wage, hedonic property value, and
travel cost methods. Among the specific environmental impacts valued were
human health effects, visibility, crop reductions, wildlife impacts, impacts on
forest recreation areas, and impacts on recreational fishing.
31 Bonneville Power Administration, U.S. Department of Energy, Draft EnvironmentalImpact Statement Resource Programs, DOE/ERS-0162 (Portland, OR: Bonneville PowerAdministration, March 1992).
43
• Examining a potentially broader range of impacts, the U.S. Department of Energy
and the Commission of the European Communities are evaluating the external
costs and benefits associated with the major fuel cycles involved in energy
production. The purposes of the study are to (1) create a unified conceptual design
for quantifying the various costs and benefits associated with the production and
consumption of energy from different fuel sources,
(2) demonstrate an accounting framework that can be used to estimate the static
measures of a broad range of costs that result from the incremental use of different
fuel types and use this information in comparative analysis, and
(3) identify critical methodological issues and information needs that will affect
expanded efforts to develop comprehensive assessments of the costs of energy use.
The objective is to develop a damage function approach which will estimate the
damage or aggregate willingness to pay for avoiding a given set of environmental
impacts associated with the development of a new electric generation facility.
This study is unique because it considers the entire fuel cycle from resource
extraction, through energy conversion, to waste disposal. Background information
regarding the approach and issues which would be addressed in the studies is
currently available, although the specific methodologies and valuations remain
under development.32
As these and similar efforts, including those under way in New York and Wisconsin, are
completed, substantially improved data and accounting methodologies should become
available for making damage cost assessments.
32 Oak Ridge National Laboratory and Resources for the Future, U.S./EC Fuel Cycle Study:Background Document to the Approach and Issues, Report No. 1 on the External Costs andBenefits of Fuel Cycles: A Study by the U.S. Department of Energy and the Commission of theEuropean Communities, ARNL/M-2500, DE93 004291 (Oak Ridge, TN: Oak Ridge NationalLaboratory and Resources for the Future, November 1992).

44
Building Consensus: Multi-Attribute Trade-Off Analysis
In the absence of reasonable consensus regarding externality valuations, how can
regulators, utilities, and other affected parties identify and seek consensus regarding the
acquisition of specific resources or an environmentally conscious resource strategy? One
approach is to: (1) analyze a number of resource alternatives under a range of possible future
scenarios; (2) identify those options that offer the lowest cost for different levels of emissions
(so as to define an efficient trade-off frontier between direct costs and environmental quality);
and (3) identify preferred strategies that robustly appear on the efficient trade-off frontier
under a variety of conditions. This approach to negotiation and decisionmaking under
uncertainty is called scenario-based multi-attribute trade-off analysis.33 Multi-attribute
analysis focuses attention on tradeoffs among economic, environmental, and/or other
attributes by analyzing the performance of multiple strategies under a range of future
scenarios (for example, high and low oil prices, load growth, or partial environmental
valuations) and applying carefully constructed rules to identify strategies and develop optimal
trade-off frontiers (this is discussed in Chapters 5 and 6). The analysis may identify sharp
breaks in the trade-off frontiers where substantial improvements in environmental quality can
be captured at a minimal incremental economic cost. With faster computers, it is possible to
33 Clinton J. Andrews, "Spurring Inventiveness by Analyzing Trade-Offs: A Public Look atNew England's Electricity Alternatives," Environmental Impact Assessment Review 12 (1992),185; Stephen R. Connors, "Side-Stepping the Adder: Planning for Least-Social-Cost ElectricService, Proceedings of the National Association of Regulatory Utility Commissioners-U.S.Department of Energy Fourth National Integrated Resource Planning Conference(Washington, D.C.: NARUC, September 1992); Connors, "Externalities, Adders and Cost-Effective Emission Reductions: Using Trade-Off Analysis to Promote Environmental RiskMitigation," Proceedings of the American Power Conference, Volume 1 (April 1993), 697.
45
look at a large number of strategies and scenarios. If undertaken in an interactive fashion, it
can help planners (and other parties) to identify new strategies.34
The approach has limits. First, the number of attributes included in the analysis should
be limited in order to make the analysis tractable and so that accepted dominance rules can be
helpful in identifying preferable strategies. If there are one or two environmental effects, or
weighted aggregations of effects, about which there is significant uncertainty or disagreement,
this approach can play a valuable role in identifying preferred options. This means that
analysts may have to develop a composite indicator of environmental quality, assign
monetary valuations to some externalities, or address issues in stages to ensure that the
analysis remains manageable. Second, if this approach is used as a fact-finding component in
a multi-party negotiation or consultation, the parties must be willing to agree on the
assumptions for the analysis and to defer normative discussions until the results of the
analysis are available to provide a factual context. The value of multi-attribute analysis in a
negotiation is that it allows parties to identify the costs and benefits of real options. It opens
the possibility that one or more options may be mutually acceptable even though the parties
are applying different normative standards to their own evaluations of the alternatives. Third,
the data and modelling requirements of this approach can be substantial; effective
participation in and review of multi-attribute analysis requires a substantial commitment by
regulators and affected parties.
Performance Standards: Shared Environmental Savings
Regulators increasingly consider incentive regulation to introduce the incentives and
discipline that would be present in competitive markets. In a similar manner, environmental
incentives programs can mimic the incentives and achieve many of the benefits of market-
34 For a description of the adoption of the trade-off approach, please refer to theConnecticut case study in Chapter 4.
46
based environmental regulation. Under the adder approach, additional emissions have no
negative financial implications for the utility. Adders act as a shadow price only in decisions
where their use is mandated by regulators. Thus, adders do not create the economic incentive
to identify and implement lower-cost means of reducing emissions.
Many commissions have adopted performance standards and incentives with respect to
power plant availability, heat rates, fuel purchasing, or other aspects of utility operations.
Incentive-based environmental performance standards could be adopted to help enforce utility
commitments under the Department of Energy's Climate Challenge program or to encourage
adoption of a broader range of environmental improvements. Such standards could provide
incentives to identify and implement low-cost emission-reduction measures not recognized in
command-and-control environmental regulation. The Climate Challenge program is a
voluntary program under which agreements will be negotiated with utilities to limit or reduce
greenhouse gas emissions. More than sixty utilities have indicated to the Department of
Energy their willingness to enter into negotiations to establish such agreements. Resulting
emission reductions would be reported to the Department under the 1992 Energy Policy Act §
1605(b) voluntary reporting structure. Alternatively, performance standards and incentives
could be structured to secure improvement in a broader index of utility emissions.
There have been reported efforts to negotiate environmental performance incentives,
although, to date, none of these negotiations has proven successful.35 Four key elements are
needed to establish an incentive-based performance standard:
• A baseline level of emissions from which to measure environmental performance.
• A reasonable and achievable target for environmental improvement such that
incentives (and disincentives) may be tied to the percentage of target improvement
achieved.
35 Jonathan B. Lowell, "Integrating Planning and the Environment at New EnglandElectric," Proceedings of the ACEEE 1992 Summer Study on Energy Efficiency in Buildings(Washington, D.C.: ACEEE, August 1992), 9.125.
47
• A maximum incremental cost per ton of reduction up to which the utility may
reasonably spend, such that the utility is not induced to make imprudent
expenditures to achieve minor incremental improvements in performance.
• A structure of incentives (and disincentives) sufficient to motivate performance.
Baseline emissions could represent simply average historical emissions for a
representative period of years. This is the approach which was utilized in Title IV of the 1990
Clean Air Act Amendments. This simple approach, however, does not take into consideration
the range of external factors (for example, economic growth, fuel costs, weather, prices of
competing energy resources, and so on), which may influence a utility's environmental
performance. An alternative that would take such factors into account would be the
development of a dynamic statistical measure. Similar to how utilities develop statistical
models for making short term load forecasts, for many utilities it may be possible to develop a
reasonable statistical model that estimates emissions based on coefficients developed from
historical data. Such a model could take into consideration changes in population, local
economic activity, relative prices of electricity and other energy sources, fuel prices, weather,
and other variables. The statistical model would be developed and tested in advance based on
the historical relationship of such variables to system-wide emissions. When actual data for
population, economic activity, etc. became available in future years, it would be introduced
into the model, and together with historically derived coefficients, used to backcast expected
emissions under actual economic, weather, and other conditions. Actual utility emissions
could then be compared to these expected emissions under actual economic, weather, and
other conditions, with the percentage change or movement towards target emissions used as
an indicator of progress.
Emission targets, specified in terms of percentage improvement and a maximum
reasonable expected incremental cost that the utility may pay for emission reductions, may be
based on analysis of the costs and emission impacts of alternative resource plans. Such
analysis should consider alternative utilization of existing resources, as well as resource

48
additions. Performance standards could function as a "soft" cap on utility system emissions,
meaning that the utility would not be expected to implement emission-reduction measures
with an incremental cost higher than a predetermined limit. Specification of a maximum
reasonable expected incremental cost guideline can help ensure that costs incurred in response
to environmental incentives remain within prudent bounds. Utility management would then
be free to implement measures if the expected incremental cost per ton of additional emission
reduction, in comparison to the next less stringent measure, was below the maximum cost
target. Prudence, of course, should be measured based on reasonably expected costs at the
time the decision was made (and any mismanagement in implementation), not on second-
guessing utility decisions based on after-the-fact results.36 Consistent application of this
practice in environmental cases is particularly important because of the potential volatility of
incremental costs, which depend not only on the cost of the measure selected, but also on the
cost and potential performance of each less stringent alternative for reducing the specific
emissions in question.
Financial incentives (or disincentives) could be based on annual progress toward CO2
stabilization or some other specified emissions target appropriate for the utility and the
conditions in which it may be operating. Incentives (and disincentives) may be set at
specified amounts based on a fraction of the estimated value of potential environmental
benefits or deferred future control cost. This relatively simple approach could provide the
utilities an economic incentive to meet broadly accepted targets with respect to greenhouse
gases or other emissions. If such programs and other voluntary efforts do not succeed, it is
quite possible that some form of mandatory greenhouse gas controls will be enacted. The
potential for recognition of reductions in future greenhouse gas or other emission-control
programs, reduces any competitive disadvantage which might result form early action. A
performance incentive could encourage the utility to act in a manner similar to market-based
36 Robert E. Burns et al., The Prudent Investment Test in the 1980s (Columbus, OH: TheNational Regulatory Research Institute, April 1985).

49
approaches and, consequently, result in lower costs of control than rigid mandatory emission
standards. Moreover, to the extent offsets from other sectors may be recognized, such
standards could approximate the impacts of broader market-based environmental regulation.
As electricity markets become more competitive, performance standards implemented at the
pool (unit commitment and dispatching) level could become a central policy tool for
achieving environmental resource diversity and other energy policy objectives without
requiring regulatory approval of market transactions.
Green Pricing
Green pricing permits environmentally-oriented customers to pay a premium in return
for additional investments in renewable or other environmentally benign resources.
Experiments with this approach are currently underway in the Sacramento Municipal Utility
District, where customer contributions are used to pay for photovoltaic units installed on
customer rooftops, and at Public Service of Colorado, where premiums are contributed to a
fund that supports the development of renewable resources. Soon (within the next few
months) a municipal utility in Traverse City, Michigan is expected to begin a similar program
in which customers paying a premium rate will support the cost of a wind farm designed to
meet their annual generation requirements.
A number of principles have been articulated to frame the structure of green pricing
experiments:37
• Green pricing must be a service that appeals to customers and to utilities. It
permits differentiation between customers who do and do not wish to support
additional environmental activities.
37 David Maskowitz, Renewable Energy: Barriers and Opportunities; Walls and Bridges(Gardener, ME: Regulatory Assistance Project, July 1992).
50
• Green pricing should be simple and easily understood by customers.
• The utility's obligation under green pricing should be easily monitored and
enforceable. It should require the utility to take measures over and above what
would be reasonably required under IRP procedures.
• Green pricing programs should be both easy to administer and consistent with
existing regulatory mechanisms.
• Appropriate safeguards should be incorporated to ensure proper use of revenues
for previously specified measures.
• Green pricing should not disadvantage nonparticipating customers or utility
shareholders.
• Green pricing should not be viewed as a charity but should be tied to the actual
purchase of additional renewable resources.
Where green pricing has been explored through customer focus groups, customer
response has been positive. However, designing an effective green pricing program can be
difficult. First, the various parties must agree that the program does not duplicate what should
occur through least-cost resource acquisition or through environmental regulation. Because
environmental quality is a public good, green pricing should not be seen as a substitute for
other environmental regulations or consideration of externalities. Second, the program must
generate sufficient funds to produce identifiable purchases of significant renewable resources
that can be difficult to accomplish.38 Moreover, while customers may respond positively in a
survey or focus group, they may not respond similarly in "real life" (that is, when the result is
a higher electric bill).
Developing a Comprehensive Framework forConsidering and Internalizing Environmental Costs
38 Robin J. Walther, "Green Pricing for Renewable Resource Development: An Idea WhoseTime is Coming?" Proceedings of the 1993 Conference on Demand-Side Management andthe Global Environment (Bala Cynwyd, PA: The Conference Connection, June 1993), 17.

51
The tools for utility regulators discussed in this section can be used in combination to
develop a well-grounded comprehensive framework for internalizing key environmental
costs. Damage studies covering readily identifiable impacts may be used to identify a floor
for estimates of environmental costs. These estimates can inform analysis of the tradeoffs
between economic costs and environmental impacts for alternative resource plans. Based on
such analysis, utility regulators could select environmental improvement targets and estimate
the incremental costs required to achieve these targets. Such targets and incremental cost
estimates could be used in setting the targets and cost limits used in establishing performance
standards to internalize key environmental costs for particular utility systems. Additionally,
green pricing could capture additional value for environmentally-oriented consumers by
allowing them to subsidize the added incremental cost of higher-cost measures. Such an
approach is not a substitute for comprehensive, market-based environmental regulation
designed to limit emissions from both utility and nonutility sources. Given coordination with
environmental regulators, such an approach could become an effective supplement to the
development of market-based environmental regulation. Performance standards and green
pricing may offer the flexibility to test the availability and effectiveness of low-cost emission-
reduction strategies before broader mandatory reductions are required. The combination of
the approaches discussed in this section may provide the means and incentives for identifying
and capturing low-cost improvements in environmental quality. It also ensures credible entity
level tracking of changes in emissions from a base-line path, which could provide the basis
for receiving credit for past voluntary actions in any future mandatory control program. A
careful and well-grounded approach could help make environmentally responsible strategies
the utility's least-cost plan for meeting customer energy-service requirements.

51
CHAPTER 4
PUBLIC UTILITY COMMISSION ACTIONON ENVIRONMENTAL EXTERNALITIES
By 1992, utility regulators in forty-one states had implemented IRP. In thirty-one of
these states, regulators are considering environmental externalities in the resource planning
or resource acquisition process. Thirteen of these states reported that externalities are
either explicitly quantified and included in economic tests (eight), considered on both a
qualitative and quantitative basis (eight, with overlap of four), or considered quantitatively
through the internalization of the risk of future environmental regulation (one).1 This
chapter examines the approaches taken in a sample of states and the rationales for their
diverse policy choices.
The development of IRP reviews was partly a natural progression from the reviews
of utility forecasts and facility siting during the 1970s. It often reflected a desire to avoid
the type of controversy generated by the completion of expensive capacity additions during
the 1980s. In some cases, the consideration of residual environmental impacts for which no
economic cost was attached by environmental regulation was a logical result of applying
benefit/cost analysis, which sought to quantify the total cost of alternate resource options.
In other cases, environmental externalities were considered in order to meet narrower
objectives, such as prudent anticipation of likely future environmental regulation or
consideration of environmental factors which would be raised in siting proceedings.
The consideration of externalities is intended to address economic inefficiencies
created by the failure of existing environmental regulation to internalize environmental
costs and to recognize such potentially lower-cost means of limiting emissions such as
1 NARUC, Utility Regulatory Policy in the United States and Canada (Washington, D.C.:NARUC, 1993), 420.

52
changing the mix of generating resources or instituting conservation programs. The
consideration of externalities in resource planning or acquisition, however, has more
limited impacts than the actual internalization of environmental costs. Unlike an emission
tax, the shadow prices of environmental adders are not costs to the sources of emissions.
This typically has limited consideration of externalities to the planning or acquisition of
new resources where such decisions are subject to explicit commission review.
Consideration of externalities has not yet been extended to unit commitment and dispatch
or other aspects of utility operations. Moreover, the dynamic incentives to reduce
emissions at lower costs that can be created by an actual emission tax will most likely not
develop as a result of commission consideration of externalities in resource planning.
Nevertheless, over time, consideration of environmental externalities in resource planning
could have an impact on the selection of new resources, life extension of existing units, and,
as a result, utility costs, prices, and emissions.2
To examine how externalities are treated in utility resource planning, this chapter
profiles practices in eight states, including four that have and four that have not established
quantified monetary or percentage externality valuations. The states reviewed that have
not adopted quantified valuations are: Virginia, Ohio, Maine, and Connecticut. The states
reviewed that have developed specific quantified valuations are: Vermont, Wisconsin,
Massachusetts, and New York. As summarized in Table 4-1, each of these states has
adopted a somewhat different position and has been motivated by different policy
2 See Frances P. Wood, "Analyzing the Effect of Including Environmental Externalities inUtility Planing," Proceedings of the ACEEE 1992 Summer Study on Energy Efficiency inBuildings (Berkeley, CA: ACEEE, August 1992), 9.223; Daniel Bloyer and Michael Bull,"Least Cost Planning at the Margin: Externalities vs. Rate Impacts," Proceedings of theACEEE 1992 Summer Study on Energy Efficiency in Buildings (Berkeley, CA: ACEEE,August 1992), 9.33; and Stephen Bernow and Donald Marron, "The Inclusion ofEnvironmental Goals in Electric Resource Evaluation: A Case Study in Vermont," eds., E.Vine, D. Crawley, and P. Centolella, Energy Efficiency and the Environment: Forging theLink (Berkeley, CA: ACEEE 1991), 249.

53
considerations. The differences in approaches and concerns among the states reflect the
richness of the debate regarding externality consideration. Virginia and Ohio opted for
qualitative consideration, but for different reasons. In Maine, the state
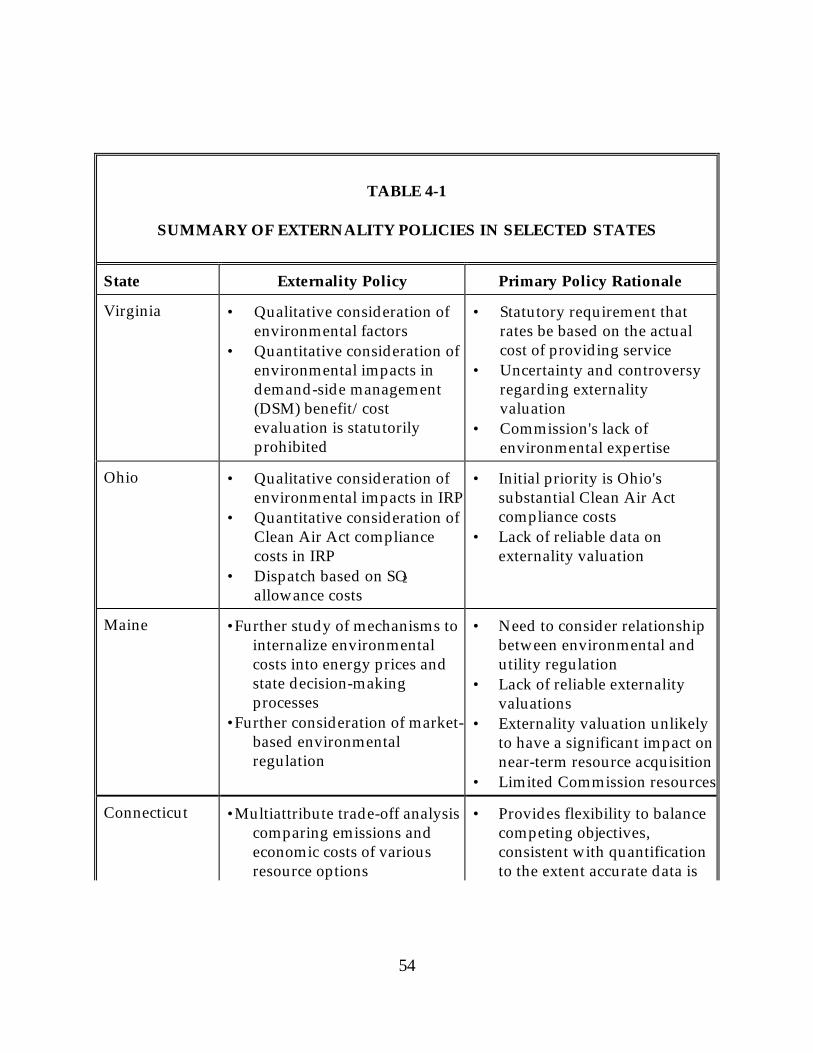
54
TABLE 4-1
SUMMARY OF EXTERNALITY POLICIES IN SELECTED STATES
State Externality Policy Primary Policy Rationale
Virginia • Qualitative consideration ofenvironmental factors
• Quantitative consideration ofenvironmental impacts indemand-side management(DSM) benefit/costevaluation is statutorilyprohibited
• Statutory requirement thatrates be based on the actualcost of providing service
• Uncertainty and controversyregarding externalityvaluation
• Commission's lack ofenvironmental expertise
Ohio • Qualitative consideration ofenvironmental impacts in IRP
• Quantitative consideration ofClean Air Act compliancecosts in IRP
• Dispatch based on SO2
allowance costs
• Initial priority is Ohio'ssubstantial Clean Air Actcompliance costs
• Lack of reliable data onexternality valuation
Maine •Further study of mechanisms tointernalize environmentalcosts into energy prices andstate decision-makingprocesses
•Further consideration of market-based environmentalregulation
• Need to consider relationshipbetween environmental andutility regulation
• Lack of reliable externalityvaluations
• Externality valuation unlikelyto have a significant impact onnear-term resource acquisition
• Limited Commission resources
Connecticut •Multiattribute trade-off analysiscomparing emissions andeconomic costs of variousresource options
• Provides flexibility to balancecompeting objectives,consistent with quantificationto the extent accurate data is

55
TABLE 4-1
SUMMARY OF EXTERNALITY POLICIES IN SELECTED STATES
State Externality Policy Primary Policy Rationale
•Environmental impacts arequantified but value notmonetized
•Reasonably certain anticipatedcosts of future regulation areconsidered
available• Better method for evaluating
resource options underuncertainty
• Identifies extent to which largeemission reductions can beachieved at minimal cost
Vermont •Rebuttable presumption of 5percent adder on supply sideresources for unpricedenvironmental impacts
•Rebuttable presumption of 10percent downwardadjustment to DSM costs forlower risk
•Public Service Board is alsoVermont's energy facilitysiting board
• Statutory requirement toconsider environmental costsin IRP
• Adder and discountpresumptions providequantitative rules of thumbthat replace implicit workingassumption of zero cost orbenefit
Wisconsin •Monetized valuation ofgreenhouse gas emissions($15 per ton CO2) in AdvancePlan proceedings
•Advance Plans must use bestavailable qualitative andquantitative methods toconsider environmentalfactors
• Prudent anticipation of futureregulation, builds on positiveexperience from state acid rainlaw
• Captures all economic costs• In facility-specific IRP or
competitive biddingproceedings, statute precludesconsideration of thoseexternalities subject to state airquality regulation
Massachusetts •Externalities must be monetizedto the greatest extent possiblein bid evaluation for new
• Allow comparison of the socialcosts of resources offeringdifferent prices, environmental

56
TABLE 4-1
SUMMARY OF EXTERNALITY POLICIES IN SELECTED STATES
State Externality Policy Primary Policy Rationaleresources and life extensions
•Implied valuations based oncontrol costs:
SOx--$1,700 per ton;NOx-- $7,200 per ton;total suspended particulates
(TSP)--$4,400 per ton;VOCs--$5,900 per ton;carbon monoxide (CO)-- $960 per
ton;CO2--$24 per ton;Methane (CH4)--$240 per ton; andnitrous oxide (N2O)--$4,400 per
ton•Off-site emission reductions
purchased through SO2
allowance or NOx or VOCoffset programs recognized inestimating emissions
impacts, and nonpricecharacteristics
• Ensure more completevaluation of environmentalimpacts than available damagecost assessments
• Encourage development ofmarket-based systems ofenvironmental regulation,without determining whetherallowance and offset programsfully internalizeenvironmental costs
New York •Estimates of environmentalmitigation costs are used tocompare resources incompetitive bidding andDSM benefit/cost analysis:
SOx .25¢ per kilowatthour (kWh);NOx .55¢ per kWh;CO2 .1¢ per kWh; particulates
.005¢ per kWh;water impacts .1¢ per kWh;land use .4¢ per kWh(1992 dollars)
• Establish a level playing fieldamong alternative resources inbid evaluation, externalityvalues are translated intopoints for ranking bids
• Reflect environmental benefitsof demand-side resources
• Pursue a long-term strategy toimprove methodologies forconsideration of externalities

57
TABLE 4-1
SUMMARY OF EXTERNALITY POLICIES IN SELECTED STATES
State Externality Policy Primary Policy Rationale•On-going investigations and/or
multiparty studies of policyand methodological issues,damage cost assessment, andtotal cost dispatching
Source: Authors' construct.
legislature and the Commission have had a constructive dialogue regarding externality
valuation and its relationship to environmental regulation. Connecticut recently opted for
a new approach--multi-attribute trade-off analysis--designed to identify robust resource
options under conditions of uncertainty and provide regulators flexibility in comparing
incremental costs and environmental benefits associated with specific options. Vermont
developed a percentage adder/discount approach as rebuttable presumptions to avoid
making, in the absence of better data, the assumption supply side resources have zero
environmental costs. Wisconsin adopted monetized values for greenhouse gas emissions in
"prudent anticipation" of future regulation. Massachusetts and New York set monetized
values for several pollutants. Additionally, Massachusetts takes into consideration off-site
emission reductions under new market-based systems of environmental regulation. New
York is undertaking a broad five-track investigation regarding how to value and consider
environmental impacts.
Virginia

58
In a generic proceeding regarding the evaluation of conservation and load
management programs, the Virginia State Corporation Commission (VCC) decided that the
analysis of DSM options should not include quantification of externalities.3 The VCC
pointed out that it gives qualitative consideration to environmental factors and that
environmental factors are analyzed during the approval of construction of major utility
facilities. The VCC found that it lacked statutory authority to go beyond the consideration
of environmental factors in approving construction certificates and qualitative
consideration of environmental impacts.
With respect to its statutory authority to promote conservation and the effective use
of energy, the Commission cited the Virginia Code §56-235.1:4
. . .that nothing in this section shall be construed to authorizethe adoption of any rate or charge which is clearly not cost-based or which is in the nature of a penalty for otherwisepermissible use of utility services.
The VCC also referenced Virginia Code §56-235.2, which requires that rates in the
aggregate not exceed actual costs incurred in serving customers within the jurisdiction of
the VCC and prohibits speculative adjustments to such costs.5 The VCC deemed the
quantification of externalities to be speculative. It also noted that incorporating some
externalities, but ignoring the impact of others could distort the balancing process and lead
to economic inefficiency. It found that Congress and the General Assembly are the proper
3 In re Investigation of Conservation and Load Management Programs, Case No.PUE900070, Final Order (March 27, 1992), 12-14.
4 Code of Virginia Annotated (Va. Code Ann.) §56-235.1.
5 Ibid.

59
bodies to provide the broader perspective necessary for consideration of environmental
factors.6
The VCC staff cites a number of factors which may have contributed to the VCC's
decision including the lack of environmental regulatory expertise at the Commission,
uncertainty and controversy regarding externality valuation, and the failure of any of the
parties to the proceeding to suggest a means to quantify externality values. This 1992
decision is viewed by the staff as closing the door on future quantitative considerations of
externalities outside facility certification proceedings. It should be noted that although
Virginia utilities file resource plans every two years, those plans include qualitative
discussions of environmental issues and are reviewed by the Commission staff, the plans
are not subject to hearing or approval by the VCC.
During the last two years there has been increased communication between the VCC
and state environmental regulators. Staff from the Department of Natural Resources now
appear before the Commission in construction certificate proceedings.7
6 Ibid.
7 Robert L. Lacy, Virginia State Corporation Commission, Personal Communication withauthor, January 13, 1994.

60
Ohio
61
The Public Utilities Commission of Ohio (PUCO) has devoted attention to Clean Air
Act compliance costs, but has not developed monetary valuations for any remaining
externalities. In the review of utility IRPs, the Commission considers a broad range of
factors in determining the reasonableness of utility resource plans, including,
"environmental impacts of the plan and their associated costs."8 Other factors considered
include the adequacy, reliability, and cost-effectiveness of the plan; whether DSM and
nonutility generation have been evaluated in a manner consistent with other electricity
resource options; uncertainty; potential rate and bill impacts; significant economic impacts
and their associated costs; impacts on the financial status of the utility; strategic
considerations including flexibility, diversity, the size and lead time of commitments, and
lost opportunities; equity among customer classes; and impacts of the plan over time.9 The
Commission staff testified in one case that environmental externalities should be reviewed
in an IRP proceeding to more accurately determine the full cost of each resource and ensure
selection of the resource that would minimize the costs to society.10 The staff testimony
supported establishing a monetized values for CO2, SO2, NOx, acid deposition, particulates,
CO, VOCs, toxic materials, aquatic impacts, and noise, on a cents-per-kW basis. The
testimony also supported qualitative discussion of water pollution and land use.11 The
implementation of these policies, however, has not led to quantitative consideration of
externalities, except to the extent that some former externalities are being internalized
through newly enacted environmental requirements.
8 Ohio Administrative Code §4901:5-5-03 (1989).
9 Ibid.
10 Prepared direct testimony of Klaus Lambeck, In the Matter of the 1990 Long-termForecast Report of the Monongahela Power Company, Case No. 90-418-EL-FOR (October29, 1990), 8-11.
11 Ibid.
62
For purposes of evaluating DSM programs under a total resource cost test, the
PUCO directed electric utilities in their 1992 IRPs to take into consideration externalities
"expressed in terms of the control costs associated with the supply resources which would
be avoided as a result of the DSM programs under evaluation."12 In their filings, utilities
reported projected control costs associated with the SO2 provisions of the 1990 Clean Air
Act Amendments, expressed in average compliance costs per kWh. Although the utilities
did not quantify values for the other externalities listed in the Commission's order, the
PUCO staff found that they had made reasonable progress by including in their DSM
evaluations Clean Air Act compliance costs.13
The PUCO has been aggressive in reviewing utility Clean Air Act compliance. It has
undertaken reviews of compliance plans both in IRP proceedings and in separate
environmental compliance plan cases under a new Ohio statute.14 The PUCO directed
utilities to take SO2 allowance costs into consideration in planned unit commitment15 and
dispatching, and adopted policies supporting prudent utility participation in allowance
trading.16
The Commission has not required utilities to undertake studies to quantify values
for environmental factors other than SO2 compliance costs. It is these other residual
emissions that would typically be considered to be environmental externalities. The
12 In the Matter of the 1992 Long-term Forecast Report Filing Requirements for OhioElectric Utilities, Case No. 91-2011-EL-FOR, Entry (November 21, 1991), 2.
13 Klaus Lambeck, PUCO Staff, Personal Communication with author, January 13, 1994.
14 Ohio Revised Code, Chapter 4913.
15 In the Matter of the Long-Term Forecast Report of the Ohio Power Company, Case No.90-660-EL-FOR (Phase II), Opinion and Order (September 24, 1991), 23.
16 In the Matter of the Commission's Investigation into the Trading and Usage of , and theAccounting Treatment for, Emission Allowances by Electric Utilities in Ohio, Case No. 91-2155-EL-COI, Entry (January 20, 1993), 1-6.

63
primary reason given by the Commission staff for not requiring such studies is the lack of
reliable data. The staff indicated that it is possible to quantify and verify projected control
costs, but there is little reliability or certainty regarding information concerning
environmental damages from other pollutants. Other factors cited by the staff include
wanting to see the results of Clean Air Act compliance before requiring consideration of
additional environmental factors and the cost of externality valuation studies.17
Maine
To date, the Maine Public Utilities Commission (Maine PUC) has not adopted
valuations for externalities in its reviews of utility resource planning, competitive bidding,
or other proceedings. The consideration of externalities, however, has been the subject of a
series of legislatively mandated studies. In the current session of the legislature, legislation
is pending that could lead to the development of externality valuations. The Commission
already has broad legislative authority that might be construed to allow adoption of
externality valuations, but the Commission's authority is not explicit.
In 1989, the legislature charged the Maine PUC with analyzing the extent to which
environmental and economic impacts should be included in the electric utility least-cost
planning process. The resulting 1991 report recommended that externality adders should
not be adopted at that time. However, the report concluded that:
We believe that, over the longer term, the use of externalityvalue approaches may offer significant advantages over thecurrent reliance on command-and-control techniques ofenvironmental management. Therefore, we recommendcontinued participation by the Commission in national andregional forums and groups that are exploring this issue . . .. We also suggest that the legislature consider whether the
17 Klaus Lambeck, PUCO Staff, Personal Communication with author, January 13, 1994.

64
state's utilities should, if it can be done at reasonable cost,apply some of the research currently being undertaken forNew England as a whole, to Maine specifically.18
The majority of the Public Utilities Commission who believed that externality valuation
should not be adopted, cited the following factors:
The interplay between existing environmental regulation andthe least-cost approach has not been thoroughly explored. Infact, it has generally been ignored, and as a result the definitionand treatment of externalities currently being used areinappropriate.
Existing externality values are, for the most part, based oninadequate conceptual foundations, and vary so widely thatthey have very little reliability. Unless the values used forexternality analysis truly reflect unaccounted-for externalities,properly valued, their use will detract from least-cost planning,not add to it. No values that purport to be relevant to Maineexist at the present time, and a considerable effort would berequired to develop plausible estimates.
. . .[I]t appears that for the short and intermediate terms (forexample, this decade) an externality approach in least-costplanning would be unlikely to have a significant impact onresource planning in Maine. First, Maine is already a leader indeveloping environmentally responsible resources. Second,few new resources are likely to be coming on line beyond whatis already committed for. Third, any new resources selectedare likely to be the more environmentally beneficial ones inany event.
At the present time (and for the foreseeable future), the PublicUtilities Commission itself does not have sufficient
18 Environmental and Economic Impacts: A Review and Analysis of its Role in MaineEnergy Policy (Augusta, ME: Maine Public Utilities Commission, May 1, 1991).

65
staff or financial resources to undertake the work that will benecessary to resolve the questions raised so far and/or toimplement such major changes to utility resource andenvironmental planning processes.19
In the Commission report it was also observed, "Without substantial and careful
coordination with other environmental agencies in the state, there is likely to be
redundancy, overlap, and duplication of function."20 Recognizing that the imposition of
adders could complicate rather than simplify environmental regulation, the Commission
nevertheless suggested that the Legislature consider environmental adder or tax
approaches in place of alternative state and local environmental regulation when there
could be substantial benefits from simplification of the administrative process.
Following the submission of this report, legislation was adopted establishing a State
Commission on Comprehensive Energy Planning. The commission included ten members
of the legislature, the Chairman of the Public Utilities Commission, the Commissioner of
Environmental Protection, the Commissioner of Conservation, the Public Advocate, the
Commissioner of Transportation, and the Director of the State Planning Office. The
Commission was charged with studying the environmental costs or externalities associated
with various energy options.
The Energy Planning Commission did not fulfill this specific charge. It recognized
that the valuation of externalities can be a difficult and subjective task. It expressed concern
regarding how to give equivalent treatment to regulated and nonregulated energy sources,
noting that energy taxes are regressive and can burden low-income consumers
disproportionately. It also noted that imposing higher costs on regulated energy sources,
and failing to address the unregulated energy arena, could promote unwanted fuel
substitution with negative environmental impacts.
19 Ibid.
20 Ibid.

66
The Commission recognized the availability of alternatives for addressing
environmental externalities, including the use of market-based systems of environmental
regulation and consideration of environmental externalities in utility resource planning.
The Commission's report framed the issue as follows:
The focus of the debate is whether unaccounted-forenvironmental impacts are more appropriately addressedthrough environmental policy and environmental regulation,whether these impacts should be considered in the energyplanning process itself (for example, the least-cost planningand competitive bid process administered by the PUC), orwhether some combination of both can be developed.21
The Comprehensive Energy Planning Commission's May 1992 report concluded that
"Energy planning cannot go forward without recognizing that almost every energy strategy
involves some degree of positive or negative environmental impact. Therefore, future
energy strategies must be coordinated with state and federal environmental policies and
regulatory mandates."22
The Energy Planning Commission found that addressing the environmental effects
of energy production and use was a "fundamental objective of state energy policy," and that
"Maine should incorporate unaccounted-for environmental costs directly into public policy
and regulatory processes that affect Maine's energy future."23 The Commission
recommended the following:
Maine establish a broad-based advisory group on Energy andthe Environment to examine fully, in an ongoing manner, how
21 Final Report of The Commission on Comprehensive Energy Planning (Auburn, ME:Maine State Planning Office, 1992).
22 Ibid.
23 Ibid.

67
to develop and implement mechanisms to incorporateenvironmental impacts that are not already internalized in theprice of energy and to the state's decision-making process. . .. The advisory group should be charged with:. . .
(1) Identifying State environmental policies and needsaffecting energy policy;
(2) Assessing the effectiveness of existing State and federalenvironmental laws and regulations in implementingthose policies; and
(3) Determining options for reconciling any discrepanciesbetween policies and existing laws and regulations.
Options to be evaluated should include:
(a) Strategies for including externalities in energy decision-making processes;
(b) Changes to Maine environmental laws; and
(c) Emission taxes and/or caps.24
The final report of the Commission was issued in May 1992, and expressed
unanimous support for the goal of addressing the environmental effects of energy
production. The report also expresses the Commission's belief that, "it is not so much a
matter of whether, but when and how" externalities will be incorporated into Maine's least-
cost planning process.25 Following the Comprehensive Energy Planning Commission's
report, three bills were introduced in the legislature in 1993 to address externality issues.
One (L.D. 102) would add language to the Maine Energy Policy Act, making
"environmental impact" an explicit factor to be considered in least-cost planning. Another
24 Ibid.
25 Ibid.

68
bill (L.D. 305) proposed similar but more extensive changes to the Maine Energy Policy Act
and would require the Maine PUC to initiate a rulemaking to establish "weighting factors"
to be used in resource selection. The third bill introduced (L.D. 356) would establish an
advisory council on energy and the environment to carry out the recommendation of the
Final Report of the Energy Planning Commission.
The Maine PUC supports L.D. 356, which seeks to establish the recommended
advisory council. The legislature may vote on L.D. 356 in 1994. Concern regarding the
availability of resources to address the externality issue continues to be a factor affecting
the development of the advisory council.26
The externalities issue was raised in a 1993 case addressing Central Maine Power's
resource planning, rate structures, and long-term avoided cost. Environmental intervenors
(the Natural Resources Council of Maine, the Conservation Law Foundation, and the
Coalition for Sensible Energy) proposed an "Ecowatts" test, which would allow pricing
particular electric end uses to promote the choice of electricity over competing fuels, if
electricity (1) is the most energy efficient alternative available regardless of fuel, (2) passes a
total resource cost test including externalities, and (3) causes no adverse environmental
impact. The Commission Examiners' Report stated that it was "intrigued" by this proposal
because it would expand the current approach to least-cost planning and add symmetry to
the debate over fuel switching. With respect to the task of quantifying externalities,
however, the Examiners' Report commented that "contemplating that challenge can inspire
both awe and humility." It encouraged parties to submit proposals for effective and
efficient ways to consider environmental externalities in utility resource planning.27 The
26 Eric VonMagnus, Maine PUC Staff, Personal Communication with author, January 13,1994.
27 In Re Investigation of Central Maine Power Company's Resource Planning, RateStructures, and Long-Term Avoided Costs, Docket No. 92-315, Examiners' Report (December14, 1993), 60-63.

69
Commission's 1991 report indicates a clear preference that any future development of
externality valuation should be undertaken based on damage cost assessment.
The Maine PUC is supporting an initial phase of preregulatory activity with respect
to greenhouse gas emissions including the developing of an inventory of greenhouse gas
emissions, an action plan, and demonstration projects. This activity is being supported by a
federal grant. Additionally, the Commission has been following regional activity that
could lead to the establishment of a NOx cap.28
The Commission staff remains concerned about the cost and rate impacts that
might be associated with consideration of environmental externalities. The staff is sensitive
to the fact that Clean Air Act and Clean Water Act requirements already may impose
significant costs on the state's economy.29 The emergence of competition has led to
discussions that additional environmental regulations on utilities, which are not shared by
competitive alternatives, might lead to uneconomic bypass and higher emissions.
28 Eric VonMagnus, Maine PUC Staff, Personal Communication with author, January 13,1994. See also the discussion of the NESCAUM NOx cap proposal in Chapter 3.
29 Ibid.

70
Connecticut
In December 1993, the Connecticut Department of Public Utilities Control (DPUC)
adopted a trade-off approach to the consideration of environmental externalities. DPUC
regulations specify that the Department is to consider likely environmental impacts in its
review of resource proposals.30 The DPUC always has considered environmental impacts
qualitatively, approving wood, hydroelectric, and waste-to-energy projects that were not
least-cost power supplies. In 1992, the legislature directed the DPUC to "conduct a study
concerning the external costs and benefits associated with energy consumption" and, in
particular, to "analyze the possibility of establishing a system of tradable allowances,
offsets, fees or numerical adders to take into consideration the indirect costs associated with
energy consumption when analyzing all new proposed resources."31 As a result of that
mandate, the DPUC completed an investigation into the external costs and benefits of
energy consumption.32 In that investigation, some parties urged the Commission to adopt
externality adders. The Department declined to do so, and instead adopted a tradeoff
approach which would require comparisons of emissions and economic costs associated
with different resource options. The appropriate weight to be placed on environmental
considerations would then be decided on a case-by-case basis. Without being limited to
uniform adder quantifications, the trade-off approach provides the Department greater
flexibility and retains the DPUC's capability to exercise judgment regarding specific
proposals.
30 Regulations of Connecticut State Agencies, §16-243a-3(b)(2), 1989.
31 Connecticut Public Act 92-106.
32 DPUC Investigation of the External Costs and Benefits Associated with EnergyConsumption, Docket No. 92-09-29, Report to the General Assembly (December 30, 1993),1.

71
The Department examined different approaches for valuing externalities and found
both the use of damage cost assessment and control cost valuation to be inappropriate at
this time.
The Department considered several approaches to determinethe value of external factors. One approach is the damageavoidance method, in which the value of the external factor isset equal to the presumed damages that are avoided by controlmeasures. . .. While this approach is conceptually sound, thedifficulty with acquiring reliable data often renders thatmethod impractical. Another approach, the cost-of-controlmethod, has readily available data, but it unfortunatelymeasures only the cost of control, not the benefits of control. . .. [A]s it becomes increasingly expensive to eliminate smallerand smaller increments of pollution, the value of furtherreduction usually declines. Therefore, the Departmentconcludes that the cost-of-control method is inappropriate as ameasure of control benefits.33
The Department concluded that adders reflect the uncertainty of specific valuation methods
and lead inevitably to piecemeal regulation. Instead, the Department adopted a tradeoff
approach in which environmental effects might be quantified (for example, tons of
emissions) but would not be monetized with specific valuations.
The Department will instead implement a more flexiblemethod of recognizing external factors. The best method forevaluating the need for action under uncertainty is a form oftradeoff analysis, which compares different strategies based onimplementation costs and a quantified indication of results.
. . .Such a measure does not specify in dollars what it would beworth to be rid of the harmful effects, but makes possible acomparison of the cost to attain different levels of pollutionreduction. Tradeoff analyses identify options which might
33 Ibid., V.

72
offer large reductions in pollution for relatively low cost, andcan lead to what has been called a "no regrets" result. Tradeoffanalyses provide the advantages of quantification, to the extentthat accurate data is available, and the flexibility to balancecompeting policy objectives.34
The Department found the tradeoff approach is preferable under conditions of uncertainty
precisely because it does not assume a high level of precision with respect to cost estimates
or damage valuation, provided that its limitations are kept in mind and data requirements
remain manageable.35
The overall result of the Department's investigation was to implement the
following four changes in its method of analyzing new energy resources:
• The Department will include in its analyses "prudently anticipated" costs of
future regulation when the effects of future regulation are reasonably certain.
• Whenever possible and relevant, externalities will be quantified (although not
monetized) to improve the subjective evaluation process already in use.
• In the specific context of new resources that are exempt from the bidding process
and conservation programs, the Department may consider proposals with direct
costs that exceed the strict definition of avoided cost, where corresponding
external benefits exist.
• The Department will discontinue use of automatic and arbitrary adders in the
evaluation of conservation projects and instead require more a thorough analysis
of costs and benefits through tradeoff analysis.
34 Ibid., V.
35 Ibid., 11-12.

73
The Department's report also discusses a number of potential externalities that will be
specifically considered, including SO2, NOx, VOCs, particulates, carbon monoxide, air
toxics, CO2 and other greenhouse gases, fuel supply diversity, land use impacts, water
impacts, electromagnetic fields (EMF), distribution system reliability, generation system
reliability and risk, noise, visual impacts, cultural and historical impacts, capacity and
demand risk, and economic development.
The DPUC's adoption of a tradeoff analysis approach reflects, in part, concern about
competition and pricing impacts. As competitors who may not bear certain environmental
costs enter power markets, the DPUC anticipates having to deal with difficult questions
about who should absorb sunk costs.36
Additionally, the DPUC took the position that it should proceed cautiously in areas
where environmental regulators have primary jurisdiction, pursuing the informal,
cooperative approach of participation in the Interagency Clean Air Policy Committee
(ICAPC). The ICAPC was formed in 1993 to coordinate Connecticut policy with respect to
the implementation of the 1990 Clean Air Act Amendments. The DPUC would like to
move in the direction of internalization of emissions cost through the establishment of a
NOx trading program and is working with the Department of Environmental Protection on
such alternatives. In its recent report to the General Assembly, the DPUC "endorses the use
of flexible, market-based control techniques such as tradable allowances, offsets and fees,"
concluding that "market-based techniques achieve the same levels of pollution reduction as
more rigid "command-and-control" methods but impose a lower total cost of compliance."37
36 George Dunn, DPUC Staff, Personal Communication with author, January 17, 1994.
37 Ibid., VI.

74
Vermont
The Vermont Public Service Board (PSB) adopted rebuttable presumptions in favor
of an environmental adder on supply side resources and a risk discount to conservation and
load management costs. These presumptions alter the assumption of zero costs or benefits
in the absence of better information.
The statutory role of the PSB is unique in two respects. First, the Board functions as
both a ratemaking authority and the siting board for major energy facilities. In siting cases,
the Board is specifically required to consider a broad range of environmental impacts.38
These include water and air pollutants; impacts on floodways, shorelands, streams, and
wetlands; impacts on water supplies; soil erosion potential; impacts on transportation,
municipal, and educational services; impacts on aesthetics; effects on areas of scenic and
natural beauty; impacts on rural and irreplaceable natural areas; effects on historic and
archeological sites; considerations of necessary wild habitat and endangered species;
impacts on agricultural soil; impacts on public investment; and impacts on outstanding
water resources.39 Additionally, Vermont law sets the criteria used to determine if new
facilities are in the public interest; the criteria include whether proposed facilities may have
undue environmental impacts.40 Data on monetized environmental impacts has been
presented in past siting cases and considered as one factor by the Board in its final decision
as to whether pollution or other external impacts were "undue." Second, the statutory
standards governing Vermont's IRP process require consideration of environmental costs.
A least-cost IRP is defined in 30 V.S.A., §218(c) as a plan to meet the public's need for
energy services at the best present value of life-cycle cost, including environmental and
economic costs.
38 30 VT State Ann. Tit. 30, §248 (1992).
39 10 V.S.A. §6086(a).
40 30 V.S.A. §248.
75
The Public Service Board addressed the issue of environmental externalities in its
1990 order establishing the framework for consideration of DSM and IRP. In that order, the
Board distinguishes between supply side and demand-side investments, establishing a pair
of rebuttable presumptions. First, the Board accepted a proposed 5 percent adder on
supply side resources as an initial proxy for their unpriced environmental impacts. Second,
the Board applied a 10 percent downward adjustment for reduced risk to the cost of DSM
options. These adjustments are rebuttable presumptions which serve as "quantitative rules
of thumb, to replace the previously implicit working assumptions of zero."41 In future
proceedings parties may argue for higher or lower values, but the Commission has made
clear that evidentiary challenges to the presumption "must be rigorous."42 The Commission
justified its position on grounds that these adders and discounts would better reflect real
environmental costs and the potential of DSM measures to reduce risk as a result of their
flexibility, short lead time, and the increase in DSM opportunities with growth in load. The
Attorney Examiner's report in the case recounted evidence regarding the 10 percent
premium for efficiency options in the Northwest Power Planning Act, the development of
externality cost valuations by the New York Public Service Commission, the 15 percent
environmental premium which at that time was used by the Wisconsin Public Service
Commission, and the effects of acid rain, greenhouse gas emissions, and other
environmental impacts associated with electric generation.43
41 Investigation into Least-Cost Investments, Energy Efficiency, Conservation, andManagement of Demand for Energy, Docket No. 5270, Order (April 16, 1990), Vol. IV, 14-15.
42 Ibid.
43 Investigation into Least-Cost Investments, Energy Efficiency, Conservation, andManagement of Demand for Energy, Docket No. 5270, Hearing Officer's Report and Proposalfor Decision (April 16, 1990), Vol. 3, 103-109.

76
The Commission has continued its investigation into environmental externalities
with the view toward advancing its understanding of the issues and developing more
accurate estimates of the unpriced environmental costs for different energy supply sources.
On September 30, 1992, the Board opened a rulemaking proceeding to revisit its
methodology for valuing externalities. The Board conducted negotiations through a series
of informal workshops, with participation by representatives from utilities, state agencies,
industry and nonprofit organizations. The negotiated effort was not successful, and the
Board is currently proceeding with a contested case. In January 1994, the parties completed
briefing of jurisdictional issues regarding the PSB's authority to consider environmental
costs and its ability to consider environmental costs occurring outside the state of Vermont.
In past cases addressing out-of-state power purchases, the Board took the position that it
would consider impacts associated with in-state projects or environmental effects on the
state associated with out-of-state purchases.
According to the PSB staff, the agency sees its role as allocating costs and risks
associated with power production. One of the risks which utilities should consider is the
fact that environmental impacts may be internalized in the future. Part of the Board's
responsibilities, particularly because of its role in siting, has been to balance economic and
environmental interests. Externality valuation is viewed as fulfilling the Board's
responsibilities to allocate costs and management of risk.44
Coordination between the Agency of Natural Resources (ANR) and the PSB is
growing. By statute, the ANR must now participate in all energy siting reviews.
Additionally, there have been meetings involving the ANR and PSB regarding the
implications of Title I of the 1990 Clean Air Act Amendments for Vermont's utilities.45
44 Michael Dworkin, Vermont PSB General Counsel, Personal Communication withauthor, January 11, 1994.
45 Ibid.

77
Because Vermont is part of an integrated power pool, the PSB staff has considered
effects of new Vermont resources on system-wide costs and emissions, but the appropriate
approach for considering such impacts is currently unresolved.46
The position of the staff is that intersectoral effects related to users switching to
other utilities or fuels as a result of externality consideration are not likely to be large
because externality considerations have not produced major bill increases. The Staff is also
aware that rate impacts might be significant when customers are comparing energy
available from different utilities. Concern about bill and price impacts from the
consideration of externalities, however, is mitigated by the fact that externality
considerations reflect an assessment of the risk for future cost internalization and are
designed to reduce likely total future costs.
46 Ibid.

78
Wisconsin
The Wisconsin Public Service Commission (PSC) considers environmental
externalities as part of an effort to consider external economic costs. Pointing out that the
market reduces many, but not all, costs and benefits to monetary terms, the Commission
concludes that incorporating environmental externalities into planning decisions is in the
long-term best interest of the public and the utilities.47 The Commission requires utilities in
their Advanced Plan filings to use the best available qualitative and quantitative methods
for considering environmental factors. However, with respect to the risk of future
greenhouse gas regulation, the Commission established the following monetary values
associated with emissions: $15 per ton for CO2; $150 per ton for methane; and $2,700 per ton
for NOx. This does not reflect an estimate of damages but an estimate of expenses that are
likely to be associated with future regulation of greenhouse gas emissions.
The Commission took the following position:
Because of widespread concern about the risks of globalwarming at state, national, and international levels, futureregulations are likely to require the utility industry to limit itsrelease of these gases. If so, utilities would incur real economiccosts to comply with these regulations.
. . . A national and international consensus to regulategreenhouse gas emissions is emerging. In the likelihood offuture regulation is high, it is reasonable to estimate the cost ofcompliance to utilities. Ignoring this financial risk would beimprudent.
. . . Monetizing the risk of greenhouse gas regulation is aprudent means of reducing utility business risk, by hedgingagainst the future. The Commission has exercised similar
47 Re Advanced Plans for Construction of Facilities, Docket No. 05-EP-6, 136 PUR 4th153 at 174-178 (September 15, 1992).

79
foresight in other Advance Plans, to benefit the public and theutilities. Concerns about greenhouse gases resembleWisconsin's earlier concerns about acid rain, which stategovernment successfully addressed in the 1980s. The State'searly response to acid rain has superbly positioned Wisconsinutilities to take advantage of the federal emissions allowanceprogram. Monetization may do the same for utilitiesconsidering the likelihood of national or internationalgreenhouse gas regulations.48
In the 1980s, Wisconsin adopted state acid rain legislation that reduced SO2
emissions to a level at or below the levels mandated under the 1990 Clean Air Act
Amendments. As a result, Wisconsin utilities have sold excess emission allowances (the
proceeds are passed on to ratepayers).
The Commission currently does not monetize other externalities. This may be, in
part, in response to litigation overturning an earlier 15 percent externality adder and
statutory limitations which continued to be an issue in the Advance Plan 6 proceeding
where greenhouse gas emissions were assigned a monetary value. The Wisconsin statutes
related to the issuance of certificates of public convenience and necessity for new facilities
include a specific limitation with respect to environmental standards. Wisconsin Statutes
§196.491(d)(4) provides, in part, that:
In its consideration of the impact on other environmentalvalues, the Commission may not determine that the proposedfacility will have an undue adverse impact on these valuesbecause of the impact of air pollution if the proposed facilitywill meet the requirements of [the state's air quality statutes].49
48 Ibid.
49 See also Wisconsin Statute §196.491(d)(3) (1980).

80
The legislative history of this provision, which predates the monetization of
externalities, is that it was designed to prevent the Commission from requiring a facility to
meet clean air standards which are more stringent than the standards approved for such a
facility by the Department of Natural Resources.50 The Commission's position is that it can
monetize values with respect to greenhouse gases because: (1) greenhouse gases are not
regulated by the Department of Natural Resources, and (2) Advance Plan proceedings are
not part of the process for issuing certificates of public convenience and necessity. Entirely
separate from the Advance Plan process, the Commission has initiated a two-stage
competitive bidding, IRP process which leads to a certificate of public convenience and
necessity. The Advance Plan proceeding determines general utility need and parameters
related to fuel cost, DSM technologies, and other factors to be used in the competitive
bidding, IRP process. The Advance Plan identifies the need for generic types of capacity,
such as baseload, intermediate, or peaking but will not identify specific resources for
acquisition. The evaluation of specific resources will occur in the two-part competitive
bidding IRP process. The Commission Staff's current position is that it may not be able to
use monetized values for greenhouse gas or other emissions in the competitive bidding IRP
process because this process may result in the issuance of a certificate of public convenience
and necessity.51 Pending legislation would specifically authorize the competitive bidding
IRP process and allow consideration of environmental externalities within that process.
The Commission finds damage cost assessment to be appealing but has not adopted
such an approach because of the difficulty in getting a comprehensive assessment of
environmental damages. Wisconsin utilities are working on a damage cost study, but the
results of that study apparently will not be presented in the current Advance Plan 7
50 Re Advanced Plans for Construction of Facilities, Docket No. 05-EP-6, 136 PUR 4th153 at 174-178 (September 15, 1992).
51 Paul Newman, Wisconsin PSC Staff, Personal Communication with author, January 17,1994.

81
proceeding.52 The Commission has said that any method chosen by the utilities should rely
on currently available information, be flexible enough to readily incorporate new
information, and be easy to understand, and that clearly identifying a method's
assumptions and steps will aid in keeping the method understandable.
In Advance Plan 7 the Commission staff intends to focus on the consideration of
other externalities which are not currently quantified, including nuclear externalities and
toxic emissions. NOx, SO2, land and water impacts will continue to be looked at in a
qualitative manner.53
In evaluating externalities, the Commission looks at the impact of resource additions
on emissions from the utility system. For example, in Advance Plan 6, the Commission
compared the addition of gas-fired units with atmospheric fluidized bed combustion coal
units in the Wisconsin Electric system. The Commission concluded that clean coal-fired
units would result in lower system-wide emissions, than the addition of gas units which by
themselves would have lower emissions, but might be less fully utilized. While a reduction
in the utility's need for new capacity has subsequently changed the utility's preference in
favor of gas-fired units, this example illustrates the possibility that looking at net changes
in system-wide emissions can lead to a different result than considering only the emissions
from the new facility.
The PSC staff works on a regular basis with staff from the Department of Natural
Resources (DNR). DNR has assembled an energy team which participates in the planning
process, screening out bids for potential flaws and testifying in Advance Plan proceedings.
Unlike the PSC, however, the DNR staff does not necessarily have an integrated
perspective of energy issues. Air quality, water resources, and other DNR divisions take
their own approaches to, for example, fossil fuel versus hydroelectric facilities and have
52 Ibid.
53 Re Advanced Plans for Construction of Facilities, Docket No. 05-EP-6, 136 PUR 4th153 at 174-178 (September 15, 1992).

82
exhibited difficulty in developing a coherent position regarding how best to meet energy
needs.54
Because of potential pricing and competitive impacts, the Commission may be
concerned about the fact that it is quantifying externalities and other states are not.
However, the record in the Advance Plan 6 case indicates that the monetized greenhouse
gas values will likely increase electric rates only slightly, by about .25 percent per year.55
Massachusetts
The Massachusetts Department of Public Utilities (DPU) has a detailed integrated
resource management (IRM) process for the review of utility resource plans and
competitive bidding procedures. In the IRM process, bids received must be compared on
the basis of total social cost, including environmental externalities. Externalities must be
monetized to the greatest extent possible and added to the direct resource costs for the
purpose of bid evaluation. The Department has adopted generic values to be used by all
electric companies in monetizing certain air-pollutant emissions. In a 1992 decision, the
Department authorized offsets to externality valuation for certain off-site emission
reductions occurring under market-based systems of environmental regulation.
The Department's rationale for externality valuation is relatively straight forward--
to ensure the selection of preferred energy resources.
The purpose of estimating environmental externality values isto enable decision makers to compare, on a consistent basis, thesocial costs associated with alternative energy resourcesoffering different prices, environmental impacts, and nonpricecharacteristics. To illustrate the value of externalities assume asituation where there are two generating facilities that meet
54 Paul Newman, Wisconsin PSC Staff, Personal Communication with author, January 17,1994.
55 Ibid.

83
federal emission limits and are alike in all respects (forexample, price, reliability) except that one facility emitssignificantly less pollution than the other. Most would agreethat the facility with lower emissions would be preferred. Ifthe value of environmental externalities resulting fromemissions permitted by federal statute were zero, we would becompletely indifferent between these two generating facilities. Since we would not be indifferent--that is we would prefer theless-polluting generating facility--externalities must have aneconomic value that we need to consider in our resourcechoices.
. . .The value of lower environmental externalities associatedwith a cleaner resource would equal the maximum differencein price between two resources (where the price of the dirtierresource is lower than the price of the clean resource) thatwould be acceptable before society preferred the dirtierresource. In theory, before society opts for the dirtier resource,the difference in prices (and presumably the cost) between thedirtier and cleaner resources (that is, the amount by which thedirtier resource is lower than the cleaner resource) must begreater than the value of the incremental environmentaldamages associated with the dirtier resource relative to thecleaner resource.56
Externality valuations are considered only in the resource planning process, which
encompasses purchase or construction or new resources and life extension of existing
facilities. The Department has not considered applying such values to unit commitment
and dispatch or other aspects of utility operations.
Externalities are to be applied in all electric company filings involving resource cost-
effectiveness tests. This has included preapprovals of utility DSM and generation
programs, qualifying facility proposals, purchase power agreements, and third party DSM
56 Investigation by the Department of Public Utilities on Its Own Motion Into ProposedRules to Implement Integrated Resource Management Practices for Electric Companies in theCommonwealth, Docket No. 89-239, Opinion and Order (August 31, 1990), 61-62.
84
contracts. The Commission is moving toward including all of these resource acquisition
activities into a uniform IRM process.
In a December 1989 Order,57 the Department first indicated its commitment to
require each electric company to consider environmental externalities in the resource
selection process. The Department held that significant impacts to humans, the natural
environment (for example, wildlife, habitat, plants), and the built environment (for
example, buildings, statues, machinery) should be considered regardless of whether those
impacts occur within Massachusetts or elsewhere. At that time, the Department suggested
a ranking and weighting approach and requested comments on three such
methodologies.58
Following the comments received in response to its 1989 Order in Case No. 89-239,
the Department chose to establish a uniform set of monetized values for externalities:59
The Department finds that effective weighting and rankingapproaches could be designed to account for the variation inenvironmental impacts among various energy resources. However, in order to design an effective weighting andranking approach, environmental impacts and the value ofthose impacts would have to be estimated so that appropriateweights could be determined. If weighting and rankingsystems require quantification of externality values in order todetermine the appropriateness of the weights, forming weightsbecomes unnecessary because the quantified externality valuescould be monetized and added directly to project costs to assist
57 Investigation into the Pricing and Ratemaking Treatment to be Afforded to New ElectricGenerating Facilities Which Are Not Qualifying Facilities, Case No. D.P.U. 86-36-G,Opinion and Order (December 6, 1989), 77-96.
58 Ibid.
59 Investigation by the Department of Public Utilities on Its Own Motion Into ProposedRules to Implement Integrated Resource Management Practices for Electric Companies in theCommonwealth, Docket No. 89-239, Opinion and Order (August 31, 1990), 51-85.

85
in the determination of the mix of resources that minimizescost and environmental impacts simultaneously.
Accordingly, the comments in this proceeding convinced theDepartment that externalities should be monetized to thegreatest extent possible and that such values would be addedto direct resource cost (that is, price bids of proposed resources,and the avoidable costs of existing and planned resources) forthe purposes of evaluating and comparing alternative energyresources. . .
As we stated in DPU 86-36-G, the Department realizes thatmonetizing externality values does not constitute theelimination of subjective judgments in the evaluation ofexternalities. We expect that as externality values are proposedby utilities and interested parties for use in the IRM process,the proponents of such values will reveal all assumptions andjudgments so that their merit can be discussed in anappropriate public forum.60
The Department concluded that qualitative environmental externality systems (for
example, weighting and ranking) only obscure implicit valuation and judgements. The
Department also found that, ideally, the costs of externalities associated with the entire fuel
cycle should be included in the resource evaluation process.61 However, the Department
determined that priority should be placed on estimating externalities that are the direct
result of power plant operation including all "downstream" effects (for example, solid
waste disposal), and directed companies to consider all impacts resulting from power plant
operation, including air, water, solid waste and spent fuel disposal impacts, and resource
use. The Department decided at that time to not include site-specific impacts, because
proposals could be made in the IRM process without an actual project site being established
60 Ibid., 58-60.
61 Ibid., 77-79.

86
and the siting process in Massachusetts specifically evaluates site impacts. Similarly,
valuation of "upstream" (before power plant operation) fuel-cycle impacts was not required
due to a lack of information and because such impacts also included, to some degree, site-
specific impacts. The Department stated that, as externality valuation experience increased,
it would consider expanding the scope of externality valuation to include those associated
with earlier stages of the fuel cycle.
The Department also concluded that damage valuation would be preferable for
externality valuation. However, the Department to date has relied upon values derived
using the implied valuation (IV) method for specific pollutants because: (1) the Department
believes that marginal control costs reflect the implicit value society, in aggregate, places on
marginal emissions; (2) the Department believes that the values that result from the IV
method are likely to underestimate the damages that result from pollutant emissions; and
(3) damage valuation estimates presented before the Department have been incomplete,
have not been accompanied by a clear presentation of the valuation method and
judgements applied, and have been dependent upon assumptions that are not supported
by the weight of scientific evidence.
In November 1992, the Department reaffirmed the externality values adopted in
Case No. 89-239.62 In its 1992 decision, the Department reviewed both damage valuation
and implied valuation methodologies. This issue was extensively litigated. The
Department found that the proposed damage valuation approaches failed to meet criteria
of comprehensiveness (addressing all important effects of emissions) and reliability (having
a basis and a clear and explicit presentation of method, data, calculations, judgements,
assumptions, variability and uncertainty in the results). In particular, the Department
62 Investigation by the Department of Public Utilities on Its Own Motion as to theEnvironmental Externality Values to be Used in Resource Cost-Effectiveness Test by ElectricCompanies Subject to the Department's Jurisdiction, Case No. 91-131, Opinion and Order(November 10, 1992), 41-43.

87
found that neither the scientific community in general nor the EPA had established or
endorsed the positions taken by the utilities' damage cost experts. The positions were: (1)
there is a threshold for human health effects of criteria pollutants (SO2, NOx, VOC, O3,
particulates, CO, and lead) at concentrations at or near the NAAQS; or (2) there is a dose-
response relationship for human health effects of criteria pollutants at concentrations close
to the NAAQS that is only a fraction of those effects experienced in locations or periods of
higher pollution concentrations. The Department also found that the utility witness'
estimates of the economic impact of global warming on the U.S. did not provide a
sufficiently comprehensive estimate of potential climate change damages.
Expressed in 1992 dollars, the specific monetized values adopted for externalities in
Case 91-13163 are shown in Table 4-2. Following the adoption of air toxic standards by the
U.S. EPA and the Massachusetts Department of Environmental Protection (DEP), the DPU
may consider establishing values for air toxics. The Order did not establish values for
water use, land use, and ash disposal, based on a lack of sufficient evidence that these
impacts are not local and/or accounted for adequately in the siting process.
The Department's 1992 Order limits the applicability of some externality valuations
based on a recognition of off-site emission reductions. The Department's recognition of
offsets for off-site emission reductions is designed to avoid interference with the operation
of the Clean Air Act SO2 allowance market and NOx and VOC offset trading markets
during their initial stages of development. In January 1993, the Massachusetts DEP
proposed an interim rule on Emission Reduction Credit banking and trading for NOx and
VOC emissions. The DPU policy supports the development of market-based mechanisms
for achieving society's environmental objectives and recognizes that market-based
mechanisms have the potential to be more economically efficient in attaining
63 Ibid., 56-79.

88
environmental goals than traditional "command-and-control" environmental regulation.
As a result of the DPU's decision, project proponents are not required to

89
TABLE 4-2
MASSACHUSETTS DPUC EXTERNALITY VALUES
Externality Mitigation Cost($/Ton)
Sulfur Oxides 1700
Nitrogen Oxides 7200
Total Suspended Particulates 4400
Volatile Organic Chemicals 5900
Carbon Monoxide 960
Carbon Dioxide 24
Methane 240
Nitrous Oxide 4400
Source: Investigation by the Department of Public Utilities on Its Own Motion as to theEnvironmental Externality Values to be Used in Resource Cost-Effectiveness Test byElectric Companies Subject to the Department's Jurisdiction, Case No. 91-131, Opinion
and Order (November 10, 1992), 56-79.
apply an externality value to any ton of emissions for which they will be required to hold
an SO2 allowance or an offset for NOx or VOCs pursuant to provisions in the Clean Air Act.
However, the Department was not willing to conclude that the 1990 Clean Air Act
Amendments had the effect of "internalizing" such emissions. This, in part, reflects the fact
that the Title IV SO2 allowance system is intended to address only the acid deposition
impacts of SO2 emissions.

90
In Case No. 89-239, the MIT Energy Lab argued against monetization and in favor of
a multi-attribute tradeoff analysis approach. Their argument was based in part on studies
that indicated that demand-side resources might perform poorly, relative to some supply
side alternatives with higher capacity factors, in reducing SO2, NOx, and particulate
emissions. The Lab argued that the impact of a given resource on system-wide emissions
might be different from the pollutants emitted by the incremental resource. The
Department addressed this criticism by directing utilities in their bid evaluation to conduct
an optimization analysis to examine interactive effects, including the interaction between
new and existing resources, and to examine the environmental impacts of various
combinations of proposed and existing resources. It is the D.P.U. staff's position that
utilities can accurately conduct this optimization with respect to their own dispatch and
should be able to identify impacts associated with the integrated dispatch in the NEPOOL
power pool.64
In Case No. 90-141, involving the application of externality valuation to Eastern
Edison Company purchases, the Department recognized the benefit of a regional approach
to valuing externalities but held that regional consensus was not a necessary condition to
the application of monetized values.65
64 Investigation by the Department of Public Utilities on Its Own Motion into ProposedRules to Implement Integrated Resource Management Practices for Electric Companies in theCommonwealth, Docket No. 89-239, Opinion and Order (August 31, 1990), 57-58.
65 Investigation into the Filing Made by Eastern Edison Company, Case No. D.P.U. 90-141, Opinion and Order (June 14, 1991).

91
The 1989 Order in Case No. 86-36-G also indicated that the Department and the DEP
were discussing coordination of issues related to the interaction of all-source bidding and
DEP permitting requirements. In April 1990, the Department of Public Utilities, the
Department of Environmental Protection, the Energy Facility Siting Council, and the
Massachusetts Environmental Policy Act Unit of the Executive Office of Environmental
Affairs entered into memoranda of understanding which, in part, provided the following:
92
• During the comment period for competitive bidding RFPs, the DPU will request
from the DEP a guidance statement regarding currently accepted baseline
regulatory standards for emissions and resource use. All proposals will be
required to incorporate price and nonprice terms reflecting at least compliance
with the DEP standards set forth in this guidance document.
• Each agency will circulate to the other agencies for comments all proposed
rulemakings fourteen days prior to providing notice of the proposal to the public
and the Secretary of State.66
In Case No. 92-131, the Department agreed that "it is appropriate to consider the
potential for increased rates and resulting economic dislocation in developing and
implementing its externality policy."67 The Department, however, did not find support in
the record for significant effects resulting from the Department's policy. The opinion notes
a number of mitigating factors. First, the externality values are considered only in the
selection of new resources and can only have a significant impact over a long period of
time. Second, the evidence indicated that even under an aggressive resource procurement
scenario rates would increase by only 5 percent by 2006 as a result of the consideration of
externalities. Finally, the Department noted that much environmental regulation is
national in scope and national environmental requirements may offset consideration of
externalities by the Department. The Department concluded that:
66 Memorandum of Understanding Between the Department of Environmental Protection,the Department of Public Utilities, The Energy Facility Siting Council, and the MassachusettsEnvironmental Policy Act Unit of the Executive Office of Environmental Affairs, in regard toDepartment of Environmental Protection Review of Electric Generating Facilities (July 10,1990), 1-2; Memorandum of Understanding on the Coordination of Regulatory Review by theDepartment of Public Utilities and the Department of Environmental Protection (July 10,1990), 1.
67 Investigation by the Department of Public Utilities On Its Own Motion As to theEnvironmental Externality Values to be Used in Resource Cost-Effectiveness Test by Electric
93
. . .[E]nvironmental externalities are real costs borne byratepayers and the rest of society in the form of increasedhealth care expenses, economic impacts on material andagricultural resources, and a reduced quality of life. Mostimportant, we noted that increased short-term costs that mayresult from an environmental externality policy will bemitigated by long-term economic benefits in the form of lowercosts to comply with increasingly stringent environmentalregulations, and lower costs associated with the impacts ofpollution upon society.68
New York
New York was among the first states to attach a monetary value to environmental
externalities. It has continued a broad effort to improve the methodologies available for
externality consideration.
In a 1989 case involving Orange & Rockland Utilities, the New York PSC reviewed
proposed guidelines for the solicitation of capacity through competitive bidding
procedures and developed monetary values which would be used in weighting alternative
capacity proposals. In that case, there was substantial agreement among the parties that
environmental impacts should be a factor in comparing different supply side technologies.
The Commission found agreement that:
(..continued)Companies Subject to the Department's Jurisdiction, Case No. 91-131, Opinion and Order(November 10, 1992), 14-15.
68 Ibid., 15-16.
94
. . .[A]lthough all projects proposed by bidders must meetenvironmental standards and must ultimately be evaluatedand permitted to operate by appropriate regulatory agencies,meeting the threshold requirements will not make all projectsenvironmentally equal. Because projects that areenvironmentally inferior (although approvable) might benefitfrom higher scores on their price bids, a fair bidding processshould allow projects to receive higher scores based onenvironmental superiority. . .. Including environmentalexternalities in the bid ranking process recognizes thatenvironmental impacts have economic value and that a projectthat reduces or avoids the level of pollution should be awardeda score that neutralizes the price advantage of a project that isless environmental benign. Recognition of environmentalexternalities in this fashion would increase efficiency in theallocation of resources and would anticipate the almostinevitable increasing cost of adverse environmental impacts inthe future.69
Thus, the PSC decided that specific weight should be given to environmental
mitigation in the scoring of supply side proposals. To establish this weight the
Commission relied on judgmental estimates of mitigation costs supplied by the State
Energy Office and developed for the State Energy Plan. Table 4-3 presents the values for
external costs adopted by the New York PSC.
In the Orange and Rockland case, these estimates were then translated into a point
total for scoring bids based on a comparison of mitigation costs to estimated levelized bid
prices. In subsequent cases, the total of 1.405 cents per kWh (inflation adjusted) was
applied to increase supply side costs when comparing the costs of demand- and supply side
resources. It should be noted that land and water values generally have been considered to
be similar for different types of supply side resources and thus have not provided a
significant distinction between different supply side alternatives.
69 Re Orange and Rockland Utilities, Inc., Case No. 88-E-241, Opinion No. 89-7, 101 PUR4th 280, 300 (April 13, 1989).

95
The New York PSC viewed these estimates as a starting point from which it would
review methodologies which might be proposed by the utilities or other parties. The
Commission has aggressively explored a broad range of issues associated with externality
valuation and consideration of environmental factors. The PSC has initiated a five-track
investigation into the consideration of Clean Air Act compliance costs and the
incorporation of environmental externalities into the long-run avoided cost (LRAC)

96
TABLE 4-3
NEW YORK PSC EXTERNAL COSTVALUATIONS
Externality Mitigation Cost(¢/kWh)
Air Emissions
Sulfur Oxides .25
Nitrogen Oxides .55
Carbon Dioxide .1
Particulates .005
Water Impacts .1
Land Use .4
Total 1.405
Source: Re Orange and Rockland Utilities, Inc., Case No. 88-E-241, Opinion
No. 89-7, 101 PUR 4th 280, 300 (April 13, 1989).
estimates used in resource planning.70 The LRAC plays a critical role in utility planning
and the acquisition of demand-side and independent power resources in New
70 Proceeding on Motion of the Commission to Determine Whether to IncorporateEnvironmental Costs into the Long-run Avoided Costs for the State's Electric Utilities andWhether and in What Context Estimates of the Value of Externalities Should be Utilized, CaseNo. 92-E-1187, Order Instituting Proceeding (December 29, 1992).

97
York. The Commission has requested comments from parties on issues related to the
treatment of Clean Air Act compliance in LRAC calculations; how environmental
externalities should be used in setting LRACs that are applied to supply side resources and
DSM; how estimates of environmental externalities should be modified to reflect Clean Air
Act compliance; whether and how estimates of externalities should reflect values for air
toxics, CO2, land use, water effluents, and thermal pollution; whether estimates of
externalities should take into consideration socioeconomic effects related to job loss, fuel
diversity, or rate impacts; determination of the appropriate values to use for externalities;
determination of the impact of using emissions or total cost dispatch to estimate LRACs;
and determination of the model to be used to incorporate externalities into LRAC
estimates.71
As noted, the Commission directed the investigation of substantive issues to
proceed in five partially parallel tracks:72
• Track 1: Clean Air Act Compliance. Utilities were required to file Compliance
Plans associated with achieving phase I SO2 emission reductions under Title IV of
the 1990 Clean Air Act Amendments. The review of these plans was completed
in June 1993. In May 1993, utilities were also required to file tentative compliance
plans for phase II SO2, Title I NOx controls, and Title IV NOx compliance.
71 Ibid.
72 Proceeding on Motion of the Commission to Determine Whether to IncorporateEnvironmental Costs into the Long-run Avoided Costs for the State's Electric Utilities andWhether and in What Context Estimates of the Value of Externalities Should be Utilized, CaseNo. 92-E-1187, Ruling on Procedural Schedule and Other Matters (April 22, 1993).

98
• Track 2: Policy Issues. This track involved the submission of policy positions and
reply papers addressing issues raised in the questions posed in the Commission's
Order initiating the investigation. A broad range of parties commented on the
questions raised by the Commission and submitted reply comments. The matter
is now before an administrative law judge with a decision expected in 1994.
• Track 3: Methodological Issues. This track would address such methodological
issues as how externality estimates would be incorporated into LRACs for supply
side resources, methods for internalizing externality valuations in

99
planning and dispatching, the externality valuations which should be used in
evaluating specific demand-side resources, and the method for adjusting LRACs
to take into consideration the cost of Clean Air Act compliance. Track 3 will
proceed following the conclusion of Track 2, with technical sessions, the filing of
direct and responsive testimony, and an evidentiary hearing. Track 3 is expected
to build on the results of the Track 2 decision.
• Track 4: Valuation Issues. This track is designed to develop appropriate
valuations for environmental externalities. It includes supervision of a
collaborative study being undertaken in New York to develop damage cost
assessments. The damage cost study is proceeding in three stages:
(1) identification of all potential externalities, (2) screening and short-listing
significant externalities for valuation, and (3) development of valuations for
significant and quantifiable externalities and development of a computer model
identifying the relationship between fuel use, emissions, dispersion of emissions,
exposure of affected populations, dose-response relationships, and willingness to
pay or other estimates of damage costs. The third stage of the study is currently
expected to be completed in November 1994.
• Track 5: Examination of the Use of Total Cost Dispatch to Estimate LRACs. This
track is examining the inclusion of externalities in utility unit commitment and
dispatch and the use of full-cost dispatching in models used to estimate LRACs.
Pursuant to a Commission Order, the New York Power Pool completed the first
phase of a study on including specific externality adders in the dispatch process.
The initial results of this study suggested that significant emission reductions
could be achieved. However, the specific adders studied resulted in an increase in
NOx emissions in downstate New York, where there are severe ozone
nonattainment problems. This issue might be addressed by the use of alternative
externality adders or seasonal changes in dispatching to reflect that O3nonattainment occurs only during warm sunny months. The Commission staff
has filed a motion to require the Power Pool to conduct additional analysis and to
incorporate in its analysis likely Clean Air Act compliance strategies.

100
In the comments in the pending docket, there has been substantial discussion of
competition, the impacts of the 1992 Energy Policy Act, retail wheeling, creating a level
playing field between utility and nonutility power providers, and the potential for bypass
because externality valuation might tend to put utilities in a noncompetitive position. The
Commission requested comments on the average price impact of considering externalities.
The PSC staff believes that rate impacts have been minimal given that the gas and DSM
alternatives which have been winners under current procedures would also be cost-
competitive without adders.73
Status of Commission Externality Consideration
These case studies, as well as decisions from other jurisdictions,74 indicate that
commission consideration of environmental externalities remains an incomplete and
evolutionary process. To date, consideration of externalities has focused on the planning
and/or acquisition of new generating capacity, unit life extensions, and DSM. A few states,
such as Maine, Connecticut, and Massachusetts, have begun to recognize the potential of
market-based systems of environmental regulation to achieve objectives that are both
similar to and broader than that of commission externality considerations. Only limited
attention, however, has been given to analyzing the best tools for internalizing
environmental costs in utility resource planning and operations.
73 Nagebdra Subbskrishna, New York PSC Staff, Personal Communication with author,January 13, 1994.
74 See, for example In the Matter of the Report of the Externalities Task Force, Docket No.U-0000-92-035, Decision No. 58237 (Arizona Corporation Commission, March 25, 1993); ReBiennial Resource Plan Update, 132 P.U.R. 4th 206 (CA PUC, April 22, 1992); Re IntegratedResource Planning, 139 P.U.R. 4th 379 (CO PUC, December 30, 1992); Re WashingtonWater Power Co., 135 P.U.R. 4th 382 (ID PUC, July 16, 1992); Re Comprehensive EnergyPlan for the State of Illinois, 132 P.U.R. 4th 49 (IL CC, March 31, 1992); Re RulemakingRegarding Resource Planning Changes Pursuant to S.B. 497, 119 P.U.R. 4th 257 (NV PSC,January 22, 1991); Re PacifiCorp, 135 P.U.R. 4th 306 (Utah PSC, June 18, 1992).

93
CHAPTER 5
RESOURCE ACQUISITION AND OPERATINGSTRATEGIES FOR ENVIRONMENTAL IMPROVEMENT
Planning and operating modern electric power systems involves several interlinkedand complex tasks (Table 5-1). Accomplishing each so that consumers receive power reliablyat an acceptable economic and environmental cost is difficult for several reasons. First, theelectric system itself encompasses an interconnected array of a large number of electricalmachines and circuits. Maintaining acceptable voltages and frequency in such systems underrapidly changing circumstances is by itself a daunting task. Second, scheduling short rungeneration and load management to minimize costs is complicated because of the sheernumber of alternative schedules that are possible and by the uncertainties in load andequipment availability. Finally, long-term planning involves sorting through a wide range ofpossible resources and in-service dates, while keeping in mind the implications of each forshort term schedules and costs.1
The various environmental policies discussed in earlier chapters--command-and-control regulations, emission caps, taxes, marketable permits, and emission adders--canimpact all aspects of system planning and operation. In return, the decisions shown in Table5-1 influence the type and degree of environmental impact caused by electricitygeneration, transmission, and use.2 The purpose of this chapter is to explore the
1 E. Hirst and C. Goldman, "Creating the Future: Integrated Resource Planning for ElectricUtilities," Annual Review of Energy 16 (1991): 91-121.
2 There are other decisions utilities can make that affect the environment. For instance,utilities can decrease environmental impacts by purchasing "offsets," such as New EnglandElectric System's announced efforts to plant trees in Central America (see J.W. Rowe andC.A. LaFleur, "Environment, Economy, and Energy: Meeting the Multiple Challenges of the1990s," Electricity Journal 5, no. 6 (1992): 42-49). Purchases of SO2 emission allowances orNOx emission offsets in non-attainment areas have similar effects. Utilities can also alter theirenvironmental impacts via rate policies, such as considering external environmental costs inratemaking policies (C.K. Woo, B.F. Hobbs, R. Orans, R. Pupp, and B. Horii, "EmissionCosts, Customer Bypass, and Ramsey Pricing of Electricity," Submitted to Resource andEnergy Economics, April 1994.) Although rate reform or offsets will often have a lower costthan other emission reduction strategies, for purposes of this discussion the focus is on howutilities can lower their emissions more directly via resource acquisition and system operation.

94
TABLE 5-1
OVERVIEW OF UTILITY PLANNING AND OPERATIONS PROBLEMS
RESOURCE AND EQUIPMENT PLANNING
MEDIUM TERM OPERATIONS PLANNING
RESOURCE PLANNING AND PRODUCTION COSTING (ten to forty year horizon)Given forecasts of loads, construction costs, fuel prices, and regulations, determinethe mix of generator additions and retirements, power purchases and sales, anddemand-side management. Risks and multiple objectives should be considered, asshould be the effect of plans on electric rates and, thus, loads.
LONG RANGE FUEL PLANNING (ten to twenty years)Given generating plants, find the least cost sources of fuel and schedule deliveries. Regulatory and environmental policy constraints (especially on air emissions) areimportant.
TRANSMISSION AND DISTRIBUTION PLANNING (five to fifteen years)Given load forecasts and planned generation additions, design circuit additions thatmaintain reliability, minimize costs, and avoid possible environmental effects suchas aesthetic impacts or exposure to EMF.
RATE DESIGN AND DSM IMPLEMENTATION PLANNING (three to fifteen years)Given base load forecasts and market opportunities, identify cost-effective DSMprograms to target at particular markets, and design marketing and financingprograms. Design rate structures for achieving load shape objectives such as valley-fill or peak shaving. Environmental benefits of DSM programs should beconsidered.
MAINTENANCE AND PRODUCTION SCHEDULING (two to five years)Given load forecasts and available equipment, schedule interutility sales of energyand routine equipment maintenance to maintain reliability and minimize costs. Schedules can account for seasonal differences in emission restrictions, if any.
FUEL SCHEDULING (one year)Within limitations of long-term fuel contracts, schedule fuel deliveries and storage tomeet plant requirements.
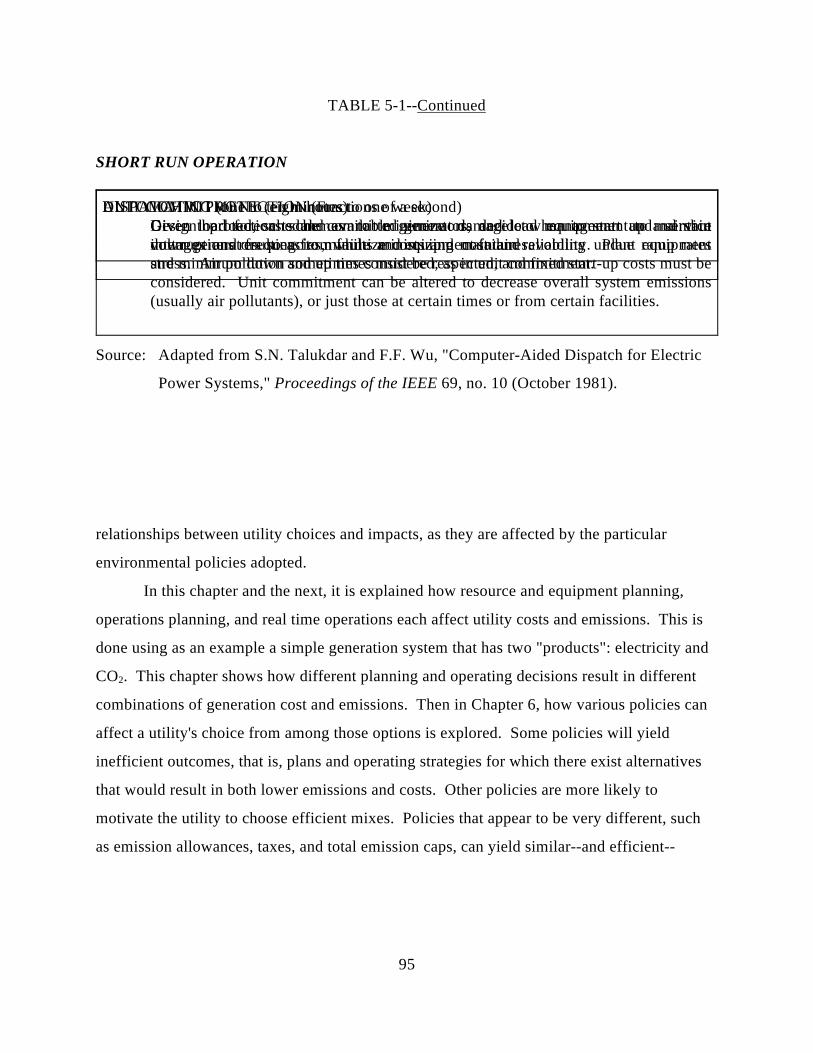
95
TABLE 5-1--Continued
SHORT RUN OPERATION
Source: Adapted from S.N. Talukdar and F.F. Wu, "Computer-Aided Dispatch for Electric
Power Systems," Proceedings of the IEEE 69, no. 10 (October 1981).
relationships between utility choices and impacts, as they are affected by the particular
environmental policies adopted.
In this chapter and the next, it is explained how resource and equipment planning,
operations planning, and real time operations each affect utility costs and emissions. This is
done using as an example a simple generation system that has two "products": electricity and
CO2. This chapter shows how different planning and operating decisions result in different
combinations of generation cost and emissions. Then in Chapter 6, how various policies can
affect a utility's choice from among those options is explored. Some policies will yield
inefficient outcomes, that is, plans and operating strategies for which there exist alternatives
that would result in both lower emissions and costs. Other policies are more likely to
motivate the utility to choose efficient mixes. Policies that appear to be very different, such
as emission allowances, taxes, and total emission caps, can yield similar--and efficient--
UNIT COMMITMENT (eight hours to one week)Given load forecasts and available generators, decide when to start up and shutdown generators so as to minimize costs and maintain reliability. Plant ramp ratesand minimum down and up times must be respected, and fixed start-up costs must beconsidered. Unit commitment can be altered to decrease overall system emissions(usually air pollutants), or just those at certain times or from certain facilities.
DISPATCHING (one to ten minutes)Given the load, schedule committed generators and load management to maintainvoltages and frequencies, while minimizing cost and avoiding undue equipmentstress. Air pollution sometimes considered, as in unit commitment.
AUTOMATIC PROTECTION (Fractions of a second)Design protection schemes to minimize damage to equipment and serviceinterruptions resulting from faults and equipment failures.

96
outcomes. Finally, also in Chapter 6, some actual examples are explored of how operating
strategies can be used to achieve cost-effective environmental improvement.
Multiobjective Framework for Evaluating Resource Optionsand Operating Strategies
Multiobjective plots, such as Figure 5-1, are a useful tool for understanding how
coherent environmental compliance plans can be assembled. This device is used to illustrate
how long- and short-run strategies complement each other; both are needed in order to ensure
an efficient outcome. Multiobjective plots can show how the options available to the utility
affect important objectives, such as costs, rates, emissions, resource use, and financial indices.
Figure 5-1 is a two-dimensional plot in which the only objectives are incremental generation
cost (the y-axis) and CO2 emissions (the x-axis). In general, each point can be a distinct plan
representing a particular combination of supply sources, environmental controls, demand-side
management programs, and rate design, along with a unique operating strategy.3
3 To be more precise, the cost axis represents all variable costs of generation, plus anyannualized costs of new generation plants and DSM programs. It is assumed here that thecosts and emissions resulting from a particular plan can be predicted with certainty. In reality,uncertain fuel prices, loads, and other factors mean that the location of each point should bedescribed by a probability distribution or confidence interval. The points shown could alsorepresent an average for each plan across a set of scenarios (C.J. Andrews and S.R. Conners,"Existing Capacity: The Key to Reducing Emissions," Energy Systems and Policy 15, no.3(1991): 211-30).

97
Fig. 5-1. Tradeoff plot: CO2 versus cost for seven plans (Source: Authors'construct).
The concepts are illustrated by examining the options facing a hypothetical small
utility. The utility's peak load in the year 2010 is projected to be 1,050 MW. Its present
generation mix consists of three coal units (500 MW total), an oil-fired steam unit (150 MW),
and natural gas-fire combustion turbines (200 MW). The options available for meeting loads
and decreasing emissions by a combination of emissions dispatch (operating cleaner plants
more and dirtier plants less), fuel switching (in particular, cofiring natural gas at the second

98
coal unit), acquiring supplies (new pulverized coal plants, gas-fired combined cycle, or
combustion turbine capacity), and investing in energy efficiency (DSM-EE) and load controls
(DSM-LC). Figure 5-1 shows the resource additions made in each of several plans, assuming
that generation is dispatched in order to minimize utility costs.4 Appendices A and B
document the linear program used to evaluate alternative plans and the assumptions made in
the case study.
Some plans in Figure 5-1 yield both high internal costs and high emissions (for
example, Plan G). These plans are obviously inferior to other plans which have both lower
costs and emissions (such as Plan A). Plans that are not superseded by any other plans are
(for purposes of this discussion) the "efficient" alternatives (here, Plans A, B, C, and D, which
are connected by a dotted line). Alternatives to a particular efficient plan have either higher
costs or higher emissions. If all a planner cares about is revenue requirements and CO2, then
only efficient plans are of interest.5 This curve can be used to calculate the marginal cost of
achieving each increment of reduction. For instance, moving from Plan B to Plan C involves
a reduction of 150,000 tons of CO2 at a cost of $1.5 million, implying a marginal cost of $10
per ton of emissions decrease. Improved technology would shift the curve in toward the
origin, lowering emissions, costs, or both.
Some researchers argue that the purpose of modelling should be to screen and define
the efficient set and eliminate inferior alternatives.6 It is then up to policymakers to make the
4 The relatively small numbers for generation capacity additions result from theassumption that fractions of units can be acquired through joint ownership of facilities withother utilities.
5 J. Cohon, Multiobjective Programming and Planning (New York: Academic Press,1978); W.J. Burke et al., "Trade Off Methods in System Planning," IEEE Transactions onPower Systems 3, no. 3 (1988): 1284-90.
6 Ibid.

99
value judgments necessary to choose from among the surviving options. This information
supports negotiations by helping participants focus on the key issues and available tradeoffs.7
7 C.J. Andrews, "The Marginality of Regulatory Marginal Investments: Why We Need aSystemic Perspective on Environmental Externality Adders," Energy Policy (May 1992): 450.

100
Environmental planning can be viewed as the process by which the utility chooses
from the possibilities in Figure 5-1. The government sets some rules as to which points are
admissible and how the utility should weigh the tradeoffs between the two objectives of
minimizing internal costs and minimizing emissions. These rules may give the utility little
discretion, or they might allow considerable flexibility. Later in this chapter, it is shown how
different rules affect the utility's choices. However, first three categories of options which
together determine the utility's costs and emissions are discussed: short-run operations,
medium-term operations planning, and long-run resource planning. It is then shown how they
can be integrated. In addition, there is a discussion on how price-elastic energy demands can
alter the outcomes of emissions-cost tradeoff analyses.
Short-Run Operations
Unit commitment and dispatch can drastically affect both system costs and emissions.
The difference between unit commitment and dispatch is that the commitment problem
involves the determination of which units should be on line and available to take load at
which times, whereas dispatch concerns how much power each on-line unit should produce
on a minute by minute basis. For the purposes of this discussion, the term "dispatch" broadly
encompasses both commitment and real-time dispatch.
Traditionally, utilities have operated their generation systems to minimize fuel and
other variable costs, subject to reliability restrictions. This generally results in "least-cost"
dispatch, in which units with the lowest variable cost are used first and more expensive units
are dispatched only when loads exceed the capacity of the cheaper units. The "merit order"--
the order in which generating units are dispatched--is constructed by ranking the units in order
of cost.8
8 Complications caused by transmission limits and losses and nonconstant variable costsare ignored here. See A.J. Wood and B.F. Wollenberg, Power Generation Operation andControl (New York: Wiley, 1984).
101
However, if a utility also is concerned with environmental impacts, it might alter the
merit order in order to decrease its emissions. This is called emissions dispatch: the operation
of a generation system so that generating units that have higher emission rates (on a pound
per kWh basis) produce less power and, thus, fewer emissions than they would if dispatched
on a strict least-cost basis. Consequently, cleaner units generate more power, system
emissions are reduced, and increase utility costs compared to least-cost dispatch. As case
studies discussed in this chapter show, the result can be significant emission reductions whose
costs are well below those of other emission-control options.
Emissions dispatch is not used here to mean "least-emissions dispatch," in which the
sole objective is to minimize the amount of emissions. Rather, it is a composition of least-
emissions and least-cost dispatching.9 As an example, consider a system with just three
generating units, each 100 megawatts (MW) in size, and imagine that SO2 is the pollutant of
concern. Unit 1 is a natural-gas fired facility with no SO2 emissions and a marginal cost of
$30 per MWh. Unit 2 burns low-sulfur coal, has an emissions rate of thirty pounds of SO2 per
MWh, and a marginal cost of $24 per MWh. Finally, Unit 3 burns high-sulfur coal, emits
forty-eight pounds per MWh, and costs $15 per MWh to run. Assume that there are no
planned or forced outages, and no operating restrictions such as minimum run levels.
Let us assume that these plants are dispatched to meet a load of 150 MW. Least-cost
dispatching would mean that Unit 3 would bear 100 MW of the load, and Unit 2 would
shoulder the rest. The resulting cost is $2,700 per hour or 100 MW X $15 per MWh + 50
MW X $24 per MWh. Emissions would be estimated by a similar calculation, and would
equal 6,300 pounds per hour. In contrast, least-emissions dispatch would run Unit 1 at 100
MW and Unit 2 at 50 MW. The total cost would increase by more than 50 percent to $4,200
per hour, and emissions would fall to 1,500 pounds per hour. The cost of reducing emissions
by moving from least-cost dispatching to least-emissions dispatching can be calculated as
9 S. Bernow, B. Biewald, and D. Marron, "Full-Cost Dispatch: Incorporating ExternalCosts in Power System Operations," The Electricity Journal (March 1991): 20-33.

102
($4,200 - $2,700)/(6,300 pounds - 1500 pounds), or $625 per ton of SO2. Compared to other
options, this may be an expensive means of lowering emissions.
However, consider the following intermediate emissions-dispatching order. Let Unit 3
produce 100 MW, as in least-cost dispatching, but use gas-fired Unit 1 rather than coal-fired
Unit 2 to meet the remaining 50 MW. The total cost would then be $3,000 per hour, and the
emissions 4,800 pounds per hour. Compared to least-cost dispatching, a reduction of 1,500
pounds per hour has been achieved at a cost of $300 per hour. This is an incremental expense
of $400 per ton, which may be cost-effective compared to other SO2 reduction options.
The simplest way to generate alternative merit orders is to add a hypothetical tax or
penalty to the variable cost of each generating unit equal to an assumed cost per pound of
emissions times that unit's emission rate.10 Then a merit order can be created based on this
composite cost objective, and the resulting emissions and out-of-pocket costs estimated. For
instance, a tax of $500 per ton would have yielded the following merit order in the above
example: Unit 3 first, then Unit 1, and last Unit 2.11
Figure 5-2 illustrates this concept for the generation system of Appendix A. A fixed
generating mix is assumed, based on Plan A of Figure 5-1 in which no additional
DSM is acquired and 145 MW of combined cycle and 212 MW of combustion turbine
capacity is purchased or built. This is the plan that minimizes total cost without regard
10 For example, see J.K. Delson, "Controlled Emission Dispatch," IEEE Transactions onPower Apparatus and Systems, PAS-93(5) (Sept./Oct. 1974): 1359-1366; J.S. Heslin and B.F.Hobbs, "A Probabilistic Production Costing Analysis of SO2 Emissions Reduction Strategiesfor Ohio: Emissions, Cost, and Employment Tradeoffs," Journal of the Air and WasteManagement Association 41, no. 7 (1991): 956-66.
11 Emissions dispatch schemes can also be used with a constraint on total emissions,constraints on individual emission rates, and constraints or taxes on pollutant concentrationsrather than emissions (R. Petrovic and B. Kralj, "Economic and Environmental PowerDispatch," European Journal of Operational Research 64, no. 1 (1993): 2-11; J.H. Talaq, F.El-Hawary, and M.E. El-Hawary, "A Summary of Environmental/Economic DispatchAlgorithms," IEEE Transactions on Power Systems (forthcoming).

103
Fig. 5-2. Effect of emissions dispatch upon emissions and cost under plan A (Source:Authors' construct).
to emissions. Strict least-cost dispatch of this system results in the point on the lower right
(marked "$0 per ton"). Coal plants are baseloaded, the oil-fired and combined cycle facilities
serve intermediate loads, and combustion turbines meet peak loads. The merit orders and
capacity factors of the facilities under this dispatch order are shown in the first column of
numbers in Table 5-2.

104
If instead a hypothetical tax of $10 per ton is applied to CO2 emissions, then the merit
order shifts, as the second column of numbers in Table 5-2 indicates. Under a zero CO2 tax,
Coal 1 was dispatched after Coal 3, because Coal 1 is scrubbed and has a

105
TABLE 5-2
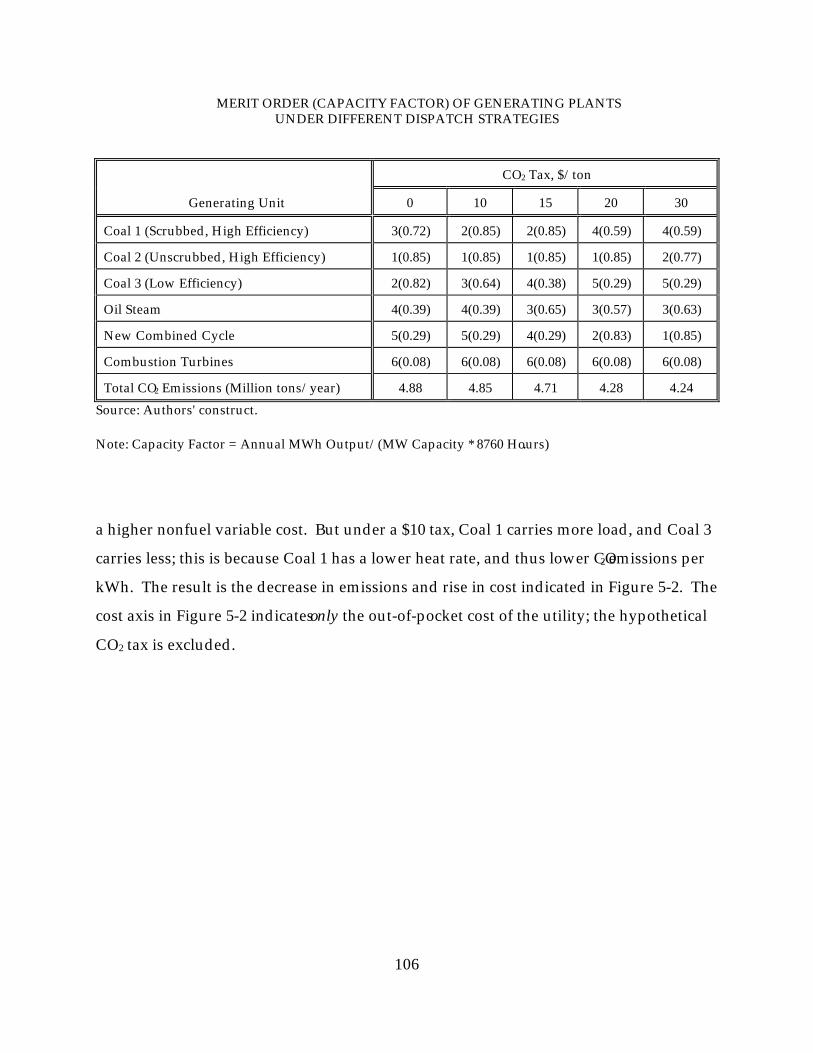
106
MERIT ORDER (CAPACITY FACTOR) OF GENERATING PLANTS UNDER DIFFERENT DISPATCH STRATEGIES
CO2 Tax, $/ton
Generating Unit 0 10 15 20 30
Coal 1 (Scrubbed, High Efficiency) 3(0.72) 2(0.85) 2(0.85) 4(0.59) 4(0.59)
Coal 2 (Unscrubbed, High Efficiency) 1(0.85) 1(0.85) 1(0.85) 1(0.85) 2(0.77)
Coal 3 (Low Efficiency) 2(0.82) 3(0.64) 4(0.38) 5(0.29) 5(0.29)
Oil Steam 4(0.39) 4(0.39) 3(0.65) 3(0.57) 3(0.63)
New Combined Cycle 5(0.29) 5(0.29) 4(0.29) 2(0.83) 1(0.85)
Combustion Turbines 6(0.08) 6(0.08) 6(0.08) 6(0.08) 6(0.08)
Total CO2 Emissions (Million tons/year) 4.88 4.85 4.71 4.28 4.24
Source: Authors' construct.
Note: Capacity Factor = Annual MWh Output/(MW Capacity * 8760 Hours).
a higher nonfuel variable cost. But under a $10 tax, Coal 1 carries more load, and Coal 3
carries less; this is because Coal 1 has a lower heat rate, and thus lower CO2 emissions per
kWh. The result is the decrease in emissions and rise in cost indicated in Figure 5-2. The
cost axis in Figure 5-2 indicates only the out-of-pocket cost of the utility; the hypothetical
CO2 tax is excluded.

107
Higher taxes shift the merit order around even more; at $15 per ton, the oil steam
plant is dispatched ahead of Coal 3 (Table 5-2), resulting in more substantial emission
reductions. At $20 per ton, the oil and combined cycle facilities are dispatched ahead of all
the coal plants except the very efficient Coal 2. At $30 per ton, the combined cycle facility is
baseloaded, and the coal plants are cycled to the extent that their minimum run restrictions
allow. Figure 5-2 shows that as a result of this, CO2 emissions can be decreased by up to 15
percent at a net cost of $10 million per year.12
The points are connected by line segments because it is possible to continuously
vary the dispatch of the system between the points shown. However, that is not always
true, as some of the emissions reductions may be achieved by discontinuously reducing the
output of some dirtier units from their minimum run levels to zero. To consider this
complication, environmental unit commitment models are necessary, some of which are
becoming available.13
12 These emission reductions are less than might be inferred from Bernow, Biewald, andMarron's ("Full-Cost Dispatch: Incorporating External Costs in Power System Operations,"20-33) hypothetical analysis because we have explicitly included minimum run requirementsthat prevent full cycling of coal facilities. Careful analyses of New England (J.F. Busch andF.L. Krause, "Environmental Externality Surcharges in Power System Planning: A CaseStudy of New England," IEEE Transactions on Power Systems 8, no. 3 (August 1993): 789-95), Ohio (J.S. Heslin and B.F. Hobbs, "A Probabilistic Production Costing Analysis of SO2
Emissions Reduction Strategies for Ohio," 956-66), and other regions have explicitly imposedoperating restrictions using sophisticated production costing models; they give a morerealistic picture of the emission reductions that are possible.
13 C. Marnay, "Intermittent Electrical Dispatch Penalties for Air Quality Improvement,"Ph.D. Dissertation, Berkeley, California, University of California, 1993; T. Gjengedal, O.Hansen, and S. Johansen, "Qualitative Approach to Economic-Environmental Dispatch;Treatment of Multiple Pollutants," IEEE Transactions on Energy Conversion, 7, no. 3(September 1992): 367-373; S. Kuloor, G.S. Hope, and O.P. Malik, "EnvironmentallyConstrained Unit Commitment," IEEE Proceedings-C 139, no. 2 (March 1992): 122-28.

108
Tradeoffs between internal cost, CO2, and other objectives, such as minimizing NOx
or maximizing employment in local coal fields, can be easily generated by a generalization
of this tax procedure. First, each objective would be mathematically defined as a linear
function of the energy produced by each generation types. Merit orders would then be
created based upon a weighted sum of all the objectives, with the generation unit with the
lowest value per MW being dispatched first. Finally, the weights would be varied
systematically, each set of weights yielding a different distribution of output among the
units. The resulting changes in the values of the various objectives for the system as a
whole are then plotted.14
The curve in Figure 5-2 can be viewed as a short-run total cost curve for emissions
reductions, as it holds capital investments fixed. Long-run curves, which reflect possible
investments in resources and control technologies, are the subject of the next two
subsections.
Medium-Term Operations Planning
The next level of complexity in an environmental planning exercise would be to go
beyond an analysis of dispatch to consider possible medium-term fuel changes and perhaps
emission-control retrofits, and their interactions with emissions dispatch. Medium-term
strategies usually involve lump-sum expenditures of capital and changes in the efficiency,
capacity, emission and outage rates of generating units. For example, switching to low-
sulfur coal will mean that fuel and handling equipment may have to be altered because of
changes in the coal's ash content or grindability. However, these investments are usually
relatively small compared to the cost of acquiring new resources.
14 Heslin and Hobbs, "A Probabilistic Production Costing Analysis of SO2 EmissionsReduction Strategies for Ohio;" Ibid., Gjengedal, Hansen, and Johansen, "QualitativeApproach to Economic-Environmental Dispatch."
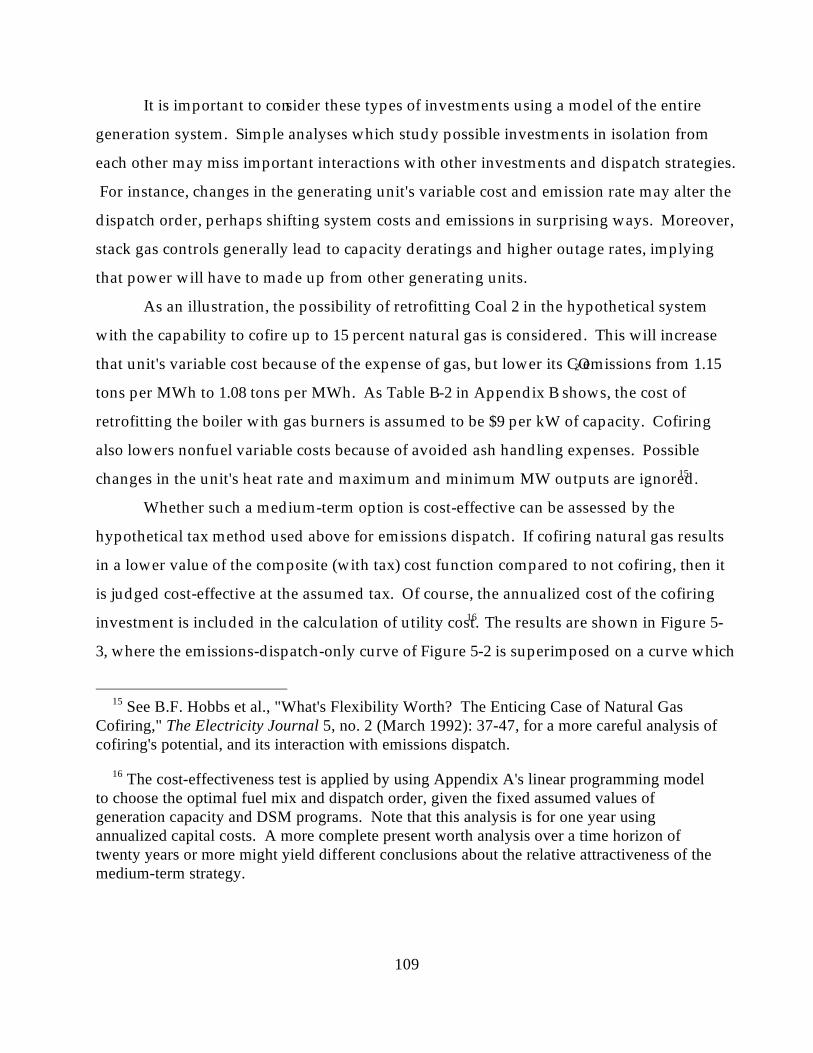
109
It is important to consider these types of investments using a model of the entire
generation system. Simple analyses which study possible investments in isolation from
each other may miss important interactions with other investments and dispatch strategies.
For instance, changes in the generating unit's variable cost and emission rate may alter the
dispatch order, perhaps shifting system costs and emissions in surprising ways. Moreover,
stack gas controls generally lead to capacity deratings and higher outage rates, implying
that power will have to made up from other generating units.
As an illustration, the possibility of retrofitting Coal 2 in the hypothetical system
with the capability to cofire up to 15 percent natural gas is considered. This will increase
that unit's variable cost because of the expense of gas, but lower its CO2 emissions from 1.15
tons per MWh to 1.08 tons per MWh. As Table B-2 in Appendix B shows, the cost of
retrofitting the boiler with gas burners is assumed to be $9 per kW of capacity. Cofiring
also lowers nonfuel variable costs because of avoided ash handling expenses. Possible
changes in the unit's heat rate and maximum and minimum MW outputs are ignored.15
Whether such a medium-term option is cost-effective can be assessed by the
hypothetical tax method used above for emissions dispatch. If cofiring natural gas results
in a lower value of the composite (with tax) cost function compared to not cofiring, then it
is judged cost-effective at the assumed tax. Of course, the annualized cost of the cofiring
investment is included in the calculation of utility cost.16 The results are shown in Figure 5-
3, where the emissions-dispatch-only curve of Figure 5-2 is superimposed on a curve which
15 See B.F. Hobbs et al., "What's Flexibility Worth? The Enticing Case of Natural GasCofiring," The Electricity Journal 5, no. 2 (March 1992): 37-47, for a more careful analysis ofcofiring's potential, and its interaction with emissions dispatch.
16 The cost-effectiveness test is applied by using Appendix A's linear programming modelto choose the optimal fuel mix and dispatch order, given the fixed assumed values ofgeneration capacity and DSM programs. Note that this analysis is for one year usingannualized capital costs. A more complete present worth analysis over a time horizon oftwenty years or more might yield different conclusions about the relative attractiveness of themedium-term strategy.

110
also includes the option of cofiring. In the cofiring curve, cofiring only takes place if it
lowers total cost (including CO2 penalties). At taxes of $0 through $15, installing cofiring is
not worthwhile, and the points of the two curves are almost coincident, as shown. The
difference between the two curves results from the (small) cost of installing the capability to
cofire gas.
But if the tax is increased to $20 per ton or more, then gas is cofired at Coal 1
because, at that tax, the additional cost of natural gas is more than offset by the value of the
emissions decrease. The result is lower emissions but higher costs compared to the
dispatch-only curve. For instance, comparing the two $30 points, cofiring would drop
emissions by 65,000 tons per year while raising costs by $1.2 million.

111
Fig. 5-3. Comparison of plan A with and without option of cofiring underemissions dispatch (Source: Authors' construct).

112
Resource Acquisition Decisions
Several categories of long-run alternatives are available to our hypothetical utility:
life extension, strategic conservation, and new fossil-fueled power plants. Utilities have
other options too, such as purchasing or sales of bulk power, other types of DSM programs,
and renewable energy sources. The number of possible combinations of

113
resources that satisfy reserve margin requirements can be very large. Figure 5-1, above,
plots just a handful of combinations; actual studies generally show many more.17 In each of
the plans shown in Figure 5-1, least-cost dispatch is assumed.
Figure 5-1, however, would be a poor way to judge the merits of the various plans.
This is because the most cost-effective emissions strategy is likely to be a combination of
emissions dispatch, fuel switching, and acquisition of cleaner resources. Figure 5-1 does not
consider the interaction of different resource mixes with operational strategies; it is likely
that some resource mixes will provide more opportunities for emissions dispatch and fuel
switching than others.
Figure 5-4 corrects this oversight by plotting the performance of combinations of
strategies. Each curve results from one capacity mix, and represents the emissions and
costs resulting from different degrees of emissions dispatch and cofiring, where available.
The right-most points on each curve are the least-cost dispatch solutions shown in Figure 5-
1. The left-most points correspond to a CO2 tax of $30 per ton. As asserted in the previous
paragraph, some plans do indeed have much more potential for emissions dispatch than
others: for instance, compare Plan G (New Coal) with Plans A, B, C, and D, each of which
involve some combined-cycle capacity (see Figure 5-1). The latter plans have a mix of gas
and coal-fired capacity that offers more opportunity for lowering emissions by altering
dispatch order.
Although some of the least-cost dispatch points appeared to be efficient in Figure 5-
1, most of them are inferior to strategies that involve some emissions dispatch in Figure 5-4.
Consider, for example, the right-most point of Plan D's curve. This is the least-cost dispatch
of a system in which 80 MW of DSM was acquired along with 265 MW of combined cycle
capacity, and cofiring capability has been installed in Coal 2. This point is now inferior to
17 For example, see Clinton J. Andrews, "The Marginality of Regulating MarginalInvestments; E.O. Crousillat, P. Dorfner, P. Alvarado, and H.M. Measill, "ConflictingObjectives and Risk in Power Systems Planning," IEEE Transactions on Power Systems 8,no. 3 (August 1993): 887-93.

114
both the second and third points from the right on Plan C's curve. The third point
represents dispatch at $15 per ton of a system in which
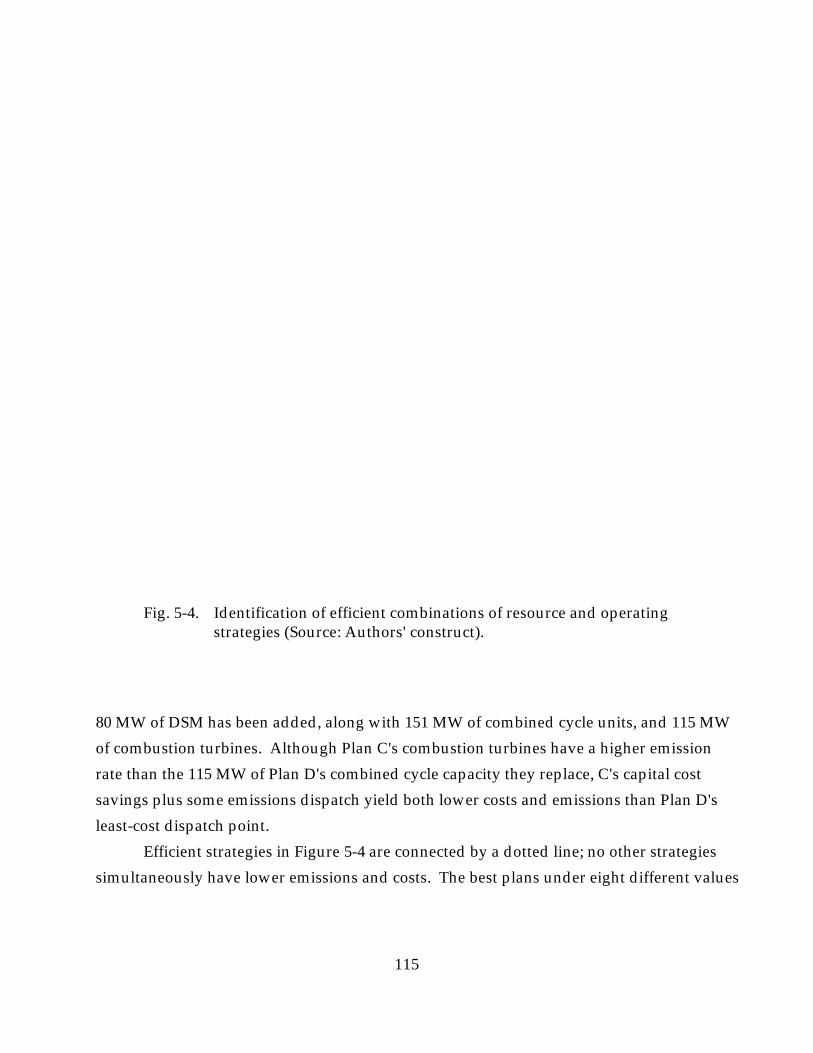
115
Fig. 5-4. Identification of efficient combinations of resource and operatingstrategies (Source: Authors' construct).
80 MW of DSM has been added, along with 151 MW of combined cycle units, and 115 MW
of combustion turbines. Although Plan C's combustion turbines have a higher emission
rate than the 115 MW of Plan D's combined cycle capacity they replace, C's capital cost
savings plus some emissions dispatch yield both lower costs and emissions than Plan D's
least-cost dispatch point.
Efficient strategies in Figure 5-4 are connected by a dotted line; no other strategies
simultaneously have lower emissions and costs. The best plans under eight different values

116
of the CO2 tax are indicated as Px, where x is the tax.18 With the exception of the least-cost
point P0, all of the efficient strategies involve at least some emissions dispatch. This is a
general rule: efficient emissions control involves both short- and long-run strategies. It can
be shown that both short- and long-run measures should be adopted until the marginal
cost of additional measures of each type equals or exceeds the assumed tax.
Effects of Rates on Loads, Costs, and Emissions
Calculations of the emissions and costs of the strategies displayed in Figures 5-1
through 5-4 all assume that differences in electric loads among the strategies result only
from differences in DSM programs. Electric rate changes caused by differences in costs are
assumed to have no effect on loads.
Of course, this is not the case. The quantity of electricity demanded is a function of
the price. Rate increases would be necessary to cover the extra $22 million per year that
Plan P30 costs compared to P0 (Figure 5-4); as a result, loads will decrease, and so will
generation costs and emissions. If rates exceed the marginal cost of generating power, then
rate increases will be even greater because of the lost revenues resulting from additional
DSM programs.
As an example of this phenomenon of rate feedback, let us assume that the load is
consistent with the costs incurred by Plan P0, and the resulting retail rate would be 6 cents
per kWh. Further, assume that the price elasticity of demand is 0.6, and that rate increases
would cause loads to decrease by an equal proportion in all periods. It can be shown that if
the resource mix and system operation is optimized using a tax of $30 per ton, then rates
would increase 10.2 percent, and loads would fall by 6.1 percent.19 The result is shown in
Figure 5-5, where Plans P0 through P30 are contrasted with a Plan P30, 18 Efficient strategies can be found more directly by optimizing the full linear program ofAppendix A, including new capacity variables, under various assumed taxes.
19 This is accomplished by using the cob-web algorithm: the full linear programming modelof Appendix A is solved under a $30 penalty and an assumed energy demand. Then theresulting costs are used to adjust the average cost-based price. A new energy demand is thencalculated and is returned to the LP, which is solved again, and so on.

117
Fig. 5-5. Effect of rate feedback upon emissions and costs of plan P (Source:Authors' construct).
which is modified to account for rate feedback. Rate feedback lowers costs by $17 million
per year compared to the no feedback case, and emissions fall by 61,000 tons per year.
Rate feedback seemingly bestows a free lunch: costs and emissions decrease
compared to the original P30. If the modified P30 is compared to P0 (the base case), the
apparent cost per ton of CO2 reduction is a mere $4 per ton; by comparison, the per ton cost
of moving from P0 to P30 is $22 per ton. If this rate feedback is calculated for all other
options, then points P5 through P25 would also shift down and to the left. This forms a new
curve connecting P0 with modified P30, where the cost per ton of reduction for all options P5

118
through P30 would be lower than when rate feedback is not considered. This points out that
rate feedback--which is too often ignored--can drastically alter the conclusions of a cost
versus emissions analysis.
However, this free lunch is illusory, because there is an important category of
societal cost that is not included in the figures. By raising rates, electric customers will be
discouraged from buying electricity that would otherwise provide value. This foregone
value is a real economic cost of the rate increase. Quantification of this lost customer value
could change the outcome of a benefit-cost analysis of emissions reductions.20,21 The
general issue of social welfare gain or loss versus the cost will be revisited in Chapter 7 in
the context of overall environmental regulation.
20 As an example, B.F. Hobbs and J.S. Heslin, "Evaluation of Conservation for SO2
Emissions Reduction Using a Multiobjective Electric Power Production Costing Model," inACEEE 1990 Summer Study on Energy Efficiency in Buildings (Washington D.C.: AmericanCouncil for an Energy Efficient Economy, 1990), 4.65-4.77, use the concept of consumers'surplus to quantify this lost value for a SO2-cost tradeoff curve for Ohio. They set lost valueequal to the price of electricity times the rate-induced decrease in energy demanded. SeeK.W. Costello and P.S. Galen, A Proposed Methodology for Evaluating Utility ConservationPrograms, Docket Nos. 83-0034 to 83-0043, Illinois Commerce Commission, Springfield,Illinois, 1983; or S.D. Braithwait and D.W. Caves, "Three Biases in Cost-Efficiency Tests ofUtility Energy Efficiency Programs," The Energy Journal 15, no. 1 (January 1994): 95-120,for discussions of the use of consumer surplus in evaluating resource plans.
21 Another impact of higher electricity prices is that electricity end users may substituteother fuels for electricity; in theory, the net environmental effects of resource choices mightthen be considerably different than just the changes in the utility's emissions. It has beenargued that because of such substitution effects, the result of including externalities in utilityplanning might actually be to worsen rather than improve the net impact of energy use on theenvironment (L. Ruff, Internalizing Environmental Costs in Electric Utility Decisions,Unpublished manuscript, May 1991).
An investigation into this question was conducted for Seattle City Light (SCL), anorthwestern U.S. utility (B.F. Hobbs, "Emission-Cost Tradeoffs for Electric Utilities: TheEffect of Rate Feedback," Journal of Energy Engineering (in review). The rate increasesnecessary to pay for a large decrease in SCL's CO2 emissions would induce significantincreases in residential consumption of fuel oil, natural gas, and wood. However, theresulting increases in CO2, NOx, and particulate emissions are unimportant compared to thedirect change in SCL's emissions and can be disregarded.

113
CHAPTER 6
ENVIRONMENTAL POLICIES AND UTILITY DECISIONS
Government laws and regulations limit those points in Figure 5-4 which can be
considered by the utility, as well as the method used by the utility to weigh the tradeoffs
among the cost and environmental objectives. In this chapter, how alternative government
environmental policies affect utility planning is discussed. The policies considered include
traditional command-and-control regulations, constrained emissions, internalization of
environmental costs via taxes or marketable emission credits, and internalization of
environmental costs via planning regulations.
The policies are compared in terms of whether they motivate the utility to choose an
efficient plan and whether that plan also minimizes total social cost. "Social" cost is defined
for purposes of this discussion, as the sum of utility costs plus emissions of each type times
the appropriate damage cost per ton for each type. As a hypothetical case, if damages are $10
per ton for CO2, then the least social cost plan in Figure 5-4 is Plan P10, which is the point at
which the marginal internal cost of reducing emissions further by moving to Plan P15 exceeds
$10 per ton.1
Command-and-Control Regulations
Examples of command-and-control regulation include local restrictions on fuel sulfur
content, federal New Source Performance Standards, and Best Available Control Technology
rules. The effect of policies of this type is to render some of the points in
Figure 5-4 illegal.2 Only those plans that conform to the regulations can be considered.
1 This assumes that changes in the price of electricity do not induce consumers to alter theamount of power they consume.
2 Of course, there are no CO2 regulations at the present time; their existence is assumed inthis section merely to make a point about the theoretical inefficiency of the command-and-control approach.

114
The utility is then free to choose from the permissible plans in order to minimize its internal
cost. The emissions of those plans are ignored.
For instance, say that a policy is adopted that prohibits new coal plants or new fossil-
fuel plants with heat rates higher than 9,000 Btus per kWh. For our hypothetical utility, this
results in elimination of all alternatives involving new combustion turbines and coal plants,
and leaves only strategies represented by the solid line in Figure 6-1. The utility will choose
Plan PC&C, which is the cheapest plan that excludes new plants of that type.

115
Fig. 6-1. Inefficiency of a ban on new coal and combustion turbine facilities (Source:Authors' construct).

116
By focusing on individual supply resources, fuels, and emission controls, the
command-and-control approach ignores the environmental benefits of DSM and emissions
dispatch. As a result, superior solutions that have lower costs and emissions may be
prematurely eliminated. For instance, Plan P10 in Figure 6-1 represents a combination of
DSM programs and emissions dispatch together with some combustion turbine additions.
The new turbines lower the system's cost but also makes the plan illegal. The utility could
compensate for the higher emissions rate of the turbines through dispatch and DSM, but
command-and-control regulations do not permit consideration of that strategy. The result is
that the utility will choose PC&C instead, which unfortunately gives both higher costs and more
emissions than point P10.
An unfortunate consequence of command-and-control regulation is that even if the
environmental damages of CO2 are high, the utility has no incentive to use dispatch and DSM
to reduce emissions beyond the legal requirements. This is true even if the cost of doing so is
small compared to those damages. Thus, the utility's choice under command-and-control
regulation is unlikely to minimize total social cost.
Constrained Emissions
Another philosophy of environmental regulation, called "environmental least-cost
utility planning" (ELCUP), instead specifies the problem as follows.3 The utility is to
minimize its internal cost, subject to a constraint on overall emissions. For instance, Figure 6-
2 shows the effect of imposing a cap of 4.4 million tons per year of CO2, 10 percent below the
least-cost level. It would motivate the utility to choose point P15, as all the lower-cost points
to the right of the constraint are rendered infeasible by the cap.
3 S. Brick and G. Edgar, "Blunting Risk With Caution: The Next Step for Least-CostPlanning," The Electricity Journal (July 1990).

117
ELCUP is law in only one jurisdiction, Wisconsin, which constrains overall utility
NOx and SO2 emissions (see Chapter 4). However, several utilities, including Niagara
Mohawk, New England Electric System, and Southern California Edison voluntarily

118
Fig. 6-2. Environmental least-cost planning: imposition of a CO2 cap (Source:Authors' construct).
adopted this approach for the case of CO2 emissions. This approach has been encouraged
under President Clinton's greenhouse warming policy. Also, some utilities complying with
the Clean Air Act's acid rain provision may naively view the number of SO2 allowances they
were granted as a fixed constraint; however, most could further lower their compliance costs
by either selling or buying allowances.

119
The advantage of ELCUP over the command-and-control approach is that the utility
can freely choose from any combination of supply resources, emission controls, DSM
programs, and dispatch strategies in order to meet the constraint. Unlike command-and-
control regulations, an efficient point will always result from this process, at least in theory.
If the marginal external cost of emissions happens to be the same as the marginal
internal cost of emissions reduction at point P15, then ELCUP also results in the least social
cost plan. However, in general, ELCUP may result in too much or too little emissions
reduction, especially if the damages of pollution are poorly understood or if the marginal
expense of pollution control was not considered in setting the constraint.4
4 A variation of the ELCUP approach is to constrain the average emissions rate, measuredin terms of pounds per kWh or pounds per mmBtu of heat input. The use of a rate rather thantotal emissions can result in inefficient solutions (that is, higher costs and emissions thannecessary) and operating difficulties. For instance, the California South Coast Air QualityManagement district limits average NOx production by Southern California Edison's units inthe Los Angeles basin using a pounds-per-MWh standard (S.W. Hess et al., "Planning SystemOperations to Meet NOx Constraints," IEEE Computer Applications in Power 5, no. 3 (July1992)). This causes problems during days with low loads, as NOx emission rates (on apounds-per-MWh basis) increase when generating units are lightly loaded, even though totalemissions (in pounds) are lower. This rule also gives no incentive to invest in DSM or shiftgeneration to less sensitive areas outside the basin.

120
Taxes and Emission Allowances
External environmental costs can be internalized by imposing emission taxes or by
creating marketable emission credits. The effect of taxes and marketable credits is to make
emissions an internal cost from the utility's perspective. For instance, assume that a CO2 tax
of $15 per ton is levied or, alternatively, that the utility must secure emission allowances
whose market price is $15 per ton. The hypothetical utility will minimize its costs by
minimizing the sum of its capital, fuel, and variable costs (COST, the vertical axis of the
figures) plus $15 X CO2, where CO2 is its emissions (the horizontal axis). This process is
shown in Figure 6-3 in which isoquants of the quantity COST + $15 X CO2 are shown. The
point lying on the lowest such isoquant is the plan that minimizes the utility's total cost. In
Figure 6-3, this is point P15. Like the ELCUP approach
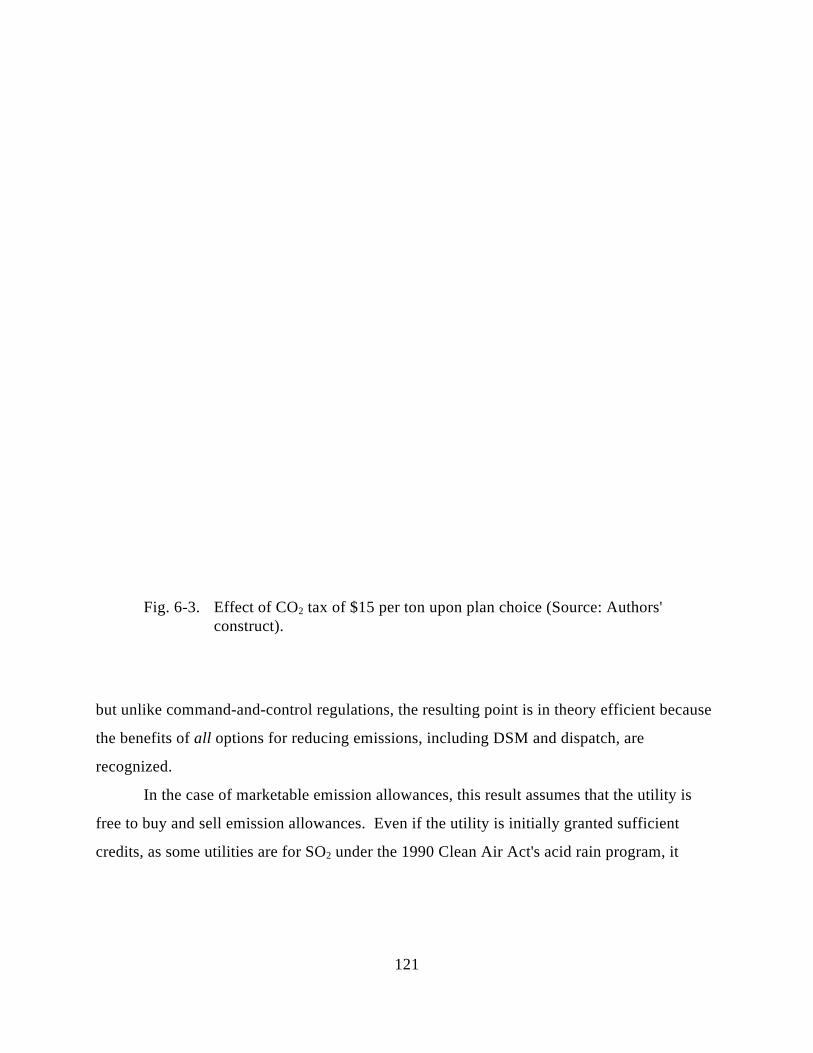
121
Fig. 6-3. Effect of CO2 tax of $15 per ton upon plan choice (Source: Authors'construct).
but unlike command-and-control regulations, the resulting point is in theory efficient because
the benefits of all options for reducing emissions, including DSM and dispatch, are
recognized.
In the case of marketable emission allowances, this result assumes that the utility is
free to buy and sell emission allowances. Even if the utility is initially granted sufficient
credits, as some utilities are for SO2 under the 1990 Clean Air Act's acid rain program, it

122
should still value them using the market price because an emission credit consumed is one
that cannot be sold. However, in practice some restrictions, such as a political constraint,5
might prevent achievement of an efficient solution. For example, under the acid rain
program, some states are considering a prohibition on utilities from selling allowances to
upwind utilities or from abandoning use of local high-sulfur coal. Possible rationales for such
restrictions are that the allowances ignore the fact that the location of emissions affects the
environmental damage they cause and that there are social objectives in addition to internal
cost and emissions.
Emission taxes will motivate the utility to choose the least social-cost point if the tax
rate equals the marginal damage cost of emissions, as discussed in Chapter 2. Then the
utility's total cost and society's cost are identical. The case of emission allowances is more
complicated. In a market in which credits are freely traded, no one is able to significantly
manipulate prices, and utilities have an incentive to operate in an efficient manner, the market
price is determined by the marginal cost of emissions control for all participants in the market.
If this price is lower than the damage cost of emissions, then the government has created too
many emission allowances (or not reduced emissions enough) and all utilities will emit more
than what would be socially optimal. The opposite is true if the price exceeds the damage
cost. In the case of too low a price, a utility would not do the environment any good if it
unilaterally decided to reduce emissions further than point P15 and sold the excess credits to
other utilities. The total emissions by the industry would be the same, but higher than
necessary control costs will have been incurred.6
5 For example, local coal interests have been a significant factor in determining the methodof compliance with the acid rain provisions of the 1990 Clean Air Act.
6 This is the effect of imposing externality adders on SO2 emissions over and above thecost of allowances (Benjamin F. Hobbs, "Environmental Adders and Emissions Trading: Oiland Water?" The Electricity Journal (1992). Utilities subject to such adders will beencouraged to emit less SO2, freeing up allowances to sell elsewhere. The national emissionsremains the same because of the 1990 Act's cap; allowances will simply be reallocated amongutilities, while compliance costs will increase. The impact of having the quantity limited orthe tax set too high or too low is discussed in Chapter 2 of this report.

123
Requirements for Considering External Costs
Another means of internalizing environmental costs is for utilities to estimate and
consider external costs when making resource acquisition or operation decisions.
Environmental impact statements are examples of such requirements. Several states have
gone further by specifying particular numerical adders to be considered in the decision
calculus (see Chapter 4). The utility does not pay a direct cost, unlike the tax or emission
allowance systems, but is forced by regulation to make decisions as if it does (with the
resulting higher cost passed through to ratepayers if implemented prudently). The most
common version of this requirement in the U.S. applies only to decisions concerning resource
acquisition. For our hypothetical utility, this would mean that the "cost," including adders, of
new combustion turbines, combined cycle facilities, and coal plants would be increased
relative to DSM. In theory, however, adders also could be extended to dispatch and pricing
decisions.7
If the utility is forced to include external costs in all its resource operation and
procurement decisions, the effect would be the same as an emission tax (Figure 6-3). An
efficient plan would be chosen, and if the estimated external cost was an accurate estimate of
actual damages, the least social cost plan would be achieved.
This outcome is unlikely to occur, however, if external costs are only factored into
resource procurement decisions and not into operation. The environmental costs of capacity
expansion and DSM programs would be considered, but the utility would dispatch its
resources to minimize internal cost. This is inefficient because, as pointed out earlier,
efficient alternatives almost always include some degree of emissions dispatch.8 These
7 S. Bernow, B. Biewald, and D. Marron, "Full-Cost Dispatch: Incorporating ExternalCosts in Power System Operations," The Electricity Journal, (March 1991); S. Wiel, "TheNew Environmental Accounting: A Status Report," The Electricity Journal 4, no. 9 (1991).
8 See the previous discussion where Figures 5-1 and 5-4 are compared.

124
inconsistent incentives can lead to inefficient decisions, such as the adoption of expensive
pollution controls when changes in dispatch order would accomplish the same emission
reductions at less cost. Thus, just like command-and-control regulations, this policy can
result in the choice of an inferior alternative over a superior one.9 Unfortunately, such
inefficient outcomes are likely in those jurisdictions that now require use of quantitative
adders in evaluating new resources.
Another example of such an inefficiency is that uneconomic life extension of coal
units might be encouraged because such decisions would not be subject to the adders system.
Consider three resource options that might be compared by our hypothetical utility:
• construction of 145 MW of combined cycle capacity;
• a load control program that clips 40 MW off the system peak, plus 86 MW (peak)
of energy efficiency programs; and
• life extension of a 145 MW coal-fired unit that would otherwise be retired.
Each option is paired with 212 MW of new combustion turbines. The amount of each
resource is chosen so that the system achieves a 15 percent reserve margin.
Table 6-1 summarizes the costs and emissions of each resource, based on how they
would be dispatched in our hypothetical system. Under least-cost dispatch, the combined
cycle would have a capacity factor of 0.29, while the repowered coal unit would have one of
0.85. The table calculates the utility cost per unit of output of the resource, along with the
societal cost, assuming for the sake of argument that CO2 emissions result in $30 per ton of
damages. The table shows that DSM is the least-cost resource either on a total cost basis or
dollars-per-MWh basis. Meanwhile, combined cycle capacity is the most costly in terms of
dollars per MWh.
9 Clinton J. Andrews, "The Marginality of Regulating Marginal Investments: Why WeNeed a Systemic Perspective on Environmental Externality Adders," Energy Policy, May1992; K.L. Palmer and A.J. Krupnick, "Environmental Costing and Electric Utilities' Planningand Investment," Resources 105 (Fall 1991).

TABLE 6-1
PER-UNIT UTILITY AND SOCIETAL COST CALCULATIONS:THREE-RESOURCE COMPARISON
Resource Option
AnnualizedCapital
Cost, $/yr
AnnualVariable
Cost, $/yr
CO2
Produced,tons/yr
EnergyProducedor Saved,MWh/yr
UtilityCost ofOption,$/MWh
SocialCost ofOption
(@ $30/ton),
$/MWh
145 MW CombinedCycle, Gas Fired
$13,900,000 $13,400,000 176,000 368,000 $74.2 $88.5
126 MW DSM $27,000,000 $0 0 385,000 $70.1 $70.1
Repowering of 145MW Coal Plant
$24,100,000 $22,700,000 1,195,000 1,080,000 $43.3 $75.7

Source: Authors' construct.
127
However, these results are somewhat misleading because the resources are used
differently. Table 6-2 presents the resulting costs and emissions for the entire system. It
reveals that the combined cycle unit results in the lowest system-wide cost for the utility,
mainly because of its dispatching flexibility. The DSM option is most expensive. So, in the
absence of an adder or tax on CO2 emissions, the utility would recommend construction of
the combined cycle unit.
However, if a $30 adder was applied to CO2 emissions from just new resources, and
not life extension of existing units, then the decision would be different. Regulators would
conclude that DSM was definitely cheaper--whether by the dollars-per-MWh measures of
Table 6-1 or the adjusted total dollar figures of Table 6-2.10 As a result, the combined cycle
plant would not be approved. In that case, the utility would decide instead to extend the
life of the coal unit, since that decision is not subject to the adders system and has the next
lowest utility system cost. If that happens, the result is both higher costs and higher
emissions than would otherwise be the case.
Although this example is contrived, it illustrates the possibility that adders applied
only to new resource additions can make matters worse from both an economic and
environmental perspective.
Examples of Efficient Operational Strategiesfor Environmental Improvement
A major complaint about command-and-control and externality adders is that they
provide no incentive for achieving the cost-effective emission reductions that emissions
dispatch can provide. The purpose of this section is to illustrate the potential cost of
10 The adjusted dollar figures include a $30-per-ton penalty for the new combined cycleunit but not for any other generators.

TABLE 6-2
TOTAL UTILITY SYSTEM COST AND SOCIETAL COST CALCULATIONS:THREE-RESOURCE COMPARISON
Resource option
Utility Costfor Entire
System, $/yr
System CO2
Produced,tons/yr
Adjusted SystemCost (includingCC CO2 costs),
$/yr
System SocietalCost
(@$30/ton),$/yr
145 MW CombinedCycle, Gas Fired
$150,300,000 4,880,000 $155,600,000 $296,700,000
126 MW DSM $153,600,000 4,660,000 $153,600,000 $293,400,000
Repowering of 145 MWCoal Plant
$152,000,000 5,090,000 $152,000,000* $304,700,000
Source: Authors' construct.
* Excludes coal plant CO2 because those emissions are not subject to the CO2 adder.

129
emissions dispatch via several case studies. The effects of resource acquisition upon
emissions were explored in a number of case studies and are not reviewed here.11
Case Study 1: SO2 Emissions Dispatch by TVA
The 1990 Clean Air Act Amendments encourages SO2 emissions dispatch because it
is a utility's total emissions that matter under the Title IV emissions allowance system.
Jackson et al., (1993)12 describe what they term "soft" strategies that the Tennessee Valley
Authority (TVA) will pursue to comply with that title. The utility is implementing an
energy management system that makes it possible to optimize unit commitment and
dispatch under either an assumed SO2 allowance price or a cap on emissions.13
Figure 6-4 shows approximately how much of an emissions reduction TVA believes
it can achieve by emissions dispatch alone. If the price of allowances is $250
11 For example, see Clinton J. Andrews, "Spurring Inventiveness by Analyzing Trade-Offs:A Public Look at New England's Electricity Alternatives," Environmental Impact AssessmentReview 12 (1992); C.J. Andrews and S.R. Conners, "Cost-Effective Emissions Reductions:Combining New England's Options into a Coordinated Strategy," Presented at the TwelfthAnnual North American Conference of the International Association for Energy Economics,Ottawa, Canada, October 2, 1990; J.F. Busch and F.L. Krause, "Environmental ExternalitySurcharges in Power System Planning: A Case Study of New England," IEEE Transactionson Power Systems 8, no. 3 (August 1993); Palmer and Krupnick. "Environmental Costingand Electric Utilities' Planning and Investment;" K. Wulfsberg, "Incorporating EnvironmentalExternalities in the Electric Utility Resource Planning Process: Methods, Effects, andLimitations," M.S. Thesis in Technology and Policy, Massachusetts Institute of Technology,Cambridge, Massachusetts, 1990.
12 T.M. Jackson et al., "Evaluating Soft Strategies for Clean-Air Compliance," IEEEComputer Applications in Power 6 (April 1993).
13 Southern Company has developed a similar system; see A.A. El-Keib, H. Ma, and J.L.Hart, "Economic Dispatch in View of the Clean Air Act of 1990," IEEE Transactions onPower Systems (in press).

130

131
Fig. 6-4. Incremental cost of emissions reduction by emissions dispatch for TVA(Source: derived from data in Jackson et al., "Evaluating Soft Strategiesfor Clean-Air Compliance," 1993).
per ton, the utility would reduce its emissions by 10 percent (from 42,000 to 37,500 tons per
month). It would earn $700,000 per month in net revenue from selling the allowances that
emissions dispatch could free up.14
14 But for many utilities, the "underutilization" or "minimum burn" constraint imposed byTitle IV of the 1990 Act may significantly constrain emissions dispatch during phase I of theAct's acid rain control program (1995-1999) (Benjamin F. Hobbs, "Emissions Dispatch under

132
Case Study 2: NOx Emissions Dispatch in the San Francisco Bay Region
Smog episodes in the San Francisco Bay region occur sporadically. Ozone
concentrations exceed ambient standards about fifteen days per year. Ozone is the result of
photochemical reactions of volatile organic chemicals and NOx, most of which is emitted by
vehicles. However, fossil-fueled power plants also emit NOx. In an effort to bring the
region into attainment for ozone, environmental regulators in California are considering
requiring retrofits of selective catalytic reduction (SCR) on some of the area's power plants.
This capital-intensive control measure would reduce emissions year round.
An alternative approach is intermittent controls, in which emissions dispatch is used
to decrease NOx emissions. Marnay (1993)15 proposes that a tax be levied on
utility NOx emissions just during the fifty-day smog season. He examined the
effectiveness of such a proposal using a unit commitment model. Assuming conservatively
that no additional power can be imported into the area, he concluded that emissions
dispatch can lower the utility's NOx emissions by about 5 percent at a per ton expense that
is 40 percent or less of the cost of SCR.16
Figure 6-5 summarizes some of the results of this analysis in the form of a
distribution of utility NOx emissions. The right-most distribution shows that without any
tax, NOx emissions would average about 2,250 tons per month. But if a tax is applied, the
distribution shifts to the left. For instance, a tax of $100 per pound results in an average
the Underutilization Provision of the 1990 U.S. Clean Air Act Amendments: Models andAnalysis," IEEE Transactions on Power Systems 8 (February 1993).
15 C. Marnay, "Intermittent Electrical Dispatch Penalties for Air Quality Improvement,"Ph.D. Dissertation, University of California, Berkeley, California, 1993.
16 If additional power could be imported, then in general more local emissions reductionswould be accomplished under a given NOx penalty.

133
decrease of about 100 tons per month. Although emissions dispatch may be insufficient by
itself to achieve compliance, it can help the utility avoid some investment

134
Fig. 6-5. Distribution of NOx emissions in San Francisco Bay area under differentNOx dispatch penalties (Source: Chris Marnay, "Intermittent ElectricalDispatch Penalties for Air Quality Improvement").
in SCR. The optimal compliance strategy is undoubtedly a combination of SCR, emissions
dispatch, and, in the long run, changes in resource mix. The benefits of such a mixed strategy
can be realized only if regulators penalize existing emissions using a tax or allowance system;

135
a command-and-control or adder approach is unlikely to give the flexibility that the utility
needs to achieve a least-cost solution.
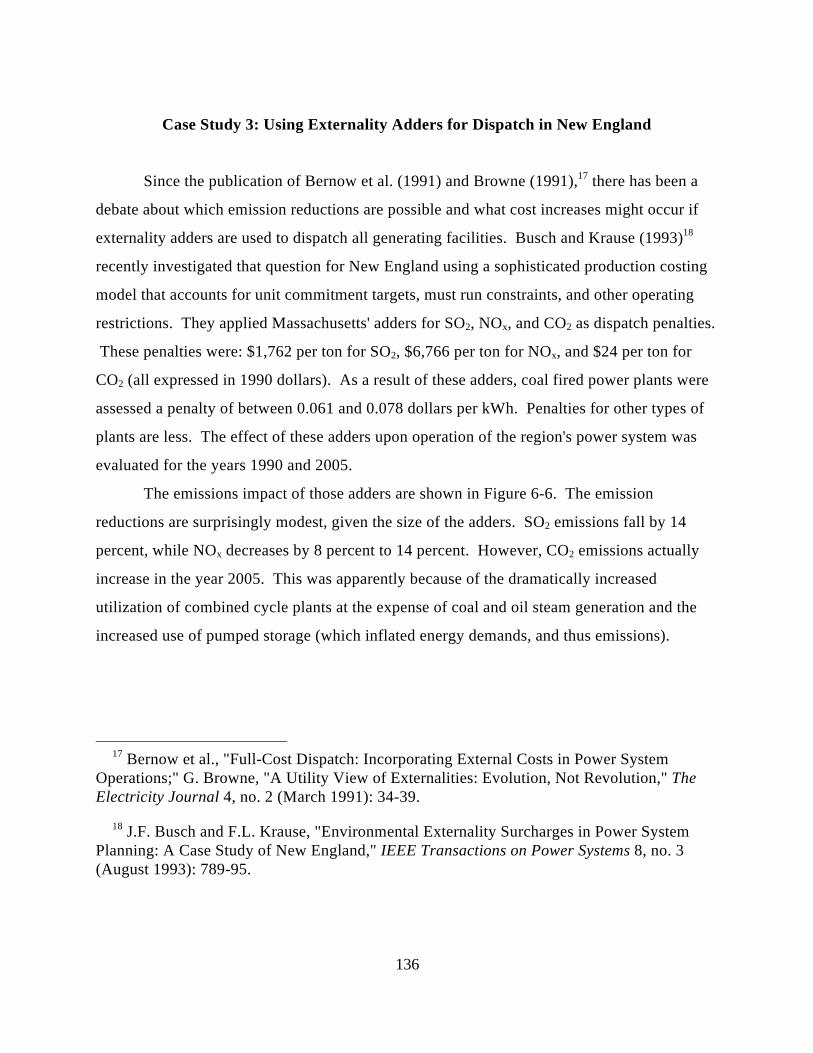
136
Case Study 3: Using Externality Adders for Dispatch in New England
Since the publication of Bernow et al. (1991) and Browne (1991),17 there has been a
debate about which emission reductions are possible and what cost increases might occur if
externality adders are used to dispatch all generating facilities. Busch and Krause (1993)18
recently investigated that question for New England using a sophisticated production costing
model that accounts for unit commitment targets, must run constraints, and other operating
restrictions. They applied Massachusetts' adders for SO2, NOx, and CO2 as dispatch penalties.
These penalties were: $1,762 per ton for SO2, $6,766 per ton for NOx, and $24 per ton for
CO2 (all expressed in 1990 dollars). As a result of these adders, coal fired power plants were
assessed a penalty of between 0.061 and 0.078 dollars per kWh. Penalties for other types of
plants are less. The effect of these adders upon operation of the region's power system was
evaluated for the years 1990 and 2005.
The emissions impact of those adders are shown in Figure 6-6. The emission
reductions are surprisingly modest, given the size of the adders. SO2 emissions fall by 14
percent, while NOx decreases by 8 percent to 14 percent. However, CO2 emissions actually
increase in the year 2005. This was apparently because of the dramatically increased
utilization of combined cycle plants at the expense of coal and oil steam generation and the
increased use of pumped storage (which inflated energy demands, and thus emissions).
17 Bernow et al., "Full-Cost Dispatch: Incorporating External Costs in Power SystemOperations;" G. Browne, "A Utility View of Externalities: Evolution, Not Revolution," TheElectricity Journal 4, no. 2 (March 1991): 34-39.
18 J.F. Busch and F.L. Krause, "Environmental Externality Surcharges in Power SystemPlanning: A Case Study of New England," IEEE Transactions on Power Systems 8, no. 3(August 1993): 789-95.

137
Emissions of SO2 are of less interest than the decrease in NOx because Massachusetts
revised its adder system in 1992 so that adders do not apply to the SO2 emissions of any plant
that has to acquire allowances. NOx will be the major air
138
Fig. 6-6. Effect of emissions dispatch upon emissions in New England (Source:derived from data in Busch and Krause, "Environmental ExternalitySurcharges in Power System Planning: A Case Study of New England").
pollutant of concern for northeastern electric utilities in the near future. Thus, the study's
conclusion that emissions dispatch can make a dent in NOx emissions is worth noting by the
region's regulators.

131
CHAPTER 7
THE ROLE OF STATE PUBLIC UTILITYCOMMISSIONS IN ENVIRONMENTAL REGULATION:
ADAPTING TO A CHANGING REGULATORY CLIMATE
State public utility commissions, in an effort to be proactive concerning the
environment, are likely to continue their efforts to internalize environmental costs. With
passage of the Energy Policy Act of 1992, which is intended to encourage more competition
in electric generation and transmission and the continued use of least-cost and integrated
resource planning by state commissions, the debate on the role of the public utility
commissions in environmental regulation is likely to persist. As discussed in Chapters 1 and
4, commissions are using qualitative or quantitative considerations applied during the
resource selection process (IRP-type process). However, there may be several limits on state
commission's abilities to be proactive on the environment in a unilateral way. These limits
suggest a more cooperative role for commissions in working with state and federal
environmental regulators, state energy or natural resource agency representatives, and
legislators.
Need for Cooperative Action on the Environment
It is clear that environmental programs that affect only new resources, such as adders,
are less effective and are a more costly means of environmental control when compared to
other methods. Methods that apply to just new resources can only have a marginal impact on
existing environmental damage.1 Also, as discussed in Chapters 5 and 6, methods that impact
1 Clinton J. Andrews, "The Marginality of Regulating Marginal Investments: Why WeNeed a Systemic Perspective on Environmental Externality Adders," Energy Policy (May1992): 450-63.

132
system operations and existing emissions and encourage more efficient operation are more
cost-effective; that is, have a lower cost per unit (tons,

133
pounds, and so on) removed. The most cost-effective pollution-control strategies are a mix of
dispatch changes, emission controls, fuel changes and, lastly, resource additions.
Environmental programs that can encourage utilities to adopt these control strategies include
emission taxes and emission limits with trading. However, state commission authority to
implement programs that affect existing emissions or that require reductions beyond federal
mandates is uncertain.2
State regulations that exceed federal mandates are permitted provided (1) Congress did
not specifically preempt state action, (2) the state regulation is not found to violate the
Commerce Clause of the Constitution, and (3) the state regulation is not in conflict with a
pervasive federal statutory scheme.3 With respect to environmental regulation, Congress has
not explicitly preempted states from taking additional action. Recent court decisions have
indicated that, absent a clear congressional intent, states exercising their historic police
powers of guaranteeing public health and safety will generally not be preempted.4
What is less certain is that with electricity increasingly becoming an interstate
commodity, future state action that exceeds the federal mandate may be subject to legal
challenges based on a Commerce Clause violation. In this case, an argument for regional or
national uniform standards could be made, even if the regulation was aimed at local issues.5
When deciding such cases, the courts balance local concerns with their affect on interstate
commerce, upholding the state regulation when it is not deemed excessive (using a "burdens
and benefits" test). Courts, however, at times defer to a
2 Paul A. Agathen (an attorney with an electric utility) in "Dealing with EnvironmentalExternalities," Public Utilities Fortnightly (February 15, 1992): 23-24, asks "what right does apublic service commission have to order. . .a utility [to] reduce pollution beyond what [thepollution] laws require?" He then notes, "[a]ssuming the utility was not violating thepollution laws to begin with, this is tantamount to ordering it to raise rates in order to reducepollution below the limits adopted by our elected officials."
3 Sinozich et al., "Preemption in Administrative Law," 45 Admin. L. Rev. 111 (1993).
4 Id., at 124.
5 Id., at 127.

134
federal agency's determination since it is believed they are better qualified than the courts to
make such determinations.6 Even if it is assumed that states are allowed to exceed federal
mandates, the question would remain as to which state agency within the state is best
equipped to develop and implement state and federal environmental policy.
States usually grant authority to directly regulate emissions to an environmental
agency. State utility commissions, because of their utility oversight and ratemaking authority,
have thus far only considered environmental consequences of new resource options. Under
their existing authority, state commissions may also attempt to more directly influence
existing emissions (such as through an incentive system described in Chapter 3). Before
deciding the type of action (if any) to take concerning the environment, commissions should
consider at least three factors: (1) their authority within their state to regulate environmental
impacts, (2) the role different state agencies play in the determination, development, and
implementation of environmental regulations and the commission's most effective role, and
(3) the inherently limited scope of the commission's influence on polluting sources. The first
issue, in-state authority, is clearly a state-specific issue. As described in Chapter 4, some
commissions have decided to consider environmental impacts while others have decided
against doing so.
The second consideration is to determine which agency is best equipped to manage
environmental regulation in the state and what the commission's role should be. Commissions
usually have an advantage in terms of being able to analyze emission-reduction options and
control costs, and instituting policies that affect utility behavior. They also are in a better
position to encourage utilities to implement environmental programs in an effective manner
through their ratemaking authority and have better access and understanding of utility options
and costs. Environmental regulators, on the other hand, clearly have an advantage with
6 Id., at 120-1, 223-4.

135
respect to calculating social costs7 and authority to implement more efficient market-based
environmental programs. They also have better access to environmental damage information,
are more acquainted with existing environmental requirements and possible new options, and
are in a better position to institute cost-effective programs that address existing emissions.
The third consideration, scope of influence, is based on the fact that even with broader
environmental authority, commissions regulate only utilities and not other sources in the state.
For certain pollutants electric utilities are a significant and sometimes the largest single
source of a pollutant in an area; for other pollutants, they are a relatively minor contributor
compared to other sectors.8 Other sources of pollution, beyond the control of the commission,
may have lower control costs than electric utilities. Environmental regulators have a wider
authority to consider all sources and can choose from a wider range of appropriate control
policies. This can prevent unfairly burdening electric utilities, that is, causing them to incur
higher control costs when alternative lower-cost sources are available. In some cases, such as
CO2 or SO2, national environmental regulations are necessary to prevent any one state from
imposing environmental costs on others and also to distribute the costs of emission reductions
fairly across states. The more comprehensive the environmental regulations, the greater the
opportunities to make them cost effective and fair.
This asymmetry of authority and information suggests that the best approach may be a
cooperative one, where the two agencies exchange information and work together to develop
and implement environmental programs. Commissions, in order to have an impact on
existing emissions in a cost-effective and timely manner, could cooperate with the
7 Of course, commissions could develop this expertise also, but only at a high cost sincethey do not, in general, currently have this capability.
8 For example, nationally, electric utilities account for about 35 percent of CO2 emissionsfrom energy consumption sources and less than 4 percent of nitrous oxide emissions(Emissions of Greenhouse Gases in the United States, 1985-1990 DOE/EIA-0573(Washington, D.C.: Energy Information Administration, U.S. Department of Energy,September 1993), calculated from tables 7, 8, 35, and 39).

136
environmental agencies in their state to develop and implement appropriate programs.
Historically, with some exceptions, these two state agencies have not always coordinated their
efforts well.9 Also, many of these programs would require multistate cooperation, something
that also is without a great deal of precedent in this industry.10 However, the potential
environmental benefit and cost savings that could occur from such cooperation could be
considerable and worth the effort to pursue.
It may be more beneficial to ratepayers for commissions to direct their efforts towards
assisting the development of market-based environmental policies, including emission taxes
and trading programs. The cost-effectiveness of market-based programs is highly dependent
on the policies of state commissions. This would include adjusting regulatory and ratemaking
policies to encourage utilities to use these programs to minimize their compliance costs. This
makes it more likely that the cost saving potential of market-based programs is realized.
As discussed in several previous sections of this report, emission taxes and trading
systems to reduce emissions, are able to achieve the desired emissions level at a lower cost
than command-and-control or adder programs. Current environmental policy is a
combination of command-and-control, taxes,11 and emissions trading and offset programs at 9 Douglas N. Jones and Richard A. Tybout, "Environmental Regulation and Electric UtilityRegulation: Compatibility and Conflict," Environmental Affairs Law Review 14, no. 1 (1986):31-59.
10 For a discussion of two exceptions see Chapter 4, "Two Major Regional Initiatives andthe FERC," in Douglas N. Jones et al., Regional Regulation of Public Utilities: Opportunitiesand Obstacles (Columbus, OH: The National Regulatory Research Institute, December 1992). Also, Utility Environmental Impacts: Incentives and Opportunities for Policy Coordinationin the New England Region (Boston, MA: Project on Regional Coordination andEnvironmental Externalities, June 1994), discusses that region's coordination of statecommission environmental actions.
11 Thomas A. Barthold, "Issues in the Design of Environmental Excise Taxes," Journal ofEconomic Perspectives 8, no. 1 (Winter 1994): 133-151, provides a list of current federal taxprovisions that have environmental consequences, although the environment may not be theprimary purpose of a tax and its effect may be less than perfect. Examples of a Pigouvianemission tax are rare in the U.S.; one may be the tax on ozone-depleting chemicals (see thediscussion in Barthold, n. 4 and pp. 136-38).
137
both the state and federal level. Currently, there are initiatives by environmental regulators
(discussed in Chapter 3) to institute more market-based environmental programs. These
include the Clean Air Act's allowance trading program, California's South Coast Air Quality
Management District emissions offset program, the eight states' program for the northeast
NESCAUM region, as well as other trading systems currently being considered.
Preliminary indications are that the national trading system for SO2 emissions is
developing and has demonstrated that these types of programs can work in the electric
industry and can be beneficial. However, there are also indications that the cost savings
potential of the SO2 trading system is not currently being fully realized.12 Reasons for this
include state legislative action that limited utility options, the negative treatment in the press
of the first trades, and utility reluctance to use a novel and untried means of compliance.
Perhaps the most significant factor is that public utility commissions have not encouraged
their jurisdictional utilities to take advantage of the opportunities that are presented by the
allowance system.13 Therefore, more consideration should be given to commission actions
that encourage utilities to take advantage of this and other trading systems. The results will be
a lower cost of compliance and lower utility rates for consumers. Moreover, using the
analysis presented in Chapter 2, a downward shift of the marginal-control cost curve (because
12 K. Rose, A. Taylor, and M. Harunuzzaman, Regulatory Treatment of Electric UtilityClean Air Act Compliance Strategies, Costs, and Emission Allowances (Columbus, OH: TheNational Regulatory Research Institute, 1993), Chapter 2.
13 Douglas R. Bohi, "Utilities and State Regulators Are Failing to Take Advantage ofEmission Allowance Trading," The Electricity Journal 7, no. 2 (March 1994).

138
of inducements from commissions to encourage cost-minimizing utility behavior14) results in
more emission reductions being feasible.15
This provides further rationale for state commissions to consider working with the
environmental regulators to implement existing environmental programs and develop new
ones rather than instituting their own programs. Commissions may consider concentrating
their efforts on the cost-effective implementation of existing environmental regulation16
instead of duplicating or attempting to supplement the environmental regulators' efforts. This
includes working with their respective state environmental regulatory agency and the federal
EPA as well as state and federal legislators to develop more effective environmental
regulation.
Some Implementation Considerations
Since state commissions usually do not have access to or expertise in determining
social cost, they often turn to control cost methods. The argument for this method is that,
while it may not be ideal, it provides a proxy value based on society's "willingness to pay."
This value is determined through the political process and resulting legislation. The control
cost, however, bears no relationship to the social cost of emissions or marginal benefit from
14 A discussion of the relative merits of cost-of-service regulation and an incentivemechanism to induce cost-minimizing behavior is in Kenneth Rose, "Regulatory Treatment ofAllowances and Compliance Costs: What's Good for Ratepayers, Utilities, and the AllowanceMarket," in Regulatory Policy Issues and the Clean Air Act: Issues and Papers from the StateImplementation Workshops, eds., Kenneth Rose and Robert E. Burns (Columbus, OH: TheNational Regulatory Research Institute, July 1993).
15 It is believed that because of the expected cost savings associated with the SO2 tradingprogram, more emission reductions were mandated in Title IV of the Clean Air Act than if itwas a command-and-control program.
16 This includes adjusting ratemaking procedures for both command-and-control, still themost common form of environmental regulation, as well as market-based programs. This isbecause utilities may not have an incentive to minimize the cost of complying with either typeof environmental program under cost-based regulation.

139
emission reductions. The control cost for a given level of reduction provides the cost at that
point, not the cost of further reductions. Also, using a current cost-of-control or emission-
credit price for existing environmental regulations "double counts" the already internalized
cost. These methods, while comparatively easy, are not a good substitute for social-cost
studies.
Given this mix of existing environmental regulations, it has been suggested that
commissions determine an "optimal adder," based on the marginal damage after
environmental regulations were accounted for.17 This optimal adder would take existing
environmental regulation into account and be based on remaining external costs. It is
doubtful, however, that many public utility commissions are equipped to determine the
optimal adder due to the nature and the substantial amount of information that would be
required.
Advocates for public utility commission environmental programs sometimes note that
while the precise value of an adder or tax is not known, they believe it is not zero. They then
conclude that even though precise values of the social cost are not known, it is some positive
number; therefore, some positive number is better than nothing. Whether this is true or not
depends on the relationship between the actual optimal tax (which is unknown) and the value
of the tax (or adder) that is selected. (Using the graphical analysis presented in Chapter 2, an
example can be constructed that demonstrates this is not always the case.) In Figure 7-1 the
tax is set at f when f* is the optimal tax. Note that the actual tax is only about 10 percent
higher than the optimal. The welfare loss of doing nothing is the area represented by G and is
less than the loss caused by setting it at f, which is represented by the area H.18
This does not, of course, suggest that in every case no action is better or no action
should be taken to improve the environment; it only suggests that the penalty of getting it
17 A. Myrick Freeman III, et al., Accounting for Environmental Costs in Electric UtilityResource Supply Planning, Discussion Paper QE92-14 (Washington, D.C.: Resources for theFuture, April 1992).
18 This comes about because of the relative slopes of the two curves. Of course, anexample can be drawn that shows the opposite case, where no action has a larger welfare lossthan more emission reduction than the optimal.

140
wrong can be severe and that the "something is better than nothing" argument does not always
hold. Care should be taken, therefore, to not cause more harm than good when instituting
even well-intended public policy. The goal of environmental policy is not necessarily to drive
all emissions to zero (except perhaps some substances that are toxic low levels), but to
balance the marginal benefit to society (when not considered by the unregulated market) with
the marginal cost of control. This can only be determined through careful consideration of
both the costs and benefits.
Cropper and Oates note that more careful economic analysis may be more necessary
now after environmental progress has been made than was needed earlier in the
"environmental revolution."19 To illustrate their point, consider the marginal-
19 Maureen L. Cropper and Wallace E. Oates, "Environmental Economics: A Survey,"Journal of Economic Literature 30 (June 1992): 730.

141
Fig. 7-1. Hypothetical example of the social welfare loss from taking no actioncompared with an emission tax that is set above the optimal (Source:Authors' construct, based on William J. Baumol and Wallace E. Oates, TheTheory of Environmental Policy, 2nd ed. (Cambridge, England: CambridgeUniversity Press, 1988)).
control cost curve in Figure 7-2. This marginal cost curve has a flat region and then

142
rises at an increasing rate as emission reductions increase.20 With some slight environmental
regulation already in place, a doubling of emission reductions from q1 to q2 results in no
change in the marginal cost (total cost, of course, would increase).
20 Control options are usually characterized as being "lumpy," that is, there arediscontinuous jumps in costs as reductions increase. This is a smoothed but fairrepresentation of what the marginal cost curve probably looks like for many pollutants.

143
Fig. 7-2. Hypothetical marginal-control cost curve and four levels of reduction(Source: Authors' construct, based on Cropper and Oates, "EnvironmentalEconomics: A Survey" 730.
However, if the current environmental standard is already more strict, at q3, and new
regulations are being considered to move to q4, the consequence is far more significant; the
marginal cost increases from MC3 to MC4. If the marginal social-benefit curve is MSB1 and
intersects the marginal cost curve at q4, then the proposed regulation is justified and should be
taken. If, on the other hand, q3 was already the optimal reduction because marginal social
benefit is MSB2, then a social welfare loss would result (the area ABC) from the further
reduction.

144
Position on the curve depends on the existing level of environmental regulations and
the pollutant being controlled. For example, there are currently no requirements to reduce
CO2 but considerable NOx requirements. This will also be very sector-specific; the electric
utility industry, for example, may (again, depending on the pollutant) have relatively more
environmental requirements than the transportation sector.
As noted, state and federal environmental regulators are in a better position in terms of
expertise to conduct a careful analysis to determine environmental benefit from emission
reductions required to avoid large welfare losses. Also, in terms of authority, environmental
regulators can institute more efficient regulations to reduce emissions. The economic
regulator may have an advantage in terms of determining the marginal cost of control,
determining where utilities are on the marginal cost curve, and encouraging utilities to
minimize their costs when implementing environmental regulations. This again suggests that
cooperation between economic and environmental regulators may be the best regulatory
strategy.
The Changing Industry and Regulatory Structure
More and more frequently, questions have been raised as to the future role of IRP in
an increasingly competitive electric service industry.21 The question then is, What type of
environmental policy is more compatible with a more competitive industry? With more
independent power, more wholesale wheeling, and the possibility of retail wheeling, state
commissions may have less control over new resources as a competitive market develops.
21 See for example, Paul L. Joskow, "Emerging Conflicts Between Competition,Conservation and Environmental Policies in the Electric Power Industry," Keynote Addressfor the Public Utility Research Center's conference on competition in regulated industries,University of Florida, April 29-30, 1993; Bernard S. Black and Richard J. Pierce, Jr., "TheChoice Between Markets and Central Planning in Regulating the U.S. Electric Industry,"Draft, unpublished paper, Columbia Law School, New York, June 1993; and Kenneth Rose,"Planning Versus Competition and Incentives: Conflicts, Complements, or Evolution?" inReforming Electricity Regulation: Fitting Regional Networks into a Federal System, Clinton J.Andrews, ed. (Westport, CT: Quorum Books, forthcoming).

145
Environmental regulators, on the other hand, will likely continue to be charged with the
responsibility of environmental management. Emission limits with trading may be an
especially appropriate means of emission control in a competitive environment where there
are multiple sources under different jurisdictions (Federal Energy Regulatory Commission,
multiple state commissions, other state and federal agencies).
This does not suggest a diminished role for state commissions in environmental
management but suggests an evolving one. As mentioned, this new role will require more
cooperation with environmental regulators and more regional considerations. It will also be a
challenge to commissions to adjust regulatory practices to encourage utilities that remain
under their jurisdiction to comply with environmental requirements in a cost-effective
manner.
More research needs to be conducted to determine the effect on the environment from
a more competitive industry structure and to identify the types of regulatory institutions and
policies that may be necessary to meet environmental and other energy policy objectives.
Currently, there is considerable focus on the possible negative impacts of competition.22
However, a comprehensive analysis would not only consider the possibility of less utility-
sponsored DSM, but also consider the positive effects from utilities and other suppliers
receiving more incentive to operate their systems more efficiently to minimize costs and
remain competitive than what would occur under cost-based regulation. This will
undoubtedly be an area of fruitful future research.
22 See for example, Armond Cohen and Steven Kihm, "The Political Economy of RetailWheeling, or How to Not Re-Fight the Last War," The Electricity Journal 7, no. 3 (April1994): 49-61.

143
APPENDIX A
A SIMPLE LINEAR PROGRAMMING IRP MODEL
A linear programming (LP) model to optimize the mix of resource acquisition and
generation dispatch, based upon the generation model of Turvey and Anderson (1977);1 see
also Lee et al. (1979)2 or Meier (1984).3 The formulation of any optimization model consists
of a description of its decision variables, objective(s), and constraints. Lower case letters
designate decision variables, and capital letters define fixed parameters supplied by the
analyst. Let the three basic decision variables of our model be:
xi = the generation capacity [MW] of supply resource i, i = 1,2,..,I. Supply resources caninclude not only utility-owned generation plants but also purchases from otherutilities or independent generators of power. For existing plants, the value of thisvariable is fixed and is not altered in the LP.
git = MW output during subperiod t, t=1,2,..,T of supply resource i. The 8760 hours ineach year are divided into T demand periods. The first period represents peakdemand, while the last period T is the lowest demand period. Commonly, thesemodels include three to six periods; additional periods generally contribute little tomodel accuracy. This variable was modified for the cofired generating unit to allowthe unit to choose between using 100 percent coal and 85 percent coal/15 percentnatural gas.
dk = 1 if DSM program k is fully implemented, k=1,2,..K. Intermediate values between 0and 1 represent partial implementation.
1 R. Turvey and D. Anderson, Electricity Economics: Essays and Case Studies (Baltimore,MD: The Johns Hopkins University, 1977), chapter 13.
2 S. Lee, N. Stoughton, and N. Badertscher, Comparative Analysis of Generation PlanningModels for Application to Regional Power System Planning, Prepared for U.S. Department ofEnergy (Palo Alto, CA: Systems Control, Inc., 1979).
3 P. Meier, Energy Systems Analysis for Developing Countries (New York: Springer-Verlag, 1984).

144
The objective is to minimize the annual worth of capital (levelized costs) and operating costs:
Min Cost = Σi=1,2,..,I CRF CXi xi + Σk=1,2,..,K CRF*CDi dk
+ Σi=1,2,..,I Σt=1,2,..,T Ht (CGit + PEN*CO2it )git
[Capital Costs] [Operating Costs + CO2 Tax or Penalty]
where the fixed parameters are as follows:
CDk = capital and other fixed costs [$] of fully implementing DSM program k.
CO2it = CO2 emissions [tons per MWh] of generation from unit i during subperiod t. This is the product of the unit's heat rate and the CO2 resulting from burning oneunit of fuel.
CRF = capital recovery factor [one per year] used to annualize capital costs.
CXi = capital and other fixed costs [dollars per MW] of building capacity of type i. Ingeneral, this parameter should include the present worth of the resource's fixedoperations and maintenance costs, while deducting the resource's salvage value atthe end of the planning period. For existing plants, this cost is omitted, as theircapacity is fixed.
CGit = the present worth of the variable operating cost [dollars per MW per hour] duringsubperiod t of supply type i. This cost includes fuel and any miscellaneousvariable operating costs:
CGivyt = HRit FCit + VO&Mit
where HRit is the unit's heat rate [fuel energy per kWh], FCit is the fuel cost[dollars per fuel energy], and VO&Mit is the nonfuel variable O&M cost. Forsome supply resources, variable costs may be the same in all t of a given year,but for others, costs may vary due to temperature-dependant heat rates orseasonal variations in fuel prices.
Ht = the number of hours in time period t.

145
PEN = dollars-per-ton tax or penalty applied to CO2 emissions. If the values of all xi anddk are fixed, then this results in emissions dispatch. If, on the other hand, thosecapacity resources are allowed to vary, then the mix of resources would bechosen to minimize the utility's cost plus CO2 taxes.
Demand, operating, and reliability constraints restrict which values of the decision variables
can be chosen. Simple yet typical formulations of these constraints are given below.
Consistent with standard mathematical programming notation, terms involving decision
variables are on the left hand side of the equation, and constants are placed on the right.
• Load must be met in each subperiod t of each year y:
Σi=1,2,..,I git - Σk=1,2,..,K SAVkt dk ≥ LOADt for all t
where LOADt is the MW load during t, including transmission and distributionlosses, and SAVkt is the MW savings resulting from fully implementing DSMprogram k. This constraint states that the sum of the MW output in subperiod tfrom all plants must equal or exceed the electricity demanded LOADt at that time,as modified by any DSM programs.
• Generation must be less than derated capacity for each resource in each t and y:
git - (1 - FORi)xi ≤ 0 for all i and t=1,2,..,T-1
where FORi is the forced or unplanned outage rate of resource i. This constraintis not needed for the time of lowest demand (subperiod T), as long as the annualenergy constraint described next is also imposed. If the resource is an existingplant, then xi is fixed and its term is instead placed on the right side of theequation.
• Annual energy constraint for each resource:
Σt=1,2,..,T Ht git - CFixi ≤ 0 for all i
where CFi is the maximum possible capacity factor (output/capacity) for resourcei. Again, for existing resources, xi is a constant and instead appears on the rightside of the equation.

146
• Reserve margin constraint:
Σi=1,2,..,I xi + Σk=1,2,..,K SAVkPEAK dk +≥ LOADPEAK (1+M)
where LOADy is the yearly peak demand, and M is the desired reserve margin.
• Upper bound on new capacity:
xi ≤ XiMAX for all i
This constraint allows additions to be no more than a predetermined maximumsize XiMAX.
• Upper bound on DSM programs:
dk ≤ 1 for all k
• Nonnegativity restrictions for all variables:
xi ≥ 0 for all i; git ≥ 0 for all i and t; dk ≥ 0 for all k
Once the model is formulated and its parameter values estimated, then it can be
inserted into standard linear programming software and solved. The solution consists of the
best values of the decision variables and the resulting total cost.
Plans A through D in Chapter 5 were generated by varying PEN from $0 to $30 per
ton, and noting the resulting optimal values of xi and dk. Varying degrees of emissions
dispatch were simulated for those solutions by fixing the values of xi and dk at their optimal
values, and then using the model to dispatch the plants (git) under a range of values of PEN.
The other plans (E, F, and G) were obtained by assuming a certain mix of plants and DSM
programs (i.e., fixing the values of xi and dk) and then using the model to dispatch those
resources under various values of PEN.

147
APPENDIX B
ASSUMPTIONS FOR THE ENVIRONMENTAL IRP EXAMPLE
Tables B-1 through B-3 detail the assumptions made in the linear programming IRP
model.
TABLE B-1
MISCELLANEOUS DATA FORLINEAR PROGRAMMING EXAMPLE
Parameter Value
Minimum Reserve Margin, M 15 percent
Maximum Additional Capacity of a SingleType, Xi1MAX
400 MW
Capital Recovery Factor for Plant Investment 12 percent per year
Load Block Widths Ht, t=1,2,3,4,5 100, 620, 1950, 2545, 3545hours
Load Block Heights LOAD1t, t=1,2,3,4,5 1050, 950, 825, 525, 275 MW
Coal Cost, CO2 Emissions $1.60 per mmBtu,221 pounds per mmBtu
Natural Gas Cost, CO2 Emissions $3.80 per mmBtu,116 pounds per mmBtu
Heavy Fuel Oil Cost $2.60 per mmBtu,168 pounds per mmBtu

TABLE B-2
GENERATING UNIT DATA, LINEAR PROGRAMMING IRP MODEL
Planti
Type CapacityMW
Must RunCapacity
MW
HeatRate Btu/
kWh
NonfuelVariable
O&M$/MWh
CapitalCost$/kW
ForcedOutage
Rate
MaximumCapacity
Factor
A Existing Coal 1(Scrubbers)
200 80 10,000 9 n.a. 0.05 0.85
B Existing Oil Steam 150 0 10,200 3 n.a. 0.04 0.85
C Existing CombustionTurbines
200 0 13,800 9 n.a. 0.035 0.8
D Existing Coal 2 150 60 10,400 5 n.a. 0.05 0.85
E Existing Coal 3 150 0 11,500 5 n.a. 0.05 0.85
F New Coal Plant 200(max)
80 10,000 5 1000 0.05 0.85
G New CombinedCycle
500(max)
0 8,230 5 800 0.05 0.85
H New CombustionTurbine
500(max)
0 13,800 8 550 0.035 0.8
i Install 15 percentNatural Gas Cofire
n.a. 80 10,400 3 9 0.05 0.85
Capability, Coal 2
Note: n.a. = Not Applicable
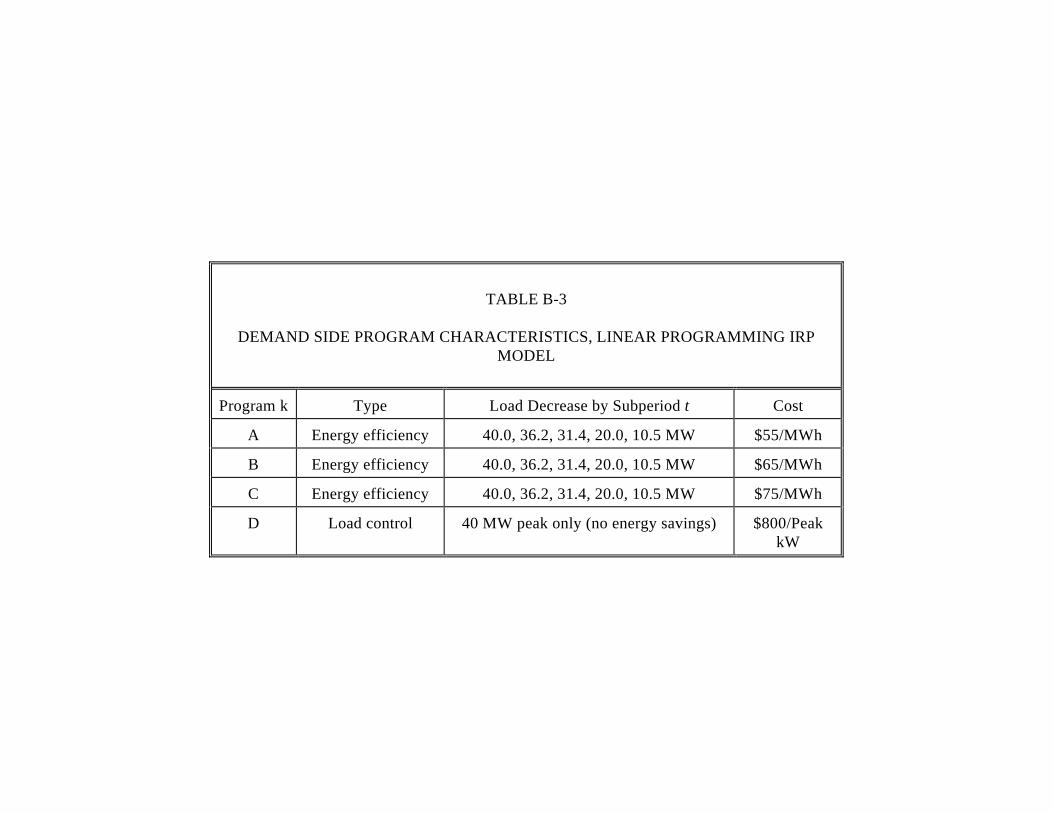
TABLE B-3
DEMAND SIDE PROGRAM CHARACTERISTICS, LINEAR PROGRAMMING IRPMODEL
Program k Type Load Decrease by Subperiod t Cost
A Energy efficiency 40.0, 36.2, 31.4, 20.0, 10.5 MW $55/MWh
B Energy efficiency 40.0, 36.2, 31.4, 20.0, 10.5 MW $65/MWh
C Energy efficiency 40.0, 36.2, 31.4, 20.0, 10.5 MW $75/MWh
D Load control 40 MW peak only (no energy savings) $800/PeakkW


151
REFERENCES
Ackerman, Bruce A. and Richard B. Stewart. "Reforming Environmental Law, Stanford LawReview 37, 1985.
Agathen, Paul A. "Dealing with Environmental Externalities," Public Utilities Fortnightly,February 15, 1992.
Andrews, Clinton J. "Spurring Inventiveness by Analyzing Trade-Offs: A Public Look atNew England's Electricity Alternatives," Environmental Impact Assessment Review, 12, 1992.
Andrews, Clinton J. "The Marginality of Regulating Marginal Investments: Why We Need aSystemic Perspective on Environmental Externality Adders," Energy Policy, May 1992.
Andrews, Clinton J. and S.R. Conners. "Existing Capacity: The Key to Reducing Emissions,Energy Systems and Policy 15, no. 3 (1991): 211-30.
Andrews, Clinton J. and S.R. Conners. "Cost-Effective Emissions Reductions:Combining New England's Options into a Coordinated Strategy." Presented at theTwelfth Annual North American Conference of the International Associationfor Energy Economics, Ottawa, Canada, October 2, 1990.
Barthold, Thomas A. "Issues in the Design of Environmental Excise Taxes," Journal ofEconomic Perspectives 8, no. 1, Winter 1994.
Baumol, William J. and Wallace E. Oates. The Theory of Environmental Policy, SecondEdition. Cambridge, England, Cambridge University Press, 1988.
Bernow, Stephen, B. Biewald, and D. Marron. "Full-Cost Dispatch: Incorporating ExternalCosts in Power System Operations," The Electricity Journal 4, no. 2, March 1991.
Bernow, Stephen and Donald Marron. "The Inclusion of Environmental Goals in ElectricResource Evaluation: A Case Study in Vermont," Energy Efficiency and the Environment:Forging the Link, E. Vine, D. Crawley, and P. Centolella, eds. Berkeley, California, ACEEE,1991.
Black, Bernard S. and Richard J. Pierce, Jr. "The Choice Between Markets and CentralPlanning in Regulatory the U.S. Electric Industry." Draft unpublished paper,Columbia Law School, New York, June 1993.

152
REFERENCES--Continued
Bloyer, Daniel and Michael Bull. "Least Cost Planning at the Margin: Externalities vs. RateImpacts," Proceedings of the CEEE 1992 Summer Study on Energy Efficiency in Buildings,August 1992.
Bohi, Douglas R. "Utilities and State Regulators Are Failing to Take Advantage of EmissionAllowance Trading," The Electricity Journal 7, no. 2, March 1994.
Bohi, Douglas R. and Dallas Burtraw, "Utility Investment Behavior and the Emission TradingMarket," Resources and Energy 14, 1992.
Bonneville Power Administration, U.S. Department of Energy. Draft Environmental ImpactStatement Resource Programs. DOE/ERS-0162. Portland, Oregon, Bonneville PowerAdministration, March 1992.
Braithwait, S.D. and D.W. Caves. "Three Biases in Cost-Efficiency Tests of Utility EnergyEfficiency Programs," The Energy Journal 15, no. 1 (1994): 95-120.
Brick, S. and G. Edgar. "Blunting Risk With Caution: The Next Step for Least-CostPlanning," The Electricity Journal, July 1990.
Browne, G. "A Utility View of Externalities: Evolution, Not Revolution," The ElectricityJournal 4, no. 2 (March 1991): 34-39.
Burke, W.J. et al. "Trade Off Methods in System Planning," IEEE Transactions on PowerSystems 3, no. 3, 1988.
Burns, Robert E. et al. The Prudent Investment Test in the 1980s. Columbus, Ohio, TheNational Regulatory Research Institute, April 1985.
Busch, J.F. and F.L. Krause. "Environmental Externality Surcharges in Power SystemPlanning: A Case Study of New England," IEEE Transactions on Power Systems 8, no. 3,August 1993.
Centolella, Paul. "Securing the Benefits of Market-Based Environmental Regulation," TheNew Clean Air Act: Compliance and Opportunity, R. Lock and D. Harkawik, eds. Arlington,Virginia, Public Utilities Reports, Inc., 1991.

153
Coase, Ronald H. "The Problem of Social Cost," Journal of Law and Economics 3, October1960.

154
REFERENCES--Continued
Cohen, Armond and Steven Kihm. "The Political Economy of Retail Wheeling, orHow to Not Re-Fight the Last War," The Electricity Journal 7, no.3, April 1994.
Cohon, J. Multiobjective Programming and Planning. New York, Academic Press, 1978.
Connors. "Externalities, Adders, and Cost-Effective Emission Reductions: Using Trade-Off Analysis to Promote Environmental Risk Mitigation," Proceedings of theAmerican Power Conference 1, April 1993.
Connors, Stephen R. "Side-Stepping the Adder: Planning for Least-Social-Cost ElectricService," Proceedings of the National Association of Regulatory Utility Commissioners-U.S.Department of Energy Fourth National Integrated Resource Planning Conference, September1992.
Cornes, Richard and Todd Sandler. The Theory of Externalities, Public Goods, and ClubGoods. Cambridge, England, Cambridge University Press, 1986.
Costello, K.W. and P.S. Galen. A Proposed Methodology for Evaluating Utility ConservationPrograms, Docket Nos. 83-0034 to 83-0043, Illinois Commerce Commission,Springfield, Illinois, 1983.
Cropper, Maureen L. and Wallace E. Oates. "Environmental Economics: A Survey," Journalof Economic Literature 30, June 1992.
Crousillat, E.O., P. Dorfner, P. Alvarado, and H.M. Measill. "Conflicting Objectives andRisk in Power Systems Planning," IEEE Transactions on Power Systems 8, no. 3, August1993.
Dales, John Harkness. Pollution, Property, and Prices. Toronto, Canada, University ofToronto Press, 1968. Formalized by W. David Montgomery. "Market in Licenses andEfficient Pollution Control Programs," Journal of Economic Theory 5, no. 3, 1972.
Delson, J.K. "Controlled Emission Dispatch," IEEE Transactions on Power Apparatus andSystems, PAS-93(5), September/October 1974.
El-Keib, A.A., H. Ma, and J.L. Hart. "Economic Dispatch in View of the Clean Air Act of1990," IEEE Transactions on Power Systems (in press).
155
REFERENCES--Continued
Freeman, A. Myrick, III et al. Accounting for Environmental Costs in Electric UtilityResource Supply Planning. Discussion paper QE92-14. Washington, D.C., Resources for theFuture, April 1992.
Gjengedal, T., O. Hansen, and S. Johansen. "Qualitative Approach to Economic-Environmental Dispatch; Treatment of Multiple Pollutants," IEEE Transactions onEnergy Conversion 7, no. 3, September 1992.
Hahn, Robert W. and Gordon L. Hester. "Where Did All The Markets Go? An Analysis ofEPA's Emissions Trading Program," Yale Journal on Regulation 6, 1989.
Heslin, J.S. and B.F. Hobbs. "A Probabilistic Production Costing Analysis of SO2 EmissionsReduction Strategies for Ohio: Emissions, Costs, and Employment Tradeoffs," Journal of theAir and Waste Management Association 41, no. 7, 1991.
Hess, S.W. et al. "Planning System Operations to Meet NOx Constraints," IEEE ComputerApplications in Power 5, no. 3, July 1992.
Hirst, Eric and C. Goldman. "Creating the Future: Integrated Resource Planning for ElectricUtilities," Annual Review of Energy 16, 1991.
Hobbs, B.F. "Emission-Cost Tradeoffs for Electric Utilities The Effect of Rate Feedback,"Journal of Energy Engineering (in review).
Hobbs, Benjamin F. "Emissions Dispatch under the Underutilization Provision of the 1990U.S. Clean Air Act Amendments: Models and Analysis," IEEE Transactions on PowerSystems 8, February 1993.
Hobbs, Benjamin F. et al. "What's Flexibility Worth? The Enticing Case of Natural GasCofiring," The Electricity Journal 5, no. 2, March 1992.
Hobbs, Benjamin F. "Environmental Adders and Emissions Trading: Oil and Water?" TheElectricity Journal, 1992).
Hobbs, Benjamin F. "The `Most Value' Test: Economic Evaluation of Electricity DemandManagement Considering Customer Value," The Energy Journal 12, no. 2 (1991): 67-91.

156
REFERENCES--Continued
Hobbs, B.F. and J.S. Heslin. "Evaluation of Conservation for SO2 Emissions ReductionUsing a Multiobjective Electric Power Production Costing Model," in ACEEE 1990 SummerStudy on Energy Efficiency in Buildings. Washington, D.C., American Council for an EnergyEfficient Economy, 1990.
ICF Resources, Inc. Economic, Environmental, and Coal Market Impacts of SO2 EmissionsTrading Under Alternative Acid Rain Control Proposals. Report for The Office ofPolicy, Planning, and Evaluation, U.S. Environmental Protection Agency, March1989.
Illinois Environmental Protection Agency. Draft Proposal: Design for NOx Trading System. September 22, 1993.
Jackson, T.M. et al. "Evaluating Soft Strategies for Clean-Air Compliance," IEEE ComputerApplications in Power 6, April 1993.
Jahnke, James A. Continuous Emission Monitoring. New York, Van Nostrand Reinhold,1993.
Jones, D.N. et al. Regional Regulation of Public Utilities: Opportunities and Obstacles. Columbus, Ohio, The National Regulatory Research Institute, December 1992.
Jones, Douglas N. and Richard A. Tybout. "Environmental Regulation and ElectricUtility Regulation: Compatibility and Conflict," Environmental Affairs Law Review 14,no. 1, 1986.
Joskow, Paul L. "Emerging Conflicts Between Competition, Conservation andEnvironmental Policies in the Electric Power Industry. Keynote address for the PublicUtility Research Center's Conference on competition in regulated industries,University of Florida, April 29-30, 1993.
Joskow, Paul L. "Weighing Environmental Externalities: Let's Do It Right!" The ElectricityJournal 5, no. 4, May 1992.
Kuloor, S., G.S. Hope, and O.P. Malik. "Environmentally Constrained Unit Commitment,"IEEE Proceedings-C 139, no. 2, March 1992.
Latin. "Ideal Versus Real Regulatory Efficiency: Implementation of Uniform Standards

157
and `Fine-Tuning' Regulatory Reform," 37 Stanford Law Review, 1267, 1985.

158
REFERENCES--Continued
Lee, S., N. Stoughton, and N. Badertscher. Comparative Analysis of Generation PlanningModels for Application to Regional Power System Planning. Prepared for U.S. Department ofEnergy. Palo Alto, California, Systems Control, Inc., 1979.
Lowell, Jonathan B. "Integrating Planning and the Environment at New England Electric,"Proceedings of the ACEEE 1992 Summer Study on Energy Efficiency in Buildings, August1992.
Maine Public Utilities Commission. Environmental and Economic Impacts: A Review andAnalysis of Its Role in Maine Energy Policy. Augusta, Maine, Maine Public UtilitiesCommission, May 1, 1991.
Marnay, C. "Intermittent Electrical Dispatch Penalties for Air Quality Improvement," Ph.D.Dissertation, University of California, Berkeley, California, 1993.
Meier, P. Energy Systems Analysis for Developing Countries. New York, Springer-Verlag,1984.
Moskowitz, David. Renewable Energy: Barriers and Opportunities; Walls and Bridges. Gardner, Maine, Regulatory Assistance Project, July 1992.
Murray, M. "Dealing in Dirt," California Lawyer, December 1993.
National Association of Regulatory Utility Commissioners. Environmental Externalities andElectric Utility Regulation. Washington, D.C., National Association of Regulatory UtilityCommissioners, September 1993.
National Association of Regulatory Utility Commissioners. Utility Regulatory Policy in theUnited States and Canada. Washington, D.C., National Association of RegulatoryUtility Commissioners, 1993.
National Association of Regulatory Utility Commissioners. Compilation of Utility RegulatoryPolicy, 1991-1992. Washington, D.C., National Association of Regulatory UtilityCommissioners, 1992.
National Research Council. Rethinking the Ozone Problem in Urban and Regional AirPollution. Washington, D.C., National Academy Press, 1991.

159
160
REFERENCES--Continued
Northeast States for Coordinated Air Use Management. Development of a Market-BasedEmissions Cap System for NOx in the NESCAUM Region: Project Summary for Section 105State Air Grant Funds for Market-Based Initiatives, September 1992.
Northeast States for Coordinated Air Use Management. NESCAUM Stationary SourceCommittee Recommendation on NOx RACT for Utility Boilers. Boston, Massachusetts,Northeast States for Coordinated Air Use Management, March 25, 1992.
Oak Ridge National Laboratory and Resources for the Future. U.S./EC Fuel Cycle Study:Background Document to the Approach and Issues. Report No. 1 on the External Costs andBenefits of Fuel Cycles: A Study by the U.S. Department of Energy and the Commission ofthe European Communities. ARNL/M-2500, DE93 004291. Oak Ridge, Tennessee, OakRidge National Laboratory and Resources for the Future, November 1992.
Office of the President. Climate Change Action Plan. Washington, D.C., 1993.
Ozone Transport Commission. OTC Memorandum of Understanding on the Need to ReduceStationary Source NOx Emissions and Activities to Develop Technical Support for RegulatoryDevelopment. Washington, D.C., Ozone Transport Commission, March 10, 1992.
Pace University Center for Environmental Legal Studies. Environmental Costs of Electricity. Prepared for the New York State Energy Research and Development Authority andthe United States Department of Energy, 1990.
Palmer, K.L. and A.J. Krupnick. "Environmental Costing and Electric Utilities' Planning andInvestment," Resources, Resources For the Future, no. 105, Fall 1991.
Petrovic, R. and B. Kralj. "Economic and Environmental Power Dispatch," EuropeanJournal of Operational Research 64, no. 1, 1993.
Pigou, A.C. The Economics of Welfare, Fourth Edition. London, MacMillan and Co.,Limited, 1932 (reprinted 1952).
Public Utilities Fortnightly. "States Advised to `Go Slow' on Internalizing Externalities,"March 15, 1993.
161
REFERENCES--Continued
Putta, Sury. "Weighing Externalities in New York State," The Electricity Journal 3, no.6,July 1990.
Rose, Kenneth. "Planning Versus Competition and Incentives: Conflicts, Complements, orEvolution?" in Reforming Electricity Regulation: Fitting Regional Networks into a FederalSystem, Clinton J. Andrews, ed. Westport, Connecticut, Quorum Books, 1994, forthcoming.
Rose, Kenneth. "Regulatory Treatment of Allowances and Compliance Costs: What's Goodfor Ratepayers, Utilities, and the Allowance Market," in Regulatory Policy Issues and theClean Air Act: Issues and Papers from the State Implementation Workshops, Kenneth Roseand Robert E. Burns, eds. Columbus, Ohio, The National Regulatory Research Institute, July1993.
Rose, Kenneth, Alan S. Taylor, and Mohammad Harunuzzaman. Regulatory Treatment ofElectric Utility Clean Air Act Compliance Strategies, Costs, and Emission Allowances. Columbus, Ohio, The National Regulatory Research Institute, December 1993.
Rose, Kenneth, Robert E. Burns, Jay S. Coggins, Mohammad Harunuzzaman, and TimothyW. Viezer, Public Utility Commission Implementation of The Clean Air Act's AllowanceTrading Program. Columbus, Ohio, The National Regulatory Research Institute, 1992.
Rowe, J.W. and C.A. LaFleur. "Environment, Economy, and Energy: Meeting the MultipleChallenges of the 1990s," Electricity Journal 5, no. 6 (1992): 42-49.
Ruff, L. Internalizing Environmental Costs in Electric Utility Decisions. Unpublishedmanuscript, May 1991.
Sinozich et al. "Preemption in Administrative Law," 45 Administrative Law Review 111,1993.
Talaq, H., F. El-Hawary, and M.E. El-Hawary. "A Summary of Environmental/ EconomicDispatch Algorithms," IEEE Transactions on Power Systems, in press.
Talukdar, S.N. and F.F. Wu. "Computer-Aided Dispatch for Electric Power Systems,"Proceedings of the IEEE 69, no. 10, October 1981.

162
REFERENCES--Continued
Thompson, Herbert G., Jr. and Lynda L. Wolf. "Regional Differences in Nuclear and Fossil-Fuel Generation of Electricity," Land Economics 69, no. 3, August 1993.
Tietenberg, T.H. Emissions Trading and Exercise in Reforming Pollution Policy. Washington, D.C., Resources for the Future, Inc., 1985.
Turvey, R. and D. Anderson. Electricity Economics: Essays and Case Studies. Baltimore,Maryland, The Johns Hopkins University, 1977.
U.S. Environmental Protection Agency. "EPA Data Show Steady Progress in CleaningNation's Air," EPA Environmental News, October 19, 1992.
U.S. Environmental Protection Agency, National Air Quality and Emissions Trends Report,1988. Office of Air Quality Planning and Standards, No. EPA-450/4-90-002, March1990.
Utility Environment Report. New York, McGraw-Hill, Inc., November 27, 1992.
Walther, Robin J. "Green Pricing for Renewable Resource Development: An Idea WhoseTime is Coming?" Proceedings of the 1993 Conference on Demand-Side Management andthe Global Environment. Bala Cynwyd, Pennsylvania, The Conference Connection, June1993.
Wiel, S. "The New Environmental Accounting: A Status Report," The Electricity Journal4,no. 9, 1991.
Woo, C.K., B.F. Hobbs, R. Orans, R. Pupp, and B. Horii. "Emission Costs, Customer Bypass,and Ramsey Pricing of Electricity." Submitted to Resource and Energy Economics, April1994.
Wood, Frances P. "Analyzing the Effect of Including Environmental Externalities in UtilityPlanning," Proceedings of the ACEEE 1992 Summer Study on Energy Efficiency in Buildings,August 1992.
Wood, A.J. and B.F. Wollenberg. Power Generation Operation and Control (New York:Wiley, 1984).

163
REFERENCES--Continued
Wulfsberg, K. "Incorporating Environmental Externalities in the Electric Utility ResourcePlanning Process: Methods, Effects, and Limitations," M.S. Thesis in Technology andPolicy, Massachusetts Institute of Technology, Cambridge, Massachusetts, 1990.
Climate Change Action Plan. Washington, D.C., Office of the President, 1993.
Emissions of Greenhouse Gases in the United States, 1985-1990. DOE/EIA-0573.Washington, D.C., Energy Information Administration, U.S. Department of Energy,September 1993.
"New England Power to Cut Salem Unit NOx Using Experimental Process," UtilityEnvironment Report, November 27, 1992.
"States Advised to `Go Slow' on Internalizing Externalities," Public Utilities Fortnightly,March 15, 1993.
Utility Environmental Impacts; Incentives and Opportunities for Policy Coordinationin the New England Region. Boston, Massachusetts, Project on Regional Coordinationand Environmental Externalities, June 1994.