UNITED STATES WATER UTILITY PERFORMANCE ASSESSMENT i United States Water Utility Performance...
12
UNITED STATES WATER UTILITY PERFORMANCE ASSESSMENT i United States Water Utility Performance Assessment Abstract By Linda L. Paralez, Ph.D. This report describes the status of performance assessment techniques in water utilities and provides input to an international report. The author discusses the analysis and processes employed to gather data using a custom water utility survey, then contrasts the methods used and survey results with those of the Governmental Accounting Standards Board survey (GASB). The use of standardized procedures for performance assessment, the use of performance indicators and ISO 9000, and the cost of implementation of performance indicator systems are also addressed. Data quality control, the accessibility and use of performance measures both internally and externally, and influencing factors and trends found from the custom survey results are considered in relation to the GASB survey. To conclude, the report addresses several aspects of performance assessment systems that need improvement and identifies key issues that can maximize the cost effectiveness of these systems.
-
Upload
independent -
Category
Documents
-
view
0 -
download
0
Transcript of UNITED STATES WATER UTILITY PERFORMANCE ASSESSMENT i United States Water Utility Performance...
UNITED STATES WATER UTILITY PERFORMANCE ASSESSMENT
i
United States Water Utility Performance Assessment
Abstract
By Linda L. Paralez, Ph.D.
This report describes the status of performance assessment techniques in water utilities and provides input to an international report. The author discusses the analysis and processes employed to gather data using a custom water utility survey, then contrasts the methods used and survey results with those of the Governmental Accounting Standards Board survey (GASB). The use of standardized procedures for performance assessment, the use of performance indicators and ISO 9000, and the cost of implementation of performance indicator systems are also addressed. Data quality control, the accessibility and use of performance measures both internally and externally, and influencing factors and trends found from the custom survey results are considered in relation to the GASB survey. To conclude, the report addresses several aspects of performance assessment systems that need improvement and identifies key issues that can maximize the cost effectiveness of these systems.
UNITED STATES WATER UTILITY PERFORMANCE ASSESSMENT
1
United States Water Utility Performance Assessment
By Linda L. Paralez, Ph.D. Overview The objective of this National report is to provide the basis and input to an International Report on the current status of the application of performance assessment techniques to water supply and wastewater systems. Sources of data used to compile this report include: • First, a custom survey, referred to here as the Water and Wastewater Utility Survey
(WWUS), designed around the objectives of this national report, was sent electronically to 560 water and wastewater utilities in all 50 of the United States. Response rate was small – 5% (29 respondents) to date – prompting additional research to augment the findings from that survey.
• Second, contextual correlation of the findings of this custom survey with those of 1998-99
research sponsored by the Government Accounting Standards Board (referred to as the GASB survey) of state and local governments about how and why these governments are using performance measures.1
By extension, the prevalence and maturity of performance measures in state and local governments can be expected to influence the development of performance assessment at those water and wastewater utilities that are governed by these same entities.
• Third, the case study profile information is provided from information gained through benchmarking studies conducted by the Western Regional Water Utilities Benchmarking Group (referred to as the WRWUBG)2
over a five-year period, facilitated by the author.
1 Additional information about the GASB’s research on service efforts and accomplishments and performance measurement can be obtained at the Performance Measurement for Government web site (www.seagov.org) or by contacting Wilson Campbell at [email protected] or 203/847-0700, ext. 228. 2 WRWUBG is a consortium of water utilities that design and participate in process and metric benchmarking studies. Member participants have included: Seattle Public Utilities, Tacoma Water Department, Portland Bureau of Water Works, San Francisco Water Department, San Francisco PUD, East Bay Municipal Utility District, Alameda County Water District, Contra Costa Water District, Las Vegas Valley Water District, Long Beach Water Department, Los Angeles Water and Power Department, Metropolitan Water of Southern California, Irvine Ranch Water District, San Diego Water Department Eastern Municipal Water District, and Tucson Water Department.
UNITED STATES WATER UTILITY PERFORMANCE ASSESSMENT
2
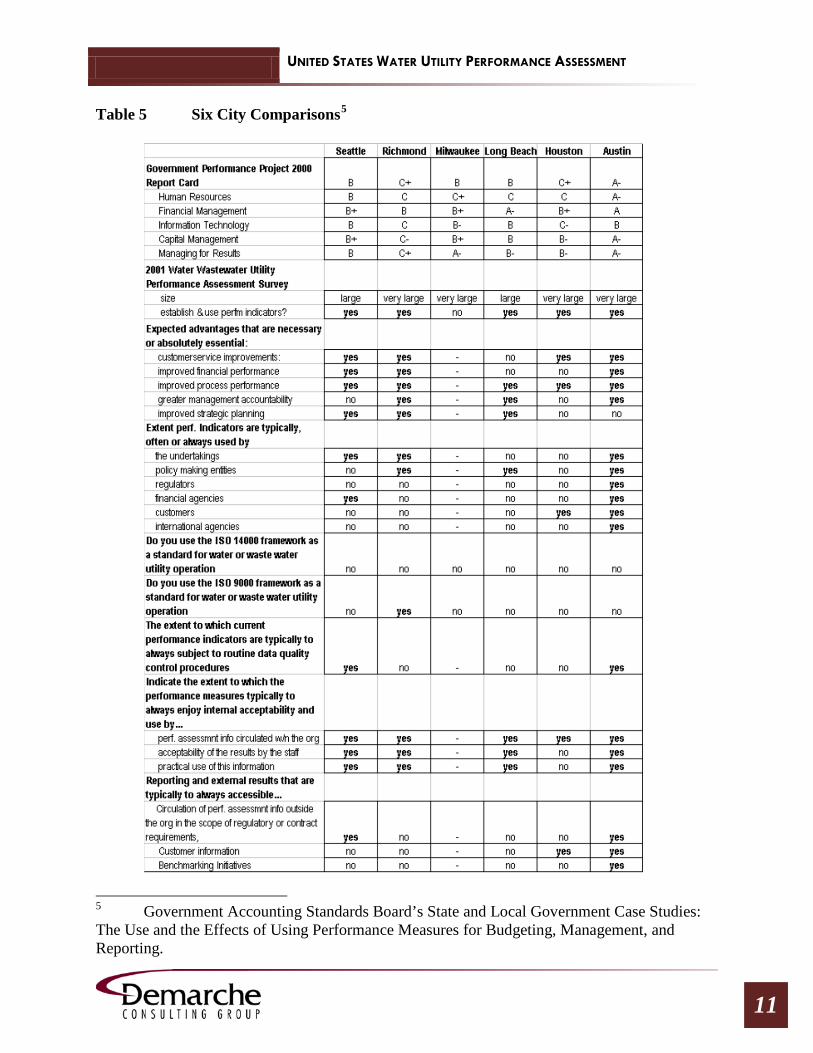
Introduction Assessing performance is not new. In 1938, International City/County Management Association issued Measuring Municipal Activities, suggesting various types of information that local governments might use to monitor and assess local services and how well these services were being delivered (ICMA, 1999). About 10 years later, Japan, with the help of the late Dr. W. Edwards Deming started its quality journey with benchmarking and statistical process control as the cornerstone of its rebuilding after World War II (Walton, 1986). Some 50 years ago, at the federal level, the Hoover Commissions, worked successfully to streamline a federal government grown too large and too disorganized because of the combined impact of the Great Depression and then World War II. Today, we have Reinventing Government, supported by a series of legislative initiatives at the federal and state levels such as the 1993 Government Results and Performance Act to streamline the respective governments to work better. During 1998 and 1999, GASB researchers conducted intensive interviews in 26 state and local governments across the country in order to learn how and why these governments are using performance measures and to understand the effects of those measures on the decision-making process. Correlation of the overall results of the GASB survey findings of the prevalence and use of performance measures in local, county, regional and state government entities compares well with the findings from the specific water and wastewater utility survey. Since water and wastewater utilities are subsets of many of these larger government entities, we would expect some consistency of findings (see Table 1). Six of those case studies, released in April 2000, are relevant contextual comparisons of data for this survey of water and wastewater utilities. Those six include: Seattle, Washington; Austin, Texas; Houston, Texas; Richmond, Virginia; Milwaukee, Wisconsin; and Long Beach, California (see Table 5). National status The analysis of the water and wastewater utility survey (WWUS) results provides the basic data for framing conclusions on the national status of performance assessment work among water and wastewater utilities in the United States. This questionnaire sought information via an electronic survey from water and/or wastewater utilities across the United States about:
• whether they have developed performance measures, • what their expected advantages are from undertaking this performance assessment work, • the extent to which these performance indicators are used for decision-making purposes,
and by whom, • what types of quality control and reliability assessment are they are using, and • to whom these measures are being circulated and reported.
The WWUS survey instrument was sent electronically to 560 entities, identified through the American Water Works Association. Responses were received from 29, or 5%. Of those responding, 55% indicated they have developed some type of performance measures (See Table 1).
UNITED STATES WATER UTILITY PERFORMANCE ASSESSMENT
3
Of those that do have some type of performance measures, those factors most frequently cited as a necessary or absolutely essential requirement of utilities investment in performance assessment measurement were:
• 75% indicated that improved process performance (efficiency and effectiveness) of the utility
• 63% indicated improved customer service performance • 56% indicated enhanced operational decision-making • 50% indicated financial performance • 50% indicated greater management/leadership accountability • 38% indicated improved strategic planning.
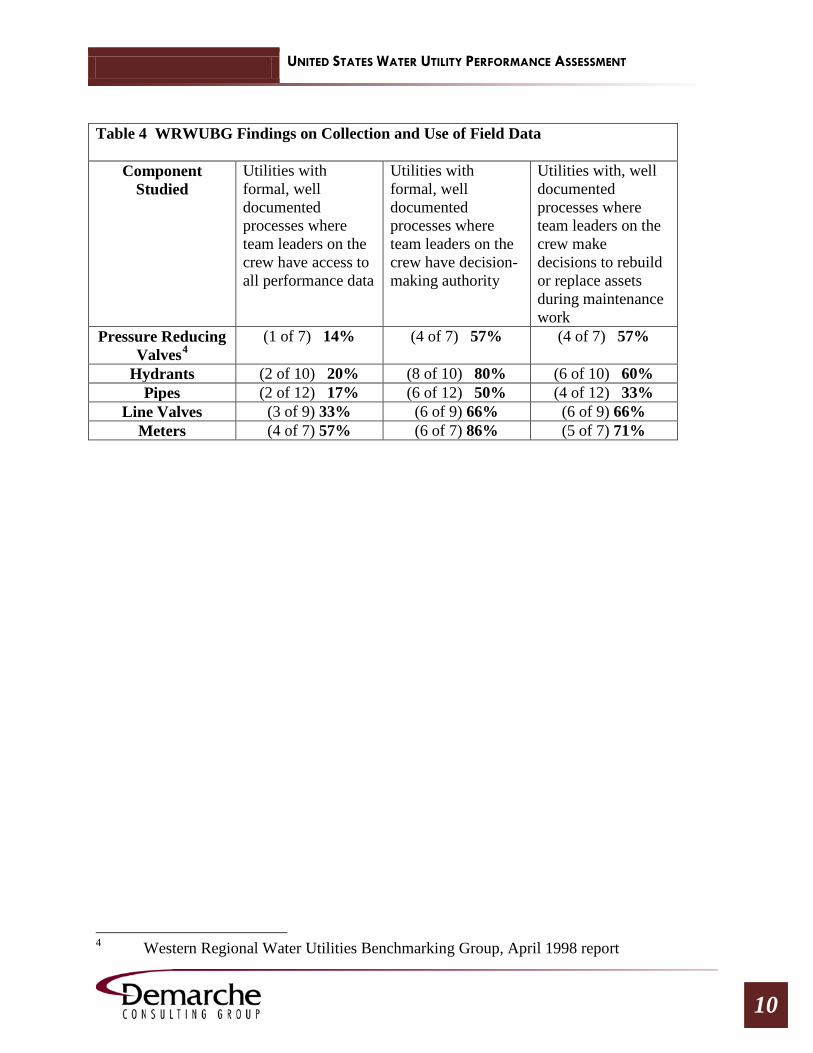
Of the utilities responding, 38% fall into a medium size category, serving a population size of 10,000 to 100,000; 42% serve large to very large populations (see Table 2). In contrast, the GASB survey sought information from 26 state and local governments across the United States about whether they have developed performance measures, whether they are using them for decision-making purposes, what types of performance measures they are using, what aspects of management these measures are being used for, to whom they are being reported, whether measures are being verified, specific programs for which performance measures are being used, whether the use of performance measures is required, and whether entities are planning to continue or begin using them in the future. Table 3 shows the contrast of findings between the GASB survey at the state and local government level against the WWUS responses on those questions that match. While there is an almost identical prevalence of the existence and use of performance measures, it appears that utilities have a slightly higher preference for using these measures in decision-making and strategic planning than government respondents. Lessons-learned from the WRWUBG data Performance measurement only gathers data and just measuring something does not improve it. Performance measurement is a planning, an improvement, or management tool. Using the data is a key element of effective investment in performance assessment work. Lessons-learned from the five-year benchmarking research effort of the WRWUBG maintenance studies revealed some universal challenges among participating utilities in use of data. WRWUBG members learned that those that gather the data don’t necessarily use the data. Findings from five component surveys asked participants to what extent labor make decisions about whether to repair or replace failed components in the field, and then asked a companion question about to what extent labor have access to the historical data about the performance and maintenance of that component. All respondents indicated routine, disciplined data collection about activity performed on components (Table 4). These results led to a search for a comparison among participating utilities for promising practices in the use of field incident data (maintenance, repair, refurbishment, etc.) as part of a whole performance picture. Indicators such as mean time before first failure, mean time between failures (repairs), and mean time before replacement or refurbishment for each of the components studied were identified as desirable performance and planning indicators. With the
UNITED STATES WATER UTILITY PERFORMANCE ASSESSMENT
4
exception of pumps and drivers, the data for these indicators for other components was difficult for WRWUBG members to provide, including mean time before first failure (measured from date of installation to date of first repair). Reasons given were primarily the lack of data accessibility, indicating that these data are not commonly used for planning or analysis. Our interviews with engineering and planning groups at several participating utilities confirm that use of field data is rarely used in creating models for replacement, selection of materials, or systems design. From the planning perspective the field data is probably most useful to the field crews – who, according to the field responses believe the data is primarily collected for the benefit of engineers and systems designers. Improvements have been made as a result of this research. In several utilities, the implementation of Maintenance Management Information Systems to manage work flow and work order control has also provided an opportunity to both access and analyze the history of maintenance and repair on a given component or area of the system before making decisions about repair versus replace or refurbish. This information is now becoming more useful to engineering for longer-term systems planning as well. Performance data about the component, the system, processes within the system, work groups, crews, and so forth are also more feasible with automated access and manipulation3
Use of standardized procedures for performance assessment
. Several of these participating utilities are using this information as a springboard to begin the development of strategic asset management plans (Paralez and Muto, 2001).
Respondents to the WWUS that have performance measures indicate that these measures are “typically,” “often,” or “always” used by:
• 69% the undertakings (those who create the measures), • 50% the policy making entities • 25% the regulators • 25% the financial agencies • 25% the customers • 6% and finally, the international agencies.
Comparatively, at the GASB study level outcome measures are reported: • 25% to internal management • 24% to elected officials, and • 21% to citizens and the media.
The use of performance indicators and ISO 9000 In the water and wastewater utility survey, a full 100% of respondents indicated no use of the ISO 14000 environmental standard, and 90% indicated no use of the ISO 9000 quality standard for any aspect of the water or wastewater utility operation. Respondents were also asked to rate the extent to which their performance measures are used in implementing the ISO 9000 or 14000 framework as a standard for any aspect of the water or waste water utility operations, for which 56% indicated these standards are never used, and 19% indicated they are used on an as-needed basis for critical programs and activities. 3 WRWUBG SPU, Tacoma, East Bay MUD, Portland, Alameda, San Diego
UNITED STATES WATER UTILITY PERFORMANCE ASSESSMENT
5
The cost of implementation of performance indicators systems Among WWUS respondents that indicated they have established performance measures some 69% indicated that the cost of the implementation of the performance indicators system matched the planned budget for implementing the system. Another 13% said the cost exceeded the budget every year of the implementation. The technical and social investment for implementing the performance indicators system exceeded or significantly exceeded expectations for 75% of WWUS respondents. Only 13% said that the technical and social investment of implementing these performance indicators matched expectations. The GASB survey did not measure a comparison factors for cost of implementation. Data quality control Current performance indicators are subject to routine data quality control procedures at responding water and wastewater utilities “typically” to “always” for 44% of the respondents. For 13% of respondents, quality control procedures are never applied. Another 25% apply quality control procedures on an as-needed basis for critical measures, programs and activities, and 19% make quality control a standard procedure of numerous measures, programs and activities for WWUS respondents. The GASB survey asked participants to indicate whether the performance measures they used were subjected to some type of verification process and to describe the type of verification and who performed it. Of the GASB respondents using performance measures, 53% said they were subjected to some type of verification process. Internal acceptability and use When asked to indicate the extent to which the performance measures have internal acceptability and use, 63% of WWUS respondents noted that performance assessment information is circulated within the utility “typically,” “often,” or “always.” Otherwise this information is circulated primarily on an as-needed basis (31%). When asked to indicate the extent to which the performance measures have internal acceptability of the results by the staff, 56% of WWUS respondents noted that this is true “typically,” “often,” or “always.” When asked to indicate the extent to which the performance measures have practical use of this information, 56% of WWUS respondents who have performance measures noted that this is true “typically,” “often,” or “always.” Reporting and external results accessibility Circulation of performance assessment information outside the utility in the scope of regulatory or contract requirements is “typically,” “often,” “always,” circulated by 13% of the WWUS respondents who have performance indicators. This information is circulated on an “as-needed” basis for critical programs and activities by 75% of respondents.
UNITED STATES WATER UTILITY PERFORMANCE ASSESSMENT
6
Customer information is “typically,” “often,” “always,” circulated by 19% of the WWUS respondents who have performance indicators. This information is never circulated by 63% of respondents who have performance measures. Benchmarking initiatives are “typically,” “often,” “always,” circulated by 25% of the WWUS respondents who have performance indicators. This information is circulated on an “as-needed” basis for critical programs and activities by 63% of respondents. Influencing factors and trends Of the 270 responding to the GASB survey stating that they are required to use performance measures, 90% of those required to use performance measures currently do so. This means that 10% of those that are required to use performance measures are not presently using them. Another 178 (20% of all of those responding) are using performance measures but are not required to do so by law, ordinance, or policy. State departments are more frequently required to use (and do use) performance measures, with 93% -- 61% of all state departments responding-- of those that are required to use performance measures actually using them. For municipalities, 81% of those that are required to use performance measures are doing so; the number for counties is 97%. Conclusions Based on the results of the water and wastewater utility questionnaire compared with the findings from the GASB survey of local and state governments on the development, use, and reporting of performance measures, the primary indication is at least among those responding that there is a slight majority using performance measures now, with 55% and 53%, respectively, saying they are using them in some way. Additionally, of those that have performance measures, 47% (WWUS) and 58% (GASB) report using those measures for decision-making. But the gap between those who have performance measures and those who use and report them is apparent from both sets of data, and is supported by the case study benchmarking. In the GASB there were 421 that use performance measures and 216 that report them to elected officials, a difference of 205 (23% of those responding) and 25% report outcome measures to internal management. In the water and wastewater utility survey, 44% of the utilities indicate that their measurement efforts don’t enjoy practical use, or aren’t accepted by the staff. When it comes to circulation of the information, performance assessment information for utilities is typically circulated on an “as-needed” basis only. For those with performance indicators, customer information is “never” circulated externally by 63% of WWUS utility respondents. Finally, information from benchmarking initiatives, which can be a key basis of learning, is only typically circulated externally by 25% of WWUS utilities responding. This appears to indicate a reticence on the part of many of those responding to proceed with the reporting of this information about some of the essential aspects of utility or government performance. While it is becoming more common for utilities to have performance measurement systems in place, the use access and sharing of the information could be significantly improved. The areas

UNITED STATES WATER UTILITY PERFORMANCE ASSESSMENT
7
that appear to be common shortcomings as identified in this research that should be actively integrated into the use and implementation of performance assessment systems include:
• those that gather the data should be those using the data • field staff (labor) should be involved in both gathering and using data; i.e., maintenance
repair, refurbishment decision-making • increase the distribution and understanding of performance data • system integration; i.e., Maintenance Management Information System implementation • maximizing data availability and use should be emphasized • appropriate Quality Control should be applied to all data • increasing the acceptability and practical use of information
In summary, much progress has been made to date by utilities, supported it seems by the efforts at the local and state government level. Maximizing the return on investment in performance assessment systems can occur by actively addressing and considering the issues identified above. About the author: Linda L. Paralez, Ph.D. is a recognized expert in benchmarking design, data analysis, team building, problem assessment and facilitation of teams. Dr. Paralez is president of Demarche Consulting Group, Inc., a consulting firm specializing in measurement theory, principles of measurement, survey design and analysis, strategy development, process analysis and performance indicators. Dr. Paralez can be reached by the email address [email protected] or by phone or fax at the Demarche Consulting Group, Inc. office: 800 Fifth Avenue Suite 4100 Seattle, WA 98104 206.505.5800 (phone) 206.505.5801 (fax) www.demarcheconsulting.com

UNITED STATES WATER UTILITY PERFORMANCE ASSESSMENT
8
REFERENCES ICMA (International City/County Management Association) Beyond Data, 1999. Current Uses
of Comparative Performance Measurement in Local Government. ICMA, Washington, DC.
Paralez, Linda, Ph.D. and Muto, David. Asset Management Template. AWWA Infrastructure
Conference, March 2001. Walton, Mary, 1986. The Deming Management Method. Putnam Publishing, New York.

UNITED STATES WATER UTILITY PERFORMANCE ASSESSMENT
9
Tables
53% yes 55% 47% no 45%
Has your utility undertaken any performance assessment work that includes establishing and using performance indicators?
GASB: Have you developed some type of performance
measures?
Table 1 Comparison Utility/Government Entity Responses
Number S
500
560 Number
900 29
Response
18%
5% Percent that have
53%
55% Percent that use measures for strategic
28
38
Percent that use measures for decision
47
56
GASB Survey US State Local G
Water and Utility Survey in
S Facto
Table 3 Comparison of
system size population size
number of utilities
responding percentsmall <10,000 2 7%medium 10,000 to 100,000 11 38%
large 100,000 to 150,000 6 21%very large >150,000 6 21%
unknown size 4 14%29
Table 2 2001 Water Wastewater Utility Performance Assessment
total
UNITED STATES WATER UTILITY PERFORMANCE ASSESSMENT
10
Table 4 WRWUBG Findings on Collection and Use of Field Data
Component Studied
Utilities with formal, well documented processes where team leaders on the crew have access to all performance data
Utilities with formal, well documented processes where team leaders on the crew have decision-making authority
Utilities with, well documented processes where team leaders on the crew make decisions to rebuild or replace assets during maintenance work
Pressure Reducing Valves4
(1 of 7) 14%
(4 of 7) 57% (4 of 7) 57%
Hydrants (2 of 10) 20% (8 of 10) 80% (6 of 10) 60% Pipes (2 of 12) 17% (6 of 12) 50% (4 of 12) 33%
Line Valves (3 of 9) 33% (6 of 9) 66% (6 of 9) 66% Meters (4 of 7) 57% (6 of 7) 86% (5 of 7) 71%
4 Western Regional Water Utilities Benchmarking Group, April 1998 report
UNITED STATES WATER UTILITY PERFORMANCE ASSESSMENT
11
Table 5 Six City Comparisons5
5 Government Accounting Standards Board’s State and Local Government Case Studies: The Use and the Effects of Using Performance Measures for Budgeting, Management, and Reporting.