
e-Business usage across and within firms in the UK: profitability, externalities and policy
11
Research Policy 38 (2009) 133–143 Contents lists available at ScienceDirect Research Policy journal homepage: www.elsevier.com/locate/respol e-Business usage across and within firms in the UK: profitability, externalities and policy Giuliana Battisti a,∗ , Alessandra Canepa b , Paul Stoneman c a The University of Nottingham, United Kingdom b Brunel University, United Kingdom c The University of Warwick, United Kingdom article info Article history: Received 12 October 2006 Received in revised form 13 October 2008 Accepted 31 October 2008 Available online 9 December 2008 Keywords: Technological diffusion e-Business Technology policy abstract Using data from the third UK Community Innovation Survey we model the usage of e-business across and within firms in the UK in the year 2000 as a single observation upon an integrated process of inter- and intra-firm diffusion. The intra-firm dimension is a significant extension to standard analysis. The model estimates indicate that the pattern of e-business usage reflects the heterogeneity of firms in terms of size, other innovative activity and labour force skills (generating differences in the payoffs to use) as well as market and non-market intermediated externalities. The policy implications of the findings are discussed. © 2008 Elsevier B.V. All rights reserved. 1. Introduction The impact of the Internet upon the cost and speed of infor- mation access will probably prove in time to make it one of the most important innovations of the last hundred years. One aim of this paper is to understand the process by which this new tech- nology has been adopted by firms and in particular to explore not only usage per se but the extent or sophistication with which the technology has been or is being used. The main theoretical tools for this exercise derive from prior studies of the diffusion of new technologies. The data available comes from the third UK Commu- nity Innovation Survey (CIS3) and is a single cross-section rather than a panel, thus we cannot estimate a full dynamic diffusion model; however the model gives clear predictions as to what differ- ences might be expected between firms and industries at a single point in time, which may be tested. The diffusion literature mainly concentrates upon the extensive margin (use across firms) with a growing literature on inter-firm diffusion (see, for example, the recent survey by Hall, 2004). There is a much smaller literature on the intensive margin (use within firms) or intra-firm diffusion (see, Battisti and Stoneman, 2005), although the relative impor- ∗ Corresponding author at: Industrial Economics Division, Nottingham Univer- sity Business School, The University of Nottingham, Jubilee Campus, Wollaton Road, Nottingham NG8 1BB, United Kingdom. Tel.: +44 115 8466128. E-mail address: [email protected] (G. Battisti). tance of both in the overall diffusion process has been shown by Battisti and Stoneman (2003). Usually however the two margins are discussed and analysed separately. A second contribution of this paper is to offer an integrated approach that combines anal- ysis of both the intensive and extensive margin. This also allows us to consider the impact upon the extent of use of e-business across and within firms of market intermediated and non-market intermediated externalities after controlling for a number of firm characteristics and environmental factors, which then enables pol- icy discussion. The data source is discussed in Section 2 and used to provide an overview of e-business use in the UK. In Section 3 a simple inte- grated inter- and intra-firm diffusion model is presented. In Section 4 this is applied to the data and the drivers of e-business use iso- lated. The policy implications of the results are discussed in Section 5. Section 6 contains conclusions. 2. The Community Innovation Survey Ideal data for the exercise performed here would be a long and thick panel. There are in fact now considerable data on the use of e-commerce in Europe collected as part of the EC e-Business Market W@tch observatory initiative. In the UK this involves the e- commerce survey that has been conducted by the Office of National Statistics, from which data on ICT usage are available annually for the period 2001–2005 (although the 2001 data are poor) and for which we have been allowed access to the individual returns. There 0048-7333/$ – see front matter © 2008 Elsevier B.V. All rights reserved. doi:10.1016/j.respol.2008.10.021
Transcript of e-Business usage across and within firms in the UK: profitability, externalities and policy
Research Policy 38 (2009) 133–143
Contents lists available at ScienceDirect
Research Policy
journa l homepage: www.e lsev ier .com/ locate / respol
e-Business usage across and within firms in the UK: profitability, externalitiesand policy
Giuliana Battisti a,∗, Alessandra Canepab, Paul Stonemanc
a The University of Nottingham, United Kingdomb Brunel University, United Kingdomc The University of Warwick, United Kingdom
a r t i c l e i n f o
Article history:Received 12 October 2006Received in revised form 13 October 2008Accepted 31 October 2008Available online 9 December 2008
a b s t r a c t
Using data from the third UK Community Innovation Survey we model the usage of e-business across andwithin firms in the UK in the year 2000 as a single observation upon an integrated process of inter- andintra-firm diffusion. The intra-firm dimension is a significant extension to standard analysis. The modelestimates indicate that the pattern of e-business usage reflects the heterogeneity of firms in terms of size,other innovative activity and labour force skills (generating differences in the payoffs to use) as well as
Keywords:Technological diffusione-BusinessT
market and non-market intermediated externalities. The policy implications of the findings are discussed.© 2008 Elsevier B.V. All rights reserved.
1
mmtnotftntmepcaro(
sN
tBatyuaici
ag4l5
0d
echnology policy
. Introduction
The impact of the Internet upon the cost and speed of infor-ation access will probably prove in time to make it one of theost important innovations of the last hundred years. One aim of
his paper is to understand the process by which this new tech-ology has been adopted by firms and in particular to explore notnly usage per se but the extent or sophistication with which theechnology has been or is being used. The main theoretical toolsor this exercise derive from prior studies of the diffusion of newechnologies. The data available comes from the third UK Commu-ity Innovation Survey (CIS3) and is a single cross-section ratherhan a panel, thus we cannot estimate a full dynamic diffusion
odel; however the model gives clear predictions as to what differ-nces might be expected between firms and industries at a singleoint in time, which may be tested. The diffusion literature mainlyoncentrates upon the extensive margin (use across firms) with
growing literature on inter-firm diffusion (see, for example, theecent survey by Hall, 2004). There is a much smaller literaturen the intensive margin (use within firms) or intra-firm diffusionsee, Battisti and Stoneman, 2005), although the relative impor-
∗ Corresponding author at: Industrial Economics Division, Nottingham Univer-ity Business School, The University of Nottingham, Jubilee Campus, Wollaton Road,ottingham NG8 1BB, United Kingdom. Tel.: +44 115 8466128.
E-mail address: [email protected] (G. Battisti).
2
toMcStw
048-7333/$ – see front matter © 2008 Elsevier B.V. All rights reserved.oi:10.1016/j.respol.2008.10.021
ance of both in the overall diffusion process has been shown byattisti and Stoneman (2003). Usually however the two marginsre discussed and analysed separately. A second contribution ofhis paper is to offer an integrated approach that combines anal-sis of both the intensive and extensive margin. This also allowss to consider the impact upon the extent of use of e-businesscross and within firms of market intermediated and non-marketntermediated externalities after controlling for a number of firmharacteristics and environmental factors, which then enables pol-cy discussion.
The data source is discussed in Section 2 and used to providen overview of e-business use in the UK. In Section 3 a simple inte-rated inter- and intra-firm diffusion model is presented. In Sectionthis is applied to the data and the drivers of e-business use iso-
ated. The policy implications of the results are discussed in Section. Section 6 contains conclusions.
. The Community Innovation Survey
Ideal data for the exercise performed here would be a long andhick panel. There are in fact now considerable data on the usef e-commerce in Europe collected as part of the EC e-Business
arket W@tch observatory initiative. In the UK this involves the e-ommerce survey that has been conducted by the Office of Nationaltatistics, from which data on ICT usage are available annually forhe period 2001–2005 (although the 2001 data are poor) and forhich we have been allowed access to the individual returns. There

1 ch Pol
aorauwmtc
IivbTpdpetawfis1tserss
ba
b
d
cfmqtnnwln8w
t
hmmWti
e2s
btptserotitCt
dBttdjtcerw‘(cp(ntattpr(
tbb
34 G. Battisti et al. / Resear
re two main problems with these data. First, there are no datan firm characteristics and these have to be observed by cross-eference to the ABI/ARD2 data sets.1 We found however that therere only 157 firms for which one can obtain full data on e-businesssage and other relevant characteristics for the period 2001–2004,hich is too small to be useful here. Secondly, even the supple-ented data do not contain measures of other innovation indicators
o be found in the CIS data and that we use below as importantontrol variables.
We have thus used responses to the third2 UK Communitynnovation Survey (CIS3) which employed a pan-European surveynstrument designed to gather information on the extent of inno-ation in European firms. This was carried out in the UK in 2001y the Office of National Statistics on behalf of the Department ofrade and Industry (now BERR—the department of Business Enter-rise and Regulatory Reform) and anonymised individual returnsata has been made available to us.3 The advantage for currenturposes of the CIS3 data is that it contains data upon both thextensive and intensive margin of e-business usage in additiono data upon other indicators of innovativeness and firm char-cteristics. The CIS3 survey was addressed to enterprises (whiche here call firms, although this is misleading for multi-plantrms) with more than 10 employees, in both manufacturing andervice industries and related to innovative activities between998 and 2000. From an original sample of 126,775 records onhe Inter Departmental Business Register, the questionnaire wasent to a stratified (by industry and firm size) sample of 19,602nterprises and 8173 responses were eventually registered, whichepresent the sample for the work reported here. We have no rea-on to believe that there are any particular biases in this finalample.
In CIS3, Question 17.2 is:17.2 Can you indicate the extent of your enterprise’s use of e-
usiness activities over the period 1998–2000 (please tick all thatpply):
a. Basic Internet presence.. Internet used for information.
c. Customers can place orders through the Internet site.. Commerce with other businesses through the Internet site.
The list of offered responses to Q 17.2 does not include a ‘no use’hoice. Although there may be non-respondents to this questionor other reasons, we measure non-users (and thus the extensive
argin) by the number in the sample of non-respondents to thisuestion. In order to check upon the validity of this we exploredhe proportion of firms who claimed in CIS2 to be using the Inter-et (34% of the sample), who also replied to CIS3 (243) but didot respond to Q17.2. Of the 243 firms only 13 (mostly small firmsith little other innovative activity) did not respond to Q17.2, which
eads us to believe that any error introduced by our assumption thaton-response means non-use will be small. Of the total sample of173 enterprises there are 1376 non-respondents/non-users. Thuse estimate that 83.2% of all enterprises in 2000 were engaged in
1 See www.statistics.gov.uk/about/data/guides/productivity/downloads/Produc-ivityHandbook Chapter10.pdf on such procedures.
2 An earlier CIS2 survey did initially hold out the prospect of a panel data set,owever the relevant question asked in that survey did not identify the intensiveargin and the extent of overlap between the two samples is small. Although weake some use of the CIS2 data it is therefore in a supportive rather than central way.e also explored the possibility of constructing a panel using CIS4. Unfortunately
he relevant questions on Internet use were dropped from CIS4 (because they werencluded in the e-commerce survey).
3 For which we are most grateful to the DTI (as was).
Iut
taisa
2
icy 38 (2009) 133–143
-business to some degree. As a check, the e-commerce survey for005 estimates that 78.8% of businesses were using the Internet toome degree in 2002 and 88.8% in 2005.4
Intra-firm diffusion (or the intensive margin) is often measuredy indicators such as the proportion of the firm’s capital stockhat embodies the new technology, or the proportion of outputroduced using the new technology, or, in the current situation,he proportion of employees connected to the Internet. Our dataource does not provide information on such measures but doesnable one to consider the intensive margin via a different met-ic. As e-business spreads, one might not only expect the numberf users in the firm to increase but also the range of tasks thathey perform using the technology (additionally or alternatively) toncrease, and/or the tasks that they perform using the technologyo increase in sophistication (see Forman et al., 2002, 2003 and laterrespi et al., 2004 for a similar approach). It is the latter definitionhat we adopt to define the metric for intra-firm diffusion.
There is some dispute in the literature as to whether one canevise a simple index of sophistication of use (see for exampleridgewater and Arnott, 2004). In this paper we are restricted byhe data available and cannot proceed other than by interpretinghe responses already made to Q17.2. These responses cover fourifferent uses to which responses are requested. Response (a) may
ust mean that the firm has an ISP whereas (b) may just mean thathe firm has done a Google search, and we do not consider onean judge either as more sophisticated than the other. Response (d)ssentially means that the firm has purchased via the web whereasesponse (c) essentially means that the firm has sold through theeb. Although we may infer that these latter two activities are more
enhanced’ than the first two one cannot necessarily order (c) andd) in terms of sophistication. It was suggested to us that one mayonsider sophistication by considering some activities as naturalrecursors to others, e.g. (a) and (b) would be natural precursors toc) and (d). However we do not see (a) as a natural precursor to (b)or (c) as a precursor to (d), nor vice versa. It has also been suggestedo us that we consider responses to (a), (b) (c) and (d) separatelynd allow the empirical method to order patterns of sophistica-ion. Unfortunately respondents did not necessarily take on boardhe instruction to tick all that apply, and thus we were unable toroceed in this way either. In fact of the sample of 8173 firms, inesponse to Q17.2, 63.4% ticked (a), 64.8% ticked (b), 16.5% tickedc), 17.3% ticked (d) and 8.2% ticked both (c) and (d).
In these circumstances we define for empirical purposes justwo categories of e-business usage upon the reasoning that we cane sure that (c) and/or (d) are more sophisticated than (a) and/or (b)ut little else. The two categories (Category 0 being non-use) are:
Category 1: Basic usage, shown by indicating (a) and/or (b) but not(c) nor (d).Category 2: Enhanced usage, shown by indicating (c) and/or (d).
We have assumed that all firms in Category 2 also have a basicnternet presence that would seem to be nested in the former. Thussers in Categories 1 and 2 represent the extensive margin whereashe proportion of users in Category 2 indicates the intensive margin.
Table 1 presents some of the detailed information upon the pat-ern of inter- and intra-firm usage of e-business in 2000. The data
re presented as proportions of the sample of enterprises that fallnto Categories 0, 1 or 2. The data indicate that in 2000, 83.2% of theample use the Internet to some degree with 57.5% being basic usersnd 25.6% being enhanced users (which may be compared to the4 Source: www.statistics.gov.uk/downloads/theme economy/ecommerce report005.pdf, Table 12.

G. Battisti et al. / Research Policy 38 (2009) 133–143 135
Table 1Patterns of e-business usage, UK, 2000.
Non-users (%) Basic users (%) Enhanced users (%) Row total = 100% no.
All firms 16.8 57.53 25.63 8173
Within-industry distribution of use (within-industry proportion of adopters)SIC-92 Description
10–14 Mining and quarrying 22.0 66.9 11.0 12715–22 Manufacturing of food, clothing, wood, paper, publishing and printing 17.8 56.3 25.9 100523–29 Manufacturing of fuels, chemicals, plastic metals and minerals 14.5 56.6 28.9 112130–33 Manufacturing of electrical and optical equipment 5.1 63.4 31.5 52734–35 Manufacturing of transport equipment 8.1 66.6 25.3 34436–37 Manufacturing not elsewhere classified 16.0 65.5 18.5 44340–41 Electricity, gas and water supply 13.2 62.3 24.5 5345 Construction 28.8 57.1 14.0 94751 Wholesale trade (incl. cars and cycles) 16.5 54.9 28.6 104160–64 Transport, storage and communication 20.3 50.5 29.2 77365–67 Financial intermediation 13.3 54.3 32.3 40570–74 Real estate, renting and business activities 15.7 58.3 26.0 1386
Total 16.8 57.5 25.6 8173
Usage by size (number of employees)10–49 22.9 53.5 23.7 476150–249 9.4 65.2 25.3 2023
Up(3apoa
piolufi
3
fimi(a
wp
cr
a(npt
2
rToattHmhs((ootTt
irdwfieme
e(tm
250–499500–999>1000Total
S figures estimated by Forman et al. (2002) of 88.6% of the sam-le being users and 12.6% being enhanced users). The extent of usefrom 71.2% to 94.9%) and the extent of enhancement (from 11% to2.3%) differ across industries (listed in Appendix A) and firm sizes measured by number of employees. Although not strictly com-arable, the data in the e-commerce survey5 show similar patternsf limited sophisticated use and similar differences across firm sizend industrial sectors.
These data indicate inter alia that inter-firm usage is an incom-lete indicator of the overall usage of a new technology, for although
n 2000, 83.2% of firms consider themselves to be e-business users,nly 26% are using the technology at anything other than a basicevel. This justifies looking at both margins. In addition inter-firmsage is not necessarily a reliable indicator of the extent of intra-rm usage and thus data on the latter contain new information.
. An integrated diffusion model
The diffusion literature has tended to model inter- and intra-rm diffusion separately, developing and applying quite distinctodels. We propose an alternative approach where both the
ntensive and extensive margins are approached simultaneouslyearlier attempts at this are to be found in Battisti, 2000; Battistind Stoneman, 2003, 2005).
Most of the limited intra-firm literature builds upon the seminalork of Mansfield (1963, 1968) based upon an epidemic learningrocess.
This is a disequilibrium type model whereby diffusion is a pro-ess of adjustment to a fixed end point deriving from uncertaintyeduction via information spreading as a result of prior usage.
Such epidemic approaches incorporate non-market intermedi-ted externalities. Stoneman and Battisti (1997) and later on Battisti
2000) have shown that this approach provides only a partial expla-ation (if any) of the intra-firm process and that an equilibriumrofitability based approach can provide a better explanation ofhe diffusion process.5 See www.statistics.gov.uk/downloads/theme economy/ecommerce report005.pdf, Tables 21 and 22.
ttttudse
6.5 62.3 31.2 7227.5 60.9 31.6 4026.4 53.8 39.8 264
16.8 57.5 25.6 8173
Karshenas and Stoneman (1993) classify the inter-firm equilib-ium models present in the literature into three main approaches.heir common ground is that at a point in time diffusion extendsnly to the point where it is profitable (or most profitable) todopt the new technology. Over time the cost of adoption, orhe size of returns, or the distribution of returns (across poten-ial users) change, and the diffusion path is then mapped out.owever in the three approaches there are different main deter-inants of profitability. The first are rank effects in that firms
ave different characteristics and thus different returns. Theecond are stock effects whereby one firm’s adoption impactsnegatively) upon the profitability of further adoption by othersand also the profitability of existing adopters). Finally there arerder effects, where returns are determined by positions in therder of adoption and one firm’s adoption reduces the returnso all other non-adopters as they are moved down the order.he latter two effects represent market intermediated externali-ies.
Following Karshenas and Stoneman (1993) we believe that theres considerable advantage in constructing an encompassing modeleflecting different strands in the literature and then letting theata indicate what is, and is not, empirically relevant. The modele present is a reduced form and is built around the view that therm will adopt new technology up to the point where the marginalxpected gross profit gain from first use or further use equals thearginal expected cost taking into account rank stock, order and
pidemic effects.For simplicity, assume that the potential investor has myopic
xpectations on both adoption costs and the gross profit gainssee Ireland and Stoneman, 1986, for a relaxation of this assump-ion) and is risk neutral (see Stoneman, 1981, for a more formal
odel with uncertainty), with all potential adopters being priceakers. Define ˘ ij(t) as the gross expected profit gain in time to firm i in industry j from (i) the use of a first unit of a newechnology if a non-user or (ii) the extension of use of a new
echnology by one unit if already a user. The profit gains fromsing and extending e-business use may arise from a number ofifferent sources such as increases in market shares, increasedelling prices, reduced marketing costs and/or processing costs,tc.
1 ch Pol
tt
(
(
∏
tuttampmabbuv
uc
∏
i
x
wt
iciFatswcy(a
epas(s
x
OficscaocFw
fact that firms that adopt innovative work practices and/orproducts are more prone to adopt ad-hoc technological inno-vations in support of their activities (see Pil and MacDuffie,1996; Bresnahan et al., 2002; Battisti et al., 2005; etc.). There-fore, they are believed to be good predictors of the use of
36 G. Battisti et al. / Resear
Reflecting the nature of the technology and the several differentheoretical approaches to diffusion summarised above, we assumehat ˘ ij(t) is a function of the following.
(i) xi(t), the extent of usage of the new technology by firm i intime t (which for a non-user will be zero). Allowing own useto impact upon the marginal gain from adoption is innovativein the intra-firm literature and essentially extends the inter-firm concept of stock effects associated with Reinganum (1981)and the inter-firm order effect associated with Fudenberg andTirole (1985) through to the intensive margin. These effectswould imply that xi(t) would impact negatively on the expectedgross profit gain from further adoption. However there mayalso be positive effects via internal network externalities andthus the overall impact may be positive or negative dependingon the strength of stock and order versus the network effects.We do not believe e-business to have particularly strong inter-nal network effects, and thus expect the overall effect to benegative—in fact if the overall impact were positive then thefirm would only choose corner solutions (zero usage or 100%usage) and not intermediate usage.
(ii) Firm characteristics, yet to be specified (a vector Fi(t)), extend-ing the inter-firm concept of rank effects associated with probitmodels of inter-firm diffusion to the intra-firm case.
iii) Other industry characteristics (a vector Fj(t)) reflecting furtherrank effects.
iv) The extent of industry usage of new technology (yi(t)), reflect-ing between-firm stock and order effects, upon the basis thatthe payoff to the firm depends upon what other firms are doing,and external network effects. The first two of these effects aregenerally expected to be negative, but the latter, network effectis expected to be positive and overall the effect may go eitherway.
(v) Two ‘experience’ terms, to reflect epidemic arguments, the firstbeing a measure of the firm’s own experience, Ei(t) (often prox-ied by time since own first adoption) the second being theexperience that the firm gains from observing other users, Ej(t)(often proxied by the extent of diffusion in time t).
Summarising, we thus write that:
ij(t) =
∏ij(xi(t), Fi(t), Fj(t), yj(t), Ei(t), Ej(t)). (1)
Define Pi(t) as the expected (annual) adoption cost to firm i inime t of a unit of new technology. If the firm was previously a non-ser then this is the cost of buying a first unit of the technology. Ifhe firm is an existing user then this is the cost of an enhancement ofhe activities being undertaken. In principle enhancement and firstdoption costs may differ from each other but we consider the uniteasure to be such as to make them equal. Pi(t) is made up of two
arts, one that reflects costs common to all buyers (e.g. the price ofachines), P(t), and the other that reflects firm-specific effects such
s adjustment and installation costs, ei(t), i.e. Pi(t) = P(t) + ei(t). It haseen suggested to us that the cost of first use or enhancement maye larger for large firms, which is possible, but this will be pickedp by this approach if ei(t) is allowed to be affected by a firm-sizeariable yet to be specified.
A firm will introduce a unit of the new technology or enhance
sage if the profit gain from so doing (given myopia) exceeds theost, i.e. if ˘ ij(t) ≥ Pi(t). Defining xi(t)* to satisfy (2):ij(xi(t)∗, Fi(t), Fj(t), yj(t), Ei(t), Ej(t)) = Pi(t) (2)
r
icy 38 (2009) 133–143
t can be shown that
∗i (t) = G{Fi(t), Fj(t), yj(t), Ej(t), Ei(t), Pi(t)} (3a)
here x∗i(t) is the firm’s desired or optimal level of use of the new
echnology at time t.The essence of a diffusion model is that it is dynamic, provid-
ng insights into the spread of a technology over time. That is theharacter of the above model with the desired extent of inter- andntra-firm diffusion extending over time as either Pi(t) declines orj(t), Fi(t), Ei(t), Ej(t) or yj(t) change. However the data available to usre a single cross-section that provides one snapshot of the state ofhat dynamic process in the year 2000. It is thus obviously not pos-ible to explore the dynamics of the process to any degree. Instead,e intend to use the model to predict the factors that should be
onsidered as determinants of inter- and intra-firm usage in theear 2000. The cross-section approach is also used by Forman et al.2002, 2003), Hollenstein (2004) and Battisti et al. (2007) in similarnalyses.
In the absence of any insight or data that would enable us toxplore any divergence between xi(t) from x∗
i(t) arising, for exam-
le, from some time-intensive adjustment process, we proceed byssuming that x∗
i(t) = xi(t), although in the presence of divergences
uch an approach will yield biased estimates. We can then write3a) as (3) where, given we have a single cross-section, all timeubscripts have been removed:
i = G{Fi, Fj, yj, Ei, Ej, Pi}. (3)
f the variables included in (3), Ei is a variable that reflects therm’s own experience of the new technology, but in a single dataross-section it is not possible to measure this. Pi = P + ei and P is theame for all firms and thus implicitly considered as included in theonstant term (and will be ignored from this point on); ei will differcross firms, but these cost impacts on the firm cannot be separatedut from the revenue impact of firm characteristics and are thusonsidered as incorporated in the impact of firm characteristics (Fi,j) upon xi. To measure the firm and industry characteristics (Fi, Fj)e use the following indicators:
(i) Firm size, measured by the number of employees6 dividedby 5 (Employ98). Size may pick up a number of other firmcharacteristics such as efficiency, management abilities, per-haps past innovations or variations in the costs of acquiringthe new technology and any scale economies, e.g. a softwareonly has to be written once, whatever the number of users.Firm size has a long history as a positive and deterministicfactor in diffusion studies (see for example Mansfield, 1968;Hannan and McDowell, 1984; Karshenas and Stoneman, 1993;Colombo and Mosconi, 1995; Astebro, 2002). Data are avail-able on size for both 2000 and 1998 and we have chosen 1998in order to better avoid endogeneity problems (see below).
(ii) Dummy variable indicators of firms’ innovativeness ProdNovand ProcNov, taking the value one if the firm introduced aproduct or a process new to the market between 1998 and2000 and zero otherwise. These variables should reflect the
e-business.
6 Division by 5 is done purely to make the coefficient larger and more easilyeportable.

ch Policy 38 (2009) 133–143 137
(
btgsmifiiswoet
4
vasesi(fbo
aovtMskts
4
t1Astblenameasured by fraction of adopters xj = 1 correctly classified while onthe x-axis we report ‘1 − Specificity’, measured as the fraction of nonadopters, xj = 0, wrongly classified by our model. For this model thearea under the ROC curve is 0.80. Given the cross-sectional nature
G. Battisti et al. / Resear
(iii) R&D Intensity R&D, which takes the value one if thefirm reports R&D activity in the period 1998–2000 andzero otherwise. This variable reflects the Schumpeterianhypothesis that formalised R&D exerts a positive impactupon the use of a technology, in line with Cohen andLevinthal (1989).
(iv) Dummy variables Mngt, which takes the value one if theenterprise indicated that advanced management techniques(e.g. knowledge management, quality circles) were intro-duced during the period 1998–2000 and zero otherwise,and Org, which takes the value one if the enterprise indi-cated that major organisational structures (e.g. investors inpeople, diversification) were introduced during the period1998–2000 and zero otherwise. These variables reflect theargument that managerial innovations may be complemen-tary to the use of other technologies and therefore enhancethe use of e-business (for empirical evidence in supportof this hypothesis see, for example Colombo and Mosconi,1995; Brynjolfsson et al., 2002; Greenan, 2003; Black andLynch, 2004).
(v) The covariates PropSci and PropOth, measuring the propor-tion of the firm’s employees with a degree in 2000 in (a)science and engineering subjects and (b) other subjects. Theimportance of skills has been emphasised by, for exam-ple, Finegold and Soskice (1988), Bartel and Lichtenberg(1987), Caroli and Van Reenan (2001) and Bresnahan et al.(2002), etc.
(vi) A series of industry dummy variables to reflect environmen-tal factors such as different industry conditions, markets, andtypes of innovations and payoffs to firms in different indus-tries (SICj). The industrial classification follows the SIC-92, butthe industries have been grouped into j wider subgroups asdefined in Appendix A.
The final variables to measure pick up the effects on firm i ofdiffusion taking place in other firms: yj reflecting stock, orderand network effects and Ej reflecting epidemic-type learning.In the absence of time-series data, within sample varianceis introduced by arguing that these variables are industry-specific. The only available proxies for measuring these effectsare variables that reflect the extent of industry usage. Weargue that industry usage is made up of both the breadthand depth of use and two indicators are thus required. Theseindicators are:
(vii) Interj, the proportion of firms in the industry who haveadopted e-business (i.e. both basic and enhanced, measuredas 100% minus the proportion of non-users).
viii) Intraj, the proportion of firms in the industry who fall intothe category of having an enhanced level of e-businessusage.
Jointly the coefficients upon these variables measure the com-ined impacts of yj and Ej. Although it is innovative to arguehat the intensive margin may be affected by the extensive mar-in and vice versa, unfortunately the approach will not enableeparation of the stock, order and network effects (market inter-ediated externalities) from the learning effects (non-market
ntermediated externalities). However, the sign(s) of the coef-cients on the two variables used will enable some insight
nto (i) whether there are externalities and (ii) whether thetock and order effects are stronger or weaker than the net-ork and learning effects. As it improved numerical stability
f the model without significantly affecting other parameterstimates, these variables were entered as logit transforma-ions.
skob
Fig. 1. Receiver Operating Characteristic (ROC) curve: inter-firm model.
. Estimates
We have estimated the diffusion model presented in the pre-ious section in two ways (with results reported in Sections 4.1nd 4.2). The first is a traditional bivariate logit version reflectingtandard inter-firm diffusion modelling of the decision to adopt-business, i.e. the extensive margin. The second is a multinomialpecification to model the extent of use of e-business by the adopt-ng firms, i.e. the intensive margin. Following Battisti and Stoneman2003, 2005) we use the same covariates (as detailed in Eq. (3))or both model specifications. This allows comparison and contrastetween the different effects upon both the adoption and the extentf use of e-business by firms in the sample.
For both models the sample size is 5822 of the original 8173,reduction resulting from missing data points.7 Initial estimates
f a fully loaded model indicated a number of industry dummyariables that were not significant and thus we proceeded withhe estimation of a more restricted model. In the literature (see
ickey and Greenland, 1989, for example) that for logistic regres-ion the use of a p-value = 0.05 often fails to identify variablesnown to be important and we thus follow the recommendationhat the 0.25 level be used as a screening criterion for variableelection.
.1. The extensive margin
For the bivariate logit estimates of the model detailed in Eq. (3) xakes the value 1 if the firm is an adopter in/by 2000 (i.e. a Categoryor Category 2 user) and zero otherwise (i.e. the firm is a non-user).t this date 83% of the sample had already adopted e-business toome degree thus in inter-firm terms the sample is very late inhe diffusion process and we thus expected many of the effects toe downplayed relative to what might have been found at an ear-
ier date. For this model the predictive power has been determinedstimating the ROC (Receiver Operating Characteristic) curve foron-users versus users (for a review of ROC techniques, see Greennd Swets, 1974). In Fig. 1 we report on the y-axis the ‘Sensitivity’,
7 A number of statistical tests have been carried out to test for possible sampleelection bias. We found no statistical differences between the distribution of theey variables in the reduced (5822) and full sample (8173). The same can be saidf the distribution of firms across industries and of the distribution over non-use,asic use and enhanced use (details available from the authors upon request).

138 G. Battisti et al. / Research Policy 38 (2009) 133–143
Table 2The extensive margin: results of fitting a logistic model.
xj Coef.a Std. Err. Wald test p > z Odds ratios
Value 95% CIb
Employ 0.039 0.005 7.660 0.000 1.040 1.030 1.050ProcNov 0.324 0.331 0.980 0.326 1.383 0.724 2.644ProdNov 0.451 0.287 1.570 0.116 1.570 0.894 2.758R&D 0.804 0.176 4.580 0.000 2.234 1.583 3.152Mngt 0.539 0.151 3.560 0.000 1.714 1.274 2.305Org 0.813 0.149 5.440 0.000 2.254 1.681 3.021PropOth 0.008 0.003 2.540 0.011 1.008 1.002 1.014PropSci 0.047 0.009 5.340 0.000 1.049 1.031 1.067Sic15–22 −0.248 0.142 −1.750 0.081 0.780 0.591 1.031Sic23–29 −0.157 0.157 −1.000 0.316 0.854 0.628 1.162Sic36–37 −0.049 0.213 −0.230 0.818 0.952 0.628 1.445Sic60–64 −0.404 0.174 −2.320 0.020 0.667 0.474 0.939Sic65–67 0.001 0.260 0.000 0.996 1.001 0.602 1.665Inter 0.488 0.207 2.360 0.018 1.629 1.086 2.443Intra 0.808 0.139 5.810 0.000 2.244 1.709 2.948Cons 1.173 0.392 2.990 0.003 – – –
Note: Number of observations = 5822. LR �2(15) = 684.28 (p-value: 0.000).log Li = −1678.57.
a Comparison group = non-users.
tt
op
ciawiou
fsopphof
esiwittoaiafi
y0tpg
Table 3Estimated p-values for the likelihood ratio test (nominal size 5%).
p(LR ≥ LRR)
xi Simple Logit model Multinomial modelMngt 0.005 0.010Org 0.005 0.010ProdNov 0.005 0.010ProcNov 0.005 0.010RPP
4
tsobC
t(tstL
getsfsLtamtrctdoTf
gfivUgvariables for either the single logit specification or its multinomialcounterpart.
For the multinomial model the predictive power has again been
b Odds ratio confidence intervals that include unity indicate that the odds ratio ofhe covariate in the relevant category (users) is not different from the odds ratio inhe base category (non-users). Odds ratios significantly different from 1 in bold.
f our data, this indicates that the estimated model exhibits goodredictive ability.8
In Table 2 we report, for the restricted Logit model, the estimatedoefficients, their standard errors, and the p-values indicating thempact of different variables upon being an adopter rather than
non-adopter. The last three columns report the odds ratios (asell as the end points of their relative 95% confidence interval),
ndicating for each covariate the relative difference between thedds in the relevant category (user) and the base category (non-sers).
The empirical evidence confirms that rank effects are importantactors in explaining the extent of inter-firm diffusion in 2000. Firmize, whether the firm carries out R&D, education/skills, and the usef other innovative management and organisational practices haveositive and significant impacts. The introductions of product androcess innovations by the firm have positive coefficients but bothave high standard errors (although the former is below our thresh-ld for significance). There is some evidence that environmentalactors play a role (see SIC15–22 and SIC60–64).
The inter-industry use variable, reflecting the impact of thextensive margin elsewhere in the industry, carries a positive andignificant coefficient. The estimate of the impact of the industry’sntensive margin on the firm’s extensive margin is a new result, and
ith a significant positive coefficient implies that greater levels ofntra-firm usage in the industry have similarly signed effects onhe external margin as do greater levels of inter-firm usage. Jointlyhe results suggest that any (negative) stock and order effects areutweighed by (positive) epidemic learning and network effects,lthough we cannot say if the non-market intermediated external-
ties (epidemic effects) or the market intermediated (stock, ordernd network effects) are the dominant externalities in the inter-rm diffusion of e-business.8 Assuming that pj is the predicted probability of a positive outcome andj:yj ∈ (0,1) the actual outcome, a prediction is classified as positive if pj > c (for≤ c ≤ 1) and negative otherwise. In Fig. 1 the curve starts at (0,0), corresponding
o c = 1, and continues to (1,1), corresponding to c = 0. In general, a model with noredictive power would be a 45◦ line, so the greater the area under the curve thereater the predictive power of the model.
d
itwtw
o
&D 0.005 0.010ropSci 0.000 0.000ropOth 0.000 0.000
.2. Extensive and intensive margins in e-business activities
In order to highlight the intensive margin we have decomposedhe dependent variable x(t) (see Eq. (3)) into three mutually exclu-ive categories reflecting the adoption decision and the intensityf use of e-business by the adopting firms. The firm is defined aseing in Category 0 if a non-adopter, Category 1 if a basic user andategory 2 if an enhanced user.
A multinomial logit specification has been chosen to best reflecthe nature of the firm’s mutually exclusive choices where distancefrom 0 to 1 and 1 to 2) is not necessarily symmetric or where adop-ion is not necessarily sequential or ‘ordered’. Alternative modelsuch as nested or ordered Logit models were also estimated, buturned out to be unsuitable or did not outperform the multinomialogit model (further details are available upon request).
In order to rule out criticisms based upon the potential endo-eneity problem, we pursue a suggestion of Burke et al. (1992) andmploy a modified version of Utts’ Rainbow test (Utts, 1982).9 Theest involves partitioning the total sample into a number of sub-amples and comparing the sum of the squared residuals derivedrom estimation using all the sample observations to the corre-ponding quantity obtained using only a partition of the sample.10
et ki (for i = 1, . . ., n) be the covariate under consideration, ‘L0’he maximised log-likelihood using the full sample of observationsnd Lr (r = 1, . . ., R) the corresponding function obtained by esti-ation using only the rth sub-sample of reordered data. Under
he null hypothesis of exogeneity the i.i.d. observations can beanked by increasing values of ki without affecting the validity ofonventional large sample procedures. Thus, the resulting statis-ic [LRR = −2[L0 − ∑R
r=1Lr] is asymptotically �2 distributed withegrees of freedom equal to � = (q − 1) × p (where q is the numberf categories and p is the number of parameters to be estimated). Inable 3 we report the estimated p-value for the LRR test calculatedor the different covariates.
In Table 3 the covariate Employ has not been tested for endo-eneity on the grounds that by using the figures for 1998 to measurerm size we have ruled out the possibility of endogeneity for thisariable. As far as the other covariates are concerned, the modifiedtts’ rainbow test suggests that we cannot reject the null of exo-eneity for any of the potentially exogenous and weakly exogenous
etermined estimating the ROC curve, this time however for both
9 It has been suggested to us that there would be some advantages in lagging ornstrumenting certain variables in the estimation of this model to overcome poten-ial endogeneity problems. The possibilities of doing so with the CIS3 are limitedhile merging the CIS2 and CIS3 gives a longitudinal sample of only 10% the size of
he observed CIS3 sample (of whom 31% did not report on Internet usage). Thereforee did not explore this possibility further.
10 We are grateful to Les Godfrey for his useful advice and discussions on this typef endogeneity test.

G. Battisti et al. / Research Policy 38 (2009) 133–143 139
teristi
nIbcas0ets
Titrtdb(
botdulc
aft(
pbassoOiao
subTwwa
Fig. 2. Receiver Operating Charac
on-users versus basic users and non-users versus enhanced users.n Fig. 2a and b, we report on the y-axis the ‘Sensitivity’ measuredy the fraction of basic users xj = 1 (advanced users, xj = 2) correctlylassified while on the x-axis we report ‘1 − Specificity’ measureds the fraction of non-users, xj = 0 (basic users, xj = 1) wrongly clas-ified by our model. In our case the areas under the ROC curve are.76 and 0.81, respectively indicating good predictive ability. How-ver, the Q–Q plot of the quantiles of the deviance residuals againsthe quantiles of the normal distribution reported in Fig. 3 showome marginal sign of kurtosis in the tails.
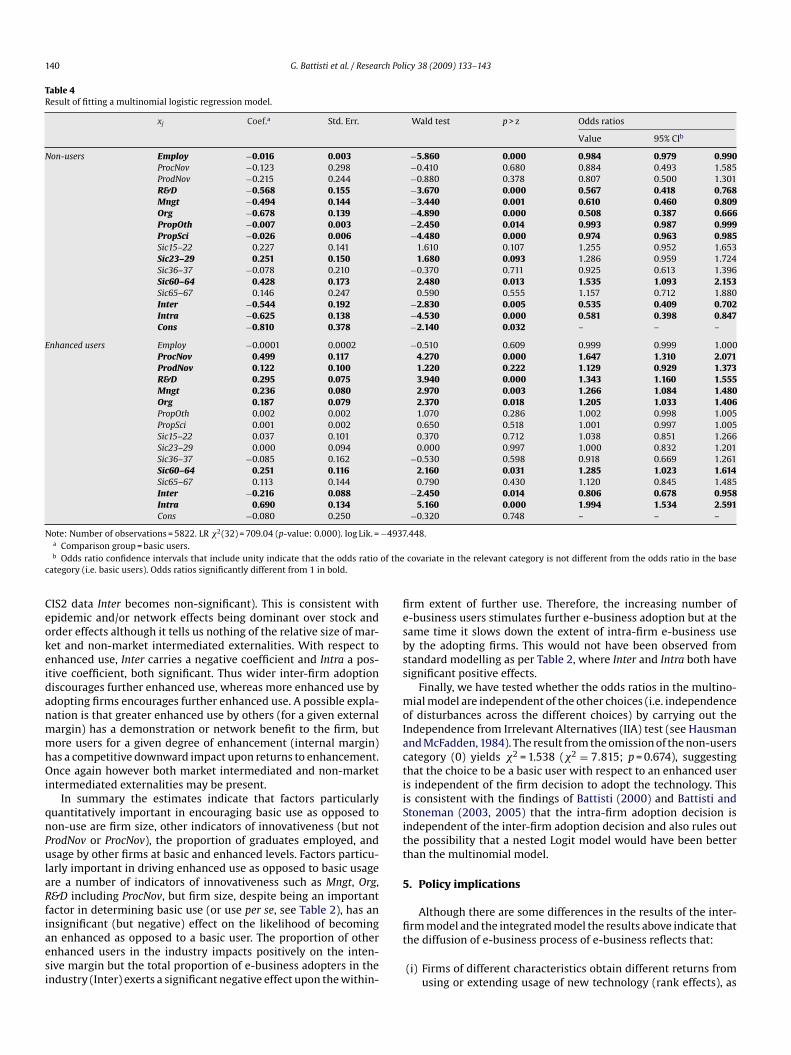
The coefficients of the multinomial specification are reported inable 4 and are to be read in the top half of the table as indicat-ng the impact of different variables upon being a non-user ratherhan a basic user, and in the bottom half of being an enhanced userather than a basic user. The last three columns of the table reporthe odds ratios (as well as the end points of their relative 95% confi-ence interval), indicating for each covariate the relative differenceetween the odds in the relevant category and the base categorybasic users).
Interpreting the estimated parameters, firm size as measuredy Employ impacts negatively and significantly on the probabilityf being a non-user (i.e. larger firms are less likely to be non-users)han a basic user. This is in line with the findings of the inter-firm
iffusion literature (see also Table 2). We see also that enhancedsage is negatively related to firm size and thus large firms areess likely to be enhanced users; however, the estimated coeffi-ient is very small and insignificant. This implies that large firms
f
nu
Fig. 3. Q–Q plot of deviance residual against the normal d
c (ROC) curve: integrated model.
re more likely to adopt e-business but do not necessarily haveaster intra-firm diffusion. In other words, enhanced usage is nothe prerogative of large firms. This is a result also found by Battisti2000) for the intra-firm diffusion of other technologies.
Although Procnov and Prodnov, indicating the introductions ofroduct and process innovations, impact negatively on the proba-ility of being a non-user, in both cases the p-value exceeds 0.25nd is not significant. Procnov and Prodnov impact positively andignificantly on enhanced usage, however, Prodnov has only limitedignificance. On the other hand Mngt, Org, R&D all impact negativelyn non-usage and positively on enhanced usage and are significant.verall these results generally support a view that a firm that is
nnovative in one dimension (technological or organisational) maylso be innovative in another, i.e. in the adoption and enhancementf e-business usage.
The skills variables PropOth and PropSci have a negative andignificant effect on non-use and thus a greater proportion of grad-ates leads to a higher probability of basic use. For enhanced useoth variables show positive coefficients but are not significant.he same can be said on the basis of the corresponding odds ratios,hich are not significantly different from unity. This is consistentith a view that skills, as measured by the two variables available,
re important for first adoption but they are not a discriminating
actor in the decision to extend e-business use.The sign of Inter and Intra are both negative and significant in theon-users results, implying that more adopters and more intensivese encourage basic use (although when instrumented with the
istribution: (a) basic users and (b) advanced users.
140 G. Battisti et al. / Research Policy 38 (2009) 133–143
Table 4Result of fitting a multinomial logistic regression model.
xj Coef.a Std. Err. Wald test p > z Odds ratios
Value 95% CIb
Non-users Employ −0.016 0.003 −5.860 0.000 0.984 0.979 0.990ProcNov −0.123 0.298 −0.410 0.680 0.884 0.493 1.585ProdNov −0.215 0.244 −0.880 0.378 0.807 0.500 1.301R&D −0.568 0.155 −3.670 0.000 0.567 0.418 0.768Mngt −0.494 0.144 −3.440 0.001 0.610 0.460 0.809Org −0.678 0.139 −4.890 0.000 0.508 0.387 0.666PropOth −0.007 0.003 −2.450 0.014 0.993 0.987 0.999PropSci −0.026 0.006 −4.480 0.000 0.974 0.963 0.985Sic15–22 0.227 0.141 1.610 0.107 1.255 0.952 1.653Sic23–29 0.251 0.150 1.680 0.093 1.286 0.959 1.724Sic36–37 −0.078 0.210 −0.370 0.711 0.925 0.613 1.396Sic60–64 0.428 0.173 2.480 0.013 1.535 1.093 2.153Sic65–67 0.146 0.247 0.590 0.555 1.157 0.712 1.880Inter −0.544 0.192 −2.830 0.005 0.535 0.409 0.702Intra −0.625 0.138 −4.530 0.000 0.581 0.398 0.847Cons −0.810 0.378 −2.140 0.032 – – –
Enhanced users Employ −0.0001 0.0002 −0.510 0.609 0.999 0.999 1.000ProcNov 0.499 0.117 4.270 0.000 1.647 1.310 2.071ProdNov 0.122 0.100 1.220 0.222 1.129 0.929 1.373R&D 0.295 0.075 3.940 0.000 1.343 1.160 1.555Mngt 0.236 0.080 2.970 0.003 1.266 1.084 1.480Org 0.187 0.079 2.370 0.018 1.205 1.033 1.406PropOth 0.002 0.002 1.070 0.286 1.002 0.998 1.005PropSci 0.001 0.002 0.650 0.518 1.001 0.997 1.005Sic15–22 0.037 0.101 0.370 0.712 1.038 0.851 1.266Sic23–29 0.000 0.094 0.000 0.997 1.000 0.832 1.201Sic36–37 −0.085 0.162 −0.530 0.598 0.918 0.669 1.261Sic60–64 0.251 0.116 2.160 0.031 1.285 1.023 1.614Sic65–67 0.113 0.144 0.790 0.430 1.120 0.845 1.485Inter −0.216 0.088 −2.450 0.014 0.806 0.678 0.958Intra 0.690 0.134 5.160 0.000 1.994 1.534 2.591Cons −0.080 0.250 −0.320 0.748 – – –
N 2 −4937
of thec
CeokeidanmmhOi
qnPulaRfiaesi
fiesbss
moIactiiSitt
5
ote: Number of observations = 5822. LR � (32) = 709.04 (p-value: 0.000). log Lik. =a Comparison group = basic users.b Odds ratio confidence intervals that include unity indicate that the odds ratio
ategory (i.e. basic users). Odds ratios significantly different from 1 in bold.
IS2 data Inter becomes non-significant). This is consistent withpidemic and/or network effects being dominant over stock andrder effects although it tells us nothing of the relative size of mar-et and non-market intermediated externalities. With respect tonhanced use, Inter carries a negative coefficient and Intra a pos-tive coefficient, both significant. Thus wider inter-firm adoptioniscourages further enhanced use, whereas more enhanced use bydopting firms encourages further enhanced use. A possible expla-ation is that greater enhanced use by others (for a given externalargin) has a demonstration or network benefit to the firm, butore users for a given degree of enhancement (internal margin)
as a competitive downward impact upon returns to enhancement.nce again however both market intermediated and non-market
ntermediated externalities may be present.In summary the estimates indicate that factors particularly
uantitatively important in encouraging basic use as opposed toon-use are firm size, other indicators of innovativeness (but notrodNov or ProcNov), the proportion of graduates employed, andsage by other firms at basic and enhanced levels. Factors particu-
arly important in driving enhanced use as opposed to basic usagere a number of indicators of innovativeness such as Mngt, Org,&D including ProcNov, but firm size, despite being an importantactor in determining basic use (or use per se, see Table 2), has an
nsignificant (but negative) effect on the likelihood of becomingn enhanced as opposed to a basic user. The proportion of othernhanced users in the industry impacts positively on the inten-ive margin but the total proportion of e-business adopters in thendustry (Inter) exerts a significant negative effect upon the within-fit
.448.
covariate in the relevant category is not different from the odds ratio in the base
rm extent of further use. Therefore, the increasing number of-business users stimulates further e-business adoption but at theame time it slows down the extent of intra-firm e-business usey the adopting firms. This would not have been observed fromtandard modelling as per Table 2, where Inter and Intra both haveignificant positive effects.
Finally, we have tested whether the odds ratios in the multino-ial model are independent of the other choices (i.e. independence
f disturbances across the different choices) by carrying out thendependence from Irrelevant Alternatives (IIA) test (see Hausmannd McFadden, 1984). The result from the omission of the non-usersategory (0) yields �2 = 1.538 (�2 = 7.815; p = 0.674), suggestinghat the choice to be a basic user with respect to an enhanced users independent of the firm decision to adopt the technology. Thiss consistent with the findings of Battisti (2000) and Battisti andtoneman (2003, 2005) that the intra-firm adoption decision isndependent of the inter-firm adoption decision and also rules outhe possibility that a nested Logit model would have been betterhan the multinomial model.
. Policy implications
Although there are some differences in the results of the inter-
rm model and the integrated model the results above indicate thathe diffusion of e-business process of e-business reflects that:(i) Firms of different characteristics obtain different returns fromusing or extending usage of new technology (rank effects), as

ch Pol
(
vfici
pobpeurt
bri(uotohaabggt
emsiabtb
ptaate
t
fiocsowotlncetmnwtn
msbattub
m(aP
gcHdem(
ranacwwmmn
cdcblepa
G. Battisti et al. / Resear
evidenced by the impact upon basic and enhanced usage in2000 of firm size, other indicators of innovativeness and indus-try dummies.
ii) There may be market intermediated stock, order or networkeffects, as well as non-market intermediated spillovers (epi-demic effects) as indicated by the significance of inter and intraon both basic and enhanced use, although there is no agreementas to which of these effects are dominant.
These findings extend to the intensive margin arguments pre-iously reserved for the extensive margin. Building upon thesendings we now explore policy implications. This discussion con-entrates upon rationales for policy rather than policy instrumentsn order to save space.
To explore implications of the results as regards the need forolicy first we consider rank effects and then externalities (stock,rder, network and epidemic effects). An initial point to note is thaty the year 2000 the inter-firm diffusion process for e-business wasretty much complete (in excess of 80% of firms were users). How-ver intra-firm usage is still quite limited. If policy is to stimulatesage there is thus much more to do to encourage enhancementather than basic use. We believe that this is common to manyechnologies after their early years (Battisti and Stoneman, 2003).
The importance of rank effects indicates that the patterns ofoth inter- and intra-firm diffusion reflect the different benefits andeturns obtained by firms of different characteristics. The underly-ng rationale for this according to our model is that to some degreeat least) different firms get different net payoffs from technologysage. This finding has an initial message viz. that potential usersf a technology may be heterogeneous in various characteristicshat affect the size of the profit to be gained (for a wider discussionf such issues see David, 2003). Current users will be those thatave seen that the technology can yield a profit gain and have thusdopted. This does not necessarily mean that such gains are avail-ble to non-users of different characteristics. Non-users may welle non-users because the technology does not yield them a profitain. To justify intervention and to stimulate further usage on therounds that past adopters have gained profits from use of a newechnology is thus not sufficient.
More formally, Ireland and Stoneman (1986) explore a rankffect inter-firm model to which an intertemporally profit-aximising supply sector is added. They show that if the supply
ector is monopolised then its pricing will generate diffusion thats welfare-optimal if the buyers have myopic price expectations butpath involving diffusion that is slower than is welfare-optimal ifuyers have perfect foresight. If the supply sector is competitivehen diffusion would be welfare-optimising under perfect foresightut too fast under myopia.
It would appear that this argument can be extended to incor-orate issues of intra-firm diffusion, although we do not intendo do that formally here. The need for intervention in both inter-nd intra-firm diffusion processes in a world where rank effectsre important is thus a matter of the structure of the supply indus-ry (which can be observed) and the nature of firms’ technologicalxpectations (which cannot).
As regards externalities, Laffont (1988) defines an externality as
“. . . the indirect effect of a consumption activity or a productionactivity on the consumption set of a consumer, the utility func-tion of a consumer or the production function of a producer. Byindirect we mean that the effect concerns an agent other than
the one exerting this economic activity and that this effect doesnot work through the price system.”The Laffont (1988) definition rules out as externalities twoypes of effects that are part of our model. The first are intra-
tew
m
icy 38 (2009) 133–143 141
rm intertemporal effects, whereby (for example) learning fromwn current experience or the impact on future profit gains fromurrent adoption affect the firm’s own future decisions. This is rea-onable for these are expected to be taken account of in the firm’swn decision-making. Secondly, the definition rules out effects thatork through the price system. Thus the impact of yj(t) on the pay-
ff to firm i (between firm stock, order and network effects) is noto be considered as an externality. On the other hand inter-firmearning is not intermediated by the market but is a classic exter-ality and is to be treated as such. Kaivanto (2004) provides a usefullassification between ‘pecuniary externalities’ and ‘technologicalxternalities’ where pecuniary externalities (sometimes called dis-ributional externalities) are external effects intermediated by the
arket and encompass the stock and order effects. Network exter-alities which arise from the benefits to users from larger networksill also fall into this category. Technological externalities (some-
imes called real income externalities) are the other effects that areot so intermediated (and encompass the learning effects, Ej(t)).
The presence of technological externalities (externalities trans-itted outside the market system) provides an unambiguous
ignal of incomplete private appropriation of the costs and orenefits of the firm’s actions. If one firm’s behaviour causes a non-ppropriated benefit to another firm by, for example, improvinghat other firm’s knowledge base, then the true social benefits ofhe actions are not gained by the decision-maker and there will bender-investment in the new technology. The diffusion path wille sub-optimal.
It is argued however that pecuniary externalities (those trans-itted by the price system) do not imply market failure. Scitovsky
1954) shows that the addition of pecuniary externalities to thessumptions underpinning a perfect market does not result in aareto-inferior equilibrium.
However Laffont (1988) shows that if the market for contin-ent claims is incomplete—as one might expect generally to be thease, then pecuniary externalities do detract from social welfare.owever Loong and Zeckhauser (1982) show that the associatedecisions do not display a systematic bias ex ante, they may beither over-cautious or over-risky and thus in our context thereay have been over- or under-investment in the new technology
see Kaivanto, 2004).One might also argue that pecuniary externalities are the pre-
ogative of oligopolistic markets. Such effects imply that one firm’sdoption of a new technology will reduce (or in the case of someetwork technologies even increase) the potential return to anotherdopter, through the impact upon either market prices or inputosts. In a perfectly competitive world such pecuniary externalitiesould not exist. All firms would be price takers and no firm’s actionsould be important enough to affect the market. As oligopolisticarkets will already be not at the social optimum, whether thearket is over- or under-investing in new technology is generally
ot possible to say.Although our empirical results are not definitive, they do indi-
ate that there are probably technological externalities in theiffusion of e-business in the UK. This is reflected in the signifi-ant positive sign on the measured coefficient of Inter and Intra onasic use and Intra on enhanced use (which if not reflecting techno-
ogical externalities must represent a very strong positive networkxternality). As detailed above it is generally accepted that in theresence of such externalities economic actors will not be able toppropriate the full social costs and benefits of their actions and
hereby their decisions will be sub-optimal—a market failure willxist. In general diffusion will be too slow. Government interventionill be recommended.Our analysis above does not rule out that pecuniary externalitiesay also exist. Although it is less well accepted, as discussed above,
1 ch Pol
tmtfseca
6
tels(
nAwgs
sawo(
atsnwiieat
wpotberieircFtl
A
IkNU
t1ssdRtr
A
S
C
111111112222222222333333334445666666677777
R
A
B
B
42 G. Battisti et al. / Resear
his may also imply a case for intervention. There may also be otherarket failures in the economy that would affect the optimality of
he diffusion path, for example there may be monopoly power inactor markets. It might also be the case that the whole nationalystem of innovation in the economy needs improvements to (forxample) training and education, capital markets, taxation regimes,orporate governance. Such issues however, although important,re beyond the scope of this paper.
. Conclusions
Using enterprise-level data from the third Community Innova-ion Survey this paper maps out the pattern of basic and enhanced-business usage in the UK in 2000. The existing diffusion literatureargely concentrates upon the extensive margin (inter-firm diffu-ion) whereas here we emphasise in addition the intensive marginthe intra-firm aspect).
The data show that the extent of inter-firm diffusion is notecessarily a good predictor of the extent of intra-firm diffusion.lthough by 2000, 83.2% of sample firms were users, only 25.6%ere enhanced users. Further usage must thus concentrate upon
reater depth (enhancement) rather than greater breadth (furtherpreading of basic usage).
We have constructed a joint model of inter- and intra-firm diffu-ion and estimated it as both (i) a traditional model of use/non-usend (ii) a joint model of use and the extent of use. Empirically,e have found differences in the way in which the four classes
f hypothesised drivers of diffusion affect the extensive margininter-firm diffusion) and intensive margin (intra-firm diffusion).
A number of rank effects, reflecting differences between firms,re found to be significant, but the direction and the intensity ofheir impact upon inter- and intra-firm diffusion is not always theame (as seen for example with the firm-size effect). Stock, order,etwork and epidemic effects are reflected in the impact of theithin-industry number of adopters and other firms’ usage (both
ntra- and inter-firm indicators being used to measure this) onndividual adoption and extent of use. Both non-market mediatedxternalities (such as epidemic learning) as well as market medi-ted pecuniary externalities (such as stock effects) are consideredo affect the firm’s extent of use.
The results with respect to e-business provide a basis uponhich to build a more general discussion of the needs of diffusionolicy. Our results indicate that adoption and therefore basic usagef e-business was already widespread by 2000 and thus interven-ion in diffusion processes, except in the very early years, may welle most effectively directed at the enhancement of use (which isxactly the aspect about which we know least). We have isolatedank effects as significant explanations of enhanced usage and thust is not necessarily the case that all basic users can make a gain fromnhanced usage. However there may be social gains from stimulat-ng enhanced usage.. Technological externalities may also play aole in the spread of basic and enhanced e-business usage. This is alassic rationale for market failure and would suggest intervention.inally there may also be pecuniary externalities but we are unableo say whether this implies diffusion that is too extensive or tooimited.
cknowledgements
We would like to thank participants in the Workshop onnformation Technology and the New Industry and Labour Mar-et Dynamics, MERIT Maastricht, 3–4 June 2004, the Europeanetwork for Industrial Policy (EUNIP) Conference, Birminghamniversity, 13–15 December 2004, the NIE Winter Conference of
B
B
icy 38 (2009) 133–143
he Network of Industrial Economists, University of Nottingham,4 December 2004, the bi-weekly Industrial Organization Work-hop in the Department of Economics, Warwick University, thetaff seminar in the Economics and Finance department at Lon-on Metropolitan University, and two referees and the editor ofesearch Policy for their useful comments on earlier versions ofhis paper. Of course all errors and omissions that remain are theesponsibility of the authors alone.
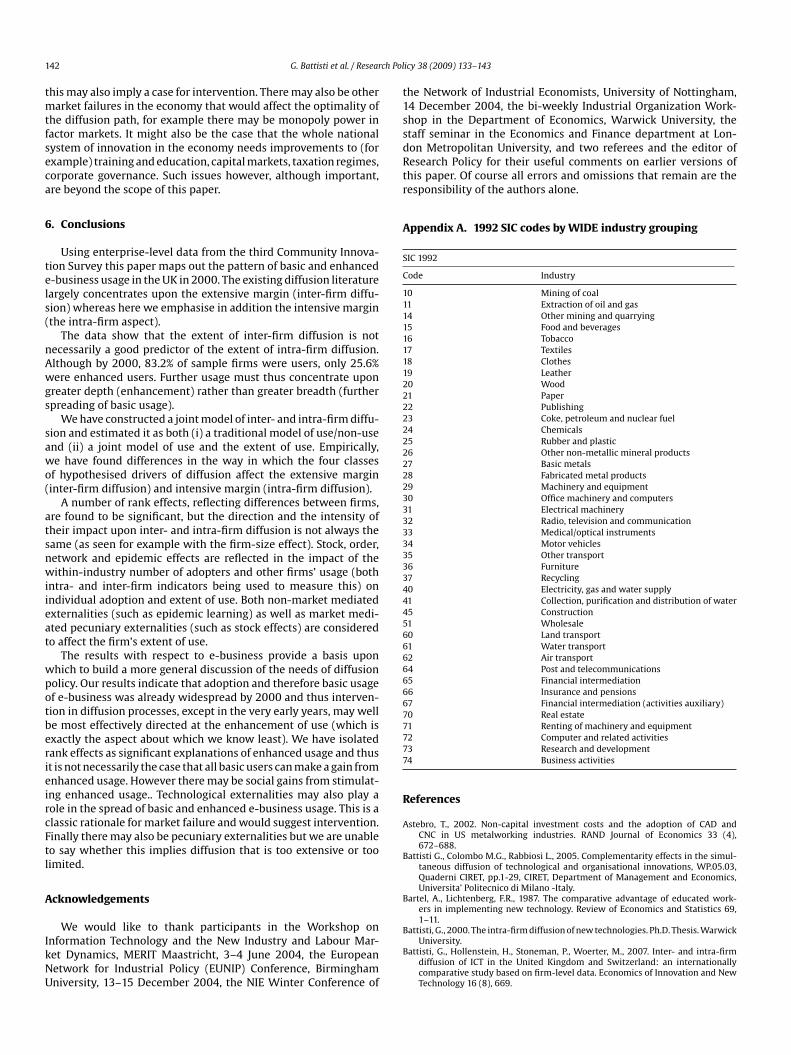
ppendix A. 1992 SIC codes by WIDE industry grouping
IC 1992
ode Industry
0 Mining of coal1 Extraction of oil and gas4 Other mining and quarrying5 Food and beverages6 Tobacco7 Textiles8 Clothes9 Leather0 Wood1 Paper2 Publishing3 Coke, petroleum and nuclear fuel4 Chemicals5 Rubber and plastic6 Other non-metallic mineral products7 Basic metals8 Fabricated metal products9 Machinery and equipment0 Office machinery and computers1 Electrical machinery2 Radio, television and communication3 Medical/optical instruments4 Motor vehicles5 Other transport6 Furniture7 Recycling0 Electricity, gas and water supply1 Collection, purification and distribution of water5 Construction1 Wholesale0 Land transport1 Water transport2 Air transport4 Post and telecommunications5 Financial intermediation6 Insurance and pensions7 Financial intermediation (activities auxiliary)0 Real estate1 Renting of machinery and equipment2 Computer and related activities3 Research and development4 Business activities
eferences
stebro, T., 2002. Non-capital investment costs and the adoption of CAD andCNC in US metalworking industries. RAND Journal of Economics 33 (4),672–688.
attisti G., Colombo M.G., Rabbiosi L., 2005. Complementarity effects in the simul-taneous diffusion of technological and organisational innovations, WP.05.03,Quaderni CIRET, pp.1-29, CIRET, Department of Management and Economics,Universita’ Politecnico di Milano -Italy.
artel, A., Lichtenberg, F.R., 1987. The comparative advantage of educated work-ers in implementing new technology. Review of Economics and Statistics 69,1–11.
attisti, G., 2000. The intra-firm diffusion of new technologies. Ph.D. Thesis. WarwickUniversity.
attisti, G., Hollenstein, H., Stoneman, P., Woerter, M., 2007. Inter- and intra-firmdiffusion of ICT in the United Kingdom and Switzerland: an internationallycomparative study based on firm-level data. Economics of Innovation and NewTechnology 16 (8), 669.

ch Pol
B
B
B
B
B
B
B
C
C
C
C
D
F
F
F
F
G
G
HH
H
H
I
K
K
LL
M
M
M
P
R
S
S
G. Battisti et al. / Resear
attisti, G., Stoneman, P., 2003. Inter firm and intra firm effects in the diffusion ofnew process technologies. Research Policy 32, 1641–1655.
attisti, G., Stoneman, P., 2005. The intra-firm diffusion of new process technologies.International Journal of Industrial Organization 23, 1–22.
lack, S.E., Lynch, L., 2004. What’s driving the new economy? The benefits of work-place innovation. Economic Journal 114, 97–116.
resnahan, T.F., Brynolfsson, E., Hitt, L.M., 2002. Information technology, workplaceorganisation and the demand for skilled labour; firm-level evidence. QuarterlyJournal of Economics 117, 339–376.
ridgewater, S., Arnott, D., 2004. The Internet and International Markets: Benefitsand Barriers. Academy of International Business Conference, June.
rynjolfsson, E., Hitt, L.M., Yang, S., 2002. Intangible assets: computers and organi-zational capital. In: Brookings Papers on Economic Activity, pp. 137–181.
urke, L., Godfrey, L.G., Mealier, M., 1992. Modification of the rainbow test. In: TheImplementation and Constructive Use of Misspecification Tests in Econometrics.Manchester University Press, Manchester.
aroli, E., Van Reenan, J., 2001. Skill biased organizational change? Evidence frompanel data of British and French establishments. Quarterly Journal of Economics116, 1447–1492.
ohen, W., Levinthal, D., 1989. Innovation and learning: the two faces of R&D. Eco-nomic Journal 99, 569–596.
olombo, M., Mosconi, R., 1995. Complementarily and cumulative learning effectsin the early diffusion of multiple technologies. Journal of Industrial Economics63 (11), 13–48.
respi, G., Mahdi, S., Patel, P., 2004. Adoption of E-commerce Technology: Do Net-work and Learning Externalities Matter? SPRU. University of Sussex.
avid, P., 2003. Zvi Griliches on diffusion, lags and productivity growth: connectingthe dots. In: Paper Presented at the Conference on R&D Education and Produc-tivity, held in Memory of Zvi Griliches 1930–1999, Paris, August.
inegold, D., Soskice, D., 1988. The failure of British training: analysis and prescrip-tion. Oxford Review of Economic Policy 4 (3), 21–53.
orman, C., Goldfarb, A., Greenstein, S., 2002. Digital dispersion: an industrial andgeographic census of commercial internet use. NBER, WP 9287.
orman, C., Goldfarb, A., Greenstein, S., 2003. How did location affect adoption of the
commercial internet? Global village, urban density and industry composition.NBER, WP 9979.udenberg, D., Tirole, J., 1985. Pre-emption and rent equalisation in the adoption ofnew technology. Review of Economic Studies 52, 383–401.
reen, D.M., Swets, J.A., 1974. Signal Detection Theory and Psychophysics, Rev. ed.Krieger, Huntington, NY.
S
U
icy 38 (2009) 133–143 143
reenan, N., 2003. Organisational change, technology, employment and skills: anempirical study of French manufacturing. Cambridge Journal of Economics 27,287–316.
all, B., 2004. Innovation and diffusion. NBER Working Paper 10212, Cambridge, MA.annan, T.H., McDowell, J.M., 1984. The determinants of technology adoption: the
case of the banking firm. RAND Journal of Economics 15, 328–335.ausman, J., McFadden, D., 1984. A specification test for the multinomial Logit
model. Econometrica 52, 1219–1240.ollenstein, H., 2004. Determinants of the adoption of information and communi-
cation technologies ICT: an empirical analysis based on firm level data for theSwiss business sector. Structural Change and Economic Dynamics 15, 42–315.
reland, N., Stoneman, P., 1986. Technological diffusion, expectations and welfare.In: Oxford Economic Papers, vol. 38, pp. 283–304.
aivanto, K., 2004. Spin Offs, Externalities and the Economic Justification of PublicExpenditure on R&D. Lancaster University, January.
arshenas, M., Stoneman, P., 1993. Rank, stock, order and epidemic effects in thediffusion of new process technologies: an empirical model. RAND Journal ofEconomics 24 (4), 503–528.
affont, J.J., 1988. Fundamentals of Public Economics. MIT Press, Cambridge, MA.oong, L.H., Zeckhauser, R., 1982. Pecuniary externalities do matter when contingent
claim markets are incomplete. Quarterly Journal of Economics 97, 171–179.ansfield, E., 1963. Intrafirm rates of diffusion of an innovation. Review of Economics
and Statistics 495, 348–359.ansfield, E., 1968. Industrial Research and Technological Innovation. W.W. Norton,
New York.ickey, J., Greenland, S., 1989. A study of the impact of confounder-selection criteria
on effect estimation. American Journal of Epidemiology 129, 125–137.il, T.D., MacDuffie, P., 1996. The adoption of high involvement work practices. Indus-
trial Relations 35, 423–455.einganum, J., 1981. The diffusion of new technology and the market for an innova-
tion. Rand Journal of Economics 17, 33–47.citovsky, T., 1954. Two concepts of external economies. Journal of Political Economy
62, 143–151.toneman, P., 1981. Intra firm diffusion, Bayesian learning and profitability. Economic
Journal 91, 375–388.toneman, P., Battisti, G., 1997. Intra-firm diffusion of new technologies: the
neglected part of technology transfer. International Journal of Industrial Engi-neering 4 (2), 270–282.
tts, J.M., 1982. The rainbow test for lack of fit in regression. Communication inStatistics: Theory and Methods 11, 2801–2815.