Abridged Annual Report - Invesco Mutual Fund
45
Abridged Annual Report 2020 - 2021 For All Fixed Income Schemes and Fixed Maturity Plans (including Matured Schemes)
-
Upload
khangminh22 -
Category
Documents
-
view
2 -
download
0
Transcript of Abridged Annual Report - Invesco Mutual Fund
AbridgedAnnualReport
2020 - 2021
For All Fixed Income Schemesand Fixed Maturity Plans(including Matured Schemes)
REGISTRARKFin Technologies Pvt. Ltd.Unit - Invesco Mutual Fund, Karvy Selenium, Tower B,Plot No. 31 & 32, Gachibowli, Financial District, Nanakramguda, Serilingampally,Hyderabad – 500 032.
CUSTODIANDeutsche Bank AG4th Floor, Block B1, Nirlon Knowledge Park,Western Express Highway, Goregaon (East),Mumbai - 400 063.
BOARD OF DIRECTORSInvesco Trustee Private Limited (Trustee to Invesco Mutual Fund)G. Anantharaman – ChairmanSatyananda MishraBakul PatelJeremy Simpson
BOARD OF DIRECTORSInvesco Asset Management (India) Private Limited (Investment Manager toInvesco Mutual Fund)Paresh Parasnis - ChairmanSanjay TripathyAndrew LoTerry PAN
SPONSORInvesco Hong Kong Limited41/F, Champion Tower, 3 Garden Road, Central, Hong Kong.
ASSET MANAGEMENT COMPANYInvesco Asset Management (India) Private Limited2101-A, A Wing, 21st Floor, Marathon Futurex,N. M. Joshi Marg, Lower Parel, Mumbai - 400 013.
TRUSTEE COMPANYInvesco Trustee Private LimitedRegd. Office: 2101-A, A Wing, 21st Floor, Marathon Futurex,N. M. Joshi Marg, Lower Parel, Mumbai - 400 013.
MUTUAL FUNDInvesco Mutual FundRegd. Office: 2101-A, A Wing, 21st Floor, Marathon Futurex,N. M. Joshi Marg, Lower Parel, Mumbai - 400 013.
AUDITORSM/s. Deloitte Haskins & Sells LLPChartered Accountants,Indiabulls Finance Centre,Tower 3, 27th - 32nd Floor, Senapati Bapat Marg,Elphinstone Road (West), Mumbai - 400 013.
Invesco Asset Management (India) Private Limited - Branches
Agra: Block No.30, Shop No.126, Sanjay Place, Agra - 282002. Tel. No.: 0562 6459171. Ahmedabad: 303/A, Raindroop Building, Opp. Yes Bank, C. G. Road, Ahmedabad - 380006. Tel. No.: 079 – 66521550. Allahabad: 21B/2/12B, Cooper Road, Civil Lines, Allahabad - 211001. Tel. No.: 0532 6455816. Bengaluru: S-317,319 & 321, 3rd Floor, South Block, Manipal Centre, 47, Dickenson Road, Bangalore - 560042. Tel No.: 080 – 42941000. Bhopal: MM-18, B-Block, Mansarovar Complex, Opp BJP Office, Hoshangabad Road, Bhopal - 462016 (M.P.). Tel. No.: 0755 4253972. Bhubhaneshwar: Room No 5, 2nd floor, Chandan Villa, Plot:1258, Road -8, Unit -9, Bhubaneswar - 751022. Tel. No.: 0674 6532062. Chandigarh: S.C.O. 2471 - 72, 2nd Floor, Sector 22C, Himalaya Marg, Chandigarh - 160 022. Tel. No.: 0769 - 6001369. Chennai: Door #2, 2nd Floor, Sun Plaza, #39 G.N.Chetty Road, Near Kamarajar Arangam, Chennai – 600006. Tel. No. 9043000628. Coimbatore: 2nd Floor, 509 E, Red Rose Plaza, D.B Road, R. S. Puram, Coimbatore 641 002. Tel. No.: 9843555682. Dehradun: 1st Floor , Room No. 3, 5, Shubhas Road, Opp. Secretariat Dehradun - 248001. Tel. No.: 0135 6453212. Delhi: 710, 711 & 712 Prakashdeep Building, 7th Floor, Tolstoy Marg, Connaught Place, New Delhi - 110001. Tel. No.: 011 43789000. Goa (Panaji): Advani Business Centre, Office No. CU2, Neelkamal Arcade, Atmaram Borkar Road, Above Federal Bank, Panaji - 403 001. Tel No: 0832-6650402. Gorakhpur: Shop No - 17, Upper Ground Floor, Radhika Complex, Asuram Chungi Medical College Road, Gorkhpur - 273 001. Tel. No.: 9919802109. Guwahati (Assam): Room No 208, 2nd floor Kejriwal Bhawan, Paltan Bazar, G. S. Road, Guwahati, Assam - 781008. Tel. No.: 8486030491. Hyderabad: 2nd Floor, S.B. Towers, H.No.6-3-354, Road No.1, Banjara Hills, Landmark: Punjagutta X Road, Beside Himalaya Book Store, Hyderabad-500 034. Tel. No.: 9030015457. Indore: Room No. 216, 2nd Floor, Starlit Tower, Y. N. Road, Indore - 452 001. Tel. No.: 0731-4257351. Jalandhar: Shop Cum Office 210,2nd Floor, Hamilton Courts, E.H 176 Civil Lines, Opp District Court, Jalandhar - 144001. Tel. No.: 0181 - 4626870. Jaipur: 204, 2nd Floor, ‘Brij Anukampa’ Ashok Marg, C-Scheme, Jaipur - 302 001. Tel. No.: 07737000761. Jamshedpur: Shop No - 16, Bharat Business Centre, Ground Floor, Bistupur, Jamshedpur -831001. Tel. No.: 0657 2321534. Kanpur: 1st Floor, KAN Chambers, 14/113 Civil Lines, Kanpur - 208 001. Tel. No.: 9044051658. Kochi: Door No.CC 40/377, 3rd Floor, Jos Annexe, Jos
Junction, M. G. Road, Kochi - 682016. Tel. No.: 9037001509. Kolkata: Room No. 7E, 235/2A, 7th Floor, Millennium Building, Acharya Jagdish Chandra Bose Road, Kolkata - 700 020. Tel : 033-40639115. Lucknow: 304, 3rd Floor, SKY HI Chamber, Park Road, Hazratganj, Lucknow - 226 001, U.P. Tel. No. - 0522-4000841/4000149. Ludhiana: Room No. 604, 6th Floor, SCO - 18, Feroze Gandhi Market, Ludhiana - 141 001. Tel. No.: 09041002258. Moradabad: G-5 Ground Floor, Shri Sai Sadan Commercial Complex, Jail Road Civil Line, Near Head Post Office. Moradabad - 244001. Tel. No.: 88590 16165. Mumbai (H.O.): 2101-A, A Wing, 21st Floor, Marathon Futurex, N.M. Joshi Marg, Lower Parel, Mumbai - 400 013. Tel. No.: 022 – 67310000. *Mumbai (Nariman Point): Office No. 17, 1st Floor, Jolly Maker Chambers II, Nariman Point, Mumbai - 400021. Tel. No.: 022 - 4341 6000. Nagpur: Business Chamber No. F2/102, Fortune Business Centre, 1st floor, NIT Plot no.6, “Vasant-Vihar Complex, West High Court Road, Shankar Nagar, Nagpur – 440010. Tel. No.: 0712 6463962. Nasik: 1st Floor, “G-21, Suyojit Sankul, Below KFin Technologies Pvt. Ltd., Near Rajiv Gandhi Bhavan, Sharanpur Road, Nashik – 422002. Tel. No.: 7507777375. Patna: No. 304, Ashiyana Harniwas Complex, Dak Banglow Road, Patna - 800001. Tel. No.: 09264457840. Pune: Shop No. 11, B Wing, Shreenath Plaza, FC Road, Dyaneshwar Paduka Chowk, Pune - 411 005. Tel No.: 020 – 41291015. Raipur: Unit No # F - 13, Raheja Tower, Fafadih Chowk, Station Road, Raipur, Chhattisgarh – 492001. Tel. No.: 0771 4056046. Rajkot: 303, 3rd Floor, Business Park-1, Opp. Ratnam Hospital, Near Eagle Travels, Moti Tanki chowk, Rajkot - 360001. Tel. No.: 9727787624. Ranchi: Shop No. 118, First Floor, Satya Ganga Arcade(commercial building), Lalji Hirji Road, Maim Road, Ranchi - 834001. Surat: 215, Jolly Plaza Athwa Gate, Near Nanpura, Surat - 395001. Tel. No.: 0261-6450848. Vadodara: Upper Ground Floor No. 06, Concorde Complex, Above Deepak Garments, Near Kabir Kitchen Restaurant, Alkapuri Vadodara - 390007. Tel. No.: 0265 - 2338446. Varanasi: Shop No. 37 & 48, 1st Floor, Kuber Complex, D 58/2 Rathyatra Crossing, Varanasi - 221010. Tel. No.: 0542 6055444. Vishakapatnam: C-6, 2nd Floor, Pavan Palace, Beside Vaibhav Jewellers, Dwarakanagar, Visakhapatnam - 530016. Tel. No.: 8886001422.
*The branch was discontinued w.e.f. close of business hours of June 30, 2021.
Abridged Annual Report 2020-21 1
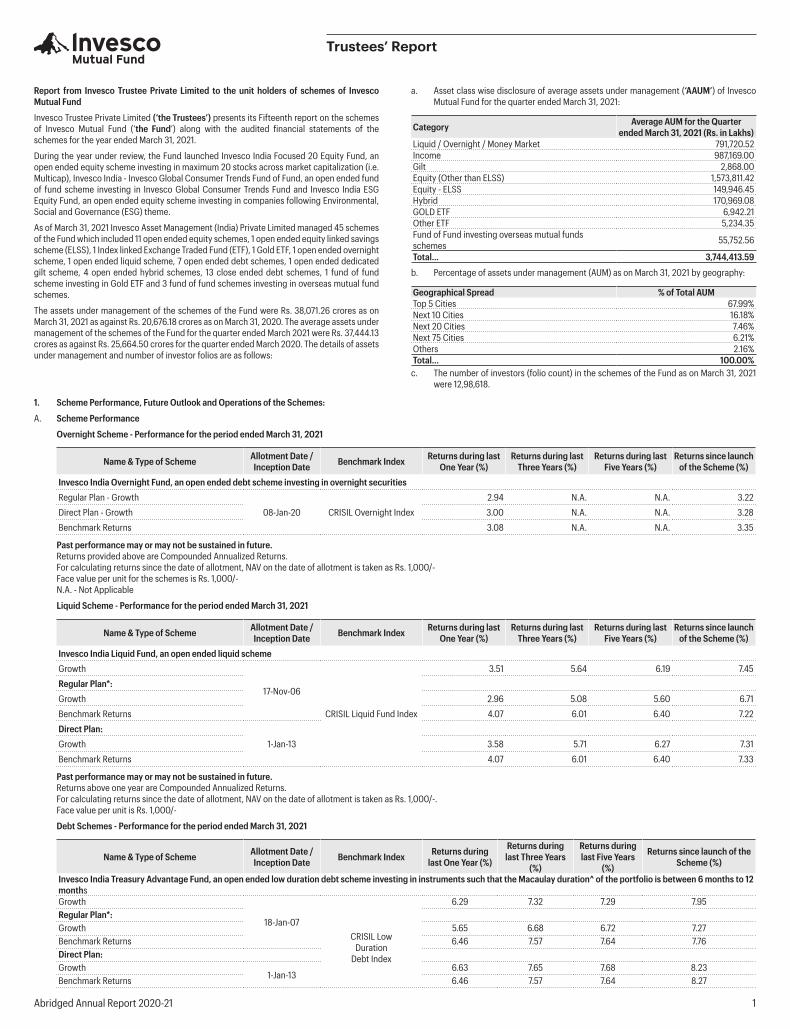
Report from Invesco Trustee Private Limited to the unit holders of schemes of Invesco Mutual Fund
Invesco Trustee Private Limited (‘the Trustees’) presents its Fifteenth report on the schemes of Invesco Mutual Fund (‘the Fund’) along with the audited financial statements of the schemes for the year ended March 31, 2021.
During the year under review, the Fund launched Invesco India Focused 20 Equity Fund, an open ended equity scheme investing in maximum 20 stocks across market capitalization (i.e. Multicap), Invesco India - Invesco Global Consumer Trends Fund of Fund, an open ended fund of fund scheme investing in Invesco Global Consumer Trends Fund and Invesco India ESG Equity Fund, an open ended equity scheme investing in companies following Environmental, Social and Governance (ESG) theme.
As of March 31, 2021 Invesco Asset Management (India) Private Limited managed 45 schemes of the Fund which included 11 open ended equity schemes, 1 open ended equity linked savings scheme (ELSS), 1 Index linked Exchange Traded Fund (ETF), 1 Gold ETF, 1 open ended overnight scheme, 1 open ended liquid scheme, 7 open ended debt schemes, 1 open ended dedicated gilt scheme, 4 open ended hybrid schemes, 13 close ended debt schemes, 1 fund of fund scheme investing in Gold ETF and 3 fund of fund schemes investing in overseas mutual fund schemes.
The assets under management of the schemes of the Fund were Rs. 38,071.26 crores as on March 31, 2021 as against Rs. 20,676.18 crores as on March 31, 2020. The average assets under management of the schemes of the Fund for the quarter ended March 2021 were Rs. 37,444.13 crores as against Rs. 25,664.50 crores for the quarter ended March 2020. The details of assets under management and number of investor folios are as follows:
a. Asset class wise disclosure of average assets under management (‘AAUM’) of Invesco Mutual Fund for the quarter ended March 31, 2021:
Category Average AUM for the Quarter ended March 31, 2021 (Rs. in Lakhs)
Liquid / Overnight / Money Market 791,720.52Income 987,169.00Gilt 2,868.00Equity (Other than ELSS) 1,573,811.42Equity - ELSS 149,946.45Hybrid 170,969.08GOLD ETF 6,942.21Other ETF 5,234.35Fund of Fund investing overseas mutual funds schemes 55,752.56
Total… 3,744,413.59
b. Percentage of assets under management (AUM) as on March 31, 2021 by geography:
Geographical Spread % of Total AUM Top 5 Cities 67.99%Next 10 Cities 16.18%Next 20 Cities 7.46%Next 75 Cities 6.21%Others 2.16%Total… 100.00%c. The number of investors (folio count) in the schemes of the Fund as on March 31, 2021
were 12,98,618.
Trustees’ Report
1. Scheme Performance, Future Outlook and Operations of the Schemes:
A. Scheme Performance
Overnight Scheme - Performance for the period ended March 31, 2021
Name & Type of Scheme Allotment Date / Inception Date Benchmark Index Returns during last
One Year (%)Returns during last
Three Years (%)Returns during last
Five Years (%)Returns since launch
of the Scheme (%)Invesco India Overnight Fund, an open ended debt scheme investing in overnight securitiesRegular Plan - Growth
08-Jan-20 CRISIL Overnight Index
2.94 N.A. N.A. 3.22
Direct Plan - Growth 3.00 N.A. N.A. 3.28
Benchmark Returns 3.08 N.A. N.A. 3.35
Past performance may or may not be sustained in future. Returns provided above are Compounded Annualized Returns. For calculating returns since the date of allotment, NAV on the date of allotment is taken as Rs. 1,000/- Face value per unit for the schemes is Rs. 1,000/- N.A. - Not Applicable
Liquid Scheme - Performance for the period ended March 31, 2021
Name & Type of Scheme Allotment Date / Inception Date Benchmark Index Returns during last
One Year (%)Returns during last
Three Years (%)Returns during last
Five Years (%)Returns since launch
of the Scheme (%)Invesco India Liquid Fund, an open ended liquid schemeGrowth
17-Nov-06
CRISIL Liquid Fund Index
3.51 5.64 6.19 7.45
Regular Plan*:Growth 2.96 5.08 5.60 6.71
Benchmark Returns 4.07 6.01 6.40 7.22
Direct Plan:1-Jan-13Growth 3.58 5.71 6.27 7.31
Benchmark Returns 4.07 6.01 6.40 7.33
Past performance may or may not be sustained in future. Returns above one year are Compounded Annualized Returns. For calculating returns since the date of allotment, NAV on the date of allotment is taken as Rs. 1,000/-. Face value per unit is Rs. 1,000/-
Debt Schemes - Performance for the period ended March 31, 2021
Name & Type of Scheme Allotment Date / Inception Date Benchmark Index Returns during
last One Year (%)
Returns during last Three Years
(%)
Returns during last Five Years
(%)
Returns since launch of the Scheme (%)
Invesco India Treasury Advantage Fund, an open ended low duration debt scheme investing in instruments such that the Macaulay duration^ of the portfolio is between 6 months to 12 monthsGrowth
18-Jan-07CRISIL Low
DurationDebt Index
6.29 7.32 7.29 7.95Regular Plan*:Growth 5.65 6.68 6.72 7.27Benchmark Returns 6.46 7.57 7.64 7.76Direct Plan:Growth
1-Jan-136.63 7.65 7.68 8.23
Benchmark Returns 6.46 7.57 7.64 8.27
Abridged Annual Report 2020-21 2
Name & Type of Scheme Allotment Date / Inception Date Benchmark Index Returns during
last One Year (%)
Returns during last Three Years
(%)
Returns during last Five Years
(%)
Returns since launch of the Scheme (%)
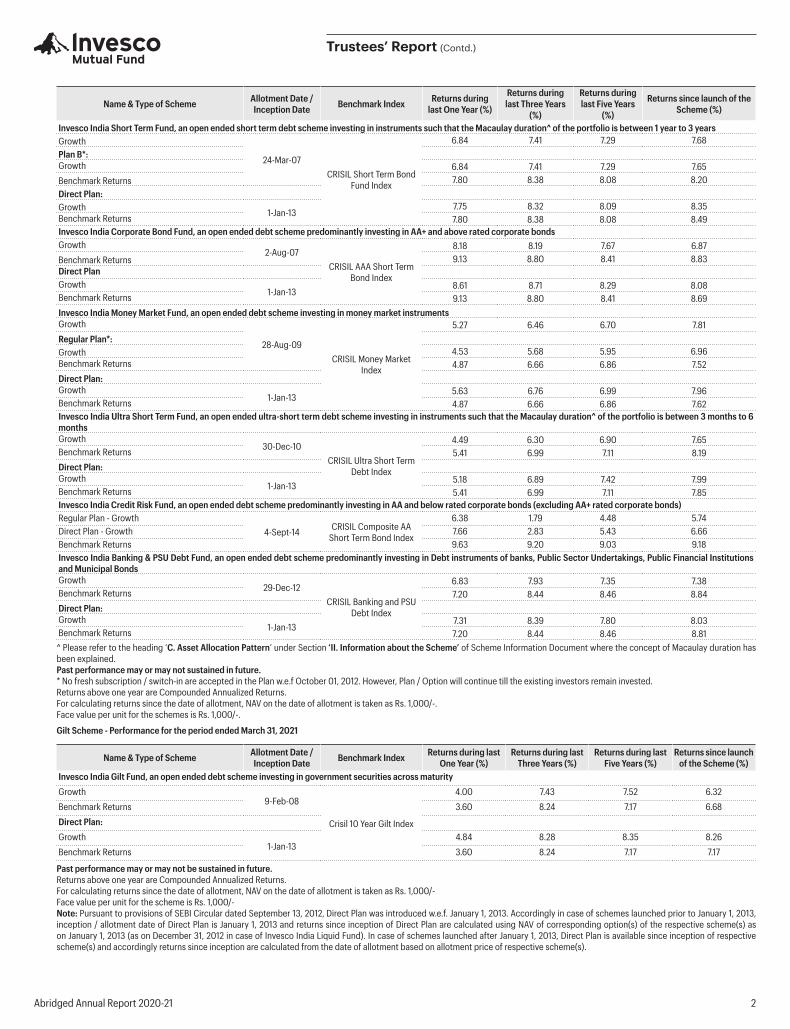
Invesco India Short Term Fund, an open ended short term debt scheme investing in instruments such that the Macaulay duration^ of the portfolio is between 1 year to 3 yearsGrowth
24-Mar-07CRISIL Short Term Bond
Fund Index
6.84 7.41 7.29 7.68Plan B*:Growth 6.84 7.41 7.29 7.65Benchmark Returns 7.80 8.38 8.08 8.20Direct Plan:Growth 1-Jan-13
7.75 8.32 8.09 8.35Benchmark Returns 7.80 8.38 8.08 8.49Invesco India Corporate Bond Fund, an open ended debt scheme predominantly investing in AA+ and above rated corporate bondsGrowth
2-Aug-07CRISIL AAA Short Term
Bond Index
8.18 8.19 7.67 6.87Benchmark Returns 9.13 8.80 8.41 8.83Direct PlanGrowth
1-Jan-138.61 8.71 8.29 8.08
Benchmark Returns 9.13 8.80 8.41 8.69Invesco India Money Market Fund, an open ended debt scheme investing in money market instrumentsGrowth
28-Aug-09CRISIL Money Market
Index
5.27 6.46 6.70 7.81Regular Plan*:Growth 4.53 5.68 5.95 6.96Benchmark Returns 4.87 6.66 6.86 7.52Direct Plan:Growth
1-Jan-135.63 6.76 6.99 7.96
Benchmark Returns 4.87 6.66 6.86 7.62Invesco India Ultra Short Term Fund, an open ended ultra-short term debt scheme investing in instruments such that the Macaulay duration^ of the portfolio is between 3 months to 6 monthsGrowth
30-Dec-10CRISIL Ultra Short Term
Debt Index
4.49 6.30 6.90 7.65Benchmark Returns 5.41 6.99 7.11 8.19Direct Plan:Growth
1-Jan-135.18 6.89 7.42 7.99
Benchmark Returns 5.41 6.99 7.11 7.85Invesco India Credit Risk Fund, an open ended debt scheme predominantly investing in AA and below rated corporate bonds (excluding AA+ rated corporate bonds)Regular Plan - Growth
4-Sept-14 CRISIL Composite AA Short Term Bond Index
6.38 1.79 4.48 5.74Direct Plan - Growth 7.66 2.83 5.43 6.66Benchmark Returns 9.63 9.20 9.03 9.18Invesco India Banking & PSU Debt Fund, an open ended debt scheme predominantly investing in Debt instruments of banks, Public Sector Undertakings, Public Financial Institutions and Municipal BondsGrowth
29-Dec-12CRISIL Banking and PSU
Debt Index
6.83 7.93 7.35 7.38Benchmark Returns 7.20 8.44 8.46 8.84Direct Plan:Growth
1-Jan-137.31 8.39 7.80 8.03
Benchmark Returns 7.20 8.44 8.46 8.81 ^ Please refer to the heading ‘C. Asset Allocation Pattern’ under Section ‘II. Information about the Scheme’ of Scheme Information Document where the concept of Macaulay duration has
been explained. Past performance may or may not sustained in future. * No fresh subscription / switch-in are accepted in the Plan w.e.f October 01, 2012. However, Plan / Option will continue till the existing investors remain invested. Returns above one year are Compounded Annualized Returns. For calculating returns since the date of allotment, NAV on the date of allotment is taken as Rs. 1,000/-. Face value per unit for the schemes is Rs. 1,000/-.
Gilt Scheme - Performance for the period ended March 31, 2021
Name & Type of Scheme Allotment Date / Inception Date Benchmark Index Returns during last
One Year (%)Returns during last
Three Years (%)Returns during last
Five Years (%)Returns since launch
of the Scheme (%)Invesco India Gilt Fund, an open ended debt scheme investing in government securities across maturityGrowth
9-Feb-08
Crisil 10 Year Gilt Index
4.00 7.43 7.52 6.32
Benchmark Returns 3.60 8.24 7.17 6.68
Direct Plan:Growth
1-Jan-134.84 8.28 8.35 8.26
Benchmark Returns 3.60 8.24 7.17 7.17
Past performance may or may not be sustained in future. Returns above one year are Compounded Annualized Returns. For calculating returns since the date of allotment, NAV on the date of allotment is taken as Rs. 1,000/- Face value per unit for the scheme is Rs. 1,000/- Note: Pursuant to provisions of SEBI Circular dated September 13, 2012, Direct Plan was introduced w.e.f. January 1, 2013. Accordingly in case of schemes launched prior to January 1, 2013,
inception / allotment date of Direct Plan is January 1, 2013 and returns since inception of Direct Plan are calculated using NAV of corresponding option(s) of the respective scheme(s) as on January 1, 2013 (as on December 31, 2012 in case of Invesco India Liquid Fund). In case of schemes launched after January 1, 2013, Direct Plan is available since inception of respective scheme(s) and accordingly returns since inception are calculated from the date of allotment based on allotment price of respective scheme(s).
Trustees’ Report (Contd.)
Abridged Annual Report 2020-21 3
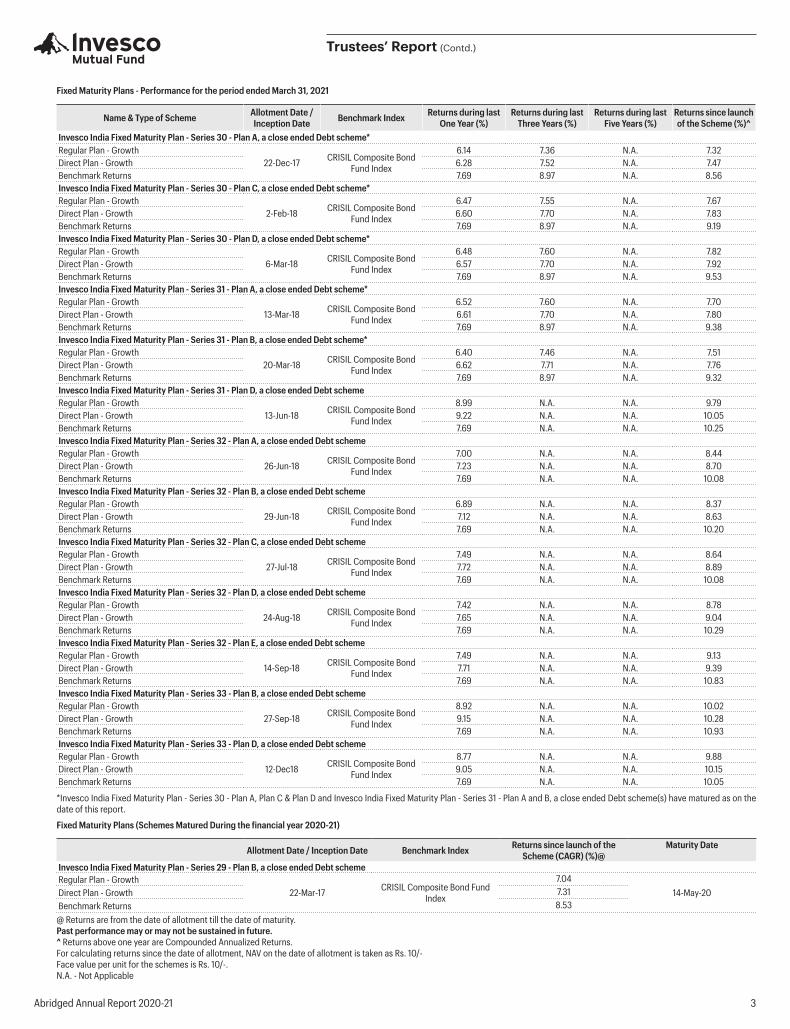
Fixed Maturity Plans - Performance for the period ended March 31, 2021
Name & Type of Scheme Allotment Date / Inception Date Benchmark Index Returns during last
One Year (%)Returns during last
Three Years (%)Returns during last
Five Years (%)Returns since launch of the Scheme (%)^
Invesco India Fixed Maturity Plan - Series 30 - Plan A, a close ended Debt scheme*Regular Plan - Growth
22-Dec-17 CRISIL Composite Bond Fund Index
6.14 7.36 N.A. 7.32Direct Plan - Growth 6.28 7.52 N.A. 7.47Benchmark Returns 7.69 8.97 N.A. 8.56Invesco India Fixed Maturity Plan - Series 30 - Plan C, a close ended Debt scheme*Regular Plan - Growth
2-Feb-18 CRISIL Composite Bond Fund Index
6.47 7.55 N.A. 7.67Direct Plan - Growth 6.60 7.70 N.A. 7.83Benchmark Returns 7.69 8.97 N.A. 9.19Invesco India Fixed Maturity Plan - Series 30 - Plan D, a close ended Debt scheme*Regular Plan - Growth
6-Mar-18 CRISIL Composite Bond Fund Index
6.48 7.60 N.A. 7.82Direct Plan - Growth 6.57 7.70 N.A. 7.92Benchmark Returns 7.69 8.97 N.A. 9.53Invesco India Fixed Maturity Plan - Series 31 - Plan A, a close ended Debt scheme*Regular Plan - Growth
13-Mar-18 CRISIL Composite Bond Fund Index
6.52 7.60 N.A. 7.70Direct Plan - Growth 6.61 7.70 N.A. 7.80Benchmark Returns 7.69 8.97 N.A. 9.38Invesco India Fixed Maturity Plan - Series 31 - Plan B, a close ended Debt scheme*Regular Plan - Growth
20-Mar-18 CRISIL Composite Bond Fund Index
6.40 7.46 N.A. 7.51Direct Plan - Growth 6.62 7.71 N.A. 7.76Benchmark Returns 7.69 8.97 N.A. 9.32Invesco India Fixed Maturity Plan - Series 31 - Plan D, a close ended Debt schemeRegular Plan - Growth
13-Jun-18 CRISIL Composite Bond Fund Index
8.99 N.A. N.A. 9.79Direct Plan - Growth 9.22 N.A. N.A. 10.05Benchmark Returns 7.69 N.A. N.A. 10.25Invesco India Fixed Maturity Plan - Series 32 - Plan A, a close ended Debt schemeRegular Plan - Growth
26-Jun-18 CRISIL Composite Bond Fund Index
7.00 N.A. N.A. 8.44Direct Plan - Growth 7.23 N.A. N.A. 8.70Benchmark Returns 7.69 N.A. N.A. 10.08Invesco India Fixed Maturity Plan - Series 32 - Plan B, a close ended Debt schemeRegular Plan - Growth
29-Jun-18 CRISIL Composite Bond Fund Index
6.89 N.A. N.A. 8.37Direct Plan - Growth 7.12 N.A. N.A. 8.63Benchmark Returns 7.69 N.A. N.A. 10.20Invesco India Fixed Maturity Plan - Series 32 - Plan C, a close ended Debt schemeRegular Plan - Growth
27-Jul-18 CRISIL Composite Bond Fund Index
7.49 N.A. N.A. 8.64Direct Plan - Growth 7.72 N.A. N.A. 8.89Benchmark Returns 7.69 N.A. N.A. 10.08Invesco India Fixed Maturity Plan - Series 32 - Plan D, a close ended Debt schemeRegular Plan - Growth
24-Aug-18 CRISIL Composite Bond Fund Index
7.42 N.A. N.A. 8.78Direct Plan - Growth 7.65 N.A. N.A. 9.04Benchmark Returns 7.69 N.A. N.A. 10.29Invesco India Fixed Maturity Plan - Series 32 - Plan E, a close ended Debt schemeRegular Plan - Growth
14-Sep-18 CRISIL Composite Bond Fund Index
7.49 N.A. N.A. 9.13Direct Plan - Growth 7.71 N.A. N.A. 9.39Benchmark Returns 7.69 N.A. N.A. 10.83Invesco India Fixed Maturity Plan - Series 33 - Plan B, a close ended Debt schemeRegular Plan - Growth
27-Sep-18 CRISIL Composite Bond Fund Index
8.92 N.A. N.A. 10.02Direct Plan - Growth 9.15 N.A. N.A. 10.28Benchmark Returns 7.69 N.A. N.A. 10.93Invesco India Fixed Maturity Plan - Series 33 - Plan D, a close ended Debt schemeRegular Plan - Growth
12-Dec18 CRISIL Composite Bond Fund Index
8.77 N.A. N.A. 9.88Direct Plan - Growth 9.05 N.A. N.A. 10.15Benchmark Returns 7.69 N.A. N.A. 10.05
*Invesco India Fixed Maturity Plan - Series 30 - Plan A, Plan C & Plan D and Invesco India Fixed Maturity Plan - Series 31 - Plan A and B, a close ended Debt scheme(s) have matured as on the date of this report.
Fixed Maturity Plans (Schemes Matured During the financial year 2020-21)
Allotment Date / Inception Date Benchmark Index Returns since launch of the Scheme (CAGR) (%)@
Maturity Date
Invesco India Fixed Maturity Plan - Series 29 - Plan B, a close ended Debt schemeRegular Plan - Growth
22-Mar-17 CRISIL Composite Bond Fund Index
7.0414-May-20Direct Plan - Growth 7.31
Benchmark Returns 8.53 @ Returns are from the date of allotment till the date of maturity. Past performance may or may not be sustained in future. ^ Returns above one year are Compounded Annualized Returns. For calculating returns since the date of allotment, NAV on the date of allotment is taken as Rs. 10/- Face value per unit for the schemes is Rs. 10/-. N.A. - Not Applicable
Trustees’ Report (Contd.)
Abridged Annual Report 2020-21 4
B. OPERATIONS OF THE SCHEMES
Liquid / Overnight / Debt Schemes:
• Invesco India Overnight Fund (An open ended debt scheme investing in overnight securities)
The Scheme is an open ended scheme with objective to generate income commensurate with low risk and high liquidity by investing in overnight securities having residual maturity of 1 business day.
The Scheme underperformed the benchmark in FY 2020-21 and since inception largely to the extent of expenses.
The Scheme has been invested mostly in TREPS, CROMS, overnight corporate bond repo and securities having residual maturity of one business day.
As at March 31, 2021, 100% of the net assets were invested in overnight securities & net current asset.
The net assets of the Scheme amounted to Rs. 808.95 crores as at March 31, 2021 as against Rs. 418.78 crores as at March 31, 2020.
• InvescoIndiaLiquidFund(An open ended liquid scheme)
The Scheme invested in the liquid money market segment of the yield curve. The portfolio followed a ladder approach to investment in order to reduce volatility and maintain high liquidity of the portfolio. The liquidity conditions within the banking system were gauged continuously and investments decided.
The Scheme underperformed the benchmark in FY 2020-21 but outperformed since inception. The underperformance was due to lower income of the Scheme compared to the benchmark as the Scheme continued to maintain a relatively higher asset quality. The Scheme continues to run on a high quality portfolio with relatively lower exposure to AA+ / AA rated papers and hence has a lower Yield to Maturity (‘YTM’) than the benchmark.
As at March 31, 2021, 98.02% of the net assets were invested in money market instruments, 1.85% in corporate debt and 0.13% in net current assets.
The net assets of the Scheme amounted to Rs. 5,451.81 crores as at March 31, 2021 as against Rs. 3,483.52 crores as at March 31, 2020.
• Invesco IndiaTreasuryAdvantageFund (An open ended low duration debt scheme investing in instruments such that the Macaulay duration^ of the portfolio is between 6 months to 12 months)
The Scheme invested from the liquid money market, debt and sovereign segment of the yield curve. The Scheme followed an active approach to duration management and managed the credit risk at very low levels. The Scheme followed ladder approach to investment and undertook interest rate duration management at the very short end of the yield curve. The Scheme also endeavored to gauge the liquidity situation within the system and build position accordingly.
The Scheme underperformed the benchmark in FY 2020-21 but outperformed since inception. The underperformance in one year period was because the credit quality of the Scheme was much better than the benchmark and hence the income was much lower than the benchmark. However, because of active management, the Scheme got the benefit of maintaining longer average duration than the benchmark during the year as the yields declined.
As at March 31, 2021, 75.84% of the net assets were invested in corporate debt, 41.95% in money market instruments and the Scheme had negative net current assets of 17.79%.
The net assets of the Scheme amounted to Rs. 3,868.32 crores as at March 31, 2021 as against Rs. 1,693.91 crores as at March 31, 2020.
• InvescoIndiaShortTermFund(An open ended short term debt scheme investing in instruments such that the Macaulay duration^ of the portfolio is between 1 year to 3 years)
The Scheme invested from the liquid money market, debt and sovereign segment of the yield curve. The Scheme followed an active approach to duration management and managed the credit risk at very low levels.
The Scheme underperformed the benchmark in FY 2020-21 and since inception. The portfolio quality was largely comprised of liquid PSU bonds and money market assets and gilts. The Scheme has maintained superior credit quality thus having relatively lower portfolio yield. This strategy was undertaken due to adverse credit environment. The Scheme has been running on higher duration as compared to the benchmark and got impacted in the interest rate hardening since January 2021.
As at March 31, 2021, 88.65% of the net assets were invested in corporate debt and 9.02% in money market instruments and 2.33% in net current assets.
The net assets of the Scheme amounted to Rs. 1,175.90 crores as at March 31, 2021 as against Rs. 621.25 crores as at March 31, 2020.
• Invesco India Corporate Bond Fund (An open ended debt scheme predominantly investing in AA+ and above rated corporate bonds)
The Scheme invested across the liquid money market, debt and sovereign segment of the yield curve. The Scheme followed both an active and passive approach to duration management at various points in time. However, in the last 1 year it followed passive
strategy on duration management. Previously the Scheme managed duration right across the yield curve with changing rate views and varying duration management approaches.
The Scheme underperformed the benchmark in FY 2020-21 and since inception. The said underperformance can be largely attributed to the Scheme’s higher duration vis-à-vis the benchmark. Since January 2021, rates have significantly hardened especially in short end due to RBI’s liquidity measure and Government’s fiscally expansionary central budget. Additionally, the Scheme has a relatively lower Yield to Maturity (‘YTM’) as it maintains a better asset quality.
As at March 31, 2021, 87.89% of the net assets were invested in corporate debt, 14.53% in money market instruments and the Scheme had negative net current assets of 2.42%.
The net assets of the Scheme amounted to Rs. 3,014.56 crores as at March 31, 2021 as against Rs. 1,039.88 crores as at March 31, 2020.
• Invesco IndiaMoneyMarketFund (An open ended debt scheme investing in money market instruments)
The Scheme invested from the liquid money market segment of credit curve. The Scheme followed a ladder approach to investment and invested across the yield curve till the 1-year maturity. The Scheme endeavored to maintain a very low interest rate risk and at the same time optimized credit risk from the available set of credits on high quality at the short end of the yield curve.
The Scheme outperformed the benchmark in FY 2020-21 and since inception. The Scheme has been able to take superior duration calls which has led the scheme to outperform the benchmark. The Scheme got the benefit of maintaining relatively significantly longer duration than the benchmark from mid-February 2021 and the sharp drop in yields has helped. Over the year also the Scheme has generally maintained a higher average duration over the benchmark.
As at March 31, 2021, 84.69% of the net assets were invested in money market instruments, 20.92% in corporate debt and the Scheme had negative net current assets of 5.61%.
The net assets of the Scheme amounted to Rs. 1,142.76 crores as at March 31, 2021 as against Rs. 595.93 crores as at March 31, 2020.
• Invesco IndiaUltraShortTermFund (An open ended ultra-short term debt scheme investing in instruments such that the Macaulay duration^ of the portfolio is between 3 months to 6 months)
The Scheme invested in liquid money market and debt segment of yield curve. The Scheme followed an active approach to duration management.
The Scheme underperformed the benchmark in FY 2020-21 and since inception. The scheme runs relatively higher credit quality compared to benchmark. The Scheme undertakes dynamic duration management to offset the lower carry due to higher credit quality. The Scheme has been able to successfully navigate the adverse credit environment for the limited dilution it has undertaken.
As at March 31, 2021, 49.46% of the net assets were invested in corporate debt, 48.34% in money market instruments and 2.20% in net current assets.
The net assets of the Scheme amounted to Rs. 720.62 crores as at March 31, 2021 as against Rs. 524.77 crores as at March 31, 2020.
• InvescoIndiaCreditRiskFund(An open ended debt scheme predominantly investing in AA and below rated corporate bonds (excluding AA+ rated corporate bonds))
The Scheme endeavored to generate returns and capital appreciation by predominantly investing in corporate debt securities of varying maturities. While the endeavor was to identify AA rated credits having stable / improving credit metrics, given the challenging credit environment led by series of credit events over past few years, the Scheme has maintained a significantly better asset quality as compared to the benchmark. Due to high differential in portfolio yield, the Scheme underperformed the benchmark in FY 2020-21. The underperformance of the Scheme since inception was due to the credit events in 2019-20 of Sintex and in 2018-19 of ITNL which dragged the performance for the period since inception as well.
As at March 31, 2021, 90.53% of the net assets were invested in corporate debt, 6.27% in money market instruments and 3.20% in net current assets.
The net assets of the Scheme amounted to Rs. 129.53 crores as at March 31, 2021 as against Rs. 178.68 crores as at March 31, 2020.
• InvescoIndiaBanking&PSUDebtFund(An open ended debt scheme predominantly investing in Debt instruments of banks, Public Sector Undertakings, Public Financial Institutions and Municipal Bonds)
The Scheme endeavored to generate optimal returns with primary exposure to the debt from banking sector and PSU.
The Scheme underperformed the benchmark in FY 2020-21 and since inception. Keeping in mind the Covid-19 era, the Scheme had relatively higher exposure to PSU bonds than banking sector bonds. The Scheme runs a 10-year roll-down strategy which is different than the benchmark and peerset. The Scheme has benefited with the easing of yields post supportive actions from RBI but underperformed in the second half of the year as yields hardened thus leading to underperformance over the benchmark during the year.
Trustees’ Report (Contd.)
Abridged Annual Report 2020-21 5
As at March 31, 2021, 95.85% of the net assets were invested in corporate debt, 22.99% in money market instruments and the Scheme had negative net current assets of 18.84%.
The net assets of the Scheme amounted to Rs. 170.61 crores as at March 31, 2021 as against Rs. 40.58 crores as at March 31, 2020.
Gilt Scheme
• InvescoIndiaGiltFund(An open ended debt scheme investing in government securities across maturity)
The Scheme invested across the liquid sovereign curve. The Scheme was actively managed depending on the view on rates, inflation and monetary policy stance of the Monetary Policy Committee (‘MPC’) members.
The Scheme outperformed the benchmark in FY 2020-21 and also since inception. The underperformance was due to maintaining Scheme duration longer during the benchmark during the phase of hardening yields and lower during phases of softening yields.
As at March 31, 2021, 90.10% of the net assets were invested in Government Securities, 8.71% in money market securities and 1.19% in net current assets.
The net assets of the Scheme amounted to Rs. 28.97 crores as at March 31, 2021 as against Rs. 26.06 crores as at March 31, 2020.
Fixed Maturity Plans
The Fixed Maturity Plans under the respective series with different tenures have generally performed in line with their respective benchmarks by investing in securities in line with the yields prevailing for the relevant tenures at the time of launch.
^ Please refer to the heading ‘C. Asset Allocation Pattern’ under Section ‘II. Information about the Scheme’ of Scheme Information Document where the concept of Macaulay duration has been explained.
Note: Money Market instruments include deployment of funds in Tri-party Repo (TREPs).
C. Future Outlook
I. Equity Market Outlook
Indian markets touched another high in the month of May 2021 with the BSE-30 Index closing at 51,937 (+6.5%) almost matching February 2021 highs while the Nifty-50 Index ended at a new peak at 15,583. The BSE Mid-cap and BSE Small-cap indices also recorded new highs gaining 7.1% and 8.9% respectively. Key driver of this move seemed to be the rapid decline in daily new infections which at ~150k were down ~60% from second wave peak. Despite this fall, several states cautiously decided to extend restrictions by another fortnight, albeit with some relaxations. India’s vaccination drive continues at a healthy pace of ~2-3mn/day, taking total adult population inoculated to ~17%/5% with single/both doses.
4QFY21 earnings of corporates were largely along the expected lines with materials having the most significant beats while consumer discretionary and financials reported modest misses. Market confidence in general has remained high since the troughs seen in March-April 2020 and even during the more recent second wave. With the second wave of the pandemic now clearly subsiding, with daily cases now down more than 60% from peak (albeit still 35% above the peak scaled in Wave 1), Governments in key states like Maharashtra, Delhi, Gujarat and UP are seen indicating passive opening of the economy although cautiously and in phases. India’s vaccination trends have also gained ground rising from nearly 1.5 Million doses/day to 3 Mn /day during this month. While expectations of a possible Wave 3 are alive, we think a combination of higher symptomatic and asymptomatic cases, improving vaccination drive and better administrative preparedness of the Govts would likely lessen its severity and allow for normal economic activity to prevail. While the market has largely ignored the short-term negatives of the pandemic but the longer-term implications of and lessons from the pandemic are still up for debate.
Markets have also taken their strength from the March 2021 earnings season and subsequent management commentaries so far that depict reasonable resilience of earnings to commodity inflation and better preparedness of corporates to manage the inevitable impact on business during the upcoming quarter due to the second wave. We reckon strong earnings contribution from commodity cyclicals and global businesses like pharma and technology may well compensate for shortfall in earnings caused by the second wave on domestic economic activity.
The outlook for developed economies, particularly the US remains sanguine led by 1) the fast pace of vaccinations, 2) USD 1.9 Trillion fiscal stimulus and counting, 3) strong household savings and 4) planned infrastructure push. While the Fed’s actions on monetary policy and quantitative easing will be the most important topic of debate during CY21, its tolerance for higher inflation through average inflation targeting, unclear labour market conditions, its preference to action based on real data than anchoring to market expectations etc. all suggest present accommodative conditions to prevail for now. Over the past week, the US Fed has announced intention to raise interest rates twice starting 2023.
In the foreseeable future, the US Fed’s QE calendar, higher commodity prices including oil, and locally India’s vaccine administration trends are key risks to the market. We however maintain our view that the Indian economy should witness a recovery in 2021, albeit of a slightly lower intensity than before the onset of the second wave
but accelerate thereafter. Supportive macro, improving banking sector, strong Govt. push towards reforms and economic normalization post Covid should enable India to commence on a new economic cycle over the next 3-5 years. Based on the current assessment, globally oriented businesses, cyclicals and industrials, healthcare and technology will likely dominate most part of 2021 even as consumer sentiment gradually repairs itself from the impact of the second wave during this period. We accordingly configure our portfolios to tactically reflect preference for cyclicals such as financials, industrials, commodities etc. in the near-term. India, however, is well-positioned to commence on a new economic upcycle over the next few years. Our chosen path to portfolio construction is a balanced approach regards sector exposure, market cap bias and the balance between growth and value. In general, our portfolios continue to be positioned for better risk-adjusted return outcomes over a 3-5-year period.
II. Debt Market Outlook
The fixed income market movements are reflecting the underlying conditions of the economy. While the economy was able to recover back to normal in early CY21, Covid-19 2nd wave has delayed and posed the downside risk to nascent economic growth recovery. Downward revision of 1% in FY22 growth projection by RBI reflects the uncertainty on growth outlook due to pandemic, unless a large part of population is vaccinated. Amidst the growth uncertainty, we expect RBI to give prime importance to the economic growth recovery & financial stability as of now, while ensuring that inflation remains within the inflation targeting framework going forward. RBI’s recent measures on Covid-19 2nd wave & readiness to act swiftly further through various tools, reassurance of surplus systemic liquidity and G-Sec Acquisition Programme 2.0 points in the same direction.
On inflation front, Monetary Policy Committee (‘MPC’) estimates average inflation to remain ~5.1% for FY22 with risks balanced on either side. Inflationary risks can emanate from supply side disruption & rise in global commodity prices while normal south-west monsoon & comfortable buffer stocks can keep the food prices contained. While the inflationary pressures persist as of now, RBI is expected to take comfort as long as the inflation remains within the inflation targeting framework of 2% to 6% and is not led by the demand driven factors.
Overall, given the uncertainty regarding economic outlook due to the impact of pandemic led state-wide lockdowns and the fears of subsequent Covid-19 waves, we expect MPC will give precedence to growth and thus the earlier fears of RBI’s policy unwinding measures are expected to be pushed further amid second wave of Covid-19 and will remain a function of growth revival, vaccination pace and inflation trajectory. RBI’s continued accommodative policy & liquidity stance coupled with the Government Securities Acquisition Program 2.0 (‘G-SAP 2.0’) programme is expected to reduce the volatility across the curve and ensure the orderly evolution of the yield curve by addressing the market concerns. The policy stance to maintain ample liquidity is positive for short end of the yield curve, while the long end also gets supported by the active yield management by RBI through the G-SAP 2.0 and regular OMOs.
Any broad-based recovery in credit environment is expected to be further delayed and we believe dispersion between high quality & low quality credits will widen again and one has to be very careful & selective in going down the credit curve.
2. Brief background of Sponsor, Trust, Trustee Company and AMC
A. Invesco Mutual Fund
Invesco Mutual Fund (“the Mutual Fund”) has been constituted as a Trust in accordance with the provisions of the Indian Trusts Act, 1882 (2 of 1882). Deed of Trust constituting the Mutual Fund was executed on April 27, 2006 and registered under the Indian Registration Act, 1908. The Mutual Fund is registered with SEBI vide Registration No. MF/052/06/01 dated July 24, 2006.
The Mutual Fund was originally set up as Lotus India Mutual Fund by Alexandra Fund Management Pte. Ltd. (the erstwhile sponsor of Lotus India Mutual Fund). On December 4, 2008, Religare Securities Limited (“RSL”), a wholly owned subsidiary of Religare Enterprises Limited (“REL”) acquired the entire shareholding in the AMC and Trustee Company from Alexandra Fund Management Pte. Ltd. and other shareholders and became sponsor of the Mutual Fund. Deed of Variation to Deed of Trust constituting the Mutual Fund was executed on January 16, 2009 to reflect Religare Securities Ltd. as the new Sponsor of the Mutual Fund. Religare Securities Ltd. had contributed Rs. 50,000/- to the corpus of the Mutual Fund in addition to Rs. 1,00,000/- contributed by erstwhile sponsor of the Mutual Fund.
Subsequently, Invesco Hong Kong Limited (“Invesco HK”), an indirect wholly owned subsidiary of Invesco Ltd., acquired 49% of shareholding in the AMC and Trustee Company from RSL on March 28, 2013 and became co-sponsor of the Mutual Fund. The Second Deed of Variation to Deed of Trust constituting the Mutual Fund was executed on March 28, 2013 to reflect Invesco HK as the Co-Sponsor of the Mutual Fund along with RSL. Pursuant to the above, Religare Mutual Fund was renamed as Religare Invesco Mutual Fund and SEBI vide its letter dated May 13, 2013 issued Fresh Registration Certificate No. MF/052/06/01 dated May 10, 2013 in the name of Religare Invesco Mutual Fund and cancelled the old Registration Certificate No. MF/052/06/01 dated July 24, 2006 in the name of Religare Mutual Fund.
Thereafter, Invesco HK acquired remaining 51% shareholding in the AMC from existing shareholders on April 7, 2016. The Third Deed of Variation to Deed of Trust constituting the Mutual Fund was executed on April 7, 2016 to reflect Invesco HK as the Sole Sponsor of the Mutual Fund and cessation/retirement of RSL as co-sponsor of the Mutual Fund.
Trustees’ Report (Contd.)
Abridged Annual Report 2020-21 6
Pursuant to the above, Religare Invesco Mutual Fund was renamed as Invesco Mutual Fund and SEBI vide its letter dated May 5, 2016 issued Fresh Registration Certificate No. MF/052/06/01 dated May 5, 2016 in the name of Invesco Mutual Fund and cancelled the old Registration Certificate No. MF/052/06/01 dated May 10, 2013 in the name of Religare Invesco Mutual Fund.
B. Invesco Trustee Pvt. Ltd.
Invesco Trustee Private Limited (“the Trustee” or “Trustee Company”), through its Board of Directors, discharges its obligations as trustee of Invesco Mutual Fund. The Trustee is the exclusive owner of the Trust Fund and holds the same in trust for the benefit of the unit holders. The Trustee has been discharging its duties and carrying out the responsibilities as provided in SEBI (Mutual Funds) Regulations, 1996 (“the Regulations”) and the Deed of Trust. The Trustee seeks to ensure that the Fund and the schemes floated thereunder are managed by the Asset Management Company in accordance with the Deed of Trust, the Regulations, directions and guidelines issued by the SEBI, the Stock Exchanges, the Association of Mutual Funds in India and other regulatory agencies.
C. Sponsor
Invesco Mutual Fund is sponsored by Invesco Hong Kong Limited.
Invesco Hong Kong Ltd. (“Invesco HK”) is a corporation incorporated under the laws of Hong Kong on October 17, 1972 having its registered office at 41/F, Champion Tower, 3 Garden Road, Central, Hong Kong. Invesco HK is engaged in the business of asset management, dealing in securities, advising on securities and advising on futures contracts. The main business focus of Invesco HK is to undertake investment management activities for retail and institutional clients. It manages a range of asset classes encompassing equity, bond, balanced and money market investments. Today, Invesco HK enjoys a leading position and a strong edge in helping investors achieve their financial objectives in one of the world’s most compelling markets. For more information, log on to www.invesco.com.hk.
D. Invesco Asset Management (India) Private Limited
Invesco Asset Management (India) Private Limited (“the AMC”) was incorporated under the Companies Act, 1956 on May 20, 2005. The AMC has been appointed as the Asset Management Company of Invesco Mutual Fund by the Trustees vide Investment Management Agreement (IMA) dated April 27, 2006 executed between the Trustees and the AMC. The IMA has been amended by the first Amendment to IMA dated March 28, 2013.
The AMC is also registered with SEBI as a Portfolio Manager vide registration no. PM/INP000005273 dated August 19, 2019 under SEBI (Portfolio Managers) Regulations, 2020. The AMC is also providing non-binding, non-discretionary and non-exclusive advisory services to offshore funds under its Portfolio Management Services.
The AMC is registered with Securities and Exchange Commission (‘SEC’), United States as Investment Advisers under Investment Advisers Act of 1940 vide registration number 801-108727 dated December 24, 2016.
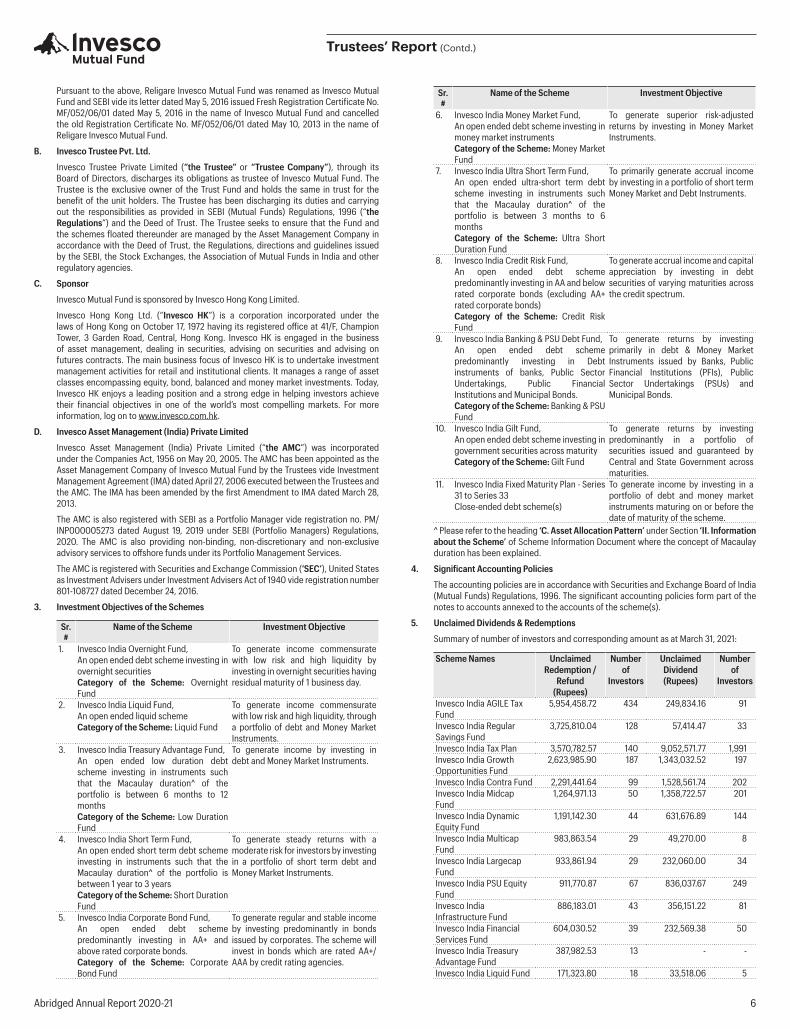
3. Investment Objectives of the Schemes
Sr. #
Name of the Scheme Investment Objective
1. Invesco India Overnight Fund,An open ended debt scheme investing in overnight securitiesCategory of the Scheme: Overnight Fund
To generate income commensurate with low risk and high liquidity by investing in overnight securities having residual maturity of 1 business day.
2. Invesco India Liquid Fund,An open ended liquid schemeCategory of the Scheme: Liquid Fund
To generate income commensurate with low risk and high liquidity, through a portfolio of debt and Money Market Instruments.
3. Invesco India Treasury Advantage Fund,An open ended low duration debt scheme investing in instruments such that the Macaulay duration^ of the portfolio is between 6 months to 12 monthsCategory of the Scheme: Low Duration Fund
To generate income by investing in debt and Money Market Instruments.
4. Invesco India Short Term Fund,An open ended short term debt scheme investing in instruments such that the Macaulay duration^ of the portfolio is between 1 year to 3 yearsCategory of the Scheme: Short Duration Fund
To generate steady returns with a moderate risk for investors by investing in a portfolio of short term debt and Money Market Instruments.
5. Invesco India Corporate Bond Fund,An open ended debt scheme predominantly investing in AA+ and above rated corporate bonds.Category of the Scheme: Corporate Bond Fund
To generate regular and stable income by investing predominantly in bonds issued by corporates. The scheme will invest in bonds which are rated AA+/ AAA by credit rating agencies.
Sr. #
Name of the Scheme Investment Objective
6. Invesco India Money Market Fund,An open ended debt scheme investing in money market instrumentsCategory of the Scheme: Money Market Fund
To generate superior risk-adjusted returns by investing in Money Market Instruments.
7. Invesco India Ultra Short Term Fund,An open ended ultra-short term debt scheme investing in instruments such that the Macaulay duration^ of the portfolio is between 3 months to 6 monthsCategory of the Scheme: Ultra Short Duration Fund
To primarily generate accrual income by investing in a portfolio of short term Money Market and Debt Instruments.
8. Invesco India Credit Risk Fund,An open ended debt scheme predominantly investing in AA and below rated corporate bonds (excluding AA+ rated corporate bonds)Category of the Scheme: Credit Risk Fund
To generate accrual income and capital appreciation by investing in debt securities of varying maturities across the credit spectrum.
9. Invesco India Banking & PSU Debt Fund,An open ended debt scheme predominantly investing in Debt instruments of banks, Public Sector Undertakings, Public Financial Institutions and Municipal Bonds.Category of the Scheme: Banking & PSU Fund
To generate returns by investing primarily in debt & Money Market Instruments issued by Banks, Public Financial Institutions (PFIs), Public Sector Undertakings (PSUs) and Municipal Bonds.
10. Invesco India Gilt Fund,An open ended debt scheme investing in government securities across maturityCategory of the Scheme: Gilt Fund
To generate returns by investing predominantly in a portfolio of securities issued and guaranteed by Central and State Government across maturities.
11. Invesco India Fixed Maturity Plan - Series 31 to Series 33Close-ended debt scheme(s)
To generate income by investing in a portfolio of debt and money market instruments maturing on or before the date of maturity of the scheme.
^ Please refer to the heading ‘C. Asset Allocation Pattern’ under Section ‘II. Information about the Scheme’ of Scheme Information Document where the concept of Macaulay duration has been explained.
4. Significant Accounting Policies
The accounting policies are in accordance with Securities and Exchange Board of India (Mutual Funds) Regulations, 1996. The significant accounting policies form part of the notes to accounts annexed to the accounts of the scheme(s).
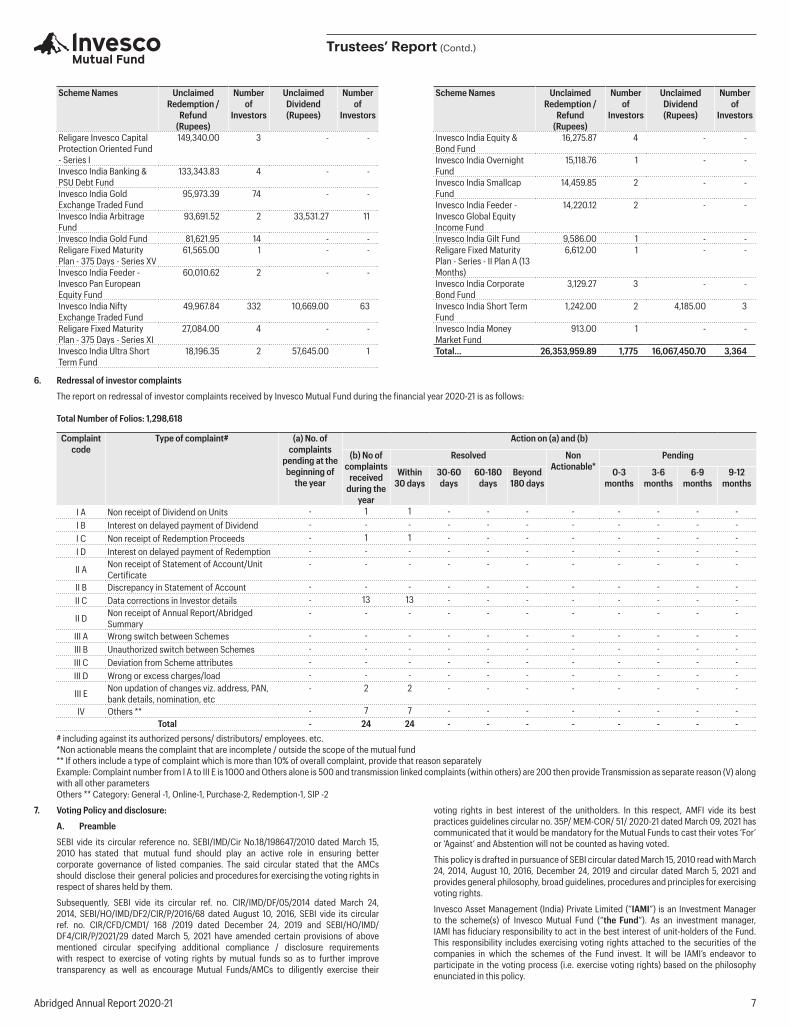
5. Unclaimed Dividends & Redemptions
Summary of number of investors and corresponding amount as at March 31, 2021:
Scheme Names Unclaimed Redemption /
Refund (Rupees)
Number of
Investors
Unclaimed Dividend (Rupees)
Number of
Investors
Invesco India AGILE Tax Fund
5,954,458.72 434 249,834.16 91
Invesco India Regular Savings Fund
3,725,810.04 128 57,414.47 33
Invesco India Tax Plan 3,570,782.57 140 9,052,571.77 1,991Invesco India Growth Opportunities Fund
2,623,985.90 187 1,343,032.52 197
Invesco India Contra Fund 2,291,441.64 99 1,528,561.74 202Invesco India Midcap Fund
1,264,971.13 50 1,358,722.57 201
Invesco India Dynamic Equity Fund
1,191,142.30 44 631,676.89 144
Invesco India Multicap Fund
983,863.54 29 49,270.00 8
Invesco India Largecap Fund
933,861.94 29 232,060.00 34
Invesco India PSU Equity Fund
911,770.87 67 836,037.67 249
Invesco India Infrastructure Fund
886,183.01 43 356,151.22 81
Invesco India Financial Services Fund
604,030.52 39 232,569.38 50
Invesco India Treasury Advantage Fund
387,982.53 13 - -
Invesco India Liquid Fund 171,323.80 18 33,518.06 5
Trustees’ Report (Contd.)
Abridged Annual Report 2020-21 7
Scheme Names Unclaimed Redemption /
Refund (Rupees)
Number of
Investors
Unclaimed Dividend (Rupees)
Number of
Investors
Religare Invesco Capital Protection Oriented Fund - Series I
149,340.00 3 - -
Invesco India Banking & PSU Debt Fund
133,343.83 4 - -
Invesco India Gold Exchange Traded Fund
95,973.39 74 - -
Invesco India Arbitrage Fund
93,691.52 2 33,531.27 11
Invesco India Gold Fund 81,621.95 14 - -Religare Fixed Maturity Plan - 375 Days - Series XV
61,565.00 1 - -
Invesco India Feeder - Invesco Pan European Equity Fund
60,010.62 2 - -
Invesco India Nifty Exchange Traded Fund
49,967.84 332 10,669.00 63
Religare Fixed Maturity Plan - 375 Days - Series XI
27,084.00 4 - -
Invesco India Ultra Short Term Fund
18,196.35 2 57,645.00 1
Scheme Names Unclaimed Redemption /
Refund (Rupees)
Number of
Investors
Unclaimed Dividend (Rupees)
Number of
Investors
Invesco India Equity & Bond Fund
16,275.87 4 - -
Invesco India Overnight Fund
15,118.76 1 - -
Invesco India Smallcap Fund
14,459.85 2 - -
Invesco India Feeder - Invesco Global Equity Income Fund
14,220.12 2 - -
Invesco India Gilt Fund 9,586.00 1 - -Religare Fixed Maturity Plan - Series - II Plan A (13 Months)
6,612.00 1 - -
Invesco India Corporate Bond Fund
3,129.27 3 - -
Invesco India Short Term Fund
1,242.00 2 4,185.00 3
Invesco India Money Market Fund
913.00 1 - -
Total… 26,353,959.89 1,775 16,067,450.70 3,364
6. Redressal of investor complaints
The report on redressal of investor complaints received by Invesco Mutual Fund during the financial year 2020-21 is as follows:
Total Number of Folios: 1,298,618
Complaint code
Type of complaint# (a) No. of complaints
pending at the beginning of
the year
Action on (a) and (b)
(b) No of complaints
received during the
year
Resolved Non Actionable*
Pending
Within 30 days
30-60 days
60-180 days
Beyond 180 days
0-3 months
3-6 months
6-9 months
9-12 months
I A Non receipt of Dividend on Units - 1 1 - - - - - - - -I B Interest on delayed payment of Dividend - - - - - - - - - - -I C Non receipt of Redemption Proceeds - 1 1 - - - - - - - -I D Interest on delayed payment of Redemption - - - - - - - - - - -
II A Non receipt of Statement of Account/Unit Certificate
- - - - - - - - - - -
II B Discrepancy in Statement of Account - - - - - - - - - - -II C Data corrections in Investor details - 13 13 - - - - - - - -
II D Non receipt of Annual Report/Abridged Summary
- - - - - - - - - - -
III A Wrong switch between Schemes - - - - - - - - - - -III B Unauthorized switch between Schemes - - - - - - - - - - -III C Deviation from Scheme attributes - - - - - - - - - - -III D Wrong or excess charges/load - - - - - - - - - - -
III E Non updation of changes viz. address, PAN, bank details, nomination, etc
- 2 2 - - - - - - - -
IV Others ** - 7 7 - - - - - - - -Total - 24 24 - - - - - - - -
# including against its authorized persons/ distributors/ employees. etc. *Non actionable means the complaint that are incomplete / outside the scope of the mutual fund ** If others include a type of complaint which is more than 10% of overall complaint, provide that reason separately Example: Complaint number from I A to III E is 1000 and Others alone is 500 and transmission linked complaints (within others) are 200 then provide Transmission as separate reason (V) along
with all other parameters Others ** Category: General -1, Online-1, Purchase-2, Redemption-1, SIP -2
7. Voting Policy and disclosure:
A. Preamble
SEBI vide its circular reference no. SEBI/IMD/Cir No.18/198647/2010 dated March 15, 2010 has stated that mutual fund should play an active role in ensuring better corporate governance of listed companies. The said circular stated that the AMCs should disclose their general policies and procedures for exercising the voting rights in respect of shares held by them.
Subsequently, SEBI vide its circular ref. no. CIR/IMD/DF/05/2014 dated March 24, 2014, SEBI/HO/IMD/DF2/CIR/P/2016/68 dated August 10, 2016, SEBI vide its circular ref. no. CIR/CFD/CMD1/ 168 /2019 dated December 24, 2019 and SEBI/HO/IMD/DF4/CIR/P/2021/29 dated March 5, 2021 have amended certain provisions of above mentioned circular specifying additional compliance / disclosure requirements with respect to exercise of voting rights by mutual funds so as to further improve transparency as well as encourage Mutual Funds/AMCs to diligently exercise their
voting rights in best interest of the unitholders. In this respect, AMFI vide its best practices guidelines circular no. 35P/ MEM-COR/ 51/ 2020-21 dated March 09, 2021 has communicated that it would be mandatory for the Mutual Funds to cast their votes ‘For’ or ‘Against’ and Abstention will not be counted as having voted.
This policy is drafted in pursuance of SEBI circular dated March 15, 2010 read with March 24, 2014, August 10, 2016, December 24, 2019 and circular dated March 5, 2021 and provides general philosophy, broad guidelines, procedures and principles for exercising voting rights.
Invesco Asset Management (India) Private Limited (“IAMI”) is an Investment Manager to the scheme(s) of Invesco Mutual Fund (“the Fund”). As an investment manager, IAMI has fiduciary responsibility to act in the best interest of unit-holders of the Fund. This responsibility includes exercising voting rights attached to the securities of the companies in which the schemes of the Fund invest. It will be IAMI’s endeavor to participate in the voting process (i.e. exercise voting rights) based on the philosophy enunciated in this policy.
Trustees’ Report (Contd.)
Abridged Annual Report 2020-21 8
B. Philosophy of Voting Policy
Good corporate governance ensures that a corporation is managed keeping in mind the long-term interest of shareholders. Promoting good corporate governance standards forms an integral part of corporate ownership responsibilities.
With this in the forefront, IAMI expects all corporations, in which it invests in, to comply with high corporate governance standards. Accordingly, as the decision to invest is generally an endorsement of sound management practices, IAMI may generally vote with the management of these corporations. However, when IAMI is of the view that the unit holders will be prejudiced by any such proposal, then it may vote against such proposal to protect the interest of unit holders. Also in case of resolutions moved by the shareholders of the company, IAMI will exercise its voting rights in the best interest of its unit holders. Other than matters mentioned under section D (I), in certain circumstances, IAMI may also decide to refrain from voting where it has insufficient information or there is conflict of interest or it does not have a clear stance on the proposal under consideration.
IAMI, as an investment manager, will generally vote in accordance with the Voting Policy. However, it may deviate from the policy if there are particular facts and/or circumstances that warrant for such deviation to protect the interests of unit-holders of the Fund.
C. Conflict of Interest in Exercising Voting Rights
IAMI, under schemes, may invest in the securities of associate/group companies (to the extent permitted under SEBI (Mutual Funds) Regulations, 1996 as amended from time to time). Further, IAMI is an Indian subsidiary of global organization consisting of many affiliates. Moreover, schemes under IAMI may invest in securities of companies which have invested in schemes of Invesco Mutual Fund. Such scenarios may lead to a situation creating conflict of interest. Potential Conflict of interest may also arise if IAMI and the investee company are associates or are part of the same group; or the investee company holds a material ownership interest in IAMI; a nominee of IAMI has been appointed as a director of the investee company or having cross-directorships, the Investee Company is an entity participating in the distribution of investment products advised or administered by the Investment Manager and/or any of its affiliate; the Investee Company is a client of Investment Manager and/or its affiliates.
IAMI will attempt to avoid conflict of interest and will exercise its voting rights in the best interest of the unit-holders. Voting decisions in such cases will be based on merits without any bias and the same parameters will be applied for taking voting decisions as are applied for other companies.
In cases where there is a potential conflict of interest, IAMI will vote exactly as per recommendations of the proxy voting advisory entity with no modifications whatsoever. In case there is need for a clearer direction, the matter may be referred to the Investment committee for its guidance. Rationale for decision taken/ voting on the issue shall be recorded.
D. Voting Policy Guidelines
I. The matters regarding, but not limited to, which the IAMI will exercise the voting rights in the Annual General Meeting (AGMs) /Extra Ordinary General Meeting (EGMs)/ Through Postal Ballots/Electronic voting of the investee companies are as follows:
• Corporate governance matters, including changes in the state of incorporation, merger and other corporate restructuring and anti- takeover provisions.
• Changes to capital structure, including increase and decrease of capital and preferred stock issuances.
• Stock option plans and other management compensation issues.
• Social and corporate responsibility issues.
• Appointment and Removal of Directors.
• Any other issue that may affect the interest of the shareholders in general and interest of the unit-holders in particular.
• Related party transactions of the investee companies (excluding own groupcompanies). For this purpose, “Related Party Transactions” shall have same meaning as assigned to them in clause (zc) of Sub-Regulation (1) of Regulation (2) of the SEBI (Listing Obligation and Disclosure Requirements) Regulations, 2015.
Effective April 01, 2021, voting shall be mandatory for all resolutions mentioned above. Further, for all remaining resolutions which are not covered in (I) above, IAMI will compulsorily be required to cast votes with effect from April 01, 2022.
II. In case of the Mutual Funds having no economic interest on the day of voting, it may be exempted from compulsorily casting of votes.
III. The vote shall be cast at Mutual Fund Level. However, in case Fund Manager/(s) of any specific scheme has strong view against the views of Fund Manager/(s) of the other schemes, the voting at scheme level shall be allowed subject to recording of detailed rationale for the same.
IAMI will exercise voting rights keeping in mind the need to improve economic value of the companies and importance of protecting the interests of unit holders of its schemes but subject to importance of the matter and cost/time implications. The analysts in equity team will make recommendations on key voting issues and same will
be approved by the Head of Equity or Fund Manager. In case of conflicts or need for a clearer direction, the matter may be referred to the Voting Committee for its guidance.
E. Voting Committee
As a guiding principle, IAMI shall exercise voting rights solely in the interest of unit holders of the Fund. IAMI has constituted a Voting Committee (VC) .The Committee is empowered to provide guidance on the voting matters referred to it, establish voting guidelines and procedures as it may consider necessary and is responsible to ensure that these guidelines and procedures are adhered to and also make changes in the Policy as may be required from time to time. The members of this Committee are as follows:
• CEO / COO/Head - Operations (any one)
• Head of Compliance or Member of compliance team
• Head of Equity or Fund Manager (equity)
• Head of Fixed Income and/ or Fund Managers (fixed income)
• Any other representative as the Committee may co-opt from time to time
Broad Guidelines for functioning of Voting Committee are:
1. Voting Committee may record its decisions by circulation including decisions/guidance on voting matters that have been referred to it.
2. Voting Committee may consult with outside experts and other investors on issues as it may deem fit
3. Decisions of Voting Committee should be maintained by compliance
4. Details of voting decisions taken by the Fund Management team will be presented to the Voting Committee/Investment Committee.
5. Voting Committee may review this policy from time to time.
F. Steps (Procedure) in Exercising Voting Rights
The following points outline the key steps in exercising Voting rights:
1) Notification of company AGMs / EGMs and relevant voting items to Fund Management Team. (Custodian)
2) The IAMI shall endeavor to vote for all holdings of the Fund aggregated for all its schemes. The voting will cover all equity holding across all schemes of Invesco Mutual Fund including passive investments like Index Funds, Exchange Traded Fund etc. (except for companies which are held only in arbitrage fund).
3) Custodian will send ballots and or other relevant papers (notice of meeting, proxy form, attendance slips etc.) to IAMI relating to AGM/EGM as soon as it receives.
4) The fund management team is authorized to decide on voting decisions but may refer decisions to the Voting Committee for its guidance/direction.
5) Based on internal discussion within the fund management team, a decision would be arrived to vote on the proposed resolution. Routine matters and ordinary resolutions like adoption of financials (unless there are significant auditor qualifications), dividend declaration, general updating/corrective amendments to the Articles of Association would also be considered for voting purpose. However, IAMI may on a case to case basis, not vote on such resolutions, if it deems fit to do so.
6) IAMI will generally support and vote “for” proposals which are likely to result in maximizing long-term investment returns for unit holders. IAMI would not support and will vote “against” proposals that appear to be detrimental to the company financials / interest of the minority shareholders or which would adversely impact shareholders’ value.
7) IAMI may exercise its voting rights by authorizing its own executives/authorized representative to attend the AGM/EGM or may instruct the Custodian to exercise voting rights in accordance with the instructions of IAMI.
8) IAMI may exercise its voting rights through Postal Ballot or may use Electronic voting mechanism, wherever available, either through its own executives or by authorizing the Custodian. The records of voting exercised through Postal Ballot will be maintained by IAMI.
9) IAMI may utilize the services of third party professional agencies for getting in-depth analyses of proposals and vote recommendations. However, the recommendations of the third party agencies will be non-binding in nature. IAMI will perform due diligence on proxy voting advisory firms at the time of initial selection as well as at the time of renewal of services of the proxy voting. The due diligence will be carried out on parameters viz. resource strength, Companies under coverage, extent of institutional ownership, depth of analysis, quality of advice / recommendations, analyst access & support, timely availability of reports, composition of board of directors, advisory board and top management, web-based interface platform and clientele.
10) The rationale supporting each voting decision (For, Against and Abstain) will be recorded and such records will be retained for number of years (currently 8 years) as may be required under the SEBI (Mutual Funds) Regulations, 1996 from time to time.
Trustees’ Report (Contd.)
Abridged Annual Report 2020-21 9
G. Details of Service Provider
IIAS (Institutional Investor advisory Services) has been appointed as our proxy voting advisor. The scope of the agreement with IIAS includes: IIAS shall provide non-binding Voting Recommendations for each Voting Event for Investee companies, access to their research portal and analysts for any discussion, access to their online voting management systems etc. The details of the service provider (currently IIAS) are provided in the “Rationale for continuation of Proxy Voting advisory report” which is prepared once in 2 years. IIAS has standardized voting policies and has a committee-based voting decision making system. Their analysis to arrive at the recommendations are detailed in nature and recommendations are fairly objective. However, the recommendations of IIAS are non-binding in nature, and IAMI, reserves the right to vote differently based on their own judgement on the matter involved.
H. Disclosures
The disclosures of voting rights exercised are as follows:
• DetailsofvotescastbytheschemesoftheFundwillbeuploadedonthewebsiteof IAMI (www.invescomutualfund.com) (in machine readable spreadsheet form) on a quarterly basis in the prescribed format within the stipulated timelines as prescribed by SEBI from time to time.
• DetailsofvotescastbytheschemesoftheFundwillbeuploadedonthewebsiteof IAMI (www.invescomutualfund.com) on an annual basis in the prescribed format. Further, AMCs shall provide the web link in the Annual Reports of the schemes of the Fund regarding the disclosure of voting details.
• Summary on actual exercise of votes cast and its break-up in terms of totalnumber of votes cast in favor or against will also be uploaded on the website of IAMI (www.invescomutualfund.com) on an annual basis.
I. Certification/Confirmation
• On an annual basis, IAMI will obtain a certification from scrutinizer (in terms of Rule 20 (3) (ix) of Companies (Management and Administration) Rules, 2014) on voting reports and the same will be placed before the Boards of AMC and Trustee. The scrutinizer’s certificate will form part of Annual Report and will also be uploaded on the website of IAMI (www.invescomutualfund.com).
• A confirmation shall also be submitted by Trustees in its half yearly report to SEBI that IAMI have voted on important decisions affecting interests of unitholders.
J. Review
The Board of Directors of IAMI and Trustees shall review and ensure that IAMI have voted on important decisions affecting interests of unitholders and the rationale recorded for vote decision is prudent and adequate.
8. Disclosure of Votes Cast by Mutual Funds
Pursuant to SEBI Circular no. SEBI/HO/IMD/DF2/CIR/P/2021/024 dated March 4, 2021, the website link to access the disclosure of voting details is as follows https://invescomutualfund.com/about-us?tab=Statutory:
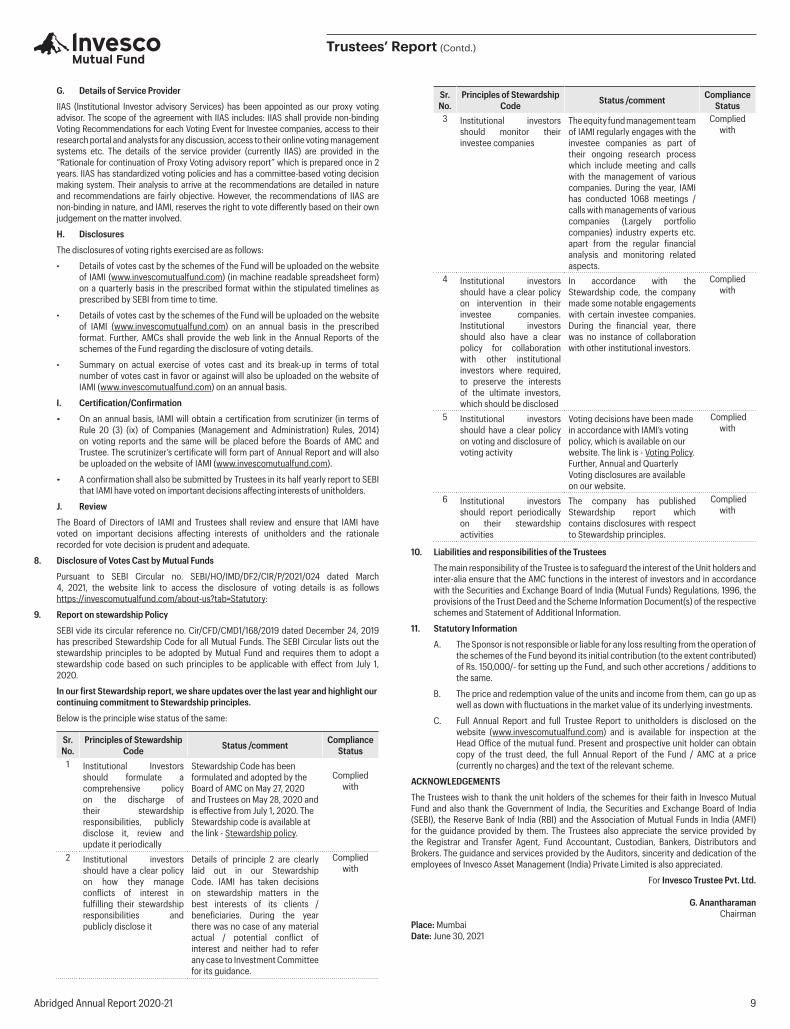
9. Report on stewardship Policy
SEBI vide its circular reference no. Cir/CFD/CMD1/168/2019 dated December 24, 2019 has prescribed Stewardship Code for all Mutual Funds. The SEBI Circular lists out the stewardship principles to be adopted by Mutual Fund and requires them to adopt a stewardship code based on such principles to be applicable with effect from July 1, 2020.
In our first Stewardship report, we share updates over the last year and highlight our continuing commitment to Stewardship principles.
Below is the principle wise status of the same:
Sr. No.
Principles of Stewardship Code Status /comment Compliance
Status1 Institutional Investors
should formulate a comprehensive policy on the discharge of their stewardship responsibilities, publicly disclose it, review and update it periodically
Stewardship Code has been formulated and adopted by the Board of AMC on May 27, 2020 and Trustees on May 28, 2020 and is effective from July 1, 2020. The Stewardship code is available at the link - Stewardship policy.
Complied with
2 Institutional investors should have a clear policy on how they manage conflicts of interest in fulfilling their stewardship responsibilities and publicly disclose it
Details of principle 2 are clearly laid out in our Stewardship Code. IAMI has taken decisions on stewardship matters in the best interests of its clients / beneficiaries. During the year there was no case of any material actual / potential conflict of interest and neither had to refer any case to Investment Committee for its guidance.
Complied with
Sr. No.
Principles of Stewardship Code Status /comment Compliance
Status3 Institutional investors
should monitor their investee companies
The equity fund management team of IAMI regularly engages with the investee companies as part of their ongoing research process which include meeting and calls with the management of various companies. During the year, IAMI has conducted 1068 meetings / calls with managements of various companies (Largely portfolio companies) industry experts etc. apart from the regular financial analysis and monitoring related aspects.
Complied with
4 Institutional investors should have a clear policy on intervention in their investee companies. Institutional investors should also have a clear policy for collaboration with other institutional investors where required, to preserve the interests of the ultimate investors, which should be disclosed
In accordance with the Stewardship code, the company made some notable engagements with certain investee companies. During the financial year, there was no instance of collaboration with other institutional investors.
Complied with
5 Institutional investors should have a clear policy on voting and disclosure of voting activity
Voting decisions have been made in accordance with IAMI’s voting policy, which is available on our website. The link is - Voting Policy.Further, Annual and Quarterly Voting disclosures are available on our website.
Complied with
6 Institutional investors should report periodically on their stewardship activities
The company has published Stewardship report which contains disclosures with respect to Stewardship principles.
Complied with
10. Liabilities and responsibilities of the Trustees
The main responsibility of the Trustee is to safeguard the interest of the Unit holders and inter-alia ensure that the AMC functions in the interest of investors and in accordance with the Securities and Exchange Board of India (Mutual Funds) Regulations, 1996, the provisions of the Trust Deed and the Scheme Information Document(s) of the respective schemes and Statement of Additional Information.
11. Statutory Information
A. The Sponsor is not responsible or liable for any loss resulting from the operation of the schemes of the Fund beyond its initial contribution (to the extent contributed) of Rs. 150,000/- for setting up the Fund, and such other accretions / additions to the same.
B. The price and redemption value of the units and income from them, can go up as well as down with fluctuations in the market value of its underlying investments.
C. Full Annual Report and full Trustee Report to unitholders is disclosed on the website (www.invescomutualfund.com) and is available for inspection at the Head Office of the mutual fund. Present and prospective unit holder can obtain copy of the trust deed, the full Annual Report of the Fund / AMC at a price (currently no charges) and the text of the relevant scheme.
ACKNOWLEDGEMENTS
The Trustees wish to thank the unit holders of the schemes for their faith in Invesco Mutual Fund and also thank the Government of India, the Securities and Exchange Board of India (SEBI), the Reserve Bank of India (RBI) and the Association of Mutual Funds in India (AMFI) for the guidance provided by them. The Trustees also appreciate the service provided by the Registrar and Transfer Agent, Fund Accountant, Custodian, Bankers, Distributors and Brokers. The guidance and services provided by the Auditors, sincerity and dedication of the employees of Invesco Asset Management (India) Private Limited is also appreciated.
For Invesco Trustee Pvt. Ltd.
G. AnantharamanChairman
Place: MumbaiDate: June 30, 2021
Trustees’ Report (Contd.)
Abridged Annual Report 2020-21 10
To
The Board of Directors of Invesco Trustee Private Limited Report on the Audit of the Financial Statements
Opinion
We have audited the accompanying financial statements of the undermentioned Schemes of INVESCO MUTUAL FUND (the “Schemes”) which comprise the Balance Sheets as at March 31, 2021, the Revenue Accounts and the Cash Flow Statements (where applicable) for the year then ended and a summary of the significant accounting policies and other explanatory information.
SchemeInvesco India Liquid FundInvesco India Gilt FundInvesco India Treasury Advantage Fund Invesco India Short Term FundInvesco India Corporate Bond Fund Invesco India Money Market Fund Invesco India Ultra Short Term Fund Invesco India Banking & PSU Debt Fund Invesco India Credit Risk Fund Invesco Overnight FundIn our opinion and to the best of our information and according to the explanations given to us, the aforesaid financial statements give the information required by the Securities and Exchange Board of India (Mutual Funds) Regulations, 1996 as amended (the “SEBI Regulations”) in the manner so required and give a true and fair view in conformity with the accounting principles generally accepted in India:
(a) in the case of the Balance Sheets, of the state of affairs of the Schemes as at the March 31, 2021;
(b) in the case of the Revenue Accounts, of the Surplus of the Schemes for the year then ended; and
(c) in the case of the Cash Flow Statements, where applicable, of the cash flows for the year then ended.
Basis for Opinion
We conducted our audit in accordance with the Standards on Auditing (SAs) issued by the Institute of Chartered Accountants of India (“ICAI”) as applicable to the schemes. Our responsibilities under those Standards are further described in the Auditor’s Responsibilities for the Audit of the Financial Statements section of our report. In conducting our audit we have taken into account the provisions of the SEBI Regulations, the accounting standards issued by the ICAI, as applicable, accounting principles generally accepted in India and matters which are required to be included in the audit report under the provisions of the SEBI Regulations. We are independent of the Schemes in accordance with the ethical requirements that are relevant to our audit of the financial statements, and we have fulfilled our other responsibilities in accordance with these requirements. We believe that the audit evidence we have obtained is sufficient and appropriate to provide a basis for our audit opinion on the financial statements.
Key Audit Matters
Key audit matters are those matters that, in our professional judgment, were of most significance in our current audit of the financial statements of the Schemes. These matters were addressed in the context of our audit of the financial statements of each Scheme as a whole, and in forming our opinion thereon, and we do not provide a separate opinion on these matters.
Sr. No.
Key Audit Matter Auditor’s Response
1 Valuation and existence of Investments:
The valuation and existence of the portfolio of investments is considered as a key audit matter since investments form the most significant component of the balance sheet and accurate valuation of investments is critical to the accurate computation of the asset value. Valuation of Investments is required to be in compliance with the valuation policy as approved by the Board of the Invesco Trustee Private Limited and Invesco Asset Management Company (India) Private Limited and in compliance with SEBI Regulations and Guidelines.
Principal audit procedures performed:
We gained an understanding of the internal control structure and operating effectiveness of key controls surrounding valuation and existence of investments.
We tested the valuation of the investments by testing the compliance with the valuation policy as approved by the Board of Invesco Trustee Private Limited and Invesco Asset Management Company (India) Private Limited and in compliance with SEBI Regulations and Guidelines and by comparing the investment valuation from prices obtained from following sources:
• security level prices received from agenciesapproved by Association of Mutual Funds in India (“AMFI”);
• NAVobtainedfromAMFI;
• We also assessed and verified the provisionsrequired as per SEBI guidance on non-investment grade and/or downgraded securities.
We tested the existence of the Investments by obtaining and reconciling the direct confirmations of the holdings from following sources:
• CustodiansoftheSchemes
• ReserveBankofIndia
• ClearingCorporationofIndiaLimited
We agreed the holdings as per above confirmations with the Schemes’ accounting records. We reviewed the reconciliations for the cases where differences were observed and obtained explanations for the same.
2 Revenue Recognition:
The accuracy and completeness of revenue is considered as a key audit matter as this is the most significant and critical component of the revenue account and drives the measurement of the performance of the scheme for the year. The revenue for the schemes arise from fixed income investments, trading activities or dividends, depending on the nature of the scheme. Revenue is required to be recognized as per the accounting policy and in compliance with SEBI Regulations.
Principal audit procedures performed:
We gained an understanding of the internal control structure and operating effectiveness of key controls surrounding recognition of revenue arising from the various streams. This included testing the automated controls in the process of recognition of revenue.
We performed the following audit procedures on revenues:
• we have recomputed the interest incomerecorded on a sample basis.
• wehavere-computedtheprofit/lossrecognisedbased on such trades on a sample basis.
• In relation to dividend, we have verified thedividend recognised by the schemes.
• Inrelationtoalltheabove,wehavealsotestedthe cut-off of revenue such recognised by testing the income accrued as at the balances sheet date.
In our testing as above, we have also tested the compliance with the accounting policy pertaining to revenue recognition in compliance with SEBI Regulations.
Information Other than the Financial Statements and Auditor’s Report Thereon
The Managements of Invesco Trustee Private Limited (“the Trustee Company”) and Invesco Asset Management Company (India) Private Limited (“the AMC/Investment Manager”) are responsible for the other information. The other information comprises the Trustee Report and Abridged Financial Statements of Invesco Mutual Fund, but does not include these financial statements and our auditor’s report thereon.
Our opinion on the financial statements does not cover the other information and we do not express any form of assurance or conclusion thereon.
In connection with our audit of these financial statements, our responsibility is to read the other information identified above when it becomes available and, in doing so, consider whether the other information is materially inconsistent with the financial statements or our knowledge obtained during the course of our audit or otherwise appears to be materially misstated.
If, based on the work we have performed, we conclude that there is a material misstatement therein of this other information, we are required to report the fact. We have nothing to report in this regard.
Independent Auditors’ Report
Abridged Annual Report 2020-21 11
Management’s Responsibility for the Financial Statements
The Managements of the Investment Manager and the Trustee Company are responsible for the preparation of these financial statements that give a true and fair view of the financial position, financial performance and cash flows of the Schemes in accordance with accounting policies and standards as specified in the Ninth Schedule of the SEBI Regulations and in accordance with the accounting principles generally accepted in India. This responsibility includes the maintenance of adequate accounting records in accordance with the provisions of the SEBI Regulations for safeguarding the assets of the Schemes and for preventing and detecting frauds and other irregularities; selection and application of appropriate accounting policies; making judgments and estimates that are reasonable and prudent; and design, implementation and maintenance of adequate internal financial controls, that were operating effectively for ensuring the accuracy and completeness of the accounting records, relevant to the preparation and presentation of the financial statements that give a true and fair view and are free from material misstatement, whether due to fraud or error.
In preparing the financial statements, managements of the Investment Manager and the Trustee Company are responsible for assessing the Schemes’ ability to continue as a going concern, disclosing, as applicable, matters related to going concern and using the going concern basis of accounting unless management either intends to liquidate the schemes, or has no realistic alternative but to do so.
The Managements of the Investment Manager and the Trustee Company are responsible for overseeing the Schemes’ financial reporting process.
Auditors’ Responsibility for the Audit of the Financial Statements
Our objectives are to obtain reasonable assurance about whether the financial statements of each Scheme as a whole are free from material misstatement, whether due to fraud or error, and to issue an auditor’s report that includes our opinion. Reasonable assurance is a high level of assurance, but is not a guarantee that an audit conducted in accordance with SAs will always detect a material misstatement when it exists. Misstatements can arise from fraud or error and are considered material if, individually or in the aggregate, they could reasonably be expected to influence the economic decisions of users taken on the basis of these financial statements.
As part of an audit in accordance with SAs, we exercise professional judgment and maintain professional skepticism throughout the audit. We also:
• Identifyandassess the risksofmaterialmisstatementof the financial statementsofeach Scheme, whether due to fraud or error, design and perform audit procedures responsive to those risks, and obtain audit evidence that is sufficient and appropriate to provide a basis for our opinion. The risk of not detecting a material misstatement resulting from fraud is higher than for one resulting from error, as fraud may involve collusion, forgery, intentional omissions, misrepresentations, or the override of internal control.
• ObtainanunderstandingofinternalfinancialcontroloftheFundasawholerelevanttothe audit in order to design audit procedures that are appropriate in the circumstances but not for the purpose of expressing an opinion on the effectiveness of the Schemes’ internal financial control.
• Evaluate theappropriatenessofaccountingpoliciesusedand the reasonablenessofaccounting estimates and related disclosures made by the management.
• Concludeontheappropriatenessofmanagement’suseofthegoingconcernbasisofaccounting and, based on the audit evidence obtained, whether a material uncertainty exists related to events or conditions that may cast significant doubt on the Schemes’ ability to continue as a going concern. If we conclude that a material uncertainty exists, we are required to draw attention in our auditor’s report to the related disclosures in the financial statements or, if such disclosures are inadequate, to modify our opinion. Our conclusions are based on the audit evidence obtained up to the date of our auditor’s report. However, future events or conditions may cause the Schemes to cease to continue as a going concern.
• Evaluate the overall presentation, structure and content of the financial statements,including the disclosures, and whether the financial statements represent the underlying transactions and events in a manner that achieves fair presentation.
Materiality is the magnitude of misstatements in the financial statements of each scheme that, individually or in aggregate, makes it probable that the economic decisions of a reasonably knowledgeable user of the financial statements may be influenced. We consider quantitative
materiality and qualitative factors in (i) planning the scope of our audit work and in evaluating the results of our work; and (ii) to evaluate the effect of any identified misstatements in the financial statements.
We communicate with those charged with governance regarding, among other matters, the planned scope and timing of the audit and significant audit findings, including any significant deficiencies in internal control that we identify during our audit.
We also provide those charged with governance with a statement that we have complied with relevant ethical requirements regarding independence, and to communicate with them all relationships and other matters that may reasonably be thought to bear on our independence, and where applicable, related safeguards.
From the matters communicated with those charged with governance, we determine those matters that were of most significance in the audit of the financial statements of the current period and are therefore the key audit matters. We describe these matters in our auditor’s report unless law or regulation precludes public disclosure about the matter or when, in extremely rare circumstances, we determine that a matter should not be communicated in our report because the adverse consequences of doing so would reasonably be expected to outweigh the public interest benefits of such communication.
Report on Other Legal and Regulatory Requirements
1. As required by Regulation 55, and Clause 5 of the Eleventh Schedule to the SEBI Regulations, we report that:
(a) we have obtained all the information and explanations which to the best of our knowledge and belief were necessary for the purposes of our audit;
(b) the Balance Sheets, the Revenue Accounts and the Cash Flow Statements (where applicable) dealt with by this report are in agreement with the books of account of the respective Schemes; and
(c) the financial statements have been prepared in accordance with accounting policies and standards as specified in the Ninth Schedule of the SEBI Regulations.
2. i) As required by Clause 2 (ii) of Eighth Schedule of the SEBI Regulations, we report that, the Invesco India Gilt Fund and Invesco India Overnight Fund does not hold any non-traded securities as at March 31, 2021.
ii) As required by Clause 2 (ii) of Eighth Schedule of the SEBI Regulations, we report that, the following Schemes have non-traded securities as at March 31, 2021 which have been valued following the “Principles of Fair Valuation” approved by the Board of Directors of the Investment Manager and the Trustee Company. In our opinion, these valuations are fair and reasonable.
(a) Invesco India Liquid Fund
(b) Invesco India Treasury Advantage Fund
(c) Invesco India Short Term Fund
(d) Invesco India Corporate Bond Fund
(e) Invesco India Money Market Fund
(f) Invesco India Ultra Short Term Fund
(g) Invesco India Banking & PSU Debt Fund
(h) Invesco India Credit Risk Fund
For Deloitte Haskins & Sells LLPChartered Accountants
(Firm’s Registration No. 117366W/W-100018)
G. K. Subramaniam(Partner)
(Membership No.109839)(UDIN: 21109839AAAAJU3285)
Date: June 30, 2021
Place: Mumbai
Independent Auditors’ Report
Abridged Annual Report 2020-21 12
To
The Board of Directors of Invesco Trustee Private Limited Report on the Audit of the Financial Statements
Opinion
We have audited the accompanying financial statements of the undermentioned Schemes of INVESCO MUTUAL FUND (the “Schemes”) which comprise the Balance Sheets, the Revenue Accounts and the Cash Flow Statements for the period/year as at the dates mentioned below and a summary of the significant accounting policies and other explanatory information.
Scheme Period / Year covered for
Revenue Account and Cash Flow
Statement (where applicable)
Balance Sheet Date
Invesco India Fixed Maturity Plan - Series 29 - Plan B April 1, 2020 to May 14, 2020
March 31, 2021
Invesco India Fixed Maturity Plan - Series 30 - Plan A April 1, 2020 to March 31, 2021
March 31, 2021
Invesco India Fixed Maturity Plan - Series 30 - Plan C April 1, 2020 to March 31, 2021
March 31, 2021
Invesco India Fixed Maturity Plan - Series 30 - Plan D April 1, 2020 to March 31, 2021
March 31, 2021
Invesco India Fixed Maturity Plan - Series 31 - Plan A April 1, 2020 to March 31, 2021
March 31, 2021
Invesco India Fixed Maturity Plan - Series 31 - Plan B April 1, 2020 to March 31, 2021
March 31, 2021
Invesco India Fixed Maturity Plan - Series 31 - Plan D April 1, 2020 to March 31, 2021
March 31, 2021
Invesco India Fixed Maturity Plan - Series 32 - Plan A April 1, 2020 to March 31, 2021
March 31, 2021
Invesco India Fixed Maturity Plan - Series 32 - Plan B April 1, 2020 to March 31, 2021
March 31, 2021
Invesco India Fixed Maturity Plan - Series 32 - Plan C April 1, 2020 to March 31, 2021
March 31, 2021
Invesco India Fixed Maturity Plan - Series 32 - Plan D April 1, 2020 to March 31, 2021
March 31, 2021
Invesco India Fixed Maturity Plan - Series 32 - Plan E April 1, 2020 to March 31, 2021
March 31, 2021
Invesco India Fixed Maturity Plan - Series 33 - Plan B April 1, 2020 to March 31, 2021
March 31, 2021
Invesco India Fixed Maturity Plan - Series 33 - Plan D April 1, 2020 to March 31, 2021
March 31, 2021
In our opinion and to the best of our information and according to the explanations given to us, the aforesaid financial statements give the information required by the Securities and Exchange Board of India (Mutual Funds) Regulations, 1996 as amended (the “SEBI Regulations”) in the manner so required and give a true and fair view in conformity with the accounting principles generally accepted in India:
(a) in the case of the Balance Sheets, of the state of affairs of the Schemes as at the dates mentioned above;
(b) in the case of the Revenue Accounts, of the Surplus of the Schemes for the period/year ended on that date; and
(c) in the case of the Cash Flow Statements of the cash flows for the period/year ended on that date.
Basis for Opinion
We conducted our audit in accordance with the Standards on Auditing (SAs) issued by the Institute of Chartered Accountants of India (“ICAI”) as applicable to the schemes. Our responsibilities under those Standards are further described in the Auditor’s Responsibilities for the Audit of the Financial Statements section of our report. In conducting our audit we have taken into account the provisions of the SEBI Regulations, the accounting standards issued by the ICAI, as applicable, accounting principles generally accepted in India and matters which are required to be included in the audit report under the provisions of the SEBI Regulations. We are independent of the Schemes in accordance with the ethical requirements that are relevant to our audit of the financial statements, and we have fulfilled our other responsibilities in accordance with these requirements. We believe that the audit evidence we have obtained is sufficient and appropriate to provide a basis for our audit opinion on the financial statements.
Key Audit Matters
Key audit matters are those matters that, in our professional judgment, were of most significance in our current audit of the financial statements of the Schemes. These matters were addressed in the context of our audit of the financial statements of each Scheme as a whole, and in forming our opinion thereon, and we do not provide a separate opinion on these matters.
Sr. No.
Key Audit Matter Auditor’s Response
1 Valuation and existence of Investments:
The valuation and existence of the portfolio of investments is considered as a key audit matter since investments form the most significant component of the balance sheet and accurate valuation of investments is critical to the accurate computation of the asset value. Valuation of Investments is required to be in compliance with the valuation policy as approved by the Board of the Invesco Trustee Private Limited and Invesco Asset Management Company (India) Private Limited and in compliance with SEBI Regulations and Guidelines.
Principal audit procedures performed:
We gained an understanding of the internal control structure and operating effectiveness of key controls surrounding valuation and existence of investments.
We tested the valuation of the investments by testing the compliance with the valuation policy as approved by the Board of Invesco Trustee Private Limited and Invesco Asset Management Company (India) Private Limited and in compliance with SEBI Regulations and Guidelines and by comparing the investment valuation from prices obtained from following sources:
• security level prices received from agenciesapproved by Association of Mutual Funds in India (“AMFI”); and
• NAVobtainedfromAMFI.
• We also assessed and verified the provisionsrequired as per SEBI guidance on non-investment grade and/or downgraded securities.
We tested the existence of the Investments by obtaining and reconciling the direct confirmations of the holdings from following sources:
• CustodiansoftheSchemes
• ReserveBankofIndia
• ClearingCorporationofIndiaLimited
We agreed the holdings as per above confirmations with the Schemes’ accounting records. We reviewed the reconciliations for the cases where differences were observed and obtained explanations for the same.
Information Other than the Financial Statements and Auditor’s Report Thereon
The Managements of Invesco Trustee Private Limited (“the Trustee Company”) and Invesco Asset Management Company (India) Private Limited (“the AMC/Investment Manager”) are responsible for the other information. The other information comprises the Trustee Report of Invesco Mutual Fund, but does not include these financial statements and our auditor’s report thereon.
Our opinion on the financial statements does not cover the other information and we do not express any form of assurance or conclusion thereon.
In connection with our audit of these financial statements, our responsibility is to read the other information identified above when it becomes available and, in doing so, consider whether the other information is materially inconsistent with the financial statements or our knowledge obtained during the course of our audit or otherwise appears to be materially misstated.
If, based on the work we have performed, we conclude that there is a material misstatement therein of this other information, we are required to report the fact. We have nothing to report in this regard.
Management’s Responsibility for the Financial Statements
The Managements of the Investment Manager and the Trustee Company are responsible for the preparation of these financial statements that give a true and fair view of the financial position, financial performance and cash flows of the Schemes in accordance with accounting policies and standards as specified in the Ninth Schedule of the SEBI Regulations and in accordance with the accounting principles generally accepted in India. This responsibility includes the maintenance of adequate accounting records in accordance with the provisions of the SEBI Regulations for safeguarding the assets of the Schemes and for preventing and detecting frauds and other irregularities; selection and application of appropriate accounting policies; making judgments and estimates that are reasonable and prudent; and design, implementation and maintenance of adequate internal financial controls, that were operating effectively for ensuring the accuracy and completeness of the accounting records, relevant to the preparation and presentation of the financial statements that give a true and fair view and are free from material misstatement, whether due to fraud or error.
In preparing the financial statements, managements of the Investment Manager and the Trustee Company are responsible for assessing the Schemes’ ability to continue as a going concern, disclosing, as applicable, matters related to going concern and using the going concern basis of accounting unless management either intends to liquidate the schemes, or has no realistic alternative but to do so.
The Managements of the Investment Manager and the Trustee Company are responsible for overseeing the Schemes’ financial reporting process.
Independent Auditors’ Report
Abridged Annual Report 2020-21 13
Auditors’ Responsibility for the Audit of the Financial Statements
Our objectives are to obtain reasonable assurance about whether the financial statements of each Scheme as a whole are free from material misstatement, whether due to fraud or error, and to issue an auditor’s report that includes our opinion. Reasonable assurance is a high level of assurance, but is not a guarantee that an audit conducted in accordance with SAs will always detect a material misstatement when it exists. Misstatements can arise from fraud or error and are considered material if, individually or in the aggregate, they could reasonably be expected to influence the economic decisions of users taken on the basis of these financial statements.
As part of an audit in accordance with SAs, we exercise professional judgment and maintain professional skepticism throughout the audit. We also:
• Identifyandassess the risksofmaterialmisstatementof the financial statementsofeach Scheme, whether due to fraud or error, design and perform audit procedures responsive to those risks, and obtain audit evidence that is sufficient and appropriate to provide a basis for our opinion. The risk of not detecting a material misstatement resulting from fraud is higher than for one resulting from error, as fraud may involve collusion, forgery, intentional omissions, misrepresentations, or the override of internal control.
• ObtainanunderstandingofinternalfinancialcontroloftheFundasawholerelevanttothe audit in order to design audit procedures that are appropriate in the circumstances but not for the purpose of expressing an opinion on the effectiveness of the Schemes’ internal financial control.
• Evaluate theappropriatenessofaccountingpoliciesusedand the reasonablenessofaccounting estimates and related disclosures made by the management.
• Concludeontheappropriatenessofmanagement’suseofthegoingconcernbasisofaccounting and, based on the audit evidence obtained, whether a material uncertainty exists related to events or conditions that may cast significant doubt on the Schemes’ ability to continue as a going concern. If we conclude that a material uncertainty exists, we are required to draw attention in our auditor’s report to the related disclosures in the financial statements or, if such disclosures are inadequate, to modify our opinion. Our conclusions are based on the audit evidence obtained up to the date of our auditor’s report. However, future events or conditions may cause the Schemes to cease to continue as a going concern.
• Evaluate the overall presentation, structure and content of the financial statements,including the disclosures, and whether the financial statements represent the underlying transactions and events in a manner that achieves fair presentation.
Materiality is the magnitude of misstatements in the financial statements of each scheme that, individually or in aggregate, makes it probable that the economic decisions of a reasonably knowledgeable user of the financial statements may be influenced. We consider quantitative materiality and qualitative factors in (i) planning the scope of our audit work and in evaluating the results of our work; and (ii) to evaluate the effect of any identified misstatements in the financial statements.
We communicate with those charged with governance regarding, among other matters, the planned scope and timing of the audit and significant audit findings, including any significant deficiencies in internal control that we identify during our audit.
We also provide those charged with governance with a statement that we have complied with relevant ethical requirements regarding independence, and to communicate with them all relationships and other matters that may reasonably be thought to bear on our independence, and where applicable, related safeguards.
From the matters communicated with those charged with governance, we determine those matters that were of most significance in the audit of the financial statements of the current period and are therefore the key audit matters. We describe these matters in our auditor’s report unless law or regulation precludes public disclosure about the matter or when, in extremely rare circumstances, we determine that a matter should not be communicated in our report because the adverse consequences of doing so would reasonably be expected to outweigh the public interest benefits of such communication.
Report on Other Legal and Regulatory Requirements
1. As required by Regulation 55, and Clause 5 of the Eleventh Schedule to the SEBI Regulations, we report that:
(a) we have obtained all the information and explanations which to the best of our knowledge and belief were necessary for the purposes of our audit;
(b) the Balance Sheets, the Revenue Accounts and the Cash Flow Statements dealt with by this report are in agreement with the books of account of the respective Schemes; and
(c) the financial statements have been prepared in accordance with accounting policies and standards as specified in the Ninth Schedule of the SEBI Regulations.
2. As required by Clause 2 (ii) of Eighth Schedule of the SEBI Regulations, we report that, in case of all above mentioned Schemes, non-traded securities as at year end have been valued following the “Principles of Fair Valuation” approved by the Board of Directors of the Investment Manager and the Trustee Company. In our opinion, these valuations are fair and reasonable.
For Deloitte Haskins & Sells LLPChartered Accountants
(Firm’s Registration No. 117366W/W-100018)
G. K. Subramaniam(Partner)
(Membership No.109839)(UDIN: 21109839AAAAJU3285)
Date: June 30, 2021
Place: Mumbai
Independent Auditors’ Report
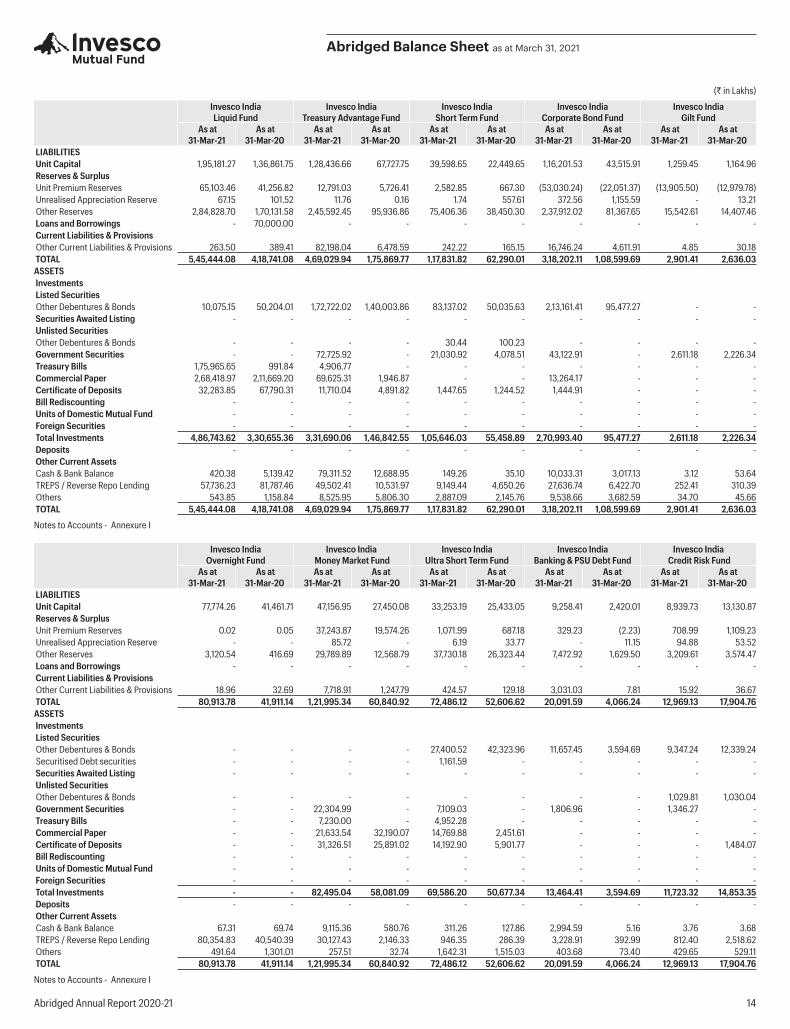
Abridged Annual Report 2020-21 14
Invesco India Liquid Fund
Invesco India Treasury Advantage Fund
Invesco India Short Term Fund
Invesco India Corporate Bond Fund
Invesco India Gilt Fund
As at As at As at As at As at As at As at As at As at As at31-Mar-21 31-Mar-20 31-Mar-21 31-Mar-20 31-Mar-21 31-Mar-20 31-Mar-21 31-Mar-20 31-Mar-21 31-Mar-20
LIABILITIES Unit Capital 1,95,181.27 1,36,861.75 1,28,436.66 67,727.75 39,598.65 22,449.65 1,16,201.53 43,515.91 1,259.45 1,164.96 Reserves & Surplus Unit Premium Reserves 65,103.46 41,256.82 12,791.03 5,726.41 2,582.85 667.30 (53,030.24) (22,051.37) (13,905.50) (12,979.78) Unrealised Appreciation Reserve 67.15 101.52 11.76 0.16 1.74 557.61 372.56 1,155.59 - 13.21 Other Reserves 2,84,828.70 1,70,131.58 2,45,592.45 95,936.86 75,406.36 38,450.30 2,37,912.02 81,367.65 15,542.61 14,407.46 Loans and Borrowings - 70,000.00 - - - - - - - - Current Liabilities & Provisions Other Current Liabilities & Provisions 263.50 389.41 82,198.04 6,478.59 242.22 165.15 16,746.24 4,611.91 4.85 30.18 TOTAL 5,45,444.08 4,18,741.08 4,69,029.94 1,75,869.77 1,17,831.82 62,290.01 3,18,202.11 1,08,599.69 2,901.41 2,636.03 ASSETS Investments Listed Securities Other Debentures & Bonds 10,075.15 50,204.01 1,72,722.02 1,40,003.86 83,137.02 50,035.63 2,13,161.41 95,477.27 - - Securities Awaited Listing - - - - - - - - - - Unlisted Securities Other Debentures & Bonds - - - - 30.44 100.23 - - - - Government Securities - - 72,725.92 - 21,030.92 4,078.51 43,122.91 - 2,611.18 2,226.34 Treasury Bills 1,75,965.65 991.84 4,906.77 - - - - - - - Commercial Paper 2,68,418.97 2,11,669.20 69,625.31 1,946.87 - - 13,264.17 - - - Certificate of Deposits 32,283.85 67,790.31 11,710.04 4,891.82 1,447.65 1,244.52 1,444.91 - - - Bill Rediscounting - - - - - - - - - - Units of Domestic Mutual Fund - - - - - - - - - - Foreign Securities - - - - - - - - - - Total Investments 4,86,743.62 3,30,655.36 3,31,690.06 1,46,842.55 1,05,646.03 55,458.89 2,70,993.40 95,477.27 2,611.18 2,226.34 Deposits - - - - - - - - - - Other Current Assets Cash & Bank Balance 420.38 5,139.42 79,311.52 12,688.95 149.26 35.10 10,033.31 3,017.13 3.12 53.64 TREPS / Reverse Repo Lending 57,736.23 81,787.46 49,502.41 10,531.97 9,149.44 4,650.26 27,636.74 6,422.70 252.41 310.39 Others 543.85 1,158.84 8,525.95 5,806.30 2,887.09 2,145.76 9,538.66 3,682.59 34.70 45.66 TOTAL 5,45,444.08 4,18,741.08 4,69,029.94 1,75,869.77 1,17,831.82 62,290.01 3,18,202.11 1,08,599.69 2,901.41 2,636.03
Notes to Accounts - Annexure I
Invesco India Overnight Fund
Invesco India Money Market Fund
Invesco India Ultra Short Term Fund
Invesco India Banking & PSU Debt Fund
Invesco India Credit Risk Fund
As at As at As at As at As at As at As at As at As at As at31-Mar-21 31-Mar-20 31-Mar-21 31-Mar-20 31-Mar-21 31-Mar-20 31-Mar-21 31-Mar-20 31-Mar-21 31-Mar-20
LIABILITIES Unit Capital 77,774.26 41,461.71 47,156.95 27,450.08 33,253.19 25,433.05 9,258.41 2,420.01 8,939.73 13,130.87 Reserves & Surplus Unit Premium Reserves 0.02 0.05 37,243.87 19,574.26 1,071.99 687.18 329.23 (2.23) 708.99 1,109.23 Unrealised Appreciation Reserve - - 85.72 - 6.19 33.77 - 11.15 94.88 53.52 Other Reserves 3,120.54 416.69 29,789.89 12,568.79 37,730.18 26,323.44 7,472.92 1,629.50 3,209.61 3,574.47 Loans and Borrowings - - - - - - - - - - Current Liabilities & Provisions Other Current Liabilities & Provisions 18.96 32.69 7,718.91 1,247.79 424.57 129.18 3,031.03 7.81 15.92 36.67 TOTAL 80,913.78 41,911.14 1,21,995.34 60,840.92 72,486.12 52,606.62 20,091.59 4,066.24 12,969.13 17,904.76 ASSETS Investments Listed Securities Other Debentures & Bonds - - - - 27,400.52 42,323.96 11,657.45 3,594.69 9,347.24 12,339.24 Securitised Debt securities - - - - 1,161.59 - - - - - Securities Awaited Listing - - - - - - - - - - Unlisted Securities Other Debentures & Bonds - - - - - - - - 1,029.81 1,030.04 Government Securities - - 22,304.99 - 7,109.03 - 1,806.96 - 1,346.27 - Treasury Bills - - 7,230.00 - 4,952.28 - - - - - Commercial Paper - - 21,633.54 32,190.07 14,769.88 2,451.61 - - - - Certificate of Deposits - - 31,326.51 25,891.02 14,192.90 5,901.77 - - - 1,484.07 Bill Rediscounting - - - - - - - - - - Units of Domestic Mutual Fund - - - - - - - - - - Foreign Securities - - - - - - - - - - Total Investments - - 82,495.04 58,081.09 69,586.20 50,677.34 13,464.41 3,594.69 11,723.32 14,853.35 Deposits - - - - - - - - - - Other Current Assets Cash & Bank Balance 67.31 69.74 9,115.36 580.76 311.26 127.86 2,994.59 5.16 3.76 3.68 TREPS / Reverse Repo Lending 80,354.83 40,540.39 30,127.43 2,146.33 946.35 286.39 3,228.91 392.99 812.40 2,518.62 Others 491.64 1,301.01 257.51 32.74 1,642.31 1,515.03 403.68 73.40 429.65 529.11 TOTAL 80,913.78 41,911.14 1,21,995.34 60,840.92 72,486.12 52,606.62 20,091.59 4,066.24 12,969.13 17,904.76
Notes to Accounts - Annexure I
(` in Lakhs)
Abridged Balance Sheet as at March 31, 2021
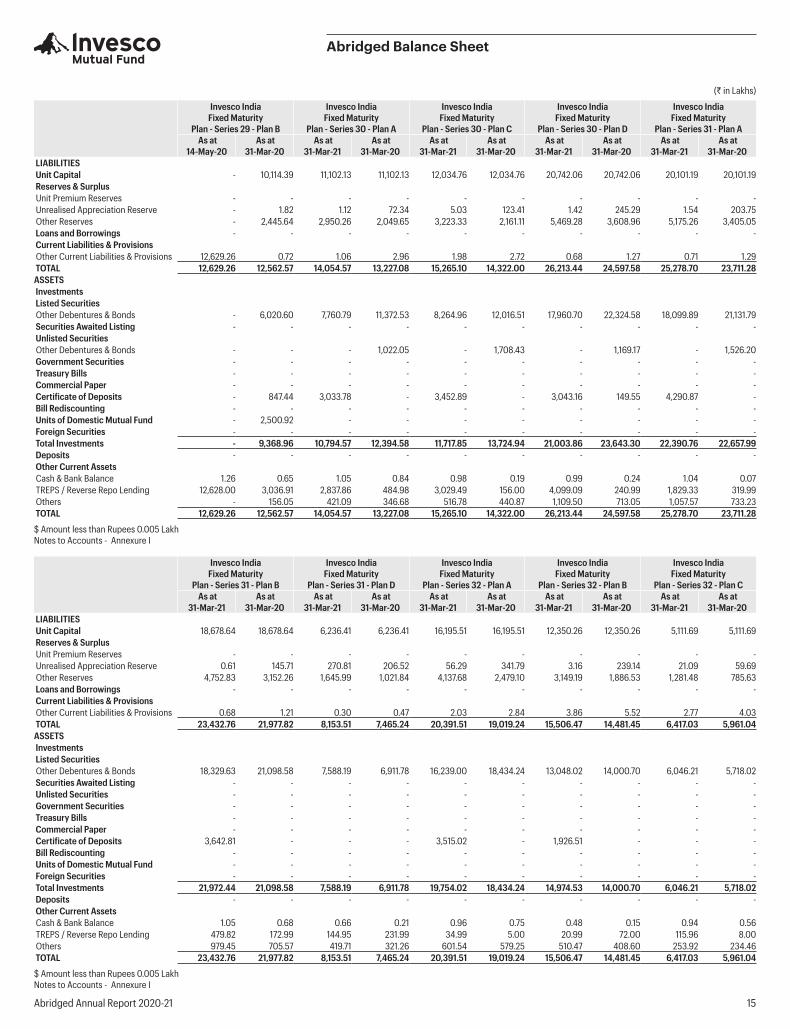
Abridged Annual Report 2020-21 15
Invesco India Fixed Maturity
Plan - Series 29 - Plan B
Invesco India Fixed Maturity
Plan - Series 30 - Plan A
Invesco India Fixed Maturity
Plan - Series 30 - Plan C
Invesco India Fixed Maturity
Plan - Series 30 - Plan D
Invesco India Fixed Maturity
Plan - Series 31 - Plan A As at As at As at As at As at As at As at As at As at As at
14-May-20 31-Mar-20 31-Mar-21 31-Mar-20 31-Mar-21 31-Mar-20 31-Mar-21 31-Mar-20 31-Mar-21 31-Mar-20 LIABILITIES Unit Capital - 10,114.39 11,102.13 11,102.13 12,034.76 12,034.76 20,742.06 20,742.06 20,101.19 20,101.19 Reserves & Surplus Unit Premium Reserves - - - - - - - - - - Unrealised Appreciation Reserve - 1.82 1.12 72.34 5.03 123.41 1.42 245.29 1.54 203.75 Other Reserves - 2,445.64 2,950.26 2,049.65 3,223.33 2,161.11 5,469.28 3,608.96 5,175.26 3,405.05 Loans and Borrowings - - - - - - - - - - Current Liabilities & Provisions Other Current Liabilities & Provisions 12,629.26 0.72 1.06 2.96 1.98 2.72 0.68 1.27 0.71 1.29 TOTAL 12,629.26 12,562.57 14,054.57 13,227.08 15,265.10 14,322.00 26,213.44 24,597.58 25,278.70 23,711.28 ASSETS Investments Listed Securities Other Debentures & Bonds - 6,020.60 7,760.79 11,372.53 8,264.96 12,016.51 17,960.70 22,324.58 18,099.89 21,131.79 Securities Awaited Listing - - - - - - - - - - Unlisted Securities Other Debentures & Bonds - - - 1,022.05 - 1,708.43 - 1,169.17 - 1,526.20 Government Securities - - - - - - - - - - Treasury Bills - - - - - - - - - - Commercial Paper - - - - - - - - - - Certificate of Deposits - 847.44 3,033.78 - 3,452.89 - 3,043.16 149.55 4,290.87 - Bill Rediscounting - - - - - - - - - - Units of Domestic Mutual Fund - 2,500.92 - - - - - - - - Foreign Securities - - - - - - - - - - Total Investments - 9,368.96 10,794.57 12,394.58 11,717.85 13,724.94 21,003.86 23,643.30 22,390.76 22,657.99 Deposits - - - - - - - - - - Other Current Assets Cash & Bank Balance 1.26 0.65 1.05 0.84 0.98 0.19 0.99 0.24 1.04 0.07 TREPS / Reverse Repo Lending 12,628.00 3,036.91 2,837.86 484.98 3,029.49 156.00 4,099.09 240.99 1,829.33 319.99 Others - 156.05 421.09 346.68 516.78 440.87 1,109.50 713.05 1,057.57 733.23 TOTAL 12,629.26 12,562.57 14,054.57 13,227.08 15,265.10 14,322.00 26,213.44 24,597.58 25,278.70 23,711.28
$ Amount less than Rupees 0.005 LakhNotes to Accounts - Annexure I
Invesco India Fixed Maturity
Plan - Series 31 - Plan B
Invesco India Fixed Maturity
Plan - Series 31 - Plan D
Invesco India Fixed Maturity
Plan - Series 32 - Plan A
Invesco India Fixed Maturity
Plan - Series 32 - Plan B
Invesco India Fixed Maturity
Plan - Series 32 - Plan C As at As at As at As at As at As at As at As at As at As at
31-Mar-21 31-Mar-20 31-Mar-21 31-Mar-20 31-Mar-21 31-Mar-20 31-Mar-21 31-Mar-20 31-Mar-21 31-Mar-20 LIABILITIES Unit Capital 18,678.64 18,678.64 6,236.41 6,236.41 16,195.51 16,195.51 12,350.26 12,350.26 5,111.69 5,111.69 Reserves & Surplus Unit Premium Reserves - - - - - - - - - - Unrealised Appreciation Reserve 0.61 145.71 270.81 206.52 56.29 341.79 3.16 239.14 21.09 59.69 Other Reserves 4,752.83 3,152.26 1,645.99 1,021.84 4,137.68 2,479.10 3,149.19 1,886.53 1,281.48 785.63 Loans and Borrowings - - - - - - - - - - Current Liabilities & Provisions Other Current Liabilities & Provisions 0.68 1.21 0.30 0.47 2.03 2.84 3.86 5.52 2.77 4.03 TOTAL 23,432.76 21,977.82 8,153.51 7,465.24 20,391.51 19,019.24 15,506.47 14,481.45 6,417.03 5,961.04 ASSETS Investments Listed Securities Other Debentures & Bonds 18,329.63 21,098.58 7,588.19 6,911.78 16,239.00 18,434.24 13,048.02 14,000.70 6,046.21 5,718.02 Securities Awaited Listing - - - - - - - - - - Unlisted Securities - - - - - - - - - - Government Securities - - - - - - - - - - Treasury Bills - - - - - - - - - - Commercial Paper - - - - - - - - - - Certificate of Deposits 3,642.81 - - - 3,515.02 - 1,926.51 - - - Bill Rediscounting - - - - - - - - - - Units of Domestic Mutual Fund - - - - - - - - - - Foreign Securities - - - - - - - - - - Total Investments 21,972.44 21,098.58 7,588.19 6,911.78 19,754.02 18,434.24 14,974.53 14,000.70 6,046.21 5,718.02 Deposits - - - - - - - - - - Other Current Assets Cash & Bank Balance 1.05 0.68 0.66 0.21 0.96 0.75 0.48 0.15 0.94 0.56 TREPS / Reverse Repo Lending 479.82 172.99 144.95 231.99 34.99 5.00 20.99 72.00 115.96 8.00 Others 979.45 705.57 419.71 321.26 601.54 579.25 510.47 408.60 253.92 234.46 TOTAL 23,432.76 21,977.82 8,153.51 7,465.24 20,391.51 19,019.24 15,506.47 14,481.45 6,417.03 5,961.04
$ Amount less than Rupees 0.005 Lakh Notes to Accounts - Annexure I
(` in Lakhs)
Abridged Balance Sheet
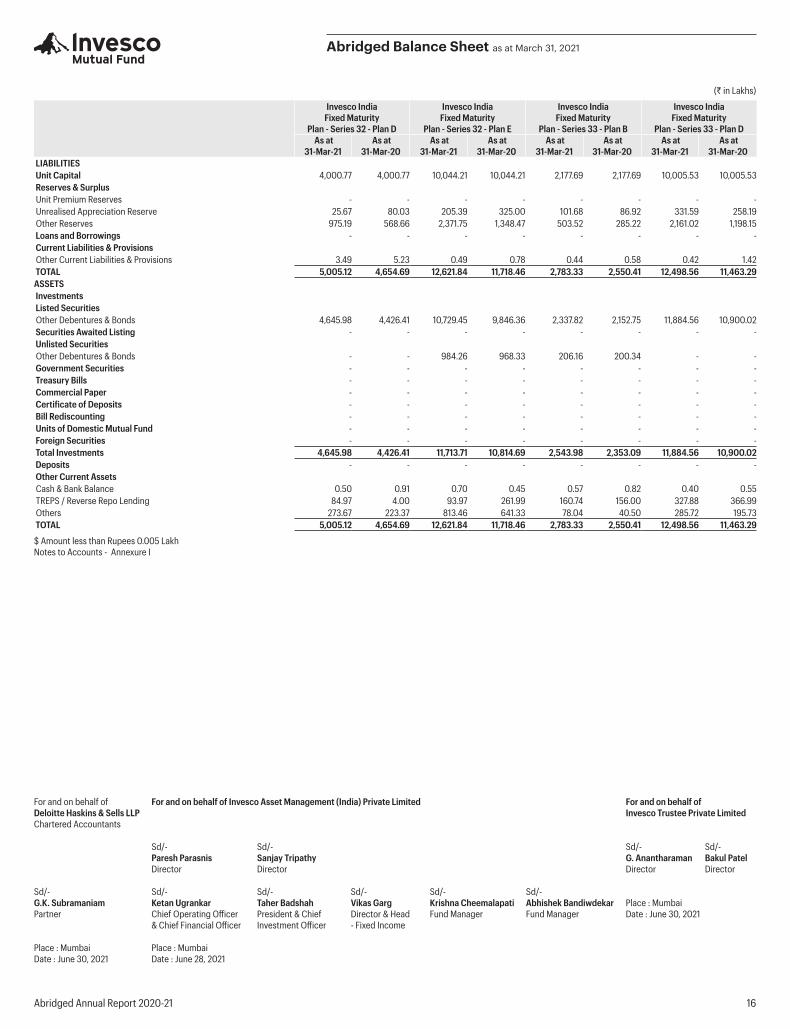
Abridged Annual Report 2020-21 16
Invesco India Fixed Maturity
Plan - Series 32 - Plan D
Invesco India Fixed Maturity
Plan - Series 32 - Plan E
Invesco India Fixed Maturity
Plan - Series 33 - Plan B
Invesco India Fixed Maturity
Plan - Series 33 - Plan D As at As at As at As at As at As at As at As at
31-Mar-21 31-Mar-20 31-Mar-21 31-Mar-20 31-Mar-21 31-Mar-20 31-Mar-21 31-Mar-20 LIABILITIES Unit Capital 4,000.77 4,000.77 10,044.21 10,044.21 2,177.69 2,177.69 10,005.53 10,005.53 Reserves & Surplus Unit Premium Reserves - - - - - - - - Unrealised Appreciation Reserve 25.67 80.03 205.39 325.00 101.68 86.92 331.59 258.19 Other Reserves 975.19 568.66 2,371.75 1,348.47 503.52 285.22 2,161.02 1,198.15 Loans and Borrowings - - - - - - - - Current Liabilities & Provisions Other Current Liabilities & Provisions 3.49 5.23 0.49 0.78 0.44 0.58 0.42 1.42 TOTAL 5,005.12 4,654.69 12,621.84 11,718.46 2,783.33 2,550.41 12,498.56 11,463.29 ASSETS Investments Listed Securities Other Debentures & Bonds 4,645.98 4,426.41 10,729.45 9,846.36 2,337.82 2,152.75 11,884.56 10,900.02 Securities Awaited Listing - - - - - - - - Unlisted Securities Other Debentures & Bonds - - 984.26 968.33 206.16 200.34 - - Government Securities - - - - - - - - Treasury Bills - - - - - - - - Commercial Paper - - - - - - - - Certificate of Deposits - - - - - - - - Bill Rediscounting - - - - - - - - Units of Domestic Mutual Fund - - - - - - - - Foreign Securities - - - - - - - - Total Investments 4,645.98 4,426.41 11,713.71 10,814.69 2,543.98 2,353.09 11,884.56 10,900.02 Deposits - - - - - - - - Other Current Assets Cash & Bank Balance 0.50 0.91 0.70 0.45 0.57 0.82 0.40 0.55 TREPS / Reverse Repo Lending 84.97 4.00 93.97 261.99 160.74 156.00 327.88 366.99 Others 273.67 223.37 813.46 641.33 78.04 40.50 285.72 195.73 TOTAL 5,005.12 4,654.69 12,621.84 11,718.46 2,783.33 2,550.41 12,498.56 11,463.29
$ Amount less than Rupees 0.005 Lakh Notes to Accounts - Annexure I
(` in Lakhs)
Abridged Balance Sheet as at March 31, 2021
For and on behalf ofDeloitte Haskins & Sells LLPChartered Accountants
For and on behalf of Invesco Asset Management (India) Private Limited For and on behalf of Invesco Trustee Private Limited
Sd/- Paresh Parasnis Director
Sd/- Sanjay Tripathy Director
Sd/- G. Anantharaman Director
Sd/- Bakul Patel Director
Sd/- G.K. SubramaniamPartner
Sd/-Ketan UgrankarChief Operating Officer & Chief Financial Officer
Sd/-Taher Badshah President & Chief Investment Officer
Sd/- Vikas GargDirector & Head- Fixed Income
Sd/- Krishna CheemalapatiFund Manager
Sd/-Abhishek BandiwdekarFund Manager
Place : MumbaiDate : June 30, 2021
Place : MumbaiDate : June 30, 2021
Place : MumbaiDate : June 28, 2021
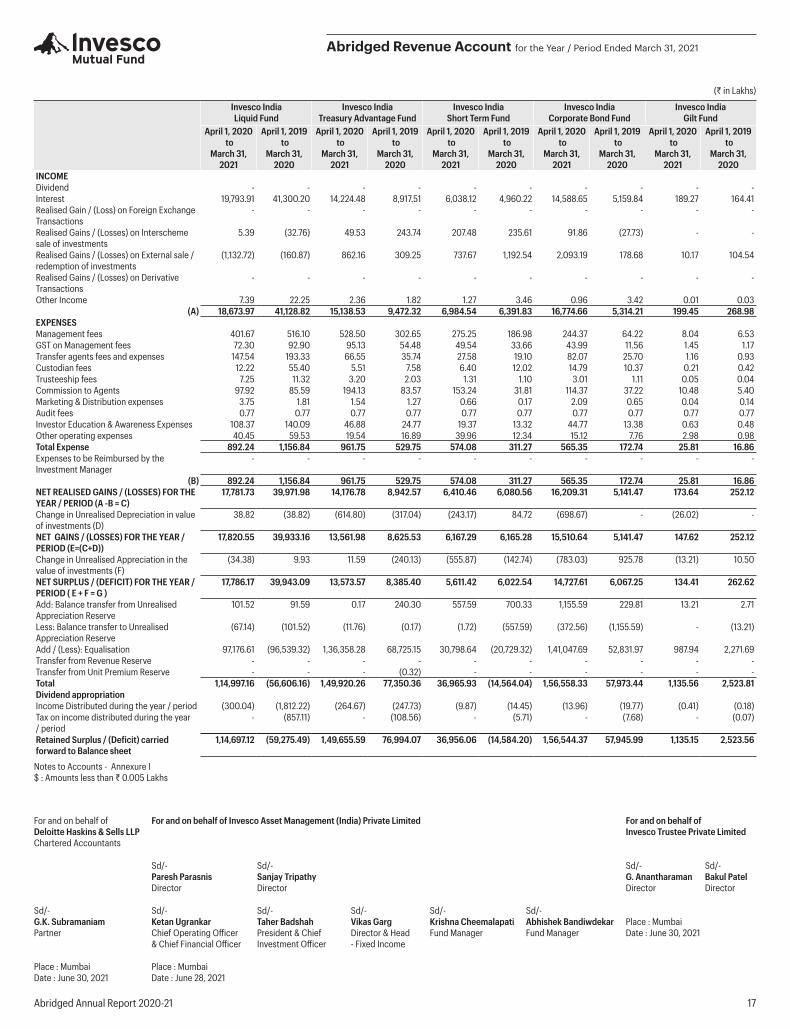
Abridged Annual Report 2020-21 17
Invesco India Liquid Fund
Invesco India Treasury Advantage Fund
Invesco India Short Term Fund
Invesco India Corporate Bond Fund
Invesco India Gilt Fund
April 1, 2020 to
March 31, 2021
April 1, 2019 to
March 31, 2020
April 1, 2020 to
March 31, 2021
April 1, 2019 to
March 31, 2020
April 1, 2020 to
March 31, 2021
April 1, 2019 to
March 31, 2020
April 1, 2020 to
March 31, 2021
April 1, 2019 to
March 31, 2020
April 1, 2020 to
March 31, 2021
April 1, 2019 to
March 31, 2020
INCOMEDividend - - - - - - - - - - Interest 19,793.91 41,300.20 14,224.48 8,917.51 6,038.12 4,960.22 14,588.65 5,159.84 189.27 164.41 Realised Gain / (Loss) on Foreign Exchange Transactions
- - - - - - - - - -
Realised Gains / (Losses) on Interscheme sale of investments
5.39 (32.76) 49.53 243.74 207.48 235.61 91.86 (27.73) - -
Realised Gains / (Losses) on External sale / redemption of investments
(1,132.72) (160.87) 862.16 309.25 737.67 1,192.54 2,093.19 178.68 10.17 104.54
Realised Gains / (Losses) on Derivative Transactions
- - - - - - - - - -
Other Income 7.39 22.25 2.36 1.82 1.27 3.46 0.96 3.42 0.01 0.03 (A) 18,673.97 41,128.82 15,138.53 9,472.32 6,984.54 6,391.83 16,774.66 5,314.21 199.45 268.98
EXPENSESManagement fees 401.67 516.10 528.50 302.65 275.25 186.98 244.37 64.22 8.04 6.53 GST on Management fees 72.30 92.90 95.13 54.48 49.54 33.66 43.99 11.56 1.45 1.17 Transfer agents fees and expenses 147.54 193.33 66.55 35.74 27.58 19.10 82.07 25.70 1.16 0.93 Custodian fees 12.22 55.40 5.51 7.58 6.40 12.02 14.79 10.37 0.21 0.42 Trusteeship fees 7.25 11.32 3.20 2.03 1.31 1.10 3.01 1.11 0.05 0.04 Commission to Agents 97.92 85.59 194.13 83.57 153.24 31.81 114.37 37.22 10.48 5.40 Marketing & Distribution expenses 3.75 1.81 1.54 1.27 0.66 0.17 2.09 0.65 0.04 0.14 Audit fees 0.77 0.77 0.77 0.77 0.77 0.77 0.77 0.77 0.77 0.77 Investor Education & Awareness Expenses 108.37 140.09 46.88 24.77 19.37 13.32 44.77 13.38 0.63 0.48 Other operating expenses 40.45 59.53 19.54 16.89 39.96 12.34 15.12 7.76 2.98 0.98 Total Expense 892.24 1,156.84 961.75 529.75 574.08 311.27 565.35 172.74 25.81 16.86 Expenses to be Reimbursed by the Investment Manager
- - - - - - - - - -
(B) 892.24 1,156.84 961.75 529.75 574.08 311.27 565.35 172.74 25.81 16.86 NET REALISED GAINS / (LOSSES) FOR THE YEAR / PERIOD (A -B = C)
17,781.73 39,971.98 14,176.78 8,942.57 6,410.46 6,080.56 16,209.31 5,141.47 173.64 252.12
Change in Unrealised Depreciation in value of investments (D)
38.82 (38.82) (614.80) (317.04) (243.17) 84.72 (698.67) - (26.02) -
NET GAINS / (LOSSES) FOR THE YEAR / PERIOD (E=(C+D))
17,820.55 39,933.16 13,561.98 8,625.53 6,167.29 6,165.28 15,510.64 5,141.47 147.62 252.12
Change in Unrealised Appreciation in the value of investments (F)
(34.38) 9.93 11.59 (240.13) (555.87) (142.74) (783.03) 925.78 (13.21) 10.50
NET SURPLUS / (DEFICIT) FOR THE YEAR / PERIOD ( E + F = G )
17,786.17 39,943.09 13,573.57 8,385.40 5,611.42 6,022.54 14,727.61 6,067.25 134.41 262.62
Add: Balance transfer from Unrealised Appreciation Reserve
101.52 91.59 0.17 240.30 557.59 700.33 1,155.59 229.81 13.21 2.71
Less: Balance transfer to Unrealised Appreciation Reserve
(67.14) (101.52) (11.76) (0.17) (1.72) (557.59) (372.56) (1,155.59) - (13.21)
Add / (Less): Equalisation 97,176.61 (96,539.32) 1,36,358.28 68,725.15 30,798.64 (20,729.32) 1,41,047.69 52,831.97 987.94 2,271.69 Transfer from Revenue Reserve - - - - - - - - - - Transfer from Unit Premium Reserve - - - (0.32) - - - - - - Total 1,14,997.16 (56,606.16) 1,49,920.26 77,350.36 36,965.93 (14,564.04) 1,56,558.33 57,973.44 1,135.56 2,523.81 Dividend appropriationIncome Distributed during the year / period (300.04) (1,812.22) (264.67) (247.73) (9.87) (14.45) (13.96) (19.77) (0.41) (0.18)Tax on income distributed during the year / period
- (857.11) - (108.56) - (5.71) - (7.68) - (0.07)
Retained Surplus / (Deficit) carried forward to Balance sheet
1,14,697.12 (59,275.49) 1,49,655.59 76,994.07 36,956.06 (14,584.20) 1,56,544.37 57,945.99 1,135.15 2,523.56
Notes to Accounts - Annexure I$ : Amounts less than ` 0.005 Lakhs
(` in Lakhs)
Abridged Revenue Account for the Year / Period Ended March 31, 2021
For and on behalf ofDeloitte Haskins & Sells LLPChartered Accountants
For and on behalf of Invesco Asset Management (India) Private Limited For and on behalf of Invesco Trustee Private Limited
Sd/- Paresh Parasnis Director
Sd/- Sanjay Tripathy Director
Sd/- G. Anantharaman Director
Sd/- Bakul Patel Director
Sd/- G.K. SubramaniamPartner
Sd/-Ketan UgrankarChief Operating Officer & Chief Financial Officer
Sd/-Taher Badshah President & Chief Investment Officer
Sd/- Vikas GargDirector & Head- Fixed Income
Sd/- Krishna CheemalapatiFund Manager
Sd/-Abhishek BandiwdekarFund Manager
Place : MumbaiDate : June 30, 2021
Place : MumbaiDate : June 30, 2021
Place : MumbaiDate : June 28, 2021
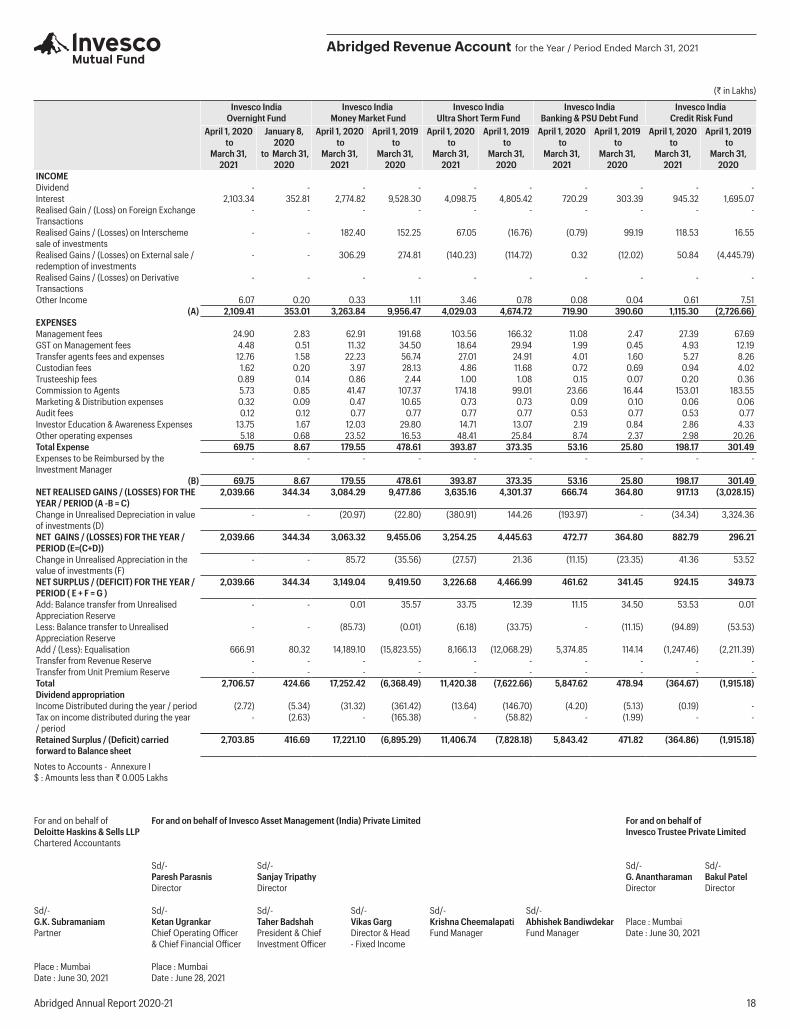
Abridged Annual Report 2020-21 18
Invesco India Overnight Fund
Invesco India Money Market Fund
Invesco India Ultra Short Term Fund
Invesco India Banking & PSU Debt Fund
Invesco India Credit Risk Fund
April 1, 2020 to
March 31, 2021
January 8, 2020
to March 31, 2020
April 1, 2020 to
March 31, 2021
April 1, 2019 to
March 31, 2020
April 1, 2020 to
March 31, 2021
April 1, 2019 to
March 31, 2020
April 1, 2020 to
March 31, 2021
April 1, 2019 to
March 31, 2020
April 1, 2020 to
March 31, 2021
April 1, 2019 to
March 31, 2020
INCOMEDividend - - - - - - - - - - Interest 2,103.34 352.81 2,774.82 9,528.30 4,098.75 4,805.42 720.29 303.39 945.32 1,695.07 Realised Gain / (Loss) on Foreign Exchange Transactions
- - - - - - - - - -
Realised Gains / (Losses) on Interscheme sale of investments
- - 182.40 152.25 67.05 (16.76) (0.79) 99.19 118.53 16.55
Realised Gains / (Losses) on External sale / redemption of investments
- - 306.29 274.81 (140.23) (114.72) 0.32 (12.02) 50.84 (4,445.79)
Realised Gains / (Losses) on Derivative Transactions
- - - - - - - - - -
Other Income 6.07 0.20 0.33 1.11 3.46 0.78 0.08 0.04 0.61 7.51 (A) 2,109.41 353.01 3,263.84 9,956.47 4,029.03 4,674.72 719.90 390.60 1,115.30 (2,726.66)
EXPENSESManagement fees 24.90 2.83 62.91 191.68 103.56 166.32 11.08 2.47 27.39 67.69 GST on Management fees 4.48 0.51 11.32 34.50 18.64 29.94 1.99 0.45 4.93 12.19 Transfer agents fees and expenses 12.76 1.58 22.23 56.74 27.01 24.91 4.01 1.60 5.27 8.26 Custodian fees 1.62 0.20 3.97 28.13 4.86 11.68 0.72 0.69 0.94 4.02 Trusteeship fees 0.89 0.14 0.86 2.44 1.00 1.08 0.15 0.07 0.20 0.36 Commission to Agents 5.73 0.85 41.47 107.37 174.18 99.01 23.66 16.44 153.01 183.55 Marketing & Distribution expenses 0.32 0.09 0.47 10.65 0.73 0.73 0.09 0.10 0.06 0.06 Audit fees 0.12 0.12 0.77 0.77 0.77 0.77 0.53 0.77 0.53 0.77 Investor Education & Awareness Expenses 13.75 1.67 12.03 29.80 14.71 13.07 2.19 0.84 2.86 4.33 Other operating expenses 5.18 0.68 23.52 16.53 48.41 25.84 8.74 2.37 2.98 20.26 Total Expense 69.75 8.67 179.55 478.61 393.87 373.35 53.16 25.80 198.17 301.49 Expenses to be Reimbursed by the Investment Manager
- - - - - - - - - -
(B) 69.75 8.67 179.55 478.61 393.87 373.35 53.16 25.80 198.17 301.49 NET REALISED GAINS / (LOSSES) FOR THE YEAR / PERIOD (A -B = C)
2,039.66 344.34 3,084.29 9,477.86 3,635.16 4,301.37 666.74 364.80 917.13 (3,028.15)
Change in Unrealised Depreciation in value of investments (D)
- - (20.97) (22.80) (380.91) 144.26 (193.97) - (34.34) 3,324.36
NET GAINS / (LOSSES) FOR THE YEAR / PERIOD (E=(C+D))
2,039.66 344.34 3,063.32 9,455.06 3,254.25 4,445.63 472.77 364.80 882.79 296.21
Change in Unrealised Appreciation in the value of investments (F)
- - 85.72 (35.56) (27.57) 21.36 (11.15) (23.35) 41.36 53.52
NET SURPLUS / (DEFICIT) FOR THE YEAR / PERIOD ( E + F = G )
2,039.66 344.34 3,149.04 9,419.50 3,226.68 4,466.99 461.62 341.45 924.15 349.73
Add: Balance transfer from Unrealised Appreciation Reserve
- - 0.01 35.57 33.75 12.39 11.15 34.50 53.53 0.01
Less: Balance transfer to Unrealised Appreciation Reserve
- - (85.73) (0.01) (6.18) (33.75) - (11.15) (94.89) (53.53)
Add / (Less): Equalisation 666.91 80.32 14,189.10 (15,823.55) 8,166.13 (12,068.29) 5,374.85 114.14 (1,247.46) (2,211.39)Transfer from Revenue Reserve - - - - - - - - - - Transfer from Unit Premium Reserve - - - - - - - - - - Total 2,706.57 424.66 17,252.42 (6,368.49) 11,420.38 (7,622.66) 5,847.62 478.94 (364.67) (1,915.18)Dividend appropriationIncome Distributed during the year / period (2.72) (5.34) (31.32) (361.42) (13.64) (146.70) (4.20) (5.13) (0.19) - Tax on income distributed during the year / period
- (2.63) - (165.38) - (58.82) - (1.99) - -
Retained Surplus / (Deficit) carried forward to Balance sheet
2,703.85 416.69 17,221.10 (6,895.29) 11,406.74 (7,828.18) 5,843.42 471.82 (364.86) (1,915.18)
Notes to Accounts - Annexure I$ : Amounts less than ` 0.005 Lakhs
(` in Lakhs)
Abridged Revenue Account for the Year / Period Ended March 31, 2021
For and on behalf ofDeloitte Haskins & Sells LLPChartered Accountants
For and on behalf of Invesco Asset Management (India) Private Limited For and on behalf of Invesco Trustee Private Limited
Sd/- Paresh Parasnis Director
Sd/- Sanjay Tripathy Director
Sd/- G. Anantharaman Director
Sd/- Bakul Patel Director
Sd/- G.K. SubramaniamPartner
Sd/-Ketan UgrankarChief Operating Officer & Chief Financial Officer
Sd/-Taher Badshah President & Chief Investment Officer
Sd/- Vikas GargDirector & Head- Fixed Income
Sd/- Krishna CheemalapatiFund Manager
Sd/-Abhishek BandiwdekarFund Manager
Place : MumbaiDate : June 30, 2021
Place : MumbaiDate : June 30, 2021
Place : MumbaiDate : June 28, 2021
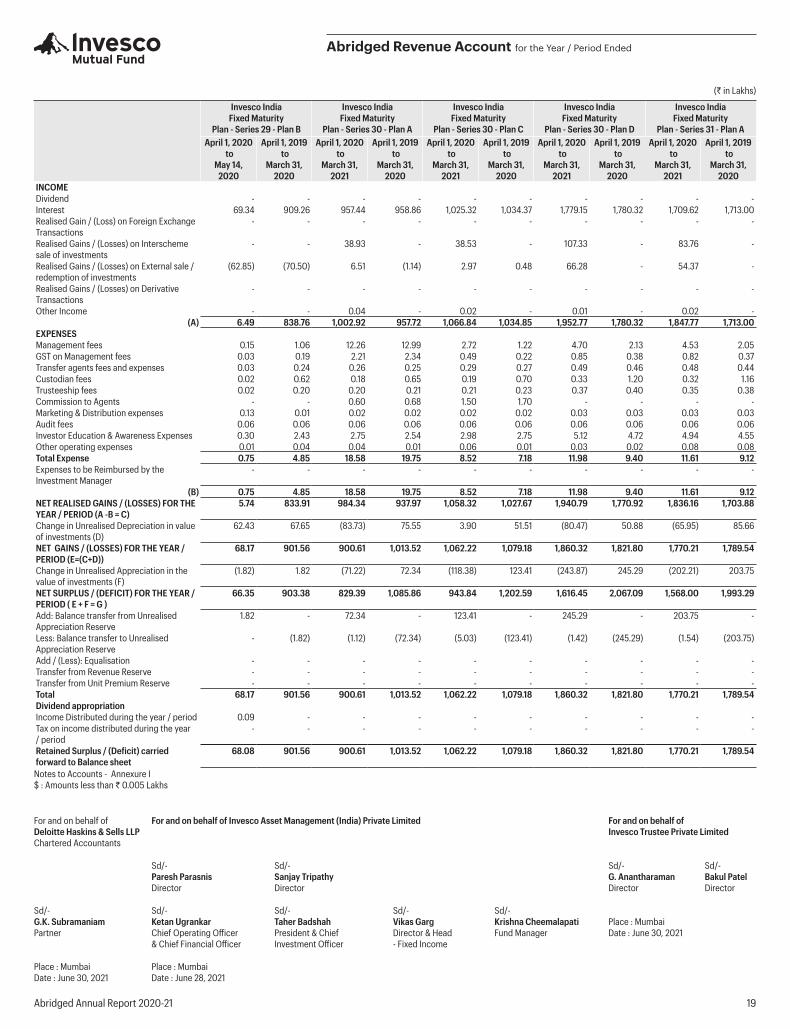
Abridged Annual Report 2020-21 19
Invesco India Fixed Maturity
Plan - Series 29 - Plan B
Invesco India Fixed Maturity
Plan - Series 30 - Plan A
Invesco India Fixed Maturity
Plan - Series 30 - Plan C
Invesco India Fixed Maturity
Plan - Series 30 - Plan D
Invesco India Fixed Maturity
Plan - Series 31 - Plan AApril 1, 2020
to May 14,
2020
April 1, 2019 to
March 31, 2020
April 1, 2020 to
March 31, 2021
April 1, 2019 to
March 31, 2020
April 1, 2020 to
March 31, 2021
April 1, 2019 to
March 31, 2020
April 1, 2020 to
March 31, 2021
April 1, 2019 to
March 31, 2020
April 1, 2020 to
March 31, 2021
April 1, 2019 to
March 31, 2020
INCOMEDividend - - - - - - - - - - Interest 69.34 909.26 957.44 958.86 1,025.32 1,034.37 1,779.15 1,780.32 1,709.62 1,713.00 Realised Gain / (Loss) on Foreign Exchange Transactions
- - - - - - - - - -
Realised Gains / (Losses) on Interscheme sale of investments
- - 38.93 - 38.53 - 107.33 - 83.76 -
Realised Gains / (Losses) on External sale / redemption of investments
(62.85) (70.50) 6.51 (1.14) 2.97 0.48 66.28 - 54.37 -
Realised Gains / (Losses) on Derivative Transactions
- - - - - - - - - -
Other Income - - 0.04 - 0.02 - 0.01 - 0.02 - (A) 6.49 838.76 1,002.92 957.72 1,066.84 1,034.85 1,952.77 1,780.32 1,847.77 1,713.00
EXPENSESManagement fees 0.15 1.06 12.26 12.99 2.72 1.22 4.70 2.13 4.53 2.05 GST on Management fees 0.03 0.19 2.21 2.34 0.49 0.22 0.85 0.38 0.82 0.37 Transfer agents fees and expenses 0.03 0.24 0.26 0.25 0.29 0.27 0.49 0.46 0.48 0.44 Custodian fees 0.02 0.62 0.18 0.65 0.19 0.70 0.33 1.20 0.32 1.16 Trusteeship fees 0.02 0.20 0.20 0.21 0.21 0.23 0.37 0.40 0.35 0.38 Commission to Agents - - 0.60 0.68 1.50 1.70 - - - - Marketing & Distribution expenses 0.13 0.01 0.02 0.02 0.02 0.02 0.03 0.03 0.03 0.03 Audit fees 0.06 0.06 0.06 0.06 0.06 0.06 0.06 0.06 0.06 0.06 Investor Education & Awareness Expenses 0.30 2.43 2.75 2.54 2.98 2.75 5.12 4.72 4.94 4.55 Other operating expenses 0.01 0.04 0.04 0.01 0.06 0.01 0.03 0.02 0.08 0.08 Total Expense 0.75 4.85 18.58 19.75 8.52 7.18 11.98 9.40 11.61 9.12 Expenses to be Reimbursed by the Investment Manager
- - - - - - - - - -
(B) 0.75 4.85 18.58 19.75 8.52 7.18 11.98 9.40 11.61 9.12 NET REALISED GAINS / (LOSSES) FOR THE YEAR / PERIOD (A -B = C)
5.74 833.91 984.34 937.97 1,058.32 1,027.67 1,940.79 1,770.92 1,836.16 1,703.88
Change in Unrealised Depreciation in value of investments (D)
62.43 67.65 (83.73) 75.55 3.90 51.51 (80.47) 50.88 (65.95) 85.66
NET GAINS / (LOSSES) FOR THE YEAR / PERIOD (E=(C+D))
68.17 901.56 900.61 1,013.52 1,062.22 1,079.18 1,860.32 1,821.80 1,770.21 1,789.54
Change in Unrealised Appreciation in the value of investments (F)
(1.82) 1.82 (71.22) 72.34 (118.38) 123.41 (243.87) 245.29 (202.21) 203.75
NET SURPLUS / (DEFICIT) FOR THE YEAR / PERIOD ( E + F = G )
66.35 903.38 829.39 1,085.86 943.84 1,202.59 1,616.45 2,067.09 1,568.00 1,993.29
Add: Balance transfer from Unrealised Appreciation Reserve
1.82 - 72.34 - 123.41 - 245.29 - 203.75 -
Less: Balance transfer to Unrealised Appreciation Reserve
- (1.82) (1.12) (72.34) (5.03) (123.41) (1.42) (245.29) (1.54) (203.75)
Add / (Less): Equalisation - - - - - - - - - - Transfer from Revenue Reserve - - - - - - - - - - Transfer from Unit Premium Reserve - - - - - - - - - - Total 68.17 901.56 900.61 1,013.52 1,062.22 1,079.18 1,860.32 1,821.80 1,770.21 1,789.54 Dividend appropriationIncome Distributed during the year / period 0.09 - - - - - - - - - Tax on income distributed during the year / period
- - - - - - - - - -
Retained Surplus / (Deficit) carried forward to Balance sheet
68.08 901.56 900.61 1,013.52 1,062.22 1,079.18 1,860.32 1,821.80 1,770.21 1,789.54
Notes to Accounts - Annexure I$ : Amounts less than ` 0.005 Lakhs
(` in Lakhs)
Abridged Revenue Account for the Year / Period Ended
For and on behalf ofDeloitte Haskins & Sells LLPChartered Accountants
For and on behalf of Invesco Asset Management (India) Private Limited For and on behalf of Invesco Trustee Private Limited
Sd/- Paresh Parasnis Director
Sd/- Sanjay Tripathy Director
Sd/- G. Anantharaman Director
Sd/- Bakul Patel Director
Sd/- G.K. SubramaniamPartner
Sd/-Ketan UgrankarChief Operating Officer & Chief Financial Officer
Sd/-Taher Badshah President & Chief Investment Officer
Sd/- Vikas GargDirector & Head- Fixed Income
Sd/- Krishna CheemalapatiFund Manager
Place : MumbaiDate : June 30, 2021
Place : MumbaiDate : June 30, 2021
Place : MumbaiDate : June 28, 2021
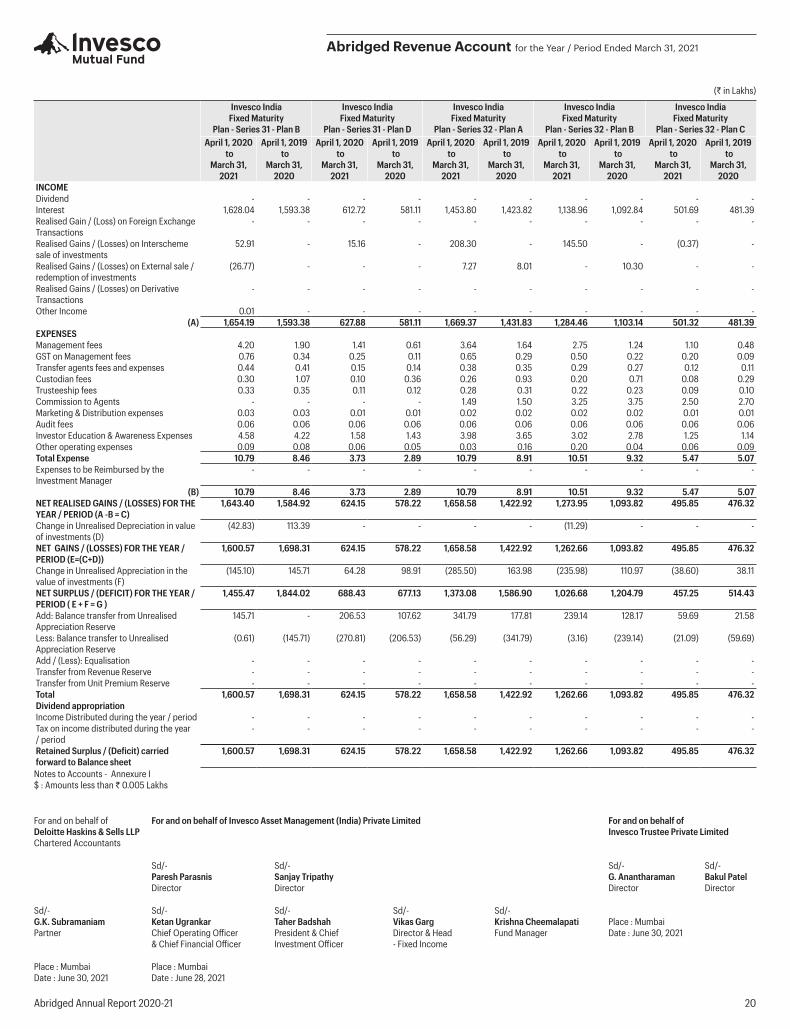
Abridged Annual Report 2020-21 20
(` in Lakhs)
Abridged Revenue Account for the Year / Period Ended March 31, 2021
Invesco India Fixed Maturity
Plan - Series 31 - Plan B
Invesco India Fixed Maturity
Plan - Series 31 - Plan D
Invesco India Fixed Maturity
Plan - Series 32 - Plan A
Invesco India Fixed Maturity
Plan - Series 32 - Plan B
Invesco India Fixed Maturity
Plan - Series 32 - Plan CApril 1, 2020
toMarch 31,
2021
April 1, 2019 to
March 31, 2020
April 1, 2020 to
March 31, 2021
April 1, 2019 to
March 31, 2020
April 1, 2020 to
March 31, 2021
April 1, 2019 to
March 31, 2020
April 1, 2020 to
March 31, 2021
April 1, 2019 to
March 31, 2020
April 1, 2020 to
March 31, 2021
April 1, 2019 to
March 31, 2020
INCOMEDividend - - - - - - - - - - Interest 1,628.04 1,593.38 612.72 581.11 1,453.80 1,423.82 1,138.96 1,092.84 501.69 481.39 Realised Gain / (Loss) on Foreign Exchange Transactions
- - - - - - - - - -
Realised Gains / (Losses) on Interscheme sale of investments
52.91 - 15.16 - 208.30 - 145.50 - (0.37) -
Realised Gains / (Losses) on External sale / redemption of investments
(26.77) - - - 7.27 8.01 - 10.30 - -
Realised Gains / (Losses) on Derivative Transactions
- - - - - - - - - -
Other Income 0.01 - - - - - - - - - (A) 1,654.19 1,593.38 627.88 581.11 1,669.37 1,431.83 1,284.46 1,103.14 501.32 481.39
EXPENSESManagement fees 4.20 1.90 1.41 0.61 3.64 1.64 2.75 1.24 1.10 0.48 GST on Management fees 0.76 0.34 0.25 0.11 0.65 0.29 0.50 0.22 0.20 0.09 Transfer agents fees and expenses 0.44 0.41 0.15 0.14 0.38 0.35 0.29 0.27 0.12 0.11 Custodian fees 0.30 1.07 0.10 0.36 0.26 0.93 0.20 0.71 0.08 0.29 Trusteeship fees 0.33 0.35 0.11 0.12 0.28 0.31 0.22 0.23 0.09 0.10 Commission to Agents - - - - 1.49 1.50 3.25 3.75 2.50 2.70 Marketing & Distribution expenses 0.03 0.03 0.01 0.01 0.02 0.02 0.02 0.02 0.01 0.01 Audit fees 0.06 0.06 0.06 0.06 0.06 0.06 0.06 0.06 0.06 0.06 Investor Education & Awareness Expenses 4.58 4.22 1.58 1.43 3.98 3.65 3.02 2.78 1.25 1.14 Other operating expenses 0.09 0.08 0.06 0.05 0.03 0.16 0.20 0.04 0.06 0.09 Total Expense 10.79 8.46 3.73 2.89 10.79 8.91 10.51 9.32 5.47 5.07 Expenses to be Reimbursed by the Investment Manager
- - - - - - - - - -
(B) 10.79 8.46 3.73 2.89 10.79 8.91 10.51 9.32 5.47 5.07 NET REALISED GAINS / (LOSSES) FOR THE YEAR / PERIOD (A -B = C)
1,643.40 1,584.92 624.15 578.22 1,658.58 1,422.92 1,273.95 1,093.82 495.85 476.32
Change in Unrealised Depreciation in value of investments (D)
(42.83) 113.39 - - - - (11.29) - - -
NET GAINS / (LOSSES) FOR THE YEAR / PERIOD (E=(C+D))
1,600.57 1,698.31 624.15 578.22 1,658.58 1,422.92 1,262.66 1,093.82 495.85 476.32
Change in Unrealised Appreciation in the value of investments (F)
(145.10) 145.71 64.28 98.91 (285.50) 163.98 (235.98) 110.97 (38.60) 38.11
NET SURPLUS / (DEFICIT) FOR THE YEAR / PERIOD ( E + F = G )
1,455.47 1,844.02 688.43 677.13 1,373.08 1,586.90 1,026.68 1,204.79 457.25 514.43
Add: Balance transfer from Unrealised Appreciation Reserve
145.71 - 206.53 107.62 341.79 177.81 239.14 128.17 59.69 21.58
Less: Balance transfer to Unrealised Appreciation Reserve
(0.61) (145.71) (270.81) (206.53) (56.29) (341.79) (3.16) (239.14) (21.09) (59.69)
Add / (Less): Equalisation - - - - - - - - - - Transfer from Revenue Reserve - - - - - - - - - - Transfer from Unit Premium Reserve - - - - - - - - - - Total 1,600.57 1,698.31 624.15 578.22 1,658.58 1,422.92 1,262.66 1,093.82 495.85 476.32 Dividend appropriationIncome Distributed during the year / period - - - - - - - - - - Tax on income distributed during the year / period
- - - - - - - - - -
Retained Surplus / (Deficit) carried forward to Balance sheet
1,600.57 1,698.31 624.15 578.22 1,658.58 1,422.92 1,262.66 1,093.82 495.85 476.32
Notes to Accounts - Annexure I$ : Amounts less than ` 0.005 Lakhs
For and on behalf ofDeloitte Haskins & Sells LLPChartered Accountants
For and on behalf of Invesco Asset Management (India) Private Limited For and on behalf of Invesco Trustee Private Limited
Sd/- Paresh Parasnis Director
Sd/- Sanjay Tripathy Director
Sd/- G. Anantharaman Director
Sd/- Bakul Patel Director
Sd/- G.K. SubramaniamPartner
Sd/-Ketan UgrankarChief Operating Officer & Chief Financial Officer
Sd/-Taher Badshah President & Chief Investment Officer
Sd/- Vikas GargDirector & Head- Fixed Income
Sd/- Krishna CheemalapatiFund Manager
Place : MumbaiDate : June 30, 2021
Place : MumbaiDate : June 30, 2021
Place : MumbaiDate : June 28, 2021
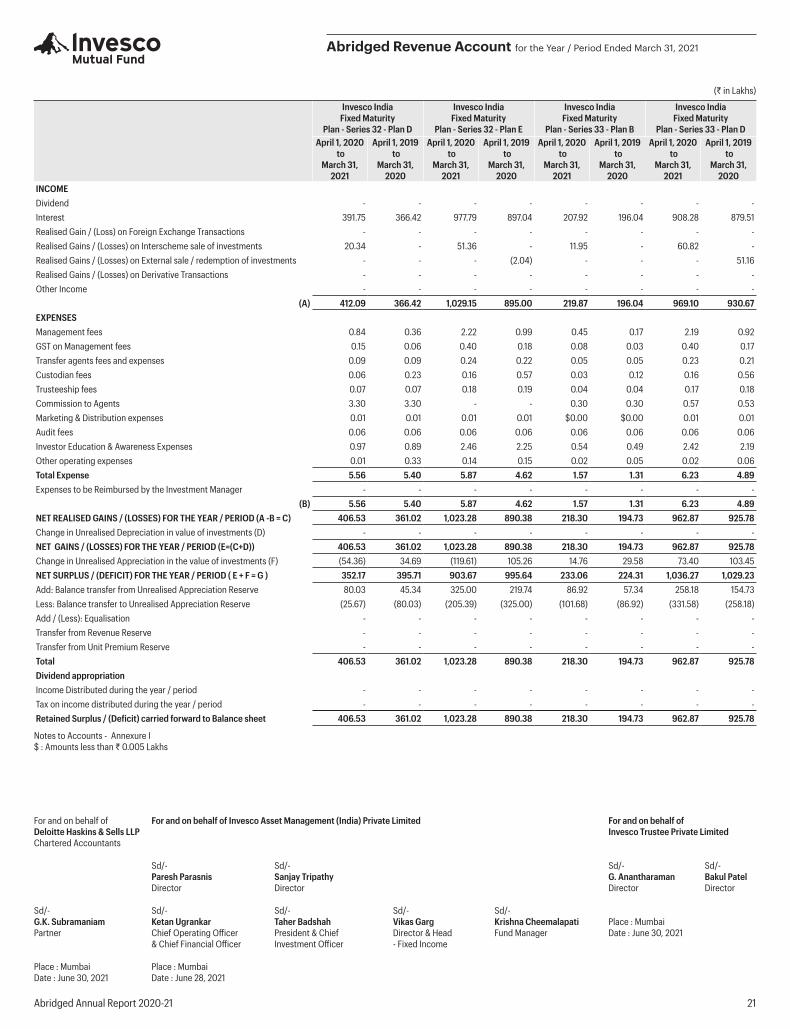
Abridged Annual Report 2020-21 21
(` in Lakhs)
Abridged Revenue Account for the Year / Period Ended March 31, 2021
Invesco India Fixed Maturity
Plan - Series 32 - Plan D
Invesco India Fixed Maturity
Plan - Series 32 - Plan E
Invesco India Fixed Maturity
Plan - Series 33 - Plan B
Invesco India Fixed Maturity
Plan - Series 33 - Plan DApril 1, 2020
toMarch 31,
2021
April 1, 2019 to
March 31, 2020
April 1, 2020 to
March 31, 2021
April 1, 2019 to
March 31, 2020
April 1, 2020 to
March 31, 2021
April 1, 2019 to
March 31, 2020
April 1, 2020 to
March 31, 2021
April 1, 2019 to
March 31, 2020
INCOMEDividend - - - - - - - - Interest 391.75 366.42 977.79 897.04 207.92 196.04 908.28 879.51 Realised Gain / (Loss) on Foreign Exchange Transactions - - - - - - - - Realised Gains / (Losses) on Interscheme sale of investments 20.34 - 51.36 - 11.95 - 60.82 - Realised Gains / (Losses) on External sale / redemption of investments - - - (2.04) - - - 51.16 Realised Gains / (Losses) on Derivative Transactions - - - - - - - - Other Income - - - - - - - -
(A) 412.09 366.42 1,029.15 895.00 219.87 196.04 969.10 930.67 EXPENSESManagement fees 0.84 0.36 2.22 0.99 0.45 0.17 2.19 0.92 GST on Management fees 0.15 0.06 0.40 0.18 0.08 0.03 0.40 0.17 Transfer agents fees and expenses 0.09 0.09 0.24 0.22 0.05 0.05 0.23 0.21 Custodian fees 0.06 0.23 0.16 0.57 0.03 0.12 0.16 0.56 Trusteeship fees 0.07 0.07 0.18 0.19 0.04 0.04 0.17 0.18 Commission to Agents 3.30 3.30 - - 0.30 0.30 0.57 0.53 Marketing & Distribution expenses 0.01 0.01 0.01 0.01 $0.00 $0.00 0.01 0.01 Audit fees 0.06 0.06 0.06 0.06 0.06 0.06 0.06 0.06 Investor Education & Awareness Expenses 0.97 0.89 2.46 2.25 0.54 0.49 2.42 2.19 Other operating expenses 0.01 0.33 0.14 0.15 0.02 0.05 0.02 0.06 Total Expense 5.56 5.40 5.87 4.62 1.57 1.31 6.23 4.89 Expenses to be Reimbursed by the Investment Manager - - - - - - - -
(B) 5.56 5.40 5.87 4.62 1.57 1.31 6.23 4.89 NET REALISED GAINS / (LOSSES) FOR THE YEAR / PERIOD (A -B = C) 406.53 361.02 1,023.28 890.38 218.30 194.73 962.87 925.78 Change in Unrealised Depreciation in value of investments (D) - - - - - - - - NET GAINS / (LOSSES) FOR THE YEAR / PERIOD (E=(C+D)) 406.53 361.02 1,023.28 890.38 218.30 194.73 962.87 925.78 Change in Unrealised Appreciation in the value of investments (F) (54.36) 34.69 (119.61) 105.26 14.76 29.58 73.40 103.45 NET SURPLUS / (DEFICIT) FOR THE YEAR / PERIOD ( E + F = G ) 352.17 395.71 903.67 995.64 233.06 224.31 1,036.27 1,029.23 Add: Balance transfer from Unrealised Appreciation Reserve 80.03 45.34 325.00 219.74 86.92 57.34 258.18 154.73 Less: Balance transfer to Unrealised Appreciation Reserve (25.67) (80.03) (205.39) (325.00) (101.68) (86.92) (331.58) (258.18)Add / (Less): Equalisation - - - - - - - - Transfer from Revenue Reserve - - - - - - - - Transfer from Unit Premium Reserve - - - - - - - - Total 406.53 361.02 1,023.28 890.38 218.30 194.73 962.87 925.78 Dividend appropriationIncome Distributed during the year / period - - - - - - - - Tax on income distributed during the year / period - - - - - - - - Retained Surplus / (Deficit) carried forward to Balance sheet 406.53 361.02 1,023.28 890.38 218.30 194.73 962.87 925.78
Notes to Accounts - Annexure I$ : Amounts less than ` 0.005 Lakhs
For and on behalf ofDeloitte Haskins & Sells LLPChartered Accountants
For and on behalf of Invesco Asset Management (India) Private Limited For and on behalf of Invesco Trustee Private Limited
Sd/- Paresh Parasnis Director
Sd/- Sanjay Tripathy Director
Sd/- G. Anantharaman Director
Sd/- Bakul Patel Director
Sd/- G.K. SubramaniamPartner
Sd/-Ketan UgrankarChief Operating Officer & Chief Financial Officer
Sd/-Taher Badshah President & Chief Investment Officer
Sd/- Vikas GargDirector & Head- Fixed Income
Sd/- Krishna CheemalapatiFund Manager
Place : MumbaiDate : June 30, 2021
Place : MumbaiDate : June 30, 2021
Place : MumbaiDate : June 28, 2021
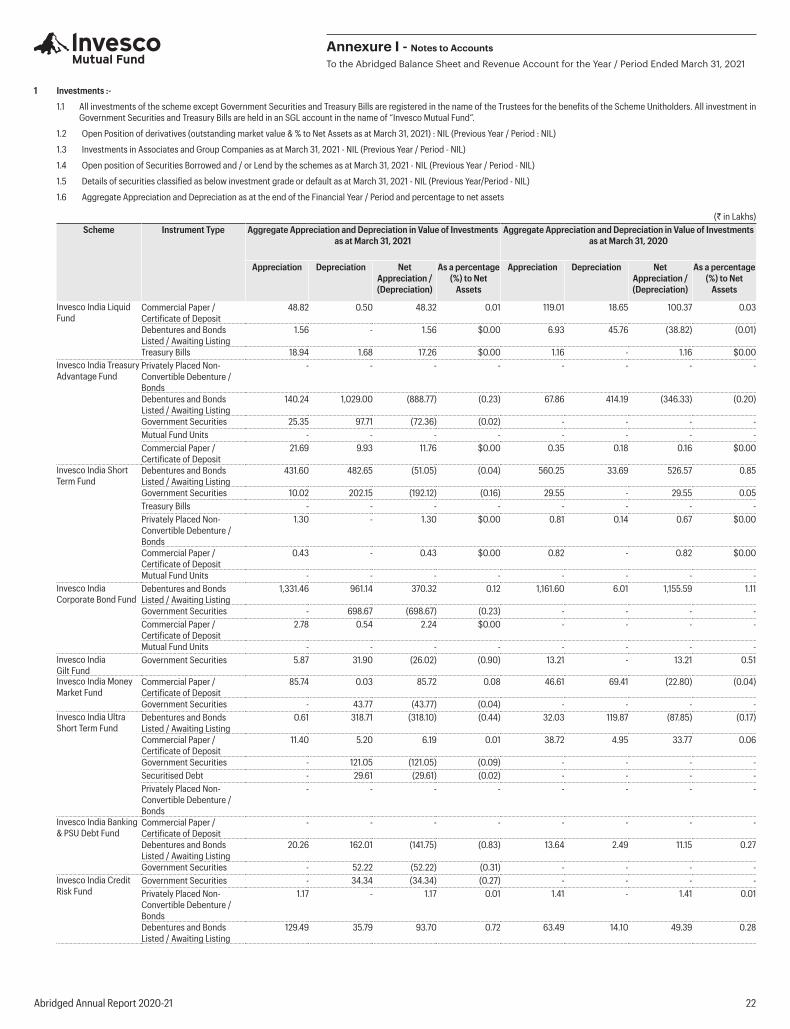
Abridged Annual Report 2020-21 22
1 Investments :-
1.1 All investments of the scheme except Government Securities and Treasury Bills are registered in the name of the Trustees for the benefits of the Scheme Unitholders. All investment in Government Securities and Treasury Bills are held in an SGL account in the name of “Invesco Mutual Fund”.
1.2 Open Position of derivatives (outstanding market value & % to Net Assets as at March 31, 2021) : NIL (Previous Year / Period : NIL)
1.3 Investments in Associates and Group Companies as at March 31, 2021 - NIL (Previous Year / Period - NIL)
1.4 Open position of Securities Borrowed and / or Lend by the schemes as at March 31, 2021 - NIL (Previous Year / Period - NIL)
1.5 Details of securities classified as below investment grade or default as at March 31, 2021 - NIL (Previous Year/Period - NIL)
1.6 Aggregate Appreciation and Depreciation as at the end of the Financial Year / Period and percentage to net assets
(` in Lakhs)Scheme Instrument Type Aggregate Appreciation and Depreciation in Value of Investments
as at March 31, 2021Aggregate Appreciation and Depreciation in Value of Investments
as at March 31, 2020
Appreciation Depreciation Net Appreciation / (Depreciation)
As a percentage (%) to Net
Assets
Appreciation Depreciation Net Appreciation / (Depreciation)
As a percentage (%) to Net
Assets
Invesco India Liquid Fund
Commercial Paper / Certificate of Deposit
48.82 0.50 48.32 0.01 119.01 18.65 100.37 0.03
Debentures and Bonds Listed / Awaiting Listing
1.56 - 1.56 $0.00 6.93 45.76 (38.82) (0.01)
Treasury Bills 18.94 1.68 17.26 $0.00 1.16 - 1.16 $0.00Invesco India Treasury Advantage Fund
Privately Placed Non-Convertible Debenture / Bonds
- - - - - - - -
Debentures and Bonds Listed / Awaiting Listing
140.24 1,029.00 (888.77) (0.23) 67.86 414.19 (346.33) (0.20)
Government Securities 25.35 97.71 (72.36) (0.02) - - - -Mutual Fund Units - - - - - - - -Commercial Paper / Certificate of Deposit
21.69 9.93 11.76 $0.00 0.35 0.18 0.16 $0.00
Invesco India Short Term Fund
Debentures and Bonds Listed / Awaiting Listing
431.60 482.65 (51.05) (0.04) 560.25 33.69 526.57 0.85
Government Securities 10.02 202.15 (192.12) (0.16) 29.55 - 29.55 0.05Treasury Bills - - - - - - - -Privately Placed Non-Convertible Debenture / Bonds
1.30 - 1.30 $0.00 0.81 0.14 0.67 $0.00
Commercial Paper / Certificate of Deposit
0.43 - 0.43 $0.00 0.82 - 0.82 $0.00
Mutual Fund Units - - - - - - - -Invesco India Corporate Bond Fund
Debentures and Bonds Listed / Awaiting Listing
1,331.46 961.14 370.32 0.12 1,161.60 6.01 1,155.59 1.11
Government Securities - 698.67 (698.67) (0.23) - - - -Commercial Paper / Certificate of Deposit
2.78 0.54 2.24 $0.00 - - - -
Mutual Fund Units - - - - - - - -Invesco India Gilt Fund
Government Securities 5.87 31.90 (26.02) (0.90) 13.21 - 13.21 0.51
Invesco India Money Market Fund
Commercial Paper / Certificate of Deposit
85.74 0.03 85.72 0.08 46.61 69.41 (22.80) (0.04)
Government Securities - 43.77 (43.77) (0.04) - - - -Invesco India Ultra Short Term Fund
Debentures and Bonds Listed / Awaiting Listing
0.61 318.71 (318.10) (0.44) 32.03 119.87 (87.85) (0.17)
Commercial Paper / Certificate of Deposit
11.40 5.20 6.19 0.01 38.72 4.95 33.77 0.06
Government Securities - 121.05 (121.05) (0.09) - - - -Securitised Debt - 29.61 (29.61) (0.02) - - - -Privately Placed Non-Convertible Debenture / Bonds
- - - - - - - -
Invesco India Banking & PSU Debt Fund
Commercial Paper / Certificate of Deposit
- - - - - - - -
Debentures and Bonds Listed / Awaiting Listing
20.26 162.01 (141.75) (0.83) 13.64 2.49 11.15 0.27
Government Securities - 52.22 (52.22) (0.31) - - - -Invesco India Credit Risk Fund
Government Securities - 34.34 (34.34) (0.27) - - - -Privately Placed Non-Convertible Debenture / Bonds
1.17 - 1.17 0.01 1.41 - 1.41 0.01
Debentures and Bonds Listed / Awaiting Listing
129.49 35.79 93.70 0.72 63.49 14.10 49.39 0.28
Annexure I - Notes to Accounts
To the Abridged Balance Sheet and Revenue Account for the Year / Period Ended March 31, 2021
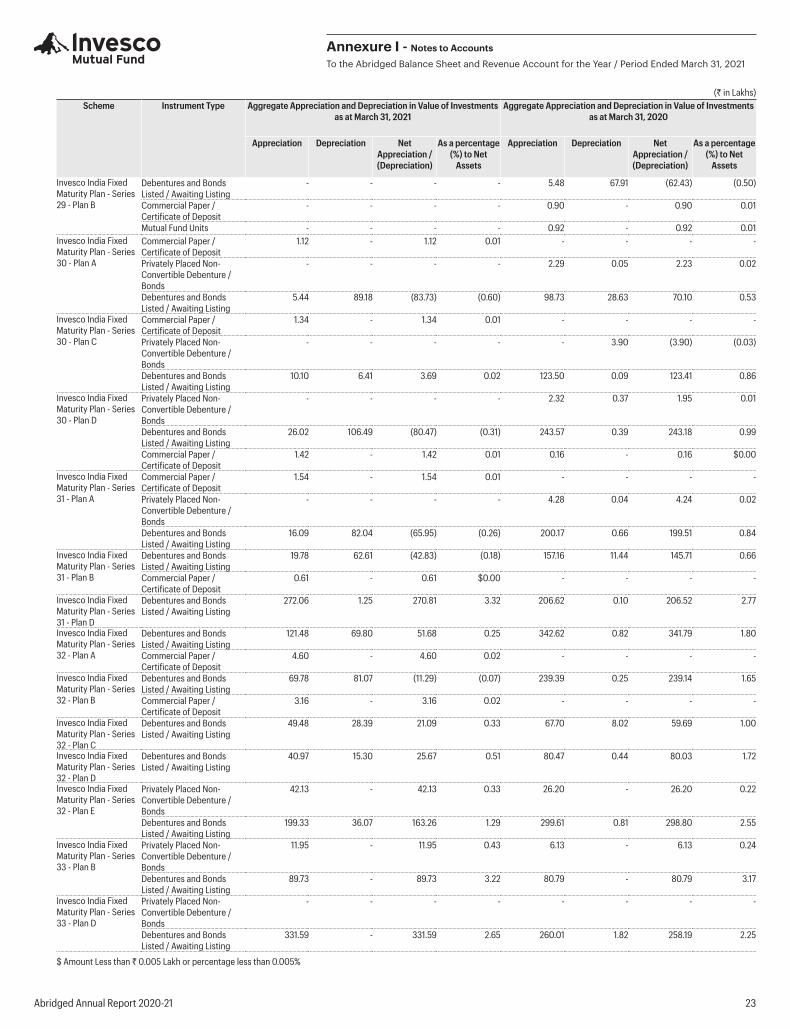
Abridged Annual Report 2020-21 23
(` in Lakhs)Scheme Instrument Type Aggregate Appreciation and Depreciation in Value of Investments
as at March 31, 2021Aggregate Appreciation and Depreciation in Value of Investments
as at March 31, 2020
Appreciation Depreciation Net Appreciation / (Depreciation)
As a percentage (%) to Net
Assets
Appreciation Depreciation Net Appreciation / (Depreciation)
As a percentage (%) to Net
Assets
Invesco India Fixed Maturity Plan - Series 29 - Plan B
Debentures and Bonds Listed / Awaiting Listing
- - - - 5.48 67.91 (62.43) (0.50)
Commercial Paper / Certificate of Deposit
- - - - 0.90 - 0.90 0.01
Mutual Fund Units - - - - 0.92 - 0.92 0.01Invesco India Fixed Maturity Plan - Series 30 - Plan A
Commercial Paper / Certificate of Deposit
1.12 - 1.12 0.01 - - - -
Privately Placed Non-Convertible Debenture / Bonds
- - - - 2.29 0.05 2.23 0.02
Debentures and Bonds Listed / Awaiting Listing
5.44 89.18 (83.73) (0.60) 98.73 28.63 70.10 0.53
Invesco India Fixed Maturity Plan - Series 30 - Plan C
Commercial Paper / Certificate of Deposit
1.34 - 1.34 0.01 - - - -
Privately Placed Non-Convertible Debenture / Bonds
- - - - - 3.90 (3.90) (0.03)
Debentures and Bonds Listed / Awaiting Listing
10.10 6.41 3.69 0.02 123.50 0.09 123.41 0.86
Invesco India Fixed Maturity Plan - Series 30 - Plan D
Privately Placed Non-Convertible Debenture / Bonds
- - - - 2.32 0.37 1.95 0.01
Debentures and Bonds Listed / Awaiting Listing
26.02 106.49 (80.47) (0.31) 243.57 0.39 243.18 0.99
Commercial Paper / Certificate of Deposit
1.42 - 1.42 0.01 0.16 - 0.16 $0.00
Invesco India Fixed Maturity Plan - Series 31 - Plan A
Commercial Paper / Certificate of Deposit
1.54 - 1.54 0.01 - - - -
Privately Placed Non-Convertible Debenture / Bonds
- - - - 4.28 0.04 4.24 0.02
Debentures and Bonds Listed / Awaiting Listing
16.09 82.04 (65.95) (0.26) 200.17 0.66 199.51 0.84
Invesco India Fixed Maturity Plan - Series 31 - Plan B
Debentures and Bonds Listed / Awaiting Listing
19.78 62.61 (42.83) (0.18) 157.16 11.44 145.71 0.66
Commercial Paper / Certificate of Deposit
0.61 - 0.61 $0.00 - - - -
Invesco India Fixed Maturity Plan - Series 31 - Plan D
Debentures and Bonds Listed / Awaiting Listing
272.06 1.25 270.81 3.32 206.62 0.10 206.52 2.77
Invesco India Fixed Maturity Plan - Series 32 - Plan A
Debentures and Bonds Listed / Awaiting Listing
121.48 69.80 51.68 0.25 342.62 0.82 341.79 1.80
Commercial Paper / Certificate of Deposit
4.60 - 4.60 0.02 - - - -
Invesco India Fixed Maturity Plan - Series 32 - Plan B
Debentures and Bonds Listed / Awaiting Listing
69.78 81.07 (11.29) (0.07) 239.39 0.25 239.14 1.65
Commercial Paper / Certificate of Deposit
3.16 - 3.16 0.02 - - - -
Invesco India Fixed Maturity Plan - Series 32 - Plan C
Debentures and Bonds Listed / Awaiting Listing
49.48 28.39 21.09 0.33 67.70 8.02 59.69 1.00
Invesco India Fixed Maturity Plan - Series 32 - Plan D
Debentures and Bonds Listed / Awaiting Listing
40.97 15.30 25.67 0.51 80.47 0.44 80.03 1.72
Invesco India Fixed Maturity Plan - Series 32 - Plan E
Privately Placed Non-Convertible Debenture / Bonds
42.13 - 42.13 0.33 26.20 - 26.20 0.22
Debentures and Bonds Listed / Awaiting Listing
199.33 36.07 163.26 1.29 299.61 0.81 298.80 2.55
Invesco India Fixed Maturity Plan - Series 33 - Plan B
Privately Placed Non-Convertible Debenture / Bonds
11.95 - 11.95 0.43 6.13 - 6.13 0.24
Debentures and Bonds Listed / Awaiting Listing
89.73 - 89.73 3.22 80.79 - 80.79 3.17
Invesco India Fixed Maturity Plan - Series 33 - Plan D
Privately Placed Non-Convertible Debenture / Bonds
- - - - - - - -
Debentures and Bonds Listed / Awaiting Listing
331.59 - 331.59 2.65 260.01 1.82 258.19 2.25
$ Amount Less than ` 0.005 Lakh or percentage less than 0.005%
Annexure I - Notes to Accounts
To the Abridged Balance Sheet and Revenue Account for the Year / Period Ended March 31, 2021
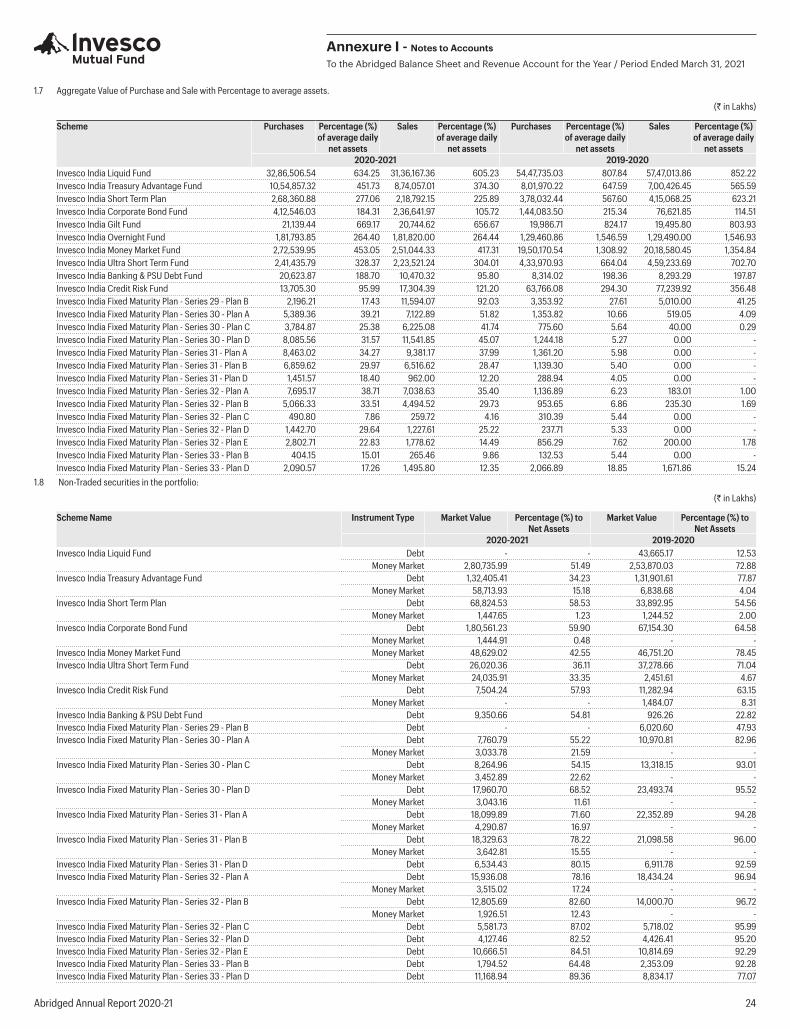
Abridged Annual Report 2020-21 24
1.7 Aggregate Value of Purchase and Sale with Percentage to average assets.
(` in Lakhs)
Scheme Purchases Percentage (%) of average daily
net assets
Sales Percentage (%) of average daily
net assets
Purchases Percentage (%) of average daily
net assets
Sales Percentage (%) of average daily
net assets2020-2021 2019-2020
Invesco India Liquid Fund 32,86,506.54 634.25 31,36,167.36 605.23 54,47,735.03 807.84 57,47,013.86 852.22Invesco India Treasury Advantage Fund 10,54,857.32 451.73 8,74,057.01 374.30 8,01,970.22 647.59 7,00,426.45 565.59Invesco India Short Term Plan 2,68,360.88 277.06 2,18,792.15 225.89 3,78,032.44 567.60 4,15,068.25 623.21Invesco India Corporate Bond Fund 4,12,546.03 184.31 2,36,641.97 105.72 1,44,083.50 215.34 76,621.85 114.51Invesco India Gilt Fund 21,139.44 669.17 20,744.62 656.67 19,986.71 824.17 19,495.80 803.93Invesco India Overnight Fund 1,81,793.85 264.40 1,81,820.00 264.44 1,29,460.86 1,546.59 1,29,490.00 1,546.93Invesco India Money Market Fund 2,72,539.95 453.05 2,51,044.33 417.31 19,50,170.54 1,308.92 20,18,580.45 1,354.84Invesco India Ultra Short Term Fund 2,41,435.79 328.37 2,23,521.24 304.01 4,33,970.93 664.04 4,59,233.69 702.70Invesco India Banking & PSU Debt Fund 20,623.87 188.70 10,470.32 95.80 8,314.02 198.36 8,293.29 197.87Invesco India Credit Risk Fund 13,705.30 95.99 17,304.39 121.20 63,766.08 294.30 77,239.92 356.48Invesco India Fixed Maturity Plan - Series 29 - Plan B 2,196.21 17.43 11,594.07 92.03 3,353.92 27.61 5,010.00 41.25Invesco India Fixed Maturity Plan - Series 30 - Plan A 5,389.36 39.21 7,122.89 51.82 1,353.82 10.66 519.05 4.09Invesco India Fixed Maturity Plan - Series 30 - Plan C 3,784.87 25.38 6,225.08 41.74 775.60 5.64 40.00 0.29Invesco India Fixed Maturity Plan - Series 30 - Plan D 8,085.56 31.57 11,541.85 45.07 1,244.18 5.27 0.00 -Invesco India Fixed Maturity Plan - Series 31 - Plan A 8,463.02 34.27 9,381.17 37.99 1,361.20 5.98 0.00 -Invesco India Fixed Maturity Plan - Series 31 - Plan B 6,859.62 29.97 6,516.62 28.47 1,139.30 5.40 0.00 -Invesco India Fixed Maturity Plan - Series 31 - Plan D 1,451.57 18.40 962.00 12.20 288.94 4.05 0.00 -Invesco India Fixed Maturity Plan - Series 32 - Plan A 7,695.17 38.71 7,038.63 35.40 1,136.89 6.23 183.01 1.00Invesco India Fixed Maturity Plan - Series 32 - Plan B 5,066.33 33.51 4,494.52 29.73 953.65 6.86 235.30 1.69Invesco India Fixed Maturity Plan - Series 32 - Plan C 490.80 7.86 259.72 4.16 310.39 5.44 0.00 -Invesco India Fixed Maturity Plan - Series 32 - Plan D 1,442.70 29.64 1,227.61 25.22 237.71 5.33 0.00 -Invesco India Fixed Maturity Plan - Series 32 - Plan E 2,802.71 22.83 1,778.62 14.49 856.29 7.62 200.00 1.78Invesco India Fixed Maturity Plan - Series 33 - Plan B 404.15 15.01 265.46 9.86 132.53 5.44 0.00 -Invesco India Fixed Maturity Plan - Series 33 - Plan D 2,090.57 17.26 1,495.80 12.35 2,066.89 18.85 1,671.86 15.24
1.8 Non-Traded securities in the portfolio:
(` in Lakhs)
Scheme Name Instrument Type Market Value Percentage (%) to Net Assets
Market Value Percentage (%) to Net Assets
2020-2021 2019-2020Invesco India Liquid Fund Debt - - 43,665.17 12.53
Money Market 2,80,735.99 51.49 2,53,870.03 72.88Invesco India Treasury Advantage Fund Debt 1,32,405.41 34.23 1,31,901.61 77.87
Money Market 58,713.93 15.18 6,838.68 4.04Invesco India Short Term Plan Debt 68,824.53 58.53 33,892.95 54.56
Money Market 1,447.65 1.23 1,244.52 2.00Invesco India Corporate Bond Fund Debt 1,80,561.23 59.90 67,154.30 64.58
Money Market 1,444.91 0.48 - -Invesco India Money Market Fund Money Market 48,629.02 42.55 46,751.20 78.45Invesco India Ultra Short Term Fund Debt 26,020.36 36.11 37,278.66 71.04
Money Market 24,035.91 33.35 2,451.61 4.67Invesco India Credit Risk Fund Debt 7,504.24 57.93 11,282.94 63.15
Money Market - - 1,484.07 8.31Invesco India Banking & PSU Debt Fund Debt 9,350.66 54.81 926.26 22.82Invesco India Fixed Maturity Plan - Series 29 - Plan B Debt - - 6,020.60 47.93Invesco India Fixed Maturity Plan - Series 30 - Plan A Debt 7,760.79 55.22 10,970.81 82.96
Money Market 3,033.78 21.59 - -Invesco India Fixed Maturity Plan - Series 30 - Plan C Debt 8,264.96 54.15 13,318.15 93.01
Money Market 3,452.89 22.62 - -Invesco India Fixed Maturity Plan - Series 30 - Plan D Debt 17,960.70 68.52 23,493.74 95.52
Money Market 3,043.16 11.61 - -Invesco India Fixed Maturity Plan - Series 31 - Plan A Debt 18,099.89 71.60 22,352.89 94.28
Money Market 4,290.87 16.97 - -Invesco India Fixed Maturity Plan - Series 31 - Plan B Debt 18,329.63 78.22 21,098.58 96.00
Money Market 3,642.81 15.55 - -Invesco India Fixed Maturity Plan - Series 31 - Plan D Debt 6,534.43 80.15 6,911.78 92.59Invesco India Fixed Maturity Plan - Series 32 - Plan A Debt 15,936.08 78.16 18,434.24 96.94
Money Market 3,515.02 17.24 - -Invesco India Fixed Maturity Plan - Series 32 - Plan B Debt 12,805.69 82.60 14,000.70 96.72
Money Market 1,926.51 12.43 - -Invesco India Fixed Maturity Plan - Series 32 - Plan C Debt 5,581.73 87.02 5,718.02 95.99Invesco India Fixed Maturity Plan - Series 32 - Plan D Debt 4,127.46 82.52 4,426.41 95.20Invesco India Fixed Maturity Plan - Series 32 - Plan E Debt 10,666.51 84.51 10,814.69 92.29Invesco India Fixed Maturity Plan - Series 33 - Plan B Debt 1,794.52 64.48 2,353.09 92.28Invesco India Fixed Maturity Plan - Series 33 - Plan D Debt 11,168.94 89.36 8,834.17 77.07
Annexure I - Notes to Accounts
To the Abridged Balance Sheet and Revenue Account for the Year / Period Ended March 31, 2021
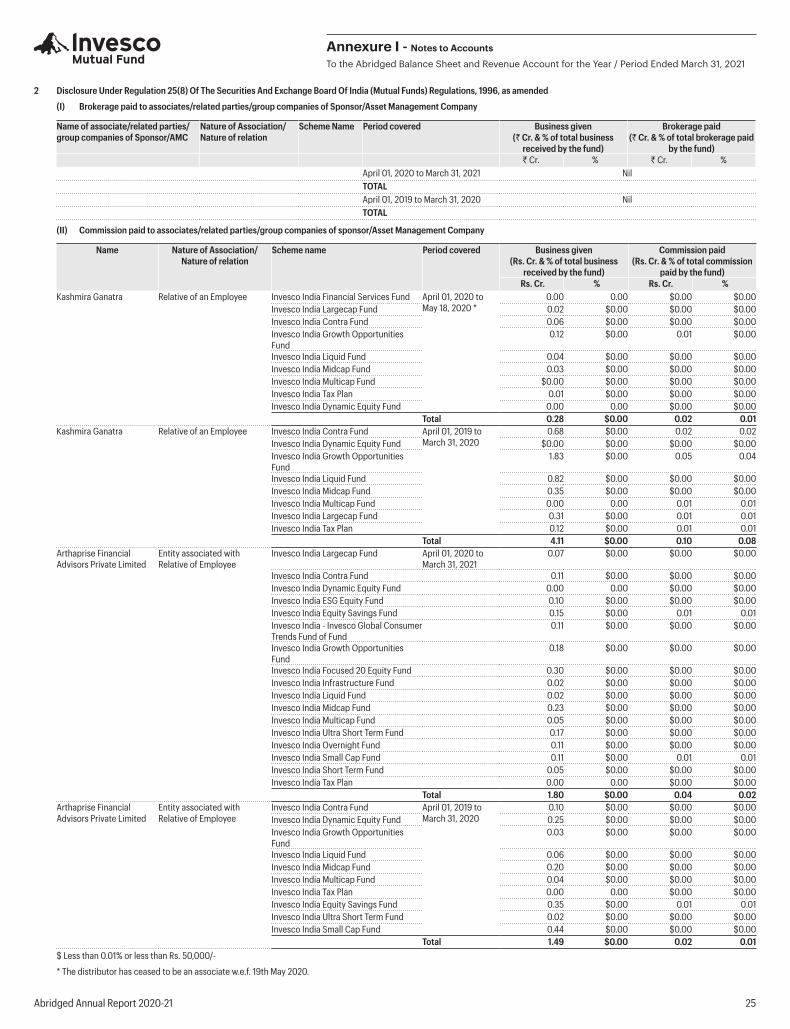
Abridged Annual Report 2020-21 25
2 Disclosure Under Regulation 25(8) Of The Securities And Exchange Board Of India (Mutual Funds) Regulations, 1996, as amended
(I) Brokerage paid to associates/related parties/group companies of Sponsor/Asset Management Company
Name of associate/related parties/group companies of Sponsor/AMC
Nature of Association/Nature of relation
Scheme Name Period covered Business given (` Cr. & % of total business
received by the fund)
Brokerage paid (` Cr. & % of total brokerage paid
by the fund)` Cr. % ` Cr. %
April 01, 2020 to March 31, 2021 NilTOTALApril 01, 2019 to March 31, 2020 NilTOTAL
(II) Commission paid to associates/related parties/group companies of sponsor/Asset Management Company
Name Nature of Association/ Nature of relation
Scheme name Period covered Business given (Rs. Cr. & % of total business
received by the fund)
Commission paid(Rs. Cr. & % of total commission
paid by the fund) Rs. Cr. % Rs. Cr. %
Kashmira Ganatra Relative of an Employee Invesco India Financial Services Fund April 01, 2020 to May 18, 2020 *
0.00 0.00 $0.00 $0.00Invesco India Largecap Fund 0.02 $0.00 $0.00 $0.00Invesco India Contra Fund 0.06 $0.00 $0.00 $0.00Invesco India Growth Opportunities Fund
0.12 $0.00 0.01 $0.00
Invesco India Liquid Fund 0.04 $0.00 $0.00 $0.00Invesco India Midcap Fund 0.03 $0.00 $0.00 $0.00Invesco India Multicap Fund $0.00 $0.00 $0.00 $0.00Invesco India Tax Plan 0.01 $0.00 $0.00 $0.00Invesco India Dynamic Equity Fund 0.00 0.00 $0.00 $0.00
Total 0.28 $0.00 0.02 0.01Kashmira Ganatra Relative of an Employee Invesco India Contra Fund April 01, 2019 to
March 31, 20200.68 $0.00 0.02 0.02
Invesco India Dynamic Equity Fund $0.00 $0.00 $0.00 $0.00Invesco India Growth Opportunities Fund
1.83 $0.00 0.05 0.04
Invesco India Liquid Fund 0.82 $0.00 $0.00 $0.00Invesco India Midcap Fund 0.35 $0.00 $0.00 $0.00Invesco India Multicap Fund 0.00 0.00 0.01 0.01Invesco India Largecap Fund 0.31 $0.00 0.01 0.01Invesco India Tax Plan 0.12 $0.00 0.01 0.01
Total 4.11 $0.00 0.10 0.08Arthaprise Financial Advisors Private Limited
Entity associated with Relative of Employee
Invesco India Largecap Fund April 01, 2020 to March 31, 2021
0.07 $0.00 $0.00 $0.00
Invesco India Contra Fund 0.11 $0.00 $0.00 $0.00Invesco India Dynamic Equity Fund 0.00 0.00 $0.00 $0.00Invesco India ESG Equity Fund 0.10 $0.00 $0.00 $0.00Invesco India Equity Savings Fund 0.15 $0.00 0.01 0.01Invesco India - Invesco Global Consumer Trends Fund of Fund
0.11 $0.00 $0.00 $0.00
Invesco India Growth Opportunities Fund
0.18 $0.00 $0.00 $0.00
Invesco India Focused 20 Equity Fund 0.30 $0.00 $0.00 $0.00Invesco India Infrastructure Fund 0.02 $0.00 $0.00 $0.00Invesco India Liquid Fund 0.02 $0.00 $0.00 $0.00Invesco India Midcap Fund 0.23 $0.00 $0.00 $0.00Invesco India Multicap Fund 0.05 $0.00 $0.00 $0.00Invesco India Ultra Short Term Fund 0.17 $0.00 $0.00 $0.00Invesco India Overnight Fund 0.11 $0.00 $0.00 $0.00Invesco India Small Cap Fund 0.11 $0.00 0.01 0.01Invesco India Short Term Fund 0.05 $0.00 $0.00 $0.00Invesco India Tax Plan 0.00 0.00 $0.00 $0.00
Total 1.80 $0.00 0.04 0.02Arthaprise Financial Advisors Private Limited
Entity associated with Relative of Employee
Invesco India Contra Fund April 01, 2019 to March 31, 2020
0.10 $0.00 $0.00 $0.00Invesco India Dynamic Equity Fund 0.25 $0.00 $0.00 $0.00Invesco India Growth Opportunities Fund
0.03 $0.00 $0.00 $0.00
Invesco India Liquid Fund 0.06 $0.00 $0.00 $0.00Invesco India Midcap Fund 0.20 $0.00 $0.00 $0.00Invesco India Multicap Fund 0.04 $0.00 $0.00 $0.00Invesco India Tax Plan 0.00 0.00 $0.00 $0.00Invesco India Equity Savings Fund 0.35 $0.00 0.01 0.01Invesco India Ultra Short Term Fund 0.02 $0.00 $0.00 $0.00Invesco India Small Cap Fund 0.44 $0.00 $0.00 $0.00
Total 1.49 $0.00 0.02 0.01$ Less than 0.01% or less than Rs. 50,000/-
* The distributor has ceased to be an associate w.e.f. 19th May 2020.
Annexure I - Notes to Accounts
To the Abridged Balance Sheet and Revenue Account for the Year / Period Ended March 31, 2021
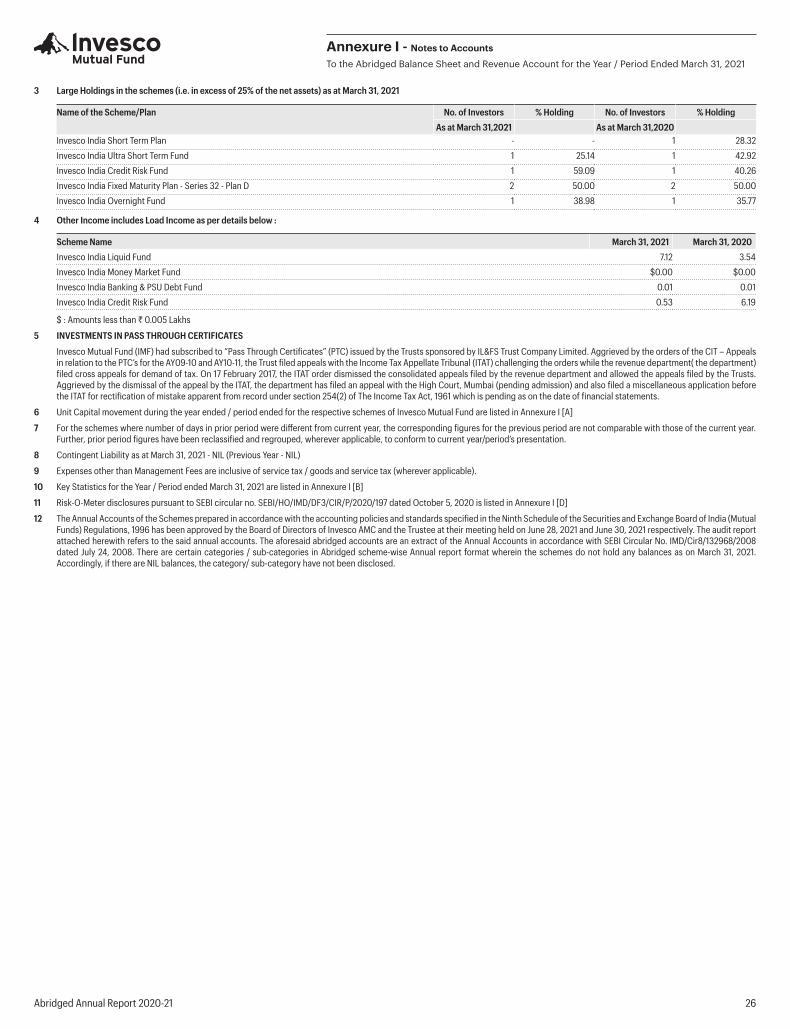
Abridged Annual Report 2020-21 26
3 Large Holdings in the schemes (i.e. in excess of 25% of the net assets) as at March 31, 2021
Name of the Scheme/Plan No. of Investors % Holding No. of Investors % HoldingAs at March 31,2021 As at March 31,2020
Invesco India Short Term Plan - - 1 28.32
Invesco India Ultra Short Term Fund 1 25.14 1 42.92
Invesco India Credit Risk Fund 1 59.09 1 40.26
Invesco India Fixed Maturity Plan - Series 32 - Plan D 2 50.00 2 50.00
Invesco India Overnight Fund 1 38.98 1 35.77
4 Other Income includes Load Income as per details below :
Scheme Name March 31, 2021 March 31, 2020Invesco India Liquid Fund 7.12 3.54
Invesco India Money Market Fund $0.00 $0.00
Invesco India Banking & PSU Debt Fund 0.01 0.01
Invesco India Credit Risk Fund 0.53 6.19
$ : Amounts less than ` 0.005 Lakhs
5 INVESTMENTS IN PASS THROUGH CERTIFICATES
Invesco Mutual Fund (IMF) had subscribed to “Pass Through Certificates” (PTC) issued by the Trusts sponsored by IL&FS Trust Company Limited. Aggrieved by the orders of the CIT – Appeals in relation to the PTC’s for the AY09-10 and AY10-11, the Trust filed appeals with the Income Tax Appellate Tribunal (ITAT) challenging the orders while the revenue department( the department) filed cross appeals for demand of tax. On 17 February 2017, the ITAT order dismissed the consolidated appeals filed by the revenue department and allowed the appeals filed by the Trusts. Aggrieved by the dismissal of the appeal by the ITAT, the department has filed an appeal with the High Court, Mumbai (pending admission) and also filed a miscellaneous application before the ITAT for rectification of mistake apparent from record under section 254(2) of The Income Tax Act, 1961 which is pending as on the date of financial statements.
6 Unit Capital movement during the year ended / period ended for the respective schemes of Invesco Mutual Fund are listed in Annexure I [A]
7 For the schemes where number of days in prior period were different from current year, the corresponding figures for the previous period are not comparable with those of the current year. Further, prior period figures have been reclassified and regrouped, wherever applicable, to conform to current year/period’s presentation.
8 Contingent Liability as at March 31, 2021 - NIL (Previous Year - NIL)
9 Expenses other than Management Fees are inclusive of service tax / goods and service tax (wherever applicable).
10 Key Statistics for the Year / Period ended March 31, 2021 are listed in Annexure I [B]
11 Risk-O-Meter disclosures pursuant to SEBI circular no. SEBI/HO/IMD/DF3/CIR/P/2020/197 dated October 5, 2020 is listed in Annexure I [D]
12 The Annual Accounts of the Schemes prepared in accordance with the accounting policies and standards specified in the Ninth Schedule of the Securities and Exchange Board of India (Mutual Funds) Regulations, 1996 has been approved by the Board of Directors of Invesco AMC and the Trustee at their meeting held on June 28, 2021 and June 30, 2021 respectively. The audit report attached herewith refers to the said annual accounts. The aforesaid abridged accounts are an extract of the Annual Accounts in accordance with SEBI Circular No. IMD/Cir8/132968/2008 dated July 24, 2008. There are certain categories / sub-categories in Abridged scheme-wise Annual report format wherein the schemes do not hold any balances as on March 31, 2021. Accordingly, if there are NIL balances, the category/ sub-category have not been disclosed.
Annexure I - Notes to Accounts
To the Abridged Balance Sheet and Revenue Account for the Year / Period Ended March 31, 2021
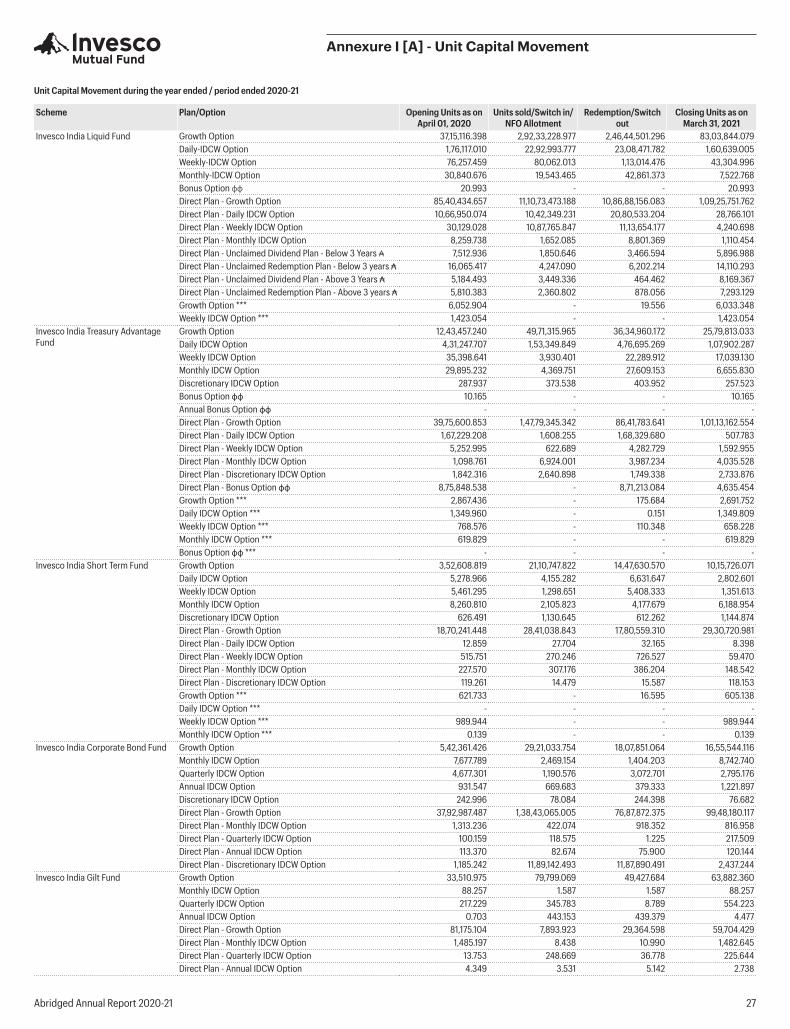
Abridged Annual Report 2020-21 27
Annexure I [A] - Unit Capital Movement
Unit Capital Movement during the year ended / period ended 2020-21
Scheme Plan/Option Opening Units as onApril 01, 2020
Units sold/Switch in/NFO Allotment
Redemption/Switch out
Closing Units as onMarch 31, 2021
Invesco India Liquid Fund Growth Option 37,15,116.398 2,92,33,228.977 2,46,44,501.296 83,03,844.079Daily-IDCW Option 1,76,117.010 22,92,993.777 23,08,471.782 1,60,639.005Weekly-IDCW Option 76,257.459 80,062.013 1,13,014.476 43,304.996Monthly-IDCW Option 30,840.676 19,543.465 42,861.373 7,522.768Bonus Option фф 20.993 - - 20.993Direct Plan - Growth Option 85,40,434.657 11,10,73,473.188 10,86,88,156.083 1,09,25,751.762Direct Plan - Daily IDCW Option 10,66,950.074 10,42,349.231 20,80,533.204 28,766.101Direct Plan - Weekly IDCW Option 30,129.028 10,87,765.847 11,13,654.177 4,240.698Direct Plan - Monthly IDCW Option 8,259.738 1,652.085 8,801.369 1,110.454Direct Plan - Unclaimed Dividend Plan - Below 3 Years ₳ 7,512.936 1,850.646 3,466.594 5,896.988Direct Plan - Unclaimed Redemption Plan - Below 3 years ₳ 16,065.417 4,247.090 6,202.214 14,110.293Direct Plan - Unclaimed Dividend Plan - Above 3 Years ₳ 5,184.493 3,449.336 464.462 8,169.367Direct Plan - Unclaimed Redemption Plan - Above 3 years ₳ 5,810.383 2,360.802 878.056 7,293.129Growth Option *** 6,052.904 - 19.556 6,033.348Weekly IDCW Option *** 1,423.054 - - 1,423.054
Invesco India Treasury Advantage Fund
Growth Option 12,43,457.240 49,71,315.965 36,34,960.172 25,79,813.033Daily IDCW Option 4,31,247.707 1,53,349.849 4,76,695.269 1,07,902.287Weekly IDCW Option 35,398.641 3,930.401 22,289.912 17,039.130Monthly IDCW Option 29,895.232 4,369.751 27,609.153 6,655.830Discretionary IDCW Option 287.937 373.538 403.952 257.523Bonus Option фф 10.165 - - 10.165Annual Bonus Option фф - - - -Direct Plan - Growth Option 39,75,600.853 1,47,79,345.342 86,41,783.641 1,01,13,162.554Direct Plan - Daily IDCW Option 1,67,229.208 1,608.255 1,68,329.680 507.783Direct Plan - Weekly IDCW Option 5,252.995 622.689 4,282.729 1,592.955Direct Plan - Monthly IDCW Option 1,098.761 6,924.001 3,987.234 4,035.528Direct Plan - Discretionary IDCW Option 1,842.316 2,640.898 1,749.338 2,733.876Direct Plan - Bonus Option фф 8,75,848.538 - 8,71,213.084 4,635.454Growth Option *** 2,867.436 - 175.684 2,691.752Daily IDCW Option *** 1,349.960 - 0.151 1,349.809Weekly IDCW Option *** 768.576 - 110.348 658.228Monthly IDCW Option *** 619.829 - - 619.829Bonus Option фф *** - - - -
Invesco India Short Term Fund Growth Option 3,52,608.819 21,10,747.822 14,47,630.570 10,15,726.071Daily IDCW Option 5,278.966 4,155.282 6,631.647 2,802.601Weekly IDCW Option 5,461.295 1,298.651 5,408.333 1,351.613Monthly IDCW Option 8,260.810 2,105.823 4,177.679 6,188.954Discretionary IDCW Option 626.491 1,130.645 612.262 1,144.874Direct Plan - Growth Option 18,70,241.448 28,41,038.843 17,80,559.310 29,30,720.981Direct Plan - Daily IDCW Option 12.859 27.704 32.165 8.398Direct Plan - Weekly IDCW Option 515.751 270.246 726.527 59.470Direct Plan - Monthly IDCW Option 227.570 307.176 386.204 148.542Direct Plan - Discretionary IDCW Option 119.261 14.479 15.587 118.153Growth Option *** 621.733 - 16.595 605.138Daily IDCW Option *** - - - -Weekly IDCW Option *** 989.944 - - 989.944Monthly IDCW Option *** 0.139 - - 0.139
Invesco India Corporate Bond Fund Growth Option 5,42,361.426 29,21,033.754 18,07,851.064 16,55,544.116Monthly IDCW Option 7,677.789 2,469.154 1,404.203 8,742.740Quarterly IDCW Option 4,677.301 1,190.576 3,072.701 2,795.176Annual IDCW Option 931.547 669.683 379.333 1,221.897Discretionary IDCW Option 242.996 78.084 244.398 76.682Direct Plan - Growth Option 37,92,987.487 1,38,43,065.005 76,87,872.375 99,48,180.117Direct Plan - Monthly IDCW Option 1,313.236 422.074 918.352 816.958Direct Plan - Quarterly IDCW Option 100.159 118.575 1.225 217.509Direct Plan - Annual IDCW Option 113.370 82.674 75.900 120.144Direct Plan - Discretionary IDCW Option 1,185.242 11,89,142.493 11,87,890.491 2,437.244
Invesco India Gilt Fund Growth Option 33,510.975 79,799.069 49,427.684 63,882.360Monthly IDCW Option 88.257 1.587 1.587 88.257Quarterly IDCW Option 217.229 345.783 8.789 554.223Annual IDCW Option 0.703 443.153 439.379 4.477Direct Plan - Growth Option 81,175.104 7,893.923 29,364.598 59,704.429Direct Plan - Monthly IDCW Option 1,485.197 8.438 10.990 1,482.645Direct Plan - Quarterly IDCW Option 13.753 248.669 36.778 225.644Direct Plan - Annual IDCW Option 4.349 3.531 5.142 2.738
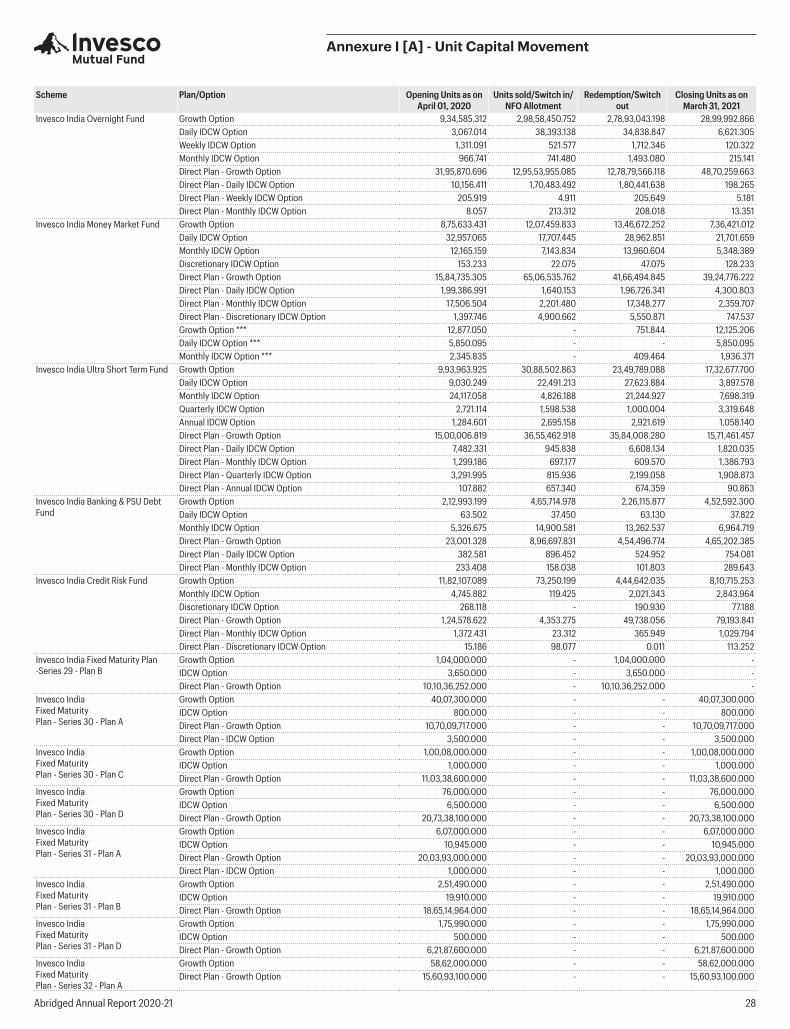
Abridged Annual Report 2020-21 28
Annexure I [A] - Unit Capital Movement
Scheme Plan/Option Opening Units as onApril 01, 2020
Units sold/Switch in/NFO Allotment
Redemption/Switch out
Closing Units as onMarch 31, 2021
Invesco India Overnight Fund Growth Option 9,34,585.312 2,98,58,450.752 2,78,93,043.198 28,99,992.866Daily IDCW Option 3,067.014 38,393.138 34,838.847 6,621.305Weekly IDCW Option 1,311.091 521.577 1,712.346 120.322Monthly IDCW Option 966.741 741.480 1,493.080 215.141Direct Plan - Growth Option 31,95,870.696 12,95,53,955.085 12,78,79,566.118 48,70,259.663Direct Plan - Daily IDCW Option 10,156.411 1,70,483.492 1,80,441.638 198.265Direct Plan - Weekly IDCW Option 205.919 4.911 205.649 5.181Direct Plan - Monthly IDCW Option 8.057 213.312 208.018 13.351
Invesco India Money Market Fund Growth Option 8,75,633.431 12,07,459.833 13,46,672.252 7,36,421.012Daily IDCW Option 32,957.065 17,707.445 28,962.851 21,701.659Monthly IDCW Option 12,165.159 7,143.834 13,960.604 5,348.389Discretionary IDCW Option 153.233 22.075 47.075 128.233Direct Plan - Growth Option 15,84,735.305 65,06,535.762 41,66,494.845 39,24,776.222Direct Plan - Daily IDCW Option 1,99,386.991 1,640.153 1,96,726.341 4,300.803Direct Plan - Monthly IDCW Option 17,506.504 2,201.480 17,348.277 2,359.707Direct Plan - Discretionary IDCW Option 1,397.746 4,900.662 5,550.871 747.537Growth Option *** 12,877.050 - 751.844 12,125.206Daily IDCW Option *** 5,850.095 - - 5,850.095Monthly IDCW Option *** 2,345.835 - 409.464 1,936.371
Invesco India Ultra Short Term Fund Growth Option 9,93,963.925 30,88,502.863 23,49,789.088 17,32,677.700Daily IDCW Option 9,030.249 22,491.213 27,623.884 3,897.578Monthly IDCW Option 24,117.058 4,826.188 21,244.927 7,698.319Quarterly IDCW Option 2,721.114 1,598.538 1,000.004 3,319.648Annual IDCW Option 1,284.601 2,695.158 2,921.619 1,058.140Direct Plan - Growth Option 15,00,006.819 36,55,462.918 35,84,008.280 15,71,461.457Direct Plan - Daily IDCW Option 7,482.331 945.838 6,608.134 1,820.035Direct Plan - Monthly IDCW Option 1,299.186 697.177 609.570 1,386.793Direct Plan - Quarterly IDCW Option 3,291.995 815.936 2,199.058 1,908.873Direct Plan - Annual IDCW Option 107.882 657.340 674.359 90.863
Invesco India Banking & PSU Debt Fund
Growth Option 2,12,993.199 4,65,714.978 2,26,115.877 4,52,592.300Daily IDCW Option 63.502 37.450 63.130 37.822Monthly IDCW Option 5,326.675 14,900.581 13,262.537 6,964.719Direct Plan - Growth Option 23,001.328 8,96,697.831 4,54,496.774 4,65,202.385Direct Plan - Daily IDCW Option 382.581 896.452 524.952 754.081Direct Plan - Monthly IDCW Option 233.408 158.038 101.803 289.643
Invesco India Credit Risk Fund Growth Option 11,82,107.089 73,250.199 4,44,642.035 8,10,715.253Monthly IDCW Option 4,745.882 119.425 2,021.343 2,843.964Discretionary IDCW Option 268.118 - 190.930 77.188Direct Plan - Growth Option 1,24,578.622 4,353.275 49,738.056 79,193.841Direct Plan - Monthly IDCW Option 1,372.431 23.312 365.949 1,029.794Direct Plan - Discretionary IDCW Option 15.186 98.077 0.011 113.252
Invesco India Fixed Maturity Plan -Series 29 - Plan B
Growth Option 1,04,000.000 - 1,04,000.000 -IDCW Option 3,650.000 - 3,650.000 -Direct Plan - Growth Option 10,10,36,252.000 - 10,10,36,252.000 -
Invesco IndiaFixed MaturityPlan - Series 30 - Plan A
Growth Option 40,07,300.000 - - 40,07,300.000IDCW Option 800.000 - - 800.000Direct Plan - Growth Option 10,70,09,717.000 - - 10,70,09,717.000Direct Plan - IDCW Option 3,500.000 - - 3,500.000
Invesco IndiaFixed MaturityPlan - Series 30 - Plan C
Growth Option 1,00,08,000.000 - - 1,00,08,000.000IDCW Option 1,000.000 - - 1,000.000Direct Plan - Growth Option 11,03,38,600.000 - - 11,03,38,600.000
Invesco IndiaFixed MaturityPlan - Series 30 - Plan D
Growth Option 76,000.000 - - 76,000.000IDCW Option 6,500.000 - - 6,500.000Direct Plan - Growth Option 20,73,38,100.000 - - 20,73,38,100.000
Invesco IndiaFixed MaturityPlan - Series 31 - Plan A
Growth Option 6,07,000.000 - - 6,07,000.000IDCW Option 10,945.000 - - 10,945.000Direct Plan - Growth Option 20,03,93,000.000 - - 20,03,93,000.000Direct Plan - IDCW Option 1,000.000 - - 1,000.000
Invesco IndiaFixed MaturityPlan - Series 31 - Plan B
Growth Option 2,51,490.000 - - 2,51,490.000IDCW Option 19,910.000 - - 19,910.000Direct Plan - Growth Option 18,65,14,964.000 - - 18,65,14,964.000
Invesco IndiaFixed MaturityPlan - Series 31 - Plan D
Growth Option 1,75,990.000 - - 1,75,990.000IDCW Option 500.000 - - 500.000Direct Plan - Growth Option 6,21,87,600.000 - - 6,21,87,600.000
Invesco IndiaFixed MaturityPlan - Series 32 - Plan A
Growth Option 58,62,000.000 - - 58,62,000.000Direct Plan - Growth Option 15,60,93,100.000 - - 15,60,93,100.000
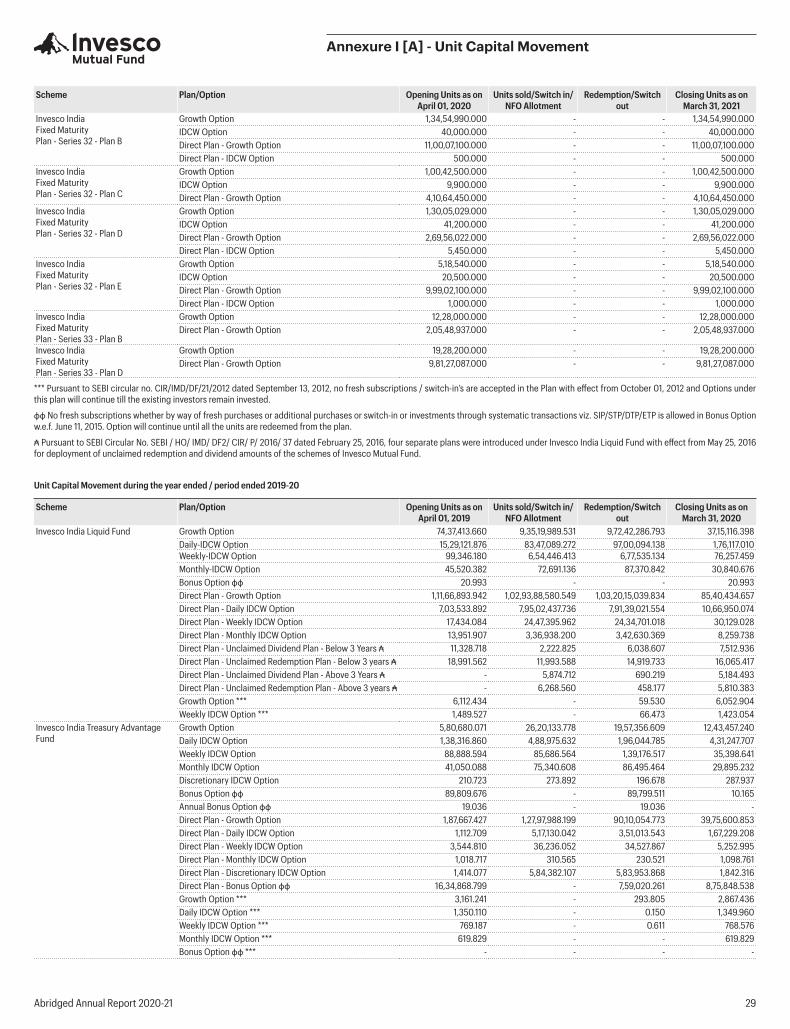
Abridged Annual Report 2020-21 29
Annexure I [A] - Unit Capital Movement
Scheme Plan/Option Opening Units as onApril 01, 2020
Units sold/Switch in/NFO Allotment
Redemption/Switch out
Closing Units as onMarch 31, 2021
Invesco IndiaFixed MaturityPlan - Series 32 - Plan B
Growth Option 1,34,54,990.000 - - 1,34,54,990.000IDCW Option 40,000.000 - - 40,000.000Direct Plan - Growth Option 11,00,07,100.000 - - 11,00,07,100.000Direct Plan - IDCW Option 500.000 - - 500.000
Invesco IndiaFixed MaturityPlan - Series 32 - Plan C
Growth Option 1,00,42,500.000 - - 1,00,42,500.000IDCW Option 9,900.000 - - 9,900.000Direct Plan - Growth Option 4,10,64,450.000 - - 4,10,64,450.000
Invesco IndiaFixed MaturityPlan - Series 32 - Plan D
Growth Option 1,30,05,029.000 - - 1,30,05,029.000IDCW Option 41,200.000 - - 41,200.000Direct Plan - Growth Option 2,69,56,022.000 - - 2,69,56,022.000Direct Plan - IDCW Option 5,450.000 - - 5,450.000
Invesco IndiaFixed MaturityPlan - Series 32 - Plan E
Growth Option 5,18,540.000 - - 5,18,540.000IDCW Option 20,500.000 - - 20,500.000Direct Plan - Growth Option 9,99,02,100.000 - - 9,99,02,100.000Direct Plan - IDCW Option 1,000.000 - - 1,000.000
Invesco IndiaFixed MaturityPlan - Series 33 - Plan B
Growth Option 12,28,000.000 - - 12,28,000.000Direct Plan - Growth Option 2,05,48,937.000 - - 2,05,48,937.000
Invesco IndiaFixed MaturityPlan - Series 33 - Plan D
Growth Option 19,28,200.000 - - 19,28,200.000Direct Plan - Growth Option 9,81,27,087.000 - - 9,81,27,087.000
*** Pursuant to SEBI circular no. CIR/IMD/DF/21/2012 dated September 13, 2012, no fresh subscriptions / switch-in’s are accepted in the Plan with effect from October 01, 2012 and Options under this plan will continue till the existing investors remain invested.
фф No fresh subscriptions whether by way of fresh purchases or additional purchases or switch-in or investments through systematic transactions viz. SIP/STP/DTP/ETP is allowed in Bonus Option w.e.f. June 11, 2015. Option will continue until all the units are redeemed from the plan.
₳ Pursuant to SEBI Circular No. SEBI / HO/ IMD/ DF2/ CIR/ P/ 2016/ 37 dated February 25, 2016, four separate plans were introduced under Invesco India Liquid Fund with effect from May 25, 2016 for deployment of unclaimed redemption and dividend amounts of the schemes of Invesco Mutual Fund.
Unit Capital Movement during the year ended / period ended 2019-20
Scheme Plan/Option Opening Units as onApril 01, 2019
Units sold/Switch in/NFO Allotment
Redemption/Switch out
Closing Units as onMarch 31, 2020
Invesco India Liquid Fund Growth Option 74,37,413.660 9,35,19,989.531 9,72,42,286.793 37,15,116.398Daily-IDCW Option 15,29,121.876 83,47,089.272 97,00,094.138 1,76,117.010Weekly-IDCW Option 99,346.180 6,54,446.413 6,77,535.134 76,257.459Monthly-IDCW Option 45,520.382 72,691.136 87,370.842 30,840.676Bonus Option фф 20.993 - - 20.993Direct Plan - Growth Option 1,11,66,893.942 1,02,93,88,580.549 1,03,20,15,039.834 85,40,434.657Direct Plan - Daily IDCW Option 7,03,533.892 7,95,02,437.736 7,91,39,021.554 10,66,950.074Direct Plan - Weekly IDCW Option 17,434.084 24,47,395.962 24,34,701.018 30,129.028Direct Plan - Monthly IDCW Option 13,951.907 3,36,938.200 3,42,630.369 8,259.738Direct Plan - Unclaimed Dividend Plan - Below 3 Years ₳ 11,328.718 2,222.825 6,038.607 7,512.936Direct Plan - Unclaimed Redemption Plan - Below 3 years ₳ 18,991.562 11,993.588 14,919.733 16,065.417Direct Plan - Unclaimed Dividend Plan - Above 3 Years ₳ - 5,874.712 690.219 5,184.493Direct Plan - Unclaimed Redemption Plan - Above 3 years ₳ - 6,268.560 458.177 5,810.383Growth Option *** 6,112.434 - 59.530 6,052.904Weekly IDCW Option *** 1,489.527 - 66.473 1,423.054
Invesco India Treasury Advantage Fund
Growth Option 5,80,680.071 26,20,133.778 19,57,356.609 12,43,457.240Daily IDCW Option 1,38,316.860 4,88,975.632 1,96,044.785 4,31,247.707Weekly IDCW Option 88,888.594 85,686.564 1,39,176.517 35,398.641Monthly IDCW Option 41,050.088 75,340.608 86,495.464 29,895.232Discretionary IDCW Option 210.723 273.892 196.678 287.937Bonus Option фф 89,809.676 - 89,799.511 10.165Annual Bonus Option фф 19.036 - 19.036 -Direct Plan - Growth Option 1,87,667.427 1,27,97,988.199 90,10,054.773 39,75,600.853Direct Plan - Daily IDCW Option 1,112.709 5,17,130.042 3,51,013.543 1,67,229.208Direct Plan - Weekly IDCW Option 3,544.810 36,236.052 34,527.867 5,252.995Direct Plan - Monthly IDCW Option 1,018.717 310.565 230.521 1,098.761Direct Plan - Discretionary IDCW Option 1,414.077 5,84,382.107 5,83,953.868 1,842.316Direct Plan - Bonus Option фф 16,34,868.799 - 7,59,020.261 8,75,848.538Growth Option *** 3,161.241 - 293.805 2,867.436Daily IDCW Option *** 1,350.110 - 0.150 1,349.960Weekly IDCW Option *** 769.187 - 0.611 768.576Monthly IDCW Option *** 619.829 - - 619.829Bonus Option фф *** - - - -
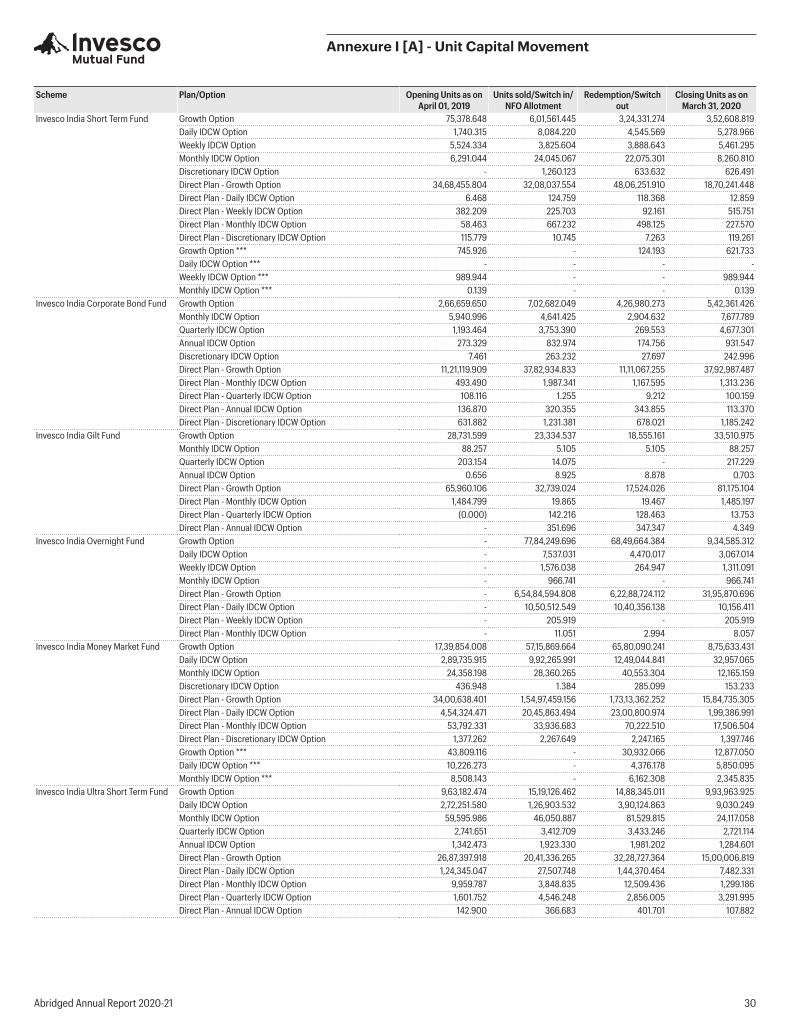
Abridged Annual Report 2020-21 30
Annexure I [A] - Unit Capital Movement
Scheme Plan/Option Opening Units as onApril 01, 2019
Units sold/Switch in/NFO Allotment
Redemption/Switch out
Closing Units as onMarch 31, 2020
Invesco India Short Term Fund Growth Option 75,378.648 6,01,561.445 3,24,331.274 3,52,608.819Daily IDCW Option 1,740.315 8,084.220 4,545.569 5,278.966Weekly IDCW Option 5,524.334 3,825.604 3,888.643 5,461.295Monthly IDCW Option 6,291.044 24,045.067 22,075.301 8,260.810Discretionary IDCW Option - 1,260.123 633.632 626.491Direct Plan - Growth Option 34,68,455.804 32,08,037.554 48,06,251.910 18,70,241.448Direct Plan - Daily IDCW Option 6.468 124.759 118.368 12.859Direct Plan - Weekly IDCW Option 382.209 225.703 92.161 515.751Direct Plan - Monthly IDCW Option 58.463 667.232 498.125 227.570Direct Plan - Discretionary IDCW Option 115.779 10.745 7.263 119.261Growth Option *** 745.926 - 124.193 621.733Daily IDCW Option *** - - - -Weekly IDCW Option *** 989.944 - - 989.944Monthly IDCW Option *** 0.139 - - 0.139
Invesco India Corporate Bond Fund Growth Option 2,66,659.650 7,02,682.049 4,26,980.273 5,42,361.426Monthly IDCW Option 5,940.996 4,641.425 2,904.632 7,677.789Quarterly IDCW Option 1,193.464 3,753.390 269.553 4,677.301Annual IDCW Option 273.329 832.974 174.756 931.547Discretionary IDCW Option 7.461 263.232 27.697 242.996Direct Plan - Growth Option 11,21,119.909 37,82,934.833 11,11,067.255 37,92,987.487Direct Plan - Monthly IDCW Option 493.490 1,987.341 1,167.595 1,313.236Direct Plan - Quarterly IDCW Option 108.116 1.255 9.212 100.159Direct Plan - Annual IDCW Option 136.870 320.355 343.855 113.370Direct Plan - Discretionary IDCW Option 631.882 1,231.381 678.021 1,185.242
Invesco India Gilt Fund Growth Option 28,731.599 23,334.537 18,555.161 33,510.975Monthly IDCW Option 88.257 5.105 5.105 88.257Quarterly IDCW Option 203.154 14.075 - 217.229Annual IDCW Option 0.656 8.925 8.878 0.703Direct Plan - Growth Option 65,960.106 32,739.024 17,524.026 81,175.104Direct Plan - Monthly IDCW Option 1,484.799 19.865 19.467 1,485.197Direct Plan - Quarterly IDCW Option (0.000) 142.216 128.463 13.753Direct Plan - Annual IDCW Option - 351.696 347.347 4.349
Invesco India Overnight Fund Growth Option - 77,84,249.696 68,49,664.384 9,34,585.312Daily IDCW Option - 7,537.031 4,470.017 3,067.014Weekly IDCW Option - 1,576.038 264.947 1,311.091Monthly IDCW Option - 966.741 - 966.741Direct Plan - Growth Option - 6,54,84,594.808 6,22,88,724.112 31,95,870.696Direct Plan - Daily IDCW Option - 10,50,512.549 10,40,356.138 10,156.411Direct Plan - Weekly IDCW Option - 205.919 - 205.919Direct Plan - Monthly IDCW Option - 11.051 2.994 8.057
Invesco India Money Market Fund Growth Option 17,39,854.008 57,15,869.664 65,80,090.241 8,75,633.431Daily IDCW Option 2,89,735.915 9,92,265.991 12,49,044.841 32,957.065Monthly IDCW Option 24,358.198 28,360.265 40,553.304 12,165.159Discretionary IDCW Option 436.948 1.384 285.099 153.233Direct Plan - Growth Option 34,00,638.401 1,54,97,459.156 1,73,13,362.252 15,84,735.305Direct Plan - Daily IDCW Option 4,54,324.471 20,45,863.494 23,00,800.974 1,99,386.991Direct Plan - Monthly IDCW Option 53,792.331 33,936.683 70,222.510 17,506.504Direct Plan - Discretionary IDCW Option 1,377.262 2,267.649 2,247.165 1,397.746Growth Option *** 43,809.116 - 30,932.066 12,877.050Daily IDCW Option *** 10,226.273 - 4,376.178 5,850.095Monthly IDCW Option *** 8,508.143 - 6,162.308 2,345.835
Invesco India Ultra Short Term Fund Growth Option 9,63,182.474 15,19,126.462 14,88,345.011 9,93,963.925Daily IDCW Option 2,72,251.580 1,26,903.532 3,90,124.863 9,030.249Monthly IDCW Option 59,595.986 46,050.887 81,529.815 24,117.058Quarterly IDCW Option 2,741.651 3,412.709 3,433.246 2,721.114Annual IDCW Option 1,342.473 1,923.330 1,981.202 1,284.601Direct Plan - Growth Option 26,87,397.918 20,41,336.265 32,28,727.364 15,00,006.819Direct Plan - Daily IDCW Option 1,24,345.047 27,507.748 1,44,370.464 7,482.331Direct Plan - Monthly IDCW Option 9,959.787 3,848.835 12,509.436 1,299.186Direct Plan - Quarterly IDCW Option 1,601.752 4,546.248 2,856.005 3,291.995Direct Plan - Annual IDCW Option 142.900 366.683 401.701 107.882
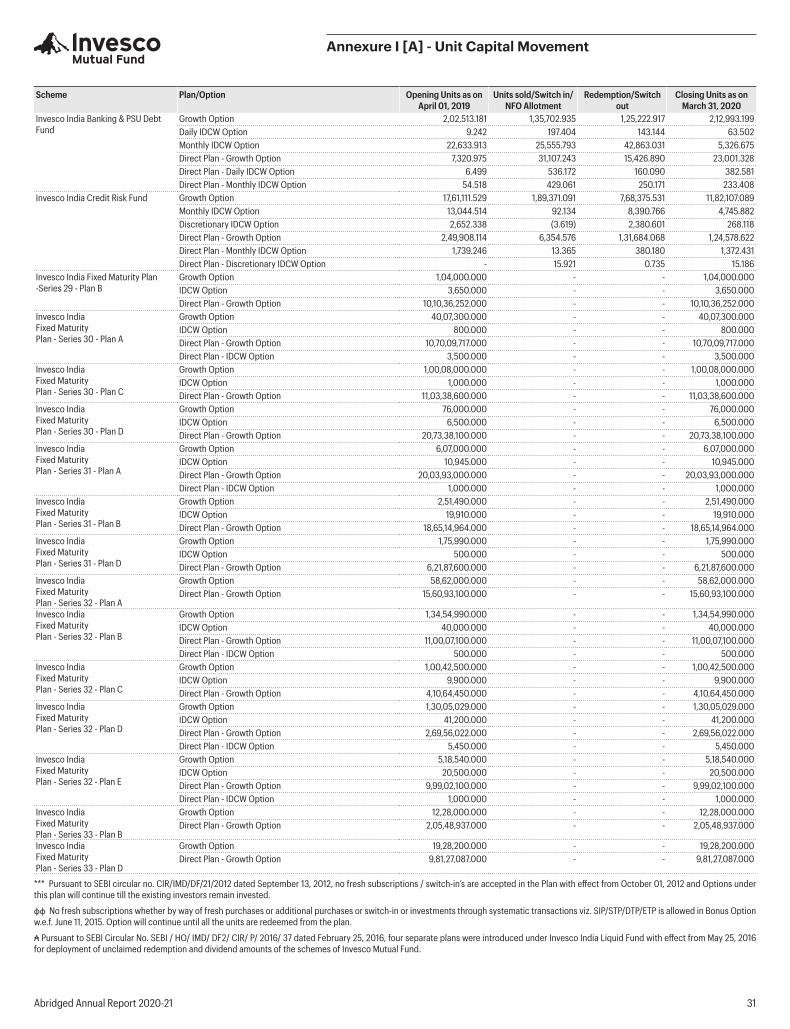
Abridged Annual Report 2020-21 31
Annexure I [A] - Unit Capital Movement
Scheme Plan/Option Opening Units as onApril 01, 2019
Units sold/Switch in/NFO Allotment
Redemption/Switch out
Closing Units as onMarch 31, 2020
Invesco India Banking & PSU Debt Fund
Growth Option 2,02,513.181 1,35,702.935 1,25,222.917 2,12,993.199Daily IDCW Option 9.242 197.404 143.144 63.502Monthly IDCW Option 22,633.913 25,555.793 42,863.031 5,326.675Direct Plan - Growth Option 7,320.975 31,107.243 15,426.890 23,001.328Direct Plan - Daily IDCW Option 6.499 536.172 160.090 382.581Direct Plan - Monthly IDCW Option 54.518 429.061 250.171 233.408
Invesco India Credit Risk Fund Growth Option 17,61,111.529 1,89,371.091 7,68,375.531 11,82,107.089Monthly IDCW Option 13,044.514 92.134 8,390.766 4,745.882Discretionary IDCW Option 2,652.338 (3.619) 2,380.601 268.118Direct Plan - Growth Option 2,49,908.114 6,354.576 1,31,684.068 1,24,578.622Direct Plan - Monthly IDCW Option 1,739.246 13.365 380.180 1,372.431Direct Plan - Discretionary IDCW Option - 15.921 0.735 15.186
Invesco India Fixed Maturity Plan -Series 29 - Plan B
Growth Option 1,04,000.000 - - 1,04,000.000IDCW Option 3,650.000 - - 3,650.000Direct Plan - Growth Option 10,10,36,252.000 - - 10,10,36,252.000
Invesco IndiaFixed MaturityPlan - Series 30 - Plan A
Growth Option 40,07,300.000 - - 40,07,300.000IDCW Option 800.000 - - 800.000Direct Plan - Growth Option 10,70,09,717.000 - - 10,70,09,717.000Direct Plan - IDCW Option 3,500.000 - - 3,500.000
Invesco IndiaFixed MaturityPlan - Series 30 - Plan C
Growth Option 1,00,08,000.000 - - 1,00,08,000.000IDCW Option 1,000.000 - - 1,000.000Direct Plan - Growth Option 11,03,38,600.000 - - 11,03,38,600.000
Invesco IndiaFixed MaturityPlan - Series 30 - Plan D
Growth Option 76,000.000 - - 76,000.000IDCW Option 6,500.000 - - 6,500.000Direct Plan - Growth Option 20,73,38,100.000 - - 20,73,38,100.000
Invesco IndiaFixed MaturityPlan - Series 31 - Plan A
Growth Option 6,07,000.000 - - 6,07,000.000IDCW Option 10,945.000 - - 10,945.000Direct Plan - Growth Option 20,03,93,000.000 - - 20,03,93,000.000Direct Plan - IDCW Option 1,000.000 - - 1,000.000
Invesco IndiaFixed MaturityPlan - Series 31 - Plan B
Growth Option 2,51,490.000 - - 2,51,490.000IDCW Option 19,910.000 - - 19,910.000Direct Plan - Growth Option 18,65,14,964.000 - - 18,65,14,964.000
Invesco IndiaFixed MaturityPlan - Series 31 - Plan D
Growth Option 1,75,990.000 - - 1,75,990.000IDCW Option 500.000 - - 500.000Direct Plan - Growth Option 6,21,87,600.000 - - 6,21,87,600.000
Invesco IndiaFixed MaturityPlan - Series 32 - Plan A
Growth Option 58,62,000.000 - - 58,62,000.000Direct Plan - Growth Option 15,60,93,100.000 - - 15,60,93,100.000
Invesco IndiaFixed MaturityPlan - Series 32 - Plan B
Growth Option 1,34,54,990.000 - - 1,34,54,990.000IDCW Option 40,000.000 - - 40,000.000Direct Plan - Growth Option 11,00,07,100.000 - - 11,00,07,100.000Direct Plan - IDCW Option 500.000 - - 500.000
Invesco IndiaFixed MaturityPlan - Series 32 - Plan C
Growth Option 1,00,42,500.000 - - 1,00,42,500.000IDCW Option 9,900.000 - - 9,900.000Direct Plan - Growth Option 4,10,64,450.000 - - 4,10,64,450.000
Invesco IndiaFixed MaturityPlan - Series 32 - Plan D
Growth Option 1,30,05,029.000 - - 1,30,05,029.000IDCW Option 41,200.000 - - 41,200.000Direct Plan - Growth Option 2,69,56,022.000 - - 2,69,56,022.000Direct Plan - IDCW Option 5,450.000 - - 5,450.000
Invesco IndiaFixed MaturityPlan - Series 32 - Plan E
Growth Option 5,18,540.000 - - 5,18,540.000IDCW Option 20,500.000 - - 20,500.000Direct Plan - Growth Option 9,99,02,100.000 - - 9,99,02,100.000Direct Plan - IDCW Option 1,000.000 - - 1,000.000
Invesco IndiaFixed MaturityPlan - Series 33 - Plan B
Growth Option 12,28,000.000 - - 12,28,000.000Direct Plan - Growth Option 2,05,48,937.000 - - 2,05,48,937.000
Invesco IndiaFixed MaturityPlan - Series 33 - Plan D
Growth Option 19,28,200.000 - - 19,28,200.000Direct Plan - Growth Option 9,81,27,087.000 - - 9,81,27,087.000
*** Pursuant to SEBI circular no. CIR/IMD/DF/21/2012 dated September 13, 2012, no fresh subscriptions / switch-in’s are accepted in the Plan with effect from October 01, 2012 and Options under this plan will continue till the existing investors remain invested.
фф No fresh subscriptions whether by way of fresh purchases or additional purchases or switch-in or investments through systematic transactions viz. SIP/STP/DTP/ETP is allowed in Bonus Option w.e.f. June 11, 2015. Option will continue until all the units are redeemed from the plan.
₳ Pursuant to SEBI Circular No. SEBI / HO/ IMD/ DF2/ CIR/ P/ 2016/ 37 dated February 25, 2016, four separate plans were introduced under Invesco India Liquid Fund with effect from May 25, 2016 for deployment of unclaimed redemption and dividend amounts of the schemes of Invesco Mutual Fund.

Abridged Annual Report 2020-21 32
Annexure I [B] - Key statistics for the year / period ended March 31, 2021
Invesco IndiaLiquid Fund
Invesco IndiaTreasury Advantage Fund
Invesco IndiaShort Term Fund
Invesco IndiaCorporate Bond Fund
April 1, 2020to
March 31, 2021
April 1, 2019to
March 31, 2020
April 1, 2020to
March 31, 2021
April 1, 2019to
March 31, 2020
April 1, 2020to
March 31, 2021
April 1, 2019to
March 31, 2020
April 1, 2020to
March 31, 2021
April 1, 2019to
March 31, 20201. NAV per unit (`):
Open*Growth 2,714.8933 2,561.6258 2,789.9973 2,582.2504 2,643.1565 2,426.6432 2,292.7437 2,093.2063Daily IDCW ! 1,001.7798 1,001.7798 1,010.2032 1,004.9344 1,033.8353 1,033.6622 - -Weekly IDCW ! 1,003.7778 1,004.0333 1,041.2515 1,032.3446 1,019.5109 1,021.9170 - -Monthly IDCW ! 1,003.3179 1,003.7482 1,045.4141 1,038.6449 1,049.9724 1,049.3215 1,427.1070 1,539.8328Quarterly IDCW ! - - - - - - 1,126.2683 1,109.8343Annual IDCW ! - - - - - - 1,881.9648 1,840.9316Discretionary IDCW ! - - 2,855.0009 2,633.3612 1,971.3023 - 2,404.4464 2,193.1122Bonus # 2,715.5166 2,561.7692 1,550.7260 1,434.5764 - - - -Annual Bonus # - - NU 2,582.2589 - - - -Regular / Plan A - Growth 2,471.9144 2,344.6605 2,565.7192 2,388.8094 - - - -Regular / Plan A - Daily IDCW ! - - 1,417.2739 1,319.5508 - - - -Regular / Plan A - Weekly IDCW ! 1,002.1116 1,002.3148 1,267.6424 1,217.9784 - - - -Regular / Plan A - Monthly IDCW ! - - 1,110.8782 1,103.6268 - - - -Regular / Plan A - Bonus # - - NU NU - - - -Institutional / Plan B - Growth - - - - 2,633.9675 2,417.9942 - -Institutional / Plan B - Daily IDCW ! - - - - NU NU - -Institutional / Plan B - Weekly IDCW ! - - - - 1,016.0190 1,018.4168 - -Institutional / Plan B - Monthly IDCW ! - - - - 1,750.5036 1,607.9856 - -Direct Plan - Growth 2,728.2639 2,572.4398 2,862.0856 2,641.0548 2,810.1745 2,558.1648 2,407.5911 2,189.3988Direct Plan - Daily IDCW ! 1,000.9596 1,000.7900 1,018.9655 1,019.3740 1,023.5517 1,016.9882 - -Direct Plan - Weekly IDCW ! 1,000.8709 1,001.9160 1,206.8107 1,209.3386 1,020.0317 1,022.0596 - -Direct Plan - Monthly IDCW ! 1,027.8879 1,028.3327 1,067.1799 1,060.2758 1,872.3710 2,112.1304 1,256.8826 1,257.4534Direct Plan - Quarterly IDCW ! - - - - - - 1,127.6160 1,111.5156Direct Plan - Annual IDCW ! - - - - - - 1,223.7640 1,238.0178Direct Plan - Discretionary IDCW ! - - 2,863.2798 2,642.1496 1,982.5572 1,804.7342 2,408.2360 2,189.3463Direct Plan - Bonus # - - 1,590.0565 1,467.2615 - - - -Direct Plan - Annual Bonus # - - - - - - - -Unclaimed Dividend Plan - Below 3 Years ₳ 1,292.9082 1,219.0292 - - - - - -Unclaimed Redemption Plan - Below 3 years ₳ 1,292.8982 1,218.9830 - - - - - -Unclaimed Dividend Plan - Above 3 Years ₳ 1,000.0000 NU - - - - - -Unclaimed Redemption Plan - Above 3 years ₳ 1,000.0000 NU - - - - - -HighGrowth 2,810.2398 2,714.8933 2,965.4173 2,789.9973 2,839.4970 2,644.3775 2,483.1703 2,295.6699Daily IDCW ! 1,002.8667 1,001.8751 1,021.1148 1,012.6153 1,046.7945 1,038.3316 - -Weekly IDCW ! 1,004.9077 1,004.7702 1,106.7091 1,061.9411 1,027.6381 1,028.2213 - -Monthly IDCW ! 1,007.4219 1,009.4409 1,080.7186 1,051.9857 1,069.3099 1,063.4353 1,527.0420 1,592.8890Quarterly IDCW ! - - - - - - 1,171.6940 1,149.5161Annual IDCW ! - - - - - - 2,038.2710 2,018.8876Discretionary IDCW ! - - 3,034.9312 2,855.0009 2,117.9795 1,972.2590 2,604.7689 2,407.8143Bonus # 2,811.7568 2,715.5166 1,649.4009 1,550.7260 - - - -Annual Bonus # - - NU 2,738.2349 - - - -Regular / Plan A - Growth 2,545.2042 2,471.9144 2,710.6982 2,565.7192 - - - -Regular / Plan A - Daily IDCW ! - - 1,479.1010 1,417.2739 - - - -Regular / Plan A - Weekly IDCW ! 1,003.2445 1,002.8828 1,301.5377 1,271.1838 - - - -Regular / Plan A - Monthly IDCW ! - - 1,128.1284 1,117.2566 - - - -Regular / Plan A - Bonus # - - - - - - - -Institutional / Plan B - Growth - - - - 2,829.6001 2,635.1770 - -Institutional / Plan B - Daily IDCW ! - - - - NU NU - -Institutional / Plan B - Weekly IDCW ! - - - - 1,024.1179 1,024.6996 - -Institutional / Plan B - Monthly IDCW ! - - - - 1,872.0863 1,752.3741 - -Direct Plan - Growth 2,826.0656 2,728.2639 3,051.8114 2,862.0856 3,038.8554 2,810.1745 2,615.6575 2,409.9524Direct Plan - Daily IDCW ! 1,000.9596 1,000.9596 1,018.9655 1,018.9655 1,023.6775 1,023.6556 - -Direct Plan - Weekly IDCW ! 1,001.8974 1,002.5181 1,213.5475 1,211.5916 1,029.3417 1,028.3884 - -Direct Plan - Monthly IDCW ! 1,052.4038 1,034.2241 1,085.6086 1,074.1472 1,999.7362 2,187.3808 1,282.8228 1,274.8886Direct Plan - Quarterly IDCW ! - - - - - - 1,173.9901 1,151.7450Direct Plan - Annual IDCW ! - - - - - - 1,329.6247 1,362.7740Direct Plan - Discretionary IDCW ! - - 3,053.1258 2,863.2798 2,143.9695 1,982.5572 2,616.4734 2,410.6242Direct Plan - Bonus # - - 1,695.4675 1,590.0565 - - - -Direct Plan - Annual Bonus # - - - - - - - -Unclaimed Dividend Plan - Below 3 Years ₳ 1,339.3420 1,292.9082 - - - - - -Unclaimed Redemption Plan - Below 3 years ₳ 1,339.2470 1,292.8982 - - - - - -Unclaimed Dividend Plan - Above 3 Years ₳ 1,000.0000 1,000.0000 - - - - - -Unclaimed Redemption Plan - Above 3 years ₳ 1,000.0000 1,000.0000 - - - - - -LowGrowth 2,715.1979 2,562.1237 2,785.0572 2,586.0640 2,620.2938 2,425.6178 2,280.2468 2,092.9348Daily IDCW ! 1,001.7458 999.8047 1,008.0869 993.9112 1,024.8919 1,004.6713 - -Weekly IDCW ! 1,002.9656 1,000.9472 1,039.4076 1,024.2172 1,007.3405 990.7510 - -Monthly IDCW ! 1,002.9389 1,002.9500 1,043.5628 1,029.2292 1,037.3019 1,020.7540 1,419.3283 1,387.4404Quarterly IDCW ! - - - - - - 1,120.1294 1,094.9635Annual IDCW ! - - - - - - 1,788.6521 1,829.6557Discretionary IDCW ! - - 2,849.9455 2,637.2503 1,954.2572 1,915.6890 2,391.3540 2,192.8894
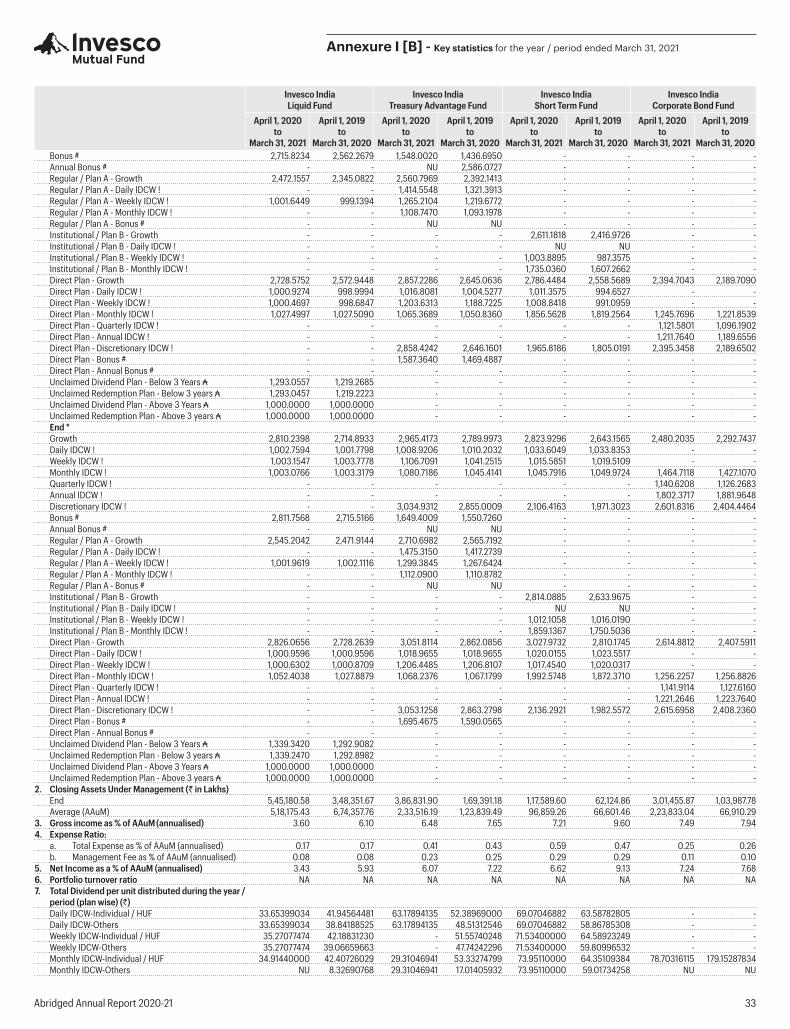
Abridged Annual Report 2020-21 33
Annexure I [B] - Key statistics for the year / period ended March 31, 2021
Invesco IndiaLiquid Fund
Invesco IndiaTreasury Advantage Fund
Invesco IndiaShort Term Fund
Invesco IndiaCorporate Bond Fund
April 1, 2020to
March 31, 2021
April 1, 2019to
March 31, 2020
April 1, 2020to
March 31, 2021
April 1, 2019to
March 31, 2020
April 1, 2020to
March 31, 2021
April 1, 2019to
March 31, 2020
April 1, 2020to
March 31, 2021
April 1, 2019to
March 31, 2020Bonus # 2,715.8234 2,562.2679 1,548.0020 1,436.6950 - - - -Annual Bonus # - - NU 2,586.0727 - - - -Regular / Plan A - Growth 2,472.1557 2,345.0822 2,560.7969 2,392.1413 - - - -Regular / Plan A - Daily IDCW ! - - 1,414.5548 1,321.3913 - - - -Regular / Plan A - Weekly IDCW ! 1,001.6449 999.1394 1,265.2104 1,219.6772 - - - -Regular / Plan A - Monthly IDCW ! - - 1,108.7470 1,093.1978 - - - -Regular / Plan A - Bonus # - - NU NU - - - -Institutional / Plan B - Growth - - - - 2,611.1818 2,416.9726 - -Institutional / Plan B - Daily IDCW ! - - - - NU NU - -Institutional / Plan B - Weekly IDCW ! - - - - 1,003.8895 987.3575 - -Institutional / Plan B - Monthly IDCW ! - - - - 1,735.0360 1,607.2662 - -Direct Plan - Growth 2,728.5752 2,572.9448 2,857.2286 2,645.0636 2,786.4484 2,558.5689 2,394.7043 2,189.7090Direct Plan - Daily IDCW ! 1,000.9274 998.9994 1,016.8081 1,004.5277 1,011.3575 994.6527 - -Direct Plan - Weekly IDCW ! 1,000.4697 998.6847 1,203.6313 1,188.7225 1,008.8418 991.0959 - -Direct Plan - Monthly IDCW ! 1,027.4997 1,027.5090 1,065.3689 1,050.8360 1,856.5628 1,819.2564 1,245.7696 1,221.8539Direct Plan - Quarterly IDCW ! - - - - - - 1,121.5801 1,096.1902Direct Plan - Annual IDCW ! - - - - - - 1,211.7640 1,189.6556Direct Plan - Discretionary IDCW ! - - 2,858.4242 2,646.1601 1,965.8186 1,805.0191 2,395.3458 2,189.6502Direct Plan - Bonus # - - 1,587.3640 1,469.4887 - - - -Direct Plan - Annual Bonus # - - - - - - - -Unclaimed Dividend Plan - Below 3 Years ₳ 1,293.0557 1,219.2685 - - - - - -Unclaimed Redemption Plan - Below 3 years ₳ 1,293.0457 1,219.2223 - - - - - -Unclaimed Dividend Plan - Above 3 Years ₳ 1,000.0000 1,000.0000 - - - - - -Unclaimed Redemption Plan - Above 3 years ₳ 1,000.0000 1,000.0000 - - - - - -End *Growth 2,810.2398 2,714.8933 2,965.4173 2,789.9973 2,823.9296 2,643.1565 2,480.2035 2,292.7437Daily IDCW ! 1,002.7594 1,001.7798 1,008.9206 1,010.2032 1,033.6049 1,033.8353 - -Weekly IDCW ! 1,003.1547 1,003.7778 1,106.7091 1,041.2515 1,015.5851 1,019.5109 - -Monthly IDCW ! 1,003.0766 1,003.3179 1,080.7186 1,045.4141 1,045.7916 1,049.9724 1,464.7118 1,427.1070Quarterly IDCW ! - - - - - - 1,140.6208 1,126.2683Annual IDCW ! - - - - - - 1,802.3717 1,881.9648Discretionary IDCW ! - - 3,034.9312 2,855.0009 2,106.4163 1,971.3023 2,601.8316 2,404.4464Bonus # 2,811.7568 2,715.5166 1,649.4009 1,550.7260 - - - -Annual Bonus # - - NU NU - - - -Regular / Plan A - Growth 2,545.2042 2,471.9144 2,710.6982 2,565.7192 - - - -Regular / Plan A - Daily IDCW ! - - 1,475.3150 1,417.2739 - - - -Regular / Plan A - Weekly IDCW ! 1,001.9619 1,002.1116 1,299.3845 1,267.6424 - - - -Regular / Plan A - Monthly IDCW ! - - 1,112.0900 1,110.8782 - - - -Regular / Plan A - Bonus # - - NU NU - - - -Institutional / Plan B - Growth - - - - 2,814.0885 2,633.9675 - -Institutional / Plan B - Daily IDCW ! - - - - NU NU - -Institutional / Plan B - Weekly IDCW ! - - - - 1,012.1058 1,016.0190 - -Institutional / Plan B - Monthly IDCW ! - - - - 1,859.1367 1,750.5036 - -Direct Plan - Growth 2,826.0656 2,728.2639 3,051.8114 2,862.0856 3,027.9732 2,810.1745 2,614.8812 2,407.5911Direct Plan - Daily IDCW ! 1,000.9596 1,000.9596 1,018.9655 1,018.9655 1,020.0155 1,023.5517 - -Direct Plan - Weekly IDCW ! 1,000.6302 1,000.8709 1,206.4485 1,206.8107 1,017.4540 1,020.0317 - -Direct Plan - Monthly IDCW ! 1,052.4038 1,027.8879 1,068.2376 1,067.1799 1,992.5748 1,872.3710 1,256.2257 1,256.8826Direct Plan - Quarterly IDCW ! - - - - - - 1,141.9114 1,127.6160Direct Plan - Annual IDCW ! - - - - - - 1,221.2646 1,223.7640Direct Plan - Discretionary IDCW ! - - 3,053.1258 2,863.2798 2,136.2921 1,982.5572 2,615.6958 2,408.2360Direct Plan - Bonus # - - 1,695.4675 1,590.0565 - - - -Direct Plan - Annual Bonus # - - - - - - - -Unclaimed Dividend Plan - Below 3 Years ₳ 1,339.3420 1,292.9082 - - - - - -Unclaimed Redemption Plan - Below 3 years ₳ 1,339.2470 1,292.8982 - - - - - -Unclaimed Dividend Plan - Above 3 Years ₳ 1,000.0000 1,000.0000 - - - - - -Unclaimed Redemption Plan - Above 3 years ₳ 1,000.0000 1,000.0000 - - - - - -
2. Closing Assets Under Management (` in Lakhs)End 5,45,180.58 3,48,351.67 3,86,831.90 1,69,391.18 1,17,589.60 62,124.86 3,01,455.87 1,03,987.78Average (AAuM) 5,18,175.43 6,74,357.76 2,33,516.19 1,23,839.49 96,859.26 66,601.46 2,23,833.04 66,910.29
3. Gross income as % of AAuM (annualised) 3.60 6.10 6.48 7.65 7.21 9.60 7.49 7.944. Expense Ratio:
a. Total Expense as % of AAuM (annualised) 0.17 0.17 0.41 0.43 0.59 0.47 0.25 0.26b. Management Fee as % of AAuM (annualised) 0.08 0.08 0.23 0.25 0.29 0.29 0.11 0.10
5. Net Income as a % of AAuM (annualised) 3.43 5.93 6.07 7.22 6.62 9.13 7.24 7.686. Portfolio turnover ratio NA NA NA NA NA NA NA NA7. Total Dividend per unit distributed during the year /
period (plan wise) (`)Daily IDCW-Individual / HUF 33.65399034 41.94564481 63.17894135 52.38969000 69.07046882 63.58782805 - -Daily IDCW-Others 33.65399034 38.84188525 63.17894135 48.51312546 69.07046882 58.86785308 - -Weekly IDCW-Individual / HUF 35.27077474 42.18831230 - 51.55740248 71.53400000 64.58923249 - -Weekly IDCW-Others 35.27077474 39.06659663 - 47.74242296 71.53400000 59.80996532 - -Monthly IDCW-Individual / HUF 34.91440000 42.40726029 29.31046941 53.33274799 73.95110000 64.35109384 78.70316115 179.15287834Monthly IDCW-Others NU 8.32690768 29.31046941 17.01405932 73.95110000 59.01734258 NU NU
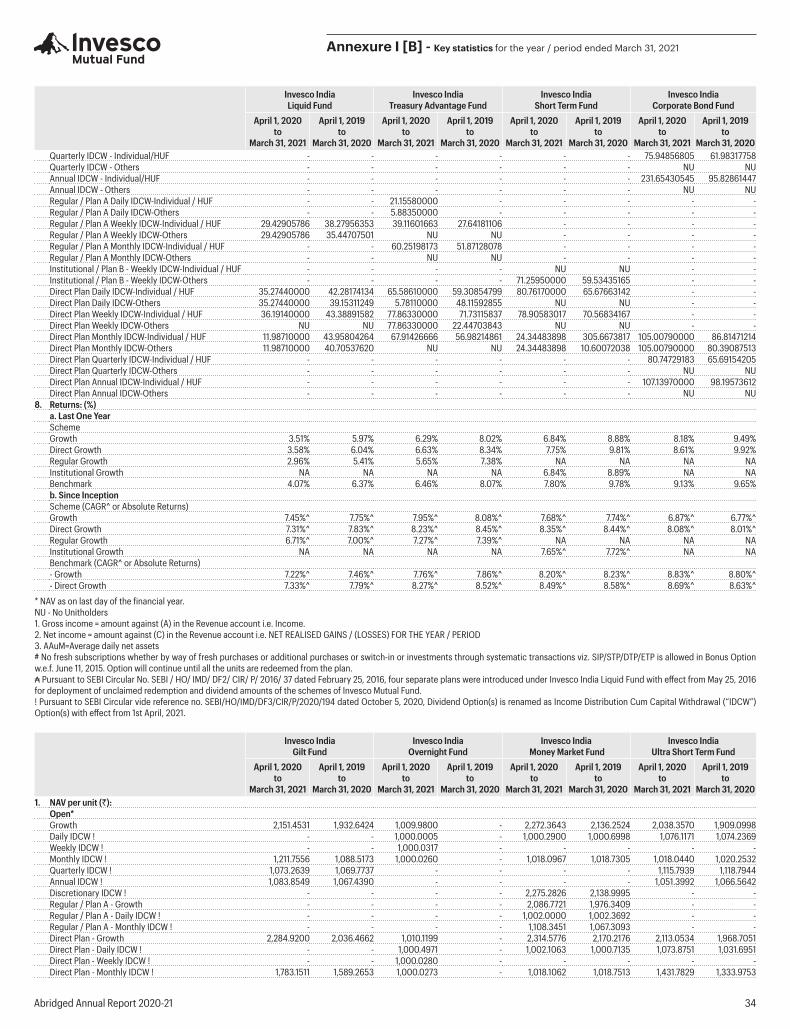
Abridged Annual Report 2020-21 34
Annexure I [B] - Key statistics for the year / period ended March 31, 2021
Invesco IndiaLiquid Fund
Invesco IndiaTreasury Advantage Fund
Invesco IndiaShort Term Fund
Invesco IndiaCorporate Bond Fund
April 1, 2020to
March 31, 2021
April 1, 2019to
March 31, 2020
April 1, 2020to
March 31, 2021
April 1, 2019to
March 31, 2020
April 1, 2020to
March 31, 2021
April 1, 2019to
March 31, 2020
April 1, 2020to
March 31, 2021
April 1, 2019to
March 31, 2020Quarterly IDCW - Individual/HUF - - - - - - 75.94856805 61.98317758Quarterly IDCW - Others - - - - - - NU NUAnnual IDCW - Individual/HUF - - - - - - 231.65430545 95.82861447Annual IDCW - Others - - - - - - NU NURegular / Plan A Daily IDCW-Individual / HUF - - 21.15580000 - - - - -Regular / Plan A Daily IDCW-Others - - 5.88350000 - - - - -Regular / Plan A Weekly IDCW-Individual / HUF 29.42905786 38.27956353 39.11601663 27.64181106 - - - -Regular / Plan A Weekly IDCW-Others 29.42905786 35.44707501 NU NU - - - -Regular / Plan A Monthly IDCW-Individual / HUF - - 60.25198173 51.87128078 - - - -Regular / Plan A Monthly IDCW-Others - - NU NU - - - -Institutional / Plan B - Weekly IDCW-Individual / HUF - - - - NU NU - -Institutional / Plan B - Weekly IDCW-Others - - - - 71.25950000 59.53435165 - -Direct Plan Daily IDCW-Individual / HUF 35.27440000 42.28174134 65.58610000 59.30854799 80.76170000 65.67663142 - -Direct Plan Daily IDCW-Others 35.27440000 39.15311249 5.78110000 48.11592855 NU NU - -Direct Plan Weekly IDCW-Individual / HUF 36.19140000 43.38891582 77.86330000 71.73115837 78.90583017 70.56834167 - -Direct Plan Weekly IDCW-Others NU NU 77.86330000 22.44703843 NU NU - -Direct Plan Monthly IDCW-Individual / HUF 11.98710000 43.95804264 67.91426666 56.98214861 24.34483898 305.6673817 105.00790000 86.81471214Direct Plan Monthly IDCW-Others 11.98710000 40.70537620 NU NU 24.34483898 10.60072038 105.00790000 80.39087513Direct Plan Quarterly IDCW-Individual / HUF - - - - - - 80.74729183 65.69154205Direct Plan Quarterly IDCW-Others - - - - - - NU NUDirect Plan Annual IDCW-Individual / HUF - - - - - - 107.13970000 98.19573612Direct Plan Annual IDCW-Others - - - - - - NU NU
8. Returns: (%)a. Last One YearSchemeGrowth 3.51% 5.97% 6.29% 8.02% 6.84% 8.88% 8.18% 9.49%Direct Growth 3.58% 6.04% 6.63% 8.34% 7.75% 9.81% 8.61% 9.92%Regular Growth 2.96% 5.41% 5.65% 7.38% NA NA NA NAInstitutional Growth NA NA NA NA 6.84% 8.89% NA NABenchmark 4.07% 6.37% 6.46% 8.07% 7.80% 9.78% 9.13% 9.65%b. Since InceptionScheme (CAGR^ or Absolute Returns)Growth 7.45%^ 7.75%^ 7.95%^ 8.08%^ 7.68%^ 7.74%^ 6.87%^ 6.77%^Direct Growth 7.31%^ 7.83%^ 8.23%^ 8.45%^ 8.35%^ 8.44%^ 8.08%^ 8.01%^Regular Growth 6.71%^ 7.00%^ 7.27%^ 7.39%^ NA NA NA NAInstitutional Growth NA NA NA NA 7.65%^ 7.72%^ NA NABenchmark (CAGR^ or Absolute Returns)- Growth 7.22%^ 7.46%^ 7.76%^ 7.86%^ 8.20%^ 8.23%^ 8.83%^ 8.80%^- Direct Growth 7.33%^ 7.79%^ 8.27%^ 8.52%^ 8.49%^ 8.58%^ 8.69%^ 8.63%^
* NAV as on last day of the financial year.NU - No Unitholders1. Gross income = amount against (A) in the Revenue account i.e. Income.2. Net income = amount against (C) in the Revenue account i.e. NET REALISED GAINS / (LOSSES) FOR THE YEAR / PERIOD3. AAuM=Average daily net assets# No fresh subscriptions whether by way of fresh purchases or additional purchases or switch-in or investments through systematic transactions viz. SIP/STP/DTP/ETP is allowed in Bonus Option w.e.f. June 11, 2015. Option will continue until all the units are redeemed from the plan.₳ Pursuant to SEBI Circular No. SEBI / HO/ IMD/ DF2/ CIR/ P/ 2016/ 37 dated February 25, 2016, four separate plans were introduced under Invesco India Liquid Fund with effect from May 25, 2016 for deployment of unclaimed redemption and dividend amounts of the schemes of Invesco Mutual Fund.! Pursuant to SEBI Circular vide reference no. SEBI/HO/IMD/DF3/CIR/P/2020/194 dated October 5, 2020, Dividend Option(s) is renamed as Income Distribution Cum Capital Withdrawal (“IDCW”) Option(s) with effect from 1st April, 2021.
Invesco India Gilt Fund
Invesco India Overnight Fund
Invesco India Money Market Fund
Invesco India Ultra Short Term Fund
April 1, 2020to
March 31, 2021
April 1, 2019to
March 31, 2020
April 1, 2020to
March 31, 2021
April 1, 2019to
March 31, 2020
April 1, 2020to
March 31, 2021
April 1, 2019to
March 31, 2020
April 1, 2020to
March 31, 2021
April 1, 2019to
March 31, 20201. NAV per unit (`):
Open*Growth 2,151.4531 1,932.6424 1,009.9800 - 2,272.3643 2,136.2524 2,038.3570 1,909.0998 Daily IDCW ! - - 1,000.0005 - 1,000.2900 1,000.6998 1,076.1171 1,074.2369 Weekly IDCW ! - - 1,000.0317 - - - - - Monthly IDCW ! 1,211.7556 1,088.5173 1,000.0260 - 1,018.0967 1,018.7305 1,018.0440 1,020.2532 Quarterly IDCW ! 1,073.2639 1,069.7737 - - - - 1,115.7939 1,118.7944 Annual IDCW ! 1,083.8549 1,067.4390 - - - - 1,051.3992 1,066.5642 Discretionary IDCW ! - - - - 2,275.2826 2,138.9995 - - Regular / Plan A - Growth - - - - 2,086.7721 1,976.3409 - - Regular / Plan A - Daily IDCW ! - - - - 1,002.0000 1,002.3692 - - Regular / Plan A - Monthly IDCW ! - - - - 1,108.3451 1,067.3093 - - Direct Plan - Growth 2,284.9200 2,036.4662 1,010.1199 - 2,314.5776 2,170.2176 2,113.0534 1,968.7051 Direct Plan - Daily IDCW ! - - 1,000.4971 - 1,002.1063 1,000.7135 1,073.8751 1,031.6951 Direct Plan - Weekly IDCW ! - - 1,000.0280 - - - - - Direct Plan - Monthly IDCW ! 1,783.1511 1,589.2653 1,000.0273 - 1,018.1062 1,018.7513 1,431.7829 1,333.9753
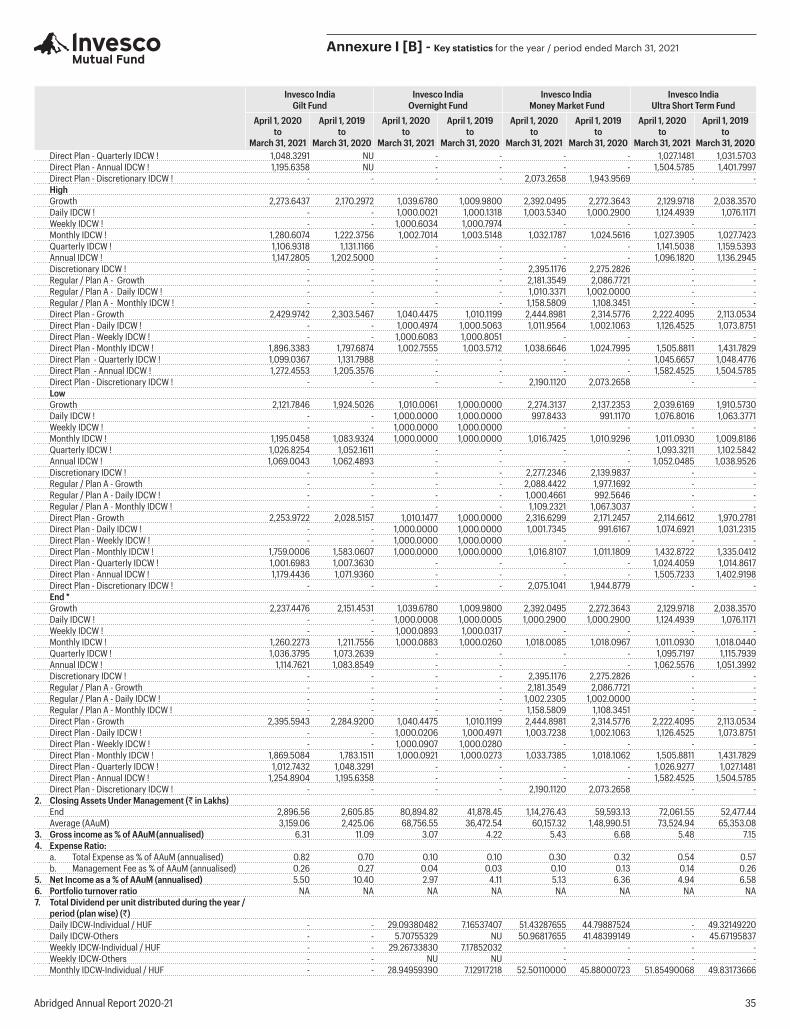
Abridged Annual Report 2020-21 35
Annexure I [B] - Key statistics for the year / period ended March 31, 2021
Invesco India Gilt Fund
Invesco India Overnight Fund
Invesco India Money Market Fund
Invesco India Ultra Short Term Fund
April 1, 2020to
March 31, 2021
April 1, 2019to
March 31, 2020
April 1, 2020to
March 31, 2021
April 1, 2019to
March 31, 2020
April 1, 2020to
March 31, 2021
April 1, 2019to
March 31, 2020
April 1, 2020to
March 31, 2021
April 1, 2019to
March 31, 2020Direct Plan - Quarterly IDCW ! 1,048.3291 NU - - - - 1,027.1481 1,031.5703 Direct Plan - Annual IDCW ! 1,195.6358 NU - - - - 1,504.5785 1,401.7997 Direct Plan - Discretionary IDCW ! - - - - 2,073.2658 1,943.9569 - - HighGrowth 2,273.6437 2,170.2972 1,039.6780 1,009.9800 2,392.0495 2,272.3643 2,129.9718 2,038.3570 Daily IDCW ! - - 1,000.0021 1,000.1318 1,003.5340 1,000.2900 1,124.4939 1,076.1171 Weekly IDCW ! - - 1,000.6034 1,000.7974 - - - - Monthly IDCW ! 1,280.6074 1,222.3756 1,002.7014 1,003.5148 1,032.1787 1,024.5616 1,027.3905 1,027.7423 Quarterly IDCW ! 1,106.9318 1,131.1166 - - - - 1,141.5038 1,159.5393 Annual IDCW ! 1,147.2805 1,202.5000 - - - - 1,096.1820 1,136.2945 Discretionary IDCW ! - - - - 2,395.1176 2,275.2826 - - Regular / Plan A - Growth - - - - 2,181.3549 2,086.7721 - - Regular / Plan A - Daily IDCW ! - - - - 1,010.3371 1,002.0000 - - Regular / Plan A - Monthly IDCW ! - - - - 1,158.5809 1,108.3451 - - Direct Plan - Growth 2,429.9742 2,303.5467 1,040.4475 1,010.1199 2,444.8981 2,314.5776 2,222.4095 2,113.0534 Direct Plan - Daily IDCW ! - - 1,000.4974 1,000.5063 1,011.9564 1,002.1063 1,126.4525 1,073.8751 Direct Plan - Weekly IDCW ! - - 1,000.6083 1,000.8051 - - - - Direct Plan - Monthly IDCW ! 1,896.3383 1,797.6874 1,002.7555 1,003.5712 1,038.6646 1,024.7995 1,505.8811 1,431.7829 Direct Plan - Quarterly IDCW ! 1,099.0367 1,131.7988 - - - - 1,045.6657 1,048.4776 Direct Plan - Annual IDCW ! 1,272.4553 1,205.3576 - - - - 1,582.4525 1,504.5785 Direct Plan - Discretionary IDCW ! - - - - 2,190.1120 2,073.2658 - - LowGrowth 2,121.7846 1,924.5026 1,010.0061 1,000.0000 2,274.3137 2,137.2353 2,039.6169 1,910.5730 Daily IDCW ! - - 1,000.0000 1,000.0000 997.8433 991.1170 1,076.8016 1,063.3771 Weekly IDCW ! - - 1,000.0000 1,000.0000 - - - - Monthly IDCW ! 1,195.0458 1,083.9324 1,000.0000 1,000.0000 1,016.7425 1,010.9296 1,011.0930 1,009.8186 Quarterly IDCW ! 1,026.8254 1,052.1611 - - - - 1,093.3211 1,102.5842 Annual IDCW ! 1,069.0043 1,062.4893 - - - - 1,052.0485 1,038.9526 Discretionary IDCW ! - - - - 2,277.2346 2,139.9837 - - Regular / Plan A - Growth - - - - 2,088.4422 1,977.1692 - - Regular / Plan A - Daily IDCW ! - - - - 1,000.4661 992.5646 - - Regular / Plan A - Monthly IDCW ! - - - - 1,109.2321 1,067.3037 - - Direct Plan - Growth 2,253.9722 2,028.5157 1,010.1477 1,000.0000 2,316.6299 2,171.2457 2,114.6612 1,970.2781 Direct Plan - Daily IDCW ! - - 1,000.0000 1,000.0000 1,001.7345 991.6167 1,074.6921 1,031.2315 Direct Plan - Weekly IDCW ! - - 1,000.0000 1,000.0000 - - - - Direct Plan - Monthly IDCW ! 1,759.0006 1,583.0607 1,000.0000 1,000.0000 1,016.8107 1,011.1809 1,432.8722 1,335.0412 Direct Plan - Quarterly IDCW ! 1,001.6983 1,007.3630 - - - - 1,024.4059 1,014.8617 Direct Plan - Annual IDCW ! 1,179.4436 1,071.9360 - - - - 1,505.7233 1,402.9198 Direct Plan - Discretionary IDCW ! - - - - 2,075.1041 1,944.8779 - - End *Growth 2,237.4476 2,151.4531 1,039.6780 1,009.9800 2,392.0495 2,272.3643 2,129.9718 2,038.3570 Daily IDCW ! - - 1,000.0008 1,000.0005 1,000.2900 1,000.2900 1,124.4939 1,076.1171 Weekly IDCW ! - - 1,000.0893 1,000.0317 - - - - Monthly IDCW ! 1,260.2273 1,211.7556 1,000.0883 1,000.0260 1,018.0085 1,018.0967 1,011.0930 1,018.0440 Quarterly IDCW ! 1,036.3795 1,073.2639 - - - - 1,095.7197 1,115.7939 Annual IDCW ! 1,114.7621 1,083.8549 - - - - 1,062.5576 1,051.3992 Discretionary IDCW ! - - - - 2,395.1176 2,275.2826 - - Regular / Plan A - Growth - - - - 2,181.3549 2,086.7721 - - Regular / Plan A - Daily IDCW ! - - - - 1,002.2305 1,002.0000 - - Regular / Plan A - Monthly IDCW ! - - - - 1,158.5809 1,108.3451 - - Direct Plan - Growth 2,395.5943 2,284.9200 1,040.4475 1,010.1199 2,444.8981 2,314.5776 2,222.4095 2,113.0534 Direct Plan - Daily IDCW ! - - 1,000.0206 1,000.4971 1,003.7238 1,002.1063 1,126.4525 1,073.8751 Direct Plan - Weekly IDCW ! - - 1,000.0907 1,000.0280 - - - - Direct Plan - Monthly IDCW ! 1,869.5084 1,783.1511 1,000.0921 1,000.0273 1,033.7385 1,018.1062 1,505.8811 1,431.7829 Direct Plan - Quarterly IDCW ! 1,012.7432 1,048.3291 - - - - 1,026.9277 1,027.1481 Direct Plan - Annual IDCW ! 1,254.8904 1,195.6358 - - - - 1,582.4525 1,504.5785 Direct Plan - Discretionary IDCW ! - - - - 2,190.1120 2,073.2658 - -
2. Closing Assets Under Management (` in Lakhs)End 2,896.56 2,605.85 80,894.82 41,878.45 1,14,276.43 59,593.13 72,061.55 52,477.44 Average (AAuM) 3,159.06 2,425.06 68,756.55 36,472.54 60,157.32 1,48,990.51 73,524.94 65,353.08
3. Gross income as % of AAuM (annualised) 6.31 11.09 3.07 4.22 5.43 6.68 5.48 7.15 4. Expense Ratio:
a. Total Expense as % of AAuM (annualised) 0.82 0.70 0.10 0.10 0.30 0.32 0.54 0.57 b. Management Fee as % of AAuM (annualised) 0.26 0.27 0.04 0.03 0.10 0.13 0.14 0.26
5. Net Income as a % of AAuM (annualised) 5.50 10.40 2.97 4.11 5.13 6.36 4.94 6.58 6. Portfolio turnover ratio NA NA NA NA NA NA NA NA 7. Total Dividend per unit distributed during the year /
period (plan wise) (`)Daily IDCW-Individual / HUF - - 29.09380482 7.16537407 51.43287655 44.79887524 - 49.32149220Daily IDCW-Others - - 5.70755329 NU 50.96817655 41.48399149 - 45.67195837Weekly IDCW-Individual / HUF - - 29.26733830 7.17852032 - - - - Weekly IDCW-Others - - NU NU - - - - Monthly IDCW-Individual / HUF - - 28.94959390 7.12917218 52.50110000 45.88000723 51.85490068 49.83173666
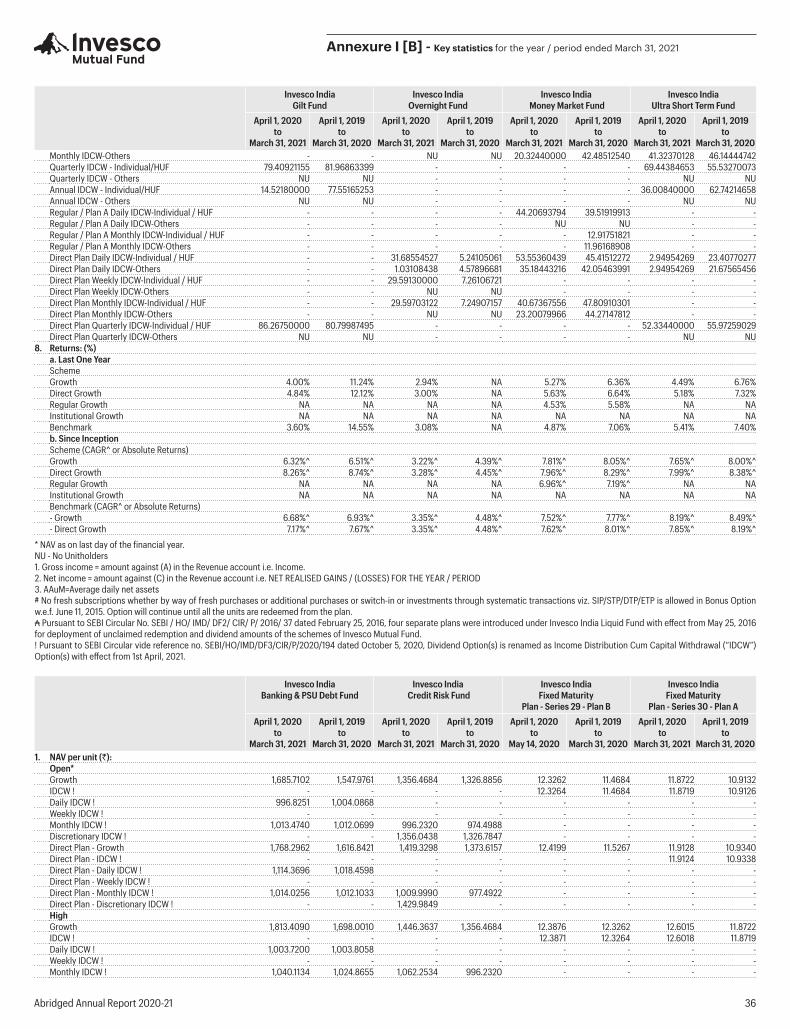
Abridged Annual Report 2020-21 36
Annexure I [B] - Key statistics for the year / period ended March 31, 2021
Invesco India Gilt Fund
Invesco India Overnight Fund
Invesco India Money Market Fund
Invesco India Ultra Short Term Fund
April 1, 2020to
March 31, 2021
April 1, 2019to
March 31, 2020
April 1, 2020to
March 31, 2021
April 1, 2019to
March 31, 2020
April 1, 2020to
March 31, 2021
April 1, 2019to
March 31, 2020
April 1, 2020to
March 31, 2021
April 1, 2019to
March 31, 2020Monthly IDCW-Others - - NU NU 20.32440000 42.48512540 41.32370128 46.14444742Quarterly IDCW - Individual/HUF 79.40921155 81.96863399 - - - - 69.44384653 55.53270073Quarterly IDCW - Others NU NU - - - - NU NU Annual IDCW - Individual/HUF 14.52180000 77.55165253 - - - - 36.00840000 62.74214658Annual IDCW - Others NU NU - - - - NU NU Regular / Plan A Daily IDCW-Individual / HUF - - - - 44.20693794 39.51919913 - - Regular / Plan A Daily IDCW-Others - - - - NU NU - - Regular / Plan A Monthly IDCW-Individual / HUF - - - - - 12.91751821 - - Regular / Plan A Monthly IDCW-Others - - - - - 11.96168908 - - Direct Plan Daily IDCW-Individual / HUF - - 31.68554527 5.24105061 53.55360439 45.41512272 2.94954269 23.40770277Direct Plan Daily IDCW-Others - - 1.03108438 4.57896681 35.18443216 42.05463991 2.94954269 21.67565456Direct Plan Weekly IDCW-Individual / HUF - - 29.59130000 7.26106721 - - - - Direct Plan Weekly IDCW-Others - - NU NU - - - - Direct Plan Monthly IDCW-Individual / HUF - - 29.59703122 7.24907157 40.67367556 47.80910301 - - Direct Plan Monthly IDCW-Others - - NU NU 23.20079966 44.27147812 - - Direct Plan Quarterly IDCW-Individual / HUF 86.26750000 80.79987495 - - - - 52.33440000 55.97259029Direct Plan Quarterly IDCW-Others NU NU - - - - NU NU
8. Returns: (%)a. Last One YearSchemeGrowth 4.00% 11.24% 2.94% NA 5.27% 6.36% 4.49% 6.76%Direct Growth 4.84% 12.12% 3.00% NA 5.63% 6.64% 5.18% 7.32%Regular Growth NA NA NA NA 4.53% 5.58% NA NAInstitutional Growth NA NA NA NA NA NA NA NABenchmark 3.60% 14.55% 3.08% NA 4.87% 7.06% 5.41% 7.40%b. Since InceptionScheme (CAGR^ or Absolute Returns)Growth 6.32%^ 6.51%^ 3.22%^ 4.39%^ 7.81%^ 8.05%^ 7.65%^ 8.00%^Direct Growth 8.26%^ 8.74%^ 3.28%^ 4.45%^ 7.96%^ 8.29%^ 7.99%^ 8.38%^Regular Growth NA NA NA NA 6.96%^ 7.19%^ NA NAInstitutional Growth NA NA NA NA NA NA NA NABenchmark (CAGR^ or Absolute Returns)- Growth 6.68%^ 6.93%^ 3.35%^ 4.48%^ 7.52%^ 7.77%^ 8.19%^ 8.49%^- Direct Growth 7.17%^ 7.67%^ 3.35%^ 4.48%^ 7.62%^ 8.01%^ 7.85%^ 8.19%^
* NAV as on last day of the financial year.NU - No Unitholders1. Gross income = amount against (A) in the Revenue account i.e. Income.2. Net income = amount against (C) in the Revenue account i.e. NET REALISED GAINS / (LOSSES) FOR THE YEAR / PERIOD3. AAuM=Average daily net assets# No fresh subscriptions whether by way of fresh purchases or additional purchases or switch-in or investments through systematic transactions viz. SIP/STP/DTP/ETP is allowed in Bonus Option w.e.f. June 11, 2015. Option will continue until all the units are redeemed from the plan.₳ Pursuant to SEBI Circular No. SEBI / HO/ IMD/ DF2/ CIR/ P/ 2016/ 37 dated February 25, 2016, four separate plans were introduced under Invesco India Liquid Fund with effect from May 25, 2016 for deployment of unclaimed redemption and dividend amounts of the schemes of Invesco Mutual Fund.! Pursuant to SEBI Circular vide reference no. SEBI/HO/IMD/DF3/CIR/P/2020/194 dated October 5, 2020, Dividend Option(s) is renamed as Income Distribution Cum Capital Withdrawal (“IDCW”) Option(s) with effect from 1st April, 2021.
Invesco India Banking & PSU Debt Fund
Invesco India Credit Risk Fund
Invesco India Fixed Maturity
Plan - Series 29 - Plan B
Invesco India Fixed Maturity
Plan - Series 30 - Plan AApril 1, 2020
toMarch 31, 2021
April 1, 2019to
March 31, 2020
April 1, 2020to
March 31, 2021
April 1, 2019to
March 31, 2020
April 1, 2020to
May 14, 2020
April 1, 2019to
March 31, 2020
April 1, 2020to
March 31, 2021
April 1, 2019to
March 31, 20201. NAV per unit (`):
Open*Growth 1,685.7102 1,547.9761 1,356.4684 1,326.8856 12.3262 11.4684 11.8722 10.9132IDCW ! - - - - 12.3264 11.4684 11.8719 10.9126Daily IDCW ! 996.8251 1,004.0868 - - - - - -Weekly IDCW ! - - - - - - - -Monthly IDCW ! 1,013.4740 1,012.0699 996.2320 974.4988 - - - -Discretionary IDCW ! - - 1,356.0438 1,326.7847 - - - -Direct Plan - Growth 1,768.2962 1,616.8421 1,419.3298 1,373.6157 12.4199 11.5267 11.9128 10.9340Direct Plan - IDCW ! - - - - - - 11.9124 10.9338Direct Plan - Daily IDCW ! 1,114.3696 1,018.4598 - - - - - -Direct Plan - Weekly IDCW ! - - - - - - - -Direct Plan - Monthly IDCW ! 1,014.0256 1,012.1033 1,009.9990 977.4922 - - - -Direct Plan - Discretionary IDCW ! - - 1,429.9849 - - - - -HighGrowth 1,813.4090 1,698.0010 1,446.3637 1,356.4684 12.3876 12.3262 12.6015 11.8722IDCW ! - - - - 12.3871 12.3264 12.6018 11.8719Daily IDCW ! 1,003.7200 1,003.8058 - - - - - -Weekly IDCW ! - - - - - - - -Monthly IDCW ! 1,040.1134 1,024.8655 1,062.2534 996.2320 - - - -
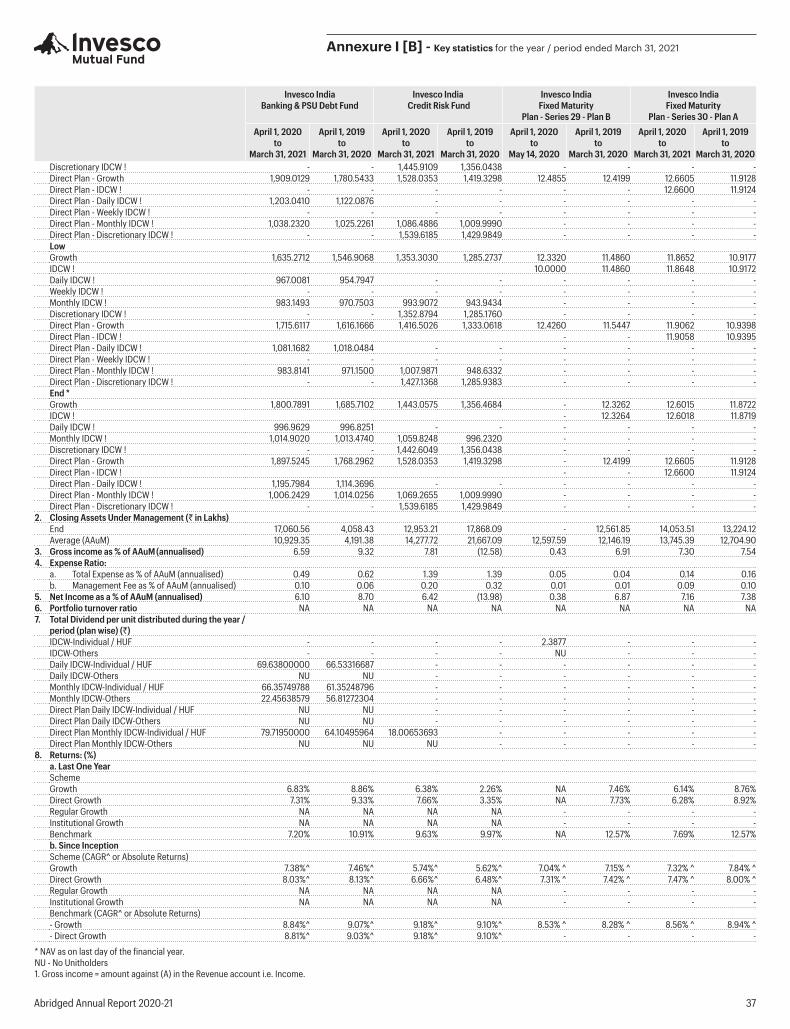
Abridged Annual Report 2020-21 37
Annexure I [B] - Key statistics for the year / period ended March 31, 2021
Invesco India Banking & PSU Debt Fund
Invesco India Credit Risk Fund
Invesco India Fixed Maturity
Plan - Series 29 - Plan B
Invesco India Fixed Maturity
Plan - Series 30 - Plan AApril 1, 2020
toMarch 31, 2021
April 1, 2019to
March 31, 2020
April 1, 2020to
March 31, 2021
April 1, 2019to
March 31, 2020
April 1, 2020to
May 14, 2020
April 1, 2019to
March 31, 2020
April 1, 2020to
March 31, 2021
April 1, 2019to
March 31, 2020Discretionary IDCW ! - - 1,445.9109 1,356.0438 - - - -Direct Plan - Growth 1,909.0129 1,780.5433 1,528.0353 1,419.3298 12.4855 12.4199 12.6605 11.9128Direct Plan - IDCW ! - - - - - - 12.6600 11.9124Direct Plan - Daily IDCW ! 1,203.0410 1,122.0876 - - - - - -Direct Plan - Weekly IDCW ! - - - - - - - -Direct Plan - Monthly IDCW ! 1,038.2320 1,025.2261 1,086.4886 1,009.9990 - - - -Direct Plan - Discretionary IDCW ! - - 1,539.6185 1,429.9849 - - - -LowGrowth 1,635.2712 1,546.9068 1,353.3030 1,285.2737 12.3320 11.4860 11.8652 10.9177IDCW ! 10.0000 11.4860 11.8648 10.9172Daily IDCW ! 967.0081 954.7947 - - - - - -Weekly IDCW ! - - - - - - - -Monthly IDCW ! 983.1493 970.7503 993.9072 943.9434 - - - -Discretionary IDCW ! - - 1,352.8794 1,285.1760 - - - -Direct Plan - Growth 1,715.6117 1,616.1666 1,416.5026 1,333.0618 12.4260 11.5447 11.9062 10.9398Direct Plan - IDCW ! - - 11.9058 10.9395Direct Plan - Daily IDCW ! 1,081.1682 1,018.0484 - - - - - -Direct Plan - Weekly IDCW ! - - - - - - - -Direct Plan - Monthly IDCW ! 983.8141 971.1500 1,007.9871 948.6332 - - - -Direct Plan - Discretionary IDCW ! - - 1,427.1368 1,285.9383 - - - -End *Growth 1,800.7891 1,685.7102 1,443.0575 1,356.4684 - 12.3262 12.6015 11.8722IDCW ! - 12.3264 12.6018 11.8719Daily IDCW ! 996.9629 996.8251 - - - - - -Monthly IDCW ! 1,014.9020 1,013.4740 1,059.8248 996.2320 - - - -Discretionary IDCW ! - - 1,442.6049 1,356.0438 - - - -Direct Plan - Growth 1,897.5245 1,768.2962 1,528.0353 1,419.3298 - 12.4199 12.6605 11.9128Direct Plan - IDCW ! - - 12.6600 11.9124Direct Plan - Daily IDCW ! 1,195.7984 1,114.3696 - - - - - -Direct Plan - Monthly IDCW ! 1,006.2429 1,014.0256 1,069.2655 1,009.9990 - - - -Direct Plan - Discretionary IDCW ! - - 1,539.6185 1,429.9849 - - - -
2. Closing Assets Under Management (` in Lakhs)End 17,060.56 4,058.43 12,953.21 17,868.09 - 12,561.85 14,053.51 13,224.12Average (AAuM) 10,929.35 4,191.38 14,277.72 21,667.09 12,597.59 12,146.19 13,745.39 12,704.90
3. Gross income as % of AAuM (annualised) 6.59 9.32 7.81 (12.58) 0.43 6.91 7.30 7.544. Expense Ratio:
a. Total Expense as % of AAuM (annualised) 0.49 0.62 1.39 1.39 0.05 0.04 0.14 0.16b. Management Fee as % of AAuM (annualised) 0.10 0.06 0.20 0.32 0.01 0.01 0.09 0.10
5. Net Income as a % of AAuM (annualised) 6.10 8.70 6.42 (13.98) 0.38 6.87 7.16 7.386. Portfolio turnover ratio NA NA NA NA NA NA NA NA7. Total Dividend per unit distributed during the year /
period (plan wise) (`)IDCW-Individual / HUF - - - - 2.3877 - - -IDCW-Others - - - - NU - - -Daily IDCW-Individual / HUF 69.63800000 66.53316687 - - - - - -Daily IDCW-Others NU NU - - - - - -Monthly IDCW-Individual / HUF 66.35749788 61.35248796 - - - - - -Monthly IDCW-Others 22.45638579 56.81272304 - - - - - -Direct Plan Daily IDCW-Individual / HUF NU NU - - - - - -Direct Plan Daily IDCW-Others NU NU - - - - - -Direct Plan Monthly IDCW-Individual / HUF 79.71950000 64.10495964 18.00653693 - - - - -Direct Plan Monthly IDCW-Others NU NU NU - - - - -
8. Returns: (%)a. Last One YearSchemeGrowth 6.83% 8.86% 6.38% 2.26% NA 7.46% 6.14% 8.76%Direct Growth 7.31% 9.33% 7.66% 3.35% NA 7.73% 6.28% 8.92%Regular Growth NA NA NA NA - - - -Institutional Growth NA NA NA NA - - - -Benchmark 7.20% 10.91% 9.63% 9.97% NA 12.57% 7.69% 12.57%b. Since InceptionScheme (CAGR^ or Absolute Returns)Growth 7.38%^ 7.46%^ 5.74%^ 5.62%^ 7.04% ^ 7.15% ^ 7.32% ^ 7.84% ^Direct Growth 8.03%^ 8.13%^ 6.66%^ 6.48%^ 7.31% ^ 7.42% ^ 7.47% ^ 8.00% ^Regular Growth NA NA NA NA - - - -Institutional Growth NA NA NA NA - - - -Benchmark (CAGR^ or Absolute Returns)- Growth 8.84%^ 9.07%^ 9.18%^ 9.10%^ 8.53% ^ 8.28% ^ 8.56% ^ 8.94% ^- Direct Growth 8.81%^ 9.03%^ 9.18%^ 9.10%^ - - - -
* NAV as on last day of the financial year.NU - No Unitholders1. Gross income = amount against (A) in the Revenue account i.e. Income.
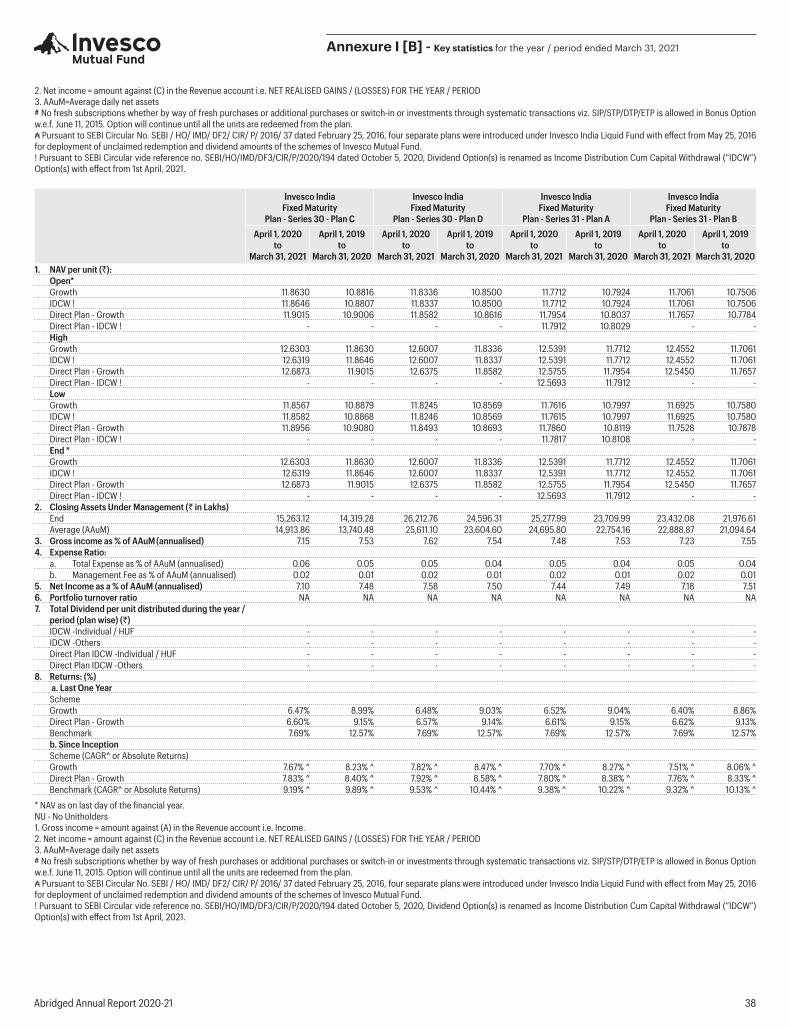
Abridged Annual Report 2020-21 38
Annexure I [B] - Key statistics for the year / period ended March 31, 2021
2. Net income = amount against (C) in the Revenue account i.e. NET REALISED GAINS / (LOSSES) FOR THE YEAR / PERIOD3. AAuM=Average daily net assets# No fresh subscriptions whether by way of fresh purchases or additional purchases or switch-in or investments through systematic transactions viz. SIP/STP/DTP/ETP is allowed in Bonus Option w.e.f. June 11, 2015. Option will continue until all the units are redeemed from the plan.₳ Pursuant to SEBI Circular No. SEBI / HO/ IMD/ DF2/ CIR/ P/ 2016/ 37 dated February 25, 2016, four separate plans were introduced under Invesco India Liquid Fund with effect from May 25, 2016 for deployment of unclaimed redemption and dividend amounts of the schemes of Invesco Mutual Fund.! Pursuant to SEBI Circular vide reference no. SEBI/HO/IMD/DF3/CIR/P/2020/194 dated October 5, 2020, Dividend Option(s) is renamed as Income Distribution Cum Capital Withdrawal (“IDCW”) Option(s) with effect from 1st April, 2021.
Invesco India Fixed Maturity
Plan - Series 30 - Plan C
Invesco India Fixed Maturity
Plan - Series 30 - Plan D
Invesco India Fixed Maturity
Plan - Series 31 - Plan A
Invesco India Fixed Maturity
Plan - Series 31 - Plan BApril 1, 2020
toMarch 31, 2021
April 1, 2019to
March 31, 2020
April 1, 2020to
March 31, 2021
April 1, 2019to
March 31, 2020
April 1, 2020to
March 31, 2021
April 1, 2019to
March 31, 2020
April 1, 2020to
March 31, 2021
April 1, 2019to
March 31, 20201. NAV per unit (`):
Open*Growth 11.8630 10.8816 11.8336 10.8500 11.7712 10.7924 11.7061 10.7506 IDCW ! 11.8646 10.8807 11.8337 10.8500 11.7712 10.7924 11.7061 10.7506 Direct Plan - Growth 11.9015 10.9006 11.8582 10.8616 11.7954 10.8037 11.7657 10.7784 Direct Plan - IDCW ! - - - - 11.7912 10.8029 - - HighGrowth 12.6303 11.8630 12.6007 11.8336 12.5391 11.7712 12.4552 11.7061 IDCW ! 12.6319 11.8646 12.6007 11.8337 12.5391 11.7712 12.4552 11.7061 Direct Plan - Growth 12.6873 11.9015 12.6375 11.8582 12.5755 11.7954 12.5450 11.7657 Direct Plan - IDCW ! - - - - 12.5693 11.7912 - - LowGrowth 11.8567 10.8879 11.8245 10.8569 11.7616 10.7997 11.6925 10.7580 IDCW ! 11.8582 10.8868 11.8246 10.8569 11.7615 10.7997 11.6925 10.7580 Direct Plan - Growth 11.8956 10.9080 11.8493 10.8693 11.7860 10.8119 11.7528 10.7878 Direct Plan - IDCW ! - - - - 11.7817 10.8108 - - End *Growth 12.6303 11.8630 12.6007 11.8336 12.5391 11.7712 12.4552 11.7061IDCW ! 12.6319 11.8646 12.6007 11.8337 12.5391 11.7712 12.4552 11.7061Direct Plan - Growth 12.6873 11.9015 12.6375 11.8582 12.5755 11.7954 12.5450 11.7657Direct Plan - IDCW ! - - - - 12.5693 11.7912 - -
2. Closing Assets Under Management (` in Lakhs)End 15,263.12 14,319.28 26,212.76 24,596.31 25,277.99 23,709.99 23,432.08 21,976.61 Average (AAuM) 14,913.86 13,740.48 25,611.10 23,604.60 24,695.80 22,754.16 22,888.87 21,094.64
3. Gross income as % of AAuM (annualised) 7.15 7.53 7.62 7.54 7.48 7.53 7.23 7.55 4. Expense Ratio:
a. Total Expense as % of AAuM (annualised) 0.06 0.05 0.05 0.04 0.05 0.04 0.05 0.04 b. Management Fee as % of AAuM (annualised) 0.02 0.01 0.02 0.01 0.02 0.01 0.02 0.01
5. Net Income as a % of AAuM (annualised) 7.10 7.48 7.58 7.50 7.44 7.49 7.18 7.51 6. Portfolio turnover ratio NA NA NA NA NA NA NA NA 7. Total Dividend per unit distributed during the year /
period (plan wise) (`)IDCW -Individual / HUF - - - - - - - - IDCW -Others - - - - - - - - Direct Plan IDCW -Individual / HUF - - - - - - - - Direct Plan IDCW -Others - - - - - - - -
8. Returns: (%) a. Last One YearSchemeGrowth 6.47% 8.99% 6.48% 9.03% 6.52% 9.04% 6.40% 8.86%Direct Plan - Growth 6.60% 9.15% 6.57% 9.14% 6.61% 9.15% 6.62% 9.13%Benchmark 7.69% 12.57% 7.69% 12.57% 7.69% 12.57% 7.69% 12.57%b. Since InceptionScheme (CAGR^ or Absolute Returns)Growth 7.67% ^ 8.23% ^ 7.82% ^ 8.47% ^ 7.70% ^ 8.27% ^ 7.51% ^ 8.06% ^Direct Plan - Growth 7.83% ^ 8.40% ^ 7.92% ^ 8.58% ^ 7.80% ^ 8.38% ^ 7.76% ^ 8.33% ^Benchmark (CAGR^ or Absolute Returns) 9.19% ^ 9.89% ^ 9.53% ^ 10.44% ^ 9.38% ^ 10.22% ^ 9.32% ^ 10.13% ^
* NAV as on last day of the financial year.NU - No Unitholders1. Gross income = amount against (A) in the Revenue account i.e. Income.2. Net income = amount against (C) in the Revenue account i.e. NET REALISED GAINS / (LOSSES) FOR THE YEAR / PERIOD3. AAuM=Average daily net assets# No fresh subscriptions whether by way of fresh purchases or additional purchases or switch-in or investments through systematic transactions viz. SIP/STP/DTP/ETP is allowed in Bonus Option w.e.f. June 11, 2015. Option will continue until all the units are redeemed from the plan.₳ Pursuant to SEBI Circular No. SEBI / HO/ IMD/ DF2/ CIR/ P/ 2016/ 37 dated February 25, 2016, four separate plans were introduced under Invesco India Liquid Fund with effect from May 25, 2016 for deployment of unclaimed redemption and dividend amounts of the schemes of Invesco Mutual Fund.! Pursuant to SEBI Circular vide reference no. SEBI/HO/IMD/DF3/CIR/P/2020/194 dated October 5, 2020, Dividend Option(s) is renamed as Income Distribution Cum Capital Withdrawal (“IDCW”) Option(s) with effect from 1st April, 2021.
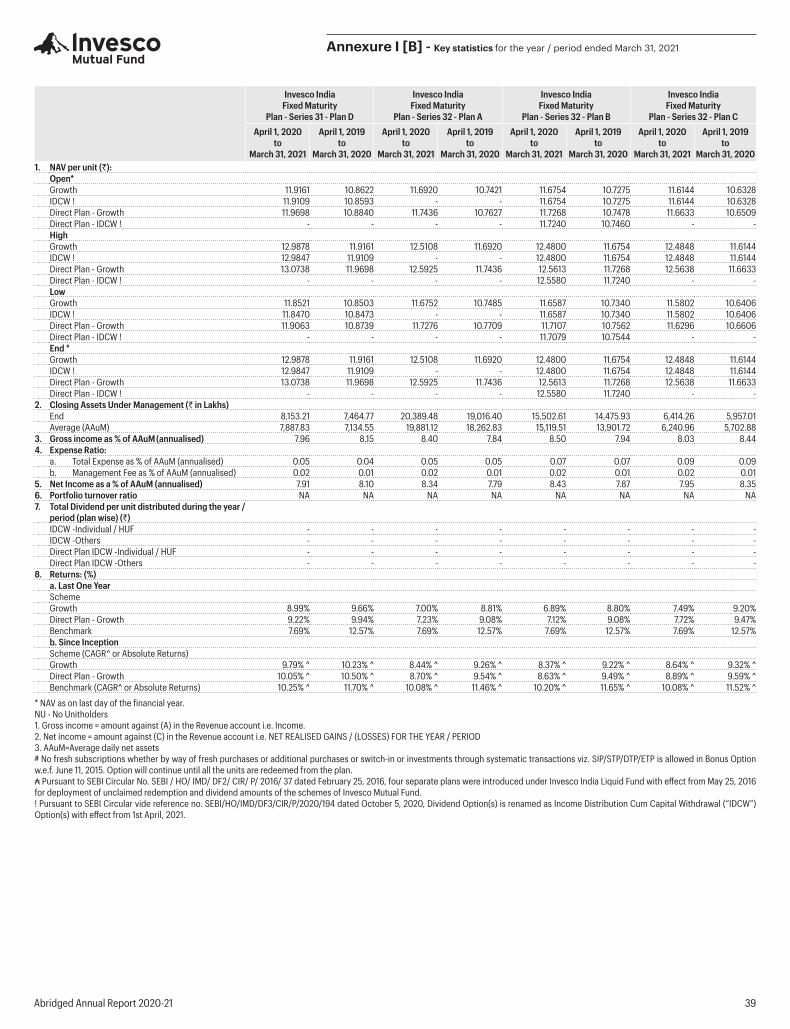
Abridged Annual Report 2020-21 39
Annexure I [B] - Key statistics for the year / period ended March 31, 2021
Invesco India Fixed Maturity
Plan - Series 31 - Plan D
Invesco India Fixed Maturity
Plan - Series 32 - Plan A
Invesco India Fixed Maturity
Plan - Series 32 - Plan B
Invesco India Fixed Maturity
Plan - Series 32 - Plan CApril 1, 2020
toMarch 31, 2021
April 1, 2019to
March 31, 2020
April 1, 2020to
March 31, 2021
April 1, 2019to
March 31, 2020
April 1, 2020to
March 31, 2021
April 1, 2019to
March 31, 2020
April 1, 2020to
March 31, 2021
April 1, 2019to
March 31, 20201. NAV per unit (`):
Open*Growth 11.9161 10.8622 11.6920 10.7421 11.6754 10.7275 11.6144 10.6328 IDCW ! 11.9109 10.8593 - - 11.6754 10.7275 11.6144 10.6328 Direct Plan - Growth 11.9698 10.8840 11.7436 10.7627 11.7268 10.7478 11.6633 10.6509 Direct Plan - IDCW ! - - - - 11.7240 10.7460 - - HighGrowth 12.9878 11.9161 12.5108 11.6920 12.4800 11.6754 12.4848 11.6144 IDCW ! 12.9847 11.9109 - - 12.4800 11.6754 12.4848 11.6144 Direct Plan - Growth 13.0738 11.9698 12.5925 11.7436 12.5613 11.7268 12.5638 11.6633 Direct Plan - IDCW ! - - - - 12.5580 11.7240 - - LowGrowth 11.8521 10.8503 11.6752 10.7485 11.6587 10.7340 11.5802 10.6406 IDCW ! 11.8470 10.8473 - - 11.6587 10.7340 11.5802 10.6406 Direct Plan - Growth 11.9063 10.8739 11.7276 10.7709 11.7107 10.7562 11.6296 10.6606 Direct Plan - IDCW ! - - - - 11.7079 10.7544 - - End *Growth 12.9878 11.9161 12.5108 11.6920 12.4800 11.6754 12.4848 11.6144IDCW ! 12.9847 11.9109 - - 12.4800 11.6754 12.4848 11.6144Direct Plan - Growth 13.0738 11.9698 12.5925 11.7436 12.5613 11.7268 12.5638 11.6633Direct Plan - IDCW ! - - - - 12.5580 11.7240 - -
2. Closing Assets Under Management (` in Lakhs)End 8,153.21 7,464.77 20,389.48 19,016.40 15,502.61 14,475.93 6,414.26 5,957.01 Average (AAuM) 7,887.83 7,134.55 19,881.12 18,262.83 15,119.51 13,901.72 6,240.96 5,702.88
3. Gross income as % of AAuM (annualised) 7.96 8.15 8.40 7.84 8.50 7.94 8.03 8.44 4. Expense Ratio:
a. Total Expense as % of AAuM (annualised) 0.05 0.04 0.05 0.05 0.07 0.07 0.09 0.09 b. Management Fee as % of AAuM (annualised) 0.02 0.01 0.02 0.01 0.02 0.01 0.02 0.01
5. Net Income as a % of AAuM (annualised) 7.91 8.10 8.34 7.79 8.43 7.87 7.95 8.35 6. Portfolio turnover ratio NA NA NA NA NA NA NA NA 7. Total Dividend per unit distributed during the year /
period (plan wise) (`)IDCW -Individual / HUF - - - - - - - - IDCW -Others - - - - - - - - Direct Plan IDCW -Individual / HUF - - - - - - - - Direct Plan IDCW -Others - - - - - - - -
8. Returns: (%)a. Last One YearSchemeGrowth 8.99% 9.66% 7.00% 8.81% 6.89% 8.80% 7.49% 9.20%Direct Plan - Growth 9.22% 9.94% 7.23% 9.08% 7.12% 9.08% 7.72% 9.47%Benchmark 7.69% 12.57% 7.69% 12.57% 7.69% 12.57% 7.69% 12.57%b. Since InceptionScheme (CAGR^ or Absolute Returns)Growth 9.79% ^ 10.23% ^ 8.44% ^ 9.26% ^ 8.37% ^ 9.22% ^ 8.64% ^ 9.32% ^Direct Plan - Growth 10.05% ^ 10.50% ^ 8.70% ^ 9.54% ^ 8.63% ^ 9.49% ^ 8.89% ^ 9.59% ^Benchmark (CAGR^ or Absolute Returns) 10.25% ^ 11.70% ^ 10.08% ^ 11.46% ^ 10.20% ^ 11.65% ^ 10.08% ^ 11.52% ^
* NAV as on last day of the financial year.NU - No Unitholders1. Gross income = amount against (A) in the Revenue account i.e. Income.2. Net income = amount against (C) in the Revenue account i.e. NET REALISED GAINS / (LOSSES) FOR THE YEAR / PERIOD3. AAuM=Average daily net assets# No fresh subscriptions whether by way of fresh purchases or additional purchases or switch-in or investments through systematic transactions viz. SIP/STP/DTP/ETP is allowed in Bonus Option w.e.f. June 11, 2015. Option will continue until all the units are redeemed from the plan.₳ Pursuant to SEBI Circular No. SEBI / HO/ IMD/ DF2/ CIR/ P/ 2016/ 37 dated February 25, 2016, four separate plans were introduced under Invesco India Liquid Fund with effect from May 25, 2016 for deployment of unclaimed redemption and dividend amounts of the schemes of Invesco Mutual Fund.! Pursuant to SEBI Circular vide reference no. SEBI/HO/IMD/DF3/CIR/P/2020/194 dated October 5, 2020, Dividend Option(s) is renamed as Income Distribution Cum Capital Withdrawal (“IDCW”) Option(s) with effect from 1st April, 2021.
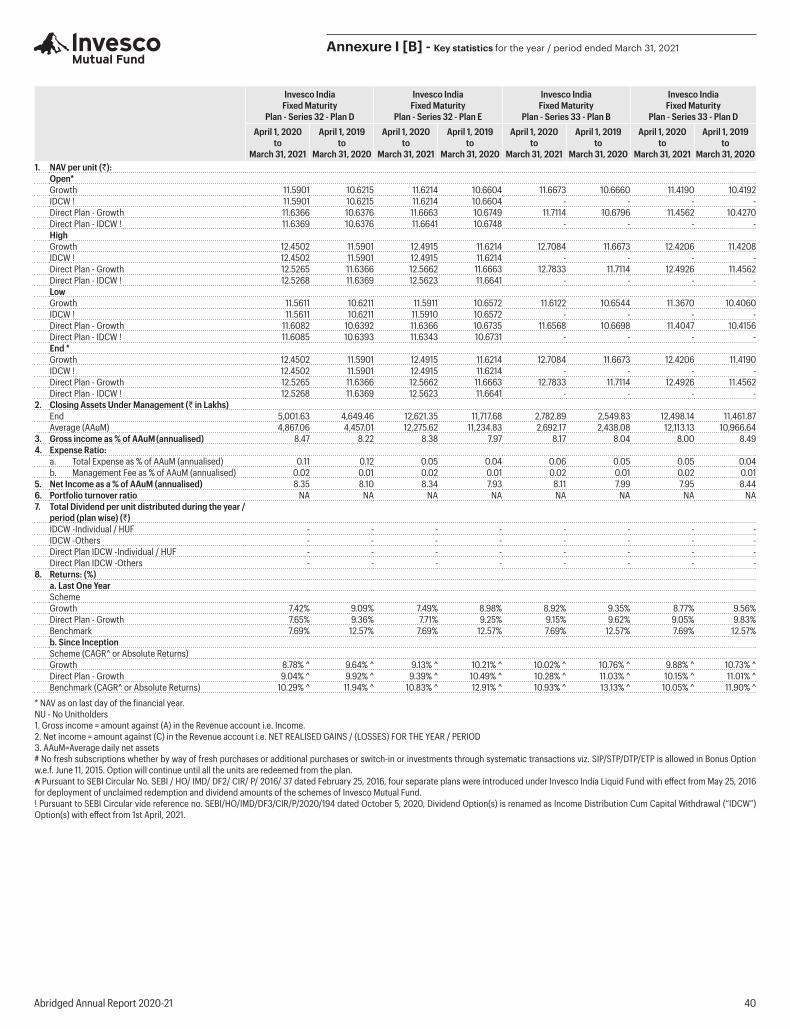
Abridged Annual Report 2020-21 40
Annexure I [B] - Key statistics for the year / period ended March 31, 2021
Invesco India Fixed Maturity
Plan - Series 32 - Plan D
Invesco India Fixed Maturity
Plan - Series 32 - Plan E
Invesco India Fixed Maturity
Plan - Series 33 - Plan B
Invesco India Fixed Maturity
Plan - Series 33 - Plan DApril 1, 2020
toMarch 31, 2021
April 1, 2019to
March 31, 2020
April 1, 2020to
March 31, 2021
April 1, 2019to
March 31, 2020
April 1, 2020to
March 31, 2021
April 1, 2019to
March 31, 2020
April 1, 2020to
March 31, 2021
April 1, 2019to
March 31, 20201. NAV per unit (`):
Open*Growth 11.5901 10.6215 11.6214 10.6604 11.6673 10.6660 11.4190 10.4192 IDCW ! 11.5901 10.6215 11.6214 10.6604 - - - - Direct Plan - Growth 11.6366 10.6376 11.6663 10.6749 11.7114 10.6796 11.4562 10.4270 Direct Plan - IDCW ! 11.6369 10.6376 11.6641 10.6748 - - - - HighGrowth 12.4502 11.5901 12.4915 11.6214 12.7084 11.6673 12.4206 11.4208 IDCW ! 12.4502 11.5901 12.4915 11.6214 - - - - Direct Plan - Growth 12.5265 11.6366 12.5662 11.6663 12.7833 11.7114 12.4926 11.4562 Direct Plan - IDCW ! 12.5268 11.6369 12.5623 11.6641 - - - - LowGrowth 11.5611 10.6211 11.5911 10.6572 11.6122 10.6544 11.3670 10.4060 IDCW ! 11.5611 10.6211 11.5910 10.6572 - - - - Direct Plan - Growth 11.6082 10.6392 11.6366 10.6735 11.6568 10.6698 11.4047 10.4156 Direct Plan - IDCW ! 11.6085 10.6393 11.6343 10.6731 - - - - End *Growth 12.4502 11.5901 12.4915 11.6214 12.7084 11.6673 12.4206 11.4190IDCW ! 12.4502 11.5901 12.4915 11.6214 - - - - Direct Plan - Growth 12.5265 11.6366 12.5662 11.6663 12.7833 11.7114 12.4926 11.4562Direct Plan - IDCW ! 12.5268 11.6369 12.5623 11.6641 - - - -
2. Closing Assets Under Management (` in Lakhs)End 5,001.63 4,649.46 12,621.35 11,717.68 2,782.89 2,549.83 12,498.14 11,461.87 Average (AAuM) 4,867.06 4,457.01 12,275.62 11,234.83 2,692.17 2,438.08 12,113.13 10,966.64
3. Gross income as % of AAuM (annualised) 8.47 8.22 8.38 7.97 8.17 8.04 8.00 8.49 4. Expense Ratio:
a. Total Expense as % of AAuM (annualised) 0.11 0.12 0.05 0.04 0.06 0.05 0.05 0.04 b. Management Fee as % of AAuM (annualised) 0.02 0.01 0.02 0.01 0.02 0.01 0.02 0.01
5. Net Income as a % of AAuM (annualised) 8.35 8.10 8.34 7.93 8.11 7.99 7.95 8.44 6. Portfolio turnover ratio NA NA NA NA NA NA NA NA 7. Total Dividend per unit distributed during the year /
period (plan wise) (`)IDCW -Individual / HUF - - - - - - - - IDCW -Others - - - - - - - - Direct Plan IDCW -Individual / HUF - - - - - - - - Direct Plan IDCW -Others - - - - - - - -
8. Returns: (%)a. Last One YearSchemeGrowth 7.42% 9.09% 7.49% 8.98% 8.92% 9.35% 8.77% 9.56%Direct Plan - Growth 7.65% 9.36% 7.71% 9.25% 9.15% 9.62% 9.05% 9.83%Benchmark 7.69% 12.57% 7.69% 12.57% 7.69% 12.57% 7.69% 12.57%b. Since InceptionScheme (CAGR^ or Absolute Returns)Growth 8.78% ^ 9.64% ^ 9.13% ^ 10.21% ^ 10.02% ^ 10.76% ^ 9.88% ^ 10.73% ^Direct Plan - Growth 9.04% ^ 9.92% ^ 9.39% ^ 10.49% ^ 10.28% ^ 11.03% ^ 10.15% ^ 11.01% ^Benchmark (CAGR^ or Absolute Returns) 10.29% ^ 11.94% ^ 10.83% ^ 12.91% ^ 10.93% ^ 13.13% ^ 10.05% ^ 11.90% ^
* NAV as on last day of the financial year.NU - No Unitholders1. Gross income = amount against (A) in the Revenue account i.e. Income.2. Net income = amount against (C) in the Revenue account i.e. NET REALISED GAINS / (LOSSES) FOR THE YEAR / PERIOD3. AAuM=Average daily net assets# No fresh subscriptions whether by way of fresh purchases or additional purchases or switch-in or investments through systematic transactions viz. SIP/STP/DTP/ETP is allowed in Bonus Option w.e.f. June 11, 2015. Option will continue until all the units are redeemed from the plan.₳ Pursuant to SEBI Circular No. SEBI / HO/ IMD/ DF2/ CIR/ P/ 2016/ 37 dated February 25, 2016, four separate plans were introduced under Invesco India Liquid Fund with effect from May 25, 2016 for deployment of unclaimed redemption and dividend amounts of the schemes of Invesco Mutual Fund.! Pursuant to SEBI Circular vide reference no. SEBI/HO/IMD/DF3/CIR/P/2020/194 dated October 5, 2020, Dividend Option(s) is renamed as Income Distribution Cum Capital Withdrawal (“IDCW”) Option(s) with effect from 1st April, 2021.
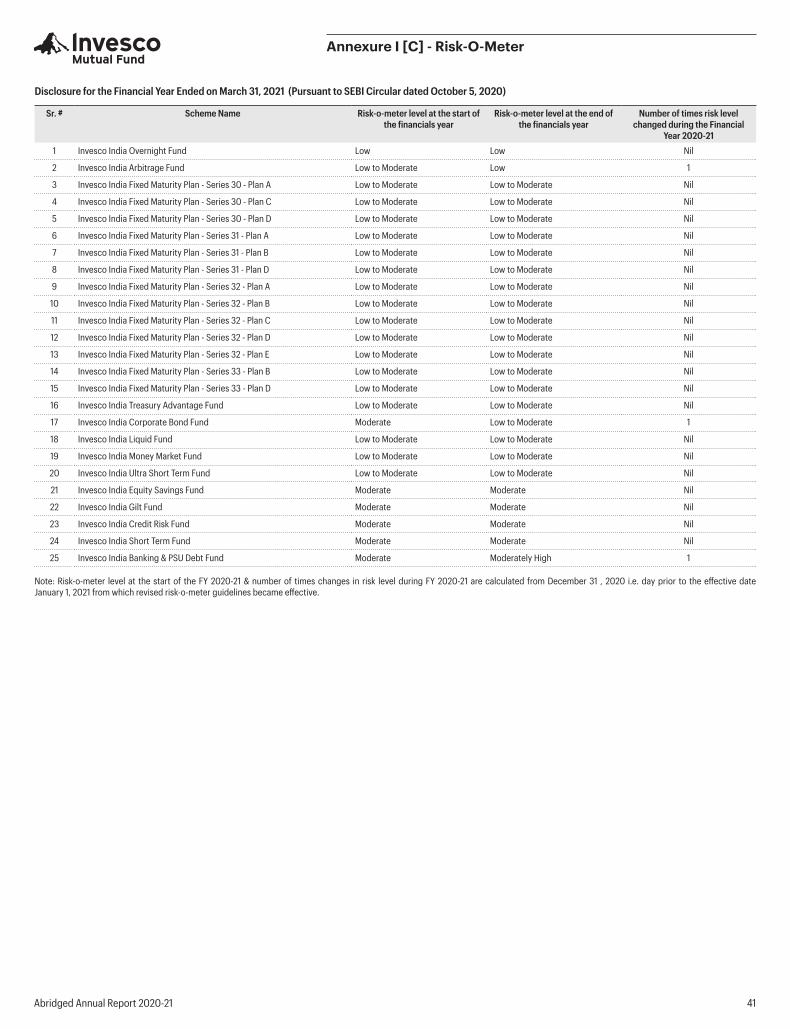
Abridged Annual Report 2020-21 41
Annexure I [C] - Risk-O-Meter
Disclosure for the Financial Year Ended on March 31, 2021 (Pursuant to SEBI Circular dated October 5, 2020)
Sr. # Scheme Name Risk-o-meter level at the start of the financials year
Risk-o-meter level at the end of the financials year
Number of times risk level changed during the Financial
Year 2020-211 Invesco India Overnight Fund Low Low Nil
2 Invesco India Arbitrage Fund Low to Moderate Low 1
3 Invesco India Fixed Maturity Plan - Series 30 - Plan A Low to Moderate Low to Moderate Nil
4 Invesco India Fixed Maturity Plan - Series 30 - Plan C Low to Moderate Low to Moderate Nil
5 Invesco India Fixed Maturity Plan - Series 30 - Plan D Low to Moderate Low to Moderate Nil
6 Invesco India Fixed Maturity Plan - Series 31 - Plan A Low to Moderate Low to Moderate Nil
7 Invesco India Fixed Maturity Plan - Series 31 - Plan B Low to Moderate Low to Moderate Nil
8 Invesco India Fixed Maturity Plan - Series 31 - Plan D Low to Moderate Low to Moderate Nil
9 Invesco India Fixed Maturity Plan - Series 32 - Plan A Low to Moderate Low to Moderate Nil
10 Invesco India Fixed Maturity Plan - Series 32 - Plan B Low to Moderate Low to Moderate Nil
11 Invesco India Fixed Maturity Plan - Series 32 - Plan C Low to Moderate Low to Moderate Nil
12 Invesco India Fixed Maturity Plan - Series 32 - Plan D Low to Moderate Low to Moderate Nil
13 Invesco India Fixed Maturity Plan - Series 32 - Plan E Low to Moderate Low to Moderate Nil
14 Invesco India Fixed Maturity Plan - Series 33 - Plan B Low to Moderate Low to Moderate Nil
15 Invesco India Fixed Maturity Plan - Series 33 - Plan D Low to Moderate Low to Moderate Nil
16 Invesco India Treasury Advantage Fund Low to Moderate Low to Moderate Nil
17 Invesco India Corporate Bond Fund Moderate Low to Moderate 1
18 Invesco India Liquid Fund Low to Moderate Low to Moderate Nil
19 Invesco India Money Market Fund Low to Moderate Low to Moderate Nil
20 Invesco India Ultra Short Term Fund Low to Moderate Low to Moderate Nil
21 Invesco India Equity Savings Fund Moderate Moderate Nil
22 Invesco India Gilt Fund Moderate Moderate Nil
23 Invesco India Credit Risk Fund Moderate Moderate Nil
24 Invesco India Short Term Fund Moderate Moderate Nil
25 Invesco India Banking & PSU Debt Fund Moderate Moderately High 1
Note: Risk-o-meter level at the start of the FY 2020-21 & number of times changes in risk level during FY 2020-21 are calculated from December 31 , 2020 i.e. day prior to the effective date January 1, 2021 from which revised risk-o-meter guidelines became effective.
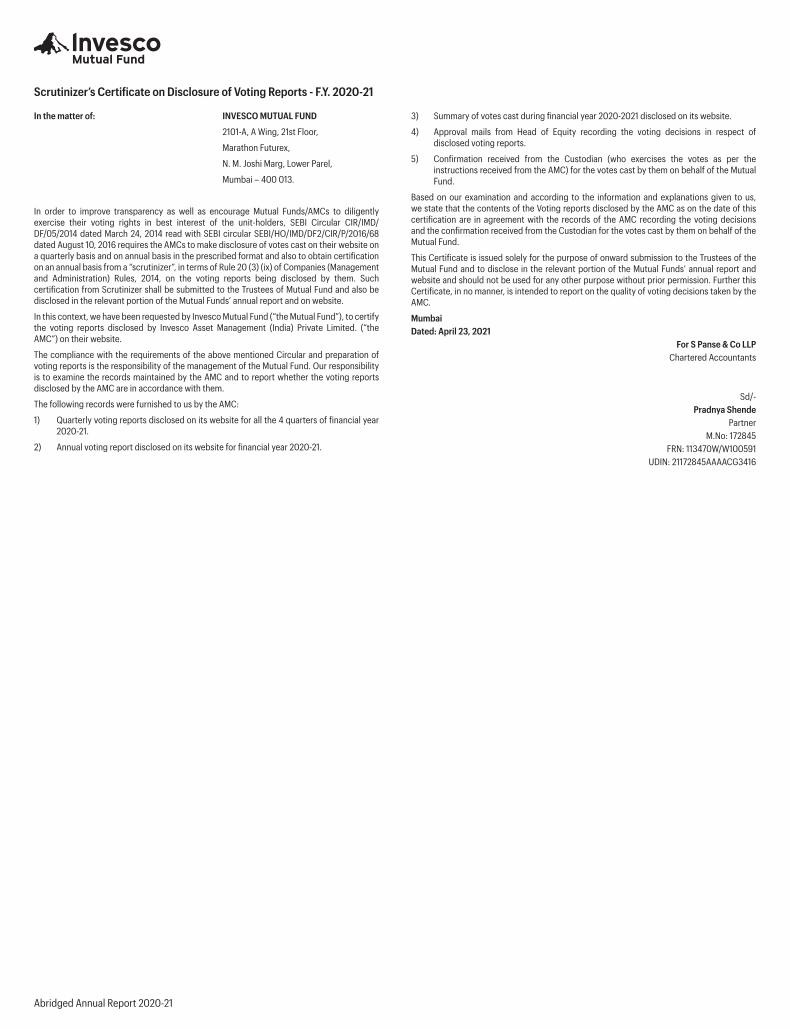
Abridged Annual Report 2020-21
In the matter of: INVESCO MUTUAL FUND
2101-A, A Wing, 21st Floor,
Marathon Futurex,
N. M. Joshi Marg, Lower Parel,
Mumbai – 400 013.
In order to improve transparency as well as encourage Mutual Funds/AMCs to diligently exercise their voting rights in best interest of the unit-holders, SEBI Circular CIR/IMD/DF/05/2014 dated March 24, 2014 read with SEBI circular SEBI/HO/IMD/DF2/CIR/P/2016/68 dated August 10, 2016 requires the AMCs to make disclosure of votes cast on their website on a quarterly basis and on annual basis in the prescribed format and also to obtain certification on an annual basis from a “scrutinizer”, in terms of Rule 20 (3) (ix) of Companies (Management and Administration) Rules, 2014, on the voting reports being disclosed by them. Such certification from Scrutinizer shall be submitted to the Trustees of Mutual Fund and also be disclosed in the relevant portion of the Mutual Funds’ annual report and on website.
In this context, we have been requested by Invesco Mutual Fund (“the Mutual Fund”), to certify the voting reports disclosed by Invesco Asset Management (India) Private Limited. (“the AMC”) on their website.
The compliance with the requirements of the above mentioned Circular and preparation of voting reports is the responsibility of the management of the Mutual Fund. Our responsibility is to examine the records maintained by the AMC and to report whether the voting reports disclosed by the AMC are in accordance with them.
The following records were furnished to us by the AMC:
1) Quarterly voting reports disclosed on its website for all the 4 quarters of financial year 2020-21.
2) Annual voting report disclosed on its website for financial year 2020-21.
3) Summary of votes cast during financial year 2020-2021 disclosed on its website.
4) Approval mails from Head of Equity recording the voting decisions in respect of disclosed voting reports.
5) Confirmation received from the Custodian (who exercises the votes as per the instructions received from the AMC) for the votes cast by them on behalf of the Mutual Fund.
Based on our examination and according to the information and explanations given to us, we state that the contents of the Voting reports disclosed by the AMC as on the date of this certification are in agreement with the records of the AMC recording the voting decisions and the confirmation received from the Custodian for the votes cast by them on behalf of the Mutual Fund.
This Certificate is issued solely for the purpose of onward submission to the Trustees of the Mutual Fund and to disclose in the relevant portion of the Mutual Funds’ annual report and website and should not be used for any other purpose without prior permission. Further this Certificate, in no manner, is intended to report on the quality of voting decisions taken by the AMC.
MumbaiDated: April 23, 2021
For S Panse & Co LLPChartered Accountants
Sd/-Pradnya Shende
PartnerM.No: 172845
FRN: 113470W/W100591UDIN: 21172845AAAACG3416
Scrutinizer’s Certificate on Disclosure of Voting Reports - F.Y. 2020-21

Invesco Asset Management (India) Private LimitedCorporate & Registered O�ice: 2101-A, A Wing,21st Floor, Marathon Futurex, N.M. Joshi Marg,Lower Parel, Mumbai – 400 013CIN No: U67190MH2005PTC153471
T: +91 22 6731 0000F: +91 22 2301 9422E: [email protected]
To invest:Call 1800 209 0007SMS ‘invest’ to 56677
invescomutualfund.com
Follow us on
Mutual Fund investments are subject to market risks,read all scheme related documents carefully.
Book Post
If undelivered, please return to :