
ABRIDGED ANNUAL REPORT FOR F. Y. 2015-16
28
ABRIDGED ANNUAL REPORT FOR F. Y. 2015-16 • ICICI Prudential Advisor Series - Long Term Savings Plan • ICICI Prudential Advisor Series - Cautious Plan • ICICI Prudential Advisor Series - Moderate Plan • ICICI Prudential Advisor Series - Very Aggressive Plan • ICICI Prudential Advisor Series - Dynamic Accrual Plan (Formerly ICICI Prudential Advisor Series - Very Cautious Plan) • ICICI Prudential Global Stable Equity Fund • ICICI Prudential Regular Gold Savings Fund Sponsors: ICICI Bank Limited Regd. Office: Landmark, Race Course Circle, Vadodara 390 007, India; and Prudential plc, Laurence Pountney Hill, London EC4ROHH, UK. Investment Manager: ICICI Prudential Asset Management Company Limited Corporate Identity Number: U99999DL1993PLC054135 Corporate Office: One BKC, 13th Floor, Bandra Kurla Complex, Mumbai - 400051, Tel: (022) 2652 5000 Fax: (022) 2652 8100. Website: www.icicipruamc.com, Email id : [email protected] Central Service Office: 2nd Floor, Block B-2, Nirlon Knowledge Park, Western Express Highway, Goregaon (East), Mumbai - 400 063. Tel.: 022-26852000, Fax No.: 022-2686 8313. Registered Office: 12th Floor, Narain Manzil, 23 Barakhamba Road, New Delhi 110 001. Trustee: ICICI Prudential Trust Limited Corporate Identity Number: U74899DL1993PLC054134 Registered Office: 12th Floor, Narain Manzil, 23 Barakhamba Road, New Delhi 110 001. Registrars: Computer Age Management Services Pvt. Ltd. (CAMS) Registered Office: New No 10. Old No. 178, Opp. to Hotel Palm Grove, MGR Salai (K.H.Road), Chennai - 600 034 ICICI Prudential Asset Management Company Limited Ms. Chanda Kochhar Nominee Director – ICICI Bank Ltd. (Chairperson) Mr. Guy Robert Strapp Nominee Director – Prudential Corporation Holdings Limited (Appointed with effect from 29.07. 2015) Mr. N. S. Kannan Nominee Director – ICICI Bank Ltd. Mr. Vijay Thacker Independent Director Mr. C. R. Muralidharan Independent Director Mr. Suresh Kumar Independent Director Ms. Lakshmi Venkatachalam Independent Director (Appointed with effect from 22.09. 2015) Mr. Ved Prakash Chaturvedi Independent Director (Appointed with effect from 14.07. 2016) Mr. Nimesh Shah Managing Director Mr. Sankaran Naren Executive Director (Appointed with effect from 22.04. 2016) ICICI Prudential Trust Limited Mr. M. N. Gopinath Independent Director (Chairman) Mr. R.K. Nair Independent Director (Appointed with effect from 05.07.2015) Mr. Vinod Dhall Independent Director Mr. Keki Bomi Dadiseth Nominee Director – Prudential Corporation Holdings Limited (Resigned with effect from 21.04.2016) Mr. Sandeep Batra Nominee Director – ICICI Bank Ltd.
-
Upload
khangminh22 -
Category
Documents
-
view
0 -
download
0
Transcript of ABRIDGED ANNUAL REPORT FOR F. Y. 2015-16

ABRIDGED ANNUAL REPORT FOR F. Y. 2015-16
• ICICIPrudentialAdvisorSeries-LongTermSavingsPlan
• ICICIPrudentialAdvisorSeries-CautiousPlan
• ICICIPrudentialAdvisorSeries-ModeratePlan
• ICICIPrudentialAdvisorSeries-VeryAggressivePlan
• ICICIPrudentialAdvisorSeries-DynamicAccrualPlan (FormerlyICICIPrudentialAdvisorSeries-VeryCautiousPlan)
• ICICIPrudentialGlobalStableEquityFund
• ICICIPrudentialRegularGoldSavingsFund
Sponsors: ICICIBankLimitedRegd. Office: Landmark, Race Course Circle, Vadodara 390 007, India; and Prudentialplc, Laurence Pountney Hill, London EC4ROHH, UK.
InvestmentManager: ICICIPrudentialAssetManagementCompanyLimited Corporate Identity Number: U99999DL1993PLC054135
Corporate Office: One BKC, 13th Floor, Bandra Kurla Complex, Mumbai - 400051, Tel: (022) 2652 5000 Fax: (022) 2652 8100. Website: www.icicipruamc.com, Email id : [email protected]
Central Service Office: 2nd Floor, Block B-2, Nirlon Knowledge Park, Western Express Highway, Goregaon (East), Mumbai - 400 063. Tel.: 022-26852000, Fax No.: 022-2686 8313.
Registered Office: 12th Floor, Narain Manzil, 23 Barakhamba Road, New Delhi 110 001.
Trustee: ICICIPrudentialTrustLimited
Corporate Identity Number: U74899DL1993PLC054134 Registered Office: 12th Floor, Narain Manzil, 23 Barakhamba Road, New Delhi 110 001.
Registrars: ComputerAgeManagementServicesPvt.Ltd.(CAMS) Registered Office: New No 10. Old No. 178, Opp. to Hotel Palm Grove, MGR Salai (K.H.Road), Chennai - 600 034
ICICI Prudential Asset Management Company LimitedMs. Chanda Kochhar Nominee Director – ICICI Bank Ltd. (Chairperson)Mr. Guy Robert Strapp Nominee Director – Prudential Corporation
Holdings Limited(Appointed with effect from 29.07. 2015)
Mr. N. S. Kannan Nominee Director – ICICI Bank Ltd.Mr. Vijay Thacker Independent Director Mr. C. R. Muralidharan Independent DirectorMr. Suresh Kumar Independent DirectorMs. Lakshmi Venkatachalam
Independent Director(Appointed with effect from 22.09. 2015)
Mr. Ved Prakash Chaturvedi
Independent Director(Appointed with effect from 14.07. 2016)
Mr. Nimesh Shah Managing DirectorMr. Sankaran Naren Executive Director
(Appointed with effect from 22.04. 2016)
ICICI Prudential Trust Limited
Mr. M. N. Gopinath Independent Director (Chairman)
Mr. R.K. Nair Independent Director (Appointed with effect from 05.07.2015)
Mr. Vinod Dhall Independent Director
Mr. Keki Bomi Dadiseth Nominee Director – Prudential Corporation Holdings Limited (Resigned with effect from 21.04.2016)
Mr. Sandeep Batra Nominee Director – ICICI Bank Ltd.

2
INDEPENDENT AUDITOR’S REPORTTotheTrusteesofICICIPrudentialMutualFund
ReportontheFinancialStatements
We have audited the accompanying financial statements of the schemes of ICICI Prudential Mutual Fund - ICICI Prudential Advisor series Long Term Savings Plan,ICICI Prudential Advisor series - Cautious Plan,ICICI Prudential Global Stable Equity Fund, ICICI Prudential Advisor series - Moderate Plan, ICICI Prudential Regular Gold Savings Fund, ICICI Prudential Advisor series - Very Aggressive Plan, ICICI Prudential Advisor Series - Dynamic Accrual Plan (Formerly ICICI Prudential Advisor series - Very Cautious Plan) (collectively “the Schemes”), which comprise the balance sheets as at March 31, 2016,the revenue accounts and cash flow statements for the year then ended, and a summary of significant accounting policies and other explanatory information.
Management’sResponsibilityfortheFinancialStatements
Management of ICICI Prudential Asset Management Company Limited, the schemes’ asset manager, is responsible for the preparation of these financial statements that give a true and fair view of the financial position, financial performance and cash flows of the Schemes in accordance with accounting principles generally accepted in India, including the accounting policies and standards specified in the Ninth Schedule to the Securities and Exchange Board of India (Mutual Funds) Regulations, 1996 and amendments thereto (‘the Regulations’). This responsibility includes the design, implementation and maintenance of internal control relevant to the preparation and presentation of the financial statements that give a true and fair view and are free from material misstatement, whether due to fraud or error.
Auditor’sResponsibility
Our responsibility is to express an opinion on these financial statements based on our audit. Weconducted our audit in accordance with the Standards on Auditing issued by the Institute of Chartered Accountants of India. Those Standards require that we comply with ethical requirements and plan and perform the audit to obtain reasonable assurance about whether the financial statements are free from material misstatement.
An audit involves performing procedures to obtain audit evidence about the amounts and disclosures in the financial statements. The procedures selected depend on the auditor’s judgment, including the assessment of the risks of material misstatement of the financial statements, whether due to fraud or error. In making those risk assessments, the auditor considers internal controls relevant to the preparation and fair presentation of the financial statements in order to design audit procedures that are appropriate in the circumstances but not for the purpose of expressing an opinion on the effectiveness of the entity’s internal controls. An audit also includes evaluating the appropriateness of accounting policies used and the reasonableness of the accounting estimates made by management, as well as evaluating the overall presentation of the financial statements. We believe that the audit evidence we have obtained is sufficient and appropriate to provide a basis for our audit opinion.
Opinion
In our opinion and to the best of our information and according to the explanations given to us, the financial statements give the information required by the Regulations in the manner so required and give a true and fair view in conformity with the accounting principles generally accepted in India:
(a) in the case of the balance sheet, of the state of affairs of the respective Schemes as at March 31, 2016;
(b) in the case of the revenue account,of the surplus/deficit, as applicable, of the respective Schemes for the year ended on that date; and
(c) in the case of the cash flow statement, of the cash flows of the respective Schemes for the year ended on that date.
ReportonOtherLegalandRegulatoryRequirements
• AsrequiredbyRegulation55(4)andclause5(ii)(2)oftheEleventhScheduleoftheRegulations,wereportthat:
a. We have obtained all the information and explanations, which to the best of our knowledge and belief were necessary for the purposes of our audit;
b. In our opinion, the balance sheet and revenue account dealt with by this report have been prepared in conformity with the accounting policies and standards specified in the Ninth Schedule to the Regulations;
c. The balance sheets,revenue accounts and cash flow statements, dealt with by this report are in agreement with the books of account of the Scheme; and
d. In our opinion, and on the basis of information and explanations given to us, the methods used to value non traded securities as at March 31, 2016 are in accordance with the Regulations and other guidelines issued by the Securities and Exchange Board of India, as applicable, and approved by the Board of Directors of ICICI Prudential Trust Limited, and are fair and reasonable.
ForS.R.Batliboi&Co.LLPChartered Accountants ICAI Firm Registration Number: 301003E/E300005
Sd- perVirenH.Mehta Partner Membership Number: 48749
Place: Mumbai Date:June 22, 2016

3
Dear Unitholder,
We have pleasure in presenting the 23rd Annual Report of the Schemes of ICICI Prudential Mutual Fund (“the Mutual Fund” or “the Fund”) for the year ended March 31, 2016, along with the audited financial statements of the Schemes.
I. SCHEMEPERFORMANCE,FUTUREOUTLOOKANDOPERATIONSOFTHESCHEMES
A. PerformanceoftheSchemesandInvestmentFolios
1. PerformanceoftheSchemes
ICICI Prudential Trust Limited (“the Company/Trustee”) is acting as the Trustee to all the Schemes/Plans of the Fund. The net asset values (NAVs) and other pertinent details of the various Schemes are given below:
SchemeName DateofAllotment
QuarterlyAAUMfortheperiodendedMarch31,2016(Rs.inlakh)
QuarterlyAAUMfortheperiodendedMarch31,2015(Rs.inlakh)
NetAssetValueperunitatMarch31,2016(Rs.)
Returns CategoryLast1yearreturn
Sinceinceptionreturns
ICICI Prudential Global Stable Equity Fund
13-Sep-13 7,876.12 7,198.26 12.66 9.30% 9.70% Open Ended Fund of Funds Scheme
MSCI World - Net Return Index 2.32% 6.46%ICICI Prudential Regular Gold Savings Fund
11-Oct-11 6,019.93 6,650.07 9.95 7.11% -0.10% Open Ended Fund of Funds Scheme
Domestic Gold prices 10.79% 2.18%ICICI Prudential Advisor Series - Dynamic Accrual Plan (Formerly ICICI Prudential Advisor series - Very Cautious Plan)
18-Dec-03 538.53 83.01 23.31 10.87% 7.13% Open Ended Fund of Funds Scheme
Crisil Liquid Fund Index (30%) + Crisil Composite Bond Fund Index (70%)
8.17% 6.55%
ICICI Prudential Advisor series - Cautious Plan
18-Dec-03 234.64 281.67 27.37 0.84% 8.54% Open Ended Fund of Funds Scheme
Nifty 50 (20%) + Crisil Composite Bond Index (60%) + Crisil Liquid Fund Index (10%) + Gold (10%)
5.12% 7.74%
ICICI Prudential Advisor series - Moderate Plan
18-Dec-03 499.30 553.56 38.24 -0.31% 11.53% Open Ended Fund of Funds Scheme
Nifty 50 (40%) + Crisil Composite Bond Fund Index (40%) + Crisil Liquid Fund Index (10%) + Gold (10%)
1.70% 9.86%
ICICI Prudential Advisor series Long Term Savings Plan
18-Dec-03 578.64 745.27 46.57 -2.26% 13.33% Open Ended Fund of Funds Scheme
Nifty 50 (50%) + Crisil Composite Bond Fund Index (30%) + Crisil Liquid Fund Index (5%) + Gold (15%)
0.16% 11.98%
ICICI Prudential Advisor series - Very Aggressive Plan
18-Dec-03 439.81 479.47 52.64 3.14% 14.47% Open Ended Fund of Funds Scheme
Nifty 50 (75%) + Crisil Composite Bond Fund Index (5%) + Crisil Liquid Fund Index (5%) + Gold (15%)
-4.11% 12.97%
Past performance may or may not be sustained in the future. NAV of growth option is considered for computation of returns without considering load. Returns are calculated on the basis of CAGR. For computation of since inception returns the allotment NAV has been taken as Rs.10.
Performance figures have been computed based on the last declared NAV.
Returns have been calculated based on NAV of Growth option, wherever applicable.
TRUSTEE’S REPORTBY
ICICI PRUDENTIAL TRUST LIMITED

4
2. InvestmentFolios
The total number of live folios as at March 31, 2016 were 40.50 lakh.
B. MarketReviewandOutlook
MarketReviewFY161
GlobalEconomy:
The International Monetary Fund (IMF) has a pessimistic outlook on global economic growth, given the slowdown in emerging markets, especially China, easing commodity prices and rising interest rates in the United States (US). The economic think-tank trimmed global economic growth forecast for 2016 to 3.4% from 3.6%. (Source: Crisil Research)
The US Federal Reserve (Fed) has given indication that it will gradually hike interest rates based on data. The Fed said that it was closely monitoring global economic and financial developments.
In February 2016, the European Central Bank (ECB) announced bold stimulus measures to boost Eurozone’s economic recovery and combat deflation. The ECB slashed its main benchmark rate to 0% from 0.05%, increased its monthly bond purchases to 80 billion Euros from 60 billion Euros and reduced the interest rate on deposits held by banks at the ECB to -0.4%, from -0.3%. The measures also included long-term cheap loans with tenors up to four years to support banks.
Indianeconomy:
According to the Central Statistics Office (CSO), the Indian economy is estimated to expand by 7.6% in FY 16. Inflation over the last one year has remained range bound. Retail inflation has remained in 5-6% range, meanwhile, wholesale prices has seen only deflation.
The external indicators too have improved with Current Account Deficit (CAD) likely to be below 1.2% in FY 16. Falling crude prices and lower gold import contributed to reduction in CAD. Fiscal deficit is also improving and the government has remained committed to bring it down further to 3% levels by FY 18.
Indianequitymarket:
Indian equity market fell in FY 16 on account of crude oil falling, Foreign Institutional Investors (FII) outflow from emerging countries, which indirectly also affected India. As reported earnings during FY 16 was less than estimation, the investment sentiment in India got dampened.
Indiandebtmarket:
Reserve Bank of India (RBI) continued its interest rate cut cycle through FY 16, it also took various other measures to increase the liquidity of the market. Meanwhile, the government too supported the RBI’s effort. In its Union Budget, the government pegged the gross borrowing for FY 17 at ` 6 lakh crore, largely unchanged from FY 16. The net borrowing for FY 17 is pegged at ` 4.25 lakh crore, lower than the FY16 figure of ` 4.56 lakh crore. Despite the pressures on the Government budgets, the Government has gone ahead with a fiscal deficit target of 3.5% of GDP for FY 17 vis-à-vis 3.9% of GDP for FY 16. This is positive for bond yields and will raise the chances of a policy rate cut by RBI in the near term.
Goldreview:
Indian gold prices closed the year at ` 29,080 per 10 grams on March 31, 2016 as against ` 26,232 per 10 grams on March 31, 2015 on the MCX (Multi-Commodity Exchange). Gold prices managed to register a positive return of 10.85% during this period. This was due to global risk aversion by investors.
SohowisFY17shapingup?
Economicoutlook
The outlook for FY 17 seems quite promising. After improvement seen in the macroeconomic environment it is time for microeconomic indicators to follow through. We believe equities could deliver good returns in the long term and the fixed income market could be boosted by the continuation in RBI’s rate-cut cycle.
With the macroeconomic indicators largely positive, we expect their effect to trickle down to the microeconomic level in FY 17. Key microeconomic indicators such as production of consumer durable goods, automobile sales, and expenditure on new projects have been quite constructive. The government’s focus to implement policies and reforms on the executive level is seen leading to an economic revival. Further, sustained foreign direct investments and some stability in crude oil prices could also boost markets. Thanks to these factors, we believe global investors focus will continue on India as its long-term economic growth story remains intact.
1 FY represents a financial year from April 1 to March 31 of the following year. FY 16 represents the financial year ended in 2016. FY 17 and FY 18 represent financial year ending in 2017 and 2018 respectively.

5
KeyStatisticsofFY16
DomesticIndices31-Mar-16 31-Mar-15 %change
Nifty50 7,738 8,491 -8.84S&PBSEMIDCAP 10,619 10,592 0.25S&PBSESensex 25,342 27,958 -9.33S&PBSESMALLCAP 10,542 10,891 -3.19
Source: MFI
InternationalIndices31-Mar-16 31-Mar-15 %change
DowJones 17,685 17,776 -0.51FTSE 6,175 6,773 -8.81HangSeng 20,777 24,901 -16.52Nasdaq 4,870 4,901 -0.63Nikkei 16,759 19,207 -12.71SSECompositeIndex 3,004 3,748 -19.80StraitTimes 2,841 3,447 -17.54
Source: MFI
CurrencyMovement CommodityPriceMovement31-Mar-16 31-Mar-15 %change 31-Mar-16 31-Mar-15 %change
INR/USD 66.24 62.49 6.00 Brent($/bbl) 40.2 56.0 -0.28INR/GBP 95.13 92.61 2.72 Gold($/ounce) 1232.8 1183.6 0.04INR/EUR 75.39 67.07 12.40 Silver($/ounce) 15.4 16.7 -0.07INR/YEN 58.85 52.03 13.11 Source: Bloomberg
Source: Bloomberg
FixedIncome 31-Mar-16 31-Mar-15 %change InstitutionalFlowasonMarch31,2016(Equity)CallRate 12.00% 9.00% 33.33 Pur(`Cr.) Sales(`Cr.) Net(`Cr.) YTD (`Cr.)91dayT-Bill 7.69% 7.06% 8.92 FIIFlows 5,927 4,406 1,522 5,857364DaysT-Bill 7.06% 7.72% -0.09 MFFlows 2,440 4,692 -2,251 4,591CBLO 7.38% 9.26% -20.30 Source: SEBIRepo 6.75% 7.50% -10.00ReverseRepo 5.75% 6.50% -11.5410YrGSec 7.5% 7.7% -3.521YrCD 8.20% 9.06% -9.49GSecVolume(` bln) 4,79,653 3,09,324 55.07US10YrBond 1.77% 1.92% -8.03
Source: Bloomberg, RBI, CRISIL
31-Mar-16 31-Mar-15 %changeS&PBSEConsumerDurables 11,481 10,418 10.17S&PBSEMidcap 10,619 10,592 0.25S&PBSEIT 11,388 11,404 -0.14S&PBSEFMCG 7,692 7,773 -1.04S&PBSEOil&Gas 9,162 9,312 -1.61S&PBSESmallCap 10,542 10,891 -3.19S&PBSEAuto 18,002 19,259 -6.51S&PBSEBankex 18,392 20,865 -11.82S&PBSEHealthCare 15,149 17,285 -12.32S&PBSEPowerIndex 1,776 2,127 -16.49S&PBSEPSU 6,107 7,608 -19.69S&PBSEMetals 7,541 9,466 -20.29S&PBSECapitalGood 12,861 17,293 -25.57S&PBSERealty 1,228 1,665 -26.14
Data source: MFI

6
Equitymarketoutlook:
Currently, capacity utilisation in the manufacturing sector is at a multi-year low. We believe that strong operating leverage and gradual improvement in demand will improve the utilisation rate and drive corporate earnings over the next three to four quarters. We also expect government to support capital expenditure in the transportation and defence sectors. Higher capacity utilisation coupled with improvement in non-performing assets in the banking space, will boost the economy.
The expectation of a good monsoon after two years of failure, improvement in asset quality of banks, implementation of reforms, higher capacity utilisation and eventual earnings growth are likely triggers for the markets in FY 17.
The Union Budget for FY 2016-17 also underlines the Government’s determination to provide an impetus to the economy especially through the infrastructure, rural and financial sectors. It lays emphasis on repairing balance sheets of the banks, reducing non-performing assets and boosting employment in the largest section of the economic pyramid.
Given this focus on reform, repair and revival, we see a prospective up-cycle in the economy.
Further, we believe that oil prices will bottom out and recover this year, which could bring about some stability in global markets and halt foreign investors from selling in emerging markets such as India.
Debtmarketoutlook:
Despite the 125 basis-points cut in the benchmark repo rate during the calendar year 2015, the performance of the debt market was lackluster as retail and global investors shied away from debt market. Yet, India was among the best performing debt markets in 2015 and we believe that the outlook for the calendar year 2016 is encouraging.
We believe interest rates will continue downward movement as structurally lower inflation shall provide scope for further rate cuts. As per the Indian Metrological Department (IMD) forecast, monsoons are predicted to be normal. This may lead to lower food inflation and provide further room for RBI to cut rates.
C. OperationsoftheSchemes
1. AverageAssetsunderManagement(AAUM)
The AAUM of the Mutual Fund for the quarter ended March 31, 2016 stood at ` 1,75,963.98 crore, while for the quarter ended March 31, 2015 the AAUM of the Mutual Fund was ` 1,48,646.88 crore.
As of March 31, 2016, the Fund comprised 47 open ended schemes, 4 exchange traded funds, 20 interval fund plans,1 fund of funds scheme investing overseas, 6 fund of fund schemes investing domestically and 269 close ended schemes. During the year under review, the Fund launched 29 fixed maturity plans, 15 capital protection oriented schemes, 3 multiple yield funds and 8 close ended equity funds.
2. OperationsandConsumerService
With a view to rendering timely and efficient customer service, the Investment Manager of the Fund, viz., ICICI Prudential Asset Management Company Ltd. (“the AMC”) has been effectively leveraging on its 147 branches including 57 functioning as official points of acceptance of transactions, as on March 31, 2016, effectively servicing the large client base. Additionally a dedicated contact center has been effective in providing investor support and redressing their grievances. The AMC’s focus has always been on technological innovation for facilitating investors’ convenience.
3. Scheme-wisecommentary
i. ICICIPrudentialAdvisorSeries
ICICI Prudential Advisor Series is an open ended asset allocation fund, which is of the nature of Fund of Funds (FOF), comprising thereunder five investment plans, which seeks to generate returns through investment in underlying schemes of onshore or offshore Mutual Fund(s).
The investments into underlying funds under each Plan of FOF would, inter alia, be governed by:
- The investment management style of such schemes (both FOF and underlying),
- The tolerance and the risk profile of such schemes (both FOF and underlying),
- The asset allocation (such as equity or debt) of such schemes (both FOF and underlying).
The Scheme has five plans as under:
a. DynamicAccrualPlan(FormerlyknownasVeryCautiousPlan)
The Plan seeks to provide reasonable returns, commensurate with low risk while providing a high level of liquidity, through investments made primarily in the schemes of domestic or offshore Mutual Fund(s) having asset allocation to:
• Moneymarketanddebtsecurities.
This Plan may be considered to be ideal for investors having a low risk appetite and a shorter duration of investment.

7
The Plan posted a return of 10.87% for FY 16, better than the benchmark comprising CRISIL Liquid Fund Index (30%) + CRISIL Composite Bond Fund Index (70%) which posted a return of 8.17% for the year.
The AAUM of the plan during the last quarter of FY 16 was `5.39 crore.
b. CautiousPlan
The Plan seeks to generate regular income primarily through investments in the schemes of domestic or offshore Mutual Fund(s) having asset allocation:
•Primarilytofixed-incomesecurities
•Toalesserextent(maximum35%)inequityandequityrelatedsecuritiessoastogeneratelongtermcapitalappreciation.
The Plan posted a return of 0.84% for FY 16. The benchmark, comprising Nifty 50 (20%) + CRISIL Composite Bond Index (60%) + CRISIL Liquid Fund Index (10%) + Gold (10%), posted a return of 5.12% for the year.
The AAUM of the plan during the last quarter of FY 16 was `2.35 crore.
c. ModeratePlan
The Plan seeks to generate long term capital appreciation and current income by creating a portfolio that is invested in the schemes of domestic or offshore Mutual Fund(s) mainly having asset allocation to:
•Equityandequityrelatedsecuritiesaswellas
•fixedincomesecurities
The Plan posted a return of -0.31% in FY 16. The benchmark comprising Nifty 50 (40%) + CRISIL Composite Bond Index (40%) + CRISIL Liquid Fund Index (10%) + Gold (10%), posted a return of 1.70% for the year.
The AAUM of the plan during the last quarter of FY 16 was `4.99 crore.
d. LongTermSavingsPlan
The Plan seeks to generate long term capital appreciation from a portfolio that is invested predominantly in the schemes of domestic or offshore Mutual Fund(s) mainly having asset allocation to:
•Equityandequityrelatedsecuritiesand
•Asmallportionindebtandmoneymarketinstruments.
The Plan posted a return of -2.26% in FY 16. The benchmark comprising of Nifty 50 (50%) + CRISIL Composite Bond Index (30%) + CRISIL Liquid Fund Index (5%) + Gold (15%), posted a return of 0.16% for the year.
The AAUM of the plan during the last quarter of FY 16 was `5.79 crore.
e. VeryAggressivePlan
The Plan seeks to generate long term capital appreciation from a portfolio that is invested predominantly in the schemes of domestic or offshore Mutual Fund(s) that actively invests in:
•Equity/equityrelatedsecurities,debt&moneymarketinstruments,GoldExchangeTradedFunds.
The Plan posted a return of 3.14% in FY 16 better than the benchmark comprising Nifty 50 (75%) + CRISIL Composite Bond Fund Index (5%) + CRISIL Liquid Fund Index (5%) + Gold (15%) posted a return of -4.11% for the year.
The AAUM of the scheme during the last quarter of FY 16 was ` 4.40 crore.
ii. ICICIPrudentialRegularGoldSavingsFund
ICICI Prudential Regular Gold Savings Fund is a fund of funds scheme with the primary objective to generate returns by investing in units of ICICI Prudential Gold Exchange Traded Fund.
The scheme posted a return of 7.11% in FY 16. The benchmark domestic prices of gold posted a return of 10.79% for the year.
The AAUM of the scheme during the last quarter of FY 16 was `60.20 crore.
iii. ICICIPrudentialGlobalStableEquityFund
ICICI Prudential Global Stable Equity Fund is an open ended fund of funds scheme that seeks to provide adequate returns by investing in the units of one or more overseas mutual fund schemes, which have the mandate to invest globally. Currently the Scheme intends to invest in the units/shares of Nordea 1 – Global Stable Equity Fund – Unhedged. The Fund manager may also invest in one or more other overseas mutual fund schemes, with similar investment policy/fundamental attributes and risk profile and is in accordance with the investment strategy of the Scheme.

8
The scheme posted a return of 9.30%in FY16 better than the 2.32% returns posted by the benchmark MSCI World – Net Return Index for the year.
The AAUM of the scheme during the last quarter of FY 16 was `78.76 crore.
II. BRIEFBACKGROUNDOFSPONSORS,TRUST,TRUSTEEANDTHEAMC
A. Sponsors
1. ICICIBankLimited
ICICI Bank is India’s largest private sector bank with total assets of ` 7,206.95 billion (US$ 109 billion) at March 31, 2016 and profit after tax Rs. 97.26 billion (US$ 1,468 million) for the year ended March 31, 2016. ICICI Bank currently has a network of 4,450 Branches and 14,082 ATM’s across India. The Bank offers a wide range of banking and financial services including commercial banking and treasury operations. ICICI Bank and their subsidiaries offers a wide range of banking and financial services including commercial banking, retail banking, project and corporate finance, working capital finance, insurance, venture capital and private equity, investment banking, broking and treasury products and services.
ICICI Bank’s international footprint consists of subsidiaries in the United Kingdom and Canada, branches in the United States, Singapore, Bahrain, Hong Kong, Sri Lanka, Dubai International Finance Centre and Qatar Financial Centre and China and representative offices in the United Arab Emirates, South Africa, Bangladesh, Thailand, Malaysia and Indonesia. The UK subsidiary of the Bank has a branch each in Belgium and Germany.
ICICI Bank’s equity shares are listed in India on BSE Limited (BSE) and National Stock Exchange of India Limited (NSE) and its American Depositary Receipts (ADRs) are listed on the New York Stock Exchange (NYSE).
2. Prudentialplc
Prudential plc and its affiliated companies constitute one of the world’s leading financial services groups, serving around 24 million insurance customers and has £509 billion of assets under management (as of 31 December 2015). Prudential plc is incorporated in England and Wales and is listed on the stock exchanges in London, Hong Kong, Singapore and New York.
Prudential plc is not affiliated in any manner with Prudential Financial, Inc, a company whose principal place of business is in the United States of America.
The Group is structured around four main business units:
PrudentialCorporationAsia
Prudential Corporation Asia has leading insurance and asset management operations across 14 markets in Asia and serves the emerging middle class families of the region‘s outperforming economies. Prudential has been operating in Asia for over 90 years and has built high performing businesses with effective multichannel distribution, a product portfolio centred on regular savings and protection, award-winning customer services and a widely recognised brand.
JacksonNationalLifeInsuranceCompany
Jackson is one of the largest life insurance companies in the US, providing retirement savings and income solutions aimed at the 75 million ‘baby-boomers’. Founded over 50 years ago, Jackson has a long and successful record of providing advisors with the products, tools and support to design effective retirement solutions for their clients.
PrudentialUK&Europe
Prudential is a long-established leading provider of life and pensions, with a relentless focus on the needs of the age cohorts where wealth is most heavily concentrated. Its core strengths in with-profits and retirement are underpinned by its expertise in areas such as longevity, risk management and multi-asset investment, together with its financial strength and highly respected brand. These attributes position Prudential UK well to meet customer needs in the UK‘s evolving market place.
M&G
M&Ghasbeeninvestingmoneyforindividualandinstitutionalclientsforover80years,andhasgrowntobeoneofEurope’slargestretailandinstitutionalfundmanagersbydevelopingitsexpertiseinactiveinvestment.M&Ghasaconvictionledandlong-termapproachtoinvestment,developingadeepunderstandingofthecompaniesandorganisationsinwhoseequities,bondsorpropertyM&Ginvests.
B. ICICIPrudentialMutualFund
ICICI Prudential Mutual Fund (“the Mutual Fund” or “the Fund”) was set up as a Trust in accordance with the provisions of the Indian Trusts Act, 1882 under a Trust Deed dated August 25, 1993 (since amended from time to time). The Fund is sponsored by Prudential plc (through its wholly owned subsidiary Prudential Corporation Holdings Ltd) and ICICI Bank Ltd. ICICI Bank Ltd. contributed ` 10 lakh and Prudential plc, with the approval of Reserve Bank of India, contributed ` 12.2 lakh to the corpus of the Fund.
C. TrusteeCompany
ICICI Prudential Trust Limited (“the Company/Trustee”) is the Trustee of the Fund (including its schemes). It was incorporated under the

9
Companies Act, 1956, in terms of a Trust Deed executed on August 25, 1993. The Trust Deed is registered under the Indian Registration Act, 1908.
The Trustee holds the Fund in trust for the benefit of the unitholders. The Trustee has been discharging its duties and carrying out the responsibilities as provided in Securities and Exchange Board of India (Mutual Fund) Regulations, 1996 (the “Regulations”) and the Trust Deed. The Trustee seeks to ensure that the Fund and the schemes floated thereunder are managed by the AMC in accordance with the Trust Deed, theRegulations,andthedirectionsandguidelinesissuedbytheSecurities&ExchangeBoardofIndia(SEBI),thestockexchangesconcerned,the Association of Mutual Funds in India and other Regulatory agencies.
1. ShareCapital
ICICI Bank Ltd. holds 51% of the share capital of the Trustee; Prudential plc, through its wholly owned subsidiary, Prudential Corporation Holdings Ltd., holds the remaining 49%.
2. BoardofDirectors
As of March 31, 2016, the Board comprised:Sr.No. NameoftheDirector Status
1. Mr. M. N. Gopinath Independent Director (Chairman)2. Mr. R.K. Nair* Independent Director3. Mr. Vinod Dhall Independent Director4. Mr. Keki Bomi Dadiseth^ Nominee Director – Prudential Corporation Holdings Limited5. Mr. Sandeep Batra Nominee Director – ICICI Bank Ltd.
* Mr. R.K. Nair has been appointed as an Independent Additional Director on the Trust Board with effect from July 05, 2015.
^ Mr.Keki Bomi Dadiseth resigned from the Trust Board with effect from April 21, 2016.
D. ICICIPrudentialAssetManagementCompanyLimited
ICICI Prudential Asset Management Company Limited (“the AMC”), a company incorporated on June 22, 1993 under the Companies Act, 1956, was registered with SEBI on October 13, 1993 to act as the Investment Manager to all the Schemes of ICICI Prudential Mutual Fund. The Trustee has entered into an Investment Management Agreement dated September 3, 1993 with the AMC to function as the Investment Manager for all the schemes of the Fund.
The AMC has been providing portfolio management services (PMS) since October 2000, with the requisite approvals/permissions from SEBI and the Trustee as envisaged under Regulation 24(b) of the Regulations. Further, the AMC is rendering Advisory Services to SEBI-registered foreign institutional investors (FIIs) and their sub-accounts. The AMC is also providing investment management services to Alternative Investment Funds registered under SEBI (Alternative Investment Funds) Regulations, 2012. These activities are not in conflict with the activities of the Mutual Fund. In the situations of unavoidable conflicts of interest, the AMC undertakes that it shall satisfy itself that adequate disclosures are made of sources of conflict, potential ‘material risk or damage’ to investor interest and develop parameters for the same.
The AMC has secured a leading position in the Indian mutual fund industry with quarterly AAUM of ` 1,75,963.98 crore for the quarter ended March 31, 2016. The AMC manages a comprehensive range of Schemes to meet the varying investment needs of its investors spread across various cities through 270 Official Points of Transactions (including 213 branches operated through the Registrar of the Mutual Fund) in the country as on March 31, 2016.
1. ShareCapital
ICICI Bank Ltd. holds 51% of the share capital of the AMC; Prudential plc, through its wholly owned subsidiary, Prudential Corporation Holdings Ltd., holds the remaining 49%.
2. BoardofDirectors
As on March 31, 2016, the Board comprised:Sr.No. NameoftheDirector Status
1. Ms. Chanda Kochhar Nominee Director – ICICI Bank Ltd. (Chairperson)2. Mr. Guy Robert Strapp* Nominee Director – Prudential Corporation Holdings Limited3. Mr. N. S. Kannan Nominee Director – ICICI Bank Ltd.4. Mr. Vijay Thacker Independent Director5. Mr. C. R. Muralidharan Independent Director6. Mr. Suresh Kumar Independent Director7. Ms. Lakshmi Venkatachalam** Independent Additional Director8. Mr. Nimesh Shah Managing Director
** Ms. Lakshmi Venkatachalam has been appointed as an Independent Additional Director on the Board of the AMC with effect from September 22, 2015.
* Mr. Guy Strapp has been appointed as a Nominee Director on the Board of the AMC with effect from July 29, 2015. - Mr. Sankaran Naren has been appointed as an Executive Director on the Board of the AMC with effect from April 22, 2016.
- Mr. Ved Prakash Chaturvedi has been appointed as an Additional Independent Director on the Board of the AMC with effect from July 14, 2016.

10
III.INVESTMENTOBJECTIVESOFTHESCHEMES
• ICICIPrudentialAdvisorSeries
ICICI Prudential Advisor Series is an Open ended asset allocation fund, which is of the nature of Fund of Funds, comprising thereunder five investment Plans, with a primary objective to generate returns through investment in underlying schemes of onshore or offshore Mutual Fund(s). The investments into underlying funds under each Plan of FOF would, inter alia, be governed by:
- The investment management style of such schemes (both FOF and underlying),
- The tolerance and the risk profile of such schemes (both FOF and underlying),
- The asset allocation (such as equity or debt) of such schemes (both FOF and underlying).
The Scheme has Five Plans to offer as under:
• DynamicAccrualPlan(FormerlyknownasVeryCautiousPlan)
The primary investment objective of this Plan is to seek to provide reasonable returns, commensurate with low risk while providing a high level of liquidity, through investments made primarily in the schemes of domestic or offshore Mutual Fund(s) having asset allocation to:
• Moneymarketanddebtsecurities.
This Plan may be considered to be ideal for investor’s having a low risk appetite and a shorter duration of investment.
However, there can be no assurance that the investment objectives of the Plan/s will be realized.
• CautiousPlan
The primary investment objective of this Plan is to seek to generate regular income primarily through investments in the schemes of domestic or offshore Mutual Fund(s) having asset allocation:
• Primarilytofixedincomesecurities
• Toalesserextent(maximum35%)inequityandequityrelatedsecuritiessoastogeneratelong-termcapitalappreciation.
However, there can be no assurance that the investment objectives of the Plan/s will be realized.
• ModeratePlan
The primary investment objective of this Plan is to seek to generate long term capital appreciation and current income by creating a portfolio that is invested in the schemes of domestic or offshore Mutual Fund(s) mainly having asset allocation to:
• Equityandequityrelatedsecuritiesaswellas
• fixedincomesecurities
However, there can be no assurance that the investment objectives of the Plan/s will be realized.
• LongTermSavingsPlan
The primary investment objective of this Plan is to seek to generate long term capital appreciation from a portfolio that is invested predominantly in the schemes of domestic or offshore Mutual Fund(s) mainly having asset allocation to:
• Equityandequityrelatedsecuritiesand
• Asmallportionindebtandmoneymarketinstruments.
However, there can be no assurance that the investment objective of the Scheme will be realized.
• VeryAggressivePlan
The primary investment objective of this Plan is to seek to generate long term capital appreciation from a portfolio that is invested predominantly in the schemes of domestic or offshore Mutual Fund(s) that actively invests in
• Equity/equityrelatedsecurities,debt&moneymarketinstruments,GoldExchangeTradedFunds
This Plan is suitable for investor’s seeking higher returns and having appetite for higher investments risks and market fluctuations.
However, there can be no assurance that the investment objective of the Scheme will be realized.
• ICICIPrudentialGlobalStableEquityFund
ICICI Prudential Global Stable Equity Fund (the Scheme) is an open-ended fund of funds scheme that seeks to provide adequate returns by investing in the units of one or more overseas mutual fund schemes, which have the mandate to invest globally. Currently the Scheme intends to invest in the units/shares of Nordea 1 – Global Stable Equity Fund – Unhedged (N1 – GSEF - U). The fund manager may also invest in one or more other overseas mutual fund schemes, with similar investment policy/fundamental attributes and risk profile and is in accordance with the investment strategy of the Scheme.

11
The Scheme may also invest a certain portion of its corpus in domestic money market securities and/or money market/liquid schemes of domestic mutual funds including that of ICICI Prudential Mutual Fund, in order to meet liquidity requirements from time to time.
However, there can be no assurance that the investment objective of the Scheme will be realized.
• ICICIPrudentialRegularGoldSavingsFund
ICICI Prudential Regular Gold Savings Fund (the Scheme) is a fund of funds scheme with the primary objective to generate returns by investing in units of ICICI Prudential Gold Exchange Traded Fund (IPru Gold ETF).
The investments into underlying funds under the Scheme would, inter alia, be governed by:
- The investment management style of such scheme
- The tolerance and the risk profile of such schemes
- The asset allocation (such as equity or debt) of such Schemes
However, there can be no assurance that the investment objective of the Scheme will be realized.
IV.SIGNIFICANTACCOUNTING/VALUATIONPOLICIES
Accounting policies are in accordance with Securities and Exchange Board of India (Mutual Fund) Regulations, 1996. The changes in the accounting/valuation policies, if any, are stated in the notes to the financial statements of the respective scheme.
V. UNCLAIMEDDIVIDENDANDREDEMPTION
Details of unclaimed dividends and redemptions under the various schemes are given below:
UnclaimeddividendandredemptiondatafortheyearendedMarch31,2016
Unclaimed Dividend/ Redemption normally represent the time lag between funding of the respective accounts (with bank) by the AMC and the time taken for presentation of redemption/ dividend warrant by the investors. Unclaimed Dividend/Redemption amount in respect of Schemes/ Plans as on March 31, 2016, is as follows:SchemeName Dividend Redemption
Amount(Rs.) Count Amount(Rs.) Count
ICICI Prudential Global Stable Equity Fund 0.00 0 954.41 2
ICICI Prudential ADVISOR SERIES - CAUTIOUS PLAN 0.00 0 11,936.95 3
ICICI Prudential ADVISOR SERIES - DYNAMIC ACCRUAL PLAN 0.00 0 38,925.38 2
ICICI Prudential ADVISOR SERIES - LONG TERM SAVINGS PLAN 0.00 0 141,210.10 6
ICICI Prudential ADVISOR SERIES - MODERATE PLAN 0.00 0 68,391.19 5
ICICI Prudential ADVISOR SERIES - VERY AGGRESSIVE PLAN 0.00 0 138,024.00 7
ICICI Prudential REGULAR GOLD SAVINGS FUND 0.00 0 514,544.81 37
VI.DISCLOSUREOFINVESTORCOMPLAINTS
The disclosure regarding investors’ complaints is given below:
RedressalofComplaintsreceivedagainsttheMutualFundfortheFinancialYearendedMarch31,2016
NameoftheMutualFund–ICICIPrudentialMutualFund
TotalNumberofFolios:40,50,544
ComplaintCode
TypeofComplaint#
(a)No.ofcomplaintspendingatthebeginningoftheYear
(b)No.ofComplaintsreceivedduringtheyear
Actionon(a)and(b)Resolved Non
ActionablePending
Within30days
30-60days
60-180 days
Beyond180days
0-3months
3-6months
6-9 months
9-12 months
I A Non receipt of Dividend on Units
2 21 23 0 0 0 0 0 0 0 0
I B Interest on delayed payment of Dividend
0 2 2 0 0 0 0 0 0 0 0
I C Non receipt of Redemption Proceeds
3 23 26 0 0 0 0 0 0 0 0
I D Interest on delayed payment of Redemption
0 1 1 0 0 0 0 0 0 0 0

12
ComplaintCode
TypeofComplaint#
(a)No.ofcomplaintspendingatthebeginningoftheYear
(b)No.ofComplaintsreceivedduringtheyear
Actionon(a)and(b)Resolved Non
ActionablePending
Within30days
30-60days
60-180 days
Beyond180days
0-3months
3-6months
6-9 months
9-12 months
II A Non receipt of Statement of Account/Unit Certificate
0 0 0 0 0 0 0 0 0 0 0
II B Discrepancy in Statement of Account
17 3502 3480 0 0 0 0 39 0 0 0
II C Data corrections in Investor details
0 77 77 0 0 0 0 0 0 0 0
II D Non receipt of Annual Report/Abridged Summary
0 0 0 0 0 0 0 0 0 0 0
III A Wrong switch between Schemes
1 86 87 0 0 0 0 0 0 0 0
III B Unauthorized switch between Schemes
0 5 4 1 0 0 0 0 0 0 0
III C Deviation from Scheme attributes
0 0 0 0 0 0 0 0 0 0 0
III D Wrong or excess charges/load
0 3 3 0 0 0 0 0 0 0 0
III E Non updation of changes viz. address, PAN, bank details, nomination, etc
5 686 686 0 0 0 0 5 0 0 0
IV Others* 3 158 159 0 0 0 0 2 0 0 0Total 31 4564 4548 1 0 0 0 46 0 0 0
* If others include a type of complaint which is more than 10% of overall complaint, provide that reason separately.
Example : Complaint number from I A to III E is 1000 and Others alone is 500 and transmission linked complaints (within others) are 200 then provide Transmission as separate reason (V) along with all other parameters
# including against its authorized persons/ distributors/ employees. etc.
Non actionable means the complaint that are incomplete / outside the scope of the mutual fund.
VII.CORPORATEGOVERNANCE
Pursuant to SEBI circular no. SEBI/IMD/CIR no. 18/198647/2010 dated March 15, 2010 and subsequent clarifications/circulars issued by SEBI, the Fund has formulated a policy for exercise of voting rights by the AMC in investee companies (i.e. companies in whose securities schemes of the Fund have invested).
The AMC has disclosed the Voting Policy and the votes exercised during FY 16 on a quarterly and annual basis alongwith Auditors certification on website of the AMC, viz. www.icicipruamc.com.
VIII.STATUTORYINFORMATION
A. The Sponsors are not responsible or liable for any loss resulting from the operation of the schemes of the Fund beyond their initial contribution of ` 22.2 lakh for setting up the Fund and accretions/additions thereto.
B. The price and redemption value of the units, and income from them, can go up as well as down with fluctuations in the market values of the underlying investments.
C. The full Annual Report shall be put on the website (www.icicipruamc.com) and shall be available for inspection at the Central Service Office of the AMC. An existing or a prospective unitholder can contact the Central Service Office of the AMC to obtain a copy of the trust deed and the full Annual Report of the Fund/ AMC. The AMC/ Fund reserve the right to charge fees for providing copies of these documents.
IX.RISKMANAGEMENTSYSTEM
As mandated by a SEBI circular dated September 30, 2002, and in line with the policies of the sponsors of the Fund, the AMC has adopted a full-fledged risk-management framework. In the opinion of the Trustee, on the basis of the data presented by the AMC and reviewed at meetings of its Board of Directors, the system serves its objectives adequately.

13
X. LIABILITYANDRESPONSIBILITYOFTHETRUSTEEANDTHESPONSORS
The Trustee’s primary responsibility is to safeguard the interests of the unitholders and, inter alia, ensure that the AMC functions in the interests of investors and in accordance with the Regulations, the provisions of the Trust Deed, and the Scheme Information Documents of the Schemes of the Fund. From the information provided to the Trustee by the AMC and discussions with AMC officials at meetings of its Board and Committee, and reviews by the Trustee through its Board of Directors at such meetings, the Trustee is of the opinion that the AMC has operated in the interests of the unitholders and functioned in compliance with the Regulations.
XI.ACKNOWLEDGEMENT
The Trustee expresses its gratitude to the unitholders for their continued support, to SEBI, RBI, AMFI, the registrars, bankers, the custodians of the Fund, the stock exchanges where the units of various Schemes are listed, ICICI Bank and Prudential plc. and the management and employees of the AMC for their continued support and assistance during the year.
ForandonbehalfofICICIPrudentialTrustLtd.
Place: Mumbai
Date: July 22, 2016 Sd/-
M.N.GopinathChairman

14
ICICIPrudentialMutualFundAddress: 2nd Floor, Block B-2, Nirlon Knowledge Park, Western Express Highway, Goregaon, Mumbai – 400063
AbridgedBalanceSheetasatMarch31,2016(figuresasperAuditedFinancials)(As per format prescribed for Abridged schemewise Annual Report- SEBI/IMD/CIR No.8/132968/2008 dt 24/07/08) (` in Lakhs)
ICICIPrudentialAdvisorseriesLongTermSavingsPlan
ICICIPrudentialAdvisorseries-CautiousPlan
ICICIPrudentialGlobalStableEquityFund
Asat31-Mar-2016
Asat31-Mar-2015
Asat31-Mar-2016
Asat31-Mar-2015
Asat31-Mar-2016
Asat31-Mar-2015
LIABILITIES
1 UnitCapital 124.66 155.33 86.91 103.77 6,659.71 5,832.22
2 Reserves&Surplus
2.1 Unit Premium Reserve 1.61 34.93 (4.30) 6.24 (58.02) (142.21)
2.2 Unrealised Appreciation Reserve 141.37 190.81 56.24 63.93 1,213.08 214.80
2.3 Other Reserves 313.24 359.19 99.14 107.75 625.27 851.86
3 Loans&Borrowings - - - - - -
4 CurrentLiabilities&Provisions
4.1 Provision for doubtful Income / Deposits - - - - - -
4.2 OtherCurrentLiabilities&Provisions 12.07 6.72 4.82 5.23 87.17 109.17
TOTAL 592.95 746.98 242.81 286.92 8,527.21 6,865.84
ASSETS
1 Investments
1.1 ListedSecurities:
1.1.1.a Equity Shares - - - - - -
1.1.1.b Indian Depository Receipts - - - - - -
1.1.1.c Warrants - - - - - -
1.1.2 Preference Shares - - - - - -
1.1.3 Equity Linked Debentures - - - - - -
1.1.4 OtherDebentures&Bonds - - - - - -
1.1.5 Securitised Debt Securities - - - - - -
1.2 SecuritiesAwaitedListing:
1.2.1 Equity Shares - - - - - -
1.2.2 Preference Shares - - - - - -
1.2.3 Equity Linked Debentures - - - - - -
1.2.4 OtherDebentures&Bonds - - - - - -
1.2.5 Securitised Debt Securities - - - - - -
1.3 UnlistedSecurities:
1.3.1 Equity Shares - - - - - -
1.3.2 Preference Shares - - - - - -
1.3.3 Equity Linked Debentures - - - - - -
1.3.4 OtherDebentures&Bonds - - - - - -
1.3.5 Securitised Debt Securities - - - - - -
1.4 GovernmentSecurities - - - - - -
1.5 TreasuryBills - - - - - -
1.6 CommercialPapers - - - - - -
1.7 CertificateofDeposits - - - - - -
1.8 BillRediscounting - - - - - -
1.9 UnitsofDomesticMutualFund 583.73 734.86 234.19 274.57 - -
1.10 ForeignSecurities - - - - 8,270.06 6,649.63
1.11 Gold - - - - - -
TotalInvestments 583.73 734.86 234.19 274.57 8,270.06 6,649.63
2 Deposits - - - - 0.01 -
3 OtherCurrentAssets
3.1 Cash&BankBalance 6.38 6.43 1.85 2.94 0.51 0.88
3.2 CBLO / Reverse Repo Lending 2.15 5.68 6.49 7.99 246.24 207.75
3.3 Others 0.69 0.01 0.28 1.42 10.39 7.58
4 DeferredRevenueExpenditure(TotheExtentnotwrittenoff)
- - - - - -
TOTAL 592.95 746.98 242.81 286.92 8,527.21 6,865.84FundManager MrinalSingh MrinalSingh ShalyaShah&RohanMaru
Annexure I- Notes to Accounts
Figures Less than ` 500 are shown as zero

15
ICICIPrudentialMutualFundAddress: 2nd Floor, Block B-2, Nirlon Knowledge Park, Western Express Highway, Goregaon, Mumbai – 400063
AbridgedBalanceSheetasatMarch31,2016(figuresasperAuditedFinancials)(As per format prescribed for Abridged schemewise Annual Report- SEBI/IMD/CIR No.8/132968/2008 dt 24/07/08) (` in Lakhs)
ICICIPrudentialAdvisorseries-ModeratePlan
ICICIPrudentialRegularGoldSavingsFund
ICICIPrudentialAdvisorseries-VeryAggressive
Plan
ICICIPrudentialAdvisorSeries-DynamicAccrualPlan(FormerlyICICIPrudentialAdvisorseries
-VeryCautiousPlan)Asat
31-Mar-2016Asat
31-Mar-2015Asat
31-Mar-2016Asat
31-Mar-2015Asat
31-Mar-2016Asat
31-Mar-2015Asat
31-Mar-2016Asat
31-Mar-2015
LIABILITIES
1 UnitCapital 131.92 141.03 6,002.90 6,690.10 85.70 91.68 206.48 39.89
2 Reserves&Surplus
2.1 Unit Premium Reserve 57.42 67.86 296.69 298.22 1.72 7.77 (137.81) (25.90)
2.2 Unrealised Appreciation Reserve 113.54 127.07 - - 89.02 89.23 20.03 10.14
2.3 Other Reserves 202.08 205.31 (321.12) (770.59) 274.74 279.24 393.62 59.73
3 Loans&Borrowings - - - - - - - -
4 CurrentLiabilities&Provisions
4.1 Provision for doubtful Income / Deposits - - - - - - - -
4.2 OtherCurrentLiabilities&Provisions 12.26 7.53 53.83 95.36 4.82 6.32 4.75 8.01
TOTAL 517.22 548.80 6,032.30 6,313.09 456.00 474.24 487.07 91.87
ASSETS
1 Investments
1.1 ListedSecurities:
1.1.1.a Equity Shares - - - - - - - -
1.1.1.b Indian Depository Receipts - - - - - - - -
1.1.1.c Warrants - - - - - - - -
1.1.2 Preference Shares - - - - - - - -
1.1.3 Equity Linked Debentures - - - - - - - -
1.1.4 OtherDebentures&Bonds - - - - - - - -
1.1.5 Securitised Debt Securities - - - - - - - -
1.2 SecuritiesAwaitedListing:
1.2.1 Equity Shares - - - - - - - -
1.2.2 Preference Shares - - - - - - - -
1.2.3 Equity Linked Debentures - - - - - - - -
1.2.4 OtherDebentures&Bonds - - - - - - - -
1.2.5 Securitised Debt Securities - - - - - - - -
1.3 UnlistedSecurities:
1.3.1 Equity Shares - - - - - - - -
1.3.2 Preference Shares - - - - - - - -
1.3.3 Equity Linked Debentures - - - - - - - -
1.3.4 OtherDebentures&Bonds - - - - - - - -
1.3.5 Securitised Debt Securities - - - - - - - -
1.4 GovernmentSecurities - - - - - - - -
1.5 TreasuryBills - - - - - - - -
1.6 CommercialPapers - - - - - - - -
1.7 CertificateofDeposits - - - - - - - -
1.8 BillRediscounting - - - - - - - -
1.9 UnitsofDomesticMutualFund 508.88 537.52 5,941.71 6,196.19 449.27 464.96 468.05 80.98
1.10 ForeignSecurities - - - - - - - -
1.11 Gold - - - - - - - -
TotalInvestments 508.88 537.52 5,941.71 6,196.19 449.27 464.96 468.05 80.98
2 Deposits - - - - - - - -
3 OtherCurrentAssets
3.1 Cash&BankBalance 5.85 6.20 6.37 9.50 5.31 5.89 8.09 8.28
3.2 CBLO / Reverse Repo Lending 2.14 4.60 82.23 104.91 1.11 3.38 9.81 2.29
3.3 Others 0.35 0.48 1.99 2.49 0.31 0.01 1.12 0.32
4 DeferredRevenueExpenditure(TotheExtentnotwrittenoff)
- - - - - - - -
TOTAL 517.22 548.80 6,032.30 6,313.09 456.00 474.24 487.07 91.87
FundManager MrinalSingh ManishBanthia MrinalSingh MrinalSingh
Annexure I- Notes to Accounts
Figures Less than ` 500 are shown as zero

16
ICICIPrudentialMutualFundAddress: 2nd Floor, Block B-2, Nirlon Knowledge Park, Western Express Highway, Goregaon, Mumbai – 400063
AbridgedRevenueAccountfortheyear/periodendedMarch31,2016(figuresasperAuditedFinancials)(As per format prescribed for Abridged schemewise Annual Report- SEBI/IMD/CIR No.8/132968/2008 dt 24/07/08) (` in Lakhs)
ICICIPrudentialAdvisorseriesLongTermSavingsPlan
ICICIPrudentialAdvisorseries-CautiousPlan
ICICIPrudentialGlobalStable EquityFund
YearEnded YearEnded YearEnded
31-Mar-2016 31-Mar-2015 31-Mar-2016 31-Mar-2015 31-Mar-2016 31-Mar-2015
1 INCOME
1.1 Dividend - - - - - -
1.2 Interest 0.29 1.41 0.52 0.75 14.97 15.86
1.3 Realised Gains /(Losses) on Foreign Exchange Transactions
- - - - 365.51 320.54
1.4 Realised Gains /(Losses) on Interscheme sale of Investments
- - - - - -
1.5 Realised Gains /(Losses) on External Sale/Redemption of Investments
35.91 40.67 10.80 8.76 22.74 1,250.21
1.6 Realised Gains /(Losses) on Derivative Transactions
- - - - - -
1.7 Other Income 1.32 0.30 0.25 0.03 2.05 44.53
(A) 37.52 42.38 11.57 9.54 405.27 1,631.14
2 EXPENSES&LOSSES(Note7)
2.1 Interest on Borrowing - - - - - -
2.2 Management Fees 0.93 - 0.45 - 79.01 73.70
2.3 Service Tax on Management Fees 0.13 - 0.07 - 11.17 9.11
2.4 TransferAgent'sFees&Expenses 0.18 0.32 0.01 0.02 2.61 4.01
2.5 Custodian Fees 0.01 0.02 - - - -
2.6 Trusteeship Fees - - - - 0.02 0.04
2.7 Commission to Agents 2.56 3.46 0.89 1.81 50.53 51.69
2.8 Marketing&DistributionExpenses - 0.02 - 0.02 0.21 0.95
2.9 Audit Fees 0.11 0.09 0.11 0.04 0.12 0.13
2.10 Other Operating Expenses 1.04 1.31 0.38 0.14 4.51 5.98
2.11 Deferred Revenue Expenses Written Off - - - - - -
(B) 4.96 5.22 1.91 2.03 148.18 145.61
3 NetRealisedGains/(Losses)fortheYear/Period(A-B=C)
32.56 37.16 9.66 7.51 257.09 1,485.53
4 Change in Unrealised Depreciation in value of Investments (D)
49.44 - 7.69 - - 526.43
5 NetGains/(Losses)fortheYear/Period(E=C-D)
(16.88) 37.16 1.97 7.51 257.09 959.10
6 Change in Unrealised Appreciation in value of Investments (F)
- 105.16 - 38.10 451.35 -
7 NetSurplus/(Deficit)fortheyear/period(G=E+F)
(16.88) 142.32 1.97 45.61 708.44 959.10
7.1 Add: Balance Transfer from Unrealised Appreciation Reserve
190.81 85.65 63.93 25.82 214.80 741.23
7.2 Less: Balance Transfer to Unrealised Appreciation Reserve
141.37 190.81 56.24 63.93 1,213.08 214.80
7.3 Add/(Less) : Equalisation (78.51) (45.15) (18.27) (11.45) 63.25 (153.27)
7.4 Surplus/(Deficit) brought forward 359.19 367.18 107.75 111.70 851.86 (480.40)
8 Total 313.24 359.19 99.14 107.75 625.27 851.86
9 DividendAppropriation
9.1 Income Distributed during the year/period - - - - - -
9.2 Tax on Income distributed during the year/period
- - - - - -
10 RetainedSurplus/(Deficit)CarriedforwardtoBalanceSheet
313.24 359.19 99.14 107.75 625.27 851.86
FundManager MrinalSingh MrinalSingh ShalyaShah&RohanMaru
Annexure I- Notes to Accounts
Figures Less than ` 500 are shown as zero

17
ICICIPrudentialMutualFundAddress: 2nd Floor, Block B-2, Nirlon Knowledge Park, Western Express Highway, Goregaon, Mumbai – 400063
AbridgedRevenueAccountfortheyear/periodendedMarch31,2016(figuresasperAuditedFinancials)(As per format prescribed for Abridged schemewise Annual Report- SEBI/IMD/CIR No.8/132968/2008 dt 24/07/08) (` in Lakhs)
ICICIPrudentialAdvisorseries-ModeratePlan
ICICIPrudentialRegularGoldSavingsFund
ICICIPrudentialAdvisorseries-VeryAggressivePlan
ICICIPrudentialAdvisorSeries-DynamicAccrualPlan(FormerlyICICI
PrudentialAdvisorseries-VeryCautiousPlan)
YearEnded YearEnded YearEnded YearEnded
31-Mar-2016 31-Mar-2015 31-Mar-2016 31-Mar-2015 31-Mar-2016 31-Mar-2015 31-Mar-2016 31-Mar-2015
1 INCOME
1.1 Dividend - - - - - - - -
1.2 Interest 0.26 1.07 5.79 7.88 0.18 0.89 0.36 0.30
1.3 Realised Gains /(Losses) on Foreign Exchange Transactions
- - - - - - - -
1.4 Realised Gains /(Losses) on Interscheme sale of Investments
- - - - - - - -
1.5 Realised Gains /(Losses) on External Sale/Redemption of Investments
14.38 31.03 (59.44) (166.71) 16.01 55.30 16.34 4.18
1.6 Realised Gains /(Losses) on Derivative Transactions
- - - - - - - -
1.7 Other Income 0.94 0.41 18.40 31.87 1.25 0.01 3.59 0.24
(A) 15.58 32.51 (35.25) (126.96) 17.44 56.20 20.29 4.72
2 EXPENSES&LOSSES(Note7)
2.1 Interest on Borrowing - - - - - - - -
2.2 Management Fees 1.13 - 4.28 - 0.68 - 0.11 0.05
2.3 Service Tax on Management Fees 0.16 - 0.62 - 0.10 - 0.02 0.01
2.4 TransferAgent'sFees&Expenses 0.10 0.03 4.94 11.18 0.12 0.18 0.13 0.03
2.5 Custodian Fees - 0.01 0.40 0.67 - 0.01 - -
2.6 Trusteeship Fees - - 0.02 0.03 - - - -
2.7 Commission to Agents 1.71 3.39 11.37 10.91 1.67 2.33 0.77 0.23
2.8 Marketing&DistributionExpenses - 0.02 0.75 2.22 - 0.09 - 0.02
2.9 Audit Fees 0.11 0.08 0.12 0.14 0.11 0.09 0.11 0.02
2.10 Other Operating Expenses 0.58 0.33 7.04 12.05 0.69 0.79 0.98 0.29
2.11 Deferred Revenue Expenses Written Off - - - - - - - -
(B) 3.79 3.86 29.54 37.20 3.37 3.49 2.12 0.65
3 NetRealisedGains/(Losses)fortheYear/Period(A-B=C)
11.79 28.65 (64.79) (164.16) 14.07 52.71 18.17 4.07
4 Change in Unrealised Depreciation in value of Investments (D)
13.53 - - 735.34 0.21 - - -
5 NetGains/(Losses)fortheYear/Period(E=C-D)
(1.74) 28.65 (64.79) (899.50) 13.86 52.71 18.17 4.07
6 Change in Unrealised Appreciation in value of Investments (F)
- 70.18 486.26 - - 12.26 9.88 6.70
7 NetSurplus/(Deficit)fortheyear/period(G=E+F)
(1.74) 98.83 421.47 (899.50) 13.86 64.97 28.05 10.77
7.1 Add: Balance Transfer from Unrealised Appreciation Reserve
127.07 56.90 - - 89.23 76.97 10.14 3.44
7.2 Less: Balance Transfer to Unrealised Appreciation Reserve
113.54 127.07 - - 89.02 89.23 20.03 10.14
7.3 Add/(Less) : Equalisation (15.02) (29.09) 28.00 51.60 (18.57) (42.66) 315.72 (0.51)
7.4 Surplus/(Deficit) brought forward 205.31 205.74 (770.59) 77.31 279.24 269.19 59.74 56.17
8 Total 202.08 205.31 (321.12) (770.59) 274.74 279.24 393.62 59.73
9 DividendAppropriation
9.1 Income Distributed during the year/period - - - - - - - -
9.2 Tax on Income distributed during the year/period
- - - - - - - -
10 RetainedSurplus/(Deficit)CarriedforwardtoBalanceSheet
202.08 205.31 (321.12) (770.59) 274.74 279.24 393.62 59.73
FundManager MrinalSingh ManishBanthia MrinalSingh MrinalSingh
Annexure I- Notes to Accounts
Figures Less than ` 500 are shown as zero

18
ICICI Prudential Mutual FundAddress: 2nd Floor, Block B-2, Nirlon Knowledge Park, Western Express Highway, Goregaon, Mumbai – 400063
Notes to Accounts – Annexure I to the Abridged Balance Sheet and Revenue Account for the Year ended March 31, 2016 for the following schemes:
Scheme Code Scheme Name
AGGRES ICICI Prudential Advisor Series Long Term Savings Plan
CAUT ICICI Prudential Advisor Series - Cautious Plan
GLOBALS ICICI Prudential Global Stable Equity Fund
MODER ICICI Prudential Advisor Series - Moderate Plan
REGGOLD ICICI Prudential Regular Gold Savings Fund
VERAGG ICICI Prudential Advisor Series - Very Aggressive Plan
VERCAU ICICI Prudential Advisor Series - Dynamic Accrual Plan (For-merly ICICI Prudential Advisor Series - Very Cautious Plan)
1 Investments
1.1 All investments of the scheme except Government Securities and Treasury Bills are registered in the name of the Trustees for the benefits of the Schemes Unitholders. All invest-ments in Government Securities and Treasury Bills are held in an SGL account in the name of “ICICI Prudential Mutual Fund”.
1.2 Open Positions of derivatives - Nil (Previous Year - Nil) Disclosure as required under SEBI Circular -Cir/ IMD/ DF/ 11/ 2010 dated August 18, 2010 – Nil (Previous year - Nil)
1.3 Investments made by schemes in Sponsor/Associates/Group Companies: Nil (Previous year - Nil) (` in Lakhs)
Name of Sponsor/ Associate/Group Company
Nature of Investment 2015-2016 2014-2015
Aggregate Market Value of Investment by all Schemes
Aggregate Market Value of Investment by all Schemes
Asian Paints Ltd $ Equity Shares - 389.35
Blue Star Ltd $ Commercial Papers - 7,440.13
Equity Shares - 7,870.23
Brigade Enterprises Limited $ Equity Shares 422.95 -
City Union Bank Ltd $ Equity Shares 9,120.41 18,219.62
Eastspring Investment Asian Equity Fund Overseas Mutual Fund Units 1,516.27 3,695.20
GMR Infrastructure Ltd - RIGHTS $ Equity Shares - 323.54
GMR Infrastructure Ltd $ Equity Shares 11,518.41 15,682.62
ICICI Bank Limited Equity Shares 270,769.36 244,387.98
Term Depostis - 58,608.18
Term Depostis Derivatives 82,108.18 -
ICICI Home Finance Company Limited Debentures and Bonds 34,969.80 160.32
Zero Coupon Debentures. 2,626.42 -
Sterling Holiday Resorts (India) Limited $ Equity Shares - 14,890.87
Thomas Cook (India) Ltd $ Debentures and Bonds - 10,143.19
Equity Shares - 678.11
Wipro Ltd $ Equity Shares - 128,480.28
The above investments are in normal course and are in accordance with the investment objective of relevant scheme.$ The disclosure has been made as director (s) of the AMC is/ are also on the board of the aforesaid companies.
1.4 Subscription by scheme (excluding Secondary Market Purchases) in the issues lead managed by the associate company during 2015-16 : Nil (Previous year - Nil)
1.5 Subscription to any issue of equity or debt on private placement basis where the sponsor or its associate companies have acted as arranger or manager during 2015-16 : Nil (Previous year - Nil)
1.6 Open Position of securities borrowed : Nil (Previous Year - Nil) Open Position of securities lend : Nil (Previous Year - Nil)
1.7 Details of NPA
Aggregate market value : Nil (Previous Year - Nil) Provision thereof Nil (Previous Year - Nil)
1.8 Aggregate Unrealised Gain / Loss as at the end of the Financial Year and percentage to net assets: (` in Lakhs)
Scheme 2015-16 2014-15
Unrealised Gain / (Loss) % of Net Assets Unrealised Gain / (Loss) % of Net Assets
AGGRES 141.37 24.34% 190.81 25.78%
CAUT 56.24 23.63% 63.93 22.69%
GLOBALS 1,213.08 14.37% 214.80 3.18%
MODER 113.54 22.49% 127.07 23.48%
REGGOLD (370.45) -6.20% (856.71) -13.78%
VERAGG 89.02 19.73% 89.23 19.07%
VERCAU 20.03 4.15% 10.14 12.09%

19
1.9 Aggregate Value of Purchase and Sale with Percentage to average assets : (` in Lakhs)
Scheme 2015-16 2014-15
AverageNetAssets
Purchases %toAverageNetAssets
Sales %toAverageNetAssets
AverageNetAssets
Purchases %toAverageNetAssets
Sales %toAverageNetAssets
OtherthanEquitySecurities
AGGRES 680.15 1,016.31 149.43% 1,157.73 170.22% 706.06 4,478.17 634.25% 4,570.85 647.37%
CAUT 257.87 1,773.20 687.63% 1,818.72 705.28% 272.02 2,279.78 838.09% 2,311.69 849.82%
GLOBALS 7,287.00 53,273.33 731.07% 52,472.46 720.08% 8,261.11 55,634.25 673.45% 59,695.89 722.61%
MODER 522.91 906.96 173.45% 939.18 179.61% 525.99 3,365.22 639.79% 3,431.41 652.38%
REGGOLD 6,042.18 19,433.89 321.64% 20,144.03 333.39% 7,514.61 23,247.29 309.36% 25,463.12 338.85%
VERAGG 452.64 661.47 146.14% 695.42 153.64% 465.59 2,968.57 637.60% 3,043.05 653.59%
VERCAU 332.63 1,980.30 595.35% 1,612.27 484.71% 91.91 983.34 1069.92% 984.92 1071.64%
Other than equity securities includes Units of Mutual Fund, debt and money market including CBLO and Fixed Deposits.
1.10 Non-Traded securities in the portfolio: (` in Lakhs)
Scheme Particulars AsatMarch31,2016 AsatMarch31,2015
Amount %ofNetAssetsValue
Amount %ofNetAssetsValue
AGGRES Aggregate value of non traded Units of Mutual Fund 583.73 100.49% 734.86 99.27%
CAUT Aggregate value of non traded Units of Mutual Fund 234.19 98.40% 274.57 97.47%
GLOBALS Aggregate value of non traded Units of Overseas Mutual Fund Units 8,270.06 97.99% 6,649.63 98.42%
MODER Aggregate value of non traded Units of Mutual Fund 508.88 100.78% 537.52 99.31%
REGGOLD Aggregate value of non traded Units of Mutual Fund 5,941.71 99.39% 6,196.19 99.65%
VERAGG Aggregate value of non traded Units of Mutual Fund 449.27 99.58% 464.96 99.37%
VERCAU Aggregate value of non traded Units of Mutual Fund 468.05 97.04% 80.98 96.55%
2 DetailsofTransactionwithAssociatesunderregulation25(8).
Commission paid to associates/related parties/group companies of Sponsor/AMC
NameofAssociate/related
parties/groupcompaniesofSponsor/AMC
NatureofAssociation/Nature
ofrelation
Scheme 2015-16 2014-15
ValueofBusinessgiven
(`inLakhs)
%oftotalvalueofbusinessreceivedbythescheme
Commission(`inLakhs)
%ofthetotal
commissionpaidbythescheme
ValueofBusinessgiven
(`inLakhs)
%oftotalvalueofbusinessreceivedbythescheme
Commission(`inLakhs)
%ofthetotal
commissionpaidbythescheme
ICICI Bank Limited
Sponsor AGGRES 9.07 13.15% 0.28 10.20% 2.22 4.18% 0.27 8.11%
CAUT 0.20 2.37% 0.09 9.95% 0.12 1.39% 0.11 9.30%
GLOBALS 43.74 1.60% 5.17 11.43% 528.61 33.84% - -
MODER 0.77 5.16% 0.18 9.74% 0.06 0.12% 0.18 7.56%
REGGOLD 385.78 25.51% 8.16 39.07% 954.84 34.63% 11.41 37.54%
VERAGG - - 0.21 11.60% - - 0.19 9.16%
VERCAU 10.97 1.20% 0.02 2.48% - - 0.01 3.27%
ICICI Securi-ties Limited
Group Company AGGRES 11.84 17.16% 0.26 9.40% 4.55 8.59% 0.27 8.25%
CAUT 1.01 12.03% 0.01 1.40% 0.40 4.63% 0.03 2.71%
GLOBALS 47.39 1.73% 1.39 3.07% 28.05 1.80% 0.39 2.56%
MODER 0.15 1.00% 0.07 3.78% 4.17 8.02% 0.07 2.82%
REGGOLD 34.83 2.30% 0.36 1.71% 81.95 2.97% 0.69 2.27%
VERAGG - - 0.26 14.51% 0.69 21.83% 0.25 12.21%
VERCAU 77.09 8.41% 0.14 15.95% 16.63 15.04% 0.06 21.28%
Unique Invest-ment Consult-ants $$
Distributor is a rela-tive of an employee of the AMC
REGGOLD - - ^^ ^^ 0.48 0.02% - -
20
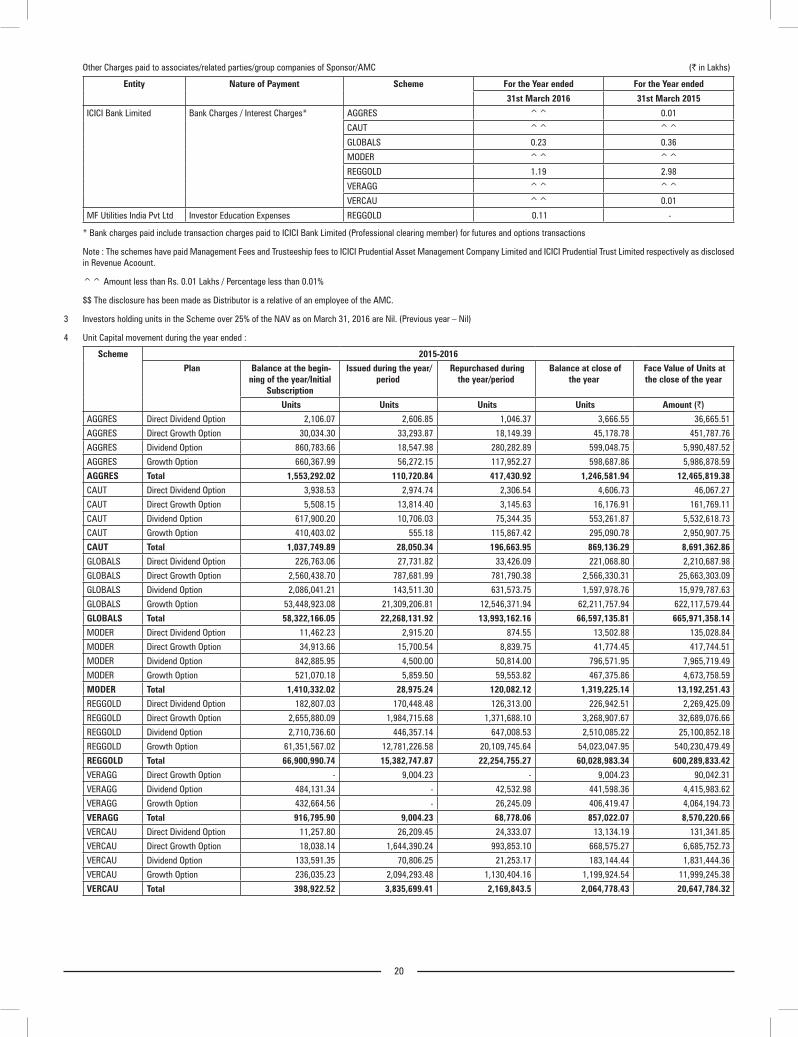
Other Charges paid to associates/related parties/group companies of Sponsor/AMC (` in Lakhs)
Entity NatureofPayment Scheme FortheYearended FortheYearended
31stMarch2016 31stMarch2015
ICICI Bank Limited Bank Charges / Interest Charges* AGGRES ^^ 0.01
CAUT ^^ ^^
GLOBALS 0.23 0.36
MODER ^^ ^^
REGGOLD 1.19 2.98
VERAGG ^^ ^^
VERCAU ^^ 0.01
MF Utilities India Pvt Ltd Investor Education Expenses REGGOLD 0.11 -
* Bank charges paid include transaction charges paid to ICICI Bank Limited (Professional clearing member) for futures and options transactions
Note : The schemes have paid Management Fees and Trusteeship fees to ICICI Prudential Asset Management Company Limited and ICICI Prudential Trust Limited respectively as disclosed in Revenue Acoount.
^^ Amount less than Rs. 0.01 Lakhs / Percentage less than 0.01%
$$ The disclosure has been made as Distributor is a relative of an employee of the AMC.
3 Investors holding units in the Scheme over 25% of the NAV as on March 31, 2016 are Nil. (Previous year – Nil)
4 Unit Capital movement during the year ended :
Scheme 2015-2016
Plan Balanceatthebegin-ningoftheyear/Initial
Subscription
Issuedduringtheyear/period
Repurchasedduringtheyear/period
Balanceatcloseoftheyear
FaceValueofUnitsatthecloseoftheyear
Units Units Units Units Amount(`)
AGGRES Direct Dividend Option 2,106.07 2,606.85 1,046.37 3,666.55 36,665.51
AGGRES Direct Growth Option 30,034.30 33,293.87 18,149.39 45,178.78 451,787.76
AGGRES Dividend Option 860,783.66 18,547.98 280,282.89 599,048.75 5,990,487.52
AGGRES Growth Option 660,367.99 56,272.15 117,952.27 598,687.86 5,986,878.59
AGGRES Total 1,553,292.02 110,720.84 417,430.92 1,246,581.94 12,465,819.38
CAUT Direct Dividend Option 3,938.53 2,974.74 2,306.54 4,606.73 46,067.27
CAUT Direct Growth Option 5,508.15 13,814.40 3,145.63 16,176.91 161,769.11
CAUT Dividend Option 617,900.20 10,706.03 75,344.35 553,261.87 5,532,618.73
CAUT Growth Option 410,403.02 555.18 115,867.42 295,090.78 2,950,907.75
CAUT Total 1,037,749.89 28,050.34 196,663.95 869,136.29 8,691,362.86
GLOBALS Direct Dividend Option 226,763.06 27,731.82 33,426.09 221,068.80 2,210,687.98
GLOBALS Direct Growth Option 2,560,438.70 787,681.99 781,790.38 2,566,330.31 25,663,303.09
GLOBALS Dividend Option 2,086,041.21 143,511.30 631,573.75 1,597,978.76 15,979,787.63
GLOBALS Growth Option 53,448,923.08 21,309,206.81 12,546,371.94 62,211,757.94 622,117,579.44
GLOBALS Total 58,322,166.05 22,268,131.92 13,993,162.16 66,597,135.81 665,971,358.14
MODER Direct Dividend Option 11,462.23 2,915.20 874.55 13,502.88 135,028.84
MODER Direct Growth Option 34,913.66 15,700.54 8,839.75 41,774.45 417,744.51
MODER Dividend Option 842,885.95 4,500.00 50,814.00 796,571.95 7,965,719.49
MODER Growth Option 521,070.18 5,859.50 59,553.82 467,375.86 4,673,758.59
MODER Total 1,410,332.02 28,975.24 120,082.12 1,319,225.14 13,192,251.43
REGGOLD Direct Dividend Option 182,807.03 170,448.48 126,313.00 226,942.51 2,269,425.09
REGGOLD Direct Growth Option 2,655,880.09 1,984,715.68 1,371,688.10 3,268,907.67 32,689,076.66
REGGOLD Dividend Option 2,710,736.60 446,357.14 647,008.53 2,510,085.22 25,100,852.18
REGGOLD Growth Option 61,351,567.02 12,781,226.58 20,109,745.64 54,023,047.95 540,230,479.49
REGGOLD Total 66,900,990.74 15,382,747.87 22,254,755.27 60,028,983.34 600,289,833.42
VERAGG Direct Growth Option - 9,004.23 - 9,004.23 90,042.31
VERAGG Dividend Option 484,131.34 - 42,532.98 441,598.36 4,415,983.62
VERAGG Growth Option 432,664.56 - 26,245.09 406,419.47 4,064,194.73
VERAGG Total 916,795.90 9,004.23 68,778.06 857,022.07 8,570,220.66
VERCAU Direct Dividend Option 11,257.80 26,209.45 24,333.07 13,134.19 131,341.85
VERCAU Direct Growth Option 18,038.14 1,644,390.24 993,853.10 668,575.27 6,685,752.73
VERCAU Dividend Option 133,591.35 70,806.25 21,253.17 183,144.44 1,831,444.36
VERCAU Growth Option 236,035.23 2,094,293.48 1,130,404.16 1,199,924.54 11,999,245.38
VERCAU Total 398,922.52 3,835,699.41 2,169,843.5 2,064,778.43 20,647,784.32
21
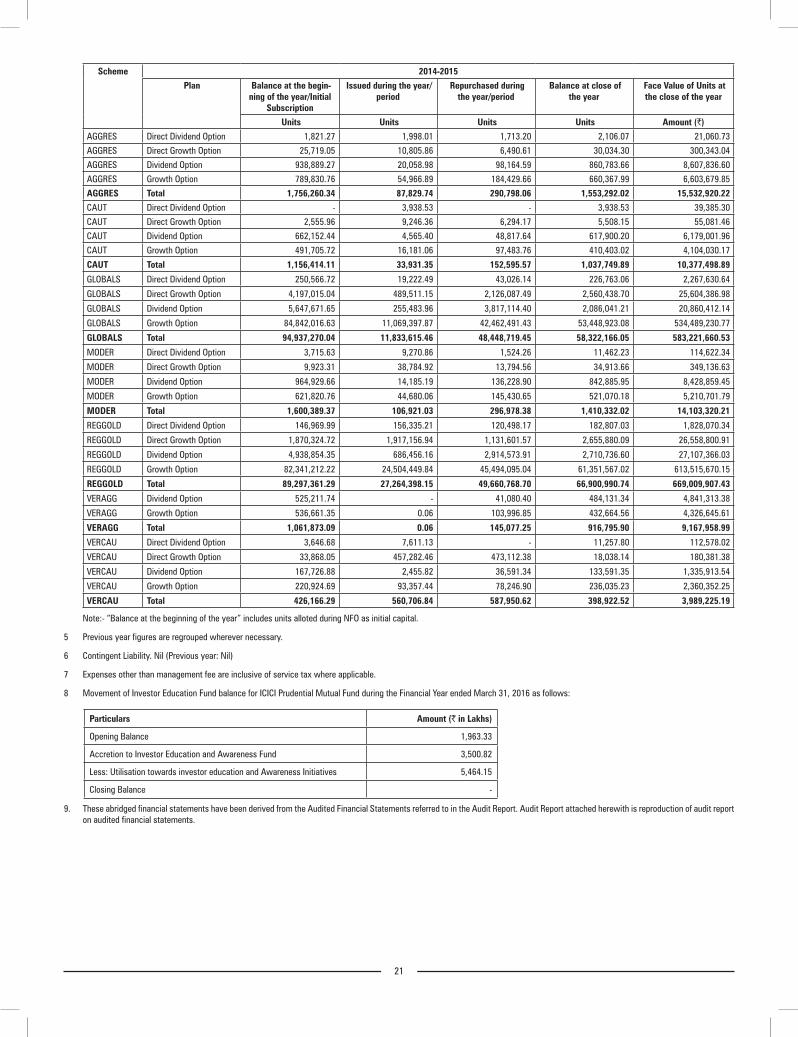
Scheme 2014-2015
Plan Balanceatthebegin-ningoftheyear/Initial
Subscription
Issuedduringtheyear/period
Repurchasedduringtheyear/period
Balanceatcloseoftheyear
FaceValueofUnitsatthecloseoftheyear
Units Units Units Units Amount(`)
AGGRES Direct Dividend Option 1,821.27 1,998.01 1,713.20 2,106.07 21,060.73
AGGRES Direct Growth Option 25,719.05 10,805.86 6,490.61 30,034.30 300,343.04
AGGRES Dividend Option 938,889.27 20,058.98 98,164.59 860,783.66 8,607,836.60
AGGRES Growth Option 789,830.76 54,966.89 184,429.66 660,367.99 6,603,679.85
AGGRES Total 1,756,260.34 87,829.74 290,798.06 1,553,292.02 15,532,920.22
CAUT Direct Dividend Option - 3,938.53 - 3,938.53 39,385.30
CAUT Direct Growth Option 2,555.96 9,246.36 6,294.17 5,508.15 55,081.46
CAUT Dividend Option 662,152.44 4,565.40 48,817.64 617,900.20 6,179,001.96
CAUT Growth Option 491,705.72 16,181.06 97,483.76 410,403.02 4,104,030.17
CAUT Total 1,156,414.11 33,931.35 152,595.57 1,037,749.89 10,377,498.89
GLOBALS Direct Dividend Option 250,566.72 19,222.49 43,026.14 226,763.06 2,267,630.64
GLOBALS Direct Growth Option 4,197,015.04 489,511.15 2,126,087.49 2,560,438.70 25,604,386.98
GLOBALS Dividend Option 5,647,671.65 255,483.96 3,817,114.40 2,086,041.21 20,860,412.14
GLOBALS Growth Option 84,842,016.63 11,069,397.87 42,462,491.43 53,448,923.08 534,489,230.77
GLOBALS Total 94,937,270.04 11,833,615.46 48,448,719.45 58,322,166.05 583,221,660.53
MODER Direct Dividend Option 3,715.63 9,270.86 1,524.26 11,462.23 114,622.34
MODER Direct Growth Option 9,923.31 38,784.92 13,794.56 34,913.66 349,136.63
MODER Dividend Option 964,929.66 14,185.19 136,228.90 842,885.95 8,428,859.45
MODER Growth Option 621,820.76 44,680.06 145,430.65 521,070.18 5,210,701.79
MODER Total 1,600,389.37 106,921.03 296,978.38 1,410,332.02 14,103,320.21
REGGOLD Direct Dividend Option 146,969.99 156,335.21 120,498.17 182,807.03 1,828,070.34
REGGOLD Direct Growth Option 1,870,324.72 1,917,156.94 1,131,601.57 2,655,880.09 26,558,800.91
REGGOLD Dividend Option 4,938,854.35 686,456.16 2,914,573.91 2,710,736.60 27,107,366.03
REGGOLD Growth Option 82,341,212.22 24,504,449.84 45,494,095.04 61,351,567.02 613,515,670.15
REGGOLD Total 89,297,361.29 27,264,398.15 49,660,768.70 66,900,990.74 669,009,907.43
VERAGG Dividend Option 525,211.74 - 41,080.40 484,131.34 4,841,313.38
VERAGG Growth Option 536,661.35 0.06 103,996.85 432,664.56 4,326,645.61
VERAGG Total 1,061,873.09 0.06 145,077.25 916,795.90 9,167,958.99
VERCAU Direct Dividend Option 3,646.68 7,611.13 - 11,257.80 112,578.02
VERCAU Direct Growth Option 33,868.05 457,282.46 473,112.38 18,038.14 180,381.38
VERCAU Dividend Option 167,726.88 2,455.82 36,591.34 133,591.35 1,335,913.54
VERCAU Growth Option 220,924.69 93,357.44 78,246.90 236,035.23 2,360,352.25
VERCAU Total 426,166.29 560,706.84 587,950.62 398,922.52 3,989,225.19
Note:- “Balance at the beginning of the year” includes units alloted during NFO as initial capital.
5 Previous year figures are regrouped wherever necessary.
6 Contingent Liability. Nil (Previous year: Nil)
7 Expenses other than management fee are inclusive of service tax where applicable.
8 Movement of Investor Education Fund balance for ICICI Prudential Mutual Fund during the Financial Year ended March 31, 2016 as follows:
Particulars Amount(`inLakhs)
Opening Balance 1,963.33
Accretion to Investor Education and Awareness Fund 3,500.82
Less: Utilisation towards investor education and Awareness Initiatives 5,464.15
Closing Balance -
9. These abridged financial statements have been derived from the Audited Financial Statements referred to in the Audit Report. Audit Report attached herewith is reproduction of audit report on audited financial statements.

22
ICICIPrudentialMutualFundAddress: 2nd Floor, Block B-2, Nirlon Knowledge Park, Western Express Highway, Goregaon, Mumbai – 400063
HistoricalPerUnitStatistics(onthebasisofclosingunits)fortheyearendedMarch31,2016(figuresasperAuditedFinancials)(As per format prescribed for Abridged schemewise Annual Report- SEBI/IMD/CIR No.8/132968/2008 dt 24/07/08)
ICICIPrudentialAdvisorseriesLongTermSavingsPlan
ICICIPrudentialAdvisorseries-CautiousPlan
ICICIPrudentialGlobalStableEquityFund
YearEnded YearEnded YearEnded
31-Mar-2016 31-Mar-2015 31-Mar-2016 31-Mar-2015 31-Mar-2016 31-Mar-2015
1 NAVPERUNIT(`)
A Open:
Direct Dividend Option 48.1812 39.0717 27.3186 - 11.71 10.36
Direct Growth Option 48.1826 39.0726 27.5075 23.0905 11.71 10.36
Dividend Option 47.6463 38.8311 27.1441 22.9383 11.58 10.31
Growth Option 47.6463 38.8311 27.1441 22.9383 11.58 10.31
B High
Direct Dividend Option 49.6218 49.4199 28.1471 27.7337 12.98 11.85
Direct Growth Option 49.6232 49.4212 28.3418 27.9254 12.98 11.85
Dividend Option 49.0461 48.8892 27.9484 27.5702 12.71 11.72
Growth Option 49.0461 48.8892 27.9484 27.5702 12.71 11.72
C Low
Direct Dividend Option 43.6148 37.9156 26.0577 22.3059 11.55 10.25
Direct Growth Option 43.616 37.9166 26.238 22.4601 11.55 10.25
Dividend Option 42.9458 37.6816 25.7533 22.3055 11.36 10.19
Growth Option 42.9458 37.6816 25.7532 22.3055 11.36 10.19
D End
Direct Dividend Option 47.3065 48.1812 27.6981 27.3186 12.93 11.71
Direct Growth Option 47.3079 48.1826 27.8897 27.5075 12.93 11.71
Dividend Option 46.5671 47.6463 27.3724 27.1441 12.66 11.58
Growth Option 46.5671 47.6463 27.3724 27.1441 12.66 11.58
2 AssetsUnderManagement (`inLakhs)
Closing 580.86 740.26 238.00 281.71 8,440.04 6,756.67
Average (AAuM) 680.15 706.06 257.87 272.02 7,285.99 8,261.11
3 GrossIncomeas%ofAAuM* 5.52% 6.00% 4.49% 3.51% 5.56% 19.74%
4 ExpenseRatio
A TotalExpenseas%ofAAuM (planwise)*
Direct Option 0.30% 0.25% 0.22% 0.08% 1.13% 1.08%
Other than Direct Option 0.75% 0.75% 0.75% 0.75% 2.08% 1.80%
B ManagementFeeas%ofAAuM (planwise)*
Direct Option 0.16% - - - 1.08% 0.89%
Other than Direct Option 0.14% - 0.18% - 1.08% 0.89%
5 NetIncomeas%ofAAuM* 4.79% 5.26% 3.75% 2.76% 3.53% 17.98%
6 PortfolioTurnoverRatio- AggregateforallAssetcategory
1.49 6.34 6.88 8.38 7.20 6.73
PortfolioTurnoverRatio–Equity - - - - - -
7 TotalDividendperunitdistributedduringtheYear/Period(plan-wise)
Direct Dividend Option - - - - - -
Direct Growth Option - - - - - -
Dividend Option - - - - - -
Growth Option - - - - - -
8 Returns
A LastOneYear
Scheme
Direct Option -1.81% 23.32% 1.39% 19.13% 10.39% 13.03%
Other than Direct Option -2.26% 22.70% 0.84% 18.34% 9.30% 12.32%
Benchmark 0.16% 17.17% 5.12% 14.37% 2.32% 10.42%

23
ICICIPrudentialAdvisorseriesLongTermSavingsPlan
ICICIPrudentialAdvisorseries-CautiousPlan
ICICIPrudentialGlobalStableEquityFund
YearEnded YearEnded YearEnded
31-Mar-2016 31-Mar-2015 31-Mar-2016 31-Mar-2015 31-Mar-2016 31-Mar-2015
B SinceInception
Scheme
Direct Option 9.00% 14.21% 9.59% 13.97% 10.61% 10.76%
Other than Direct Option 13.33% 14.83% 8.54% 9.25% 9.70% 9.96%
Benchmark
Direct Option 7.58% 11.07% 8.91% 10.87% 6.46% 9.24%
Other than Direct Option 11.98% 13.10% 7.74% 7.97% 6.46% 9.24%
BenchmarkIndex 50%Nifty50,30%CrisilCompositeBondFundIndex,5%CrisilLiquidFund
Index,15%Gold
20%Nifty50,60%CrisilCompositeBondFundIndex,10%CrisilLiquid
FundIndex,10%Gold
MSCIWorldNetReturnIndex
* Annualised^^ Less than 0.01%
Note:1 Scheme Returns and Benchmark Returns for schemes launched during the year are computed from date of allotment. These returns are shown on absolute basis. For the remaining schemes,
Scheme Returns and Benchmark Returns are shown on CAGR basis.2 Returns have been calculated based on Growth option except for plans where Growth option NAV is not available Dividend option NAV is considered.3 Gross Income = Amount against (A) in the Revenue account i.e income4 Net Income = Amount against (C) in the Revenue account i.e Net realised gains/(Losses) for the Year / Period5 Portfolio Turnover = Lower of sales or purchase divided by Average AUM for the Year / Period6 AAuM = Average daily net assets7 Performanceforschemeoptionsinwhichunitsarefullyredeemed&werereissuedatFaceValueonfreshsubcriptions(exceptincaseofDirectPlanwhereNAVofcorresponding‘Other
than Direct’ Plan is considered) made by the investors during the year are shown on absolute basis and accordingly corresponding previous year figures are not shown.8 Performance figures have been computed based on the last declared NAV.9 Plans closed during the year are not considered for above disclosure

24
ICICIPrudentialMutualFundAddress: 2nd Floor, Block B-2, Nirlon Knowledge Park, Western Express Highway, Goregaon, Mumbai – 400063
HistoricalPerUnitStatistics(onthebasisofclosingunits)fortheyearendedMarch31,2016(figuresasperAuditedFinancials)(As per format prescribed for Abridged schemewise Annual Report- SEBI/IMD/CIR No.8/132968/2008 dt 24/07/08)
ICICIPrudentialAdvisorseries-ModeratePlan
ICICIPrudentialRegularGoldSavingsFund
ICICIPrudentialAdvisorseries-VeryAggressivePlan
ICICIPrudentialAdvisorSeries-DynamicAccrualPlan(FormerlyICICI
PrudentialAdvisorseries-VeryCautiousPlan)
YearEnded YearEnded YearEnded YearEnded
31-Mar-2016 31-Mar-2015 31-Mar-2016 31-Mar-2015 31-Mar-2016 31-Mar-2015 31-Mar-2016 31-Mar-2015
1 NAVPERUNIT(`)
A Open:
Direct Dividend Option 38.9052 31.9828 9.3555 10.4916 - - 21.1594 18.7462
Direct Growth Option 38.9239 31.9981 9.3551 10.4912 - - 21.0811 18.678
Dividend Option 38.3591 31.7422 9.2911 10.4351 51.0374 44.3886 21.0186 18.6774
Growth Option 38.3591 31.7422 9.2911 10.4351 51.0374 44.3886 21.0186 18.6774
B High
Direct Dividend Option 39.8191 39.6902 10.494 11.0022 - - 23.5437 21.1594
Direct Growth Option 39.8383 39.7092 10.4935 11.0018 52.858 - 23.4566 21.0811
Dividend Option 39.234 39.1521 10.403 10.9415 52.6421 51.6058 23.3106 21.0186
Growth Option 39.234 39.1522 10.403 10.9415 52.6421 51.6058 23.3106 21.0186
C Low
Direct Dividend Option 36.2088 31.1844 8.8479 9.0538 - - 21.1307 18.6356
Direct Growth Option 36.2262 31.1993 8.8476 9.0535 49.4481 - 21.0526 18.5775
Dividend Option 35.5129 30.9409 8.7824 8.9922 49.2588 41.831 20.9837 18.5666
Growth Option 35.5129 30.941 8.7824 8.9922 49.2588 41.831 20.9837 18.5666
D End
Direct Dividend Option 38.9941 38.9052 10.0428 9.3555 - - 23.5437 21.1594
Direct Growth Option 39.0128 38.9239 10.0424 9.3551 52.858 - 23.4566 21.0811
Dividend Option 38.2417 38.3591 9.9539 9.2911 52.6421 51.0374 23.3106 21.0186
Growth Option 38.2417 38.3591 9.9539 9.2911 52.6421 51.0374 23.3106 21.0186
2 AssetsUnderManagement (`inLakhs)
Closing 504.92 541.25 5,978.44 6,217.71 451.18 467.91 482.32 83.88
Average (AAuM) 522.91 525.99 6,042.18 7,514.61 452.64 465.59 332.63 91.91
3 GrossIncomeas%ofAAuM* 2.98% 6.18% -0.58% -1.69% 3.86% 12.07% 6.10% 5.14%
4 ExpenseRatio
A TotalExpenseas%ofAAuM (planwise)*
Direct Option 0.21% 0.09% 0.30% 0.35% 0.30% - 0.41% 0.45%
Other than Direct Option 0.75% 0.75% 0.50% 0.50% 0.75% 0.75% 0.75% 0.75%
B ManagementFeeas%ofAAuM (planwise)*
Direct Option 0.04% - 0.07% ^^ 0.02% - 0.03% 0.05%
Other than Direct Option 0.22% - 0.07% ^^ 0.15% - 0.03% 0.05%
5 NetIncomeas%ofAAuM* 2.25% 5.45% -1.07% -2.18% 3.11% 11.32% 5.46% 4.43%
6 PortfolioTurnoverRatio- AggregateforallAssetcategory
1.73 6.40 3.22 3.09 1.46 6.38 4.85 10.70
PortfolioTurnoverRatio–Equity - - - - - - - -
7 TotalDividendperunitdistributedduringtheYear/Period(plan-wise)
Direct Dividend Option - - - - - - - -
Direct Growth Option - - - - - - - -
Dividend Option - - - - - - - -
Growth Option - - - - - - - -
8 Returns
A LastOneYear
Scheme
Direct Option 0.23% 21.64% 7.33% -10.83% - - 11.24% 12.87%
Other than Direct Option -0.31% 20.85% 7.11% -10.96% 3.14% 14.98% 10.87% 12.53%
Benchmark 1.70% 16.77% 10.79% -5.30% -4.11% 20.10% 8.16% 12.88%

25
ICICIPrudentialAdvisorseries-ModeratePlan
ICICIPrudentialRegularGoldSavingsFund
ICICIPrudentialAdvisorseries-VeryAggressivePlan
ICICIPrudentialAdvisorSeries-DynamicAccrualPlan(FormerlyICICI
PrudentialAdvisorseries-VeryCautiousPlan)
YearEnded YearEnded YearEnded YearEnded
31-Mar-2016 31-Mar-2015 31-Mar-2016 31-Mar-2015 31-Mar-2016 31-Mar-2015 31-Mar-2016 31-Mar-2015
B SinceInception
Scheme
Direct Option 9.34% 13.73% -3.58% -8.09% 4.60% - 12.45% 9.03%
Other than Direct Option 11.53% 12.65% -0.10% -2.10% 14.47% 15.53% 7.13% 6.80%
Benchmark
Direct Option 8.02% 11.01% -1.40% -6.40% -1.94% - 10.85% 9.12%
Other than Direct Option 9.86% 10.61% 2.18% -0.18% 12.97% 14.62% 6.55% 6.40%
BenchmarkIndex 40%Nifty50,40%CrisilCompositeBondFundIndex,10%CrisilLiquidFundIndex,
10%Gold
DomesticGoldPrices 75%Nifty50,5%CrisilCompositeBondFundIndex,5%CrisilLiquidFundIndex,
15%Gold
70%CrisilCompositeBondFundIndex,30%CrisilLiquid
FundIndex
* Annualised^^ Less than 0.01%
Note:1 Scheme Returns and Benchmark Returns for schemes launched during the year are computed from date of allotment. These returns are shown on absolute basis. For the remaining schemes,
Scheme Returns and Benchmark Returns are shown on CAGR basis.2 Returns have been calculated based on Growth option except for plans where Growth option NAV is not available Dividend option NAV is considered.3 Gross Income = Amount against (A) in the Revenue account i.e income4 Net Income = Amount against (C) in the Revenue account i.e Net realised gains/(Losses) for the Year / Period5 Portfolio Turnover = Lower of sales or purchase divided by Average AUM for the Year / Period6 AAuM = Average daily net assets7 Performanceforschemeoptionsinwhichunitsarefullyredeemed&werereissuedatFaceValueonfreshsubcriptions(exceptincaseofDirectPlanwhereNAVofcorresponding‘Other
than Direct’ Plan is considered) made by the investors during the year are shown on absolute basis and accordingly corresponding previous year figures are not shown.8 Performance figures have been computed based on the last declared NAV.9 Plans closed during the year are not considered for above disclosure

26

27
TheAbridgedAnnualReporthasbeenextractedfromtheAuditedBalanceSheet,RevenueAccountandNotestoAccounts.FullAnnualReportisavailableonthewebsitewww.icicipruamc.com.UnitholdersmayrefertothefullAnnualReportdisplayedonthewebsitew.r.t.generalpoliciesandproceduresforexercisingvotingrights,thedetailsofproxyvotingexercisedduringtheFinancialYear2015-16alongwithauditor’scertification.ForUnitholdersoftheScheme,fullAnnualReport isavailableforinspectionattheCorporateOffice/CentralServiceOfficeoftheAMCandacopythereofshallbemadeavailabletotheUnitholderonrequest.
MutualFundinvestmentsaresubjecttomarketrisks,readallschemerelateddocumentscarefully.Disclaimer
Some of the material used in the document may have been obtained from members/persons other than the AMC and/or its affiliates and which may have been made available to the AMC and/or to its affiliates. Information gathered and material used in this document is believed to be from reliable sources. The AMC / Trustee Company however does not warrant the accuracy, reasonableness and / or completeness of any information. We have included statements / opinions / recommendations in this document, which contain words, or phrases such as “will”, “expect”, “should”, “believe” and similar expressions or variations of such expressions, that are “forward looking statements”. Actual results may differ materially from those suggested by the forward looking statements due to risk or uncertainties associated with our expectations with respect to, but not limited to, exposure to market risks, general economic and political conditions in India and other countries globally, which have an impact on our services and / or investments, the monetary and interest policies of India, inflation, deflation, unanticipated turbulence in interest rates, foreign exchange rates, equity prices or other rates or prices etc.
Investors are requested to refer the Scheme Information Document for Product Label assigned to various schemes in terms of risk associated with investing in such Products.

Designed&PrintedbyUchithaGraphic(www.uchitha.com)
9
“Licensed to post under prepayment of postage in cash system under license No.BDC/VDR-001/ICICI PAM/2016-17“