Aims to weather it all - Tata Mutual Fund
28
Aims to weather it all This product is suitable for investors who are seeking*: • Long Term Capital Appreciaon. • An equity scheme that invests predominantly in Indian markets with focus on riding business cycles through dynamic allocaon between various sectors and stocks at different stages of business cycles. *Investors should consult their financial advisors if in doubt about whether the product is suitable for them. NFO Opens: 16th July, 2021 NFO Closes: 30th July, 2021
-
Upload
khangminh22 -
Category
Documents
-
view
2 -
download
0
Transcript of Aims to weather it all - Tata Mutual Fund

Aims to weather it all
This product is suitable for investors who are seeking*:• LongTermCapitalAppreciation.• An equity scheme that invests predominantly in Indian markets with
focusonridingbusinesscyclesthroughdynamicallocationbetweenvarioussectorsandstocksatdifferentstagesofbusinesscycles.
*Investors should consult their financial advisors if in doubt about whether the product is suitable for them.
NFO Opens: 16th July, 2021NFO Closes: 30th July, 2021

Extreme heat
Rising Humidity
Days getting shorter
Intermittent Thunderstorms DO YOU KNOW WHATS COMING?
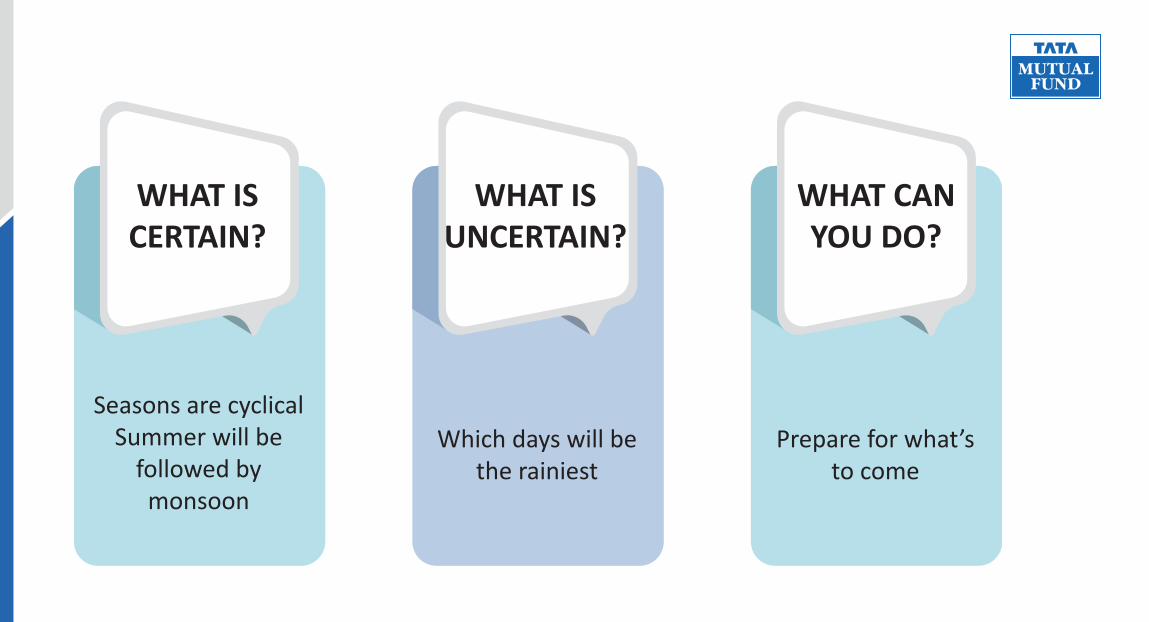
WHAT IS CERTAIN?
WHAT IS UNCERTAIN?
WHAT CAN YOU DO?
Seasons are cyclicalSummer will be
followed by monsoon
Which days will be the rainiest
Prepare for what’s to come

I think it’s essential to remember that just about everything is cyclical. There’s little I’m certain of, but these things are true: Cycles always prevail
Howard Marks

BUSINESS CYCLES
The economy goes through a series of stages as it expands and contracts, characterised bydownwardorupwardfluctuationsofGDP.
Each Economic Cycle/Business Cycle has 4 phases
GDP
TIME
Recession Recovery Expansion Slowdown

GDP
Time
• FallingActivity• Credit slowdown• ProfitsDecline• Policy eases• Inventories &
Sales fall
•Growthpeaking• Credit growth strong• Profitgrowthpeaks• Policy benign• Inventories & sales
grow, equilibrium reached
• GrowthModerating• Credit Tightens• Earnings under
pressure• Contractionarypolicy• Higher inventories,
lower sales
•Activityrebounds(GDP,Employment)
• Credit begins to grow• Profitsgrowrapidly• Policystillstimulative• Inventories low, sales
improve
Recession Recovery Expansion Slowdown
CHARACTERISTICS OF BUSINESS CYCLES PHASES

Expansion Companies innovate and
produce new products and services.
They create jobs that help individuals build their purchasingpower.
RecessionRecessionsoffer
opportunitiesforbusinessesto reorganize their operationsandrebuildforfuture growth
Recovery The cyclical nature of
economicactivityprovidesbusinesses with the impetus to invest in the present and grow for the future
SlowdownBusinessactivitydeclines
as companies and markets mature
Continuedinnovationsandimprovements have lesser impacts,
Consumer spending slows
WHAT DRIVES THE BUSINESS CYCLE?

Business Conditions
Market Conditions
Macro Conditions
? Are Businesses planning expansion orcuttingcosts?
?What is the
investorsentiment?
?IsInflationrisingor
falling?
? Are factories running at full capacity?
? What is favoured, large or small
companies
? Are people spending onnecessitiesor
luxuries?
?Is credit readily
available?
?Are investors
greedyorfearful?
?Are people able to
findwork?
?Are earnings growing
orcontracting?
?Are investors seeking growthorvalue?
?Monetary policy is accommodativeor
restrictive?
IDENTIFYING A PHASE
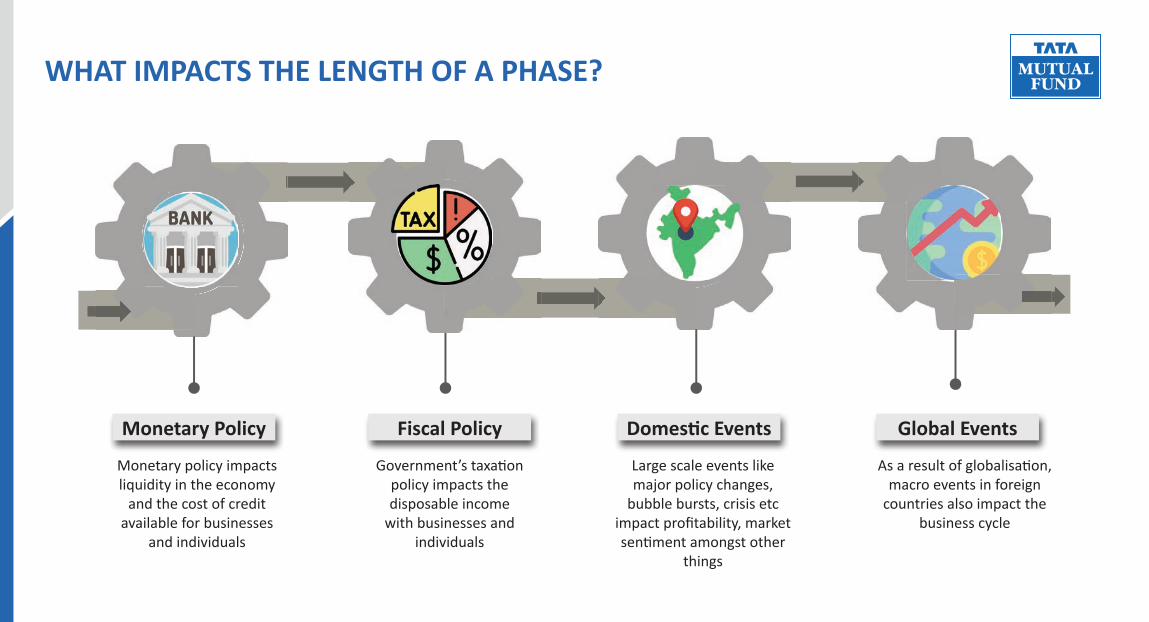
Monetary Policy Fiscal Policy Domestic Events Global Events
Monetary policy impacts liquidity in the economy
and the cost of credit available for businesses
and individuals
Government’staxationpolicy impacts the disposable income
with businesses and individuals
Large scale events like major policy changes,
bubble bursts, crisis etc impactprofitability,marketsentimentamongstother
things
Asaresultofglobalisation,macro events in foreign
countries also impact the business cycle
WHAT IMPACTS THE LENGTH OF A PHASE?

BUSINESS CYCLE INVESTING

BUSINESS CYCLE INVESTING
Eachphaseinthebusinesscyclepresentsuniqueinvestmentopportunities.Incorporatingbusinesscycles theme into investments helps make the most of the current economic environment
Recovery & ExpansionInvestor Sentiment: Increased Risk AppetiteInvestmentsthataremoresensitivetofastereconomic growth and business activity willlikelyoutperform.
Stocks of midsize and small companies, aswellasemerginlgmarketequities
Younger, growth-oriented firms andindustries
Generally referred to as Cyclical Stocks
Slowdown & RecessionInvestor Sentiment: Fearful and Cautious
Defensive investments and those that aresensitivetofallinginterestrateshavegreaterpotentialtooutperform
Stocks of larger and stable companies
Businesses that experience steady consumer demand even during economic slowdowns
Generally referred to as Defensive Stocks

Cyclical stocks• Directrelationshiptotheeconomy
• Companiesthatmakeorselldiscretionaryitems and services that are in demand when the economy is doing well
• These are stocks which do well during phasesofincreasedconsumptionandhigh employment
• CapitalGoods,Industrialsandotherhighcapex sectors tend to perform well during economic upcycle
Defensive stocks
• Defensive/Structural growth Stocks outperform the market when economic growth slows
• They produce or distribute goods and services we always need
• Characterisedbylowpenetrationi.elongrunway for growth, strong balance sheet androbustESGtrackrecord
CYCLICALS VS DEFENSIVES

Predominantly Large Cap
• Utilities
• Pharma
• FMCG
Diversified across Market Cap
• Auto
• Metals & Mining
• Large Financials
• InformationTechnology
More Mid & Small Cap• Financialsincl.
NBFCs• Real estate• Consumer
Discretionary• CapitalGoods&
Industrials
Predominantly Diversified & Bottom-up stock picking• Utilities• Pharma• FMCG• IT services
Recession Recovery Expansion Slowdown
GDP
TimeSectors/industriesmentionedaboveisforillustrationpurposeonlyanditmayormaynotformpartofactualportfolioofTataBusinessCycleFund.Theoreticallythesesectors/segmentsareexpectedtoperformwell,actualperformancemaybeimpactedbyotherexternalfactorsandmaynotalignwiththeaboverepresentation
INVESTING IN DIFFERENT PHASES

2008-09 2010-12 2013-17 2018-19 2020-21
Auto: 14.05%
IT: 10.70%
Pharma: 8.93%
Realty: -45.64%
Consumer Disc: -16.57%
Industrials: -16.36%
Realty: -17.42%
Metal: -13.36%
Utilities: -11.78%
Realty: 3.83%
Metal: 5.62%
Utilities: 7.38%
Auto: -16.76%
Metal: -16.33%
Industrials: -13.34%
Realty: 11.82%
FMCG: 10.09%
Financial Services: 9.84%
FMCG: 28.61%
Pharma: 17.21%
Auto: 15.70%
Consumer Disc: 20.79%
Auto: 18.15%
Financial Services: 14.91%
Financial Services: 18.53%
IT: 16.59%
FMCG: 3.67%
Metal: 50.53%
Pharma: 48.27%
IT: 47.04%
Recession Recovery Expansion Slowdown Double-dip + Recovery
Time
Source:MFI,Indices:NiftyFinancialServices,NiftyIT,NiftyPharma,S&PBSEAUTO,S&PBSECG,S&PBSEConsumerDiscGoods&Services,S&PBSEFMCG,S&PBSEIndustrials,S&PBSEMETAL,S&PBSERealty,S&PBSEUtilities.Phasesclassifiedonthebasisofalignmentofeconomicindicators(Inflation,InterestRate,CapacityUtilisation,GDPAnnualGrowthRate)withtheoreticallyexpectedtrendsinbusinesscyclesphases
GDP
TOP SECTORS
BOTTOM SECTORS
SECTOR PERFORMANCES

Overthelastdecade,Businesscycleshavebecomeshorter and harder to predict.Thisisresultofa number of factors:
Increasingly dynamic and responsive monetary policy
Activeimpetusorrestrictionsthroughgovernment policy
Impactofdomesticmacrovariables, ie, policy changes,
industry crisis etc
Impact of global macro variables, ie, global crisis, foreign interest rates etc
THE CHALLENGE
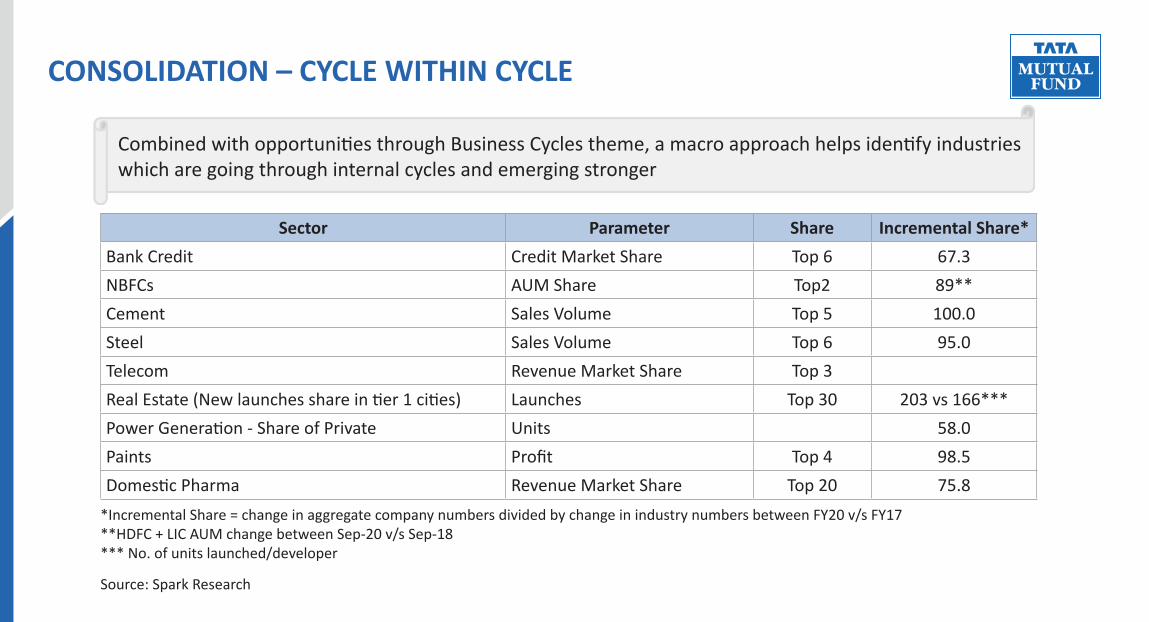
CombinedwithopportunitiesthroughBusinessCyclestheme,amacroapproachhelpsidentifyindustrieswhich are going through internal cycles and emerging stronger
Sector Parameter Share Incremental Share*Bank Credit Credit Market Share Top 6 67.3NBFCs AUM Share Top2 89**Cement Sales Volume Top 5 100.0Steel Sales Volume Top 6 95.0Telecom Revenue Market Share Top3RealEstate(Newlaunchesshareintier1cities) Launches Top30 203vs166***PowerGeneration-ShareofPrivate Units 58.0Paints Profit Top 4 98.5DomesticPharma Revenue Market Share Top 20 75.8
*Incremental Share = change in aggregate company numbers divided by change in industry numbers between FY20 v/s FY17**HDFC+LICAUMchangebetweenSep-20v/sSep-18***No.ofunitslaunched/developer
Source: Spark Research
CONSOLIDATION – CYCLE WITHIN CYCLE

WHERE ARE WE NOW?
Interest Rates
Inflation
Capacity Utilisation
GDP Annual Growth Rate
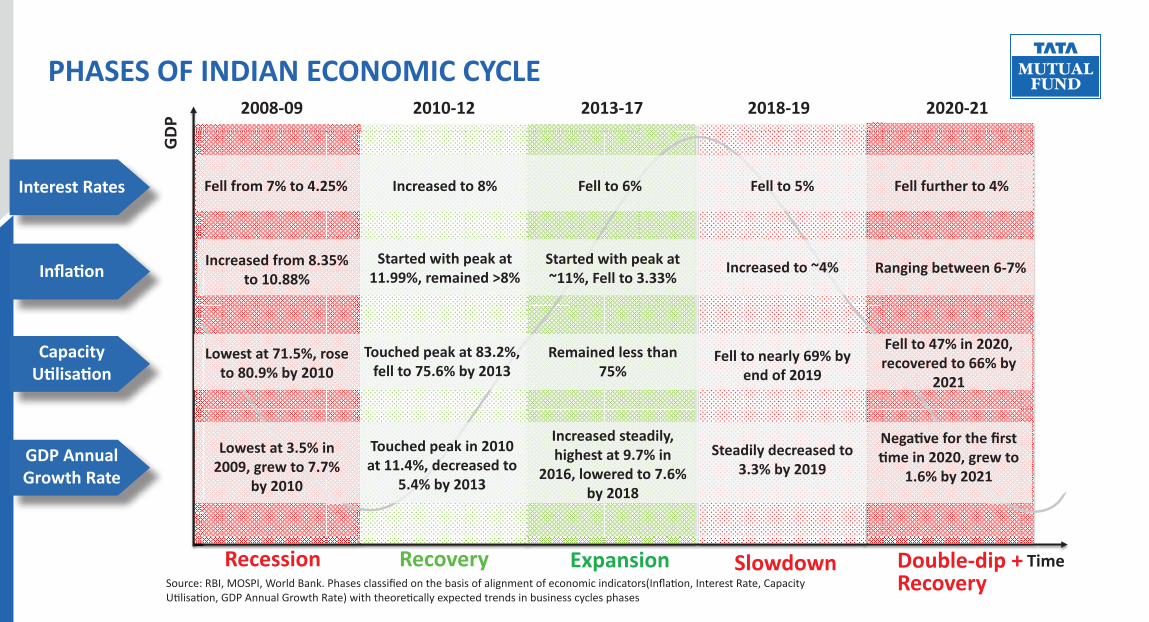
PHASES OF INDIAN ECONOMIC CYCLE2008-09 2010-12 2013-17 2018-19 2020-21
Time
GDP
Recession Recovery Expansion Slowdown Double-dip + RecoverySource:RBI,MOSPI,WorldBank.Phasesclassifiedonthebasisofalignmentofeconomicindicators(Inflation,InterestRate,Capacity
Utilisation,GDPAnnualGrowthRate)withtheoreticallyexpectedtrendsinbusinesscyclesphases
Fell from 7% to 4.25%
Increased from 8.35% to 10.88%
Lowest at 71.5%, rose to 80.9% by 2010
Lowest at 3.5% in 2009, grew to 7.7%
by 2010
Increased to 8%
Started with peak at 11.99%, remained >8%
Touched peak at 83.2%, fell to 75.6% by 2013
Touched peak in 2010 at 11.4%, decreased to
5.4% by 2013
Fell to 5%
Increased to ~4%
Fell to nearly 69% by end of 2019
Steadily decreased to 3.3% by 2019
Fell further to 4%
Ranging between 6-7%
Fell to 47% in 2020, recovered to 66% by
2021
Negative for the first time in 2020, grew to
1.6% by 2021
Fell to 6%
Started with peak at ~11%, Fell to 3.33%
Remained less than 75%
Increased steadily, highest at 9.7% in
2016, lowered to 7.6% by 2018

0
2
4
6
8
10
12
2015 2016 2017 2018 2019 2020
Credit Increased
Crash Cleanse
Cure Covid
• Highly leveraged corporates
• Increased lending and NPAs
• Weaker Banking System
• Multiplecompanyspecificevents of bankruptcy & defaults were excesses of the past
Source: RBI
• Banks provision coverage ratio–70%to80%
• Deleveragingcycleofcorporates
CYCLE OF CREDIT Graph - NPLs
• RBI introduced AQR• NBFCs saw an opportunity
and expanded their loan book• High rates, low growth-
Corporatesfounditdifficulttoservice debt
• Lockdowns impaired businesses• Banks raised capital• Structural cost cuts• High commodity prices
improvescashflows
CRAZY SOWS SEEDS OF CALM

GREEN SHOOTS
Deleveraging Wage Growth
ConsumptionBanks
Highcashflowsleadingtobalancesheetcleansing.Creatingagroundforfreshinvestmentcycleinnext1-2 years
As economic growth is picking up, companiesarereinstatingsalarycutsintroduced at the start of FY21
Most consumer companies were able to recover and secure higher sales
New bad loans are tapering, and older bad loans are well provided for
Source:Companies,KotakInstitutionalEquities
Company Debt Reduced in FY21 Debt added in FY08A 1,996 23,909B 9,124 1,560C 974 7,963D 15,625 (752)E 31,389 28,699Illustrationusingsteelcompanies
Provisionsforbadloans-Provisioncoverageratio(%)
020406080
100
Public Bank A Old PrivateBank A
New PrivateBank A
Small FinanceBank A
2018201920202021
-40-20
02040
ConsumerStaples
DiversifiedFinancials
Metals andMining
Real Estate Total (allsectors)
Employee Expenses (YoY Growth %)
4QFY201QFY212QFY213QFY214QFY21
20
-40-20
0204060
Staples CompanyA
Staples CompanyB
Discre�onaryCompany A
Discre�onaryCompany B
QoQ Volume Growth of Consumer Companies
4QFY19 4QFY20 4QFY21

Aims to weather it all

Aim
Economic Trends
Focus on Sector Calls
Stock Selection
Todeploythebusinesscycleapproachtoinvestingtoidentifyeconomictrendsandinvestinsectorsand stocks that are likely to outperform
Investingaspertheeconomicconditions–CyclicalsduringExpansionandDefensivesduringContraction
ExpansionBuy either the sector leaders or Companies
benefittingdisproportionatelyfromthesectoraltailwinds during economic & business cycles
Extent of leverage to the cycle Marketcapagnostic Management record
ContractionInvest in companies from sectors which provide
cushion during downcycles
INVESTMENT APPROACH

Thesizeoftheportfoliowillvarydependingonthecycle.Inacontractionarycycle,wemayhave more stocks compared to an expansionary cycle
The business cycle theme may allow for a more aggressive stance in terms of sector over/under weight compared to other diversifiedfunds
With no constraint on market cap allocation,thesplitwillbepurelybased on the business cycle phase, with focus on segments most likely to do well
Thechurnintheportfoliowilldepend on how quickly the cycles areturning.Suddenupswingsordownswings may cause higher churn
Portfolio SizeSector Allocation
Portfolio ChurnMarket Cap Allocation
FUND CHARACTERISTICS

01 02
.
03
Withthedurationofbusiness cycles
shortened, the need for a fund that changes with change in
cycle has arisen
Overthelastfewyears, the impact of sectorallocationshasbeen greater on alpha generationversusstock
levelallocations.
A fund that adapts to changes is needed because:
• Markets are at fair valuations
• Macro challenges posedbyinflationandbondyieldsgoingup.
SHORTER BUSINESS CYCLES
IMPACT OF SECTOR ALLOCATIONS
MARKET CONDITIONS
WHY NOW?

ASSET ALLOCATION OF THE FUND
Instruments Indicative allocations (% of net assets)
Risk Profile
Minimum Maximum High/Medium/LowEquity and equity related instruments selected on the basis of business cycle 80 100 HighOtherEquity&EquityrelatedInstruments 0 20 Medium to HighDebtandmoneymarketinstruments&GoldETF 0 20 Low to MediumUnitsissuedbyREITs&InvITs. 0 10 Medium to High
• Investments in Foreign Securities(to theextentof 20%of net assets) shall be subject to the investment restrictionsspecifiedbySEBI/RBIfromtimetotime.ThefundmanagerswillconsiderallrelevantriskbeforemakinganyinvestmentinForeignSecurities.
• Further,theportfoliooftheSchemewillbeconstructedinaccordancewiththeinvestmentrestrictionsspecifiedundertheRegulationswhichwouldhelpinmitigatingcertainrisksrelatingtoinvestmentsinsecuritiesmarket.
• TheSchememay invest inequityderivatives instruments to theextentpermittedunderand inaccordancewith theapplicableRegulations

Scheme Name Tata Business Cycle Fund
NFO Dates NFO Opens: 16th July 2021
NFO Closes: 30thJuly2021
Investment Objective Togeneratelong-termcapitalappreciationbyinvestingwithfocusonridingbusinesscyclesthroughallocationbetweensectorsandstocksatdifferentstagesofbusinesscycles.
However,thereisnoassuranceorguaranteethattheinvestmentobjectiveoftheSchemewillbeachieved.Theschemedoesnotassureorguaranteeanyreturns.
Type of Scheme Anopen-endedequityschemefollowingbusinesscyclesbasedinvestingtheme.
Fund Manager RahulSingh,VenkatSamala(OverseasInvestment)andMurthyNagarajan(DebtPortfolio)
Benchmark Nifty500TRI
Min. Investment Amount Minimum subscription amount:Rs5,000/-andinmultipleofRe.1/-thereafter.
Additional Purchase: Rs.1000/-&inmultiplesofRe.1/-thereafter.
Load Structure Entry Load:N.A.
Exit Load:Redemption/Switch-out/SWP/STPonorbeforeexpiryof365daysfromthedateofallotment:Ifthewithdrawalamountorswitchedoutamountisnotmorethan12%oftheoriginalcostofinvestment-NIL
Redemption/Switch-out/SWP/STPonorbeforeexpiryof365daysfromthedateofallotment:Ifthewithdrawalamountorswitchedoutamountismorethan12%oftheoriginalcostofinvestment-1%ofapplicableNAV
Redemption/Switch-out/SWP/STPafterexpiryof365daysfromthedateofallotment-NIL
FUND DETAILS

This product is suitable for investors who are seeking*:
• LongTermCapitalAppreciation.
• An equity scheme that invests predominantly in Indian markets with focusonridingbusinesscyclesthroughdynamicallocationbetweenvarioussectorsandstocksatdifferentstagesofbusinesscycles.
*Investors should consult their financial advisors if in doubt about whether the product is suitable for them

Thank you
Mutual Fund Investments are subject to market risks, read all scheme related documents carefully
Call: (022) 6282 7777 (Mon to Sat 9:00 am to 5:30 pm) | SMS: TMF to 57575 | www.tatamutualfund.com