TR15.pdf - National Weather Service
100
-
Upload
khangminh22 -
Category
Documents
-
view
1 -
download
0
Transcript of TR15.pdf - National Weather Service

NOI\A TEI.l!NICAL REP0RTS
National Weather Service Series
The National Weather Service (N\'iS) makes observations and measurements of atmospheric phenomena, develops and distributes forecasts of weather conditions and warnings of adverse weather, and collects and disseminates weather information to meet the needs of the public and specialized users. The 1\WS develops the national meteorological service system and the improved procedures and techniques for weather and hydrologic measurements and forecasts, and for their dissemination.
N\'IS series of NOAI\ Technical Reports is a continuation of the former series, ESSI\ Technical Report Weather Bureau (\VB).
Reports 1 to 3 are available from the Nation8l Technical Information Service, fl.S. Denartment of Commerce, Sills Bldg., 5285 Port Royal Road, Springfield, Va. 22151. Prices vary. Order by accession number (at end of each entry). Beginninr, with 4, Reports are available from the Superintendent of Documents, U.S. Governnent Printing Office, Washington, D.C. 20402.
ESSI\ Technical Renorts
\VB '·lonthly 'lean 100-, SO-, 30-, and 10-'lilHbar Charts January 1964 through December 1965 of the IQSY Period. Staff, Upper Air Branch, National ~leteorological Center, February 1967 (AD 651 101)
\I'B 2 Weekly Synoptic Analyses, 5-, 2-, and 0.4-Hb Surfaces for 1964 (based on observations of, the 11eteorological Rocket Network during the I(lSY). Staff, Ppner 1\ir Branch, National ~·!eteorological Center, April 1967 (AD 652 696)
li'B 3 1\'eekly Synoptic Analyses, 5-, 2-, and 0. 4-'!b Surfaces for 1965 (based on observations of the Heteorological Rocket Network during tlw IQSY). Staff, !lpner Air Branch, :-.lational 'leteorolo~,;ical Center, August 1<167 (AD 662 053)
I'!B 4 The 'larch-/lay 1965 Floods in the Upper '1ississippi, 'lissouri, and Red River of the North Basins. J. L. !!. Paulhus and E. lt. Nelson, Office of Ilydrology, August 1967. Price $0.60.
\\'B 5 Climatological Probabilities of Precinitation for the Conterminous United States. Donald L. Jorgensen, Techniques Developnent Laboratory, December 1967. Price $0.40.
1\'B 6 Climatology of Atlantic Tropical Storms and Hurricanes. H. A. Alaka, Techniques Development Laboratory, 'lay 1968. Price $0.20.
l'IB 7 Frequency and Areal Distributions of Tropical Storm Rainfall in the l!ni ted States Coastal Region on the Gulf of )fexico. l!ugo V. Goodyear, Office of l!ydr.ology, July 1968. Price $0.35.
\\'B 8 Critical Fire \\'eat her Patterns in the Conterminous llni ted States. 'lark ,T. Schroeder, Weather Bureau, January 1969. Price $0.40.
WB 9 Weekly Synontic Analyses, 5-, 2-, and 0. 4-'!b Surfaces for 1966 (based on meteorological rocket-sonde and high-level rawinsonde observations). Staff, llpper Air Branch, National ~leteorological Center, January 1~69. Price $1.50.
WB 10 ·llemispheric Teleconnections of /lean Circulation Anomalies at 700 ~fill ibars. James F. 0 'Connor, National 'leteorological Center, Fehruary 1969. Price S 1. 00.
Wll 11 llonthly He an 100-, 50-, 30-, and lfl-1-lillibar Charts and Standard Deviation I laps, 1966:..196 7. Staff, Upper Air Branch, National l·leteorological Center, Apri 1 1969. Price $1.25.
1\B 12 Weekly Synoptic Analyses, 5-, 2-, and 0. 4-'!illibar Surfaces for 196 7. Staff, Upper Air Branch, National l!eteorological Center, January 1970. Price $1.50.
~!OAA Technical Reports
Nl'iS 13 The l·!arch-April 1969 Snowr1el t Floods in the P,ed River of the 1\orth, llpper Jfississippi, and 'lissouri Basins. Joseph L. ll. Paulhus, Office of !lydrology, Octoher 1970. Price $1.25. (C0\1-71-50269)
~!IVS 14 l'ieekly Synontic Analyses, 5-, 2-, and 0.4-"illihar Surfaces for 1968. Staff, llpper /\ir Branch, National 'leteorolop,ical Center, Hoy 1971. Price $1.55. (Cm!-71-50383)

NOAA Technical Report NWS 15
Some Climatological Characteristics of Hurricanes and Tropical Storms, Gulf and East Coasts of the United States Francis P. Ho, Richard W. Schwerdt, and Hugo V. Goodyear
WASHINGTON, D.C. MAY 1975
UNITED STATES /NATIONAL OCEANIC AND / Nat10nal Weather DEPARTMENT OF COMMERCE ATMOSPHERIC ADMINISTRATION Service Rogers C. B. Morton, Secretary Robert M. White. Administrator George P. Cressman, Director


Contents
Page 1. Introduction . . . . . . . . . . . . . . . . . . . . . . . . . . . . . . . . . . . . . . . . . . . . . . . . . . . . 1
1. 1 Purpose . . . . . . . . . . . . . . . . . . . . . . . . . . . . . . . . . . . . . . . . . . . . . . . . . . . . . . . . . 1
1.2 Scope of report 2
1.3 Sources of data 4
1.4 Previo.us studies . . . . . . . . . . . . . . . . . . . . . . . . . . . . . . . . . . . . . . . . . . . . . . . . 4
1.5 Funding . . . . . . . . . .. . . . . . . . . . . . . . . . .. . . . . . . . . . . . . . . . . . . . . . . . . . . . . . . 13
2. Frequency of hurricane and tropical storm occurrences •..•..•.... 13
2.1 Classification of hurricanes and data ••••.•..••.•.••••..•.•....• 13
2.2 Frequency of landfalling hurricanes and tropical storms .•••.•.•• 13
2.3 Frequency of exiting hurricanes and tropical storms •...••.•..... 23
2. 4 Frequency of alongshore hurricanes and t.ropical storms • . • • . . • • • • 23
2.5 Ratio of hurricane to total storm occurrences .••.••.•••.•.•.•.•• 25
3. Probability distribution of central pressure •...•..••...•.•.•.•• 30
3.1 Data . . . . . . . . . . . . . . . . . . . . . . . . . . . . . . . . . . . . . . . . . . . . . . . . . . . . . . . . . . . . 30
3.2 Analysis . . . . . . . . . . . . . . . . . . . . . . . . . . . . . . . . . . . . . . . . . . . . . . . . . . . . . . . . 33
3.3 Results . . . . . . . . . . . . . . . . . . . . . . . . . . . . . . . . . . . . . . . . . . . . . . . . . . . . . . . . . 35
3.4 Evaluation of results . . . . . . . . . . . . . . . . . . . . .. . .. . . .. . .. . .. . .. . . . . . . . . . . . 39
4. Probability distribution of radius of maximum winds •.•••.••..••• 41
4.1 Data . . . . . . . . . .. . .. . . . . .. . . . . . . . . . . . . . . . . . . . . . . . . . . . . . . . . . . . . . . . . . . . 41
4.2 Analysis . . . . . . . . . . . . . . . . . . . . . . . . . . . . . . . . . . . . . . . . . . . . . . . . . . . . . . . . 48
4.3 Reasonableness of analysis • • • • • . . • • . • • . • . • • . . • • • • • • • . . • . . . • • . . • • 51
4.4 The radius of maximum winds of Hurricane Camille •••••...••..•..• 52
5. Probability distribution of speed and direction of storm motion • 55
5.1 Speed of storm motion ....••••....•••..•.•••.•••••.•.•••..••.•••. 55
iii

Page
5.2 Forward speed probability distribution for landfalling hurricanes 55
5.3 Forward speed probability distribution for alongshore hurricanes 56
5.4 Probability distribution of direction of storm motion for landfalling tropical storms and hurricanes .••.•......•........•.. 59
6. The joint probability question ................................... 67
6.1 Central pressure, p0
, vs. radius of maximum wind, R ••.•.....•.••• 67
6.2 Forward speed, T, vs. direction of motion, 8 .•...•............... 70
6. 3 Other joint probability questions ................................ 71
7 . Sunu:nary . . . . . . . . . . • . . . . . . . . . . . . . . . . . . . . . . . • . . . . . . . . . . . . . • . . . . . . . . . 71
7.1 Highlights .......•••.•.••••.•..••...•.••••....•.•.•.•.•...•••.•... 71
Re.ferences ............................................... ., ......... 74
Acknowledgments • • • • . . . • . . . . . . . • • . . . • • • . . . . . • • . . • . . . • • • . • • • • . . . . . . 7 6
Appendix- Track density method for storm frequency .•....••....•• 77
Track frequency . . .. . . . . . . . . . . . . . . . . . . . . . . . . . . . . . . . . . . . . . . . . . . . . . . 7 7
Direction probability ••.....••••.•..•....••.•........••..•..•••. 78
Landfalling frequency· ....•.•••.......•.•........•.•...•.......•• 78
Necessity of octagons ......•..••............••••.....•...•...••. 79
iv

Tables
Table !.--Hurricanes with central pressure < 982mb (29.00 in) ranked in chronological order from 1900-73,
Page
gulf coast United States . . . . . . . . . . . . . . . . . . . . . . . . . . . . . . . . . . . . . 5
Table 2.--Hurricanes with central pressure< 982mb (29.00 in) ranked in chronological order from 1900-73, east coast United States . . . . . . . . . . . . . . . . . . . . . . . . . . . . . . . . . . . . . . . . . . 9
Table 3.--Count of hurricane and tropical storm tracks crossing lines normal to the coast -- Q871-1973) • . . . . . • . . . . . • . . . . . . . . . . 26
Table 4.--Frequency of hurricane and tropical storm tracks crossing lines normal to the coast-- Q871-197~ .............. 27
Table 5. --Data for probability analysis . . . . . . . . . . . • . • . • . . . . . . . . . . . . . . . . 72
Illustrations
Figure
!.--Locator map with coastal distance intervals marked (n.mi.)......... 3
2.--Count of landfalling tropical storms and hurricanes (1871-1973) by 50-n.mi. segments of a smoothed coastline (points plotted and connected by dashed lines). Solid line denotes the entry frequency curve obtained by applying the objective smoothing function .......................... 15
3.--Smoothed coastline obtained by applying the objective smoothing function of figure 2.~ ..............•..............•.•... 17
4.--Coastal segments selected for frequency analysis by track density method (result shown in fig. 5) ............•.•....... 18
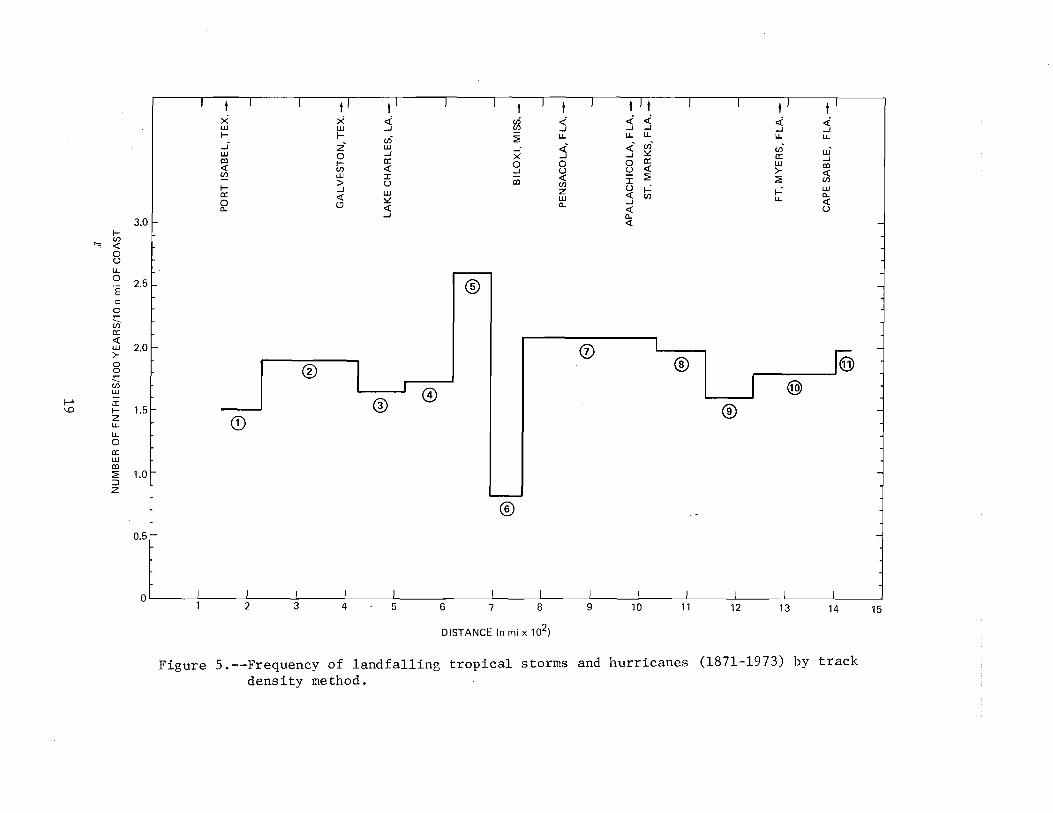
5.--Frequency of landfalling tropical storms and hurricanes 0871-1973) by track density method................................. 19
6.--Adopted frequency of landfalling tropical storms and hurricanes (1871-1973) for the gulf and east coasts of the United States.................................................. 21
7.--Frequency of exiting hurricanes and tropical storms (1871-1973). Curve fitted subjectively............................ 24
8.--Accumulative count of hurricane and tropical storm tracks passing the coast at sea (1871~1973). Based on counts along heavy dashed lines shown projected normal to coast .•.•.....•. 28
v
Figure Page
9.--Ratio of landfalling hurricanes to total number of landfalling hurricanes and tropical storms (1886-1973). Based on counts in overlapping zones centered at 50-n.mi. intervals and objective smoothing along the coast ....•.•....•.•...•••••.•..•••••••. ~ • . • • • • • 29
10.--Graphs of central pressure vs. cumulative percent of occurrences (a) Gulf of Mexico (milepost 750), near Bay St. Louis, Miss., where hurricane Camille went ashore and (b) east coast (milepost 1950) along central South Carolina coast. . . . . . . . . . . . . . . . . . . . . . . . . . . . . . . . . . . . . . . . . . . . . . . 34
11.--Probability distribution of central pressure of hurricanes, gulf and east coasts (1900-73). Numbered lines denote the percent of storms with p0 equal to or lower than the value indicated along the ordinate. Plotted points (A) ·are taken from frequency analyses at 50-n.mi. intervals for the 5th percentile (sec. 3. 2).................................. 36
12.--0ne-percentile chart of minimum central pressure of hurricanes and tropical storms for the Gulf of Mexico and surrounding areas. Pressure values plotted at the centroid of data reference points for each 50-n.mi. increment of coast .............................................. .,.... 37
13.--Fifty-percentile chart of minimum central pressure of hurricanes and tropical storms for the Gulf of Mexico and surrounding areas. Pressure values plotted at the centroid of data reference points for each 50-n.mi. increment of coast . ............................................... .
14.--Graph of wind speed and station-to-hurricane-center distance vs. time at Miami, Fla., Se.ptember 15-16, 1945. The radius of maximum winds determined by the relation of peaks in the wind curve to distance from Miami to the storm center is 24 n.mi ................................... ~ ... .
15.--Radius of maximum winds (RMW) vs. inner radar eye radius (IRR). Points falling on the 45° line are those where the RMW and IRR coincide. The curved line indicates the best fit curve (from Shea 1972) •.••..••..•••••....•••••••••..••••••
16.--Difference between the radius of maximum winds (RMW) and the inner radar eye radius (IRR) vs. maximum wind speed. The best fit curve is indicated by th.e heavy line (from Shea 1972) ...................... .......... · · · · · · • · • · · • · · · · · · • • • · • • ·
17.--Variation of the radius of maximum winds with. elevation for (a) storms with simultaneous lower and upper tropospheric reconnaissance data and (b) storms in which two or more simultaneous reconnaissance missions were flown in the lower troposphere only ·(from Shea 1972) ••••...•.•••••••..•. • • • • •. • •
vi
38
43
44
44
45

Figure
18.--Graphs of rad~~~ of maximum winds vs. cumulative percent of occurrences (a) Gulf of Mexico (milepost 750), near Bay St. Louis, Mi~s., where hurricane Camille went ashore and (b) east coast (milepost 1950), along central South Carolina coast ... ................................................... .
19.--Probability distribution of radius of maximum winds of hurricanes, gulf and east coasts (1900-73). Numbered. lines denote the percent of storms with R equal to or less than the value indicated along the ordinate. Plotted points (A) are taken from frequency analyses at 50-n.mi. intervals for the 16-2/3 percentile (sec.4.2) ••....••..
20.--Hand-drawn sketch of New Orleans (Moisant Field) radar image, August 18, 1969, at 0431 GMT. Note locations of the eye center (x), inner wall cloud radius (a), wall cloud center radius (b), and outer wall cloud radius (c) ...•••••.•.
21.--Composite graph of inner wall cloud radius, wall cloud center radius, and outer wall cloud radius vs. time for Camille. Storm made landfall about 0430 GMT •••••••••••••••••••••••
22.--Landfalling hurricanes, forward speed vs. cumulative percent of occurrences, (a) Gulf of Mexico (milepost 750) near Bay St. Louis, Miss., (b) east coast (mile-post 1950) along central South Carolina coast .•••.•...•••••••••.•••
23.--Probability distribution of forward speed for landfalling hurricanes, 1886-1973. Numbered lines denote the percent of storms with forward speed equal to or less than the value indicated along the ordinate. Plotted points (A) are taken from frequency analyses at 50-n.mi. intervals for the BOt~ percentile (par. 5.2.1) .....••••.•...•••••••••.•.••.••
24.--Probability distribution of forward speed for alongshore hurricanes, 1886-1973. Numbered lines denote the percent of storms with forward speed equal to or less than the value indicated along the ordinate. Plotted points (A) are taken from frequency analyses for the 80th percentile (par. 5.3.1) ....................... ............................... .
25.--Scatter diagram of direction of storm motion measured at the point of landfall, 1871-1973. Circled dots denote
Page
49
50
53
54
57
58
60
two events. . . . . . . . . . . . . . . . . . . . . . . . . . . . . . . . . . . . . . . . . . . . . . . . . . . . . . . . . 61
26.--Landfalling hurricanes and tropical storms, direction of motion vs. cumulative precent' of occurrences, (a) Gulf of Hexico (milepost 750) near Bay St. Louis, Miss., (b) east coast (milepost 1950) along central South Carolina coast .....••••.• ; ..... 62
vii

Figure
27.--Probability distribution of direction of landfalling storm motion for gulf coast. Numbered lines denote the percent of storms approaching the coast at an angle equal to or less than the value indicated along the ordinate. Plotted points (A) are taken from frequency analyses at 50-n.mi. intervals for the 50th percentile (sec. 5.4) ••...•••.•..••...•••...•.•.•...•.•••..•
28a.-Probability distribution of direction of landfalling storm motion for east coast, south of Cape Hatteras, N.C. Notations are the same as figure 27 •..•••...•.•..••...•••••
28b.-Probability distribution of direction of landfalling storm motion for east coast, north of Cape Hatteras, N.C. Notations are the same as figure 27 •...••.•••••••.....•••••
29.--R vs. p0 , Gulf of Mexico hurricanes. Data from table 1. Numbered lines denote the percentile of storm occurrences •.•..•..
30.--Same as figure 29 except for east coast hurricanes;
Page
63
64
65
68
data from table 2. . . . . . . • . . • • . . . . . . . . . . . . . . . . . • . . . . . . • • • . . . . . . • • . 69
Appendix Illustrations
A-1.--0ctagon for counting hurricane tracks........................... 79
A-2.--Hurricane and tropical storm track count for 2.5° octagons in the Gulf of Mexico. 1871-1973...................... 80
A-3 to A-16.--Hurricane and tropical storm track direction histograms and probability distributions for gulf coast octagons. 1871-1973...................................... 81-87
viii

Some Climatological Characteristics of Hurricanes and Tropical Storms, Gulf and East Coasts
of the United States
Francis P. Ho, Richard W. Schwerdt, and Hugo V. Goodyear
ABSTRACT
A climatology of hurricane factors important to storm surges is presented for the U.S. gulf and east coasts. A smoothed frequency of tropical storms and hurricanes entering and exiting the coast and storms passing within 150 n.mi. of the coast during the period 1871-1973 is given. The central pressure for hurricanes and tropical storms and the radius of maximum winds and speed of forward motion for hurricanes were obtained from data analysis. Directions of landfalling hurricanes and tropical storms at the time they crossed the coast at selected points were also analyzed. The probability distribution of each factor was plotted and analyzed for each 50-n.mi. interval along the coast. Selected probability levels of each distribution were then summarized, and smoothed variations along the coast were obtained by analysis. The speeds of motion for two classes df hurricanes (those that entered the coast and those that passed within 150 n.mi. of the coast) were studied separately and a smooth speed analysis determined for each. The question of joint probability among the various factors and with latitude is discussed qualitatively.
1. INTRODUCTION
1.1 Purpose
This report assembles in one volume hurricane climatological data that have been developed in studies by the National Weather Service (NWS) of the National Oceanic and Atmospheric Administration (NOAA) for the Federal Insurance Administration (FIA) of the Department of Housing and Urban Development (HUD) and the Corps of Engineers (CoE), U.S. Army.
The FIA is the executive agency for the "National Flood Insurance Act of 1968" (Public Law 448, 90th Congress, Title XIII). This act provides for a national Flood Insurance Program for insuring residences and small businesses against the hazard of damage or destruction by floods. A flood frequency analysis is essential to establishing this program for a given community. The Flood Insurance Act directs other federal agencies to cooperate with HUD in developing the frequency analyses required by the Flood Insurance Program. HUD has solicited the assistance of NOAA in these technical assessments for

coastal regions. Coastal tidal inundations on the gulf and Atlantic coasts on the United States are primarily caused by hurricanes.! Therefore, the characteristics of these storms are the beginning point in making tidal flooding frequency analyses. This report is a climatological assessment of the central pressures, radius of maximum winds, forward speed, and other characteristics of hurricanes along the U.S. east and gulf coasts in a manner suitable for determining the frequency of storm surge levels. The report includes only the atmospheric characteristics of hurricanes and does not include surge levels that are contained in other reports.
The Flood Control Act of 1936 gave the Corps of Engineers responsibility for constructing flood control proj~cts throughout the United States. This includes coastal protective works against high storm tides. Public Law 71, 84th Congress, 1st session, 1955, directs the Chief of Engineers to determine areas of potential damage from hurricanes and to propose remedial measures. This "shall include the securing of data on the behavior and frequency of hurricanes, ... and possible means of preventing loss of human lives and damages to property, with due consideration to the economics of proposed breakwaters, seawalls, dikes, dams, and other structures, warning services or other measures which might be required." Under reimbursable funds the Hydrometeorological Branch, NWS, since 1955 has assisted the Corps of Engineers by carrying out studies determining meteorological factors important to storm surges, reconstructing wind fields of historical and hypothetical storms, and developing criteria for a Standard Project Hurricane, defined as the "most severe hurricane considered reasonably characteristic of a region" for the gulf and Atlantic Coasts.
The present report is an update of similar hurricane climatological data published in the first Standard Project Hurricane bulletin (Graham and Nunn 1959). It includes hurricanes influencing the coast through 1973 and more detPtled regional analysis than the earlier report. It is the first step in a proposed revision of the Standard Project Hurricane criteria.
1.2 Scope of Report
The geographical region covered by the report is the U.S. gulf and Atlantic coasts from Texas to Maine (fig. 1). The first objective is to define climatologically the frequency of hurricanes and tropical storms influencing each coastal reach. This is done in three classes -- storms entering the coast from the sea (entering or fandfalling), storms having entered one coast and then proceeding from land to sea at another coaptal point (exiting), and, thirdly, storms skirting the coast close to shore b~c with the center remaining at sea within 150 n.mi. of the point under consi~eration (alongshore or bypassing). It is possible for the same storm to be considered in each of the three classes at different times. Probability diacributions are developed and the along-coast variation depicted of hurricane central pressures,
1of course, extratropical storms such as that of March 1962 have also wrought severe damage.
2

Figure 1.--Locator map with coastal distance intervals marked (n.mi.).
3

an index to storm intensity; the radius of maximum wind, an index to the storm lateral extent; forward speed; and direction of motion. Each of these factors influences the capability of the storms to produce storm tides. The degree of statistical independence of these four parameters is discussed in chapter 6 of this report.
Hurricanes are a threat to life and property not only from storm tides, but from the wind, and from rain-induced floods. These factors are not included in the present report. Thorn (1968) discusses extreme fastest-mile wind speeds and illustrates this with 2-, 10-, 25-, 50-, and 100-yr mean recurrence interval maps for the United States. The great majority of extreme fastest-mile wind speeds along the gulf and Atlantic Coasts south of Cape Cod have occurred during hurricanes. ~he frequency and areal distributions of tropical storm rainfalls in a form suitable for use in engineeri~g design criteria along the gulf coast is the subject of a report by Goodyear (1968).
1.3 Sources of Data
Tables 1 and 2 list the factors discussed in the various chapters of this report for hurricanes during the years 1900-73. These data are an update, revision, and extension of table A in National Hurricane Research Project Report No. 33 (Graham and Nunn 1959). The original sources of the data are barograph traces from land stations and ships, wind records from National Weather Service and military stations', aircraft reconnaissance flight data, radar data, miscellaneous pressure and wind reports, and textual descriptions in scientific literature. These descriptions have appeared in the periodicals Monthly Weather Review (published since June 1872), and Climatological Data National Summary (since 1950), National Hurricane Research Project Report No. 39 (Graham and Hudson 1960), NOAA Technical Memorandum NWS SR-56 (Sugg et al. 1971), the book Tropical Cyclones (Cline 1926), and a few other sources.
Tropical cyclone track information_was used to determine the frequency of entering, exiting, and alongshore tropical storms and hurricanes, direction of forward motion, and in some cases forward speed. Tracks from 1871-1963 are from Cry (1965),-and from the Monthly Weather Review beginning with 1964.
1.4 Previous Studies
One of the first systematic compilations of the characteristics of hurricanes affecting the coast of the United States is Tropical Cyclones (Cline 1926). Table 1 in Hydrometeorological Report No. 32 (Myers 1954) provides the first compilation of all hurricane central pressures and Rs (radius of maximum winds) during a definite period of years. National Hurricane Research Project Report No. 33 (Graham and Nunn 1959) updates the list and systematizes the geographical distribution of the factors. Technical Paper No. 55 (Cry 1965) describes all the hurricane tracks during a definite period of time and cites the earlier works of this kind. HUR 7--97, Interim Report -Meteorological Characteristics of the Probable Maximum Hurricane, Atlantic and Gulf Coasts of the United States (NOAA 1968) updates and revises the data in NHRP No. 33 and gives the geographical distribution of the characteristics of the hypothetical hurricane having that combination of characteristics
4

VI
Table 1.--llurricanes with central pressure < 982 mb (29.00 in.) ranked in chronological order from 190Q-73
Date* (GMT)
Sept. 9, 1900
Aug. 15, 1901
June 17, 1906
Sept, 27, 1906
Oct. 18, 1906
July 21, 1909
Sept. 20, 1909
Oct. 11, 1909
Oct. 17, 1910
Aug. 17, 1915
Sept. 29, 1915
July 5, 1916
Aug. 18, 1916
Oct. 18, 1916
Sept. 29, 1917
Sept. 10, 1919
Sept. 14, 1919
Sept. 21, 1920
June 22, 1921
0<\t. 25' 1921
Storm name
Approx. coastal reference point t (see fig. 1)
373
763
1393
795
1419
360
657
1419by
1343
373
671
810
184
842
892
1355by
213
630
309
1207
Oct. 20, 1924 · 1355
- See Legend at end ot · table 2.
Storm direction (clockwise from north)
130°
195°
1ss•
160°
230°
us•
rso•
235°
2oo•
130°
no•
160°
ns•
220"
230°
no•
105°
155°
175°
235°
2so•
Gulf Coast United States
p Pot Station(s) R where R was
(mb) (in.) P 6 value applied to
a (mb)
Station(s) where P a was
observed (n. mi.) observed T
(kt) Remarks
936.0
972.6
979.0
965.1
976.6
958.7
980.0
957.0
941.4
948.5
932.3
961.1
948.2
973.9
964.4
929.2
947.9
979.7
953.9
952.3
971.9
27.644 •
28.72 ...
28. 9lb'
28.84b'
28. 94b.
28.01.
27.534•
28. 38a'
28.76°,
a' 28.48
Coast
Coast
Coast
Coast
Coast
Coast
Coast
964~4 Galveston~ Tex. 14a
992,6 Mobile, Ala. 33a
997.6 Jupiter, Fla. 26a
965.1 SS Winona 43° Mobile, Ala. anchored off Scranton, Miss.
990.9 Jupiter, Fla. 35"
982.1 Bay City, Tex. 194
989.8 New Orleans, La. MSG
Knights Key,957.0 Knights Key,Fla. 22b Key West, Fla. Fla.
12 n.mi. S, 941.4 Dry TortuJ:laS. Fla.
Coast 952.9
SS Jean
Velasco, Tex.
16"
29b Galveston and Houston, Tex.
10
14
10
16 SS Winona in eye of storm while anchored off Scranton, Miss.
12
11
10
11 SS Jean in eye of storm (12 n.mi. south of Dry Tortugas • Fla.)
11
21 .o•N. 89, 3"W
935.0 HMS Hennione 264 b New Orleans, La. 10 & other· stttt.ipJta
HMS Hermione experienced some eye effects at an unknown distance from the point of minimum pressure*
Coast
Coast
Coast
Coast
979.3 Mobile. Ala. 45b Mobile, Ala; 25
946.2 Santa Gertrud is • 258
Tex. 11
973.9 Pensacola, Fla. Pensacola, Fla. 21
965.5 Pensacola~ Fla. 33b Pensacola, Fla. 13
d' · Dry 929.2 See Remarks 154
8 Lowest pressure obtained from mean of two ships (lake Winona, Fred W. Weller) and Dey Tortugas, Fla.
27.99°.
28.17b'
28.12c'
Tortugas, Fla.
Coast
Coast
Coast
Coast
947.9 Port Aransas, Tex.
981.7 Houma, La.
MSG
283
994.6 Houston, Tex. 173
952. 3 Tarpon Springs, lBa Fla.
a' 28.70 Dry Tortugas, See Remarks 19a
Fla.
20
28
11
10
8 :Parameters obtained by interpolation between SS Toledo (off western end of Cuba) and Miami, Fla., and applied to the vicinity of Dry Tortugas, Fla.

(j\
Aug.
Date* (GMT)
26, 1926
Sept. 20, 1926
Oct. 21, 1926
Sept. 17, 1928
June 28, 1929
Sept. 30, 1929
Aug. 14, 1932
Aug. 5. 1933
Sept. 4, 1933
Sept. 5, 19 33
June 16, 1934
Sept. 3, 1935
Nov. 5, 1935
July 31, 1936
Aug. 8, 1940
Sept. 23, 1941
Oct. 7, 1941
Aug. 30, 1942
July 27, 1943
Oct. 19, 1944
Aug. 27, 1945
Storm name
Approx. coastal reference point
t (see fig. 1)
603
842
1419by
1552
296
966
373
109
1525
139
617
1393
1393ex
904
468
348
996
309
419
1292
309
See Legend at end of table 2.
Storm direction (clockwise from north)
1so•
140°
220
120°
130°
160°
135°
070°
120°
o9o•
1so•
130°
065°
150°
140°
180°
170°
135°
uo•
195°
185°
Table !.--Continued
Gulf Coast United States
p 0 t p p Station(s) R where R was
(mb) (in.) o value
§pplied to a
(mb)
Station(s) where P a was
observed (n.mi.) observed T
(kt) Remarks
958.7
955.0
931.9
958.3
969.2
975.3
942.4
975.3
964.4
948.9
965.8
892.3
972.9
963.8
971.9
958.7
981.4
950.6
974.6
948.9
967.5
28.3la' c'
28.2oc'
Coast
CoaSt
958.7
955.0
Houma, La.
Perdido BeaCh, Ala.
27a
17b-. Pensacola, Fla.
218 27.52a'
28.3o•'
28.62a'
2S.soc'
27.s{'
60 n.mi. So. 987.5 Ker West,Fla.
50 n. mi. East inland Coast from coast 935.3
Coast 986.1
Key West, Fla.
West Palm Beach MSG and Everglade& Exp. Sta., Fla.
Port O'Connor, 13a Tex.
Coast 975.3 Panama City, Fla.
55b Pensacola, Fla.
Coast 942.4 East Columbia, 128
Tex.
10
16
12
15
15
2s.soa' Coast 981.4 Brownsville,Tex. 25b Brownsville,Tex. 10
Lowest pressure for the gulf coast occurred as th'e storm was fill~ng about 9 n.mi. west of Avon Park, Fla., or about 50 n.mi. eastsoutheast of Tampa Bay.
Storm becoming extratropicaL
28.48a' 50 n.mi. East inland from Coast coast 947.5
Jupiter, Fla. 29b Tampa, Fla. 11 Lowest pressure for the gulf coast
28.028•
28.528•
26. 35c'
Coast
Coast
Long Key, Fla.
950.6 Brownsville, Tex. 20b Brownsville, Tex.
967.8 Jeanerette, La. 37a
892.3 Long Key, Fla. 6a
c' 28.73 East Coast 972.9 Miami,Fla. lOb c d Miami, Fla.
28.468•
28. 70c'
28. Jlb. is. 98a'
28.078•
28. 78c'
ref. point 1459
Coast
Coast
Coast
Coast
Coast
Coast
972.9 Valpariso, Fla. 198
971.9 Sabdne, Tex.
970.5 Houston, Tex.
u•
21"
982.1 Carrabelle,Fla. 18a
951.6 Seadrift, Tex. 18a
974.6 Ellington Field, 16b Houston, Tex. Tex.
c' a 28.02 Dry 948.9 Dry Tortugas,Fla.27
Tortugas,Fla.
28.57c' Coast 967.5 Palacios, Tex. 188
16
.15
8
13
11
14
8
13
occurred as the stom was filling just west of Avon Park, Fla., or 50 n.mi. east-southeast of Tampa Bay.

Table !.--Continued
Gulf Coast United States
Approx. coastal Storm direction p
0 + p p Station(s) Station(s)
Date* Storm reference point from o value a where Pa was R where R was T (GMT) name t (see fig. 1) (mb) (in.) applied to (mb) observed (n.mi.) observed (kt) Remarks
-------·~-·--·--------------------,· Sept. 15, 1945 1433 130. 951.2 28.09c Coast 951.2 Homestead • Fla ~ 21l~ Miami, Fla. 10 l,owest pressure observed by Fla.
East Coast Railroad personnel at Homestead, Fla • .
28.03"' 34b Sept. 18, 1947 1330ex 085 949.2 50 n.llli. East Hillsboro, Fla. Miami, Fla. 7 Lowest pressure for the gulf coast inland from Coast coast 947.2 occurred some 50 n, mi. east-north-
east of the Ten Thousand Island area of southwest Florida as the storm vas weakening.
Sept. 19, 1947 716 us• 966,5 28,548 I 9 n.mi. SW 967.5 New Orleans WBO, New Orleans, La. 16 New Orleans La.
Sept. 21, 1948 27 .628'
IIBO, La. 7" 1380 no• 935.3 8 n. mi. east 963. 4 Boca Chica 8
Boca Chica Airport, Fla. Airport ,Fla ~
Oct. 5, 1948 1446 230' 977.0 28.858' Coast 979,3 Miami, Fla. 31" Miami, Fla. 13
Aug. 27. 1949 1525 130' 960.7 28.378' 50 n,mi, East West Palm Beach, West Palm Beach, 14 Lowest pressure for the gulf co».st
inland from Coast Fla. Fla. occurred as the storm was filling coast 954.0 about 10 n.mi. east-southeast of
-....! Lake Placid, Fla., or 50 n.mL north-east of Charlotte Harbor (Gulf of Mexico).
Oct. 4, 1949 360 190' 963.4 28.4581
Coast 978.0 5 Miles SW of 20b Composite of many 11 Freeport, Tex. ·Texas stations
Aug, 31, 1950 (Baker) 810 190. 979.3 28. n"' Coast 979.3 Ft. Morgan. Ala. 214
23
Sept. 5, 1950 (Easy) 1162 230° 958.3 28.3o"' Cedar Key, 958.3 Cedar Key, Fla. 15" d Fla.
Oct. 18, 1950 (King) 1459 1so• 978.0 28.884 • 50 n.mi. East Miami, l'la. MSG 17 Lowest pressure for the gulf coast inland from Coast occurred as the storm was filling coast 955.0 about 12 n.mi. east-southeast of
Haines City, Fla., or 50 n.mi. east-northeast of Tampa Bay.
Sept. 24, 1956 (Flossy) 904 zso• 973.9 28. 76d t e• Coast 973.9 See Remarks 22b Burr·wood , La. 10 Lowest pressure taken from the barom-eter of a dredge within the eye at Destin, Fla.1 and from a reconnaissance plane just off the coast at Pensacolat Fla.
June 27. 1957 (Audrey) 451 200. 946.5 27.958 , Coast 958.4 Hackberry, La. 198
14
Sept. 10, 1960 (!lonna) 1330 170° 933.0 27.55 c' Conch Key. 933.0 Conch Key, Fla. zoe Near Conch Key, 9 Fla. Fla.
Sept. 15, 1960 (Ethel) 747 175• 972.0 28. 70e' 150 n.mi. s.972.0 Aircraft 18b Keesler AFB,Miss. 10 off Mias. Reconnaissance Delta
S-ee Legend at end of table 2~

Table !.--Continued
Gulf Coast United States
Approx. coastal Storm direction p t p p Station(s) Station(s) Storm reference point (clockwise from () o value a where P8 was lt where R was T name t (see fig. 1) north) (mb) (in.) applied to (mb) observed (n.mi.) observed (kt) Remarks
---------
Sept. 11, 1961 (Carla) 296 170' 930.9 27.49e' Coast 930.9 Aircraft 20d 0 Lowest pressure indicated by air-Reconnaissance craft reconnaissance off Po'ft
OfConnor, Tex. A recently cali-brated barometer at Port Lavaca, Tex. ~ read 27.62 in. (935.3 Jllb) for 1 hr, 50 min. Available information indicated the needle was below scale during that period.
Oct. 4, 1964 (Hilda) 590 175' 959.4 Coast 961.7 Franklin., La~ n" Near 26°N, 92iJW
Oct. 14, 1964 (Isbell) 1368 no• 964.1. 28.47"' 24.3'N, 964.1 Aircraft lOd e Near 24°N, 831)W 15 82. 7'W Reconnaissance
Sept. 8, 1965 (Betsy) 1419 090' 947.9 27.99el 25~2°N• 947.9 Aircraft 198
e West of Cape 15 82.1'W Reconnaissanee Sable, Fla.
Sept. 10, 1965 (Betsy) 657 135' 941.1 27.79111
28. 2°N 1 946.2 Aircraft 32a b c Port Sulphur ,La. 17
89. 2•w Reconnaissance at 27 .. 9.,Nt 88.s•w
(X) 23c d e Near 30°N, c 1 e Dry Tor-tugas Dry Tortugas,
June 9, 1966 (Alma) 1026 200' 970.2 28.65 & 60 n.mi. W 970.2 Fla. & Air- 84'W of Cedt.n Key; craf.t Recon.
za.as"' Fla.
Oct. 4, 1966 (Inez) l419by 065' 977 .o 24.l'N, 977.0 Aircraft 19b Key West, Fla. 84.2'W Reconnaissance I Lowest pressure 135 n.roi. w-sw
Key West, Fla.
Sept. 20, 1967 (Beulah) 169 155' 923.1 27.26e' 24.8-oN, 923.1 Aircraft 2Sh Brownsville,Tex. 96.3°11 Reconnaissance
Oct. 19, 1968 (Gladys) 1162 235' 977.0 28.85e' Coast 977 .o Aircraft n• 10 Reconnaissance
Aug. 18, 1969 (Camille) 747 160' 907.9 26.81 e' 28 .. 2.,N, 907.9 Aircraft 8d e Near 28°N, s9•w 16 See pa~es 32, 52, 55.
as.a•w Reconnaissance
Aug. 3, 1970 (Celia) 243 115' 944.5 Coast 944.5 Ingleside, Tex. 9b Corpus Christi; 14 Tex~
Sept. 12, 19 70 (Ella) 11 1oo• 966.8 28. 55•' Coast 966.8 Aircraft 2l" Reconnaissance
Sept. 10, 1971 (Fern) 243 o5o• 979.0 28.91•' Near coastal 979.0 Aircraft 26b Palacios and 5 Aircraft reconnaissance Ref. Point Reconnaissance Point Comfort, Te'K. lowest pressure just the Tex ..
za.sa•' 340 coast: south of Matagorda, Tex.
Sept. 16, 1971 (Edith) 500 230° 978.0 Coast 978.0 Aircraft 27b Lake Charles, La. 15 Reconnaissance
June 19, 1972 (Agnes) 966 195° 978.0 28.8a•' 28.5'N, 978.0 Aircraft 20d e Near 28'JN, 86 c.w 11 85. 7'11 Reconnaissance
See Legend at end of table 2.

Table 2.--llurricanes with central pressure < 982mb (29.00 in.) ranked in chronological order from 190o-73
East Coast United States
Approx. coastal Storm direction Po t Pa
Station(s) Station(s) Date* Storm reference point (clockwise from where Pa was R where R was T (GMT) name t (see fig. 1) north) (mb) (in.) applied to (mb) observed (n.mi,) observed (kt) R~arks
Sept. 12, 1903 1499 120" 976.6 28.84b' Coast 998.0 Tampat Fla. 438
June 17, 1906 1552ex 220" 979.0 28.91b' Gulf Coast 997.6 Jupiter, Fla. 268 12
ref. point 1393
Sept. 17, 1906 2011 105" 981.4 28.98b. Coast 999.0 Columbia, SC 44b Charleston. SC 16
Oct. 18, 1906 l459ex 220° 976.6 28.84b' Coastal ref .!190,9 Jupiter, Fla. 358
61 point 1419
Oct. 11, 1909, 1419by 230° 957.0 28.26c' Knights Key,957.0 Knights Key, Fla. 22' Key West, Fla. 10 Fla.
Aug. 28, 1911 1886 100° 979.3 28.92b. Coast 982.7 Savannah , Ga. 27b Savannah, Ga.
Sept •. 3, 1913 2157 us• 975.6 28,8lb' Coast 994.2 Raleigh, NC 384 b Hatteras, NC 16
Sept. 10, 1919 1355by 120° 929.2 27.44°, d' Dry 929,2 See Remarks 158
8 Lowest pressure obtained Tortugas, Fla. from mean of two ships
1.0 (Lake Winona, Fred II. Weller) and Dry Tortugas, Fla.
Oct. 26, 1921 l659ex 260° 979.0 28.9la' 50 n.mi. Gulf Tarpon Springs,Fla, MSG 10 for the inland from Coast occurred as coast 952.3 the storm was f !I ling a
few miles north of Cler-mont, Fla. • or about 50 n.mi. from the Atlantic Ocean (north of Titus-ville, Fla.)
Aug. 26~ 192~ 2182by 210' 9'/1;9 28.7o"' 25 to 30 n;mf97s. 3 SE of Cape
Hatteras_", ·Nc Cape Hatteras,NC 22
Hatteras, NC
§ Aug. 26, 1924 2731by 220' 971.9 28. 708' 12 n.mi, SE 972,2 Nantucket • Mass 66b Nantucket, Mass. 29 Storm becoming ex.tr.a-
Nantucket, tropical. Mass.
Dec. 2, 1925 2130 220' 980.4 28.954• Coast 987.8 Wilmington, NC Wilmington, NC 14 11. B. Technical Paper
No. 55 that this storm was extra-tropical and did not have hurricane-force winds when
July 28, 1926 isoo 28.343'
it struck the NC eoaat .. 1619 959.7 Coast 975.3 Meritt Island,F1a. 148
Sept. 18, 1926 1433 uo• 934.3 27.594 • Coast 935.0 Miamit Fla .. 244
17
See Legend at end of table 2.

1-' 0
Date* (GMT)
Oct. 21, 1926
Sept. 17, 1928
Sept. 28, 1929
Aug, 23, 1933
Sept. 4, 1933
Sept. 16, 1933
Sept. 3, 1935
Nov. 4, 1935
Sept. 18, 1936
Sept. 21, 1938
Aug. 11, 1940
Sept. 14, 1944
Sept. 15, 1944
Sept. 15, 1945
Sept, 17, 1947
Oct. 15, 1947
Sept. 2i, 1948
Oct, S, 1948
Aug. 24, 1949
Storm name
Approx. coastal reference point
t (see fig. 1)
1419by
1552
1393
2219
iszs
2194
1393
1459
2219by
2576
1899
2194
2601
1433
1485
1858
1538ex
1446ex
2182by
See Legend at end of table 2.
Storm direction (clockwise from north)
220°
120°
roo•
145°
120°
zzo•
130°
060°
rso•
180°
100°
195°
zzo•
no•
oso•
oso•
230°
230°
zzo•
Table 2. --Continued
East Coast United States
0 t Station(s)
R where R was (mb) (in.)
Po value
applied to '~'a (mb)
Station(s) where Pa was
observed (n. mi.) observed I
(kt) Remarks
931.9
935.3
948.2
969.5
947.5
956.7
892.3
972.9
965.8
939.7
974.6
944.1
958.7
951.2
940.1
968.2
962.1
977.0
977.3
27.52"' 60 n.mi.south 987.5 Key West, Fla
27.62c'
28.09c'
poas:t 935.3
Key Largo,Fla 948.2
Coast 970.5
Coast 947.5
Coast 956.7
Long Key, Fla 892. 3
Coast
38 n.mi Hatteras,
Coast
Coast
Coast
Coast
Coast
Coast
972.9
965.8
949.5
974.6
947.2
958.7
951.2
947.2
973.9
Key West~ Fl. a.
V~\ Palm Beach and Everglades Exp. Sta., Fla.
Key Largo • Fla.
Cape Henry f V a.
Jupiter, Fla.
Hatteras, NC
·Long Key, Fla.
Miami. Fla.
See Remarks
Hartford, Conn.
Savannah, Ga.
Hatteras~ NC
Pt. Judith, Rl
Homestead, Fla.
Hillsboro, Fla.
Savannah, Ga.
21a
288
2s•
36b
HSG
40b
6"
Hatteras, NC
Hatteras, NC
lOb c d Miami, Fla.
34a
so"
Savannah, Ga~
16
13
10
18
11
12
4 7 Storm becoming extratropical.
9 27b
17b
36b
Hatteras, NC 23
24b
34b
13a
Providence, RI 30 Storm becoming extratropical.
Miami, Fla..
Miami, Fla.
10 Lowest observed
10
17
by Fla. Coast Rail-road personnel at Homestead, Fla.
•' 28.41 50 n. mi. inland from coast
963.4 , Eoca Chic a Airport, 168
Fla. l~ Lowest pressure for the East
CoaS-t occurred some 50 n~mi. west of the Atlantic Ocean north of Boca Ration or 12 n.mi. s-sw of Clewiston, Fla. The storm filled only an additional 2-3 mb before entering the Atlantic near Jenson Beach,
Coast 979.3
d' 28.86 Diamond 977.3
Shoals Light-ship, NC
Miami. Fla.
Diamond Shoals Lightship, NC
. Fla.
3lb Miami, Fla. 13
248
22

Table 2.--Continued
East Coast United States
Approx. coastal Stornt direction p 0 t
Po Stat:lon(s) Station(s) Date* Storm reference point (clockwise from value Pa where Pa was R where R was T (GMT) nome t (see fig, 1) north) (mb) (in.) applied to (mb) observed (n.m:l.) observed (kt) Remarks
---Aug. 27. 1949 1525 130° 953.6
a• 23b 28.16 Coast 954.0 W. Palm Beac::h~Fla. W. Palm Beach, 14
Fla.
Oct. 18, 1950 (King) 1459 ).50' 955.0 28.2oc' Coast 955.0 Miami, Fla, 6c d
Miami, Fla.
Aug. 31, 1954 (Carol) 2169 no• 960.0 zs. 35•' 33.4°N, 960.0 Aircraft MSG 10 76.8'W Rec<mnaissance
Aug. 31, 1954 (carol) 2614 zoo• 961,1 28.3s"' Coast 962.4 Suffolk Co, AFB, NY 22b See Remarks 33 R was obtained from a com-posite of many New Enpoland and middle Atlantic coastal stations. Three stations which were heavily relied upon are Block Island, and Quonset Point, R~ I .. and
27.97"' Suffolk Co. AFB,
Sept. 11, 1954 (Edna) 2718 210' 947.2 39. 7"N, 949.9 Chatham 1 Mass. 18b Nantucket, Mass~ 40 71.3°W
Oct. 15, 1954 (llazel) 2045 190" 936.7 27.663' Coast 938.0 Tilgham Point, NC, 2lb ;•\'rt l.f' 26
1-' f :lshing boat 1-' ::tP.d/1
Aug. 12. 1955 (Connie) 2182 180' 961.7 28.40c' Coast 961.7 Fort Macon t NC 453
Sept. 19, 1955 (lone) 2145 175" 960.0 28.3sc' Coast 960.0 Morehead City, NC 423
Aug. 28, 1958 (Daisy) 2182by 195' 957.0 28.26e' 65 n.mi. 957 .o Aircraft 25d e Near 35"N, 74°W 17 east of Cape Reconnaissance Hatteras.
§ Aug. 29, 1958 (Daisy) 27l8by 240' 979.0 2a.n•' 60 n. mi. 979.0 Aircraft 50" 6o n.mi,SE 21 SE Nantucket 1 Reconnaissance nantucket, Mass. Mass.
Sept. 27, 1958 (Helene) 2132by 2i.o• 932.0 21 .5z•' 80 n.mL 932.0 Aircraft 218
14 ESE Charles- Reconnaissance ton. SC ..
32.2"N, Aircraft 10° 28.08". 950.9 Reconnaissance Near 30°N, 78(jW 12
Sept. 29, 1959 (Gracie) 1913 150' 950.9 80. 2'W
170" 933.0 Conch Key,Fla.933.0 Conch Key ,Fla. zoe Near Conch Key_., Sept. 10, 1960 (Donna) 1330 Fla.
e' 958.0 Aircraft 34b Wilmington, NC 26 Sept. 12, 1960 (Donna) 2132 215° 958.0 28,29 33.9•N,
34.6"N, Reconnaissance
205' 961.1 28.38c' Coast 961.1 Brookhaven, N.Y. 48b Suffolk Co. 'J N. Y .. 32 Storm becoming extrs.tropical § Sept. 12, 1960 (Donna) 2601 AFB radius of eye was
See Legend at end of table 2~

1-' N
'--· Storm direction
Date* Storm (clockwise from (GMT) name north) (mb)
Aug. 27. 1964 (Cleo) 1499 160° 967.5
Sept. 10, 1964 (Oora) 1724 1oo• 965.8
Sept. 8. 1965 (Betsy) 1419 o9o• 9SL9
Sept. 17, 1967 (Doria) 2262 ozo• 981.0
Sept. 10, 1969 (Gerda) 3060 195° 979.0
General Legend
P a lowest pressure detected by barometer or drop sonde
P - minimum central pressure {for either the East or 0 Gulf Coast)
R - radius of maximum winds
T forward speed of storm
by bypassing storm
ex - exiting storm
MSG- missing
Table 2.--Continued
East Coast United States
p Po Station(s) 0 ~ value Pa where Pa was
(mb) observed (in.) applied to
Coast 967.5 N. Miami, Fla.
28.52c' Coast 965.8 St. Augustine,Fla
28.113' Few mL W
Tavernier, Fla. 952.3 Tavernier,. Fla.
28.97"' Js.o•N, 981.0 Aircraft 71.9•w Reconnaissance
28.91 d' 65 n. mi. 979.0 Nantucket SE Cape Cod Lightship
Legend
Source of Radius of Maximum Winds Data
a computed from pressure profile
b - observed from wind speed record
c - axtracted from Monthly Weather Review
d - approximation (about 5 or 6 n~ mi. added to eye radius as observed by aircraft or
e - aircraft reconnaissa~ce wind data
* Date applies to approximate coastal reference point
Point at which storm entered, exited, or came closest to the coast
Station (s) R where R was T
(n.tnL) observed (kt) Remarks
7b d e Miami, Fla.
zo• Near 30°N,80°W
223 b e Plantation Key, 11
20e
MSG
Fla.
N eor '18°!1, 7~ •w 9 Lowest pressure 150 n.mi .. east of Delmarva Peninsula.
40
Legend
Source of Minimum Central Pressure Data
a r computed from pressure profile along or near coast
b' - computed from pressure profile and adjusted to the coast
c • - observed by land ba:rometer
d' ..... observed by ship barometer
e' - observed by reconnaissance plane dropsonde,
t Lower central pressures at distances greater than 150 n. mL from the coast were not considered
Same hurricane as previous line

which will make it the most severe that can probably occur in the particular region involved.
1.5 Funding
Preparation of this report was funded by the Corps of Engineers, U.S. Army, and the Federal Insurance Administration, HUD, under reimbursable agreements. Annual agreements between the Office of Chief of Engineers, Department of the Army, and the National Weather Service, NOAA, have provided for hydrometeorological studies by the NWS in support of Corps of Engineers requirements. Annual agreements between the FIA and NOAA since 1970 have provided general authority for NOAA to carry out flood insurance studies for coastal regions. Specific project orders authorized studies for specific locations. This report is a collection and synthesis of the hurricane climatological studies made over the last 4 years under these authorities.
2. FREQUENCY OF HURRICANE AND TROPICAL STORM OCCURRENCES
2.1 Classification of Hurricanes and Data
The frequency that the coastal area under study experiences tropical storms and hurricanes based on the period 1871-1973 is analyzed in this chapter. There are three categories of storms that affect the coast in different ways. It is therefore logical to examine the frequency of hurricane and t.ropical storm occurrences according to these three ~ategories: 1) landfalling storms, 2) exiting storms, and 3) alongshore storms. These classes of storms are defined in the previous chapter. The frequency of the storm occurrences is defined as the number of tracks of each class of storms per year per nautical mile of a smoothed coast.
The statistics on the frequency of hurricane and tropical storm occurrences are based on the yearly storm track charts by Cry (1965) from 1871-1963 and from Monthly Weather Review articles between 1964-73. Following the criteria used in the track charts, tropical storms are defined as storms with maximum winds 34 to 63 knots, and hurricanes as storms with winds 64 knots or greater. For conciseness we use the term "tropical cyclone" in this report to include both. Storms classified as "tropical depressions" (less than 34 knots) are not included in the statistics.
2.2 Frequency of Landfalling Hurricanes and Tropical Storms
Determination of the frequency of landfalling storms in a given area would be relatively simple if an infinite sample were available. However, data are available for only about 100 years. During the period 1871 to 1973, 281 tropical cyclones entered the gulf coast of the United States and 131 the east coast, a total of 412. Inspection of this sample reveals variations within short coastal strips which may be chance occurrences due to small sample size. A goal of this report is to smooth out such variations. In the vocabulary of statistics it is desired to describe the population, not the sample. Special effort was made to take into account the effect of coastal orientation on the frequency of storms landfalling on the coast of the Gulf of Mexico.
13

2.2.1 Direct Count Method
The most direct method of assessing the frequency of landfalling hurricanes and tropical storms is to count the tracks, then smooth along the coast. The number of entries was totaled for each 50-n.mi. segment of the smoothed coastline from a point some 250 n.mi. south of the Texas-Mexico border to the Maine-Canada border. The 50-n.mi. segment counts are then smoothed by an objective,technique. Figure 2 shows the frequency plot of these discrete storm entry values at 50-n.mi. intervals (points joined by a dashed line) and the smoothing obtained as described in the next paragraph. These frequencies do not take into consideration the lateral extent of coast affected by an individual hurricane, but depict the frequency of tracks of storm centers.
2.2.1.1 Objective Smoothing Procedure. The 50-n.mi. segment counts were smoothed by weighted averaging of each successive 11 data points. These discrete values (A) may be considered as a continuous input series. The smoothed frequency values (Fi) are obtained from the equation:
5
Fi = z Wn Ai+n/ZW n=-5 n n (1)
If the weights (Wn) were set to l,the above equation would yield a smoothed curve of !!-interval running means. Here we used a weight function in the same manner as in low-pass filtering in time series analysis. The adopted function has the following assigned weights (after Craddock 1969):
W = 0.300, 0.252, 0.140, 0.028, -0.040, -0.030; for n
n = 0, ±1, ±2, ±3, ±4, ±5, respectively.
An alternate smoothing procedure often applied in climatological analyses uses a running mean approach (Wn = 1). The results thus obtained may have distortions in phase angle variation (shifting of maximum or minimum positions) and in the total area under the curve. The weighting function adopted here is designed to maintain the frequency and phase angle of the original input series. These weights were applied to all successive discrete values from Texas to Maine, yielding a weighted mean number of landfalling storms for each 50-n.mi. interval of the smoothed coastline. The tail end of the input series was extended as a mirror image of the original series to permit application of equation (1) all the way to the Canadian border. These values were connected to give a continuous smoothed curve of the frequency of landfalling tropical cyclones (solid curve of fig. 2).
2.2.1.2 Evaluation of Procedure. The direct count method derives its data from counting of tropical cyclones at the coast and not out over the water. It gives the best measure of the variation along a smooth coastline of the frequency of landfalling storms. However, it tends to obscure real variations due to coastal shape. A stretch of the coast that turns sharply in a direction almost parallel to that of the predominant storm motion is less exposed than adjace~t coastal segments more nearly normal to the track
14

1-' V1
+ I I +I + ' I I + I + ' I t I I .I I + I I • I I I + I ' + I I I •• I . ct'
. ' + "1l C) r OJ "'0 (/) ., :1: 0 () () z m
0 )> )> ;= m -i -i ); )> J: )> m 0 )> ::0 r A z -< )> "1l ~ (/) (/)
-i < m 0 (/) :1: :1: :1: -i ::0 m -i -i m X )> )> -< -- r J: -< 0 "'0 0
. 3.61- iii (/) () -- () ::0 m m 0 z 0
)> -i J: :1: 0 ::0 ., z
(/) )>
::0 ::0 A )> -i OJ 0 )> r r -i :1: -i iii (/) (/) )> -i A m z ::0 )> ' OJ 0 ' )> (/) m :1: r ' r ' ., ., m z ::0 z (/) -i m ., r r )> )> ~ (/) m
-i m !'>
Y, r )> ;x> () (/)
m ?< ;x> ,::t 0 (/)
3.2 ?< r ;x> ., z
~ II 9 r 0 II ~ ;x> II
0 II
? I I (.) 2,8 I I u.. 'I II 0 ,. .E I I I\ I I
I I II c I I I: ~ 2.4 I I I I I I
I I ' (/) a: <1: UJ >-0 0 ...:::::: (/) UJ
a: 1-z UJ u.. 0 a: UJ Ill :lE ::> z
I I I . I I
I I I 0 f i• 0 v • I II I I ,,
I I 0 I I I I I I
I I I I II I I II I
f II I
I I ,, 0 I I
I I I f
I I I 0
0 L 0 2 12
("\
16
DISTANCE (n mix 102)
22 24
0
' II II I' I I I I
I I I I I I I I I I I
26 28 30
Figure 2.--Count of landfalling tropical storms and hurricanes (1871-1973) 50-n.mi. segments of a smoothed coastline (points plotted and connected by dashed lines). Solid line denotes the entry frequency curve obtained by applying the objective smoothing function.

direction. We have implicitly smoothed out the coast while smoothing out the accidental landfallirig points of storms.
To identify areas where the implied smooth coastal direction differs significantly from the actual coastline, a smoothed coastline was constructed. Coastal locations at 50-n.mi. intervals along the entire gulf and east _coasts were smoothed (separately by latitude and then by longitude) using the same smoothing function mentioned earlier. These points were plotted and a continuous line joining these points was drawn as shown in figure 3. This diagram reveals that this smo,Pth line cuts across the actual coastline at· several places -- specifically, along the west coast of Florida and across the Mis~issippi Delta. For the most part, the smoothed coastline approximates quite well the orientation of the actual coast.
2.2.2 Track Density Method
To provide a tool for varying storm landfalling frequency where the coast turns abruptly on a scale of less than 50 n.mi., for example at Apalachee Bay, the track density method was developed. This method enables us to smooth storm behavior without regard to the coast. It must assume, however, homogeneity of storm behavior over a fairly sizable map area, including both land and sea. This method was carried out for only the Gulf of Mexico.
2.2.2.1 Basic Data. Tropical cyclo~e tracks on the charts by Cry and successors (sec. 2.1) over the Gulf of Mexico and adjacent areas were counted passing through each 2.5° latitude-longitude square, with the corners cut off to form an octagon, approximating a circle. Frequencies of track directions by 15° class intervals were also tabulated for each octagon. The track count through each octagon is construed as the number of storms passing through a circle of 142-n.mi. diameter per 103 years and is converted to point track density. A detailed description of procedures is given in the appendix.
2.2.2.2 Landfalling Frequency from Basic Data. Figure 4 shows straight-line segments representing the gulf coast to which the track density method was applied to obtain a separate estimate of the frequency of landfalling tropical cyclones. ·The direction of each segment was used to separate storms that strike the coast from those that exit the coast, a 180° direction span for each. To get the landfalling frequency the 180° landfalling direction span is further subdivided into 15° class intervals (par. 2.2.2.1). The frequency with which storms enter the coast for a particular direction class is the product of the point track density of the region, the fraction of total storms within the class interval, and the sine of the angle between the coast and the storm direction class interval mean. Summing over class intervals gives the total frequency. Since (by definition) alongshore storms move at a small angle or parallel to the coast, the sine of the angle between the coast and the alongshore storm direction approaches zero. Alongshore storm counts automatically disappear in the resulting frequency value. Further details on this procedure are given in the appendix. Figure 5 shows the frequency values of landfalling storms on the stylized gulf coast of figure 4 from application of this method.
16

Figure 3.--Smoothed coastline obtained by applying the objective smoothing function of figure 2.
17

1-' 00
Figure 4.--Coastal segments selected for frequency analysis by track density method (result shown in fig. 5).
1-Vl ,.., <!. 0 u Ll. 0 .E c
0
;n a: <!. w >-0 0
--Vl ~
1-' a: \0 1-
z w Ll. 0 a: w CXl :2: :::l z
x x <i. ui <i. <i. <i. <i. <i. w w ...J Vl ...J ...J ...J ...J ...J 1- 1- Vl. :2: Ll. Ll. Ll. Ll. Ll. ...J. z' w <!.' <!.. Vl • Vl. w· w 0 ...J X ...J ...J :.:: a: ...J CXl 1- a: 0 0 0 a: w CXl <!. Vl <!. ...J u u <!. >- <!. Vl w I iii <!. J: :2: :2: Vl - > u Vl 1- ...J z u ...: ...: w a: <!. w <!. Vl Ll.
c.. :.:: w ...J <!. 0 t:J <!. c.. <!. u c..
...J c.. 3.0 f.- <!.
2.5
2.0
® @
1.5
<D ® ®
1.0
® 0.5
0 1 .., ~ ,., c ,.. - ~ 12 13 14
DISTANCE (n mix 1021
Figure 5.--Frequency of landfalling tropical storms and hurricanes (1871-1973) by track density method.
15

2.2.2.3 Evaluation of Method. Areas where a smoothed coastal direction differs substantially from the actual coastal direction may be detected in figure 3. These areas may either be sheltered from or exposed to the prevailing direction of storm motion more than the smoothed coastal direction would predict; the track density method was designed to tackle this problem. The effect of the coastal orientation on frequency count is illustrated in figure 5 by differences in frequency values between north-south segment 6 and adjacent east-west segments 5 and 7.
2.2.3 Combination of Methods
Figure 6 is a combined depiction of the frequency of landfalling tropical cyclones. The east coast portion of the frequency curve is the same as that shown in figure 2, obtained from applying the smoothing function cited earlier. On the gulf coast, differences between the direct count method (fig. 2) and the track density method (fig. 5) were treated as follows: At the southern tip of the Florida peninsula, the curve branches. The upper branch applies to the Florida Keys, smoothly joining Florida east coast values. The lower branch pertains to the mainland coast of Florida Bay, continuing from Florida west coast values, and is a smoothed version of figure 5. The northeast gulf coastal region, mile 1,000 to mile 1,250, is also a smoothed version of figure 5. In the eastern Mississippi Delta region no attempt was made to compromise the two curves and figure 2 is replicated here. The user is advised to consider fully both figure 2 and figure 5 for applications in this area. On the remainder of the gulf coast the two approaches give substantially the same result and we adopt the figure 2 smoothed curve.
2.2.4 Discussion of Results
2.2.4.1 Overall View. Figure 6 reveals that the range of occurrence of landfalling tropical cyclones over a 100-yr period varies from a minimum of 0.1 storms per 10 n.mi. of smoothed coastline near Boston, Mass., to a maximum of 2. 2 in the middle of the gulf coast of northwest Florida and in the Florida Keys. A frequency of close to 2.0 storms per 10 n.mi. per 100 years appears to the south of Galveston, Tex. Highest frequency of landfalling tropical cyclones on the east coast is in southern Florida, and a comparatively high frequency appears to the south of Cape Hatteras, N.C. The frequency of entries drops off rapidly from Miami to Daytona Beach, Fla., and from Cape Hatteras northward to Maine.
2.2.4.2 Areas of High Entry Frequencies
a. Northwest Florida. The high frequency of storm entries along the northwest Florida coast near Pensacola (fig. 6) suggests that this stretch of the coast is a favorable crossroad for tropical cyclones which passed east of the Yucatan Peninsula and recurved in the Gulf of Mexico. This coastal region is also vulnerable to Atlantic storms that cross the Florida peninsula.
b. South Florida. A maximum in landfalling storm frequency appears near the tip of the Florida peninsula and along the Florida Keys. The southernmost portion of thi.s area is exposed to both. Atlantic and Caribbean hurri-
20

1-(/) <( 0 u u. 0 .E c
0
--(/)
a:: <( UJ >-0 0 ~ --(/) UJ
a:: N 1-1-' z
UJ
u. 0 a:: UJ aJ :2; :;) z
" 0 ::0 -!
Ui )> OJ m r -! m ?<
+ ' I ' + I + ' I + ' I +I I + I I +' I ' . I I + I I I ' . I ti' I + r OJ " (/) "Tl s: 0 () () z m )> - m -! -! ); )> I )> m 0 )> A r z -< )> " ~ (/) (/)
m 0 (/) s: s: s: -! ::0 m -! -! X )> )> -< .- 0 r I -< 0 " () .- () 0 0
I ::0 m "Tl z m )> z 0 ::0
)> s: A ::0 r )> (/) -! ::0
Ui r (/) y> )> -! -! A s: -! ::0 )> OJ 0 )> r (/) . "Tl m m s: "Tl z ::0 z (/)
-! m "Tl r r )> )> ~ ill m m .Ul r )> )> () (/)
?< r "!" .I 0 .Ul
"!" "Tl z
r 0 "!"
0.8
0.4 LANDFALLING STORMS
0
DISTANCE (n mi x 102)
Figure 6.--Adopted frequency of landfalling tropical storms and hurricanes (1871-1973) for the gulf and east coasts of the United States.
canes. Generally, tropical cyclones strike the east coast of South Florida from an east-southeasterly direction -- a predominant direction for Atlantic hurricanes before recurvature. The west coast of South Florida is vulnerable to late-season tropical cyclones moving in a northeastward direction after recurvature. The most frequent areas of recurvature in the month of October have been near Bermuda and over the northwestern Caribbean (Cry 1965). ·
c. Upper Texas Coast. The comparatively high frequency along the upper Texas coast is partially caused by the predominantly westward-moving storms in the Gulf of Mexico during ~he early hurricane season. Only six storms have recurved and moved northeastward (away from the Texas coast) during the months of June, July, and August since 1901. These early season storms accounted for more than half the total number of storms that struck the Texas coast.
d. Cape Hatteras. The high frequency of storm entries just south of Cape Hatteras, N.C. (1.6 storms per 10 n.mi. per 100 years) is the combined result of the number of storms that reentered the North Carolina coast after exiting the east coast of Florida and Georgia in addition to hurricanes of Atlantic origin that move in a northerly direction after recurvature. Almost 90% of the storms entered the North Carolina coast, south of Cape Hatteras, in a northwesterly to a northeasterly direction.
2.2.4.3 Areas of Low Entry Frequencies. The frequency of storm entries is less than 1 per 10 n.mi. of coastline per 100 years over the northern section of the east coast from a point some 50 n.mi. north of Cape Hatteras northward to the Canadian border and also in the vicinity of Daytona Beach, Fla. The rapidly decreased frequency of entries nort~ of Cape Hatteras, N.C., is easily understandable. With a few exceptions, hurricanes recurving south of Cape Hatteras either enter the North Carolina coast or move northeastward farther from the U.S. mainland.
a. East Coast. Colon (1953) has shown the locus of points of highest frequency of recurvature for different months of the hurricane season. Hurricanes off the east coast of the United States frequently recurve between latitudes 27° and 29°N during the months July through September. For the other months of the hurricane season, recurvatures occur in latitudes farther south, following the shift of the subtropical ridge (Alaka 1968). The northern limit of hurricane recurvature at about 29°N appears to coincide with an area of minimum frequency of landfalling hurricanes along the east coast. Hurricane Dora of September 1964 was the only hurricane that struck the northeastern Florida coast in recent years.
b. Gulf Coast. The relative minimum in storm entry frequency along the west coast of Florida (compared to the mid-gulf coast and the southern tip of the Florida peninsula) can be explained by the pr~vailing westward motion of hurricanes of Atlantic origin. The relatively low frequency of storm entries along the Louisiana Coast west of the Mississippi Delta does not have a ready explanation.
22

2.3 Frequency of Exiting Hurricanes and Tropical Storms
2. 3.1 Analysis
The frequency of exiting tropical cyclones was defined by a subjective smoothing of 50-n.mi. segment coastal crossings. These counts were obtained from the storm track information previously cited. A total of 141 tropical cyclones exited the east coast and 20 the guif coast during the period 1871-1973. The shape of the coast relative to storm tracks and meteorological considerations were taken into account in the smoothing. For storms exiting the coasts of Florida, consistency in frequency and direction of movement was maintained with the frequency of landfalling storms on the opposite coast. The objective smoothing technique was not used in this analysis because the observed data are closely related to the geographical features of the coasts and. because of physical considerations. For these reasons, the high frequencies of exiting storms that concentrated in two areas of the east coast were not smoothed out by averaging with lower frequencies of adjacent coastal areas.
2.3.2 Results and Discussion
Figure 7 shows the smoothed frequency distribution of exiting tropical cyclones. This curve indicates high frequencies along the coasts of ~orthern Florida and Georgia and along the North Carolina coast north of Cape Hptteras.
2.3.2.1 Gulf Coast. The comparatively few exiting storms along the northern portion of the west coast of Florida agrees '"ith the decrease of landfalling storms northward along the Atlantic coast of Florida. A maximum of exiting storm frequency occurred near Fort Myers, Fla.
2.3.2.2 East Coast. The maximum frequency of exiting storm occurrence appears near Jacksonville, Fla. with 3 storms per 100 years per 10 n.mi. of the smoothed coastline (see fig. 7). The frequencies decrease southward with 2 storms/100 years/10 n.mi. near Daytona Beach, 1 storm/100 years/10 n.mi. near West Palm Beach, and 0.4 storm/100 years/10 n.mi. near Miami, Fla. The frequency diminishes rapidly north of Jacksonville. Higher values appear between Cape Hatteras, N.C., and Cape Henry, Va.
Many exiting storms along the Atlantic coast originally were eastwardmoving storms in the Gulf of Mexico. They can also be traced to storms that recurved over the gulf or over the Florida peninsula south of the 29th parallel and moved northeastward north of the subtropical ridge. This last group accounts for the high frequency of exiting storms over the northeastern por-tion of the Florida peninsula. The concentration of exit storms just north of Cape Hatteras and Cape Cod reflects the orientation of the coastline and the comparatively high counts of entering storms south of these capes.
2.4 Frequency of Alongshore Hurricanes and Tropical Storms
2.4.1 Analysis
The frequency of tropical cyclones that bypassed the coast is based on the
23

1-en <( 0 (.)
u. 0 .E c
0 ..... en a: <( UJ
>-0 0 -..... en !::: ><
N UJ
~ u. 0 a: UJ 00 ::!!: :::> z
+I + ' + I + ' I + ' I +' + I I . ' ' . I I • ' . ~I I t -o Cl r OJ -o en ., ;5: 0 (") (") z m 0 )> )> - m -1 -1 )> )> I )> m 0 ~· ::0 r A r z -< )> -o :§' en -1 < m 0 en ;5: ;5: ;5: -1 ::0 m -1 -1
m (") >< )> )> -< .- 0 r I -< 0 -o iii en .- (") ::0 m m 0 z 0 )> -1 I ;5: 0 A
., z en )> ::0 ::0
)> ::0 r )> :::j 0 OJ 0 r en en -1 A ;5: -1 m z ::0 iii )> - )>
OJ 0 )> r r en - . ., ., m z m z en ;5:
-1 m ., r r )> ::0 :..: en m -1 m Y' r )> !> (") en )> m ?< !> _I
en X r 0 -
!> ., 0 z r 0 !>
0
0
0 0
0
0 EXITING STORMS
0
o 1 1 1 1 1 1 1 1 1 1 1Lo1 1 1 1 , 1 1 1 1 10 '0"'6 1 1 1 , • 0 b 1 d 1 •o 1 1 0 2 4 6 8 10 12 14 16 18 20 22
DISTANCE (n mix 1021
Figure 7.--Frequency of exiting hurricanes and tropical storms (1871-1973). Curve fitted subjectively.

same maps and data period used before (sec. 2.2). A count was made of storms intersecting 5-n.mi. intervals along lines drawn perpendicular to a smoothed coastline centered at each of the coastal locations (A to Z in fig. 8). The same storm may be counted several times as it moves parallel to the coast. These track counts are summarized in table 3. The cumulative track counts along each of tn.e 26 lines normal to the coast were plotted against the distance from the coast. A smooth curve was then fitted by eye to the data on each of these frequency plots. Storm track frequencies were then scaled from the smooth curves for certain distance intervals from the coast. These frequencies are listed in table 4 with units of tracks per nautical mile per 100 years.
The frequency distributions were also plotted on a map and smoothed subjectively both along the coast and perpendicularly outward. This distribution is shown in figure 8 by isolines of accumulated number of storm tracks bypassing the coast at sea for the period 1871-1973.
2.4.2 Results and Discussion
Figure 8· reveals that the I'1aximum concentration of alongshore storms occurred off Cape Hatteras, N.C. Fewer than 5 tropical cyclones bypassed within 50 to 80 n.mi. off the coasts of northwest Florida, Alabama, and Mississippi and within some 100 n.mi. of the Texas coast. The higher values off the Mississippi Delta may be caused by geographic protrusion. There is a high frequency of bypassing storms off the coast'of Cape Hatteras for the same reason that there is a high frequency of landfalling storms' south of Cape Hatteras. This was discussed in par. 2.2.4.2d.
2.5 Ratio of Hurricane to Total Storm Occurrences
Figure 9 shows the ratio of hurricanes to the total number of tropical cyclones that entered the coast during the 88-yr period 1886-1973. These ratios are needed to adjust the hurricane central pressure frequencies to full range. A description of this application is included in chapter 3. The source of data for this analysis is the storm track charts previously cited. Tracks prior to 1886 were not used because the classifications of hurricanes and tropical storms are not specified in the earlier data. The designation of "hurricane'' or "tropical storm" by Cry (1965) (based on maximum surface wind speeds) was accepted. These criteria were mentioned in section 2.1.
2.5.1 Analysis of Data
To determine a smooth ratio of hurricane occurrences to tropical cyclones at a set of coastal points the numbers of landfalling hurricanes (H) and tropical storms (T) per 50-n.mi. increments were counted separately. Then ratios of H to H+T were computed. For consistency, the sampling and smoothing of the ratios were designed in the same manner as those for the hurricane central pressure (chap. 3) since pressures are the principal application. The count of hurricane or tropical storm tracks (centered at each of the 61 coastal points at 50-n.mi. intervals) included landfalling storm tracks intersecting the coast within 500 n.mi. along the gulf coast and within 400 n .mi. along the east coast. These ratios were used as input to the
25

Table. 3.---Count of hurricane and tropical storm tracks
Line on Figure 8 0-5 5-10 10-15 15-20 20-25 25-30
A
B
c D
E
F
G
H
l
J
K
N L 0'
H
N
0
p
Q
R
s T
u
v h1
X
y
z
Line on
0
0
0
0
0
0
0
0
0
1
1
0
2
2
0
I)
1
0
0
0
0
0
0
0
1
1
0
0
1
0
0
0
1
0
0
0
0
0
0
0
0
0
1
0
0
1
1
2
1
0
0
0
0
1
1
0
0
0
0
4
0
0
0
0
1
0
0
4
1
1
0
3
0
0
0
0
4
1
0
0
0
0
0
1
0
0
0
0
2
2
1
3
3
2
1
0
1
0
1
0
0
1
4
0
0
0
1
4
3
1
4
1
1
1
2
1
0
2
2
1
2
1
crossing lines normal to coast ·-- 1871-1973
Distance intervals from coast (n.mi.) 30-35 35-40 40-45 -60 60-70 70-80
0
0
0
1
0
0
0
0
1
0
0
0
0
0
0
0
.1
1
0
0
0
0
0
0
0
0
0
2
0
0
0
1
0
0
1
2
1
1
2
2
3
2
1
1
2
1
0
1
3
0
0
0
0
0
0
0
0
0
0
1
0
1
1
0
0
0
1
()
0
0
0
0
2
0
0
0
0
1
2
1
0
0
1
5
4
0
2
3
0
2
1
0
0
1
1
0
t,
1
4
0
1
6
0
3
4
1
0
0
2
1
0
1
1
3
3
0
0
1
2
3
3
1
4
2
4
4
4
3
2
2
2
6
I,
4
2
4
2
5
2
1
4
3
2
4
4
2
5
5
6
4
6
5
4
3
6
0
3
0
4
0
1
2
0
3
0
1
3
0
1
3
5
3
5
2
3
1
1
1
1
6
4
1
1
3
/+
5
6
6
5
3
5
4
100-110 110-120 120-130 130-140
l
2
1
2
2
l
1
5
2
1
0
1
0
2
0
4
2
2
3
2
2
1
0
3
0
2
3
0
0
0
1
0
2
3
3
4
5
4
4
3
4
1
3
1
3
4
3
2
0
2
9
3
6
10
11
5
5
1
4
7
0
1
2
3
2
1
0
0
0
0
0
3
2
3
0
4
0
6
1
4
2
3
2
140-l:D
2
1
1
1
1
1
5
3
0
1
0
4
8
3
2
5
5
4
0
3
I+
2
4
Fi~ure 8 0-5 5-10 10-15 15-20 2<)-25 25-30 30-35 35-40 40-45 45 50-60 60-·70 70-80 80-90 90-100 100-110 110-120 120-130 130-140 140-150

Table 4.--Frequen~y of hurricane and tropical storm tracks* crossing lines normal to coast -- 1871-1973
---- -'----~ ---·-~·
Line on Distance interval from coast (n.mi.)
Figure 8 0-10 10·-20 20-30 30-40 40-60 60-80 80-100
A 0 .039 .098 .078 .087 .11 .12
B·. 0 0 0 0 .068 .13 .14
c .025 .025 .049 .049 .082 .087 .14
D 0 .01 .078 .12 .18 .21 .28
E .17 .19 .21 .24 .25 .27 .28
F 0 0 0 0 0 .068 .27
G 0 0 0 0 .022 .11 .12
H 0 0 0 0 .05 .14 .24
I 0 .048 .087 .097 .088 .088 .097
J .13 .13 .19 .21 .23 .24 .24
K .12 .12 .16 .18 .21 .25 .28
L .16 .14 .11 .12 .12 .14 .25
M .35 .35 .33 .33 . 31 .31 .29
N .12 .18 .18 .19 .20 .26 .31
0 .019 .11 .18 .19 .21 .27 .35 p .048 .14 .18 .19 .21 .27 .37
Q .16 .21 .27 .33 .34 .42 .42
R .097 .21 .23 .37 .43 .46 .48
s .27 .12 .16 .18 .23 .34 .41
T .16 .19 .25 .29 .36 .42 .43
u .01 .039 .068 .12 .14 .21 .32
v 0 .078 .14 .18 .29 .44 .51
w .27 .27 .24 .24 .24 -23 .23
X .02 .078 .097 .16 .18 .20 .27 y .05 .087 .16 .16 .17 .18 .22
z 0 .058 .14 .19 .27 .27 .27
0-10 10-20 20--30 30.:..40 40-60 60-80 80·-100
* storm tracks/n.mi./100 years. Derived by smoothing table 3. Unit is
27

TEX.
\ M
X \
Figure 8.--Accurnulative count of hurricane and tropical storm tracks passing the coast at sea (1871-1973). Based on counts along heavy dashed lines shown projected normal to coast.
28

..
in ~ a: 0 1-(/)
..J <( 1-0 t:: (/) w z <(
52 a: a:
N :::> \0 !.
0 i= <( a:
I I t I t. tl t I I I t I t I I t ' I .I I t I I • I I I • I I + I I I ' . I ' ct' I
" Cl r co " (/) ., S': 0 () () z 0 )> )> ;::: m -i -i )> )> I )> m 0 ::0 r A z -< )> " ::§: (/)
-i < m 0 (/) S': S': S': -i ::0 m -i m X )> )> -< .- 0 r I -< 0
Ui (/) () .- () ::0 m m )> 0 z
)> -i I S': 0 ., z
(/) ::0 )> A ::0 r )> -i co 0 Ui r (/) (/) )> -i -i A S': m z ::0 )> co 0 . )> (/) m r . r ., ., m z z (/) . -i m ., r r )> :0
~ (/)
-i m (/) r )> '? () (/) )> m ?< '? .I h .(/)
?< r '? z .,
0 r '?
nsl
0
DISTANCE (n mix 102)
Figure 9.--Ratio of landfalling hurricanes to total number of landfalling hurricanes and tropical storms (1886-1973). Based on counts in overlapping zones centered at 50-n.mi. intervals and objective smoothing along the coast.
I + m )> (/) -i
" 0 ::0 -i
S': m

objective smoothing scheme previously described. A smgothed continuous curve along the coast was obtained in the same manner as for landfalling hurricane frequency distribution. This is shown in figure 9.
2.5.2 Results and Discussion
Figure 9 shows high ratios of hurricanes to total tropical cyclones for the vicinity of Miami, Fla., (0.62), Cape Hatteras, N.C., (0.64),Long Island, N.Y., (0.59), and in areas south of Galveston, Tex., (0.56). These localities are ciose to areas having high frequencies of landfalling tropical cyclones (compare . 6 and 9). This suggests that areas most vulnerable to weaker tropical storms are also vulnerable to hurricanes. The one exception is the coastal area of northwest Florida. Only 42% of landfalling storms attained hurricane intensity along the northwest Florida coast where the frequency of landfalling tropical cyclones has the highest value of all. A dip in the ratio along the west coast of Florida, north of Fort Myers also indicates that this coastal area experienced more landfalling tropical storms than hurricanes. This implies a less frequent visit of more intense hurricanes and is reflected in a trend of decreasing storm intensity northward along the west coast of the Florida Peninsula as discussed further in the next chapter.
3. PROBABILITY DISTRIBUTION OF CENTRAL PRESSURE
3.1 Data
Minimum central pressure is a universally used index of hurricane intensity. Harris (1959) demonstrated that storm surge height is approximately proportional to the central pressure depression, other factors being constant. This chapter develops probability distributions of minimum hurricane and tropical storm central pressure at the coast.
The data on which to base hurricane central pressure probability distributions for the gulf and east coasts of the United States have been collected in tables 1 and 2, which are updated and revised versions of table A in National Hurricane Research Project Report No. 33, Meteorological Considerations Pertinent to Standard Project Hurricane, Atlantic and Gulf Coasts of the United States (Graham and Nunn 1959). This paper is hereafter referred to as "Report No. 33." Revisions were made in table A data where the authors discovered that recent published reports (e.g., Sugg et al.l971) had uncovered new data or had verified suspect data not accepted for Report No. 33, and, in a very few cases, as an analyses judgment after reviewing all the data. The tables list parameters of all hurricanes with a central pressure less than 982mb (29.00 in) that crossed the gulf and east coasts or passed within 150 n.mi. on the seaward side of the coast during the 74-yr period, 1900-73. The year 1900 was chosen to initiate the central pressure study by weighing the inaccuracies that would result from the sparse data of earlier years against the desirability of a longer record. Those exiting storms, still of hurricane intensity at the coast of exit and within 50 n.mi. of the coast, are included.
30

The specific pressure values given for each hurricane are the lowest pressure from actual observations (p
0) by a barometer or dropsonde and the min
imum central pressure (p0 ) estimated from the observations. Observed pressures are extrapolated inward to p0 where necessary from Pa by using visually-fitted radial pressure profiles based. on the formula
= e -R/r
(2)
where p is the pressure at radius r, p0 is the pressure at the center, Pn is the pressure at some large distance from the center to which the profile is asymptotic, and R is the radius at which the wind speed is greatest. Schloemer (1954) tested 10 possible pressure profile formulas before selecting the one above as best fitting 9 sample hurricanes. The observing station for Pa values and a geographical reference point for p0 values indicating whether the lowest central pressure pertains to the coast or as far as 150 n.mi. offshore are also listed in tables 1 and 2. The superscript letters following the p0 values refer the reader to notes at the end of the table giving the source of minimum central pressures.
In some areas, barometric pressures could not be obtained near the coast. The central pressure was determined at the location nearest the coast where reliable observations could be obtained and adjusted downward tc a coastal value. The adjustments of this type made in Report No. 33 were carried over to this report. Since the 1950s the availability of reconnaissance data has eliminated the need for this kind of adjustment.
The criterion that the central pressure be less than 982 mb was based on the consideration that the maximum clclostrophic wind speed, computed from the Hydrometeorological Branch model (Myers 1954), with a central pressure of 29.00 in (982mb) and an asymptotic pressure of 30.00 in (1015.9 mb), is
where
l(p - p ) p n o
-R/r (3)
v c = cyclostrophic wind speed, at which the centripetal acceleration
exactly balances the horizontal pressure gradient force at radius, r.
p density of air
= asymptotic pressure
p • central pressure 0
R :::: radius of maximum wind
31

73 mi/hr, or about the wind speed required for classification as a hurricane. 2
A virtual absence of pressure data made it necessary to omit one storm altogether ~. the Louisiana hurricane of August 6, 1918, in which the closest recorded pressure was some 90 n.mi. from the path of the storm center. An estimate of the central pressure from such a distance would be so unreliable as to be useless.
Two storms used in an earlier tabulation of hurricanes (Report No. 33, table A), those of September 11, 1903 (gulf coast) and October 20, 1924 (east coast), have been eliminated from the present summary. Upon reanalysis of the data, it was decided that both had weakened to tropical storm strength before they reached a point 50 n.mi. from where they would exit the coast.
Questions have been raised as to the minimum central pressure of Hurricane Camille which struck the northern coast in 1969. The best obtainable value is needed because Camille had the lowest central pressure on the mainland coast since record-keeping began during the last century, and strongly influences the lower end of the probability distribution of central pressure. A minimum pressure of 905 mb was measured by an Air Force reconnaissance aircraft at 0016 GHT on August 17, 1969 near 25.:2°N, 87 .2°W, or 250 mi southeast of the mouth of the Mississippi River. Eighteen hours later, and only a few hours before the center made landfall, another reconnaissance aircraft penetrated the hurricane, and reported an even lower central pressure of 901mb. A post-audit of the dropsonde computation at the National Climatic Center adjusted this to 908mb. This value, which is quoted by Bradbury (1971), is the value in table 2. The eye passed over Bay St. Louis, Miss,, at landfall and an aneroid barometer a few blocks from the west end of the Bay St. LouisPass Christian bridge read 26.85 in (909.4 mb). This barometer was later checked and found to be accurate by the New Orleans National Weather Service Office (DeAngelis and Nelson 1969). One may assume then that Camille remained in a near steady state during its last 28-plus hours at sea.
Table A of Report No. 33 listed hurricanes by zone and in many cases a particular storm appeared in more than one zone. Tables 1 and 2 of this report do not list storms by zone; the tables l;ist a storm twice only if it crosses the coastline a second time (or if a bypassing storm makes another approach to the coast) after it has traveled a distance of 400 n.mi. (500 n.mi. along the gulf coast). These duplicate storms are identified by a section mark (§) in the two tables.
2we realize that there have been storms with hurricane-force winds and central pressures as high as 990mb south of 35°N. A recent example· is hurricane Alma (May 1970, 993mb, 70-kt winds). There have also been recent tropical storms whose central pressure was less than 990 mb (Delia, September 1973, 986mb, 60-kt winds). TI1e 982-mb criterion is to put definite bounds around a data sample. It is not intended to be used as a forecasting criterion to distinguish hurricanes from tropical storms.
32

With central pressure available for an average of less than one hurricane per year for the period of record for each coast, the data in tables 1 and 2 are a limited sample. Additional data will change the results of the study.
3.2 Analysis
Cumulative frequencies of hurricane central pressures were determined from the p0
1 s in tables 1 and 2 for overlapping zone centered 50 n.mi. apart (fig. 3). These increments were 400 n.mi. long on the east coast, and 500 n.mi. on the gulf coast, approximately comparable to the zones in Report No. 33.
On the east coast, a new overlapping zone was used each 50 n.mi. as far north as the mouth of Chesapeake Bay, each 100 n.mi. from there to eastern Long Island, and a s zone from there to the Canadian border. Gulf coast data were grouped into overlapping zones at 50-n.mi. intervals, except at twice this interval in south Texas, because of sparse data.
Tables 1 and 2 include only hurricanes with central pressures below 982mb. The track counts, by contrast, on which the storm frequency count (chap. 2) is based, include tropical cyclones of hurricane and tropical storm intensities. In order to enforce consistency at this point, we must either expand the central pressure probability distribution to statistically include the weaker storms, or else adjust the storm track count to storms with central pressures less than 982mb. We must'make this choice because the frequency of a representative climatologically specified hurricane of given characteristics is the product 9f the frequency of all storms and the probability of a storm having those particular characteristics. We chose to expand the central pressure frequency distribution rather than contract the storm track count, in the manner to be described.
For each 400- or 500-mile zone the p0's from tables 1 or 2 were plotted on
a graph of central pressure vs. cumulative percent of storms by the usual formula
R-0. (100) (4) p = N
where p is the probability expressed as a percent of the total number of storms, N, and R is the rank from lowest to highest. To get N for all tropical cyclones, the count of p0 's (up to 982mb) is divided by the ratio of hurricanes to total storms from figure 9. The upper part of the eye-fitted curve for each graph is extended smoothly to 1003 mb at the 100% level to arbitrarily represent the tropical cyclones with central pressures~ 982mb. Examples of cumulative frequency curves for two coast zones are shown in figure 10. The first is centered near Biloxi, Miss. and the second along the central South Carolina coast.
Using the smoothed set of cumulative frequency of minimum central pressure graphs, we then read the 1, 5, 15, 30, 50, 70, and 90th percentiles for each increment and plotted as alongshore profiles. Raw data obtained from strict adherence to best-fit cumulative frequency curves (without alongshore
33

lOOr-----------------------------------------~,~
CENTRAL PRESSURE (mb)
I I
I I I
I I I I
I I I
I I I I
I I
I I
o'
,
100r---------------------------------------~/~
en w
~ 80 I.IJ a: a: :::> () ()
0 ~ 60
1-:z I.IJ () a: I.IJ
c.. 40 0 I.IJ 1-<t: ...J :::> ::iE
a 20 ~
920 940
CENTRAL PRESSURE (mb)
I , I
I I
I I
I I
I I
I I
I I
I
o/
(b)
980 1000
Figure 10.--Graphs of central pressure vs. cumulative percent of occurrences (a) Gulf of-Mexico (milepost 750), near Bay St. Louis, Miss., where hurricane Camille went ashore and (b) east coast (milepost 1950) along central South Carolina coast.
34

smoothing) are shown at the 5% level in figure 11. Analysis was then undertaken with the object of obtaining a set of curves representing a consistent view of the probability distribution of central pressure for the gulf and east coasts of the United States. The first attempt at the coastal analysis of the data was not acceptable to the authors in many areas because the best fit data of the cumulative frequency graphs were not always the most consistent solution for successive 50-n.mi. increments. The cumulative frequency graphs were then reexamined and those needing adjustment away from ~ best fit to enforce consistency were reanalyzed. A new set of percentiles for each increment was plotted and then analyzed smoothly·using the same weighting function employed in chapter 2. The 5% curve from mile 600 to 1~200 is drawn below the data to fit the 1% curve, which in turn is drawn to Camille.
The relative infrequency of hurricanes near the Canadian border and of p0 data near the Mexican border forced us to further smooth these end areas by eye. A discontinuity in the analysis with respect to all but the uppermost class interval was found to exist between the chain of Florida Keys and Cape Sable because of the physical separation of some 0.5° of latitude (30 n.mi.). This discontinuity is reflected in the graphs.
For additional control, maps of the gulf and the lower portion of the east coast were analyzed at various percentages using a central location for the pressure data from each overlapping 400-or 500-n.mi. zone. These locations (indicated by stars in figure 12) are the centroids of pressure-observing land stations, ships, or reconnaissance planes supplying observed pressures (pa's) for the zone; they were used to approximate the centroids of p0 's. The central pressure for the respective zone at the given probability level was assigned to each centroid location and the data were then analyzed on constant percentile charts. The resulting analyses were studied along broad lines to see if there was any basis for further alteration of the coastal analyses cited in the paragraph above. Some minor changes were made.
The 1% and 50% control maps are illustrated in figures 12 and 13.
3.3 Results
An inspection of figure 11 reveals that there is an overall increase in central pressure from south to north, a well-known fact primarily caused by decreasing water temperature toward the north. Distinct minima ranked in order of lowest·pressure at the 5% level are found on 1) the Florida Peninsula south of about 28°N; 2) at the Texas-Mexico border; 3) at the South Carolina-North Carolina border; 4) near Louisiana's Mississippi D~lta; 5) and over the southern New England coast.
The primary maximum 1) rests near the (until-recently) sparsely populated coastal area west of Cross City, Fla. (mile 1,080 in fig. 11). Secondary maxima lie 2) near the mouth of Delaware Bay; and 3) near Jacksonville, Fla. The 'Jacksonville maximum exceeds the Delaware Bay maximum when the three lowermost class intervals are ignored. Pressures also rise northward along the upper New England coast.
35

w Q'\
:0 _g w a: ::> ~ w a: 0..
+I t ' I I t I t ' t t I t I I t ' I t ' I ' t .. I 'Tl I r 'l -c G> r to -c (.1) , s,: o n ("') z to m 0 )> )> ;= m -1 -; - )> ::t: )> m 0 )> ;:JJ r A O Z ;,. ""' )> -< )> -c :!! ~ ~ -; < m (,/) ""' ""' s,: -; :Il m -. -. - m ("') ~ )> )> -< 0 ,... ::t: 0-< 0 (3 (.1) (.1) ..... • n :Il m z m )> Z )> -; ... S,: 0 A :Il , (.1) :Il • :Il o:l 0 )> - r (.1) (.1) ')> )> -1 j A So: .-1 m z :Il (,/) )> • • to o -. • )> r · ' (,/) · , , m z ~ z (,/) s ...., -; rn , ,... ,... )> • )> ~ ill m m m • ,... )> )> n (.1) ·- •
X X r {> . • ::t: (;
. • ?> • .
940
920
900 o~~--2~~--~4--L-~e--~~a--~-1~o--~~12--~_J14--~~1~6--L--1~a--L-~2~o--~-2~2--~--~---~~~~~--~~~~
DISTANCE (n mix 102)
Figure 11.--Probability distribution of central pressure of hurricanes, gulf and east coasts (1900-73). Numbered lines denote the percent of storms with p0 equal to or lower than the value indicated along the ordinate. Plotted points (6) are taken from frequency analyses at 50-n.mi. intervals for the 5th percentile (sec. 3.2).

w '-.I
--,_ .,
900
_,I /...----T-------/ ..
__ .. ,..,.,.....,.. ..
N.C.
so' .•• / so' ...__ .L350 85° I -··-- l .,-..._, I I ---,----- ---·-!-350- --~-· •. -i-
.. r--~. .· ' !' •' ---~ ·, / ' ' '·· ' •. t' ! \ \, '
/
' ' . --------- ' I I '
95° I
• -j-35°
' --1 MISS · ' '· { :
1• ALA \ . ~ ..
\ . . I ; LA / i } TEX
GA
95° : - j-3oo I
----------900
895
95°
/
!--25° 90° I ·I --j-25°
895
Q PRESSURE (mb)
Figure 12.--0ne-percentile chart of minimum central pressure of hurricanes and tropical storms for the Gulf of Mexico and surrounding areas. Pressure values plotted at the centroid of data reference points for each 50-n.mi. increment of coast.
0
1<0 rrF 1_.'3 .... ,

w OJ
",_../ / -
/ ---- 0
~--_7-·
/
1t'3~p ~ -,
80° ~~ N.C.
9
0 I ~ ~ ,5 0 J -- - •• -t ::;, ~
-- 350 goO 85 o • / ....,___ •• r9 •. I ...)..35 _.. -. "'
' -j-35°- --;--·----,I ( ~<:) ""'-.., / . \ .• o"'-~
"'-··----··-v-. ,' I \ "' S.C. ~~('j -~ f ! -,
I ' J
~-----·---) MISS { ALA \ GA \ 985
t ;· , i (\ Ot982.71 ' I I ~ 1984.9)
. LA : I I 990 0 985
1 L \ ~- 1\88 t.;ss.s\
---··-... 990 --- • 0 • • '---------.........~ BO 0
950 L' 988---t--~---L.---· -- 0 A .\-30 -!-300 " 900 --815 fl • I
9'0~.--, !b'l; -!-3~ 0 0 ···3oo, c;_o~ ~,g<o?.'P,a -~~'P"rk><~;>" f:~-~-P-- o o ........ \~ ~ dJ5 ~~-~· > <::::>~ ,c§' ~ ,J? R ~f<>· ,_~ ... ~ , ~\ t985.4l ~ "' _(b , .Oj • , ~ "' . ... P' 'V 0)' <:l {!!' "' _....,_ "' 1:1)1?5 ~· ' I
0 ~· a· ~- ' ~ '~<~;> ' I {976.9) .f!!! ~ ~ ~'0 ' rc:,!-:'\ '\ ~ I 0 \o_,9J ' ~·
(975.8) "...9,\e \ / o (976.8) 0 \9'01 ' ~ .. \ .t:r 975
1974.2) ~_g<ou:t\ '~ (975.71
~ ..
970 (984· 0~96 -o..'l. so7 ~~ 9.5}
.\.W -'·250 95° 0 .. g9J \
' 0 900 85 ..... ~ /i-25 -'-25" -\- 25°'-- "--::? ./
970 I ----c;./ (969.8)
',
"
TEX
980 975
Q PRESSURE {mb)
Figure 13.--Fifty-percentile chart of minimum central pressure of hurricanes and tropical storms for the Gulf of Mexico and surrounding areas. Pressure values plotted at the centroid of data reference points for each 50-n.mi. increment of coast.
3.4 Evaluation of Results
3.4.1 Minima
Reasons for the increase in central pressure from south to north include: the inability of hurricanes to carry their warm, moist, tropical atmosphere into temperate latitudes and the entrance of colder and drier air at low levels, which destroys the upward slope of the isotherms from outside to inside the circulation and decreases the amount of energy avail~ble to the storm. Finally, jet streams at high levels, which according to Riehl (1954) are detrimental to tropical storms, are more common in temperate latitudes. RiehL states that the "arrival of the equatorward margin of a westerly jet stream at high levels will destroy a (trop.ical cyclone) circulation rapidly since it favors upper convergence, entrance of cold air aloft, subsidence, and drying."
a. South Florida Minimum--The lowest accepted sea level barometer reading (892.3 mb) not including tornadoes, in the Western Hemisphere occurred at Long Key, Fla., in the hurricane of September 2, 1935. This implies a South Florida minimum for the United States.
b. South Texas Minimum--Hurricane Beulah (923mb), the third most intense storm (in terms of central pressure) included in this study, struck the Port Isabel area of Texas in September 1967. Hurricane Carla (931mb) and the Galveston hurricane (936mb), two other notably severe hurricanes struck the Texas coast between Matagorda and Galveston Islands. There is no reason why Carla and the Galveston storm would not have been at least as strong if they had struck the South Texas coast. If we look at storms outside the bounds of this report, Hurricane Janet (1955) also lends strong support for the South Texas minimum. Janet brought a minimum central pressure of 914 mb to Chetumal, Mexico (l8°N) in September 1955 (Dunn et al. 1955).
c. and d. Carolinas and Southern New England Minima--The two lowest tropical cyclone central pressures observed along the coast of Georgia, South Carolina, North Carolina, and Virginia were in Hurricane Haz~l (Oct. 1954) and Helene (Sept. 1958). Hazel struck the coast near the border of the two Carolinas. Helene aimed her winds at the same area but turned away to the n9rtheast a few hours before the center made landfall. The eastward projec-tion of the coast it a high exposure to north-northeastward-moving cyclones, some of which like Hazel and Helene are of great intensity. Over southern New England, the same reasoning holds true.
e. Mississippi Delta Minimum--This minimum was induced principally·by Hurricane Camille (1969), and its effect is most prominent in the lowermost percentiles. Even though Camille passed east of Louisiana on her way to the Mississippi coast, the minimum appears near the mouth of the Nississippi River because of the lower latitude. The raw data near the Mississippi Delta do not s4ow a minimum. The data at the 1% (now shown) do show a well-defined minimum; the 5% analysis in figure 11 was lowered to provide continuity with the 1% curve.
39

3.4.2 Maxima
a. Cross City, Fla. Maximum--The lowest central pressure recorded in a hurricane entering the northern gulf coast of the Florida Peninsula tvas 952 mb in the storm of October 1921, which entered the coast near Tarpon Springs. This is not nearly as low as hurricane central pressures observed on the Mid-gulf coast (Mississippi, Alabama, and the Pensacola area) a~d on the Florida Peninsula gulf coast to the south. Is an extreme low p
0 here
less likely climatologically or is this simply sampling variation during the period of record? Present indications are for a real variation and the 1% to 15% curves in figure 11 reflect this. A possible explanation follows.
A good many storms have paralleled the west coast of Florida close to shore from the Keys northward. Although 1the eye of the hurricane remains over water, air entering the storm at the surface has to cross the Florida Peninsula from east to west. Miller (1963) has shown that sensible heat is lost from a parcel as it travels westward across the Peninsula. His calculations from Hurricane Donna (1960) show that the surface inflow over land is essentially a moist adiabatic process, which leads to the hypothesis that since the major portion of the eastern semicircle of an alongshore west Florida hurricane is over land, a quantity of the storm's surface latent and sensible heat source is removed, the equivalent potential temperature of the surface air is lowered, and the radial gradient of equivalent potential temperature at the surface is weakened. Movement of the storm out of tropical waters further weakens the gradient. The Labor Day hurricane of 1935 is a good example of what can happen when an intense hurricane leaves the Florida Keys and heads up the west coast of Florida. After crossing Long Key with a central pressure of 892.3 mb (26.35 in), the hurricane brushed Cape Sable and paralleled the west coast of Florida for about 30 hours before entering the coast near Dead Mans Bay. By then, the storm had reduced to minimal hurricane intensity. The air mass north of the hurricane and surface water temperatures had remained essentially constant as the storm skirted no more than 50 n.mi. off the coast for those 30 hours.
Caution; the Cross City area is exposed to hurricanes moving in from the southwest (e.g., appendix fig. A-12) although there has not been a severe one in recent years. The land effect would not apply. For example, a hurricane could develop over the Bay of Campeche, attain great strength over the central gulf, and then aim its destructive winds directly at the area. Figure 11 is intended to combine these possibilities.
b. Delaware Bay Maximum--Just as the shape of the coastline plays the major role in establishing the Massachusetts minimum, the north-south orientation of the east coast between Cape Hatteras and New York City militates against landfalls and establishes a central pressure distribution maximum near the mouth of Delaware Bay. The strongest tropical cyclone to move inland on the New Jersey coast during this century was a minimal hurricane (September 1903) with central pressure above 982 mb. Also, only one tropical storm (less than hurricane intensity) has penetrated the Delmarva Peninsula during the last 74 years - in October 1943. Storms heading northnortheastward over Delmarva after having entered the coast at a point farther south are more common, but ,these storms have usually filled to a considerable
40

degree by the time reach Delaware Bay.
The raw data of f 11 have been deliberately undercut in the Delaware Bay area because our method of data collection is more sensitive to landfall-ing storms than storms. 1'1ost of the hurricanes affecting this of the coast bypass offshore before striking or bypassing southern New England but they~~~ turn into the Delmarva-New Jersey coast. These storms have central comparable with the landfalling storms of southern New England. Therefore, the curves for Delaware Bay are tailored to reflect both the raw Delaware data and the New England analysis farther up the coast.
c. Jacksonville Maximum--The central pressure probabilities achieve another high point along the northeast coast of Florida. Again, the shape of the coastline plays a major role. The direction of the coastline is about 160° to. 340° (measured from north) in this region. When a storm recurves sufficiently to miss the southeast coast, it usually misses the northeast coast. Until 1964, the city of Jacksonville was unique in that it was the only large city on the Atlantic Coast south of Connecticut that had never sustained winds of hurricane force in modern times. Hurricane Dora spoiled this fortuitous record in September 1964, lashing the Jacksonville area with 82-mi/hr winds and demons that Jacksonville is not immune to a major hurricane.
Although the incidence of exiting tropical cyclones near Jacksonville is as high as or higher than at any other place on either coast, all but a ·_few of these are tropical storms with central pressure higher than 982 mb and have little impact on the lower central pressures.
d. Northern New England Coastal Maximum--The central pressure of hurricanes rises steadily as we move from southeastern Massachusetts northward to Canada. The tlcold wall" of the Labrador Current is principally responsible for this effect. During August, the month of warmest sea-surface temperatures, water temperatures average between 65° and 70°F from Long Island to Cod. Alorg the coast of Maine during the same month, the temperature is in the upper SO's - cold enough to give any hurricane an extratropical character.
4. PROBABILITY DISTRIBUTION OF RADIUS OF :1:-'lAXIMUM WHi'DS
4.1 Data
The data used to arrive at a distribution of radius of maximum winds (radius, R, from the center of a hurricane to the radius at which the wind speed is the t) for the gulf and east coasts of the United States are listed in tables 1 and 2, which are described in sections 1.3 and 3.1. The values of R are for certain locations and times. would most likely be different at other locations and times.
4.1.1 Source of Radius of Maximum Winds
The numerical values of R entered in the table are derived from several sources. 1) When possible, wind speed records from land stations were used. When wind records were not available, the data were 2) approximated
41
from eye radii gathered by aircraft or radar, or 3) drawn from aerial reconnaissance wind reports. When the latter type of data were not available (usually for pre-1950 storms), the R value was 4) computed from an estimate of the pressure profile, or 5) checked against narrative or tabular data in the Monthly Weather Review. Each R in the tables is followed by a superscript letter or letters that r~er to a legend at the end of the tables giving the source of the R value.
4.1.1.1 R fro~ Wind Records. Observed winds were acquired by noting the tfuE when a wind-reporting station (also identified in tables 1 and 2) experienced a maximum wind speed prior to the wind slacking off in the hurricane eye. From a knowledge of the location of the storm center at that time, one can then make an estimate of the value of R .. Figure 14 is a graph of wind speed at Miami and distance of the station from the hurricane's wind center vs. time for the hurricane that struck the southeast Florida coast on September 15, 1945. The radius of maximum winds for the forward and rear portions of the storm is seen to be about 24 n.mi. No. 32 (Hyers 1954) contains a detailed discussion obtaining R from wind records. Additional examples are of that report.
4.1.1.2 R from Eye Radius. In his work, The Structure and Dynamics of the Hurricane's Inner Core Region, Shea (1972) states that in the mean the radius of maximum winds occurs at radii 5 to 6 n.mi. outside the inner radar eye radius (IRR) - assumed synonymous with the inner cloud wall. The IRR may be obtained from land-based radar, ships at sea, or aircraft. Figure 15, taken from Shea, shows the position of R relative to the IRR for 21 Atlantic Ocean and Gulf of Mexico hurricanes. Figure 16, aleo from Shea, shows the difference between Rand IRR vs. the maximum wind speed for radial legs. Note that the more intense the wind the better the agreement between R and the IRR.
4.1.1.3 R from Aerial Reconnaissance. Flight reports from reconnaissance aircraft usually include a plain language report of the radius of maximum winds at flight level (around 700mb). Shea finds that "only the weaker storms exhibit a tendency for a slope of the radius of maximum winds with height; more intense storms (fig. 17) do not. The vertical slope of the radius of maximum winds is probably related to the intensity of cumulus convection. Stronger eye wall convection in intense storms is more effective in transporting horizontal momentum to upper levels. This causes the cumuli to stand straighter and the maximum winds at upper levels to occur more directly above those at lower levels." Thus, reliable can be used to approximate the surface value of R in hurricanes of average or greater than average intensity when more direct data sources do not exist.
4.1.1.4 R from Pressure Fit. Computed Rs are arrived at by fitting an exponential pressure profile to a given hurricane. By their nature, computed values of Rare more subject to error than observed Rs. The procedure is:
a. Plot the observed pressure data for each particular time and quadrant on a graph of pressure vs. distance from the ~urricane center.
b. Draw a smooth curve to the plotted data, a first approximation of the pressure
42

.E ] 0 w w c.. ((>
0 z 3: 0 z <(
E £ w (.) z <( f-~ 0
100,.-----,-----,-----,-----,-----,-----.-----.-----.-----.-----.l
R 24 n rni .
60
40
80
I
,/(', )>1 \
R=24nrni 1 I \ I I I \ 0
-9' 9 : 0 ...... pI O\ O I I O,
I I \ : I b ... , 1 I \ I 1 0,0
I I \ I 1 '.0 0 I \ I I ', /
0 ~ I I ' I ~d I ~
'
1
/... 1
1 0-,oo 0 010 / WIND SPEED (mi/hr~ , ,
, ' ,, ', ,' ~ ...
, ~0 o.,_' .. P---- o o 9.6. 0 0
p/ I I I 1 I I I I "I I I I I
DISTANCE TO HURRICANE CENTER FROM MIAMI, FLA.
20
0L_1L6------~1~7~----~1~a------~1~9----~~2~o------~2~1----~~2~2c·-----:2~3----~2~4/~omo-----co~1------(o~2~ SEPT. 15, 1945 TIME (GMT) SEPT. 16, 1945
Figure 14.--Graph of wind speed and station-to-hurricane-center distance vs. time at Niami, Fla., September 15-16, 1945. The radius of maximum winds determined by the relation of peaks in the wind curve to distance from Miami to the storm center is 24 n.mi.
43

e c
(f)
::> 0 <l cr:: w >-w
~ -' w > w -' oc w ;!; 0 ..J
0 z ~ ::?:: ::> ::?:: X <:(
::?:: 1.1.. 0 (f)
::> 0 <:( cr::
30
e 25
.:
"' ::> 0 20 <( 0::
w >-w
0:: 15
<( 0 <l 0::
0:: w 10 z ~
5
30
.. .. . . . .
·:· . .. ~·
.. .. .. ·: ~·· . . •: .. . .. . .. ··~ ::- .. .. . . .: .. ... .. .
·~ .. •: .. .. .. .•.• . . .. ··:· ~:~ .. :·
10 15 20 25 30 35 40 45 50
RADIUS OF MAXIMUM WIND
Figure 15.--Radius of maximum winds (RMW) vs. inner radar eye radius (IRR). Points falling on the 45° line are those where the ID1W and IRR coincide. The curved line indicates the best fit curve (from Shea 1972).
<t w cr:: <:(
0 ::> g u w I 1-
w 0 (f)
z
~
~
•
•
••
•
• •••
• •
:E • • • • .. •
• •
• • • • • • • •• •••• . . .. .... :.
0:: • • ••
•
• • • •
• • •
• •
'
•
: I
" • • •
• .... • •
•• • • # •• •
•• • •
• • • ••a' , .... , :·.,· •• J• ., ••• • • • RMW • .. . . . .... ,. · ... _. . .. . .... .
• • I • • .• •. .: r·,··· .,. • •• • . _.._. . . .. . ..... , • NO Dl FFERENCE • ;-" ~- ---.--....-.::.:..-.......... ---:---=--..---.~.--__ ----• ~
IRR •
50 60
• • • • • • •
110 MAXIMUM WIND SPEED ( knots )
120 130 140
Figure 16.--Difference between the radius of maximum winds (RMW) and the inner radar eye radius (IRR) vs. maximum wind speed. The best fit curve is indicated by the heavy line (from Shea 1972).
44
150
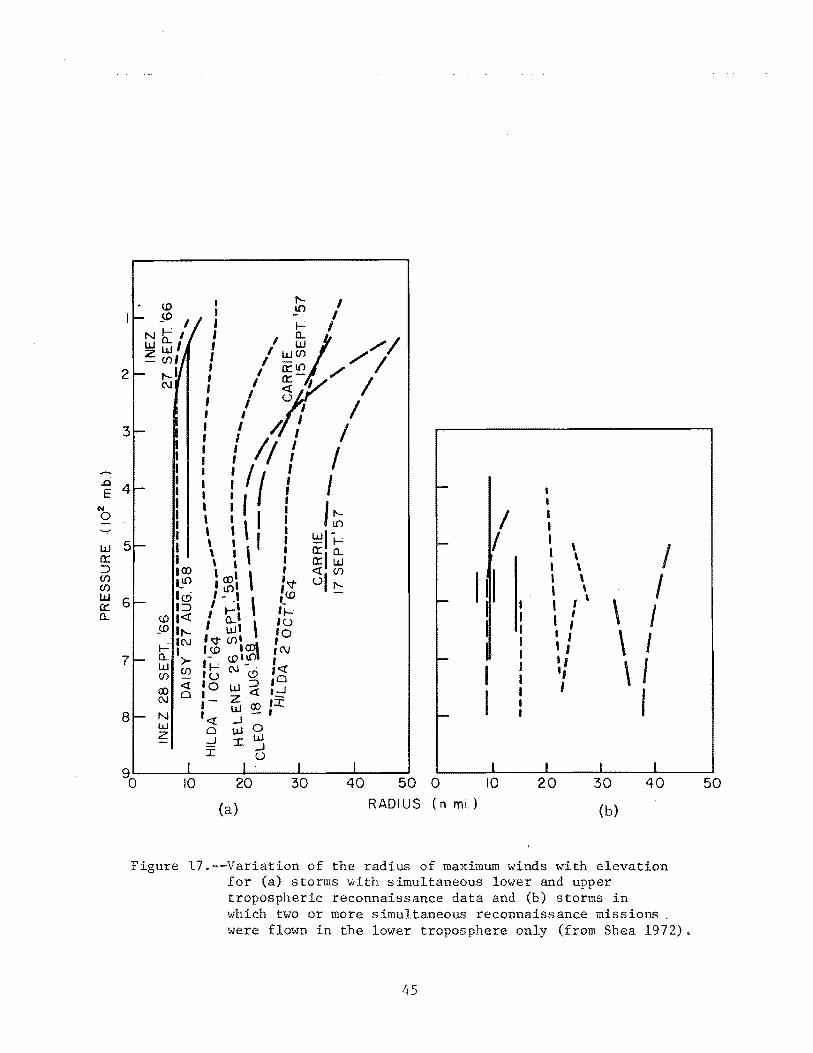
..ci E
N 0
1..1..1 0:: ::l (f) (f) 1..1..1 a:: a..
2
I I I I I I I I I 100 a_LD 10 l::l
<.OI<! _<.0 lr--
. IN ..__, a.. >w (/) (f)
00 <! (\J 0
N w z
I 1'- I I 10 I I ~ I
I / 1.1..1~ I /// I / fi.l£2/// I f / 1(5 " II f I I
' I A I I I I /f I I I I I : I I I I I I I I I I ' I ~ : \I : /;;; \ ! r : ~P--C \ ~ \ : ~, ~ ' I \ , <!I (f) I 00 I I '\t U 1'-
/ :?_, \ [<.0 -I 1-t l"i-1 a..l \ IU l«;t ~! :o l<e> acol tC\1 - (,()ti.DI ' lt---:{\.1-· <!
• (.) (.!) ,' 0 •o ::l I 1..1..1 <! t-J
'- ffi 00 ,;z: I - I
<! __J 0 0 1..1..1 w ~ ::r. __J I (.)
I I
111 I
10 20 30 50 0 10
(a) RADIUS (n.mi.)
• I I I I \ I \ I \ I \ I ' I I \
' 1, I
' :
20
I I ,, I
I I
\ I
30
(b)
\ I \ I
' 40
Figure 17.--Variation of the radius of maximum winds with elevation for (a) storms with simultaneous lower and upper tropospheric reconnaissance data and (b) storms in \vhich two or more simultaneous reconnaissance missions . were flown in the lower troposphere only (from Shea 1972).
45
50

c. Fit a curve to each tentative profile of the family:
p - Po -R/r = e
Pn- Po (2)
which, solved for R, reads
R rlr2
ln pl - Po
= rl - r2 p2 - Po
(5)
Where p = pressure at distance r from hurricane center, p0 = central pressure, Pn = asymptotic pressure, R = radius of maximum winds, and r = radius at pressure p (rl and r 2 are known radii of observed pressures p1 and p2).
The value of p1 is usually taken from an observation about 250 to 300 n.mi. from the hurricane center and p2 from a point close to the storm center. The radius of maximum winds for each quadrant is the R parameter. Reliability depends on the quantity and consistency of data and whether there is a pressure observation close to the center. At the radius of maximum winds in a hurricane, the centrifugal force term~xceeds Coriolis force by an order of magnitude. Thus, the wind if balanced is essentially cyclostrophic. Differentiating (2) shows that the maximum cyclostrophic wind is at R (Myers 1954, pp. 2, 3, 27). In using equation (2), Pn is taken from the outer edge of the hurricane's sphere of influence.
d. Obtain the best overall value of R by averaging the Rs of the forward and rear halves of the storm. Some subjectivity is involved here. Frontal systems and polar highs distort the pressure profile around a hurricane. Values of R should not be derived from the above equation beyond the frontal boundary or in quadrants of the storm that show a marked baroclinicity.
4.1.1.5 R from Monthly Weather Review. Radius of maximum winds reports extracted from the Review usually consist of estimates of eye diameters from the measured time interval between the slackening and resumption of hurricaneforce winds over some point near or along the east or gulf coast. In other instances, researchers have reported their findings in the Review, and these results (including estimates of the radius of maximum winds) have been accepted by the authors.
4.1.1.6 R not Measured. In a few cases, R could not be obtained by any reliable method. Storms with Rs in this category are represented in tables 1 and 2 by the abbreviation MSG (missing).
4.1.2 Limited Representativeness of Large Rs
Do the larger values of R represent a true hurricane or one that is in an advanced stage of becoming extratropical? The answer to this question is an integral part of a climatology because nontropical influences upon the value of hurricane factors will limit the way in which the data may be used.
46

The numerical values appearing in tables 1 and 2 range from 6 to 66 n.mi. Myers (1970) ignores all Rs larger than 45 mi (39.1 n.mi.) in his study Joint Probability Method of Tide Frequency Analysis Applied to Atlantic City and Long Beach Island, N.J. since the employed storm surge model is less reliable with Rs much larger t~an this. Studies of radar films of hurricanes have failed to provide visual confirmation of any hurricane having an R as large as 50 n.mi. unless it was becoming extratropical. Keeping this in mind, the authors >vere able to revise downward several of the large values of R listed in table A of Report No. 33 (see sec. 3.1 for reasons for revising other R values).
Six of the 124 hurricane positions in tables 1 and 2 have an R greater than 45 n.mi. One of these large Rs (September 21, 1938) is a computed value uncopfirmed by direct wind observations. This hurricane had also appeared to develop extratropical characteristics (Myers and Jordan 1956). The R=66 n.mi. in the August 26, 1924 hurricane (near Nantucket, Hass.) was observed at a time. when the hurricane was becomins extratropical. The R=54 n.mi. in the December 2, 1925 hurricane; the R=55 n.mi. in the Septem:Jer 30, 1929 storm; the R=50 n.mi. in Hurricane Daisy off Nantucket; and the R=48 n.mi. in Hurricane Donna off Long Island >vere also noted at a time when the hurricanes were becoming extratropical. The highest winds in extratropical storms are usually observed much farther from the storm center than the maximum winds within hurricanes. Based on the above discussion, all Rs > 45 n.mi. are eliminated from the frequency analysis to be described.
4.1.3 Determination of R in Hurricane of September 1928
The hurricane of September 16, 1928 is an exception to the rule in par. 4.1.1 that observed values of R would be accepted in preference to computed values. This hurricane passed directly over West Palm Beach, Fla. The wind-time graph at Miami (no wind records are available for West Palm Beach) appears to indicate an average R of 53 n.mi. which is only about 5 n.mi. short of the distance between the two South Florida cities.
However, in the Monthly Weather Review for that year, Charles L. Mitchell (1928) relates, "The damage at Miami was negligible, being confined principally to a few plate-glass windows and to awnings. Hollywood and Fort Lauderdale escaped with only slight structural damage to buildings, the most serious ·losses being from water damage, resulting from broken windows and leaking roofs. A few thousand dollars will cover the losses at both places. From Pompano north to Jupiter, especially at Delray, Lake Worth, Palm Beach, West Palm Beach, and Kelsey City there was serious structural and water damage, the losses being greatest at Palm Beach and West Palm Beach. There has been no authentic statement as to the total losses, but they amount to several million dollars. 11
Pompano is about 30 n.mi. down the coast from West Palm Beach, and it was at Pompano where serious damage became apparent. The value of R is not 53 but 28 n.mi. when the exponential pressure profile equation is used. The latter value agrees very \vell with the damage information in the Monthly Weather Review. The lull at Miami apparently was not the eye but some other phenomenon.
47

4.2 Analysis
Cumulative frequencies of radius of maximum wind for each storm counted (in some cases a hurricane is counted more than once as described in chapter 3) within 150 n.mi. seaward from the coast and 50 n.mi. inland from the coast were determined from the Rs in tables 1 and 2 for the same overlapping zones centered 50 n.mi. apart used for the p
0 analysis. The frequencies were
analyzed according to the procedure illustrated in section 3.2. Greater freedom was taken in analyzing the cumulative frequency graphs of radius of maximum winds for each 50-n.mi. increment and the eventual probability distribution along both coasts than for p0 because the best available R data were deemed to be often too sparse and to be less reliable on the average. Examples of the graph analyses are given in 18. Three per-centiles (16-2/3, 50, and 83-1/3) were chosen, instead of the 7 chosen for minimum central pressure, to portray the end product of the analysis procedure--the coastal trend in R (fig. 19) along the east and gulf coasts. Raw data from initial best fit curves for the cumulative frequency of minimum central pressure graphs are shown at the 16-2/3 percentile of figure 19. Centroids of R data were not used for additional control.
We did not expand the radius of maximum winds distribution to enforce consistency with the storm frequency count as we did with the central pressure distribution; instead we used only those values presented in tables 1 and 2 (central pressure of all listed hurricanes less than 982 mb, period of record 1900-73). Tropical storms, especially the weaker ones, often have no welldefined radius of maximum winds, and when they do it is often a hundred or more miles from the storm center. Ass values of R to these storms \vould be haphazard at best. Only hurricanes (those in tables 1 and 2 with R < 45 n.mi.) were considered in the frequency analysis of R along the coast.
4.2.1 East Coast
Since it was shown in previous papers (Weather Bureau 1957; Graham and Nunn 1959) that R tends to increase with increasing latitude along the east coast, the cumulative at the three intervals should show this relation in figure 19. For the most part, the above concept holds true at all three percentiles from the southern end of Florida to the mouth of the Chesapeake Bay. An initial analysis showed a dip in the three percentile curves toward lower R values between the northeast' coast of Florida and the southeast coast of South Carolina ranging from 2 to 3 n.mi. in the lowermost curve (16 2/3%) to 4 n.mi. in the uppermost curve (83 1/3%). This was smoothed out in the final analysis . 19) because 1) the data in this area compared with that over most of Florida and the rest of the Carolinas are relatively sparse, and 2} the dip could not be accounted for on physical grounds.
We encountered a particular problem when R on the southeast Florida coast to the same latitude on the Texas coast. The raw data, particularly at the 83-1/3% level (not shatvn in . 19), had significantly larger values in Florida. This difference was reduced in South Florida such that Rs there exceed their Texas counterparts only about 20% at the uppermost percentile. Also, the Florida gulf coast curve at the 16-2/3% level was
48

.j:-..
1..0
100r----.----.----r----.----r----.----r----.-~~
(/) 80. w (.) I /0 z w a: a: ::J (.) (.)
0 60 u. 0 .... z w (.) a: Ul
0... 40 0 Ul .... <{ ...J ::J 2 ::J (.) (.) <{ 20
I 1-(a)
COASTAL REFERENCE MILEPOST 750
Ol ~ (NEAR BAY ST. LOUIS, MISS)
0 io 20 30 40
RADIUS OF MAXIMUM WINDS (n mi)
(/) 80 Ul (.)
z w a: a: ::J (.) (.)
0 60 u. 0 .... z Ul (.) a: Ul 0... 0 40 Ul
~ ...J ::J 2 ::J (.) (.)
<{ 20
{bl
COASTAL REFERENCE MILEPOST 1950
0 I _........c- (CENTRAL SOUTH CAROLINAC~
0 10 20 30 40
RADIUS OF MAXIMUM WINDS (n mi)
Figure 18.--Graphs of radius of maximum winds vs. cumulative percent of occurrences (a) Gulf of Mexico (milepost 750), near Bay St. Louis, Miss., where hurricane Camille went ashore and (b) east coast (milepost 1950), along central South Carolina coast •
•

Vl 0
(/)
0 z 3: 30 ::2 ::J ::2
lL 0
"0 Q 0 )> J:J r -l <
m (i) Ul )> -l OJ 0 m z r
-l -l m m ?< X
. ' I + I + r CD "0 - m )> r z 7 0 Ul m X )> () ,- () I :;: 0 )> r J:J (i) )>
!Jl r rn -n
r ,Ul
? r )>
I -n )> r -l
-l :;: ? CD m z m
m J:J ~
-n -n )> )> r r () Ul
(/) )> ? 0 I z -n 0 r
?
831/3%
50%
16 2/3%
0 ~ 0 2 4 6 8 22 24
DISTANCE (n mix 102)
19.--Probability distribution of radius of maximum winds of hurricanes, and east coasts (1900-73). Numbered lines denote the percent of storms with R equal to or less than the value indicated along the ordinate. Plotted points (A) are taken from frequency analyses at 50-n.mi. intervals for the 16-2/3 percentile (sec. 4.2).
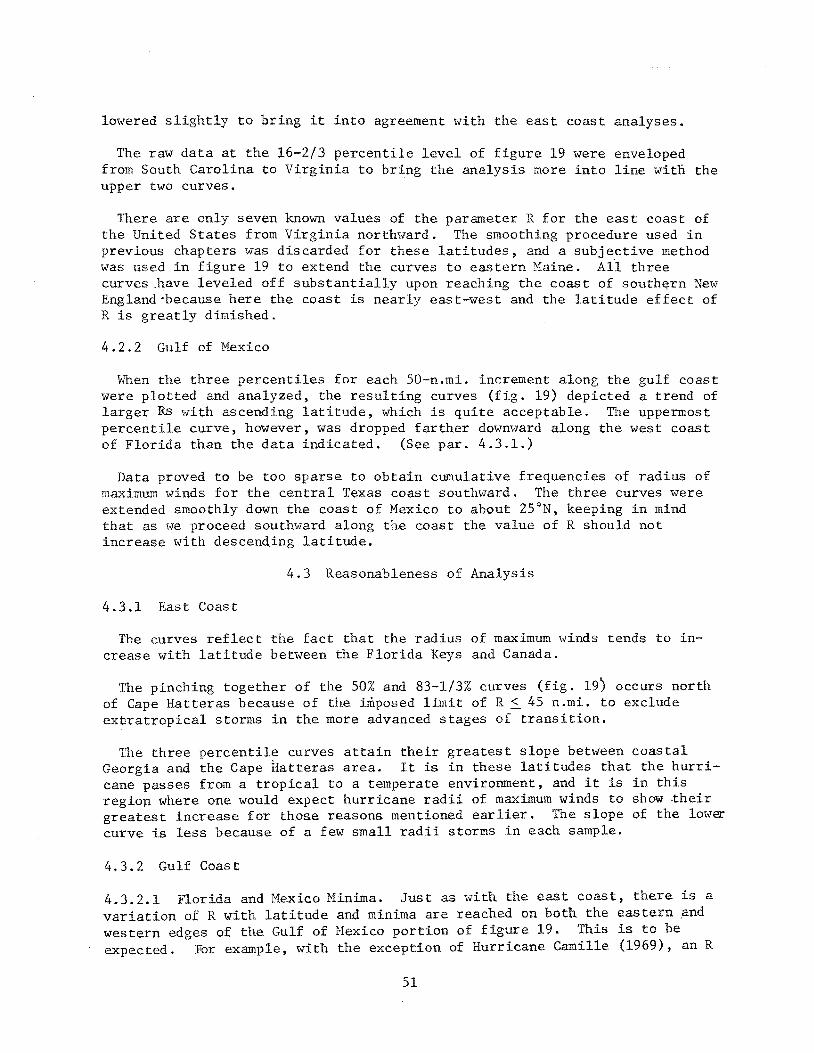
lowered slightly to bring it into agreement with the east coast analyses.
The raw data at the 16-2/3 percentile level of figure 19 were enveloped from South Carolina to Virginia to bring the analysis more into line witn the upper two curves.
There are only seven known values of the parameter R for the east coast of the United States from Virginia northward. The smoothing procedure used in previous chapters was discarded for these latitudes, and a subjective method was used in figure 19 to extend the curves to eastern !1aine. All three curves .have leveled off substantially upon reaching the coast of southern New England·because here the coast is nearly east-west and the latitude effect of R is greatly dimished.
4.2.2 Gulf of Mexico
When the three percentiles for each 50-n.mi. increment along the gulf coast were plotted and analyzed, the resulting curves (fig. 19) depicted a trend of larger Rs ~..:rith ascending latitude, which is quite acceptable. The uppermost percentile curve, however, was dropped farther downward along the west coast of Florida than the data indicated. (See par. 4.3.1.)
Data proved to be too sparse to obtain cumulative frequencies of radius of maximum winds for the central Texas coast southward. The three curves were extended smoothly down the coast of Mexico to about 25°N, keeping in mind that as we proceed south\..:rard along the coast the value of R should not increase with descending latitude.
4.3 Reasonableness of Analysis
4.3.1 East Coast
The curves reflect the fact that the radius of maximum \..:rinds tends to increase with latitude between the Florida Keys and Canada.
The pinching together of the 50% and 83-1/3% curves (fig. 19) occurs north of Cape Hatteras because of the imposed limit of R < 45 n.mi. to exclude extratropical storms in the more advanced stages of transition.
The three percentile curves attain their greatest slope between coastal Georgia and the Cape Hatteras area. It is in these latitudes that the hurricane passes from a tropical to a temperate environment, and it is in this regiop where one would expect hurricane radii of maximum winds to show -their greatest increase for those reasons mentioned earlier. The slope of the lo\..:rer curve is less because of a few small radii storms in each sample.
4.3.2 Gulf Coast
4.3.2.1 Florida and Mexico Minima. Just as with the east coast, there is a variation of R with latitude and minima are reached on both the eastern ?nd western edges of the Gulf of Mexico portion of figure 19. This is to be expected. For example, with the exception of Hurricane Camille (1969), an R
51
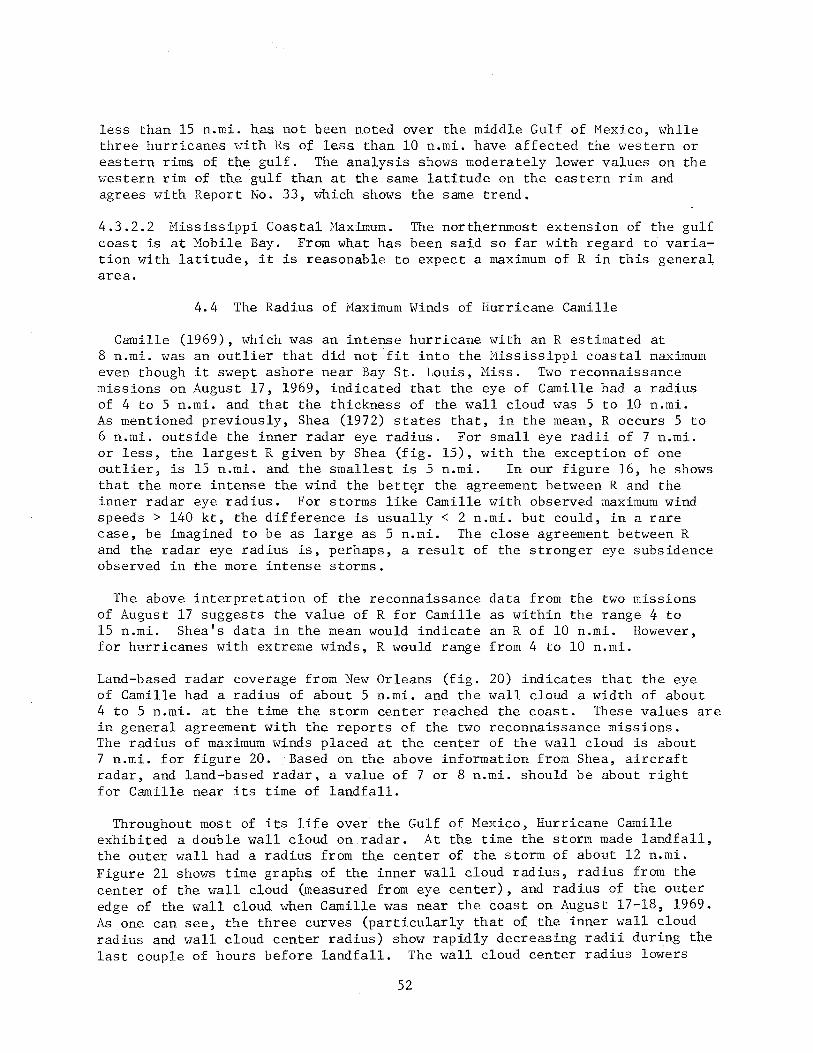
less than 15 n.mi. has not been noted over the middle Gulf of Mexico, while three hurricanes -vlith Rs of less than 10 n.mi. have affected the western or eastern rims of the gulf. The analysis shows moderately lower values on the western rim of the gulf than at the same latitude on the eastern rim and agrees with Report No. 33, which shows the same trend.
4.3. 2. 2 Mississippi Coastal Haximum. The northernmost extension of the gulf coast is at Mobile Bay. From what has been said so far with regard to variation with latitude, it is reasonable to expect a maximum of R in this general area.
4.4 The Radius of Maximum Winds of Hurricane Camille
Camille (1969), which was an intense hurricane with an R estimated at 8 n.mi. was an outlier that did not fit into the Mississippi coastal maximum even though it swept ashore near Bay St. Louis, Miss. Two reconnaissance missions on August 17, 1969, indicated that the eye of Camille had a radius of 4 to 5 n.mi. and that the thickness of the wall cloud was 5 to 10 n.mi. As mentioned previously, Shea (1972) states that, in the mean, R occurs 5 to 6 n.mi. outside the inner radar eye radius. For small eye radii of 7 n.mi. or less, the largest R given by Shea (fig. 15), with the exception of one outlier, is 15 n.mi. and the smallest is 5 n.mi. In our figure 16, he shows that the more intense the wind the bett~r the agreement between R and the inner radar eye radius. For storms like Camille with observed maximum wind speeds > 140 kt, the difference is usually < 2 n.mi. but could, in a rare case, be imagined to be as large as 5 n.mi. The close agreement between R and the radar eye radius is, perhaps, a result of the stronger eye subsidence observed in the more intense storms.
The above interpretation of the reconnaissance data from the two missions of August 17 suggests the value of R for Camille as within the range 4 to 15 n.mi. Shea's data in the mean would indicate an R of 10 n.mi. However, for hurricanes with extreme winds, R would range from 4 to 10 n.mi.
Land-based radar coverage from New Orleans (fig. 20) indicates that the eye of Camille had a radius of about 5 n.mi. and the wall cloud a width of about 4 to 5 n.mi. at the time the storm center reached the coast. These values are in general agreement with the reports of the two reconnaissance missions. The radius of maximum winds placed at the center of the wall cloud is about 7 n.mi. for figure 20. Based on the above information from Shea, aircraft radar, and land-based radar, a value of 7 or 8 n.mi. should be about right for Camille near its time of landfall.
Throughout most of its life over the Gulf of Mexico, Hurricane Camille exhibited a double wall cloud on radar. At the time the storm made landfall, the outer wall had a radius from the center of the storm of about 12 n.mi. Figure 21 shows time graphs of the inner wall cloud radius, radius from the center of the wall cloud (measured from eye center), and radius of the outer edge of the wall cloud when Camille was near the coast on August 17-18, 1969. As one can see, the three curves (particularly that of the inner wall cloud radius and wall cloud center radius) show rapidly decreasing radii during the last couple of hours before landfall. The wall cloud center radius lowers
52

NEW ORLEANS FRAME NO. 3282 0431 GMT AUG. 18, 1969
0° LEGEND
X EYE CENTER A INNER WALL CLOUD RADIUS B WALL CLOUD CENTER RADIUS C OUTER WALL CLOUD RADIUS D ATTENUATION
'II
111 f)f
Figure 20.--Hand-drawn sketch of New Orleans (Moisant Field) radar image, August 18, 1969, at 0431 GMT. Note locations of the eye center (x), inner wall cloud radius (a), wall cloud center radius (b), and outer wall cloud radius (c).
53

25
20
15
? •··-··- 0 OUTER WALL CLOUD
\ \. o., 0
--- A INNER WALL CLOUD
• .......... , 0 WALL CLOUD AXIS (RADIUS FROM
EYE CENTER)
0 ·.,0 0 ., ·~··q,
~'b. .• ~ 0 ••
f:!. •• o'·· o O""o-.q_o o ....... .......
0 o''o 0 ......... 0 6
o o'· : 0 0 ·..;..
: ·o .. o ......... . ~ . • • 0 •.. • • . o ... : \
•• .. : ·o 0 0 ••• •• fl. •••• • •
Do • \ o o ·····a \ · · o······· ····· o • : ••• .......................... o· o o o A o \,0 o \ 0 0 0 0 00 '}.. '.0
0 • • 0\, . . . • •\o 1:.. '·a o . • \~ ·,_-o#l'f:J
••••• 0
••••• I.J.O 0 ..... n.O···
o a·-.. 9 .. ~;~ .. ,.
A
A
LAN~FALL . • 0
ou14--~--~~6~-L--1~8--~~2~0--~~2~2--~~24~~--0~2~~~M~·~--~oo~~--~oo~~--~~o~~~12 AUG. 17, 1969 TIME {GMT) AUG. 18, 1969
Figure 21.--Composite graph of inner wall cloud radius, wall cloud center radius, and outer wall cloud radius vs. time for Camille. Storm made landfall about 0430 GMT.
54

from more than 10 n.mi. to 7 n.mi. in about 2·-1/2 hours, or during Camille's last 40 n.mi. at sea before landfall.
Based on what has been said in the last four paragraphs, \ve have chosen an R of 8 n.mi. as our best estimate of the radius of maximum '..rinds of Camille during the last hour or two before landfall.
The National Weather Service dynamic model (Jelesnianski 1972) replicates a hurricane wind field from an index R, then computes the coastal surge. With Camille, the best replication of the surge is with an index R of 12 n.mi. This discrepancy suggests that Camille did not fit the standardized wind profile of the storm surge model. The reader is therefore alerted to the fact that other radii of maximum winds listed in tables 1 and 2 may not be the uniquely best values for replicating observed surges with a standardized wind profile.
5. PROBABILITY DISTRIBUTION OF SPEED AND DIRECTION OF STORH MOTION
5.1 of Storm Motion
Speed of forward motion of landfalling and alongshore hurricanes was extracted from storm track charts. Forward speeds were carried forward from table A of Report No. 33 for the storms listed there. Those speeds were mostly derived from detailed track charts depicting hourly or hi-hourly tions in the vicinity of the coast (e.g., Myers 1954, Graham,and Hudson 1960). The forward speeds pertain to the time of landfall or closest approach to the coast. Cry's tracks and the charts published in the Monthly \~eather Review for recent years were used to update and extend table A. These charts give 12- or 24-hr positions and sometimes indicate slower forward speeds than detailed hourly tracks because of the acceleration associated with recurvature. Speed data used in this analysis included all hurricanes since 1886 as defined by Cry (maximum surface winds 64 knots or greater),regardless of central pressure.
Tropical storms are omitted from this analysis of storm speeds to eliminate the transition of recurved storms from hurricane to tropical storm to extratropical storm stages. The high speeds characteristic of the latter transition are not necessarily representative of the hurricane stage. It is not always possible to identify these transition s individually.
Forward speeds of the hurricanes with central pressure below 982 mb during the period 1900-73 are listed in tables 1 and 2 for information but the speed probabilities are derived from the larger sample just described.
5. 2 Fonvard Speed Probability Distribution
For Landfalling Hurricanes
5.2.1 Analysis
From the data summarized in the preceding paragraph, cumulative frequencies of speed of forward motion for landfalling hurricanes were determined for
55

locations spaced at 50-n.mi. intervals along the gulf and east coasts. The cumulative frequency curve for each location was based on 30 data points, i.e., speed data for the 15 hurricanes landfalling on each side of the location. (This more generous subsample than for p
0 and R is appropriate to the
larger total sample.) The curves were determined in this manner for locations on the east coast as far north as Cape Charles, Va. A lack of data to the north necessitated analyzing the frequencies with a smaller data sample and at larger intervals. Seven data points were used in the frequency curves for locations near New York, N.Y., and Boston, Mass., and six for Eastport, Me.
The cumulative probability curves were constructed using eq. (4) for the plotting position. Figure 22 shows examples of these curves for two coastal locations, near Bay St. Louis, Miss., and on the central South Carolina coast. Values at the 5, 20, 40, 60, 80, and 95th percentiles from each probability curve were then smoothed along the coast by the weighted mean procedure described in par. 2.2.1.1, except that north of Cape Hatteras on the east coast subjective smoothing was used. The resultant smoothed profiles are shown in figure 23. The 80%-level points from the curves before this final smoothing step are plotted on the figure.
5.2.2 Results and Discussion
Figure 23 shows the probability distributions of forward speed for landfalling hurricanes. The speed of hurricane forward motion generally increases with their northward progression, especially after recurvature to a northerly or northeasterly direction. The diagram reveals no significant variation in the speed of forward motion of hurricanes along either coast of the Florida peninsula, but north of Daytona Beach, Fla., on the east coast the forward speed of hurricanes increases. The upper 50% of forward speeds increases from 10-17 knots near Jacksonville, Fla., to 30-48 knots at the northern U.S. boundary. A latitudinal variation is also found in the Gulf of Mexico. Hurricanes striking the mid-gulf coast have higher speeds, especially the upper 10%.
5.3 Forward Speed Probabil~ty Distribution
For Alongshore Hurricanes
5.3.1 Analysis
The probability distributions of forward speed for alongshore storms were based on data grouped into zones extending 250 n.mi. along the coast and from the coast to 150 n.mi. at sea. A probability curve constructed for each 250-n.mi.-long zone was assumed to be representative of hurricanes crossing a line drawn perpendicular to the coast at the center of the zone. Speeds at the same selected probability levels (par. 5.2.1) were used to const~uct smoothed profiles along the coasts. This was accomplished by subjective analysis, using figure 23 as a background guide. (Analysis at 50-n.mi. intervals of speeds of alongshore hurricanes based on 12- and 24-hour movements would be redundant and would result in repeated counts of the same storms.) The resultant probability distributions are shown in figure 24.
56

(/) w (.) z w a: a: :::> 8 0 I..L. 0 1-z w (.) a: w 0.. 40 0 w
~ ..J :::> ~ :::> (.)
~ (a)
COASTAL REFERENCE MILEPOST 750
(NEAR BAY ST. LOUIS, MISS.
FORWARD SPEED(kt)
(b}
COASTAL REFERENCE MILEPOST 1950
0
( CENTRAL SOUTH CAROLINA COAST}
oL-------5~~----1LO------~-------L------~25
FORWARD SPEED(kt)
Figure 22.--Landfalling hurricanes, forward speed vs. cumulative percent of occurrences, (a) Gulf of Hexico (milepost 750) near Bay St. Louis, Miss., (b) east coast (milepost 1950) along central South Carolina coast.
57

Lil co
(
g Cl UJ UJ 0.. U')
Cl c: <t s c: 0 IJ..
" 0 ::u -l
Vi )> to m r -l m X
tl t ' I t I t ' It I .I I + I t ' I t I l I I ' j ' ~~ I t G> ' to " (f) .,., $ 0 (") (") z m )> )> r= m -l -l );; )> :r: )> m 0 )>
' A 0 z -< )> " ~ (J) (f)
< m (f) $ $ $ -l ;u m -l -l m (")
X )> )> -< .- 0 ' :r: -< 0 " (f) .- (") 0 z 0 :r: ;u m .,., z m )> -l )> $ 0 A ::0 r )> (f) -l :::0 :::0 0 Vi ' (./} 5:ll )> -l -l A $ -l z ::0 )> IJJ 0 )> r fll .,., ,., m z m z (./} $ -l m .,., r r )> .:::0
~ (J) m
m _(J) r )> !> (") (J) )>
?< }" _:r: 0 (/)
r !> .,., z
r 0 }"
5%
.L~ __ _L .. .L_j____L_.J.__L___J__.l____._ _ _~__j____L_.J.___r_...~..-___,..,_---~.._-'--'
12 14 22 26 30
DISTANCE (n mix 1021
23.--Probability distribution of forward speed for landfalling hurricanes, 1886-1973. Numbered lines denote the percent of storms with forward speed equal to or less than the value indicated along the ordinate. Plotted points (A) are taken from frequency analyses at 50-n.mi. intervals for the 80th percentile (par. 5.2.1).

5.3.2 Results and Discussion
A comparison of the two distributions (figs. 23 and 24) reveals that the forward speeds of alongshore hurricanes of the east coast are generally higher than those of landfalling hurricanes, while alongshore hurricanes of the gulf coast move more slowly than landfalling hurricanes. Alongshore hurricanes off the east coast are northward-moving storms that maintain a faster forward motion after recurvature. Alongshore hurrican~s in the central portion of the gulf are eastward- and westward-moving storms traveling at a slower speed.
The comparison of the two classes of hur.ricanes further reveals that alongshore hurricanes off the coasts· of southern Florida moved at a slightly slower speed than landfalling hurricanes.
5.4 Probability Distribution of Direction of Storm Motion
for Landfalling Tropical Storms and Hurricanes
5.4.1 Data and Analysis
Hurricane and tropical storm tracks in Cry's publication since 1871 and charts published in the Monthly Weather Review for recent years were used in summarizing the directions of storm motion. Directions of landfalling tropical cyclones ~vere measured at the time they crossed the coast. A plot of these entry directions against the landfalling points is shown in figure 25. Cumulative frequencies of the entry direction for each tropical cyclone within 75 n.mi. on each side of a location were counted at 50-n.mi. incremenm along the east and gulf coasts, except that where the coastline turns abruptly, frequency counts over a shorter distance were used. Because of insufficient data north of Cape Hatteras, analyses ~-rere made at larger distance increments. Using the plotting position formula given in eq. (4), cumulative probability curves were plotted and analyzed for each of the selected points. Examples of these diagrams are shown in figure 26. Values at the 16-2/3, 50 and 83-1/3% levels of each probability curve were grouped into three sections along the coast: the gulf coast, and the east coast north and south of Cape Hatteras. The values were connected with continuous curves by subjective analyses.
5.4.2 Results and Discussion
Figures 27, 28(a), and 28(b) show the smoothed profiles along sections of the· coast for the probability distributions of directions of landfalling hurricane and tropical storm motion mentioned in the preceding paragraph. The direction of landfalling storm motion curves parallel the coastal orientation curve because the definition of "landfalling" restricts the storm direction data selection, 11 exiting11 and 1'alongshore'' storm motions being excluded. Under the influence of the easterly circulation of the lower latitudes the general movement of storms in the tropics is westward. There is a tenqency for these low latitude storms to drift slowly northward. As the storms drift toward higher latitude, they come under the influence of westerly winds and Tecurve northeastward.
59

-;;-~ 0 w w 0.. (f)
0 a: <( 3: a: 0
0\ u..
0
• I I I f I f I I + I I +I I + I • I I I f I I + l I I • + ~I I + .., G) r- at .., (/) ., s: 0 (') (') z m 0 )> )> r: m ....; ....; ); )> :I: )> m 0 )> :D r- i'\ 0 z -( )> ..,
~ (/) en ....; < m (f) s: s: s: ....; :D m ....; ....;
m X )> )> -( .- 0 :I: -( 0 ..,
Ui (") (') r- 0 z 0 (f) :I: :D m ., z m )> )> ....; s: 0 :D (/) :D . :D
0 )> i'\ r- )> ....; s: ....; OJ Ui r- Y> (f) )> ....; ....; i'\ m z :D )> . OJ 0 )>
r- . r- (f) . , , m z m z (/) s: . -i m ., r- r- )> :D :..: Vl m ....; m Y> r- )> '!" (") (/) )>
m ?< '!" _:::t: (-) .(f)
?< r-'!" z .,
0 r-'!"
001 ~95%
50 I / ..-80%
I / / -60%
I / ../ / ~ 40%
I I I _., 20%
5%
l---'----1...--''-- L .. L ..... L_J.........._L__L_~_.L__jl,-_L_-}:--'--~___l.--!:.-__L--:1:--_J._--::!:::--_L_-:::-___JL..._~---'----;:;~-"--~;;---' 4 6 8 12
DISTANCE (n mix 102)
Figure 24.--Probability distribution of forward speed for alongshore hurricanes, 1886-1973. Numbered lines denote the percent of storms with forward speed equal to or less than the value indicated along the ordinate. Plotted points (4) are taken from frequency analyses for the 80th ile (par. 5.3.1).
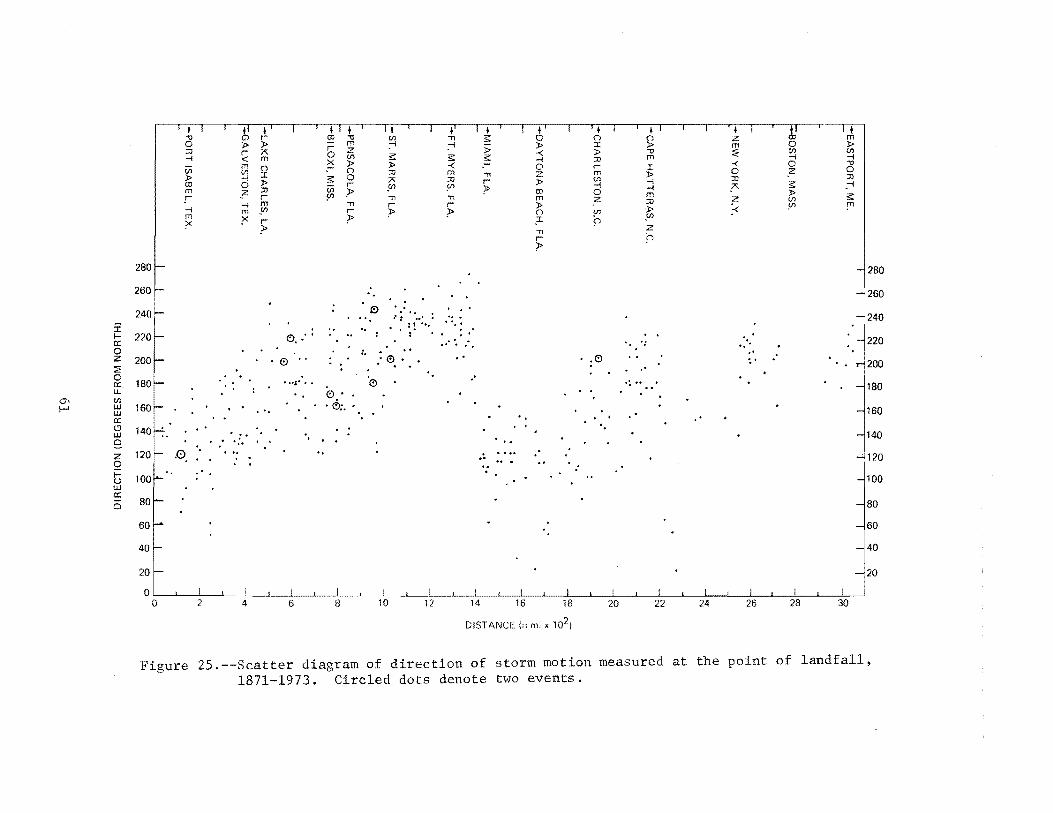
:i 1-0:: 0 z
(I) w LU 0:: 0 w e z Q 1-(.) w 0::
0
" C) r 0 J;> J;> :n r 7\ -; < m
m iii (J) 0 J;> -; :c
J;> 1:0 0 m z :n r . r
...; m ...; m (/) m ?< ?< r
?>
0.· ..
0 .. ... ;• ..
: . . ..
... . :. .0 ... .
..
0'--------'-----'----' 0 2 4
1:0 .., r= m
z 0 (J)
>< J;> .- 0 '5: 0 iii r
J;> (I) ,
r ;to
.. .. .. ..
:
0• . 6:. .
(I) --;
'5: J;> :n 7\ (J) . ., r .:P
.. £) •*; . · .... : .. =! ....
: :
.. :0,. .
·e
.
I 10
. . .
+I I t I I t I 1 I t ! I • I I I •• I ~~ I + ., '5: 0 0 0 z m -; );; J;> :c J;> m 0 J;>
-< J;> " ~ (I) (I)
'5: '5: -; :n m -; -; -< ,- 0 r :c -< 0 .., m m 0 z 0 :n
., z (J)
J;> :n :n r J;> -; (/) J;>
...; -; 7\ '5: --; 1:0 0 . J;>
. , m z m z (I) ;;;;: :n r J;> J;> ~ (I) m
;to () (J)
_:c h .en z , 0 r
;to
. .. ·· ..
.. ...... .. .. . .0 . . . . ..
·~ .. . . . . . .
.. .. : .
DISTANCE (n m1 x
Figure 25.--Scatter diagram of direction of storm motion measured at the of landfall, 1871-1973. Circled dots denote two events.

(/) w ()
z w a: a: :::::> () ()
0 u. 0 1-z w () a: w c.. a w 1-
0\ <l: N
...J :::::> ~ :::::> () () <l:
1oo~~~~-..--,-,~~r-r-~~-r?A~ 100r-~-r~-,--.-,--.-,-,.-.--.-.-,~r--.~
80
-
60
-
0
-
-
-
-(a)
COASTAL REFERENCE _ MILEPOST 750
(NEAR BAY ST. LOUIS, MISS.)
(/) w () z w a: a: :::::> () ()
0 u. 0 1-z w () a: w c.. a w 1-<l: ...J :::::> ~ :::::> () ()
<l:
80
60
40
(b)
COASTAL REFERENCE Ml LEPOST 1950
(CENTRAL SOUTH CAROLINA COAST)
1~00~~~~~--~-~~--~~~~--~~~~~ 160 180 200 240 220 100 120 140 160 180 200 220
DIRECTION (DEGREES FROM NORTH) DIRECTION (DEGREES FROM NORTH)
Figure 26.--Landfalling hurricanes and tropical storms, direction of motion vs. cumulative percent of occurrences, (a) Gulf of Mexico (milepost 750) near Bay St. Louis, Miss., (b) east coast (milepost 1950) along central South Carolina coast.
240

z 0 i=~ Or-a cr. ao cr;Z Oa 1-0 Cllcr; u.. u.. 0(1) zw ow -CX:: 1-l? Uw
(J\ wo ex:-
w 0
...J' U! !X) <( ~ 1-cr. 0 Q_
240
200
160
l"'"' 120 50%
16 2/3% 080
040 0 1 2
x <( U! ...J 1- ui z' w
~ ...J a:
U) <( w :J: > u ...J w <( ~ l? <(
...J
4 5
ui ~ a X 0 ...J
m
7
DISTANCE (n mix
<( <( <( ...J ...J ...J u.. u.. u.. <i. <{: (/).
...J ...J ~ 0 0 a: u u <(
;;; :r a z u Iii w <( Q_ ...J ..... · .. .:::::.·•-···
<( Q_ <(
8 9 10 11 12
<( ...J u.. (/)- w' ex: ...J Ll.l !X)
>- ;;; a w ,...: Q_
u.. <( u
~---831/3%
~50%
......__162/3%
13 14 15
F 27.--Probability distribution of direction of landfalling storm motion for gulf coast •. Numbered lines denote the percent of storms approaching the coast at an angle
to or less than the value indicated the ordinate. Plotted points (~) are taken from frequency analyses at 50-n.mi. intervals for the 50th percentile
ec. 5.4).

0'\ -+:'-
z 0 i=:C 0;-:;:a: :,;:0 a:Z 02 f-0 <f.> a: u.u.. Om zw ow _a: f-<::J uw wo a:-0
260
240
220
160
100
I t
~ u.. :c' ;;{ w co 0 0:: w >
:c ;;{ w co <( z ~ ><( 0
ui" <( a: w
~ :c w 0..
<S
83 1/3%
16 2/3%
BOLL----~--~7---~----~----~--~~--~----~----~--~~--~----~----~--~~--~----~~~
DISTANCE (n mix 102}
Figure 28a.--Probability distribution of direction of landfalling storm motion for east coast, south of Cape Hatteras, N.C. Notations are the same as figure 27.

0' Vl
z 0 f=:t Ol:20: :20 o:Z o::Ti l-0 UlO: u..u.. Ooo zw ow _o: l-<.!l (.)UJ UJQ a:-Cl
60.~--L_~L__J __ ~~-L--~---L--~--~~~--L_~~_J--~~-L--~--~~ 22 23 24 25 26 27 28 29 30 31
DISTANCE (n mix 1021
Figure 28b.--Probability distribution of direction of landfalling storm motion for east coast, north of Cape Hatteras, N.C. Notations are the same as figure 27.

5.4.2.1 Gulf Coast. Figure 27 shows the alongshore profile at selected percentiles for the direction of motion for landfalling tropical cyclones of the gulf coast. As expected, the tropical cyclones striking the west coast of Florida come from the southwest direction and those striking the Texas coast from the southeast. Along the mid-gulf, coastal areas are vulnerable to storms approaching from both southeast and southwest.
5.4.2.2 East Coast, South of Cape Hatteras. Figure 28(a) confirms that for landfalling S'torms near Miami, Fla., the predominant direction of storm motion is from the east or southeast. North of Daytona Beach, Fla., the higher percentage of landfalling storms coming from the south and southeast reflects the increasing number of recurving storms. North of Brunswick, Ga., the percentage of northeastward-moving 'storms increases gradually northward. This group of landfalling storms includes recurving tropical cyclones of Atlantic origin and storms that exited the Florida coast and reentered the coast south of Cape Hatteras. More than 50% of the landfalling tropical cyclones near Cape Hatteras are northeastward-or north-northeastward-moving storms.
5.4.2.3 East Coast, North of Cape Hatteras. Figure 28(b) shows the alongshore profile at selected percentiles for the direction of landfalling tropical cyclones north of Cape Hatteras. These smoothed profiles are based on a rather small sample and the data are sparse. The stretch of coast south of Cape Henry, Va., is vulnerable to landfalling tropical cyclones coming mainly from the easterly directions, the coastal orientation excluding the northeastward moving storms from the landfalling category. Tropical cyclones striking this part of the coast from the northeast are generally weak. Figure 28(b) also reveals that tropical cyclones striking the coast east of New York consist mostly of northward or northeastward moving storms.
5.4.3 Areas of Discontinuous Direction Profile
The directions of landfalling storm profiles along the east coast are not continuous in the vicinity of Cape Hatteras, N.C. and Cape Cod, Mass., beca~ of abrupt turning of the coast. It is advisable to use the direction distributions to the south of these corner points in applications at these capes, since the maximum wind region of a hurricane lies to the right of the hurricane track. The values indicated for Cape Sable (fig. 27) may be used as representative for hurricanes striking the mainland coast of Florida Bay. Where the coastal orientation departs greatly from a smoothed coastline (fig. 3) along the gulf coast, the direction of storm motion for landfalling tropical cyclones may be obtained from the track direction over a 2.5° octagon as described in the following paragraph.
5.4.4 Track Direction Frequency by 2.5° Octagons--Gulf Coast
In the frequency analysis of landfalling storms for the gulf coast using the track density method (see chap. 2), frequencies of track directions by 15° class intervals for each 2.5° octagon were tabulated and histograws constructed. A smoothed probability distribution was fitted to each histogram. More detailed description of the procedure involved is discussed in the appendix. The resultant histograms and eye-fitted probability distributions
66

for the gulf coast are shown in figures A3 to Al6 of the appendix. From these diagrams the proportion of occurrences for landfalling storm directions may be determined for various coastal orientations.
6. THE JOINT PROBABILITY QUESTION
An objective of this report has been to define climatological probability distributions of hurricane central pressure (p0 ), radius of maximum winds (R), forward speed (T), and direction of motion (6)along the Atlantic and gulf coasts of the United States. In some applications of these data--for example, in calculating frequency distributions of hurricane-induced surges on the coast--it would be necessary to combine two or more of the individual probability distributions and form a joint probability distribution. In such applications, the question of statistical independence of the probability distributions has to be dealt with. Example: Of all the hurricanes affecting a given coastal stretch over a long period of time, consider the 10% with lowest p0 (intensity index) and the 10% with largest R (size index). What fraction of the storms are both this intense and this large? The answers are: If p
0 and Rare independent, 1% (.10 x .10 = .01); p0 and R positively
correlated, more than 1%; p0 and R negatively correlated, less than 1%.
Establishing the joint probability of two parameters with a given degree of reliability requires a much larger sample ot data than required for the same degree of reliability for a single probability distribution. The hurricanes listed in tables 1 and 2 are insufficient to give unequivocal results in joint probability analysis. The data must be supplemented by a generous measure of deduction and judgment. This chapter discusses the joint probability question in qualitative terms, but leaves it to the user of the report to make final judgments that are suited to his particular problem.
The discussion is restricted to interrelation of the basic hurricane parameters with each other and with latitude. In storm tide frequency analysis, the joint probability of the hurricane surge and the astronomical tide must also be taken into account, but th particular application is outside the scope of the present report.
6.1 Central Pressure, p0
, vs. Radius of Maximum Wind, R
6.1.1 Overall Relation
A significant joint probability question is whether hurricane size (R) and intensity (p
0) are independent. A storm that is both large and intense would
have enormous destructive power. Myers, in Hydrometeorological Report No. 32 (1954, chap .. 7), applied a kinetic energy index to coastal hurricanes and found a suggestion of an inverse relation between size and intensity, at least at the extreme. Our analysis indicates the same conclusion. Figures 29 and 30 are plots of R vs. p0 from tables 1 and 2 for gulf coast and Atlantic hurricanes, respectively.
Probability distribution curves (expressed in percent) have been sketched on the two graphs. These depict the R distribution for a given p0 band; they
67

:0 .§ w 0: :::> (/) (/) w 0: 0.. ..J <( 0: 1-z w (.)
LIMIT OF OATA
0
0
0
~ Ltl
RADIUS OF MAXIMUM WINDS (n mi)
Figure 29.--R vs. p0 , Gulf of Nexico hurricanes. Data from table L Numbered lines denote the percentile of storm occurrences.
68

'1i .5 w 0:: :::> t/) t/) w a: 0.. ...J <( a: 1-2 w u
LIMIT OF DATA ---- ---0 980
970 0 0 0
0 0 0
960 0
0 0
950 0 0
940
0 930 as:
II)
920
RADIUS OF MAXIMUM WINDS (n mi)
Figure 30.--Same as figure 29 except for east coast hurricanes; data from table 2.
69

do not show the p0
distribution for a given R band -- a different set of curves. The curves on the two graphs have been forced to agree at the lowpressure end of the diagrams. The lowest p
0 of 892 mb in both diagrams is
from the September 1935 Florida Keys hurricane.
6.1.1.1 Conclusions and Judgments from Figures 29 and 30.
a. Both hurricanes with central pressures below 920mb have small Rs. It is inferred that these are intense, well-formed vortices. It is a matter of judgment as to what the largest R is that can be expected in a hurricane with a very low central pressure.
b. Hu~ricanes with very large Rs (in excess of 45 n.mi.) are,as expected, of moderate or weak intensity. In h~rricanes moving northward in the Atlantic and becoming extratropical, the radi.us of maximum winds becomes larger and more diffuse and the central pressure rises. The one exception to this pressure rise tendency (R = 50 n.mi., p
0 = 940 mb) is the Ne~;..r England
hurricane of 1938. Not all the weaker storms have large Rs; some are small (upper left-hand corner of figs. 29 and 30).
c. If the extremes are excluded--for example, on figure 30 if the pressure range is restricted to 920 to 970 mb--there is no detectable relation between R and p .
0
6.1.2 Local Relation
The relation shown in figure 30 is accounted for, at least in part, by the trend toward larger, weaker hurricanes off the northern part of the Atlantic seaboard as compared with the southern part.' This trend and synoptic meteorological factors related to it were discussed in chapter 4. Locally, is there any relation between p
0 and R? Any such relation is obscured by the
latitudinal trend present in both p0
and R. This was removed for comparison purposes for the hurricanes in table 2 by converting the p
0 to a probability
level by entering figure 11 at the appropriate coastal point and by converting the Rs to local probability levels in the same way from figure 19. A plot (not shown) of the resulting p probability level in individual storms vs. the R probability level revealeg a random scatter. This implies that, in general, there is little local interrelation between p
0 and R. It is left to
the user of this report to look at this more closely at latitudes where low p
0's may be expected.
A similar analysis (in a different sequence) was made for gulf hurricanes in NHRP No. 33 (Graham and Nunn 1959). It was found that when the R vs. p
0 interrelation is removed, no latitudinal trend in R remains (fig. 18 of NHRP No. 33).
6.2 Forward Speed, T, vs. Direction of Motion, 8
Another joint probability question is whether there is an interrelation between hurricane forward speed and direction of motion. On the east coast, hurricanes that have recurved from their low latitude east-to-west motion to a track toward the north-northeast generally move faster than the storms at
70

the same latitude still having a westward component of motion. With this in mind, separate probability distribution analyses were made of forward speed for alongshore hurricanes, all of which have recurved, and landfalling. hurricanes, most of which are still drifting westward (figs. 23 and 24).
In the central Gulf of Mexico, the situation is reversed, as discussed in chapter 5. Hurricanes that have recurved are typically gaining speed as they move across the coast. Storms moving parallel to the mid-gulf coast, either eastward or west\vard, are more apt to be drifting slowly in an indifferent steering current. This behavior difference, too, is taken care of, at least in part, by the separate analysis of forward speeds for alongshore and landfalling hurricanes. Along the north part of the west coast of the Florida peninsula alongshore and landfalling hurricanes would be expected to have the same forward speed characteristics as on the Atlantic east coast; the respective forward speed diagrams (figs. 23 and 24) reflect this.
In sunnnary, providing two forward speed probability graphs is a partial recognition of T and e interdependence, and may be a sufficient recognition for practical applications.
6.3 Other Joint Probability Questions
Is there any dependence of p0
and R on track direction or forward speed? There may well be some subtle relation. For example, we suspect that storms landfalling from the east-northeast on the Atlantic coast between 35° and 39°N (see fig. 28b) are mostly \veak. It is left to the user of the report to discover other relations from the data in tables 1 and 2 or deduce them from synoptic experience.
7. SUMMARY
This report presents a probability analysis of the geographical distribution of major hurricane and tropical storm factors. The charts depicting our solutions are shown in figures 6, 7, 8, 11, 19, 23, 24, 27, and 28. Judicious smoothing was employed along the gulf and east coasts and across the frequency spectra.
Table 5 shows the source of data and the classes of tropical cyclones represented. These are not the same for the several factors, for the reasons stated in the report.
7.1 Highlights
7.1.1 Frequency of Hurricane and Tropical Storm Occurrences
The frequency of landfalling, exiting, and alongshore (within 150 n.mi. of the coast) tropical storms and hurricanes (figs. 6, 7, and 8) were sunnnarized.
The fraction of storms that are hurricanes is presented as a continuous smooth curve along both coasts. A striking result applies to the northwest
71

-...J N
Climatological characteristic
Storm frequency (landfalling, alongshore, exiting)
Central pressure
Radius of maximum winds
Forward speed
Direction of
motion
Table 5.--Data for probability analysis
Data source
Cry's tracks 1871-1963; Monthly Weather Review since 1964, (hurricanes plus tropical storms)
Tables 1 and 2 (hurricanes with p
9 < 982 mb
s1.nce 1900)
Tables 1 and 2 (hurricanes with p0 < 982 mb since 1900)
Cry's tracks 1886-1963; Monthly Weather Review since 1964, (hurricanes only)
Cry's tracks 1871-1963; Monthly Weather Review since 1964, (hurricanes plus tropical storms)
Adjustments
Statistically adjusted to include tropical storms
Rs > 45 n.mi. excluded
Range of resulting probability distribution
Hurricanes plus tropical storms
Hurricanes plus tropical storms
Hurricanes
Hurricanes
Hurricanes or hurricanes plus tropical storms (assumed the same)
Figures for results
I Fig. 6, 7, 8
Fig. 11
Fig. 19
Fig. 23, 24
Fig. 27, 28a, 28b

Florida coast. Here, frequency of landfalling storms has its highest value, but only 42% of these storms have attained hurricane intens Else;;.;rhere, areas most vulnerable to tropical cyclones experience a high percentage of storms of hurricane intensity.
7 .1. 2 Probability Distributions of Central Pressure, Radius of Haximum Winds, For;;vard Speed and Direction of Storm Motion
Analysis of the data led to a set of graphs depicting the probability distribution of central pressure, radius of maximum winds, forward speed, and direction of storm motion. The central pressure distribution (fig. 11) is for hurricanes and tropical storms and is broken down for illustrative pur-poses into 7 probability levels (percentiles) from 1 to 90%. The radius of maximum winds distribution (fig. 19) is for hurricanes only and is separated into three probability levels--16-2/3, 50, and 83-1/3%. The forward speed distribution consists of two charts~-one for landfalling hurricanes (fig. 23) and one for alongshore hurricanes (fig. 24). Both charts consist of 6 selected probability level curves, ranging from 5 to 95%. The direction of storm motion distribution for landfalling hurricanes and tropical storms (figs.27, 28a and 28b) is illustrated by three probability levels--16-2/3, 50, and 83-1/3%.
A detailed analysis was made of the radius of maximum winds of Hurricane Camille, the most intense hurricane of record on the middle gulf coast.
7.1.3 Joint Probability
Establishing the joint probability of two factors, such as central pressure (p0 ) and radius of maximum winds (R), with a given of reliability re-quires a much larger sample of data than that present in tables 1 and 2. Knowing this to be true, we can say that the interrelation between p0 and R indicates that for the gulf and east coasts, 1) hurricanes with central pressures below 920 mb have small Rs; 2) hurricanes with large Rs are nearly always of moderate or \veak intensity; 3) not all the weaker storms have large Rs; 4) if the pressure range is restricted to the range 920 to 970mb there is no detectable interrelation bet,veen R and p
0; 5) if the latitudinal trend
is removed from p0 and R little local interrelation between p0
and R remains.
There is an interrelation between hurricane forward speed and direction of motion along both coasts. Hurricanes that have recurved toward the northnortheast generally move faster than the storms at the same latitude still moving >ves tward .
Other joint probability questions involving the various hurricane factors (i.e., a dependence of p
0 and Ron track direction or forward speed) also
exist, although these relations are often not as obvious.
73

REFERENCES
Alaka, Hikhail A., 1968: '1Climatology of Atlantic Tropical Storms and Hurricanes, 11 ESSA Teclinical_Report WB-6, Environmental Science Services Administration, U.S. Department of Commerce, Washington, D.C., 18 pp.
Bradbury, Dorothy L., 1971: "The Fill:i,ng Over Land of Hurricane Camille~" Satellite and Mesometeorology Research Project Paper No. 96, NOAA Grant E-198-68(B) Hod No. 2, Department of the Geophysical Sciences, The University of Chicago, Chicago, Ill., 25 pp.
Cline, Issac M., 1926: Tropical Cyclones, HcMillan Company, New York, N.Y., 301 pp.
Colon, Jose A., 1953: "A Study of Hurricane Tracks for Forecasting Purposes,: Honthly Weather Review, Vol. 81, No. 3, March, pp. 53-66.
Craddock, J. M., 1969: Statistics in the Computer Age, American Elsevier Pub. Co., New York, N.Y., 214 pp.
Crutcher, Harold L., 1971: "Atlantic Tropical Cyclone Statistics," National Oceanic and Atmospheric Administration, U.S. Department of Commerce, Washington, D.C., 83 pp.
Cry, George W., 1965: "Tropical Cyclones of the North Atlantic Ocean. Tracks and Frequencies of Hurricanes and Tropical Storms, 1871-1963," Technical Paper No. 55, Weather Bureau, U.S. Department of Commerce, Washington, D.C., 148 pp.
DeAngelis, Richard M. and Nelson, Elmer R., 1969: "Hurricane Camille, August 5-22, tt Climatological Data National Summary, Vol. 20, No. 8, August, Environmental Science Services Administration, U.S. Department of Commerce, pp. 451-474.
Dunn, Gordon E., Davis, W.R., and Hoore, P.L., 1955: ttHurricanes of 1955," Monthly Weather Review, Vol. 83, No. 12, December, pp. 315-326.
Goodyear, Hugo V., 1968: It Frequency and Areal Distributions of Tropical Storm Rainfall in the United States Coastal Region on the Gulf of Mexico," ESSA Technical Report WB-7, Environmental Science Services Administration, U.S. Department of Commerce, Silver Spring, Md., 33 pp.
Graham, Howard E. and Hudson, Georgina N., 1960: "Surface Winds Near the Center of Hurricanes (and other Cyclones)," National Hurricane Research Project Report No. 39, Weather Bureau, U.S. Department of Commerce, Washington, D.C., 200 pp.
Graham, Howard E. and Nunn, Dwight E., 1959: "Meteorological Considerations Pertinent to Standard Project Hurricane, Atlantic and Gulf Coasts of the United States," National Hurricane Research Project Report No. 33, Weather Bureau, U.S. Department of Commerce, Washington, D.C., 76 pp.
74

Harris,D. Lee, 1959: "An Interim Hurricane Storm Surge Guide," National Hurricane Research Project Report No. 32, Weather Bureau, U.S. Department of Commerce, Washington, D.C., 24 pp.
Jelesnianski, Chester P., 1972: "SPLASH (Special Program to List Amplitudes of Surges from Hurricanes) I. Landfall Storms," NOAA Technical Memorandum NWS TDL-46, National Oceanic and Atmospheric Administration, U.S. Department of Commerce, Silver Spring, Md., 52 pp.
Miller, Banner I., 1963: "On the Filling of Tropical Cyclones Over Land, with Particular Reference to Hurricane Donna of 1960," National Hurricane Research Project Report No. 66, Weather Bureau, U.S. Department of Commerce, Washington, D.C., 82 pp. •
Mitchell·, Charles L., 1928: "The West Indian Hurricane of September 10-20, 1928," Monthly Weather Review, Vol. 56, No. 9, September, pp. 347-350.
Myers, Vance A., 1954: "Characteristics of United States Hurricanes Pertinent to Levee Design for Lake Okeechobee, Florida," Hydrometeorological Report No. 32, Weather Bureau, U.S. Department of Commerce, and Corps of Engineers, U.S. Department of the Army, Washington, D.C., 106 pp.
Myers, Vance A., 1970: "Joint Probability Method of Tide Frequency Analysis Applied to Atlantic City and Long Beach Island, N.J., 11 ESSA Technical Memorandum WBTM Hydro-11, Environmental Science Services Administration, U.S. Department of Commerce, Silver Sp,ring, Md., 109 pp.
Myers, Vance A., and Jordan, Elizabeth S., 1956: "Winds and Pressures Over the Sea in the Hurricane of September 1938," Monthly Weather Review, Vol. 84, No. 7, July, pp. 261-270.
National Oceanic and Atmospheric Administration, 1973: "Flood Insurance Study, Puerto Rico," study for Federal Insurance Administration, Department of Housing and Urban Development, U.S. Department of Commerce, Washington, D.C., 42 pp.
Riehl, Herbert, 1954: Tropical Meteorology, McGraw-Hill Book Company, New York, N.Y., 392 pp.
Schloemer, Robert l.J., 1954: "Analysis and Synthesis of Hurricane \Und Patterns Over Lake Okeechobee, Florida," Hydrometeorological Report No. 31, Weather Bureau, U.S. Department of Commerce, and Corps of Engineers, U.S. Department of the Army, Washington, D.C., 49 pp.
Shea, Dennis J., 1972: "The Structure and Dynamics of the Hurricane's Inner Core Region, 11 Atmospheric Science Paper No. 182, NOAA Grant N22-65-72 (G), NSF Grant GA 19937, Department of Atmospheric Science, Colorado State University, Fort Collins, Colo., 134 pp.
75

Sugg, Arnold L., Pardue, ~eonard G., and Carrodus, Robert L., 1971: 1 ~emorable Hurricanes of the United States Since 1873,u NOAA Technical Memorandum NWS SR-56, National Oceanic and Atmospheric Administration, U.S. Department of Commerce, Fort Worth, Tex., 52 pp.
Thorn, Herbert C. S., 1968: "New Distributions of Extreme Winds in the United States," Journal of the Structural Division, Proceedings of the American Society of Civil Engineers, Vol. 94, No. ST7, July, pp. 1787-1801.
Weather Bureau, 1968: 11 Interim Report--Meteorological Characteristics of the Probable Maximum Hurricane, Atlantic and Gulf Coasts of United States," unpublished memorandum HUR 7-97, U.S. Department of Commerce, Silver Spring, Md~~ 45 pp.
Weather Bureau, 1957: 11Survey· of Meteorological Factors Pertinent to Reduction of Loss of Life and Property in Hurricane Situations, 11
Kutschenreuter,.Paul H., Compiler, National Hurricane Research Project Report No. 5, U.S. Department of Commerce, Washington, D.C., 87 pp.
ACKNOWLEDGMENTS
The authors are grateful for the help of numerous members of the Water Management Information Division, Office of Hydrology, National Weather Service during the course of this study. The guidance and critical review of the manuscript given by Vance A. Myers, Chief of the Special Studies Branch; John T. Riedel, Chief of the Hydrometeorological Branch; and John F. Miller, Chief of the Water Management Information Division was especially helpful. Roger Watkins is credited with providing valuable information concerning previous hurricane studies carried out by the Hydrometeorological Branch. Normalee Foat, Miriam McCarty, Marion Choate, Owen Gourley, Samuel Otlin, Keith Bell, Raymond Evans, and Samuel Srbljan provided valuable research support. Typing through various stages of the report was done by Clara Brown, Laura Nelson, Virginia Hostler, Cora Ludwig, Kathryn Carey, and the late Edna Grooms. ·
Dr. Gerald F. Cotton, National Weather Service, advised•us on some statistical procedures. Dr .. Harry F. Hawkins, Assistant Director of the National Hurricane Research Laboratory was kind enough to provide us with radius of maximum winds data for some recent hurricanes.
76

APPENDIX
TRACK DENSITY METHOD FOR STORM FREQUENcY
Assessing the frequency with which tropical cyclones landfall on the coast of the Gulf of Mexico is more complicated than for the east coast because of the small angle between prevailing track directions and the coast, on the one hand, and varying coastal directions (e.g., the Mississippi Delta) on the other. In order to handle this in a straightforward manner we resort to the track density method in which storm track behavior is assessed independently of coastal direction and of whether the track is over water or over land. The method described here is applied in chapter 2 of the report.
Track Frequency
Definitions
a. Storm track density. The frequency of occurrence of tropical cyclones may be expressed as storm track density at a point. This is defined as the number of storm tracks •vhich cross that point, from any direction, per unit length normal to track per unit time. In concept~ one obtains this number by a limit process which may be expressed as:
Storm track density at a point =lim(~) Dt
as D-+O,t-+oo (A-1)
where N is the count of tracks passing through a circle of diameter D in time t. Practically, it is necessary to count storm tracks passing through a large enough circle over a long enough period of time to smooth out random fluctuations.
Crutcher has extensively analyzed oceanic hurricane track frequencies by 5° squares (e.g., Crutcher 1971) and has developed a concise method of bivariate presentation of direction and speed. We made a new track count in our limited area to obtain information by 2.5° areas. We used a more empirical method of analysis rather than Crutcher's method because a bimodal direction distribution is especially prominent in some parts of the gulf area (e.g., fig. A-3) and would have been smoothed out. Our method retains more detail of the direction distribution, which we needed, but yields no information on the association of direction and speed, which his method vmuld give. tve had to judge this separately and subjectively (chap. 6).
b. Storm track count. In this study the track density of tropical cyclones (hurricanes plus tropical storms) was approximated by counting tracks from Cry's maps (1965) for the period 1871-1963 (and from the annual Monthly Weather Review articles starting in 1964) that passed through 2.5° longitudelatitude squares with the corners cut off to form octagons. This was done for each 2.5° square in the Gulf of Mexico and adjacent land areas. Such an octagon is shown schematically in figure A~l. Octagon5 are used to approximate circles, the theoretically correct form for ti'te later track direction analysis (par. 8.3.4). The resulting count for the Gulf of Mexico and adjacent areas
77

is shown in figure A-2 together >vith an isopleth analysis made by eye. The average "diameter!! of the octagon is 142 n.mi. The analysis of figure A-2 is construed as depicting the point track density per 103 years per 142 n.mi. T£o&onvert to track density per 10 n.mi. per 100 years, multiply by (103
x 1i~) or 0.068.
Direction Probability
The second part of the track density analysis for each 2.5° octagon is the track direction. The prevailing direction of each track within each octagon \vas tabulated by 15° class intervals and then histograms like figure A-3 were constructed for each octagon. The ordinate is the normalized frequency of occurrences (f/Ni), where f is the count in a direction class interval, N is the total count for all directions for the octagon, and (i) the class interval (15°).
Smoothing of Track Direction Histograms
There are several procedures for smoothing the direction histograms into continuous probability distributions. In another study (NOAA, Flood Insurance Study, Puerto Rico, 1973) in which the distributions exhibited a single mode, "beta" distributions were fitted using a library computer program. With the distributions like figure A-3 the distributions were sketched and successively revised by eye until the area equaled 1.0 under each curve, and smooth transitions between adjacent octagons, \vere obtained. For some octagons a normal (Gaussian) curve was fitted as an aid to the· eye in obtaining the proper area under the curve. The resulting histograms and eye-fitted p~obability distributions for gulf coast octagons are shown in figures A-3 to A-16.
Landfalling Frequency
The track frequency (fig. A-2) and the track direction distribution (figs. A-3 to A-16) are presented as continuous spatial variables, the latter by interpolation between the respective octagon diagrams. The storm landfalling frequency at a coastal point, Fn, is given by the integral
F = F n
18 0 f !0 ( Ni)a sin a da
where F = track density (all directions) from figure A-2,
f/Ni =normalized direction probability (in degrees -l), and a= angle between track direction and coast direction (degrees).
This is evaluated numerically from
12 ( f ) . 1.. = F l: Ni k s J..n ak
k=l
(A-2)
(A-3)
wnere the k' s denote 15° class intervals and a is the mean angle for the class interval between track and coast.
Exiting and alongshore track frequencies may be counted by the same proce-
78

dure by the appropriate choice of a. This applicatiun was not made in the present study.
Necessity for Octagons
Counting tracks in complete latitude-longitude squares and then applying the type of direction analysis used here biases the direction probability toward higher values normal to the main diagonals of the square. A test showed that this bias is significant for the purposes of this report and needs to be avoided.
N
Figure A-i.--Octagon for counting hurricane tracks.
79

(X) 0
-lot --.....r- -
2 ' . 15.
' fl
·g
20 30 52
Figure A-2.--Hurricane and tropical storm track <count for 2.5° octagons in the Gulf of Mexico. 1871-1973.

--~ 0
~ ~
3,4
32
3.0
2.8
2.6
2.4
,r r
2T 1.8
1.6' I
''t 1.2
~:~ 06 ~
"·r 0.2 ~
14 ~
1.0
0.8
H~RICANE DIRECTIONS 1871-1973
LAT. 25·27.5°N
LONG. 80 · 82.5° W
I I I
I I
\
\
fr'ill~ 300 270 240
O!A:ECTIONS 1871-1973
LAT. 25 • 27.5° N
lONG. 82.5 ~ 65° W
210
"\. / 0.2 ~
\ l L ,---- ,I ,_
--~
180 150
OIRE:CTION \DEGREES)
0.6~.{/ O L 300 270 2c':4Q:--'--·-'-·-:::':!---..ti.-
DIRECTION iOEGREESl
~, r-
'\
120
·-· c·l:; '-./?"\--·--·i-,, ... ··{ ..... )::::i. ,:; ...
<-···' ·--' /i\<:"' ·: ~ .•.. \ :r-~---"
Q--·· .. --.. 25 •
.,. -;-;:;:;;--'1---"-:-;;--l'ooi-co 20 as" aoo
o~~L~j
Figure A-3(upper), Figure A-4(1ower).--Hurricane and tropical storm track direction histograms and probability distributions for gulf coast octagons. 1871-1973.
81

3,4
2.6
2.4
2.2
--£ 2.0 Cl
~ 1.8 X
~ 1.6
1.4
1.0
0.8
0.6
0.4
0.2
3.4
:£ c 2.0
§ 1.8 X
~ 1.6
1.4
1.2
1.0
0,8
0.6
0.4
OIRECTIONS 1871-1973
LAT. 27.5-30° N
LONG. 82.5 • 85° W
r /
I -'-
270 240
HURRICANE DIRECTIONS 1871-1973
Nn ~ lAT.27.S·30°N
LONG. 85 • 87.5° N
\
~ 210
DtRECTION {DEGREES!
DIRECTION (QEGAEES)
l ~
'fl-f1 090 030
030
Figure A-5(upper), Figure A-6(lower).--Hurricane and tropical storm track direction histograms and probability distributions for gulf coast octagons. 1871-1973.
82

.:-iil 0
~ #. "'
3.4
2.2
2.0
1,8
1.6
1.4
1.2
1.0
0.8
0.6
04
lAT. 27.5 · 30° N LONG. 87.5 • 90" W
0.2
~ 300 270 240 210
'l ~ . L-~~_L~~~--~--L-~~-L-L1~oo~-~~~:-lJLI J,::t:-±~_J~~o--~~rodo~~--3.4
HURRtCANE DIRECTIONS 181'1·1973
3.2 N"" §2 lAT. 27.5·l0°N
lONG. 90 • 92.51;) W
3.0
2.6
2.4
l
~
I 1.4 r-
1 1.2 I-
~ 1.0
~~--
::r 02 ~ oL I
300
/ I
'-
I / v
2Yo ._._L_ klo'-' 210
omecrJON \DEGREES!
l -v' '
"{:" r-
'.., 180 150 120 090
DIRECTION /OfGAEf:S)
Figure ·A-7(upper), Figure A-8(lower).--Hurricane and tropical storm track direction histograms and probability distributions for gulf coast octagons. 1871-1973.
83
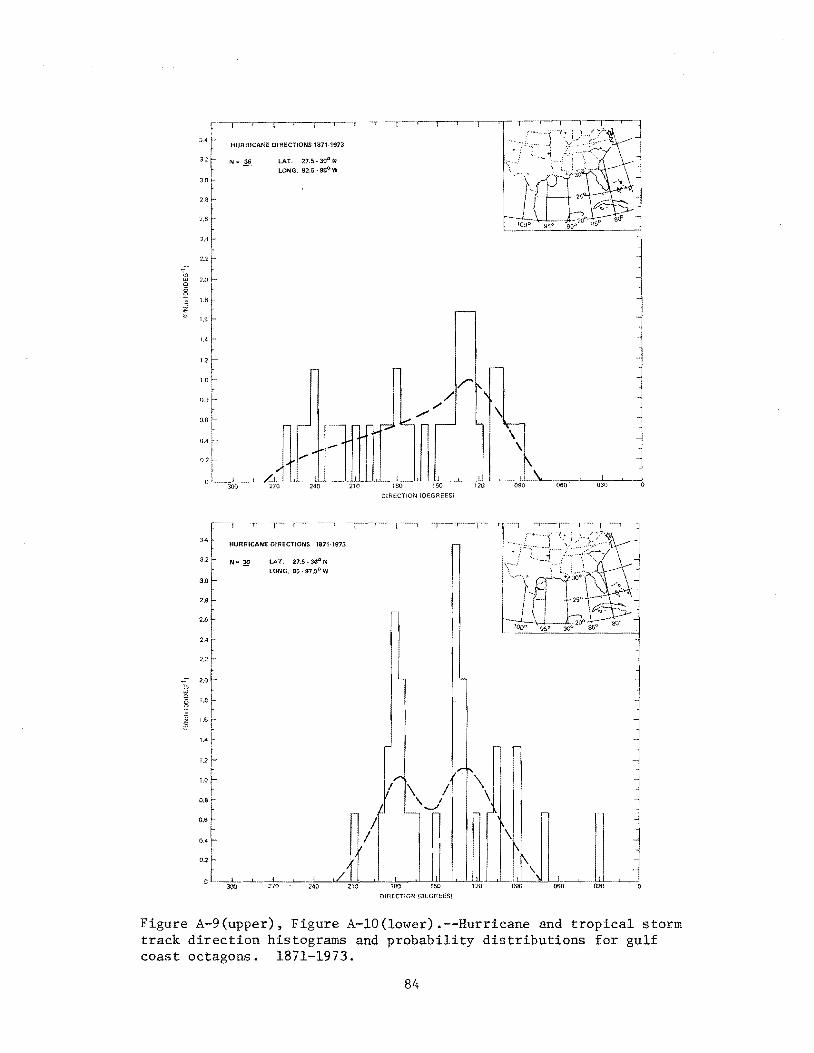
:il " §
~
b w 0
! §
3.4
2.2
2.0
1.8
1,6
1.4
1l 1.0~
HURRICANE DIRECTIONS 1871-1913
N"' .!f?. LAT. 27.5 · 30° N LONG. 92:.5 · 95° W
0+
:~L~~, 1l ]~_L~--'~ 300 270 240 210 180 150
3.4
3.2
3.0
2.8
2.6
2.4
2.2
2.0
1.8
1.6
1.4
lAT. 27.5-30°N
LONG. 95 · 91.5° W
DIRECTION {DEGREES)
DIRECTION !DEGREES!
Figure A-9(upper), Figure A-lO(lower).--Hurricane and tropical storm track direction histograms and probability distributions for gulf coast octagons. 1871-1973.
84

3.4 HURRICANE DIRECTIONS 1871-1973
3.2 N= ~ LAT. 25·z7.5°N
LONG. 95 • 97.5° W 3.0
2.8
2.6
2.4
2.2
8 2.0
" § 1.8
~ 1.6
1.4
1.2
1.0
0.8
"' 0.6 t- I ,_
OJ .~ n_ 0: t
I 300 270 240 210 180 150
'\
~ \
iil j 060 030
DIRECTION (DEGREES!
~,....---,---,-------,----,.--,
3.4 L HUR
32 ~ N • :CANE D~::CTI:S :::·:73 r LONG. 82.5-85°W
::f 2.6
2.4
22 ~ -- 't };: a
~ 1.8
~ 1,6 f-
14 ~ 12
1.0
~ 0.8
0.6 J
0.4 ~
0.2
_J
300 270
.~J.LLL..cL.L_LL_'IlliUll_i_J 240 210 180 150 120 090 060 .. 030 . 0
DIR.f:CTION (DEGREES!
Figure A-ll(upper), Figure A-12(1ower).--Hurricane and tropical storm track direction histograms and probability distributions for gulf coast octagons. 1871-1973.
85

3.4
3.2
3.0
2.8
2.6
2,4
2.2
2.0
1.8
1.8
1.4
1.2
1.0
0.8
0,6
0.4 f-
0.2
0
3.4
3.2
3.0
2.8
2.6
2.4
2.2
" 2,0 "' 0
~ ~
1.0
0.6
0.4
0,2
HURRiCANE OtRECTlONS 1871·1973
N• .~ lAT. 30 · 32.5° N
LONG. 85-87.5°W
t..-~
\ .-- ,L
/
I
v /,
300 270 240
HURRICANE DIRECTIONS 1871·1973
N"' ~ LAT. 30-32.5°N LONG, .87.5-90°W
\
I
/
T
/~~,
.,_.I r-
' '
210 180 150 fU
120 090 060 030
DIRECTION (DEGREES)
/ 300 ..... , .. ~2"'7o~u.L~2lo·LL'--.l2JJ1o_J__u_l_1llso_U__,L_~,s~o_t.u_L!Ll_w_J_,L!..J:::::...__-::i:::--,_·-;;:!::--'--.J,
DIRECTION (DEGREES)
A-13(upper), Figure A-14(lmver) .--Hurricane and tropical storm track direction histograms and probability distributions for gulf coast octagons; 1871-1973.
86

iil 0
~ §
3.4
"l 0.6
0.4
0.2
J
3.4
3.2
3.0
28~ 2.6 r 2.4 L
2.2
2.0
1.8
1.6
1.4
1.2
1.0 ~
oa ~
:.t oJ
LAT. 30- 32.5o- N
LONG. 90 · 92.5° W
I
I I
I 300 270
:--'···u..--~''----'~ lao _t·4-'---'----'---~,'!czoj_L~
HURRtCANE DIRECTIONS 1871-1973
N"' 1§. lAT. 30-32.5°N
LONG. 92.5 • 95° W
OIAECTlOI\l !DEGREE$)
0 t___l_L_j/__u.'-:~......Ll 300 270 240
l-~~.f~t~'~~:" •''"· .
f--1---l-25 •
.,. -;:;::;:--\-91-s•c--··--J19of-o 2<f'J s-oQ arf'
-
-
030
Figure A-15(upper), Figure A-16(1ower).--Hurricane and tropical storm track direction histograms and probability distributions for gulf coast octagons. 1871-1973.
87