
quant mutual fund - FACTSHEET
25
1 quant mutual fund FACTSHEET APRIL 2020
-
Upload
khangminh22 -
Category
Documents
-
view
0 -
download
0
Transcript of quant mutual fund - FACTSHEET

1
quant mutual fund
FACTSHEET APRIL 2020
Go to Top As on 31stMarch 2020 2
Table of content From the Investment Desk 3
Scheme Details
quant Liquid Fund 6
quant Active Fund 7
quant Small Cap Fund 8
quant Tax Plan 9
quant Mid Cap Fund 10
quant Large & Mid-Cap Fund 11
quant Focused Fund 12
quant Multi Asset Fund 13
quant Absolute Fund 14
quant Infrastructure Fund 15
quant Consumption Fund 16
quant Dynamic Bond 17
quant Money Market Fund 18
Dividend History 19
Glossary 21
Asset Management Company (AMC) Location 22
Point of Service (PoS) Location 23
Disclaimer: The Factsheetis for general reading purpose only and is not meant to serve as a professional guide. This document has been prepared on the basis of publicly available information, internally developed data and other sources believed to be reliable. The Sponsor, the Investment Manager, the Trustee or any of their respective directors, employees, affiliates or representatives (“entities & their affiliates”) do not assume any responsibility for, or warrant the authenticity, accuracy, completeness, adequacy and reliability of such information. Whilst no action has been solicited based upon the information provided herein; due care has been taken to ensure that the facts are accurate and opinions given are fair and reasonable. This information is not intended to be an offer or solicitation for the purchase or sale of any financial product or instrument. Recipients of this information are advised to rely on their own analysis, interpretations & investigations. Readers are also advised to seek independent professional advice order to arrive at an informed investment decision. Entities & their affiliates shall not be liable for any direct, indirect, special, incidental, consequential, punitive or exemplary damages, including loss of profits, arising in any way from the information contained in this material. Entities & their affiliates including persons involved in the preparation or issuance of this material may from time to time have long or short positions in and buy or sell the securities there of, of company (ies)/ specific economic sectors mentioned herein. NAV of the plan/option of certain schemes are not provided for certain cases as the NAV was not computed because there were no investors as on the date on which the NAV details are provided.
Mutual Fund investments are subject to market risks, read all scheme related documents carefully

Go to Top As on 31stMarch 2020 3
Equity Outlook: Madness of the many Indian equity indices S&P BSE Sensex and Nifty 50 tanked 23% each in March 2020 due to worries about the rapid spread of Covid-19 in the country and the government's lockdown decision. The benchmark indices capitulated on March 23 and hit their lower circuits twice in the month, triggering trading halts for 45 minutes. Risk appetite in global economies has touched a 40 year low as indicated by our proprietary indicators. However, with global liquidity (stimulus liquidity) at all-time high, we see support for global equities, as well as for Indian equities going forward. The S&P BSE Auto Index and S&P BSE Metal index declined 31%, each. Defensive counters such as fast-moving consumer goods (FMCG), healthcare and information technology (IT) were the outperformers with the least fall. The S&P BSE FMCG index, S&P BSE Healthcare index and S&P BSE IT index declined 6%, 10% and 14%, respectively. Our strategy in the previous month of upping our pharma & healthcare exposure has yielded a positive result and we have used this rally to capture our profits. Although, we have a clear intent to rebuild our exposures at lower values. From the near-term perspective, we will tactically increase our exposure to financial services, however we remain cautious on BFSI in the longer term. Covid-19 will have its own impact on manufacturing sector, and hence we will continue to avoid industrials. We remain constructive on consumption, pharma & healthcare and agrochem stocks as we believe in their outperformance going forward. We firmly believe volatility is here to stay and, in this scenario, active Investing strategies, optimized by our proprietary VLRT framework will tend to outperform passive buy and hold strategies.
Fixed Income Outlook: Latching onto a ray of hope In the past few weeks, there has been a drastic change in the global and domestic macroeconomic scenario. COVID-19 has crippled global supply chains and disrupted economic activity in many countries. Under such unprecedented circumstances, governments and central banks across the globe have come up with policy measures on both the fiscal and monetary frontiers. The measures have been taken towards: Providing a substantial boost to the economy Restoring the confidence of the producers, consumers, investors and savers, by putting them as priority over inflation and fiscal deficit
concerns. Mitigating the economic difficulties arising out of the virus outbreak. The Government of India has announced a comprehensive package of INR 1.70 lakh Crore, covering cash transfers and food security. The centre focus of this package has been the vulnerable sections of society comprising of farmers, migrant workers, the urban and rural poor. In a plethora of measures, noteworthy steps from the Monetary Policy Committee (MPC) include the reduction of the policy repo rate by 75 basis points to 4.40 per cent from 5.15 per cent and the reduction of the reverse repo rate under LAF by 90 basis points to 4.0 per cent. Further, the Reserve Bank has also decided to undertake several measures to improve liquidity via: Forex swaps, LTROs, operation twists, OMOs. Monetary transmission and credit flows to the economy Providing relief on debt servicing via forbearance measures, facilitating all stakeholders to fight against the pandemic. Looking ahead, food prices may soften even further given the record production of food grains and horticulture, at least till the peak summer hits. Further, the collapse in Brent crude prices by more than 50 per cent should work towards easing both fuel and core inflation pressures. The effects will be consequent on the level of pass-through to retail prices. Heightened volatility in the financial markets could also have a bearing on inflation. The proactive monetary and liquidity measures undertaken by the RBI paired with the fiscal measures undertaken by the government will aid in the mitigation of an adverse impact on domestic demand. Consequently, economic activity will be spurred on once normalcy is restored in the nation. From a very short term standpoint, the we anticipate that the 10-yr GOI benchmark will likely trade in the range of 6.25-6.50 per cent
Go to Top As on 31stMarch 2020 4
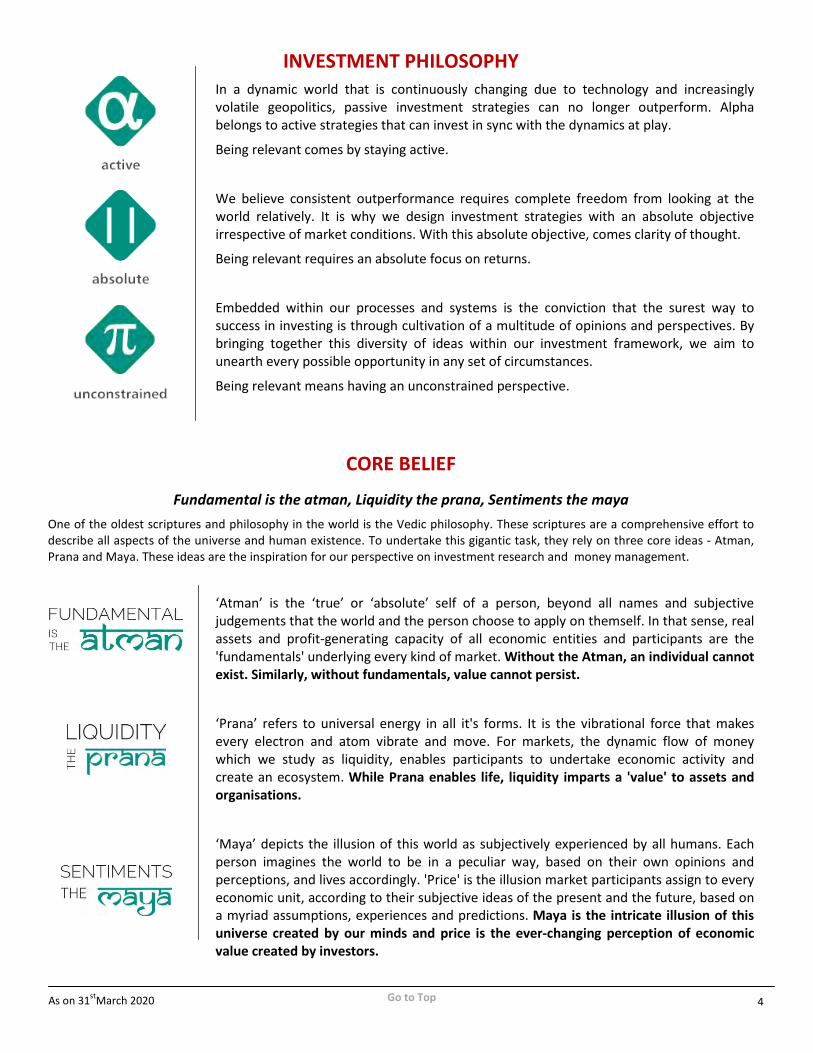
INVESTMENT PHILOSOPHY In a dynamic world that is continuously changing due to technology and increasingly volatile geopolitics, passive investment strategies can no longer outperform. Alpha belongs to active strategies that can invest in sync with the dynamics at play.
Being relevant comes by staying active.
We believe consistent outperformance requires complete freedom from looking at the world relatively. It is why we design investment strategies with an absolute objective irrespective of market conditions. With this absolute objective, comes clarity of thought.
Being relevant requires an absolute focus on returns.
Embedded within our processes and systems is the conviction that the surest way to success in investing is through cultivation of a multitude of opinions and perspectives. By bringing together this diversity of ideas within our investment framework, we aim to unearth every possible opportunity in any set of circumstances.
Being relevant means having an unconstrained perspective.
CORE BELIEF
Fundamental is the atman, Liquidity the prana, Sentiments the maya One of the oldest scriptures and philosophy in the world is the Vedic philosophy. These scriptures are a comprehensive effort to describe all aspects of the universe and human existence. To undertake this gigantic task, they rely on three core ideas - Atman, Prana and Maya. These ideas are the inspiration for our perspective on investment research and money management.
‘Atman’ is the ‘true’ or ‘absolute’ self of a person, beyond all names and subjective judgements that the world and the person choose to apply on themself. In that sense, real assets and profit-generating capacity of all economic entities and participants are the 'fundamentals' underlying every kind of market. Without the Atman, an individual cannot exist. Similarly, without fundamentals, value cannot persist.
‘Prana’ refers to universal energy in all it's forms. It is the vibrational force that makes every electron and atom vibrate and move. For markets, the dynamic flow of money which we study as liquidity, enables participants to undertake economic activity and create an ecosystem. While Prana enables life, liquidity imparts a 'value' to assets and organisations.
‘Maya’ depicts the illusion of this world as subjectively experienced by all humans. Each person imagines the world to be in a peculiar way, based on their own opinions and perceptions, and lives accordingly. 'Price' is the illusion market participants assign to every economic unit, according to their subjective ideas of the present and the future, based on a myriad assumptions, experiences and predictions. Maya is the intricate illusion of this universe created by our minds and price is the ever-changing perception of economic value created by investors.

Go to Top As on 31stMarch 2020 5
INVESTMENT PRINCIPLES Measurable is reliable
For success in investing, discipline is of more importance than any other attribute of the investment process. Our battle-tested suite of proprietary valuation, liquidity and risk indicators along with extensive financial modelling ensure that we consistently deliver superior results.
Quantamental investing
While measurable is reliable, we also believe the economy and markets cannot be captured completely by models and indicators. Human judgement that comes from years of trading and investing experience has immense value. For optimal results, our decision-making seeks to find the harmony between objectivity and subjectivity.
Multi-asset, multi-manager
We believe that safeguarding investor wealth is paramount. Apart from reducing risk by investing across asset classes, we take diversification to another dimension by ensuring every investment decision comes from a focused discussion between investment managers with a diverse set of capabilities and experience.
Money flows from one asset class to another.
Money is a form of economic energy - the quantification of human effort. As the world evolves, a dynamic set of ideas continuously lead the change. Money flows and grows with these pioneering ideas. Identifying them and the specific assets that benefit is the surest and most consistent method for generating wealth.
Timing is everything
In our framework, time is a critical aspect of investing as the three dimensions of Valuation, Liquidity and Risk interact and move together in cycles across different periods. Alpha generation is optimised only by sanguine identification of the extremes.
quant Global Research (qGR) PREDICTIVE ANALYTICS | ACTIONABLE INDICATORS Market moves are highly dependent on the aptitude and
appetite of market participants. To address this, we at qGR track several proprietary indicators which measure market sentiments from different perspectives. Extreme euphoria or fear can be gauged by many of these indicators, helping us to deduce how players are positioned and how they react to a particular situation. Once we understand investor behavior through these indicators, we can identify times when players are being irrational or making illogical decisions or showing signs of exuberance/paranoia. qGR objectively follows this paradigm, ever enhancing domain knowledge with technology as an enabler, to develop tools and techniques, and translating them into indicators that have accurately been able to identify cross asset and cross market inflexion points. qGR predictive analytics indicators are identifiers of inflexion points and opportunities in the complex investing environment. They provide clarity during difficult times when there are many questions that entail event and polity risk.

Go to Top As on 31stMarch 2020 6
SCHEME SNAPSHOT PORTFOLIO TOP HOLDING RATING PROFILE/ ASSET ALLOCATION (%)
INVESTMENT OBJECTIVE The investment objective of the scheme is to generate income through a portfolio comprising money market and debt instruments. There is no assurance that the investment objective of the Scheme will be realized. DATE OF ALLOTMENT
October 03, 2005
FUND MANAGER
Sanjeev Sharma(Debt)
NAV as on 31 March 2020
Daily Dividend Option 13.7597 Daily Dividend Option-Direct Plan 13.9630
Growth Option 31.0473 Growth Option-Direct Plan 31.3923 Monthly Dividend Option 15.2136 Monthly Dividend Option-Direct Plan 15.4491
Weekly Dividend Option 13.8909 Weekly Dividend Option-Direct Plan 14.3899
MINIMUM INVESTMENT 100/- and multiple of Re. 1/-
TOTAL EXPENSE RATIO
Regular 0.97% Direct 0.62%
LOAD STRUCTURE Entry Nil Exit (w.e.f. October 20, 2019)
lnvestor exit upon subscription / switch-In
Exit Load as a % of redemption Proceeds
Day 1 Day 2 Day 3 Day 4 Day 5 Day 6 Day 7 onwards
0.0070% 0.0065% 0.0060% 0.0055% 0.0050% 0.0045% 0.0000%
Average Maturity 19Days Modified Duration 18 Days Yield to Maturity 6.70%
FUND SIZE 60.08Crore
BENCHMARK INDEX
CRISIL LIQUID FUND INDEX
Company Rating % TO NAV TIME TECHNOPLAST LTD. CP 29-APR-2020 A1+ 28.10
JM FINANCIAL SERVICES LTD. CP 050520 A1+ 27.25
TOTAL COMMERCIAL PAPER 55.35
SIDBI CD 03-Apr-2020 A1+ 28.29
TOTAL CERTIFICATE OF DEPOSIT 28.29
CASH & CASH EQUIVALENT 16.36
GRAND TOTAL 100.00
Period Scheme Return (%)
Benchmark Return (%)
Value of`10,000 invested Scheme Benchmark
7 Days 0.17% 0.36% 10,017 10,036 15 Days 0.21% 0.25% 10,021 10,025 1 Month 0.51% 0.51% 10,051 10,051 3 Month 1.46% 1.40% 10,146 10,140 6 Month 3.03% 2.88% 10,303 10,288 Last 1 Year 6.71% 6.43% 10,671 10,643 Last 3 Years 6.90% 6.95% 12,216 12,234 Last 5 Years 7.56% 7.38% 14,397 14,278 Since Inception 8.13% 7.32% 31,044 27,843
Past performance may or may not be sustained in the future. Returns greater than 1 year period are compounded annualized (CAGR). Load is not taken into consideration for computation of performance.
This Product is suitable for investors who are seeking* Riskometer
• To provide income & liquidity over the short term.
• Investment in debt &money market instruments.
*Investors should consult their financial advisers if in doubt
about whether the product is suitable for them
Cash & Cash Equivalents , 16.36
Commerical Paper, 55.35
Certificate Of Deposit, 28.29
A1+, 83.64
Cash & Cash Equivalents , 16.36
quant Liquid Fund (A Liquid Fund)
Go to Top As on 31stMarch 2020 7
SCHEME SNAPSHOT PORTFOLIO TOP HOLDING INDUSTRY/ SECTOR ALLOCATION (%)
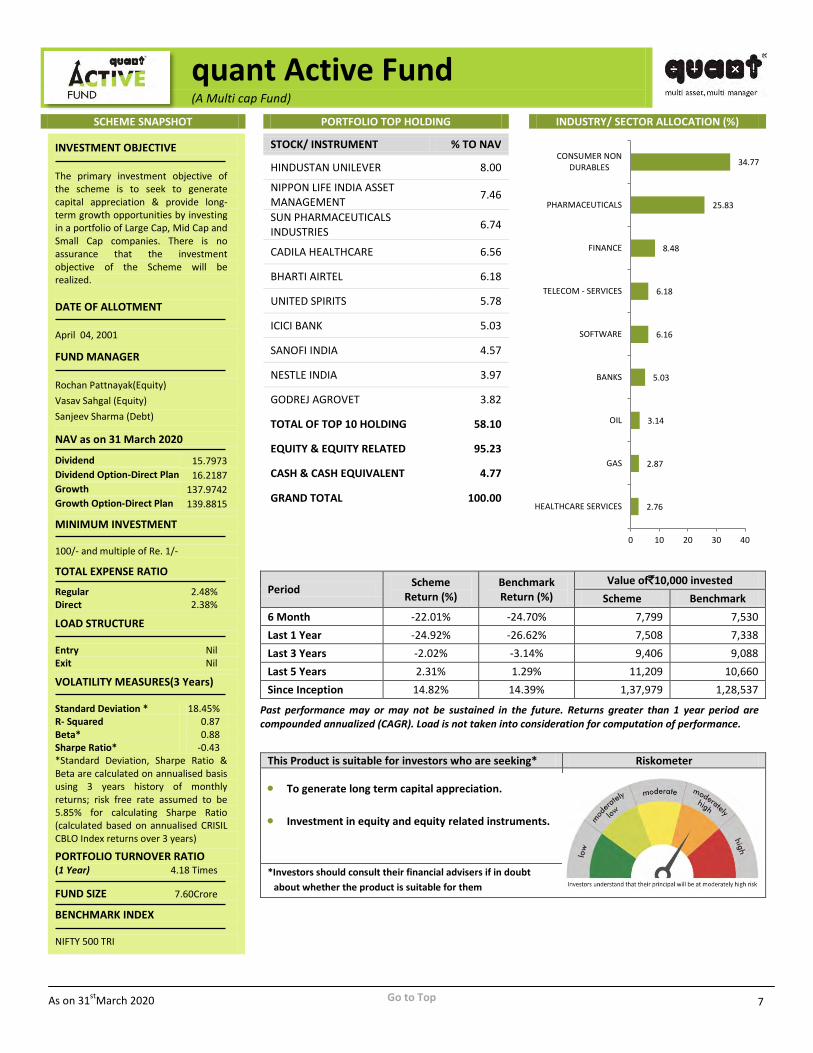
INVESTMENT OBJECTIVE The primary investment objective of the scheme is to seek to generate capital appreciation & provide long-term growth opportunities by investing in a portfolio of Large Cap, Mid Cap and Small Cap companies. There is no assurance that the investment objective of the Scheme will be realized. DATE OF ALLOTMENT
April 04, 2001
FUND MANAGER
Rochan Pattnayak(Equity) Vasav Sahgal (Equity) Sanjeev Sharma (Debt)
NAV as on 31 March 2020
Dividend 15.7973 Dividend Option-Direct Plan 16.2187 Growth 137.9742 Growth Option-Direct Plan 139.8815
MINIMUM INVESTMENT 100/- and multiple of Re. 1/-
TOTAL EXPENSE RATIO
Regular 2.48% Direct 2.38%
LOAD STRUCTURE Entry Nil Exit Nil
VOLATILITY MEASURES(3 Years) Standard Deviation * 18.45% R- Squared 0.87 Beta* 0.88 Sharpe Ratio* -0.43 *Standard Deviation, Sharpe Ratio & Beta are calculated on annualised basis using 3 years history of monthly returns; risk free rate assumed to be 5.85% for calculating Sharpe Ratio (calculated based on annualised CRISIL CBLO Index returns over 3 years)
PORTFOLIO TURNOVER RATIO (1 Year) 4.18 Times
FUND SIZE 7.60Crore
BENCHMARK INDEX NIFTY 500 TRI
STOCK/ INSTRUMENT % TO NAV
HINDUSTAN UNILEVER 8.00
NIPPON LIFE INDIA ASSET MANAGEMENT 7.46
SUN PHARMACEUTICALS INDUSTRIES 6.74
CADILA HEALTHCARE 6.56
BHARTI AIRTEL 6.18
UNITED SPIRITS 5.78
ICICI BANK 5.03
SANOFI INDIA 4.57
NESTLE INDIA 3.97
GODREJ AGROVET 3.82
TOTAL OF TOP 10 HOLDING 58.10
EQUITY & EQUITY RELATED 95.23
CASH & CASH EQUIVALENT 4.77
GRAND TOTAL 100.00
Period Scheme Return (%)
Benchmark Return (%)
Value of`10,000 invested Scheme Benchmark
6 Month -22.01% -24.70% 7,799 7,530 Last 1 Year -24.92% -26.62% 7,508 7,338 Last 3 Years -2.02% -3.14% 9,406 9,088 Last 5 Years 2.31% 1.29% 11,209 10,660 Since Inception 14.82% 14.39% 1,37,979 1,28,537
Past performance may or may not be sustained in the future. Returns greater than 1 year period are compounded annualized (CAGR). Load is not taken into consideration for computation of performance.
This Product is suitable for investors who are seeking* Riskometer
• To generate long term capital appreciation.
• Investment in equity and equity related instruments.
*Investors should consult their financial advisers if in doubt
about whether the product is suitable for them
2.76
2.87
3.14
5.03
6.16
6.18
8.48
25.83
34.77
0 10 20 30 40
HEALTHCARE SERVICES
GAS
OIL
BANKS
SOFTWARE
TELECOM - SERVICES
FINANCE
PHARMACEUTICALS
CONSUMER NONDURABLES
quant Active Fund (A Multi cap Fund)

Go to Top As on 31stMarch 2020 8
SCHEME SNAPSHOT PORTFOLIO TOP HOLDING RATING PROFILE/ ASSET ALLOCATION (%)
INVESTMENT OBJECTIVE The primary investment objective of the scheme is to seek to generate capital appreciation & provide long-term growth opportunities by investing in a portfolio of Small Cap companies. There is no assurance that the investment objective of the Scheme will be realized. DATE OF ALLOTMENT
November 21, 1996
FUND MANAGER
Rochan Pattnayak (Equity) Vasav Sahgal (Equity) Sanjeev Sharma (Debt)
NAV as on 31 March 2020
Dividend 30.2844 Dividend Option-Direct Plan 24.0218 Growth 24.1485 Growth Option-Direct Plan 30.7934
MINIMUM INVESTMENT 100/- and multiple of Re. 1/-
TOTAL EXPENSE RATIO
Regular 2.48% Direct 2.38%
LOAD STRUCTURE Entry Nil Exit 1% if exit <= 1 Year
VOLATILITY MEASURES(3 Years) Standard Deviation * 20.29% R- Squared 0.65 Beta* 0.59 Sharpe Ratio* -1.02 *Standard Deviation, Sharpe Ratio &Beta are calculated on annualised basis using 3 years history of monthly returns; risk free rate assumed to be 5.85% for calculating Sharpe Ratio (calculated based on annualised CRISIL CBLO Index returns over 3 years)
PORTFOLIO TURNOVER RATIO (1 Year) 2.480Times
FUND SIZE 1.53Crore BENCHMARK INDEX NIFTY SMALL CAP 250 TRI
STOCK/ INSTRUMENT % TO NAV
ASTRAZENECA PHARMA INDIA 9.38
FDC 9.25
STRIDES PHARMA SCIENCE 8.68
BASF INDIA 7.35
MAJESCO 6.24
METROPOLIS HEALTHCARE 5.79
MIRZA INTERNATIONAL 4.57
BHAGERIA INDUSTRIES 4.05
DHANUKA AGRITECH 2.97
BLUE DART EXPRESS 2.87
TOTAL OF TOP 10 HOLDING 61.17
EQUITY & EQUITY RELATED 78.76
CASH & CASH EQUIVALENT 21.24
GRAND TOTAL 100
Period Scheme Return (%)
Benchmark Return (%)
Value of`10,000 invested Scheme Benchmark
6 Month -22.74% -31.06% 7,726 6,894 Last 1 Year -41.13% -40.22% 5,887 5,978 Last 3 Years -14.85% -16.09% 6,173 5,908 Last 5 Years -6.23% -4.82% 7,250 7,810 Since Inception -0.67% 10.44% 9,498 21,413
Past performance may or may not be sustained in the future. Returns greater than 1 year period are compounded annualized (CAGR). Load is not taken into consideration for computation of performance.
This Product is suitable for investors who are seeking* Riskometer • To generate long term capital appreciation.
• Investment in small cap companies with growth
potential.
*Investors should consult their financial advisers if in doubt
about whether the product is suitable for them
0.25
2.01
2.54
2.66
2.78
2.87
2.97
5.79
6.49
9.10
11.40
29.88
0 10 20 30 40
CONSTRUCTION
CONSTRUCTION PROJECT
TRADING
TEXTILE PRODUCTS
FINANCE
TRANSPORTATION
PESTICIDES
HEALTHCARE SERVICES
CONSUMER DURABLES
SOFTWARE
CHEMICALS
PHARMACEUTICALS
quant Small Cap Fund (A Small Cap Fund)

Go to Top As on 31stMarch 2020 9
SCHEME SNAPSHOT PORTFOLIO TOP HOLDING INDUSTRY/ SECTOR ALLOCATION (%)
INVESTMENT OBJECTIVE The investment objective of the Scheme is to generate Capital Appreciation by investing predominantly in a well-diversified portfolio of Equity Shares with growth potential. This income may be complemented by possible dividend and other income.
DATE OF ALLOTMENT
March 31,2000
FUND MANAGER
Rochan Pattnayak (Equity) Vasav Sahgal (Equity)
NAV as on 31 March 2020
Dividend 9.5549 Dividend Option-Direct Plan 9.5057 Growth 69.0035 Growth Option-Direct Plan 71.1828
MINIMUM INVESTMENT 100/- and multiple of Re. 1/-
TOTAL EXPENSE RATIO
Regular 2.48% Direct 0.57%
LOAD STRUCTURE Entry Nil Exit Nil Lock-in of 3 years being ELSS
VOLATILITY MEASURES(3 Years) Standard Deviation * 18.69% R- Squared 0.85 Beta* 0.92 Sharpe Ratio* -0.54 *Standard Deviation, Sharpe Ratio & Beta are calculated on annualised basis using 3 years history of monthly returns; risk free rate assumed to be 5.85%for calculating Sharpe Ratio (calculated based on annualised CRISIL CBLO Index returns over 3 years)
PORTFOLIO TURNOVER RATIO (1 Year) 4.02Times
FUND SIZE 7.49Crore
BENCHMARK INDEX
NIFTY 50 TRI
STOCK/ INSTRUMENT % TO NAV NIPPON LIFE INDIA ASSET MANAGEMENT 8.17
SUN PHARMACEUTICALS INDUSTRIES 7.38
BHARTI AIRTEL 7.06
HINDUSTAN UNILEVER 5.97
UNITED SPIRITS 5.84
CADILA HEALTHCARE 5.26
NESTLE INDIA 4.68
SANOFI INDIA 4.42
ICICI BANK 3.67
MARICO 3.57
TOTAL OF TOP 10 HOLDING 53.86
EQUITY & EQUITY RELATED 97.29
CASH & CASH EQUIVALENT 2.71
GRAND TOTAL 100.00
Period Scheme Return (%)
Benchmark Return (%)
Value of`10,000 invested Scheme Benchmark
6 Month -23.92% -24.68% 7,608 7,532 Last 1 Year -26.79% -25.02% 7,321 7,498 Last 3 Years -4.25% -0.82% 8,777 9,757 Last 5 Years 3.57% 1.56% 11,920 10,807 Since Inception 10.14% 10.90% 69,003 79,202
Past performance may or may not be sustained in the future. Returns greater than 1 year period are compounded annualized (CAGR). Load is not taken into consideration for computation of performance.
This Product is suitable for investors who are seeking* Riskometer
• To generate long term capital appreciation.
• Investment in equity and equity related instruments.
*Investors should consult their financial advisers if in doubt
about whether the product is suitable for them
2.36
3.11
3.67
3.92
6.73
7.06
8.17
25.27
33.11
0 10 20 30 40
GAS
OIL
BANKS
HEALTHCARE SERVICES
SOFTWARE
TELECOM - SERVICES
FINANCE
PHARMACEUTICALS
CONSUMER NONDURABLES
quant Tax Plan (An ELSS Fund)
Go to Top As on 31stMarch 2020 10
SCHEME SNAPSHOT PORTFOLIO TOP HOLDING INDUSTRY/ SECTOR ALLOCATION (%)
INVESTMENT OBJECTIVE
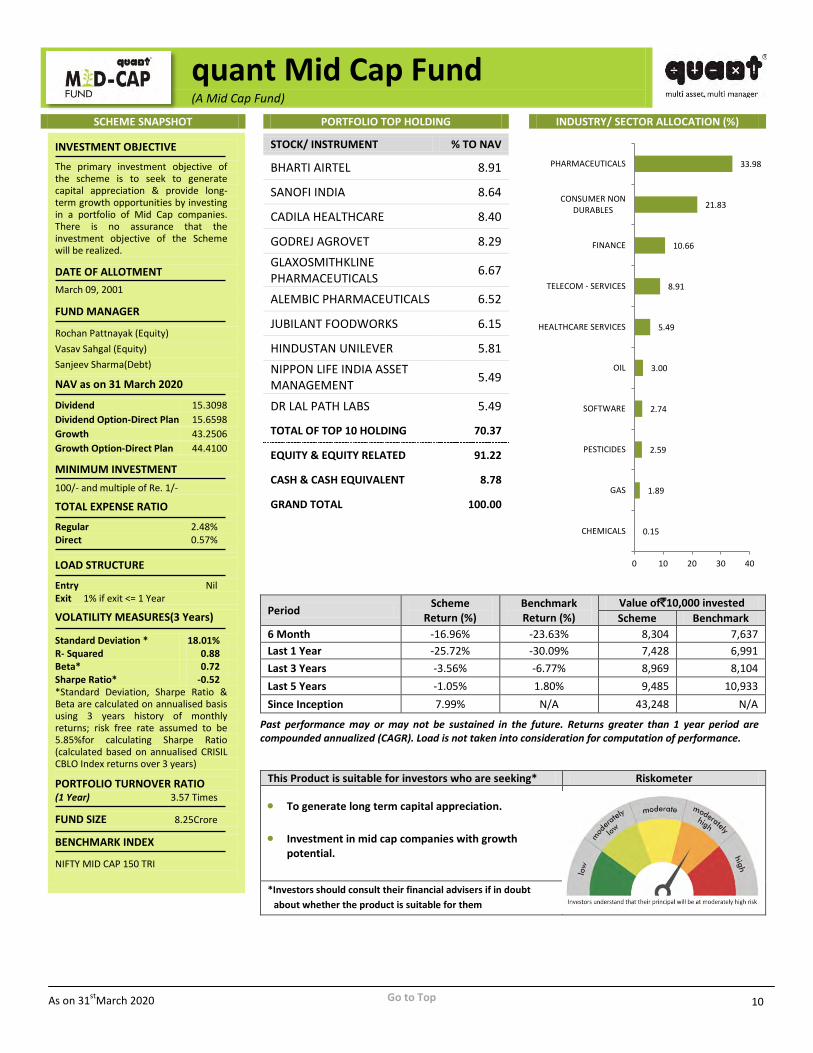
The primary investment objective of the scheme is to seek to generate capital appreciation & provide long-term growth opportunities by investing in a portfolio of Mid Cap companies. There is no assurance that the investment objective of the Scheme will be realized.
DATE OF ALLOTMENT March 09, 2001
FUND MANAGER
Rochan Pattnayak (Equity) Vasav Sahgal (Equity) Sanjeev Sharma(Debt)
NAV as on 31 March 2020
Dividend 15.3098 Dividend Option-Direct Plan 15.6598 Growth 43.2506 Growth Option-Direct Plan 44.4100
MINIMUM INVESTMENT
100/- and multiple of Re. 1/-
TOTAL EXPENSE RATIO
Regular 2.48% Direct 0.57%
LOAD STRUCTURE
Entry Nil Exit 1% if exit <= 1 Year
VOLATILITY MEASURES(3 Years) Standard Deviation * 18.01% R- Squared 0.88 Beta* 0.72 Sharpe Ratio* -0.52 *Standard Deviation, Sharpe Ratio & Beta are calculated on annualised basis using 3 years history of monthly returns; risk free rate assumed to be 5.85%for calculating Sharpe Ratio (calculated based on annualised CRISIL CBLO Index returns over 3 years)
PORTFOLIO TURNOVER RATIO (1 Year) 3.57 Times
FUND SIZE 8.25Crore
BENCHMARK INDEX
NIFTY MID CAP 150 TRI
STOCK/ INSTRUMENT % TO NAV
BHARTI AIRTEL 8.91
SANOFI INDIA 8.64
CADILA HEALTHCARE 8.40
GODREJ AGROVET 8.29 GLAXOSMITHKLINE PHARMACEUTICALS 6.67
ALEMBIC PHARMACEUTICALS 6.52
JUBILANT FOODWORKS 6.15
HINDUSTAN UNILEVER 5.81 NIPPON LIFE INDIA ASSET MANAGEMENT 5.49
DR LAL PATH LABS 5.49
TOTAL OF TOP 10 HOLDING 70.37
EQUITY & EQUITY RELATED 91.22
CASH & CASH EQUIVALENT 8.78
GRAND TOTAL 100.00
Period Scheme Return (%)
Benchmark Return (%)
Value of`10,000 invested Scheme Benchmark
6 Month -16.96% -23.63% 8,304 7,637 Last 1 Year -25.72% -30.09% 7,428 6,991 Last 3 Years -3.56% -6.77% 8,969 8,104 Last 5 Years -1.05% 1.80% 9,485 10,933 Since Inception 7.99% N/A 43,248 N/A
Past performance may or may not be sustained in the future. Returns greater than 1 year period are compounded annualized (CAGR). Load is not taken into consideration for computation of performance.
This Product is suitable for investors who are seeking* Riskometer
• To generate long term capital appreciation.
• Investment in mid cap companies with growth potential.
*Investors should consult their financial advisers if in doubt
about whether the product is suitable for them
0.15
1.89
2.59
2.74
3.00
5.49
8.91
10.66
21.83
33.98
0 10 20 30 40
CHEMICALS
GAS
PESTICIDES
SOFTWARE
OIL
HEALTHCARE SERVICES
TELECOM - SERVICES
FINANCE
CONSUMER NONDURABLES
PHARMACEUTICALS
quant Mid Cap Fund (A Mid Cap Fund)

Go to Top As on 31stMarch 2020 11
SCHEME SNAPSHOT PORTFOLIO TOP HOLDING INDUSTRY/ SECTOR ALLOCATION (%)
INVESTMENT OBJECTIVE The primary investment objective of the scheme is to seek to generate capital appreciation & provide long-term growth opportunities by investing in a portfolio of Large Cap and Mid Cap companies. There is no assurance that the investment objective of the Scheme will be realized.
DATE OF ALLOTMENT
December 12, 2006
FUND MANAGER
Rochan Pattnayak (Equity) Vasav Sahgal (Equity) Sanjeev Sharma (Debt)
NAV as on 31 March 2020
Bonus Option 30.2670 Bonus Option-Direct Plan 30.2670 Dividend Option 18.3755 Dividend Option-Direct Plan 14.4180 Growth Option 30.2757 Growth Option-Direct Plan 30.8466
MINIMUM INVESTMENT 100/- and multiple of Re. 1/-
TOTAL EXPENSE RATIO
Regular 2.48% Direct 2.38%
LOAD STRUCTURE Entry Nil Exit 1% if exit <= 1 Year
VOLATILITY MEASURES(3 Years) Standard Deviation * 15.23% R- Squared 0.87 Beta* 0.69 Sharpe Ratio* -0.66 *Standard Deviation, Sharpe Ratio & Beta are calculated on annualised basis using 3 years history of monthly returns; risk free rate assumed to be 5.85% for calculating Sharpe Ratio (calculated based on annualised CRISIL CBLO Index returns over 3 years)
PORTFOLIO TURNOVER RATIO (1 Year) 3.90 Times FUND SIZE 3.15Crore BENCHMARK INDEX NIFTY LARGE MIDCAP 250 TRI
STOCK/ INSTRUMENT % TO NAV
BHARTI AIRTEL 7.86
CADILA HEALTHCARE 7.55
NIPPON LIFE INDIA ASSET MANAGEMENT 6.09
UNITED SPIRITS 5.92
HINDUSTAN UNILEVER 5.65
OIL AND NATURAL GAS CORPORATION 5.09
DABUR INDIA 5.01
ALEMBIC PHARMACEUTICALS 4.93
ABBOTT INDIA 4.90
GLAXOSMITHKLINE PHARMACEUTICALS 4.79
TOTAL OF TOP 10 HOLDING 57.80
EQUITY & EQUITY RELATED 91.92
CASH & CASH EQUIVALENT 8.08
GRAND TOTAL 100.0
Period Scheme Return (%)
Benchmark Return (%)
Value of`10,000 invested Scheme Benchmark
6 Month -17.07% -23.93% 8,293 7,607 Last 1 Year -18.37% -27.48% 8,163 7,252 Last 3 Years -4.23% -4.00% 8,783 8,848 Last 5 Years 4.28% 1.92% 12,330 10,999 Since Inception 8.69% 8.77% 30,274 30,583
Past performance may or may not be sustained in the future. Returns greater than 1 year period are compounded annualized (CAGR). Load is not taken into consideration for computation of performance.
This Product is suitable for investors who are seeking* Riskometer
• To generate long term capital appreciation.
• Investment predominantly in large cap & mid cap companies with growth potential.
*Investors should consult their financial advisers if in doubt
about whether the product is suitable for them
0.01
1.58
1.64
3.53
4.99
5.09
7.86
8.12
25.44
33.65
0 8 16 24 32 40
CHEMICALS
HEALTHCARE SERVICES
PESTICIDES
GAS
SOFTWARE
OIL
TELECOM - SERVICES
FINANCE
PHARMACEUTICALS
CONSUMER NON DURABLES
quant Large & Mid-Cap Fund (A Large & Midcap Fund)
Go to Top As on 31stMarch 2020 12
SCHEME SNAPSHOT PORTFOLIO TOP HOLDING INDUSTRY/ SECTOR ALLOCATION (%)
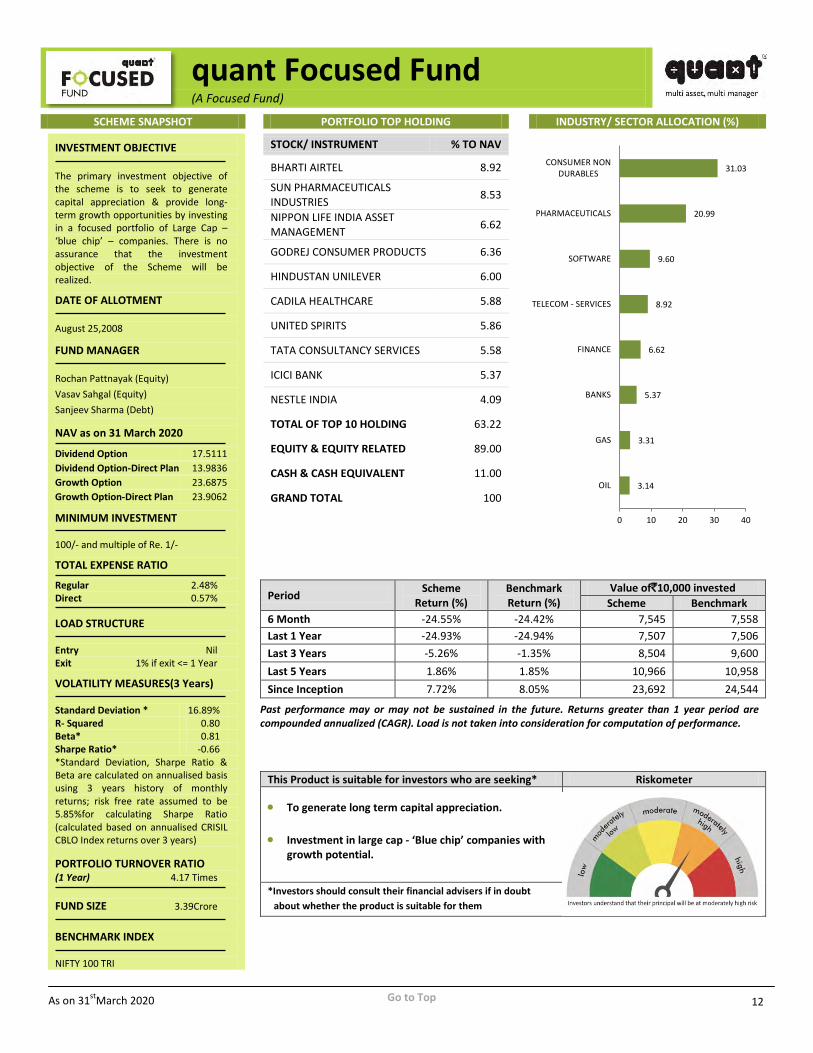
INVESTMENT OBJECTIVE The primary investment objective of the scheme is to seek to generate capital appreciation & provide long-term growth opportunities by investing in a focused portfolio of Large Cap – ‘blue chip’ – companies. There is no assurance that the investment objective of the Scheme will be realized.
DATE OF ALLOTMENT
August 25,2008
FUND MANAGER
Rochan Pattnayak (Equity) Vasav Sahgal (Equity) Sanjeev Sharma (Debt)
NAV as on 31 March 2020
Dividend Option 17.5111 Dividend Option-Direct Plan 13.9836 Growth Option 23.6875 Growth Option-Direct Plan 23.9062
MINIMUM INVESTMENT 100/- and multiple of Re. 1/-
TOTAL EXPENSE RATIO
Regular 2.48% Direct 0.57%
LOAD STRUCTURE Entry Nil Exit 1% if exit <= 1 Year
VOLATILITY MEASURES(3 Years) Standard Deviation * 16.89% R- Squared 0.80 Beta* 0.81 Sharpe Ratio* -0.66 *Standard Deviation, Sharpe Ratio & Beta are calculated on annualised basis using 3 years history of monthly returns; risk free rate assumed to be 5.85%for calculating Sharpe Ratio (calculated based on annualised CRISIL CBLO Index returns over 3 years)
PORTFOLIO TURNOVER RATIO (1 Year) 4.17 Times FUND SIZE 3.39Crore BENCHMARK INDEX NIFTY 100 TRI
STOCK/ INSTRUMENT % TO NAV
BHARTI AIRTEL 8.92
SUN PHARMACEUTICALS INDUSTRIES 8.53
NIPPON LIFE INDIA ASSET MANAGEMENT 6.62
GODREJ CONSUMER PRODUCTS 6.36
HINDUSTAN UNILEVER 6.00
CADILA HEALTHCARE 5.88
UNITED SPIRITS 5.86
TATA CONSULTANCY SERVICES 5.58
ICICI BANK 5.37
NESTLE INDIA 4.09
TOTAL OF TOP 10 HOLDING 63.22
EQUITY & EQUITY RELATED 89.00
CASH & CASH EQUIVALENT 11.00
GRAND TOTAL 100
Period Scheme Return (%)
Benchmark Return (%)
Value of`10,000 invested Scheme Benchmark
6 Month -24.55% -24.42% 7,545 7,558 Last 1 Year -24.93% -24.94% 7,507 7,506 Last 3 Years -5.26% -1.35% 8,504 9,600 Last 5 Years 1.86% 1.85% 10,966 10,958 Since Inception 7.72% 8.05% 23,692 24,544
Past performance may or may not be sustained in the future. Returns greater than 1 year period are compounded annualized (CAGR). Load is not taken into consideration for computation of performance.
This Product is suitable for investors who are seeking* Riskometer
• To generate long term capital appreciation.
• Investment in large cap - ‘Blue chip’ companies with growth potential.
*Investors should consult their financial advisers if in doubt
about whether the product is suitable for them
3.14
3.31
5.37
6.62
8.92
9.60
20.99
31.03
0 10 20 30 40
OIL
GAS
BANKS
FINANCE
TELECOM - SERVICES
SOFTWARE
PHARMACEUTICALS
CONSUMER NONDURABLES
quant Focused Fund (A Focused Fund)

Go to Top As on 31stMarch 2020 13
SCHEME SNAPSHOT PORTFOLIO TOP HOLDING ASSET ALLOCATION (%)
INVESTMENT OBJECTIVE The investment objective of the scheme is to generate capital appreciation & provide long-term growth opportunities by investing in instruments across the three asset classes viz. Equity, Debt and Commodity. There is no assurance that the investment objective of the Scheme will be realized.
DATE OF ALLOTMENT
April 04, 2001
FUND MANAGER
Sanjeev Sharma (Debt) Rochan Pattnayak (Equity) Vasav Sahgal (Equity) Nikunj Pherwani (Commodity)
NAV as on 31 March 2020
Dividend 28.3315 Dividend Option-Direct Plan 28.4511 Growth 30.9488 Growth Option-Direct Plan 30.8608
MINIMUM INVESTMENT 100/- and multiple of Re. 1/-
TOTAL EXPENSE RATIO
Regular 2.48% Direct 2.38%
LOAD STRUCTURE Entry Nil Exit Nil
Average Maturity 39Days Modified Duration 37Days Yield to Maturity 5.43% PORTFOLIO TURNOVER RATIO (1 Year) 3.67 Times
FUND SIZE 0.89 Crore
BENCHMARK INDEX
1/3 NIFTY 50 INDEX + 1/3 CRISIL COMPOSITE BOND FUND INDEX+1/3 INR PRICE OF GOLD FUTURENEAR-MONTH PRICE ON MCX
Stock/ Instrument % TO NAV
SANOFI INDIA 5.99 ALEMBIC PHARMACEUTICALS 4.82
GLAXOSMITHKLINE PHARMACEUTICALS 4.25
MANAPPURAM FINANCE 4.15 MIRZA INTERNATIONAL 3.99 STRIDES PHARMA SCIENCE 3.96
BIRLASOFT 3.75 BHAGERIA INDUSTRIES 3.49 MAJESCO 3.38 FDC 3.11 INFO EDGE (INDIA) 2.52 MSTC 2.23 BIRLA CORPORATION 0.61 HINDALCO INDUSTRIES 0.01 TOTAL EQUITY & EQUITY RELATED 46.26 HDFC MF - Gold ETF - Growth 11.98
Kotak Mutual Fund - Gold ETF
10.44
Aditya Birla Sun Life Gold ETF - Growth 0.50
TOTAL EXCHANGE TRADED FUNDS 22.93 7.16% GOI 2023 Sovereign 3.55 TOTAL GOVERMENT SECURITIES 3.55 EQUITY & EQUITY RELATED 46.26 CASH & CASH EQUIVALENT 27.27 GRAND TOTAL 100.00
Period Scheme Return (%)
Benchmark Return (%)
Value of`10,000 invested Scheme Benchmark
6 Month -19.93% -3.39% 8,007 9,661 Last 1 Year -15.86% 4.58% 8,414 10,458 Last 3 Years -2.94% 6.71% 9,142 12,152 Last 5 Years 1.85% 6.24% 10,962 13,531 Since Inception 7.08% N/A 36,645 N/A
Past performance may or may not be sustained in the future. Returns greater than 1 year period are compounded annualized (CAGR). Load is not taken into consideration for computation of performance.
This Product is suitable for investors who are seeking* Riskometer
• To generate income & capital appreciation in the long term.
• Investment in instruments across the three asset classes vizEquity, Debt and Commodity.
*Investors should consult their financial advisers if in doubt about whether the product is suitable for them
Total Equity & Equity Related,
46.26
Total ETF, 22.93
Government Securities,
3.55
Cash & Cash
Equivalents , 27.27
Sovereign, 3.55
Cash & Cash
Equivalents , 27.27
Others, 69.18
quant Multi Asset Fund (A Multi Asset Allocation Fund)
Go to Top As on 31stMarch 2020 14
SCHEME SNAPSHOT PORTFOLIO TOP HOLDING INDUSTRY/ SECTOR ALLOCATION (%)
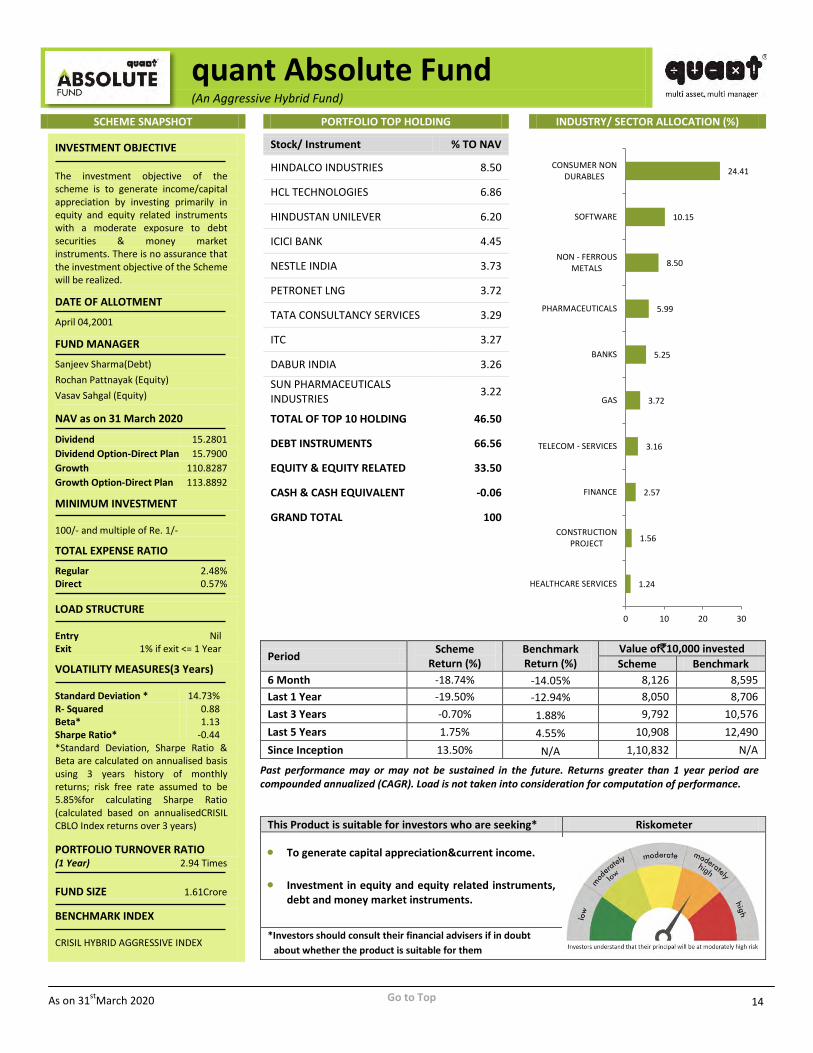
INVESTMENT OBJECTIVE The investment objective of the scheme is to generate income/capital appreciation by investing primarily in equity and equity related instruments with a moderate exposure to debt securities & money market instruments. There is no assurance that the investment objective of the Scheme will be realized.
DATE OF ALLOTMENT
April 04,2001
FUND MANAGER
Sanjeev Sharma(Debt) Rochan Pattnayak (Equity) Vasav Sahgal (Equity)
NAV as on 31 March 2020
Dividend 15.2801 Dividend Option-Direct Plan 15.7900 Growth 110.8287 Growth Option-Direct Plan 113.8892
MINIMUM INVESTMENT 100/- and multiple of Re. 1/-
TOTAL EXPENSE RATIO
Regular 2.48% Direct 0.57%
LOAD STRUCTURE Entry Nil Exit 1% if exit <= 1 Year
VOLATILITY MEASURES(3 Years) Standard Deviation * 14.73% R- Squared 0.88 Beta* 1.13 Sharpe Ratio* -0.44 *Standard Deviation, Sharpe Ratio & Beta are calculated on annualised basis using 3 years history of monthly returns; risk free rate assumed to be 5.85%for calculating Sharpe Ratio (calculated based on annualisedCRISIL CBLO Index returns over 3 years)
PORTFOLIO TURNOVER RATIO (1 Year) 2.94 Times FUND SIZE 1.61Crore
BENCHMARK INDEX CRISIL HYBRID AGGRESSIVE INDEX
Stock/ Instrument % TO NAV
HINDALCO INDUSTRIES 8.50
HCL TECHNOLOGIES 6.86
HINDUSTAN UNILEVER 6.20
ICICI BANK 4.45
NESTLE INDIA 3.73
PETRONET LNG 3.72
TATA CONSULTANCY SERVICES 3.29
ITC 3.27
DABUR INDIA 3.26
SUN PHARMACEUTICALS INDUSTRIES 3.22
TOTAL OF TOP 10 HOLDING 46.50
DEBT INSTRUMENTS 66.56
EQUITY & EQUITY RELATED 33.50
CASH & CASH EQUIVALENT -0.06
GRAND TOTAL 100
Period Scheme Return (%)
Benchmark Return (%)
Value of`10,000 invested Scheme Benchmark
6 Month -18.74% -14.05% 8,126 8,595 Last 1 Year -19.50% -12.94% 8,050 8,706 Last 3 Years -0.70% 1.88% 9,792 10,576 Last 5 Years 1.75% 4.55% 10,908 12,490 Since Inception 13.50% N/A 1,10,832 N/A
Past performance may or may not be sustained in the future. Returns greater than 1 year period are compounded annualized (CAGR). Load is not taken into consideration for computation of performance.
This Product is suitable for investors who are seeking* Riskometer
• To generate capital appreciation¤t income.
• Investment in equity and equity related instruments, debt and money market instruments.
*Investors should consult their financial advisers if in doubt
about whether the product is suitable for them
1.24
1.56
2.57
3.16
3.72
5.25
5.99
8.50
10.15
24.41
0 10 20 30
HEALTHCARE SERVICES
CONSTRUCTIONPROJECT
FINANCE
TELECOM - SERVICES
GAS
BANKS
PHARMACEUTICALS
NON - FERROUSMETALS
SOFTWARE
CONSUMER NONDURABLES
quant Absolute Fund (An Aggressive Hybrid Fund)

Go to Top As on 31stMarch 2020 15
SCHEME SNAPSHOT PORTFOLIO TOP HOLDING INDUSTRY/ SECTOR ALLOCATION (%)
INVESTMENT OBJECTIVE The primary investment objective of the scheme is to seek to generate capital appreciation & provide long-term growth opportunities by investing in a portfolio of Infrastructure focused companies. There is no assurance that the investment objective of the Scheme will be realized.
DATE OF ALLOTMENT
September 21,2007
FUND MANAGER
Rochan Pattnayak (Equity) Vasav Sahgal (Equity)
NAV as on 31 March 2020
Dividend 5.7741 Dividend Option-Direct Plan 5.9519 Growth 5.7937 Growth Option-Direct Plan 5.9519
MINIMUM INVESTMENT 100/- and multiple of Re. 1/-
TOTAL EXPENSE RATIO
Regular 2.48% Direct 0.57%
LOAD STRUCTURE Entry Nil Exit 1% if exit <= 1 Year
VOLATILITY MEASURES(3 Years)
Standard Deviation * 24.24% R- Squared 0.88 Beta* 1.08 Sharpe Ratio* -0.59 *Standard Deviation, Sharpe Ratio & Beta are calculated on annualised basis using 3 years history of monthly returns; risk free rate assumed to be 5.85%for calculating Sharpe Ratio (calculated based on annualised CRISIL CBLO Index returns over 3 years)
PORTFOLIO TURNOVER RATIO (1 Year) 3.75Times
FUND SIZE 1.05Crore BENCHMARK INDEX NIFTY INFRASTRUCTURE TRI
STOCK/ INSTRUMENT % TO NAV
BHARTI AIRTEL 9.44
HINDUSTAN UNILEVER 9.36
POWER GRID CORPORATION OF INDIA 8.20
NIPPON LIFE INDIA ASSET MANAGEMENT 7.58
NTPC 7.23
PETRONET LNG 6.95
OIL AND NATURAL GAS CORPORATION 6.15
ICICI BANK 5.15
GAIL (INDIA) 5.08
MANAPPURAM FINANCE 3.64
TOTAL OF TOP 10 HOLDING 68.79
EQUITY & EQUITY RELATED 80.83
CASH & CASH EQUIVALENT 19.17
GRAND TOTAL 100
Period Scheme Return (%)
Benchmark Return (%)
Value of`10,000 invested Scheme Benchmark
6 Month -31.97% -25.79% 6,803 7,421 Last 1 Year -34.58% -24.89% 6,542 7,511 Last 3 Years -8.41% -6.95% 7,683 8,057 Last 5 Years -4.22% -4.67% 8,059 7,871 Since Inception -4.26% -3.65% 5,793 6,275
Past performance may or may not be sustained in the future. Returns greater than 1 year period are compounded annualized (CAGR). Load is not taken into consideration for computation of performance.
This Product is suitable for investors who are seeking* Riskometer
• To generate long term capital appreciation.
• Investment in equity and equity related instruments of companies in the infrastructure sector.
*Investors should consult their financial advisers if in doubt
about whether the product is suitable for them
3.02
3.86
5.15
6.15
9.44
11.56
12.03
0 5 10 15
CEMENT
SOFTWARE
BANKS
OIL
TELECOM - SERVICES
CONSUMER NONDURABLES
GAS
quant Infrastructure Fund (ASectoral/Thematic Fund)

Go to Top As on 31stMarch 2020 16
SCHEME SNAPSHOT PORTFOLIO TOP HOLDING INDUSTRY/ SECTOR ALLOCATION (%)
INVESTMENT OBJECTIVE The primary investment objective of the scheme is to seek to generate capital appreciation & provide long-term growth opportunities by investing in a portfolio of Consumption driven companies. There is no assurance that the investment objective of the Scheme will be realized.
DATE OF ALLOTMENT
October 15,2008
FUND MANAGER
Rochan Pattnayak (Equity) Vasav Sahgal (Equity)
NAV as on 31 March 2020
Dividend 13.6074 Dividend Option-Direct Plan 13.6556 Growth 18.9987 Growth Option-Direct Plan 20.0354
MINIMUM INVESTMENT 100/- and multiple of Re. 1/-
TOTAL EXPENSE RATIO
Regular 2.48% Direct 0.57%
LOAD STRUCTURE Entry Nil Exit 1% if exit <= 1 Year
VOLATILITY MEASURES(3 Years) Standard Deviation * 17.09% R- Squared 0.66 Beta* 0.80 Sharpe Ratio* -0.73 *Standard Deviation, Sharpe Ratio & Beta are calculated on annualised basis using 3 years history of monthly returns; risk free rate assumed to be 5.85%for calculating Sharpe Ratio (calculated based on annualised CRISIL CBLO Index returns over 3 years)
PORTFOLIO TURNOVER RATIO (1 Year) 3.11Times
FUND SIZE 0.51Crore BENCHMARK INDEX NIFTY INDIA CONSUMPTION TRI
STOCK/ INSTRUMENT % TO NAV
GODREJ CONSUMER PRODUCTS 10.07
HINDUSTAN UNILEVER 9.38
BHARTI AIRTEL 8.99
DABUR INDIA 7.65
GODREJ AGROVET 7.43
NIPPON LIFE INDIA ASSET MANAGEMENT 7.19
SUN PHARMACEUTICALS INDUSTRIES 6.16
UNITED SPIRITS 5.84
JUBILANT FOODWORKS 5.09
NESTLE INDIA 5.07
TOTAL OF TOP 10 HOLDING 72.86
EQUITY & EQUITY RELATED 90.34
CASH & CASH EQUIVALENT 9.66
GRAND TOTAL 100
Period Scheme Return (%)
Benchmark Return (%)
Value of`10,000 invested Scheme Benchmark
6 Month -20.49% -17.39% 7,951 8,261 Last 1 Year -27.74% -14.88% 7,226 8,512 Last 3 Years -6.68% 1.89% 8,127 10,577 Last 5 Years 1.84% 4.86% 10,957 12,675 Since Inception 5.76% 13.43% 19,001 42,366
Past performance may or may not be sustained in the future. Returns greater than 1 year period are compounded annualized (CAGR). Load is not taken into consideration for computation of performance.
This Product is suitable for investors who are seeking* Riskometer
• To generate long term capital appreciation.
• Investment inequity & equity-related instruments of companies likely to benefit from the consumption theme.
*Investors should consult their financial advisers if in doubt
about whether the product is suitable for them
2.84
7.19
8.99
13.84
57.47
0 10 20 30 40 50 60 70
PESTICIDES
FINANCE
TELECOM - SERVICES
PHARMACEUTICALS
CONSUMER NONDURABLES
quant Consumption Fund (ASectoral/Thematic Fund)

Go to Top As on 31stMarch 2020 17
SCHEME SNAPSHOT PORTFOLIO TOP HOLDING RATING PROFILE/ ASSET ALLOCATION(%)
INVESTMENT OBJECTIVE The investment objective of the scheme is to generate income / capital appreciation through a portfolio comprising money market and debt instruments. There is no assurance that the investment objective of the Scheme will be realized. DATE OF ALLOTMENT
June 01, 1998
FUND MANAGER
Sanjeev Sharma (Debt) Rochan Pattnayak (Equity) Vasav Sahgal (Equity)
NAV as on 31 March 2020
Bonus 32.7896 Bonus Option-Direct Plan 32.7896 Dividend 11.8669 Dividend Option-Direct Plan 12.0667 Growth 62.3446 Growth Option-Direct Plan 63.2127
MINIMUM INVESTMENT 100/- and multiple of Re. 1/-
TOTAL EXPENSE RATIO
Regular 0.21% Direct 0.11%
LOAD STRUCTURE Entry Nil Exit Nil
Average Maturity 141 Days Modified Duration 134 Days Yield to Maturity 5.28%
FUND SIZE 20.18Crore BENCHMARK INDEX I-SEC MI-BEX
INSTRUMENT RATING % TO NAV
JM FINANCIAL SERVICES 2020 A1+ 8.61
TIME TECHNOPLAST CP 2020 A1+ 7.38
TOTAL COMMERCIAL PAPER 15.99 SMALL INDUSTRIES DEVELOPMENT BANK OF INDIA CD 2020
A1+ 7.43
TOTAL CERTIFICATE OF DEPOSIT 7.43 7.16% GOI 2023 Sovereign 5.30 8.23% GOI 2027 Sovereign 2.66 TOTAL GOVERNMENT SECURITIES 7.97 9.95% STATE BANK OF INDIA NCD 2026 AAA 0.63
12% INDIA INFOLINE HOUSING FINANCE LTD NCD 2020
AA 0.10
TOTAL NON CONVERTIBLE DEBENTURES 0.73
CASH & CASH EQUIVALENT 67.88 GRAND TOTAL 100.00
Period Scheme Return (%)
Benchmark Return (%)
Value of`10,000 invested Scheme Benchmark
6 Month 3.11% 5.19% 10,311 10,519 Last 1 Year 6.23% 11.06% 10,623 11,106 Last 3 Years 4.55% 8.50% 11,430 12,772 Last 5 Years 6.22% 9.19% 13,520 15,521
Since Inception 8.74% N/A 62,336 N/A
Past performance may or may not be sustained in the future. Returns greater than 1 year period are compounded annualized (CAGR). Load is not taken into consideration for computation of performance.
This Product is suitable for investors who are seeking* Riskometer
• To generate incomeand capital appreciation over the long term.
• Investment in debt & and money market instruments.
*Investors should consult their financial advisers if in doubt
about whether the product is suitable for them
A1+, 23.42
Sovereign, 7.97
AAA, 0.63
AA, 0.10
Cash & Cash Equivalents , 67.88
Cash & Cash Equivalents , 67.88
Commerical Paper, 15.99
Certificate Of
Deposit, 7.43
Bonds, 0.73 Sovereign, 2.66
quant Dynamic Bond (A Dynamic Bond Fund)

Go to Top As on 31stMarch 2020 18
SCHEME SNAPSHOT PORTFOLIO TOP HOLDING RATING PROFILE/ ASSET ALLOCATION (%)
INVESTMENT OBJECTIVE The investment objective of the scheme is to generate income through a portfolio comprising money market and debt instruments. There is no assurance that the investment objective of the Scheme will be realized.
DATE OF ALLOTMENT
December 29, 2005
FUND MANAGER
Sanjeev Sharma(Debt)
NAV as on 31 March 2020
Dividend Option 16.7909 Dividend Option-Direct Plan 16.8073 Growth Option 31.1579 Growth Option-Direct Plan 31.4291
MINIMUM INVESTMENT 100/- and multiple of Re. 1/-
TOTAL EXPENSE RATIO
Regular 0.21% Direct 0.11%
LOAD STRUCTURE Entry Nil Exit Nil
Average Maturity 5 Days Modified Duration 5 Days Yield to Maturity 5.16%
FUND SIZE 20.08 Crore
BENCHMARK INDEX
CRISIL MONEY MARKET INDEX
Company Rating % To NAV
JM FINANCIAL SERVICES LTD. CP 050520 A1+ 8.65
TIME TECHNOPLAST LTD. CP 29-APR-2020 A1+ 7.42
TOTAL COMMERCIAL PAPER 16.07
SMALL INDUSTRIES DEVELOPMENT BANK OF INDIA CD 03-04-2020
A1+ 7.47
TOTAL CERTIFICATE OF DEPOSIT 7.47
CASH & CASH EQUIVALENT 76.46
GRAND TOTAL 100.00
Period Scheme Return (%)
Benchmark Return (%)
Value of`10,000 invested Scheme Benchmark
3 Month 1.54% 1.59% 10,154 10,159 6 Month 3.27% 3.21% 10,327 10,321 Last 1 Year 7.24% 7.12% 10,724 10,712 Last 3 Years 7.17% 7.36% 12,310 12,374 Last 5 Years 7.81% 7.72% 14,566 14,507 Since Inception 8.30% 9.28% 31,150 35,438
Past performance may or may not be sustained in the future. Returns greater than 1 year period are compounded annualized (CAGR). Load is not taken into consideration for computation of performance.
This Product is suitable for investors who are seeking* Riskometer
• To generate income over the short term.
• Investment in debt securities andmoney market Instruments.
*Investors should consult their financial advisers if in doubt
about whether the product is suitable for them
A1+, 23.54
Cash & Cash Equivalents , 76.46
Certificate Of Deposit, 7.47
Commerical Paper, 16.07
Cash & Cash Equivalents , 76.46
quant Money Market Fund (A Money Market Fund)

Go to Top As on 31stMarch 2020 19
Dividend History
quant Active Fund Period Record Date Dividend `Per Unit 2017-2018 26-Feb-18 1.50 2016-2017 1-Mar-17 1.50 2015-2016 2-Feb-16 1.00
quant Large & Mid Cap Fund Period Record Date Dividend ` Per Unit 2018-2019 6-Aug-18 0.60 2017-2018 26-Feb-18 0.45 2017-2018 27-Dec-17 0.45 2017-2018 26-Sep-17 0.45 2017-2018 20-Jun-17 0.45 2016-2017 30-Mar-17 0.45 2016-2017 1-Jan-17 0.45 2016-2017 27-Sep-16 0.45 2016-2017 21-Jun-16 0.45 2015-2016 29-Feb-16 0.45 2015-2016 4-Nov-15 0.45
quant Small Cap Fund Period Record Date Dividend ` Per Unit 2017-2018 26-Feb-18 0.09 2017-2018 28-Jan-18 0.09 2017-2018 27-Dec-17 0.09 2017-2018 7-Dec-17 0.09 2017-2018 1-Nov-17 0.09 2017-2018 2-Oct-17 0.09 2017-2018 26-Sep-17 0.10 2017-2018 29-Aug-17 0.10 2017-2018 23-Jul-17 0.10 2017-2018 20-Jun-17 0.10 2017-2018 28-May-17 0.10 2017-2018 5-May-17 0.10 2016-2017 30-Mar-17 0.10 2016-2017 1-Mar-17 0.10 2016-2017 30-Jan-17 0.10 2016-2017 1-Jan-17 0.10 2016-2017 5-Dec-16 0.10 2016-2017 1-Nov-16 0.10 2016-2017 27-Sep-16 0.10 2016-2017 30-Aug-16 0.10 2016-2017 24-Jul-16 0.10 2016-2017 21-Jun-16 0.10 2016-2017 29-May-16 0.10 2016-2017 5-May-16 0.10 2015-2016 28-Mar-16 0.10 2015-2016 29-Feb-16 0.10 2015-2016 2-Feb-16 0.10 2015-2016 28-Dec-15 0.10 2015-2016 2-Dec-15 0.10 2015-2016 4-Nov-15 0.10 2015-2016 29-Sep-15 0.10 2015-2016 1-Sep-15 0.10 2015-2016 30-Jul-15 0.10
2015-2016 1-Jul-15 0.10 2015-2016 21-May-15 0.10 2015-2016 5-May-15 0.10
quant Focused Fund Period Record Date Dividend ` Per Unit 2017-2018 26-Feb-18 2.0 2016-2017 1-Mar-17 2.0 2015-2016 2-Feb-16 2.5
quant Tax Plan Period Record Date Dividend ` Per Unit 2017-2018 26-Feb-18 1.50 2017-2018 26-Sep-17 1.25 2016-2017 1-Mar-17 1.50 2016-2017 27-Sep-16 1.25
quant Liquid Plan Period Record Date Dividend ` Per Unit 2019-2020 31-Mar-20 0.01 2019-2020 28-Feb-20 0.07 2019-2020 28-Jan-20 0.07 2019-2020 31-Dec-19 0.09 2019-2020 26-Nov-19 0.08 2019-2020 29-Oct-19 0.09 2019-2020 24-Sept-19 0.07 2019-2020 27-Aug-19 0.08 2019-2020 30-July-19 0.10 2019-2020 25-June-19 0.08 2019-2020 28-May-19 0.09 2019-2020 30-Apr-19 0.10 2018-2019 26-Mar-19 0.09 2018-2019 26-Feb-19 0.09 2018-2019 29-Jan-19 0.10 2018-2019 31-Dec-18 0.09 2018-2019 27-Nov-18 0.09 2018-2019 30-Oct-18 0.06 2018-2019 24-Sep-18 0.08 2018-2019 27-Aug-18 0.08 2018-2019 30-Jul-18 0.10 2018-2019 25-Jun-18 0.08 2018-2019 28-May-18 0.09 2018-2019 23-Apr-18 0.08 2017-2018 26-Mar-18 0.08 2017-2018 26-Feb-18 0.07 2017-2018 29-Jan-18 0.09 2017-2018 25-Dec-17 0.07 2017-2018 27-Nov-17 0.07 2017-2018 30-Oct-17 0.09 2017-2018 25-Sep-17 0.08 2017-2018 28-Aug-17 0.10 2017-2018 24-Jul-17 0.09 2017-2018 26-Jun-17 0.09 2017-2018 29-May-17 0.12 2017-2018 25-Apr-17 0.09
Go to Top As on 31stMarch 2020 20
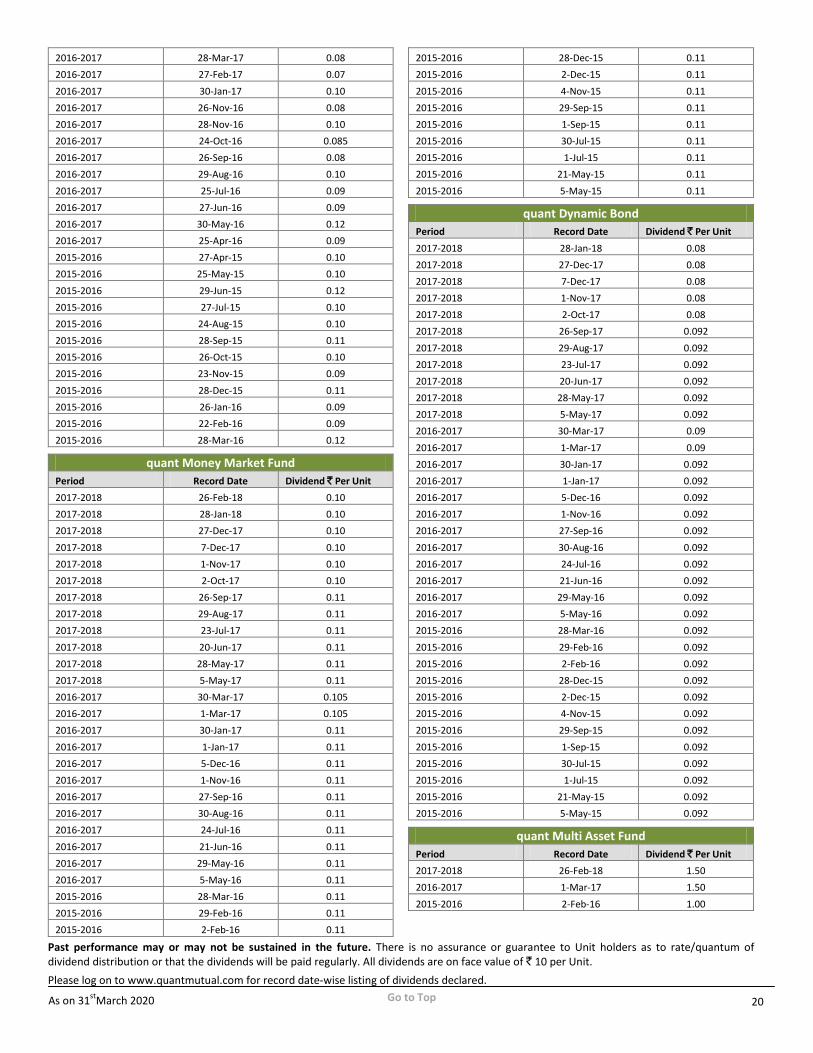
2016-2017 28-Mar-17 0.08 2016-2017 27-Feb-17 0.07 2016-2017 30-Jan-17 0.10 2016-2017 26-Nov-16 0.08 2016-2017 28-Nov-16 0.10 2016-2017 24-Oct-16 0.085 2016-2017 26-Sep-16 0.08 2016-2017 29-Aug-16 0.10 2016-2017 25-Jul-16 0.09 2016-2017 27-Jun-16 0.09 2016-2017 30-May-16 0.12 2016-2017 25-Apr-16 0.09 2015-2016 27-Apr-15 0.10 2015-2016 25-May-15 0.10 2015-2016 29-Jun-15 0.12 2015-2016 27-Jul-15 0.10 2015-2016 24-Aug-15 0.10 2015-2016 28-Sep-15 0.11 2015-2016 26-Oct-15 0.10 2015-2016 23-Nov-15 0.09 2015-2016 28-Dec-15 0.11 2015-2016 26-Jan-16 0.09 2015-2016 22-Feb-16 0.09 2015-2016 28-Mar-16 0.12
quant Money Market Fund Period Record Date Dividend ` Per Unit 2017-2018 26-Feb-18 0.10 2017-2018 28-Jan-18 0.10 2017-2018 27-Dec-17 0.10 2017-2018 7-Dec-17 0.10 2017-2018 1-Nov-17 0.10 2017-2018 2-Oct-17 0.10 2017-2018 26-Sep-17 0.11 2017-2018 29-Aug-17 0.11 2017-2018 23-Jul-17 0.11 2017-2018 20-Jun-17 0.11 2017-2018 28-May-17 0.11 2017-2018 5-May-17 0.11 2016-2017 30-Mar-17 0.105 2016-2017 1-Mar-17 0.105 2016-2017 30-Jan-17 0.11 2016-2017 1-Jan-17 0.11 2016-2017 5-Dec-16 0.11 2016-2017 1-Nov-16 0.11 2016-2017 27-Sep-16 0.11 2016-2017 30-Aug-16 0.11 2016-2017 24-Jul-16 0.11 2016-2017 21-Jun-16 0.11 2016-2017 29-May-16 0.11 2016-2017 5-May-16 0.11 2015-2016 28-Mar-16 0.11 2015-2016 29-Feb-16 0.11 2015-2016 2-Feb-16 0.11
2015-2016 28-Dec-15 0.11 2015-2016 2-Dec-15 0.11 2015-2016 4-Nov-15 0.11 2015-2016 29-Sep-15 0.11 2015-2016 1-Sep-15 0.11 2015-2016 30-Jul-15 0.11 2015-2016 1-Jul-15 0.11 2015-2016 21-May-15 0.11 2015-2016 5-May-15 0.11
quant Dynamic Bond
Period Record Date Dividend ` Per Unit 2017-2018 28-Jan-18 0.08 2017-2018 27-Dec-17 0.08 2017-2018 7-Dec-17 0.08 2017-2018 1-Nov-17 0.08 2017-2018 2-Oct-17 0.08 2017-2018 26-Sep-17 0.092 2017-2018 29-Aug-17 0.092 2017-2018 23-Jul-17 0.092 2017-2018 20-Jun-17 0.092 2017-2018 28-May-17 0.092 2017-2018 5-May-17 0.092 2016-2017 30-Mar-17 0.09 2016-2017 1-Mar-17 0.09 2016-2017 30-Jan-17 0.092 2016-2017 1-Jan-17 0.092 2016-2017 5-Dec-16 0.092 2016-2017 1-Nov-16 0.092 2016-2017 27-Sep-16 0.092 2016-2017 30-Aug-16 0.092 2016-2017 24-Jul-16 0.092 2016-2017 21-Jun-16 0.092 2016-2017 29-May-16 0.092 2016-2017 5-May-16 0.092 2015-2016 28-Mar-16 0.092 2015-2016 29-Feb-16 0.092 2015-2016 2-Feb-16 0.092 2015-2016 28-Dec-15 0.092 2015-2016 2-Dec-15 0.092 2015-2016 4-Nov-15 0.092 2015-2016 29-Sep-15 0.092 2015-2016 1-Sep-15 0.092 2015-2016 30-Jul-15 0.092 2015-2016 1-Jul-15 0.092 2015-2016 21-May-15 0.092 2015-2016 5-May-15 0.092
quant Multi Asset Fund Period Record Date Dividend ` Per Unit 2017-2018 26-Feb-18 1.50 2016-2017 1-Mar-17 1.50 2015-2016 2-Feb-16 1.00
Past performance may or may not be sustained in the future. There is no assurance or guarantee to Unit holders as to rate/quantum of dividend distribution or that the dividends will be paid regularly. All dividends are on face value of ` 10 per Unit. Please log on to www.quantmutual.com for record date-wise listing of dividends declared.
Go to Top As on 31stMarch 2020 21
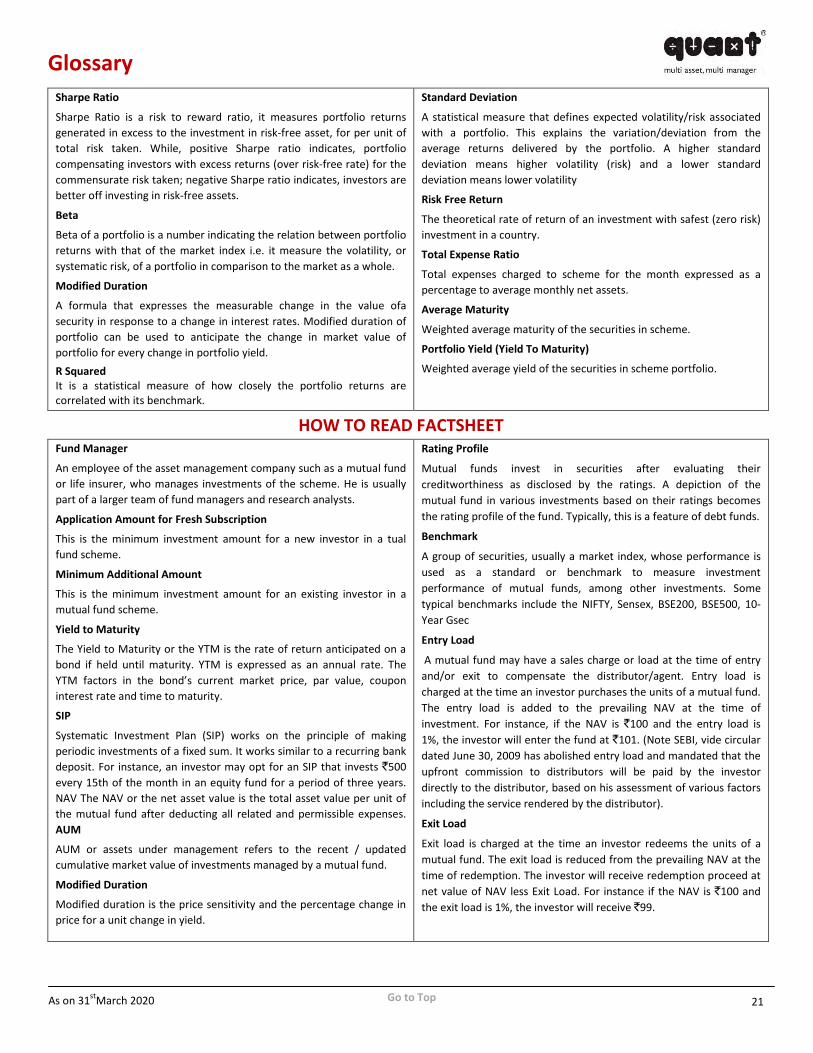
Glossary Sharpe Ratio
Sharpe Ratio is a risk to reward ratio, it measures portfolio returns generated in excess to the investment in risk-free asset, for per unit of total risk taken. While, positive Sharpe ratio indicates, portfolio compensating investors with excess returns (over risk-free rate) for the commensurate risk taken; negative Sharpe ratio indicates, investors are better off investing in risk-free assets.
Beta
Beta of a portfolio is a number indicating the relation between portfolio returns with that of the market index i.e. it measure the volatility, or systematic risk, of a portfolio in comparison to the market as a whole.
Modified Duration
A formula that expresses the measurable change in the value ofa security in response to a change in interest rates. Modified duration of portfolio can be used to anticipate the change in market value of portfolio for every change in portfolio yield. R Squared It is a statistical measure of how closely the portfolio returns are correlated with its benchmark.
Standard Deviation
A statistical measure that defines expected volatility/risk associated with a portfolio. This explains the variation/deviation from the average returns delivered by the portfolio. A higher standard deviation means higher volatility (risk) and a lower standard deviation means lower volatility
Risk Free Return
The theoretical rate of return of an investment with safest (zero risk) investment in a country.
Total Expense Ratio
Total expenses charged to scheme for the month expressed as a percentage to average monthly net assets.
Average Maturity
Weighted average maturity of the securities in scheme.
Portfolio Yield (Yield To Maturity)
Weighted average yield of the securities in scheme portfolio.
HOW TO READ FACTSHEET Fund Manager
An employee of the asset management company such as a mutual fund or life insurer, who manages investments of the scheme. He is usually part of a larger team of fund managers and research analysts.
Application Amount for Fresh Subscription
This is the minimum investment amount for a new investor in a tual fund scheme.
Minimum Additional Amount
This is the minimum investment amount for an existing investor in a mutual fund scheme.
Yield to Maturity
The Yield to Maturity or the YTM is the rate of return anticipated on a bond if held until maturity. YTM is expressed as an annual rate. The YTM factors in the bond’s current market price, par value, coupon interest rate and time to maturity.
SIP
Systematic Investment Plan (SIP) works on the principle of making periodic investments of a fixed sum. It works similar to a recurring bank deposit. For instance, an investor may opt for an SIP that invests `500 every 15th of the month in an equity fund for a period of three years. NAV The NAV or the net asset value is the total asset value per unit of the mutual fund after deducting all related and permissible expenses. AUM
AUM or assets under management refers to the recent / updated cumulative market value of investments managed by a mutual fund.
Modified Duration
Modified duration is the price sensitivity and the percentage change in price for a unit change in yield.
Rating Profile
Mutual funds invest in securities after evaluating their creditworthiness as disclosed by the ratings. A depiction of the mutual fund in various investments based on their ratings becomes the rating profile of the fund. Typically, this is a feature of debt funds.
Benchmark
A group of securities, usually a market index, whose performance is used as a standard or benchmark to measure investment performance of mutual funds, among other investments. Some typical benchmarks include the NIFTY, Sensex, BSE200, BSE500, 10-Year Gsec
Entry Load
A mutual fund may have a sales charge or load at the time of entry and/or exit to compensate the distributor/agent. Entry load is charged at the time an investor purchases the units of a mutual fund. The entry load is added to the prevailing NAV at the time of investment. For instance, if the NAV is `100 and the entry load is 1%, the investor will enter the fund at `101. (Note SEBI, vide circular dated June 30, 2009 has abolished entry load and mandated that the upfront commission to distributors will be paid by the investor directly to the distributor, based on his assessment of various factors including the service rendered by the distributor).
Exit Load
Exit load is charged at the time an investor redeems the units of a mutual fund. The exit load is reduced from the prevailing NAV at the time of redemption. The investor will receive redemption proceed at net value of NAV less Exit Load. For instance if the NAV is `100 and the exit load is 1%, the investor will receive `99.

Go to Top As on 31stMarch 2020 22
Asset Management Company (AMC) Location
MUMBAI (Registered Office) quant Money Managers
6th Floor, Sea Breeze Building,
AppasahebMaratheMarg, Prabhadevi, Mumbai - 400 025.
Tel.: 022-6295 5000
AHMEDABAD quant Money Managers
537, IsconEmprio, Next to Star Bazar,
Jodhpur Cross Road, Satellite, Ahmedabad-380015.
Tel.: +9179489 13875
BANGALORE quant Money Managers
Residential Representative
Tel.: +91 98860 25553
NEW DELHI quant Money Managers
Regus Grandeur, Mezzanine Floor, Shivaji Stadium Metro Station,
Baba Kharak Singh Marg, New Delhi-110001
Tel.: 011-61273122

Go to Top As on 31stMarch 2020 23
Point of Service (POS Location) KARVY COMPUTERSHARE PRIVATE LIMITED
Agartala: BidurkartaChowmuhani, J N Bari Road, Tripura (West), Agartala - 799001. Agra: 1st Floor, Deepak Wasan Plaza, Behind Holiday Inn, OppMegdootFurnitures,Sanjay Place, Agra - 282002. Ahmedabad: 201/202 Shail, Opp: Madhusudan House, Navrangpura, Ahmedabad - 380006. Ajmer: S. No. 1 & 2, 2Nd Floor, Ajmer Tower, Kutchery Road, Ajmer - 305001. Akola: Yamuna Tarang Complex, Shop No 30, Ground Floor, N. H. No- 06, Akola, Akola - 444004. Aligarh: 1St Floor, Kumar Plaza, Aligarh - 202001. Allahabad: RSATowers, 2nd Floor, Above Sony Tv Showroom, 57, S P Marg, Civil Lines, Allahabad - 211001. Alleppy: X1V 172, JP Towers, Mullackal, KSRTC Bus Stand, Alleppy - 688011. Alwar: 101, Saurabh Tower, Opp. Uit, Near Bhagat Singh Circle, Road No. 2, Alwar - 301001. Ambala: 6349, Nicholson Road,Adjacent Kos Hospitalambala Cant, Ambala - 133001. Amravati: Shop No 13 & 27, Gulshan Plaza, Badnera Road, Near BhartiyaMahavidhyalaya, Rajapeth, Amravati - 444605. Amritsar: 72-A, Taylor’S Road, Opp Aga Heritage Club, Amritsar - 143001. Anand: B-42 Vaibhav Commercial Center, Nr Tvs Down Town Show Room, Grid Char Rasta, Anand - 380001. Ananthapur: #15/149,1st Floor, S R Towers, Subash Road, Opp. To Lalitha Kala Parishad, Anantapur - 515001.Ankleshwar: L/2 Keval Shopping Center, Old National Highway, Ankleshwar - 393002. Asansol: 114/71 G T Road, Near Sony Centre, BhangaPachil, Asansol - 713303. Aurangabad: RamkunjNiwas, Railway Station Road, Near Osmanpura Circle, Aurangabad - 431005. Azamgarh: 1st Floor, Alkal Building, Opp. Nagaripalika Civil Line, Azamgarh - 276001. Balasore: Gopalgaon, M.S Das Street, Gopalgaon, Balasore, Orissa, Balasore - 756001. Bangalore: 59, SkandaPuttanna Road, Basavanagudi, Bangalore - 560004. Bankura: Ambika Market Complex (Ground Floor), Nutanganj, Post &DistBankura, Bankura - 722101. Bareilly: 1st Floor,165, Civil Linesopp. Hotel Bareilly Palace, Near Railway Station, Bareilly - 243001.Barhampore (Wb): Thakur Market Complex, Gorabazar, Post Berhampore, Dist-Murshidabad, 72 No Nayasarak Road, Barhampore (Wb) - 742101. Baroda: Sb-5, Mangaldeep Complex, Opp. Masonic Hall, Productivity Road, Alkapuri, Baroda - 390007. Begusarai: Near Hotel Diamond Surbhi Complex, O.C Township Gate, KapasiyaChowk, Begusarai - 851117. Belgaum: CTSNo 3939/ A2 A1, Above Raymonds Show Room|Beside Harsha Appliances, Club Road, Belgaum - 590001. Bellary: No. 1, Khb Colony, Gandhi Nagar, Bellary - 583103. Berhampur (Or): 3rd Lane Dharam Nagar, Opp – DivyaNandanKalyanMandap, Near Lohiya Motor, Orissa, Berhampur (Or) - 760001. Betul: 107,1st Floor, Hotel Utkarsh, | J. H. College Road, Betul - 460001. Bhagalpur: 2Nd Floor, Chandralok Complex, Ghantaghar, Radha Rani Sinha Road, Bhagalpur - 812001. Bharuch: Shop No 147-148, Aditya Complex, Near Kasak Circle, Bharuch - 392001. Bhatinda: #2047-A 2Nd Floor, The Mall Road, Above Max New York Life Insurance, New Delhi - 151001. Bhavnagar: G-11 Giranjali Complex, Beside Bhavnagar Municipal Corporation & Collector Office, Kalanala, Bhavnagar - 364001. Bhilai: Shop No -1, First Floor, Plot No -1, Commercial Complex, Nehru Nagar - East, Bhilai - 490020. Bhilwara: Shop No. 27-28, 1st Floor, HeeraPanna Market, Pur Road, Bhilwara - 311001. Bhopal: Kay Kay Business Centre, 133, Zone I, Mp Nagar, Above City Bank, Bhopal - 462011. Bhubaneswar: A/181, Back Side OfShivam Honda Show Room, Saheed Nagar, Bhubaneswar - 751007. Bikaner: 70-71, 2Nd Floor | Dr.Chahar Building, Panchsati Circle, SadulGanj, Bikaner - 334001. Bilaspur: Shop No-201 & 202, 1st Floor, V R Plaza, Link Road, Bilaspur, C. G. Bilaspur - 495001. Bokaro: B-1, 1st Floor, City Centre, Sector - 4, Near SonaChandiJwellars, Bokaro - 827004. Burdwan: 63 Gt Road, Halder Complex 1st Floor, Burdwan - 713101. Calicut: Iind Floor Soubhagya Shopping Complex, Arayidathpalam, Mavoor Road, Calicut - 673004. Chandigarh: Sco-371-372S, Above Hdfc Bank, Sector 35-B, Chandigarh - 160036. Chandrapur: Shop No-6, Office No-2 1st Floor, RautsRaghuvanshi Complex, Beside Azad Garden Main Road, Chandrapur - 442402. Chennai: F-11, Akshaya Plaza, 1st Floor, 108, AdhithanarSalai, Egmore, Opp To Chief Metropolitan Court, Chennai - 600002. Chinsura: J C Ghosh Saranu, BhangaGara, Chinsurah, Hooghly, Chinsurah - 712101. Cochin: Ali Arcade, 1st Floor, Kizhavana Road, Panampilly Nagar, Near Atlantis Junction, Ernakualm - 682036. Coimbatore: 1057/1058 Jaya Enclave, 2nd Floor, Avinashi Road, Coimbatore - 641018. Cuttack: Po - Buxi Bazar, Cuttack, OppDargha Bazar, Dargha Bazar, Cuttack - 753001. Darbhanga: Jaya Complex, 2Nd Floor, Above Furniture Planet, Donar, Chowk, Darbhanga - 846003. Davangere: 376/2, 4th Main, 8th Cross, P J Extn, Davangere - 577002. Dehradun: Kaulagarh Road, Near SirmaurMargabove, Reliance Webworld, Dehradun - 248001. Deoria: 1st Floor, 1st Floor, Opp. ZilaPanchayat, Civil Lines, Deoria - 274001. Dewas: 27 Rmo House, Station Road, Above MaaChamundaGaes Agency, Dewas - 455001.Dhanbad: 208 New Market 2Nd Floor, Bank More, Dhanbad - 826001.Dharwad: G, 7&8 Banashankari Avenue, OppNttf,, P B Road, Dharwad - 580001. Dhule: Ashoka Estate, Shop No. 14/A, Upper Ground Floor, Sakri Road, Opp. Santoshi Mata Mandir, Dhule - 424001. Dindigul: No : 9 Old No: 4/B, New Agraharam, Palani Road, Dindigul - 624001. Durgapur: 1st Floor, Old Dutta Automobile Bldg, Nachan Road, Benachity, Durgapur - 713213. Eluru: D.No: 23B-5-93/1, Savithri Complex, Edaravari Street, Near Dr.PrabhavathiHospital,R. R. Pet, Eluru - 534002. Erode: No: 4, Veerappan Traders Complex, KMY Salai, Sathy Road, Opp. Erode Bus Stand, Erode - 638003. Faridabad: A-2B, Ist Floor, Nehru Groundnit, Faridabad - 121001. Ferozpur: The Mall Road, ChawlaBulding, Ist Floor, Opp. Centrail Jail, Near Hanuman Mandir, Ferozepur - 152002. Gandhidham: 203 2Nd Floor, Bhagwati Chamber, Kutchkala Road, Gandhidham - 370201. Gandhinagar: Plot No - 945/2, Sector - 7/C, OppPathika, Gandhinagar - 382007. Gaya: 1st Floor LalBhawan, Tower Chowk, Near Kiran Cinema, Gaya - 823001. Ghaziabad: 1st Floorc-7, Lohia Nagar, Ghaziabad - 201001. Ghazipur: 2Nd Floor, Shubhra Hotel Complex, Mahaubagh, Ghazipur - 233001. Gonda: Shri Market, Sahabgunj, Station Road, Gonda - 271001. Gorakhpur: Above V. I. P. Houseajdacent, A.D. Girls College, Bank Road, Gorakpur - 273001. Gulbarga: Cts No 2913 1st Floor, Asian Towers, Jagath Station Main Road, Next To Adithya Hotel, Gulbarga - 585105. Guntur: D No 6-10-27, Srinilayam, Arundelpet, 10/1, Guntur - 522002. Gurgaon: Shop No.18, Ground Floor, Sector - 14, Opp. Akd Tower, Near Huda Office, Gurgaon - 122001. Guwahati: 54 SagarikaBhawan 2Nd Floor, R G Barooah Road, Aidc, Near Baskin Robbins, Guwahati - 781024. Gwalior: 37/38, Lashkar, MlbRoadshinde Ki Chhawani, Near Nadi Gate Pul, Gwalior - 474001. Haldwani: Above Kapilaz, Sweet House, OppLic Building, Pilikothi, Haldwani - 263139. Haridwar: 8, GovindPuri, Opp. LIC - 2, Above Vijay Bank, Main Road, Ranipur More, Haridwar - 249401. Hassan: St Anthony’S Complex, Ground Floor, H.N. Pura Road, Hassan - 573201. Hissar: Sco-71, 1st Floor, Red Square Market, Hissar - 125001. Hoshiarpur: 1st Floor, The Mall Tower, OppKapila Hospital, Sutheri Road, Hoshiarpur - 146001. Hubli: 22Nd & 23Rd, 3Rd Floor, Eureka Junction, Travellers Bunglow, Hubli - 580029. Hyderabad: 8-2-596, Avenue 4, Karvy Plaza, Street No 1, Banjara Hills, Hyderabad - 500034. Indore: 213 B City Center, M.G. Road, Opp. High Court, Indore - 452001. Jabalpur: Grover Chamber, 43 Naya Bazar MalviyaChowk, OppShyam Market, Jabalpur - 482002. Jaipur: S16/A Iiird Floor, Land Mark Building Opp Jai Club, MahaverMarg C Scheme, Jaipur - 302001. Jalandhar: Arora Prime Tower, Lowe Ground Floor, Office No 3 Plot No 28, Jalandhar - 144001. Jalgaon: 113, NaviPeth, B/H Mahalaxmi Dairy, Jalgaon - 425001. Jalpaiguri: D B C Road OppNirala Hotel, OppNirala Hotel, Jalpaiguri - 735101. Jammu: 5 A/D Extension 2, Near Panama Chowk Petrol Pump, Panama Chowk, Jammu - 180012. Jamnagar: 108 MadhavPalaza, OppSbi Bank, Nr LalBunglow, Jamnagar - 361001. Jamshedpur: Kanchan Tower, 3Rd Floor, Main Road, Bistupur, Near Traffic Signal, Jamshedpur - 831001. Jaunpur: R N Complex, 1-1-9-G, In Front Of Pathak Honda, Ummarpur, Jaunpur - 222002. Jhansi: 371/01, Narayan Plaza,Gwalior Road, Near Jeevan Shah Chauraha, Jhansi - 284001. Jodhpur: 203, Modi Arcade, ChopasniRoad , Jodhpur - 342001. Junagadh: 124-125 Punit Shopping Center, M.G Road, RanavavChowk, Junagadh - 362001. Kannur: 2 Nd Floor, Prabhath Complex, Fort Road, Nr. Icici Bank, Kannur - 670001. Kanpur: 15/46, B, Ground Floor, Opp: Muir Mills, Civil Lines, Kanpur - 208001. Karaikudi: Gopi Arcade, 100 Feet Road, Karaikudi - 630001. Karimnagar: H.No.4-2-130/131, Above Union Bank, Jafri Road, Rajeev Chowk, Karimnagar - 505001. Karnal: 18/369, Char Chaman, Kunjpura Road, Behind Miglani Hospital, Karnal - 132001. Karur: No.6, old No.1304, Thiru-vi-ka Road, Near G.R. KalyanMahal, Karur - 639001. Kharagpur: 180 Malancha Road, Beside Axis Bank ,Kharagpur - 721304. Kolhapur: 605/1/4 E Ward, Shahupuri 2Nd Lane, LaxmiNiwas, Near Sultane Chambers, Kolhapur - 416001. Kolkata: 166 A Rashbihari Avenue 2Nd Floor, Opp - Fortish Hospital, Kolkata - 700029. Kollam: SreeVigneswaraBhavan, Shastri Junction, Kollam - 691001. Korba: 1st Floor, 35, Indira Complex, P. Nagar, Korba - 495677. Kota: 29, Ist Floor, Near LalaLajpatRai Circle, Shopping Centre, Kota - 324007. Kottayam: 1st Floor Csiascension Square, Railway Station Road, Collectorate P O, Kottayam - 686002. Kurnool: Shop No.43, 1st Floor, S V Complex, Railway Station Road, Near Sbi Main Branch, Kurnool - 518004. Lucknow: 24, Prem Nagar, Ashok Marg, Lucknow - 226001. Ludhiana: Sco - 136, 1st Floor AboveAirtel Showroom, Feroze Gandhi Market, Ludhiana - 141001. Madurai: Rakesh towers, 30-C, Ist floor, Bye pass Road, OppNagappa motors, Madurai - 625010. Malappuram: First Floor, Cholakkal Building, Near U P School, Up Hil, Malappuram - 676505. Malda: SahisTuli, Under Ward No.6, No.1 Govt Colony, English Bazar Municipality, Malda - 732101. Mandi: 149/11, School Bazaar, Mandi - 175001. Mangalore: Mahendra Arcade Opp Court Road, KarangalPadi, Mangalore - 575003. Margoa: 2Nd Floor, Dalal Commercial Complex, Pajifond, Margao - 403601. Mathura: Ambey Crown, Iind Floor, In Front Of Bsa College, Gaushala Road, Mathura - 281001. Meerut: 1st Floor, MediCentreoppIcici Bank, Hapur Road NearBachha Park, Meerut - 250002. Mehsana: Ul/47 Apollo Enclave, OppSimandhar Temple, Modhera Cross Road, Mehsana - 384002. Mirzapur: GirjaSadan, DawariGunj, Mirzapur - 231001. Moga: 1stFloor,Dutt Road, MandirWaliGali, Civil Lines, Barat Ghar, Moga - 142001. Moradabad: Om Arcade, Parker Road, Above Syndicate Bank,ChowkTariKhana, Moradabad - 244001. Morena: Moti Palace, Near RamjankiMandir, Near RamjankiMandir, Morena - 476001. Mumbai: 24/B, Raja Bahadur Compound, Ambalal Doshi Marg, Behind BseBldg, Fort - 400001. Muzaffarpur: I St Floor, Uma Market, Thana GumtimotiJheel, Muzaffarpur - 842001. Mysore: L-350,Silver Tower, Ashoka Road, Opp.Clock Tower, Mysore - 570001. Nadiad: 104/105, Near Paras Cinema, City Point Nadiad, Nadiad - 387001. Nagerkoil: 3A, South Car Street, Nagercoil - 629001. Nagpur: Plot No 2/1 House No 102/1, Mata Mandir Road, MangaldeepAppartmentOppKhandelwal Jewelers, Dharampeth, Nagpur - 440010. Namakkal: 105/2, Arun Towers, Paramathi Street, Namakkal - 637001. Nanded: Shop No.4, Santakripa Market, G G Road, Opp. Bank Of India, Nanded - 431601. Nasik: S-12,SuyojitSankul, Sharanpur Road, Near Rajiv Gandhi Bhavan, Nasik - 422002. Navsari: 1/1 ChinmayAracade, OppSattapir Rd, Tower Rd, Mavsari - 396445. Nellore: 16-2-230, Room No : 27, 2Nd Floor, Keizen Heights, Gandhi Nagar, Pogathota, Nellore - 524001. New Delhi: 305 New Delhi House, 27 Barakhamba Road, New Delhi - 110001. Nizamabad: H No:5-6-430, A Bove Bank Of Baroda First Floor, Beside Hdfc Bank, Hyderabad Road, Nizamabad - 503003. Noida: 307 JaipuriaPlazad 68 A, 2Nd Floor, Opp Delhi Public School, Sector 26, Noida - 201301. Palghat: No: 20 & 21, Metro Complex H.P.O.Road Palakkad, H.P.O.Road, Palakkad - 678001. Panipat: 1st Floor,, Krishna Tower, Above Amertex, G.T. Road, Panipat - 132103. Panjim: City Business Centre, Coelho Pereira Building, Room No 18,19& 20, Dada Vaidya Road, Panjim - 403001. Pathankot: 1st Floor, 9 A, Improvement Trust Building, Patel Chowk, Pathankot - 145001. Patiala: Sco 27 D, ChottiBaradari, Near Car Bazaar, Patiala - 147001. Patna: 3A, 3Rd Floor Anand Tower, Exhibition Road, OppIcici Bank, Patna - 800001. Pollachi: S S Complex, New Scheme Road, Pollachi - 642002. Pondicherry: No:7, Thiayagaraja Street, Pondicherry - 605001. Proddatur: Shop No:4, Araveti Complex, Mydukur Road, Beside Syndicate Bank, Proddatur - 516360. Pudukottai: SundaramMasilamani Towers, Ts No. 5476 - 5479, Pm Road, Old TirumayamSalai, Near Anna Statue, Jublie Arts, Pudukottai - 622001. Pune: Office # 16, Ground Floor, Shrinath Plaza, Near DyaneshwarPadukaChowk, F C Road, Pune - 411005. Raipur: 2 & 3 Lower Level, Millenium Plaza, Room No. Ll 2& 3, Behind Indian Coffee House, Raipur - 492001.Rajahmundry: D.No.6-1-4, Rangachary Street, T. Nagar, Near Axis Bank Street, Rajahmundry - 533101. Rajapalayam: Sri Ganapathy Complex, 14B/5/18, T P Mills Road, Rajapalayam - 626117. Rajkot: 104, Siddhi Vinyak Com. OppRamkrishna Ashram, DrYagnik Road, Rajkot - 360001. Ranchi: Room No 307 3Rd Floor, Commerce Tower, Beside Mahabir Tower, Ranchi - 834001. Ratlam: 1 NagpalBhawan, Free GanjRoad , Do Batti, Near Nokia Care,

Go to Top As on 31stMarch 2020 24
Ratlam - 457001.Renukoot: Shop No.18, Near Complex Birla Market, Renukoot - 231217. Rewa: Ist Floor, Angoori Building, Besides Allahabad Bank, Trans University Road, Civil Lines, Rewa - 485001. Rohtak: 1st Floor, Ashoka Plaza, Delhi Road, Rohtak - 124001. Roorkee: Shree Ashadeep Complex, 16, Civil Lines, Near Income Tax Office, Roorkee - 247667. Rourkela: 1st Floor Sandhu Complex, Kachery Road, Uditnagar, Rourekla - 769012. Sagar: Above Poshak Garments, 5 Civil Lines, Infront Of Income Tax Office, Sagar - 470002. Saharanpur: 18 Mission Market, Court Road, Saharanpur - 247001. Salem: No:40, 2nd Floor, Brindavan Road, Fairlands, Near PerumalKoil, Salem - 636016. Sambalpur: Ground Floor Quality Massion, Sambalpur - 768001. Satna: 1st Floor, Gopal Complex, Near Bus Stand, Rewa Road, Satna - 485001. Shaktinagar: 1St/A-375, V V Colony, DistSonebhadra, Shaktinagar - 231222. Shillong: Annex Mani Bhawan, Lower Thana Road, Near R K M Lp School, Shillong - 793001. Shimla: Triveni Building, By Pas Chowkkhallini, Shimla - 171002. Shimoga: Udaya Ravi Complex, LLR Road, DurgiGudi, Shimoga - 577201. Shivpuri: 1st Floor, M.P.R.P. Building, Near Bank Of India, Shivpuri - 473551. Sikar: First Floor, Super Tower, Behind Ram MandirNearTaparyaBagichi, Sikar - 332001. Silchar: N.N. Dutta Road, Chowchakra Complex, Premtala, Silchar - 788001. Siliguri: Nanak Complex, Sevoke Road, Siliguri - 734001. Sitapur: 12/12-A Sura Complex, Arya Nagar Opp, Mal Godam, Sitapur - 261001. Sivakasi: 363, Thiruthangal Road, Opp: TNEB, Sivakasi - 626123. Solan: SahniBhawan, Adjacent Anand Cinema Complex, The Mall, Solan - 173212. Solapur: Block No 06, Vaman Nagar, Opp D-Mart, JuleSolapur - 413004. Sonepat: 205 R Model Town, Above Central Bank Of India, Sonepat - 131001. Sri Ganganagar: 35E Block, Opp: Sheetla Mata Vaateka Sri Ganganagar, Sri Ganganagar - 335001. Srikakulam: D.No-4-1-28/1, Venkateswara Colony, Near Income Tax Office, Srikakulam - 532001. Sultanpur: Rama Shankar Complex, Civil Lines, Faizabad Road, Sultanpur - 228001.Surat: G-5 Empire State Buliding, Nr UdhnaDarwaja, Ring Road, Surat - 395002. Thanjavur: No. 70, Nalliah Complex, SrinivasamPillai Road, Tanjore - 613001. Thodupuzha: First Floor, Pulimoottil Pioneer, Pala Road, Thodupuzha - 685584. Tirunelveli: 55/18, Jeney Building, S N Road, Near Aravind Eye Hospital, Tirunelveli - 627001. Tirupathi: Flot No: 16, 1st Floor, R C Road, Near Palani Theater, Tirupathi - 517501. Tirupur: First floor, 224 A, Kamaraj Road, Opp to Cotton market complex, Tirupur - 641604. Tiruvalla: 2Nd Floor, Erinjery Complex, Ramanchira, Opp Axis Bank, Thiruvalla - 689107. Trichur: 2Nd Floor, Brothers Complex, Naikkanal Junction, Shornur Road, Near Dhanalakshmi Bank H O, Thrissur - 680001. Trichy: 60, Sri Krishna Arcade, Thennur High Road, Trichy - 620017. Trivandrum: 2Nd Floor, Akshaya Tower, Sasthamangalam, Trivandrum - 695010. Tuticorin: 4 - B, A34 - A37, Mangalmal Mani Nagar, Opp. Rajaji Park, Palayamkottai Road, Tuticorin - 628003. Udaipur: 201-202, Madhav Chambers, Opp G P O, Chetak Circle, Udaipur - 313001. Ujjain: 101 Aashta Tower, 13/1 DhanwantriMarg, Freeganj, Ujjain - 456010. Valsad: Shop No 2, Phiroza Corner, Opp Next Show Room, Tithal Road, Valsad - 396001. Vapi: Shop No-12, Ground Floor, SheetalAppatment, Near K P Tower, Vapi - 396195. Varanasi: D-64/132, 1st Floor, Anant Complex, Sigra, Varanashi - 221010. Vellore: 1, M N R Arcade, Officers Line, Krishna Nagar, Vellore - 632001. Vijayanagaram: Soubhagya, 19-6-1/3, 2Nd Floor, Near Fort Branch, Opp: Three Temples, Vizianagaram - 535002. Vijayawada: 39-10-7, Opp : Municipal Water Tank, Labbipet, Vijayawada - 520010. Visakhapatnam: Door No 47-14-5/1, Eswar Paradise, Dwarakanagar Main Road, Visakhapatnam - 530016. Warangal: 5-6-95, 1 st Floor, Opp: B.Ed Collage, Lashkar Bazar, Chandra Complex, Hanmakonda, Warangal - 506001. Yamuna Nagar: Jagdhari Road, Above Uco Bank, Near D.A.V. Girls College, Yamuna Nagar - 135001.

Go to Top As on 31stMarch 2020 25
Go to Top
quant mutual fund registered office: 6th floor, sea breeze building, appasaheb marathe marg, prabhadevi, mumbai - 400 025. tel: +91 22 6295 5000 | cell/whatsapp: +91 9920 21 22 23 | [email protected] | [email protected]
www.quantmutual.com
![arXiv:1608.06335v2 [quant-ph] 28 Feb 2017](https://static.fdokumen.com/doc/165x107/6339e24a98e5ee8a52037b37/arxiv160806335v2-quant-ph-28-feb-2017.jpg)
![arXiv:2111.07859v2 [quant-ph] 18 Nov 2021](https://static.fdokumen.com/doc/165x107/631b538f7d4b3c24320cc42b/arxiv211107859v2-quant-ph-18-nov-2021.jpg)
![arXiv:1806.07276v2 [quant-ph] 24 Dec 2020](https://static.fdokumen.com/doc/165x107/633bb451cd5110484f0e1c96/arxiv180607276v2-quant-ph-24-dec-2020.jpg)
![arXiv:1908.11213v3 [quant-ph] 5 May 2020](https://static.fdokumen.com/doc/165x107/633b4929499936f8590235b5/arxiv190811213v3-quant-ph-5-may-2020.jpg)


![arXiv:2105.04867v2 [quant-ph] 17 May 2021](https://static.fdokumen.com/doc/165x107/631db64c85e2495e150f9506/arxiv210504867v2-quant-ph-17-may-2021.jpg)
![arXiv:2205.04730v1 [quant-ph] 10 May 2022](https://static.fdokumen.com/doc/165x107/63269bcbcedd78c2b50d2bff/arxiv220504730v1-quant-ph-10-may-2022.jpg)


![arXiv:2011.08839v2 [quant-ph] 29 May 2021](https://static.fdokumen.com/doc/165x107/630bbddfdda8f2dbde09c57e/arxiv201108839v2-quant-ph-29-may-2021.jpg)
![arXiv:2111.06534v2 [quant-ph] 3 Mar 2022](https://static.fdokumen.com/doc/165x107/6328b20421c8de9666003cfd/arxiv211106534v2-quant-ph-3-mar-2022.jpg)

![arXiv:2203.06711v1 [quant-ph] 13 Mar 2022](https://static.fdokumen.com/doc/165x107/633ce4f0e2cdc4832c08b42e/arxiv220306711v1-quant-ph-13-mar-2022.jpg)


