Trade and Investment Factsheet - GOV.UK
15
China This factsheet provides the latest statistics on trade and investment between the UK and China. Date of release: 3 February 2022; Date of next planned release: 10 February 2022 Total trade in goods and services (exports plus imports) between the UK and China was £94.5 billion in the four quarters to the end of Q3 2021, an increase of 13.5% or £11.2 billion from the four quarters to the end of Q3 2020. Of this £94.5 billion: • Total UK exports to China amounted to £26.1 billion in the four quarters to the end of Q3 2021 (a decrease of 18.6% or £6.0 billion compared to the four quarters to the end of Q3 2020); • Total UK imports from China amounted to £68.5 billion in the four quarters to the end of Q3 2021 (an increase of 33.5% or £17.2 billion compared to the four quarters to the end of Q3 2020). China was the UK’s 3 rd largest trading partner in the four quarters to the end of Q3 2021 accounting for 7.5% of total UK trade. 1 In 2019, the outward stock of foreign direct investment (FDI) from the UK in China was £10.7 billion accounting for 0.7% of the total UK outward FDI stock. In 2019, the inward stock of foreign direct investment (FDI) in the UK from China was £3.2 billion accounting for 0.2% of the total UK inward FDI stock. 2 1 Trade data sourced from the latest ONS publication of UK total trade: all countries seasonally adjusted data. 2 Investment data sourced from ONS publication on Foreign Direct Investment Involving UK Companies.
-
Upload
khangminh22 -
Category
Documents
-
view
0 -
download
0
Transcript of Trade and Investment Factsheet - GOV.UK

China
This factsheet provides the latest statistics on trade and investment between the UK and China.
Date of release: 3 February 2022; Date of next planned release: 10 February 2022
Total trade in goods and services (exports plus imports) between the UK and China was £94.5 billion in the four quarters to the end of Q3 2021, an increase of 13.5% or £11.2 billion from the four quarters to the end of Q3 2020. Of this £94.5 billion:
• Total UK exports to China amounted to £26.1 billion in the four quarters to the end of Q3 2021 (a decrease of 18.6% or £6.0 billion compared to the four quarters to the end of Q3 2020);
• Total UK imports from China amounted to £68.5 billion in the four quarters to the end of Q3 2021 (an increase of 33.5% or £17.2 billion compared to the four quarters to the end of Q3 2020).
China was the UK’s 3rd largest trading partner in the four quarters to the end of Q3 2021 accounting for 7.5% of total UK trade.1
In 2019, the outward stock of foreign direct investment (FDI) from the UK in China was £10.7 billion accounting for 0.7% of the total UK outward FDI stock.
In 2019, the inward stock of foreign direct investment (FDI) in the UK from China was £3.2 billion accounting for 0.2% of the total UK inward FDI stock.2
1 Trade data sourced from the latest ONS publication of UK total trade: all countries seasonally adjusted data. 2 Investment data sourced from ONS publication on Foreign Direct Investment Involving UK Companies.

About these statistics
This factsheet presents the latest statistics on trade and investment between the UK and China. It summarises a wide range of publicly available data, from data providers such as the Office for National Statistics (ONS) and HM Revenue and Customs (HMRC), as well as international data providers.
This factsheet is part of a wider range produced by the Department for International Trade which draws together many data sources into one single compendium document for each individual trade and investment partner. The full set of factsheets for different individual partners can be found on the Trade and Investment Factsheets website on GOV.UK.
Where data are available, these factsheets contain metrics on:
• Headline trade statistics between the UK and each trading partner for the latest four quarters.
• Trade statistics by commodity and service type.
• Trade between the UK and each trading partner, broken down by UK country and English region.
• UK’s market share as a total of all imports for each trading partner.
• Number of VAT-registered businesses trading goods.
• UK’s Foreign Direct Investment (FDI) with each investment partner.
• Summary trade and investment data as reported by each trade and investment partner, as well as economic data and projections.
Change to data source - Headline trade statistics: On 27 January 2022, ONS published a new dataset presenting UK trade by each partner market on a seasonally adjusted basis. All factsheets now present seasonally adjusted headline trade statistics from this new ONS ‘UK total trade: all countries, seasonally adjusted’ quarterly dataset.
Prior to the 3 February 2022 publication of the factsheets, the China trade and investment factsheet instead presented these data from the ONS ‘Balance of payments, UK’ publication. This was one of nine partners where seasonally adjusted data were available. The recommendation to present these seasonally adjusted data instead was approved by the Chief Statistician at the Department for International Trade.
The removal of this dataset also ensures consistency when comparing across all trading partners through using the same data source for all headline trade statistics. Note the removal of the UK Economic Accounts data should not affect trade figures reported as data remain consistent between these two seasonally adjusted data sources. However, as the UK Economic Accounts dataset is published a few weeks before the ONS total trade for all partners dataset is published, timelier quarterly trade data may be found within the most recent ONS UK Economic Accounts publication.
All statistics are correct at the time of publication, with upcoming release dates available on the Government update schedule for Official Statistics. The Department for International Trade strongly recommends users download the latest factsheet to ensure the most up-to-date statistics are used as some statistics are revised on a regular basis.
For the most up to date snapshot of the UK’s trade and investment position with all partners, please see the trade and investment core statistics book. These statistics are based on the same data sources as the trade and investment factsheets and therefore are comparable between the two publications. A list of all Official Statistics publications from the Department for International Trade can be found online.
Contact Details
Responsible statistician: Rebekah Paul
Author: Danielle Fothergill and Ben Hubbard
Media contact number: 020 7215 2000
Public contact e-mail address: [email protected]

Trade with China (ONS)3 4 5
Trade definitions
UK exports - Goods and services that were produced or sourced in the UK, which were sold to China.
UK imports - Goods and services that were sold to the UK, which were produced or sourced by China.
Total or ‘bilateral’ trade - The value of total trade between the UK and China (exports plus imports).
Trade balance - The difference between exports and imports, calculated by UK exports minus UK imports.
Trade surplus - This occurs when the value of UK exports to China is greater than the value of UK imports from China.
Trade deficit - This occurs when the value of UK exports to China is less than the value of UK imports from China.
Headline trade statistics include trade in non-monetary gold (reported within the unspecified goods category), which can significantly affect trends for some partners. Please see the factsheet quality and methodology report for more information. These statistics are given on a balance of payments (change of ownership) basis.
Note: The latest data include trade between October 2020 and September 2021. Trade was affected by the COVID-19 pandemic and the associated lockdown measures globally. There was also a change in data collection for Great Britain (England, Scotland and Wales) exports to the EU between 2020 and 2021. Consequently, data quality has been affected and may be subject to larger revisions than normal.
Total trade in goods and services (exports plus imports) between the UK and China was £94.5 billion in the four quarters to the end of Q3 2021, an increase of 13.5% or £11.2 billion from the four quarters to the end of Q3 2020.
In the four quarters to the end of Q3 2021, total UK exports to China amounted to £26.1 billion (a decrease of 18.6% or £6.0 billion compared to the four quarters to the end of Q3 2020).
Of all UK exports to China in the four quarters to the end of Q3 2021, £18.4 billion (70.6%) were goods and £7.7 billion (29.4%) were services. In the four quarters to the end of Q3 2021, UK exports of goods to China decreased by 21.4% or £5.0 billion compared to the four quarters to the end of Q3 2020 while UK exports of services to China decreased by 10.8% or £931 million compared to the four quarters to the end of Q3 2020.
In the four quarters to the end of Q3 2021, total UK imports from China were £68.5 billion (an increase of 33.5% or £17.2 billion compared to the four quarters to the end of Q3 2020).
Of all UK imports from China in the four quarters to the end of Q3 2021, £66.1 billion (96.5%) were goods and £2.4 billion (3.5%) were services. In the same period, UK imports of goods from China increased by 34.1% or £16.8 billion compared to the four quarters to the end of Q3 2020 while UK imports of services from China increased by 17.7% or £363 million compared to the four quarters to the end of Q3 2020.
This means the UK reported a total trade deficit of £42.4 billion with China, compared to a trade deficit of £19.3 billion in the four quarters to the end of Q3 2020. In the four quarters to the end of Q3 2021, the UK had a trade in goods deficit of £47.6 billion with China, compared to a trade in goods deficit of £25.8 billion in the four quarters to the end of Q3 2020. Meanwhile, in the four quarters to the end of Q3 2021 the UK reported a trade in services surplus of £5.3 billion with China, compared to a trade in services surplus of £6.5 billion in the four quarters to the end of Q3 2020.
3 Office of National Statistics (ONS) data source for total trade: UK total trade data (seasonally adjusted). Please note this data source has changed following the publication of the new ONS seasonally adjusted dataset on 27 January 2022. 4 This factsheet contains data as reported by the UK, users are advised to use UK-reported data where possible for consistency between partners. These data are subject to asymmetries e.g. the value of UK exports to China (reported by the UK) may not match the value of China imports from the UK (reported by China). 5 Data are in nominal terms, meaning no adjustment has been made to account for changes in inflation or exchange rate. The totals may not exactly match the sum of their parts due to rounding.
The charts below present a time series for trade between the UK and China for each year between 2011 and 2020:
The data that are presented in the charts above are given in the table below in £ billion:
Year 2011 2012 2013 2014 2015 2016 2017 2018 2019 2020
Value of total trade 46.8 47.1 49.7 55.2 58.0 62.4 70.4 73.2 86.8 82.9
Value of exports 14.8 15.6 16.9 19.4 18.4 19.5 25.2 27.1 36.3 26.0
Value of imports 32.0 31.5 32.8 35.9 39.6 42.9 45.2 46.1 50.5 56.9
Trade balance -17.2 -16.0 -15.9 -16.5 -21.1 -23.4 -19.9 -18.9 -14.2 -30.8
In the four quarters to the end of Q3 2021, China was the UK’s:6
• 3rd largest trading partner (accounting for 7.5% of total UK trade).
– 3rd largest goods trading partner (10.6% of UK goods trade).
– 10th largest services trading partner (2.2% of UK services trade).
• 6th largest export market (accounting for 4.3% of total UK exports).
– 6th largest goods export market (5.9% of UK goods exports).
– 7th largest services export market (2.6% of UK services exports).
• 2nd largest import market (accounting for 10.6% of total UK imports).
– Largest goods import market (13.7% of UK goods imports).
– 17th largest services import market (1.5% of UK services imports).
More timely data, for trade in goods only7, show that UK exports of goods to China decreased by 9.2% in the 12 months to November 2021 compared to the same period the previous year. UK imports of goods from China increased by 24.9% over the same period.
Note: As these data are presented for the 12 months ending November 2021, the UK and its trading partners have been affected by lockdown and other measures during the COVID-19 pandemic. Data quality has also been affected and may be subject to larger revisions than usual.
6 Rankings are based on the ONS dataset which contains data for all individual partners: UK total trade data (seasonally adjusted). 7 ONS data source for trade in the latest 12 months up to November 2021: UK Trade data (seasonally adjusted).

Trade in goods by commodity (ONS)8 9
Please note, these data are presented on a non-seasonally adjusted basis and are not directly comparable to seasonally adjusted data, including the headline trade statistics presented before.
The top 5 goods exported from the UK to China in the four quarters to the end of Q3 2021 were:
• 33O - Crude oil (£3.9 billion or 21.0% of all UK goods exported to China)
• 78M - Cars (£3.6 billion or 19.3%)
• 54 - Medicinal & pharmaceutical products (£1.5 billion or 7.9%)
• 68 - Non-ferrous metals (£1.3 billion or 6.9%)
• 87K - Scientific instruments (capital) (£676.2 million or 3.6%)
The top 5 goods imported to the UK from China in the four quarters to the end of Q3 2021 were:
• 76K - Telecoms & sound equipment (capital) (£7.3 billion or 11.3% of all UK goods imported from China)
• 75K - Office machinery (capital) (£7.3 billion or 11.2%)
• 89OC - Other manufactures (consumer) (£5.2 billion or 8.1%)
• 84 - Clothing (£4.6 billion or 7.2%)
• 59 - Other chemicals (£4.0 billion or 6.1%)
The chart below shows the top 5 products exported from the UK to China and the top 5 products imported to the UK from China, by value, in the four quarters to the end of Q3 2021. All data shown in the chart are provided in the text above.
8 Data on trade in goods by commodity are sourced from data by the ONS: UK trade release (non-seasonally adjusted). These statistics for exports and imports present the latest data from the November 2021 ONS publication which are given on a monthly basis. 9 The commodities are categorised based on SITC codes using a mixture of level 2 and level 3 codes.

Trade in services by service type (ONS)10 11 12
Please note, these data are presented on a non-seasonally adjusted basis and are not directly comparable to seasonally adjusted data, including the headline trade statistics presented before.
The top 5 service types exported from the UK to China in the four quarters to the end of Q3 2021 were:
• Travel (£2.4 billion or 31.2% of all UK services exported to China)
• Other Business Services (£1.4 billion or 18.7%)
• Transportation (£1.2 billion or 15.4%)
• Intellectual property (£926 million or 12.0%)
• Financial (£873 million or 11.3%)
The top 5 service types imported to the UK from China in the four quarters to the end of Q3 2021 were:
• Other Business Services (£1.2 billion or 52.1% of all UK services imported from China)
• Financial (£309 million or 13.0%)
• Insurance and Pension (£252 million or 10.6%)
• Transportation (£148 million or 6.2%)
• Telecommunications, computer and information services (£133 million or 5.6%)
The chart below shows the top 5 service types exported from the UK to China and the top 5 service types imported to the UK from China, by value, in the four quarters to the end of Q3 2021. All data shown in the chart are provided in the text above.
10 Trade in services by service type is sourced from data by the ONS: UK trade in services by partner country (non-seasonally adjusted). 11 Data are classified on the EBOPS 2010 basis. ‘Other business services’ include: Research and development, professional and management consulting services, technical services and trade related services. A full description of all service types can be found on the UN Statistics Division website. 12 Service type data may be unavailable for some quarters, due to the suppression of figures for the confidentiality of individual traders.

Trade in goods by UK countries and English regions (HMRC)13 14
Regional trade definitions
UK regions - The UK is categorised into 12 regions based on the International Territorial level 1 (ITL1). This level includes 9 regions in England, as well as Wales, Scotland and Northern Ireland.
Regional trade data - The data are compiled by merging HM Revenues & Customs (HMRC) trade data with employment data from the Interdepartmental Business Register (IDBR) so a business’ trade can be allocated to a UK region based on the proportion of its employees employed in that region. Where a trader is not matched with the IDBR, its trade is matched with ONS postcode data to obtain the UK region in which the Head Office of the VAT-registered business is based.
The maps below show the value of UK goods exports and imports between each UK region and China in 2020. The maps are shaded with the 3 UK regions with the highest amount of trade as the darkest colour, and the 3 UK regions with the lowest amount of trade as the lightest colour.
The data that are presented in the maps above for 2020 in £ billion are also given in the table below:
UK country or English region
North East
North West
Yorkshire and the Humber
East Midlands
West Midlands East London South
East South West Wales Scotland Northern
Ireland
Value of goods exports to China 0.5 1.7 0.5 0.6 2.2 2.1 1.1 1.6 0.6 0.5 1.8 0.1
Percentage of total goods exports to
China 3.5% 11.9% 3.8% 4.0% 15.6% 14.7% 7.7% 11.3% 4.2% 3.4% 13.1% 1.0%
Value of goods imports from China 1.0 4.6 3.2 3.5 3.9 3.1 5.1 6.7 2.4 1.2 3.0 0.7
Percentage of total goods imports from
China 1.9% 8.7% 6.0% 6.6% 7.4% 5.8% 9.5% 12.5% 4.4% 2.2% 5.7% 1.3%
Note that these figures from HMRC are reported on a physical movement basis and are not directly comparable to trade data from ONS which are reported on a change of ownership basis. Percentages will not total 100% as data not allocated to a single UK country or English region are not presented.
13 HMRC data source for regional UK trade data: HMRC Regional Trade Statistics (data extracted from the spreadsheet download using the HMRC interactive tables). 14 Totals presented here will differ from overall HMRC trade figures due to the exclusion of trade in non-monetary gold and non-response estimates and the exclusion of data not allocated to a UK country or region. Figures for 2020 are provisional and subject to change.
UK Market Share (ONS and UNCTAD)15 16
Market Share definitions
UK market share – Imports from the UK as a percentage of all the goods and services imported by China. Market share is provided for total imports from the UK, as well as for goods and services separately.
Market share methodology – These UK market share statistics are derived by the Department for International Trade, using publicly available data from the Office of National Statistics (ONS) and the United Nations Conference on Trade and Development (UNCTAD). These new statistics allows users to estimate the importance of UK trade on imports to each trading partner. Market share is calculated as the value of imports from the UK using data from ONS, divided by the value of total imports using data from UNCTAD. Data from UNCTAD are converted from US dollars into pounds sterling by using the annual average spot exchange rate17.
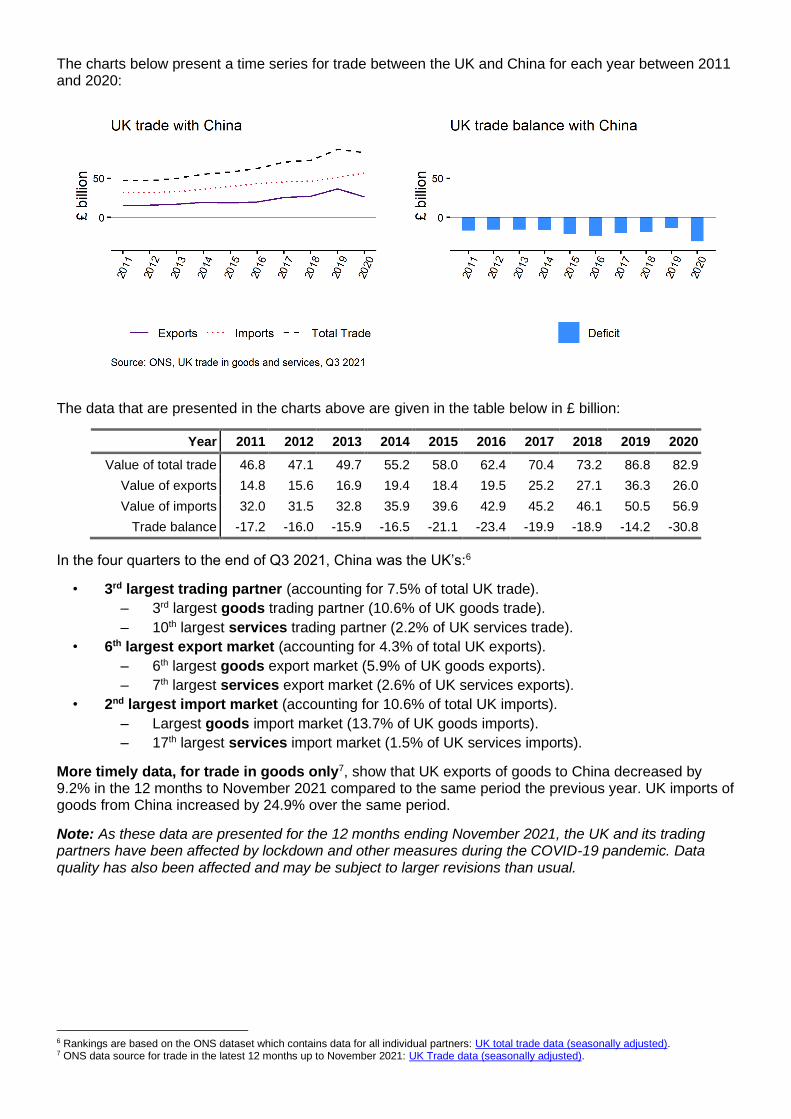
The UK’s market share for China in 2020 was as follows:
• The total UK market share in China was 1.4% in 2020 for goods and services. This is a decrease of 0.4 percentage points from 2019.
• The UK market share in China was 1.2% in 2020 for goods only. This is a decrease of 0.6 percentage points from 2019.
• The UK market share in China was 2.7% in 2020 for services only. This is an increase of 0.5 percentage points from 2019.
Number of VAT-registered businesses trading goods (HMRC)18 19 20 21
VAT-registered businesses definition
VAT-registered businesses - Any company with a VAT taxable turnover of more than £85,000 must be registered for VAT with HM Revenue & Customs (HMRC). These estimates do not cover unregistered businesses (those businesses who are not registered for VAT and do not have an Economic Operator Registration and Identification (EORI) number), or those businesses that trade in services.
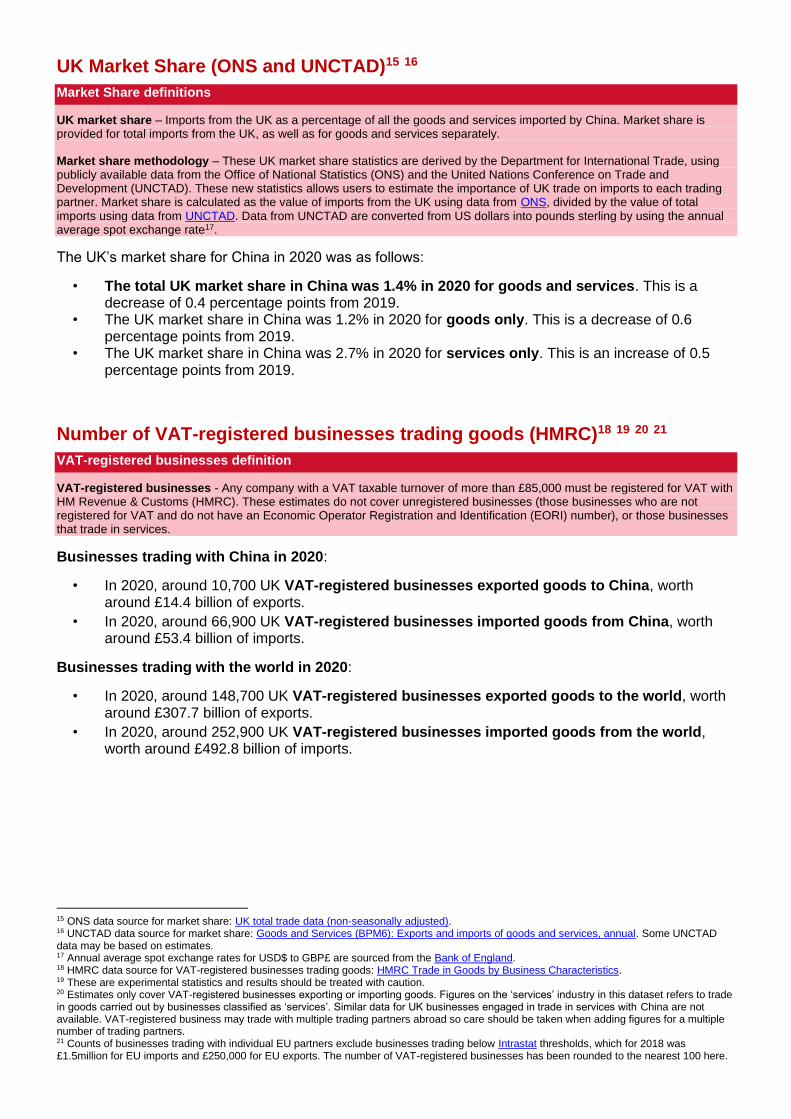
Businesses trading with China in 2020:
• In 2020, around 10,700 UK VAT-registered businesses exported goods to China, worth around £14.4 billion of exports.
• In 2020, around 66,900 UK VAT-registered businesses imported goods from China, worth around £53.4 billion of imports.
Businesses trading with the world in 2020:
• In 2020, around 148,700 UK VAT-registered businesses exported goods to the world, worth around £307.7 billion of exports.
• In 2020, around 252,900 UK VAT-registered businesses imported goods from the world, worth around £492.8 billion of imports.
15 ONS data source for market share: UK total trade data (non-seasonally adjusted). 16 UNCTAD data source for market share: Goods and Services (BPM6): Exports and imports of goods and services, annual. Some UNCTAD data may be based on estimates. 17 Annual average spot exchange rates for USD$ to GBP£ are sourced from the Bank of England. 18 HMRC data source for VAT-registered businesses trading goods: HMRC Trade in Goods by Business Characteristics. 19 These are experimental statistics and results should be treated with caution. 20 Estimates only cover VAT-registered businesses exporting or importing goods. Figures on the ‘services’ industry in this dataset refers to trade in goods carried out by businesses classified as ‘services’. Similar data for UK businesses engaged in trade in services with China are not available. VAT-registered business may trade with multiple trading partners abroad so care should be taken when adding figures for a multiple number of trading partners. 21 Counts of businesses trading with individual EU partners exclude businesses trading below Intrastat thresholds, which for 2018 was £1.5million for EU imports and £250,000 for EU exports. The number of VAT-registered businesses has been rounded to the nearest 100 here.
Trade in Value Added (OECD)22 23
Trade in Value Added definitions
Trade in Value Added (TiVA) - TiVA is a statistical approach to examine supply chains, which is not possible with conventional (‘gross’) trade statistics. This is because TiVA treats international trade flows as flows of value added rather than gross flows of final goods and services.
Domestic and foreign value added - In TiVA, gross exports are decomposed into domestic and foreign value added. Domestic value added measures the value added generated by the domestic economy in the production of its exports (e.g. the value added by UK car manufacturers and their UK supply chains in car exports). Foreign value added measures the value added contribution that foreign suppliers make to these exports (e.g. the import of foreign car parts).
TiVA statistics - Although TiVA offers advantages over traditional ways of measuring trade, these statistics are not fully developed. These results are estimates which should be considered complementary to conventional trade statistics and not be over-interpreted. In addition, the geographical detail is limited for developing countries. More information on TiVA can be found in a recent research report by the Department for International Trade and Cambridge Econometrics.
UK forward linkages for exports - Measures the reliance of foreign exporters on UK value added (inputs).
UK backward linkages for exports - Measures the reliance of UK exporters on foreign value added (inputs).
Employment supported by exports - This provides an estimate of the number of employees in exporting industries, and their domestic supply chains that are supported by exporting activity.
UK forward linkages for exports:
• In 2018, 0.2% of the total value added in gross exports from China originated in the UK.
• In 2018, 17.2% of the value added content in gross exports from China reflected foreign imports from abroad. The largest sources of foreign value added for gross exports from China were South Korea (2.0%), United States (1.7%), and Japan (1.5%).
UK backward linkages for exports:
• In 2018, 0.9% of the total value added in gross exports from the UK originated in China.
• In 2018, 17.8% of the value added content in gross exports from the UK reflected foreign imports from abroad. The largest sources of foreign value added for gross exports from the UK were United States (2.7%), Germany (1.8%), and Norway (1.5%).
Employment supported by exports:24
• Exporting activity in China supported 98.2 million persons in 2015 (12.7% of total China employment). Exports to the UK supported around 3,089,600 jobs in China.
• Exporting activity in the UK supported 6.6 million persons in 2015 (21.2% of total UK employment). Exports to China supported around 296,600 jobs in the UK.
22 The estimates in this factsheet are based on Trade in Value Added statistics published by the Organisation for Economic Co-operation and Development (OECD): a) Trade in Value Added database (origin of value added in gross exports, November 2021); and b) Trade in Employment (TiM) database: Principal indicators, December 2018, indicators EXGR_DEM and EMPN_EXGRDEM. 23 The latest data available from OECD are for 2018, with trade in employment data only available up to 2015 at the current time. Trade in Value Added data are currently awaiting revisions and are correct as of 3 February 2022. 24 These estimates measure employees directly and indirectly supported by exports i.e. workers employed in exporting businesses and in other domestic businesses supplying inputs to the exporting businesses. The estimates should be interpreted as employment supported by exports, rather than employment created by exports, as the jobs may have previously existed to serve the domestic market. Employees may also be supported by exports from a multiple number of trading partners. As with the core TiVA data, these estimates are based on a number of assumptions and modelling, so should be interpreted with caution.
Foreign Direct Investment with China (ONS)25 26 27
Foreign direct investment definitions
Foreign direct investment (FDI) - Investment made by a firm or individual in one economy (‘direct investor’) to acquire a ‘lasting interest’ in an enterprise operating in another economy. The lasting interest is deemed to exist if the direct investor acquires at least 10% of equity, or equivalently 10% of the voting rights, of the company.
FDI stock - The accumulated value of all previous investments at the end of a reference period. Figures are net, that is the value of investment minus disinvestment. UK outward FDI stock provides the total value of FDI by UK investors in economies abroad (investment of a UK parent company in China), while UK inward FDI stock provides the total value of FDI by non-UK investors in the UK (investment of a China parent company in the UK).
Data disclosure - It can happen that FDI is coming from only a few investors. In that case, figures are suppressed by the ONS to avoid disclosure of information relating to individual enterprises.
UK outward FDI stock:
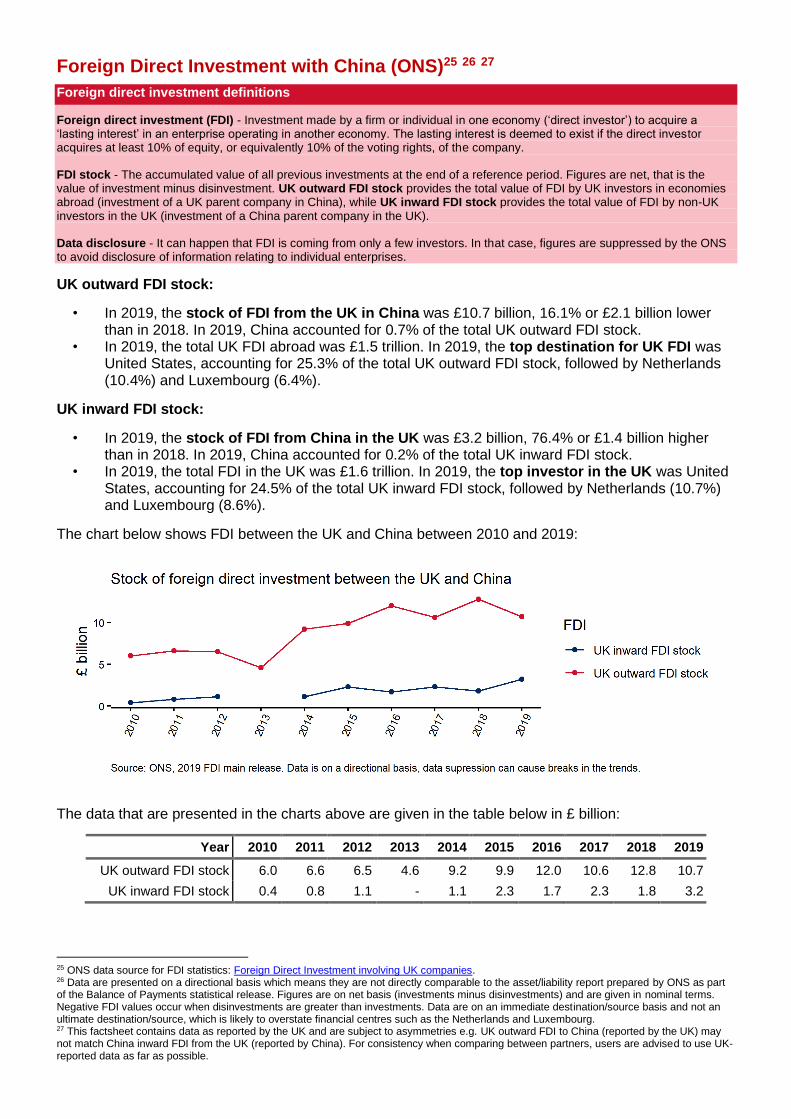
• In 2019, the stock of FDI from the UK in China was £10.7 billion, 16.1% or £2.1 billion lower than in 2018. In 2019, China accounted for 0.7% of the total UK outward FDI stock.
• In 2019, the total UK FDI abroad was £1.5 trillion. In 2019, the top destination for UK FDI was United States, accounting for 25.3% of the total UK outward FDI stock, followed by Netherlands (10.4%) and Luxembourg (6.4%).
UK inward FDI stock:
• In 2019, the stock of FDI from China in the UK was £3.2 billion, 76.4% or £1.4 billion higher than in 2018. In 2019, China accounted for 0.2% of the total UK inward FDI stock.
• In 2019, the total FDI in the UK was £1.6 trillion. In 2019, the top investor in the UK was United States, accounting for 24.5% of the total UK inward FDI stock, followed by Netherlands (10.7%) and Luxembourg (8.6%).
The chart below shows FDI between the UK and China between 2010 and 2019:
The data that are presented in the charts above are given in the table below in £ billion:
Year 2010 2011 2012 2013 2014 2015 2016 2017 2018 2019
UK outward FDI stock 6.0 6.6 6.5 4.6 9.2 9.9 12.0 10.6 12.8 10.7
UK inward FDI stock 0.4 0.8 1.1 - 1.1 2.3 1.7 2.3 1.8 3.2
25 ONS data source for FDI statistics: Foreign Direct Investment involving UK companies. 26 Data are presented on a directional basis which means they are not directly comparable to the asset/liability report prepared by ONS as part of the Balance of Payments statistical release. Figures are on net basis (investments minus disinvestments) and are given in nominal terms. Negative FDI values occur when disinvestments are greater than investments. Data are on an immediate destination/source basis and not an ultimate destination/source, which is likely to overstate financial centres such as the Netherlands and Luxembourg. 27 This factsheet contains data as reported by the UK and are subject to asymmetries e.g. UK outward FDI to China (reported by the UK) may not match China inward FDI from the UK (reported by China). For consistency when comparing between partners, users are advised to use UK-reported data as far as possible.

Economic statistics (as reported by China)
Trade and investment data for China (UNCTAD)28 29 30
The following data are reported by China and are for reference only. Whenever possible use data from UK sources for trade and investment. All data below are presented in USD$ in billions.
Year 2013 2014 2015 2016 2017 2018 2019 2020
TRADE
Nominal exports 2,355.6 2,462.9 2,361.4 2,199.0 2,444.3 2,688.9 2,669.8 2,777.8
Nominal imports 2,120.2 2,241.6 2,002.1 1,952.7 2,207.9 2,562.5 2,494.3 2,363.2
Nominal trade balance
235.4 221.3 359.3 246.3 236.4 126.4 175.5 414.5
INVESTMENT
Inward FDI stock 955.9 1,084.4 1,219.9 1,353.6 1,490.0 1,628.3 1,769.5 1,918.8
Outward FDI stock
660.5 882.6 1,097.9 1,357.4 1,809.0 1,982.3 2,198.9 2,351.8
28 United Nations Conference on Trade and Development (UNCTAD) data sources for trade: Goods and Services (BPM6): Exports and imports of goods and services, annual; and for investment: Foreign direct investment: Inward and outward flows and stock, annual. 29 Estimates are given in italics. Historic data pre-2013 can be found on the UNCTAD website. 30 All trade data are on a Balance of Payments basis. The FDI data are on a directional and net (investment minus disinvestment) basis. These figures are given in current prices and are rounded to the nearest $0.1 billion, with missing data represented by dashes.

Economic data and projections for China (IMF)31 32
The following table presents economic statistics for China. Projections include assumptions of the effects of COVID-19 and may be subject to change in the future. Estimated data, as well as projections up to 2026, are presented in italics and are subject to revision.
Year 2018 2019 2020 2021 2022 2023 2024 2025 2026
TRADE GROWTH
Change in exports (%) 4.0 0.4 2.2 19.7 4.6 4.8 3.8 3.8 3.8
Change in imports (%) 7.3 -3.7 -1.4 19.1 8.5 5.8 4.5 4.1 4.1
CURRENT ACCOUNT
Current account balance
(% of GDP) 0.2 0.7 1.8 1.6 1.5 1.4 1.1 0.8 0.5
GDP
Change in real GDP (%) 6.8 6.0 2.3 8.1 4.8 5.2 5.2 5.1 4.9
GDP per capita (1000 USD) 9.8 10.2 10.5 11.9 13.0 14.0 15.1 16.3 17.5
GDP PPP (Int'l $billion)
21,657.0 23,356.2 24,191.3 27,072.0 29,375.3 31,661.3 34,082.2 36,603.0 39,204.8
INFLATION
Inflation, year average (CPI %) 2.1 2.9 2.4 1.1 1.8 1.9 2.0 2.0 2.0
UNEMPLOYMENT
Unemployment rate (% of total labour force) 3.8 3.6 4.2 3.8 3.7 3.6 3.6 3.6 3.6
POPULATION
Population (million) 1,405.4 1,410.1 1,414.4 1,418.1 1,421.3 1,424.0 1,426.2 1,427.8 1,428.9
INVESTMENT-SAVINGS
Total investment (% of GDP) 44.0 43.1 43.1 42.9 43.3 43.1 42.9 42.5 42.1
Gross national savings (% of GDP) 44.1 43.8 45.0 44.6 44.8 44.6 44.0 43.3 42.7
BUDGET DEFICIT-DEBT
General government net lending/borrowing
(% of GDP) -4.7 -6.3 -11.2 -7.5 -6.8 -6.2 -5.6 -5.0 -4.5
General government gross debt
(% of GDP) 53.8 57.1 66.3 68.9 72.1 74.5 76.6 78.5 80.1
31 International Monetary Fund (IMF) provide economic commentary in their World Economic Outlook reports. The latest data presented here can be found in the World Economic Database, October 2021. Changes in real GDP (%) includes latest estimates from the January 2022 World Economic Outlook report for those economies where data were provided. 32 Projections and estimates are given in italics. More information for each metric and each partner, as well as historic data pre-2018, can be found on the IMF website.

Top goods traded with the world by China (UN Comtrade)33 34
Data presented here shows the top commodities traded to the world, not solely the UK, by China. These commodities are presented on a different classification from the earlier data by commodity from the ONS and should not be directly compared.
You access more statistics about individual export and import markets for China by using the online UN Comtrade tool developed by the Department for International Trade and the Department for Business, Energy and Industrial Strategy.
Top goods exported to the world by China in 2020:
Rank HS Commodity USD
billion % of total goods
exported
1 85 - Electrical machinery and equipment 710.1 27.4%
2 84 - Machinery and mechanical appliances 440.3 17.0%
3 94 - Furniture; bedding, mattresses, cushions 109.4 4.2%
4 39 - Plastics and articles thereof 96.4 3.7%
5 90 - Optical, photographic, cinematographic and medical equipment
80.2 3.1%
6 87 - Vehicles other than railway or tramway stock 76.3 2.9%
7 63 - Other made up textile articles; sets 75.6 2.9%
8 95 - Toys, games and sports requisites 71.5 2.8%
9 73 - Articles of iron or steel 71.1 2.7%
10 62 - Articles of apparel and clothing, not knitted 62.3 2.4%
All goods exported 2590.6 100.0%
Top goods imported from the world by China in 2020:
Rank HS Commodity USD
billion % of total goods
imported
1 85 - Electrical machinery and equipment 548.7 26.7%
2 27 - Mineral fuels or oils, products of their distillation 267.6 13.0%
3 84 - Machinery and mechanical appliances 192.0 9.3%
4 26 - Ores, slag and ash 180.0 8.8%
5 90 - Optical, photographic, cinematographic and medical equipment
99.1 4.8%
6 87 - Vehicles other than railway or tramway stock 74.0 3.6%
7 39 - Plastics and articles thereof 71.0 3.5%
8 74 - Copper and articles thereof 48.5 2.4%
9 29 - Organic chemicals 45.6 2.2%
10 12 - Oil seeds and oleaginous fruits 45.0 2.2%
All goods imported 2055.6 100.0%
33 United Nations (UN) Comtrade data are sourced from the online UN Comtrade tool. The data reported above are for 2020, but as the data upload to UN Comtrade is continuous, more timely data may be available from the source. 34 Data are classified using the Harmonized System and are given on a physical movement basis, with UK data comparable to HMRC data sources rather than the headline trade figures presented here from ONS.

Top services traded with the world by China (ITC Trade Map)35 36 37
Data presented here shows the top service types traded to the world, not solely the UK, by China.
Top services exported to the world by China in 2020:
Rank EBOPS Service Type USD
billion % of total services
exported
1 Other business services 75.4 26.9%
2 Telecommunications, computer, and information services 59.0 21.0%
3 Transport 57.6 20.5%
4 Construction 23.9 8.5%
5 Travel 17.1 6.1%
All services exported 280.6 100.0%
Top services imported from the world by China in 2020:
Rank EBOPS Service Type USD
billion % of total services
imported
1 Travel 131.2 34.4%
2 Transport 94.7 24.8%
3 Other business services 50.5 13.2%
4 Charges for the use of intellectual property n.i.e. 37.6 9.9%
5 Telecommunications, computer, and information services 33.0 8.7%
All services imported 381.1 100.0%
35 International Trade Centre (ITC) Trade Map data are sourced from the online ITC Trade Map tool. The data above are for 2020, but as the data upload to ITC is continuous, more timely data may be available from the source. 36 Data are classified on the EBOPS 2010 basis. ‘Other business services’ include: Research and development, professional and management consulting services, technical services and trade related services. A full description of all service types can be found on the UN Statistics Division website. 37 Estimates are shown in italics, where for some partners only estimates are available - These data have been included for information and should be treated with caution.

Background Notes
This document is one of a wider set of factsheets between the UK and its individual trade and investment partners which can be found on the Trade and Investment Factsheets website. All of these factsheets are published as Official Statistics as defined by the UK Statistics Authority, and are compliant with the Code of Practice for Statistics where they meet user needs as well as promoting trustworthiness, quality and public value in Government statistics. The publication of these factsheets as Official Statistics was agreed by the Chief Statistician at the Department for International Trade, who monitors these factsheets to ensure they continue to adhere to the Code of Practice for Statistics. These factsheets have not been formally assessed by the Office of Statistics Regulation and are therefore not designated as National Statistics.
As a requisite of publishing as Official Statistics, a quality and methodology report has been produced which outlines the quality of these factsheets, as well as providing more information on the methodology of the data sources presented here. This report contains hyperlinks to information on the strengths and weaknesses for each data source. Statistics contained in the factsheets from UK data providers all come from Official Statistics publications, with some sources also being from National Statistics publications.
Future updates of these factsheets can be found on the Government update schedule for Official Statistics. These scheduled updates are in line with significant updates from UK data providers when they release new data. Unscheduled releases of the factsheets may also be necessary to accommodate data updates where little or no advanced notice are given, such as in the case of international data updates. Please see the data update schedule and revisions policy in the quality and methodology report for more information. Please note that there may be occasions where more recent data than is provided here can be found directly from the data providers.
The Department for International Trade welcome any feedback or comments on these factsheets, please send these to [email protected].
© Crown copyright 2022
This publication is licensed under the terms of the except where otherwise stated.
Where the Department for International Trade have identified any third party copyright information, users will need to obtain permission from the copyright holders concerned.
This publication is available on the GOV.UK website.
Any media enquiries regarding this publication should be directed to the Department of International Trade website or by phoning 0207 215 2000.