Wireless Weather Monitor
83
Wireless Weather Monitor (Michael Onari LawsonWokoma) 1 Wireless Weather Monitor Michael Onari LawsonWokoma
Transcript of Wireless Weather Monitor

Wireless Weather Monitor (Michael Onari Lawson-‐Wokoma)
1
Wireless Weather Monitor
Michael Onari Lawson-‐Wokoma

Wireless Weather Monitor (Michael Onari Lawson-‐Wokoma)
2
ABSTRACT
The device developed in this project is required to detect the weather conditions of a place using appropriate instruments for temperature, air pressure and humidity sensor. The device has the functionality of providing outputs to be displayed to the user. These outputs will be made available for display both physically and remotely. Using an LCD display will provide the physical display to the user; this will enable the data to be viewed when the user is in the same location as the device. Remote access to the weather conditions will be available through the use of a webpage, which consists of a HTML GUI where data is transmitted. As weather conditions affect personal health and it is necessary to be in a healthy environment, the storage of certain items like plants and household heating cost. It is relevant to keep track of weather conditions. The features of the device include small size, portability, on-‐device display and remote display, which will aid the device to be used in a wide number of occasions.

Wireless Weather Monitor (Michael Onari Lawson-‐Wokoma)
3
TABLE OF CONTENTS
Table of Contents
Chapter 1 .............................................................................................................................. 5
Introduction ........................................................................................................................ 5 Introduction & Problem Definition ..................................................................................... 5 Proposed Solution ..................................................................................................................... 5 Aim: ................................................................................................................................................. 6 Objectives: .................................................................................................................................... 6
Chapter 2 .............................................................................................................................. 8
Literature Review ............................................................................................................. 8 Introduction ................................................................................................................................. 8 Weather stations ........................................................................................................................ 8 Microcontroller based weather monitors ......................................................................... 9 Wireless Technology ................................................................................................................. 9 Types of Wireless Data Acquisition ................................................................................... 10 Justifying the use of wireless technology as a means of transmission and HTML GUI for display of weather monitor. .................................................................................. 11
Chapter 3 ............................................................................................................................ 13 Requirement Analysis ................................................................................................... 13 Introduction ............................................................................................................................... 13 Functional Requirements ..................................................................................................... 13 Non-‐Functional Requirements ............................................................................................ 14 Performance Requirements ................................................................................................. 14
Chapter 4 ............................................................................................................................ 15
Methodology ..................................................................................................................... 15 Introduction ............................................................................................................................... 15 Systems Development Life Cycle ........................................................................................ 15 Systems Development Approaches .................................................................................... 15 Chosen Design Methodology ................................................................................................ 17
Chapter 5 ............................................................................................................................ 18
Design ................................................................................................................................. 18 Introduction ............................................................................................................................... 18 Design Strategy ......................................................................................................................... 18 Actors .......................................................................................................................................................... 19 Procedures ............................................................................................................................................... 20 Use cases ................................................................................................................................................... 21 Use Cases Description ......................................................................................................................... 21 Use case diagram ................................................................................................................................... 23
Materials ..................................................................................................................................... 24 Design Improvements ............................................................................................................ 33 Flow Chart for the Microcontroller .................................................................................... 33 System Block Diagram ............................................................................................................ 35 Design Summary ...................................................................................................................... 36
Chapter 6 ............................................................................................................................ 37

Wireless Weather Monitor (Michael Onari Lawson-‐Wokoma)
4
Build .................................................................................................................................... 37 Introduction ............................................................................................................................... 37 Schematic Diagram .................................................................................................................. 37 Stage 1 (LCD) ............................................................................................................................. 39 Stage 2 (Temperature Sensor) ............................................................................................ 40 Stage 4(Air Pressure Sensor) ............................................................................................... 43 Prototype of the Design ......................................................................................................... 46 Web Page Design (HTML GUI) ............................................................................................. 46 HTML GUI .................................................................................................................................... 48 Web server ................................................................................................................................. 49 Webpage Script for getting Arduino data ........................................................................ 50 Plotly API (Real time Graphing) .......................................................................................... 51
Chapter 7 ............................................................................................................................ 53 Validation .......................................................................................................................... 53 Introduction ............................................................................................................................... 53 Testing ......................................................................................................................................... 53 Test Cases Results Analysis .................................................................................................. 55 Calibration .................................................................................................................................. 56 Browser Test ............................................................................................................................. 56 Problems Identified during Design .................................................................................... 57
Chapter 8 ............................................................................................................................ 58
Conclusion and Evaluation .......................................................................................... 58 Introduction ............................................................................................................................... 58 Project Evaluation ................................................................................................................... 58 Evaluation against Requirements Based on the Functional and Performance Requirements ............................................................................................................................ 59 Personal Reflection Achievements and Contribution ................................................. 60 Benefits of the System ............................................................................................................ 61 Further Development and Use ............................................................................................ 61
References ......................................................................................................................... 62 Appendix A ........................................................................................................................ 64 Source Code ................................................................................................................................ 64
Appendix B ........................................................................................................................ 72 Data Sheets ................................................................................................................................. 72

Wireless Weather Monitor (Michael Onari Lawson-‐Wokoma)
5
Chapter 1
Introduction
Introduction & Problem Definition The state of the atmosphere at a particular place and time as regards heat, cloudiness, dryness, sunshine, wind, rain is regarded as the weather condition of the place. The state of the weather of our environment plays a major role in human lives regarding good health and hygiene. The weather conditions of homes affect the thermal comfort of human beings and this in turn affects the state of mind, which leads to the decrease in productivity of individuals. According to the HSE (Health and Safety Executive) the thermal comfort is that condition of an individual’s mind, which expresses satisfaction with the thermal environment. It is the degree of how hot or how cold an individual is feeling. The weather conditions of most homes are currently not monitored and so subjects the residents to health risks. The thermal comfort of a place is affected by six parameters (HSE).
• Air Temperature: The temperature of the air surrounding the body • Radiant Temperature: The Thermal radiation from warm objects • Air Velocity: The speed of moving air across the body • Humidity: The amount of water vapor in air • Metabolic heat: The heat the body produces as physical activities are
carried out • Clothing Insulation: The ability of clothes to retain heat.
Maintaining the thermal comfort of individuals is a goal of the HVAC (Heating, Ventilation and Air Conditioning) engineers. Regulative processes carried out by these engineers need to be accompanied by Monitoring processes in order to achieve a well stable environmental weather condition for individuals. Expense on heating and cooling is a major financial problem faced by a lot of residents in homes today. The majority spends a lot through the process of overheating homes to avoid potential health risks as professional monitoring processes are not carried out to keep homes at the desired temperature that is suitable for both good health and money saving. Environmental weather monitoring requires Temperature, Humidity and Air Pressure to be monitored, as these are the major factors that affect the weather conditions of the environment.
Proposed Solution As we live on, improvement in technology increases and solutions to our everyday needs are developed. The issue regarding health problems relating to poor home weather condition could be resolved by maintaining the comfort levels in homes and workplaces through proper monitoring and maintenance.

Wireless Weather Monitor (Michael Onari Lawson-‐Wokoma)
6
A method of weather monitoring which gives users the ability of access to reliable readings regardless of distance or time needs to be devised. The Internet is a global system of interconnected computers. From the Internet World Statistics, the number of Internet users has risen from 16 million in 1995 to 2,749 million in 2013. This proves that the Internet has become a more accessible item over time. Through the introduction of modern smartphones in 2010, the Internet has become more accessible on the go and this enables users to frequently gain access to it, leading to majority of individuals relying on it for certain everyday purposes. The Internet is steadily available and only relies on proper connection. Through the Internet as a transmission medium, a data acquisition method monitoring the weather wirelessly could be implemented enabling users to utilize the advantages of the Internet for the purpose of monitoring their home weather conditions at any point in time. Measurements of weather conditions are carried out through the use of sensors. Sensors are devices basically designed just to take measurements and so do not have the capability of providing outputs visible to the user. With the aid of microcontrollers these measurements can be transmitted and outputted through various mediums, including the Internet. A device transmitting data wirelessly from the sensors to a webpage where the user will be able to monitor and keep track at any given point in time using a HTML GUI will be created to resolve the problems regarding weather monitoring.
Aim: This project will be aimed at developing a portable device capable of monitoring weather conditions wirelessly through the use of a microcontroller, which will have onboard sensors for the ability to carry out measurements of the following variables:
• Temperature (°C & K) • Humidity (%) • Air Pressure (kPa)
The readings will be made available on an LCD display on the device and wirelessly over the Internet using a HTML GUI.
Objectives: The core objectives to this project in order to achieve this aim are: Research: Research has to be carried out on the materials and resources that will be used in the development of the device. There is a wide range of resources available and these have to be chosen based on the requirements of the system through the chosen design strategy. A literature analysis relevant to weather monitoring also has to be carried out to demonstrate the need for a wireless weather monitor.

Wireless Weather Monitor (Michael Onari Lawson-‐Wokoma)
7
Build: This involves the physical build state of the prototype device Connection of the sensors to the microcontroller Getting respective outputs based on their calculations Outputting the data on the device display. Creating the HTML GUI on the webpages, this will display the data to the user. Transmit and output the data from the microcontroller to the webpage Validation: Developing test cases to be applied to the device in order to test for full functionality and show the accuracy and reliability of its readings. Also show that the data is transmitted from the device to the webpage where wireless remote weather monitoring occurs. The readings of the device will be compared with that of a thermometer, barometer and hygrometer.

Wireless Weather Monitor (Michael Onari Lawson-‐Wokoma)
8
Chapter 2
Literature Review
Introduction The literature analysis of weather stations and previous microcontroller based weather-‐monitoring projects will be reviewed in this chapter. This will also justify why a wireless weather monitoring device using the Internet as a medium for transmission and display would help in addressing the problems described in chapter 1.
Weather stations A weather station is a facility, either on land or sea, with instruments and equipment for observing atmospheric conditions to provide information for weather forecast and to study the weather and climate. Weather stations could either be on a large scale or a small scale. Large-‐scale weather stations provide weather details for a large area like a town or city and take measurements for a wider number of variables. Small-‐scale weather stations are more personal and are most times developed for private use. They usually go by the name personal weather stations. Weather conditions vary across places and difficulty occurs in determining the accurate weather condition of places where stations are not positioned. In such situations approximations are made and these lead to diminished accuracy and unreliability. Jeff Masters developed a service called the Weather Underground in the United States in 1995. The weather underground service showed the need for the use of personal weather stations in order to provide more reliable and accurate weather conditions measurement for various areas by providing readings from various personal weather stations online. Through the success of this service, customer growth increased over time and there are currently about 25,000 personal weather stations providing data worldwide on the service. These personal weather stations possess the ability of sending data derived to the Weather Underground Network, which then provides the reading for that location on the map. By providing various weather conditions through multiple PWS in an area, a more approximate weather condition for the area is derived. Through this process a wider network was achieved and this provided readings for various areas leading to a wider and more reliable service for users. This service utilized the Internet as a medium for both transmission and display, and succeeded in providing users with a more reliable outdoor weather monitoring system, which can be accessed at any given point in time through the Weather Underground webpage www.wunderground.com Utilizing the modern day wide availability of the Internet, the customer usage kept increasing and this then led to a larger network.

Wireless Weather Monitor (Michael Onari Lawson-‐Wokoma)
9
Microcontroller based weather monitors The advancement in technology has made small and reliable electronic sensors capable of monitoring environmental parameters more favorably and with the aid of a data acquisition system; a better approach for weather monitoring could be developed (Chow Chee Onn and Mohamad Faizal Ismail, 2006).
A basic format is thereby followed when making the design of a microcontroller based weather monitor. This format requires some specific materials to be utilized. When considering the design, appropriate sensors are needed which are to be properly connected to a microcontroller. Various methods could then be determined in the transmission and output of data to the user.
Chow Chee Onn and Mohamad Faizal Ismail developed a microcontroller-‐based weather monitoring system for the above-‐mentioned significant weather conditions using a data logging operation. The system developed possessed an onboard LCD display and a GUI operating on a PC when the device is connected through the USB interface. The developed system featured the connection of an ADC to the circuit of analog sensors outputting signals proportional to the relative measurement to obtain digital signals that were fed to the microcontroller. Chow Chee Onn and Mohamad Faizal Ismail approach for data logging was the process of using an EEPROM.
EEPROM (Electrically erasable programmable read-‐only memory) is user-‐modifiable read-‐only memory that can be erased and reprogrammed repeatedly through the application of higher than normal electrical voltage (Magaret Rouse, EEPROM).
Chow Chee Onn and Mohamad Faizal Ismail devices EEPROM had a storage capacity of 512kb capable of storing data for up to 60 days, which will be accessed by the GUI on the PC when connected.
Chow Chee Onn and Mohamad Faizal Ismail showed that analog sensors connected to an ADC are capable of providing reliable readings for a weather monitoring system. The requirement of the physical connectivity to the PC for access to the data in the GUI hinders the system design to the availability of the PC. GUI’s allow the interaction of users and electronic devices. A system that needs to be constantly connected to a PC to enable the operation of the GUI will affect its positioning and functionality.
Wireless Technology Wireless technology has enabled the transfer of information between electronic devices through a wireless connection medium. Wireless means communication without the use of wires other than the antenna, the ether, and ground taking the place of wires (John Wiley). Through the process of wireless technology, wireless data acquisition mediums where developed. Wired systems have several drawbacks when compared to wireless systems (Kalyanramu Vemishetty, 2005).

Wireless Weather Monitor (Michael Onari Lawson-‐Wokoma)
10
Types of Wireless Data Acquisition Radio Frequency: Radio frequency (RF) is a rate of oscillation in the range of about 3 KHz to 300 GHz, which corresponds to the frequency of radio waves and the alternating currents, which carry radio signals. Bluetooth is an example of radio frequency data acquisition method but problems concerning power consumption and interference occur during utilization (Kalyanramu Vemishetty, 2005).
Infrared: Infrared is a transmission process using ad-‐hoc standard designed for shorter distances between 0 and 1 meter (Kalyanramu Vemishetty, 2005). Infrared cannot be used in transmitting data through large distances.
High Speed LAN: HiSLIP (High-‐Speed LAN Instrument Protocol) is an Ethernet-‐based protocol for remote instrument control of LAN-‐based test & measurement instruments using the Virtual Instruments Software Architecture. It involves the transfer of data at a very fast rate through the local area network.
Kalyanramu Vemishetty developed a data acquisition system, which transmits data from sensors to a PC through wireless format. The system possessed both a transmission and receiver station using microcontrollers transferring data through radio frequency.
M. Benghanem developed a better but not perfect solution to the weather-‐monitoring problem faced similar to that of Kalyanramu Vemishetty through the process of adopting wireless technology and developing a wireless data acquisition system with a server. The system he devised was based on Emitter and Receiver architecture, which had remote stations that transmit data to the base station. The base station is connected to a computer, which feeds the data to a server.
The system M. Benghanem implemented uses 1-‐wire technology for the Emitter design. This process enabled the use of multiples sensors by assigning unique digital addresses and transmitting data to the microcontroller over a single twisted pair cable. Currently available versions of 1-‐Wire weather systems use an onboard web server to serve data to clients via the Ethernet. However, these systems are constrained by lower memory limitations for storage of large amounts of data. Hence, clients connecting to that web server can view only limited data (M. Benghanem, 2010). M. Benghanem then proposed a design addressing that limitation by interfacing a PC having a GUI for display and storage to a wireless unit “the base station” which receives data wirelessly. Data is transferred from the emitter to the receiver through radio frequency signals.
An advantage of the system developed by M. Benghanem is that multiple remote stations could be interfaced in the design feeding data wirelessly to the base station by transferring the data through radio signals.
Adopting wireless technology, similar to the system by M Benghanem, a data logger and remote monitoring system using short message service (SMS) was developed by G.S. Nhivekar and R.R.Mudholker. Similar to Chow Lee’s EEPROM technique for data logging, this system possessed an onboard real-‐time clock

Wireless Weather Monitor (Michael Onari Lawson-‐Wokoma)
11
(RTC) and multimedia memory card (MMC) that will enable the system to store data. G.S. Nhivekar and R.R.Mudholker used an ATmega32 microcontroller providing analog inputs with a 10-‐bit ADC. He then interfaced this system with a Nokia 3310 mobile phone using a Nokia F-‐Bus Protocol to be able to send the derived data through the process of SMS (Short Message Service) to the user. Graphical user interfaces are necessary for providing visual data to users. Apart from the onboard 16*2 LCD display on the system, a GUI on a PC was implemented allowing logged data on the MMC to be accessed when connected.
An advantage of this proposed system is the use of the SMS provided by the Nokia protocol. This enables the system to provide data to the user over a cellular network at regular intervals making weather monitoring possible irrespective of distance and unavailability of a graphical user interface
Similar to Chow Chee Onn / Mohamad Faizal Ismail system and M Benghanem, the proposed architecture by G.S. Nhivekar requires the availability of a PC for implementation of the GUI to the user. The PC is also responsible for providing the data to the server for access through the Internet in M Benghanem’s system. Designs involving a PC enabled with the GUI possess a limitation involving the user relying on the PC equipped with the GUI as a means of display thereby reducing wide access to data.
Justifying the use of wireless technology as a means of transmission and HTML GUI for display of weather monitor.
Through the literature analysis of the systems above, a system that doesn’t rely on a specific PC for the provision of a GUI needs to be considered. Wireless technology has proven a better solution to weather monitoring through the means of remote access to data and reduced number of wires in connection. Providing data to users directly from a monitoring device would tackle the problem of limiting users data access to a device equipped with the GUI. To enable the functionality of being able to access the GUI on various devices a HTML GUI would be considered. The high speed LAN not only provides a method for the HTML GUI to be implemented but also provides a fast medium for data transfer. Through the operation of the Internet, html pages could be accessed through a reliable connection and so the GUI could be accessed on a large variety of devices depending on the browser. The Internet is a system of interconnected computer networks, which uses TCP IP for transmitting and receiving data between devices. Through modern technology, devices have gained the ability of connecting to the Internet by being assigned specific IP addresses. The TCP IP protocol provides connectivity between a source and destination for data transfer. For the full functionality of the web based GUI, transmission of data from the device to the webpage is required. A system design in which data would be transmitted from the device to a webpage through a TCP IP connection will give users greater access to data. 1-‐wire systems having webservers have been developed but have the problem of limiting users to reduced amount of data (M. Benghanem, 2010).

Wireless Weather Monitor (Michael Onari Lawson-‐Wokoma)
12
The process of providing a web based GUI capable of outputting a larger amount of data will need to be developed. JSON (JavaScript Object Notation) is an alternative to XML, which uses user readable text to transmit data objects using communication protocols between a server and web application. A procedure involving a webserver running on the microcontroller streaming derived data in JSON format to be polled by a webpage, which contains a HTML GUI will provide a design for transmitting the data.

Wireless Weather Monitor (Michael Onari Lawson-‐Wokoma)
13
Chapter 3
Requirement Analysis
Introduction This chapter outlines the requirements, which the system has to adhere to for full functionality to be determined. The aim of this project is to provide a portable weather-‐monitoring device, which is capable of measuring the weather condition of a place with the aid of a microcontroller and sensors for taking the following weather measurements: Temperature(C & k) Atmospheric pressure (kPa) Humidity (%) The system is also aimed at providing the real time readings to the user both physically and remotely. The system will provide the reading to the user wirelessly through the use of a webpage, which has a HTML GUI where the data will be transmitted to and physically with the use of an onboard display. Below are the functional, non-‐functional and performance requirements of the system.
Functional Requirements These are the requirements for the functions the system will provide to the user.
• From the BBC study “How warm is your house,” the temperatures below reflect actual home temperatures in the UK and their effects. 18-‐21C -‐ comfortable temperature
9-‐12 or 24+C: Risk of stroke and heart attack
21-‐24C or 16-‐18C -‐ some discomfort
12-‐16C -‐ risk of respiratory disease
Less than 9C -‐ risk of hypothermia Therefore, approximately the temperature sensor should have an operational range of at least 0°C to 50°C
• From the BBC study “Isobars and Fronts” Air pressure ranges from 890mb(89 kPa) to 1060mb(106 kPa)
• At sea level the average air pressure is 101kpa
Wireless Weather Monitor (Michael Onari Lawson-‐Wokoma)
14
Therefore, approximately the pressure sensor should have an operational range of at least 89 kpa to 106kpa Low pressure emphasizes wet and windy weather while high pressure emphasizes dry and sunny weather
1. The system should be able to measure temperature between 0°C to 50°C 2. The system should be able to measure Atmospheric pressure between 89
kpa and 106 kpa 3. The system should be able to measure Humidity between 0% and 100% 4. The system should be able to be powered by low voltage (5V) 5. The system should have internet connectivity
Data should be passed from the microcontroller to the Webpage for viewing on the HTML GUI
6. The system should output data on the onboard display
Non-‐Functional Requirements These are the requirements for how functions of the system will be provided.
1. The system should be Portable for easy movement and storage 2. The sensors be of analog output 3. The microcontroller should have analog inputs 4. The display should be capable of displaying special characters. 5. The microcontroller should have Plotly API
Performance Requirements These are the requirements of how well the systems functions are achieved.
1. The system should be reliable 2. The system should have an accuracy of
• 2 C for temperature measurements • 1 kpa for Pressure measurements • 2% for humidity measurements
3. The system response time for stable readings should not be greater than 10 seconds.

Wireless Weather Monitor (Michael Onari Lawson-‐Wokoma)
15
Chapter 4
Methodology
Introduction This chapter will discuss the software development techniques and the chosen method used in this project.
Systems Development Life Cycle The systems development life cycle (SDLC) can be defined as a process of understanding how an information system can support business needs or requirements of an organization, modelling the business processes, designing the systems components, and building the system (Mohammad A. Rob). The software development life cycle consists of phases, which are a series of steps required in order to achieve a deliverable. All developed systems pass through a development cycle and there are different development cycle approaches.
Systems Development Approaches Object Oriented Approach: This involves a bottom-‐ up approach to systems development, which uses UML (Unified Modelling Language) to show the system functionality. The Unified Modelling Language follows an iterative and incremental approach to systems development and in each increment or phase, the developers move through the activities of gathering requirements, analyzing the requirements, designing the system, implementing the design, and testing the system (Mohammad A. Rob). Object-‐oriented analysis is made up of interacting objects that maintain their own local state and provide operations on that state information and is considered a more cost-‐effective and a faster way to develop software and systems (Rakesh Kumar Mishra, Bharat Lohani). This process uses increment stages and the system develops over time and all phases of the systems development lifecycle are visited with each increment until the requirements are achieved. Sometimes system requirements change and the requirements at a final stage might not be the same requirements at the initial stage. This approach provides a system where requirements could be changed if not desired. With each incremental stage, part of the system is developed and this serves as a feed back to developers. Figure 1 shows phases in the development lifecycle and changes applied with time.

Wireless Weather Monitor (Michael Onari Lawson-‐Wokoma)
16
Figure 1 Incremental Model of Software Development Lifecycle
Structured Approach: This is a structured methodology based on the waterfall model. It involves a step-‐by-‐step approach in software development in which one phase must be completed before moving to the next stage. The output from one phase serves as the input to the next. It involves a feedback from one phase to the next, thereby problems in the requirements will be identified in the design stage and problems with the design will be identified in the implementation stage. The processes are presented in a Data Flow Diagram, which contains information such as inputs, outputs, processes and data storage. (Mohammad A. Rob)

Wireless Weather Monitor (Michael Onari Lawson-‐Wokoma)
17
Figure 2 Structured approach to Software Development
Chosen Design Methodology Through the analysis of the above methodologies, I chose to utilize the Object Oriented Approach for this project. The Object Oriented Approach cuts development time, overhead and enables software engineers to make reusable, reliable and easily maintainable applications (Rakesh Kumar Mishra, Bharat Lohani). Due to the short time available for the project I decided that this technique would be appropriate for success in the design. Figure 1 shows that requirements could be changed through increment stages, so it would be reasonable to use a technique that can support changes in the requirements without causing a problem.

Wireless Weather Monitor (Michael Onari Lawson-‐Wokoma)
18
.
Chapter 5
Design
Introduction This chapter explains and gives an overview of the techniques followed during the design phase of this project. Based on the determined requirements in chapter 3 a strategy to achieve a system to adhere to those requirements is achieved in this chapter.
Design Strategy Following the literature analysis I developed the following strategy for the system to take measurements of the weather conditions and output it through both physical and wireless mediums to the user. Sensors could be either digital output or analog output. Digital sensors convert the measurement signal to digital and also transmit it through the cable digitally. Analog sensors give output signals of varying voltage levels. Analog sensors could then be described as resistors that change its value when a condition is met. The Wireless Weather Monitor will be developed using analog sensors, which output voltages linearly proportional to its specified measurement. Analog sensors provide their voltage output as analog signals and so cannot be processed by the microcontroller in that form. An ADC (Analog to Digital Converter) is required to convert these analog signals to digital for processing. Problems faced by an analog sensor:
• Signal Noise: The atmosphere is filled with electromagnetic noise from other devices operating like mobile phones. This noise is in analog signal form and so could be picked up by the ADC along with the signal from the sensor, which could lead to noise interference in readings. The length of the wires and distance between the sensor and the ADC affects amount of noise it gets.
In order to reduce the amount of noise picked up the sensors will be connected to the microcontroller with short wire connections to the ADC. The device will also be calibrated to eliminate any additional signal noise gained.
The device is required to be portable and so should be able to run on low voltage power supply. The sensors will also output an analog voltage output of between 0v to 5v and so the microcontroller should be able to operate within that range.

Wireless Weather Monitor (Michael Onari Lawson-‐Wokoma)
19
Being a wireless weather monitor, the device should be able to display data to users both physically and wirelessly. The data will be displayed physically through an onboard LCD display and wirelessly through a webpage. A HTML GUI will be created on the webpage to display the data to the user. This will be in the form of gauges and graphs. The device is required to be connected to the Internet in order to transmit data from the sensors to the webpage. To enable this functionality the microcontroller has to be web enabled allowing a webserver to be created, running on the microcontroller transmitting data to the HTML GUI. An external webserver could then host the webpage consisting of the HTML GUI. Data from the sensors will be transmitted from the microcontroller to the webpage through JSON AJAX methods. Graphical images showing the various readings at various time intervals from the sensor will be required to monitor the changes in the weather conditions over time. Plotly is a data analysis and graphing tool, it has the ability of connecting to microcontrollers and getting data from it wirelessly using the API. Data sent to plotly will be stored and graphed and will be displayed at time intervals on the graph. The microcontroller will transmit the derived data from the sensors to Plotly, using the Plotly Api available at “https://plot.ly/api/” for real time graphing. These graphs could then be embedded into the webpages running on the webserver containing the HTML GUI. Following the systems functional requirements, I derived the following:
Actors • User • Sensors • Microcontroller • LCD • Web page • Plotly
User Accesses webpage Sensors Takes measurements of the weather conditions Microcontroller Makes calculations Runs the webserver Sends JSON data to webpage

Wireless Weather Monitor (Michael Onari Lawson-‐Wokoma)
20
LCD Displays data from sensors Web page Request and retrieves JSON data from the microcontroller webserver Displays HTML GUI Plotly Gets data from sensors Creates a graph with derived data
Procedures
1. Take Measurements • Sensors take readings of the weather
2. Request JSON data
• Webpage sends request for JSON data containing sensors readings using the IP address of the microcontroller streaming the JSON data.
3. Return JSON data • Microcontroller returns the value of the sensors through
JSON to the webpage
4. Graph Data • Data is transmitted from microcontroller to Plotly using the
API • Graph is created with derived data in Plotly
5. Display Data
• LCD displays the sensors reading to the user • Webpage displays HTML GUI to the user

Wireless Weather Monitor (Michael Onari Lawson-‐Wokoma)
21
Use cases
Use Case ID Use case name 1 Take Measurements 2 Request JSON data 3 Return JSON data 4 Transmit and Graph Data 5 Display Data
Table 1 Use Cases
Use Cases Description Use Case Description Use case ID 1 Use case name Take Measurements Actor Sensor Goal Take reading of the weather condition Pre -‐ Requisites Connect system to power supply Post-‐Requisites Provides readings for microcontroller Scenario 1. Analog sensors take readings and provide output
voltage, which is linearly proportional to measurement and is converted to digital signal using the ADC for processing by the microcontroller.
Use Case Description Use case ID 2 Use case name Request JSON data Actor Webpage Goal Get JSON data string containing sensor readings from
microcontroller Pre -‐ Requisites Take Measurements Post-‐Requisites Return JSON data Scenario 1. The webpage sends a request for the JSON string
using the IP address of the microcontroller that streams the data.

Wireless Weather Monitor (Michael Onari Lawson-‐Wokoma)
22
Use Case Description Use case ID 4 Use case name Transmit and Graph data Actor Plotly Goal Transmit data to Plotly and create a graph with sensor
readings Pre -‐ Requisites Take Measurements Post-‐Requisites Display Data Scenario 1. Microcontroller continuously transmits sensor
readings data from microcontroller to Plotly through the API
2. Plots will be created in Plotly and embedded in the webpage for the HML GUI
Use Case Description Use case ID 3 Use case name Return JSON data Actor Microcontroller Goal Send JSON data containing sensor readings to the
webpage Pre -‐ Requisites Request JSON data Post-‐Requisites Display data on HTML GUI Scenario 1. The Microcontroller streams the JSON data
through the webserver. 2. After the request for the JSON data is sent. The
JSON data is retrieved and parsed to be displayed on the webpage
Use Case Description Use case ID 5 Use case name Display Data Actor LCD, Webpage Goal Display data Pre -‐ Requisites Take Measurements, Return JSON data, Transmit &
Graph Data Post-‐Requisites Display data Scenario 1. Microcontroller prints data to LCD display
2. Webpage outputs the HTML GUI which includes data transmitted through JSON and graph plotted

Wireless Weather Monitor (Michael Onari Lawson-‐Wokoma)
23
Use case diagram
Figure 3 Use Case Diagram

Wireless Weather Monitor (Michael Onari Lawson-‐Wokoma)
24
Materials Hardware: The hardware materials are the components used in building the physical design of the project.
Microcontroller: From the requirements of the system, the requirements for the microcontroller for the design of this project include:
• Analog inputs: The sensors chosen for the design of this project are analog output sensors. These sensors detect signals and transfer them in analog form, which will be in the form of output voltages. The analog sensors used in this project provide low output voltages in the range of 0 -‐5 volts so the microcontroller should be capable of taking analog inputs in that range.
• ADC (Analog to Digital Converter): The sensors used in this project are analog output sensors. An ADC will be required to convert the output signals from the sensors to digital form, which will later be processed by digital processors
• Internet Access (Ethernet port or Wi-‐Fi): Data will have to be transferred to the Internet so a medium of Internet connection is required.
• Operational Power: It should have a capability of operating at a low voltage of 5v.
• Plotly API: Required for real-‐time transmission to Plotly for creating graphs of data readings with time.
Available microcontrollers for design:
1. Arduino Uno: The Arduino Uno is a microcontroller board, which has: 14 digital input/output pins (of which 6 can be used as PWM outputs) 6 analog inputs, 16 MHz clock speed, USB connection, 5v power jack, ICSP header The Arduino board has an in built 10-‐bit ADC that has a maximum value of 1023 and has the ability of adding extra shields for additional capabilities. It has an Ethernet shield, which gives the Arduino the ability of connecting to the Internet using a 10/100 Mbs Ethernet slot and a micro SD card expansion slot for memory. It also has a Wi-‐Fi shield for the ability of connecting to the Internet through Wi-‐Fi, but due to cost the Ethernet shield will be preferred. The Arduino Uno possesses an API for plotly and can be found at: https://plot.ly/api/. The Arduino Uno supports C as its programming language and uses the Arduino IDE as its development platform.

Wireless Weather Monitor (Michael Onari Lawson-‐Wokoma)
25
Figure 4 Arduino Uno
Figure 5 Arduino Ethernet Shield
Wireless Weather Monitor (Michael Onari Lawson-‐Wokoma)
26
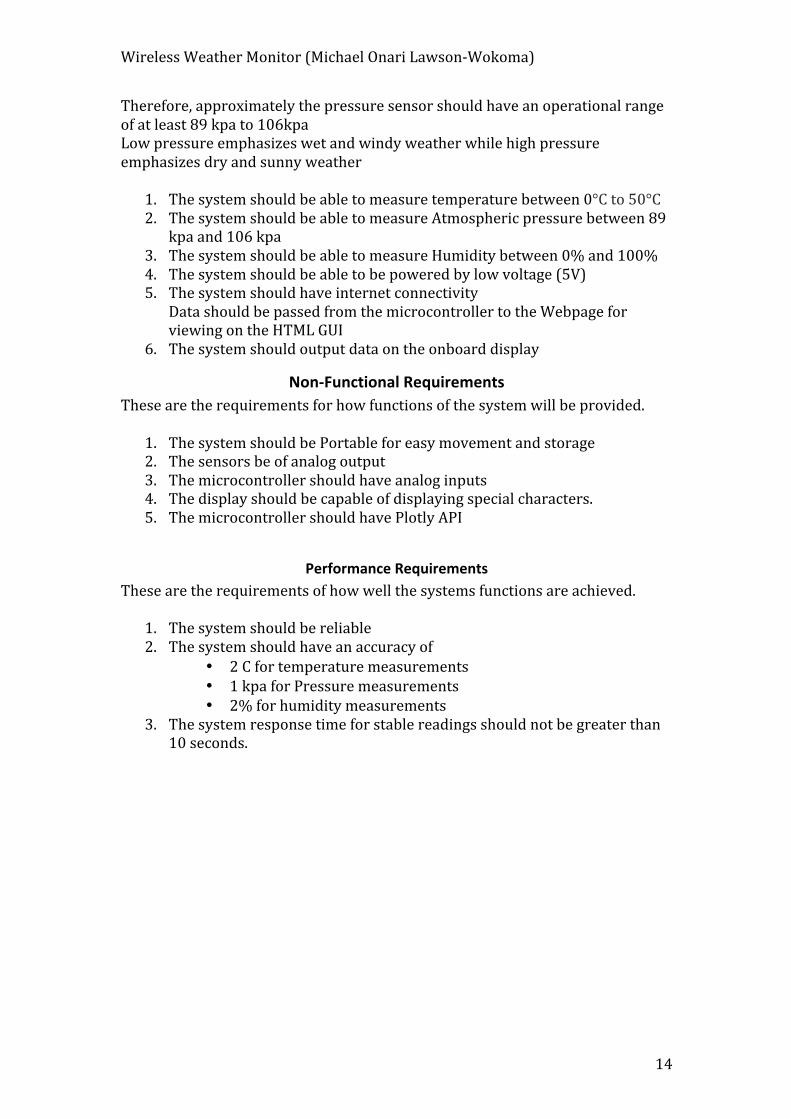
2. Raspberry Pi: The raspberry pi is a single board computer. It includes a
Broadcom BCM2835 system on a chip with an ARM1176JZF-‐S 700 MHz processor. 10/100 Mbs Ethernet slot, 8 GPIO pins 1-‐USART, 1-‐SPI, 1-‐I2C USB 5v power supply An SD card slot for booting up and storage It runs on basic Linux OS like Debian. The raspberry pi doesn’t support analog inputs and an onboard ADC but an external such as the MCP3008 could be used in making connection. The raspberry pi possesses an API for Plotly, which can be found at: https://plot.ly/api/. The raspberry pi supports python as its primary programming language and could be developed using Eclipse and Linux.
Figure 6 Raspberry Pi
3. Beagle bone Black: This is a Linux based single board computer. It is an
open source hardware development platform which has: 1GHz TI Sitara ARM Cortex-‐A8 processor, 512MB DDR3L 400MHz memory, 2GB storage with SD card slot, 10/100 Mbs Ethernet slot, USB 5v and DC Jack power supply The beagle bone black possesses 7 analog inputs with a built in 12-‐bit ADC, which gives a maximum value of 4095. The Beaglebone Black doesn’t currently possess an API for Plotly. The Beaglebone Black supports python as the primary programming language and could be developed using Eclipse and Linux

Wireless Weather Monitor (Michael Onari Lawson-‐Wokoma)
27
Figure 7 Beagle bone Black
Chosen Microcontroller: After careful consideration of the available microcontrollers, The Arduino Uno was chosen as it meets all existing requirements for my design and I have existing knowledge of use. It also gives me the opportunity of taking an advanced step for a better design the Wi-‐Fi shield could be used, which gives the device the ability of connecting to the Internet through WI-‐FI and be stationed at any location provided there is a Wi-‐Fi connection eliminating the wired Ethernet connection.

Wireless Weather Monitor (Michael Onari Lawson-‐Wokoma)
28
Sensors Temperature Sensor: From the requirements of the system, the requirements for the temperature sensor for the design of this project include:
• Operational voltage of 5v • Analog output • Temperature measuring range of 0 C to 50C • Accuracy of 2°C
Available sensors: TMP35 TMP36 TMP37 DHT22 DHT11 BMP085 These sensors provide a voltage output that is linearly proportional to the Celsius temperature. They also do not require external calibration to provide typical accuracies of ±1°C at +25°C and ±2°C, over the −40°C to +125°C temperature range. They have a low voltage operaton of about 2.7 to 5.5 volts
(TMP35): The TMP35 has a linear operation temperature range of 10°C to 125°C (TMP36): The TMP36 has a linear operation temperature range of -‐40°C to 125°C (TMP37): The TMP35 has a linear operation temperature range of 5°C to 100°C
Figure 8 TMP 35/36/37
Chosen Sensor: The TMP36 was chosen in the system design as it has the widest operational temperature range, meets the requirements and it’s currently easy to find on the market.

Wireless Weather Monitor (Michael Onari Lawson-‐Wokoma)
29
Humidity Sensor: From the requirements of the system, the requirements for the humidity sensor for the design of this project include:
• Operational voltage of 5v • Analog output • Humidity measuring range of 0% to 100% • Accuracy of 2%
Available sensors DHT22 DHT11 HIH-‐4030 DHT This is a low cost digital sensor group, which reads both humidity and temperature. The DHT11 is of a lower cost and has the following specifications: Humidity reading range of 20% to 80% with an accuracy of 5% Temperature reading range of 0°C to 50°C with an accuracy of ±2°C The DHT22 has the following specifications: Humidity reading range of 0% to 100% with an accuracy of 2% to 5% Temperature reading range of -‐40°C to 125°C with an accuracy of ±0.5°C
Figure 9 DHT 22/11
HIH-‐4030 This is a Honeywell near linear analog voltage output humidity sensor. This sensor provides a voltage output, which is near linear to the relative humidity. It has a voltage supply range of 4 to 5.8 volts with enhanced accuracy and a fast response time. It has an operational humidity range of 0 to 100% and an operational temperature range of -‐40 to 85 C.

Wireless Weather Monitor (Michael Onari Lawson-‐Wokoma)
30
Figure 10 HIH 40-‐30
Chosen Sensor: The HIH4030 sensor was chosen in the system design as it is an analog sensor with a sufficient voltage intake and has a voltage output which is linearly proportional to the relative humidity. The DHT sensors are digital and so will not be used. Air Pressure Sensor: From the requirements of the system, the requirements for the air pressure sensor for the design of this project include:
• Operational voltage of 5v • Analog output • Pressure measuring range of 89 kPa to 106 kPa • Accuracy of 1kpa
Available sensors BMP085 MPX4115a BMP085: This is an analog barometric pressure sensor, which also has the ability of also measuring temperature. I already chose the TMP36 sensor for reading the temperature and so will only be require this sensor for reading the atmospheric pressure. It has a pressure sensing range of 30 to 110 kPa and a temperature operational range of -‐40 to +85°C operational range, with +-‐2°C temperature accuracy.
Figure 11 BMP085

Wireless Weather Monitor (Michael Onari Lawson-‐Wokoma)
31
MPX4115A: This is a barometric air pressure sensor developed by Freescale. This analog sensor gives a voltage output, which is linearly proportional to the air pressure. It has an operational temperature of -‐40 to 125 C with a 1.5% error over the temperature range of 0C to 85 C It has a pressure sensing range of 15 to 115 kPa and a supply voltage of 4.85 to 5.35 volts. It is fairly accurate with an accuracy of +-‐1.5% between 0 and 85 C.
Figure 12 MPX 4115A
Chosen Sensor: The MPX4115A was chosen for the system design as it possesses a sufficient pressure sensing range, and the voltage output is linearly proportional to the pressure. The BMP085 has a lot of complex calculations in achieving the air pressure.
Display From the requirements of the system, the requirements for the air pressure sensor for the design of this project include:
• Operational voltage of 5v • Ability to display special characters
LCD Display: The (16*2) LCD display was chosen for the system design. This display outputs 16 characters per line and there are 2 lines, with each character in a 5*7 pixel matrix. This is a very basic LCD display and serves the purpose of the project LCDs are more economical, easily programmable and have the ability of displaying special characters.

Wireless Weather Monitor (Michael Onari Lawson-‐Wokoma)
32
Figure 13 16*2 LCD
Other displays considered for the design are listed below: 7-‐segment display: This is a module, which displays digits from 0 to 9 by an arrangement of 8 LED’s in a special pattern. The first 7 are for numerals while the 8th is for decimal point. Using this display module will result in my design being ambiguous and the system will not be able to display special characters.
Figure 14 7 Segment LED
Multi segment LED: These are similar to the 7-‐segment LED display and work on the same principle but have multiple segments. The same problems apply to this also.

Wireless Weather Monitor (Michael Onari Lawson-‐Wokoma)
33
Figure 15 Multi Segment LED
Software
Arduino IDE: This is the current open source software used in compiling and uploading sketches into the Arduino board. Net beans: This is the software I used in the design of the webpage. Fritzing: This is open-‐source simulation software that is available at http://fritzing.org/download/. This software was used in the simulation of the design and drawing the schematic diagram.
Design Improvements For the ease of build and simplicity an attachment of the microcontroller and Breadboard was made to the wooden base in order to hold all elements together for ease of design.
Flow Chart for the Microcontroller Figure 16 shows the working process of the microcontroller in the form of a flow chart. The program behavior is explained as follows: When the device is powered on, the initialization process begins, which initializes all internal and external peripherals such as LCD, Ethernet and Plotly. A webserver is started using the IP and MAC address assigned to the device and the Ethernet connection. The analog sensors take data readings, which are converted to digital by the microcontrollers ADC. Calculations with the readings are processed providing the actual data. Using the Plotly API the data is streamed in JSON format to Plotly. The webserver waits for a client to be connected and data is streamed in JSON format, which is polled for by the webpage.

Wireless Weather Monitor (Michael Onari Lawson-‐Wokoma)
34
Figure 16 Flow-‐Chart

Wireless Weather Monitor (Michael Onari Lawson-‐Wokoma)
35
System Block Diagram
Figure 17 Block Diagram

36
Design Summary This is a short summary of the steps taken in the design of the system:
1. The sensors are attached to the breadboard and connected to the analog input pins of the Arduino Uno.
2. Calculations for outputs are derived from the respective datasheets. 3. The LCD display is connected to the Arduino digital pins to create physical
display for the user. 4. The Arduino Ethernet shield allows Ethernet support and so will be
capable of connecting the device to the Local Area Network. The shield is connected to the microcontroller to enable this process.
5. The HTML GUI is created for display to the user in the form of a webpage. Gauges and graphs showing data are implemented in the HTML GUI.
6. The Arduino and Ethernet shield support the creation of a microcontroller Webserver. An IP and MAC address is assigned to the microcontroller. A webserver running on the microcontroller is then created using the assigned IP and MAC address.
7. The Arduino IDE is the platform used in writing C codes for the calculation and output from the sensors, output to LCD and Web server.
8. The webserver running on the microcontroller transmits data in JSON format
9. Data is transmitted from the microcontroller to Plotly for real time graphing using the given API and the graph is embedded in the webpage holding the HTML GUI.
10. The webpage containing the HTML GUI polls for the JSON data from the Arduino webserver parses the data and outputs it to the user.

Wireless Weather Monitor (Michael Onari Lawson-‐Wokoma)
37
Chapter 6
Build
Introduction The design of this project was taken in stages in other to ensure components worked properly, ease of design and to make improvements to the design. The design was first created and simulated on the Fritzing software first (Figure 18) and then the development of the below schematic diagram was made from which the design was physically built and tests where perfomed for outputs. Snippets of code will be added to the stages respectively for better understanding.
Schematic Diagram
Figure 18 Schematic Diagrams 1

Wireless Weather Monitor (Michael Onari Lawson-‐Wokoma)
38
Figure 19 Schematic Diagrams 2
After developing the schematic, the next procedure was to design, connect the components together and program the microcontroller. Programming the arduino microcontroller involves initializing libraries and variables used in the sketch. Void setup(): This function is called at the start of the sketch and its used to initialize variables, pin modes and start using libraries. This function is only run once when the microcontroller is switched on. Void loop(): This is a function in the sketch which keeps a repeated loop of the sketch. The codes for calculation and output are put into a loop so the microcontroller keeps performing the processes.

Wireless Weather Monitor (Michael Onari Lawson-‐Wokoma)
39
Stage 1 (LCD) Connections: From the LCD data sheet I made the following connections Pin 1 GND to the GND Pin 2 VDD to VCC Pin 3 V0: I used a potentiometer connected to LCD pin V0 to adjust the contrast of the display. Pin 4 RS pin to Arduino pin 7 Pin 5 R/W pin to GND Pin 6 E pin to Arduino pin 8 Pin 7 to 10 DB0 to DB3 are left unconnected Pin 11 DB4 to Arduino pin 9 Pin 12 DB5 to Arduino pin 3 Pin 13 DB6 to Arduino pin 5 Pin 14 DB7 to Arduino pin 6 Pin 15 BL1 to the VCC Pin 16 BL2 to GND Snippets of Code The Arduino has a Library for the LCD display, which needs to be initialized with the data pins set. Library and Initialization: #include <LiquidCrystal.h> LiquidCrystal lcd(7, 8, 9, 3, 5, 6); To debug the 16*2 LCD display to enable functionality of both lines of the display, under function setup() I included the following code: lcd.begin(16, 2); To print data to the LCD: lcd.print(); To set the cursor for the LCD: lcd.setCursor(box number , line); Special characters need specific code to enable display. The temperature is going to be outputted in °C and the degree is a special character. From the LCD character set, the code for the degrees symbol is 11011111. This is the binary for 223. To display this character the following code was entered: lcd.print((char)223); Serial Monitor: When the device is connected to the Arduino IDE, outputs can be viewed on the serial monitor. To ensure accuracy of the performance of all aspects of the microcontroller, during the design stages the output of the device will also be monitored on the serial monitor when connected to the Arduino IDE.
Wireless Weather Monitor (Michael Onari Lawson-‐Wokoma)
40
To debug the serial monitor for full functionality under function setup() the following code is included: Serial.begin(9600); To output data on the serial monitor, the following code is used while in the loop: Serial.print(); For a new line in the serial monitor, the following code is used: Serial.println();
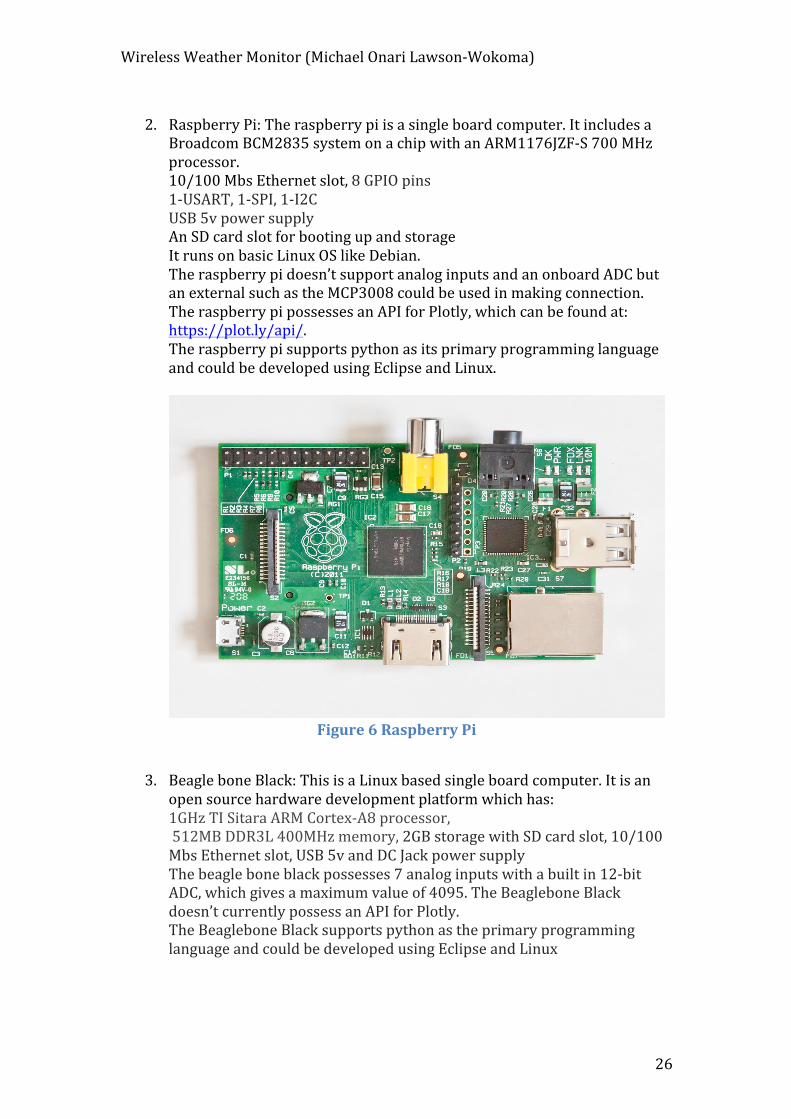
Stage 2 (Temperature Sensor) TMP36 Connection: From the data sheet for TMP36 I connected the sensor as follows: Pin1= VCC Pin2= Data (Analog pin 0)(A0) Pin3= GND The sensor gives a linear output of voltages proportional to its operational temperature, which is of -‐40 to 125 C according to the plot below:
Figure 20 Output Voltage vs Temperature
At 0.5v, temp. = 0C At 1.0v, temp. = 50C At 1.5v, temp. = 100C

Wireless Weather Monitor (Michael Onari Lawson-‐Wokoma)
41
Calculation: First the output voltage is gotten from the sensor with the formula below: V out= (analog input/1024)*5 The following formula thus derives the conversion from output voltage to temperature according to the above graph: Celsius temperature= (V out -‐ 0.5) / 0.01 Kelvin temperature= Celsius temperature + 273 Snippets of code //Initialization: int KelvinTemperature; int CelciusTemperature; //Input: int tempsensorval=analogRead(A0);// Temperature //Calculation and Output: //read analog pin A0 for temperature int tempsensorval=analogRead(A0);// Temperature //Convert the analog reading to voltage float voltage =(tempsensorval/1024.0)*5.0; //Calculates celcius temperature CelciusTemperature = (voltage-‐0.5)/0.01; //Converts the celcius temperature to kelvin KelvinTemperature = CelciusTemperature+273; lcd.setCursor(0,0); lcd.print("T="); lcd.print(CelciusTemperature); lcd.print((char)223); lcd.print("C"); lcd.setCursor(0,1); lcd.print("T="); lcd.print(KelvinTemperature); lcd.print("k");
Stage 3 (Humidity Sensor) HIH-‐4030 Connection From the data sheet for HIH-‐4030 the sensor was connected as follows: Pin1= GND Pin2= Data (Analog pin 1)(A1) Pin3= VCC At 25 C, which is an average indoor temperature and 5 volts power supply, the HIH 4030 gives the following analog voltage outputs, which is linearly proportional to the relative humidity.

Wireless Weather Monitor (Michael Onari Lawson-‐Wokoma)
42
Figure 21 Output Voltage vs. Relative Humidity
At extreme temperature conditions such as 0 C and 70 C, the HIH 4030 gives the following analog voltage outputs.
Figure 22 Output voltage vs. Relative Humidity at Extreme Temperatures

Wireless Weather Monitor (Michael Onari Lawson-‐Wokoma)
43
Calculation: At 5v supply Voltage output at 0% RH = 0.958V Voltage output at 75.3% RH = 3.268V First I calculate the output voltage V out= (analog input/1024)*5 Zero Offset= 0.958V Slope= 30.680mV/%RH = 0.0307 Sensor RH= (V out – Zero offset)/slope =(V out – 0.958)/0.0307 True RH= (Sensor RH)/(1.0546 – 0.00216T)
Where T is temperature in Celsius, which is derived from the TMP36 sensor
Snippets of code //Initialization: int Humidity; //Input: int humiditysensorval=analogRead(A1);//Humidity //Calculation and Output: int humiditysensorval=analogRead(A1);//Humidity //Convert the analog reading to voltage float voltage1= (humiditysensorval/1024.0)*5.0; float SensorRH= (voltage1-‐0.958)/0.0307; //Calculate True humidity with temperature gotten from TMP36 float TrueRH= (SensorRH)/(1.0546-‐ (0.00216*CelciusTemperature)); Humidity= TrueRH; lcd.setCursor(7,0); lcd.print("H="); lcd.print(Humidity); lcd.print("%");
Stage 4(Air Pressure Sensor) MPX4115A Connection: From the data sheet the following connections were made Pin 1= Data (Analog pin 2)(A2) Pin 2= GND Pin 3= VCC Below is the graph of the output voltage, which is linearly proportional to the pressure.

Wireless Weather Monitor (Michael Onari Lawson-‐Wokoma)
44
Figure 23 Output Voltage vs. Absolute Pressure
The temperature error factor for temperature 0 to 80 C is 1, for over 125 C and below -‐40 C the temperature error factor is 3. The device wont be used in such critical conditions of -‐40 C or 125 C, so the temperature error factor is set to 1 Temperature Error factor= 1
Figure 24 Temperature Error Band

Wireless Weather Monitor (Michael Onari Lawson-‐Wokoma)
45
Figure 25 Pressure Error Band
From the graph the pressure error for its operational range is 1.5kPa Error= (1.5* 1*0.009*5) Error= 0.0675 kPa Calculation: First the voltage output was derived V out= (analog input/1024)*5 Voltage supply (Vs.)=5v V out= Vs. (P * 0.009 – 0.095) +-‐(Pressure Error * Temp. factor * 0.009 * Vs.) Therefore P= (((V out/ 5)+0.0095)/0.009) +-‐ Error Snippets of code: //Initialization: int AirPressure; //Input: int pressuresensorval=analogRead(A2);//AirPressure //Calculation and Output: int pressuresensorval=analogRead(A2);//AirPressure //Convert the analog reading to voltage float voltage2= (pressuresensorval/1024.0)*5.0; //Calculate air pressure AirPressure= (((voltage2/5)+0.095)/0.009); lcd.setCursor(7,1); lcd.print("P="); lcd.print(AirPressure); lcd.print("kPa");
-‐

Wireless Weather Monitor (Michael Onari Lawson-‐Wokoma)
46
Prototype of the Design
Figure 26 Device Prototype
Figure 26 shows the design prototype of the system, which is the physical look of the system.
Web Page Design (HTML GUI)
This is the Graphical User Interface provided to the user in the form of html documents. The design of the web pages was done with Net beans. A basic cloud image was used as the background for the webpages and the styling of each page was done with internal style sheets located in the header tag. Displaying sensor data: The data from the sensors will be sent from the microcontroller to the web page through JSON AJAX methods. These values will then be displayed on the Webpage To make the webpage user-‐friendlier an implementation of the GUI in the form of gauges and graphs was made. Mykhailo Stadnyk “https://github.com/Mikhus/canv-‐gauge” created the JavaScript Gauge script and it is available as open source. Each gauge has the corresponding label and unit for which it is measuring.

Wireless Weather Monitor (Michael Onari Lawson-‐Wokoma)
47
Figure 27 Web Gauges
The JavaScript source code for the gauge is located in a gauge.js JavaScript file and is sourced into the script tag of the Head for the webpages. The gauge functions are put into a canvas tag and set to the respective qualities for the measurement of the weather conditions.
Plotly Graphs: Using the Arduino library and API from plotly, graphs were developed and embedded into the webpage using data streamed from the microcontroller. Live data at time intervals from the device are streamed, displayed and stored on the line graph.
Figure 28 Plotly Graphs
Temperature Gauge Humidity Gauge Air Pressure Gauge Maximum value=100 Maximum
Value=100 Maximum value=120
Minimum value= 0 Minimum value= 0 Minimum value= 0
Table 2 Web Gauges Data

Wireless Weather Monitor (Michael Onari Lawson-‐Wokoma)
48
HTML GUI Figure 29 shows the Graphical User Interface presented to the user in the form of a html page.
Figure 29 HTML GUI

Wireless Weather Monitor (Michael Onari Lawson-‐Wokoma)
49
Web server A simple Arduino webserver created by David A. Mellis and modified by Tom Igoe was used in the system design. Through the process of the webserver developed by Tom Igoe HTML values could be sent from the microcontroller to the web. Taking a further step to the design, instead of transmitting HTML values to the web, JSON values can be sent from the microcontroller and polled for by a webpage using a callback technique (Sam Fentress, 2012). Firstly the Ethernet libraries need to be included. The microcontroller needs to be assigned a unique Media Access Control (MAC) address and an Internet Protocol (IP) address to be able to communicate with external devices through the Internet. The Ethernet server also needs to be initialized at a port, this device is set to port 80. #include <SPI.h> #include <Ethernet.h> byte mac[] = 0xDE, 0xAD, 0xBE, 0xEF, 0xFE, 0xED ; IPAddress ip(192,168,129,109); EthernetServer server (80); To enable full functionality the Ethernet and server have to be started under function setup (): Ethernet.begin(mac, ip); server.begin(); The server searches for a new client in each loop, while the client is available it is connected and JSON data is sent from the microcontroller. Below is the webserver code under function loop(): EthernetClient client = server.available(); if (client) boolean currentLineIsBlank = true; while (client.connected()) if (client.available()) char c = client.read(); if (c == '\n' && currentLineIsBlank) client.println("HTTP/1.1 200 OK"); client.println("Content-‐Type: application/json"); client.println(); client.print(""); client.print("\"CelciusTemperature"); client.print("\":"); client.print(CelciusTemperature); client.print(","); client.print("\"KelvinTemperature"); client.print("\":");

Wireless Weather Monitor (Michael Onari Lawson-‐Wokoma)
50
client.print(KelvinTemperature); client.print(","); client.print("\"Humidity"); client.print("\":"); client.print(Humidity); client.print(","); client.print("\"AirPressure"); client.print("\":"); client.print(AirPressure); client.print(""); break; if (c == '\n') currentLineIsBlank = true; else if (c != '\r') currentLineIsBlank = false; delay(1); client.stop();
Webpage Script for getting Arduino data Call Back Technique: This technique gets the JSON data from the microcontroller webserver using the IP address of the microcontroller and JSON AJAX methods. function getData() var data_file ="http://192.168.0.17"; var http_request = new XMLHttpRequest(); try http_request = new XMLHttpRequest(); catch (e) try http_request = new ActiveXObject("Msxml2.XMLHTTP"); catch (e) try http_request = new ActiveXObject("Microsoft.XMLHTTP"); catch (e) alert("Your browser broke!"); return false; http_request.onreadystatechange = function() if (http_request.readyState == 4 ) var jsonObj = JSON.parse(http_request.responseText); document.getElementById("CelciusTemperature").innerHTML = jsonObj.CelciusTemperature;
Wireless Weather Monitor (Michael Onari Lawson-‐Wokoma)
51
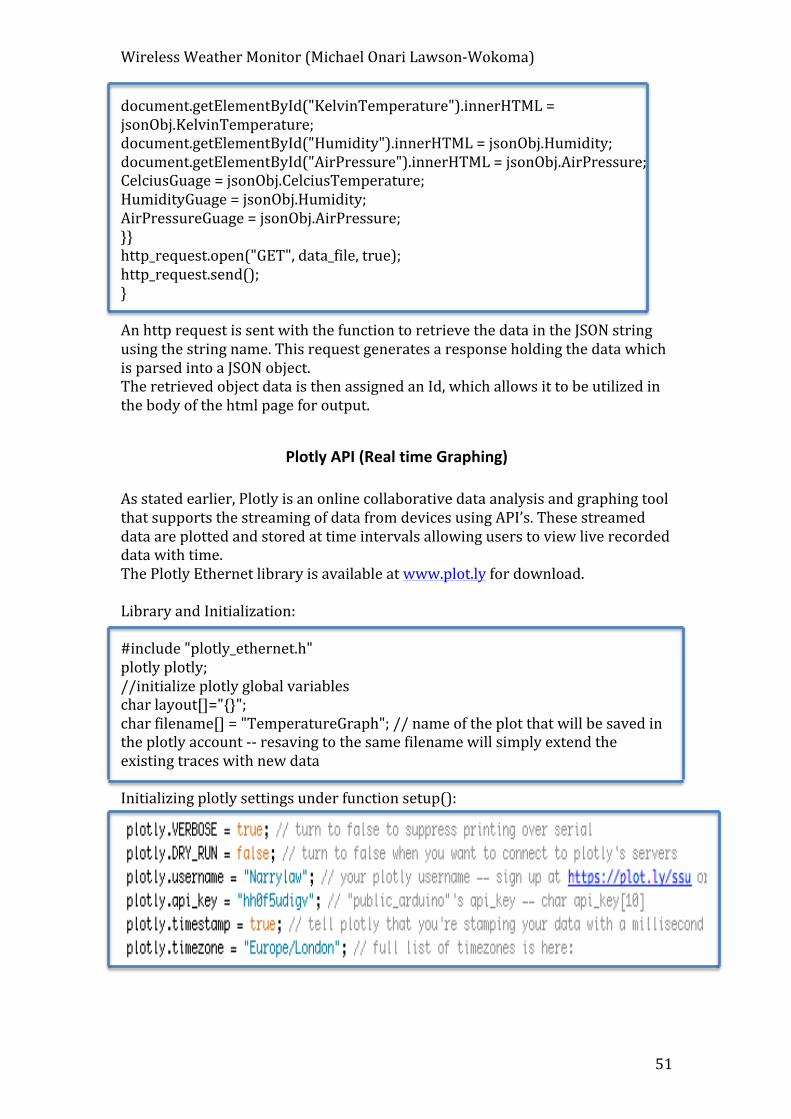
document.getElementById("KelvinTemperature").innerHTML = jsonObj.KelvinTemperature; document.getElementById("Humidity").innerHTML = jsonObj.Humidity; document.getElementById("AirPressure").innerHTML = jsonObj.AirPressure; CelciusGuage = jsonObj.CelciusTemperature; HumidityGuage = jsonObj.Humidity; AirPressureGuage = jsonObj.AirPressure; http_request.open("GET", data_file, true); http_request.send(); An http request is sent with the function to retrieve the data in the JSON string using the string name. This request generates a response holding the data which is parsed into a JSON object. The retrieved object data is then assigned an Id, which allows it to be utilized in the body of the html page for output.
Plotly API (Real time Graphing)
As stated earlier, Plotly is an online collaborative data analysis and graphing tool that supports the streaming of data from devices using API’s. These streamed data are plotted and stored at time intervals allowing users to view live recorded data with time. The Plotly Ethernet library is available at www.plot.ly for download. Library and Initialization: #include "plotly_ethernet.h" plotly plotly; //initialize plotly global variables char layout[]=""; char filename[] = "TemperatureGraph"; // name of the plot that will be saved in the plotly account -‐-‐ resaving to the same filename will simply extend the existing traces with new data Initializing plotly settings under function setup():

Wireless Weather Monitor (Michael Onari Lawson-‐Wokoma)
52
The username and API key are gotten from the user account in plotly. Streaming data to Plotly under function loop(): int nTraces = 3; int nPoints = 1; plotly.open_stream(nPoints, nTraces, filename, layout); // plotlystream(number_of_points, number_of_traces, filename, layout) plotly.post(millis(),CelciusTemperature); // post temperature to plotly (trace 1) delay(150); plotly.post(millis(),Humidity); // post humidity to plotly (trace 2) delay(150); plotly.post(millis(),AirPressure); // post Pressure to plotly (trace 3) delay(150); A delay of 150 milliseconds is added after each post to avoid clashing.
Wireless Weather Monitor (Michael Onari Lawson-‐Wokoma)
53
Chapter 7
Validation
Introduction This chapter will discuss the different testing techniques used to test the developed Wireless Weather Monitor System, the analysis of the tests conducted and the calibration required for the system.
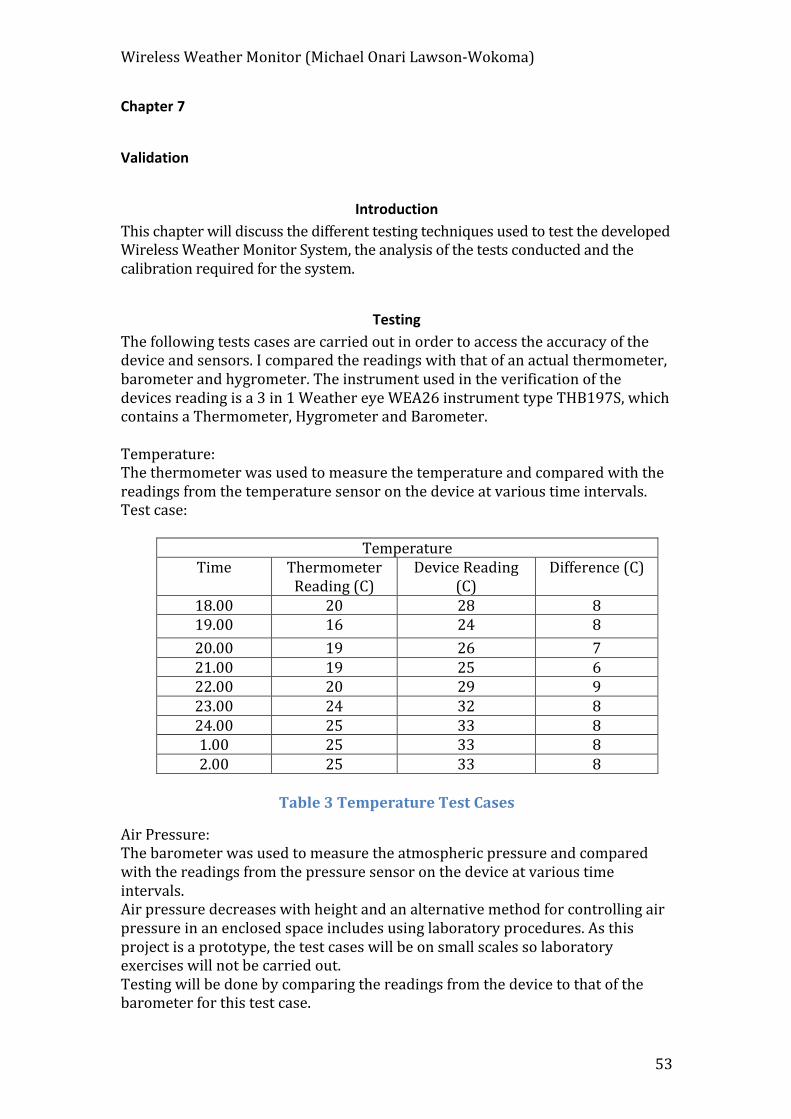
Testing The following tests cases are carried out in order to access the accuracy of the device and sensors. I compared the readings with that of an actual thermometer, barometer and hygrometer. The instrument used in the verification of the devices reading is a 3 in 1 Weather eye WEA26 instrument type THB197S, which contains a Thermometer, Hygrometer and Barometer. Temperature: The thermometer was used to measure the temperature and compared with the readings from the temperature sensor on the device at various time intervals. Test case:
Temperature Time Thermometer
Reading (C) Device Reading
(C) Difference (C)
18.00 20 28 8 19.00 16 24 8 20.00 19 26 7 21.00 19 25 6 22.00 20 29 9 23.00 24 32 8 24.00 25 33 8 1.00 25 33 8 2.00 25 33 8
Table 3 Temperature Test Cases
Air Pressure: The barometer was used to measure the atmospheric pressure and compared with the readings from the pressure sensor on the device at various time intervals. Air pressure decreases with height and an alternative method for controlling air pressure in an enclosed space includes using laboratory procedures. As this project is a prototype, the test cases will be on small scales so laboratory exercises will not be carried out. Testing will be done by comparing the readings from the device to that of the barometer for this test case.

Wireless Weather Monitor (Michael Onari Lawson-‐Wokoma)
54
Air Pressure
Time Barometer Reading (kPa)
Device Reading (kPa)
Difference (kPa)
18.00 100 98 2 19.00 100 99 1 20.00 100 99 1 21.00 100 99 1 22.00 100 99 1 23.00 100 99 1 24.00 100 99 1 1.00 100 99 1 2.00 100 99 1
Table 4 Air Pressure Test Cases
Humidity: Humidity is simply the amount of water vapor in the air and could be measured with a hygrometer. The hygrometer was used to measure the humidity and compared with the readings from the humidity sensor on the device at various time intervals. Test Case:
Humidity Time Hygrometer
Reading (%) Device Reading
(%) Difference (%)
18.00 30 30 0 19.00 30 32 2 20.00 34 32 2 21.00 29 31 2 22.00 28 26 2 23.00 23 25 2 24.00 25 22 3 1.00 25 23 2 2.00 24 22 2
Table 5 Humidity Test Cases
Time taken for reliable readings Following the test cases for accuracy and calibration of the device, Table 6, shows the test cases for the time taken for a reliable reading to occur after the device is switched on, based on the performance requirements. Test No. Thermometer Reading
(C) Device Reading (C) Time Taken (Sec)
1 26 25 3 2 19 21 1 3 16 15 5

Wireless Weather Monitor (Michael Onari Lawson-‐Wokoma)
55
4 19 20 3 5 27 25 4
Test No. Barometer Reading
(kPa) Device Reading
(kPa) Time Taken (Sec)
1 101 100 0 2 101 100 0 3 101 100 0 4 101 101 0 5 100 99 0
Test No. Hygrometer Reading
(%) Device Reading (%) Time Taken (Sec)
1 30 32 0 2 35 34 4 3 25 23 0 4 30 30 6 5 27 25 3
Table 6 Time taken for reliable readings
Test Cases Results Analysis Through the above test cases in Tables 3, 4 & 5 carried out on the system below is an analysis of the results obtained. Temperature: From Table 3, it can be concluded that the temperature sensor TMP36 doesn’t really give the correct measurement. It is quite stable and proportional and only needs to be calibrated downwards in order to achieve the appropriate measurement. Air Pressure: Table 4 shows the test cases for the Air pressure sensor MPX4115a. The sensor is fairly accurate and only needs to be calibrated by about 1 unit upwards in order to achieve the appropriate measurement. Humidity: Table 5 shows the test cases for the humidity sensor. The temperature sensor reading plays a role in determining the humidity by the HIH-‐4030 sensor. There is a minor difference in the test case readings and should be corrected when the temperature sensor is calibrated correctly. Table 6 shows the test cases to ensure reliability of the device by checking the time taken to achieve reliable data when turn on. Below is the analysis of the performance of the system. The performance requirement for the time allowed for reliable readings is 10 seconds.

Wireless Weather Monitor (Michael Onari Lawson-‐Wokoma)
56
The test cases show that the temperature sensor, Air Pressure sensor and Air Pressure satisfy the performance requirements after calibration generating reliable data in under the required 10 seconds.
Calibration After conducting certain test cases, to achieve more reliable results the device had to be calibrated. Below is the calibration for the sensors connected to the device. Using the average of the difference in the readings, the sensors can be calibrated effectively to generate reliable outputs. Temperature Sensor: Readings Total: 70 Number of Readings: 9 Average: 70/9= 7.778 Therefore the TMP36 sensor will be calibrated by a decrease in 7.778 C Air Pressure Sensor: Readings Total: 10 Number of Readings: 9 Average: 10/9= 1.111 Therefore the MPX4115a sensor will be calibrated by an increase in 1.111kPa.
Browser Test Through the use of a HTML GUI, a browser support functionality test is considered. This is done through the use of a support matrix, which tests the most popular browsers gotten from stat counter.
Figure 30 Stat Counter Graph
According to the Figure 30 (Stat Counter Graph) gotten from www.statcounter.com.

Wireless Weather Monitor (Michael Onari Lawson-‐Wokoma)
57
The most used web browsers are thus derived. Support matrix
1. Fully functioning GUI in the browser. 2. Slight changes in the display of the GUI as opposed to the design. 3. Non support of GUI
Problems Identified during Design
1. First design: SD card web server Description: A webserver hosting the webpage containing the HTML GUI was the first design strategy. This webpage is to be saved on the SD card and data will be transferred from the microcontroller to the webpage through the use of Ajax and XML. Problem: The webpage being hosted on the microcontroller limits regular updates being made to it. The SD card initialization failed a couple of times upon test Solution (Final Design): External webserver hosting the webpage Webserver on microcontroller providing data in JSON format Webpage deriving data from microcontroller using JSON callback
2. First design: Serial Monitor Output Description: Printing all data to the serial monitor Problem: Leaving the serial monitor printing in the code increases the amount of tasks the microcontroller has to perform, thereby slowing its performance down. Solution (Final Design): Taking out all serial monitor-‐printing codes. This provides a faster design.
3. Problem:
Interference with data measurement resulting in the device generating wrong data when shook. Solution: To avoid such interference the device should be kept in a stable position without regular movements.
Browser Support Chrome 3
Internet Explorer 3 Firefox 3 Safari 3
Table 7 Browser Support

Wireless Weather Monitor (Michael Onari Lawson-‐Wokoma)
58
Chapter 8
Conclusion and Evaluation
Introduction This chapter gives a critical review of the project. It discusses the project evaluation, which is extent of which the aims and objectives have been achieved and the personal reflection, achievements and contribution to the project. The overall aim of this project was to develop a portable device capable of monitoring weather conditions wirelessly through the use of a microcontroller, which have onboard sensors for the ability to carry out measurements of the following variables:
• Temperature (°C & K) • Humidity (%) • Air Pressure (kPa)
The objectives set to carry out the aim were as follows: Research: To identify the problem area and a solution to tackle it. This involved the use of a literature analysis of the subject area. Build: The use of a design strategy to implement a prototype device capable of carrying out the derived solution. This involved the implementation using the resources in developing the wireless weather monitor. This also involved the development of the HTML GUI capable of receiving data from the microcontroller and outputting to the user through the GUI. Validation: The use of test cases to analyze the device based on the requirements.
Project Evaluation This section judges the success of the project by comparing the final output to the requirements of the system. The literature analysis identified various forms of weather monitors including microcontroller based weather monitors and why a system which implemented a HTML GUI using the Internet as a medium of transfer and access would be a better procedure for tackle the problem with weather monitoring. The design strategy produced a feasible procedure for the system to be implemented through the following processes:
• The use of the arduino microcontroller connected to appropriate sensors for measurements and an LCD for onboard display.
• The use of linearly proportional analog sensors for taking readings.

Wireless Weather Monitor (Michael Onari Lawson-‐Wokoma)
59
• The use of an arduino Ethernet shield for providing access to the Internet through the Ethernet medium. A webserver running on the microcontroller streaming derived data in JSON format to be polled by the webpage containing the HTML GUI.
• The use of arduino’s plotly api for streaming data from the arduino to plotly for real time graphing. The graphs were then embedded into the webpage containing the HTML GUI.
The test cases put the system to critical tests and provided results from the produced system to be compared with the requirements of the system.
Evaluation against Requirements Based on the Functional and Performance Requirements
Requirement Evaluation
The system should be able to measure temperature between 0°C to 50°C
Using the TMP36 temperature sensor gives the system the ability of measuring temperature between the ranges that satisfies the requirement.
The system should be able to measure Atmospheric pressure between 89 kpa and 106 kpa
Using the MPX4115a pressure sensor gives the system the ability of measuring atmospheric pressure between the ranges, which satisfies the requirement.
The system should be able to measure Humidity between 0% and 100%
Using the HIH-‐4030 humidity sensor gives the system the ability of measuring humidity between 0% and 100%, which satisfies the requirement.
The system should be able to be powered by low voltage (5V)
The Arduino microcontroller used in the design is capable of functioning with a 5v power supply. The sensors also have an operational power supply within the range of 5v and provide an analog voltage output of less than 5v.
The system should have internet connectivity
The Arduino Ethernet shield gives the system the ability to connect to the internet using an Ethernet connection. The developed webserver allows the streaming of data in JSON format.
Data should be passed from the microcontroller to the Webpage for viewing on the HTML GUI
A webserver was developed which streams the sensor readings in JSON format. JSON AJAX methods were utilized in the webpage for polling for the streamed data using the IP address assigned to the microcontroller and parsing it to be displayed.
The system should be reliable Following the test cases developed, and appropriate calibration a reliable system for wireless weather monitoring has been

Wireless Weather Monitor (Michael Onari Lawson-‐Wokoma)
60
developed.
The system should have an accuracy of 2 C for temperature 1 kpa for Pressure 2% for humidity
Following the derived test cases, appropriate calibrations were carried out to achieve accuracy of the device to meet its requirements.
The system response time for stable readings should not be greater than 10 seconds
The system is considered reliable according to test cases, which measures the reliability of the system to provide reliable readings in appropriate time shown in Table 6.
Table 8 Requirements Evaluation
Personal Reflection Achievements and Contribution The contribution of the design in this project is the integration of a weather monitor with a GUI. Through the literature analysis a justification for the use of a HTML GUI was derived, which is in the form of a Webpage thereby increasing the availability of access to users. This GUI provides users with a well monitoring system for their environments temperature, humidity and air pressure. Thereby helping in providing knowledge of their environmental conditions and regulative processes could be taken. According to Table 8(Requirements Evaluation), it can be deduced that a reliable and accurate wireless weather monitor prototype design has been achieved in this project. Through the aid of this project, I have been able to develop skills, which I been lacking and needed to work on attaining. During the beginning of this project I had some existing knowledge of working with microcontrollers and very little experience of creating designs with the Arduino microcontroller. This project has given me sufficient experience not only in the working with the related subjects but also in making suitable research and carrying out and presenting assigned tasks in a more professional and logical way. I have been able to utilize this attained research skill to find suitable techniques to attain a better design approach and also fix existing errors when such was needed. Through the help of my supervisor also giving me remarkable assistance, I believe the structure of my work and writing style has improved significantly.

Wireless Weather Monitor (Michael Onari Lawson-‐Wokoma)
61
Benefits of the System
• The device works on low voltage (5V), so could be battery powered and if power failure occurs, it will not be affected.
• Provides users with a display on the device for viewing readings.
• Readings can be viewed remotely via the Internet by using the HTML GUI
• Due to portability weather conditions can be measured at any location as the device could be easily moved.
• Increase and decrease in respective data can be monitored on the graph in the webpage over time.
• Provides a well home weather monitoring system which when utilized properly could save users money on heating bills.
Further Development and Use Thermostats are devices currently used to keep an environment at a desired temperature by controlling heating and cooling units. NEST is example of a central home heating system, which uses thermostat technology to enable users maintain home environment temperatures using one unit. It also gives users the ability to remotely control their home thermostat through the use of the Internet. Reviews from NEST, show that customers could save a lot of money on heating bills when regulative processes are adapted. Devices like NEST provide a well maintenance system for home atmospheric conditions, but lacks in the department of monitoring these conditions. With the collaboration of the developed device in this project and Central home heating systems like NEST, a well maintenance and monitoring system could then be derived as users can view the temperature conditions of their homes and choose to regulate it to their specific needs.

Wireless Weather Monitor (Michael Onari Lawson-‐Wokoma)
62
References
BBC “How warm is your home “(2011) Available at: http://www.bbc.co.uk/news/magazine-‐12606943 BBC “Isobars and Fronts”(2014) Available at: http://www.bbc.co.uk/schools/gcsebitesize/geography/weather_climate/weather_systems_rev2.shtml Website Weather Widget (2014) Available at: http://www.forecast.co.uk Mykhailo Stadnyk (2012) JavaScript Canvas Gauge Available at: https://github.com/Mikhus/canv-‐gauge Arduino Plotly Api (2014) Available at: https://plot.ly/api/ Health and Safety Executive What is thermal for? Visited 15/11/13 Available at: http://www.hse.gov.uk/temperature/thermal/explained.htm Internet Growth Statistics (2014) Available at: http://www.internetworldstats.com/emarketing.htm Weather Underground (2014) Available at: http://www.wunderground.com/weatherstation Margaret Rouse EEPROM Visited on 16/12/13 Available at: http://searchcio-‐midmarket.techtarget.com/definition/EEPROM
Kamarul Ariffin Noordin*, Chow Chee Onn and Mohamad Faizal Ismail (2006) A Low-‐Cost Microcontroller-‐based Weather Monitoring System
M. Benghanem (2010) Renewable Energy Available at: http://www.elsevier.com/locate/renene John Wiley A history of Wireless Technology

Wireless Weather Monitor (Michael Onari Lawson-‐Wokoma)
63
Available at: http://media.johnwiley.com.au/product_data/excerpt/95/04708494/0470849495.pdf Visited on 10/12/13
Kalyanramu Vemishetty (2005) Embedded Wireless Data Acquisition System G.S. Nhivekar, R.R.Mudholker (2011) DATA LOGGER AND REMOTE MONITORING SYSTEM FOR MULTIPLE PARAMETER MEASUREMENT APPLICATIONS M.A.Joshi*, M.R.Jathar**, S.C.Mehrotra* (2011) Distributed System for Weather Data Collection through TINI Microcontroller Arduino Webserver (2014) Available at: http://arduino.cc/en/Tutorial/WebServer W.A.Smith (2013) Arduino SD Card Webserver Available at: http://startingelectronics.com/tutorials/arduino/ethernet-‐shield-‐web-‐server-‐tutorial/SD-‐card-‐web-‐server/ Stat Counter (2014) Available at: http://statcounter.com Sam Fentress (2012) Streaming Arduino Data to a Browser without Flash or Java Available at: http://blog.concord.org/streaming-‐arduino-‐data-‐to-‐a-‐browser
JSON with AJAX (2014) Tutorials Point Available at: http://www.tutorialspoint.com/json/index.htm Rakesh Kumar Mishra, Bharat Lohani AN OBJECT-‐ORIENTED SOFTWARE DEVELOPMENT APPROACH TO DESIGN SIMULATOR FOR AIRBORNE ALTIMETRIC LIDAR Visited on: 25/01/14 Available at: http://home.iitk.ac.in/~blohani/Limulator/publication/Rakesh_Indore_SE.pdf Mohammad A. Rob Dilemma Between the Structured and Object-‐Oriented Approaches to Systems Analysis And Design Visited on: 29/01/14

Wireless Weather Monitor (Michael Onari Lawson-‐Wokoma)
64
Available at: https://mis.uhcl.edu/rob/Professional/Publications/Dilemma%20of%20Structured%20and%20OO%20Methodology.pdf
Appendix A
Source Code Microcontroller Code: //Michael Lawson-‐Wokoma (1133681) //Brunel University //Wireless Weather Monitor #include <SPI.h> #include <Ethernet.h> #include <LiquidCrystal.h> #include "plotly_ethernet.h" LiquidCrystal lcd(7, 8, 9, 3, 5, 6); //Initialization int KelvinTemperature; int CelciusTemperature; int Humidity; int AirPressure; //Plotly Initialization plotly plotly; char layout[]=""; char filename[] = "TemperatureGraph"; // name of the plot that will be saved in your plotly account -‐-‐ resaving to the same filename will simply extend the existing traces with new data //Mac and IP address for the microcontroller byte mac[] = 0xDE, 0xAD, 0xBE, 0xEF, 0xFE, 0xED ; IPAddress ip(192,168,0,17);//ip address set to the microcontroller, also same that would be used in the JSON data poll in the webpage //Ethernet server set at port 80 EthernetServer server(80); void setup() // Open serial communications and wait for port to open: Serial.begin(9600); while (!Serial) ; //Initialize LCD for full functionality lcd.begin(16, 2); // start the Ethernet connection and the server: Ethernet.begin(mac, ip); server.begin(); //Initialize Plotly settings plotly.VERBOSE = true; // turn to false to suppress printing over serial

Wireless Weather Monitor (Michael Onari Lawson-‐Wokoma)
65
plotly.DRY_RUN = true; // turn to false when you want to connect to plotly's servers plotly.username = "Narrylaw"; // your plotly username -‐-‐ sign up at https://plot.ly/ssu or feel free to use this public account. password of the account is "password" plotly.api_key = "hh0f5udigv"; // "public_arduino"'s api_key -‐-‐ char api_key[10] plotly.timestamp = true; // tell plotly that you're stamping your data with a millisecond counter and that you want plotly to convert it into a date-‐formatted graph plotly.timezone = "Europe/London"; // For time stamping according to time zone void loop() //Inputs int tempsensorval=analogRead(A0); int humiditysensorval=analogRead(A1); int pressuresensorval=analogRead(A2); //Calculation // Convert the analog reading to voltage float voltage =(tempsensorval/1024.0)*5.0; //Calculates celcius temperature CelciusTemperature = ((voltage-‐0.5)/0.01)-‐7.778; //Converts the celcius temperature to kelvin KelvinTemperature = CelciusTemperature+273; // Convert the analog reading to voltage float voltage1= (humiditysensorval/1024.0)*5.0; float SensorRH= (voltage1-‐0.958)/0.0307; //Calculate True humidity with temperature gotten from TMP36 float TrueRH= (SensorRH)/(1.0546-‐(0.00216*CelciusTemperature)); Humidity= TrueRH; //Convert the analog reading to voltage float voltage2= (pressuresensorval/1024.0)*5.0; // Calculate air pressure AirPressure= (((voltage2/5)+0.095)/0.009)+1.111; //Output lcd.setCursor(0,0); lcd.print("T="); lcd.print(CelciusTemperature); lcd.print((char)223); lcd.print("C"); lcd.setCursor(0,1); lcd.print("T="); lcd.print(KelvinTemperature); lcd.print("k"); lcd.setCursor(7,0); lcd.print("H="); lcd.print(Humidity); lcd.print("%");

Wireless Weather Monitor (Michael Onari Lawson-‐Wokoma)
66
lcd.setCursor(7,1); lcd.print("P="); lcd.print(AirPressure); lcd.print("kPa"); //Plotly Data Steraming int nTraces = 3; int nPoints = 1; plotly.open_stream(nPoints, nTraces, filename, layout); // plotlystream(number_of_points, number_of_traces, filename, layout) plotly.post(millis(),CelciusTemperature); // post temperature to plotly (trace 1) delay(150); plotly.post(millis(),Humidity); // post humidity to plotly (trace 2) delay(150); plotly.post(millis(),AirPressure); // post Pressure to plotly (trace 3) delay(150); //Websever // listen for incoming clients EthernetClient client = server.available(); if (client) Serial.println("new client"); boolean currentLineIsBlank = true; while (client.connected()) if (client.available()) char c = client.read(); Serial.write(c); if (c == '\n' && currentLineIsBlank) // send a standard http response header client.println("HTTP/1.1 200 OK"); client.println("Content-‐Type: application/json"); client.println(); //JSON string with sensor reading data client.print(""); client.print("\"CelciusTemperature"); client.print("\":"); client.print(CelciusTemperature); client.print(","); client.print("\"KelvinTemperature"); client.print("\":"); client.print(KelvinTemperature); client.print(","); client.print("\"Humidity"); client.print("\":"); client.print(Humidity); client.print(","); client.print("\"AirPressure"); client.print("\":"); client.print(AirPressure); client.print("");

Wireless Weather Monitor (Michael Onari Lawson-‐Wokoma)
67
break; if (c == '\n') currentLineIsBlank = true; else if (c != '\r') currentLineIsBlank = false; // give the web browser time to receive the data delay(1); // close the connection: client.stop(); Serial.println("client disonnected"); Webpage Source Code: <!DOCTYPE html> <html> <head> <title>Wireless Weather Monitor</title> <script src='gauge.js'></script> <script> // call the update function every 100 micro seconds setInterval(getData,100); // function that retrieves updated data from Arduino and update the gauges function getData() var data_file ="http://192.168.0.17";//IP address from microcontroller var http_request = new XMLHttpRequest(); try // Opera 8.0+, Firefox, Chrome, Safari http_request = new XMLHttpRequest(); catch (e) // Internet Explorer Browsers try http_request = new ActiveXObject("Msxml2.XMLHTTP"); catch (e) try http_request = new ActiveXObject("Microsoft.XMLHTTP"); catch (e) // Something went wrong alert("Your browser broke!"); return false;

Wireless Weather Monitor (Michael Onari Lawson-‐Wokoma)
68
http_request.onreadystatechange = function() if (http_request.readyState == 4 ) // Javascript function JSON.parse to parse JSON data from webserver var jsonObj = JSON.parse(http_request.responseText); document.getElementById("CelciusTemperature").innerHTML = jsonObj.CelciusTemperature; document.getElementById("KelvinTemperature").innerHTML = jsonObj.KelvinTemperature; document.getElementById("Humidity").innerHTML = jsonObj.Humidity; document.getElementById("AirPressure").innerHTML = jsonObj.AirPressure; CelciusGuage = jsonObj.CelciusTemperature; HumidityGuage = jsonObj.Humidity; AirPressureGuage = jsonObj.AirPressure; http_request.open("GET", data_file, true); http_request.send(); </script> <style> h1 position:absolute; left:300px; h2.a position:absolute; top:60px; left:50px; h2.b position:absolute; top:60px; left:400px; h2.c position:absolute; top:60px; left:700px; p.a position:absolute;

Wireless Weather Monitor (Michael Onari Lawson-‐Wokoma)
69
top:100px; left:50px; p.b position:absolute; top:130px; left:50px; p.c position:absolute; top:100px; left:400px; p.d position:absolute; top:100px; left:700px; canvas.a position:absolute; top:165px; left:0px; canvas.b position:absolute; top:165px; left:300px; canvas.c position:absolute; top:165px; left:600px; iframe.a position:absolute; top:470px; left:5px; a.a position:absolute; top: 1020px;

Wireless Weather Monitor (Michael Onari Lawson-‐Wokoma)
70
p.e position:absolute; top: 1030px; p.f position:absolute; top: 1050px; </style> </head> <body onload="getData()" background="picture1.jpg"> <h1>Wireless Weather Monitor</h1> <h2 class="a">Thermometer</h2> <p class="a">Temperature(C): <span id="CelciusTemperature">...</span></p> <p class="b">Temperature(K): <span id="KelvinTemperature">...</span></p> <canvas id="gauge_1" width="300" height="300" class="a" data-‐major-‐ticks="0 10 20 30 40 50 60 70 80 90 100" data-‐units="Celcius" data-‐title="Thermometer" data-‐type="canv-‐gauge" data-‐min-‐value="0" data-‐max-‐value="100" data-‐stroke-‐ticks="true" data-‐glow="true" data-‐animation-‐fn="bounce" data-‐onready="setInterval( function() Gauge.Collection.get('gauge_1').setValue(CelciusGuage);,500);"> </canvas> <h2 class="b">Hygrometer</h2> <p class="c"> Humidity(%): <span id="Humidity">...</span></p> <canvas id="gauge_2" width="300" height="300" class="b" data-‐major-‐ticks="0 10 20 30 40 50 60 70 80 90 100" data-‐units="%" data-‐title="Humidity" data-‐type="canv-‐gauge" data-‐min-‐value="0" data-‐max-‐value="100" data-‐stroke-‐ticks="true" data-‐glow="true" data-‐animation-‐fn="bounce" data-‐onready="setInterval( function() Gauge.Collection.get('gauge_2').setValue(HumidityGuage);,500);">

Wireless Weather Monitor (Michael Onari Lawson-‐Wokoma)
71
</canvas> <h2 class="c">Barometer</h2> <p class="d">Air Pressure(kPa): <span id="AirPressure">...</span></p> <canvas id="gauge_3" width="300" height="300" class="c" data-‐major-‐ticks="0 20 40 60 80 100 120" data-‐units="kPa" data-‐title="Air Pressure" data-‐type="canv-‐gauge" data-‐min-‐value="0" data-‐max-‐value="120" data-‐stroke-‐ticks="true" data-‐glow="true" data-‐animation-‐fn="bounce" data-‐onready="setInterval( function() Gauge.Collection.get('gauge_3').setValue(AirPressureGuage);,500);"> </canvas> <iframe class="a" id="igraph" src="https://plot.ly/~Narrylaw/0/1000/550/" width="1000" height="600" seamless="seamless" scrolling="no"></iframe> <a class="a" href='https://home.nest.com'>Nest Login</a> <p class="e">Control the Home Central Heating System by logging into your nest account with the link above</p> <p class="f">Michael Lawson-‐Wokoma (Brunel University)</p> </body> </html>

Wireless Weather Monitor (Michael Onari Lawson-‐Wokoma)
72
Appendix B
Data Sheets Attached to this are the data sheets for hardware materials used in the design of the project as advised by my supervisor. Arduino Datasheet:
EAGLE files: arduino-duemilanove-uno-design.zip Schematic: arduino-uno-schematic.pdf
Microcontroller ATmega328
Operating Voltage 5V
Input Voltage (recommended) 7-12V
Input Voltage (limits) 6-20V
Digital I/O Pins 14 (of which 6 provide PWM output)
Analog Input Pins 6
DC Current per I/O Pin 40 mA
DC Current for 3.3V Pin 50 mA
Flash Memory32 KB of which 0.5 KB used by bootloader
SRAM 2 KB
EEPROM 1 KB
Clock Speed 16 MHz

Wireless Weather Monitor (Michael Onari Lawson-‐Wokoma)
73
16 * 2 LCD Datasheet:
TC1602A-01T
Ver.V00 2009-09-23 www.tinsharp.com - 5 -
INTERFACE PIN FUNCTIONS
ABSOLUTE MAXIMUM RATINGS ( Ta = 25ć )
Parameter Symbol Min Max Unit Supply voltage for logic VDD -0.3 +7.0 V Supply voltage for LCD Vo 0 VDD +0.3 V Input voltage VI -0.3 VDD +0.3 V Normal Operating temperature TOP -20 +70 ć Normal Storage temperature TST -30 +80 ć
Note: Stresses beyond those given in the Absolute Maximum Rating table may cause operational errors or damage to the device. For normal operational conditions see AC/DC Electrical Characteristics.
DC ELECTRICAL CHARACTERISTICS
Parameter Symbol Condition Min TYP Max Unit Supply voltage for logic VDD -- 4.8 5.0 5.2 V Supply current for logic IDD -- -- 120 150 mA
-10ć 25ć 4.8 5.0 5.2 V Operating voltage for LCD VLCD
+60ć Input voltageĀHālevel VIH -- 0.7 VDD -- VDD+0.3 V Input voltage “L” level VIL -- 0 -- 0.2VDD V
LED BACKLIGHT CHARACTERISTICS
COLOR Wavelength ¬p(nm)
Operating Voltage(f0.15V)
Spectral line half width ¬QP
Forward Current (mA)
Yellow-green -- 4.1 -- 100 NOTE: Do not connect +5V directly to the backlight terminals. This will ruin the backlight.
Pin No. Symbol Level Description
1 VSS 0V Ground. 2 VDD +5.0V Power supply for logic operating. 3 V0 -- Adjusting supply voltage for LCD driving.
4 RS H/L A signal for selecting registers: 1: Data Register (for read and write) 0: Instruction Register (for write), Busy flag-Address Counter (for read).
5 R/W H/L R/W = “H”: Read mode. R/W = “L”: Write mode.
6 E H/L An enable signal for writing or reading data. 7 DB0 H/L 8 DB1 H/L 9 DB2 H/L 10 DB3 H/L 11 DB4 H/L 12 DB5 H/L 13 DB6 H/L 14 DB7 H/L
This is an 8-bit bi-directional data bus.
15 LED+ +5.0V Power supply for backlight. 16 LED- 0V The backlight ground.

Wireless Weather Monitor (Michael Onari Lawson-‐Wokoma)
74
TC1602A-01T
Ver.V00 2009-09-23 www.tinsharp.com - 11 -
COMMAND TABLE

Wireless Weather Monitor (Michael Onari Lawson-‐Wokoma)
75
TMP 36 Temperature Sensor:
TC1602A-01T
Ver.V00 2009-09-23 www.tinsharp.com - 15 -
CHARACTER GENERATOR ROM
SPLC780D1-001A:

Wireless Weather Monitor (Michael Onari Lawson-‐Wokoma)
76
TMP35/TMP36/TMP37
Rev. F | Page 3 of 20
SPECIFICATIONS VS = 2.7 V to 5.5 V, −40°C ≤ TA ≤ +125°C, unless otherwise noted.
Table 1. Parameter1 Symbol Test Conditions/Comments Min Typ Max Unit ACCURACY
TMP35/TMP36/TMP37 (F Grade) TA = 25°C ±1 ±2 °C TMP35/TMP36/TMP37 (G Grade) TA = 25°C ±1 ±3 °C TMP35/TMP36/TMP37 (F Grade) Over rated temperature ±2 ±3 °C TMP35/TMP36/TMP37 (G Grade) Over rated temperature ±2 ±4 °C Scale Factor, TMP35 10°C ≤ TA ≤ 125°C 10 mV/°C Scale Factor, TMP36 −40°C ≤ TA ≤ +125°C 10 mV/°C Scale Factor, TMP37 5°C ≤ TA ≤ 85°C 20 mV/°C 5°C ≤ TA ≤ 100°C 20 mV/°C 3.0 V ≤ VS ≤ 5.5 V Load Regulation 0 µA ≤ IL ≤ 50 µA −40°C ≤ TA ≤ +105°C 6 20 m°C/µA −105°C ≤ TA ≤ +125°C 25 60 m°C/µA Power Supply Rejection Ratio PSRR TA = 25°C 30 100 m°C/V 3.0 V ≤ VS ≤ 5.5 V 50 m°C/V Linearity 0.5 °C Long-Term Stability TA = 150°C for 1 kHz 0.4 °C
SHUTDOWN Logic High Input Voltage VIH VS = 2.7 V 1.8 V Logic Low Input Voltage VIL VS = 5.5 V 400 mV
OUTPUT TMP35 Output Voltage TA = 25°C 250 mV TMP36 Output Voltage TA = 25°C 750 mV TMP37 Output Voltage TA = 25°C 500 mV Output Voltage Range 100 2000 mV Output Load Current IL 0 50 µA Short-Circuit Current ISC Note 2 250 µA Capacitive Load Driving CL No oscillations2 1000 10000 pF Device Turn-On Time Output within ±1°C, 100 kΩ||100 pF load2 0.5 1 ms
POWER SUPPLY Supply Range VS 2.7 5.5 V Supply Current ISY (ON) Unloaded 50 µA Supply Current (Shutdown) ISY (OFF) Unloaded 0.01 0.5 µA
1 Does not consider errors caused by self-heating. 2 Guaranteed but not tested.
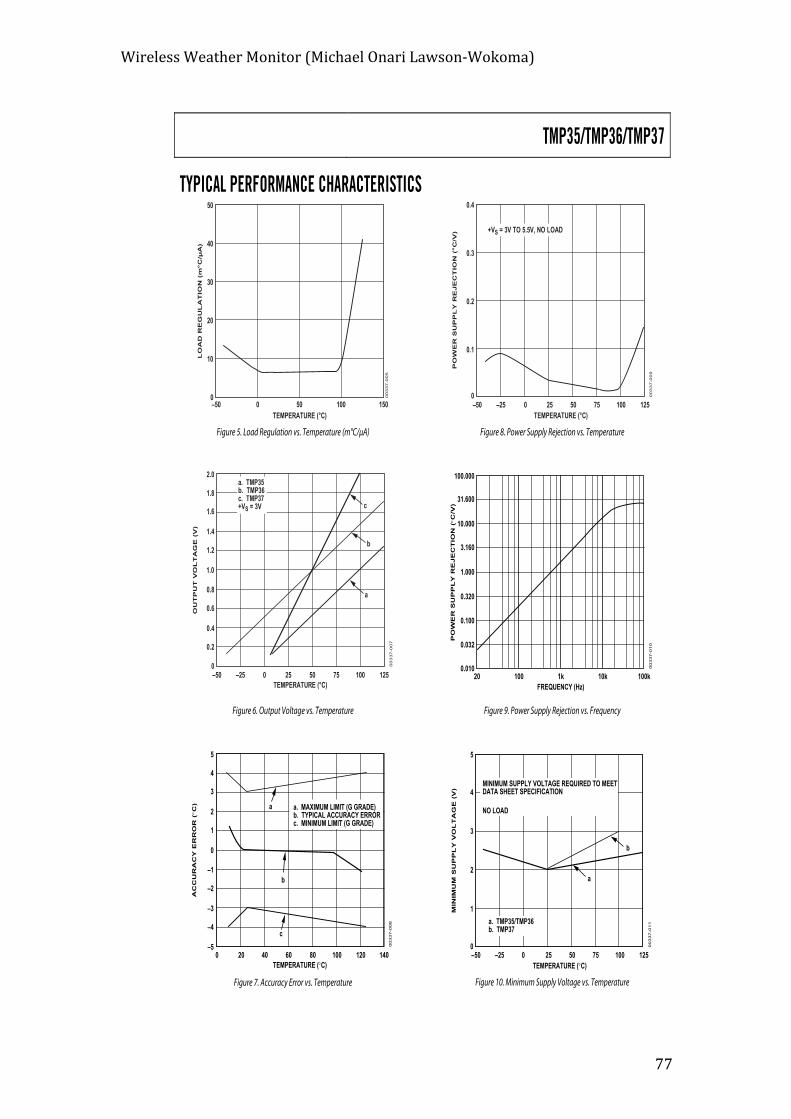
Wireless Weather Monitor (Michael Onari Lawson-‐Wokoma)
77
TMP35/TMP36/TMP37
Rev. F | Page 5 of 20
TEMPERATURE (°C)–50
LO
AD
RE
GU
LA
TIO
N (
m°C
/µA
)TYPICAL PERFORMANCE CHARACTERISTICS
0 50 100 150
50
30
20
10
0
40
TEMPERATURE (°C)
0.4
0.3
0–50 125–25 0 25 50 75 100
0.2
0.1
PO
WE
R S
UP
PL
Y R
EJE
CT
ION
(°C
/V) +VS = 3V TO 5.5V, NO LOAD
00337-009
FREQUENCY (Hz)
100.000
0.01020 100k100 1k 10k
00337-005
Figure 5. Load Regulation vs. Temperature (m°C/µA)
TEMPERATURE (°C)
1.4
0
1.2
1.0
0.8
0.6
0.4
0.2
1.6
1.8
2.0
–50 –25 0 25 50 75 100 125
OU
TP
UT
VO
LT
AG
E (
V)
a
b
c
a. TMP35b. TMP36c. TMP37+VS = 3V
00337-007
Figure 6. Output Voltage vs. Temperature
a. MAXIMUM LIMIT (G GRADE)b. TYPICAL ACCURACY ERRORc. MINIMUM LIMIT (G GRADE)
TEMPERATURE (qC)
2
–5
1
0
–1
–2
–3
–4
3
4
5
0 20 40 60 80 100 120 140
a
b
c
AC
CU
RA
CY
ER
RO
R (qC
)
00337-008
Figure 7. Accuracy Error vs. Temperature
Figure 8. Power Supply Rejection vs. Temperature
31.600
10.000
3.160
1.000
0.320
0.100
0.032
PO
WE
R S
UP
PL
Y R
EJ
EC
TIO
N (qC
/V)
00337-010
Figure 9. Power Supply Rejection vs. Frequency
TEMPERATURE (qC)
4
3
0
2
1
5
–50 125–25 0 25 50 75 100
MIN
IMU
M S
UP
PL
Y V
OL
TA
GE
(V
)
b
a
MINIMUM SUPPLY VOLTAGE REQUIRED TO MEETDATA SHEET SPECIFICATION
NO LOAD
a. TMP35/TMP36b. TMP37
00337-011
Figure 10. Minimum Supply Voltage vs. Temperature
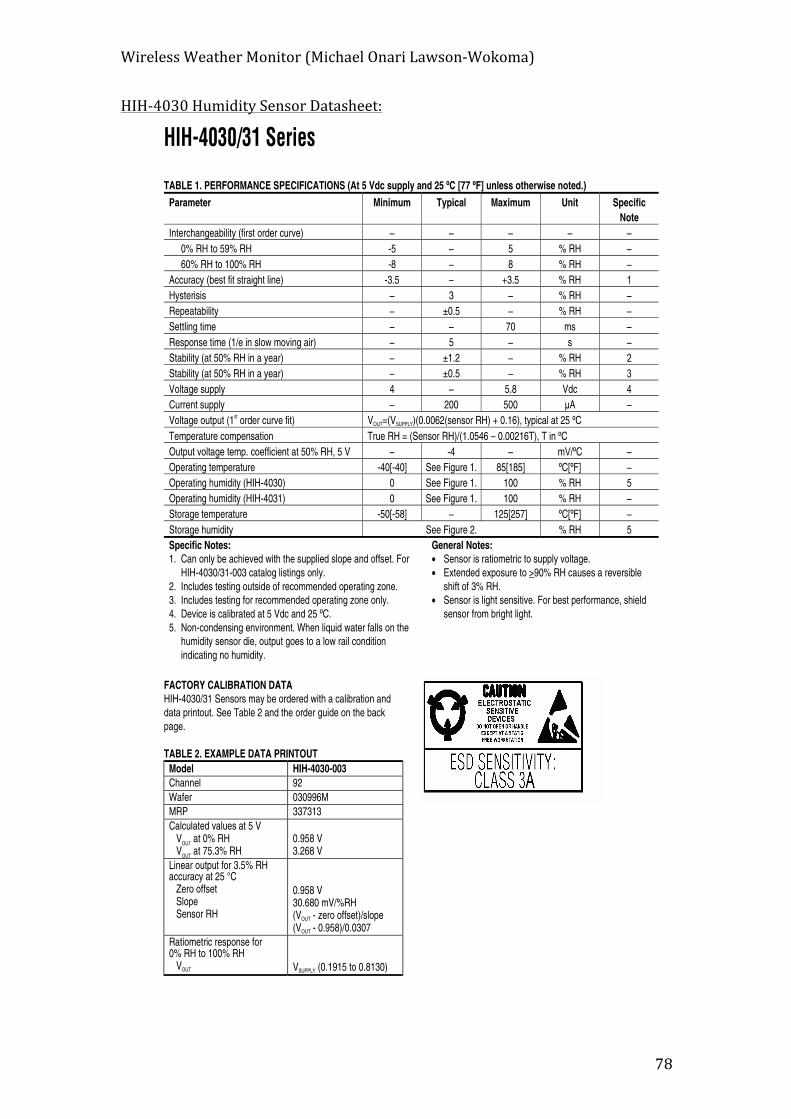
Wireless Weather Monitor (Michael Onari Lawson-‐Wokoma)
78
HIH-‐4030 Humidity Sensor Datasheet:
HIH-4030/31 Series
2 www.honeywell.com/sensing
TABLE 1. PERFORMANCE SPECIFICATIONS (At 5 Vdc supply and 25 ºC [77 ºF] unless otherwise noted.) Parameter Minimum Typical Maximum Unit Specific
Note Interchangeability (first order curve) – – – – –
0% RH to 59% RH -5 – 5 % RH – 60% RH to 100% RH -8 – 8 % RH –
Accuracy (best fit straight line) -3.5 – +3.5 % RH 1 Hysterisis – 3 – % RH – Repeatability – ±0.5 – % RH – Settling time – – 70 ms – Response time (1/e in slow moving air) – 5 – s – Stability (at 50% RH in a year) – ±1.2 – % RH 2 Stability (at 50% RH in a year) – ±0.5 – % RH 3 Voltage supply 4 – 5.8 Vdc 4 Current supply – 200 500 ȝA – Voltage output (1st order curve fit) VOUT=(VSUPPLY)(0.0062(sensor RH) + 0.16), typical at 25 ºC Temperature compensation True RH = (Sensor RH)/(1.0546 – 0.00216T), T in ºC Output voltage temp. coefficient at 50% RH, 5 V – -4 – mV/ºC – Operating temperature -40[-40] See Figure 1. 85[185] ºC[ºF] – Operating humidity (HIH-4030) 0 See Figure 1. 100 % RH 5 Operating humidity (HIH-4031) 0 See Figure 1. 100 % RH – Storage temperature -50[-58] – 125[257] ºC[ºF] – Storage humidity See Figure 2. % RH 5 Specific Notes: 1. Can only be achieved with the supplied slope and offset. For
HIH-4030/31-003 catalog listings only. 2. Includes testing outside of recommended operating zone. 3. Includes testing for recommended operating zone only. 4. Device is calibrated at 5 Vdc and 25 ºC. 5. Non-condensing environment. When liquid water falls on the
humidity sensor die, output goes to a low rail condition indicating no humidity.
General Notes: • Sensor is ratiometric to supply voltage. • Extended exposure to >90% RH causes a reversible
shift of 3% RH. • Sensor is light sensitive. For best performance, shield
sensor from bright light.
FACTORY CALIBRATION DATA HIH-4030/31 Sensors may be ordered with a calibration and data printout. See Table 2 and the order guide on the back page. TABLE 2. EXAMPLE DATA PRINTOUT
Model HIH-4030-003 Channel 92 Wafer 030996M MRP 337313 Calculated values at 5 V VOUT at 0% RH VOUT at 75.3% RH
0.958 V 3.268 V
Linear output for 3.5% RH accuracy at 25 °C Zero offset Slope Sensor RH
0.958 V 30.680 mV/%RH (VOUT - zero offset)/slope (VOUT - 0.958)/0.0307
Ratiometric response for 0% RH to 100% RH VOUT
VSUPPLY (0.1915 to 0.8130)

Wireless Weather Monitor (Michael Onari Lawson-‐Wokoma)
79
Humidity Sensors
Honeywell Sensing and Control 3
FIGURE 1. OPERATING ENVIRONMENT (Non-condensing environment for HIH-4030 catalog listings only.)
FIGURE 2. STORAGE ENVIRONMENT (Non-condensing environment for HIH-4030 catalog listings only.)
0%
10%
20%
30%
50%
40%
60%
70%
80%
90%
100%
-40 20-20 0 40 60 80 100 120 140
Temperature ºCRecommended storage zone

Wireless Weather Monitor (Michael Onari Lawson-‐Wokoma)
80
HIH-4030/31 Series
4 www.honeywell.com/sensing
FIGURE 3. TYPICAL OUTPUT VOLTAGE VS RELATIVE HUMIDITY (At 25 ºC and 5 V.)
0.5
1
1.5
2
2.5
3
3.5
4
0 20 40 60 80 100
Relative Humidity (%RH)
Ou
tpu
t V
olt
age
(Vd
c)
Sensor ResponseSensor ResponseBest Linear Fit
FIGURE 4. TYPICAL OUTPUT VOLTAGE (BFSL) VS RELATIVE HUMIDITY (At 0 ºC, 70 ºC and 5 V.)
0
0.5
1
1.5
2
2.5
3
3.5
4
4.5
0 10 20 30 40 50 60 70 80 90 100
Relative Humidity (%)
Ou
tpu
t V
olt
age
(Vd
c)
0 C70 C

Wireless Weather Monitor (Michael Onari Lawson-‐Wokoma)
81
MPX4115a Air Pressure Sensor Datasheet:
SensorsFreescale Semiconductor 3
MPX4115 SERIES
Table 2. Operating Characteristics (VS = 5.1 Vdc, TA = 25°C unless otherwise noted, P1 > P2 Decoupling circuit shown in Figure 3 required to meet electrical specifications.)
Characteristic Symbol Min Typ Max Unit
Pressure Range(1)
1. 1.0kPa (kiloPascal) equals 0.145 psi.
POP 15 - 115 kPa
Supply Voltage(2)
2. Device is ratiometric within this specified excitation range.
VS 4.85 5.1 5.35 Vdc
Supply Current Io ó 7.0 10 mAdc
Minimum Pressure Offset(3) (0 to 85°C)@ VS = 5.1 Volts
3. Offset (Voff) is defined as the output voltage at the minimum rated pressure.
Voff 0.135 0.204 0.273 Vdc
Full Scale Output(4) (0 to 85°C)@ VS = 5.1 Volts
4. Full Scale Output (VFSO) is defined as the output voltage at the maximum or full rated pressure.
VFSO 4.725 4.794 4.863 Vdc
Full Scale Span(5) (0 to 85°C)@ VS = 5.1 Volts
5. Full Scale Span (VFSS) is defined as the algebraic difference between the output voltage at full rated pressure and the output voltage at the minimum rated pressure.
VFSS ó 4.59 ó Vdc
Accuracy(6) (0 to 85°C)
6. Accuracy (error budget) consists of the following:Linearity:Output deviation from a straight line relationship with pressure, using end point method, over the specified pressure range.Temperature Hysteresis:Output deviation at any temperature within the operating temperature range, after the temperature is cycled to and
from the minimum or maximum operating temperature points, with zero differential pressure applied.Pressure Hysteresis:Output deviation at any pressure within the specified range, when this pressure is cycled to and from the
minimum or maximum rated pressure at 25°C.TcSpan:Output deviation over the temperature range of 0° to 85°C, relative to 25°C.TcOffset:Output deviation with minimum pressure applied, over the temperature range of 0° to 85°C, relative
to 25°C.Variation from Nominal:The variation from nominal values, for Offset or Full Scale Span, as a percent of VFSS at 25°C.
ó ó ó ±1.5 %VFSS
Sensitivity V/P ó 46 ó mV/kPa
Response Time(7)
7. Response Time is defined as the time for the incremental change in the output to go from 10% to 90% of its final value when subjected to a specified step change in pressure.
tR ó 1.0 ó ms
Output Source Current at Full Scale Output lo+ ó 0.1 ó mAdc
Warm-Up Time(8)
8. Warm-up is defined as the time required for the product to meet the specified output voltage after the Pressure has been stabilized.
ó ó 20 ó mSec
Offset Stability(9)
9. Offset stability is the product's output deviation when subjected to 1000 hours of Pulsed Pressure, Temperature Cycling with Bias Test.
ó ó ±0.5 ó %VFSS
Table 3. Mechanical Characteristics
Characteristic Symbol Min Typ Max Unit
Weight, Basic Element (Case 867) ó ó 4.0 ó Grams
Common Mode Line Pressure(1)
1. Common mode pressures beyond what is specified may result in leakage at the case-to-lead interface.
ó ó ó 690 kPa

Wireless Weather Monitor (Michael Onari Lawson-‐Wokoma)
82 Sensors
4 Freescale Semiconductor
MPX4115 SERIES
Figure 2 illustrates the absolute sensing chip in the basic chip carrier (Case 867). A fluorosilicone gel isolates the die surface and wire bonds from the environment, while allowing the pressure signal to be transmitted to the sensor diaphragm. The MPX4115A series pressure sensor operating characteristics, and internal reliability and qualification tests are based on use of dry air as the pressure media. Media, other than dry air, may have adverse effects on
sensor performance and long-term reliability. Contact the factory for information regarding media compatibility in your application.
Figure 4 shows the sensor output signal relative to pressure input. Typical, minimum, and maximum output curves are shown for operation over a temperature range of 0° to 85°C. (The output will saturate outside of the specified pressure range.)
Figure 2. Cross-Sectional Diagram (Not to Scale)
Figure 3. Recommended Power Supply Decoupling.(For output filtering recommendations, please refer to Application Note AN1646.)
Figure 4. Output versus Absolute Pressure
Fluoro SiliconeGel Die Coat Die
P1Metal Cover
Epoxy PlasticCase
Absolute ElementP2
Lead Frame
Wire Bond
DieBond
Stainless Steel
Sealed Vacuum Reference
IPS
1
2
3 OUTPUT
1.0 µF 0.01 µF
+5.0 V
51
01
52
02
53
03
54
04
55
05
56
06
57
07
58
08
59
09
51
00
10
51
10
11
51
20
TRANSFER FUNCTION:Vout = Vs* (.009*P-.095) ± ErrorVS = 5.1 VdcTEMP = 0 to 85°C
Pressure (ref. to sealed vacuum) in kPa
TYP
MAX
MIN
5.04.5
3.5
4.0
3.0
2.5
2.0
1.5
1.0
0
0.5
Out
put (
Vol
ts)

Wireless Weather Monitor (Michael Onari Lawson-‐Wokoma)
83
SensorsFreescale Semiconductor 5
MPX4115 SERIES
Nominal Transfer Value: Vout = VS (P x 0.009 - 0.095) ± (Pressure Error x Temp. Factor x 0.009 x VS) VS = 5.1 V ± 0.25 Vdc
Transfer Function (MPX4115)
MPX4115A Series
Temp Multiplier
- 40 30 to 85 1+125 3
Temperature in C°
4.0
3.0
2.0
0.0
1.0
-40 -20 0 20 40 60 14012010080
TemperatureError
Factor
Temperature Error Band
Pressure Error (Max)
9.0
6.0
3.0
-3.0
-6.0
-9.0
0.0 Pressure (in kPa)
Pre
ssure
Err
or
(kP
a)
15 to 115 (kPa) ±1.5 (kPa)
Pressure Error Band
30 40 50 60 70 80 90 110 12010 20 100