Specific Aims - Emory Theses and Dissertations
227
Page | 1 Distribution Agreement In presenting this Thesis as a partial fulfillment of the requirements for an advanced degree from Emory University, I hereby grant to Emory University and its agents the non-exclusive license to archive, make accessible, and display my Thesis in whole or in part in all forms of media, now or hereafter known, including display on the World Wide Web. I understand that I may select some access restrictions as part of the online submission of this Thesis. I retain all ownership rights to the copyright of the Thesis. I also retain the right to use in future works (such as articles or books) all or part of this Thesis. _______________________________________________________4/19/2012__ Signature of Student Date
-
Upload
khangminh22 -
Category
Documents
-
view
0 -
download
0
Transcript of Specific Aims - Emory Theses and Dissertations

Page | 1
Distribution Agreement
In presenting this Thesis as a partial fulfillment of the requirements for an advanced degree from Emory University, I hereby grant to Emory University and its agents the non-exclusive license to archive, make accessible, and display my Thesis in whole or in part in all forms of media, now or hereafter known, including display on the World Wide Web. I understand that I may select some access restrictions as part of the online submission of this Thesis. I retain all ownership rights to the copyright of the Thesis. I also retain the right to use in future works (such as articles or books) all or part of this Thesis. _______________________________________________________4/19/2012__
Signature of Student Date

Page | 2
HISTORY OF TREATMENT WITH ANTACID MEDICATION INCREASES PREVALENCE OF DIAGNOSIS OF FOOD ALLERGY IN CHILDREN
BY Karen Ann DeMuth
Degree to be awarded: M.P.H. Career MPH
_______________________________________________________4/19/2012__ Kevin Sullivan PhD MPH, MHA Date _______________________________________________________4/19/2012_ Arlene Stecenko, MD Date _______________________________________________________4/19/2012__
Melissa Alperin, MPH, CHES Date

Page | 3
HISTORY OF TREATMENT WITH ANTACID MEDICATION INCREASE PREVALENCE OF
DIAGNOSIS OF FOOD ALLERGY IN CHILDREN
BY
Karen Ann DeMuth M.P.H., Emory University, 2012
M.D., Ross University School of Medicine, 1999 B.S.N., University of Virginia, 1992
Thesis Committee Chair: Kevin Sullivan PhD MPH, MHA
An abstract of A Thesis submitted to the Faculty of the
Rollins School of Public Health of Emory University in partial fulfillment of the requirements of the degree of
Master of Public Health in the Career MPH program 2012

Page | 4
Abstract
HISTORY OF TREATMENT WITH ANTACID MEDICATION INCREASE PREVALENCE OF DIAGNOSIS OF FOOD ALLERGY IN CHILDREN
BY
Karen Ann DeMuth
Background: Food allergy affects 6-8% of preschool children, but factors responsible for food allergy in children are poorly understood. Use of antacid medication may be a contributing factor. Objective: The purpose of this study was to determine if parent-reported antacid medication use was associated with higher prevalence of food allergy in atopic children. Methods: In this cross-sectional study, parents of children with atopic diseases completed a questionnaire relating to a history of treatment with antacid medication and food allergy. Charts were independently reviewed for food specific IgE and/or skin prick test results. Food allergy was defined as a reaction to a food consistent with the anaphylaxis consensus statement and either an elevated food specific IgE or a positive food skin prick test. Results: 104 questionnaires were completed. Mean age of the participating children was 7.0 ± 4.3 years (Range 5 months to 18 years of age). Fifty-four children (41%) were reported to have taken an antacid medication in the past. History of taking antacid medication was associated with an increased prevalence [57% (27/47) versus 32% (18/57) p 0.008] and higher prevalence of food allergy of having food allergy [aPR 1.7 (1.1 – 2.5)]. Mean peanut food specific IgE was higher in those with a history of taking antacid medication (11.0 ± 5.0 versus 1.0 ± 5.5 p = 0.01). Conclusion: History of treatment with antacid medication is associated with an increased prevalence of having food allergy.
Length: 231 words

Page | 5
HISTORY OF TREATMENT WITH ANTACID MEDICATION INCREASE PREVALENCE OF DIAGNOSIS OF FOOD
BY
Karen Ann DeMuth M.P.H., Emory University, 2012
M.D., Ross University School of Medicine, 1999 B.S.N., University of Virginia, 1992
Thesis Committee Chair: Thesis Committee Chair: Kevin Sullivan PhD MPH, MHA
A Thesis submitted to the Faculty of the Rollins School of Public Health of Emory University
in partial fulfillment of the requirements of the degree of Master of Public Health in the Career MPH program
2012

Page | 6
ACKNOWLEDGEMENTS
Many people contributed to the success of this project. I would like to acknowledge them. I
would like to thank my Thesis Committee Chair, Kevin Sullivan PhD MPH, MHA for his help
during all stages of this thesis. Without his help and guidance throughout this project were
invaluable. I would like to thank Arlene Stecenko, MD for her input and support as my field
advisor. I would also like to thank Anne Mentro Fitzpatrick PhD, MSCR, APRN who has been
a wonderful mentor and role model.
Several faculty members also assisted me with this project. Lisa Kobrynski, MD MPH
provided input into the development of the study design, and plan of statistical analysis. Gina
Watts, RN, Patience Jackson, LPN and Shaeshe Schuler helped identify appropriate clinic
patients, and facilitated collection of data. Barbara Reynolds, assisted with the preparation of
the manuscript.
Finally, I would also like to acknowledge the families and children who participated in this
project. Without their time and dedication this project would never have been completed.

Page | 7
Table of Contents
1. Thesis Pages 8 - 21
2. Tables Pages 22 - 23
3. References Page 24 - 25
4. Appendix
a. Questionnaire Pages 26
b. SAS Results with Annotations Page 27 - 228

Page | 8
Introduction:
Food Allergy is estimated to affect 8% of children ≤ 4 years old.[1-3] It is the most common
cause of anaphylaxis in children presenting to the emergency room, with approximately 150
deaths reported in the US due to food allergy each year.[4] The prevalence of food allergy has
increased 18% since 1997.[5] The reasons for the increase in prevalence are poorly defined.
Although some risk factors have been proposed (antacid medication, delay in introduction of
foods, etc.), definitive evidence linking these risk factors to the development of food allergy is
lacking especially in children.
Gastroesophageal reflux (GER) is also very common in this same age group (infants and
young children) and affects 10-30% of that population.[6, 7] Treatment of GER includes use of
antacid medications (Proton Pump inhibitors and H2 blockers), which reduce the amount of
hydrochloric acid produced by the parietal cells in the stomach thereby increasing gastric pH.
There is some evidence linking treatment with antacid medications to development
of food allergy in humans. Use of antacid medication is known to increase sensitization to food
(either skin prick testing or food-specific IgE) in adults.[8] Milk allergy appears to be more
prevalent (41%) in children diagnosed with GERD than what is typically expected in children
(2.5%).9,10 Development of food allergy to hazelnut has been associated with antacid therapy in

Page | 9
both a murine models and human adults.[9] In murine models of food allergy development of
food allergy to seafood and egg has been shown to be related to raising gastric pH.[10, 11]
However, in a recent abstract no association between antacid medication (H2 blockers) and
prevalence of food allergy was found in a cohort of healthy children. Since these studies varied
in methods, population, and definition of food allergy, we felt it was important to determine if the
relationship between antacid medication and food allergy would be maintained in children since
they typically have a higher prevalence of food allergy. We hypothesized that parental report of
antacid medications in children will be associated an increased prevalence of physician-
diagnosed food allergy in children, and conducted a proof of concept study.

Page | 10
Methods:
Study Design: A cross-sectional study design was used to test our hypothesis with the primary
outcome measure was whether parental report of treatment with antacid medication was
associated with increased prevalence in physician diagnosed food allergy.
Secondary measures include: 1. Determining if age at initiation of antacid therapy, or duration
of antacid therapy are associated with increased prevalence of development of food allergy, and
2. determining if there was a difference in parental report of prevalence of life-threatening food
reactions, total IgE levels, or specific IgE levels between those treated and untreated with
antacid medications. We collected questionnaires by convenience sampling.
Subjects: A suggested sample size of 114 was obtained using a power calculation (8%
prevalence rate, an α of 0.05 and 95% confidence level. All children (birth to 18 years of age)
presenting to the Emory Children’s Center Allergy-Immunology Clinic for evaluation for atopic
diseases (asthma, allergic rhinitis, atopic dermatitis, asthma and food allergy) from 2009 to 2010
were eligible for inclusion. Exclusion criteria were: Children with chronic illness other than
atopic diseases, including Eosinophilic Esophagitis without evidence of IgE mediated food
allergy, and those not giving informed consent.
Study Definitions: Food allergy was defined as: a reaction consistent with anaphylaxis according

Page | 11
to the symposium on the definition and management of anaphylaxis summary statement:
[1. Acute onset of symptoms (minutes to hours) with involvement of skin/mucosal tissue and
airway compromise or reduced BP or associated symptoms (e.g., hypotonia, syncope) 2. Two
or more of the following after exposure (minutes to hours) to known allergen for that patient:
skin/mucosal tissue involvement, airway compromise, reduced BP or associated symptoms
(e.g., hypotonia, syncope), gastrointestinal symptoms, or 3. hypotension after exposure (min to
hours) to known allergen for that patient)]14 and food specific IgE (either serum food specific IgE
or skin prick test) or positive open graded food challenge as per practice parameters.15
Children were separated into two categories: 1. Food allergy as previously defined and 2. No
history of food allergy.
Questionnaire: Parent(s) or guardian(s) of all children were asked to complete a questionnaire
with 15 questions that included information on age, gender, diagnosis of GER, treatment with
antacid medication (ever being treated with antacid medication, current treatment with antacid
medication, type of antacid medication, age antacid medication was started, duration of
treatment with antacid medication), diagnosis of food allergy, report of previous history of life-
threatening reaction to a food, and reported physician diagnosis of atopic dermatitis, allergic
rhinitis, and asthma. See addendum.

Page | 12
Additional Data Collected: History of previous reactions to foods was obtained during clinic visit.
Total IgE and food specific IgE determination (egg, milk, peanut, shrimp, soy and wheat) by skin
prick testing and/or serum food specific IgE), and outcome of open graded food challenges were
obtained from the chart and other clinical records by the Primary Investigator (KD)
independently of the completion of the questionnaire in an attempt to blind the investigator to
the results of the questionnaire.
IRB Considerations: The study was approved by the Emory University IRB. Informed consent
was obtained from the parent(s)/guardian(s) of all children participating in the study, verbal
assent was obtained from children 6-10 years old, written assent was obtained from children
11-17 years old.
Statistical Analysis: Means, and frequency percents were calculated. Continuous data was
examined for normal distribution. Data that were not normally distributed (total IgE level, and
specific IgE level) were log transformed prior to analysis and the antilog of the results were
presented. Chi-Square (dichotomous data) and t-test (continuous data) was used to determine
differences between those with and without a history of treatment with antacid medication.
Crude prevalence ratio of parental report of history of treatment with antacid medication and
food allergy, probable food allergy and no food allergy was calculated. An adjusted model was

Page | 13
used to identify factors associated with food allergy. The dependant variable was food allergy
category (food allergy, or no food allergy) and the independent variables included parental
report that child was treated with antacid medication, age, gender, and history of atopic
dermatitis. We used Proc Gen Mod with a backward elimination method. Variables included in
the initial model were guided by previous knowledge of association with food allergy (e.g. young
age, and history of atopic dermatitis). We removed the least significant variable until identifying
the most parsimonious model. Confounding was defined as > 10% difference between the
crude and adjusted estimate. We included all interaction terms (between exposure and all other
variables of interest) to evaluate for interaction using a p < 0.05 to define significant interaction.
An ANOVA analysis was used to determine differences in age at initiation of and length
of therapy with antacid medication between those with food allergy and no food allergy. Chi-
Square (dichotomous data) and t-test (continuous data) were used to determine differences
between those with a history of treatment with antacid medication and those without a history of
treatment with antacid medication including percent of the population with food allergy, age at
diagnosis of food allergy, length of diagnosis with food allergy (years), percent of the population
with a history of life-threatening reactions to food, total IgE, and food specific IgE. All statistical
analysis were computed using SAS 9.2 or OpenEpi.

Page | 14
Results:
One hundred and four participants were invited to complete the questionnaire and
100% completed the questionnaire. Forty-five percent (47/104) had a parental report of
treatment with antacid medication, and 45% (47/104) had a diagnosis of food allergy.
Demographic data for those with and without a history of taking antacid medication is shown in
Table 1. There was no significant difference in age, gender, or percent of population with atopic
diseases (atopic dermatitis, asthma, allergic rhinitis) between those who had ever been treated
with antacid medications and those not treated. Children with a history of ever taking an
antacid medication had a greater prevalence of food allergy 57% (27/47) versus 32% (18/57) p
= 0.008. Crude prevalence ratio for factors potentially associated with prevalence of food
allergy are presented in Table 2. Children with a history of treatment with antacid medication
had greater prevalence of having food allergy. Crude prevalence ratio 1.8 (1.2, 2.9). Age ≤ 5
years of age [crude prevalence ratio 1.7 (1.1, 2.6)], and history of atopic dermatitis [crude
prevalence ratio 2.5 (1.2, 4.9)] were also associated with greater prevalence of food allergy. All
other variables examined were not associated with an increase in prevalence of food allergy.
The results of an adjusted model are shown in Table 2. History of ever having an
antacid medication was associated with increased prevalence of food allergy [adjusted

Page | 15
prevalence ratio 1.7 (1.1, 2.5)]. Atopic dermatitis was also associated with an increased
prevalence of food allergy [adjusted prevalence ratio 2.4 (1.2, 4.7)], and age (≤ 5 years of age)
was associated with a increased prevalence of food allergy [adjusted prevalence ratio 1.5 (1.03,
2.2)].
There was no difference in age at initiation of therapy with antacid medication (2.7 + 4.8 years
vs. 2.8 + 3.4 years p 0.13) or length of therapy with antacid medication (1.2 + 1.8 years vs.
1.3 + 2.0 years p 0.15).
Results of the analysis of the subgroup of individuals with food allergy are presented in
Table 3. Individuals who had ever taken an antacid medication had a higher mean peanut
specific IgE than those who had never taken an antacid medication (11.0 ± 5.0 versus 2.0 ± 5.5
p = 0.01). We found no difference in: percent of food allergic individuals reporting life-
threatening reactions to food, percent of population that are allergic to egg, milk, peanut, shrimp,
soy or wheat, total IgE levels or food specific IgE levels to milk, egg, wheat, soy, or shrimp
between individuals between those reporting ever being treated with antacid medication and
never being treated with antacid medications.
Page | 16
Discussion:
This cross-sectional study in children demonstrates that treatment with antacid
medication was associated with increased of prevalence of food allergy, and higher levels of
peanut specific IgE. The importance of these data is that it strengthens the link between
increased gastric pH and development of food allergy in humans, and has implications for
clinical practice. Previous studies have demonstrated an association between treatment with
antacid medication and development of food sensitization (i.e. positive skin tests and/or specific
IgE) in human adults and mice.[9-11] In a study of 153 adults treated for 3 months with H2
blockers or Proton Pump Inhibitor (PPI) demonstrated that 5/153 (3.3%) developed Hazelnut
specific IgE, and 3/153 (1.9%) had a positive oral food challenge to hazelnuts as compared to
that found in the general population (0.2-0.7%).[9] Using murine models of food allergy, it has
been demonstrated that administration of antacid medication is crucial for the development of
reactivity (reduced body temperature) after food challenge.[9, 11] Our data also lend support to
the idea that treatment with antacid medication is associated with development of food allergy in
children.
A recent abstract examining the effect of H2 blockers in a population of 259 children did not
find any relationship between antacid use and food allergy[12]. There are important differences
Page | 17
between that analysis and the one reported here. That population was obtained mostly from the
general pediatric clinic while this population was obtained from an allergy-immunology clinic and
enriched for atopy, and they focused on use of H2 blockers and did not examine the effect of
PPI’s. There is some evidence that the histamine receptor gene is important in allergy[13-15],
and that stimulation via the histamine H2 receptor reduces both eosinophil and neutrophil
chemotaxis[16], enhances IL10 production[17], inhibits IL13 production[18], inhibits proliferation
of both Th1 and Th2 T-cells[18]. It has been hypothesized that the H2 receptor may be an
important regulator of H1 receptor induced allergic inflammation. We would have liked to look at
the difference in effect between H2 blockers and PPI’s but were unable to do this because of
the small numbers, lack of access to pharmacy data, and inability to collect this data by recall
since many parents were unable to remember the name of the medication used.
We were only able to replicate the increase in IgE levels that has been reported by other
authors for peanut specific IgE. We did not find any differences in total IgE or other food
specific IgE (milk, wheat, soy, or shrimp) between those reporting treatment with antacid
medication and those with no exposure to antacid medication. This pilot study was not
designed or powered to detect these differences, and the numbers of participants with complete
laboratory data was small.

Page | 18
Threats to internal validity include: exposure (history of treatment with antacid medications)
was determined in a retrospective fashion using parental report (possibly introducing reca65ull
bias and making determination of whether the exposure preceded the disease difficult), the
definition of food allergy was not based on double-blind placebo controlled food challenges
(possibly adding misclassification bias), the fact the questionnaire was not validated, and the
small numbers. We were unable to do further analysis on the subgroup that was currently
taking antacid medication due the small numbers (n = 15). Generalization is also limited due to
the fact that this is a pediatric population obtained from a tertiary care center allergy clinic which
specializes in diagnosis and management of food allergy and the population consisted of
children with a personal or family history of atopy.
We feel that the results from this pilot study are valid as the analysis demonstrates that
report of treatment with antacid medication was independently associated with development of
food allergy, and the data are in-line with what previous authors have found in both murine and
human studies.
The results also have biologic plausibility, although the data is unable to elucidate the
mechanism. Eating is known to be a complicated and delicate balance between tolerance and
immune response.[19] Normally, immunologic responses to food protein in the gastrointestinal
Page | 19
(GI) tract are mediated by multiple factors including the strong physical barrier of the GI
epithelium, digestive processes (pH & proteolytic enzymes), T-Cells in the lymphoid gut tissue,
and secretory IgA.[19] Together these processes lead to a general immunosuppressed/tolerant
environment in the gastrointestinal tract. Any abnormalities in this balancing act, such as that
seen by the addition of antacid medication, may lead to lack of tolerance and development of
food allergy. Increasing stomach pH could lead to conformational changes in important food
allergen epitopes, and does lead to decrease efficiency of pepsinogen digestion. Any resultant
changes in protein structure (either conformational or via protein digestion) could lead to
enhanced binding (humoral or cellular) and increased recognition.
The data supports the need for prospective studies (clinical and basic science) to determine
the effects of treatment with antacid medication on development of food allergy and the biologic
mechanism responsible for this association. The clinical studies should address some of the
questions this study raises: 1. Will the relationship be maintained in a more rigorous,
prospective study, 2. Is the increased prevalence across all populations or just those with a
personal/family history of atopy, 3. Is the effect due to treatment with antacid medication or the
gastroesophageal reflux itself, 4. Is this effect related to any antacid medication or just to one
class (such as H2 blockers or PPI’s).

Page | 20
Additional basic science studies are necessary to define the mechanism by which antacid
medications predispose to the development. If a relationship between treatment with antacid
medication and development of food allergy can be clearly be demonstrated, clinicians will need
to consider the risk of development of food allergy with the benefits from treating GER when
starting a child on antacid medications.

Page | 21
Table 1: Demographic and background data*
*Data represents mean ± SD, or frequency % Table 2: Factors associated with prevalence of food allergy
Crude Prevalence Ratio (95% CI)
Adjusted Prevalence Ratio (95% CI)
History of taking antacid medication Yes 1.8 (1.2, 2.9) 1.7 (1.1, 2.5) No (Reference) 1 (-) 1 (-)
History of Atopic Dermatitis Yes 2.5 (1.2, 4.9) 2.4 (1.2, 4.7) No (Reference) 1 (-) 1 (-)
Age ≤ 5 years of age Yes 1.7 (1.1, 2.6) 1.5 (1.03, 2.2) No (Reference) 1 (-) 1 (-)
*CI = Confidence Interval
All participants Population Distribution n (%)
Population that had ever had antacid medication % (95% CI)
n = 47
Population of those that had food allergy % (95% CI)
n = 45
Overall population 104 (100) 45 43%
Diagnosis of food allergy? Yes No
45 (43) 59 (57)
57 (46 - 74) 32 (22 - 46)
Ever having taken antacid medication? Yes No
47 (45) 57 (55)
57 (43 - 72) 32 (20 - 44)
Child’s Age ≤ 5 years old > 5 to 10 years of age ≥ 10 years of age
44 (42) 34 (33) 26 (25)
40 (28 - 53) 55 (40 - 70) 27 (12 - 41)
57 (42 - 71) 35 (19 - 51) 31 (13 - 49)
Child’s Gender Female Male
32 (31) 72 (69)
46 (31 - 62) 39 (29 - 49)
47 (30 - 64) 42 (30 - 53)
% Population with atopic dermatitis Yes No
66 (63) 38 (37)
41 (30 - 51) 50 (33 - 67)
55 (43 - 67) 23 (8 - 37)
% Population with asthma Yes No
69 (66) 35 (34)
43 (33 - 53) 43 (27 - 59)
45 (33 - 57) 34 (17 - 52)
% Population with allergic rhinitis Yes No
46 (44) 58 (56)
43 (29 - 56) 43 (29 - 56)
50 (36 - 64) 33 (20 - 47)

Page | 22
Table 3: Subgroup analysis of participants with food allergy (n = 45) by history of treatment with antacid medication
Never had antacid medication* History of ever taking antacid medication *
p
N 18 27
Age (years) 5.6 ± 5.1 6.1 ± 2.9 0.7
Age (years) at diagnosis of food allergy‡ 2.4 ± 2.7 2.0 ± 1.6 0.6
Time (years) since diagnosis of food allergy 1.3 ± 3.0 3.0 ± 2.0 0.6
Egg allergic n (%) 6/18 (33%) 14/27 (52%) 0.2
Milk allergic n (%) 8/18 (44%) 11/27 (41%) 0.8
Peanut allergic n (%) 12/18 (67%) 13/27 (48%) 0.2
Shellfish allergic n (%) 7/18 (39%) 4/27 (11%) 0.07
Soy allergic n (%) 3/18 (17%) 6/27 (22%) 0.7
Wheat allergic n (%) 2/18 (11%) 6/27 (22%) 0.3
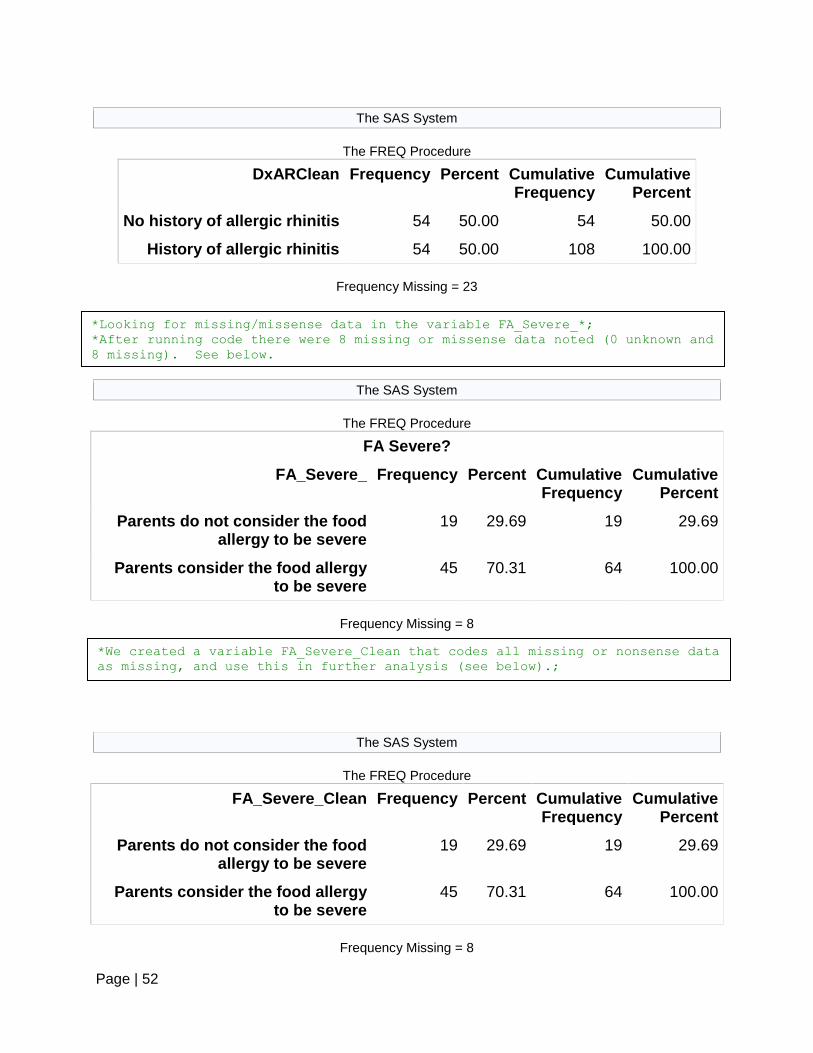
% with history of life-threatening reactions to food 8/18 (44.4%) 15/26 (56%)** 0.7
Food allergy considered severe by parent 11/16 (69%)** 18/24 (75%)‡‡ 0.6
Total IgE‡ 164 ± 4.1 244 ± 4.5 0.5
IgE Egg‡ 2.2 ± 12.2 3.3 ± 5.5 0.7
IgE Milk‡ 1.3 ± 20.1 7.4 ±6.7 0.2
IgE Peanut‡ 2.0 ± 5.5 11.0 ± 5.0 0.01
IgE Soy 4.3 ± 5.0 0.7 ± 0.5 0.2
IgE Shrimp‡ 2.7± 5.5 4.3 ± 24.5 0.8
IgE Wheat‡ 1.5 ± 7.4 2.2 ± 6.7 0.7
*Data represents mean ± SD, or frequency % ‡ Log transformed prior to analysis ** 2 missing response, ‡‡ 3 missing responses
n = 45 n = 59 n = 45 n = 59
Page | 23
References
1. Sicherer, S.H., A. Munoz-Furlong, and H.A. Sampson, Prevalence of peanut and tree nut allergy in the United States determined by means of a random digit dial telephone survey: a 5-year follow-up study. J Allergy Clin Immunol, 2003. 112(6): p. 1203-7.
2. Sampson, H.A., Food allergy. Part 1: immunopathogenesis and clinical disorders. J Allergy Clin Immunol, 1999. 103(5 Pt 1): p. 717-28.
3. Burks, A.W., Peanut allergy. Lancet, 2008. 371(9623): p. 1538-46. 4. Yocum, M.W., et al., Epidemiology of anaphylaxis in Olmsted County: A
population-based study. J Allergy Clin Immunol, 1999. 104(2 Pt 1): p. 452-6. 5. Branum, A.M. and S.L. Lukacs, Food allergy among U.S. children: trends in
prevalence and hospitalizations. NCHS Data Brief, 2008(10): p. 1-8. 6. Sretenovic, A., et al., Gastroesophageal reflux in infants and children. Acta Chir
Iugosl, 2008. 55(1): p. 47-53. 7. Dent, J., et al., Epidemiology of gastro-oesophageal reflux disease: a systematic
review. Gut, 2005. 54(5): p. 710-7. 8. Untersmayr, E., et al., Anti-ulcer drugs promote IgE formation toward dietary
antigens in adult patients. FASEB J, 2005. 19(6): p. 656-8. 9. Scholl, I., et al., Antiulcer drugs promote oral sensitization and hypersensitivity to
hazelnut allergens in BALB/c mice and humans. Am J Clin Nutr, 2005. 81(1): p. 154-60.
10. Untersmayr, E., et al., Antacid medication inhibits digestion of dietary proteins and causes food allergy: a fish allergy model in BALB/c mice. J Allergy Clin Immunol, 2003. 112(3): p. 616-23.
11. Diesner, S.C., et al., Dose-dependent food allergy induction against ovalbumin under acid-suppression: a murine food allergy model. Immunol Lett, 2008. 121(1): p. 45-51.
12. Savides C, H.K., Gruenberg DA, Does early H2 blocker use promote food allergy in children. Journal of Allergy and Clinical Immunology, 2011. 127(2): p. AB111.
13. Horio, S., et al., Interleukin-4 up-regulates histamine H1 receptors by activation of H1 receptor gene transcription. Naunyn Schmiedebergs Arch Pharmacol, 2010. 381(4): p. 305-13.
14. Dinh, Q.T., et al., Transcriptional up-regulation of histamine receptor-1 in epithelial, mucus and inflammatory cells in perennial allergic rhinitis. Clin Exp Allergy, 2005. 35(11): p. 1443-8.
15. Mizuguchi, H., et al., [Histamine H receptor gene as an allergic diseases-sensitive gene and its impact on therapeutics for allergic diseases]. Yakugaku Zasshi, 2011. 131(2): p. 171-8.
16. Akdis, C.A. and F.E. Simons, Histamine receptors are hot in immunopharmacology. Eur J Pharmacol, 2006. 533(1-3): p. 69-76.
17. Osna, N., K. Elliott, and M.M. Khan, Regulation of interleukin-10 secretion by histamine in TH2 cells and splenocytes. Int Immunopharmacol, 2001. 1(1): p. 85-96.

Page | 24
18. Jutel, M., et al., Histamine regulates T-cell and antibody responses by differential expression of H1 and H2 receptors. Nature, 2001. 413(6854): p. 420-5.
19. Mayer, L., Mucosal immunity. Pediatrics, 2003. 111(6 Pt 3): p. 1595-600.

Page | 25
□ New Patient □ Return Patient Age (months): ______________ 1. Was your child ever diagnosed with reflux? □ Yes □ No □ Don’t know 2. Was your child ever given medication to treat reflux? □ Yes □ No □ Don’t know If No or Don’t know skip to Question 7 3. What was the name of the medication given to treat reflux? ___________________ 4. How old (months) was your child when he/she was given this medication? ________ 5. How long (months) was your child treated for reflux? ________________________ 6. Is your child still taking medication for reflux? □ Yes □ No □ Don’t know 7. Has your child ever been diagnosed with: A. Food Allergy: □ Yes □ No □ Don’t know B. Eczema: □ Yes □ No □ Don’t know C. Hay fever (allergic nose): □ Yes □ No □ Don’t know D. Asthma: □ Yes □ No □ Don’t know If no history of food allergy then stop. 8. What food(s) are you allergic to: _________________________________________ 9. How were you diagnosed with food allergy?:
A. Lab testing B. Skin testing C. Other: ________________________________________________________
10. How old were you when you were diagnosed with food allergy? ________________ 11. How long (years)have you had food allergies: _____________________________
Research Staff Only
Food Allergy Diagnosis: A. Clear (+ Test + History)
B. Unclear
C. No food allergy

Page | 26
The SAS System 07:09 Saturday, April 7, 2012 251 The CONTENTS Procedure Data Set Name WORK.FAR Observations 131 Member Type DATA Variables 62 Engine V9 Indexes 0 Created Saturday, April 07, 2012 07:44:58 AM Observation Length 528 Last Modified Saturday, April 07, 2012 07:44:58 AM Deleted Observations 0 Protection Compressed NO Data Set Type Sorted NO Label Data Representation WINDOWS_32 Encoding wlatin1 Western (Windows) Engine/Host Dependent Information Data Set Page Size 16384 Number of Data Set Pages 5 First Data Page 1 Max Obs per Page 30 Obs in First Data Page 16 Number of Data Set Repairs 0 Filename C:\Users\demu2307\AppData\Local\Temp\SAS Temporary Files\_TD5860\far.sas7bdat Release Created 9.0201M0 Host Created W32_VSPRO Alphabetic List of Variables and Attributes # Variable Type Len Format Informat Label AMY Char 1 $1. $1. AMY Age Num 8 Age AgeFAYr Num 8 AgeFAYr CTx Num 8 CTx Disease Num 8 Disease Disease1 Num 8 Disease1 Disease2 Num 8 Disease2 DxAD Num 8 DxAD DxAR Num 8 DxAR DxAsthma Num 8 DxAsthma DxFA Num 8 DxFA EPV_NPV Char 3 $3. $3. EPV/NPV EggAllergy Num 8 EggAllergy Exposure Num 8 Exposure FA Char 97 $97. $97. FA FA_Severe_ Num 8 FA Severe? FamHxAtopy Num 8 FamHxAtopy Gender Num 8 Gender HowDxFA Char 10 $10. $10. HowDxFA IgE Num 8 IgE IgEEgg Num 8 IgEEgg IgEMilk Num 8 IgEMilk IgEPeanut Num 8 IgEPeanut IgESesame Char 1 $1. $1. IgESesame IgEShrimp Num 8 IgEShrimp IgETilapia Num 8 IgETilapia IgEWalnut Char 1 $1. $1. IgEWalnut IgEWheat Num 8 IgEWheat LTR_food Num 8 LTR food LengthFAYr Num 8 LengthFAYr MilkAllergy Num 8 MilkAllergy OtherAllergy Num 8 OtherAllergy PeanutAllergy Num 8 PeanutAllergy
*Data set imported using the File Input Data function*;
*Section of code to clean the data and look for normality*;

Page | 27
ShellfishAllergy Num 8 ShellfishAllergy SoyAllergy Num 8 SoyAllergy Subject__ Num 8 Subject # WheatAllergy Num 8 WheatAllergy
The SAS System 07:09 Saturday, April 7, 2012 254 The FREQ Procedure Age Cumulative Cumulative Age Frequency Percent Frequency Percent ƒƒƒƒƒƒƒƒƒƒƒƒƒƒƒƒƒƒƒƒƒƒƒƒƒƒƒƒƒƒƒƒƒƒƒƒƒƒƒƒƒƒƒƒƒƒƒƒƒƒƒƒƒƒƒƒƒƒ 8.5 1 0.76 88 67.18 8.75 1 0.76 89 67.94 8.83 1 0.76 90 68.70 9 2 1.53 92 70.23 9.08 1 0.76 93 70.99 9.34 1 0.76 94 71.76 9.67 1 0.76 95 72.52 9.75 1 0.76 96 73.28 10 1 0.76 97 74.05 10.17 1 0.76 98 74.81 10.6 1 0.76 99 75.57 10.75 1 0.76 100 76.34 11 5 3.82 105 80.15 11.58 1 0.76 106 80.92 11.75 1 0.76 107 81.68 12 4 3.05 111 84.73 12.75 1 0.76 112 85.50 13 4 3.05 116 88.55 13.34 1 0.76 117 89.31 13.84 1 0.76 118 90.08 13.96 1 0.76 119 90.84 14 4 3.05 123 93.89 14.5 1 0.76 124 94.66 14.75 1 0.76 125 95.42 15 1 0.76 126 96.18 16 1 0.76 127 96.95 16.83 1 0.76 128 97.71 17 1 0.76 129 98.47 17.5 1 0.76 130 99.24 18 1 0.76 131 100.00
The SAS System 07:09 Saturday, April 7, 2012 255
The UNIVARIATE Procedure Variable: Age (Age) Moments N 131 Sum Weights 131 Mean 7.00206107 Sum Observations 917.27 Std Deviation 4.33414222 Variance 18.7847888 Skewness 0.67953939 Kurtosis -0.5532318 Uncorrected SS 8864.8031 Corrected SS 2442.02254 Coeff Variation 61.8980923 Std Error Mean 0.37867576 Basic Statistical Measures Location Variability Mean 7.002061 Std Deviation 4.33414 Median 6.000000 Variance 18.78479 Mode 7.000000 Range 17.58000
*Looking for missing/missense data in the variable age*;
*After running code there was no missing or missense data noted. See below;
*Looking for normality in the variable age*;
*After running code age appeared to be normally distributed. See below;

Page | 28
Interquartile Range 7.10000 Tests for Location: Mu0=0 Test -Statistic- -----p Value------ Student's t t 18.49091 Pr > |t| <.0001 Sign M 65.5 Pr >= |M| <.0001 Signed Rank S 4323 Pr >= |S| <.0001 Tests for Normality Test --Statistic--- -----p Value------ Shapiro-Wilk W 0.928782 Pr < W <0.0001 Kolmogorov-Smirnov D 0.133778 Pr > D <0.0100 Cramer-von Mises W-Sq 0.545356 Pr > W-Sq <0.0050 Anderson-Darling A-Sq 3.171663 Pr > A-Sq <0.0050 Quantiles (Definition 5) Quantile Estimate 100% Max 18.00 99% 17.50 95% 14.75 90% 13.84 75% Q3 10.60 50% Median 6.00 25% Q1 3.50
The SAS System 07:09 Saturday, April 7, 2012 257 The FREQ Procedure AgeFAYr Cumulative Cumulative AgeFAYr Frequency Percent Frequency Percent ƒƒƒƒƒƒƒƒƒƒƒƒƒƒƒƒƒƒƒƒƒƒƒƒƒƒƒƒƒƒƒƒƒƒƒƒƒƒƒƒƒƒƒƒƒƒƒƒƒƒƒƒƒƒƒƒƒƒƒƒ 0.17 2 2.82 2 2.82 0.25 1 1.41 3 4.23 0.34 1 1.41 4 5.63 0.5 4 5.63 8 11.27 0.67 2 2.82 10 14.08 0.75 4 5.63 14 19.72 0.92 3 4.23 17 23.94 1 16 22.54 33 46.48 1.34 1 1.41 34 47.89 1.5 6 8.45 40 56.34 1.67 1 1.41 41 57.75 1.83 1 1.41 42 59.15 2 6 8.45 48 67.61 2.25 1 1.41 49 69.01 2.4 1 1.41 50 70.42 3 3 4.23 53 74.65 4 4 5.63 57 80.28 5 4 5.63 61 85.92 6 3 4.23 64 90.14 7 1 1.41 65 91.55 8 1 1.41 66 92.96 9 2 2.82 68 95.77 11 1 1.41 69 97.18 13 1 1.41 70 98.59
*Looking for missing/missense data in the variable agefayr (age that food
allergy was diagnosed) in those children with a diagnosis of food allergy*;
*After running the code, there is 1 missing data point* I decided to leave
this data point in the analysis*;

Page | 29
16 1 1.41 71 100.00 Frequency Missing = 1 The SAS System 07:09 Saturday, April 7, 2012 258 The UNIVARIATE Procedure Variable: AgeFAYr (AgeFAYr) Moments N 71 Sum Weights 71 Mean 2.7115493 Sum Observations 192.52 Std Deviation 3.11023961 Variance 9.67359042 Skewness 2.26011814 Kurtosis 5.57494451 Uncorrected SS 1199.1788 Corrected SS 677.15133 Coeff Variation 114.703414 Std Error Mean 0.36911753 Basic Statistical Measures Location Variability Mean 2.711549 Std Deviation 3.11024 Median 1.500000 Variance 9.67359 Mode 1.000000 Range 15.83000 Interquartile Range 3.00000 Tests for Location: Mu0=0 Test -Statistic- -----p Value------ Student's t t 7.346032 Pr > |t| <.0001 Sign M 35.5 Pr >= |M| <.0001 Signed Rank S 1278 Pr >= |S| <.0001 Tests for Normality Test --Statistic--- -----p Value------ Shapiro-Wilk W 0.712197 Pr < W <0.0001 Kolmogorov-Smirnov D 0.266535 Pr > D <0.0100 Cramer-von Mises W-Sq 1.329517 Pr > W-Sq <0.0050 Anderson-Darling A-Sq 7.048368 Pr > A-Sq <0.0050 Quantiles (Definition 5) Quantile Estimate 100% Max 16.00 99% 16.00 95% 9.00 90% 6.00 75% Q3 4.00 50% Median 1.50 25% Q1 1.00

Page | 30
The SAS System 07:09 Saturday, April 7, 2012 259 The UNIVARIATE Procedure Variable: AgeFAYr (AgeFAYr) Quantiles (Definition 5) Quantile Estimate 10% 0.50 5% 0.34 1% 0.17 0% Min 0.17 Extreme Observations ----Lowest---- ----Highest--- Value Obs Value Obs 0.17 118 9 4 0.17 5 9 127 0.25 6 11 28 0.34 15 13 30 0.50 126 16 122 Moments N 71 Sum Weights 71 Mean 0.50019332 Sum Observations 35.5137258 Std Deviation 0.99488615 Variance 0.98979845 Skewness 0.18872568 Kurtosis -0.165521 Uncorrected SS 87.0496199 Corrected SS 69.2858915 Coeff Variation 198.900327 Std Error Mean 0.11807126 Basic Statistical Measures Location Variability Mean 0.500193 Std Deviation 0.99489 Median 0.405465 Variance 0.98980 Mode 0.000000 Range 4.54455 Interquartile Range 1.38629 Tests for Location: Mu0=0 Test -Statistic- -----p Value------ Student's t t 4.236368 Pr > |t| <.0001 Sign M 10.5 Pr >= |M| 0.0065 Signed Rank S 472 Pr >= |S| <.0001 Tests for Normality Test --Statistic--- -----p Value------ Shapiro-Wilk W 0.967712 Pr < W 0.0643 Kolmogorov-Smirnov D 0.157224 Pr > D <0.0100 Cramer-von Mises W-Sq 0.211691 Pr > W-Sq <0.0050 Anderson-Darling A-Sq 1.085906 Pr > A-Sq 0.0075
*Looking for normality in the variable AgeFAYr. Only in those with Food
Allergy and Probable Food Allergy.*
*After running code: skewness = 2.26 and Kurtosis = 5.6 so data are not
normally distributed. We will log transform the data to see if this improves
the curve.*;

Page | 31
Quantiles (Definition 5) Quantile Estimate 100% Max 2.772589 99% 2.772589 95% 2.197225 90% 1.791759 75% Q3 1.386294 50% Median 0.405465 25% Q1 0.000000
The SAS System 07:09 Saturday, April 7, 2012 260 The UNIVARIATE Procedure Variable: AgeFAYRLog Moments N 71 Sum Weights 71 Mean 0.50019332 Sum Observations 35.5137258 Std Deviation 0.99488615 Variance 0.98979845 Skewness 0.18872568 Kurtosis -0.165521 Uncorrected SS 87.0496199 Corrected SS 69.2858915 Coeff Variation 198.900327 Std Error Mean 0.11807126 Basic Statistical Measures Location Variability Mean 0.500193 Std Deviation 0.99489 Median 0.405465 Variance 0.98980 Mode 0.000000 Range 4.54455 Interquartile Range 1.38629 Tests for Location: Mu0=0 Test -Statistic- -----p Value------ Student's t t 4.236368 Pr > |t| <.0001 Sign M 10.5 Pr >= |M| 0.0065 Signed Rank S 472 Pr >= |S| <.0001 Tests for Normality Test --Statistic--- -----p Value------ Shapiro-Wilk W 0.967712 Pr < W 0.0643 Kolmogorov-Smirnov D 0.157224 Pr > D <0.0100 Cramer-von Mises W-Sq 0.211691 Pr > W-Sq <0.0050 Anderson-Darling A-Sq 1.085906 Pr > A-Sq 0.0075 Quantiles (Definition 5) Quantile Estimate 100% Max 2.772589 99% 2.772589 95% 2.197225 90% 1.791759 75% Q3 1.386294 50% Median 0.405465
*Log transformed AgeFAYr, and then evaluated for normality in AgeFAYrLog*
**Skewness after log transformation = 0.19, Kurtosis = -0.17, so log
transformation was helpful so we will use the log transformed data in the
analysis and present the anti-log.*;

Page | 32
25% Q1 0.000000 Quantiles (Definition 5) Quantile Estimate 10% -0.693147 5% -1.078810 1% -1.771957 0% Min -1.771957 Extreme Observations ------Lowest------ -----Highest----- Value Obs Value Obs -1.771957 118 2.19722 4 -1.771957 5 2.19722 127 -1.386294 6 2.39790 28 -1.078810 15 2.56495 30 -0.693147 126 2.77259 122
The SAS System 07:09 Saturday, April 7, 2012 262 The FREQ Procedure LengthFAYr Cumulative Cumulative LengthFAYr Frequency Percent Frequency Percent ƒƒƒƒƒƒƒƒƒƒƒƒƒƒƒƒƒƒƒƒƒƒƒƒƒƒƒƒƒƒƒƒƒƒƒƒƒƒƒƒƒƒƒƒƒƒƒƒƒƒƒƒƒƒƒƒƒƒƒƒƒƒƒ 0.13 1 1.52 1 1.52 0.5 3 4.55 4 6.06 0.84 1 1.52 5 7.58 1 8 12.12 13 19.70 1.25 1 1.52 14 21.21 1.34 1 1.52 15 22.73 1.5 3 4.55 18 27.27 1.67 1 1.52 19 28.79 1.75 1 1.52 20 30.30 2 8 12.12 28 42.42 2.5 1 1.52 29 43.94 2.67 1 1.52 30 45.45 3 9 13.64 39 59.09 3.75 1 1.52 40 60.61 4 3 4.55 43 65.15 4.25 1 1.52 44 66.67 4.5 3 4.55 47 71.21 5 3 4.55 50 75.76 6 2 3.03 52 78.79 7 2 3.03 54 81.82 8 1 1.52 55 83.33 8.75 1 1.52 56 84.85 9 4 6.06 60 90.91 9.25 1 1.52 61 92.42 10 1 1.52 62 93.94 10.75 1 1.52 63 95.45 12 1 1.52 64 96.97 13 1 1.52 65 98.48 15.3 1 1.52 66 100.00 Frequency Missing = 6
*Looking for missing/missense data in the variable lengthfayr (length of
diagnosis of food allergy) in those children with a diagnosis of food
allergy*;
*After running the code, there were 6 missing data points for this variable.*;
*Skewness 1.3, Kurtosis 1.1 so normally distributed*;

Page | 33
The SAS System 07:09 Saturday, April 7, 2012 263 The UNIVARIATE Procedure Variable: LengthFAYr (LengthFAYr) Moments N 66 Sum Weights 66 Mean 4.04090909 Sum Observations 266.7 Std Deviation 3.44797141 Variance 11.8885069 Skewness 1.307607 Kurtosis 1.13520083 Uncorrected SS 1850.4634 Corrected SS 772.752945 Coeff Variation 85.3266266 Std Error Mean 0.42441594 Basic Statistical Measures Location Variability Mean 4.040909 Std Deviation 3.44797 Median 3.000000 Variance 11.88851 Mode 3.000000 Range 15.17000 Interquartile Range 3.50000 Tests for Location: Mu0=0 Test -Statistic- -----p Value------ Student's t t 9.521106 Pr > |t| <.0001 Sign M 33 Pr >= |M| <.0001 Signed Rank S 1105.5 Pr >= |S| <.0001 Tests for Normality Test --Statistic--- -----p Value------ Shapiro-Wilk W 0.85241 Pr < W <0.0001 Kolmogorov-Smirnov D 0.209541 Pr > D <0.0100 Cramer-von Mises W-Sq 0.608724 Pr > W-Sq <0.0050 Anderson-Darling A-Sq 3.415469 Pr > A-Sq <0.0050 Quantiles (Definition 5) Quantile Estimate 100% Max 15.30 99% 15.30 95% 10.75 90% 9.00 75% Q3 5.00 50% Median 3.00 25% Q1 1.50

Page | 34
The SAS System 07:09 Saturday, April 7, 2012 264
The UNIVARIATE Procedure Variable: LengthFAYr (LengthFAYr) Quantiles (Definition 5) Quantile Estimate 10% 1.00 5% 0.50 1% 0.13 0% Min 0.13 Extreme Observations ----Lowest---- ----Highest---- Value Obs Value Obs 0.13 17 10.00 23 0.50 19 10.75 112 0.50 14 12.00 89 0.50 13 13.00 18 0.84 107 15.30 5
The SAS System 07:09 Saturday, April 7, 2012 265 The FREQ Procedure IgE Cumulative Cumulative IgE Frequency Percent Frequency Percent ƒƒƒƒƒƒƒƒƒƒƒƒƒƒƒƒƒƒƒƒƒƒƒƒƒƒƒƒƒƒƒƒƒƒƒƒƒƒƒƒƒƒƒƒƒƒƒƒƒƒƒƒƒƒƒƒƒƒ 1 1 1.79 1 1.79 6 2 3.57 3 5.36 11 2 3.57 5 8.93 24 1 1.79 6 10.71 29 1 1.79 7 12.50 36 1 1.79 8 14.29 44 1 1.79 9 16.07 52 1 1.79 10 17.86 58.3 1 1.79 11 19.64 62 1 1.79 12 21.43 73 1 1.79 13 23.21 85 1 1.79 14 25.00 90 1 1.79 15 26.79 93 1 1.79 16 28.57 98 1 1.79 17 30.36 100 1 1.79 18 32.14 100.5 1 1.79 19 33.93 101 1 1.79 20 35.71 102 1 1.79 21 37.50 155 1 1.79 22 39.29 163 1 1.79 23 41.07 203 1 1.79 24 42.86 220 1 1.79 25 44.64 252 1 1.79 26 46.43 265 2 3.57 28 50.00 311 1 1.79 29 51.79 312 1 1.79 30 53.57 314 1 1.79 31 55.36 321 1 1.79 32 57.14 329 1 1.79 33 58.93 364 1 1.79 34 60.71

Page | 35
366 1 1.79 35 62.50 419 1 1.79 36 64.29 454 2 3.57 38 67.86 476 1 1.79 39 69.64 485 1 1.79 40 71.43 621 1 1.79 41 73.21 636 1 1.79 42 75.00 808 1 1.79 43 76.79 810 1 1.79 44 78.57 855 1 1.79 45 80.36 863 1 1.79 46 82.14 1120 1 1.79 47 83.93 1281 1 1.79 48 85.71 1585 1 1.79 49 87.50 1923 1 1.79 50 89.29 1951 1 1.79 51 91.07 1959 1 1.79 52 92.86 2530 1 1.79 53 94.64 3676 1 1.79 54 96.43 4212 1 1.79 55 98.21 5511 1 1.79 56 100.00 Frequency Missing = 16 The UNIVARIATE Procedure Variable: IgE (IgE) Moments N 57 Sum Weights 57 Mean 712.961404 Sum Observations 40638.8 Std Deviation 1122.47634 Variance 1259953.13 Skewness 2.56795961 Kurtosis 6.93454499 Uncorrected SS 99531271.1 Corrected SS 70557375.3 Coeff Variation 157.438584 Std Error Mean 148.675623 Basic Statistical Measures Location Variability Mean 712.9614 Std Deviation 1122 Median 311.0000 Variance 1259953 Mode 6.0000 Range 5510 Interquartile Range 718.00000 NOTE: The mode displayed is the smallest of 4 modes with a count of 2. Tests for Location: Mu0=0 Test -Statistic- -----p Value------ Student's t t 4.795416 Pr > |t| <.0001 Sign M 28.5 Pr >= |M| <.0001 Signed Rank S 826.5 Pr >= |S| <.0001 Tests for Normality Test --Statistic--- -----p Value------ Shapiro-Wilk W 0.64194 Pr < W <0.0001 Kolmogorov-Smirnov D 0.282221 Pr > D <0.0100 Cramer-von Mises W-Sq 1.408704 Pr > W-Sq <0.0050 Anderson-Darling A-Sq 7.324406 Pr > A-Sq <0.0050 Quantiles (Definition 5) Quantile Estimate 100% Max 5511 99% 5511 95% 3676 90% 1959 75% Q3 808 Quantiles (Definition 5)
*Looking for normality in the variable IgE (total IgE) in those children with
a diagnosis of food allergy*;
*Skewness 2.6, Kurtosis = 6.9, so not normally distributed. We will log
transform the variable and present the anti-log.*;

Page | 36
Quantile Estimate 50% Median 311 25% Q1 90 10% 24 5% 6 1% 1 0% Min 1 Extreme Observations ----Lowest---- ----Highest--- Value Obs Value Obs 1 119 2530 21 6 120 2987 58 6 118 3676 23 11 99 4212 110 11 10 5511 122
The SAS System 07:09 Saturday, April 7, 2012 269
The UNIVARIATE Procedure Variable: LogIgE Moments N 57 Sum Weights 57 Mean 5.42207765 Sum Observations 309.058426 Std Deviation 1.77877254 Variance 3.16403174 Skewness -0.6095957 Kurtosis 0.57035853 Uncorrected SS 1852.92456 Corrected SS 177.185777 Coeff Variation 32.8061059 Std Error Mean 0.23560418 Basic Statistical Measures Location Variability Mean 5.422078 Std Deviation 1.77877 Median 5.739793 Variance 3.16403 Mode 1.791759 Range 8.61450 Interquartile Range 2.19475 NOTE: The mode displayed is the smallest of 4 modes with a count of 2. Tests for Location: Mu0=0 Test -Statistic- -----p Value------ Student's t t 23.0135 Pr > |t| <.0001 Sign M 28 Pr >= |M| <.0001 Signed Rank S 798 Pr >= |S| <.0001 Tests for Normality Test --Statistic--- -----p Value------ Shapiro-Wilk W 0.972023 Pr < W 0.2082 Kolmogorov-Smirnov D 0.085466 Pr > D >0.1500 Cramer-von Mises W-Sq 0.059178 Pr > W-Sq >0.2500 Anderson-Darling A-Sq 0.388632 Pr > A-Sq >0.2500 Quantiles (Definition 5) Quantile Estimate 100% Max 8.61450 99% 8.61450 95% 8.20958 90% 7.58019 75% Q3 6.69456
*After running code new Skewness -0.6, Kurtosis = 0.6, so improved.
*We will use the log transformed variable *;

Page | 37
Quantiles (Definition 5) Quantile Estimate 50% Median 5.73979 25% Q1 4.49981 10% 3.17805 5% 1.79176 1% 0.00000 0% Min 0.00000 Extreme Observations ------Lowest----- -----Highest----- Value Obs Value Obs 0.00000 119 7.83597 21 1.79176 120 8.00202 58 1.79176 118 8.20958 23 2.39790 99 8.34569 110 2.39790 10 8.61450 122
The SAS System 07:09 Saturday, April 7, 2012 271 The FREQ Procedure IgEEgg Cumulative Cumulative IgEEgg Frequency Percent Frequency Percent ƒƒƒƒƒƒƒƒƒƒƒƒƒƒƒƒƒƒƒƒƒƒƒƒƒƒƒƒƒƒƒƒƒƒƒƒƒƒƒƒƒƒƒƒƒƒƒƒƒƒƒƒƒƒƒƒƒƒƒ 0 2 7.69 2 7.69 0.08 1 3.85 3 11.54 0.2 1 3.85 4 15.38 0.37 1 3.85 5 19.23 0.72 1 3.85 6 23.08 0.93 1 3.85 7 26.92 1.22 1 3.85 8 30.77 1.39 1 3.85 9 34.62 1.87 1 3.85 10 38.46 2.59 1 3.85 11 42.31 3.24 1 3.85 12 46.15 3.98 1 3.85 13 50.00 4.22 1 3.85 14 53.85 4.57 1 3.85 15 57.69 8.16 1 3.85 16 61.54 11.3 1 3.85 17 65.38 13.3 1 3.85 18 69.23 14.2 1 3.85 19 73.08 15.3 1 3.85 20 76.92 17.3 1 3.85 21 80.77 19.9 1 3.85 22 84.62 21.8 1 3.85 23 88.46 30.79 1 3.85 24 92.31 55 1 3.85 25 96.15 55.7 1 3.85 26 100.00 Frequency Missing = 6 The SAS System 07:09 Saturday, April 7, 2012 274 The UNIVARIATE Procedure Variable: IgEEgg (IgEEgg) Moments N 35 Sum Weights 35 Mean 9.07714286 Sum Observations 317.7 Std Deviation 14.0410383 Variance 197.150756
*Looking for missing/missense data in the variable IgEEgg (Egg Specific IgE)
in those children with a diagnosis of food allergy to egg*;
*After running code, there are 6 missing data points, and 26 with data.*;
*Looking for normality in the variable IgEEgg (Egg Specific IgE) in those
children with a diagnosis of food allergy to Egg*;
*After running the code, Skewness 2.3, Kurtosis 5.3 so not normally
distributed*;
*We will log transform the variable and present the anti-log.

Page | 38
Skewness 2.27160946 Kurtosis 5.33965449 Uncorrected SS 9586.934 Corrected SS 6703.12571 Coeff Variation 154.685659 Std Error Mean 2.37336865 Basic Statistical Measures Location Variability Mean 9.077143 Std Deviation 14.04104 Median 2.590000 Variance 197.15076 Mode 0.000000 Range 55.70000 Interquartile Range 14.10000 Tests for Location: Mu0=0 Test -Statistic- -----p Value------ Student's t t 3.824582 Pr > |t| 0.0005 Sign M 14.5 Pr >= |M| <.0001 Signed Rank S 217.5 Pr >= |S| <.0001 Tests for Normality Test --Statistic--- -----p Value------ Shapiro-Wilk W 0.678529 Pr < W <0.0001 Kolmogorov-Smirnov D 0.258987 Pr > D <0.0100 Cramer-von Mises W-Sq 0.643956 Pr > W-Sq <0.0050 Anderson-Darling A-Sq 3.747415 Pr > A-Sq <0.0050 Quantiles (Definition 5) Quantile Estimate 100% Max 55.70 99% 55.70 95% 55.00 90% 21.80 75% Q3 14.20 50% Median 2.59 25% Q1 0.10 Quantiles (Definition 5) Quantile Estimate 10% 0.00 5% 0.00 1% 0.00 0% Min 0.00 Extreme Observations ----Lowest---- ----Highest---- Value Obs Value Obs 0 122 19.90 20 0 116 21.80 126 0 100 30.79 107 0 99 55.00 25 0 27 55.70 110 The SAS System 07:09 Saturday, April 7, 2012 276 The UNIVARIATE Procedure Variable: LogIgEEgg
*After log transforming data and running the code. The new Skewness -0.6, and
Kurtosis -0.7, which is improved. We will use the log transformed variable.

Page | 39
Moments N 29 Sum Weights 29 Mean 1.15329051 Sum Observations 33.4454248 Std Deviation 2.01192119 Variance 4.04782688 Skewness -0.5737844 Kurtosis -0.6879783 Uncorrected SS 151.911444 Corrected SS 113.339153 Coeff Variation 174.450511 Std Error Mean 0.37360439 Basic Statistical Measures Location Variability Mean 1.153291 Std Deviation 2.01192 Median 1.439835 Variance 4.04783 Mode . Range 7.01571 Interquartile Range 2.80042 Tests for Location: Mu0=0 Test -Statistic- -----p Value------ Student's t t 3.08693 Pr > |t| 0.0045 Sign M 6.5 Pr >= |M| 0.0241 Signed Rank S 124.5 Pr >= |S| 0.0049 Tests for Normality Test --Statistic--- -----p Value------ Shapiro-Wilk W 0.937267 Pr < W 0.0850 Kolmogorov-Smirnov D 0.144211 Pr > D 0.1240 Cramer-von Mises W-Sq 0.097092 Pr > W-Sq 0.1201 Anderson-Darling A-Sq 0.617865 Pr > A-Sq 0.0981 Quantiles (Definition 5) Quantile Estimate 100% Max 4.0199801 99% 4.0199801 95% 4.0073332 90% 3.4271900 75% Q3 2.7278528 50% Median 1.4398351 25% Q1 -0.0725 Quantiles (Definition 5) Quantile Estimate 10% -2.3025851 5% -2.5257286 1% -2.9957323 0% Min -2.9957323 Extreme Observations ------Lowest----- -----Highest----- Value Obs Value Obs -2.99573 4 2.99072 20 -2.52573 119 3.08191 126 -2.30259 3 3.42719 107 -1.60944 120 4.00733 25 -1.51413 95 4.01998 110

Page | 40
The SAS System 07:09 Saturday, April 7, 2012 278 The FREQ Procedure IgEMilk Cumulative Cumulative IgEMilk Frequency Percent Frequency Percent ƒƒƒƒƒƒƒƒƒƒƒƒƒƒƒƒƒƒƒƒƒƒƒƒƒƒƒƒƒƒƒƒƒƒƒƒƒƒƒƒƒƒƒƒƒƒƒƒƒƒƒƒƒƒƒƒƒƒƒƒ 0 1 5.88 1 5.88 0.05 1 5.88 2 11.76 0.45 1 5.88 3 17.65 1.09 1 5.88 4 23.53 2.36 1 5.88 5 29.41 6.11 1 5.88 6 35.29 17.1 1 5.88 7 41.18 17.2 1 5.88 8 47.06 17.4 1 5.88 9 52.94 19.9 1 5.88 10 58.82 30.8 1 5.88 11 64.71 46.2 1 5.88 12 70.59 48.1 1 5.88 13 76.47 51.07 1 5.88 14 82.35 96 1 5.88 15 88.24 100 2 11.76 17 100.00 Frequency Missing = 8 The SAS System 07:09 Saturday, April 7, 2012 279 The UNIVARIATE Procedure Variable: IgEMilk (IgEMilk) Moments N 27 Sum Weights 27 Mean 21.0522222 Sum Observations 568.41 Std Deviation 32.0150177 Variance 1024.96136 Skewness 1.70370624 Kurtosis 1.85425256 Uncorrected SS 38615.2889 Corrected SS 26648.9953 Coeff Variation 152.074291 Std Error Mean 6.16129302 Basic Statistical Measures Location Variability Mean 21.05222 Std Deviation 32.01502 Median 4.23000 Variance 1025 Mode 0.00000 Range 100.00000 Interquartile Range 30.70000 Tests for Location: Mu0=0 Test -Statistic- -----p Value------ Student's t t 3.416851 Pr > |t| 0.0021 Sign M 11.5 Pr >= |M| <.0001 Signed Rank S 138 Pr >= |S| <.0001 Tests for Normality Test --Statistic--- -----p Value------ Shapiro-Wilk W 0.68926 Pr < W <0.0001 Kolmogorov-Smirnov D 0.271014 Pr > D <0.0100 Cramer-von Mises W-Sq 0.589306 Pr > W-Sq <0.0050 Anderson-Darling A-Sq 3.332742 Pr > A-Sq <0.0050 Quantiles (Definition 5)
*Looking for missing/missense data in the variable IgEMilk (Milk Specific IgE)
in those children with a diagnosis of food allergy*;
*There are 8 missing data for children with food allergy to milk.*;
*Looking for normality in the variable IgEMilk (Milk Specific IgE) in those
children with a diagnosis of food allergy to Milk*;
*After running the code, *Skewness 1.7, Kurtosis 1.9, so +/- normal
distribution*;
*We will log transform the variable and present the anti-log.

Page | 41
Quantile Estimate 100% Max 100.00 99% 100.00 95% 100.00 90% 96.00 75% Q3 30.80 50% Median 4.23 25% Q1 0.10 Quantiles (Definition 5) Quantile Estimate 10% 0.00 5% 0.00 1% 0.00 0% Min 0.00 Extreme Observations ----Lowest---- -----Highest---- Value Obs Value Obs 0.00 116 48.10 104 0.00 100 51.07 90 0.00 99 96.00 20 0.00 27 100.00 25 0.05 8 100.00 106
The SAS System 07:09 Saturday, April 7, 2012 281
The UNIVARIATE Procedure Variable: LogIgEMilk Moments N 23 Sum Weights 23 Mean 1.64134636 Sum Observations 37.7509662 Std Deviation 2.39035395 Variance 5.71379203 Skewness -0.6168923 Kurtosis -0.6062491 Uncorrected SS 187.665835 Corrected SS 125.703425 Coeff Variation 145.633732 Std Error Mean 0.49842325 Basic Statistical Measures Location Variability Mean 1.64135 Std Deviation 2.39035 Median 1.82777 Variance 5.71379 Mode -2.99573 Range 7.60090 Interquartile Range 3.74680 NOTE: The mode displayed is the smallest of 2 modes with a count of 2. Tests for Location: Mu0=0 Test -Statistic- -----p Value------ Student's t t 3.293077 Pr > |t| 0.0033 Sign M 6.5 Pr >= |M| 0.0106 Signed Rank S 89 Pr >= |S| 0.0041 Tests for Normality Test --Statistic--- -----p Value------ Shapiro-Wilk W 0.922045 Pr < W 0.0737 Kolmogorov-Smirnov D 0.1701 Pr > D 0.0834 Cramer-von Mises W-Sq 0.074627 Pr > W-Sq 0.2368 Anderson-Darling A-Sq 0.530838 Pr > A-Sq 0.1616 Quantiles (Definition 5) Quantile Estimate 100% Max 4.6051702 99% 4.6051702 95% 4.6051702 90% 4.5643482
*After log transforming data and running the code. The new Skewness is -0.6,
Kurtosis -0.6, which is improved. We will use the log transformed data in
analysis, and present the antilog.

Page | 42
75% Q3 3.8329798 Quantiles (Definition 5) Quantile Estimate 50% Median 1.8277699 25% Q1 0.0861777 10% -2.3025851 5% -2.9957323 1% -2.9957323 0% Min -2.9957323 Extreme Observations ------Lowest------ -----Highest----- Value Obs Value Obs -2.995732 8 3.87328 104 -2.995732 4 3.93320 90 -2.302585 3 4.56435 20 -0.798508 103 4.60517 25 -0.527633 122 4.60517 106 The SAS System 14:54 Saturday, April 7, 2012 32 The UNIVARIATE Procedure Variable: IgEPeanut (IgEPeanut) Moments N 47 Sum Weights 47 Mean 18.9765957 Sum Observations 891.9 Std Deviation 31.0822844 Variance 966.108406 Skewness 1.99586954 Kurtosis 2.7201757 Uncorrected SS 61366.2124 Corrected SS 44440.9867 Coeff Variation 163.792731 Std Error Mean 4.53381715 Basic Statistical Measures Location Variability Mean 18.97660 Std Deviation 31.08228 Median 4.57000 Variance 966.10841 Mode 0.00000 Range 100.00000 Interquartile Range 19.24000 Tests for Location: Mu0=0 Test -Statistic- -----p Value------ Student's t t 4.185567 Pr > |t| 0.0001 Sign M 20 Pr >= |M| <.0001 Signed Rank S 410 Pr >= |S| <.0001 Tests for Normality Test --Statistic--- -----p Value------ Shapiro-Wilk W 0.624412 Pr < W <0.0001 Kolmogorov-Smirnov D 0.289674 Pr > D <0.0100 Cramer-von Mises W-Sq 1.279535 Pr > W-Sq <0.0050 Anderson-Darling A-Sq 7.119778 Pr > A-Sq <0.0050 Quantiles (Definition 5) Quantile Estimate 10% 0.00 5% 0.00
*Looking for normality in the variable IgEPeanut (Peanut Specific IgE) in
those children with a diagnosis of food allergy to Peanut*;
*After running the code, *Skewness 1.7, Kurtosis 1.9, so +/- normal
distribution*;
*We will log transform the variable and present the anti-log.

Page | 43
1% 0.00 0% Min 0.00 Extreme Observations ----Lowest---- ----Highest--- Value Obs Value Obs 0 116 100 20 0 100 100 29 0 99 100 95 0 31 100 102 0 27 100 117
The SAS System 14:54 Saturday, April 7, 2012 34
The UNIVARIATE Procedure Variable: LogIgEPeanut Moments N 40 Sum Weights 40 Mean 1.84122988 Sum Observations 73.6491953 Std Deviation 1.92457276 Variance 3.70398031 Skewness -0.5080622 Kurtosis -0.1913541 Uncorrected SS 280.060331 Corrected SS 144.455232 Coeff Variation 104.526479 Std Error Mean 0.30430167 Basic Statistical Measures Location Variability Mean 1.841230 Std Deviation 1.92457 Median 2.062013 Variance 3.70398 Mode 4.605170 Range 7.60090 Interquartile Range 2.35756 Tests for Location: Mu0=0 Test -Statistic- -----p Value------ Student's t t 6.050673 Pr > |t| <.0001 Sign M 13 Pr >= |M| <.0001 Signed Rank S 333 Pr >= |S| <.0001 Tests for Normality Test --Statistic--- -----p Value------ Shapiro-Wilk W 0.960741 Pr < W 0.1775 Kolmogorov-Smirnov D 0.109571 Pr > D >0.1500 Cramer-von Mises W-Sq 0.053154 Pr > W-Sq >0.2500 Anderson-Darling A-Sq 0.385477 Pr > A-Sq >0.2500 Quantiles (Definition 5) Quantile Estimate 100% Max 4.605170 99% 4.605170 95% 4.605170 90% 4.605170 75% Q3 3.170409 50% Median 2.062013 25% Q1 0.812852 Quantiles (Definition 5) Quantile Estimate 10% -0.913175 5% -1.568648 1% -2.995732 0% Min -2.995732 Extreme Observations ------Lowest------ -----Highest----- Value Obs Value Obs -2.995732 8 4.60517 20
*After log transforming data and running the code. The new Skewness is -0.2,
Kurtosis -0.5, which is improved. We will use the log transformed data in
analysis, and present the antilog.

Page | 44
-1.966113 119 4.60517 29 -1.171183 4 4.60517 95 -1.049822 9 4.60517 102 -0.776529 120 4.60517 117
The SAS System 14:54 Saturday, April 7, 2012 36 The FREQ Procedure IgEShrimp Cumulative Cumulative IgEShrimp Frequency Percent Frequency Percent ƒƒƒƒƒƒƒƒƒƒƒƒƒƒƒƒƒƒƒƒƒƒƒƒƒƒƒƒƒƒƒƒƒƒƒƒƒƒƒƒƒƒƒƒƒƒƒƒƒƒƒƒƒƒƒƒƒƒƒƒƒƒ 0 1 8.33 1 8.33 0.05 1 8.33 2 16.67 0.86 1 8.33 3 25.00 1.1 1 8.33 4 33.33 1.24 1 8.33 5 41.67 4.82 1 8.33 6 50.00 6.97 1 8.33 7 58.33 10.4 1 8.33 8 66.67 24.4 1 8.33 9 75.00 25 1 8.33 10 83.33 100 2 16.67 12 100.00 Frequency Missing = 7 The SAS System 14:54 Saturday, April 7, 2012 37 The UNIVARIATE Procedure Variable: IgEShrimp (IgEShrimp) Moments N 18 Sum Weights 18 Mean 16.3766667 Sum Observations 294.78 Std Deviation 31.4680798 Variance 990.240047 Skewness 2.39842016 Kurtosis 4.80358264 Uncorrected SS 21661.5946 Corrected SS 16834.0808 Coeff Variation 192.151922 Std Error Mean 7.41709754 Basic Statistical Measures Location Variability Mean 16.37667 Std Deviation 31.46808 Median 2.89000 Variance 990.24005 Mode 0.00000 Range 100.00000 Interquartile Range 15.40000 Tests for Location: Mu0=0 Test -Statistic- -----p Value------ Student's t t 2.207962 Pr > |t| 0.0413 Sign M 6.5 Pr >= |M| 0.0002 Signed Rank S 45.5 Pr >= |S| 0.0002 Tests for Normality Test --Statistic--- -----p Value------ Shapiro-Wilk W 0.561009 Pr < W <0.0001 Kolmogorov-Smirnov D 0.301385 Pr > D <0.0100 Cramer-von Mises W-Sq 0.607354 Pr > W-Sq <0.0050 Anderson-Darling A-Sq 3.336033 Pr > A-Sq <0.0050 Quantiles (Definition 5) Quantile Estimate 100% Max 100.00 99% 100.00 95% 100.00 90% 100.00
*Looking for missing/missense data in the variable IgEShrimp (Shrimp Specific
IgE) in those children with a diagnosis of food allergy to Shrimp*;
*There are 7 missing data for children with food allergy to shrimp.*;
*Looking for normality in the variable IgEShrimp (Shrimp Specific IgE) in
those children with a diagnosis of food allergy to Shrimp*;
*After running the code, *Skewness 1.7, Kurtosis 1.9, so +/- normal
distribution*;
*We will log transform the variable and present the anti-log.

Page | 45
75% Q3 15.40 50% Median 2.89 25% Q1 0.00 Quantiles (Definition 5) Quantile Estimate 10% 0.00 5% 0.00 1% 0.00 0% Min 0.00 Extreme Observations ----Lowest---- ----Highest---- Value Obs Value Obs 0 109 15.4 91 0 100 24.4 124 0 89 25.0 122 0 28 100.0 123 0 27 100.0 127
The SAS System 14:54 Saturday, April 7, 2012 39 The UNIVARIATE Procedure Variable: LogIgEShrimp Moments N 13 Sum Weights 13 Mean 1.76085809 Sum Observations 22.8911552 Std Deviation 2.10593218 Variance 4.43495034 Skewness -0.7354708 Kurtosis 0.83477967 Uncorrected SS 93.5274799 Corrected SS 53.2194041 Coeff Variation 119.596928 Std Error Mean 0.5840805 Basic Statistical Measures Location Variability Mean 1.760858 Std Deviation 2.10593 Median 1.941615 Variance 4.43495 Mode 4.605170 Range 7.60090 Interquartile Range 2.97947 Tests for Location: Mu0=0 Test -Statistic- -----p Value------ Student's t t 3.014752 Pr > |t| 0.0108 Sign M 4.5 Pr >= |M| 0.0225 Signed Rank S 34.5 Pr >= |S| 0.0134 Tests for Normality Test --Statistic--- -----p Value------ Shapiro-Wilk W 0.945136 Pr < W 0.5267 Kolmogorov-Smirnov D 0.145449 Pr > D >0.1500 Cramer-von Mises W-Sq 0.035771 Pr > W-Sq >0.2500 Anderson-Darling A-Sq 0.274324 Pr > A-Sq >0.2500 Quantiles (Definition 5) Quantile Estimate 100% Max 4.605170 99% 4.605170 95% 4.605170 90% 4.605170 75% Q3 3.194583 50% Median 1.941615 25% Q1 0.215111 Quantiles (Definition 5) Quantile Estimate 10% -0.150823 5% -2.995732 1% -2.995732
*After log transforming data and running the code. The new Skewness is -0.7,
Kurtosis 0.8, which is improved. We will use the log transformed data in
analysis, and present the antilog.

Page | 46
0% Min -2.995732 Extreme Observations -------Lowest------ -----Highest----- Value Obs Value Obs -2.9957323 4 2.73437 91 -0.1508229 115 3.19458 124 0.0953102 95 3.21888 122 0.2151114 110 4.60517 123 1.5129270 117 4.60517 127
The SAS System 14:54 Saturday, April 7, 2012 41 The FREQ Procedure IgESoy Cumulative Cumulative IgESoy Frequency Percent Frequency Percent ƒƒƒƒƒƒƒƒƒƒƒƒƒƒƒƒƒƒƒƒƒƒƒƒƒƒƒƒƒƒƒƒƒƒƒƒƒƒƒƒƒƒƒƒƒƒƒƒƒƒƒƒƒƒƒƒƒƒƒ 0.94 1 20.00 1 20.00 1.19 1 20.00 2 40.00 6.75 1 20.00 3 60.00 10.1 1 20.00 4 80.00 15.8 1 20.00 5 100.00
Frequency Missing = 5
The SAS System 14:54 Saturday, April 7, 2012 43 The UNIVARIATE Procedure Variable: IgESoy (IgESoy) Moments N 16 Sum Weights 16 Mean 5.985 Sum Observations 95.76 Std Deviation 6.94241937 Variance 48.1971867 Skewness 1.01380963 Kurtosis -0.2551547 Uncorrected SS 1296.0814 Corrected SS 722.9578 Coeff Variation 115.996982 Std Error Mean 1.73560484 Basic Statistical Measures Location Variability Mean 5.985000 Std Deviation 6.94242 Median 2.360000 Variance 48.19719 Mode 0.000000 Range 20.30000 Interquartile Range 9.27000 Tests for Location: Mu0=0 Test -Statistic- -----p Value------ Student's t t 3.448366 Pr > |t| 0.0036 Sign M 6.5 Pr >= |M| 0.0002 Signed Rank S 45.5 Pr >= |S| 0.0002 Tests for Normality Test --Statistic--- -----p Value------ Shapiro-Wilk W 0.821854 Pr < W 0.0054 Kolmogorov-Smirnov D 0.233352 Pr > D 0.0202 Cramer-von Mises W-Sq 0.184849 Pr > W-Sq 0.0073 Anderson-Darling A-Sq 1.114632 Pr > A-Sq <0.0050
*Looking for missing/missense data in the variable IgESoy (Soy Specific IgE)
in those children with a diagnosis of food allergy to Soy*;
*There are 5 missing data for children with food allergy to soy.*;
*Looking for normality in the variable IgESoy (Soy Specific IgE) in those
children with a diagnosis of food allergy to Soy*;
*After running the code, *Skewness 1.0, Kurtosis -0.3, so normally
distributed*;

Page | 47
Quantiles (Definition 5) Quantile Estimate 100% Max 20.30 99% 20.30 95% 20.30 90% 18.10 75% Q3 9.77 50% Median 2.36 25% Q1 0.50 Variable: IgESoy (IgESoy) Quantiles (Definition 5) Quantile Estimate 10% 0.00 5% 0.00 1% 0.00 0% Min 0.00 Extreme Observations ----Lowest---- ----Highest---- Value Obs Value Obs 0.0 99 9.44 25 0.0 27 10.10 125 0.0 9 15.80 26 0.3 4 18.10 117 0.7 110 20.30 58
The SAS System 14:54 Saturday, April 7, 2012 45 The FREQ Procedure IgEWheat Cumulative Cumulative IgEWheat Frequency Percent Frequency Percent ƒƒƒƒƒƒƒƒƒƒƒƒƒƒƒƒƒƒƒƒƒƒƒƒƒƒƒƒƒƒƒƒƒƒƒƒƒƒƒƒƒƒƒƒƒƒƒƒƒƒƒƒƒƒƒƒƒƒƒƒƒ 0.37 1 12.50 1 12.50 0.94 1 12.50 2 25.00 1.03 1 12.50 3 37.50 2.49 1 12.50 4 50.00 16.3 1 12.50 5 62.50 19.3 1 12.50 6 75.00 52.2 1 12.50 7 87.50 100 1 12.50 8 100.00 Frequency Missing = 4
The UNIVARIATE Procedure Variable: IgEWheat (IgEWheat) Moments N 19 Sum Weights 19 Mean 13.1357895 Sum Observations 249.58 Std Deviation 24.7354438 Variance 611.842181 Skewness 2.8500803 Kurtosis 8.76927178 Uncorrected SS 14291.5896 Corrected SS 11013.1593 Coeff Variation 188.305727 Std Error Mean 5.6747 Basic Statistical Measures Location Variability Mean 13.13579 Std Deviation 24.73544 Median 2.49000 Variance 611.84218 Mode 0.00000 Range 100.00000
*Looking for missing/missense data in the variable IgEWheat (Wheat Specific
IgE) in those children with a diagnosis of food allergy to Wheat*;
*There are 4 missing data for children with food allergy to Wheat.*;
*Looking for normality in the variable IgEWheat (Wheat Specific IgE) in those
children with a diagnosis of food allergy to Wheat*;
*After running the code, *Skewness 2.9, Kurtosis 8.8, so not normally
distributed*;
* We will log transform to improve the normality.

Page | 48
Interquartile Range 18.93000 Tests for Location: Mu0=0 Test -Statistic- -----p Value------ Student's t t 2.314799 Pr > |t| 0.0326 Sign M 8 Pr >= |M| <.0001 Signed Rank S 68 Pr >= |S| <.0001 Tests for Normality Test --Statistic--- -----p Value------ Shapiro-Wilk W 0.585055 Pr < W <0.0001 Kolmogorov-Smirnov D 0.297692 Pr > D <0.0100 Cramer-von Mises W-Sq 0.557126 Pr > W-Sq <0.0050 Anderson-Darling A-Sq 2.979067 Pr > A-Sq <0.0050 Quantiles (Definition 5) Quantile Estimate 100% Max 100.00 99% 100.00 95% 100.00 90% 52.20 75% Q3 19.30 50% Median 2.49 25% Q1 0.37 Variable: IgEWheat (IgEWheat) Quantiles (Definition 5) Quantile Estimate 10% 0.00 5% 0.00 1% 0.00 0% Min 0.00 Extreme Observations ----Lowest---- ----Highest---- Value Obs Value Obs 0.00 116 19.3 125 0.00 99 20.4 58 0.00 27 20.9 25 0.23 4 52.2 90 0.37 103 100.0 126
The SAS System 14:54 Saturday, April 7, 2012 48 The UNIVARIATE Procedure Variable: LogIgEWheat Moments N 16 Sum Weights 16 Mean 1.43324803 Sum Observations 22.9319684 Std Deviation 1.8290189 Variance 3.34531015 Skewness 0.07544846 Kurtosis -1.0183463 Uncorrected SS 83.0468507 Corrected SS 50.1796522 Coeff Variation 127.613565 Std Error Mean 0.45725473 Basic Statistical Measures Location Variability Mean 1.433248 Std Deviation 1.82902 Median 1.110471 Variance 3.34531 Mode . Range 6.07485 Interquartile Range 3.00398 Tests for Location: Mu0=0 Test -Statistic- -----p Value------ Student's t t 3.134463 Pr > |t| 0.0068 Sign M 4 Pr >= |M| 0.0768 Signed Rank S 47 Pr >= |S| 0.0131
*After log transforming data and running the code. The new Skewness is 0.8,
Kurtosis -1.1, which is improved. We will use the log transformed data in
analysis, and present the antilog.

Page | 49
Tests for Normality Test --Statistic--- -----p Value------ Shapiro-Wilk W 0.960786 Pr < W 0.6761 Kolmogorov-Smirnov D 0.146086 Pr > D >0.1500 Cramer-von Mises W-Sq 0.043721 Pr > W-Sq >0.2500 Anderson-Darling A-Sq 0.267672 Pr > A-Sq >0.2500 Quantiles (Definition 5) Quantile Estimate 100% Max 4.6051702 99% 4.6051702 95% 4.6051702 90% 3.9550825 75% Q3 2.9878200 50% Median 1.1104706 25% Q1 -0.0161583 Variable: LogIgEWheat Quantiles (Definition 5) Quantile Estimate 10% -0.9942523 5% -1.4696760 1% -1.4696760 0% Min -1.4696760 Extreme Observations -------Lowest------ -----Highest----- Value Obs Value Obs -1.4696760 4 2.96011 125 -0.9942523 103 3.01553 58 -0.7765288 9 3.03975 25 -0.0618754 91 3.95508 90 0.0295588 108 4.60517 126
The SAS System 14:54 Saturday, April 7, 2012 50
The FREQ Procedure Disease Cumulative Cumulative Disease Frequency Percent Frequency Percent ƒƒƒƒƒƒƒƒƒƒƒƒƒƒƒƒƒƒƒƒƒƒƒƒƒƒƒƒƒƒƒƒƒƒƒƒƒƒƒƒƒƒƒƒƒƒƒƒƒƒƒƒƒƒƒƒƒƒƒƒƒƒƒƒƒƒƒƒƒƒƒƒƒƒ No Disease 59 45.04 59 45.04 Possible Food Allergy 27 20.61 86 65.65 Food Allergy 45 34.35 131 100.00 The SAS System 14:54 Saturday, April 7, 2012 51 The FREQ Procedure Exposure Cumulative Cumulative Exposure Frequency Percent Frequency Percent ƒƒƒƒƒƒƒƒƒƒƒƒƒƒƒƒƒƒƒƒƒƒƒƒƒƒƒƒƒƒƒƒƒƒƒƒƒƒƒƒƒƒƒƒƒƒƒƒƒƒƒƒƒƒƒƒƒƒƒƒƒƒƒƒƒƒƒƒƒƒƒƒƒƒƒƒƒƒƒƒƒƒƒƒƒƒƒƒƒƒƒ Never treated with antacid medications 77 58.78 77 58.78 Treated with antacid medications 54 41.22 131 100.00
*Looking for missing/missense data in the variable Disease*;
*After running code there was no missing or missense data noted. See below;
*Looking for missing/missense data in the variable Exposure*;
*After running code there was no missing or missense data noted. See below;
*Looking for missing/missense data in the variable Gender*;
*After running code there was no missing or missense data noted. See below;

Page | 50
The SAS System
The FREQ Procedure
Gender
Gender Frequency Percent Cumulative Frequency
Cumulative Percent
Female 39 29.77 39 29.77
Male 92 70.23 131 100.00
The SAS System
The FREQ Procedure
DxAD
DxAD Frequency Percent Cumulative Frequency
Cumulative Percent
No history of Atopic Dermatitis 34 27.42 34 27.42
History of Atopic Dermatitis 86 69.35 120 96.77
2 4 3.23 124 100.00
Frequency Missing = 7
The SAS System
The FREQ Procedure
DxADClean Frequency Percent Cumulative Frequency
Cumulative Percent
No history of Atopic Dermatitis 34 28.33 34 28.33
History of Atopic Dermatitis 86 71.67 120 100.00
Frequency Missing = 11
*Looking for missing/missense data in the variable DxAD*;
*After running code there were 11 missing or missense data noted (4 responses
of unknown and 7 missing). See below.;
*We created a variable DxADClean that codes all missing or nonsense data as
missing, and use this in further analysis (see below).;
*Looking for missing/missense data in the variable DxAsthma*;
*After running code there were 8 missing or missense data noted (5 unknown and
3 missing). See below.

Page | 51
The SAS System
The FREQ Procedure
DxAsthma
DxAsthma Frequency Percent Cumulative Frequency
Cumulative Percent
No history of asthma 37 28.91 37 28.91
History of asthma 86 67.19 123 96.09
2 5 3.91 128 100.00
Frequency Missing = 3
The SAS System
The FREQ Procedure
DxAsthmaClean Frequency Percent Cumulative Frequency
Cumulative Percent
No history of asthma 37 30.08 37 30.08
History of asthma 86 69.92 123 100.00
Frequency Missing = 8
The SAS System
The FREQ Procedure
DxAR
DxAR Frequency Percent Cumulative Frequency
Cumulative Percent
No history of allergic rhinitis 54 46.15 54 46.15
History of allergic rhinitis 54 46.15 108 92.31
2 9 7.69 117 100.00
Frequency Missing = 14
*We created a variable DxAsthmaClean that codes all missing or nonsense data
as missing, and use this in further analysis (see below).;
*Looking for missing/missense data in the variable DxAR*;
*After running code there were 23 missing or missense data noted (9 unknown
and 14 missing). See below.
*We created a variable DxARClean that codes all missing or nonsense data as
missing, and use this in further analysis (see below).;
Page | 52
The SAS System
The FREQ Procedure
DxARClean Frequency Percent Cumulative Frequency
Cumulative Percent
No history of allergic rhinitis 54 50.00 54 50.00
History of allergic rhinitis 54 50.00 108 100.00
Frequency Missing = 23
The SAS System
The FREQ Procedure
FA Severe?
FA_Severe_ Frequency Percent Cumulative Frequency
Cumulative Percent
Parents do not consider the food allergy to be severe
19 29.69 19 29.69
Parents consider the food allergy to be severe
45 70.31 64 100.00
Frequency Missing = 8
The SAS System
The FREQ Procedure
FA_Severe_Clean Frequency Percent Cumulative Frequency
Cumulative Percent
Parents do not consider the food allergy to be severe
19 29.69 19 29.69
Parents consider the food allergy to be severe
45 70.31 64 100.00
Frequency Missing = 8
*Looking for missing/missense data in the variable FA_Severe_*;
*After running code there were 8 missing or missense data noted (0 unknown and
8 missing). See below.
*We created a variable FA_Severe_Clean that codes all missing or nonsense data
as missing, and use this in further analysis (see below).;

Page | 53
The SAS System
The FREQ Procedure
LTR food
LTR_food Frequency Percent Cumulative Frequency
Cumulative Percent
No report of life threatening reactions to food
42 59.15 42 59.15
Report of life threatening reactions to food
29 40.85 71 100.00
Frequency Missing = 1
The SAS System
The FREQ Procedure
LTR_FoodClean Frequency Percent Cumulative Frequency
Cumulative Percent
No report of life threatening reactions to food
42 59.15 42 59.15
Report of life threatening reactions to food
29 40.85 71 100.00
Frequency Missing = 1
The SAS System
The FREQ Procedure
Frequency
Percent
Row Pct
Col Pct
Table of ExposureFinal by Disease
ExposureFinal Disease(Disease)
Food Allergy
No Disease
Possible Food
Allergy
Total
*Looking for missing/missense data in the variable LTR_Food.*;
*After running code there were 1 missing or missense data noted (0 unknown and
1 missing). See below.
*We created a variable LTR_FoodClean that codes all missing or nonsense data
as missing, and use this in further analysis (see below).;
*Univariate analysis of association of exposure and disease unadjusted model.
*We will use the Prevalence Ratio to look for significance.*;
* Mantel-Haenszel Chi-Square 0.0107 * So there is a significant association between exposure and disease.*;

Page | 54
Had taken antacid medication
27
20.61
50.00
60.00
20
15.27
37.04
33.90
7
5.34
12.96
25.93
54
41.22
Never took antacid medication
18
13.74
23.38
40.00
39
29.77
50.65
66.10
20
15.27
25.97
74.07
77
58.78
Total 45
34.35
59
45.04
27
20.61
131
100.00
Statistics for Table of ExposureFinal by Disease
Statistic DF Value Prob
Chi-Square 2 10.4622 0.0053
Likelihood Ratio Chi-Square 2 10.5089 0.0052
Mantel-Haenszel Chi-Square 1 6.5169 0.0107
Phi Coefficient 0.2826
Contingency Coefficient 0.2720
Cramer's V 0.2826
Statistic Value ASE
Gamma 0.4484 0.1273
Kendall's Tau-b 0.2589 0.0789
Stuart's Tau-c 0.2876 0.0882
Somers' D C|R 0.2968 0.0905
Somers' D R|C 0.2259 0.0690
Pearson Correlation -0.2239 0.0863
Spearman Correlation 0.2729 0.0832
Lambda Asymmetric C|R 0.0972 0.0905

Page | 55
Statistic Value ASE
Lambda Asymmetric R|C 0.1667 0.1134
Lambda Symmetric 0.1270 0.0910
Uncertainty Coefficient C|R 0.0381 0.0231
Uncertainty Coefficient R|C 0.0592 0.0358
Uncertainty Coefficient Symmetric 0.0464 0.0281
Sample Size = 131
Summary Statistics for ExposureFinal by Disease
Cochran-Mantel-Haenszel Statistics (Based on Table Scores)
Statistic Alternative Hypothesis DF Value Prob
1 Nonzero Correlation 1 6.5169 0.0107
2 Row Mean Scores Differ 1 6.5169 0.0107
3 General Association 2 10.3824 0.0056
Total Sample Size = 131
The SAS System
The FREQ Procedure
Frequency
Percent
Row Pct
Col Pct
Table of ExposureFinal by Disease
ExposureFinal Disease(Disease)
No Disease Food Allergy Total
Had taken antacid medication 20
19.23
42.55
33.90
27
25.96
57.45
60.00
47
45.19
*Because Disease is a 3 level variable it is unclear where the association
lies (ie between those with food allergy, possible food allergy and/or no food
allergy).*;
*We will now determine where the association is.*;
*There is an association between those with food allergy and no food allergy
and antacid medication.*;
*Mantel-Haenszel Chi Square 0.5/Prevalence Ratio 1.8 (1.2, 2.9)

Page | 56
Never took antacid medication 39
37.50
68.42
66.10
18
17.31
31.58
40.00
57
54.81
Total 59
56.73
45
43.27
104
100.00
Statistics for Table of ExposureFinal by Disease
Statistic DF Value Prob
Chi-Square 1 7.0220 0.0081
Likelihood Ratio Chi-Square 1 7.0782 0.0078
Continuity Adj. Chi-Square 1 6.0078 0.0142
Mantel-Haenszel Chi-Square 1 6.9545 0.0084
Phi Coefficient -0.2598
Contingency Coefficient 0.2515
Cramer's V -0.2598
Fisher's Exact Test
Cell (1,1) Frequency (F) 20
Left-sided Pr <= F 0.0070
Right-sided Pr >= F 0.9979
Table Probability (P) 0.0049
Two-sided Pr <= P 0.0101
Statistic Value ASE
Gamma -0.4904 0.1558
Kendall's Tau-b -0.2598 0.0951
Stuart's Tau-c -0.2563 0.0941
Somers' D C|R -0.2587 0.0948
Somers' D R|C -0.2610 0.0956
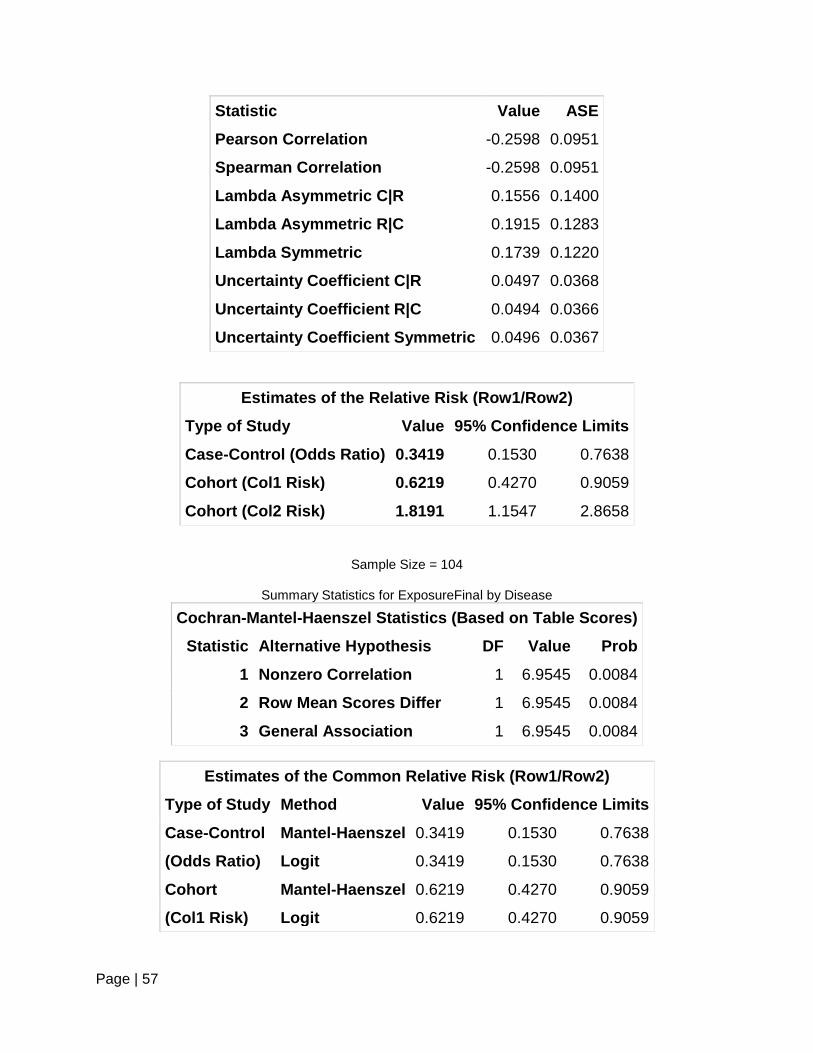
Page | 57
Statistic Value ASE
Pearson Correlation -0.2598 0.0951
Spearman Correlation -0.2598 0.0951
Lambda Asymmetric C|R 0.1556 0.1400
Lambda Asymmetric R|C 0.1915 0.1283
Lambda Symmetric 0.1739 0.1220
Uncertainty Coefficient C|R 0.0497 0.0368
Uncertainty Coefficient R|C 0.0494 0.0366
Uncertainty Coefficient Symmetric 0.0496 0.0367
Estimates of the Relative Risk (Row1/Row2)
Type of Study Value 95% Confidence Limits
Case-Control (Odds Ratio) 0.3419 0.1530 0.7638
Cohort (Col1 Risk) 0.6219 0.4270 0.9059
Cohort (Col2 Risk) 1.8191 1.1547 2.8658
Sample Size = 104
Summary Statistics for ExposureFinal by Disease
Cochran-Mantel-Haenszel Statistics (Based on Table Scores)
Statistic Alternative Hypothesis DF Value Prob
1 Nonzero Correlation 1 6.9545 0.0084
2 Row Mean Scores Differ 1 6.9545 0.0084
3 General Association 1 6.9545 0.0084
Estimates of the Common Relative Risk (Row1/Row2)
Type of Study Method Value 95% Confidence Limits
Case-Control Mantel-Haenszel 0.3419 0.1530 0.7638
(Odds Ratio) Logit 0.3419 0.1530 0.7638
Cohort Mantel-Haenszel 0.6219 0.4270 0.9059
(Col1 Risk) Logit 0.6219 0.4270 0.9059

Page | 58
Estimates of the Common Relative Risk (Row1/Row2)
Type of Study Method Value 95% Confidence Limits
Cohort Mantel-Haenszel 1.8191 1.1547 2.8658
(Col2 Risk) Logit 1.8191 1.1547 2.8658
Total Sample Size = 104
The SAS System
The FREQ Procedure
Frequency
Percent
Row Pct
Col Pct
Table of ExposureFinal by Disease1
ExposureFinal Disease1(Disease1)
Possible Food
Allergy
No Food Allergy
Total
Had taken antacid medication
7
8.14
25.93
25.93
20
23.26
74.07
33.90
27
31.40
Never took antacid medication
20
23.26
33.90
74.07
39
45.35
66.10
66.10
59
68.60
Total 27
31.40
59
68.60
86
100.00
Frequency Missing = 45
Statistics for Table of ExposureFinal by Disease1
Statistic DF Value Prob
Chi-Square 1 0.5466 0.4597
*There is no association between those with no food allergy and possible food
allergy and antacid medication.*;
*Mantel-Haenszel Chi Square 0.5/Prevalence Ratio 0.8 (0.4, 1.6)

Page | 59
Statistic DF Value Prob
Likelihood Ratio Chi-Square 1 0.5576 0.4552
Continuity Adj. Chi-Square 1 0.2391 0.6248
Mantel-Haenszel Chi-Square 1 0.5403 0.4623
Phi Coefficient -0.0797
Contingency Coefficient 0.0795
Cramer's V -0.0797
Fisher's Exact Test
Cell (1,1) Frequency (F) 7
Left-sided Pr <= F 0.3160
Right-sided Pr >= F 0.8387
Table Probability (P) 0.1547
Two-sided Pr <= P 0.6175
Statistic Value ASE
Gamma -0.1887 0.2499
Kendall's Tau-b -0.0797 0.1043
Stuart's Tau-c -0.0687 0.0902
Somers' D C|R -0.0797 0.1045
Somers' D R|C -0.0797 0.1045
Pearson Correlation -0.0797 0.1043
Spearman Correlation -0.0797 0.1043
Lambda Asymmetric C|R 0.0000 0.0000
Lambda Asymmetric R|C 0.0000 0.0000
Lambda Symmetric 0.0000 0.0000
Uncertainty Coefficient C|R 0.0052 0.0138
Uncertainty Coefficient R|C 0.0052 0.0138
Uncertainty Coefficient Symmetric 0.0052 0.0138
Estimates of the Relative Risk (Row1/Row2)

Page | 60
Type of Study Value 95% Confidence Limits
Case-Control (Odds Ratio) 0.6825 0.2472 1.8844
Cohort (Col1 Risk) 0.7648 0.3684 1.5877
Cohort (Col2 Risk) 1.1206 0.8398 1.4952
Effective Sample Size = 86 Frequency Missing = 45
WARNING: 34% of the data are missing.
Summary Statistics for ExposureFinal by Disease1
Cochran-Mantel-Haenszel Statistics (Based on Table Scores)
Statistic Alternative Hypothesis DF Value Prob
1 Nonzero Correlation 1 0.5403 0.4623
2 Row Mean Scores Differ 1 0.5403 0.4623
3 General Association 1 0.5403 0.4623
Estimates of the Common Relative Risk (Row1/Row2)
Type of Study Method Value 95% Confidence Limits
Case-Control Mantel-Haenszel 0.6825 0.2472 1.8844
(Odds Ratio) Logit 0.6825 0.2472 1.8844
Cohort Mantel-Haenszel 0.7648 0.3684 1.5877
(Col1 Risk) Logit 0.7648 0.3684 1.5877
Cohort Mantel-Haenszel 1.1206 0.8398 1.4952
(Col2 Risk) Logit 1.1206 0.8398 1.4952
Effective Sample Size = 86 Frequency Missing = 45
WARNING: 34% of the data are missing.
Total Sample Size = 86 *There is an association between those with food allergy and possible food
allergy and antacid medication.*;
*Mantel-Haenszel Chi Square 0.005/Prevalence Ratio 1.7 (1.2, 2.4).* See
below.*;

Page | 61
The SAS System
The FREQ Procedure
Frequency
Percent
Row Pct
Col Pct
Table of ExposureFinal by Disease
ExposureFinal Disease(Disease)
Food Allergy
Possible Food
Allergy
Total
Had taken antacid medication
27
37.50
79.41
60.00
7
9.72
20.59
25.93
34
47.22
Never took antacid medication
18
25.00
47.37
40.00
20
27.78
52.63
74.07
38
52.78
Total 45
62.50
27
37.50
72
100.00
Statistics for Table of ExposureFinal by Disease
Statistic DF Value Prob
Chi-Square 1 7.8613 0.0051
Likelihood Ratio Chi-Square 1 8.1166 0.0044
Continuity Adj. Chi-Square 1 6.5536 0.0105
Mantel-Haenszel Chi-Square 1 7.7521 0.0054
Phi Coefficient 0.3304
Contingency Coefficient 0.3137
Cramer's V 0.3304

Page | 62
Fisher's Exact Test
Cell (1,1) Frequency (F) 27
Left-sided Pr <= F 0.9990
Right-sided Pr >= F 0.0048
Table Probability (P) 0.0038
Two-sided Pr <= P 0.0072
Statistic Value ASE
Gamma 0.6216 0.1639
Kendall's Tau-b 0.3304 0.1085
Stuart's Tau-c 0.3194 0.1064
Somers' D C|R 0.3204 0.1066
Somers' D R|C 0.3407 0.1116
Pearson Correlation -0.3304 0.1085
Spearman Correlation 0.3304 0.1085
Lambda Asymmetric C|R 0.0741 0.2197
Lambda Asymmetric R|C 0.2647 0.1692
Lambda Symmetric 0.1803 0.1676
Uncertainty Coefficient C|R 0.0852 0.0573
Uncertainty Coefficient R|C 0.0815 0.0550
Uncertainty Coefficient Symmetric 0.0833 0.0561
Estimates of the Relative Risk (Row1/Row2)
Type of Study Value 95% Confidence Limits
Case-Control (Odds Ratio) 4.2857 1.5040 12.2123
Cohort (Col1 Risk) 1.6765 1.1507 2.4425
Cohort (Col2 Risk) 0.3912 0.1893 0.8083
Sample Size = 72

Page | 63
Summary Statistics for ExposureFinal by Disease
Cochran-Mantel-Haenszel Statistics (Based on Table Scores)
Statistic Alternative Hypothesis DF Value Prob
1 Nonzero Correlation 1 7.7521 0.0054
2 Row Mean Scores Differ 1 7.7521 0.0054
3 General Association 1 7.7521 0.0054
Estimates of the Common Relative Risk (Row1/Row2)
Type of Study Method Value 95% Confidence Limits
Case-Control Mantel-Haenszel 4.2857 1.5040 12.2123
(Odds Ratio) Logit 4.2857 1.5040 12.2123
Cohort Mantel-Haenszel 1.6765 1.1507 2.4425
(Col1 Risk) Logit 1.6765 1.1507 2.4425
Cohort Mantel-Haenszel 0.3912 0.1893 0.8083
(Col2 Risk) Logit 0.3912 0.1893 0.8083
Total Sample Size = 72
The SAS System
The TTEST Procedure Variable: Age (Age)
Disease N Mean Std Dev Std Err Minimum Maximum
0 59 7.7232 4.4089 0.5740 0.4200 18.0000
2 45 5.8989 3.8953 0.5807 1.0000 16.8300
Diff (1-2) 1.8243 4.1951 0.8303
Disease Method Mean 95% CL Mean Std Dev 95% CL Std Dev
*In the following section we will determine if there is any additional
differences between the disease groups: food allergy, possible food allergy,
and no food allergy.*;
*We will start with the continuous variables. Beginning with Age.*;
* There is a significant difference between those with food allergy and those
with no food allergy (p = 0.03). *;
* There is no significant difference between those with food allergy and
possible food allergy (p = 0.2).*;
* There is no significant difference between those with no food allergy and
possible food allergy (p = 0.7).*;

Page | 64
Disease Method Mean 95% CL Mean Std Dev 95% CL Std Dev
0 7.7232 6.5742 8.8722 4.4089 3.7323 5.3875
2 5.8989 4.7286 7.0692 3.8953 3.2247 4.9205
Diff (1-2) Pooled 1.8243 0.1775 3.4712 4.1951 3.6899 4.8617
Diff (1-2) Satterthwaite 1.8243 0.2044 3.4443
Method Variances DF t Value Pr > |t|
Pooled Equal 102 2.20 0.0303
Satterthwaite Unequal 99.748 2.23 0.0277
Equality of Variances
Method Num DF Den DF F Value Pr > F
Folded F 58 44 1.28 0.3937
The SAS System
The TTEST Procedure
Variable: Age (Age)
Disease N Mean Std Dev Std Err Minimum Maximum
1 27 7.2648 4.6395 0.8929 1.7900 17.0000
2 45 5.8989 3.8953 0.5807 1.0000 16.8300
Diff (1-2) 1.3659 4.1872 1.0193
Disease Method Mean 95% CL Mean Std Dev 95% CL Std Dev
1 7.2648 5.4295 9.1001 4.6395 3.6537 6.3581
2 5.8989 4.7286 7.0692 3.8953 3.2247 4.9205
Diff (1-2) Pooled 1.3659 -0.6670 3.3988 4.1872 3.5938 5.0171
Diff (1-2) Satterthwaite 1.3659 -0.7760 3.5079
Method Variances DF t Value Pr > |t|
Pooled Equal 70 1.34 0.1846
Satterthwaite Unequal 47.611 1.28 0.2059
Equality of Variances

Page | 65
Method Num DF Den DF F Value Pr > F
Folded F 26 44 1.42 0.3007
The SAS System
The TTEST Procedure
Variable: Age (Age)
Disease N Mean Std Dev Std Err Minimum Maximum
0 59 7.7232 4.4089 0.5740 0.4200 18.0000
1 27 7.2648 4.6395 0.8929 1.7900 17.0000
Diff (1-2) 0.4584 4.4816 1.0413
Disease Method Mean 95% CL Mean Std Dev 95% CL Std Dev
0 7.7232 6.5742 8.8722 4.4089 3.7323 5.3875
1 7.2648 5.4295 9.1001 4.6395 3.6537 6.3581
Diff (1-2) Pooled 0.4584 -1.6123 2.5291 4.4816 3.8943 5.2790
Diff (1-2) Satterthwaite 0.4584 -1.6755 2.5923
Method Variances DF t Value Pr > |t|
Pooled Equal 84 0.44 0.6609
Satterthwaite Unequal 48.237 0.43 0.6678
Equality of Variances
Method Num DF Den DF F Value Pr > F
Folded F 26 58 1.11 0.7278
The SAS System
The TTEST Procedure Variable: AgeFAYRLog
Disease N Mean Std Dev Std Err Minimum Maximum
1 26 0.7057 1.1552 0.2266 -1.7720 2.7726
* There is no significant difference between those with food allergy and
possible food allergy (p = 0.2) for the variable AgeFAYrLog.*;
* I did not run this analysis for those with no food allergy.*;

Page | 66
Disease N Mean Std Dev Std Err Minimum Maximum
2 45 0.3815 0.8815 0.1314 -1.7720 2.1972
Diff (1-2) 0.3242 0.9895 0.2437
Disease Method Mean 95% CL Mean Std Dev 95% CL Std Dev
1 0.7057 0.2391 1.1723 1.1552 0.9060 1.5946
2 0.3815 0.1166 0.6463 0.8815 0.7298 1.1135
Diff (1-2) Pooled 0.3242 -0.1620 0.8105 0.9895 0.8484 1.1873
Diff (1-2) Satterthwaite 0.3242 -0.2043 0.8528
Method Variances DF t Value Pr > |t|
Pooled Equal 69 1.33 0.1878
Satterthwaite Unequal 41.954 1.24 0.2226
Equality of Variances
Method Num DF Den DF F Value Pr > F
Folded F 25 44 1.72 0.1148
The SAS System
The TTEST Procedure
Variable: LengthFAYr (LengthFAYr)
Disease N Mean Std Dev Std Err Minimum Maximum
1 23 3.7974 2.9609 0.6174 0.5000 10.0000
2 43 4.1712 3.7090 0.5656 0.1300 15.3000
Diff (1-2) -0.3738 3.4701 0.8964
Disease Method Mean 95% CL Mean Std Dev 95% CL Std Dev
1 3.7974 2.5170 5.0778 2.9609 2.2900 4.1908
2 4.1712 3.0297 5.3126 3.7090 3.0582 4.7142
Diff (1-2) Pooled -0.3738 -2.1646 1.4170 3.4701 2.9592 4.1958
* There is no significant difference between those with food allergy and
possible food allergy (p = 0.7) for the variable LengthFAYrLog.*;
* I did not run this analysis for those with no food allergy.*;

Page | 67
Disease Method Mean 95% CL Mean Std Dev 95% CL Std Dev
Diff (1-2) Satterthwaite -0.3738 -2.0522 1.3047
Method Variances DF t Value Pr > |t|
Pooled Equal 64 -0.42 0.6781
Satterthwaite Unequal 54.366 -0.45 0.6571
Equality of Variances
Method Num DF Den DF F Value Pr > F
Folded F 42 22 1.57 0.2585
The SAS System
The TTEST Procedure
Variable: LogIgE
Disease N Mean Std Dev Std Err Minimum Maximum
1 19 5.4517 2.2688 0.5205 0 8.6145
2 37 5.3371 1.4681 0.2414 2.3979 8.3457
Diff (1-2) 0.1146 1.7756 0.5011
Disease Method Mean 95% CL Mean Std Dev 95% CL Std Dev
1 5.4517 4.3582 6.5452 2.2688 1.7143 3.3551
2 5.3371 4.8476 5.8266 1.4681 1.1939 1.9071
Diff (1-2) Pooled 0.1146 -0.8901 1.1193 1.7756 1.4948 2.1872
Diff (1-2) Satterthwaite 0.1146 -1.0648 1.2940
Method Variances DF t Value Pr > |t|
Pooled Equal 54 0.23 0.8200
Satterthwaite Unequal 25.973 0.20 0.8432
Equality of Variances
Method Num DF Den DF F Value Pr > F
* There is no significant difference between those with food allergy and
possible food allergy (p = 0.8) for the variable LogIgE.*;
* I did not run this analysis for those with no food allergy.*;

Page | 68
Equality of Variances
Method Num DF Den DF F Value Pr > F
Folded F 18 36 2.39 0.0257
The SAS System
The TTEST Procedure Variable: LogIgEEgg
Disease N Mean Std Dev Std Err Minimum Maximum
1 11 1.2050 2.1961 0.6622 -2.5257 4.0073
2 17 1.0471 1.9900 0.4826 -2.9957 4.0200
Diff (1-2) 0.1579 2.0717 0.8017
Disease Method Mean 95% CL Mean Std Dev 95% CL Std Dev
1 1.2050 -0.2704 2.6804 2.1961 1.5345 3.8541
2 1.0471 0.0240 2.0703 1.9900 1.4821 3.0286
Diff (1-2) Pooled 0.1579 -1.4899 1.8057 2.0717 1.6315 2.8391
Diff (1-2) Satterthwaite 0.1579 -1.5517 1.8675
Method Variances DF t Value Pr > |t|
Pooled Equal 26 0.20 0.8454
Satterthwaite Unequal 19.932 0.19 0.8492
The SAS System
The TTEST Procedure Variable: LogIgEMilk
Disease N Mean Std Dev Std Err Minimum Maximum
1 6 2.6148 2.0850 0.8512 -0.5276 4.6052
2 16 1.2887 2.5331 0.6333 -2.9957 4.6052
* There is no significant difference between those with food allergy and
possible food allergy (p = 0.8) for the variable LogIgEEgg.*;
* I did not run this analysis for those with no food allergy.*;
* There is no significant difference between those with food allergy and
possible food allergy (p = 0.7) for the variable LogIgEMilk.*;
* I did not run this analysis for those with no food allergy.*;

Page | 69
Disease N Mean Std Dev Std Err Minimum Maximum
Diff (1-2) 1.3261 2.4289 1.1627
Disease Method Mean 95% CL Mean Std Dev 95% CL Std Dev
1 2.6148 0.4267 4.8029 2.0850 1.3015 5.1137
2 1.2887 -0.0611 2.6385 2.5331 1.8712 3.9205
Diff (1-2) Pooled 1.3261 -1.0993 3.7515 2.4289 1.8582 3.5075
Diff (1-2) Satterthwaite 1.3261 -1.0103 3.6626
Method Variances DF t Value Pr > |t|
Pooled Equal 20 1.14 0.2675
Satterthwaite Unequal 10.949 1.25 0.2374
Equality of Variances
Method Num DF Den DF F Value Pr > F
Folded F 15 5 1.48 0.7057
The SAS System
The TTEST Procedure Variable: LogIgEPeanut
Disease N Mean Std Dev Std Err Minimum Maximum
1 15 2.2395 2.0209 0.5218 -1.9661 4.6052
2 25 1.6023 1.8649 0.3730 -2.9957 4.6052
Diff (1-2) 0.6372 1.9239 0.6283
Disease Method Mean 95% CL Mean Std Dev 95% CL Std Dev
1 2.2395 1.1203 3.3587 2.0209 1.4796 3.1872
2 1.6023 0.8325 2.3721 1.8649 1.4562 2.5944
Diff (1-2) Pooled 0.6372 -0.6348 1.9092 1.9239 1.5723 2.4794
* There is no significant difference between those with food allergy and
possible food allergy (p = 0.7) for the variable LogIgEPeanut.*;
* I did not run this analysis for those with no food allergy.*;

Page | 70
Disease Method Mean 95% CL Mean Std Dev 95% CL Std Dev
Diff (1-2) Satterthwaite 0.6372 -0.6772 1.9516
Method Variances DF t Value Pr > |t|
Pooled Equal 38 1.01 0.3169
Satterthwaite Unequal 27.737 0.99 0.3291
Equality of Variances
Method Num DF Den DF F Value Pr > F
Folded F 14 24 1.17 0.7057
The SAS System
The TTEST Procedure Variable: LogIgEShrimp
Disease N Mean Std Dev Std Err Minimum Maximum
1 6 2.3256 1.6798 0.6858 -0.1508 4.6052
2 7 1.2768 2.4344 0.9201 -2.9957 4.6052
Diff (1-2) 1.0488 2.1249 1.1822
Disease Method Mean 95% CL Mean Std Dev 95% CL Std Dev
1 2.3256 0.5627 4.0885 1.6798 1.0486 4.1200
2 1.2768 -0.9746 3.5282 2.4344 1.5687 5.3606
Diff (1-2) Pooled 1.0488 -1.5532 3.6507 2.1249 1.5052 3.6078
Diff (1-2) Satterthwaite 1.0488 -1.4888 3.5864
Method Variances DF t Value Pr > |t|
Pooled Equal 11 0.89 0.3940
Satterthwaite Unequal 10.595 0.91 0.3811
Equality of Variances
* There is no significant difference between those with food allergy and
possible food allergy (p = 0.4) for the variable LogIgEShrimp.*;
* I did not run this analysis for those with no food allergy.*;

Page | 71
Method Num DF Den DF F Value Pr > F
Folded F 6 5 2.10 0.4329
The SAS System
The TTEST Procedure
Variable: IgESoy (IgESoy)
Disease N Mean Std Dev Std Err Minimum Maximum
1 7 7.9257 6.9979 2.6449 0 18.1000
2 8 2.4975 3.7901 1.3400 0 10.1000
Diff (1-2) 5.4282 5.5078 2.8506
Disease Method Mean 95% CL Mean Std Dev 95% CL Std Dev
1 7.9257 1.4538 14.3977 6.9979 4.5094 15.4098
2 2.4975 -0.6711 5.6661 3.7901 2.5059 7.7138
Diff (1-2) Pooled 5.4282 -0.7301 11.5865 5.5078 3.9929 8.8734
Diff (1-2) Satterthwaite 5.4282 -1.2827 12.1391
Method Variances DF t Value Pr > |t|
Pooled Equal 13 1.90 0.0792
Satterthwaite Unequal 8.9688 1.83 0.1005
Equality of Variances
Method Num DF Den DF F Value Pr > F
Folded F 6 7 3.41 0.1336
The SAS System
The TTEST Procedure Variable: LogIgEWheat
Disease N Mean Std Dev Std Err Minimum Maximum
* There is no significant difference between those with food allergy and
possible food allergy (p = 0.08) for the variable LogIgESoy.*;
* I did not run this analysis for those with no food allergy.*;
* There is no significant difference between those with food allergy and
possible food allergy (p = 0.08) for the variable LogIgEWheat.*;
* I did not run this analysis for those with no food allergy.*;

Page | 72
Disease N Mean Std Dev Std Err Minimum Maximum
1 6 2.3468 1.4335 0.5852 0.8329 4.6052
2 9 0.6484 1.8320 0.6107 -1.4697 3.9551
Diff (1-2) 1.6984 1.6899 0.8907
Disease Method Mean 95% CL Mean Std Dev 95% CL Std Dev
1 2.3468 0.8424 3.8512 1.4335 0.8948 3.5158
2 0.6484 -0.7598 2.0566 1.8320 1.2374 3.5097
Diff (1-2) Pooled 1.6984 -0.2257 3.6225 1.6899 1.2251 2.7225
Diff (1-2) Satterthwaite 1.6984 -0.1358 3.5326
Method Variances DF t Value Pr > |t|
Pooled Equal 13 1.91 0.0789
Satterthwaite Unequal 12.531 2.01 0.0667
Equality of Variances
Method Num DF Den DF F Value Pr > F
Folded F 8 5 1.63 0.6108
The SAS System
The FREQ Procedure
Frequency
Percent
Row Pct
Col Pct
Table of Gender by Disease1
Gender(Gender) Disease1(Disease1)
Possible Food Allergy
No Food Allergy Total
Female 7
8.14
17
19.77
24
27.91
* In this next section we will look for differences in dichotomous data
between those with food allergy, possible food allergy, and no food allergy.*;
* We will begin with the variable, Gender*;
* There was no association between those with no food allergy and possible
food allergy M-H Chi Square 0.8, PR 0.8 (0.4, 1.9).*;
* There was no association between those with food allergy and no food allergy
M-H Chi Square 0.6, PR 1.1 (0.7, 1.8)
* There was no association between those with food allergy and possible food
allergy. M-H Chi Square 0.5, PR 1.1 (0.8, 1.6).*;
* So, overall no difference in gender for any of the disease categories.*;

Page | 73
29.17
25.93
70.83
28.81
Male 20
23.26
32.26
74.07
42
48.84
67.74
71.19
62
72.09
Total 27
31.40
59
68.60
86
100.00
Frequency Missing = 45
Statistics for Table of Gender by Disease1
Statistic DF Value Prob
Chi-Square 1 0.0768 0.7817
Likelihood Ratio Chi-Square 1 0.0774 0.7808
Continuity Adj. Chi-Square 1 0.0003 0.9856
Mantel-Haenszel Chi-Square 1 0.0759 0.7830
Phi Coefficient -0.0299
Contingency Coefficient 0.0299
Cramer's V -0.0299
Fisher's Exact Test
Cell (1,1) Frequency (F) 7
Left-sided Pr <= F 0.4986
Right-sided Pr >= F 0.7000
Table Probability (P) 0.1986
Two-sided Pr <= P 1.0000
Statistic Value ASE
Gamma -0.0726 0.2611

Page | 74
Statistic Value ASE
Kendall's Tau-b -0.0299 0.1064
Stuart's Tau-c -0.0249 0.0887
Somers' D C|R -0.0309 0.1101
Somers' D R|C -0.0289 0.1029
Pearson Correlation -0.0299 0.1064
Spearman Correlation -0.0299 0.1064
Lambda Asymmetric C|R 0.0000 0.0000
Lambda Asymmetric R|C 0.0000 0.0000
Lambda Symmetric 0.0000 0.0000
Uncertainty Coefficient C|R 0.0007 0.0052
Uncertainty Coefficient R|C 0.0008 0.0054
Uncertainty Coefficient Symmetric 0.0007 0.0053
Estimates of the Relative Risk (Row1/Row2)
Type of Study Value 95% Confidence Limits
Case-Control (Odds Ratio) 0.8647 0.3091 2.4190
Cohort (Col1 Risk) 0.9042 0.4400 1.8581
Cohort (Col2 Risk) 1.0456 0.7678 1.4241
Effective Sample Size = 86 Frequency Missing = 45
WARNING: 34% of the data are missing.
Summary Statistics for Gender by Disease1
Cochran-Mantel-Haenszel Statistics (Based on Table Scores)
Statistic Alternative Hypothesis DF Value Prob
1 Nonzero Correlation 1 0.0759 0.7830
2 Row Mean Scores Differ 1 0.0759 0.7830
3 General Association 1 0.0759 0.7830
Estimates of the Common Relative Risk (Row1/Row2)
Type of Study Method Value 95% Confidence Limits

Page | 75
Estimates of the Common Relative Risk (Row1/Row2)
Type of Study Method Value 95% Confidence Limits
Case-Control Mantel-Haenszel 0.8647 0.3091 2.4190
(Odds Ratio) Logit 0.8647 0.3091 2.4190
Cohort Mantel-Haenszel 0.9042 0.4400 1.8581
(Col1 Risk) Logit 0.9042 0.4400 1.8581
Cohort Mantel-Haenszel 1.0456 0.7678 1.4241
(Col2 Risk) Logit 1.0456 0.7678 1.4241
Effective Sample Size = 86 Frequency Missing = 45
WARNING: 34% of the data are missing.
The SAS System
The FREQ Procedure
Frequency
Percent
Row Pct
Col Pct
Table of Gender by Disease
Gender(Gender) Disease(Disease)
Food Allergy No Disease Total
Female 15
14.42
46.88
33.33
17
16.35
53.13
28.81
32
30.77
Male 30
28.85
41.67
66.67
42
40.38
58.33
71.19
72
69.23
Total 45
43.27
59
56.73
104
100.00
Statistics for Table of Gender by Disease
Statistic DF Value Prob

Page | 76
Statistic DF Value Prob
Chi-Square 1 0.2448 0.6207
Likelihood Ratio Chi-Square 1 0.2441 0.6213
Continuity Adj. Chi-Square 1 0.0786 0.7792
Mantel-Haenszel Chi-Square 1 0.2425 0.6224
Phi Coefficient 0.0485
Contingency Coefficient 0.0485
Cramer's V 0.0485
Fisher's Exact Test
Cell (1,1) Frequency (F) 15
Left-sided Pr <= F 0.7613
Right-sided Pr >= F 0.3884
Table Probability (P) 0.1497
Two-sided Pr <= P 0.6714
Statistic Value ASE
Gamma 0.1053 0.2113
Kendall's Tau-b 0.0485 0.0984
Stuart's Tau-c 0.0444 0.0901
Somers' D C|R 0.0521 0.1056
Somers' D R|C 0.0452 0.0917
Pearson Correlation -0.0485 0.0984
Spearman Correlation 0.0485 0.0984
Lambda Asymmetric C|R 0.0000 0.0000
Lambda Asymmetric R|C 0.0000 0.0000
Lambda Symmetric 0.0000 0.0000
Uncertainty Coefficient C|R 0.0017 0.0070
Uncertainty Coefficient R|C 0.0019 0.0077
Uncertainty Coefficient Symmetric 0.0018 0.0073

Page | 77
Estimates of the Relative Risk (Row1/Row2)
Type of Study Value 95% Confidence Limits
Case-Control (Odds Ratio) 1.2353 0.5346 2.8545
Cohort (Col1 Risk) 1.1250 0.7109 1.7804
Cohort (Col2 Risk) 0.9107 0.6231 1.3311
Sample Size = 104 Summary Statistics for Gender by Disease
Cochran-Mantel-Haenszel Statistics (Based on Table Scores)
Statistic Alternative Hypothesis DF Value Prob
1 Nonzero Correlation 1 0.2425 0.6224
2 Row Mean Scores Differ 1 0.2425 0.6224
3 General Association 1 0.2425 0.6224
Estimates of the Common Relative Risk (Row1/Row2)
Type of Study Method Value 95% Confidence Limits
Case-Control Mantel-Haenszel 1.2353 0.5346 2.8545
(Odds Ratio) Logit 1.2353 0.5346 2.8545
Cohort Mantel-Haenszel 1.1250 0.7109 1.7804
(Col1 Risk) Logit 1.1250 0.7109 1.7804
Cohort Mantel-Haenszel 0.9107 0.6231 1.3311
(Col2 Risk) Logit 0.9107 0.6231 1.3311
Total Sample Size = 104
The SAS System
The FREQ Procedure
Frequency
Percent
Row Pct
Table of Gender by Disease
Gender(Gender) Disease(Disease)
Food Allergy Possible Food Allergy
Total

Page | 78
Col Pct
Female 15
20.83
68.18
33.33
7
9.72
31.82
25.93
22
30.56
Male 30
41.67
60.00
66.67
20
27.78
40.00
74.07
50
69.44
Total 45
62.50
27
37.50
72
100.00
Statistics for Table of Gender by Disease
Statistic DF Value Prob
Chi-Square 1 0.4364 0.5089
Likelihood Ratio Chi-Square 1 0.4423 0.5060
Continuity Adj. Chi-Square 1 0.1571 0.6918
Mantel-Haenszel Chi-Square 1 0.4303 0.5118
Phi Coefficient 0.0778
Contingency Coefficient 0.0776
Cramer's V 0.0778
Fisher's Exact Test
Cell (1,1) Frequency (F) 15
Left-sided Pr <= F 0.8220
Right-sided Pr >= F 0.3490
Table Probability (P) 0.1710
Two-sided Pr <= P 0.6022
Statistic Value ASE

Page | 79
Statistic Value ASE
Gamma 0.1765 0.2622
Kendall's Tau-b 0.0778 0.1152
Stuart's Tau-c 0.0694 0.1030
Somers' D C|R 0.0818 0.1211
Somers' D R|C 0.0741 0.1098
Pearson Correlation -0.0778 0.1152
Spearman Correlation 0.0778 0.1152
Lambda Asymmetric C|R 0.0000 0.0000
Lambda Asymmetric R|C 0.0000 0.0000
Lambda Symmetric 0.0000 0.0000
Uncertainty Coefficient C|R 0.0046 0.0138
Uncertainty Coefficient R|C 0.0050 0.0149
Uncertainty Coefficient Symmetric 0.0048 0.0143
Estimates of the Relative Risk (Row1/Row2)
Type of Study Value 95% Confidence Limits
Case-Control (Odds Ratio) 1.4286 0.4946 4.1261
Cohort (Col1 Risk) 1.1364 0.7894 1.6358
Cohort (Col2 Risk) 0.7955 0.3952 1.6012
Sample Size = 72
Summary Statistics for Gender by Disease
Cochran-Mantel-Haenszel Statistics (Based on Table Scores)
Statistic Alternative Hypothesis DF Value Prob
1 Nonzero Correlation 1 0.4303 0.5118
2 Row Mean Scores Differ 1 0.4303 0.5118
3 General Association 1 0.4303 0.5118
Estimates of the Common Relative Risk (Row1/Row2)

Page | 80
Type of Study Method Value 95% Confidence Limits
Case-Control Mantel-Haenszel 1.4286 0.4946 4.1261
(Odds Ratio) Logit 1.4286 0.4946 4.1261
Cohort Mantel-Haenszel 1.1364 0.7894 1.6358
(Col1 Risk) Logit 1.1364 0.7894 1.6358
Cohort Mantel-Haenszel 0.7955 0.3952 1.6012
(Col2 Risk) Logit 0.7955 0.3952 1.6012
Total Sample Size = 72
The FREQ Procedure
Frequency
Percent
Row Pct
Col Pct
Table of FamHxAtopy by Disease
FamHxAtopy(FamHxAtopy) Disease(Disease)
Food Allergy
No Disease
Possible Food
Allergy
Total
No 5
4.95
26.32
11.63
14
13.86
73.68
24.14
0
0.00
0.00
.
19
18.81
Yes 38
37.62
46.34
88.37
44
43.56
53.66
75.86
0
0.00
0.00
.
82
81.19
Total 43
42.57
58
57.43
0
0.00
101
100.00
Frequency Missing = 30
Statistics for Table of FamHxAtopy by Disease
* We next look at the variable, FamHxAtopy.*;
* There was no difference in the variable FamHxAtopy.*;

Page | 81
(Rows and Columns with Zero Totals Excluded)
Statistic DF Value Prob
Chi-Square 1 2.5303 0.1117
Likelihood Ratio Chi-Square 1 2.6423 0.1041
Continuity Adj. Chi-Square 1 1.7775 0.1825
Mantel-Haenszel Chi-Square 1 2.5052 0.1135
Phi Coefficient -0.1583
Contingency Coefficient 0.1563
Cramer's V -0.1583
Fisher's Exact Test
Cell (1,1) Frequency (F) 5
Left-sided Pr <= F 0.0897
Right-sided Pr >= F 0.9702
Table Probability (P) 0.0599
Two-sided Pr <= P 0.1297
Statistic Value ASE
Gamma -0.4149 0.2343
Kendall's Tau-b -0.1583 0.0917
Stuart's Tau-c -0.1223 0.0729
Somers' D C|R -0.2003 0.1151
Somers' D R|C -0.1251 0.0745
Pearson Correlation 0.1583 0.0917
Spearman Correlation -0.1583 0.0917
Lambda Asymmetric C|R 0.0000 0.0000
Lambda Asymmetric R|C 0.0000 0.0000
Lambda Symmetric 0.0000 0.0000
Uncertainty Coefficient C|R 0.0192 0.0229
Uncertainty Coefficient R|C 0.0271 0.0320

Page | 82
Statistic Value ASE
Uncertainty Coefficient Symmetric 0.0224 0.0267
Estimates of the Relative Risk (Row1/Row2)
Type of Study Value 95% Confidence Limits
Case-Control (Odds Ratio) 0.4135 0.1363 1.2542
Cohort (Col1 Risk) 0.5679 0.2583 1.2483
Cohort (Col2 Risk) 1.3732 0.9817 1.9209
Effective Sample Size = 101 Frequency Missing = 30
WARNING: 23% of the data are missing.
Summary Statistics for FamHxAtopy by Disease
(Rows and Columns with Zero Totals Excluded)
Cochran-Mantel-Haenszel Statistics (Based on Table Scores)
Statistic Alternative Hypothesis DF Value Prob
1 Nonzero Correlation 1 2.5052 0.1135
2 Row Mean Scores Differ 1 2.5052 0.1135
3 General Association 1 2.5052 0.1135
Estimates of the Common Relative Risk (Row1/Row2)
Type of Study Method Value 95% Confidence Limits
Case-Control Mantel-Haenszel 0.4135 0.1363 1.2542
(Odds Ratio) Logit 0.4135 0.1363 1.2542
Cohort Mantel-Haenszel 0.5679 0.2583 1.2483
(Col1 Risk) Logit 0.5679 0.2583 1.2483
Cohort Mantel-Haenszel 1.3732 0.9817 1.9209

Page | 83
Estimates of the Common Relative Risk (Row1/Row2)
Type of Study Method Value 95% Confidence Limits
(Col2 Risk) Logit 1.3732 0.9817 1.9209
The SAS System
The FREQ Procedure
Frequency
Percent
Row Pct
Col Pct
Table of DxADClean by Disease
DxADClean Disease(Disease)
Food Allergy
No Disease
Possible Food
Allergy
Total
History of Atopic Dermatitis
36
30.00
41.86
83.72
29
24.17
33.72
54.72
21
17.50
24.42
87.50
86
71.67
No history of Atopic Dermatitis
7
5.83
20.59
16.28
24
20.00
70.59
45.28
3
2.50
8.82
12.50
34
28.33
Total 43
35.83
53
44.17
24
20.00
120
100.00
Frequency Missing = 11
* We next look at the variable, DxADClean.*;
* There was an overall significant difference in the variable DxADClean (p =
0.001).*;
* There was a significant difference between those with no food allergy and
possible food allergy (Fischer Exact test due to a cell with n = 3) p =
0.005). PR 3.8 (1.2, 11.5)*;
* There was a significant difference between those with food allergy and no
food allergy. MH Chi Square 0.003 PR 2.5 (1.2, 4.9).*;
* There was no difference between those with food allergy and possible food
allergy. MH Chi Square 0.7. PR 0.9 (0.6, 1.4)

Page | 84
Statistics for Table of DxADClean by Disease
Statistic DF Value Prob
Chi-Square 2 13.5388 0.0011
Likelihood Ratio Chi-Square 2 13.7645 0.0010
Mantel-Haenszel Chi-Square 1 10.2991 0.0013
Phi Coefficient 0.3359
Contingency Coefficient 0.3184
Cramer's V 0.3359
Statistic Value ASE
Gamma 0.1072 0.1477
Kendall's Tau-b 0.0560 0.0779
Stuart's Tau-c 0.0569 0.0791
Somers' D C|R 0.0701 0.0972
Somers' D R|C 0.0447 0.0625
Pearson Correlation 0.2942 0.0854
Spearman Correlation 0.0590 0.0820
Lambda Asymmetric C|R 0.1045 0.1139
Lambda Asymmetric R|C 0.0000 0.0000
Lambda Symmetric 0.0693 0.0771
Uncertainty Coefficient C|R 0.0546 0.0285
Uncertainty Coefficient R|C 0.0962 0.0495
Uncertainty Coefficient Symmetric 0.0697 0.0361
Effective Sample Size = 120 Frequency Missing = 11
Summary Statistics for DxADClean by Disease
Cochran-Mantel-Haenszel Statistics (Based on Table Scores)
Statistic Alternative Hypothesis DF Value Prob
1 Nonzero Correlation 1 10.2991 0.0013

Page | 85
Cochran-Mantel-Haenszel Statistics (Based on Table Scores)
Statistic Alternative Hypothesis DF Value Prob
2 Row Mean Scores Differ 1 10.2991 0.0013
3 General Association 2 13.4260 0.0012
Effective Sample Size = 120 Frequency Missing = 11
The SAS System
The FREQ Procedure
Frequency
Percent
Row Pct
Col Pct
Table of DxADCleanFinal by Disease1
DxADCleanFinal Disease1(Disease1)
Possible Food
Allergy
No Food Allergy
Total
History of Atopic Dermatitis 21
27.27
42.00
87.50
29
37.66
58.00
54.72
50
64.94
No History of Atopic Dermatitis
3
3.90
11.11
12.50
24
31.17
88.89
45.28
27
35.06
Total 24
31.17
53
68.83
77
100.00
Frequency Missing = 54
Statistics for Table of DxADCleanFinal by Disease1
Statistic DF Value Prob
Chi-Square 1 7.7973 0.0052

Page | 86
Statistic DF Value Prob
Likelihood Ratio Chi-Square 1 8.6824 0.0032
Continuity Adj. Chi-Square 1 6.4239 0.0113
Mantel-Haenszel Chi-Square 1 7.6960 0.0055
Phi Coefficient 0.3182
Contingency Coefficient 0.3032
Cramer's V 0.3182
Fisher's Exact Test
Cell (1,1) Frequency (F) 21
Left-sided Pr <= F 0.9994
Right-sided Pr >= F 0.0042
Table Probability (P) 0.0036
Two-sided Pr <= P 0.0052
Statistic Value ASE
Gamma 0.7056 0.1698
Kendall's Tau-b 0.3182 0.0918
Stuart's Tau-c 0.2813 0.0865
Somers' D C|R 0.3089 0.0924
Somers' D R|C 0.3278 0.0961
Pearson Correlation 0.3182 0.0918
Spearman Correlation 0.3182 0.0918
Lambda Asymmetric C|R 0.0000 0.0000
Lambda Asymmetric R|C 0.0000 0.0000
Lambda Symmetric 0.0000 0.0000
Uncertainty Coefficient C|R 0.0909 0.0556
Uncertainty Coefficient R|C 0.0870 0.0535
Uncertainty Coefficient Symmetric 0.0889 0.0544
Estimates of the Relative Risk (Row1/Row2)

Page | 87
Type of Study Value 95% Confidence Limits
Case-Control (Odds Ratio) 5.7931 1.5396 21.7973
Cohort (Col1 Risk) 3.7800 1.2389 11.5330
Cohort (Col2 Risk) 0.6525 0.4976 0.8556
Effective Sample Size = 77 Frequency Missing = 54
WARNING: 41% of the data are missing.
Summary Statistics for DxADCleanFinal by Disease1
Cochran-Mantel-Haenszel Statistics (Based on Table Scores)
Statistic Alternative Hypothesis DF Value Prob
1 Nonzero Correlation 1 7.6960 0.0055
2 Row Mean Scores Differ 1 7.6960 0.0055
3 General Association 1 7.6960 0.0055
Estimates of the Common Relative Risk (Row1/Row2)
Type of Study Method Value 95% Confidence Limits
Case-Control Mantel-Haenszel 5.7931 1.5396 21.7973
(Odds Ratio) Logit 5.7931 1.5396 21.7973
Cohort Mantel-Haenszel 3.7800 1.2389 11.5330
(Col1 Risk) Logit 3.7800 1.2389 11.5330
Cohort Mantel-Haenszel 0.6525 0.4976 0.8556
(Col2 Risk) Logit 0.6525 0.4976 0.8556
Effective Sample Size = 77 Frequency Missing = 54
WARNING: 41% of the data are missing.
The SAS System

Page | 88
The FREQ Procedure
Frequency
Percent
Row Pct
Col Pct
Table of DxADClean by Disease
DxADClean Disease(Disease)
Food Allergy No Disease Total
History of Atopic Dermatitis 36
37.50
55.38
83.72
29
30.21
44.62
54.72
65
67.71
No history of Atopic Dermatitis 7
7.29
22.58
16.28
24
25.00
77.42
45.28
31
32.29
Total 43
44.79
53
55.21
96
100.00
Frequency Missing = 8
Statistics for Table of DxADClean by Disease
Statistic DF Value Prob
Chi-Square 1 9.1339 0.0025
Likelihood Ratio Chi-Square 1 9.5690 0.0020
Continuity Adj. Chi-Square 1 7.8555 0.0051
Mantel-Haenszel Chi-Square 1 9.0387 0.0026
Phi Coefficient 0.3085
Contingency Coefficient 0.2948
Cramer's V 0.3085
Fisher's Exact Test
Cell (1,1) Frequency (F) 36
Left-sided Pr <= F 0.9996

Page | 89
Fisher's Exact Test
Right-sided Pr >= F 0.0022
Table Probability (P) 0.0017
Two-sided Pr <= P 0.0040
Statistic Value ASE
Gamma 0.6195 0.1531
Kendall's Tau-b 0.3085 0.0918
Stuart's Tau-c 0.2869 0.0878
Somers' D C|R 0.3280 0.0972
Somers' D R|C 0.2900 0.0886
Pearson Correlation 0.3085 0.0918
Spearman Correlation 0.3085 0.0918
Lambda Asymmetric C|R 0.1628 0.1716
Lambda Asymmetric R|C 0.0000 0.0000
Lambda Symmetric 0.0946 0.1038
Uncertainty Coefficient C|R 0.0725 0.0447
Uncertainty Coefficient R|C 0.0792 0.0485
Uncertainty Coefficient Symmetric 0.0757 0.0465
Estimates of the Relative Risk (Row1/Row2)
Type of Study Value 95% Confidence Limits
Case-Control (Odds Ratio) 4.2562 1.6075 11.2687
Cohort (Col1 Risk) 2.4527 1.2335 4.8772
Cohort (Col2 Risk) 0.5763 0.4139 0.8023
Effective Sample Size = 96 Frequency Missing = 8
Summary Statistics for DxADClean by Disease
Cochran-Mantel-Haenszel Statistics (Based on Table Scores)

Page | 90
Statistic Alternative Hypothesis DF Value Prob
1 Nonzero Correlation 1 9.0387 0.0026
2 Row Mean Scores Differ 1 9.0387 0.0026
3 General Association 1 9.0387 0.0026
Estimates of the Common Relative Risk (Row1/Row2)
Type of Study Method Value 95% Confidence Limits
Case-Control Mantel-Haenszel 4.2562 1.6075 11.2687
(Odds Ratio) Logit 4.2562 1.6075 11.2687
Cohort Mantel-Haenszel 2.4527 1.2335 4.8772
(Col1 Risk) Logit 2.4527 1.2335 4.8772
Cohort Mantel-Haenszel 0.5763 0.4139 0.8023
(Col2 Risk) Logit 0.5763 0.4139 0.8023
Effective Sample Size = 96 Frequency Missing = 8
The SAS System
The FREQ Procedure
Frequency
Percent
Row Pct
Col Pct
Table of DxADClean by Disease
DxADClean Disease(Disease)
Food Allergy No Disease Total
History of Atopic Dermatitis 36
37.50
55.38
83.72
29
30.21
44.62
54.72
65
67.71
No history of Atopic Dermatitis 7
7.29
22.58
16.28
24
25.00
77.42
45.28
31
32.29

Page | 91
Total 43
44.79
53
55.21
96
100.00
Frequency Missing = 8
Statistics for Table of DxADClean by Disease
Statistic DF Value Prob
Chi-Square 1 9.1339 0.0025
Likelihood Ratio Chi-Square 1 9.5690 0.0020
Continuity Adj. Chi-Square 1 7.8555 0.0051
Mantel-Haenszel Chi-Square 1 9.0387 0.0026
Phi Coefficient 0.3085
Contingency Coefficient 0.2948
Cramer's V 0.3085
Fisher's Exact Test
Cell (1,1) Frequency (F) 36
Left-sided Pr <= F 0.9996
Right-sided Pr >= F 0.0022
Table Probability (P) 0.0017
Two-sided Pr <= P 0.0040
Statistic Value ASE
Gamma 0.6195 0.1531
Kendall's Tau-b 0.3085 0.0918
Stuart's Tau-c 0.2869 0.0878
Somers' D C|R 0.3280 0.0972
Somers' D R|C 0.2900 0.0886
Pearson Correlation 0.3085 0.0918
Spearman Correlation 0.3085 0.0918
Lambda Asymmetric C|R 0.1628 0.1716

Page | 92
Statistic Value ASE
Lambda Asymmetric R|C 0.0000 0.0000
Lambda Symmetric 0.0946 0.1038
Uncertainty Coefficient C|R 0.0725 0.0447
Uncertainty Coefficient R|C 0.0792 0.0485
Uncertainty Coefficient Symmetric 0.0757 0.0465
Estimates of the Relative Risk (Row1/Row2)
Type of Study Value 95% Confidence Limits
Case-Control (Odds Ratio) 4.2562 1.6075 11.2687
Cohort (Col1 Risk) 2.4527 1.2335 4.8772
Cohort (Col2 Risk) 0.5763 0.4139 0.8023
Effective Sample Size = 96 Frequency Missing = 8
Summary Statistics for DxADClean by Disease
Cochran-Mantel-Haenszel Statistics (Based on Table Scores)
Statistic Alternative Hypothesis DF Value Prob
1 Nonzero Correlation 1 9.0387 0.0026
2 Row Mean Scores Differ 1 9.0387 0.0026
3 General Association 1 9.0387 0.0026
Estimates of the Common Relative Risk (Row1/Row2)
Type of Study Method Value 95% Confidence Limits
Case-Control Mantel-Haenszel 4.2562 1.6075 11.2687
(Odds Ratio) Logit 4.2562 1.6075 11.2687
Cohort Mantel-Haenszel 2.4527 1.2335 4.8772
(Col1 Risk) Logit 2.4527 1.2335 4.8772
Cohort Mantel-Haenszel 0.5763 0.4139 0.8023
(Col2 Risk) Logit 0.5763 0.4139 0.8023

Page | 93
Effective Sample Size = 96 Frequency Missing = 8
The SAS System
The FREQ Procedure
Frequency
Percent
Row Pct
Col Pct
Table of DxADClean by Disease
DxADClean Disease(Disease)
Food Allergy
Possible Food
Allergy
Total
History of Atopic Dermatitis 36
53.73
63.16
83.72
21
31.34
36.84
87.50
57
85.07
No history of Atopic Dermatitis
7
10.45
70.00
16.28
3
4.48
30.00
12.50
10
14.93
Total 43
64.18
24
35.82
67
100.00
Frequency Missing = 5
Statistics for Table of DxADClean by Disease
Statistic DF Value Prob
Chi-Square 1 0.1732 0.6772
Likelihood Ratio Chi-Square 1 0.1772 0.6738
Continuity Adj. Chi-Square 1 0.0034 0.9532
Mantel-Haenszel Chi-Square 1 0.1707 0.6795
Phi Coefficient -0.0508
Contingency Coefficient 0.0508
Cramer's V -0.0508

Page | 94
Statistic DF Value Prob
WARNING: 25% of the cells have expected counts less than 5. Chi-Square may not be a valid test.
Fisher's Exact Test
Cell (1,1) Frequency (F) 36
Left-sided Pr <= F 0.4867
Right-sided Pr >= F 0.7763
Table Probability (P) 0.2630
Two-sided Pr <= P 1.0000
Statistic Value ASE
Gamma -0.1529 0.3627
Kendall's Tau-b -0.0508 0.1178
Stuart's Tau-c -0.0348 0.0809
Somers' D C|R -0.0684 0.1584
Somers' D R|C -0.0378 0.0879
Pearson Correlation -0.0508 0.1178
Spearman Correlation -0.0508 0.1178
Lambda Asymmetric C|R 0.0000 0.0000
Lambda Asymmetric R|C 0.0000 0.0000
Lambda Symmetric 0.0000 0.0000
Uncertainty Coefficient C|R 0.0020 0.0095
Uncertainty Coefficient R|C 0.0031 0.0147
Uncertainty Coefficient Symmetric 0.0025 0.0115
Estimates of the Relative Risk (Row1/Row2)
Type of Study Value 95% Confidence Limits
Case-Control (Odds Ratio) 0.7347 0.1714 3.1498
Cohort (Col1 Risk) 0.9023 0.5744 1.4173
Cohort (Col2 Risk) 1.2281 0.4491 3.3581

Page | 95
Effective Sample Size = 67 Frequency Missing = 5
Summary Statistics for DxADClean by Disease
Cochran-Mantel-Haenszel Statistics (Based on Table Scores)
Statistic Alternative Hypothesis DF Value Prob
1 Nonzero Correlation 1 0.1707 0.6795
2 Row Mean Scores Differ 1 0.1707 0.6795
3 General Association 1 0.1707 0.6795
Estimates of the Common Relative Risk (Row1/Row2)
Type of Study Method Value 95% Confidence Limits
Case-Control Mantel-Haenszel 0.7347 0.1714 3.1498
(Odds Ratio) Logit 0.7347 0.1714 3.1498
Cohort Mantel-Haenszel 0.9023 0.5744 1.4173
(Col1 Risk) Logit 0.9023 0.5744 1.4173
Cohort Mantel-Haenszel 1.2281 0.4491 3.3581
(Col2 Risk) Logit 1.2281 0.4491 3.3581
Effective Sample Size = 67 Frequency Missing = 5
The SAS System
The FREQ Procedure
Frequency
Percent
Row Pct
Col Pct
Table of DxAsthmaClean by Disease
DxAsthmaClean Disease(Disease)
Food Allergy
No Disease
Possible Food
Allergy
Total
* We next look at the variable, DxAsthmaClean.*;
* There was no overall significant difference in the variable DxAsthmaClean (p
= 0.5).*;

Page | 96
History of asthma 31
25.20
36.05
75.61
38
30.89
44.19
66.67
17
13.82
19.77
68.00
86
69.92
No history of asthma
10
8.13
27.03
24.39
19
15.45
51.35
33.33
8
6.50
21.62
32.00
37
30.08
Total 41
33.33
57
46.34
25
20.33
123
100.00
Frequency Missing = 8
Statistics for Table of DxAsthmaClean by Disease
Statistic DF Value Prob
Chi-Square 2 0.9617 0.6182
Likelihood Ratio Chi-Square 2 0.9816 0.6121
Mantel-Haenszel Chi-Square 1 0.8619 0.3532
Phi Coefficient 0.0884
Contingency Coefficient 0.0881
Cramer's V 0.0884
Statistic Value ASE
Gamma 0.1331 0.1606
Kendall's Tau-b 0.0687 0.0836
Stuart's Tau-c 0.0709 0.0864
Somers' D C|R 0.0842 0.1025
Somers' D R|C 0.0560 0.0683
Pearson Correlation 0.0841 0.0881
Spearman Correlation 0.0724 0.0881

Page | 97
Statistic Value ASE
Lambda Asymmetric C|R 0.0000 0.0000
Lambda Asymmetric R|C 0.0000 0.0000
Lambda Symmetric 0.0000 0.0000
Uncertainty Coefficient C|R 0.0038 0.0076
Uncertainty Coefficient R|C 0.0065 0.0130
Uncertainty Coefficient Symmetric 0.0048 0.0096
Effective Sample Size = 123 Frequency Missing = 8
Summary Statistics for DxAsthmaClean by Disease
Cochran-Mantel-Haenszel Statistics (Based on Table Scores)
Statistic Alternative Hypothesis DF Value Prob
1 Nonzero Correlation 1 0.8619 0.3532
2 Row Mean Scores Differ 1 0.8619 0.3532
3 General Association 2 0.9539 0.6207
Effective Sample Size = 123 Frequency Missing = 8
The SAS System
The FREQ Procedure
Frequency
Percent
Row Pct
Col Pct
Table of DxARClean by Disease
DxARClean Disease(Disease)
Food Allergy
No Disease
Possible Food
Allergy
Total
History of allergic rhinitis
23
21.30
23
21.30
8
7.41
54
50.00
* We next look at the variable, DxARClean.*;
* There was no overall significant difference in the variable DxARClean (p =
0.1).*;

Page | 98
42.59
60.53
42.59
43.40
14.81
47.06
No history of allergic rhinitis
15
13.89
27.78
39.47
30
27.78
55.56
56.60
9
8.33
16.67
52.94
54
50.00
Total 38
35.19
53
49.07
17
15.74
108
100.00
Frequency Missing = 23
Statistics for Table of DxARClean by Disease
Statistic DF Value Prob
Chi-Square 2 2.6676 0.2635
Likelihood Ratio Chi-Square 2 2.6830 0.2615
Mantel-Haenszel Chi-Square 1 2.5070 0.1133
Phi Coefficient 0.1572
Contingency Coefficient 0.1553
Cramer's V 0.1572
Statistic Value ASE
Gamma 0.2206 0.1596
Kendall's Tau-b 0.1238 0.0912
Stuart's Tau-c 0.1368 0.1008
Somers' D C|R 0.1368 0.1008
Somers' D R|C 0.1120 0.0826
Pearson Correlation 0.1531 0.0948
Spearman Correlation 0.1297 0.0955
Lambda Asymmetric C|R 0.0000 0.1233
Lambda Asymmetric R|C 0.1481 0.1430

Page | 99
Statistic Value ASE
Lambda Symmetric 0.0734 0.1137
Uncertainty Coefficient C|R 0.0123 0.0149
Uncertainty Coefficient R|C 0.0179 0.0217
Uncertainty Coefficient Symmetric 0.0146 0.0177
Effective Sample Size = 108 Frequency Missing = 23
WARNING: 18% of the data are missing.
Summary Statistics for DxARClean by Disease
Cochran-Mantel-Haenszel Statistics (Based on Table Scores)
Statistic Alternative Hypothesis DF Value Prob
1 Nonzero Correlation 1 2.5070 0.1133
2 Row Mean Scores Differ 1 2.5070 0.1133
3 General Association 2 2.6429 0.2668
Effective Sample Size = 108 Frequency Missing = 23
WARNING: 18% of the data are missing.
The SAS System
The FREQ Procedure
Frequency
Percent
Row Pct
Col Pct
Table of FA_Severe_Clean by Disease
FA_Severe_Clean Disease(Disease)
Food Allergy
Possible Food
Allergy
Total
Parents consider the food allergy to be severe
29
45.31
16
25.00
45
70.31
* We next look at the variable, FA_Severe_Clean.*;
* There was no overall significant difference in the variable FA_Severe_Clean
(p = 0.6).*;

Page | 100
64.44
72.50
35.56
66.67
Parents do not consider the food allergy to be severe
11
17.19
57.89
27.50
8
12.50
42.11
33.33
19
29.69
Total 40
62.50
24
37.50
64
100.00
Frequency Missing = 8
Statistics for Table of FA_Severe_Clean by Disease
Statistic DF Value Prob
Chi-Square 1 0.2445 0.6210
Likelihood Ratio Chi-Square 1 0.2425 0.6224
Continuity Adj. Chi-Square 1 0.0449 0.8322
Mantel-Haenszel Chi-Square 1 0.2407 0.6237
Phi Coefficient 0.0618
Contingency Coefficient 0.0617
Cramer's V 0.0618
Fisher's Exact Test
Cell (1,1) Frequency (F) 29
Left-sided Pr <= F 0.7823
Right-sided Pr >= F 0.4126
Table Probability (P) 0.1950
Two-sided Pr <= P 0.7783
Statistic Value ASE
Gamma 0.1373 0.2744

Page | 101
Statistic Value ASE
Kendall's Tau-b 0.0618 0.1263
Stuart's Tau-c 0.0547 0.1119
Somers' D C|R 0.0655 0.1339
Somers' D R|C 0.0583 0.1193
Pearson Correlation 0.0618 0.1263
Spearman Correlation 0.0618 0.1263
Lambda Asymmetric C|R 0.0000 0.0000
Lambda Asymmetric R|C 0.0000 0.0000
Lambda Symmetric 0.0000 0.0000
Uncertainty Coefficient C|R 0.0029 0.0117
Uncertainty Coefficient R|C 0.0031 0.0127
Uncertainty Coefficient Symmetric 0.0030 0.0122
Estimates of the Relative Risk (Row1/Row2)
Type of Study Value 95% Confidence Limits
Case-Control (Odds Ratio) 1.3182 0.4404 3.9456
Cohort (Col1 Risk) 1.1131 0.7165 1.7294
Cohort (Col2 Risk) 0.8444 0.4374 1.6303
Effective Sample Size = 64 Frequency Missing = 8
WARNING: 11% of the data are missing.
Summary Statistics for FA_Severe_Clean by Disease
Cochran-Mantel-Haenszel Statistics (Based on Table Scores)
Statistic Alternative Hypothesis DF Value Prob
1 Nonzero Correlation 1 0.2407 0.6237
2 Row Mean Scores Differ 1 0.2407 0.6237

Page | 102
Cochran-Mantel-Haenszel Statistics (Based on Table Scores)
Statistic Alternative Hypothesis DF Value Prob
3 General Association 1 0.2407 0.6237
Estimates of the Common Relative Risk (Row1/Row2)
Type of Study Method Value 95% Confidence Limits
Case-Control Mantel-Haenszel 1.3182 0.4404 3.9456
(Odds Ratio) Logit 1.3182 0.4404 3.9456
Cohort Mantel-Haenszel 1.1131 0.7165 1.7294
(Col1 Risk) Logit 1.1131 0.7165 1.7294
Cohort Mantel-Haenszel 0.8444 0.4374 1.6303
(Col2 Risk) Logit 0.8444 0.4374 1.6303
Effective Sample Size = 64 Frequency Missing = 8
WARNING: 11% of the data are missing.
The SAS System
The FREQ Procedure
Frequency
Percent
Row Pct
Col Pct
Table of LTR_FoodCleanFinal by Disease
LTR_FoodCleanFinal Disease(Disease)
Food Allergy
Possible Food
Allergy
Total
History of Life Threatening Reaction to Food
23
32.39
79.31
6
8.45
20.69
29
40.85
* We next look at the variable, LTR_FoodCleanFinal.*;
* There was an overall significant difference in the variable
LTR_FoodCleanFinal (MH Chi Square p = 0.0.01) PR 1.6 (1.1, 2.3).*;

Page | 103
52.27
22.22
No History of Life Threatening Reaction to Food
21
29.58
50.00
47.73
21
29.58
50.00
77.78
42
59.15
Total 44
61.97
27
38.03
71
100.00
Frequency Missing = 1
Statistics for Table of LTR_FoodCleanFinal by Disease
Statistic DF Value Prob
Chi-Square 1 6.2536 0.0124
Likelihood Ratio Chi-Square 1 6.5230 0.0106
Continuity Adj. Chi-Square 1 5.0717 0.0243
Mantel-Haenszel Chi-Square 1 6.1655 0.0130
Phi Coefficient 0.2968
Contingency Coefficient 0.2845
Cramer's V 0.2968
Fisher's Exact Test
Cell (1,1) Frequency (F) 23
Left-sided Pr <= F 0.9975
Right-sided Pr >= F 0.0112
Table Probability (P) 0.0087
Two-sided Pr <= P 0.0144
Statistic Value ASE
Gamma 0.5862 0.1814
Kendall's Tau-b 0.2968 0.1081

Page | 104
Statistic Value ASE
Stuart's Tau-c 0.2833 0.1049
Somers' D C|R 0.2931 0.1078
Somers' D R|C 0.3005 0.1099
Pearson Correlation -0.2968 0.1081
Spearman Correlation 0.2968 0.1081
Lambda Asymmetric C|R 0.0000 0.2400
Lambda Asymmetric R|C 0.0690 0.2207
Lambda Symmetric 0.0357 0.1996
Uncertainty Coefficient C|R 0.0692 0.0518
Uncertainty Coefficient R|C 0.0679 0.0510
Uncertainty Coefficient Symmetric 0.0685 0.0514
Estimates of the Relative Risk (Row1/Row2)
Type of Study Value 95% Confidence Limits
Case-Control (Odds Ratio) 3.8333 1.2977 11.3230
Cohort (Col1 Risk) 1.5862 1.1122 2.2622
Cohort (Col2 Risk) 0.4138 0.1908 0.8974
Effective Sample Size = 71 Frequency Missing = 1
Summary Statistics for LTR_FoodCleanFinal by Disease
Cochran-Mantel-Haenszel Statistics (Based on Table Scores)
Statistic Alternative Hypothesis DF Value Prob
1 Nonzero Correlation 1 6.1655 0.0130
2 Row Mean Scores Differ 1 6.1655 0.0130
3 General Association 1 6.1655 0.0130
Estimates of the Common Relative Risk (Row1/Row2)
Type of Study Method Value 95% Confidence Limits

Page | 105
Estimates of the Common Relative Risk (Row1/Row2)
Type of Study Method Value 95% Confidence Limits
Case-Control Mantel-Haenszel 3.8333 1.2977 11.3230
(Odds Ratio) Logit 3.8333 1.2977 11.3230
Cohort Mantel-Haenszel 1.5862 1.1122 2.2622
(Col1 Risk) Logit 1.5862 1.1122 2.2622
Cohort Mantel-Haenszel 0.4138 0.1908 0.8974
(Col2 Risk) Logit 0.4138 0.1908 0.8974
Effective Sample Size = 71 Frequency Missing = 1
The SAS System
The FREQ Procedure
DiseaseFinal=1
Exposure1 Frequency Percent Cumulative Frequency
Cumulative Percent
1 27 60.00 27 60.00
2 18 40.00 45 100.00
Binomial Proportion for Exposure1 = 1
Proportion (P) 0.6000
ASE 0.0730
*After the above analysis, and due to the fact that those with possible food
allergy did not appear to significantly
affect the association between antacid medication and prevalence of food
allergy, I decided to exclude the Possible
Food Allergy group from analysis to improve the ease of analysis and clarity
of results.*;
*Univariate analysis of FAR13 dataset using only those with food allergy
defined as consistent history and Ige
(Disease = 2) and those without disease (Disease = 0)*;
*We will now define the populations (Those who were exposed to antacid
medication, and those who had food allergy). Beginning with those who were
exposed to antacid medication.*;
*Starting with DiseaseFinal.*;

Page | 106
Type 95% Confidence Limits
Wald 0.4569 0.7431
Wilson 0.4545 0.7298
Agresti-Coull 0.4543 0.7300
Jeffreys 0.4543 0.7333
Clopper-Pearson (Exact) 0.4433 0.7430
Test of H0: Proportion = 0.5
ASE under H0 0.0745
Z 1.3416
One-sided Pr > Z 0.0899
Two-sided Pr > |Z| 0.1797
Exact Test
One-sided Pr >= P 0.1163
Two-sided = 2 * One-sided 0.2327
Sample Size = 45
The SAS System
The FREQ Procedure
DiseaseFinal=0
Exposure1 Frequency Percent Cumulative Frequency
Cumulative Percent
1 20 33.90 20 33.90
2 39 66.10 59 100.00
Binomial Proportion for Exposure1 = 1
Proportion (P) 0.3390
ASE 0.0616
Type 95% Confidence Limits
Wald 0.2182 0.4598
* We will start with the variable, Disease.*;

Page | 107
Type 95% Confidence Limits
Wilson 0.2314 0.4663
Agresti-Coull 0.2310 0.4667
Jeffreys 0.2282 0.4652
Clopper-Pearson (Exact) 0.2208 0.4739
Test of H0: Proportion = 0.5
ASE under H0 0.0651
Z -2.4736
One-sided Pr < Z 0.0067
Two-sided Pr > |Z| 0.0134
Exact Test
One-sided Pr <= P 0.0092
Two-sided = 2 * One-sided 0.0183
Sample Size = 59
The SAS System
The FREQ Procedure
DiseaseFinal=1
Exposure1 Frequency Percent Cumulative Frequency
Cumulative Percent
1 27 60.00 27 60.00
2 18 40.00 45 100.00
Binomial Proportion for Exposure1 = 1
Proportion (P) 0.6000
ASE 0.0730
Type 95% Confidence Limits
Wald 0.4569 0.7431

Page | 108
Type 95% Confidence Limits
Wilson 0.4545 0.7298
Agresti-Coull 0.4543 0.7300
Jeffreys 0.4543 0.7333
Clopper-Pearson (Exact) 0.4433 0.7430
Test of H0: Proportion = 0.5
ASE under H0 0.0745
Z 1.3416
One-sided Pr > Z 0.0899
Two-sided Pr > |Z| 0.1797
Exact Test
One-sided Pr >= P 0.1163
Two-sided = 2 * One-sided 0.2327
Sample Size = 45
The SAS System
The FREQ Procedure
AgeGroup=0
Exposure1 Frequency Percent Cumulative Frequency
Cumulative Percent
1 23 40.35 23 40.35
2 34 59.65 57 100.00
Binomial Proportion for Exposure1 = 1
Proportion (P) 0.4035
ASE 0.0650
Type 95% Confidence Limits
* Next variable, AgeGroup.*;

Page | 109
Type 95% Confidence Limits
Wald 0.2761 0.5309
Wilson 0.2862 0.5330
Agresti-Coull 0.2860 0.5332
Jeffreys 0.2835 0.5330
Clopper-Pearson (Exact) 0.2756 0.5418
Test of H0: Proportion = 0.5
ASE under H0 0.0662
Z -1.4570
One-sided Pr < Z 0.0726
Two-sided Pr > |Z| 0.1451
Exact Test
One-sided Pr <= P 0.0924
Two-sided = 2 * One-sided 0.1849
Sample Size = 57
The SAS System
The FREQ Procedure
AgeGroup=1
Exposure1 Frequency Percent Cumulative Frequency
Cumulative Percent
1 22 55.00 22 55.00
2 18 45.00 40 100.00
Binomial Proportion for Exposure1 = 1
Proportion (P) 0.5500
ASE 0.0787
Type 95% Confidence Limits
Wald 0.3958 0.7042

Page | 110
Type 95% Confidence Limits
Wilson 0.3983 0.6929
Agresti-Coull 0.3982 0.6930
Jeffreys 0.3969 0.6962
Clopper-Pearson (Exact) 0.3849 0.7074
Test of H0: Proportion = 0.5
ASE under H0 0.0791
Z 0.6325
One-sided Pr > Z 0.2635
Two-sided Pr > |Z| 0.5271
Exact Test
One-sided Pr >= P 0.3179
Two-sided = 2 * One-sided 0.6358
Sample Size = 40
The SAS System
The FREQ Procedure
AgeGroup=2
Exposure1 Frequency Percent Cumulative Frequency
Cumulative Percent
1 9 26.47 9 26.47
2 25 73.53 34 100.00
Binomial Proportion for Exposure1 = 1
Proportion (P) 0.2647
ASE 0.0757
Type 95% Confidence Limits
Wald 0.1164 0.4130
Wilson 0.1460 0.4312

Page | 111
Type 95% Confidence Limits
Agresti-Coull 0.1442 0.4330
Jeffreys 0.1398 0.4278
Clopper-Pearson (Exact) 0.1288 0.4436
Test of H0: Proportion = 0.5
ASE under H0 0.0857
Z -2.7440
One-sided Pr < Z 0.0030
Two-sided Pr > |Z| 0.0061
Exact Test
One-sided Pr <= P 0.0045
Two-sided = 2 * One-sided 0.0090
Sample Size = 34
The SAS System
The FREQ Procedure
Gender=0
Exposure1 Frequency Percent Cumulative Frequency
Cumulative Percent
1 18 46.15 18 46.15
2 21 53.85 39 100.00
Binomial Proportion for Exposure1 = 1
Proportion (P) 0.4615
ASE 0.0798
Type 95% Confidence Limits
Wald 0.3051 0.6180
* Next variable, Gender.*;

Page | 112
Type 95% Confidence Limits
Wilson 0.3157 0.6143
Agresti-Coull 0.3156 0.6143
Jeffreys 0.3125 0.6160
Clopper-Pearson (Exact) 0.3009 0.6282
Test of H0: Proportion = 0.5
ASE under H0 0.0801
Z -0.4804
One-sided Pr < Z 0.3155
Two-sided Pr > |Z| 0.6310
Exact Test
One-sided Pr <= P 0.3746
Two-sided = 2 * One-sided 0.7493
Sample Size = 39
The SAS System
The FREQ Procedure
Gender=1
Exposure1 Frequency Percent Cumulative Frequency
Cumulative Percent
1 36 39.13 36 39.13
2 56 60.87 92 100.00
Binomial Proportion for Exposure1 = 1
Proportion (P) 0.3913
ASE 0.0509
Type 95% Confidence Limits
Wald 0.2916 0.4910
Wilson 0.2979 0.4935

Page | 113
Type 95% Confidence Limits
Agresti-Coull 0.2978 0.4936
Jeffreys 0.2962 0.4931
Clopper-Pearson (Exact) 0.2912 0.4986
Test of H0: Proportion = 0.5
ASE under H0 0.0521
Z -2.0851
One-sided Pr < Z 0.0185
Two-sided Pr > |Z| 0.0371
Exact Test
One-sided Pr <= P 0.0235
Two-sided = 2 * One-sided 0.0470
Sample Size = 92
The SAS System
The FREQ Procedure
DxADClean=0
Exposure1 Frequency Percent Cumulative Frequency
Cumulative Percent
1 17 50.00 17 50.00
2 17 50.00 34 100.00
Binomial Proportion for Exposure1 = 1
Proportion (P) 0.5000
ASE 0.0857
Type 95% Confidence Limits
Wald 0.3319 0.6681
Wilson 0.3407 0.6593
* Next variable, ADClean.*;

Page | 114
Type 95% Confidence Limits
Agresti-Coull 0.3407 0.6593
Jeffreys 0.3377 0.6623
Clopper-Pearson (Exact) 0.3243 0.6757
Test of H0: Proportion = 0.5
ASE under H0 0.0857
Z 0.0000
One-sided Pr < Z 0.5000
Two-sided Pr > |Z| 1.0000
Exact Test
One-sided Pr <= P 0.5679
Two-sided = 2 * One-sided 1.0000
Sample Size = 34
The SAS System
The FREQ Procedure
DxADClean=1
Exposure1 Frequency Percent Cumulative Frequency
Cumulative Percent
1 35 40.70 35 40.70
2 51 59.30 86 100.00
Binomial Proportion for Exposure1 = 1
Proportion (P) 0.4070
ASE 0.0530
Type 95% Confidence Limits
Wald 0.3031 0.5108
Wilson 0.3093 0.5126
Agresti-Coull 0.3092 0.5127

Page | 115
Type 95% Confidence Limits
Jeffreys 0.3076 0.5125
Clopper-Pearson (Exact) 0.3022 0.5183
Test of H0: Proportion = 0.5
ASE under H0 0.0539
Z -1.7253
One-sided Pr < Z 0.0422
Two-sided Pr > |Z| 0.0845
Exact Test
One-sided Pr <= P 0.0526
Two-sided = 2 * One-sided 0.1052
Sample Size = 86
The SAS System
The FREQ Procedure
DxAsthmaClean=.
Exposure1 Frequency Percent Cumulative Frequency
Cumulative Percent
1 1 12.50 1 12.50
2 7 87.50 8 100.00
Binomial Proportion for Exposure1 = 1
Proportion (P) 0.1250
ASE 0.1169
Type 95% Confidence Limits
Wald 0.0000 0.3542
Wilson 0.0224 0.4709
* Next variable, AsthmaClean.*;

Page | 116
Type 95% Confidence Limits
Agresti-Coull 0.0011 0.4922
Jeffreys 0.0138 0.4537
Clopper-Pearson (Exact) 0.0032 0.5265
Test of H0: Proportion = 0.5
ASE under H0 0.1768
Z -2.1213
One-sided Pr < Z 0.0169
Two-sided Pr > |Z| 0.0339
Exact Test
One-sided Pr <= P 0.0352
Two-sided = 2 * One-sided 0.0703
Sample Size = 8
The SAS System
The FREQ Procedure
DxAsthmaClean=0
Exposure1 Frequency Percent Cumulative Frequency
Cumulative Percent
1 16 43.24 16 43.24
2 21 56.76 37 100.00
Binomial Proportion for Exposure1 = 1
Proportion (P) 0.4324
ASE 0.0814
Type 95% Confidence Limits
Wald 0.2728 0.5921
Wilson 0.2867 0.5909
Agresti-Coull 0.2866 0.5910

Page | 117
Type 95% Confidence Limits
Jeffreys 0.2829 0.5921
Clopper-Pearson (Exact) 0.2710 0.6051
Test of H0: Proportion = 0.5
ASE under H0 0.0822
Z -0.8220
One-sided Pr < Z 0.2055
Two-sided Pr > |Z| 0.4111
Exact Test
One-sided Pr <= P 0.2557
Two-sided = 2 * One-sided 0.5114
Sample Size = 37
The SAS System
The FREQ Procedure
DxAsthmaClean=1
Exposure1 Frequency Percent Cumulative Frequency
Cumulative Percent
1 37 43.02 37 43.02
2 49 56.98 86 100.00
Binomial Proportion for Exposure1 = 1
Proportion (P) 0.4302
ASE 0.0534
Type 95% Confidence Limits
Wald 0.3256 0.5349
Wilson 0.3308 0.5356
Agresti-Coull 0.3308 0.5357
Jeffreys 0.3293 0.5357
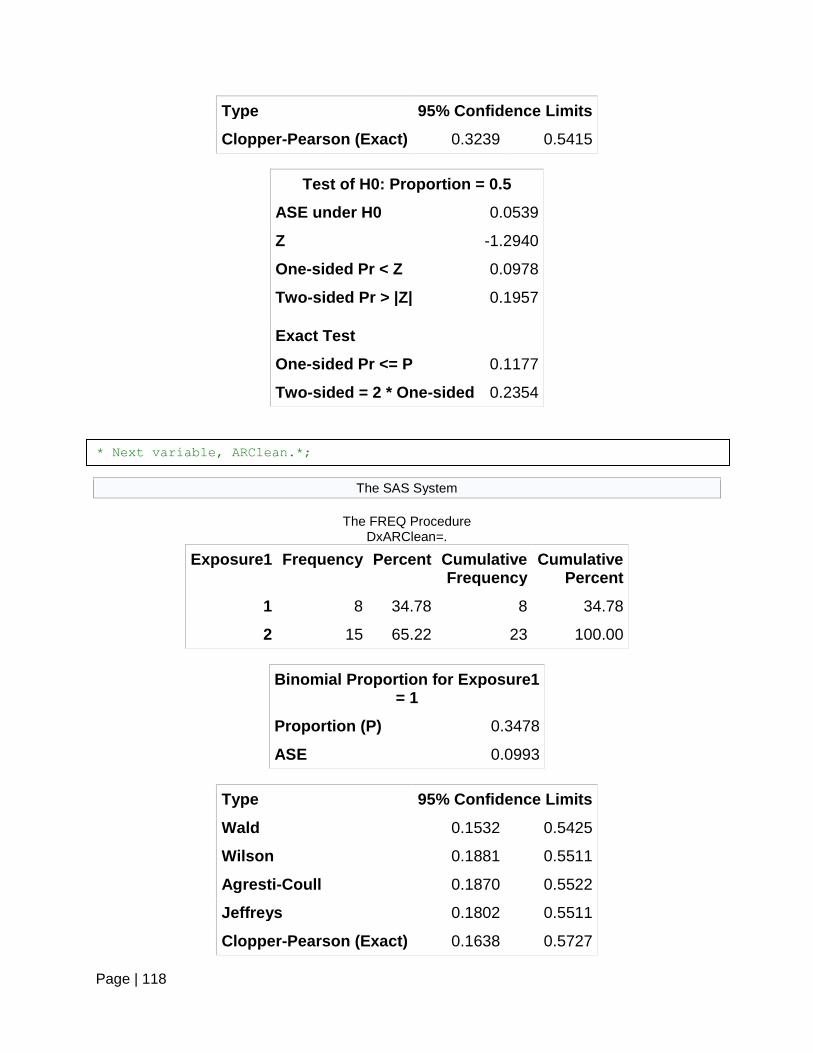
Page | 118
Type 95% Confidence Limits
Clopper-Pearson (Exact) 0.3239 0.5415
Test of H0: Proportion = 0.5
ASE under H0 0.0539
Z -1.2940
One-sided Pr < Z 0.0978
Two-sided Pr > |Z| 0.1957
Exact Test
One-sided Pr <= P 0.1177
Two-sided = 2 * One-sided 0.2354
Sample Size = 86
The SAS System
The FREQ Procedure
DxARClean=.
Exposure1 Frequency Percent Cumulative Frequency
Cumulative Percent
1 8 34.78 8 34.78
2 15 65.22 23 100.00
Binomial Proportion for Exposure1 = 1
Proportion (P) 0.3478
ASE 0.0993
Type 95% Confidence Limits
Wald 0.1532 0.5425
Wilson 0.1881 0.5511
Agresti-Coull 0.1870 0.5522
Jeffreys 0.1802 0.5511
Clopper-Pearson (Exact) 0.1638 0.5727
* Next variable, ARClean.*;

Page | 119
Test of H0: Proportion = 0.5
ASE under H0 0.1043
Z -1.4596
One-sided Pr < Z 0.0722
Two-sided Pr > |Z| 0.1444
Exact Test
One-sided Pr <= P 0.1050
Two-sided = 2 * One-sided 0.2100
Sample Size = 23
The SAS System
The FREQ Procedure
DxARClean=0
Exposure1 Frequency Percent Cumulative Frequency
Cumulative Percent
1 23 42.59 23 42.59
2 31 57.41 54 100.00
Binomial Proportion for Exposure1 = 1
Proportion (P) 0.4259
ASE 0.0673
Type 95% Confidence Limits
Wald 0.2940 0.5578
Wilson 0.3033 0.5584
Agresti-Coull 0.3032 0.5585
Jeffreys 0.3007 0.5588
Clopper-Pearson (Exact) 0.2923 0.5679
Test of H0: Proportion = 0.5

Page | 120
Test of H0: Proportion = 0.5
ASE under H0 0.0680
Z -1.0887
One-sided Pr < Z 0.1382
Two-sided Pr > |Z| 0.2763
Exact Test
One-sided Pr <= P 0.1704
Two-sided = 2 * One-sided 0.3409
Sample Size = 54
The SAS System
The FREQ Procedure
DxARClean=1
Exposure1 Frequency Percent Cumulative Frequency
Cumulative Percent
1 23 42.59 23 42.59
2 31 57.41 54 100.00
Binomial Proportion for Exposure1 = 1
Proportion (P) 0.4259
ASE 0.0673
Type 95% Confidence Limits
Wald 0.2940 0.5578
Wilson 0.3033 0.5584
Agresti-Coull 0.3032 0.5585
Jeffreys 0.3007 0.5588
Clopper-Pearson (Exact) 0.2923 0.5679
Test of H0: Proportion = 0.5
ASE under H0 0.0680

Page | 121
Test of H0: Proportion = 0.5
Z -1.0887
One-sided Pr < Z 0.1382
Two-sided Pr > |Z| 0.2763
Exact Test
One-sided Pr <= P 0.1704
Two-sided = 2 * One-sided 0.3409
Sample Size = 54
The SAS System
The FREQ Procedure
Exposure=0
Disease3 Frequency Percent Cumulative Frequency
Cumulative Percent
1 18 31.58 18 31.58
2 39 68.42 57 100.00
Frequency Missing = 20
Binomial Proportion for Disease3 = 1
Proportion (P) 0.3158
ASE 0.0616
Type 95% Confidence Limits
Wald 0.1951 0.4365
Wilson 0.2100 0.4448
Agresti-Coull 0.2095 0.4453
Jeffreys 0.2065 0.4433
Clopper-Pearson (Exact) 0.1991 0.4524
*Now we will look at the population with food allergy. We will Recode Disease
in order to get 95% confidence intervals for those who were exposed.*;

Page | 122
Test of H0: Proportion = 0.5
ASE under H0 0.0662
Z -2.7815
One-sided Pr < Z 0.0027
Two-sided Pr > |Z| 0.0054
Exact Test
One-sided Pr <= P 0.0038
Two-sided = 2 * One-sided 0.0075
Effective Sample Size = 57 Frequency Missing = 20
WARNING: 26% of the data are missing.
The SAS System
The FREQ Procedure
Exposure=1
Disease3 Frequency Percent Cumulative Frequency
Cumulative Percent
1 27 57.45 27 57.45
2 20 42.55 47 100.00
Frequency Missing = 7
Binomial Proportion for Disease3 = 1
Proportion (P) 0.5745
ASE 0.0721
Type 95% Confidence Limits
Wald 0.4331 0.7158
Wilson 0.4328 0.7049
Agresti-Coull 0.4327 0.7050
Jeffreys 0.4322 0.7079
Clopper-Pearson (Exact) 0.4218 0.7174

Page | 123
Test of H0: Proportion = 0.5
ASE under H0 0.0729
Z 1.0211
One-sided Pr > Z 0.1536
Two-sided Pr > |Z| 0.3072
Exact Test
One-sided Pr >= P 0.1908
Two-sided = 2 * One-sided 0.3817
Effective Sample Size = 47 Frequency Missing = 7
WARNING: 13% of the data are missing.
The SAS System
The FREQ Procedure
AgeGroup=0
Disease3 Frequency Percent Cumulative Frequency
Cumulative Percent
1 25 56.82 25 56.82
2 19 43.18 44 100.00
Frequency Missing = 13
Binomial Proportion for Disease3 = 1
Proportion (P) 0.5682
ASE 0.0747
Type 95% Confidence Limits
Wald 0.4218 0.7145
Wilson 0.4222 0.7032
Agresti-Coull 0.4221 0.7033
Jeffreys 0.4214 0.7063
Clopper-Pearson (Exact) 0.4103 0.7165
*Now we will look at the variable AgeGroup.*;

Page | 124
Test of H0: Proportion = 0.5
ASE under H0 0.0754
Z 0.9045
One-sided Pr > Z 0.1829
Two-sided Pr > |Z| 0.3657
Exact Test
One-sided Pr >= P 0.2257
Two-sided = 2 * One-sided 0.4514
Effective Sample Size = 44 Frequency Missing = 13
WARNING: 23% of the data are missing.
The SAS System
The FREQ Procedure
AgeGroup=1
Disease3 Frequency Percent Cumulative Frequency
Cumulative Percent
1 12 35.29 12 35.29
2 22 64.71 34 100.00
Frequency Missing = 6
Binomial Proportion for Disease3 = 1
Proportion (P) 0.3529
ASE 0.0820
Type 95% Confidence Limits
Wald 0.1923 0.5136
Wilson 0.2149 0.5209
Agresti-Coull 0.2142 0.5215
Jeffreys 0.2095 0.5203
Clopper-Pearson (Exact) 0.1975 0.5351

Page | 125
Test of H0: Proportion = 0.5
ASE under H0 0.0857
Z -1.7150
One-sided Pr < Z 0.0432
Two-sided Pr > |Z| 0.0863
Exact Test
One-sided Pr <= P 0.0607
Two-sided = 2 * One-sided 0.1214
Effective Sample Size = 34 Frequency Missing = 6
WARNING: 15% of the data are missing.
The SAS System
The FREQ Procedure
AgeGroup=2
Disease3 Frequency Percent Cumulative Frequency
Cumulative Percent
1 8 30.77 8 30.77
2 18 69.23 26 100.00
Frequency Missing = 8
Binomial Proportion for Disease3 = 1
Proportion (P) 0.3077
ASE 0.0905
Type 95% Confidence Limits
Wald 0.1303 0.4851
Wilson 0.1650 0.4999
Agresti-Coull 0.1634 0.5015
Jeffreys 0.1575 0.4980
Clopper-Pearson (Exact) 0.1433 0.5179
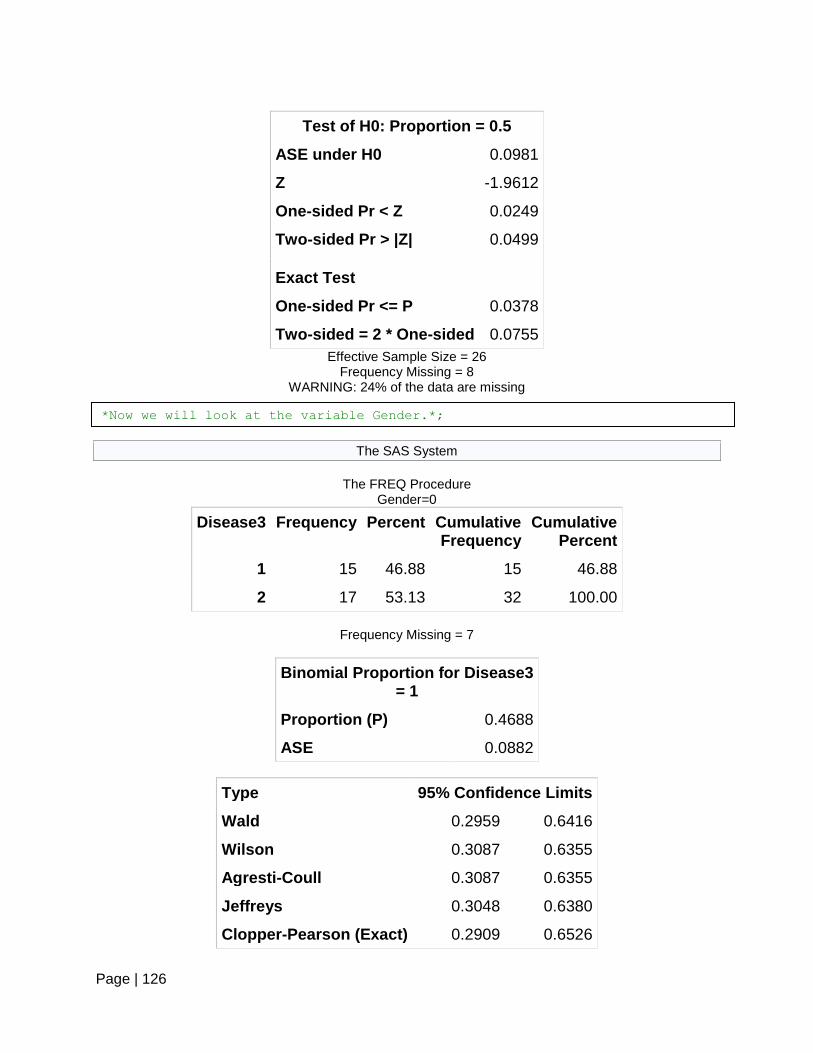
Page | 126
Test of H0: Proportion = 0.5
ASE under H0 0.0981
Z -1.9612
One-sided Pr < Z 0.0249
Two-sided Pr > |Z| 0.0499
Exact Test
One-sided Pr <= P 0.0378
Two-sided = 2 * One-sided 0.0755
Effective Sample Size = 26 Frequency Missing = 8
WARNING: 24% of the data are missing
The SAS System
The FREQ Procedure
Gender=0
Disease3 Frequency Percent Cumulative Frequency
Cumulative Percent
1 15 46.88 15 46.88
2 17 53.13 32 100.00
Frequency Missing = 7
Binomial Proportion for Disease3 = 1
Proportion (P) 0.4688
ASE 0.0882
Type 95% Confidence Limits
Wald 0.2959 0.6416
Wilson 0.3087 0.6355
Agresti-Coull 0.3087 0.6355
Jeffreys 0.3048 0.6380
Clopper-Pearson (Exact) 0.2909 0.6526
*Now we will look at the variable Gender.*;

Page | 127
Test of H0: Proportion = 0.5
ASE under H0 0.0884
Z -0.3536
One-sided Pr < Z 0.3618
Two-sided Pr > |Z| 0.7237
Exact Test
One-sided Pr <= P 0.4300
Two-sided = 2 * One-sided 0.8601
Effective Sample Size = 32 Frequency Missing = 7
WARNING: 18% of the data are missing.
The SAS System
The FREQ Procedure
Gender=1
Disease3 Frequency Percent Cumulative Frequency
Cumulative Percent
1 30 41.67 30 41.67
2 42 58.33 72 100.00
Frequency Missing = 20
Binomial Proportion for Disease3 = 1
Proportion (P) 0.4167
ASE 0.0581
Type 95% Confidence Limits
Wald 0.3028 0.5305
Wilson 0.3099 0.5319
Agresti-Coull 0.3098 0.5320
Jeffreys 0.3079 0.5320

Page | 128
Type 95% Confidence Limits
Clopper-Pearson (Exact) 0.3015 0.5389
Test of H0: Proportion = 0.5
ASE under H0 0.0589
Z -1.4142
One-sided Pr < Z 0.0786
Two-sided Pr > |Z| 0.1573
Exact Test
One-sided Pr <= P 0.0973
Two-sided = 2 * One-sided 0.1945
Effective Sample Size = 72 Frequency Missing = 20
WARNING: 22% of the data are missing.
The SAS System
The FREQ Procedure
DxADClean=.
Disease3 Frequency Percent Cumulative Frequency
Cumulative Percent
1 2 25.00 2 25.00
2 6 75.00 8 100.00
Frequency Missing = 3
Binomial Proportion for Disease3 = 1
Proportion (P) 0.2500
ASE 0.1531
Type 95% Confidence Limits
Wald 0.0000 0.5501
Wilson 0.0715 0.5907
*Now we will look at the variable Gender.*;

Page | 129
Type 95% Confidence Limits
Agresti-Coull 0.0631 0.5991
Jeffreys 0.0560 0.5916
Clopper-Pearson (Exact) 0.0319 0.6509
Test of H0: Proportion = 0.5
ASE under H0 0.1768
Z -1.4142
One-sided Pr < Z 0.0786
Two-sided Pr > |Z| 0.1573
Exact Test
One-sided Pr <= P 0.1445
Two-sided = 2 * One-sided 0.2891
Effective Sample Size = 8 Frequency Missing = 3
WARNING: 27% of the data are missing.
The SAS System
The FREQ Procedure
DxADClean=0
Disease3 Frequency Percent Cumulative Frequency
Cumulative Percent
1 7 22.58 7 22.58
2 24 77.42 31 100.00
Frequency Missing = 3
Binomial Proportion for Disease3 = 1
Proportion (P) 0.2258
ASE 0.0751
Type 95% Confidence Limits
Wald 0.0786 0.3730

Page | 130
Type 95% Confidence Limits
Wilson 0.1140 0.3981
Agresti-Coull 0.1111 0.4010
Jeffreys 0.1071 0.3930
Clopper-Pearson (Exact) 0.0959 0.4110
Test of H0: Proportion = 0.5
ASE under H0 0.0898
Z -3.0533
One-sided Pr < Z 0.0011
Two-sided Pr > |Z| 0.0023
Exact Test
One-sided Pr <= P 0.0017
Two-sided = 2 * One-sided 0.0033
Effective Sample Size = 31 Frequency Missing = 3
The SAS System
The FREQ Procedure
DxADClean=1
Disease3 Frequency Percent Cumulative Frequency
Cumulative Percent
1 36 55.38 36 55.38
2 29 44.62 65 100.00
Frequency Missing = 21
Binomial Proportion for Disease3 = 1
Proportion (P) 0.5538
ASE 0.0617
Type 95% Confidence Limits

Page | 131
Type 95% Confidence Limits
Wald 0.4330 0.6747
Wilson 0.4334 0.6683
Agresti-Coull 0.4333 0.6683
Jeffreys 0.4329 0.6702
Clopper-Pearson (Exact) 0.4253 0.6773
Test of H0: Proportion = 0.5
ASE under H0 0.0620
Z 0.8682
One-sided Pr > Z 0.1926
Two-sided Pr > |Z| 0.3853
Exact Test
One-sided Pr >= P 0.2285
Two-sided = 2 * One-sided 0.4570
Effective Sample Size = 65 Frequency Missing = 21
WARNING: 24% of the data are missing.
The SAS System
The FREQ Procedure
DxAsthmaClean=0
Disease3 Frequency Percent Cumulative Frequency
Cumulative Percent
1 10 34.48 10 34.48
2 19 65.52 29 100.00
Frequency Missing = 8
Binomial Proportion for Disease3 = 1
Proportion (P) 0.3448
ASE 0.0883
*Now we will look at the variable DxAsthmaClean.*;
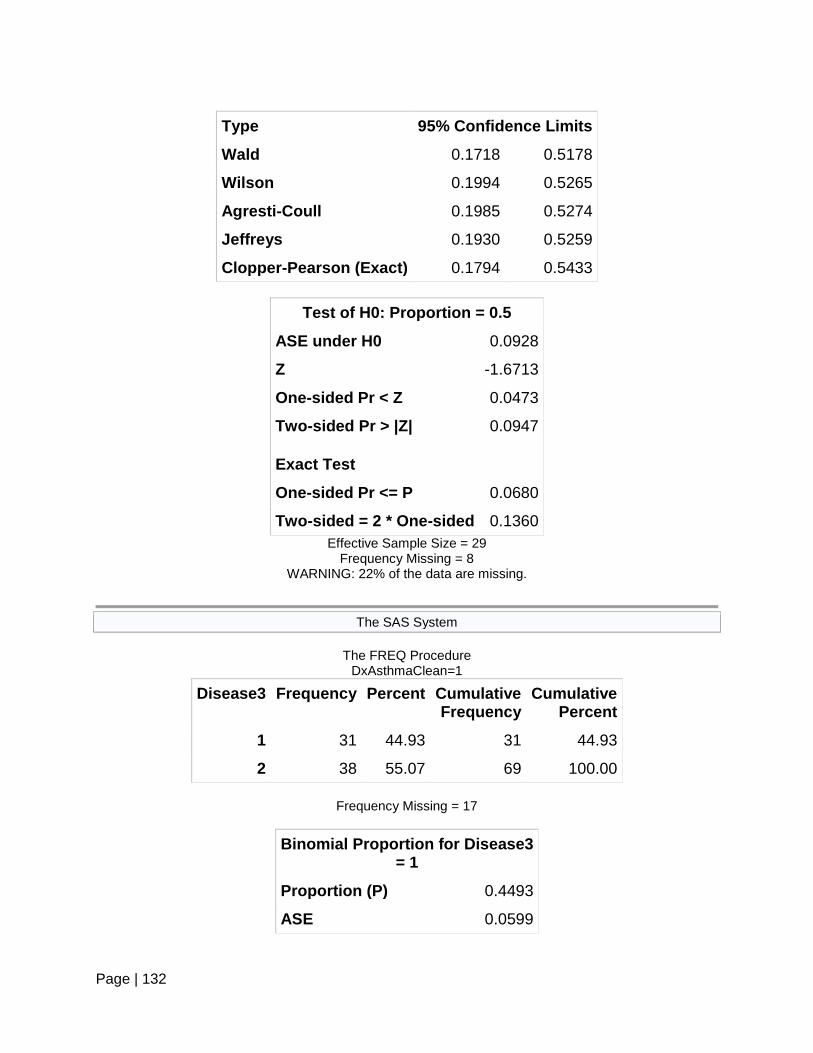
Page | 132
Type 95% Confidence Limits
Wald 0.1718 0.5178
Wilson 0.1994 0.5265
Agresti-Coull 0.1985 0.5274
Jeffreys 0.1930 0.5259
Clopper-Pearson (Exact) 0.1794 0.5433
Test of H0: Proportion = 0.5
ASE under H0 0.0928
Z -1.6713
One-sided Pr < Z 0.0473
Two-sided Pr > |Z| 0.0947
Exact Test
One-sided Pr <= P 0.0680
Two-sided = 2 * One-sided 0.1360
Effective Sample Size = 29 Frequency Missing = 8
WARNING: 22% of the data are missing.
The SAS System
The FREQ Procedure
DxAsthmaClean=1
Disease3 Frequency Percent Cumulative Frequency
Cumulative Percent
1 31 44.93 31 44.93
2 38 55.07 69 100.00
Frequency Missing = 17
Binomial Proportion for Disease3 = 1
Proportion (P) 0.4493
ASE 0.0599

Page | 133
Type 95% Confidence Limits
Wald 0.3319 0.5666
Wilson 0.3377 0.5662
Agresti-Coull 0.3377 0.5662
Jeffreys 0.3360 0.5667
Clopper-Pearson (Exact) 0.3292 0.5738
Test of H0: Proportion = 0.5
ASE under H0 0.0602
Z -0.8427
One-sided Pr < Z 0.1997
Two-sided Pr > |Z| 0.3994
Exact Test
One-sided Pr <= P 0.2352
Two-sided = 2 * One-sided 0.4704
Effective Sample Size = 69 Frequency Missing = 17
WARNING: 20% of the data are missing.
The SAS System
The FREQ Procedure
DxARClean=.
Disease3 Frequency Percent Cumulative Frequency
Cumulative Percent
1 7 53.85 7 53.85
2 6 46.15 13 100.00
Frequency Missing = 10
Binomial Proportion for Disease3 = 1
Proportion (P) 0.5385
ASE 0.1383
*Now we will look at the variable DxARClean.*;

Page | 134
Type 95% Confidence Limits
Wald 0.2675 0.8095
Wilson 0.2914 0.7679
Agresti-Coull 0.2913 0.7681
Jeffreys 0.2829 0.7789
Clopper-Pearson (Exact) 0.2513 0.8078
Test of H0: Proportion = 0.5
ASE under H0 0.1387
Z 0.2774
One-sided Pr > Z 0.3908
Two-sided Pr > |Z| 0.7815
Exact Test
One-sided Pr >= P 0.5000
Two-sided = 2 * One-sided 1.0000
Effective Sample Size = 13 Frequency Missing = 10
WARNING: 43% of the data are missing.
The SAS System
The FREQ Procedure
DxARClean=0
Disease3 Frequency Percent Cumulative Frequency
Cumulative Percent
1 15 33.33 15 33.33
2 30 66.67 45 100.00
Frequency Missing = 9
Binomial Proportion for Disease3 = 1
Proportion (P) 0.3333
ASE 0.0703

Page | 135
Type 95% Confidence Limits
Wald 0.1956 0.4711
Wilson 0.2136 0.4793
Agresti-Coull 0.2130 0.4799
Jeffreys 0.2093 0.4780
Clopper-Pearson (Exact) 0.2000 0.4895
Test of H0: Proportion = 0.5
ASE under H0 0.0745
Z -2.2361
One-sided Pr < Z 0.0127
Two-sided Pr > |Z| 0.0253
Exact Test
One-sided Pr <= P 0.0178
Two-sided = 2 * One-sided 0.0357
Effective Sample Size = 45 Frequency Missing = 9
WARNING: 17% of the data are missing.
The SAS System
The FREQ Procedure
DxARClean=1
Disease3 Frequency Percent Cumulative Frequency
Cumulative Percent
1 23 50.00 23 50.00
2 23 50.00 46 100.00
Frequency Missing = 8
Binomial Proportion for Disease3 = 1
Proportion (P) 0.5000
ASE 0.0737

Page | 136
Type 95% Confidence Limits
Wald 0.3555 0.6445
Wilson 0.3612 0.6388
Agresti-Coull 0.3612 0.6388
Jeffreys 0.3592 0.6408
Clopper-Pearson (Exact) 0.3490 0.6510
Test of H0: Proportion = 0.5
ASE under H0 0.0737
Z 0.0000
One-sided Pr < Z 0.5000
Two-sided Pr > |Z| 1.0000
Exact Test
One-sided Pr <= P 0.5585
Two-sided = 2 * One-sided 1.0000
Effective Sample Size = 46 Frequency Missing = 8
WARNING: 15% of the data are missing.
The SAS System
The TTEST Procedure
Variable: Age (Age)
DiseaseFinal N Mean Std Dev Std Err Minimum Maximum
0 59 7.7232 4.4089 0.5740 0.4200 18.0000
1 45 5.8989 3.8953 0.5807 1.0000 16.8300
Diff (1-2) 1.8243 4.1951 0.8303
DiseaseFinal Method Mean 95% CL Mean Std Dev 95% CL Std Dev
0 7.7232 6.5742 8.8722 4.4089 3.7323 5.3875
1 5.8989 4.7286 7.0692 3.8953 3.2247 4.9205
*Univariate analysis of continuous variables between those with food allergy
and those with no food allergy.*;

Page | 137
DiseaseFinal Method Mean 95% CL Mean Std Dev 95% CL Std Dev
Diff (1-2) Pooled 1.8243 0.1775 3.4712 4.1951 3.6899 4.8617
Diff (1-2) Satterthwaite 1.8243 0.2044 3.4443
Method Variances DF t Value Pr > |t|
Pooled Equal 102 2.20 0.0303
Satterthwaite Unequal 99.748 2.23 0.0277
Equality of Variances
Method Num DF Den DF F Value Pr > F
Folded F 58 44 1.28 0.3937
The SAS System
The FREQ Procedure
Frequency
Percent
Row Pct
Col Pct
Table of Exposure1 by DiseaseFinal
Exposure1 DiseaseFinal
Food Allergy
No Food Allergy
Total
Had taken antacid medication
27
25.96
57.45
60.00
20
19.23
42.55
33.90
47
45.19
Never took antacid medication
18
17.31
31.58
40.00
39
37.50
68.42
66.10
57
54.81
**Univariate analysis of dichotomous variables between those with and without
food allergy*;
*Mantel-Haenszel Chi-Square 1 6.9545 0.0084
Unadjusted Case-Control (Prevalence Ratio) 1..8 (1.5, 2.9)*
This represents significant difference*;

Page | 138
Total 45
43.27
59
56.73
104
100.00
Frequency Missing = 27
Statistics for Table of Exposure1 by DiseaseFinal
Statistic DF Value Prob
Chi-Square 1 7.0220 0.0081
Likelihood Ratio Chi-Square 1 7.0782 0.0078
Continuity Adj. Chi-Square 1 6.0078 0.0142
Mantel-Haenszel Chi-Square 1 6.9545 0.0084
Phi Coefficient 0.2598
Contingency Coefficient 0.2515
Cramer's V 0.2598
Fisher's Exact Test
Cell (1,1) Frequency (F) 27
Left-sided Pr <= F 0.9979
Right-sided Pr >= F 0.0070
Table Probability (P) 0.0049
Two-sided Pr <= P 0.0101
Statistic Value ASE
Gamma 0.4904 0.1558
Kendall's Tau-b 0.2598 0.0951
Stuart's Tau-c 0.2563 0.0941
Somers' D C|R 0.2587 0.0948
Somers' D R|C 0.2610 0.0956
Pearson Correlation -0.2598 0.0951
Spearman Correlation 0.2598 0.0951

Page | 139
Statistic Value ASE
Lambda Asymmetric C|R 0.1556 0.1400
Lambda Asymmetric R|C 0.1915 0.1283
Lambda Symmetric 0.1739 0.1220
Uncertainty Coefficient C|R 0.0497 0.0368
Uncertainty Coefficient R|C 0.0494 0.0366
Uncertainty Coefficient Symmetric 0.0496 0.0367
Estimates of the Relative Risk (Row1/Row2)
Type of Study Value 95% Confidence Limits
Case-Control (Odds Ratio) 2.9250 1.3092 6.5352
Cohort (Col1 Risk) 1.8191 1.1547 2.8658
Cohort (Col2 Risk) 0.6219 0.4270 0.9059
Effective Sample Size = 104 Frequency Missing = 27
WARNING: 21% of the data are missing.
Summary Statistics for Exposure1 by DiseaseFinal
Cochran-Mantel-Haenszel Statistics (Based on Table Scores)
Statistic Alternative Hypothesis DF Value Prob
1 Nonzero Correlation 1 6.9545 0.0084
2 Row Mean Scores Differ 1 6.9545 0.0084
3 General Association 1 6.9545 0.0084
Estimates of the Common Relative Risk (Row1/Row2)
Type of Study Method Value 95% Confidence Limits
Case-Control Mantel-Haenszel 2.9250 1.3092 6.5352
(Odds Ratio) Logit 2.9250 1.3092 6.5352
Cohort Mantel-Haenszel 1.8191 1.1547 2.8658
(Col1 Risk) Logit 1.8191 1.1547 2.8658
Cohort Mantel-Haenszel 0.6219 0.4270 0.9059
(Col2 Risk) Logit 0.6219 0.4270 0.9059

Page | 140
Effective Sample Size = 104 Frequency Missing = 27
WARNING: 21% of the data are missing.
The SAS System
The FREQ Procedure
Frequency
Percent
Row Pct
Col Pct
Table of Gender by DiseaseFinal
Gender(Gender) DiseaseFinal
Food Allergy No Food Allergy Total
Female 15
14.42
46.88
33.33
17
16.35
53.13
28.81
32
30.77
Male 30
28.85
41.67
66.67
42
40.38
58.33
71.19
72
69.23
Total 45
43.27
59
56.73
104
100.00
Frequency Missing = 27
Statistics for Table of Gender by DiseaseFinal
Statistic DF Value Prob
Chi-Square 1 0.2448 0.6207
Likelihood Ratio Chi-Square 1 0.2441 0.6213
Continuity Adj. Chi-Square 1 0.0786 0.7792
Mantel-Haenszel Chi-Square 1 0.2425 0.6224
*Examining the variable, Gender *;
*Mantel-Haenszel Chi-Square 1 0.2425 0.6224 Prevalence Ratio 1.1250 0.7109
1.7804*;

Page | 141
Statistic DF Value Prob
Phi Coefficient 0.0485
Contingency Coefficient 0.0485
Cramer's V 0.0485
Fisher's Exact Test
Cell (1,1) Frequency (F) 15
Left-sided Pr <= F 0.7613
Right-sided Pr >= F 0.3884
Table Probability (P) 0.1497
Two-sided Pr <= P 0.6714
Statistic Value ASE
Gamma 0.1053 0.2113
Kendall's Tau-b 0.0485 0.0984
Stuart's Tau-c 0.0444 0.0901
Somers' D C|R 0.0521 0.1056
Somers' D R|C 0.0452 0.0917
Pearson Correlation -0.0485 0.0984
Spearman Correlation 0.0485 0.0984
Lambda Asymmetric C|R 0.0000 0.0000
Lambda Asymmetric R|C 0.0000 0.0000
Lambda Symmetric 0.0000 0.0000
Uncertainty Coefficient C|R 0.0017 0.0070
Uncertainty Coefficient R|C 0.0019 0.0077
Uncertainty Coefficient Symmetric 0.0018 0.0073
Estimates of the Relative Risk (Row1/Row2)
Type of Study Value 95% Confidence Limits
Case-Control (Odds Ratio) 1.2353 0.5346 2.8545
Cohort (Col1 Risk) 1.1250 0.7109 1.7804

Page | 142
Estimates of the Relative Risk (Row1/Row2)
Type of Study Value 95% Confidence Limits
Cohort (Col2 Risk) 0.9107 0.6231 1.3311
Effective Sample Size = 104 Frequency Missing = 27
WARNING: 21% of the data are missing.
Summary Statistics for Gender by DiseaseFinal
Cochran-Mantel-Haenszel Statistics (Based on Table Scores)
Statistic Alternative Hypothesis DF Value Prob
1 Nonzero Correlation 1 0.2425 0.6224
2 Row Mean Scores Differ 1 0.2425 0.6224
3 General Association 1 0.2425 0.6224
Estimates of the Common Relative Risk (Row1/Row2)
Type of Study Method Value 95% Confidence Limits
Case-Control Mantel-Haenszel 1.2353 0.5346 2.8545
(Odds Ratio) Logit 1.2353 0.5346 2.8545
Cohort Mantel-Haenszel 1.1250 0.7109 1.7804
(Col1 Risk) Logit 1.1250 0.7109 1.7804
Cohort Mantel-Haenszel 0.9107 0.6231 1.3311
(Col2 Risk) Logit 0.9107 0.6231 1.3311
Effective Sample Size = 104 Frequency Missing = 27
WARNING: 21% of the data are missing.
The SAS System
The FREQ Procedure
*Examining the variable, AgeGroup;
*There was a significant difference in AgeGroupm byt this was largely between
those 5 and younger and those older than 5. So we will reclassify the
variable <5 and > 5 (Ages) and use this in further analysis.

Page | 143
Frequency
Percent
Row Pct
Col Pct
Table of AgeGroup by DiseaseFinal
AgeGroup DiseaseFinal
Food Allergy No Food Allergy Total
> 5 to <= 10 years of age 12
11.54
35.29
26.67
22
21.15
64.71
37.29
34
32.69
0 to <= 5 years of age 25
24.04
56.82
55.56
19
18.27
43.18
32.20
44
42.31
> 10 years of age 8
7.69
30.77
17.78
18
17.31
69.23
30.51
26
25.00
Total 45
43.27
59
56.73
104
100.00
Frequency Missing = 27
Statistics for Table of AgeGroup by DiseaseFinal
Statistic DF Value Prob
Chi-Square 2 5.8265 0.0543
Likelihood Ratio Chi-Square 2 5.8626 0.0533
Mantel-Haenszel Chi-Square 1 5.1185 0.0237
Phi Coefficient 0.2367
Contingency Coefficient 0.2303
Cramer's V 0.2367
Statistic Value ASE

Page | 144
Statistic Value ASE
Gamma 0.0090 0.1588
Kendall's Tau-b 0.0052 0.0920
Stuart's Tau-c 0.0059 0.1041
Somers' D C|R 0.0045 0.0798
Somers' D R|C 0.0060 0.1060
Pearson Correlation -0.2229 0.0945
Spearman Correlation 0.0055 0.0973
Lambda Asymmetric C|R 0.1333 0.1372
Lambda Asymmetric R|C 0.0500 0.1040
Lambda Symmetric 0.0857 0.1026
Uncertainty Coefficient C|R 0.0412 0.0336
Uncertainty Coefficient R|C 0.0262 0.0214
Uncertainty Coefficient Symmetric 0.0320 0.0261
Effective Sample Size = 104 Frequency Missing = 27
WARNING: 21% of the data are missing.
Summary Statistics for AgeGroup by DiseaseFinal
Cochran-Mantel-Haenszel Statistics (Based on Table Scores)
Statistic Alternative Hypothesis DF Value Prob
1 Nonzero Correlation 1 5.1185 0.0237
2 Row Mean Scores Differ 2 5.7705 0.0558
3 General Association 2 5.7705 0.0558
Effective Sample Size = 104 Frequency Missing = 27

Page | 145
WARNING: 21% of the data are missing.

Page | 146
The SAS System
The FREQ Procedure
Frequency
Percent
Row Pct
Col Pct
Table of AgeGroup by DiseaseFinal
AgeGroup DiseaseFinal
Food Allergy No Food Allergy Total
> 5 to <= 10 years of age 12
15.38
35.29
32.43
22
28.21
64.71
53.66
34
43.59
0 to <= 5 years of age 25
32.05
56.82
67.57
19
24.36
43.18
46.34
44
56.41
Total 37
47.44
41
52.56
78
100.00
Frequency Missing = 19
Statistics for Table of AgeGroup by DiseaseFinal
Statistic DF Value Prob
Chi-Square 1 3.5636 0.0591
Likelihood Ratio Chi-Square 1 3.6006 0.0578
Continuity Adj. Chi-Square 1 2.7526 0.0971
Mantel-Haenszel Chi-Square 1 3.5179 0.0607
Phi Coefficient -0.2137
Contingency Coefficient 0.2090
Cramer's V -0.2137

Page | 147
Fisher's Exact Test
Cell (1,1) Frequency (F) 12
Left-sided Pr <= F 0.0481
Right-sided Pr >= F 0.9833
Table Probability (P) 0.0314
Two-sided Pr <= P 0.0706
Statistic Value ASE
Gamma -0.4139 0.1950
Kendall's Tau-b -0.2137 0.1101
Stuart's Tau-c -0.2117 0.1092
Somers' D C|R -0.2152 0.1109
Somers' D R|C -0.2123 0.1095
Pearson Correlation -0.2137 0.1101
Spearman Correlation -0.2137 0.1101
Lambda Asymmetric C|R 0.1622 0.1641
Lambda Asymmetric R|C 0.0882 0.1798
Lambda Symmetric 0.1268 0.1495
Uncertainty Coefficient C|R 0.0334 0.0347
Uncertainty Coefficient R|C 0.0337 0.0350
Uncertainty Coefficient Symmetric 0.0335 0.0349
Estimates of the Relative Risk (Row1/Row2)
Type of Study Value 95% Confidence Limits
Case-Control (Odds Ratio) 0.4145 0.1648 1.0426
Cohort (Col1 Risk) 0.6212 0.3682 1.0479
Cohort (Col2 Risk) 1.4985 0.9844 2.2809
Effective Sample Size = 78 Frequency Missing = 19

Page | 148
WARNING: 20% of the data are missing.
Summary Statistics for AgeGroup by DiseaseFinal
Cochran-Mantel-Haenszel Statistics (Based on Table Scores)
Statistic Alternative Hypothesis DF Value Prob
1 Nonzero Correlation 1 3.5179 0.0607
2 Row Mean Scores Differ 1 3.5179 0.0607
3 General Association 1 3.5179 0.0607
Estimates of the Common Relative Risk (Row1/Row2)
Type of Study Method Value 95% Confidence Limits
Case-Control Mantel-Haenszel 0.4145 0.1648 1.0426
(Odds Ratio) Logit 0.4145 0.1648 1.0426
Cohort Mantel-Haenszel 0.6212 0.3682 1.0479
(Col1 Risk) Logit 0.6212 0.3682 1.0479
Cohort Mantel-Haenszel 1.4985 0.9844 2.2809
(Col2 Risk) Logit 1.4985 0.9844 2.2809
Effective Sample Size = 78 Frequency Missing = 19
WARNING: 20% of the data are missing.

Page | 149
The SAS System
The FREQ Procedure
Frequency
Percent
Row Pct
Col Pct
Table of AgeGroup by DiseaseFinal
AgeGroup DiseaseFinal
Food Allergy No Food Allergy Total
0 to <= 5 years of age 25
35.71
56.82
75.76
19
27.14
43.18
51.35
44
62.86
> 10 years of age 8
11.43
30.77
24.24
18
25.71
69.23
48.65
26
37.14
Total 33
47.14
37
52.86
70
100.00
Frequency Missing = 21
Statistics for Table of AgeGroup by DiseaseFinal
Statistic DF Value Prob
Chi-Square 1 4.4503 0.0349
Likelihood Ratio Chi-Square 1 4.5391 0.0331
Continuity Adj. Chi-Square 1 3.4663 0.0626
Mantel-Haenszel Chi-Square 1 4.3867 0.0362
Phi Coefficient 0.2521
Contingency Coefficient 0.2445
Cramer's V 0.2521

Page | 150
Fisher's Exact Test
Cell (1,1) Frequency (F) 25
Left-sided Pr <= F 0.9914
Right-sided Pr >= F 0.0306
Table Probability (P) 0.0220
Two-sided Pr <= P 0.0481
Statistic Value ASE
Gamma 0.4950 0.1973
Kendall's Tau-b 0.2521 0.1138
Stuart's Tau-c 0.2433 0.1107
Somers' D C|R 0.2605 0.1173
Somers' D R|C 0.2441 0.1110
Pearson Correlation -0.2521 0.1138
Spearman Correlation 0.2521 0.1138
Lambda Asymmetric C|R 0.1818 0.1818
Lambda Asymmetric R|C 0.0000 0.0000
Lambda Symmetric 0.1017 0.1068
Uncertainty Coefficient C|R 0.0469 0.0430
Uncertainty Coefficient R|C 0.0491 0.0450
Uncertainty Coefficient Symmetric 0.0480 0.0440
Estimates of the Relative Risk (Row1/Row2)
Type of Study Value 95% Confidence Limits
Case-Control (Odds Ratio) 2.9605 1.0628 8.2465
Cohort (Col1 Risk) 1.8466 0.9820 3.4724
Cohort (Col2 Risk) 0.6237 0.4078 0.9540
Effective Sample Size = 70 Frequency Missing = 21

Page | 151
WARNING: 23% of the data are missing.
Summary Statistics for AgeGroup by DiseaseFinal
Cochran-Mantel-Haenszel Statistics (Based on Table Scores)
Statistic Alternative Hypothesis DF Value Prob
1 Nonzero Correlation 1 4.3867 0.0362
2 Row Mean Scores Differ 1 4.3867 0.0362
3 General Association 1 4.3867 0.0362
Estimates of the Common Relative Risk (Row1/Row2)
Type of Study Method Value 95% Confidence Limits
Case-Control Mantel-Haenszel 2.9605 1.0628 8.2465
(Odds Ratio) Logit 2.9605 1.0628 8.2465
Cohort Mantel-Haenszel 1.8466 0.9820 3.4724
(Col1 Risk) Logit 1.8466 0.9820 3.4724
Cohort Mantel-Haenszel 0.6237 0.4078 0.9540
(Col2 Risk) Logit 0.6237 0.4078 0.9540
Effective Sample Size = 70 Frequency Missing = 21
WARNING: 23% of the data are missing.

Page | 152
The SAS System
The FREQ Procedure
Frequency
Percent
Row Pct
Col Pct
Table of AgeGroup by DiseaseFinal
AgeGroup DiseaseFinal
Food Allergy No Food Allergy Total
> 5 to <= 10 years of age 12
20.00
35.29
60.00
22
36.67
64.71
55.00
34
56.67
> 10 years of age 8
13.33
30.77
40.00
18
30.00
69.23
45.00
26
43.33
Total 20
33.33
40
66.67
60
100.00
Frequency Missing = 14
Statistics for Table of AgeGroup by DiseaseFinal
Statistic DF Value Prob
Chi-Square 1 0.1357 0.7125
Likelihood Ratio Chi-Square 1 0.1362 0.7120
Continuity Adj. Chi-Square 1 0.0085 0.9266
Mantel-Haenszel Chi-Square 1 0.1335 0.7148
Phi Coefficient 0.0476
Contingency Coefficient 0.0475
Cramer's V 0.0476
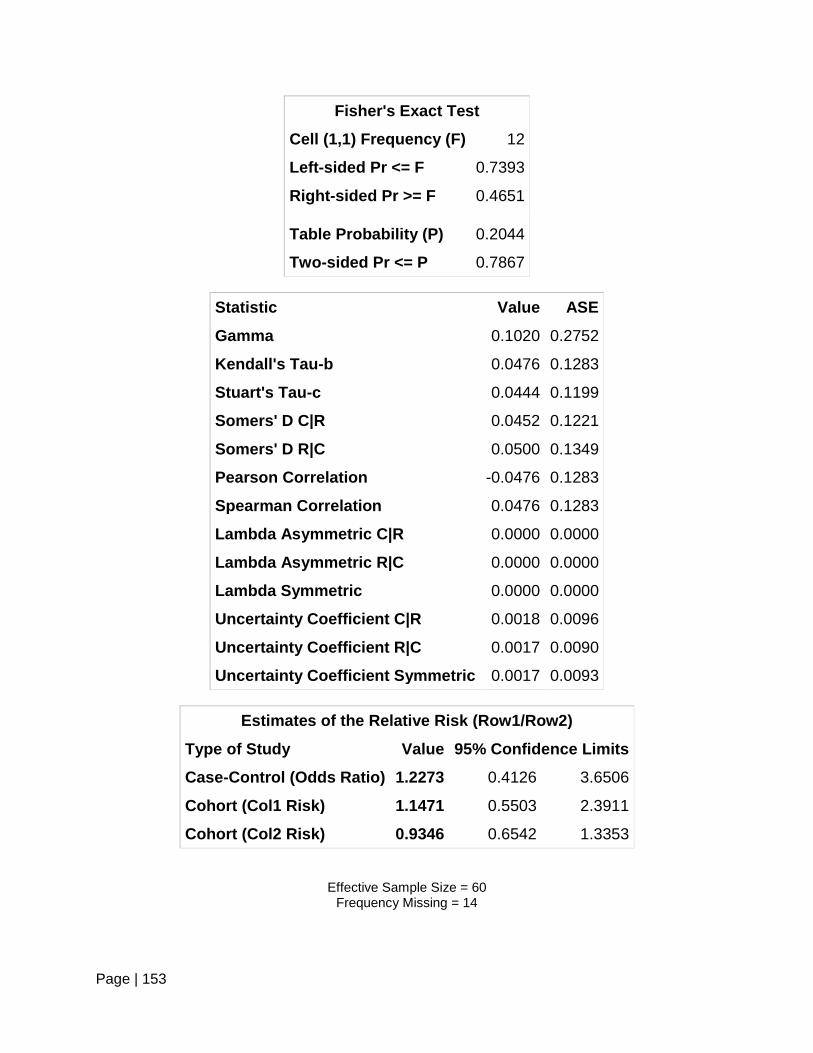
Page | 153
Fisher's Exact Test
Cell (1,1) Frequency (F) 12
Left-sided Pr <= F 0.7393
Right-sided Pr >= F 0.4651
Table Probability (P) 0.2044
Two-sided Pr <= P 0.7867
Statistic Value ASE
Gamma 0.1020 0.2752
Kendall's Tau-b 0.0476 0.1283
Stuart's Tau-c 0.0444 0.1199
Somers' D C|R 0.0452 0.1221
Somers' D R|C 0.0500 0.1349
Pearson Correlation -0.0476 0.1283
Spearman Correlation 0.0476 0.1283
Lambda Asymmetric C|R 0.0000 0.0000
Lambda Asymmetric R|C 0.0000 0.0000
Lambda Symmetric 0.0000 0.0000
Uncertainty Coefficient C|R 0.0018 0.0096
Uncertainty Coefficient R|C 0.0017 0.0090
Uncertainty Coefficient Symmetric 0.0017 0.0093
Estimates of the Relative Risk (Row1/Row2)
Type of Study Value 95% Confidence Limits
Case-Control (Odds Ratio) 1.2273 0.4126 3.6506
Cohort (Col1 Risk) 1.1471 0.5503 2.3911
Cohort (Col2 Risk) 0.9346 0.6542 1.3353
Effective Sample Size = 60 Frequency Missing = 14

Page | 154
WARNING: 19% of the data are missing.
Summary Statistics for AgeGroup by DiseaseFinal
Cochran-Mantel-Haenszel Statistics (Based on Table Scores)
Statistic Alternative Hypothesis DF Value Prob
1 Nonzero Correlation 1 0.1335 0.7148
2 Row Mean Scores Differ 1 0.1335 0.7148
3 General Association 1 0.1335 0.7148
Estimates of the Common Relative Risk (Row1/Row2)
Type of Study Method Value 95% Confidence Limits
Case-Control Mantel-Haenszel 1.2273 0.4126 3.6506
(Odds Ratio) Logit 1.2273 0.4126 3.6506
Cohort Mantel-Haenszel 1.1471 0.5503 2.3911
(Col1 Risk) Logit 1.1471 0.5503 2.3911
Cohort Mantel-Haenszel 0.9346 0.6542 1.3353
(Col2 Risk) Logit 0.9346 0.6542 1.3353
Effective Sample Size = 60 Frequency Missing = 14
WARNING: 19% of the data are missing.

Page | 155
The SAS System
The FREQ Procedure
Frequency
Percent
Row Pct
Col Pct
Table of Ages by DiseaseFinal
Ages DiseaseFinal
Food Allergy No Food Allergy Total
0 25
24.04
56.82
55.56
19
18.27
43.18
32.20
44
42.31
1 20
19.23
33.33
44.44
40
38.46
66.67
67.80
60
57.69
Total 45
43.27
59
56.73
104
100.00
Frequency Missing = 27
Statistics for Table of Ages by DiseaseFinal
Statistic DF Value Prob
Chi-Square 1 5.7036 0.0169
Likelihood Ratio Chi-Square 1 5.7263 0.0167
Continuity Adj. Chi-Square 1 4.7870 0.0287
Mantel-Haenszel Chi-Square 1 5.6487 0.0175
Phi Coefficient 0.2342
Contingency Coefficient 0.2280
Cramer's V 0.2342

Page | 156
Fisher's Exact Test
Cell (1,1) Frequency (F) 25
Left-sided Pr <= F 0.9953
Right-sided Pr >= F 0.0143
Table Probability (P) 0.0095
Two-sided Pr <= P 0.0270
Statistic Value ASE
Gamma 0.4493 0.1634
Kendall's Tau-b 0.2342 0.0960
Stuart's Tau-c 0.2293 0.0943
Somers' D C|R 0.2348 0.0963
Somers' D R|C 0.2335 0.0959
Pearson Correlation -0.2342 0.0960
Spearman Correlation 0.2342 0.0960
Lambda Asymmetric C|R 0.1333 0.1372
Lambda Asymmetric R|C 0.1136 0.1435
Lambda Symmetric 0.1236 0.1261
Uncertainty Coefficient C|R 0.0402 0.0332
Uncertainty Coefficient R|C 0.0404 0.0334
Uncertainty Coefficient Symmetric 0.0403 0.0333
Estimates of the Relative Risk (Row1/Row2)
Type of Study Value 95% Confidence Limits
Case-Control (Odds Ratio) 2.6316 1.1795 5.8711
Cohort (Col1 Risk) 1.7045 1.0968 2.6491
Cohort (Col2 Risk) 0.6477 0.4415 0.9503
Effective Sample Size = 104 Frequency Missing = 27

Page | 157
WARNING: 21% of the data are missing.
Summary Statistics for Ages by DiseaseFinal
Cochran-Mantel-Haenszel Statistics (Based on Table Scores)
Statistic Alternative Hypothesis DF Value Prob
1 Nonzero Correlation 1 5.6487 0.0175
2 Row Mean Scores Differ 1 5.6487 0.0175
3 General Association 1 5.6487 0.0175
Estimates of the Common Relative Risk (Row1/Row2)
Type of Study Method Value 95% Confidence Limits
Case-Control Mantel-Haenszel 2.6316 1.1795 5.8711
(Odds Ratio) Logit 2.6316 1.1795 5.8711
Cohort Mantel-Haenszel 1.7045 1.0968 2.6491
(Col1 Risk) Logit 1.7045 1.0968 2.6491
Cohort Mantel-Haenszel 0.6477 0.4415 0.9503
(Col2 Risk) Logit 0.6477 0.4415 0.9503
Effective Sample Size = 104 Frequency Missing = 27
WARNING: 21% of the data are missing.
The SAS System
The FREQ Procedure
Frequency
Percent
Row Pct
Col Pct
Table of FamHxAtopyFinal by Disease3
FamHxAtopyFinal Disease3
Food Allergy
No Food Allergy
Total
Family History of Atopy 38 44 82
*Examining the variable, FamHxAtopyFinal.*;
*We found no significant difference.*;

Page | 158
37.62
46.34
88.37
43.56
53.66
75.86
81.19
No Family History of Atopy
5
4.95
26.32
11.63
14
13.86
73.68
24.14
19
18.81
Total 43
42.57
58
57.43
101
100.00
Frequency Missing = 30
Statistics for Table of FamHxAtopyFinal by Disease3
Statistic DF Value Prob
Chi-Square 1 2.5303 0.1117
Likelihood Ratio Chi-Square 1 2.6423 0.1041
Continuity Adj. Chi-Square 1 1.7775 0.1825
Mantel-Haenszel Chi-Square 1 2.5052 0.1135
Phi Coefficient 0.1583
Contingency Coefficient 0.1563
Cramer's V 0.1583
Fisher's Exact Test
Cell (1,1) Frequency (F) 38
Left-sided Pr <= F 0.9702
Right-sided Pr >= F 0.0897
Table Probability (P) 0.0599
Two-sided Pr <= P 0.1297
Statistic Value ASE

Page | 159
Statistic Value ASE
Gamma 0.4149 0.2343
Kendall's Tau-b 0.1583 0.0917
Stuart's Tau-c 0.1223 0.0729
Somers' D C|R 0.2003 0.1151
Somers' D R|C 0.1251 0.0745
Pearson Correlation 0.1583 0.0917
Spearman Correlation 0.1583 0.0917
Lambda Asymmetric C|R 0.0000 0.0000
Lambda Asymmetric R|C 0.0000 0.0000
Lambda Symmetric 0.0000 0.0000
Uncertainty Coefficient C|R 0.0192 0.0229
Uncertainty Coefficient R|C 0.0271 0.0320
Uncertainty Coefficient Symmetric 0.0224 0.0267
Estimates of the Relative Risk (Row1/Row2)
Type of Study Value 95% Confidence Limits
Case-Control (Odds Ratio) 2.4182 0.7973 7.3343
Cohort (Col1 Risk) 1.7610 0.8011 3.8709
Cohort (Col2 Risk) 0.7282 0.5206 1.0187
Effective Sample Size = 101 Frequency Missing = 30
WARNING: 23% of the data are missing.
Summary Statistics for FamHxAtopyFinal by Disease3
Cochran-Mantel-Haenszel Statistics (Based on Table Scores)
Statistic Alternative Hypothesis DF Value Prob
1 Nonzero Correlation 1 2.5052 0.1135
2 Row Mean Scores Differ 1 2.5052 0.1135
3 General Association 1 2.5052 0.1135
Estimates of the Common Relative Risk (Row1/Row2)

Page | 160
Type of Study Method Value 95% Confidence Limits
Case-Control Mantel-Haenszel 2.4182 0.7973 7.3343
(Odds Ratio) Logit 2.4182 0.7973 7.3343
Cohort Mantel-Haenszel 1.7610 0.8011 3.8709
(Col1 Risk) Logit 1.7610 0.8011 3.8709
Cohort Mantel-Haenszel 0.7282 0.5206 1.0187
(Col2 Risk) Logit 0.7282 0.5206 1.0187
Effective Sample Size = 101 Frequency Missing = 30
WARNING: 23% of the data are missing.
The SAS System
The FREQ Procedure
Frequency
Percent
Row Pct
Col Pct
Table of DxADClean by Disease3
DxADClean Disease3
Food Allergy
No Food Allergy
Total
History of Atopic Dermatitis 36
37.50
55.38
83.72
29
30.21
44.62
54.72
65
67.71
No history of Atopic Dermatitis
7
7.29
22.58
16.28
24
25.00
77.42
45.28
31
32.29
Total 43
44.79
53
55.21
96
100.00
*Examining the variable, DxADClean.*;
*We found a significant difference between those who had food allergy and
those who did not.*;
*Mantel-Haenszel Chi-Square 1 9.0387 0.0026*;
*Prevalence Ratio: 2.5 (1.2, 4.87

Page | 161
Frequency Missing = 35
Statistics for Table of DxADClean by Disease3
Statistic DF Value Prob
Chi-Square 1 9.1339 0.0025
Likelihood Ratio Chi-Square 1 9.5690 0.0020
Continuity Adj. Chi-Square 1 7.8555 0.0051
Mantel-Haenszel Chi-Square 1 9.0387 0.0026
Phi Coefficient 0.3085
Contingency Coefficient 0.2948
Cramer's V 0.3085
Fisher's Exact Test
Cell (1,1) Frequency (F) 36
Left-sided Pr <= F 0.9996
Right-sided Pr >= F 0.0022
Table Probability (P) 0.0017
Two-sided Pr <= P 0.0040
Statistic Value ASE
Gamma 0.6195 0.1531
Kendall's Tau-b 0.3085 0.0918
Stuart's Tau-c 0.2869 0.0878
Somers' D C|R 0.3280 0.0972
Somers' D R|C 0.2900 0.0886
Pearson Correlation -0.3085 0.0918
Spearman Correlation 0.3085 0.0918
Lambda Asymmetric C|R 0.1628 0.1716
Lambda Asymmetric R|C 0.0000 0.0000
Lambda Symmetric 0.0946 0.1038

Page | 162
Statistic Value ASE
Uncertainty Coefficient C|R 0.0725 0.0447
Uncertainty Coefficient R|C 0.0792 0.0485
Uncertainty Coefficient Symmetric 0.0757 0.0465
Estimates of the Relative Risk (Row1/Row2)
Type of Study Value 95% Confidence Limits
Case-Control (Odds Ratio) 4.2562 1.6075 11.2687
Cohort (Col1 Risk) 2.4527 1.2335 4.8772
Cohort (Col2 Risk) 0.5763 0.4139 0.8023
Effective Sample Size = 96 Frequency Missing = 35
WARNING: 27% of the data are missing. Summary Statistics for DxADClean by Disease3
Cochran-Mantel-Haenszel Statistics (Based on Table Scores)
Statistic Alternative Hypothesis DF Value Prob
1 Nonzero Correlation 1 9.0387 0.0026
2 Row Mean Scores Differ 1 9.0387 0.0026
3 General Association 1 9.0387 0.0026
Estimates of the Common Relative Risk (Row1/Row2)
Type of Study Method Value 95% Confidence Limits
Case-Control Mantel-Haenszel 4.2562 1.6075 11.2687
(Odds Ratio) Logit 4.2562 1.6075 11.2687
Cohort Mantel-Haenszel 2.4527 1.2335 4.8772
(Col1 Risk) Logit 2.4527 1.2335 4.8772
Cohort Mantel-Haenszel 0.5763 0.4139 0.8023
(Col2 Risk) Logit 0.5763 0.4139 0.8023
Effective Sample Size = 96 Frequency Missing = 35
WARNING: 27% of the data are missing.
*Examining the variable, DxAsthmaClean.*;
*We found no significant difference between those who had food allergy and
those who did not.*;

Page | 163
The SAS System
The FREQ Procedure
Frequency
Percent
Row Pct
Col Pct
Table of DxAsthmaClean by Disease3
DxAsthmaClean Disease3
Food Allergy No Food Allergy Total
History of asthma 31
31.63
44.93
75.61
38
38.78
55.07
66.67
69
70.41
No history of asthma 10
10.20
34.48
24.39
19
19.39
65.52
33.33
29
29.59
Total 41
41.84
57
58.16
98
100.00
Frequency Missing = 33
Statistics for Table of DxAsthmaClean by Disease3
Statistic DF Value Prob
Chi-Square 1 0.9154 0.3387
Likelihood Ratio Chi-Square 1 0.9272 0.3356
Continuity Adj. Chi-Square 1 0.5365 0.4639
Mantel-Haenszel Chi-Square 1 0.9061 0.3412
Phi Coefficient 0.0966
Contingency Coefficient 0.0962
Cramer's V 0.0966
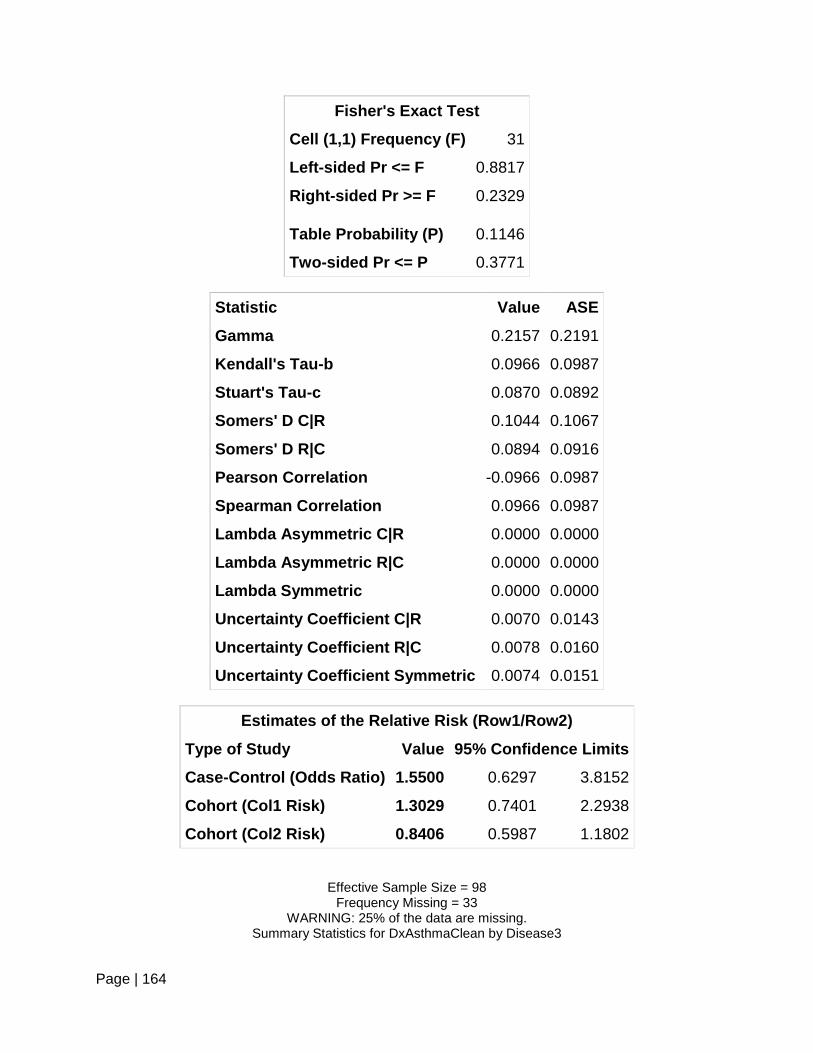
Page | 164
Fisher's Exact Test
Cell (1,1) Frequency (F) 31
Left-sided Pr <= F 0.8817
Right-sided Pr >= F 0.2329
Table Probability (P) 0.1146
Two-sided Pr <= P 0.3771
Statistic Value ASE
Gamma 0.2157 0.2191
Kendall's Tau-b 0.0966 0.0987
Stuart's Tau-c 0.0870 0.0892
Somers' D C|R 0.1044 0.1067
Somers' D R|C 0.0894 0.0916
Pearson Correlation -0.0966 0.0987
Spearman Correlation 0.0966 0.0987
Lambda Asymmetric C|R 0.0000 0.0000
Lambda Asymmetric R|C 0.0000 0.0000
Lambda Symmetric 0.0000 0.0000
Uncertainty Coefficient C|R 0.0070 0.0143
Uncertainty Coefficient R|C 0.0078 0.0160
Uncertainty Coefficient Symmetric 0.0074 0.0151
Estimates of the Relative Risk (Row1/Row2)
Type of Study Value 95% Confidence Limits
Case-Control (Odds Ratio) 1.5500 0.6297 3.8152
Cohort (Col1 Risk) 1.3029 0.7401 2.2938
Cohort (Col2 Risk) 0.8406 0.5987 1.1802
Effective Sample Size = 98 Frequency Missing = 33
WARNING: 25% of the data are missing. Summary Statistics for DxAsthmaClean by Disease3

Page | 165
Cochran-Mantel-Haenszel Statistics (Based on Table Scores)
Statistic Alternative Hypothesis DF Value Prob
1 Nonzero Correlation 1 0.9061 0.3412
2 Row Mean Scores Differ 1 0.9061 0.3412
3 General Association 1 0.9061 0.3412
Estimates of the Common Relative Risk (Row1/Row2)
Type of Study Method Value 95% Confidence Limits
Case-Control Mantel-Haenszel 1.5500 0.6297 3.8152
(Odds Ratio) Logit 1.5500 0.6297 3.8152
Cohort Mantel-Haenszel 1.3029 0.7401 2.2938
(Col1 Risk) Logit 1.3029 0.7401 2.2938
Cohort Mantel-Haenszel 0.8406 0.5987 1.1802
(Col2 Risk) Logit 0.8406 0.5987 1.1802
Effective Sample Size = 98 Frequency Missing = 33
WARNING: 25% of the data are missing.
The SAS System
The FREQ Procedure
Frequency
Percent
Row Pct
Col Pct
Table of DxARClean by Disease3
DxARClean Disease3
Food Allergy
No Food Allergy
Total
History of allergic rhinitis 23
25.27
50.00
60.53
23
25.27
50.00
43.40
46
50.55
No history of allergic rhinitis
15 30 45
*Examining the variable, DxARClean.*;
*We found no significant difference between those who had food allergy and
those who did not.*;

Page | 166
16.48
33.33
39.47
32.97
66.67
56.60
49.45
Total 38
41.76
53
58.24
91
100.00
Frequency Missing = 40
Statistics for Table of DxARClean by Disease3
Statistic DF Value Prob
Chi-Square 1 2.5981 0.1070
Likelihood Ratio Chi-Square 1 2.6131 0.1060
Continuity Adj. Chi-Square 1 1.9580 0.1617
Mantel-Haenszel Chi-Square 1 2.5695 0.1089
Phi Coefficient 0.1690
Contingency Coefficient 0.1666
Cramer's V 0.1690
Fisher's Exact Test
Cell (1,1) Frequency (F) 23
Left-sided Pr <= F 0.9663
Right-sided Pr >= F 0.0807
Table Probability (P) 0.0470
Two-sided Pr <= P 0.1378
Statistic Value ASE
Gamma 0.3333 0.1922
Kendall's Tau-b 0.1690 0.1031
Stuart's Tau-c 0.1666 0.1018
Somers' D C|R 0.1667 0.1018
Somers' D R|C 0.1713 0.1045

Page | 167
Statistic Value ASE
Pearson Correlation -0.1690 0.1031
Spearman Correlation 0.1690 0.1031
Lambda Asymmetric C|R 0.0000 0.1785
Lambda Asymmetric R|C 0.1556 0.1487
Lambda Symmetric 0.0843 0.1410
Uncertainty Coefficient C|R 0.0211 0.0259
Uncertainty Coefficient R|C 0.0207 0.0254
Uncertainty Coefficient Symmetric 0.0209 0.0257
Estimates of the Relative Risk (Row1/Row2)
Type of Study Value 95% Confidence Limits
Case-Control (Odds Ratio) 2.0000 0.8570 4.6674
Cohort (Col1 Risk) 1.5000 0.9060 2.4835
Cohort (Col2 Risk) 0.7500 0.5258 1.0699
Effective Sample Size = 91 Frequency Missing = 40
WARNING: 31% of the data are missing.
Summary Statistics for DxARClean by Disease3
Cochran-Mantel-Haenszel Statistics (Based on Table Scores)
Statistic Alternative Hypothesis DF Value Prob
1 Nonzero Correlation 1 2.5695 0.1089
2 Row Mean Scores Differ 1 2.5695 0.1089
3 General Association 1 2.5695 0.1089
Estimates of the Common Relative Risk (Row1/Row2)
Type of Study Method Value 95% Confidence Limits
Case-Control Mantel-Haenszel 2.0000 0.8570 4.6674
(Odds Ratio) Logit 2.0000 0.8570 4.6674
Cohort Mantel-Haenszel 1.5000 0.9060 2.4835
(Col1 Risk) Logit 1.5000 0.9060 2.4835

Page | 168
Estimates of the Common Relative Risk (Row1/Row2)
Type of Study Method Value 95% Confidence Limits
Cohort Mantel-Haenszel 0.7500 0.5258 1.0699
(Col2 Risk) Logit 0.7500 0.5258 1.0699
Effective Sample Size = 91 Frequency Missing = 40
WARNING: 31% of the data are missing.
The SAS System
The GENMOD Procedure
Model Information
Data Set WORK.FAR15
Distribution Binomial
Link Function Log
Dependent Variable DiseaseFinal
Number of Observations Read 131
Number of Observations Used 104
Number of Events 45
Number of Trials 104
Missing Values 27
Class Level Information
Class Value Design Variables
Exposure 0 0
1 1
Response Profile
*We will to need run a regression analysis, and will use proc gen mod. We
will begin by using a basic, unadjusted model to compare to the unadjusted
prevalence ratio we previously calculated.*;

Page | 169
Ordered Value
DiseaseFinal Total Frequency
1 1 45
2 0 59
PROC GENMOD is modeling the probability that DiseaseFinal='1'.
Parameter Information
Parameter Effect Exposure
Prm1 Intercept
Prm2 Exposure 1
Criteria For Assessing Goodness Of Fit
Criterion DF Value Value/DF
Log Likelihood -67.6030
Full Log Likelihood -67.6030
AIC (smaller is better) 139.2060
AICC (smaller is better) 139.3249
BIC (smaller is better) 144.4948
Algorithm converged.
Analysis Of Maximum Likelihood Parameter Estimates
Parameter DF Estimate Standard Error
Wald 95% Confidence Limits
Wald Chi-Square
Pr > ChiSq
Intercept 1 -1.1527 0.1950 -1.5348 -0.7706 34.95 <.0001
Exposure 1 1 0.5984 0.2319 0.1439 1.0529 6.66 0.0099
Scale 0 1.0000 0.0000 1.0000 1.0000
Note: The scale parameter was held fixed.
Contrast Estimate Results
Label Mean Estima
te
Mean L'Beta Estima
te
Standard
Error
Alpha
L'Beta Chi-Squa
re
Pr > ChiS
q Confidence
Limits Confidence
Limits

Page | 170
Contrast Estimate Results
Label Mean Estima
te
Mean L'Beta Estima
te
Standard
Error
Alpha
L'Beta Chi-Squa
re
Pr > ChiS
q Confidence
Limits Confidence
Limits
Exposure 1.8191 1.1547
2.8658
0.5984 0.2319 0.05 0.1439
1.0529
6.66 0.0099
Exp(Exposure)
1.8191 0.4218 0.05 1.1547
2.8658
The SAS System
The GENMOD Procedure
Model Information
Data Set WORK.FAR15
Distribution Binomial
Link Function Log
Dependent Variable DiseaseFinal
Number of Observations Read 131
Number of Observations Used 81
Number of Events 34
Number of Trials 81
Missing Values 50
Class Level Information
Class Value Design Variables
Exposure 0 0
1 1
Ages 0 1
*We run a regression model with all variables and interaction terms to
evaluate for confounding and interaction. We will use backwards elimination
starting with interaction terms.*;
*After running the model (see below) we will remove Exposure*ADClean from the
next model p = 0.9422.

Page | 171
Class Level Information
Class Value Design Variables
1 0
Gender 0 1
1 0
FamHxAtopy 0 0
1 1
DxADClean 0 0
1 1
DxAsthmaClean 0 0
1 1
DxARClean 0 0
1 1
Response Profile
Ordered Value
DiseaseFinal Total Frequency
1 1 34
2 0 47
PROC GENMOD is modeling the probability that DiseaseFinal='1'.
Criteria For Assessing Goodness Of Fit
Criterion DF Value Value/DF
Log Likelihood -50.7166
Full Log Likelihood -50.7166
AIC (smaller is better) 129.4333
AICC (smaller is better) 135.7969
BIC (smaller is better) 162.9556
WARNING: The relative Hessian convergence criterion of 0.5221076385 is greater than the limit of 0.0001. The convergence is questionable.

Page | 172
Analysis Of Maximum Likelihood Parameter Estimates
Parameter DF
Estimate
Standard Error
Wald 95% Confidence
Limits
Wald Chi-
Square
Pr > ChiS
q
Intercept 1 -3.0788 1.4819 -5.9834
-0.1743
4.32 0.0377
Exposure 1 1 2.3640 1.5162 -0.6078
5.3357 2.43 0.1190
Ages 0 1 0.2241 0.2320 -0.2306
0.6788 0.93 0.3341
Gender 0 1 -0.0196 0.2111 -0.4333
0.3942 0.01 0.9262
FamHxAtopy 1 1 2.2463 1.4489 -0.5935
5.0861 2.40 0.1211
DxADClean 1 1 0.2429 0.2247 -0.1974
0.6833 1.17 0.2796
DxAsthmaClean 1 1 0.0207 0.2439 -0.4574
0.4988 0.01 0.9324
DxARClean 1 1 0.2077 0.2395 -0.2617
0.6771 0.75 0.3858
Exposure*Gender 1 0 1 -0.0271 0.2731 -0.5623
0.5082 0.01 0.9211
Exposure*Ages 1 0 1 -0.0568 0.3834 -0.8082
0.6946 0.02 0.8822
Exposure*FamHxAtopy
1 1 1 -2.0581 1.4707 -4.9405
0.8244 1.96 0.1617
Exposure*DxADClean 1 1 1 -0.0245 0.3383 -0.6876
0.6386 0.01 0.9422
Exposure*DxAsthmaCle
1 1 1 0.1098 0.3403 -0.5571
0.7767 0.10 0.7469
Exposure*DxARClean 1 1 1 -0.1972 0.3140 -0.8126
0.4181 0.39 0.5299
Scale 0 1.0000 0.0000 1.0000 1.0000
Note: The scale parameter was held fixed.

Page | 173
The SAS System
The GENMOD Procedure
Model Information
Data Set WORK.FAR15
Distribution Binomial
Link Function Log
Dependent Variable DiseaseFinal
Number of Observations Read 131
Number of Observations Used 81
Number of Events 34
Number of Trials 81
Missing Values 50
Class Level Information
Class Value Design Variables
Exposure 0 0
1 1
Ages 0 1
1 0
Gender 0 1
1 0
FamHxAtopy 0 0
1 1
DxADClean 0 0
1 1
DxAsthmaClean 0 0
1 1
*After running the new model (see below) we will remove Exposure*Gender from
the next model p = 0.9281.

Page | 174
Class Level Information
Class Value Design Variables
DxARClean 0 0
1 1
Response Profile
Ordered Value
DiseaseFinal Total Frequency
1 1 34
2 0 47
PROC GENMOD is modeling the probability that DiseaseFinal='1'.
Criteria For Assessing Goodness Of Fit
Criterion DF Value Value/DF
Log Likelihood -50.8874
Full Log Likelihood -50.8874
AIC (smaller is better) 127.7748
AICC (smaller is better) 133.2076
BIC (smaller is better) 158.9026
WARNING: The relative Hessian convergence criterion of 0.4817507877 is greater than the limit of 0.0001. The convergence is questionable.
Analysis Of Maximum Likelihood Parameter Estimates
Parameter DF
Estimate
Standard Error
Wald 95% Confidence
Limits
Wald Chi-
Square
Pr > ChiS
q
Intercept 1 -3.0620 1.4783 -5.9594
-0.1645
4.29 0.0383
Exposure 1 1 2.3448 1.5005 -0.5961
5.2858 2.44 0.1181
Ages 0 1 0.2208 0.2240 -0.2183
0.6599 0.97 0.3244
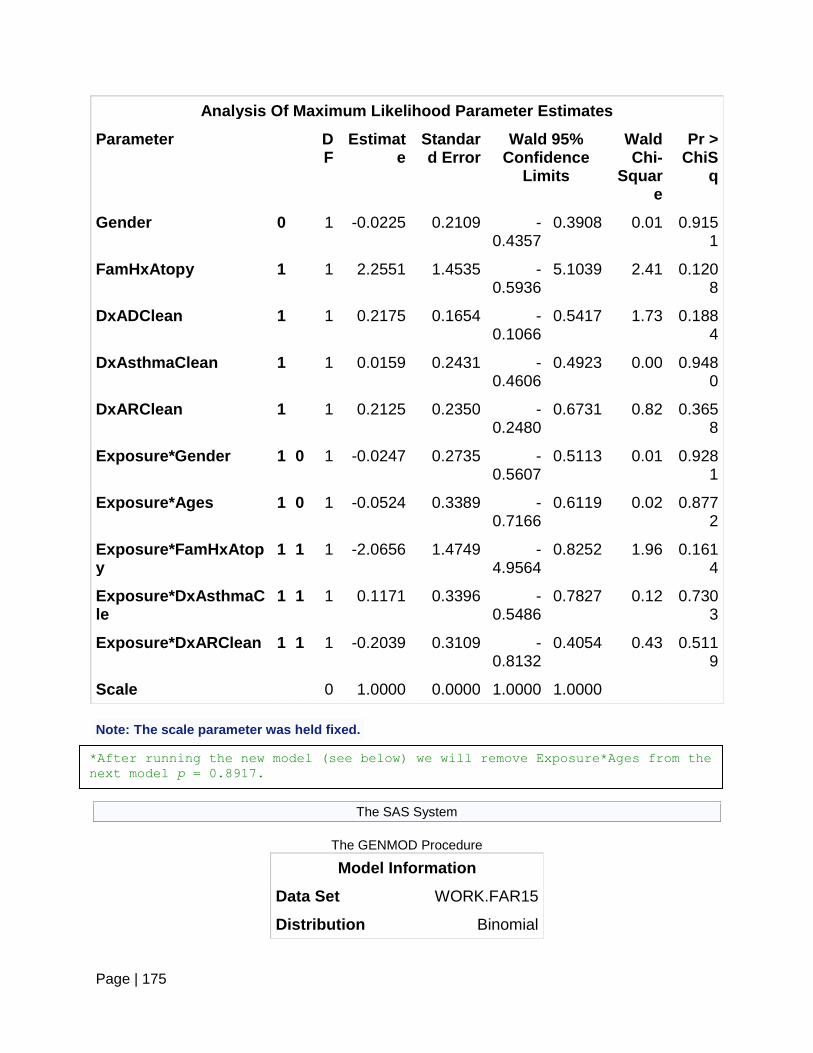
Page | 175
Analysis Of Maximum Likelihood Parameter Estimates
Parameter DF
Estimate
Standard Error
Wald 95% Confidence
Limits
Wald Chi-
Square
Pr > ChiS
q
Gender 0 1 -0.0225 0.2109 -0.4357
0.3908 0.01 0.9151
FamHxAtopy 1 1 2.2551 1.4535 -0.5936
5.1039 2.41 0.1208
DxADClean 1 1 0.2175 0.1654 -0.1066
0.5417 1.73 0.1884
DxAsthmaClean 1 1 0.0159 0.2431 -0.4606
0.4923 0.00 0.9480
DxARClean 1 1 0.2125 0.2350 -0.2480
0.6731 0.82 0.3658
Exposure*Gender 1 0 1 -0.0247 0.2735 -0.5607
0.5113 0.01 0.9281
Exposure*Ages 1 0 1 -0.0524 0.3389 -0.7166
0.6119 0.02 0.8772
Exposure*FamHxAtopy
1 1 1 -2.0656 1.4749 -4.9564
0.8252 1.96 0.1614
Exposure*DxAsthmaCle
1 1 1 0.1171 0.3396 -0.5486
0.7827 0.12 0.7303
Exposure*DxARClean 1 1 1 -0.2039 0.3109 -0.8132
0.4054 0.43 0.5119
Scale 0 1.0000 0.0000 1.0000 1.0000
Note: The scale parameter was held fixed.
The SAS System
The GENMOD Procedure
Model Information
Data Set WORK.FAR15
Distribution Binomial
*After running the new model (see below) we will remove Exposure*Ages from the
next model p = 0.8917.

Page | 176
Model Information
Link Function Log
Dependent Variable DiseaseFinal
Number of Observations Read 131
Number of Observations Used 81
Number of Events 34
Number of Trials 81
Missing Values 50
Class Level Information
Class Value Design Variables
Exposure 0 0
1 1
Ages 0 1
1 0
Gender 0 1
1 0
FamHxAtopy 0 0
1 1
DxADClean 0 0
1 1
DxAsthmaClean 0 0
1 1
DxARClean 0 0
1 1
Response Profile
Ordered Value
DiseaseFinal Total Frequency
1 1 34

Page | 177
Response Profile
Ordered Value
DiseaseFinal Total Frequency
2 0 47
PROC GENMOD is modeling the probability that DiseaseFinal='1'.
Criteria For Assessing Goodness Of Fit
Criterion DF Value Value/DF
Log Likelihood -50.9123
Full Log Likelihood -50.9123
AIC (smaller is better) 125.8245
AICC (smaller is better) 130.4128
BIC (smaller is better) 154.5579
WARNING: The relative Hessian convergence criterion of 0.4781799913 is greater than the limit of 0.0001. The convergence is questionable.
Analysis Of Maximum Likelihood Parameter Estimates
Parameter DF
Estimate
Standard Error
Wald 95% Confidence
Limits
Wald Chi-
Square
Pr > ChiS
q
Intercept 1 -3.0575 1.4782 -5.9547
-0.1604
4.28 0.0386
Exposure 1 1 2.3341 1.4986 -0.6031
5.2713 2.43 0.1194
Ages 0 1 0.2161 0.2190 -0.2130
0.6453 0.97 0.3236
Gender 0 1 -0.0383 0.1343 -0.3014
0.2248 0.08 0.7755
FamHxAtopy 1 1 2.2598 1.4549 -0.5917
5.1113 2.41 0.1204
DxADClean 1 1 0.2201 0.1649 -0.1030
0.5433 1.78 0.1818
DxAsthmaClean 1 1 0.0142 0.2402 - 0.4850 0.00 0.952

Page | 178
Analysis Of Maximum Likelihood Parameter Estimates
Parameter DF
Estimate
Standard Error
Wald 95% Confidence
Limits
Wald Chi-
Square
Pr > ChiS
q
0.4565 7
DxARClean 1 1 0.2076 0.2321 -0.2473
0.6626 0.80 0.3711
Exposure*Ages 1 0 1 -0.0454 0.3335 -0.6990
0.6082 0.02 0.8917
Exposure*FamHxAtopy
1 1 1 -2.0691 1.4762 -4.9624
0.8242 1.96 0.1610
Exposure*DxAsthmaCle
1 1 1 0.1174 0.3370 -0.5430
0.7778 0.12 0.7276
Exposure*DxARClean 1 1 1 -0.1973 0.3075 -0.8001
0.4055 0.41 0.5212
Scale 0 1.0000 0.0000 1.0000 1.0000
Note: The scale parameter was held fixed.
The SAS System
The GENMOD Procedure
Model Information
Data Set WORK.FAR15
Distribution Binomial
Link Function Log
Dependent Variable DiseaseFinal
Number of Observations Read 131
Number of Observations Used 81
Number of Events 34
Number of Trials 81
*After running the new model (see below) we will remove Exposure*DxAsthmaClean
from the next model p = 0.6997.

Page | 179
Missing Values 50
Class Level Information
Class Value Design Variables
Exposure 0 0
1 1
Ages 0 1
1 0
Gender 0 1
1 0
FamHxAtopy 0 0
1 1
DxADClean 0 0
1 1
DxAsthmaClean 0 0
1 1
DxARClean 0 0
1 1
Response Profile
Ordered Value
DiseaseFinal Total Frequency
1 1 34
2 0 47
PROC GENMOD is modeling the probability that DiseaseFinal='1'.
Criteria For Assessing Goodness Of Fit
Criterion DF Value Value/DF
Log Likelihood -51.1767
Full Log Likelihood -51.1767
AIC (smaller is better) 124.3534

Page | 180
Criteria For Assessing Goodness Of Fit
Criterion DF Value Value/DF
AICC (smaller is better) 128.1795
BIC (smaller is better) 150.6924
WARNING: The relative Hessian convergence criterion of 0.4519802115 is greater than the limit of 0.0001. The convergence is questionable.
Analysis Of Maximum Likelihood Parameter Estimates
Parameter DF
Estimate
Standard Error
Wald 95% Confidence
Limits
Wald Chi-
Square
Pr > ChiS
q
Intercept 1 -3.0204 1.4724 -5.9063
-0.1345
4.21 0.0402
Exposure 1 1 2.2926 1.4868 -0.6215
5.2066 2.38 0.1231
Ages 0 1 0.1812 0.1771 -0.1658
0.5282 1.05 0.3061
Gender 0 1 -0.0392 0.1341 -0.3020
0.2235 0.09 0.7698
FamHxAtopy 1 1 2.2530 1.4525 -0.5938
5.0998 2.41 0.1209
DxADClean 1 1 0.2168 0.1595 -0.0958
0.5293 1.85 0.1741
DxAsthmaClean 1 1 0.0032 0.2351 -0.4576
0.4640 0.00 0.9891
DxARClean 1 1 0.2069 0.2203 -0.2249
0.6388 0.88 0.3476
Exposure*FamHxAtopy
1 1 1 -2.0656 1.4747 -4.9559
0.8248 1.96 0.1613
Exposure*DxAsthmaCle
1 1 1 0.1284 0.3328 -0.5239
0.7806 0.15 0.6997
Exposure*DxARClean 1 1 1 -0.1961 0.2820 -0.7488
0.3565 0.48 0.4867
Scale 0 1.0000 0.0000 1.0000 1.0000

Page | 181
Note: The scale parameter was held fixed.
The SAS System
The GENMOD Procedure
Model Information
Data Set WORK.FAR15
Distribution Binomial
Link Function Log
Dependent Variable DiseaseFinal
Number of Observations Read 131
Number of Observations Used 81
Number of Events 34
Number of Trials 81
Missing Values 50
Class Level Information
Class Value Design Variables
Exposure 0 0
1 1
Ages 0 1
1 0
Gender 0 1
1 0
FamHxAtopy 0 0
1 1
DxADClean 0 0
1 1
*After running the new model (see below) we will remove Exposure*DxARClean
from the next model p = 0.5374.

Page | 182
Class Level Information
Class Value Design Variables
DxAsthmaClean 0 0
1 1
DxARClean 0 0
1 1
Response Profile
Ordered Value
DiseaseFinal Total Frequency
1 1 34
2 0 47
PROC GENMOD is modeling the probability that DiseaseFinal='1'.
Criteria For Assessing Goodness Of Fit
Criterion DF Value Value/DF
Log Likelihood -54.5370
Full Log Likelihood -54.5370
AIC (smaller is better) 127.0740
AICC (smaller is better) 129.6093
BIC (smaller is better) 148.6241
WARNING: The relative Hessian convergence criterion of 0.3971594656 is greater than the limit of 0.0001. The convergence is questionable.
Analysis Of Maximum Likelihood Parameter Estimates
Parameter DF
Estimate
Standard Error
Wald 95% Confidence
Limits
Wald Chi-
Square
Pr > ChiSq
Intercept 1 -2.9190 1.4084 -5.6794
-0.1587
4.30 0.0382
Exposure 1 1 2.2568 1.4122 - 5.0246 2.55 0.110

Page | 183
Analysis Of Maximum Likelihood Parameter Estimates
Parameter DF
Estimate
Standard Error
Wald 95% Confidence
Limits
Wald Chi-
Square
Pr > ChiSq
0.5111 0
Ages 0 1 0.1637 0.1489 -0.1281
0.4554 1.21 0.2716
Gender 0 1 -0.0262 0.1216 -0.2645
0.2121 0.05 0.8295
FamHxAtopy 1 1 2.2514 1.3973 -0.4872
4.9900 2.60 0.1071
DxADClean 1 1 0.1971 0.1319 -0.0614
0.4556 2.23 0.1350
DxAsthmaClean 1 1 0.0741 0.1456 -0.2113
0.3596 0.26 0.6107
DxARClean 1 1 0.0627 0.1336 -0.1991
0.3246 0.22 0.6386
Exposure*FamHxAtopy
1 1 1 -2.0868 1.4171 -4.8642
0.6907 2.17 0.1409
Scale 0 1.0000 0.0000 1.0000 1.0000
Note: The scale parameter was held fixed.
The SAS System
The GENMOD Procedure
Model Information
Data Set WORK.FAR15
Distribution Binomial
Link Function Log
Dependent Variable DiseaseFinal
*After running the new model (see below) we will remove Exposure*FamHxAtopy
from the next model p = 0.1409.*;
*This section I will begin elimination of variables to determine the final
model. This will be the most parsimonious model*
*After running the code (See Below) we will remove Gender (p = 0.77)*;
Page | 184
Number of Observations Read 131
Number of Observations Used 81
Number of Events 34
Number of Trials 81
Missing Values 50
Class Level Information
Class Value Design Variables
Exposure 0 0
1 1
Ages 0 1
1 0
Gender 0 0
1 1
FamHxAtopy 0 0
1 1
DxADClean 0 0
1 1
DxAsthmaClean 0 0
1 1
DxARClean 0 0
1 1
Response Profile
Ordered Value
DiseaseFinal Total Frequency
1 1 34
2 0 47
PROC GENMOD is modeling the probability that DiseaseFinal='1'.
Parameter Information

Page | 185
Parameter
Effect Exposure
Ages
Gender
FamHxAtopy
DxADClean
DxAsthmaClean
DxARClean
Prm1 Intercept
Prm2 Exposure 1
Prm3 Ages 0
Prm4 Gender 1
Prm5 FamHxAtopy
1
Prm6 DxADClean
1
Prm7 DxAsthmaClean
1
Prm8 DxARClean
1
Criteria For Assessing Goodness Of Fit
Criterion DF Value Value/DF
Log Likelihood -60.5625
Full Log Likelihood -60.5625
AIC (smaller is better) 137.1251
AICC (smaller is better) 139.1251
BIC (smaller is better) 156.2807
WARNING: The relative Hessian convergence criterion of 0.3973090352 is greater than the limit of 0.0001. The convergence is questionable.
Analysis Of Maximum Likelihood Parameter Estimates
Parameter DF Estimate Standard Error
Wald 95% Confidence
Limits
Wald Chi-
Square
Pr > ChiSq
Intercept 1 -0.8695 0.2435 -1.3467 -0.3923 12.75 0.0004
Exposure 1 1 0.1713 0.1083 -0.0409 0.3835 2.50 0.1136
Ages 0 1 0.1448 0.1285 -0.1071 0.3966 1.27 0.2599
Gender 1 1 0.0244 0.1128 -0.1966 0.2455 0.05 0.8284

Page | 186
Analysis Of Maximum Likelihood Parameter Estimates
Parameter DF Estimate Standard Error
Wald 95% Confidence
Limits
Wald Chi-
Square
Pr > ChiSq
FamHxAtopy 1 1 0.2245 0.1615 -0.0920 0.5410 1.93 0.1645
DxADClean 1 1 0.1787 0.1198 -0.0561 0.4135 2.22 0.1359
DxAsthmaClean 1 1 0.0683 0.1278 -0.1823 0.3188 0.29 0.5932
DxARClean 1 1 0.0576 0.1186 -0.1750 0.2901 0.24 0.6275
Scale 0 1.0000 0.0000 1.0000 1.0000
Note: The scale parameter was held fixed.
Contrast Estimate Results
Label Mean Estim
ate
Mean L'Beta Estim
ate
Standard
Error
Alpha
L'Beta Chi-Squa
re
Pr > ChiSq
Confidence Limits
Confidence Limits
Exposure 1.1869
0.9599
1.4674
0.1713
0.1083 0.05 -0.04
09
0.3835
2.50 0.1136
Exp(Exposure) 1.1869
0.1285 0.05 0.9599
1.4674
Ages 1.1558
0.8984
1.4868
0.1448
0.1285 0.05 -0.10
71
0.3966
1.27 0.2599
Exp(Ages) 1.1558
0.1485 0.05 0.8984
1.4868
Gender 1.0247
0.8215
1.2782
0.0244
0.1128 0.05 -0.19
66
0.2455
0.05 0.8284
Exp(Gender) 1.0247
0.1156 0.05 0.8215
1.2782
FamHxAtopy 1.2517
0.9121
1.7176
0.2245
0.1615 0.05 -0.09
20
0.5410
1.93 0.1645
Exp(FamHxAtopy)
1.2517
0.2021 0.05 0.9121
1.7176

Page | 187
Contrast Estimate Results
Label Mean Estim
ate
Mean L'Beta Estim
ate
Standard
Error
Alpha
L'Beta Chi-Squa
re
Pr > ChiSq
Confidence Limits
Confidence Limits
DxADClean 1.1957
0.9454
1.5122
0.1787
0.1198 0.05 -0.05
61
0.4135
2.22 0.1359
Exp(DxADClean)
1.1957
0.1433 0.05 0.9454
1.5122
DxAsthmaClean
1.0707
0.8334
1.3755
0.0683
0.1278 0.05 -0.18
23
0.3188
0.29 0.5932
Exp(DxAsthmaClean)
1.0707
0.1369 0.05 0.8334
1.3755
DxARClean 1.0593
0.8395
1.3366
0.0576
0.1186 0.05 -0.17
50
0.2901
0.24 0.6275
Exp(DxARClean)
1.0593
0.1257 0.05 0.8395
1.3366
The SAS System
The GENMOD Procedure
Model Information
Data Set WORK.FAR15
Distribution Binomial
Link Function Log
Dependent Variable DiseaseFinal
Number of Observations Read 131
Number of Observations Used 81
Number of Events 34
Number of Trials 81
*After running the code (See Below) we will remove Gender (p = 0.77) from the
next model.*;

Page | 188
Missing Values 50
Class Level Information
Class Value Design Variables
Exposure 0 0
1 1
Ages 0 1
1 0
FamHxAtopy 0 0
1 1
DxADClean 0 0
1 1
DxAsthmaClean 0 0
1 1
DxARClean 0 0
1 1
Response Profile
Ordered Value
DiseaseFinal Total Frequency
1 1 34
2 0 47
PROC GENMOD is modeling the probability that DiseaseFinal='1'.
Parameter Information
Parameter
Effect Exposure
Ages
FamHxAtopy
DxADClean
DxAsthmaClean
DxARClean
Prm1 Intercept
Prm2 Exposure 1
Prm3 Ages 0
Prm4 FamHxAtop 1

Page | 189
Parameter Information
Parameter
Effect Exposure
Ages
FamHxAtopy
DxADClean
DxAsthmaClean
DxARClean
y
Prm5 DxADClean 1
Prm6 DxAsthmaClean
1
Prm7 DxARClean 1
Criteria For Assessing Goodness Of Fit
Criterion DF Value Value/DF
Log Likelihood -55.5191
Full Log Likelihood -55.5191
AIC (smaller is better) 125.0381
AICC (smaller is better) 126.5724
BIC (smaller is better) 141.7993
WARNING: The relative Hessian convergence criterion of 0.3967820559 is greater than the limit of 0.0001. The convergence is questionable.
Analysis Of Maximum Likelihood Parameter Estimates
Parameter DF Estimate Standard Error
Wald 95% Confidence
Limits
Wald Chi-
Square
Pr > ChiSq
Intercept 1 -1.0114 0.2723 -1.5450 -0.4778 13.80 0.0002
Exposure 1 1 0.2088 0.1252 -0.0366 0.4541 2.78 0.0954
Ages 0 1 0.1740 0.1497 -0.1193 0.4674 1.35 0.2449
FamHxAtopy 1 1 0.2537 0.1886 -0.1160 0.6235 1.81 0.1786
DxADClean 1 1 0.2285 0.1430 -0.0518 0.5088 2.55 0.1101
DxAsthmaClean 1 1 0.0747 0.1506 -0.2204 0.3698 0.25 0.6197
DxARClean 1 1 0.0716 0.1405 -0.2038 0.3470 0.26 0.6103
Scale 0 1.0000 0.0000 1.0000 1.0000
Note: The scale parameter was held fixed.

Page | 190
Contrast Estimate Results
Label Mean Estim
ate
Mean L'Beta Estim
ate
Standard
Error
Alpha
L'Beta Chi-Squa
re
Pr > ChiSq
Confidence Limits
Confidence Limits
Exposure 1.2322
0.9641
1.5748
0.2088
0.1252 0.05 -0.03
66
0.4541
2.78 0.0954
Exp(Exposure) 1.2322
0.1542 0.05 0.9641
1.5748
Ages 1.1901
0.8875
1.5959
0.1740
0.1497 0.05 -0.11
93
0.4674
1.35 0.2449
Exp(Ages) 1.1901
0.1781 0.05 0.8875
1.5959
FamHxAtopy 1.2888
0.8905
1.8654
0.2537
0.1886 0.05 -0.11
60
0.6235
1.81 0.1786
Exp(FamHxAtopy)
1.2888
0.2431 0.05 0.8905
1.8654
DxADClean 1.2567
0.9495
1.6633
0.2285
0.1430 0.05 -0.05
18
0.5088
2.55 0.1101
Exp(DxADClean)
1.2567
0.1797 0.05 0.9495
1.6633
DxAsthmaClean
1.0776
0.8022
1.4474
0.0747
0.1506 0.05 -0.22
04
0.3698
0.25 0.6197
Exp(DxAsthmaClean)
1.0776
0.1622 0.05 0.8022
1.4474
DxARClean 1.0742
0.8157
1.4148
0.0716
0.1405 0.05 -0.20
38
0.3470
0.26 0.6103
Exp(DxARClean)
1.0742
0.1509 0.05 0.8157
1.4148

Page | 191
The SAS System
The GENMOD Procedure
Model Information
Data Set WORK.FAR15
Distribution Binomial
Link Function Log
Dependent Variable DiseaseFinal
Number of Observations Read 131
Number of Observations Used 88
Number of Events 38
Number of Trials 88
Missing Values 43
Class Level Information
Class Value Design Variables
Exposure 0 0
1 1
Ages 0 1
1 0
FamHxAtopy 0 0
1 1
DxADClean 0 0
1 1
DxAsthmaClean 0 0
1 1
Response Profile
*After running the code (See Below) we will remove DxARClean (p = 0.6275) from
the next model.*;

Page | 192
Ordered Value
DiseaseFinal Total Frequency
1 1 38
2 0 50
PROC GENMOD is modeling the probability that DiseaseFinal='1'.
Parameter Information
Parameter
Effect Exposure
Ages
FamHxAtopy
DxADClean
DxAsthmaClean
Prm1 Intercept
Prm2 Exposure 1
Prm3 Ages 0
Prm4 FamHxAtopy 1
Prm5 DxADClean 1
Prm6 DxAsthmaClean
1
Criteria For Assessing Goodness Of Fit
Criterion DF Value Value/DF
Log Likelihood -49.5937
Full Log Likelihood -49.5937
AIC (smaller is better) 111.1875
AICC (smaller is better) 112.2245
BIC (smaller is better) 126.0515
WARNING: The relative Hessian convergence criterion of 0.2426241531 is greater than the limit of 0.0001. The convergence is questionable.
Analysis Of Maximum Likelihood Parameter Estimates
Parameter DF Estimate Standard Error
Wald 95% Confidence
Limits
Wald Chi-
Square
Pr > ChiSq
Intercept 1 -1.6469 0.4280 -2.4857 -0.8080 14.81 0.0001
Exposure 1 1 0.3461 0.1894 -0.0251 0.7172 3.34 0.0676

Page | 193
Analysis Of Maximum Likelihood Parameter Estimates
Parameter DF Estimate Standard Error
Wald 95% Confidence
Limits
Wald Chi-
Square
Pr > ChiSq
Ages 0 1 0.3023 0.1939 -0.0778 0.6824 2.43 0.1190
FamHxAtopy 1 1 0.2658 0.2498 -0.2238 0.7553 1.13 0.2873
DxADClean 1 1 0.5098 0.2254 0.0681 0.9514 5.12 0.0237
DxAsthmaClean 1 1 0.2230 0.2149 -0.1982 0.6441 1.08 0.2994
Scale 0 1.0000 0.0000 1.0000 1.0000
Note: The scale parameter was held fixed.
Contrast Estimate Results
Label Mean Estim
ate
Mean L'Beta Estim
ate
Standard
Error
Alpha
L'Beta Chi-Squa
re
Pr > ChiSq
Confidence Limits
Confidence Limits
Exposure 1.4135
0.9752
2.0488
0.3461
0.1894 0.05 -0.02
51
0.7172
3.34 0.0676
Exp(Exposure) 1.4135
0.2677 0.05 0.9752
2.0488
Ages 1.3530
0.9252
1.9785
0.3023
0.1939 0.05 -0.07
78
0.6824
2.43 0.1190
Exp(Ages) 1.3530
0.2624 0.05 0.9252
1.9785
FamHxAtopy 1.3045
0.7995
2.1283
0.2658
0.2498 0.05 -0.22
38
0.7553
1.13 0.2873
Exp(FamHxAtopy)
1.3045
0.3258 0.05 0.7995
2.1283
DxADClean 1.6649
1.0704
2.5894
0.5098
0.2254 0.05 0.0681
0.9514
5.12 0.0237
Exp(DxADClean)
1.6649
0.3752 0.05 1.0704
2.5894
DxAsthmaClea 1.249 0.82 1.90 0.223 0.2149 0.05 - 0.64 1.08 0.29

Page | 194
Contrast Estimate Results
Label Mean Estim
ate
Mean L'Beta Estim
ate
Standard
Error
Alpha
L'Beta Chi-Squa
re
Pr > ChiSq
Confidence Limits
Confidence Limits
n 8 02 43 0 0.1982
41 94
Exp(DxAsthmaClean)
1.2498
0.2685 0.05 0.8202
1.9043
The SAS System
The GENMOD Procedure
Model Information
Data Set WORK.FAR15
Distribution Binomial
Link Function Log
Dependent Variable DiseaseFinal
Number of Observations Read 131
Number of Observations Used 94
Number of Events 42
Number of Trials 94
Missing Values 37
Class Level Information
Class Value Design Variables
Exposure 0 0
1 1
Ages 0 1
1 0
*After running the code (See Below) we will remove FamHxAtopy (p = 0.2974)
from the next model.*;
* MH Chi Square: 0.0127. Our adjusted Prevalence Ratio for Exposure is: 1.7
(1.1, 2.5)

Page | 195
Class Level Information
Class Value Design Variables
FamHxAtopy 0 0
1 1
DxADClean 0 0
1 1
Response Profile
Ordered Value
DiseaseFinal Total Frequency
1 1 42
2 0 52
PROC GENMOD is modeling the probability that DiseaseFinal='1'.
Parameter Information
Parameter Effect Exposure Ages FamHxAtopy DxADClean
Prm1 Intercept
Prm2 Exposure 1
Prm3 Ages 0
Prm4 FamHxAtopy 1
Prm5 DxADClean 1
Criteria For Assessing Goodness Of Fit
Criterion DF Value Value/DF
Log Likelihood -51.3767
Full Log Likelihood -51.3767
AIC (smaller is better) 112.7535
AICC (smaller is better) 113.4353
BIC (smaller is better) 125.4699
Algorithm converged.

Page | 196
Analysis Of Maximum Likelihood Parameter Estimates
Parameter DF Estimate Standard Error
Wald 95% Confidence Limits
Wald Chi-Square
Pr > ChiSq
Intercept 1 -2.4070 0.4867 -3.3609 -1.4532 24.46 <.0001
Exposure 1 1 0.5113 0.2052 0.1090 0.9135 6.21 0.0127
Ages 0 1 0.4209 0.2001 0.0288 0.8130 4.43 0.0354
FamHxAtopy 1 1 0.3956 0.3797 -0.3486 1.1398 1.09 0.2974
DxADClean 1 1 1.0048 0.3684 0.2828 1.7268 7.44 0.0064
Scale 0 1.0000 0.0000 1.0000 1.0000
Note: The scale parameter was held fixed.
Contrast Estimate Results
Label Mean Estim
ate
Mean L'Beta Estim
ate
Standard
Error
Alpha
L'Beta Chi-Squa
re
Pr > ChiS
q Confidence Limits
Confidence Limits
Exposure 1.6674 1.1152
2.4931
0.5113 0.2052 0.05 0.1090
0.9135
6.21 0.0127
Exp(Exposure)
1.6674 0.3422 0.05 1.1152
2.4931
Ages 1.5234 1.0293
2.2547
0.4209 0.2001 0.05 0.0288
0.8130
4.43 0.0354
Exp(Ages) 1.5234 0.3048 0.05 1.0293
2.2547
FamHxAtopy 1.4853 0.7057
3.1261
0.3956 0.3797 0.05 -0.348
6
1.1398
1.09 0.2974
Exp(FamHxAtopy)
1.4853 0.5639 0.05 0.7057
3.1261
DxADClean 2.7312 1.3268
5.6224
1.0048 0.3684 0.05 0.2828
1.7268
7.44 0.0064
Exp(DxADClean)
2.7312 1.0061 0.05 1.3268
5.6224
*This is the most parsimonious and best model*;

Page | 197
The SAS System
The GENMOD Procedure
Model Information
Data Set WORK.FAR15
Distribution Binomial
Link Function Log
Dependent Variable DiseaseFinal
Number of Observations Read 131
Number of Observations Used 96
Number of Events 43
Number of Trials 96
Missing Values 35
Class Level Information
Class Value Design Variables
Exposure 0 0
1 1
Ages 0 1
1 0
DxADClean 0 0
1 1
Response Profile
Ordered Value
DiseaseFinal Total Frequency
1 1 43
2 0 53
PROC GENMOD is modeling the probability that DiseaseFinal='1'.
Parameter Information

Page | 198
Parameter Effect Exposure Ages DxADClean
Prm1 Intercept
Prm2 Exposure 1
Prm3 Ages 0
Prm4 DxADClean 1
Criteria For Assessing Goodness Of Fit
Criterion DF Value Value/DF
Log Likelihood -55.8027
Full Log Likelihood -55.8027
AIC (smaller is better) 119.6055
AICC (smaller is better) 120.0450
BIC (smaller is better) 129.8629
Algorithm converged.
Analysis Of Maximum Likelihood Parameter Estimates
Parameter DF Estimate Standard Error
Wald 95% Confidence Limits
Wald Chi-Square
Pr > ChiSq
Intercept 1 -1.9584 0.3628 -2.6694 -1.2474 29.14 <.0001
Exposure 1 1 0.5228 0.2095 0.1121 0.9335 6.22 0.0126
Ages 0 1 0.4141 0.1978 0.0264 0.8018 4.38 0.0363
DxADClean 1 1 0.8713 0.3402 0.2044 1.5382 6.56 0.0104
Scale 0 1.0000 0.0000 1.0000 1.0000
Note: The scale parameter was held fixed.
Contrast Estimate Results
Label Mean Estim
ate
Mean L'Beta Estim
ate
Standard
Error
Alpha
L'Beta Chi-Squa
re
Pr > ChiS
q Confidence Limits
Confidence Limits
Exposure 1.6867 1.1186
2.5433
0.5228 0.2095 0.05 0.1121
0.9335
6.22 0.0126

Page | 199
Contrast Estimate Results
Label Mean Estim
ate
Mean L'Beta Estim
ate
Standard
Error
Alpha
L'Beta Chi-Squa
re
Pr > ChiS
q Confidence Limits
Confidence Limits
Exp(Exposure)
1.6867 0.3534 0.05 1.1186
2.5433
Ages 1.5130 1.0267
2.2295
0.4141 0.1978 0.05 0.0264
0.8018
4.38 0.0363
Exp(Ages) 1.5130 0.2993 0.05 1.0267
2.2295
DxADClean 2.3900 1.2268
4.6560
0.8713 0.3402 0.05 0.2044
1.5382
6.56 0.0104
Exp(DxADClean)
2.3900 0.8132 0.05 1.2268
4.6560
The SAS System 11:39 Thursday, April 12, 2012 712 The TTEST Procedure Variable: Age (Age) Exposure N Mean Std Dev Std Err Minimum Maximum 0 18 5.6489 5.0947 1.2008 1.0000 16.8300 1 27 6.0656 2.9385 0.5655 2.0000 13.3400 Diff (1-2) -0.4167 3.9348 1.1973 Exposure Method Mean 95% CL Mean Std Dev 95% CL Std Dev 0 5.6489 3.1154 8.1824 5.0947 3.8230 7.6376 1 6.0656 4.9031 7.2280 2.9385 2.3141 4.0270 Diff (1-2) Pooled -0.4167 -2.8313 1.9979 3.9348 3.2510 4.9855 Diff (1-2) Satterthwaite -0.4167 -3.1527 2.3193 Method Variances DF t Value Pr > |t| Pooled Equal 43 -0.35 0.7295 Satterthwaite Unequal 24.586 -0.31 0.7562 Equality of Variances Method Num DF Den DF F Value Pr > F Folded F 17 26 3.01 0.0114
The SAS System
The TTEST Procedure Variable: AgeFAYRLog
*Focusing on the subgroup that were food allergic, and looking for differences
in continuous variables.*;

Page | 200
Exposure N Mean Std Dev Std Err Minimum Maximum
0 18 0.2866 1.1291 0.2661 -1.7720 2.1972
1 27 0.4447 0.6864 0.1321 -0.6931 1.7918
Diff (1-2) -0.1581 0.8882 0.2703
Exposure Method Mean 95% CL Mean Std Dev 95% CL Std Dev
0 0.2866 -0.2749 0.8481 1.1291 0.8473 1.6927
1 0.4447 0.1731 0.7162 0.6864 0.5406 0.9407
Diff (1-2) Pooled -0.1581 -0.7031 0.3870 0.8882 0.7338 1.1254
Diff (1-2) Satterthwaite -0.1581 -0.7695 0.4534
Method Variances DF t Value Pr > |t|
Pooled Equal 43 -0.58 0.5617
Satterthwaite Unequal 25.401 -0.53 0.5994
Equality of Variances
Method Num DF Den DF F Value Pr > F
Folded F 17 26 2.71 0.0218

Page | 201

Page | 202
The SAS System
The TTEST Procedure
Variable: LengthFAYr (LengthFAYr)
Exposure N Mean Std Dev Std Err Minimum Maximum
0 16 3.9075 4.7770 1.1942 0.1300 15.3000
1 27 4.3274 2.9982 0.5770 0.8400 12.0000
Diff (1-2) -0.4199 3.7482 1.1825
Exposure Method Mean 95% CL Mean Std Dev 95% CL Std Dev
0 3.9075 1.3620 6.4530 4.7770 3.5288 7.3933
1 4.3274 3.1414 5.5134 2.9982 2.3611 4.1088
Diff (1-2) Pooled -0.4199 -2.8081 1.9683 3.7482 3.0840 4.7796
Diff (1-2) Satterthwaite -0.4199 -3.1696 2.3298
Method Variances DF t Value Pr > |t|
Pooled Equal 41 -0.36 0.7243
Satterthwaite Unequal 22.125 -0.32 0.7545
Equality of Variances
Method Num DF Den DF F Value Pr > F
Folded F 15 26 2.54 0.0360

Page | 203

Page | 204
The SAS System 11:39 Thursday, April 12, 2012 715 ------------------------------------------ Exposure=0 ------------------------------------------ The FREQ Procedure EggAllergy Cumulative Cumulative EggAllergy Frequency Percent Frequency Percent ƒƒƒƒƒƒƒƒƒƒƒƒƒƒƒƒƒƒƒƒƒƒƒƒƒƒƒƒƒƒƒƒƒƒƒƒƒƒƒƒƒƒƒƒƒƒƒƒƒƒƒƒƒƒƒƒƒƒƒƒƒƒƒ 0 23 60.53 23 60.53 1 15 39.47 38 100.00 Frequency Missing = 39 Chi-Square Test for Equal Proportions ƒƒƒƒƒƒƒƒƒƒƒƒƒƒƒƒƒƒƒƒƒ Chi-Square 1.6842 DF 1 Pr > ChiSq 0.1944 Effective Sample Size = 38 Frequency Missing = 39 WARNING: 51% of the data are missing.

Page | 205
------------------------------------------ Exposure=1 ------------------------------------------ The FREQ Procedure EggAllergy Cumulative Cumulative EggAllergy Frequency Percent Frequency Percent ƒƒƒƒƒƒƒƒƒƒƒƒƒƒƒƒƒƒƒƒƒƒƒƒƒƒƒƒƒƒƒƒƒƒƒƒƒƒƒƒƒƒƒƒƒƒƒƒƒƒƒƒƒƒƒƒƒƒƒƒƒƒƒ 0 15 46.88 15 46.88 1 17 53.13 32 100.00 Frequency Missing = 22 Chi-Square Test for Equal Proportions ƒƒƒƒƒƒƒƒƒƒƒƒƒƒƒƒƒƒƒƒƒ Chi-Square 0.1250 DF 1 Pr > ChiSq 0.7237 Effective Sample Size = 32 Frequency Missing = 22
WARNING: 41% of the data are missing.
2 x 2 Table Statistics
Single Table Analysis
Egg Allergy
(+) (-)
(+) 14 13 27
Exposure (-) 6 12 18
20 25 45
Chi Square and Exact Measures of Association
Test Value p-value(1-tail)
p-value(2-tail)
Uncorrected chi square 1.5 0.1106 0.2211
Yates corrected chi square
0.8438 0.1792 0.3583
Mantel-Haenszel chi square
1.467 0.1132 0.2264
Fisher exact
0.1795 0.3589
Mid-P exact
0.1207 0.2414
All expected values (row total*column total/grand total) are >=5
OK to use chi square.

Page | 206
------------------------------------------ Exposure=0 ------------------------------------------ The FREQ Procedure MilkAllergy Cumulative Cumulative MilkAllergy Frequency Percent Frequency Percent ƒƒƒƒƒƒƒƒƒƒƒƒƒƒƒƒƒƒƒƒƒƒƒƒƒƒƒƒƒƒƒƒƒƒƒƒƒƒƒƒƒƒƒƒƒƒƒƒƒƒƒƒƒƒƒƒƒƒƒƒƒƒƒƒ 0 10 55.56 10 55.56 1 8 44.44 18 100.00 Chi-Square Test for Equal Proportions ƒƒƒƒƒƒƒƒƒƒƒƒƒƒƒƒƒƒƒƒƒ Chi-Square 0.2222 DF 1 Pr > ChiSq 0.6374
Sample Size = 18
------------------------------------------ Exposure=1 ------------------------------------------ The FREQ Procedure MilkAllergy Cumulative Cumulative MilkAllergy Frequency Percent Frequency Percent ƒƒƒƒƒƒƒƒƒƒƒƒƒƒƒƒƒƒƒƒƒƒƒƒƒƒƒƒƒƒƒƒƒƒƒƒƒƒƒƒƒƒƒƒƒƒƒƒƒƒƒƒƒƒƒƒƒƒƒƒƒƒƒƒ 0 14 56.00 14 56.00 1 11 44.00 25 100.00 Frequency Missing = 2 Chi-Square Test for Equal Proportions ƒƒƒƒƒƒƒƒƒƒƒƒƒƒƒƒƒƒƒƒƒ Chi-Square 0.3600 DF 1 Pr > ChiSq 0.5485 Effective Sample Size = 25
Frequency Missing = 2
2 x 2 Table Statistics
Single Table Analysis
Milk Allergy
(+) (-)
(+) 11 16 27
Exposure (-) 8 10 18

Page | 207
19 26 45
Chi Square and Exact Measures of Association
Test Value p-value(1-tail)
p-value(2-tail)
Uncorrected chi square 0.06073 0.4027 0.8053
Yates corrected chi square
0.003796 0.4754 0.9509
Mantel-Haenszel chi square
0.05938 0.4037 0.8075
Fisher exact
0.5232(P) >0.9999999
Mid-P exact
0.4062(P) 0.8124
All expected values (row total*column total/grand total) are >=5
The SAS System 11:39 Thursday, April 12, 2012 743
------------------------------------------ Exposure=0 ------------------------------------------ The FREQ Procedure PeanutAllergy Cumulative Cumulative PeanutAllergy Frequency Percent Frequency Percent ƒƒƒƒƒƒƒƒƒƒƒƒƒƒƒƒƒƒƒƒƒƒƒƒƒƒƒƒƒƒƒƒƒƒƒƒƒƒƒƒƒƒƒƒƒƒƒƒƒƒƒƒƒƒƒƒƒƒƒƒƒƒƒƒƒƒ 0 6 33.33 6 33.33 1 12 66.67 18 100.00 Chi-Square Test for Equal Proportions ƒƒƒƒƒƒƒƒƒƒƒƒƒƒƒƒƒƒƒƒƒ Chi-Square 2.0000 DF 1 Pr > ChiSq 0.1573
Sample Size = 18
The SAS System 11:39 Thursday, April 12, 2012 744 ------------------------------------------ Exposure=1 ------------------------------------------ The FREQ Procedure PeanutAllergy Cumulative Cumulative PeanutAllergy Frequency Percent Frequency Percent ƒƒƒƒƒƒƒƒƒƒƒƒƒƒƒƒƒƒƒƒƒƒƒƒƒƒƒƒƒƒƒƒƒƒƒƒƒƒƒƒƒƒƒƒƒƒƒƒƒƒƒƒƒƒƒƒƒƒƒƒƒƒƒƒƒƒ 0 12 48.00 12 48.00 1 13 52.00 25 100.00 Frequency Missing = 2

Page | 208
Chi-Square Test for Equal Proportions ƒƒƒƒƒƒƒƒƒƒƒƒƒƒƒƒƒƒƒƒƒ Chi-Square 0.0400 DF 1 Pr > ChiSq 0.8415 Effective Sample Size = 25
Frequency Missing = 2
2 x 2 Table Statistics
Single Table Analysis
Peanut Allergy
(+) (-)
(+) 13 14 27
Exposure (-) 12 6 18
25 20 45
Chi Square and Exact Measures of Association
Test Value p-value(1-tail)
p-value(2-tail)
Uncorrected chi square 1.5 0.1106 0.2211
Yates corrected chi square
0.8438 0.1792 0.3583
Mantel-Haenszel chi square
1.467 0.1132 0.2264
Fisher exact
0.1795(P) 0.3589
Mid-P exact
0.1207(P) 0.2414
------------------------------------------ Exposure=0 ------------------------------------------ The FREQ Procedure ShellfishAllergy Cumulative Cumulative ShellfishAllergy Frequency Percent Frequency Percent ƒƒƒƒƒƒƒƒƒƒƒƒƒƒƒƒƒƒƒƒƒƒƒƒƒƒƒƒƒƒƒƒƒƒƒƒƒƒƒƒƒƒƒƒƒƒƒƒƒƒƒƒƒƒƒƒƒƒƒƒƒƒƒƒƒƒƒƒƒ 0 11 61.11 11 61.11 1 7 38.89 18 100.00 Chi-Square Test

Page | 209
for Equal Proportions ƒƒƒƒƒƒƒƒƒƒƒƒƒƒƒƒƒƒƒƒƒ Chi-Square 0.8889 DF 1 Pr > ChiSq 0.3458 Sample Size = 18 ------------------------------------------ Exposure=1 ------------------------------------------ The FREQ Procedure ShellfishAllergy Cumulative Cumulative ShellfishAllergy Frequency Percent Frequency Percent ƒƒƒƒƒƒƒƒƒƒƒƒƒƒƒƒƒƒƒƒƒƒƒƒƒƒƒƒƒƒƒƒƒƒƒƒƒƒƒƒƒƒƒƒƒƒƒƒƒƒƒƒƒƒƒƒƒƒƒƒƒƒƒƒƒƒƒƒƒ 0 21 84.00 21 84.00 1 4 16.00 25 100.00 Frequency Missing = 2 Chi-Square Test for Equal Proportions ƒƒƒƒƒƒƒƒƒƒƒƒƒƒƒƒƒƒƒƒƒ Chi-Square 11.5600 DF 1 Pr > ChiSq 0.0007 Effective Sample Size = 25
Frequency Missing = 2

Page | 210
2 x 2 Table Statistics
Single Table Analysis
Shellfish Allergy
(+) (-)
(+) 4 23 27
Exposure (-) 7 11 18
11 34 45
Chi Square and Exact Measures of Association
Test Value p-value(1-tail)
p-value(2-tail)
Uncorrected chi square 3.389 0.03282 0.06564
Yates corrected chi square
2.211 0.06856 0.1371
Mantel-Haenszel chi square
3.314 0.03436 0.06871
Fisher exact
0.06943(P) 0.1389
Mid-P exact
0.04192(P) 0.08384
------------------------------------------ Exposure=0 ------------------------------------------ The FREQ Procedure SoyAllergy Cumulative Cumulative SoyAllergy Frequency Percent Frequency Percent ƒƒƒƒƒƒƒƒƒƒƒƒƒƒƒƒƒƒƒƒƒƒƒƒƒƒƒƒƒƒƒƒƒƒƒƒƒƒƒƒƒƒƒƒƒƒƒƒƒƒƒƒƒƒƒƒƒƒƒƒƒƒƒ 0 15 83.33 15 83.33 1 3 16.67 18 100.00 Chi-Square Test for Equal Proportions ƒƒƒƒƒƒƒƒƒƒƒƒƒƒƒƒƒƒƒƒƒ Chi-Square 8.0000 DF 1 Pr > ChiSq 0.0047
Sample Size = 18
------------------------------------------ Exposure=1 ------------------------------------------

Page | 211
The FREQ Procedure SoyAllergy Cumulative Cumulative SoyAllergy Frequency Percent Frequency Percent ƒƒƒƒƒƒƒƒƒƒƒƒƒƒƒƒƒƒƒƒƒƒƒƒƒƒƒƒƒƒƒƒƒƒƒƒƒƒƒƒƒƒƒƒƒƒƒƒƒƒƒƒƒƒƒƒƒƒƒƒƒƒƒ 0 19 76.00 19 76.00 1 6 24.00 25 100.00 Frequency Missing = 2 Chi-Square Test for Equal Proportions ƒƒƒƒƒƒƒƒƒƒƒƒƒƒƒƒƒƒƒƒƒ Chi-Square 6.7600 DF 1 Pr > ChiSq 0.0093 Effective Sample Size = 25
Frequency Missing = 2
2 x 2 Table Statistics
Single Table Analysis
Soy Allergy
(+) (-)
(+) 6 21 27
Exposure (-) 3 15 18
9 36 45
Chi Square and Exact Measures of Association
Test Value p-value(1-tail)
p-value(2-tail)
Uncorrected chi square 0.2083 0.3240 0.6481
Yates corrected chi square
0.005787 0.4697 0.9394
Mantel-Haenszel chi square
0.2037 0.3259 0.6517
Fisher exact
0.4763 0.9526
Mid-P exact
0.3400 0.6800
The SAS System 11:39 Thursday, April 12, 2012 747 ------------------------------------------ Exposure=0 ------------------------------------------

Page | 212
The FREQ Procedure WheatAllergy Cumulative Cumulative WheatAllergy Frequency Percent Frequency Percent ƒƒƒƒƒƒƒƒƒƒƒƒƒƒƒƒƒƒƒƒƒƒƒƒƒƒƒƒƒƒƒƒƒƒƒƒƒƒƒƒƒƒƒƒƒƒƒƒƒƒƒƒƒƒƒƒƒƒƒƒƒƒƒƒƒ 0 16 88.89 16 88.89 1 2 11.11 18 100.00 Chi-Square Test for Equal Proportions ƒƒƒƒƒƒƒƒƒƒƒƒƒƒƒƒƒƒƒƒƒ Chi-Square 10.8889 DF 1 Pr > ChiSq 0.0010
Sample Size = 18
The SAS System 11:39 Thursday, April 12, 2012 748 ------------------------------------------ Exposure=1 ------------------------------------------ The FREQ Procedure WheatAllergy Cumulative Cumulative WheatAllergy Frequency Percent Frequency Percent ƒƒƒƒƒƒƒƒƒƒƒƒƒƒƒƒƒƒƒƒƒƒƒƒƒƒƒƒƒƒƒƒƒƒƒƒƒƒƒƒƒƒƒƒƒƒƒƒƒƒƒƒƒƒƒƒƒƒƒƒƒƒƒƒƒ 0 19 76.00 19 76.00 1 6 24.00 25 100.00 Frequency Missing = 2 Chi-Square Test for Equal Proportions ƒƒƒƒƒƒƒƒƒƒƒƒƒƒƒƒƒƒƒƒƒ Chi-Square 6.7600 DF 1 Pr > ChiSq 0.0093 Effective Sample Size = 25
Frequency Missing = 2
2 x 2 Table Statistics
Single Table Analysis
Wheat Allergic
(+) (-)
(+) 6 21 27

Page | 213
Exposure (-) 2 16 18
8 37 45
Chi Square and Exact Measures of Association
Test Value p-value(1-tail)
p-value(2-tail)
Uncorrected chi square 0.9122 0.1698 0.3395
Yates corrected chi square
0.3104 0.2887 0.5774
Mantel-Haenszel chi square
0.8919 0.1725 0.3450
Fisher exact
0.2946 0.5891
Mid-P exact
0.1895 0.3790
The SAS System 11:39 Thursday, April 12, 2012 729 ------------------------------------------ Exposure=0 ------------------------------------------ The FREQ Procedure LTR food Cumulative Cumulative LTR_food Frequency Percent Frequency Percent ƒƒƒƒƒƒƒƒƒƒƒƒƒƒƒƒƒƒƒƒƒƒƒƒƒƒƒƒƒƒƒƒƒƒƒƒƒƒƒƒƒƒƒƒƒƒƒƒƒƒƒƒƒƒƒƒƒƒƒƒƒ 0 10 55.56 10 55.56 1 8 44.44 18 100.00 Chi-Square Test for Equal Proportions ƒƒƒƒƒƒƒƒƒƒƒƒƒƒƒƒƒƒƒƒƒ Chi-Square 0.2222 DF 1 Pr > ChiSq 0.6374 Sample Size = 18
The SAS System 11:39 Thursday, April 12, 2012 730 ------------------------------------------ Exposure=1 ------------------------------------------ The FREQ Procedure LTR food Cumulative Cumulative LTR_food Frequency Percent Frequency Percent ƒƒƒƒƒƒƒƒƒƒƒƒƒƒƒƒƒƒƒƒƒƒƒƒƒƒƒƒƒƒƒƒƒƒƒƒƒƒƒƒƒƒƒƒƒƒƒƒƒƒƒƒƒƒƒƒƒƒƒƒƒ 0 11 42.31 11 42.31 1 15 57.69 26 100.00 Frequency Missing = 1

Page | 214
Chi-Square Test for Equal Proportions ƒƒƒƒƒƒƒƒƒƒƒƒƒƒƒƒƒƒƒƒƒ Chi-Square 0.6154 DF 1 Pr > ChiSq 0.4328 Effective Sample Size = 26 Frequency Missing = 1
2 x 2 Table Statistics
Single Table Analysis
Life Threatening
Reaction
(+) (-)
(+) 15 11 26
Exposure (-) 8 10 18
23 21 44
Chi Square and Exact Measures of Association
Test Value p-value(1-tail)
p-value(2-tail)
Uncorrected chi square 0.7482 0.1935 0.3870
Yates corrected chi square
0.3114 0.2884 0.5768
Mantel-Haenszel chi square
0.7312 0.1962 0.3925
Fisher exact
0.2885 0.5771
Mid-P exact
0.2046 0.4091
The SAS System 11:39 Thursday, April 12, 2012 731 ------------------------------------------ Exposure=0 ------------------------------------------ The FREQ Procedure FA Severe? Cumulative Cumulative FA_Severe_ Frequency Percent Frequency Percent ƒƒƒƒƒƒƒƒƒƒƒƒƒƒƒƒƒƒƒƒƒƒƒƒƒƒƒƒƒƒƒƒƒƒƒƒƒƒƒƒƒƒƒƒƒƒƒƒƒƒƒƒƒƒƒƒƒƒƒƒƒƒƒ 0 5 31.25 5 31.25 1 11 68.75 16 100.00 Frequency Missing = 2 Chi-Square Test for Equal Proportions

Page | 215
ƒƒƒƒƒƒƒƒƒƒƒƒƒƒƒƒƒƒƒƒƒ Chi-Square 2.2500 DF 1 Pr > ChiSq 0.1336 Effective Sample Size = 16 Frequency Missing = 2 WARNING: 11% of the data are missing. ------------------------------------------ Exposure=1 ------------------------------------------ The FREQ Procedure FA Severe? Cumulative Cumulative FA_Severe_ Frequency Percent Frequency Percent ƒƒƒƒƒƒƒƒƒƒƒƒƒƒƒƒƒƒƒƒƒƒƒƒƒƒƒƒƒƒƒƒƒƒƒƒƒƒƒƒƒƒƒƒƒƒƒƒƒƒƒƒƒƒƒƒƒƒƒƒƒƒƒ 0 6 25.00 6 25.00 1 18 75.00 24 100.00 Frequency Missing = 3 Chi-Square Test for Equal Proportions ƒƒƒƒƒƒƒƒƒƒƒƒƒƒƒƒƒƒƒƒƒ Chi-Square 6.0000 DF 1 Pr > ChiSq 0.0143 Effective Sample Size = 24 Frequency Missing = 3 WARNING: 11% of the data are missing.
2 x 2 Table Statistics
Single Table Analysis
Food Allergy
Severe
(+) (-)
(+) 15 9 24
Exposure (-) 11 5 16
26 14 40
Chi Square and Exact Measures of Association
Test Value p-value(1-tail)
p-value(2-tail)
Uncorrected chi square 0.1648 0.3424 0.6847
Yates corrected chi square
0.004579 0.4730 0.9461
Mantel-Haenszel chi 0.1607 0.3442 0.6885

Page | 216
square
Fisher exact
0.4759(P) 0.9519
Mid-P exact
0.3529(P) 0.7058
The SAS System
The TTEST Procedure
Variable: LogIgE
Exposure N Mean Std Dev Std Err Minimum Maximum
0 15 5.1311 1.3711 0.3540 2.3979 7.5616
1 22 5.4776 1.5462 0.3296 2.3979 8.3457
Diff (1-2) -0.3465 1.4787 0.4951
Exposure Method Mean 95% CL Mean Std Dev 95% CL Std Dev
0 5.1311 4.3718 5.8904 1.3711 1.0038 2.1624
1 5.4776 4.7921 6.1631 1.5462 1.1896 2.2096
Diff (1-2) Pooled -0.3465 -1.3517 0.6586 1.4787 1.1993 1.9288
Diff (1-2) Satterthwaite -0.3465 -1.3313 0.6382
Method Variances DF t Value Pr > |t|
Pooled Equal 35 -0.70 0.4886
Satterthwaite Unequal 32.509 -0.72 0.4789
Equality of Variances
Method Num DF Den DF F Value Pr > F
Folded F 21 14 1.27 0.6540

Page | 217

Page | 218
The SAS System
The TTEST Procedure Variable: LogIgEEgg
Exposure N Mean Std Dev Std Err Minimum Maximum
0 7 0.8203 2.4675 0.9326 -2.9957 2.9069
1 10 1.2059 1.7068 0.5397 -1.5141 4.0200
Diff (1-2) -0.3856 2.0453 1.0079
Exposure Method Mean 95% CL Mean Std Dev 95% CL Std Dev
0 0.8203 -1.4617 3.1023 2.4675 1.5900 5.4335
1 1.2059 -0.0151 2.4269 1.7068 1.1740 3.1160
Diff (1-2) Pooled -0.3856 -2.5340 1.7627 2.0453 1.5109 3.1655
Diff (1-2) Satterthwaite -0.3856 -2.7882 2.0170
Method Variances DF t Value Pr > |t|
Pooled Equal 15 -0.38 0.7074
Satterthwaite Unequal 9.9484 -0.36 0.7279
Equality of Variances
Method Num DF Den DF F Value Pr > F
Folded F 6 9 2.09 0.3079

Page | 219

Page | 220
The SAS System
The TTEST Procedure Variable: LogIgEMilk
Exposure N Mean Std Dev Std Err Minimum Maximum
0 7 0.3207 3.0294 1.1450 -2.9957 3.8330
1 9 2.0417 1.9211 0.6404 -0.7985 4.6052
Diff (1-2) -1.7210 2.4581 1.2388
Exposure Method Mean 95% CL Mean Std Dev 95% CL Std Dev
0 0.3207 -2.4810 3.1224 3.0294 1.9521 6.6709
1 2.0417 0.5649 3.5184 1.9211 1.2976 3.6805
Diff (1-2) Pooled -1.7210 -4.3778 0.9359 2.4581 1.7996 3.8766
Diff (1-2) Satterthwaite -1.7210 -4.6592 1.2173
Method Variances DF t Value Pr > |t|
Pooled Equal 14 -1.39 0.1864
Satterthwaite Unequal 9.6336 -1.31 0.2200
Equality of Variances
Method Num DF Den DF F Value Pr > F
Folded F 6 8 2.49 0.2328

Page | 221

Page | 222
The SAS System
The TTEST Procedure Variable: LogIgEPeanut
Exposure N Mean Std Dev Std Err Minimum Maximum
0 12 0.6846 1.7100 0.4936 -2.9957 3.1179
1 13 2.4494 1.6296 0.4520 -0.2614 4.6052
Diff (1-2) -1.7648 1.6686 0.6680
Exposure Method Mean 95% CL Mean Std Dev 95% CL Std Dev
0 0.6846 -0.4019 1.7711 1.7100 1.2114 2.9034
1 2.4494 1.4646 3.4342 1.6296 1.1686 2.6901
Diff (1-2) Pooled -1.7648 -3.1466 -0.3830 1.6686 1.2968 2.3406
Diff (1-2) Satterthwaite -1.7648 -3.1507 -0.3789
Method Variances DF t Value Pr > |t|
Pooled Equal 23 -2.64 0.0146
Satterthwaite Unequal 22.609 -2.64 0.0149
Equality of Variances
Method Num DF Den DF F Value Pr > F
Folded F 11 12 1.10 0.8663
Page | 223

Page | 224
The SAS System 11:39 Thursday, April 12, 2012 737 The TTEST Procedure Variable: LogIgEShrimp Exposure N Mean Std Dev Std Err Minimum Maximum 0 4 1.4732 3.2018 1.6009 -2.9957 4.6052 1 3 1.0149 1.4903 0.8604 0.0953 2.7344 Diff (1-2) 0.4583 2.6532 2.0264 Exposure Method Mean 95% CL Mean Std Dev 95% CL Std Dev 0 1.4732 -3.6216 6.5680 3.2018 1.8138 11.9380 1 1.0149 -2.6871 4.7170 1.4903 0.7759 9.3660 Diff (1-2) Pooled 0.4583 -4.7507 5.6673 2.6532 1.6561 6.5072 Diff (1-2) Satterthwaite 0.4583 -4.4007 5.3173 Method Variances DF t Value Pr > |t| Pooled Equal 5 0.23 0.8300 Satterthwaite Unequal 4.4291 0.25 0.8122 Equality of Variances Method Num DF Den DF F Value Pr > F Folded F 3 2 4.62 0.3664

Page | 225
The SAS System
The TTEST Procedure
Variable: IgESoy (IgESoy)
Exposure N Mean Std Dev Std Err Minimum Maximum
0 4 4.2875 4.9710 2.4855 0 10.1000
1 4 0.7075 0.5123 0.2562 0 1.1900
Diff (1-2) 3.5800 3.5336 2.4987
Exposure Method Mean 95% CL Mean Std Dev 95% CL Std Dev
0 4.2875 -3.6224 12.1974 4.9710 2.8160 18.5345
1 0.7075 -0.1077 1.5227 0.5123 0.2902 1.9103
Diff (1-2) Pooled 3.5800 -2.5340 9.6940 3.5336 2.2770 7.7813
Diff (1-2) Satterthwaite 3.5800 -4.2791 11.4391
Method Variances DF t Value Pr > |t|
Pooled Equal 6 1.43 0.2019
Satterthwaite Unequal 3.0637 1.43 0.2456
Equality of Variances
Method Num DF Den DF F Value Pr > F
Folded F 3 3 94.14 0.0036

Page | 226

Page | 227
The SAS System 11:39 Thursday, April 12, 2012 739 The TTEST Procedure Variable: LogIgEWheat Exposure N Mean Std Dev Std Err Minimum Maximum 0 4 0.4065 1.9745 0.9873 -1.4697 2.9601 1 5 0.8419 1.9192 0.8583 -0.9943 3.9551 Diff (1-2) -0.4353 1.9431 1.3035 Exposure Method Mean 95% CL Mean Std Dev 95% CL Std Dev 0 0.4065 -2.7354 3.5485 1.9745 1.1186 7.3621 1 0.8419 -1.5411 3.2249 1.9192 1.1498 5.5148 Diff (1-2) Pooled -0.4353 -3.5175 2.6469 1.9431 1.2847 3.9547 Diff (1-2) Satterthwaite -0.4353 -3.5803 2.7096 Method Variances DF t Value Pr > |t| Pooled Equal 7 -0.33 0.7482 Satterthwaite Unequal 6.4745 -0.33 0.7498 Equality of Variances Method Num DF Den DF F Value Pr > F Folded F 3 4 1.06 0.9188