Vanguard ETF Series Annual Report For the period ended 31 ...
171
Vanguard ETF Series Annual Report For the period ended 31 December 2014 Vanguard Sub-Funds covered in this annual report Vanguard FTSE Asia ex Japan Index ETF SEHK Stock code: 2805 Vanguard FTSE Developed Europe Index ETF SEHK Stock code: 3101 Vanguard FTSE Japan Index ETF SEHK Stock code: 3126 Vanguard FTSE Asia ex Japan High Dividend Yield Index ETF SEHK Stock code: 3085
-
Upload
khangminh22 -
Category
Documents
-
view
0 -
download
0
Transcript of Vanguard ETF Series Annual Report For the period ended 31 ...
Vanguard ETF Series
Annual ReportFor the period ended 31 December 2014
Vanguard Sub-Funds covered in this annualreport
Vanguard FTSE Asia ex Japan Index ETF SEHK Stock code: 2805Vanguard FTSE Developed Europe Index ETF SEHK Stock code: 3101Vanguard FTSE Japan Index ETF SEHK Stock code: 3126Vanguard FTSE Asia ex Japan High Dividend Yield Index ETF SEHK Stock code: 3085
Vanguard ETF SeriesFor the period ended 31 December 2014
ContentsPage
Report of the manager to the unitholders 1Report of the trustee to the unitholders 2Statement of responsibilities of the manager and the trustee 3Independent auditor’s report 4Statement of financial position 6Statement of comprehensive income 8Statement of changes in net assets attributable to unitholders 10Statement of cash flows 12Notes to the financial statements 14Vanguard FTSE Asia ex Japan Index ETFInvestment portfolio (Unaudited) 41Statement of movements in investment portfolio (Unaudited) 63Performance record (Unaudited) 84
Vanguard FTSE Developed Europe Index ETFInvestment portfolio (Unaudited) 85Statement of movements in investment portfolio (Unaudited) 102Performance record (Unaudited) 117
Vanguard FTSE Japan Index ETFInvestment portfolio (Unaudited) 118Statement of movements in investment portfolio (Unaudited) 132Performance record (Unaudited) 145
Vanguard FTSE Asia ex Japan High Dividend Yield Index ETFInvestment portfolio (Unaudited) 146Statement of movements in investment portfolio (Unaudited) 158Performance record (Unaudited) 168
Administration and management 169
Report of the manager to the unitholders
The Vanguard ETF Series (the “Trust”) is an umbrella unit trust authorised under the Securities and Futures Ordinance(Cap. 571) of Hong Kong. The Manager of the Trust is The Vanguard Group, Inc. (the “Manager”). The Trustee is StateStreet Trust (HK) Limited (the “Trustee”). The Trustee and the Manager may issue different sub-funds representing separateportfolios of assets. The assets of each sub-fund will be invested in accordance with the investment objective and policiesapplicable to the sub-fund.
Vanguard FTSE Asia ex Japan Index ETF
The Vanguard FTSE Asia ex Japan Index ETF (the “Sub-Fund”) was launched on 10 May 2013 and commenced trading inHKD under stock code 2805 on The Stock Exchange of Hong Kong Limited (the “SEHK”) on 15 May 2013. The Sub-Fundis benchmarked against the FTSE Asia Pacific ex Japan, Australia and New Zealand Index* and adopts a representativesampling strategy.
Vanguard FTSE Developed Europe Index ETF
The Vanguard FTSE Developed Europe Index ETF (the “Sub-Fund”) was launched on 10 June 2014 and commencedtrading in HKD under stock code 3101 on the SEHK on 13 June 2014. The Sub-Fund is benchmarked against the FTSEDeveloped Europe Index* and adopts a representative sampling strategy.
Vanguard FTSE Japan Index ETF
The Vanguard FTSE Japan Index ETF (the “Sub-Fund”) was launched on 10 June 2014 and commenced trading in HKDunder stock code 3126 on the SEHK on 13 June 2014. The Sub-Fund is benchmarked against the FTSE Japan Index* andadopts a representative sampling strategy.
Vanguard FTSE Asia ex Japan High Dividend Yield Index ETF
The Vanguard FTSE Asia ex Japan High Dividend Yield Index ETF (the “Sub-Fund”) was launched on 10 June 2014 andcommenced trading in HKD under stock code 3085 on the SEHK on 13 June 2014. The Sub-Fund is benchmarked againstthe FTSE Asia Pacific ex Japan, Australia and New Zealand High Dividend Yield Index* and adopts a representativesampling strategy.
*The above-mentioned indices are compiled and published by FTSE International Limited. Each index operates underclearly defined rules published by the index provider and is a tradable index.
For and on behalf ofThe Vanguard Group, Inc.as the Manager
25 March 2015
Vanguard ETF SeriesAnnual Report 2014
-1-
Report of the trustee to the unitholders
We hereby confirm that, in our opinion, the Manager of the Vanguard FTSE Asia ex Japan Index ETF, Vanguard FTSEDeveloped Europe Index ETF, Vanguard FTSE Japan Index ETF and Vanguard FTSE Asia ex Japan High Dividend YieldIndex ETF (the “Sub-Funds”) has, in all material respects, managed the Sub-Funds in accordance with the provisions of theTrust Deed dated 18 March 2013, as amended by the Supplemental Deed dated 25 April 2014 and the Supplemental DeedNo. 2 dated 23 June 2014 (collectively the “Trust Deed”), for the period ended 31 December 2014.
For and on behalf ofState Street Trust (HK) Limited,as the Trustee
25 March 2015
Vanguard ETF SeriesAnnual Report 2014
-2-
Statement of responsibilities of the manager and the trustee
MANAGER’S RESPONSIBILITIES
The Manager of the Sub-Funds is required by the Code on Unit Trusts and Mutual Funds established by the Securities &Futures Commission of Hong Kong and the Trust Deed dated 18 March 2013, as amended by the Supplemental Deeddated 25 April 2014 and the Supplemental Deed No. 2 dated 23 June 2014 (collectively the “Trust Deed”) to preparefinancial statements for each annual accounting period which give a true and fair view of the financial position of theSub-Funds at the end of that period and of the transactions for the period then ended. In preparing these financialstatements the Manager is required to:
• select suitable accounting policies and then apply them consistently;
• make judgements and estimates that are prudent and reasonable; and
• prepare the financial statements with the assistance of the Trustee on the basis that the Sub-Funds will continue inoperation unless it is inappropriate to presume this.
The Manager is also required to manage the Sub-Funds in accordance with the Trust Deed and take reasonable steps forthe prevention and detection of fraud and other irregularities.
The Trust is an umbrella unit trust governed by its Trust Deed. As at 31 December 2014, the Trust has established thefollowing Sub-Funds:
• Vanguard FTSE Asia ex Japan Index ETF
• Vanguard FTSE Developed Europe Index ETF
• Vanguard FTSE Japan Index ETF
• Vanguard FTSE Asia ex Japan High Dividend Yield Index ETF
TRUSTEE’S RESPONSIBILITIES
The Trustee of the Sub-Funds is required to:
• ensure that the Sub-Funds are managed by the Manager in accordance with the Trust Deed and that the investmentand borrowing powers are complied with;
• satisfy itself that sufficient accounting and other records have been maintained;
• safeguard the property of the Sub-Funds and rights attaching thereto; and
• report to the Unitholders for each annual accounting period on the conduct of the Manager in the management of theSub-Funds.
Vanguard ETF SeriesAnnual Report 2014
-3-
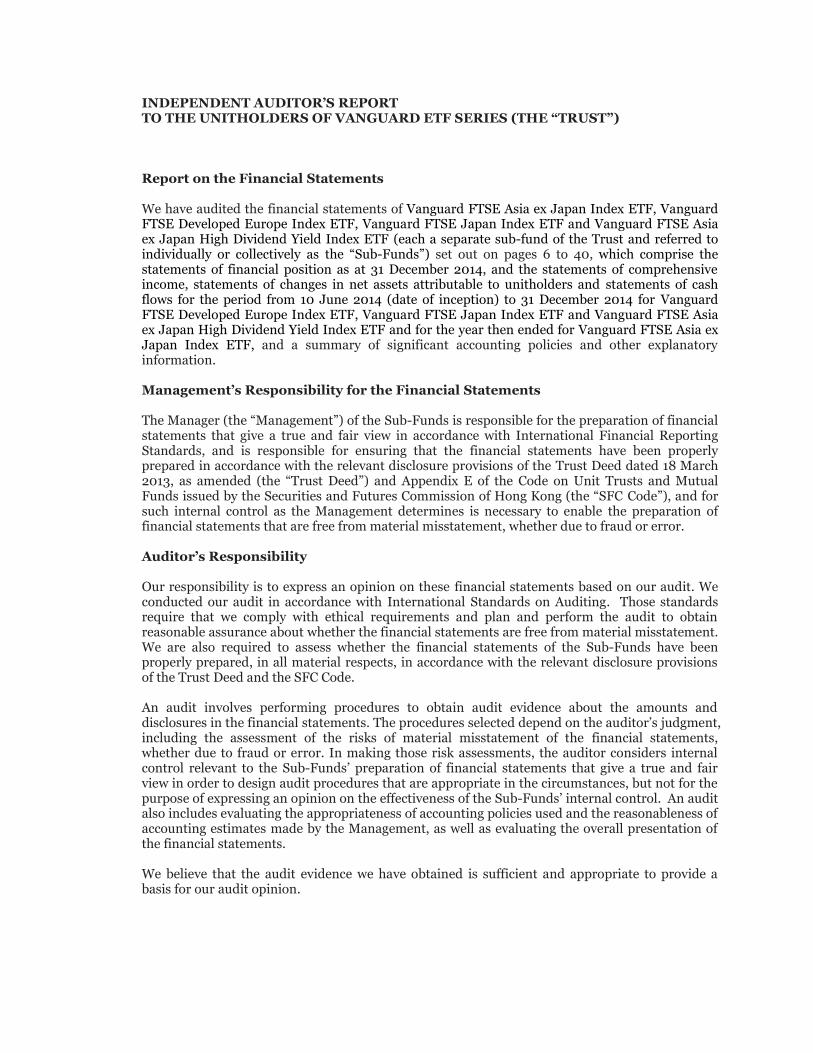
INDEPENDENT AUDITOR’S REPORT TO THE UNITHOLDERS OF VANGUARD ETF SERIES (THE “TRUST”) Report on the Financial Statements We have audited the financial statements of Vanguard FTSE Asia ex Japan Index ETF, Vanguard FTSE Developed Europe Index ETF, Vanguard FTSE Japan Index ETF and Vanguard FTSE Asia ex Japan High Dividend Yield Index ETF (each a separate sub-fund of the Trust and referred to individually or collectively as the “Sub-Funds”) set out on pages 6 to 40, which comprise the statements of financial position as at 31 December 2014, and the statements of comprehensive income, statements of changes in net assets attributable to unitholders and statements of cash flows for the period from 10 June 2014 (date of inception) to 31 December 2014 for Vanguard FTSE Developed Europe Index ETF, Vanguard FTSE Japan Index ETF and Vanguard FTSE Asia ex Japan High Dividend Yield Index ETF and for the year then ended for Vanguard FTSE Asia ex Japan Index ETF, and a summary of significant accounting policies and other explanatory information. Management’s Responsibility for the Financial Statements The Manager (the “Management”) of the Sub-Funds is responsible for the preparation of financial statements that give a true and fair view in accordance with International Financial Reporting Standards, and is responsible for ensuring that the financial statements have been properly prepared in accordance with the relevant disclosure provisions of the Trust Deed dated 18 March 2013, as amended (the “Trust Deed”) and Appendix E of the Code on Unit Trusts and Mutual Funds issued by the Securities and Futures Commission of Hong Kong (the “SFC Code”), and for such internal control as the Management determines is necessary to enable the preparation of financial statements that are free from material misstatement, whether due to fraud or error. Auditor’s Responsibility Our responsibility is to express an opinion on these financial statements based on our audit. We conducted our audit in accordance with International Standards on Auditing. Those standards require that we comply with ethical requirements and plan and perform the audit to obtain reasonable assurance about whether the financial statements are free from material misstatement. We are also required to assess whether the financial statements of the Sub-Funds have been properly prepared, in all material respects, in accordance with the relevant disclosure provisions of the Trust Deed and the SFC Code. An audit involves performing procedures to obtain audit evidence about the amounts and disclosures in the financial statements. The procedures selected depend on the auditor’s judgment, including the assessment of the risks of material misstatement of the financial statements, whether due to fraud or error. In making those risk assessments, the auditor considers internal control relevant to the Sub-Funds’ preparation of financial statements that give a true and fair view in order to design audit procedures that are appropriate in the circumstances, but not for the purpose of expressing an opinion on the effectiveness of the Sub-Funds’ internal control. An audit also includes evaluating the appropriateness of accounting policies used and the reasonableness of accounting estimates made by the Management, as well as evaluating the overall presentation of the financial statements. We believe that the audit evidence we have obtained is sufficient and appropriate to provide a basis for our audit opinion.
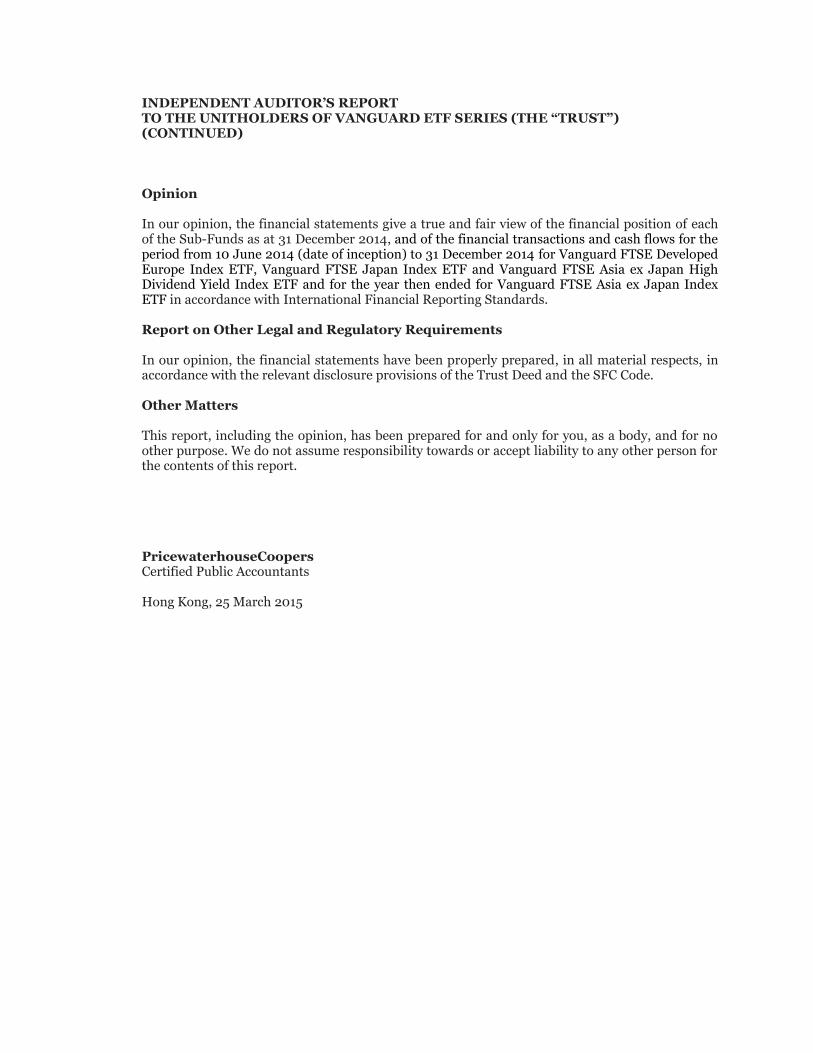
INDEPENDENT AUDITOR’S REPORT TO THE UNITHOLDERS OF VANGUARD ETF SERIES (THE “TRUST”) (CONTINUED) Opinion In our opinion, the financial statements give a true and fair view of the financial position of each of the Sub-Funds as at 31 December 2014, and of the financial transactions and cash flows for the period from 10 June 2014 (date of inception) to 31 December 2014 for Vanguard FTSE Developed Europe Index ETF, Vanguard FTSE Japan Index ETF and Vanguard FTSE Asia ex Japan High Dividend Yield Index ETF and for the year then ended for Vanguard FTSE Asia ex Japan Index ETF in accordance with International Financial Reporting Standards. Report on Other Legal and Regulatory Requirements In our opinion, the financial statements have been properly prepared, in all material respects, in accordance with the relevant disclosure provisions of the Trust Deed and the SFC Code. Other Matters This report, including the opinion, has been prepared for and only for you, as a body, and for no other purpose. We do not assume responsibility towards or accept liability to any other person for the contents of this report. PricewaterhouseCoopers Certified Public Accountants Hong Kong, 25 March 2015

Statement of financial positionAs at 31 December 2014
Vanguard FTSE Asia ex Japan Index ETF
Notes 31 December 2014HK$
31 December 2013HK$
Current Assets
Cash and cash equivalents 404,904 550,831Margin deposits - 11,170Amounts due from brokers - 797,055Dividends receivable 254,763 42,234Financial assets at fair value throughprofit or loss 9(b) 149,982,813 145,147,702
Total Assets 150,642,480 146,548,992
Current Liabilities
Amounts due to brokers 147,203 251,823Management fee payable 6(a) 48,267 46,976Financial liabilities at fair valuethrough profit or loss 9(b), 10 142 43
Total Liabilities 195,612 298,842
Equity
Net assets attributable to unitholders 4 150,446,868 146,250,150
The financial statements on pages 6 to 40 were approved by the Trustee and the Manager on 25 March 2015 and weresigned on their behalf.
For and on behalf ofThe Vanguard Group, Inc.as the Manager
For and on behalf ofState Street Trust (HK) Limited,as the Trustee
The notes on pages 14 to 40 form part of these financial statements.
Vanguard ETF SeriesAnnual Report 2014
-6-
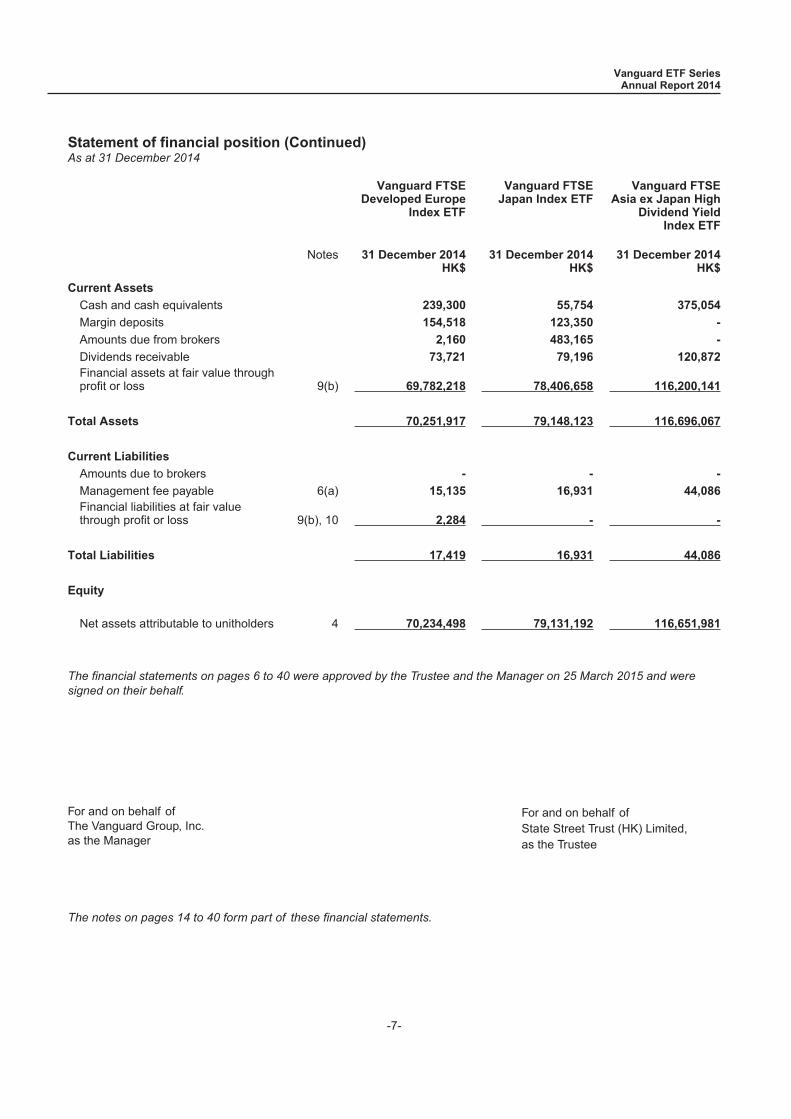
Statement of financial position (Continued)As at 31 December 2014
Vanguard FTSEDeveloped Europe
Index ETF
Vanguard FTSEJapan Index ETF
Vanguard FTSEAsia ex Japan High
Dividend YieldIndex ETF
Notes 31 December 2014HK$
31 December 2014HK$
31 December 2014HK$
Current Assets
Cash and cash equivalents 239,300 55,754 375,054
Margin deposits 154,518 123,350 -
Amounts due from brokers 2,160 483,165 -
Dividends receivable 73,721 79,196 120,872Financial assets at fair value throughprofit or loss 9(b) 69,782,218 78,406,658 116,200,141
Total Assets 70,251,917 79,148,123 116,696,067
Current Liabilities
Amounts due to brokers - - -
Management fee payable 6(a) 15,135 16,931 44,086Financial liabilities at fair valuethrough profit or loss 9(b), 10 2,284 - -
Total Liabilities 17,419 16,931 44,086
Equity
Net assets attributable to unitholders 4 70,234,498 79,131,192 116,651,981
The financial statements on pages 6 to 40 were approved by the Trustee and the Manager on 25 March 2015 and weresigned on their behalf.
For and on behalf ofThe Vanguard Group, Inc.as the Manager
For and on behalf ofState Street Trust (HK) Limited,as the Trustee
The notes on pages 14 to 40 form part of these financial statements.
Vanguard ETF SeriesAnnual Report 2014
-7-
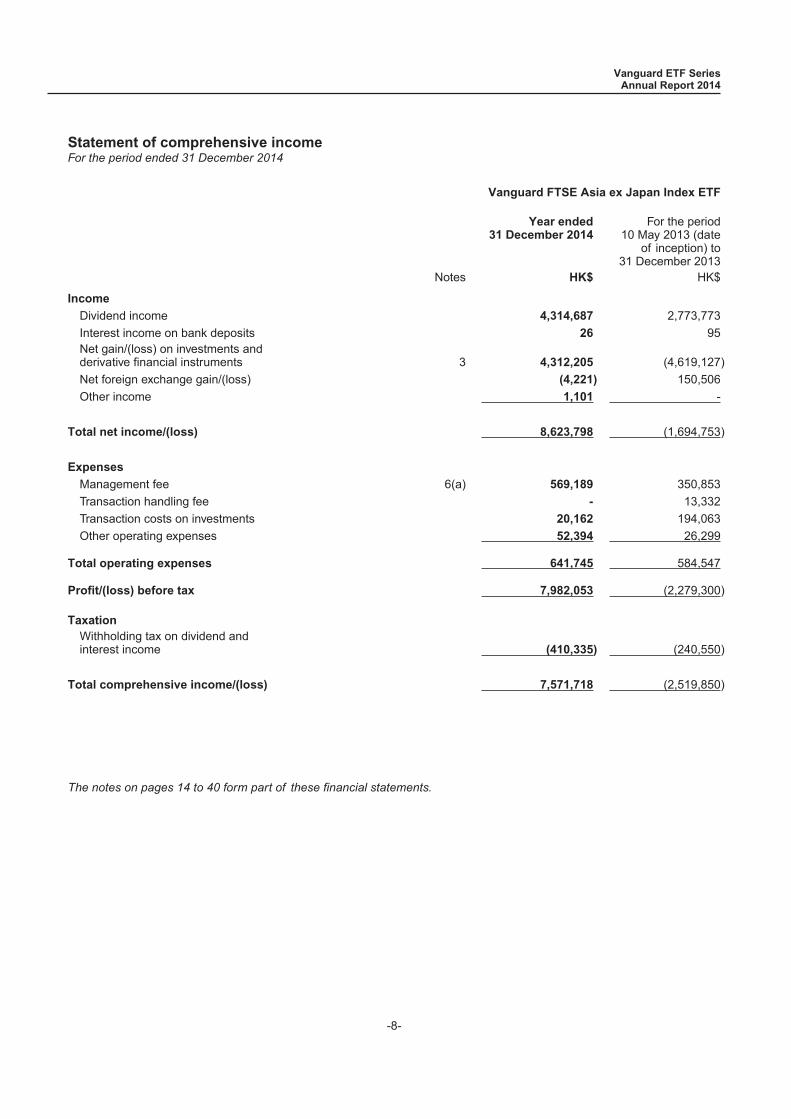
Statement of comprehensive incomeFor the period ended 31 December 2014
Vanguard FTSE Asia ex Japan Index ETF
Year ended31 December 2014
For the period10 May 2013 (date
of inception) to31 December 2013
Notes HK$ HK$
Income
Dividend income 4,314,687 2,773,773Interest income on bank deposits 26 95Net gain/(loss) on investments andderivative financial instruments 3 4,312,205 (4,619,127)Net foreign exchange gain/(loss) (4,221) 150,506Other income 1,101 -
Total net income/(loss) 8,623,798 (1,694,753)
Expenses
Management fee 6(a) 569,189 350,853Transaction handling fee - 13,332Transaction costs on investments 20,162 194,063Other operating expenses 52,394 26,299
Total operating expenses 641,745 584,547
Profit/(loss) before tax 7,982,053 (2,279,300)
TaxationWithholding tax on dividend andinterest income (410,335) (240,550)
Total comprehensive income/(loss) 7,571,718 (2,519,850)
The notes on pages 14 to 40 form part of these financial statements.
Vanguard ETF SeriesAnnual Report 2014
-8-
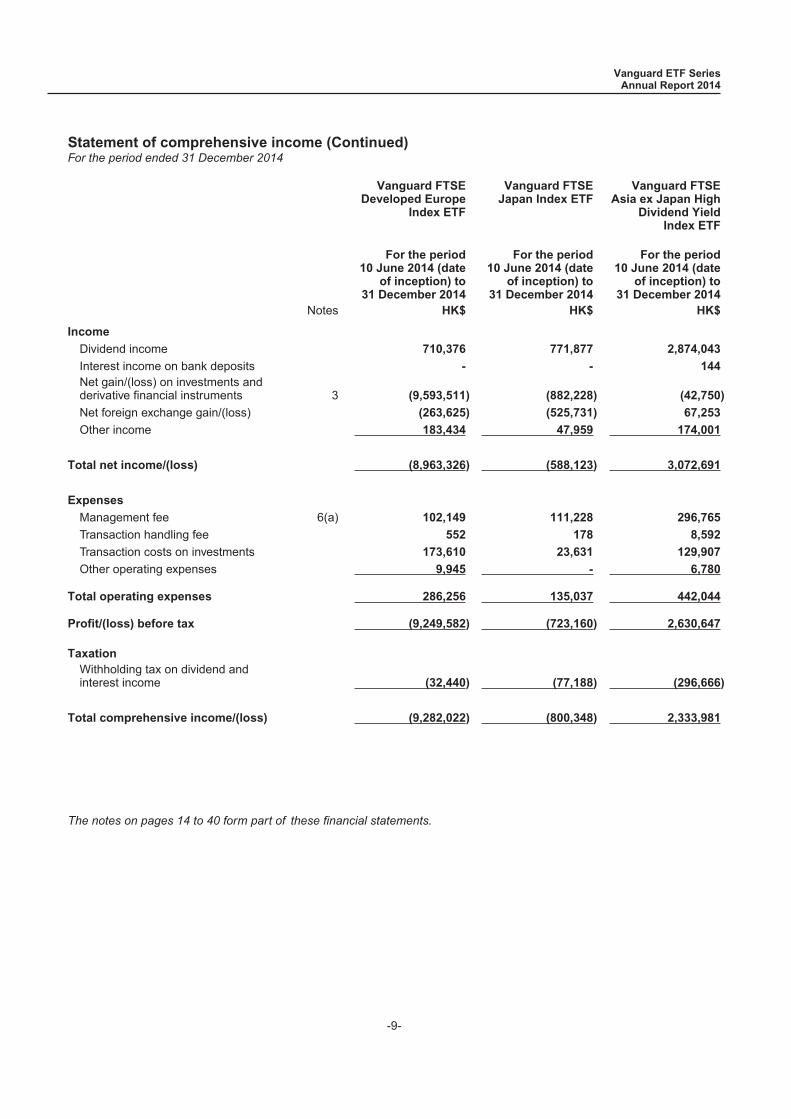
Statement of comprehensive income (Continued)For the period ended 31 December 2014
Vanguard FTSEDeveloped Europe
Index ETF
Vanguard FTSEJapan Index ETF
Vanguard FTSEAsia ex Japan High
Dividend YieldIndex ETF
For the period10 June 2014 (date
of inception) to31 December 2014
For the period10 June 2014 (date
of inception) to31 December 2014
For the period10 June 2014 (date
of inception) to31 December 2014
Notes HK$ HK$ HK$
Income
Dividend income 710,376 771,877 2,874,043
Interest income on bank deposits - - 144Net gain/(loss) on investments andderivative financial instruments 3 (9,593,511) (882,228) (42,750)
Net foreign exchange gain/(loss) (263,625) (525,731) 67,253Other income 183,434 47,959 174,001
Total net income/(loss) (8,963,326) (588,123) 3,072,691
Expenses
Management fee 6(a) 102,149 111,228 296,765
Transaction handling fee 552 178 8,592
Transaction costs on investments 173,610 23,631 129,907
Other operating expenses 9,945 - 6,780
Total operating expenses 286,256 135,037 442,044
Profit/(loss) before tax (9,249,582) (723,160) 2,630,647
TaxationWithholding tax on dividend andinterest income (32,440) (77,188) (296,666)
Total comprehensive income/(loss) (9,282,022) (800,348) 2,333,981
The notes on pages 14 to 40 form part of these financial statements.
Vanguard ETF SeriesAnnual Report 2014
-9-
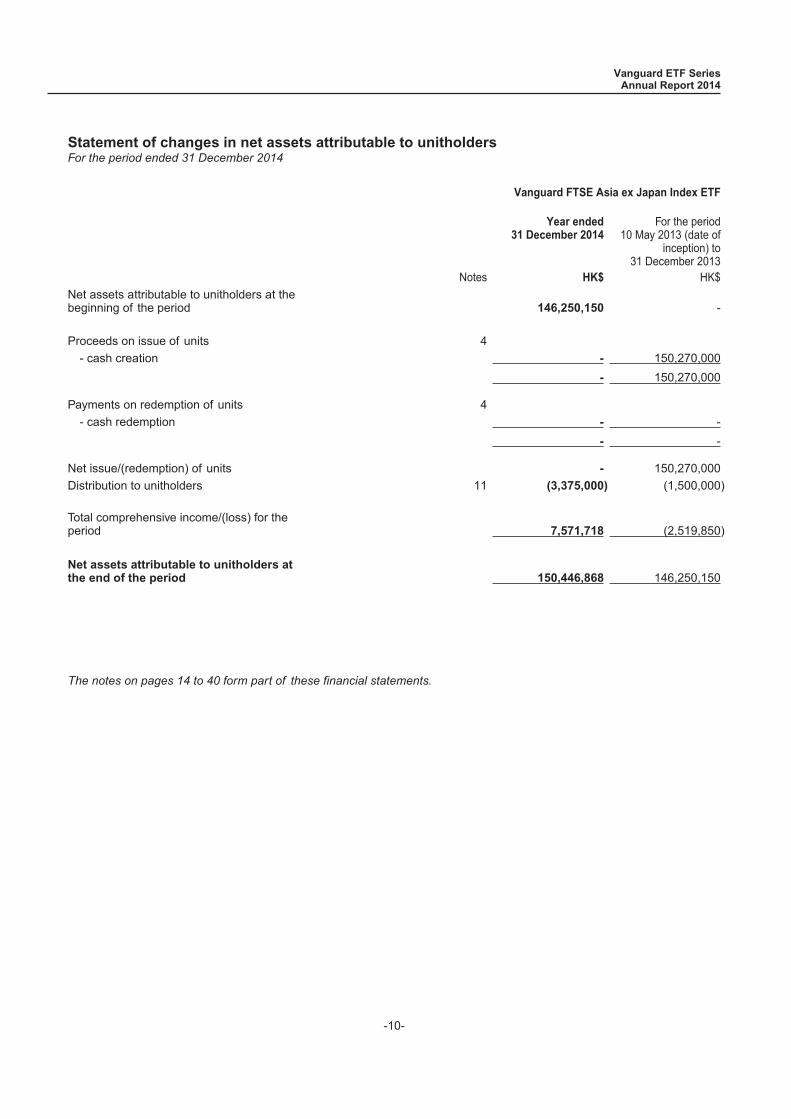
Statement of changes in net assets attributable to unitholdersFor the period ended 31 December 2014
Vanguard FTSE Asia ex Japan Index ETF
Year ended31 December 2014
For the period10 May 2013 (date of
inception) to31 December 2013
Notes HK$ HK$Net assets attributable to unitholders at thebeginning of the period 146,250,150 -
Proceeds on issue of units 4- cash creation - 150,270,000
- 150,270,000
Payments on redemption of units 4- cash redemption - -
- -
Net issue/(redemption) of units - 150,270,000Distribution to unitholders 11 (3,375,000) (1,500,000)
Total comprehensive income/(loss) for theperiod 7,571,718 (2,519,850)
Net assets attributable to unitholders atthe end of the period 150,446,868 146,250,150
The notes on pages 14 to 40 form part of these financial statements.
Vanguard ETF SeriesAnnual Report 2014
-10-
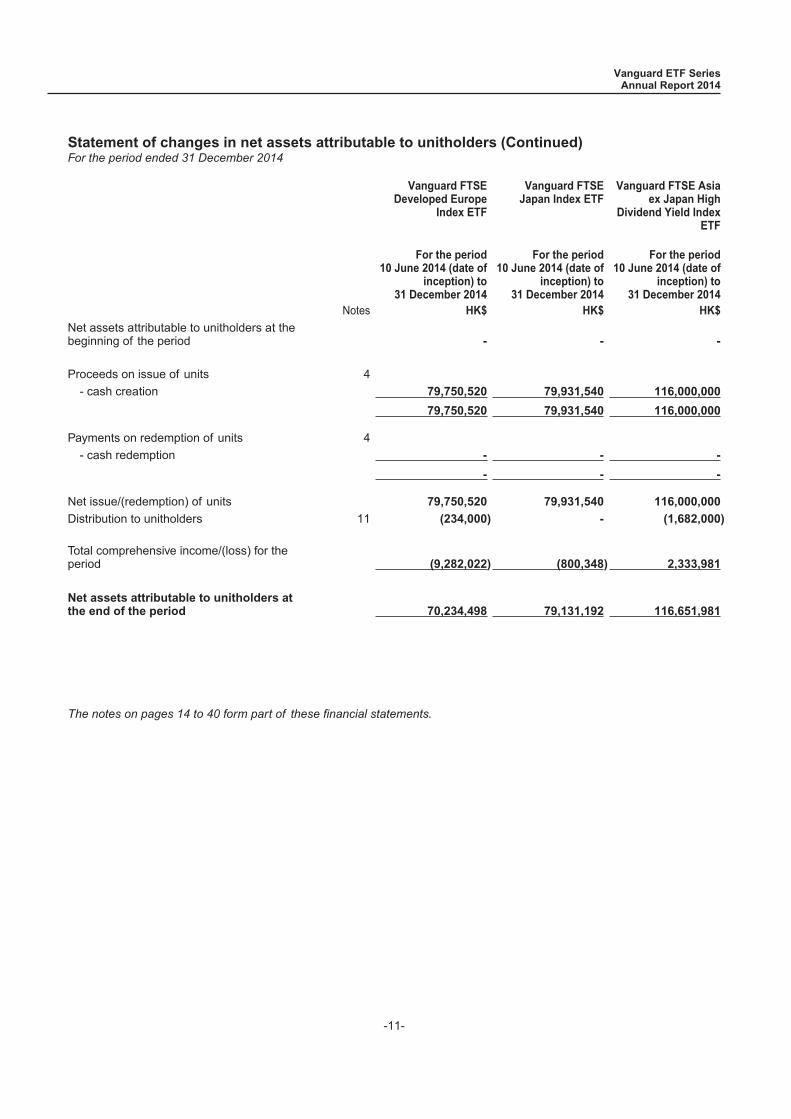
Statement of changes in net assets attributable to unitholders (Continued)For the period ended 31 December 2014
Vanguard FTSEDeveloped Europe
Index ETF
Vanguard FTSEJapan Index ETF
Vanguard FTSE Asiaex Japan High
Dividend Yield IndexETF
For the period10 June 2014 (date of
inception) to31 December 2014
For the period10 June 2014 (date of
inception) to31 December 2014
For the period10 June 2014 (date of
inception) to31 December 2014
Notes HK$ HK$ HK$
Net assets attributable to unitholders at thebeginning of the period - - -
Proceeds on issue of units 4- cash creation 79,750,520 79,931,540 116,000,000
79,750,520 79,931,540 116,000,000
Payments on redemption of units 4- cash redemption - - -
- - -
Net issue/(redemption) of units 79,750,520 79,931,540 116,000,000
Distribution to unitholders 11 (234,000) - (1,682,000)
Total comprehensive income/(loss) for theperiod (9,282,022) (800,348) 2,333,981
Net assets attributable to unitholders atthe end of the period 70,234,498 79,131,192 116,651,981
The notes on pages 14 to 40 form part of these financial statements.
Vanguard ETF SeriesAnnual Report 2014
-11-
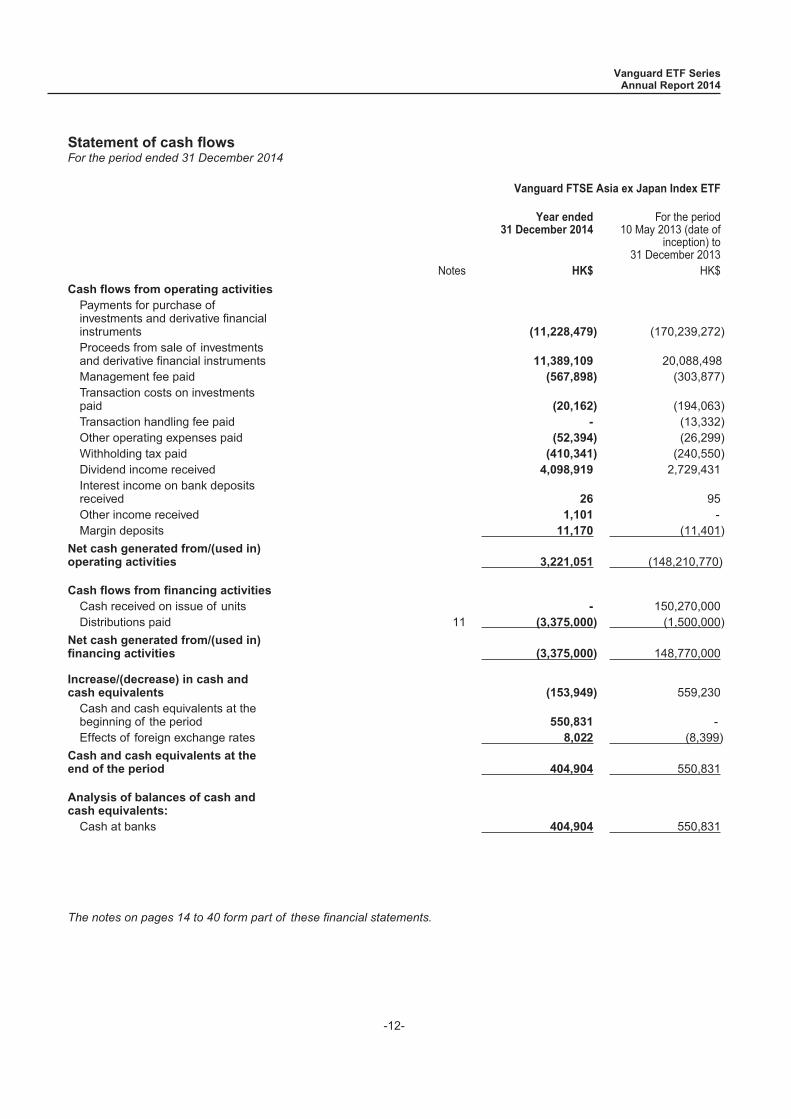
Statement of cash flowsFor the period ended 31 December 2014
Vanguard FTSE Asia ex Japan Index ETF
Year ended31 December 2014
For the period10 May 2013 (date of
inception) to31 December 2013
Notes HK$ HK$Cash flows from operating activitiesPayments for purchase ofinvestments and derivative financialinstruments (11,228,479) (170,239,272)Proceeds from sale of investmentsand derivative financial instruments 11,389,109 20,088,498Management fee paid (567,898) (303,877)Transaction costs on investmentspaid (20,162) (194,063)Transaction handling fee paid - (13,332)Other operating expenses paid (52,394) (26,299)Withholding tax paid (410,341) (240,550)Dividend income received 4,098,919 2,729,431Interest income on bank depositsreceived 26 95Other income received 1,101 -Margin deposits 11,170 (11,401)
Net cash generated from/(used in)operating activities 3,221,051 (148,210,770)
Cash flows from financing activitiesCash received on issue of units - 150,270,000Distributions paid 11 (3,375,000) (1,500,000)
Net cash generated from/(used in)financing activities (3,375,000) 148,770,000
Increase/(decrease) in cash andcash equivalents (153,949) 559,230Cash and cash equivalents at thebeginning of the period 550,831 -Effects of foreign exchange rates 8,022 (8,399)
Cash and cash equivalents at theend of the period 404,904 550,831
Analysis of balances of cash andcash equivalents:Cash at banks 404,904 550,831
The notes on pages 14 to 40 form part of these financial statements.
Vanguard ETF SeriesAnnual Report 2014
-12-
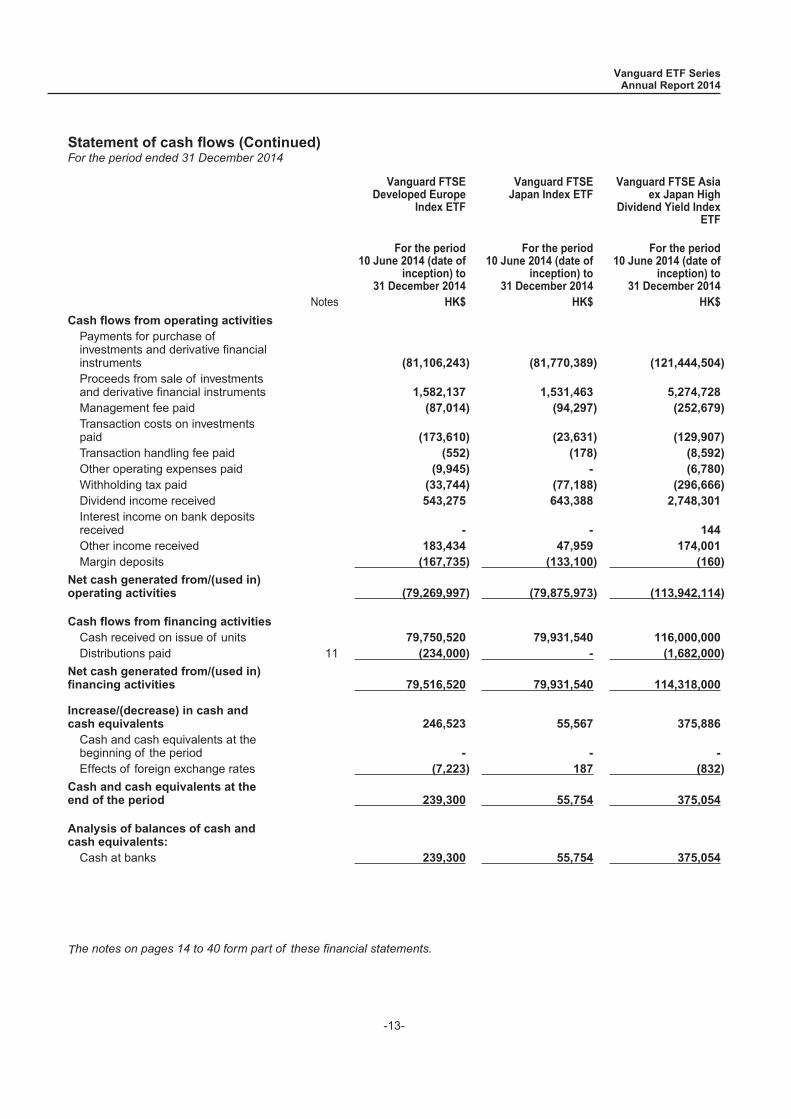
Statement of cash flows (Continued)For the period ended 31 December 2014
Vanguard FTSEDeveloped Europe
Index ETF
Vanguard FTSEJapan Index ETF
Vanguard FTSE Asiaex Japan High
Dividend Yield IndexETF
For the period10 June 2014 (date of
inception) to31 December 2014
For the period10 June 2014 (date of
inception) to31 December 2014
For the period10 June 2014 (date of
inception) to31 December 2014
Notes HK$ HK$ HK$
Cash flows from operating activitiesPayments for purchase ofinvestments and derivative financialinstruments (81,106,243) (81,770,389) (121,444,504)Proceeds from sale of investmentsand derivative financial instruments 1,582,137 1,531,463 5,274,728Management fee paid (87,014) (94,297) (252,679)Transaction costs on investmentspaid (173,610) (23,631) (129,907)Transaction handling fee paid (552) (178) (8,592)Other operating expenses paid (9,945) - (6,780)Withholding tax paid (33,744) (77,188) (296,666)Dividend income received 543,275 643,388 2,748,301Interest income on bank depositsreceived - - 144Other income received 183,434 47,959 174,001Margin deposits (167,735) (133,100) (160)
Net cash generated from/(used in)operating activities (79,269,997) (79,875,973) (113,942,114)
Cash flows from financing activitiesCash received on issue of units 79,750,520 79,931,540 116,000,000Distributions paid 11 (234,000) - (1,682,000)
Net cash generated from/(used in)financing activities 79,516,520 79,931,540 114,318,000
Increase/(decrease) in cash andcash equivalents 246,523 55,567 375,886Cash and cash equivalents at thebeginning of the period - - -Effects of foreign exchange rates (7,223) 187 (832)
Cash and cash equivalents at theend of the period 239,300 55,754 375,054
Analysis of balances of cash andcash equivalents:Cash at banks 239,300 55,754 375,054
The notes on pages 14 to 40 form part of these financial statements.
Vanguard ETF SeriesAnnual Report 2014
-13-
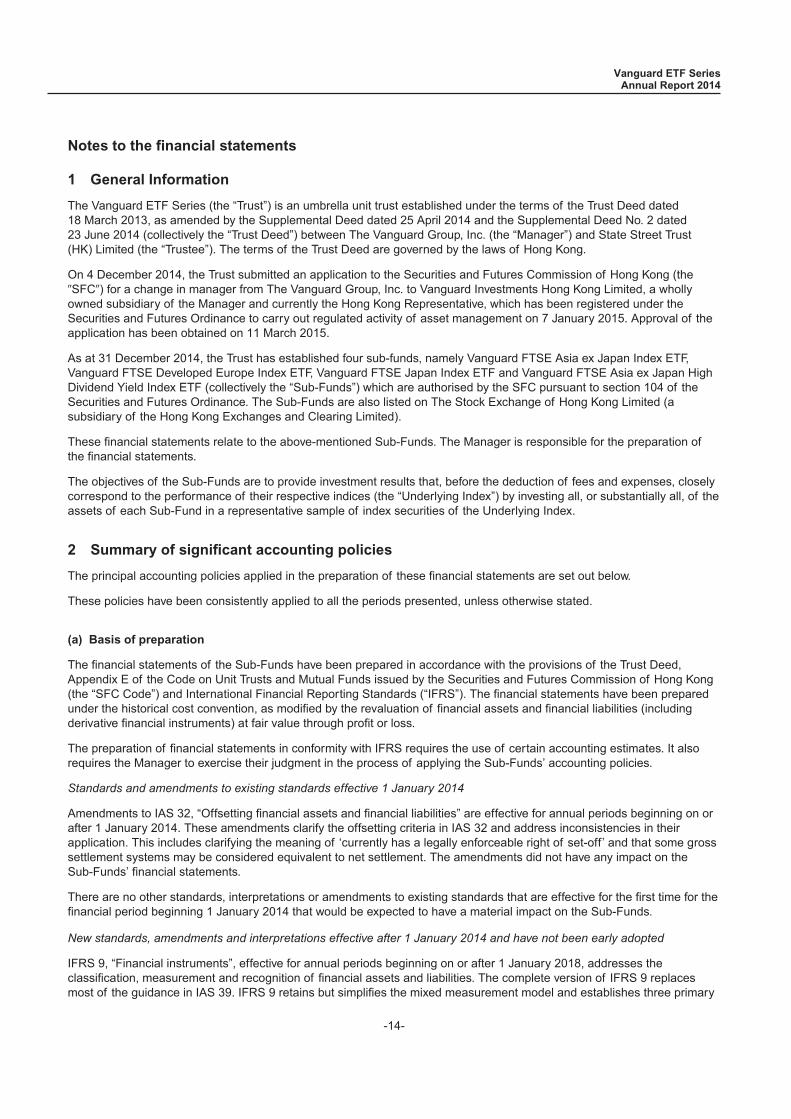
1 General Information
The Vanguard ETF Series (the “Trust”) is an umbrella unit trust established under the terms of the Trust Deed dated18 March 2013, as amended by the Supplemental Deed dated 25 April 2014 and the Supplemental Deed No. 2 dated23 June 2014 (collectively the “Trust Deed”) between The Vanguard Group, Inc. (the “Manager”) and State Street Trust(HK) Limited (the “Trustee”). The terms of the Trust Deed are governed by the laws of Hong Kong.
On 4 December 2014, the Trust submitted an application to the Securities and Futures Commission of Hong Kong (the�SFC�) for a change in manager from The Vanguard Group, Inc. to Vanguard Investments Hong Kong Limited, a whollyowned subsidiary of the Manager and currently the Hong Kong Representative, which has been registered under theSecurities and Futures Ordinance to carry out regulated activity of asset management on 7 January 2015. Approval of theapplication has been obtained on 11 March 2015.
As at 31 December 2014, the Trust has established four sub-funds, namely Vanguard FTSE Asia ex Japan Index ETF,Vanguard FTSE Developed Europe Index ETF, Vanguard FTSE Japan Index ETF and Vanguard FTSE Asia ex Japan HighDividend Yield Index ETF (collectively the “Sub-Funds”) which are authorised by the SFC pursuant to section 104 of theSecurities and Futures Ordinance. The Sub-Funds are also listed on The Stock Exchange of Hong Kong Limited (asubsidiary of the Hong Kong Exchanges and Clearing Limited).
These financial statements relate to the above-mentioned Sub-Funds. The Manager is responsible for the preparation ofthe financial statements.
The objectives of the Sub-Funds are to provide investment results that, before the deduction of fees and expenses, closelycorrespond to the performance of their respective indices (the “Underlying Index”) by investing all, or substantially all, of theassets of each Sub-Fund in a representative sample of index securities of the Underlying Index.
2 Summary of significant accounting policies
The principal accounting policies applied in the preparation of these financial statements are set out below.
These policies have been consistently applied to all the periods presented, unless otherwise stated.
(a) Basis of preparation
The financial statements of the Sub-Funds have been prepared in accordance with the provisions of the Trust Deed,Appendix E of the Code on Unit Trusts and Mutual Funds issued by the Securities and Futures Commission of Hong Kong(the “SFC Code”) and International Financial Reporting Standards (“IFRS”). The financial statements have been preparedunder the historical cost convention, as modified by the revaluation of financial assets and financial liabilities (includingderivative financial instruments) at fair value through profit or loss.
The preparation of financial statements in conformity with IFRS requires the use of certain accounting estimates. It alsorequires the Manager to exercise their judgment in the process of applying the Sub-Funds’ accounting policies.
Standards and amendments to existing standards effective 1 January 2014
Amendments to IAS 32, “Offsetting financial assets and financial liabilities” are effective for annual periods beginning on orafter 1 January 2014. These amendments clarify the offsetting criteria in IAS 32 and address inconsistencies in theirapplication. This includes clarifying the meaning of ‘currently has a legally enforceable right of set-off’ and that some grosssettlement systems may be considered equivalent to net settlement. The amendments did not have any impact on theSub-Funds’ financial statements.
There are no other standards, interpretations or amendments to existing standards that are effective for the first time for thefinancial period beginning 1 January 2014 that would be expected to have a material impact on the Sub-Funds.
New standards, amendments and interpretations effective after 1 January 2014 and have not been early adopted
IFRS 9, “Financial instruments”, effective for annual periods beginning on or after 1 January 2018, addresses theclassification, measurement and recognition of financial assets and liabilities. The complete version of IFRS 9 replacesmost of the guidance in IAS 39. IFRS 9 retains but simplifies the mixed measurement model and establishes three primary
Vanguard ETF SeriesAnnual Report 2014
Notes to the financial statements
-14-
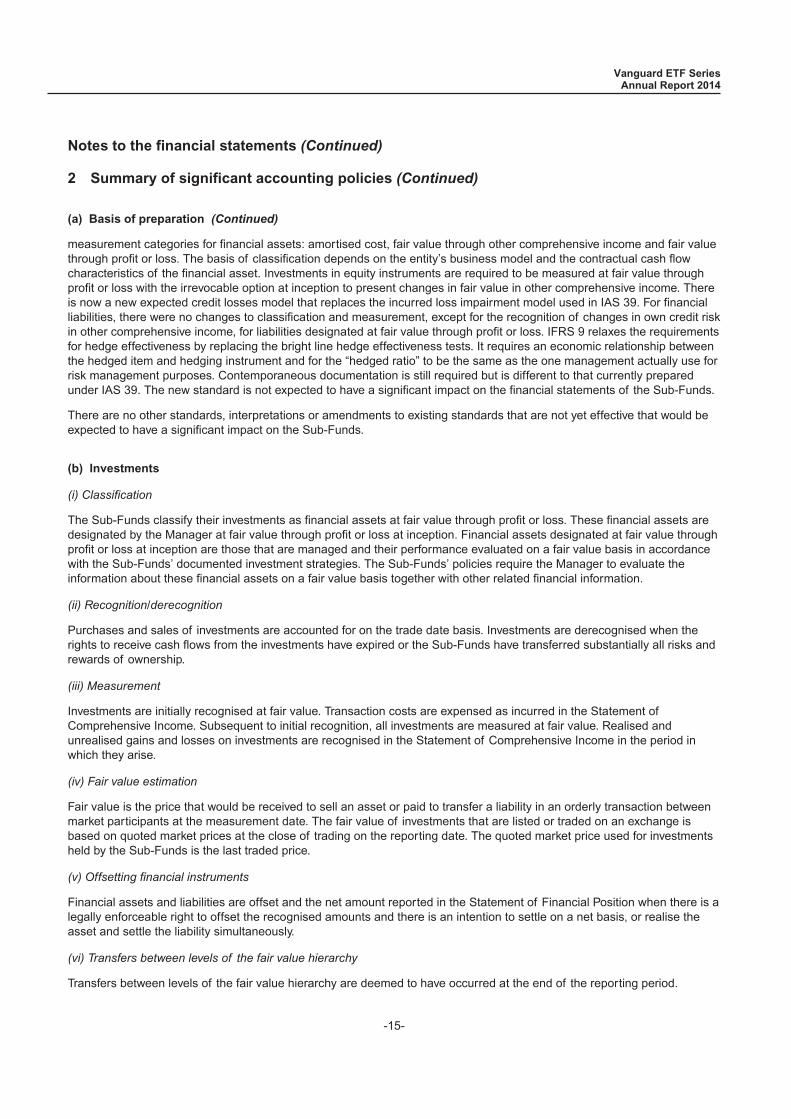
2 Summary of significant accounting policies (Continued)
(a) Basis of preparation (Continued)
measurement categories for financial assets: amortised cost, fair value through other comprehensive income and fair valuethrough profit or loss. The basis of classification depends on the entity’s business model and the contractual cash flowcharacteristics of the financial asset. Investments in equity instruments are required to be measured at fair value throughprofit or loss with the irrevocable option at inception to present changes in fair value in other comprehensive income. Thereis now a new expected credit losses model that replaces the incurred loss impairment model used in IAS 39. For financialliabilities, there were no changes to classification and measurement, except for the recognition of changes in own credit riskin other comprehensive income, for liabilities designated at fair value through profit or loss. IFRS 9 relaxes the requirementsfor hedge effectiveness by replacing the bright line hedge effectiveness tests. It requires an economic relationship betweenthe hedged item and hedging instrument and for the “hedged ratio” to be the same as the one management actually use forrisk management purposes. Contemporaneous documentation is still required but is different to that currently preparedunder IAS 39. The new standard is not expected to have a significant impact on the financial statements of the Sub-Funds.
There are no other standards, interpretations or amendments to existing standards that are not yet effective that would beexpected to have a significant impact on the Sub-Funds.
(b) Investments
(i) Classification
The Sub-Funds classify their investments as financial assets at fair value through profit or loss. These financial assets aredesignated by the Manager at fair value through profit or loss at inception. Financial assets designated at fair value throughprofit or loss at inception are those that are managed and their performance evaluated on a fair value basis in accordancewith the Sub-Funds’ documented investment strategies. The Sub-Funds’ policies require the Manager to evaluate theinformation about these financial assets on a fair value basis together with other related financial information.
(ii) Recognition/derecognition
Purchases and sales of investments are accounted for on the trade date basis. Investments are derecognised when therights to receive cash flows from the investments have expired or the Sub-Funds have transferred substantially all risks andrewards of ownership.
(iii) Measurement
Investments are initially recognised at fair value. Transaction costs are expensed as incurred in the Statement ofComprehensive Income. Subsequent to initial recognition, all investments are measured at fair value. Realised andunrealised gains and losses on investments are recognised in the Statement of Comprehensive Income in the period inwhich they arise.
(iv) Fair value estimation
Fair value is the price that would be received to sell an asset or paid to transfer a liability in an orderly transaction betweenmarket participants at the measurement date. The fair value of investments that are listed or traded on an exchange isbased on quoted market prices at the close of trading on the reporting date. The quoted market price used for investmentsheld by the Sub-Funds is the last traded price.
(v) Offsetting financial instruments
Financial assets and liabilities are offset and the net amount reported in the Statement of Financial Position when there is alegally enforceable right to offset the recognised amounts and there is an intention to settle on a net basis, or realise theasset and settle the liability simultaneously.
(vi) Transfers between levels of the fair value hierarchy
Transfers between levels of the fair value hierarchy are deemed to have occurred at the end of the reporting period.
Vanguard ETF SeriesAnnual Report 2014
Notes to the financial statements (Continued)
-15-

2 Summary of significant accounting policies (Continued)
(c) Derivative financial instruments
Derivative financial instruments are recognised at fair value on the date on which a derivative contract is entered into andare subsequently re-measured at their fair values. Fair values are obtained from quoted market prices in active markets,including recent market transactions, and valuation techniques, including discounted cash flow models and option pricingmodels, as appropriate. All derivative financial instruments are carried as assets when fair value is positive and as liabilitieswhen fair value is negative.
The best evidence of the fair value of derivative financial instrument at initial recognition is the transaction price (i.e. the fairvalue of the consideration given or received). Subsequent changes in the fair value of any derivative financial instrumentare recognised immediately in the Statement of Comprehensive Income.
(d) Income
Interest income is recognised on a time-proportionate basis using the effective interest method.
Dividend income on equity securities is recorded on the ex-dividend date with the corresponding foreign withholding taxesrecorded as an expense. Dividend income on equity securities where no ex-dividend date is quoted is accounted for whenthe Sub-Funds’ right to receive payment is established. Other income is accounted for on an accrual basis.
(e) Expenses
Expenses are accounted for on an accrual basis.
(f) Cash component
Cash issue component represents the amount being equal to the difference between the issue price on the relevanttransaction date and the value of the securities exchanged in kind for those units.
Cash redemption component represents the amount being equal to the difference between the redemption value on therelevant transaction date on which such units are redeemed and the value of securities transferred in kind to the redeemingunitholder in respect of such units.
(g) Cash and cash equivalents
Cash and cash equivalents include cash in hand, deposits held at call with banks and other short-term highly liquidinvestments with original maturities of three months or less.
(h) Translation of foreign currencies
Functional and presentation currency
Items included in the financial statements are measured using the currency of the primary economic environment in whichthe Sub-Funds operate (the “functional currency”). The performance of each Sub-Fund is measured and reported to theunitholders in Hong Kong dollars. The Manager considers the Hong Kong dollar as the currency that most faithfullyrepresents the economic effects of the underlying transactions, events and conditions. The financial statements arepresented in Hong Kong dollars, which is each Sub-Fund’s functional and presentation currency.
Transactions and balances
Foreign currency transactions are translated into the functional currency using the exchange rates prevailing at the dates ofthe transactions. Foreign currency assets and liabilities are translated into the functional currency using the exchange rateprevailing at the period end date.
Vanguard ETF SeriesAnnual Report 2014
Notes to the financial statements (Continued)
-16-
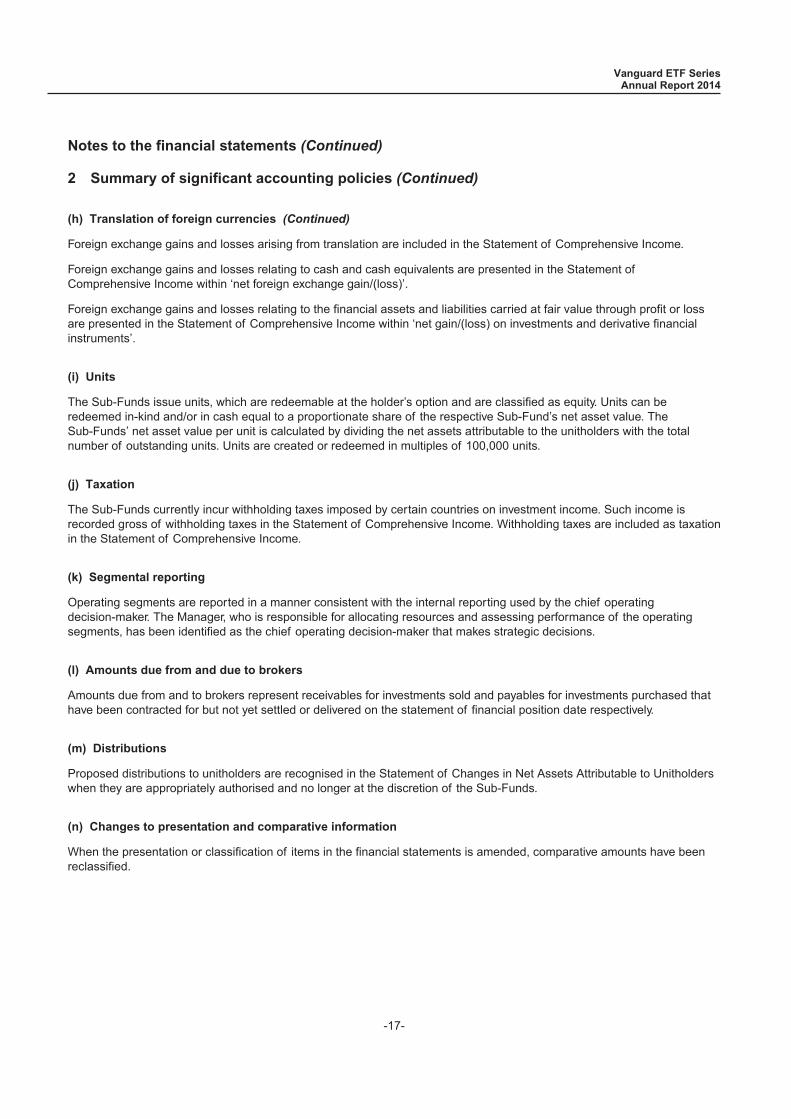
2 Summary of significant accounting policies (Continued)
(h) Translation of foreign currencies (Continued)
Foreign exchange gains and losses arising from translation are included in the Statement of Comprehensive Income.
Foreign exchange gains and losses relating to cash and cash equivalents are presented in the Statement ofComprehensive Income within ‘net foreign exchange gain/(loss)’.
Foreign exchange gains and losses relating to the financial assets and liabilities carried at fair value through profit or lossare presented in the Statement of Comprehensive Income within ‘net gain/(loss) on investments and derivative financialinstruments’.
(i) Units
The Sub-Funds issue units, which are redeemable at the holder’s option and are classified as equity. Units can beredeemed in-kind and/or in cash equal to a proportionate share of the respective Sub-Fund’s net asset value. TheSub-Funds’ net asset value per unit is calculated by dividing the net assets attributable to the unitholders with the totalnumber of outstanding units. Units are created or redeemed in multiples of 100,000 units.
(j) Taxation
The Sub-Funds currently incur withholding taxes imposed by certain countries on investment income. Such income isrecorded gross of withholding taxes in the Statement of Comprehensive Income. Withholding taxes are included as taxationin the Statement of Comprehensive Income.
(k) Segmental reporting
Operating segments are reported in a manner consistent with the internal reporting used by the chief operatingdecision-maker. The Manager, who is responsible for allocating resources and assessing performance of the operatingsegments, has been identified as the chief operating decision-maker that makes strategic decisions.
(l) Amounts due from and due to brokers
Amounts due from and to brokers represent receivables for investments sold and payables for investments purchased thathave been contracted for but not yet settled or delivered on the statement of financial position date respectively.
(m) Distributions
Proposed distributions to unitholders are recognised in the Statement of Changes in Net Assets Attributable to Unitholderswhen they are appropriately authorised and no longer at the discretion of the Sub-Funds.
(n) Changes to presentation and comparative information
When the presentation or classification of items in the financial statements is amended, comparative amounts have beenreclassified.
Vanguard ETF SeriesAnnual Report 2014
Notes to the financial statements (Continued)
-17-
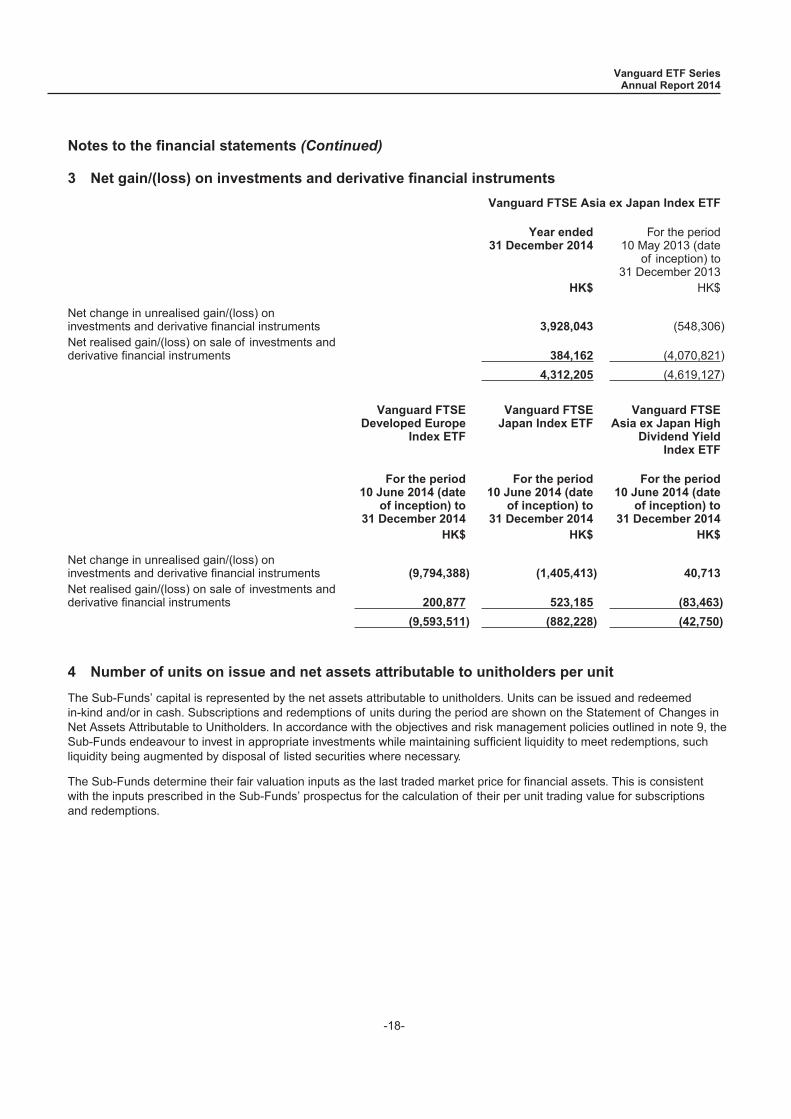
3 Net gain/(loss) on investments and derivative financial instruments
Vanguard FTSE Asia ex Japan Index ETF
Year ended31 December 2014
For the period10 May 2013 (date
of inception) to31 December 2013
HK$ HK$
Net change in unrealised gain/(loss) oninvestments and derivative financial instruments 3,928,043 (548,306)Net realised gain/(loss) on sale of investments andderivative financial instruments 384,162 (4,070,821)
4,312,205 (4,619,127)
Vanguard FTSEDeveloped Europe
Index ETF
Vanguard FTSEJapan Index ETF
Vanguard FTSEAsia ex Japan High
Dividend YieldIndex ETF
For the period10 June 2014 (date
of inception) to31 December 2014
For the period10 June 2014 (date
of inception) to31 December 2014
For the period10 June 2014 (date
of inception) to31 December 2014
HK$ HK$ HK$
Net change in unrealised gain/(loss) oninvestments and derivative financial instruments (9,794,388) (1,405,413) 40,713Net realised gain/(loss) on sale of investments andderivative financial instruments 200,877 523,185 (83,463)
(9,593,511) (882,228) (42,750)
4 Number of units on issue and net assets attributable to unitholders per unit
The Sub-Funds’ capital is represented by the net assets attributable to unitholders. Units can be issued and redeemedin-kind and/or in cash. Subscriptions and redemptions of units during the period are shown on the Statement of Changes inNet Assets Attributable to Unitholders. In accordance with the objectives and risk management policies outlined in note 9, theSub-Funds endeavour to invest in appropriate investments while maintaining sufficient liquidity to meet redemptions, suchliquidity being augmented by disposal of listed securities where necessary.
The Sub-Funds determine their fair valuation inputs as the last traded market price for financial assets. This is consistentwith the inputs prescribed in the Sub-Funds’ prospectus for the calculation of their per unit trading value for subscriptionsand redemptions.
Vanguard ETF SeriesAnnual Report 2014
Notes to the financial statements (Continued)
-18-

4 Number of units on issue and net assets attributable to unitholders per unit (Continued)
Vanguard FTSE Asia ex Japan Index ETF
Year ended31 December 2014
For the period10 May 2013 (date
of inception) to31 December 2013
Units in issue at the beginning of the period 7,500,000 -Issue of units - 7,500,000Units in issue at the end of the period 7,500,000 7,500,000
Net assets attributable to unitholders per unitHK$
20.06HK$19.50
Vanguard FTSEDeveloped Europe
Index ETF
Vanguard FTSEJapan Index ETF
Vanguard FTSEAsia ex Japan High
Dividend YieldIndex ETF
For the period10 June 2014 (date
of inception) to31 December 2014
For the period10 June 2014 (date
of inception) to31 December 2014
For the period10 June 2014 (date
of inception) to31 December 2014
Units in issue at the beginning of the period - - -
Issue of units 4,000,000 4,000,000 5,800,000
Units in issue at the end of the period 4,000,000 4,000,000 5,800,000
Net assets attributable to unitholders per unitHK$
17.56HK$
19.78HK$
20.11
5 Taxation
No provision for Hong Kong profits tax has been made as the Sub-Funds are authorised as collective investment schemesunder section 104 of the Hong Kong Securities and Futures Ordinance and are therefore exempted from profits tax undersection 26A(1A) of the Hong Kong Inland Revenue Ordinance.
Vanguard FTSE Asia ex Japan Index ETF and Vanguard FTSE Asia ex Japan High Dividend Yield Index ETF invest inH-shares of the People’s Republic of China (“PRC”) securities listed on the Hong Kong Stock Exchange and B-shares ofPRC securities listed on the Shanghai Stock Exchange and the Shenzhen Stock Exchange. Under the PRC CorporateIncome Tax Law, the Sub-Funds may be liable to pay PRC tax on the capital gains realised in the trading of thesesecurities. However, no provision was made for taxation from such gains in the financial statements as the Managerbelieves that the Sub-Funds can sustain a position for not filing a tax return based on the existing tax regulations and thatthe enforcement of PRC tax on capital gains is not probable.
Vanguard ETF SeriesAnnual Report 2014
Notes to the financial statements (Continued)
-19-
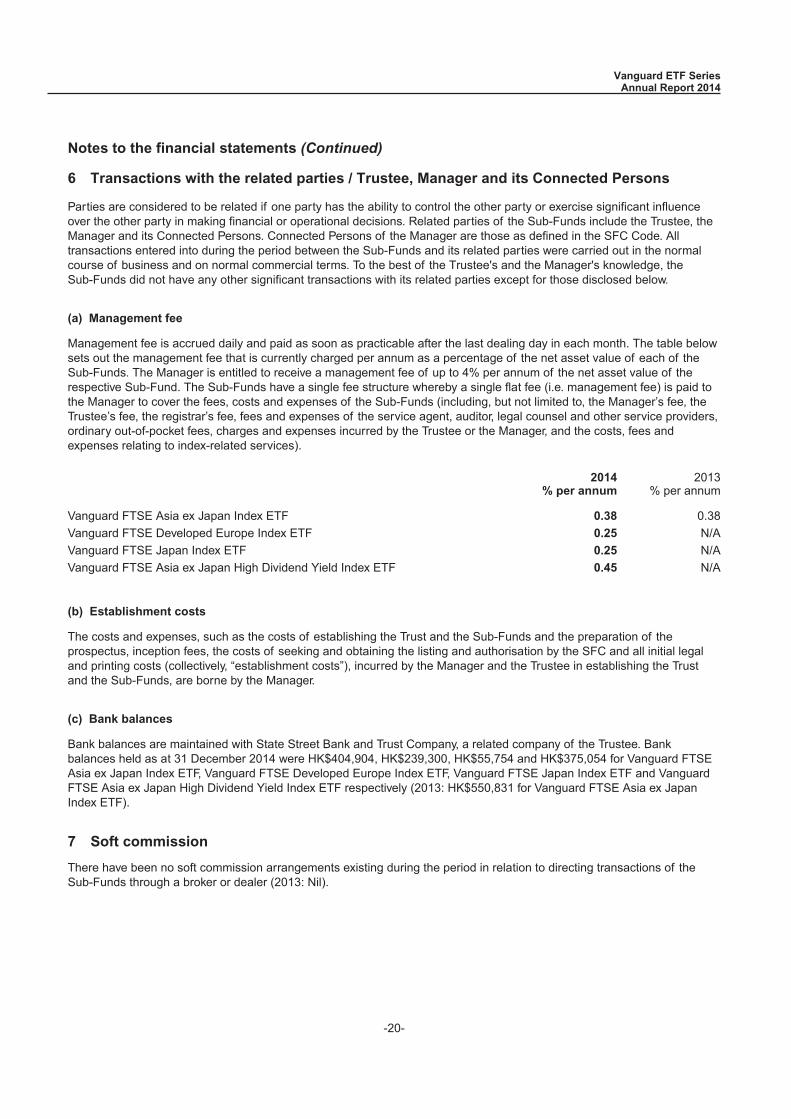
6 Transactions with the related parties / Trustee, Manager and its Connected Persons
Parties are considered to be related if one party has the ability to control the other party or exercise significant influenceover the other party in making financial or operational decisions. Related parties of the Sub-Funds include the Trustee, theManager and its Connected Persons. Connected Persons of the Manager are those as defined in the SFC Code. Alltransactions entered into during the period between the Sub-Funds and its related parties were carried out in the normalcourse of business and on normal commercial terms. To the best of the Trustee's and the Manager's knowledge, theSub-Funds did not have any other significant transactions with its related parties except for those disclosed below.
(a) Management fee
Management fee is accrued daily and paid as soon as practicable after the last dealing day in each month. The table belowsets out the management fee that is currently charged per annum as a percentage of the net asset value of each of theSub-Funds. The Manager is entitled to receive a management fee of up to 4% per annum of the net asset value of therespective Sub-Fund. The Sub-Funds have a single fee structure whereby a single flat fee (i.e. management fee) is paid tothe Manager to cover the fees, costs and expenses of the Sub-Funds (including, but not limited to, the Manager’s fee, theTrustee’s fee, the registrar’s fee, fees and expenses of the service agent, auditor, legal counsel and other service providers,ordinary out-of-pocket fees, charges and expenses incurred by the Trustee or the Manager, and the costs, fees andexpenses relating to index-related services).
2014% per annum
2013% per annum
Vanguard FTSE Asia ex Japan Index ETF 0.38 0.38Vanguard FTSE Developed Europe Index ETF 0.25 N/AVanguard FTSE Japan Index ETF 0.25 N/AVanguard FTSE Asia ex Japan High Dividend Yield Index ETF 0.45 N/A
(b) Establishment costs
The costs and expenses, such as the costs of establishing the Trust and the Sub-Funds and the preparation of theprospectus, inception fees, the costs of seeking and obtaining the listing and authorisation by the SFC and all initial legaland printing costs (collectively, “establishment costs”), incurred by the Manager and the Trustee in establishing the Trustand the Sub-Funds, are borne by the Manager.
(c) Bank balances
Bank balances are maintained with State Street Bank and Trust Company, a related company of the Trustee. Bankbalances held as at 31 December 2014 were HK$404,904, HK$239,300, HK$55,754 and HK$375,054 for Vanguard FTSEAsia ex Japan Index ETF, Vanguard FTSE Developed Europe Index ETF, Vanguard FTSE Japan Index ETF and VanguardFTSE Asia ex Japan High Dividend Yield Index ETF respectively (2013: HK$550,831 for Vanguard FTSE Asia ex JapanIndex ETF).
7 Soft commission
There have been no soft commission arrangements existing during the period in relation to directing transactions of theSub-Funds through a broker or dealer (2013: Nil).
Vanguard ETF SeriesAnnual Report 2014
Notes to the financial statements (Continued)
-20-
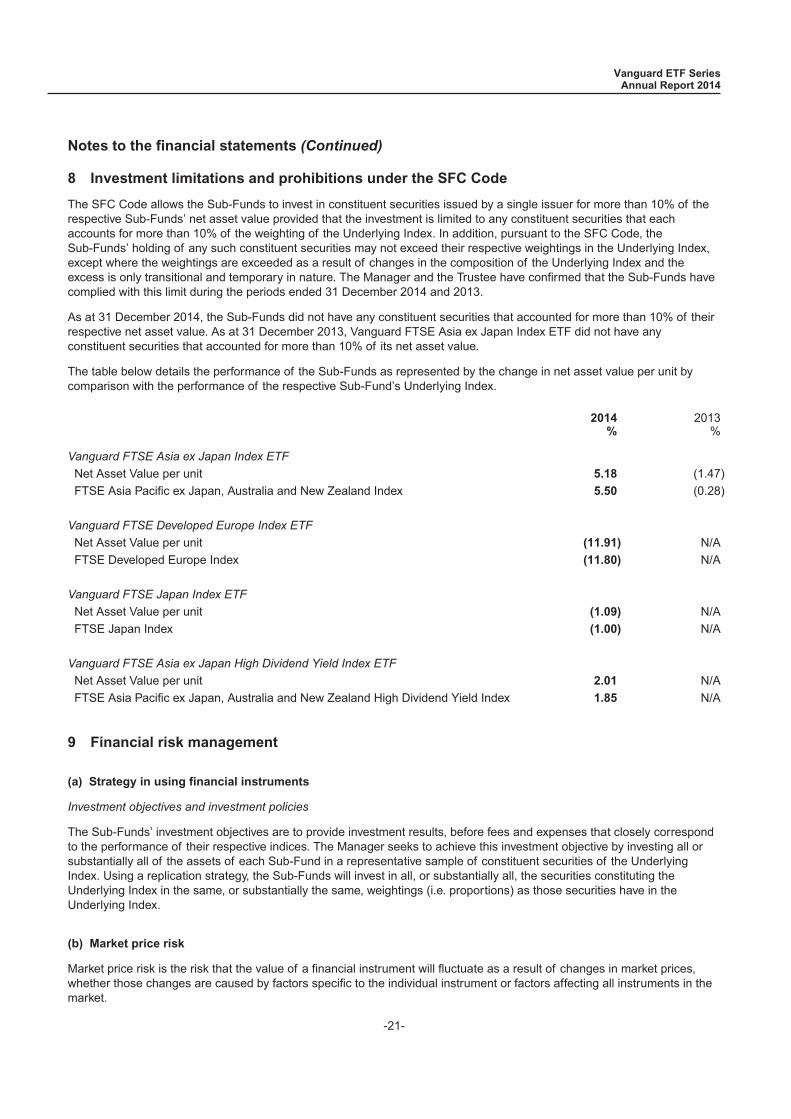
8 Investment limitations and prohibitions under the SFC Code
The SFC Code allows the Sub-Funds to invest in constituent securities issued by a single issuer for more than 10% of therespective Sub-Funds’ net asset value provided that the investment is limited to any constituent securities that eachaccounts for more than 10% of the weighting of the Underlying Index. In addition, pursuant to the SFC Code, theSub-Funds’ holding of any such constituent securities may not exceed their respective weightings in the Underlying Index,except where the weightings are exceeded as a result of changes in the composition of the Underlying Index and theexcess is only transitional and temporary in nature. The Manager and the Trustee have confirmed that the Sub-Funds havecomplied with this limit during the periods ended 31 December 2014 and 2013.
As at 31 December 2014, the Sub-Funds did not have any constituent securities that accounted for more than 10% of theirrespective net asset value. As at 31 December 2013, Vanguard FTSE Asia ex Japan Index ETF did not have anyconstituent securities that accounted for more than 10% of its net asset value.
The table below details the performance of the Sub-Funds as represented by the change in net asset value per unit bycomparison with the performance of the respective Sub-Fund’s Underlying Index.
2014%
2013%
Vanguard FTSE Asia ex Japan Index ETF
Net Asset Value per unit 5.18 (1.47)FTSE Asia Pacific ex Japan, Australia and New Zealand Index 5.50 (0.28)
Vanguard FTSE Developed Europe Index ETF
Net Asset Value per unit (11.91) N/AFTSE Developed Europe Index (11.80) N/A
Vanguard FTSE Japan Index ETF
Net Asset Value per unit (1.09) N/AFTSE Japan Index (1.00) N/A
Vanguard FTSE Asia ex Japan High Dividend Yield Index ETF
Net Asset Value per unit 2.01 N/AFTSE Asia Pacific ex Japan, Australia and New Zealand High Dividend Yield Index 1.85 N/A
9 Financial risk management
(a) Strategy in using financial instruments
Investment objectives and investment policies
The Sub-Funds’ investment objectives are to provide investment results, before fees and expenses that closely correspondto the performance of their respective indices. The Manager seeks to achieve this investment objective by investing all orsubstantially all of the assets of each Sub-Fund in a representative sample of constituent securities of the UnderlyingIndex. Using a replication strategy, the Sub-Funds will invest in all, or substantially all, the securities constituting theUnderlying Index in the same, or substantially the same, weightings (i.e. proportions) as those securities have in theUnderlying Index.
(b) Market price risk
Market price risk is the risk that the value of a financial instrument will fluctuate as a result of changes in market prices,whether those changes are caused by factors specific to the individual instrument or factors affecting all instruments in themarket.
Vanguard ETF SeriesAnnual Report 2014
Notes to the financial statements (Continued)
-21-

9 Financial risk management (Continued)
(b) Market price risk (Continued)
All securities investments present a risk of loss of capital. The Sub-Funds’ market price risk is managed throughdiversification of investment portfolio. The Manager monitors the investments on a daily basis and rebalances the portfolioof investments from time to time to reflect any changes to the composition of, or the weighting of shares in, the UnderlyingIndex.
As at 31 December 2014 and 2013, the Sub-Funds’ investments were concentrated in the following industries:
Vanguard FTSE Asia ex Japan IndexETF
As at 31 December 2014 As at 31 December 2013
Fair value HK$ % of net assets Fair value HK$ % of net assetsEquities
Consumer discretionary 12,950,667 8.61 14,884,981 10.16Consumer staples 8,154,431 5.42 8,326,571 5.71Energy 6,939,571 4.61 8,122,389 5.52Financials 46,771,932 31.09 37,591,118 25.70Health care 2,713,421 1.80 1,850,618 1.29Industrials 13,272,547 8.82 13,272,081 9.08Information technology 28,790,639 19.14 26,549,339 18.15Materials 9,846,937 6.54 11,431,807 7.78Real estate 4,647,214 3.09 8,734,365 5.99Telecommunication services 9,847,188 6.55 9,290,930 6.37Utilities 6,048,266 4.02 5,093,503 3.49
149,982,813 99.69 145,147,702 99.24Derivative financial instruments
Financial liabilitiesForeign currency contracts(note 10) (142) - (43) -
149,982,671 99.69 145,147,659 99.24
Vanguard ETF SeriesAnnual Report 2014
Notes to the financial statements (Continued)
-22-
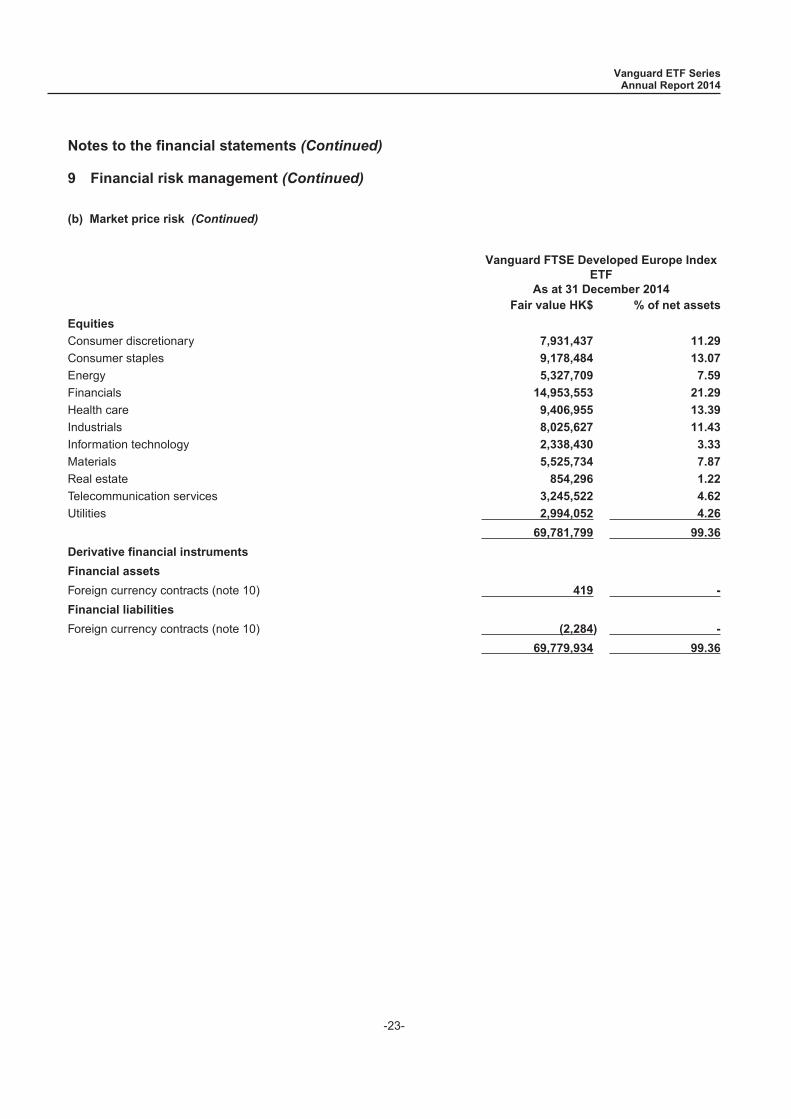
9 Financial risk management (Continued)
(b) Market price risk (Continued)
Vanguard FTSE Developed Europe IndexETF
As at 31 December 2014Fair value HK$ % of net assets
Equities
Consumer discretionary 7,931,437 11.29
Consumer staples 9,178,484 13.07
Energy 5,327,709 7.59Financials 14,953,553 21.29
Health care 9,406,955 13.39
Industrials 8,025,627 11.43
Information technology 2,338,430 3.33
Materials 5,525,734 7.87
Real estate 854,296 1.22
Telecommunication services 3,245,522 4.62
Utilities 2,994,052 4.26
69,781,799 99.36Derivative financial instruments
Financial assets
Foreign currency contracts (note 10) 419 -
Financial liabilities
Foreign currency contracts (note 10) (2,284) -
69,779,934 99.36
Vanguard ETF SeriesAnnual Report 2014
Notes to the financial statements (Continued)
-23-
9 Financial risk management (Continued)
(b) Market price risk (Continued)
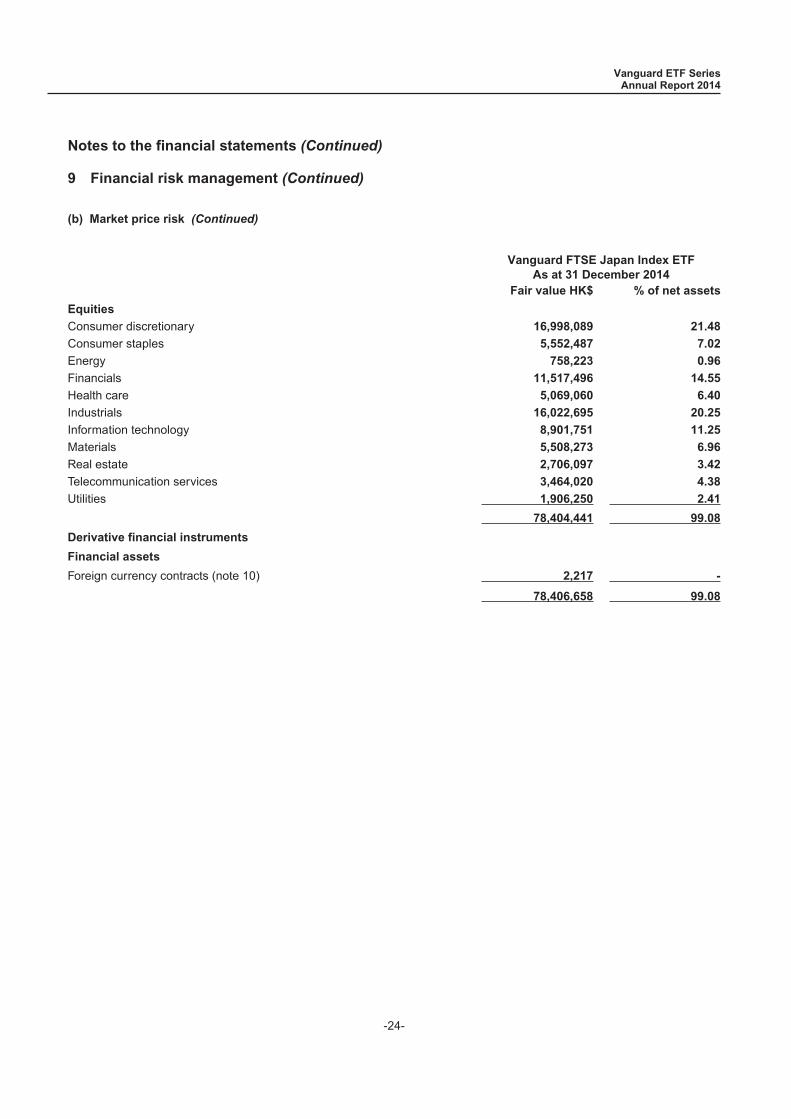
Vanguard FTSE Japan Index ETFAs at 31 December 2014
Fair value HK$ % of net assets
Equities
Consumer discretionary 16,998,089 21.48
Consumer staples 5,552,487 7.02
Energy 758,223 0.96
Financials 11,517,496 14.55
Health care 5,069,060 6.40
Industrials 16,022,695 20.25
Information technology 8,901,751 11.25
Materials 5,508,273 6.96
Real estate 2,706,097 3.42
Telecommunication services 3,464,020 4.38
Utilities 1,906,250 2.41
78,404,441 99.08
Derivative financial instruments
Financial assets
Foreign currency contracts (note 10) 2,217 -
78,406,658 99.08
Vanguard ETF SeriesAnnual Report 2014
Notes to the financial statements (Continued)
-24-

9 Financial risk management (Continued)
(b) Market price risk (Continued)
Vanguard FTSE Asia ex Japan HighDividend Yield Index ETFAs at 31 December 2014
Fair value HK$ % of net assets
Equities
Consumer discretionary 7,596,072 6.51
Consumer staples 5,128,130 4.40
Energy 8,622,598 7.39
Financials 40,496,027 34.71
Industrials 9,052,815 7.76
Information technology 15,761,500 13.51
Materials 6,139,298 5.26
Real estate 4,638,418 3.98
Telecommunication services 13,518,573 11.59
Utilities 5,246,710 4.50
116,200,141 99.61
Vanguard ETF SeriesAnnual Report 2014
Notes to the financial statements (Continued)
-25-
9 Financial risk management (Continued)
(b) Market price risk (Continued)
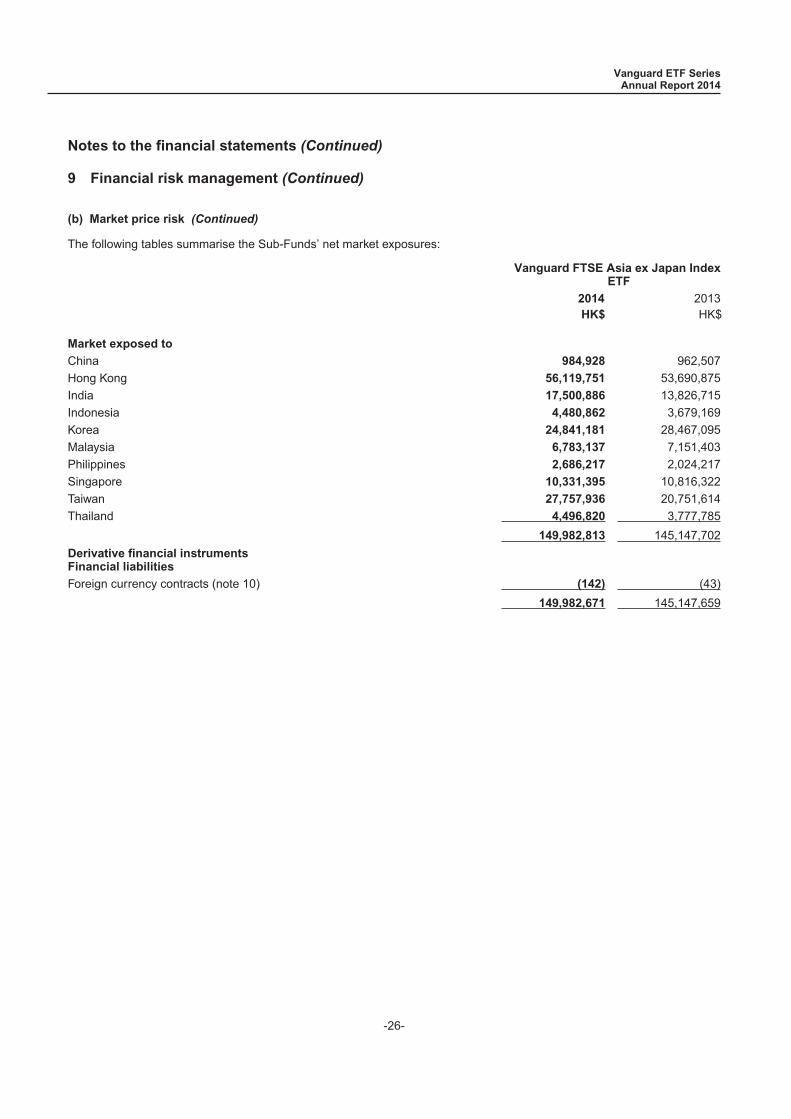
The following tables summarise the Sub-Funds’ net market exposures:
Vanguard FTSE Asia ex Japan IndexETF
2014HK$
2013HK$
Market exposed to
China 984,928 962,507Hong Kong 56,119,751 53,690,875India 17,500,886 13,826,715Indonesia 4,480,862 3,679,169Korea 24,841,181 28,467,095Malaysia 6,783,137 7,151,403Philippines 2,686,217 2,024,217Singapore 10,331,395 10,816,322Taiwan 27,757,936 20,751,614Thailand 4,496,820 3,777,785
149,982,813 145,147,702Derivative financial instrumentsFinancial liabilities
Foreign currency contracts (note 10) (142) (43)149,982,671 145,147,659
Vanguard ETF SeriesAnnual Report 2014
Notes to the financial statements (Continued)
-26-
9 Financial risk management (Continued)
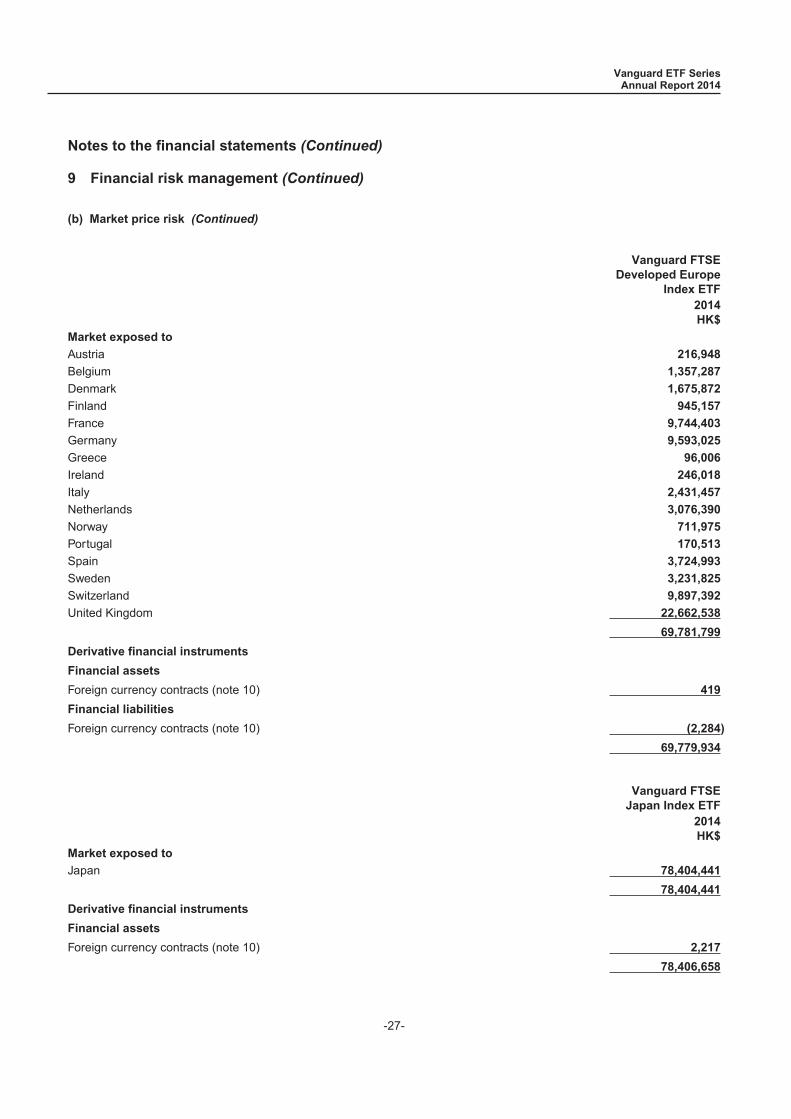
(b) Market price risk (Continued)
Vanguard FTSEDeveloped Europe
Index ETF2014HK$
Market exposed to
Austria 216,948
Belgium 1,357,287
Denmark 1,675,872
Finland 945,157
France 9,744,403
Germany 9,593,025
Greece 96,006
Ireland 246,018
Italy 2,431,457
Netherlands 3,076,390
Norway 711,975
Portugal 170,513
Spain 3,724,993
Sweden 3,231,825
Switzerland 9,897,392
United Kingdom 22,662,538
69,781,799
Derivative financial instruments
Financial assets
Foreign currency contracts (note 10) 419
Financial liabilities
Foreign currency contracts (note 10) (2,284)
69,779,934
Vanguard FTSEJapan Index ETF
2014HK$
Market exposed to
Japan 78,404,441
78,404,441
Derivative financial instruments
Financial assets
Foreign currency contracts (note 10) 2,217
78,406,658
Vanguard ETF SeriesAnnual Report 2014
Notes to the financial statements (Continued)
-27-
9 Financial risk management (Continued)
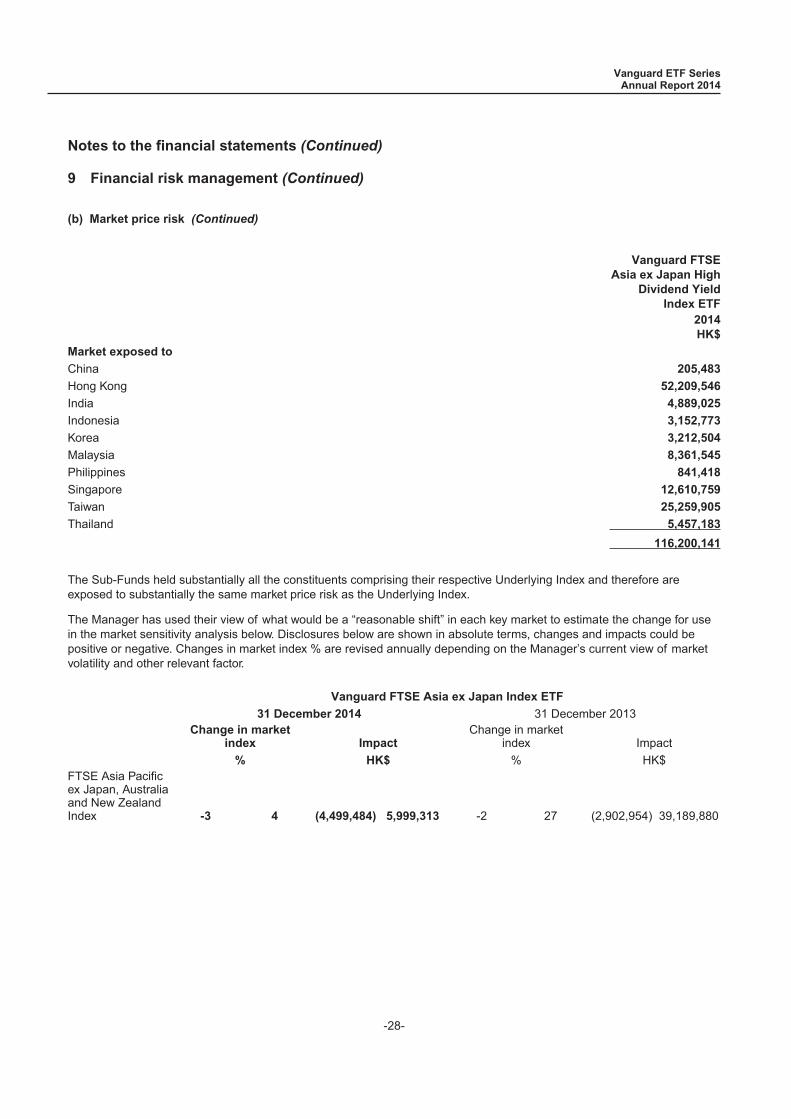
(b) Market price risk (Continued)
Vanguard FTSEAsia ex Japan High
Dividend YieldIndex ETF
2014HK$
Market exposed to
China 205,483
Hong Kong 52,209,546
India 4,889,025
Indonesia 3,152,773
Korea 3,212,504
Malaysia 8,361,545
Philippines 841,418
Singapore 12,610,759
Taiwan 25,259,905
Thailand 5,457,183
116,200,141
The Sub-Funds held substantially all the constituents comprising their respective Underlying Index and therefore areexposed to substantially the same market price risk as the Underlying Index.
The Manager has used their view of what would be a “reasonable shift” in each key market to estimate the change for usein the market sensitivity analysis below. Disclosures below are shown in absolute terms, changes and impacts could bepositive or negative. Changes in market index % are revised annually depending on the Manager’s current view of marketvolatility and other relevant factor.
Vanguard FTSE Asia ex Japan Index ETF
31 December 2014 31 December 2013Change in market
index ImpactChange in market
index Impact% HK$ % HK$
FTSE Asia Pacificex Japan, Australiaand New ZealandIndex -3 4 (4,499,484) 5,999,313 -2 27 (2,902,954) 39,189,880
Vanguard ETF SeriesAnnual Report 2014
Notes to the financial statements (Continued)
-28-
9 Financial risk management (Continued)
(b) Market price risk (Continued)
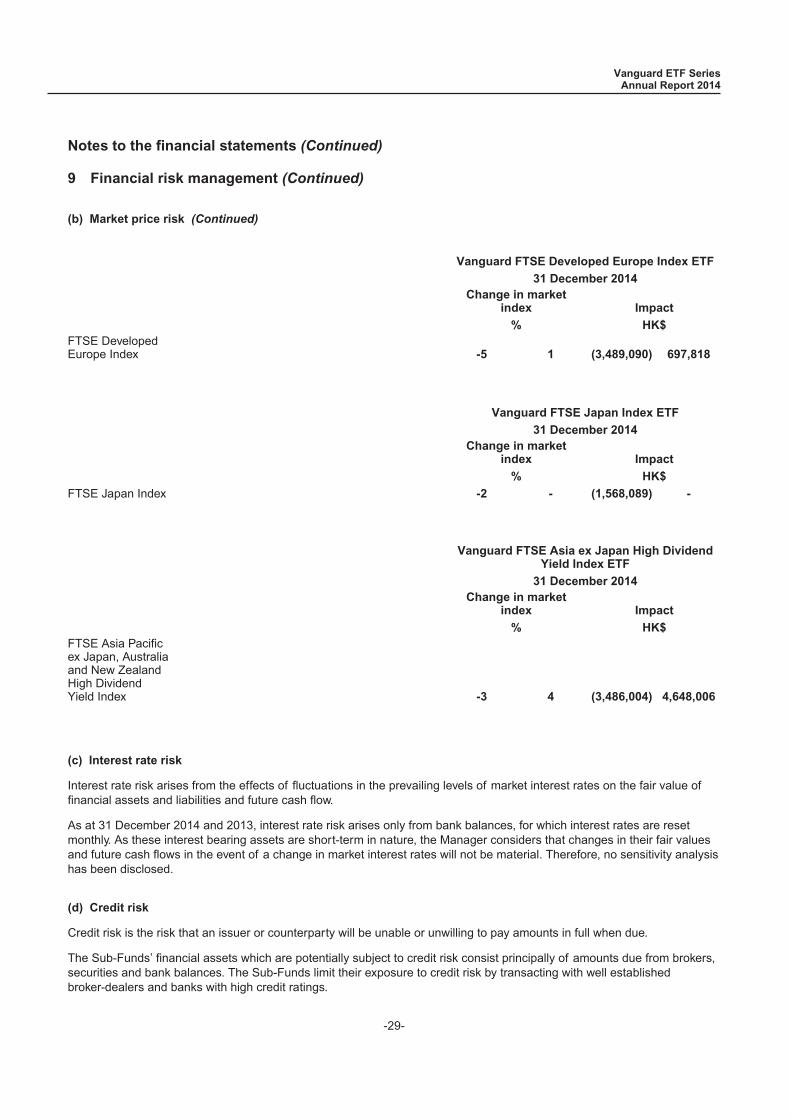
Vanguard FTSE Developed Europe Index ETF
31 December 2014Change in market
index Impact
% HK$FTSE DevelopedEurope Index -5 1 (3,489,090) 697,818
Vanguard FTSE Japan Index ETF
31 December 2014Change in market
index Impact
% HK$
FTSE Japan Index -2 - (1,568,089) -
Vanguard FTSE Asia ex Japan High DividendYield Index ETF
31 December 2014Change in market
index Impact
% HK$FTSE Asia Pacificex Japan, Australiaand New ZealandHigh DividendYield Index -3 4 (3,486,004) 4,648,006
(c) Interest rate risk
Interest rate risk arises from the effects of fluctuations in the prevailing levels of market interest rates on the fair value offinancial assets and liabilities and future cash flow.
As at 31 December 2014 and 2013, interest rate risk arises only from bank balances, for which interest rates are resetmonthly. As these interest bearing assets are short-term in nature, the Manager considers that changes in their fair valuesand future cash flows in the event of a change in market interest rates will not be material. Therefore, no sensitivity analysishas been disclosed.
(d) Credit risk
Credit risk is the risk that an issuer or counterparty will be unable or unwilling to pay amounts in full when due.
The Sub-Funds’ financial assets which are potentially subject to credit risk consist principally of amounts due from brokers,securities and bank balances. The Sub-Funds limit their exposure to credit risk by transacting with well establishedbroker-dealers and banks with high credit ratings.
Vanguard ETF SeriesAnnual Report 2014
Notes to the financial statements (Continued)
-29-
9 Financial risk management (Continued)
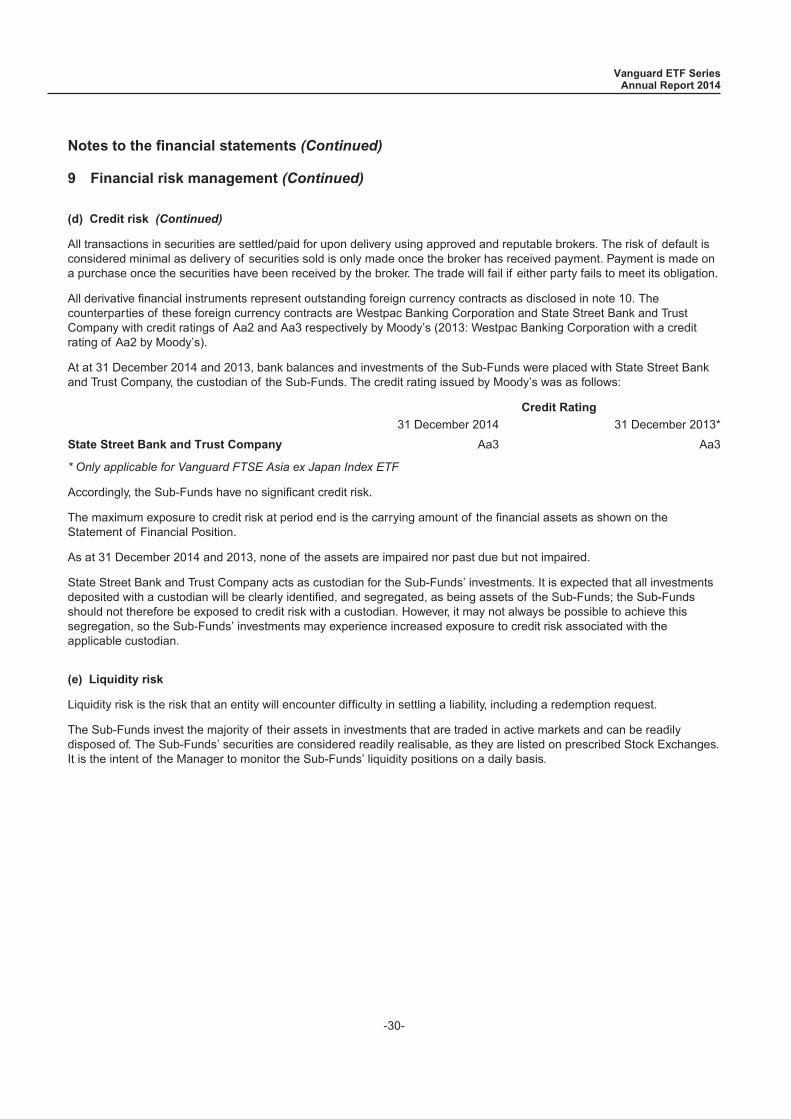
(d) Credit risk (Continued)
All transactions in securities are settled/paid for upon delivery using approved and reputable brokers. The risk of default isconsidered minimal as delivery of securities sold is only made once the broker has received payment. Payment is made ona purchase once the securities have been received by the broker. The trade will fail if either party fails to meet its obligation.
All derivative financial instruments represent outstanding foreign currency contracts as disclosed in note 10. Thecounterparties of these foreign currency contracts are Westpac Banking Corporation and State Street Bank and TrustCompany with credit ratings of Aa2 and Aa3 respectively by Moody’s (2013: Westpac Banking Corporation with a creditrating of Aa2 by Moody’s).
At at 31 December 2014 and 2013, bank balances and investments of the Sub-Funds were placed with State Street Bankand Trust Company, the custodian of the Sub-Funds. The credit rating issued by Moody’s was as follows:
Credit Rating
31 December 2014 31 December 2013*
State Street Bank and Trust Company Aa3 Aa3
* Only applicable for Vanguard FTSE Asia ex Japan Index ETF
Accordingly, the Sub-Funds have no significant credit risk.
The maximum exposure to credit risk at period end is the carrying amount of the financial assets as shown on theStatement of Financial Position.
As at 31 December 2014 and 2013, none of the assets are impaired nor past due but not impaired.
State Street Bank and Trust Company acts as custodian for the Sub-Funds’ investments. It is expected that all investmentsdeposited with a custodian will be clearly identified, and segregated, as being assets of the Sub-Funds; the Sub-Fundsshould not therefore be exposed to credit risk with a custodian. However, it may not always be possible to achieve thissegregation, so the Sub-Funds’ investments may experience increased exposure to credit risk associated with theapplicable custodian.
(e) Liquidity risk
Liquidity risk is the risk that an entity will encounter difficulty in settling a liability, including a redemption request.
The Sub-Funds invest the majority of their assets in investments that are traded in active markets and can be readilydisposed of. The Sub-Funds’ securities are considered readily realisable, as they are listed on prescribed Stock Exchanges.It is the intent of the Manager to monitor the Sub-Funds’ liquidity positions on a daily basis.
Vanguard ETF SeriesAnnual Report 2014
Notes to the financial statements (Continued)
-30-

9 Financial risk management (Continued)
(e) Liquidity risk (Continued)
The following table illustrates the expected liquidity of non-derivative financial assets held at 31 December 2014 and 2013and gives the contractual undiscounted cash-flow projection of the Sub-Funds’ non-derivative financial liabilities. TheSub-Funds manage their liquidity risk by investing in securities that they expect to be able to liquidate within 1 month orless. Although the Sub-Funds have the ability to liquidate the securities, it is not the intention of the Sub-Funds to sell within1 month. Balances due within 12 months equal their carrying balances, as the impact of discounting is not significant.
Vanguard FTSE Asia ex Japan Index ETF
31 December 2014 31 December 2013
Less than 1monthHK$
1 month toless than 3
monthsHK$
Over 3months
HK$
Less than 1monthHK$
1 month toless than 3monthsHK$
Over 3monthsHK$
Financial assets
Cash and cash equivalents 404,904 - - 550,831 - -Margin deposits - - - 11,170 - -Amounts due from brokers - - - 797,055 - -Dividends receivable 254,763 - - 42,234 - -Financial assets at fair valuethrough profit or loss 149,982,813 - - 145,147,702 - -
Total financial assets 150,642,480 - - 146,548,992 - -
Financial liabilities
Amounts due to brokers 147,203 - - 251,823 - -Management fee payable 48,267 - - 46,976 - -
Total financial liablities 195,470 - - 298,799 - -
Vanguard ETF SeriesAnnual Report 2014
Notes to the financial statements (Continued)
-31-
9 Financial risk management (Continued)
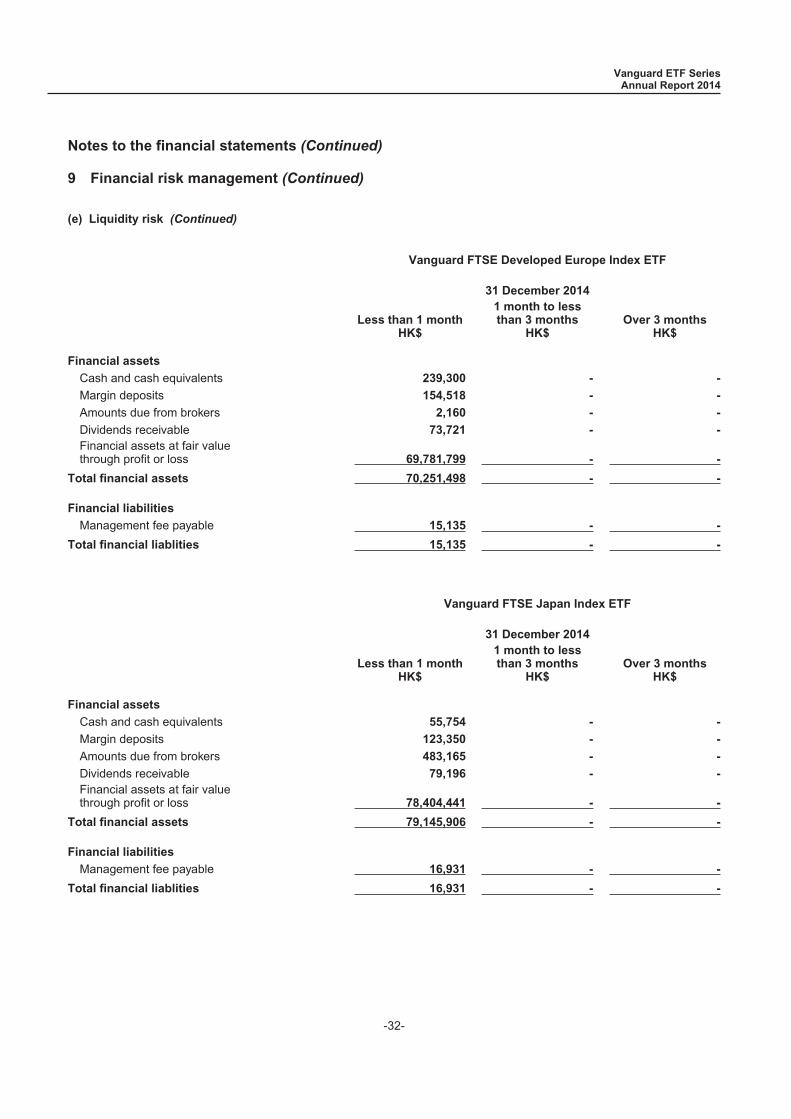
(e) Liquidity risk (Continued)
Vanguard FTSE Developed Europe Index ETF
31 December 2014
Less than 1 monthHK$
1 month to lessthan 3 months
HK$Over 3 months
HK$
Financial assets
Cash and cash equivalents 239,300 - -
Margin deposits 154,518 - -
Amounts due from brokers 2,160 - -
Dividends receivable 73,721 - -Financial assets at fair valuethrough profit or loss 69,781,799 - -
Total financial assets 70,251,498 - -
Financial liabilities
Management fee payable 15,135 - -
Total financial liablities 15,135 - -
Vanguard FTSE Japan Index ETF
31 December 2014
Less than 1 monthHK$
1 month to lessthan 3 months
HK$Over 3 months
HK$
Financial assets
Cash and cash equivalents 55,754 - -
Margin deposits 123,350 - -
Amounts due from brokers 483,165 - -
Dividends receivable 79,196 - -Financial assets at fair valuethrough profit or loss 78,404,441 - -
Total financial assets 79,145,906 - -
Financial liabilities
Management fee payable 16,931 - -
Total financial liablities 16,931 - -
Vanguard ETF SeriesAnnual Report 2014
Notes to the financial statements (Continued)
-32-
9 Financial risk management (Continued)
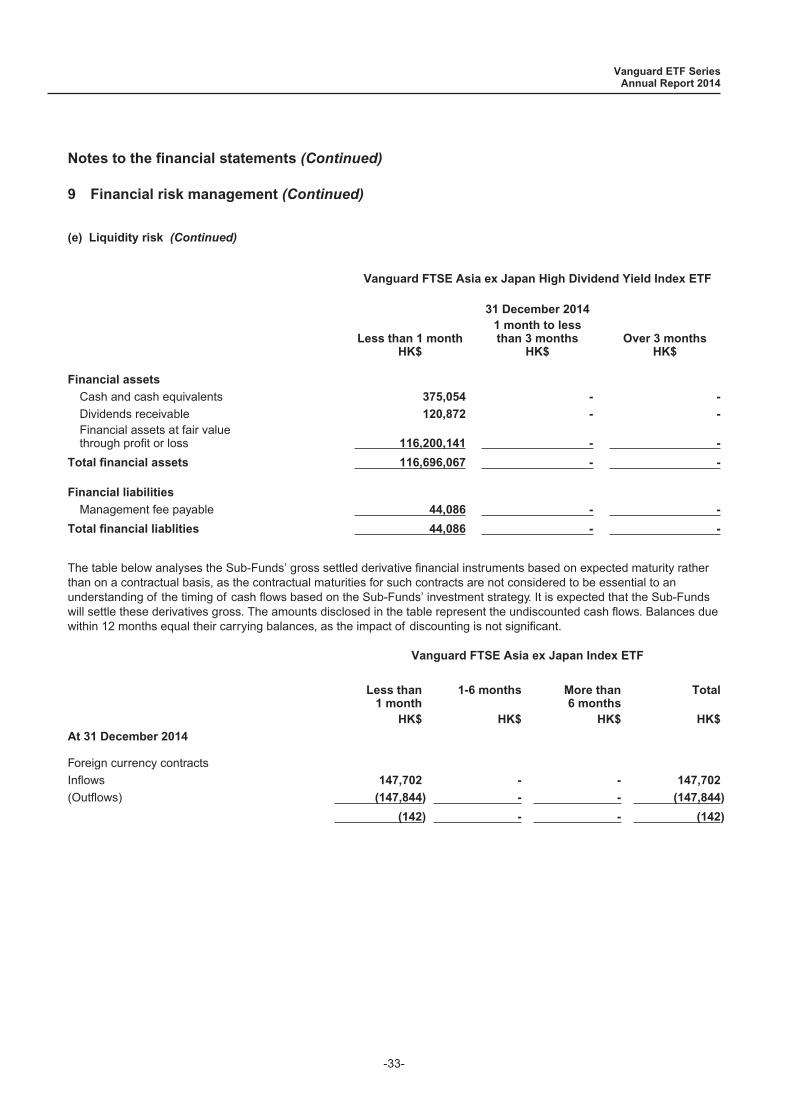
(e) Liquidity risk (Continued)
Vanguard FTSE Asia ex Japan High Dividend Yield Index ETF
31 December 2014
Less than 1 monthHK$
1 month to lessthan 3 months
HK$Over 3 months
HK$
Financial assets
Cash and cash equivalents 375,054 - -
Dividends receivable 120,872 - -Financial assets at fair valuethrough profit or loss 116,200,141 - -
Total financial assets 116,696,067 - -
Financial liabilities
Management fee payable 44,086 - -
Total financial liablities 44,086 - -
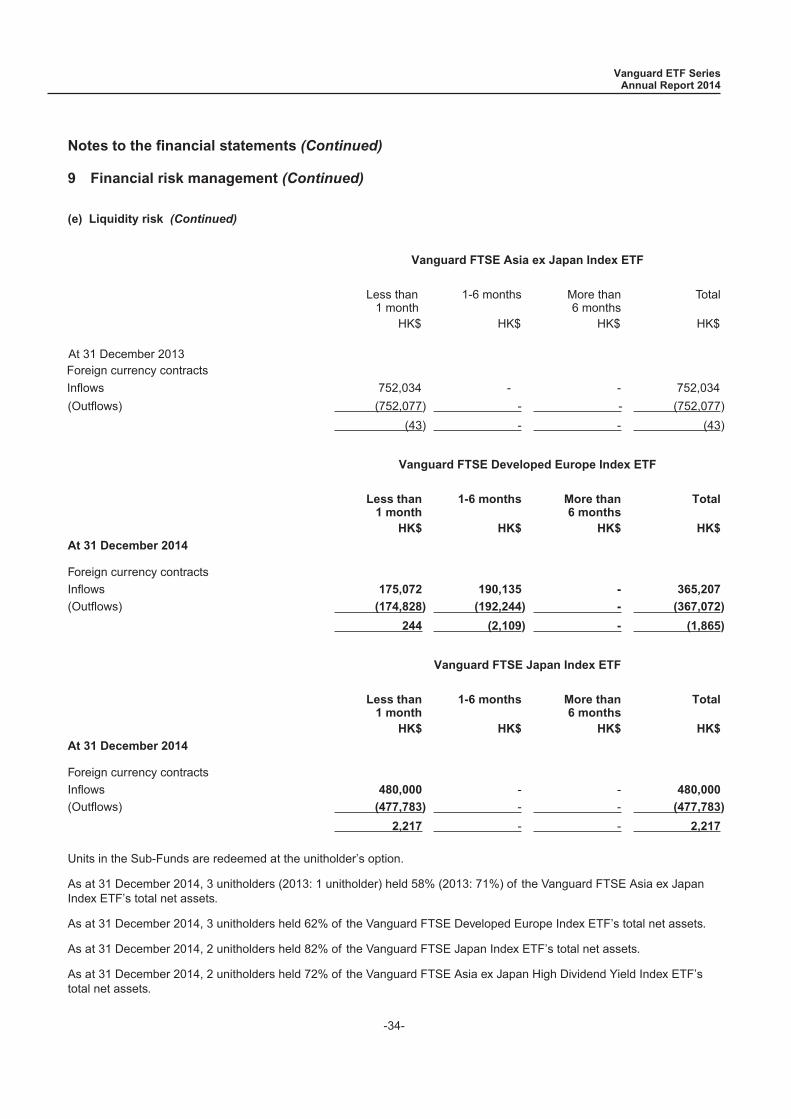
The table below analyses the Sub-Funds’ gross settled derivative financial instruments based on expected maturity ratherthan on a contractual basis, as the contractual maturities for such contracts are not considered to be essential to anunderstanding of the timing of cash flows based on the Sub-Funds’ investment strategy. It is expected that the Sub-Fundswill settle these derivatives gross. The amounts disclosed in the table represent the undiscounted cash flows. Balances duewithin 12 months equal their carrying balances, as the impact of discounting is not significant.
Vanguard FTSE Asia ex Japan Index ETF
Less than1 month
1-6 months More than6 months
Total
HK$ HK$ HK$ HK$
At 31 December 2014
Foreign currency contractsInflows 147,702 - - 147,702
(Outflows) (147,844) - - (147,844)
(142) - - (142)
Vanguard ETF SeriesAnnual Report 2014
Notes to the financial statements (Continued)
-33-
9 Financial risk management (Continued)
(e) Liquidity risk (Continued)
Vanguard FTSE Asia ex Japan Index ETF
Less than1 month
1-6 months More than6 months
Total
HK$ HK$ HK$ HK$
(Outflows) (752,077) - - (752,077)(43) - - (43)
Vanguard FTSE Developed Europe Index ETF
Less than1 month
1-6 months More than6 months
Total
HK$ HK$ HK$ HK$
At 31 December 2014
Foreign currency contractsInflows 175,072 190,135 - 365,207
(Outflows) (174,828) (192,244) - (367,072)
244 (2,109) - (1,865)
Vanguard FTSE Japan Index ETF
Less than1 month
1-6 months More than6 months
Total
HK$ HK$ HK$ HK$
At 31 December 2014
Foreign currency contractsInflows 480,000 - - 480,000
(Outflows) (477,783) - - (477,783)
2,217 - - 2,217
Units in the Sub-Funds are redeemed at the unitholder’s option.
As at 31 December 2014, 3 unitholders (2013: 1 unitholder) held 58% (2013: 71%) of the Vanguard FTSE Asia ex JapanIndex ETF’s total net assets.
As at 31 December 2014, 3 unitholders held 62% of the Vanguard FTSE Developed Europe Index ETF’s total net assets.
As at 31 December 2014, 2 unitholders held 82% of the Vanguard FTSE Japan Index ETF’s total net assets.
As at 31 December 2014, 2 unitholders held 72% of the Vanguard FTSE Asia ex Japan High Dividend Yield Index ETF’stotal net assets.
At 31 December 2013 Foreign currency contracts
Vanguard ETF SeriesAnnual Report 2014
Notes to the financial statements (Continued)
-34-
Inflows 752,034 - - 752,034

9 Financial risk management (Continued)
(f) Currency risk
The Sub-Funds’ foreign exchange exposure on international equity securities is embedded in the price risk as presented innote 9(b). Other than the Sub-Funds’ exposure to foreign exchange on international equity securities the Sub-Funds haveno significant currency risk as substantially all other assets and liabilities are denominated in Hong Kong dollars, theSub-Funds’ functional and presentation currency.
Currency risk is the risk that the value of financial instruments will fluctuate due to changes in foreign exhange rates.
(g) Capital risk management
The Sub-Funds’ objectives are to provide investment results that closely correspond to the performance of their respectiveUnderlying Indices. The Manager may:
• Redeem and issue new units in accordance with the constitutive documents of the Sub-Funds, which include theability to amend the creation unit and redemption unit size upon giving prior notice to the Trustee;
• Suspend the creation and redemption of units under certain circumstances stipulated in the Trust Deed.
(h) Fair value estimation
The fair value of financial assets and liabilities traded in active markets (such as publicly traded derivatives and tradingsecurities) are based on quoted market prices at the close of trading on the period end date. The Sub-Funds use lasttraded market price as their fair valuation inputs for their investments.
An active market is a market in which transactions for the asset or liability take place with sufficient frequency and volume toprovide pricing information on an ongoing basis.
A financial instrument is regarded as quoted in an active market if quoted prices are readily and regularly available from anexchange, dealer, broker, industry group, pricing service, or regulatory agency, and those prices represent actual andregularly occurring market transactions on an arm’s length basis.
The carrying value less impairment provision of other receivables and payables are assumed to approximate their fairvalues. The fair value of financial liabilities for disclosure purposes is estimated by discounting the future contractual cashflows at the current market interest rate that is available to the Sub-Funds for similar financial instruments.
IFRS 13 requires the Sub-Funds to classify fair value measurements using a fair value hierarchy that reflects thesignificance of the inputs used in making the measurements. The fair value hierarchy has the following levels:
• Quoted prices (unadjusted) in active markets for identical assets or liabilities that the entity can access at themeasurement date (level 1).
• Inputs other than quoted prices included within level 1 that are observable for the asset or liability, either directly orindirectly (level 2).
• Inputs for the asset or liability that are unobservable inputs (level 3).
The level in the fair value hierarchy within which the fair value measurement is categorised in its entirety is determined onthe basis of the lowest level input that is significant to the fair value measurement in its entirety. For this purpose, thesignificance of an input is assessed against the fair value measurement in its entirety. If a fair value measurement usesobservable inputs that require significant adjustment based on unobservable inputs, that measurement is a level 3measurement. Assessing the significance of a particular input to the fair value measurement in its entirety requiresjudgment, considering factors specific to the asset or liability.
The determination of what constitutes ‘observable’ requires significant judgment by the Sub-Funds. The Sub-Fundsconsider observable data to be that market data that is readily available, regularly distributed or updated, reliable andverifiable, not proprietary, and provided by independent sources that are actively involved in the relevant market.
Vanguard ETF SeriesAnnual Report 2014
Notes to the financial statements (Continued)
-35-
9 Financial risk management (Continued)
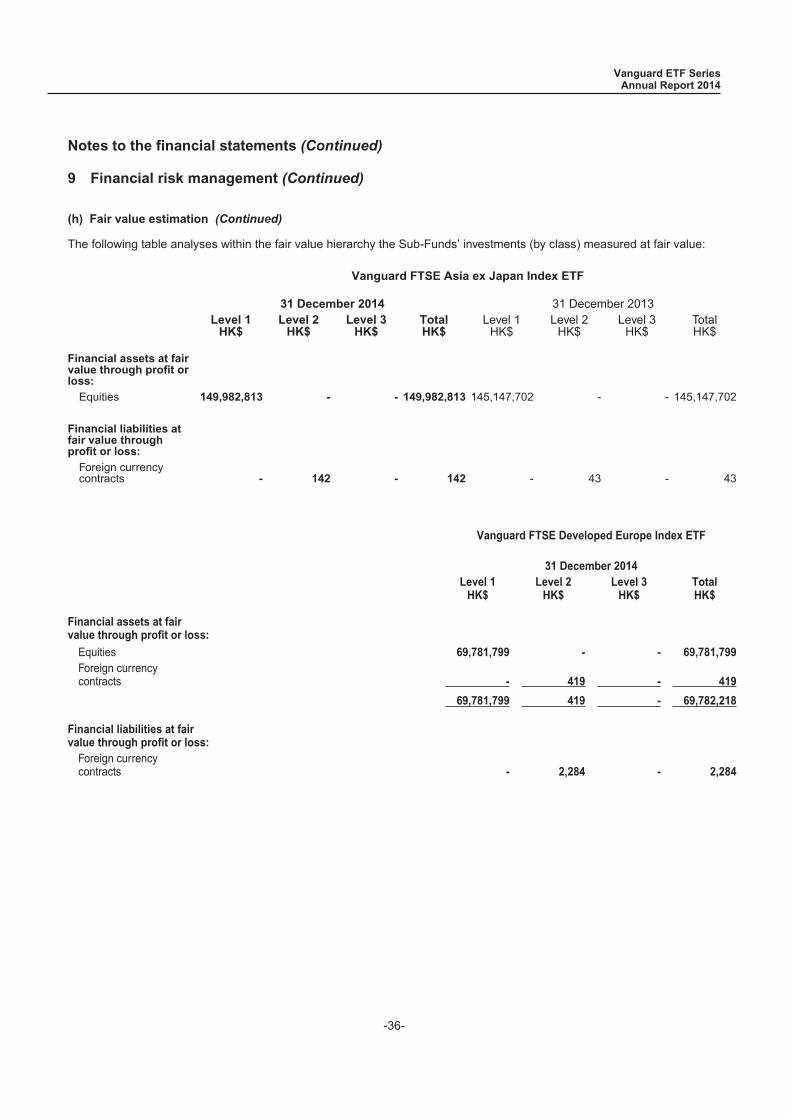
(h) Fair value estimation (Continued)
The following table analyses within the fair value hierarchy the Sub-Funds’ investments (by class) measured at fair value:
Vanguard FTSE Asia ex Japan Index ETF
31 December 2014 31 December 2013Level 1
HK$Level 2
HK$Level 3
HK$TotalHK$
Level 1HK$
Level 2HK$
Level 3HK$
TotalHK$
Financial assets at fairvalue through profit orloss:Equities 149,982,813 - - 149,982,813 145,147,702 - - 145,147,702
Financial liabilities atfair value throughprofit or loss:Foreign currencycontracts - 142 - 142 - 43 - 43
Vanguard FTSE Developed Europe Index ETF
31 December 2014Level 1
HK$Level 2
HK$Level 3
HK$TotalHK$
Financial assets at fairvalue through profit or loss:
Equities 69,781,799 - - 69,781,799Foreign currencycontracts - 419 - 419
69,781,799 419 - 69,782,218
Financial liabilities at fairvalue through profit or loss:Foreign currencycontracts - 2,284 - 2,284
Vanguard ETF SeriesAnnual Report 2014
Notes to the financial statements (Continued)
-36-
9 Financial risk management (Continued)
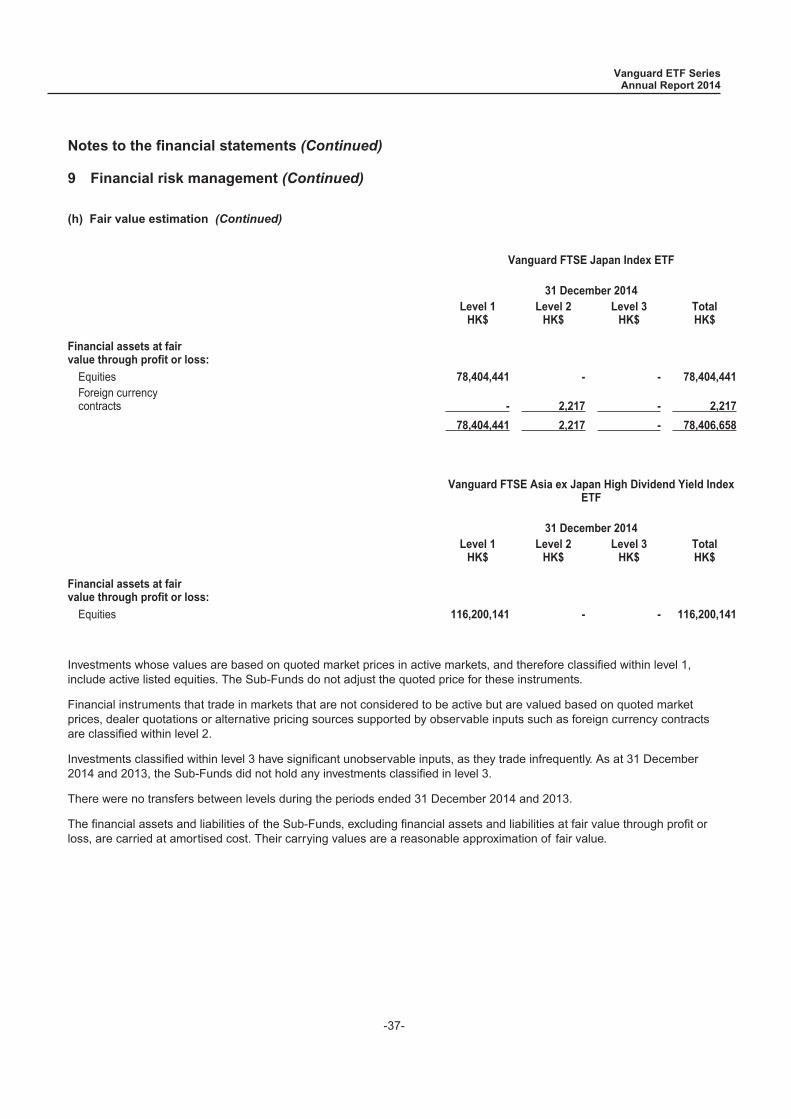
(h) Fair value estimation (Continued)
Vanguard FTSE Japan Index ETF
31 December 2014Level 1
HK$Level 2
HK$Level 3
HK$TotalHK$
Financial assets at fairvalue through profit or loss:
Equities 78,404,441 - - 78,404,441Foreign currencycontracts - 2,217 - 2,217
78,404,441 2,217 - 78,406,658
Vanguard FTSE Asia ex Japan High Dividend Yield IndexETF
31 December 2014Level 1
HK$Level 2
HK$Level 3
HK$TotalHK$
Financial assets at fairvalue through profit or loss:
Equities 116,200,141 - - 116,200,141
Investments whose values are based on quoted market prices in active markets, and therefore classified within level 1,include active listed equities. The Sub-Funds do not adjust the quoted price for these instruments.
Financial instruments that trade in markets that are not considered to be active but are valued based on quoted marketprices, dealer quotations or alternative pricing sources supported by observable inputs such as foreign currency contractsare classified within level 2.
Investments classified within level 3 have significant unobservable inputs, as they trade infrequently. As at 31 December2014 and 2013, the Sub-Funds did not hold any investments classified in level 3.
There were no transfers between levels during the periods ended 31 December 2014 and 2013.
The financial assets and liabilities of the Sub-Funds, excluding financial assets and liabilities at fair value through profit orloss, are carried at amortised cost. Their carrying values are a reasonable approximation of fair value.
Vanguard ETF SeriesAnnual Report 2014
Notes to the financial statements (Continued)
-37-
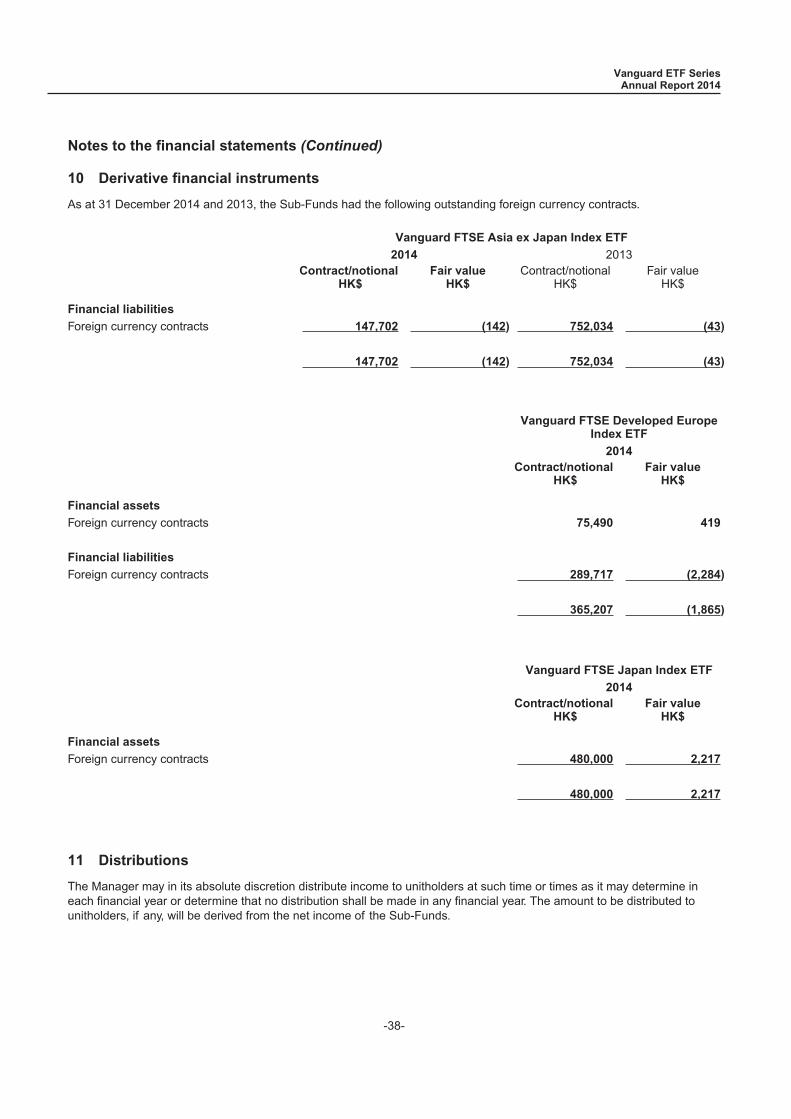
10 Derivative financial instruments
As at 31 December 2014 and 2013, the Sub-Funds had the following outstanding foreign currency contracts.
Vanguard FTSE Asia ex Japan Index ETF
2014 2013Contract/notional
HK$Fair value
HK$Contract/notional
HK$Fair value
HK$
Financial liabilities
Foreign currency contracts 147,702 (142) 752,034 (43)
147,702 (142) 752,034 (43)
Vanguard FTSE Developed EuropeIndex ETF
2014Contract/notional
HK$Fair value
HK$
Financial assets
Foreign currency contracts 75,490 419
Financial liabilities
Foreign currency contracts 289,717 (2,284)
365,207 (1,865)
Vanguard FTSE Japan Index ETF
2014Contract/notional
HK$Fair value
HK$
Financial assets
Foreign currency contracts 480,000 2,217
480,000 2,217
11 Distributions
The Manager may in its absolute discretion distribute income to unitholders at such time or times as it may determine ineach financial year or determine that no distribution shall be made in any financial year. The amount to be distributed tounitholders, if any, will be derived from the net income of the Sub-Funds.
Vanguard ETF SeriesAnnual Report 2014
Notes to the financial statements (Continued)
-38-
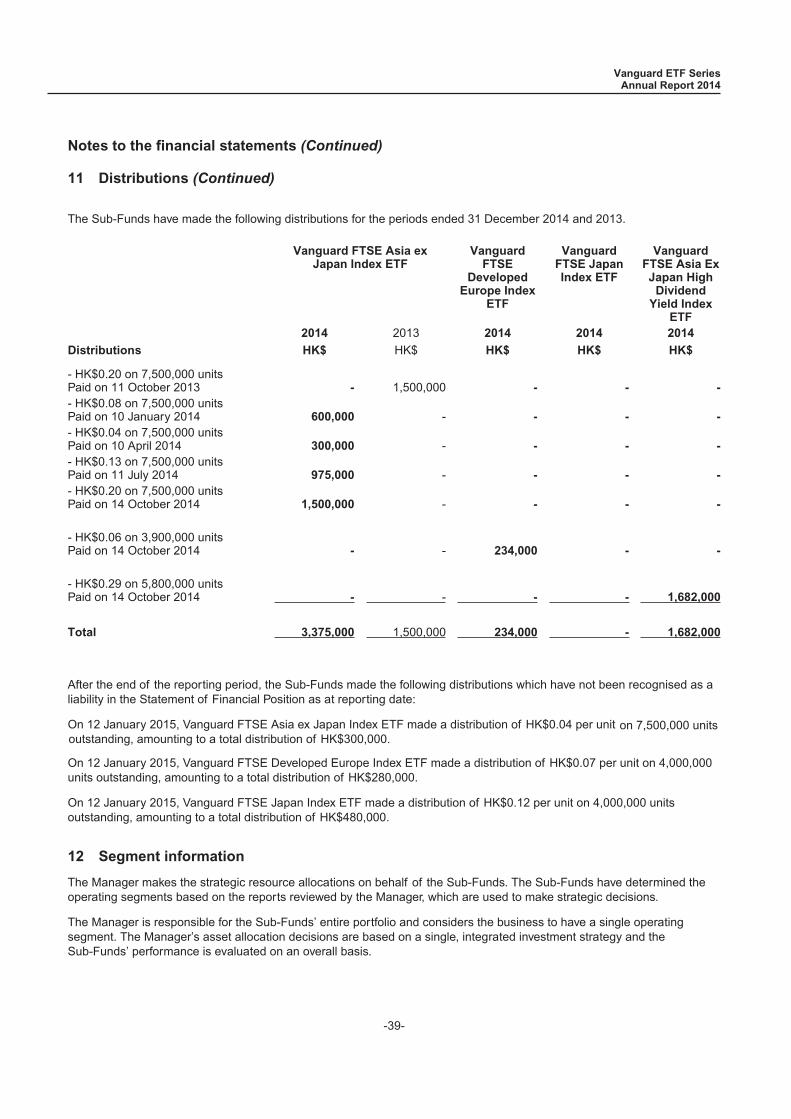
11 Distributions (Continued)
The Sub-Funds have made the following distributions for the periods ended 31 December 2014 and 2013.
Vanguard FTSE Asia exJapan Index ETF
VanguardFTSE
DevelopedEurope Index
ETF
VanguardFTSE JapanIndex ETF
VanguardFTSE Asia ExJapan High
DividendYield Index
ETF2014 2013 2014 2014 2014
Distributions HK$ HK$ HK$ HK$ HK$
- HK$0.20 on 7,500,000 unitsPaid on 11 October 2013 - 1,500,000 - - -- HK$0.08 on 7,500,000 unitsPaid on 10 January 2014 600,000 - - - -- HK$0.04 on 7,500,000 unitsPaid on 10 April 2014 300,000 - - - -- HK$0.13 on 7,500,000 unitsPaid on 11 July 2014 975,000 - - - -- HK$0.20 on 7,500,000 unitsPaid on 14 October 2014 1,500,000 - - - -
- HK$0.06 on 3,900,000 unitsPaid on 14 October 2014 - - 234,000 - -
- HK$0.29 on 5,800,000 unitsPaid on 14 October 2014 - - - - 1,682,000
Total 3,375,000 1,500,000 234,000 - 1,682,000
After the end of the reporting period, the Sub-Funds made the following distributions which have not been recognised as aliability in the Statement of Financial Position as at reporting date:
On 12 January 2015, Vanguard FTSE Asia ex Japan Index ETF made a distribution of HK$0.04 per unit on 7,500,000 unitsoutstanding, amounting to a total distribution of HK$300,000.
On 12 January 2015, Vanguard FTSE Developed Europe Index ETF made a distribution of HK$0.07 per unit on 4,000,000units outstanding, amounting to a total distribution of HK$280,000.
On 12 January 2015, Vanguard FTSE Japan Index ETF made a distribution of HK$0.12 per unit on 4,000,000 unitsoutstanding, amounting to a total distribution of HK$480,000.
12 Segment information
The Manager makes the strategic resource allocations on behalf of the Sub-Funds. The Sub-Funds have determined theoperating segments based on the reports reviewed by the Manager, which are used to make strategic decisions.
The Manager is responsible for the Sub-Funds’ entire portfolio and considers the business to have a single operatingsegment. The Manager’s asset allocation decisions are based on a single, integrated investment strategy and theSub-Funds’ performance is evaluated on an overall basis.
Vanguard ETF SeriesAnnual Report 2014
Notes to the financial statements (Continued)
-39-

12 Segment information (Continued)
The Sub-Funds trade in the constituent securities of the Underlying Index with the objective to provide investment resultsthat closely correspond to the performance of the Underlying Index.
The internal reporting provided to the Manager for the Sub-Funds’ assets, liabilities and performance is prepared on aconsistent basis with the measurement and recognition principles of IFRS.
There were no changes in the reportable segment during the periods ended 31 December 2014 and 2013.
The Sub-Funds are domiciled in Hong Kong. All of the Sub-Funds’ income is derived from investments in constituentsecurities of the Underlying Index.
The Sub-Funds have no assets classified as non-current assets. The Sub-Funds have a diversified portfolio of investments.During the periods ended 31 December 2014 and 2013, there was no investment which accounted for more than 10% ofthe Sub-Funds’ income. As at 31 December 2014 and 2013, there was no investment which accounted for more than 10%of the Sub-Funds’ net assets.
13 Approval of financial statements
The financial statements were approved by the Trustee and the Manager on 25 March 2015.
Vanguard ETF SeriesAnnual Report 2014
Notes to the financial statements (Continued)
-40-
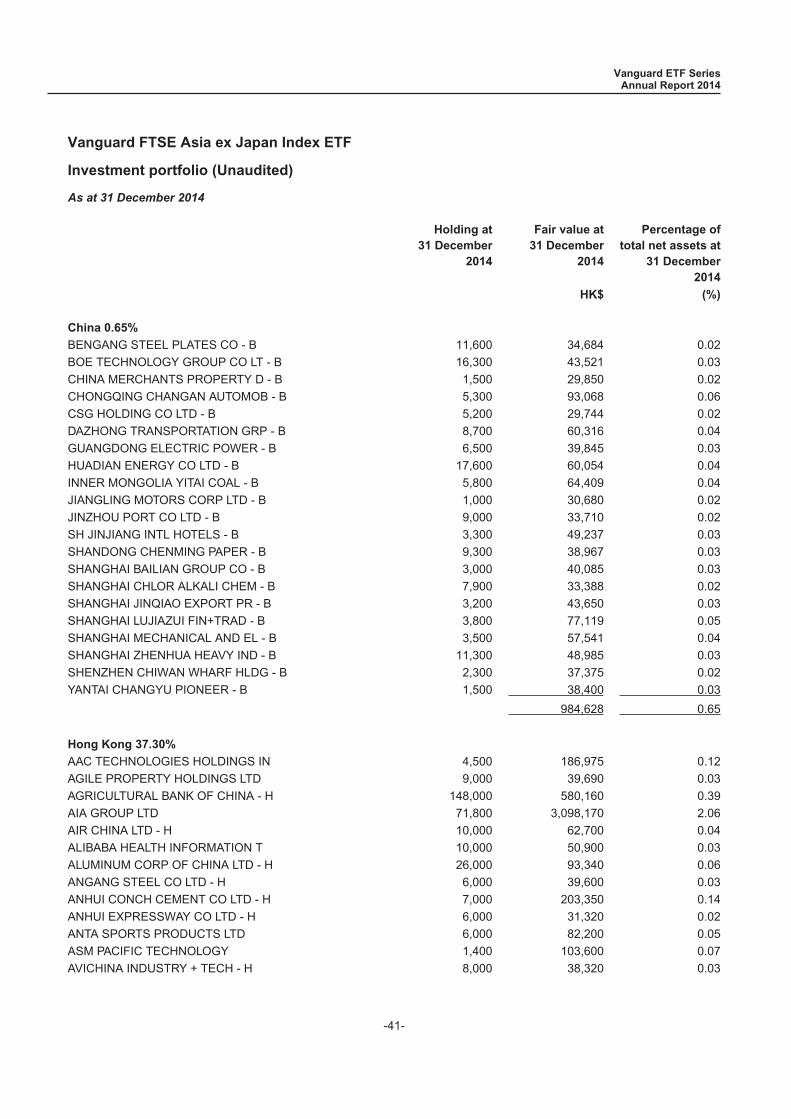
Vanguard FTSE Asia ex Japan Index ETF
Investment portfolio (Unaudited)
As at 31 December 2014
Holding at31 December
2014
Fair value at31 December
2014
Percentage oftotal net assets at
31 December2014
HK$ (%)
China 0.65%
BENGANG STEEL PLATES CO - B 11,600 34,684 0.02BOE TECHNOLOGY GROUP CO LT - B 16,300 43,521 0.03CHINA MERCHANTS PROPERTY D - B 1,500 29,850 0.02CHONGQING CHANGAN AUTOMOB - B 5,300 93,068 0.06CSG HOLDING CO LTD - B 5,200 29,744 0.02DAZHONG TRANSPORTATION GRP - B 8,700 60,316 0.04GUANGDONG ELECTRIC POWER - B 6,500 39,845 0.03HUADIAN ENERGY CO LTD - B 17,600 60,054 0.04INNER MONGOLIA YITAI COAL - B 5,800 64,409 0.04JIANGLING MOTORS CORP LTD - B 1,000 30,680 0.02JINZHOU PORT CO LTD - B 9,000 33,710 0.02SH JINJIANG INTL HOTELS - B 3,300 49,237 0.03SHANDONG CHENMING PAPER - B 9,300 38,967 0.03SHANGHAI BAILIAN GROUP CO - B 3,000 40,085 0.03SHANGHAI CHLOR ALKALI CHEM - B 7,900 33,388 0.02SHANGHAI JINQIAO EXPORT PR - B 3,200 43,650 0.03SHANGHAI LUJIAZUI FIN+TRAD - B 3,800 77,119 0.05SHANGHAI MECHANICAL AND EL - B 3,500 57,541 0.04SHANGHAI ZHENHUA HEAVY IND - B 11,300 48,985 0.03SHENZHEN CHIWAN WHARF HLDG - B 2,300 37,375 0.02YANTAI CHANGYU PIONEER - B 1,500 38,400 0.03
984,628 0.65
Hong Kong 37.30%
AAC TECHNOLOGIES HOLDINGS IN 4,500 186,975 0.12AGILE PROPERTY HOLDINGS LTD 9,000 39,690 0.03AGRICULTURAL BANK OF CHINA - H 148,000 580,160 0.39AIA GROUP LTD 71,800 3,098,170 2.06AIR CHINA LTD - H 10,000 62,700 0.04ALIBABA HEALTH INFORMATION T 10,000 50,900 0.03ALUMINUM CORP OF CHINA LTD - H 26,000 93,340 0.06ANGANG STEEL CO LTD - H 6,000 39,600 0.03ANHUI CONCH CEMENT CO LTD - H 7,000 203,350 0.14ANHUI EXPRESSWAY CO LTD - H 6,000 31,320 0.02ANTA SPORTS PRODUCTS LTD 6,000 82,200 0.05ASM PACIFIC TECHNOLOGY 1,400 103,600 0.07AVICHINA INDUSTRY + TECH - H 8,000 38,320 0.03
Vanguard ETF SeriesAnnual Report 2014
-41-
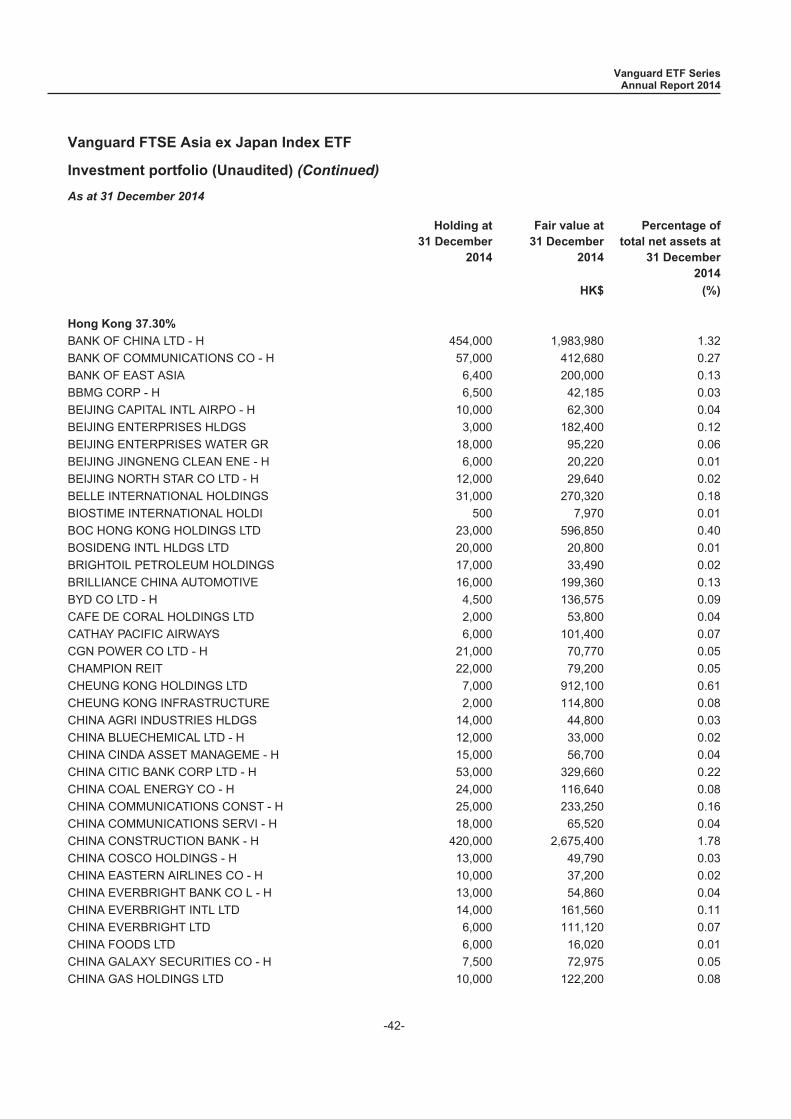
Vanguard FTSE Asia ex Japan Index ETF
Investment portfolio (Unaudited) (Continued)
As at 31 December 2014
Holding at31 December
2014
Fair value at31 December
2014
Percentage oftotal net assets at
31 December2014
HK$ (%)
Hong Kong 37.30%
BANK OF CHINA LTD - H 454,000 1,983,980 1.32BANK OF COMMUNICATIONS CO - H 57,000 412,680 0.27BANK OF EAST ASIA 6,400 200,000 0.13BBMG CORP - H 6,500 42,185 0.03BEIJING CAPITAL INTL AIRPO - H 10,000 62,300 0.04BEIJING ENTERPRISES HLDGS 3,000 182,400 0.12BEIJING ENTERPRISES WATER GR 18,000 95,220 0.06BEIJING JINGNENG CLEAN ENE - H 6,000 20,220 0.01BEIJING NORTH STAR CO LTD - H 12,000 29,640 0.02BELLE INTERNATIONAL HOLDINGS 31,000 270,320 0.18BIOSTIME INTERNATIONAL HOLDI 500 7,970 0.01BOC HONG KONG HOLDINGS LTD 23,000 596,850 0.40BOSIDENG INTL HLDGS LTD 20,000 20,800 0.01BRIGHTOIL PETROLEUM HOLDINGS 17,000 33,490 0.02BRILLIANCE CHINA AUTOMOTIVE 16,000 199,360 0.13BYD CO LTD - H 4,500 136,575 0.09CAFE DE CORAL HOLDINGS LTD 2,000 53,800 0.04CATHAY PACIFIC AIRWAYS 6,000 101,400 0.07CGN POWER CO LTD - H 21,000 70,770 0.05CHAMPION REIT 22,000 79,200 0.05CHEUNG KONG HOLDINGS LTD 7,000 912,100 0.61CHEUNG KONG INFRASTRUCTURE 2,000 114,800 0.08CHINA AGRI INDUSTRIES HLDGS 14,000 44,800 0.03CHINA BLUECHEMICAL LTD - H 12,000 33,000 0.02CHINA CINDA ASSET MANAGEME - H 15,000 56,700 0.04CHINA CITIC BANK CORP LTD - H 53,000 329,660 0.22CHINA COAL ENERGY CO - H 24,000 116,640 0.08CHINA COMMUNICATIONS CONST - H 25,000 233,250 0.16CHINA COMMUNICATIONS SERVI - H 18,000 65,520 0.04CHINA CONSTRUCTION BANK - H 420,000 2,675,400 1.78CHINA COSCO HOLDINGS - H 13,000 49,790 0.03CHINA EASTERN AIRLINES CO - H 10,000 37,200 0.02CHINA EVERBRIGHT BANK CO L - H 13,000 54,860 0.04CHINA EVERBRIGHT INTL LTD 14,000 161,560 0.11CHINA EVERBRIGHT LTD 6,000 111,120 0.07CHINA FOODS LTD 6,000 16,020 0.01CHINA GALAXY SECURITIES CO - H 7,500 72,975 0.05CHINA GAS HOLDINGS LTD 10,000 122,200 0.08
Vanguard ETF SeriesAnnual Report 2014
-42-
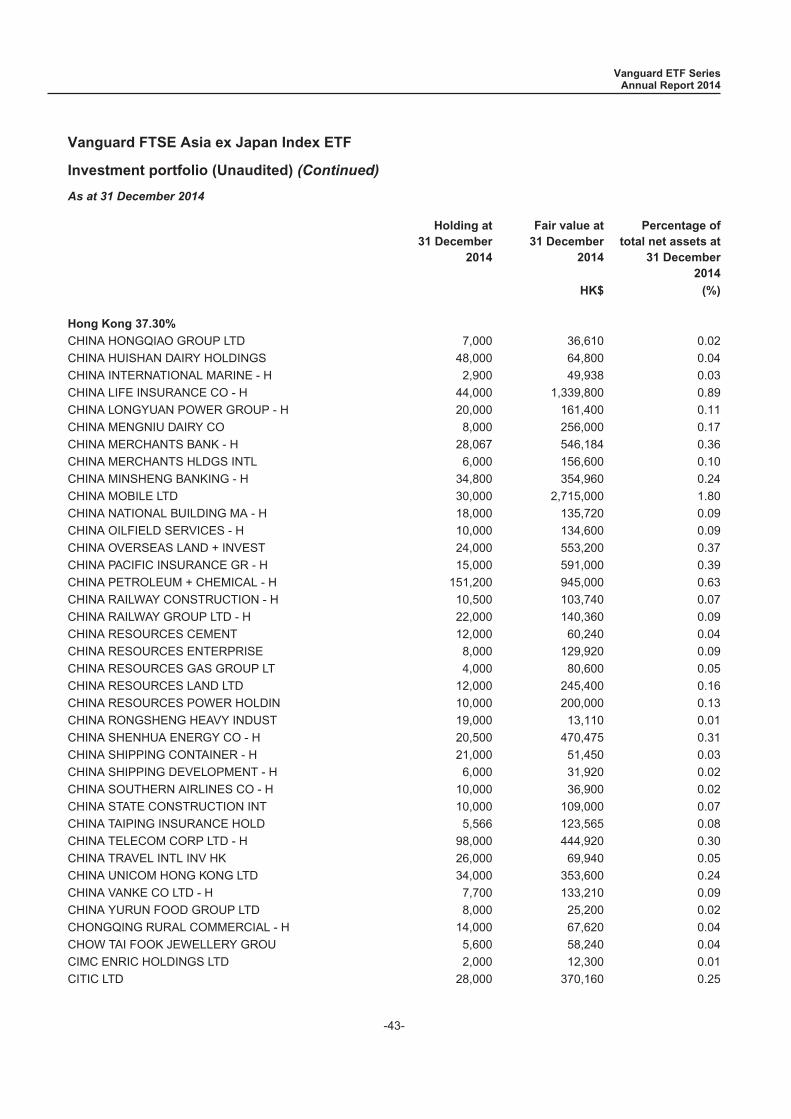
Vanguard FTSE Asia ex Japan Index ETF
Investment portfolio (Unaudited) (Continued)
As at 31 December 2014
Holding at31 December
2014
Fair value at31 December
2014
Percentage oftotal net assets at
31 December2014
HK$ (%)
Hong Kong 37.30%
CHINA HONGQIAO GROUP LTD 7,000 36,610 0.02CHINA HUISHAN DAIRY HOLDINGS 48,000 64,800 0.04CHINA INTERNATIONAL MARINE - H 2,900 49,938 0.03CHINA LIFE INSURANCE CO - H 44,000 1,339,800 0.89CHINA LONGYUAN POWER GROUP - H 20,000 161,400 0.11CHINA MENGNIU DAIRY CO 8,000 256,000 0.17CHINA MERCHANTS BANK - H 28,067 546,184 0.36CHINA MERCHANTS HLDGS INTL 6,000 156,600 0.10CHINA MINSHENG BANKING - H 34,800 354,960 0.24CHINA MOBILE LTD 30,000 2,715,000 1.80CHINA NATIONAL BUILDING MA - H 18,000 135,720 0.09CHINA OILFIELD SERVICES - H 10,000 134,600 0.09CHINA OVERSEAS LAND + INVEST 24,000 553,200 0.37CHINA PACIFIC INSURANCE GR - H 15,000 591,000 0.39CHINA PETROLEUM + CHEMICAL - H 151,200 945,000 0.63CHINA RAILWAY CONSTRUCTION - H 10,500 103,740 0.07CHINA RAILWAY GROUP LTD - H 22,000 140,360 0.09CHINA RESOURCES CEMENT 12,000 60,240 0.04CHINA RESOURCES ENTERPRISE 8,000 129,920 0.09CHINA RESOURCES GAS GROUP LT 4,000 80,600 0.05CHINA RESOURCES LAND LTD 12,000 245,400 0.16CHINA RESOURCES POWER HOLDIN 10,000 200,000 0.13CHINA RONGSHENG HEAVY INDUST 19,000 13,110 0.01CHINA SHENHUA ENERGY CO - H 20,500 470,475 0.31CHINA SHIPPING CONTAINER - H 21,000 51,450 0.03CHINA SHIPPING DEVELOPMENT - H 6,000 31,920 0.02CHINA SOUTHERN AIRLINES CO - H 10,000 36,900 0.02CHINA STATE CONSTRUCTION INT 10,000 109,000 0.07CHINA TAIPING INSURANCE HOLD 5,566 123,565 0.08CHINA TELECOM CORP LTD - H 98,000 444,920 0.30CHINA TRAVEL INTL INV HK 26,000 69,940 0.05CHINA UNICOM HONG KONG LTD 34,000 353,600 0.24CHINA VANKE CO LTD - H 7,700 133,210 0.09CHINA YURUN FOOD GROUP LTD 8,000 25,200 0.02CHONGQING RURAL COMMERCIAL - H 14,000 67,620 0.04CHOW TAI FOOK JEWELLERY GROU 5,600 58,240 0.04CIMC ENRIC HOLDINGS LTD 2,000 12,300 0.01CITIC LTD 28,000 370,160 0.25
Vanguard ETF SeriesAnnual Report 2014
-43-
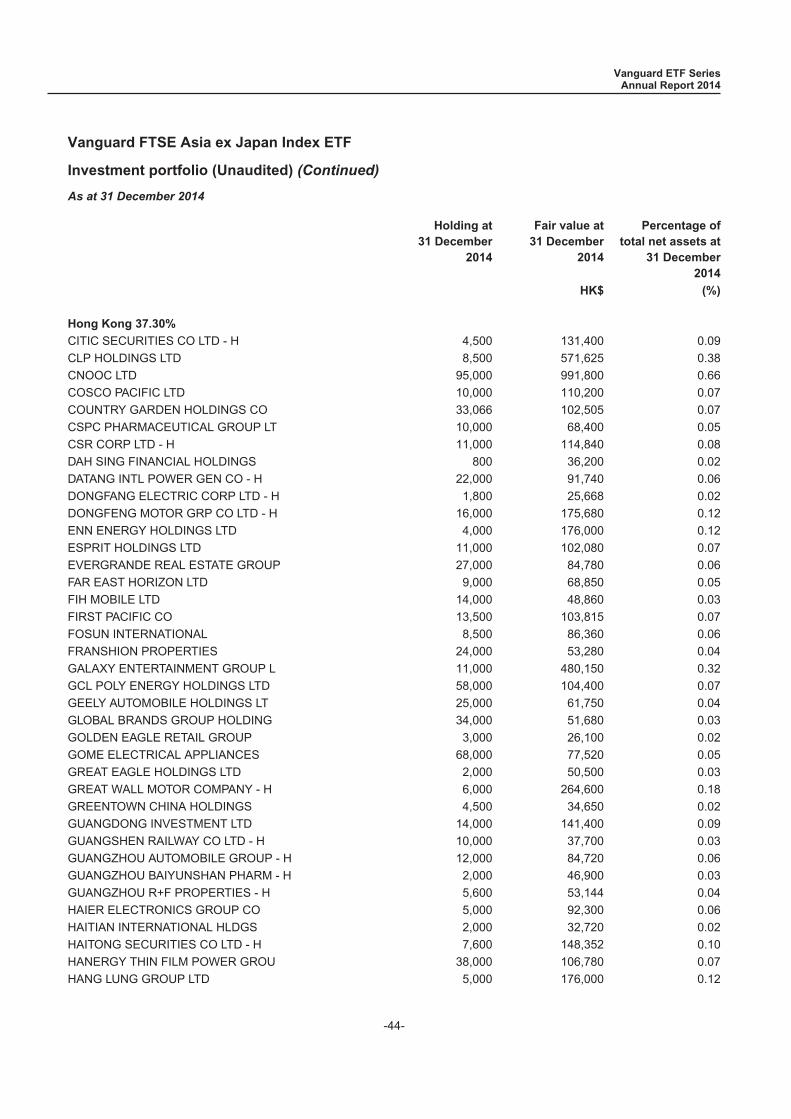
Vanguard FTSE Asia ex Japan Index ETF
Investment portfolio (Unaudited) (Continued)
As at 31 December 2014
Holding at31 December
2014
Fair value at31 December
2014
Percentage oftotal net assets at
31 December2014
HK$ (%)
Hong Kong 37.30%
CITIC SECURITIES CO LTD - H 4,500 131,400 0.09CLP HOLDINGS LTD 8,500 571,625 0.38CNOOC LTD 95,000 991,800 0.66COSCO PACIFIC LTD 10,000 110,200 0.07COUNTRY GARDEN HOLDINGS CO 33,066 102,505 0.07CSPC PHARMACEUTICAL GROUP LT 10,000 68,400 0.05CSR CORP LTD - H 11,000 114,840 0.08DAH SING FINANCIAL HOLDINGS 800 36,200 0.02DATANG INTL POWER GEN CO - H 22,000 91,740 0.06DONGFANG ELECTRIC CORP LTD - H 1,800 25,668 0.02DONGFENG MOTOR GRP CO LTD - H 16,000 175,680 0.12ENN ENERGY HOLDINGS LTD 4,000 176,000 0.12ESPRIT HOLDINGS LTD 11,000 102,080 0.07EVERGRANDE REAL ESTATE GROUP 27,000 84,780 0.06FAR EAST HORIZON LTD 9,000 68,850 0.05FIH MOBILE LTD 14,000 48,860 0.03FIRST PACIFIC CO 13,500 103,815 0.07FOSUN INTERNATIONAL 8,500 86,360 0.06FRANSHION PROPERTIES 24,000 53,280 0.04GALAXY ENTERTAINMENT GROUP L 11,000 480,150 0.32GCL POLY ENERGY HOLDINGS LTD 58,000 104,400 0.07GEELY AUTOMOBILE HOLDINGS LT 25,000 61,750 0.04GLOBAL BRANDS GROUP HOLDING 34,000 51,680 0.03GOLDEN EAGLE RETAIL GROUP 3,000 26,100 0.02GOME ELECTRICAL APPLIANCES 68,000 77,520 0.05GREAT EAGLE HOLDINGS LTD 2,000 50,500 0.03GREAT WALL MOTOR COMPANY - H 6,000 264,600 0.18GREENTOWN CHINA HOLDINGS 4,500 34,650 0.02GUANGDONG INVESTMENT LTD 14,000 141,400 0.09GUANGSHEN RAILWAY CO LTD - H 10,000 37,700 0.03GUANGZHOU AUTOMOBILE GROUP - H 12,000 84,720 0.06GUANGZHOU BAIYUNSHAN PHARM - H 2,000 46,900 0.03GUANGZHOU R+F PROPERTIES - H 5,600 53,144 0.04HAIER ELECTRONICS GROUP CO 5,000 92,300 0.06HAITIAN INTERNATIONAL HLDGS 2,000 32,720 0.02HAITONG SECURITIES CO LTD - H 7,600 148,352 0.10HANERGY THIN FILM POWER GROU 38,000 106,780 0.07HANG LUNG GROUP LTD 5,000 176,000 0.12
Vanguard ETF SeriesAnnual Report 2014
-44-
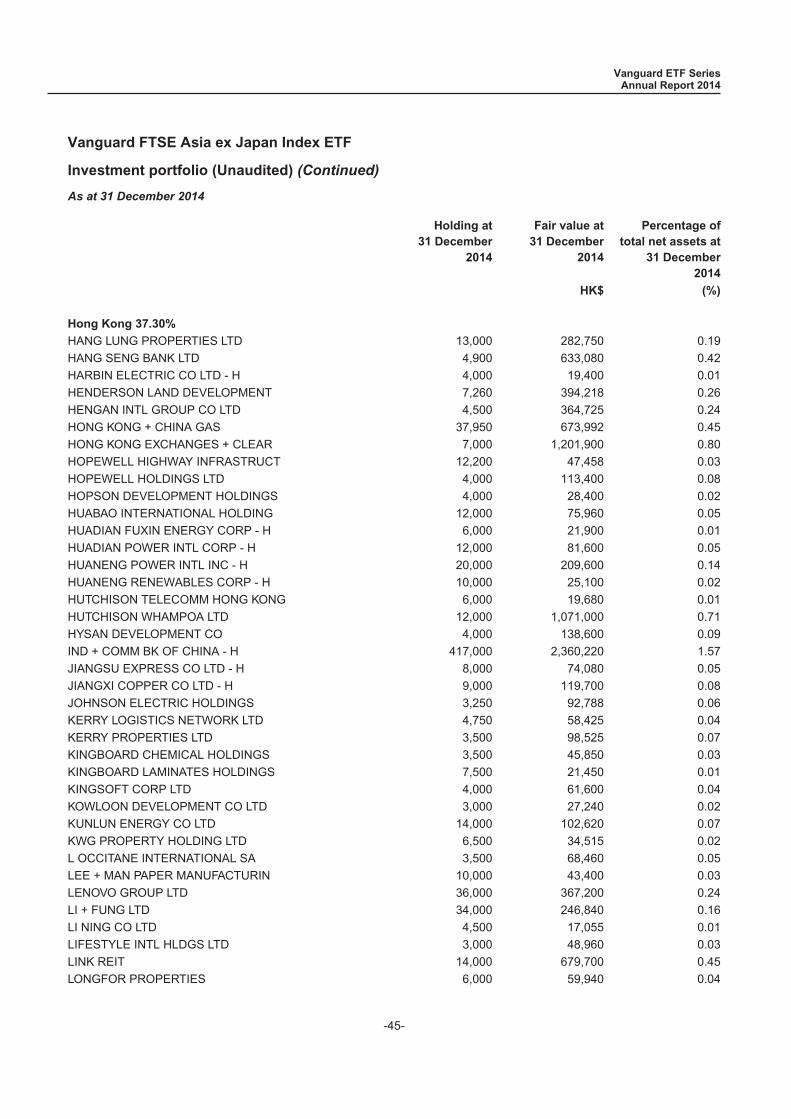
Vanguard FTSE Asia ex Japan Index ETF
Investment portfolio (Unaudited) (Continued)
As at 31 December 2014
Holding at31 December
2014
Fair value at31 December
2014
Percentage oftotal net assets at
31 December2014
HK$ (%)
Hong Kong 37.30%
HANG LUNG PROPERTIES LTD 13,000 282,750 0.19HANG SENG BANK LTD 4,900 633,080 0.42HARBIN ELECTRIC CO LTD - H 4,000 19,400 0.01HENDERSON LAND DEVELOPMENT 7,260 394,218 0.26HENGAN INTL GROUP CO LTD 4,500 364,725 0.24HONG KONG + CHINA GAS 37,950 673,992 0.45HONG KONG EXCHANGES + CLEAR 7,000 1,201,900 0.80HOPEWELL HIGHWAY INFRASTRUCT 12,200 47,458 0.03HOPEWELL HOLDINGS LTD 4,000 113,400 0.08HOPSON DEVELOPMENT HOLDINGS 4,000 28,400 0.02HUABAO INTERNATIONAL HOLDING 12,000 75,960 0.05HUADIAN FUXIN ENERGY CORP - H 6,000 21,900 0.01HUADIAN POWER INTL CORP - H 12,000 81,600 0.05HUANENG POWER INTL INC - H 20,000 209,600 0.14HUANENG RENEWABLES CORP - H 10,000 25,100 0.02HUTCHISON TELECOMM HONG KONG 6,000 19,680 0.01HUTCHISON WHAMPOA LTD 12,000 1,071,000 0.71HYSAN DEVELOPMENT CO 4,000 138,600 0.09IND + COMM BK OF CHINA - H 417,000 2,360,220 1.57JIANGSU EXPRESS CO LTD - H 8,000 74,080 0.05JIANGXI COPPER CO LTD - H 9,000 119,700 0.08JOHNSON ELECTRIC HOLDINGS 3,250 92,788 0.06KERRY LOGISTICS NETWORK LTD 4,750 58,425 0.04KERRY PROPERTIES LTD 3,500 98,525 0.07KINGBOARD CHEMICAL HOLDINGS 3,500 45,850 0.03KINGBOARD LAMINATES HOLDINGS 7,500 21,450 0.01KINGSOFT CORP LTD 4,000 61,600 0.04KOWLOON DEVELOPMENT CO LTD 3,000 27,240 0.02KUNLUN ENERGY CO LTD 14,000 102,620 0.07KWG PROPERTY HOLDING LTD 6,500 34,515 0.02L OCCITANE INTERNATIONAL SA 3,500 68,460 0.05LEE + MAN PAPER MANUFACTURIN 10,000 43,400 0.03LENOVO GROUP LTD 36,000 367,200 0.24LI + FUNG LTD 34,000 246,840 0.16LI NING CO LTD 4,500 17,055 0.01LIFESTYLE INTL HLDGS LTD 3,000 48,960 0.03LINK REIT 14,000 679,700 0.45LONGFOR PROPERTIES 6,000 59,940 0.04
Vanguard ETF SeriesAnnual Report 2014
-45-

Vanguard FTSE Asia ex Japan Index ETF
Investment portfolio (Unaudited) (Continued)
As at 31 December 2014
Holding at31 December
2014
Fair value at31 December
2014
Percentage oftotal net assets at
31 December2014
HK$ (%)
Hong Kong 37.30%
MACAU LEGEND DEVELOPMENT LTD 8,000 23,280 0.02MELCO INTERNATIONAL DEVELOP. 5,000 85,500 0.06METALLURGICAL CORP OF CHIN - H 14,000 36,120 0.02MGM CHINA HOLDINGS LTD 4,400 86,768 0.06MTR CORP 8,500 270,300 0.18NEW CHINA LIFE INSURANCE C - H 3,600 140,940 0.09NEW WORLD CHINA LAND LTD 18,000 82,800 0.06NEW WORLD DEVELOPMENT 29,333 261,650 0.17NINE DRAGONS PAPER HOLDINGS 10,000 68,000 0.05NWS HOLDINGS LTD 9,000 128,700 0.09ORIENT OVERSEAS INTL LTD 1,000 45,350 0.03PARKSON RETAIL GROUP LTD 7,500 14,550 0.01PCCW LTD 23,000 121,900 0.08PEOPLE S INSURANCE CO GROU - H 20,000 72,600 0.05PETROCHINA CO LTD - H 128,000 1,100,800 0.73PICC PROPERTY + CASUALTY - H 17,440 262,995 0.17PING AN INSURANCE GROUP CO - H 14,000 1,107,400 0.74POLY PROPERTY GROUP CO LTD 10,000 31,900 0.02POWER ASSETS HOLDINGS LTD 7,000 526,750 0.35PRADA S.P.A. 3,200 140,640 0.09RENHE COMMERCIAL HOLDINGS 90,000 30,600 0.02SAMSONITE INTERNATIONAL SA 9,300 213,900 0.14SANDS CHINA LTD 14,400 549,360 0.37SEMICONDUCTOR MANUFACTURING 133,000 94,430 0.06SHANDONG WEIGAO GP MEDICAL - H 12,000 75,120 0.05SHANGHAI ELECTRIC GRP CO L - H 16,000 66,080 0.04SHANGHAI FOSUN PHARMACEUTI - H 1,500 41,850 0.03SHANGHAI INDUSTRIAL HLDG LTD 3,000 69,750 0.05SHANGHAI PHARMACEUTICALS - H 4,300 75,250 0.05SHANGRI LA ASIA LTD 8,000 85,600 0.06SHENZHEN INTL HOLDINGS 5,750 65,435 0.04SHENZHEN INVESTMENT LTD 14,000 31,220 0.02SHENZHOU INTERNATIONAL GROUP 3,000 76,800 0.05SHIMAO PROPERTY HOLDINGS LTD 8,000 138,720 0.09SHOUGANG FUSHAN RESOURCES GR 18,000 30,420 0.02SHUI ON LAND LTD 17,500 32,025 0.02SHUN TAK HOLDINGS LTD 14,000 50,260 0.03SIHUAN PHARMACEUTICAL HLDGS 18,000 93,420 0.06
Vanguard ETF SeriesAnnual Report 2014
-46-
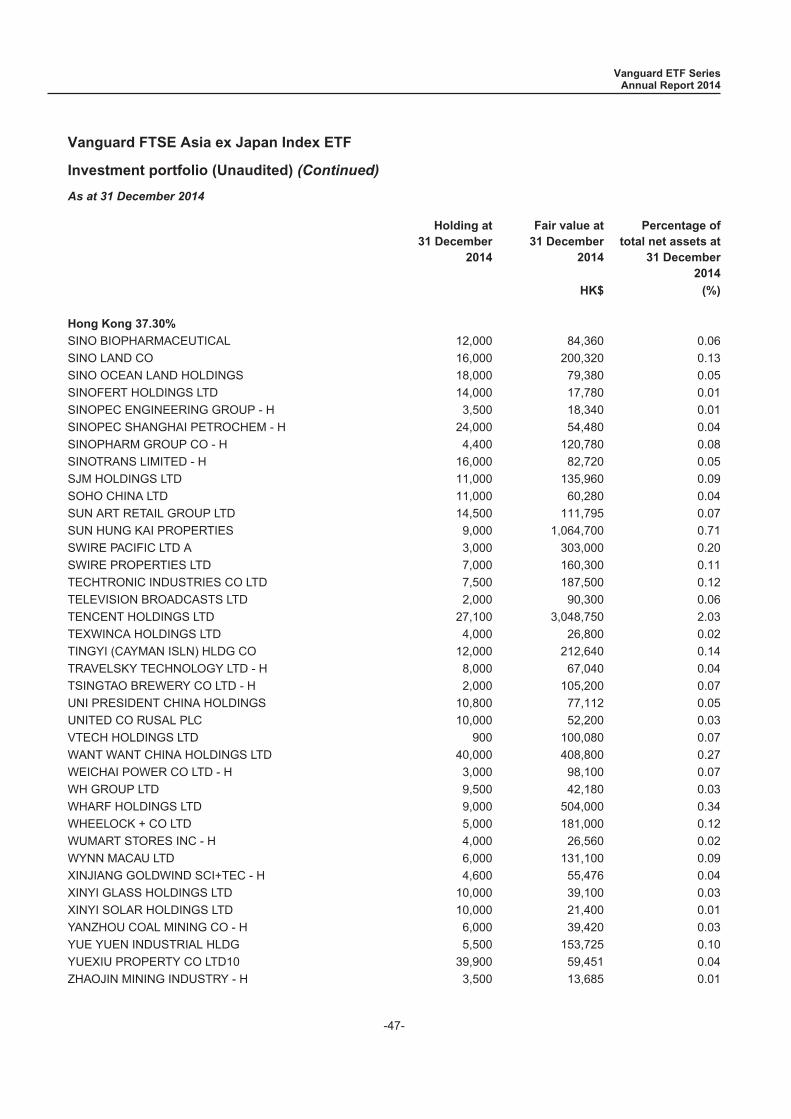
Vanguard FTSE Asia ex Japan Index ETF
Investment portfolio (Unaudited) (Continued)
As at 31 December 2014
Holding at31 December
2014
Fair value at31 December
2014
Percentage oftotal net assets at
31 December2014
HK$ (%)
Hong Kong 37.30%
SINO BIOPHARMACEUTICAL 12,000 84,360 0.06SINO LAND CO 16,000 200,320 0.13SINO OCEAN LAND HOLDINGS 18,000 79,380 0.05SINOFERT HOLDINGS LTD 14,000 17,780 0.01SINOPEC ENGINEERING GROUP - H 3,500 18,340 0.01SINOPEC SHANGHAI PETROCHEM - H 24,000 54,480 0.04SINOPHARM GROUP CO - H 4,400 120,780 0.08SINOTRANS LIMITED - H 16,000 82,720 0.05SJM HOLDINGS LTD 11,000 135,960 0.09SOHO CHINA LTD 11,000 60,280 0.04SUN ART RETAIL GROUP LTD 14,500 111,795 0.07SUN HUNG KAI PROPERTIES 9,000 1,064,700 0.71SWIRE PACIFIC LTD A 3,000 303,000 0.20SWIRE PROPERTIES LTD 7,000 160,300 0.11TECHTRONIC INDUSTRIES CO LTD 7,500 187,500 0.12TELEVISION BROADCASTS LTD 2,000 90,300 0.06TENCENT HOLDINGS LTD 27,100 3,048,750 2.03TEXWINCA HOLDINGS LTD 4,000 26,800 0.02TINGYI (CAYMAN ISLN) HLDG CO 12,000 212,640 0.14TRAVELSKY TECHNOLOGY LTD - H 8,000 67,040 0.04TSINGTAO BREWERY CO LTD - H 2,000 105,200 0.07UNI PRESIDENT CHINA HOLDINGS 10,800 77,112 0.05UNITED CO RUSAL PLC 10,000 52,200 0.03VTECH HOLDINGS LTD 900 100,080 0.07WANT WANT CHINA HOLDINGS LTD 40,000 408,800 0.27WEICHAI POWER CO LTD - H 3,000 98,100 0.07WH GROUP LTD 9,500 42,180 0.03WHARF HOLDINGS LTD 9,000 504,000 0.34WHEELOCK + CO LTD 5,000 181,000 0.12WUMART STORES INC - H 4,000 26,560 0.02WYNN MACAU LTD 6,000 131,100 0.09XINJIANG GOLDWIND SCI+TEC - H 4,600 55,476 0.04XINYI GLASS HOLDINGS LTD 10,000 39,100 0.03XINYI SOLAR HOLDINGS LTD 10,000 21,400 0.01YANZHOU COAL MINING CO - H 6,000 39,420 0.03YUE YUEN INDUSTRIAL HLDG 5,500 153,725 0.10YUEXIU PROPERTY CO LTD10 39,900 59,451 0.04ZHAOJIN MINING INDUSTRY - H 3,500 13,685 0.01
Vanguard ETF SeriesAnnual Report 2014
-47-
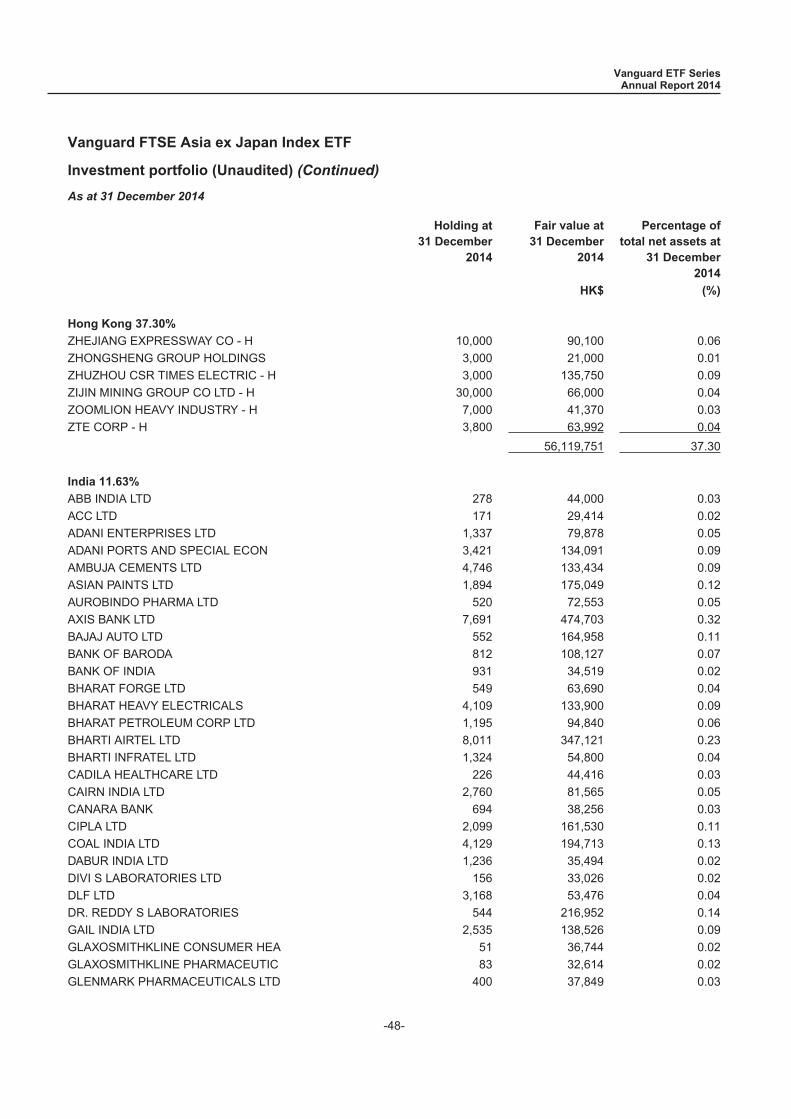
Vanguard FTSE Asia ex Japan Index ETF
Investment portfolio (Unaudited) (Continued)
As at 31 December 2014
Holding at31 December
2014
Fair value at31 December
2014
Percentage oftotal net assets at
31 December2014
HK$ (%)
Hong Kong 37.30%
ZHEJIANG EXPRESSWAY CO - H 10,000 90,100 0.06ZHONGSHENG GROUP HOLDINGS 3,000 21,000 0.01ZHUZHOU CSR TIMES ELECTRIC - H 3,000 135,750 0.09ZIJIN MINING GROUP CO LTD - H 30,000 66,000 0.04ZOOMLION HEAVY INDUSTRY - H 7,000 41,370 0.03ZTE CORP - H 3,800 63,992 0.04
56,119,751 37.30
India 11.63%
ABB INDIA LTD 278 44,000 0.03ACC LTD 171 29,414 0.02ADANI ENTERPRISES LTD 1,337 79,878 0.05ADANI PORTS AND SPECIAL ECON 3,421 134,091 0.09AMBUJA CEMENTS LTD 4,746 133,434 0.09ASIAN PAINTS LTD 1,894 175,049 0.12AUROBINDO PHARMA LTD 520 72,553 0.05AXIS BANK LTD 7,691 474,703 0.32BAJAJ AUTO LTD 552 164,958 0.11BANK OF BARODA 812 108,127 0.07BANK OF INDIA 931 34,519 0.02BHARAT FORGE LTD 549 63,690 0.04BHARAT HEAVY ELECTRICALS 4,109 133,900 0.09BHARAT PETROLEUM CORP LTD 1,195 94,840 0.06BHARTI AIRTEL LTD 8,011 347,121 0.23BHARTI INFRATEL LTD 1,324 54,800 0.04CADILA HEALTHCARE LTD 226 44,416 0.03CAIRN INDIA LTD 2,760 81,565 0.05CANARA BANK 694 38,256 0.03CIPLA LTD 2,099 161,530 0.11COAL INDIA LTD 4,129 194,713 0.13DABUR INDIA LTD 1,236 35,494 0.02DIVI S LABORATORIES LTD 156 33,026 0.02DLF LTD 3,168 53,476 0.04DR. REDDY S LABORATORIES 544 216,952 0.14GAIL INDIA LTD 2,535 138,526 0.09GLAXOSMITHKLINE CONSUMER HEA 51 36,744 0.02GLAXOSMITHKLINE PHARMACEUTIC 83 32,614 0.02GLENMARK PHARMACEUTICALS LTD 400 37,849 0.03
Vanguard ETF SeriesAnnual Report 2014
-48-
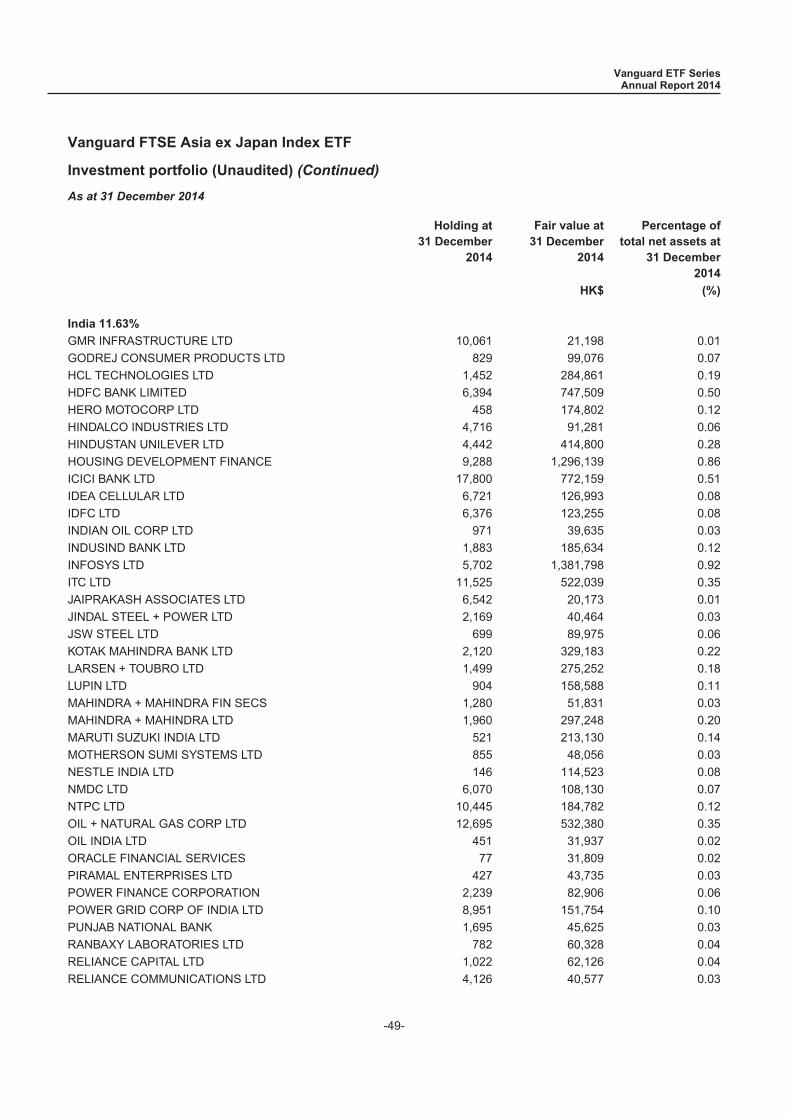
Vanguard FTSE Asia ex Japan Index ETF
Investment portfolio (Unaudited) (Continued)
As at 31 December 2014
Holding at31 December
2014
Fair value at31 December
2014
Percentage oftotal net assets at
31 December2014
HK$ (%)
India 11.63%
GMR INFRASTRUCTURE LTD 10,061 21,198 0.01GODREJ CONSUMER PRODUCTS LTD 829 99,076 0.07HCL TECHNOLOGIES LTD 1,452 284,861 0.19HDFC BANK LIMITED 6,394 747,509 0.50HERO MOTOCORP LTD 458 174,802 0.12HINDALCO INDUSTRIES LTD 4,716 91,281 0.06HINDUSTAN UNILEVER LTD 4,442 414,800 0.28HOUSING DEVELOPMENT FINANCE 9,288 1,296,139 0.86ICICI BANK LTD 17,800 772,159 0.51IDEA CELLULAR LTD 6,721 126,993 0.08IDFC LTD 6,376 123,255 0.08INDIAN OIL CORP LTD 971 39,635 0.03INDUSIND BANK LTD 1,883 185,634 0.12INFOSYS LTD 5,702 1,381,798 0.92ITC LTD 11,525 522,039 0.35JAIPRAKASH ASSOCIATES LTD 6,542 20,173 0.01JINDAL STEEL + POWER LTD 2,169 40,464 0.03JSW STEEL LTD 699 89,975 0.06KOTAK MAHINDRA BANK LTD 2,120 329,183 0.22LARSEN + TOUBRO LTD 1,499 275,252 0.18LUPIN LTD 904 158,588 0.11MAHINDRA + MAHINDRA FIN SECS 1,280 51,831 0.03MAHINDRA + MAHINDRA LTD 1,960 297,248 0.20MARUTI SUZUKI INDIA LTD 521 213,130 0.14MOTHERSON SUMI SYSTEMS LTD 855 48,056 0.03NESTLE INDIA LTD 146 114,523 0.08NMDC LTD 6,070 108,130 0.07NTPC LTD 10,445 184,782 0.12OIL + NATURAL GAS CORP LTD 12,695 532,380 0.35OIL INDIA LTD 451 31,937 0.02ORACLE FINANCIAL SERVICES 77 31,809 0.02PIRAMAL ENTERPRISES LTD 427 43,735 0.03POWER FINANCE CORPORATION 2,239 82,906 0.06POWER GRID CORP OF INDIA LTD 8,951 151,754 0.10PUNJAB NATIONAL BANK 1,695 45,625 0.03RANBAXY LABORATORIES LTD 782 60,328 0.04RELIANCE CAPITAL LTD 1,022 62,126 0.04RELIANCE COMMUNICATIONS LTD 4,126 40,577 0.03
Vanguard ETF SeriesAnnual Report 2014
-49-
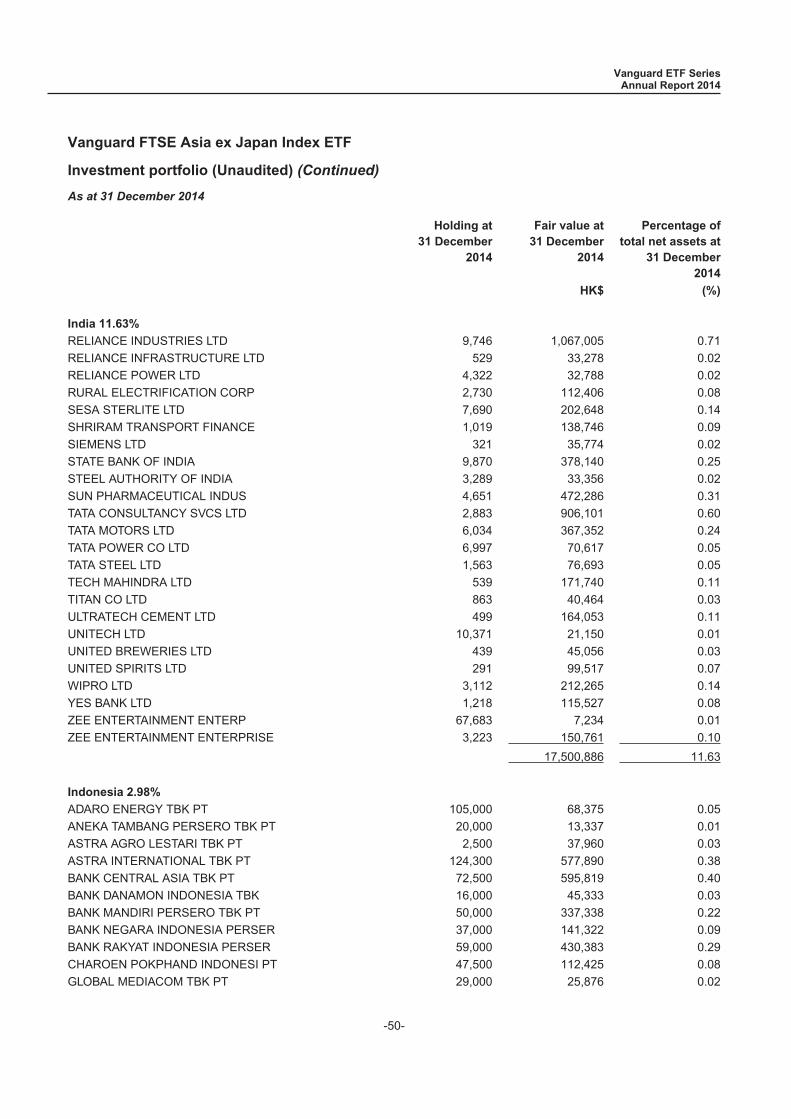
Vanguard FTSE Asia ex Japan Index ETF
Investment portfolio (Unaudited) (Continued)
As at 31 December 2014
Holding at31 December
2014
Fair value at31 December
2014
Percentage oftotal net assets at
31 December2014
HK$ (%)
India 11.63%
RELIANCE INDUSTRIES LTD 9,746 1,067,005 0.71RELIANCE INFRASTRUCTURE LTD 529 33,278 0.02RELIANCE POWER LTD 4,322 32,788 0.02RURAL ELECTRIFICATION CORP 2,730 112,406 0.08SESA STERLITE LTD 7,690 202,648 0.14SHRIRAM TRANSPORT FINANCE 1,019 138,746 0.09SIEMENS LTD 321 35,774 0.02STATE BANK OF INDIA 9,870 378,140 0.25STEEL AUTHORITY OF INDIA 3,289 33,356 0.02SUN PHARMACEUTICAL INDUS 4,651 472,286 0.31TATA CONSULTANCY SVCS LTD 2,883 906,101 0.60TATA MOTORS LTD 6,034 367,352 0.24TATA POWER CO LTD 6,997 70,617 0.05TATA STEEL LTD 1,563 76,693 0.05TECH MAHINDRA LTD 539 171,740 0.11TITAN CO LTD 863 40,464 0.03ULTRATECH CEMENT LTD 499 164,053 0.11UNITECH LTD 10,371 21,150 0.01UNITED BREWERIES LTD 439 45,056 0.03UNITED SPIRITS LTD 291 99,517 0.07WIPRO LTD 3,112 212,265 0.14YES BANK LTD 1,218 115,527 0.08ZEE ENTERTAINMENT ENTERP 67,683 7,234 0.01ZEE ENTERTAINMENT ENTERPRISE 3,223 150,761 0.10
17,500,886 11.63
Indonesia 2.98%
ADARO ENERGY TBK PT 105,000 68,375 0.05ANEKA TAMBANG PERSERO TBK PT 20,000 13,337 0.01ASTRA AGRO LESTARI TBK PT 2,500 37,960 0.03ASTRA INTERNATIONAL TBK PT 124,300 577,890 0.38BANK CENTRAL ASIA TBK PT 72,500 595,819 0.40BANK DANAMON INDONESIA TBK 16,000 45,333 0.03BANK MANDIRI PERSERO TBK PT 50,000 337,338 0.22BANK NEGARA INDONESIA PERSER 37,000 141,322 0.09BANK RAKYAT INDONESIA PERSER 59,000 430,383 0.29CHAROEN POKPHAND INDONESI PT 47,500 112,425 0.08GLOBAL MEDIACOM TBK PT 29,000 25,876 0.02
Vanguard ETF SeriesAnnual Report 2014
-50-
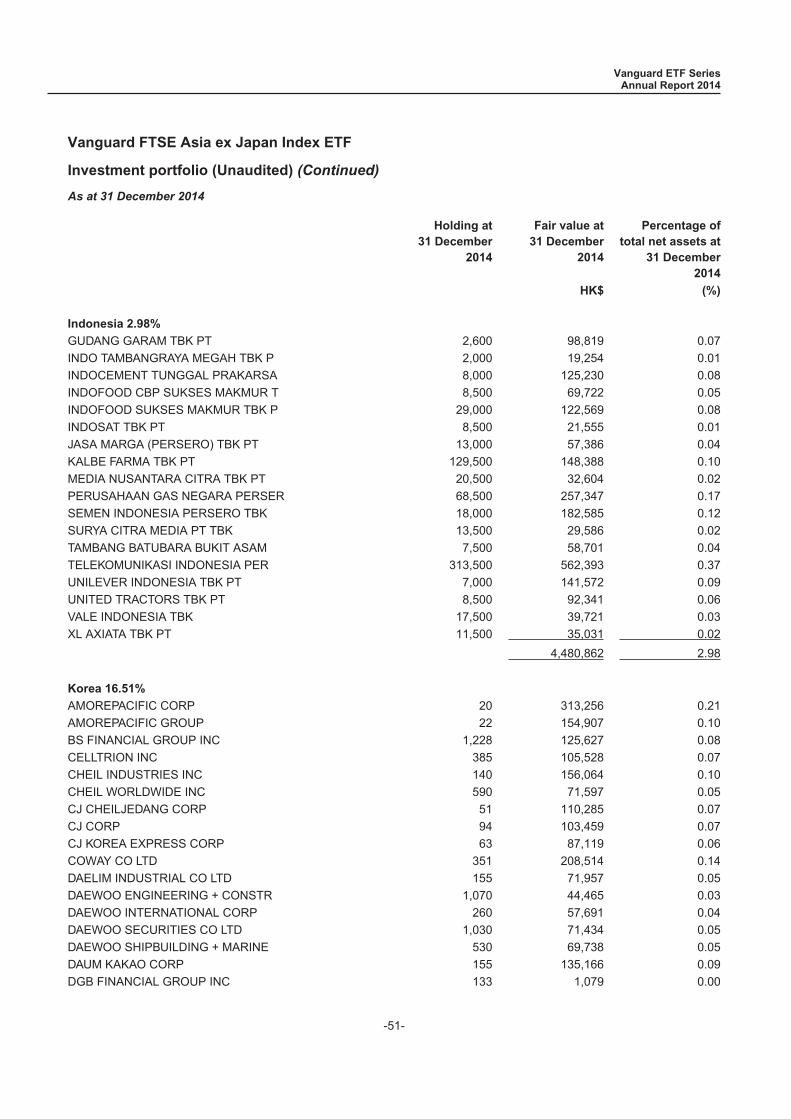
Vanguard FTSE Asia ex Japan Index ETF
Investment portfolio (Unaudited) (Continued)
As at 31 December 2014
Holding at31 December
2014
Fair value at31 December
2014
Percentage oftotal net assets at
31 December2014
HK$ (%)
Indonesia 2.98%
GUDANG GARAM TBK PT 2,600 98,819 0.07INDO TAMBANGRAYA MEGAH TBK P 2,000 19,254 0.01INDOCEMENT TUNGGAL PRAKARSA 8,000 125,230 0.08INDOFOOD CBP SUKSES MAKMUR T 8,500 69,722 0.05INDOFOOD SUKSES MAKMUR TBK P 29,000 122,569 0.08INDOSAT TBK PT 8,500 21,555 0.01JASA MARGA (PERSERO) TBK PT 13,000 57,386 0.04KALBE FARMA TBK PT 129,500 148,388 0.10MEDIA NUSANTARA CITRA TBK PT 20,500 32,604 0.02PERUSAHAAN GAS NEGARA PERSER 68,500 257,347 0.17SEMEN INDONESIA PERSERO TBK 18,000 182,585 0.12SURYA CITRA MEDIA PT TBK 13,500 29,586 0.02TAMBANG BATUBARA BUKIT ASAM 7,500 58,701 0.04TELEKOMUNIKASI INDONESIA PER 313,500 562,393 0.37UNILEVER INDONESIA TBK PT 7,000 141,572 0.09UNITED TRACTORS TBK PT 8,500 92,341 0.06VALE INDONESIA TBK 17,500 39,721 0.03XL AXIATA TBK PT 11,500 35,031 0.02
4,480,862 2.98
Korea 16.51%
AMOREPACIFIC CORP 20 313,256 0.21AMOREPACIFIC GROUP 22 154,907 0.10BS FINANCIAL GROUP INC 1,228 125,627 0.08CELLTRION INC 385 105,528 0.07CHEIL INDUSTRIES INC 140 156,064 0.10CHEIL WORLDWIDE INC 590 71,597 0.05CJ CHEILJEDANG CORP 51 110,285 0.07CJ CORP 94 103,459 0.07CJ KOREA EXPRESS CORP 63 87,119 0.06COWAY CO LTD 351 208,514 0.14DAELIM INDUSTRIAL CO LTD 155 71,957 0.05DAEWOO ENGINEERING + CONSTR 1,070 44,465 0.03DAEWOO INTERNATIONAL CORP 260 57,691 0.04DAEWOO SECURITIES CO LTD 1,030 71,434 0.05DAEWOO SHIPBUILDING + MARINE 530 69,738 0.05DAUM KAKAO CORP 155 135,166 0.09DGB FINANCIAL GROUP INC 133 1,079 0.00
Vanguard ETF SeriesAnnual Report 2014
-51-
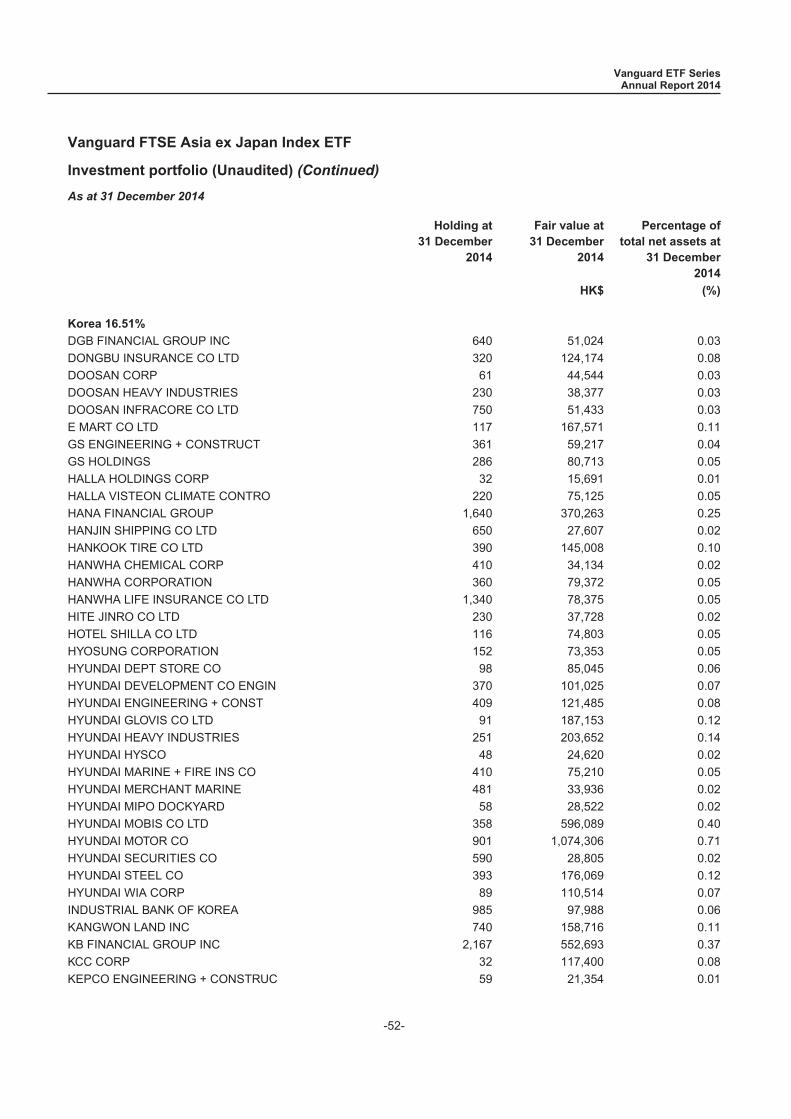
Vanguard FTSE Asia ex Japan Index ETF
Investment portfolio (Unaudited) (Continued)
As at 31 December 2014
Holding at31 December
2014
Fair value at31 December
2014
Percentage oftotal net assets at
31 December2014
HK$ (%)
Korea 16.51%
DGB FINANCIAL GROUP INC 640 51,024 0.03DONGBU INSURANCE CO LTD 320 124,174 0.08DOOSAN CORP 61 44,544 0.03DOOSAN HEAVY INDUSTRIES 230 38,377 0.03DOOSAN INFRACORE CO LTD 750 51,433 0.03E MART CO LTD 117 167,571 0.11GS ENGINEERING + CONSTRUCT 361 59,217 0.04GS HOLDINGS 286 80,713 0.05HALLA HOLDINGS CORP 32 15,691 0.01HALLA VISTEON CLIMATE CONTRO 220 75,125 0.05HANA FINANCIAL GROUP 1,640 370,263 0.25HANJIN SHIPPING CO LTD 650 27,607 0.02HANKOOK TIRE CO LTD 390 145,008 0.10HANWHA CHEMICAL CORP 410 34,134 0.02HANWHA CORPORATION 360 79,372 0.05HANWHA LIFE INSURANCE CO LTD 1,340 78,375 0.05HITE JINRO CO LTD 230 37,728 0.02HOTEL SHILLA CO LTD 116 74,803 0.05HYOSUNG CORPORATION 152 73,353 0.05HYUNDAI DEPT STORE CO 98 85,045 0.06HYUNDAI DEVELOPMENT CO ENGIN 370 101,025 0.07HYUNDAI ENGINEERING + CONST 409 121,485 0.08HYUNDAI GLOVIS CO LTD 91 187,153 0.12HYUNDAI HEAVY INDUSTRIES 251 203,652 0.14HYUNDAI HYSCO 48 24,620 0.02HYUNDAI MARINE + FIRE INS CO 410 75,210 0.05HYUNDAI MERCHANT MARINE 481 33,936 0.02HYUNDAI MIPO DOCKYARD 58 28,522 0.02HYUNDAI MOBIS CO LTD 358 596,089 0.40HYUNDAI MOTOR CO 901 1,074,306 0.71HYUNDAI SECURITIES CO 590 28,805 0.02HYUNDAI STEEL CO 393 176,069 0.12HYUNDAI WIA CORP 89 110,514 0.07INDUSTRIAL BANK OF KOREA 985 97,988 0.06KANGWON LAND INC 740 158,716 0.11KB FINANCIAL GROUP INC 2,167 552,693 0.37KCC CORP 32 117,400 0.08KEPCO ENGINEERING + CONSTRUC 59 21,354 0.01
Vanguard ETF SeriesAnnual Report 2014
-52-
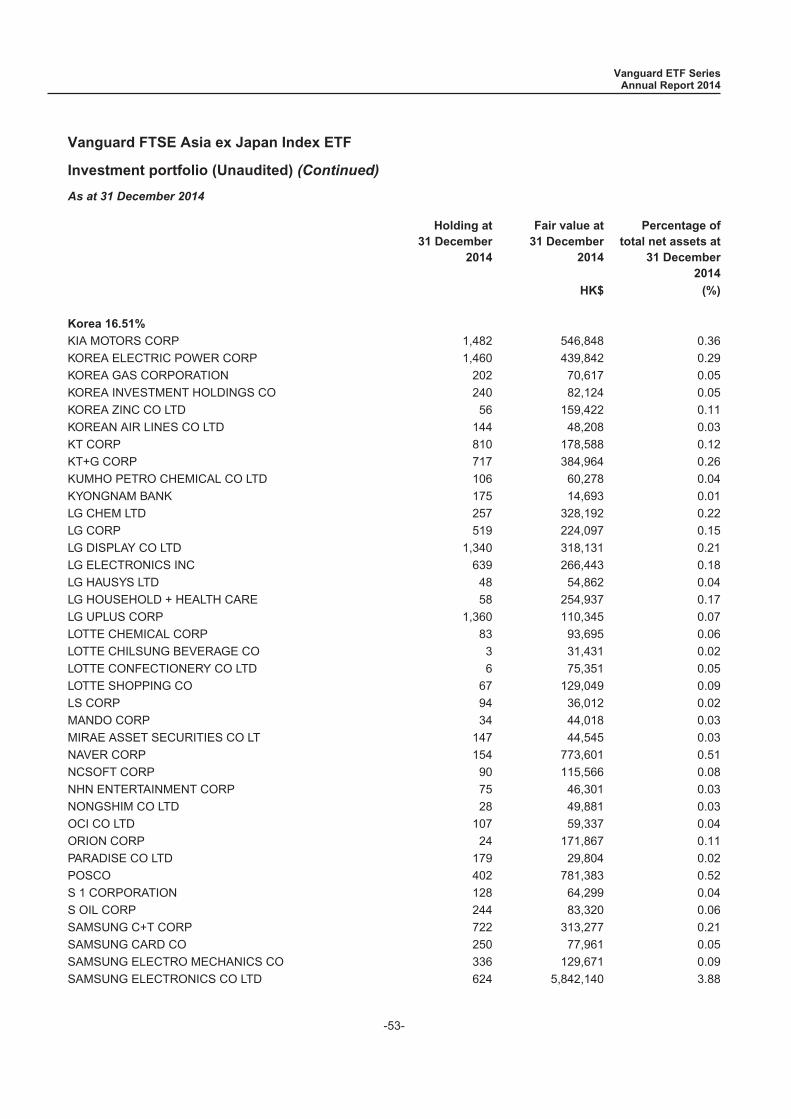
Vanguard FTSE Asia ex Japan Index ETF
Investment portfolio (Unaudited) (Continued)
As at 31 December 2014
Holding at31 December
2014
Fair value at31 December
2014
Percentage oftotal net assets at
31 December2014
HK$ (%)
Korea 16.51%
KIA MOTORS CORP 1,482 546,848 0.36KOREA ELECTRIC POWER CORP 1,460 439,842 0.29KOREA GAS CORPORATION 202 70,617 0.05KOREA INVESTMENT HOLDINGS CO 240 82,124 0.05KOREA ZINC CO LTD 56 159,422 0.11KOREAN AIR LINES CO LTD 144 48,208 0.03KT CORP 810 178,588 0.12KT+G CORP 717 384,964 0.26KUMHO PETRO CHEMICAL CO LTD 106 60,278 0.04KYONGNAM BANK 175 14,693 0.01LG CHEM LTD 257 328,192 0.22LG CORP 519 224,097 0.15LG DISPLAY CO LTD 1,340 318,131 0.21LG ELECTRONICS INC 639 266,443 0.18LG HAUSYS LTD 48 54,862 0.04LG HOUSEHOLD + HEALTH CARE 58 254,937 0.17LG UPLUS CORP 1,360 110,345 0.07LOTTE CHEMICAL CORP 83 93,695 0.06LOTTE CHILSUNG BEVERAGE CO 3 31,431 0.02LOTTE CONFECTIONERY CO LTD 6 75,351 0.05LOTTE SHOPPING CO 67 129,049 0.09LS CORP 94 36,012 0.02MANDO CORP 34 44,018 0.03MIRAE ASSET SECURITIES CO LT 147 44,545 0.03NAVER CORP 154 773,601 0.51NCSOFT CORP 90 115,566 0.08NHN ENTERTAINMENT CORP 75 46,301 0.03NONGSHIM CO LTD 28 49,881 0.03OCI CO LTD 107 59,337 0.04ORION CORP 24 171,867 0.11PARADISE CO LTD 179 29,804 0.02POSCO 402 781,383 0.52S 1 CORPORATION 128 64,299 0.04S OIL CORP 244 83,320 0.06SAMSUNG C+T CORP 722 313,277 0.21SAMSUNG CARD CO 250 77,961 0.05SAMSUNG ELECTRO MECHANICS CO 336 129,671 0.09SAMSUNG ELECTRONICS CO LTD 624 5,842,140 3.88
Vanguard ETF SeriesAnnual Report 2014
-53-
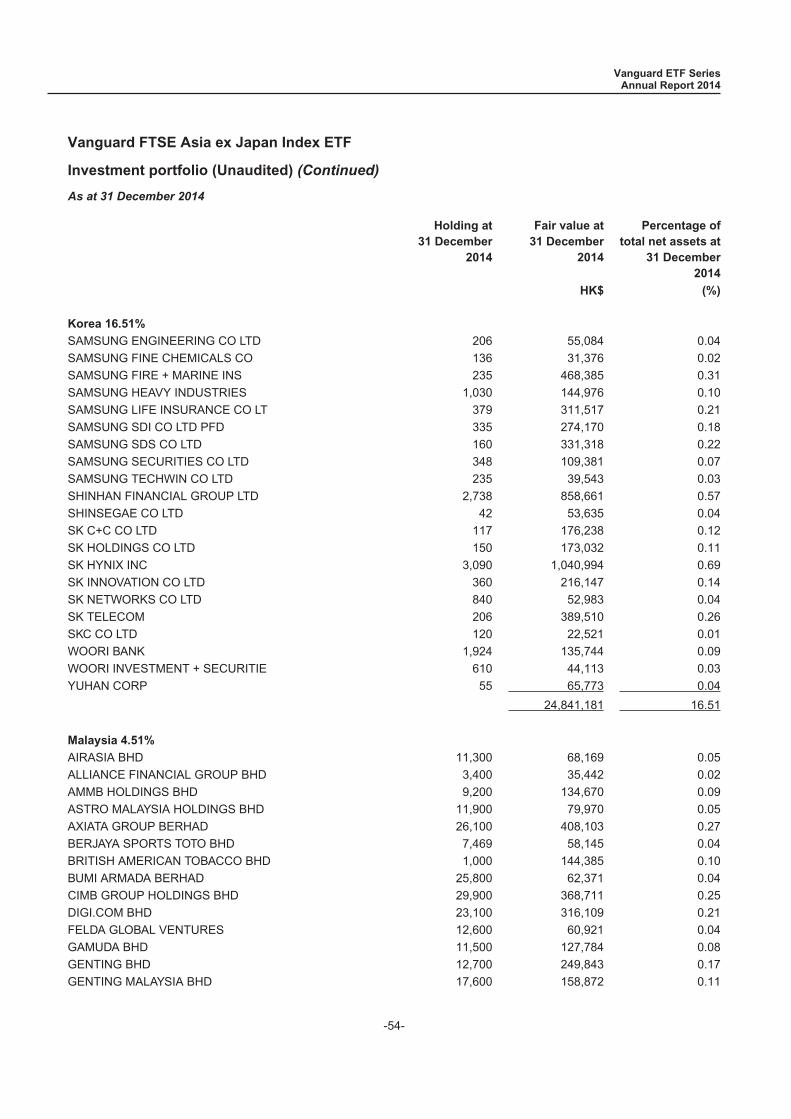
Vanguard FTSE Asia ex Japan Index ETF
Investment portfolio (Unaudited) (Continued)
As at 31 December 2014
Holding at31 December
2014
Fair value at31 December
2014
Percentage oftotal net assets at
31 December2014
HK$ (%)
Korea 16.51%
SAMSUNG ENGINEERING CO LTD 206 55,084 0.04SAMSUNG FINE CHEMICALS CO 136 31,376 0.02SAMSUNG FIRE + MARINE INS 235 468,385 0.31SAMSUNG HEAVY INDUSTRIES 1,030 144,976 0.10SAMSUNG LIFE INSURANCE CO LT 379 311,517 0.21SAMSUNG SDI CO LTD PFD 335 274,170 0.18SAMSUNG SDS CO LTD 160 331,318 0.22SAMSUNG SECURITIES CO LTD 348 109,381 0.07SAMSUNG TECHWIN CO LTD 235 39,543 0.03SHINHAN FINANCIAL GROUP LTD 2,738 858,661 0.57SHINSEGAE CO LTD 42 53,635 0.04SK C+C CO LTD 117 176,238 0.12SK HOLDINGS CO LTD 150 173,032 0.11SK HYNIX INC 3,090 1,040,994 0.69SK INNOVATION CO LTD 360 216,147 0.14SK NETWORKS CO LTD 840 52,983 0.04SK TELECOM 206 389,510 0.26SKC CO LTD 120 22,521 0.01WOORI BANK 1,924 135,744 0.09WOORI INVESTMENT + SECURITIE 610 44,113 0.03YUHAN CORP 55 65,773 0.04
24,841,181 16.51
Malaysia 4.51%
AIRASIA BHD 11,300 68,169 0.05ALLIANCE FINANCIAL GROUP BHD 3,400 35,442 0.02AMMB HOLDINGS BHD 9,200 134,670 0.09ASTRO MALAYSIA HOLDINGS BHD 11,900 79,970 0.05AXIATA GROUP BERHAD 26,100 408,103 0.27BERJAYA SPORTS TOTO BHD 7,469 58,145 0.04BRITISH AMERICAN TOBACCO BHD 1,000 144,385 0.10BUMI ARMADA BERHAD 25,800 62,371 0.04CIMB GROUP HOLDINGS BHD 29,900 368,711 0.25DIGI.COM BHD 23,100 316,109 0.21FELDA GLOBAL VENTURES 12,600 60,921 0.04GAMUDA BHD 11,500 127,784 0.08GENTING BHD 12,700 249,843 0.17GENTING MALAYSIA BHD 17,600 158,872 0.11
Vanguard ETF SeriesAnnual Report 2014
-54-
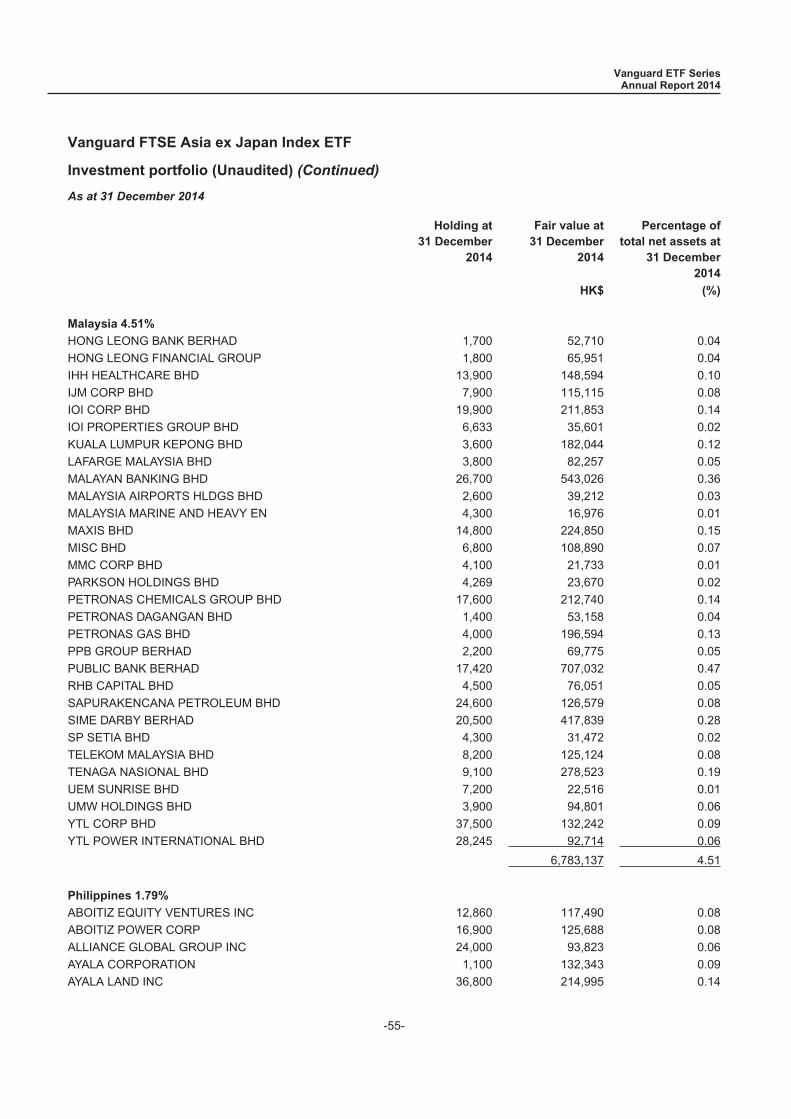
Vanguard FTSE Asia ex Japan Index ETF
Investment portfolio (Unaudited) (Continued)
As at 31 December 2014
Holding at31 December
2014
Fair value at31 December
2014
Percentage oftotal net assets at
31 December2014
HK$ (%)
Malaysia 4.51%
HONG LEONG BANK BERHAD 1,700 52,710 0.04HONG LEONG FINANCIAL GROUP 1,800 65,951 0.04IHH HEALTHCARE BHD 13,900 148,594 0.10IJM CORP BHD 7,900 115,115 0.08IOI CORP BHD 19,900 211,853 0.14IOI PROPERTIES GROUP BHD 6,633 35,601 0.02KUALA LUMPUR KEPONG BHD 3,600 182,044 0.12LAFARGE MALAYSIA BHD 3,800 82,257 0.05MALAYAN BANKING BHD 26,700 543,026 0.36MALAYSIA AIRPORTS HLDGS BHD 2,600 39,212 0.03MALAYSIA MARINE AND HEAVY EN 4,300 16,976 0.01MAXIS BHD 14,800 224,850 0.15MISC BHD 6,800 108,890 0.07MMC CORP BHD 4,100 21,733 0.01PARKSON HOLDINGS BHD 4,269 23,670 0.02PETRONAS CHEMICALS GROUP BHD 17,600 212,740 0.14PETRONAS DAGANGAN BHD 1,400 53,158 0.04PETRONAS GAS BHD 4,000 196,594 0.13PPB GROUP BERHAD 2,200 69,775 0.05PUBLIC BANK BERHAD 17,420 707,032 0.47RHB CAPITAL BHD 4,500 76,051 0.05SAPURAKENCANA PETROLEUM BHD 24,600 126,579 0.08SIME DARBY BERHAD 20,500 417,839 0.28SP SETIA BHD 4,300 31,472 0.02TELEKOM MALAYSIA BHD 8,200 125,124 0.08TENAGA NASIONAL BHD 9,100 278,523 0.19UEM SUNRISE BHD 7,200 22,516 0.01UMW HOLDINGS BHD 3,900 94,801 0.06YTL CORP BHD 37,500 132,242 0.09YTL POWER INTERNATIONAL BHD 28,245 92,714 0.06
6,783,137 4.51
Philippines 1.79%
ABOITIZ EQUITY VENTURES INC 12,860 117,490 0.08ABOITIZ POWER CORP 16,900 125,688 0.08ALLIANCE GLOBAL GROUP INC 24,000 93,823 0.06AYALA CORPORATION 1,100 132,343 0.09AYALA LAND INC 36,800 214,995 0.14
Vanguard ETF SeriesAnnual Report 2014
-55-

Vanguard FTSE Asia ex Japan Index ETF
Investment portfolio (Unaudited) (Continued)
As at 31 December 2014
Holding at31 December
2014
Fair value at31 December
2014
Percentage oftotal net assets at
31 December2014
HK$ (%)
Philippines 1.79%
BANK OF THE PHILIPPINE ISLAN 8,620 140,471 0.09BDO UNIBANK INC 6,560 124,870 0.08BLOOMBERRY RESORTS CORP 12,000 25,796 0.02DMCI HOLDINGS INC 23,600 64,234 0.04EMPERADOR INC 13,700 24,653 0.02ENERGY DEVELOPMENT CORP 62,900 89,416 0.06GLOBE TELECOM INC 235 70,480 0.05GT CAPITAL HOLDINGS INC 280 50,094 0.03INTL CONTAINER TERM SVCS INC 4,970 99,084 0.07JG SUMMIT HOLDINGS INC 10,500 120,139 0.08JOLLIBEE FOODS CORP 2,930 109,208 0.07LT GROUP INC 11,800 24,834 0.02MANILA ELECTRIC COMPANY 1,390 61,689 0.04METROPOLITAN BANK + TRUST 6,033 86,808 0.06PHILIPPINE LONG DISTANCE TEL 525 264,488 0.18SAN MIGUEL CORP 5,290 67,680 0.04SM INVESTMENTS CORP 1,775 250,788 0.17SM PRIME HOLDINGS INC 39,200 115,799 0.08UNIVERSAL ROBINA CORP 6,220 211,347 0.14
2,686,217 1.79
Singapore 6.87%
ASCENDAS REAL ESTATE INV TRT 12,000 167,141 0.11CAPITACOMMERCIAL TRUST 13,000 133,520 0.09CAPITALAND LTD 14,000 271,194 0.18CAPITAMALL TRUST 16,000 191,018 0.13CITY DEVELOPMENTS LTD 4,000 240,412 0.16COMFORTDELGRO CORP LTD 15,000 228,239 0.15COSCO CORP SINGAPORE LTD 5,000 16,386 0.01DBS GROUP HOLDINGS LTD 10,000 1,205,569 0.80GENTING SINGAPORE PLC 35,000 221,216 0.15GLOBAL LOGISTIC PROPERTIES L 17,000 246,732 0.16GOLDEN AGRI RESOURCES LTD 42,000 113,066 0.08HONGKONG LAND HOLDINGS LTD 7,000 366,960 0.24HUTCHISON PORT HOLDINGS TR U 31,000 165,876 0.11INDOFOOD AGRI RESOURCES LTD 6,000 25,457 0.02JARDINE CYCLE + CARRIAGE LTD 600 149,584 0.10JARDINE MATHESON HLDGS LTD 1,200 567,190 0.38
Vanguard ETF SeriesAnnual Report 2014
-56-
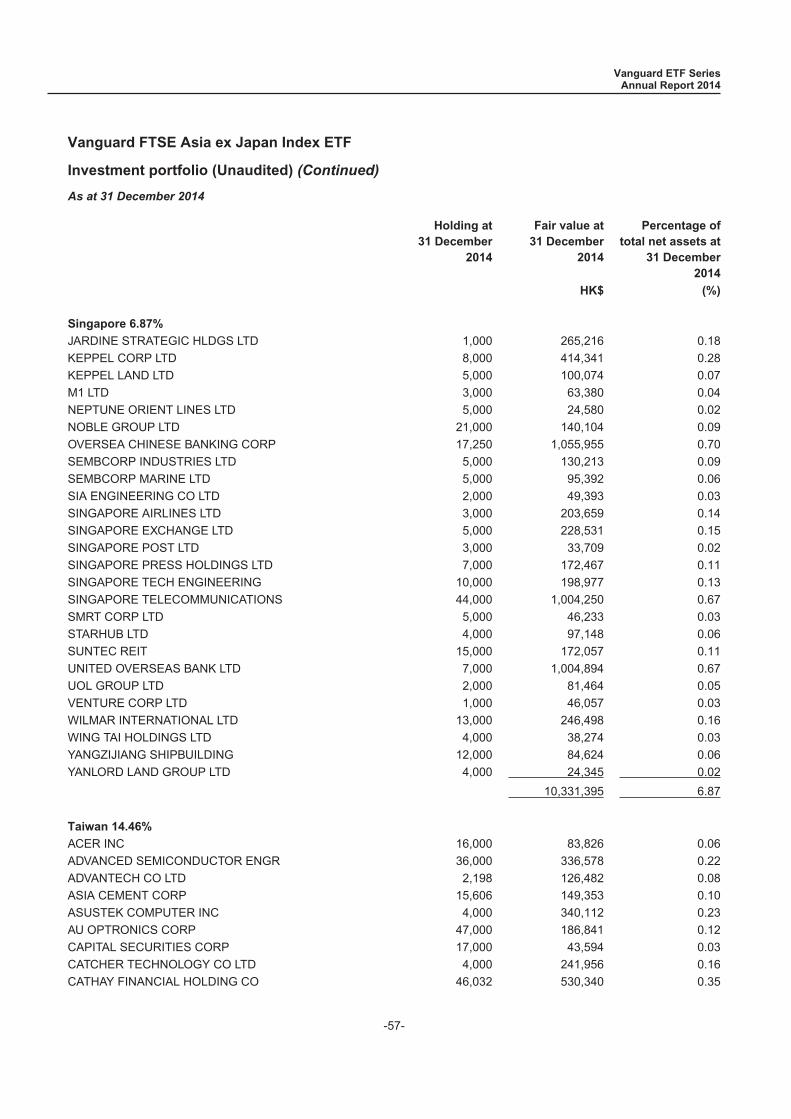
Vanguard FTSE Asia ex Japan Index ETF
Investment portfolio (Unaudited) (Continued)
As at 31 December 2014
Holding at31 December
2014
Fair value at31 December
2014
Percentage oftotal net assets at
31 December2014
HK$ (%)
Singapore 6.87%
JARDINE STRATEGIC HLDGS LTD 1,000 265,216 0.18KEPPEL CORP LTD 8,000 414,341 0.28KEPPEL LAND LTD 5,000 100,074 0.07M1 LTD 3,000 63,380 0.04NEPTUNE ORIENT LINES LTD 5,000 24,580 0.02NOBLE GROUP LTD 21,000 140,104 0.09OVERSEA CHINESE BANKING CORP 17,250 1,055,955 0.70SEMBCORP INDUSTRIES LTD 5,000 130,213 0.09SEMBCORP MARINE LTD 5,000 95,392 0.06SIA ENGINEERING CO LTD 2,000 49,393 0.03SINGAPORE AIRLINES LTD 3,000 203,659 0.14SINGAPORE EXCHANGE LTD 5,000 228,531 0.15SINGAPORE POST LTD 3,000 33,709 0.02SINGAPORE PRESS HOLDINGS LTD 7,000 172,467 0.11SINGAPORE TECH ENGINEERING 10,000 198,977 0.13SINGAPORE TELECOMMUNICATIONS 44,000 1,004,250 0.67SMRT CORP LTD 5,000 46,233 0.03STARHUB LTD 4,000 97,148 0.06SUNTEC REIT 15,000 172,057 0.11UNITED OVERSEAS BANK LTD 7,000 1,004,894 0.67UOL GROUP LTD 2,000 81,464 0.05VENTURE CORP LTD 1,000 46,057 0.03WILMAR INTERNATIONAL LTD 13,000 246,498 0.16WING TAI HOLDINGS LTD 4,000 38,274 0.03YANGZIJIANG SHIPBUILDING 12,000 84,624 0.06YANLORD LAND GROUP LTD 4,000 24,345 0.02
10,331,395 6.87
Taiwan 14.46%
ACER INC 16,000 83,826 0.06ADVANCED SEMICONDUCTOR ENGR 36,000 336,578 0.22ADVANTECH CO LTD 2,198 126,482 0.08ASIA CEMENT CORP 15,606 149,353 0.10ASUSTEK COMPUTER INC 4,000 340,112 0.23AU OPTRONICS CORP 47,000 186,841 0.12CAPITAL SECURITIES CORP 17,000 43,594 0.03CATCHER TECHNOLOGY CO LTD 4,000 241,956 0.16CATHAY FINANCIAL HOLDING CO 46,032 530,340 0.35
Vanguard ETF SeriesAnnual Report 2014
-57-
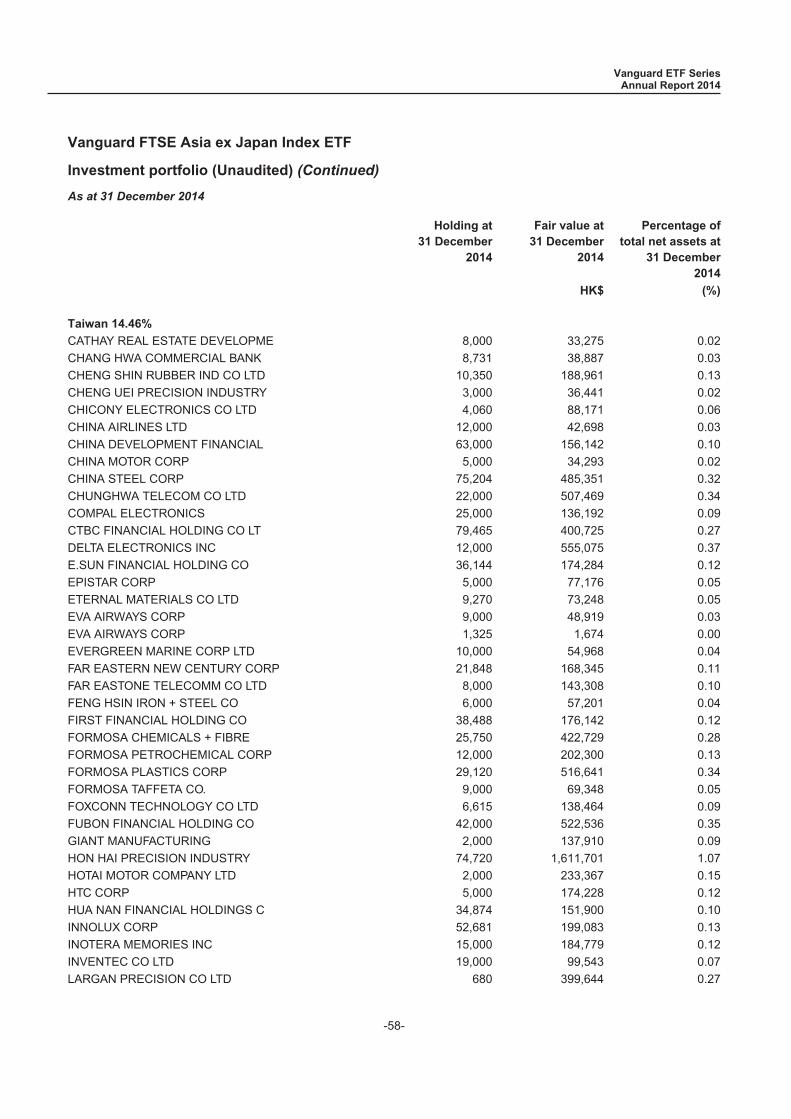
Vanguard FTSE Asia ex Japan Index ETF
Investment portfolio (Unaudited) (Continued)
As at 31 December 2014
Holding at31 December
2014
Fair value at31 December
2014
Percentage oftotal net assets at
31 December2014
HK$ (%)
Taiwan 14.46%
CATHAY REAL ESTATE DEVELOPME 8,000 33,275 0.02CHANG HWA COMMERCIAL BANK 8,731 38,887 0.03CHENG SHIN RUBBER IND CO LTD 10,350 188,961 0.13CHENG UEI PRECISION INDUSTRY 3,000 36,441 0.02CHICONY ELECTRONICS CO LTD 4,060 88,171 0.06CHINA AIRLINES LTD 12,000 42,698 0.03CHINA DEVELOPMENT FINANCIAL 63,000 156,142 0.10CHINA MOTOR CORP 5,000 34,293 0.02CHINA STEEL CORP 75,204 485,351 0.32CHUNGHWA TELECOM CO LTD 22,000 507,469 0.34COMPAL ELECTRONICS 25,000 136,192 0.09CTBC FINANCIAL HOLDING CO LT 79,465 400,725 0.27DELTA ELECTRONICS INC 12,000 555,075 0.37E.SUN FINANCIAL HOLDING CO 36,144 174,284 0.12EPISTAR CORP 5,000 77,176 0.05ETERNAL MATERIALS CO LTD 9,270 73,248 0.05EVA AIRWAYS CORP 9,000 48,919 0.03EVA AIRWAYS CORP 1,325 1,674 0.00EVERGREEN MARINE CORP LTD 10,000 54,968 0.04FAR EASTERN NEW CENTURY CORP 21,848 168,345 0.11FAR EASTONE TELECOMM CO LTD 8,000 143,308 0.10FENG HSIN IRON + STEEL CO 6,000 57,201 0.04FIRST FINANCIAL HOLDING CO 38,488 176,142 0.12FORMOSA CHEMICALS + FIBRE 25,750 422,729 0.28FORMOSA PETROCHEMICAL CORP 12,000 202,300 0.13FORMOSA PLASTICS CORP 29,120 516,641 0.34FORMOSA TAFFETA CO. 9,000 69,348 0.05FOXCONN TECHNOLOGY CO LTD 6,615 138,464 0.09FUBON FINANCIAL HOLDING CO 42,000 522,536 0.35GIANT MANUFACTURING 2,000 137,910 0.09HON HAI PRECISION INDUSTRY 74,720 1,611,701 1.07HOTAI MOTOR COMPANY LTD 2,000 233,367 0.15HTC CORP 5,000 174,228 0.12HUA NAN FINANCIAL HOLDINGS C 34,874 151,900 0.10INNOLUX CORP 52,681 199,083 0.13INOTERA MEMORIES INC 15,000 184,779 0.12INVENTEC CO LTD 19,000 99,543 0.07LARGAN PRECISION CO LTD 680 399,644 0.27
Vanguard ETF SeriesAnnual Report 2014
-58-
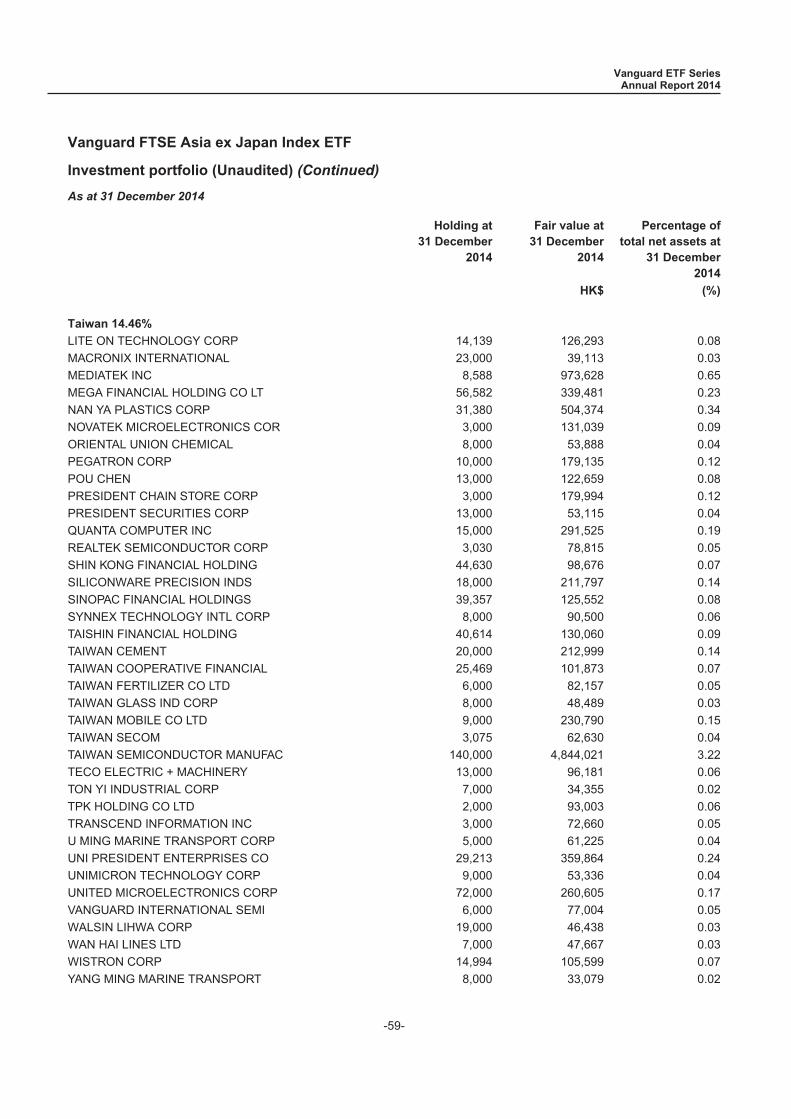
Vanguard FTSE Asia ex Japan Index ETF
Investment portfolio (Unaudited) (Continued)
As at 31 December 2014
Holding at31 December
2014
Fair value at31 December
2014
Percentage oftotal net assets at
31 December2014
HK$ (%)
Taiwan 14.46%
LITE ON TECHNOLOGY CORP 14,139 126,293 0.08MACRONIX INTERNATIONAL 23,000 39,113 0.03MEDIATEK INC 8,588 973,628 0.65MEGA FINANCIAL HOLDING CO LT 56,582 339,481 0.23NAN YA PLASTICS CORP 31,380 504,374 0.34NOVATEK MICROELECTRONICS COR 3,000 131,039 0.09ORIENTAL UNION CHEMICAL 8,000 53,888 0.04PEGATRON CORP 10,000 179,135 0.12POU CHEN 13,000 122,659 0.08PRESIDENT CHAIN STORE CORP 3,000 179,994 0.12PRESIDENT SECURITIES CORP 13,000 53,115 0.04QUANTA COMPUTER INC 15,000 291,525 0.19REALTEK SEMICONDUCTOR CORP 3,030 78,815 0.05SHIN KONG FINANCIAL HOLDING 44,630 98,676 0.07SILICONWARE PRECISION INDS 18,000 211,797 0.14SINOPAC FINANCIAL HOLDINGS 39,357 125,552 0.08SYNNEX TECHNOLOGY INTL CORP 8,000 90,500 0.06TAISHIN FINANCIAL HOLDING 40,614 130,060 0.09TAIWAN CEMENT 20,000 212,999 0.14TAIWAN COOPERATIVE FINANCIAL 25,469 101,873 0.07TAIWAN FERTILIZER CO LTD 6,000 82,157 0.05TAIWAN GLASS IND CORP 8,000 48,489 0.03TAIWAN MOBILE CO LTD 9,000 230,790 0.15TAIWAN SECOM 3,075 62,630 0.04TAIWAN SEMICONDUCTOR MANUFAC 140,000 4,844,021 3.22TECO ELECTRIC + MACHINERY 13,000 96,181 0.06TON YI INDUSTRIAL CORP 7,000 34,355 0.02TPK HOLDING CO LTD 2,000 93,003 0.06TRANSCEND INFORMATION INC 3,000 72,660 0.05U MING MARINE TRANSPORT CORP 5,000 61,225 0.04UNI PRESIDENT ENTERPRISES CO 29,213 359,864 0.24UNIMICRON TECHNOLOGY CORP 9,000 53,336 0.04UNITED MICROELECTRONICS CORP 72,000 260,605 0.17VANGUARD INTERNATIONAL SEMI 6,000 77,004 0.05WALSIN LIHWA CORP 19,000 46,438 0.03WAN HAI LINES LTD 7,000 47,667 0.03WISTRON CORP 14,994 105,599 0.07YANG MING MARINE TRANSPORT 8,000 33,079 0.02
Vanguard ETF SeriesAnnual Report 2014
-59-

Vanguard FTSE Asia ex Japan Index ETF
Investment portfolio (Unaudited) (Continued)
As at 31 December 2014
Holding at31 December
2014
Fair value at31 December
2014
Percentage oftotal net assets at
31 December2014
HK$ (%)
Taiwan 14.46%
YFY INC 19,000 63,642 0.04YUANTA FINANCIAL HOLDING CO 53,300 201,422 0.13YULON MOTOR COMPANY 5,000 57,053 0.04
21,757,936 14.46
Thailand 2.99%
ADVANCED INFO SERVICE FOR RG 7,300 431,891 0.29AIRPORTS OF THAILAND PCL FOR 2,500 166,175 0.11BANGKOK BANK PCL FOREIGN REG 2,000 92,398 0.06BANGKOK DUSIT MED SERVICE F 20,000 81,084 0.05BANK OF AYUDHYA PUBLIC NVDR 7,100 74,891 0.05BANPU PUBLIC CO LTD FOR REG 4,500 26,411 0.02BEC WORLD PCL FOREIGN 5,800 69,723 0.05BERLI JUCKER PUB CO FORGN 2,400 23,335 0.02BIG C SUPERCENTER PCL 1,500 83,795 0.06BTS GROUP HOLDINGS PCL 18,200 41,398 0.03CENTRAL PATTANA PUB CO FOREI 7,600 81,508 0.05CHAROEN POKPHAND FOOD FORGN 18,200 116,900 0.08CP ALL PCL FOREIGN 26,500 265,468 0.18DELTA ELECTRONICS THAI FORGN 4,000 66,470 0.05ELECTRICITY GEN PUB CO FOR R 1,500 59,222 0.04GLOW ENERGY PCL FOREIGN 3,500 73,630 0.05INDORAMA VENTURES FOREIGN 6,600 31,425 0.02INTOUCH HOLDINGS PCL F 11,600 213,954 0.14IRPC PCL FOREIGN 91,000 65,636 0.04KASIKORNBANK PCL FOREIGN 7,300 394,036 0.26KRUNG THAI BANK PUB CO FOREI 14,400 77,049 0.05LAND + HOUSES PUB CO FOR REG 17,000 36,264 0.02MINOR INTERNATIONAL PCL FOR 5,800 44,431 0.03PTT EXPLORATION + PROD FOR 8,100 213,836 0.14PTT GLOBAL CHEMICAL PCL FOR 9,100 109,929 0.07PTT PCL/FOREIGN 5,300 404,761 0.27RATCHABURI ELEC GEN HODG FOR 4,800 66,470 0.05SIAM CEMENT PUB CO FOR REG 1,700 180,318 0.12SIAM CITY CEMENT PCL FOR 500 51,149 0.03SIAM COMMERCIAL BANK FOREIGN 8,900 381,803 0.25THAI OIL PCL FRGN 7,000 69,299 0.05THAI UNION FROZEN PROD FOREI 3,800 81,060 0.05
Vanguard ETF SeriesAnnual Report 2014
-60-
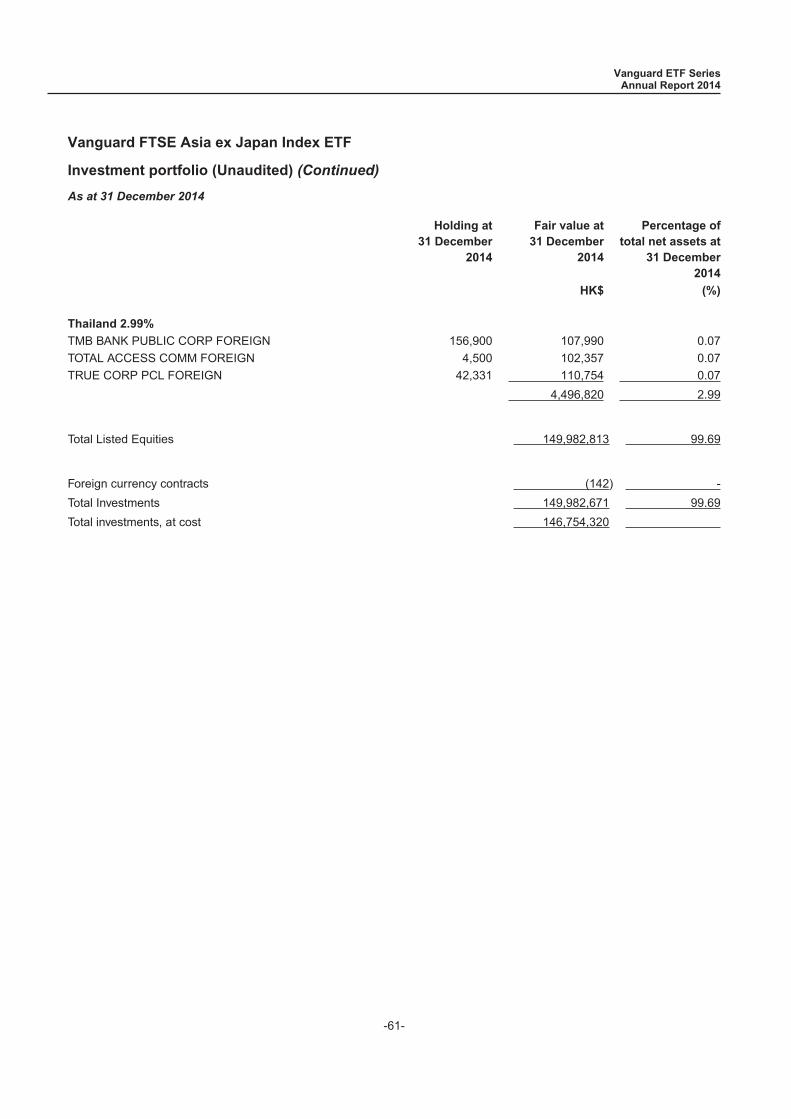
Vanguard FTSE Asia ex Japan Index ETF
Investment portfolio (Unaudited) (Continued)
As at 31 December 2014
Holding at31 December
2014
Fair value at31 December
2014
Percentage oftotal net assets at
31 December2014
HK$ (%)
Thailand 2.99%
TMB BANK PUBLIC CORP FOREIGN 156,900 107,990 0.07TOTAL ACCESS COMM FOREIGN 4,500 102,357 0.07TRUE CORP PCL FOREIGN 42,331 110,754 0.07
4,496,820 2.99
Total Listed Equities 149,982,813 99.69
Foreign currency contracts (142) -Total Investments 149,982,671 99.69Total investments, at cost 146,754,320
Vanguard ETF SeriesAnnual Report 2014
-61-
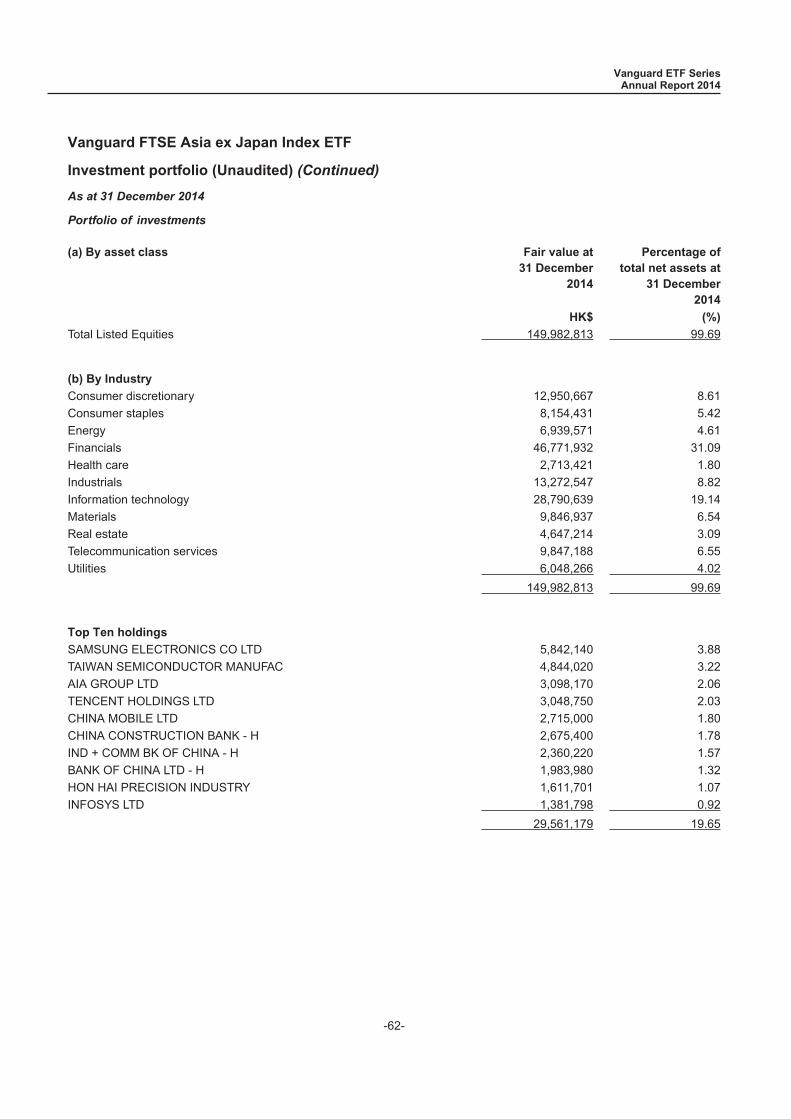
Vanguard FTSE Asia ex Japan Index ETF
Investment portfolio (Unaudited) (Continued)
As at 31 December 2014
Portfolio of investments
(a) By asset class Fair value at31 December
2014
Percentage oftotal net assets at
31 December2014
HK$ (%)
Total Listed Equities 149,982,813 99.69
(b) By Industry
Consumer discretionary 12,950,667 8.61Consumer staples 8,154,431 5.42Energy 6,939,571 4.61Financials 46,771,932 31.09Health care 2,713,421 1.80Industrials 13,272,547 8.82Information technology 28,790,639 19.14Materials 9,846,937 6.54Real estate 4,647,214 3.09Telecommunication services 9,847,188 6.55Utilities 6,048,266 4.02
149,982,813 99.69
Top Ten holdings
SAMSUNG ELECTRONICS CO LTD 5,842,140 3.88TAIWAN SEMICONDUCTOR MANUFAC 4,844,020 3.22AIA GROUP LTD 3,098,170 2.06TENCENT HOLDINGS LTD 3,048,750 2.03CHINA MOBILE LTD 2,715,000 1.80CHINA CONSTRUCTION BANK - H 2,675,400 1.78IND + COMM BK OF CHINA - H 2,360,220 1.57BANK OF CHINA LTD - H 1,983,980 1.32HON HAI PRECISION INDUSTRY 1,611,701 1.07INFOSYS LTD 1,381,798 0.92
29,561,179 19.65
Vanguard ETF SeriesAnnual Report 2014
-62-
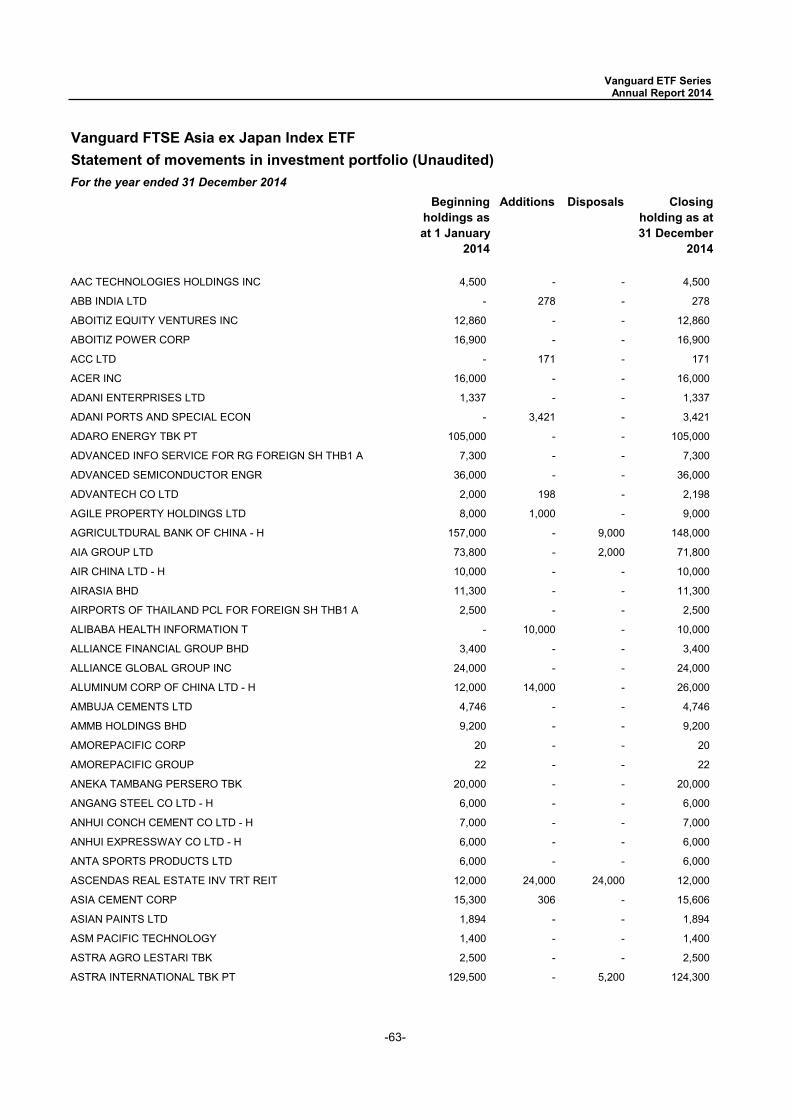
-63-
Vanguard FTSE Asia ex Japan Index ETFStatement of movements in investment portfolio (Unaudited) For the year ended 31 December 2014
Beginning holdings as at 1 January
2014
Additions Disposals Closing holding as at 31 December
2014
AAC TECHNOLOGIES HOLDINGS INC 4,500 - - 4,500
ABB INDIA LTD - 278 - 278
ABOITIZ EQUITY VENTURES INC 12,860 - - 12,860
ABOITIZ POWER CORP 16,900 - - 16,900
ACC LTD - 171 - 171
ACER INC 16,000 - - 16,000
ADANI ENTERPRISES LTD 1,337 - - 1,337
ADANI PORTS AND SPECIAL ECON - 3,421 - 3,421
ADARO ENERGY TBK PT 105,000 - - 105,000
ADVANCED INFO SERVICE FOR RG FOREIGN SH THB1 A 7,300 - - 7,300
ADVANCED SEMICONDUCTOR ENGR 36,000 - - 36,000
ADVANTECH CO LTD 2,000 198 - 2,198
AGILE PROPERTY HOLDINGS LTD 8,000 1,000 - 9,000
AGRICULTDURAL BANK OF CHINA - H 157,000 - 9,000 148,000
AIA GROUP LTD 73,800 - 2,000 71,800
AIR CHINA LTD - H 10,000 - - 10,000
AIRASIA BHD 11,300 - - 11,300
AIRPORTS OF THAILAND PCL FOR FOREIGN SH THB1 A 2,500 - - 2,500
ALIBABA HEALTH INFORMATION T - 10,000 - 10,000
ALLIANCE FINANCIAL GROUP BHD 3,400 - - 3,400
ALLIANCE GLOBAL GROUP INC 24,000 - - 24,000
ALUMINUM CORP OF CHINA LTD - H 12,000 14,000 - 26,000
AMBUJA CEMENTS LTD 4,746 - - 4,746
AMMB HOLDINGS BHD 9,200 - - 9,200
AMOREPACIFIC CORP 20 - - 20
AMOREPACIFIC GROUP 22 - - 22
ANEKA TAMBANG PERSERO TBK 20,000 - - 20,000
ANGANG STEEL CO LTD - H 6,000 - - 6,000
ANHUI CONCH CEMENT CO LTD - H 7,000 - - 7,000
ANHUI EXPRESSWAY CO LTD - H 6,000 - - 6,000
ANTA SPORTS PRODUCTS LTD 6,000 - - 6,000
ASCENDAS REAL ESTATE INV TRT REIT 12,000 24,000 24,000 12,000
ASIA CEMENT CORP 15,300 306 - 15,606
ASIAN PAINTS LTD 1,894 - - 1,894
ASM PACIFIC TECHNOLOGY 1,400 - - 1,400
ASTRA AGRO LESTARI TBK 2,500 - - 2,500
ASTRA INTERNATIONAL TBK PT 129,500 - 5,200 124,300
Vanguard ETF Series Annual Report 2014
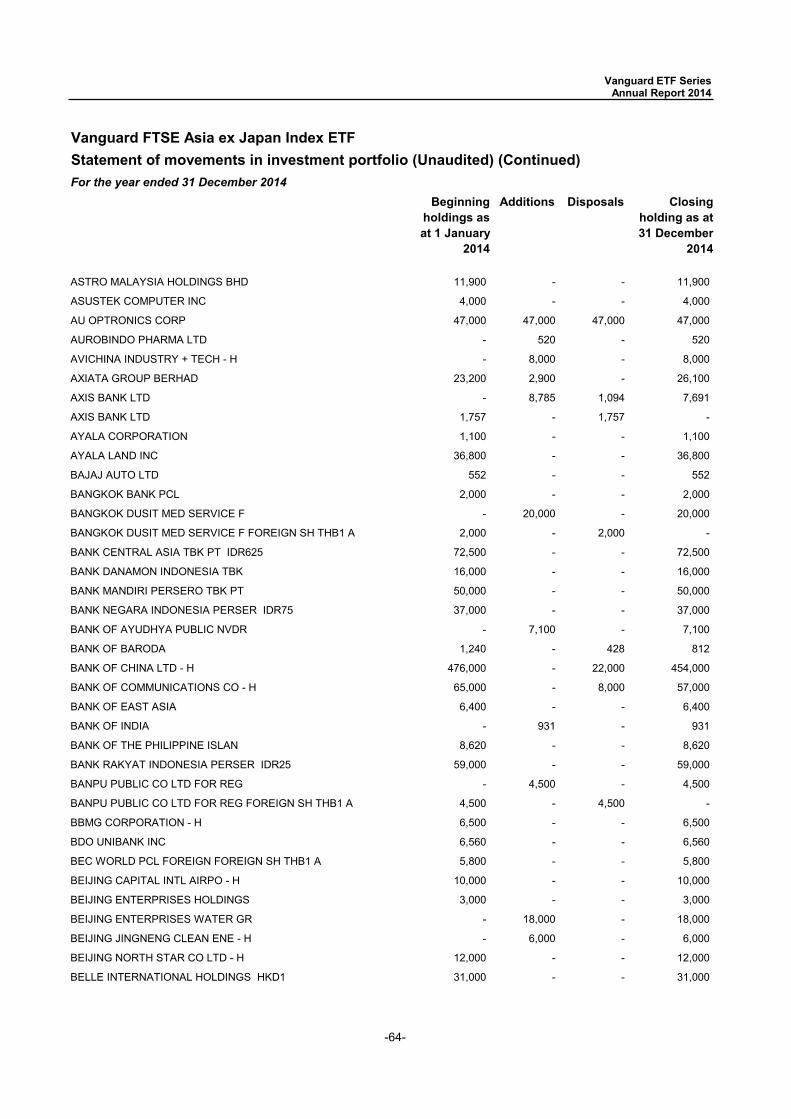
-64-
Vanguard FTSE Asia ex Japan Index ETFStatement of movements in investment portfolio (Unaudited) (Continued)For the year ended 31 December 2014
Beginning holdings as at 1 January
2014
Additions Disposals Closing holding as at 31 December
2014
Vanguard ETF Series Annual Report 2014
ASTRO MALAYSIA HOLDINGS BHD 11,900 - - 11,900
ASUSTEK COMPUTER INC 4,000 - - 4,000
AU OPTRONICS CORP 47,000 47,000 47,000 47,000
AUROBINDO PHARMA LTD - 520 - 520
AVICHINA INDUSTRY + TECH - H - 8,000 - 8,000
AXIATA GROUP BERHAD 23,200 2,900 - 26,100
AXIS BANK LTD - 8,785 1,094 7,691
AXIS BANK LTD 1,757 - 1,757 -
AYALA CORPORATION 1,100 - - 1,100
AYALA LAND INC 36,800 - - 36,800
BAJAJ AUTO LTD 552 - - 552
BANGKOK BANK PCL 2,000 - - 2,000
BANGKOK DUSIT MED SERVICE F - 20,000 - 20,000
BANGKOK DUSIT MED SERVICE F FOREIGN SH THB1 A 2,000 - 2,000 -
BANK CENTRAL ASIA TBK PT IDR625 72,500 - - 72,500
BANK DANAMON INDONESIA TBK 16,000 - - 16,000
BANK MANDIRI PERSERO TBK PT 50,000 - - 50,000
BANK NEGARA INDONESIA PERSER IDR75 37,000 - - 37,000
BANK OF AYUDHYA PUBLIC NVDR - 7,100 - 7,100
BANK OF BARODA 1,240 - 428 812
BANK OF CHINA LTD - H 476,000 - 22,000 454,000
BANK OF COMMUNICATIONS CO - H 65,000 - 8,000 57,000
BANK OF EAST ASIA 6,400 - - 6,400
BANK OF INDIA - 931 - 931
BANK OF THE PHILIPPINE ISLAN 8,620 - - 8,620
BANK RAKYAT INDONESIA PERSER IDR25 59,000 - - 59,000
BANPU PUBLIC CO LTD FOR REG - 4,500 - 4,500
BANPU PUBLIC CO LTD FOR REG FOREIGN SH THB1 A 4,500 - 4,500 -
BBMG CORPORATION - H 6,500 - - 6,500
BDO UNIBANK INC 6,560 - - 6,560
BEC WORLD PCL FOREIGN FOREIGN SH THB1 A 5,800 - - 5,800
BEIJING CAPITAL INTL AIRPO - H 10,000 - - 10,000
BEIJING ENTERPRISES HOLDINGS 3,000 - - 3,000
BEIJING ENTERPRISES WATER GR - 18,000 - 18,000
BEIJING JINGNENG CLEAN ENE - H - 6,000 - 6,000
BEIJING NORTH STAR CO LTD - H 12,000 - - 12,000
BELLE INTERNATIONAL HOLDINGS HKD1 31,000 - - 31,000
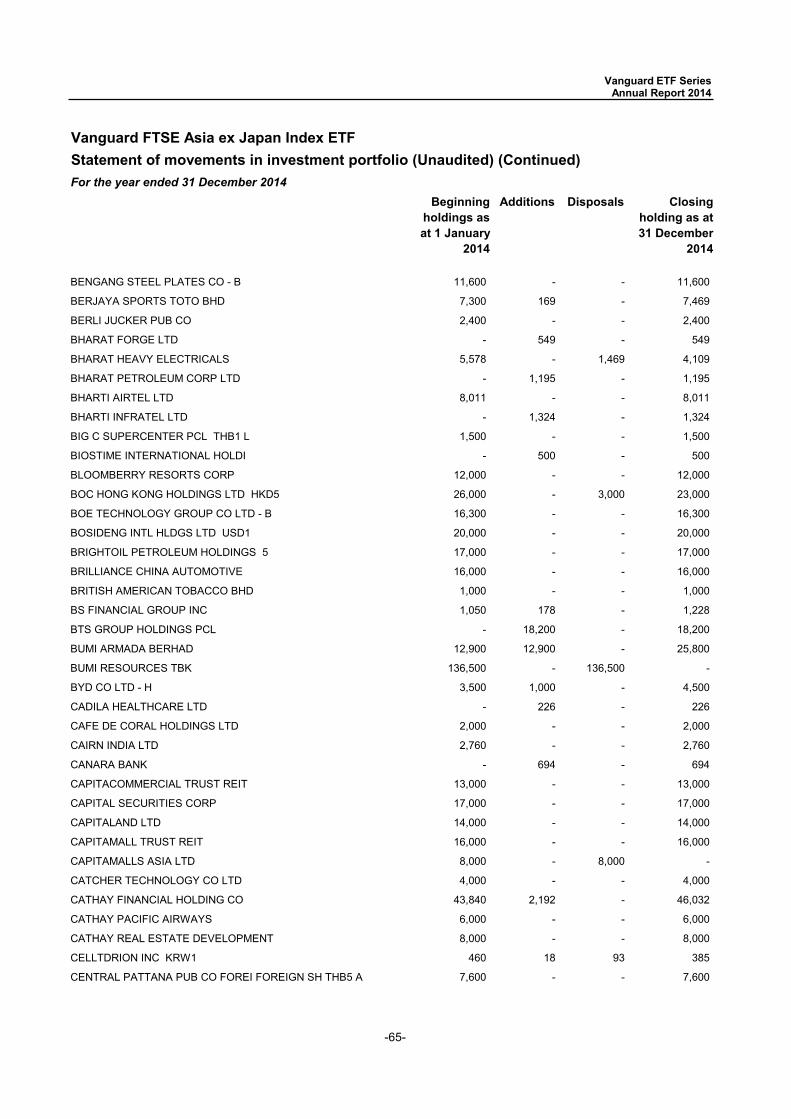
-65-
Vanguard FTSE Asia ex Japan Index ETFStatement of movements in investment portfolio (Unaudited) (Continued)For the year ended 31 December 2014
Beginning holdings as at 1 January
2014
Additions Disposals Closing holding as at 31 December
2014
Vanguard ETF Series Annual Report 2014
BENGANG STEEL PLATES CO - B 11,600 - - 11,600
BERJAYA SPORTS TOTO BHD 7,300 169 - 7,469
BERLI JUCKER PUB CO 2,400 - - 2,400
BHARAT FORGE LTD - 549 - 549
BHARAT HEAVY ELECTRICALS 5,578 - 1,469 4,109
BHARAT PETROLEUM CORP LTD - 1,195 - 1,195
BHARTI AIRTEL LTD 8,011 - - 8,011
BHARTI INFRATEL LTD - 1,324 - 1,324
BIG C SUPERCENTER PCL THB1 L 1,500 - - 1,500
BIOSTIME INTERNATIONAL HOLDI - 500 - 500
BLOOMBERRY RESORTS CORP 12,000 - - 12,000
BOC HONG KONG HOLDINGS LTD HKD5 26,000 - 3,000 23,000
BOE TECHNOLOGY GROUP CO LTD - B 16,300 - - 16,300
BOSIDENG INTL HLDGS LTD USD1 20,000 - - 20,000
BRIGHTOIL PETROLEUM HOLDINGS 5 17,000 - - 17,000
BRILLIANCE CHINA AUTOMOTIVE 16,000 - - 16,000
BRITISH AMERICAN TOBACCO BHD 1,000 - - 1,000
BS FINANCIAL GROUP INC 1,050 178 - 1,228
BTS GROUP HOLDINGS PCL - 18,200 - 18,200
BUMI ARMADA BERHAD 12,900 12,900 - 25,800
BUMI RESOURCES TBK 136,500 - 136,500 -
BYD CO LTD - H 3,500 1,000 - 4,500
CADILA HEALTHCARE LTD - 226 - 226
CAFE DE CORAL HOLDINGS LTD 2,000 - - 2,000
CAIRN INDIA LTD 2,760 - - 2,760
CANARA BANK - 694 - 694
CAPITACOMMERCIAL TRUST REIT 13,000 - - 13,000
CAPITAL SECURITIES CORP 17,000 - - 17,000
CAPITALAND LTD 14,000 - - 14,000
CAPITAMALL TRUST REIT 16,000 - - 16,000
CAPITAMALLS ASIA LTD 8,000 - 8,000 -
CATCHER TECHNOLOGY CO LTD 4,000 - - 4,000
CATHAY FINANCIAL HOLDING CO 43,840 2,192 - 46,032
CATHAY PACIFIC AIRWAYS 6,000 - - 6,000
CATHAY REAL ESTATE DEVELOPMENT 8,000 - - 8,000
CELLTDRION INC KRW1 460 18 93 385
CENTRAL PATTANA PUB CO FOREI FOREIGN SH THB5 A 7,600 - - 7,600
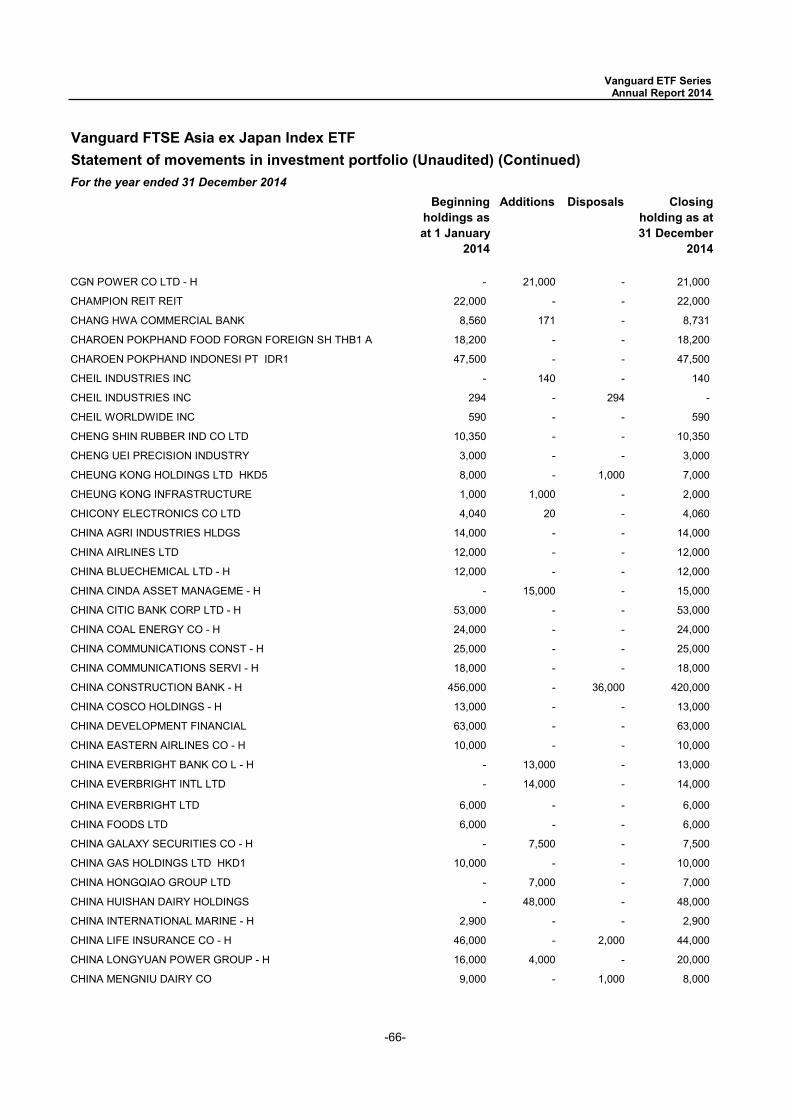
-66-
Vanguard FTSE Asia ex Japan Index ETFStatement of movements in investment portfolio (Unaudited) (Continued)For the year ended 31 December 2014
Beginning holdings as at 1 January
2014
Additions Disposals Closing holding as at 31 December
2014
Vanguard ETF Series Annual Report 2014
CGN POWER CO LTD - H - 21,000 - 21,000
CHAMPION REIT REIT 22,000 - - 22,000
CHANG HWA COMMERCIAL BANK 8,560 171 - 8,731
CHAROEN POKPHAND FOOD FORGN FOREIGN SH THB1 A 18,200 - - 18,200
CHAROEN POKPHAND INDONESI PT IDR1 47,500 - - 47,500
CHEIL INDUSTRIES INC - 140 - 140
CHEIL INDUSTRIES INC 294 - 294 -
CHEIL WORLDWIDE INC 590 - - 590
CHENG SHIN RUBBER IND CO LTD 10,350 - - 10,350
CHENG UEI PRECISION INDUSTRY 3,000 - - 3,000
CHEUNG KONG HOLDINGS LTD HKD5 8,000 - 1,000 7,000
CHEUNG KONG INFRASTRUCTURE 1,000 1,000 - 2,000
CHICONY ELECTRONICS CO LTD 4,040 20 - 4,060
CHINA AGRI INDUSTRIES HLDGS 14,000 - - 14,000
CHINA AIRLINES LTD 12,000 - - 12,000
CHINA BLUECHEMICAL LTD - H 12,000 - - 12,000
CHINA CINDA ASSET MANAGEME - H - 15,000 - 15,000
CHINA CITIC BANK CORP LTD - H 53,000 - - 53,000
CHINA COAL ENERGY CO - H 24,000 - - 24,000
CHINA COMMUNICATIONS CONST - H 25,000 - - 25,000
CHINA COMMUNICATIONS SERVI - H 18,000 - - 18,000
CHINA CONSTRUCTION BANK - H 456,000 - 36,000 420,000
CHINA COSCO HOLDINGS - H 13,000 - - 13,000
CHINA DEVELOPMENT FINANCIAL 63,000 - - 63,000
CHINA EASTERN AIRLINES CO - H 10,000 - - 10,000
CHINA EVERBRIGHT BANK CO L - H - 13,000 - 13,000
CHINA EVERBRIGHT INTL LTD - 14,000 - 14,000
CHINA EVERBRIGHT LTD 6,000 - - 6,000
CHINA FOODS LTD 6,000 - - 6,000
CHINA GALAXY SECURITIES CO - H - 7,500 - 7,500
CHINA GAS HOLDINGS LTD HKD1 10,000 - - 10,000
CHINA HONGQIAO GROUP LTD - 7,000 - 7,000
CHINA HUISHAN DAIRY HOLDINGS - 48,000 - 48,000
CHINA INTERNATIONAL MARINE - H 2,900 - - 2,900
CHINA LIFE INSURANCE CO - H 46,000 - 2,000 44,000
CHINA LONGYUAN POWER GROUP - H 16,000 4,000 - 20,000
CHINA MENGNIU DAIRY CO 9,000 - 1,000 8,000
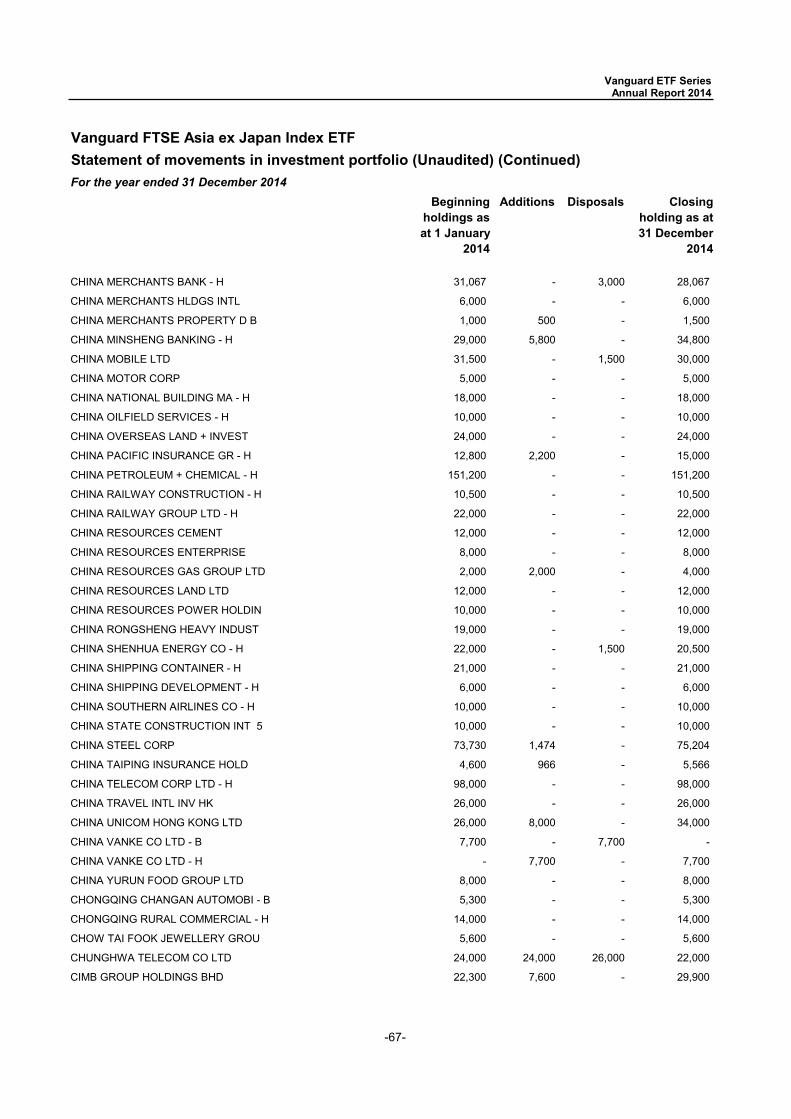
-67-
Vanguard FTSE Asia ex Japan Index ETFStatement of movements in investment portfolio (Unaudited) (Continued)For the year ended 31 December 2014
Beginning holdings as at 1 January
2014
Additions Disposals Closing holding as at 31 December
2014
Vanguard ETF Series Annual Report 2014
CHINA MERCHANTS BANK - H 31,067 - 3,000 28,067
CHINA MERCHANTS HLDGS INTL 6,000 - - 6,000
CHINA MERCHANTS PROPERTY D B 1,000 500 - 1,500
CHINA MINSHENG BANKING - H 29,000 5,800 - 34,800
CHINA MOBILE LTD 31,500 - 1,500 30,000
CHINA MOTOR CORP 5,000 - - 5,000
CHINA NATIONAL BUILDING MA - H 18,000 - - 18,000
CHINA OILFIELD SERVICES - H 10,000 - - 10,000
CHINA OVERSEAS LAND + INVEST 24,000 - - 24,000
CHINA PACIFIC INSURANCE GR - H 12,800 2,200 - 15,000
CHINA PETROLEUM + CHEMICAL - H 151,200 - - 151,200
CHINA RAILWAY CONSTRUCTION - H 10,500 - - 10,500
CHINA RAILWAY GROUP LTD - H 22,000 - - 22,000
CHINA RESOURCES CEMENT 12,000 - - 12,000
CHINA RESOURCES ENTERPRISE 8,000 - - 8,000
CHINA RESOURCES GAS GROUP LTD 2,000 2,000 - 4,000
CHINA RESOURCES LAND LTD 12,000 - - 12,000
CHINA RESOURCES POWER HOLDIN 10,000 - - 10,000
CHINA RONGSHENG HEAVY INDUST 19,000 - - 19,000
CHINA SHENHUA ENERGY CO - H 22,000 - 1,500 20,500
CHINA SHIPPING CONTAINER - H 21,000 - - 21,000
CHINA SHIPPING DEVELOPMENT - H 6,000 - - 6,000
CHINA SOUTHERN AIRLINES CO - H 10,000 - - 10,000
CHINA STATE CONSTRUCTION INT 5 10,000 - - 10,000
CHINA STEEL CORP 73,730 1,474 - 75,204
CHINA TAIPING INSURANCE HOLD 4,600 966 - 5,566
CHINA TELECOM CORP LTD - H 98,000 - - 98,000
CHINA TRAVEL INTL INV HK 26,000 - - 26,000
CHINA UNICOM HONG KONG LTD 26,000 8,000 - 34,000
CHINA VANKE CO LTD - B 7,700 - 7,700 -
CHINA VANKE CO LTD - H - 7,700 - 7,700
CHINA YURUN FOOD GROUP LTD 8,000 - - 8,000
CHONGQING CHANGAN AUTOMOBI - B 5,300 - - 5,300
CHONGQING RURAL COMMERCIAL - H 14,000 - - 14,000
CHOW TAI FOOK JEWELLERY GROU 5,600 - - 5,600
CHUNGHWA TELECOM CO LTD 24,000 24,000 26,000 22,000
CIMB GROUP HOLDINGS BHD 22,300 7,600 - 29,900
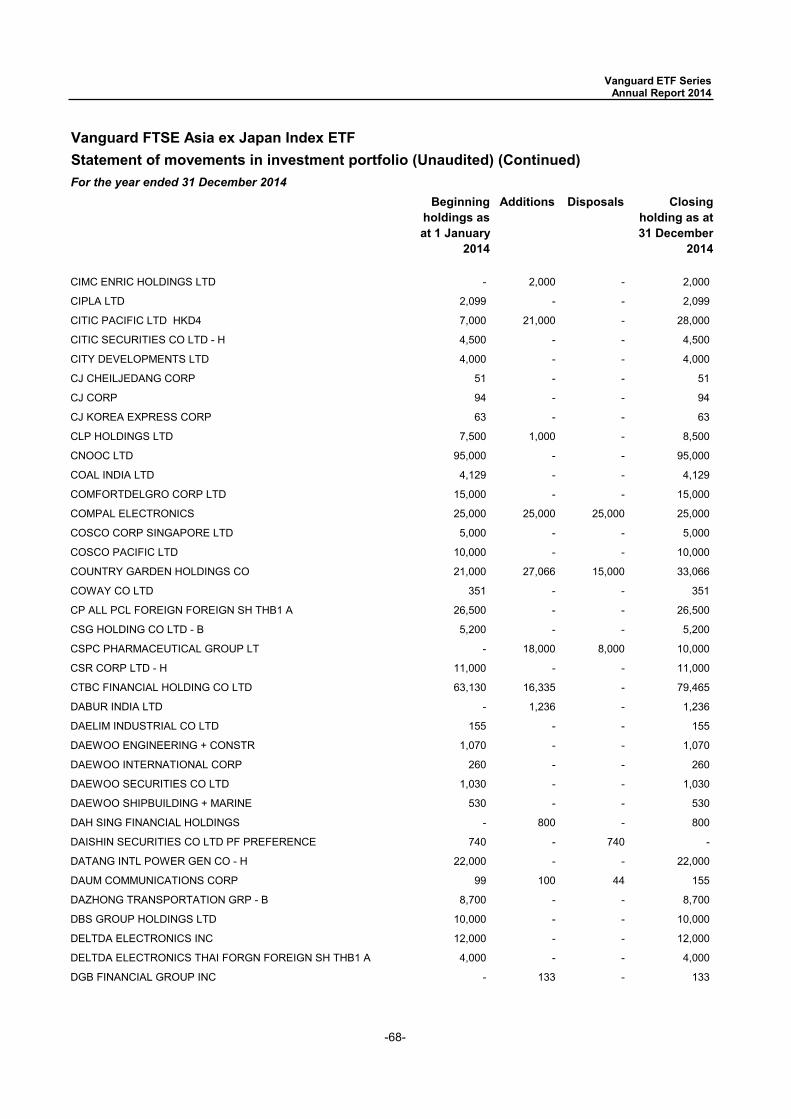
-68-
Vanguard FTSE Asia ex Japan Index ETFStatement of movements in investment portfolio (Unaudited) (Continued)For the year ended 31 December 2014
Beginning holdings as at 1 January
2014
Additions Disposals Closing holding as at 31 December
2014
Vanguard ETF Series Annual Report 2014
CIMC ENRIC HOLDINGS LTD - 2,000 - 2,000
CIPLA LTD 2,099 - - 2,099
CITIC PACIFIC LTD HKD4 7,000 21,000 - 28,000
CITIC SECURITIES CO LTD - H 4,500 - - 4,500
CITY DEVELOPMENTS LTD 4,000 - - 4,000
CJ CHEILJEDANG CORP 51 - - 51
CJ CORP 94 - - 94
CJ KOREA EXPRESS CORP 63 - - 63
CLP HOLDINGS LTD 7,500 1,000 - 8,500
CNOOC LTD 95,000 - - 95,000
COAL INDIA LTD 4,129 - - 4,129
COMFORTDELGRO CORP LTD 15,000 - - 15,000
COMPAL ELECTRONICS 25,000 25,000 25,000 25,000
COSCO CORP SINGAPORE LTD 5,000 - - 5,000
COSCO PACIFIC LTD 10,000 - - 10,000
COUNTRY GARDEN HOLDINGS CO 21,000 27,066 15,000 33,066
COWAY CO LTD 351 - - 351
CP ALL PCL FOREIGN FOREIGN SH THB1 A 26,500 - - 26,500
CSG HOLDING CO LTD - B 5,200 - - 5,200
CSPC PHARMACEUTICAL GROUP LT - 18,000 8,000 10,000
CSR CORP LTD - H 11,000 - - 11,000
CTBC FINANCIAL HOLDING CO LTD 63,130 16,335 - 79,465
DABUR INDIA LTD - 1,236 - 1,236
DAELIM INDUSTRIAL CO LTD 155 - - 155
DAEWOO ENGINEERING + CONSTR 1,070 - - 1,070
DAEWOO INTERNATIONAL CORP 260 - - 260
DAEWOO SECURITIES CO LTD 1,030 - - 1,030
DAEWOO SHIPBUILDING + MARINE 530 - - 530
DAH SING FINANCIAL HOLDINGS - 800 - 800
DAISHIN SECURITIES CO LTD PF PREFERENCE 740 - 740 -
DATANG INTL POWER GEN CO - H 22,000 - - 22,000
DAUM COMMUNICATIONS CORP 99 100 44 155
DAZHONG TRANSPORTATION GRP - B 8,700 - - 8,700
DBS GROUP HOLDINGS LTD 10,000 - - 10,000
DELTDA ELECTRONICS INC 12,000 - - 12,000
DELTDA ELECTRONICS THAI FORGN FOREIGN SH THB1 A 4,000 - - 4,000
DGB FINANCIAL GROUP INC - 133 - 133

-69-
Vanguard FTSE Asia ex Japan Index ETFStatement of movements in investment portfolio (Unaudited) (Continued)For the year ended 31 December 2014
Beginning holdings as at 1 January
2014
Additions Disposals Closing holding as at 31 December
2014
Vanguard ETF Series Annual Report 2014
DGB FINANCIAL GROUP INC 640 - - 640
DIGICOM BHD 23,100 - - 23,100
DIVI S LABORATORIES LTD - 156 - 156
DLF LTD 4,578 - 1,410 3,168
DMCI HOLDINGS INC 4,720 18,880 - 23,600
DONGBU INSURANCE CO LTD 320 - - 320
DONGFANG ELECTRIC CORP LTD - H 1,800 - - 1,800
DONGFENG MOTOR GRP CO LTD - H 16,000 - - 16,000
DOOSAN CORP 61 - - 61
DOOSAN HEAVY INDUSTRIES 230 - - 230
DOOSAN INFRACORE CO LTD 470 280 - 750
DR REDDY S LABORATORIES 544 - - 544
E MART CO LTD 133 - 16 117
ELECTRICITY GEN PUB CO FOR R FOREIGN SH THB1 A 2,400 - 900 1,500
EMPERADOR INC - 13,700 - 13,700
ENERGY DEVELOPMENT CORP 62,900 - - 62,900
ENN ENERGY HOLDINGS LTD 4,000 - - 4,000
EPISTAR CORP 5,000 5,000 5,000 5,000
ESPRIT HOLDINGS LTD 11,000 - - 11,000
ESUN FINANCIAL HOLDING CO 22,000 14,144 - 36,144
ETERNAL CHEMICAL CO LTD 12,000 270 3,000 9,270
EVA AIRWAYS CORP - 1,325 - 1,325
EVA AIRWAYS CORP 9,000 - - 9,000
EVERGRANDE REAL ESTATE GROUP 27,000 - - 27,000
EVERGREEN MARINE CORP LTD 10,000 - - 10,000
FAR EAST HORIZON LTD HKD1 9,000 - - 9,000
FAR EASTERN NEW CENTURY CORP 21,420 428 - 21,848
FAR EASTONE TELECOMM CO LTD 11,000 11,000 14,000 8,000
FELDA GLOBAL VENTURES 12,600 - - 12,600
FENG HSIN IRON + STEEL CO 6,000 - - 6,000
FIH MOBILE LTD USD4 14,000 - - 14,000
FIRST FINANCIAL HOLDING CO 26,625 11,863 - 38,488
FIRST PACIFIC CO 13,500 - - 13,500
FORMOSA CHEMICALS + FIBRE 25,750 - - 25,750
FORMOSA PETROCHEMICAL CORP 14,000 - 2,000 12,000
FORMOSA PLASTICS CORP 29,120 - - 29,120
FORMOSA TAFFETA CO 9,000 - - 9,000
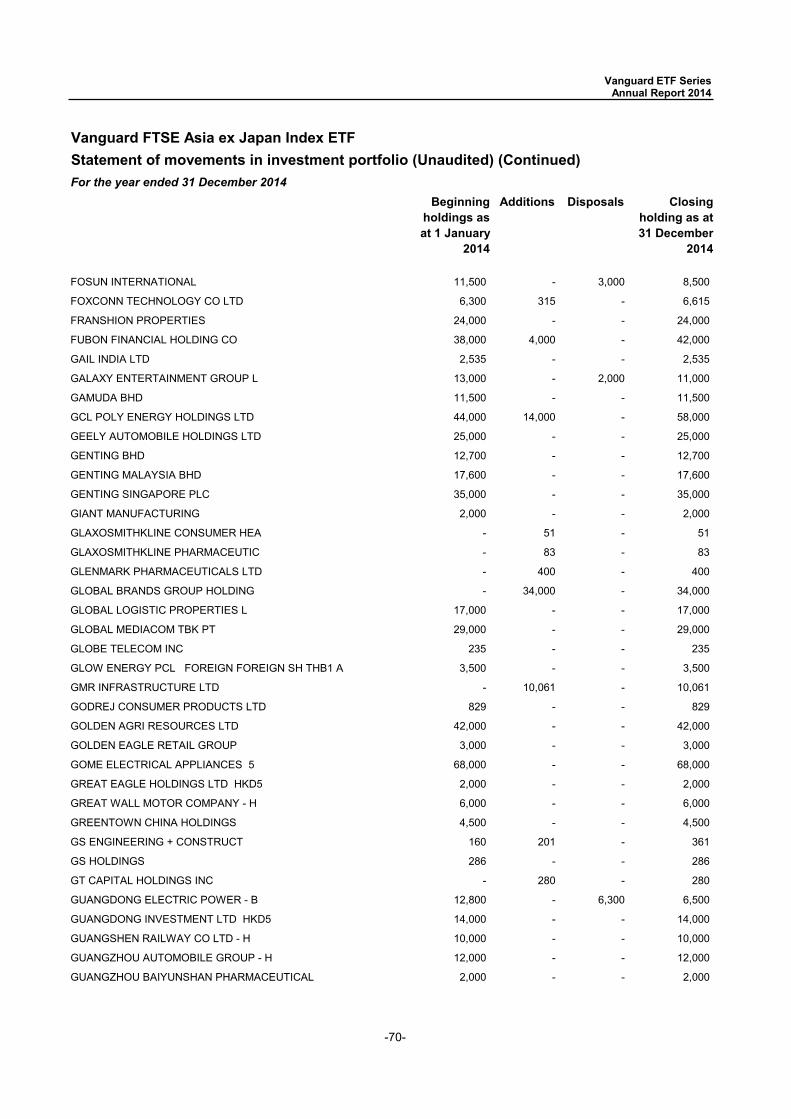
-70-
Vanguard FTSE Asia ex Japan Index ETFStatement of movements in investment portfolio (Unaudited) (Continued)For the year ended 31 December 2014
Beginning holdings as at 1 January
2014
Additions Disposals Closing holding as at 31 December
2014
Vanguard ETF Series Annual Report 2014
FOSUN INTERNATIONAL 11,500 - 3,000 8,500
FOXCONN TECHNOLOGY CO LTD 6,300 315 - 6,615
FRANSHION PROPERTIES 24,000 - - 24,000
FUBON FINANCIAL HOLDING CO 38,000 4,000 - 42,000
GAIL INDIA LTD 2,535 - - 2,535
GALAXY ENTERTAINMENT GROUP L 13,000 - 2,000 11,000
GAMUDA BHD 11,500 - - 11,500
GCL POLY ENERGY HOLDINGS LTD 44,000 14,000 - 58,000
GEELY AUTOMOBILE HOLDINGS LTD 25,000 - - 25,000
GENTING BHD 12,700 - - 12,700
GENTING MALAYSIA BHD 17,600 - - 17,600
GENTING SINGAPORE PLC 35,000 - - 35,000
GIANT MANUFACTURING 2,000 - - 2,000
GLAXOSMITHKLINE CONSUMER HEA - 51 - 51
GLAXOSMITHKLINE PHARMACEUTIC - 83 - 83
GLENMARK PHARMACEUTICALS LTD - 400 - 400
GLOBAL BRANDS GROUP HOLDING - 34,000 - 34,000
GLOBAL LOGISTIC PROPERTIES L 17,000 - - 17,000
GLOBAL MEDIACOM TBK PT 29,000 - - 29,000
GLOBE TELECOM INC 235 - - 235
GLOW ENERGY PCL FOREIGN FOREIGN SH THB1 A 3,500 - - 3,500
GMR INFRASTRUCTURE LTD - 10,061 - 10,061
GODREJ CONSUMER PRODUCTS LTD 829 - - 829
GOLDEN AGRI RESOURCES LTD 42,000 - - 42,000
GOLDEN EAGLE RETAIL GROUP 3,000 - - 3,000
GOME ELECTRICAL APPLIANCES 5 68,000 - - 68,000
GREAT EAGLE HOLDINGS LTD HKD5 2,000 - - 2,000
GREAT WALL MOTOR COMPANY - H 6,000 - - 6,000
GREENTOWN CHINA HOLDINGS 4,500 - - 4,500
GS ENGINEERING + CONSTRUCT 160 201 - 361
GS HOLDINGS 286 - - 286
GT CAPITAL HOLDINGS INC - 280 - 280
GUANGDONG ELECTRIC POWER - B 12,800 - 6,300 6,500
GUANGDONG INVESTMENT LTD HKD5 14,000 - - 14,000
GUANGSHEN RAILWAY CO LTD - H 10,000 - - 10,000
GUANGZHOU AUTOMOBILE GROUP - H 12,000 - - 12,000
GUANGZHOU BAIYUNSHAN PHARMACEUTICAL 2,000 - - 2,000
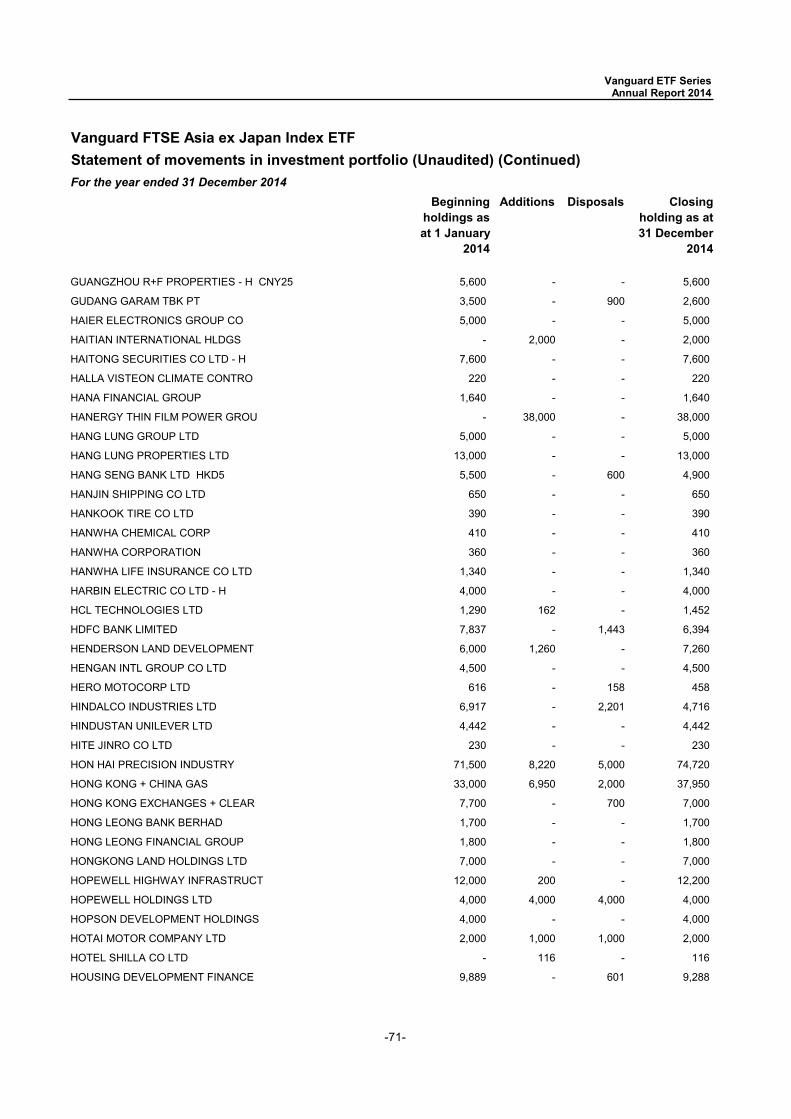
-71-
Vanguard FTSE Asia ex Japan Index ETFStatement of movements in investment portfolio (Unaudited) (Continued)For the year ended 31 December 2014
Beginning holdings as at 1 January
2014
Additions Disposals Closing holding as at 31 December
2014
Vanguard ETF Series Annual Report 2014
GUANGZHOU R+F PROPERTIES - H CNY25 5,600 - - 5,600
GUDANG GARAM TBK PT 3,500 - 900 2,600
HAIER ELECTRONICS GROUP CO 5,000 - - 5,000
HAITIAN INTERNATIONAL HLDGS - 2,000 - 2,000
HAITONG SECURITIES CO LTD - H 7,600 - - 7,600
HALLA VISTEON CLIMATE CONTRO 220 - - 220
HANA FINANCIAL GROUP 1,640 - - 1,640
HANERGY THIN FILM POWER GROU - 38,000 - 38,000
HANG LUNG GROUP LTD 5,000 - - 5,000
HANG LUNG PROPERTIES LTD 13,000 - - 13,000
HANG SENG BANK LTD HKD5 5,500 - 600 4,900
HANJIN SHIPPING CO LTD 650 - - 650
HANKOOK TIRE CO LTD 390 - - 390
HANWHA CHEMICAL CORP 410 - - 410
HANWHA CORPORATION 360 - - 360
HANWHA LIFE INSURANCE CO LTD 1,340 - - 1,340
HARBIN ELECTRIC CO LTD - H 4,000 - - 4,000
HCL TECHNOLOGIES LTD 1,290 162 - 1,452
HDFC BANK LIMITED 7,837 - 1,443 6,394
HENDERSON LAND DEVELOPMENT 6,000 1,260 - 7,260
HENGAN INTL GROUP CO LTD 4,500 - - 4,500
HERO MOTOCORP LTD 616 - 158 458
HINDALCO INDUSTRIES LTD 6,917 - 2,201 4,716
HINDUSTAN UNILEVER LTD 4,442 - - 4,442
HITE JINRO CO LTD 230 - - 230
HON HAI PRECISION INDUSTRY 71,500 8,220 5,000 74,720
HONG KONG + CHINA GAS 33,000 6,950 2,000 37,950
HONG KONG EXCHANGES + CLEAR 7,700 - 700 7,000
HONG LEONG BANK BERHAD 1,700 - - 1,700
HONG LEONG FINANCIAL GROUP 1,800 - - 1,800
HONGKONG LAND HOLDINGS LTD 7,000 - - 7,000
HOPEWELL HIGHWAY INFRASTRUCT 12,000 200 - 12,200
HOPEWELL HOLDINGS LTD 4,000 4,000 4,000 4,000
HOPSON DEVELOPMENT HOLDINGS 4,000 - - 4,000
HOTAI MOTOR COMPANY LTD 2,000 1,000 1,000 2,000
HOTEL SHILLA CO LTD - 116 - 116
HOUSING DEVELOPMENT FINANCE 9,889 - 601 9,288
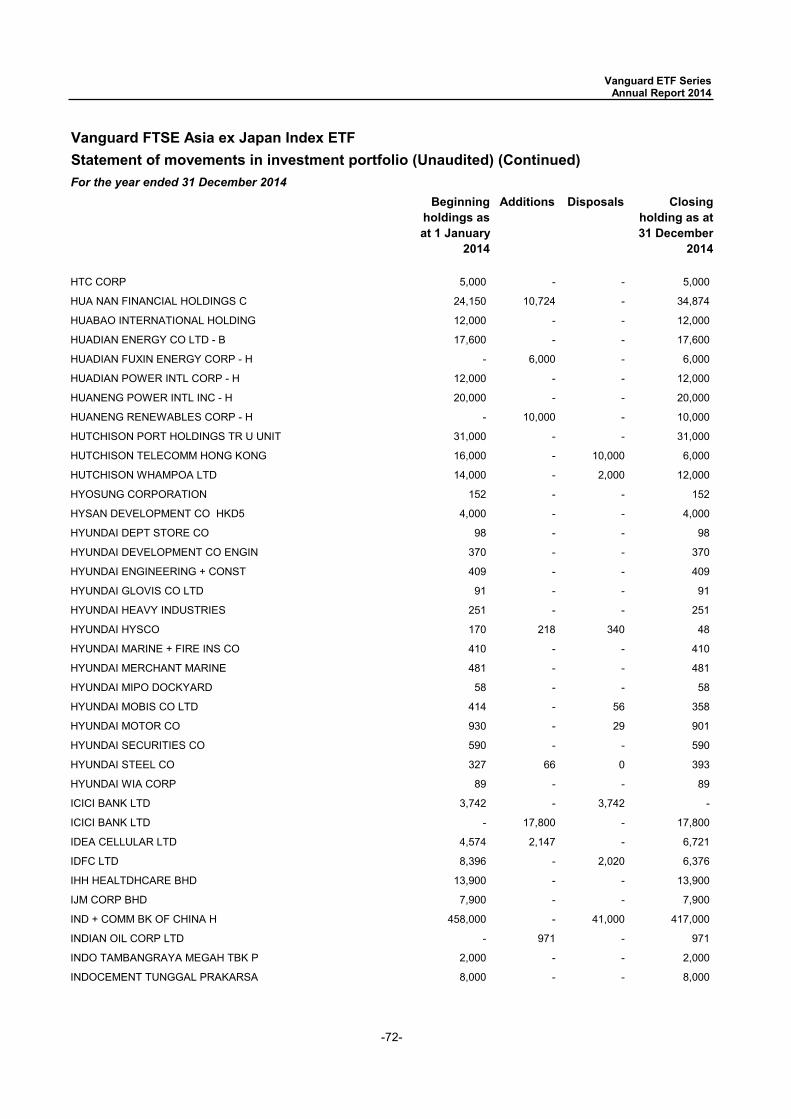
-72-
Vanguard FTSE Asia ex Japan Index ETFStatement of movements in investment portfolio (Unaudited) (Continued)For the year ended 31 December 2014
Beginning holdings as at 1 January
2014
Additions Disposals Closing holding as at 31 December
2014
Vanguard ETF Series Annual Report 2014
HTC CORP 5,000 - - 5,000
HUA NAN FINANCIAL HOLDINGS C 24,150 10,724 - 34,874
HUABAO INTERNATIONAL HOLDING 12,000 - - 12,000
HUADIAN ENERGY CO LTD - B 17,600 - - 17,600
HUADIAN FUXIN ENERGY CORP - H - 6,000 - 6,000
HUADIAN POWER INTL CORP - H 12,000 - - 12,000
HUANENG POWER INTL INC - H 20,000 - - 20,000
HUANENG RENEWABLES CORP - H - 10,000 - 10,000
HUTCHISON PORT HOLDINGS TR U UNIT 31,000 - - 31,000
HUTCHISON TELECOMM HONG KONG 16,000 - 10,000 6,000
HUTCHISON WHAMPOA LTD 14,000 - 2,000 12,000
HYOSUNG CORPORATION 152 - - 152
HYSAN DEVELOPMENT CO HKD5 4,000 - - 4,000
HYUNDAI DEPT STORE CO 98 - - 98
HYUNDAI DEVELOPMENT CO ENGIN 370 - - 370
HYUNDAI ENGINEERING + CONST 409 - - 409
HYUNDAI GLOVIS CO LTD 91 - - 91
HYUNDAI HEAVY INDUSTRIES 251 - - 251
HYUNDAI HYSCO 170 218 340 48
HYUNDAI MARINE + FIRE INS CO 410 - - 410
HYUNDAI MERCHANT MARINE 481 - - 481
HYUNDAI MIPO DOCKYARD 58 - - 58
HYUNDAI MOBIS CO LTD 414 - 56 358
HYUNDAI MOTOR CO 930 - 29 901
HYUNDAI SECURITIES CO 590 - - 590
HYUNDAI STEEL CO 327 66 0 393
HYUNDAI WIA CORP 89 - - 89
ICICI BANK LTD 3,742 - 3,742 -
ICICI BANK LTD - 17,800 - 17,800
IDEA CELLULAR LTD 4,574 2,147 - 6,721
IDFC LTD 8,396 - 2,020 6,376
IHH HEALTDHCARE BHD 13,900 - - 13,900
IJM CORP BHD 7,900 - - 7,900
IND + COMM BK OF CHINA H 458,000 - 41,000 417,000
INDIAN OIL CORP LTD - 971 - 971
INDO TAMBANGRAYA MEGAH TBK P 2,000 - - 2,000
INDOCEMENT TUNGGAL PRAKARSA 8,000 - - 8,000
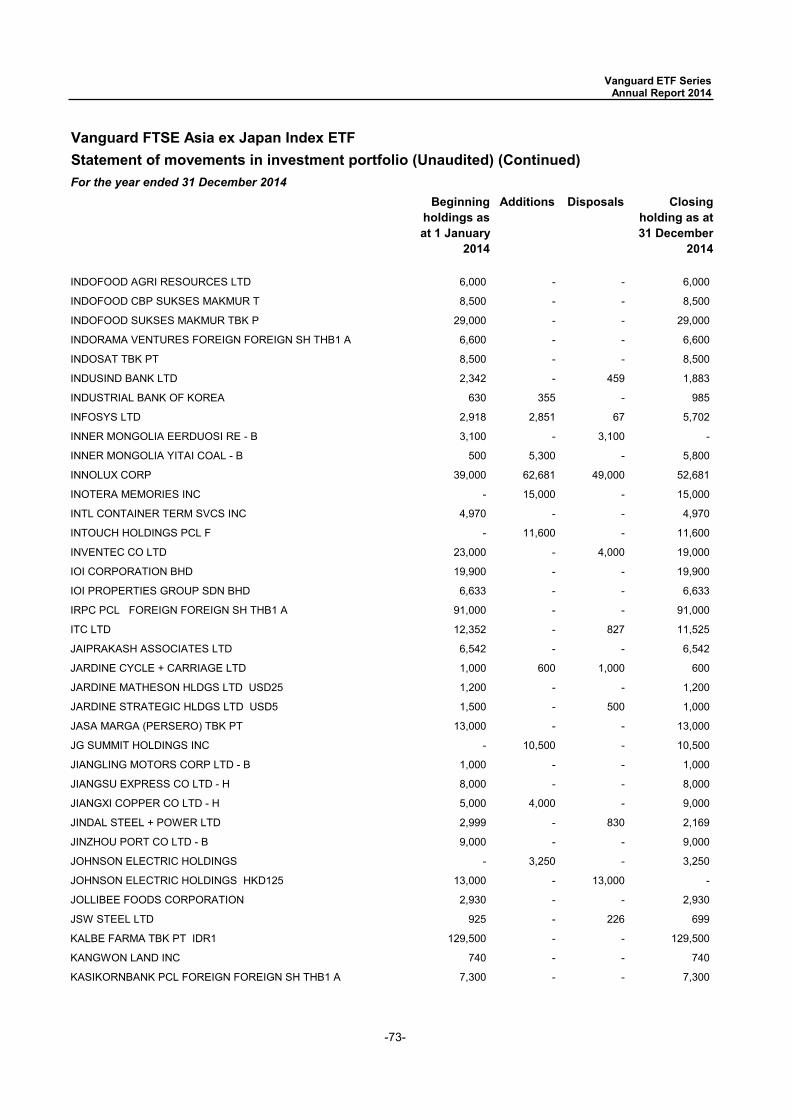
-73-
Vanguard FTSE Asia ex Japan Index ETFStatement of movements in investment portfolio (Unaudited) (Continued)For the year ended 31 December 2014
Beginning holdings as at 1 January
2014
Additions Disposals Closing holding as at 31 December
2014
Vanguard ETF Series Annual Report 2014
INDOFOOD AGRI RESOURCES LTD 6,000 - - 6,000
INDOFOOD CBP SUKSES MAKMUR T 8,500 - - 8,500
INDOFOOD SUKSES MAKMUR TBK P 29,000 - - 29,000
INDORAMA VENTURES FOREIGN FOREIGN SH THB1 A 6,600 - - 6,600
INDOSAT TBK PT 8,500 - - 8,500
INDUSIND BANK LTD 2,342 - 459 1,883
INDUSTRIAL BANK OF KOREA 630 355 - 985
INFOSYS LTD 2,918 2,851 67 5,702
INNER MONGOLIA EERDUOSI RE - B 3,100 - 3,100 -
INNER MONGOLIA YITAI COAL - B 500 5,300 - 5,800
INNOLUX CORP 39,000 62,681 49,000 52,681
INOTERA MEMORIES INC - 15,000 - 15,000
INTL CONTAINER TERM SVCS INC 4,970 - - 4,970
INTOUCH HOLDINGS PCL F - 11,600 - 11,600
INVENTEC CO LTD 23,000 - 4,000 19,000
IOI CORPORATION BHD 19,900 - - 19,900
IOI PROPERTIES GROUP SDN BHD 6,633 - - 6,633
IRPC PCL FOREIGN FOREIGN SH THB1 A 91,000 - - 91,000
ITC LTD 12,352 - 827 11,525
JAIPRAKASH ASSOCIATES LTD 6,542 - - 6,542
JARDINE CYCLE + CARRIAGE LTD 1,000 600 1,000 600
JARDINE MATHESON HLDGS LTD USD25 1,200 - - 1,200
JARDINE STRATEGIC HLDGS LTD USD5 1,500 - 500 1,000
JASA MARGA (PERSERO) TBK PT 13,000 - - 13,000
JG SUMMIT HOLDINGS INC - 10,500 - 10,500
JIANGLING MOTORS CORP LTD - B 1,000 - - 1,000
JIANGSU EXPRESS CO LTD - H 8,000 - - 8,000
JIANGXI COPPER CO LTD - H 5,000 4,000 - 9,000
JINDAL STEEL + POWER LTD 2,999 - 830 2,169
JINZHOU PORT CO LTD - B 9,000 - - 9,000
JOHNSON ELECTRIC HOLDINGS - 3,250 - 3,250
JOHNSON ELECTRIC HOLDINGS HKD125 13,000 - 13,000 -
JOLLIBEE FOODS CORPORATION 2,930 - - 2,930
JSW STEEL LTD 925 - 226 699
KALBE FARMA TBK PT IDR1 129,500 - - 129,500
KANGWON LAND INC 740 - - 740
KASIKORNBANK PCL FOREIGN FOREIGN SH THB1 A 7,300 - - 7,300
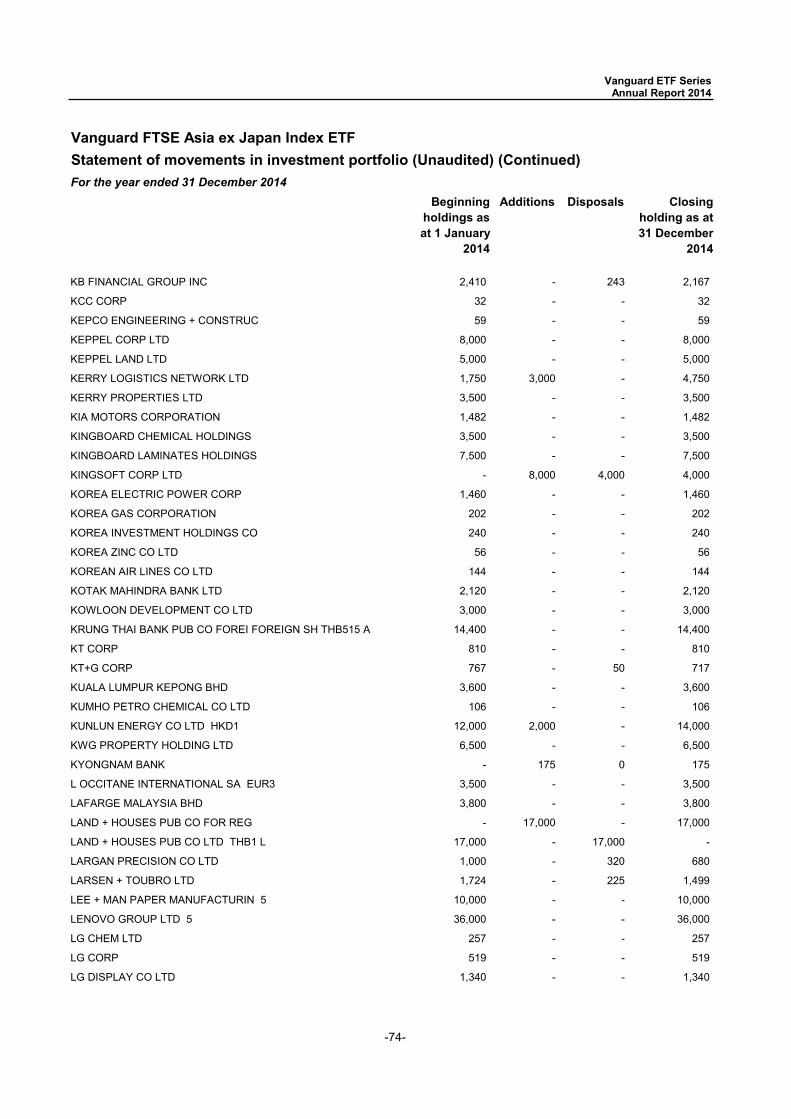
-74-
Vanguard FTSE Asia ex Japan Index ETFStatement of movements in investment portfolio (Unaudited) (Continued)For the year ended 31 December 2014
Beginning holdings as at 1 January
2014
Additions Disposals Closing holding as at 31 December
2014
Vanguard ETF Series Annual Report 2014
KB FINANCIAL GROUP INC 2,410 - 243 2,167
KCC CORP 32 - - 32
KEPCO ENGINEERING + CONSTRUC 59 - - 59
KEPPEL CORP LTD 8,000 - - 8,000
KEPPEL LAND LTD 5,000 - - 5,000
KERRY LOGISTICS NETWORK LTD 1,750 3,000 - 4,750
KERRY PROPERTIES LTD 3,500 - - 3,500
KIA MOTORS CORPORATION 1,482 - - 1,482
KINGBOARD CHEMICAL HOLDINGS 3,500 - - 3,500
KINGBOARD LAMINATES HOLDINGS 7,500 - - 7,500
KINGSOFT CORP LTD - 8,000 4,000 4,000
KOREA ELECTRIC POWER CORP 1,460 - - 1,460
KOREA GAS CORPORATION 202 - - 202
KOREA INVESTMENT HOLDINGS CO 240 - - 240
KOREA ZINC CO LTD 56 - - 56
KOREAN AIR LINES CO LTD 144 - - 144
KOTAK MAHINDRA BANK LTD 2,120 - - 2,120
KOWLOON DEVELOPMENT CO LTD 3,000 - - 3,000
KRUNG THAI BANK PUB CO FOREI FOREIGN SH THB515 A 14,400 - - 14,400
KT CORP 810 - - 810
KT+G CORP 767 - 50 717
KUALA LUMPUR KEPONG BHD 3,600 - - 3,600
KUMHO PETRO CHEMICAL CO LTD 106 - - 106
KUNLUN ENERGY CO LTD HKD1 12,000 2,000 - 14,000
KWG PROPERTY HOLDING LTD 6,500 - - 6,500
KYONGNAM BANK - 175 0 175
L OCCITANE INTERNATIONAL SA EUR3 3,500 - - 3,500
LAFARGE MALAYSIA BHD 3,800 - - 3,800
LAND + HOUSES PUB CO FOR REG - 17,000 - 17,000
LAND + HOUSES PUB CO LTD THB1 L 17,000 - 17,000 -
LARGAN PRECISION CO LTD 1,000 - 320 680
LARSEN + TOUBRO LTD 1,724 - 225 1,499
LEE + MAN PAPER MANUFACTURIN 5 10,000 - - 10,000
LENOVO GROUP LTD 5 36,000 - - 36,000
LG CHEM LTD 257 - - 257
LG CORP 519 - - 519
LG DISPLAY CO LTD 1,340 - - 1,340
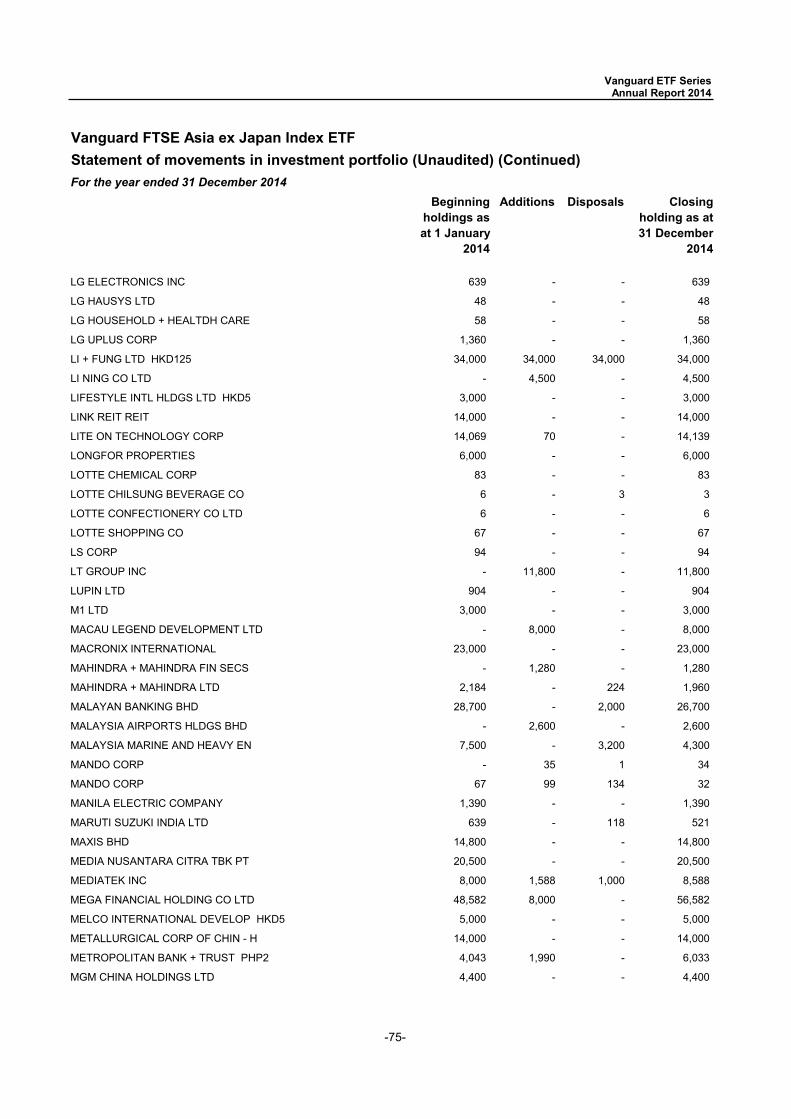
-75-
Vanguard FTSE Asia ex Japan Index ETFStatement of movements in investment portfolio (Unaudited) (Continued)For the year ended 31 December 2014
Beginning holdings as at 1 January
2014
Additions Disposals Closing holding as at 31 December
2014
Vanguard ETF Series Annual Report 2014
LG ELECTRONICS INC 639 - - 639
LG HAUSYS LTD 48 - - 48
LG HOUSEHOLD + HEALTDH CARE 58 - - 58
LG UPLUS CORP 1,360 - - 1,360
LI + FUNG LTD HKD125 34,000 34,000 34,000 34,000
LI NING CO LTD - 4,500 - 4,500
LIFESTYLE INTL HLDGS LTD HKD5 3,000 - - 3,000
LINK REIT REIT 14,000 - - 14,000
LITE ON TECHNOLOGY CORP 14,069 70 - 14,139
LONGFOR PROPERTIES 6,000 - - 6,000
LOTTE CHEMICAL CORP 83 - - 83
LOTTE CHILSUNG BEVERAGE CO 6 - 3 3
LOTTE CONFECTIONERY CO LTD 6 - - 6
LOTTE SHOPPING CO 67 - - 67
LS CORP 94 - - 94
LT GROUP INC - 11,800 - 11,800
LUPIN LTD 904 - - 904
M1 LTD 3,000 - - 3,000
MACAU LEGEND DEVELOPMENT LTD - 8,000 - 8,000
MACRONIX INTERNATIONAL 23,000 - - 23,000
MAHINDRA + MAHINDRA FIN SECS - 1,280 - 1,280
MAHINDRA + MAHINDRA LTD 2,184 - 224 1,960
MALAYAN BANKING BHD 28,700 - 2,000 26,700
MALAYSIA AIRPORTS HLDGS BHD - 2,600 - 2,600
MALAYSIA MARINE AND HEAVY EN 7,500 - 3,200 4,300
MANDO CORP - 35 1 34
MANDO CORP 67 99 134 32
MANILA ELECTRIC COMPANY 1,390 - - 1,390
MARUTI SUZUKI INDIA LTD 639 - 118 521
MAXIS BHD 14,800 - - 14,800
MEDIA NUSANTARA CITRA TBK PT 20,500 - - 20,500
MEDIATEK INC 8,000 1,588 1,000 8,588
MEGA FINANCIAL HOLDING CO LTD 48,582 8,000 - 56,582
MELCO INTERNATIONAL DEVELOP HKD5 5,000 - - 5,000
METALLURGICAL CORP OF CHIN - H 14,000 - - 14,000
METROPOLITAN BANK + TRUST PHP2 4,043 1,990 - 6,033
MGM CHINA HOLDINGS LTD 4,400 - - 4,400
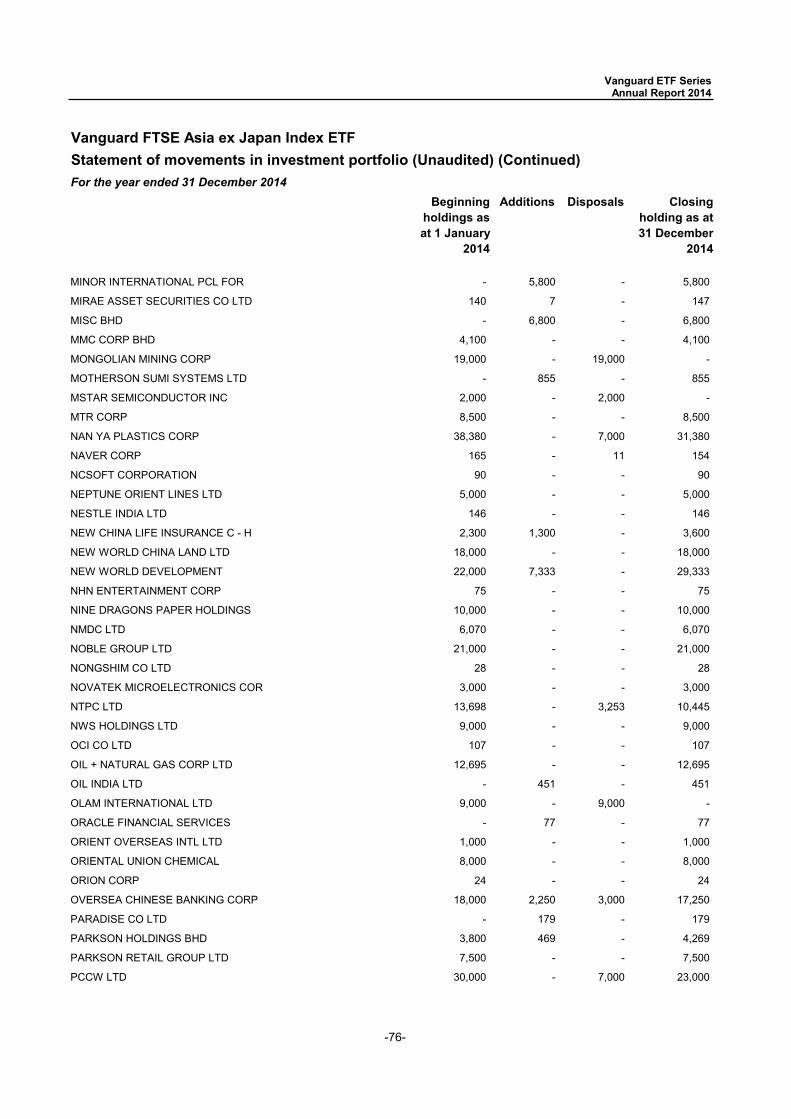
-76-
Vanguard FTSE Asia ex Japan Index ETFStatement of movements in investment portfolio (Unaudited) (Continued)For the year ended 31 December 2014
Beginning holdings as at 1 January
2014
Additions Disposals Closing holding as at 31 December
2014
Vanguard ETF Series Annual Report 2014
MINOR INTERNATIONAL PCL FOR - 5,800 - 5,800
MIRAE ASSET SECURITIES CO LTD 140 7 - 147
MISC BHD - 6,800 - 6,800
MMC CORP BHD 4,100 - - 4,100
MONGOLIAN MINING CORP 19,000 - 19,000 -
MOTHERSON SUMI SYSTEMS LTD - 855 - 855
MSTAR SEMICONDUCTOR INC 2,000 - 2,000 -
MTR CORP 8,500 - - 8,500
NAN YA PLASTICS CORP 38,380 - 7,000 31,380
NAVER CORP 165 - 11 154
NCSOFT CORPORATION 90 - - 90
NEPTUNE ORIENT LINES LTD 5,000 - - 5,000
NESTLE INDIA LTD 146 - - 146
NEW CHINA LIFE INSURANCE C - H 2,300 1,300 - 3,600
NEW WORLD CHINA LAND LTD 18,000 - - 18,000
NEW WORLD DEVELOPMENT 22,000 7,333 - 29,333
NHN ENTERTAINMENT CORP 75 - - 75
NINE DRAGONS PAPER HOLDINGS 10,000 - - 10,000
NMDC LTD 6,070 - - 6,070
NOBLE GROUP LTD 21,000 - - 21,000
NONGSHIM CO LTD 28 - - 28
NOVATEK MICROELECTRONICS COR 3,000 - - 3,000
NTPC LTD 13,698 - 3,253 10,445
NWS HOLDINGS LTD 9,000 - - 9,000
OCI CO LTD 107 - - 107
OIL + NATURAL GAS CORP LTD 12,695 - - 12,695
OIL INDIA LTD - 451 - 451
OLAM INTERNATIONAL LTD 9,000 - 9,000 -
ORACLE FINANCIAL SERVICES - 77 - 77
ORIENT OVERSEAS INTL LTD 1,000 - - 1,000
ORIENTAL UNION CHEMICAL 8,000 - - 8,000
ORION CORP 24 - - 24
OVERSEA CHINESE BANKING CORP 18,000 2,250 3,000 17,250
PARADISE CO LTD - 179 - 179
PARKSON HOLDINGS BHD 3,800 469 - 4,269
PARKSON RETAIL GROUP LTD 7,500 - - 7,500
PCCW LTD 30,000 - 7,000 23,000
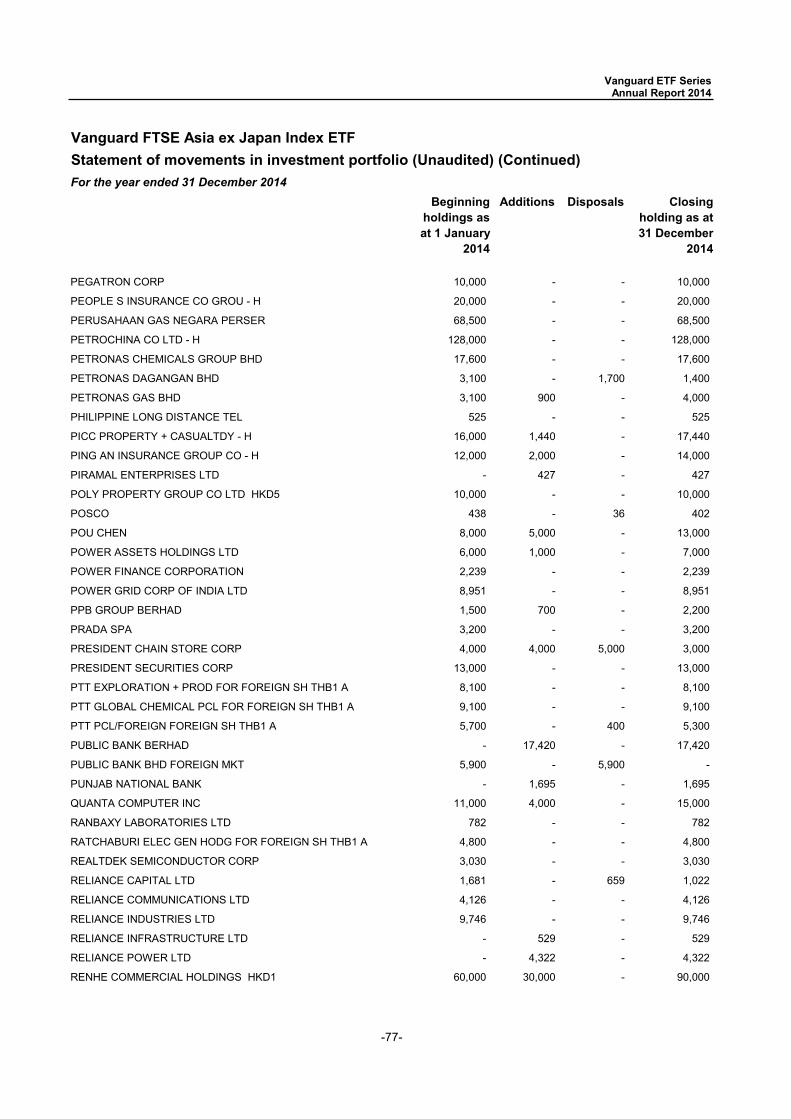
-77-
Vanguard FTSE Asia ex Japan Index ETFStatement of movements in investment portfolio (Unaudited) (Continued)For the year ended 31 December 2014
Beginning holdings as at 1 January
2014
Additions Disposals Closing holding as at 31 December
2014
Vanguard ETF Series Annual Report 2014
PEGATRON CORP 10,000 - - 10,000
PEOPLE S INSURANCE CO GROU - H 20,000 - - 20,000
PERUSAHAAN GAS NEGARA PERSER 68,500 - - 68,500
PETROCHINA CO LTD - H 128,000 - - 128,000
PETRONAS CHEMICALS GROUP BHD 17,600 - - 17,600
PETRONAS DAGANGAN BHD 3,100 - 1,700 1,400
PETRONAS GAS BHD 3,100 900 - 4,000
PHILIPPINE LONG DISTANCE TEL 525 - - 525
PICC PROPERTY + CASUALTDY - H 16,000 1,440 - 17,440
PING AN INSURANCE GROUP CO - H 12,000 2,000 - 14,000
PIRAMAL ENTERPRISES LTD - 427 - 427
POLY PROPERTY GROUP CO LTD HKD5 10,000 - - 10,000
POSCO 438 - 36 402
POU CHEN 8,000 5,000 - 13,000
POWER ASSETS HOLDINGS LTD 6,000 1,000 - 7,000
POWER FINANCE CORPORATION 2,239 - - 2,239
POWER GRID CORP OF INDIA LTD 8,951 - - 8,951
PPB GROUP BERHAD 1,500 700 - 2,200
PRADA SPA 3,200 - - 3,200
PRESIDENT CHAIN STORE CORP 4,000 4,000 5,000 3,000
PRESIDENT SECURITIES CORP 13,000 - - 13,000
PTT EXPLORATION + PROD FOR FOREIGN SH THB1 A 8,100 - - 8,100
PTT GLOBAL CHEMICAL PCL FOR FOREIGN SH THB1 A 9,100 - - 9,100
PTT PCL/FOREIGN FOREIGN SH THB1 A 5,700 - 400 5,300
PUBLIC BANK BERHAD - 17,420 - 17,420
PUBLIC BANK BHD FOREIGN MKT 5,900 - 5,900 -
PUNJAB NATIONAL BANK - 1,695 - 1,695
QUANTA COMPUTER INC 11,000 4,000 - 15,000
RANBAXY LABORATORIES LTD 782 - - 782
RATCHABURI ELEC GEN HODG FOR FOREIGN SH THB1 A 4,800 - - 4,800
REALTDEK SEMICONDUCTOR CORP 3,030 - - 3,030
RELIANCE CAPITAL LTD 1,681 - 659 1,022
RELIANCE COMMUNICATIONS LTD 4,126 - - 4,126
RELIANCE INDUSTRIES LTD 9,746 - - 9,746
RELIANCE INFRASTRUCTURE LTD - 529 - 529
RELIANCE POWER LTD - 4,322 - 4,322
RENHE COMMERCIAL HOLDINGS HKD1 60,000 30,000 - 90,000
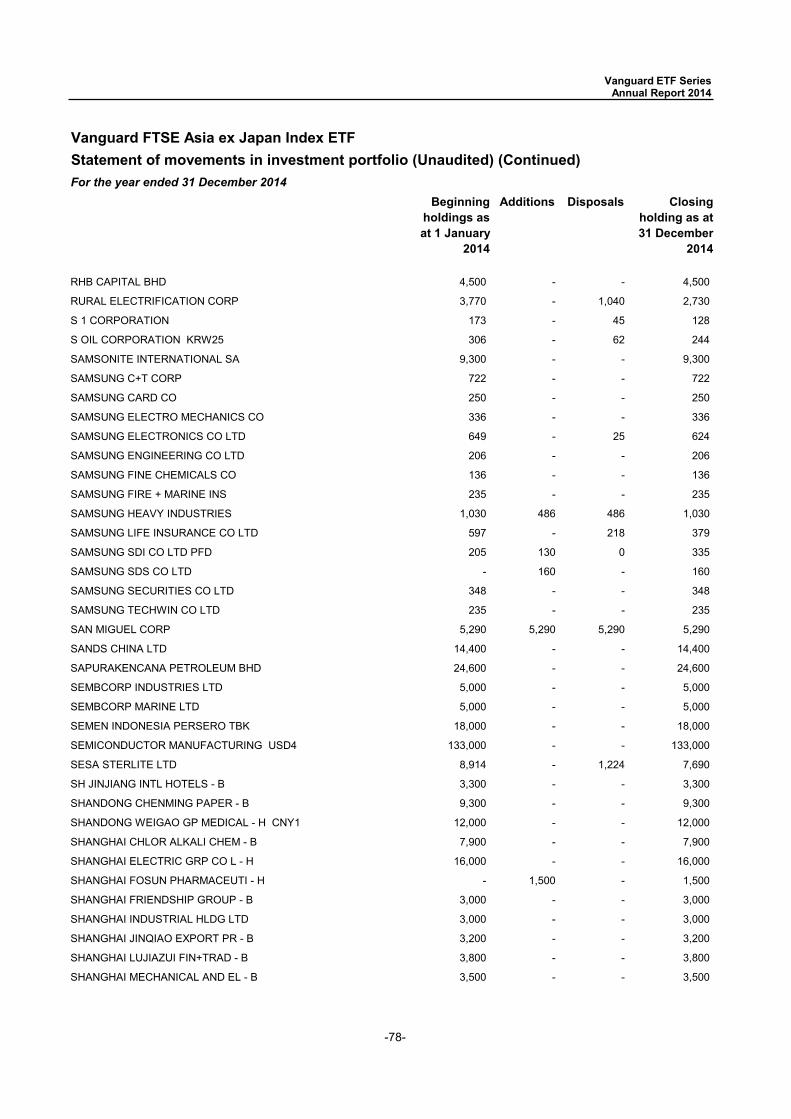
-78-
Vanguard FTSE Asia ex Japan Index ETFStatement of movements in investment portfolio (Unaudited) (Continued)For the year ended 31 December 2014
Beginning holdings as at 1 January
2014
Additions Disposals Closing holding as at 31 December
2014
Vanguard ETF Series Annual Report 2014
RHB CAPITAL BHD 4,500 - - 4,500
RURAL ELECTRIFICATION CORP 3,770 - 1,040 2,730
S 1 CORPORATION 173 - 45 128
S OIL CORPORATION KRW25 306 - 62 244
SAMSONITE INTERNATIONAL SA 9,300 - - 9,300
SAMSUNG C+T CORP 722 - - 722
SAMSUNG CARD CO 250 - - 250
SAMSUNG ELECTRO MECHANICS CO 336 - - 336
SAMSUNG ELECTRONICS CO LTD 649 - 25 624
SAMSUNG ENGINEERING CO LTD 206 - - 206
SAMSUNG FINE CHEMICALS CO 136 - - 136
SAMSUNG FIRE + MARINE INS 235 - - 235
SAMSUNG HEAVY INDUSTRIES 1,030 486 486 1,030
SAMSUNG LIFE INSURANCE CO LTD 597 - 218 379
SAMSUNG SDI CO LTD PFD 205 130 0 335
SAMSUNG SDS CO LTD - 160 - 160
SAMSUNG SECURITIES CO LTD 348 - - 348
SAMSUNG TECHWIN CO LTD 235 - - 235
SAN MIGUEL CORP 5,290 5,290 5,290 5,290
SANDS CHINA LTD 14,400 - - 14,400
SAPURAKENCANA PETROLEUM BHD 24,600 - - 24,600
SEMBCORP INDUSTRIES LTD 5,000 - - 5,000
SEMBCORP MARINE LTD 5,000 - - 5,000
SEMEN INDONESIA PERSERO TBK 18,000 - - 18,000
SEMICONDUCTOR MANUFACTURING USD4 133,000 - - 133,000
SESA STERLITE LTD 8,914 - 1,224 7,690
SH JINJIANG INTL HOTELS - B 3,300 - - 3,300
SHANDONG CHENMING PAPER - B 9,300 - - 9,300
SHANDONG WEIGAO GP MEDICAL - H CNY1 12,000 - - 12,000
SHANGHAI CHLOR ALKALI CHEM - B 7,900 - - 7,900
SHANGHAI ELECTRIC GRP CO L - H 16,000 - - 16,000
SHANGHAI FOSUN PHARMACEUTI - H - 1,500 - 1,500
SHANGHAI FRIENDSHIP GROUP - B 3,000 - - 3,000
SHANGHAI INDUSTRIAL HLDG LTD 3,000 - - 3,000
SHANGHAI JINQIAO EXPORT PR - B 3,200 - - 3,200
SHANGHAI LUJIAZUI FIN+TRAD - B 3,800 - - 3,800
SHANGHAI MECHANICAL AND EL - B 3,500 - - 3,500

-79-
Vanguard FTSE Asia ex Japan Index ETFStatement of movements in investment portfolio (Unaudited) (Continued)For the year ended 31 December 2014
Beginning holdings as at 1 January
2014
Additions Disposals Closing holding as at 31 December
2014
Vanguard ETF Series Annual Report 2014
SHANGHAI PHARMACEUTICALS H 4,300 - - 4,300
SHANGHAI ZHENHUA HEAVY IND - B 11,300 - - 11,300
SHANGRI LA ASIA LTD 8,000 - - 8,000
SHENZHEN CHIWAN WHARF HLDG - B 2,300 - - 2,300
SHENZHEN INTL HOLDINGS - 5,750 - 5,750
SHENZHEN INTL HOLDINGS 57,500 - 57,500 -
SHENZHEN INVESTMENT LTD 14,000 - - 14,000
SHENZHOU INTERNATIONAL GROUP 3,000 - - 3,000
SHIMAO PROPERTY HOLDINGS LTD 8,000 8,000 8,000 8,000
SHIN CORP PCL THB1 L 9,200 - 9,200 -
SHIN KONG FINANCIAL HOLDING 42,335 2,295 - 44,630
SHINHAN FINANCIAL GROUP LTD 2,860 - 122 2,738
SHINSEGAE CO LTD 42 - - 42
SHOUGANG FUSHAN RESOURCES GR 18,000 - - 18,000
SHRIRAM TRANSPORT FINANCE 1,353 - 334 1,019
SHUI ON LAND LTD USD25 17,500 - - 17,500
SHUN TAK HOLDINGS LTD 14,000 - - 14,000
SIA ENGINEERING CO LTD 2,000 - - 2,000
SIAM CEMENT PUB CO FOR REG FOREIGN SH THB1 A 1,700 - - 1,700
SIAM CITY CEMENT PCL FOR FOREIGN SH THB1 A 500 - - 500
SIAM COMMERCIAL BANK FOREIGN FOREIGN SH THB1 A 8,900 - - 8,900
SIEMENS LTD - 321 - 321
SIHUAN PHARMACEUTICAL HLDGS - 18,000 - 18,000
SILICONWARE PRECISION INDS 18,000 - - 18,000
SIME DARBY BERHAD 20,500 - - 20,500
SINGAPORE AIRLINES LTD 3,000 - - 3,000
SINGAPORE EXCHANGE LTD 5,000 - - 5,000
SINGAPORE POST LTD 17,000 - 14,000 3,000
SINGAPORE PRESS HOLDINGS LTD 3,000 4,000 - 7,000
SINGAPORE TECH ENGINEERING 10,000 - - 10,000
SINGAPORE TELECOMMUNICATIONS 45,000 - 1,000 44,000
SINO BIOPHARMACEUTICAL - 12,000 - 12,000
SINO LAND CO 16,000 - - 16,000
SINO OCEAN LAND HOLDINGS HKD8 18,000 - - 18,000
SINOFERT HOLDINGS LTD 14,000 - - 14,000
SINOPAC FINANCIAL HOLDINGS 34,548 4,809 - 39,357
SINOPEC ENGINEERING GROUP - H - 3,500 - 3,500
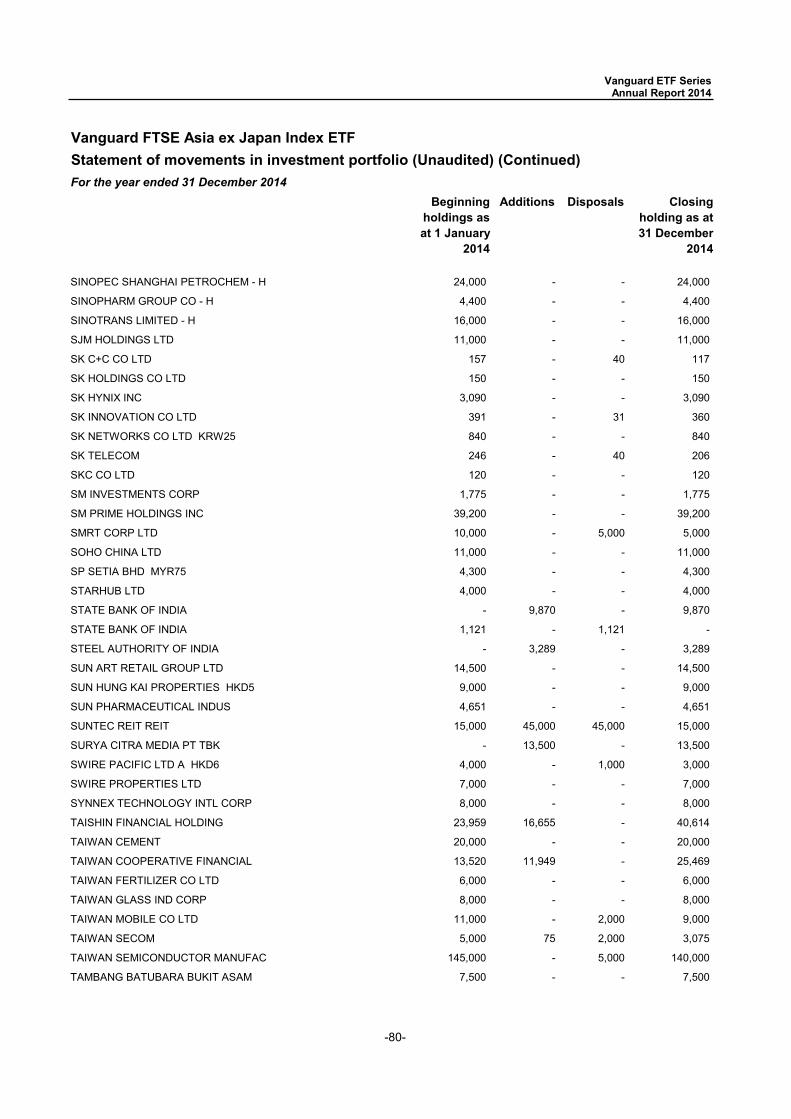
-80-
Vanguard FTSE Asia ex Japan Index ETFStatement of movements in investment portfolio (Unaudited) (Continued)For the year ended 31 December 2014
Beginning holdings as at 1 January
2014
Additions Disposals Closing holding as at 31 December
2014
Vanguard ETF Series Annual Report 2014
SINOPEC SHANGHAI PETROCHEM - H 24,000 - - 24,000
SINOPHARM GROUP CO - H 4,400 - - 4,400
SINOTRANS LIMITED - H 16,000 - - 16,000
SJM HOLDINGS LTD 11,000 - - 11,000
SK C+C CO LTD 157 - 40 117
SK HOLDINGS CO LTD 150 - - 150
SK HYNIX INC 3,090 - - 3,090
SK INNOVATION CO LTD 391 - 31 360
SK NETWORKS CO LTD KRW25 840 - - 840
SK TELECOM 246 - 40 206
SKC CO LTD 120 - - 120
SM INVESTMENTS CORP 1,775 - - 1,775
SM PRIME HOLDINGS INC 39,200 - - 39,200
SMRT CORP LTD 10,000 - 5,000 5,000
SOHO CHINA LTD 11,000 - - 11,000
SP SETIA BHD MYR75 4,300 - - 4,300
STARHUB LTD 4,000 - - 4,000
STATE BANK OF INDIA - 9,870 - 9,870
STATE BANK OF INDIA 1,121 - 1,121 -
STEEL AUTHORITY OF INDIA - 3,289 - 3,289
SUN ART RETAIL GROUP LTD 14,500 - - 14,500
SUN HUNG KAI PROPERTIES HKD5 9,000 - - 9,000
SUN PHARMACEUTICAL INDUS 4,651 - - 4,651
SUNTEC REIT REIT 15,000 45,000 45,000 15,000
SURYA CITRA MEDIA PT TBK - 13,500 - 13,500
SWIRE PACIFIC LTD A HKD6 4,000 - 1,000 3,000
SWIRE PROPERTIES LTD 7,000 - - 7,000
SYNNEX TECHNOLOGY INTL CORP 8,000 - - 8,000
TAISHIN FINANCIAL HOLDING 23,959 16,655 - 40,614
TAIWAN CEMENT 20,000 - - 20,000
TAIWAN COOPERATIVE FINANCIAL 13,520 11,949 - 25,469
TAIWAN FERTILIZER CO LTD 6,000 - - 6,000
TAIWAN GLASS IND CORP 8,000 - - 8,000
TAIWAN MOBILE CO LTD 11,000 - 2,000 9,000
TAIWAN SECOM 5,000 75 2,000 3,075
TAIWAN SEMICONDUCTOR MANUFAC 145,000 - 5,000 140,000
TAMBANG BATUBARA BUKIT ASAM 7,500 - - 7,500
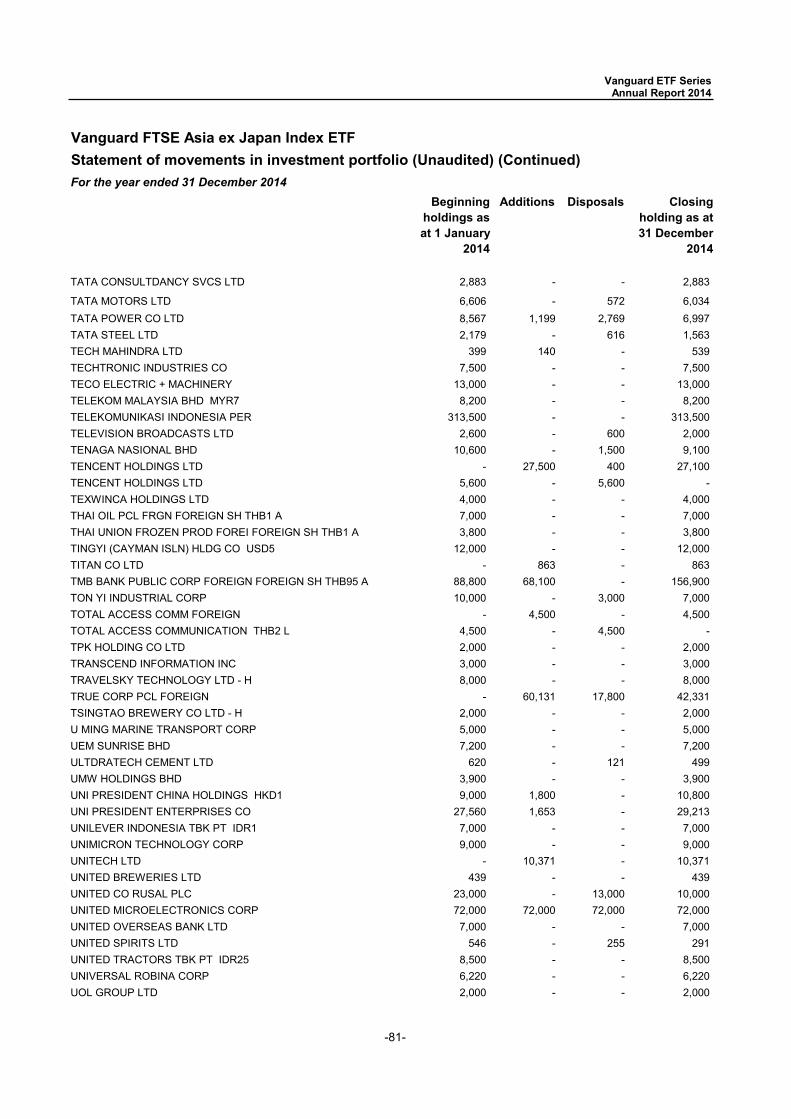
-81-
Vanguard FTSE Asia ex Japan Index ETFStatement of movements in investment portfolio (Unaudited) (Continued)For the year ended 31 December 2014
Beginning holdings as at 1 January
2014
Additions Disposals Closing holding as at 31 December
2014
Vanguard ETF Series Annual Report 2014
TATA CONSULTDANCY SVCS LTD 2,883 - - 2,883
TATA MOTORS LTD 6,606 - 572 6,034 TATA POWER CO LTD 8,567 1,199 2,769 6,997 TATA STEEL LTD 2,179 - 616 1,563 TECH MAHINDRA LTD 399 140 - 539 TECHTRONIC INDUSTRIES CO 7,500 - - 7,500 TECO ELECTRIC + MACHINERY 13,000 - - 13,000 TELEKOM MALAYSIA BHD MYR7 8,200 - - 8,200 TELEKOMUNIKASI INDONESIA PER 313,500 - - 313,500 TELEVISION BROADCASTS LTD 2,600 - 600 2,000 TENAGA NASIONAL BHD 10,600 - 1,500 9,100 TENCENT HOLDINGS LTD - 27,500 400 27,100 TENCENT HOLDINGS LTD 5,600 - 5,600 -TEXWINCA HOLDINGS LTD 4,000 - - 4,000 THAI OIL PCL FRGN FOREIGN SH THB1 A 7,000 - - 7,000 THAI UNION FROZEN PROD FOREI FOREIGN SH THB1 A 3,800 - - 3,800 TINGYI (CAYMAN ISLN) HLDG CO USD5 12,000 - - 12,000 TITAN CO LTD - 863 - 863 TMB BANK PUBLIC CORP FOREIGN FOREIGN SH THB95 A 88,800 68,100 - 156,900 TON YI INDUSTRIAL CORP 10,000 - 3,000 7,000 TOTAL ACCESS COMM FOREIGN - 4,500 - 4,500 TOTAL ACCESS COMMUNICATION THB2 L 4,500 - 4,500 -TPK HOLDING CO LTD 2,000 - - 2,000 TRANSCEND INFORMATION INC 3,000 - - 3,000 TRAVELSKY TECHNOLOGY LTD - H 8,000 - - 8,000 TRUE CORP PCL FOREIGN - 60,131 17,800 42,331 TSINGTAO BREWERY CO LTD - H 2,000 - - 2,000 U MING MARINE TRANSPORT CORP 5,000 - - 5,000 UEM SUNRISE BHD 7,200 - - 7,200 ULTDRATECH CEMENT LTD 620 - 121 499 UMW HOLDINGS BHD 3,900 - - 3,900 UNI PRESIDENT CHINA HOLDINGS HKD1 9,000 1,800 - 10,800 UNI PRESIDENT ENTERPRISES CO 27,560 1,653 - 29,213 UNILEVER INDONESIA TBK PT IDR1 7,000 - - 7,000 UNIMICRON TECHNOLOGY CORP 9,000 - - 9,000 UNITECH LTD - 10,371 - 10,371 UNITED BREWERIES LTD 439 - - 439 UNITED CO RUSAL PLC 23,000 - 13,000 10,000 UNITED MICROELECTRONICS CORP 72,000 72,000 72,000 72,000 UNITED OVERSEAS BANK LTD 7,000 - - 7,000 UNITED SPIRITS LTD 546 - 255 291 UNITED TRACTORS TBK PT IDR25 8,500 - - 8,500 UNIVERSAL ROBINA CORP 6,220 - - 6,220 UOL GROUP LTD 2,000 - - 2,000
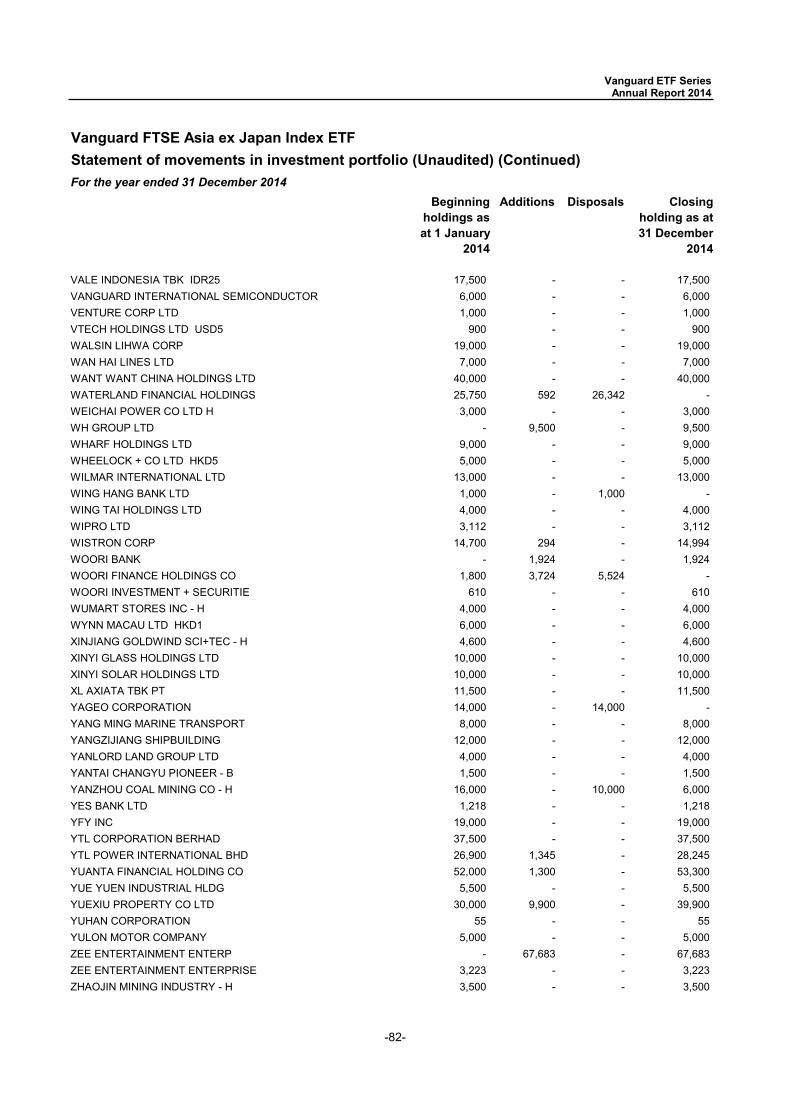
-82-
Vanguard FTSE Asia ex Japan Index ETFStatement of movements in investment portfolio (Unaudited) (Continued)For the year ended 31 December 2014
Beginning holdings as at 1 January
2014
Additions Disposals Closing holding as at 31 December
2014
Vanguard ETF Series Annual Report 2014
VALE INDONESIA TBK IDR25 17,500 - - 17,500 VANGUARD INTERNATIONAL SEMICONDUCTOR 6,000 - - 6,000 VENTURE CORP LTD 1,000 - - 1,000 VTECH HOLDINGS LTD USD5 900 - - 900 WALSIN LIHWA CORP 19,000 - - 19,000 WAN HAI LINES LTD 7,000 - - 7,000 WANT WANT CHINA HOLDINGS LTD 40,000 - - 40,000 WATERLAND FINANCIAL HOLDINGS 25,750 592 26,342 -WEICHAI POWER CO LTD H 3,000 - - 3,000 WH GROUP LTD - 9,500 - 9,500 WHARF HOLDINGS LTD 9,000 - - 9,000 WHEELOCK + CO LTD HKD5 5,000 - - 5,000 WILMAR INTERNATIONAL LTD 13,000 - - 13,000 WING HANG BANK LTD 1,000 - 1,000 -WING TAI HOLDINGS LTD 4,000 - - 4,000 WIPRO LTD 3,112 - - 3,112 WISTRON CORP 14,700 294 - 14,994 WOORI BANK - 1,924 - 1,924 WOORI FINANCE HOLDINGS CO 1,800 3,724 5,524 -WOORI INVESTMENT + SECURITIE 610 - - 610 WUMART STORES INC - H 4,000 - - 4,000 WYNN MACAU LTD HKD1 6,000 - - 6,000 XINJIANG GOLDWIND SCI+TEC - H 4,600 - - 4,600 XINYI GLASS HOLDINGS LTD 10,000 - - 10,000 XINYI SOLAR HOLDINGS LTD 10,000 - - 10,000 XL AXIATA TBK PT 11,500 - - 11,500 YAGEO CORPORATION 14,000 - 14,000 -YANG MING MARINE TRANSPORT 8,000 - - 8,000 YANGZIJIANG SHIPBUILDING 12,000 - - 12,000 YANLORD LAND GROUP LTD 4,000 - - 4,000 YANTAI CHANGYU PIONEER - B 1,500 - - 1,500 YANZHOU COAL MINING CO - H 16,000 - 10,000 6,000 YES BANK LTD 1,218 - - 1,218 YFY INC 19,000 - - 19,000 YTL CORPORATION BERHAD 37,500 - - 37,500 YTL POWER INTERNATIONAL BHD 26,900 1,345 - 28,245 YUANTA FINANCIAL HOLDING CO 52,000 1,300 - 53,300 YUE YUEN INDUSTRIAL HLDG 5,500 - - 5,500 YUEXIU PROPERTY CO LTD 30,000 9,900 - 39,900 YUHAN CORPORATION 55 - - 55 YULON MOTOR COMPANY 5,000 - - 5,000 ZEE ENTERTAINMENT ENTERP - 67,683 - 67,683 ZEE ENTERTAINMENT ENTERPRISE 3,223 - - 3,223 ZHAOJIN MINING INDUSTRY - H 3,500 - - 3,500
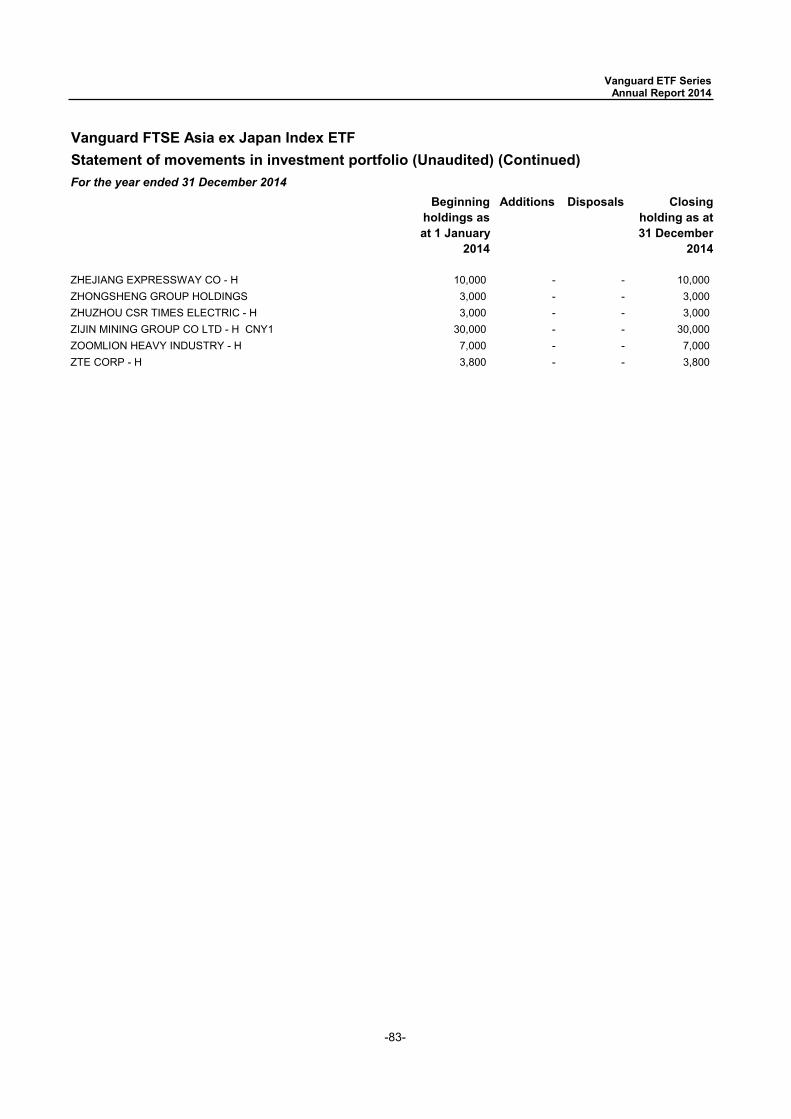
-83-
Vanguard FTSE Asia ex Japan Index ETFStatement of movements in investment portfolio (Unaudited) (Continued)For the year ended 31 December 2014
Beginning holdings as at 1 January
2014
Additions Disposals Closing holding as at 31 December
2014
Vanguard ETF Series Annual Report 2014
ZHEJIANG EXPRESSWAY CO - H 10,000 - - 10,000 ZHONGSHENG GROUP HOLDINGS 3,000 - - 3,000 ZHUZHOU CSR TIMES ELECTRIC - H 3,000 - - 3,000 ZIJIN MINING GROUP CO LTD - H CNY1 30,000 - - 30,000 ZOOMLION HEAVY INDUSTRY - H 7,000 - - 7,000 ZTE CORP - H 3,800 - - 3,800
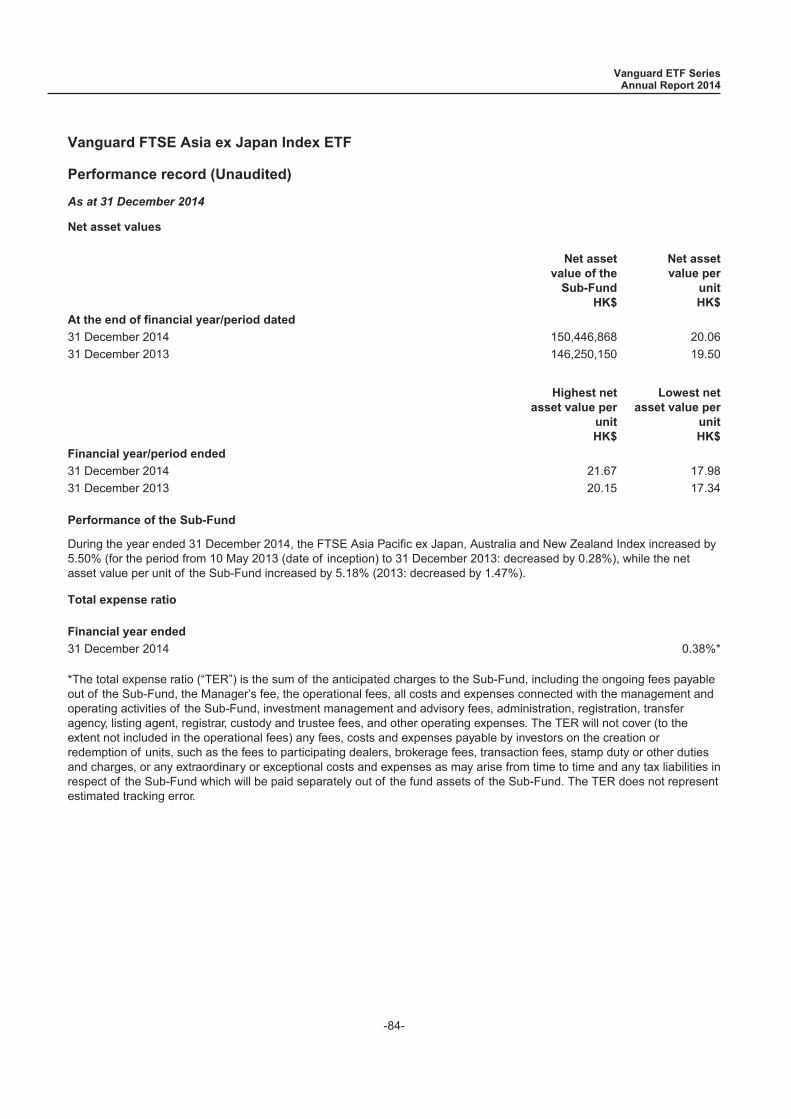
Vanguard FTSE Asia ex Japan Index ETF
Performance record (Unaudited)
As at 31 December 2014
Net asset values
Net assetvalue of the
Sub-FundHK$
Net assetvalue per
unitHK$
At the end of financial year/period dated
31 December 2014 150,446,868 20.0631 December 2013 146,250,150 19.50
Highest netasset value per
unitHK$
Lowest netasset value per
unitHK$
Financial year/period ended
31 December 2014 21.67 17.9831 December 2013 20.15 17.34
Performance of the Sub-Fund
During the year ended 31 December 2014, the FTSE Asia Pacific ex Japan, Australia and New Zealand Index increased by5.50% (for the period from 10 May 2013 (date of inception) to 31 December 2013: decreased by 0.28%), while the netasset value per unit of the Sub-Fund increased by 5.18% (2013: decreased by 1.47%).
Total expense ratio
Financial year ended
31 December 2014 0.38%*
*The total expense ratio (“TER”) is the sum of the anticipated charges to the Sub-Fund, including the ongoing fees payableout of the Sub-Fund, the Manager’s fee, the operational fees, all costs and expenses connected with the management andoperating activities of the Sub-Fund, investment management and advisory fees, administration, registration, transferagency, listing agent, registrar, custody and trustee fees, and other operating expenses. The TER will not cover (to theextent not included in the operational fees) any fees, costs and expenses payable by investors on the creation orredemption of units, such as the fees to participating dealers, brokerage fees, transaction fees, stamp duty or other dutiesand charges, or any extraordinary or exceptional costs and expenses as may arise from time to time and any tax liabilities inrespect of the Sub-Fund which will be paid separately out of the fund assets of the Sub-Fund. The TER does not representestimated tracking error.
Vanguard ETF SeriesAnnual Report 2014
-84-
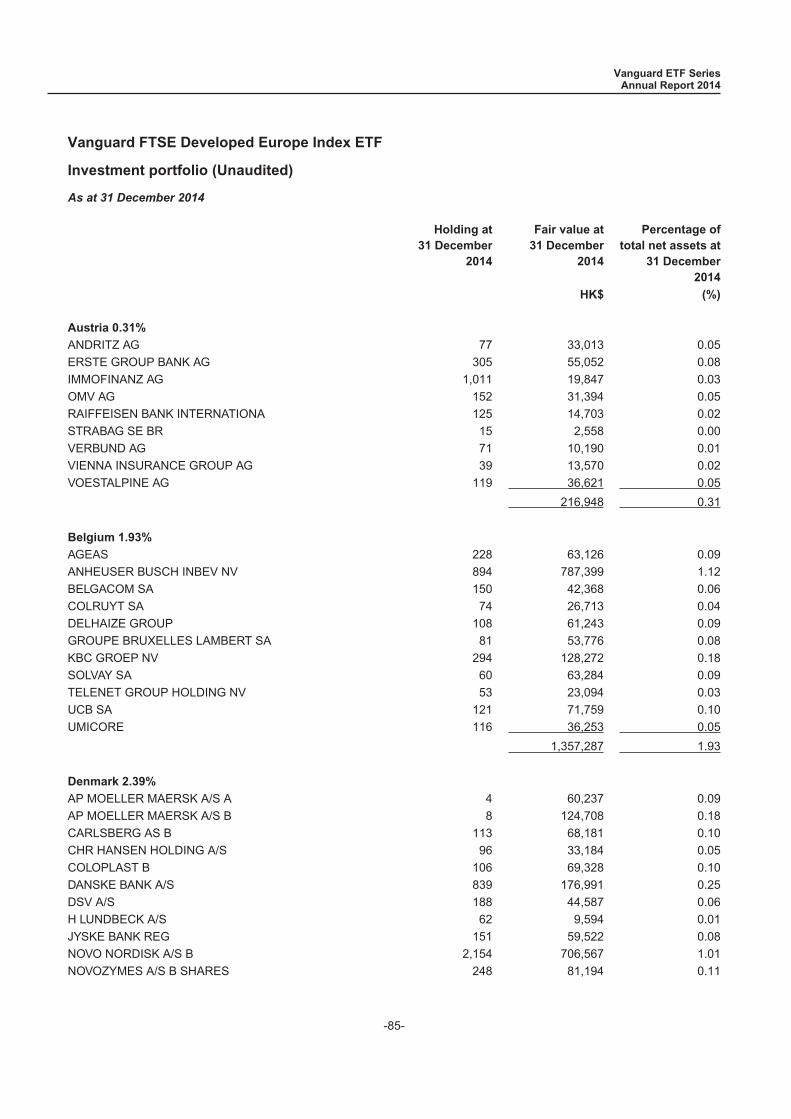
Vanguard FTSE Developed Europe Index ETF
Investment portfolio (Unaudited)
As at 31 December 2014
Holding at31 December
2014
Fair value at31 December
2014
Percentage oftotal net assets at
31 December2014
HK$ (%)
Austria 0.31%
ANDRITZ AG 77 33,013 0.05ERSTE GROUP BANK AG 305 55,052 0.08IMMOFINANZ AG 1,011 19,847 0.03OMV AG 152 31,394 0.05RAIFFEISEN BANK INTERNATIONA 125 14,703 0.02STRABAG SE BR 15 2,558 0.00VERBUND AG 71 10,190 0.01VIENNA INSURANCE GROUP AG 39 13,570 0.02VOESTALPINE AG 119 36,621 0.05
216,948 0.31
Belgium 1.93%
AGEAS 228 63,126 0.09ANHEUSER BUSCH INBEV NV 894 787,399 1.12BELGACOM SA 150 42,368 0.06COLRUYT SA 74 26,713 0.04DELHAIZE GROUP 108 61,243 0.09GROUPE BRUXELLES LAMBERT SA 81 53,776 0.08KBC GROEP NV 294 128,272 0.18SOLVAY SA 60 63,284 0.09TELENET GROUP HOLDING NV 53 23,094 0.03UCB SA 121 71,759 0.10UMICORE 116 36,253 0.05
1,357,287 1.93
Denmark 2.39%
AP MOELLER MAERSK A/S A 4 60,237 0.09AP MOELLER MAERSK A/S B 8 124,708 0.18CARLSBERG AS B 113 68,181 0.10CHR HANSEN HOLDING A/S 96 33,184 0.05COLOPLAST B 106 69,328 0.10DANSKE BANK A/S 839 176,991 0.25DSV A/S 188 44,587 0.06H LUNDBECK A/S 62 9,594 0.01JYSKE BANK REG 151 59,522 0.08NOVO NORDISK A/S B 2,154 706,567 1.01NOVOZYMES A/S B SHARES 248 81,194 0.11
Vanguard ETF SeriesAnnual Report 2014
-85-
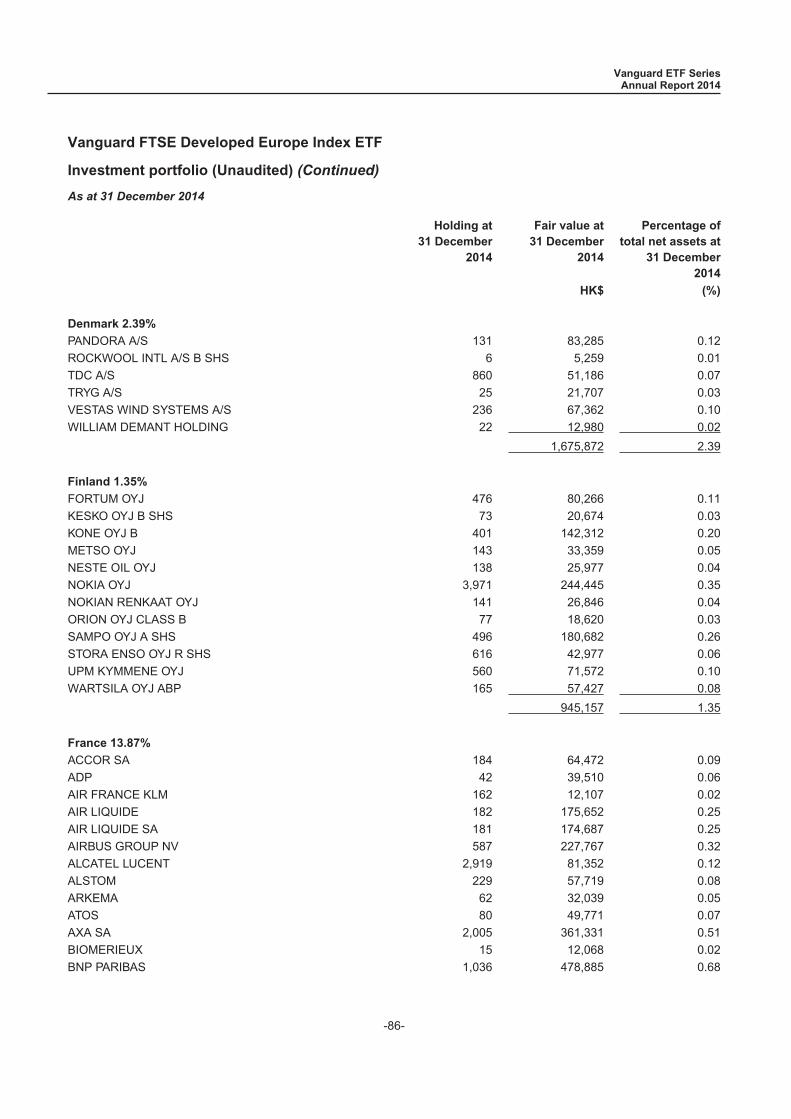
Vanguard FTSE Developed Europe Index ETF
Investment portfolio (Unaudited) (Continued)
As at 31 December 2014
Holding at31 December
2014
Fair value at31 December
2014
Percentage oftotal net assets at
31 December2014
HK$ (%)
Denmark 2.39%
PANDORA A/S 131 83,285 0.12ROCKWOOL INTL A/S B SHS 6 5,259 0.01TDC A/S 860 51,186 0.07TRYG A/S 25 21,707 0.03VESTAS WIND SYSTEMS A/S 236 67,362 0.10WILLIAM DEMANT HOLDING 22 12,980 0.02
1,675,872 2.39
Finland 1.35%
FORTUM OYJ 476 80,266 0.11KESKO OYJ B SHS 73 20,674 0.03KONE OYJ B 401 142,312 0.20METSO OYJ 143 33,359 0.05NESTE OIL OYJ 138 25,977 0.04NOKIA OYJ 3,971 244,445 0.35NOKIAN RENKAAT OYJ 141 26,846 0.04ORION OYJ CLASS B 77 18,620 0.03SAMPO OYJ A SHS 496 180,682 0.26STORA ENSO OYJ R SHS 616 42,977 0.06UPM KYMMENE OYJ 560 71,572 0.10WARTSILA OYJ ABP 165 57,427 0.08
945,157 1.35
France 13.87%
ACCOR SA 184 64,472 0.09ADP 42 39,510 0.06AIR FRANCE KLM 162 12,107 0.02AIR LIQUIDE 182 175,652 0.25AIR LIQUIDE SA 181 174,687 0.25AIRBUS GROUP NV 587 227,767 0.32ALCATEL LUCENT 2,919 81,352 0.12ALSTOM 229 57,719 0.08ARKEMA 62 32,039 0.05ATOS 80 49,771 0.07AXA SA 2,005 361,331 0.51BIOMERIEUX 15 12,068 0.02BNP PARIBAS 1,036 478,885 0.68
Vanguard ETF SeriesAnnual Report 2014
-86-
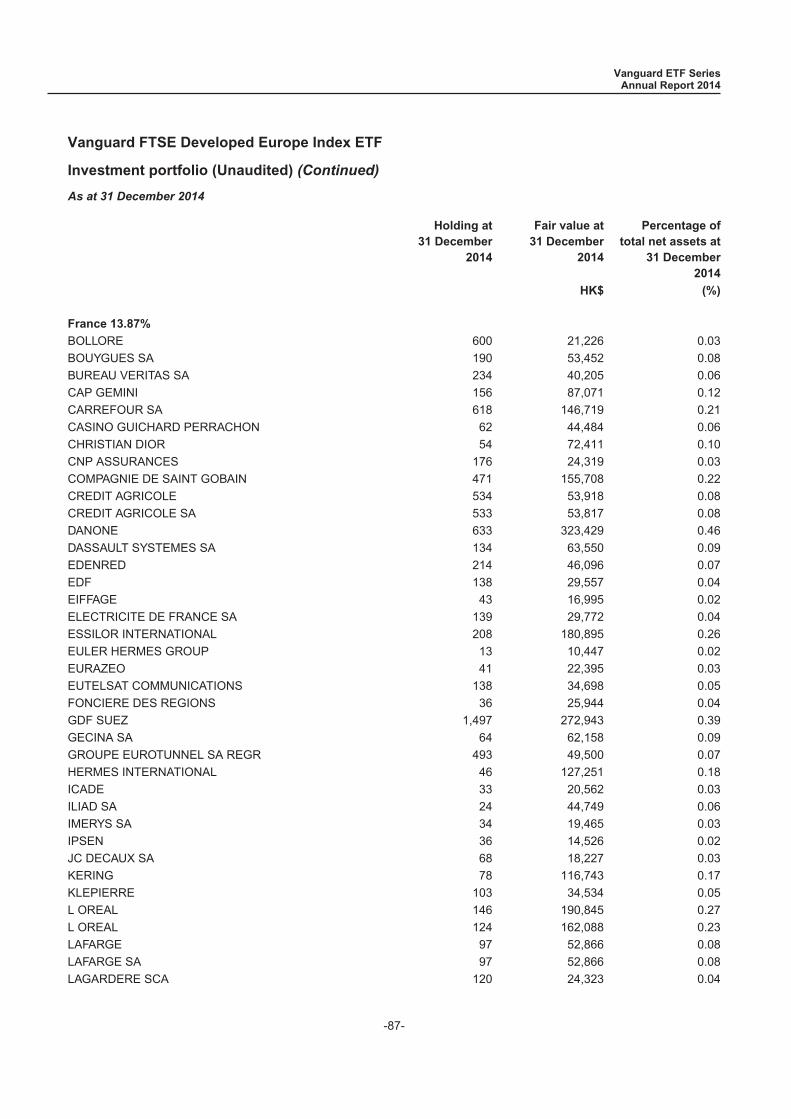
Vanguard FTSE Developed Europe Index ETF
Investment portfolio (Unaudited) (Continued)
As at 31 December 2014
Holding at31 December
2014
Fair value at31 December
2014
Percentage oftotal net assets at
31 December2014
HK$ (%)
France 13.87%
BOLLORE 600 21,226 0.03BOUYGUES SA 190 53,452 0.08BUREAU VERITAS SA 234 40,205 0.06CAP GEMINI 156 87,071 0.12CARREFOUR SA 618 146,719 0.21CASINO GUICHARD PERRACHON 62 44,484 0.06CHRISTIAN DIOR 54 72,411 0.10CNP ASSURANCES 176 24,319 0.03COMPAGNIE DE SAINT GOBAIN 471 155,708 0.22CREDIT AGRICOLE 534 53,918 0.08CREDIT AGRICOLE SA 533 53,817 0.08DANONE 633 323,429 0.46DASSAULT SYSTEMES SA 134 63,550 0.09EDENRED 214 46,096 0.07EDF 138 29,557 0.04EIFFAGE 43 16,995 0.02ELECTRICITE DE FRANCE SA 139 29,772 0.04ESSILOR INTERNATIONAL 208 180,895 0.26EULER HERMES GROUP 13 10,447 0.02EURAZEO 41 22,395 0.03EUTELSAT COMMUNICATIONS 138 34,698 0.05FONCIERE DES REGIONS 36 25,944 0.04GDF SUEZ 1,497 272,943 0.39GECINA SA 64 62,158 0.09GROUPE EUROTUNNEL SA REGR 493 49,500 0.07HERMES INTERNATIONAL 46 127,251 0.18ICADE 33 20,562 0.03ILIAD SA 24 44,749 0.06IMERYS SA 34 19,465 0.03IPSEN 36 14,526 0.02JC DECAUX SA 68 18,227 0.03KERING 78 116,743 0.17KLEPIERRE 103 34,534 0.05L OREAL 146 190,845 0.27L OREAL 124 162,088 0.23LAFARGE 97 52,866 0.08LAFARGE SA 97 52,866 0.08LAGARDERE SCA 120 24,323 0.04
Vanguard ETF SeriesAnnual Report 2014
-87-
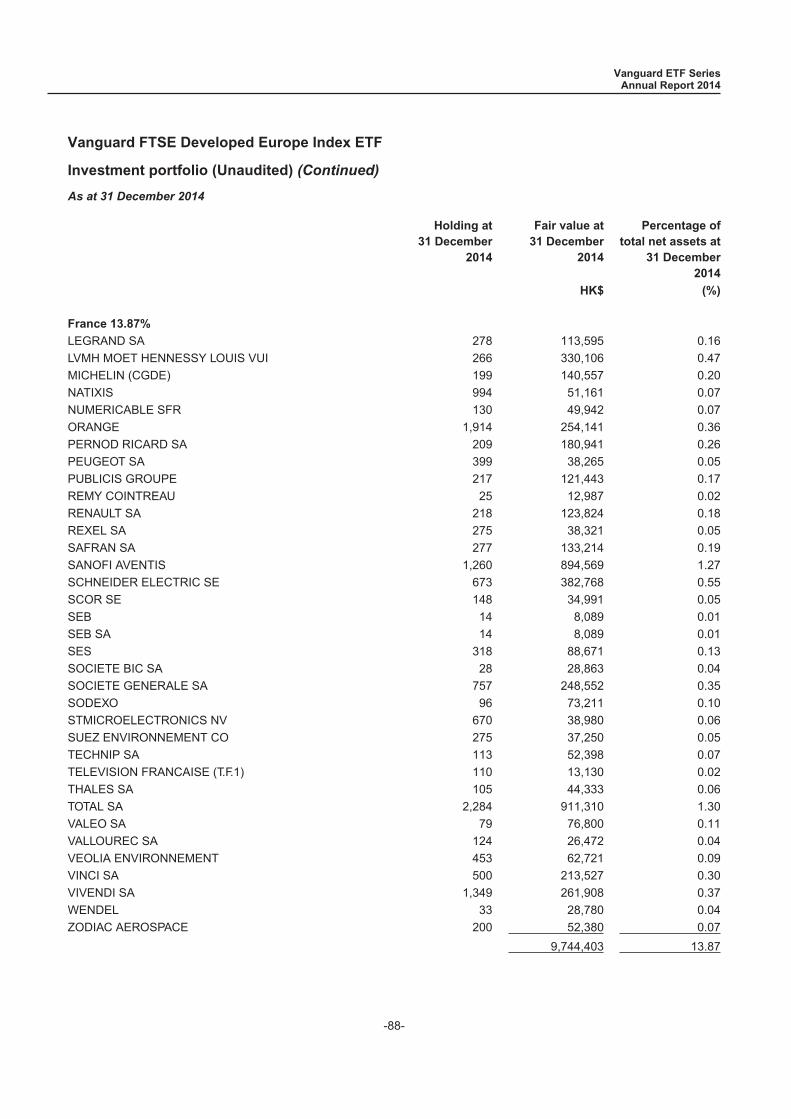
Vanguard FTSE Developed Europe Index ETF
Investment portfolio (Unaudited) (Continued)
As at 31 December 2014
Holding at31 December
2014
Fair value at31 December
2014
Percentage oftotal net assets at
31 December2014
HK$ (%)
France 13.87%
LEGRAND SA 278 113,595 0.16LVMH MOET HENNESSY LOUIS VUI 266 330,106 0.47MICHELIN (CGDE) 199 140,557 0.20NATIXIS 994 51,161 0.07NUMERICABLE SFR 130 49,942 0.07ORANGE 1,914 254,141 0.36PERNOD RICARD SA 209 180,941 0.26PEUGEOT SA 399 38,265 0.05PUBLICIS GROUPE 217 121,443 0.17REMY COINTREAU 25 12,987 0.02RENAULT SA 218 123,824 0.18REXEL SA 275 38,321 0.05SAFRAN SA 277 133,214 0.19SANOFI AVENTIS 1,260 894,569 1.27SCHNEIDER ELECTRIC SE 673 382,768 0.55SCOR SE 148 34,991 0.05SEB 14 8,089 0.01SEB SA 14 8,089 0.01SES 318 88,671 0.13SOCIETE BIC SA 28 28,863 0.04SOCIETE GENERALE SA 757 248,552 0.35SODEXO 96 73,211 0.10STMICROELECTRONICS NV 670 38,980 0.06SUEZ ENVIRONNEMENT CO 275 37,250 0.05TECHNIP SA 113 52,398 0.07TELEVISION FRANCAISE (T.F.1) 110 13,130 0.02THALES SA 105 44,333 0.06TOTAL SA 2,284 911,310 1.30VALEO SA 79 76,800 0.11VALLOUREC SA 124 26,472 0.04VEOLIA ENVIRONNEMENT 453 62,721 0.09VINCI SA 500 213,527 0.30VIVENDI SA 1,349 261,908 0.37WENDEL 33 28,780 0.04ZODIAC AEROSPACE 200 52,380 0.07
9,744,403 13.87
Vanguard ETF SeriesAnnual Report 2014
-88-

Vanguard FTSE Developed Europe Index ETF
Investment portfolio (Unaudited) (Continued)
As at 31 December 2014
Holding at31 December
2014
Fair value at31 December
2014
Percentage oftotal net assets at
31 December2014
HK$ (%)
Germany 13.66%
ADIDAS AG 221 119,493 0.17ALLIANZ SE REG 507 653,452 0.93AXEL SPRINGER SE 44 20,677 0.03BASF SE 1,039 681,311 0.97BAYER AG REG 902 956,449 1.36BAYERISCHE MOTOREN WERKE AG 346 291,463 0.42BEIERSDORF AG 106 67,061 0.10BILFINGER SE 42 18,269 0.03BRENNTAG AG 165 72,012 0.10CELESIO AG 50 12,537 0.02COMMERZBANK AG 1,005 103,549 0.15CONTINENTAL AG 115 189,442 0.27DAIMLER AG REGISTERED SHARES 1,078 697,679 0.99DEUTSCHE BANK AG REGISTERED 1,570 368,092 0.52DEUTSCHE BOERSE AG 194 107,807 0.15DEUTSCHE LUFTHANSA REG 244 31,666 0.05DEUTSCHE POST AG REG 1,007 255,560 0.36DEUTSCHE TELEKOM AG REG 3,423 425,598 0.61DEUTSCHE WOHNEN AG BR 304 55,855 0.08E.ON SE 1,944 258,946 0.37EVONIK INDUSTRIES AG 70 17,817 0.03FIELMANN AG 26 13,797 0.02FRAPORT AG FRANKFURT AIRPORT 41 18,483 0.03FRESENIUS MEDICAL CARE AG + 229 132,908 0.19FRESENIUS SE + CO KGAA 417 168,886 0.24FUCHS PETROLUB SE 33 9,829 0.01FUCHS PETROLUB SE PREF 78 24,370 0.04GEA GROUP AG 187 64,224 0.09HANNOVER RUECK SE 64 45,024 0.06HEIDELBERGCEMENT AG 149 82,227 0.12HENKEL AG + CO KGAA 121 91,334 0.13HENKEL AG + CO KGAA VORZUG 186 156,072 0.22HOCHTIEF AG 28 15,376 0.02HUGO BOSS AG ORD 59 56,305 0.08INFINEON TECHNOLOGIES AG 1,187 98,520 0.14K S AG REG 204 43,866 0.06KABEL DEUTSCHLAND HOLDING AG 23 24,259 0.03LANXESS AG 89 32,116 0.05
Vanguard ETF SeriesAnnual Report 2014
-89-
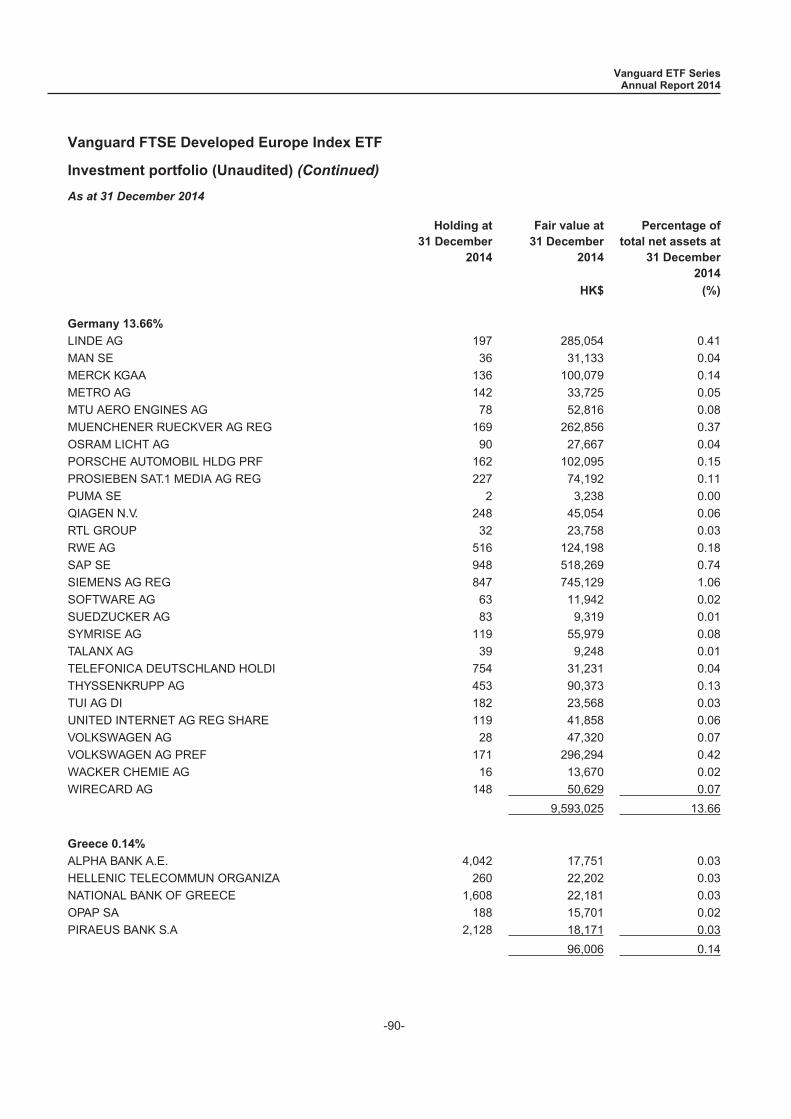
Vanguard FTSE Developed Europe Index ETF
Investment portfolio (Unaudited) (Continued)
As at 31 December 2014
Holding at31 December
2014
Fair value at31 December
2014
Percentage oftotal net assets at
31 December2014
HK$ (%)
Germany 13.66%
LINDE AG 197 285,054 0.41MAN SE 36 31,133 0.04MERCK KGAA 136 100,079 0.14METRO AG 142 33,725 0.05MTU AERO ENGINES AG 78 52,816 0.08MUENCHENER RUECKVER AG REG 169 262,856 0.37OSRAM LICHT AG 90 27,667 0.04PORSCHE AUTOMOBIL HLDG PRF 162 102,095 0.15PROSIEBEN SAT.1 MEDIA AG REG 227 74,192 0.11PUMA SE 2 3,238 0.00QIAGEN N.V. 248 45,054 0.06RTL GROUP 32 23,758 0.03RWE AG 516 124,198 0.18SAP SE 948 518,269 0.74SIEMENS AG REG 847 745,129 1.06SOFTWARE AG 63 11,942 0.02SUEDZUCKER AG 83 9,319 0.01SYMRISE AG 119 55,979 0.08TALANX AG 39 9,248 0.01TELEFONICA DEUTSCHLAND HOLDI 754 31,231 0.04THYSSENKRUPP AG 453 90,373 0.13TUI AG DI 182 23,568 0.03UNITED INTERNET AG REG SHARE 119 41,858 0.06VOLKSWAGEN AG 28 47,320 0.07VOLKSWAGEN AG PREF 171 296,294 0.42WACKER CHEMIE AG 16 13,670 0.02WIRECARD AG 148 50,629 0.07
9,593,025 13.66
Greece 0.14%
ALPHA BANK A.E. 4,042 17,751 0.03HELLENIC TELECOMMUN ORGANIZA 260 22,202 0.03NATIONAL BANK OF GREECE 1,608 22,181 0.03OPAP SA 188 15,701 0.02PIRAEUS BANK S.A 2,128 18,171 0.03
96,006 0.14
Vanguard ETF SeriesAnnual Report 2014
-90-
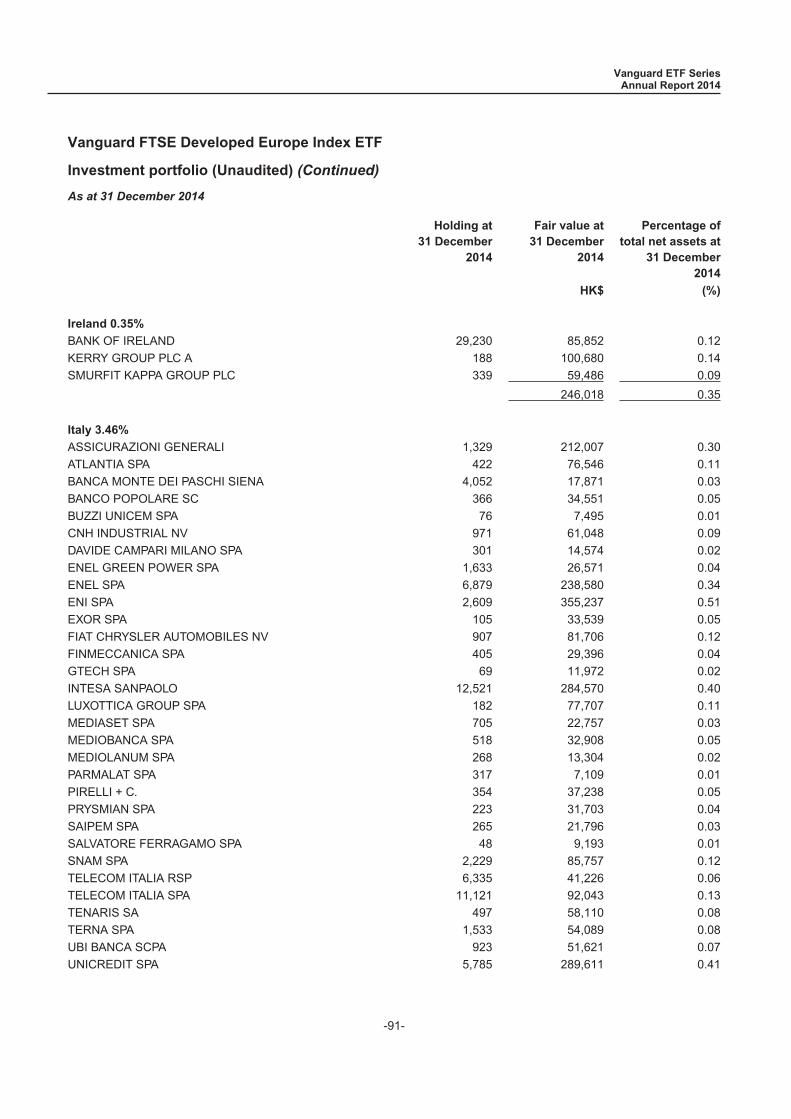
Vanguard FTSE Developed Europe Index ETF
Investment portfolio (Unaudited) (Continued)
As at 31 December 2014
Holding at31 December
2014
Fair value at31 December
2014
Percentage oftotal net assets at
31 December2014
HK$ (%)
Ireland 0.35%
BANK OF IRELAND 29,230 85,852 0.12KERRY GROUP PLC A 188 100,680 0.14SMURFIT KAPPA GROUP PLC 339 59,486 0.09
246,018 0.35
Italy 3.46%
ASSICURAZIONI GENERALI 1,329 212,007 0.30ATLANTIA SPA 422 76,546 0.11BANCA MONTE DEI PASCHI SIENA 4,052 17,871 0.03BANCO POPOLARE SC 366 34,551 0.05BUZZI UNICEM SPA 76 7,495 0.01CNH INDUSTRIAL NV 971 61,048 0.09DAVIDE CAMPARI MILANO SPA 301 14,574 0.02ENEL GREEN POWER SPA 1,633 26,571 0.04ENEL SPA 6,879 238,580 0.34ENI SPA 2,609 355,237 0.51EXOR SPA 105 33,539 0.05FIAT CHRYSLER AUTOMOBILES NV 907 81,706 0.12FINMECCANICA SPA 405 29,396 0.04GTECH SPA 69 11,972 0.02INTESA SANPAOLO 12,521 284,570 0.40LUXOTTICA GROUP SPA 182 77,707 0.11MEDIASET SPA 705 22,757 0.03MEDIOBANCA SPA 518 32,908 0.05MEDIOLANUM SPA 268 13,304 0.02PARMALAT SPA 317 7,109 0.01PIRELLI + C. 354 37,238 0.05PRYSMIAN SPA 223 31,703 0.04SAIPEM SPA 265 21,796 0.03SALVATORE FERRAGAMO SPA 48 9,193 0.01SNAM SPA 2,229 85,757 0.12TELECOM ITALIA RSP 6,335 41,226 0.06TELECOM ITALIA SPA 11,121 92,043 0.13TENARIS SA 497 58,110 0.08TERNA SPA 1,533 54,089 0.08UBI BANCA SCPA 923 51,621 0.07UNICREDIT SPA 5,785 289,611 0.41
Vanguard ETF SeriesAnnual Report 2014
-91-
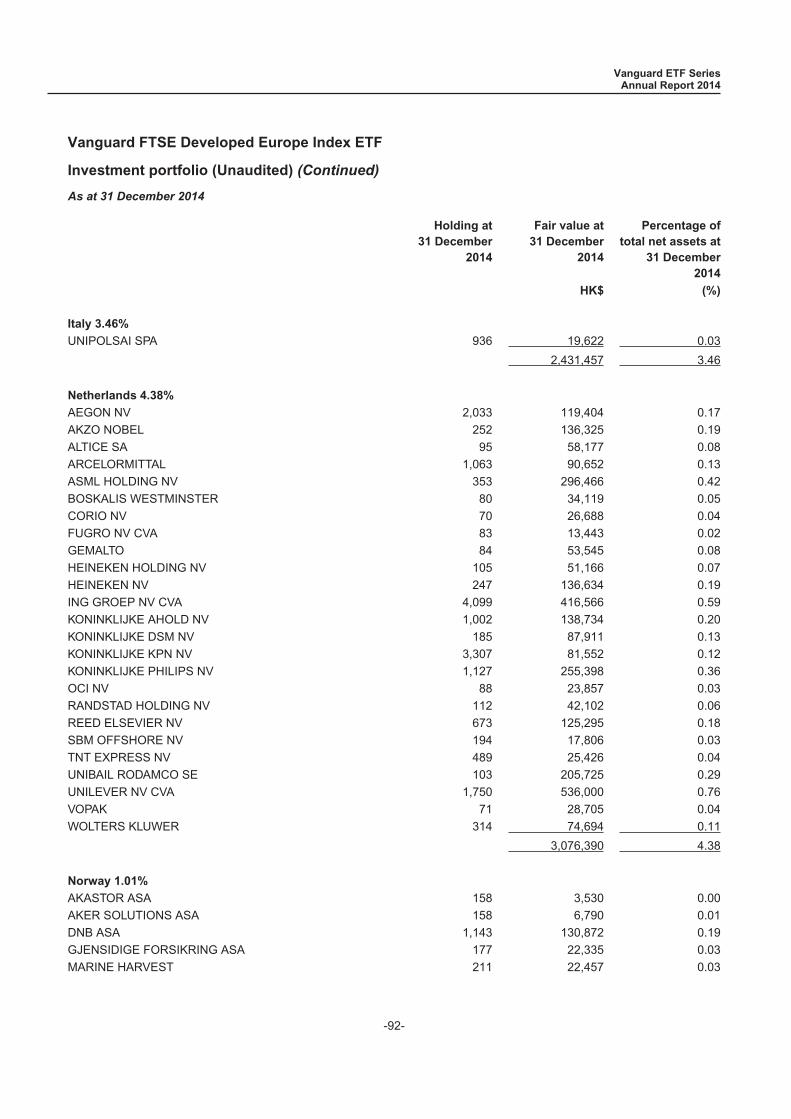
Vanguard FTSE Developed Europe Index ETF
Investment portfolio (Unaudited) (Continued)
As at 31 December 2014
Holding at31 December
2014
Fair value at31 December
2014
Percentage oftotal net assets at
31 December2014
HK$ (%)
Italy 3.46%
UNIPOLSAI SPA 936 19,622 0.032,431,457 3.46
Netherlands 4.38%
AEGON NV 2,033 119,404 0.17AKZO NOBEL 252 136,325 0.19ALTICE SA 95 58,177 0.08ARCELORMITTAL 1,063 90,652 0.13ASML HOLDING NV 353 296,466 0.42BOSKALIS WESTMINSTER 80 34,119 0.05CORIO NV 70 26,688 0.04FUGRO NV CVA 83 13,443 0.02GEMALTO 84 53,545 0.08HEINEKEN HOLDING NV 105 51,166 0.07HEINEKEN NV 247 136,634 0.19ING GROEP NV CVA 4,099 416,566 0.59KONINKLIJKE AHOLD NV 1,002 138,734 0.20KONINKLIJKE DSM NV 185 87,911 0.13KONINKLIJKE KPN NV 3,307 81,552 0.12KONINKLIJKE PHILIPS NV 1,127 255,398 0.36OCI NV 88 23,857 0.03RANDSTAD HOLDING NV 112 42,102 0.06REED ELSEVIER NV 673 125,295 0.18SBM OFFSHORE NV 194 17,806 0.03TNT EXPRESS NV 489 25,426 0.04UNIBAIL RODAMCO SE 103 205,725 0.29UNILEVER NV CVA 1,750 536,000 0.76VOPAK 71 28,705 0.04WOLTERS KLUWER 314 74,694 0.11
3,076,390 4.38
Norway 1.01%
AKASTOR ASA 158 3,530 0.00AKER SOLUTIONS ASA 158 6,790 0.01DNB ASA 1,143 130,872 0.19GJENSIDIGE FORSIKRING ASA 177 22,335 0.03MARINE HARVEST 211 22,457 0.03
Vanguard ETF SeriesAnnual Report 2014
-92-
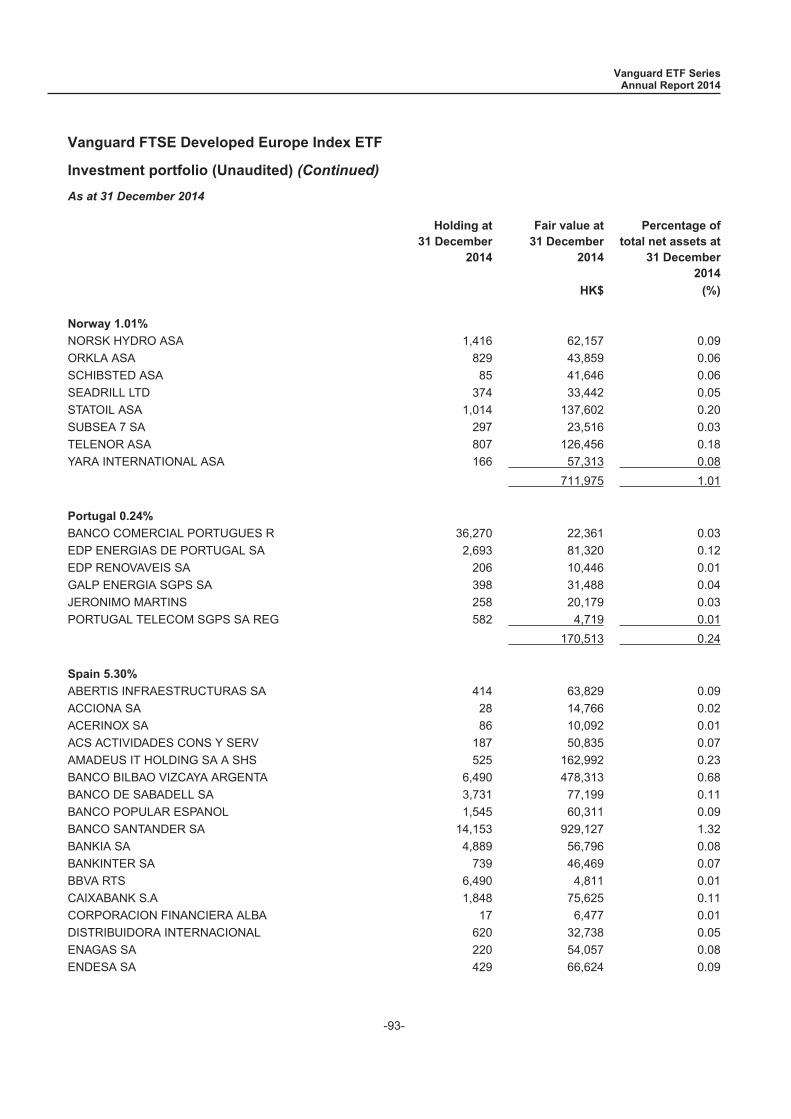
Vanguard FTSE Developed Europe Index ETF
Investment portfolio (Unaudited) (Continued)
As at 31 December 2014
Holding at31 December
2014
Fair value at31 December
2014
Percentage oftotal net assets at
31 December2014
HK$ (%)
Norway 1.01%
NORSK HYDRO ASA 1,416 62,157 0.09ORKLA ASA 829 43,859 0.06SCHIBSTED ASA 85 41,646 0.06SEADRILL LTD 374 33,442 0.05STATOIL ASA 1,014 137,602 0.20SUBSEA 7 SA 297 23,516 0.03TELENOR ASA 807 126,456 0.18YARA INTERNATIONAL ASA 166 57,313 0.08
711,975 1.01
Portugal 0.24%
BANCO COMERCIAL PORTUGUES R 36,270 22,361 0.03EDP ENERGIAS DE PORTUGAL SA 2,693 81,320 0.12EDP RENOVAVEIS SA 206 10,446 0.01GALP ENERGIA SGPS SA 398 31,488 0.04JERONIMO MARTINS 258 20,179 0.03PORTUGAL TELECOM SGPS SA REG 582 4,719 0.01
170,513 0.24
Spain 5.30%
ABERTIS INFRAESTRUCTURAS SA 414 63,829 0.09ACCIONA SA 28 14,766 0.02ACERINOX SA 86 10,092 0.01ACS ACTIVIDADES CONS Y SERV 187 50,835 0.07AMADEUS IT HOLDING SA A SHS 525 162,992 0.23BANCO BILBAO VIZCAYA ARGENTA 6,490 478,313 0.68BANCO DE SABADELL SA 3,731 77,199 0.11BANCO POPULAR ESPANOL 1,545 60,311 0.09BANCO SANTANDER SA 14,153 929,127 1.32BANKIA SA 4,889 56,796 0.08BANKINTER SA 739 46,469 0.07BBVA RTS 6,490 4,811 0.01CAIXABANK S.A 1,848 75,625 0.11CORPORACION FINANCIERA ALBA 17 6,477 0.01DISTRIBUIDORA INTERNACIONAL 620 32,738 0.05ENAGAS SA 220 54,057 0.08ENDESA SA 429 66,624 0.09
Vanguard ETF SeriesAnnual Report 2014
-93-
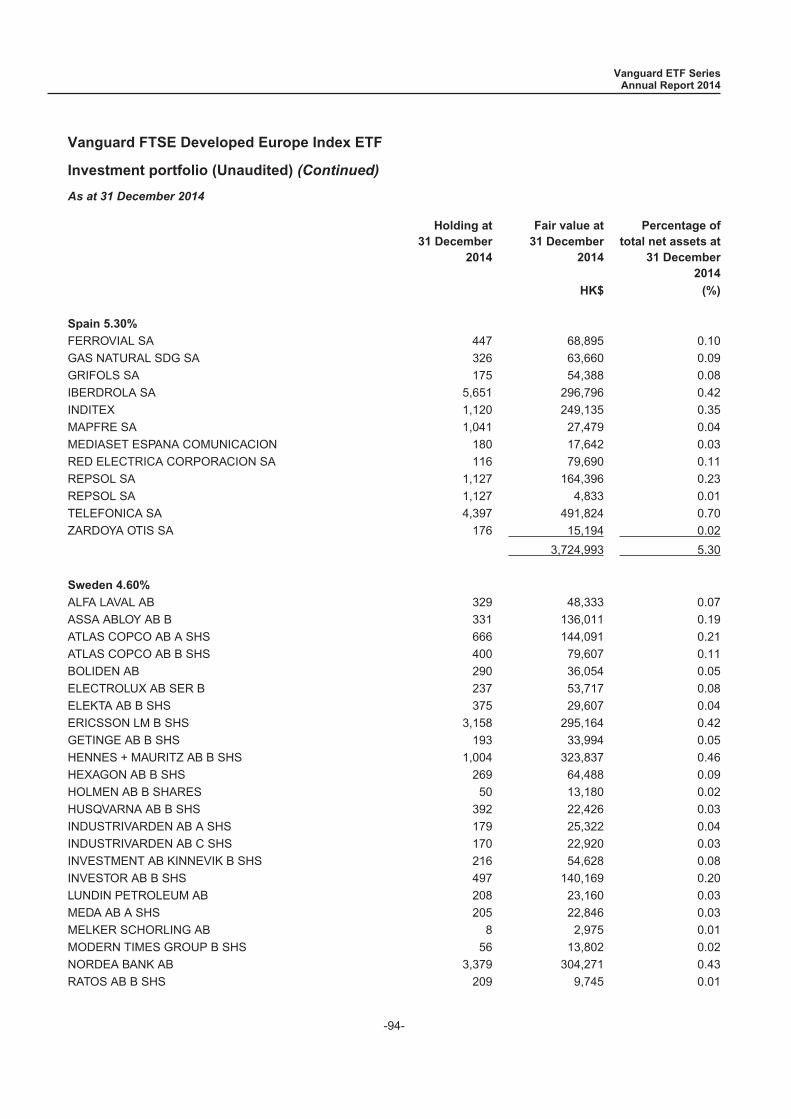
Vanguard FTSE Developed Europe Index ETF
Investment portfolio (Unaudited) (Continued)
As at 31 December 2014
Holding at31 December
2014
Fair value at31 December
2014
Percentage oftotal net assets at
31 December2014
HK$ (%)
Spain 5.30%
FERROVIAL SA 447 68,895 0.10GAS NATURAL SDG SA 326 63,660 0.09GRIFOLS SA 175 54,388 0.08IBERDROLA SA 5,651 296,796 0.42INDITEX 1,120 249,135 0.35MAPFRE SA 1,041 27,479 0.04MEDIASET ESPANA COMUNICACION 180 17,642 0.03RED ELECTRICA CORPORACION SA 116 79,690 0.11REPSOL SA 1,127 164,396 0.23REPSOL SA 1,127 4,833 0.01TELEFONICA SA 4,397 491,824 0.70ZARDOYA OTIS SA 176 15,194 0.02
3,724,993 5.30
Sweden 4.60%
ALFA LAVAL AB 329 48,333 0.07ASSA ABLOY AB B 331 136,011 0.19ATLAS COPCO AB A SHS 666 144,091 0.21ATLAS COPCO AB B SHS 400 79,607 0.11BOLIDEN AB 290 36,054 0.05ELECTROLUX AB SER B 237 53,717 0.08ELEKTA AB B SHS 375 29,607 0.04ERICSSON LM B SHS 3,158 295,164 0.42GETINGE AB B SHS 193 33,994 0.05HENNES + MAURITZ AB B SHS 1,004 323,837 0.46HEXAGON AB B SHS 269 64,488 0.09HOLMEN AB B SHARES 50 13,180 0.02HUSQVARNA AB B SHS 392 22,426 0.03INDUSTRIVARDEN AB A SHS 179 25,322 0.04INDUSTRIVARDEN AB C SHS 170 22,920 0.03INVESTMENT AB KINNEVIK B SHS 216 54,628 0.08INVESTOR AB B SHS 497 140,169 0.20LUNDIN PETROLEUM AB 208 23,160 0.03MEDA AB A SHS 205 22,846 0.03MELKER SCHORLING AB 8 2,975 0.01MODERN TIMES GROUP B SHS 56 13,802 0.02NORDEA BANK AB 3,379 304,271 0.43RATOS AB B SHS 209 9,745 0.01
Vanguard ETF SeriesAnnual Report 2014
-94-
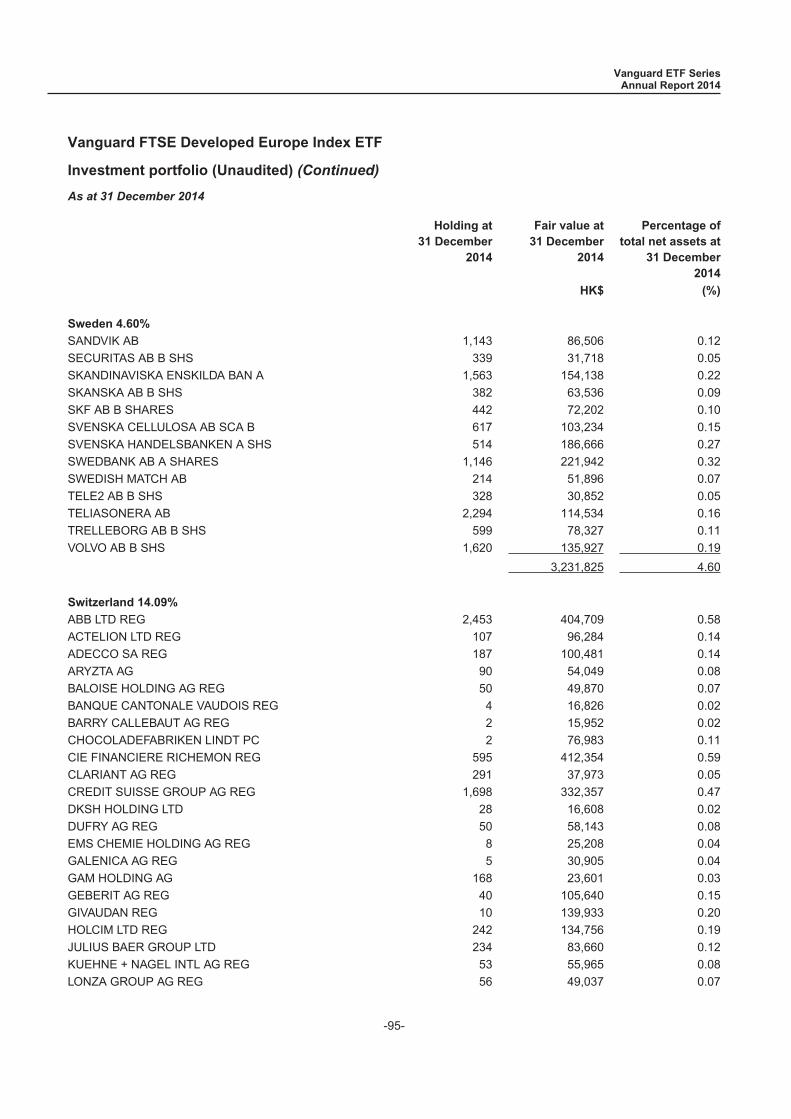
Vanguard FTSE Developed Europe Index ETF
Investment portfolio (Unaudited) (Continued)
As at 31 December 2014
Holding at31 December
2014
Fair value at31 December
2014
Percentage oftotal net assets at
31 December2014
HK$ (%)
Sweden 4.60%
SANDVIK AB 1,143 86,506 0.12SECURITAS AB B SHS 339 31,718 0.05SKANDINAVISKA ENSKILDA BAN A 1,563 154,138 0.22SKANSKA AB B SHS 382 63,536 0.09SKF AB B SHARES 442 72,202 0.10SVENSKA CELLULOSA AB SCA B 617 103,234 0.15SVENSKA HANDELSBANKEN A SHS 514 186,666 0.27SWEDBANK AB A SHARES 1,146 221,942 0.32SWEDISH MATCH AB 214 51,896 0.07TELE2 AB B SHS 328 30,852 0.05TELIASONERA AB 2,294 114,534 0.16TRELLEBORG AB B SHS 599 78,327 0.11VOLVO AB B SHS 1,620 135,927 0.19
3,231,825 4.60
Switzerland 14.09%
ABB LTD REG 2,453 404,709 0.58ACTELION LTD REG 107 96,284 0.14ADECCO SA REG 187 100,481 0.14ARYZTA AG 90 54,049 0.08BALOISE HOLDING AG REG 50 49,870 0.07BANQUE CANTONALE VAUDOIS REG 4 16,826 0.02BARRY CALLEBAUT AG REG 2 15,952 0.02CHOCOLADEFABRIKEN LINDT PC 2 76,983 0.11CIE FINANCIERE RICHEMON REG 595 412,354 0.59CLARIANT AG REG 291 37,973 0.05CREDIT SUISSE GROUP AG REG 1,698 332,357 0.47DKSH HOLDING LTD 28 16,608 0.02DUFRY AG REG 50 58,143 0.08EMS CHEMIE HOLDING AG REG 8 25,208 0.04GALENICA AG REG 5 30,905 0.04GAM HOLDING AG 168 23,601 0.03GEBERIT AG REG 40 105,640 0.15GIVAUDAN REG 10 139,933 0.20HOLCIM LTD REG 242 134,756 0.19JULIUS BAER GROUP LTD 234 83,660 0.12KUEHNE + NAGEL INTL AG REG 53 55,965 0.08LONZA GROUP AG REG 56 49,037 0.07
Vanguard ETF SeriesAnnual Report 2014
-95-
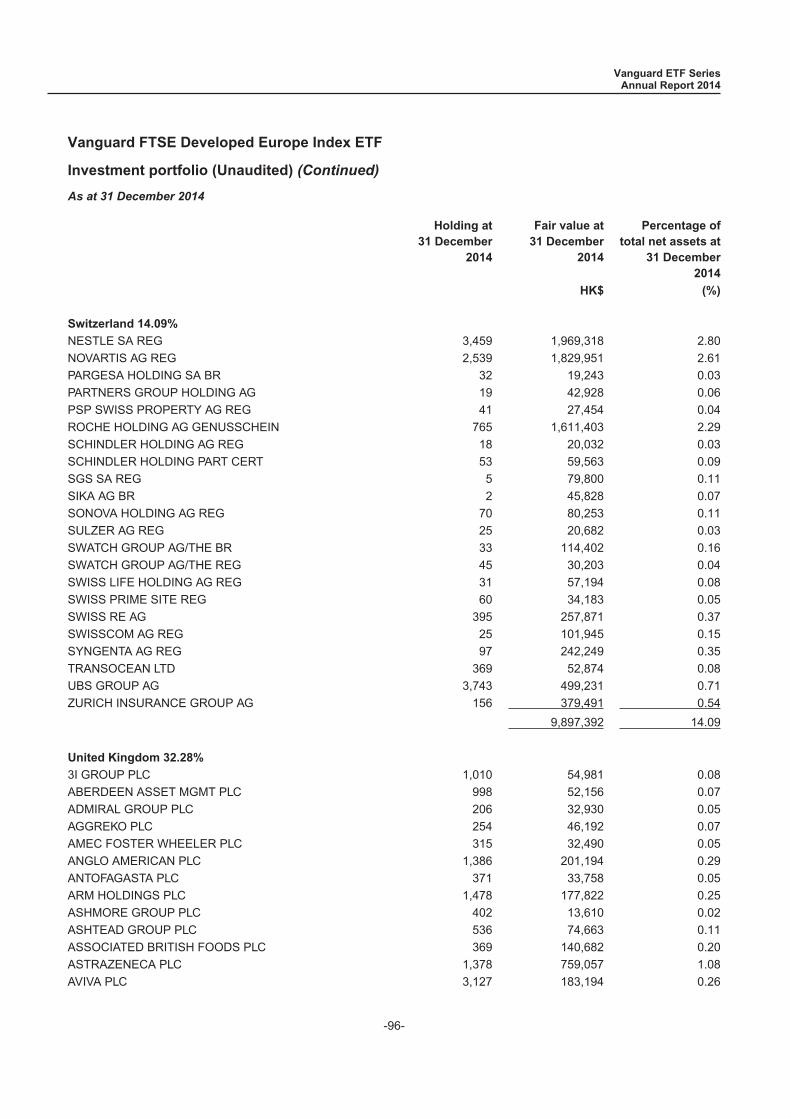
Vanguard FTSE Developed Europe Index ETF
Investment portfolio (Unaudited) (Continued)
As at 31 December 2014
Holding at31 December
2014
Fair value at31 December
2014
Percentage oftotal net assets at
31 December2014
HK$ (%)
Switzerland 14.09%
NESTLE SA REG 3,459 1,969,318 2.80NOVARTIS AG REG 2,539 1,829,951 2.61PARGESA HOLDING SA BR 32 19,243 0.03PARTNERS GROUP HOLDING AG 19 42,928 0.06PSP SWISS PROPERTY AG REG 41 27,454 0.04ROCHE HOLDING AG GENUSSCHEIN 765 1,611,403 2.29SCHINDLER HOLDING AG REG 18 20,032 0.03SCHINDLER HOLDING PART CERT 53 59,563 0.09SGS SA REG 5 79,800 0.11SIKA AG BR 2 45,828 0.07SONOVA HOLDING AG REG 70 80,253 0.11SULZER AG REG 25 20,682 0.03SWATCH GROUP AG/THE BR 33 114,402 0.16SWATCH GROUP AG/THE REG 45 30,203 0.04SWISS LIFE HOLDING AG REG 31 57,194 0.08SWISS PRIME SITE REG 60 34,183 0.05SWISS RE AG 395 257,871 0.37SWISSCOM AG REG 25 101,945 0.15SYNGENTA AG REG 97 242,249 0.35TRANSOCEAN LTD 369 52,874 0.08UBS GROUP AG 3,743 499,231 0.71ZURICH INSURANCE GROUP AG 156 379,491 0.54
9,897,392 14.09
United Kingdom 32.28%
3I GROUP PLC 1,010 54,981 0.08ABERDEEN ASSET MGMT PLC 998 52,156 0.07ADMIRAL GROUP PLC 206 32,930 0.05AGGREKO PLC 254 46,192 0.07AMEC FOSTER WHEELER PLC 315 32,490 0.05ANGLO AMERICAN PLC 1,386 201,194 0.29ANTOFAGASTA PLC 371 33,758 0.05ARM HOLDINGS PLC 1,478 177,822 0.25ASHMORE GROUP PLC 402 13,610 0.02ASHTEAD GROUP PLC 536 74,663 0.11ASSOCIATED BRITISH FOODS PLC 369 140,682 0.20ASTRAZENECA PLC 1,378 759,057 1.08AVIVA PLC 3,127 183,194 0.26
Vanguard ETF SeriesAnnual Report 2014
-96-
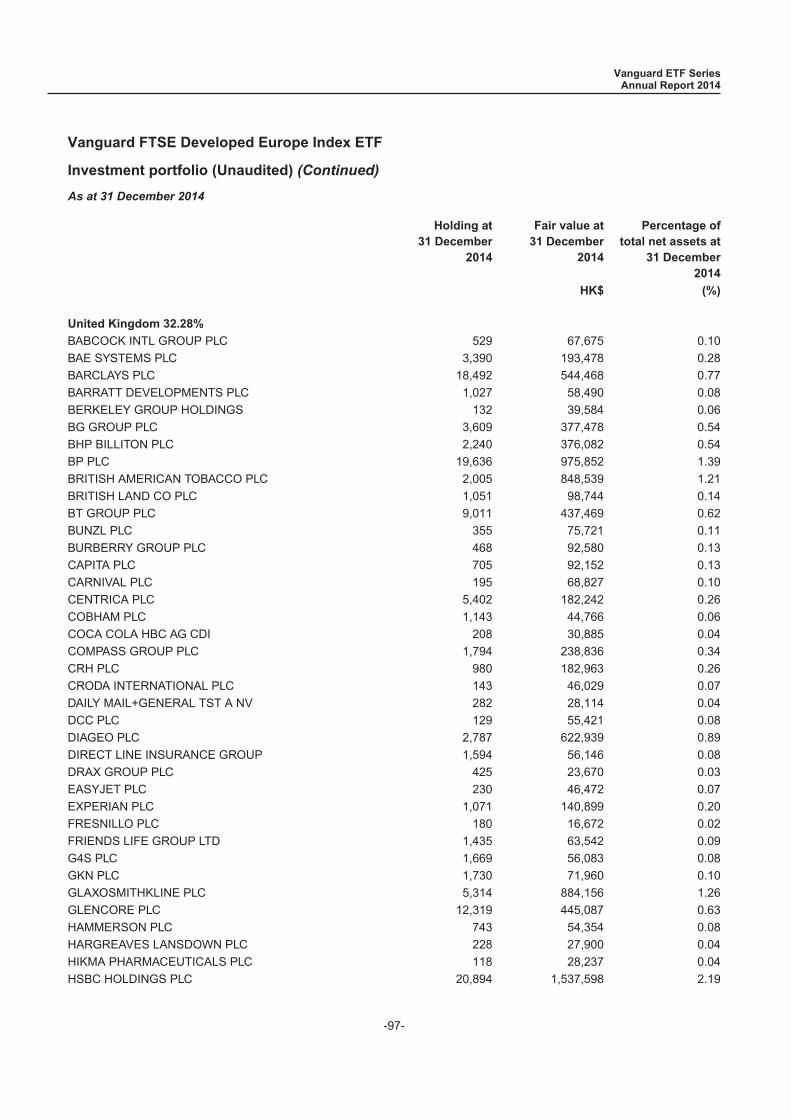
Vanguard FTSE Developed Europe Index ETF
Investment portfolio (Unaudited) (Continued)
As at 31 December 2014
Holding at31 December
2014
Fair value at31 December
2014
Percentage oftotal net assets at
31 December2014
HK$ (%)
United Kingdom 32.28%
BABCOCK INTL GROUP PLC 529 67,675 0.10BAE SYSTEMS PLC 3,390 193,478 0.28BARCLAYS PLC 18,492 544,468 0.77BARRATT DEVELOPMENTS PLC 1,027 58,490 0.08BERKELEY GROUP HOLDINGS 132 39,584 0.06BG GROUP PLC 3,609 377,478 0.54BHP BILLITON PLC 2,240 376,082 0.54BP PLC 19,636 975,852 1.39BRITISH AMERICAN TOBACCO PLC 2,005 848,539 1.21BRITISH LAND CO PLC 1,051 98,744 0.14BT GROUP PLC 9,011 437,469 0.62BUNZL PLC 355 75,721 0.11BURBERRY GROUP PLC 468 92,580 0.13CAPITA PLC 705 92,152 0.13CARNIVAL PLC 195 68,827 0.10CENTRICA PLC 5,402 182,242 0.26COBHAM PLC 1,143 44,766 0.06COCA COLA HBC AG CDI 208 30,885 0.04COMPASS GROUP PLC 1,794 238,836 0.34CRH PLC 980 182,963 0.26CRODA INTERNATIONAL PLC 143 46,029 0.07DAILY MAIL+GENERAL TST A NV 282 28,114 0.04DCC PLC 129 55,421 0.08DIAGEO PLC 2,787 622,939 0.89DIRECT LINE INSURANCE GROUP 1,594 56,146 0.08DRAX GROUP PLC 425 23,670 0.03EASYJET PLC 230 46,472 0.07EXPERIAN PLC 1,071 140,899 0.20FRESNILLO PLC 180 16,672 0.02FRIENDS LIFE GROUP LTD 1,435 63,542 0.09G4S PLC 1,669 56,083 0.08GKN PLC 1,730 71,960 0.10GLAXOSMITHKLINE PLC 5,314 884,156 1.26GLENCORE PLC 12,319 445,087 0.63HAMMERSON PLC 743 54,354 0.08HARGREAVES LANSDOWN PLC 228 27,900 0.04HIKMA PHARMACEUTICALS PLC 118 28,237 0.04HSBC HOLDINGS PLC 20,894 1,537,598 2.19
Vanguard ETF SeriesAnnual Report 2014
-97-
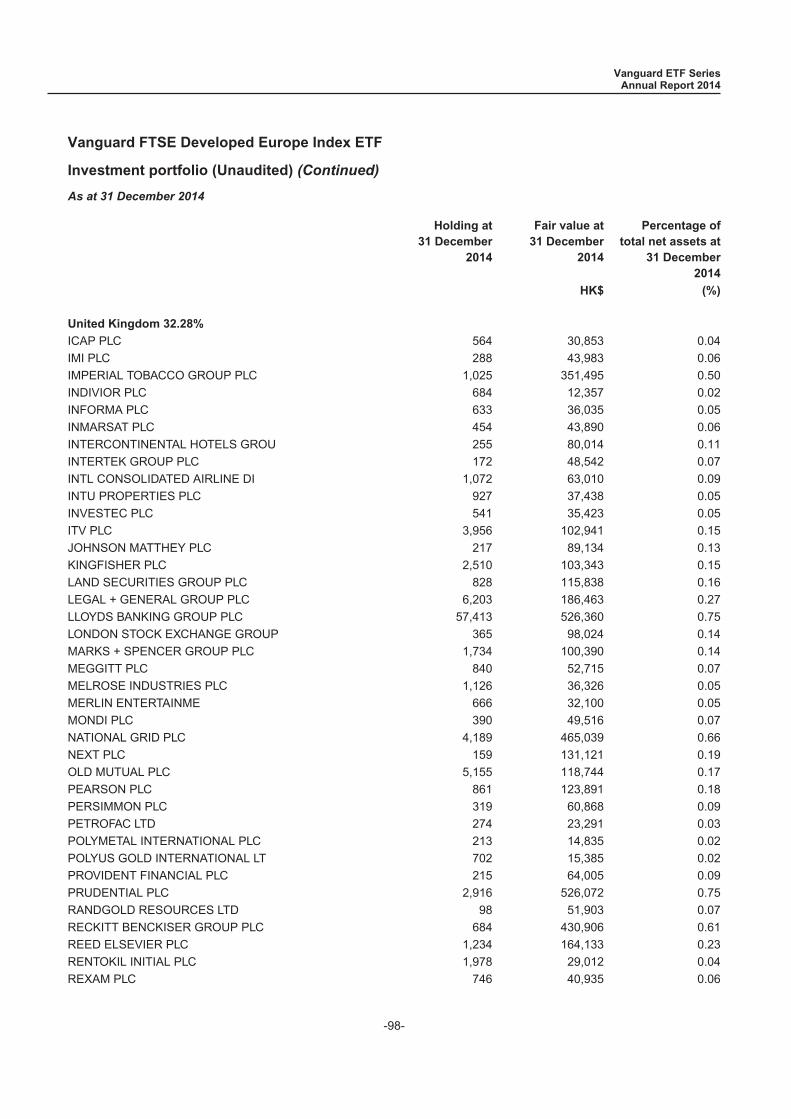
Vanguard FTSE Developed Europe Index ETF
Investment portfolio (Unaudited) (Continued)
As at 31 December 2014
Holding at31 December
2014
Fair value at31 December
2014
Percentage oftotal net assets at
31 December2014
HK$ (%)
United Kingdom 32.28%
ICAP PLC 564 30,853 0.04IMI PLC 288 43,983 0.06IMPERIAL TOBACCO GROUP PLC 1,025 351,495 0.50INDIVIOR PLC 684 12,357 0.02INFORMA PLC 633 36,035 0.05INMARSAT PLC 454 43,890 0.06INTERCONTINENTAL HOTELS GROU 255 80,014 0.11INTERTEK GROUP PLC 172 48,542 0.07INTL CONSOLIDATED AIRLINE DI 1,072 63,010 0.09INTU PROPERTIES PLC 927 37,438 0.05INVESTEC PLC 541 35,423 0.05ITV PLC 3,956 102,941 0.15JOHNSON MATTHEY PLC 217 89,134 0.13KINGFISHER PLC 2,510 103,343 0.15LAND SECURITIES GROUP PLC 828 115,838 0.16LEGAL + GENERAL GROUP PLC 6,203 186,463 0.27LLOYDS BANKING GROUP PLC 57,413 526,360 0.75LONDON STOCK EXCHANGE GROUP 365 98,024 0.14MARKS + SPENCER GROUP PLC 1,734 100,390 0.14MEGGITT PLC 840 52,715 0.07MELROSE INDUSTRIES PLC 1,126 36,326 0.05MERLIN ENTERTAINME 666 32,100 0.05MONDI PLC 390 49,516 0.07NATIONAL GRID PLC 4,189 465,039 0.66NEXT PLC 159 131,121 0.19OLD MUTUAL PLC 5,155 118,744 0.17PEARSON PLC 861 123,891 0.18PERSIMMON PLC 319 60,868 0.09PETROFAC LTD 274 23,291 0.03POLYMETAL INTERNATIONAL PLC 213 14,835 0.02POLYUS GOLD INTERNATIONAL LT 702 15,385 0.02PROVIDENT FINANCIAL PLC 215 64,005 0.09PRUDENTIAL PLC 2,916 526,072 0.75RANDGOLD RESOURCES LTD 98 51,903 0.07RECKITT BENCKISER GROUP PLC 684 430,906 0.61REED ELSEVIER PLC 1,234 164,133 0.23RENTOKIL INITIAL PLC 1,978 29,012 0.04REXAM PLC 746 40,935 0.06
Vanguard ETF SeriesAnnual Report 2014
-98-
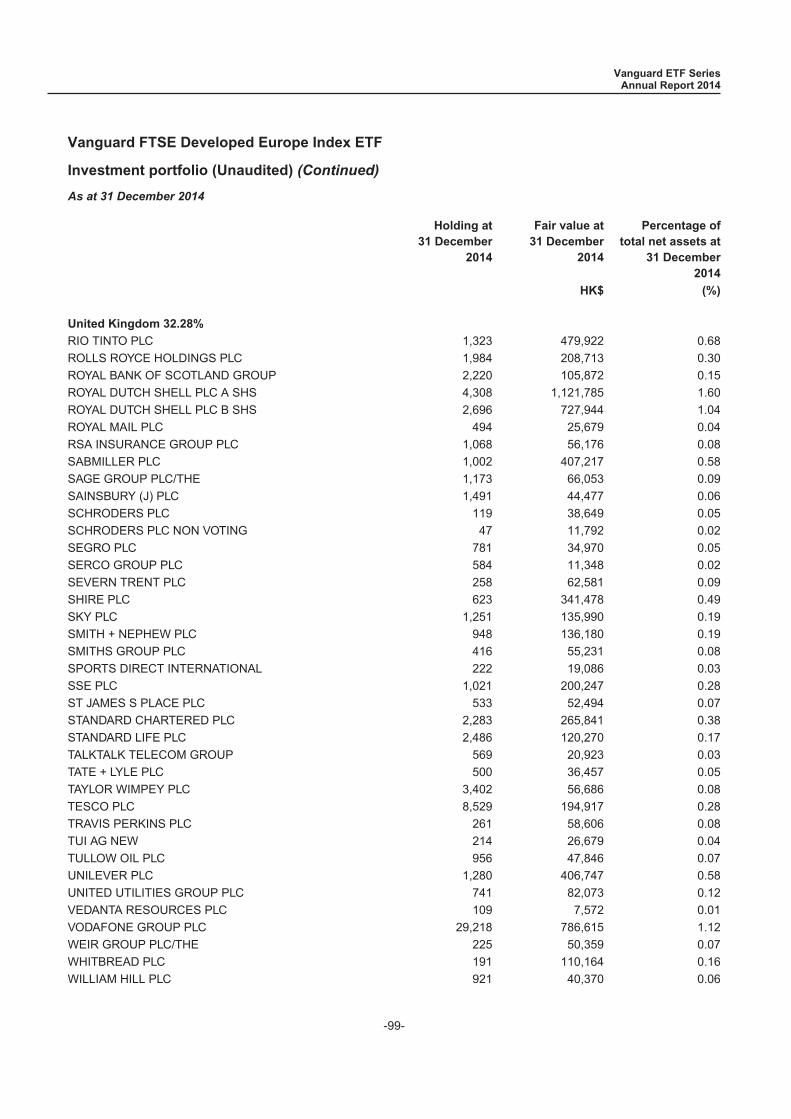
Vanguard FTSE Developed Europe Index ETF
Investment portfolio (Unaudited) (Continued)
As at 31 December 2014
Holding at31 December
2014
Fair value at31 December
2014
Percentage oftotal net assets at
31 December2014
HK$ (%)
United Kingdom 32.28%
RIO TINTO PLC 1,323 479,922 0.68ROLLS ROYCE HOLDINGS PLC 1,984 208,713 0.30ROYAL BANK OF SCOTLAND GROUP 2,220 105,872 0.15ROYAL DUTCH SHELL PLC A SHS 4,308 1,121,785 1.60ROYAL DUTCH SHELL PLC B SHS 2,696 727,944 1.04ROYAL MAIL PLC 494 25,679 0.04RSA INSURANCE GROUP PLC 1,068 56,176 0.08SABMILLER PLC 1,002 407,217 0.58SAGE GROUP PLC/THE 1,173 66,053 0.09SAINSBURY (J) PLC 1,491 44,477 0.06SCHRODERS PLC 119 38,649 0.05SCHRODERS PLC NON VOTING 47 11,792 0.02SEGRO PLC 781 34,970 0.05SERCO GROUP PLC 584 11,348 0.02SEVERN TRENT PLC 258 62,581 0.09SHIRE PLC 623 341,478 0.49SKY PLC 1,251 135,990 0.19SMITH + NEPHEW PLC 948 136,180 0.19SMITHS GROUP PLC 416 55,231 0.08SPORTS DIRECT INTERNATIONAL 222 19,086 0.03SSE PLC 1,021 200,247 0.28ST JAMES S PLACE PLC 533 52,494 0.07STANDARD CHARTERED PLC 2,283 265,841 0.38STANDARD LIFE PLC 2,486 120,270 0.17TALKTALK TELECOM GROUP 569 20,923 0.03TATE + LYLE PLC 500 36,457 0.05TAYLOR WIMPEY PLC 3,402 56,686 0.08TESCO PLC 8,529 194,917 0.28TRAVIS PERKINS PLC 261 58,606 0.08TUI AG NEW 214 26,679 0.04TULLOW OIL PLC 956 47,846 0.07UNILEVER PLC 1,280 406,747 0.58UNITED UTILITIES GROUP PLC 741 82,073 0.12VEDANTA RESOURCES PLC 109 7,572 0.01VODAFONE GROUP PLC 29,218 786,615 1.12WEIR GROUP PLC/THE 225 50,359 0.07WHITBREAD PLC 191 110,164 0.16WILLIAM HILL PLC 921 40,370 0.06
Vanguard ETF SeriesAnnual Report 2014
-99-
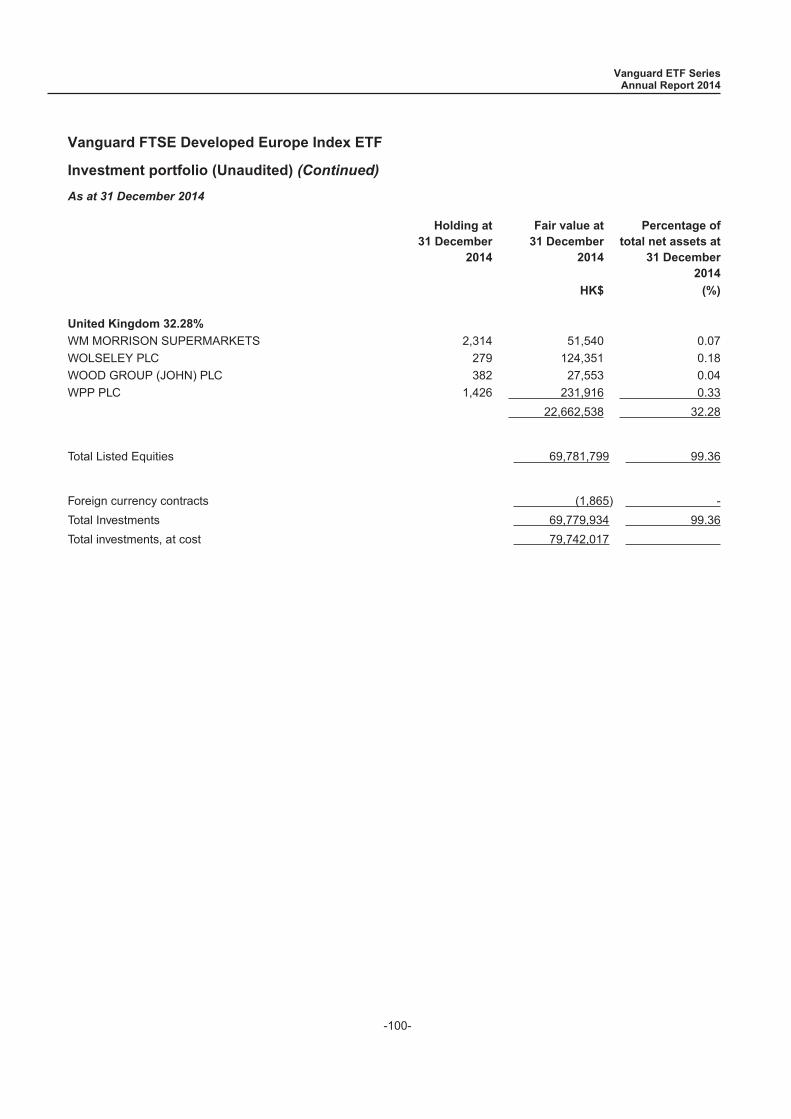
Vanguard FTSE Developed Europe Index ETF
Investment portfolio (Unaudited) (Continued)
As at 31 December 2014
Holding at31 December
2014
Fair value at31 December
2014
Percentage oftotal net assets at
31 December2014
HK$ (%)
United Kingdom 32.28%
WM MORRISON SUPERMARKETS 2,314 51,540 0.07WOLSELEY PLC 279 124,351 0.18WOOD GROUP (JOHN) PLC 382 27,553 0.04WPP PLC 1,426 231,916 0.33
22,662,538 32.28
Total Listed Equities 69,781,799 99.36
Foreign currency contracts (1,865) -Total Investments 69,779,934 99.36Total investments, at cost 79,742,017
Vanguard ETF SeriesAnnual Report 2014
-100-
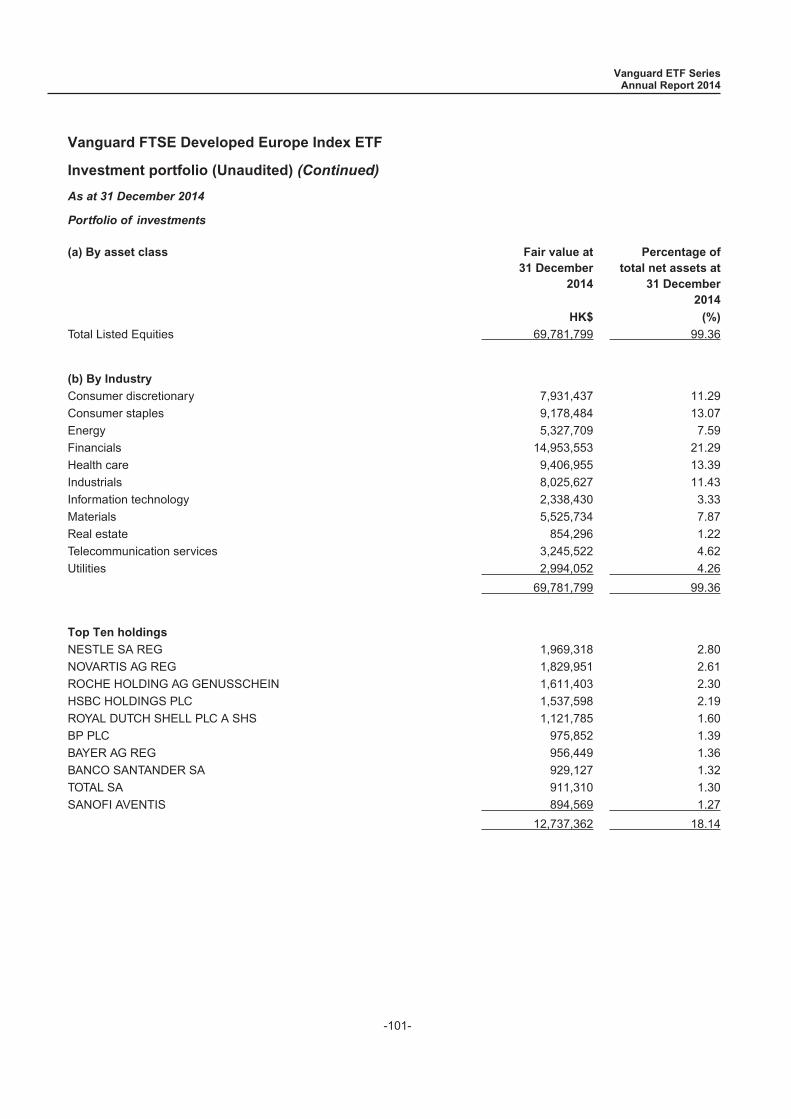
Vanguard FTSE Developed Europe Index ETF
Investment portfolio (Unaudited) (Continued)
As at 31 December 2014
Portfolio of investments
(a) By asset class Fair value at31 December
2014
Percentage oftotal net assets at
31 December2014
HK$ (%)
Total Listed Equities 69,781,799 99.36
(b) By Industry
Consumer discretionary 7,931,437 11.29Consumer staples 9,178,484 13.07Energy 5,327,709 7.59Financials 14,953,553 21.29Health care 9,406,955 13.39Industrials 8,025,627 11.43Information technology 2,338,430 3.33Materials 5,525,734 7.87Real estate 854,296 1.22Telecommunication services 3,245,522 4.62Utilities 2,994,052 4.26
69,781,799 99.36
Top Ten holdings
NESTLE SA REG 1,969,318 2.80NOVARTIS AG REG 1,829,951 2.61ROCHE HOLDING AG GENUSSCHEIN 1,611,403 2.30HSBC HOLDINGS PLC 1,537,598 2.19ROYAL DUTCH SHELL PLC A SHS 1,121,785 1.60BP PLC 975,852 1.39BAYER AG REG 956,449 1.36BANCO SANTANDER SA 929,127 1.32TOTAL SA 911,310 1.30SANOFI AVENTIS 894,569 1.27
12,737,362 18.14
Vanguard ETF SeriesAnnual Report 2014
-101-
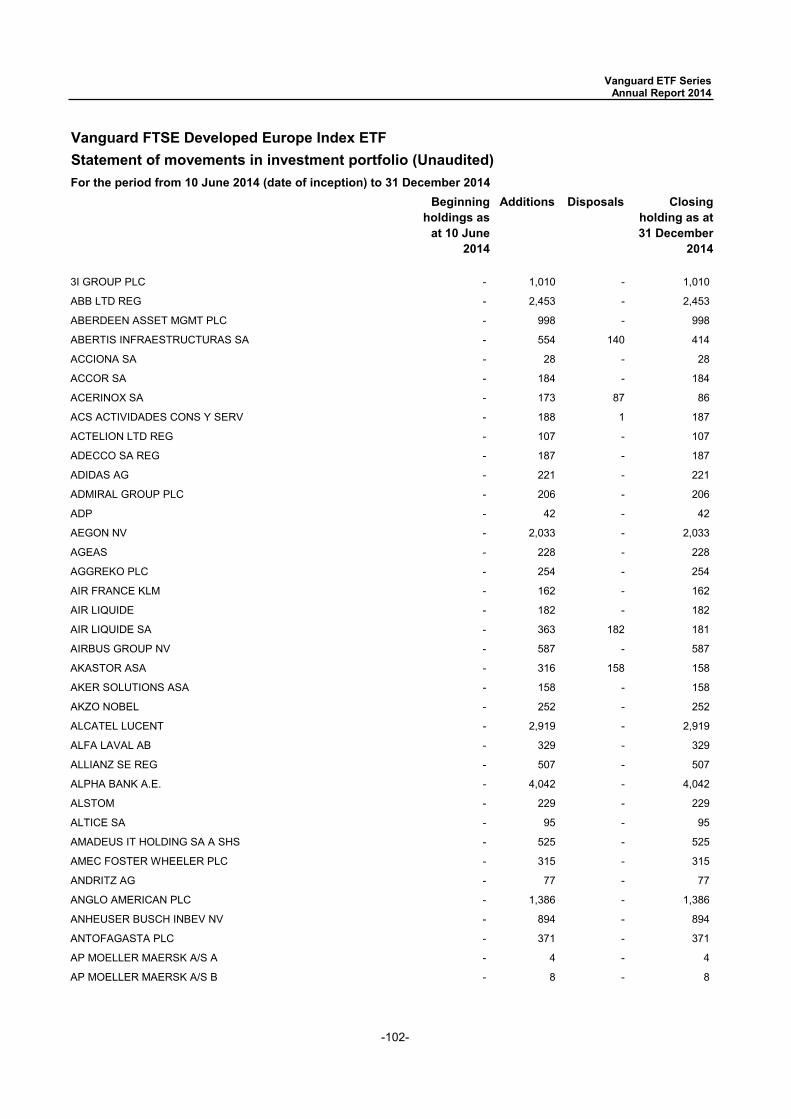
-102-
Vanguard FTSE Developed Europe Index ETFStatement of movements in investment portfolio (Unaudited)
Beginning holdings as
at 10 June 2014
Additions Disposals Closing holding as at 31 December
2014
3I GROUP PLC - 1,010 - 1,010
ABB LTD REG - 2,453 - 2,453
ABERDEEN ASSET MGMT PLC - 998 - 998
ABERTIS INFRAESTRUCTURAS SA - 554 140 414
ACCIONA SA - 28 - 28
ACCOR SA - 184 - 184
ACERINOX SA - 173 87 86
ACS ACTIVIDADES CONS Y SERV - 188 1 187
ACTELION LTD REG - 107 - 107
ADECCO SA REG - 187 - 187
ADIDAS AG - 221 - 221
ADMIRAL GROUP PLC - 206 - 206
ADP - 42 - 42
AEGON NV - 2,033 - 2,033
AGEAS - 228 - 228
AGGREKO PLC - 254 - 254
AIR FRANCE KLM - 162 - 162
AIR LIQUIDE - 182 - 182
AIR LIQUIDE SA - 363 182 181
AIRBUS GROUP NV - 587 - 587
AKASTOR ASA - 316 158 158
AKER SOLUTIONS ASA - 158 - 158
AKZO NOBEL - 252 - 252
ALCATEL LUCENT - 2,919 - 2,919
ALFA LAVAL AB - 329 - 329
ALLIANZ SE REG - 507 - 507
ALPHA BANK A.E. - 4,042 - 4,042
ALSTOM - 229 - 229
ALTICE SA - 95 - 95
AMADEUS IT HOLDING SA A SHS - 525 - 525
AMEC FOSTER WHEELER PLC - 315 - 315
ANDRITZ AG - 77 - 77
ANGLO AMERICAN PLC - 1,386 - 1,386
ANHEUSER BUSCH INBEV NV - 894 - 894
ANTOFAGASTA PLC - 371 - 371
AP MOELLER MAERSK A/S A - 4 - 4
AP MOELLER MAERSK A/S B - 8 - 8
For the period from 10 June 2014 (date of inception) to 31 December 2014
Vanguard ETF Series Annual Report 2014
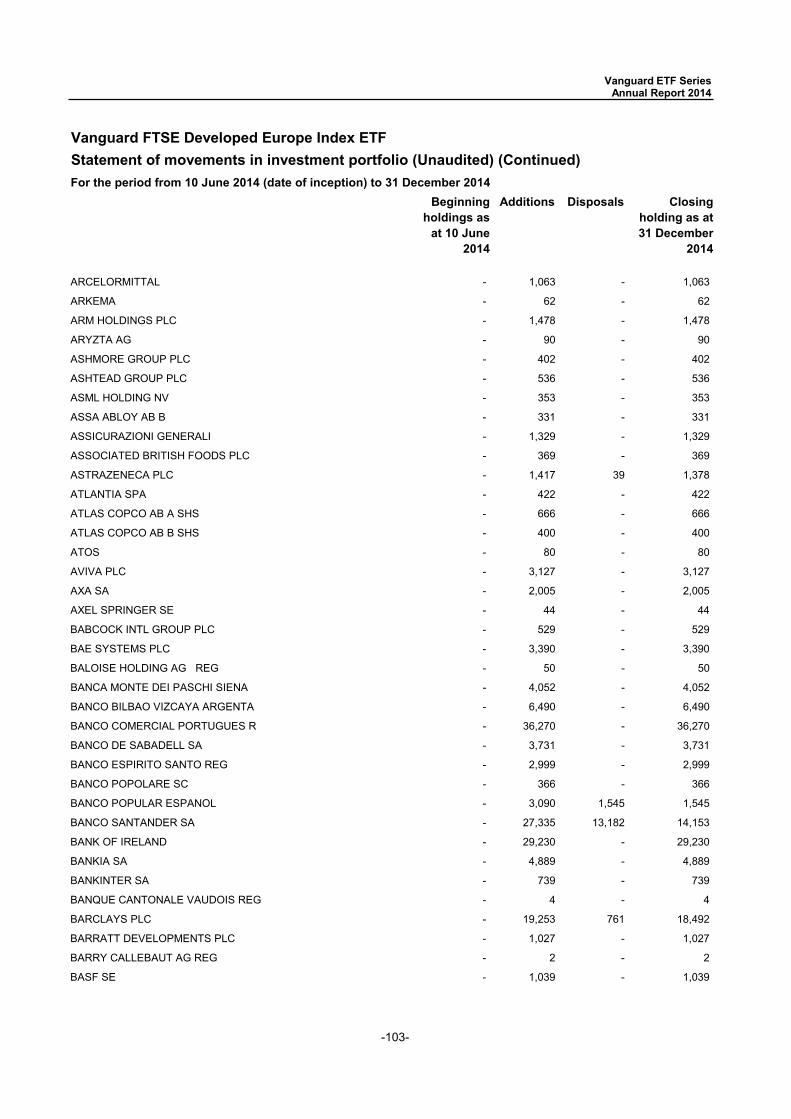
-103-
Vanguard FTSE Developed Europe Index ETFStatement of movements in investment portfolio (Unaudited) (Continued)
Beginning holdings as
at 10 June 2014
Additions Disposals Closing holding as at 31 December
2014
For the period from 10 June 2014 (date of inception) to 31 December 2014
Vanguard ETF Series Annual Report 2014
ARCELORMITTAL - 1,063 - 1,063
ARKEMA - 62 - 62
ARM HOLDINGS PLC - 1,478 - 1,478
ARYZTA AG - 90 - 90
ASHMORE GROUP PLC - 402 - 402
ASHTEAD GROUP PLC - 536 - 536
ASML HOLDING NV - 353 - 353
ASSA ABLOY AB B - 331 - 331
ASSICURAZIONI GENERALI - 1,329 - 1,329
ASSOCIATED BRITISH FOODS PLC - 369 - 369
ASTRAZENECA PLC - 1,417 39 1,378
ATLANTIA SPA - 422 - 422
ATLAS COPCO AB A SHS - 666 - 666
ATLAS COPCO AB B SHS - 400 - 400
ATOS - 80 - 80
AVIVA PLC - 3,127 - 3,127
AXA SA - 2,005 - 2,005
AXEL SPRINGER SE - 44 - 44
BABCOCK INTL GROUP PLC - 529 - 529
BAE SYSTEMS PLC - 3,390 - 3,390
BALOISE HOLDING AG REG - 50 - 50
BANCA MONTE DEI PASCHI SIENA - 4,052 - 4,052
BANCO BILBAO VIZCAYA ARGENTA - 6,490 - 6,490
BANCO COMERCIAL PORTUGUES R - 36,270 - 36,270
BANCO DE SABADELL SA - 3,731 - 3,731
BANCO ESPIRITO SANTO REG - 2,999 - 2,999
BANCO POPOLARE SC - 366 - 366
BANCO POPULAR ESPANOL - 3,090 1,545 1,545
BANCO SANTANDER SA - 27,335 13,182 14,153
BANK OF IRELAND - 29,230 - 29,230
BANKIA SA - 4,889 - 4,889
BANKINTER SA - 739 - 739
BANQUE CANTONALE VAUDOIS REG - 4 - 4
BARCLAYS PLC - 19,253 761 18,492
BARRATT DEVELOPMENTS PLC - 1,027 - 1,027
BARRY CALLEBAUT AG REG - 2 - 2
BASF SE - 1,039 - 1,039
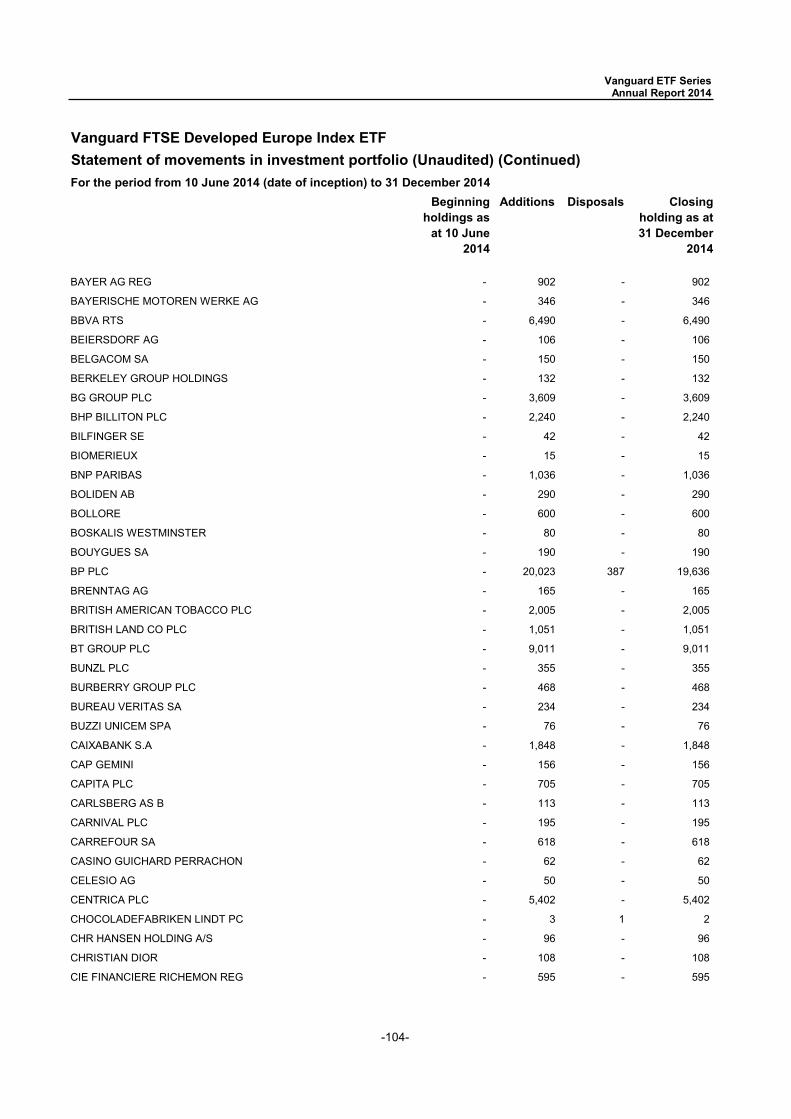
-104-
Vanguard FTSE Developed Europe Index ETFStatement of movements in investment portfolio (Unaudited) (Continued)
Beginning holdings as
at 10 June 2014
Additions Disposals Closing holding as at 31 December
2014
For the period from 10 June 2014 (date of inception) to 31 December 2014
Vanguard ETF Series Annual Report 2014
BAYER AG REG - 902 - 902
BAYERISCHE MOTOREN WERKE AG - 346 - 346
BBVA RTS - 6,490 - 6,490
BEIERSDORF AG - 106 - 106
BELGACOM SA - 150 - 150
BERKELEY GROUP HOLDINGS - 132 - 132
BG GROUP PLC - 3,609 - 3,609
BHP BILLITON PLC - 2,240 - 2,240
BILFINGER SE - 42 - 42
BIOMERIEUX - 15 - 15
BNP PARIBAS - 1,036 - 1,036
BOLIDEN AB - 290 - 290
BOLLORE - 600 - 600
BOSKALIS WESTMINSTER - 80 - 80
BOUYGUES SA - 190 - 190
BP PLC - 20,023 387 19,636
BRENNTAG AG - 165 - 165
BRITISH AMERICAN TOBACCO PLC - 2,005 - 2,005
BRITISH LAND CO PLC - 1,051 - 1,051
BT GROUP PLC - 9,011 - 9,011
BUNZL PLC - 355 - 355
BURBERRY GROUP PLC - 468 - 468
BUREAU VERITAS SA - 234 - 234
BUZZI UNICEM SPA - 76 - 76
CAIXABANK S.A - 1,848 - 1,848
CAP GEMINI - 156 - 156
CAPITA PLC - 705 - 705
CARLSBERG AS B - 113 - 113
CARNIVAL PLC - 195 - 195
CARREFOUR SA - 618 - 618
CASINO GUICHARD PERRACHON - 62 - 62
CELESIO AG - 50 - 50
CENTRICA PLC - 5,402 - 5,402
CHOCOLADEFABRIKEN LINDT PC - 3 1 2
CHR HANSEN HOLDING A/S - 96 - 96
CHRISTIAN DIOR - 108 - 108
CIE FINANCIERE RICHEMON REG - 595 - 595
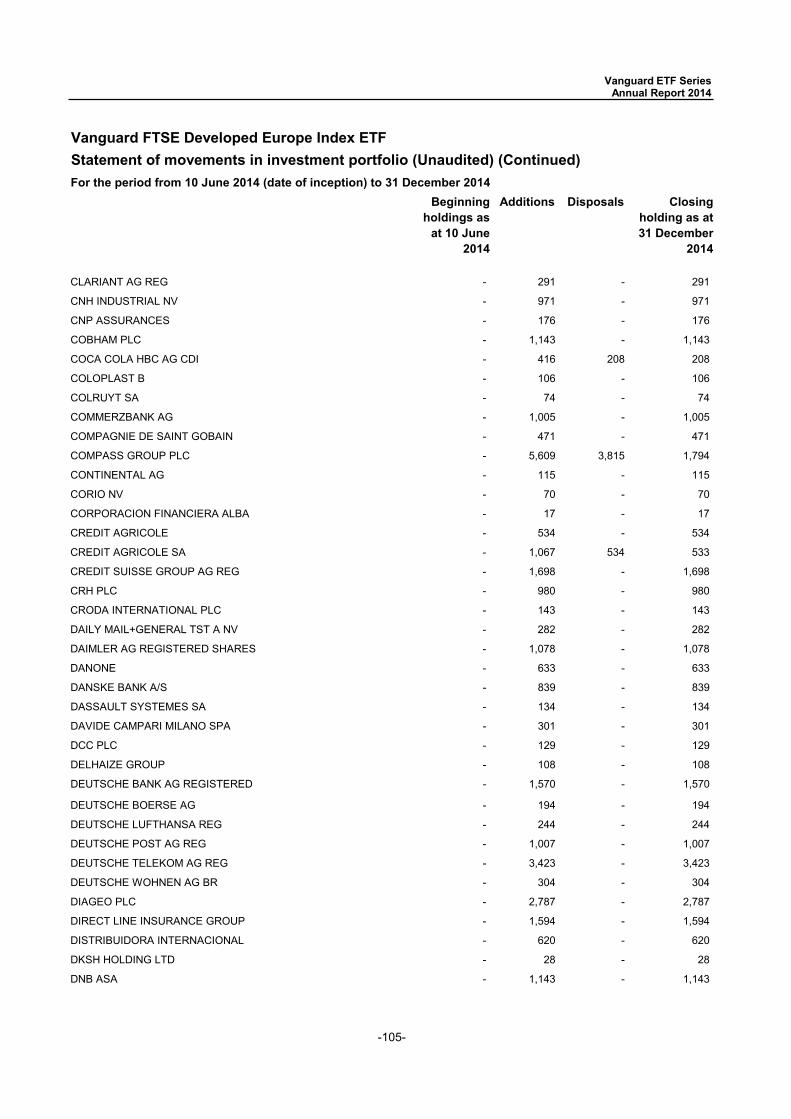
-105-
Vanguard FTSE Developed Europe Index ETFStatement of movements in investment portfolio (Unaudited) (Continued)
Beginning holdings as
at 10 June 2014
Additions Disposals Closing holding as at 31 December
2014
For the period from 10 June 2014 (date of inception) to 31 December 2014
Vanguard ETF Series Annual Report 2014
CLARIANT AG REG - 291 - 291
CNH INDUSTRIAL NV - 971 - 971
CNP ASSURANCES - 176 - 176
COBHAM PLC - 1,143 - 1,143
COCA COLA HBC AG CDI - 416 208 208
COLOPLAST B - 106 - 106
COLRUYT SA - 74 - 74
COMMERZBANK AG - 1,005 - 1,005
COMPAGNIE DE SAINT GOBAIN - 471 - 471
COMPASS GROUP PLC - 5,609 3,815 1,794
CONTINENTAL AG - 115 - 115
CORIO NV - 70 - 70
CORPORACION FINANCIERA ALBA - 17 - 17
CREDIT AGRICOLE - 534 - 534
CREDIT AGRICOLE SA - 1,067 534 533
CREDIT SUISSE GROUP AG REG - 1,698 - 1,698
CRH PLC - 980 - 980
CRODA INTERNATIONAL PLC - 143 - 143
DAILY MAIL+GENERAL TST A NV - 282 - 282
DAIMLER AG REGISTERED SHARES - 1,078 - 1,078
DANONE - 633 - 633
DANSKE BANK A/S - 839 - 839
DASSAULT SYSTEMES SA - 134 - 134
DAVIDE CAMPARI MILANO SPA - 301 - 301
DCC PLC - 129 - 129
DELHAIZE GROUP - 108 - 108
DEUTSCHE BANK AG REGISTERED - 1,570 - 1,570
DEUTSCHE BOERSE AG - 194 - 194
DEUTSCHE LUFTHANSA REG - 244 - 244
DEUTSCHE POST AG REG - 1,007 - 1,007
DEUTSCHE TELEKOM AG REG - 3,423 - 3,423
DEUTSCHE WOHNEN AG BR - 304 - 304
DIAGEO PLC - 2,787 - 2,787
DIRECT LINE INSURANCE GROUP - 1,594 - 1,594
DISTRIBUIDORA INTERNACIONAL - 620 - 620
DKSH HOLDING LTD - 28 - 28
DNB ASA - 1,143 - 1,143
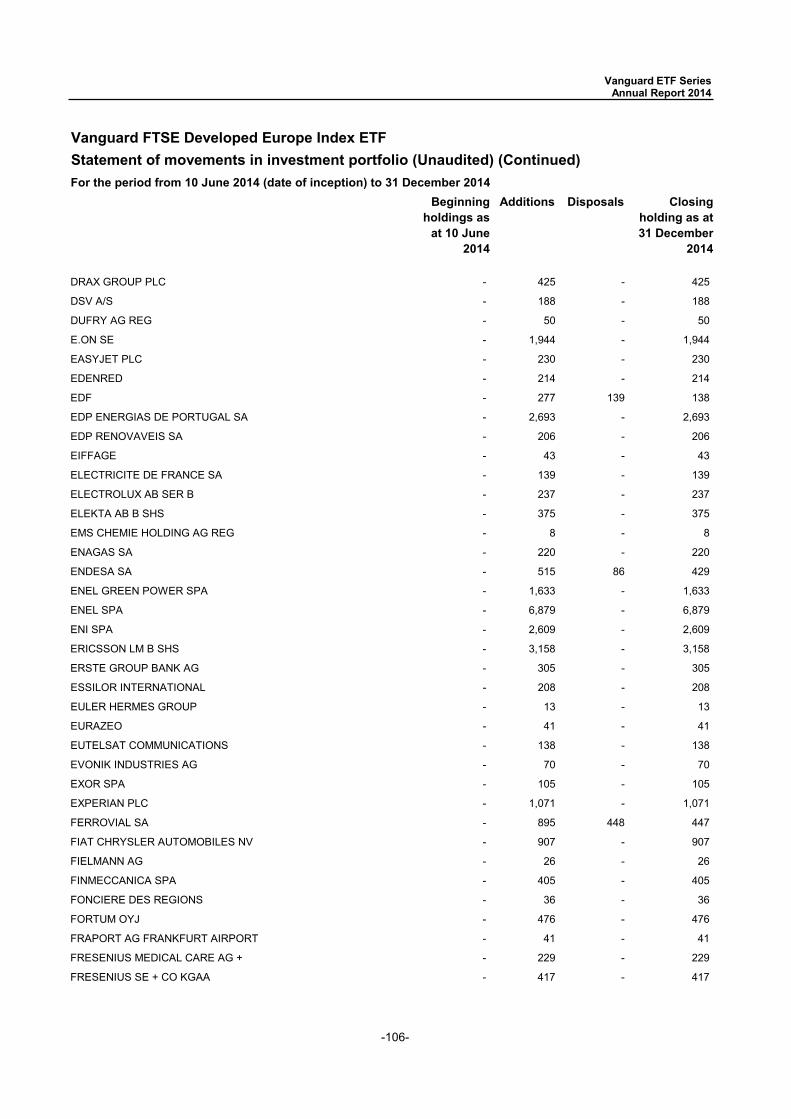
-106-
Vanguard FTSE Developed Europe Index ETFStatement of movements in investment portfolio (Unaudited) (Continued)
Beginning holdings as
at 10 June 2014
Additions Disposals Closing holding as at 31 December
2014
For the period from 10 June 2014 (date of inception) to 31 December 2014
Vanguard ETF Series Annual Report 2014
DRAX GROUP PLC - 425 - 425
DSV A/S - 188 - 188
DUFRY AG REG - 50 - 50
E.ON SE - 1,944 - 1,944
EASYJET PLC - 230 - 230
EDENRED - 214 - 214
EDF - 277 139 138
EDP ENERGIAS DE PORTUGAL SA - 2,693 - 2,693
EDP RENOVAVEIS SA - 206 - 206
EIFFAGE - 43 - 43
ELECTRICITE DE FRANCE SA - 139 - 139
ELECTROLUX AB SER B - 237 - 237
ELEKTA AB B SHS - 375 - 375
EMS CHEMIE HOLDING AG REG - 8 - 8
ENAGAS SA - 220 - 220
ENDESA SA - 515 86 429
ENEL GREEN POWER SPA - 1,633 - 1,633
ENEL SPA - 6,879 - 6,879
ENI SPA - 2,609 - 2,609
ERICSSON LM B SHS - 3,158 - 3,158
ERSTE GROUP BANK AG - 305 - 305
ESSILOR INTERNATIONAL - 208 - 208
EULER HERMES GROUP - 13 - 13
EURAZEO - 41 - 41
EUTELSAT COMMUNICATIONS - 138 - 138
EVONIK INDUSTRIES AG - 70 - 70
EXOR SPA - 105 - 105
EXPERIAN PLC - 1,071 - 1,071
FERROVIAL SA - 895 448 447
FIAT CHRYSLER AUTOMOBILES NV - 907 - 907
FIELMANN AG - 26 - 26
FINMECCANICA SPA - 405 - 405
FONCIERE DES REGIONS - 36 - 36
FORTUM OYJ - 476 - 476
FRAPORT AG FRANKFURT AIRPORT - 41 - 41
FRESENIUS MEDICAL CARE AG + - 229 - 229
FRESENIUS SE + CO KGAA - 417 - 417

-107-
Vanguard FTSE Developed Europe Index ETFStatement of movements in investment portfolio (Unaudited) (Continued)
Beginning holdings as
at 10 June 2014
Additions Disposals Closing holding as at 31 December
2014
For the period from 10 June 2014 (date of inception) to 31 December 2014
Vanguard ETF Series Annual Report 2014
FRESNILLO PLC - 180 - 180
FRIENDS LIFE GROUP LTD - 1,435 - 1,435
FUCHS PETROLUB SE - 33 - 33
FUCHS PETROLUB SE PREF - 78 - 78
FUGRO NV CVA - 83 - 83
G4S PLC - 1,669 - 1,669
GALENICA AG REG - 5 - 5
GALP ENERGIA SGPS SA - 398 - 398
GAM HOLDING AG - 168 - 168
GAS NATURAL SDG SA - 326 - 326
GDF SUEZ - 1,497 - 1,497
GEA GROUP AG - 187 - 187
GEBERIT AG REG - 40 - 40
GECINA SA - 64 - 64
GEMALTO - 84 - 84
GETINGE AB B SHS - 193 - 193
GIVAUDAN REG - 10 - 10
GJENSIDIGE FORSIKRING ASA - 177 - 177
GKN PLC - 1,730 - 1,730
GLAXOSMITHKLINE PLC - 5,314 - 5,314
GLENCORE PLC - 12,319 - 12,319
GRIFOLS SA - 175 - 175
GROUPE BRUXELLES LAMBERT SA - 81 - 81
GROUPE EUROTUNNEL SA REGR - 493 - 493
GTECH SPA - 69 - 69
GTECH SPA RTS - 69 - 69
H LUNDBECK A/S - 62 - 62
HAMMERSON PLC - 743 - 743
HANNOVER RUECK SE - 64 - 64
HARGREAVES LANSDOWN PLC - 228 - 228
HEIDELBERGCEMENT AG - 149 - 149
HEINEKEN HOLDING NV - 105 - 105
HEINEKEN NV - 306 59 247
HELLENIC TELECOMMUN ORGANIZA - 260 - 260
HENKEL AG + CO KGAA - 121 - 121
HENKEL AG + CO KGAA VORZUG - 186 - 186
HENNES + MAURITZ AB B SHS - 1,004 - 1,004
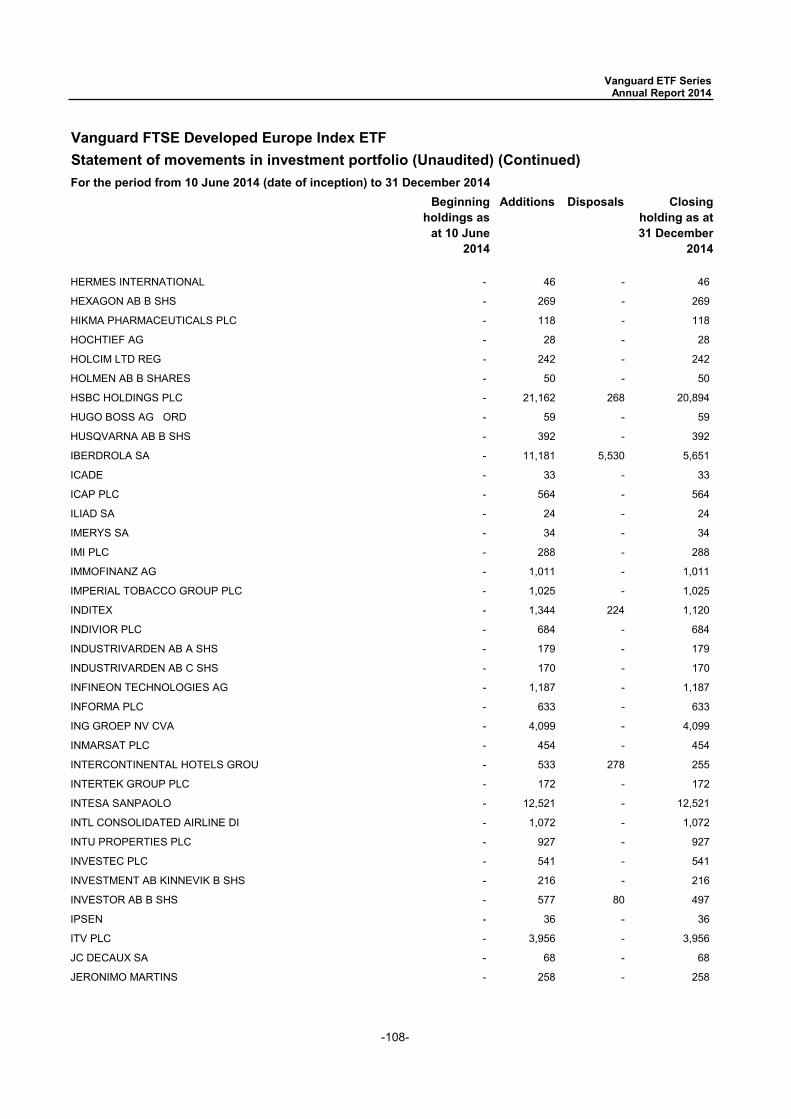
-108-
Vanguard FTSE Developed Europe Index ETFStatement of movements in investment portfolio (Unaudited) (Continued)
Beginning holdings as
at 10 June 2014
Additions Disposals Closing holding as at 31 December
2014
For the period from 10 June 2014 (date of inception) to 31 December 2014
Vanguard ETF Series Annual Report 2014
HERMES INTERNATIONAL - 46 - 46
HEXAGON AB B SHS - 269 - 269
HIKMA PHARMACEUTICALS PLC - 118 - 118
HOCHTIEF AG - 28 - 28
HOLCIM LTD REG - 242 - 242
HOLMEN AB B SHARES - 50 - 50
HSBC HOLDINGS PLC - 21,162 268 20,894
HUGO BOSS AG ORD - 59 - 59
HUSQVARNA AB B SHS - 392 - 392
IBERDROLA SA - 11,181 5,530 5,651
ICADE - 33 - 33
ICAP PLC - 564 - 564
ILIAD SA - 24 - 24
IMERYS SA - 34 - 34
IMI PLC - 288 - 288
IMMOFINANZ AG - 1,011 - 1,011
IMPERIAL TOBACCO GROUP PLC - 1,025 - 1,025
INDITEX - 1,344 224 1,120
INDIVIOR PLC - 684 - 684
INDUSTRIVARDEN AB A SHS - 179 - 179
INDUSTRIVARDEN AB C SHS - 170 - 170
INFINEON TECHNOLOGIES AG - 1,187 - 1,187
INFORMA PLC - 633 - 633
ING GROEP NV CVA - 4,099 - 4,099
INMARSAT PLC - 454 - 454
INTERCONTINENTAL HOTELS GROU - 533 278 255
INTERTEK GROUP PLC - 172 - 172
INTESA SANPAOLO - 12,521 - 12,521
INTL CONSOLIDATED AIRLINE DI - 1,072 - 1,072
INTU PROPERTIES PLC - 927 - 927
INVESTEC PLC - 541 - 541
INVESTMENT AB KINNEVIK B SHS - 216 - 216
INVESTOR AB B SHS - 577 80 497
IPSEN - 36 - 36
ITV PLC - 3,956 - 3,956
JC DECAUX SA - 68 - 68
JERONIMO MARTINS - 258 - 258
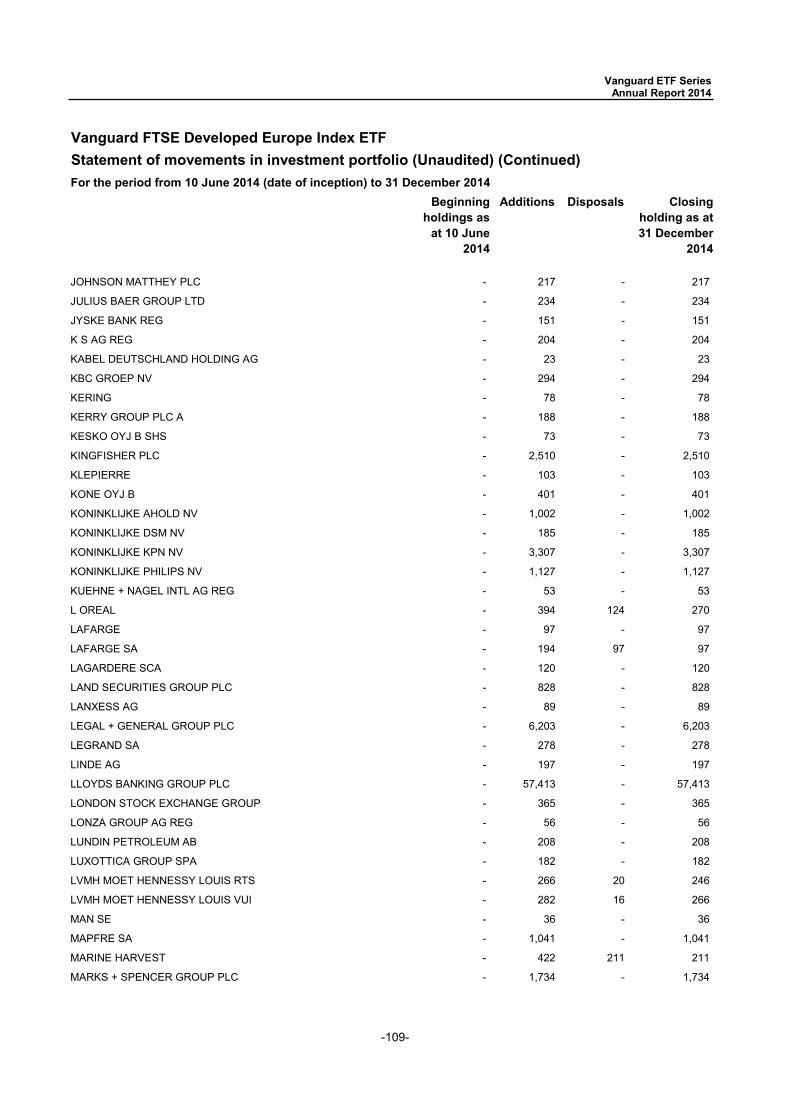
-109-
Vanguard FTSE Developed Europe Index ETFStatement of movements in investment portfolio (Unaudited) (Continued)
Beginning holdings as
at 10 June 2014
Additions Disposals Closing holding as at 31 December
2014
For the period from 10 June 2014 (date of inception) to 31 December 2014
Vanguard ETF Series Annual Report 2014
JOHNSON MATTHEY PLC - 217 - 217
JULIUS BAER GROUP LTD - 234 - 234
JYSKE BANK REG - 151 - 151
K S AG REG - 204 - 204
KABEL DEUTSCHLAND HOLDING AG - 23 - 23
KBC GROEP NV - 294 - 294
KERING - 78 - 78
KERRY GROUP PLC A - 188 - 188
KESKO OYJ B SHS - 73 - 73
KINGFISHER PLC - 2,510 - 2,510
KLEPIERRE - 103 - 103
KONE OYJ B - 401 - 401
KONINKLIJKE AHOLD NV - 1,002 - 1,002
KONINKLIJKE DSM NV - 185 - 185
KONINKLIJKE KPN NV - 3,307 - 3,307
KONINKLIJKE PHILIPS NV - 1,127 - 1,127
KUEHNE + NAGEL INTL AG REG - 53 - 53
L OREAL - 394 124 270
LAFARGE - 97 - 97
LAFARGE SA - 194 97 97
LAGARDERE SCA - 120 - 120
LAND SECURITIES GROUP PLC - 828 - 828
LANXESS AG - 89 - 89
LEGAL + GENERAL GROUP PLC - 6,203 - 6,203
LEGRAND SA - 278 - 278
LINDE AG - 197 - 197
LLOYDS BANKING GROUP PLC - 57,413 - 57,413
LONDON STOCK EXCHANGE GROUP - 365 - 365
LONZA GROUP AG REG - 56 - 56
LUNDIN PETROLEUM AB - 208 - 208
LUXOTTICA GROUP SPA - 182 - 182
LVMH MOET HENNESSY LOUIS RTS - 266 20 246
LVMH MOET HENNESSY LOUIS VUI - 282 16 266
MAN SE - 36 - 36
MAPFRE SA - 1,041 - 1,041
MARINE HARVEST - 422 211 211
MARKS + SPENCER GROUP PLC - 1,734 - 1,734
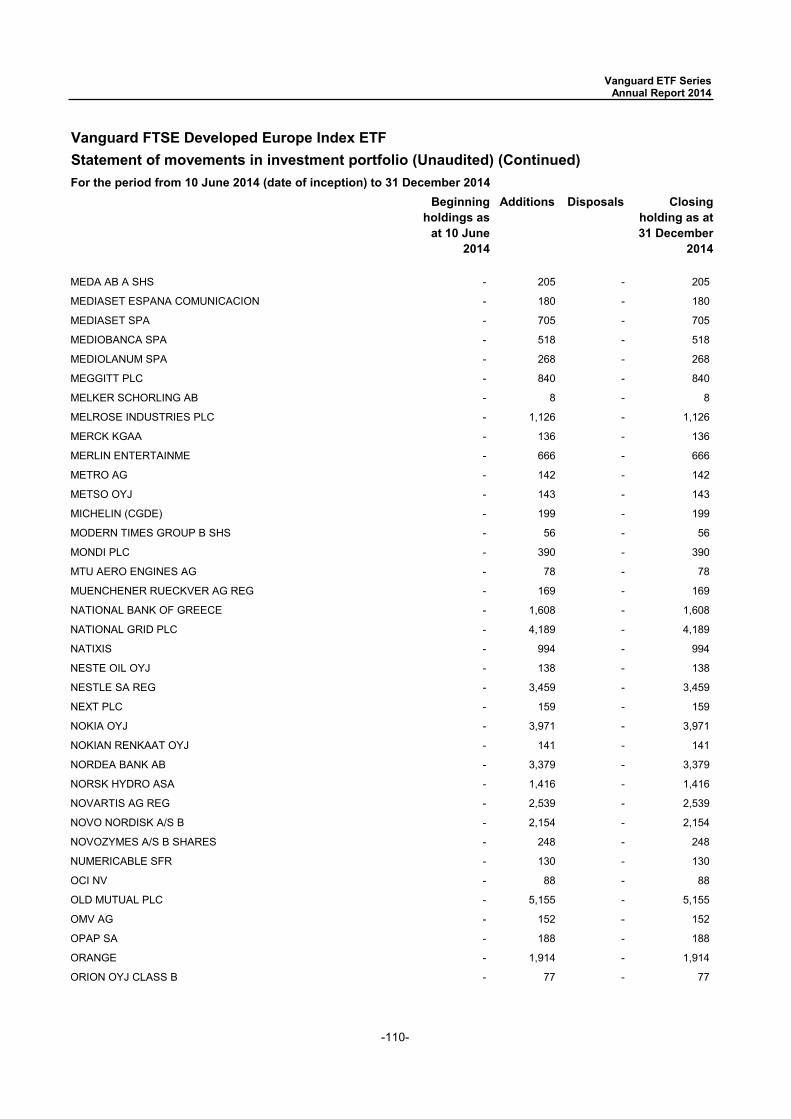
-110-
Vanguard FTSE Developed Europe Index ETFStatement of movements in investment portfolio (Unaudited) (Continued)
Beginning holdings as
at 10 June 2014
Additions Disposals Closing holding as at 31 December
2014
For the period from 10 June 2014 (date of inception) to 31 December 2014
Vanguard ETF Series Annual Report 2014
MEDA AB A SHS - 205 - 205
MEDIASET ESPANA COMUNICACION - 180 - 180
MEDIASET SPA - 705 - 705
MEDIOBANCA SPA - 518 - 518
MEDIOLANUM SPA - 268 - 268
MEGGITT PLC - 840 - 840
MELKER SCHORLING AB - 8 - 8
MELROSE INDUSTRIES PLC - 1,126 - 1,126
MERCK KGAA - 136 - 136
MERLIN ENTERTAINME - 666 - 666
METRO AG - 142 - 142
METSO OYJ - 143 - 143
MICHELIN (CGDE) - 199 - 199
MODERN TIMES GROUP B SHS - 56 - 56
MONDI PLC - 390 - 390
MTU AERO ENGINES AG - 78 - 78
MUENCHENER RUECKVER AG REG - 169 - 169
NATIONAL BANK OF GREECE - 1,608 - 1,608
NATIONAL GRID PLC - 4,189 - 4,189
NATIXIS - 994 - 994
NESTE OIL OYJ - 138 - 138
NESTLE SA REG - 3,459 - 3,459
NEXT PLC - 159 - 159
NOKIA OYJ - 3,971 - 3,971
NOKIAN RENKAAT OYJ - 141 - 141
NORDEA BANK AB - 3,379 - 3,379
NORSK HYDRO ASA - 1,416 - 1,416
NOVARTIS AG REG - 2,539 - 2,539
NOVO NORDISK A/S B - 2,154 - 2,154
NOVOZYMES A/S B SHARES - 248 - 248
NUMERICABLE SFR - 130 - 130
OCI NV - 88 - 88
OLD MUTUAL PLC - 5,155 - 5,155
OMV AG - 152 - 152
OPAP SA - 188 - 188
ORANGE - 1,914 - 1,914
ORION OYJ CLASS B - 77 - 77
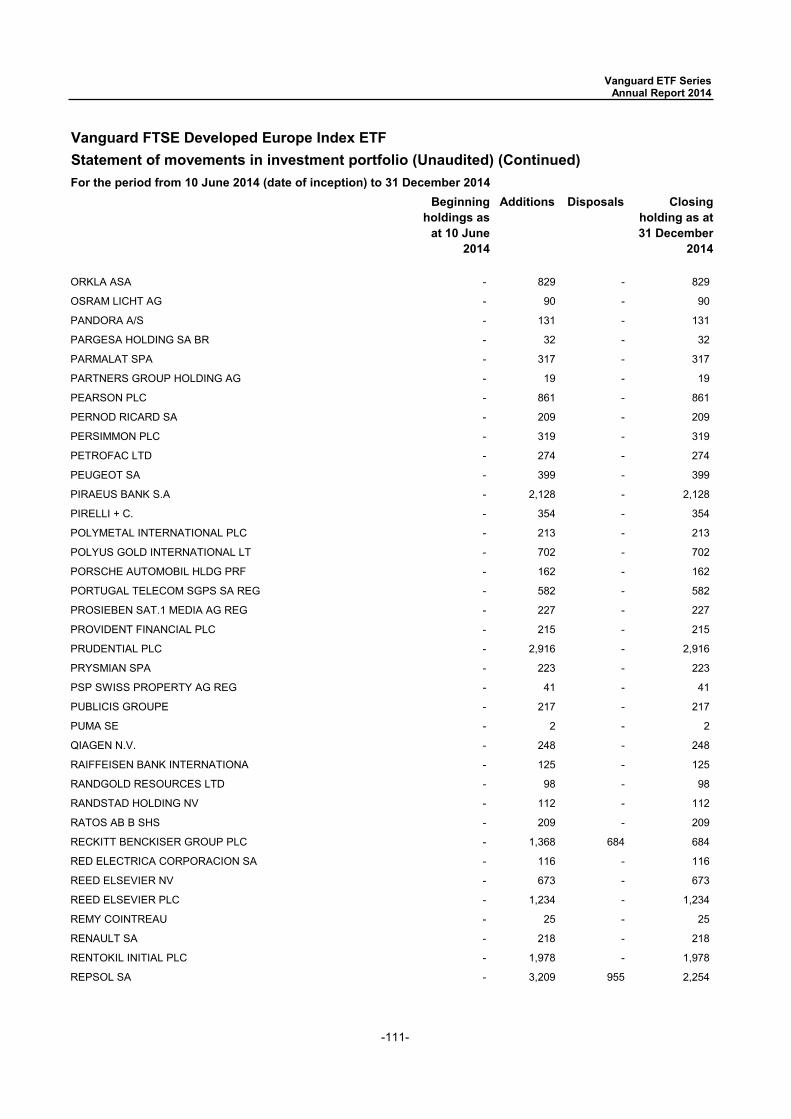
-111-
Vanguard FTSE Developed Europe Index ETFStatement of movements in investment portfolio (Unaudited) (Continued)
Beginning holdings as
at 10 June 2014
Additions Disposals Closing holding as at 31 December
2014
For the period from 10 June 2014 (date of inception) to 31 December 2014
Vanguard ETF Series Annual Report 2014
ORKLA ASA - 829 - 829
OSRAM LICHT AG - 90 - 90
PANDORA A/S - 131 - 131
PARGESA HOLDING SA BR - 32 - 32
PARMALAT SPA - 317 - 317
PARTNERS GROUP HOLDING AG - 19 - 19
PEARSON PLC - 861 - 861
PERNOD RICARD SA - 209 - 209
PERSIMMON PLC - 319 - 319
PETROFAC LTD - 274 - 274
PEUGEOT SA - 399 - 399
PIRAEUS BANK S.A - 2,128 - 2,128
PIRELLI + C. - 354 - 354
POLYMETAL INTERNATIONAL PLC - 213 - 213
POLYUS GOLD INTERNATIONAL LT - 702 - 702
PORSCHE AUTOMOBIL HLDG PRF - 162 - 162
PORTUGAL TELECOM SGPS SA REG - 582 - 582
PROSIEBEN SAT.1 MEDIA AG REG - 227 - 227
PROVIDENT FINANCIAL PLC - 215 - 215
PRUDENTIAL PLC - 2,916 - 2,916
PRYSMIAN SPA - 223 - 223
PSP SWISS PROPERTY AG REG - 41 - 41
PUBLICIS GROUPE - 217 - 217
PUMA SE - 2 - 2
QIAGEN N.V. - 248 - 248
RAIFFEISEN BANK INTERNATIONA - 125 - 125
RANDGOLD RESOURCES LTD - 98 - 98
RANDSTAD HOLDING NV - 112 - 112
RATOS AB B SHS - 209 - 209
RECKITT BENCKISER GROUP PLC - 1,368 684 684
RED ELECTRICA CORPORACION SA - 116 - 116
REED ELSEVIER NV - 673 - 673
REED ELSEVIER PLC - 1,234 - 1,234
REMY COINTREAU - 25 - 25
RENAULT SA - 218 - 218
RENTOKIL INITIAL PLC - 1,978 - 1,978
REPSOL SA - 3,209 955 2,254
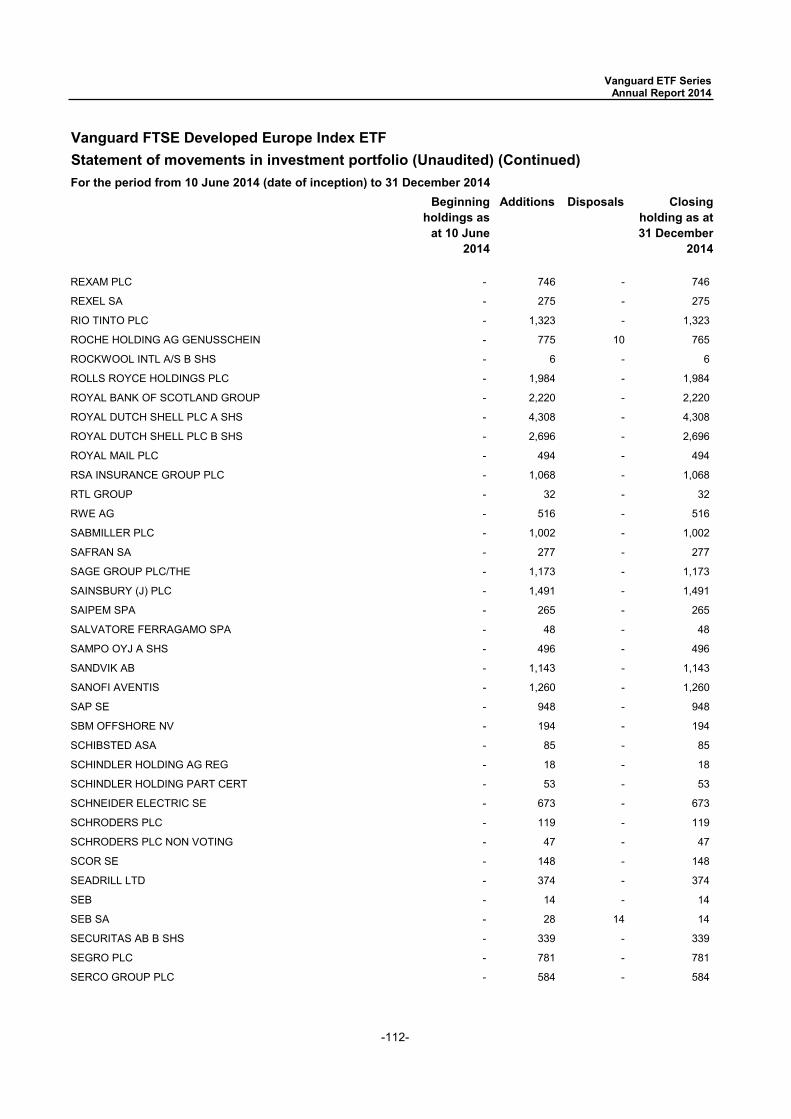
-112-
Vanguard FTSE Developed Europe Index ETFStatement of movements in investment portfolio (Unaudited) (Continued)
Beginning holdings as
at 10 June 2014
Additions Disposals Closing holding as at 31 December
2014
For the period from 10 June 2014 (date of inception) to 31 December 2014
Vanguard ETF Series Annual Report 2014
REXAM PLC - 746 - 746
REXEL SA - 275 - 275
RIO TINTO PLC - 1,323 - 1,323
ROCHE HOLDING AG GENUSSCHEIN - 775 10 765
ROCKWOOL INTL A/S B SHS - 6 - 6
ROLLS ROYCE HOLDINGS PLC - 1,984 - 1,984
ROYAL BANK OF SCOTLAND GROUP - 2,220 - 2,220
ROYAL DUTCH SHELL PLC A SHS - 4,308 - 4,308
ROYAL DUTCH SHELL PLC B SHS - 2,696 - 2,696
ROYAL MAIL PLC - 494 - 494
RSA INSURANCE GROUP PLC - 1,068 - 1,068
RTL GROUP - 32 - 32
RWE AG - 516 - 516
SABMILLER PLC - 1,002 - 1,002
SAFRAN SA - 277 - 277
SAGE GROUP PLC/THE - 1,173 - 1,173
SAINSBURY (J) PLC - 1,491 - 1,491
SAIPEM SPA - 265 - 265
SALVATORE FERRAGAMO SPA - 48 - 48
SAMPO OYJ A SHS - 496 - 496
SANDVIK AB - 1,143 - 1,143
SANOFI AVENTIS - 1,260 - 1,260
SAP SE - 948 - 948
SBM OFFSHORE NV - 194 - 194
SCHIBSTED ASA - 85 - 85
SCHINDLER HOLDING AG REG - 18 - 18
SCHINDLER HOLDING PART CERT - 53 - 53
SCHNEIDER ELECTRIC SE - 673 - 673
SCHRODERS PLC - 119 - 119
SCHRODERS PLC NON VOTING - 47 - 47
SCOR SE - 148 - 148
SEADRILL LTD - 374 - 374
SEB - 14 - 14
SEB SA - 28 14 14
SECURITAS AB B SHS - 339 - 339
SEGRO PLC - 781 - 781
SERCO GROUP PLC - 584 - 584
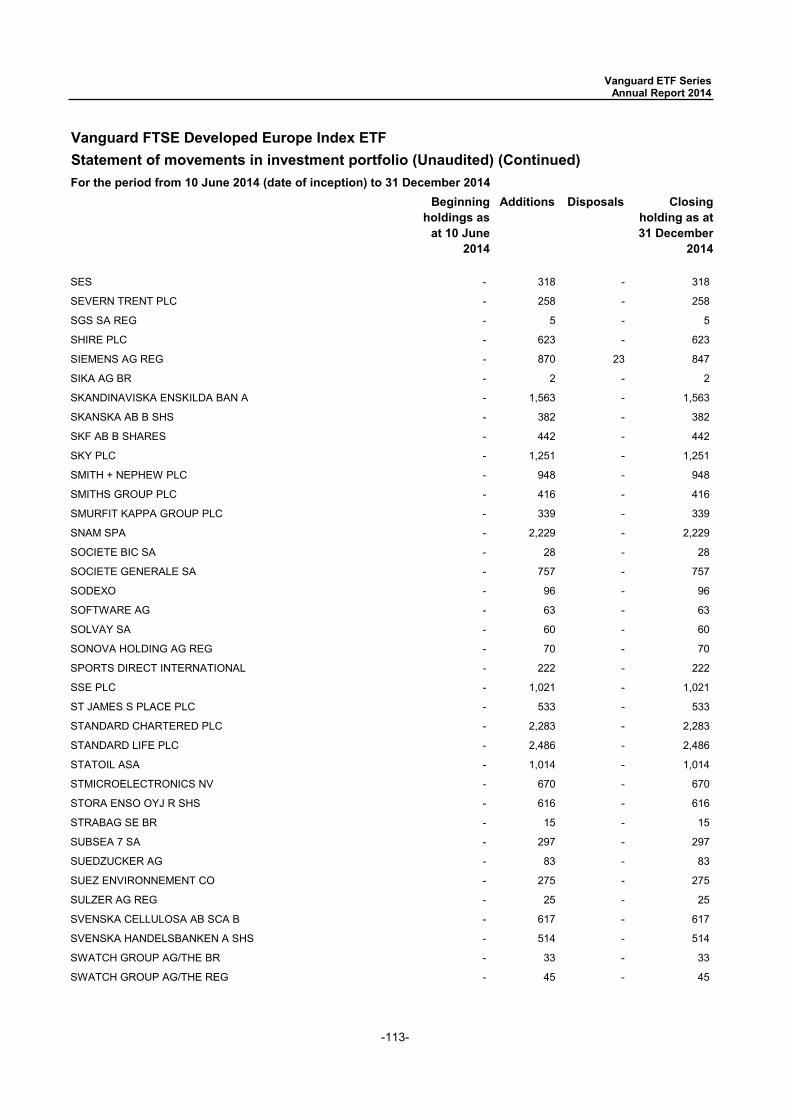
-113-
Vanguard FTSE Developed Europe Index ETFStatement of movements in investment portfolio (Unaudited) (Continued)
Beginning holdings as
at 10 June 2014
Additions Disposals Closing holding as at 31 December
2014
For the period from 10 June 2014 (date of inception) to 31 December 2014
Vanguard ETF Series Annual Report 2014
SES - 318 - 318
SEVERN TRENT PLC - 258 - 258
SGS SA REG - 5 - 5
SHIRE PLC - 623 - 623
SIEMENS AG REG - 870 23 847
SIKA AG BR - 2 - 2
SKANDINAVISKA ENSKILDA BAN A - 1,563 - 1,563
SKANSKA AB B SHS - 382 - 382
SKF AB B SHARES - 442 - 442
SKY PLC - 1,251 - 1,251
SMITH + NEPHEW PLC - 948 - 948
SMITHS GROUP PLC - 416 - 416
SMURFIT KAPPA GROUP PLC - 339 - 339
SNAM SPA - 2,229 - 2,229
SOCIETE BIC SA - 28 - 28
SOCIETE GENERALE SA - 757 - 757
SODEXO - 96 - 96
SOFTWARE AG - 63 - 63
SOLVAY SA - 60 - 60
SONOVA HOLDING AG REG - 70 - 70
SPORTS DIRECT INTERNATIONAL - 222 - 222
SSE PLC - 1,021 - 1,021
ST JAMES S PLACE PLC - 533 - 533
STANDARD CHARTERED PLC - 2,283 - 2,283
STANDARD LIFE PLC - 2,486 - 2,486
STATOIL ASA - 1,014 - 1,014
STMICROELECTRONICS NV - 670 - 670
STORA ENSO OYJ R SHS - 616 - 616
STRABAG SE BR - 15 - 15
SUBSEA 7 SA - 297 - 297
SUEDZUCKER AG - 83 - 83
SUEZ ENVIRONNEMENT CO - 275 - 275
SULZER AG REG - 25 - 25
SVENSKA CELLULOSA AB SCA B - 617 - 617
SVENSKA HANDELSBANKEN A SHS - 514 - 514
SWATCH GROUP AG/THE BR - 33 - 33
SWATCH GROUP AG/THE REG - 45 - 45
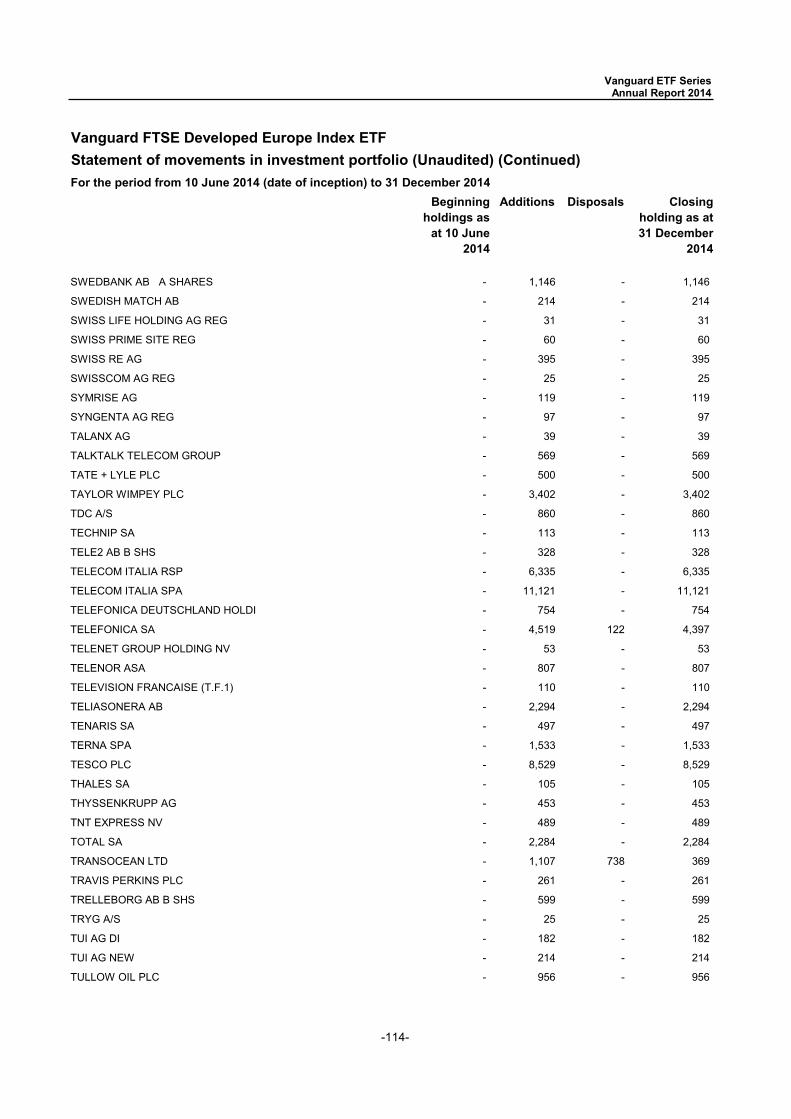
-114-
Vanguard FTSE Developed Europe Index ETFStatement of movements in investment portfolio (Unaudited) (Continued)
Beginning holdings as
at 10 June 2014
Additions Disposals Closing holding as at 31 December
2014
For the period from 10 June 2014 (date of inception) to 31 December 2014
Vanguard ETF Series Annual Report 2014
SWEDBANK AB A SHARES - 1,146 - 1,146
SWEDISH MATCH AB - 214 - 214
SWISS LIFE HOLDING AG REG - 31 - 31
SWISS PRIME SITE REG - 60 - 60
SWISS RE AG - 395 - 395
SWISSCOM AG REG - 25 - 25
SYMRISE AG - 119 - 119
SYNGENTA AG REG - 97 - 97
TALANX AG - 39 - 39
TALKTALK TELECOM GROUP - 569 - 569
TATE + LYLE PLC - 500 - 500
TAYLOR WIMPEY PLC - 3,402 - 3,402
TDC A/S - 860 - 860
TECHNIP SA - 113 - 113
TELE2 AB B SHS - 328 - 328
TELECOM ITALIA RSP - 6,335 - 6,335
TELECOM ITALIA SPA - 11,121 - 11,121
TELEFONICA DEUTSCHLAND HOLDI - 754 - 754
TELEFONICA SA - 4,519 122 4,397
TELENET GROUP HOLDING NV - 53 - 53
TELENOR ASA - 807 - 807
TELEVISION FRANCAISE (T.F.1) - 110 - 110
TELIASONERA AB - 2,294 - 2,294
TENARIS SA - 497 - 497
TERNA SPA - 1,533 - 1,533
TESCO PLC - 8,529 - 8,529
THALES SA - 105 - 105
THYSSENKRUPP AG - 453 - 453
TNT EXPRESS NV - 489 - 489
TOTAL SA - 2,284 - 2,284
TRANSOCEAN LTD - 1,107 738 369
TRAVIS PERKINS PLC - 261 - 261
TRELLEBORG AB B SHS - 599 - 599
TRYG A/S - 25 - 25
TUI AG DI - 182 - 182
TUI AG NEW - 214 - 214
TULLOW OIL PLC - 956 - 956
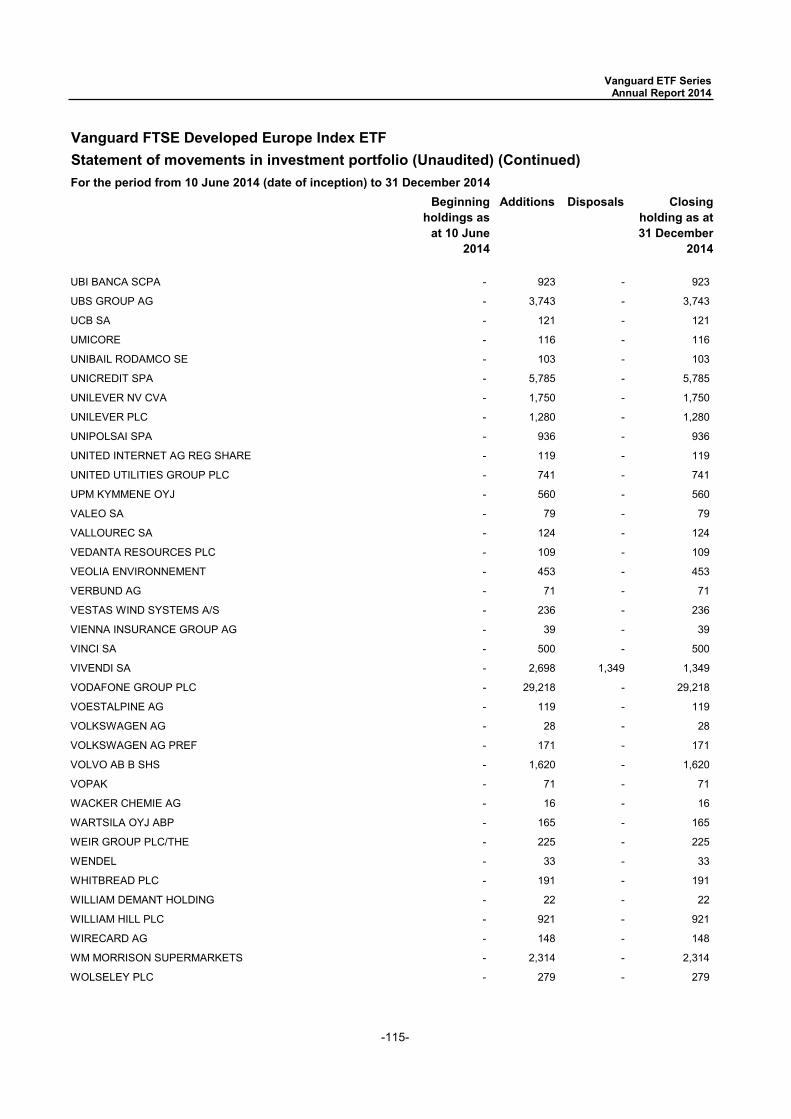
-115-
Vanguard FTSE Developed Europe Index ETFStatement of movements in investment portfolio (Unaudited) (Continued)
Beginning holdings as
at 10 June 2014
Additions Disposals Closing holding as at 31 December
2014
For the period from 10 June 2014 (date of inception) to 31 December 2014
Vanguard ETF Series Annual Report 2014
UBI BANCA SCPA - 923 - 923
UBS GROUP AG - 3,743 - 3,743
UCB SA - 121 - 121
UMICORE - 116 - 116
UNIBAIL RODAMCO SE - 103 - 103
UNICREDIT SPA - 5,785 - 5,785
UNILEVER NV CVA - 1,750 - 1,750
UNILEVER PLC - 1,280 - 1,280
UNIPOLSAI SPA - 936 - 936
UNITED INTERNET AG REG SHARE - 119 - 119
UNITED UTILITIES GROUP PLC - 741 - 741
UPM KYMMENE OYJ - 560 - 560
VALEO SA - 79 - 79
VALLOUREC SA - 124 - 124
VEDANTA RESOURCES PLC - 109 - 109
VEOLIA ENVIRONNEMENT - 453 - 453
VERBUND AG - 71 - 71
VESTAS WIND SYSTEMS A/S - 236 - 236
VIENNA INSURANCE GROUP AG - 39 - 39
VINCI SA - 500 - 500
VIVENDI SA - 2,698 1,349 1,349
VODAFONE GROUP PLC - 29,218 - 29,218
VOESTALPINE AG - 119 - 119
VOLKSWAGEN AG - 28 - 28
VOLKSWAGEN AG PREF - 171 - 171
VOLVO AB B SHS - 1,620 - 1,620
VOPAK - 71 - 71
WACKER CHEMIE AG - 16 - 16
WARTSILA OYJ ABP - 165 - 165
WEIR GROUP PLC/THE - 225 - 225
WENDEL - 33 - 33
WHITBREAD PLC - 191 - 191
WILLIAM DEMANT HOLDING - 22 - 22
WILLIAM HILL PLC - 921 - 921
WIRECARD AG - 148 - 148
WM MORRISON SUPERMARKETS - 2,314 - 2,314
WOLSELEY PLC - 279 - 279
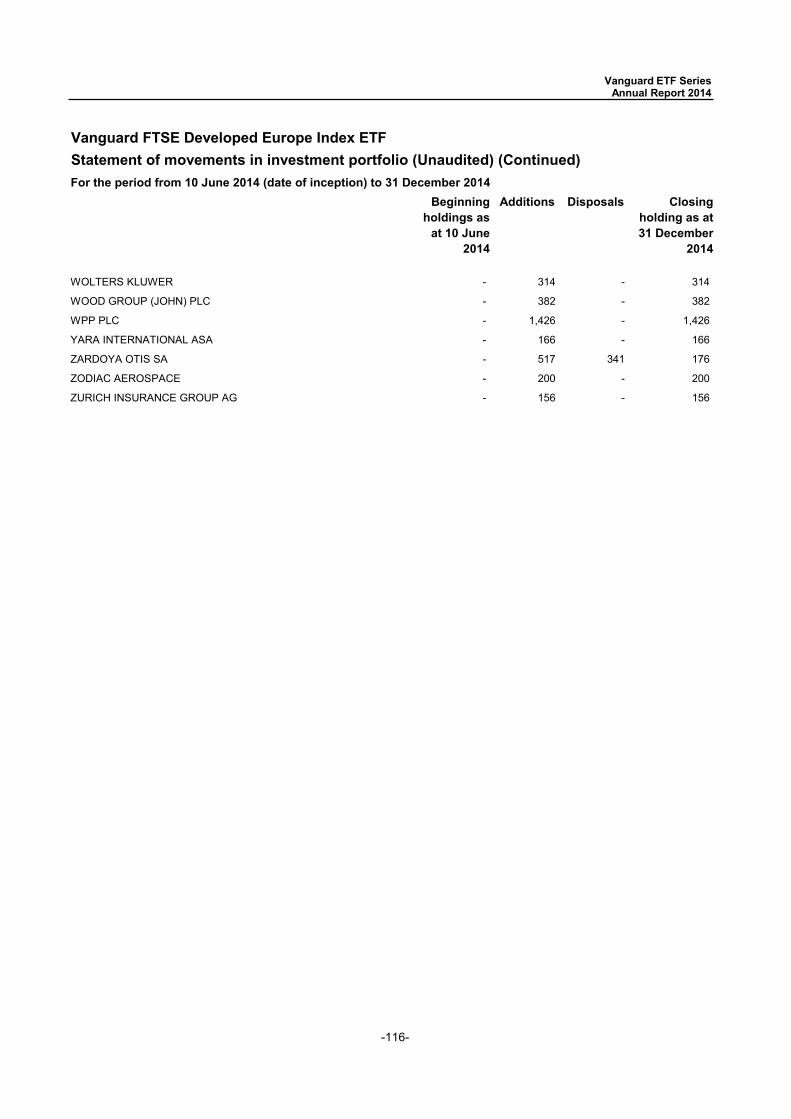
-116-
Vanguard FTSE Developed Europe Index ETFStatement of movements in investment portfolio (Unaudited) (Continued)
Beginning holdings as
at 10 June 2014
Additions Disposals Closing holding as at 31 December
2014
For the period from 10 June 2014 (date of inception) to 31 December 2014
Vanguard ETF Series Annual Report 2014
WOLTERS KLUWER - 314 - 314
WOOD GROUP (JOHN) PLC - 382 - 382
WPP PLC - 1,426 - 1,426
YARA INTERNATIONAL ASA - 166 - 166
ZARDOYA OTIS SA - 517 341 176
ZODIAC AEROSPACE - 200 - 200
ZURICH INSURANCE GROUP AG - 156 - 156
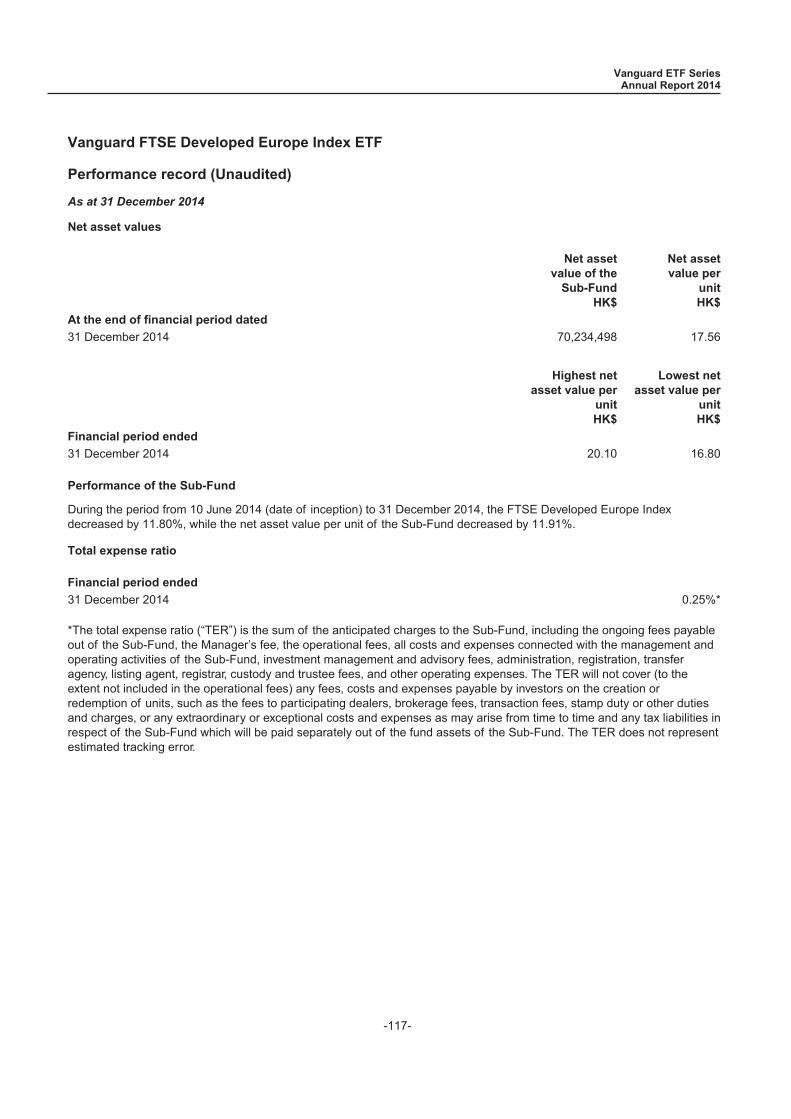
Vanguard FTSE Developed Europe Index ETF
Performance record (Unaudited)
As at 31 December 2014
Net asset values
Net assetvalue of the
Sub-FundHK$
Net assetvalue per
unitHK$
At the end of financial period dated
31 December 2014 70,234,498 17.56
Highest netasset value per
unitHK$
Lowest netasset value per
unitHK$
Financial period ended
31 December 2014 20.10 16.80
Performance of the Sub-Fund
During the period from 10 June 2014 (date of inception) to 31 December 2014, the FTSE Developed Europe Indexdecreased by 11.80%, while the net asset value per unit of the Sub-Fund decreased by 11.91%.
Total expense ratio
Financial period ended
31 December 2014 0.25%*
*The total expense ratio (“TER”) is the sum of the anticipated charges to the Sub-Fund, including the ongoing fees payableout of the Sub-Fund, the Manager’s fee, the operational fees, all costs and expenses connected with the management andoperating activities of the Sub-Fund, investment management and advisory fees, administration, registration, transferagency, listing agent, registrar, custody and trustee fees, and other operating expenses. The TER will not cover (to theextent not included in the operational fees) any fees, costs and expenses payable by investors on the creation orredemption of units, such as the fees to participating dealers, brokerage fees, transaction fees, stamp duty or other dutiesand charges, or any extraordinary or exceptional costs and expenses as may arise from time to time and any tax liabilities inrespect of the Sub-Fund which will be paid separately out of the fund assets of the Sub-Fund. The TER does not representestimated tracking error.
Vanguard ETF SeriesAnnual Report 2014
-117-
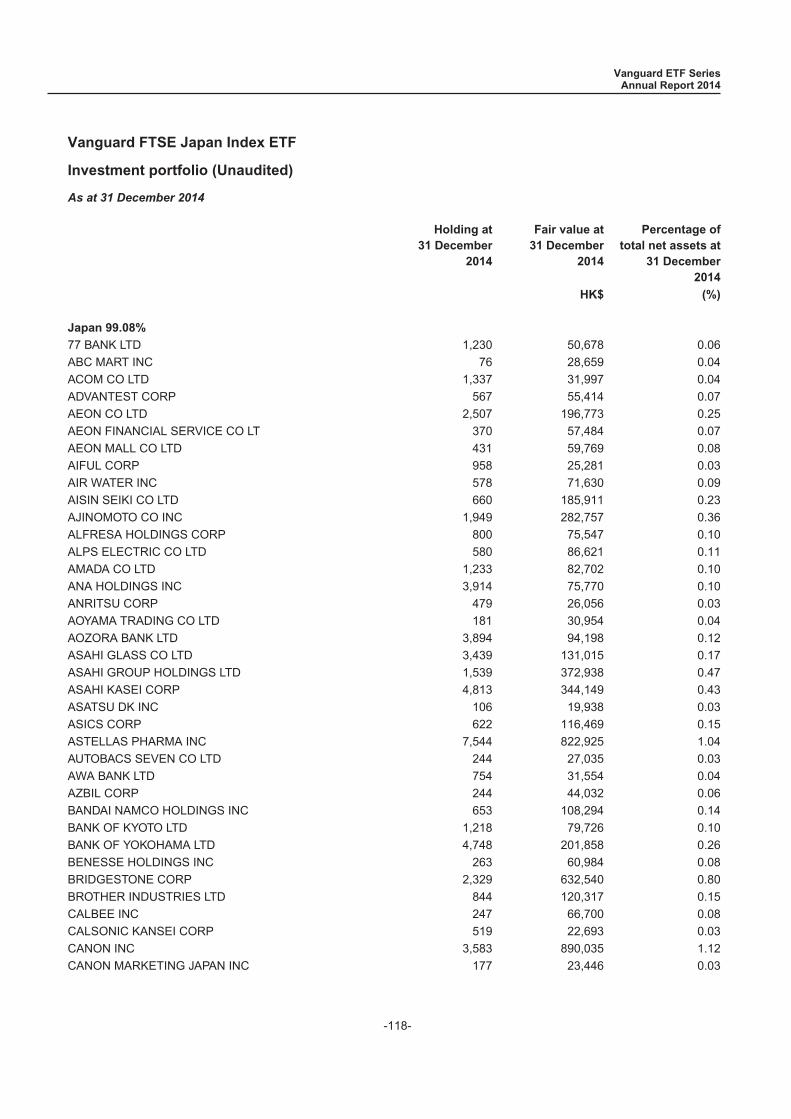
Vanguard FTSE Japan Index ETF
Investment portfolio (Unaudited)
As at 31 December 2014
Holding at31 December
2014
Fair value at31 December
2014
Percentage oftotal net assets at
31 December2014
HK$ (%)
Japan 99.08%
77 BANK LTD 1,230 50,678 0.06ABC MART INC 76 28,659 0.04ACOM CO LTD 1,337 31,997 0.04ADVANTEST CORP 567 55,414 0.07AEON CO LTD 2,507 196,773 0.25AEON FINANCIAL SERVICE CO LT 370 57,484 0.07AEON MALL CO LTD 431 59,769 0.08AIFUL CORP 958 25,281 0.03AIR WATER INC 578 71,630 0.09AISIN SEIKI CO LTD 660 185,911 0.23AJINOMOTO CO INC 1,949 282,757 0.36ALFRESA HOLDINGS CORP 800 75,547 0.10ALPS ELECTRIC CO LTD 580 86,621 0.11AMADA CO LTD 1,233 82,702 0.10ANA HOLDINGS INC 3,914 75,770 0.10ANRITSU CORP 479 26,056 0.03AOYAMA TRADING CO LTD 181 30,954 0.04AOZORA BANK LTD 3,894 94,198 0.12ASAHI GLASS CO LTD 3,439 131,015 0.17ASAHI GROUP HOLDINGS LTD 1,539 372,938 0.47ASAHI KASEI CORP 4,813 344,149 0.43ASATSU DK INC 106 19,938 0.03ASICS CORP 622 116,469 0.15ASTELLAS PHARMA INC 7,544 822,925 1.04AUTOBACS SEVEN CO LTD 244 27,035 0.03AWA BANK LTD 754 31,554 0.04AZBIL CORP 244 44,032 0.06BANDAI NAMCO HOLDINGS INC 653 108,294 0.14BANK OF KYOTO LTD 1,218 79,726 0.10BANK OF YOKOHAMA LTD 4,748 201,858 0.26BENESSE HOLDINGS INC 263 60,984 0.08BRIDGESTONE CORP 2,329 632,540 0.80BROTHER INDUSTRIES LTD 844 120,317 0.15CALBEE INC 247 66,700 0.08CALSONIC KANSEI CORP 519 22,693 0.03CANON INC 3,583 890,035 1.12CANON MARKETING JAPAN INC 177 23,446 0.03
Vanguard ETF SeriesAnnual Report 2014
-118-
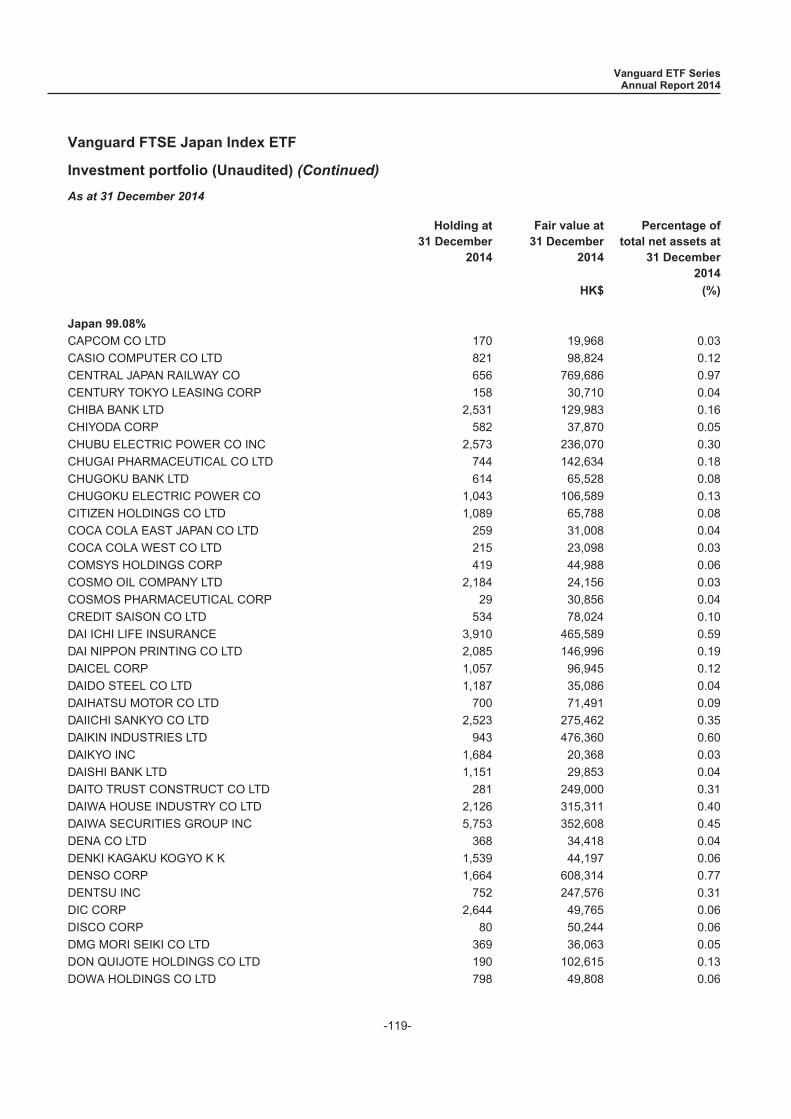
Vanguard FTSE Japan Index ETF
Investment portfolio (Unaudited) (Continued)
As at 31 December 2014
Holding at31 December
2014
Fair value at31 December
2014
Percentage oftotal net assets at
31 December2014
HK$ (%)
Japan 99.08%
CAPCOM CO LTD 170 19,968 0.03CASIO COMPUTER CO LTD 821 98,824 0.12CENTRAL JAPAN RAILWAY CO 656 769,686 0.97CENTURY TOKYO LEASING CORP 158 30,710 0.04CHIBA BANK LTD 2,531 129,983 0.16CHIYODA CORP 582 37,870 0.05CHUBU ELECTRIC POWER CO INC 2,573 236,070 0.30CHUGAI PHARMACEUTICAL CO LTD 744 142,634 0.18CHUGOKU BANK LTD 614 65,528 0.08CHUGOKU ELECTRIC POWER CO 1,043 106,589 0.13CITIZEN HOLDINGS CO LTD 1,089 65,788 0.08COCA COLA EAST JAPAN CO LTD 259 31,008 0.04COCA COLA WEST CO LTD 215 23,098 0.03COMSYS HOLDINGS CORP 419 44,988 0.06COSMO OIL COMPANY LTD 2,184 24,156 0.03COSMOS PHARMACEUTICAL CORP 29 30,856 0.04CREDIT SAISON CO LTD 534 78,024 0.10DAI ICHI LIFE INSURANCE 3,910 465,589 0.59DAI NIPPON PRINTING CO LTD 2,085 146,996 0.19DAICEL CORP 1,057 96,945 0.12DAIDO STEEL CO LTD 1,187 35,086 0.04DAIHATSU MOTOR CO LTD 700 71,491 0.09DAIICHI SANKYO CO LTD 2,523 275,462 0.35DAIKIN INDUSTRIES LTD 943 476,360 0.60DAIKYO INC 1,684 20,368 0.03DAISHI BANK LTD 1,151 29,853 0.04DAITO TRUST CONSTRUCT CO LTD 281 249,000 0.31DAIWA HOUSE INDUSTRY CO LTD 2,126 315,311 0.40DAIWA SECURITIES GROUP INC 5,753 352,608 0.45DENA CO LTD 368 34,418 0.04DENKI KAGAKU KOGYO K K 1,539 44,197 0.06DENSO CORP 1,664 608,314 0.77DENTSU INC 752 247,576 0.31DIC CORP 2,644 49,765 0.06DISCO CORP 80 50,244 0.06DMG MORI SEIKI CO LTD 369 36,063 0.05DON QUIJOTE HOLDINGS CO LTD 190 102,615 0.13DOWA HOLDINGS CO LTD 798 49,808 0.06
Vanguard ETF SeriesAnnual Report 2014
-119-
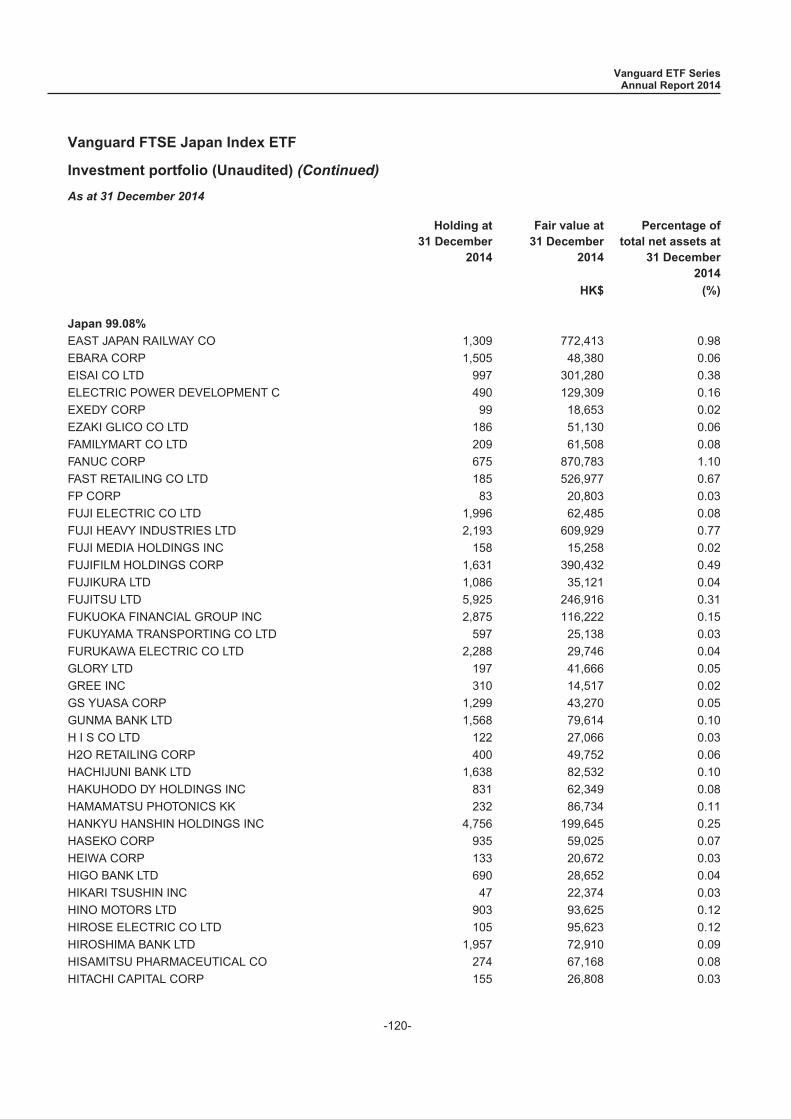
Vanguard FTSE Japan Index ETF
Investment portfolio (Unaudited) (Continued)
As at 31 December 2014
Holding at31 December
2014
Fair value at31 December
2014
Percentage oftotal net assets at
31 December2014
HK$ (%)
Japan 99.08%
EAST JAPAN RAILWAY CO 1,309 772,413 0.98EBARA CORP 1,505 48,380 0.06EISAI CO LTD 997 301,280 0.38ELECTRIC POWER DEVELOPMENT C 490 129,309 0.16EXEDY CORP 99 18,653 0.02EZAKI GLICO CO LTD 186 51,130 0.06FAMILYMART CO LTD 209 61,508 0.08FANUC CORP 675 870,783 1.10FAST RETAILING CO LTD 185 526,977 0.67FP CORP 83 20,803 0.03FUJI ELECTRIC CO LTD 1,996 62,485 0.08FUJI HEAVY INDUSTRIES LTD 2,193 609,929 0.77FUJI MEDIA HOLDINGS INC 158 15,258 0.02FUJIFILM HOLDINGS CORP 1,631 390,432 0.49FUJIKURA LTD 1,086 35,121 0.04FUJITSU LTD 5,925 246,916 0.31FUKUOKA FINANCIAL GROUP INC 2,875 116,222 0.15FUKUYAMA TRANSPORTING CO LTD 597 25,138 0.03FURUKAWA ELECTRIC CO LTD 2,288 29,746 0.04GLORY LTD 197 41,666 0.05GREE INC 310 14,517 0.02GS YUASA CORP 1,299 43,270 0.05GUNMA BANK LTD 1,568 79,614 0.10H I S CO LTD 122 27,066 0.03H2O RETAILING CORP 400 49,752 0.06HACHIJUNI BANK LTD 1,638 82,532 0.10HAKUHODO DY HOLDINGS INC 831 62,349 0.08HAMAMATSU PHOTONICS KK 232 86,734 0.11HANKYU HANSHIN HOLDINGS INC 4,756 199,645 0.25HASEKO CORP 935 59,025 0.07HEIWA CORP 133 20,672 0.03HIGO BANK LTD 690 28,652 0.04HIKARI TSUSHIN INC 47 22,374 0.03HINO MOTORS LTD 903 93,625 0.12HIROSE ELECTRIC CO LTD 105 95,623 0.12HIROSHIMA BANK LTD 1,957 72,910 0.09HISAMITSU PHARMACEUTICAL CO 274 67,168 0.08HITACHI CAPITAL CORP 155 26,808 0.03
Vanguard ETF SeriesAnnual Report 2014
-120-
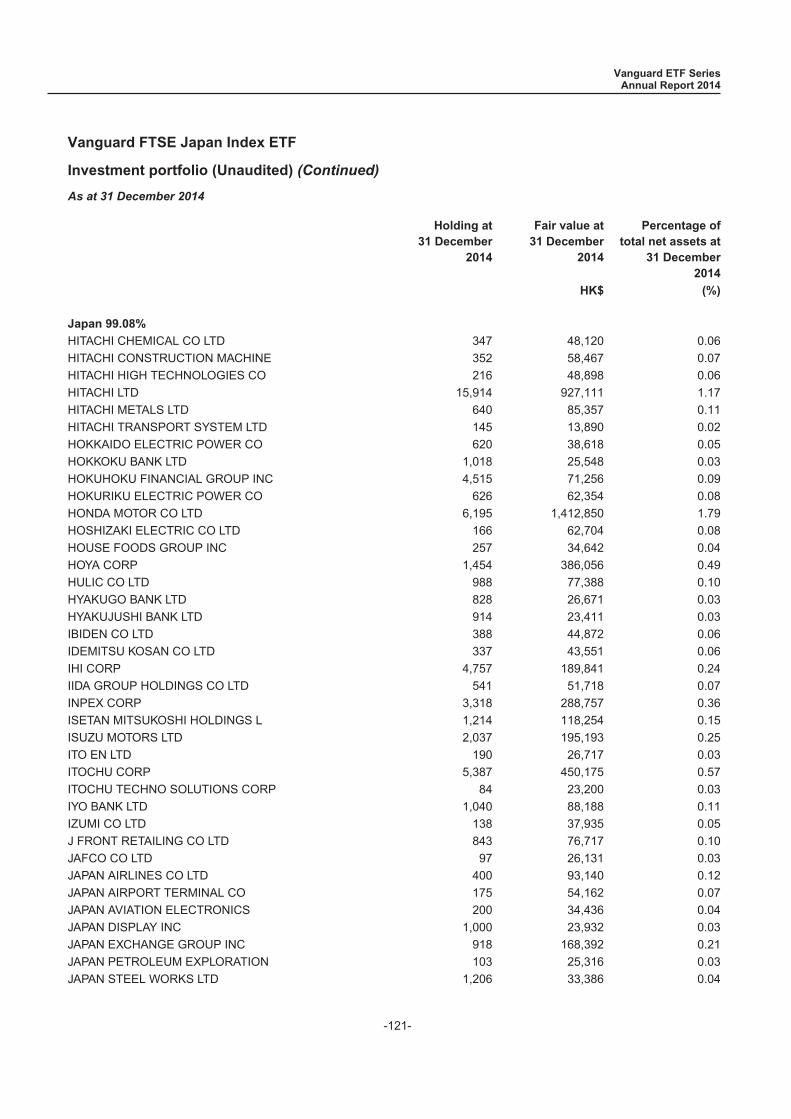
Vanguard FTSE Japan Index ETF
Investment portfolio (Unaudited) (Continued)
As at 31 December 2014
Holding at31 December
2014
Fair value at31 December
2014
Percentage oftotal net assets at
31 December2014
HK$ (%)
Japan 99.08%
HITACHI CHEMICAL CO LTD 347 48,120 0.06HITACHI CONSTRUCTION MACHINE 352 58,467 0.07HITACHI HIGH TECHNOLOGIES CO 216 48,898 0.06HITACHI LTD 15,914 927,111 1.17HITACHI METALS LTD 640 85,357 0.11HITACHI TRANSPORT SYSTEM LTD 145 13,890 0.02HOKKAIDO ELECTRIC POWER CO 620 38,618 0.05HOKKOKU BANK LTD 1,018 25,548 0.03HOKUHOKU FINANCIAL GROUP INC 4,515 71,256 0.09HOKURIKU ELECTRIC POWER CO 626 62,354 0.08HONDA MOTOR CO LTD 6,195 1,412,850 1.79HOSHIZAKI ELECTRIC CO LTD 166 62,704 0.08HOUSE FOODS GROUP INC 257 34,642 0.04HOYA CORP 1,454 386,056 0.49HULIC CO LTD 988 77,388 0.10HYAKUGO BANK LTD 828 26,671 0.03HYAKUJUSHI BANK LTD 914 23,411 0.03IBIDEN CO LTD 388 44,872 0.06IDEMITSU KOSAN CO LTD 337 43,551 0.06IHI CORP 4,757 189,841 0.24IIDA GROUP HOLDINGS CO LTD 541 51,718 0.07INPEX CORP 3,318 288,757 0.36ISETAN MITSUKOSHI HOLDINGS L 1,214 118,254 0.15ISUZU MOTORS LTD 2,037 195,193 0.25ITO EN LTD 190 26,717 0.03ITOCHU CORP 5,387 450,175 0.57ITOCHU TECHNO SOLUTIONS CORP 84 23,200 0.03IYO BANK LTD 1,040 88,188 0.11IZUMI CO LTD 138 37,935 0.05J FRONT RETAILING CO LTD 843 76,717 0.10JAFCO CO LTD 97 26,131 0.03JAPAN AIRLINES CO LTD 400 93,140 0.12JAPAN AIRPORT TERMINAL CO 175 54,162 0.07JAPAN AVIATION ELECTRONICS 200 34,436 0.04JAPAN DISPLAY INC 1,000 23,932 0.03JAPAN EXCHANGE GROUP INC 918 168,392 0.21JAPAN PETROLEUM EXPLORATION 103 25,316 0.03JAPAN STEEL WORKS LTD 1,206 33,386 0.04
Vanguard ETF SeriesAnnual Report 2014
-121-
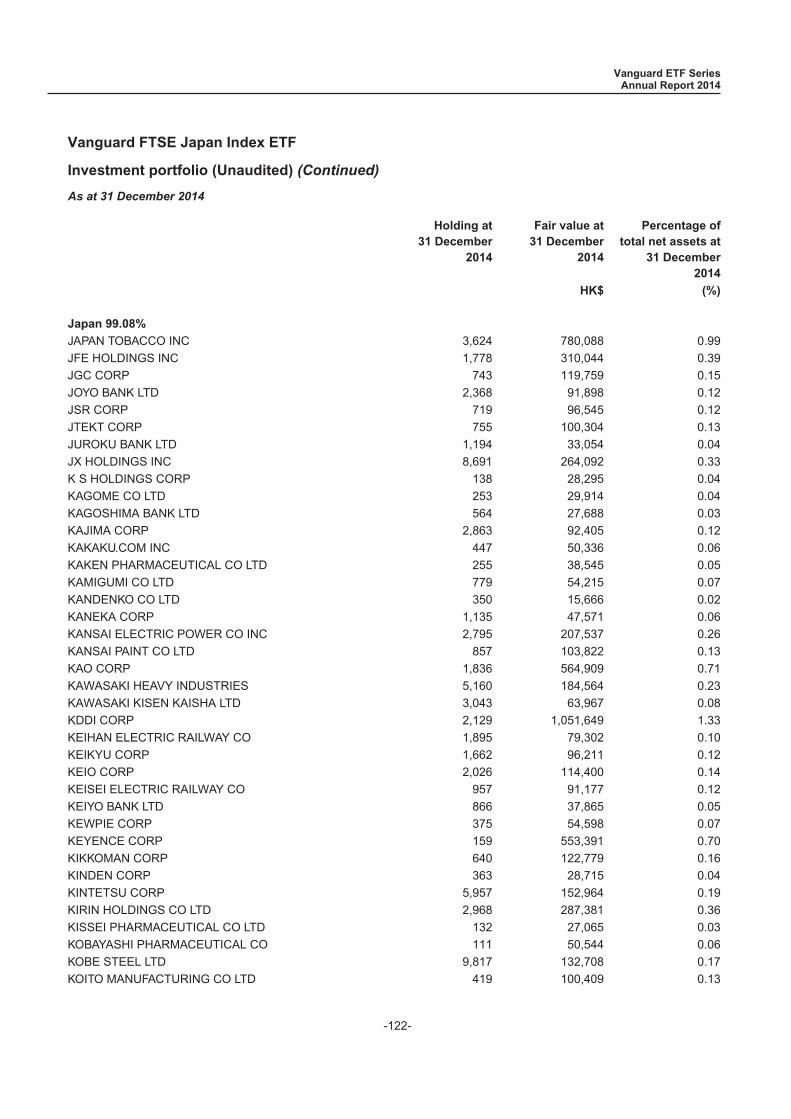
Vanguard FTSE Japan Index ETF
Investment portfolio (Unaudited) (Continued)
As at 31 December 2014
Holding at31 December
2014
Fair value at31 December
2014
Percentage oftotal net assets at
31 December2014
HK$ (%)
Japan 99.08%
JAPAN TOBACCO INC 3,624 780,088 0.99JFE HOLDINGS INC 1,778 310,044 0.39JGC CORP 743 119,759 0.15JOYO BANK LTD 2,368 91,898 0.12JSR CORP 719 96,545 0.12JTEKT CORP 755 100,304 0.13JUROKU BANK LTD 1,194 33,054 0.04JX HOLDINGS INC 8,691 264,092 0.33K S HOLDINGS CORP 138 28,295 0.04KAGOME CO LTD 253 29,914 0.04KAGOSHIMA BANK LTD 564 27,688 0.03KAJIMA CORP 2,863 92,405 0.12KAKAKU.COM INC 447 50,336 0.06KAKEN PHARMACEUTICAL CO LTD 255 38,545 0.05KAMIGUMI CO LTD 779 54,215 0.07KANDENKO CO LTD 350 15,666 0.02KANEKA CORP 1,135 47,571 0.06KANSAI ELECTRIC POWER CO INC 2,795 207,537 0.26KANSAI PAINT CO LTD 857 103,822 0.13KAO CORP 1,836 564,909 0.71KAWASAKI HEAVY INDUSTRIES 5,160 184,564 0.23KAWASAKI KISEN KAISHA LTD 3,043 63,967 0.08KDDI CORP 2,129 1,051,649 1.33KEIHAN ELECTRIC RAILWAY CO 1,895 79,302 0.10KEIKYU CORP 1,662 96,211 0.12KEIO CORP 2,026 114,400 0.14KEISEI ELECTRIC RAILWAY CO 957 91,177 0.12KEIYO BANK LTD 866 37,865 0.05KEWPIE CORP 375 54,598 0.07KEYENCE CORP 159 553,391 0.70KIKKOMAN CORP 640 122,779 0.16KINDEN CORP 363 28,715 0.04KINTETSU CORP 5,957 152,964 0.19KIRIN HOLDINGS CO LTD 2,968 287,381 0.36KISSEI PHARMACEUTICAL CO LTD 132 27,065 0.03KOBAYASHI PHARMACEUTICAL CO 111 50,544 0.06KOBE STEEL LTD 9,817 132,708 0.17KOITO MANUFACTURING CO LTD 419 100,409 0.13
Vanguard ETF SeriesAnnual Report 2014
-122-
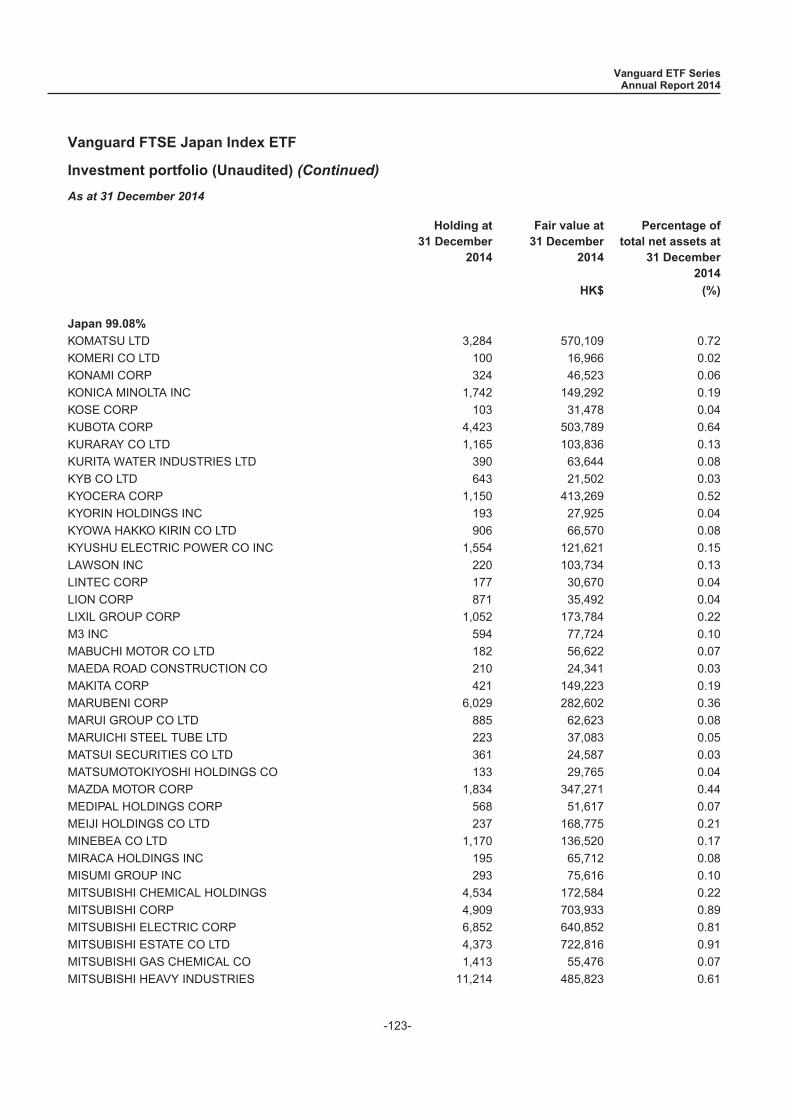
Vanguard FTSE Japan Index ETF
Investment portfolio (Unaudited) (Continued)
As at 31 December 2014
Holding at31 December
2014
Fair value at31 December
2014
Percentage oftotal net assets at
31 December2014
HK$ (%)
Japan 99.08%
KOMATSU LTD 3,284 570,109 0.72KOMERI CO LTD 100 16,966 0.02KONAMI CORP 324 46,523 0.06KONICA MINOLTA INC 1,742 149,292 0.19KOSE CORP 103 31,478 0.04KUBOTA CORP 4,423 503,789 0.64KURARAY CO LTD 1,165 103,836 0.13KURITA WATER INDUSTRIES LTD 390 63,644 0.08KYB CO LTD 643 21,502 0.03KYOCERA CORP 1,150 413,269 0.52KYORIN HOLDINGS INC 193 27,925 0.04KYOWA HAKKO KIRIN CO LTD 906 66,570 0.08KYUSHU ELECTRIC POWER CO INC 1,554 121,621 0.15LAWSON INC 220 103,734 0.13LINTEC CORP 177 30,670 0.04LION CORP 871 35,492 0.04LIXIL GROUP CORP 1,052 173,784 0.22M3 INC 594 77,724 0.10MABUCHI MOTOR CO LTD 182 56,622 0.07MAEDA ROAD CONSTRUCTION CO 210 24,341 0.03MAKITA CORP 421 149,223 0.19MARUBENI CORP 6,029 282,602 0.36MARUI GROUP CO LTD 885 62,623 0.08MARUICHI STEEL TUBE LTD 223 37,083 0.05MATSUI SECURITIES CO LTD 361 24,587 0.03MATSUMOTOKIYOSHI HOLDINGS CO 133 29,765 0.04MAZDA MOTOR CORP 1,834 347,271 0.44MEDIPAL HOLDINGS CORP 568 51,617 0.07MEIJI HOLDINGS CO LTD 237 168,775 0.21MINEBEA CO LTD 1,170 136,520 0.17MIRACA HOLDINGS INC 195 65,712 0.08MISUMI GROUP INC 293 75,616 0.10MITSUBISHI CHEMICAL HOLDINGS 4,534 172,584 0.22MITSUBISHI CORP 4,909 703,933 0.89MITSUBISHI ELECTRIC CORP 6,852 640,852 0.81MITSUBISHI ESTATE CO LTD 4,373 722,816 0.91MITSUBISHI GAS CHEMICAL CO 1,413 55,476 0.07MITSUBISHI HEAVY INDUSTRIES 11,214 485,823 0.61
Vanguard ETF SeriesAnnual Report 2014
-123-
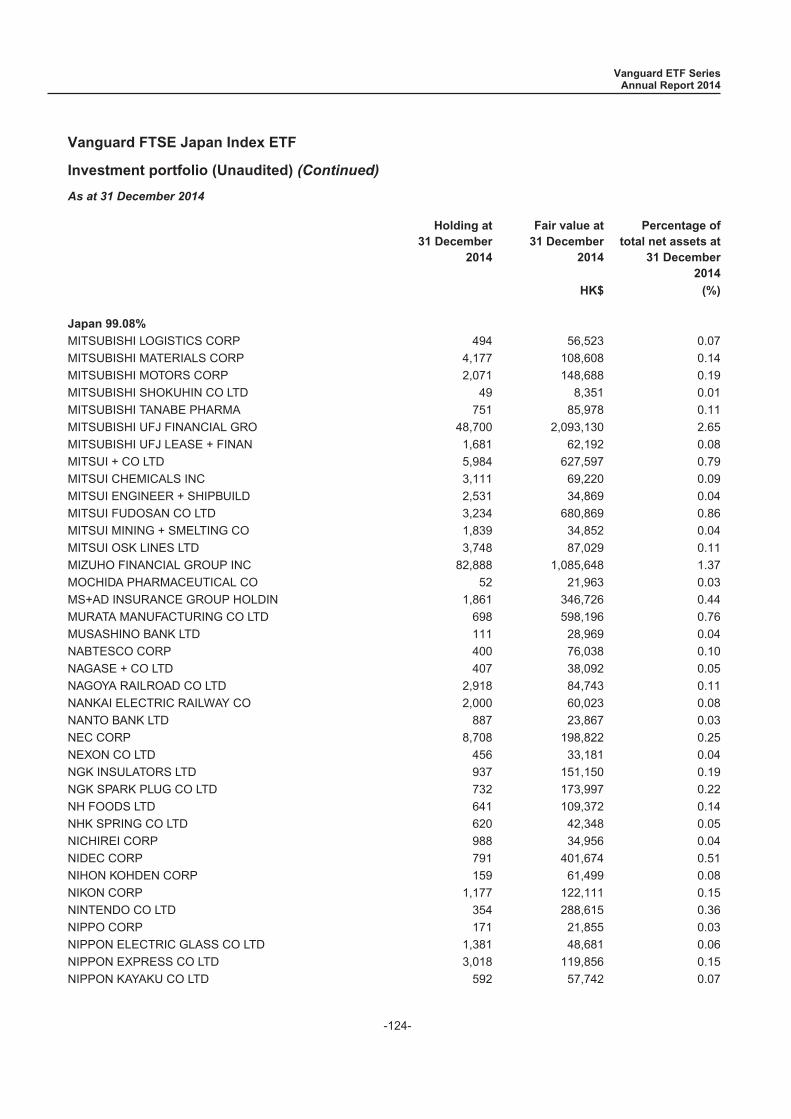
Vanguard FTSE Japan Index ETF
Investment portfolio (Unaudited) (Continued)
As at 31 December 2014
Holding at31 December
2014
Fair value at31 December
2014
Percentage oftotal net assets at
31 December2014
HK$ (%)
Japan 99.08%
MITSUBISHI LOGISTICS CORP 494 56,523 0.07MITSUBISHI MATERIALS CORP 4,177 108,608 0.14MITSUBISHI MOTORS CORP 2,071 148,688 0.19MITSUBISHI SHOKUHIN CO LTD 49 8,351 0.01MITSUBISHI TANABE PHARMA 751 85,978 0.11MITSUBISHI UFJ FINANCIAL GRO 48,700 2,093,130 2.65MITSUBISHI UFJ LEASE + FINAN 1,681 62,192 0.08MITSUI + CO LTD 5,984 627,597 0.79MITSUI CHEMICALS INC 3,111 69,220 0.09MITSUI ENGINEER + SHIPBUILD 2,531 34,869 0.04MITSUI FUDOSAN CO LTD 3,234 680,869 0.86MITSUI MINING + SMELTING CO 1,839 34,852 0.04MITSUI OSK LINES LTD 3,748 87,029 0.11MIZUHO FINANCIAL GROUP INC 82,888 1,085,648 1.37MOCHIDA PHARMACEUTICAL CO 52 21,963 0.03MS+AD INSURANCE GROUP HOLDIN 1,861 346,726 0.44MURATA MANUFACTURING CO LTD 698 598,196 0.76MUSASHINO BANK LTD 111 28,969 0.04NABTESCO CORP 400 76,038 0.10NAGASE + CO LTD 407 38,092 0.05NAGOYA RAILROAD CO LTD 2,918 84,743 0.11NANKAI ELECTRIC RAILWAY CO 2,000 60,023 0.08NANTO BANK LTD 887 23,867 0.03NEC CORP 8,708 198,822 0.25NEXON CO LTD 456 33,181 0.04NGK INSULATORS LTD 937 151,150 0.19NGK SPARK PLUG CO LTD 732 173,997 0.22NH FOODS LTD 641 109,372 0.14NHK SPRING CO LTD 620 42,348 0.05NICHIREI CORP 988 34,956 0.04NIDEC CORP 791 401,674 0.51NIHON KOHDEN CORP 159 61,499 0.08NIKON CORP 1,177 122,111 0.15NINTENDO CO LTD 354 288,615 0.36NIPPO CORP 171 21,855 0.03NIPPON ELECTRIC GLASS CO LTD 1,381 48,681 0.06NIPPON EXPRESS CO LTD 3,018 119,856 0.15NIPPON KAYAKU CO LTD 592 57,742 0.07
Vanguard ETF SeriesAnnual Report 2014
-124-
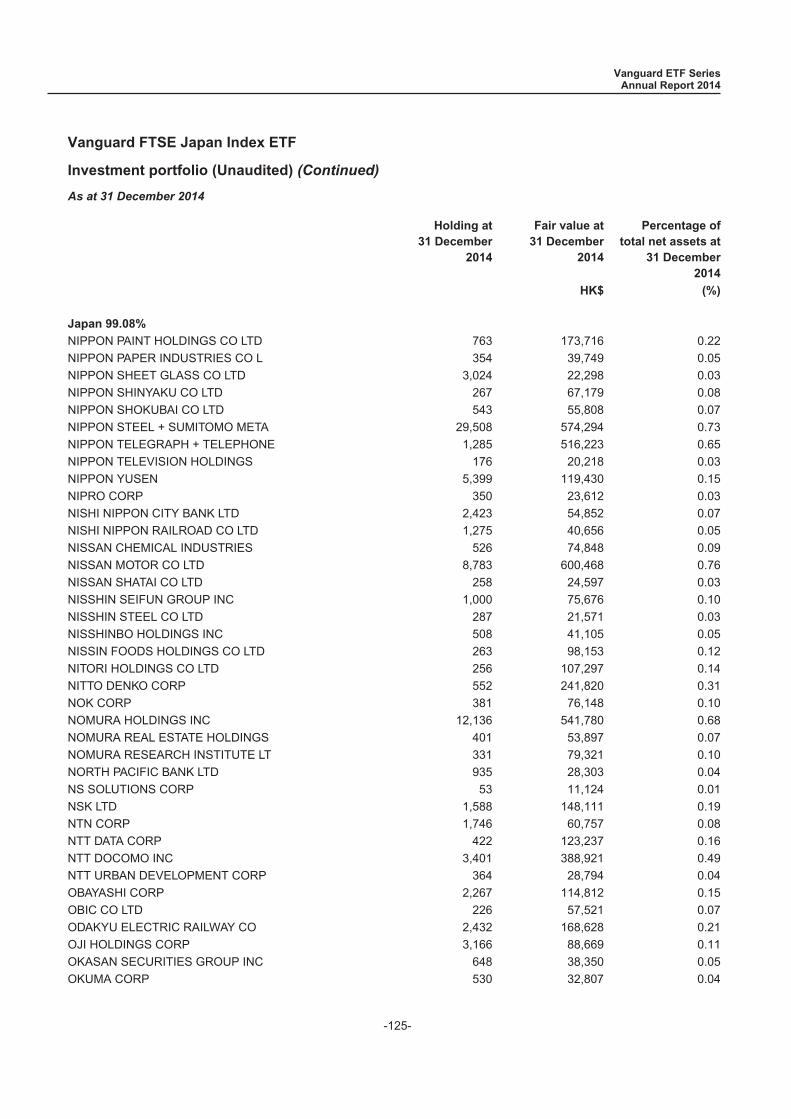
Vanguard FTSE Japan Index ETF
Investment portfolio (Unaudited) (Continued)
As at 31 December 2014
Holding at31 December
2014
Fair value at31 December
2014
Percentage oftotal net assets at
31 December2014
HK$ (%)
Japan 99.08%
NIPPON PAINT HOLDINGS CO LTD 763 173,716 0.22NIPPON PAPER INDUSTRIES CO L 354 39,749 0.05NIPPON SHEET GLASS CO LTD 3,024 22,298 0.03NIPPON SHINYAKU CO LTD 267 67,179 0.08NIPPON SHOKUBAI CO LTD 543 55,808 0.07NIPPON STEEL + SUMITOMO META 29,508 574,294 0.73NIPPON TELEGRAPH + TELEPHONE 1,285 516,223 0.65NIPPON TELEVISION HOLDINGS 176 20,218 0.03NIPPON YUSEN 5,399 119,430 0.15NIPRO CORP 350 23,612 0.03NISHI NIPPON CITY BANK LTD 2,423 54,852 0.07NISHI NIPPON RAILROAD CO LTD 1,275 40,656 0.05NISSAN CHEMICAL INDUSTRIES 526 74,848 0.09NISSAN MOTOR CO LTD 8,783 600,468 0.76NISSAN SHATAI CO LTD 258 24,597 0.03NISSHIN SEIFUN GROUP INC 1,000 75,676 0.10NISSHIN STEEL CO LTD 287 21,571 0.03NISSHINBO HOLDINGS INC 508 41,105 0.05NISSIN FOODS HOLDINGS CO LTD 263 98,153 0.12NITORI HOLDINGS CO LTD 256 107,297 0.14NITTO DENKO CORP 552 241,820 0.31NOK CORP 381 76,148 0.10NOMURA HOLDINGS INC 12,136 541,780 0.68NOMURA REAL ESTATE HOLDINGS 401 53,897 0.07NOMURA RESEARCH INSTITUTE LT 331 79,321 0.10NORTH PACIFIC BANK LTD 935 28,303 0.04NS SOLUTIONS CORP 53 11,124 0.01NSK LTD 1,588 148,111 0.19NTN CORP 1,746 60,757 0.08NTT DATA CORP 422 123,237 0.16NTT DOCOMO INC 3,401 388,921 0.49NTT URBAN DEVELOPMENT CORP 364 28,794 0.04OBAYASHI CORP 2,267 114,812 0.15OBIC CO LTD 226 57,521 0.07ODAKYU ELECTRIC RAILWAY CO 2,432 168,628 0.21OJI HOLDINGS CORP 3,166 88,669 0.11OKASAN SECURITIES GROUP INC 648 38,350 0.05OKUMA CORP 530 32,807 0.04
Vanguard ETF SeriesAnnual Report 2014
-125-
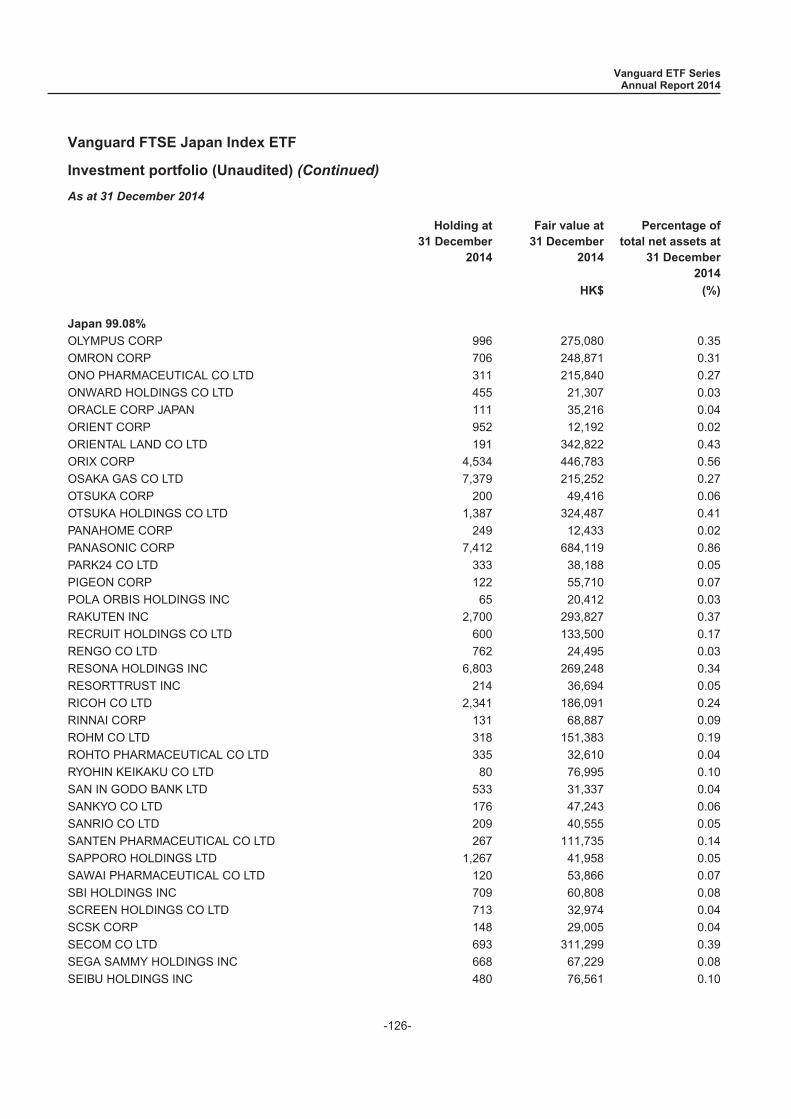
Vanguard FTSE Japan Index ETF
Investment portfolio (Unaudited) (Continued)
As at 31 December 2014
Holding at31 December
2014
Fair value at31 December
2014
Percentage oftotal net assets at
31 December2014
HK$ (%)
Japan 99.08%
OLYMPUS CORP 996 275,080 0.35OMRON CORP 706 248,871 0.31ONO PHARMACEUTICAL CO LTD 311 215,840 0.27ONWARD HOLDINGS CO LTD 455 21,307 0.03ORACLE CORP JAPAN 111 35,216 0.04ORIENT CORP 952 12,192 0.02ORIENTAL LAND CO LTD 191 342,822 0.43ORIX CORP 4,534 446,783 0.56OSAKA GAS CO LTD 7,379 215,252 0.27OTSUKA CORP 200 49,416 0.06OTSUKA HOLDINGS CO LTD 1,387 324,487 0.41PANAHOME CORP 249 12,433 0.02PANASONIC CORP 7,412 684,119 0.86PARK24 CO LTD 333 38,188 0.05PIGEON CORP 122 55,710 0.07POLA ORBIS HOLDINGS INC 65 20,412 0.03RAKUTEN INC 2,700 293,827 0.37RECRUIT HOLDINGS CO LTD 600 133,500 0.17RENGO CO LTD 762 24,495 0.03RESONA HOLDINGS INC 6,803 269,248 0.34RESORTTRUST INC 214 36,694 0.05RICOH CO LTD 2,341 186,091 0.24RINNAI CORP 131 68,887 0.09ROHM CO LTD 318 151,383 0.19ROHTO PHARMACEUTICAL CO LTD 335 32,610 0.04RYOHIN KEIKAKU CO LTD 80 76,995 0.10SAN IN GODO BANK LTD 533 31,337 0.04SANKYO CO LTD 176 47,243 0.06SANRIO CO LTD 209 40,555 0.05SANTEN PHARMACEUTICAL CO LTD 267 111,735 0.14SAPPORO HOLDINGS LTD 1,267 41,958 0.05SAWAI PHARMACEUTICAL CO LTD 120 53,866 0.07SBI HOLDINGS INC 709 60,808 0.08SCREEN HOLDINGS CO LTD 713 32,974 0.04SCSK CORP 148 29,005 0.04SECOM CO LTD 693 311,299 0.39SEGA SAMMY HOLDINGS INC 668 67,229 0.08SEIBU HOLDINGS INC 480 76,561 0.10
Vanguard ETF SeriesAnnual Report 2014
-126-

Vanguard FTSE Japan Index ETF
Investment portfolio (Unaudited) (Continued)
As at 31 December 2014
Holding at31 December
2014
Fair value at31 December
2014
Percentage oftotal net assets at
31 December2014
HK$ (%)
Japan 99.08%
SEIKO EPSON CORP 468 154,076 0.19SEINO HOLDINGS CO LTD 521 41,045 0.05SEKISUI CHEMICAL CO LTD 1,430 134,577 0.17SEKISUI HOUSE LTD 2,100 215,560 0.27SENSHU IKEDA HOLDINGS INC 765 27,115 0.03SEVEN + I HOLDINGS CO LTD 2,687 757,490 0.96SEVEN BANK LTD 2,190 71,958 0.09SHARP CORP 5,985 103,746 0.13SHIGA BANK LTD 862 35,962 0.05SHIKOKU ELECTRIC POWER CO 517 48,989 0.06SHIMACHU CO LTD 172 32,596 0.04SHIMADZU CORP 990 78,889 0.10SHIMAMURA CO LTD 90 60,541 0.08SHIMANO INC 263 266,221 0.34SHIMIZU CORP 2,188 116,471 0.15SHIN ETSU CHEMICAL CO LTD 1,426 725,514 0.92SHINKO ELECTRIC INDUSTRIES 226 12,060 0.02SHINSEI BANK LTD 5,980 81,612 0.10SHIONOGI + CO LTD 1,168 236,083 0.30SHISEIDO CO LTD 1,310 143,450 0.18SHIZUOKA BANK LTD 2,113 151,293 0.19SHOCHIKU CO LTD 384 29,060 0.04SHOWA DENKO K K 5,007 48,254 0.06SHOWA SHELL SEKIYU KK 642 49,456 0.06SKY PERFECT JSAT HOLDINGS 691 31,956 0.04SMC CORP 219 452,855 0.57SOFTBANK CORP 3,232 1,507,228 1.90SOHGO SECURITY SERVICES CO 227 42,961 0.05SOJITZ CORP 4,178 45,670 0.06SOMPO JAPAN NIPPONKOA HOLDIN 1,392 274,697 0.35SONY CORP 4,004 640,328 0.81SONY FINANCIAL HOLDINGS INC 582 67,082 0.08SOTETSU HOLDINGS INC 1,481 47,704 0.06SQUARE ENIX HOLDINGS CO LTD 250 40,555 0.05STANLEY ELECTRIC CO LTD 515 87,273 0.11START TODAY CO LTD 165 26,979 0.03SUGI HOLDINGS CO LTD 150 47,783 0.06SUMCO CORP 345 39,028 0.05
Vanguard ETF SeriesAnnual Report 2014
-127-
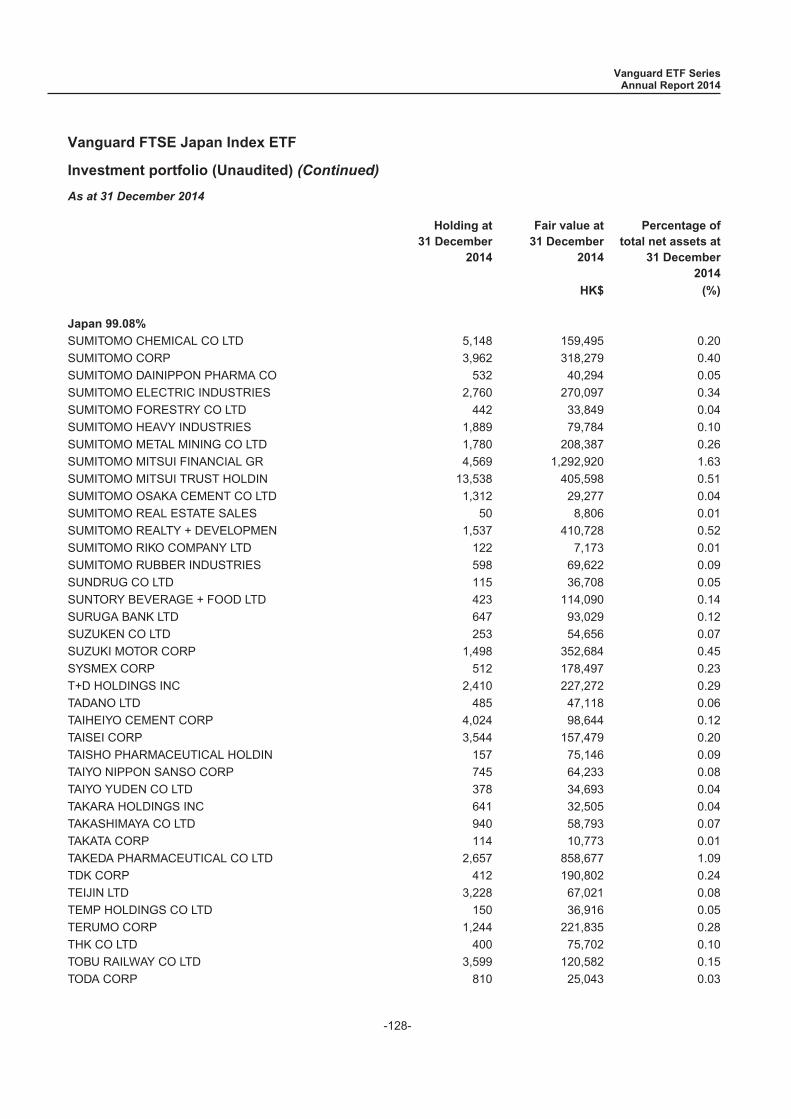
Vanguard FTSE Japan Index ETF
Investment portfolio (Unaudited) (Continued)
As at 31 December 2014
Holding at31 December
2014
Fair value at31 December
2014
Percentage oftotal net assets at
31 December2014
HK$ (%)
Japan 99.08%
SUMITOMO CHEMICAL CO LTD 5,148 159,495 0.20SUMITOMO CORP 3,962 318,279 0.40SUMITOMO DAINIPPON PHARMA CO 532 40,294 0.05SUMITOMO ELECTRIC INDUSTRIES 2,760 270,097 0.34SUMITOMO FORESTRY CO LTD 442 33,849 0.04SUMITOMO HEAVY INDUSTRIES 1,889 79,784 0.10SUMITOMO METAL MINING CO LTD 1,780 208,387 0.26SUMITOMO MITSUI FINANCIAL GR 4,569 1,292,920 1.63SUMITOMO MITSUI TRUST HOLDIN 13,538 405,598 0.51SUMITOMO OSAKA CEMENT CO LTD 1,312 29,277 0.04SUMITOMO REAL ESTATE SALES 50 8,806 0.01SUMITOMO REALTY + DEVELOPMEN 1,537 410,728 0.52SUMITOMO RIKO COMPANY LTD 122 7,173 0.01SUMITOMO RUBBER INDUSTRIES 598 69,622 0.09SUNDRUG CO LTD 115 36,708 0.05SUNTORY BEVERAGE + FOOD LTD 423 114,090 0.14SURUGA BANK LTD 647 93,029 0.12SUZUKEN CO LTD 253 54,656 0.07SUZUKI MOTOR CORP 1,498 352,684 0.45SYSMEX CORP 512 178,497 0.23T+D HOLDINGS INC 2,410 227,272 0.29TADANO LTD 485 47,118 0.06TAIHEIYO CEMENT CORP 4,024 98,644 0.12TAISEI CORP 3,544 157,479 0.20TAISHO PHARMACEUTICAL HOLDIN 157 75,146 0.09TAIYO NIPPON SANSO CORP 745 64,233 0.08TAIYO YUDEN CO LTD 378 34,693 0.04TAKARA HOLDINGS INC 641 32,505 0.04TAKASHIMAYA CO LTD 940 58,793 0.07TAKATA CORP 114 10,773 0.01TAKEDA PHARMACEUTICAL CO LTD 2,657 858,677 1.09TDK CORP 412 190,802 0.24TEIJIN LTD 3,228 67,021 0.08TEMP HOLDINGS CO LTD 150 36,916 0.05TERUMO CORP 1,244 221,835 0.28THK CO LTD 400 75,702 0.10TOBU RAILWAY CO LTD 3,599 120,582 0.15TODA CORP 810 25,043 0.03
Vanguard ETF SeriesAnnual Report 2014
-128-
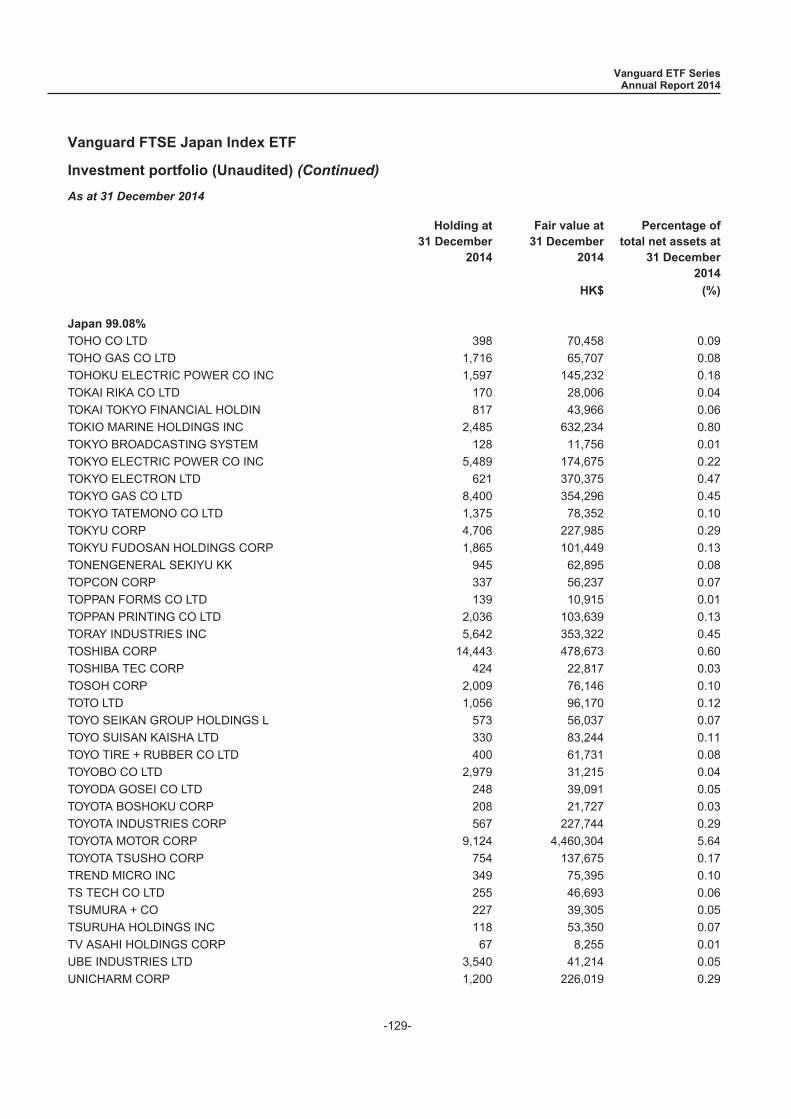
Vanguard FTSE Japan Index ETF
Investment portfolio (Unaudited) (Continued)
As at 31 December 2014
Holding at31 December
2014
Fair value at31 December
2014
Percentage oftotal net assets at
31 December2014
HK$ (%)
Japan 99.08%
TOHO CO LTD 398 70,458 0.09TOHO GAS CO LTD 1,716 65,707 0.08TOHOKU ELECTRIC POWER CO INC 1,597 145,232 0.18TOKAI RIKA CO LTD 170 28,006 0.04TOKAI TOKYO FINANCIAL HOLDIN 817 43,966 0.06TOKIO MARINE HOLDINGS INC 2,485 632,234 0.80TOKYO BROADCASTING SYSTEM 128 11,756 0.01TOKYO ELECTRIC POWER CO INC 5,489 174,675 0.22TOKYO ELECTRON LTD 621 370,375 0.47TOKYO GAS CO LTD 8,400 354,296 0.45TOKYO TATEMONO CO LTD 1,375 78,352 0.10TOKYU CORP 4,706 227,985 0.29TOKYU FUDOSAN HOLDINGS CORP 1,865 101,449 0.13TONENGENERAL SEKIYU KK 945 62,895 0.08TOPCON CORP 337 56,237 0.07TOPPAN FORMS CO LTD 139 10,915 0.01TOPPAN PRINTING CO LTD 2,036 103,639 0.13TORAY INDUSTRIES INC 5,642 353,322 0.45TOSHIBA CORP 14,443 478,673 0.60TOSHIBA TEC CORP 424 22,817 0.03TOSOH CORP 2,009 76,146 0.10TOTO LTD 1,056 96,170 0.12TOYO SEIKAN GROUP HOLDINGS L 573 56,037 0.07TOYO SUISAN KAISHA LTD 330 83,244 0.11TOYO TIRE + RUBBER CO LTD 400 61,731 0.08TOYOBO CO LTD 2,979 31,215 0.04TOYODA GOSEI CO LTD 248 39,091 0.05TOYOTA BOSHOKU CORP 208 21,727 0.03TOYOTA INDUSTRIES CORP 567 227,744 0.29TOYOTA MOTOR CORP 9,124 4,460,304 5.64TOYOTA TSUSHO CORP 754 137,675 0.17TREND MICRO INC 349 75,395 0.10TS TECH CO LTD 255 46,693 0.06TSUMURA + CO 227 39,305 0.05TSURUHA HOLDINGS INC 118 53,350 0.07TV ASAHI HOLDINGS CORP 67 8,255 0.01UBE INDUSTRIES LTD 3,540 41,214 0.05UNICHARM CORP 1,200 226,019 0.29
Vanguard ETF SeriesAnnual Report 2014
-129-
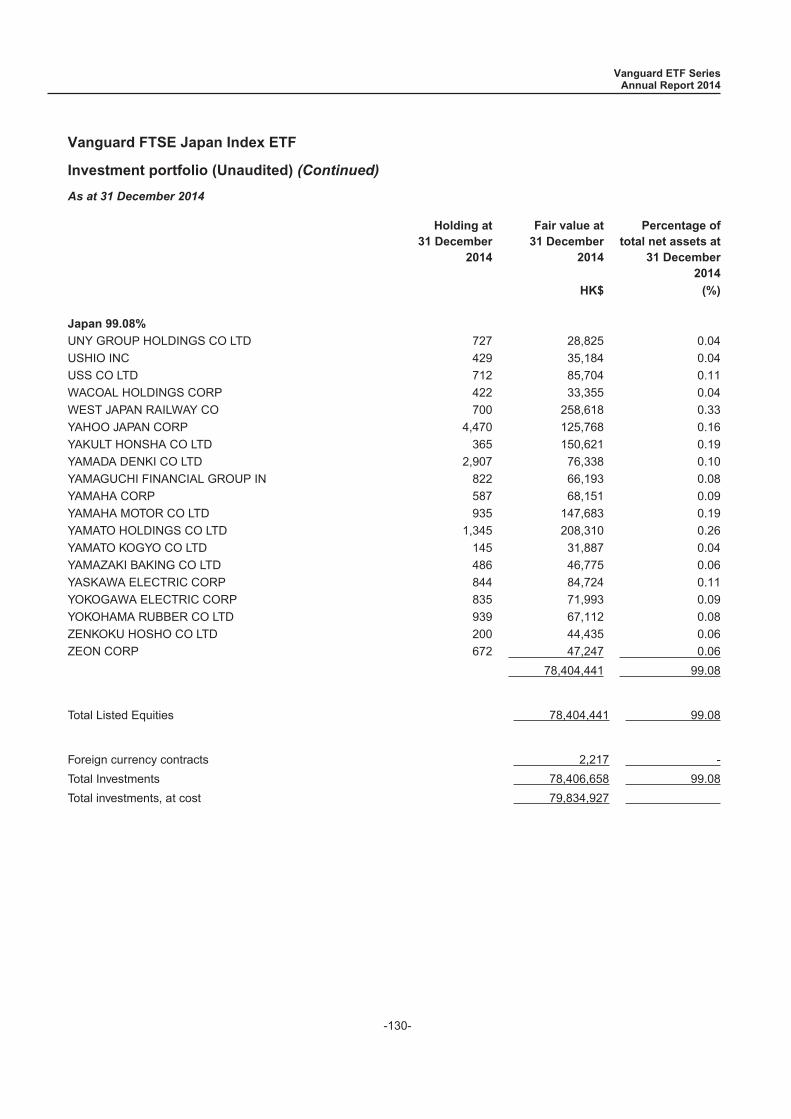
Vanguard FTSE Japan Index ETF
Investment portfolio (Unaudited) (Continued)
As at 31 December 2014
Holding at31 December
2014
Fair value at31 December
2014
Percentage oftotal net assets at
31 December2014
HK$ (%)
Japan 99.08%
UNY GROUP HOLDINGS CO LTD 727 28,825 0.04USHIO INC 429 35,184 0.04USS CO LTD 712 85,704 0.11WACOAL HOLDINGS CORP 422 33,355 0.04WEST JAPAN RAILWAY CO 700 258,618 0.33YAHOO JAPAN CORP 4,470 125,768 0.16YAKULT HONSHA CO LTD 365 150,621 0.19YAMADA DENKI CO LTD 2,907 76,338 0.10YAMAGUCHI FINANCIAL GROUP IN 822 66,193 0.08YAMAHA CORP 587 68,151 0.09YAMAHA MOTOR CO LTD 935 147,683 0.19YAMATO HOLDINGS CO LTD 1,345 208,310 0.26YAMATO KOGYO CO LTD 145 31,887 0.04YAMAZAKI BAKING CO LTD 486 46,775 0.06YASKAWA ELECTRIC CORP 844 84,724 0.11YOKOGAWA ELECTRIC CORP 835 71,993 0.09YOKOHAMA RUBBER CO LTD 939 67,112 0.08ZENKOKU HOSHO CO LTD 200 44,435 0.06ZEON CORP 672 47,247 0.06
78,404,441 99.08
Total Listed Equities 78,404,441 99.08
Foreign currency contracts 2,217 -Total Investments 78,406,658 99.08Total investments, at cost 79,834,927
Vanguard ETF SeriesAnnual Report 2014
-130-

Vanguard FTSE Japan Index ETF
Investment portfolio (Unaudited) (Continued)
As at 31 December 2014
Portfolio of investments
(a) By asset class Fair value at31 December
2014
Percentage oftotal net assets at
31 December2014
HK$ (%)
Total Listed Equities 78,404,441 99.08
(b) By Industry
Consumer discretionary 16,998,089 21.48Consumer staples 5,552,487 7.02Energy 758,223 0.96Financials 11,517,496 14.55Health care 5,069,060 6.40Industrials 16,022,695 20.25Information technology 8,901,751 11.25Materials 5,508,273 6.96Real estate 2,706,097 3.42Telecommunication services 3,464,020 4.38Utilities 1,906,250 2.41
78,404,441 99.08
Top Ten holdings
TOYOTA MOTOR CORP 4,460,304 5.64MITSUBISHI UFJ FINANCIAL GRO 2,093,130 2.65SOFTBANK CORP 1,507,228 1.90HONDA MOTOR CO LTD 1,412,850 1.79SUMITOMO MITSUI FINANCIAL GR 1,292,920 1.63MIZUHO FINANCIAL GROUP INC 1,085,648 1.37KDDI CORP 1,051,649 1.33HITACHI LTD 927,111 1.17CANON INC 890,035 1.12FANUC CORP 870,783 1.10
15,591,658 19.70
Vanguard ETF SeriesAnnual Report 2014
-131-
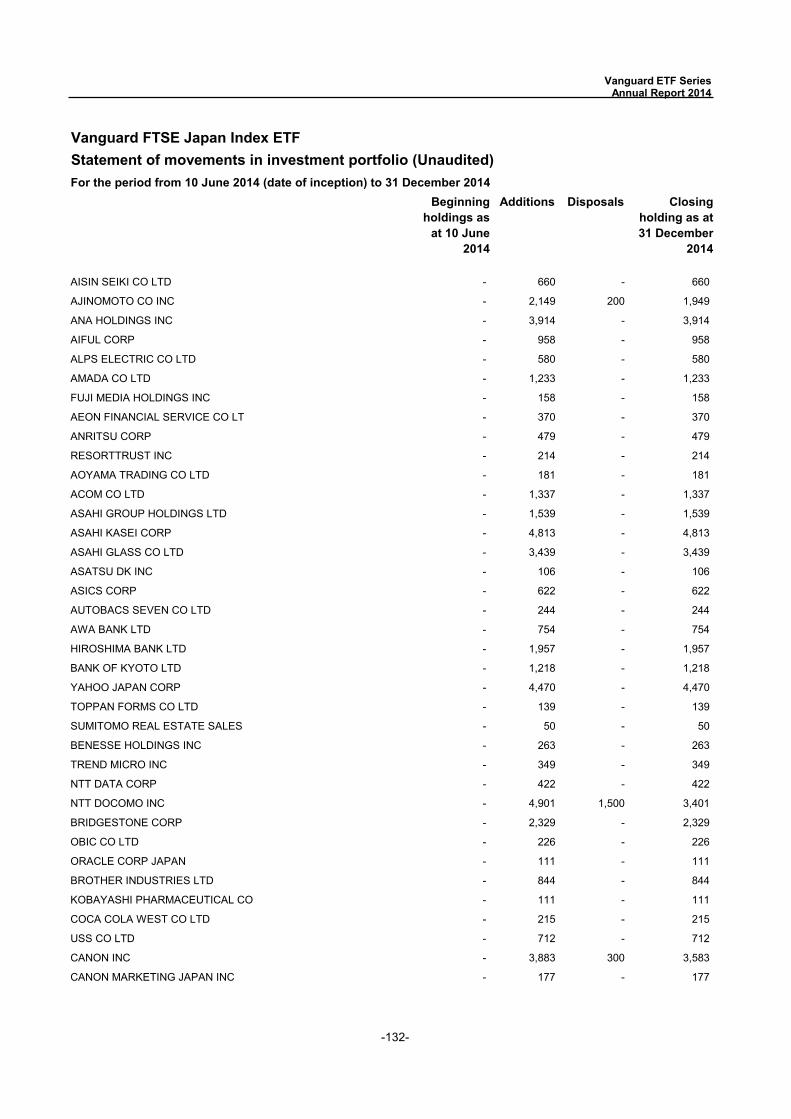
-132-
Vanguard FTSE Japan Index ETFStatement of movements in investment portfolio (Unaudited)
Beginning holdings as
at 10 June 2014
Additions Disposals Closing holding as at 31 December
2014
AISIN SEIKI CO LTD - 660 - 660
AJINOMOTO CO INC - 2,149 200 1,949
ANA HOLDINGS INC - 3,914 - 3,914
AIFUL CORP - 958 - 958
ALPS ELECTRIC CO LTD - 580 - 580
AMADA CO LTD - 1,233 - 1,233
FUJI MEDIA HOLDINGS INC - 158 - 158
AEON FINANCIAL SERVICE CO LT - 370 - 370
ANRITSU CORP - 479 - 479
RESORTTRUST INC - 214 - 214
AOYAMA TRADING CO LTD - 181 - 181
ACOM CO LTD - 1,337 - 1,337
ASAHI GROUP HOLDINGS LTD - 1,539 - 1,539
ASAHI KASEI CORP - 4,813 - 4,813
ASAHI GLASS CO LTD - 3,439 - 3,439
ASATSU DK INC - 106 - 106
ASICS CORP - 622 - 622
AUTOBACS SEVEN CO LTD - 244 - 244
AWA BANK LTD - 754 - 754
HIROSHIMA BANK LTD - 1,957 - 1,957
BANK OF KYOTO LTD - 1,218 - 1,218
YAHOO JAPAN CORP - 4,470 - 4,470
TOPPAN FORMS CO LTD - 139 - 139
SUMITOMO REAL ESTATE SALES - 50 - 50
BENESSE HOLDINGS INC - 263 - 263
TREND MICRO INC - 349 - 349
NTT DATA CORP - 422 - 422
NTT DOCOMO INC - 4,901 1,500 3,401
BRIDGESTONE CORP - 2,329 - 2,329
OBIC CO LTD - 226 - 226
ORACLE CORP JAPAN - 111 - 111
BROTHER INDUSTRIES LTD - 844 - 844
KOBAYASHI PHARMACEUTICAL CO - 111 - 111
COCA COLA WEST CO LTD - 215 - 215
USS CO LTD - 712 - 712
CANON INC - 3,883 300 3,583
CANON MARKETING JAPAN INC - 177 - 177
For the period from 10 June 2014 (date of inception) to 31 December 2014
Vanguard ETF Series Annual Report 2014
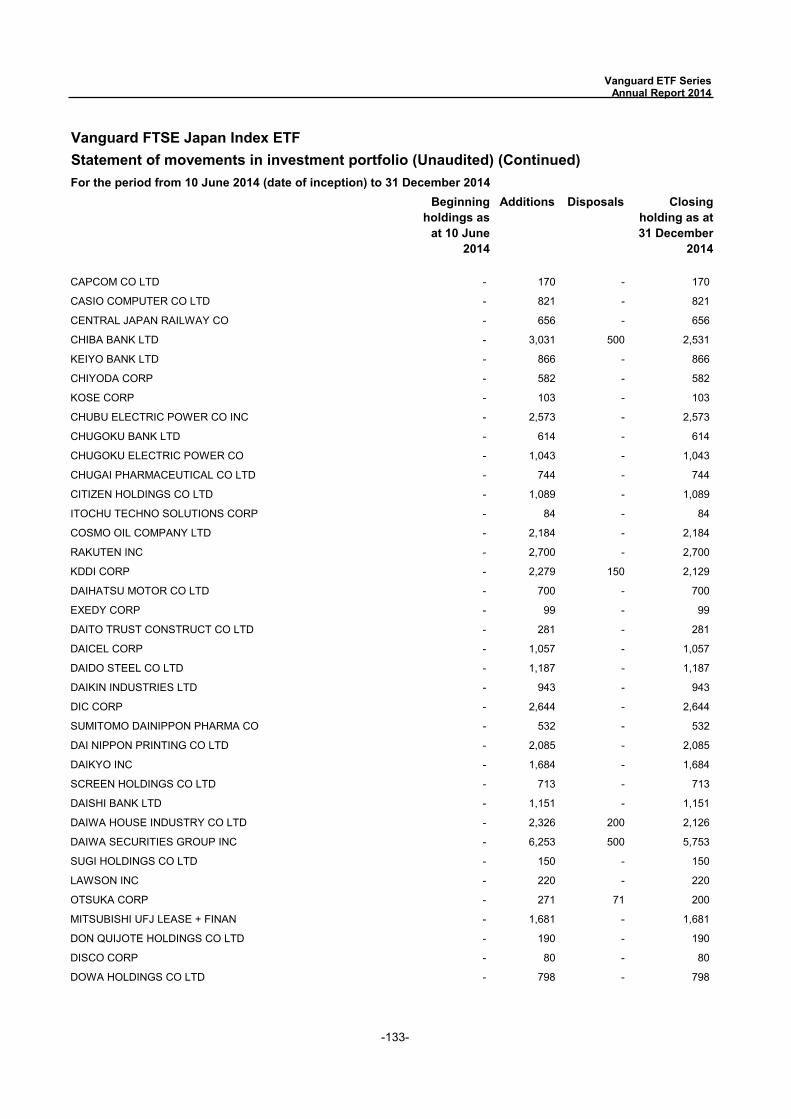
-133-
Vanguard FTSE Japan Index ETFStatement of movements in investment portfolio (Unaudited) (Continued)
Beginning holdings as
at 10 June 2014
Additions Disposals Closing holding as at 31 December
2014
For the period from 10 June 2014 (date of inception) to 31 December 2014
Vanguard ETF Series Annual Report 2014
CAPCOM CO LTD - 170 - 170
CASIO COMPUTER CO LTD - 821 - 821
CENTRAL JAPAN RAILWAY CO - 656 - 656
CHIBA BANK LTD - 3,031 500 2,531
KEIYO BANK LTD - 866 - 866
CHIYODA CORP - 582 - 582
KOSE CORP - 103 - 103
CHUBU ELECTRIC POWER CO INC - 2,573 - 2,573
CHUGOKU BANK LTD - 614 - 614
CHUGOKU ELECTRIC POWER CO - 1,043 - 1,043
CHUGAI PHARMACEUTICAL CO LTD - 744 - 744
CITIZEN HOLDINGS CO LTD - 1,089 - 1,089
ITOCHU TECHNO SOLUTIONS CORP - 84 - 84
COSMO OIL COMPANY LTD - 2,184 - 2,184
RAKUTEN INC - 2,700 - 2,700
KDDI CORP - 2,279 150 2,129
DAIHATSU MOTOR CO LTD - 700 - 700
EXEDY CORP - 99 - 99
DAITO TRUST CONSTRUCT CO LTD - 281 - 281
DAICEL CORP - 1,057 - 1,057
DAIDO STEEL CO LTD - 1,187 - 1,187
DAIKIN INDUSTRIES LTD - 943 - 943
DIC CORP - 2,644 - 2,644
SUMITOMO DAINIPPON PHARMA CO - 532 - 532
DAI NIPPON PRINTING CO LTD - 2,085 - 2,085
DAIKYO INC - 1,684 - 1,684
SCREEN HOLDINGS CO LTD - 713 - 713
DAISHI BANK LTD - 1,151 - 1,151
DAIWA HOUSE INDUSTRY CO LTD - 2,326 200 2,126
DAIWA SECURITIES GROUP INC - 6,253 500 5,753
SUGI HOLDINGS CO LTD - 150 - 150
LAWSON INC - 220 - 220
OTSUKA CORP - 271 71 200
MITSUBISHI UFJ LEASE + FINAN - 1,681 - 1,681
DON QUIJOTE HOLDINGS CO LTD - 190 - 190
DISCO CORP - 80 - 80
DOWA HOLDINGS CO LTD - 798 - 798

-134-
Vanguard FTSE Japan Index ETFStatement of movements in investment portfolio (Unaudited) (Continued)
Beginning holdings as
at 10 June 2014
Additions Disposals Closing holding as at 31 December
2014
For the period from 10 June 2014 (date of inception) to 31 December 2014
Vanguard ETF Series Annual Report 2014
TV ASAHI HOLDINGS CORP - 67 - 67
ABC MART INC - 76 - 76
EAST JAPAN RAILWAY CO - 1,309 - 1,309
EBARA CORP - 1,505 - 1,505
EISAI CO LTD - 997 - 997
SQUARE ENIX HOLDINGS CO LTD - 250 - 250
SBI HOLDINGS INC - 709 - 709
DENKI KAGAKU KOGYO K K - 1,539 - 1,539
EZAKI GLICO CO LTD - 599 413 186
FP CORP - 83 - 83
LINTEC CORP - 177 - 177
FAMILYMART CO LTD - 209 - 209
FAST RETAILING CO LTD - 185 - 185
MITSUBISHI UFJ FINANCIAL GRO - 48,700 - 48,700
COCA COLA EAST JAPAN CO LTD - 259 - 259
FUJI ELECTRIC CO LTD - 1,996 - 1,996
FUJI HEAVY INDUSTRIES LTD - 2,193 - 2,193
FUJIFILM HOLDINGS CORP - 1,631 - 1,631
MIRACA HOLDINGS INC - 195 - 195
FUJIKURA LTD - 1,086 - 1,086
FANUC CORP - 675 - 675
FUJITSU LTD - 6,425 500 5,925
FUKUYAMA TRANSPORTING CO LTD - 597 - 597
FURUKAWA ELECTRIC CO LTD - 2,288 - 2,288
TONENGENERAL SEKIYU KK - 945 - 945
MATSUI SECURITIES CO LTD - 361 - 361
GLORY LTD - 197 - 197
NOMURA RESEARCH INSTITUTE LT - 331 - 331
GUNMA BANK LTD - 1,568 - 1,568
H I S CO LTD - 222 100 122
HACHIJUNI BANK LTD - 1,638 - 1,638
HAMAMATSU PHOTONICS KK - 232 - 232
HANKYU HANSHIN HOLDINGS INC - 4,756 - 4,756
H2O RETAILING CORP - 1,070 670 400
HASEKO CORP - 935 - 935
DENTSU INC - 852 100 752
HIKARI TSUSHIN INC - 47 - 47
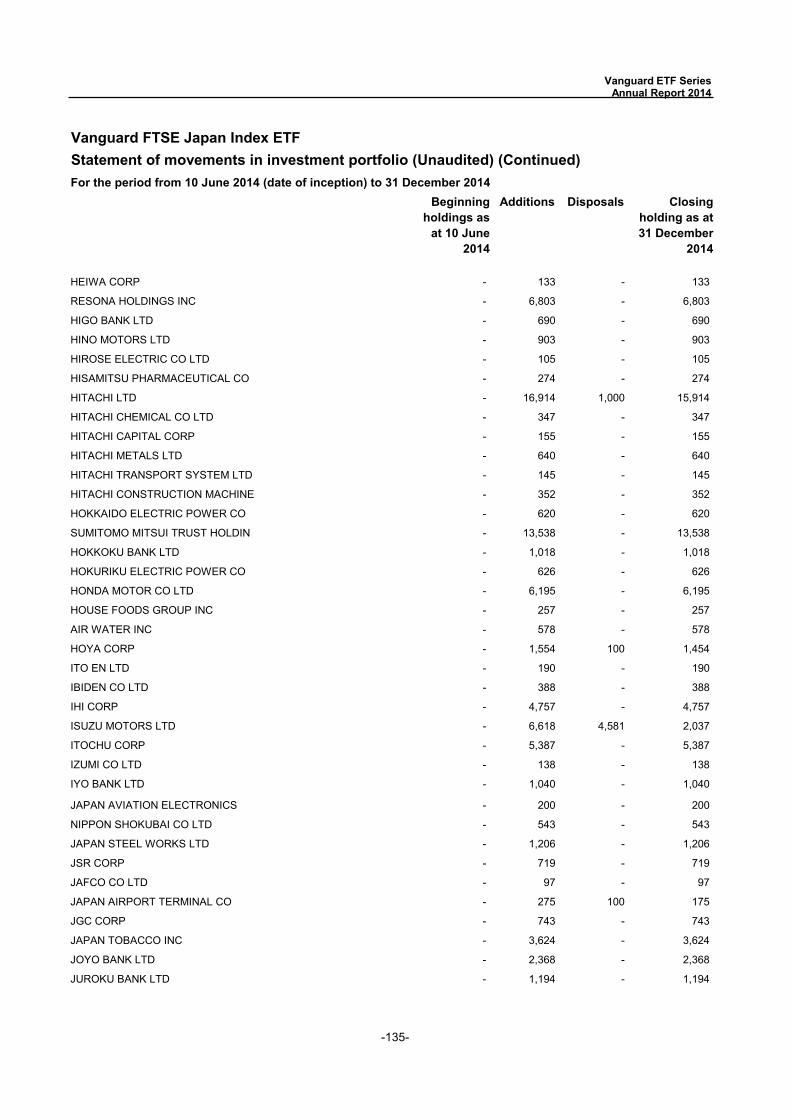
-135-
Vanguard FTSE Japan Index ETFStatement of movements in investment portfolio (Unaudited) (Continued)
Beginning holdings as
at 10 June 2014
Additions Disposals Closing holding as at 31 December
2014
For the period from 10 June 2014 (date of inception) to 31 December 2014
Vanguard ETF Series Annual Report 2014
HEIWA CORP - 133 - 133
RESONA HOLDINGS INC - 6,803 - 6,803
HIGO BANK LTD - 690 - 690
HINO MOTORS LTD - 903 - 903
HIROSE ELECTRIC CO LTD - 105 - 105
HISAMITSU PHARMACEUTICAL CO - 274 - 274
HITACHI LTD - 16,914 1,000 15,914
HITACHI CHEMICAL CO LTD - 347 - 347
HITACHI CAPITAL CORP - 155 - 155
HITACHI METALS LTD - 640 - 640
HITACHI TRANSPORT SYSTEM LTD - 145 - 145
HITACHI CONSTRUCTION MACHINE - 352 - 352
HOKKAIDO ELECTRIC POWER CO - 620 - 620
SUMITOMO MITSUI TRUST HOLDIN - 13,538 - 13,538
HOKKOKU BANK LTD - 1,018 - 1,018
HOKURIKU ELECTRIC POWER CO - 626 - 626
HONDA MOTOR CO LTD - 6,195 - 6,195
HOUSE FOODS GROUP INC - 257 - 257
AIR WATER INC - 578 - 578
HOYA CORP - 1,554 100 1,454
ITO EN LTD - 190 - 190
IBIDEN CO LTD - 388 - 388
IHI CORP - 4,757 - 4,757
ISUZU MOTORS LTD - 6,618 4,581 2,037
ITOCHU CORP - 5,387 - 5,387
IZUMI CO LTD - 138 - 138
IYO BANK LTD - 1,040 - 1,040
JAPAN AVIATION ELECTRONICS - 200 - 200
NIPPON SHOKUBAI CO LTD - 543 - 543
JAPAN STEEL WORKS LTD - 1,206 - 1,206
JSR CORP - 719 - 719
JAFCO CO LTD - 97 - 97
JAPAN AIRPORT TERMINAL CO - 275 100 175
JGC CORP - 743 - 743
JAPAN TOBACCO INC - 3,624 - 3,624
JOYO BANK LTD - 2,368 - 2,368
JUROKU BANK LTD - 1,194 - 1,194

-136-
Vanguard FTSE Japan Index ETFStatement of movements in investment portfolio (Unaudited) (Continued)
Beginning holdings as
at 10 June 2014
Additions Disposals Closing holding as at 31 December
2014
For the period from 10 June 2014 (date of inception) to 31 December 2014
Vanguard ETF Series Annual Report 2014
AEON CO LTD - 2,507 - 2,507
KAGOME CO LTD - 253 - 253
KAGOSHIMA BANK LTD - 564 - 564
KAJIMA CORP - 2,863 - 2,863
KAKEN PHARMACEUTICAL CO LTD - 255 - 255
KAMIGUMI CO LTD - 779 - 779
KANEKA CORP - 1,135 - 1,135
KANSAI ELECTRIC POWER CO INC - 2,795 - 2,795
KANDENKO CO LTD - 350 - 350
KANSAI PAINT CO LTD - 857 - 857
KAO CORP - 1,936 100 1,836
ONWARD HOLDINGS CO LTD - 455 - 455
K S HOLDINGS CORP - 138 - 138
KAWASAKI HEAVY INDUSTRIES - 5,160 - 5,160
KAWASAKI KISEN KAISHA LTD - 3,043 - 3,043
KYB CO LTD - 643 - 643
KEIHAN ELECTRIC RAILWAY CO - 1,895 - 1,895
KEIKYU CORP - 1,662 - 1,662
KEIO CORP - 2,026 - 2,026
KEISEI ELECTRIC RAILWAY CO - 957 - 957
KIKKOMAN CORP - 640 - 640
KEYENCE CORP - 159 - 159
KINDEN CORP - 363 - 363
KINTETSU CORP - 5,957 - 5,957
KIRIN HOLDINGS CO LTD - 2,968 - 2,968
KISSEI PHARMACEUTICAL CO LTD - 132 - 132
KOBE STEEL LTD - 9,817 - 9,817
KOMERI CO LTD - 100 - 100
KOITO MANUFACTURING CO LTD - 419 - 419
KOMATSU LTD - 3,284 - 3,284
KONAMI CORP - 324 - 324
KONICA MINOLTA INC - 1,742 - 1,742
JTEKT CORP - 755 - 755
KUBOTA CORP - 4,423 - 4,423
KURARAY CO LTD - 1,165 - 1,165
KURITA WATER INDUSTRIES LTD - 390 - 390
KYOCERA CORP - 1,150 - 1,150
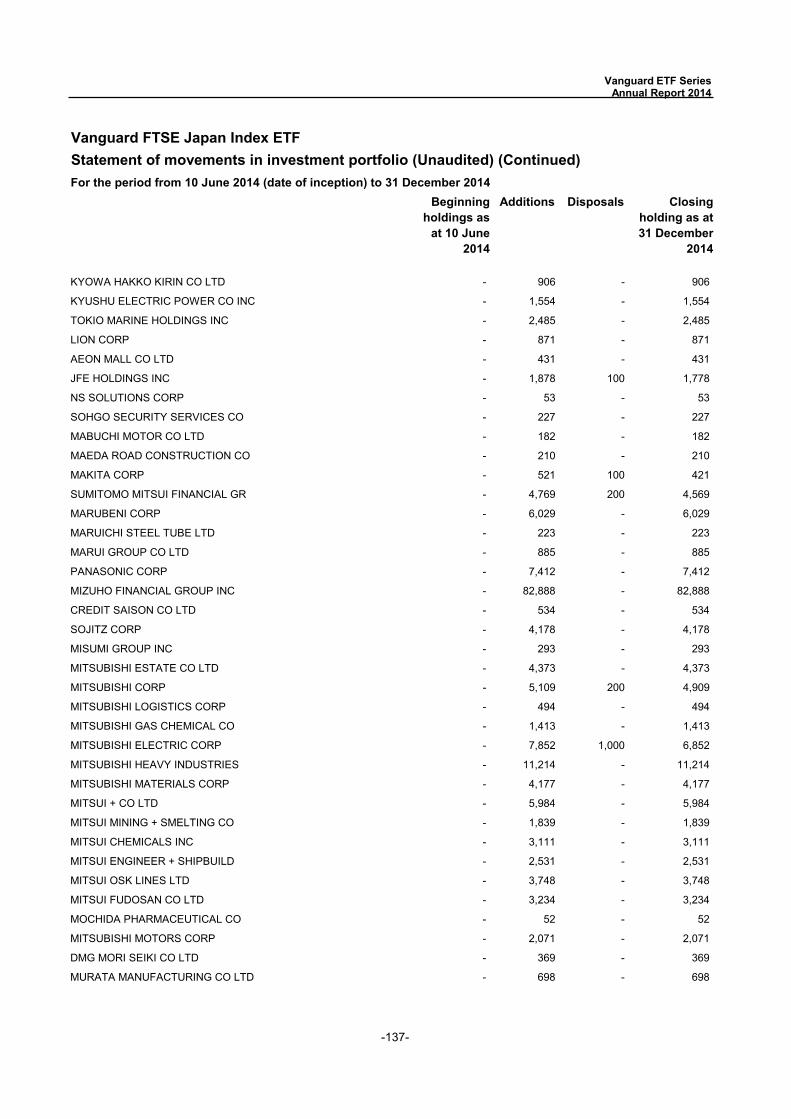
-137-
Vanguard FTSE Japan Index ETFStatement of movements in investment portfolio (Unaudited) (Continued)
Beginning holdings as
at 10 June 2014
Additions Disposals Closing holding as at 31 December
2014
For the period from 10 June 2014 (date of inception) to 31 December 2014
Vanguard ETF Series Annual Report 2014
KYOWA HAKKO KIRIN CO LTD - 906 - 906
KYUSHU ELECTRIC POWER CO INC - 1,554 - 1,554
TOKIO MARINE HOLDINGS INC - 2,485 - 2,485
LION CORP - 871 - 871
AEON MALL CO LTD - 431 - 431
JFE HOLDINGS INC - 1,878 100 1,778
NS SOLUTIONS CORP - 53 - 53
SOHGO SECURITY SERVICES CO - 227 - 227
MABUCHI MOTOR CO LTD - 182 - 182
MAEDA ROAD CONSTRUCTION CO - 210 - 210
MAKITA CORP - 521 100 421
SUMITOMO MITSUI FINANCIAL GR - 4,769 200 4,569
MARUBENI CORP - 6,029 - 6,029
MARUICHI STEEL TUBE LTD - 223 - 223
MARUI GROUP CO LTD - 885 - 885
PANASONIC CORP - 7,412 - 7,412
MIZUHO FINANCIAL GROUP INC - 82,888 - 82,888
CREDIT SAISON CO LTD - 534 - 534
SOJITZ CORP - 4,178 - 4,178
MISUMI GROUP INC - 293 - 293
MITSUBISHI ESTATE CO LTD - 4,373 - 4,373
MITSUBISHI CORP - 5,109 200 4,909
MITSUBISHI LOGISTICS CORP - 494 - 494
MITSUBISHI GAS CHEMICAL CO - 1,413 - 1,413
MITSUBISHI ELECTRIC CORP - 7,852 1,000 6,852
MITSUBISHI HEAVY INDUSTRIES - 11,214 - 11,214
MITSUBISHI MATERIALS CORP - 4,177 - 4,177
MITSUI + CO LTD - 5,984 - 5,984
MITSUI MINING + SMELTING CO - 1,839 - 1,839
MITSUI CHEMICALS INC - 3,111 - 3,111
MITSUI ENGINEER + SHIPBUILD - 2,531 - 2,531
MITSUI OSK LINES LTD - 3,748 - 3,748
MITSUI FUDOSAN CO LTD - 3,234 - 3,234
MOCHIDA PHARMACEUTICAL CO - 52 - 52
MITSUBISHI MOTORS CORP - 2,071 - 2,071
DMG MORI SEIKI CO LTD - 369 - 369
MURATA MANUFACTURING CO LTD - 698 - 698
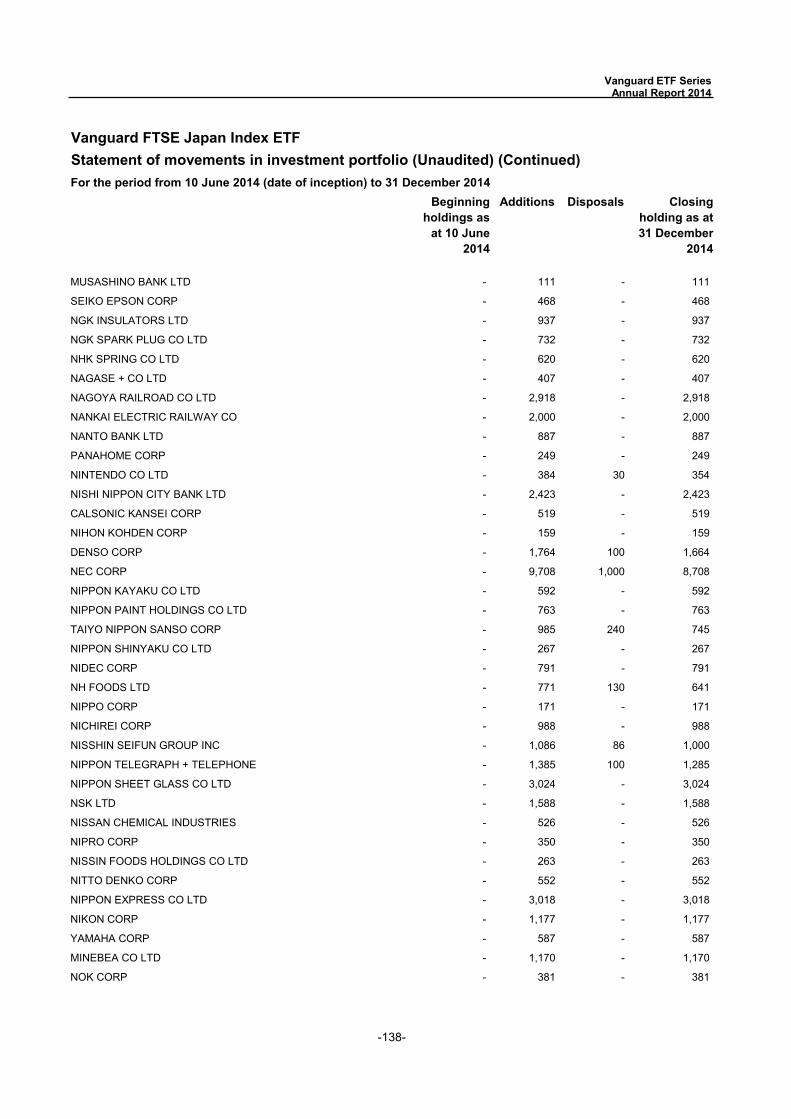
-138-
Vanguard FTSE Japan Index ETFStatement of movements in investment portfolio (Unaudited) (Continued)
Beginning holdings as
at 10 June 2014
Additions Disposals Closing holding as at 31 December
2014
For the period from 10 June 2014 (date of inception) to 31 December 2014
Vanguard ETF Series Annual Report 2014
MUSASHINO BANK LTD - 111 - 111
SEIKO EPSON CORP - 468 - 468
NGK INSULATORS LTD - 937 - 937
NGK SPARK PLUG CO LTD - 732 - 732
NHK SPRING CO LTD - 620 - 620
NAGASE + CO LTD - 407 - 407
NAGOYA RAILROAD CO LTD - 2,918 - 2,918
NANKAI ELECTRIC RAILWAY CO - 2,000 - 2,000
NANTO BANK LTD - 887 - 887
PANAHOME CORP - 249 - 249
NINTENDO CO LTD - 384 30 354
NISHI NIPPON CITY BANK LTD - 2,423 - 2,423
CALSONIC KANSEI CORP - 519 - 519
NIHON KOHDEN CORP - 159 - 159
DENSO CORP - 1,764 100 1,664
NEC CORP - 9,708 1,000 8,708
NIPPON KAYAKU CO LTD - 592 - 592
NIPPON PAINT HOLDINGS CO LTD - 763 - 763
TAIYO NIPPON SANSO CORP - 985 240 745
NIPPON SHINYAKU CO LTD - 267 - 267
NIDEC CORP - 791 - 791
NH FOODS LTD - 771 130 641
NIPPO CORP - 171 - 171
NICHIREI CORP - 988 - 988
NISSHIN SEIFUN GROUP INC - 1,086 86 1,000
NIPPON TELEGRAPH + TELEPHONE - 1,385 100 1,285
NIPPON SHEET GLASS CO LTD - 3,024 - 3,024
NSK LTD - 1,588 - 1,588
NISSAN CHEMICAL INDUSTRIES - 526 - 526
NIPRO CORP - 350 - 350
NISSIN FOODS HOLDINGS CO LTD - 263 - 263
NITTO DENKO CORP - 552 - 552
NIPPON EXPRESS CO LTD - 3,018 - 3,018
NIKON CORP - 1,177 - 1,177
YAMAHA CORP - 587 - 587
MINEBEA CO LTD - 1,170 - 1,170
NOK CORP - 381 - 381
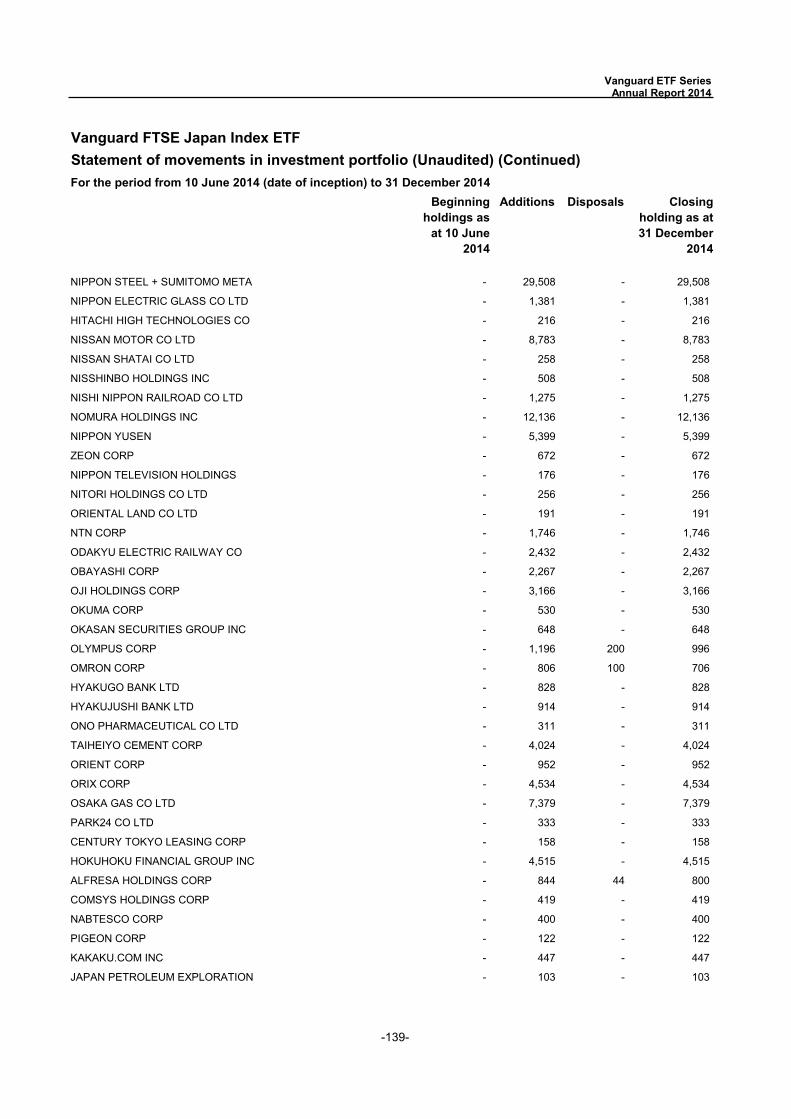
-139-
Vanguard FTSE Japan Index ETFStatement of movements in investment portfolio (Unaudited) (Continued)
Beginning holdings as
at 10 June 2014
Additions Disposals Closing holding as at 31 December
2014
For the period from 10 June 2014 (date of inception) to 31 December 2014
Vanguard ETF Series Annual Report 2014
NIPPON STEEL + SUMITOMO META - 29,508 - 29,508
NIPPON ELECTRIC GLASS CO LTD - 1,381 - 1,381
HITACHI HIGH TECHNOLOGIES CO - 216 - 216
NISSAN MOTOR CO LTD - 8,783 - 8,783
NISSAN SHATAI CO LTD - 258 - 258
NISSHINBO HOLDINGS INC - 508 - 508
NISHI NIPPON RAILROAD CO LTD - 1,275 - 1,275
NOMURA HOLDINGS INC - 12,136 - 12,136
NIPPON YUSEN - 5,399 - 5,399
ZEON CORP - 672 - 672
NIPPON TELEVISION HOLDINGS - 176 - 176
NITORI HOLDINGS CO LTD - 256 - 256
ORIENTAL LAND CO LTD - 191 - 191
NTN CORP - 1,746 - 1,746
ODAKYU ELECTRIC RAILWAY CO - 2,432 - 2,432
OBAYASHI CORP - 2,267 - 2,267
OJI HOLDINGS CORP - 3,166 - 3,166
OKUMA CORP - 530 - 530
OKASAN SECURITIES GROUP INC - 648 - 648
OLYMPUS CORP - 1,196 200 996
OMRON CORP - 806 100 706
HYAKUGO BANK LTD - 828 - 828
HYAKUJUSHI BANK LTD - 914 - 914
ONO PHARMACEUTICAL CO LTD - 311 - 311
TAIHEIYO CEMENT CORP - 4,024 - 4,024
ORIENT CORP - 952 - 952
ORIX CORP - 4,534 - 4,534
OSAKA GAS CO LTD - 7,379 - 7,379
PARK24 CO LTD - 333 - 333
CENTURY TOKYO LEASING CORP - 158 - 158
HOKUHOKU FINANCIAL GROUP INC - 4,515 - 4,515
ALFRESA HOLDINGS CORP - 844 44 800
COMSYS HOLDINGS CORP - 419 - 419
NABTESCO CORP - 400 - 400
PIGEON CORP - 122 - 122
KAKAKU.COM INC - 447 - 447
JAPAN PETROLEUM EXPLORATION - 103 - 103
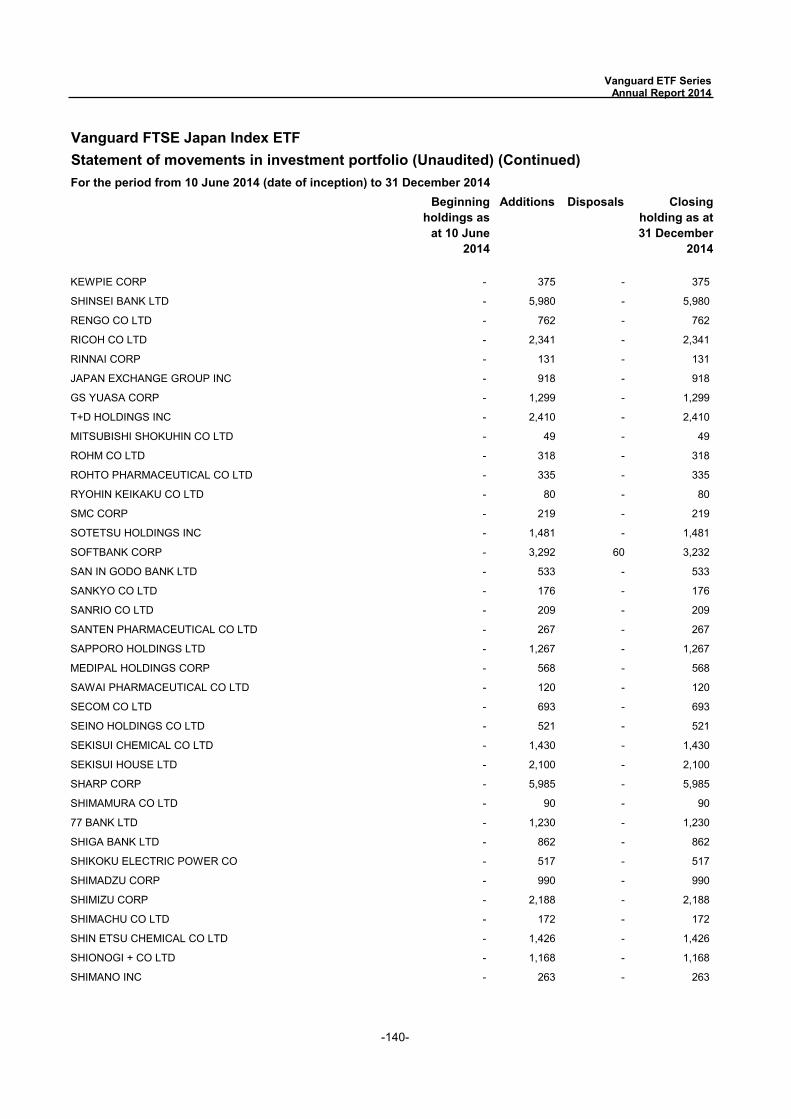
-140-
Vanguard FTSE Japan Index ETFStatement of movements in investment portfolio (Unaudited) (Continued)
Beginning holdings as
at 10 June 2014
Additions Disposals Closing holding as at 31 December
2014
For the period from 10 June 2014 (date of inception) to 31 December 2014
Vanguard ETF Series Annual Report 2014
KEWPIE CORP - 375 - 375
SHINSEI BANK LTD - 5,980 - 5,980
RENGO CO LTD - 762 - 762
RICOH CO LTD - 2,341 - 2,341
RINNAI CORP - 131 - 131
JAPAN EXCHANGE GROUP INC - 918 - 918
GS YUASA CORP - 1,299 - 1,299
T+D HOLDINGS INC - 2,410 - 2,410
MITSUBISHI SHOKUHIN CO LTD - 49 - 49
ROHM CO LTD - 318 - 318
ROHTO PHARMACEUTICAL CO LTD - 335 - 335
RYOHIN KEIKAKU CO LTD - 80 - 80
SMC CORP - 219 - 219
SOTETSU HOLDINGS INC - 1,481 - 1,481
SOFTBANK CORP - 3,292 60 3,232
SAN IN GODO BANK LTD - 533 - 533
SANKYO CO LTD - 176 - 176
SANRIO CO LTD - 209 - 209
SANTEN PHARMACEUTICAL CO LTD - 267 - 267
SAPPORO HOLDINGS LTD - 1,267 - 1,267
MEDIPAL HOLDINGS CORP - 568 - 568
SAWAI PHARMACEUTICAL CO LTD - 120 - 120
SECOM CO LTD - 693 - 693
SEINO HOLDINGS CO LTD - 521 - 521
SEKISUI CHEMICAL CO LTD - 1,430 - 1,430
SEKISUI HOUSE LTD - 2,100 - 2,100
SHARP CORP - 5,985 - 5,985
SHIMAMURA CO LTD - 90 - 90
77 BANK LTD - 1,230 - 1,230
SHIGA BANK LTD - 862 - 862
SHIKOKU ELECTRIC POWER CO - 517 - 517
SHIMADZU CORP - 990 - 990
SHIMIZU CORP - 2,188 - 2,188
SHIMACHU CO LTD - 172 - 172
SHIN ETSU CHEMICAL CO LTD - 1,426 - 1,426
SHIONOGI + CO LTD - 1,168 - 1,168
SHIMANO INC - 263 - 263
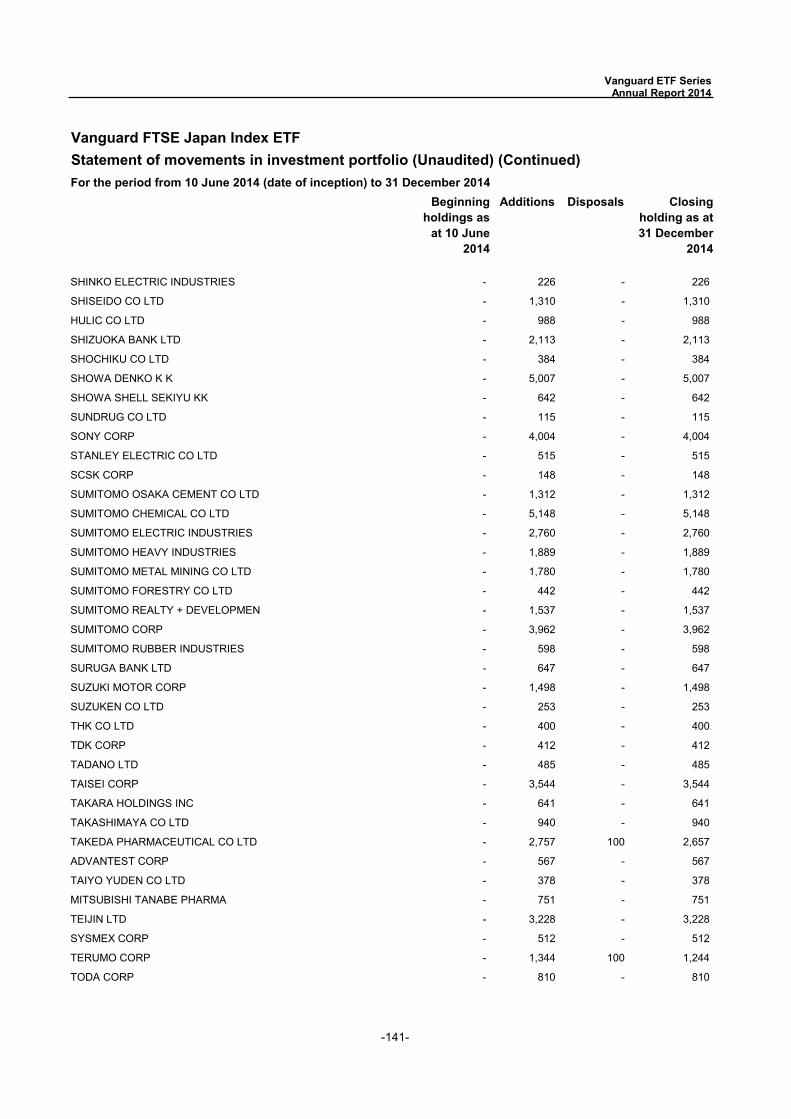
-141-
Vanguard FTSE Japan Index ETFStatement of movements in investment portfolio (Unaudited) (Continued)
Beginning holdings as
at 10 June 2014
Additions Disposals Closing holding as at 31 December
2014
For the period from 10 June 2014 (date of inception) to 31 December 2014
Vanguard ETF Series Annual Report 2014
SHINKO ELECTRIC INDUSTRIES - 226 - 226
SHISEIDO CO LTD - 1,310 - 1,310
HULIC CO LTD - 988 - 988
SHIZUOKA BANK LTD - 2,113 - 2,113
SHOCHIKU CO LTD - 384 - 384
SHOWA DENKO K K - 5,007 - 5,007
SHOWA SHELL SEKIYU KK - 642 - 642
SUNDRUG CO LTD - 115 - 115
SONY CORP - 4,004 - 4,004
STANLEY ELECTRIC CO LTD - 515 - 515
SCSK CORP - 148 - 148
SUMITOMO OSAKA CEMENT CO LTD - 1,312 - 1,312
SUMITOMO CHEMICAL CO LTD - 5,148 - 5,148
SUMITOMO ELECTRIC INDUSTRIES - 2,760 - 2,760
SUMITOMO HEAVY INDUSTRIES - 1,889 - 1,889
SUMITOMO METAL MINING CO LTD - 1,780 - 1,780
SUMITOMO FORESTRY CO LTD - 442 - 442
SUMITOMO REALTY + DEVELOPMEN - 1,537 - 1,537
SUMITOMO CORP - 3,962 - 3,962
SUMITOMO RUBBER INDUSTRIES - 598 - 598
SURUGA BANK LTD - 647 - 647
SUZUKI MOTOR CORP - 1,498 - 1,498
SUZUKEN CO LTD - 253 - 253
THK CO LTD - 400 - 400
TDK CORP - 412 - 412
TADANO LTD - 485 - 485
TAISEI CORP - 3,544 - 3,544
TAKARA HOLDINGS INC - 641 - 641
TAKASHIMAYA CO LTD - 940 - 940
TAKEDA PHARMACEUTICAL CO LTD - 2,757 100 2,657
ADVANTEST CORP - 567 - 567
TAIYO YUDEN CO LTD - 378 - 378
MITSUBISHI TANABE PHARMA - 751 - 751
TEIJIN LTD - 3,228 - 3,228
SYSMEX CORP - 512 - 512
TERUMO CORP - 1,344 100 1,244
TODA CORP - 810 - 810
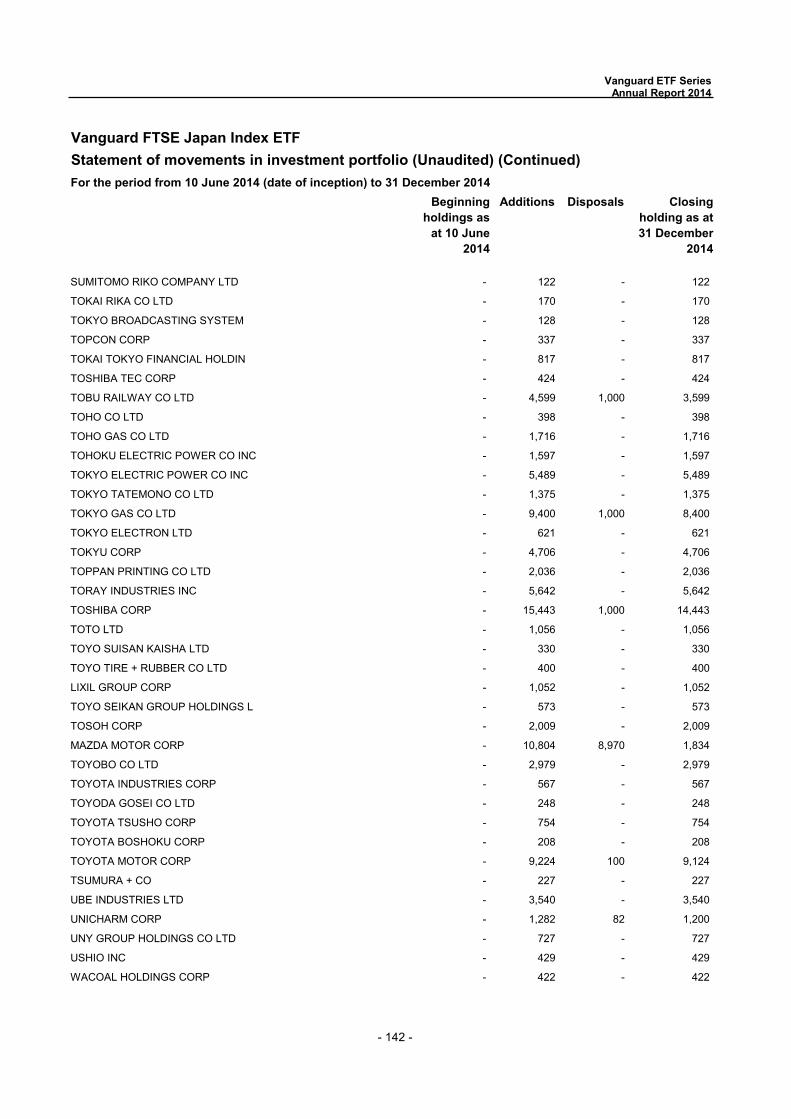
- 142 -
Vanguard FTSE Japan Index ETFStatement of movements in investment portfolio (Unaudited) (Continued)
Beginning holdings as
at 10 June 2014
Additions Disposals Closing holding as at 31 December
2014
For the period from 10 June 2014 (date of inception) to 31 December 2014
Vanguard ETF Series Annual Report 2014
SUMITOMO RIKO COMPANY LTD - 122 - 122
TOKAI RIKA CO LTD - 170 - 170
TOKYO BROADCASTING SYSTEM - 128 - 128
TOPCON CORP - 337 - 337
TOKAI TOKYO FINANCIAL HOLDIN - 817 - 817
TOSHIBA TEC CORP - 424 - 424
TOBU RAILWAY CO LTD - 4,599 1,000 3,599
TOHO CO LTD - 398 - 398
TOHO GAS CO LTD - 1,716 - 1,716
TOHOKU ELECTRIC POWER CO INC - 1,597 - 1,597
TOKYO ELECTRIC POWER CO INC - 5,489 - 5,489
TOKYO TATEMONO CO LTD - 1,375 - 1,375
TOKYO GAS CO LTD - 9,400 1,000 8,400
TOKYO ELECTRON LTD - 621 - 621
TOKYU CORP - 4,706 - 4,706
TOPPAN PRINTING CO LTD - 2,036 - 2,036
TORAY INDUSTRIES INC - 5,642 - 5,642
TOSHIBA CORP - 15,443 1,000 14,443
TOTO LTD - 1,056 - 1,056
TOYO SUISAN KAISHA LTD - 330 - 330
TOYO TIRE + RUBBER CO LTD - 400 - 400
LIXIL GROUP CORP - 1,052 - 1,052
TOYO SEIKAN GROUP HOLDINGS L - 573 - 573
TOSOH CORP - 2,009 - 2,009
MAZDA MOTOR CORP - 10,804 8,970 1,834
TOYOBO CO LTD - 2,979 - 2,979
TOYOTA INDUSTRIES CORP - 567 - 567
TOYODA GOSEI CO LTD - 248 - 248
TOYOTA TSUSHO CORP - 754 - 754
TOYOTA BOSHOKU CORP - 208 - 208
TOYOTA MOTOR CORP - 9,224 100 9,124
TSUMURA + CO - 227 - 227
UBE INDUSTRIES LTD - 3,540 - 3,540
UNICHARM CORP - 1,282 82 1,200
UNY GROUP HOLDINGS CO LTD - 727 - 727
USHIO INC - 429 - 429
WACOAL HOLDINGS CORP - 422 - 422
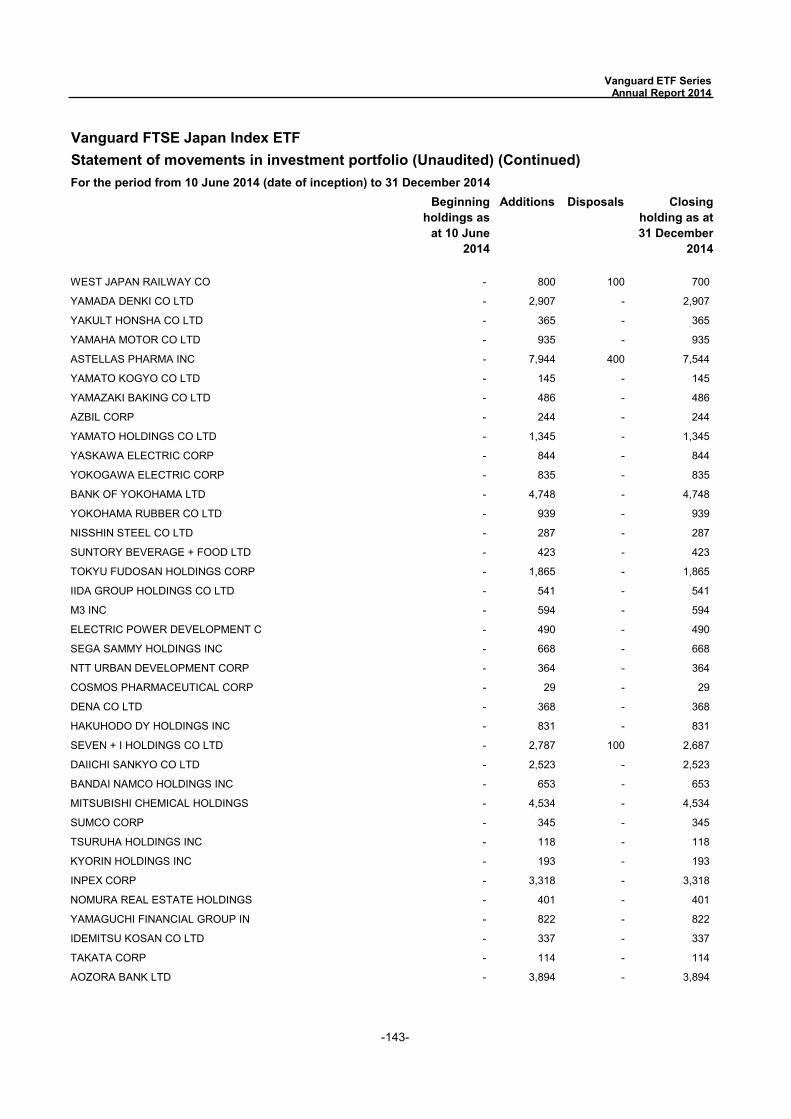
-143-
Vanguard FTSE Japan Index ETFStatement of movements in investment portfolio (Unaudited) (Continued)
Beginning holdings as
at 10 June 2014
Additions Disposals Closing holding as at 31 December
2014
For the period from 10 June 2014 (date of inception) to 31 December 2014
Vanguard ETF Series Annual Report 2014
WEST JAPAN RAILWAY CO - 800 100 700
YAMADA DENKI CO LTD - 2,907 - 2,907
YAKULT HONSHA CO LTD - 365 - 365
YAMAHA MOTOR CO LTD - 935 - 935
ASTELLAS PHARMA INC - 7,944 400 7,544
YAMATO KOGYO CO LTD - 145 - 145
YAMAZAKI BAKING CO LTD - 486 - 486
AZBIL CORP - 244 - 244
YAMATO HOLDINGS CO LTD - 1,345 - 1,345
YASKAWA ELECTRIC CORP - 844 - 844
YOKOGAWA ELECTRIC CORP - 835 - 835
BANK OF YOKOHAMA LTD - 4,748 - 4,748
YOKOHAMA RUBBER CO LTD - 939 - 939
NISSHIN STEEL CO LTD - 287 - 287
SUNTORY BEVERAGE + FOOD LTD - 423 - 423
TOKYU FUDOSAN HOLDINGS CORP - 1,865 - 1,865
IIDA GROUP HOLDINGS CO LTD - 541 - 541
M3 INC - 594 - 594
ELECTRIC POWER DEVELOPMENT C - 490 - 490
SEGA SAMMY HOLDINGS INC - 668 - 668
NTT URBAN DEVELOPMENT CORP - 364 - 364
COSMOS PHARMACEUTICAL CORP - 29 - 29
DENA CO LTD - 368 - 368
HAKUHODO DY HOLDINGS INC - 831 - 831
SEVEN + I HOLDINGS CO LTD - 2,787 100 2,687
DAIICHI SANKYO CO LTD - 2,523 - 2,523
BANDAI NAMCO HOLDINGS INC - 653 - 653
MITSUBISHI CHEMICAL HOLDINGS - 4,534 - 4,534
SUMCO CORP - 345 - 345
TSURUHA HOLDINGS INC - 118 - 118
KYORIN HOLDINGS INC - 193 - 193
INPEX CORP - 3,318 - 3,318
NOMURA REAL ESTATE HOLDINGS - 401 - 401
YAMAGUCHI FINANCIAL GROUP IN - 822 - 822
IDEMITSU KOSAN CO LTD - 337 - 337
TAKATA CORP - 114 - 114
AOZORA BANK LTD - 3,894 - 3,894
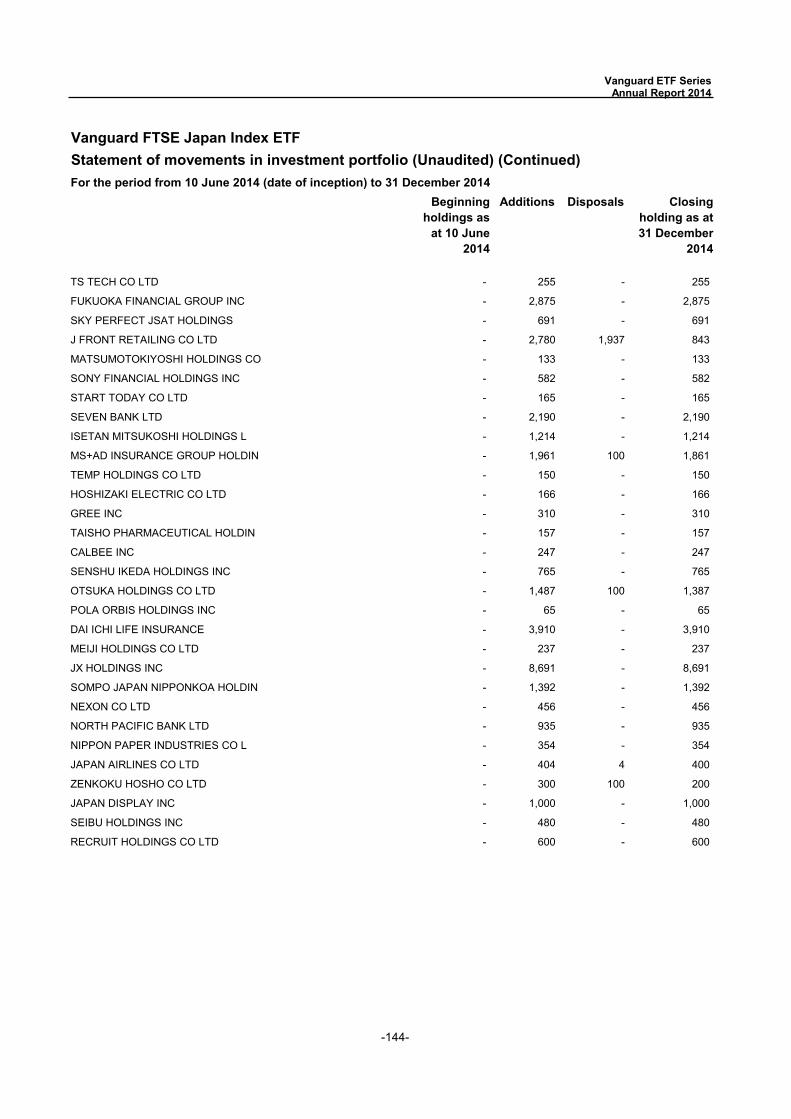
-144-
Vanguard FTSE Japan Index ETFStatement of movements in investment portfolio (Unaudited) (Continued)
Beginning holdings as
at 10 June 2014
Additions Disposals Closing holding as at 31 December
2014
For the period from 10 June 2014 (date of inception) to 31 December 2014
Vanguard ETF Series Annual Report 2014
TS TECH CO LTD - 255 - 255
FUKUOKA FINANCIAL GROUP INC - 2,875 - 2,875
SKY PERFECT JSAT HOLDINGS - 691 - 691
J FRONT RETAILING CO LTD - 2,780 1,937 843
MATSUMOTOKIYOSHI HOLDINGS CO - 133 - 133
SONY FINANCIAL HOLDINGS INC - 582 - 582
START TODAY CO LTD - 165 - 165
SEVEN BANK LTD - 2,190 - 2,190
ISETAN MITSUKOSHI HOLDINGS L - 1,214 - 1,214
MS+AD INSURANCE GROUP HOLDIN - 1,961 100 1,861
TEMP HOLDINGS CO LTD - 150 - 150
HOSHIZAKI ELECTRIC CO LTD - 166 - 166
GREE INC - 310 - 310
TAISHO PHARMACEUTICAL HOLDIN - 157 - 157
CALBEE INC - 247 - 247
SENSHU IKEDA HOLDINGS INC - 765 - 765
OTSUKA HOLDINGS CO LTD - 1,487 100 1,387
POLA ORBIS HOLDINGS INC - 65 - 65
DAI ICHI LIFE INSURANCE - 3,910 - 3,910
MEIJI HOLDINGS CO LTD - 237 - 237
JX HOLDINGS INC - 8,691 - 8,691
SOMPO JAPAN NIPPONKOA HOLDIN - 1,392 - 1,392
NEXON CO LTD - 456 - 456
NORTH PACIFIC BANK LTD - 935 - 935
NIPPON PAPER INDUSTRIES CO L - 354 - 354
JAPAN AIRLINES CO LTD - 404 4 400
ZENKOKU HOSHO CO LTD - 300 100 200
JAPAN DISPLAY INC - 1,000 - 1,000
SEIBU HOLDINGS INC - 480 - 480
RECRUIT HOLDINGS CO LTD - 600 - 600
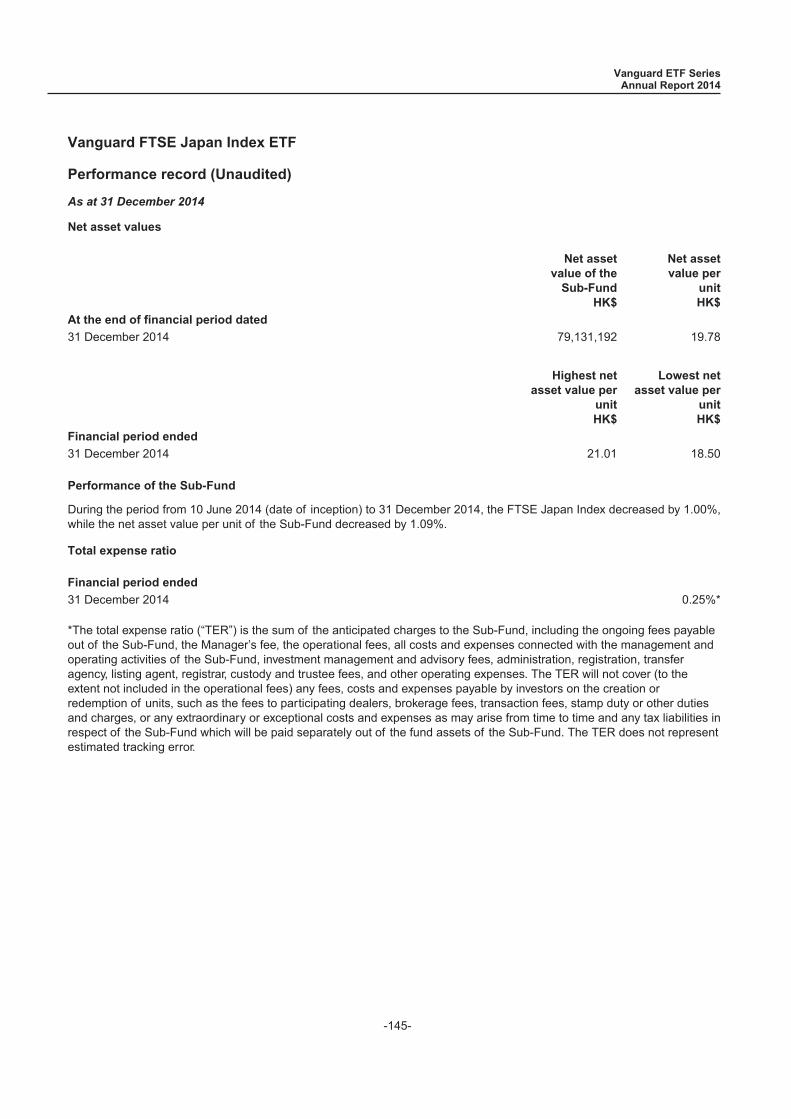
Vanguard FTSE Japan Index ETF
Performance record (Unaudited)
As at 31 December 2014
Net asset values
Net assetvalue of the
Sub-FundHK$
Net assetvalue per
unitHK$
At the end of financial period dated
31 December 2014 79,131,192 19.78
Highest netasset value per
unitHK$
Lowest netasset value per
unitHK$
Financial period ended
31 December 2014 21.01 18.50
Performance of the Sub-Fund
During the period from 10 June 2014 (date of inception) to 31 December 2014, the FTSE Japan Index decreased by 1.00%,while the net asset value per unit of the Sub-Fund decreased by 1.09%.
Total expense ratio
Financial period ended
31 December 2014 0.25%*
*The total expense ratio (“TER”) is the sum of the anticipated charges to the Sub-Fund, including the ongoing fees payableout of the Sub-Fund, the Manager’s fee, the operational fees, all costs and expenses connected with the management andoperating activities of the Sub-Fund, investment management and advisory fees, administration, registration, transferagency, listing agent, registrar, custody and trustee fees, and other operating expenses. The TER will not cover (to theextent not included in the operational fees) any fees, costs and expenses payable by investors on the creation orredemption of units, such as the fees to participating dealers, brokerage fees, transaction fees, stamp duty or other dutiesand charges, or any extraordinary or exceptional costs and expenses as may arise from time to time and any tax liabilities inrespect of the Sub-Fund which will be paid separately out of the fund assets of the Sub-Fund. The TER does not representestimated tracking error.
Vanguard ETF SeriesAnnual Report 2014
-145-
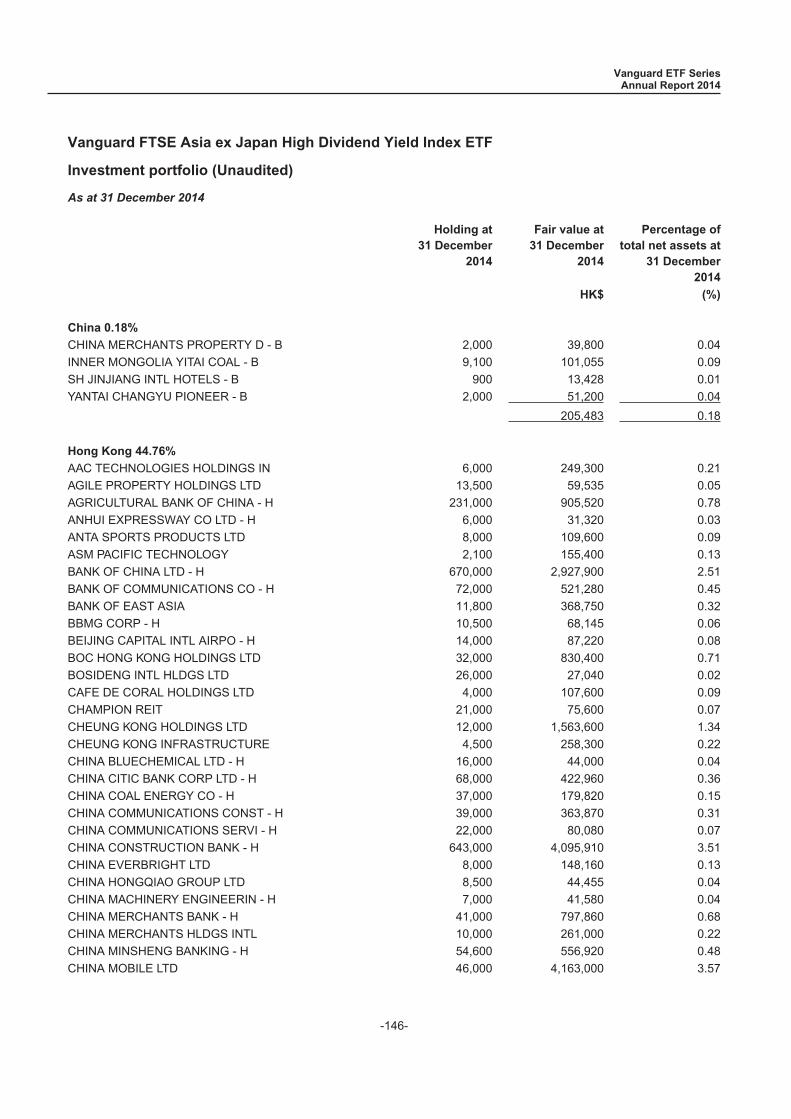
Vanguard FTSE Asia ex Japan High Dividend Yield Index ETF
Investment portfolio (Unaudited)
As at 31 December 2014
Holding at31 December
2014
Fair value at31 December
2014
Percentage oftotal net assets at
31 December2014
HK$ (%)
China 0.18%
CHINA MERCHANTS PROPERTY D - B 2,000 39,800 0.04INNER MONGOLIA YITAI COAL - B 9,100 101,055 0.09SH JINJIANG INTL HOTELS - B 900 13,428 0.01YANTAI CHANGYU PIONEER - B 2,000 51,200 0.04
205,483 0.18
Hong Kong 44.76%
AAC TECHNOLOGIES HOLDINGS IN 6,000 249,300 0.21AGILE PROPERTY HOLDINGS LTD 13,500 59,535 0.05AGRICULTURAL BANK OF CHINA - H 231,000 905,520 0.78ANHUI EXPRESSWAY CO LTD - H 6,000 31,320 0.03ANTA SPORTS PRODUCTS LTD 8,000 109,600 0.09ASM PACIFIC TECHNOLOGY 2,100 155,400 0.13BANK OF CHINA LTD - H 670,000 2,927,900 2.51BANK OF COMMUNICATIONS CO - H 72,000 521,280 0.45BANK OF EAST ASIA 11,800 368,750 0.32BBMG CORP - H 10,500 68,145 0.06BEIJING CAPITAL INTL AIRPO - H 14,000 87,220 0.08BOC HONG KONG HOLDINGS LTD 32,000 830,400 0.71BOSIDENG INTL HLDGS LTD 26,000 27,040 0.02CAFE DE CORAL HOLDINGS LTD 4,000 107,600 0.09CHAMPION REIT 21,000 75,600 0.07CHEUNG KONG HOLDINGS LTD 12,000 1,563,600 1.34CHEUNG KONG INFRASTRUCTURE 4,500 258,300 0.22CHINA BLUECHEMICAL LTD - H 16,000 44,000 0.04CHINA CITIC BANK CORP LTD - H 68,000 422,960 0.36CHINA COAL ENERGY CO - H 37,000 179,820 0.15CHINA COMMUNICATIONS CONST - H 39,000 363,870 0.31CHINA COMMUNICATIONS SERVI - H 22,000 80,080 0.07CHINA CONSTRUCTION BANK - H 643,000 4,095,910 3.51CHINA EVERBRIGHT LTD 8,000 148,160 0.13CHINA HONGQIAO GROUP LTD 8,500 44,455 0.04CHINA MACHINERY ENGINEERIN - H 7,000 41,580 0.04CHINA MERCHANTS BANK - H 41,000 797,860 0.68CHINA MERCHANTS HLDGS INTL 10,000 261,000 0.22CHINA MINSHENG BANKING - H 54,600 556,920 0.48CHINA MOBILE LTD 46,000 4,163,000 3.57
Vanguard ETF SeriesAnnual Report 2014
-146-
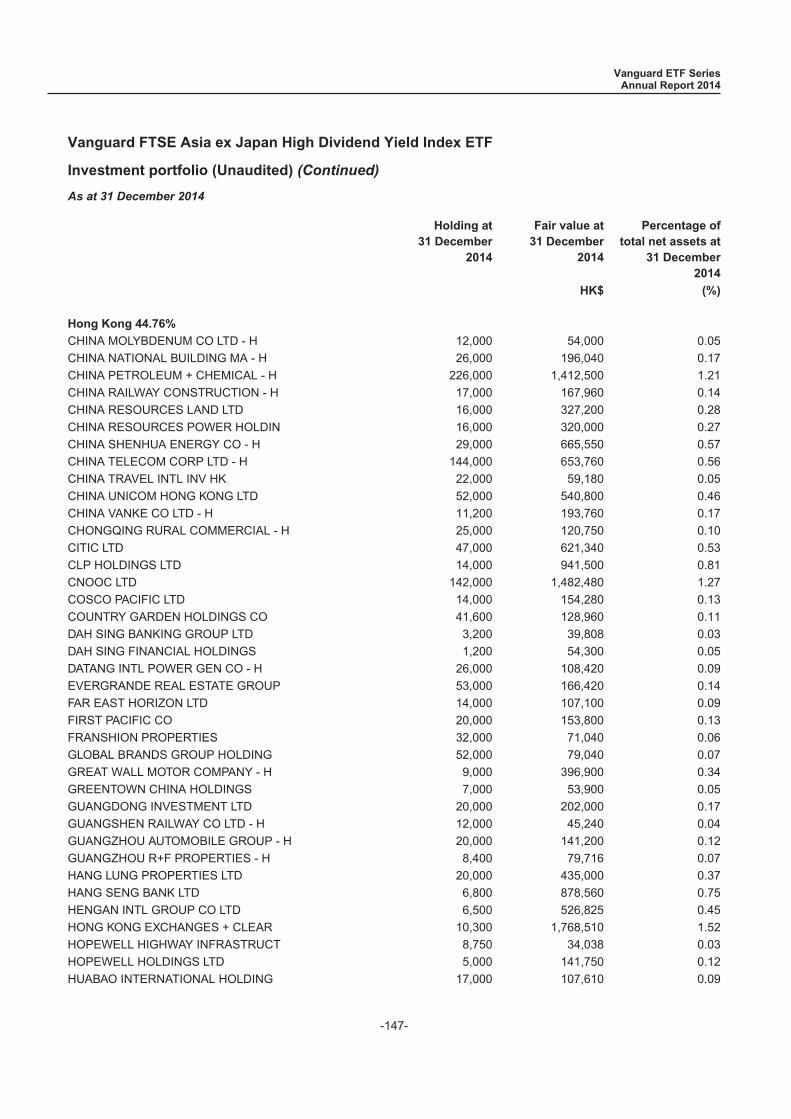
Vanguard FTSE Asia ex Japan High Dividend Yield Index ETF
Investment portfolio (Unaudited) (Continued)
As at 31 December 2014
Holding at31 December
2014
Fair value at31 December
2014
Percentage oftotal net assets at
31 December2014
HK$ (%)
Hong Kong 44.76%
CHINA MOLYBDENUM CO LTD - H 12,000 54,000 0.05CHINA NATIONAL BUILDING MA - H 26,000 196,040 0.17CHINA PETROLEUM + CHEMICAL - H 226,000 1,412,500 1.21CHINA RAILWAY CONSTRUCTION - H 17,000 167,960 0.14CHINA RESOURCES LAND LTD 16,000 327,200 0.28CHINA RESOURCES POWER HOLDIN 16,000 320,000 0.27CHINA SHENHUA ENERGY CO - H 29,000 665,550 0.57CHINA TELECOM CORP LTD - H 144,000 653,760 0.56CHINA TRAVEL INTL INV HK 22,000 59,180 0.05CHINA UNICOM HONG KONG LTD 52,000 540,800 0.46CHINA VANKE CO LTD - H 11,200 193,760 0.17CHONGQING RURAL COMMERCIAL - H 25,000 120,750 0.10CITIC LTD 47,000 621,340 0.53CLP HOLDINGS LTD 14,000 941,500 0.81CNOOC LTD 142,000 1,482,480 1.27COSCO PACIFIC LTD 14,000 154,280 0.13COUNTRY GARDEN HOLDINGS CO 41,600 128,960 0.11DAH SING BANKING GROUP LTD 3,200 39,808 0.03DAH SING FINANCIAL HOLDINGS 1,200 54,300 0.05DATANG INTL POWER GEN CO - H 26,000 108,420 0.09EVERGRANDE REAL ESTATE GROUP 53,000 166,420 0.14FAR EAST HORIZON LTD 14,000 107,100 0.09FIRST PACIFIC CO 20,000 153,800 0.13FRANSHION PROPERTIES 32,000 71,040 0.06GLOBAL BRANDS GROUP HOLDING 52,000 79,040 0.07GREAT WALL MOTOR COMPANY - H 9,000 396,900 0.34GREENTOWN CHINA HOLDINGS 7,000 53,900 0.05GUANGDONG INVESTMENT LTD 20,000 202,000 0.17GUANGSHEN RAILWAY CO LTD - H 12,000 45,240 0.04GUANGZHOU AUTOMOBILE GROUP - H 20,000 141,200 0.12GUANGZHOU R+F PROPERTIES - H 8,400 79,716 0.07HANG LUNG PROPERTIES LTD 20,000 435,000 0.37HANG SENG BANK LTD 6,800 878,560 0.75HENGAN INTL GROUP CO LTD 6,500 526,825 0.45HONG KONG EXCHANGES + CLEAR 10,300 1,768,510 1.52HOPEWELL HIGHWAY INFRASTRUCT 8,750 34,038 0.03HOPEWELL HOLDINGS LTD 5,000 141,750 0.12HUABAO INTERNATIONAL HOLDING 17,000 107,610 0.09
Vanguard ETF SeriesAnnual Report 2014
-147-
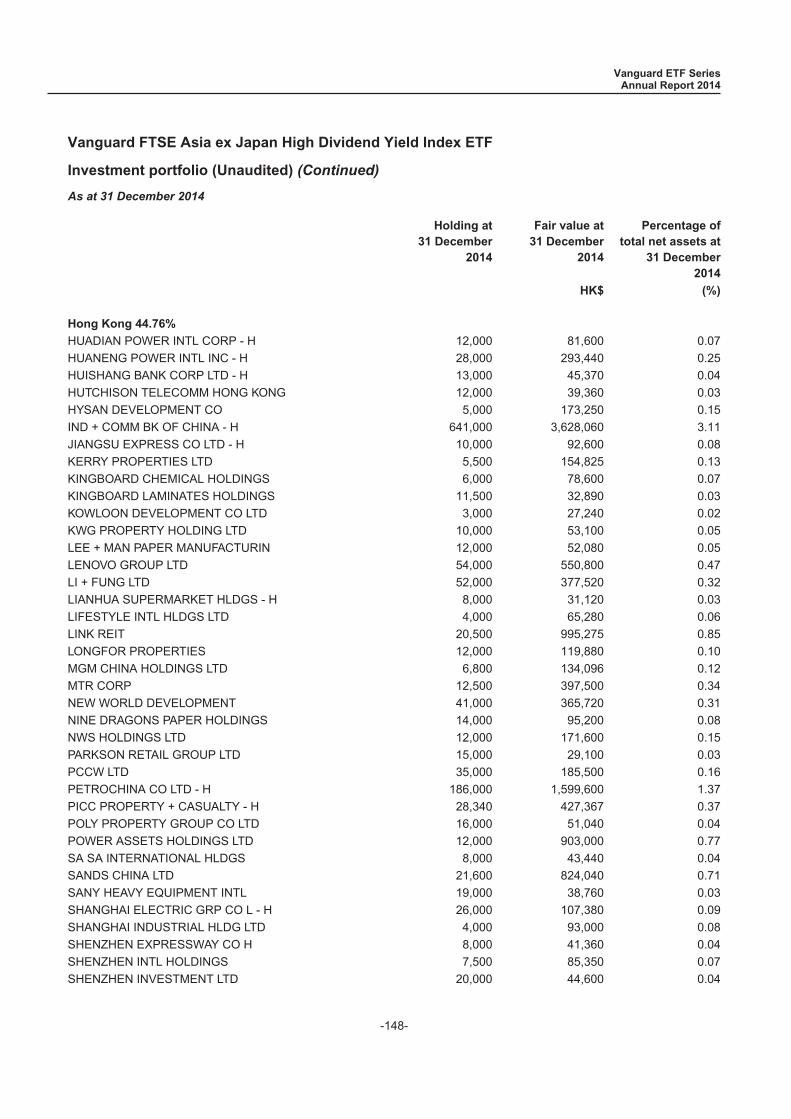
Vanguard FTSE Asia ex Japan High Dividend Yield Index ETF
Investment portfolio (Unaudited) (Continued)
As at 31 December 2014
Holding at31 December
2014
Fair value at31 December
2014
Percentage oftotal net assets at
31 December2014
HK$ (%)
Hong Kong 44.76%
HUADIAN POWER INTL CORP - H 12,000 81,600 0.07HUANENG POWER INTL INC - H 28,000 293,440 0.25HUISHANG BANK CORP LTD - H 13,000 45,370 0.04HUTCHISON TELECOMM HONG KONG 12,000 39,360 0.03HYSAN DEVELOPMENT CO 5,000 173,250 0.15IND + COMM BK OF CHINA - H 641,000 3,628,060 3.11JIANGSU EXPRESS CO LTD - H 10,000 92,600 0.08KERRY PROPERTIES LTD 5,500 154,825 0.13KINGBOARD CHEMICAL HOLDINGS 6,000 78,600 0.07KINGBOARD LAMINATES HOLDINGS 11,500 32,890 0.03KOWLOON DEVELOPMENT CO LTD 3,000 27,240 0.02KWG PROPERTY HOLDING LTD 10,000 53,100 0.05LEE + MAN PAPER MANUFACTURIN 12,000 52,080 0.05LENOVO GROUP LTD 54,000 550,800 0.47LI + FUNG LTD 52,000 377,520 0.32LIANHUA SUPERMARKET HLDGS - H 8,000 31,120 0.03LIFESTYLE INTL HLDGS LTD 4,000 65,280 0.06LINK REIT 20,500 995,275 0.85LONGFOR PROPERTIES 12,000 119,880 0.10MGM CHINA HOLDINGS LTD 6,800 134,096 0.12MTR CORP 12,500 397,500 0.34NEW WORLD DEVELOPMENT 41,000 365,720 0.31NINE DRAGONS PAPER HOLDINGS 14,000 95,200 0.08NWS HOLDINGS LTD 12,000 171,600 0.15PARKSON RETAIL GROUP LTD 15,000 29,100 0.03PCCW LTD 35,000 185,500 0.16PETROCHINA CO LTD - H 186,000 1,599,600 1.37PICC PROPERTY + CASUALTY - H 28,340 427,367 0.37POLY PROPERTY GROUP CO LTD 16,000 51,040 0.04POWER ASSETS HOLDINGS LTD 12,000 903,000 0.77SA SA INTERNATIONAL HLDGS 8,000 43,440 0.04SANDS CHINA LTD 21,600 824,040 0.71SANY HEAVY EQUIPMENT INTL 19,000 38,760 0.03SHANGHAI ELECTRIC GRP CO L - H 26,000 107,380 0.09SHANGHAI INDUSTRIAL HLDG LTD 4,000 93,000 0.08SHENZHEN EXPRESSWAY CO H 8,000 41,360 0.04SHENZHEN INTL HOLDINGS 7,500 85,350 0.07SHENZHEN INVESTMENT LTD 20,000 44,600 0.04
Vanguard ETF SeriesAnnual Report 2014
-148-
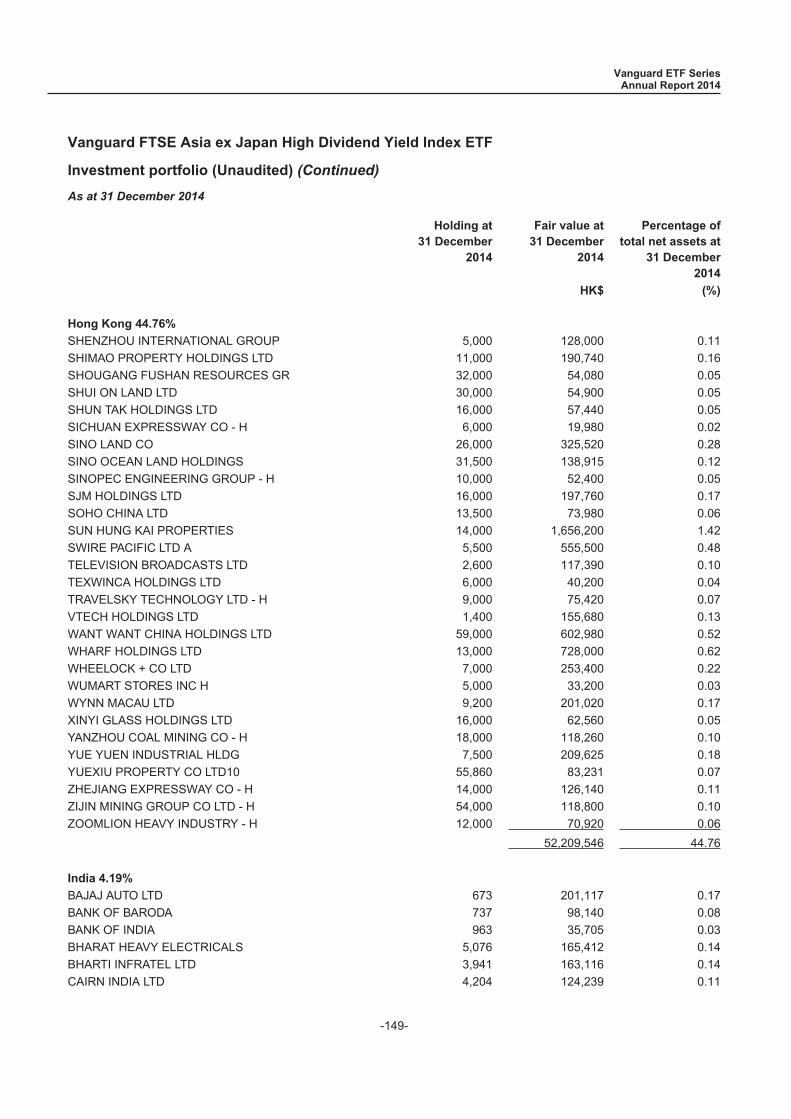
Vanguard FTSE Asia ex Japan High Dividend Yield Index ETF
Investment portfolio (Unaudited) (Continued)
As at 31 December 2014
Holding at31 December
2014
Fair value at31 December
2014
Percentage oftotal net assets at
31 December2014
HK$ (%)
Hong Kong 44.76%
SHENZHOU INTERNATIONAL GROUP 5,000 128,000 0.11SHIMAO PROPERTY HOLDINGS LTD 11,000 190,740 0.16SHOUGANG FUSHAN RESOURCES GR 32,000 54,080 0.05SHUI ON LAND LTD 30,000 54,900 0.05SHUN TAK HOLDINGS LTD 16,000 57,440 0.05SICHUAN EXPRESSWAY CO - H 6,000 19,980 0.02SINO LAND CO 26,000 325,520 0.28SINO OCEAN LAND HOLDINGS 31,500 138,915 0.12SINOPEC ENGINEERING GROUP - H 10,000 52,400 0.05SJM HOLDINGS LTD 16,000 197,760 0.17SOHO CHINA LTD 13,500 73,980 0.06SUN HUNG KAI PROPERTIES 14,000 1,656,200 1.42SWIRE PACIFIC LTD A 5,500 555,500 0.48TELEVISION BROADCASTS LTD 2,600 117,390 0.10TEXWINCA HOLDINGS LTD 6,000 40,200 0.04TRAVELSKY TECHNOLOGY LTD - H 9,000 75,420 0.07VTECH HOLDINGS LTD 1,400 155,680 0.13WANT WANT CHINA HOLDINGS LTD 59,000 602,980 0.52WHARF HOLDINGS LTD 13,000 728,000 0.62WHEELOCK + CO LTD 7,000 253,400 0.22WUMART STORES INC H 5,000 33,200 0.03WYNN MACAU LTD 9,200 201,020 0.17XINYI GLASS HOLDINGS LTD 16,000 62,560 0.05YANZHOU COAL MINING CO - H 18,000 118,260 0.10YUE YUEN INDUSTRIAL HLDG 7,500 209,625 0.18YUEXIU PROPERTY CO LTD10 55,860 83,231 0.07ZHEJIANG EXPRESSWAY CO - H 14,000 126,140 0.11ZIJIN MINING GROUP CO LTD - H 54,000 118,800 0.10ZOOMLION HEAVY INDUSTRY - H 12,000 70,920 0.06
52,209,546 44.76
India 4.19%
BAJAJ AUTO LTD 673 201,117 0.17BANK OF BARODA 737 98,140 0.08BANK OF INDIA 963 35,705 0.03BHARAT HEAVY ELECTRICALS 5,076 165,412 0.14BHARTI INFRATEL LTD 3,941 163,116 0.14CAIRN INDIA LTD 4,204 124,239 0.11
Vanguard ETF SeriesAnnual Report 2014
-149-
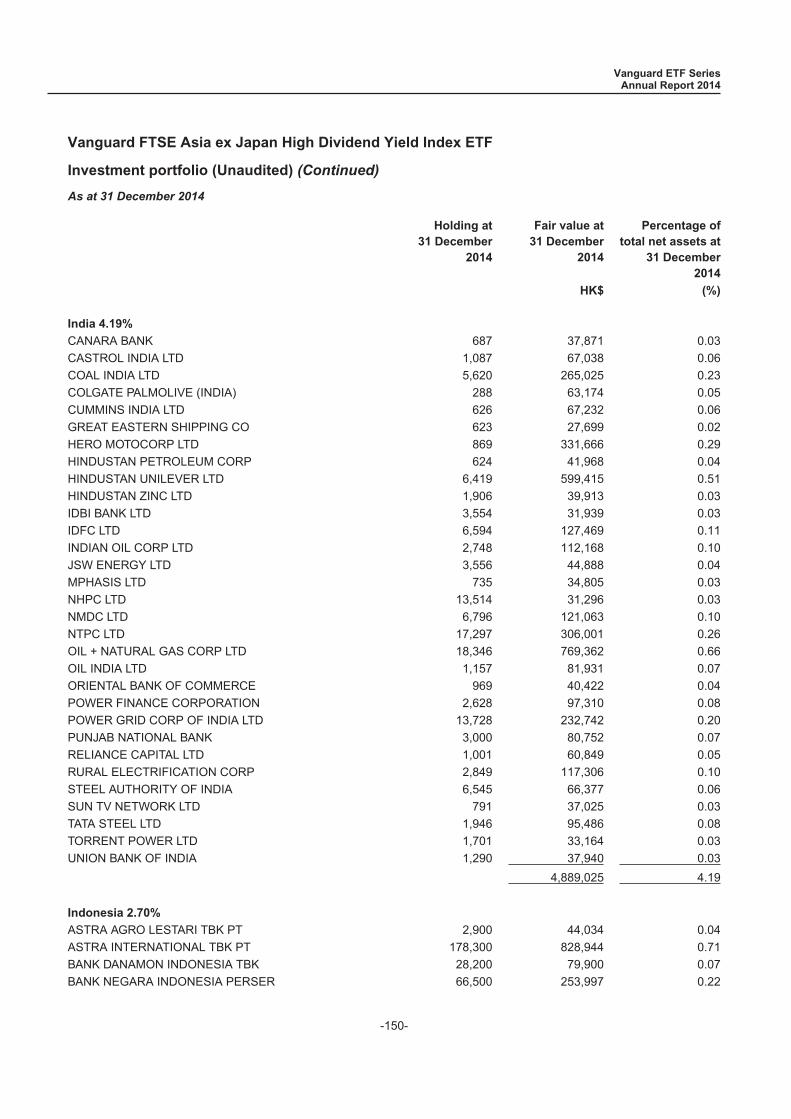
Vanguard FTSE Asia ex Japan High Dividend Yield Index ETF
Investment portfolio (Unaudited) (Continued)
As at 31 December 2014
Holding at31 December
2014
Fair value at31 December
2014
Percentage oftotal net assets at
31 December2014
HK$ (%)
India 4.19%
CANARA BANK 687 37,871 0.03CASTROL INDIA LTD 1,087 67,038 0.06COAL INDIA LTD 5,620 265,025 0.23COLGATE PALMOLIVE (INDIA) 288 63,174 0.05CUMMINS INDIA LTD 626 67,232 0.06GREAT EASTERN SHIPPING CO 623 27,699 0.02HERO MOTOCORP LTD 869 331,666 0.29HINDUSTAN PETROLEUM CORP 624 41,968 0.04HINDUSTAN UNILEVER LTD 6,419 599,415 0.51HINDUSTAN ZINC LTD 1,906 39,913 0.03IDBI BANK LTD 3,554 31,939 0.03IDFC LTD 6,594 127,469 0.11INDIAN OIL CORP LTD 2,748 112,168 0.10JSW ENERGY LTD 3,556 44,888 0.04MPHASIS LTD 735 34,805 0.03NHPC LTD 13,514 31,296 0.03NMDC LTD 6,796 121,063 0.10NTPC LTD 17,297 306,001 0.26OIL + NATURAL GAS CORP LTD 18,346 769,362 0.66OIL INDIA LTD 1,157 81,931 0.07ORIENTAL BANK OF COMMERCE 969 40,422 0.04POWER FINANCE CORPORATION 2,628 97,310 0.08POWER GRID CORP OF INDIA LTD 13,728 232,742 0.20PUNJAB NATIONAL BANK 3,000 80,752 0.07RELIANCE CAPITAL LTD 1,001 60,849 0.05RURAL ELECTRIFICATION CORP 2,849 117,306 0.10STEEL AUTHORITY OF INDIA 6,545 66,377 0.06SUN TV NETWORK LTD 791 37,025 0.03TATA STEEL LTD 1,946 95,486 0.08TORRENT POWER LTD 1,701 33,164 0.03UNION BANK OF INDIA 1,290 37,940 0.03
4,889,025 4.19
Indonesia 2.70%
ASTRA AGRO LESTARI TBK PT 2,900 44,034 0.04ASTRA INTERNATIONAL TBK PT 178,300 828,944 0.71BANK DANAMON INDONESIA TBK 28,200 79,900 0.07BANK NEGARA INDONESIA PERSER 66,500 253,997 0.22
Vanguard ETF SeriesAnnual Report 2014
-150-
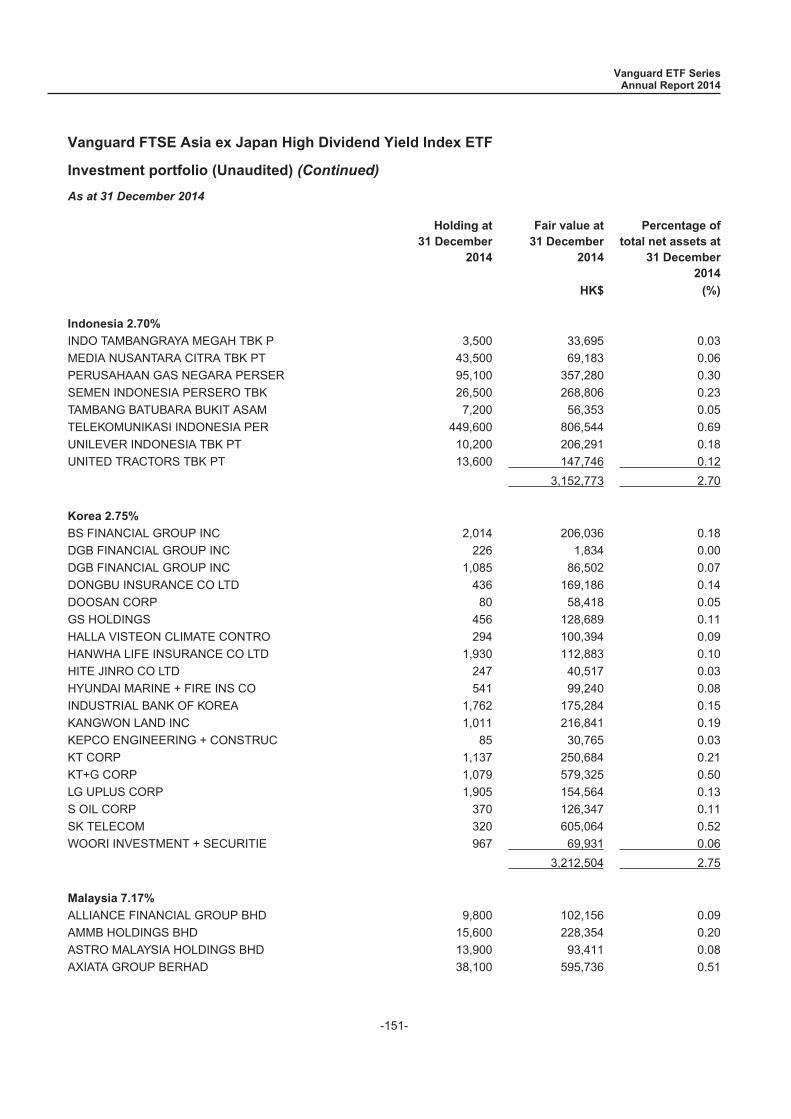
Vanguard FTSE Asia ex Japan High Dividend Yield Index ETF
Investment portfolio (Unaudited) (Continued)
As at 31 December 2014
Holding at31 December
2014
Fair value at31 December
2014
Percentage oftotal net assets at
31 December2014
HK$ (%)
Indonesia 2.70%
INDO TAMBANGRAYA MEGAH TBK P 3,500 33,695 0.03MEDIA NUSANTARA CITRA TBK PT 43,500 69,183 0.06PERUSAHAAN GAS NEGARA PERSER 95,100 357,280 0.30SEMEN INDONESIA PERSERO TBK 26,500 268,806 0.23TAMBANG BATUBARA BUKIT ASAM 7,200 56,353 0.05TELEKOMUNIKASI INDONESIA PER 449,600 806,544 0.69UNILEVER INDONESIA TBK PT 10,200 206,291 0.18UNITED TRACTORS TBK PT 13,600 147,746 0.12
3,152,773 2.70
Korea 2.75%
BS FINANCIAL GROUP INC 2,014 206,036 0.18DGB FINANCIAL GROUP INC 226 1,834 0.00DGB FINANCIAL GROUP INC 1,085 86,502 0.07DONGBU INSURANCE CO LTD 436 169,186 0.14DOOSAN CORP 80 58,418 0.05GS HOLDINGS 456 128,689 0.11HALLA VISTEON CLIMATE CONTRO 294 100,394 0.09HANWHA LIFE INSURANCE CO LTD 1,930 112,883 0.10HITE JINRO CO LTD 247 40,517 0.03HYUNDAI MARINE + FIRE INS CO 541 99,240 0.08INDUSTRIAL BANK OF KOREA 1,762 175,284 0.15KANGWON LAND INC 1,011 216,841 0.19KEPCO ENGINEERING + CONSTRUC 85 30,765 0.03KT CORP 1,137 250,684 0.21KT+G CORP 1,079 579,325 0.50LG UPLUS CORP 1,905 154,564 0.13S OIL CORP 370 126,347 0.11SK TELECOM 320 605,064 0.52WOORI INVESTMENT + SECURITIE 967 69,931 0.06
3,212,504 2.75
Malaysia 7.17%
ALLIANCE FINANCIAL GROUP BHD 9,800 102,156 0.09AMMB HOLDINGS BHD 15,600 228,354 0.20ASTRO MALAYSIA HOLDINGS BHD 13,900 93,411 0.08AXIATA GROUP BERHAD 38,100 595,736 0.51
Vanguard ETF SeriesAnnual Report 2014
-151-
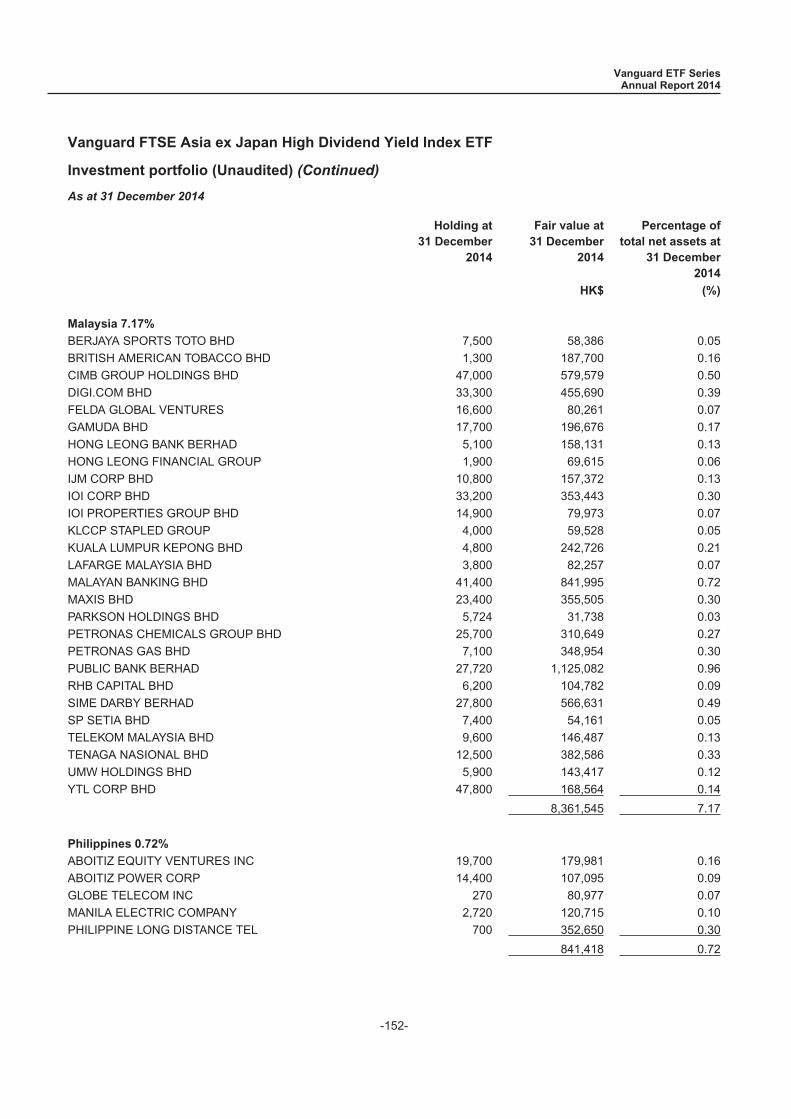
Vanguard FTSE Asia ex Japan High Dividend Yield Index ETF
Investment portfolio (Unaudited) (Continued)
As at 31 December 2014
Holding at31 December
2014
Fair value at31 December
2014
Percentage oftotal net assets at
31 December2014
HK$ (%)
Malaysia 7.17%
BERJAYA SPORTS TOTO BHD 7,500 58,386 0.05BRITISH AMERICAN TOBACCO BHD 1,300 187,700 0.16CIMB GROUP HOLDINGS BHD 47,000 579,579 0.50DIGI.COM BHD 33,300 455,690 0.39FELDA GLOBAL VENTURES 16,600 80,261 0.07GAMUDA BHD 17,700 196,676 0.17HONG LEONG BANK BERHAD 5,100 158,131 0.13HONG LEONG FINANCIAL GROUP 1,900 69,615 0.06IJM CORP BHD 10,800 157,372 0.13IOI CORP BHD 33,200 353,443 0.30IOI PROPERTIES GROUP BHD 14,900 79,973 0.07KLCCP STAPLED GROUP 4,000 59,528 0.05KUALA LUMPUR KEPONG BHD 4,800 242,726 0.21LAFARGE MALAYSIA BHD 3,800 82,257 0.07MALAYAN BANKING BHD 41,400 841,995 0.72MAXIS BHD 23,400 355,505 0.30PARKSON HOLDINGS BHD 5,724 31,738 0.03PETRONAS CHEMICALS GROUP BHD 25,700 310,649 0.27PETRONAS GAS BHD 7,100 348,954 0.30PUBLIC BANK BERHAD 27,720 1,125,082 0.96RHB CAPITAL BHD 6,200 104,782 0.09SIME DARBY BERHAD 27,800 566,631 0.49SP SETIA BHD 7,400 54,161 0.05TELEKOM MALAYSIA BHD 9,600 146,487 0.13TENAGA NASIONAL BHD 12,500 382,586 0.33UMW HOLDINGS BHD 5,900 143,417 0.12YTL CORP BHD 47,800 168,564 0.14
8,361,545 7.17
Philippines 0.72%
ABOITIZ EQUITY VENTURES INC 19,700 179,981 0.16ABOITIZ POWER CORP 14,400 107,095 0.09GLOBE TELECOM INC 270 80,977 0.07MANILA ELECTRIC COMPANY 2,720 120,715 0.10PHILIPPINE LONG DISTANCE TEL 700 352,650 0.30
841,418 0.72
Vanguard ETF SeriesAnnual Report 2014
-152-

Vanguard FTSE Asia ex Japan High Dividend Yield Index ETF
Investment portfolio (Unaudited) (Continued)
As at 31 December 2014
Holding at31 December
2014
Fair value at31 December
2014
Percentage oftotal net assets at
31 December2014
HK$ (%)
Singapore 10.81%
ASCENDAS REAL ESTATE INV TRT 18,000 250,711 0.22CAPITACOMMERCIAL TRUST 17,000 174,603 0.15CAPITAMALL TRUST 23,000 274,589 0.24COMFORTDELGRO CORP LTD 18,000 273,886 0.24DBS GROUP HOLDINGS LTD 15,500 1,868,632 1.60HUTCHISON PORT HOLDINGS TR U 45,000 240,788 0.21JARDINE CYCLE + CARRIAGE LTD 900 224,376 0.19JARDINE MATHESON HLDGS LTD 2,150 1,016,215 0.87KEPPEL CORP LTD 13,000 673,304 0.58KEPPEL LAND LTD 6,000 120,089 0.10M1 LTD 3,000 63,380 0.05NOBLE GROUP LTD 34,000 226,834 0.19OLAM INTERNATIONAL LTD 4,000 47,286 0.04OVERSEA CHINESE BANKING CORP 27,125 1,660,451 1.42SEMBCORP INDUSTRIES LTD 8,000 208,341 0.18SEMBCORP MARINE LTD 7,000 133,549 0.11SIA ENGINEERING CO LTD 2,000 49,393 0.04SINGAPORE AIRLINES LTD 5,000 339,432 0.29SINGAPORE EXCHANGE LTD 8,000 365,650 0.31SINGAPORE POST LTD 13,000 146,073 0.13SINGAPORE PRESS HOLDINGS LTD 14,000 344,933 0.30SINGAPORE TECH ENGINEERING 14,000 278,568 0.24SINGAPORE TELECOMMUNICATIONS 65,000 1,483,552 1.27STARHUB LTD 5,000 121,435 0.10SUNTEC REIT 21,000 240,880 0.21UNITED OVERSEAS BANK LTD 10,700 1,536,053 1.32VENTURE CORP LTD 2,000 92,115 0.08WING TAI HOLDINGS LTD 3,000 28,705 0.02YANGZIJIANG SHIPBUILDING 18,000 126,936 0.11
12,610,759 10.81
Taiwan 21.65%
ADVANCED SEMICONDUCTOR ENGR 57,000 532,916 0.46ADVANTECH CO LTD 3,298 189,781 0.16ASIA CEMENT CORP 20,400 195,233 0.17ASUSTEK COMPUTER INC 6,500 552,682 0.47CATCHER TECHNOLOGY CO LTD 6,500 393,178 0.34CATHAY REAL ESTATE DEVELOPME 8,000 33,275 0.03
Vanguard ETF SeriesAnnual Report 2014
-153-

Vanguard FTSE Asia ex Japan High Dividend Yield Index ETF
Investment portfolio (Unaudited) (Continued)
As at 31 December 2014
Holding at31 December
2014
Fair value at31 December
2014
Percentage oftotal net assets at
31 December2014
HK$ (%)
Taiwan 21.65%
CHENG SHIN RUBBER IND CO LTD 18,000 328,628 0.28CHENG UEI PRECISION INDUSTRY 3,000 36,441 0.03CHICONY ELECTRONICS CO LTD 5,025 109,128 0.09CHINA MOTOR CORP 6,000 41,152 0.04CHINA STEEL CORP 111,180 717,532 0.62CHUNGHWA TELECOM CO LTD 34,000 784,270 0.67COMPAL ELECTRONICS 37,000 201,564 0.17CTBC FINANCIAL HOLDING CO LT 136,883 690,272 0.59DELTA ELECTRONICS INC 18,000 832,612 0.71ETERNAL MATERIALS CO LTD 7,210 56,970 0.05FAR EASTERN NEW CENTURY CORP 34,680 267,219 0.23FAR EASTONE TELECOMM CO LTD 14,000 250,790 0.22FENG HSIN IRON + STEEL CO 4,000 38,134 0.03FORMOSA CHEMICALS + FIBRE 39,000 640,250 0.55FORMOSA PETROCHEMICAL CORP 17,000 286,592 0.25FORMOSA PLASTICS CORP 44,000 780,638 0.67FORMOSA TAFFETA CO. 9,000 69,348 0.06FUBON FINANCIAL HOLDING CO 65,000 808,686 0.69GIANT MANUFACTURING 2,500 172,387 0.15HOTAI MOTOR COMPANY LTD 4,000 466,734 0.40INVENTEC CO LTD 27,000 141,456 0.12LARGAN PRECISION CO LTD 900 528,941 0.45LITE ON TECHNOLOGY CORP 19,095 170,561 0.15MEDIATEK INC 13,000 1,473,819 1.26MEGA FINANCIAL HOLDING CO LT 88,000 527,984 0.45NAN YA PLASTICS CORP 51,000 819,729 0.70NOVATEK MICROELECTRONICS COR 5,000 218,398 0.19ORIENTAL UNION CHEMICAL 6,000 40,416 0.03PEGATRON CORP 15,000 268,703 0.23POU CHEN 24,000 226,447 0.19PRESIDENT CHAIN STORE CORP 5,000 299,991 0.26QUANTA COMPUTER INC 24,000 466,439 0.40REALTEK SEMICONDUCTOR CORP 4,000 104,046 0.09SILICONWARE PRECISION INDS 26,000 305,929 0.26SYNNEX TECHNOLOGY INTL CORP 12,000 135,750 0.12TAIWAN CEMENT 29,000 308,849 0.26TAIWAN FERTILIZER CO LTD 7,000 95,850 0.08TAIWAN MOBILE CO LTD 15,000 384,651 0.33
Vanguard ETF SeriesAnnual Report 2014
-154-
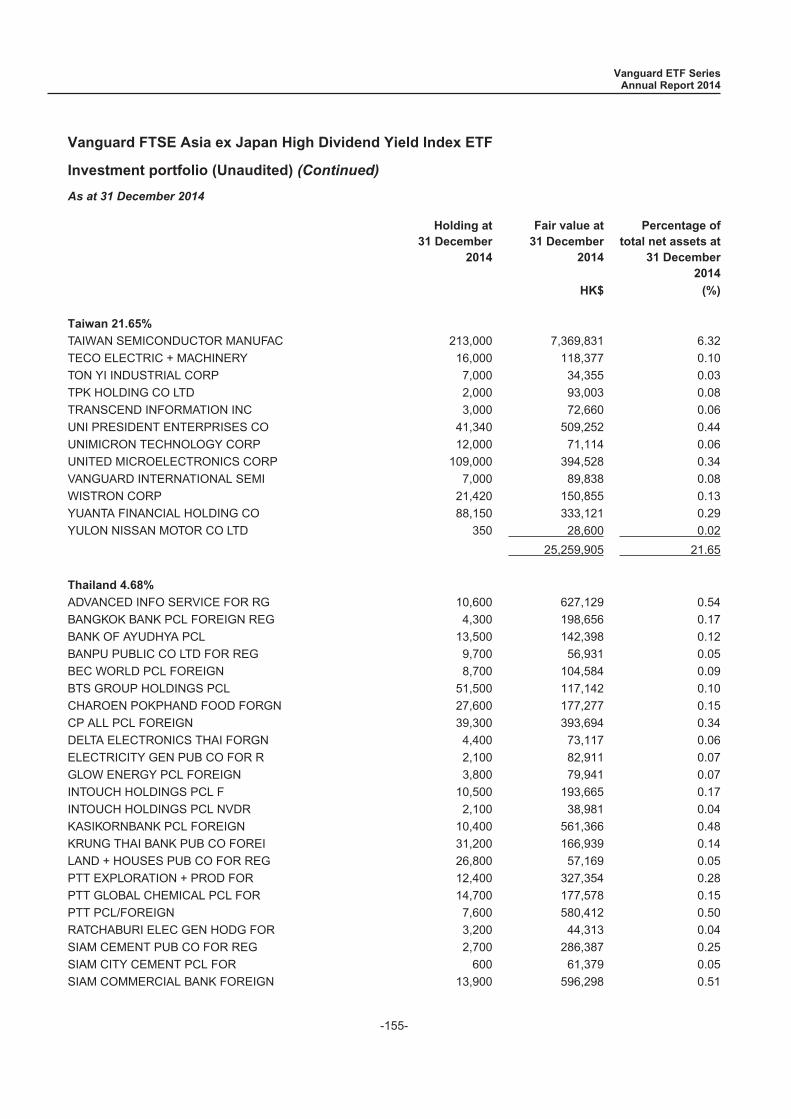
Vanguard FTSE Asia ex Japan High Dividend Yield Index ETF
Investment portfolio (Unaudited) (Continued)
As at 31 December 2014
Holding at31 December
2014
Fair value at31 December
2014
Percentage oftotal net assets at
31 December2014
HK$ (%)
Taiwan 21.65%
TAIWAN SEMICONDUCTOR MANUFAC 213,000 7,369,831 6.32TECO ELECTRIC + MACHINERY 16,000 118,377 0.10TON YI INDUSTRIAL CORP 7,000 34,355 0.03TPK HOLDING CO LTD 2,000 93,003 0.08TRANSCEND INFORMATION INC 3,000 72,660 0.06UNI PRESIDENT ENTERPRISES CO 41,340 509,252 0.44UNIMICRON TECHNOLOGY CORP 12,000 71,114 0.06UNITED MICROELECTRONICS CORP 109,000 394,528 0.34VANGUARD INTERNATIONAL SEMI 7,000 89,838 0.08WISTRON CORP 21,420 150,855 0.13YUANTA FINANCIAL HOLDING CO 88,150 333,121 0.29YULON NISSAN MOTOR CO LTD 350 28,600 0.02
25,259,905 21.65
Thailand 4.68%
ADVANCED INFO SERVICE FOR RG 10,600 627,129 0.54BANGKOK BANK PCL FOREIGN REG 4,300 198,656 0.17BANK OF AYUDHYA PCL 13,500 142,398 0.12BANPU PUBLIC CO LTD FOR REG 9,700 56,931 0.05BEC WORLD PCL FOREIGN 8,700 104,584 0.09BTS GROUP HOLDINGS PCL 51,500 117,142 0.10CHAROEN POKPHAND FOOD FORGN 27,600 177,277 0.15CP ALL PCL FOREIGN 39,300 393,694 0.34DELTA ELECTRONICS THAI FORGN 4,400 73,117 0.06ELECTRICITY GEN PUB CO FOR R 2,100 82,911 0.07GLOW ENERGY PCL FOREIGN 3,800 79,941 0.07INTOUCH HOLDINGS PCL F 10,500 193,665 0.17INTOUCH HOLDINGS PCL NVDR 2,100 38,981 0.04KASIKORNBANK PCL FOREIGN 10,400 561,366 0.48KRUNG THAI BANK PUB CO FOREI 31,200 166,939 0.14LAND + HOUSES PUB CO FOR REG 26,800 57,169 0.05PTT EXPLORATION + PROD FOR 12,400 327,354 0.28PTT GLOBAL CHEMICAL PCL FOR 14,700 177,578 0.15PTT PCL/FOREIGN 7,600 580,412 0.50RATCHABURI ELEC GEN HODG FOR 3,200 44,313 0.04SIAM CEMENT PUB CO FOR REG 2,700 286,387 0.25SIAM CITY CEMENT PCL FOR 600 61,379 0.05SIAM COMMERCIAL BANK FOREIGN 13,900 596,298 0.51
Vanguard ETF SeriesAnnual Report 2014
-155-
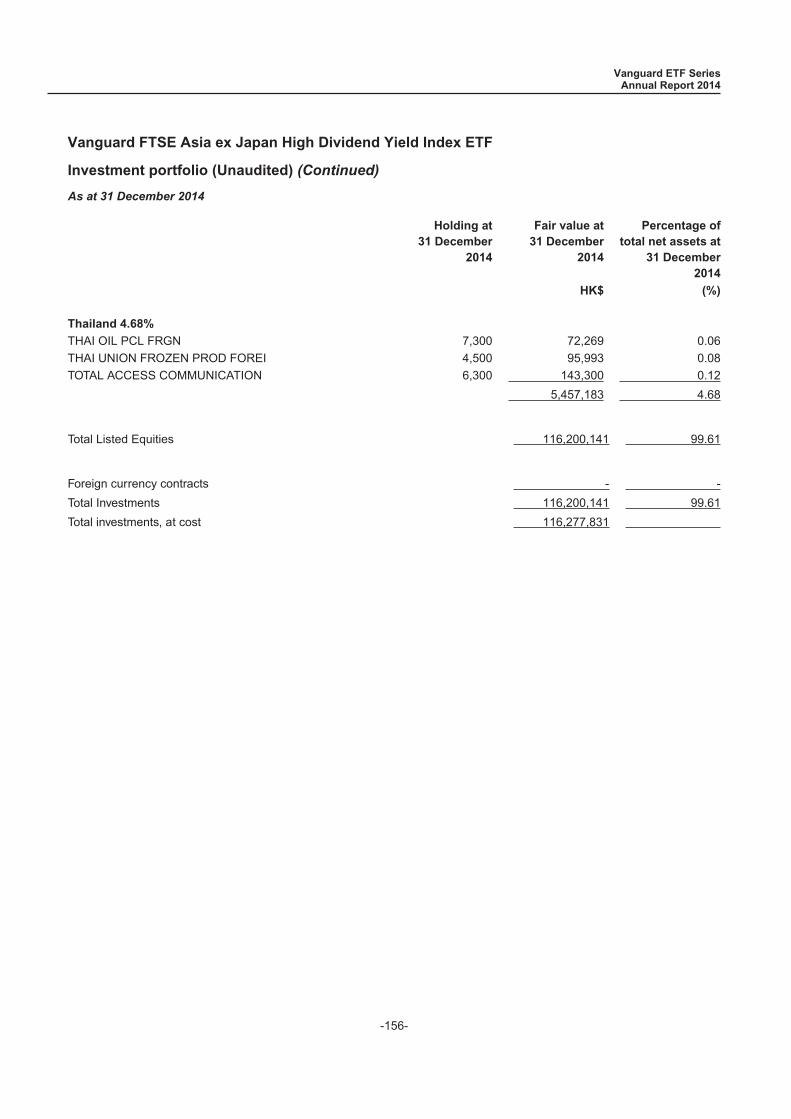
Vanguard FTSE Asia ex Japan High Dividend Yield Index ETF
Investment portfolio (Unaudited) (Continued)
As at 31 December 2014
Holding at31 December
2014
Fair value at31 December
2014
Percentage oftotal net assets at
31 December2014
HK$ (%)
Thailand 4.68%
THAI OIL PCL FRGN 7,300 72,269 0.06THAI UNION FROZEN PROD FOREI 4,500 95,993 0.08TOTAL ACCESS COMMUNICATION 6,300 143,300 0.12
5,457,183 4.68
Total Listed Equities 116,200,141 99.61
Foreign currency contracts - -Total Investments 116,200,141 99.61Total investments, at cost 116,277,831
Vanguard ETF SeriesAnnual Report 2014
-156-
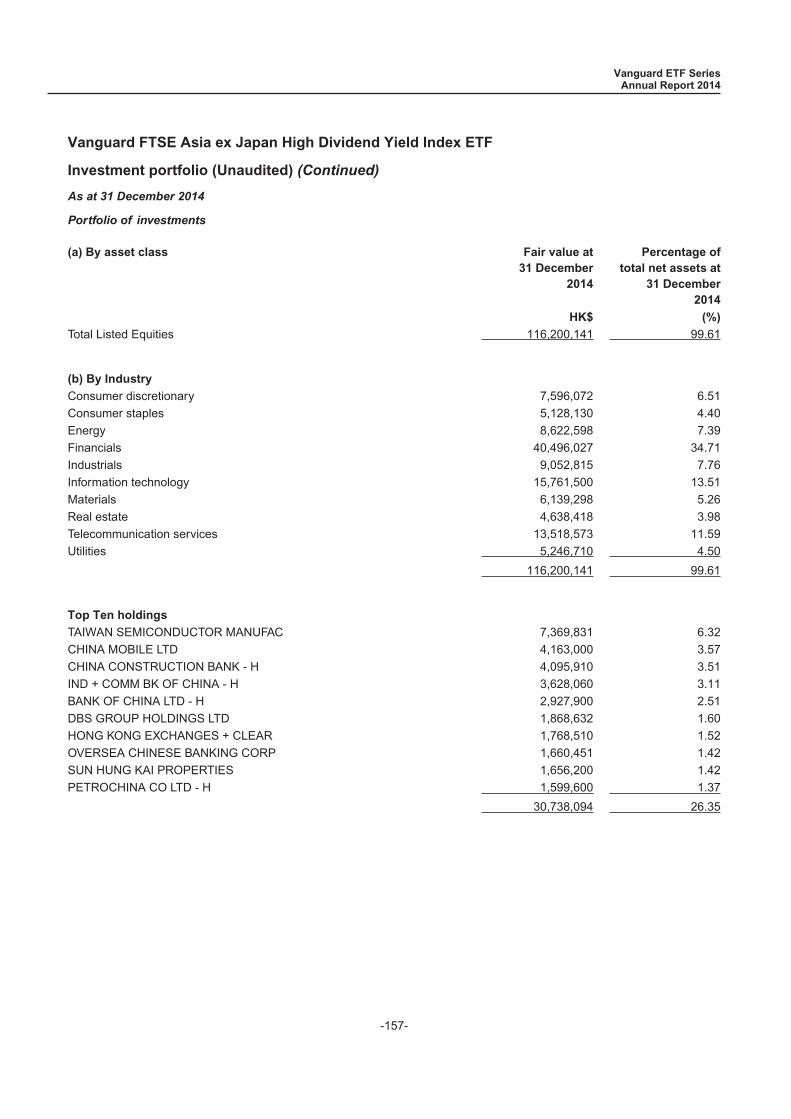
Vanguard FTSE Asia ex Japan High Dividend Yield Index ETF
Investment portfolio (Unaudited) (Continued)
As at 31 December 2014
Portfolio of investments
(a) By asset class Fair value at31 December
2014
Percentage oftotal net assets at
31 December2014
HK$ (%)
Total Listed Equities 116,200,141 99.61
(b) By Industry
Consumer discretionary 7,596,072 6.51Consumer staples 5,128,130 4.40Energy 8,622,598 7.39Financials 40,496,027 34.71Industrials 9,052,815 7.76Information technology 15,761,500 13.51Materials 6,139,298 5.26Real estate 4,638,418 3.98Telecommunication services 13,518,573 11.59Utilities 5,246,710 4.50
116,200,141 99.61
Top Ten holdings
TAIWAN SEMICONDUCTOR MANUFAC 7,369,831 6.32CHINA MOBILE LTD 4,163,000 3.57CHINA CONSTRUCTION BANK - H 4,095,910 3.51IND + COMM BK OF CHINA - H 3,628,060 3.11BANK OF CHINA LTD - H 2,927,900 2.51DBS GROUP HOLDINGS LTD 1,868,632 1.60HONG KONG EXCHANGES + CLEAR 1,768,510 1.52OVERSEA CHINESE BANKING CORP 1,660,451 1.42SUN HUNG KAI PROPERTIES 1,656,200 1.42PETROCHINA CO LTD - H 1,599,600 1.37
30,738,094 26.35
Vanguard ETF SeriesAnnual Report 2014
-157-

-158-
Vanguard FTSE Asia ex Japan High Dividend Yield Index ETFStatement of movements in investment portfolio (Unaudited)
Beginning holdings as
at 10 June 2014
Additions Disposals Closing holding as at 31 December
2014
AAC TECHNOLOGIES HOLDINGS IN - 7,000 1,000 6,000
ABOITIZ EQUITY VENTURES INC - 19,700 - 19,700
ABOITIZ POWER CORP - 14,400 - 14,400
ADVANCED INFO SERVICE FOR RG - 10,600 - 10,600
ADVANCED SEMICONDUCTOR ENGR - 57,000 - 57,000
ADVANTECH CO LTD - 3,298 - 3,298
AGILE PROPERTY HOLDINGS LTD - 13,500 - 13,500
AGRICULTURAL BANK OF CHINA H - 231,000 - 231,000
ALLIANCE FINANCIAL GROUP BHD - 9,800 - 9,800
AMMB HOLDINGS BHD - 15,600 - 15,600
ANHUI EXPRESSWAY CO LTD H - 6,000 - 6,000
ANTA SPORTS PRODUCTS LTD - 8,000 - 8,000
ASCENDAS REAL ESTATE INV TRT - 36,000 18,000 18,000
ASIA CEMENT CORP - 20,400 - 20,400
ASM PACIFIC TECHNOLOGY - 2,100 - 2,100
ASTRA AGRO LESTARI TBK PT - 2,900 - 2,900
ASTRA INTERNATIONAL TBK PT - 186,000 7,700 178,300
ASTRO MALAYSIA HOLDINGS BHD - 13,900 - 13,900
ASUSTEK COMPUTER INC - 6,500 - 6,500
AXIATA GROUP BERHAD - 44,400 6,300 38,100
BAJAJ AUTO LTD - 673 - 673
BANGKOK BANK PCL FOREIGN REG - 4,300 - 4,300
BANK DANAMON INDONESIA TBK - 28,200 - 28,200
BANK NEGARA INDONESIA PERSER - 66,500 - 66,500
BANK OF AYUDHYA PCL - 13,500 - 13,500
BANK OF BARODA - 737 - 737
BANK OF CHINA LTD H - 681,000 11,000 670,000
BANK OF COMMUNICATIONS CO H - 72,000 - 72,000
BANK OF EAST ASIA - 11,800 - 11,800
BANK OF INDIA - 963 - 963
BANPU PUBLIC CO LTD FOR REG - 9,700 - 9,700
BBMG CORP H - 10,500 - 10,500
BEC WORLD PCL FOREIGN - 8,700 - 8,700
BEIJING CAPITAL INTL AIRPO H - 14,000 - 14,000
BERJAYA SPORTS TOTO BHD - 7,500 - 7,500
BHARAT HEAVY ELECTRICALS - 5,076 - 5,076
BHARTI INFRATEL LTD - 3,941 - 3,941
For the period from 10 June 2014 (date of inception) to 31 December 2014
Vanguard ETF Series Annual Report 2014

-159-
Vanguard FTSE Asia ex Japan High Dividend Yield Index ETFStatement of movements in investment portfolio (Unaudited) (Continued)
Beginning holdings as
at 10 June 2014
Additions Disposals Closing holding as at 31 December
2014
For the period from 10 June 2014 (date of inception) to 31 December 2014
Vanguard ETF Series Annual Report 2014
BOC HONG KONG HOLDINGS LTD - 32,000 - 32,000
BOSIDENG INTL HLDGS LTD - 26,000 - 26,000
BRITISH AMERICAN TOBACCO BHD - 1,300 - 1,300
BS FINANCIAL GROUP INC - 2,014 - 2,014
BTS GROUP HOLDINGS PCL - 51,500 - 51,500
CAFE DE CORAL HOLDINGS LTD - 4,000 - 4,000
CAIRN INDIA LTD - 4,204 - 4,204
CANARA BANK - 687 - 687
CAPITACOMMERCIAL TRUST - 17,000 - 17,000
CAPITAMALL TRUST - 23,000 - 23,000
CASTROL INDIA LTD - 1,087 - 1,087
CATCHER TECHNOLOGY CO LTD - 6,500 - 6,500
CATHAY REAL ESTATE DEVELOPME - 8,000 - 8,000
CHAMPION REIT - 21,000 - 21,000
CHAROEN POKPHAND FOOD FORGN - 27,600 - 27,600
CHENG SHIN RUBBER IND CO LTD - 18,000 - 18,000
CHENG UEI PRECISION INDUSTRY - 3,000 - 3,000
CHEUNG KONG HOLDINGS LTD - 12,000 - 12,000
CHEUNG KONG INFRASTRUCTURE - 4,500 - 4,500
CHICONY ELECTRONICS CO LTD - 5,025 - 5,025
CHINA BLUECHEMICAL LTD H - 16,000 - 16,000
CHINA CITIC BANK CORP LTD H - 68,000 - 68,000
CHINA COAL ENERGY CO H - 37,000 - 37,000
CHINA COMMUNICATIONS CONST H - 39,000 - 39,000
CHINA COMMUNICATIONS SERVI H - 22,000 - 22,000
CHINA CONSTRUCTION BANK H - 650,000 7,000 643,000
CHINA EVERBRIGHT LTD - 8,000 - 8,000
CHINA HONGQIAO GROUP LTD - 8,500 - 8,500
CHINA MACHINERY ENGINEERIN H - 7,000 - 7,000
CHINA MERCHANTS BANK H - 41,000 - 41,000
CHINA MERCHANTS HLDGS INTL - 10,000 - 10,000
CHINA MERCHANTS PROPERTY D B - 2,000 - 2,000
CHINA MINSHENG BANKING H - 54,600 - 54.600
CHINA MOBILE LTD - 47,000 1,000 46,000
CHINA MOLYBDENUM CO LTD H - 12,000 - 12,000
CHINA MOTOR CORP - 6,000 - 6,000
CHINA NATIONAL BUILDING MA H - 26,000 - 26,000
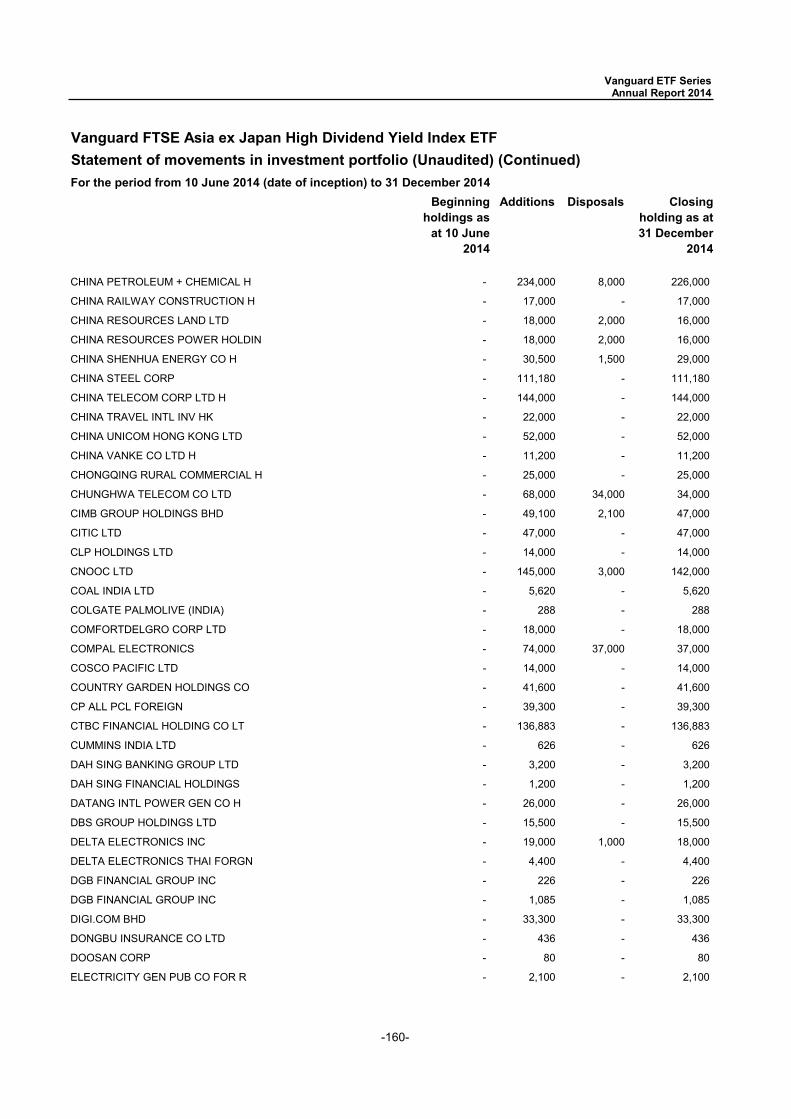
-160-
Vanguard FTSE Asia ex Japan High Dividend Yield Index ETFStatement of movements in investment portfolio (Unaudited) (Continued)
Beginning holdings as
at 10 June 2014
Additions Disposals Closing holding as at 31 December
2014
For the period from 10 June 2014 (date of inception) to 31 December 2014
Vanguard ETF Series Annual Report 2014
CHINA PETROLEUM + CHEMICAL H - 234,000 8,000 226,000
CHINA RAILWAY CONSTRUCTION H - 17,000 - 17,000
CHINA RESOURCES LAND LTD - 18,000 2,000 16,000
CHINA RESOURCES POWER HOLDIN - 18,000 2,000 16,000
CHINA SHENHUA ENERGY CO H - 30,500 1,500 29,000
CHINA STEEL CORP - 111,180 - 111,180
CHINA TELECOM CORP LTD H - 144,000 - 144,000
CHINA TRAVEL INTL INV HK - 22,000 - 22,000
CHINA UNICOM HONG KONG LTD - 52,000 - 52,000
CHINA VANKE CO LTD H - 11,200 - 11,200
CHONGQING RURAL COMMERCIAL H - 25,000 - 25,000
CHUNGHWA TELECOM CO LTD - 68,000 34,000 34,000
CIMB GROUP HOLDINGS BHD - 49,100 2,100 47,000
CITIC LTD - 47,000 - 47,000
CLP HOLDINGS LTD - 14,000 - 14,000
CNOOC LTD - 145,000 3,000 142,000
COAL INDIA LTD - 5,620 - 5,620
COLGATE PALMOLIVE (INDIA) - 288 - 288
COMFORTDELGRO CORP LTD - 18,000 - 18,000
COMPAL ELECTRONICS - 74,000 37,000 37,000
COSCO PACIFIC LTD - 14,000 - 14,000
COUNTRY GARDEN HOLDINGS CO - 41,600 - 41,600
CP ALL PCL FOREIGN - 39,300 - 39,300
CTBC FINANCIAL HOLDING CO LT - 136,883 - 136,883
CUMMINS INDIA LTD - 626 - 626
DAH SING BANKING GROUP LTD - 3,200 - 3,200
DAH SING FINANCIAL HOLDINGS - 1,200 - 1,200
DATANG INTL POWER GEN CO H - 26,000 - 26,000
DBS GROUP HOLDINGS LTD - 15,500 - 15,500
DELTA ELECTRONICS INC - 19,000 1,000 18,000
DELTA ELECTRONICS THAI FORGN - 4,400 - 4,400
DGB FINANCIAL GROUP INC - 226 - 226
DGB FINANCIAL GROUP INC - 1,085 - 1,085
DIGI.COM BHD - 33,300 - 33,300
DONGBU INSURANCE CO LTD - 436 - 436
DOOSAN CORP - 80 - 80
ELECTRICITY GEN PUB CO FOR R - 2,100 - 2,100
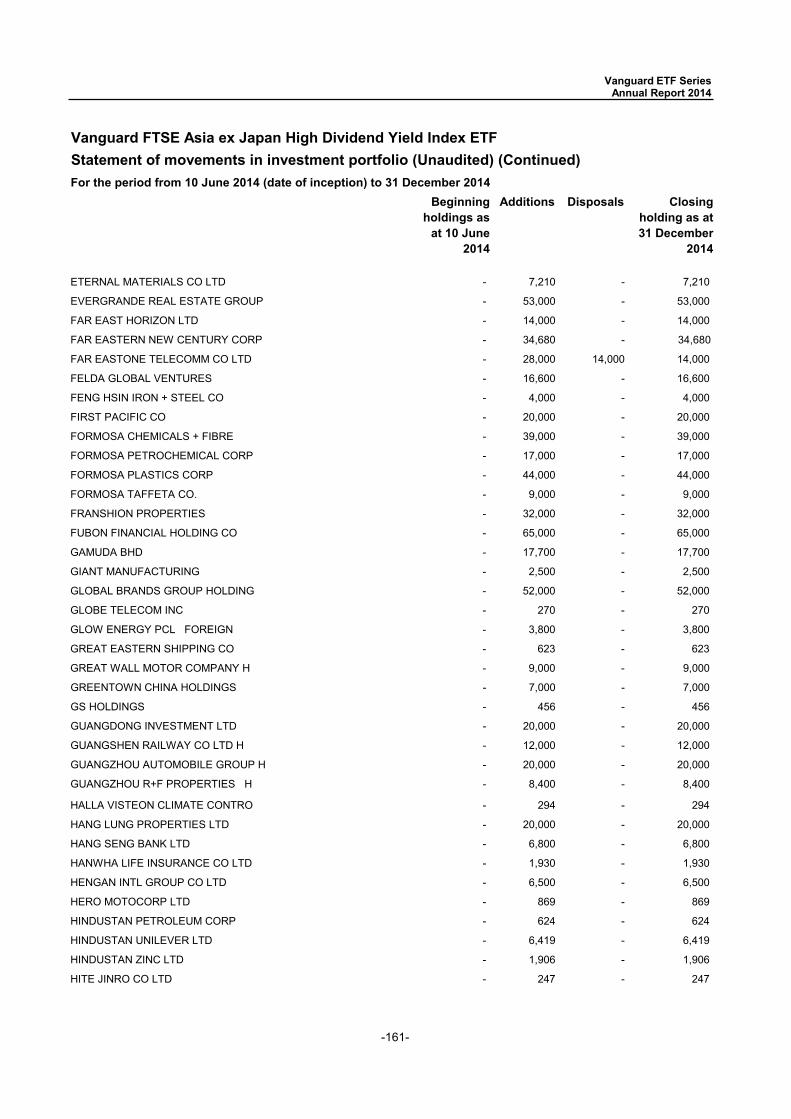
-161-
Vanguard FTSE Asia ex Japan High Dividend Yield Index ETFStatement of movements in investment portfolio (Unaudited) (Continued)
Beginning holdings as
at 10 June 2014
Additions Disposals Closing holding as at 31 December
2014
For the period from 10 June 2014 (date of inception) to 31 December 2014
Vanguard ETF Series Annual Report 2014
ETERNAL MATERIALS CO LTD - 7,210 - 7,210
EVERGRANDE REAL ESTATE GROUP - 53,000 - 53,000
FAR EAST HORIZON LTD - 14,000 - 14,000
FAR EASTERN NEW CENTURY CORP - 34,680 - 34,680
FAR EASTONE TELECOMM CO LTD - 28,000 14,000 14,000
FELDA GLOBAL VENTURES - 16,600 - 16,600
FENG HSIN IRON + STEEL CO - 4,000 - 4,000
FIRST PACIFIC CO - 20,000 - 20,000
FORMOSA CHEMICALS + FIBRE - 39,000 - 39,000
FORMOSA PETROCHEMICAL CORP - 17,000 - 17,000
FORMOSA PLASTICS CORP - 44,000 - 44,000
FORMOSA TAFFETA CO. - 9,000 - 9,000
FRANSHION PROPERTIES - 32,000 - 32,000
FUBON FINANCIAL HOLDING CO - 65,000 - 65,000
GAMUDA BHD - 17,700 - 17,700
GIANT MANUFACTURING - 2,500 - 2,500
GLOBAL BRANDS GROUP HOLDING - 52,000 - 52,000
GLOBE TELECOM INC - 270 - 270
GLOW ENERGY PCL FOREIGN - 3,800 - 3,800
GREAT EASTERN SHIPPING CO - 623 - 623
GREAT WALL MOTOR COMPANY H - 9,000 - 9,000
GREENTOWN CHINA HOLDINGS - 7,000 - 7,000
GS HOLDINGS - 456 - 456
GUANGDONG INVESTMENT LTD - 20,000 - 20,000
GUANGSHEN RAILWAY CO LTD H - 12,000 - 12,000
GUANGZHOU AUTOMOBILE GROUP H - 20,000 - 20,000
GUANGZHOU R+F PROPERTIES H - 8,400 - 8,400
HALLA VISTEON CLIMATE CONTRO - 294 - 294
HANG LUNG PROPERTIES LTD - 20,000 - 20,000
HANG SENG BANK LTD - 6,800 - 6,800
HANWHA LIFE INSURANCE CO LTD - 1,930 - 1,930
HENGAN INTL GROUP CO LTD - 6,500 - 6,500
HERO MOTOCORP LTD - 869 - 869
HINDUSTAN PETROLEUM CORP - 624 - 624
HINDUSTAN UNILEVER LTD - 6,419 - 6,419
HINDUSTAN ZINC LTD - 1,906 - 1,906
HITE JINRO CO LTD - 247 - 247
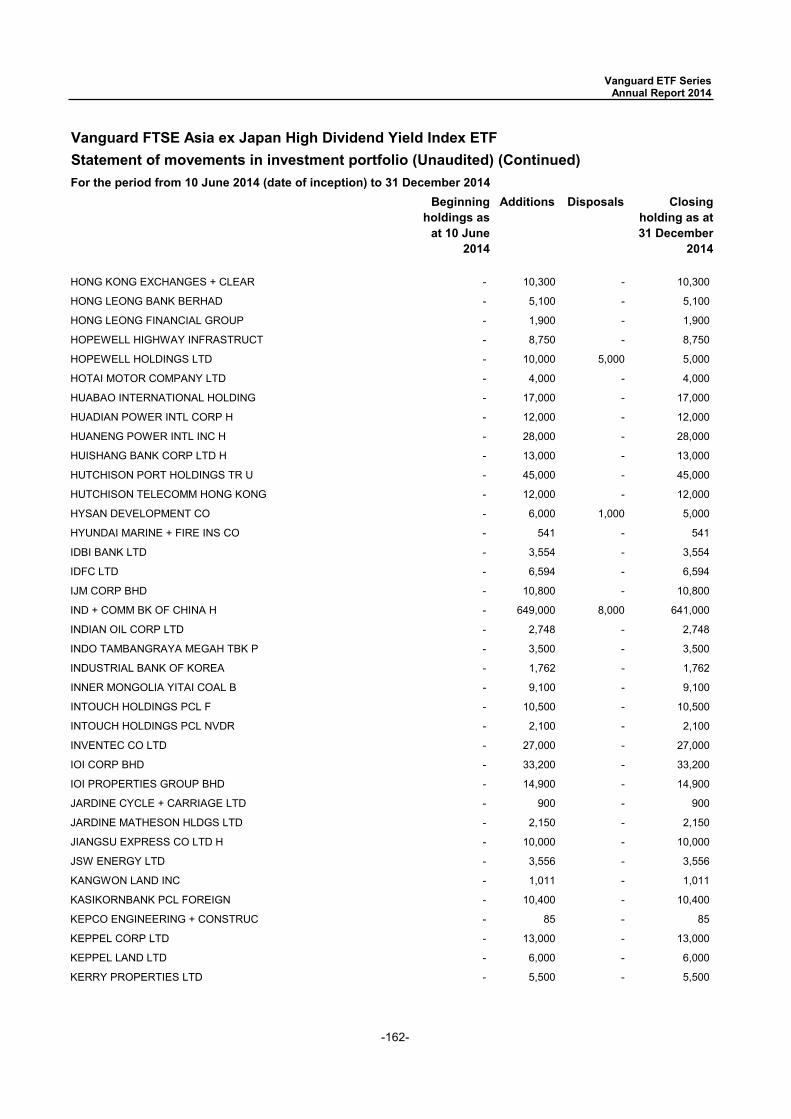
-162-
Vanguard FTSE Asia ex Japan High Dividend Yield Index ETFStatement of movements in investment portfolio (Unaudited) (Continued)
Beginning holdings as
at 10 June 2014
Additions Disposals Closing holding as at 31 December
2014
For the period from 10 June 2014 (date of inception) to 31 December 2014
Vanguard ETF Series Annual Report 2014
HONG KONG EXCHANGES + CLEAR - 10,300 - 10,300
HONG LEONG BANK BERHAD - 5,100 - 5,100
HONG LEONG FINANCIAL GROUP - 1,900 - 1,900
HOPEWELL HIGHWAY INFRASTRUCT - 8,750 - 8,750
HOPEWELL HOLDINGS LTD - 10,000 5,000 5,000
HOTAI MOTOR COMPANY LTD - 4,000 - 4,000
HUABAO INTERNATIONAL HOLDING - 17,000 - 17,000
HUADIAN POWER INTL CORP H - 12,000 - 12,000
HUANENG POWER INTL INC H - 28,000 - 28,000
HUISHANG BANK CORP LTD H - 13,000 - 13,000
HUTCHISON PORT HOLDINGS TR U - 45,000 - 45,000
HUTCHISON TELECOMM HONG KONG - 12,000 - 12,000
HYSAN DEVELOPMENT CO - 6,000 1,000 5,000
HYUNDAI MARINE + FIRE INS CO - 541 - 541
IDBI BANK LTD - 3,554 - 3,554
IDFC LTD - 6,594 - 6,594
IJM CORP BHD - 10,800 - 10,800
IND + COMM BK OF CHINA H - 649,000 8,000 641,000
INDIAN OIL CORP LTD - 2,748 - 2,748
INDO TAMBANGRAYA MEGAH TBK P - 3,500 - 3,500
INDUSTRIAL BANK OF KOREA - 1,762 - 1,762
INNER MONGOLIA YITAI COAL B - 9,100 - 9,100
INTOUCH HOLDINGS PCL F - 10,500 - 10,500
INTOUCH HOLDINGS PCL NVDR - 2,100 - 2,100
INVENTEC CO LTD - 27,000 - 27,000
IOI CORP BHD - 33,200 - 33,200
IOI PROPERTIES GROUP BHD - 14,900 - 14,900
JARDINE CYCLE + CARRIAGE LTD - 900 - 900
JARDINE MATHESON HLDGS LTD - 2,150 - 2,150
JIANGSU EXPRESS CO LTD H - 10,000 - 10,000
JSW ENERGY LTD - 3,556 - 3,556
KANGWON LAND INC - 1,011 - 1,011
KASIKORNBANK PCL FOREIGN - 10,400 - 10,400
KEPCO ENGINEERING + CONSTRUC - 85 - 85
KEPPEL CORP LTD - 13,000 - 13,000
KEPPEL LAND LTD - 6,000 - 6,000
KERRY PROPERTIES LTD - 5,500 - 5,500
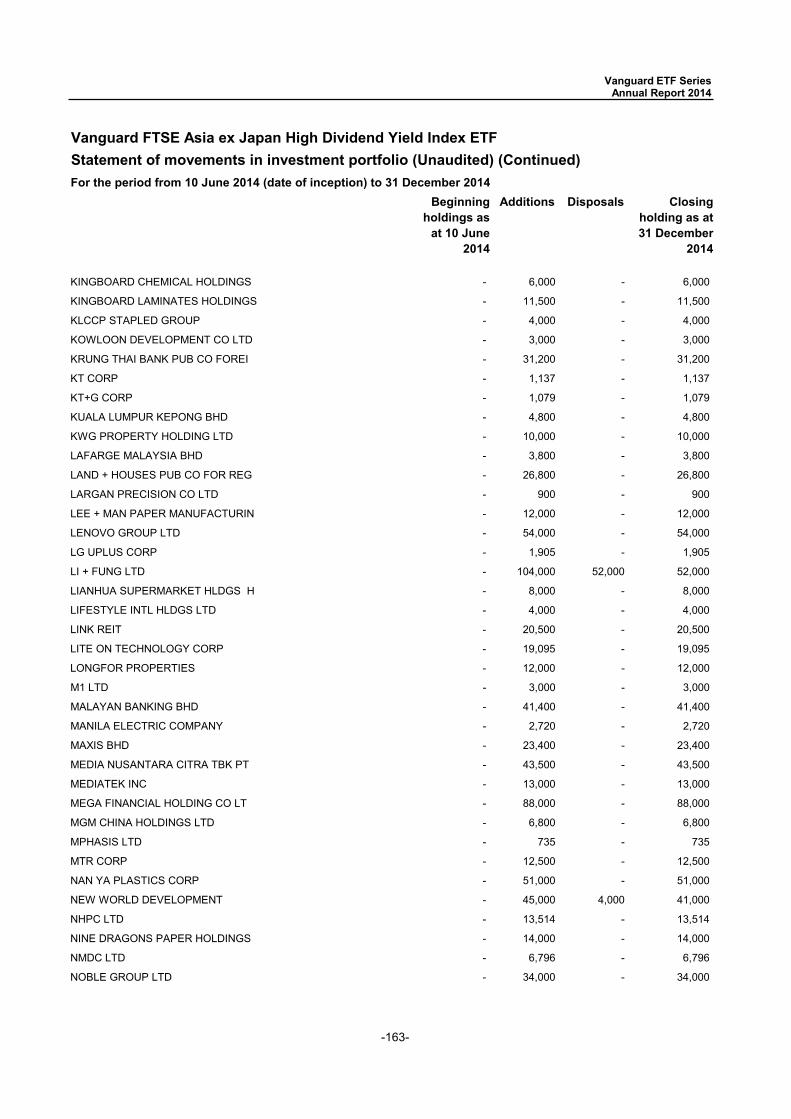
-163-
Vanguard FTSE Asia ex Japan High Dividend Yield Index ETFStatement of movements in investment portfolio (Unaudited) (Continued)
Beginning holdings as
at 10 June 2014
Additions Disposals Closing holding as at 31 December
2014
For the period from 10 June 2014 (date of inception) to 31 December 2014
Vanguard ETF Series Annual Report 2014
KINGBOARD CHEMICAL HOLDINGS - 6,000 - 6,000
KINGBOARD LAMINATES HOLDINGS - 11,500 - 11,500
KLCCP STAPLED GROUP - 4,000 - 4,000
KOWLOON DEVELOPMENT CO LTD - 3,000 - 3,000
KRUNG THAI BANK PUB CO FOREI - 31,200 - 31,200
KT CORP - 1,137 - 1,137
KT+G CORP - 1,079 - 1,079
KUALA LUMPUR KEPONG BHD - 4,800 - 4,800
KWG PROPERTY HOLDING LTD - 10,000 - 10,000
LAFARGE MALAYSIA BHD - 3,800 - 3,800
LAND + HOUSES PUB CO FOR REG - 26,800 - 26,800
LARGAN PRECISION CO LTD - 900 - 900
LEE + MAN PAPER MANUFACTURIN - 12,000 - 12,000
LENOVO GROUP LTD - 54,000 - 54,000
LG UPLUS CORP - 1,905 - 1,905
LI + FUNG LTD - 104,000 52,000 52,000
LIANHUA SUPERMARKET HLDGS H - 8,000 - 8,000
LIFESTYLE INTL HLDGS LTD - 4,000 - 4,000
LINK REIT - 20,500 - 20,500
LITE ON TECHNOLOGY CORP - 19,095 - 19,095
LONGFOR PROPERTIES - 12,000 - 12,000
M1 LTD - 3,000 - 3,000
MALAYAN BANKING BHD - 41,400 - 41,400
MANILA ELECTRIC COMPANY - 2,720 - 2,720
MAXIS BHD - 23,400 - 23,400
MEDIA NUSANTARA CITRA TBK PT - 43,500 - 43,500
MEDIATEK INC - 13,000 - 13,000
MEGA FINANCIAL HOLDING CO LT - 88,000 - 88,000
MGM CHINA HOLDINGS LTD - 6,800 - 6,800
MPHASIS LTD - 735 - 735
MTR CORP - 12,500 - 12,500
NAN YA PLASTICS CORP - 51,000 - 51,000
NEW WORLD DEVELOPMENT - 45,000 4,000 41,000
NHPC LTD - 13,514 - 13,514
NINE DRAGONS PAPER HOLDINGS - 14,000 - 14,000
NMDC LTD - 6,796 - 6,796
NOBLE GROUP LTD - 34,000 - 34,000
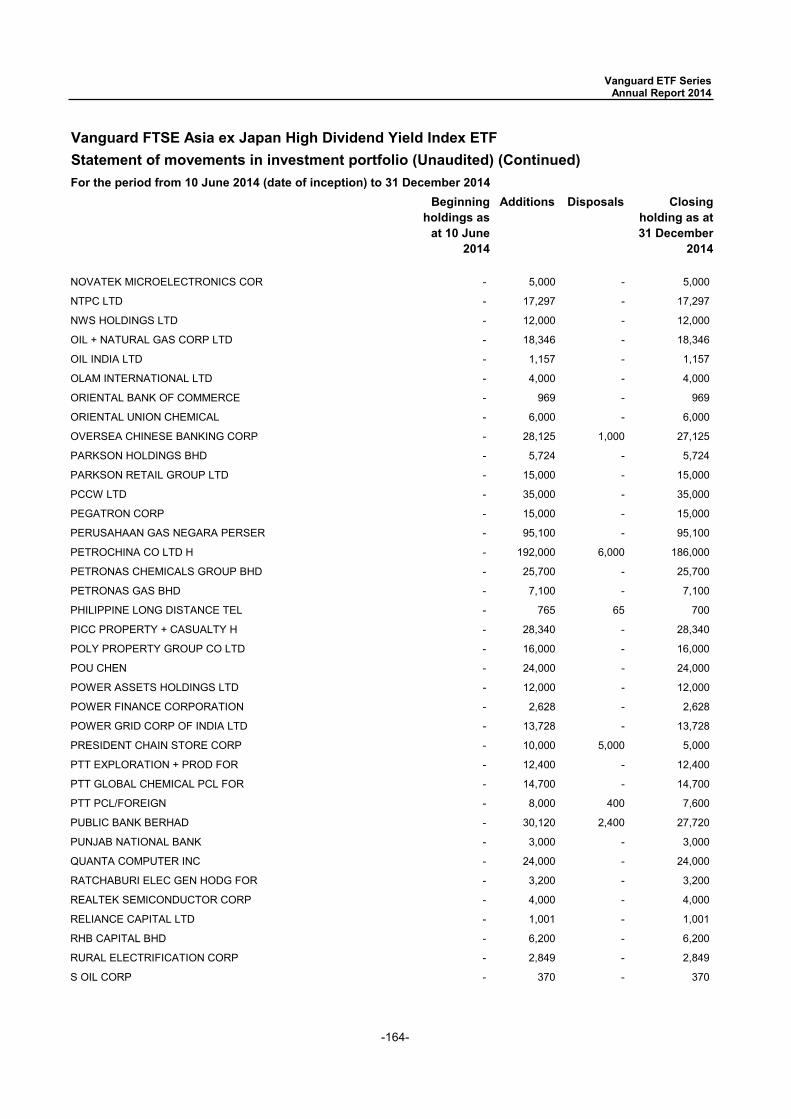
-164-
Vanguard FTSE Asia ex Japan High Dividend Yield Index ETFStatement of movements in investment portfolio (Unaudited) (Continued)
Beginning holdings as
at 10 June 2014
Additions Disposals Closing holding as at 31 December
2014
For the period from 10 June 2014 (date of inception) to 31 December 2014
Vanguard ETF Series Annual Report 2014
NOVATEK MICROELECTRONICS COR - 5,000 - 5,000
NTPC LTD - 17,297 - 17,297
NWS HOLDINGS LTD - 12,000 - 12,000
OIL + NATURAL GAS CORP LTD - 18,346 - 18,346
OIL INDIA LTD - 1,157 - 1,157
OLAM INTERNATIONAL LTD - 4,000 - 4,000
ORIENTAL BANK OF COMMERCE - 969 - 969
ORIENTAL UNION CHEMICAL - 6,000 - 6,000
OVERSEA CHINESE BANKING CORP - 28,125 1,000 27,125
PARKSON HOLDINGS BHD - 5,724 - 5,724
PARKSON RETAIL GROUP LTD - 15,000 - 15,000
PCCW LTD - 35,000 - 35,000
PEGATRON CORP - 15,000 - 15,000
PERUSAHAAN GAS NEGARA PERSER - 95,100 - 95,100
PETROCHINA CO LTD H - 192,000 6,000 186,000
PETRONAS CHEMICALS GROUP BHD - 25,700 - 25,700
PETRONAS GAS BHD - 7,100 - 7,100
PHILIPPINE LONG DISTANCE TEL - 765 65 700
PICC PROPERTY + CASUALTY H - 28,340 - 28,340
POLY PROPERTY GROUP CO LTD - 16,000 - 16,000
POU CHEN - 24,000 - 24,000
POWER ASSETS HOLDINGS LTD - 12,000 - 12,000
POWER FINANCE CORPORATION - 2,628 - 2,628
POWER GRID CORP OF INDIA LTD - 13,728 - 13,728
PRESIDENT CHAIN STORE CORP - 10,000 5,000 5,000
PTT EXPLORATION + PROD FOR - 12,400 - 12,400
PTT GLOBAL CHEMICAL PCL FOR - 14,700 - 14,700
PTT PCL/FOREIGN - 8,000 400 7,600
PUBLIC BANK BERHAD - 30,120 2,400 27,720
PUNJAB NATIONAL BANK - 3,000 - 3,000
QUANTA COMPUTER INC - 24,000 - 24,000
RATCHABURI ELEC GEN HODG FOR - 3,200 - 3,200
REALTEK SEMICONDUCTOR CORP - 4,000 - 4,000
RELIANCE CAPITAL LTD - 1,001 - 1,001
RHB CAPITAL BHD - 6,200 - 6,200
RURAL ELECTRIFICATION CORP - 2,849 - 2,849
S OIL CORP - 370 - 370
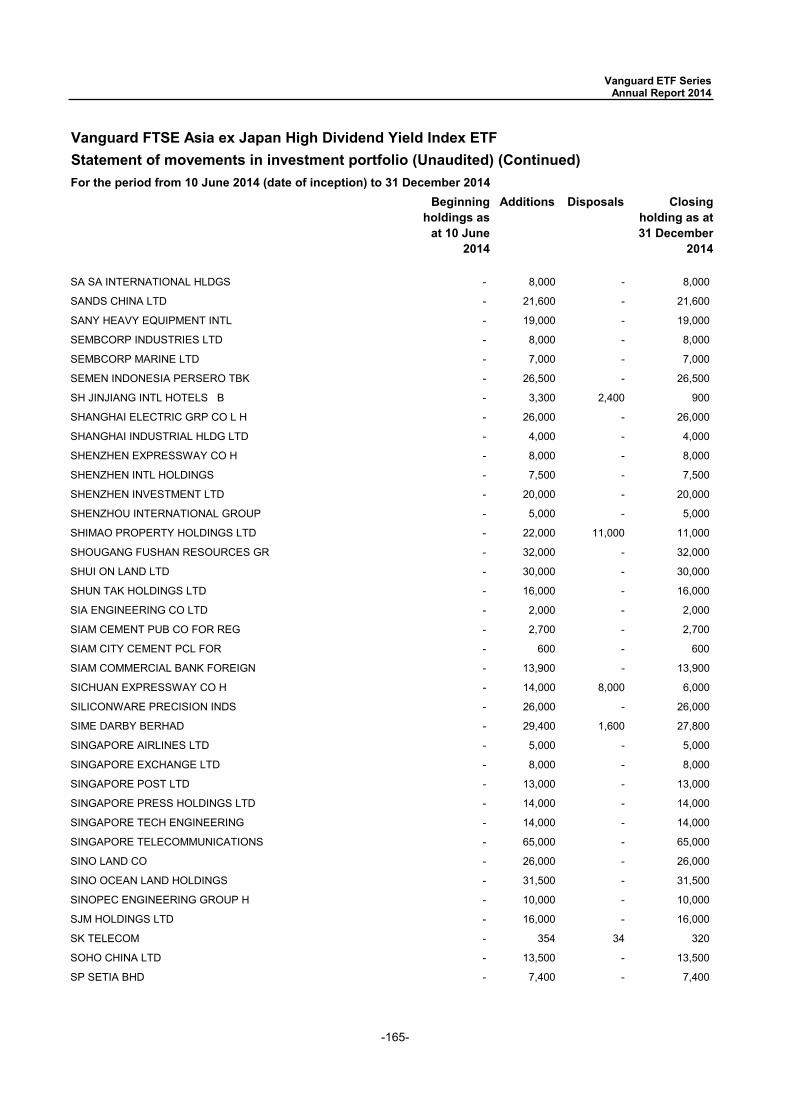
-165-
Vanguard FTSE Asia ex Japan High Dividend Yield Index ETFStatement of movements in investment portfolio (Unaudited) (Continued)
Beginning holdings as
at 10 June 2014
Additions Disposals Closing holding as at 31 December
2014
For the period from 10 June 2014 (date of inception) to 31 December 2014
Vanguard ETF Series Annual Report 2014
SA SA INTERNATIONAL HLDGS - 8,000 - 8,000
SANDS CHINA LTD - 21,600 - 21,600
SANY HEAVY EQUIPMENT INTL - 19,000 - 19,000
SEMBCORP INDUSTRIES LTD - 8,000 - 8,000
SEMBCORP MARINE LTD - 7,000 - 7,000
SEMEN INDONESIA PERSERO TBK - 26,500 - 26,500
SH JINJIANG INTL HOTELS B - 3,300 2,400 900
SHANGHAI ELECTRIC GRP CO L H - 26,000 - 26,000
SHANGHAI INDUSTRIAL HLDG LTD - 4,000 - 4,000
SHENZHEN EXPRESSWAY CO H - 8,000 - 8,000
SHENZHEN INTL HOLDINGS - 7,500 - 7,500
SHENZHEN INVESTMENT LTD - 20,000 - 20,000
SHENZHOU INTERNATIONAL GROUP - 5,000 - 5,000
SHIMAO PROPERTY HOLDINGS LTD - 22,000 11,000 11,000
SHOUGANG FUSHAN RESOURCES GR - 32,000 - 32,000
SHUI ON LAND LTD - 30,000 - 30,000
SHUN TAK HOLDINGS LTD - 16,000 - 16,000
SIA ENGINEERING CO LTD - 2,000 - 2,000
SIAM CEMENT PUB CO FOR REG - 2,700 - 2,700
SIAM CITY CEMENT PCL FOR - 600 - 600
SIAM COMMERCIAL BANK FOREIGN - 13,900 - 13,900
SICHUAN EXPRESSWAY CO H - 14,000 8,000 6,000
SILICONWARE PRECISION INDS - 26,000 - 26,000
SIME DARBY BERHAD - 29,400 1,600 27,800
SINGAPORE AIRLINES LTD - 5,000 - 5,000
SINGAPORE EXCHANGE LTD - 8,000 - 8,000
SINGAPORE POST LTD - 13,000 - 13,000
SINGAPORE PRESS HOLDINGS LTD - 14,000 - 14,000
SINGAPORE TECH ENGINEERING - 14,000 - 14,000
SINGAPORE TELECOMMUNICATIONS - 65,000 - 65,000
SINO LAND CO - 26,000 - 26,000
SINO OCEAN LAND HOLDINGS - 31,500 - 31,500
SINOPEC ENGINEERING GROUP H - 10,000 - 10,000
SJM HOLDINGS LTD - 16,000 - 16,000
SK TELECOM - 354 34 320
SOHO CHINA LTD - 13,500 - 13,500
SP SETIA BHD - 7,400 - 7,400
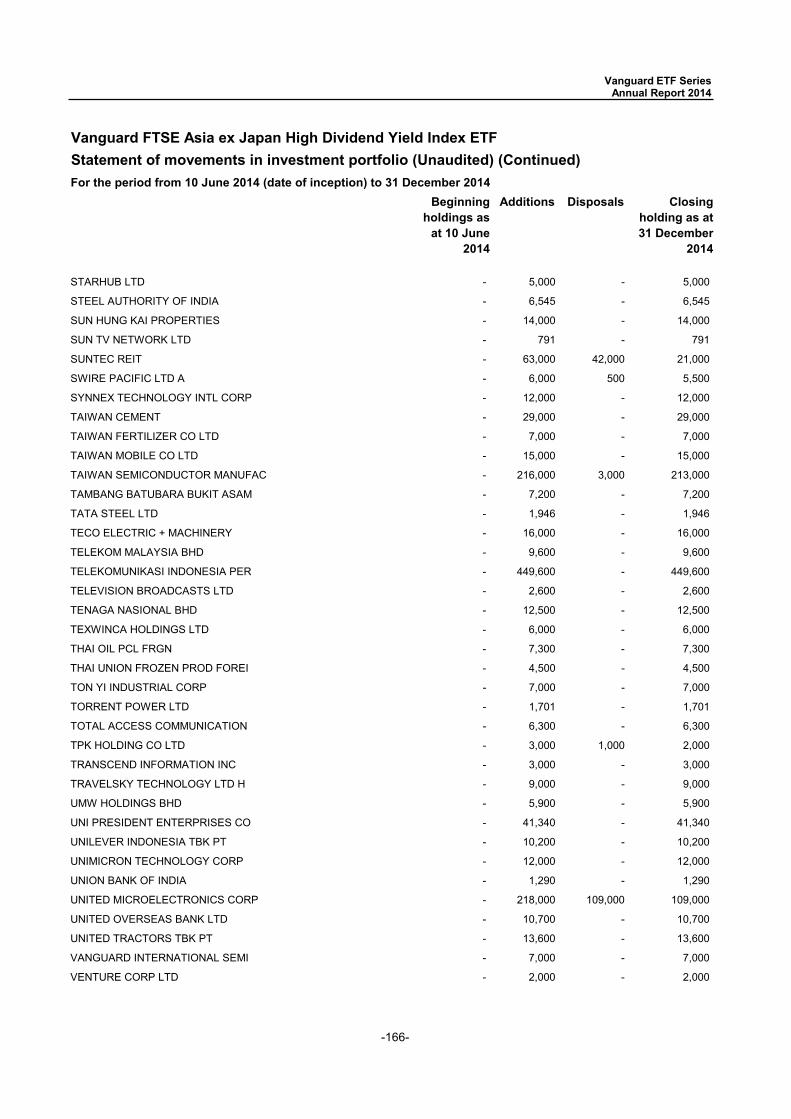
-166-
Vanguard FTSE Asia ex Japan High Dividend Yield Index ETFStatement of movements in investment portfolio (Unaudited) (Continued)
Beginning holdings as
at 10 June 2014
Additions Disposals Closing holding as at 31 December
2014
For the period from 10 June 2014 (date of inception) to 31 December 2014
Vanguard ETF Series Annual Report 2014
STARHUB LTD - 5,000 - 5,000
STEEL AUTHORITY OF INDIA - 6,545 - 6,545
SUN HUNG KAI PROPERTIES - 14,000 - 14,000
SUN TV NETWORK LTD - 791 - 791
SUNTEC REIT - 63,000 42,000 21,000
SWIRE PACIFIC LTD A - 6,000 500 5,500
SYNNEX TECHNOLOGY INTL CORP - 12,000 - 12,000
TAIWAN CEMENT - 29,000 - 29,000
TAIWAN FERTILIZER CO LTD - 7,000 - 7,000
TAIWAN MOBILE CO LTD - 15,000 - 15,000
TAIWAN SEMICONDUCTOR MANUFAC - 216,000 3,000 213,000
TAMBANG BATUBARA BUKIT ASAM - 7,200 - 7,200
TATA STEEL LTD - 1,946 - 1,946
TECO ELECTRIC + MACHINERY - 16,000 - 16,000
TELEKOM MALAYSIA BHD - 9,600 - 9,600
TELEKOMUNIKASI INDONESIA PER - 449,600 - 449,600
TELEVISION BROADCASTS LTD - 2,600 - 2,600
TENAGA NASIONAL BHD - 12,500 - 12,500
TEXWINCA HOLDINGS LTD - 6,000 - 6,000
THAI OIL PCL FRGN - 7,300 - 7,300
THAI UNION FROZEN PROD FOREI - 4,500 - 4,500
TON YI INDUSTRIAL CORP - 7,000 - 7,000
TORRENT POWER LTD - 1,701 - 1,701
TOTAL ACCESS COMMUNICATION - 6,300 - 6,300
TPK HOLDING CO LTD - 3,000 1,000 2,000
TRANSCEND INFORMATION INC - 3,000 - 3,000
TRAVELSKY TECHNOLOGY LTD H - 9,000 - 9,000
UMW HOLDINGS BHD - 5,900 - 5,900
UNI PRESIDENT ENTERPRISES CO - 41,340 - 41,340
UNILEVER INDONESIA TBK PT - 10,200 - 10,200
UNIMICRON TECHNOLOGY CORP - 12,000 - 12,000
UNION BANK OF INDIA - 1,290 - 1,290
UNITED MICROELECTRONICS CORP - 218,000 109,000 109,000
UNITED OVERSEAS BANK LTD - 10,700 - 10,700
UNITED TRACTORS TBK PT - 13,600 - 13,600
VANGUARD INTERNATIONAL SEMI - 7,000 - 7,000
VENTURE CORP LTD - 2,000 - 2,000
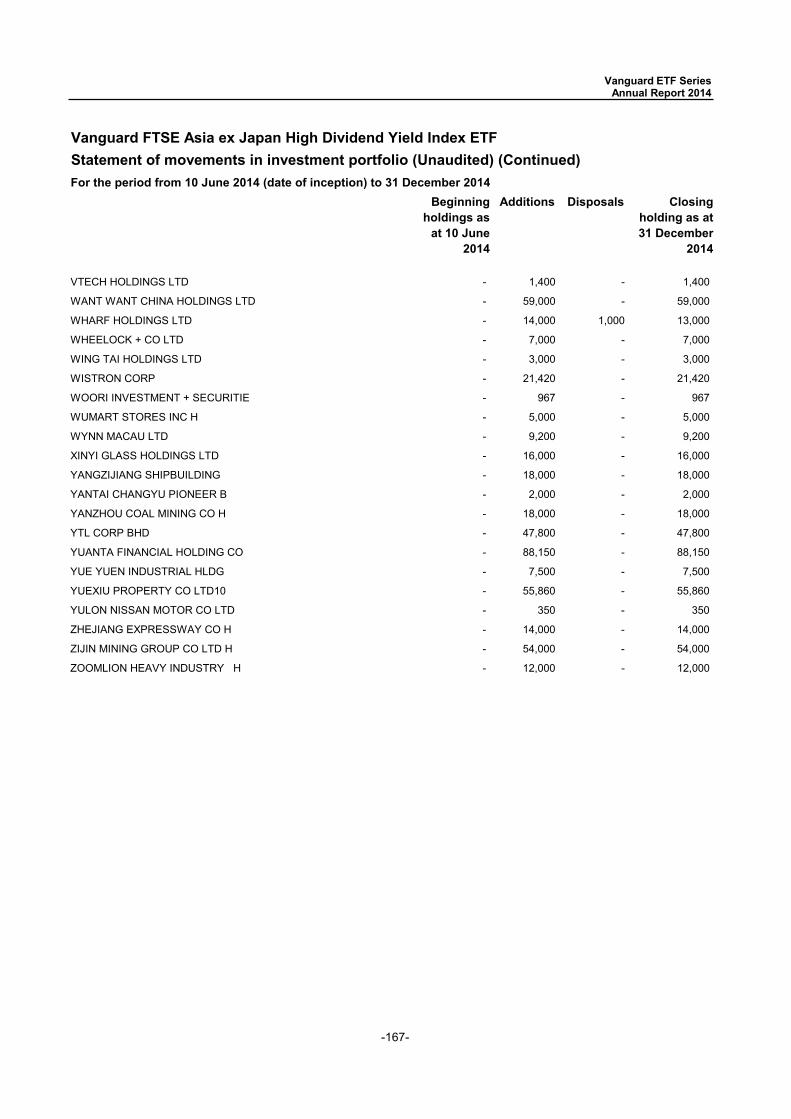
-167-
Vanguard FTSE Asia ex Japan High Dividend Yield Index ETFStatement of movements in investment portfolio (Unaudited) (Continued)
Beginning holdings as
at 10 June 2014
Additions Disposals Closing holding as at 31 December
2014
For the period from 10 June 2014 (date of inception) to 31 December 2014
Vanguard ETF Series Annual Report 2014
VTECH HOLDINGS LTD - 1,400 - 1,400
WANT WANT CHINA HOLDINGS LTD - 59,000 - 59,000
WHARF HOLDINGS LTD - 14,000 1,000 13,000
WHEELOCK + CO LTD - 7,000 - 7,000
WING TAI HOLDINGS LTD - 3,000 - 3,000
WISTRON CORP - 21,420 - 21,420
WOORI INVESTMENT + SECURITIE - 967 - 967
WUMART STORES INC H - 5,000 - 5,000
WYNN MACAU LTD - 9,200 - 9,200
XINYI GLASS HOLDINGS LTD - 16,000 - 16,000
YANGZIJIANG SHIPBUILDING - 18,000 - 18,000
YANTAI CHANGYU PIONEER B - 2,000 - 2,000
YANZHOU COAL MINING CO H - 18,000 - 18,000
YTL CORP BHD - 47,800 - 47,800
YUANTA FINANCIAL HOLDING CO - 88,150 - 88,150
YUE YUEN INDUSTRIAL HLDG - 7,500 - 7,500
YUEXIU PROPERTY CO LTD10 - 55,860 - 55,860
YULON NISSAN MOTOR CO LTD - 350 - 350
ZHEJIANG EXPRESSWAY CO H - 14,000 - 14,000
ZIJIN MINING GROUP CO LTD H - 54,000 - 54,000
ZOOMLION HEAVY INDUSTRY H - 12,000 - 12,000
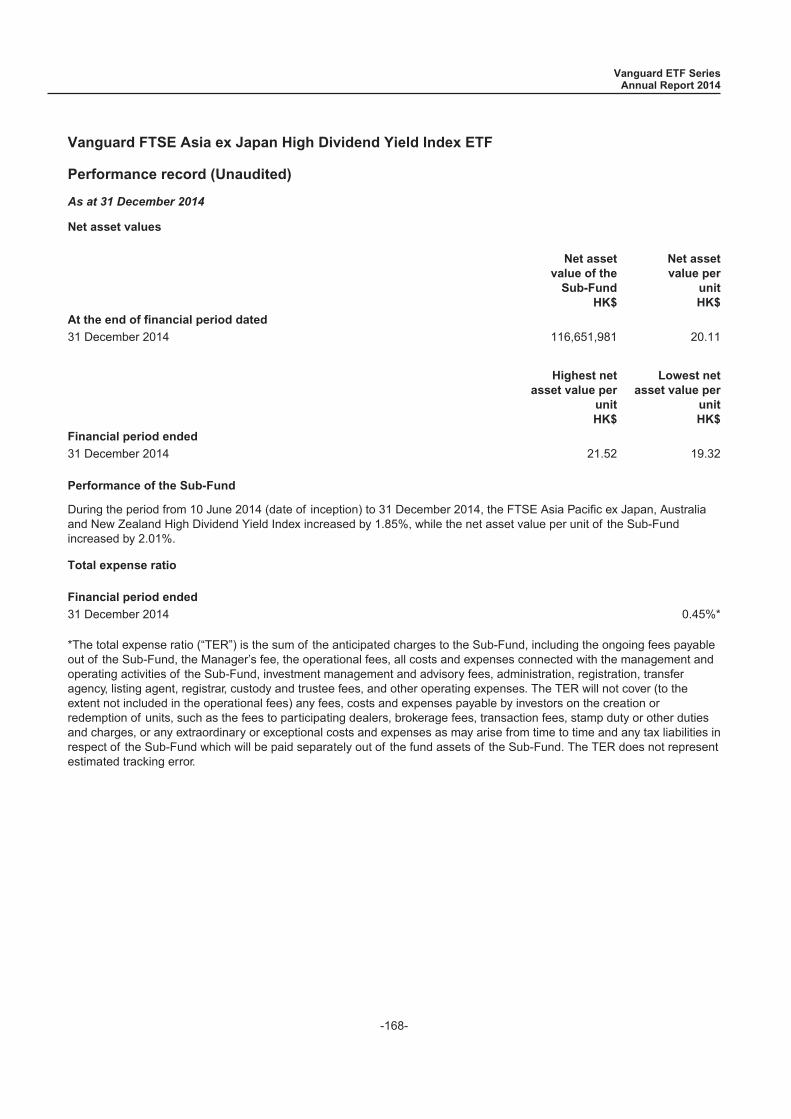
Vanguard FTSE Asia ex Japan High Dividend Yield Index ETF
Performance record (Unaudited)
As at 31 December 2014
Net asset values
Net assetvalue of the
Sub-FundHK$
Net assetvalue per
unitHK$
At the end of financial period dated
31 December 2014 116,651,981 20.11
Highest netasset value per
unitHK$
Lowest netasset value per
unitHK$
Financial period ended
31 December 2014 21.52 19.32
Performance of the Sub-Fund
During the period from 10 June 2014 (date of inception) to 31 December 2014, the FTSE Asia Pacific ex Japan, Australiaand New Zealand High Dividend Yield Index increased by 1.85%, while the net asset value per unit of the Sub-Fundincreased by 2.01%.
Total expense ratio
Financial period ended
31 December 2014 0.45%*
*The total expense ratio (“TER”) is the sum of the anticipated charges to the Sub-Fund, including the ongoing fees payableout of the Sub-Fund, the Manager’s fee, the operational fees, all costs and expenses connected with the management andoperating activities of the Sub-Fund, investment management and advisory fees, administration, registration, transferagency, listing agent, registrar, custody and trustee fees, and other operating expenses. The TER will not cover (to theextent not included in the operational fees) any fees, costs and expenses payable by investors on the creation orredemption of units, such as the fees to participating dealers, brokerage fees, transaction fees, stamp duty or other dutiesand charges, or any extraordinary or exceptional costs and expenses as may arise from time to time and any tax liabilities inrespect of the Sub-Fund which will be paid separately out of the fund assets of the Sub-Fund. The TER does not representestimated tracking error.
Vanguard ETF SeriesAnnual Report 2014
-168-
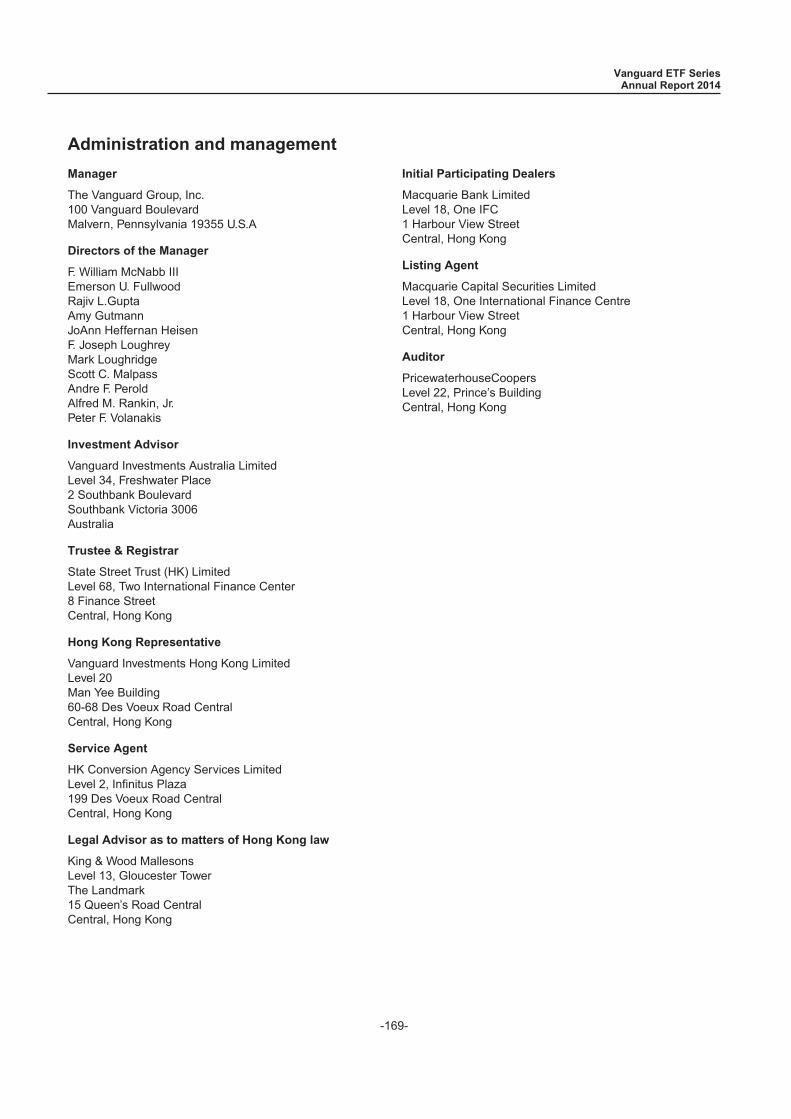
Administration and management
Manager
The Vanguard Group, Inc.100 Vanguard BoulevardMalvern, Pennsylvania 19355 U.S.A
Directors of the Manager
F. William McNabb IIIEmerson U. FullwoodRajiv L.GuptaAmy GutmannJoAnn Heffernan HeisenF. Joseph LoughreyMark LoughridgeScott C. MalpassAndre F. PeroldAlfred M. Rankin, Jr.Peter F. Volanakis
Investment Advisor
Vanguard Investments Australia LimitedLevel 34, Freshwater Place2 Southbank BoulevardSouthbank Victoria 3006Australia
Trustee & Registrar
State Street Trust (HK) LimitedLevel 68, Two International Finance Center8 Finance StreetCentral, Hong Kong
Hong Kong Representative
Vanguard Investments Hong Kong LimitedLevel 20Man Yee Building60-68 Des Voeux Road CentralCentral, Hong Kong
Service Agent
HK Conversion Agency Services LimitedLevel 2, Infinitus Plaza199 Des Voeux Road CentralCentral, Hong Kong
Legal Advisor as to matters of Hong Kong law
King & Wood MallesonsLevel 13, Gloucester TowerThe Landmark15 Queen’s Road CentralCentral, Hong Kong
Initial Participating Dealers
Macquarie Bank LimitedLevel 18, One IFC1 Harbour View StreetCentral, Hong Kong
Listing Agent
Macquarie Capital Securities LimitedLevel 18, One International Finance Centre1 Harbour View StreetCentral, Hong Kong
Auditor
PricewaterhouseCoopersLevel 22, Prince’s BuildingCentral, Hong Kong
Vanguard ETF SeriesAnnual Report 2014
-169-